abstract moody, kaitlyn danielle. varietal response
TRANSCRIPT

ABSTRACT
MOODY, KAITLYN DANIELLE. Varietal Response to Increasing Nitrogen Rates Compared to
Sensor Based Rate in Soft Red Winter Wheat Using GreenSeekerTM Technology. (Under the
direction of Dr. Angela Post).
Soft red winter wheat’s demand for nitrogen changes season to season and can depend
heavily on management practices and seasonal weather conditions. The GreenSeekerTM sensor
along with an algorithm can provide a predicted yield as well as an in-season nitrogen fertilizer
recommendation. Tissue samples are historically used to aid in the decision of how much top-
dress nitrogen to apply, but active optical sensors such as the GreenSeekerTM can provide the
grower with real-time data to ensure efficient crop management decisions. The sensor works in
conjunction with a nitrogen rich strip, which is applied at planting and should be at a rate where
the wheat is not limited in nitrogen throughout the growing season. This strip gives a baseline for
the algorithm to estimate the yield potential in that field. A modified version of the Oklahoma
and Virginia sensor-based nitrogen rate recommendation algorithms has been tested for adoption
by North Carolina. This study evaluated 15 of the top-yielding varieties in North Carolina across
two years and 5 locations comparing increasing nitrogen rates to the sensor-based rate using the
GreenSeekerTM sensor technology in conjunction with the algorithm. Parameters such as yield,
test weight, partial factor productivity, and nitrogen use efficiency were evaluated and compared
variety by nitrogen rate combinations. Varieties responded differently to the various amount of
nitrogen applied depending on the year, region, and seasonal weather conditions. Union County,
North Carolina is the only location that was statistically significant for yield, partial factor
productivity, and nitrogen use efficiency across both years. Camden and Lenoir Counties both
performed similarly with 12 of the 15 varieties yielding the highest at the sensor-based rate while
Union County only had two. In Union County, 10 varieties had the highest nitrogen use

efficiency at the sensor-based rate. In Moore County seven varieties had the highest nitrogen use
efficiency at the sensor-based rate. Varieties varied in how they performed based on nitrogen
rate, location, and year. Some varieties increased in yield as more nitrogen was applied while
other varieties stayed at the same yield level regardless of the nitrogen rate. Information such as
this is imperative to small grain farmers across North Carolina while making management
decisions. A grower in a higher yielding environment may benefit from a variety that more
positively responds to N while a grower in a lower yielding environment may choose a variety
with lower nitrogen responsiveness.
© Copyright 2019 by Kaitlyn Danielle Moody
All Rights Reserved

Varietal Response to Increasing Nitrogen Rates Compared to Sensor Based Rate in Soft Red
Winter Wheat Using GreenSeekerTM Technology
by
Kaitlyn Danielle Moody
A thesis submitted to the Graduate Faculty of
North Carolina State University
in partial fulfillment of the
requirements for the degree of
Master of Science
Crop Science
Raleigh, North Carolina
2019
APPROVED BY:
_______________________________ ______________________________
Dr. Angela Post Dr. Brian Arnall
Committee Chair External Member
_______________________________ _______________________________
Dr. Gary Roberson Dr. Amy Johnson
_______________________________
Robert Austin
Technical Consultant

ii
DEDICATION
This is dedicated to all of my grandparents, John and Rose Moody and Charlie and Mary Norwood, for
always believing in me to do my best. To my parents, Gerald and Kim Moody, for constantly believing I could do
whatever I set my mind to do. To my brother, Seth, for putting up with me during this process. To my husband,
Justin, for everything. To the rest of my family, for being there and supporting me through it all.
iii
BIOGRAPHY
Kaitlyn Danielle Moody, daughter of Gerald and Kim Moody, was born in Townsville, North Carolina on
October 30, 1994. She grew up right down the road from the family farm close to all of her grandparents, uncles,
aunt, as well as extended family. Kaitlyn graduated form Northern Vance High School in 2013. She attended North
Carolina State University where she received a Bachelor of Science in Plant and Soil Sciences with a concentration
in Crop Production in May 2017. During her time at NCSU she spent most of her time in Williams Hall where she
met her husband, Justin Milstein. In August of 2017 she began working toward her Master of Science degree in
Crop and Soil Science Department at North Carolina State University under the direction of Dr. Angela Post.
iv
ACKNOWLEDGMENTS
I would like to thank my advisor, Dr. Angela Post, for your support and guidance over
the last two years. This would not have been possible without your dedication. I would like to
thank the rest of my committee members, Dr. Brian Arnall, Dr. Gary Roberson, Dr. Amy
Johnson, and Robert Austin for their continued patience and support through this process.
I would like to thank all of the members from over the years of the Small Grains and
Official Variety Trial program: Ryan Heiniger, Jeremy Davis, Ian Fleming, Megan Miller,
Andrew Baucom, Ezekiel Overbaugh, Phil Johnson, Johnny Denton, Taylor Purucker, and
Jonathan Moore. I would not have been able to accomplish this work without all of you.

v
TABLE OF CONTENTS
LIST OF TABLES ........................................................................................................................ vi
LIST OF FIGURES ..................................................................................................................... vii
Chapter I: Literature Review ..................................................................................................... 1
Primary Objectives......................................................................................................................... 8
References .................................................................................................................................... 10
Chapter II: Soft Red Winter Wheat In-Season Nitrogen Rate Determination Using
GreenSeekerTM Technology ...................................................................................................... 22
Abstract ........................................................................................................................................ 22
Introduction .................................................................................................................................. 23
Materials and Methods ................................................................................................................. 25
Results and Discussion ................................................................................................................ 29
References .................................................................................................................................... 34
Chapter III: The Effects of Variety and Nitrogen Management on Yield and Nitrogen Use
Efficiency of Soft Red Winter Wheat ....................................................................................... 52
Abstract ........................................................................................................................................ 52
Introduction .................................................................................................................................. 53
Materials and Methods ................................................................................................................. 56
Results .......................................................................................................................................... 58
Discussion .................................................................................................................................... 60
References .................................................................................................................................... 65

vi
LIST OF TABLES
Chapter II: Soft Red Winter Wheat In-Season Nitrogen Rate Determination Using
GreenSeekerTM Technology
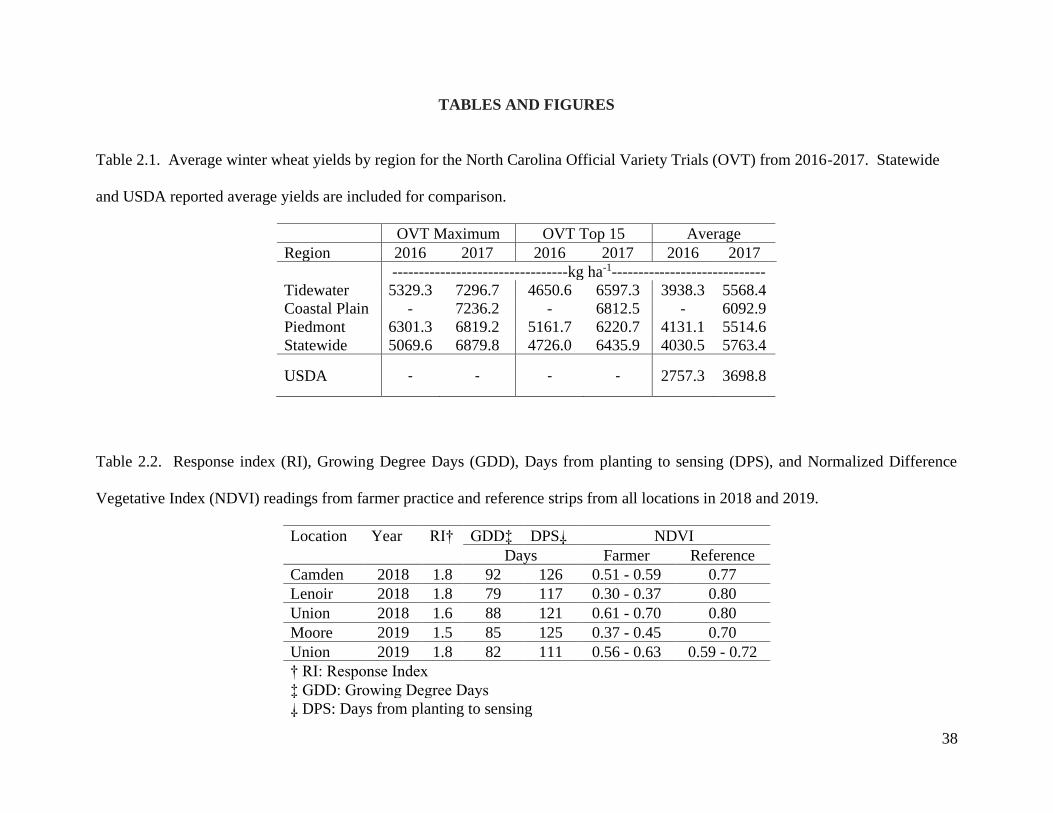
Table 2.1 Average winter wheat yields by region for the North Carolina Official Variety
Trials (OVT) from 2016-2017. Statewide and USDA reported average yields
are included for comparison ..................................................................................... 38
Table 2.2 Response index (RI), Growing Degree Days (GDD), Days from planting to
sensing (DPS), and Normalized Difference Vegetative Index (NDVI) readings
from farmer practice and reference strips from all locations in 2018 and 2019 ...... 38
Table 2.3 Camden County 2018 Normalized Difference Vegetative Index (NDVI) from
the farmer practice (FP) plot and the associated Yield Potential without
additional nitrogen (YP0), Yield Potential with recommended nitrogen
addition (YPN), recommended nitrogen rate for each algorithm: VA, OK, and
NC, respectively. Actual yield for each variety is included. The reference strip
NDVI for this location was 0.77 kg ha-1 .................................................................. 39
Table 2.4 Lenoir County 2018 Normalized Difference Vegetative Index (NDVI) from the
farmer practice (FP) plot and the associated Yield Potential without additional
nitrogen (YP0), Yield Potential with recommended nitrogen addition (YPN),
recommended nitrogen rate for each algorithm: VA, OK, and NC, respectively.
Actual yield for each variety is included. The reference strip NDVI for this
location was 0.80 kg ha-1 .......................................................................................... 40
Table 2.5 Union County 2018 Normalized Difference Vegetative Index (NDVI) from the
farmer practice (FP) plot and the associated Yield Potential without additional
nitrogen (YP0), Yield Potential with recommended nitrogen addition (YPN),
recommended nitrogen rate for each algorithm: VA, OK, and NC, respectively.
Actual yield for each variety is included. The reference strip NDVI for this
location was 0.80 kg ha-1 .......................................................................................... 41
Table 2.6 Moore County 2019 Normalized Difference Vegetative Index (NDVI) from the
reference strip (RS) and farmer practice (FP) plots; and the associated Yield
Potential without additional nitrogen (YP0), Yield Potential with recommended
nitrogen addition (YPN), recommended nitrogen rate for each algorithm: VA,
OK, and NC, respectively. Actual yield for each variety is included. The
reference strip NDVI for this location was 0.70 kg ha-1 .......................................... 42
Table 2.7 Union County 2019 Normalized Difference Vegetative Index (NDVI) and
associated Yield Potential without additional nitrogen (YP0), Yield Potential
with recommended nitrogen addition (YPN), recommended nitrogen rate for
each algorithm: VA, OK, and NC, respectively. Actual yield for each variety
is included. The reference strip NDVI range for this location was 0.59 to 0.72 ..... 43

vii
Table 2.8 GPS coordinates, soil types, planting dates, and dates of sensing and sampling
for all locations in 2018 and 2019 ........................................................................... 44
Table 2.9 Comparison of Oklahoma and Virginia algorithms to the modified North
Carolina version ....................................................................................................... 45
Chapter III: The Effects of Variety and Nitrogen Management on Yield and Nitrogen Use
Efficiency of Soft Red Winter Wheat
Table 3.1 Grain Yield x (Nitrogen Rate x Variety) .................................................................. 71
Table 3.2 Test Weight x (Nitrogen Rate x Variety). ................................................................ 71
Table 3.3 Partial Factor Productivity x (Nitrogen Rate x Variety) for 2018. ........................... 72
Table 3.4 Nitrogen Use Efficiency x (Nitrogen Rate x Variety) for 2019 ............................... 72
Table 3.5 Percent nitrogen use efficiency (NUE) from all nitrogen rates applied at Moore
County location in 2019 ........................................................................................... 73
Table 3.6 Average yield by variety for all nitrogen rates applied at Camden and Lenoir
in 2018 ..................................................................................................................... 74
Table 3.7 Average yield by variety for all nitrogen rates applied at Union in 2018 ................ 75
Table 3.8 Average yield by variety for all nitrogen rates applied at Moore in 2019 ............... 76
Table 3.9 Average yield by variety for all nitrogen rates applied at Union in 2019 ................ 77
Table 3.10 Partial Factor Productivity (PFP) by variety for all nitrogen rates applied in
2018 .......................................................................................................................... 78
Table 3.11 GPS coordinates, soil types, planting dates, and dates of top-dress nitrogen
application for all locations in 2018 and 2019 ......................................................... 79
Table 3.12 Number of LSMeans comparison statements where a variety was estimated to
yield higher than another variety at the same nitrogen rate or at a higher
nitrogen rate in Union County in 2018 and 2019 ..................................................... 80
Table 3.13 Varieties separated into categories high, moderate, low, and nitrogen rate
dependent in response to additional nitrogen from Union County in 2019 ............. 81
viii
LIST OF FIGURES
Chapter I: Literature Review
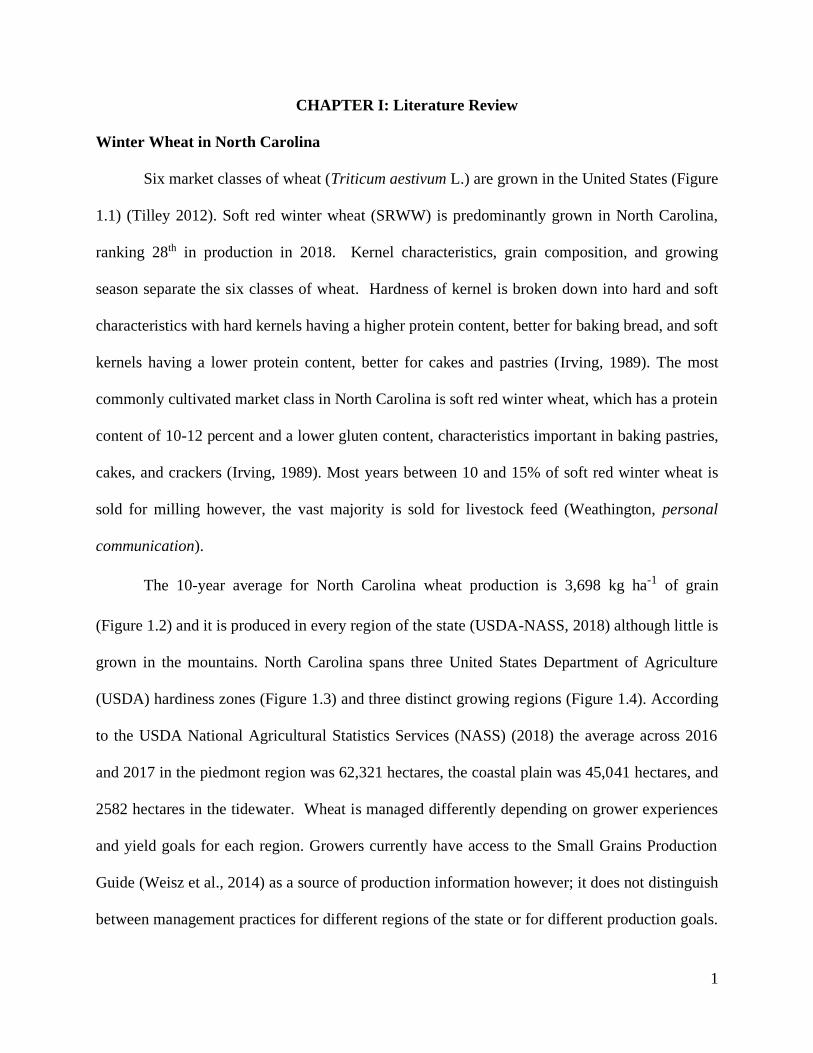
Figure 1.1 Distribution of the six market classes of wheat grown in the United States (US
Wheat Associates 2019; Tilley 2012) ...................................................................... 17
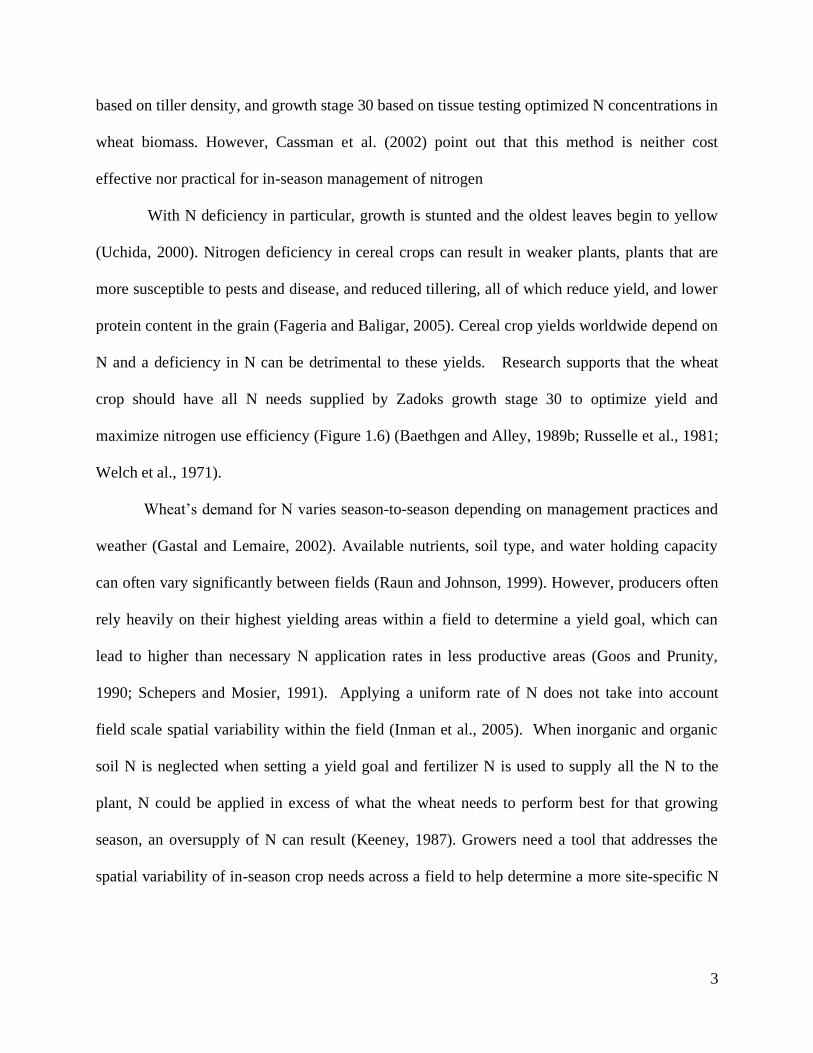
Figure 1.2 Ten-year average North Carolina wheat yields (USDA-NASS 2018) ..................... 18
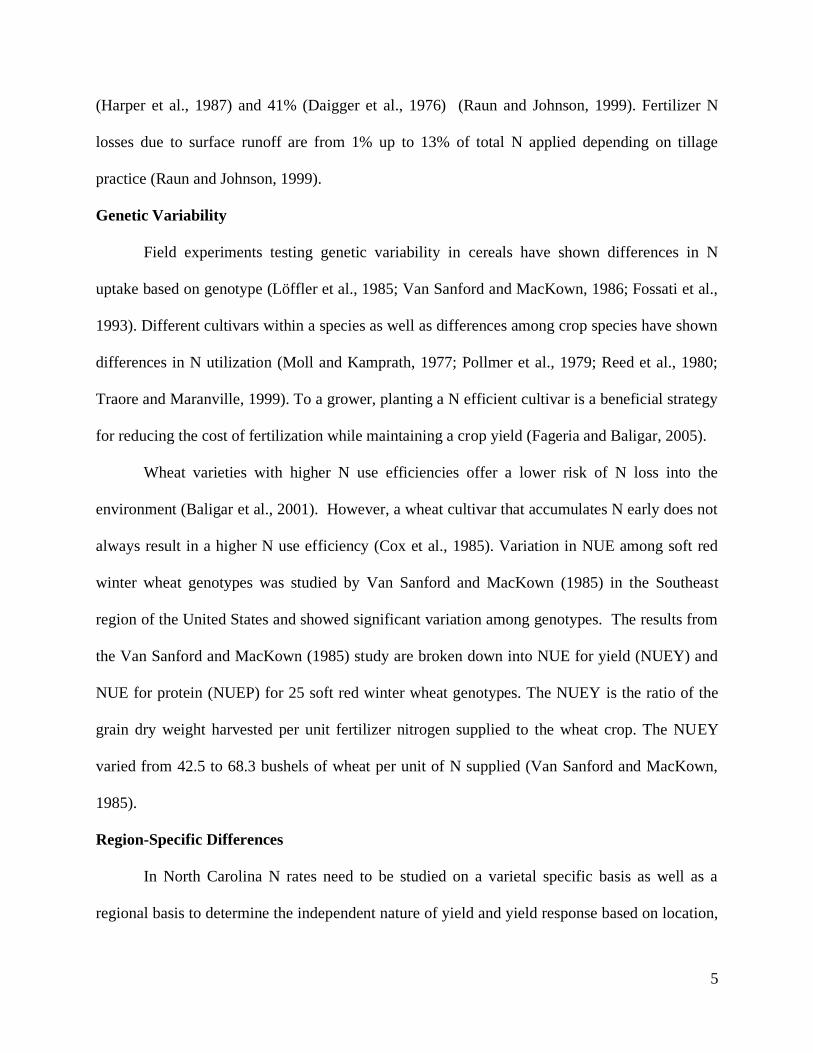
Figure 1.3 Plant hardiness zones for North Carolina (USDA-ARS and PRISM Climate
Group – Oregon State University)............................................................................ 19
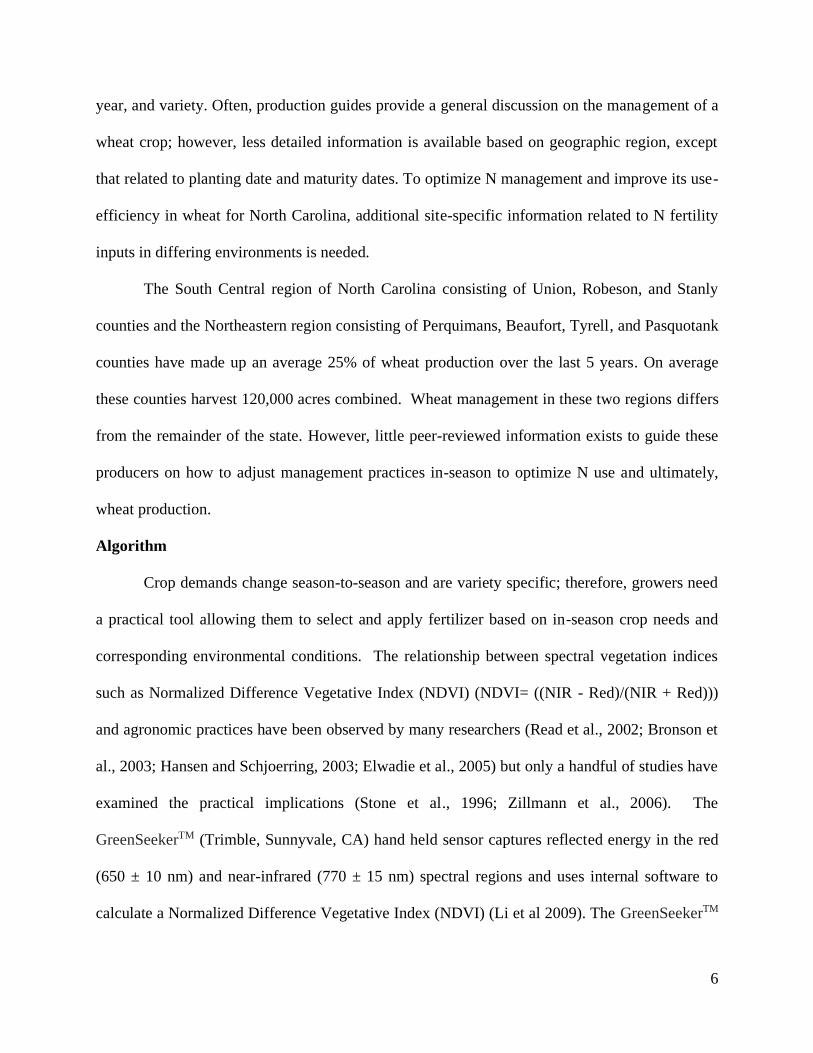
Figure 1.4 Geographic regions of North Carolina (Adapted from Raisa, E. 1940. Landforms
of the United States. Reprinted in The North Carolina Atlas Revisited) ................. 20
Figure 1.5 Zadoks and Feekes scales describing the growth stages of wheat (Large 1954) ..... 20
Figure 1.6 Nitrogen uptake pattern for winter wheat (McGuire et al. 1998). ............................ 21
Chapter II: Soft Red Winter Wheat In-Season Nitrogen Rate Determination Using
GreenSeekerTM Technology
Figure 2.1 Prescribed nitrogen application rate by Normalized Difference Vegetative
Index (NDVI) as recommended by the Virginia GreenSeekerTM algorithm.
(Thomason et al. 2011) ............................................................................................. 46
Figure 2.2 Percentage of nitrogen in the wheat tissue for all 15 varieties at Moore County
in 2019 by nitrogen application rate measured before (x) and after (●)
application of nitrogen.............................................................................................. 47
Chapter III: The Effects of Variety and Nitrogen Management on Yield and Nitrogen Use
Efficiency of Soft Red Winter Wheat
Figure 3.1 Yield response to nitrogen for each variety at all locations in 2018 and 2019.
For all varieties except AgriMAXX 474 (2018 only), Syngenta Viper
(2019 only), Harvey’s AP 1882 (2018 only), and Dyna-Gro 9811 (2019 only)
the left graph describes yield responses from 2018, while the right graph
describes yield responses from 2019. Within each graph: ● denotes values
from Union County, + denotes values from Camden County, - denotes
values from Lenoir County, and × denotes values from Moore County. ................. 82
Figure 3.2 The difference in yield regressed against nitrogen use efficiency by variety in
Union County in 2019 .............................................................................................. 91
Figure 3.3 The difference in yield regressed against nitrogen use efficiency by variety. A)
Parsed by varieties with high NUE and high delta yield; B) Parsed by varieties

ix
with low NUE and high delta yield; C) Parsed by varieties with a low NUE
and low delta yield; D) Parsed by varieties with high NUE and high delta yield,
low NUE and high delta yield, and low NUE and low delta yield. .......................... 92
1
CHAPTER I: Literature Review
Winter Wheat in North Carolina
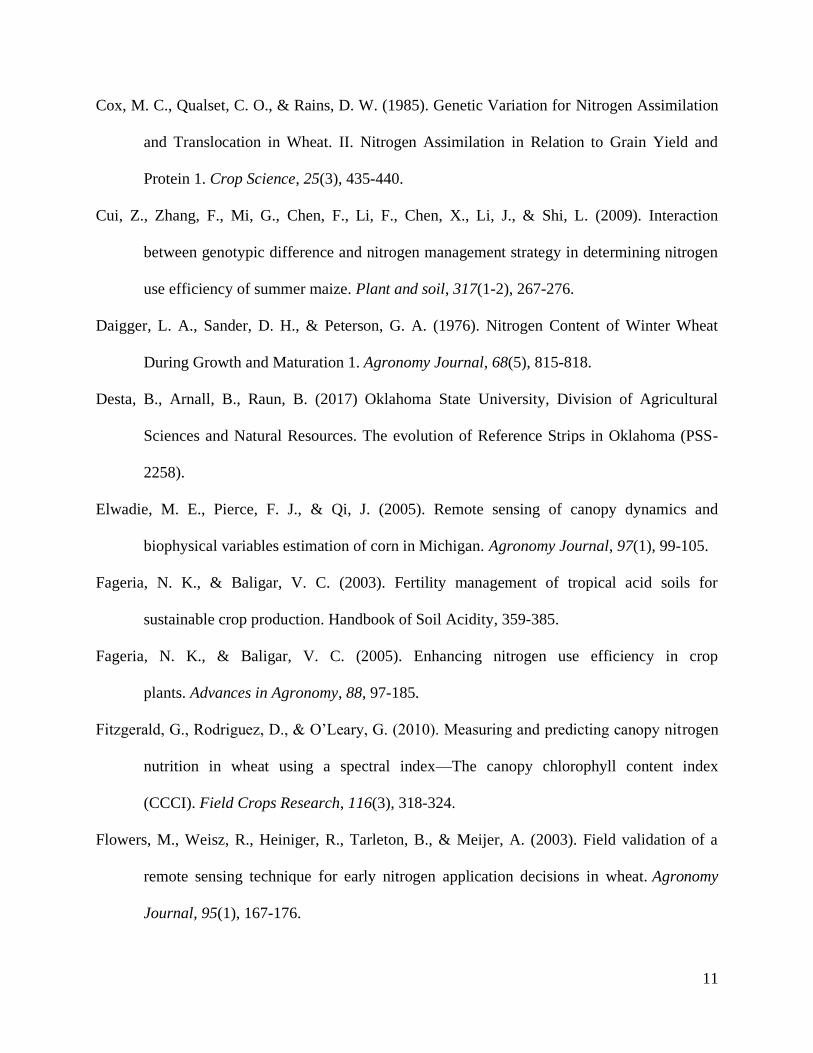
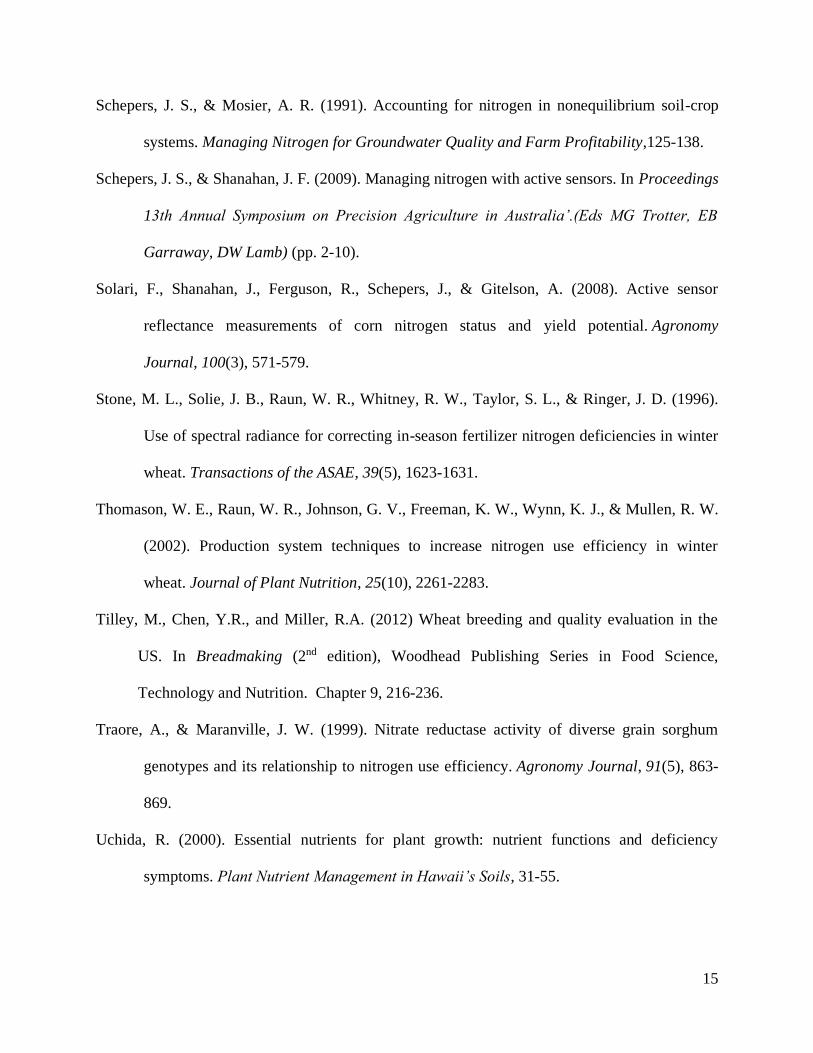
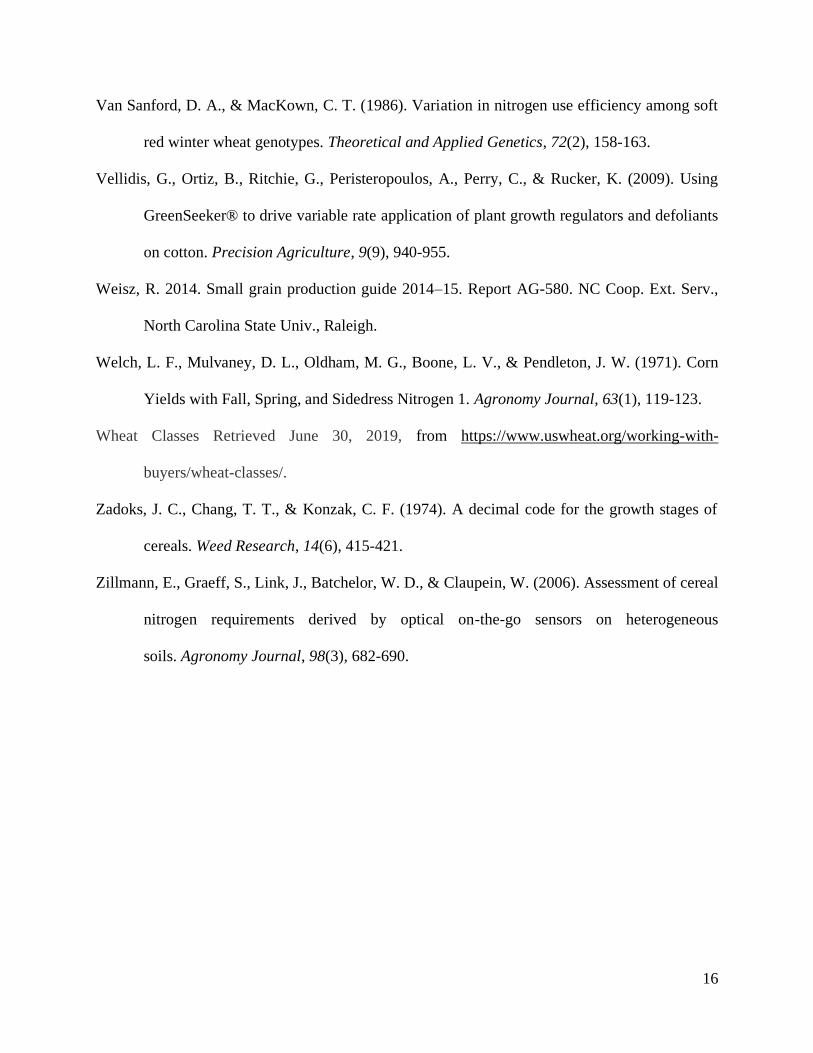
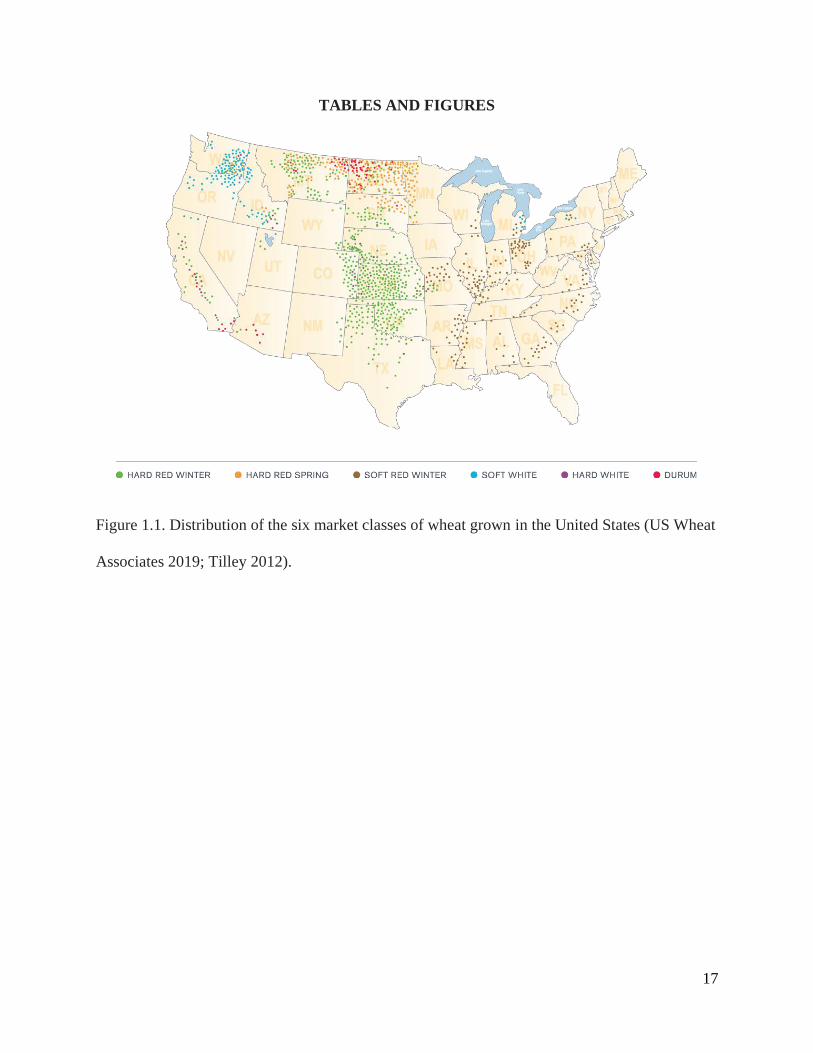
Six market classes of wheat (Triticum aestivum L.) are grown in the United States (Figure
1.1) (Tilley 2012). Soft red winter wheat (SRWW) is predominantly grown in North Carolina,
ranking 28th in production in 2018. Kernel characteristics, grain composition, and growing
season separate the six classes of wheat. Hardness of kernel is broken down into hard and soft
characteristics with hard kernels having a higher protein content, better for baking bread, and soft
kernels having a lower protein content, better for cakes and pastries (Irving, 1989). The most
commonly cultivated market class in North Carolina is soft red winter wheat, which has a protein
content of 10-12 percent and a lower gluten content, characteristics important in baking pastries,
cakes, and crackers (Irving, 1989). Most years between 10 and 15% of soft red winter wheat is
sold for milling however, the vast majority is sold for livestock feed (Weathington, personal
communication).
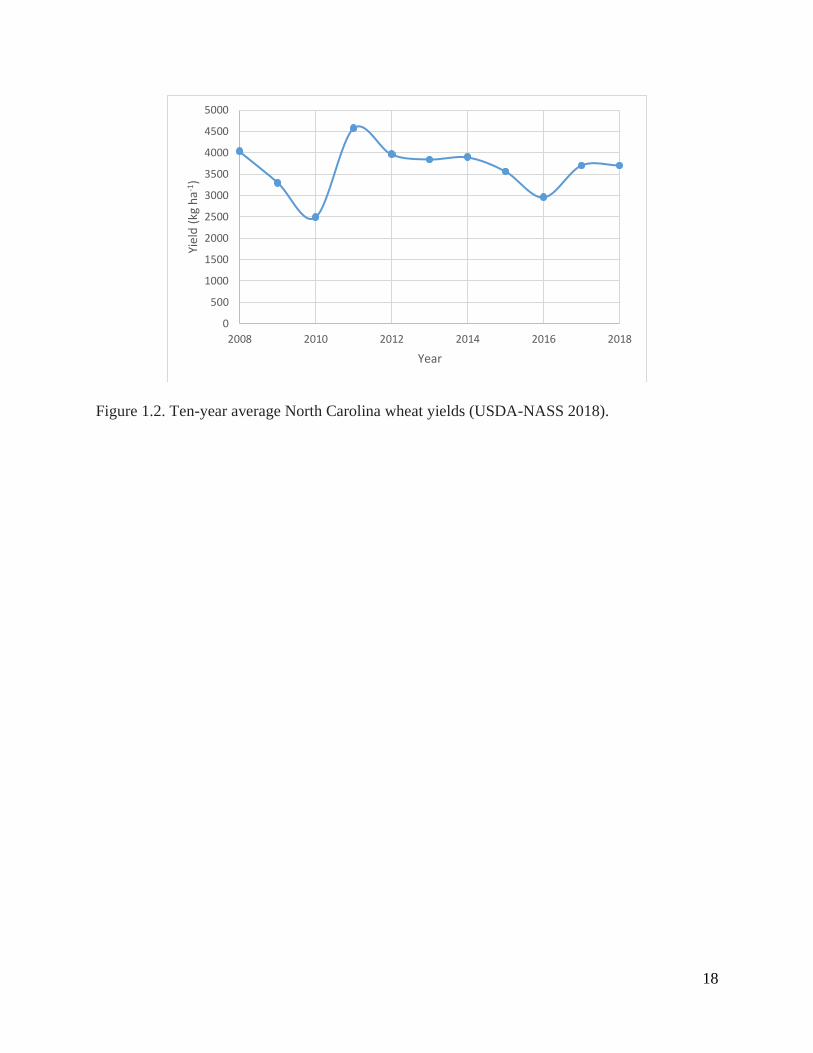
The 10-year average for North Carolina wheat production is 3,698 kg ha-1 of grain
(Figure 1.2) and it is produced in every region of the state (USDA-NASS, 2018) although little is
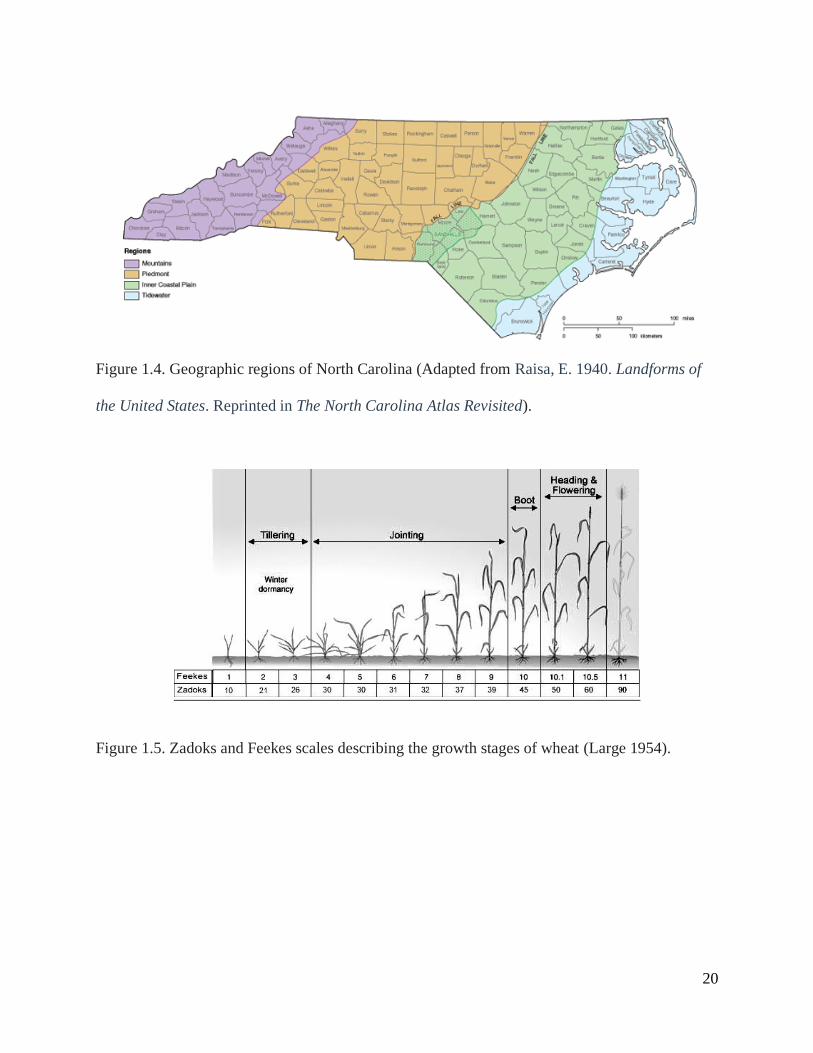
grown in the mountains. North Carolina spans three United States Department of Agriculture
(USDA) hardiness zones (Figure 1.3) and three distinct growing regions (Figure 1.4). According
to the USDA National Agricultural Statistics Services (NASS) (2018) the average across 2016
and 2017 in the piedmont region was 62,321 hectares, the coastal plain was 45,041 hectares, and
2582 hectares in the tidewater. Wheat is managed differently depending on grower experiences
and yield goals for each region. Growers currently have access to the Small Grains Production
Guide (Weisz et al., 2014) as a source of production information however; it does not distinguish
between management practices for different regions of the state or for different production goals.

2
An important crop input for winter wheat in North Carolina is fertilizer, and particularly nitrogen
(N) fertilizer. Producers in North Carolina manage N differently varying source, amount, and
timing across the state and with no predictable pattern of use.
Nitrogen Use Efficiency
Modern wheat production requires efficient and sustainable management practices to
increase wheat yield and promote environmentally sound N fertilizer strategies (Fageria and
Baligar, 2005). Wheat is often responsive to management intensification strategies that are
necessary to minimize loss of N into the environment while still supplying wheat with an
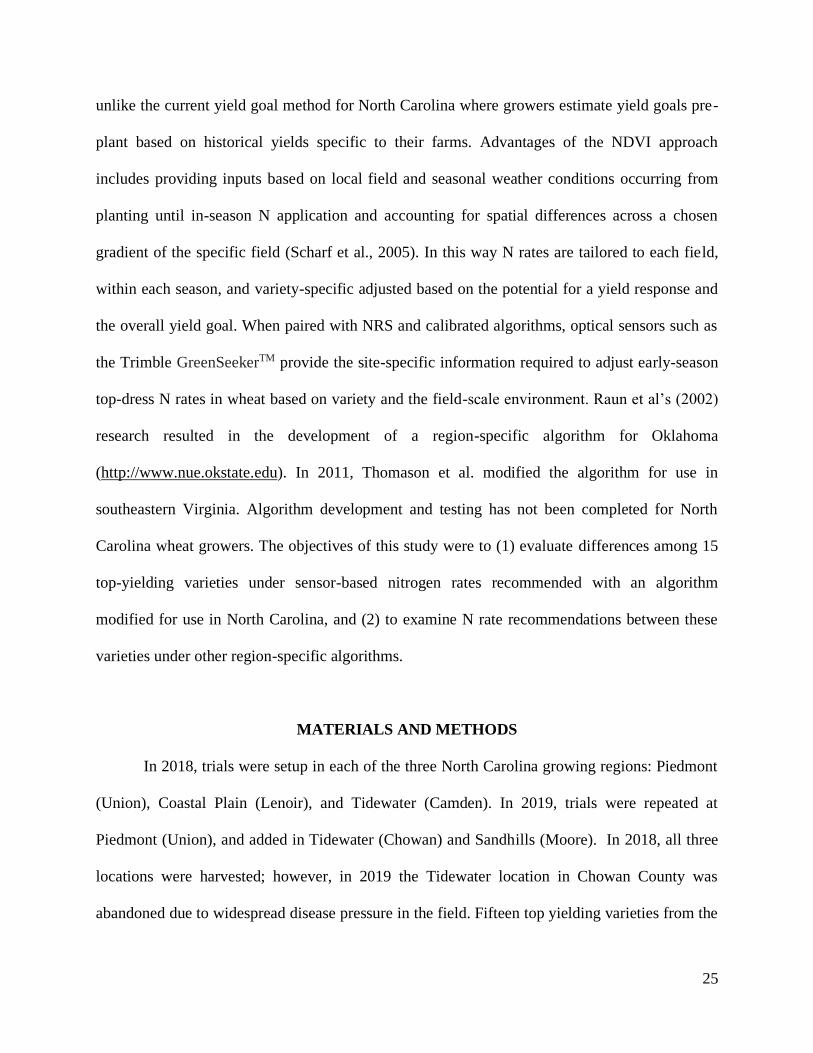
optimum rate for growth (Fageria et al., 2003a). The timing of N fertilizer application is based on
the Zadoks growth scale (Figure 1.5) (Zadoks et al., 1974). An increase in Nitrogen Use
Efficiency (NUE) is crucial for maximum yields, quality wheat, environmental considerations,
and economically feasible practices (Campbell et al., 1995; Grant et al., 2002). Moll et al.,
(1982) defined NUE as grain yield per unit of N available through soil and fertilizer N.
Improving NUE while also meeting demands for nutrients, an appropriate fertilizer
program needs to consist of an appropriate source of N as well as a proper rate and timing
combination (Fageria and Baligar, 2005). When farmers select a source of N to apply on wheat
they consider convenience, economics, effectiveness, and availability with the most common
sources of N fertilizer being urea and ammonium sulfate (Fageria and Baligar, 2005). The
traditional method to determine in-season N need or identify deficiency is by plant tissue
analysis, which is not immediate and is more labor intensive than by remote sensing methods
(Baethgen and Alley, 1989a; Flowers et al., 2003). Keeney (1982) suggests that to increase NUE,
N needs to be supplied as needed throughout the season to reduce the chance of N loss through
leaching. Alley et al. (1996) found that nitrogen applied to the wheat crop at growth stage 25
3
based on tiller density, and growth stage 30 based on tissue testing optimized N concentrations in
wheat biomass. However, Cassman et al. (2002) point out that this method is neither cost
effective nor practical for in-season management of nitrogen
With N deficiency in particular, growth is stunted and the oldest leaves begin to yellow
(Uchida, 2000). Nitrogen deficiency in cereal crops can result in weaker plants, plants that are
more susceptible to pests and disease, and reduced tillering, all of which reduce yield, and lower
protein content in the grain (Fageria and Baligar, 2005). Cereal crop yields worldwide depend on
N and a deficiency in N can be detrimental to these yields. Research supports that the wheat
crop should have all N needs supplied by Zadoks growth stage 30 to optimize yield and
maximize nitrogen use efficiency (Figure 1.6) (Baethgen and Alley, 1989b; Russelle et al., 1981;
Welch et al., 1971).
Wheat’s demand for N varies season-to-season depending on management practices and
weather (Gastal and Lemaire, 2002). Available nutrients, soil type, and water holding capacity
can often vary significantly between fields (Raun and Johnson, 1999). However, producers often
rely heavily on their highest yielding areas within a field to determine a yield goal, which can
lead to higher than necessary N application rates in less productive areas (Goos and Prunity,
1990; Schepers and Mosier, 1991). Applying a uniform rate of N does not take into account
field scale spatial variability within the field (Inman et al., 2005). When inorganic and organic
soil N is neglected when setting a yield goal and fertilizer N is used to supply all the N to the
plant, N could be applied in excess of what the wheat needs to perform best for that growing
season, an oversupply of N can result (Keeney, 1987). Growers need a tool that addresses the
spatial variability of in-season crop needs across a field to help determine a more site-specific N

4
rate that meets the needs of wheat while reducing N loss from areas requiring less N in the field
(Hong et al., 2007).
In Oklahoma, Stone et al. (1996) found that a sensor, which uses normalized difference
vegetative index (NDVI) can be used to detect differences across a field down to 1 m2 and field
variability can be managed accordingly with N fertilizer. In the mid-Atlantic region of the United
States Baethgen and Alley (1989a) studied N uptake response, calculated by multiplying the N
concentration in the tissue by the dry matter production, for different application timings and
rates. Results of this study showed that differences in seasonal weather characteristics over the 2
years corresponded with differences in N uptake amount and pattern (Baethgen and Alley,
1989a). Raun and Johnson (1999) found that only about 33% of N worldwide is recovered in
cereal grain production resulting in $15.9 billion loss every year from N fertilizer additions
alone.
Assessing the N supply of the soil through pre-plant soil tests has become an important
tool; however, N recommendations based on pre-plant soil tests often are not accurate at the time
of application due to continued N transformations and transport (Cui et al., 2009). Many states
including North Carolina do not have a pre-plant soil test for N. The complex nature of N
transformations (e.g. mineralization, immobilization) in soils and poor management practices
often lead to low NUE (Raun and Johnson, 1999). Different forms of plant available nitrogen
such as ammonium (NH4+) and nitrate (NO3
-) can also effect the N use efficiency (Thomason et
al., 2002). According to Pan (2001) in a study of an intensive wheat-maize system the crop used
only 25% of the N fertilizer, the soil accumulated 25-45%, and 30-50% was lost to the
environment. Nitrogen is translocated to the grain at flowering causing N loss to increase
(Thomason et al., 2002). Cereal plants release N as NH3 following anthesis ranging between 21%
5
(Harper et al., 1987) and 41% (Daigger et al., 1976) (Raun and Johnson, 1999). Fertilizer N
losses due to surface runoff are from 1% up to 13% of total N applied depending on tillage
practice (Raun and Johnson, 1999).
Genetic Variability
Field experiments testing genetic variability in cereals have shown differences in N
uptake based on genotype (Löffler et al., 1985; Van Sanford and MacKown, 1986; Fossati et al.,
1993). Different cultivars within a species as well as differences among crop species have shown
differences in N utilization (Moll and Kamprath, 1977; Pollmer et al., 1979; Reed et al., 1980;
Traore and Maranville, 1999). To a grower, planting a N efficient cultivar is a beneficial strategy
for reducing the cost of fertilization while maintaining a crop yield (Fageria and Baligar, 2005).
Wheat varieties with higher N use efficiencies offer a lower risk of N loss into the
environment (Baligar et al., 2001). However, a wheat cultivar that accumulates N early does not
always result in a higher N use efficiency (Cox et al., 1985). Variation in NUE among soft red
winter wheat genotypes was studied by Van Sanford and MacKown (1985) in the Southeast
region of the United States and showed significant variation among genotypes. The results from
the Van Sanford and MacKown (1985) study are broken down into NUE for yield (NUEY) and
NUE for protein (NUEP) for 25 soft red winter wheat genotypes. The NUEY is the ratio of the
grain dry weight harvested per unit fertilizer nitrogen supplied to the wheat crop. The NUEY
varied from 42.5 to 68.3 bushels of wheat per unit of N supplied (Van Sanford and MacKown,
1985).
Region-Specific Differences
In North Carolina N rates need to be studied on a varietal specific basis as well as a
regional basis to determine the independent nature of yield and yield response based on location,
6
year, and variety. Often, production guides provide a general discussion on the management of a
wheat crop; however, less detailed information is available based on geographic region, except
that related to planting date and maturity dates. To optimize N management and improve its use-
efficiency in wheat for North Carolina, additional site-specific information related to N fertility
inputs in differing environments is needed.
The South Central region of North Carolina consisting of Union, Robeson, and Stanly
counties and the Northeastern region consisting of Perquimans, Beaufort, Tyrell, and Pasquotank
counties have made up an average 25% of wheat production over the last 5 years. On average
these counties harvest 120,000 acres combined. Wheat management in these two regions differs
from the remainder of the state. However, little peer-reviewed information exists to guide these
producers on how to adjust management practices in-season to optimize N use and ultimately,
wheat production.
Algorithm
Crop demands change season-to-season and are variety specific; therefore, growers need
a practical tool allowing them to select and apply fertilizer based on in-season crop needs and
corresponding environmental conditions. The relationship between spectral vegetation indices
such as Normalized Difference Vegetative Index (NDVI) (NDVI= ((NIR - Red)/(NIR + Red)))
and agronomic practices have been observed by many researchers (Read et al., 2002; Bronson et
al., 2003; Hansen and Schjoerring, 2003; Elwadie et al., 2005) but only a handful of studies have
examined the practical implications (Stone et al., 1996; Zillmann et al., 2006). The
GreenSeekerTM (Trimble, Sunnyvale, CA) hand held sensor captures reflected energy in the red
(650 ± 10 nm) and near-infrared (770 ± 15 nm) spectral regions and uses internal software to
calculate a Normalized Difference Vegetative Index (NDVI) (Li et al 2009). The GreenSeekerTM

7
sensor is an active optical sensor (AOS) used to adjust in-season N rates, especially useful in
measuring spatial uncertainty about the available N in the soil (Schepers and Shanahan, 2009).
Many AOS’s are used to measure the reflectance of a crop canopy and provide vegetation
indices based on photosynthetically active biomass (Fitzgerald et al., 2010). These
measurements provide the user with a real-time measurement about the crop status, mainly
focusing on N and plant biomass (Fitzgerald et al., 2010). In wheat, researchers have used
GreenSeekerTM technology to predict grain yield (Raun et al., 2001) and provide in-season N
fertilizer recommendations (Li et al., 2009). The GreenSeekerTM technology has also been used
in cotton to determine variable rate applications of plant growth regulators (Vellidis et al., 2009),
and other crops such as corn and rice for nitrogen status and yield potential (Ali, Thind, &
Sharma (2014); Solari et al., (2008)).
Using NDVI from this sensor Raun et al. (2001) was successfully able to predict an in-
season estimated yield potential (INSEY) for winter wheat. To help improve the N predictions
the NDVI is divided by the number of growing degree days greater than 0°F (GDD > 0°F) (Eq.1)
to eliminate any days wheat does not grow (Lukina et al., 2001). This method provides a
regional algorithm that is paired with a nitrogen-rich strip (NRS) applied at of planting (Desta, et
al., 2017).
A NRS is a strip extending across some gradient in a field that captures a range in yield
potential to ensure that N will not be limiting during the growing season (Raun et al., 2002).
Without a NRS it is difficult to show wide differences in N demand in the field (Raun et al.,
2011). To determine the maximum potential wheat yield the algorithm measures the difference
between the average/max/min NDVI from the NRS and that measured from standard farmer
practice. The NRS provides site-specific information required by the GreenSeekerTM system to

8
make mid-season N fertilizer recommendations. As such, the system is able to account for
specific field conditions, variety differences, and seasonal weather conditions (Desta, et al.,
2017). Nitrogen Rich Strips are combating under- or over-applications of N, targeting N supply
to crop needs, minimizing waste, and maximizing economic returns (Desta, et al., 2017).
According to Raun et al. (2002) NUE increased greater than 15% using this algorithm
than with traditional farmer practice when averaged over 16 locations in Oklahoma and seven
locations in Virginia. This method of predicting in-season N application rates estimates yield
after the crop is well-established, unlike the current yield goal method for North Carolina where
growers estimate yield goals pre-plant based on historical yields specific to their farms.
Advantages of this approach include providing inputs based on local field and seasonal weather
conditions occurring from planting until in-season N application and accounting for spatial
differences across chosen gradient of the specific field (Scharf et al., 2005). Using this approach,
N rates are tailored to each field, each season, and variety specific adjusted based on the potential
for a yield response and the overall yield goal.
This research has resulted in the development of region-specific algorithms for Oklahoma
(http://www.nue.okstate.edu). Little research has been done for North Carolina wheat concerning
in-season application of nitrogen. When paired with NRS and calibrated algorithms, optical
sensors such as the Trimble GreenSeekerTM provide the site-specific information required to
adjust early-season (top-dress) N rates in wheat based on variety the field-scale environment.
Objectives
The main objective for this research is to determine in-season crop demands for a range
of soft red winter wheat varieties based on the region of production in North Carolina. The
following research objectives were developed:

9
1. Improve the precision of nitrogen applications in wheat using GreenSeekerTM technology
to more efficiently identify top-dress nitrogen rates
2. Examine the variety specific response to nitrogen comparing increasing nitrogen rates
with a sensor-based rate recommendation for 15 high-yielding varieties grown in North
Carolina

10
REFERENCES
Ali, A. M., Thind, H. S., & Sharma, S. (2014). Prediction of dry direct-seeded rice yields using
chlorophyll meter, leaf color chart and GreenSeeker optical sensor in northwestern
India. Field Crops Research, 161, 11-15.
Alley, M. M., Scharf, P., Brann, D. E., Baethgen, W. E., & Hammons, J. L. (1996). Nitrogen
Fertilization for Winter Wheat: Principles and Recommendations. Virginia Cooperative
Extension.
Baethgen, W. E., & Alley, M. M. (1989a). Optimizing soil and fertilizer nitrogen use by
intensively managed winter wheat. I. Crop nitrogen uptake. Agronomy Journal, 81(1),
116-120.
Baethgen, W. E., & Alley, M. M. (1989b). Optimizing soil and fertilizer nitrogen use by
intensively managed winter wheat. II. Critical levels and optimum rates of nitrogen
fertilizer. Agronomy Journal, 81(1), 120-125.
Baligar, V. C., Fageria, N. K., & He, Z. L. (2001). Nutrient use efficiency in
plants. Communications in Soil Science and Plant Analysis, 32(7-8), 921-950.
Bronson, K. F., Chua, T. T., Booker, J. D., Keeling, J. W., & Lascano, R. J. (2003). In-season
nitrogen status sensing in irrigated cotton. Soil Science Society of America Journal, 67(5),
1439-1448.
Campbell, C. A., Myers, R. J. K., & Curtin, D. (1995). Managing nitrogen for sustainable crop
production. Fertilizer Research, 42(1-3), 277-296.
Cassman, K. G., Dobermann, A., & Walters, D. T. (2002). Agroecosystems, nitrogen-use
efficiency, and nitrogen management. AMBIO: A Journal of the Human
Environment, 31(2), 132-141.
11
Cox, M. C., Qualset, C. O., & Rains, D. W. (1985). Genetic Variation for Nitrogen Assimilation
and Translocation in Wheat. II. Nitrogen Assimilation in Relation to Grain Yield and
Protein 1. Crop Science, 25(3), 435-440.
Cui, Z., Zhang, F., Mi, G., Chen, F., Li, F., Chen, X., Li, J., & Shi, L. (2009). Interaction
between genotypic difference and nitrogen management strategy in determining nitrogen
use efficiency of summer maize. Plant and soil, 317(1-2), 267-276.
Daigger, L. A., Sander, D. H., & Peterson, G. A. (1976). Nitrogen Content of Winter Wheat
During Growth and Maturation 1. Agronomy Journal, 68(5), 815-818.
Desta, B., Arnall, B., Raun, B. (2017) Oklahoma State University, Division of Agricultural
Sciences and Natural Resources. The evolution of Reference Strips in Oklahoma (PSS-
2258).
Elwadie, M. E., Pierce, F. J., & Qi, J. (2005). Remote sensing of canopy dynamics and
biophysical variables estimation of corn in Michigan. Agronomy Journal, 97(1), 99-105.
Fageria, N. K., & Baligar, V. C. (2003). Fertility management of tropical acid soils for
sustainable crop production. Handbook of Soil Acidity, 359-385.
Fageria, N. K., & Baligar, V. C. (2005). Enhancing nitrogen use efficiency in crop
plants. Advances in Agronomy, 88, 97-185.
Fitzgerald, G., Rodriguez, D., & O’Leary, G. (2010). Measuring and predicting canopy nitrogen
nutrition in wheat using a spectral index—The canopy chlorophyll content index
(CCCI). Field Crops Research, 116(3), 318-324.
Flowers, M., Weisz, R., Heiniger, R., Tarleton, B., & Meijer, A. (2003). Field validation of a
remote sensing technique for early nitrogen application decisions in wheat. Agronomy
Journal, 95(1), 167-176.

12
Fossati, D., Fossati, A., & Feil, B. (1993). Relationship between grain yield and grain nitrogen
concentration in winter triticale. Euphytica, 71(1-2), 115-123.
Gastal, F., & Lemaire, G. (2002). N uptake and distribution in crops: an agronomical and
ecophysiological perspective. Journal of Experimental Botany, 53(370), 789-799.
Goos, R. J., & Prunty, L. (1990). Yield variability and the yield goal decision. In Proceedings of
the Great Plain Soil Fertility Conference. Denver, CO (pp. 187-189).
Grant, C. A., Peterson, G. A., & Campbell, C. A. (2002). Nutrient considerations for diversified
cropping systems in the northern Great Plains. Agronomy Journal, 94(2), 186-198.
Hansen, P. M., & Schjoerring, J. K. (2003). Reflectance measurement of canopy biomass and
nitrogen status in wheat crops using normalized difference vegetation indices and partial
least squares regression. Remote Sensing of Environment, 86(4), 542-553.
Harper, L. A., Langdale, G. W., & Giddens, J. E. (1987). Nitrogen Cycling in a Wheat Crop:
Soil, Plant, and Aerial Nitrogen Transport 1. Agronomy Journal, 79(6), 965-973.
Hong, N., Scharf, P. C., Davis, J. G., Kitchen, N. R., & Sudduth, K. A. (2007). Economically
optimal nitrogen rate reduces soil residual nitrate. Journal of Environmental
Quality, 36(2), 354-362.
Inman, D., Khosla, R., Westfall, D. G., & Reich, R. (2005). Nitrogen uptake across site specific
management zones in irrigated corn production systems. Agronomy Journal, 97(1), 169-
176.
Irving, D. W., Fulcher, R. G., Bean, M. M., & Saunders, R. M. (1989). Differentiation of wheat
based on fluorescence, hardness, and protein. Cereal Chem, 66(6), 471-477.
Keeney, D. R. (1982). Nitrogen management for maximum efficiency and minimum
pollution. Nitrogen in Agricultural Soils, 605-649.

13
Keeney, D., & Olson, R. A. (1987). Sources of nitrate to ground water. Critical Reviews in
Environmental Science and Technology, 16(3), 257-304.
Li, F., Miao, Y., Zhang, F., Cui, Z., Li, R., Chen, X., Zhang, H., Schroder, J., Raun, W.R.,& Jia,
L. (2009). In-season optical sensing improves nitrogen-use efficiency for winter
wheat. Soil Science Society of America Journal, 73(5), 1566-1574.
Loffer, C. M., Rauch, T. L., & Busch, R. H. (1985). Grain and Plant Protein Relationships in
Hard Red Spring Wheat 1. Crop Science, 25(3), 521-524.
Lukina, E. V., Freeman, K. W., Wynn, K. J., Thomason, W. E., Mullen, R. W., Stone, M. L.,&
Raun, W. R. (2001). Nitrogen fertilization optimization algorithm based on in-season
estimates of yield and plant nitrogen uptake. Journal of Plant Nutrition, 24(6), 885-898.
Moll, R. H., & Kamprath, E. J. (1977). Effects of population density upon agronomic traits
associated with genetic increases in yield of Zea mays L. Agronomy Journal, 69(1), 81-
84.
Moll, R. H., Kamprath, E. J., & Jackson, W. A. (1982). Analysis and interpretation of factors
which contribute to efficiency of nitrogen utilization 1. Agronomy Journal, 74(3), 562-
564.
NASS, U. (2018). Census of agriculture. US Department of Agriculture, National Agricultural
Statistics Service, Washington, DC, 1.
Pan, J. R. (2001). Fate of fertilizer nitrogen in winter wheat-summer maize rotation system at
North China Plain. Chinese.) Ph. D. diss. China Agric. Univ., Beijing.
Pollmer, W. G., Eberhard, D., Klein, D., & Dhillon, B. S. (1979). Genetic Control of Nitrogen
Uptake and Translocation in Maize 1. Crop Science, 19(1), 82-86.

14
Raun, W. R., & Johnson, G. V. (1999). Improving nitrogen use efficiency for cereal
production. Agronomy Journal, 91(3), 357-363.
Raun, W. R., Solie, J. B., & Stone, M. L. (2011). Independence of yield potential and crop
nitrogen response. Precision Agriculture, 12(4), 508-518.
Raun, W. R., Solie, J. B., Johnson, G. V., Stone, M. L., Lukina, E. V., Thomason, W. E., &
Schepers, J. S. (2001). In-season prediction of potential grain yield in winter wheat using
canopy reflectance. Agronomy Journal, 93(1), 131-138.
Raun, W. R., Solie, J. B., Johnson, G. V., Stone, M. L., Mullen, R. W., Freeman, K. W., &
Lukina, E. V. (2002). Improving nitrogen use efficiency in cereal grain production with
optical sensing and variable rate application. Agronomy Journal, 94(4), 815-820.
Read, J. J., Tarpley, L., McKinion, J. M., & Reddy, K. R. (2002). Narrow-waveband reflectance
ratios for remote estimation of nitrogen status in cotton. Journal of Environmental
Quality, 31(5), 1442-1452.
Reed, A. J., Below, F. E., & Hageman, R. H. (1980). Grain protein accumulation and the
relationship between leaf nitrate reductase and protease activities during grain
development in maize (Zea mays L.): I. Variation between genotypes. Plant
Physiology, 66(1), 164-170.
Russelle, M. P., Deibert, E. J., Hauck, R. D., Stevanovic, M., & Olson, R. A. (1981). Effects of
Water and Nitrogen Management on Yield and 15N-Depleted Fertilizer Use Efficiency of
Irrigated Corn 1. Soil Science Society of America Journal, 45(3), 553-558.
Scharf, P. C., Kitchen, N. R., Sudduth, K. A., Davis, J. G., Hubbard, V. C., & Lory, J. A. (2005).
Field-scale variability in optimal nitrogen fertilizer rate for corn. Agronomy
Journal, 97(2), 452-461.
15
Schepers, J. S., & Mosier, A. R. (1991). Accounting for nitrogen in nonequilibrium soil-crop
systems. Managing Nitrogen for Groundwater Quality and Farm Profitability,125-138.
Schepers, J. S., & Shanahan, J. F. (2009). Managing nitrogen with active sensors. In Proceedings
13th Annual Symposium on Precision Agriculture in Australia’.(Eds MG Trotter, EB
Garraway, DW Lamb) (pp. 2-10).
Solari, F., Shanahan, J., Ferguson, R., Schepers, J., & Gitelson, A. (2008). Active sensor
reflectance measurements of corn nitrogen status and yield potential. Agronomy
Journal, 100(3), 571-579.
Stone, M. L., Solie, J. B., Raun, W. R., Whitney, R. W., Taylor, S. L., & Ringer, J. D. (1996).
Use of spectral radiance for correcting in-season fertilizer nitrogen deficiencies in winter
wheat. Transactions of the ASAE, 39(5), 1623-1631.
Thomason, W. E., Raun, W. R., Johnson, G. V., Freeman, K. W., Wynn, K. J., & Mullen, R. W.
(2002). Production system techniques to increase nitrogen use efficiency in winter
wheat. Journal of Plant Nutrition, 25(10), 2261-2283.
Tilley, M., Chen, Y.R., and Miller, R.A. (2012) Wheat breeding and quality evaluation in the
US. In Breadmaking (2nd edition), Woodhead Publishing Series in Food Science,
Technology and Nutrition. Chapter 9, 216-236.
Traore, A., & Maranville, J. W. (1999). Nitrate reductase activity of diverse grain sorghum
genotypes and its relationship to nitrogen use efficiency. Agronomy Journal, 91(5), 863-
869.
Uchida, R. (2000). Essential nutrients for plant growth: nutrient functions and deficiency
symptoms. Plant Nutrient Management in Hawaii’s Soils, 31-55.
16
Van Sanford, D. A., & MacKown, C. T. (1986). Variation in nitrogen use efficiency among soft
red winter wheat genotypes. Theoretical and Applied Genetics, 72(2), 158-163.
Vellidis, G., Ortiz, B., Ritchie, G., Peristeropoulos, A., Perry, C., & Rucker, K. (2009). Using
GreenSeeker® to drive variable rate application of plant growth regulators and defoliants
on cotton. Precision Agriculture, 9(9), 940-955.
Weisz, R. 2014. Small grain production guide 2014–15. Report AG-580. NC Coop. Ext. Serv.,
North Carolina State Univ., Raleigh.
Welch, L. F., Mulvaney, D. L., Oldham, M. G., Boone, L. V., & Pendleton, J. W. (1971). Corn
Yields with Fall, Spring, and Sidedress Nitrogen 1. Agronomy Journal, 63(1), 119-123.
Wheat Classes Retrieved June 30, 2019, from https://www.uswheat.org/working-with-
buyers/wheat-classes/.
Zadoks, J. C., Chang, T. T., & Konzak, C. F. (1974). A decimal code for the growth stages of
cereals. Weed Research, 14(6), 415-421.
Zillmann, E., Graeff, S., Link, J., Batchelor, W. D., & Claupein, W. (2006). Assessment of cereal
nitrogen requirements derived by optical on-the-go sensors on heterogeneous
soils. Agronomy Journal, 98(3), 682-690.
17
TABLES AND FIGURES
Figure 1.1. Distribution of the six market classes of wheat grown in the United States (US Wheat
Associates 2019; Tilley 2012).
18
Figure 1.2. Ten-year average North Carolina wheat yields (USDA-NASS 2018).
0
500
1000
1500
2000
2500
3000
3500
4000
4500
5000
2008 2010 2012 2014 2016 2018
Yiel
d (
kg h
a-1)
Year

19
Figure 1.3. Plant hardiness zones for North Carolina (USDA-ARS and PRISM Climate Group –
Oregon State University).
20
Figure 1.4. Geographic regions of North Carolina (Adapted from Raisa, E. 1940. Landforms of
the United States. Reprinted in The North Carolina Atlas Revisited).
Figure 1.5. Zadoks and Feekes scales describing the growth stages of wheat (Large 1954).

21
Figure 1.6. Nitrogen uptake pattern for winter wheat (McGuire et al. 1998).

22
Chapter II: Soft Red Winter Wheat In-Season Nitrogen Rate Determination Using
GreenSeekerTM Technology
ABSTRACT
GreenSeekerTM sensor technology allows farmers to make real-time decisions based on
in-season crop demands when used in conjunction with a nitrogen rich strip (NRS) applied at
planting and a calibrated algorithm. Nitrogen rich strips are setup by the grower and used by the
sensor to calculate a normalized difference vegetative index (NDVI). Which in turn is used to
parameterize an algorithm that predicts a yield potential with no additional nitrogen (YP0), a
yield potential with additional nitrogen (YPN), and a recommended nitrogen rate for in-season
top-dress application. Oklahoma and Virginia have developed algorithms specific to their region
and growing conditions. Modifications were made to these for use in North Carolina. All three
algorithm outputs were compared utilizing field plots in 5 locations across NC that were
established in 2018 and 2019. Tissue samples were taken for each plot at all 5 locations to
compare normalized difference vegetative index to the percent tissue N. In Moore County, tissue
samples were taken before and after top-dress nitrogen and used to observe nitrogen uptake by
the wheat. By using the sensor-based approach to formulate in-season nitrogen recommendations
the N is specific for each field, season, and variety. Successful modification of the Oklahoma
algorithm for use in NC has provided growers with a tool that allows real-time data to be used in
making a N rate recommendation. Overall, the Virginia algorithm recommended higher N rates
at top-dress than Oklahoma or North Carolina with N rate recommendations as high as 197 kg
ha-1. This information can lead to the development of a finalized algorithm specific for use by
North Carolina growers.

23
INTRODUCTION
NDVI
Crop nutrient demands change season-to-season and can be variety specific; therefore,
growers need practical tools allowing them to select and apply fertilizer based on in-season crop
needs and corresponding environmental conditions. The relationships between spectral
vegetation indices such as NDVI and agronomic practices have been observed by many
researchers (Read et al., 2002; Bronson et al., 2003; Hansen and Schjoerring, 2003; Elwadie et
al., 2005) but, only a handful of studies have examined the practical implications (Stone et al.,
1996; Zillmann et al., 2006). The GreenSeekerTM (Trimble, Sunnyvale, CA) hand-held sensor
captures reflected energy in the red (650 ± 10 nm) and near-infrared (770 ± 15 nm) spectral
regions and uses internal software to calculate a Normalized Difference Vegetative Index
(NDVI) (Li et al. 2009). The GreenSeekerTM sensor is an active optical sensor (AOS) used to
adjust in-season nitrogen (N) rates, especially useful in measuring spatial uncertainty about the
potentially available N in the soil (Schepers and Shanahan, 2009). Many AOS’s measure the
reflectance of a crop canopy and provide vegetation indices based on photosynthetically active
biomass (Fitzgerald et al., 2010). These measurements provide the user with real-time
information about crop status, mainly focusing on N and plant biomass status (Fitzgerald et al.,
2010). In wheat, researchers have used GreenSeekerTM technology to predict grain yield (Raun et
al., 2001) and to provide in-season N fertilizer recommendations (Li et al., 2009). The
GreenSeekerTM technology has also been used in cotton to determine variable rate applications of
plant growth regulators (Vellidis et al., 2009), and in other crops such as corn and rice to
determine nitrogen status and yield potential (Ali, Thind, & Sharma 2014; Solari et al., 2008).

24
Using GreenSeekerTM sensor for NDVI, Raun et al. (2001) successfully predicted an in-
season estimated yield potential (INSEY) for winter wheat. To help improve the N
recommendations, NDVI is divided by the number of growing degree days greater than 0°F
(GDD > 0°F) (Eq.1) to eliminate any days below a temperature where wheat does not grow
(Lukina et al., 2001). This new method provides a region-specific algorithm to pair with a
nitrogen-rich strip (NRS) that a grower applies in his/her field at the time of planting (Desta et
al., 2017).
Nitrogen Rich Strip
A NRS is applied across some gradient in a field that captures a range in yield potential
to ensure that N will not be limiting during the growing season (Raun et al., 2002). Without a
NRS it would be difficult to show wide differences in N demand in the field (Raun et al., 2011).
To determine the maximum wheat yield potential, the mean NDVI from the NRS and that
measured from within the plots are compared using an algorithm. The NRS provides site-specific
information required to determine mid-season N fertilizer recommendations. As such, the NRS
paired with the GreenSeekerTM and the region-specific algorithm is able to account for specific
field conditions, variety differences, and seasonal weather conditions (Desta, et al., 2017).
Nitrogen Rich Strips are combating under- or over-applications of N, targeting N supply to crop
needs, minimizing waste, and maximizing economic returns (Desta, et al., 2017).
Algorithm
According to Raun et al. (2002) Nitrogen Use Efficiency (NUE) increased greater than
15% using the algorithm to determine fertilizer rates than with traditional farmer practice when
averaged over 16 locations in Oklahoma and seven locations in Virginia. This method of
recommending in-season N application rates estimates yield after the crop is well-established,
25
unlike the current yield goal method for North Carolina where growers estimate yield goals pre-
plant based on historical yields specific to their farms. Advantages of the NDVI approach
includes providing inputs based on local field and seasonal weather conditions occurring from
planting until in-season N application and accounting for spatial differences across a chosen
gradient of the specific field (Scharf et al., 2005). In this way N rates are tailored to each field,
within each season, and variety-specific adjusted based on the potential for a yield response and
the overall yield goal. When paired with NRS and calibrated algorithms, optical sensors such as
the Trimble GreenSeekerTM provide the site-specific information required to adjust early-season
top-dress N rates in wheat based on variety and the field-scale environment. Raun et al’s (2002)
research resulted in the development of a region-specific algorithm for Oklahoma
(http://www.nue.okstate.edu). In 2011, Thomason et al. modified the algorithm for use in
southeastern Virginia. Algorithm development and testing has not been completed for North
Carolina wheat growers. The objectives of this study were to (1) evaluate differences among 15
top-yielding varieties under sensor-based nitrogen rates recommended with an algorithm
modified for use in North Carolina, and (2) to examine N rate recommendations between these
varieties under other region-specific algorithms.
MATERIALS AND METHODS
In 2018, trials were setup in each of the three North Carolina growing regions: Piedmont
(Union), Coastal Plain (Lenoir), and Tidewater (Camden). In 2019, trials were repeated at
Piedmont (Union), and added in Tidewater (Chowan) and Sandhills (Moore). In 2018, all three
locations were harvested; however, in 2019 the Tidewater location in Chowan County was
abandoned due to widespread disease pressure in the field. Fifteen top yielding varieties from the

26
North Carolina Official Variety Testing (OVT) Program from 2017 were evaluated in a split-plot
design with whole plot being nitrogen (N) rate and sub-plot being variety to identify variety-
specific responses to different nitrogen treatment levels. Plots were 1.5 meters wide and 8.5
meters long, seeded at a rate of 5.16 million seed per ha-1. Nitrogen treatments in 2018 included
100.88 kg ha-1, 134.5 kg ha-1, 168.13 kg ha-1 and a variety-specific, sensor-based rate. Initially,
33.63 kg ha-1 of 32 percent urea ammonium nitrate (UAN) was applied at planting with a
backpack and sprayer utilizing Streamjet SJ7 fertilizer nozzles and the remainder prior to Zadoks
growth stage (GS) 30 in one spring application. In 2019, the total N rates were 0 kg ha-1, 134.5
kg ha-1, 168.13 kg ha-1, 201.75 kg ha-1 and variety-specific, sensor-based rate using 30 percent
UAN. All sites received herbicide and fungicide as necessary using commercially available
pesticides. All locations had 1-meter row tissue samples taken from the third row in each plot
just prior to Zadoks growth stage (GS) 30. Waters Agricultural Laboratories, Inc. in Warsaw,
North Carolina analyzed the samples for nutrient content. On the same date as tissue sampling,
each plot was also evaluated using a GreenSeekerTM Sensor (Trimble, Sunnyvale, CA). The
GreenSeekerTM Sensor measures the chlorophyll content and provides the user with a
Normalized Difference Vegetative Index (NDVI). NDVI was used in conjunction with an
algorithm modified specifically for North Carolina growing conditions and a Nitrogen Rich Strip
(NRS) to predict in-season nitrogen recommendations for individual varieties at each location. In
2018, the NRS was applied at planting across the wheat field, planted by the cooperator
surrounding the trial area. The NRS was applied in a direction at each location that captured the
maximum amount of variability within that particular field (soil type, slope, etc.). In 2019, the
NRS was placed in two additional replications of each of the 15 varieties where the
GreenSeekerTM sensor was used to compare the NDVI from the NRS to the variety-specific plot
27
to form in-season nitrogen recommendations. The Moore County location was selected in and a
zero N rate plot added to aid in algorithm development. This location is referred to as the
Sandhills in NC as it is a very sandy soil where residual N leftover from previous crops and
applications is low, due to high leaching potential. Locations were harvested with a
Wintersteiger Delta small plot combine (Wintersteiger, Salt Lake, Utah). Harvest moisture, test
weight, and grain weight were collected per plot using a HarvestMaster Classic (Juniper
Systems, Logan, Utah). Data were analyzed in SAS 9.4 using PROC GLIMMIX at p<0.05 (SAS
Institute Cary, NC).
A GreenSeekerTM algorithm originally developed for the Southern Great Plains region
was modified for North Carolina (NC) and used to recommend in-season nitrogen rates for each
location. The modifications were made using preliminary data from previous growing seasons
NDVIs and yields. The algorithm was used in conjunction with the GreenSeekerTM sensor,
which provides the user with a Normalized Difference Vegetative Index (NDVI). Spectral
reflectance data was collected in each plot in the same direction that the rows were planted using
the GreenSeekerTM sensor, which emits light in the R (650 ± 10 nm) and NIR (770 ± 15 nm).
These values are used to calculate the NDVI (NDVI= ((NIR - Red)/(NIR + Red))), which the
GreenSeekerTM provides for the user. The algorithm modified for use in North Carolina has
parameters including yield potential with no additional N (YP0) and yield potential with
additional N (YPN). The YP0 (Eq.1) is predicted using the in season estimated yield which is the
NDVI divided by the growing degree days greater than 0 degrees Fahrenheit (Li et al., 2009).
YP0 changes year-to-year because of seasonal variability (Girma et al., 2007). Next, the YPN
(Eq.2) to N fertilizer predicts the magnitude of response to an in-season N fertilizer application
and is calculated by multiplying the response index (RI) by the ratio from the NDVI from the

28
non-N limiting wheat to the NDVI measured from the grower’s crop with only pre-plant N
applied (Raun et al., 2002). Depending on the year, location and crop, RI’s can range from 1.0 to
3.0 (Johnson & Raun., 2003). The RI for NC ranged from 1.5 to 1.8 depending on location. The
theoretical maximum NUE is set to 0.70, which is then subtracted from the previous equation
(Li, et al., 2009). The in-season fertilizer N recommendation (Eq. 3) is determined by subtracting
YP0 from YPN, then multiplying by the ratio of %N grain (0.02) over NUE=0.6 (Raun et al.,
2002; Li, et al., 2009).
The equation developed for NC uses one NRS applied at planting with a nitrogen (N) rate
that will be non-limiting throughout the growing season. For our tests the NRS rate was 134.5
kg/ha which is the recommend total nitrogen rate that will not be limiting throughout the
growing season. The VA and OK algorithms call for a NRS to be applied at GS 25 at a rate 2x
that of the intended rate for the rest of the grower’s field as well as an equivalent area left
unfertilized. In 2018, the Nitrogen Rich Strip (NRS) was applied at planting across the wheat
field, planted by the cooperator surrounding the trial area. The NRS was applied in a direction
that captured the maximum amount of variability within a particular field (soil type, slope, etc.)
determined by looking at soil, topography, and yield maps. In 2019, the NRS was placed in two
additional replications of each of the 15 varieties where the GreenSeekerTM sensor was used to
compare the NDVI from the NRS to the variety-specific plot to determine in-season nitrogen
recommendations. At each location, sensing, tissue sampling, and in-season N application took
place on the same date. Once all NDVI numbers were collected they were averaged over the four
replications and compared to that of the NRS NDVI. These numbers entered into the algorithm
resulted in YP0, YPN, and a recommended N rate. When developing the algorithm for North
Carolina the algorithm output was compared to ones currently in place for Virginia (Thomason et

29
al., 2011) and Oklahoma (Raun et al., 2005) (Table 2.3 through 2.7). The VA algorithm uses the
days from planting to sensing (DFP) as part of the equation while NC and OK use growing
degree days greater than 0° (GDD>0°) to account for season length and wheat crop stage of
growth at time of sensing based on crop canopy (Thomason et al., 2011; Raun et al., 2005).
Once entered into the algorithm the RI was manually changed between 1.5 and 1.8 for each
location to capture the YPN and recommended N rate that simulated a realistic yield goals for
growers in that region using the previous two years of official variety testing information for
North Carolina as a baseline yield goal for each region in question (Post et al., 2016) (Table 2.1).
After sensing took place but before the in-season N was applied, a 1-meter row tissue
sample was taken from each plot and submitted to Waters Agricultural Laboratories, Inc. in
Warsaw, North Carolina. These samples had a complete nutrient analysis performed. The N
percent from each sample was compared to the NDVI for that plot. Topdress N was applied the
same day as sensing following tissue sampling. In Moore county, tissue samples were taken a
second time 4 weeks after top-dress to compare N percentage in the plants before and after N
application.
Plots were harvested with a Wintersteiger Quantum small plot combine (Wintersteiger, Salt
Lake, Utah). Harvest moisture, test weight, and grain weight were collected per plot using a
HarvestMaster Classic (Juniper Systems, Logan, Utah).
RESULTS AND DISCUSSION
Union County
The VA algorithm made a similar range of YP0 predictions for varieties in Union County
in both years (Tables 2.5 and 2.7). YPN predictions (Table 2.5 and 2.7) were slightly lower for
30
Union in 2019 verses 2018 possibly due to fewer days between planting and sensing as well as a
much wetter season, causing NDVI readings from the farmer practice in 2019 to be closer to
those of the NRS (Table 2.2). Oklahoma algorithm YPN predictions for the same location did
not maximize yields expected by the best growers in this region who regularly seek yields above
7200 Kg ha-1. Both the NC and VA algorithms predicted YPNs within the range of maximum
yield for this region, though the VA algorithm recommended extravagant N rates to reach those
goals (Tables 2.5 and 207).
Lenoir County
All three algorithms made high N rate recommendations for the Lenoir county location in
2018, which is mainly due to the wide difference between the NDVI of the NRS compared to the
farmer practice and the limited number of positive growing degree days (79) before sensing
compared to other locations (Table 2.2). Despite high N applications actual yields differed from
NC predicted YPN by a wide margin for all varieties (Table 2.4).
A high NDVI earlier in the season can be indicative of quicker canopy closure and higher yield
potential (Thomason et al., 2011). Similar to work done in Virginia, more N is recommended for
a variety as the NDVI from Farmer Practice increases to meet the Nitrogen Rich Strip NDVI and
lowers the N applied as the NDVI is equivalent or exceeds the Nitrogen Rich Strip NDVI (Figure
2.1) (Thomason et al., 2011). This phenomenon was most evident in our tests in Lenoir County
2018 where average varieties NDVIs were 0.33 and the reference strip was 0.80 (Table 2.2).
With the reference strip and the farmer practice far apart, N rate recommendations were high for
all three algorithms (Table 2.4)

31
Camden County
In Camden County 2018, the VA algorithm YPN predictions were much closer to actual
yields than the OK or NC predictions; though again, suggesting they be achieved using higher N
rates than the NC algorithm (Tables 2.3). The NC algorithm YPN predictions for this location
best match yield goals for the region as one would set them using previous OVT data (Table
2.1), though we did not quite achieve maximum yield potential in this season. We did reach the
region average from the previous year of 6092.9 (Table 2.1).
Algorithm Comparison
Overall, the Virginia algorithm recommended the highest N rates at top-dress compared
to the Oklahoma and North Carolina algorithms with N rate recommendations as high as 197 kg
ha-1. Regular N use patterns in North Carolina would not support top-dress applications higher
than 134 kg ha-1, which is the total seasonal recommendation for N by the North Carolina Small
Grain Production Guide (Weisz 2014). In addition, a high N rate recommendation at top-dress
resulting in a lower yield potential with added N compared to the North Carolina algorithm is
counter-intuitive. Oklahoma’s algorithm had a wide range of recommended N some being too
high for the YPN and some even being negative as seen in Union 2019 (Table 2.7). The
Oklahoma algorithm recommended more realistic N rates for North Carolina producers than the
VA algorithm, but overall, the YPN predictions from the OK algorithm were lower than targets
for the most progressive producers in North Carolina who aim for yields over 7200 kg ha-1.
There are also differences between soils, seasonal weather, and the market class of wheat grown
between the two regions (Tilley 2012).
32
Nitrogen Uptake
Tissue samples were taken at the time of sensing to determine N rate for top-dress in
individual plots. In Moore county tissue samples were taken a second time after top-dress to
compare N percentage in the plants before and after N application. By using a sandy location
varieties were observed on how different N treatments influenced the concentration of N within
the wheat crop. Due to this being a low yielding environment the low NDVI used to calculate the
N rate could be attributed to a thinner canopy at the time of sensing. Studies by Colwell (1974)
and Huete et al., (1985) show how differences in soil backgrounds can affect canopy reflectance.
For example, the greater the canopy cover, the more leaf area for the sensor to read while a
thinner canopy cover exposes more of the background soil, which can distort the NDVI. We used
this location to observe N uptake before and after top-dress N was applied. The zero N rate tissue
samples still increased in percent N between the two sampling dates (Figure 2.2). The sufficiency
range for N in small grains in the southern region of the United States is 4-5% (Baker et al.,
2000). Only 4 out of the 15 sensor-based N rates were in the sufficiency range while the
remainder did not. The sensor-based N rates were lower overall at this location and did not
exceed the lowest standard applied rate of 100 kg N ha-1. Mansour et al. (2017) found different
varieties could be managed differently based on favorable environmental conditions and high
levels of N. Applied N should match crop demand for fertilizer where possible. However, crop
demand for N is influenced by seasonal weather (Barraclough et al., 2010). Moriondo et al.
(2007) suggesting the most accurate yield assessments are through crop growth models using
spatial and temporal data on a local scale. However, a lack of spatial information on
environmental and agronomic factors that could affect crop yield on a regional basis. Further
33
studies need to be performed in order to improve the validity of recommendations made using
spatial information.
Developing an algorithm for using Nitrogen Rich Strips (NRS) specifically for North
Carolina has particular relevance for producers making decisions on timing and rate of nitrogen
(N) applications based on seasonal and regional climatic conditions. North Carolina has distinct
growing regions for soft red winter wheat (SRWW) and each of these regions needs to be studied
on a site-specific basis due to differences in grower management practices. Successful
modification of the OK algorithm for use in NC has provided growers with a tool that allows
real-time data to be used in making a N rate recommendation. Overall, the Virginia algorithm
recommended higher N rates at top-dress than Oklahoma or North Carolina with N rate
recommendations as high as 197 kg ha-1. Regular N use patterns in North Carolina would not
support top-dress applications higher than 134 kg ha-1 the total seasonal recommendation for N
by the North Carolina Small Grain Production Guide (Weisz 2014). In addition, a high N rate
recommendation at top-dress coupled with a lower yield potential with added N is counter-
intuitive. Oklahoma’s algorithm had a wide range of recommended N some being too high for
the YPN and some even being negative. Further testing to compare the three algorithms in on-
farm test to see differences across the state in how management practices differ based on region.

34
REFERENCES
Ali, A. M., Thind, H. S., & Sharma, S. (2014). Prediction of dry direct-seeded rice yields using
chlorophyll meter, leaf color chart and GreenSeeker optical sensor in northwestern
India. Field Crops Research, 161, 11-15.
Baker, W. H., Bell, P. F., Campbell, C. R., Cox, F. R., Donohue, S. J., Gascho, G. J., … Unruh,
L. (2000). Reference Sufficiency Ranges for Plant Analysis in the Southern Region of the
United States. Southern Cooperative Series Bulletin #394 (pp. 3–4, 11).
Barraclough, P. B., Howarth, J. R., Jones, J., Lopez-Bellido, R., Parmar, S., Shepherd, C. E., &
Hawkesford, M. J. (2010). Nitrogen efficiency of wheat: Genotypic and environmental
variation and prospects for improvement. European Journal of Agronomy, 33(1), 1–11.
Bronson, K. F., Chua, T. T., Booker, J. D., Keeling, J. W., & Lascano, R. J. (2003). In-season
nitrogen status sensing in irrigated cotton. Soil Science Society of America Journal, 67(5),
1439-1448.
Colwell, J. E. (1974). Vegetation canopy reflectance. Remote Sensing of Environment, 3(3), 175–
183.
Desta, B., Arnall, B., Raun, B. (2017) Oklahoma State University, Division of Agricultural
Sciences and Natural Resources. The evolution of Reference Strips in Oklahoma (PSS-
2258).
Elwadie, M. E., Pierce, F. J., & Qi, J. (2005). Remote sensing of canopy dynamics and
biophysical variables estimation of corn in Michigan. Agronomy Journal, 97(1), 99-105.
Fitzgerald, G., Rodriguez, D., & O’Leary, G. (2010). Measuring and predicting canopy nitrogen
nutrition in wheat using a spectral index—The canopy chlorophyll content index
(CCCI). Field Crops Research, 116(3), 318-324.

35
Girma, K., Freeman, K. W., Teal, R., Arnall, D. B., Tubana, B., Holtz, S., & Raun, W. R. (2007).
Analysis of yield variability in winter wheat due to temporal variability, and nitrogen and
phosphorus fertilization. Archives of Agronomy and Soil Science, 53(4), 435-442.
Hansen, P. M., & Schjoerring, J. K. (2003). Reflectance measurement of canopy biomass and
nitrogen status in wheat crops using normalized difference vegetation indices and partial
least squares regression. Remote Sensing of Environment, 86(4), 542-553.
Huete, A. R., Jackson, R. D., Post, D. F. (1985) Spectral response of a plant canopy with
different soil backgrounds. Remote Sensing of Environment. , 17 (1), p. 37
Johnson, G. V., & Raun, W. R. (2003). Nitrogen response index as a guide to fertilizer
management. Journal of plant Nutrition, 26(2), 249-262.
Large, E. G. (1954). Growth stages in cereals: Illustration of the Feeke’s scale. Pl. Path. 3:128-
129.
Li, F., Miao, Y., Zhang, F., Cui, Z., Li, R., Chen, X., Zhang, H., Schroder, J., Raun, W.R., & Jia,
L. (2009). In-season optical sensing improves nitrogen-use efficiency for winter
wheat. Soil Science Society of America Journal, 73(5), 1566-1574.
McGuire, A.M., Bryant, D.C., Denison, R.F. (1998). Wheat yields, nitrogen uptake, and soil
moisture following winter legume cover crop vs. fallow. Agronomy Journal. 90:404-410.
Mansour, E., Merwad, A. M. A., Yasin, M. A. T., Abdul-Hamid, M. I. E., El-Sobky, E. E. A., &
Oraby, H. F. (2017). Nitrogen use efficiency in spring wheat: Genotypic variation and
grain yield response under sandy soil conditions. Journal of Agricultural
Science, 155(9), 1407–1423.
Moriondo, M., Maselli, F., & Bindi, M. (2007). A simple model of regional wheat yield based
on NDVI data. European Journal of Agronomy, 26(3), 266–274.

36
Nguyen, G. N., Panozzo, J., Spangenberg, G., & Kant, S. (2016). Phenotyping approaches to
evaluate nitrogen-use efficiency related traits of diverse wheat varieties under field
conditions. Crop and Pasture Science, 67(11), 1139–1148.
Post, A.R., Denton, J., Johnson, P., Ryan, N., Arellano, C. (2016) North Carolina Measured Crop
Performance Small Grains 2016. Crop Science Research Report No. 249,
Raun, W. R., Solie, J. B., & Stone, M. L. (2011). Independence of yield potential and crop
nitrogen response. Precision Agriculture, 12(4), 508-518.
Raun, W. R., Solie, J. B., Johnson, G. V., Stone, M. L., Lukina, E. V., Thomason, W. E., &
Schepers, J. S. (2001). In-season prediction of potential grain yield in winter wheat using
canopy reflectance. Agronomy Journal, 93(1), 131-138.
Raun, W. R., Solie, J. B., Johnson, G. V., Stone, M. L., Mullen, R. W., Freeman, K. W., &
Lukina, E. V. (2002). Improving nitrogen use efficiency in cereal grain production with
optical sensing and variable rate application. Agronomy Journal, 94(4), 815-820.
Raun, W. R., Solie, J. B., Stone, M. L., Martin, K. L., Freeman, K. W., Mullen, R. W., Johnson,
G. V. (2005). Optical sensor-based algorithm for crop nitrogen
fertilization. Communications in Soil Science and Plant Analysis, 36(19–20), 2759–
2781.
Read, J. J., Tarpley, L., McKinion, J. M., & Reddy, K. R. (2002). Narrow-waveband reflectance
ratios for remote estimation of nitrogen status in cotton. Journal of Environmental
Quality, 31(5), 1442-1452.
Scharf, P. C., Kitchen, N. R., Sudduth, K. A., Davis, J. G., Hubbard, V. C., & Lory, J. A. (2005).
Field-scale variability in optimal nitrogen fertilizer rate for corn. Agronomy
Journal, 97(2), 452-461.
37
Schepers, J. S., & Shanahan, J. F. (2009). Managing nitrogen with active sensors. In Proceedings
13th Annual Symposium on Precision Agriculture in Australia’.(Eds MG Trotter, EB
Garraway, DW Lamb) (pp. 2-10).
Solari, F., Shanahan, J., Ferguson, R., Schepers, J., & Gitelson, A. (2008). Active sensor
reflectance measurements of corn nitrogen status and yield potential. Agronomy
Journal, 100(3), 571-579.
Stone, M. L., Solie, J. B., Raun, W. R., Whitney, R. W., Taylor, S. L., & Ringer, J. D. (1996).
Use of spectral radiance for correcting in-season fertilizer nitrogen deficiencies in winter
wheat. Transactions of the ASAE, 39(5), 1623-1631.
Thomason, W. E., Phillips, S. B., Davis, P. H., Warren, J. G., Alley, M. M., & Reiter, M. S.
(2011). Variable nitrogen rate determination from plant spectral reflectance in soft red
winter wheat. Precision Agriculture, 12(5), 666–681.
Vellidis, G., Ortiz, B., Ritchie, G., Peristeropoulos, A., Perry, C., & Rucker, K. (2009). Using
GreenSeeker® to drive variable rate application of plant growth regulators and defoliants
on cotton. Precision Agriculture, 9(9), 940-955.
Weisz, R. (2014). Small grain production guide 2014–15. Report AG-580. NC Coop. Ext. Serv.,
North Carolina State Univ., Raleigh.
Zillmann, E., Graeff, S., Link, J., Batchelor, W. D., & Claupein, W. (2006). Assessment of cereal
nitrogen requirements derived by optical on-the-go sensors on heterogeneous
soils. Agronomy Journal, 98(3), 682-690.
38
TABLES AND FIGURES
Table 2.1. Average winter wheat yields by region for the North Carolina Official Variety Trials (OVT) from 2016-2017. Statewide
and USDA reported average yields are included for comparison.
OVT Maximum OVT Top 15 Average
Region 2016 2017 2016 2017 2016 2017 ---------------------------------kg ha-1-----------------------------
Tidewater 5329.3 7296.7 4650.6 6597.3 3938.3 5568.4
Coastal Plain - 7236.2 - 6812.5 - 6092.9
Piedmont 6301.3 6819.2 5161.7 6220.7 4131.1 5514.6
Statewide 5069.6 6879.8 4726.0 6435.9 4030.5 5763.4
USDA - - - - 2757.3 3698.8
Table 2.2. Response index (RI), Growing Degree Days (GDD), Days from planting to sensing (DPS), and Normalized Difference
Vegetative Index (NDVI) readings from farmer practice and reference strips from all locations in 2018 and 2019.
Location Year RI† GDD‡ DPS⸸ NDVI
Days Farmer Reference
Camden 2018 1.8 92 126 0.51 - 0.59 0.77
Lenoir 2018 1.8 79 117 0.30 - 0.37 0.80
Union 2018 1.6 88 121 0.61 - 0.70 0.80
Moore 2019 1.5 85 125 0.37 - 0.45 0.70
Union 2019 1.8 82 111 0.56 - 0.63 0.59 - 0.72
† RI: Response Index
‡ GDD: Growing Degree Days
⸸ DPS: Days from planting to sensing

39
Table 2.3. Camden County 2018 Normalized Difference Vegetative Index (NDVI) from the farmer practice (FP) plot and the
associated Yield Potential without additional nitrogen (YP0), Yield Potential with recommended nitrogen addition (YPN),
recommended nitrogen rate for each algorithm: VA, OK, and NC, respectively. Actual yield for each variety is included. The
reference strip NDVI for this location was 0.77 kg ha-1.
VA OK NC
NDVI† YP0⸷ YPN⸸ Rate YP0 YPN Rate YP0 YPN Rate Yield
Variety FP‡ kg ha -1 kg ha -1 kg ha -1 kg ha -1
Dyna-Gro
9701
0.54 1950 5581 121 2690 4573 62 3766 7061 108 5296
Pioneer 26R41 0.59 2286 5783 117 3093 4640 62 4909 8137 106 5709 Pioneer 26R59 0.51 1815 5514 124 2488 4573 84 3228 6456 108 5982 AgriMAXX
473
0.53 1883 5581 122 2622 4573 84 3564 6859 108 5275
AgriMAXX
474
0.55 2017 5649 121 2757 4573 72 3967 7263 108 5656
AGS 2024 0.54 1950 5581 121 2690 4573 76 3766 7061 108 5144 AP 1882 0.55 2017 5649 121 2757 4573 72 3967 7263 108 5333 FSVA 258 0.55 2017 5649 121 2757 4573 72 3967 7263 108 5593 Gerard 557 0.54 1950 5581 121 2690 4573 76 3766 7061 108 5187 Hilliard 0.52 1883 5581 123 2555 4573 80 3362 6657 108 5456
SH 4300 0.54 1950 5581 121 2690 4573 76 3766 7061 108 6079 SH 7200 0.52 1883 5581 123 2555 4573 80 3362 6657 108 5993 SRW 8550 0.52 1883 5581 123 2555 4573 80 3362 6657 108 4850 USG 3536 0.54 1950 5581 121 2690 4573 76 3766 7061 108 4840 USG 3895 0.54 1883 5581 123 2555 4573 80 3362 6657 108 5544 † NDVI: Normalized Difference Vegetative Index ‡ FP: Farmer practice plot; 33.6 kg ha-1 of nitrogen at planting
⸷ YP0: Yield potential without additional nitrogen ⸸ YPN: Yield potential with recommended nitrogen addition
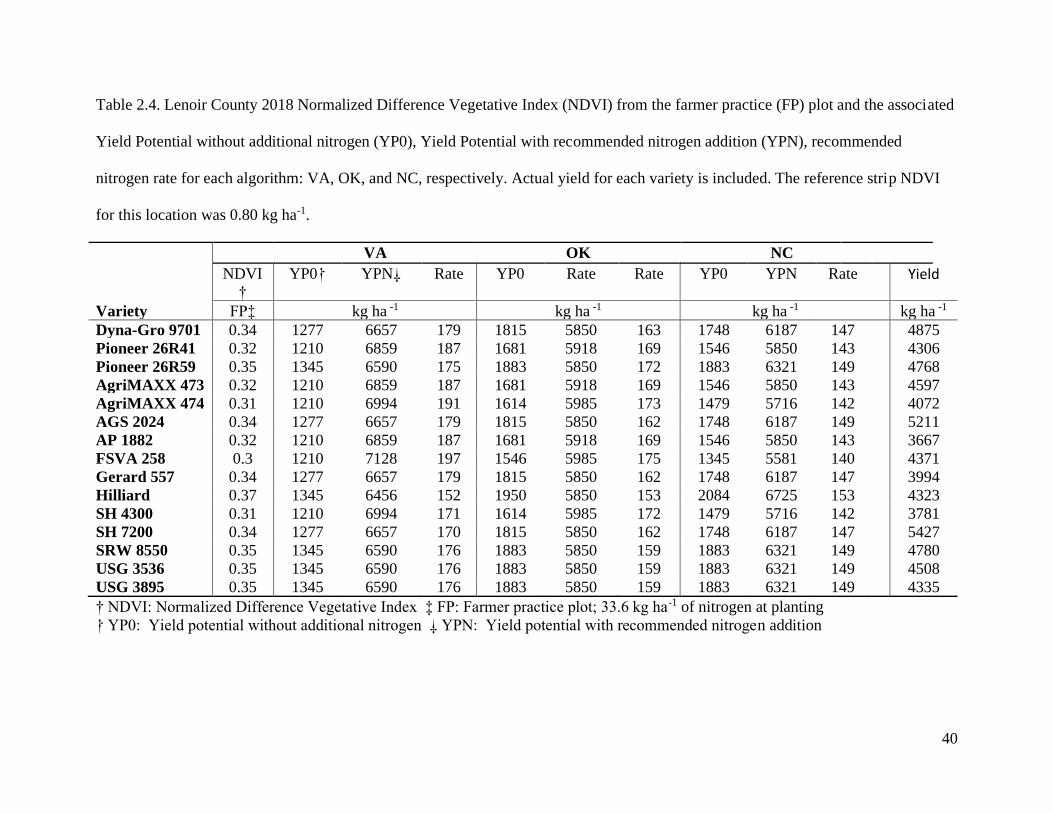
40
Table 2.4. Lenoir County 2018 Normalized Difference Vegetative Index (NDVI) from the farmer practice (FP) plot and the associated
Yield Potential without additional nitrogen (YP0), Yield Potential with recommended nitrogen addition (YPN), recommended
nitrogen rate for each algorithm: VA, OK, and NC, respectively. Actual yield for each variety is included. The reference strip NDVI
for this location was 0.80 kg ha-1.
VA OK NC
NDVI
†
YP0⸷ YPN⸸ Rate YP0 Rate Rate YP0 YPN Rate Yield
Variety FP‡ kg ha -1 kg ha -1 kg ha -1 kg ha -1 Dyna-Gro 9701 0.34 1277 6657 179 1815 5850 163 1748 6187 147 4875
Pioneer 26R41 0.32 1210 6859 187 1681 5918 169 1546 5850 143 4306
Pioneer 26R59 0.35 1345 6590 175 1883 5850 172 1883 6321 149 4768
AgriMAXX 473 0.32 1210 6859 187 1681 5918 169 1546 5850 143 4597
AgriMAXX 474 0.31 1210 6994 191 1614 5985 173 1479 5716 142 4072
AGS 2024 0.34 1277 6657 179 1815 5850 162 1748 6187 149 5211
AP 1882 0.32 1210 6859 187 1681 5918 169 1546 5850 143 3667
FSVA 258 0.3 1210 7128 197 1546 5985 175 1345 5581 140 4371
Gerard 557 0.34 1277 6657 179 1815 5850 162 1748 6187 147 3994
Hilliard 0.37 1345 6456 152 1950 5850 153 2084 6725 153 4323
SH 4300 0.31 1210 6994 171 1614 5985 172 1479 5716 142 3781
SH 7200 0.34 1277 6657 170 1815 5850 162 1748 6187 147 5427
SRW 8550 0.35 1345 6590 176 1883 5850 159 1883 6321 149 4780
USG 3536 0.35 1345 6590 176 1883 5850 159 1883 6321 149 4508
USG 3895 0.35 1345 6590 176 1883 5850 159 1883 6321 149 4335
† NDVI: Normalized Difference Vegetative Index ‡ FP: Farmer practice plot; 33.6 kg ha-1 of nitrogen at planting
⸷ YP0: Yield potential without additional nitrogen ⸸ YPN: Yield potential with recommended nitrogen addition
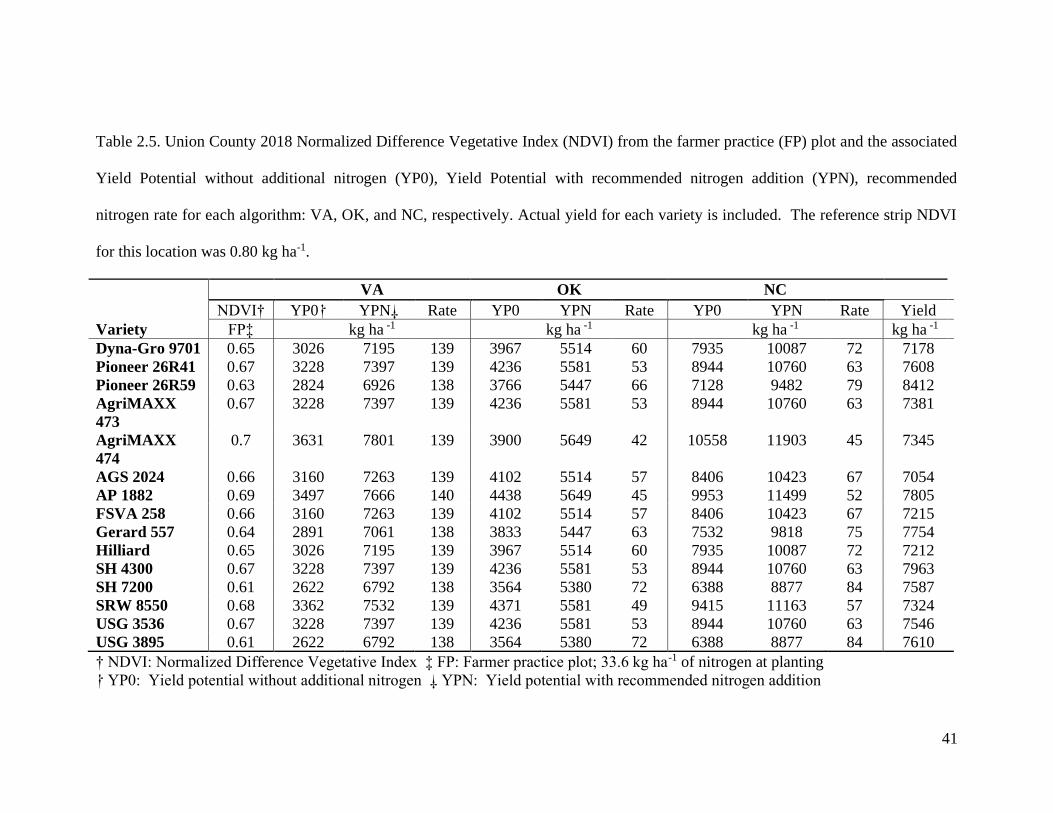
41
Table 2.5. Union County 2018 Normalized Difference Vegetative Index (NDVI) from the farmer practice (FP) plot and the associated
Yield Potential without additional nitrogen (YP0), Yield Potential with recommended nitrogen addition (YPN), recommended
nitrogen rate for each algorithm: VA, OK, and NC, respectively. Actual yield for each variety is included. The reference strip NDVI
for this location was 0.80 kg ha-1.
VA OK NC
NDVI† YP0⸷ YPN⸸ Rate YP0 YPN Rate YP0 YPN Rate Yield
Variety FP‡ kg ha -1 kg ha -1 kg ha -1 kg ha -1 Dyna-Gro 9701 0.65 3026 7195 139 3967 5514 60 7935 10087 72 7178
Pioneer 26R41 0.67 3228 7397 139 4236 5581 53 8944 10760 63 7608
Pioneer 26R59 0.63 2824 6926 138 3766 5447 66 7128 9482 79 8412
AgriMAXX
473
0.67 3228 7397 139 4236 5581 53 8944 10760 63 7381
AgriMAXX
474
0.7 3631 7801 139 3900 5649 42 10558 11903 45 7345
AGS 2024 0.66 3160 7263 139 4102 5514 57 8406 10423 67 7054
AP 1882 0.69 3497 7666 140 4438 5649 45 9953 11499 52 7805
FSVA 258 0.66 3160 7263 139 4102 5514 57 8406 10423 67 7215
Gerard 557 0.64 2891 7061 138 3833 5447 63 7532 9818 75 7754
Hilliard 0.65 3026 7195 139 3967 5514 60 7935 10087 72 7212
SH 4300 0.67 3228 7397 139 4236 5581 53 8944 10760 63 7963
SH 7200 0.61 2622 6792 138 3564 5380 72 6388 8877 84 7587
SRW 8550 0.68 3362 7532 139 4371 5581 49 9415 11163 57 7324
USG 3536 0.67 3228 7397 139 4236 5581 53 8944 10760 63 7546
USG 3895 0.61 2622 6792 138 3564 5380 72 6388 8877 84 7610
† NDVI: Normalized Difference Vegetative Index ‡ FP: Farmer practice plot; 33.6 kg ha-1 of nitrogen at planting
⸷ YP0: Yield potential without additional nitrogen ⸸ YPN: Yield potential with recommended nitrogen addition
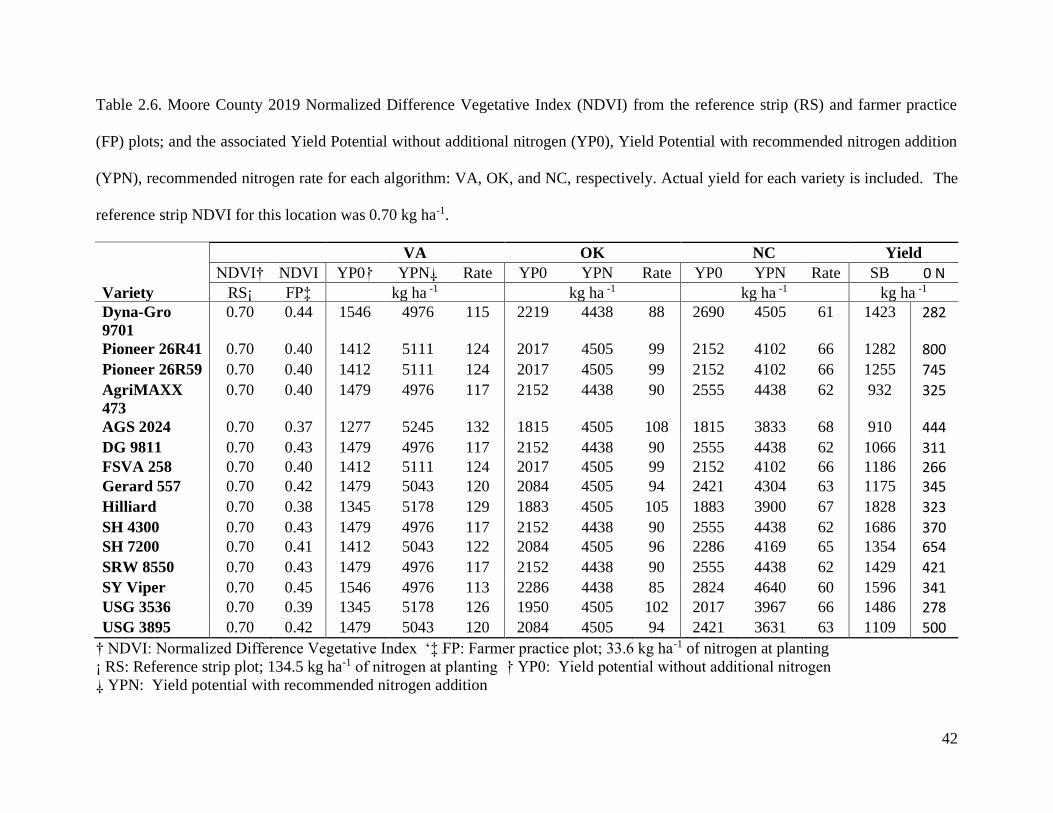
42
Table 2.6. Moore County 2019 Normalized Difference Vegetative Index (NDVI) from the reference strip (RS) and farmer practice
(FP) plots; and the associated Yield Potential without additional nitrogen (YP0), Yield Potential with recommended nitrogen addition
(YPN), recommended nitrogen rate for each algorithm: VA, OK, and NC, respectively. Actual yield for each variety is included. The
reference strip NDVI for this location was 0.70 kg ha-1.
VA OK NC Yield
NDVI† NDVI YP0⸷ YPN⸸ Rate YP0 YPN Rate YP0 YPN Rate SB 0 N Variety RS¡ FP‡ kg ha -1 kg ha -1 kg ha -1 kg ha -1 Dyna-Gro
9701
0.70 0.44 1546 4976 115 2219 4438 88 2690 4505 61 1423 282
Pioneer 26R41 0.70 0.40 1412 5111 124 2017 4505 99 2152 4102 66 1282 800
Pioneer 26R59 0.70 0.40 1412 5111 124 2017 4505 99 2152 4102 66 1255 745
AgriMAXX
473
0.70 0.40 1479 4976 117 2152 4438 90 2555 4438 62 932 325
AGS 2024 0.70 0.37 1277 5245 132 1815 4505 108 1815 3833 68 910 444
DG 9811 0.70 0.43 1479 4976 117 2152 4438 90 2555 4438 62 1066 311 FSVA 258 0.70 0.40 1412 5111 124 2017 4505 99 2152 4102 66 1186 266 Gerard 557 0.70 0.42 1479 5043 120 2084 4505 94 2421 4304 63 1175 345
Hilliard 0.70 0.38 1345 5178 129 1883 4505 105 1883 3900 67 1828 323
SH 4300 0.70 0.43 1479 4976 117 2152 4438 90 2555 4438 62 1686 370 SH 7200 0.70 0.41 1412 5043 122 2084 4505 96 2286 4169 65 1354 654
SRW 8550 0.70 0.43 1479 4976 117 2152 4438 90 2555 4438 62 1429 421
SY Viper 0.70 0.45 1546 4976 113 2286 4438 85 2824 4640 60 1596 341 USG 3536 0.70 0.39 1345 5178 126 1950 4505 102 2017 3967 66 1486 278 USG 3895 0.70 0.42 1479 5043 120 2084 4505 94 2421 3631 63 1109 500
† NDVI: Normalized Difference Vegetative Index ‘‡ FP: Farmer practice plot; 33.6 kg ha-1 of nitrogen at planting
¡ RS: Reference strip plot; 134.5 kg ha-1 of nitrogen at planting ⸷ YP0: Yield potential without additional nitrogen
⸸ YPN: Yield potential with recommended nitrogen addition

43
Table 2.7. Union County 2019 Normalized Difference Vegetative Index (NDVI) and associated Yield Potential without additional
nitrogen (YP0), Yield Potential with recommended nitrogen addition (YPN), recommended nitrogen rate for each algorithm: VA, OK,
and NC, respectively. Actual yield for each variety is included. The reference strip NDVI range for this location was 0.59 to 0.72 kg
ha-1.
VA OK NC Yield
NDVI† NDVI YP0⸷ YPN⸸ Rate YP0 YPN Rate YP0 YPN Rate SB 0 N Variety RS¡ FP‡ kg ha -1 kg ha -1 kg ha -1 kg ha -1 Dyna-Gro
9701
0.67 0.61 3160 6456 108 4035 4573 23 8070 10222 72 6161 4799
Pioneer 26R41 0.60 0.56 2622 5985 111 3429 3833 15 6052 7464 46 6291 4552 Pioneer 26R59 0.70 0.6 3093 6321 108 3900 4976 42 7733 10760 103 6891 5075 AgriMAxx
473
0.59 0.63 3429 6725 107 4304 3833 -15 9213 9280 1 4458 4573
AGS 2024 0.73 0.6 3093 6321 108 3900 5380 59 7733 8742 34 5570 4008 DG 9811 0.68 0.61 3228 6456 108 4035 4842 31 8271 10894 86 6368 4678 FSVA 258 0.70 0.60 3093 6388 108 3967 5043 43 7868 9146 44 6881 5384 Gerard 557 0.72 0.61 3228 6456 108 4035 5178 44 8204 10625 79 5805 5271 Hilliard 0.69 0.60 3093 6388 108 3967 4842 35 7868 10692 94 6723 4686 SH 4300 0.65 0.59 2959 6254 109 3766 4371 24 7263 9280 68 6772 5225 SH 7200 0.72 0.59 3026 6321 109 3900 5111 49 7599 11029 114 6737 4875 SRW 8550 0.61 0.61 3160 6456 108 4035 3967 -1 8204 9011 26 6353 5136 SY Viper 0.61 0.59 2959 6254 109 3766 3967 6 7263 8406 39 6424 4681 USG 3536 0.65 0.62 3295 6523 108 4102 4438 13 8473 10154 56 3769 5016 USG 3895 0.67 0.58 2824 6119 109 3698 4573 36 6859 9415 86 6278 4724
† NDVI: Normalized Difference Vegetative Index ‡ FP: Farmer practice plot; 33.6 kg ha-1 of nitrogen at planting¡ RS: Reference
strip plot; 134.5 kg ha-1 of nitrogen at planting ⸷ YP0: Yield potential without additional nitrogen
⸸ YPN: Yield potential with recommended nitrogen addition
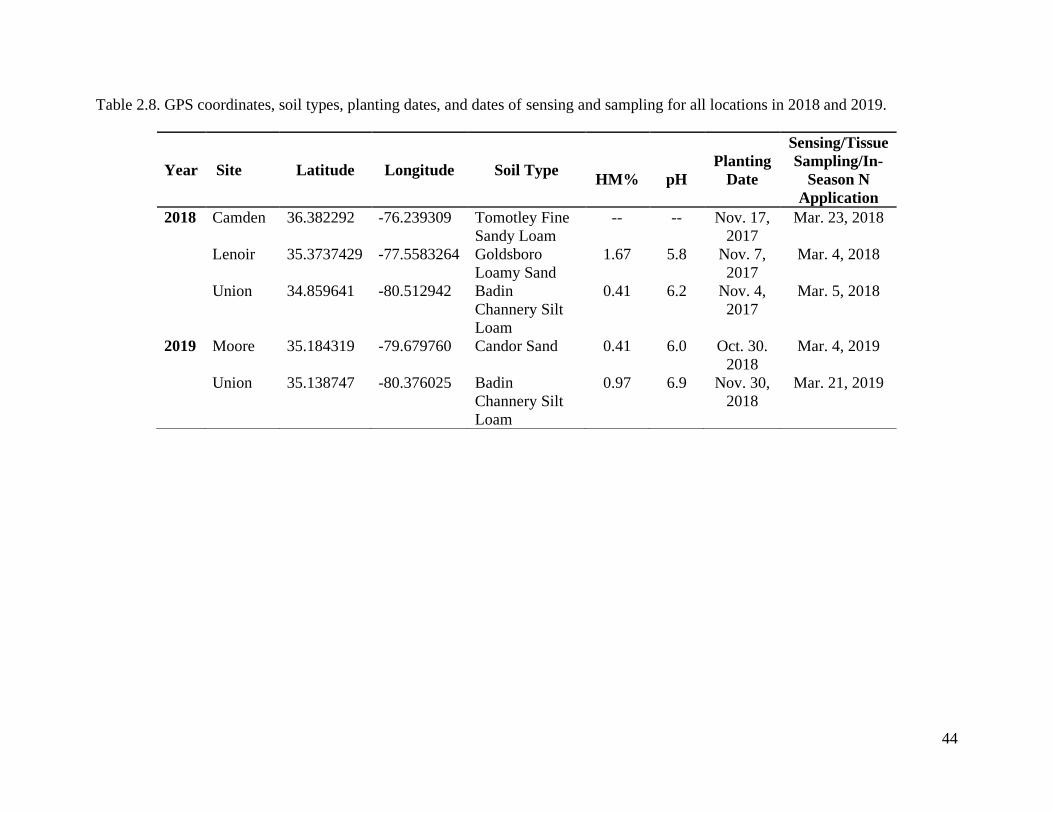
44
Table 2.8. GPS coordinates, soil types, planting dates, and dates of sensing and sampling for all locations in 2018 and 2019.
Year Site Latitude Longitude Soil Type
HM%
pH
Planting
Date
Sensing/Tissue
Sampling/In-
Season N
Application
2018 Camden 36.382292 -76.239309 Tomotley Fine
Sandy Loam
-- -- Nov. 17,
2017
Mar. 23, 2018
Lenoir 35.3737429 -77.5583264 Goldsboro
Loamy Sand
1.67 5.8 Nov. 7,
2017
Mar. 4, 2018
Union 34.859641 -80.512942 Badin
Channery Silt
Loam
0.41 6.2 Nov. 4,
2017
Mar. 5, 2018
2019 Moore 35.184319 -79.679760 Candor Sand 0.41 6.0 Oct. 30.
2018
Mar. 4, 2019
Union 35.138747 -80.376025 Badin
Channery Silt
Loam
0.97 6.9 Nov. 30,
2018
Mar. 21, 2019
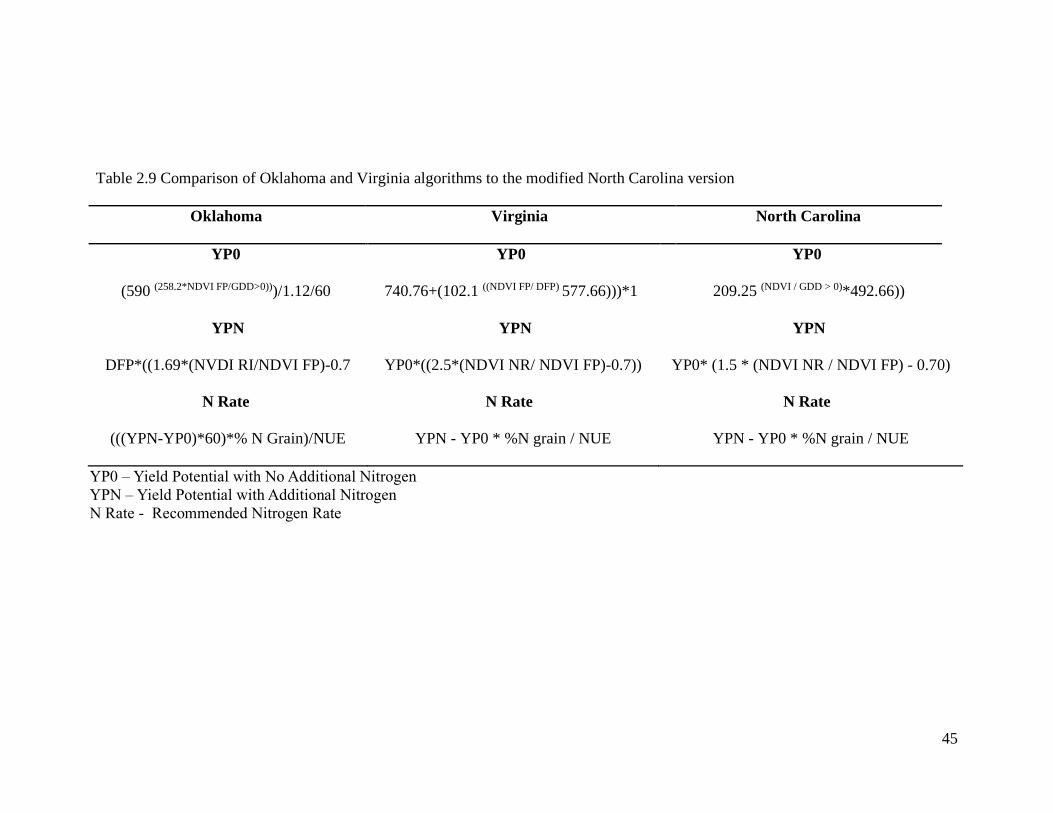
45
Table 2.9 Comparison of Oklahoma and Virginia algorithms to the modified North Carolina version
Oklahoma Virginia North Carolina
YP0
(590 (258.2*NDVI FP/GDD>0)))/1.12/60
YP0
740.76+(102.1 ((NDVI FP/ DFP) 577.66)))*1
YP0
209.25 (NDVI / GDD > 0)*492.66))
YPN
DFP*((1.69*(NVDI RI/NDVI FP)-0.7
YPN
YP0*((2.5*(NDVI NR/ NDVI FP)-0.7))
YPN
YP0* (1.5 * (NDVI NR / NDVI FP) - 0.70)
N Rate
(((YPN-YP0)*60)*% N Grain)/NUE
N Rate
YPN - YP0 * %N grain / NUE
N Rate
YPN - YP0 * %N grain / NUE
YP0 – Yield Potential with No Additional Nitrogen
YPN – Yield Potential with Additional Nitrogen
N Rate - Recommended Nitrogen Rate
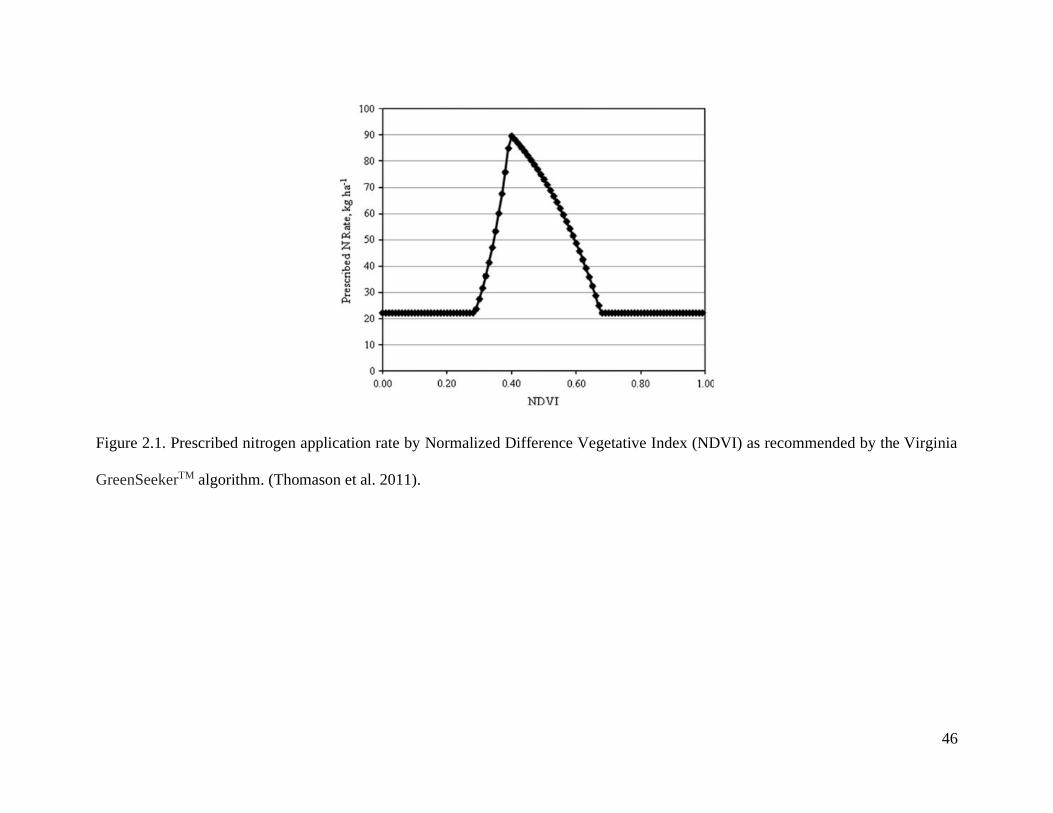
46
Figure 2.1. Prescribed nitrogen application rate by Normalized Difference Vegetative Index (NDVI) as recommended by the Virginia
GreenSeekerTM algorithm. (Thomason et al. 2011).

47
Figure 2.2. Percentage of nitrogen in the wheat tissue for all 15 varieties at Moore County in 2019 by nitrogen application rate
measured before (x) and after (●) application of nitrogen.
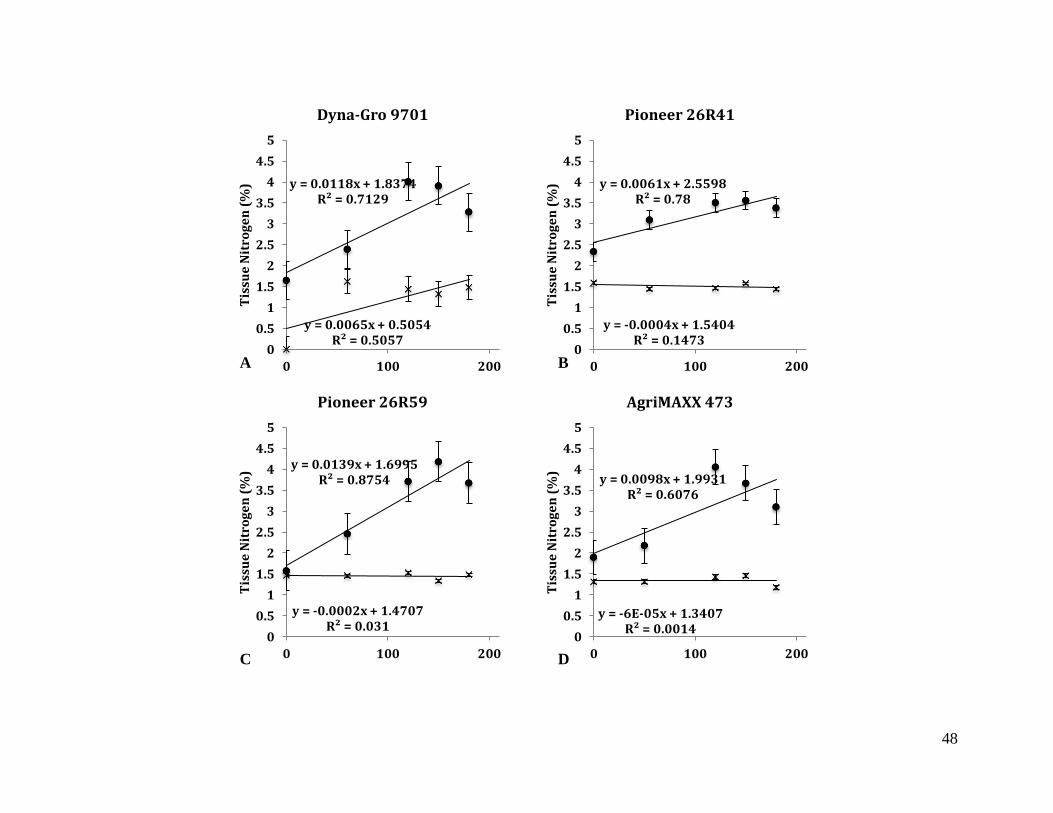
48
y = 0.0065x + 0.5054R² = 0.5057
y = 0.0118x + 1.8374R² = 0.7129
0
0.5
1
1.5
2
2.5
3
3.5
4
4.5
5
0 100 200
Tis
sue
Nit
rog
en
(%
)
Dyna-Gro 9701
y = -0.0004x + 1.5404R² = 0.1473
y = 0.0061x + 2.5598R² = 0.78
0
0.5
1
1.5
2
2.5
3
3.5
4
4.5
5
0 100 200
Tis
sue
Nit
rog
en
(%
)
Pioneer 26R41
y = -0.0002x + 1.4707R² = 0.031
y = 0.0139x + 1.6995R² = 0.8754
0
0.5
1
1.5
2
2.5
3
3.5
4
4.5
5
0 100 200
Tis
sue
Nit
rog
en
(%
)
Pioneer 26R59
y = -6E-05x + 1.3407R² = 0.0014
y = 0.0098x + 1.9931R² = 0.6076
0
0.5
1
1.5
2
2.5
3
3.5
4
4.5
5
0 100 200
Tis
sue
Nit
rog
en
(%
)
AgriMAXX 473
B A
C D
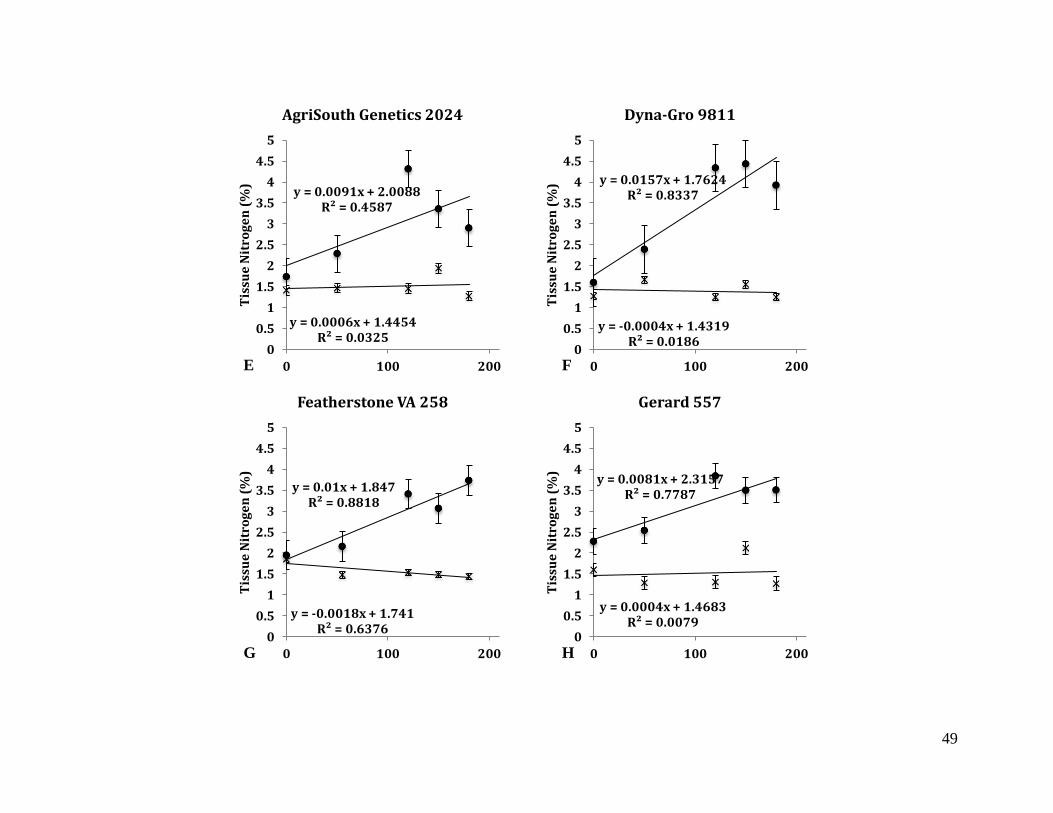
49
y = 0.0006x + 1.4454R² = 0.0325
y = 0.0091x + 2.0088R² = 0.4587
0
0.5
1
1.5
2
2.5
3
3.5
4
4.5
5
0 100 200
Tis
sue
Nit
rog
en
(%
)
AgriSouth Genetics 2024
y = -0.0004x + 1.4319R² = 0.0186
y = 0.0157x + 1.7624R² = 0.8337
0
0.5
1
1.5
2
2.5
3
3.5
4
4.5
5
0 100 200
Tis
sue
Nit
rog
en
(%
)
Dyna-Gro 9811
y = -0.0018x + 1.741R² = 0.6376
y = 0.01x + 1.847R² = 0.8818
0
0.5
1
1.5
2
2.5
3
3.5
4
4.5
5
0 100 200
Tis
sue
Nit
rog
en
(%
)
Featherstone VA 258
y = 0.0004x + 1.4683R² = 0.0079
y = 0.0081x + 2.3157R² = 0.7787
0
0.5
1
1.5
2
2.5
3
3.5
4
4.5
5
0 100 200
Tis
sue
Nit
rog
en
(%
)
Gerard 557
F E
G H
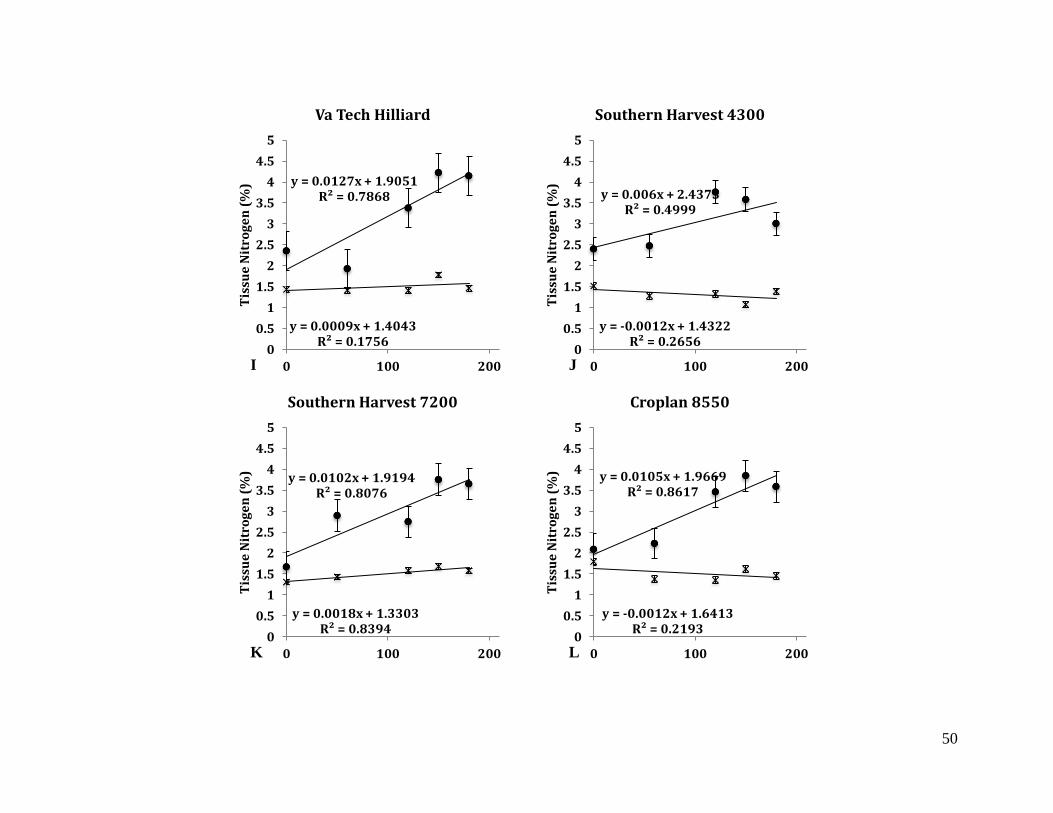
50
y = 0.0009x + 1.4043R² = 0.1756
y = 0.0127x + 1.9051R² = 0.7868
0
0.5
1
1.5
2
2.5
3
3.5
4
4.5
5
0 100 200
Tis
sue
Nit
rog
en
(%
)
Va Tech Hilliard
y = -0.0012x + 1.4322R² = 0.2656
y = 0.006x + 2.4373R² = 0.4999
0
0.5
1
1.5
2
2.5
3
3.5
4
4.5
5
0 100 200
Tis
sue
Nit
rog
en
(%
)
Southern Harvest 4300
y = 0.0018x + 1.3303R² = 0.8394
y = 0.0102x + 1.9194R² = 0.8076
0
0.5
1
1.5
2
2.5
3
3.5
4
4.5
5
0 100 200
Tis
sue
Nit
rog
en
(%
)
Southern Harvest 7200
y = -0.0012x + 1.6413R² = 0.2193
y = 0.0105x + 1.9669R² = 0.8617
0
0.5
1
1.5
2
2.5
3
3.5
4
4.5
5
0 100 200
Tis
sue
Nit
rog
en
(%
)
Croplan 8550
J I
K L

51
y = 0.0001x + 1.4477R² = 0.0137
y = 0.0086x + 2.1823R² = 0.8998
0
0.5
1
1.5
2
2.5
3
3.5
4
4.5
5
0 100 200
Tis
sue
Nit
rog
en
(%
)
Syngenta Viper
y = -0.0002x + 1.5374R² = 0.0366
y = 0.0128x + 2.0708R² = 0.8766
0
0.5
1
1.5
2
2.5
3
3.5
4
4.5
5
0 100 200
Tis
sue
Nit
rog
en
(%
)
UniSouth Genetics 3895
y = 0.0012x + 1.2556R² = 0.3229
y = 0.0048x + 2.4329R² = 0.3953
0
0.5
1
1.5
2
2.5
3
3.5
4
4.5
5
0 100 200
Tis
sue
Nit
rog
en
(%
)UniSouth Genetics 3536
N M
O

52
Chapter III: The Effects of Variety and Nitrogen Management on Yield and Nitrogen Use
Efficiency of Soft Red Winter Wheat
ABSTRACT
Soft red winter wheat’s demand for nitrogen varies depending on management practices
and seasonal weather conditions. This study was conducted to examine the varietal and regional
differences to increasing nitrogen rates compared to sensor-based rates. The effects of yield, test
weight, partial factor productivity and nitrogen use efficiency were investigated in Camden,
Lenoir, Moore, and Union Counties in North Carolina between 2017-2019. Union County was
the only location both years that showed significant differences when evaluating yield, partial
factor productivity, and nitrogen use efficiency. Varieties responded to differing amounts of
nitrogen in various ways depending on region grown, year, and seasonal weather. Some
increased in yield as additional nitrogen was applied while others yielded consistent no matter
how much or how little nitrogen was applied. Dyna-Gro 9701 and 9811, Pioneer 26R59,
AgriMAXX 473 and 474, VA Tech Hilliard, UniSouth Genetics 3895, and Syngenta Viper
continued to increase in yield as more N was applied. Varieties Featherstone VA 258, Gerard
557, Southern Harvest 4300, and Harvey’s AP 1882 produced similar yield regardless of the N
rate. With some varieties, the greatest yield was observed at lower rates. This information can be
imperative to growers across North Carolina as they make management decisions on variety and
nitrogen usage based on their environmental conditions and yield goal expectations.
53
INTRODUCTION
Nitrogen
Modern wheat production requires efficient and sustainable management practices to
increase wheat yield and promote environmentally sound Nitrogen (N) fertilizer strategies
(Fageria and Baligar, 2005). Wheat is often responsive to management intensification strategies
that are necessary to minimize loss of N into the environment while still supplying wheat with an
optimum rate for growth (Fageria et al., 2003a). Nitrogen fertilizer is applied based on growth
stage (Zadoks et al., 1974). An increase in Nitrogen Use Efficiency (NUE) is crucial for
maximum yields, quality wheat, environmental considerations, and economically feasible
practices (Campbell et al., 1995; Grant et al., 2002). Moll et al., (1982) defined NUE as grain
yield per unit of N available through soil and fertilizer N.
Improving NUE while also meeting demands for nutrients, requires an appropriate
fertilizer program consisting of an appropriate source of N as well as a proper rate and timing
combination (Fageria and Baligar, 2005). The most common method to determine in-season N
need or to identify deficiency is plant tissue analysis, which is not immediate and is more labor
intensive than remote sensing (Baethgen and Alley, 1989a; Flowers et al., 2003). Keeney (1982)
suggests that to increase N use efficiency, N needs to be supplied as needed throughout the
season so as to reduce the chance of N loss through leaching. Alley et al. (1996) found that N
applied to the wheat crop at growth stage 25 based on tiller density, and growth stage 30 based
on tissue testing, optimized N concentrations in wheat biomass (Alley et al., 1996). However,
Cassman et al. (2002) point out/argue that this idea is neither cost effective nor practical for in-
season management of N. The wheat crop should have all N needs supplied by Zadoks growth
stage 30 to optimize yield and maximize NUE (Baethgen and Alley, 1989b; Russelle et al.,
54
1981; Welch et al., 1971).
Wheat crop demand for N varies season-to-season depending on management practices
and weather (Gastal and Lemaire, 2002). Available nutrients, soil type, and plant biomass can
change across gradients in a field (Raun and Johnson, 1999). However, producers often rely
heavily on their highest yielding areas of a field to determine a yield goal, which leads to higher
than necessary N application rates in less productive areas (Goos and Prunity, 1990; Schepers
and Mosier, 1991). Applying a high rate of N in a uniform application does not take in to account
spatial variability within the field (Inman et al., 2005). Growers need a tool that addresses the
spatial variability of in-season crop needs across a field to help determine a more site-specific N
rate to meet the needs of wheat and reduce N loss from areas requiring less N in the field (Hong
et al., 2007).
In Oklahoma, Stone et al. (1996) found that a sensor, which uses normalized difference
vegetative index (NDVI), could be used to detect differences across a field down to 1 m2 and
specific fields can be managed accordingly with N fertilizer. In the mid-Atlantic region of the
United States, Baethgen and Alley (1989a) studied N uptake response, calculated by multiplying
the N concentration in the tissue by the dry matter production, for different application timings
and rates. Results of this study showed differences in seasonal weather characteristics over the 2
years, which corresponded with differences in N uptake amount and pattern (Baethgen and
Alley, 1989a). Raun and Johnson (1999) found that only about 33% of N worldwide is recovered
in cereal grain production resulting in $15.9 billion loss every year from N fertilizer additions
alone.
Assessing the N supply of the soil through pre-plant soil tests has become an important
tool; however, N recommendations based on pre-plant soil tests often are not accurate at the time
55
of application due to continued N transformations and transport (Cui et al., 2009). The complex
nature of N transformations (e.g. mineralization, immobilization) in soils and poor management
practices can lead to low NUE (Raun and Johnson, 1999). Different forms of plant available
nitrogen such as ammonium (NH4+) and nitrate (NO3
-) can have effects on the N use efficiency
(Thomason et al., 2002). According to Pan (2001) the crop used only 25% of the N fertilizer, the
soil accumulated 25-45%, and 30-50% is lost to the environment in a study of an intensive
wheat-maize system.
Genetic Variability
Field experiments testing genetic variability in cereal production have shown differences
in N uptake based on genotype (Löffler et al., 1985; Van Sanford and MacKown, 1986; Fossati
et al., 1993). Different cultivars within a species as well as differences among crop species have
shown differences in N utilization (Moll and Kamprath, 1977; Pollmer et al., 1979; Reed et al.,
1980; Traore and Maranville, 1999). To a grower, planting a N-efficient cultivar is a beneficial
strategy for reducing the cost of fertilization while maintaining a crop yield (Fageria and Baligar,
2005).
Wheat varieties with higher N use efficiency offer a lower risk of N loss into the
environment (Baligar et al., 2001). However, a wheat cultivar that accumulates N early does not
always result in a higher N use efficiency (Cox et al., 1985). Van Sanford and MacKown (1985)
studied variation in NUE among soft red winter wheat genotypes in the Southeast region of the
United States and showed significant variation among genotypes. The results from the Van
Sanford and MacKown (1985) study are broken down into NUE for yield (NUEY) and NUE for
protein (NUEP) for 25 soft red winter wheat genotypes. The NUEY is the ratio of the grain dry

56
weight harvested per unit fertilizer nitrogen supplied to the wheat crop. The NUEY varied from
42.5 to 68.3 (Van Sanford and MacKown, 1985).
In North Carolina N rates need to be studied on a varietal specific basis as well as a
regional basis to determine independent nature of yield and yield response based on location,
year, and variety. Often, production guides provide a general discussion on the management of a
wheat crop; however, less so on the specific geographic information, except that related to
planting date and maturity dates. To accurately manage N and improve its use-efficiency in
wheat for North Carolina, additional site-specific information related to N fertility inputs in
differing environments is needed.
In North Carolina, the South Central region consisting of Union, Robeson, and Stanly
counties and the Northeastern region consisting of Perquimans, Beaufort, Tyrell, and Pasquotank
counties have made up on average 25% of NC wheat production over the last 5 years and
generally harvest 120,000 acres annually combined. Wheat management in these two regions
differs from each other and also differs from the remainder of the state. However, little peer-
reviewed information exists to guide these producers on how to adjust management practices in-
season to maximize N use and ultimately, wheat yield. The main objectives for this research
were to (1) examine the variety specific response to N and compare sensor-based rates with the
standard nitrogen rate recommendation for 15 high-yielding varieties grown in North Carolina,
(2) test different nitrogen recommendation strategies by variety, region of production, and
grower production yield goals, and (3) improve the precision of nitrogen applications in wheat
using GreenSeekerTM technology to more efficiently utilize nitrogen
57
MATERIALS AND METHODS
Fifteen top yielding varieties from the North Carolina Official Variety Testing (OVT)
Program from 2017 were evaluated in a split-plot design with whole plot being nitrogen (N) rate
and sub-plot being variety to identify variety-specific responses to different nitrogen treatment
levels. For the 2017-2018 growing season replicated trials took place at three locations in North
Carolina (NC); Camden, Lenoir, and Union Counties. Plots were 1.5 meters wide and 8.5 meters
long, seeded at a rate of 5.16 million seed per ha-1. Nitrogen treatments in 2018 included 100.88
kg ha-1, 134.5 kg ha-1, 168.13 kg ha-1 and a variety-specific, sensor-based rate. Initially, 33.63 kg
ha-1 of 32 percent urea ammonium nitrate (UAN) was applied at planting with a backpack and
sprayer utilizing Streamjet SJ7 fertilizer nozzles and the remainder prior to Zadoks growth stage
(GS) 30 in one spring application. In 2019, the total N rates were 0 kg ha-1, 134.5 kg ha-1, 168.13
kg ha-1, 201.75 kg ha-1 and variety-specific, sensor-based rate using 30 percent UAN. All sites
received herbicide and fungicide as necessary using commercially available pesticides. All
locations had 1-meter row tissue samples taken from the third row in each plot just prior to
Zadoks growth stage (GS) 30. Waters Agricultural Laboratories, Inc. in Warsaw, North Carolina
analyzed the samples for nutrient content. On the same date as tissue sampling, each plot was
also evaluated using a GreenSeekerTM Sensor (Trimble, Sunnyvale, CA). The GreenSeekerTM
Sensor measures the light reflectance of the wheat canopy and provides the user with a
Normalized Difference Vegetative Index (NDVI). NDVI was used in conjunction with an
algorithm modified specifically for North Carolina growing conditions and a Nitrogen Rich Strip
(NRS) to support in-season nitrogen recommendations for individual varieties at each location.
In 2018, the NRS was applied at planting across the wheat field, planted by the cooperator
surrounding the trial area. The NRS was applied in a direction at each location that captured the
58
maximum amount of variability within that particular field (soil type, slope, etc.). In 2019, the
NRS was placed in two additional replications of each of the 15 varieties where the
GreenSeekerTM sensor was used to compare the NDVI from the NRS to the variety-specific plot
to form in-season nitrogen recommendations. Locations were harvested with a Wintersteiger
Delta small plot combine (Wintersteiger, Salt Lake, Utah). Harvest moisture, test weight, and
grain weight were collected per plot using a HarvestMaster Classic (Juniper Systems, Logan,
Utah). Data were analyzed in SAS 9.4 using PROC GLIMMIX at p<0.05 (SAS Institute Cary,
NC).
RESULTS
Grain Yield x (Nitrogen Rate x Variety)
The interaction between nitrogen rate and variety was significant in Union County, both
in 2018 and 2019 in yield and total nitrogen rate (Table 3.1). In 2018 Camden and Lenoir
Counties were not significant. In 2019, Moore County was not significant.
In 2018, when comparing LSMEANS, Pioneer 26R59 yielded higher in 21 comparisons
at the same N rate and 28 combinations of varieties by a higher N rate (Table 3.12). AgriMaxx
474 was estimated a higher yield than 25 combinations of variety by similar nitrogen rate and 17
combinations of varieties with a higher N rate. Southern Harvest 4300 was estimated a higher
yield than 11 varieties by similar nitrogen rate combinations and nine combinations of variety
with a higher N rate. In 2019, Featherstone VA 258 was estimated a higher yield than 12
combinations of variety by similar nitrogen rate and seven combinations of variety with a higher
nitrogen rate. Syngenta Viper was estimated a higher yield than eight combinations of variety by
similar nitrogen rate. Dyna-Gro 9811 was estimated a higher yield than nine combinations of
59
variety by similar N rate and two varieties at a higher N rate. Hilliard behaved similarly with a
higher yield than six combinations of variety by similar nitrogen rate and three combinations of
varieties at higher N rates. CROPLAN 8550 also behaved similarly across both years with a
higher yield than four combinations of variety by similar nitrogen rate and one combination of
variety at a higher N rate.
Average yield by variety by N rate interaction are shown in tables 3.6 through table 3.9.
Camden and Lenoir County locations responded similarly, with 12 of 15 varieties yielding
highest with the sensor-based rate and three yielding highest at the 168 kg ha-1 N rate. In Union
County, two varieties yielded highest at the sensor-based N rate in both years, Gerard 557 and
Southern Harvest 7200 in 2018 and Southern Harvest 4300 and 7200 in 2019. The 168 kg N ha-1
resulted in the highest yield in ten varieties in 2018 and six in 2019. In 2018, three of 15
varieties yielded highest at a N rate of 134 kg ha-1. In 2019, 201 kg N ha-1 resulted in a higher
yield in seven varieties.
Test Weight x (Nitrogen Rate x Variety)
The test weight by nitrogen rate interaction was not significant at any location in 2018 or
2019. (Table 3.2)
Partial Factor Productivity x (Nitrogen Rate x Variety)
Partial factor productivity (PFP) by nitrogen rate interaction was significant at Union
County in 2018. However, the same interaction was not significant at Camden or Lenoir counties
in the same year (Table 3.3).
Camden had a higher PFP in 14 of 15 varieties at 134 kg N ha-1 and one variety at 168 kg
N ha-1. Lenoir was similar with 12 out of 15 performing higher at 134 kg ha-1, two at 168 kg ha-1
and one at the sensor-based rate. Eight of 15 varieties at Union had a higher PFP at 134 kg ha-1
60
and six at the sensor-based rate. Pioneer 26R41, in Union had a sensor-based N rate that was
equivalent to the 134 kg N ha-1 rate that resulted in having the same PFP (Table 3.10).
Nitrogen Use Efficiency x (Nitrogen Rate x Variety)
Nitrogen Use Efficiency (NUE) was examined in 2019 with the addition of a zero kg ha-1
N rate. The nitrogen use efficiency (NUE) by nitrogen rate interaction was significant at Union
County in 2019 but not in Moore County (Table 3.4). In Moore County (Table 3.5) the sensor-
based N rate resulted in the highest NUE in seven of the variety and N rate combinations, 134 kg
ha-1 N resulted in four, and 168 kg ha-1 N resulted in six. Featherstone VA had the same NUE at
134 and 168 kg ha-1 N while Southern Harvest 7200 had the same NUE at 134 kg ha-1 N and the
sensor-based N rate. In Union County, ten of the sensor-based N rates resulted in the highest
NUE, five at the 134 kg ha-1 N, three at the 168 kg ha-1 N, and one at the 201 kg ha-1 N. Dyna-
Gro 9701 resulted in the same NUE at 134 kg ha-1 N and the sensor based rate, Pioneer 26R59
resulted in the same NUE at 134 kg ha-1 N, 168 kg ha-1 N, and the sensor based rate, and Hilliard
resulted in the same NUE at 134 kg ha-1 N and the sensor based rate.
DISCUSSION
Genetic Variability in Nitrogen Use Efficiency
The higher the NUE, the lower the nitrogen loss into the environment, which is
particularly important in higher yielding environments where N fertilization is higher (Mansour
et al., 2017). Ten of fifteen lines in Union County in 2019 had their highest nitrogen use
efficiencies under the sensor-based N rate. These findings support the use of a sensor-based
nitrogen rate recommendation in high-yielding environments like Union County North Carolina.
Previous research supports this finding (Foulkes et al., 2009; Li et al., 2009; Barracough et al.,

61
2010; Garnett et al., 2015; and Mansour et al., 2017). Tinker & Widdowson (1982) found that
higher yield and improved NUE’s can be attributed to genetic improvements in varieties.
Genetic Variability in Yield
Using varieties that are able to recover and utilize a greater amount of N from the soil to
increase yield is important, both economically and environmentally (Mansour et al., 2017).
Evaluating traits associated with yield and NUE on a variety-specific basis are beneficial for
plant breeders, agronomists, and growers when selecting high yielding varieties that perform
well based on environment (Mansour et al., 2017). Both low and high yielding environments
exist for winter wheat in North Carolina and need to be evaluated separately. Building N
response curves by genotype could be useful in determining a favorable environment under
different N rates. Mansour et al. (2017) studied variation in 16 genotypes of spring wheat
assessing differences in NUE and yield over a range of five N levels and similar results were
found.
AGSouth Genetics 2024 (Figure 3.1 I) and Featherstone VA 258 (Figure 3.1 K)
performed similarly in Union County in 2018 to Pioneer 26R41 (Figure 3.1 B) in Moore County
with the 134 kg ha-1 N resulting in a higher yield than all other N. Lenoir had three, Union in
2019 had six, and Moore had nine varieties that all performed similarly at a N rate of 168 kg ha-1
resulting in a higher yield than all other N rates when 168 kg ha-1 was not the highest rate applied
to that variety. These finding support that certain genotypes can provide a similar or higher yield
at a lower N rate in certain environments. Growers in environments where higher N rates are not
preferred may want to choose a variety that can perform just as well under lower fertilization.
Pioneer 26R41 yielded higher at lower N rates in both years at three locations; however, two
locations were at the higher N rate of 168 kg ha-1 while one location was at the lower N rate of

62
134 kg ha-1(Figure 3.1A & 1B). Featherstone VA 258 was at a N rate of 134 kg ha-1 at Union in
2018 (Figure 3.1K) and at 168 kg ha-1 in 2019 (Figure 3.1 L) at Moore when it outperformed
other N rates. Varieties AgriMAXX 473, CROPLAN 8550, Uni-South Genetics 3536, and Uni-
South Genetics 3895 yielded more at 168 kg N ha-1 than higher N rates at both locations in 2019.
These varieties show the possibility of reducing the amount of N needed to achieve the same
yield. At Union, in both years, each had one variety perform similarly to nine other varieties at
Camden where the sensor-based rate, which was not the highest N rate applied, outperformed all
other N rates. Depending on grain and fertilizer prices the optimum economic return for the
grower probably lies within the use of one of these varieties and N rate combinations where a
equal or higher yield is achieved using a lower N rate.
Contrastingly, one variety in Union 2019 performed similarly to ten varieties at Lenoir
where the sensor-based rate, which was the highest N rate applied, outperformed all other N
rates. In this situation, the yield continued to increase as the N rate increased and never met a
maximum yield potential for that particular variety, year, and location. These varieties are
considered highly responsive to N and could be recommended to growers in both low and high
yielding environments. Barraclough et al. (2010) found, in order to improve N fertilizer
management practices, the N supply needs to meet the crop demand and seasonal weather
conditions. The differences in variety performance in Union between years can be attributed to
seasonal weather differences and planting date differences (Table 3.11).
In 2018, ten varieties in Union, and three varieties each in Camden and Lenoir never
reached top yield potential, continuing to increase in yield as more N was applied. In 2019,
seven varieties at Union and five at Moore performed similarly. In 2018, AgriMAXX 474 never
reached maximum yield potential at any location even at the highest N rates (Figure 3.1 AA).
63
This variety was unavailable in 2019 and could not be included in the study. However,
AgriMAXX 474’s yield response to increasing nitrogen rates in 2018 indicate its potential to
respond well as more N is applied, making it an ideal choice for producers who want to push
yield with nitrogen inputs. Syngenta Viper behaved similarly, never reaching maximum yield
potential at either location in 2019 (Figure 3.1 M). Genotypes that continue to increase in yield
as additional N is applied could be used in favorable, high-yielding environments where high N
rates are applied to push maximum yield potentials.
In Camden, Uni-South Genetics 3536 and AgriMaxx 474 performed similarly to Pioneer
26R41 in Lenoir as well as Pioneer 26R41 and 26R59 in Union, In this case, no matter what N
rate was applied, the varieties performed evenly and did not respond to an increase in N. These
varieties are less responsive to N and recommended for growers in a lower yielding environment
where N availability is poor, or for growers using wheat as a cover crop and do not want to waste
resources on N inputs. Similar results that show differences in yield and NUE parameters have
been established by Guarda et al. (2004), Barraclough et al. (2010), Sadras & Lawson (2015,
Ruisi et al. (2015), Nguyen et al. (2016), and Mansour et al. (2017).
Gerard 557 and Southern Harvest 4300 yielded similarly regardless of the N rate. (Table
3.13). These varieties have a low NUE and result in a lower yield (Figure 3.2). Dyna-Gro 9811,
Pioneer 26R59 and 26R41, AgriMAXX 473, VA Tech Hilliard, AG South Genetics 2024, and
Syngenta Viper increase in yield as more N is applied. Growers in higher yielding environments
would prefer these varieties where a high yield and high NUE are achieved as more N is applied.
The high response to N category is for growers in those regions who have management practices
that support supplying wheat with additional N to increase yield. Dyna-Gro 9701, CROPLAN
8550, and Southern Harvest 7200 perform moderately well but not as well as the varieties in the

64
high nitrogen response category. Varieties in the moderate category are for growers who make
mid-season decisions on N management practices and still wish to achieve a higher yield
potentials with increasing N rate. Uni-South Genetics 3536 and 3895 and Featherstone VA 258
did not perform consistently across all nitrogen rates or locations and should be chosen based on
location and management practices. For example, Featherstone VA 258 performs similarly at
three locations where yield increases as additional N is applied and at two other locations, the
amount of N applied does not significantly change the yield.
Varieties respond differently to nitrogen rates in high yielding environments, sometimes
even yielding higher at lower nitrogen rates than compared varieties. Where the variety by
nitrogen rate interaction was significant, the sensor-based rate did an excellent job of
recommending N rates to match crop demands. This research will continue to investigate
additional varieties to keep growers informed about best-fit varieties for their environmental
conditions. Additional work needs be completed to determine optimum N rates for each variety
and location.
65
REFERENCES
Alley, M. M., Scharf, P., Brann, D. E., Baethgen, W. E., & Hammons, J. L. (1996). Nitrogen
Fertilization for Winter Wheat: Principles and Recommendations. Virginia Cooperative
Extension.
Baethgen, W. E., & Alley, M. M. (1989a). Optimizing soil and fertilizer nitrogen use by
intensively managed winter wheat. I. Crop nitrogen uptake. Agronomy Journal, 81(1),
116-120.
Baethgen, W. E., & Alley, M. M. (1989b). Optimizing soil and fertilizer nitrogen use by
intensively managed winter wheat. II. Critical levels and optimum rates of nitrogen
fertilizer. Agronomy Journal, 81(1), 120-125.
Baligar, V. C., Fageria, N. K., & He, Z. L. (2001). Nutrient use efficiency in
plants. Communications in Soil Science and Plant Analysis, 32(7-8), 921-950.
Barraclough, P. B., Howarth, J. R., Jones, J., Lopez-Bellido, R., Parmar, S., Shepherd, C. E., &
Hawkesford, M. J. (2010). Nitrogen efficiency of wheat: Genotypic and environmental
variation and prospects for improvement. European Journal of Agronomy, 33(1), 1–11.
Campbell, C. A., Myers, R. J. K., & Curtin, D. (1995). Managing nitrogen for sustainable crop
production. Fertilizer Research, 42(1-3), 277-296.
Cox, M. C., Qualset, C. O., & Rains, D. W. (1985). Genetic Variation for Nitrogen Assimilation
and Translocation in Wheat. II. Nitrogen Assimilation in Relation to Grain Yield and
Protein 1. Crop Science, 25(3), 435-440.
Cui, Z., Zhang, F., Mi, G., Chen, F., Li, F., Chen, X., Li, J., & Shi, L. (2009). Interaction
between genotypic difference and nitrogen management strategy in determining nitrogen
use efficiency of summer maize. Plant and soil, 317(1-2), 267-276.

66
Daigger, L. A., Sander, D. H., & Peterson, G. A. (1976). Nitrogen Content of Winter Wheat
During Growth and Maturation 1. Agronomy Journal, 68(5), 815-818.
Fageria, N. K., & Baligar, V. C. (2003a). Fertility management of tropical acid soils for
sustainable crop production. Handbook of Soil Acidity, 359-385.
Fageria, N. K., & Baligar, V. C. (2005). Enhancing nitrogen use efficiency in crop
plants. Advances in Agronomy, 88, 97-185.
Flowers, M., Weisz, R., Heiniger, R., Tarleton, B., & Meijer, A. (2003). Field validation of a
remote sensing technique for early nitrogen application decisions in wheat. Agronomy
Journal, 95(1), 167-176.
Fossati, D., Fossati, A., & Feil, B. (1993). Relationship between grain yield and grain nitrogen
concentration in winter triticale. Euphytica, 71(1-2), 115-123.
Foulkes MJ, Hawkesford MJ, Barraclough PB, Holdsworth MJ, Kerr S, Kightley S, Shewry PR
(2009) Identifying traits to improve the nitrogen economy of wheat: Recent advances and
future prospects. Field Crops Research 114, 329–342.
Garnett T, Plett D, Heuer S, Okamoto M (2015) Genetic approaches to enhancing nitrogen-use
efficiency (NUE) in cereals: challenges and future directions. Functional Plant Biology
42, 921–941.
Goos, R. J., & Prunty, L. (1990). Yield variability and the yield goal decision. In Proceedings of
the Great Plain Soil Fertility Conference. Denver, CO (pp. 187-189).
Grant, C. A., Peterson, G. A., & Campbell, C. A. (2002). Nutrient considerations for diversified
cropping systems in the northern Great Plains. Agronomy Journal, 94(2), 186-198.
67
Guarda, G., Padovan, S., & Delogu, G. (2004). Grain yield, nitrogen-use efficiency and baking
quality of old and modern Italian bread-wheat cultivars grown at different nitrogen
levels. European Journal of Agronomy, 21(2), 181–192.
Harper, L. A., Langdale, G. W., & Giddens, J. E. (1987). Nitrogen Cycling in a Wheat Crop:
Soil, Plant, and Aerial Nitrogen Transport 1. Agronomy Journal, 79(6), 965-973.
Hong, N., Scharf, P. C., Davis, J. G., Kitchen, N. R., & Sudduth, K. A. (2007). Economically
optimal nitrogen rate reduces soil residual nitrate. Journal of Environmental
Quality, 36(2), 354-362.
Inman, D., Khosla, R., Westfall, D. G., & Reich, R. (2005). Nitrogen uptake across site-specific
management zones in irrigated corn production systems. Agronomy Journal, 97(1), 169-
176.
Keeney, D. R. (1982). Nitrogen management for maximum efficiency and minimum
pollution. Nitrogen in Agricultural Soils, 605-649.
Keeney, D., & Olson, R. A. (1987). Sources of nitrate to ground water. Critical Reviews in
Environmental Science and Technology, 16(3), 257-304.
Li, F., Miao, Y., Zhang, F., Cui, Z., Li, R., Chen, X., Zhang, H., Schroder, J., Raun, W.R., & Jia,
L. (2009). In-season optical sensing improves nitrogen-use efficiency for winter
wheat. Soil Science Society of America Journal, 73(5), 1566-1574.
Loffer, C. M., Rauch, T. L., & Busch, R. H. (1985). Grain and Plant Protein Relationships in
Hard Red Spring Wheat 1. Crop Science, 25(3), 521-524.
Mansour, E., Merwad, A. M. A., Yasin, M. A. T., Abdul-Hamid, M. I. E., El-Sobky, E. E. A., &
Oraby, H. F. (2017). Nitrogen use efficiency in spring wheat: Genotypic variation and

68
grain yield response under sandy soil conditions. Journal of Agricultural Science, 155(9),
1407–1423.
Moll, R. H., & Kamprath, E. J. (1977). Effects of population density upon agronomic traits
associated with genetic increases in yield of Zea mays L. Agronomy Journal, 69(1), 81-
84.
Nguyen, G. N., Panozzo, J., Spangenberg, G., & Kant, S. (2016). Phenotyping approaches to
evaluate nitrogen-use efficiency related traits of diverse wheat varieties under field
conditions. Crop and Pasture Science, 67(11), 1139–1148.
Pan, J. R. (2001). Fate of fertilizer nitrogen in winter wheat-summer maize rotation system at
North China Plain. Chinese. Ph. D. diss. China Agric. Univ., Beijing.
Pollmer, W. G., Eberhard, D., Klein, D., & Dhillon, B. S. (1979). Genetic Control of Nitrogen
Uptake and Translocation in Maize 1. Crop Science, 19(1), 82-86.
Raun, W. R., & Johnson, G. V. (1999). Improving nitrogen use efficiency for cereal
production. Agronomy Journal, 91(3), 357-363.
Reed, A. J., Below, F. E., & Hageman, R. H. (1980). Grain protein accumulation and the
relationship between leaf nitrate reductase and protease activities during grain
development in maize (Zea mays L.): I. Variation between genotypes. Plant
Physiology, 66(1), 164-170.
Ruisi, P., Frangipane, B., Amato, G., Frenda, A. S., Plaia, A., Giambalvo, D., & Saia, S. (2015).
Nitrogen uptake and nitrogen fertilizer recovery in old and modern wheat genotypes
grown in the presence or absence of interspecific competition. Frontiers in Plant
Science, 6 (MAR), 1-10.

69
Russelle, M. P., Deibert, E. J., Hauck, R. D., Stevanovic, M., & Olson, R. A. (1981). Effects of
Water and Nitrogen Management on Yield and 15N-Depleted Fertilizer Use Efficiency of
Irrigated Corn 1. Soil Science Society of America Journal, 45(3), 553-558.
Sadras, V. O., & Lawson, C. (2013). Nitrogen and water-use efficiency of Australian wheat
varieties released between 1958 and 2007. European Journal of Agronomy, 46, 34–41.
Schepers, J. S., & Mosier, A. R. (1991). Accounting for nitrogen in nonequilibrium soil-crop
systems. Managing Nitrogen for Groundwater Quality and Farm Profitability,125-138.
Stone, M. L., Solie, J. B., Raun, W. R., Whitney, R. W., Taylor, S. L., & Ringer, J. D. (1996).
Use of spectral radiance for correcting in-season fertilizer nitrogen deficiencies in winter
wheat. Transactions of the ASAE, 39(5), 1623-1631.
Thomason, W. E., Raun, W. R., Johnson, G. V., Freeman, K. W., Wynn, K. J., & Mullen, R. W.
(2002). Production system techniques to increase nitrogen use efficiency in winter
wheat. Journal of Plant Nutrition, 25(10), 2261-2283.
Tinker, P.B., and F. V. Widdowson. (1982). Maximizing wheat yields and some causes of yield
variation. Proc. Fert. Soc. 211:149-184.
Traore, A., & Maranville, J. W. (1999). Nitrate reductase activity of diverse grain sorghum
genotypes and its relationship to nitrogen use efficiency. Agronomy Journal, 91(5), 863-
869.
Uchida, R. (2000). Essential nutrients for plant growth: nutrient functions and deficiency
symptoms. Plant Nutrient Management in Hawaii’s Soils, 31-55.
Van Sanford, D. A., & MacKown, C. T. (1985). Variation in nitrogen use efficiency among soft
red winter wheat genotypes. Theoretical and Applied Genetics, 72(2), 158-163.
70
Welch, L. F., Mulvaney, D. L., Oldham, M. G., Boone, L. V., & Pendleton, J. W. (1971). Corn
Yields with Fall, Spring, and Sidedress Nitrogen 1. Agronomy Journal, 63(1), 119-123.
Zadoks, J. C., Chang, T. T., & Konzak, C. F. (1974). A decimal code for the growth stages of
cereals. Weed Research, 14(6), 415-421.
USDA-NASS. (2018). Census of agriculture. US Department of Agriculture, National
Agricultural Statistics Service, Washington, DC, 1.
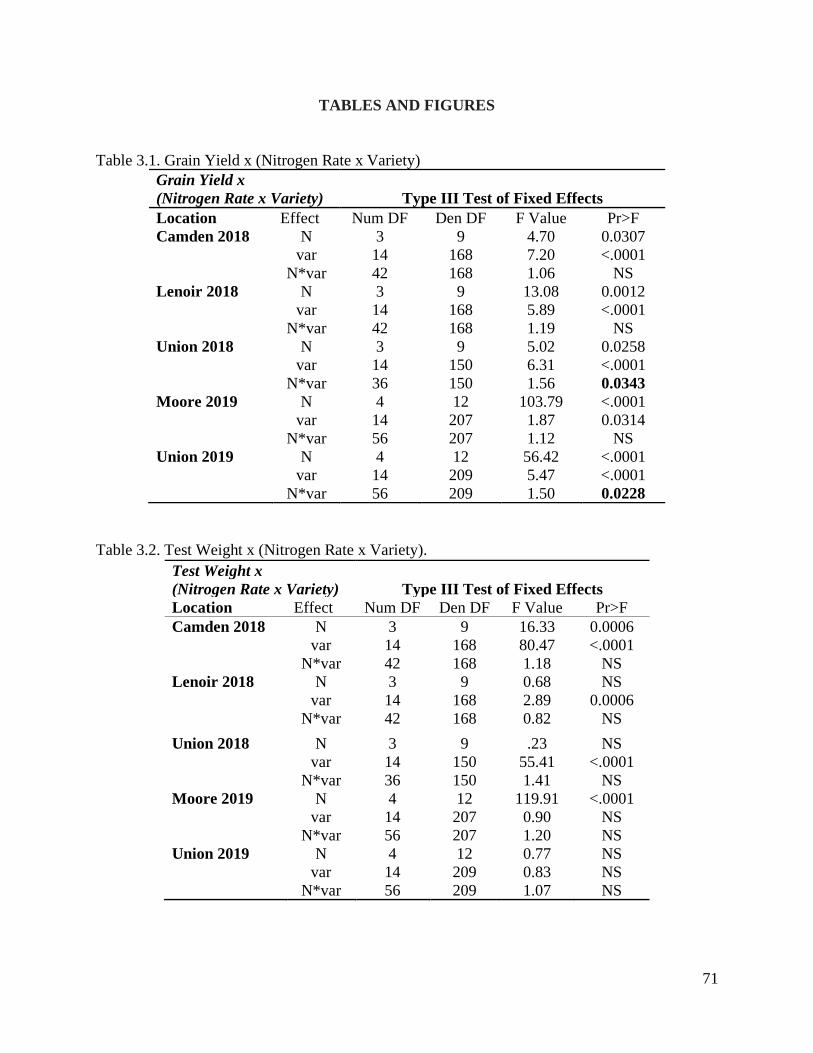
71
TABLES AND FIGURES
Table 3.1. Grain Yield x (Nitrogen Rate x Variety)
Grain Yield x
(Nitrogen Rate x Variety)
Type III Test of Fixed Effects
Location Effect Num DF Den DF F Value Pr>F
Camden 2018 N 3 9 4.70 0.0307
var 14 168 7.20 <.0001
N*var 42 168 1.06 NS
Lenoir 2018 N 3 9 13.08 0.0012
var 14 168 5.89 <.0001
N*var 42 168 1.19 NS
Union 2018 N 3 9 5.02 0.0258
var 14 150 6.31 <.0001
N*var 36 150 1.56 0.0343
Moore 2019 N 4 12 103.79 <.0001
var 14 207 1.87 0.0314
N*var 56 207 1.12 NS
Union 2019 N 4 12 56.42 <.0001
var 14 209 5.47 <.0001
N*var 56 209 1.50 0.0228
Table 3.2. Test Weight x (Nitrogen Rate x Variety).
Test Weight x
(Nitrogen Rate x Variety)
Type III Test of Fixed Effects
Location Effect Num DF Den DF F Value Pr>F
Camden 2018 N 3 9 16.33 0.0006
var 14 168 80.47 <.0001
N*var 42 168 1.18 NS
Lenoir 2018 N 3 9 0.68 NS
var 14 168 2.89 0.0006
N*var 42 168 0.82 NS
Union 2018 N 3 9 .23 NS
var 14 150 55.41 <.0001
N*var 36 150 1.41 NS
Moore 2019 N 4 12 119.91 <.0001
var 14 207 0.90 NS
N*var 56 207 1.20 NS
Union 2019 N 4 12 0.77 NS
var 14 209 0.83 NS
N*var 56 209 1.07 NS

72
Table 3.3. Partial Factor Productivity x (Nitrogen Rate x Variety) for 2018.
Partial Factor
Productivity x (Nitrogen
Rate x Variety)
Type III Test of Fixed Effects
Location Effect Num DF Den DF F Value Pr>F
Camden 2018 N 3 9 15.29 0.0007
var 14 168 5.88 <.0001
N*var 42 168 1.22 NS
Lenoir 2018 N 3 9 17.76 0.0004
var 14 168 5.51 <.0001
N*var 42 168 1.22 NS
Union 2018 N 3 9 334.05 <.0001
var 14 150 10.20 <.0001
N*var 36 150 3.45 <.0001
Table 3.4. Nitrogen Use Efficiency x (Nitrogen Rate x Variety) for 2019.
Nitrogen Use Efficiency x
(Nitrogen Rate x Variety)
Type III Test of Fixed Effects
Location Effect Num DF Den DF F Value Pr>F
Union 2019 N 4 12 56.49 <.0001
var 14 209 5.47 <.0001
N*var 56 209 1.50 0.0227
Moore 2019 N 4 12 103.79 <.001
var 14 207 1.87 0.0314
N*var 56 207 1.12 NS
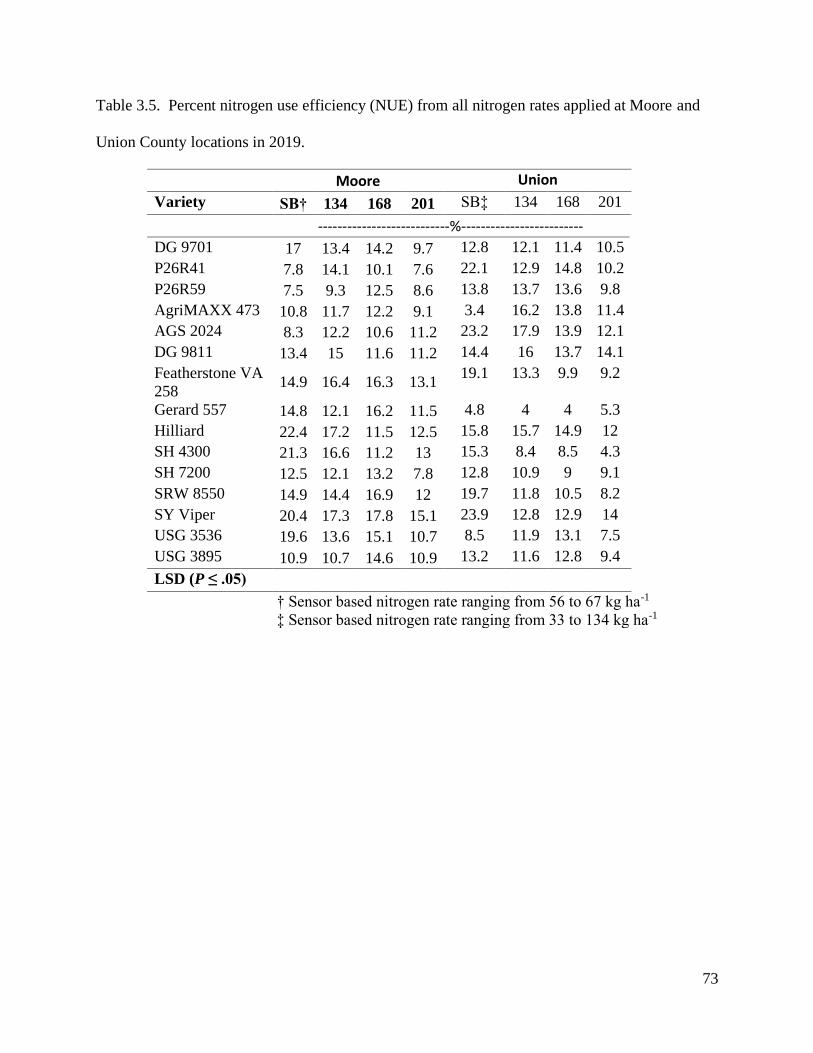
73
Table 3.5. Percent nitrogen use efficiency (NUE) from all nitrogen rates applied at Moore and
Union County locations in 2019.
Moore Union
Variety SB† 134 168 201 SB‡ 134 168 201
---------------------------%-------------------------
DG 9701 17 13.4 14.2 9.7 12.8 12.1 11.4 10.5
P26R41 7.8 14.1 10.1 7.6 22.1 12.9 14.8 10.2
P26R59 7.5 9.3 12.5 8.6 13.8 13.7 13.6 9.8
AgriMAXX 473 10.8 11.7 12.2 9.1 3.4 16.2 13.8 11.4
AGS 2024 8.3 12.2 10.6 11.2 23.2 17.9 13.9 12.1
DG 9811 13.4 15 11.6 11.2 14.4 16 13.7 14.1
Featherstone VA
258 14.9 16.4 16.3 13.1
19.1 13.3 9.9 9.2
Gerard 557 14.8 12.1 16.2 11.5 4.8 4 4 5.3
Hilliard 22.4 17.2 11.5 12.5 15.8 15.7 14.9 12
SH 4300 21.3 16.6 11.2 13 15.3 8.4 8.5 4.3
SH 7200 12.5 12.1 13.2 7.8 12.8 10.9 9 9.1
SRW 8550 14.9 14.4 16.9 12 19.7 11.8 10.5 8.2
SY Viper 20.4 17.3 17.8 15.1 23.9 12.8 12.9 14
USG 3536 19.6 13.6 15.1 10.7 8.5 11.9 13.1 7.5
USG 3895 10.9 10.7 14.6 10.9 13.2 11.6 12.8 9.4
LSD (P ≤ .05)
† Sensor based nitrogen rate ranging from 56 to 67 kg ha-1
‡ Sensor based nitrogen rate ranging from 33 to 134 kg ha-1
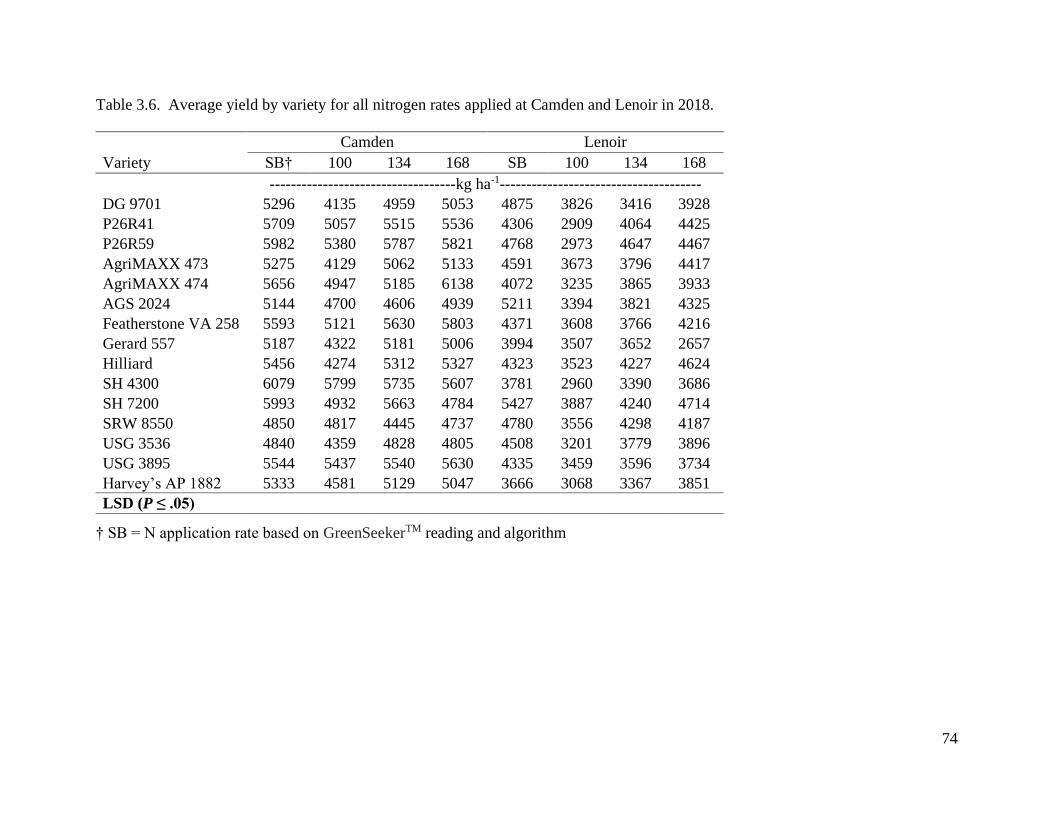
74
Table 3.6. Average yield by variety for all nitrogen rates applied at Camden and Lenoir in 2018.
Camden Lenoir
Variety SB† 100 134 168 SB 100 134 168
-----------------------------------kg ha-1-------------------------------------- DG 9701 5296 4135 4959 5053 4875 3826 3416 3928
P26R41 5709 5057 5515 5536 4306 2909 4064 4425
P26R59 5982 5380 5787 5821 4768 2973 4647 4467
AgriMAXX 473 5275 4129 5062 5133 4591 3673 3796 4417
AgriMAXX 474 5656 4947 5185 6138 4072 3235 3865 3933
AGS 2024 5144 4700 4606 4939 5211 3394 3821 4325
Featherstone VA 258 5593 5121 5630 5803 4371 3608 3766 4216
Gerard 557 5187 4322 5181 5006 3994 3507 3652 2657
Hilliard 5456 4274 5312 5327 4323 3523 4227 4624
SH 4300 6079 5799 5735 5607 3781 2960 3390 3686
SH 7200 5993 4932 5663 4784 5427 3887 4240 4714
SRW 8550 4850 4817 4445 4737 4780 3556 4298 4187
USG 3536 4840 4359 4828 4805 4508 3201 3779 3896
USG 3895 5544 5437 5540 5630 4335 3459 3596 3734
Harvey’s AP 1882 5333 4581 5129 5047 3666 3068 3367 3851
LSD (P ≤ .05)
† SB = N application rate based on GreenSeekerTM reading and algorithm

75
Table 3.7. Average yield by variety for all nitrogen rates applied at Union in 2018.
Union
Variety SB † 100 134 168
------------------%----------------
DG 9701 7178bcde 7296a-e 7546a-e 7620a-e
P26R41 7608a-e 7573a-e 7734a-e 7677a-e
P26R59 8412abc 8033a-e 8208abcd 8669a
AgriMAXX 473 7381a-e 7248a-e 7564a-e 7848a-e
AgriMAXX 474 7345a-e 8228abcd 8171ab 8506abcd
AGS 2024 7045a-e 7175bcde 7608a-e 7242a-e
Featherstone VA 258 7215a-e 7616a-e 7653a-e 7093bcde
Gerard 557 7754a-e 7296a-e 7511a-e 7473a-e
Hilliard 7212bcde 6991cde 7973a-e 8241abcd
SH 4300 7963a-e 7924a-e 8037a-e 7805a-e
SH 7200 7587a-e 6801de 7066bcde 6715e
CROPLAN 8550 7324a-e 7195bcde 7619a-e 8172abcd
USG 3536 7546a-e 7452a-e 7187bcde 8093a-e
USG 3895 7610a-e 7662a-e 7823a-e 8144a-e
Harvey’s AP 1882 7805a-e 7346a-e 7479a-e 7851a-e
LSD (P ≤ .05)
† SB = N application rate based on GreenSeekerTM reading and algorithm

76
Table 3.8. Average yield by variety for all nitrogen rates applied at Moore in 2019.
Moore
Variety SB† 0 134 168 201
---------------------kg ha-1-------------------
DG 9701 1425 282 2084 2663 2253
P26R41 1281 800 2699 2497 2344
P26R59 1254 745 1998 2850 2474
AgriMAXX 473 932 324 1906 2380 2160
AGS 2024 907 443 2084 2229 2699
DG 9811 1062 311 2332 2268 2580
Featherstone VA 258 1186 266 2470 3002 2917
Gerard 557 1174 345 1971 3067 2666
Hilliard 1828 322 2636 2256 2846
SH 4300 1686 369 2609 2250 3000
SH 7200 1354 654 2279 2876 2223
SRW 8550 1425 421 2362 3257 2844
SY Viper 1596 341 2673 3329 3389
USG 3536 1486 277 2111 2816 2441
USG 3895 1109 499 1939 2946 2698
LSD (P ≤ .05)
† SB = N application rate based on GreenSeekerTM reading and algorithm

77
Table 3.9 Average yield by variety for all nitrogen rates applied at Union in 2019.
Moore
Variety SB† 0 134 168 201
---------------------kg ha-1------------------- DG 9701 6160a-o 4799k-p 6427a-m 6718a-i 6920a-e
P26R41 6291a-o 4552op 6291a-o 7039abc 6611a-j
P26R59 6926a-h 5075g-p 6917abc 7362a 7049abc
AgriMAXX 473 4573i-p 4458p 6634a-i 6774a-g 6756a-h
AGS 2024 5568b-p 4008p 6428a-m 6351a-n 6455a-l
DG 9811 6368a-n 4678nop 6833a-f 6989abcd 7518a
Featherstone VA 258 6881a-e 5384c-p 7171ab 7050abc 7241ab
Gerard 557 5805a-o 5271e-p 5809a-o 5951a-o 6333a-n
Hilliard 6723a-h 4686mnop 6799a-g 7187ab 7111abc
SH 4300 6772a-g 5225e-p 6349a-n 6657a-i 6093a-o
SH 7200 6737a-h 4875j-p 6345a-n 6384a-o 6713a-i
SRW 8550 6353a-n 5136f-p 6719a-i 6899a-e 6797a-g
SY Viper 6424a-m 4680nop 6399a-n 6841a-f 7511a
USG 3536 5786a-o 5016h-p 6629a-i 7215ab 6536a-k
USG 3895 6277a-o 4724l-p 6289a-o 6889a-e 6622a-i
LSD (P ≤ .05)
† SB = N application rate based on GreenSeekerTM reading and algorithim

78
Table 3.10. Partial Factor Productivity (PFP) by variety for all nitrogen rates applied in 2018.
Camden Lenoir Union SB† 134 SB† SB† SB† SB† 168 201 SB† 134 168 201 Variety ----------------------------------------------------------------%---------------------------------------
----------------------- DG 9701 0.61 0.69 1.12 1.12 1.12 1.12 0.42 .39 1.12 1.21 0.94 0.76 P26R41 0.68 0.84 1.25 1.25 1.25 1.25 0.5 0.44 1.25 1.25 0.96 0.76 P26R59 0.68 0.89 1.25 1.25 1.25 1.25 0.5 0.44 1.25 1.32 1.02 0.86 AgriMAXX
473
0.6 0.68 1.22 1.22 1.22 1.22 0.47 0.44 1.22 1.19 0.94 0.78
AGS 2024 0.59 0.78 1.17 1.17 1.17 1.17 0.47 0.43 1.17 1.18 0.94 0.72 Featherstone
VA 258
0.64 0.85 1.19 1.19 1.19 1.19 0.47 0.42 1.19 1.26 0.95 0.7
Gerard 557 0.59 0.71 1.15 1.15 1.15 1.15 0.45 0.36 1.15 1.21 0.93 0.74 Hilliard 0.62 0.71 1.13 1.13 1.13 1.13 0.53 0.46 1.13 1.15 0.98 0.81 SH 4300 0.7 0.96 1.31 1.31 1.31 1.31 0.42 0.37 1.31 1.3 1 0.77 SH 7200 0.69 0.64 1.07 1.07 1.07 1.07 0.53 0.47 1.07 1.12 0.87 0.67 SRW 8550 0.55 0.8 1.36 1.36 1.36 1.36 0.53 0.42 1.36 1.19 0.94 0.81 AgriMAXX
474
0.65 0.82 1.56 1.56 1.56 1.56 0.39 0.38 1.56 1.36 1.05 0.81
USG 3536 0.55 0.72 1.25 1.25 1.25 1.25 0.47 0.39 1.25 1.23 0.89 0.78 USG 3895 0.63 0.9 1.07 1.07 1.07 1.07 0.45 0.37 1.07 1.26 0.97 0.81 Harvey’s AP
1882
0.61 0.76 1.45 1.45 1.45 1.45 0.42 0.38 1.45 1.21 0.93 0.78
LSD (P ≤ .05)

79
Table 3.11. GPS coordinates, soil types, planting dates, and dates of top-dress nitrogen application for all locations in 2018 and 2019.
Year Site Latitude Longitude Soil Type
HM%
pH
Planting
Date
Sensing/Tissue
Sampling/In-
Season N
Application
2018 Camden 36.382292 -76.239309 Tomotley Fine
Sandy Loam
-- -- Nov. 17,
2017
Mar. 23, 2018
Lenoir 35.3737429 -77.5583264 Goldsboro
Loamy Sand
1.67 5.8 Nov. 7,
2017
Mar. 4, 2018
Union 34.859641 -80.512942 Badin
Channery Silt
Loam
0.41 6.2 Nov. 4,
2017
Mar. 5, 2018
2019 Moore 35.184319 -79.679760 Candor Sand 0.41 6.0 Oct. 30.
2018
Mar. 4, 2019
Union 35.138747 -80.376025 Badin
Channery Silt
Loam
0.97 6.9 Nov. 30,
2018
Mar. 21, 2019

80
Table 3.12. Number of LSMeans comparison statements where a variety was estimated to yield
higher than another variety at the same nitrogen rate or at a higher nitrogen rate in Union County
in 2018 and 2019.
Variety 2018 2019
Same N
Rate
Higher N
Rate
Same N
Rate
Higher N
Rate
Dyna-Gro 9701 1 1 3 0
Southern Harvest 7200 1 1 2 0
Uni-South Genetics
3536
4 5 6 2
Pioneer 26R59 21 28 8 6
CROPLAN 8550 4 1 4 1
Southern Harvest 4300 11 9 2 3
Gerard 557 1 2 2 0
Featherstone VA 258 2 0 12 7
Hilliard 6 3 6 3
Syngenta Viper -- -- 8 0
Dyna-Gro 9811 -- -- 9 2
Pioneer 26R41 2 2 1 0
Uni-South Genetics
3895
5 4 2 0
AgriMaxx 473 1 1 2 0
AG South 2024 0 1 -- --
AP 1882 2 7 -- --
AgriMaxx 474 25 17 -- --

81
Table 3.13 Varieties separated into categories high, moderate, low, and nitrogen rate dependent
in response to additional nitrogen from Union County in 2019.
Variety High Moderate Low Nitrogen Rate Dependent
USG 3536
✓
DG 9701
✓
AGS 2024 ✓
AgriMAXX 473 ✓
FSVA258
✓
CROPLAN 8550
✓
VA Tech Hilliard ✓
Pioneer 26R41 ✓
Pioneer 26R59 ✓
SH 7200
✓
USG 3895
✓
SH 4300
✓
Gerard 557
✓
Syngenta Viper ✓
DG 9811 ✓

82
Figure 3.1. Yield response to nitrogen for each variety at all locations in 2018 and 2019. For all varieties except AgriMAXX 474
(2018 only), Syngenta Viper (2019 only), Harvey’s AP 1882 (2018 only), and Dyna-Gro 9811 (2019 only) the left graph describes
yield responses from 2018, while the right graph describes yield responses from 2019. Within each graph: ● denotes values from
Union County, + denotes values from Camden County, - denotes values from Lenoir County, and × denotes values from Moore
County.

83
Pioneer 26R41
A B
Dyna-Gro 9701
C D
y = 1.5563x + 7452.2R² = 0.4875
y = 18.049x + 1296.3R² = 0.8486
y = 7.6817x + 4410.8R² = 0.5778
0
1000
2000
3000
4000
5000
6000
7000
8000
90 110 130 150 170 190 210
Yie
ld k
g h
a-1
y = 9.167x + 886.83R² = 0.8092
y = 10.627x + 4918.5R² = 0.7935
0 50 100 150 200
y = 6.0972x + 6633R² = 0.8199
y = 11.183x + 2382.2R² = 0.4131
y = 15.175x + 2777.8R² = 0.7115
0
1000
2000
3000
4000
5000
6000
7000
8000
90 110 130 150 170 190 210
Yie
ld k
g h
a-1
y = 10.785x + 508.81R² = 0.8825
y = 10.759x + 4890.7R² = 0.9814
0 50 100 150 200

84
Pioneer 26R59
E F
AgriMAXX 473
G H
y = 7.415x + 7374.9R² = 0.6448
y = 18.753x + 1455.3R² = 0.6985
y = 7.4478x + 4720.3R² = 0.6622
0
1000
2000
3000
4000
5000
6000
7000
8000
9000
90 110 130 150 170 190 210
Yie
ld k
g h
a-1
y = 10.02x + 733.81R² = 0.9067
y = 11.189x + 5236.6R² = 0.894
0 50 100 150 200
y = 7.8839x + 6516.5R² = 0.9551
y = 12.306x + 2328R² = 0.9195
y = 16.12x + 2686.7R² = 0.7501
0
1000
2000
3000
4000
5000
6000
7000
8000
90 110 130 150 170 190 210
Yie
ld k
g h
a-1
y = 10.02x + 733.81R² = 0.9067
y = 11.189x + 5236.6R² = 0.894
0 50 100 150 200

85
AG South Genetics 2024
I J
Featherstone VA 258
K L
y = 3.0559x + 6884.7R² = 0.1703
y = 20.48x + 1204R² = 0.8637
y = 4.7912x + 4189.1R² = 0.308
0
1000
2000
3000
4000
5000
6000
7000
8000
9000
90 110 130 150 170 190 210
Yie
ld k
g h
a-1
y = 11.432x + 391.7R² = 0.9864
y = 12.025x + 4387.7R² = 0.8647
0 50 100 150 200
y = -3.7224x + 7863.8R² = 0.1802
y = 10.366x + 2494.6R² = 0.9342
y = 10.013x + 4162.6R² = 0.9219
0
1000
2000
3000
4000
5000
6000
7000
8000
90 110 130 150 170 190 210
Yie
ld k
g h
a-1
y = 14.355x + 343.32R² = 0.9633
y = 8.6699x + 5735.1R² = 0.7943
0 50 100 150 200
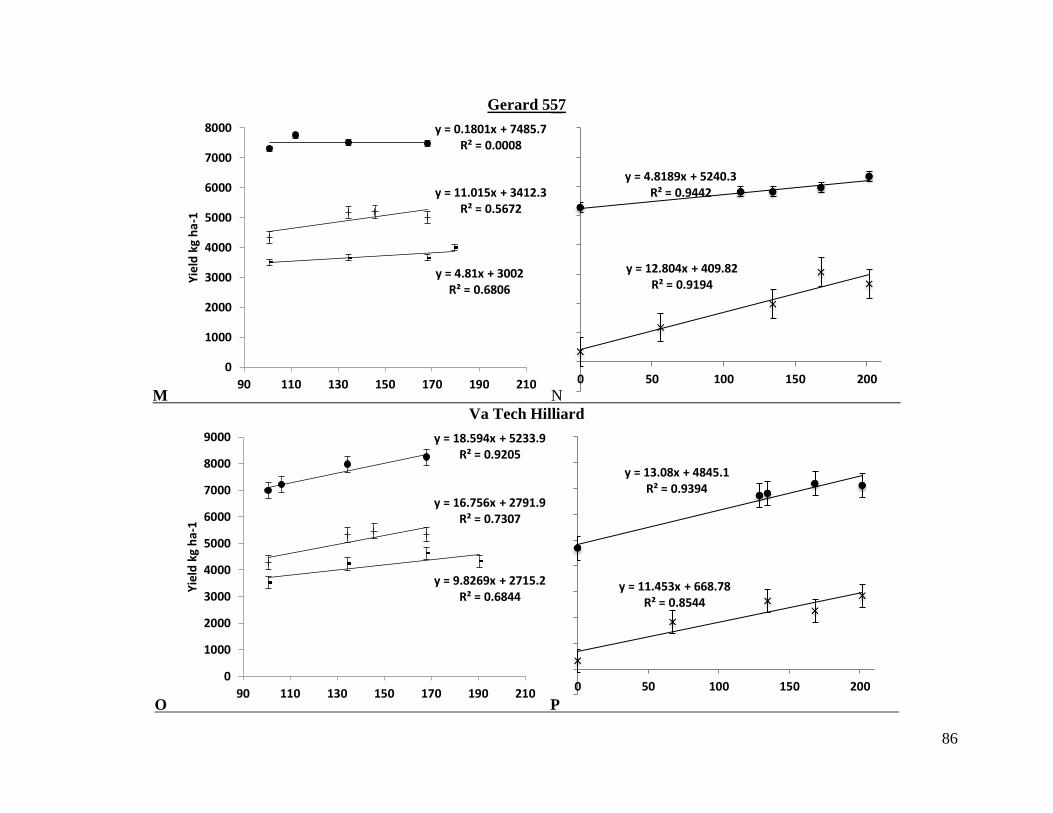
86
Gerard 557
M N
Va Tech Hilliard
O P
y = 0.1801x + 7485.7R² = 0.0008
y = 4.81x + 3002R² = 0.6806
y = 11.015x + 3412.3R² = 0.5672
0
1000
2000
3000
4000
5000
6000
7000
8000
90 110 130 150 170 190 210
Yie
ld k
g h
a-1
y = 12.804x + 409.82R² = 0.9194
y = 4.8189x + 5240.3R² = 0.9442
0 50 100 150 200
y = 18.594x + 5233.9R² = 0.9205
y = 9.8269x + 2715.2R² = 0.6844
y = 16.756x + 2791.9R² = 0.7307
0
1000
2000
3000
4000
5000
6000
7000
8000
9000
90 110 130 150 170 190 210
Yie
ld k
g h
a-1
y = 11.453x + 668.78R² = 0.8544
y = 13.08x + 4845.1R² = 0.9394
0 50 100 150 200

87
Southern Harvest 4300
Q R
Southern Harvest 7200
S T
y = -1.6301x + 8138.2R² = 0.2934
y = 10.367x + 1944.2R² = 0.9901
y = -1.4419x + 6003.4R² = 0.041
0
1000
2000
3000
4000
5000
6000
7000
8000
9000
90 110 130 150 170 190 210
Yie
ld k
g h
a-1
y = 11.798x + 647.48R² = 0.8901
y = 5.0642x + 5606.6R² = 0.4049
0 50 100 150 200
y = -4.8681x + 7677R² = 0.1266
y = 17.608x + 2001.6R² = 0.8785
y = 14.064x + 3662.7R² = 0.7303
0
1000
2000
3000
4000
5000
6000
7000
8000
9000
90 110 130 150 170 190 210
Yie
ld k
g h
a-1
y = 9.5817x + 803.7R² = 0.8247
y = 9.47x + 4980R² = 0.9029
0 50 100 150 200
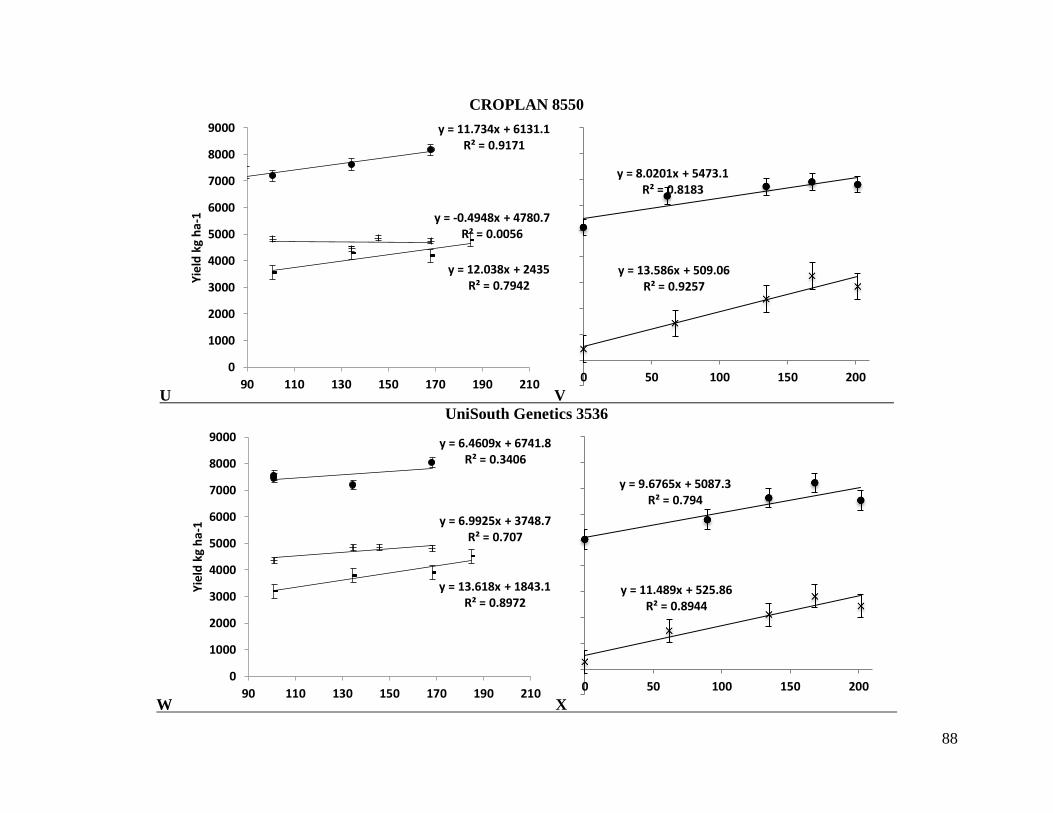
88
CROPLAN 8550
U V
UniSouth Genetics 3536
W X
y = 11.734x + 6131.1R² = 0.9171
y = 12.038x + 2435R² = 0.7942
y = -0.4948x + 4780.7R² = 0.0056
0
1000
2000
3000
4000
5000
6000
7000
8000
9000
90 110 130 150 170 190 210
Yie
ld k
g h
a-1
y = 13.586x + 509.06R² = 0.9257
y = 8.0201x + 5473.1R² = 0.8183
0 50 100 150 200
y = 6.4609x + 6741.8R² = 0.3406
y = 13.618x + 1843.1R² = 0.8972
y = 6.9925x + 3748.7R² = 0.707
0
1000
2000
3000
4000
5000
6000
7000
8000
9000
90 110 130 150 170 190 210
Yie
ld k
g h
a-1
y = 11.489x + 525.86R² = 0.8944
y = 9.6765x + 5087.3R² = 0.794
0 50 100 150 200
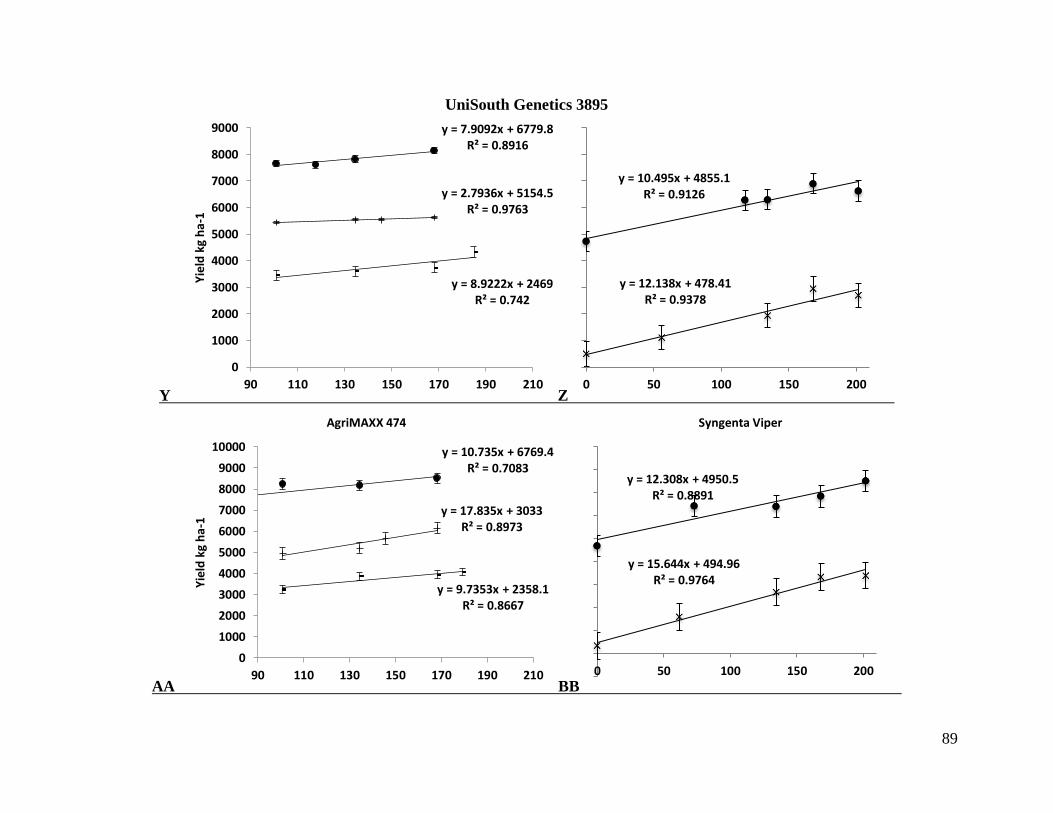
89
UniSouth Genetics 3895
Y Z
AA BB
y = 7.9092x + 6779.8R² = 0.8916
y = 8.9222x + 2469R² = 0.742
y = 2.7936x + 5154.5R² = 0.9763
0
1000
2000
3000
4000
5000
6000
7000
8000
9000
90 110 130 150 170 190 210
Yie
ld k
g h
a-1
y = 12.138x + 478.41R² = 0.9378
y = 10.495x + 4855.1R² = 0.9126
0 50 100 150 200
y = 10.735x + 6769.4R² = 0.7083
y = 9.7353x + 2358.1R² = 0.8667
y = 17.835x + 3033R² = 0.8973
0
1000
2000
3000
4000
5000
6000
7000
8000
9000
10000
90 110 130 150 170 190 210
Yie
ld k
g h
a-1
AgriMAXX 474
y = 15.644x + 494.96R² = 0.9764
y = 12.308x + 4950.5R² = 0.8891
0 50 100 150 200
Syngenta Viper

90
CC DD
y = 2.3101x + 7335.7R² = 0.1102
y = 9.1027x + 2162.1R² = 0.8811
y = 8.1276x + 3907R² = 0.5141
0
1000
2000
3000
4000
5000
6000
7000
8000
90 110 130 150 170 190 210
Yie
ld k
g h
a-1
Nitrogen Rate (kg/ha)
Harvey's AP 1882
y = 11.551x + 416.41R² = 0.9534
y = 14.075x + 4726.6R² = 0.987
0 50 100 150 200Nitrogen Rate (kg/ha)
Dyna-Gro 9811
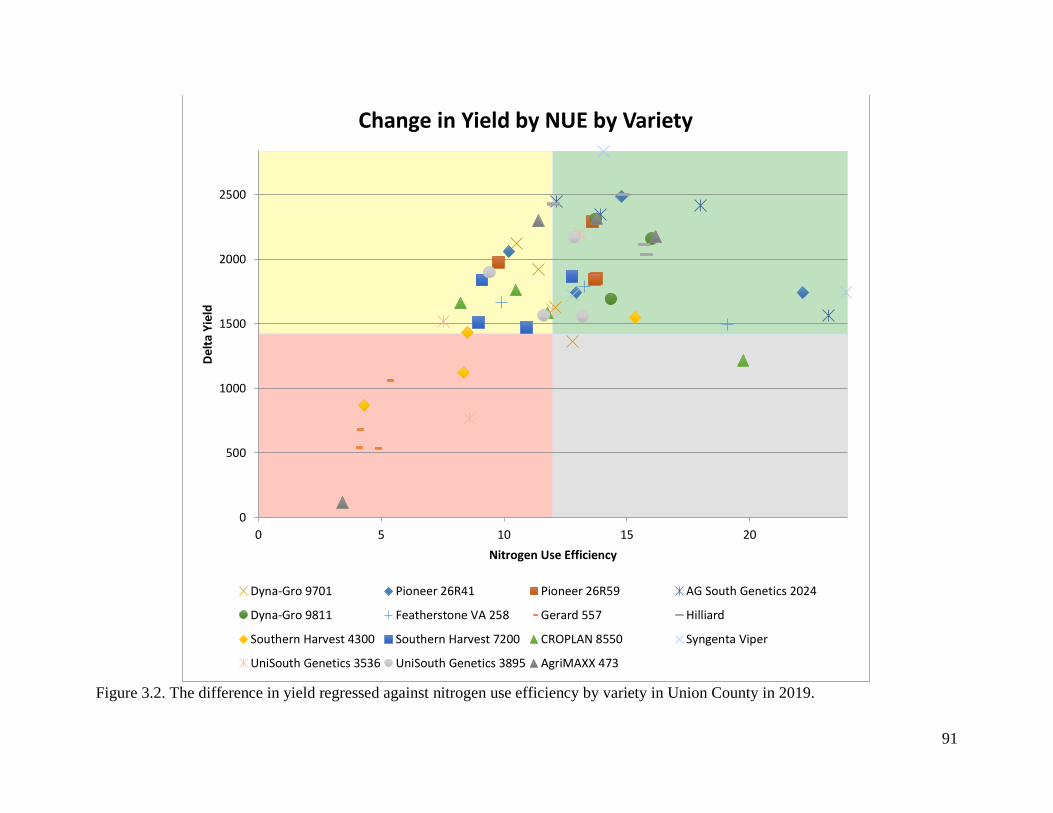
91
Figure 3.2. The difference in yield regressed against nitrogen use efficiency by variety in Union County in 2019.
0
500
1000
1500
2000
2500
0 5 10 15 20
Del
ta Y
ield
Nitrogen Use Efficiency
Change in Yield by NUE by Variety
Dyna-Gro 9701 Pioneer 26R41 Pioneer 26R59 AG South Genetics 2024
Dyna-Gro 9811 Featherstone VA 258 Gerard 557 Hilliard
Southern Harvest 4300 Southern Harvest 7200 CROPLAN 8550 Syngenta Viper
UniSouth Genetics 3536 UniSouth Genetics 3895 AgriMAXX 473
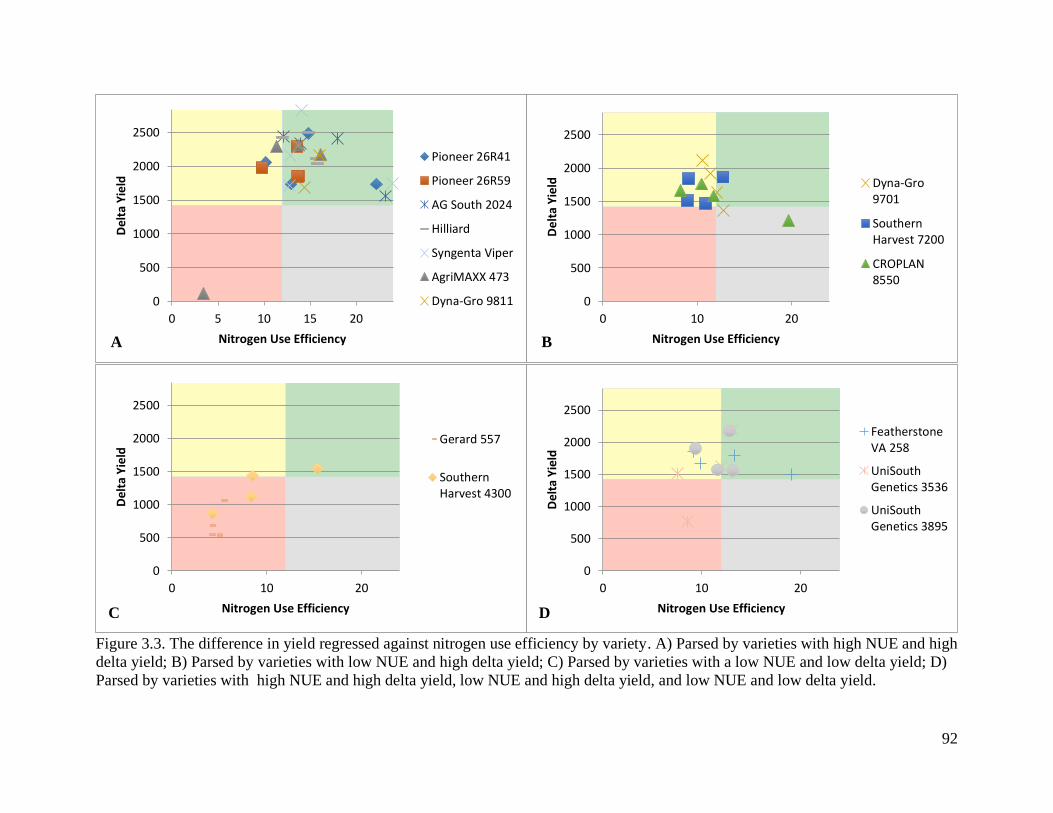
92
Figure 3.3. The difference in yield regressed against nitrogen use efficiency by variety. A) Parsed by varieties with high NUE and high
delta yield; B) Parsed by varieties with low NUE and high delta yield; C) Parsed by varieties with a low NUE and low delta yield; D)
Parsed by varieties with high NUE and high delta yield, low NUE and high delta yield, and low NUE and low delta yield.
0
500
1000
1500
2000
2500
0 5 10 15 20
Del
ta Y
ield
Nitrogen Use Efficiency
Pioneer 26R41
Pioneer 26R59
AG South 2024
Hilliard
Syngenta Viper
AgriMAXX 473
Dyna-Gro 9811 0
500
1000
1500
2000
2500
0 10 20
Del
ta Y
ield
Nitrogen Use Efficiency
Dyna-Gro9701
SouthernHarvest 7200
CROPLAN8550
0
500
1000
1500
2000
2500
0 10 20
Del
ta Y
ield
Nitrogen Use Efficiency
Gerard 557
SouthernHarvest 4300
0
500
1000
1500
2000
2500
0 10 20
Del
ta Y
ield
Nitrogen Use Efficiency
FeatherstoneVA 258
UniSouthGenetics 3536
UniSouthGenetics 3895
A B
C D