chemical reactions of explosive molecules for
TRANSCRIPT
University of Rhode Island University of Rhode Island
DigitalCommons@URI DigitalCommons@URI
Open Access Dissertations
2013
CHEMICAL REACTIONS OF EXPLOSIVE MOLECULES FOR CHEMICAL REACTIONS OF EXPLOSIVE MOLECULES FOR
DETECTION APPLICATIONS DETECTION APPLICATIONS
Christopher A. Latendresse University of Rhode Island, [email protected]
Follow this and additional works at: https://digitalcommons.uri.edu/oa_diss
Recommended Citation Recommended Citation Latendresse, Christopher A., "CHEMICAL REACTIONS OF EXPLOSIVE MOLECULES FOR DETECTION APPLICATIONS" (2013). Open Access Dissertations. Paper 60. https://digitalcommons.uri.edu/oa_diss/60
This Dissertation is brought to you for free and open access by DigitalCommons@URI. It has been accepted for inclusion in Open Access Dissertations by an authorized administrator of DigitalCommons@URI. For more information, please contact [email protected].

CHEMICAL REACTIONS OF EXPLOSIVE
MOLECULES FOR DETECTION APPLICATIONS
BY
CHRISTOPHER A. LATENDRESSE
A DISSERTATION SUBMITTED IN PARTIAL FULFILLMENT OF THE
REQUIREMENTS FOR THE DEGREE OF
DOCTOR OF PHILOSOPHY
IN
CHEMISTRY
UNIVERSITY OF RHODE ISLAND
2013

DOCTORATE OF CHEMISTRY DISSERTATION
OF
CHRISTOPHER A. LATENDRESSE
APPROVED:
Dissertation Committee:
Major Professor William B. Euler
James L. Smith
Otto J. Gregory
Nasser H. Zawia
DEAN OF THE GRADUATE SCHOOL
UNIVERSITY OF RHODE ISLAND
2013
ABSTRACT
Explosive analytes and their decomposition products are of great interest to the
scientific community, in large part due to events of international terrorism and
warfare, but also as environmental pollutants. Chapter 1 of this dissertation shows for
the first time that the hydroxide adducts of trinitrobenzene (TNB) and trinitrotoluene
(TNT), TNB-OH– and TNT-OH
–, are emissive while TNT
– is not. This has great
impact on pre-existing sensors, which may be affected negatively by an increase in
emission competing with the observation of a quench. Additionally, we described a
competing reaction with the solvent, N,N-dimethylformamide (DMF), which is also
capable of nucleophilic attack upon TNT and observable due to its overwhelming
quantity.
Chapter 2 of this dissertation shows the similarities of TNT products formed by
OH– exposure and amine exposure, covering a wide variety of amines.
1H NMR and
rapid absorbance measurements showed formation of TNT– or TNT adducts, the
relative rates of which are observed to be strongly dependent on solvation. Intrinsic
rate constants in methanol implied that all amine reactions were forming the same
adduct (TNT-OCH3–). The credibility of amine adduct formation was further explored
in Chapter 3 through computational approaches. High level ab initio calculations were
performed to obtain models of reactants and products of the investigated reactions, and
their relative energies and thermodynamic quantities were computed. The data
showed a striking disparity in the calculated thermodynamics, with OH– and OCH3
–
adduct formation being much more favorable than amine adduct formation. Charge
transfer (CT) complexes between TNT and the explored amines were converged and
also found to be of higher energy than alkoxide adducts.
In Chapter 4, a sensing array based on highly fluorescent reporter molecules in
DMF solution is described. Eight xanthene-based fluorophores were chosen based on
their high quantum yields, and their interactions with twelve relevant explosive
analytes were interpreted through absorbance and emission data. The resulting array
showed promise in observing an identifying "fingerprint" response to each class of
analyte, with the largest responses coming from the formation of TNB and TNT
products. In addition, these products were observed to be involved in an electron
transfer (ET) mechanism where they donated energy to cationic fluorophores,
enhancing the fluorophores' emission.
The findings of this dissertation indicate the need for caution in TNT sensor
development, as trace water provides OH– and common solvents are capable of
competing for TNT reactivity. Trace water should be monitored and minimized for
appropriate sensor testing and subsequent use, and solution based sensors require an
understanding of solvent competition. Amines are not capable of direct deprotonation
of TNT, and do not compete significantly with OH– or alkoxides in forming a sigma
adduct with TNT. Rather, the formation of colorful complexes that has been attributed
to a TNT-NR3 adduct in the literature is due to the deprotonation of ambient water or
solvent molecules, which in turn react with TNT. Finally, xanthene-based
fluorophores may selectively interact with explosive analytes, with trinitroaromatic
products capable of electron transfer to fluorescent reporters leading to emission
enhancement.

iv
ACKNOWLEDGMENTS
I would like to take this opportunity to gratefully thank the following people:
Bill Euler, for countless hours of teaching, patience, and pep-talks. I'm forever
thankful for the opportunity to learn, mentor, and teach. You've always set me up for
success, even in softball (high and outside)!
Nichole, for being my comforter, my dose of reality, and my best friend. You've
been there since the beginning of this process and have never wavered in your loving
support. I am consistently in awe of you.
Meredith, for being my sounding board and simply for putting up with me. This
lab would be a boring place without a friend like you.
The members of the Euler group, past and present, especially those who I've had
the pleasure of working directly with: Drew, Katie, Emily, Syrena, Jessie, Vicky,
Courtney, Alessandra, Alex, Jess, Shayna, and Christina.
Billy, for being my other half and my built-in lead guitarist. You're the only one
who believed in me so much that you bought me a guitar well before I finished.
My family, for their love and blind faith in me. To Dad, who set an incredible
example of a hard day's work so the next generation didn't "have to work in the

v
factory." To Mom, for imprinting me with the right balance of self-esteem and
humility. All of your hard work and perseverance gave me the opportunity to be the
first in our family to graduate from college, and now to defend a Ph.D. I wouldn't be
anywhere close to where I am without you. To Hapme, for being a third parent and
providing a grandmother's love. To Becca, Julie, and Emma, for constant motivation
in words of support.
The Aviators: John, Kyle, Tom, Jay, and Billy, for giving me the musical outlet I
so desperately need and for picking up the slack when work came first. I wouldn't
have half of the confidence I do if I didn't have the chance to be your front man.
vi
PREFACE
The following research is presented in manuscript format according to the
guidelines provided by the Graduate School of the University of Rhode Island. The
dissertation is separated into four chapters.
The first chapter is entitled "Fluorescent Species Formed by the Reaction of
Trinitroaromatics With N,N-Dimethylformamide and Hydroxide" and has been
accepted and published ASAP by the Journal of Physical Chemistry A.
The second chapter is entitled "Comparing the Roles of Hydroxide and Amines in
TNT Reactions: Clarifying Absorbance Spectra Assignments For Use in Detection
Methods" and is in preparation for submission to the Journal of the American
Chemical Society.
The third chapter is entitled "Relative Thermodynamics of TNT Reactions
Commonly Used for Sensor Applications: Computational Modeling in Vacuo and in
Solution" and is in preparation for submission to the Journal of the American
Chemical Society.
The fourth chapter is entitled "A Fluorometric Sensing Array for the Detection of
Military Explosive and IED Materials" and is in preparation for submission to Analyst.

vii
TABLE OF CONTENTS
ABSTRACT ............................................................................................................. ii
ACKNOWLEDGMENTS....................................................................................... iv
PREFACE ............................................................................................................... vi
TABLE OF CONTENTS ....................................................................................... vii
LIST OF TABLES ................................................................................................ viii
LIST OF FIGURES ..................................................................................................x
LIST OF SCHEMES .............................................................................................xvi
CHAPTER 1 ..............................................................................................................1
CHAPTER 2 ............................................................................................................ 37
CHAPTER 3 ............................................................................................................ 97
CHAPTER 4 .......................................................................................................... 121
viii
LIST OF TABLES
TABLE PAGE
Chapter 1:
Table 1. Fitting parameters for TNB/TNT emission product spectra. ....................... 18
Chapter 2:
Table 1. Observed rate constants for pseudo-first order TNT + NaOH experiments in
THF and MeOH. ...................................................................................................... 59
Table 2. Intrinsic rate constants for the formation of TNT− calculated using kinetic
model and absorbance data at 520 nm and 700 nm ................................................... 61
Table 3. Calculated rate parameters for reactions of excess TNT + amines in MeOH
................................................................................................................................ 66
Chapter 3:
Table 1. Structural parameters from TNT products optimized at the HF/6-311+G**
level ....................................................................................................................... 106
Table 2. 1H NMR Computations compared with experimental results for TNT + OH
−
reaction .................................................................................................................. 107
Table 3. Thermodynamic parameters calculated for each explored reaction between
TNT and bases ....................................................................................................... 110
Chapter 4:
Table 1. Observed percent emission changes compared to inner filter effect corrected

ix
changes for the fluorophores with addition of TNB or TNT ................................... 131
x
LIST OF FIGURES
FIGURE PAGE
Chapter 1:
Figure 1. Initial and final absorbance spectra from trinitroaromatics titrated with water
in DMF ......................................................................................................................6
Figure 2. Absorbance spectra and emission spectra resultant from 7×10⁻⁵
M TNB in
DMF ..........................................................................................................................8
Figure 3. Absorbance spectra and emission spectra resultant from 1.1×10⁻⁴
M TNT in
DMF ........................................................................................................................ 11
Figure 4. Initial and final emission spectra from trinitroaromatics titrated with water
in DMF .................................................................................................................... 14
Figure 5. Excitation spectra from trinitroaromatics with water in DMF ................... 15
Figure 6. Emission spectra of OH– adducts fit with a three Gaussian spectrum for
initial modeling parameters ...................................................................................... 16
Figure 7. Emission spectra of DMF adducts fit with a two Gaussian spectrum for
initial modeling parameters ...................................................................................... 17
Figure 8. Emission spectra of trinitroaromatics with water in DMF as a function of
excitation wavelength (410 to 450 nm excitation) .................................................... 19
Figure 9. Emission spectra from TNB titration with water in DMF, fit with a two
species model for TNB-OH– & TNB-DMF .............................................................. 20
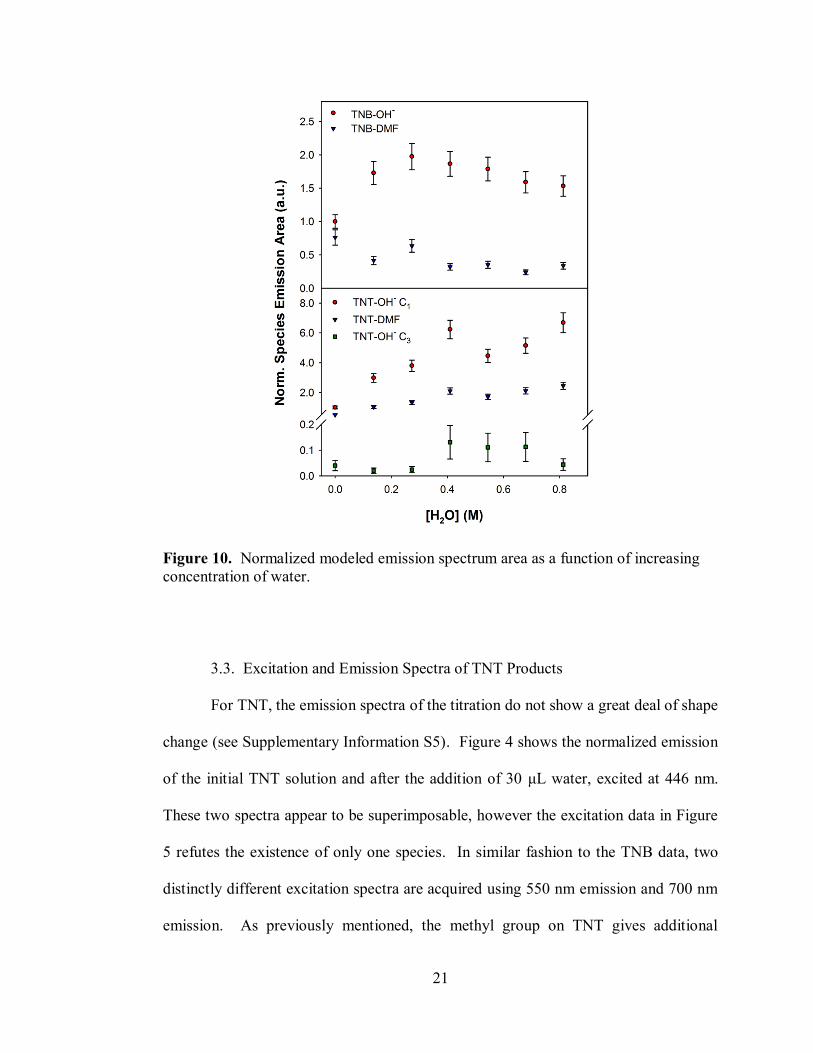
Figure 10. Normalized modeled emission spectrum area as a function of increasing
concentration of water .............................................................................................. 21
xi
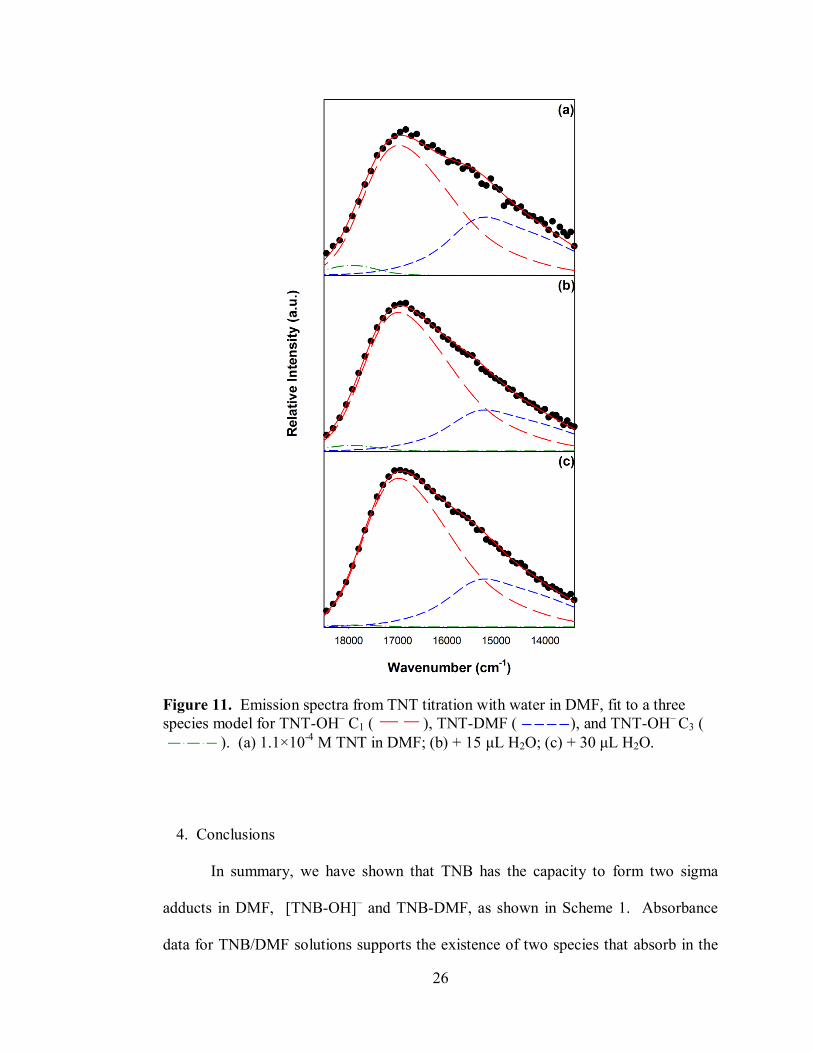
Figure 11. Emission spectra from TNT titration with water in DMF, fit to a three
species model for TNT-OH– C1, TNT-DMF, and TNT-OH
– C3 ............................... 26
Figure S1. Absorbance spectra evolution from TNB titrated with water in DMF ..... 32
Figure S2. Absorbance spectra evolution from TNT titrated with water in DMF ..... 33
Figure S3. Emission spectra evolution from TNB titrated with water in DMF ......... 33
Figure S4. Emission spectra evolution from TNB titrated with water in DMF, fit using
static model established through spectral peak fitting. .............................................. 34
Figure S5. Emission spectra evolution from TNT titrated with water in DMF ......... 35
Figure S6. UV/Vis Computations performed at the B3LYP/6-311+G**//HF/6-
311+G** level for the two hydroxide adducts of TNT, in vacuum and at 273.15K ... 36
Figure S7. Emission spectra evolution from TNT titrated with water in DMF (λex =
446nm), fit using static model established through spectral peak fitting .................... 36
Chapter 2:
Figure 1. 1H NMR spectra for the reaction of 1.3×10
-2 M TNT with increasing
concentration of NaOD/D2O in d8-THF .................................................................... 45
Figure 2. 1H NMR spectra for the reaction of 1.5×10
-2 M TNT with increasing
concentration of NaOD/D2O in d4-MeOD ................................................................ 47
Figure 3. 1H NMR spectra for the reaction of TNT with addition of excess bases in d8-
THF ......................................................................................................................... 49
Figure 4. 1H NMR spectra for the reaction of TNT with addition of excess bases in
MeOD ...................................................................................................................... 51
Figure 5. Initial five minute absorbance experiment observing the products of 100x
xii
excess NaOH with 4.2×10⁻⁵
M TNT in THF............................................................. 54
Figure 6. Initial five minute absorbance experiment observing the products of 100x
excess 2.2×10⁻³
M TNT with NaOH in THF............................................................. 55
Figure 7. Initial five minute absorbance experiment observing the products of 100x
excess NaOH with 2.5×10⁻⁴
M TNT in MeOH ......................................................... 56
Figure 8. Initial absorbance experiment observing the products of 100x excess TNT
(4.1×10⁻²
M) with NaOH in MeOH .......................................................................... 58
Figure 9. Absorbance evolution for the reaction of 100x excess TNT with amines in
MeOH ...................................................................................................................... 63
Figure 10. Absorbance overlay of TNT reactions with hydroxide and amine bases at
equilibrium established within 10 seconds ................................................................ 65
Figure S1. 13
C NMR spectrum of TNT in d8-THF prior to addition of base ............. 73
Figure S2. 13
C DEPT 135 spectrum of TNT + NaOD in d8-THF with quick addition
of excess DCl ........................................................................................................... 74
Figure S3. 13
C NMR spectrum of TNT in MeOD before addition of base ................ 75
Figure S4. 13
C DEPT 135 spectrum of TNT + NaOD after the addition of excess DCl
in d4-MeOD ............................................................................................................. 76
Figure S5. Absorbance evolution for the reaction of 1TNT + 100NaOH in THF,
where [TNT] = 4.2×10⁻⁵
M and [OH−] = 4.2×10
-3 M ................................................ 80
Figure S6. Absorbance evolution for the reaction of 1TNT + 100NaOH in THF,
where [TNT] = 3.2×10⁻⁵
M and [OH−] = 3.2×10
-3 M ................................................ 81
Figure S7. Absorbance evolution for the reaction of 1TNT + 100NaOH in THF,
where [TNT] = 2.2×10⁻⁵
M and [OH−] = 2.2×10
-3 M ............................................... 82
xiii
Figure S8. Absorbance evolution for the reaction of 100TNT + 1NaOH in THF,
where [TNT] = 2.2×10⁻³
M and [OH−] = 2.2×10
-5 M ............................................... 83
Figure S9. Absorbance evolution for the reaction of 100TNT + 1NaOH in THF,
where [TNT] = 1.7×10⁻³
M and [OH−] = 1.7×10
-5 M ............................................... 84
Figure S10. Absorbance evolution for the reaction of 100TNT + 1NaOH in THF,
where [TNT] = 1.3×10⁻³
M and [OH−] = 1.3×10
-5 M ............................................... 85
Figure S11. Absorbance evolution for the reaction of 100TNT + 1NaOH in THF,
where [TNT] = 2.5×10⁻⁴
M and [OH−] = 2.5×10
-2 M ............................................... 86
Figure S12. Absorbance evolution for the reaction of 100TNT + 1NaOH in THF,
where [TNT] = 1.9×10⁻⁴
M and [OH−] = 1.8×10
-2 M ............................................... 87
Figure S13. Absorbance evolution for the reaction of 100TNT + 1NaOH in THF,
where [TNT] = 1.5×10⁻⁴
M and [OH−] = 1.4×10
-2 M ............................................... 88
Figure S14. Absorbance evolution for the reaction of 100TNT + 1NaOH in MeOH,
where [TNT] = 4.1×10⁻²
M, [OH−] = 4.0×10
-4 M ..................................................... 89
Figure S15. Absorbance evolution for the reaction of 100TNT + 1NaOH in MeOH,
where [TNT] = 2.9×10⁻²
M, [OH−] = 2.9×10
-4 M ..................................................... 90
Figure S16. Absorbance evolution for the reaction of 100TNT + 1NaOH in MeOH,
where [TNT] = 2.2×10⁻²
M, [OH-] = 2.2×10
-4 M ..................................................... 91
Figure S17. Absorbance evolution for the reaction of 100TNT + 1DEA in MeOH .. 92
Figure S18. Absorbance evolution for the reaction of 100TNT + 1TEA in MeOH ... 93
Figure S19. Absorbance evolution for the reaction of 100TNT + 1EA in MeOH ..... 94
Figure S20. Absorbance evolution for the reaction of 100TNT + 1PA in MeOH ..... 95
Figure S21. Absorbance evolution for the reaction of 100TNT + 1BA in MeOH ..... 96
xiv
Chapter 3:
Figure 1. Converged equilibrium geometries of TNT and possible acid/base and
sigma attack products ............................................................................................. 103
Figure 2. ΔErxn plotted as a function of dielectric constant for TNT reactions with
bases ...................................................................................................................... 112
Figure 3. Computed MO diagram of explored TNT products with bases at the
B3LYP/6-311+G**//HF/6-311+G** level ............................................................. 115
Figure 4. Absorbance spectra computed at the B3LYP/6-311+G**//HF/6-311+G**
level, normalized to individual species' computed maximum .................................. 116
Chapter 4:
Figure 1. Absorbance overlay of selected fluorophores in DMF ............................ 126
Figure 2. Emission overlay of selected fluorophores in DMF ................................ 126
Figure 3. Emission difference spectra for the exposure of explosive analytes to
selected fluorophores in DMF solution, normalized to the initial emission maximum
.............................................................................................................................. 128
Figure 4. Normalized absorbance overlay of fluorophores in DMF, compared with the
normalized emission of TNB products. .................................................................. 133
Figure 5. HOMO/LUMO diagram for energy comparison between sensing
fluorophores, trinitroaromatics, and trinitroaromatic products .............................. 134
Figure S1. Structures of fluorescent reporter molecules that comprise the sensing
array ...................................................................................................................... 140
Figure S2. Structures of the explosive analytes exposed to the sensing array ......... 141
xv
Figure S3. Normalized absorbance and emission overlays from Rh560 and Rh6G
.............................................................................................................................. 142
Figure S4. Normalized absorbance and emission overlays from Fl548 and SRhB .. 143
Figure S5. Normalized absorbance and emission overlays from Rh640 and SRh640
.............................................................................................................................. 144
Figure S6. Normalized absorbance and emission overlays from Rh700 and Rh800
.............................................................................................................................. 145
xvi
LIST OF SCHEMES
SCHEME PAGE
Chapter 1:
Scheme 1. ............................................................................................................... 12
Chapter 2:
Scheme 1. ............................................................................................................... 40
Chapter 3:
Scheme 1. ............................................................................................................. 102
1
CHAPTER 1
Fluorescent Species Formed by the Reaction of
Trinitroaromatics With N,N-
Dimethylformamide and Hydroxide
Christopher A. Latendresse, Syrena C. Fernandes, Sangmin You, Hui Qi Zhang, and
William B. Euler*
University of Rhode Island Department of Chemistry, 51 Lower College Road,
Kingston, RI 02881, USA
The following is submitted to the Journal of Physical Chemistry A, and is presented
here in manuscript format.
2
ABSTRACT
Trinitrobenzene (TNB) and trinitrotoluene (TNT) react in N,N-dimethylformamide
(DMF) to form multiple species in solution. Despite structural similarities, electronic
spectra show that the reactivity is different for TNB and TNT. In addition to reaction
with the DMF solvent, residual water in nominally dry DMF generates sufficient
hydroxide for reaction with TNB and TNT. Multiple sigma adducts are formed and
observed to be fluorescent, which has not been previously reported. Both TNB and
TNT show the capacity to form sigma adducts with hydroxide and DMF, while methyl
hydrogens of TNT can be deprotonated by hydroxide.
KEYWORDS: trinitrobenzene (TNB); trinitrotoluene (TNT); Meisenheimer complex.
1. Introduction
Common reactions of nitroaromatic molecules are of interest to the scientific
community, especially for the application of explosive detection. Many products of
these reactions have absorbances in the visible range, which allow for a multitude of
detection approaches including colorimetry1,2
and fluorescence methods.3-8
2,4,6-
Trinitrotoluene (TNT) and 1,3,5-trinitrobenzene (TNB) are perhaps the most studied
of the nitroaromatic family, having the highest electron deficiency in their pi system
from their three nitro groups; this leaves them the most susceptible to nucleophilic
attack, thereby converting the original species with no visible absorbance features to a
vibrantly colorful product (commonly referred to as a "Meisenheimer complex").
3
While TNT and TNB share this type of reactivity, TNT also has acidic hydrogens that
can be abstracted to form the TNT anion (TNT–).
9-12 Since both TNT products have
absorbances in similar locations in the visible range,9,10
and basicity and
nucleophilicity tend to go hand in hand, it is a precarious process to be able to
differentiate TNT sigma adducts from TNT–.
It is commonly believed that nitroaromatics and their nucleophilic substitution
products are not fluorescent, and therefore additional mechanisms need to be imposed
in order to address their sensing using a fluorescence method. Many sensors rely on
the fluorescence quenching of a reporter molecule, where the emission of a selected
fluorophore decreases as a function of interacting with an explosive analyte. This
process may result from either dynamic or static quenching, but is most often observed
as a combination of both mechanisms.13-18
Since quenching decreases the observed
signal as a function of addition of analyte, these collective mechanisms are commonly
referred to as "turn-off" mechanisms.
Another typical approach utilizes absorbance features of an analyte in a
resonance energy transfer mechanism (RET). In this mechanism, the excited state of a
donor molecule is deactivated by the transfer of energy across space to an acceptor
molecule, promoting it to its excited state. Since the mechanism does not necessitate
direct contact between donor and acceptor, a sensor developed using RET has the
capacity to be more sensitive. If the acceptor is emissive, then the observation is
ratiometric with a decrease of donor emission concurrent with an increase in acceptor
emission; otherwise, the observation is just a quenching of the donor's emission.
Because many explosive analytes do not have visible absorbance features or react
4
under the same conditions, this is also touted as a selectivity parameter to differentiate
nitroaromatics. Many proposals in the literature3,6-8
use the visible absorbance
features of nitroaromatic products to justify their use as a RET acceptor, but since
these products lack emissive features the sensing remains a "turn-off" mechanism.
We describe herein the observation of fluorescence emission from TNT and
TNB products formed in N,N-dimethylformamide (DMF), without addition of any
strong base or nucleophile. The competing equilibria are complicated. TNT is
observed to react with OH–
(present from the trace water in nominally dry DMF)
forming the non-emissive TNT– or an emissive sigma adduct with DMF or OH
–. TNB
also shows the ability to form emissive sigma adducts with either DMF or OH–. In
addition, the emission of TNT adducts may give a long desired method to clarify their
abundance from that of TNT–. This is the first description of these products as being
emissive, with evidence of the formation of products through a reaction with DMF.
This work also demonstrates the need to understand the role of even trace amounts of
water in working TNT sensors.
2. Materials and Methods
2.1. Materials. TNB was purchased from Fisher Scientific wetted with ca.
40% water with 98.0% purity. Concentrations of TNB solution were thus calculated
using a value of 60% TNB solid by mass. TNT was obtained from Drs. Jimmie Oxley
and James Smith and was used without further purification. DMF (≥99.5%) was
purchased from Fisher Scientific and used as received. H2O (HPLC grade) was
5
purchased from Sigma and used as received. Aqueous 0.1 M NaOH and HCl
solutions were purchased from Anachemia.
2.2. Absorbance and Fluorescence Measurements. Absorbance spectra were
obtained between 300 and 800 nm on a Perkin-Elmer Lambda 900 UV/Vis/NIR
spectrophotometer. Fluorescence spectra were obtained with a Horiba Fluorolog-3,
Xe arc lamp excitation source, 3 nm excitation and emission slits for TNB, 5 nm
excitation and emission slits for TNT, 0.1 sec integration time, and ambient
temperature. TNB and TNT titration emission scans were excited at 446 nm, while
additional samples were investigated using excitations every 10 nm from 350 to 600
nm. TNB and TNT excitation scans were monitored at an emission wavelength of 550
and 700 nm.
2.3. Peak Fitting Method. The commercially available software PeakFit© and
SigmaPlot© were employed to fit emission spectra to constituent peaks. Initially,
spectra were fit with an increasing number of Gaussian peaks with vibrationally
related maxima, FWHM (full width at half maximum), and height until a consistent
set of peaks were obtained for each individual spectrum in a given titration. After this,
a global fit was undertaken upon all related spectra at the same time using the average
initial parameters as a starting point. Converged fits were obtained without unrealistic
or inconsistent parameters to support chemical mechanisms.
2.4. Computational Analysis. Spartan '10 computational software19
was used
to propose the relative absorbance maxima for the isomers of [TNT-OH]–. Structures
were optimized at the HF/6-311+G** level without imaginary vibrational frequencies.
6
TDDFT energies and absorbance spectra were calculated using the converged
structures at the B3LYP/6-311+G** level.
3. Results and Discussion
3.1. UV/Vis Absorption
The addition of a few crystals of TNB or TNT into DMF rapidly generates
colorful products visible to the naked eye. To monitor these products, a 7×10⁻⁵
M
solution of TNB and a 1.1×10⁻⁴
M TNT solution were prepared in DMF and
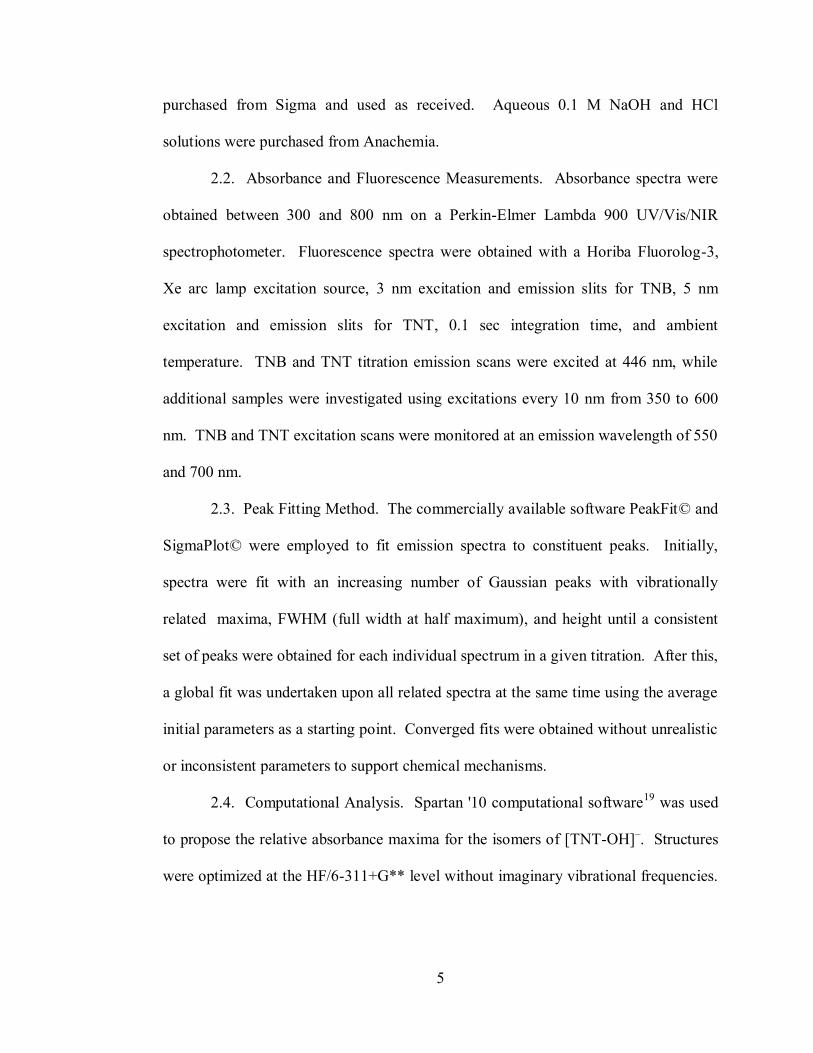
immediately observed using absorbance and fluorescence spectroscopy. The initial
absorbance spectrum for the TNB solution (Figure 1a) shows maxima at 452 nm and
523 nm, reminiscent of other "Meisenheimer" type adducts reported in literature with
a narrow feature around 420 nm and a broader set of features around 500 nm.9,10
Figure 1. Initial and final absorbance spectra from trinitroaromatics titrated with
water in DMF: (a) 7×10⁻⁵
M TNB in DMF; (b) TNB + 30 μL H2O in DMF; (c)
1.1×10⁻⁴
M TNT in DMF; (d) TNT + 30 μL H2O in DMF.

7
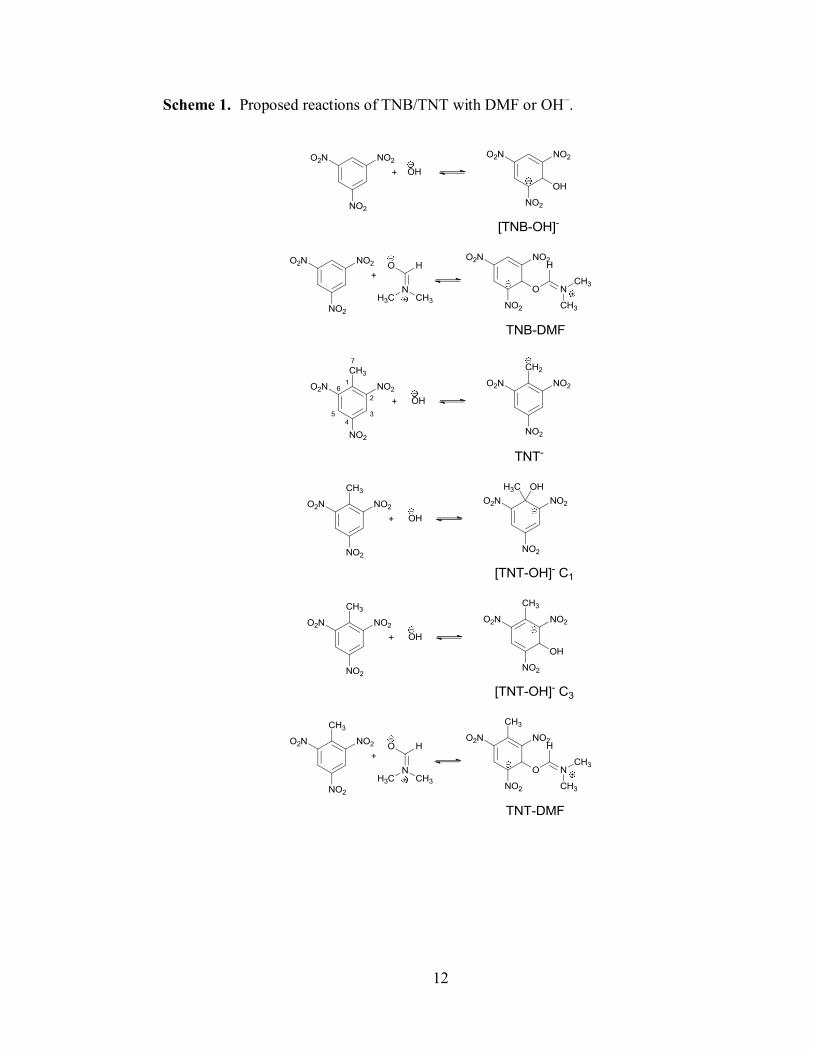
Only two possible products are expected to be formed by TNB, which are sigma
adducts with DMF or OH– (TNB-DMF and [TNB-OH]
–, respectively - see Scheme 1);
the absorbance changes observed suggest an equilibrium between the DMF adduct and
the hydroxide adduct with free TNB. Titration of water to the TNB solution was done
in increments of 5 μL. The initial concentration of water in the TNB solutions was
6×10⁻⁴
M due to the availability as a wetted solid, whereas TNT was not pre-wetted.
While the autoionization constant of water in DMF is not available, we estimate the
initial [OH–] in the TNB solutions to be on the order of 10
-10 M using Kw in pure water
as an approximation. The initial [OH–] in the TNT solutions will be less than this, as
the same amount of water is not carried in by solid addition. Titration of water gives
evidence of a tight isosbestic point at 318 nm early in the titration and a second
isosbestic point at 475 nm later in the titration (see Supplementary Information, Fig.
S1). Addition of water decreases the initial absorbance features at higher wavelengths
while increasing the new features at lower wavelengths; after 30 μL of water are
added, new maxima are observed at 438 nm and 514 nm. This likely indicates the
indirect conversion of the TNB-DMF adduct to the [TNB-OH]– adduct. The isosbestic
point that is well defined at 318 nm represents the loss of UV features of TNB in
solution with the rise of an absorbance peak from [TNB-OH]–. The late forming
isosbestic point at 475 nm shows a decrease in absorbance at higher wavelengths from
the loss of TNB-DMF while features at lower wavelength increase from the generation
of [TNB-OH]–; the late isosbestic point formation may be resultant from a third
species that completely disappears after the second addition of water - this may be a
dinitrobenzene impurity in the TNB or a charge-transfer complex that goes below
8
limits of detection. TNB CT complexes have been reported in the literature, with
maxima ranging from the UV to the violet end of the visible spectrum.20
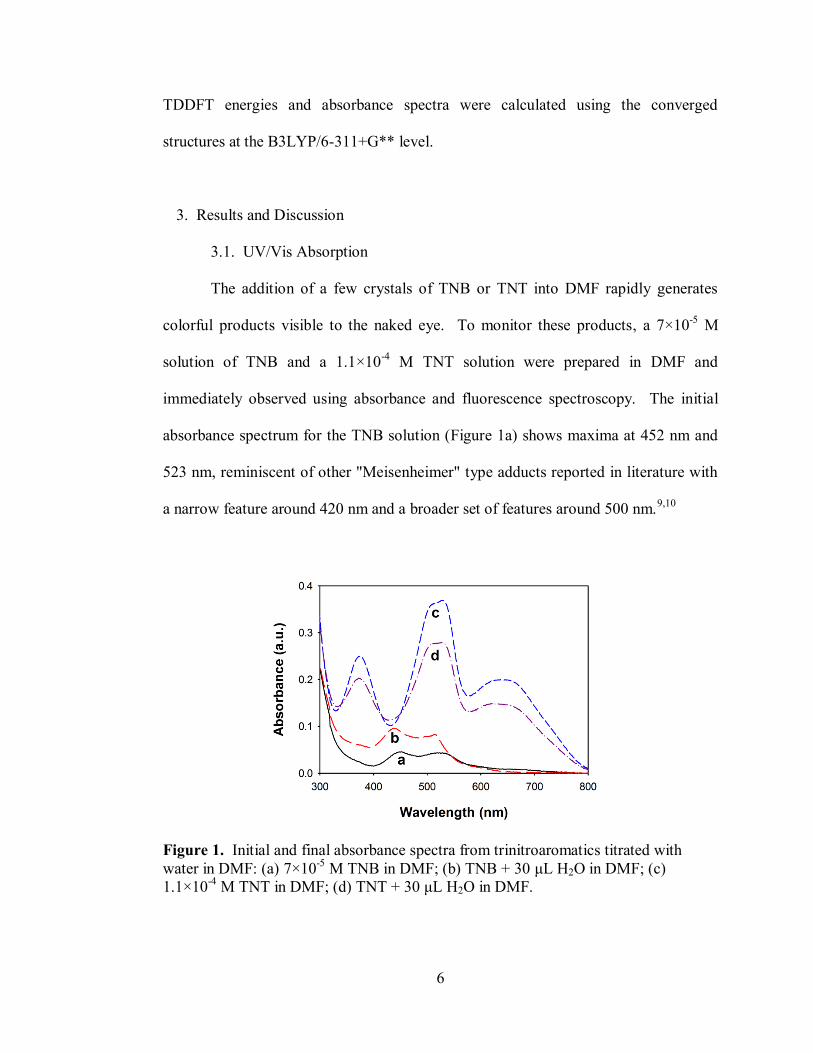
To help confirm our assignments, we monitored the absorbance of the TNB
solution with the addition of 5 μL of 0.1 M NaOH/H2O and the addition of 5 μL of 0.1
M HCl/H2O. Figure 2a shows the absorbance increase from the addition of NaOH and
the decrease from the addition of HCl.
Figure 2. (a) Absorbance spectra and (b) emission spectra resultant from 7×10⁻⁵
M
TNB in DMF ( ); + 5 μL of 0.1 M NaOH/H2O ([OH–]/[TNB] = 3.6) ( ); +
5 μL of 0.1 M HCl/H2O ([H+]/[TNB] = 3.6) ( ). Samples were excited at 446
nm. The addition of NaOH increases the concentration of [TNB-OH]– in solution,
increasing the initial absorbance and emission spectra. The addition of HCl decreases
9
the concentration of [TNB-OH]–, leaving TNB-DMF as the only observed absorbing
and emitting species in the visible range. The insets show the lower intensity features
closer to baseline.
The initial spectral shape is retained with the NaOH addition, supporting that the
initial spectrum is at least in part resultant from the formation of [TNB-OH]–. There is
a small shift in the absorbance maximum, initially observed at 450 nm shifting to 440
nm. This indicates that there is another absorbing species involved. The addition of
HCl helps to clarify this spectrum, as it removes OH– from solution. Two very weak
signals are retained after the acidification, as seen in the inset on Figure 2a. We
attribute these features to be from the TNB-DMF adduct, since there is still an
overwhelming amount of DMF available that is not protonated. These experiments
support our assignments of the generation of [TNB-OH]– and TNB-DMF in our
titration of water into TNB/DMF solution.
The addition of TNT to DMF shows a very different absorbance spectrum
(Figure 1c), suggesting different products. Maxima for this initial spectrum are
observed at 375 nm, 509 nm, 529 nm, and 645 nm. Since TNT has acidic methyl
protons whereas TNB does not, it is not surprising that this absorbance spectrum has
been previously attributed to TNT–;9-12
in this particular system, hydroxide from
ambient water is likely acting as the Brønsted-Lowry base. The addition of water
leads to the observation of isosbestic points at 339 nm, 414 nm, and 451 nm (see
Supplementary Information Fig. S2), suggesting the contribution of only two
absorbing species. This can be explained through the loss of TNT– and the increase in
10
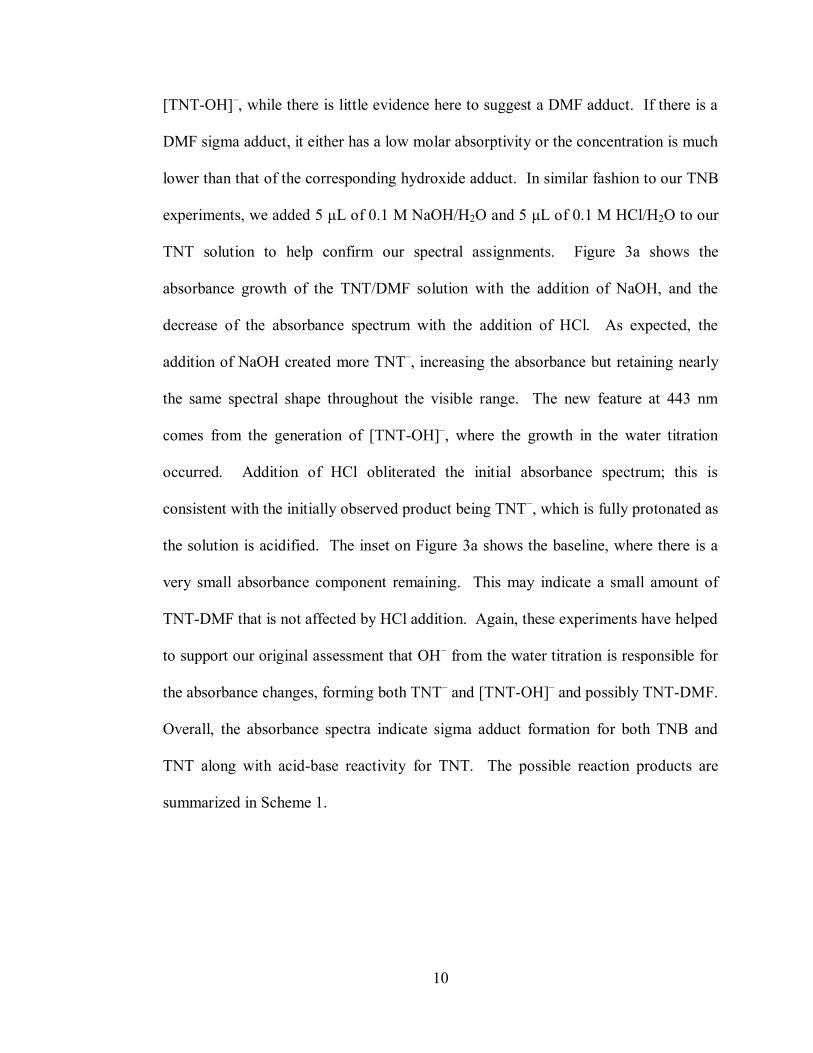
[TNT-OH]–, while there is little evidence here to suggest a DMF adduct. If there is a
DMF sigma adduct, it either has a low molar absorptivity or the concentration is much
lower than that of the corresponding hydroxide adduct. In similar fashion to our TNB
experiments, we added 5 μL of 0.1 M NaOH/H2O and 5 μL of 0.1 M HCl/H2O to our
TNT solution to help confirm our spectral assignments. Figure 3a shows the
absorbance growth of the TNT/DMF solution with the addition of NaOH, and the
decrease of the absorbance spectrum with the addition of HCl. As expected, the
addition of NaOH created more TNT–, increasing the absorbance but retaining nearly
the same spectral shape throughout the visible range. The new feature at 443 nm
comes from the generation of [TNT-OH]–, where the growth in the water titration
occurred. Addition of HCl obliterated the initial absorbance spectrum; this is
consistent with the initially observed product being TNT–, which is fully protonated as
the solution is acidified. The inset on Figure 3a shows the baseline, where there is a
very small absorbance component remaining. This may indicate a small amount of
TNT-DMF that is not affected by HCl addition. Again, these experiments have helped
to support our original assessment that OH– from the water titration is responsible for
the absorbance changes, forming both TNT– and [TNT-OH]
– and possibly TNT-DMF.
Overall, the absorbance spectra indicate sigma adduct formation for both TNB and
TNT along with acid-base reactivity for TNT. The possible reaction products are
summarized in Scheme 1.

11
Figure 3. (a) Absorbance spectra and (b) emission spectra resultant from 1.1×10⁻⁴
M
TNT in DMF ( ); + 5 μL of 0.1 M NaOH/H2O ([OH–]/[TNT] = 2.3) ( ); + 5
μL of 0.1 M HCl/H2O ([H+]/[TNT] = 2.3) ( ). Samples were excited at 446 nm.
The addition of NaOH increases the concentration of [TNT-OH]– in solution,
increasing the initial absorbance and emission spectra. The addition of HCl decreases
the concentration of [TNT-OH]–, leaving TNT-DMF as the only observed absorbing
and emitting species in the visible range. The insets show the lower intensity features
closer to baseline.
12
Scheme 1. Proposed reactions of TNB/TNT with DMF or OH–.
13
3.2. Emission & Excitation Spectra of TNB Products
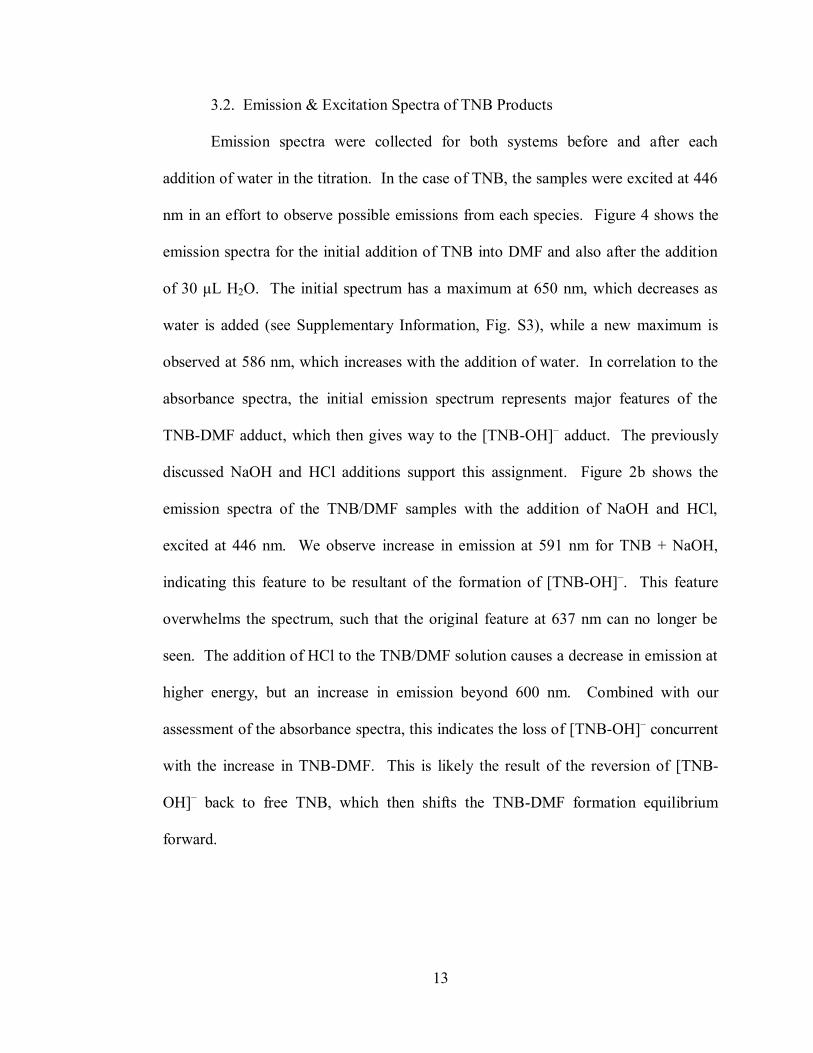
Emission spectra were collected for both systems before and after each
addition of water in the titration. In the case of TNB, the samples were excited at 446
nm in an effort to observe possible emissions from each species. Figure 4 shows the
emission spectra for the initial addition of TNB into DMF and also after the addition
of 30 μL H2O. The initial spectrum has a maximum at 650 nm, which decreases as
water is added (see Supplementary Information, Fig. S3), while a new maximum is
observed at 586 nm, which increases with the addition of water. In correlation to the
absorbance spectra, the initial emission spectrum represents major features of the
TNB-DMF adduct, which then gives way to the [TNB-OH]– adduct. The previously
discussed NaOH and HCl additions support this assignment. Figure 2b shows the
emission spectra of the TNB/DMF samples with the addition of NaOH and HCl,
excited at 446 nm. We observe increase in emission at 591 nm for TNB + NaOH,
indicating this feature to be resultant of the formation of [TNB-OH]–. This feature
overwhelms the spectrum, such that the original feature at 637 nm can no longer be
seen. The addition of HCl to the TNB/DMF solution causes a decrease in emission at
higher energy, but an increase in emission beyond 600 nm. Combined with our
assessment of the absorbance spectra, this indicates the loss of [TNB-OH]– concurrent
with the increase in TNB-DMF. This is likely the result of the reversion of [TNB-
OH]– back to free TNB, which then shifts the TNB-DMF formation equilibrium
forward.
14
Figure 4. Initial and final emission spectra from trinitroaromatics titrated with water
in DMF: (a) 7×10⁻⁵
M TNB in DMF; (b) TNB + 30 μL H2O in DMF; (c) 1.1×10⁻⁴
M
TNT in DMF; (d) TNT + 30 μL H2O in DMF. TNB spectra normalized at 650 nm,
TNT spectra normalized at 591 nm.
In an effort to understand the exchange between the emissive species in the
titration, a separate pair of samples were prepared with identical concentration of
nitroaromatic and water as the final point in the titration. These samples were allowed
to equilibrate for one hour before obtaining emission and excitation data. Both sets of
emission spectra were fit to a modeled set of Gaussian peaks, based on initial
parameters from selective excitation of individual products; the TNB and TNT
samples show a unique excitation spectrum for emission at 550 nm and evidence of a
separate species at 700 nm emission (see Figure 5).
15
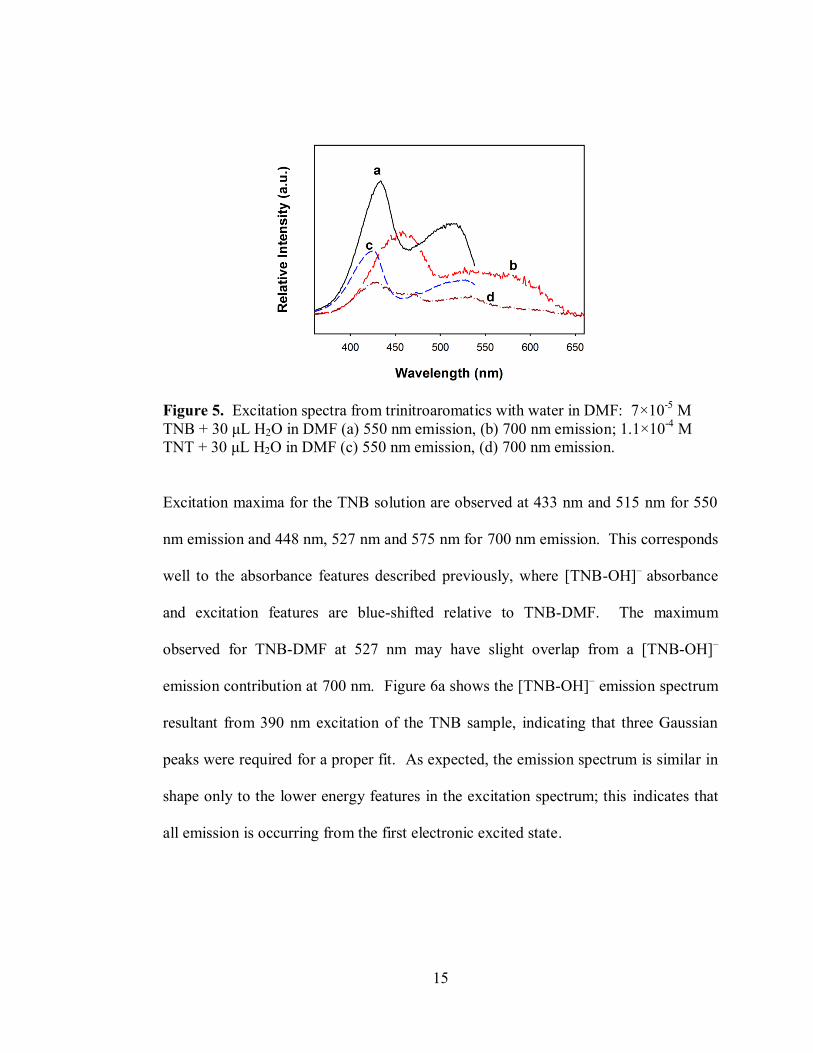
Figure 5. Excitation spectra from trinitroaromatics with water in DMF: 7×10⁻⁵
M
TNB + 30 μL H2O in DMF (a) 550 nm emission, (b) 700 nm emission; 1.1×10⁻⁴
M
TNT + 30 μL H2O in DMF (c) 550 nm emission, (d) 700 nm emission.
Excitation maxima for the TNB solution are observed at 433 nm and 515 nm for 550
nm emission and 448 nm, 527 nm and 575 nm for 700 nm emission. This corresponds
well to the absorbance features described previously, where [TNB-OH]–
absorbance
and excitation features are blue-shifted relative to TNB-DMF. The maximum
observed for TNB-DMF at 527 nm may have slight overlap from a [TNB-OH]–
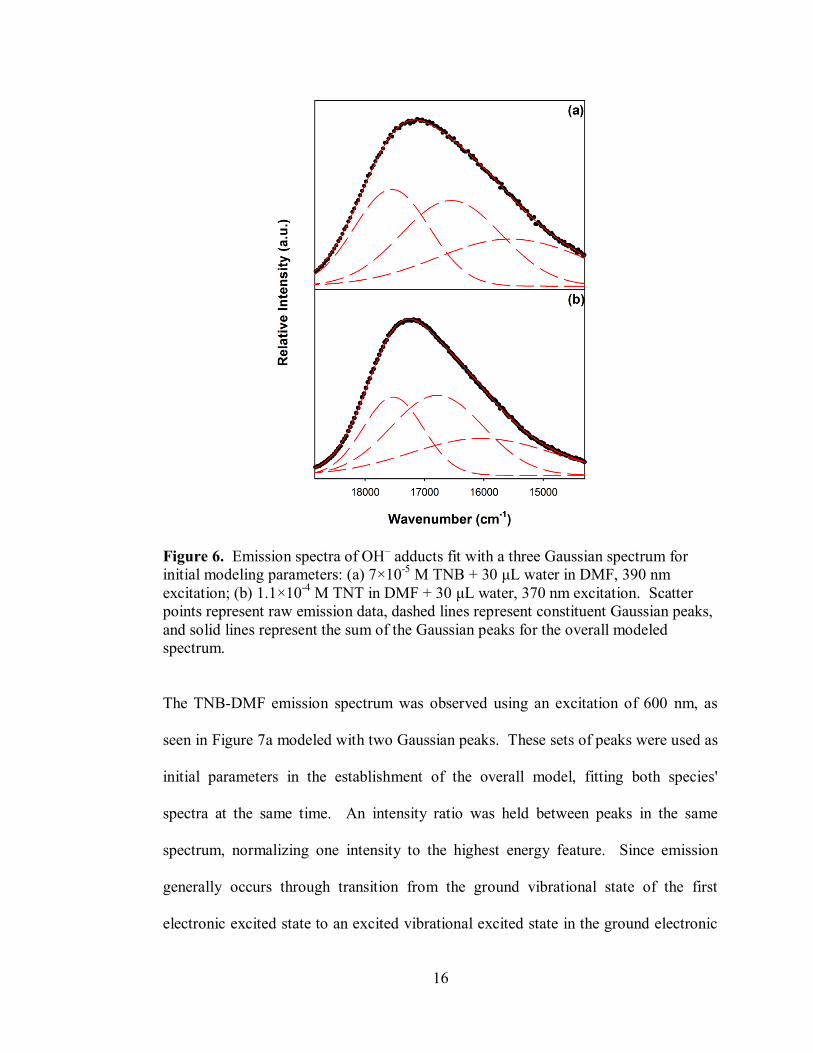
emission contribution at 700 nm. Figure 6a shows the [TNB-OH]– emission spectrum
resultant from 390 nm excitation of the TNB sample, indicating that three Gaussian
peaks were required for a proper fit. As expected, the emission spectrum is similar in
shape only to the lower energy features in the excitation spectrum; this indicates that
all emission is occurring from the first electronic excited state.
16
Figure 6. Emission spectra of OH– adducts fit with a three Gaussian spectrum for
initial modeling parameters: (a) 7×10⁻⁵
M TNB + 30 μL water in DMF, 390 nm
excitation; (b) 1.1×10⁻⁴
M TNT in DMF + 30 μL water, 370 nm excitation. Scatter
points represent raw emission data, dashed lines represent constituent Gaussian peaks,
and solid lines represent the sum of the Gaussian peaks for the overall modeled
spectrum.
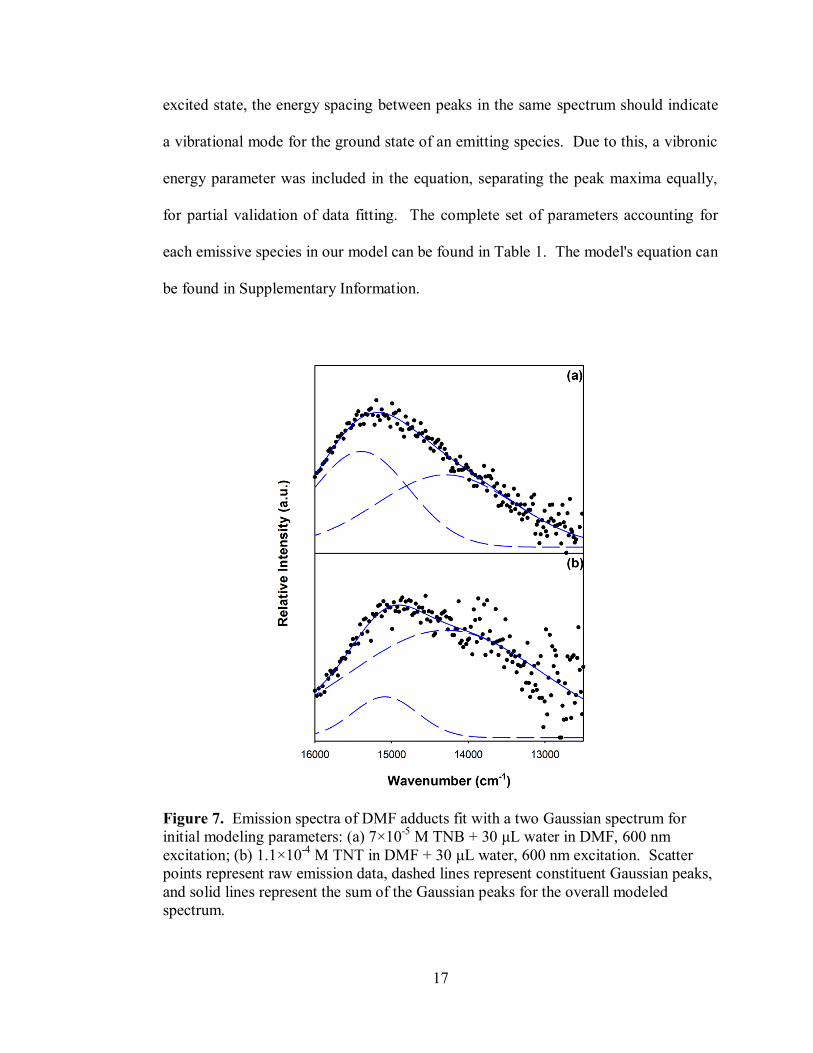
The TNB-DMF emission spectrum was observed using an excitation of 600 nm, as
seen in Figure 7a modeled with two Gaussian peaks. These sets of peaks were used as
initial parameters in the establishment of the overall model, fitting both species'
spectra at the same time. An intensity ratio was held between peaks in the same
spectrum, normalizing one intensity to the highest energy feature. Since emission
generally occurs through transition from the ground vibrational state of the first
electronic excited state to an excited vibrational excited state in the ground electronic
17
excited state, the energy spacing between peaks in the same spectrum should indicate
a vibrational mode for the ground state of an emitting species. Due to this, a vibronic
energy parameter was included in the equation, separating the peak maxima equally,
for partial validation of data fitting. The complete set of parameters accounting for
each emissive species in our model can be found in Table 1. The model's equation can
be found in Supplementary Information.
Figure 7. Emission spectra of DMF adducts fit with a two Gaussian spectrum for
initial modeling parameters: (a) 7×10⁻⁵
M TNB + 30 μL water in DMF, 600 nm
excitation; (b) 1.1×10⁻⁴
M TNT in DMF + 30 μL water, 600 nm excitation. Scatter
points represent raw emission data, dashed lines represent constituent Gaussian peaks,
and solid lines represent the sum of the Gaussian peaks for the overall modeled
spectrum.

18
Table 1. Fitting parameters for TNB/TNT emission product spectra.
Intensity
Ratio (a.u.) Peak max
(cm-1) FWHM (cm-1)
Vibronic Energy (cm-1)
[TNB-OH]-
a1 1* λ1 17496 ± 7 FWHM1 640 ± 10 ν1 990 ± 10
a2 0.89 ± 0.02 16510 ± 10 FWHM2 850 ± 10
a3 0.49 ± 0.01 15530 ± 20 FWHM3 1220 ± 10
TNB-DMF a4 1* λ2 15370 ± 30 FWHM4 626 ± 3 ν2 1000 ± 30
a5 0.76 ± 0.02 14370 ± 40 FWHM5 900 ± 20
[TNT-OH]-
C1
a1 1* λ1 17317 ± 6 FWHM1 530 ± 30 ν1 770 ± 30
a2 1.04 ± 0.03 16550 ± 30 FWHM2 710 ± 40
a3 0.48 ± 0.02 15780 ± 60 FWHM3 1220 ± 40
TNT-DMF a4 1* λ2 15390 ± 10 FWHM4 440 ± 20 ν2 630 ± 20
a5 2.8 ± 0.9 14760 ± 20 FWHM5 1190 ± 60
[TNT-OH]- C3
a6 1* λ3 17930 ± 20 FWHM6 499 ± 3 N/A
*Normalized in fitting equation
In the assigned [TNB-OH]– spectrum, the energy difference between the two
modeled peaks is 990 cm-1
, while the difference in the TNB-DMF spectrum is 1000
cm-1
. These energies may represent out of plane ring bending modes, formed by the
nucleophilic attack. To verify that these modeling parameters are valid, the TNB
fitting model was applied to emission data with varying excitation wavelengths.
Figure 8a shows emission data excited from 410 to 450 nm with the TNB model
overlaid on the raw data. The model clearly applies well to data collected across a
range of excitation wavelengths that excite each species in varying quantities.

19
Figure 8. Emission spectra of trinitroaromatics with water in DMF as a function of
excitation wavelength (410 to 450 nm excitation): (a) 7×10⁻⁵
M TNB + 30 μL water in
DMF; (b) 1.1×10⁻⁴
M TNT in DMF + 30 μL water. Scatter points represent raw
emission data, and lines represent the fit resultant from each established model.
Figure 9 shows emission spectra for the individual species fit to the initial, middle, and
final point of the water titration. The two modeled species' spectra fit the overall
spectrum very well throughout the titration, indicating the decrease of TNB-DMF
relative to [TNB-OH]–. The entire set of TNB titration spectra with the model fitting
can be found in the Supplementary Information (Figure S4). Using these modeled fits,
the area under each species' spectrum was calculated at each titration point.
20
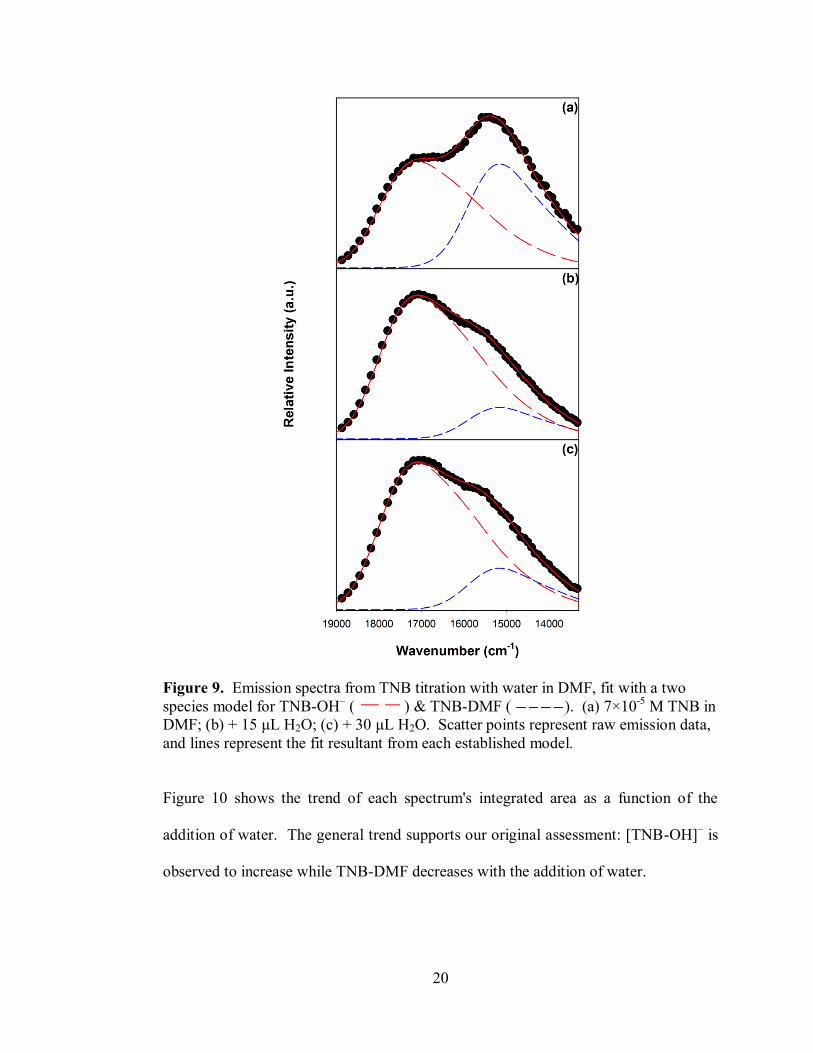
Figure 9. Emission spectra from TNB titration with water in DMF, fit with a two
species model for TNB-OH– ( ) & TNB-DMF ( ). (a) 7×10
-5 M TNB in
DMF; (b) + 15 μL H2O; (c) + 30 μL H2O. Scatter points represent raw emission data,
and lines represent the fit resultant from each established model.
Figure 10 shows the trend of each spectrum's integrated area as a function of the
addition of water. The general trend supports our original assessment: [TNB-OH]– is
observed to increase while TNB-DMF decreases with the addition of water.
21
Figure 10. Normalized modeled emission spectrum area as a function of increasing
concentration of water.
3.3. Excitation and Emission Spectra of TNT Products
For TNT, the emission spectra of the titration do not show a great deal of shape
change (see Supplementary Information S5). Figure 4 shows the normalized emission
of the initial TNT solution and after the addition of 30 μL water, excited at 446 nm.
These two spectra appear to be superimposable, however the excitation data in Figure
5 refutes the existence of only one species. In similar fashion to the TNB data, two
distinctly different excitation spectra are acquired using 550 nm emission and 700 nm
emission. As previously mentioned, the methyl group on TNT gives additional
22
reactions that TNB cannot exhibit, so identification of emissive species requires
caution. Since the emission intensity increases (Supplementary Information Fig. S5)
while the absorbance of TNT– is decreasing, TNT
– cannot be the emissive species.
Also, the established TNT–
absorbance spectrum9,10
has absorbance at lower energy
beyond 700 nm; this rules out TNT–
emitting at higher energy wavelengths. These
emission spectra show similarity to the products that are formed from TNB, which
does not have the ability to be deprotonated. In addition, Figure 5 shows that the
excitation spectra are similar for [TNB-OH]– and the TNT product after adding 30 μL
of water; with an observed emission at 550 nm, excitation maxima are observed at 424
nm and 526 nm. This supports that this excitation spectrum belongs to one of the
possible [TNT-OH]– species. Features similar to TNB-DMF are seen for the
excitation spectrum at 700 nm emission, with maxima around 460 nm and 590 nm, but
are not as pronounced relative to the hydroxide sigma adduct features. Figure 3b
shows the emission spectra from the aforementioned addition of NaOH and HCl to the
TNT/DMF solution. The addition of NaOH causes a sizable increase in emission at
603 nm, too large of a change to be consistent with the more modest increase in the
absorbance of TNT–. Instead, this is consistent with the magnitude of the absorbance
increase seen for [TNT-OH]–. The addition of HCl to the TNT/DMF solution
eliminates the [TNT-OH]– emission signal, again by removing hydroxide from the
formation equilibrium. The inset on Figure 3b shows a component of the original
emission that remains around 655 nm after the acidification, which is consistent with
the analogous formation of a DMF adduct, TNT-DMF.

23
To further understand the TNT reactions, the emission data were also modeled
using the same approach as described above. Figure 6b shows the emission spectrum
resultant from 370 nm excitation, where only [TNT-OH]– is excited. The outcome
was a three peak spectrum with slight differences from the [TNB-OH]–
model, which
was not able to reasonably fit all spectra in the titration by itself even when allowing
for relaxation of initial parameters. TNT-DMF emission peaks were initially fit using
a 600 nm excitation (see Figure 7b), and subsequently iterated with the [TNT-OH]–
parameters to establish an overall model. It became obvious that there was an
additional emitting feature for several reasons. First, the emission maximum appears
to shift to higher energy as the excitation shifts to higher energy (see Figure 8b),
which was not observed for TNB. Also, the initial fits for [TNT-OH]– and TNT-DMF
were unable to account for all of the observed emission data collected between
samples excited at varying wavelengths, even when the parameters were allowed to
change dramatically. The addition of one extra Gaussian peak at a higher energy
maximum than [TNT-OH]– was able to globally satisfy all data without drastically
altering the initial [TNT-OH]– and TNT-DMF fits. The complete equation for the
TNT model can be found in the Supplementary Information.
The existence of a third species seems to go against the observation of tight
isosbestic points, which typically indicate only two absorbing species in solution.
TNT– and [TNT-OH]
– are well established and clearly evident here. TNT-DMF has
been observed through fluorescence, and supported through analogous chemistry to
the formation of TNB-DMF. As a third contributing species, we cannot ascertain the
magnitude of TNT-DMF's molar absorptivity nor its quantum yield. The addition of
24
another [TNT-OH]– species appears to cloud this even further; however, there are
systems that may exhibit isosbestic points with three contributing species. Such a
situation can arise in a system with absorbance contributions from a Lewis acid with
two binding sites and one Lewis base, where the free acid and each form of the adduct
absorb in the same range with different molar extinction coefficients.21
In our case,
TNT acts as the Lewis acid, which has two binding sites (C1 & C3 - see numbering for
TNT carbons in Scheme 1). While TNT does not absorb in the visible range, TNT–
does; the three products of the reaction of TNT with hydroxide (TNT–, [TNT-OH]
– C1,
and [TNT-OH]– C3) should therefore still show isosbestic points if TNT-DMF is at or
below absorbance detection limits. The question arises as to which form of [TNT-
OH]– belongs to which modeled spectrum. While Fyfe et. al. previously described
[TNT-OCH3]– C3 as the only observable sigma adduct via
1H NMR
9, we cannot
appropriately correlate this to our measurements without knowing how significantly
the sterics affect methoxide attack versus hydroxide attack. We also do not know each
species' molar absorptivity and quantum yield. If we estimate that both [TNT-OH]–
species have molar absorptivities and quantum yields on the same order of magnitude,
then the three peak emission spectrum that we initially fit plausibly belongs to [TNT-
OH]– C1. Also, TDDFT UV-Vis calculations may support this assignment by
projecting the C3 adduct as having higher energy transitions (Supplementary
Information Fig. S6). Absorbance computations at the B3LYP/6-311+G**//HF/6-
311+G** level suggest that the HOMO/LUMO gap for the C1 sigma adduct is of
lower energy than the C3 form. If each hydroxide sigma adduct has a similar Stokes
25
shift, this would assign the higher energy, single peak emission spectrum to [TNT-
OH]– C3.
Figure 11 shows the initial emission spectrum of the TNT/DMF solution, the
addition of 15 μL of water, and addition of 30 μL of water. All spectra in this titration
fit well using our established model (full titration fitting can be found in
Supplementary Information Fig. S7). The converged parameters for the TNT product
emission spectra model can be found in Table 1. The vibronic energy for [TNT-OH]–
C1 is 770 cm-1
and 630 cm-1
for TNT-DMF; these energies may represent ring bending
modes in each respective species. The integrated area of each spectrum as a function
of water addition is found in Figure 10. Unlike the trend for TNB, all emissive species
are observed to grow as more water is added to the system. This could be an
indication that TNT-DMF formation requires [TNT-OH]– C3 as an intermediate with a
subsequent SN2 step.
26
Figure 11. Emission spectra from TNT titration with water in DMF, fit to a three
species model for TNT-OH– C1 ( ), TNT-DMF ( ), and TNT-OH
– C3 (
). (a) 1.1×10⁻⁴
M TNT in DMF; (b) + 15 μL H2O; (c) + 30 μL H2O.
4. Conclusions
In summary, we have shown that TNB has the capacity to form two sigma
adducts in DMF, [TNB-OH]– and TNB-DMF, as shown in Scheme 1. Absorbance
data for TNB/DMF solutions supports the existence of two species that absorb in the
27
region expected for sigma adducts. Further investigation into excitation and emission
data supports the two species. The development of a multi-Gaussian model (with
parameters given in Table 1) clarifies the relative quantities of emission from each
species, showing the two to be linked by equilibrium. The methyl group of TNT
causes different reactivity than TNB. TNT has the ability to form four products in
DMF (Scheme 1), leading to spectral differences and similarities which require careful
analysis to discern. The major absorbing species, TNT–, is shown to be non-emissive.
Absorbance features consistent with sigma adducts of TNT are observed to grow as a
function of water addition. The three possible sigma adducts, [TNT-OH]– C1, [TNT-
OH]– C3, and TNT-DMF, all exhibit excitation and emission features that have distinct
similarity to their TNB counterparts. A multi-Gaussian model was also established to
differentiate the TNT sigma adducts' relative emission (Table 1), showing that all
grow together as a function of added water. This is not observed for the TNB sigma
adducts, and implies different mechanisms for DMF sigma adduct formation.
This is the first report of fluorescent emission from Meisenheimer adducts of
TNB and TNT, with both nitroaromatics capable of nucleophilic attack by hydroxide
and the less sterically hindered TNB capable of attack by DMF. All reactions show
significant changes within minutes, which allow these reactions to be further explored
in the context of sensor development. The emissions may be able to be enhanced by
using a resonance energy transfer from a donor fluorophore with a long excited state
lifetime to these adducts as acceptors; this could further amplify this form of a "turn-
on" mechanism. Alternatively, a solid state sensor capable of capturing these
nitroaromatics through stronger nucleophilic attack may be able to serve in a facile
28
turn-on approach. Future work should compare dinitrotoluene (DNT) emission
characteristics to those described here. DNTs are common impurities in TNT, but
since DNTs have a much higher vapor pressure than TNT they will each deliver
similar amounts in the vapor phase to a sensor. Depending on the relative equilibrium
constants for each adduct formation and their relative quantum yield, it may be found
that DNTs are more observable in this capacity. In addition, the different reactivity
between TNT and TNB means that caution must be used when using TNB as a
surrogate for TNT in the development and testing of TNT sensors. Finally, this work
shows that TNT sensors are expected to perform differently under wet or humid
conditions than under dry conditions. Water can react with nitroaromatics even at
trace levels.
ASSOCIATED CONTENT
Supporting Information.
UV/Vis Absorbance spectra, excitation and emission spectra of trinitroaromatics in
DMF with water titration. This material is available free of charge via the Internet at
http://pubs.acs.org.
AUTHOR INFORMATION
Corresponding Author
*Email: [email protected]
Notes
29
The authors declare no competing financial interest.
ACKNOWLEDGMENT
We would like to gratefully acknowledge Drs. Jimmie Oxley and James Smith for
providing us with TNT. We also thank the Department of Homeland Security ALERT
Center for funding.
ABBREVIATIONS
TNB, trinitrobenzene; TNT, trinitrotoluene; DMF, N,N-dimethylformamide.
REFERENCES
(1) Jiang, Y.; Zhao, H.; Zhu, N.; Lin, Y.; Yu, P.; Mao, L. Angew. Chem. Int. Ed.
2008, 47, 8601-8604.
(2) Üzer, A.; Erçağ, E.; Apak, R. For. Sci. Int. 2008, 239-243.
(3) Xia, Y.; Song, L.; Zhu, C. Anal. Chem. 2011, 83, 1401-1407.
(4) Chen, Y.; Chen, Z.; He, Y.; Lin, H.; Sheng, P.; Liu, C.; Luo, S.; Cai, Q.
Nanotechnology 2010, 21, 125502-125507.
(5) Tu, R.; Liu, B.; Wang, Z.; Gao, D.; Wang, F.; Fang, Q.; Zhang, Z. Anal. Chem.
2008, 80, 3458-3465.
(6) Gao, D.; Wang, Z.; Liu, B.; Ni, L.; Wu, M.; Zhang, Z. Anal. Chem. 2008, 80,
8545-8553.
30
(7) Fang, Q.; Geng, J.; Liu, B.; Gao, D.; Li, F.; Wang, Z.; Guan, G.; Zhang, Z.
Chem. Eur. J. 2009, 15, 11507-11514.
(8) Zhang, K.; Zhou, H.; Mei, Q.; Wang, S.; Guan, G.; Liu, R.; Zhang, J.; Zhang,
Z. J. Am. Chem. Soc. 2011, 133, 8424-8427.
(9) Fyfe, C.; Malkiewich, C.; Damji, S.; Norris, A. J. Am. Chem. Soc. 1976, 98,
6983.
(10) Bernasconi, C. J. Org. Chem. 1971, 36, 1671.
(11) Shipp, K.; Kaplan, L. J. Org. Chem. 1966, 31, 857.
(12) Buncel, E.; Norris, A.; Russell, K.; Tucker, R. J. Am. Chem. Soc. 1972, 94,
1646.
(13) Lakowicz, J.R. Principles of Fluorescence Spectroscopy, third ed., Springer
Science, New York, 2006.
(14) Rahman, M.; Harmon, H.J. Spectrochimica Acta A 2006, 65, 901-906.
(15) Olley, D.A.; Wren, E.J.; Vamvounis, G.; Fernee, M.J.; Wang, X.; Burn, P.L.;
Meredith, P.; Shaw, P.E. Chem. Mater. 2011, 23, 789-794.
(16) Algarra, M.; Campos, B.B.; Miranda, M.S.; Esteves da Silva, J.C.G. Talanta,
2011, 83, 1335-1340.
(17) Thomas III, S.W.; Joly, G.D.; Swager, T.M. Chem. Rev. 2007, 107, 1339-
1386.
31
(18) Shi, G.H.; Shang, Z.B.; Wang, Y.; Jin, W.J.; Zhang, T.C. Spectrochimica Acta
A 2008, 70, 247-252.
(19) Spartan '10; Wavefunction, Inc.: Irvine, CA, 2010. Version 1.1.0.
(20) Foster, R.; Mackie, R.K. J. Chem. Soc. 1962, 3843.
(21) Drago, R.S. Physical Methods for Chemists, second ed., Saunders College
Publishing, New York, 1992.
32
Supplementary Information for:
Fluorescent Species Formed by the Reaction of Trinitroaromatics With N,N-
Dimethylformamide and Hydroxide
by
Christopher A. Latendresse, Syrena C. Fernandes, Sangmin You, Hui Qi Zhang, and
William B. Euler*
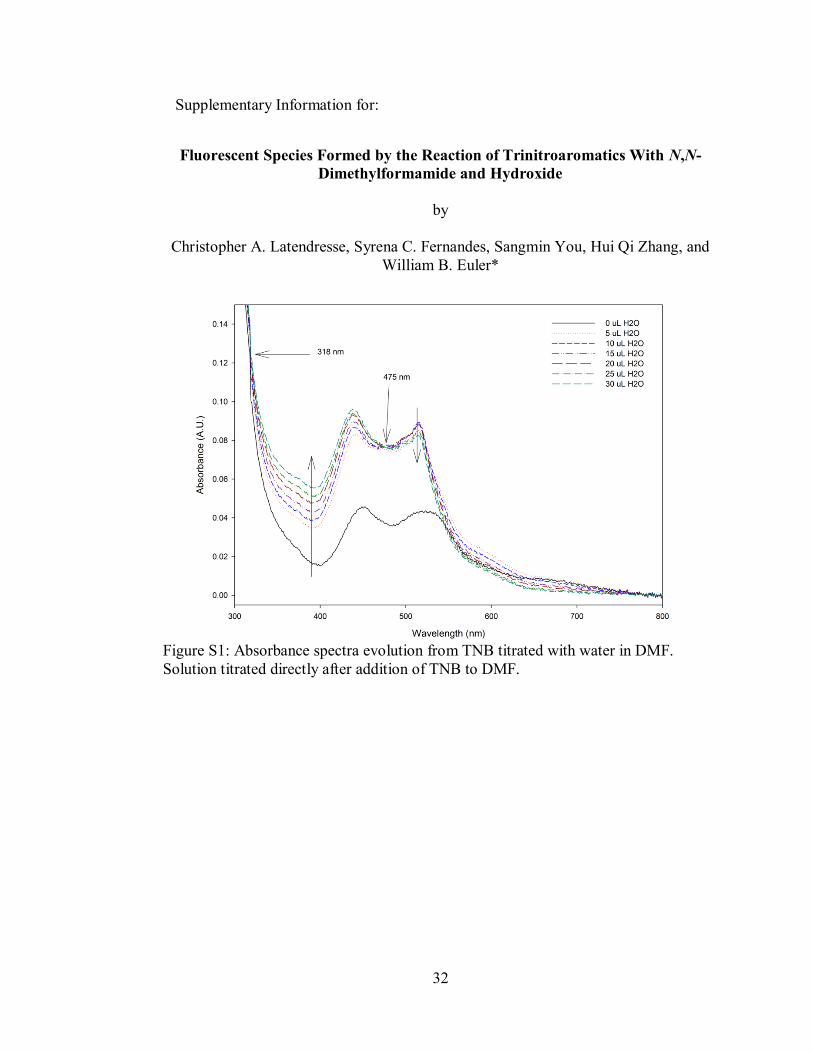
Figure S1: Absorbance spectra evolution from TNB titrated with water in DMF.
Solution titrated directly after addition of TNB to DMF.

33
Figure S2: Absorbance spectra evolution from TNT titrated with water in DMF.
Solution titrated directly after addition of TNT to DMF.
Figure S3: Emission spectra evolution from TNB titrated with water in DMF (λex =
446nm). Solution titrated directly after addition of TNB to DMF.
34
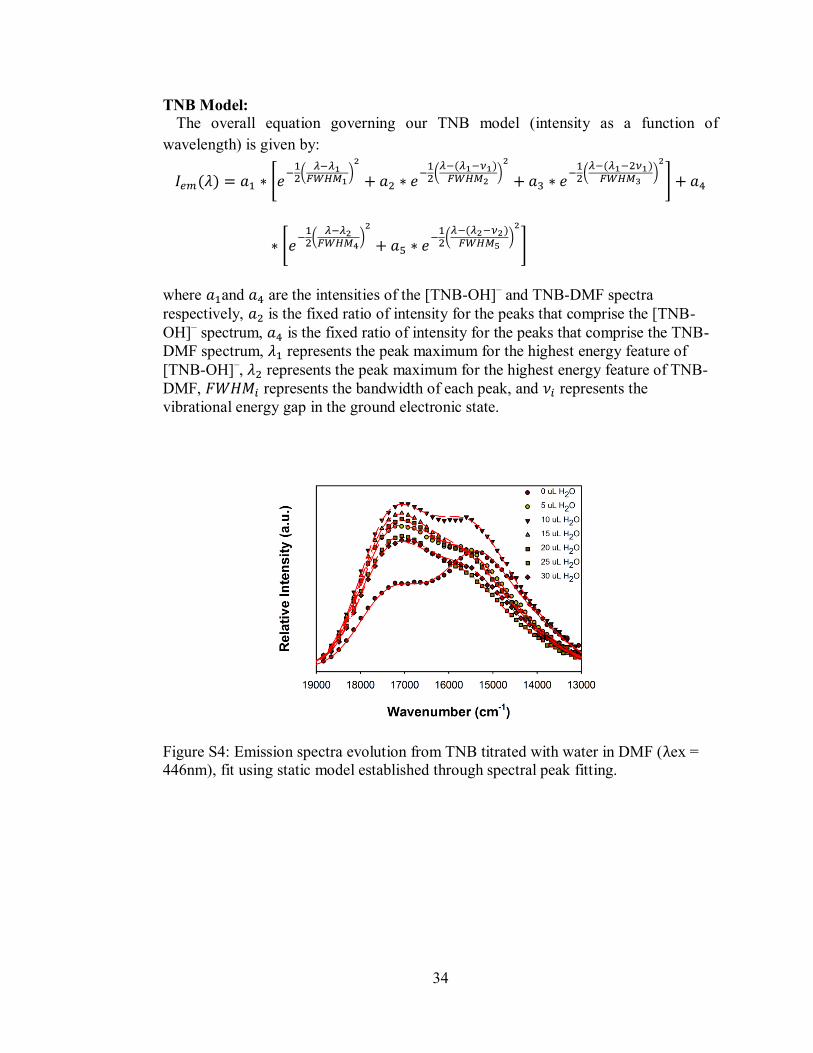
TNB Model:
The overall equation governing our TNB model (intensity as a function of
wavelength) is given by:
where and are the intensities of the [TNB-OH]– and TNB-DMF spectra
respectively, is the fixed ratio of intensity for the peaks that comprise the [TNB-
OH]– spectrum, is the fixed ratio of intensity for the peaks that comprise the TNB-
DMF spectrum, represents the peak maximum for the highest energy feature of
[TNB-OH]–, represents the peak maximum for the highest energy feature of TNB-
DMF, represents the bandwidth of each peak, and represents the
vibrational energy gap in the ground electronic state.
Figure S4: Emission spectra evolution from TNB titrated with water in DMF (λex =
446nm), fit using static model established through spectral peak fitting.
35
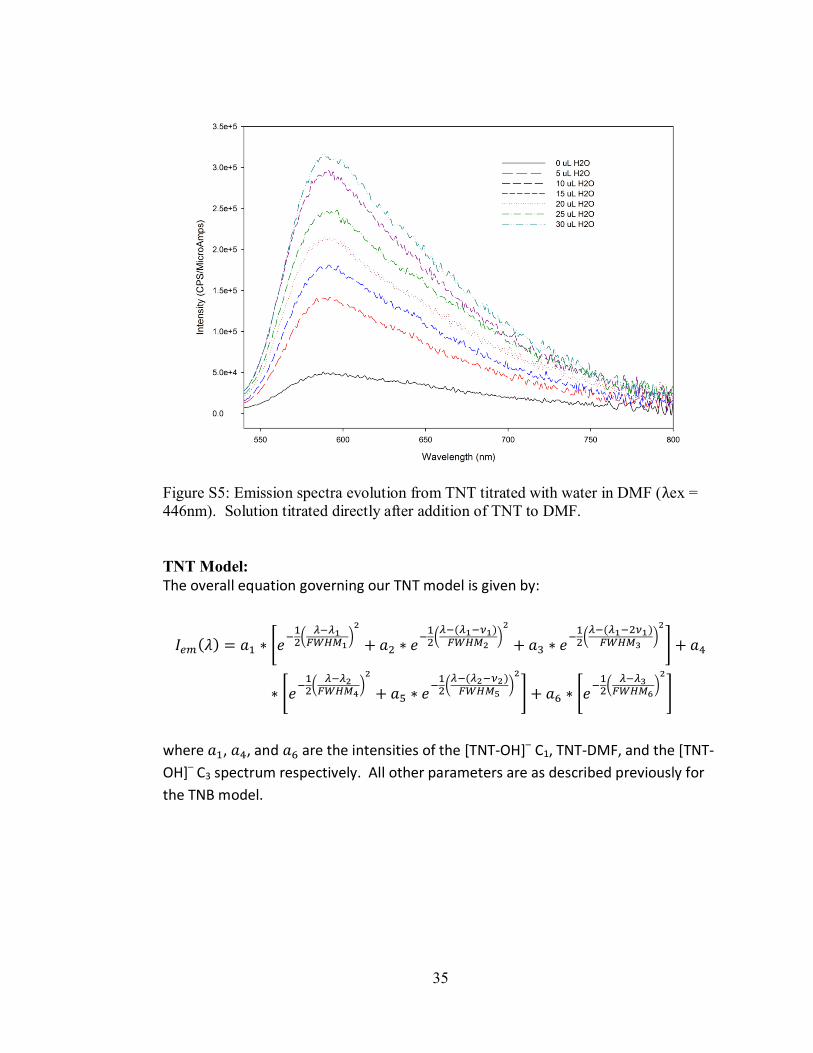
Figure S5: Emission spectra evolution from TNT titrated with water in DMF (λex =
446nm). Solution titrated directly after addition of TNT to DMF.
TNT Model:
The overall equation governing our TNT model is given by:
where , , and are the intensities of the [TNT-OH]– C1, TNT-DMF, and the [TNT-
OH]– C3 spectrum respectively. All other parameters are as described previously for
the TNB model.

36
Figure S6: UV/Vis Computations performed at the B3LYP/6-311+G**//HF/6-
311+G** level for the two hydroxide adducts of TNT, in vacuum and at 273.15K.
Note that while the computed maxima are generally poor for this approach, the
relative position of the maxima are typically representative of experimental
observation.
Figure S7: Emission spectra evolution from TNT titrated with water in DMF (λex =
446nm), fit using static model established through spectral peak fitting.

37
CHAPTER 2
Comparing the Roles of Hydroxide and
Amines in TNT Reactions: Clarifying
Absorbance Spectra Assignments For Use in
Detection Methods
Christopher A. Latendresse, Syrena C. Fernandes, Sangmin You, and William B.
Euler*
University of Rhode Island Department of Chemistry, 51 Lower College Road,
Kingston, RI 02881, USA
The following is in preparation for submission to the Journal of the American
Chemical Society, and is presented here in manuscript format.
38
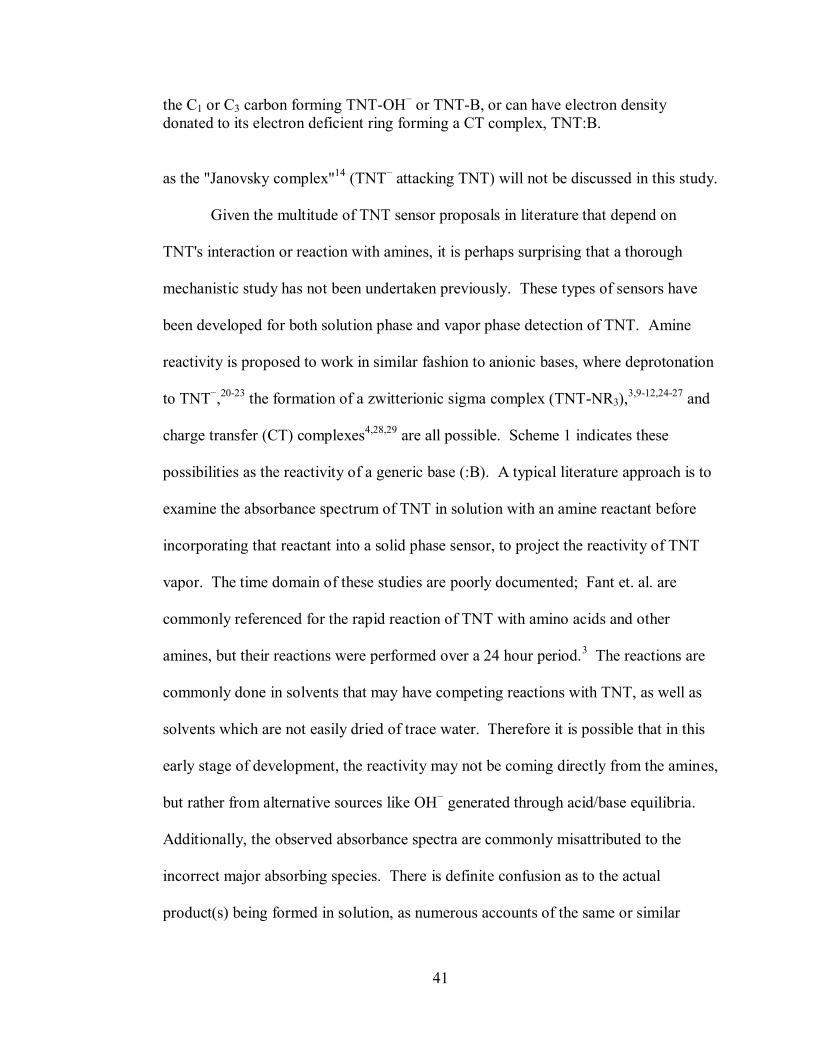
ABSTRACT
Many contemporary TNT sensors rely on the reaction of primary amines with
TNT to form a species that absorbs in the visible range. The mechanism of this
reaction has been attributed to charge transfer (CT) complexes, the deprotonation of
TNT's methyl group forming TNT−, or the nucleophilic attack upon TNT forming the
zwitterionic sigma adduct TNT-NR3. All of these species are commonly used to
justify similar absorbance spectra, which are especially important in the development
of RET based sensors. Anionic base reactions with TNT are well established, but
amine reactions with TNT have not been thoroughly investigated in the literature. We
clarify herein the role of amines in TNT reactions in solution. Amines are found to be
ineffective in directly deprotonating TNT. Amines also do not compete significantly
in the formation of sigma complexes with alkoxide or hydroxide bases, which may be
generated through acid/base reactions between amines and solvent molecules or
ambient water. Since direct amine reactions are not observed as a primary rapid
reaction with TNT, they are not expected to be an effective means of ultra-trace rapid
sensing of TNT vapor. Additionally, solvent choice and the quantification of water
content are crucial to the development and effective use of TNT sensors, in both
solution and vapor phase.
INTRODUCTION
The detection of trinitrotoluene (TNT) has become an increasingly prevalent
research topic over the past decade, due in part to the rise in international terrorism
and the toxic nature of TNT in the environment. Many methods of detection have

39
been proposed in literature, including methods that rely on reactivity from TNT’s
electron deficient aromatic ring. Since these reactions generate species that absorb in
the visible range, simple colorimetric sensors have been developed in the solution
phase.1-4
More complex and sensitive fluorometric sensors have been developed,5-8
with many using the colorful species in a resonance energy transfer (RET) sensing
mechanism.9-12
In such a sensor, a donor fluorophore is chosen based on significant
overlap of its emission spectrum with the absorbance spectrum of the TNT product
acceptor. In this fashion, a sensor can be tailored for a species that absorbs in a
specific range.
Alkoxide reactions with TNT have been studied for a number of years, with
two major competing reactions resulting. Scheme 1 shows the possible reactions
between TNT and hydroxide or a generic Lewis base. The literature reports the ability
of hydroxide or alkoxide to deprotonate the methyl group of TNT, forming TNT−, or
to attack the ring forming the sigma adduct TNT-OR−.13-19
While alkoxides are
believed to attack TNT's C3 carbon, hydroxide is much less sterically hindered and is
able to form the TNT-OH− C1 adduct, pushing TNT's methyl group out of plane.
Since this study and others established C1 as the most favorable nucleophilic attack
site, this is commonly attributed as the site of attack by weaker nucleophiles, such as
amines.3,4,9-12,20-29
However, given the scope of our study, we also indicate here the
possibility of a Lewis base attack on C3 as a function of decreased sterics at that site.
While there are other proposals for TNT mechanisms, these are the possible initial
elementary steps for any further reactions; therefore, these are the most crucial to
understand in the context of a rapid TNT sensor. Due to this, further reactions such
40
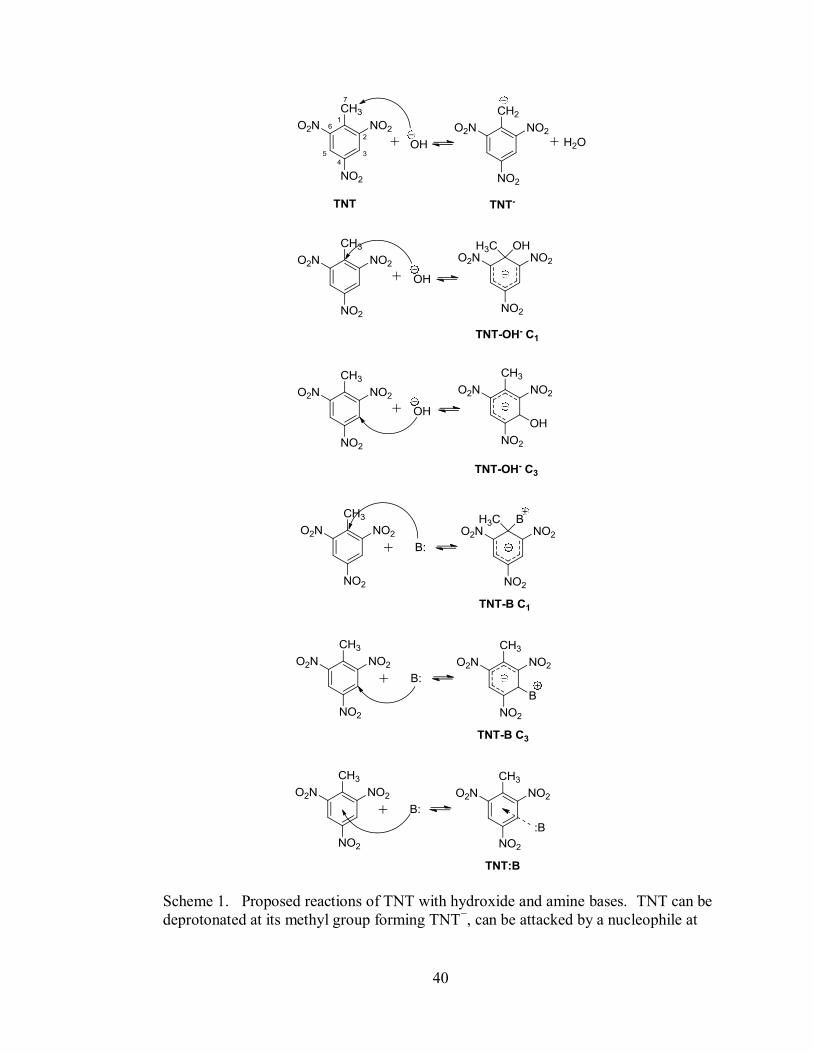
Scheme 1. Proposed reactions of TNT with hydroxide and amine bases. TNT can be
deprotonated at its methyl group forming TNT−, can be attacked by a nucleophile at
41
the C1 or C3 carbon forming TNT-OH− or TNT-B, or can have electron density
donated to its electron deficient ring forming a CT complex, TNT:B.
as the "Janovsky complex"14
(TNT− attacking TNT) will not be discussed in this study.
Given the multitude of TNT sensor proposals in literature that depend on
TNT's interaction or reaction with amines, it is perhaps surprising that a thorough
mechanistic study has not been undertaken previously. These types of sensors have
been developed for both solution phase and vapor phase detection of TNT. Amine
reactivity is proposed to work in similar fashion to anionic bases, where deprotonation
to TNT−,20-23
the formation of a zwitterionic sigma complex (TNT-NR3),3,9-12,24-27
and
charge transfer (CT) complexes4,28,29
are all possible. Scheme 1 indicates these
possibilities as the reactivity of a generic base (:B). A typical literature approach is to
examine the absorbance spectrum of TNT in solution with an amine reactant before
incorporating that reactant into a solid phase sensor, to project the reactivity of TNT
vapor. The time domain of these studies are poorly documented; Fant et. al. are
commonly referenced for the rapid reaction of TNT with amino acids and other
amines, but their reactions were performed over a 24 hour period.3 The reactions are
commonly done in solvents that may have competing reactions with TNT, as well as
solvents which are not easily dried of trace water. Therefore it is possible that in this
early stage of development, the reactivity may not be coming directly from the amines,
but rather from alternative sources like OH− generated through acid/base equilibria.
Additionally, the observed absorbance spectra are commonly misattributed to the
incorrect major absorbing species. There is definite confusion as to the actual
product(s) being formed in solution, as numerous accounts of the same or similar
42
reactions lead to a different proposed product; for example, the same absorbance
spectrum has been explained by a charge transfer complex,28
TNT−,21
or a sigma
adduct with an amine.27
The overall goal of this study is to clarify the product
formation of the reaction of TNT with amines, and address the relative rates of the
TNT reactions with hydroxide against those of amines. In addition, we set out to
clarify the timescale in which amine functionalized TNT sensors may or may not be
applicable.
MATERIALS AND METHODS
TNT was obtained from Drs. Jimmie Oxley and James Smith and was used
without further purification. NMR experiments were conducted in either d8-THF
(99.5% D) or in d4-MeOD (99.8% D), both purchased from Cambridge Isotope
Laboratories. DCl/D2O (35% w/w, 99% D) solution and NaOD/D2O (40% w/w,
99.5% D) solution were purchased from Sigma Aldrich. Additional D2O (99.8% D)
for dilution was purchased from Acros. TNT solutions were quantitatively prepared
and 1H and
13C spectra were acquired before and after the addition of base on a Bruker
300 MHz NMR. Time delay from the start of reaction to data acquisition was
approximately five minutes per spectrum, due to solvent locking and shimming.
Solutions containing TNT for absorbance measurements were made
quantitatively using either HPLC grade THF (99.9%, inhibitor-free) or HPLC grade
MeOH (99.9%), both purchased from Sigma. TNT stock solutions were added to a
cuvette and observed prior to addition of amine. While stirring, amine solutions were
quantitatively added using a micropipette. To rapidly gather absorbance data, a setup
43
was constructed in house with a Peltier temperature controlled cuvette holder held at
20.00°C and a white light tungsten lamp directed by OceanOptics© fiber optics upon
the sample. Our setup was capable of acquiring one spectrum about every 50 msec,
limiting our temporal resolution to that value.
In order to address the kinetic evaluation in a reasonable fashion, a pseudo-first
order kinetic approach was used. Experiments were prepared so that one reactant
concentration would be 100x excess of the other, so that the loss of the excess reactant
was negligible, simplifying the calculations. Data were fit to exponential trends using
commercially available graphing software (Microsoft Excel, SigmaPlot).
RESULTS AND DISCUSSION
To elucidate the reaction between TNT and aliphatic or aromatic amines, our
group utilized a similar approach to Fyfe et. al. by exploring relationships between 1H
NMR and absorbance spectra. In order to be consistent with what is known about
hydroxide's reaction with TNT, we were able to perform our experiments first with
hydroxide and subsequently with a group of selected amines of various basicity,
nucleophilicity, and sterics. The aliphatic amines explored in this study included
diethylamine (DEA), triethylamine (TEA), ethylamine (EA), propylamine (PA), and
n-butylamine (BA). The aromatic amines explored in this study included 2,6-lutidine,
collidine, pyridine, and aniline. Color changes were not observed with the addition of
reasonable amounts of TNT and aromatic amines. Visible range absorbances were
detected only when tens of milligrams of TNT were added to these as solvents;
because of this, the further study of TNT reactions with aromatic amines was

44
discarded and only the aliphatic amines were used. In our attempt to investigate the
formation of TNT products in differing environments, methanol and tetrahydrofuran
(THF) were used as solvents to assess polar and slightly polar surroundings
respectively.
Product identification through NMR:
1H NMR was employed to determine the possible contributors to visible range
absorbance. While we recognize the time discrepancy between our ability to acquire
1H NMR data (on the order of 5 minutes) and our ability to monitor visible absorbance
changes (on the order of tens of milliseconds), we were able to correlate our spectral
data to faster data acquisitions from the literature.13
Since we anticipate ambient water
to be present in even the most nominally dry solvents, our first investigation was the
reaction of TNT with OH−.
Hydroxide/methoxide as competing species:
In order to understand the relation of TNT/amine products in systems with any
trace water, reactions of TNT and sodium deuteroxide in deuterium oxide solution
(NaOD/D2O) were carried out in deuterated THF and deuterated methanol. Figure 1
represents the reaction with increasing concentration of NaOD/D2O in d8-THF, while
Figure 2 represents the same reaction in d4-MeOD.
45
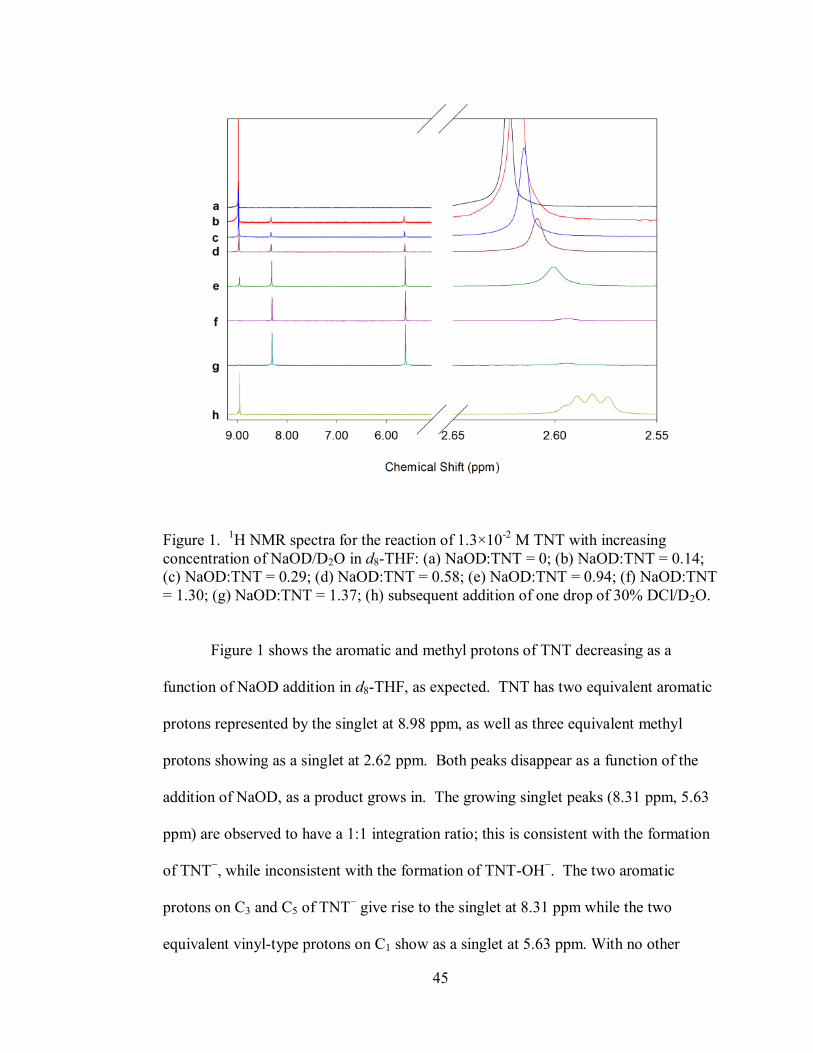
Figure 1. 1H NMR spectra for the reaction of 1.3×10
-2 M TNT with increasing
concentration of NaOD/D2O in d8-THF: (a) NaOD:TNT = 0; (b) NaOD:TNT = 0.14;
(c) NaOD:TNT = 0.29; (d) NaOD:TNT = 0.58; (e) NaOD:TNT = 0.94; (f) NaOD:TNT
= 1.30; (g) NaOD:TNT = 1.37; (h) subsequent addition of one drop of 30% DCl/D2O.
Figure 1 shows the aromatic and methyl protons of TNT decreasing as a
function of NaOD addition in d8-THF, as expected. TNT has two equivalent aromatic
protons represented by the singlet at 8.98 ppm, as well as three equivalent methyl
protons showing as a singlet at 2.62 ppm. Both peaks disappear as a function of the
addition of NaOD, as a product grows in. The growing singlet peaks (8.31 ppm, 5.63
ppm) are observed to have a 1:1 integration ratio; this is consistent with the formation
of TNT−, while inconsistent with the formation of TNT-OH
−. The two aromatic
protons on C3 and C5 of TNT− give rise to the singlet at 8.31 ppm while the two
equivalent vinyl-type protons on C1 show as a singlet at 5.63 ppm. With no other
46
features apparent in this figure, TNT− appears to be the exclusive product on this
relative timescale of approximately one hour. The relative peak positions are
consistent with the report of TNT− formation in DMSO/MeOH using alkoxide bases
from Fyfe et. al.13
Small shifts in unreacted TNT’s methyl peaks are likely related to
H/D exchange. Also, the final addition of excess DCl to the system would be
expected to re-deuterate the methylene group on TNT−, forming a CH2D methyl
group. The observation of three singlet peaks in the methyl region supports this, as
does the restoration of the aromatic proton peaks to nearly their original chemical
shift. Since the addition of excess DCl re-establishes an equilibrium state, a 13
C DEPT
135 spectrum was acquired with the final sample of the titration (Supplementary
Information Fig. S2). The unreacted TNT peaks for the methyl carbons and the ring
carbons (C3 & C5) with aromatic protons were apparent, given the hydrogens
associated with them, while the other carbons did not show signals with a one hour
acquisition time. After the deprotonation and subsequent deuteration, the DEPT 135
spectrum shows the aromatic carbons remaining at the same chemical shift; however,
the methyl carbon peak is no longer visible. This is likely a result of two phenomena:
the removal of a hydrogen from the methyl carbon lowers its relative enhancement
factor, and the addition of a deuterium splits the signal to a triplet, further lowering the
S/N ratio.
47
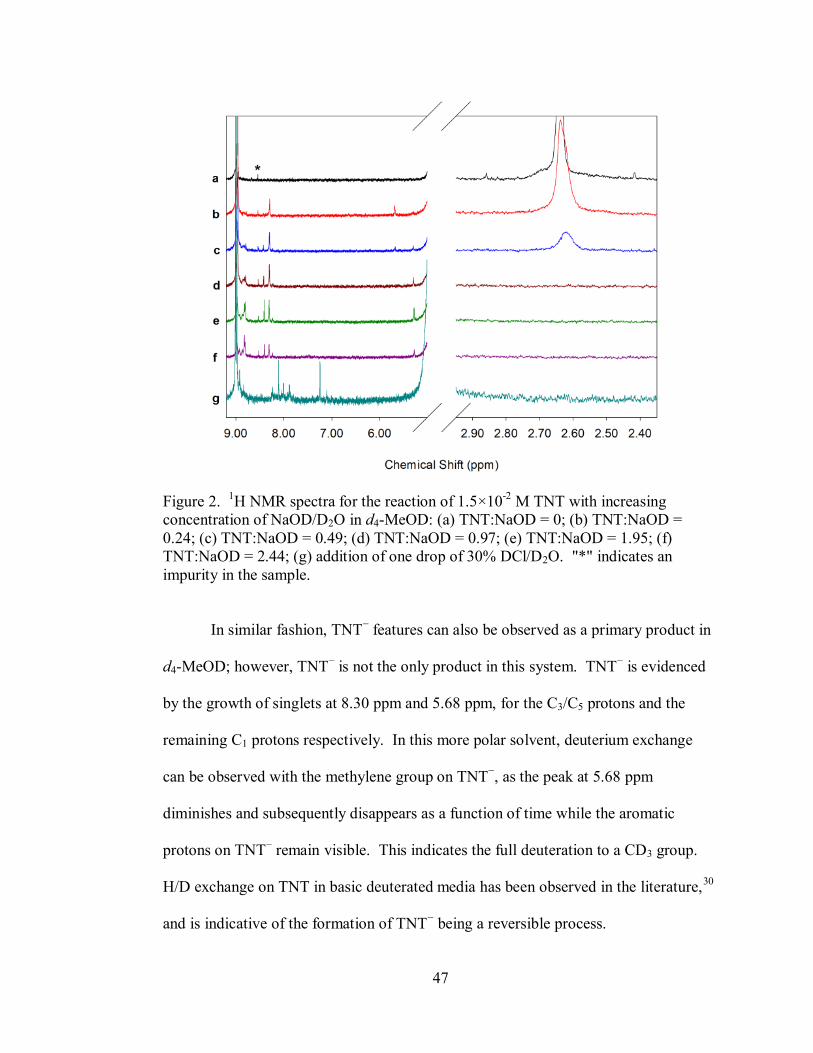
Figure 2. 1H NMR spectra for the reaction of 1.5×10
-2 M TNT with increasing
concentration of NaOD/D2O in d4-MeOD: (a) TNT:NaOD = 0; (b) TNT:NaOD =
0.24; (c) TNT:NaOD = 0.49; (d) TNT:NaOD = 0.97; (e) TNT:NaOD = 1.95; (f)
TNT:NaOD = 2.44; (g) addition of one drop of 30% DCl/D2O. "*" indicates an
impurity in the sample.
In similar fashion, TNT− features can also be observed as a primary product in
d4-MeOD; however, TNT− is not the only product in this system. TNT
− is evidenced
by the growth of singlets at 8.30 ppm and 5.68 ppm, for the C3/C5 protons and the
remaining C1 protons respectively. In this more polar solvent, deuterium exchange
can be observed with the methylene group on TNT−, as the peak at 5.68 ppm
diminishes and subsequently disappears as a function of time while the aromatic
protons on TNT− remain visible. This indicates the full deuteration to a CD3 group.
H/D exchange on TNT in basic deuterated media has been observed in the literature,30
and is indicative of the formation of TNT− being a reversible process.
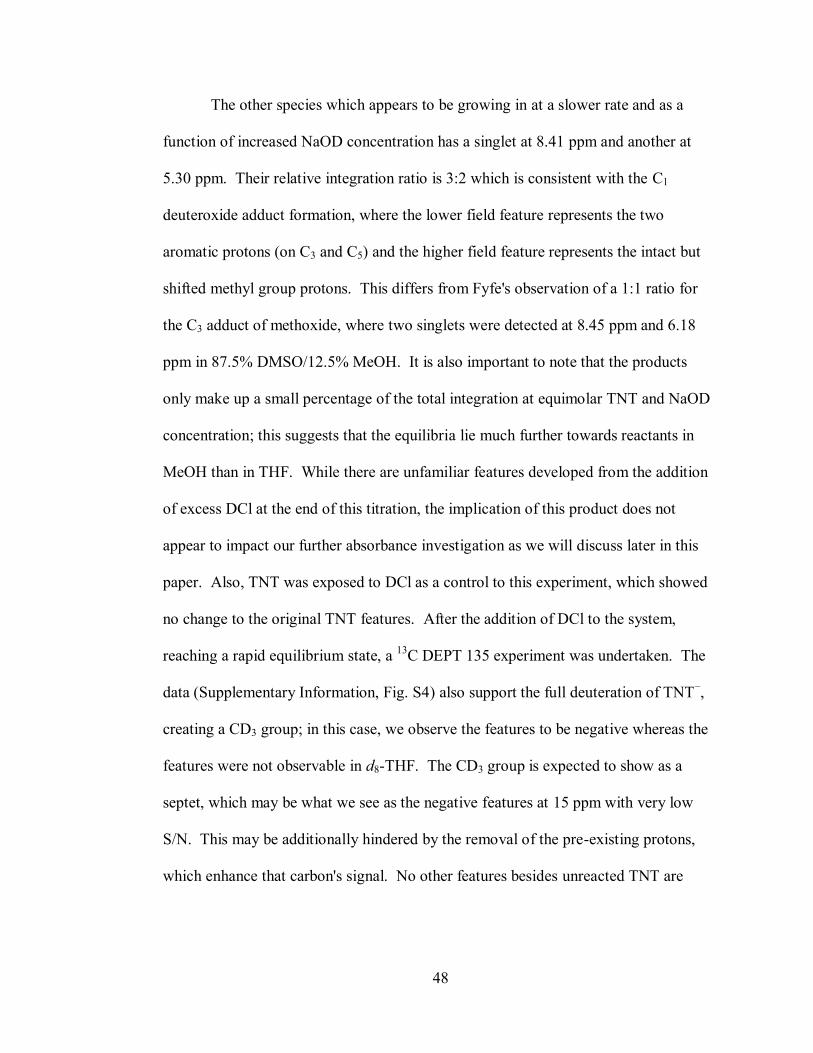
48
The other species which appears to be growing in at a slower rate and as a
function of increased NaOD concentration has a singlet at 8.41 ppm and another at
5.30 ppm. Their relative integration ratio is 3:2 which is consistent with the C1
deuteroxide adduct formation, where the lower field feature represents the two
aromatic protons (on C3 and C5) and the higher field feature represents the intact but
shifted methyl group protons. This differs from Fyfe's observation of a 1:1 ratio for
the C3 adduct of methoxide, where two singlets were detected at 8.45 ppm and 6.18
ppm in 87.5% DMSO/12.5% MeOH. It is also important to note that the products
only make up a small percentage of the total integration at equimolar TNT and NaOD
concentration; this suggests that the equilibria lie much further towards reactants in
MeOH than in THF. While there are unfamiliar features developed from the addition
of excess DCl at the end of this titration, the implication of this product does not
appear to impact our further absorbance investigation as we will discuss later in this
paper. Also, TNT was exposed to DCl as a control to this experiment, which showed
no change to the original TNT features. After the addition of DCl to the system,
reaching a rapid equilibrium state, a 13
C DEPT 135 experiment was undertaken. The
data (Supplementary Information, Fig. S4) also support the full deuteration of TNT−,
creating a CD3 group; in this case, we observe the features to be negative whereas the
features were not observable in d8-THF. The CD3 group is expected to show as a
septet, which may be what we see as the negative features at 15 ppm with very low
S/N. This may be additionally hindered by the removal of the pre-existing protons,
which enhance that carbon's signal. No other features besides unreacted TNT are
49
apparent from the carbon spectrum, implying that TNT− is the major early product of
this reaction.
Reaction of TNT with amines:
With an understanding of hydroxide’s role in TNT reactivity, we subsequently
investigated the formation of products of TNT with various amines using 1H NMR, as
seen in Figure 3.
Figure 3. 1H NMR spectra for the reaction of TNT with addition of excess bases in d8-
THF: (a) unreacted TNT; (b) TNT + NaOD; (c) TNT + DEA; (d) TNT + TEA; (e)
TNT + EA/H2O; (f) TNT + PA; (g) TNT + BA. The data at higher chemical shift
have been cut off due to similarity to unreacted TNT, while lower chemical shifts are
overwhelmed by amine features.
In a qualitative assessment of reaction products, it is first apparent that TNT−
features exist in the reaction of TNT with EA or PA while similar features are not
50
apparent for TEA, DEA and BA. This observation does not correlate well with the
expected basicity of each amine in water; however, it does correlate well to their
expected water content. EA is a gas at ambient temperatures, and thus was only
available as an aqueous solution. As a larger quantity of PA was necessary for
product observation, a small water impurity may exist in this system as well. Since
the addition of water directly generates hydroxide, it is difficult to clarify which
species seen here are resultant from hydroxide or amine reactivity. Other features are
seen in these spectra, which may relate to amine adducts, but are barely observable
over the baseline noise and are a very small contributor even with excess amine – this
suggests that the equilibrium constant for these reactions is low, with mainly unreacted
TNT being observed at equilibrium.
It is interesting to note here the possible appearance of two sigma adducts in
the reaction of TNT with DEA, as Figure 3c shows two quartets in the spectrum for
this reaction. The quartets may come from the inequivalence of the alkyl groups on
DEA after covalently bonding to TNT, but may also come from two different attack
sites. As the size of the nucleophile increases and sterics begin to play a larger role, it
is conceivable that DEA can attack either the C1 carbon or the C3 carbon with similar
energies. Computational analysis supports this proposal, as the relative energies of
formation for the two sigma adducts shows the C3 adduct to be slightly more favorable
(vide infra).
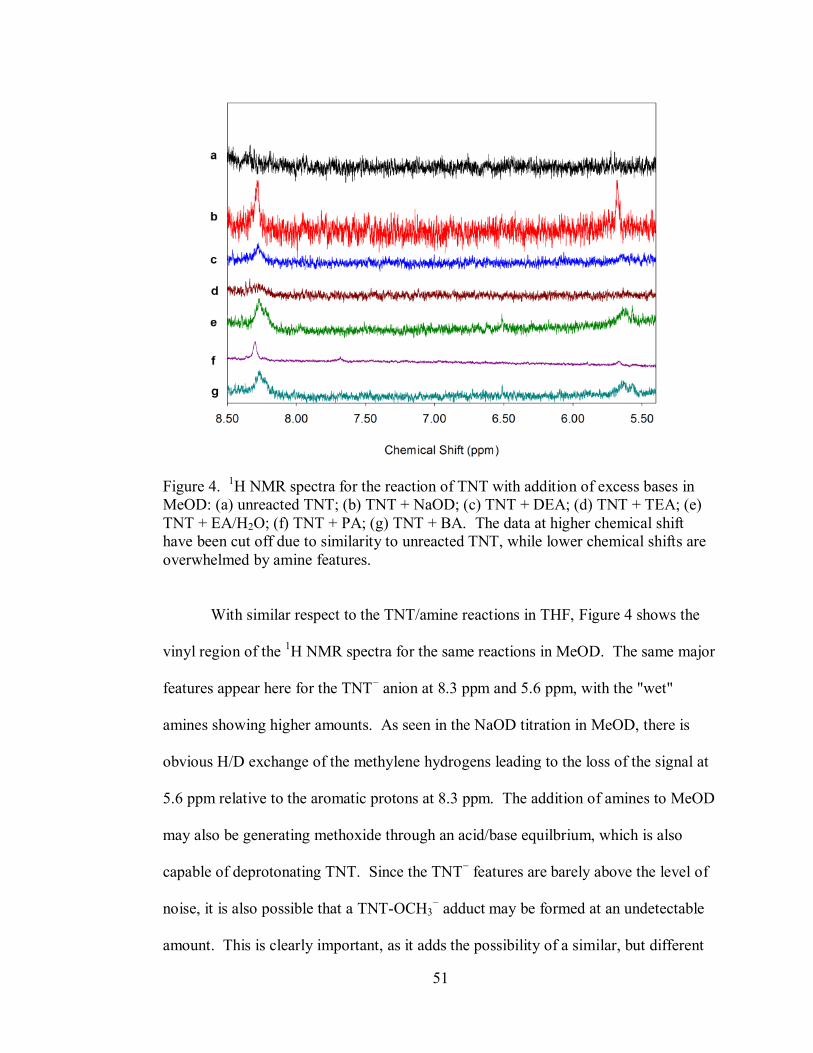
51
Figure 4. 1H NMR spectra for the reaction of TNT with addition of excess bases in
MeOD: (a) unreacted TNT; (b) TNT + NaOD; (c) TNT + DEA; (d) TNT + TEA; (e)
TNT + EA/H2O; (f) TNT + PA; (g) TNT + BA. The data at higher chemical shift
have been cut off due to similarity to unreacted TNT, while lower chemical shifts are
overwhelmed by amine features.
With similar respect to the TNT/amine reactions in THF, Figure 4 shows the
vinyl region of the 1H NMR spectra for the same reactions in MeOD. The same major
features appear here for the TNT− anion at 8.3 ppm and 5.6 ppm, with the "wet"
amines showing higher amounts. As seen in the NaOD titration in MeOD, there is
obvious H/D exchange of the methylene hydrogens leading to the loss of the signal at
5.6 ppm relative to the aromatic protons at 8.3 ppm. The addition of amines to MeOD
may also be generating methoxide through an acid/base equilbrium, which is also
capable of deprotonating TNT. Since the TNT− features are barely above the level of
noise, it is also possible that a TNT-OCH3− adduct may be formed at an undetectable
amount. This is clearly important, as it adds the possibility of a similar, but different

52
set of absorbance features in our further experiments; it also implicates the sensitivity
of TNT reactions to competition with solvent molecules. The unreacted TNT signals
(not shown) are the predominant features with approximately 500 times the intensity
of the products. Clearly, the equilibria for these reactions lie much closer to reactants
than products or the kinetics for these reactions are very slow.
Absorbance Characteristics/Kinetic Evaluation
Although absorbance spectroscopy is not a clear identification method for
product structure, it can be a powerful tool when coupled with a method like NMR.
Here, we set out to observe similarities in absorbance measurements to propose that
there is no significant visible absorbance from TNT-amine adducts. In addition, we
put to question whether amines are basic enough to deprotonate the methyl group on
TNT. A simple experiment was conducted by dropping a few crystals (≈ 10-3
− 10-4
M) of TNT into a few milliliters of dry TEA and observing the absorbance.
Surprisingly, no visible absorbance features were generated. This observation has
dual consequence. First TEA is one of the most basic of the aliphatic amines, and
although its steric hindrance is enough to rule out a sigma complex it would not be
expected to limit its ability to deprotonate TNT's methyl group. Secondly TEA is one
of the highest known solvents on Gutmann's Donor Number (DN)31
scale, as it has the
capacity to donate electron density to an electron-poor species, forming a charge-
transfer (CT) complex. Trinitrobenzene (TNB) has been shown to form CT
complexes with aliphatic amines (including TEA) in cyclohexane, but their
absorbance maxima are in the UV range.32
TNT is not fully planar like TNB, so the
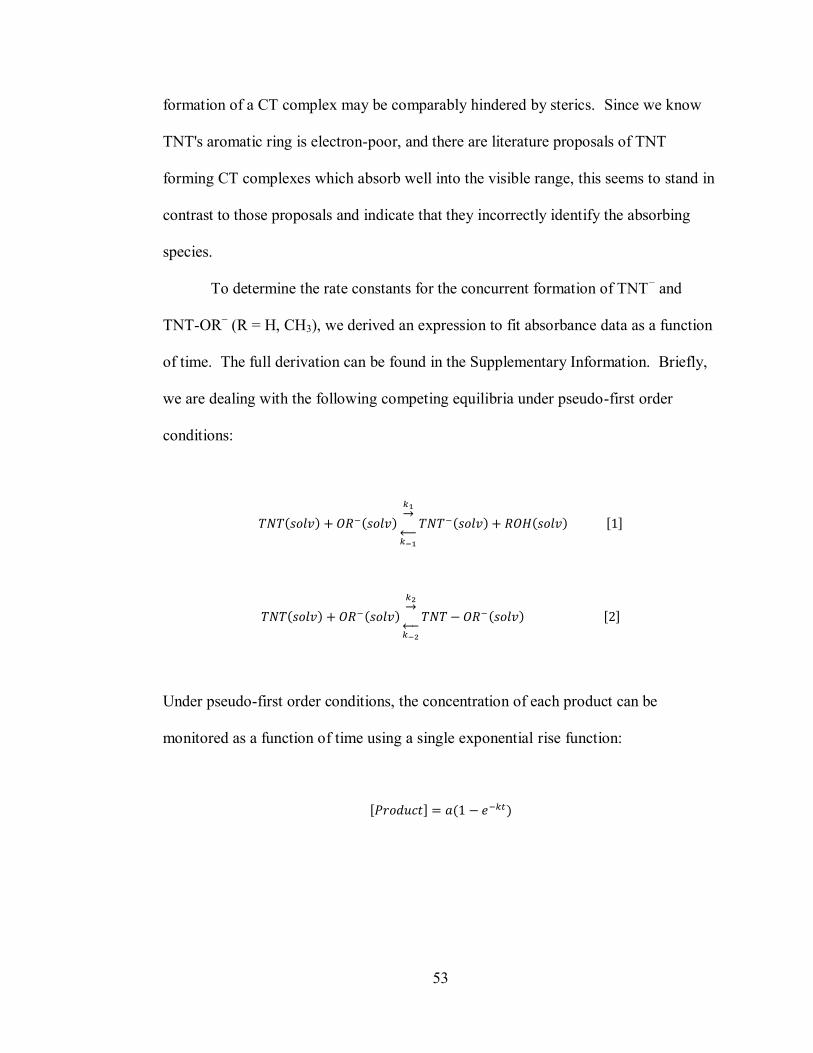
53
formation of a CT complex may be comparably hindered by sterics. Since we know
TNT's aromatic ring is electron-poor, and there are literature proposals of TNT
forming CT complexes which absorb well into the visible range, this seems to stand in
contrast to those proposals and indicate that they incorrectly identify the absorbing
species.
To determine the rate constants for the concurrent formation of TNT− and
TNT-OR− (R = H, CH3), we derived an expression to fit absorbance data as a function
of time. The full derivation can be found in the Supplementary Information. Briefly,
we are dealing with the following competing equilibria under pseudo-first order
conditions:
Under pseudo-first order conditions, the concentration of each product can be
monitored as a function of time using a single exponential rise function:
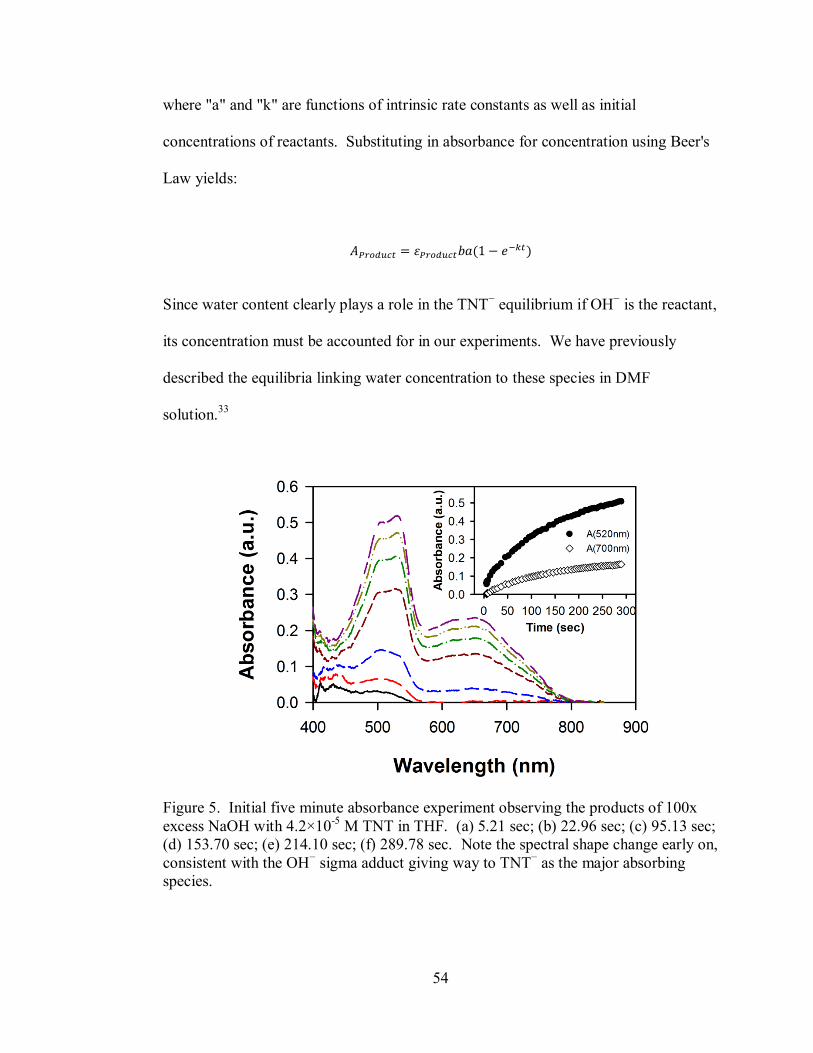
54
where "a" and "k" are functions of intrinsic rate constants as well as initial
concentrations of reactants. Substituting in absorbance for concentration using Beer's
Law yields:
Since water content clearly plays a role in the TNT− equilibrium if OH
− is the reactant,
its concentration must be accounted for in our experiments. We have previously
described the equilibria linking water concentration to these species in DMF
solution.33
Figure 5. Initial five minute absorbance experiment observing the products of 100x
excess NaOH with 4.2×10⁻⁵
M TNT in THF. (a) 5.21 sec; (b) 22.96 sec; (c) 95.13 sec;
(d) 153.70 sec; (e) 214.10 sec; (f) 289.78 sec. Note the spectral shape change early on,
consistent with the OH− sigma adduct giving way to TNT
− as the major absorbing
species.
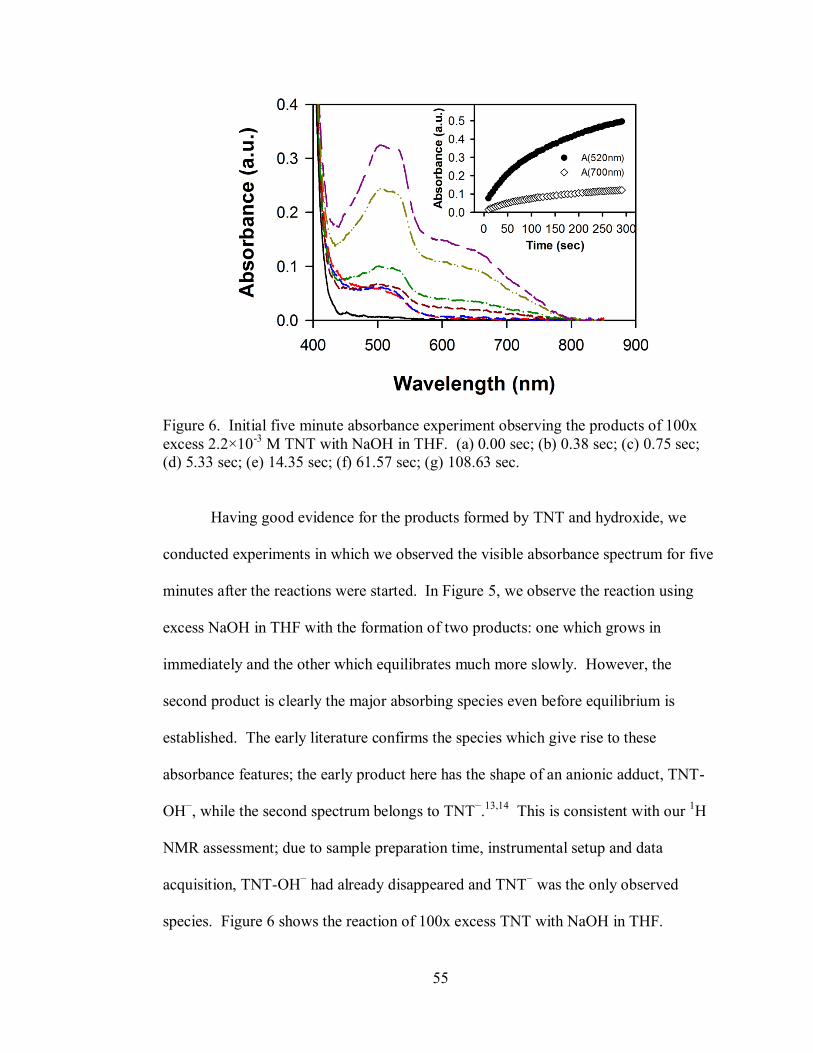
55
Figure 6. Initial five minute absorbance experiment observing the products of 100x
excess 2.2×10⁻³
M TNT with NaOH in THF. (a) 0.00 sec; (b) 0.38 sec; (c) 0.75 sec;
(d) 5.33 sec; (e) 14.35 sec; (f) 61.57 sec; (g) 108.63 sec.
Having good evidence for the products formed by TNT and hydroxide, we
conducted experiments in which we observed the visible absorbance spectrum for five
minutes after the reactions were started. In Figure 5, we observe the reaction using
excess NaOH in THF with the formation of two products: one which grows in
immediately and the other which equilibrates much more slowly. However, the
second product is clearly the major absorbing species even before equilibrium is
established. The early literature confirms the species which give rise to these
absorbance features; the early product here has the shape of an anionic adduct, TNT-
OH−, while the second spectrum belongs to TNT
−.13,14
This is consistent with our 1H
NMR assessment; due to sample preparation time, instrumental setup and data
acquisition, TNT-OH− had already disappeared and TNT
− was the only observed
species. Figure 6 shows the reaction of 100x excess TNT with NaOH in THF.
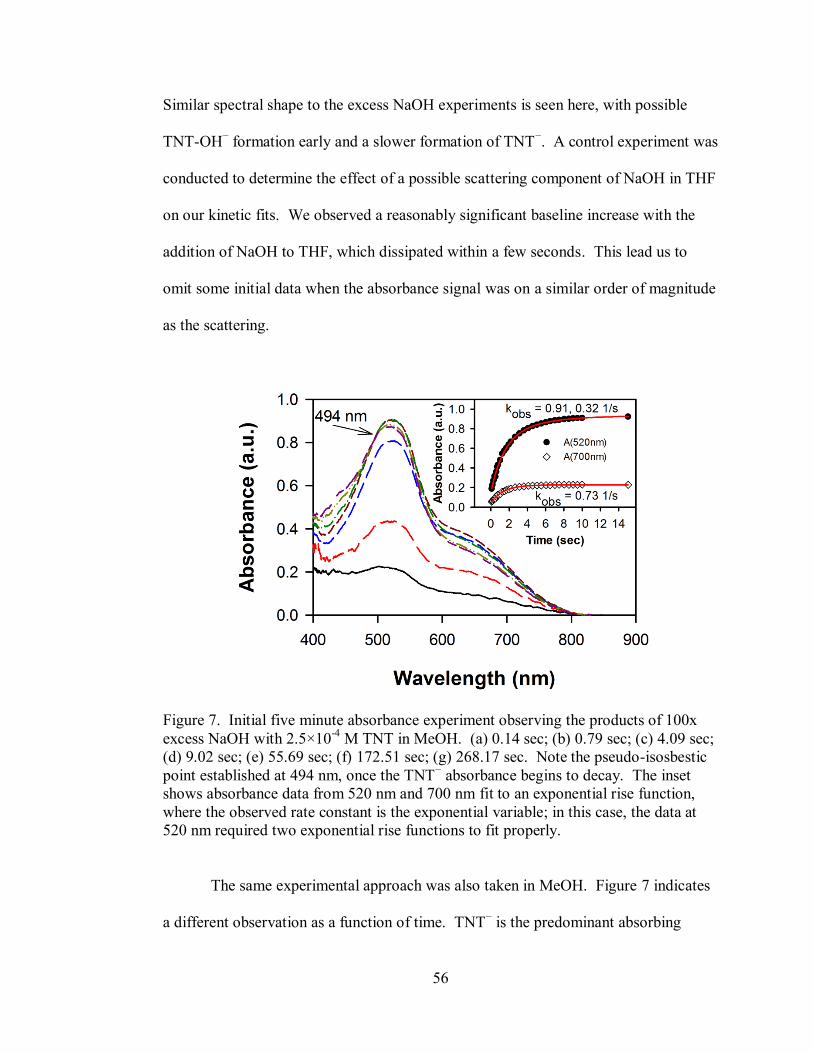
56
Similar spectral shape to the excess NaOH experiments is seen here, with possible
TNT-OH− formation early and a slower formation of TNT
−. A control experiment was
conducted to determine the effect of a possible scattering component of NaOH in THF
on our kinetic fits. We observed a reasonably significant baseline increase with the
addition of NaOH to THF, which dissipated within a few seconds. This lead us to
omit some initial data when the absorbance signal was on a similar order of magnitude
as the scattering.
Figure 7. Initial five minute absorbance experiment observing the products of 100x
excess NaOH with 2.5×10⁻⁴
M TNT in MeOH. (a) 0.14 sec; (b) 0.79 sec; (c) 4.09 sec;
(d) 9.02 sec; (e) 55.69 sec; (f) 172.51 sec; (g) 268.17 sec. Note the pseudo-isosbestic
point established at 494 nm, once the TNT− absorbance begins to decay. The inset
shows absorbance data from 520 nm and 700 nm fit to an exponential rise function,
where the observed rate constant is the exponential variable; in this case, the data at
520 nm required two exponential rise functions to fit properly.
The same experimental approach was also taken in MeOH. Figure 7 indicates
a different observation as a function of time. TNT− is the predominant absorbing
57
species early on, which then gives way to absorbances at lower wavelengths from
TNT-OH−. This is consistent with the order of appearance of these species in our
NMR. While we are able to fit our entire five minute data set to a phenomenological
set of exponential rise and decay functions (see Supplementary Information Figs. S11-
13), we are not able to identify the secondary products nor do they appear to absorb
strongly in the visible range. In addition, there is no analytic solution for the
sequential equilibria that we have phenomenologically modeled. Due to this and the
stronger importance of the initial processes on TNT detection, we continued by
modeling the early absorbance evolution in MeOH.
The inset on Figure 7 shows a relatively close relationship between the
observed rate constants at 520 nm and 700 nm, indicating the observation of the same
species. However, it is interesting to note the late appearance of pseudo-isosbestic
points, as seen in Figure 7 at 494 nm; these inflection points are apparent in each
experiment but are not observed at the same location, which invalidates their
assignment as a true isosbestic point. Instead, these points seem to shift to higher
energy as the [TNT] decreases. This may serve to imply a visible absorbance
component of an additional species, or it may indicate that TNT− and TNT-OH
− are
not directly mechanistically linked. It may also result from lingering scattering
component that does not fully dissipate. The scattering component from NaOH
addition was smaller in MeOH than observed in THF, but still significant enough to
warrant the omission of some initial data points.

58
Figure 8. Initial absorbance experiment observing the products of 100x excess TNT
(4.1×10⁻²
M) with NaOH in MeOH. The spectrum increases then decreases, with no
additional features appearing during the observation. The inset shows absorbance data
from 520 nm and 700 nm fit to an exponential rise function, where the observed rate
constant is the exponential variable.
Figure 8 shows the excess TNT experiment in MeOH, where a new dominant
species is observed. These spectral features are consistent with TNT-OH− formation,
while there is still slight evidence to suggest a small TNT− component given the
curvature of the spectrum beyond 700 nm. Also, note that the relative absorbance of
the feature at 450 nm and the feature at 520 nm changes slightly over the course of the
observation; this implies that more than one species is being observed. The observed
rate constants are virtually identical however, suggesting that we are observing TNT-
OH− formation at both wavelengths. This is also important because this indicates that
TNT-OH− does have an absorption component at 700 nm, although relatively small.

59
The early absorbance growths fit well to a set of exponential growths, as
anticipated in our derivation and indicated on the insets to the absorbance evolution
figures. The observed rate constants can be found collectively in Table 1.
[TNT] (M) [OH−] (M)
kobs
A(520 nm)
kobs
A(700 nm) Species Observed
TH
F
4.2E-05 4.2E-03 6.7E-03 7.6E-03
TNT− 3.2E-05 3.2E-05 6.1E-03 7.1E-03
2.2E-05 2.2E-03 7.0E-03 7.8E-03
2.2E-03 2.2E-05 3.9E-03 7.3E-03
TNT− 1.7E-03 1.7E-05 5.7E-03 7.0E-03
1.3E-03 1.3E-05 5.3E-03 8.0E-03
MeO
H
2.5E-04 2.5E-02 9.1E-01 7.3E-01
TNT− 1.9E-04 1.8E-02 8.3E-01 8.5E-01
1.5E-04 1.4E-02 9.0E-01 7.5E-01
4.1E-02 4.0E-04 1.2E+00 1.2E+00
TNT-OH− 2.9E-02 2.9E-04 2.1E+00 2.2E+00
2.2E-02 2.2E-04 1.7E+00 1.6E+00
Table 1. Observed rate constants for pseudo-first order TNT + NaOH experiments in
THF and MeOH. The observed rate constants were calculated by fitting absorbance
data at 520 nm or 700 nm to a single exponential rise function.
Note that the observed rate constants are reproducible within the anticipated errors of
the kinetic method. In THF, the major absorbing species is TNT−, which has
absorbance at both observed wavelengths. In MeOH, the excess NaOH experiments
show TNT− as the major absorbing species, while the excess TNT experiments show
TNT-OH− as the major absorbing species. The observed rate constants for TNT
− are
equivalent to ; since the excess water concentration is relatively high for
the replicate experiments and is not directly related to [TNT], we expect not
to change dramatically with differing [TNT] or [OH−]. In the case of TNT-OH
−, the
observed rate constant is equal to and so reproducibility of this parameter is also
60
expected. These observations indicate that our kinetic model is appropriate for the
reactions of interest.
The molar absorptivity of TNT− ( ) was calculated in THF, under the
assumption that all TNT was deprotonated by 100x excess OH−; this is shown to be
appropriate given the TNT/OH− 1H NMR titration. If we assume that TNT-OH
− does
not significantly absorb at 700 nm,13,14
this gives us the capacity to quantify the
[TNT−] at any point of time and to calculate kinetic parameters by starting with TNT
−
at 700 nm. Also, if we assume that the absorbance component from TNT-OH− is
negligible at equilibrium, we can determine at 520 nm as well. Since there is
little absorbance evidence for TNT-OH− in THF at later time, this is an acceptable
assumption. Using the extrapolated absorbance at equilibrium and the initial [TNT],
the resulting calculations yielded 4000 L/mol and 11200 L/mol for at 700 nm
and 520 nm respectively. Unfortunately, the same reaction in MeOH is shown to be
more complicated by NMR, so the same approach may not be appropriate to calculate
the molar absorptivity of TNT− in MeOH. We estimate the molar absorptivities to be
the same for both solvents, within reasonable approximation.
A similar approach could not be taken to calculate the molar absorptivity of
TNT-OH− ( ) at 520 nm, since there is no way of calculating [TNT-OH
−] in
any of our explored systems. Knowing that should be a constant, we
proceeded able to calculate the product of the molar absorptivity and the forward rate
constant ( ). If there is no significant observation of an amine sigma
adduct, then each amine experiment should yield this same parameter within
experimental error. Given that the excess TNT experiments in MeOH gave the
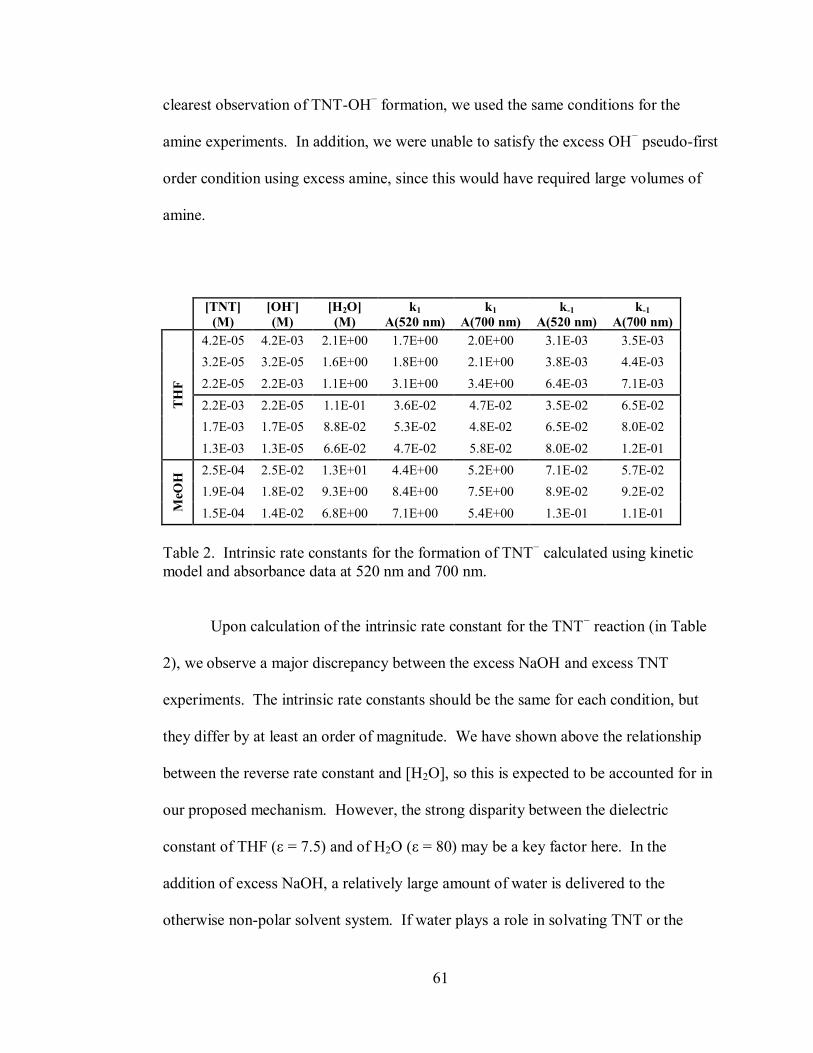
61
clearest observation of TNT-OH− formation, we used the same conditions for the
amine experiments. In addition, we were unable to satisfy the excess OH− pseudo-first
order condition using excess amine, since this would have required large volumes of
amine.
[TNT]
(M)
[OH-]
(M)
[H2O]
(M)
k1
A(520 nm)
k1
A(700 nm)
k-1
A(520 nm)
k-1
A(700 nm)
TH
F
4.2E-05 4.2E-03 2.1E+00 1.7E+00 2.0E+00 3.1E-03 3.5E-03
3.2E-05 3.2E-05 1.6E+00 1.8E+00 2.1E+00 3.8E-03 4.4E-03
2.2E-05 2.2E-03 1.1E+00 3.1E+00 3.4E+00 6.4E-03 7.1E-03
2.2E-03 2.2E-05 1.1E-01 3.6E-02 4.7E-02 3.5E-02 6.5E-02
1.7E-03 1.7E-05 8.8E-02 5.3E-02 4.8E-02 6.5E-02 8.0E-02
1.3E-03 1.3E-05 6.6E-02 4.7E-02 5.8E-02 8.0E-02 1.2E-01
MeO
H 2.5E-04 2.5E-02 1.3E+01 4.4E+00 5.2E+00 7.1E-02 5.7E-02
1.9E-04 1.8E-02 9.3E+00 8.4E+00 7.5E+00 8.9E-02 9.2E-02
1.5E-04 1.4E-02 6.8E+00 7.1E+00 5.4E+00 1.3E-01 1.1E-01
Table 2. Intrinsic rate constants for the formation of TNT− calculated using kinetic
model and absorbance data at 520 nm and 700 nm.
Upon calculation of the intrinsic rate constant for the TNT− reaction (in Table
2), we observe a major discrepancy between the excess NaOH and excess TNT
experiments. The intrinsic rate constants should be the same for each condition, but
they differ by at least an order of magnitude. We have shown above the relationship
between the reverse rate constant and [H2O], so this is expected to be accounted for in
our proposed mechanism. However, the strong disparity between the dielectric
constant of THF (ε = 7.5) and of H2O (ε = 80) may be a key factor here. In the
addition of excess NaOH, a relatively large amount of water is delivered to the
otherwise non-polar solvent system. If water plays a role in solvating TNT or the
62
transition state in the formation of TNT−, this trend may show up in our intrinsic rate
constants. This is consistent with what we observe in the solvent change from THF to
MeOH; the relative rate of formation of TNT− vs. TNT-OH
− shifts in favor of TNT
−
with higher dielectric. Also, in the excess NaOH experiments in THF the forward and
reverse rate constants increase as the [H2O] decreases. This may be resultant from the
effect of ambient water on our calculations. As the added water component from the
NaOH solution decreases, the relative error in our [H2O] due to the hygroscopic nature
of each solvent system increases. Since k-1 is calculated using [H2O], this would
account for the observed increase in k-1. It would also account for the observed
increase in k1, as the calculation of k1 depends on k-1 in our model. With these factors
in mind, performing the amine experiments in MeOH with excess TNT and
intentionally added water should minimize any of these effects on our analysis, as well
as the scattering effect of NaOH in MeOH.
Amine reactions in MeOH:
Solutions of TNT ranging from 10-2
to 10-1
M were prepared, as well as diluted
amine solutions in MeOH. Using the same techniques described above, the amine
solutions were quantitatively added to the TNT solutions in a stirring cuvette while
absorbance measurements were taken. Absorbance spectra evolved very rapidly and
equilibrated within several seconds, as in the case of OH− addition. Figure 9 shows
the absorbance evolution of the reaction of excess TNT with EA, DEA, and TEA in
MeOH.

63
Figure 9. Absorbance evolution for the reaction of 100x excess TNT with amines in
MeOH. (a) 8.4×10⁻²
M TNT + EA, (b) 9.5×10⁻²
M TNT + DEA, (c) 9.0×10⁻²
M TNT
+ TEA.
Insets on Figure 9 indicate the observed rate constants for the reaction, which are
equivalent to . The observed rate constants at 520 nm and 700 nm are similar for
each individual experiment, as seen in the hydroxide reactions. They are not similar,
however, for the reactions with different amines; the EA and DEA experiments agree
within random error, but the TEA reaction shows a much larger observed rate
constant. The shape of each set of spectra are strikingly similar, which is not expected
for these three amines. TEA is too sterically hindered to form a sigma complex with
64
TNT, while EA and DEA are expected to form sigma complexes to different degrees.
A normalized set of spectra from the initial equilibrium are found in Figure 10a. All
spectra were normalized to their shared amine reaction absorbance maximum at 450
nm. The amine reaction spectra overlap well from about 420 to 460 nm, implying that
only one species absorbs in this range, while the OH− reaction spectrum shows slightly
different shape. It is likely that TNT-OH− is the major absorbing species formed in
the OH− reaction, and that the amines are deprotonating MeOH leading to the
formation of TNT-OCH3−. This would account for the similar spectral shape, since
both sigma adducts are expected to have similar MO energies. Towards lower energy,
the spectra diverge but retain similar spectral shape consistent with the established
spectrum of TNT−. Difference spectra of the amine reaction spectra subtracted from
the OH− reaction spectra are found in Figure 10b, which further establish the similar
spectral shape of TNT− formation. Different amounts of TNT
− are expected at
equilibrium, due to the different strengths of the amine bases deprotonating water or
methanol and slightly different amounts of water. Due to the similar spectral shapes in
Figure 10, this supports the assessment of only two significantly absorbing species in
the visible range (TNT− and TNT-OCH3
−), which cannot include an amine sigma
adduct.
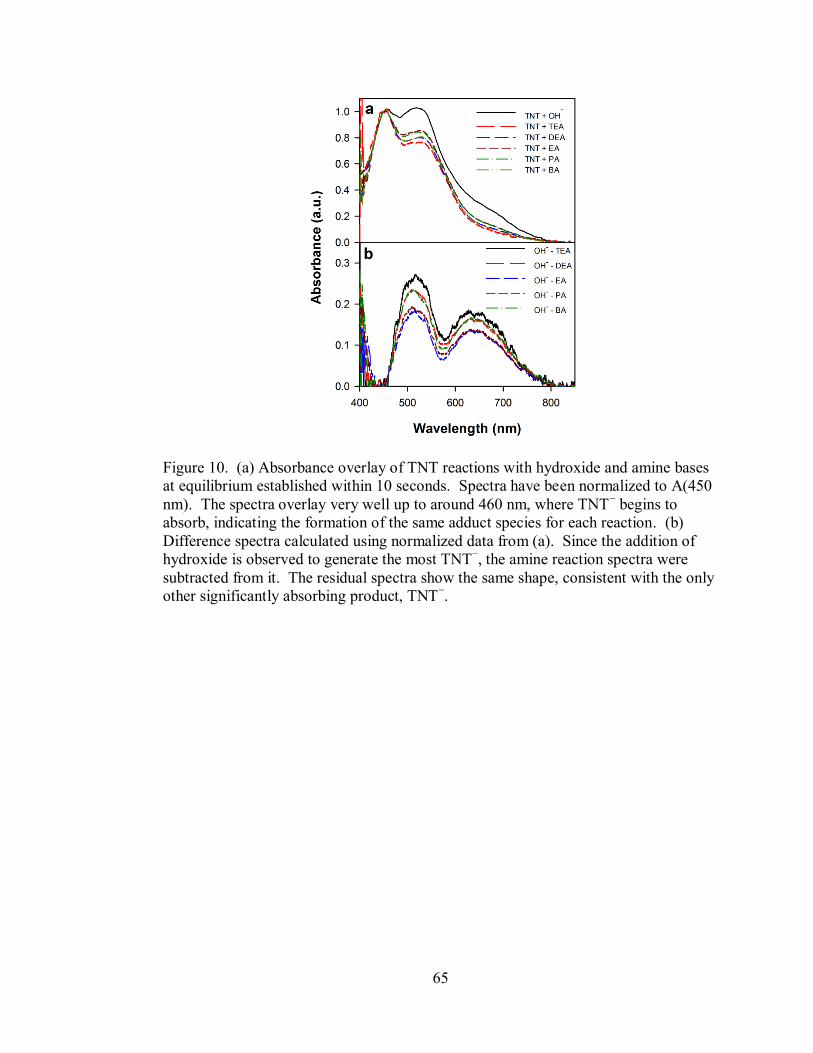
65
Figure 10. (a) Absorbance overlay of TNT reactions with hydroxide and amine bases
at equilibrium established within 10 seconds. Spectra have been normalized to A(450
nm). The spectra overlay very well up to around 460 nm, where TNT− begins to
absorb, indicating the formation of the same adduct species for each reaction. (b)
Difference spectra calculated using normalized data from (a). Since the addition of
hydroxide is observed to generate the most TNT−, the amine reaction spectra were
subtracted from it. The residual spectra show the same shape, consistent with the only
other significantly absorbing product, TNT−.
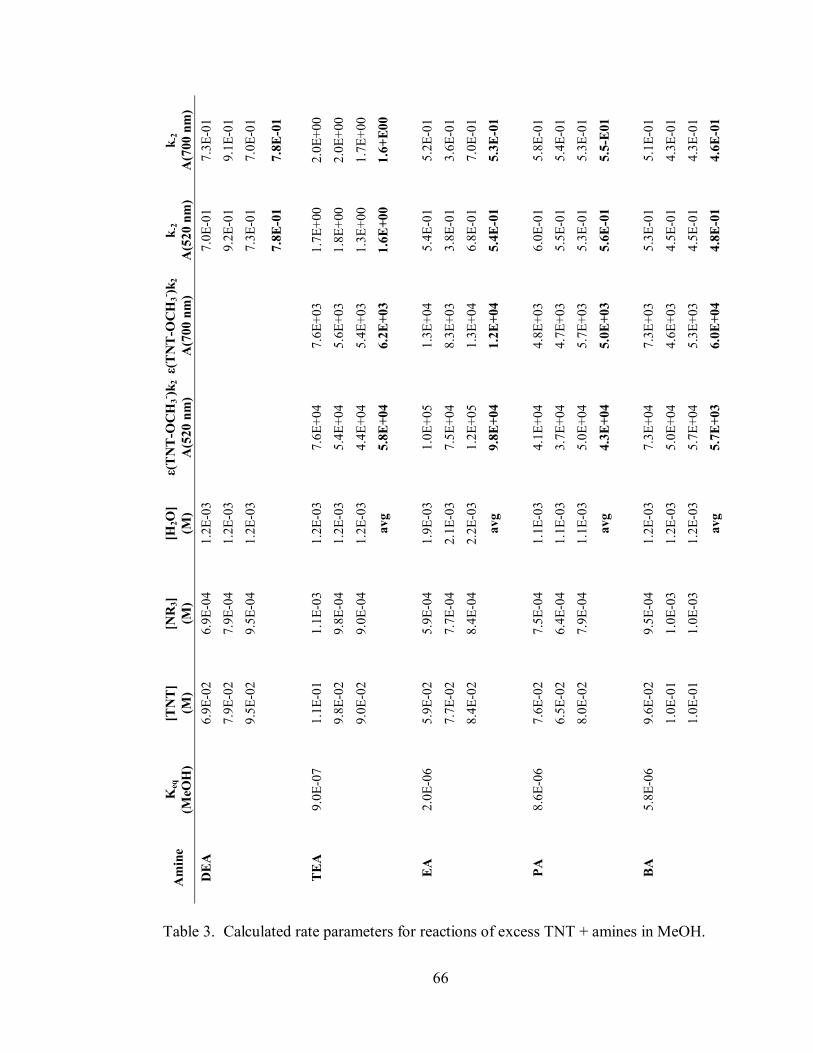
66
k-2
A(7
00 n
m)
7.3
E-0
1
9.1
E-0
1
7.0
E-0
1
7.8
E-0
1
2.0
E+
00
2.0
E+
00
1.7
E+
00
1.6
+E
00
5.2
E-0
1
3.6
E-0
1
7.0
E-0
1
5.3
E-0
1
5.8
E-0
1
5.4
E-0
1
5.3
E-0
1
5.5
-E01
5.1
E-0
1
4.3
E-0
1
4.3
E-0
1
4.6
E-0
1
k-2
A(5
20
nm
)
7.0
E-0
1
9.2
E-0
1
7.3
E-0
1
7.8
E-0
1
1.7
E+
00
1.8
E+
00
1.3
E+
00
1.6
E+
00
5.4
E-0
1
3.8
E-0
1
6.8
E-0
1
5.4
E-0
1
6.0
E-0
1
5.5
E-0
1
5.3
E-0
1
5.6
E-0
1
5.3
E-0
1
4.5
E-0
1
4.5
E-0
1
4.8
E-0
1
ε(T
NT
-OC
H3
- )k2
A(7
00 n
m)
7.6
E+
03
5.6
E+
03
5.4
E+
03
6.2
E+
03
1.3
E+
04
8.3
E+
03
1.3
E+
04
1.2
E+
04
4.8
E+
03
4.7
E+
03
5.7
E+
03
5.0
E+
03
7.3
E+
03
4.6
E+
03
5.3
E+
03
6.0
E+
04
ε(T
NT
-OC
H3
- )k2
A(5
20
nm
)
7.6
E+
04
5.4
E+
04
4.4
E+
04
5.8
E+
04
1.0
E+
05
7.5
E+
04
1.2
E+
05
9.8
E+
04
4.1
E+
04
3.7
E+
04
5.0
E+
04
4.3
E+
04
7.3
E+
04
5.0
E+
04
5.7
E+
04
5.7
E+
03
[H2O
]
(M)
1.2
E-0
3
1.2
E-0
3
1.2
E-0
3
1.2
E-0
3
1.2
E-0
3
1.2
E-0
3
av
g
1.9
E-0
3
2.1
E-0
3
2.2
E-0
3
av
g
1.1
E-0
3
1.1
E-0
3
1.1
E-0
3
av
g
1.2
E-0
3
1.2
E-0
3
1.2
E-0
3
av
g
[NR
3]
(M)
6.9
E-0
4
7.9
E-0
4
9.5
E-0
4
1.1
E-0
3
9.8
E-0
4
9.0
E-0
4
5.9
E-0
4
7.7
E-0
4
8.4
E-0
4
7.5
E-0
4
6.4
E-0
4
7.9
E-0
4
9.5
E-0
4
1.0
E-0
3
1.0
E-0
3
[TN
T]
(M)
6.9
E-0
2
7.9
E-0
2
9.5
E-0
2
1.1
E-0
1
9.8
E-0
2
9.0
E-0
2
5.9
E-0
2
7.7
E-0
2
8.4
E-0
2
7.6
E-0
2
6.5
E-0
2
8.0
E-0
2
9.6
E-0
2
1.0
E-0
1
1.0
E-0
1
Keq
(MeO
H)
9.0
E-0
7
2.0
E-0
6
8.6
E-0
6
5.8
E-0
6
Am
ine
DE
A
TE
A
EA
PA
BA
Table 3. Calculated rate parameters for reactions of excess TNT + amines in MeOH.
67
Table 3 summarizes the calculated rate parameters for the reactions of excess
TNT with amines in MeOH. As mentioned above, the reverse rate constants for TEA
differs substantially from those of the less sterically hindered amines. This could be
explained through the early formation of a charge-transfer complex, although we saw
no evidence in the visible range to support the formation of such a species. Foster
reported the formation of CT complexes of trinitrobenzene (TNB) with aliphatic
amines in cyclohexane, where the CT bands for EA, DEA, and TEA all had
absorbance maxima in the UV. TNT has a different conformation than TNB, with the
methyl group forcing the nitro groups out of plane with the ring; this not only
decreases the electron withdrawing capacity of the nitro groups, but adds a steric
component that TNB does not have. This increases the relative electron density of the
ring and alters the relative MO energies. Due to these two factors, the formation of a
CT complex would be hindered and may not form as readily and may have absorbance
maxima at higher energies. Therefore, it is possible that CT species are being formed
with TNT but out of our observational range, as well as overlapping with the TNT
absorbance in the UV. This is consistent with our observation that the reversibility of
the TEA reaction is fastest, as it has the most favorable CT complex formed earlier to
compete with.
The forward rate constant product ( ) was calculated for the amine
reactions under the assumption that OCH3− is the major attacking nucleophile, using
the acid/base equilibrium constants for the amine deprotonation of MeOH.34
These
calculated values agree very well between TEA, PA, and BA, indicating that the same
forward reaction is occurring. The EA reaction has a value that is about
68
twice as large. This may be related to the water content in this reaction relative to the
other amine reactions. Since EA is delivered from an aqueous solution, the water
which accompanies it may cloud this calculation. Not only does the water shift the
overall dielectric higher to a more polar environment, but the extra water also carries
extra hydroxide generated by the deprotonation of water by EA. In light of this, the
observed reaction of EA may be two sigma attack reactions occurring at the same time
with similar kinetics, or a poor assessment of the actual amount of OCH3− formed
prior to reaction with TNT. However this may be, the consistency of the
parameter through the PA, BA, and TEA reactions clearly indicates that the amines are
not directly involved in the reactions that generate the visible range absorbing species
in the initially observed reactions. It is plausible that direct amine attack is much
slower, or perhaps requires a substitution reaction where it replaces an anionic
nucleophile. Therefore, their use for ultra-trace vapor detection of TNT is not
appropriate.
CONCLUSIONS
To conclude, we have shown through related 1H NMR and visible absorbance
experiments that amines do not play a direct role in the initial formation of
decomposition products of TNT. Amines are not basic enough to directly deprotonate
the methyl group of TNT, nor are they strong enough nucleophiles to compete with the
small quantity of anionic species that they form through acid/base reactions in
solution. The observation of visible range absorbances, which are commonly used in
sensor development, instead are resultant from TNT− or TNT-OR
− depending on the

69
solvent identity and dielectric. This finding may indicate the need for reassessment of
existing sensors for better mechanistic clarification, as well as caution regarding the
choice of solvent in similar systems. Also, this study shows the need to assess trace
amounts of water in solution or vapor during the development and employment of
sensors that rely on these reactions.
70
REFERENCES
1 Lu, Q.; Collins, G.E.; Smith, M.; Wang, J. Anal. Chim. Acta 2002, 469, 253.
2 Üzer, A.; Erçağ, E.; Apak, R. For. Sci. Int. 2008, 239.
3 Fant, F.; De Sloovere, A.; Matthijsen, K.; Marlé, C.; El Fantroussi, S.;
Verstraete, W. Environ. Pollut. 2001, 111, 503.
4 Jiang, Y.; Zhao, H.; Zhu, N.; Lin, Y.; Yu, P.; Mao, L. Angew. Chem. Int. Ed.
2008, 47, 8601.
5 Kumar, M.; Vij, V.; Bhalla, V. Langmuir 2012, 28, 12417.
6 Yang, J.S.; Swager, T.M. J. Am. Chem. Soc. 1998, 120, 5321.
7 Algarra, M.; Campos, B.B.; Miranda, M.S.; Esteves da Silva, J.C.G. Talanta
2011, 83, 1335.
8 Olley, D.A.; Wren, E.J.; Vamvounis, G.; Fernee, M.J.; Wang, X.; Burn, P.L.;
Meredith, P.; Shaw, P.E. Chem. Mater. 2011, 23, 789.
9 Gao, D.; Wang, Z.; Liu, B.; Ni, L.; Wu, M.; Zhang, Z. Anal. Chem. 2008, 80,
8545.
10 Fang, Q.; Geng, J.; Liu, B.; Gao, D.; Li, F.; Wang, Z.; Guan, G.; Zhang, Z.
Chem. Eur. J. 2009, 15, 11507.
11 Zhang, K.; Zhou, H.; Mei, Q.; Wang, S.; Guan, G.; Liu, R.; Zhang, J.; Zhang,
Z. J. Am. Chem. Soc. 2011, 133, 8424.
12 Xia, Y.; Song, L.; Zhu, C. Anal. Chem. 2011, 83, 1401.
13 Fyfe, C.A.; Malkiewich, C.D.; Damji, S.W.H.; Norris, A.R. J. Am. Chem. Soc.
1976, 98, 6983.
14 Bernasconi, C.F. J. Org. Chem. 1971, 36, 1671.
71
15 Buncel, E.; Norris, A.R.; Russell, K.E.; Tucker, R. J. Am. Chem. Soc. 1972,
94, 1646.
16 Shipp, K.G.; Kaplan, L.A. J. Org. Chem. 1966, 31, 857.
17 Caldin, E.F.; Long, G. Proc. Roy. Soc. A 1955, 226, 263.
18 Norris, A.R. Can. J. Chem. 1980, 58, 2178.
19 Buncel, E.; Norris, A.R.; Russell, K.E.; Wilson, H. Can. J. Chem. 1974, 52,
2306.
20 Tu, R.; Liu, B.; Wang, Z.; Gao, D.; Wang, F.; Fang, Q.; Zhang, Z. Anal.
Chem. 2008, 80, 3458.
21 Xie, C.; Liu, B.; Wang, Z.; Gao, D.; Guan, G.; Zhang, Z. Anal. Chem. 2008,
80, 437.
22 Zhou, H.; Zhang, Z.; Jiang, C.; Guan, G.; Zhang, K.; Mei, Q.; Liu, R.; Wang,
S. Anal. Chem. 2011, 83, 6913.
23 Wang, Y.Q.; Zou, W.S. Talanta 2011, 85, 469.
24 Chen, Y.; Chen, Z.; He, Y.; Lin, H.; Sheng, P.; Liu, C.; Luo, S.; Cai, Q.
Nanotechnology 2010, 21, 125502.
25 Guan, G.; Liu, R.; Wu, M.; Li, Z.; Liu, B.; Wang, Z.; Gao, D.; Zhang, Z.
Analyst 2009, 134, 1880.
26 Zou, W.S.; Sheng, D.; Ge, X.; Qiao, J.Q.; Lian, H.Z. Anal. Chem. 2011, 83, 30.
27 Dasary, S.S.R.; Singh, A.K.; Senapati, D.; Yu, H.; Ray, P.C. J. Am. Chem.
Soc. 2009, 131, 13806.
28 Xie, C.; Zhang, Z.; Wang, D.; Guan, G.; Gao, D.; Liu, J. Anal. Chem. 2006,
78, 8339.
29 Gao, D.; Zhang, Z.; Wu, M.; Xie, C.; Guan, G.; Wang, D. J. Am. Chem. Soc.
2007, 129, 7859.
30 Buncel, E.; Russell, K.E.; Wood, J. Chem. Comm. 1968, 253.
31 Gutmann, V. Electrochimica Acta 1976, 21, 661.
32 Foster, R.; Mackie, R.K. J. Chem. Soc. 1962, 3843.

72
33 Latendresse, C.A.; Fernandes, S.C.; You, S.; Zhang, H.Q.; Euler, W.B.
published ASAP by J. Phys. Chm. A. 2013.
34 Rived, F.; Canals, I.; Bosch, E.; Rosés, M. Anal. Chim. Acta 2001, 439, 315.

73
Supplementary Information for:
Comparing the Roles of Hydroxide and Amines in TNT Reactions: Clarifying
Absorbance Spectra Assignments For Use in Detection Methods
by
Christopher A. Latendresse, Syrena C. Fernandes, Sangmin You, and William B.
Euler*
Figure S1. 13
C NMR spectrum of TNT in d8-THF prior to addition of base.
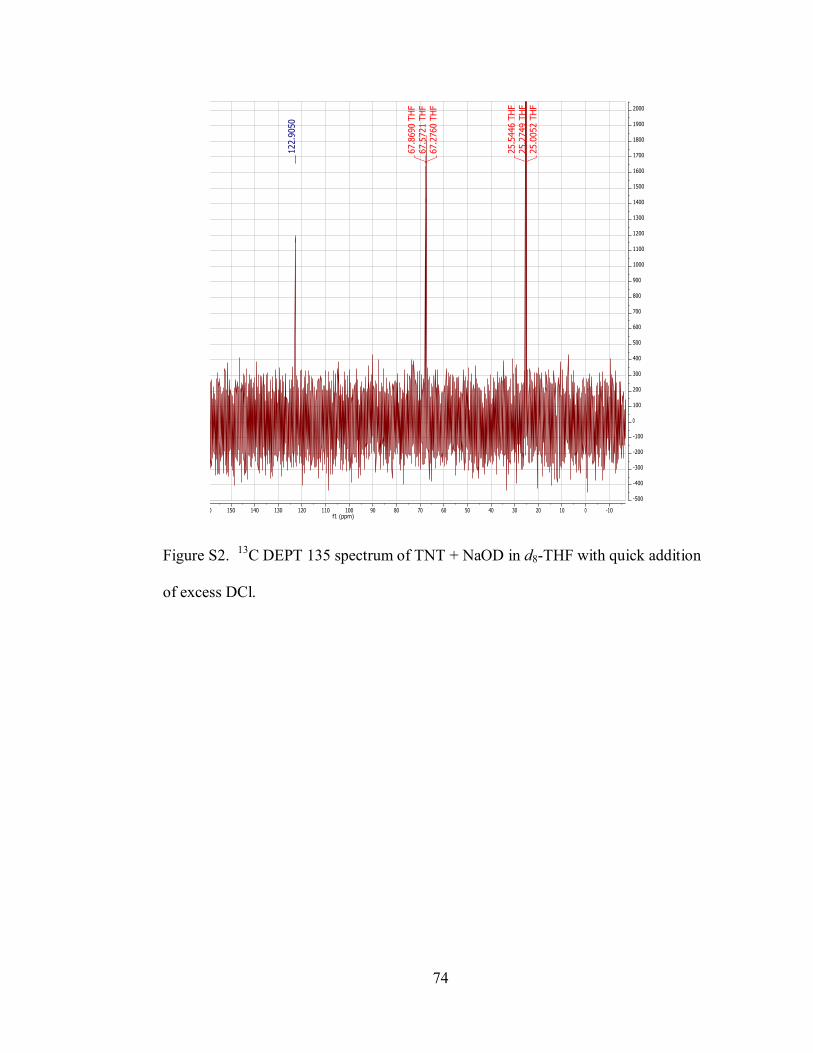
74
Figure S2. 13
C DEPT 135 spectrum of TNT + NaOD in d8-THF with quick addition
of excess DCl.

75
Figure S3. 13
C NMR spectrum of TNT in MeOD before addition of base.
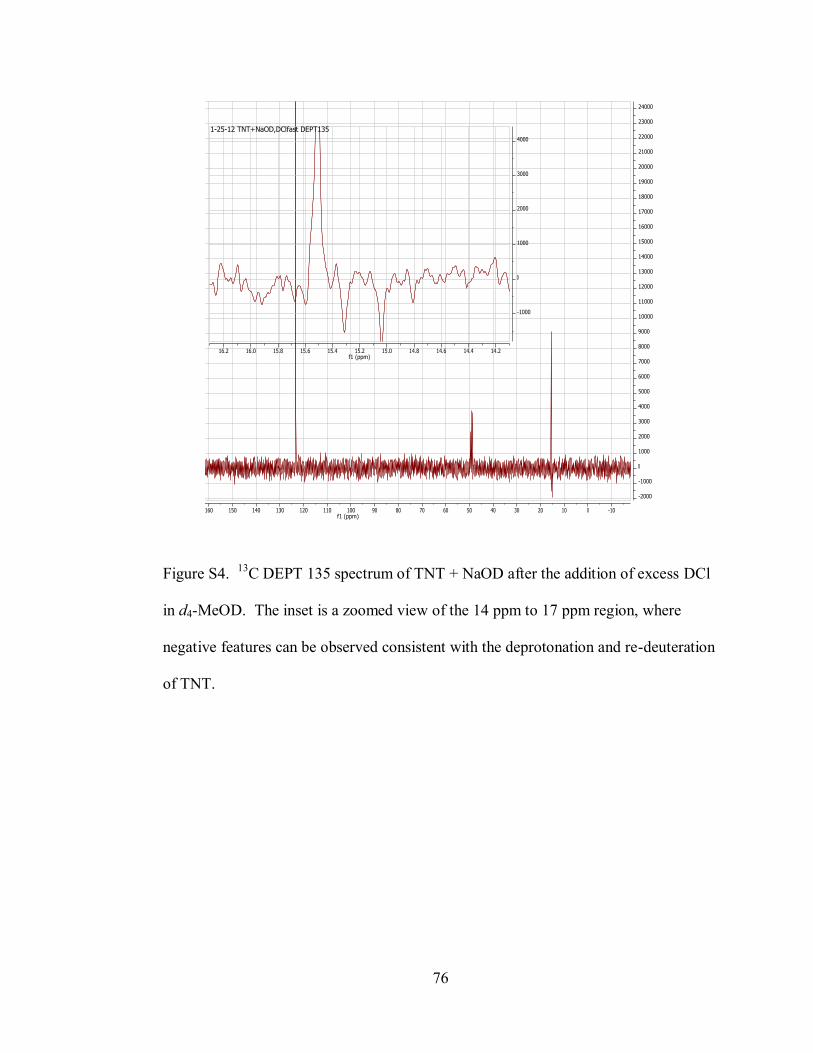
76
Figure S4. 13
C DEPT 135 spectrum of TNT + NaOD after the addition of excess DCl
in d4-MeOD. The inset is a zoomed view of the 14 ppm to 17 ppm region, where
negative features can be observed consistent with the deprotonation and re-deuteration
of TNT.
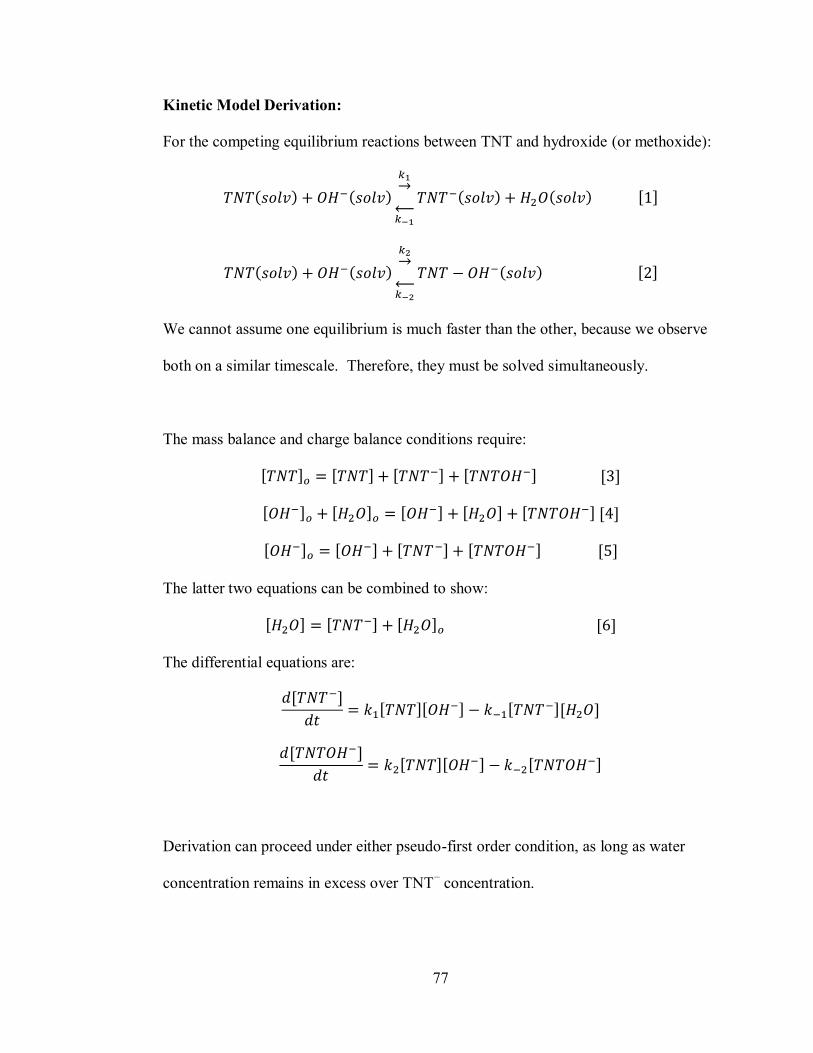
77
Kinetic Model Derivation:
For the competing equilibrium reactions between TNT and hydroxide (or methoxide):
We cannot assume one equilibrium is much faster than the other, because we observe
both on a similar timescale. Therefore, they must be solved simultaneously.
The mass balance and charge balance conditions require:
The latter two equations can be combined to show:
The differential equations are:
Derivation can proceed under either pseudo-first order condition, as long as water
concentration remains in excess over TNT− concentration.
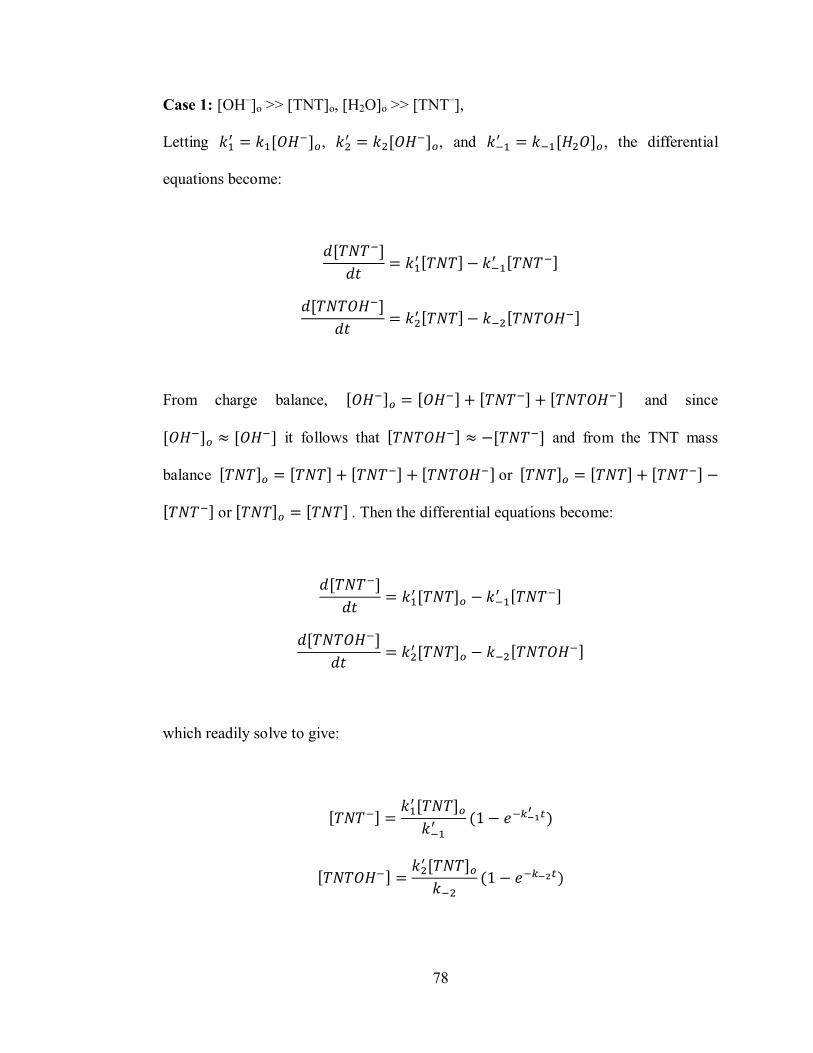
78
Case 1: [OH–]o >> [TNT]o, [H2O]o >> [TNT
–],
Letting ,
, and , the differential
equations become:
From charge balance, and since
it follows that and from the TNT mass
balance or
or . Then the differential equations become:
which readily solve to give:
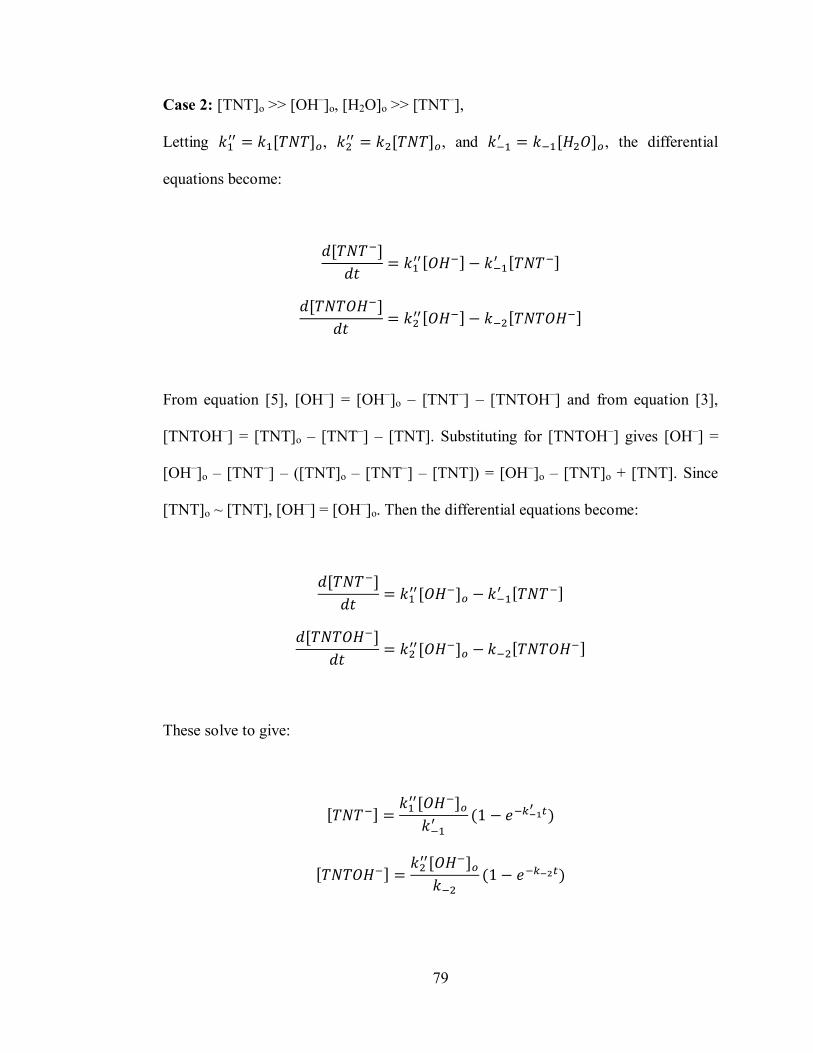
79
Case 2: [TNT]o >> [OH–]o, [H2O]o >> [TNT
–],
Letting ,
, and , the differential
equations become:
From equation [5], [OH–] = [OH
–]o – [TNT
–] – [TNTOH
–] and from equation [3],
[TNTOH–] = [TNT]o – [TNT
–] – [TNT]. Substituting for [TNTOH
–] gives [OH
–] =
[OH–]o – [TNT
–] – ([TNT]o – [TNT
–] – [TNT]) = [OH
–]o – [TNT]o + [TNT]. Since
[TNT]o ~ [TNT], [OH–] = [OH
–]o. Then the differential equations become:
These solve to give:
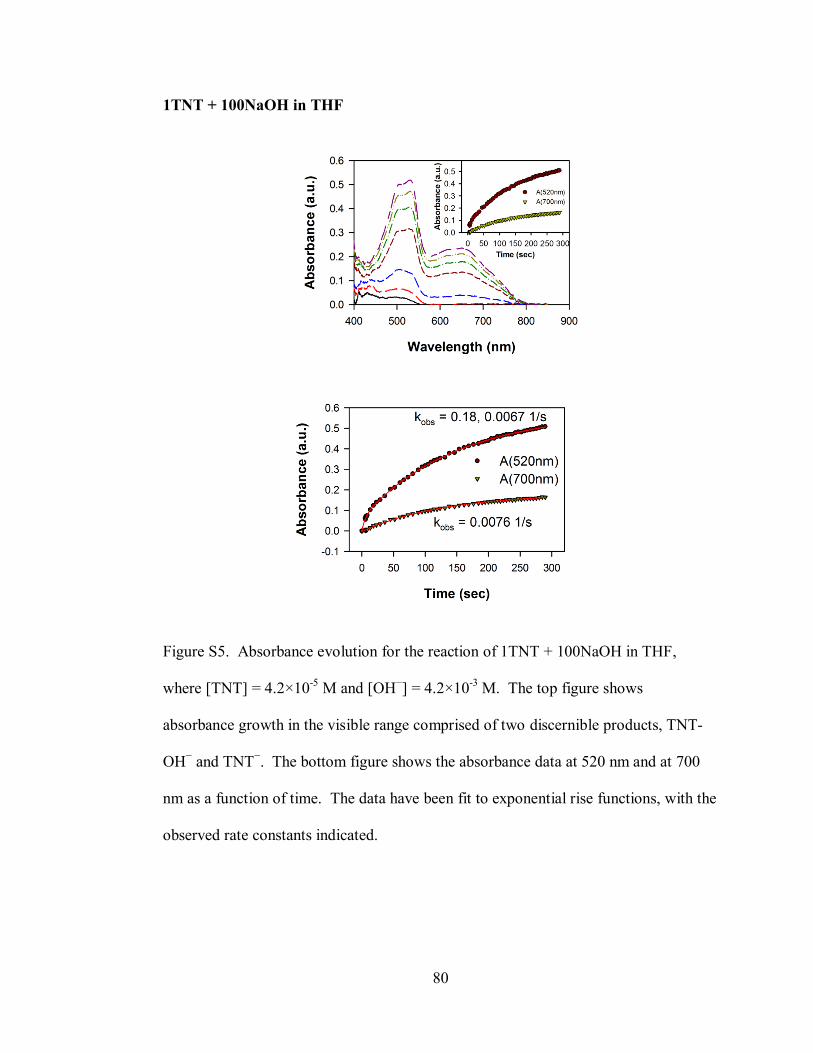
80
1TNT + 100NaOH in THF
Figure S5. Absorbance evolution for the reaction of 1TNT + 100NaOH in THF,
where [TNT] = 4.2×10⁻⁵
M and [OH−] = 4.2×10
-3 M. The top figure shows
absorbance growth in the visible range comprised of two discernible products, TNT-
OH− and TNT
−. The bottom figure shows the absorbance data at 520 nm and at 700
nm as a function of time. The data have been fit to exponential rise functions, with the
observed rate constants indicated.
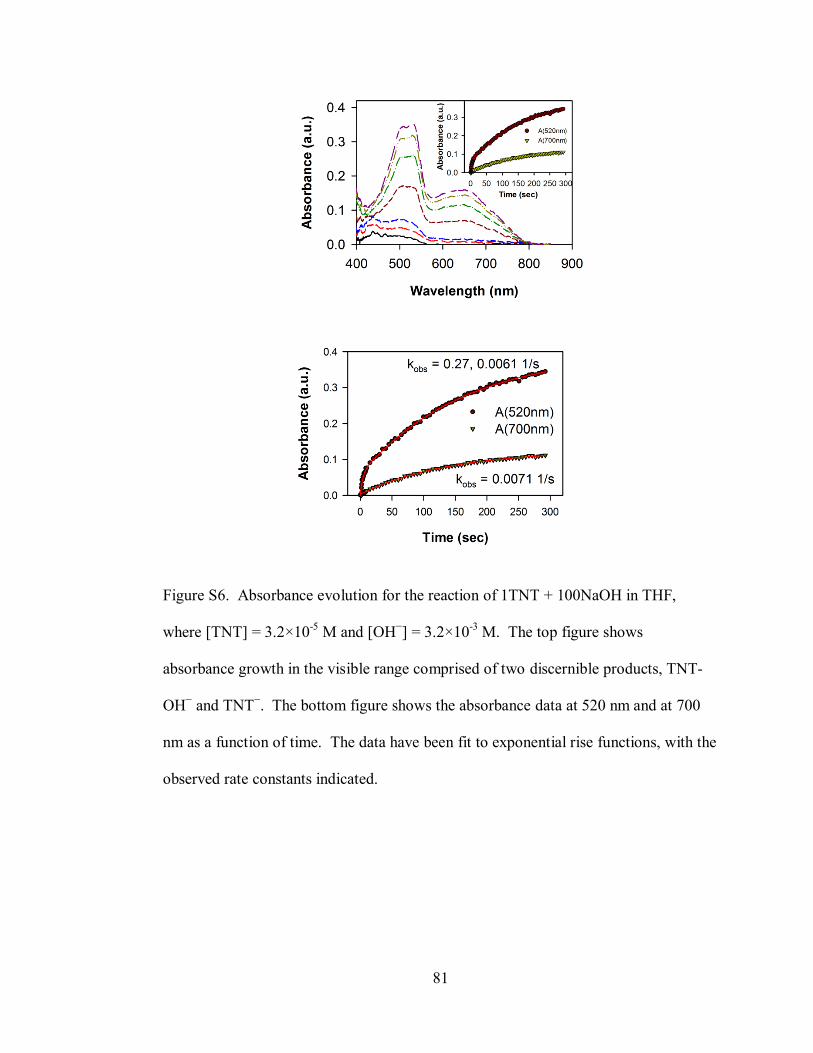
81
Figure S6. Absorbance evolution for the reaction of 1TNT + 100NaOH in THF,
where [TNT] = 3.2×10⁻⁵
M and [OH−] = 3.2×10
-3 M. The top figure shows
absorbance growth in the visible range comprised of two discernible products, TNT-
OH− and TNT
−. The bottom figure shows the absorbance data at 520 nm and at 700
nm as a function of time. The data have been fit to exponential rise functions, with the
observed rate constants indicated.
82
Figure S7. Absorbance evolution for the reaction of 1TNT + 100NaOH in THF,
where [TNT] = 2.2×10⁻⁵
M and [OH−] = 2.2×10
-3 M. The top figure shows
absorbance growth in the visible range comprised of two discernible products, TNT-
OH− and TNT
−. The bottom figure shows the absorbance data at 520 nm and at 700
nm as a function of time. The data have been fit to exponential rise functions, with the
observed rate constants indicated.

83
100TNT + 1NaOH in THF
Figure S8. Absorbance evolution for the reaction of 100TNT + 1NaOH in THF,
where [TNT] = 2.2×10⁻³
M and [OH−] = 2.2×10
-5 M. The top figure shows
absorbance growth in the visible range comprised of two discernible products, TNT-
OH− and TNT
−. The bottom figure shows the absorbance data at 520 nm and at 700
nm as a function of time. The data have been fit to exponential rise functions, with the
observed rate constants indicated.

84
Figure S9. Absorbance evolution for the reaction of 100TNT + 1NaOH in THF,
where [TNT] = 1.7×10⁻³
M and [OH−] = 1.7×10
-5 M. The top figure shows
absorbance growth in the visible range comprised of two discernible products, TNT-
OH− and TNT
−. The bottom figure shows the absorbance data at 520 nm and at 700
nm as a function of time. The data have been fit to exponential rise functions, with the
observed rate constants indicated.
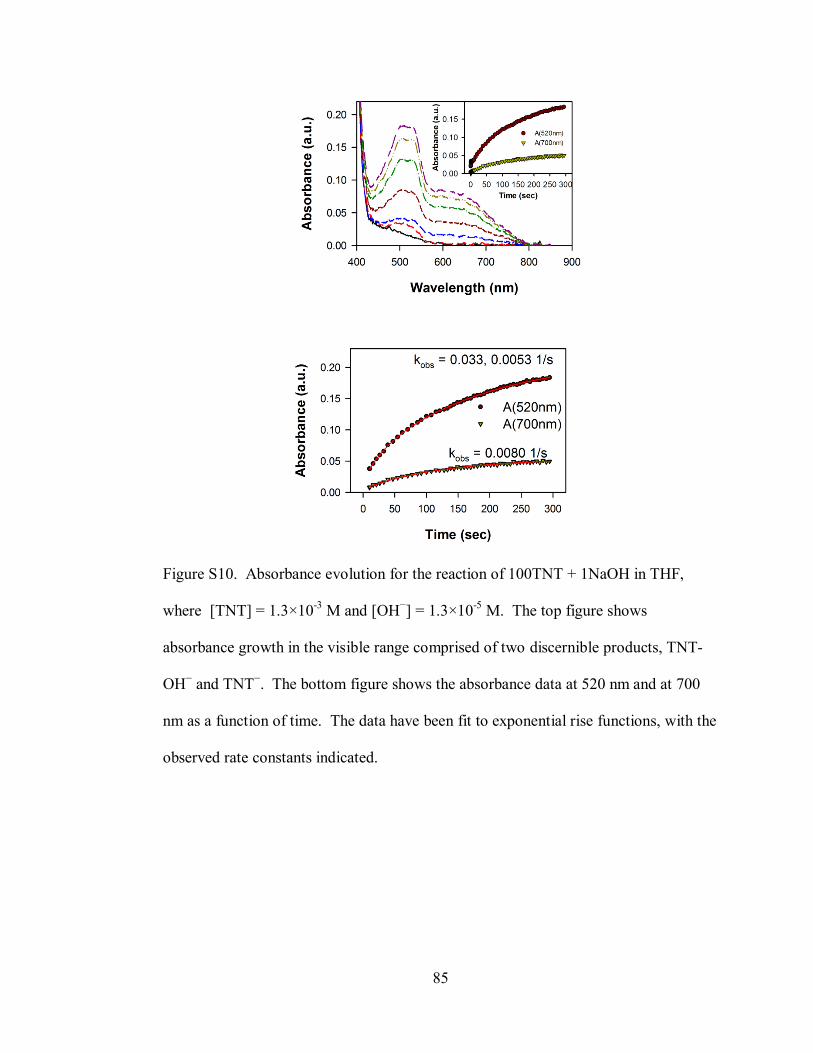
85
Figure S10. Absorbance evolution for the reaction of 100TNT + 1NaOH in THF,
where [TNT] = 1.3×10⁻³
M and [OH−] = 1.3×10
-5 M. The top figure shows
absorbance growth in the visible range comprised of two discernible products, TNT-
OH− and TNT
−. The bottom figure shows the absorbance data at 520 nm and at 700
nm as a function of time. The data have been fit to exponential rise functions, with the
observed rate constants indicated.

86
1TNT + 100NaOH in MeOH
Figure S11. Absorbance evolution for the reaction of 100TNT + 1NaOH in THF,
where [TNT] = 2.5×10⁻⁴
M and [OH−] = 2.5×10
-2 M. The top figure shows
absorbance growth in the visible range comprised of two discernible products, TNT-
OH− and TNT
−. The top figure inset shows the phenomenological fit of the
absorbance data at 520 nm and 700 nm over the first five minutes of reaction to a set
of exponential rise and decay functions. The bottom figure shows the initial
absorbance data at 520 nm and at 700 nm as a function of time. The data have been fit
to exponential rise functions, with the observed rate constants indicated.

87
Figure S12. Absorbance evolution for the reaction of 100TNT + 1NaOH in THF,
where [TNT] = 1.9×10⁻⁴
M and [OH−] = 1.8×10
-2 M. The top figure shows
absorbance growth in the visible range comprised of two discernible products, TNT-
OH− and TNT
−. The top figure inset shows the phenomenological fit of the
absorbance data at 520 nm and 700 nm over the first five minutes of reaction to a set
of exponential rise and decay functions. The bottom figure shows the initial
absorbance data at 520 nm and at 700 nm as a function of time. The data have been fit
to exponential rise functions, with the observed rate constants indicated.
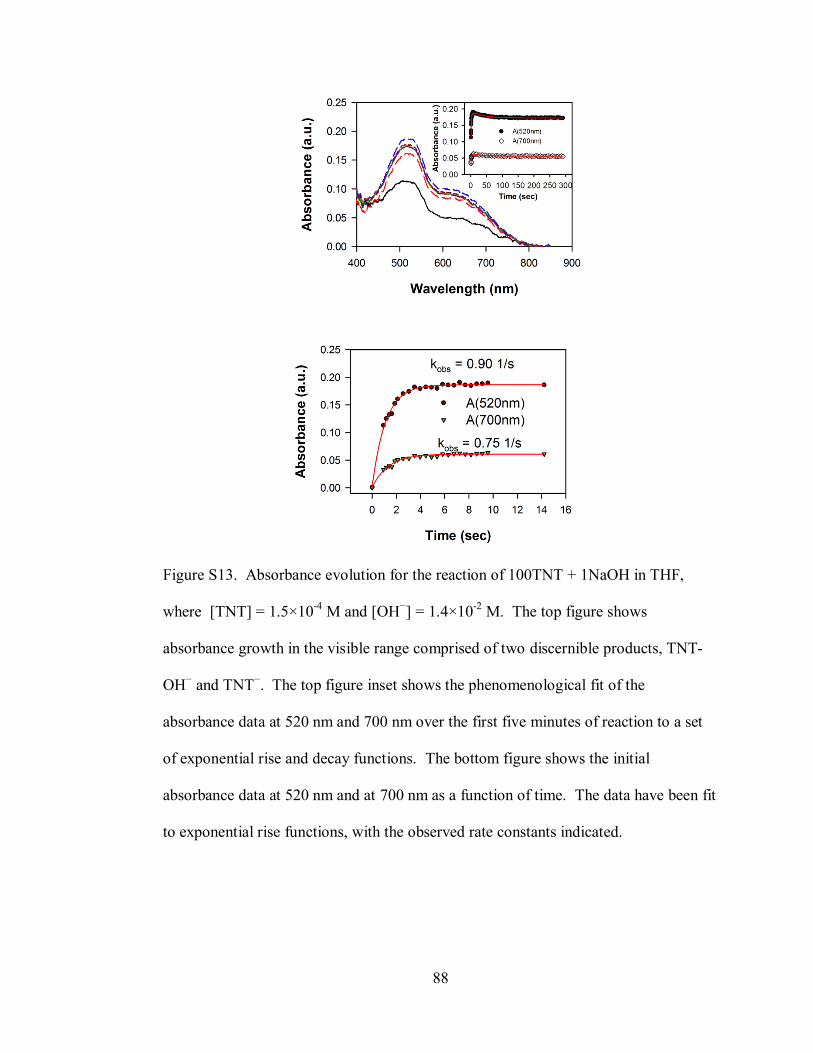
88
Figure S13. Absorbance evolution for the reaction of 100TNT + 1NaOH in THF,
where [TNT] = 1.5×10⁻⁴
M and [OH−] = 1.4×10
-2 M. The top figure shows
absorbance growth in the visible range comprised of two discernible products, TNT-
OH− and TNT
−. The top figure inset shows the phenomenological fit of the
absorbance data at 520 nm and 700 nm over the first five minutes of reaction to a set
of exponential rise and decay functions. The bottom figure shows the initial
absorbance data at 520 nm and at 700 nm as a function of time. The data have been fit
to exponential rise functions, with the observed rate constants indicated.
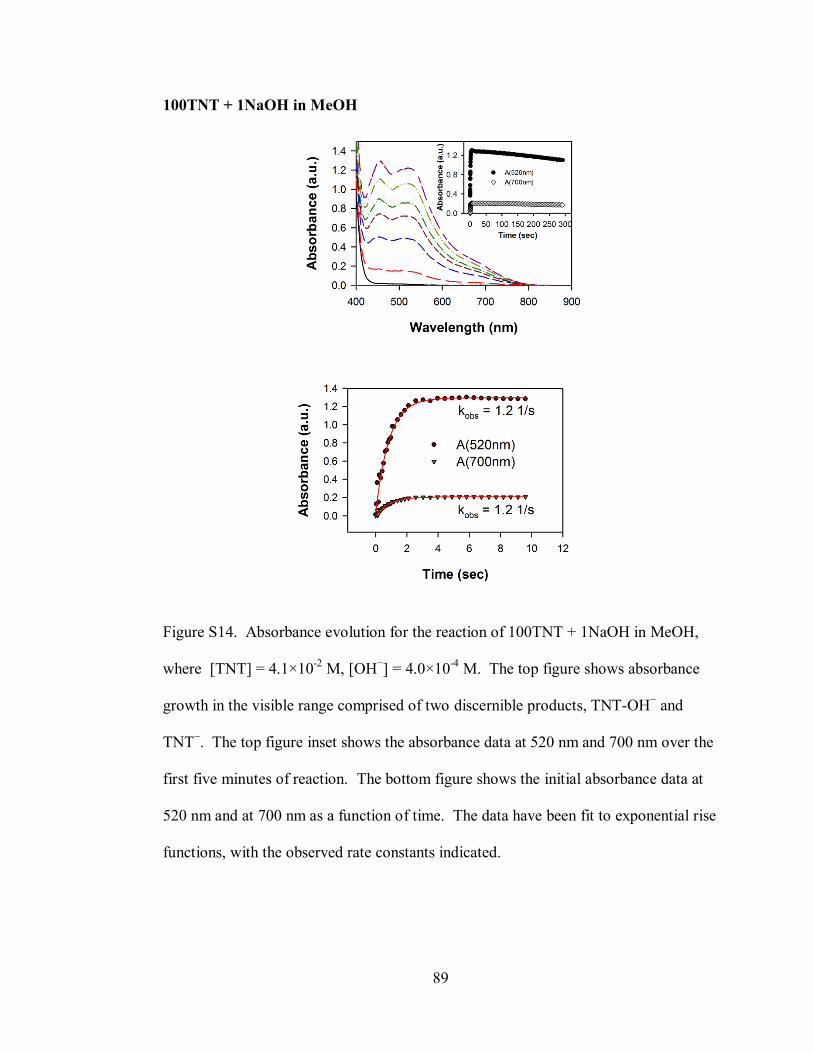
89
100TNT + 1NaOH in MeOH
Figure S14. Absorbance evolution for the reaction of 100TNT + 1NaOH in MeOH,
where [TNT] = 4.1×10⁻²
M, [OH−] = 4.0×10
-4 M. The top figure shows absorbance
growth in the visible range comprised of two discernible products, TNT-OH− and
TNT−. The top figure inset shows the absorbance data at 520 nm and 700 nm over the
first five minutes of reaction. The bottom figure shows the initial absorbance data at
520 nm and at 700 nm as a function of time. The data have been fit to exponential rise
functions, with the observed rate constants indicated.
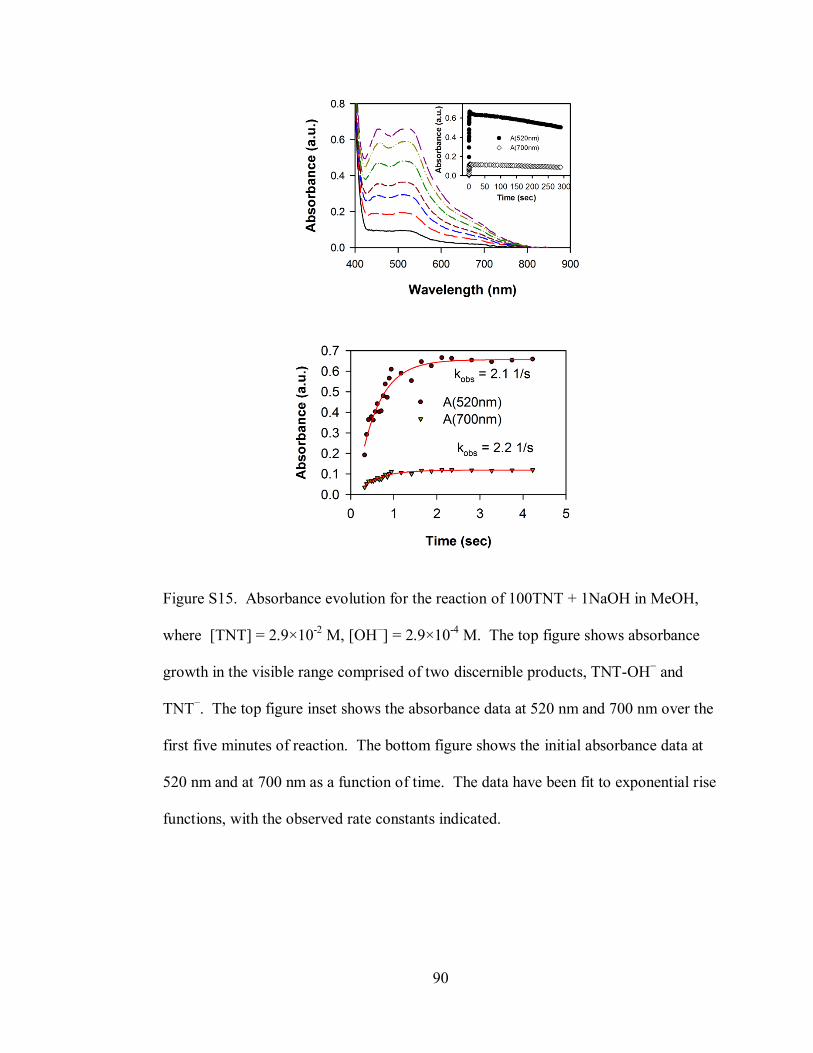
90
Figure S15. Absorbance evolution for the reaction of 100TNT + 1NaOH in MeOH,
where [TNT] = 2.9×10⁻²
M, [OH−] = 2.9×10
-4 M. The top figure shows absorbance
growth in the visible range comprised of two discernible products, TNT-OH− and
TNT−. The top figure inset shows the absorbance data at 520 nm and 700 nm over the
first five minutes of reaction. The bottom figure shows the initial absorbance data at
520 nm and at 700 nm as a function of time. The data have been fit to exponential rise
functions, with the observed rate constants indicated.
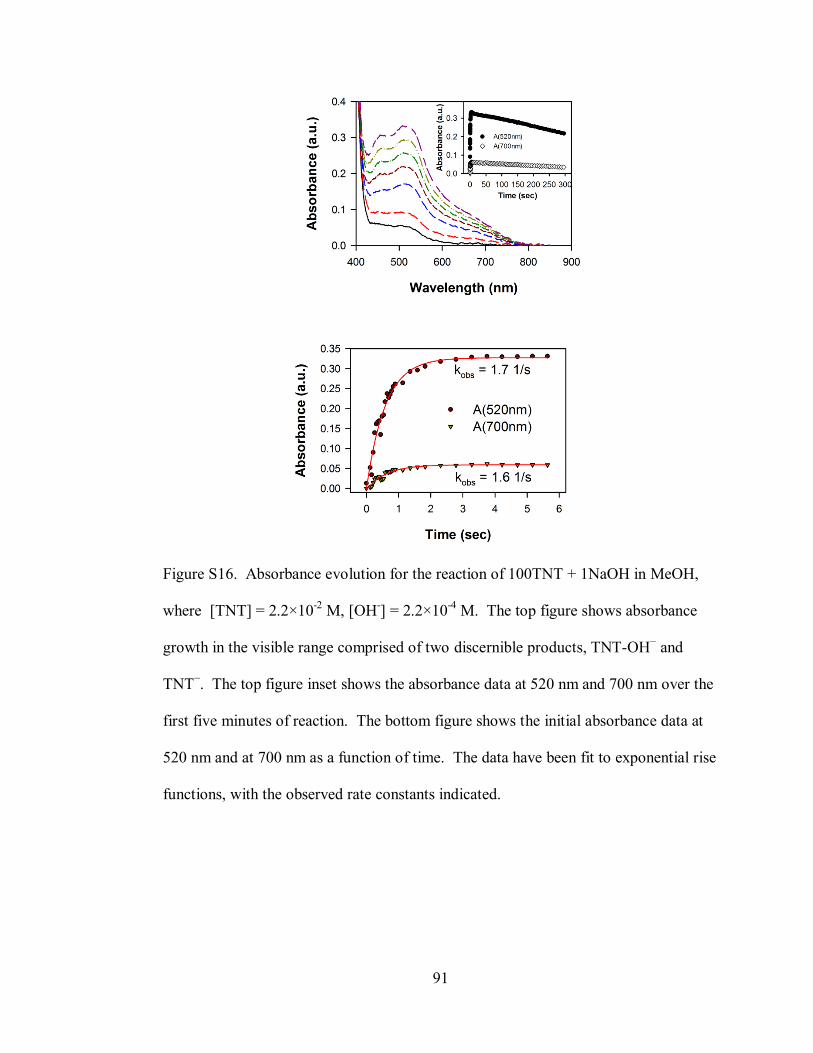
91
Figure S16. Absorbance evolution for the reaction of 100TNT + 1NaOH in MeOH,
where [TNT] = 2.2×10⁻²
M, [OH-] = 2.2×10
-4 M. The top figure shows absorbance
growth in the visible range comprised of two discernible products, TNT-OH− and
TNT−. The top figure inset shows the absorbance data at 520 nm and 700 nm over the
first five minutes of reaction. The bottom figure shows the initial absorbance data at
520 nm and at 700 nm as a function of time. The data have been fit to exponential rise
functions, with the observed rate constants indicated.
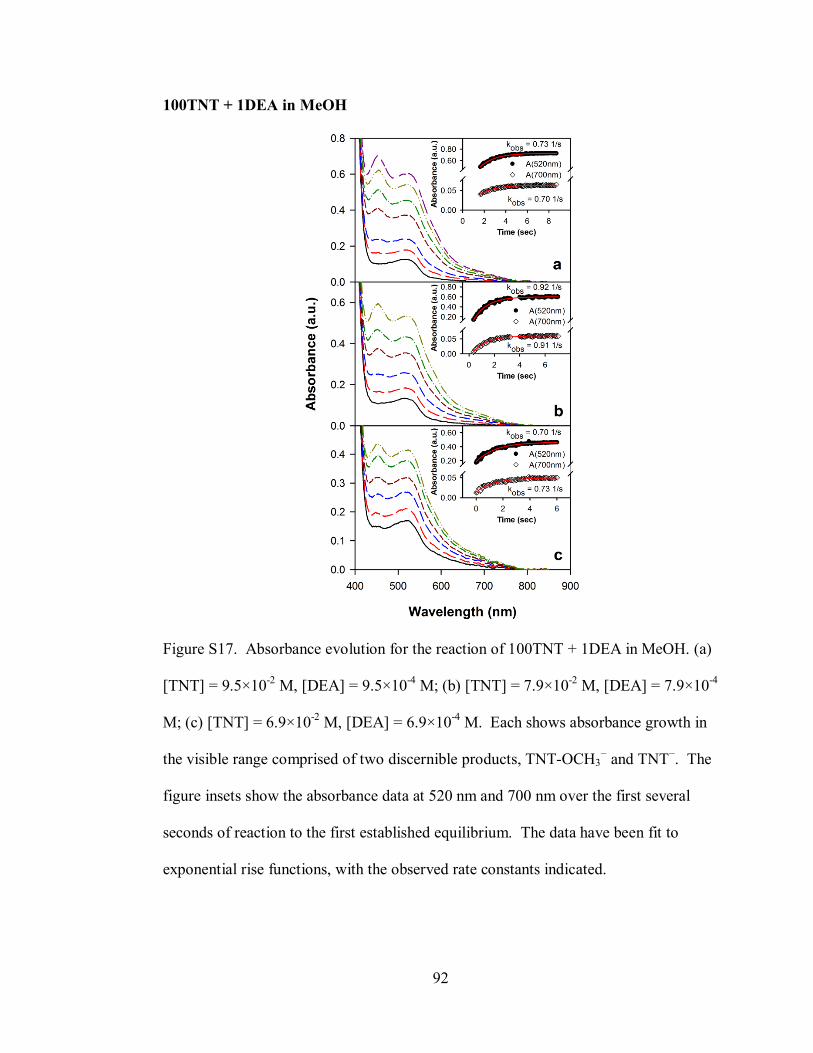
92
100TNT + 1DEA in MeOH
Figure S17. Absorbance evolution for the reaction of 100TNT + 1DEA in MeOH. (a)
[TNT] = 9.5×10⁻²
M, [DEA] = 9.5×10⁻⁴
M; (b) [TNT] = 7.9×10⁻²
M, [DEA] = 7.9×10⁻⁴
M; (c) [TNT] = 6.9×10⁻²
M, [DEA] = 6.9×10⁻⁴
M. Each shows absorbance growth in
the visible range comprised of two discernible products, TNT-OCH3− and TNT
−. The
figure insets show the absorbance data at 520 nm and 700 nm over the first several
seconds of reaction to the first established equilibrium. The data have been fit to
exponential rise functions, with the observed rate constants indicated.
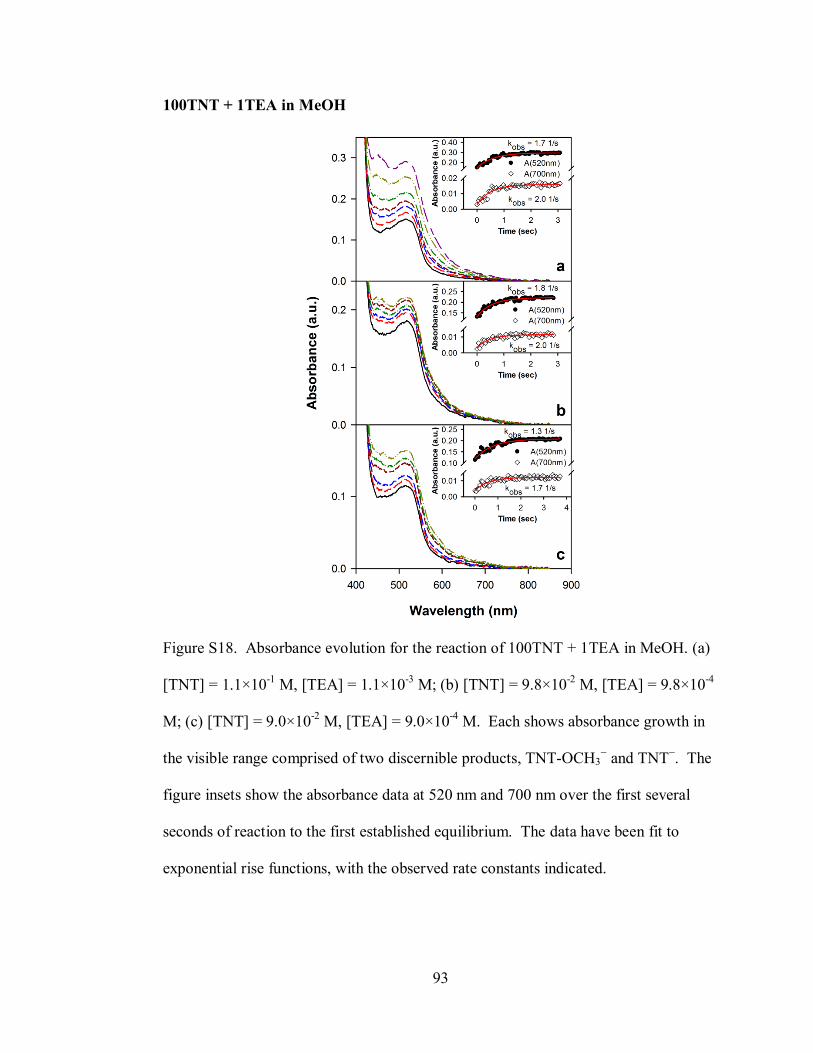
93
100TNT + 1TEA in MeOH
Figure S18. Absorbance evolution for the reaction of 100TNT + 1TEA in MeOH. (a)
[TNT] = 1.1×10⁻¹
M, [TEA] = 1.1×10⁻³
M; (b) [TNT] = 9.8×10⁻²
M, [TEA] = 9.8×10⁻⁴
M; (c) [TNT] = 9.0×10⁻²
M, [TEA] = 9.0×10⁻⁴
M. Each shows absorbance growth in
the visible range comprised of two discernible products, TNT-OCH3− and TNT
−. The
figure insets show the absorbance data at 520 nm and 700 nm over the first several
seconds of reaction to the first established equilibrium. The data have been fit to
exponential rise functions, with the observed rate constants indicated.

94
100TNT + 1EA in MeOH
Figure S19. Absorbance evolution for the reaction of 100TNT + 1EA in MeOH. (a)
[TNT] = 8.4×10⁻²
M, [EA] = 8.4×10⁻⁴
M; (b) [TNT] = 7.7×10⁻²
M, [EA] = 7.7×10⁻⁴
M;
(c) [TNT] = 5.9×10⁻²
M, [EA] = 5.9×10⁻⁴
M. Each shows absorbance growth in the
visible range comprised of two discernible products, TNT-OCH3− and TNT
−. The
figure insets show the absorbance data at 520 nm and 700 nm over the first several
seconds of reaction to the first established equilibrium. The data have been fit to
exponential rise functions, with the observed rate constants indicated.
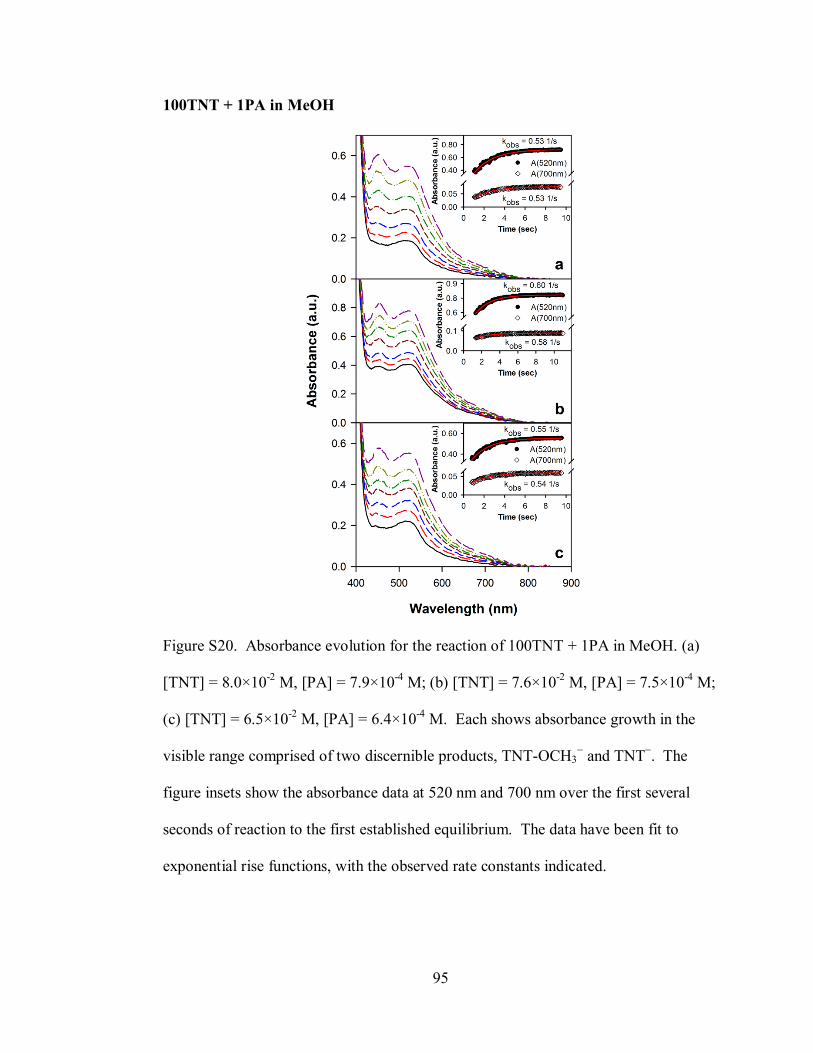
95
100TNT + 1PA in MeOH
Figure S20. Absorbance evolution for the reaction of 100TNT + 1PA in MeOH. (a)
[TNT] = 8.0×10⁻²
M, [PA] = 7.9×10⁻⁴
M; (b) [TNT] = 7.6×10⁻²
M, [PA] = 7.5×10⁻⁴
M;
(c) [TNT] = 6.5×10⁻²
M, [PA] = 6.4×10⁻⁴
M. Each shows absorbance growth in the
visible range comprised of two discernible products, TNT-OCH3− and TNT
−. The
figure insets show the absorbance data at 520 nm and 700 nm over the first several
seconds of reaction to the first established equilibrium. The data have been fit to
exponential rise functions, with the observed rate constants indicated.
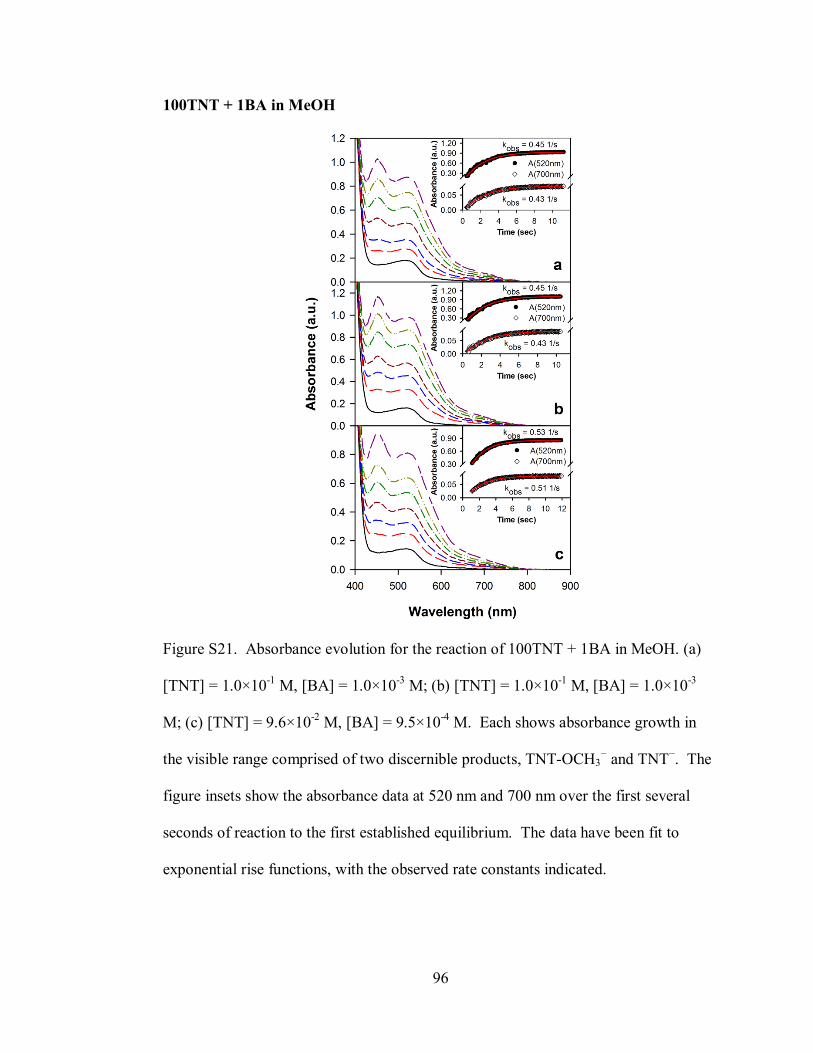
96
100TNT + 1BA in MeOH
Figure S21. Absorbance evolution for the reaction of 100TNT + 1BA in MeOH. (a)
[TNT] = 1.0×10⁻¹
M, [BA] = 1.0×10⁻³
M; (b) [TNT] = 1.0×10⁻¹
M, [BA] = 1.0×10⁻³
M; (c) [TNT] = 9.6×10⁻²
M, [BA] = 9.5×10⁻⁴
M. Each shows absorbance growth in
the visible range comprised of two discernible products, TNT-OCH3− and TNT
−. The
figure insets show the absorbance data at 520 nm and 700 nm over the first several
seconds of reaction to the first established equilibrium. The data have been fit to
exponential rise functions, with the observed rate constants indicated.
97
CHAPTER 3
Relative Thermodynamics of TNT
Reactions Commonly Used for Sensor
Applications: Computational Modeling in
Vacuo and in Solution
Christopher A. Latendresse and William B. Euler*
University of Rhode Island Department of Chemistry, 51 Lower College Road,
Kingston, RI 02881, USA
The following is in preparation for submission to the Journal of the American
Chemical Society, and is presented here in manuscript format.
98
ABSTRACT
Computational analysis was performed at the B3LYP/6-311+G**//HF/6-
311+G** level to determine the relative thermodynamics of reactions involving
trinitrotoluene (TNT). The products of the modeled TNT reactions are commonly
invoked for the use in colorimetric and fluorometric detection. The deprotonation of
the methyl group of TNT was explored through the formation of free ions and ion
pairs, and the sigma attack of hydroxide and various aliphatic amines at two plausible
sites on TNT were also modeled. Additionally, charge transfer (CT) complexes were
investigated. The SM8 implicit solvation model was applied to converged geometries,
which suggests a strong solvation effect upon product formation. Thermodynamic
analysis suggests a significant disparity between the favorability of hydroxide attack
versus amine attack, indicating that TNT-OH− or TNT-OCH3
− formation is most
favorable at any modeled dielectric.
INTRODUCTION
Trinitrotoluene (TNT) is a commonly used military grade explosive, due to its
relatively high explosive output and its low shock sensitivity. TNT is also a
complicated reactive substrate: TNT's methyl group can be deprotonated in basic
solution forming TNT−, and TNT can undergo nucleophilic attack forming a sigma
complex commonly referred to as a "Meisenheimer" complex.1-4
Both reactions are
promoted by the TNT's electron poor ring, which is able to distribute more electron
density through each of the aforementioned reactions.

99
These transient products have strong absorbances in the visible range. Due to
this, these reactions are commonly invoked for the design of TNT sensors, both in
solution and in solid/vapor phase. Colorimetric indication is commonly used for
sensing TNT as an environmental toxin in the solution phase,5-8
whereas more
sensitive fluorometric methods have been developed to detect trace quantities of TNT
vapor.9-13
The competing reactions of TNT forming TNT− or a sigma complex, TNT-
B, serve to complicate the design of these sensors, especially those that rely on
resonance energy transfer (RET).11,12,14,15
RET-based TNT sensors typically employ a
strong fluorophore, whose emission is quenched as it donates energy from its excited
state to the excited state of the TNT product acceptor. The choice of donor
fluorophore is inherently dependent on the absorbance features and subsequent
molecular orbital energies of the TNT product, which is not always identified properly
in contemporary literature. In some cases, these absorbance features have even been
attributed to the formation of a charge-transfer (CT) complex.10,16-18
Further, the rate
of formation of these products is also an important feature, as environmental analysis
has a much lower demand for rapid detection than the detection of landmines or
improvised explosive devices (IEDs). Our group and others have investigated the
relative kinetics of the formation of each of these TNT products,19-21
which has proven
to be intimately tied to solvation effects. In many cases, one product will act only as a
transient species, yielding the dominance of the visible absorbance range to the second
product rapidly. With a change in solvation, these roles can be observed to reverse,
causing the other product to appear as the transient species. This indicates the
importance of considering the effect of solvation on TNT sensor development.
100
Finally, the relative thermodynamics of each competing reaction are also solvent
dependent, and secondary reactions are observed to occur removing TNT− or TNT-B
from detection.
All of the discussion up to this point is made more convoluted by the proposed
reaction of aliphatic amines with TNT to form TNT−13,18,22,23
or zwitterionic sigma
adducts.6,11,12,14,15,24,25
With lower basicity, we question herein the ability of aliphatic
amines to deprotonate TNT significantly, as well as their ability to form a
thermodynamically stable sigma complex relative to that of alkoxide bases. For many
of these reasons, experimental approaches have proven to be limited in their ability to
assess the actual chemistry that is being observed. Several groups have
computationally addressed similar systems/reactions previously. However, some
restricted their structural optimization computations to molecular mechanics
forcefields,26
semi-empirical methods,27
and DFT methods.28,29
No computational
studies have been performed that compare alkoxide and amine reactivity through
TNT− formation, sigma adduct formation, and CT complex formation using the same
method, let alone a high level ab initio method and solvation modeling. By
computationally modeling the reactants and products of these proposed reactions, we
are able to calculate the relative thermodynamics of each reaction and observe a
significant trend in solvation. Our results may also shed some light on the role of
water in functional solid/vapor sensors, as the amines used in these sensors may only
be deprotonating water to form hydroxide, which then gives rise to its related TNT
products.
101
COMPUTATIONAL METHODS
In order to gain further insight into the proposed reactions, computational
modeling was employed using the commercially available Spartan '10 software.30
Reactants and products of TNT reactions with OH−, CH3O
−, NH3, ethylamine (EA),
diethylamine (DEA), and triethylamine (TEA) were modeled; the generic set of
reactions of TNT with base (B) can be found in Scheme 1. The amines were chosen to
cover a range of basicity and sterics. EA is a good nucleophile and is an appropriate
stand-in for the primary amines that are commonly used in the aforementioned
sensors. DEA is more basic than EA but has greater steric hindrance. TEA is the best
electron donor out of the modeled amines, but is so sterically hindered that it cannot
attack the TNT ring. The deprotonation reaction was modeled using TNT− with a
subsequent conjugate acid as free molecules/ions or as an ion pair. Sigma complexes
formed through nucleophilic attack at either the C1 or the C3 carbon of TNT were
modeled (TNT-OH− C1, TNT-OH
− C3, TNT-NH3 C1, etc. - see numbering convention
on TNT in Scheme 1). Also, CT complexes between free TNT and the aliphatic
amines were converged. All species were geometrically optimized initially using the
Hartree-Fock (HF) method with the 6-311+G** basis set. Outputs with reasonable
geometries and lacking imaginary frequencies were used in a single point B3LYP
functional energy calculation with the 6-31G* basis set. 1H NMR estimations were
also computed for each species at the same level of theory, while molecular orbital
energies were obtained using the B3LYP functional with the higher basis set, 6-
311+G**. In addition, the SM8 solvation model31
was applied to propose relative
thermodynamics in a wide range of dielectrics, to assist in our description of observed
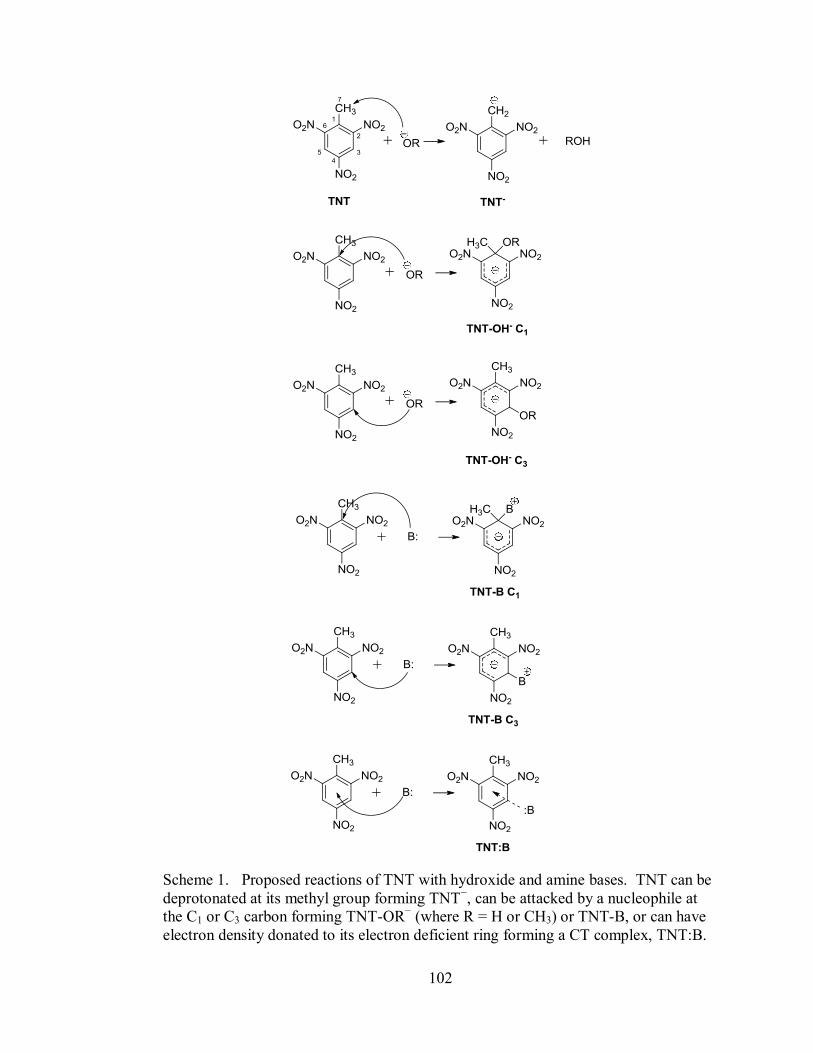
102
Scheme 1. Proposed reactions of TNT with hydroxide and amine bases. TNT can be
deprotonated at its methyl group forming TNT−, can be attacked by a nucleophile at
the C1 or C3 carbon forming TNT-OR− (where R = H or CH3) or TNT-B, or can have
electron density donated to its electron deficient ring forming a CT complex, TNT:B.
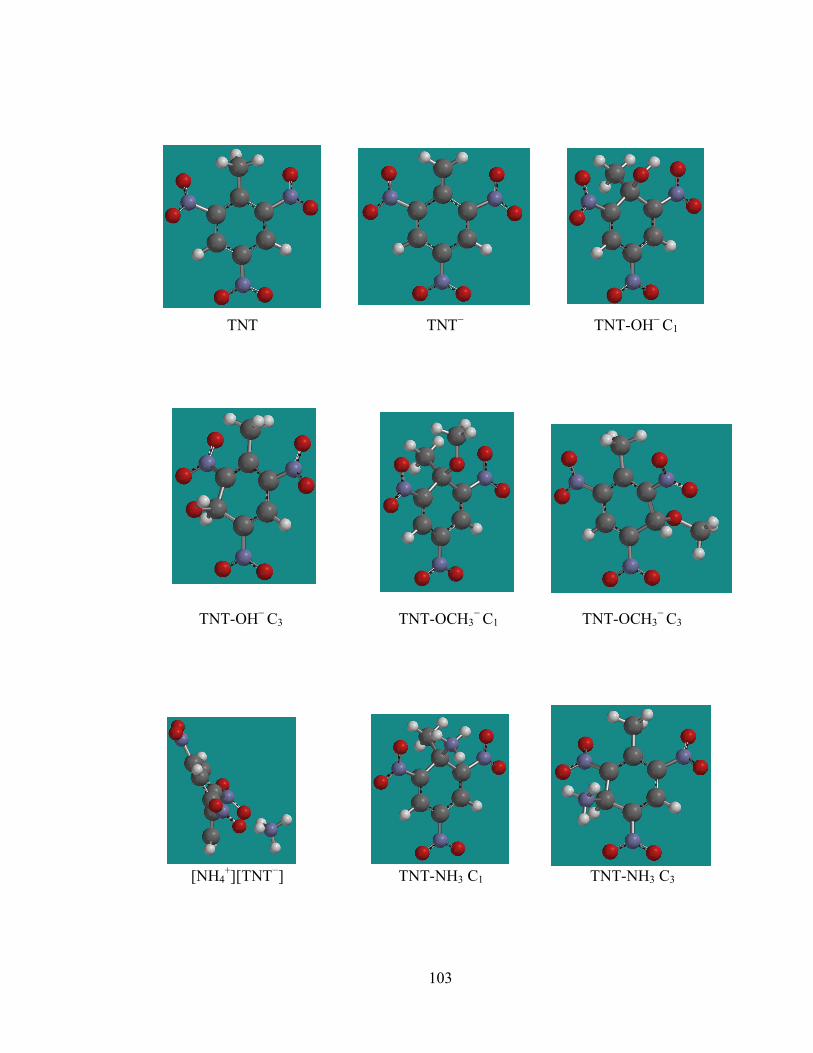
103
TNT TNT− TNT-OH
− C1
TNT-OH−
C3 TNT-OCH3−
C1 TNT-OCH3−
C3
[NH4+][TNT
−] TNT-NH3 C1 TNT-NH3 C3
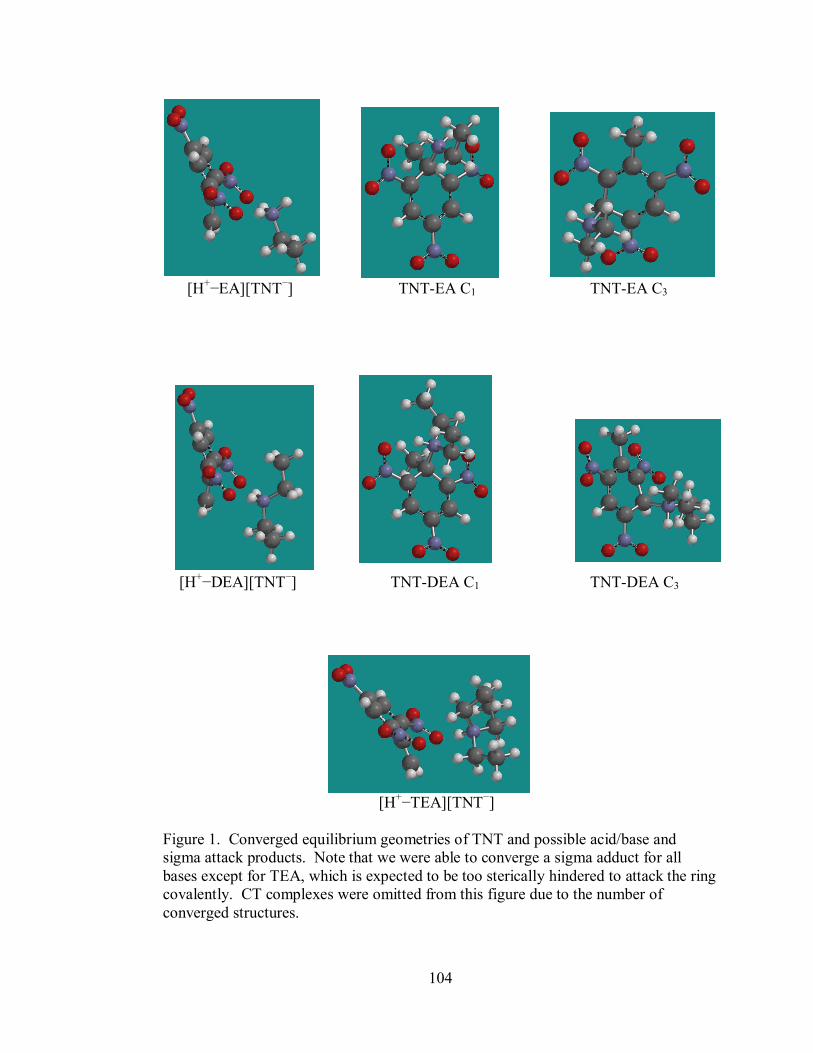
104
[H+−EA][TNT
−] TNT-EA C1 TNT-EA C3
[H+−DEA][TNT
−] TNT-DEA C1 TNT-DEA C3
[H+−TEA][TNT
−]
Figure 1. Converged equilibrium geometries of TNT and possible acid/base and
sigma attack products. Note that we were able to converge a sigma adduct for all
bases except for TEA, which is expected to be too sterically hindered to attack the ring
covalently. CT complexes were omitted from this figure due to the number of
converged structures.
105
solvation dependency. In these solvation computations, the converged structures from
the HF outputs were used to perform single point energy calculations at the B3LYP/6-
31G* level; this approach was chosen since it was used as a fitting method for the
development of the SM8 model. To cover a wide range of dielectric constants, the
following solvent models were used: vacuum (ε = 0), hexane (ε = 2.02),
tetrahydrofuran (ε = 7.52), 1-propanol (ε = 20.1), methanol (ε = 33), formic acid (ε =
58), water (ε = 80), and formamide (ε = 109). All computations were performed using
an input temperature of 298.15 K and a pressure of 1 atm.
DISCUSSION
STRUCTURAL ASSESSMENT
The set of converged structures for the acid/base and sigma attack reactions
can be found in Figure 1. Although we investigated the formation of a multitude of
CT complexes, they are omitted here for simplicity. We have also omitted the
converged structure of the isolated protonated amines, which were used in the
deprotonation reaction calculations to form free ions. The ion pairs are shown, and
converged so that the positive hydrogens on the alkylammonium cation interact
directly with the oxygens from the nitro group, where the greatest electron density
from the TNT anion is located. This distorts the methylene group much further out of
the plane of the ring than calculated for the isolated TNT anion. As expected, we were
able to converge sigma adducts for all of the amines with the exception of TEA.
These optimizations pushed TEA away from the ring, and stabilized in an electrostatic
interaction or CT complex type orientation.
106
Table 1 shows some related structural parameters from each species' optimized
geometry. As expected, the nucleophiles show a general trend of increasing bond
length as their nucleophilic strength decreases and their sterics increase. The largest
bond angle distortions from that of TNT are seen for the TNT-OH− and TNT-OCH3
−
Species Bond Lengths (Å) Bond Angles (°) Dihedral Angles (°)
Nu – C C2-C1-C6 C2-C3-C4
C1-C2-
C3-C4
C7-C1-
C2-C3
Nu-C1-
C2-C3
TNT - 114 118.09 1.26 174.56 -
TNT- - 110.38 120.91 4.90 162.29 -
TNT-OH- C1
1.408
106.59
-
3.67
112.09
126.92
TNT-OCH3- C1 1.418 106.37 - 1.46 112.75 121.44
TNT-NH3 C1 1.541 107.88 - 4.74 115.67 126.68
TNT-EA C1 1.540 107.81 - 4.49 115.01 127.84
TNT-DEA C1 1.597 106.77 - 1.34 122.49 118.93
TNT-OH- C3
1.422
-
108.46
20.29
177.53
100.79
TNT-OCH3- C3 1.420 - 107.64 29.28 159.57 90.78
TNT-NH3 C3 1.561 - 110.48 12.68 169.12 109.28
TNT-EA C3 1.554 - 110.15 13.37 168.87 110.81
TNT-DEA C3 1.584 - 109.06 24.13 164.56 97.53
Table 1. Structural parameters from TNT products optimized at the HF/6-311+G**
level. Note that "Nu" refers to the bonding site of the nucleophile.
adducts, stretching the ring in plane. These adducts also distort the calculated dihedral
angles to the greatest degree of all of the nucleophiles, bending the ring out of plane.
The distortions may play a large contributing factor to the destabilization of the
frontier MOs, whose density surfaces are localized on the ring. Since the amine
adducts do not distort the ring as much as OH− or OCH3
−, their MOs have closer
relative energies to those of TNT. The amine adducts show a definite trend of
increasing sterics resulting in increased distortion. TNT− formation distorts the bond
107
angles and dihedrals the least, which is expected due to the enhanced resonance
stabilizing the ring. The C1 adducts appear to distort the ring less than their C3
counterparts, which may explain their slightly greater MO stability. In addition, the
C1 adducts push the electron donating methyl group out of plane of the ring, replacing
a portion of its electron donation with that of the nucleophile. Although the C3
adducts are not displacing an electron donating group, their nucleophiles are
significantly more orthogonal to the ring, which negatively affects their ability to
donate electron density. This may be another stabilizing advantage of the C1 adduct
over the C3 adduct.
Species Computational (Vacuum) THF MeOH
TNT Aromatic H's 8.320 (1) 8.97 (1) 8.96 (1)
Methyl H's 2.107 (1) 2.62 (1) 2.64 (1)
TNT− Aromatic H's 7.752, 7.733 (1) 8.30 (1) 8.29 (1)
Methyl H's 4.854, 4.829 (1) 5.64 (1) 5.68 (1)
TNT-OH− Aromatic H's 7.597, 7.482 (1) NOT OBSERVED 8.41 (1)
Methyl H's 1.461 (1) NOT OBSERVED 5.28 (1)
Table 2. 1H NMR Computations compared with experimental results for TNT and
alkoxide reactions. Peak multiplicity is indicated in parentheses.
Since the TNT/hydroxide reactions show much greater thermodynamic
favorability and more significant experimental signal, NMR computations were done
using those products. Table 2 shows the comparison of the computations (in vacuum)
to the experimentally observed features in tetrahydrofuran (THF) and methanol. Note
that some features are computed to be reasonably close but not identical, indicating the
limitation of slight asymmetry of the calculated aromatic hydrogens. Although the
values differ substantially based on the lack of solvation in the calculations, the
108
differences are in a reasonable range to account for solvent shifts. As we have shown
previously,19
there are only small chemical shifts effects when changing from the non-
polar THF to the more polar methanol system. The calculated chemical shifts, in
comparison, are found at lower field than their experimental counterparts as we would
expect. The magnitude of the solvation shifts (from calculated to experimental) are
almost all approximately the same, at about 0.5 to 0.9 ppm shifted downfield. The one
significant outlier here is the computation for the methyl protons in TNT-OH−; while
the change of the adjacent carbon from sp2 to sp
3 hybridization would be expected to
lower the chemical shift, the inclusion of the hydroxyl group in close proximity would
be expected to raise the chemical shift. With additional reorientation of the nitro
groups, it is not implausible to observe a shift higher than 5 ppm, as we have in
methanol.
Given the literature discussion of charge transfer (CT) complexes in which
TNT acts as an acceptor, we investigated several converged CT structures. In
addition, since TEA has the largest Gutmann donor number (DN)32,33
of the amines in
our investigation, we added solid TNT to dry TEA. No color change was observed,
with no apparent absorbance features in the visible range. In a comparison of the
computed TNT:TEA CT complexes, the relative energies of the formation reactions
were much lower than the TNT− formation reactions; as the dielectric increases, the
reactions have energies on the same order of magnitude, but the relationship between
their relative molar absorptivities remains unknown. This suggests that the formation
of any CT complex will not play an observable role in the overall equilibrium of these
systems at low concentration. Politzer et. al.28
have reported computations of similar
109
TNT-amine CT structures, with calculations well into the UV range; this seems to
correspond well with literature reports of TNB CT complexes with EA, DEA, and
TEA with absorbance maxima between 280 and 420 nm.34
This is consistent with the
lack of CT bands in our previously reported absorbance spectra.
RELATIVE THERMODYNAMICS
Thermodynamic quantities were calculated only in vacuum, since the SM8
solvation model assumes no change to the vibrational modes which the
thermodynamic calculations directly depend on; however, these calculations were
computed under the same level of theory as the solvation calculations. Enthalpy
changes for each modeled reaction can be estimated given a system at constant
temperature and volume, whereby ΔHrxn ≈ ΔErxn ≈ Eproducts - Ereactants. Entropy values
were also computed, in order to further assess the negligibility of the TΔS term in the
Gibb's free energy equation in vacuum. Given the assumption that this term is
negligible, ΔGrxn can be estimated by ΔErxn.
Table 3 shows the thermodynamic parameter ΔErxn, as well as ΔGrxn, ΔHrxn,
and ΔSrxn, which are calculated using vibrational mode analysis. Several points are
immediately apparent from the data set. ΔSrxn contributions from most of the
reactions are significant, breaking down the approximation that ΔGrxn ≈ ΔErxn. As
expected, the lowest values of ΔSrxn are from the acid/base reactions, where proton
transfer does not dramatically affect the overall entropy of the system. Here, the only
calculated positive ΔSrxn comes from hydroxide deprotonating TNT; this is an
important distinction, as this is a driving force towards spontaneity and
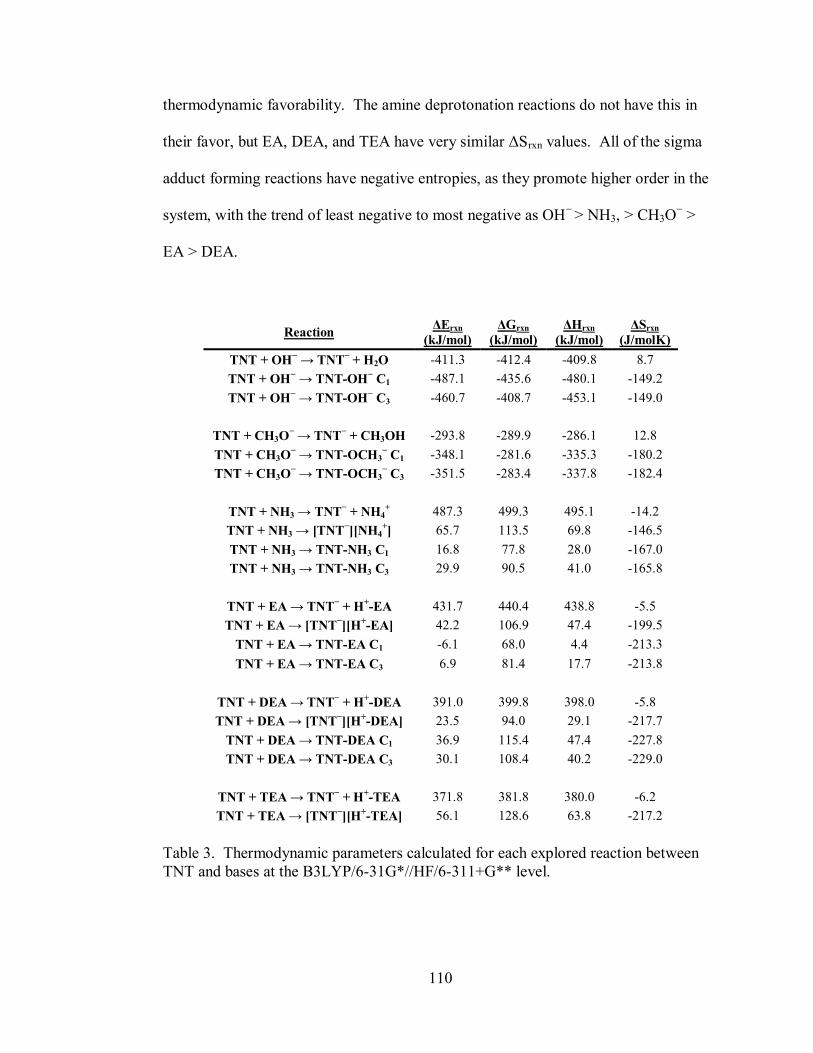
110
thermodynamic favorability. The amine deprotonation reactions do not have this in
their favor, but EA, DEA, and TEA have very similar ΔSrxn values. All of the sigma
adduct forming reactions have negative entropies, as they promote higher order in the
system, with the trend of least negative to most negative as OH−
> NH3, > CH3O− >
EA > DEA.
Reaction ΔErxn
(kJ/mol)
ΔGrxn
(kJ/mol)
ΔHrxn
(kJ/mol)
ΔSrxn
(J/molK)
TNT + OH− → TNT
− + H2O -411.3 -412.4 -409.8 8.7
TNT + OH− → TNT-OH
− C1 -487.1 -435.6 -480.1 -149.2
TNT + OH− → TNT-OH
− C3 -460.7 -408.7 -453.1 -149.0
TNT + CH3O
− → TNT
− + CH3OH -293.8 -289.9 -286.1 12.8
TNT + CH3O− → TNT-OCH3
− C1 -348.1 -281.6 -335.3 -180.2
TNT + CH3O− → TNT-OCH3
− C3 -351.5 -283.4 -337.8 -182.4
TNT + NH3 → TNT
− + NH4
+ 487.3 499.3 495.1 -14.2
TNT + NH3 → [TNT−][NH4
+] 65.7 113.5 69.8 -146.5
TNT + NH3 → TNT-NH3 C1 16.8 77.8 28.0 -167.0
TNT + NH3 → TNT-NH3 C3 29.9 90.5 41.0 -165.8
TNT + EA → TNT
− + H
+-EA 431.7 440.4 438.8 -5.5
TNT + EA → [TNT−][H
+-EA] 42.2 106.9 47.4 -199.5
TNT + EA → TNT-EA C1 -6.1 68.0 4.4 -213.3
TNT + EA → TNT-EA C3 6.9 81.4 17.7 -213.8
TNT + DEA → TNT
− + H
+-DEA 391.0 399.8 398.0 -5.8
TNT + DEA → [TNT−][H
+-DEA] 23.5 94.0 29.1 -217.7
TNT + DEA → TNT-DEA C1 36.9 115.4 47.4 -227.8
TNT + DEA → TNT-DEA C3 30.1 108.4 40.2 -229.0
TNT + TEA → TNT
− + H
+-TEA 371.8 381.8 380.0 -6.2
TNT + TEA → [TNT−][H
+-TEA] 56.1 128.6 63.8 -217.2
Table 3. Thermodynamic parameters calculated for each explored reaction between
TNT and bases at the B3LYP/6-31G*//HF/6-311+G** level.
111
Similar trends continue to ΔHrxn and ΔGrxn. The hydroxide reactions have
reasonably similar spontaneity to each other, with the formation of the sigma complex
having the edge in vacuum. Besides the alkoxide reactions, all others are calculated to
be significantly non-spontaneous. The deprotonation reactions forming free ions are
less favorable than their sigma adduct forming counterparts; for the amines, the
disparity is especially noticeable. This is partly expected, given the lack of a solvation
parameter in these calculations to support an isolated charge. The capability of
forming an ion pair improves the favorability substantially, and while NH3 and EA
still have a more favorable ΔGrxn for sigma adduct formation, the larger DEA has a
more favorable deprotonation reaction. The basicity of the amines in vacuum, as
calculated by the ion pair formation ΔGrxn, trends as DEA>EA>NH3>TEA.
Since most of the modeled reactions had a sizeable entropy component, the
approximation of ΔGrxn ≈ ΔErxn is not appropriate. However, the dramatic differences
between the calculated values of ΔGrxn for each hydroxide reaction and the most
favorable amine reaction, the formation of TNT-EA, are significant. It is unlikely that
the inclusion of a solvation model would bridge this gap; therefore, these
computations indicate that amine reactions would not be expected to be observed with
even trace amounts of water in solution, as hydroxide reactions with TNT would be
predominant. This would especially be true in a methanoic solution, as a substantial
amount of CH3O− would be produced by the methanol/amine acid/base equilibrium.

112
Figure 2. ΔErxn plotted as a function of dielectric constant for TNT reactions with
bases. The plot indicates the solvation dependence of TNT reactions with hydroxide
and selected amines. Energy calculations performed at B3LYP/6-31G*//HF/6-
311+G** level of computation using the SM8 solvation model. Note that some points
from the free ion computations at lower dielectric are off scale and are thus omitted
from this figure. Also, note that the ΔErxn data for the methoxide adducts overlap such
that the data points cannot be discerned.
Figure 2 shows the relative energy change of each explored TNT reaction as a
function of solvent dielectric. The hydroxide and methoxide reactions appear to be
relatively independent of solvation modeling, as the energy spacing between the
computed species remains similar for any dielectric. The C1 TNT-OH− adduct is
predicted to be the more thermodynamically favorable product, which is what we
observe in our absorbance spectra in more polar solvents at long time periods. The
TNT-OCH3− adduct isomers show very similar thermodynamics at all modeled
113
dielectrics, as the larger nucleophile is sterically hindered at the C1 attack site. This
also emphasizes the kinetic hindrance to the adduct formation, as TNT− is typically
observed prior to the adduct's appearance.
NH3 and EA products follow a similar trend, where the adduct reactions are of
lower relative energy than the ion pair or the free ions. By no surprise, the free ion
formations are calculated to be the least thermodynamically favorable, especially
towards low dielectrics which cannot stabilize the charges through intermolecular
forces. In addition, the change in relative energy of the NH3 and EA adduct
formations is about an order of magnitude less than the hydroxide adducts in methanol
(ε = 33). In vacuum, the computation indicates a non-favorable reaction for the
ammonia adduct, and a barely favorable adduct formation with EA. Since the
hydroxide reactions are calculated to become even more thermodynamically favorable
as the dielectric decreases, the relative energy gap between the hydroxide and amine
adduct reactions increases substantially; this does not project well for the solid-vapor
applications of TNT and primary amine reactions for TNT detection.
The size difference of DEA relative to EA changes the relative favorability of
action as a Brønsted-Lowry base versus a nucleophile. The calculations predict the
ion pair of [H+−DEA][TNT
−] to be the most favorable reaction, with the free ions still
more favorable than either adducts at dielectrics higher than that of 1-propanol (ε =
20.1). It is interesting to note that the C3 carbon is expected to be the more
thermodynamically favorable attack site for the larger DEA nucleophile, but not so
much so that we would not expect evidence of both adducts at equilibrium. This is
consistent with our 1H NMR observation for this reaction, where there is evidence of
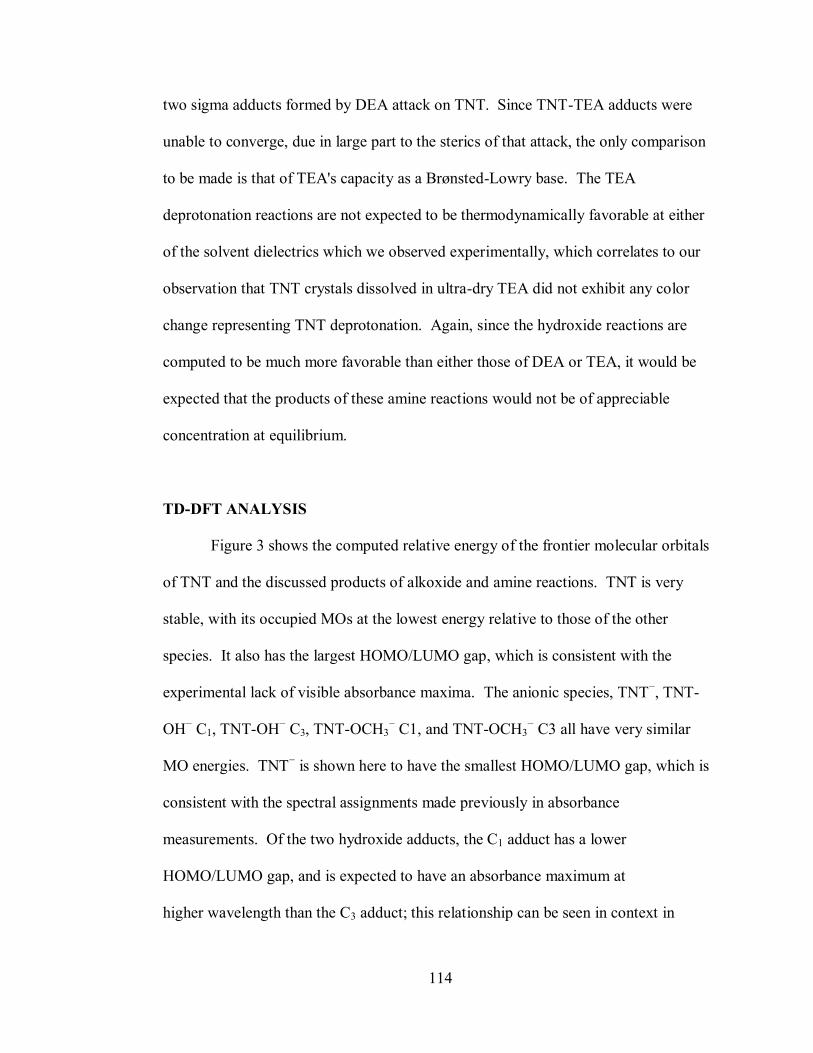
114
two sigma adducts formed by DEA attack on TNT. Since TNT-TEA adducts were
unable to converge, due in large part to the sterics of that attack, the only comparison
to be made is that of TEA's capacity as a Brønsted-Lowry base. The TEA
deprotonation reactions are not expected to be thermodynamically favorable at either
of the solvent dielectrics which we observed experimentally, which correlates to our
observation that TNT crystals dissolved in ultra-dry TEA did not exhibit any color
change representing TNT deprotonation. Again, since the hydroxide reactions are
computed to be much more favorable than either those of DEA or TEA, it would be
expected that the products of these amine reactions would not be of appreciable
concentration at equilibrium.
TD-DFT ANALYSIS
Figure 3 shows the computed relative energy of the frontier molecular orbitals
of TNT and the discussed products of alkoxide and amine reactions. TNT is very
stable, with its occupied MOs at the lowest energy relative to those of the other
species. It also has the largest HOMO/LUMO gap, which is consistent with the
experimental lack of visible absorbance maxima. The anionic species, TNT−, TNT-
OH− C1, TNT-OH
− C3, TNT-OCH3
− C1, and TNT-OCH3
− C3 all have very similar
MO energies. TNT− is shown here to have the smallest HOMO/LUMO gap, which is
consistent with the spectral assignments made previously in absorbance
measurements. Of the two hydroxide adducts, the C1 adduct has a lower
HOMO/LUMO gap, and is expected to have an absorbance maximum at
higher wavelength than the C3 adduct; this relationship can be seen in context in
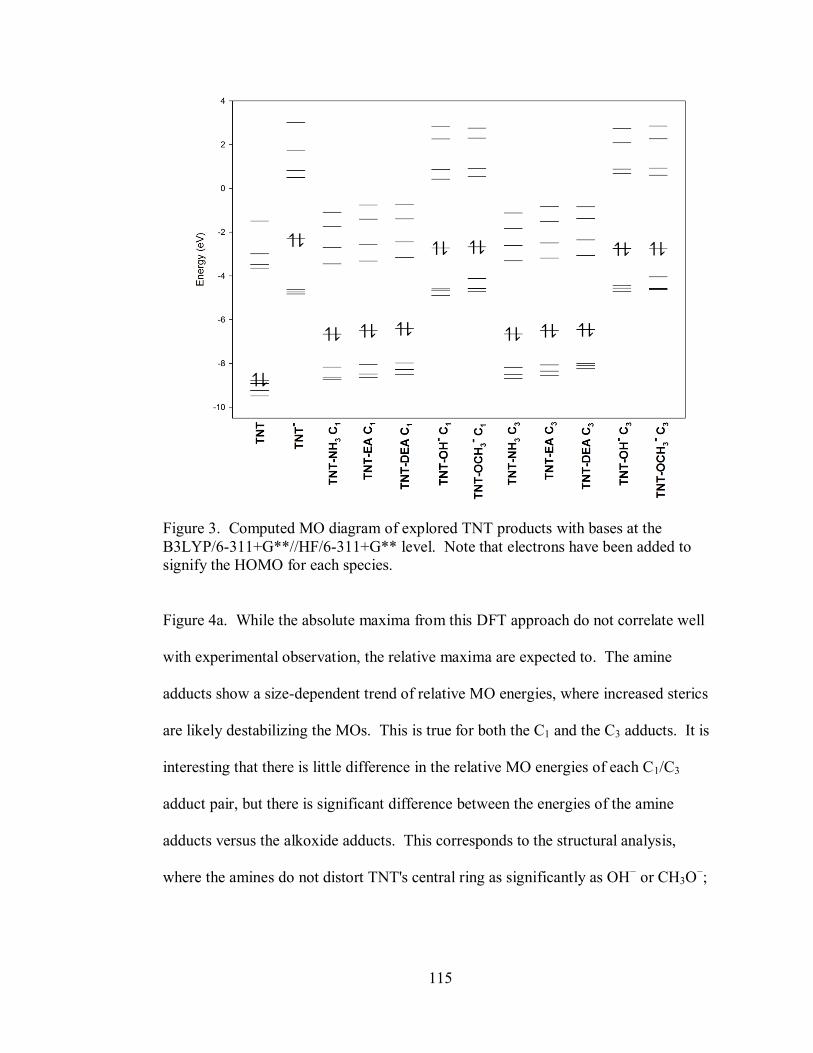
115
Figure 3. Computed MO diagram of explored TNT products with bases at the
B3LYP/6-311+G**//HF/6-311+G** level. Note that electrons have been added to
signify the HOMO for each species.
Figure 4a. While the absolute maxima from this DFT approach do not correlate well
with experimental observation, the relative maxima are expected to. The amine
adducts show a size-dependent trend of relative MO energies, where increased sterics
are likely destabilizing the MOs. This is true for both the C1 and the C3 adducts. It is
interesting that there is little difference in the relative MO energies of each C1/C3
adduct pair, but there is significant difference between the energies of the amine
adducts versus the alkoxide adducts. This corresponds to the structural analysis,
where the amines do not distort TNT's central ring as significantly as OH− or CH3O
−;
↿⇂ ↿⇂
↿⇂ ↿⇂ ↿⇂
↿⇂ ↿⇂
↿⇂ ↿⇂ ↿⇂
↿⇂
↿⇂
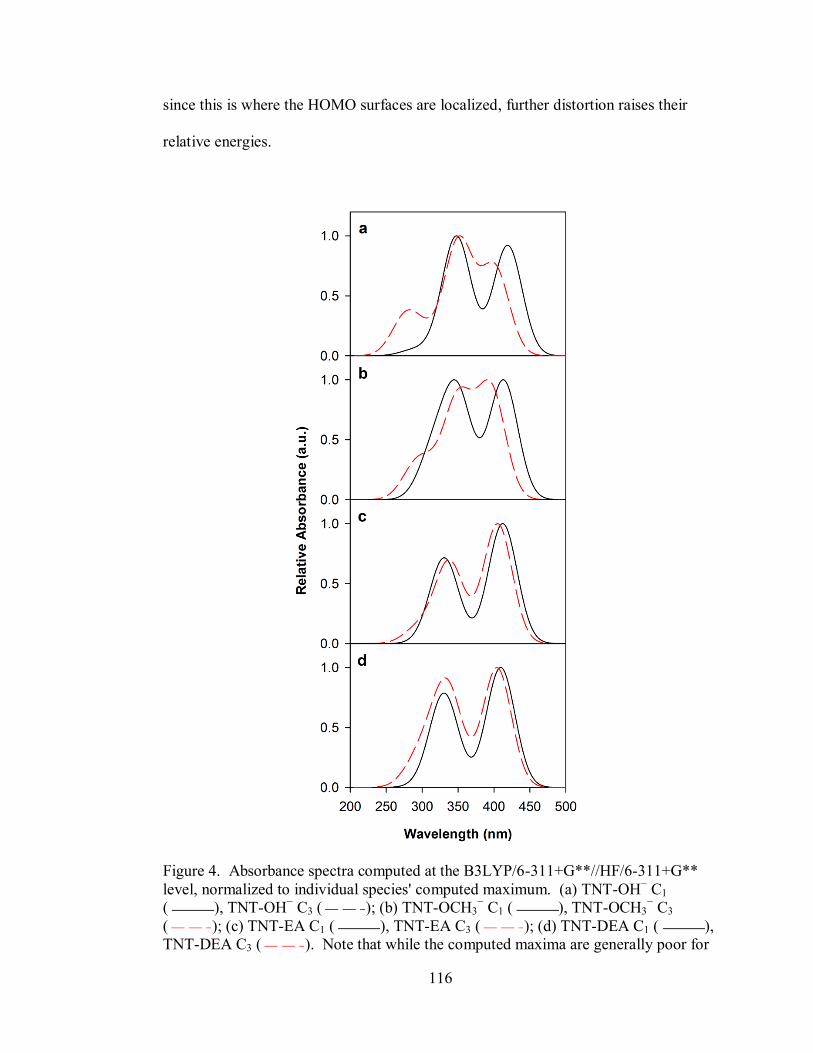
116
since this is where the HOMO surfaces are localized, further distortion raises their
relative energies.
Figure 4. Absorbance spectra computed at the B3LYP/6-311+G**//HF/6-311+G**
level, normalized to individual species' computed maximum. (a) TNT-OH− C1
( ), TNT-OH− C3 ( ); (b) TNT-OCH3
− C1 ( ), TNT-OCH3
− C3
( ); (c) TNT-EA C1 ( ), TNT-EA C3 ( ); (d) TNT-DEA C1 ( ),
TNT-DEA C3 ( ). Note that while the computed maxima are generally poor for

117
this approach, the relative position of the maxima are typically representative of
experimental observation.
CONCLUSIONS
High level ab initio computations were performed to assess the relative
thermodynamics of TNT product formation, from reaction with OH−, CH3O
−, and
aliphatic amines. The deprotonation of the methyl group of TNT forming TNT−, and
the nucleophilic attack upon TNT forming TNT-B, are calculated in vacuum to be
very favorable and spontaneous for OH− and CH3O
− while non-spontaneous for
amines. The application of the SM8 solvation model decreases the favorability of
OH− and CH3O
− reactions while improving the amine reactions as the solvent
dielectric increases, but not enough to justify a significant amine reaction contribution
at equilibrium. OH− and CH3O
− adducts are calculated to have the greatest degree of
ring distortion out of the investigated adducts, resulting in destabilized MOs relative to
TNT, but a lower HOMO/LUMO gap yielding visible range absorbances. This study
indicates the significance of solvation effects on TNT reactions, as well as the role of
OH− and ambient water in the formation of these products. The use of methanol as a
solvent system for TNT/amine reactions is likely to lead to CH3O− based products and
subsequent visible absorbance features instead of amine based products. Therefore,
solvent choice is crucial for further investigation of this and similar systems. Based on
these calculations, amines employed in existing TNT sensors are not directly
responsible for the sensing mechanism. Since OH− plays a much more significant

118
thermodynamic role, especially in the gas phase, water content should be monitored
and controlled for an accurate assessment of sensor effectiveness.

119
REFERENCES
1 Fyfe, C.A.; Malkiewich, C.D.; Damji, S.W.H.; Norris, A.R. J. Am. Chem. Soc.
1976, 98, 6983.
2 Bernasconi, C.F. J. Org. Chem. 1971, 36, 1671.
3 Buncel, E.; Norris, A.R.; Russell, K.E.; Tucker, R. J. Am. Chem. Soc. 1972,
94, 1646.
4 Shipp, K.G.; Kaplan, L.A. J. Org. Chem. 1966, 31, 857.
5 Fant, F.; De Sloovere, A.; Matthijesen, K.; Marlé, C.; El Fantroussi, S.;
Verstraete, W. Environ. Pollut. 2001, 111, 503.
6 Jiang, Y.; Zhao, H.; Zhu, N.; Lin, Y.; Yu, P.; Mao, L. Angew. Chem. Int. Ed.
2008, 47, 8601.
7 Üzer, A.; Erçağ, E.; Apak. R. For. Sci. Int. 2008, 239.
8 Lu, Q.; Collins, G.E.; Smith, M.; Wang, J. Anal. Chim. Acta 2002, 469, 253.
9 Yang, J.S.; Swager, T.M. J. Am. Chem. Soc. 1998, 120, 5321.
10 Kumar, M.; Vij, V.; Bhalla, V. Langmuir 2012, 28, 12417.
11 Fang, Q.; Geng, J.; Liu, B.; Gao, D.; Li, F.; Wang, Z.; Guan, G.; Zhang, Z.
Chem. Eur. J. 2009, 15, 11507.
12 Gao, D.; Wang, Z.; Liu, B.; Ni, L.; Wu, M.; Zhang, Z. Anal. Chem. 2008, 80,
8545.
13 Tu, R.; Liu, B.; Wang, Z.; Gao, D.; Wang, F.; Fang, Q.; Zhang, Z. Anal. Chem.
2008, 80, 3458.
14 Xia, Y.; Song, L.; Zhu, C. Anal. Chem. 2011, 83, 1401.
15 Zhang, K.; Zhou, H.; Mei, Q.; Wang, S.; Guan, G.; Liu, R.; Zhang, J.; Zhang,
Z. J. Am. Chem. Soc. 2011, 133, 8424.
16 Xie, C.; Zhang, Z.; Wang, D.; Guan, G.; Gao, D.; Liu, J. Anal. Chem. 2006,
78, 8339.
17 Gao, D.; Zhang, Z.; Wu, M.; Xie, C.; Guan, G.; Wang, D. J. Am. Chem. Soc.
2007, 129, 7859.
120
18 Zhou, H.; Zhang, Z.; Jiang, C.; Guan, G.; Zhang, K.; Mei, Q.; Liu, R.; Wang,
S. Anal. Chem. 2011, 83, 6913.
19 Latendresse, C.A.; Fernandes, S.C.; You, S.; Euler, W.B. to be submitted to J.
Am. Chem. Soc.
20 Caldin, E.F.; Long, G. Proc. R. Soc. Lond. A 1955, 228, 263.
21 Oxley, J.C.; Smith, J.L.; Yue, J.; Moran, J. Propellants, Explos., Pyrotech.
2009, 34, 421.
22 Xie, C.; Liu, B.; Wang, Z.; Gao, D.; Guan, G.; Zhang, Z. Anal. Chem. 2008,
80, 437.
23 Wang, Y.Q.; Zou, W.S. Talanta 2011, 85, 469.
24 Chen, Y.; Chen, Z.; He, Y.; Lin, H.; Sheng, P.; Liu, C.; Luo, S.; Cai, Q.
Nanotechnology 2010, 21, 125502.
25 Guan, G.; Liu, R.; Wu, M.; Li, Z.; Liu, B.; Wang, Z.; Gao, D.; Zhang, Z.
Analyst 2009, 134, 1880.
26 Qasim, M., Gorb, L., Magers, D., Honea, P., Leszczynski, J., Moore, B.,
Taylor, L., Middleton, M. J. Haz. Mat. 2009, 167, 154.
27 Qasim, M.M., Moore, B., Taylor, L., Honea, P., Gorb, L., Leszczynski, J. Int.
J. Mol. Sci. 2007, 8, 1234.
28 Politzer, P., Murray, J.S., Koppes, W.M., Concha, M.C., Lane, P. Cent. Eur. J.
Energetic Mater. 2009, 6, 167.
29 Hill, F.C., Sviatenko, L.K., Gorb, L., Okovytyy, S.I., Blaustein, G.S.,
Leszczynski, J. Chemosphere 2012, 88, 635.
30 Spartan '10; Wavefunction, Inc.: Irvine, CA, 2010. Version 1.1.0.
31 Marenich, A.V.; Olson, R.M.; Kelly, C.P.; Cramer, C.J.; Truhlar, D.G. J.
Chem. Theory Comput. 2007, 3, 2011.
32 Mayer, U.; Gutmann, V.; Gerger, W. Monatshefte für Chemie 1975, 106,
1235.
33 Mayer, U.; Gerger, W.; Gutmann, V. Monatshefte für Chemie 1977, 108, 489.
34 Foster, R.; Mackie, R.K. J. Chem. Soc., 1962, 3843.
121
CHAPTER 4
A Fluorometric Sensing Array for the
Detection of Military Explosive and IED
Materials
Christopher A. Latendressea, Syrena C. Fernandes
a, Sangmin You
a, Hui Qi Zhang
a,
and William B. Eulera*
aUniversity of Rhode Island Department of Chemistry, 51 Lower College Road,
Kingston, RI 02881, USA
The following is in preparation to be submitted to Analyst, and is presented here in
manuscript format.

122
Abstract
A fluorometric sensing array was developed to detect and discern common
military explosives as well as materials used in improvised explosive devices (IEDs).
Xanthene-based fluorophores were chosen as reporter molecules and were exposed to
explosive analytes in DMF solution. Unique responses were observed for each
analyte, with the strongest observed responses resultant from trinitrobenzene (TNB) or
trinitrotoluene (TNT) addition. Evidence for substantial electron transfer (ET)
between TNB and TNT products and fluorophores was observed. Computational
support indicates that anionic trinitroaromatic products are likely donating electrons to
cationic fluorophores, leading to an observed enhancement of their emission.
1. Introduction
With the rise in domestic and international terroristic events in the past decade,
the scientific community has been pushed by the need to develop rapid and sensitive
means of detection of explosive analytes. Explosive sensors have been developed
based on a number of methods of detection, including colorimetry,1,2
fluorescence,3-9
mass spectrometry,10-12
electrochemical,13-15
and Surface Enhanced Raman Scattering
(SERS),16-18
among others.
Sensitivity and selectivity remain at the heart of an effective sensor, and while
many sensors are able to claim one, most cannot achieve both. Fluorescence sensing
benefits from the inherently high sensitivity of contemporary fluorescence
instrumentation, which can achieve attomolar detection for molecules with high
quantum yields in solution.19
Additionally, detection limits may be improved by

123
another order of magnitude using metal enhanced fluorescence.20,21
Selectivity,
although difficult to achieve using a single interactive sensor, can be induced by the
use of a sensor array where multiple sensors can be exposed to the same analyte
stream and their responses observed together. This “fingerprint” can be read as a
function of a specific analyte; whereas one of the sensors may not be able to discern
one analyte from another, it is unlikely that two analytes will interact with the
multitude of sensors in the exact same fashion.
Perhaps surprisingly, the rhodamine family has not been well explored in the
field of explosive detection. Meaney & coworkers investigated the fluorescence
quenching of common fluorophores including Rhodamine 6G against nitrobenzene, 4-
nitrotoluene and 2,6-dinitrotoluene, but did not explore more contemporarily relevant
analytes.9 Rhodamines have notoriety as being very strong fluorophores, and were
therefore selected to test as fluorescence reporters against explosive analytes.
Rhodamines also have the advantage of possessing visible range excitations and
emissions that are not subject to interference by absorbance bands of explosive
analytes. The rhodamines investigated in this study were Rhodamine 560 Chloride
(Rh560), Rhodamine 6G (Rh6G), Sulforhodamine B (SRhB), Rhodamine 640
Perchlorate (Rh640), Sulforhodamine 640 (SRh640), Rhodamine 700 (Rh700) and
Rhodamine 800 (Rh800). Fluorescein 548 (Fl548) was also included, as another
representative xanthene derivative with a high quantum yield. The structures of the
selected fluorophores can be found in Supplementary Information Fig. S1. The
analytes exposed to the aforementioned fluorophores were selected based on current
military relevance: trinitrobenzene (TNB), trinitrotoluene (TNT),
124
cyclotrimethylenetrinitramine (RDX), and cyclotetramethylenetetranitramine (HMX)
are common military grade secondary explosives; pentaerythritoltetranitrate (PETN)
and triacetonetriperoxide (TATP) have been used in improvised explosive devices
(IEDs) and large scale terrorist events over the past two decades due to their relatively
simple synthesis and high output;10,11,22
and 2,3-dinitrotoluene (2,3-DNT), 2,4-
dinitrotoluene (2,4-DNT), 2,6-dinitrotoluene (2,6-DNT), 3,4-dinitrotoluene (3,4-
DNT), 2-nitrotoluene (2-NT) and 4-nitrotoluene (4-NT) are common impurities in
crude and refined TNT due to incomplete nitration.23
Due to the much higher vapor
pressures and saturated vapor densities of DNTs and NTs relative to TNT, these
species may serve as useful analytes for the implication of TNT sensing. The
structures of the aforementioned explosive analytes can be found in Supplementary
Information Fig. S2.
2. Experimental
Chemicals and materials
DMF (≥99.5%) was purchased from Fisher Scientific and used as received. Rh560,
Fl548, Rh640, SRh640, Rh700, and Rh800 were purchased from Exciton (Dayton,
Ohio) and used as received. Rh6G (99%) was purchased from Acros and used as
received. SRhB was purchased from Lambda Physik and used as received. TNT,
TATP, PETN, HMX, and RDX were obtained from Drs. Jimmie Oxley and James
Smith and were used without further purification. TNB was purchased from Fisher
Scientific wetted with ca. 40% water with 98.0% purity; 2,3-DNT (99%), 2,6-DNT
(98%), and 3,4-DNT (99%) were purchased from Aldrich; 2,4-DNT (95%) was
125
purchased from Alfa Aesar; and 2-NT (99%) and 4-NT (99%) were purchased from
Acros. All were used as received.
Apparatus and Procedure
Fluorophore solutions in DMF were created and diluted to a maximum visible
range absorbance of 0.1 abs. units. Solutions of Rh700 and Rh800 were acidified with
trifluoroacetic acid (TFA) to prevent photobleaching prior to use. Absorbance data
(PerkinElmer Lambda900 UV/Vis/NIR spectrophotometer) and emission data (Horiba
Fluorolog-3, Xe arc lamp excitation) were obtained before and after the addition of a
few crystals of solid explosive, or the addition of a small drop in the case of 2-NT(l).
Excitation and emission slits were used between 2 and 5 nm, but did not vary between
initial and final spectra acquisitions.
Computational Analysis
Spartan '10 computational software24
was used to propose the relative
absorbance maxima for the isomers of [TNT-OH]–. Structures were optimized at the
HF/6-311+G** level without imaginary vibrational frequencies. TDDFT energies and
absorbance spectra were calculated using the converged structures at the B3LYP/6-
311+G** level.
3. Results and discussion
Solutions of fluorophores were prepared in DMF, with absorbance and
emission spectra acquired before and after the addition of explosive analyte. Figure 1
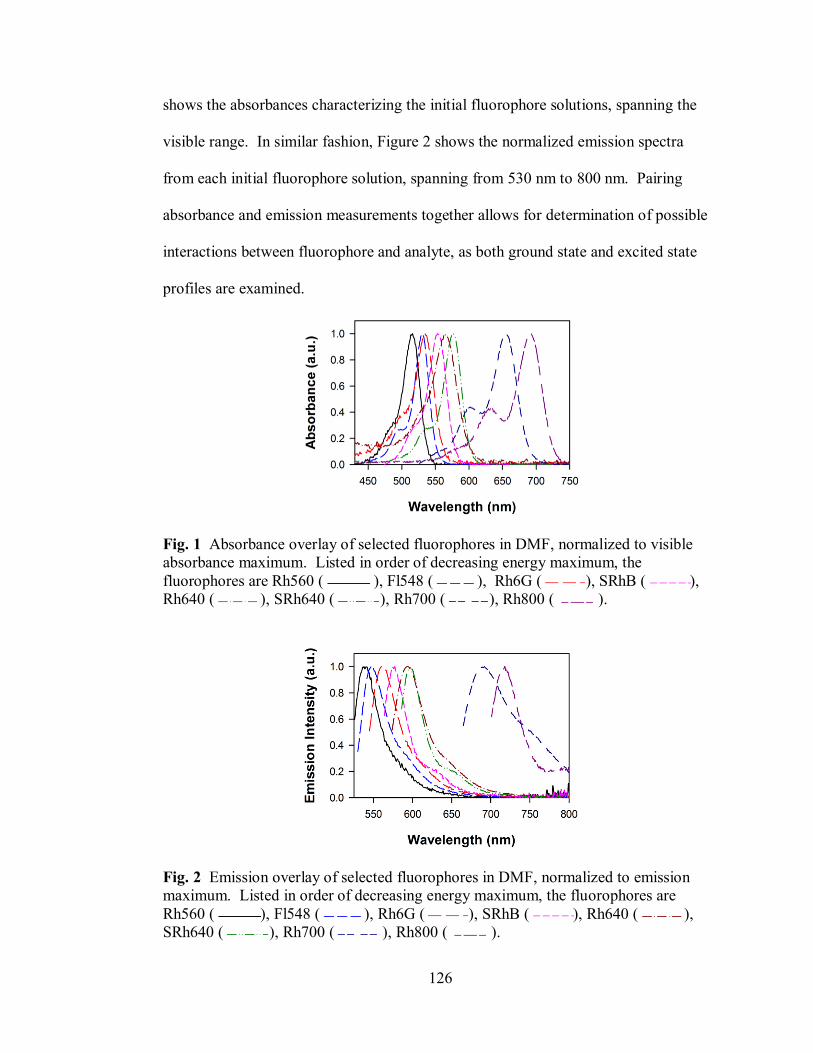
126
shows the absorbances characterizing the initial fluorophore solutions, spanning the
visible range. In similar fashion, Figure 2 shows the normalized emission spectra
from each initial fluorophore solution, spanning from 530 nm to 800 nm. Pairing
absorbance and emission measurements together allows for determination of possible
interactions between fluorophore and analyte, as both ground state and excited state
profiles are examined.
Fig. 1 Absorbance overlay of selected fluorophores in DMF, normalized to visible
absorbance maximum. Listed in order of decreasing energy maximum, the
fluorophores are Rh560 ( ), Fl548 ( ), Rh6G ( ), SRhB ( ),
Rh640 ( ), SRh640 ( ), Rh700 ( ), Rh800 ( ).
Fig. 2 Emission overlay of selected fluorophores in DMF, normalized to emission
maximum. Listed in order of decreasing energy maximum, the fluorophores are
Rh560 ( ), Fl548 ( ), Rh6G ( ), SRhB ( ), Rh640 ( ),
SRh640 ( ), Rh700 ( ), Rh800 ( ).
127
Figure 3 shows the output of the sensing array, as indicated by emission
difference spectra. Note that the ordinate axis for TNB and TNT interactions are set to
100% change in emission. All others are zoomed to 10% for clarity, with a select few
zoomed to 40% marked by "× ¼." The trinitroaromatics, TNB and TNT, both show
very strong observed quenching. This is in large part due to the products which they
form in DMF, reacting with hydroxide generated by trace amounts of water. Others
have previously described the absorbance properties25-28
and recently we have
described the emission properties of these products;29
both of these factors complicate
the observations made here as added variables. TNB and TNT are capable of
nucleophilic attack by hydroxide and DMF; in addition, TNT is capable of
deprotonation by hydroxide. The resulting strong absorbance features can be seen in
Supplementary Information Figs. S3-S6. Consistently, these products are diminished
in the observations with Rh700 and Rh800, as these solutions were slightly acidified
to inhibit photobleaching during analysis. Since the product formation is reliant on
hydroxide in solution, acidification removes hydroxide and shifts the equilibria back
towards free TNT or TNB. The formation of these products serves to complicate the
interactions with the fluorophores in solution, due to their inner filter effect and
possible ground state interactions. Both of these factors will be discussed in greater
detail later in the paper.
PETN, RDX, and HMX are all nitroaliphatics, which show a mixture of
quenches and enhancements through interactions with the sensing fluorophores. There
is no observed change in any fluorophore's absorbance upon these exposures (see Figs.
S3-S6), implying that emission changes are only resultant from excited state
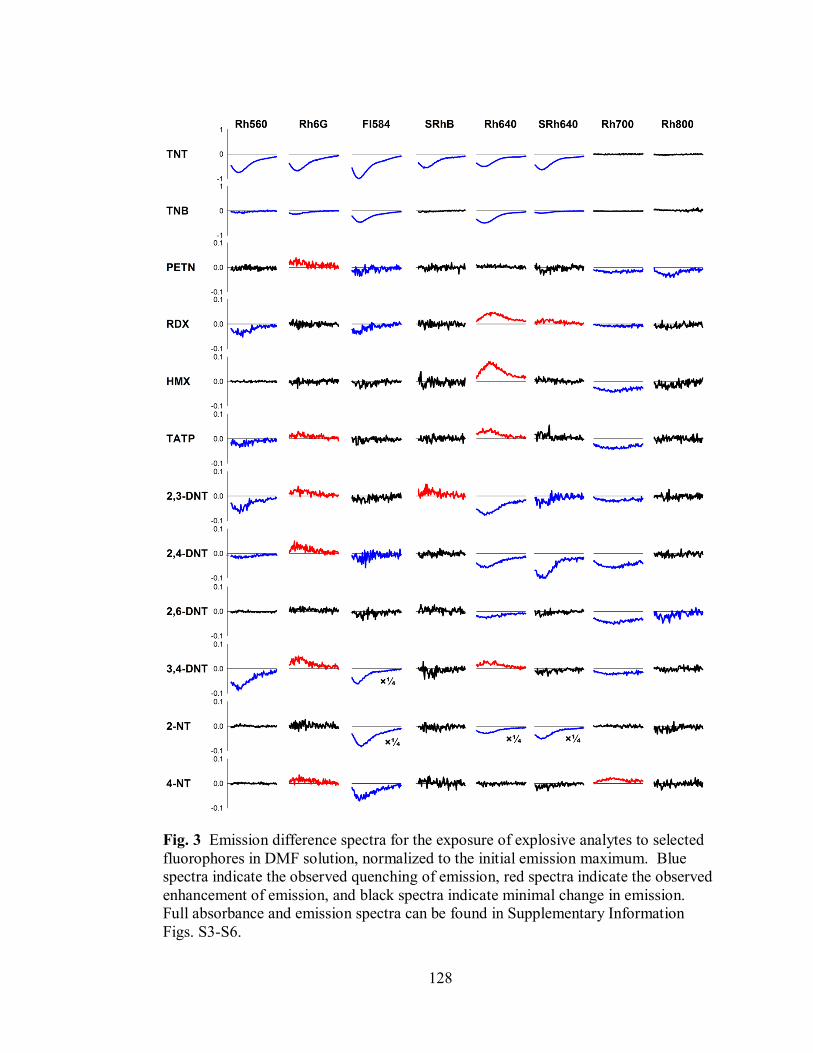
128
Fig. 3 Emission difference spectra for the exposure of explosive analytes to selected
fluorophores in DMF solution, normalized to the initial emission maximum. Blue
spectra indicate the observed quenching of emission, red spectra indicate the observed
enhancement of emission, and black spectra indicate minimal change in emission.
Full absorbance and emission spectra can be found in Supplementary Information
Figs. S3-S6.
129
interactions. Emission decreases are likely resultant from dynamic mechanisms.
Increases in emission may result from interactions that either decrease the lifetime of
the excited state, or perhaps increase the rigidity of the fluorochrome leading to more
favorable emission kinetics. Rh640 most strongly shows this capacity here with both
RDX and HMX. TATP, the only explored peroxide based explosive, also shows this
capacity with Rh640 and Rh6G. Since TATP is known to decompose to H2O2 and
acetone in the presence of acid,30,31
it might be proposed that oxidation of Rh700 and
Rh800 might occur by H2O2 due to the small amount of TFA in solution. Absorbance
measurements do not show this, as there is no change to support such a ground state
reaction. Instead, TATP or its decomposition products appear to quench Rh700
through a collisional mechanism.
The DNT isomers that were explored show a range of emission quenching and
enhancement, but with fingerprint patterns that differentiate them from the other
analytes. DNTs have a similar capacity to TNT to be deprotonated to a varying
degree, and the ability to form a sigma complex with hydroxide from ambient water in
solution. In some of our additions, absorbance features arise to support this
assessment. For example, Fig. S5 shows an increase in absorbance for the addition of
2,4-DNT to SRh640 centered around 650 nm; this absorbance spectrum has been
shown previously to be resultant from the deprotonation of 2,4-DNT.32
Likewise,
Fig. S4 shows an increase in absorbance for the addition of 3,4-DNT to Fl548 between
400 and 500 nm; this would be consistent with the formation of a hydroxide adduct.
While these absorbance features contribute to an inner filtering effect, they are
minimal compared to those of the TNB or TNT products, which will be described
130
later. In addition, there are observable emission changes for DNT additions that either
do not show these absorbance growths or are not fully resultant from an inner filter
effect. 3,4-DNT causes a larger decrease in the emission of Fl548 than its product's
absorbance growth (Fig. S4). Another example can be found in Fig. S6, where 2,4-
DNT causes a dynamic quench to the emission of Rh700, while the absorbance
spectrum is unchanged. The NT isomers also show differentiating patterns from each
other, and from other analytes. Colorful products similar to those formed by
hydroxide reacting with TNT or DNTs are not observed with NTs, and so all observed
absorbance spectra remained unchanged upon addition of 2-NT or 4-NT. Dynamic
quenching was observed from the addition of 2-NT and 4-NT to Fl548 (Fig. S4), as
well as 2-NT added to Rh640 or SRh640.
One issue with the trinitroaromatic products involves the degree of inner filter
effect (IFE) caused by their absorbance. While we observe large quenches in
emission, this may not be related to excited state interactions, but rather simple
absorbance of emitted photons by other components in solution. To account for this,
IFE corrections were done using the following equation:19
where Fcorr is the corrected emission intensity, Fobs is the observed emission intensity,
Aex is the absorbance at the excitation wavelength, and Aem is the absorbance at the
emission maximum. Although the DNTs showed some slight evidence of product
formation, which were consistent with sigma adduct formation or deprotonation, their
absorbance changes were minute and did not have a dramatic impact on the IFE
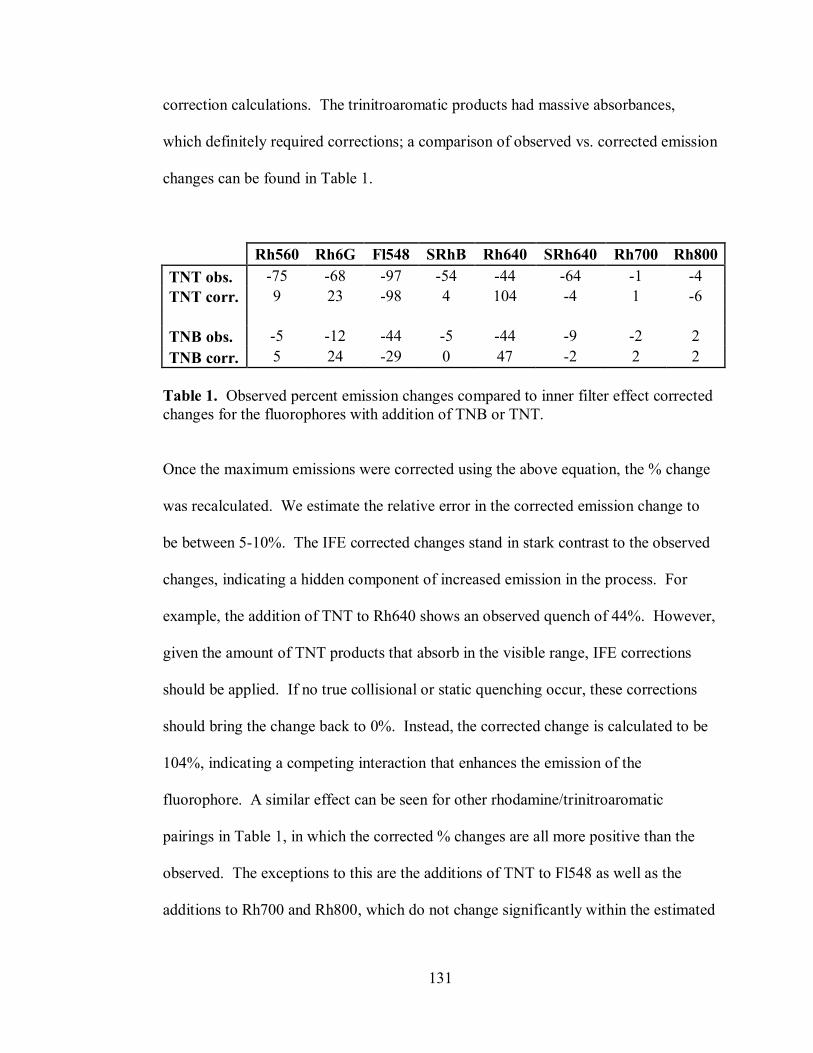
131
correction calculations. The trinitroaromatic products had massive absorbances,
which definitely required corrections; a comparison of observed vs. corrected emission
changes can be found in Table 1.
Rh560 Rh6G Fl548 SRhB Rh640 SRh640 Rh700 Rh800
TNT obs. -75 -68 -97 -54 -44 -64 -1 -4
TNT corr. 9 23 -98 4 104 -4 1 -6
TNB obs. -5 -12 -44 -5 -44 -9 -2 2
TNB corr. 5 24 -29 0 47 -2 2 2
Table 1. Observed percent emission changes compared to inner filter effect corrected
changes for the fluorophores with addition of TNB or TNT.
Once the maximum emissions were corrected using the above equation, the % change
was recalculated. We estimate the relative error in the corrected emission change to
be between 5-10%. The IFE corrected changes stand in stark contrast to the observed
changes, indicating a hidden component of increased emission in the process. For
example, the addition of TNT to Rh640 shows an observed quench of 44%. However,
given the amount of TNT products that absorb in the visible range, IFE corrections
should be applied. If no true collisional or static quenching occur, these corrections
should bring the change back to 0%. Instead, the corrected change is calculated to be
104%, indicating a competing interaction that enhances the emission of the
fluorophore. A similar effect can be seen for other rhodamine/trinitroaromatic
pairings in Table 1, in which the corrected % changes are all more positive than the
observed. The exceptions to this are the additions of TNT to Fl548 as well as the
additions to Rh700 and Rh800, which do not change significantly within the estimated
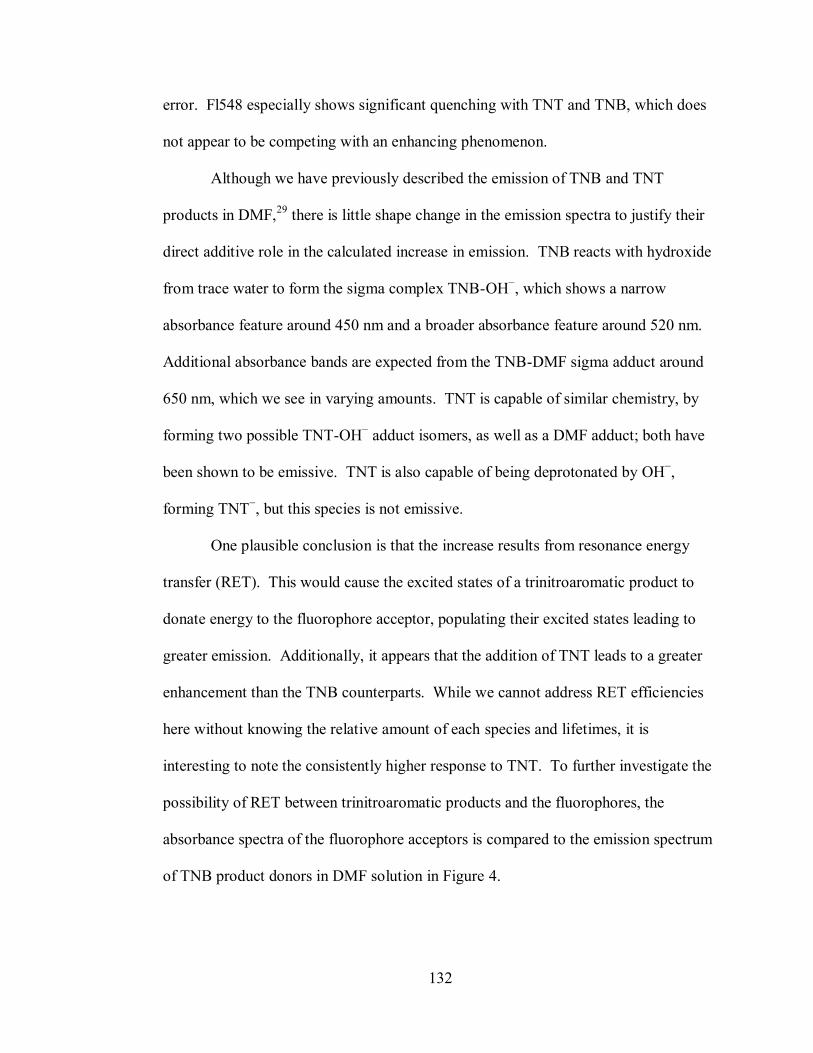
132
error. Fl548 especially shows significant quenching with TNT and TNB, which does
not appear to be competing with an enhancing phenomenon.
Although we have previously described the emission of TNB and TNT
products in DMF,29
there is little shape change in the emission spectra to justify their
direct additive role in the calculated increase in emission. TNB reacts with hydroxide
from trace water to form the sigma complex TNB-OH−, which shows a narrow
absorbance feature around 450 nm and a broader absorbance feature around 520 nm.
Additional absorbance bands are expected from the TNB-DMF sigma adduct around
650 nm, which we see in varying amounts. TNT is capable of similar chemistry, by
forming two possible TNT-OH− adduct isomers, as well as a DMF adduct; both have
been shown to be emissive. TNT is also capable of being deprotonated by OH−,
forming TNT−, but this species is not emissive.
One plausible conclusion is that the increase results from resonance energy
transfer (RET). This would cause the excited states of a trinitroaromatic product to
donate energy to the fluorophore acceptor, populating their excited states leading to
greater emission. Additionally, it appears that the addition of TNT leads to a greater
enhancement than the TNB counterparts. While we cannot address RET efficiencies
here without knowing the relative amount of each species and lifetimes, it is
interesting to note the consistently higher response to TNT. To further investigate the
possibility of RET between trinitroaromatic products and the fluorophores, the
absorbance spectra of the fluorophore acceptors is compared to the emission spectrum
of TNB product donors in DMF solution in Figure 4.
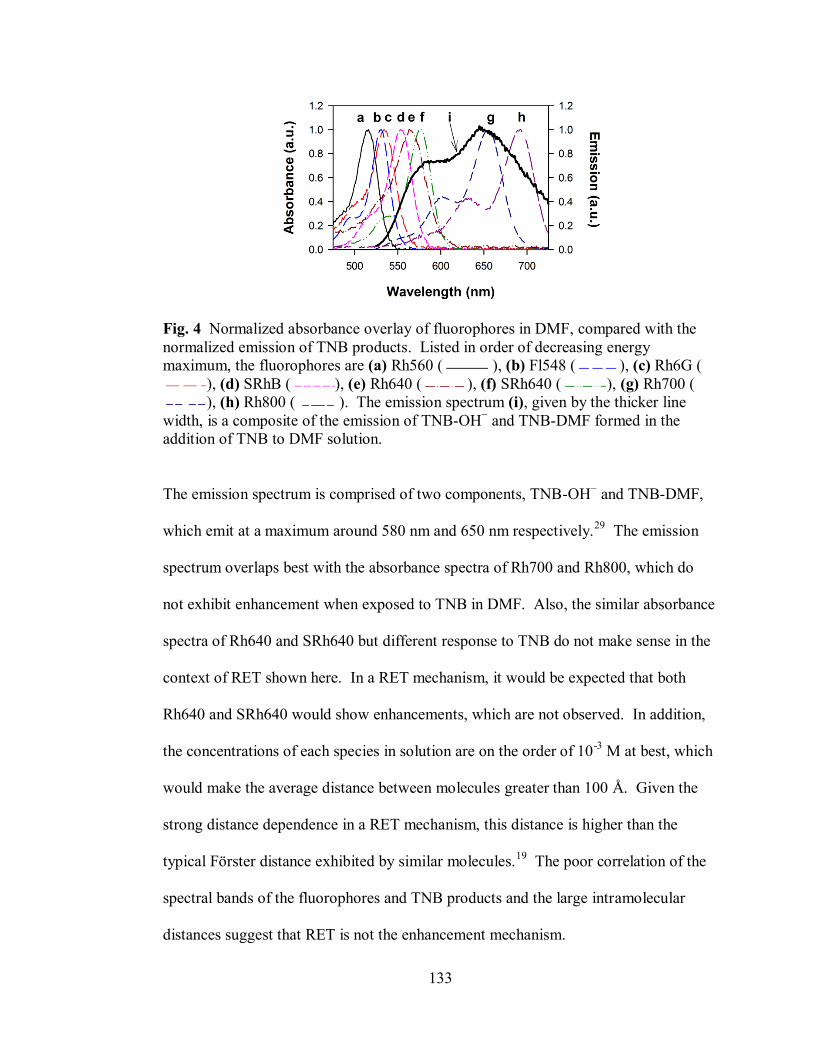
133
Fig. 4 Normalized absorbance overlay of fluorophores in DMF, compared with the
normalized emission of TNB products. Listed in order of decreasing energy
maximum, the fluorophores are (a) Rh560 ( ), (b) Fl548 ( ), (c) Rh6G (
), (d) SRhB ( ), (e) Rh640 ( ), (f) SRh640 ( ), (g) Rh700 (
), (h) Rh800 ( ). The emission spectrum (i), given by the thicker line
width, is a composite of the emission of TNB-OH− and TNB-DMF formed in the
addition of TNB to DMF solution.
The emission spectrum is comprised of two components, TNB-OH− and TNB-DMF,
which emit at a maximum around 580 nm and 650 nm respectively.29
The emission
spectrum overlaps best with the absorbance spectra of Rh700 and Rh800, which do
not exhibit enhancement when exposed to TNB in DMF. Also, the similar absorbance
spectra of Rh640 and SRh640 but different response to TNB do not make sense in the
context of RET shown here. In a RET mechanism, it would be expected that both
Rh640 and SRh640 would show enhancements, which are not observed. In addition,
the concentrations of each species in solution are on the order of 10-3
M at best, which
would make the average distance between molecules greater than 100 Å. Given the
strong distance dependence in a RET mechanism, this distance is higher than the
typical Förster distance exhibited by similar molecules.19
The poor correlation of the
spectral bands of the fluorophores and TNB products and the large intramolecular
distances suggest that RET is not the enhancement mechanism.
134
Other possibilities for an enhanced fluorescence are charge transfer (CT) or
electron transfer (ET) mechanisms. A CT complex may be formed if the HOMOs of
the TNB or TNT products are close enough in energy to the LUMOs of the sensing
fluorophores, for a small amount of overlap to occur. If either of the TNB or TNT
products have HOMOs of high energy relative to the LUMOs of the fluorophores, ET
may justify the enhanced excited state population and subsequent enhanced emission
of the fluorophores. To help in our assignment of the mechanism of enhanced
emission, molecular orbital energies were calculated using Spartan '10 computational
software. Figure 5 shows the calculated relative energies of the HOMO and LUMO
for TNB, TNB-OH−, TNT, TNT-OH
−, TNT
−, and the sensing fluorophores.
Fig. 5 HOMO/LUMO diagram for energy comparison between sensing fluorophores,
trinitroaromatics, and trinitroaromatic products. Relative energies were computed at
the B3LYP/6-311+G**//HF/6-311+G** level in vacuum at 298.15 K and 1 atm.
Arrows are shown to designate the HOMO.
It is clear that there is a dramatic difference between the frontier orbital energies of the
free trinitroaromatics, with the transient anionic products (TNT− and the OH
− adducts)
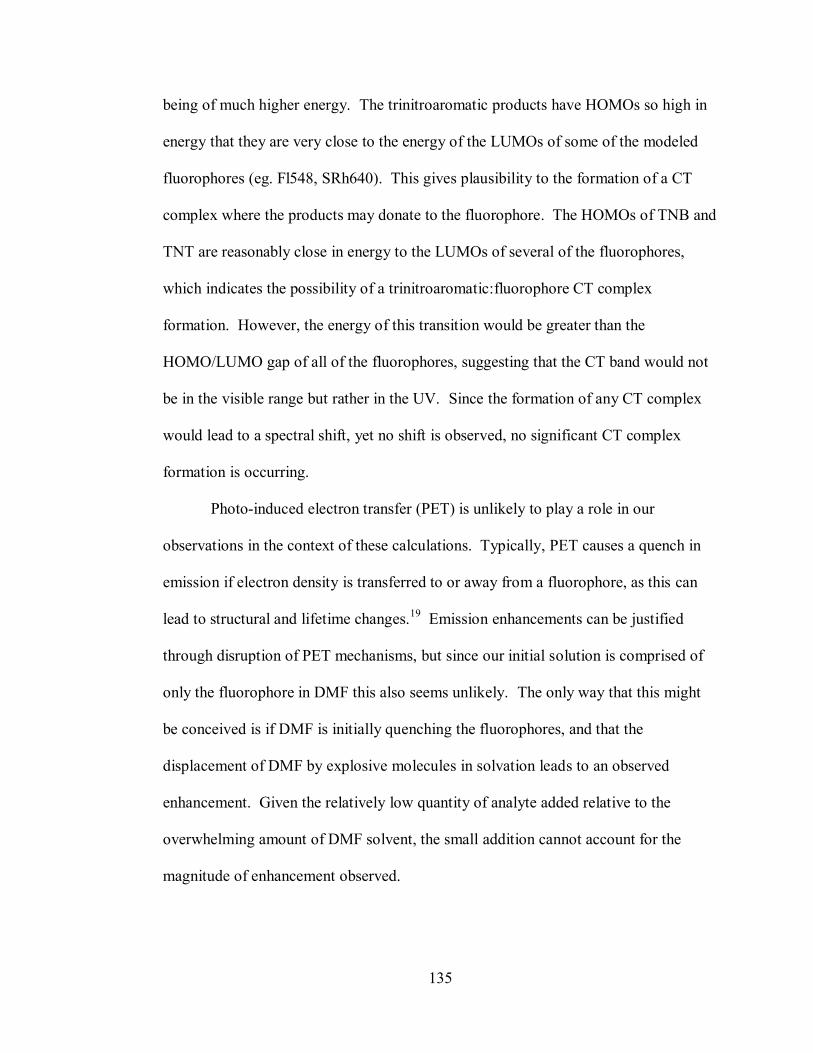
135
being of much higher energy. The trinitroaromatic products have HOMOs so high in
energy that they are very close to the energy of the LUMOs of some of the modeled
fluorophores (eg. Fl548, SRh640). This gives plausibility to the formation of a CT
complex where the products may donate to the fluorophore. The HOMOs of TNB and
TNT are reasonably close in energy to the LUMOs of several of the fluorophores,
which indicates the possibility of a trinitroaromatic:fluorophore CT complex
formation. However, the energy of this transition would be greater than the
HOMO/LUMO gap of all of the fluorophores, suggesting that the CT band would not
be in the visible range but rather in the UV. Since the formation of any CT complex
would lead to a spectral shift, yet no shift is observed, no significant CT complex
formation is occurring.
Photo-induced electron transfer (PET) is unlikely to play a role in our
observations in the context of these calculations. Typically, PET causes a quench in
emission if electron density is transferred to or away from a fluorophore, as this can
lead to structural and lifetime changes.19
Emission enhancements can be justified
through disruption of PET mechanisms, but since our initial solution is comprised of
only the fluorophore in DMF this also seems unlikely. The only way that this might
be conceived is if DMF is initially quenching the fluorophores, and that the
displacement of DMF by explosive molecules in solvation leads to an observed
enhancement. Given the relatively low quantity of analyte added relative to the
overwhelming amount of DMF solvent, the small addition cannot account for the
magnitude of enhancement observed.
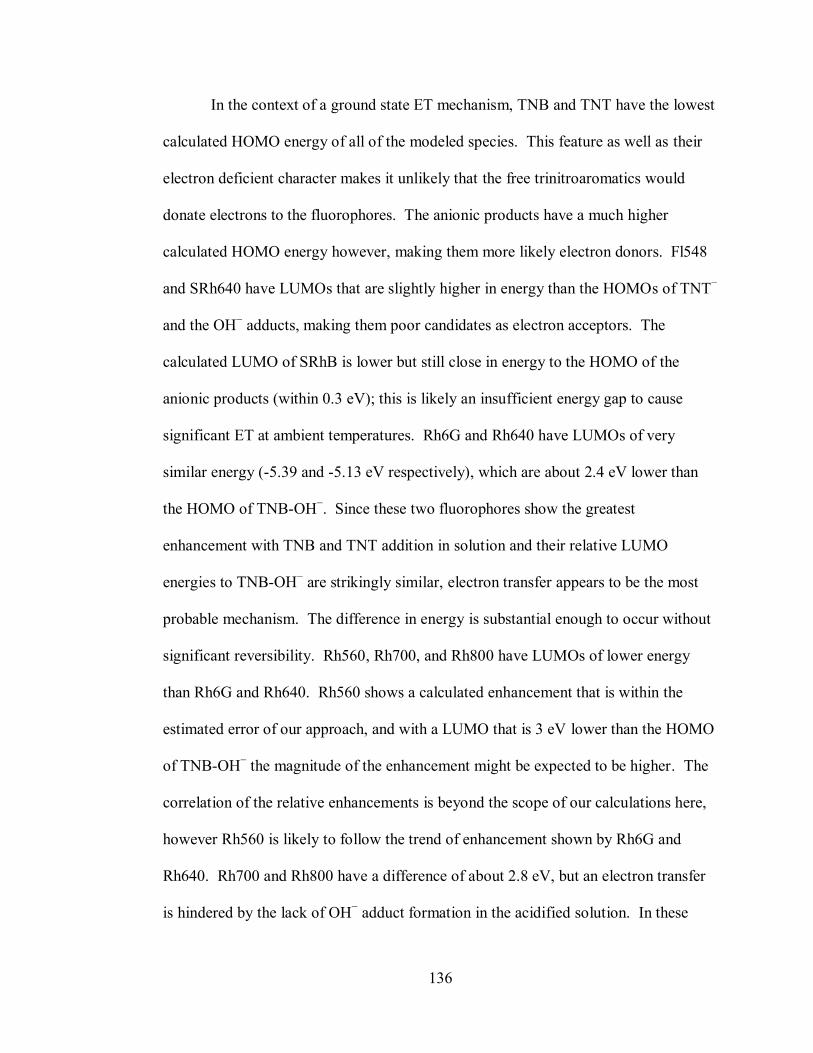
136
In the context of a ground state ET mechanism, TNB and TNT have the lowest
calculated HOMO energy of all of the modeled species. This feature as well as their
electron deficient character makes it unlikely that the free trinitroaromatics would
donate electrons to the fluorophores. The anionic products have a much higher
calculated HOMO energy however, making them more likely electron donors. Fl548
and SRh640 have LUMOs that are slightly higher in energy than the HOMOs of TNT−
and the OH− adducts, making them poor candidates as electron acceptors. The
calculated LUMO of SRhB is lower but still close in energy to the HOMO of the
anionic products (within 0.3 eV); this is likely an insufficient energy gap to cause
significant ET at ambient temperatures. Rh6G and Rh640 have LUMOs of very
similar energy (-5.39 and -5.13 eV respectively), which are about 2.4 eV lower than
the HOMO of TNB-OH−. Since these two fluorophores show the greatest
enhancement with TNB and TNT addition in solution and their relative LUMO
energies to TNB-OH− are strikingly similar, electron transfer appears to be the most
probable mechanism. The difference in energy is substantial enough to occur without
significant reversibility. Rh560, Rh700, and Rh800 have LUMOs of lower energy
than Rh6G and Rh640. Rh560 shows a calculated enhancement that is within the
estimated error of our approach, and with a LUMO that is 3 eV lower than the HOMO
of TNB-OH− the magnitude of the enhancement might be expected to be higher. The
correlation of the relative enhancements is beyond the scope of our calculations here,
however Rh560 is likely to follow the trend of enhancement shown by Rh6G and
Rh640. Rh700 and Rh800 have a difference of about 2.8 eV, but an electron transfer
is hindered by the lack of OH− adduct formation in the acidified solution. In these
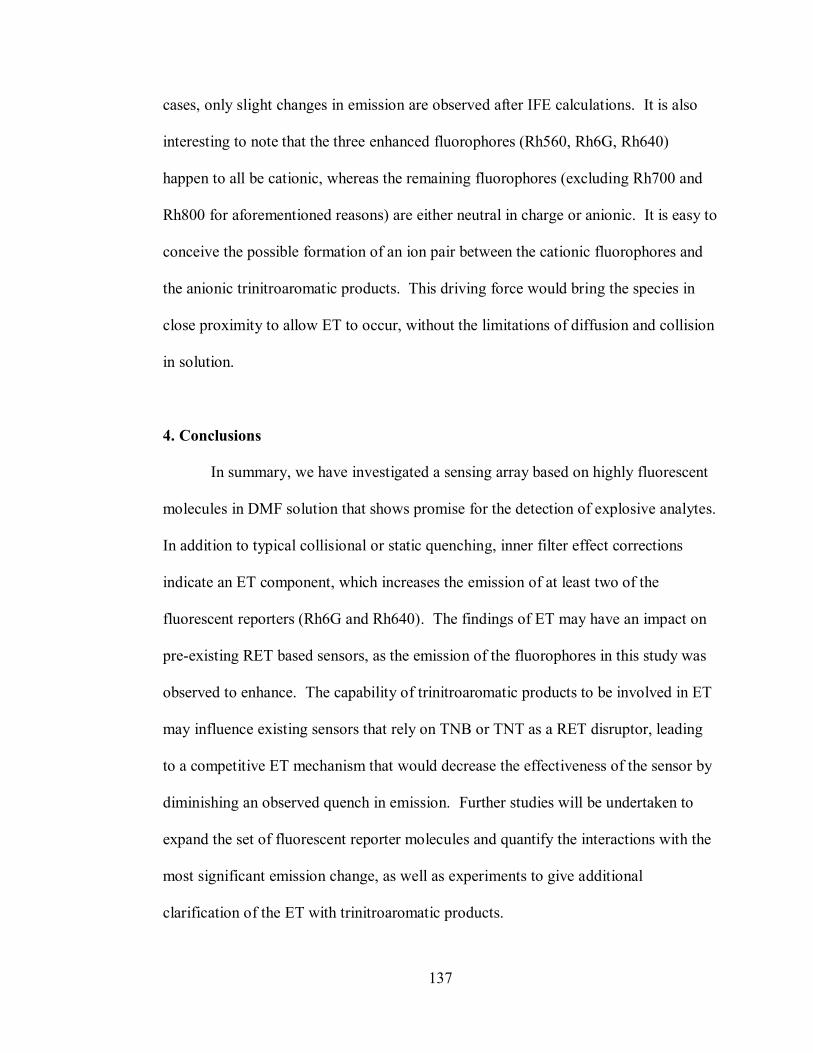
137
cases, only slight changes in emission are observed after IFE calculations. It is also
interesting to note that the three enhanced fluorophores (Rh560, Rh6G, Rh640)
happen to all be cationic, whereas the remaining fluorophores (excluding Rh700 and
Rh800 for aforementioned reasons) are either neutral in charge or anionic. It is easy to
conceive the possible formation of an ion pair between the cationic fluorophores and
the anionic trinitroaromatic products. This driving force would bring the species in
close proximity to allow ET to occur, without the limitations of diffusion and collision
in solution.
4. Conclusions
In summary, we have investigated a sensing array based on highly fluorescent
molecules in DMF solution that shows promise for the detection of explosive analytes.
In addition to typical collisional or static quenching, inner filter effect corrections
indicate an ET component, which increases the emission of at least two of the
fluorescent reporters (Rh6G and Rh640). The findings of ET may have an impact on
pre-existing RET based sensors, as the emission of the fluorophores in this study was
observed to enhance. The capability of trinitroaromatic products to be involved in ET
may influence existing sensors that rely on TNB or TNT as a RET disruptor, leading
to a competitive ET mechanism that would decrease the effectiveness of the sensor by
diminishing an observed quench in emission. Further studies will be undertaken to
expand the set of fluorescent reporter molecules and quantify the interactions with the
most significant emission change, as well as experiments to give additional
clarification of the ET with trinitroaromatic products.
138
References
1 Y. Jiang, H. Zhao, N. Zhu, Y. Lin, P. Yu, L. Mao, Angew. Chem. Int. Ed.,
2008, 47, 8601.
2 A. Üzer, E. Erçağ, R. Apak., For. Sci. Int., 2008, 239.
3 Y. Xia, L. Song, C. Zhu, Anal. Chem., 2011, 83, 1401.
4 Y. Chen, Z. Chen, Y. He, H. Lin, P. Sheng, C. Liu, S. Luo, Q. Cai,
Nanotechnology, 2010, 21, 125502.
5 R. Tu, B. Liu, Z. Wang, D. Gao, F. Wang, Q. Fang, Z. Zhang, Anal. Chem.,
2008, 80, 3458.
6 D. Gao, Z. Wang, B. Liu, L. Ni, M. Wu, Z. Zhang, Anal. Chem., 2008, 80,
8545.
7 Q. Fang, J. Geng, B. Liu, D. Gao, F. Li, Z. Wang, G. Guan, Z. Zhang, Chem.
Eur. J., 2009, 15, 11507.
8 K. Zhang, H. Zhou, Q. Mei, S. Wang, G. Guan, R. Liu, J. Zhang, Z. Zhang, J.
Am. Chem. Soc., 2011, 133, 8424.
9 M.S. Meaney, V.L. McGuffin, Anal. Chim. Acta, 2008, 610, 57.
10 Y. Takada, Y. Suzuki, H. Nagano, M. Sugiyama, E. Nakajima, M. Sugaya, Y.
Hashimoto, M. Sakairi, IEEE Sensors, 2012, 12, 1673.
11 J. Kozole, J. Tomlinson-Phillips, J.R. Stairs, J.D. Harper, S.R. Lukow, R.T.
Lareau, H. Boudries, H. Lai, C.S. Brauer, Talanta, 2012, 99, 799.
12 P. Sulzer, F. Petersson, . Agarwal, .H. ecker, S. rschik, T.D. M rk, D.
Perry, P. Watts, C.A. Mayhew, Anal. Chem., 2012, 84, 4161.
13 P.K. Sekhara, E.L. Broshaa, R. Mukundana, K.L. Linkerb, C. Brusseaub, F.H.
Garzona, J. Haz. Mat., 2011, 190, 125.
14 M.Y. Ho, N. D’Souza, P. Migliorato, Anal. Chem., 2012, 84, 4245.
15 R.L. Marple, W.R. LaCourse, Anal. Chem., 2005, 77, 6709.
16 X. Liua, L. Zhaob, H. Shenb, H. Xub, L. Lua, Talanta, 2011, 83, 1023.
17 T. Demeritte, R. Kanchanapally, Z. Fan, A. K. Singh, D. Senapati, M. Dubey,
E. Zakarb, P. C. Ray, Analyst, 2012, 137, 5041.
139
18 P. R. Sajanlal and T. Pradeep, Nanoscale, 2012, 4, 3427.
19 J.R. Lakowicz, Principles of Fluorescence Spectroscopy, third ed., Springer
Science, New York, 2006.
20 Y. Wang, Z. Li, H. Li, M. Vukib, D. Xua, H.Y. Chen, Biosensors and
Bioelectronics, 2012, 32, 76.
21 H. Li, C.Y. Chen, X. Wei, W. Qiang, Z. Li, Q. Cheng, D. Xu, Anal. Chem.,
2012, 84, 8656.
22 W. Fan, M. Young, J. Canino, J. Smith, J. Oxley, J.R. Almirall, Anal. Bioanal.
Chem., 2012, 403, 401.
23 Military Explosives, Dept. of the Army Technical Manual, updated 1990.
24 Spartan '10; Wavefunction, Inc.: Irvine, CA, 2010. Version 1.1.0.
25 C. Fyfe, C. Malkiewich, S. Damji, A. Norris, J. Am. Chem. Soc., 1976, 98,
6983.
26 C. Bernasconi, J. Org. Chem., 1971, 36, 1671.
27 K. Shipp, L. Kaplan, J. Org. Chem., 1966, 31, 857.
28 E. Buncel, A. Norris, K. Russell, R. Tucker, J. Am. Chem. Soc., 1972, 94,
1646.
29 C.A. Latendresse, S.C. Fernandes, S. You, H.Q. Zhang, W.B. Euler, J. Phys.
Chm. A., accepted. DOI: 10.1021/jp309709h
30 H. Lin, K.S. Suslick, J. Am. Chem. Soc., 2010, 132, 15519.
31 J.C. Oxley, J.L. Smith, H. Chen, Prop., Explos., Pyro., 2002, 27, 209.
32 E.J. Olson, T.T. Xiong, C.J. Cramer, P. Bühlmann, J. Am. Chem. Soc., 2011,
133, 12858.
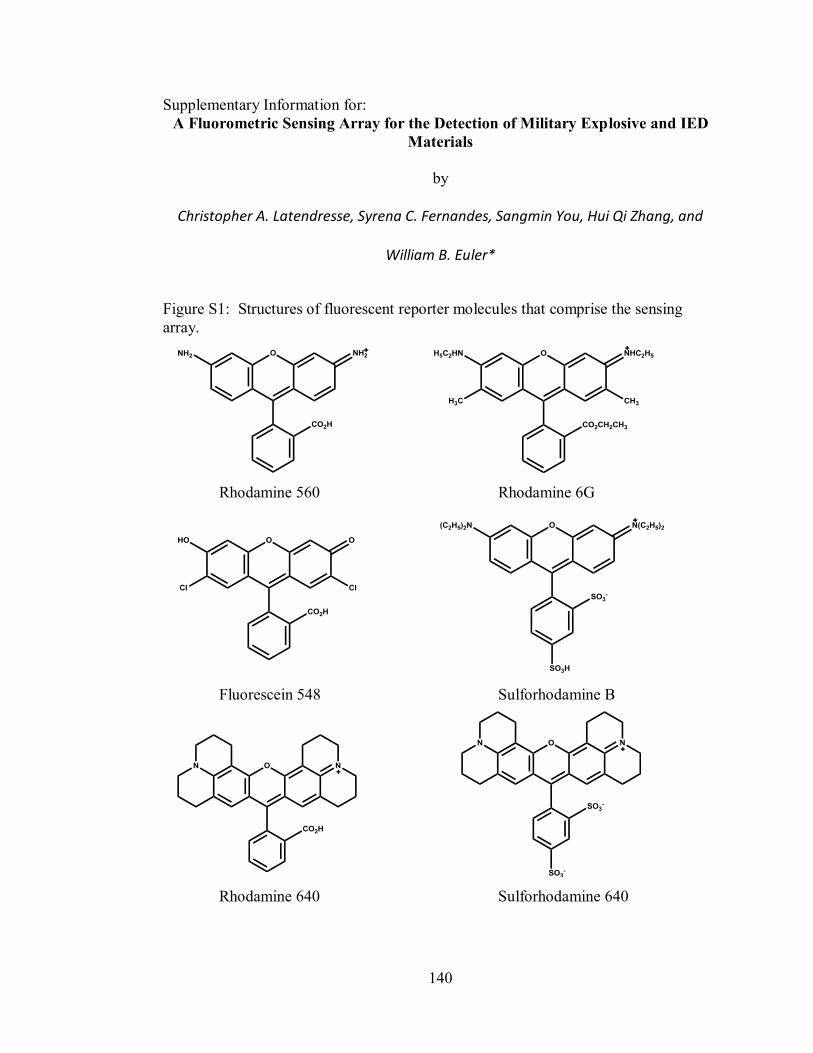
140
Supplementary Information for:
A Fluorometric Sensing Array for the Detection of Military Explosive and IED
Materials
by
Christopher A. Latendresse, Syrena C. Fernandes, Sangmin You, Hui Qi Zhang, and
William B. Euler*
Figure S1: Structures of fluorescent reporter molecules that comprise the sensing
array.
Rhodamine 560 Rhodamine 6G
Fluorescein 548 Sulforhodamine B
Rhodamine 640 Sulforhodamine 640

141
Rhodamine 700 Rhodamine 800
Figure S2: Structures of the explosive analytes exposed to the sensing array.
TNB TNT RDX
HMX PETN TATP
2,3-DNT 2,4-DNT 2,6-DNT
3,4-DNT 2-NT 4-NT
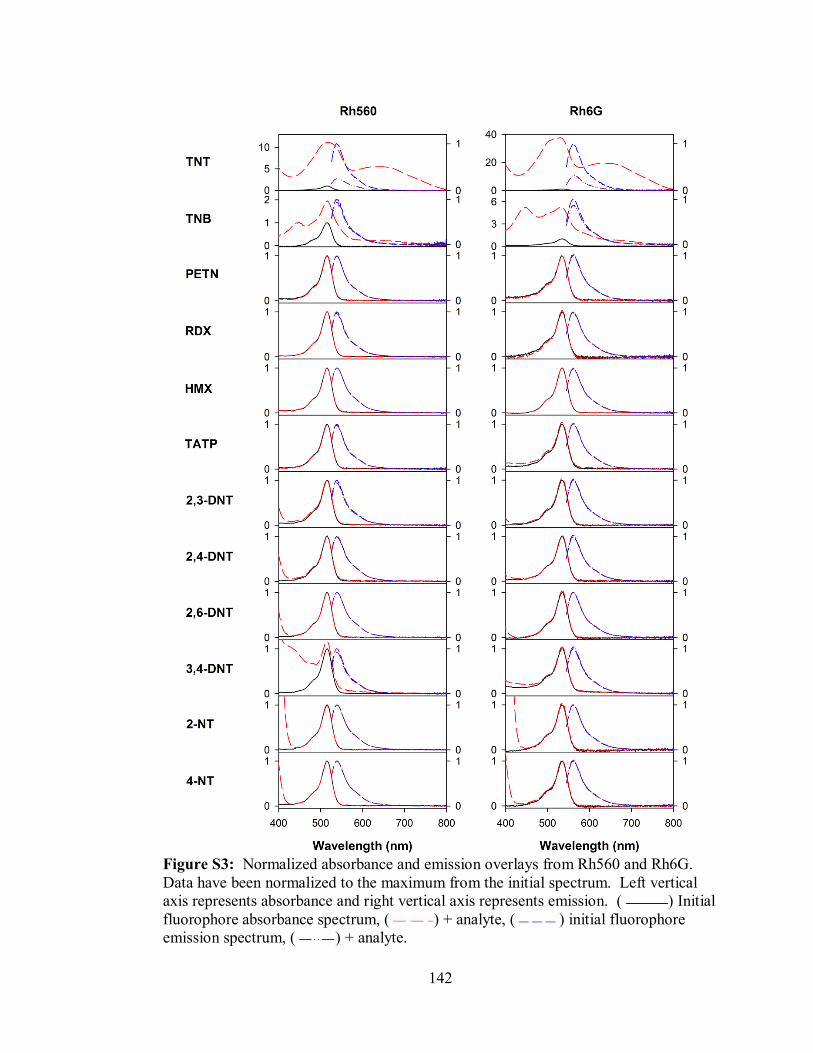
142
Figure S3: Normalized absorbance and emission overlays from Rh560 and Rh6G.
Data have been normalized to the maximum from the initial spectrum. Left vertical
axis represents absorbance and right vertical axis represents emission. ( ) Initial
fluorophore absorbance spectrum, ( ) + analyte, ( ) initial fluorophore
emission spectrum, ( ) + analyte.
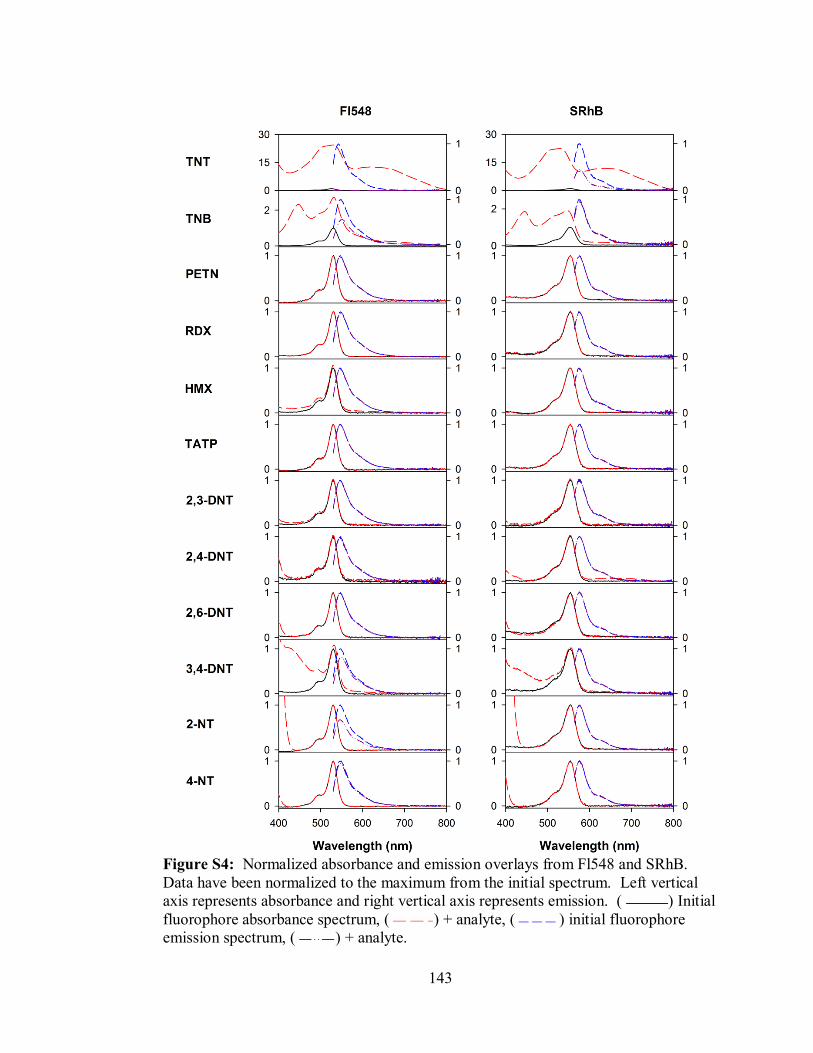
143
Figure S4: Normalized absorbance and emission overlays from Fl548 and SRhB.
Data have been normalized to the maximum from the initial spectrum. Left vertical
axis represents absorbance and right vertical axis represents emission. ( ) Initial
fluorophore absorbance spectrum, ( ) + analyte, ( ) initial fluorophore
emission spectrum, ( ) + analyte.
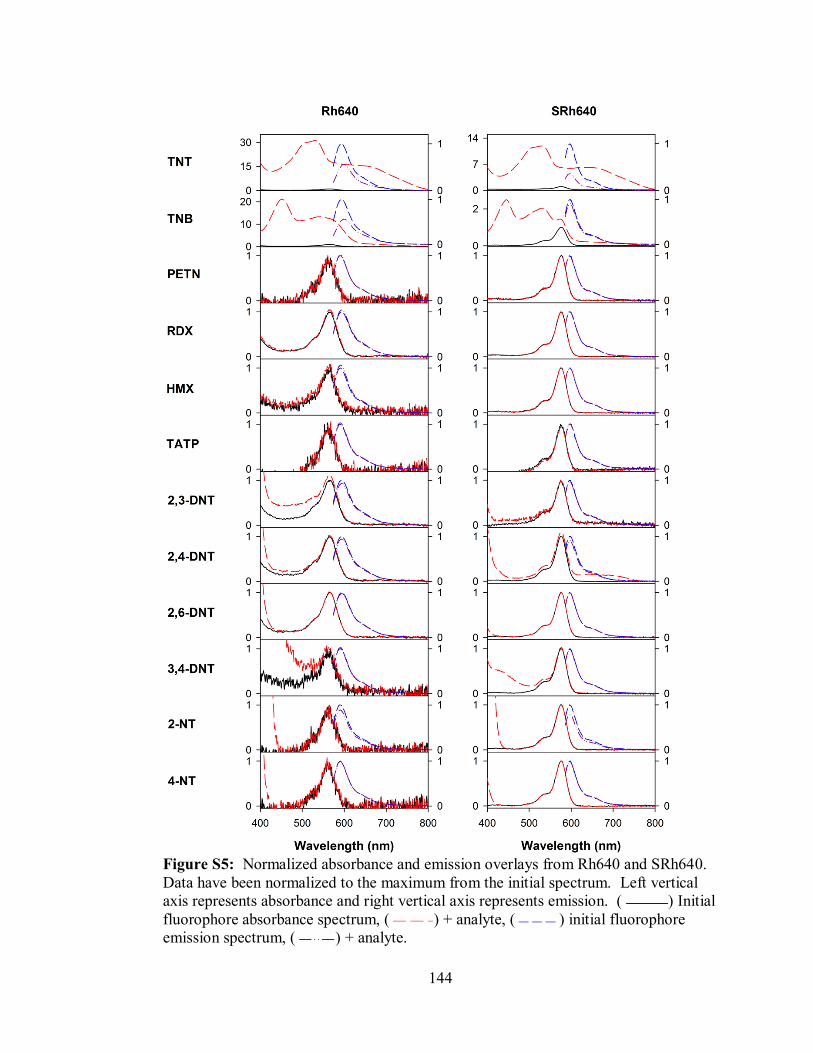
144
Figure S5: Normalized absorbance and emission overlays from Rh640 and SRh640.
Data have been normalized to the maximum from the initial spectrum. Left vertical
axis represents absorbance and right vertical axis represents emission. ( ) Initial
fluorophore absorbance spectrum, ( ) + analyte, ( ) initial fluorophore
emission spectrum, ( ) + analyte.
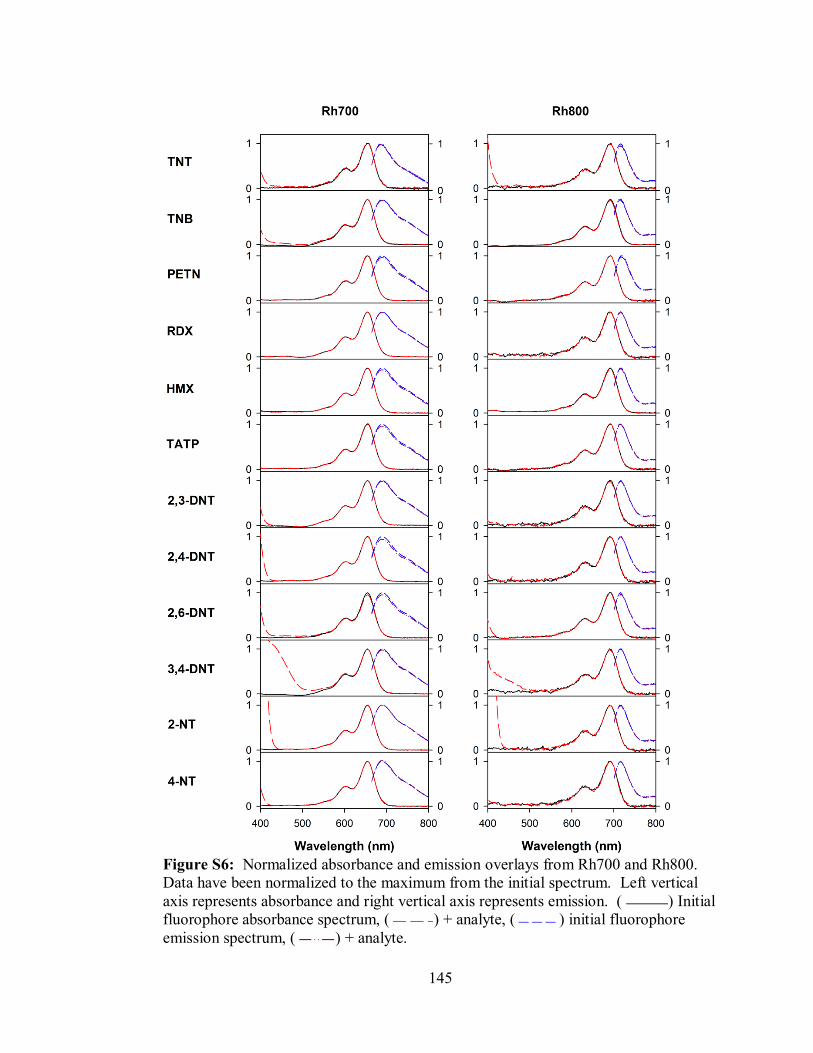
145
Figure S6: Normalized absorbance and emission overlays from Rh700 and Rh800.
Data have been normalized to the maximum from the initial spectrum. Left vertical
axis represents absorbance and right vertical axis represents emission. ( ) Initial
fluorophore absorbance spectrum, ( ) + analyte, ( ) initial fluorophore
emission spectrum, ( ) + analyte.