amcp 706-180, principles of explosive behavior - bulletpicker
TRANSCRIPT
A M O P A M P H L E T D 0 A M C ? 706-180P A U L M . S C H U M A C H f R
062-40-5056
HANDBOOK
PRINCIPLES OF -
EXPLOSIVE BEHAVIOR
■■t
H E A D Q U A R T E R S , U S A R M Y M A T E R I E L C O M M A N D A P R I L 1972
AMC PAMPHLET No. 706-180.
PAUL M.SCHUMACHElHEADQUARTERS...
U N lV l) STATES ARMY MATERIEL COMMAND WASHINGTON, DC 20315
062-40-5Q54
10 A p r i l 1972
ENGINEERING DESIGN HANDBOOK
PRINCIPLES OF EXPLOSIVE BEHAVIOR
TABLE OF CONTENTSP fagmpk Page
LIST bF ILLUSTRATIONS ........................ ........... viiiL lS f OF TABLES............................................. xvPREFACE ........................................, ............... xvii
CHAPTER 1. INTRODUCTION
1-1 Introductorj.nemarks ......................................................... 1-T
1-2 Description o f Explosive Processes.......................... 1-21-3 Types o f Explosives..................... * ...................................... 1-2
1- 4 Some D efin itions............................................. ........; .......... 1-4
CHAPTER 2. THEORETICAL BACKGROUND
2- 1 Introduction......... ....................... ........................................ 2-12-2 Description o f the Com position................................ .... . . 2-1
2-3 The Lays o f Thermodynamics............................................. 2-42-4 General Thermodynamic Identities ..................................... 2-10
2-5 Approximations fo r the ThermodynamicProperties on an Isentrope ............... ......................... 2-16
2-6 Hydrodynamics o f Reacting Continua................................ 2-162-7 Uniformly Isentropic Flow in One D im ension .................... 2-21
2-8 Conservation Conditions at a Discontinuity.
The Hugoniot E qu ation .................................................. 2-27References............................................................................ 2-31
AMCR7G6-10O
TABLE OF CONTENTS (Conttd)
Paragraph Page
CHAPTER 3. ENERGY OF EXPLOSIVES
3-1 Introduction............ ................................... ........................... 3-i3-2 Heat o f Detonation .............................................................. 3-1
3-3 Thermochemistry o f High Explosives.................................. 3-1
3-4 Computation o f Q .............. . ............................................... 3-33-5 Fragment V elocities........................... . . . . .................. 3-4
3-6, Air-blast.........................., ................................... ................ 3-53:T Underwater Performance ................................ ................ .. 3-53- 8 C-J Parameters...................... ................................................ 3-63;9 Maximum W o rk ........................................ .............. .. 3-6
References......................... . ................................................ 3-8
CHAPTER 4. THERM AL DECOMPOSITION QF EXPLOSIVES
4- 1 Introduction..................... .......................... ...................... 4-1
4-‘2 Decomposition Energies............................... . ..................... 4-14-3 Decomposition Mechanisms................... . ........................... 4-3
4-3.1 CovalentXiquids and Solids.............. ................ .............. 4-44-3.2 Ionic Solids (A zides). ........................................................ 4464-3.3 Ammonium S a lts ........................ ..................................... 4-16
4- 4 Radiation Damage in Explosive S o lid s ................................. 4-18References ........................... ............................................ 4-20
CHAPTER 5. MEASUREMENT OF DETONATION PROPERTIES
5- 1 Introduction.................................................... .............. ........ 5-1
5-2 Detonation Veloci t y . . .......................................................... 5-i5-2.1 High-speed Photography............................... ................... 5-1
5-2.2 Photo-optical S ystem s.............................................. .. .. 5-45-2.3 Electrical Systems........................................... .................. 5-4
5-2.4 D’AutricheMethod..................................... i . « , .......... . ; 5-55-3 Detonation Pressure............................................................. 5-5
5-3.1 Pressure in Adjacent P la tes.............................. ................ 5-8545.1.1 Plane Wave Explosive Systems ................................... 5-95-3.1.2 Pressure Transducers........................ ............................. 5-10
54.1.3 Particle Vslocity Measurement ....................... 0155-3.2 X-ray Flash Photography ................................................. 5-185-4 Blast Wave Pressure.............................................................. 5-195-5 Detonation Temperature ............................... ....................... 5-215-6 Electrical Conductivity in the Detonation Z o n e .................. 5-22
A'MG PAMPHLET No. 706-180
PAUL M. SCHUMACHERHEADQUARTERS..
UNITED STATES ARMY MATERIEL COMMAND WASHINGTON, DC- 20315
06240-5054
10 A p r i l 1972
ENGINEERING DESIGN HANDBOOK
PRINCIPLES OF EXPLOSIVE BEHAVIOR
TABLE OF CONTENTSParagraph Page
LIST OF ILLUSTRATIONS .............. .................... viiiLIST OF T A B L E S ...... ................................ . xvP R E F A C E ............., ....... _____________ • x«ii
CHAPTER i. INTRODUCTION
1-1 Introductory Remarks.................................................... .. 1-11-2 Description o f Explosive Processes .................. .................... 1-2
1-3 Types of Explosives...................................... . . . . . . . . . . . . 1-21- 4 Some D efin itions................................... ............................... 1-4
CHAPTER 2. THEORETICAL BACKGROUND
2- 1 Introduction........................................................................... 2-1
2-2 Description o f tU> Composition ........... .............. 2-1
2-3 The Laiys o f Thermodynamics............................................. 2-42-4 General Thermodynamic Identities ...................................... 2-10
2-5 Approximations for the ThermodynamicProperties on an Iseritrope ........................................... 2-16
2-6 Hydrodynamics o f Reactiiig Continua ................................ 2-162-7 Uniformly Isentropic Flow in One D im ension .................. 2-212-8 Conservation Conditions at a Discontinuity.
The Hugoniot E quation ............. ...................................... 2-27References........................................ 2-31
i
AMCP 706-180
TABLE OF CONTENTS (Cont'd)
Paragraph Page
CHAPTER 3. ENERGY OF EXPLOSIVES *
3-1. In t ro d u c t io n .. .,........................ ............, ........................... 3-13-2 Heat o f Detonation ........................................................... 3-1
3-3 Thermochemistry o f High Explosives.......... ..................... 3-13-4 Computation o f Q ................................................................. 3-33-5 Fragment V elocities.............................. ...................... 3-4
3-6 Air-blast.............................................................. . . . .■ . . . 3-53-7 Underwater Performance........................................................ 3-5
3-8 C4 Parameters .................................................. . . . 8 5.3- 9 Maximum Work .................................... .............. .. — , f . 3-6
References .......................................................... .. .......,... 3-8;
CHAPTER 4. THERM AL DECOMPOSITION OF EXPLOSIVES
4- 1 Introduction........... . ............................ ............» . . . . , . . . . , , 4-14-2 Decomposition-Energies ................. . . . . . . . . . . . . . . . , . , . , 4-14-3 Decomposition Mechanisms.................. . 4-34-3.i Covalent Liquids and S o lid s .......... ( ; ................... 4-44-3.2 Ionic So!ids.(Azides)..................... , .............. ................ .. AS4-3.3 .Ammonium:Salts ...................................................... .. 4-164- 4 Radiation Damage in Explosive S o lid s ................................ 4-18
References ........................................... .................. . . . . . . 4-20
CHAPTER S. MEASUREMENT OF DETONATION PROPERTIES
5- 1 Introduction........................................................................... 5-15-2 Detonation V e loc ity ...................... ................. ....................... 5-1
5-2.1 High-speed Photography................................................. . 5-1
5-2.2 Photo-optical Systems ............................................. . 5-45-2.3 Electrical Systems, ................. ........................................ 5-4
5-2.4 D ’Autriche Method......... .................................................. 5-55-3 Detonation Pressure ..................................... ............ .. 5-5
5-3.1 Pressure in Adjacent P lates............................ .................. 5-85-3,1.1 Plane Wave Explosive System s.................................... 5-95-3.1.2 Pressure Transducers.................................................... 5-105-3.1.3 Particle Velocity Measurement.................................... M 5
5-3.2 X-ray Elash Photography............................ .................... 5-i85-4 Blast Wave Pressure .............................................................. 5-19
5-5 Detonation Temperature ...................................................... 5-21
5-6 Electrical Conductivity in *he Detonation Z o n e .................... 5 .2 2
ii
TABLE OF CONTENTS (Cont'd)
AMCP 706-180
Paragraph Page
5- 7 Empirical Tests........................ .............................................. ’ 5-24References.................................... ............ ; .................... ... 5-27
CHAPTER 6. ELEM ENTARY THEORY OF THE PLANE DETONATION
WAVE
6- 1 Introduction . . . . . . . . . . . . . .............. .............................. 6-16-2 TheRankine-Hugoniot-Equation . . . . . . , 6J_6-3 Properties o f the Hugoniot Curve . ................ . ..................... . 6-86-4 Existence and Uniqueness o f Flows Involving
Reaction Waves........................ ....... ............... . ......... ..... '6-14
6-5 The Chapman-Jouguet Hypothesis........................................ 6-196- 6 Theory o f the Detonation Velocity and o f the
Thermodynamic State o f the Explosion Gas.................. . 6-24
References ; ............................... ; , ................ ................ 6;26
CHAPTER 7. APPLICATION OF THEORY TO CONDENSED EXPLOSIVES
7- 1 Introduction____ ; .......... ....................... ............. ........1-17-2 The Abel Equation o f State ......................... ........................ 7‘27-3 Determination of the Detonation State; from Velocity Data 7-57-4 Modifications of the Abel Equation-............ .................. , 7-87-5 Application o f the Chapman-Jouguet Condition to
Mixtures With VaryingiComposition ............. .......... ........ 7-i37-6 Explosives Whose Products Contain a Solid Phase ........... 7-157-7 The Virial Equation olS tate ................... 7-16
7- 8 TheHalford-Kistiakowsky-Wiison Equation o f S ta te ... 7-18References 7-21
CHAPTER 8. STRUCTURE OF THE PLANE DETONATiON W AVE; FINITE REACTION ZONE
8- 1 In tro d u c t io n .,........... .................................................. .. . 8-1
8-2 Conservation Conditions for Steady Reaction Waves inOne Dimension............... .................... : , ......................... 8-1
8-3 The Steady Deflagration Wave ................. ........................... 8-38-4 The Steady Detonation W a ve .......................................... 8-4.
8-5 Flow Behind a Chapman-Jouguet, Wave .............................. 8-68-6 The Detonation-Wave With Equilibrium Product Composition
Composition...................................................................... 8-9
8-7 Fine Structure of Detonation in Gases and L iq u id s ..... 8-14References............................................ * ............................. 8-17
iii
AMCP 706-180
TABLE OF CONTENTS (Cont'd)
Paragraph Page
CHAPTER 9. DETONATION-WAVES OF CYLIND R ICAL AND SPHERICAL SYMMETRY
9-1 Introduction............... .............u........... ................. .......... .. . 9-1
9- 2 The Effect o f Charge Diameter on the Detonation Velocity 9-19-3 Diverging Flow Within a Cylindrical Symmetric Steady
Reaction Zone ...................... . . _____ 9^49-4 Theories o f the Charge Diameter E f fe c t ............................... 9-99- 5 The Release Wave Model ............................. . . . .............. .. . 9-12
9 6 The Spherical Detonation Wave Initiated at a P o in t ...... 9-13References ............... .. . ............. 9-18
CHAPTER 10. THERM AL EXPLOSION
191 Introduction........................................ .................... . 191
192 Description o f the Thermal Explosion Process................ 10-1193 Mathematical Treatments o f Thermal Explosion . . . . . . . . 19 7
193.1 The Heat Conduction Equation ........ .............. 197193.2 Steady-state Condition dT/dt« 0, and the Concept o f
Critical’Temperatuie and Size . . . . . . . . . . . . . . . . . . 10-8
193.3 Adiabatic Heating (V s T “ 0) and the Concept o f
Explosion Time ............................ ...... . . . . . .... . . 199
193.4 Approximate Solutions fo r te With NOnadiabaticKeating...................................................... .............. 1910,
10- 3.5 Numerical hflethods .................... ...... ....................... 10-17.
194 Thermal Explosion at Hot Spots ................... ..................... 1914
10- 5 Thermal Explosion and .Safety in Handling High Explosives 1918References............................................................. .............. 10-21
CHAPTER 11. IN IT IAT IO N OF DETONATION BY SHOCK WAVES
11- 1 Underdriven and Overdriven D etona tion ....................... 11-1
11-2 The Gap T e s t ........ ................................................................ 11-1
11-3 Shock-pressure Measurements in the Gap T e s t ............... 11-211-4 Effects o f Shock Waves in Condensed Explosives.......... 11-3
11-5 Shock Initiation in Homogeneousand Nonhomogeneous Explosives....................... ............ 11-5
11-6 Thermal Explosion Theory Applied to Shock Initiation . . . 11-1011-6.1 Homogeneous Explos ives................ ............................. 11-1011-6.2 Behavior o f Hot Spots .................................................. 11-13
11-7 Hot Spot Creation by Shock Waves .............................. 11-1711-8 Sensitivity to Shock In itia tion ....................................... 11-19
Iv
AM CP7M -180
T A B L E O F CONTENTS (Cant'd)
Paragraph Page
11-9 Theory o f Shock Wave Initiation in Solid Explosives... 11-2311- 10 Low-velocity Detonation.(LVD) _______________ . , ___ 11-26
References ............................................. l i-3 1
CHAPTER 12;.iNITiATION AND GROWTH OF DETONATION FROM IMPACT, FRICTION, AND THERM AL SOURCES
•124 Sensitivity to Impact and Friction ;.............. . . . . . . . . . . . . . . 12-112- 2 Design and Analysis o f Sensitivity Experiments ................. 12-412-3 Theory o f IinpactlSensitivity 12-612- 4 Transitiomof'Deflagratirai tn'Detonation . . . . . , ......... 12-13
References............. ................................................. 12-21
CHAPTER 13. SHOCKW AVES FROM EXPLOSIVE CHARGES
13- 1 In t ro d u c t io n .. . . ; ........ ...............................................13-113-2 Expansion o f the Explosion Products................ ............. .... 13-3
13-3 Energy Transport by Shock Wave Propagation .................. . 13-5
13-4 Blast Waves in A ir from Explosive Charges . . . . . _____...... 13-713-5 Results o f Numerical Integration o f the Hydndy.idmic
Equations fo r Blast Waves in A i r . . . . ; ................. , ....... 13-1013-6 Underwater arid Underground Explos ions.......................... 13-1913-7 The Initial Shock Wave Pressures ........................... 13-25
13-8 An Approximate Theory o f Shock Wave Propagation . . . . 13-2613-9 Shock Wave Scaling 13-33
13- 10 Explosively-produced Shock Waves in Solids . . . . ; . ... 13-38References................................... 13-40
CHAPTER 14. COMPUTER PROGRAMS FOR EXPLOSIVE CALCULATIONS
14- 1 Introduction.................... ................ .......; ........................... 14-114-2 Methods o f Hydrodynamic Calculations.............................. 14-1
14-2.1 Introduction ............ .................................................... 14-114-2.2 Method o f Characteristics............................................ 14-114-2.3 Method o f Artificial Viscosity...................................... 14-6
14-2.4 Particle-in-cell Method ............................................ 14-1114-3 Equation-of-state Computations........................................... 14-1114-4 Reaction Mechanisms fo r Computations ............................. 14-1S
14-5 Summary o f Calculations o f Wave Propagation WithReactive Mechanisms............................... 14-13
References............................................................................. 14-15
v
AMCP 706-180
TABLE. OF CONTENTS (Cont'd)
Paragraph Page
APPENDIX A . EVALUATION OF THE THERM ODYNAMIC PROPERTIES
A - l Introduction.................................. . .................................. . A - lA-2 ^erm odynam ic Properties o f Pure Condensed Phases_____ A - lA-3 Thermodynamic Properties o f a Gas'M ixture.........i .......... A-3A-4 Thermodynamic Properties o f Heterogeneous Systems . . . A-6
References . ....................... ........................................ , ....... A -l
APPENDIX B. GENERAL PROCEDURE FOR THE CALCULATION OF EQUILIBRIUM COMPOSITION
B-l Introduction......................................................................... B -l
B-2' loca lization o f the Equilibrium Conditions .................. .... B -l
B-3 Relations fo r an Equation.of State Explicit inPressure and Temperature............... .. ........... .......... ........ B-2
B-4 Relations for ah Equation o f State Explicit in
Volume and Temperature ................ ............................. B 4B-5 The Initial Approxim ation........................................... B-5B-6 Calculation o f the Equilibrium Partial D erivatives_______ _ B-6
References .. .; . . . . , .......................................................... B-7
APPENDIX C. METHOD FOR THE DESK CALCULATION OF EQUILIBRIUM COMPOSITION OF SYSTEMS CONTAINING
COMPOUNDS OF CARBON. HYDROGEN, O XY0EN , AND NITROGEN
C-l Introduction..................................................................... C -lC-2 Systems With Solid Carbon ............................................. C-2C-3 Rich System Without Solid Carbon, q0 < 2 qc + qw /2 . . . C-2
C-4 Lean Systems Without Solid Carbon q0 > 2 qc + /2 , . . C-3
APPENDIX D. IMPERFECT GASXONTRIBUTIONS TO THE THERM ODYNAMIC PROPERTIES FOR SEVERAL EQUATIONS OF STATE
D-l Introduction..................................................................... D -lD-2 Tl>e Abel Equation o f S ta te ......................................... D -l
D-3 The Abel Equation o f State as Modified by J o n e s ....... D -lD-4 The Abel Equation o f State as Modified by Cook ................ D-2
D-5 The Virial Equation o f State o f Hirschfelder and Roseveare D-2D-6 The Halford-Kistiakowsky-Wilson Equation o f S ta te .. D-3
vi
B V
ii> •
'■ ?' i
iiiIi
• i
\
s
t
v
AMCF 706-180
LIST OF ILLUSTRATIONS
Fig. No. Title Page
1- 1 Model o f Explosive Charge .............. .....................1-5
2- 1 The Coefficients o f a,* ■mi.§u for.theExplosipn.Eroduetso f T N T i ............. ................... , ........................... ................ 2-5
2-2 Region o f Influence o f a Point P ........... ...................... 2-23
&3 Domain o f Dependence o f A r c AB o f a SpacelikeTtiitialValue:CUTVe.............................................. ............ ................ 2-24
2-4 Domain o f Dependence o f Arc A B o f a Timelike Initial
Value Curve and Arc BC o f a Timelike or Characteristic
Initial Value Curve ............................ ...................... ............ 2-252-5 Straight Characteristics C+, Piston Path, and. Particle Path
in a Simple Rarefaction W ave.............................................. 2-262-6 In tersec t in g S tra igh t Characteristics C+ During
Compression Wave .............. ; .......... ................................... 2-272-7 One-dimensional Shock W ave..........., ................................. 2-282-8 Flow in a Steady One-dimensional Shock Supported by a
Piston', S low ing a Particle Path and C+ CharacteristicsThrough Points on the Particle P a th .................................... 2-30
4-1 Thermal Decomposition Sigmoid C u rve............................ 4-24-2 Plot o f Logarithm o f .Rate constant k vs. Reciprocal o f
Absolute Temperature to Detennihe Activation Energyfrom Slope o f the L in e .......................... ................ ............ 4-3
4-3 Representation o f the Orbital System o f the Acide Ion — 4-74-4 Schematic Showing Energy E to Excite an Electron from
Valence. Band to Conduction Band in. Silver Azide . . . . . . . 4-84-5 Showing Technique for Studying Silver Nuclei from
Decomposed Silver Azide ................................. 4-10
4-G Schematic for Determining Optical Absorption Spectra .... 4-114-7 Absorption Coefficients <r as Function o f Wavelength X. At
High Absorption, Photon Energy hv Assumed to
Correspond.to Band Gap Energy E .................................... 4-124-8 Showing Exciton Leve ls ................. 4-124-9 Energy Gaps E- and £ 2 in Silver A z id e ......................... 4-134-10 Schematic for Studying Photoconductivity o f Crystal . . . . 4-15
4- 11 Orbital System of Covalent Azide, H N , ....................... 4-175- 1 Elements o f the Rotating Drum Camera System ............... 5-2
5-2 Optical System in AEC-Bowen Framing Camera ............... 5-35-3 Arrangement o f a Kerr-effect Shutter........................ . . . . 5-45-4 Block Diagram o f Equipment fo r Measuring Detonation
Velocity With. Ionization P rob es ................. ...................... 5-65-5 Zig-zag Oscilloscope Trace Obtained With Raster Generator 5-7
5-6 D ’Autriche Test .System........................................................ 5-8
AMCP 706-iSO
LIST OF ILLUSTRATIONS (Cont'd)
Fig No. Title Page
5-7 Plane-wave Generator (A ), and Shock Wave Before (B ) andA fter (C) It Impingesonthe MetaLPlate . ............. . . . 5-11
5-8 Compressibility o f Various Materials Under Shock WaveConditions..................................................................... ..... 5-12
5-9 Configuration for the Measurement of Interface StressUsing a Quartz Pressure Transducer ....................„ .............. 5-13
5-10 Configuration of Manganin-epoxy Pressure Transducer . . . 5-14
5-11 Form o f Polarization Signal^from Polarizatioa Gage . . . . . . 5-15
51 2 “ Wedge” Technique for Measuring Free-surface Velocity
and Shock V e lo c ity .............................. . . . . . ; ......... .. 5-165-13 Laver Interferometer System ...................................... 5-175-14 The Stretched-diaphragm BRL Piezoelectric Gage fo r
Measuring Face-on Air-blast Pressures ............... ................ 5-20
5- 15 Electrical Conductivity as a Function o f Time in theDetonation Reaction Zone o f Various Explosives . . . . . . . 5-24
6- 1 One-dimensional Reaction Wave........................................... C ?6-2 Hugoniot Curve for Detonations and Deflagratic-i ............ 6-4
6-3 Nomenclature on the Hugoniot Curve for Detonations andDeflagrations ....................................................... ................ 6-5
6-4 Hugoniot Curve (H ), Rayleigh line (R ), and Isentropes (dashed curves) for (A ) Strong Detonations and Weak Deflagrations, (B ) Chapman-Jouguet Detonation and Deflagration, and (C ) Weak Detonations arid StrongDeflagrations........................................................................ 3-6
6-5 Wave Path (W ) and Particle Path (P ) for (A ) a Detonationand (B) a Deflagration With u0 « 0 ...................................... 6-7
6-6 Physically Realizable Detonation and Deflagration States . 6-8
6-7 Flow in a Strong Detonation ................... 6-16
6-8 Flow-in Chapman-.'ouguet Detonation............ .................. 6-176-9 Particle Velocity Behind Detonation Waves: Strong
Detonations, (A ) and (B ); Chapman-JouguetDetonations(B ), (C), and (D ) ....................... ........................................... 6-17
6-10 Flow in Weak Deflagration With Closed End ....................... 6-18
6-11 A Detonation as a Deflagration With a PrecompressionShock................... .......................... . .............................. 6-20
6- 12 Attenuation of a Strong Detonation Wave by a RarefactionWave;............. ................................... ............ .. ...................... 6-21
7- 1 Covo lume Function for Detonation Products o f
Condensed Explosives .......................................................... 7-11
7- 2 Covolfme Function for Detonation Products o f PFTN 7-12
8- 1 Family o f Hugoniot Curves for Steady Deflagration
AMCP 706-180
LIST OF ILLUSTRATIONS (Cont'd)
Fig, No. Title Page
8-2 Family o f Hugoniot Curves for Steady DetonationWave. . . . . . . . ........................................ ............................ 8-6
8-3 The von Neumann Pathological Weak Detonation ............. 8-78-4 Pressure and Particle Velocity Behind an Unsupported
Chapman-Jouguet Detonation ............................................ 8-10
8- 5 Constant Composition and Equilibrium HugoniotCurves . . . . . ; ...................................................................... 8-13
9- 1 Effect of'Charge Diameter on the Detonation Velocity o f
RDX, p„ » 0 . 9 ...................................... ............... ............... 9-29-2 Cylindrical Symmetric Flow Through a Detonation-
Wave ................... ............................................., . . ................ 9-5
9-3 Models o f the Reaction Zone Employed by Wood andKirkwood ..................................................... .................... .... 9-8
9-4 Models o f the Reaction Zone Employed by (A ) Jones, (B )Eyring and Coworkers, and (C ) C o o k .................................. 9-11
9-5 TypicaTHistogram Representation o f the Pressure Pulse fo r
Use in “ Release Wave” Calculations Together With the'Simplified Square Pulse Approximation .............................. 9-13
9-6 Illustration o f Progress o f Characteristic Surfaces in a Three-dimensional Explosive Charge, as Described in the
“ Release Wave” Theory ................... .............. . .............. 9-14
9-7 Particle Velocity Behind a Spherical Detonation Wave in
Pentolite, pa v 1.85 ...................................... 9-16
9- 8 Pressure Behind a SphcricalWave in Pentolite,f t - 1 . 6 5 . . ' ............... .......................................................... 9-17
10- 1 An Experiment To Illustrate the Critical Nature o f a
Thermal Explosion .......................................... .................... 10-410-2 Heat Production and Heat Loss Rates in ah Experiment o f
the Type Depicted in Fig. 10-1............... ......., .................. 10-510-3 Heating Curves (Temperature vs Time) in an Experiment
o f the Type Depicted in Fig. 10-1 and Consistent With theData in Fig. 10-2 ................................................... .............. 10-6
10-4 Tempt ’ re Profiles for Times Near the End o f the
Induction Period, as Calculated for 1-in. Spheres o f RDX
Initially at 2 5 °C .................................... ............................... 10-1310-5 Explosion Times vs l/Tt fo r RDX in Various Geometries
Initially at 2 5 ^ ............................. .................................. 10-1410-6 Graphs of Xf./pca1 vs E/Ter-E/T, fo r Spheres, Cylinders,
and Slabs, A ll Initially at 2 5 °C ............................................ 10-15
10-7 Temperature Distribution During Cooling o f a Spherical Element o f Inert Material That Has Been Raised Initially to a Uniform Temperature Greater Than That o f the Surroundings ............... ........................................................ 10-17
x
AMCP 708-180
LIST OF ILLUSTRATIONS (Corn'd)
Fig. No. Vtle Page
11-1 Transmission o f Detonation from a. Donor to an Acceptor
C h arge .......... . ......... ......................................>................... 11-211-2 The Gap T e s t ......................................................................... 11-2
11-3 Charge Assembly and Dimensions fo r NO L Gap T e s t .......... 11-3
11-4 Shock Wave Pressure at the End o f the Liicite Gap in the
NOL Gap T e s t ...................................................................... 11411-5 Comparison of Shock Loading at 50 Percent Point With
Initial Pressure=in.Charge _____________ Ti-5l l - 6 ( A ) Arrangement to Measure Shock and Detonation Travel in a
Nonhpmbgeneous Solid Explosive Using the WedgeTechnique ................... 11-7
11-6(B) Arrangement to Measure Shock and Detonation Travel in aHomogeneous Liquid Explosive (Nitromethane) ............... 11-7
11-7 Distance vs Time Behavior in Shock Wave Initiation ofNonhomogeneous and Homogeneous Explosives . . . . . . . . 11-8
11-8 Smear Camera Record o f E ffect o f Rough Shock Wave onInduction Time .......a . . . ........ ............... ..................................
11-9 Shock Initiation Induction Times in Nitromethane at
Different Shock Pressures and" at Different Initial
Temperatures....................., ................................... ...... 13,4111-10 Smear Camera Record Showing Effect o f Bubbles in
Initiation o f Nitromethane .......................... .. 11-1211-11 Pressure-distance Profiles at Various Times for the Shock
Initiation o f Nitromethane by a 92-kbar Shock .................. 11-14
11-12 Pressure-radius Profiles at Various Times for theDevelopment o f a Detonation in Shocked Nitromethane (94.7 kbar, 1230°K) from a Sphcri' -1 Temperature HotSpot (1404°K ) o f 0.292 -cm Radius....... .......................... 11-14
11-13 Pressure-radius Profiles at Various Times for theDevelopment o f a Detonation in Shocked Nitromethane
(94.7 kbar, 1230°K) from a Spherical Temperature HotSpot (1404°K ) o f 0.06 -cm Radius............. ....................... 1.1-15
11-14 Pressure-radius Profiles at Various Times fo r the Failure of f 0.0292-cm-radius Temperature Hot Spot(1404oK ) to
Initiate Propagating Detonation in Shocked Nitromethane(94.7 kbar, 1230°K) ........................................................... 11-16
11-15 Successive Configurations o f Shock and Bubble.................. 11-18
11-16 Isotherm Plots for the Shock in Helium Hitting a Neon
Bubble . . . ........................................................................... 11-191147 Normalised Initiation Criteria ............................................. 11-2111-18 Effect o f Pulse Width on Minimum Initiating Shock
Pressure ............................................................... 11-22
xi
AMCF 706-180
LIST OF ILLUSTRATIONS (Cont'd)
Fig. No. Title Page
11-19 Build-up o f Shock Wave in Solid Explosiye to Detonation fo i a Surface Erosion (Grain Burning) Law o f HeatRelease........ ■;...................................................... ........ 11-25
11-20 Peak Pleasure and Position of the Wave as a Function o fTim e for the Case in Fig. 11-19 .......................................... 11-25
11- 21 Propa^tion Failure in Blasting Gelatin ........ ......... ............ 11-2712- 1 Impsce Apparatus Showing Anvil-striking Pin Assembly. . . 12-2
12-2 Illustration o f Apparatus for -Determining the FrictionSensitivity'of Solid Explosives............... .............. .............. 12-3
12-3 Example o f a Sensitivity Test Result Comprising 100 TrialsFollowing the Up-and-down Method ............... ............... 12-5
12-4 Curves for Calculating s from M When M < 0.40 in theStatistical Reduction of Impact Sensitivity D a ta ------ . . . . 12-7
12-5 Cavity Striker, Showing Small A ir Bubble Inside Cavity. . . 12-9
12-6 Explosive Decomposition Data from the AdiabaticFurnace ...................................... . * ....... .............. ;............. 12-11
12-7 Correlation Plot o f 50 Percent Explosion Drop Height in the Sensitivity Test ys Critical Explosion Temperature for
H o f Spot o f Radius 10 p ............................................... 12-1412-8 Charge Arrangement Used by Macek to Study Deflagration
to Detonation Transition .......................................... .......... 12-1612-9 Characteristics Diagram (C+) fo r the Development o f a
Compression Wave from Deflagration in a Rigidly
Confined High Explosive .................................................... 12-18
12- 10 Development o f Compression Wave from Deflagration asTransposed from the Characteristics Diagram in Fig.1 2 -9 ...................................................................................... 12-19
l & l Development o f Shock Wave About Cylindrical Explosive
Charge Initiated at One E n d ...... ............................... .......... 13-213- 2 Schematic Illustration o f the Energy Retention Resulting
from the Entropy Increase at the Shock F ron t............. 13-613-3 Pressure-distance Curves for Blast Waves in A ir at
Successive Times ................................................................. 13-813-4 Particle Velocity-distance Curves for Blast Waves in Air at
Successive Times ........ ........................................................ 13-913-5 Pressure-time Curves for Blast Waves in A i r ............... . 13-913-6 Hugoniot Properties o f the Shock Wave fo r Ideal
PolytrOpic Air ...................................................................... 13-1113-7 Peak Pressure-distance Curves for Shock Waves in Air
Calculated With the Point Source Model (B ro d e )............... 13-1413-8 Pressure in Atmospheres as a Function o f the Lagrange or
Mass Position for the Point Source Solution at Times
In d ica ted ................................................ ............................. 13-15
xii
AMCP 708-180
LIST OF ILLUSTRATIONS (Cont'd)
Fig. No. Title Page
13-9 Space-time Diagram fo r Shocks and Contact Surface fo rTN T Blast in A ir (Brode) ................................ ; .................. 13-16
13-10 Pressure-distance Curves at Successive Times fo r TN T BlastWaves in Air (Brode) ........................... ............................... 13-17
13-11 Peak Pressure-distance Curve for TN T Blast Waves in A ir(B rode )............................................ .............. ...................... 13-18
13-12 Pressure-distance Curves for the Underwater Shock WaVeProduced by a 300-lb TNT Charge..................... ................ 13-20
13-13 Pressure-time Curve for the Underwater Shock WaveProduced by a.SOOlb TNT Charge................. .................. i 13-21
13-14 Bubble Oscillations from an Underwater Explosion .......... 13-2213-15 Pressure-time Curve fo r Underwater Pressure Waves 50 ft
from a 30Olb TN T Charge............................ 13-2213-16 Hugbhiot Properties for-Shock Waves in Sea Water ............ 13-2413-17 Peak Pressure-distance Curve fo r the Underwater
Explosion o f T N T as .Calculated by Penney andDaiigupta ............ 13-27
13-18 Pressure-time Curves of Shock Wave in Water, Showing Dissipation at Front as Described by Kirkwood andS e th e ................... .. ........ ............ .................... ............. ... 13-27
13-19 Peak -Pressure-distance Curve for the UnderwaterExplosion o f TN T as Calculated by Kirkwood andBrinkley . . . . . . . . . i . .......... 13-33
13-20 Peak Excess Pressure Ratio vs Distance in Charge Radii fo rT N T at a Loading Density o f 1.5 g/cmJ .............................. 13-34
13-21 Peak Excess Pressure Ratio vs Distance in Charge Radii fo r Pentolite at a Leading Density o f 1.65 g/cm3 (Shear and W right)................ 13-35
13- 22 Positive Impulse-distance Curve fo r Pen tolite................. 14-314- 1 TypkalCharacteristic Grids in the Distance-time Plane . . . 14-3
14-2 Characteristic Grid fo r Harttee Computation Scheme . . . . 14-414-3 Paths Traversed by Thermodynamic and Mechanical Stress
Through a Shock Front; Definition o f Artificial ViscousStress.............................................................................. 14-6
14-4( A ) Stress Histories Generated in Tungsten by an Impact With C-7 Epoxy: Quadratic Artificial Viscosity Only With aCoefficient o f 4 .0 ................................................ 14-7
14-4(B) Stress Histories Generated in Tun p ten by an Impact With C-7 Epoxy: Linear Artificial Viscosity Only With aCoefficient o f 0 .5 ........................................................... 14-8
14-5 Grid for Depicting Coordinates and Time Increments.... 14-9
xHi
fM CP 706-180
LIST OF ILLUSTRATIONS (Corn'd)Fig. No. Title Page
14-6 Stress Profiles Following,Impact in a Material Representedby Simple Anelastic Model ............. .......... . . . . . . 1 4 0 . 0
14-7 Hugoniota andPaths for Steady-state Shock add Reactionin a Homogeneous Explosive . . . . . . . . . . . . . . . . . . . . . . . 14-12
t(k
£
t
i'iA*>44\
(4
tt}i.■*
i;
v
xiv
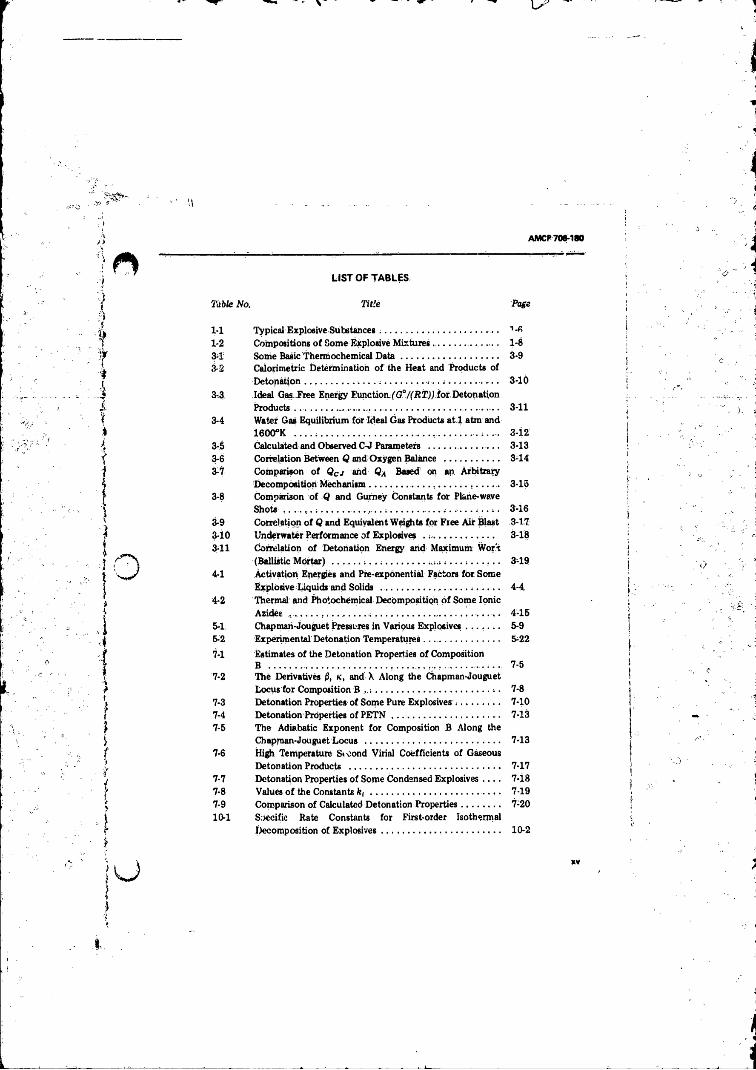
LIST OF TABLES
Table No. Title Page
1-1 Typical Explosive Substances . . . . ...................................... ... 1-6
1-2 Compositions o f Some Explosive Mixtures .............. . . , ....... 1-83-1 Some Basic Thermochemical D a ta ............................... .. 3-93-2 Calorimetric Determination o f the Heat and Products o f
Detonation . . , ............. . . . . . ................. . . ; ..................... 3-10
3-3 Ideal Gas. Free Energy Eunction/G°/('ftrjlfor Detonation
Products................... ............................................ ................. 3-113-4 Water Gas Equilibrium for Ideal Gas Products a t.l atm and
1600°K ..................................................... ................. ........ 3-i2
3-5 Calculated and Observed C-J Parameters ...................... .. 3-133-6 Correlation Between Q and Oxygen Balance ....................... 3-14
3-7 Comparison o f Qc j and Based on an ArbitraryDecomposition Mechanism............... ................................... 3-15
3-8 Comparison o f Q and Gurney Constants fo r Plane-waveShots ........... .............. ............................. . . . ; . . ........... . 3-16
3-9 Correlation o f Q and Equivalent Weight* for Free A ir Blast 3-1.7
3-i0 Underwater Performance o f Explosives . ......................... 3-183- 11 Correlation o f Detonation Energy arid Maximum Wor t
(Ballistic Mortar) ____. . . . .................. . . . . . . . . . . . . . . . 3-194- 1 Activation Energies and Pre-exponential Factors fo r Some
Explosive Liquids and Solids ..................... ............ . . . . . . 4-44- 2 Thermal and Photochemical Decomposition o f Some Ionic
A d d is ...... .......................................................................... ... 4-15
5- 1 Chapman-Jouguet Pressures in Various Explosives . . . . . . . 5-95-2 Experimental Detonation Temperatures .............................. 5-22
7-1 Estimates o f the Detonation Propert ies o f CompositionB .............. ............. ! ................ ................................... . 7-5
7-2 The Derivatives 6, k , and A Along the Ghapman-Jouguet
Locus for Composition B , . t ............................................ .... 7-87-3 Detonation Properties'of Some Pure Explosives .................. 7-107-4 Detonation Properties o f P E T N ........................................... 7-137-5 The Adiabatic Exponent for Composition B Along the
Chapman-Jouguet Locus .................................................... 7-137-6 High Temperature Si oond Virial Coefficients o f Gaseous
Detonation Products ............................................................ 7-177-7 Detonation Properties o f Some Condensed Explosives . . . . 7-187-8 Values o f the Constants fe|............................................. 7-197-9 Comparison o f Calculated Detonation Properties...... 7-2010-1 Specific Rate Constants for First-order Isothermal
Decomposition o f Explosives..................... .................... 10-2
AMCP7M-1M
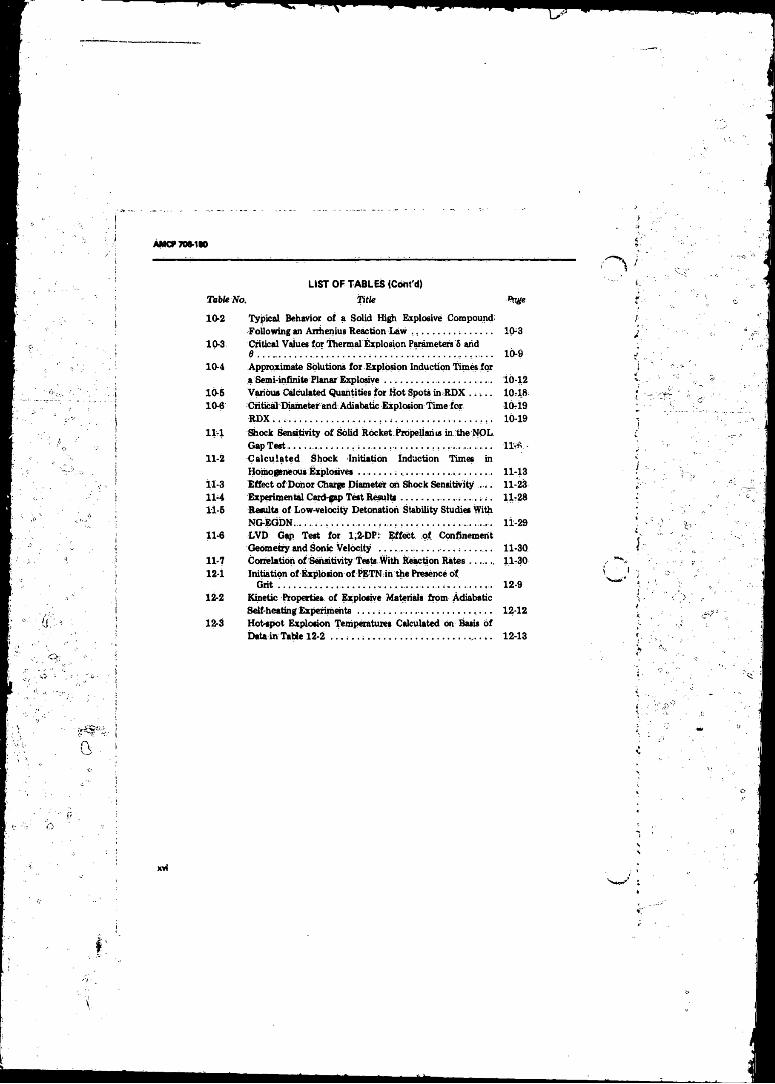
LIST OF TABLES (Cont'd)
Table No. Title Pdge
10-2 Typical Behavior o f a Solid High Explosive Compound;
Following an Arrhenius Reaction -Law ................ .............. 10-310-3 Critical Values fo r Thermal Explosion Parameters 5 and
.............................. .................... ..’............... . 10-910-4 Approximate Solutions fo r Explosion Induction Times for
a Semi-infinite Planar Explosive................... ................ ...... 10-1210-5 Various Calculated Quantities for Hot Spots in R D X ......... 10-18
10- 6 Critical Diameter and Adiabatic Explosion Time for 10-19
R D X . . . .................................. ...................................... .. 10-19
11- 1 Shock Sensitivity o f Solid Rocket Propellants in the NOL
Gap Test........................ . . .......... ................ .., -------- ------ llv fi.11-2 C a lcu la ted Shock Initiation Induction Times in
Homogeneous Explosives ............. ............. ......... ............... 11-13I- 1-3 Effect o f Donor Charge Diameter on Shock Sensitivity . . . 11-23I I - 4 Experimental Card-gap Test Results....................... 11-2811-5 Results o f Low-velocity Detonation Stability Studies With
NG-EGDN....... . ., .......... ........................ ............ ................ 11-2911-6 DVD Gap Test for 1,2-DP: Effect o f Confinement
Geometry and Sonic Velocity ............................. .............. 11-3011- 7 Correlation o f Sensitivity Tests With Reaction R a tes____ _ 1130
12- i Initiation o f Explosion o f PETN in the Presence o fG r it .................................... ............................,.......... 12-9
12-2 Kinetic Properties o f Explosive Materials from AdiabaticSelf-heating Experiments . . . . . ............. ................... .. 12-12
12-3 H otspot Explosion Temperatures Calculated on Basis o fDate in Table 12-2 ................................................................ 12-13
( I
xvi
AMCP 708-180
PREFACE
The Engineering Design Handbooks o f the U S Army Materiel Command are a coordinated series o f handbooks containing basic information and fundamental data useful m the design and development o f Army materiel and systems.
In the last several decades—certainly since World War I I—a great deal o f work, both experimental and theoretical, has been performed on explosives and their effects. There- did not exist in any language a satisfactory, comprehensive compilation presenting a unified, self-consistent, theoretically competent treatment o f this material. AlsOj a large''number o f interesting contributions from Government-supported and Government laboratories, which have now been declassified and should provide valuable information, was comparatively inaccessible to the average scientist and engineer.
This. Handbook attempts to correct the situation. Presented is a unified treatment o f the important open literature in which is included not only articles in professional journals but also the available military reports o f importance. Original contributions also have been made to the theoretical portions. Much current research on explosion phenomena involves numerical solutions to complex mathematical equations o f fluid dynamics, chemical kinetics, thermodynamics, and. heat transport. For this reason a description o f some o f the novel computational techniques, (computer codes) that have been developed fo r these purposes is included: While the Handbook is not a comprehensive treatise on explosives, it does discuss at length topic areas that are considered to be o f greatest value in an exposition o f the principles c f explosive behavior o f liquid and solid explosives, and thus provides a readily accessible collection o f important theoretical and experimental results on.explosives and explosive effects.
The Handbook does not cover the synthesis o f explosive substances, compilation o f properties of explosives, or the manufacture o f explosives—these topics are the subjects o f existing handbooks.
The Engineering Design Handbooks fall into two basic categories, those approved for release and sale, and those classified for security reasons. The Arm y Materiel Command policy is to release these Engineering Design Handbooks to other DOD activities and their contractors and other Government agencies in accordance with cu.ient Army Regulation 70-31, dated 9 September 1966. It will be noted that the majority o f these Handbooks can be obtained from the National Technical Information Service (NTIS). Procedures fo r acquiring these Handbooks follow:
xvll
AMCP 706-180
PREFACE (Cont'd)
t. Activities within AMC, DOD agencies, and Government agencies other than DOD having need for the Handbooks should direct their request on an official form to:
Commanding Officer Letterkenhy Army Depot A TTN : AM XLE-ATD dhambersburg, Pennsylvania Vf&Bil
b. Contractors and universities must forward then: requests to:
National Technical Information Service Department o f Commerce Springfield, Virginia 22151
(Requests for classified documents mu?t be sent, with appropriate “ Need to K n ow " justification, ;to Letterkeiiny Army Depot.)
Comments and suggestions on this Handbook are welcome and should be addressed to:
U S Army Materiel CommandA TTN : AMCRD-TV -Washingto D C 20315
(DA Forms 2028 (Recommended Changes: to P u b l ic a t io n s ) , which a re a v a i la b le through normal p u b lic a t io n s supp ly channels, may be used f o r con inen ts/su ggestlons.)
A M C P 70H 80
CHAPTER 1 INTRODUCTION
1-1 INTRODUCTORY REMARKS
Explosives have been known and used lo t a very long time, Black powder—a mixture o f potassium or sodium nitrate, sulfur, and carbon black—has been employed as an explosive since ancient times. Nitroglycerin, discovered in 1846 b y Som brero , and the invention o f nitroglycerin-based dynamite by Nobel in 1867 can be considered as the start o f the era o f high explosive technology. This era which extends to current times has been the development o f a vast number o f military and commercial explosives and explosive applications.
The development o f a fundamental theory o f detonation also had its beginnings in the latter part o f the 19th century, starting with the investigations by Mallard and L ‘ Chatelier (1881) and o f Berthelot and Vieille (1882) on gaseous explosions. They found that the explosion process consisted o f a progressing wave o f chemical reaction and distinguished two types o f reaction waves. The first type is a relatively slow moving flame having linear velocities on the order o f 1 to 10 cm/sec, and the second, a very much faster wave (i.e., a detonation wave) moving on the order o f the speed o f sound (AO4 to lO * cm/sec). In 1893 Shuster suggested that there is an analogy between a detonation wave, which is supported by energy release from chemical reaction, and a nonreactive shock wave, which has to be supported by a piston pr similar mechanical source o f energy. Shock waves had been theoretically described in detail by Riemann (1860), Lord Rayleigh, and others, and a physica l model consisting o f a moving discontinuity in pressure had been shown satisfactorily to account fo r the observed properties o f shock waves. The laws o f mass, momentum, and energy conservation across a discontinuous shock front had already been deduced by Rankine in 1870 and by Hugoniot in 1889. The suggestion o f Shuster that a detonation wave is a reactive shock formed the basis fo r the development by Chapman (1899) and by Jouguet (1905) o f the classical hydrodynam ic-therm odynam ic theory o f
steady-stale detonation. This theory employs an idealized one-dimensional model in which it is assumed that the explosion energy is instantaneously released in a discontinuous shock front across which the conservation conditions, o f Rankine-Hugoniot apply; The velocity of the detonation wave was assumed to be the minimum velocity Compatible with the hydrodynamic conservation equations. The Chapman-Jouguet (C-J) theory thus defined a unique steady-state detonation velocity which c ou l d be compared with experimentally observed velocities, and detailed,calculations icr gaseous detonations were shown to be in excellent agreement with experiment.
In the period 1940-1943, Zeldovich (USSR), von Neumann (USA), and Doering (Germany), each working independently, refined the C-J theory and extended it to the case where chemical reaction occurs in a finite zone behind the front o f the detonation wave, This work was stimulated by the events o f World War II, which ;°so gave great impetus to the development of marly o f the modern high-speed electronic and photographic techniques fo r studying details of explosion phenomena.
A t the present lime there exists a substantial corpus o f theory and experimental data that can be said to provide a good description o f many aspects o f explosion processes. The theory is, however, incomplete in many respects in that it deals, in the maim with idealized configurations not met with in practice and does not treat at all some o f the events.upon which the performance o f an explosive depends, I f we use the existing theory as a point o f departure, there are many areas which can be fruitfully explored in the theoretical and experimental investigations.
In this handbook an attempt has been made to describe the principles of explosive behavior as they apply to condensed explosives. It has been the principal aim .to present a comprehensive treatment o f those topics that are necessary for an appreciation o f the literature reporting the results o f current research. The authors have developed most o f the important relations of thermodynamics and hydrodynamics upon which the theoretical treatment o f explosion
1-1
AMCP 706-180
phenomena is based. The classical theory is developed rigorously and in detail, since this theory is the basis both fo r an understanding o f actual explosion phenomena and for the theoretical investigations that are currently in progress. The treatment of topics for which theory is incomplete is necessarily more qualitative and relies heavily on discussions o f experimental data and simple physical models. The techniques employed in obtaining the experimental data are therefore discussed in some detail. Much current research on explosion phenomena involves numerical solutions to complex mathematical equations o f fluid dynamics, chemical kinetics, thermodynamics, hydrodynamics, and heat transport. For this reason some o f the novel computational techniques (computer codes) which have been developed for these purposes have been described.
It has not V 'n the aim o f the authors to provide a comprehensive treatise on explosives, but rather to discuss at length topic areas which are thought to be o f greatest value in an exposition o f the principles o f behavior o f liquid and solid explosives.
1-2 D E S C R I P T I O N OF EX PL O S IV E PROCESSES
Explosives are substances or mixtures of substances which are capable of undergoing exothermic chemical reaction at extremely fast rates to produce gaseous and/or solid reaction products at high pressure and temperature. In the case o f a typical “ CHNO” explosive such as TNT, the molecule—which contains carbon, hydrogen, nitrogen, and oxygen (see Table 1-1) undergoes a decomposition reaction followed by reduction-oxidation reactions which eventually lead to low molecular weight detonation products such as COj, CO, HaO, N2 .and solid carton (cf. Chapter 3). The chemical reactions
* occur in microseconds with an energy release of 103 cal/g. For cast T N T this can result in a
detonation wave with pressure, temperature, and velocity o f * 200,000 atm, * 3000°K and 7000 m/sec, respectively. The large energy release and fast velocity o f the detonation wave represent a tremendous power level of energy conversion, * 5 X 10* W per sq cm of detonation front. This value can be compared
with ihe total United States electric generating capacity o f * .3 X 1011 W. It is the high power level and high reaction pressure generated which give rise to the primary application o f explosives, namely, as compact sources o f energy fo r blasting. Other applications (e.g., welding) relate to the strong shock wave that is associated with the detonation front.
Since the performance o f an explosive depends strongly on its energy release in de to n a tion , considerable theoretical and experimental effort has been carried out to predict and to measure the energy o f d e ton a tion . Th e thermodynamic theory developed in Chapter 2 and the discussions in Chapter 3 relate directly-to this subject.
Observation o f a detonation wave progressing along a long cylindrical charge o f explosive will show that the wave moves at constant velocity. In the more energetic military explosives this velocity may be as high as 8000 m/sec. The detonation velocity is relatively easy to measure and for many years was virtually the only experimental data available. However,, with the advent < i high speed electronic recording equipment, streak camera photography, flash X-ray, and manganin pressure gages, having time resolutions o f * I f f 8 sec, it has been possible-to measure detonation pmssures as high as 400,000 atm, and particle velocities at the detonation f r o n t <d. Chapter 5 ). Unfortunately, ex p er im en ta l techniques f o r re lia b le measurement o f detonation temperature have not as yet been developed.
The constancy o f the speed o f detonation can be r e a d i l y exp la in ed in term s o f Chapman-Jouguet (C-J) theory arid the Zeldovich-von Neumann-DOering (ZND ) model, which are developed in detail in Chapters 6-8. In this approach, the detonation wave may be considered as a strong shock wave supported by energy release in a small zone o f chemical reaction just behind the front o f the shock, i.e., the detonation front. The almost instantaneous compression and heating o f the explosive as it passes through the detonation front triggers the supporting chemical reactions.
The stable detonation velocity as described by classical C-J theory represents an upper limit ov ideal detonation velocity, and strictly refers to a planar detonation wave. Such waves are indeed found to be approached in cylindrical charges o f
1-2
AMCF 706-1*0
large diameter. In practice, however, it is found that in small diameter cylindrical charges the detonation front is curved, and its velocity depends upon the degree o f charge confineme’ i and charge diameter. Also it is observed that for each explosive there is a critical value o f charge diameter dc below which a steady-state detonation will not propagate. For example, dc is about 1 cm for cast TNT, about 10 cm for ammonium nitrate, and about 160 cm for some types o f rubber-base composite propellant. The explanation o f these “ nonideal" detonation phenomena relates to the effects o f charge expansion and lateral energy losses on the rate o f chemical reaction in the detonation reaction zone. “ Nonideal” detonation behavior is discussed in detail in Chapters 9 and 11.
I f we take a solid explosive such as cast TN T and set a match to it, it will probably bum (deflagrate) with a linear velocity o f * 1 cm/sec. However, if we strongly shock the explosive it will detonate at * 7 X 105 cm/sec. I t can also be observed that i f a burning explosive is confined or i f the explosive is porous, a deflagration to detonation transition will occur some place in the material. This brings up very practical questions such as what are the conditions which cause the initiation o f detonation in an explosive, and why do different explosives, or even the same explosive at different bulk densities , react differently to initiating stimuli—e.g., shock, impact, friction, spark, heat, etc.'/ The need to design reliable detonation initiation devices and to prevent accidental initiations lent early impetus to studies devoted to characterizing the ease o f initiation or sensitivity of explosive materials,
There is now substantial evidence that all .detonation initiation processes are essentially thermal in origin. By this is meant that initiating external stimuli such as shock, impact, and spark cause heating o f the explosive and the creation o f thermal explosion—sometimes in small localized regons o f the explosive charge, i.e., hot spots, The thermal explosion, if it is o f sufficient intensity, will propagate a deflagration and/or shock wave which eventually leads to the formation o f a detonation wave. The factors which determine whether or not the stimulus is sufficient to cause thermal explosion and whether or not the thermal explosion is o f sufficient intensity to grow to detonation are
very complex, involving chemical kinetics, thermodynamics, mass and heat transport, and hydrodynamic flow . A detailed discussion o f thermal explosion and its application to detonation initiation are given in Chapters 10-12.
As indicated earlier, one o f the main applications o f condensed explosives is as an energy source for blasting. The transmission o f detonation energy to the medium surrounding an explosive relates not only to the properties o f the medium but also to the properties o f the explosive; e.g., detonation velocity, energy, pressure, product composition, etc. The theory o f blast propagation in air and water from an spherical explosive charge is described in detail in Chapter 13. The theory is o f significance in a book on explosive behavior since it sets, the foundation and limitations o f the concept of “ TN T Equivalent” which ia often used in evaluating explosive performance, as well as- Torming the basis o f some of the experimental determinations o f the energy o f detonation (cf. Chapter 3).
Finally in Chapter 14 we discuss some o f the equilibrium thermodynamic and time dependent hydrodynamic computer codes which are currently being used in calculating explosive properties and explosives’ behavior.
1-3 TYPES OF EXPLOSIVE
It has become traditional to distinguish between various types o f explosive*. Most military explosives consist o f pure compounds or o f relatively simple mixtures o f explosive compounds. In such compounds the oxygen is normally bound in nitro- or nitrate-groups, and th e exp los ion reaction consists o f the decomposition o f the molecule o f the explosive substance. Many commercial explosives consist o f mixtures o f various kinds. The rok ijra may consist o f a substance which itself is an explosive to which are added various materials which may serve as added fuel, added oxidizer, or inerts. When inerts are present, their function is usually to serve as a thermal ballast and thus to moderate the energy available for useful work or the temperature o f the gaseous products. I f one or more o f the ingredients o f such mixtures is an explosive substance, it is useful to call the m ixture a hybrid explosive. Commercial dynamites provide an example o f explosives o f
1-3
AM CP 706-180
this type. A very large number o£ formulations exist, each o f them tailored to meet a particular commercial need and to comply with safety requirements imposed by the particular use. Another type o f explosive mixture may consist o f two or more substances none of which o f themselves are explosives. Those may be called composite explosives. Typically they consist of mixtures o f a substance serving as fuel and a substance serving as oxidizer. Mixtures o f the oxidizer ammonium nitrate, which can only be exploded with great difficulty, and fuel oil are examples o f this type which have recently become very prominent as cheap blasting agents.
Most explosive charges contain a main charge which is designed to accomplish the particular task fo r which the explosive is intended. The common explosives with a sufficiently high energy and pressure o f explosion are normally somewhat difficult to initiate. These materials are called secondary er plosives. Typical o f this class are the military explosives TN T , RDX, and the commercial dynamites. To provide reliable initiation, the charge will contain an initiator employing a substance easily initiated by a thermal source or by mechanical shock but whose energy and pressure o f explosion are too low fo r use as a main charge. These materials are called primary explosives. Lead azide and mercury fulminate are well-known examples. A typical explosive device (see Fig. 1-1) consists of a train composed o f an initiating charge o f primary explosive, a main charge o f secondary explosive, and a booster charge which is initiates by the pr imary explosive and which accomplishes the initiation o f the main charge. The booster, therefore, serves as an intermediate step in the detonation o f the main charge. The m ore sensitive secondary explosives are employed as boosters. Tetryl and PETN are frequently used for this purpose. Blasting caps are themselves explosive trains, containing a small amount o f primary explosive and a booster charge which today is often PETN.
Some typical explosive compounds are listed in Table 1-1. Table 1-2 gives the compositions of some explosive mixtures.
1-4 SOME DEFINITIONS
We wish here to define the meamng o f several terms that are employed in the discussion o f the
1-4
properties and behavior o f explosive substances. Some o f these terms are in everyday use with meanings that arc in varying degrees o f imprecision. Some are not even capable o f precise definition but are in such common use as to have a more or less established meaning through usage. The word "explosion" is in this category as is, for example, the word “ fire” . Some terms are susceptible to exact definition but are frequently misused; such as the word “ detonation” , which should only be used in the case o f reaction by a detonation wave.,An explosive can be loosely defined as a
substance capable o f undergoing an explosion. More precisely we shall employ the word as we have in par. 1-2 to designate a substance or mixture o f substances capable o f undergoing exothermic chemical reaction with the evolution o f gaseous products at an extremely high rate. Explosives may be in the gaseous, liquid, or solid state o f aggregation. In this handbook we shall be mainly concerned with condensed explosives that are either liquid ex solid.
An explosion is literally the sudden out’.vard projection o f a quantity o f matter. The term is, for example, applied io the event following the rupture o f a steam boiler in which steam and possibly boiler case fragments undergo a rapid excursion. The term is also applied, for example, to the event that follows the sudden admixture o f liquid water to molten materials at a temperature substantially in excess o f the boiiing point o f water. As a final example, the term applies to the event resulting from the overpressurizatiori o f any container. A ll o f these meanings are endorsed by everyday use. However, in this handbook we shall employ the word in a more restricted sense to refer to the overall process by means o f which an explosive is suddenly converted to gaseous products which; as will be shown, are-at high temperature and pressure. We shall frequently reifer to the chemical products o f this process as explosion products.
It may be noted that explosives may undergo slow reactions to gaseous products (c f. Chapter' 3). I f the rate o f these reactions is so siow that high temperature and high pressure are not obtained, the process is not an explosion.
The term thermal explosion is ussd in a special sense that is fully discussed in Chapter 10. I t is the result o f runaway exothermic chemical reaction which occurs when the rate
AM CP7M -180
CONFINEMENT ( METAL)
MAIN CHARGE OF SECONDARY HIGH EXPLO SIVE (TNT)
BOOSTER CHARGE (TETRYL)
INITIATING CHARGE OF PRIMARY EXPLOSIVE ( LEAD AZIDE.)
INITIATION STIMULUS ( BRIDGEWIRE)
V ELECTRICAL LEADS
Figure 1 -1. Model o f Expletive Charge
evolution o f heat within a reacting volume is greater than the rate at which that volume can lose heat by conduction to a heat sink which surrounds the volume. This is a precisely defined process that can be fully described by the laws o f chemical reaction rates and heat conduction. For the present we wish only to note that it is a process that occurs in a static system, does not involve the flow o f either reactants or products, and in consequence does not depend upon the laws o f hydrodynamics.. I f a substance is capable o f undergoing an exothermic reaction, which we are calling an explosive, and if such a reaction is initiated in some local region o f a larger mass o f material, then a reaction wave may propagate from the point o f initiation throughout the mass. Under
these circumstances the chemical reaction takes place within the wave. Even i f the mass is initially static, the propagating wave- induces flow in the material and thus is governed by hydrodynamica l as w ell as chemical considerations. If the propagation velocity is constant, the wave may be said; to be sLady-state (even though the associated flow may not be stationary everywhere in any frame o f reference). In general, two flow regimes are observed. I f the propagation velocity (i.e,, the rate at which the wave advances into unreacted material) is less than the velocity o f sound in the unreacted material, the reaction wave is said to be a deflagration. I f a deflagration wave is held stationary by a flumoholder such as a burner rim and the unreacted material flows through it, the
1-5
; <S
AMCT 7 0 M K )
TABLE 1-1 TYPICAL EXPLOSIVE SUBSTANCES
(CMi) NamElsMntslPojill*
Xtructursl romli , •XHmI#sIu«»
(AN) AmmIua nltrst* W j M4* *°3~ solid «Mi*#r(AP) Asaonlua psrehlorsts KjXOCl m* cio~ •olid tmidissTIITNIU> lit (N '-trlnUpoMthyl)
'A W s \°30. X - C - CH„ - XK/ 2 \
*>* P-'JsscOBdirjrhlihMSloslv*
/o,» -'c - ck, - m
(D) Am o n I ms ylcrsts V . V -sscoadiry hlsh•xpUsiv*
(CATNB) DlamlMtrla<(r*^4M«M
Vla
(DtXA>-H«tlnyUltrMlM d ln ltr tU
<CBM) Cthyl«M dliiitr*a lM'Walts"
V - 0 ' « w
02V - 0 - « SCT,
K C - -N -^ a *1 'H
I ..HO,H,C - H_ 3
/U
(COOK) COtylBM fly eo l d li lt r s U
M,C - 0 - N0„
W i°* V ' 0 * M*liquid ospioslv*
(rcro ) * i » . <2Pa-r fi«itr t> "2 -fiim *' Btkyl) (AMUl
y - c - cx_ ~ o
dm.") CyelqtstrMHtKyltMutrsnitrsBln* V - ? y - noi *1XjC
O.K . i X - NO,V
»»«OAd*ry hl hSHplMlVB
1-6\ a ^
* 1
TABLE 1-1 TYPICAL EXPLOSIVE SUBSTANCES (CpnttmMd)
AMCP 70S-1S0
o
L**d atypknata
Mareurjr fu la irn ta » w .
prS»«ry axploaiva
pr\+>M axploaiva
(NO) MitroRlycarlnC*2 - 0 - MOa CM - 0 - .HOj CM - 0 - MO.
Ilivld ••eawlBrjr axplaatva 1 i f pallia atIn cam iiw reUl
(MM) 'M itroM tkana H^uU aa«aa4arf•>p lM l<P3
V - 0 ■ / * , - 0 ■ » ic
o_» - o - - o - *o.
W t aacoadary kick axploaiva
(Tatryl) Ti-lnicrophaitylMthylAltrs ina
V - * N .v ot,r
f O
M conBary axplaaiva M o t la r
(TJfTr*) J,3,a-tplnUroath7l-4 a 4 ,4 -t r ia l trokutyrata
o - CH2C(*>2)3 C - 0''S - «I-C(!»3)3
aaconrfary M |h axploaiva
(T)M) T « t r sn U ro M t lisMi *'
v - s - ! U p L U axploaiva
(TXT) rrln tc ro to lu BM W A M caadary kick axploaiva
AMCC 706-180
TABLE 1-2 COMPOSITIONS OF SOME EXPLOSIVE MIXTURES
NameAmatol
Ammonium Nitrate Dynamite
Blasting Gelatin
Composition B
Cyclotol
Dynamite
PBXS404
Fentolite
Composition .
Mixture o f TN T and AN (80% A N , 20% T N T is typical)
10% NG, 80% AN, 10% carbonaceous material is typical
67% Barium nitrate, 33% TN T
92% NG, 8% nitrocellulose
6.0% RDX,. 40% T N T (with 1% wax)
Mixture o f RDX and TN T (50% RDX, 50% TN T is typical)
Mixture o f NG, sodium or potassium nitrate, and wood pulp (40% NG is typical)
Plastic bonded HMX.(94% HMX)
Mixture o f TN T and PETN (50% TNT, 50% PETN is typical)
deflagration wave is the familiar flame. The propagation rate o f a deflagration wave is called either the deflagration velocity or more customarily,, in combustion literature, the burning velocity. I f the propagation velocity o f the reaction wave is supersonic with respect to the unrcacted material, the wave is called a detonation wave and its velocity o f propagation is called the detonation velocity.
I t is worth noting that a process involving a detonation wave can always be called an explosion. However, not all explosions involve a detonation wave since tire explosion roily result from a deflagration wave or a thermal explosion.
In citing various typical explosives we have noted that they are frequently broadly classified into primary and secondary explosives, and that some secondary explosives are employed as boosters. This is a working classification based upon the use to which the substance is normally put in an explosive system or train and which is based upon a property o f the material called the sensitivity. Primary explosives are used because they can be initiated by thermal sources such as hot wires or flames. As a class they can also be initiated by relatively mild blows. Such
explosives are said to have a high sensitivity. In contrast, secondary explosives, as a class, are difficult to initiate from 'thermal' sources and require a relatively severe impact to initiate explosion. These explosives are considered to have a lousensitivity.
The concept o f sensitivity is, at least historically, a qualitative one. Sensitivity has usually been measured by a variety o f different empirical tests in which samples.of explosive are subjected to controlled and measurable initiation stimuli. Typical o f such tests is one in which the sensitivity is measured.by the distance o f travel o f a falling weight, onto a small mass o f explosive, that is required to produce an explosion. Thus, the impact sensitivity o f an explosive is its response to an impact test in a specific drop-weight apparatus. Similarly, the friction sensitivity is the response to an empirical friction test. Test results depend on the test method and also upon a variety o f physical and chemical properties o f the explosive in a way that is hot usually well defined. In consequence, different methods o f evaluating sensitivity may not place explosives in the same order o f sensitivity.
1-8
AMCP 706-180
CHAPTER 2 THEORETICAL BACKGROUND2-1 INTRODUCTION
The theoretical description o f explosion phenomena has relied mainly on the science o f thermodynamics to provide a description o f the properties of the product o f the decomposition o f an explosive and on the science o f hydrodynamics to formulate the laws governing the motion o f these products. It is the intention o f this chapter to present the results, o f these sciences that are required in the later development o f the topics covered in this handbook, and to state the assumptions that are made in order to apply the methods o f these sciences to the description o f explosion phenomena. The topics discussed in this chapter may be pursued in greater detail in standard trea ties on th erm odyn am ics1-s * and hydrodynamics3'4.
Mthough this chapter and others are replete with mathematical formulas and notation, the nonmathemStician will find the text material amply rewarding fo r the time spent in reading i t —i t is n o t essential that one be a mathematician to understand the text.
2-2 DESCRIPTION OF THE COMPOSITION
In this paragraph is defined the notation used to describe the unreacted explosive and the explosion products. As an example o f the reaction equations to be considered, let us consider decomposition o f the explosive TNT, C .H jO N 3. The predominant products are expected to be C, CO, H2, and N_. A conventional decomposition equation fo r TNT is
W s Na + C + 6CO + | H, + -| N„ (2-la )
which provides an approximation to the composition o f the explosion products. A more general decomposition equation is
c7h 6o6n 3- m (?1C + g2eo + <j3H2
+ 94N2 + ^ C02
(2-lb )
+ g ^ O + « 7H)
* Superscript numbers refer to references at the end o f a chapter.
where g indicates the quantity (moles/gram) o f a product and M is the gram-molecular weight, o f the explosive. It is often assumed that the composition o f the mixture remains “ frozen” during the flow following decomposition, i.e., that each g is constant. In the more general case considered here, each q is allowed to vary within the constraints o f chemical equilibrium. In preparation fo r this treatment, we introduce a notation which allows development o f the thermodynamics and hydrodynamics in general terms without restriction to the chemical nature o f the mixtures.
We consider a mixture o f a different chemical species or constituents and employ the index i ( i = 1, 2, ... s ) as a constituent index. Thus, for example, i f the list o f chemical species is C, CO, etc., the index i = 1 designates the species C, the index i = 2 designates the species CO, etc. The composition o f the gas phase o f a mixture o f many constituents can be described by the mote numbers n] (i *= 1, 2, ... s), where n( (moles/gram) is the number o f moles o f the i-th constituent in unit weight (e.g., one gram) of mixture. We shall assume that any condensed phase in the mixture is a pure phase, thus excluding consideration o f . solid or liquid solutions, and we denote by n,(f > and n/'1: the number o f moles o f liquid and solid species i in unit weight o f the mixture. The composition o f the mixture is thus described by the numbers n,, n{(t>, and n[,J (i = 1, 2; ... s). The phase rule imposes a restriction on the number o f the quantities n-<v and n ^ that may be nonzero. In mixtures o f practical interest, most o f these quantities will be zero. I f they are all zero, the system is homogeneous, consisting o f a gas phase only.
We designate by c the number of different chemical elements contained in the s different species comprising the mixture and employ an index, k(k -■ 1, 2, ... c), as an element index. Thus, fo r example, i f the list o f elements is C, H, etc,, the index * » 1 designates the clement C, the index k » 2 designates the element H, etc.
The gross composition o f the system can be described by the quantities q'Jt (k = 1, 2 ,... c), where q^ is the number o f gram-atomic weights o f the k-th element contained in unit weight o f the mixture. I f the gross composition o f the
2-1
AMCI* 706-180
system o f interest is described by some other set o f parameters, the quantities qk can always be ob ta in ed by sim p le consideration o f stoichiometry, and we assume that this has been done, For example, the TN T formula referred to in Eq. 2-la is associated with the set o f numbers which can be represented by the vector q' » CUM, 5/M, 6/M, 3/M).
In a system containing liu ty constituents, it is possible to select a set o f constituents which are sufficient for the complete description o f the gross composition. Thus i f the mixture consisted o f the selected constituents only, the amounts o f each element present in the hypothetical system would be the same as those in the system o f interest. The constituents thus sufficient to describe the system are called the components of the system. One possible set o f components for the reaction products o f TN T is given in Eq.2-la. The.number o f components is usually, but not necessarily, equal to the number o f elements. For the development here in which the explosion products, as well as the explosive are expressed as a sum o f the components, the number o f components c is set equal to the number o f elements. We employ an index, /gist 1, 2, ... c), as a component index. Thus, for example, if the list o f components is C, CO, etc., the index / ** 1 designates the component C, the index j ■* 2 designates the component CO, etc.
The molecular formula o f the i-th constituent or chemical species o f the mixture o f explosion products can,be formally represented by
y<0 „ X U> . . . - X <c>“ l l “ ill “ ic
( 2-2)
where X lk> is the symbol o f the k-th element and a|t is the subscript (which may be zero) to this symbol in the forumla o f the i-th species. For every species /, the array aJt (k * 1, 2,... c) defines a yector
y, " - «fc) <2-3)
that can he called the formula vector o f the i-th substance. As shown by Brinkley* it is a necessary condition fo r the selection o f a proper set o f components that the formula vectors of the se lected constitu en ts be linearly independent, which implies that the determinant |a|k|does not vanish.
We denote by q{ (moles/gram) the number o f moles o f the j-th component in unit weight o f the h yp o th e tic a l system consisting of components only. The quad Sties qf (J - 1, 2, ... c ) are called the stoichiometric constants, o f the system for a particular choice o f components. For a proper set o f components we require that the stoichiometric constants q. be greater than zero for ail ;. The stoichiometric constants indicate the quantity o f each component without regard to phase; hence, they are sums o f the mole numbers:
q. = n. + n.'*' + n!J ‘ > (2 4 )
Since this hypothetical system is to have the same gross composition as the system o f interest, then the quantity o f each element must be the same in each system. Hence
2^ ct,kqJ = q'k for k " 1 , 2, — c ( 2"®i
The qs provide a specification o f the gross composition o f the system that is an alternative to that provided by the-qk .
A choice o f components is generally not unique. I f i t is arbitrarily assumed that the chemical elements in their standard states (e.g., C, 0 2, N ...) are members o f the systeih (even though the concentrations o f the elementary species may be so low as to be negligible), the elements constitute a proper choice o f components. The elements as atoms (i.e., in dissociated forms) always constitute a proper set o f components even though they may be present in negligible concentrations. Then q “ q '. However, use a set o f components other than the elements is advantageous i f the hypothetical system of components is a good approximation to the system o f interest. This will be the case if it is possible to select as components the predominant species o f the mixture and i f the concentrations o f the species that are not selected are small enough to be neglected as a reasonable approximation.
I f the hypothetical system o f components is an adequate representation for the mixture resulting from the decomposition o f an explosive, the equation for the decomposition reaction can be written from stoichiometric
2-2
AMCP 706-180
considerations alone. An example o f such a simple reaction is given as Eq. 2-la. We can generalize the decomposition o f an explosive by the equation
X ? ’ ... -tfk} ~ 'X <C} -+ M S q.y<* (2-6)* 1 xk xc i '
where {x .... xk ...xc) is the formula vec to ro f the explosive o f gram-molecular weight M, and Ya> represent the formulas o f the constituents o f a hypothetical mixture o f products satisfying the critera o f a proper set o f components. The q. o f Eq. 2-6 satisfy Eqs. 2-5 with q'k = X.JM. A decomposition equation o f the form o f Eq. 2-6 is called a conventional decomposition equation. Conventional decomposition equations have been widely employed to obtain approximate descriptions Of the composition o f the products o f the decomposition o f explosives. The validity o f the approximation cannot be judged a priori. In general, it is necessary to compare the results with those o f a ber ;r approximation such as that resulting from the assumption that the explosion products are in thermodynamic equilibrium.
The calculation o f the composition at equilibrium o f a system o f many constituents is carried out by a method o f successive approximations, The procedure requires the specification o f an initial approximation. I f the calculation is to Be carried but on a computer, the initial approximation must be specified in a w e ll-d e fin ed manner. The approximation provided by the hypothetical set o f components is well-suited for this purpose. It leads to a more rap id con vergen ce Of the successive approximations to the equilibrium composition than is obtained with a physically less realistic initial approximation.-
We now introduce the algebra required to express the constituents in terms Of the components. Then the method o f calculating equilibrium composition o f the product mixture can be discussed. The formula vector o f the i-th constituent can be expressed as a linear combination o f the formula vectors o f the components
£ 0(Jyy = y, (i = 1, 2, ... SJ (2-7a)
where y; = formula vector o f the j-th component. I f the dissociated elements are
taken to be the components, * a (/. T o each o f Eqs. 2-7a there corresponds a chemical reaction that can be represented formally by
£ 0, Y » = V iJ (2-7b)j-i »
resulting in the formation of each o f the con stitu en ts o f the mixture from the components.
For a given choice o f components, the reactions in the form o f Eqs; 2-7b can always be written by inspection, using the customary, rules for balancing chemical equations. The formal discussion o f this paragraph is intended only to display the meaning o f the coefficients 0(y, since it is possible to formulate a computer program that will construct' & table (matrix) o f the coefficients /iy from the coefficients alk.
The conservation o f mass by the reactions o f Eqs. 2-7b can be expressed by the relations
M = £ (3..M, (2-8)i j . i r ‘l lwhere M. and M (grams/mole) are the gram-molecular weights o f the i-th onstituent and j-th com ponen t, respectively. The conservation o f mass in the system as a whole requires that
A J "r i 'W = ?•i ’ i jZ i1) 1(2-9)
On substituting Eqs. 2-7b into Eq. 2-9 and equating the coefficients o f Mj} there are obtained
£ V " , + „ /» + n?) - q, (2-10)
(j = 1, 2, ... s). Eqs. 2-10 are the stoichiometric conditions.
According to the phase rule, the number o f condensed phases is at most c e l (and this number o f condensed phases can coexist in equilibrium with a gas phase only for a uniquely specified set o f stoichiometric constants at a uniquely specified temperature and pressure). We simplify Eqs. 2-10 by making the assumption that any condensed phase is a pure component whose state o f aggregation (solid or liquid) is know n. M ore getieral threatments, o f heterogeneous systems present' no special d i f f ic u lt y but result in a considerable amplification o f the notation required fo r a
2-3
AMCP 706-180
general discussion. The systems ot interest in this handbook are all compatible with this restriction. With this assumption, Eqs. 2-10 can be written
where nj is the number of moles o f condensed (solid or liquid) component j in unit weight of the mixture.
I f the equilibrium composition o f a mixture is to be determined, the constituents to be considered must be chosen a priori. The selection w ill usually imply the neglect of ce rta in species whose concentrations at equilibrium can be expected to be negligibly small. In general, the correctness o f the choice can only by confirmed a posteriori by a c a l c u la t i o n dem onstra ting that the concentrations o f the negected species are in fact negligible. In some applications, additional species may be arbitrarily excluded from consideration even though their equilibrium concentrations may be significant, provided kinetic consideratons imply that thereto o f their formation is too small to be significant under the conditions o f their application.
We may illustrate the rotation o f this section by considering the decomposition products o f TNT. We assume a priori that the products consist o f a mixture o f solid carbon with a gas phase comprised ot C, CO, H , N 2, CO ., H O, H, In this list we have arbifrarily neglected a number o f possible dissociation products; they can be included if desired. Because o f the oxygen deficit in the TN T molecule, we expect the most abundant species to be C, CO, H2, N2, und we?select these species as components. The coefficients o f the formula vectors and /l, .o f Eqs. 2-7 are collected in Pig.. 2-1. The first four rows o f the array (matrix) o f the correspond to the identities resulting from the choice o f components. The remaining rows represent the chemical reactions o f Eqs. 2-7.
2 CO - C = C02
Hj + CO - C = H20
’/4H2 = H
by means o f which those constituents that are not components are formed from those that are. For TNT, C ,H 6 0 6N3,
q[ = 7IM; q’2 = 6/M; q'3 = 5/M; = 3/M
where M - 228.18 is the molecular weight of TNT. The solution o f Eqs. 2-3 is
9l = 1 IM; q2 = 6/JVf; gs = 5/21M; ?4 = 3/2M
2-3 THE LAWS OF THERMODYNAMICS
Thermodynamics is an exact mathematical science, based upon a small number o f basic premises or postulates from which all the results o f the science are deduced by logical processes. Application of the science to physical systems always involves . lditional hypotheses separate from the science itself. It is.necessary to assume the relevance o f the mathematical model to the physical system to the one-to-one correlation of quantities, employed by the science to physically measurable properties o f the system. It is also necessary, except in trivial cases, to appeal either to experiment or to other theory to evaluate the various functions required by the application of thermodynamics in their dependence upon the independent variables o f the physical system.
A thermodynamic system (closed system) is one that interacts with the surroundings by exchanging heat and work through its boundary; an isolated system is one that does not interact with the surroundings, The state of a system is determined by the values o f its various properties, the nature and necessary number of which are to be determined. A system is composed o f a finite number o f homogeneous parts, called phases. For some applications, it may be necessary to consider the finite number o f nonhomogeneous regions forming the boundaries between pairs o f homogeneous phases; for most cases, the extent o f such regions is small and they can be neglected in comparison to the homogeneous regions. Some properties o f the homogeneous phases are regarded as fundamental; i.e., temperature, internal energy, pressure, entropy, and volume.
Properties such as internal energy, volume and entropy are called extensive because their values for a given phase are proportional to the mass of the phase. The value o f an extensive property of an entire system is the sum of the values o f each o f the constituent phases, The molar value o f an extensive property is that for a suitably defined gram-molecular weight or mole o f material. The specific value ot an extensive property is that for
i t
2-4 j
CON
STIT
UEN
TS
CON
STIT
UEN
TS
AMCP/O0-1SO
ELEMENTS
C 0 H Nik = 1 2 3 4
c i=l 1 p 0 0 ,
CO 2 T 1 0 0 .
H2 3 0 0 2 0
n2 4 !o 0 0 2
C02 5 1 2 0 0
HjO 6 0 ? 2 0
H 7 _o 0 T o_
COMPONENTSC CO h2 n2
1 = T 2 3 4
c j=1 ~ 0 0 0
c p 2 0 1 0 0
h2 3 0 0 1 0
n2 4 0 0 0 1
c o 2 5 -1 2 0 0
H20 6 -1 1 1 0
7 _0 0 1/2 0_
<a ik>
( * j >
Figure 2-1. The Coefficients a,k and for the Explosion Products o f TNT
AMC> 706-180
unit weight (e.g., one gram o f .material. We will generally employ a capital letter to designate an extensive property fo r weight M o f material, where M may be a suitably defined gram-molecular weight, and the lower case letter designates the value o f the extensive property fo r unit weight. A property is called intensive if its value for a given phase is independeht o f the mass o f the phase.. The temperature and pressure are such intensive-properties.
A thermodynamic process is said to have taken place if a change is observed to have taken place in any macroscopic property o f the system. An infinitesimal process is a process in which there is only an infinitesimal change in any macroscopic property o f the system. A natural process is an infinitesimal process that occurs spontaneously in real systems; an unnatural process is one that cannot occur spontaneously iii real systems. Reversible processes are either natural or unnatural- processes which can occur in either direction between two states o f equilibrium.
The first law o f thermodynamics for an isolated system can be stated as follows: There exists a function of the state of a uniform phase called the energy which is conserved for any process over all the phases participating in the process. For an infinitesimal process, the first law is
2 -dtr"" " '■ (2-1 2 )
where E,kl is the energy o f the h-th phase. Note that h now refers to the phase (solid, liquid, or gas), not to the element as in the preceding paragraph. Because energy is an extensive property, the energy o f the whole system is defined by
E = 2 E,kl (2-13)k
circumstances the external work performed on the h-th phase is reversible, equals p(k) dv,k>, and
dE = bq(kl- p tk>d V H> (2-14)
where 5q,kl is the heat absorbed by the k-'.n phase, ptk> is the pressure o f the k-th phase, and dVlkl is the differential increase in volume o f the phase during the process producing the change dE,kl inE tk>..
The second law q f thermodynamics fo r an isolated system can be stated as follows: There exists a function of the state of a uniform phase called the entropy which is conserved for any reversible process and which increases for any irreversible process over ail o f the phases participating in the process. For an infinitesimal process
2 dS<k> > 0 (2-1S)
where S,k> is the entropy o f the A-fnphase. The equality sign refers to a reversible process and the inequality sign to an irreversible one. Because entropy is an extensive property, the entropy o f the: whole system,^ defintSTpy
S = 2 SW (2-16)
The statement o f the second lav completed by the further assumption that ror a particular phase participating in a reversible process
dS,f>) _||rt>
(2rl7 )
where Ttk> is ti-e temperature o f the uniform k th phase and 6 ?,k) is the heat absorbed by the phase from its surroundings in the reversible process producing: the change dSlk> in S<k>. Then Eq. 2-14 can be written
We shall here lim it consideration to the case in which all o f the work done on a phase is produced by the pressure exerted on the phase. We suppose that the phase is in pressure equilibrium with its surroundings in the sense that i f the pressure exerted by the phase on its surroundings is p, the pressure exerted by the surroundings is p + dp or p - dp. Under these
dE<kl = Tik,dS,k> - p<k,dV(k> (2-18)
for a reversible process.Note that toe summation o f Eqs. 2-12 and
2-15 is over all o f the phases performing work or exchanging heat during the process, and the total system described by these equations is an isolated system for which the total volume is
2 -6
AMCF7M-1M
constant and tho,,'ih the boundary o f which no heat flows.
In textbooks on thermodynamics, it is shown that a general (reversible or irreversible) infinitesimal change in the energy Etk> o f a phase k can be written
dEm „ j/W jgW _ p<l’>dVhl (2-19)
+ MTp]k,dnlk>
dS » ZdS0" , dll = XdHlk>
d V = I r f v " " , dF = JcIF"1'A *
dE - EdE<k> , <JG - 2dG w <r a
(2-23)
When the definitions o f Eqs. 2-20, 2-21, and 2-22 are differentiated and combined w ith Eq. 2-19, we obtain
where Af is the total mass o f the system (not the gram-molecular weight as in the previous paragraph) ujkJ is called the chemical potential o f the k-th phase o f the i-th constituent. Equation 2-19 can be shown to be compatible w ith the fir s t and second laws of thermodynamics.
I f independent variables other than the entropy and. volume are to be employed for a particular system, it is convenient to define new extensive variables: enthalpy, Helmholtz free energy, and Gibbs free energy. The new state variables are defined in terms o f quantities already introduced; they do not provide additional information concerning the state. The characteristic function fo r die independent variables entropy, pressure, and the mole numbers is called the enthalpy, denoted by if, and defined fo r a phase k by
H<k> - Elkl + p ' " V w (2-20) 1
F o r the independent variables—temperature, v o lu m e , a n d th e m o le n u m b e rs —-the characteristic function is called the Helmholtz free energy, denoted by F, and defined for a phase k by
f <kl a £<k) - 'ftk,^kl ( 2 -2 1 )
For the independent variables—temperature, pressure, and the m ole numberr-the characteristic function is called the Gibbs free energy, denoted by G, and defined for a phase k by
G<k> ~ „ j fr ig fw (2-22)
For any infinitesimal process o f the whole system the extensive properties satisfy the equations
du"'1 „ + v“»dp"‘i +
i f * ’ . - Sli,d7/il V W - ' +■ M ^ d f 1
dG,k> » - Slk,dT"" + v'k,dpm + MXit,kldn,kl
(2-24)
For a particular phase, the chemical potential can be defined by any one o f the relations
tk)
M M
i ) r M van,
sj>.
H I(2-25)
I f the system consists o f a single pure phsse, Eqs. 2-19 and 2-24 can be written
dE ■■
dH-
dF •
dG
TdS - pdV
TdS + Vdp
- S d T - pdV
- SdT + Vdp
(2-26)
when it is unnecessary to retain the superscript label o f the phase. These expressions, fo r any infinitesimal process involving only a single pure phase, satisfy the first said second laws as expmsed by Eq. 2-18,
The variations o f Eqs. 2-23, with Eqs. 2-19 and 2-24 are arbitrary, except that the variationsdn,l k> must sa tis fy the stoich,__ ;etricconditions, Eqs. 2-10, which we write in the form,
SSPudnlk> - 0 (2-27)
When the assumption is made that a process occurs at fixed composition, these connections
2-7
A M C f 706-180
are automatically satisfied since
dn,"" = 0 (2-28)
for all i and k by definition.The equilibrium.conditions are the conditions
under w,.ich a process in an isolated system—as described by Eqs. 2-23 and 2-24, and subject to the stoichiometric constraints o f Eq. 2-27~-is a reversible process, i.e., satisfies Eqs. 2:12 and2-15. The analysis for the case of. fixed c o m p o s i t i o n is g iv e n in standard thermodynamics textbooks, e.g., that o f G uggenheim 3 . T h e analysis, when the stoichiometric conditions are expressed in the form o f Eq. 2-27, has been published by Brinkley*.
Both under constant composition constraint and under the constraint expressed by Eq. 2-27, the mechanical and thermal equilibrium conditions are obtained in the form
p,k> ** P 1(2-29)
T " 0 * T J
may be at constant temperature, or constant pressure, or both. It can then be shown! that Eqs.2-29 and 2-30 are the conditions that, a process be reversible when the process occurs at constant entropy and pressure, at constant temperature and volume, or at constant temperature and pressure o f the system o f interest. Eqs. 2-29 and 2-30 are thus the conditions fo r any infinitesimal process to be a reversible process and they are thus the general conditions equilibrium.
When Eqs, 2-28 and 2-29 are satisfied, the system is in mechanical and thermal equilibrium, but is constrained to constant composition. I t is a state o f partial equilibrium tbet may provide a good approximation to to- state o f a transient system if relaxation time, fo r equilibration o f temperature and pressure ire short and relaxation time's for equilibration o f composition are long compared to the time characterizing the transient nr.cure o f the system. When E *s. 2-28 ana 2-29 are satisfied, Eqs. 2-19, 2-23, and 2-24 can be written
dE - TdS - pdV
where p and T ere the uniform, pressure and temperature, respectively, o f the whole system. For the general stoichiometric conditions expressed by Eq. 2-27, the chemical equilibrium conditions can be obtained in the form
p f ' - RTZP,^ (2-30)
where the X; are parameters that can be eliminated between Eqs. 2-27 and 2-30.
In the derivation o f Eqs, 2-29 and 2-30 that has bean outlined, a process occurring at constant total volume and constant totalentropy in an isolated system was considered. The analysis can be extended to cases where the system o f interest exchanges heat with its surroundings or performs work on itssurroundings by conceiving o f an isolated system consisting o f the system o f interest surrounded by an additional phase and separated from It bya. membrane impermeable to the exchange o f matter but through which heat can betransferred or upon which work can beperformed, or both. I f the added phase is assumed to be so large that the exchange o f heat results in a negligible change in its pressure, then the process occurring in the system of interest
dH - TdS + Vdp
dF = - S dT- pdV
dG = - SdT + Vdp
.(2-31)
Eqs. 2-31 are identical with Eqs. 2-26 for a pure single phase. We conclude that the equations for an infinitesimal process in a mixture—which maintains thermal and mechanical equilibrium during the pmcets and also is constrained to constant composition-are identical with those for a single pure phase. .
When Eqs. 2-29 and 2-30 are satisfied, the system is in a state o f complete equilibrium. I t may provide a good approximation to the state o f a transient system if relaxation limes fo r equilibration o f temperature, pressure, and composition are all short compared to the time characterizing the transient nature o f the system, When Eqs. 2-29 and 2-30 are satisfied, Eq. 2-19 and the third o f Eqs. 2-23 can be combined to give
dE = TdS - pdV + sm iE X E m .a n 1!0J * k I ** *
In view o f Eq, 2*27, this expression reduces’ to
AMCR 706*180
dE = TdS - pdV
Similarly, Eqs. 2-23 and 2-24 expression
dH = TdS + Vdp
dF - - SdT - pdV
dG - - SdT + Vdp
lSW 2 )
result in the
(2-33)
Eqs. 2-32 and 2-33 are identical with Eqs. 2-26 fo r a pure single phase. We conclude that the equatioru for an infinitesimal process ,,j a mixture that maintains equilibrium during the process are identical with those for a single pure phase.
Using Eqs. 2-29 and the extensive nature of the enthalpy find free energy functions, we can also write
H = E pV .
F = E - TS (2-34)
G = H - TS
fo r a mixture. These expressions have the same form as the,definitions given by Eqs. 2-20,2r2l, and 2 -2 2 fo r a single phase.
The energy and enthalpy are undefined to the extent o f an arbitrary additive constant. The entropy is undefined to the extent o f an additional: arbitrary additive constant. The free energies are thus undefined to the extent o f an additive constant and an additive linear function o f temperature. In practice, this lack, of definition occasions no difficulty since one is always concerned with the energy or entropy difference between two states and these differences are completely defined. The lack of definition can be removed by defining for each constituent o f a mixture a standard state in which energy and entropy are arbitrarily assigned the value zero. I t is not necessary that the standard state be physically accessible, provided a process can be defined that will produce the state o f interest from the standard state and for which the change in energy and entropy can be calculated.
Now suppose that the entropy and volume are known as functions o f the independent variables pressure, temperature, and the mole numbers n(,i.e., that the functions represented by,
s = s(p, T; nt , - n )
v » v(p, T; nv - n t )
are known. The the sake o f definiteness, we employ the specific entropy and specific volume. I f (1) the system is a single pure phase, if (2 ) the system is a mixture constrained to. constant composition, or if (3 ) the composition o f the system satisfies the equilibrium and stoichiometric conditions at all values o f p and T\ we may regard the entropy .and volume as implicitly prescribed functions o f p and T only,
s = s{p, T)(2-35)
v = vip, T)I f a standard state has been defined, the third o f Eqs. 2-33 end the information summarized by Eqs. 2-35 suffice to evaluate the Gibba free energy as a function o f pressure and temperature. Therefore, the function
g = g(P, T)may be regarded as known, where g is the sp ec ific Gibbs free energy. The other thermodynamic properties-are then also known. In particular, the apecifit energy can be regarded a known function o f pressure and, temperature aa expressed by
e(p, T) = g(p, T) + Ts(p, T) - pt/(p,T) (2-36)
Similarly, it may be supposed that the entropy and pressure are known as functions o f the independent variables volume, temperature, and the mole number; n(,
**■ a(u, T ;nx, - n )
V = P(c. T; ns , - f t )
Under these circumstances, wo may regard the entropy and pressure as implicitly prescribed functions o f v and T only, i.e.,
s = s(v, T)(2-37)
P = P(c, 2')I f a standard state has been defined, the second o f Eqs. 2-33 and the information summarized by Eqs. 2-37 suffice tp determine the specific Helmholtz free energy as a function o f volume and temperature
f = flu. T)
AMCP 706-180
The other thermodynamic properties are then also known. In particular, the specific energy can be regarded: a known function o f volume and temperature, as expressed by
e(v, T) = f(v, T) - Ts[v, T)
Either of the expressions
v = ti(p, T; /ip •••«,)
P “ /?(«. T; (Jp •■■«,)
(2-38)
(2-39)
represent a relation between pressure, volume, a id temperature that is called an equation of state. Either of the repressions
s = s(p, T; n y , -n )
s = s(u, IV nt , ... n .)(2-40)
can be evaluated if an equation o f state and certaiin thermal data, to be specified later, are known. The information summarized by Eqs. 2-i'J is sometimes called the caloric equation of state, although these data cannot usually be expressed in analytical form.
A similar discussion results i f the pairs (s,p) aiid (s,u) are considered as independent variables. The energy is most naturally, from a purely thermodynamic standpoint, considered a variable o f the latter pair. However, except in an approximation to be noted later, equation o f state and thermal data are always presented in the forms summarized by Eqs. 2-39 and 2-40 so that the energy, regarded a function o f entropy and volume, is determined parametrically by Eq. 2-38 or by Eqs. 2-36 and 2-37.
W e conclude that the thermodynamic state o f a system is uniquely determined by the values o f two independent properties o f the system (state variables) i f the laws o f thermodynamics, an equation o f state, and the thermal data summarized by one o f Eqs. 2-40 are simultaneously satisfied and i f the system consists o f a single pure phase, a mixture constrained to constant composition, or a m ixture whose composition satisfies the stoichiometric and equilibrium conditions at all values o f the independent state variables. The state o f a system is uniquely specified in this way from purely thermodynamic considerations under no other circumstances.
2A G E N E R A L T H E R M O D Y N A M I C IDENTITIES
To determine the thermodynamic properties (such as energy, pressure, enthalpy, temperature; specific heat, etc.) o f an actual system, it is first necessary to define or to determine its composition. I t is also- necessary to know the equation o f state o f the gaseous mixture and the equation o f »uiw> o f each phase present. Then the thermodynamic properties are determined by the general relations to be summarized in .this paragraph. These relations are described by partial derivatives o f thermodynamic quantifies. To determine the properties themselves, the derivatives must be integrated along some thermodynamic path. Examples o f such in teg ra ted expressions are presented in Appendix A.
The general thermodynamic relations are derived fo r a heterogeneous mixture. First the partial derivatives o f volume with respect to temperature and pressure, .'re derived, end then the derivatives o f pressure with respect to volume and temperature are derived. Then specific heats, and derivatives o f entropy, energy, enthalpy, and chemical potential are considered. Finally the adiabatic exponent and the sound speeds, are derived.
The equation o f state o f a heterogeneous mixture is constructed from thep-u-T relations for each of the constituent phases, making use of the fact that the volume Of a .mixture is the sum o f the volumes o f its constituent phases. We will let u denote the' specific volume of a mixture, VJ the molar volume o f the j-th condensed component, and r the volume o f the gas phase fo r unit weight o f mixture. For a homogeneous system consisting o f a gas phase only, u =• r . Iri.generai, we consider
v = r + SnJV) (2-41)
since we have restricted our discussion to mi ctures in which ar-y condensed phase consists o f a pure component.
The equation o f state o f a pure condensed phase is an expression giving
Yj = Y, IP, T) (2-42)
The dependence o f the molar volume o f a pure
2 -1 0
AMCP 706-180
condensed phase on pressure and temperature is usually determined for each substance by experimental measurements, and tne data have been represented by a variety o f empirical equations. Without such data, the molar volume o f' a pure condensed component may be regarded—as an approximation—a constant, and at temperatures and pressures far removed from ordinary values treated as an adjustable parameter.
The equation o f state o f a gas phase may be an expression giving
t “ T(p, T ;n l t - n t) (2-43)
Later we consider the case where pressure is a function of T, T, and the n’s. The partial molar volume of the i-fh gaseous constituent is defined
by - k \V< W J (2-44)
-T w -w ana»a l . V is a f i i n p h n r j f * f t i i o . f i i r m . V•/.v% T '
nv In textbooks on thermodynamics, it is shown that
r » Sn,lf (2-45)
Therefore, Eq. 2-41 can be written
v - Xn.V. + Zn'v! (2-46)i l l j 1 i
when the equation o f state o f the gas phase is explicit in temperature and pressure. The partial derivatives o f the volume with respect to temperature and pressure and at constant composition are
+ Zn' l ‘ 3T
( SV!* s « l ( r )
(2-47)
where the subscript n means that the differentiation is to be performed at constant composition. Equilibrium partial derivatives of the volume with respect to temperature and pressure are related to the derivatives at constant composition by
where the equilibrium nature o f the derivative is indicated by omitting the subscript u. The derivatives o f the mole numbers with respect to temperature and pressure are to be determined from the variation o f the equilibrium composition with temperature and pressure. Their explicit evaluation is described in Appendix B.
Alternatively, the equation o f state o f a gas phase may be an expression giving
p = p (r , T; nt , — n ) (2-49)
I f the system consists only o f a gas phase, so that, r — u the evaluation o f the. .equilibrium, partial derivatives o f pressure with respect to tem pera tu re and m ixtu re vo lum e is straightforward. I t is convenient to define
(2-50)
(p, is not a partial molar quantity). From the ordinary rules o£ differentiation, we obtain the relations,
The derivatives o f the mole numbers with respect to temperature and gas volume are to be determ in ed from the variation o f the equilibrium composition fo r changes in these variables. I f the mixture is heterogeneous, the /xpressions for the partial derivatives of the
pressure with respect to temperature and mixture volume are o f an awkward form because o f the muted character o f the equations o f state. To evaluate them, we first evaluate the quantities
2-11
AMCP 706-180
Eqs. 2;52 are obtained by differentiation o f Eq. 2-41. Then .the fixed composition partial derivatives o f the pressure with respect to temperature and mixture volume can be obtained.from identities.
Wa. .nvryirwwi. ,jw a-eimilov m arttsnr fA.mrsjInaio. thd
equilibrium partial derivatives. From Eq. 2-41, we obtain
Then the equilibrium partial derivatives o f pressure with respect to temperature and mixture volume can be obtained from the identities o f Eqs. 2-51, written for the equilibrium derivatives by the elimination o f the subscript n.
A secondary thermodynamic property is the heat capacity. I f a system is heated from temperature T to T + dT, the heat absorbed 5 q by unit weight o f the system is evidently proportional to ciT
Sq = c d T
where c is the heat capacity per unit weight. I f the changes taking place in the heating process are reversible, we may employ Eqs. 2-16, 2-17, and the second o f Eqs. 2-29 to write
Sq - X Sq ’ « Tds = cdTk
where s is tire specific entropy. I f the volume is held constant during the heating process, the
quantity c is called the specific heat capacity at constant volume and denoted by cu. If ' the pressure is held constant during the heating process, the constant c is called the specific heat at constant pressure and denoted by c .
(2-65)
I f in addition to pressure or volume the composition is assumed; to remain fixed during the heating process, the heat capacities are called the heat capacities fo r constant composition, or more shortly, the ‘ *frozen” heat capacities. They can be denoted by e0 n or >c n, where
'2-56)
p, nThe expressions for specific energy e and specific enthalpy h (from Eqs. 2-26) can be written
de » cdT - pdu , dh = cdT + edpvalid either for a change between equilibrium states or for a change at constant composition. It follows that alternate-definitions for the.heat capacities are given by the expressions
(2-57)
p,n
To evaluate the frozen heat capacity at constant volume for a heterogeneous system, we introduce the abbreviation
he°T,n 3 T> r.n
and employ the identity
- f t j r.n
(2-53)
(2-59)
2 1 2
AMCP 706-180
Expressions for the quantities cT n and (de/dr)^ n are given in Appendix 'A, and expressions fo r the derivatives of the mixture volume are given by Eqs. 2-52.
To calculate the equilibrium heat capacity at constant volume fo r a heterogeneoUisystem, we employ, the quantity cT,
where we have introduced the abbreviation
( 2-61)
and where E'. is the molar energy o f the i-th condensed component. The quantity ■El is not a partial m o!«r quantity. An. expression for E, is given in Appendix A . Then cv can be obtained from the identity o f Eq. 2-59, written fo r the equilibrium derivatives by the elimination o f the subscript n.
An expression connecting the frozen and equilibrium, heat capacities at constant pressure can be writtenih the form
(2-62)
where Rt is the partial molar enthalpy of the i-th gaseous constituent
(2-63)
and where Rj is the molar enthalpy of the i-th condensed component. Expressions for the c B and R f are given in Appendix A . '
We shall have occasion to employ the fixed composition partial derivatives o f several thermodynamic functions with respect to temperature and pressure or with respect to temperature and volume. They can all easily be obtained from the definitions o f the functions
and the thermodynamics laws by application o f the rules for partial differentiation. For purposes o f reference, we list certain o f these relations without derivation. The derivatives o f entropy with respect to pressure and volume at constant temperature are .
The derivatives o f energy and enthalpy with respect to volume and pressure, respectively, at constant temperature are
Eqs. 2-64 and 2-65 complement Eqs. 2-56 and 2-57. The partial . derivatives o f the, chemical potential o f the i-th gaseous constituent can be written .
3(H./T)- y f
( 2-66)
w y T )
L 3T J= - f t / r 2
Similar relations apply to the chemical potential o f a pure condensed phase,
- Vatft'/T)
ST~_= - y f 1
2-13
<AMCPTOe-180
Derivations o f these relations can be found in thermodynamics textbooks.
A relation between the fixed composition heat capacity at constant pressure and that at constant volume can be obtained'in either o f the • equivalent forms
(2-68)
the first o f which is convenient fo r the independent variables ii and T, and the second o f which is convenient for the independent variables p and T. It can be shown that an expression o f the same form connects the equilibrium heat capacities
(2-69)
The adiabatic exponent K is defined by _ v jdp\
P w ,(2-72)
This exponent its used to describe the.adiabatic expansion o f gaahs; For detonation products k has a value o f approximately 3, and for perfect gases K ■ 7 .
By use o f the thermodynamic identity
- V l“ 7
Eq. 2-72 can be written
/v\ /3p\k = - 7 (2-73)
An adiabatic exponent for fixed composition iq,...........
■ - T
where the equilibrium didvatives o f pressure or volum e are employed in evaluating the right-hand side o f the equations.
The ratio o f the heat capacity 7 at constant pressure to that at constant volume can be defined fo r either the frozen.heat capacities or fo r the equilibrium heat capacities. We definethe quantities ___ . %
4 7 % K |
} (2-70)7 = c lc' n p , n l U.R
Using Eqs. 2-68 and 2-69, following useful relations:
w e obtain the
(2-71)
17
I f Eqs. 2-73 and 2-74 are combined with Eqs. 2-71, we obtain the useful expressions
_ v_ fdp\ vT /opY
*" P W Tj„ + P%„ \dTjun
■K 1 (HE\ + — (& Yp \dv/T pc, \BT/V
(2-75)
i _ P /3lA pT /diA2k u \dp)T vcp \3T/p
The sound velocity c is defined by
(2-76)
where p « l/o is the density o f the mixture. A fixed composition or frozen sound velocity cn ean.be similarly defined by
\
i
!i
i
l2-14
AMCP 708-180
Eqs, 2-75 can be combined with the definition o f the sound velocity to obtain useful expressions relating this quantity to the derivatives o f the equation o f state, We obtain the relations
P h ys ica lly , the fro z e n sound velocity corresponds to the velocity o f propagation o f sound waves in a limit, attained at high ftequency and the equilibrium, sound velocity corresponds to the propagation velocity o f sound waves in a limit attained at low frequency.
A d if fe re n t ia l c o e f f ic ie n t which is complementary to the adiabatic exponent K and which is useful in analysis where volume and entropy are taken os independent variables can be defined for an equilibrium system by
(2-79)
and for a system constrained composition by
-
T V * A '
to fixed
( 2-80)
These quantities are related to derivatives o f the equation o f state by
It is sometimes useful to regard the energy as a function o f pressure and volume, with the partial derivatives
(2-82)
which define the coefficient \ for a system constrained to fixed composition and the, coefficient X for an equilibrium system. The corresponding derivatives o f the energy with respect to the pressure are '
The coefficients X,(3, and K are not independent, but are related by file expression
An analogous relation exists' between file corresponding coefficients fo r a system o f fixed composition,
Integrated expressions for the thermodynamic properties o f a gas mixture, o f a condensed phase, and o f a composite heterogeneous system are derived in Appendix A . These expressions give the property o f interest as the sum of two terms: the first is the value fo r an ideal system and the second is the contribution arising from the nonideal nature o f the actual system. Terms o f the second type involved integrals o f the equation o f state. In Appendix D, we list the gas imperfection contributions to the various thermodynamic properties as evaluated for several equations o f state that have been employed to describe properties o f the explosion products o f explosives.
It has been noted that the equilibrium mixture is often employed to represent the composition o f real mixtures o f explosion products. The composition of this mixture is determined by the stoichiometric conditions, Eqs. 2-10, and by
2-16
AMCP 706-180
the chemical equilibrium conditions, Eqs. 2-30. Because Eqs. 2-10 are linear in the mole numbers, while Eqs. 2-30 are linear in the logarithms o f the mole numbers, an iterative procedure must be -employed to determine the equilibrium mixture. A general method to solve these algebraic equations is formulated in Appendix B. This method can be employed as the basis for a computer program o f very broad application, but it is not well adapted fo r hand Calculations. In Appendix C, there is presented a simplified method o f computation for systems containing compounds o f carbon, hydrogen, oxygen, and nitrogen in which, with the chemical nature o f the system specified, it is possible to achieve a partial separation of the variables and thus to simplify markedly the computational process.
2-5 A P P R O X I M A T I O N S F O R TH E THERMODYNAMIC PROPERTIES ON AN ISENTROPE
I t is possible to perform an exact calculation o f all o f the properties o f the system, provided that the equations o f state exist for the various phases comprising the system. This calculation, however, involves a large number o f successive numerical steps, and the dependence o f a property such as the energy on the independent state variables such as entropy and volume, i.e., the function e(u,t) is obtained implicitly and not analytically. For some theoretical investigations, there is a need for approximate analytical expressions o f such functions.
For an ideal gas o f constant composition, the adiabatic exponent defined by Eq. 2-74 is equal to the ratio o f the heat capacity at constant pressure to that at constant volume, x = 7 . The then; properties o f an ideal gas are frequently represented with sufficient accuracy by the assumption that 7 is a constant. Such a gas is ca lled an id ea l p o ly t r o p ic gas. The thermodynamic properties of such gases can be expressed in relatively ample form and the approximation lias been extensively employed in the development o f the hydrodynamics o f compressible fluids such as air fo r which at moderate temperatures and pressures the polytropic assumption is a good approximation.
For the products o f condensed explosives, it has been experimentally found that the
a d iaba tic ex p on en t 7 is, to a good approximation, independent o f the density and a function o f entropy only fo r a considerable range o f pressure. I t seems proper to designate as a nonideal polytropic gas any gas foe which k is constant on an isentrope.
I f the adiabatic exponent is a function of entropy only, Eq. 2-72 can be integrated along a path o f constant entropy with the result
p = Av~ * = Ap “ (-2-85)
where p = 1/u is the density and A ? A(a) is a function of entropy only. Eq. 2-85 can also be expressed in the form
P(u.s') = P V A O = p '(PIp ') (2-86)
where p ' = p(v',s') and K = k(s'). From Eq. 2-32, (de/dv)t = -p . Using Eq. 2-85 and integrating along a path o f constant entropy, we obtain
.4 PV . „K -----------1/ -r a ---------- L> 14-01 f.K - 1 K - 1
where B = B(s) is a function o f entropy o<iiy. Eq. 2-87-car: also be expressed in the form
e = e ' + —-— (pu - p V ) 1,2-83) K - 1
where e ' = e(v',s'). The enthalpy h e + pv is given by
h = ( “ j pu + B\K - V (2-89)
= h' + ~ r~ j ( P v ~ p 'v')
where t i = h(p’a'). By using Eq. 2-76, the sound velocity c can be introduced into Eqs. 2-87 and 2-89 with the result
cs = kpv = k(k - l ) ( e - B )
= ( « - 1 )(h - B)(2-90)
2-6 HYDRODYNAM ICS OF REACTING CONTI NUA
The fundamental differential equations o f motion for a reacting fluid are derived in this paragraph. For ons-dimensionai problems they are simplified to the usual Euleiian and Lagrangian equations. In par. 2-7 the r.iethod o f
AMCP ?06-Ttf0
characteristics is applied to the one-dimensional problem. The treatment o f shock waves as discontinuities is given in par. 2-8 .
In the macroscopic description o f a physical system, the information concerning the state at one instant o f time may be considered adequate i f one can obtain from it a reasonable description, o f the state at some later time. It is assumed that the process can be performed in series (making each estimate from the previous estimate) over subintervals o f the desired time interval .with die final, result insensitive to the length o f the subinterval. One expects the procedure to fail fo ; information o f a given typo i f the subintervals become much smaller than a critical time interval, characteristic o f the system and o f the type o f information, which can be called the “ time resolution” . This paragraph is confined to the consideration o f systems and of time resolutions fo r which adequate information consiuV o f a knowledge o f the spatial distribution o f the following densities:
(1 ) The concentrations pn, expressed in moies per unif volume of each o f the chemical constituents o f the system, where p is the mass density.
(2 ) The momentum density m “ pis', where i?is the (vector) particle velocity
(3 ) The total energy density p(e + u?/2), where e it the specific energy as measured by an observer moving with the fluid and u* /2 , u1 “ ! ? l * . is the specific kinetic energy o f mass motion.as measured by a fixed observer.
We simplify the system at the outset by making several assumptions:
(1 ) The velocity o f each individual species is that o f the mixture; therefore the diffusion o f gaseous species is neglected and any condensed species is completely entrained in the flow.
(2 ) Heat conduction is neglected.(3 ) The fluid is inviscid; hence no energy is
dissipated by mechanical processes except across shock discontinuities.
(4 ) The only force acting on the fluid is the hydrostatic pressure (gravity and other body forces are neglected).
These four assumptions produce a valid model for the flows with which we are principally concerned, where, the bulk velocity o f the fluid is large compared to relative velocities o f heat and diffusion, The model without heat conduction or diffusion is not gn accurate one
for the flow associated with ordinary flame propagation. For derivations of the flow equ ations in w h ich these simplifying assumptions are not made, reference is made to a review by Richardson and Brinkley*.
The next step is the derivation o f the rate of change o f any property o f the fluid. Consider any vector or scalar property o f position and time, G(r\t), whereT is the position vector and V is a movile volume whose surface a moves with velocity it. Now, the total rate o f change is separated into a partial derivative with respect-to. time and a convective term (fo r this derivation, see Band?, for example).
Yt f GdV= f ^~dV + j~Gu • da (2-911 J y J y J d
where da = n da, n is ar. outward pointing normal to the surface, do is a differential surface area and Git is interpreted as a dyadic if G is a vector (see Gibbs10 fo r an introduction. to dyadics). The left hand term expresses the time rate o f the quantity G averaged over the volume V. It is equal to the sum o f the: contributions o f each stationary volume element dV and the changes associated with the movement o f the surface. I f the velocity vector it is defined everywhere in the volume, the surface integral may be transformed with the aid o f the Gauss: integral theorem and w e obtain the general kinematical relation,
f °"' /Iv v L
+ V • (uG) dV (2-92)
Consider an arbitrary mobile volume V whose surface moves with the particle velocity u. In the absence o f diffusion, the time rate o f change of the species i in V can be written
J t f p n , dV = f RtdVv J v
(2-93)
where it, is the reaction rate. Using Eq. 2-92, we have
+ V • (upnt) - Rt dV = 0 (2-94)
Since the surface o f the volume moves with velocity it, the total mass in V is conserved
2-17
AMCP 706-180
d_lit + V ■ (pu) dV= 0 (2-95)
Considering again the mobile volume V previously defined, one can obtain the equation for momentum transport by a straightforward application o f Newton’s second law o f motion. According to this law, the total force acting on the mass o f fluid in V is <..;ual to the rate o f change o f linear momentum o f the fluid in V. For an inviscid fluid in the absentia o f body forces, we have
I P“ d V (2-96) • v
since the force normal to the area da is -p n . Using Eq. 2-92 with 0 ™pu, we have
/ + V ■ (itPM) + VP d V = 0 (2-97) d t -J
where the integral o f the pressure over the surface is transformed to a volume integral by the use o f Gauss’ theorem. The time rate o f change o f the total energy is equal to the rate at which work is performed on the material in V i f the conduction o f heat is neglected. Thus,
u pie + u da (2-98)
Again using Eq. 2-92 and Gauss’ theorem to transform the surface integral, we obtain
naj [ p ( e + u2/ 2) + V . « ( « + u212),
+ V ■ (u p ) ] i dV = 0(2-99)
The volume V o f Eqs. 2-94, 2-97, 2-99, and 2-93, is arbitrary. Therefore, the integrands o f each expression must equal zero, giving
-£■ * v . (up) - o mass conservation
* v . (Jp?) » - w momentum 31 conservation
£ [p(< + u*m]+ V . i7p(e * ua/2) - - V. (up)
energy conservation
+ O • (ups,) - «,
■ (2-100)
2-18
The equation o f mass conservation is used to simplify the other three equations, and the energy equation is further simplified! by using the m om entum equ ation . A fter some manipulation, Eqs. 2-100 become
dp -p-7 T + V • (up) = 0 ot
Ou 1— + u • Vu = - -V Pot p
de -+ P -r— + u ■ Ve -------V • uot pOn,
( 2-101)
dt+ u • v « , = /?,Ip
A more familiar form of these equations o f hydrodynamics i? obtained by introducing a total time derivative by the definition
± = 1 X i? s v ( 2;1 0 2 )dt dt
by means o f which the rates o f change are measured by an observer moving with the fluid. Then Eqs. 2-101 become
dp _ -*■ - mass—■■ + p V • u = 0 dt conservation
dlt 1— ■ + - VP = 0 dt p
momentumconservation
de o da----- --- --- ss Q energydt p2 dt dn.
i r - R>lp
conservation
) (2-103)
and the last equation can be taken as a definition o f the quantity it,. Rates/?, o f production o f the constituents o f the mixture are not all independent but most obey the stoichiometric conditions o f par. 2-2. Thus; only s - c o f the quantities /?, may be regarded as independent.
The further development o f the theory o f irreversible processes o f nonUniform systems that are not in equilibrium is based on two assumptions: (1) temperature T and chemical potentials p can be defined as functions o f the fundamental densities pnr pu, and p(e + u2/2 );(2 ) T and jj( can, to a good approximation, be
AMCP709-180
regarded as point functions o f the fundamental densities. To simplify the development, we shall assume initally that all infinitesimal processes, including chemical .ones, in a given volume element are reversible. (Later, we shall explore the analysis without this assumption.) With this, assumption o f reversibility we can regard a given volume element as being in equilibrium. The assumption o f local reversibility makes it possible to employ the thermodynamic relations between the various siate variables in a nonuniform system.
Eq. 2-19 fo r a general change in the energy can be written
de~dt
R. (2-104)
(For simplicity, we assume that the system is a gas mixture. Our conclusions are unchanged if condensed phases are present, although the atLumptions o f this paragraph require that such phases be completely entrained in the flow .) The reaction rates must satisfy the stoichiometric conditions, Eqs, 2-27, and therefore
(; - 1, 2, ...c) (2-105)
Now, i f chemical changes in the system are reversible, the equilibrium conditions, Sqs. 2-30, are satisfied, and Eq. 2-194 can be written
de
dt+ - - 2A^/)yi! ((2-106)
Therefore, i f all o f the changes, including chemical ones, are reversible,
(2-107)
Combining this equation with the energy transport equation 2-103, it follows that
Eq. 2-108 states that the entropy contained in an element o f fluid, does not change as the element move* i f diffusion and heat conduction are negl; ;d, i f the dissipative effects o f viscosity t neglected, and if all changes in state o f the element are reversible.
I f the processes represented by Eq. 2-104 are no t reversible, the assumption of local equilibrium h no longer possible. In considering
a single element o f volume one must now em p loy a quasi-therm odyn am ics , the justification o f which is beyond the scope o f this paragraph. However, the results arc that one can define a specific entropy s such that fo r a fixed volume element
Td (p i) = d(pe) - 2p,d(pn,) (2-109)
in which T and p, are calculated as though the element were in thermodynamic equilibrium. This expression can be transformed.to
Tds » de - dp - Tp( drt! <2-110)
where p ' m p^ s - e + s p( dn(J
t h e q u a n t i t y p ’ 1? ev id e n tly the thermodynamically defined pressure. In general, it differs from the dynamic) defined quantity o f this paragraph because 51 the irreversible chemical rsacitons. I t is usually a good a p p r o x im a t io n to assume th a t the thermodynamic and dynar - pressures are identical. Then the equation fo r entropy transport becomes
I f chemical reactions are irreversible, the entropy contained in an element o f fluid changes in accord with Eq. 2-111 is a consequence o f the entropy increase during an irreversible process,
A steady flow is defined as one in which all o f the partial derivatives with respect to time are zero. A flow is called subsonic, sonic, or supersonic at a point as u * I o ' I is less than, equal to, or greater than the velocity o f sound c at that point in the particular coordinate system being used,
Sqs, 2-103 are to be solved subject to initial and boundary conditions and to a specification o f the state o f the fluid, i.e., a knowledge of the function
e » e(p, p ; ....)
I f all o f the processes occurring are reversible, so that the energy transport equetion can be replaced by the entropy transport equation as expressed by p.q. 2-108, then the state of the system is auffim. ntly specified i f the function
P = P(P, s)
2-19
AMCP 706*180
is known. Under these circumstances,/Eqs 2-103 can also be expressed in the form
i mc2 \dt)
+ P 7 . u = 0
da
dt © W 0 ( 2-112)
dudt
© ■ '
7 © "
where u is the particle velocity in the x -d ire c t io n . The Eulerian equations for one-dimensional, radial flow with spherical symmetry can bo written
dpdt
0»— = 0 dl
which involves derivatives o f only the pressure and particle velocity.
Eqs. 2-103, and their alternative forms are c a l le d th e E u le r ia n equ ation s o f h ydrod yn am ics. When supplemented-as previously mentioned by initial and boundary conditions and by an equation o f state, they can isv principle be solved to determine p, p, and i f regarded as functions o f position and time. The initial conditions consist o f a knowledge o f these quantities as functions o f position at some time which is taken as the initial instant. Boundary conditions are of two types, kinematical (velocity and displacement conditions) and physical (pressure). A kinematical condition is the requirement that the components o f velocity normal to an interface be equal on both sides o f the interface. A physical condition that must be satisfied by an inviscid fluid in contact with a rigid boundary is that the pressure shall be normal to the boundary. In the case o f two inviscid fluids presenting a surface o f separation the physical condition to be satisfied is that the pressure shall be continuous at the boundary in passing from one side to the other. The surface separating two fluids or the same fluid at different densities is called a contact surface.
The equations of hydrodynamics comprise a system o f partial differential equations o f the first order that are quasi-Hnear, i.e., the partial derivatives appear linearly. Formal solutions o f these equations can be obtained only in special cases.
As an example, the Eulerian equations o f hydrodynamics for nondissipative (ds/dt = 0 ) flow can be written for motion in one dl in the form dp
— + pdt P
du — + dt p
■ © * ?
7 © "
0(2-114)
where u is now the particle velocity in the direction o f the radial coordinate r.
There is another mode o f expression o f the fundamental equations called the Lagrangian form, th e label coordinates o f a point may consist o f its position coordinates or Eulerian coordinates at the initial instant o f time. Thus a partial derivative with respect to time at constant values o f the label coordinates has the same meaning as the operator d/dt in Eulerian coordinates, and
-t 3r u " at
where r is the position vector o f a point at time t. The Lagrangian representation is especially useful for problems in which interfaces and boundaries must be preserved,and in which high precision in the conservation o f mass and momentum is desired. Lagrangian is generally superior to Eulerian for one-dimensional problems but not necessarily fo r two- or three-dimensional problems.
As an example o f the Lagrange representation, we may consider the case o f plane flow in one dimension and let the label coordinate of a particle x o to be vhe value o f its position (Eulerian) coordinate x at t » 0. The particle velocity is given by
u * (3x/3t)x (2 -H 5 )
The form taken by the equation o f continuity in Lagrangian coordinates is meat easily deduced for the particular initial circumstances o f the fluid. Suppose that the fluid is initially uniform with constant density po . The conservation o f mass can be expressed by
(2-113)*tx0, o
\P„ = J P(x- 0 <**XlQ, t}
(2-H6)
2 -2 0
AMCP 706*180
M
where x(xo,t) is the Eulerian coordinate at time t o f the point whose Eulerian coordinate at t » 0 was x&, and x(o;t) is the Eulerian coordinate of the point that was on a plane through the origin at t = 0. Differentiating this expression with respect to xo at constant (, we obtain the Lagrangian equation of continuity for plane flow o f ah initially uniform fluid in the form
The Lagrangian equation o f motion for the same fluid in plane flow can be obtained from the second o f Eqs. 2-11-3 by the use o f Eqs, 2-115 and 2-117. We obtain
For nondissipative flow, the entropy transport equation has the form
( - ) - 0 ( 2-H 9 )
The Lagrangian form envisages the possibility o f obtaining a description o f the properties of th eflow , including the Eulerian coordinates, as functions o f the time and the label coordinates.
2-7 UNIFORMLY ISENTROPIC FLOW IN ONE DIMENSION
We will consider ah application o f the fundamental equation to a flow for which a formal solution is possible. The flow is considered to be in one direction—e.g., the x-direction—which means that the properties o f the flow are functions o f the x*coordinate only and independent o f the y - and z-coordinates in a rectangular coordinate system. Whenever there is a portion o f the x-t plane in which all the material is on tho same isentrope—i.e., when the m a te r ia l is u n ifo rm ly isen tro p ic or homehtropic—it is possible to transform the fundamental equations o ' par. 2*6 to another form that is due to Riemann.
For nondissipative flow as described by the entropy transport equation in the form o f Eq. 2-108, the pressure and the sound velocity vary within the flow as functions o f the density only. It is 'hen convenient to introduce the quantity
o = j (clp)dp
idol dp), = c/p
(2-120)
where the integral is along a path o f constant entropy and where c it> the sound velocity, defined by Eq. 2-76. The quantity o is undefined to the extent o f an additive constant w hich can be arbitrarily issigned fo r convenience o f calculation by the assignment o f a lower limit o f integration. Then Eqs. 2-113 and 2-108 can be written
Addition and subtraction o f the first tw o o f these equations yields the new set
[ i + (“ + C ) i ] (a + U)
f e + ( “ ' C ) ^ ] (° -fa a ] „v " + “ “ Is = 0
1.3 f 3*J
u) = 0 (2-122)
which is due to Riemann. The form o f Eqs. 2 - 1 2 2 suggests the definition of three characteristic directions—labeled C+, C_, and C —by the definitions
C,dxdt
= U + c
C . * L~ dt
u ~ c
Codxdt
= u
(2-123)
A characteristic curve in the x,t plane is defined as one that is tangent at every point to a characteristic direction. Thus, Eqs. 2-123 are the equations for the characteristic curves. The characteristics C'o are evidently the particle
2-21
X
AM Cf 700-1(0
paths in the x-t plane. With these definitions. Eqs. 2-122 can be interpreted as stating that on characteristic curves C+
r « 3 + u = constant (2-124)
on characteristic curves C_
s * a - u “ constant (2-125)
while on the particle paths Co ,. the entropy is constant. The entropy transport equation states that if -the entropy is initially constant, it will remain constant fo r flow without discontinuities in the x-t plane.
The quantities 7 and 7 are called the Riemann invariants. I f they are known at a given point, then u and a are known there, i.e.,
o « (F + *)/2
« - (F - F)/2(2-126)
From these, the density can be obtamed from Eq. 2-120 and the pressure from the equation o f state. For materials with a constant adiabatic exponent, as described in par, ’ -5
a - 2c/(<c - 1 )An especially simple case occurs for K * 3, since thena ■ c , T “ c +u, andT” c - '< .T h e first two o f Eqa. 2-123 become
Cdxdt
( * “ 3)
s
(2-127)
Since T is constant along curves C+ and T is constant along lines C_, Eqs, 2-127 can be integrated to give
C+ : * - rt + constant
C : x ■ - sf + constant
so that the characteristic curves o f each kind are straight lines for tc » 3. This case is o f practical interest because the explosion products for condensed explosives have an adiabatic exponent that is near the value 3 and, consequently, flows for vnich k ■ 3 present the qualitative feature o f the flows o f such gases.
In general, the characteristic curves have the following useful properties;
(1 ) There is a curve oi' each type through every point on the x-t plane.
(2 ) I f curves o f a given type having different values o f the invariant associated with that type intersect at a point, the flow cannot remain continuous because different values o f the dependent variables would be obtained i f one characteristic or the other were used in computation. Thus, there will be a discontinuity in u, pi etc. at that point.
(3 ) If, in a given region, s has the same value along adjacent C_ curves, the C+ curves are straight lines in that region. For 7 is constant along a C+ curve which will cross the C_ curves and if T is also constant along the C+ curves, both u and a, therefore u and c, and therefore the slope o f the C+ curves must be constant.
(4 ) Similarly, i f 7 has the same value along adjacent C+ curves in a given region, the C_ curves are straight lines in that region.
(5 ) A weak discontinuity (not a shock), i.e., a discontinuity in a derivative o f a function without a change in the function itself, is propagated into the flow from a boundary along a characteristic curve.
I f both the density and the particle velocity are known along a line in the x-t plane, then 7 and < and the two characteristic directions can be calculated for each point along the line. Such a line may be the x-axis, in which case the information on the line describes the initial state o f the fluid. Information may also be given as to one or more properties o f the flow along additional paths in the x-t plane. For example, ths path of a piston may be prescribed along which the velocity u ic known. Similarly, the path of a shock wave may be given along which, as we shall see, the density and particle velocity are known. It is necessary to consider briefly the amount o f initial and boundary information that is required, from which the propagation e q u a t io n s —E q s . 2-124 , 2-125, and2-126—uniquely determine the flow, I f a point following a given curve in the x-t plane moves supersonically with respect to the local flow,
,,e’ ’ \dx/dt - u I > c
then the curve is called spacelike; i f such a point moves subsonically with respect to the local flow, i.e.,
I dx/dt - ul < othen it is called timelike, and i f such a point
, i
2 -2 2
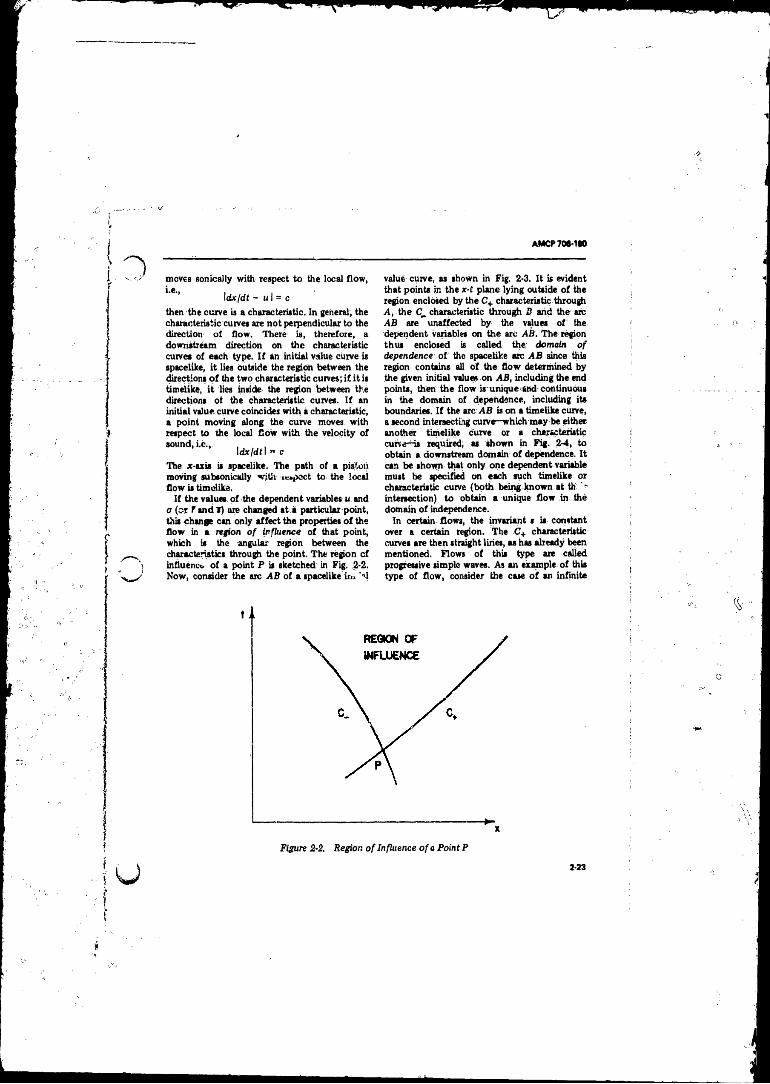
AMCP7oe-iao
moves sonically with respect to the local flow, i.e., , , .
Idc/dt r* u l = c
then the curve is a characteristic. In general, the characteristic curves are not perpendicular to the direction o f flow. There is, therefore, a downstream direction on the characteristic curves o f each type. I f an initial value curve is spacelike, it lies outside the region between the directions o f the two characteristic curves; i f it is timelike, i t lies inside the region between the directions ot the characteristic curves. I f an initial value, curve coincides with a characteristic, a point moving along the curve moves with respect to the local flow with the velocity o f
The x-axis is spacelike. The path of a piston moving subsonically with respect to the locai flow is timelike.
I f the values o f the dependent variables u and d (o r T sndT) are changed at a particular point, this change can only affect the properties o f the flow in a region of influence o f that point, which is the angular region between the characteristics through the point. The region c f influence o f a point P is sketched in Fig. 2-2. Now, consider the arc AB ot a spacelike in > 'd
value curve, as shown in Fig. 2-3. I t is evident that points in the x-t plane lying outside o f the region enclosed by the C+ characteristic through A, the C_ characteristic through B and the arc AB are unaffected by die values o f the dependent variables on the arc AB. The region thus enclosed is called the domain of dependence o f the spacelike arc AB since this region contains all o f the flow determined by the given initial values on AB, including the end points, then the flow is unique and continuous in the domain of dependence, including its boundaries. I f the arc AB is on a timelike curve, a second intersecting curve—which may be either another timelike curve or a characteristic curve—is required, as shown in Fig. 2-4, to obtain a downstream domain o f dependence. It can be shown that only one dependent variable must be specified on each such timelike or characteristic curve (both being-known at th ~~ intersection) to obtain a unique flow in the domain o f independence.
In certain flows, the invariant s is constant over a certain region. The ,C+ characteristic curves are then straight lines, as has already been mentioned. Flows o f this type are called progressive simple waves. As an example o f this type o f flow, consider the case o f an infinite
* -X
Figure 2-2. Region of Influence of a Point P
2-23
AMCP 706-180
tube closed at one end by a piston initially at rest. A t the initial instant o f time, the material in the cylinder is at rest with u » o = 0 (the lower limit o f integration o f Eq. 2-120 is here taken to be po , the density o f the undisturbed material). Thus, on the spacelikc x-axis, 7 =s = 0 : Therefore! both kinds o f characteristic curves originating oh the x-axis are straight lines. The C _ characteristics through points on the x-axis cover the whole x-t- plane since the tube is supposed to-be infinitely long. Therefore, i f s = Q on the x-axis; 5 - 0, u “ o, and 7 = 2u everywhere, ar.d the C+ characteristics are straight lines everywhere. Suppose as shown in Tig. 2-5, that the piston begins- to move in the negative x-direction at the initial instant o f time thus initiating -a rarefaction wave moving down the tube in the positive x-direction. The particle velocity on the piston path is equal to the piston velocity and r is known on this path. Since the C+ characteristics are straight lines, their slope is constant. Since T is changing from one C+ characteristic to another, the slopes o f the C+
characteristics increase in moving backward into the flow and the C.characteristics are curved. I f the piston path is specified, an analytic solution o f the flow equations is easily constructed. Now suppose that the acceleration o f the piston ceases and its (backward) velocity becomes constant. The characteristics, o f both types originating on this part o f the piston path are then straight lines. The flow in the x-f,plane thus consists o f three regions;
(1 ) : The initial undisturbed region o f uniform density and zero particle velocity between the xr-axis and the C+ characteristic labeled A in Fig. 2-5.
(2 ) The simple wave generated by the accelerating,piston in the region between the C+ characteristics labeled A and B.
(3 ) The filial state in the region to the left o f the C+ characteristic labeled B. ,of: uniform density and particle velocity accommodated to the piston velocity.
I t will be -noticed that the front of the rarefaction wave propagates with the velocity o f
Figure 2-3. Domain of Dependence of Arc AB of a SpaceWte Initial Value Curve
2*24
A
AMCP 706-180
sound in the undisturbed medium while the rear o f the wave propagates with the velocity o f sound in the final medium o f reduced density plus the (negative) particle velocity in the final medium. Therefore, the rarefaction wave broadens as it passes down the tube, and no strong discontinuities occur. I f the piston had been instantaneously accelerated to its final velocity, all o f the C+ characteristics in the wave region would hove emerged from the point at which the piston motion began. Such a wave is called a centered simple wave.
Now, in contrast to the flow just discussed, suppose that the direction o f the piston is in the positive .T-direction, as shown in Fig. 2-6, generating a progressive compression wave. The resulting flow remains a simple wave w ithT « 0 everywhere and, cpnsequentlly, with C+ characteristics thatare straight lines. In this case, however, the C+ characteristics originating on the piston path do not diverge but converge, and
they must in consequence intersect. I t has been noted that the flow cannot remain continuous i f two characteristics o f the same type overtake each other, for different values o f the flow variables obtain on each o f the intersecting characteristics. The discontinuity that appears in a.progressive compression wave is called smhock wave and, in any such compression wave, shock waves form in the body o f the fluid. The boundary between a region where characteristics o f the same type intersect and one where, they do not is an envelope o f these characteristics. Intersecting characteristics o f the same type being physically impossible, the shock wave begins at the first poirit o f that envelope. I f the piston is instantaneously accelerated to some, final finite velocity. the envelope begins on the piston path.
I t can be concluded that compression wave: o f finite amplitude cannot propagate without the formation o f shock waves. Each o f the two
Figure 2-4, Domain of Dependence of Arc AB of a Timolike Initial Value Curve and Arc BC of a Timelike or Chara^teritlic Initial Value Curve
2-26
s
)
Figure 2-5. Straight Characteristics C+, Piston Path, and Particle Path in a Simple Rarefaction Wave ,
O8M
O£<
0M
V
AMCP 706-180
characteristic curves passing through a point corresponds to a sound wave, the one to a forward-moving wave and the other to a backward-moving wave. The intersection o f two C+ characteristics corresponds physically to the overtaking o f one forward-moving sound wave by a later one with higher velocity. When later sound waves overtake earlier ones, there is a steepening o f wave profiles until discontinuities o f tile dependent quantities velocity, pressure, and d en s ity are fo rm ed . That such discontinuities should form in the case of compression waves=supported: by an accelerating piston is apparent in the fact that the sound v e lo c ity is greater in the compressed, adiabatically heated medium resulting from the piston motion than in the undisturbed medium.
The one-dimensional unsteady flow equations that have been discussedin this paragraph are an example o f a general caae involving two simultaneous first order partial differential equations for which two reel characteristic
directions can be defined and which, fo r that reason, are said to form a hyperbolic system. I f the equations are linear, as in the example o f this paragraph, they are said to be reducible. The equ ations fo r two-dimensional, steady, irrotational, Uniformly isentropic flow form such a reducible hyperbolic system. The theory o f hyperbolic systems o f equations is treated in detail by Courant and Friedrichs3.
2-8 CONSERVATION CONDITIONS A ' A D ISC O N T IN U IT Y . THE HUGONIOT EQUATION
A shock wave consists o f a very thin region iii which tiie properties of the undisturbed medium very rapidly become those o f the shocked medium. The structure o f this region is. determined by the viscosity o f the me<fiuni-and is affected by the irreversible process o f heat conduction along the very steep temperature
Figure 2-6. Intersecting Straight Characteristics C+ During Compression V/ave
2-27
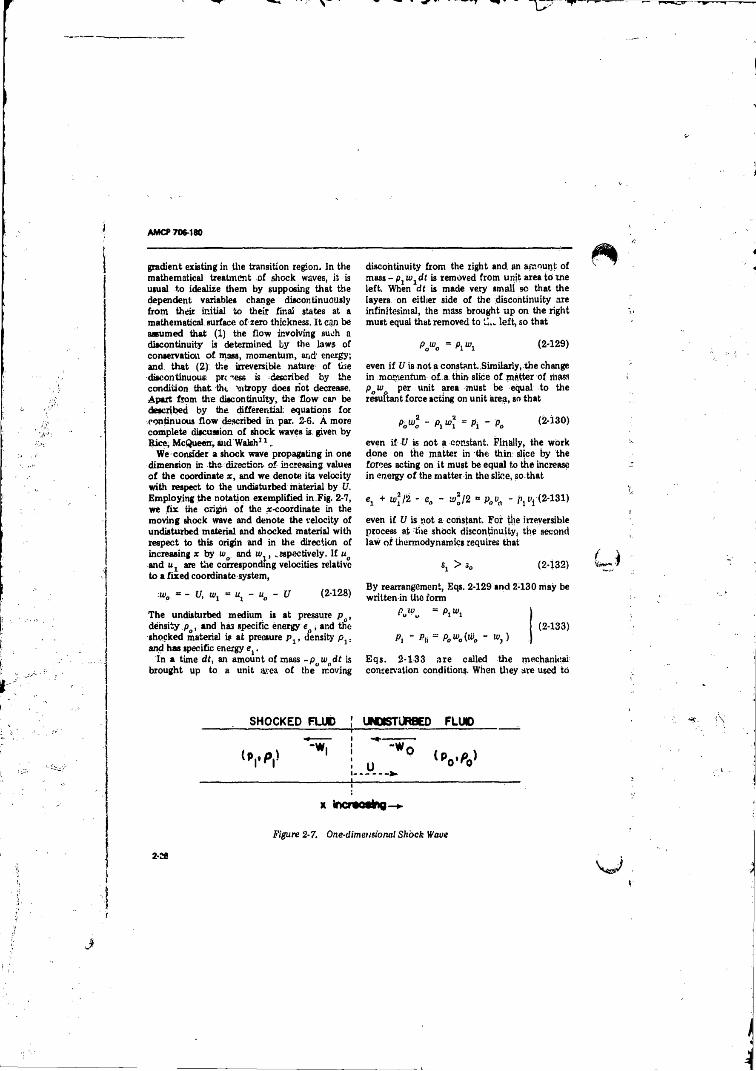
AMCP 706-180
gradient existing in the transition region. In the mathematical treatment of shock waves, it is usual to idealize them by supposing that the dependent variables change discontinuously from their initial to their final states at a mathematical surface o f zero thickness. I t can be assumed that ( 1 ) the flow involving such a discontinuity is determined by the laws o f conservation o f mass, momentum, arid' energy; and that ( 2 ): the irreversible nature* of the discontinuous: pm ess is described by the condition that the Intropy does riot decrease. Apart from the discontinuity, the flow car> be described by the differential: equations for continuous flow described in par. 2-6. A more complete discussion o f shock waves is given by Rice; McQueen; and Walsh11,
We consider a shock wave propagating in one dimension in the direction o f increasing values o f the coordinate x , and we denote its velocity with respect to the undisturbed material by IT. Employing the notation exemplified in Fig. 2-7, we f ix the origin o f the x-coordinate in the moving shock wave and denote the velocity o f undisturbed material and shocked material with respect to this origin and in the direction of increasing x by wg and w , respectively. I f ug and ut are the corresponding velocities relative to a fixed coordinate system,
:w0 = - U, w} = Uj - uo - U (2-128)
The undisturbed medium is at pressure p o, density ,po, and has specific energy eo , and the shocked material is at pressure p x, density P j : and has specific energy et .
In a time dt, an amount o f mass ~pgwgdt is brought up to a unit area o f the moving
discontinuity from the right and. an amount o f mass - pj uijdt is removed from unit area to xne left. When dt is made very small so that the layers on either side o f the discontinuity are infinitesimal, the mass brought up on the right must equal that removed to left, so that
Pw0 = Pi (2-129)
even i f U is not a constant.,Similarly, the change in momentum o f a thin slice o f matter o f mass p0v>0 per unit area must be equal to the resultant force acting on unit area, so that
~ P iwi ” Pi ~ P„ (2-130)
even i f U is not a constant. Finally, the work done on the matter in the thin: slice by the forces acting on it must be equal to the increase in energy o f the matter in the slice, so that
h + ui“ /2 - e„ - u>*/2 ° p„va - (2-131)
even i f XJ is not a constant. For the irreversible process at the shock discontinuity ( the second law o f thermodynamics requires that
> 30 (2-132)
By rearrangement, Eqs. 2-129 and 2-130 may be written in tire form
Pi - Pa “ )(2-133)
E qs. 2-133 are called the mechanical conservation conditions. When they are U8ed to
SH O C K E D F LU E ! UNDISTURBED FLUIO
i s -W ,
" Y ' V 1“ W
P
x in c rM a ln o -
Figure 2-7. One-dimensional Shock Wave
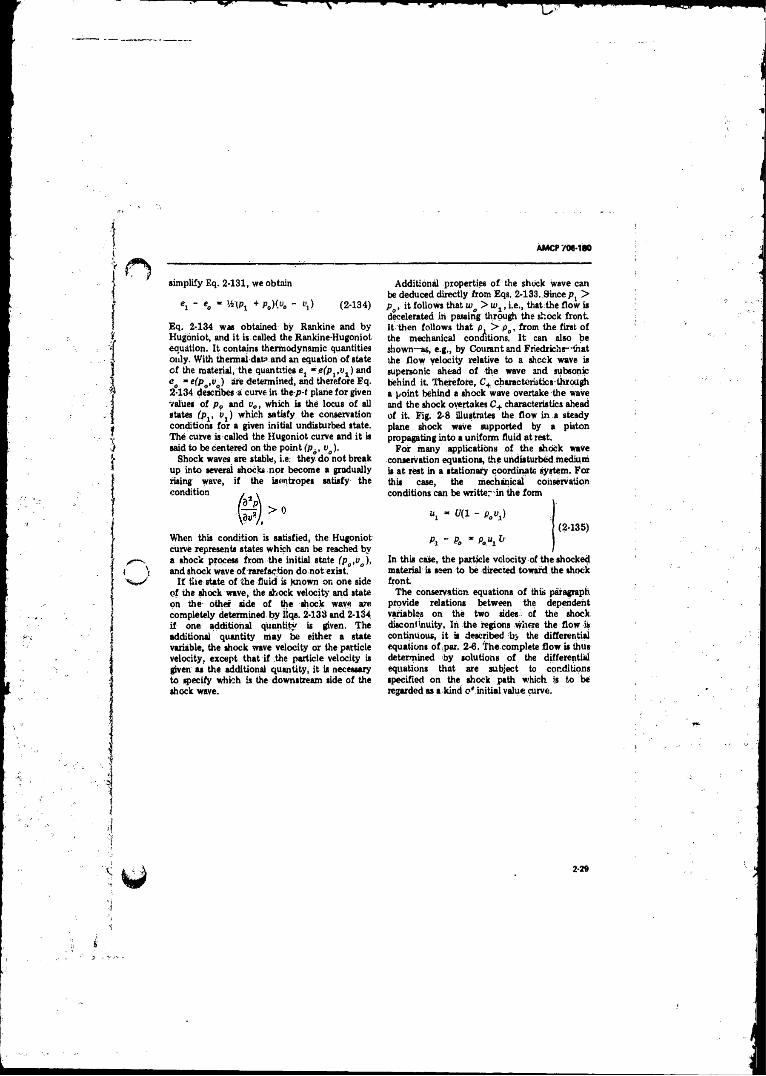
AMCP/Oe-180
simplify Eq. 2-131, we obtain
ei " % ~ 'MPX + P0)<v„ - t'j) (2-134)
Eq. 2-134 was obtained by Ranking and by Hugoniot, and it is called the Rankine-Hugoniot, equation. I t contains thermodynamic quantities only. With therm a ldaband an equation o f state o f the material, the quantities e , me(p1,u1) and eo “ ‘ (P o 'V *** Setermined, and therefore Eq. 2-134 describes a curve in the-p-f plane fo r given values o f p „ and v„, which is the locus o f all states (p , h j) which satisfy the conservation conditions for a given initial undisturbed state. The curve is called the Hugoniot curve and it is said to be centered on the point (po, vo).
Shock waves are stable, i.e: they, do not break up into several shocks nor become a gradually rising wave, i f the isentropes satisfy the
When this condition is satisfied, the Hugoniot curve represents states which can be reached by a shock process from the initial state (pa,vo), and shock wave o f rarefaction do not exist.
I f f i le state o f the fluid is known on one side o f the shock wave, the shock velocity and state on the other side o f the shock wave are completely determined by Eqs. 2-133 and 2-134 i f one additional quantity is given. The additional quantity may be either a state variable, the shock wave velocity or the particle velocity, except that i f the particle velocity is given ax the additional quantity, it is necessary to specify which is the downstream side o f the shock wave.
Additional properties o f the shock wave can be deduced directly from Eqs. 2-133. Since p t > p , it follows that wo > w lt i.e., that the flow is decelerated in passing through the shock fron t It then follows that p > po, from the first o f the mechanical conditions. I t can also be shown—as, e.g., by Courantand Friedrichs—that the flow velocity relative to a shcck wave is supersonic ahead o f the wave and subsonic behind it. Therefore, C+ characteristics through a point behind a shock wave overtake the wave and the shock overtakes C+ characteristics ahead o f it. Fig. 2-8 illustrates the flow in a steady plane shock wave supported by a piston propagating into a uniform fluid at rest.
For many applications o f the shock wave conservation equations, the undisturbed medium is at rest in a stationary coordinate system. For this case, the mechanical conservationconditions can be writte—in the form
« i “ 0 ( 1 - PoVX) J(2-135)
Pi - Po - PoU! 0 )
In this case, the particle velocity of the shocked material is seen to be directed toward the shock fron t
The conservation equations o f this paragraph provide relations between the dependent variables on the two sides of the shock discontinuity, In the regions where the flow is continuous, it is described by the differential equations o f par. 2-6, The complete flow is thus determined by solutions o f the differential equations that are subject to conditions specified on the shock path which, is to be regarded as a kind o',initial value curve.
2-29
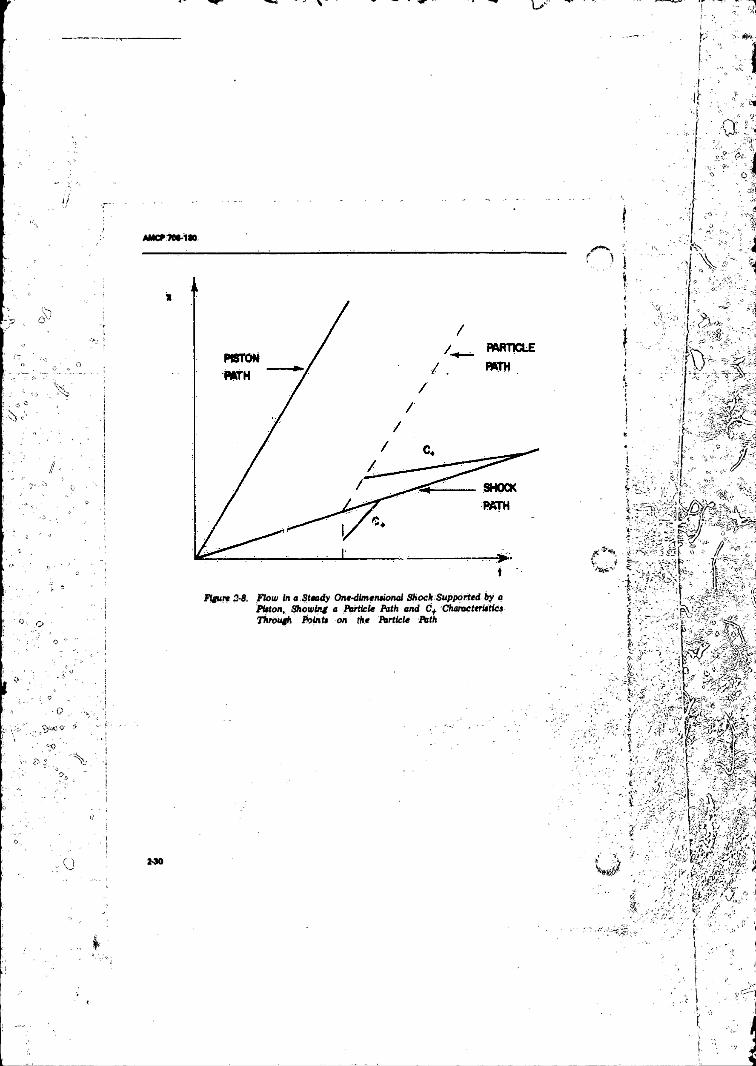
AM CT7W -1M
Figure 2-8. plow lit a Steady One-dimensional Shock Supported by a Piston, Showing a Particle Path and C+ Characteristics Through Points on the Particle nth
AMCP706-1W
O — : .... ' ' ’REFERENCES
* it !' w '
X. J. Willard Gibb*, The Scientific Papert ofJ. Willard Gibbs, Vol. 1, Thermodynamics, Dover Publications, Inc., New York, New York, 1981.
2. E. A. Guggenheim, Thermodynamic!, An Advanced Treatment for Chemist and Physicist!, Interscience Publishers, New York, 1957.
3. R. Coursnt and K . O. Friedrichs, Supersonic Flow and Shock Waves, Interscience Publishers, Inc., New York, 1948.
4. R. D. Richtirieyer arid K . W. Morton, Difference Methods for Initial Value Problems. 2nd Edition, Interscience Publishers, N ew York, 1967.
5. S. R. Brinkley, Jr., “ Note on the Conditions o f Equilibrium for Systems o f Many Constituents’ ', J. Chem. Phys. 14, 563-564,686 (1946).
6. S. R. Brinkley, Jr., “ Calculations o f the Equilibrium Composition o f Systems o f Many Constituents” , J. Chem. Phys. 15, 107-110 (1947).
7. S. R. Brinkley, Jr., “ Computational •Methods in Combustion Calculations” , High Speed Aerodynamics ana Jet Propulsion—Combustion Processes, Princeton Univ. Press, Princeton, New Jersey, 1966, Vol. II, pp. 64-97.
8. J. M. Richardson and S. R . Brinkley, Jr., “Mechanics o f Reacting Con. nua” , High Speed Aerodynamics arid Jet Propulsic n—Combustion Processes, Princeton Univ. Press, Princeton, New Jersey, 1956, Vol. n , pp. 203-16.
9. W illiam Band, introduction to Mathematical Physics, Van Noatrand, Princeton, New Jersey, 1959,
10. J. Willard Gibbs, Vector Analysis, Dover Publications, Inc., New York, New York, 1960.
11. M. H. Rice, f t . G. McQueen, and J. M. Walsh, “ Compression o f Solids by Strong Shock Waves” , Solid State Physics, Vol. 6, F. Seitz and D. Turnbull, Ed., Academic Press, New York, 1958.
AMCP 706-180
CHAPTER 3 ENERGY OF EXPLOSIVES3-1 INTRODUCTION
Explosives are substances that rapidly liberate their chemical energy as heat to form gaseous and solid decomposition products at high pressure and temperature. The hot and very dense detonation products produce shock waves in the surrounding medium and upon expansion impart kinetic energy to the surrounding medium. The energy released in the detonation process and the energy available after some degree of expansion respectively measure the ability o f the explosive to generate shocks and to im part motion to the environment. Consequently the energy o f an explosive is a measure o f its performance. Moreover the heat release in the detonation is an important qu an tity , as w ill be shown, in the thermo-hydrodynamic Chapinan-Jouguet (C-J) theory o f detonation (see Chapter 6 fo r a discussion o f the C-J theory).
3-2 HEAT OF DETONATION
In principle, Q, the heat released in a detonation, is obtained for some standard state by Hess’ law according to
0 ‘ t, «, (W°rh - £ mj(AH°,)j (3-1)
where n, is the number o f moles the i-th species o f detonation products whose standard heat o f formation is and mj is the number o fmoles o f unreacted explosive o f the j-th species whose standard heat o f formation is (A//“ j; , I f the Lewis and Randall convention is used, the right hand side o f Eq. 3 -1would be negative for an exothermic reaction. However, it is customary to have Q positive for exothermic reactions. Thus Q * - A H r„ ot(o„ where A fT„action !* the right hand side o f Eq. 3-1. In practice it turns out that the compositions o f the detonation products in the C-J state, or at different degrees o f expansion, are unknown. Since chemical equilibria can be influenced by the total pressure o f the system, the product composition and consequently Q can change as the products expand and the total pressure decreases. Expansion also results in cooling and
consequent product composition change. Below some temperature, chemical reaction rates become so slow that further temperature and pressure decrease (expansion) produces virtually no further change in composition, i.e., the composition is “ frozen". Thus any calorimetric measurement o f the heat o f detonation AHd, may not be the Q fo r the C-J'state, but the heat o f reaction fo r some expanded “ frozen” equilibrium composition. Measured heats of rea c tion w ill vary depending on how the calorimeter measurements arc made, i.e., on how much the products are allowed t o expand before the composition is frozen. This is probably the main reason why many conflicting values o f AHd have been reported. Further confusion arises from the fact that sometimes calorimetric heats o f detonation are “corrected” for the heat o f vaporization o f wafer (one o f the m ajor detonation products in secondary explosives). In a calorimeter measurement water is in its liquid state, but under detonation conditions it is in the gaseous state. Thus to obtain Q from calorimeter measurements a heat o f vaporization correction should be made, but unfortunately it is not always possible to estimate how much water was present under detonation conditions even though the amount o f water formed during the reaction in the calorimeter has been determined. ‘
3-3 T H E R M O C H E M I S T R Y OF H IGH EXPLOSIVES
Thermochemical data and empirical formulas for several explosives, explosive mixtures, and ingredients o f explosive mixtures are given in Table 3-1, together with data fo r their major decomposition products. These are important quantities from which theoretical properties o f explosives can be calculated. There is no obvious correlation between AH°r or A Hd and the “ stability” or “ sensitivity” o f an explosive. For example, NG and PETN which are known to be “ sensitive” have large negative AHJ’s, i.e., these compounds are thermally stable with respect to their constituent elements. On the other hand TN T which is quite “ insensitive" is almost thermoneutral with respect to its elements.
3-1
AMCP706-180
HMX and RDX which are certainly less “ sensitive” than PETN or NG are thermally unstable with respect to their elements. S im ilarly AHd ’s do not correlate with sensitivity, e;g., tetryl is much more "sensitive” than n itrom ethan e bu t (A Hd) NM > (AHdj tfirJl. Moreover it does not necessarily follow that a positive A H°r results in a large A jrd,e .g .,(A H d; (( try l < ( h H i ) r F , T N •
By far the best available determinations o f AHd and product composition are those o f Omellas; . His results are given in Table 3-2. Note the excellent thermal and material balance obtained. Certain useful generalization can be drawn from these data, namely:
1. Confinement increases AHd and changes product composition in Oxygen-negative explosives but not in oxygen-balanced explosives (see par. 3,4 and Table 3-6).
2. In c o n f in e d oxygen -n ega tive explosives, at large packing density, an appreciable amount o f solid carbon is found in the products even though sufficient oxygen is available to form CO, e.g., in HMX.
3. The fluorine o f fluorine-containing explosiyes appears as HF in the detonation products.
Consider the data o f Omellas, (Table 3-2) fo r unconfined explosives. I f the products fo r linconfined shots expand very rapidly so that the pressure becomes much less than PCJ at Tfr , die temperature at which equilibria are frozen, then these products should approach perfect gas behavior at Tfr. I f we know the equilibriainvolved and their ideal equilibrium constants as a function o f temperature, we can compute Tfr . Table 3-3 gives the free energy function G°/RT for the important detonation products o f CHNO* explosives.. From these data AG°/(RT)cm be obtained for different temperatures fo r the reactions o f interest, and ideal equilibrium constants computed according to
inK = - A G°/(RT) (3-2)
where
G°* standard state Gibbs free energy R “ gas constant T m absolute temperature
Let us assume that the water-gas reaction
* Since these are the explosives o f military interest all the subsequent discussion in this chapter will b e confined to CHNO explosive*.
C 02 + H 2 = C 0 + H20 (a)
is the controlling equilibrium. To illustrate the computation we will use PETN, C6H8N 4Oj 2, as an example. Let X be the number o f moles o f C 0 2 at equilibrium, and C, H, O the original gram atoms o f carbon, hydrogen and oxygen respectively. Then from mass balance arid Raoult’s law
P c oB C .rX )
rtf
P oosPXn,
P h 2o = {- ' (O -C -X )
(3-3)
P „ 2 =-£- ( « H + C - 0 + X)n,wherent = total number o f moles o f gas at equilibrium p = partial pressure p = total pressure at equilibrium
The ideal equilibrium constant fo r reaction (a) is
PcoPh2o ffi-X) ( O - C - X )K “ = Pco2Phs =X(WH + e - 0 + X )
•(5 '- X ) , (7 - X )
~ X ( X - 3 )For PETN with K = 2.96 corresponding to Tfr = 1600°K:
X * 3,50 - molci CO, per mole of PETN C -X t 1.50 * moles CO per mole of PETN
O • C • X * 3.50 - moles HjO per mole of PETN WH + C ■ O + X 1 0.50 * molee H, per mole of PETN
N/2 “ 2.00 » molee N, per mote of PETN
This equilibrium mixture matches .almost exactly the composition found by Omellas1 for unconfined PETN (see Table 3-2). In Table 3-4 we show that for Ttr = 1600°K the computed ideal gas mixtures for HMX, TNT, as well as PETN, agree closely with the results o f Omellas fo r unconfined charges.
Other reactions which must be considered at high pressures (confined charges) are
2CO = C 02 + C(s) (b)
CO + H2 = H20 + C(s) (c)
3-2
AMCP 706-180
A t low total pressures (unconfined charges) the data in Table 3-3 give Kc 9 X 10'6 and Kb ~ i X 10‘ 6 for the equilibria (b) and (c ) at Tfr = 1600° K. Thus the neglect o f reactions (b ) and (c) at low pressure is entirely justified. According to Le Ghatelier’s Principle, reactions (b) and (c ) will shift to the right at high pressure, and we should expect more C 02, H20 and C(s) fo r confined charges than for unconfined.charges. A t high pressures, the ideal gas laws are no longer applicable and simple computations o f equilibrium compositions are no longer.possible without the appropriatejPVT equation o f state for the products. Omellas1 has made computations for C-J isentrope compositions at 1500°K and at 1800° K using the Becker-Kistiakowsky-Wilson (BKW) and Lennard-Jones Devonshire (LJD ) equations of state for the products. Agreement between observed and computed product compositions is
. quite good. This suggests that T,r fo r confined charges is between 1500° and 1800°K in agreement with Tfr = 1600° K for unconfined charges.
A t high pressures and temperatures o f the order o f 1500° to 2000° K the reactions
Na + 3H j = 2NH3 (d)
C(s) + 2H2 “ CH4 (e)
are-no longer neglible i f the equilibrium mixture (before considering reactions (d ) and (e )) contains appreciable H2. Equilibria (a ) through (e) account for all the observed products (Table3-2) with the exception o f very minor amounts o fflC N .
3-4 COMPUTATION OF Q
Examination o f computations for unconfined charges (perfect gas) as well as the more elaborate calculations fo r confined charges BK\V, LJD, etc.) clearly show that when an explosive contains sufficient oxygen to convert all its hydrogen to steam and its carbon to C 0 2 (oxygen-balanced), the water gas equilibrium completely determines the composition o f the products. Thie equilibrium is rather insensitive to th e to ta l pressure at equilibrium. Confirmation o f these theoretical computations is found in Omellss’ data for confined and uncorifined PETN (Table 3-2) which show essentially the same product composition at high
pressure and at ambient pressure. Conversely, in oxygen deficient explosives equilibria (b ) through (e ) play an important role and as expected, the product compositions for an oxygen-negative explosive are very different for confined and unconfined charges (Table 3-2).
We now return to the question of Q the heat released in a detonation and its relationship to AHj which is determined calorimetrically. Q cannot be measured directly. It can be computed i f a. PVT equation o f state is known, for tiie dense detonation products. Since there is no generalagreement about the proper form o f a PVT equation o f state for detonation products, the best we can do is to compare Q'> computed with different-equations o f state. This is done in Table 3-5 using three rather different equations o f state: Somewhat unexpectedly it turns out that Q is quite insensitive to the type o f equation o f state used. Thus <J’s computed, fo r a given explosive at a given density but using different equations o f state, agree closely. What appears to be even more remarkable is that for explosives that are n o t too deficient in oxygen
« « m d (3-4)
and for oxygen deficient explosives
Q * 1.1 Aff,, (3-5)
where the calorimetric measurements A ffd were made on confined explosives. Actually this coincidence is not totally unexpected. In a calorimeter water is in the liquid state and even for strong confinement one might expect some pressure drop before the thermal measurements are completed. In the C-J state, water is gaseous and the pressure is at its highest possible level. I f there were no pressure drop, then AHd > Q by t h e h e a t o f v a p o r i z a t i o n o f water. However there is some pressure drop and, consequently, the equilibria o f such reactions as (b ) and (c ) lie further to the right in the C-J state than in the calorimeter. Reactions (b ) and (c ) (as well as (d ) and (e) the less important reactions) are exothermic, and their greater degree o f completion in the C-J state tends to compensate for the effect o f the heat of vaporization o f water.
Some further conclusions may be drawn from the data in Table 3-5. As already stated, at a
3-3
AM CP706180
fixed density fo r a given explosive, Q does not change with the equation o f state but the computed C-J temperatures do change. The computed C-J pressures (which are generally in reasonable agreement with experiment) do not change appreciably with these equations o f state, but do change strongly with initial density. Now fo r a given equation o f state, a change in initial density produces a much greater change in the computed pressure than in the computed temperature. This computed pressure change is confirmed by experiment. Note that the computed Q fo r a particular explosive in all cases decreases as the computed pressure decreases but that it is fairly independent o f the computed temperatures. This same trend appeared in the data o f Table 3-2 where the freeze-out temperatures for all the explosives were about 1600° K but the equilibrium pressures and product compositions varied depending on whether the explosive was confined or unconfined. Thus it appears that product composition (which determines Q) is more strongly influenced by the final pressure than by the final temperature o f the system.
The relative nondependenCe o f Q on C-J temperature may be rationalized as follows. For oxygen-balanced or oxygen-rich explosives, the water gas equilibrium (reaction(a)) is the primary reaction which determines the product composition. This equilibrium changes rather slowly with temperature and furthermore small changes in equilibrium composition produce very little change in Q because reaction (a) is almost thermo-neutral, i.e., (AU/)C 0 %(AHf)co + (A H ? )H j0 . For oxygen-poor exploaves the explanation is not as apparent. Reactions (b) and (c ) are sensitive to temperature, and they are not thermo-neutral. It may be that equilibria (b ) and (c ) lie far to the right (as written) oyer wide ranges o f detonation temperature and pressure.
Two further generalizations can be made about the results in Table 3-5. I f we arrange explosives according to their oxygen balance in order o f increasing unbalance, as we have done in Table 3-6, then it becomes apparent that the largest Q’s are obtained with balanced explosives and that the Q’s decrease fairly slowly for moderately oxygen-poor explosives, and more rapidly for oxygen-rich explosives. The reader must be warned that there are exceptions to this
generalization—(e.g., Explosive D and Hydrazine nitrate in Table 3-6).
A more fruitful approach to o priori estimates o f Q is shown in Table 3-7. It.is clear that Q’s based on the best available computations agree closely with QA’s computed solely oh the basis o f in it ia l ex p lo s ive com position and th e rm o c h e m is tr y w ith th e a rb itra ry assumptions:
(1) A ll the initially available hydrogen forms steam.
(2) Any oxygen remaining forms-0C>2.(3 ) Any carbon remaining appears as solid
graphite. -(4 ) A ll the nitrogen goes to N 2.
Thus quite accurate estimates o f Q appear possible i f the initial explosive composition and A Hf o f this composition are Known.
3-5 FRAGMENT VELOCITIES
One o f the most useful functions o f a secondary explosive is its ability to produce and accelerate fragments formed from its immediate environment. It seems likely that the efficiency o f an explosive in accelerating fragments should be related to the energy contained in the explosive. The discussion which follows will sho\7 that this expectation is fulfilled.
The so-called Gurney formulas5 are very successful in determining terminal fragment velocities. The86 formulas are derived oh the basis o f three fundamental assumptions, namely:
(1) The chemical energy o f the explosive is converted into kinetic energy o f fragments and detonation products.
(2 ) The velocity distribution of the detonation products varies linearly from zero to the velocity o f the fragment.
(3 ) The density o f the products is uniform or at lease independent o f position, he., p = p (t ) butp fp(xj.
For cased cylindrical explosive charges these assumptions lead to
v -V® M m (3'6)
3-4
AMCP 706-180
whereV
CM
For the
= terminal fragme.-* velocity (no air drag)
= empirical Gurney constant (having the dimensions o f y )
= weight o f explosive = weight o f casingcase o f a plane wave detonation
accelerating a flat plate, the Gurney formula is
1 + 5,W/C + i(K / C f (3-7)
Gurney constants Computed front experiments; data obtained from several sources are compared with Q in Table 3-8: On the average (with Q obtained from Eq. 3-4, using experimental AHd) v^E /^20 » 0.95, however, there may be a trend for this ratio to decrease as p„ decreases. The results for T N T are contradictory. The only available information for nitromethane (NM ) makes it appear as an inefficient plate driving explosive. Nevertheless, the data in Table 3-8 c lea r ly show that in one-dimensional detonations the chemical energy o f explosives is very efficiently converted into kinetic energy (around 90% conversion) o f fragments and explosion products.
3-6 AIR-BLAST
The efficiency o f an explosive in producing air-blast is usually given in terms o f equivalent weight, i.e., the weight o f TN T (or some other standard explosive) to give the same air-blast overpressure as the test explosive where both measurements are made at a fixed distance from the charges (see Chapter 13). For measurements made far away from the explosive charge, Landau and Lifshitz2 have shown that the overpressure is proportional to the initial energy o f the explosive, i.e., to mQ where m is the mass o f explosive; consequently,
equivalent weight = m°/m = Q/Q° (3-8)
where the superscript o refers to the standard explosive.
Experimental equivalent weights are compared to computed Q / Q T n t and to experimental AHd/(AHd)T/ T in Table 3-9. Agreement between mTNT/m and Q/QTn t is seen to be quite good. AHdl{AHd)VNr> mTNT/m except
for Comp. B and Pentolite which contain large proportions o f TNT. This is not surprising since it is <3 and not A Hd which should correlate with equivalent weights. Using, the approximation, of Eq. 3-5 brings the AHd ratios into much better agreement with the equivalent weight ratios, except in the case o f aluminized explosives for which the “ corrected” A Hd ratio is still greater than the equivalent weight ratio. This suggests that in unconfined aluminized explosive charges ttie aluminum does hot contribute all its chemical energy presumably because the aluminum reactions ate slower than the other detonation reactions.
3-7 UNDERWATER PERFORMANCE
Price3 has suggested that a criterion o f the underwater performance o f ar» explosive is given by the sum o f the shock wave energy (a t affixed distance which is large compared to the explosive dimensions) and the oscillating bubble energy. TO a first approximation both shock energy and bubble vary directly with explosive weight, and the sum should be approximately equal to the chemical energy o f the explosive4. Consequently, Eq. 3-8 is also applicable to underwater explosions i f the m ’s are th e sums of equivalent weights for shock wave and bubble energies. The data in Table 3-10 show excellent agreement between equivalent weigits and Q / Q t k t except for two explosives (TNE TB and P E T N ) which have only slight oxygen deficiences. As discussed in par. 3-3 the composition and, consequently, Q fo r these two explosives do not change with confinement; For the other explosives in Table 3-10, and particularly fo r TNT, composition could be affected by confinement in the direction of smaller Q as co.ifiriement is reduced. I t is conceivable that the computed Q ’s for the oxygen negative explosives are overestimates o f the actual Q’s for the conditions o f the experiment, and consequently Qp e t n /Qt n t or Q t n e t b / Q t n t should be larger than shown in Table 3-10.
Note that aluminum greatly adds to the u nderw ater perform ance of aluminized explosives. Presumably this is due to the longer confinement period o f the surrounding water which allows the aluminum reactions to go to completion before too much expansion occurs.
3-5
AMCC 706-180
3-8 C-J PARAMETERS
In par. 3-4 we indicated that calculated Q ’s for dense explosives are insensitive to the form o f PVT equation o f state used in the computation. This means that Q, i f available experimentally, is a poor criterion fo r choosing the best equation o f state. On the other hand quite good estimates o f Q appear possible based oh QA or A Hd. These estimates can then be used to get approximate values o f Tv the equilibrium terriperature o f a constant volume explosion, P c i the Chapin an-Jouguet pressure, and D the steady detonation velocity. Approximate values fo r IV can be obtained from
TvQa
En, c,+ T0 (3-9)
whereQa *■ heat released in an explosion
com pu ted on in itia l explosive composition and thermochemistry and arbitrary assignment o f products shown in par. ,3-4.
n, • number o f moles o f gas at equilibrium estimated from arbitrary reactions used in obtaining QA
= specific heats o f products averaged over the temperature,range T v - T 0
The T v obtained from Eq. 3-9 should represent an upper limit to T c j , since all the chemical energy is assumed to go into thermal energy o f the products and no allowance is made fo r energy o f repulsion which surely must be present in the highly compressed C-J state. I f the detonation products obey the polytropic gas law, i.e., PV‘ * constant, then
D « 2Qa (ic1- 1) (3-10)
and experimental Pcj is 6%(+15 to -11% maximum deviation). For ten other explosives for which experimental data are also available the deviation is greater than that given. Seven o f these ten explosives contain NM or TNM or both. For other values o f K, agreement is even poorer.
A better approach fo r estimating PCj is to use experimental D values which are often available where experimental PCj data are not. A convenient equation to use is
p . R .& (3-12)
Calculations on 26 explosives (some o f these are at about 1 / 2 o f voidless density), using Eq; 3-12 and experimental D and Pcj, give ah average K o f 2.8 with a maximum range o f 2.4 to 3.0. Four explosives which give k ’s outside the above range are NM, TNM and two aluminized Comp B mixtures.
3-9 MAXIMUM WORK
In an adiabatic process, according, to the first law, the maximum work Wm ax that an element o f explosive can do on its surroundings is -A £ (note that the term adiabatic refers to- no heat gain or loss by the element from, or to tiie surroundings). For a constant volume explosion, explosion products (formed in an exo-thermic reaction) assumed to be a poly tropic gas, and neglecting the Pv term fo r the solid unreacted explosive.
AE Ef -E 0 ~ E(AHf) products
+PpVf
E(AHf)txplOllUt (3-13)
and
P c j * 2QA P p ( K - l ) ( 3 - H )
Agreement between experimental values o f D arid PCj, and those computed using Eqs. 3-10 and 3-11 is only moderately good. Using QA -(or Q) and k - 2.5 the average deviation of computed and experimental D ’s (detonation velocity) is 6 % (+ 6 to-13% maximum deviation) for 13 almost voidless explosives. For these same explosives the average deviation o f computed
“ Qc.u. + = - Wme*
For a polytropic gas vf may be related to va according to
P/KI2 = Pm and P p ] = P0v,
where the subscript 1 refers to some intermediate state above which the polytropic coefficient is K and below which die coefficient is 7 = cp/c„, Fc_„, * Pjl2 is the constant volume explosion pressure, and the subscript o refers
3 4
AMCP 706-1*0
to the standard explosive. For typical values o f the parameters involved and an arbitrary assignment o f f f y P ,)/2 * 1 0 3 it can be shown that Po0f
(y -V Q c > < 0 -04- Consequently fo r a constant volume (c.v.), explosion ^ „ Q_ (3.14)
Eq. 3-13 is also applicable to a C-J detonation except that vf fo r a C-J detonation is different from V f fo r a constant volume explosion. For a C-J detonation
P,Vf - Pfly0K/(K + 1 ) ] “
arid as before P/c7
P VWith the same assumptions as before—— < 6 .0 3 arid
Wmax * Q
Because the pressures are different arid consequently the chemical equilibria could be different Q does not necessarily equal Qc.„.. The deta in Table 3-5 suggest that Q > Qc „ becauser ,> ? .....
There are no completely unambiguous measurements o f the maximum work done by an explosive; however, the Ballistic Mortar probably conns closest to being a valid test o f the maximum work. In this test a standard weight o f explosive is fired in a suspended
mortar with a tightly fitting steel projectile and the angle o f recOil o f the mortar is measured Results are gmeraily expressed in terms o f a standard explosive, e.g., TNT. In Table .3-11 we comp-re measured Ballistic Mortar results with Q where both quantities are taken relative to TNT. I t is obvious.that correlation is poor. I f the comparison is made with AHd rather than Q, correlation is much betterand-it becomes better yet if one arbitrarily assigns (d i fd ) rJvr “ 1 .0 0 kcal/g rather than the measured (A H d)r « r » 1.09 kcal/g fo r tightly confined charge3, As already discussed the heat release o f TNT, but not o f other.explonves such ks PETN, is strongly influenced by confinement The explosive loads in the Ballistic Mortar are generally at fairly low packing densities so that detonation products can expand slightly before the projectile starts to move. During, the period o f acceleration of the projectile there is further gas expansion and re-equilibration o f products. The whole process appeare-to be quite similar to what is happening in a partially confined charge fired in a calorimeter. Thus one. might expect that A Hd, and not Q is a better measure o f the “ maximum work" measured by the Ballistic Mortar, hi Table 3-2 we dhow that 6H4 for TNT varies from 0.68 to 1.09 kcal/g depending on the degree o f confinement. Consequently, the arbitrary choice o f (A f Id)rs T “ 1 .0 0 kcal/g is riot unreasonable iri this case.
In the Ballistic Mortar, as in air-blast arid fragment propulsion, aluminized explosives do not perform as well as expected from their theoretical Q values.
3-7
AMCP 706-180
REFERENCES
1. D. L. Omellas, J. Phys. Chem. 72, 2390 (1968) and Orneilas et tj., Rev. o f Sci. Instx. 37, 907 (1966).
2. L. D. Landau and E. M. Lifshitz, Fluid Mechanics 6,372-377, 392-396 (1969).
3. D. Price, Chem. Rev. 59, 821 (1959).4. R. M. Cole, Underwater Explosion,
Princeton Univ. Press, Princeton, N . J., 1948.
5. W. Gurney, BRL Report 405,1943.
AMCS704-UO
TABLE 3-1. SOME BASIC THERMOCHEMICAL DATA
a, Satirical Sarnia 1 a Sawrca*Sara Xaplealta* roraula *al*b l
a 4.t/i
ef ft.
Mltngtyetrln (AC) H W » 1ST -tO<B , .
mw V . V n 31* - m . v l.TB 1.41 UL
« « CW > 2M ♦ 1T.» l .M 1.4* UIL
•n#r CM » .an - IT ,* I . S3 1.0* 1*1
>U;aaa Maria (M) CX9A0a »i * ar;o 1.13 1.33 UL
TatraRltrwaMaaa (TMT) C(A0)^ 1M 4 13 l .M - -
m oW M
310 l.M l.S* uawx
s w . 331 « M ,7 1.43 1.34(a) uaTatiyl w . ° « SIT ♦ a 1.30 l . It UL
DaTHOW . V
M l - 34.t l.aO 1.01 UL
r o V .V . . J»« • l i t . * 1.70 1.4T MOL
im vW n
MB • i t ; * l .M l.SO AOL
Marie MU W * ° 4 2 » • 34.3 1.03 A4DI
IM i a l a BIBrata (aiR laaln D)
b. Malaalva M itw M
V M SB* - 47.0
M M M *i.« *a .7» ,<a.s7#3 4 l . M 1.4A UL
Ztmf >•> c*.o*“*.» i"» . is#j.BT J0C% ♦ k 1 .0 1.34 UL
»0/» CyclatalV i i V u
BBS • 1.1 V.l* aim
*0/40 taalal
C, M ^ fia ra
- 4A.4 t.S* l . M AOL
Baaaa'lw lltrata (A*> AK.AOj SB -4 7 -
toiaaaliat Mitral* <KM) 101.1 -11* -
Jtaaa'taa forahlarata (AS)' W4..C104 U7.S » 71
U'uM t a n * * <L0*> «< 33 - 3 -
Tatraaitraaathaaa
4, fuala
m a 13
Alw law At ST 0 -
Ctrbaa C 12 0 -
Pttralam (M U ( « a) IB - T -
Callulaaa (Cal)V . o V
1*2 •334 -
Sulfur
a. Baartlaa hraAwta
3 33 0 -CtrMa NaaaaMa » SB •W.B
Ctabaa. DlaalBa M •BB.O -
■ atar (Cu) V I t •ST,* -
Aplr?*** CklarUa ACl M.3 •22.1 -
«r«rlMa» flaarUa tv SO «*4.3 -
*uUur DtaaWa *B -71.0 -
Alla taw OalBa " A 103 •W4.1 -
fataaalw OilAa v . *B,J •M.4
* StaaSarB M i l t f Maaallaa at X**°4 ta* 1
* CaiariaatrlcuUy OalaralaaJ t««t «f BateaaltB* I * Mart iU N | M n i tar- it»zplaatvat W N 4aa|(aa* UMaaa HjOU)
* U L • Im n k i AaBlitiM U M t iU r ?IKK. % lUvil OrBaaaca UtoMalMfABM • Anaaaaal MHWh'MM Catabllalw)* (V.K.)
fa) UMaatlaM.
oi-e
TABLE 3-2. CALORIMETRIC DETERMINATION OF THE HEAT AND PRODUCTS OF DETONATION1
EXPLOSIVE PKTK PETE HMX KMX TKT TOT EM PEFO
C o o d lt lo o Confined. Unconfined C onfined U nconfin *d C onfined Unconfined Confined Confined
Pfl(g/cc ) ^ 1.74 1.74 1.60 1.90 1.33 1.53 1.13 1.60
1.49 1.50 1.49 - 1 . 09- - 1 ;23- :1.28 -
<M,)cb1 (k cal/gl* i.so 1.31. 1.31 1.33 1.16 0.63 1.25 1.35
Prod uctsMola/wola
C02 3.3S- 3.50- 1.92 1.44 1.25 0.063 0.261 3.16
CO 1.64 1.59 1,04 2; S3 1.98 3.89 0.550 l . M
CK4 0.003 <0.0002 0.039 0.0006 0.099 0.009 0 .093- 0.001
C(s) son* non* 0.97 ROM 3.63 1.01 0.095 now*
»2° ( t ) 3'S0 3.45 3.18 2.50 1.60 0.17 0 . M 2 2.14
“ 2 0.45 0.31 0.30 1.53 0.46 2.31 0.294 0.046
X2 2.00 2.00 3.69 4.01 1.32 1.36 0.394 1.99
W 3. 0;037 0 .0 0 2 0.395 ROM 0.162 0;022 0.118 0.023
HCK non* non* 0.009 0.0006 0.020 0.024 0.008 -
Kf - - - - - - - 1.87
K w p lr lc a l fo rw u lao f * x p io * l v * a b J « don .p rod ucts**
C 5.03 3.01 4.00 4.09 2.00 6.99 4 .99(a ) 3.04(9)
H 5.02 7.92 8.31 9.06 .5.03 5.08 3.04 6.30
N 4.04 4.00 ^.77 1.04 2.68 2.76 0.92 4.00
0 11,92 11.99 8.09 8.03 6.08 6.19 1.95 10.34
P - r - - - - - 1.87
* Prow product cospoaltion and 4H°*a of Tabla 3-1.** Caspar* with enpirical forwul* of Tabla 3-1. ,(« ) A n a ly s i s o f c r i t i c a l w a t d r l s l gava ^
M ta.ljr.1. of nt.fl.1 , . y , Cs.0OK5.7A,0.°lO.O«ri.J7,
’ " •<&-
TABLE 3-3. IDEAL GAS FREE ENERGY FUNCTIONS ((TVfffiTJI FOR DETONATION PRODUCTS
T,°K C°2CO . V H2
1000 -75-69 -38.88 -53.94 rl7 .49
1400 -63.66 -36.03 046;77 018.39
1500 -61.74 -33.61 -45.66 -18.59
1600 -60.09 -35.26 -44 i 70 -18.78
1800 -57.42 -34.72 -43.17 -19.14
2000 -55.36 -34.34 -42.00 -19.47
2500 -51.89 -33.79 -40.11 -20.20
3000 -49.83 -33.58 -39.07 -20.84
4000 -47.70 -33.58 -38.1? -21.90
5000 -46.81 -33.81 -37.99 -22.77
C (. ) nh3*2 CH. H;4’ ................. 6
-1.522 -31.70 -24.95 -34.17
-2.064 -31.44 -25;97 -33.38
-2.190 -31.49 -26.20 -33.38 '
-2.312 -31;57 -26.43 -33.41 -0.435 •-2V84
-2.454 -81.79 -26.84. -33.59
^2.764 -32.06 -27.24 -33.85 -3.31 -7 .0 *
-3.256 -32.83 -28.12 -34.70
-3.686 -33.65 -28.89 -35.67
-4;406 t-35.24 -30.19 -37.61 -11.41 -16.11
-4;996 -36.67 -31.29 -39.41.
AMCP7M-1B0
TABLE 3-4 WATER GAS EQUILIBRIUM FOR IDEAL GAS PRODUCTS AT 1 ATM AND 1600°K
ProductCompo$ition, Exptoiiuemoles/mole PETN HMX TNT NM
CO, 3.50 1.46 0.043 0.25CO 1.60 2.54 5:86 0.75H jO 3.50 2,54 0.057 0.75
H , 0.50 1.46 2.46 0.76
N , 5.50 4.00 1.50 0.50C (.) None None 1:09 —
NH , 1.5 X 10' 5 1 X 1 0 4 1.5 X I f f * —
c h 4 None None 0 .0 12 —
Q* kcal/g 1.41 1.24 0.67 0.98
*Bnmd on computed composition, H20 ^

AMCP 706-180
o — . . . . . . . . . . . . . . . . . . . . . . . . . . . . . . . . — — •TABLE 3-5. c a l c u l a t e d a n d o b s e r v e d cu p a r a m e t e r s
u
(Capital**Po. Mid«r rickvtt * lobar./* * Mador Fl«k«tt Iub*r»v Nadar Flckatt Tubarav
rsw 1.77 1.32 . . 1.49 318 310 2130 - 4400
1.77 a :«j • .48 340(1} 4200(1)
1.87 1.32 1.48(a) 1.43 280 231(a) 210 3020 4300(0 4300
1.87 310(2) 3400fc«(3)
[ 1.00 1.38 1.43 "* 102 80 M 2870 4730 4130
RDX 1.80 1.48 1.48 1.47 347 325 310 2380 4040 4000
1.80 .46Sb) 347(2)1370(2)
3700(1)
1.40 1.43 1.43 - 200 192 3270 4380 --
1.40 . . — . . 213(3)
1.20 1.3B . . 143 — 133(C) 3473 — 4540
1.20 132(3)
1.00 1.33 1.28 1.33 108 104. 104 3300 4373 4360
HAS l.CO 1.48 . . 383 - 2361 - --
l 1.80 *"d - 1.48 390(2)
w 1.13 i.ao 1.37 ... 130 123 3120 3*M
J 1.13 » v 1.23 129(3)144(2)
3400(0(2)3700(1)
TKT 1.83 1.27 1.28 1.23 308 184 184 2840 2M0 3749
1.83 325(2)
1.3* 2020)
1.33 A ««, < 1.091.401.41
1.24 '* 143i ; i „ ,i i t ( i )
" 3110 3720
1.00 1.14 1.11 1.13 78 71 U 3200 3630 3870
1.01 113(2)
1.00 M O)
Out** 1.7* 1.12 . . . . 283 . . 2663 _
i 1.78 1.01 238(2)
Totryl- 1.70 1.42 „ 1.40 232 230 2820 - 4000
11.70 2630) 2*30(1)
1.30 AMjpl 17
Tan l.«4 0.3* 0.33 . . 283 132 . . 1340 3440 ...
i 2.84 1380) 2*00(7)3100(1)
s/aw/l/sraa 1.40 1.44 1.30 . . 182 133 — 3363 4435 —1*6(2) 3360(2)
o.B0Mt/0.2oraM i.s i 1.S8 1.82 . . 111 13# .. 4000 3040 -
1.31 138(2) 3730(2)
M3 1.80 1.46 1.48 . . 747 M l 3220 4860' -
J 1.80 3330) 4000(1)
TMt/fiCdl i.70 1.43 - - 300 - 3003 - - -
rrato(a) 1.88 1.48 333 - 28)3 - -
* It*i*r U 2800} IMS.
’ * mum w jfj*. iMi." * * ZuMray and OMladjr 1 M ,452,(18*4).
(1) Apia And VMkrtolnikw, MNET
(2) CUM In M >W.(a) SrMlfi it* PokM). DpkUily IM.fM.JltM). <•) pfl . i,6<) */?c«(bl AiitMwd (o h> U « )tM a* (or «r*.<v) pQ > 1.25 l/fc.<d) M L cc*fut*tle * u a li* HV ORUttloA.
AMCP 706-180
TABLE 3-6. CORRELATIONBETWEEN Q AND OXYGEN BALANCE
A «* , Oxygen
E x p los ive f/c C kcal/g B a lan ce**
0 .8 NK/0.2 TNM 1.31 1.61 0.00
BTNEU 1.86 1.49 0.00
NG 1.60 1.47 +3.5
TNETB 1.70 1.45 -4 .0
PETN 1.7.7 1.50 -10 iO
2/ 3NM/1/ 3TNH 1.40 1.30 +15.1
KMX 1.90 1.48 -2 2 .0
RDX 1.80 1.48 -22 .0
NM 1.13 1.33 -3 9 .3
Comp. B 1 .7 1.41 -4 0 .3
T e t r y l 1.70 1.41 -47 .4
TNT 1.63 1.27 -7 7 .0
TNM 1.64 0.55 +49.0
E x p lo s iv e D 1.50 1.27 -52
DATNB 1.79 1.12 -56
H ydrazine n it r a t e 1.63 0.90 +8.4
*Average va lu e ah own in T a b le 3-5
* Oxygen ba lance « - ^ ^ ^ xa''~w<sitht ^2C ®t0,ns +H//2 a - 0 atom s]
3-14
AMCP 706180
TABLE 3-7. COMPARISON OF Q & AND Q* BASED ON AN ARBITRARY DECOMPOSITION MECHANISM
E x p lo s iv e Po, 2/ cc
*Q.
keal/gK
keal/g
PETN W i ° 1 21.75 1.50 1 .52
BTNEU C5H6N8°131.86 1 .4 9 1.48
RDXW 6°6
1.80 1.48 1.48
HMXC4H8N8°8
1.90 1.48 1.48
TNETBC6H6N6°14
1.70 1.45 1,43
TBTRYL C7H5k5°81.70 i . 4 i l - 43
NM CH3N021.-13 1.33 1.36
TNTW 3 ° 6
1.63 1.27 1.28
PICRIC ACIDW 3°4
1.7 1.23 1.25
3ATNBC6H5N5°6
li-79 1.12 1.12
E x p lo s iv e DC8H6N4°7 ■
1 .70 1.07 1.08
PBX 9404 C1.40?I2.75K2.5702.691.84 1.46 1.47
COMP.B-3 C2 . 05H2 .51N2 . 15 °2 .671.7 1.40 1.39
OCTOL C6 . 84H10. 03N9 . 22°10.431.81 i .4 3 1.43
From T a b le 3 -5 , and NOLand LASL co m p ila t ion s .
From a rb it r a r y decom position mechanism a ss ign in g a l l a v a i la b le oxygen to H20 and CO^ w ith excess carbon appearing as C (s ) .
3-16
AMCP7W-1I0
TABLE 3-8. COMPARISON OF 0 AND GURNEY CONSTANTS FOR PLANE-WAVESHOTS
HZ Po. J5 q : \Z5iT. y/at/,29 Sourceg/c5 a*Alsec m/usec-
Baratol 2.61 -2 .0 1.94 -0.97 SRI1.72 Bin -0.86 siln
•3/17 HUX/Taflon 1 <911 3 .3 .(*> 3,22 0.995 LRL
■ 84/14. JQtXj. if luorc arbon 1.894 3 .2 6 ^ 3.32 1.02 LRL
KMX 1.891 3.52 3.55 1.01 LRL
HMX 1.89 3.52 23.45 20.980 -SRI
84/i* KHX/Kel-P 1.882 3.27(a> 3.28 1.00 LRL
80/20 mx/viton 3.876 ' 3.13C,) 3.14 0;995 LRL
90/10 KKX/Viton 1.865 3 .3 8 ^ 3.32 0.980 LRL
85/15 WX/Vlton 1.865 3.24W 3.19 0.984 LIU.
PBX 9404 1,841 3.42 3.38 0.988 LRL
POX 9404 1.84 3.42 3.21 0.938(0.99nax)5Rl
78/22v HHX/lHT 1 821 3 . i l (B> 3.29 0.965 LRL
88/12 KMX/Pluorcarbon 1.79$ 3,30<4> 3.17 0.960 LRL
90/7/0 RDX/Xel T 1.787- 3.23( , ) 3.13 0.972 LRL
90/10 HHX/Urethana Polymer 1.777 3 .3 8 ^ 3.14 0.929 LRL
PITH l.?65 3.57 57m 0.940 LRL
77/23 Cyclotol >1 .'754 3 . 3 3 W 3.14 0.938: LRL
92/8 HMX/PE 1.719 3 . « < * ) 3.10 0.905 LRL
Co*p, 9 grd.A 1.717 3,26 2.990 0.915 LRL ,
Coep, B-3 i.68 3.22 2.99 0.930 SRI
Coap, B-3 1.68 3.22 3.00 0.933 NOL
90/8/2 RDX/P.S./D.O.P 1.875 3.37( , ) 2.97 0.909 LRL
TOT 1.630 3.02 2.54 6.84 alii, LRL
TOT 1.630 a.37m 2;,54- 1.07 aax MTOT preased J.02 <3.00 SRI
TOT pressed 3.02 :C 2 .« LA5L
HU- 1.143 3.21 2.IB 0.68 LRL
XU 1.143 2.86*®* 2.18 0.76 sin
i
ii
* Q a AH for confined charges.
** Determined by Kq. 3-6 using experiaental dats.
^ Q » ifMtX) (Qj^X, i . « . i a l l other asterlsls sssuiwd inert.
(l>! 0 * En1Q1 fc) Plane wave lens contributes to driving the netiil.
^ Baaed on AHd for unconfined charges (see Tfible 3-4).
AMCP706-180
TABLE 3-9. CORRELATION OF Q AND EQUIVALENT WEIGHTS FOR FREE AIRBLAST
* ExperimentalPo, Q. A Hd, Equlvalegg
^ T N T ah ./ (ah .)d d TNTExplosive g/cc kcal/g kcal/g Weight
TNT 1.6 1.27 1.09 1.00 1;00 1.00
TNITB 1.7 1.45 1.47 1.13 1.14 1.35
Coap B-3 1.7 1.40(»> 1.24 1.13 lilQ .1.14
98/2 RDX/Wax 1.6 1.45(W 1.45<b) 1.19 1.14 1.33
95/3 iU>X/Wax 1.6 ■1,41<b) 1.41(b) 1.19 1.11 1.29
91/9 RDX (Coap.A-3) •1.6 1.35(b) 1.35 1.09 .
*1 .2
1.06 1.24
PETN 1.55 1.48 1.49 1.17 1.36.
50/50 Pen to llte 1.6 - 1.26 <*» 1.16; - 1.18
Explosive D * 1 .0 7 ^ - «0 .85 0.84
Aliualnized explosives
80/20 Tritonal 1.7 1.63 1.07 *1 .4 1.52
HBX-3 1.8 - 1.995 1.16 - 1.83
Minol IX 1.7 - 1.51 1.24 - 1.39
Torpex 11 1.7 - 1.60 1.23 - 1.47
Average o f values shown In Table 3-5.
**
<>)
<b>
Tsken from J. Fete.:,Annals S.V. Academy of Sciences 152, 315 (1968),,
Assumed s ligh t ly smaller than the 1.42 to 1,45 kcal/g confuted by Ljp o r BKW methods fo r 64/36 OMt/TST.
« ■ £ SjH
4H. = E n <4H ) a i a
^ Unpublished data, Stanford Research Institu te
^ NOL calcu lation using -the BKV equation
<e) Based on i/3 C ^ N ^ + 0.7Al203 „Q.83R20 + 7/3 C (*) + l/2N2
3*17
MWcrm-iao
TABLE 3-10. UNDERWATER PERFORMANCE OF EXPLOSIVES
E x p lo s iv eE qu iva len t
W e igh t*Q/Q'Tnt
TNETB 1.28 i . i 4
PETN 1.25 1 .18
HHX 1.19 1.17
RDX 1.16 1.17
95/5 RDX/Wax 1.13 1.11 (8 )
75/25 C y c lo t o l 1 .12 1 .1 2 <?)
Comp. B 1.11 1.11
50/50 P e n t p l i t e 1 .09 1 .0 9 (a ^
T e t r y l 1 .08 1.11
E x p lo s iv e D 0.91 O .B d ^
A lum inized
70/30 TNETB/A1 1.80 » 1 . 9 0 fc )
HBX-3 1.59 *1 .5 7 (d )
70/5/25 RDX/Wax/Al s a l .60 * 1 .7 (e )
* ■ .R e la t iv e to TNT, th is i s the eq u iva len t w e igh t fo ij shock energy + bubble en ergy. Data taken from R e f. 3.
( a ) Q s E n^Q ; wax, i f p re sen t, assumed in e r t
(b ) NOL com putation o f Q
( c ) Q = 2 .42 k ca l/ g f o r C,HLN„0, + 6A1 = 3A1„0 + 3H„0 + C0„+5C+3N„A b o o l 4; 4 0 a a &
0 0 Assuming Q = AH^
( O Q. a 2 .2 kca l/g fo r 1/3 CoHeNo0 „+ 0 .98 A1 =A w J b o b
0 .A 9 A l2O3 + O.53r*2O + 0.47Hj + C (s ) +N2
3-18
AM CF7W -1M
TABLE 3-11. CORRELATION OF DETONATION ENERGY AND MAXIMUM WORK (BALLISTIC MORTAR)
B a llis t ic Mort.rBxplofllv* Rela tive to TNT ^ 'TNT d a* TNT
- 1.09TUT ' “ ^TKT - l i0
HMX 1.50 1.17 1.36 1.49nix 1.50 1.17 1.36 1.48
PITO 1.45 1.18 1.37 1.50
WJ 1.40 1.16 1.35 1>46TKKTB 1.36 1.14 1.35
Comp, A-3 1.35 <b> <b) 1.35U>
Crop, B' 1.33 i . i o 1.14 1.24Tatryl 1.2 to 1.3 l . i i 1.07 1.17Pcn tolit* 1.26 1.02( , ) !.!.<■> 1.2®'**P icr ic Acid 1.12 0.97 0.93 1.03
DATPB i.o o 0.88 0.93 1.01
Explosive D 0.99 0.84 ).98 1.07
Kiool 2 1.43 - 1.39 1.51Torpex 2 1.38 “ 1.47 1.60
Trltdnal 80/20 1.24 - 1.50 M 'SHBX-3 l . l i - 1.83 2.00
» <J - C ojOj I * d - t V ' V i
i M kcal/g
(b ) Aiauaid wax is ccw p l.t.ly Inart
3-19
AMCP 70*110
CHAPTER 4 THERMAL DECOMPOSITION OF EXPLOSIVES4-1 INTRODUCTION
Explosive liquids and solids can be decomposed by heat and light at relatively moderate temperatures. During decomposition, considerable heat is liberated since these reactions are exothermic. When the rate o f decomposition in. the condensed phase is sufficiently high, then an explosion mav result due to self-heating, i.e., the heat generated during decomposition exceeds heat loss to the ambient by conduction and other means. This phase o f decomposition (self-heating) is analyzed in C op ter 10. It is clear that.detailed information on the stability o f liquids and solids is needed for two reasons. First, to determine the conditions under which the unstable materials may be handled with some degree o f safety. Second, to determine the conditions under which explosion will result since many explosions are preceded by a phase o f rapid decomposition.
The first step in assessing the stability o f a liquid or solid is to consider the thermochemical properties. Detailed information is needed on rates o f decomposition, activation energies, and heats o f decomposition. Some information on these properties is becoming available but there is considerable discrepancy in the values quoted by different workers. There is also a lack o f reliable values for many o f the thermal properties such as specific heat, thermal expansion, thermal conductivity, and other similar properties.
I f the conditions under which explosion develops are to be controlled, then it is vital to understand the mechanism o f the decomposition. This has been recognized in the last ten to fifteen years, and there are active centers o f research throughout the world concentrating on this problem. Liquid explosives are usually characterized by covalent bonds, and there is considerable background o f research for related materials to make it possible to propose reasonable decomposition mechanisms. A t the same time, the development o f modern equipment makes possible the analysis and id en tifica t ion o f intermediates in small concentrations and o f short life. Mass spectrometers, electron spin resonance and
nu clear m agnetic resonance equipment, chromatography, and spectroscopy are all being employed in this connection.
The majority o f explosive materials, however, are solids and here the situation is more complex. The decomposition may be mainly a surface reaction or it may develop in the bulk material. Defects and impurities can influence the course o f ti.e reactions. It is perhaps essential to have a phase change o f to melt the solid before an appreciable decomposition rate can be measured. The methods used to study explosive solids fo llow closely those developed fo r the study o f semiconductors. It is necessary to show the natureof the bonds in the solid and to decide whether the solid is ionic or covalent. Covalent solids can be o f the valence type or o f the molecular type. For this purpose, studies are being made o f the optical properties o f the solid (ultraviolet, visible, and infrared' spectra; refractive index; birefringence), as well as electrical properties (conductivity at low and high tem pera tu re ), photoconductivity, crystallographic studies, and electron microscope and electron diffraction studies. In this way much has been learned about simple azides although it cannot be said that one can yet speak with confidence about solids such as lead azide.
4-2 DECOMPOSITION ENERGIES
The decomposition o f most liquid and solid explosives results in the formation o f gas. The simplest way to fo llow the reaction is t make pressure, time measurements in a closed system at constant volume. These curves are sigmoid in shape (Fig. 4-1), and from such curves the rate constant k can be obtained. Numerous relations have been obtained experimentally for solids, for example
kt + constant (4-1)
L Pfh (4-2)\p, - p
where p is the gas pressure at time t and pf the final gas pressure. For many solids nuclei are formed in localized regions, and these play a role.
4-1
AMCF7M-1M
in the decomposition. These nuclei grow and eventually overlap and interfere. Many investigators have derived expressions to fit the experimental curves in terms o f the production o f nuclei. Thus, Prout and Tompkins give the relation / \
* " ( l - a ) “ kt + c (4-3)
where c is a constant and a. the fraction o f explosive decomposed; this holds fo r the decomposition o f many solids such ns permanganates and oxalates, and some o f the azides. Another relation by Avrami and Erofeev is gaining in popularity. Their analysis involving three-dimensional growth o f nuclei is o f the
form - in ( i - a ) - <*t)" (4-4)
For some reactions n “ 4 at the beginning o f the reaction and n * 3 in the decay period.
When melting takes place, the nature o f the rate equation is modified. The decomposition of liquid explosives has been successfully followed by determining the concentration o f one o f the products o f decomposition with time, e.g., the formation o f nitrogen dioxide during the decomposition o f the nitrate esters or the nitro compounds. Here, o f course, the assumption is made that the nitrogen dioxide is one o f the primary products o f decomposition: It is hot intended to list here all the various methods in use to fo llow decomposition since these are too numerous. Accounts can be found in Chemiitry of the Solid State*, Reactivity o f Solid*3, and in many other Symposia and. papers published in recent yean.
Once the rate constant has been determined, then a study o f the variation of the rate -constant k with absolute temperature T gives a measure
Figure 4-1. Thermal Decompotition Sigmoid Curve
AM CP7W -1M
the activation energy E (refer to Fig. 4-2) from, the general relation
k = Z exp [-£/ (flr )J (4-5)
where 2 is the pre-exponential factor and R the gaa constant. Unless it is stated specifically, the values for E are usually the overall activation energies. O f greater interest is the value for the activation energy for each individual step in the decomposition complex o f reactions; these are gradually becoming available. More refined equations are available for analysis o f rate measurements but the experimental results obtained so far do not lend themselves to the use o f advanced theory.
Values which have been given for activation energies o f various explosives are listed in Table4-1. These have been selected as possible values but the agreement between different investigators is hot good. Both E and Z may vary with temperature, particularly at high temperatures. Autocatalysis may also take place
and the products o f decomposition can exert a profound influence on the Tate. The table is included to give an idea o f the magnitude o f the energies, however, too niuch reliance should nOt be placed on the absolute values given. The values usually range between 30 and 50 kcal/mole, and are not very different from those normally found for many other nonexplosive materials. This is not surprising as the processes involved in the decomposition: o f explosive and nonexplosive systems can be very similar. It is the exothermic nature of. many o f the decompositions that makes the reaction run away to explosion. Chain mechanisms may also play a part in the decomposition.
4-3 DECOMPOSITION MECHANISMS
I t will be convenient to consider explosives in three groups:
(1 ) Covalent liquids and solids (the organic nitrates and nitrocompounds). Here the initial
'A
Figure 4-2. Plot o f Logarithm of Rate Constant k vs Reciprocal o f Absolute Temperature to Determine Activation Energy from Slope of the Line ,
4-3
AMCF 704-1*0
TABLE 4-1
■ ' ■ - ■ ■ ' ■
ACTIVATION ENERGIES AND PRE-EXPONENTIAL FACTORS FOR SOME EXPLOSIVE LIQUIDS AND SOLIDS
' 1
Temperature
CompoundRange,.°C
E,,kcal/moU
logZ
Nitroglycerin 160-190 50 23.5Tetryl 211-260 38.4 15.4Ethylene dinitramine 174-178 30.5 1 2 .8PETN 160-230 47 19.8TNT — 37 —
DINA — 35.5 —Picric acid 153 58 —
Lead .azide — 36-38Silver azide below 190 44
above 190 31Mercury fulminate 100-115 32.2Lead styphnate 225-255 40 ?
step in the decomposition is usually bond fission and a free radical mechanism applies. Intramolecular elimination reactions have also been considered.
(2 ) Ionic solids. Many of the primary explosives such as the azides, metal picrates, and acetylides belong to this group; electronic processes will dominate the reaction mechanism.
(3) Ammonium salts. Ammonium salts in principle belong to group ( 2) since they are generally ionic solids. There are, however, twc possible paths for the decomposition, and fo r this.reason they .are considered separately.
4-3.1 COVALENT LIQUIDS AND SOLIDS
There is no doubt that the organic nitrates form thn only class o f materials which have been studied in a systematic way. It is generally agreed that the first step in the decomposition is the fission o f the oxygen-nitrogen bond in which an alkoxyl radical is produced. This is also the rate determining step. Thus, for a simple compound such as methyl nitrate
CH jONO, - C H jO + N 0 a
The activation energies favored by Gray7,1 fo r
the decomposition are methyl nitrate, 38.4 kcal/mole; ethyl nitrate, 36.4 kcal/mole: n-propyl nitrate, 37.6 kcal/mole; and this is equated to the energy recjired in the bond fission process given in the given decomposition reaction. The reactions in the gas phase in particu la r are hom ogeneou s with pre-exponential factors approximately equal, to 10“ The decompositions are also inhibited by the addition o f nitrogen dioxide and nitric oxide by the possible reactions o f the alkoxyl radicals RO in the manner
RO- + N 0 2 -*• R0N O 2
RO- + NO ->• RONOthus indicating the way in which nitrates may be reformed and also how nitrites can be produced during decomposition o f the nitrate esters.
The alkoxyl radicals can undergo a variety o f reactions and rearrangements, and in the case o f the simpler alkoxyl radicals these have been described in detail in a review by Gray and Williams*. There may be association withradicals, hydrogen abstraction, rearrangements(isomerization), decomposition o f the radical to simpler radicals and ah’ hydes or ketones, disproportionation, and decomposition by
A M C P T M -IM
radical attack. It is evident that ail these reactions can lead to complex products and these are found in the decomposition products;
For the decomposition o f a nitrate ester such as n-propyl nitrate the following set o f equations may be written as a sequence o f reactions during decomposition:
n -C j F • ONO j -*■ n - C, H7 O + N 0 2
n -C jH 70 - +
C2H5- + NO.,-* Cj Hj O- + NO
and some C2 H 5N 0 2
CjH 6 0- -+ CHj- + CH jO
CH3- + N 0 2 -*■ etc.
n-C j H7 O + NO -+ n-C j H7 ONO
etc.
Schemes such as this have been proposed for many nitrates and related esters. What is needed is the activation energy for each step; some o f these are now known fairly accurately.
Systems such as glycol dinitrate, nitroglycerin, and PETN will behave in the same way but, since there are more nitrate groups in each molecule, there is difficulty in working out the precise order o f the steps to the final products. Thus, glycol dinitrate would be assumed to decompose ideally in the manner
N 0 jOCH2CH2ONO2 - * 2 N 0 2 + •OCHjCHjO
l
2CH20
or for more complex dinitrates ■
(CH3)2COj N02
CHj -*■ 2 (CHs )a CO + 2 N 0 2 + C2H 4
OH, ,
(CHS )a CO l N02
For PETN, nitroglycerin, and related systems,
carbonyl compounds—such as formaldehyde, more complex aldehydes and ketones—are formed simultaneously, and these together with the alkyl rad’cals are oxidized by ,he nitrogen dioxide. The decomposition o f nitroglycerin accelerates i f the products are allowed to accumulate or if water or adds ar» introduced. Apart from gaseous products—such as NO, N.O, H20, CO, CH4, N 2, and HCN-liquid end solid residues o f complicated structure are also found.
The nitrate esters are also decomposed by ultraviolet light, and again it is assumed that the initial step is bond fission. First there is the formation o f an excited state
RO NO j + KONO* -> RO + N 0 2
excited state
which may revert to the ground state or dissociate to give free radicals. ■
Andreev has made an extensive study o f the decomposition o f nitrate esters, and o f the effect o f products and additives on the reaction rate. He followed the decomposition o f PETN in a variety o f physical states: the solid, molten, dissolved, and gaseous states. The rate o f decomposition is greatest in the gaseous state and least in the solid state.
The nitro compounds have also been studied in some detail,. A review o f the decomposition o f nitromethane by Makovsky and. Lenji10 records the information available up to 1958. The vapor phase decomposition at different temperatures and pressures has been followed by static and flow methods. The reaction has been shown to be first order and a large number Of the products o f decomposition identified. These include NO* N jO, HjO , CO, CH4, C 0 2, and traces o f C2 H2, Cj H6, and N O ,. More complicated products are formed at high pressures, e.g., HCN, CH3 CN, HCHO, etc. The overall acuvation energy for decomposition is in the region o f 50-53 keal/mote. Most.investigators favor■ bond fission as the initial step in the decomposition
C H jNO a -*■ CHj " + N 0 2
Numerous other stepr, have been proposed to account for the products o f decomposition, and some o f these are, given to indicate the type o f reactions envisaged
4-5
AM CP7M -1S0
CHa- + CH3NO j CH4 + 'CHj NOj
•CHj NO j + N O j -*■ C H jO + NO + N 0 2
CH20 + NOs -*■ CO + NO ■) H20
2 CH3- h- C jH ,
Reaction! o fth e typeCH3- + NO -* CH jNO -* CHa =NOH - » HCN
+ H jO
ue also probable reactions,On the other hand at high pressure!, in the
region 12-40 atm, Makovsky10 and Guenwald consider the reactions
CHjNO j ■+ GHjNO + O
O + CHjNO j -> CHjO + H NO j, etc.
may also take place. The photolysis o f nitromethane has been studied recently by Nicholson11 who postulates bond fission as the initial step in the decomposition.
The decomposition o f the higher nitro alkuies-e.g., nitroethane, 1 and 2 nkropropane—has also been studied though in less detail. For nitroethane, values o f the activation energy ranging between 41 and 46 kcal/mole seem to be the most reliable. There is considerable debate concerning the first step in the decomposition. The O N bond strength is estimated at 58 kcal ai.d the activation energy measured is some 1 0 kcal smaller than this for nitroethane. Possible schemes starting with
Cj Hj NO j -> C jH , + NO j
aa the first step have been evolved but the alternative reaction
C ,H jN O j -- CjH< + HNO j
is a strong <.,\n didate. For this reason the detailed schemes for the two rival mechanisms will not be given; the details may be found in the literature.
For 2-nitropropane, a careful study by iSwiith and Calvert11 gives the following exprcssiijnfpr the decomposition rate constant:
k * 1 . 1 1 X 10u exp [-39.3/(1177], sec"’ :(4-6)
This is based on propylene formation in a static system. Many o f the arguments put forward for nitroethane also apply to the nitropropane system. Again, there is disagreement a3 to the first step o f the decomposition but the weight, is perhaps in favor o f a step o f the kind
CHsCHNOjCHa -+ CHj=CHCH, + HNOj
Here, intramolecular elimination o f propylene and nitrous acid takes place via a cyclic activated complex. This is followed by a series o f radical reactions. Some o f ti ose proposed are
HNOj -+ OH + NO
OH + C H jCH NO jCH j-t-H jO
+ C H jb N O jC H ,
■+ H jO
+ CHjCHNOjCHj-
C H jC N O jC H j -*■ CHjCOCH, + NO
C H jCH NO jCH a CHjCHNO + CHjO
-+ CHj CH“ CH j + NO j
CHjCHNO -*■ CHjCNOH
CHjCNOH + NO -► CH jCN + HNO j
The higher aliphatic nitrocompounds have not been studied in sufficient detail fo r likely mechanisms to be proposed. This is also true for some o f the aromatic compounds such as picric acid.
4-3.2 IONIC SOLIDS (AZIDES)
From the practical point o f view, lead azide is the most interesting o f the azides. On the qualitative side considerable information exists on rates o f decomposition, explosion temperatures and the like. It has only been realized in recent years, however, that one needs to go further into this problem of the* decomposition o f the azides, Figures were available but no real understanding o f the mechanism o f decomposition; this is still.true to some extent,
A start has been marie on the simpler azides in the solid state which are represented as M N 3,
)
/-“ N :■ 1
i
I
{
<
AM CP700-1M
and on the related compounds—the fulminates CH 0 and cyanamides C N *‘ —since these form an isoelectronic series. Consider a solid like K N , . I t is.known that it is composed o f .ions K + and NJ, and that it is a relatively stable compound. The azide ion is a linear symmetrical group N*;13*N 1 ,16* N~ wit*1 sixteen valence electrons, and the orbital system can be represented simply as in Fig. 4-3 where the a -bonds, lone pairs, and the ir-bonds are indicated'; The orbitals which are o f interest from the point o f view o f electronic transitions are the delocalized ir, and » nonbonding
a .2 .orbitals since electrons will be excited from these orbitals to higher orbitals.
The azide ion is also isoelectronic with the CD, molecule and all the values fo r the vibration frequencies-syrometrical stretching, asymmetrical stretching, and bending—are known from infrared and Raman spectra. From these, force constants may be calculated.
I f one considers a ample series of the m o n o v a le n t a z id es—K N , , T IN ,, A g N , , CuN,,Hg2 (N 3) and organic azides (solid), it is found that the stability varies in the order K N 3> T IN , > A g N ,> CuN,< H g, (N , j , < solid azides. The stability decreases along the series K to Cu as the ionization potential I increases, or
more accurately as ( I - E j increases. Here £ is the electron affin ity o f the azide (N 3) radical and is in the order c f 2 ,8 ev, although higher values than this have been quoted. T h e problem is to explain why the stability varies in this way,; a reasonable explanation can be given if we use the band theory o f solids.
In the case o f K N 3, 1= 4.32 ev, £*>2.8 ev; therefore ( I -E ) is small. For greatest stability, the solid should be composed o f ions K+ and N , . The structure is tetragonal and all metal-nitrogen distances are the same. It has properties typical o f ionic' solids such as KBr, the refractive index is low (o f the order 1.5), and. the optical absorption edge occurs in <the vacuum ultraviolet part o f the spectnim. The silver salts AgN , and AgBr, however, are unstable solids and readily decompose on heating, o f during irradiation with light o f suitable wave length or ionizing radiation.
kT2A S: '„ 2Ag + 3 N , + 0
similar to
2AgBr -+ 2Ag + Br,
where Q represents the heat o f decomposition.
W u non bonding orbital
IT , bonding orbitalVi '
Figure 4-3. Representation of the Orbital Syutem of the Azide Ion
4-7
A M C f 706-180
The bromides are mentioned since there is in fact a close resemblance between the behavior of the azides and the corresponding bromides. The ionic radii o f Ag+ and o f K+ are 1.26A and 1.33A, respectively, which are not too different. On the other hand, the structure o f A gN 3 is orthorhombic, and there arc directed bonds. In the solid, there are four long silver-nitrogen bonds o f 2.79A and four short bonds o f 2.56A. The solid has a partial layer-type structure. The physical properties depend markedly on crystal direction. The refractive index is. high arid is approximately 2;0 for li^ it of.long wave length; and the optical absorption edge is now much further into the visible part o f the spectrum. AH these properties indicate a departure from an ionic ty pe o f lattice in the stiver salt.
The decomposition o f silver azide by heat is exothermic to the extent <3=1.48 kcal/mole. From the given chemical equation it is clear that while the lattice is composed mainly Of ions, the products are neutral, so-that an electron transfer
mechanism must operate at some stage o f the decomposition. Before the mechanism o f the decomposition can be established, it is necessary to determine the electron energy levels in the solid—in other words the energy E required to excite an electron from the valence band to the conduction band where, as in Fig. 4-4, we assume the valence band is formed by the overlap o f orbitals o f the azide N 3 ions while the conduction band is formed by the overlap of orbitals o f the metal M+ ions.
On the experimental side the overall activation energy fo r ihe decomposition o f silver azide has been determined from pressure-time curves, and below 190°C the value is 44 kcal/mole or 1:9 ev molecule. Some information is also available on the collapse o f the lattice in passing from silver azide to metallic silver. This is obtained from electron diffraction studies o f a crystal as it decomposes under the action o f an election beam in the diffraction camera. Oriented, silver is formed with lattice parameters slightly greater
n
Conduction bond(overlap of orbital* from iTion*)
Valence band(ovorlap of orbital* from N~ ion*)
Figure 4-4. Schematic Showing Energy E to Excite an Electron from Valence Band to Conduction Band in Silver Azide
4-81
AMCP 706-180
than for normal silver, and it is concluded that a diffusion o f silver takes place to lattice sites made vacant by the removal o f azide ions N j during decomposition. This will give oriented silver nuclei with large silver-silver rpacings. Finally, there is a collapse to normal silver. The silver that is formed during decomposition is very mobile and appears on the surface mainly as discrete nuclei which grow in size until they cover the whole o f the surface. The nuclei may be less than 10A in diameter (the lim it o f resolution o f the electron microscope used to determine their size) to greater than 2000A. These nuclei play an important part in the decomposition, and for this reason a knowledge o f their size and distribution is needed. The technique used is simple. Crystals o f silver azide are heated or irradiated with light giving a surface film o f silver, which consists o f the large and small nuclei as illustrated In Fig. 4-5(A). A carbon film is evaporated on to the nuclei (Fig.4-5(B), and undecomposed silver azide dissolved away in dilute ammonia solution. The carbon film floats on the liquid surface and is picked up on an electron microscope grid which is then studied in the normal way. It is possible that silver forms internally along dislocations in the crystal in the manner found by Miteheli and illustrated in Fig. 4-5(C). No evidence for this type o f behavior has as yet been found fo r the azides. Even with crystals o f silver cyanamide which resembles silver azide but which are more stable, the silver is mainly at the surface. This has been verified frequently in electron microscope studies. The situation, as far as dislocations and their influence on the decomposition o f the azides is concerned, is that a possibility exists that they do play a part in the decomposition but direct proof is not at present available. An etching technique might perhaps give better results. The main decomposition seem to take place at the surface.
Reference was made earlier to use o f the band theory of solids in connection with the explanation o f the stability o f azides, and it was stated that it is necessary to determine electron energy levels in the solid. The simplest way to determine energy gaps is from the optical and electrical properties of the solid. The optical absorption spectra are determined in the normal way, and one can represent the light path as in Fig. 4-6. If /„ is the incident intensity o f light and I the transmitted intensity, then in the ideal
case the absorption coefficient ex in cm ' 1 is given by the expression /=/ e , where t is the thickness o f the crystal in cm. Absorption coefficients a are determined as functions o f the wavelength o f light 7 and for values o f a in the region o f high absorption corresponding to I 06 to 1 0 6 cm'1, it is assumed that photon energies hv correspond to the band gap E as shown in Fig. 4-7. Here one is concerned with direct transitions from the valence band, to the conduction band fo r values o f the wave vector !: = 0. On a simple ideal this would correspond to the energy required fo r the following process but this concept should not be pushed too far:
N - ^ N 3 + e
azide ion azide radical electron inin lattice (positive hole) conduction band
Measurements o f the absorption spectra at low temperatures, particularly at liquid helium temperatures, reveal the presence o f excited states. These are exciton levels and lie below the conduction band (Fig. 4-8). They form a hydrogen-like series and their frequency is given ’by an expression o f the form
v„ = v„ - R/n1 (4-7)
where vn is the frequency corresponding to the exciton o f quantum number n, is the frequency o f the series limit, and R is an exciton Rydberg constant. In the case o f the alkali metal azides, Deb has resolved the n - 1,2 and 3 lines and has found that at liquid helium temperatures the band gap fo r KN3 is 8 .6 ev corresponding to light o f wavelength 1450A in the vacuum ultraviolet, and the n = 1 exciton line occurs at 1895A or 6 .6 ev. These gaps are quite large.
Exciton levels have also been identified in T IN j and AgN3. However, one now finds th $ the absorption edge is in the vicinity o f 3500 A or 3.5 ev for silver azide. The values for the gaps are: = 3.5 ev optical; E2 = 0.6 ev optical(see Fig. 4-9). These are much smaller than for potassium azide.
can also be estimated from electrical conductivity measurements at high temperatures but the interpretation o f the results is not always easy since both ionic and electronic conductivity have to be considered. En can also
4-9
AM CF7W -1M
I I l ——— - — —silvsr ihicM
silver azide crystal (A)
sIHer along dislocations
AgBrcrystal ( C )
(
Figure 4-5. Showing Technique for Studying Silver Nuclei from Decomposed Silver Azide
*10
c o
Figure 4-6. Schematic for Determining Optical Abebrption Spec t*a
AMCP796-1W
. \AMCP 706-180 '
hv X
Figure 4-7. Absorption Coefficients a as Function of Wavelength X. At High Absorption, Photon Energy hv Assumed to Correspond to Band Gap Energy E
I \ vaienct bond
X
i
f
ii(i
*
*
Figure 4-5. Showing Exciton Levels
AMCP706-180
j o ---------- -------- — —lI CONDUCTION BAND
4
Figure 4-9. Energy Gaps E1 and J?2 in Silver Azide
A M C f 706-1M
be estim ated fro m photoconductiv ity experiments. Here it is assumed that one measures the thermal energy required to dissociate optically formed excitons in the manner
- , - * heatN 3 + hv % n 3 ---- - N 3 + (e )
excitonBoth T1N3 and AgN? are good photoconductors when they are irradiated with light near to the optical absorption edge. The experiment is quite a simple one, and a schematic diagram is shown in Fig. 4-10. Light o f known wavelength is allowed to fall on to a crystal held at a DC potential o f a few volts. A photocurrent will result and the magnitude o f this photocurrent depends on the wavelength o f the light and the temperature o f the crystal. Since the resistance o f the crystal is usually high, o f the order of 1 0 10 f l cm., the photocurrents are very small and can be in the region o f 10' 1 2 A. For this reason electrometers are in general used to record the currents. From the variation in photocurrent with temperature it is possible to determine an activation energy for the photoconduction process; fo r silver azide this is in the region 0.38 ev. This is a. thermal energy which can be shown to be in good agreement with the value E2 obtained optically.
Energy gaps obtained from spectroscopic measurements give optical energies. One also needs to know thermal energy gaps. These are not the same, ana arguments based on the Franck-Condon principle led M ott and Gurney to give the approximate relation
where Et is a thermal energy, E„ the corresponding optical energy, K0 the high frequency dielectric constant, and K the static or low frequency dielectric constant. K0 is estimated from values for the refractive index n and for values o f n corresponding to wavelengths well away from the absorption edge K a = n2. Substituting the appropriate values fo r silver azide, one obtains for E, a value o f 1.88 ev. This is the thermal energy required to excite an electron from the valence band to the conduction band. This agrees remarkably well w ith the activation energy for thermal decomposition o f 1.9 ev (below 190°C)
determined from pressure-time curves. It is suggested in fact that in Fig. 4-9 for silver azide is connected with thermal decomposition and E2 with the activation energy fo r photochemical decomposition. It is, therefore, possible to propose a generalized scheme fo r the thermal and photochemical decomposition o f the heavy metal azides. This is shown in Table4-2.
It must be emphasized that this scheme is very general. The detailed mechanism is much mpre complex since the presence o f point defects, dislocations, impurities, metal particles and. the like have been ignored. In a general sense, however, it is probably correct, and resembles in outline the mechanism o f decomposition o f silver bromide in the photographic.process.
An attempt can also be made to explain how the stability decreases along the azide series K, Tl, Ag, Cu. Along this series Et is found to decrease quite appreciably; this can mean that the rate o f decomposition at a given temperature can be, higher. The situation with K N 3 is a little more complicated. The bend gaps are very large and the exciton level n = 1 is well below the conduction band. With K N 3 Jacobs and Tompkins assume that during decomposition, for example by light, excitons are formed. These may be trapped at vacant lattice sites, fo r example where K + ions are missing. The electron from the exciton is then lost to form an F center, The positive holes (N 3) finally can give nitrogen gas. Such a mechanism is plausible because just as in the case o f the alkali halides, color centers o f the F center type readiiy form in the alkali azides and could play a part in the decomposition.
As soon as the ionization potential becomes too large—e.g., I > 8 .0 ev—the solid is no longer composed o f ions but a covalent type o f solid is fo rm ed . Examples are mercurous azide Hg2 (N 3)2, hydrazoic acid HN3, and the organic azides. There are now directed bonds to one end of the azide group
In this diagram M represents the metal, hydrogen or organic groups, and the bonds are shown. The distance N j N„ is now much larger than N 2 N j . For example in methyl azide, CHj Nj , the bond lengths and bond angles are:
4-1*
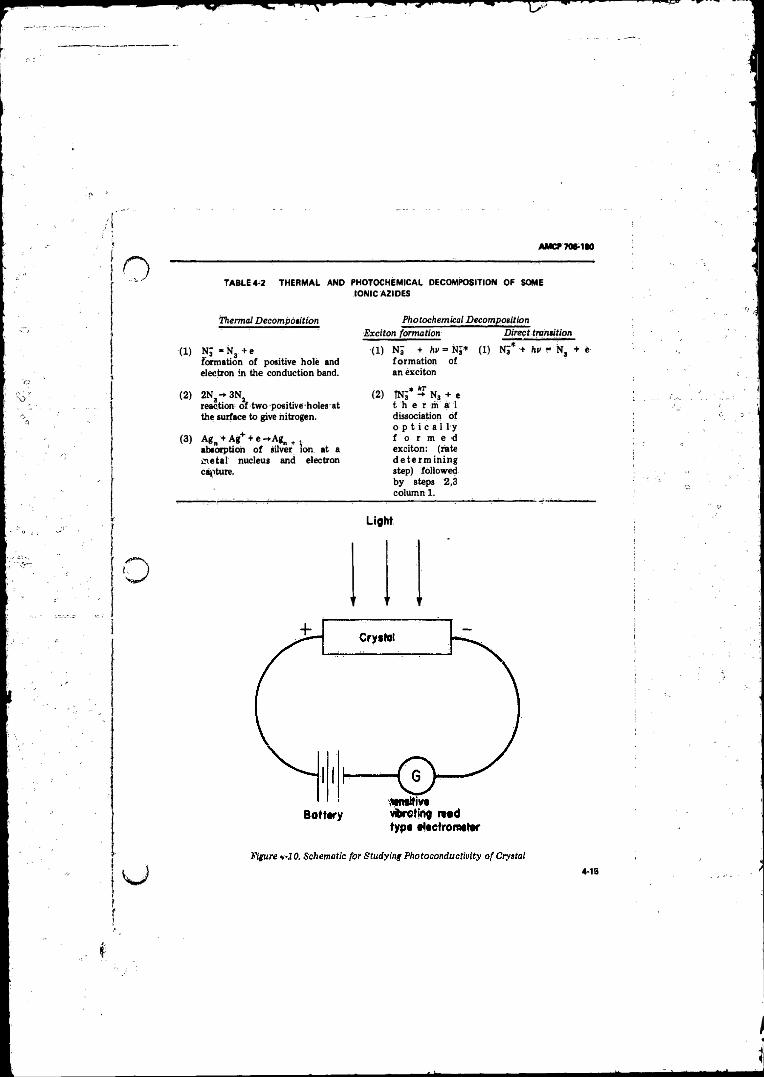
AM C P7M -1Mo TABLE 4-2 THERMAL AND PHOTOCHEMICAL DECOMPOSITION OF SOME IONIC AZIDES
j Thermal Decomposition4 . . . -
( 1 ) N J - N 3. + eformation o f positive hole and electron in the conduction band.
( 2 ) 2N3 h- 3Nj
reaction o f two positive-holesat the surface to give nitrogen.
(3 ) A g B + Ag+ + e-*'Agll + v absorption o f silver ion at a irietal nucleus and electron culture.
Photochemical Decomposition Exciton formation Direct transition
(1 ) NJ + hv= NJ* (1) NJ* + hv - N , + e formation ofan exciton
(2 ) 1NJ* % N3 + e t h e r m a 1 dissociation of o p t i c a l l y f o r m e d exciton: (rate d e te r m in in g step) followed by steps 2,3 column 1 .
\ Light
It o
AMCPTOtiaO
I f we consider hydrazoic acid as the simplest o f these covalent azides, the orbital system may be written as shown in Fig. 4-11.
There now exist differences in physical properties to the ionic azides in vibration frequencies, since all are now infrared active, and in the decomposition behavior to heat and light. The initial step in the decomposition is probably bond fission, e.g , o f the longest N-N bond,
MN3heat,
lightMN + Njj
HNa -*■ HN + N 2
The subsequent steps in the decomposition depend on the stability o f M N i f M is a metal atom, or on the reactivity o f the free radical i f it is o f the type HN. For example, ammonium azide can be formed from hydrazoic acid. The detailed mechanism is, however, the subject o f rather violent argument and controversy at the present time, so that all the steps will not be given here. In the case o f the organic azides the rad ica l R N ' can undergo rearrangement particularly i f it is o f the complex variety and is derived, for example, from triphenyl methyl and similar groups R. Usually the covalent azides are more stable than the ionic azides, although the statement must be qualified to some extent since some o f the covalent azides are exceedingly unstable, e.g., BrN? , 1N3, NONa and the like. Solid HN3 is also said to be very unstable but there is no reliable information on this point.
A number o f other systems are being studied in the same way as the azides, The list would include the acetylides, fulminates, styphnates, and picrates. A t the present time it is impossible to predict accurately the properties o f these solids. Potassium fulminate, for example, is one o f the most unstable materials in this list and the reason fo r this is not clear. I t should in fact be a reasonably stable solid from what one knows o f the structure and other properties.
The solids previously discussed are all o f the simple type. In die case o f azides and acetylides
formed from transition metals such as nickel and cobalt, die situation is a little more complicated. Here one deals with coordination complexes; ligand-field theory, the study o f the effects o f environment o f anions on the energies o f the d-orbitals o f the cation, has proved valuable in discussing the optical and magnetic properties and the stability o f these solids. .
4-3.3 AMMONIUM SALTS
The decomposition o f both ammonium nitrate and ammonium perchlorate has been studied extensively. These are widely used as explosive materials. The decomposition can, however, be quite complex since the physical state o f the solid mr.y change and it is possible to have sublimiicion and melting. Ammonium nitrate in the solid state can undergo a large number o f phase changes over a relatively small temperature range. This has led to useful information on rotation o f the nitrate ion and diffu1 :o ' ,f the ammonium ions in the solid.
Bet. . ii 210°-260° C ammonium nitrate gives o ff nitrous oxide and water, but above 300° C explosion can take place. Some nitrogen is produced and impurities, fo r example Cl~, can have a profound effect on the decomposition. The overall decomposition can be represented by
NH4N03 -+ N20 + 2 HjO
Bircumshaw has discussed the decomposition o f ammonium perchlorate. The solid exists in two modifications, orthorhombic below 240° C and cubic above 240° C. The products o f decomposition are oxygen, nitrogen, chlorine, chlorine dioxide, nitrous oxide, nitrogen tetroxide, hydrochloric and perchloric acids, and water. An unusual phenomenon is observed during thermal decomposition o f single crystals below 300° C. An amorphous solid is le ft as a residue and, strangely enough, this is also ammonium perchlorate. A similar observation has also been made for sodium azide by Secco.
The decomposition o f ammonium perchlorate, like ammonium nitrate, depends very markedly on the surface area o f the solid. In the case o f ammonium nitrate, considerable effort has gone into the preparation o f a solid o f low density (ca, 0.6) and high surface area. This material is said to be very sensitive to shock but there is
4-16
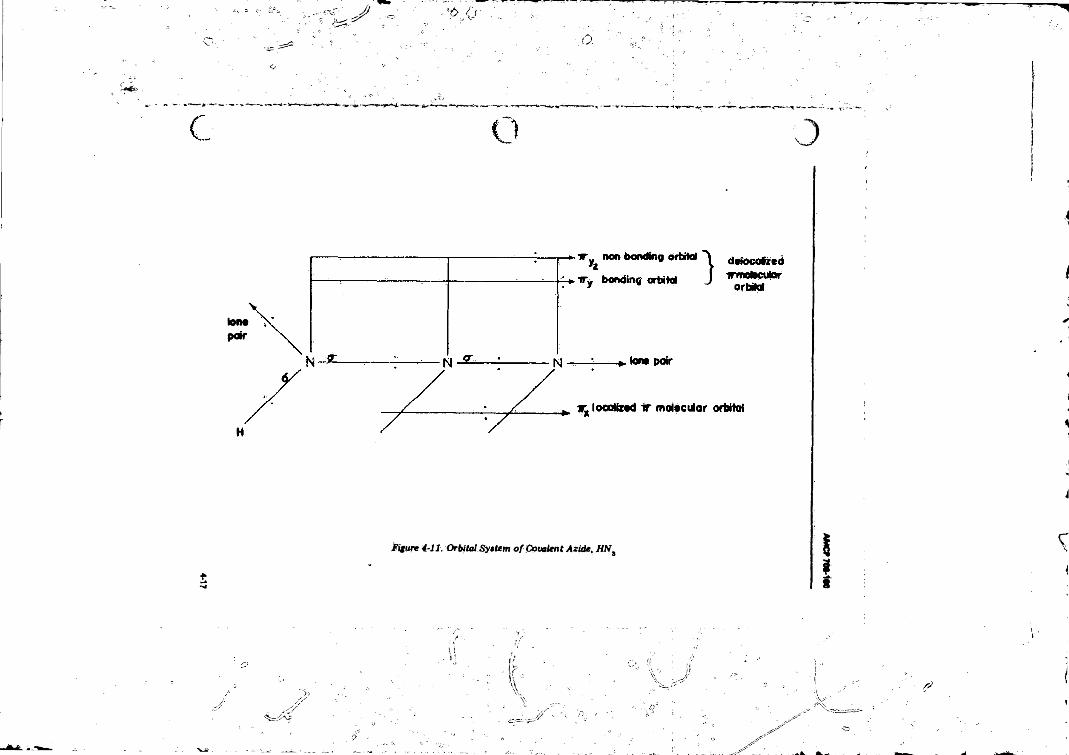
4-17
o
Ion*P®r
.Figure 4-11. OrbitaISy*Um o f Covalent Azide* HN3
. f ■■
S'! V
X\
xI. Ii
; Vf t
Ml-«
U4D
*Wr
AMCFTOUtO
/ ' “ N
some disagreement on this. The effect o f metal oxide catalysts on the decomposition o f ammonium perchlorate can be quite marked. Manganese dioxide, nickel oxide, chromic oxide, cupric oxide, and zinc oxide have all been tried; fo r example, the addition o f zinc oxide can have a profound effect. In this case, the rate and extent o f decomposition can be increased, and the explosion temperature can be lowered by some 200° C. Many o f these effects have been interpreted in terms o f electronic processes which occur during decomposition; accordingly, detailed knowledge o f the catalyst, particularly by ita semiconductor properties, is needed. Carbon hat alto been added to ammonium perchlorate and can influence the kinetics o f the decomposition.
The ammonium salts are ionic solid* and' just at for the azides, electron transfer can occur during decomposition. On a molecular iicale one may visualize the NH4 and C i0 4 ions in the solid, and the formation of. NH4 and C104 radicals (under the action o f suitable stimuli) and their subsequent reactions. Another possibility, however, is the dissociation o f NH4 C104 according to the equation
NH 4 c io 4 -+ NH 3 + HC104
This is referred to as proton traufer and the reaction w ill be dominated by the subsequent decomposition and reactions o f HC104. Which o f these two mechanisms will operate will depend on temperature, and Galwey and Jacobs1* have juggested that below 280° C the electron transfer mechansim is the important one. Here only 30 percent o f the solid decompose* and, at mentioned, the residue is still NH4 C l0 4 in an amorphoua form. The activation energy for decomposition is 32 kcal/mole A t hitfier temperatures, 350° - 400° C, the proton transfer mechanism will be the more important and the activation energy for decompoaition is 39.5 kcal/mole. The proton transfer takes plsce on the surface o f the solid followed by the oxidation c f the ammonia gas.
Soma o f the steps in the decomposition o f perchloric acid which have been proposed are
2HC104 -* Hs O + C1,0,
2C1j 0 7 *♦ 2Cla + 7 0 j (probably a chain reaction)
4NH3 + 502 -+ 6H ,0 + 4NO
The overall decomposition may be represented
** 2NH4 C104 -+ 4HjO + 2NO + 0 2 + Cl2
Similar schemes .have also been proposed for ammonium nitrate. One favored by Russian workers is
NH4N 0 3 * NH3 + HNOa
iNOj + HjO + 0,
NH3 + NO. -*• NHj- + HNOj
NHj- + NO, -*• NH jNO ,
N,0 + H20
NO + N % ■+ NHjNO -> HjO
etc.As in many schemes o f this kind, there is no problem in writing down free radicalreactions. The main, difficulty is to determine whether these in fact do take place and the energies involved in the processes. ,
4-4 RADIATION DAMAGE IN EXPLOSIONSOLIDS
Explosive solids have been subjected to a variety o f ionizing radiations and nuclear particles. There are electron beams, x-and •prays, a particles, H 3 ijiciei, neutrons, proton fission fragments and doubtless others not lilted here. These would include mesons and those pa rtic les d iscovered in rec en t years. Decomposition can be induced in solids by these particles and, by taking noncxplosive solids as models, some insight into the radiation damage that is produced can be obtained. For the lighter particles the damage caused is studied by a variety o f techniques. Optical and electrical properties, spin resonance techniques, chemical methods to identify new species, radioactive techniques — all are studied to determine change* within the crystal such as interstitials, vacancies, free radicals, color centers, and impurity formation. When the damage is i ^nsive as with fission fragments, high resolution electron mic.oscopy coupled with Moire' fringe techniques can show tracks and. dislocation loops in the crystal
A4-11
7QMM
For ionic solida the main damage is caused by ionization, and electron processes, similar to those discussed earlier, operate. In addition, thermal, effects, recoil, and decomposition o f the anion may occur depending on the nature o f the radiation. Covalent solids are in general more stable. Point defects can be created; and strain and dislocations introduced into the lattice. Localized decomposition has also been found. Fission fragments can cause an appreciable increase in surface area o f the solid. All o f these factors can influence the rate o f the subsequent
d ecom p os it ion . A lthough the rates o f decomposition may be enhanced, the effects observed up to the present have not been very spectacular. In no Case has an explosion resulted with the possible exception o f electron bombardment andhefe heating has been shown to be responsible , for the explosion. This is perhaps a fortunate result since explosive solids are already sufficiently dangerous to handle, without the added concern o f excessive sensitization by ionizing radiation.
AMCP706-1K)
REFERENCES
Books:
1. F. P. Bowden and A . 0 . Yoffe, 'Fast Reactions in Solids, Butterworths, 1958.
2. J. H; De Boer, E d ., Reactivity of Solids, Elsevier, 1961.
3. C. B. Colburn, Ed ., Developments in Inorganic Nitrogen Chemistry., Elsevier, 1965. Chapter on Inorganic Azides by A . D. Yoffe.
4. W. E. Gamer, Ed. Chemistry of the Solid State, Butterworths, 1955. Contains a num ber o f e x c e lle n t chapters on decomposition of explosives.
5. “ Radiation Damage in Solids” , Course 18, 1962, Proceedings of the International School o f Physics, “ Enrico Ferm i” , Academic Press.
Reviews:
6 . F. P. Bowden and A. D. Yoffe, Endeavour 21,125 (1962). See also A. D. Yoffe, Proc. Royal Inst, Chem,, 1961, p. 174 on properties o f sensitive compounds.
7. B. L. Evans, P. Gray and A. D. Yo ffe Chem, Rev. 59, 515 (1959) for review on azides. Also P. Gray, Quart. Rev. Chem. Soc., London, 17,441 (1963).
8 . P; Gray and A . Williams, Chem. Rev. 59, 239 (1959) on the thermochemistry and reactivity if alkoxyl radicals.
9. A . Mace,, Chem. Rev. 62, 41 (1962), sensitivity o f explosives.
10. A . Makovsky and L. Lenji, Chem. Rev. 58,
627 (1958), on nitromethane.
The following references are given to act moreas a source o f reference than to show priorityover other investigations.
11. Trudy E. Smith and J. C. Calvert, J. Phys;Chem. 63, 1305 (1 9 5 9 ), thermaldecomposition o f 2-nitropropane.
12. A. J. C. Nicholson, Nature 190, 143 (1961), Photolysis o f nitromethane.
13. A. K. Galwey and P. W. M. Jacobs, J. Chem. Soc., p. 837, (1959); p, 5031, (1 9 6 0 ). High tem perature thermal decomposition o f ammonium perchlorate.
14. F. Solymosi and L. Revesz, Zeit. fur Auorg.Chem. 322, 8 6 (1 9 6 3 ). Therm aldecomposition o f ammonium perchlorate in the presence o f zinc oxide.
15. R. D. Smith, Trans. Faraday Soc. 53,1340 (1 9 5 7 ). Th erm al decomposition of ammonium nitrate.
16. R. N. Browi. and A- C. McLaren, Proc, Roy. Soc. (London) 266A, 329 (1962). Mechanism o f thermal transformations in solid ammonium nitrate.
17. Abstracts o f Russian work onnitrate/ssters — the work o f K. K . Andre«v and coworkers; see Chem. Abstr. 60, 2713 (1964).
18. Some recent work on radiation damage of explosives. See T . B. Flanagan, a, Phys. Chem. 66,416 (1962). Lead styphnate.
19. J. Jack, Trans. Faraday Soc. 59, 947 (1 9 6 3 ). T h erm a l decomposition of irradiated lead azide.
4-20
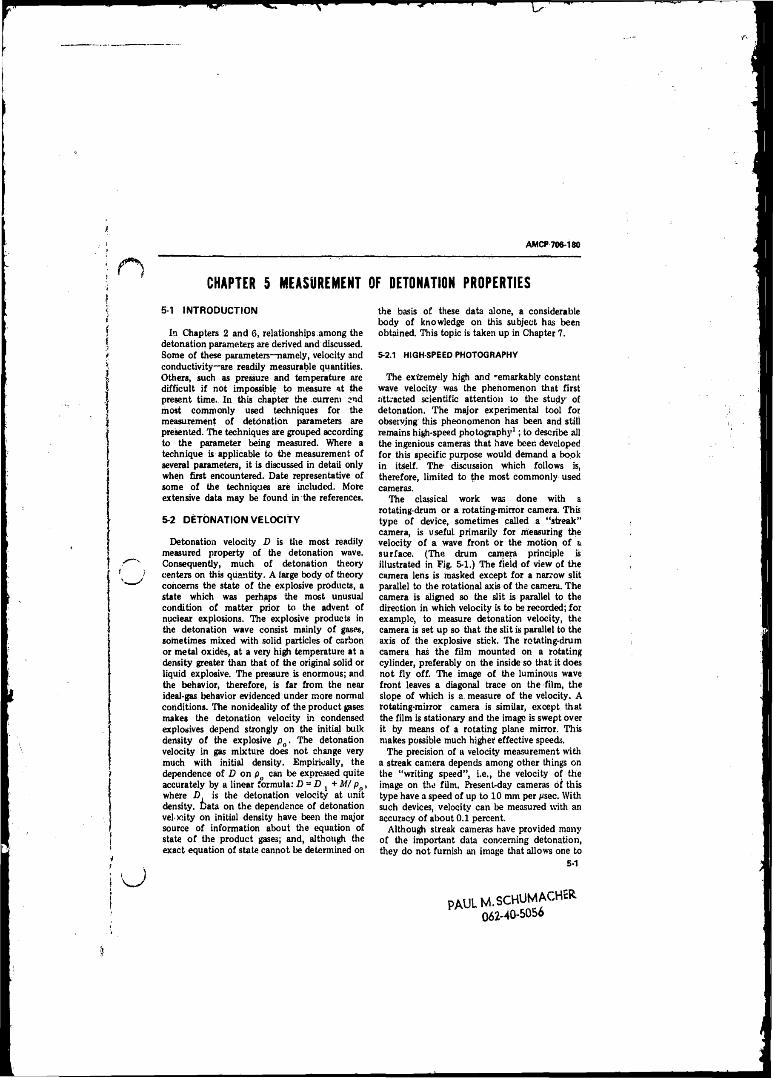
AMCP 706-180
CHAPTER 5 MEASUREMENT OF DETONATION PROPERTIES5-1 INTRODUCTION
In Chapters 2 and 6 , relationships among the detonation parameters are derived and discussed. Some o f these parameters—namely, velocity and conductivity—are readily measurable quantities. Others, such as pressure and temperature are difficult i f not impossible to measure at the present time. In this chapter the currem end most commonly used techniques for the measurement o f detonation parameters are presented. The techniques are grouped according to the parameter being measured. Where a technique is applicable to the measurement o f several parameters, it is discussed in detail only when first encountered. Date representative o f some o f the techniques are included. More extensive data may be found in the references.
5-2 DETONATION VELOCITY
Detonation velocity D is the most readily measured property o f the detonation wave. Consequently, much o f detonation theory centers on this quantity. A large body o f theory concerns the state o f the explosive products, a state which was perhaps the most unusual condition o f matter prior to the advent o f nuclear explosions. The explosive products in the detonation wave consist mainly o f gases, sometimes mixed with solid particles o f carbon or metal oxides, at a very high temperature at a density greater than that o f the original solid or liquid explosive. The pressure is enormous; and the behavior, therefore, is far from the near ideal-gas behavior evidenced under more normal conditions. The nonideality o f the product gases makes the detonation velocity in condensed explosives depend strongly on the initial bulk density o f the explosive pa. The detonation velocity in gas mixture does not change very much with initial density. Empirically, the dependence o f D on po can be expressed quite accurately by a linear formula: D - D + Af/ po , where D is the detonation velocity at unit density. Data on the dependence o f detonation velocity on initial density have been the major source o f information about the equation of state o f the product gases; and, although the exact equation o f state cannot be determined on
the basis o f these data alone, a considerable body o f knowledge on this subject has been obtained. This topic is taken up in Chapter 7.
5-2.1 HIGH-SPEED PHOTOGRAPHY
The extremely high and -emarkably constant wave velocity was the phenomenon that first attracted scientific attention to the study of detonation. The major experimental tool for observing this pheonomenon has been and still remains high-speed photography1; to describe all the ingenious cameras that have been developed for this specific purpose would demand a book in itself. The- discussion which follows is, therefore, limited to the most commonly used cameras.
The classical work was done with a rotating-drum or a rotating-mirror camera. This type o f device, sometimes called a “ streak” camera, is useful primarily for measuring the velocity o f a wave front or the motion o f a surface. (The drum camera principle is illustrated in F ig 5-1.) The field o f view o f the camera lens is masked except for a narrow slit parallel to the rotational axis o f the camera. The camera is aligned so the slit is parallel to the direction in which velocity is to be recorded; for example, to measure detonation velocity, the camera is set up so that the slit is parallel to the axis o f the explosive stick. The rotating-drum camera has the film mounted on a rotating cylinder, preferably on the inside so that it does not fly off. The image o f the luminous wave front leaves a diagonal trace on the film, the slope o f which is a measure o f the velocity. A rotating-mirror camera is similar, except that the film is stationary and the image is swept over it by means o f a rotating plane mirror. This makes possible much higher effective speeds,
The precision o f a velocity measurement with a streak camera depends among other things on the “ writing speed” , i.e., the velocity o f the image on the film. Present-day cameras o f this type have a speed o f up to 10 mm per psec. With such devices, velocity can be measured with an accuracy o f about 0 .1 percent.
Although streak cameras have provided many o f the important data concerning detonation, they do not furnish an image that allows one to
5-1
PAULM.SCHUMACHER062-40-5056
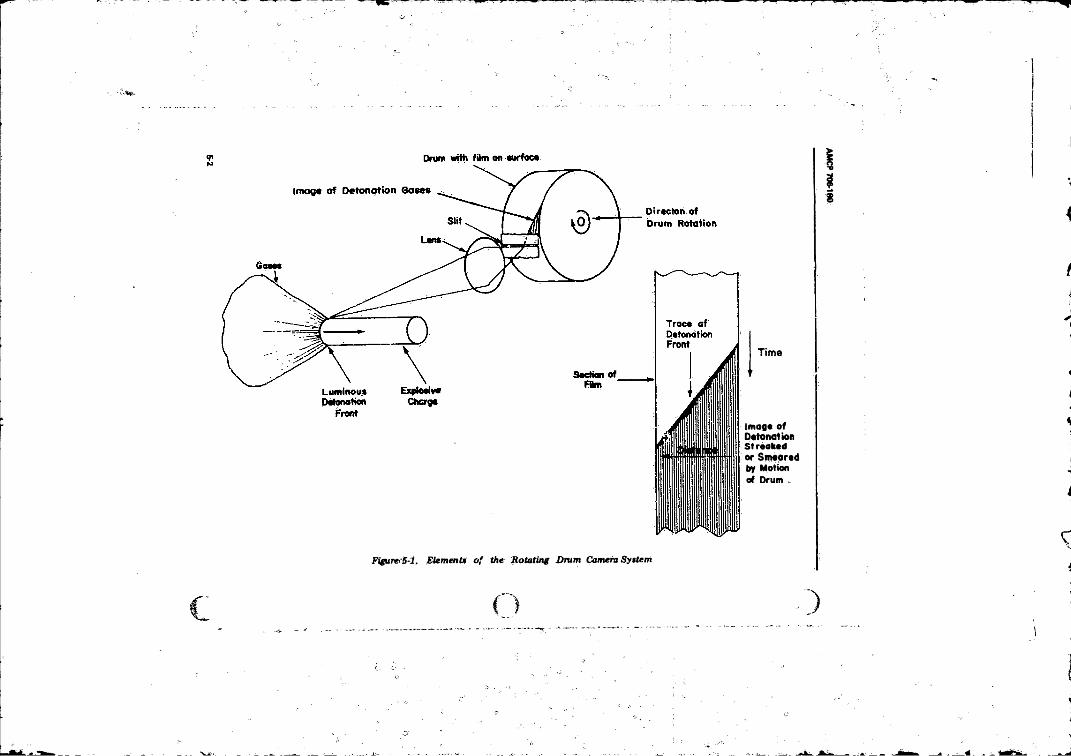
-
\ ■-*?.-
Time
Image of Detonation Streaked or Smeored by Motion of Drum ,
i
FigureS-1. Element* of the Rotating Drum CemeraSyttem
)1
AMCP 706-180
directly "see” a phenomenon. Great advances came about during World War II, therefore, when very high-speed motion picture cameras (or “ framing” cameras as they are usually called) were developed. (The principal elements in the scheme are depicted in Fig. 5-2.) With these devices, rates up to 15 X 106 frames per second have been obtained. Such cameras are now available commercially. A rotating mirror is used to sweep the image over a bans o f individual “ relay” lenses that serve to “ stop” the motion in discrete intervals and project on the film a sequence o f stationary images, one for each lens. Thus, the number o f frames is limited by the number o f lenses. A common camera of this type has some 24 lenses and supplies a c o rre sp o n d in g num ber o f sequ en tia l photographs.
So-called “ image dissection” has been applied to obtain much higher effective framing rates, up to 10® or even 10® frames per second. This technique involves dividing the image into elements that are “ scrambled” on the film, thereby redu-'ing the length o f Him that has to be scanned in each frame by the rotating mirror. To reassemble the image, the separate parts are “ unscrambled” by reversing the process. Image dissection results in a loss o f detail in those techniques where portions between elements are actually not recorded on the film, or loss of resolution when optical distortion o f the separate parts is involved in displacing or compressing the images on the film.
In photographing many high-explosive phenomena the self-light produced by the detonation is all that is needed to form the desired image on the photographic plate. But in some cases external illumination is needed. A
common lijjht source for this purpose is the argon flash charge. Essentially this is just an explosive charge such as Composition B in ah atmosphere o f argon. Because argon is monatomic and has a high electronic excitation energy, the shock wave near the surface o f an ex p lo s ive charge produces a very high temperature and thus an intense source o f light. By tailoring the geometry o f the charge and the size and shape o f the argon envelope, the intensity and duration o f the light can be modified to suit the experiment. Timing o f the light flash can be synchronized by use o f a suitable circuit to fire the charge. The peak luminosity o f the argon flash charge is said to be 5 to 7 million cnndlepower per square centimeter. Duration may be varied from as l i t t le as. 1 0 '® sec to several hundred microseconds.
A n o th e r lig h t source for high-speed photography it the exploding wire. Electrical energy stored at high voltage in a condenser is discharged into a fine wire o f silver or copper. A bright flash is obtained, lasting for 50 to 60 psec. Alternatively, a spark discharge is often used to obtain a very brief exposure.
Single-exposure photographs o f exploding charges can be made in a variety o f ways. I f the. self-luminosity is not too great, an argon flash, charge or a spark o f brief duration cun be used. Or, if the luminosity o f the charge itself is too high, the motion can be stopped by means o f a high-speed shutter1. One type o f shutter exploits the Kerr effect (see Fig. 5-3), which is the polarization o f light passing through certain liquids when they are subjected to a high electric field. The Kerr shutter uses nitrobenzene in a glass ceil containing two electrodes. The cell is
Figure 5-2. Optical System in AEC-Bowen Framing Camera
6-3
AMCP 706-180
situated betw ';n crossed Nico! prisms, and the assembly is piaced in front o f the camera lens. When an electrical pulse o f short duration is applied to the electrodes, light is allowed to pass. The open time of the Kerr cell can be as small as a few nanoseconds (10 ‘ 9 sec ). Another type o f shutter which is more convenient but n b t as' fa st exploits the Faraday, or magneto-optic, effect. Here polarization is produced in a dense flint glass plate by inducing a strong magnetic field.
5-2.2 PHOTO-OPTICAL SYSTEMS
While mechanical and: optical techniques.have been highly developed in the photography o f detonation phenomena, the possibilities that exist in the field o f electronics involving, for example, the photoelectric, effect and the cathode ray tube have only recently been exploited. Ingenious work in this area is the work o f J. S. Courtney-Pratt3 which has been directed especially toward the study o f fast events on am icro scale, such as the initiation o f detonation in a single: crystal o f lead azide. One application is’ the image-converter tube in which a photosensitive screen acts as the source o f electrons (cathode) in a cathode ray tube. With this device the intensity o f the image can be
amplified many fold. Also, by means o f electrostatic or magnetic deflection o f the electrons, the image can be scanned at very high speed. A combination o f these techniques makes it possible to achieve effective writing speeds some 10 0 times greater than those in a rotating mirror camera; Also, a very effective shutter for single-frame or multiframe photographs can be obtained by “ gating” the passage o f electrons in the image converter tube. Several -image converter cameras are presently available commercially.
5-2.3 ELECTRICAL SYSTEMS
Although the streak camera is an important and in some cases indispensable tool for m easuring detonation velocity,, a more convenient technique4 commonly employed in routine work is th e use o f “ ionization probes” . These detect the passage o f the detonation wave as a result o f the electrical conductivity in the reaction zone. A series o f two or more such probes are imbedded in the charge spaced at intervals along the surface. By means o f suitable electrical circuits, the passage o f the detonation wave front is signaled to a cathode ray tube and: displayed on a time base. The average detonation velocity between tw o probes may
AM C? 706-180
then be calculated from the separation distance and the time interval between signals.
The ionization probe itself may consist o f two wires held a small distance apart with a voltage source—such as a charged condenser—applied across the gap and a series resistance to indicate the passage o f current. A convenient type o f probe for many purposes consists o f a pair o f enamel-covered wires that are twisted together. The enamel is quickly burned o ff in the heat-of the detonation front.
For the time base, a combination o f a triangle-wave generator applied to the horizontal deflection plates o f an oscilloscope and a single linear sweep applied to the vertical plates gives a zig-zag raster o f long duration and high resolution. Tim e markings may be applied by means o f either beam intensity modulation or beam deflection. The circuit elements are shown schematically in Fig. 5-4, arid the type o f record obtained is shown in Fig. 5-5.
The common ionization probe method is useful only fo r obtaining average velocities in a series o f intervals. When one wants to measure accurately a rapidly changing velocity (fo r example, in ionization experiments), a variation o f this technique can be used which yields a continuous distance-time trace.like Ahat given by a streak camera. In this arrangement two long parallel lengths of resistance wire are inserted on the axis o f the explosive charge and attached to a voltage source. As the detonation wave advances it effectively shorts out the two wires at the wave front and thus reduces the series resistance in the electrical circuit by the fractional extent to which the wave has progressed along the length o f the wires from the open end. By suitable circuitry a resistance vs time trace can be displayed on an oscilloscope screen, which is essentially equivalent to distance vs time for the detonation wave.
Still another method o f measuring detonation velocity has been studied by Cook1 ; this involves using the explosive charge as a wave guide for microwaves.
5-2.4 D'AUTRICHE METHOD
Besides these re la tive ly sophisticated techniques, there is a simple velocity test known as the D ’Autriche method. This is still used to
some extent in routine testing o f dynamites. It employs a detonating cord as a standard and gives a measure o f the velocity in the test stick compared to that in the cord. The test arrangement is shown in Fig. 5-6. The ends o f a loop o f detonating cord are inserted in the test stick and the middle is taped to a metal “ teller” rod (lead or steel are often used). The exact mid-point o f the detonating cord is marked on the teller rod. When the stick detonates it induces detonation in the two ends o f the detonating cord, not simultaneously, but at an interval between equal to: the test base line R( divided by the detonation velocity D t in the test stick. The two detonation fronts traveling from opposite ends o f the cord with a speed i>t converge at some point a distance R beyond the mid-point toward the rear end o f the loop; A t the point o f meeting head-on, the detonation waves produce a sharp dent in the teller rod which is readily identified: The ratio DJD of the velocities is equal to one-half the ratio X(/£j o f the lengths and if Dt is known, D, can be determined. The accuracy, o f course, depends on the reliability o f the value for Dt and on the care with which the test is carried out.
5-3 DETONATION PRESSURE
The problem o f measuring the extremely high and short-lived pressure in tire detonation wave initially seems insurmountable. Theory predicts the magnitude to be some hundreds o f kilobars, a level that may be compared, for example, to a head o f water thousands o f miles deep. These pressures equal o f exceed the highest levels that can be produced in any other way at the present time. Indeed, the generation o f shock waves in materials placed in contact with high explosives or impacted by explosively accelerated plates affords an important unique means for studying certain phenomena at the limit o f man-made pressures.
No direct standards or scales are available against which pressures o f this magnitude can be compared. However, a sound basis for the determination o f pressure is provided in the laws o f motion. In fact, we now posess very accurate measurements o f pressure in the detonation o f various explosives, plus a wealth o f precise data on the behavior o f many inert materials at these high pressures6.
5 t
r
Figure 5-4. Block Diagram o f Equipment for Measuring Detonation Velocity With lonaation Probee
"I
i3
i
OSCiLLO-SCOPE
I
J
AMCP 706-180
T h e m echanical ‘ conservation equation expressing conservation o f momentum across a shock, front (Eq. 2-133 o f Chapter 2) relates pressure across the front p s - p0 to three measurable quantities—initial density po o f the unshocked material,' shock velocity C7, ai d p a r t ic le v e lo c ity u o f the shocked material—according to
P, - Pc = Poui U ( 3 ' 1 )
In a steady state wave, U is readily measured. Determination o fp1 hingej, then, on finding U j. In general, two ways are possible to determine u , the most common being to measure the velocity uf) at a free surface. For a shock wave in a condensed nonporous medium, u/4 may be equated without much error to exactly twice U j, i.e.,
uh = 2ut (5-2)
Eq. 5-2 is rigorous only in the infinitesimal acou stic approximation. It amounts to neglecting the entropy increase at the shock front and the energy dissipated in plastic
.deformation. For many condensed, nonporous materials, Eq. 5-2 is a reasonable approximation at high pressure.
Another method o f obtaining ut is to measure the density pt behind the shock front by flash X-ray densitometry'. This value may then be used to determine u through the equation for conservation of;mass (Eq. 2-129)
P0 U “ P i W - “ r ) (5 -3 )
A close estimate o f the particle velocity associated with the C-J pressure (equilibrium
Figure 5-5. Z ig -zag Oscilloscope Trace Obtained With Ratter Generator
5-7
AMCP 706-180
pressure at the end o f the reaction zone) in a detonating explosive can be obtained from a theoretical equation due to H. Jones0, which is discussed in par. 7-3. This equation (Eq. 7-30) relates ut to detonation velocity and other properties o f the explosive.
\ = D / [g 0 (. 2 + a)] (5-4)
where g0 = 1 + dtnD/d&n p0, and a is a d im ension less number that depends oh certain thermodynamic properties. The value o f a is close to 0.25. For many explosives g0 is approximately equal to 1.7; hence, one may estimate u1 from D by the approximate relation
Uj * 0.26 D (5-5)
Combining Eq. 5-5 and Eq. 5-1, one obtains (neglecting po)
pl = 0.26 p j? <5'6)
Eq. 5*6 gives values usually within a few percent o f those determined experimentally.
Pressure measurements obtained at the Los Alamos Laboratory1 are given in Table 5-1. The number o f significant figures reported i3 indicative o f the accuracy o f this work. The last line o f the table gives the pressure calculated by substitution o f the values fo r po and D in the approximate relation Eq. 5-6. The agreement shows that this is indeed quite a useful formula.
5-3.1 PRESSURE, IN ADJACENT PLATES
Pressures in the detonation wave have been very accurately determined by the measurement o f pressure in a metal plate in contact with an explosive. The method was proposed by Goransoh9 at Los Alamos in 1945, but such were the rigors o f the technique that results were not forthcoming until some ten years later 5-9. Both the theory and the methods in this type o f experiment are somewhat involved and cannot be discussed fully here. The reader is
TEST EXPLOSIVE
Figure 5-6. D'Autriche Test System
5-8
AMCP 706-1*0
TABLE 5-1 CHAPMAN-JOUGUET PRESSURES IN VARIOUS EXPLOSIVES
Parameter RDX*
Density Po.g/cm* 1.767
Detonation Velocity D,m/see 8639
C-J Pressure, kbar: meas. 337,9Eq. 5-6 345
63/37 64/36 77/23
TNT* Comp. B1 Comp. B* Cycloid*
1.637 1.67 1.713 1.743
6942 7868 8018 8252
189.1 272 292.2 312.5207 272 290 312
referred for details to the given references. However, the basic ideas are simple. The pressure pm behind the shock wave in the metal plate is determined through Eqs. 5-1 and 5-2 by a simultaneous measurement o f shock wave velocity U and free-surfacc velocity ufi . This determination is made for several thicknesses o f metal and extrapolated to zero or near-zero thickness, depending on whether the initial pressure in the precursor shock (the so-called “ von Neumann spike” ) or the Chapman-Jouguet pressure is desired (see Fig. 5-7). The reason an extrapolation must be made is that the shock front in the metal it continually attenuated as it passes throu^i the metal because o f the “ overtaking” effect o f the rarefaction traveling behind i t Thus, i f one wishes to determine the pressure st the interface between metal and explosive at the instant the detonation front first reaches that point, 1* is necessary to know the shock and free-surface velocity that would be produced in an" infinitely thin platc. When the initial pressure p„ in the metal at the interface is known, pressure px in the incident detonation w a v e ca n b e ca lcu la ted from the “ impedance-match'' formula that governs the interaction which the waie experiences at the interface. An approximate tu t quite accurate version o f this formula was dcduced by Duff and Houston1 ; it is
P jP * “ ^Pn Vm/{pxUx + pn Um) ( 5-7f
where p is the initial density, U the shock wave velocity, and the subscripts m and x refer to metal and explosive, respectively,
The P«!S,!,'re in the adjacent plate is usually d, iterrut!" , y .measuring particle velocity, free surface ve» v ity , or stress transmitted to a. second material. Techniques for generation o f
pressure pulses and measurement o f pressure in the second material are discussed in the next, three subparagraphs.
5-3.1.1 Flaw Wavs Exptoi^s.Systtmi
A prerequisite for measurements o f pressure in plates is a'imeans to obtain a T?fy flat (planer) detonation wave front. Since the wave is initiated in a small area by a .idonator cap, it starts out as a spreading spherical fron t The problem is, therefore, to mike an explosive “ lets” that will convert the diverging wave front to a plane. This development cs •' abou t at the Los Aiamos Scientific Labored../ shortly after World War II. The “ plane wave lens” has become indispensable for studying strong shock waves, The Los Alamos experiments customarily employ an 8-in,-diameter lens to initiate detonation in a precisely machined block o f ex p lo s ive . Experimental observations are confined to the central portion o f the charge to avoid edge effects (rarefactions due to lateral expansion). Fig. 5-7(A) shows the charge geometry.
Fig. 5-7(B) shows the contour (pressure vs distance) o f the detonation wave in the ex p lo s ive charge before it reaches the explosive-metal in terrace-. The wi a front is a shock, and this is followed by a very rapid pressure decay in the narrow region where chemical reaction takes place. This portion is called the “ von Neumann spike” . Following the steep decay, a much more gradual pressure drop occurs in the rarefaction that proceeds from the detonating end o f the charge. This portion is called trie "Taylor wave". The Chapman-Jouguet point (C-J point) is at the juncture o f these two portions, i.e., at the termination o f the “ von Neumann spike” . A t this point chemical
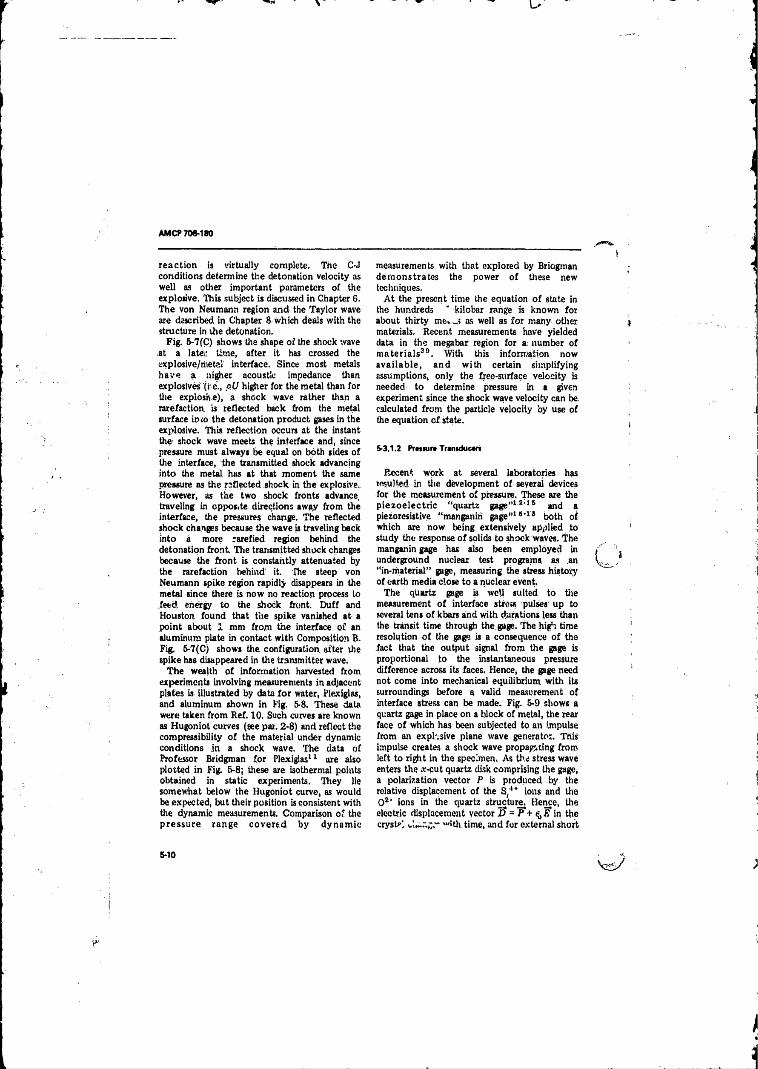
AMCT 706-180
reaction is virtually complete. The C-J conditions determine the detonation velocity as well as other important parameters o f the explosive. This subject is discussed in Chapter 6 . The von Neumann region and the Taylor wave are described in Chapter 8 which deals with the structure in vhe detonation.
Fig. 5-7(C) shows the shape o f the shock wave ,at a late:; time, after it has crossed the explosive/metei interface. Since most metals have a Higher acoustic impedance than explosives' '(he'., pU higher for the metal than for tlie explosive), a shock wave rather than a rarefaction, is reflected back from the metal surface inro the detonation product gases in the explosive. This reflection occurs at the instant the shock wave meets the interface and, since pressure must always be equal on both sides o f the interface, the transmitted shock advancing into the metal has at that moment the same pressure as the reflected shock in the explosive. However, as the two shock fronts advance, traveling in opposite directions away from the interface, the pressures change. The reflected shock changes because the wave is traveling back into a more rarefied region behind the detonation fron t The transmitted shock changes because the front is constantly attenuated by the rarefaction behind it. The steep von Neumann spike region rapidly disappears in the metal since there is now no reaction process to feed energy to the shook front. Duff and Houston found that the spike vanished at a point about 1 mm from the interface o£ an aluminum plate in contact with Composition B. Fig. 5-7(C) shows the. configuration, after the spike has disappeared in the transmitter wave.
The wealth o f information harvested from experiments involving measurements in adjacent plates is illustrated by data fo r water, Plexiglas, and aluminum shown in Fig. 5-8. These data were taken from Ref. 10. Such curves are known as Hugoniot curves (see par. 2-8) and reflect the compressibility o f the material under dynamic conditions in a shock wave. The data o f Professor Bridgman fo r Plexiglas1 1 are also plotted in Fig. 5-8; these are isothermal points obtained in static experiments. They lie somewhat below the Hugoniot curve, as would be expected, but their position is consistent with the dynamic measurements. Comparison o f the pressure range co vered by dynam ic
measurements with that explored by Briogman dem onstrates the power o f these new techniques.
A t the present time the equation o f state in the hundreds ’ kilobar range is known for about thirty m e u j as well as fo r many- other materials. Recent measurements have yielded data in the megabar region for a: number o f m ateria ls30. With this information now ava ilab le, and with certain simplifying assumptions, only the free-surface velocity is needed to determine pressure in a given experiment since the shock wave velocity can be. calculated from the particle velocity by use o f the equation o f state.
5-3.1.2 Pmnira Tramducari
Recent work at several laboratories has resulted in the development o f seyeral devices for the measurement o f pressure. These are the p ie zo e lec tr ic “ quartz gage” 1 * ' 15 and a piezorcsistive “ manganin gage” 1 8 ’ 1 5 both o f which are now being extensively applied to study the response o f solids to shock waves. The manganin gage has also been employed in underground nuclear test programs as an “ in-material” gage, measuring the stress history of earth media close to a nuclear event.
The quartz gage is well suited to tire measurement o f interface stress pulses up to several tens o f kbars and with derations less than the transit time through the.gage. The high time resolution o f the gsge is a consequence o f the fact that the output signal from the gage is proportional to the instantaneous pressure difference across its faces. Hence, the ^ g e need not come into mechanical equilibrium with its surroundings before a valid measurement o f interface stress can be made. Fig. 5-9 shows a quartz gage in place on a block of metal, the rear face o f which has been subjected to an impulse from an explosive plane wave generator. This impulse creates a shock wave propagating from left to right in the specimen. As the stress wave enters the x-cut quartz disk comprising the gage, a polarization vector P is produced by the relative displacement o f the S,H ions and the O2’ ions in the quartz structure. Hence, the electric displacement vector D - P + in the crest?) UltM time, and for external short
5*10
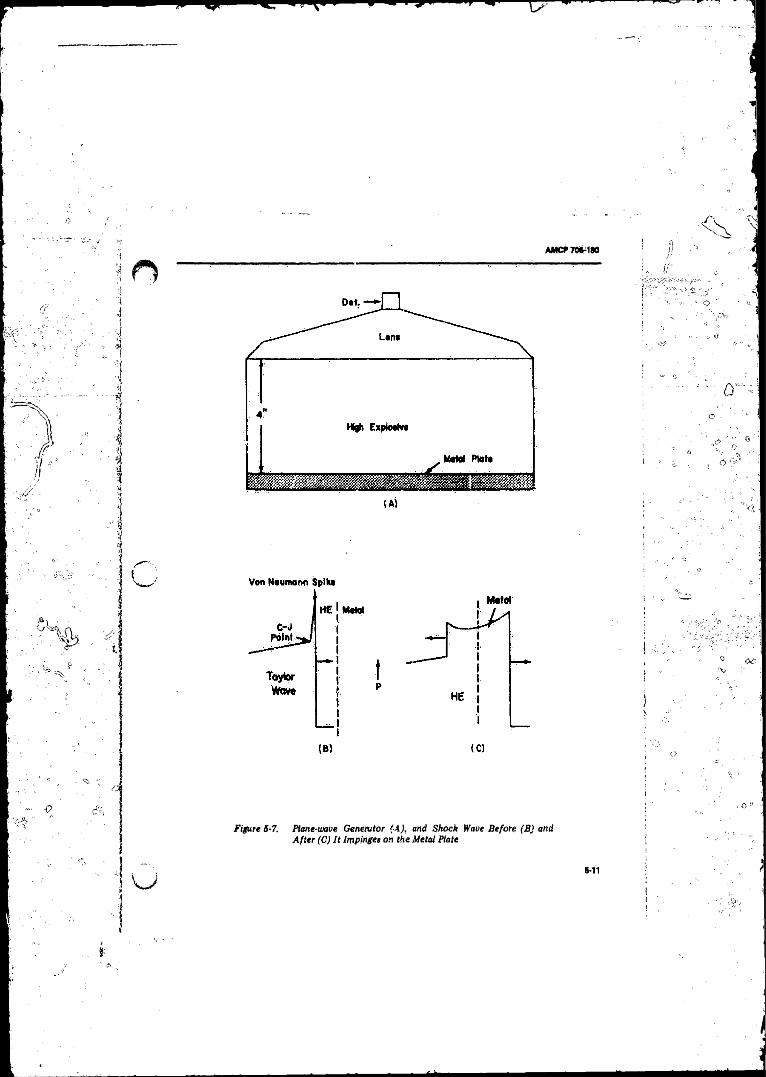
AMCF70t-1#0
Figure 5-7. Plane-wave Generator (A), and Shock Wave Before, (B) and After (C) I t Impinges on the Metal Plate
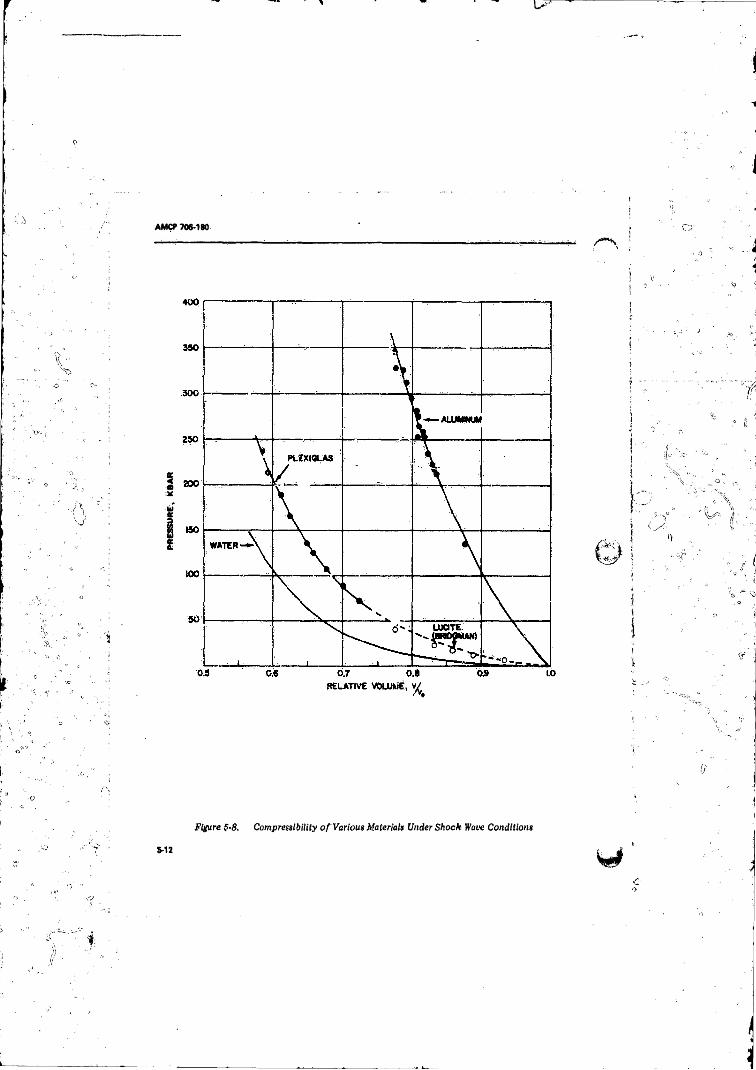
PR
ES
SU
RE
, K
BA
R
AMCP 706-180
/— N
Figure 5-8. Compressibility o f Various Materials Under Shock Wave Conditions
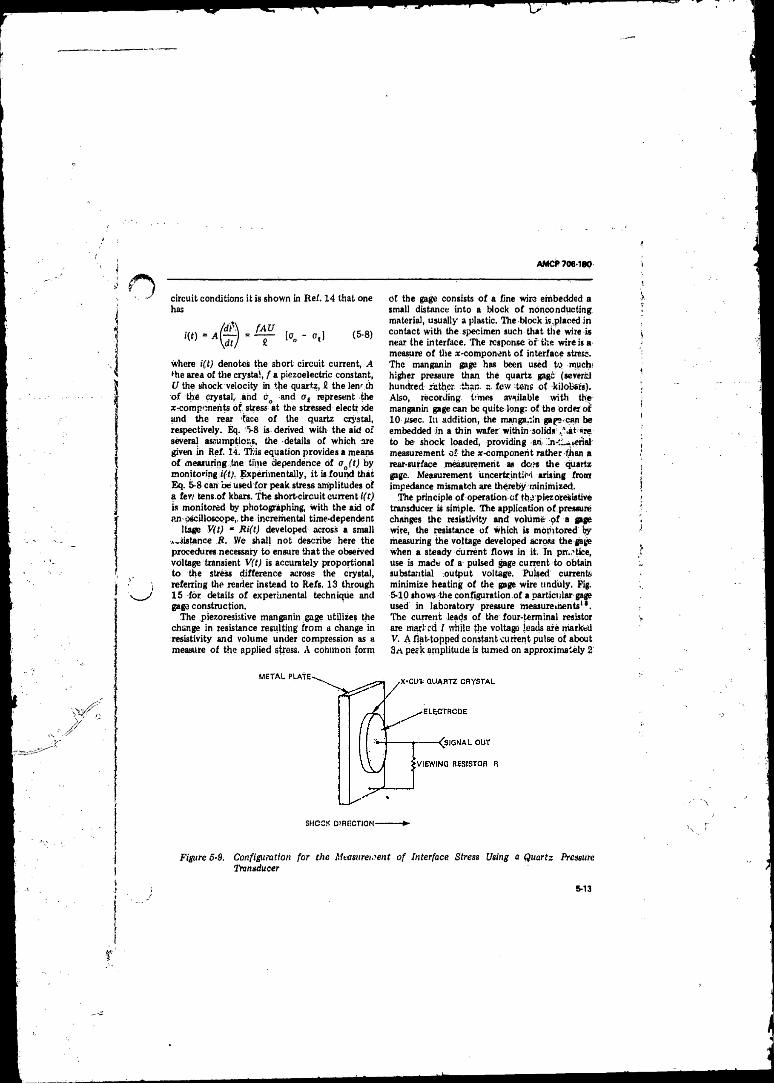
AMCP 706-180
circuit conditions it is shown in Ref. 14 that one has
Ht) - ~ K - a ,] (5-8)
where i(t) denotes the short circuit current, A the area of the crystal, f a piezoelectric constant, V the shock velocity in the quartz, £ the Jen' th o f the crystal, and d and at represent the Xtcomponents o f stress at the stressed elect! jde and the rear face o f the quartz crystal, respectively. Eq. > 8 is derived with the aid o f several assumptions, the details o f which are given in Ref. 14. This equation provides a means o f measuring ,tne time dependence o f o j t ) by monitoring iff), Experimentally, i t is found that Eq. 5-8 can be used fo r peak stress amplitudes o f a few tens.of kbars. The short-circuit current i(t) is monitored by photographing, with the aid o f an oscilloscope,, the incremental time-dependent
ltage V(t) ■ Ri(t) developed across a small Assistance R. We shall not describe here the procedures necessary to ensure that the observed voltage transient V(t) is accurately proportional to the stress difference across the crystal, referring the reader instead to Refs. 13 through 15 for details o f experimental technique and gage construction.
The piezoresiative manganin .gage utilizes the change in resistance resulting from a change in resistivity and volume under compression as a measure o f the applied stress. A coiiimoh form
o f the gage consists o f a fine wire embedded a small distance into a block o f nonconducting material, usually aplastic. The block is,placed in contact with the specimen such that tire wire is near the interface. The response o r the wire is a measure o f the x-component o f interface stress. The manganin gage has been used to much higher pressure than the quartz gige (severe! hundred rather than a few tens o f kilobats). Also, recording times available with the- manganin gage can be quite long: o f the order o f 10-twee. In addition, the manganin gage-can be embedded in a thin wafer within solids- .hat are. to be shock loaded, providing ah ln-£.«ienai' measurement ot the x-component rather than a rear-surface measurement as dors the quartz gage. Measurement uncertrintiM arising from impedance mismatch are thereby minimized.
The principle o f operation o f the piezorCsistive transducer is simple. The application o f pressure changes the resistivity and volume o f a gage wire, the resistance o f which is monitored oy measuring the voltage developed across the gage when a steady current flows in it. Tn prt.ctice, use is made o f a pulsed gage current to obtain substantial output voltage. Pulsed currents minimize heating o f the gage wire unduly. Fig 5-10 shows the configuration .of a particular gage used in laboratory pressure measureihents". The current leads o f the four-terminal resistor are marl ed ! while the voltage leads are marked V. A flat-topped constant current pulse o f about 3rt perk amplitude is turned on approximately 2
SHOCK DIRECTION------------ ►
Figure 5-9. Configuration for the Measurei.'ent of Interface Stress Using a Quartz Pressure Transducer
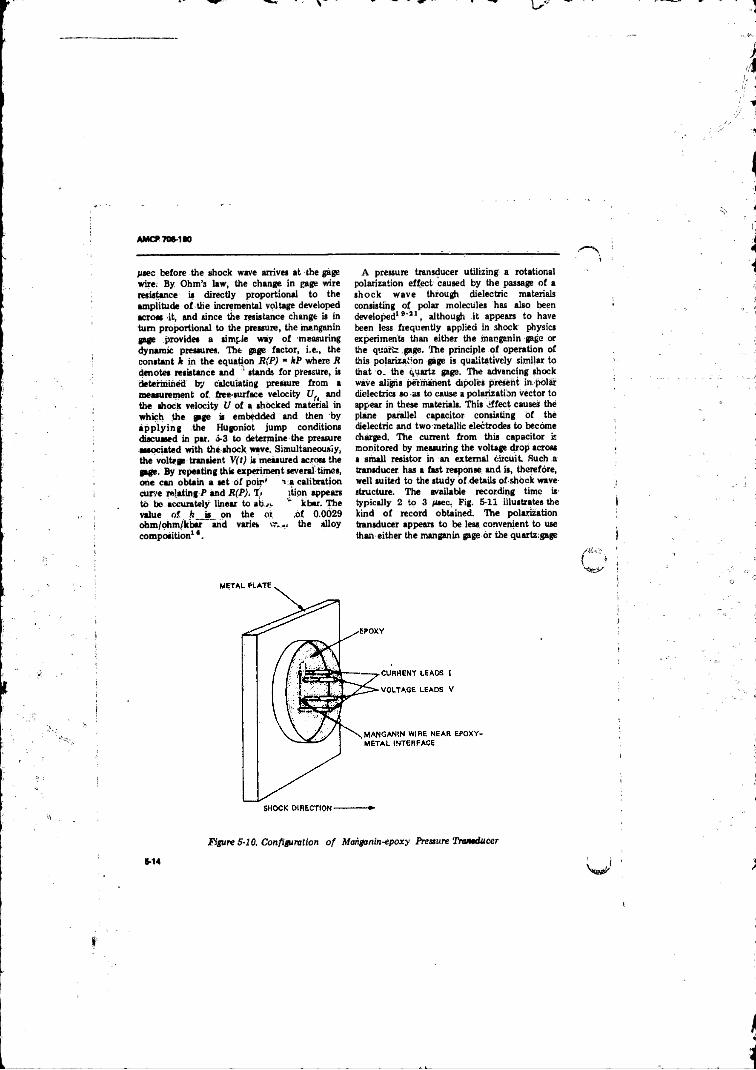
AM CP7M -1S0
Uses before the shock wave arrives at the gage wire. By Ohm ’3 law, the change in gage wire resistance is directly proportional to the amplitude o f the incremental voltage developed across it, and since the resistance change is in turn proportional to the pressure, the manganin gage provides a simple way o f measuring dynamic pressures. The gage factor, i.e., the constant * in the equation R(P) “ kP where R denotes resistance and ' stands for pressure, is determined by calculating pressure from a measurement o f free-surface velocity Ufl and the shock velocity U o f a shocked material in which the gage is embedded and then by a p p ly in g the Hugoniot jump conditions discussed in par. a-3 to determine the pressure Msociated with the.shock wave. Simultaneously, the voltage transient V(t) is measured across the gage. By repeating this experiment several times, one can obtain a set o f po ir ' v a calibration curve relating P and R(P). T . ltion appears to be accurately linear to abw " kbar. The value o f . ft is on the or ,6 f 0.0029 ohm/ohm/kbar and varies vr.... the alloy composition1*.
A pressure transducer utilizing a rotational polarization effect caused by the passage o f a shock w ave through dielectric materials consisting o f polar molecules has also been developed19'* 1, although it appears to have been less frequently applied in shock physics experiments than either the manganin gage or the quartz gage. The principle o f operation of this polarization gage is qualitatively similar to that o.. the quartz gage. The advancing shock wave aligns permanent dipoles present in.pblar dielectrics so as to cause a polarization vector to appear in these materials. This effect causes the plane parallel capacitor consisting o f the dielectric and two metallic electrodes to become charged. The current from this capacitor is monitored by measuring the voltage drop across a small resistor in an external circuit Such a transducer has a fast response and is, therefore, well suited to the study o f details ofshock wave structure. The available recording time is typically 2 to 3 psec. Fig. 5-11 illustrates the kind o f record obtained. The polarization transducer appears to be less convenient to use than either the manganin gage or the quartz;gage
Figure 5-10. Configuration o f Manganin-epoxy Pressure Transducer
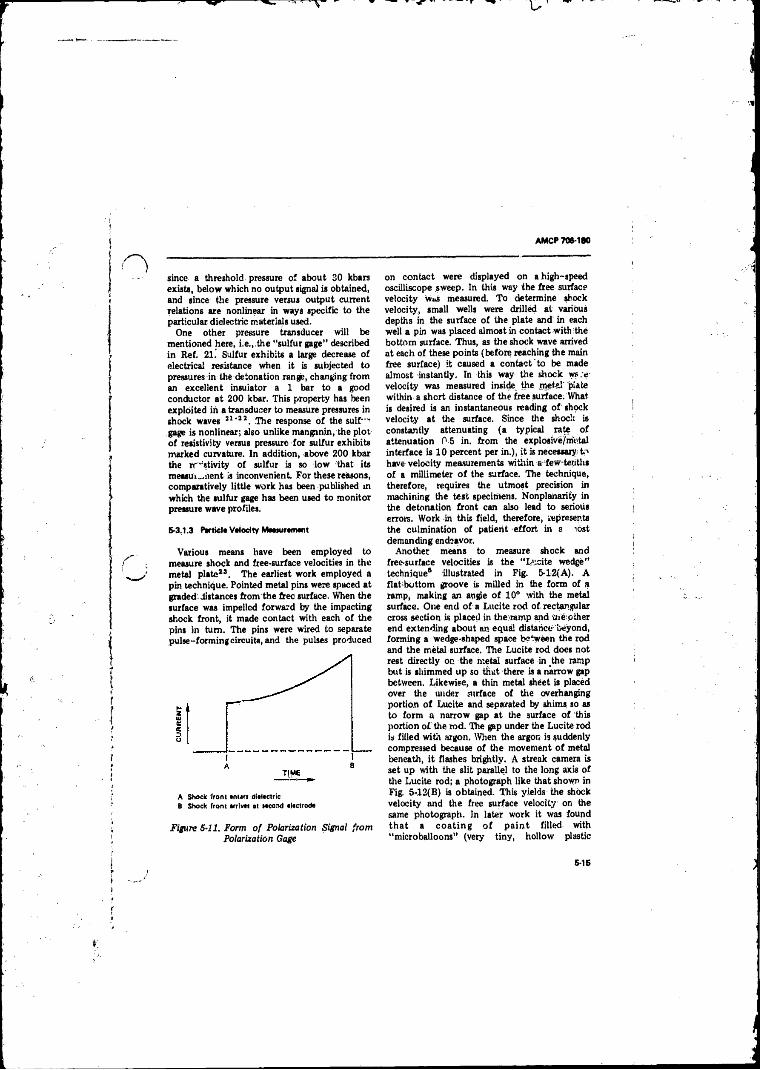
AMCP 706-180
since a threshold pressure o f about 30 kbars exists, below which no output signal is obtained, and since the pressure versus output current relations are nonlinear in ways specific to the particular dielectric materials used.
One other pressure transducer will be mentioned here, i.e.,.the “ sulfur gage” described in Ref. 21. Sulfur exhibits a large decrease o f electrical resistance when it is subjected to pressures in the detonation range, changing from an excellent insuiator a 1 bar to a good conductor at 200 kbar. This property has been exploited in a transducer to measure pressures in shock waves 21' 22. The response o f the suit’" gage is nonlinear; also unlike manganin, the plot o f resistivity versus pressure for sulfur exhibits marked curvature. In addition, above 200 kbar the r f “ stivity o f sulfur is so low that its measui-.nent is inconvenient. For these reasons, comparatively little work has been published in which the sulfur gage has been used to monitor pressure wave profiles.
5-3,1.3 Particle Velocity Meeiurement
Various means have been employed to measure shock and free-surfaee velocities in the metal plate2’ . The earliest work employed a pin technique. Pointed metal pins were spaced at graded, distances from the free surface. When the surface was impelled forward by the impacting shock front, it made contact with each o f the pins in turn. The pins were wired to separate pulse-forming circuits, and the pulses produced
A Shock front s n u r i d isitctric B Shock front srrfwt at weend alactrode
Figure S -ll. Form of Polarization Signal from Polarization Gage
on contact were displayed on a high-speed oscilliscope sweep. In this way the free surface velocity was measured. To determine shock velocity, small wells were drilled at various depths in the surface o f the plate and' in each well a pin was placed almost in contact with the bottom surface. Thus, as the shock wave arrived at each o f these points (before reaching the main free surface) it caused a contact to be made almost instantly. In this way the shock ws :e velocity was measured inside the mete! plate within a short distance o f the free surface. What is desired is an instantaneous reading o f shock velocity at the surface. Since the shock is constantly attenuating (a typical rate o f attenuation 0 5 in. from the explosive/metal interface is 1 0 percent per in.), it is necessary to have velocity measurements within a few tenths o f a millimeter o f the surface. The technique, therefore, requires the utmost precision in machining the test specimens. Nonplanarity in the detonation front can also lead to serious errors. Work in this field, therefore, represents the culmination o f patient effort in a -ost demanding endeavor.
Another means to measure shock and free-surface velocities is the “ Lucite wedge” technique5 illustrated in Fig. 5 4 2 (A ). A flat-bottom groove is milled in the form o f a ramp, making an angle o f 1 0 ° with the metal surface. One end o f a Lucite rod o f rectangular cross section is placed in the ramp and ineoiher end extending about an equal distance beyond, forming a wedge-shaped space between the rod and the metal surface. The Lucite rod does not rest directly or. the metal surface in the ramp but is slummed up so that there is a narrow gap between. Likewise, a thin metal sheet is placed over the under surface o f the overhanging portion o f Lucite and separated by shims so as to form a narrow gap at the surface o f this portion o f the rod. The gap under the Lucite rod is filled with argon. When the argon is suddenly compressed because o f the movement o f metal beneath, it flashes brightly. A streak camera is set up with the slit parallel to the long axis o f the Lucite rod; a photograph like that shown in F ig 542 (B ) is obtained. This yields the shock velocity and the free surface velocity on the same photograph. In later work it was found that a co a tin g o f p a in t filled with “ microballoons” (very tiny, hollow plastic
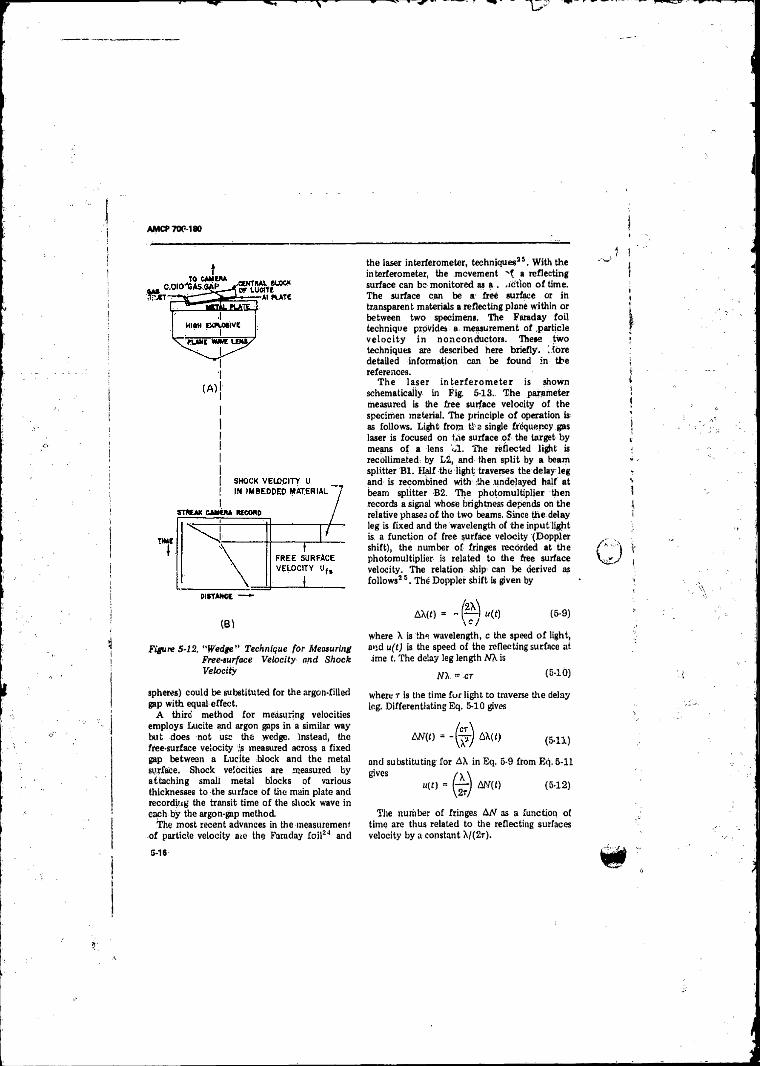
AMCP70P-180
IB)
Figure 5-12. "Wedge" Technique for Measuring Free-surface Velocity and Shock Velocity
the laser interferometer, techniques15. With the interferometer, the movement '■f a reflecting surface can be monitored as a . action o f time. The surface can be a free surface or in transparent materials a reflecting plane within or between two specimens. The Faraday fo il technique provides a measurement o f particle v e lo c ity in nonconductors. These two techniques are described here briefly. Llore detailed information can be found in tbe references.
The laser in te r fe ro m e te r is shown schematically in Fig. 5-13.. The parameter measured is the free surface velocity o f the specimen material. The principle o f operation is as follows. Light from t ie single frequency gas laser is focused on Lie surface o f the target by means o f a lens L I. The reflected light is recollimated- by L i, and then split by a beam splitter B l. Half the light traverses the delajrleg and is recombined with :!he undelayed half at beam splitter B2. The photomultiplier then records a signal whose brightness depends on the relative phases o f the two beams. Since the delay leg is fixed and the Wavelength o f the input light is. a function o f free surface velocity (Doppler shift), the number o f fringes recorded at the photomultiplier is related to the free surface velocity. The relation ship can be derived as follows2 5. The Doppler shift is given by
AX(t) = (5-9)
where X is the wavelength, c the speed o f light, and u(t) is the speed o f the reflecting surface at ame t. The delay leg length NX is
W . = ct (5-10)
spheres) could be substituted for the argon-filled gap with equal effect.
A third method for measuring velocities employs Lucite and argon gaps in a similar way biit does not use the wedge. Instead, the free-surface velocity ,'s measured across a fixed gap between a Lucite block and the metal surface. Shock velocities are measured by attaching small metal blocks of various thicknesses to the surface o f the main plate and recording the transit time o f the shock wave in each by the argon-gap method.
The most recent advances in the measurement o f particle velocity aie the Faraday fo il24 and
where r is the time fur light to traverse the delay leg. Differentiating Eq. 5-10 gives
AN (t) = (5-11)
and substituting for AX in Eq. 5-9 from Eq, 5-11 gives A \
« ( t ) = (— ) m t ) (5-12)
The number o f fringes A N as a function of time are thus related to the reflecting surfaces velocity by a constant X/(2r).
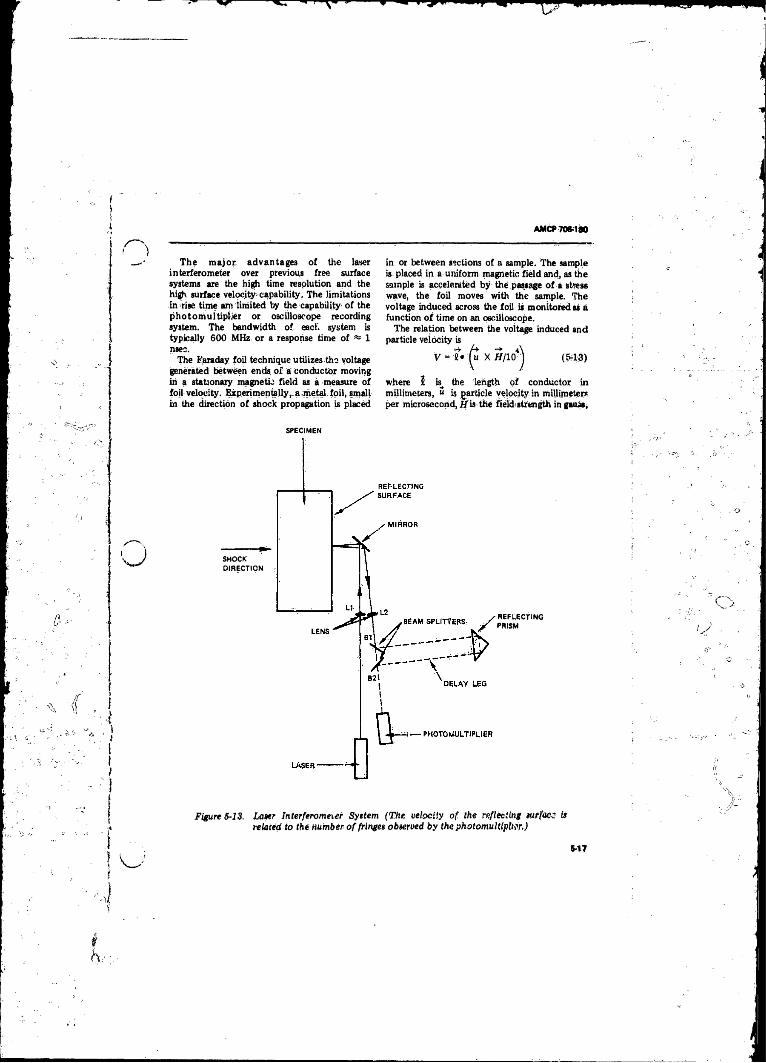
AMCP706-180
The major, advantages o f the laser interferometer over previous free surface systems are the high time resolution and the high surface velocity capability, The limitations in rise time am limited by the capability o f the photom ultiplier or oscilloscope recording system. The bandwidth o f each system is typically 600 MHz or a response time o f 1 nsec.
The Faraday foil technique utilizes the voltage generated between ends o f a conductor moving iti a stationary magnetic field as a measure o f foil velocity. Experimentally,, a ;metal foil, small in the direction o f shock propagation is placed
in or between sections o f a sample. The sample is placed in a uniform magnetic field and, as the sample is accelerated by the passage o f a stress wave, the foil moves with the sample. The voltage induced across the foil is monitored as a function o f time on an oscilloscope.
The relation between the voltage induced and particle velocity is
V = « • ( U X H ilo j (6 *3 )
where iS is the length o f conductor in millimeters, u is garfcicle velocity in millimeters per microsecond, i f is-the fieldstrength in gauss*
SHOCKDIRECTION
SPECIMEN
REFLECTINGPRISM
Figure 5-13. Later Interferomeier System (The velocity of the reflecting surface if related to the number of fringes observed by the photomultiplier.)
5-17
AMCP 706-180
and V is the voltage in volts. The accuracy of measurement is limited by the ability to measure 5 and the effective length 5 o f the conductor, and by a knowledge o f the magnetic susceptibility change o f the sample during shock loading.
Advantages o f the Faraday fo il feeLmque are (1) high time resolution, (R) simplicity, and (3 ) most important, the capability o f measurement within a test speci . en. Disadvantages are the difficulty in calibration o f the system and the restriction to measurement in a nonconductor.
o-J.2 X-RAY FLASH PHOTOGRAPHY
The use o f X-ray holds great promise for the study o f explosives but until quite recently X-ray sources have been inadequate to exploit the technique fully.
X-ray absorption furnishes an absolute measure o f the density o f matter. However, in many applications the important observations to be made with X-rays concern the geometrical relationships o f shock fronts and contact surfaces; it is in this area where X-rays, because they make it possible to ' ’see inside” the detonating explosive, provide a uniquely appropriate tool. Until now the difficulty has been the inability o f available sources to penetrate charges more than a few inches in diameter. This has been a serious limitation. The advent o f PHERMEX2 8 will greatly reduce this problem.
The majer published work with Bash X-rays has been done by Schall21 at Weil am Rhine (Institute dft Saint Louis in France). In Ref. 27 Schall lists three determinations o f detonation pressure based on flash X-ray photographs. One method involves the acceleration f a brass plate in contact with explosive. By measuring the curvature o f the plate in the vicinity o f the wave fro n t, Schall estimated the pressure in Composition B to be 1.6 X IQ 6 atm. This figure must underestimate the pressure at the front because it is obtained from an average value o f the acceleration during the expansion o f the explosive gas against the plate. Accordingly, the figure is not the instataneous initial "alue that relates to p 2.
Another pressure estimate reported Schall was derived from an X-ray photograph showing the boundary o f the expanding gas from an
6-16
unconfined charge. Schaii used the following approximate theoretical expression, ascribed to W. Dtfcring and G. Burkhardt23, which relates the angle a that this b ou n d rm a k es with the charge axis and the eff'-ctlve adiabatic exponent o f the product gases k :
2 \k - 1/From the observed sgigie o f 40“ , K was calculated using Eq. 5-14. The value found was 2.8. The theory o f detonation (Chapter 6 ) shows that the particle velocity Uj is equal to D/(k + 1); hence, from Eq. 5-1
Pl = poD2/(K + 1) (5-15)
Substituting the yalue for K in Eq. 5-11, Schall obtained a value o f 2,5 X 10⁸ atm for the detonation pressure in Composition B.
I t may be noted that the value o f K obtained by Schall from this simple measurement agrees very well with the value o f 2 77 obtained from the isenbope; as determined by Deal. Also, the factor i ( (K + 1), which on the basis o f Schali’s work has a value o f 0.26, agrees with the number obtained independently from the theoretical expression of Jones in Eq. 5-5. We have previously pointed to the agreement betw een pressures obtained froth Jones’ expression and the measured data (Table 5-1). Taken all together, these observations form a highly consistent picture.
B y comparing the optical density in the X-ray photograph immediately behind the wave with that in front, Schall was able to estimate the ratio PitP0, and hence to calculate the pressure, using Eq. 5-4 to find in terms o f D. In this way he obtained u value o f 1.9 X 10s atm fo r the detonation pressure in Composition B. This value is about 30 percent too low. The error is probably indicative o f the limitations o f the equipment in precise quantitative measurements o f ihis kind.
An a d d it io n a l method o f measuring detonation pressures involves flash X-rays to measure wave velocities in adjacent plates. Perpendicular incidence o f a detonation at an interface can have one o f several effects, depending on the impedance match between the explosive and the particular inert medium in contact. For dense metals, such as steel or lead, perpendicular incidence always results in a reflected shock. However, if the direction o f
AMCP 706-180
waye propagation is parallel to the surface o f the metal or at a small angle, a rarefaction is produced in the explosive by the interaction. As the angle o f incidence is increased, a point is reached where neither a rarefaction nor a shock is reflected, i.e., a “ match” is obtained. This condition can be detected in flash X-ray photographs, Dr. Jane Dewey30 o f Ballistic Research Laboratories showed that when this co n d it io n o f no reflection occurs, the detonation pressure can be calculated from a relationship involving the angle o f incidence a and the angle 8 by which the surface o f the metal is depressed at the edge o f the advancing detonation fron t The relation is
= ft,-P2sin S (5-16)
1 cos a. sin (a + 8)
Observation o f the precise angle for zero reflection proved to be difficult bu„ '.he pressure values obtained independently in this manner confirm the validity o f figures derived by other methods.
Work done with X-rays up to the present time thus corroborates very well the data obtained from other more precise but less direct types o f measurements o f the properties in the detonation wave. With the hew commercially available high energy machines, much greater precision in data o f this sort should be possible. More importantly, we sh.ould be able to learn a great dcs> more about three-dimensional effects in the detonation wave (e.g., the effect o f the charge boundary) than is known at present.
5-4 BLAST WAVE PRESSURE
Precise measurements o f shock wave pressures in air or under water are usually made by means o f piezoelectric transducers. The favorite piezoelectric material is tourmaline but quartz has also been used. A good description o f piezoelectric blast gages and how they are used is given in Ref. 81.
Measurement o f pressure in air blest waves poses a special problem because o f the large particle velocity or “ wind” asso.iated with the shock. The presence o f the gage itself disturbs the flow in the medium and this can lead to serious errors unless special precautions are taken in the construction and mounting o f the transducer. There sie two well-defined ways to
measure the pressure in the blast wave, usually referred to as “ side-on” and “ face-on.” The first term applies to a measurement o f the pressure sensed on the face o f 2 transducer when it is oriented along the direction of travel o f the shock wave, i.e., in a direction perpendicular to the shock front. Ideally, the gage should be mounted in an infinite baffle, or wall, which is aligned along a radiusfrom the explosive charge. I f the charge were fired on the ground, a side-on measurement could be made by mounting the gage Audi with the ground surface. For side-on measurements in free air, the piezoelectric element must be mounted in a baffle o f sufficient size and suitably shaped at the leading edge t o minimize the distortion o f the pressure field produced by the blast wave around the gage. Construction o f a gage designed for this purpose at the Ballistic Research Laboratories.is shown in Fig, 5-1,4.
Face-on measurement refers to the recording o f pressure behind the reflected shock produced when the air blast wave strikes a massive wall at normal incidence. Since the air is brought to rest by the reflection, no problem o f aerodynamic distortion arises here. A serious source o f spurious signals in this case, however, is mechanical vibration o f the wall or components o f the mounting fixture. Special precautions must be taken to eliminate these undesirable effects. The peak overpressure o f a face-on measurement is twice that o f a side-on measurement at very lew pressure levels (acoustic approximation) and increeses to several times the side-on pressure, at higher pressures.
For the shock waves produced in\air by high explosives, the most important parameters are the peak pressure and positive impulse {pdt. Under water, the energy quantity obtained by evaluating the integral / p 2dt under the pressure-time curve is also important fo r some considera tions . A pressure and flow phenomenon known as the "bubble pulse", which follows at some distance behind the shock front, is also important in underwater effects. Some characteristics o f shock waves in air and water are discussed in Chapter IS,
Various mechanical devices have been used to record shock wave effects both in air and underwater. The best known o f these is the diaphragm or “ Bikini” gage, the latter name deriving from the use o f this device at the first
5-19
AMCP 706-1S0
nuclear bomb tests at Bikini Island after World War II. This gage consists o f a sheet o f aluminum foil clamped between two steel plates which have circular openings o f various diameters. Several o f these gages are placed face-on to the blast at various distances from the cha.ge. A fter the charge is fired, the gages are inspected to determine the smallest-diameter hole in which the aluminum foil is broken in each case. This is a measure o f the peak blast overpressure. These gages can be calibrated with known charges by means o f the peak-pressure vs distance curves that have been compiled from piezoelectric data. I f a sufficient number o f diaphragm gages is used on a test so that significant statistical averages, can be taken, these devices produce quite reliable information.
A mechanical fpge for measuring blast impulse close to explosive charges is described in Ref. 32. This gage consists simply o f a,projectile in a cylindrical barrel which is mounted in the wall o f a heavy concrete enclosure strong enough to withstand the blast. The projectile is placed on the mouth o f the tube where it is exposed to the incident blast wave. It acquires a velocity proportional to the positive impulse in the, wave. This gage appears to give quite accurate absolute measurements ;n a son where delicate piezoelectric instru, .on is not entirely practical:
Dewey33, at the Sheffield Experimental Station in Alberta, Canada, has developed a technique to measure the air velocity associated with die blast wave. The method involves measuring the displacement o f smoke trails in motion picture photographs. It is applicable especially to large charges o f chemical explosives and to nuclear explosions. Good agreement with theoretical predictions has been obtained, except for oxygen-poor explosives like TNT. In the case o f the latter, the detonation products continue to bum in the oxygen o f the air. The relatively slow release o f energy from this source causes an outward flow o f air which contributes to the pressure and particle velocity in the “ tail” o f the blast wave, However, even for TNT, the particle velocity data at short distances behind the shock front are in good agreement with theory.
5-5 DETONATION TEMPERATURE
The agreement o f various values o f detonation pressure reviewed in this chapter may convey
the impression that, our knowledge o f the detonation state is quite secure. Actually this is far from true. Except for Eq. 5-5, which is based on a theoretical deduction o f Jones, the consistency o f various estimates o f pressure is m ere ly testim on y to the accuracy o f experimental obsanationa. The concepts from which these various means to measure pressure are derived are the continuity equation (conservation o f matter) and the equation o f motion (Newton’s second law). The energy relation is not involved. Hence, experimental observations o f pressure tell nothing about the therm' 1 properties o f the explosion products. This is obviously a matter o f considerable interest, yet, strange to say, it has received relatively little attention from workers in this field. The reasons are not apparent because measurement o f temperature would not seem to be fraught with unusual difficulties compared with other experimental determinations on explosives.
A method to measure detonation temperature and some experimental results are described by Gibson and his coworkers in Ref. 34. The tem perature determ ination depends on measurement o f the relative intensity o f light at two different wavelengths and is based on the Wien displacement law (or Planck’s distribution law). There are several assumptions implicit in this method: (1 ) that the emi«sivity o f the medium at the two wavelengths is the same; this assumption is not likely to lead to serious errors, and ( 2 ) that the contribution to the measured light levels by the cooled expansion products is small. The apparatus was calibrated^ by standard methods, using a source o f known temperature. N arrow bands o f radiation at various wavelengths were obtained with a grating spectrograph. Several cross-checks were made in the determinations.
A summary o f the temperature results for various explosives is given in Table 5-2. The authors varied the density o f the explosives through a considerable range with the hope o f answering the rather crucial question: whether the temperature increases or decreases when density is raised. They interpreted their results to show one trend in some cases and the other in other cases. However, the scatter is rather large and, i f the few data for explosives with initial density below about 1 .2 0 g/cm3 are left out one is forced to conclude that these
5-21
AMCP 706-180
m easurem ents demonstrate no statistically significant trend one way. or another. Therefore, in Table 5-2 the values in the density range 1.20 to 1.60 g/cm3 fo r each explosive have been averaged. The figures in the table have probably have an experimental standard error o f about 100° to 200bK.
The results in Table 5-2 are not consistent with theoretical values corresponding to any one o f the several equations o f state that have been suggested to describe the behavior o f detonation products. The equation o f state is an important part o f the theoretical treatment o f high explosives; and Chapter 7 is largely devoted to this subject. H one divides the equations of.state that have been proposed into those Wiiich ( 1 ) postulate that little ,or none o f the internal energy in the detonation products is due to intermolecular repulsive forces and ( 2 ) those which postulate that a relatively large fraction o f the energy is in this form, these results generally fa vo r the former. Indeed the measured temperatures in Table E-2 for PETN, RDX, and EDNA are comparable with the highest values to result from any o f the state equations that has been proposed.
A serious p rob lem in experimental measurement o f detonation temperature is due to the, very high temperature produced jn gases either on the inside or on the outside and in the vicinity o f the explosive charge. Unless great precautions are taken, it is quite possible that radiation from shock-heated gases will be mistaken for radiation from the detonation products themselves. Since the luminosity depends on the fourth power o f temperature, a relatively small quantity o f gas at a very high temperature can contribute a very large amount o f radiation. This effect was discovered by
Gibson34 who found that replacing the air o cc lu d ed in the explosive charge with propane—propane having a much lower ratio o f specific heats—led to much lower apparent temperatures, especially in charges o f low bulk density. The authors reported, however, that these gas effects were essentially eliminated when the charges were “ impregnated” with propane.
It may be significant that the temperature reported for nitroglycerin in Table 5-2 is considerably lower than would be expected in comparison with that for the other highly energetic explosives PETN. and RDX,.No matter which equation o f state is chosen-, the-calculated detonation temperature o f nitroglycerin is among the .highest for any explosive, arid yet it is far down on the scale in Table 5-2. This may be indicative that occluded gas effects, which are certainly hot serious in liquid explosives like nitroglycerin, were not entirely eliminated in spite o f the pains taken by the authors o f Ref. 34 in this regard.
In concluding this review of detonation temperature, one is compelled to say that no completely satisfactory solution has been forthcoming up to tois time. Workers in the field o f detonation physics have in this area a challenging problem for the future.
5-6 ELECTRICAL CONDUCTIVITY IN THE DETONATION ZONE
Considerable interest in recent years has centered on the study o f electrical conductivity in the detonation zone o f high explosives. In some explosives the conductivity is relatively la rge , and there has been considerable sp ecu la tion abou t the source o f this
TABLE 6-2 EXPERIMENTAL DETONATION TEMPERATUR ES 34
■plotive T ,°K Explotive T .’ K
PETN 5720 Nitroglycerin 4020 (high order) 32P0 (low order)
RDX 5550 Nitromethane 380G
EDNA 5430 Dynamite
Tetryl 5180 (Po =1.05 g/cm3) 2670
AMCP 706-180
phenomenon. Here we shall only attempt to describe briefly the experimental methods and indicate the nature of some o f the results. 'Hie reader may refer to the original works listed in the references cited in this paragraph for detailed interpretations.
In principle, various methods that have been used to measure conductivity are similar, although they differ in experimental detail and rigor o f treatment. By measurement o f the current i conducted between two electrodes in contact with a detonating charge when a voltage V is impressed, the resistance R is determined according to Ohm’s law, i.e., R = V/i. A t any given instant the electrodes make contact with a conducting zone o f some given shape which may either be conjectured or experimentally mapped out in some way. I f the conducting zone is considered to have uniform conductivity a throughout, the value o f this quantity may be obtained from R through the use o f a factor K, which may be sailed the effective “ cell constant” ; thus, a = K/R. The term “ cell constant” derives from the more familiar problem o f measuring the conductivity o f an electrolyte solution in a “ cell” or container into which the electrodes dip. The cell constant in this case is determined by tue size, shape, and separation o f the electrodes; the size and shape o f the cell; and the placement o f the electrodes in the cell or, in a word, by the “ geometry” o f the measuring device.
In Ref. 35 Jameson describes a method o f placing electrical probes within the charge and by this means determining the shape o f the zone having a high electrical conductivity. He finds that this is o f a conical shape, the base o f the cone being coincident with the detonation shock front and comprising the full cross section o f the charge at this point. The conical surface presumably represents the front o f the advancing rarefaction or “ release” wave that spreads into the detonation zone from the free surface. Jameson made a “ mock-up” o f the conical conducting zone from graphite sheets o f known electrical conductivity and in this way determined the cell constants for the particular electrode arrangement used in the explosive experiment. The implicit assumption here is that a is constant throughout the highly conducting zone mapped out by the probes. The value determined in this way for the resistivity o f
Composition B was 0.29 ohm-cm. Within an order o f magnitude this agrees with values reported by otherworkers36.
The method reported by Hayes37 is considerably more elaborate. In the first place, Hayes extended the time resolution o f his measurements about iOOO-fold over other workers, employing nanosecond circuitry where others had used microsecond circuitry. And, instead o f assuming that the conductivity throughout the detonation zone is constant, he has assumed that it varies as a function o f time (or distance) behind the shock front, and has determined this function-by an elaborate scheme using a high-speed digital computer to analyze the observed electrical wave form from the conductivity probe. Hayes discovered that the onset o f conductivity begins immediately at the precursor shock front (see Chapter 8) and in some cases passes a peak within a few nanoseconds (which means, in terms of distance, only some several microns) behind the front. As between various explosives, the peak conductivity varies by orders o f magnitude; also the variation o f conductivity with time is decidedly different in various cases. Undoubtedly, this reflects wide differences in the reaction kinetics and in the physical and chemical nature o f the reaction products.
Fig. 5-15, reproduced from Ref. 37, shows the conductivity profile in the detonation zone fo r three explosives: nitromethane, Composition B, and liquid TNT. Here, conductivity is shown as a function o f time. For purposes o f orientation, time may be derived from distance at the rate o f about 6 microns/nsec. Thus, the full scale on the abscissa o f Fig. 5-15 corresponds to little more than 1 mm. The units on the ordinate scale in Fig. 5-15 may be divided into 100 to obtain the resistivity in ohm-cm. Thus the lowest resistivity recorded fo r nitromethane is about 1 ohm-cm, for Comp. B about 0.1 ohm-cm, and for liquid TN T about 0.01 ohm-cm. The close agreement in the case o f Comp. B with the value given by Jameson may be noted.
T h e highest value o f conductivity in detonating explosives that has been recorded thus far (liquid TNT, Ref. 37) compares with that fo r an intrinsic semiconductor like germanium. It is less by a factor o f 10 than the conductivity o f graphite. I f considered as a gaseous plasma, the detonation zone in liquid
8-23
AMCP 706-180
TN T has a rather high conductivity; but, i f it is considered, as a condensed phase comparable with carbon black, for example, its conductivity is not.suiprising. Hayes’ finding in Ref. 37 that the peak conductivity o f various explosives shows a close correlation with the amount of solid carbon in the detonation products may, therefore, have a significant bearing on the nature o.f this phenomenon.
5-7 EMPIRICAL TESTS
In the early development of explosives, a number o f empirical tests evolved to measure
various “ qualities” and “ quantities” associated ' with the explosives. Among the qualities that different explosives possessed in varying degree was what came to be known by the French term “ brisance” which was meant to reflect the sh atte rin g a b il ity o f an expips..,e, as distinguished from the “ pow er" or ability to do work in moving rock, etc. Thus, it was recognized that the work capability was an extensive property that depended on the quantity o f explosive; and the term “ power” , which in this connection is quite confusing to physicists, meant a “ specific” property related
Figure 5-15, IJIectrica! Conductivity as a Function o f Time in tke Detonation Reaction Zone of Various Explosives
5-24
i*
AMCP 706-180
phenomenon. Here we shall only attempt to describe briefly the experimental methods and indicate the nature o f some o f the results. The reader may refer to the original works listed in the references cited in this paragraph for detailed interpretations.
In principle, various methods that have been used to measure conductivity, are similar, although they differ in experimental detail and rigor o f treatment. B y measurement of the current i conducted between two electrodes in contact with a detonating charge when a voltage V is impressed, the resistance R is determined according to Ohm’s law, i.e., R = V/i. A t any given instant the electrodes make contact with a conducting zone o f some given shape which may either be conjectured or experimentally, mapped out in some way. I f the conducting zone is considered to have uniform conductivity a throughout, the value of this quantity may be obtained from 12 through the use o f a factor K, which may be called the effective “ cell constant” ; thus, o = K/R. The term “ cell constant” derives from the more familiar problem o f measuring the conductivity o f an electrolyte solution in a “ cell” or container into which the electrodes dip. The cell constant in this case is determined by the size, shape, and separation o f the electrodes', the size and shape of the cell; and the placement o f the electrodes in the cell or, in a word, by the “ geometry” o f the measuring device.
In Ref. 35 Jameson describes a method o f placing electrical probes within the charge and by this means determining the shape o f the zone having a high electrical conductivity. He finds that this is o f a conical shape, the base o f the cone being coincident with the detonation shock front and comprising the full cross section o f the charge at this point. The conical surface presumably represents the front o f the advancing rarefaction or “ release” wave that spreads into the detonatii <n zone from, the free surface. Jameson made a “mock-up” o f the conical conducting zone from graphite sheets o f known electrical conductivity and in this way determined the cell constant K fo r the particular electrode arrangement used in the explosive experiment. The implicit assumption here is that a is constant throughout the highly conducting zone mapped out by the probes. The value determined in this way fo r the resistivity o f
Composition B was 0.29 ohm-cm. Within an order o f magnitude this agrees with values reported by other workers8 6.
The method reported by Hayec37 is considerably more elaborate. In the first place, Hayes extended the time resolution o f his measurements about iOOO-fold over other workers, employing nanosecond circuitry where others had used microsecond circuitry. And, instead o f assuming that the conductivity throughout the detonation zone is constant, he has assumed that it varies as:a function o f time (or distance) behind the shock front, and has determined this function by an elaborate scheme using a high-speed digital computer to analyze the observed electrical wave form from the conductivity probe. Hayes discovered that the onset o f conductivity begins immediately at the precursor shock front (see Chapter 8) and in some cases passes a peak within a few nanoseconds (which means, in terms o f distance, only some several microns) behind the front. As between various explosives, the peak conductivity varies by orders o f magnitude; also the variation o f conductivity with time is decidedly different in various cases. Undoubtedly, this reflects wide differences in the reaction kinetics and in the physical and chemical nature o f the reaction products.
Fig. 5-15; reproduced-from.Ref. 37, shows the conductivity profile in the detonation zone fo r three explosives; nitromethane, Composition B, and liquid TNT. Here, conductivity is shown us a function o f time. For purposes o f orientation, time may be derived from distance at the rate o f about 6 microns./nsec. Thus, the full scale oh the abscissa o f Fig. 5-15 corresponds to little more than 1 mm. The units on the ordinate scale in Fig. 5-15 may be divided into 100 to obtain the resistivity in ohm-cm. Thus the lowest resistivity recorded for nitromethane is about 1 ohm-cm, for Comp. B about 0.1 obm-cm, and fo r liquid TN T about 0.01 ohm-cm. The close agreement in the case o f Comp. B with the value given by Jemeson may be noted.
T h e highest value o f conductivity in detonating explosives that has been recorded thus far (liquid TN T , Ref. 37) compares with that for an intrinsic semiconductor like germanium. It is less by a factor o f 10 than the conductivity o f graphite. I f considered as a gaseous plasma, the detonation zone in liquid
5-23
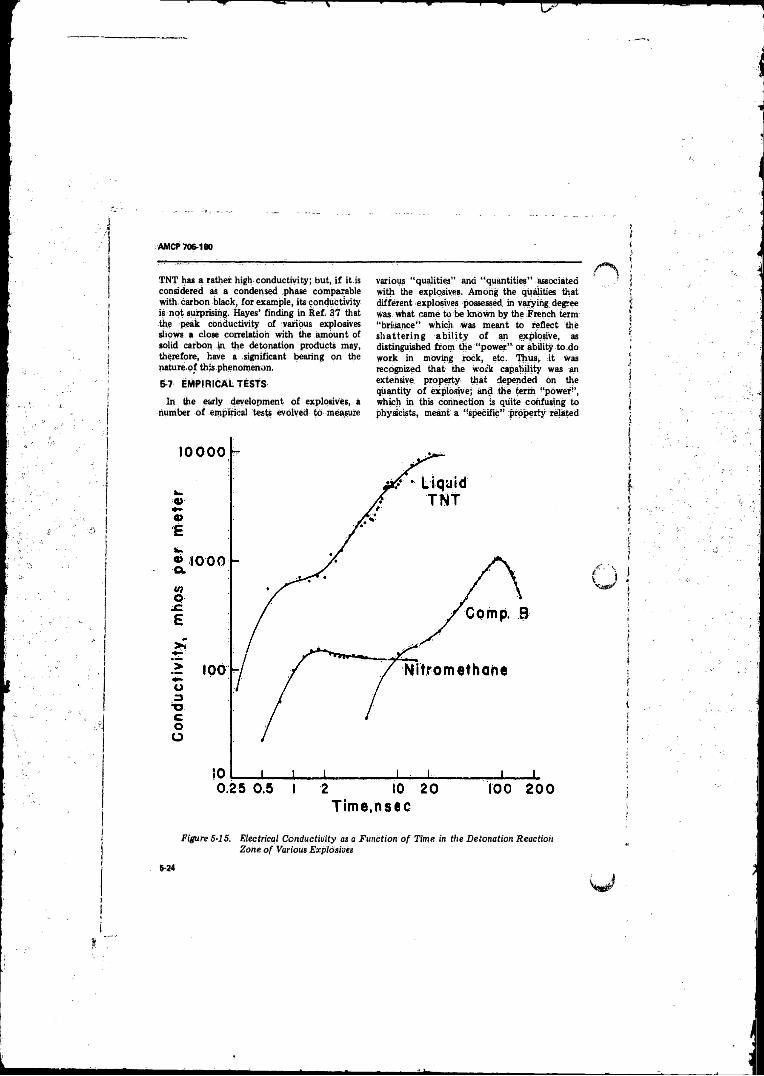
AMCP 706-180
TN T has a rather high-conductivity; but, i f it.is considered as a condensed -phase comparable with, carbon black, for example, its conductivity is not surprising. Hayes’ finding in Ref. 37 that the peak conductivity o f various explosives shows a close correlation with the amount of solid carbon in the detonation products may, therefore, have a significant bearing on the nature.of this phenomenon.
5-7 EMPIRICAL TESTS
In the early development o f explosives, a number o f empirical tests evolved- to measure
various “ qualities” and “ quantities” associated with the explosives. Among the qualities that different explosives possessed in varying degree was what came to be known by the French term “ brisance” which, was meant to reflect the sh attering a b il it y o f an explosive, as distinguished from the “ power.” or ability to.do work in moving rock, etc. Thus, it was recognized that the work capability was an extensive, property that depended on the quantity o f explosive; and the term “ pOwer” , which in this connection is quite confusing to physicists, meant a “ specific” property related
Figure 5-1S. Electrical Conductivity as a Function of Time in the Detonation Reaction Zone of Various Explosives
6-24
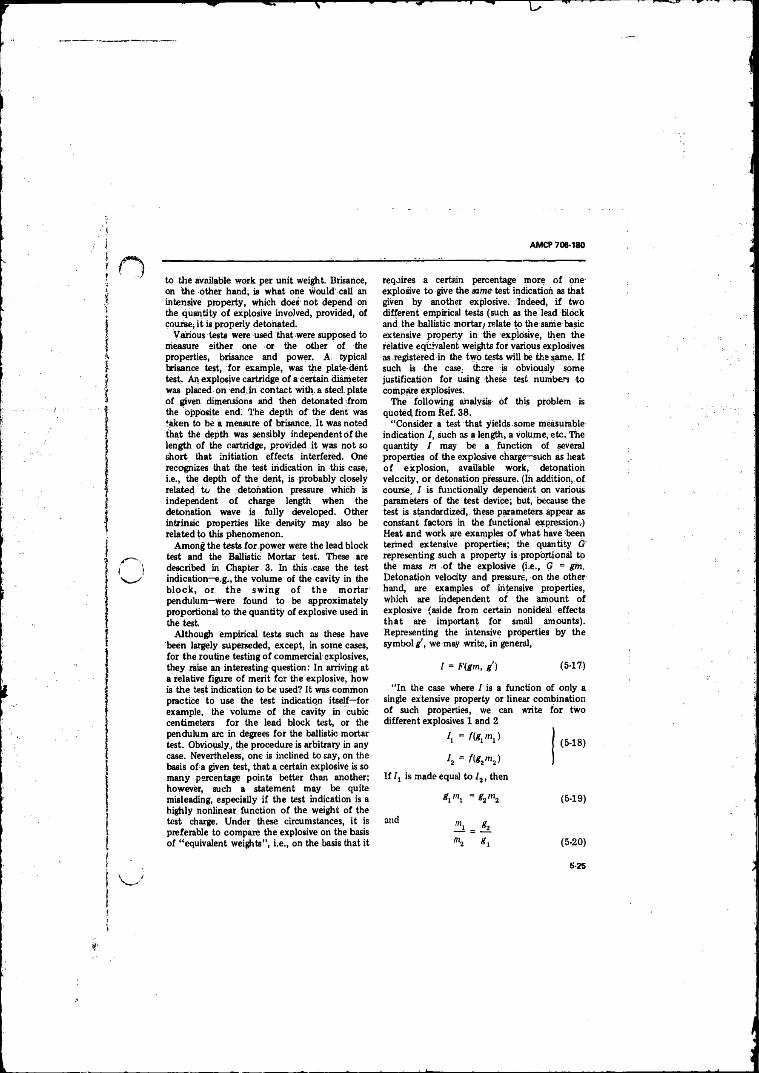
AMCP 706-180
to the available work per unit weight. Brisance, on the other hand, is what one would call an intensive property, which does not depend on the quantity o f explosive involved; provided, of course; it is properly detonated.
Various tests were used that were supposed to measure either one or the other o f the properties, brisance and power. A typical brisance test, for example, was the plate-dent test. An explosive cartridge o f a certain diameter was placed- on endJn contact with, a steel plate o f given dimensions arid then detonated -from the opposite end. The depth o f the dent was taken to be a measure o f brisance. i t was noted that the depth was sensibly independent o f the length o f the cartridge, provided it was not so short that initiation effects interfered. One recognizes that the test indication in this case,i.e., the depth o f the dent, is probably closely related tc the detonation pressure which is independent o f charge length when the detonation wave is fully developed. Other intrinsic properties like density may also be related to this phenomenon.
Among the tests for power were the lead block test and the Ballistic Mortar test. These are described in Chapter 3. In this case the test indication—e.g., the volume o f the cavity in the b lo ck , or th e sw ing o f the mortar pendulum—were found to be approximately proportional to the quantity o f explosive used in the test.
Although empirical tests such as these have been largely superseded, except, in some cases, for the routine testing o f commercial explosives, they raise an interesting question: In arriving at a relative figure o f merit for the explosive, how is the test indication to be used? It was common practice to use the test indication itself—for example, the volume o f the cavity in cubic centimeters fo r the lead block test, or the pendulum arc in degrees fo r the ballistic mortar test. Obvioysly i the procedure is arbitrary in any case. Nevertheless, one is inclined to say, on the basis o f a given test, that a certain explosive is so many percentage points better than another; however, such a statement may be quite misleading, especially i f the test indication is a highly nonlinear function o f the weight o f the test charge. Under these circumstances, it is preferable to compare the explosive on the basis o f “ equivalent weights” , i.e., on the basis that it
requires a certain percentage more o f one explosive to give the aa me test indication as that given by another explosive. Indeed, i f two different empirical tests (such as the lead block and the ballistic mortar^ relate to the same basic extensive property in the explosive, then the relative equivalent weights for various explosives as registered in the two tests will be the same. I f such is the case, there is obviously some justification for using these test numbers to compare explosives.
The following analysis o f this problem is quoted, from Ref. 38.
“ Consider a test that yields.some measurable indication /, such as a length, a volume, etc. The quantity / may be a function of several properties o f the explosive charge—such as heat o f explosion, available work, detonation velocity, or detonation pressure. (In addition, o f course. I is functionally dependent on various parameters o f the test device; but, because the test is standardized, these parameters appear as constant factors in the functional expression,) Heat and work are examples o f what have beep termed extensive properties; the quantity G representing such a property is proportional to the mass m o f the explosive (i.e., 6 - gm. Detonation velocity and pressure, on the other hand, are examples o f intensive properties, which are independent o f the amount o f explosive (aside from certain nonideal effects that are important for small amounts). Representing the intensive properties by the symbol g', we may write, in general,
I = F(gm, g ) (5-17)
“ In the case where / is a function of only a single extensive property or linear combination o f such properties, we can write for twodifferent explosives 1 and 2
I] = flg jm j)(5-18)
h = f(g2m2)
I f /j is made equal to I2, then
gLm j = g2m2 (5-19)
and _ ft
<f, (5-20)
6-25
AMCP 706-180
REFERENCES
1. M; A. Cook, The Science of High E x p lo s i v es , C h ap . 2, “ M odern Instrumentation and Methods” , Reinhold, New York, 1958.
2. W. G. Sykes, “ Study o f Fast Events” , Science 130,1051 ( i 959).
3. J. S. Courtney-Pratt, “ Some New Methods o f Fast Photography and Their Application to C om bustion Processes” , Fourth Sy mposium ( In te rna t i ona l ) on Combustion, The Williams and. Wilkins Company, Baltimore, 1953.
4. A. W. Campbell, M. E. Malin, T. ). Boyd, Jr., and J. A . H u ll, “ Precision Measurement o f Detonation Velocities in Liquid and Solid Explosives” , Rev. Sci. Instr. 27, 567 (1956).
5. M. H. Rice,. R. G. McQueen, and J. M. Walsh, “ Compression o f Solids by Strong Shock Waves” , Solid State Physics, V01. 6 , Frederick Seitz, Ed., Academic Press, New York, 1958,
6 . H. Jones, European Scientific Notes 3,388 (1949); Third Symposium on Combustion, Flames, and Explosion Phenomena, The Williams and Wilkins Company, Baltimore, 1949, p. 590.
7. R. E. D u ff and E. Houston, “ Measurement o f the Chapman-Jouguet Pressure and Reaction Zone Length in a Detonating High Explosive” , J. Chem. Phys. 23, 1268 (1955),
8. W. E . D e a l , “ M easurem ent o f Chapman-Jouguet Pressure fo r Explosives” , J, Chem. Phys, 27, 796 (1957).
9. R. W. Goranson, D. Bancroft, B. L. Burton, T._ Blechar, E. E. Houston, E. F. Gittings and S. A . Lancieen. “ D ynam ic Determination o f the Compressibility o f Metals” , J. Appl. Phys. 26, 14*72 (1955).
10. N . L . C o leb u rn , The Dynamic Compressibility of Solids from Single Experiments Using Light Reflection Techniques, NAVWEFS Rep, No. 6026, U.S. Naval Ord. Lab., Silver Spring, Md., 1960.
11. P. W. Bridgman, “ Rough Compression o f 177 Substances to 40,000 kg/cm2” , Proc. Am. Acad. Arts Sci. 76, 71-87 (1948).
12. R. G. McQueen, “ Laboratory Techniques fo r Very High Pressures and the Behavior o f Metals Under Dynamic Loading” , Metallurgy at High Pressures and High Temperatures, K. A . Gschneider,. Jr. et al., Ed., Gordon arid Breach Science Publishers, Inc., New York, 1964.
13. R. A. Graham, “ Technique for Studying Piezoelectricity under Transient High Stress Condition” , R.S.I. 32,1308,1961.
14. R. A. Graham, eta l.,“ Piezoelectrie Current F ro m S h o c k Loaded Q uartz—A Submicrosecond Stress Gage” , J. Appl. Phys. 36,1775 (1965).
15- W. J, Halpin, e ta l., ‘ ‘A Submicroscopic Technique fo r Simultaneous Observation o f Input and Propagated Impact Stresses” , ASTM Special Technical Publication No: 336, Symposium on Dynamic Behavior of Materials, Philadephia, 1963,
16. D . B e r n s t e in and D . Keou gh , “ Piezoresistivity o f Mahganin” , J. Appl. Phys. 35, No. 5,1471-1474 (1964).
17. D. D. Keough,. Pressure Transducer for Measuring Shock Wave Profiles, Phase IX: Additional Gage Development, Final Report DASA No. 49-146-XZ-096, SRI Project GSU-3 7 1 3 , Stanford Research Institute, November 30,1964.
18. D. D. Keough, Procedure for Fabrication and Operation of Mahganin Shock Pressure Gages, T e c h n i c a l R e p o r t N o . AFWL-TR-68-57, SRI Project PGU-6979, StandfOrd Research Institute, August 1968.
19. F. E. Allison, “ Shock Induced Polarization in Plastics, I. Theory” , J; Appl. Phys. 36, 2111 (1965).
20. G. E. Hauver, “ Shock-Induced Polarization in Plastics, II. Experimental Study o f Plexiglass and Polystyrene", J. Appl. Phys. 36,2113 (1965).
21. R. J. Eichelberger and G. E. Hauver, “ Solid State Transducers fo r Recording o f Intense Pressure Pulses” , Les Ondes de Detonation, Col loques Intemationaux du Centre National de la Recherche Scientifique, Gil-sur-Yvette, 1961.
22. G. E. Hauver and P. H. Netherwood, Pressure Profiles o f Detonating Baratol
5-27
*
AM C? >706-180
REFERENCES (Cont'd)
Measured with Sulfur Gages, BRL Technical Note No. 1452, Aberdeen Proving Ground, Md., 1962.
23. D. G. Doran; High Pressure Measurement, Giardini and Lloyd, Eds., Butterworth, Washington, D.C., 1963.
24. W, M urri, C. Petersen , and M; C o w p e r t h w a i t e , “ H U gon io t arid Release-Adiabat Measurements for Selected Geologic Materials” , J. Geophys, Res. 75, No. 11 (1970).
25. L . M. Barker, “ Firie Structure o f Compressive arid Release Wave Shapes in Aluminum Measured by the Velocity Interferometer Technique” , Symposium High Dynamic Pressure, Paris, France, 11-15 September 1967.
26. D. Venable, “ PHERMEX” , Physics Today 17, i9 December 1964.
27. R. Schall, “Methoden and Ergebnisse der Detonations Druckbestimmung bei festen Sprengstoffen” , Zeit. f. Elektrochemic, 61, 629(1957).
28; W. Doering and G. I. Burkhardt, Tech. Rpt. No. F ;T.S;rl227-il8 (GDAM p-T-46).
29. W. E. Deal, “ Measurement o f thellefiected Shock HugOniot and lsentrope for Explosive Reaction Products” , Phys. Fluids 1, 523 (1958).
30; J. W. Gehring, Jr. and J. Dewey, An Experimental Determination of Detonation Pressure in Two Solid High Explosives, BRL Report No. 935, Ballistic Research Laboratories, Aberdeen Proving Ground, Md., 1955.
31. R . H. Cole, Underwater Explosions, Princeton University Press, Prineetori, N. J., 1948, p. 159 ff.
32. 0 . T. Johnson, J. C. Patterson, II, and W.
C. Olson, A Simple Mechanical Method for Measuring the Reflected Impulse of Air Blast Waves, B RL Memorandum Report No. 1088, Aberdeen Proving Ground, Md., 1957. '
33. J. M. Dewey, “ The A ir Velocity in Blast Waves from T N T Explosions” , PrOc. Roy. Soc. A 279, 366 (1964).
34; F. C: Gibson, M, L. Bowser; C. R. Summers, F. H. Scott, Sind C. M. Mason, “ Use o f an, Electro-Optical Method to Determine tonation Temperatures in High Explosives” , J. Appl. Phys. 29, 628 (1958).
35. R . L. Jameson, Electrical Measurements in Detonating Pentpiite and Composition B, B R L Memorandum Report No. 1371, Aberdeen Proving Ground, Md., 1961.
36. M. A. Cook, The Science o f High Explosives, Chap. 7, “ Ionization, Electrical, Magnetic arid EleCtrOmagrietic Phenomena Accompanying Detonation” , Reinhold Publishing Cofp.j New York, 1958,
37. B. Hayes, “ Electrical Measurements in Reaction Zones o f HighExplosives” , Tenth Sym posium (In te rn a tio n a l) on Combustion, The Combustion Institute, 1965.
38. W. E. Gordon, F. E. Reed, and B. A . Lepper, “ Lead Block Test fo r Explosives” , Ind. Eng; Chem. 47,1794 (1955).
39. L . V. Altshuler, S. B. Konrier, M. I. Brazhnik, L. A . Vladimirov, M. P. Speranskaya, arid A. I. Funtikov, "The Isentropic Compressibility o f Aluminum, Copper, Lead, arid Iron at High Pressures” , Soviet Physics JETP (translation) II (4 ), 766(1960).
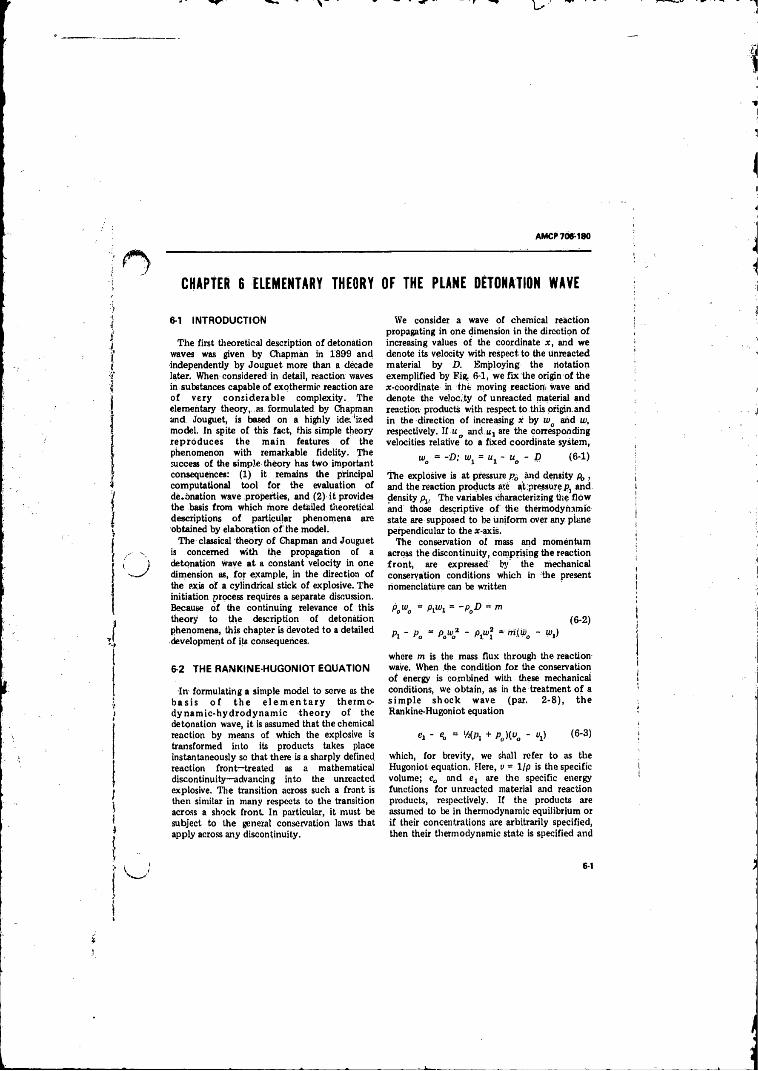
AMCC 706-180
CHAPTER 6 ELEMENTARY THEORY OF THE PLANE DETONATION WAVE
6-1 INTRODUCTION
The first theoretical description o f detonation waves was given by Chapman in 1899 and independently by Jouguet more than a decade later. When considered in detail, reaction waves in substances capable o f exothermic reaction are o f very con s id erab le complexity. The elementary theory,, as. formulated by Chapman and Jouguet, is based on a highly ide; 'ized model. In spite o f this fact, this simple theory reprodu ces the main features o f the phenomenon with remarkable fidelity. The success o f the simple theory has two important consequences: (1 ) it remains the principal computational tool fo r the evaluation o f de.onation wave properties, and (2 ) it provides the basis from which more detailed theoretical descriptions o f particular phenomena are obtained by elaboration o f the model.
The classical theory o f Chapman and Jouguet is concerned with the propagation of a detonation wave at a constant velocity in one dimension as, for example, in the direction o f the axis o f a cylindrical stick o f explosive. The initiation process requires a separate discussion. Because o f the continuing relevance o f this theory to the description of detonation phenomena, this chapter is devoted to a detailed development o f its consequences.
6-2 THE RANKINE-HUGONIOT EQUATION
In formulating a simple model to serve as the b a s is o f th e e le m e n t a r y therm od yn am ic-h yd rodyn am ic th eo ry o f the detonation wave, it is assumed that the chemical reaction by means o f which the explosive is transformed into its products takes place instantaneously so that there is a sharply defined reaction front—treated as a mathematical discontinuity—advancing into the unreacted explosive. The transition across such a front is then similar in many respects to the transition across a shock front. In particular, it must be subject to the general conservation laws that apply across any discontinuity.
We consider a wave o f chemical reaction propagating in one dimension in the direction o f increasing values o f the coordinate x , and we denote its velocity with respect to the unreacted material by D. Employing the notation exemplified by Fig. 6-1, we fix the origin o f the x-coordinate in the moving reaction) wave arid denote the velocity o f unreacted material arid reaction products with respect to this origin and in the direction o f increasing x by wo arid w, respectively. I f u o and u-, are the corresponding velocities relative to a fixed coordinate system,
wo = -D; w1 = ut - uo - D (6-1)
The explosive is at pressure pa and density £ , , and the reaction products ate at pressure p, and density pv The variables characterizing die flow and those descriptive o f the thermodynamic state are supposed to be uniform over any. plane perpendicular to the x-axis.
The conservation of mass and momentum across the discontinuity, comprising the reaction fron t, are expressed by the mechanical conservation conditions which in the present riomenclature can be written
PoWo = Ptwi = -PoD = m( 6-2)
P i - Pa = PaWo2 ~ P lWl ~ U'l)
where m is the mass flux through the reaction wave. When the condition fo r the conservation o f energy is combined with these mechanical conditions, we obtain, as in the treatment o f a s im p le sh ock w ave (par. 2 -8 ), the Rankine-Hugoniot equation
c-i " % = 'MPi + P„)(va - ui> ( 6 ‘ 3 >
which, for brevity, we shall refer to as the Hugoniot equation. Here, e = 1 Ip is the specific volume; ea and are the specific energy functions for unreactcd material and reaction products, respectively. If the products are assumed to be in thermodynamic equilibrium or i f their concentrations are arbitrarily specified, then their thermodynamic state is specified and
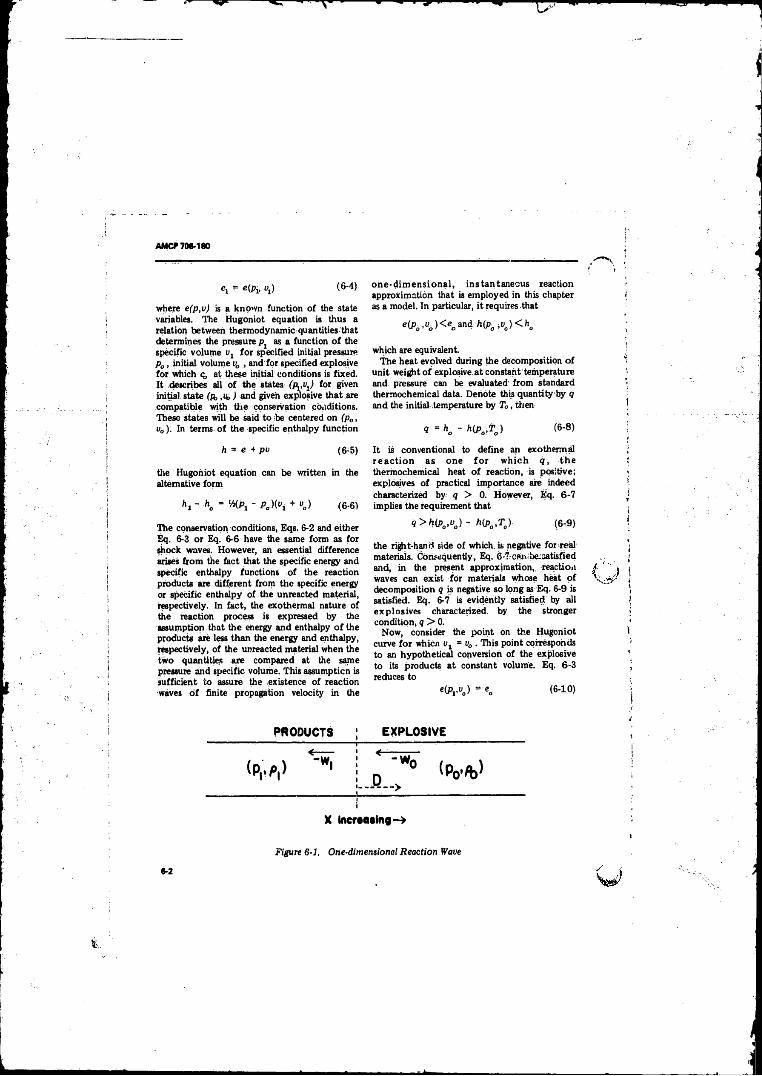
AMCP 706-180
Cl ~ «(Pi, « i ) (® '4)
where e(p,v) is a known function o f the state variables. The Hugoniot equation is thus a relation between thermodynamic quantities-that determines the pressure pJ as a function o f the specific volume vx fo r specified initial pressure p0 , initial volume v0 , and for specified explosive for which q, at these initial conditions is fixed. It describes all o f the states (Pj.Ujj for given initial, state (p, ,u, ) and given explosive that are compatible with tire conservation conditions. These states will be said to be centered on (p0, v0). In terms o f the specific enthalpy function
one-d im en siona l, instantaneous reaction approximation that is employed in this chapter as a model. In particular, it requires that
e(po ,u6 )< e o and h{po ivo)< h o
which are equivalent.The heat evolved during the decomposition o f
unit weight o f explosive at constant temperature and pressure can be evaluated from standard thermochemical data. Denote this quantity by q and the initial temperature by To, then
1 “ K - biPo’K ') (6‘ 8)
h w e + pv (6-5)
the Hugoniot equation can be written in the alternative form
hi~ h0 = WtP, - p.Xo* + e ,) ( 6-6 )
The conservation conditions, Eqs. 6-2 and either Eq. 6-3 or Eq. 6-6 have the same form as for shock waves. However, ah essential difference arises from the fact that the specific energy and specific enthalpy functions o f the reaction products are different from the specific energy or specific enthalpy o f the unreacted material, respectively. In fact, the exothermal nature o f the reaction process is expressed by the assumption that the energy and enthalpy o f the products ate less than the energy and enthalpy, respectively, o f the unreacted material when the two quantities are compared at the same pressure and specific volume. This assumption is sufficient to assure the existence o f reaction waves o f finite propagation velocity in the
It is conventional to define an exothermal re a c t io n as one fo r w hich q, th e thermochemical heat o f reaction, is positive; explosives o f practical importance are indeed characterized by <j > 0. However, Eq. 6-7 implies the requirement that
<i>h(po,vo) - h{po,To) (6-9)
the right-hand side o f which is negative for real materials. Consequently, Eq. 6'7-can;be:satisfied and, in the present approximation,, reaction waves can exist for materials whose heat o f decomposition q is negative so long as Eq. 6-9 is satisfied. Eq. 6-7 is evidently satisfied by all explosives characterized, by the stronger condition, q > 0.
Now, consider the point on the Hugoniot curve fo r whicn Uj = u ,. This point corresponds to an hypothetical conversion of the explosive to its products at constant volume. Eq. 6-3 reduces to
e(Pv »„) = (6-10)
PRODUCTS ; EXPLOSIVE
! ‘ ' w° <Po’% >
iiX Increasing-*
Figure 6-1, One-dimemionel .Reaction Wave
6-2
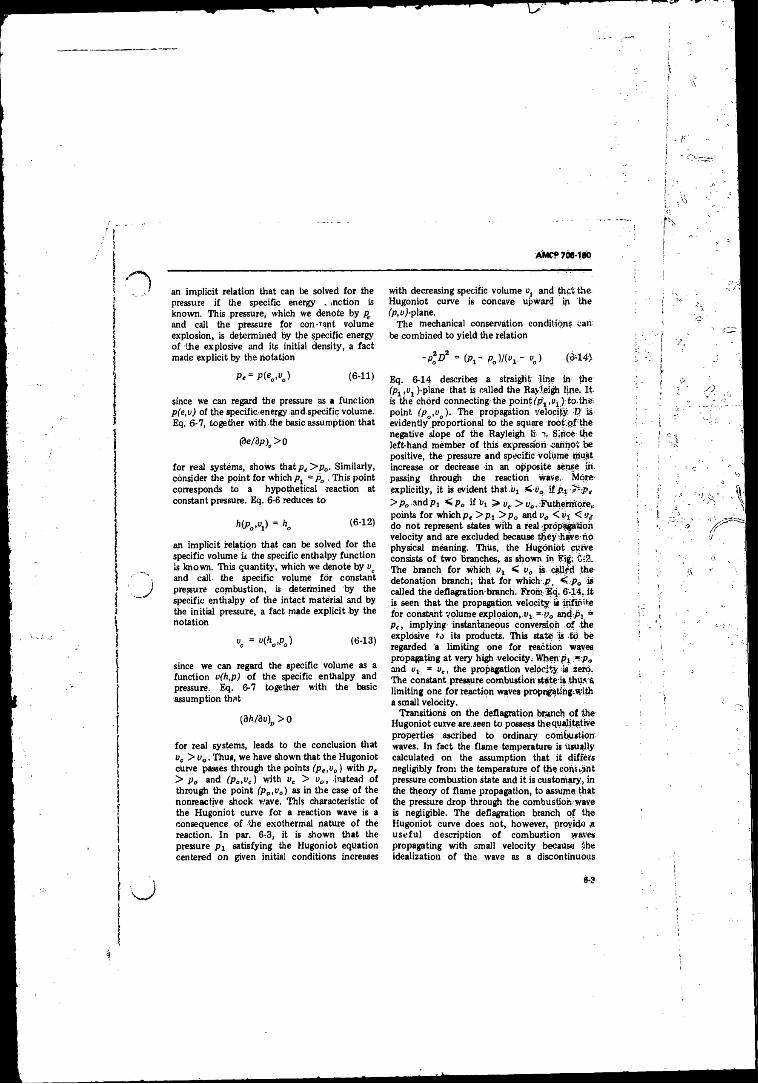
AMCP7M-1M
an implicit relation that can be solved fo r the pressure i f the specific energy . .notion is known. This pressure, which we denote by pe and call the pressure for con-rant volume explosion, is determined by the specific energy o f the explosive and its initial density, a fact made explicit by the notation
P*= P{eo,vo) (6-11)
since we can regard the pressure as a function p(e,u) of the specif ie,energy .andspecific volume. Eq. 6-7, together with the basic assumption that
<f>e/i)p\> 0
for real systems, shows that pe > p 0. Similarly, consider the point for which pt = p0 . This point corresponds to a hypothetical reaction at constant pressure. Eq. 6-6 reduces to
= h, (6-12)
an implicit relation that can be solved for the specific volume k the specific enthalpy function is known. This quantity, which we denote by u, and call the specific volume for constant pressure combustion, is determined by the specific enthalpy o f the intact material and by the initial pressure, a fact made explicit by the notation
v, = u(hc’P j
since we can regard the specific volume as a function v(h,p) o f the specific enthalpy and pressure. Eq. 6-7 together with the basic assumption that
(3h/3u)p > 0
for real systems, leads to the conclusion that vc > v 0. Thus, we have shown that the Hugoniot curve passes through the points (p„v0) with p, > p0 and (p„,vc ) with vc > uot instead o f through the point (po,v0) as in the case o f the nonreactjve shock wave. This characteristic of the Hugoniot curve for a reaction wave is a consequence o f the exothermal nature o f the reaction. In par. 6.3, it is shown that the pressure satisfying the Hugoniot equation centered on given initial conditions increases
with decreasing specific volume o, and that the Hugoniot curve is concave upward in the (p,v)-plane.
The mechanical conservation conditions can be combined to yield the relation
- pI d 2 = (Pt - po )/(o1 - v„) (6-14)
Eq. 6-14 describes a straight line in the (p1 ,v1 )-plane that is called the Rayleigh line. It is the chord connecting the point(pj,ej):tp-the> point O ,i» ). The propagation velocity R is evidently proportional to the square root o f the negative slope o f the Rayleigh li. a, Sipce the left-hand member o f this expression cannot be positive, the'pressure and specific volume must increase or decrease in an opposite sense in passing through the reaction wave. More explicitly, it is evident that-Pi < 9 0. if P i — P*
> P „ and P i < p 0 i f Vj > >tb..-fa0M)n&deB points fo r which pt > P i > p 0 and v0 < < pjdo not represent states with a real ipropiaigatioh velocity and are excluded because they h w e rid physical meaning. Thus, the Hugoniot curve consists o f two branches, as shown in Rig: C-l. The branch fo r which o , < » a is cglljfsJ the detonation branch; that for which p , < p „ is called the deflagration-branch. Erom Eq. 6-T4,.it is seen that the propagation velocity is infinite for constant volume explosion, ^ - v0 andp, » pr , implying instantaneous conversion o f the explosive to its products. This state is to be regarded a limiting one for reaction waves propagating at very high velocity. When pr wrp„ and al. = uc, the propagation velocity is zero. The constant pressure combustion state!; thvisa limiting one fo r reaction waves propr£atihg.with a small velocity.
Transitions on the deflagration branch o f the Hugoniot curve are.seen to possess thequsiitative properties ascribed to ordinary combustion, waves. In fact the flame temperature is usually calculated on the assumption that it differs negligibly from the temperature o f the consent pressure combustion state and i t is customary, in the theory o f flame propagation, to assume that the pressure drop through the combustion wave is negligible. The deflagration branch o f the Hugoniot curve does not, however, provide & usefu l description o f combustion waves propagating with small velocity because the idealization o f the wave as a discontinuous
6-3
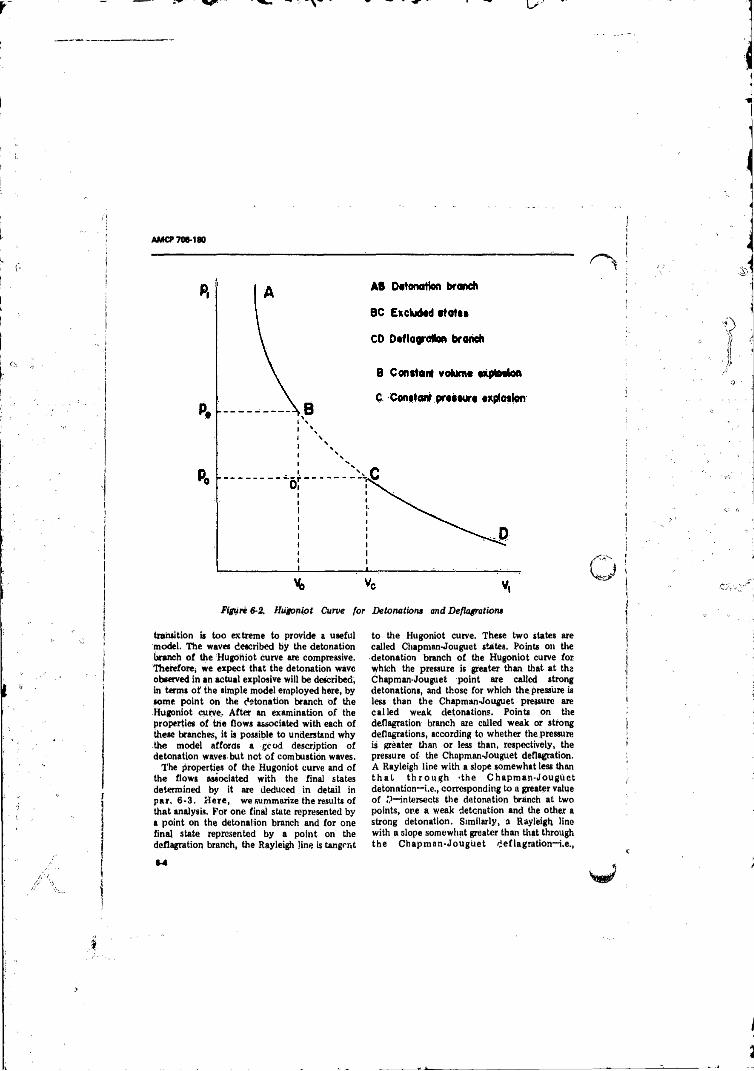
AMCP 706-180
Figure 6-2. Hugoniot Curve for Detonation! and Deflagration!
transition it too extreme to provide a useful model. The waves described by the detonation branch o f the Hugoniot curve are compressive. Therefore, we expect that the detonation wave observed in an actual explosive will be described, in terms o f the simple model employed here, by some point on the detonation branch o f the Hugoniot curve. A fter an examination o f the properties o f the flows associated with each o f these branches, it is possible to understand why the model affords a gcod description o f detonation waves but not o f combustion waves.
The properties o f the Hugoniot curve and o f the flows associated with the final states determined by it are deduced in detail in par, 6-3. H ere , we summarize the results o f that analysis. For one final state represented by a point on the detonation branch and for one final state represented by a point on the deflagration branch, the Rayleigh line is tangent
to the Hugoniot curve. These two states are called Chapman-Jouguet states. Points on the detonation branch o f the Hugoniot curve for which the pressure is greater than that at the Chapman-Jouguet point are called strong detonations, and those for which thepress'ure is less than the Chapman-Jouguet pressure are ca lled weak detonations. Points on the deflagration branch are called weak or strong deflagrations, according to whether the pressure is greater than or less than, respectively, the pressure o f the Chapman-Jouguet deflagration. A Rayleigh line with a slope somewhat less than th a t th ro u g h -the Chapm an-Jouguet detonation—i.e., corresponding to a greater value o f D—intersects the detonation branch at two points, one a weak detonation and the other a strong detonation. Similarly, a Rayleigh line with a slope somewhat greater than that through the Chapm an-Jouguet deflagration—i.e.,
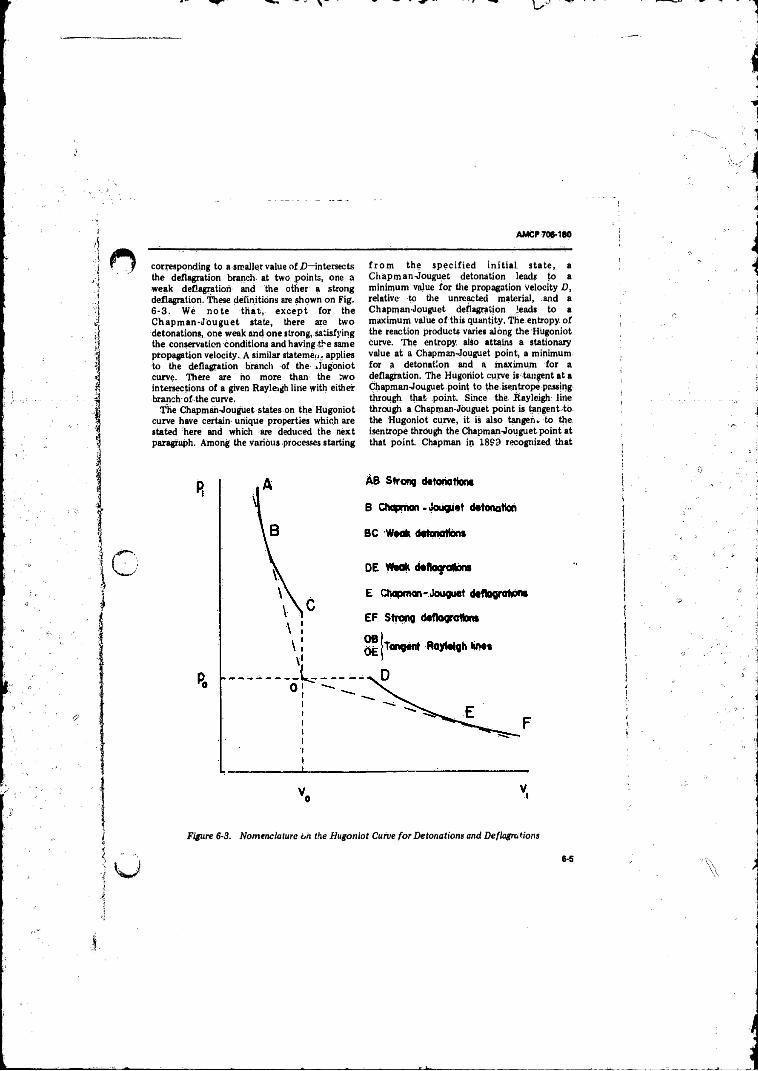
AMCP 708-180
corresponding to a smaller value o f Z>—intersects the deflagration branch at two points, one a weak deflagration and the other a strong deflagration. These definitions are shown on Fig.6-3 . We n o te that, e x c ep t for the Chapm an-Jouguet state, there are two detonations, one weak and one strong, satisfying the conservation conditions and having the same propagation velocity. A similar statemeiij applies to the deflagration branch of the .lugoniot curve. There are no more than the two intersections o f a given Rayleigh line with either branch of-the curve.
The Chapman-Jouguet states on the Hugoniot curve have certain unique properties which are stated here and which are deduced the next paragraph. Among the various processes starting
fr o m the sp ec ified in it ia l state, a Chapman-Jouguet detonation leads to a minimum value fo r the propagation velocity D, relative to the unreacted material, and a Chapman-Jouguet deflagration leads to a maximum value o f this quantity. The entropy o f the reaction products varies along the Hugoniot curve. The entropy, also attains a stationary value at a Chapman-Jouguet point, a minimum for a detonation and a maximum for a deflagration. The Hugoniot curve is tangent at a Chapman-Jouguet point to the isentrope passing through that point. Since the Rayleigh line through a Chapman-Jouguet point is tangent to the Hugoniot curve, it is also tangent to the isentrope through the Chapman Jouguet point at that point. Chapman in 18P3 recognized that
Figure 6-3. Nomenclature on the Hugoniot Curve for Detonation) and Deflagrations
6-5
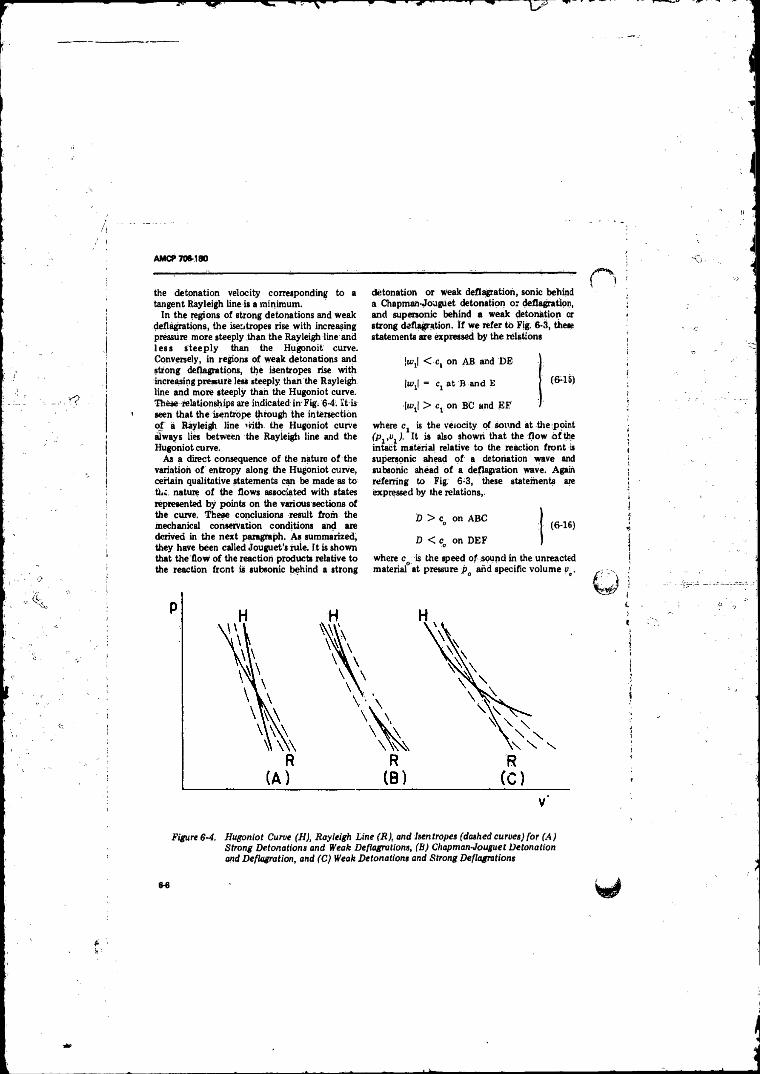
AMCP 706-180
the detonation velocity corresponding to a tangent Rayleigh line is a minimum.
In the regions o f strong detonations and weak deflagrations, the iseritropes rise with increasing pressure more steeply than the Rayleigh line and less s teep ly than the Hugonoit curve. Conversely, in repons o f weak detonations and strong deflagrations, the iSentropes rise with increasing pressure less steeply than the Rayleigh line arid more steeply than the Hugoniot curve. These relationships are indicated in Fig, 6-4. It-is seen that the isentrope through the intersection o f a Rayleigh line 'rith the Hugoniot curve always lies between the Rayleigh line and the Hugoniot curve.
As a direct consequence o f the nature o f the variation o f entropy along the Hugoniot curve, certain qualitative statements can be made as to tl.c nature o f the flows associated with states represented by points on the various sections o f the curve. These conclusions result from the mechanical conservation conditions and are derived in the next paragraph. As summarized, they have been called jouguet’s rule. I t is shown that the flow o f the reaction products relative to the reaction front is subsonic behind a strong
detonation or weak deflagration, sonic behind a Chapman-Jouguet detonation or deflagration, and supersonic behind a weak detonation or strong deflagration, i f we refer to Fig. 6-3, these statements are expressed by the relations
|io,| < Cj on AB and DE
|uij| = Cj at B and E (6-15)
(u/jl > c on BC and EF
where c1 is the velocity of sound at theipoint (P1,v1). It is also shown that the flow o f the intact material relative to the reaction front is supersonic ahead o f a detonation wave and subsonic ahead o f a deflagration wave. Again referring to F ig 6-3, these statements are expressed by the relations,
D > c on ABC 0 (6-16)
D < c on DEF•C
where co is the speed o f sound in the unreacted material at pressure po arid specific volume u .
Figure 6-4. Hugoniot Curve (H), Rayleigh Line (R), and Isentropes (dashed curvesj for (A ) Strong Detonations and Weak Deflagrations, (B) Chapman-Jouguet Detonation and Deflagration, and (C) Weak Detonations and Strong Deflagrations
6-6
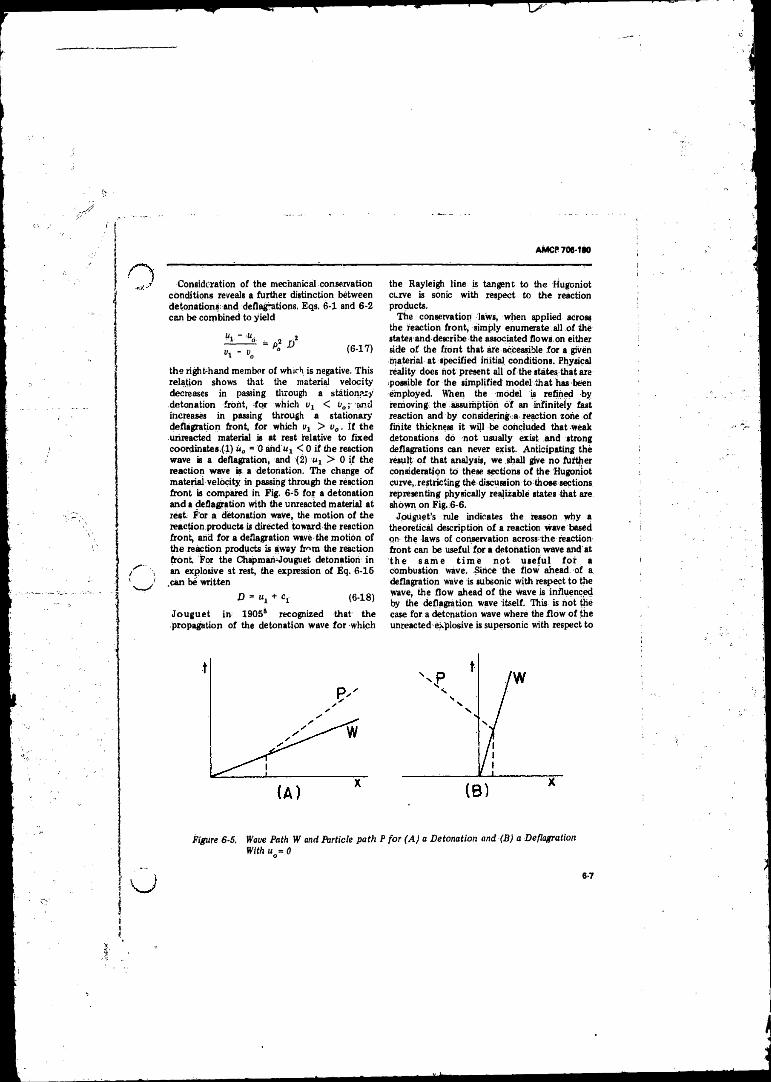
AMCP 706-180
1 \\ I
Consideration o f the mechanical conservation conditions reveals a further distinction between detonations; and deflagrations. Eqs. 6-1 and 6-2 can be combined to yield
the right-hand member o f which is negative. This relation shows that the material velocity decreases in passing through a stationary detonation front, fo r which vl < l>„; and increases in passing through a stationary deflagration front, fo r which ul > v0. i f the urireacted material is at rest relative to fixed coordinates (1 ) u0 = 0 and Uj < 0 i f the reaction wave is a deflagration, and ( 2) Uj > 0 if the reaction wave is. a detonation. The change o f material velocity in passing through the reaction front is compared in Fig. 6-5 fo r a detonation and a deflagration with the unreacted material at rest. For a detonation wave, the motion o f the reaction products is directed toward the reaction front, and for a deflagration wave-the motion o f the reaction products is away fr^m the reaction fron t For the Chapman-Jouguet detonation in an explosive at rest, the expression of Eq. 6-15
.can be written
D = ux + Cj (6-18)
Jouguet in; 1905s recognized that the propagation o f the detonation wave fo r which
the Rayleigh line is tangent to the Hugoniot curve is sonic with respect to the reaction products.
The conservation laws, when applied across the reaction front, simply enumerate all o f the states and describe the associated flows.on either side o f the front that are accessible fo r a given material at specified initial conditions. Physical reality does hot present all o f the states that are possible fo r the simplified model that has been employed. When the model is refined by removing the assumption o f an infinitely fast reaction and by considering.a reaction zone o f finite thickness it will be Concluded that weak detonations do not usually exist and strong deflagrations can never exist. Anticipating the result o f that analysis, we shall give no further consideration to these sections o f the Hugoniot curve, restricting the discussion to those sections representing physically realizable states that are shown on Fig. 6-6 .
Jouguet’s rule indicates the reason why a theoretical description o f a reaction wave based on the laws of conservation across; the reaction front can be useful fo r a detonation wave and at th e sa m e t im e n o t u sefu l fo r a combustion wave. Since the flow ahead, of a deflagration wave is subsonic with respect to the wave, the flow ahead o f the wave is influenced by the deflagration wave itself. This is not the case for a detonation wave where the flo w o f the unreacted explosive is supersonic with respect to
Figure 6-5, Wave Path W and Particle path P for (A ) a Detonation and (Bj a Deflagration With ua=0
6-7
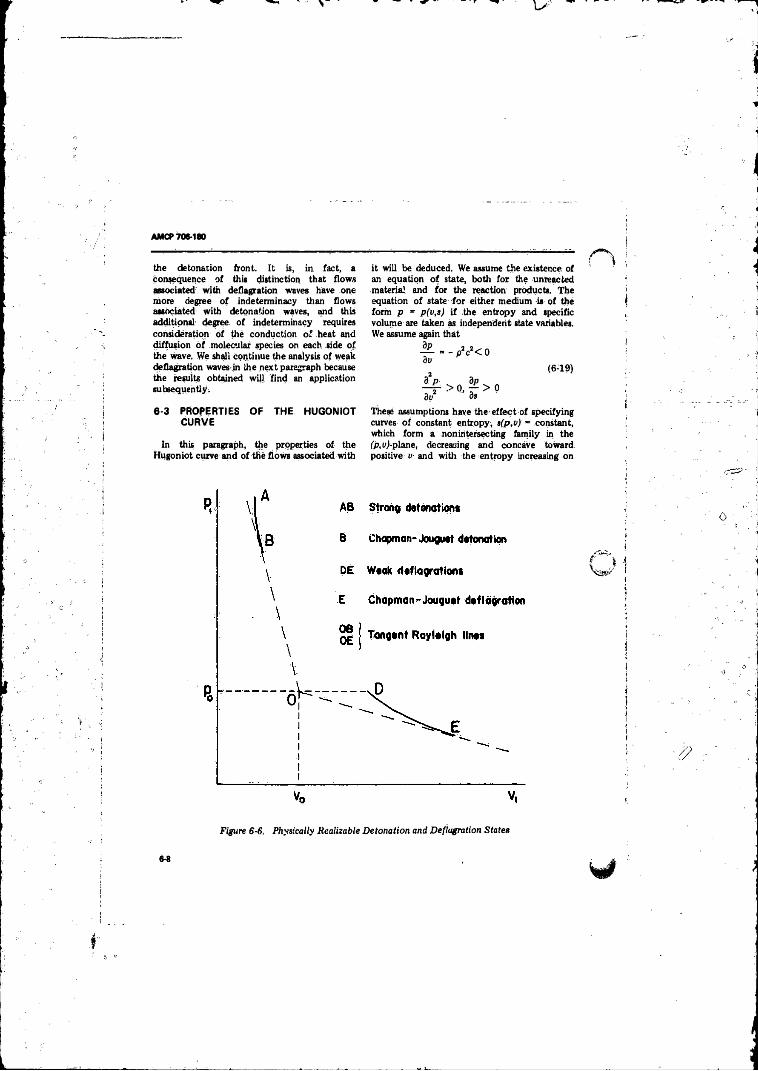
AMCC 706-180
the detonation front. It is, in fact, a consequence o f this distinction that flows associated with deflagration waves have one more degree o f indeterminacy than flows associated with detonation waves, and this additional degree o f indeterminacy requires consideration of the conduction o f heat and diffusion o f molecular species on each side o f the wave. We shah continue the analysis o f weak deflagration waves in the next paragraph because the results obtained will find an application subsequently.
it will be deduced. We assume the existence of an equation o f state, both for the unreacted material and for the reaction products. The equation o f state for either medium is of the form p ” p(v,s) i f the entropy and specific volume are taken as independent state variables. We assume again that
- f = - PV < o
, (6-19)3 p dp
t t > Q> r > 03u ds
6-3 PROPERTIES OF THE HUGONIOT CURVE
In this paragraph, the properties o f the Hugoniot curve and o f the flows associated with
These assumptions have the-effect o f specifying curves o f constant entropy, s(p,v) ~ constant, which form a nonintersecting family in the fp,uj-plane, decreasing and concave toward positive v and with the entropy increasing on
Figure 6S. Physically Realizable Detonation and Deflagration States
AMCP 708-180
any radius from the origin. We assume that the composition o f the unreacted material is fixed and given by the initial specifications o f the system, and that the reaction products are in thermodynamic equilibrium. Then for either medium, the second law o f thermodynamics is expressed by
de = Tds - pdv (6-20*)
and the derivatives o f Eqs. 6-19, in the case o f the reaction products, are taken at equilibrium composition*. The exothermic character of the reaction is expressed by the requirement that fo r the same pressure and specific volume the specific energy o f the unreacted material is greater than the specific energy o f the reaction products.
The discussion o f the properties o f the Hugoniot curve is facilitated by the definition o f the Hugoniot function
ff(p,v) = e(p,v) - e(po,vo) (g 2 1 )
+ V6(p + P0)(v - vo)
In terms or this function, the Hugoniot equation Eq. 6-3; can be written
= eo " e^ o 'vo1 = J(Po’vo1 (6-22)
The exothermal character o f the reaction is expressed by the requirement that J(pg,v J > 0.
First, we want to prove that the entropy has at most a single extremum on a straight line in the (p,b)-plane and that such an extremum is a maximuni. A ray R through the point (P0,"o ) can be represented in terms o f the parameter r and two constants a and b by
p = p + ar , v = v * br0 ° (6-23)
a = P, - PQ , b = Vl - v o
Then, on R, dp = adr, dv ~ bdr, and
i l [ - - * © ] < - .
A t an extremum, dsfdr- 0, so.that an extremum
d p I d j s )
3s \ d r j \3i/ft* a
f )(6-25)
By Eqs. 6-19, 3p/3s > 0 and 'd2p/5v2 > 0. Therefore, at an extremum d2s/dr2 < 0. We have proved that the extremum, i f it exists, must be a maximum. Therefore, the entropy can attain at most one such stationary value on a straight line or ray through (p0,Vo) in the ('p,a)-plane.
Now, consider the value o f the Hugoniot function Ii(p,v) along the ray R represented by Eqs. 6-23. Differentiating Eq. 6-21 at constant p and v , we obtainc O O'
dH = de + Vt{p + P0)du + 'h(v - vg)iip (6-26)
and with Eq. 6-20, this becomes
dff = Tds - 'MP - P„ )du+ 'A{v - t>0 )dp (6-27)
Therefore, on the ray It
dH * Tds (6-28)
I f both the entropy and the Hugoniot function are considered functions of the parameter r on the ray R, we have proved that they are simultaneously stationary i f either one is stationary. Furthermore, since a stationary value o f the entropy is a maximum, a stationary value o f the Hugoniot function is a maximum on R. Since the entropy can attain at most one maximum on a ray R, it follows that the Hugoniot function can attain at m ost, one maximum on R,
Having shown that the entropy and the H u go n io t function simultaneously attain maxima at not more than one point on any-ray in the (p,i/)-plane, we want to prove that there is on e such point on any Rayleigh line corresponding to finite propagation velocity; In view o f Eq. 6-24, the entropy is a maximum on R i f
3p
dv- - f? c2 - alb (6-29)
*Since Eq. 6-20 applies either to changes at equilibrium or to changes at an arbitrarily specified composition, the analysis bt this paragraph is also applicable if it is assumed that the explosion products are constrained to such an arbitrarily specified constant composition.
Along any Rayleigh line, defined by Eq. 6-14
a/b = ~ p ; D2 < 0 (6'3° )
* 0
AMCP 706*180
Therefore, the entropy—and simultaneously, the Hugoniot function—attains a maximum at a point (p,v) determined by
pc = poD
p - p(v,a), c = c(u,s)(6-31)
-together with Eqs. 6-22, where the sound speed c is a . 5sitive quantity and a function o f the state o f the gas. Eq. 6-31 is the condition that a line o f slope a/b oe tangent to an isentrope. By Eqs. 6-19, the slope o f any isentrope is always nega tive , increasing monotonically with increasing v. Fo: a gas, the slope tends a sym p to tic a lly '.0 zero as v increases indefinitely. Therefore, any isentrope has a point o f tangehcy <f >„i line o f specified slope a/b i f a/b < 0, and sue , line is parallel to the Rayleigh line o f thssame slope through a fixed initial point Since, yy Eqs. 6-19, the entropy increases m onotone,lly along any radius through the origin in the (p,el-plane, there exists an isentrope whose tangent o f specified slope a/b passes through the fixed initial point and is thus identical with, the Rayleigh line. Therefore, Eqs. 6-22 and 6-31 always possess a solution. We have proved that the entropy and the Hugoniot function simultaneously attain maxima at one and only one point on every Rayleigh line corresponding to finite propagation velocity.
Each point (P\ tV,) on the Hugoniot curve described by Eq, 6-21 is on a Rayleigh line defined by Eq. 6-14, when, the propagation velocity D is fixed by the point (pl ,v1). Since the Hugoniot function is constant on the Hugoniot curve and since it attains a maximum on a Rayleigh line, the Rayleigh line througn (p1 ,U j.) must have a seconder,tersection with the Hugoniot curve—i.e,, (p[ ,1 ) —unless (p1 ,ux) is a point on the Rayleigh line at which the Hugoniot function is a maximum. Since the Hugoniot function attains only a single maximum on a Rayleigh line, a Rayleigh line cannot intersect the Hugoniot curve at more than two points. We now consider: the case of two intersections and, fo r definiteness, we let
< Vt. Then the requirement that the slope o f the Rayleigh line be negative implies that p [ > P i. We call the point (p\,v 1) an upper point and the point (px ,r,j a lower point. An upper point on the detonation branch o f the Hugoniot curve is a strong detonation; on the deflagration
branch, an upper point is a weak deflagration. A lower point on the detonation branch is a weak detonation, and a lower point on the deflagration branch is a strong deflagration.
Since the Hugoniot function has the same value at the two points (p1 ,v1) and (pj ,u|.) o f the intersection o f a Rayleigh litte with the Hugoniot curve, it attains a maximum at some intermediate point. The entropy attains a maximum at the same intermediate point. Therefore
^ > 0 at (p ,1),) dr
< 0 at (p'.u’) dr 1 1
(6-32)
on the detonation branch (where rij < vo) andds I— < 0 at (p^o,)
(6-33)ds I— > 0 at ( p ^ ) J
on the deflagration branch (where ux > u0). Since bp/'ds > 0 by Eq. 6-19, we can write, for, either branch
1vl va
< 0 at (Pj.u,)
S) fe)>o at (b34)By use o f Eqs. 6-23, ,6-24, and 6-30, these inequalities become
Pi c l - r f l ? < 0 at (p.,i>)(6-35)
p'lcl - piD * > 0 at (P>;) j
Because o f the conservation o f mass across the discontinuity, Eq. 6-2, these statements can be transformed to ,
|UXI > S at (p ,,^ )
i t y < ca at (p>;>
(6-36)
We have proved that the gas flow relative to the reaction front is subsonic behind an upper point, i.e., a strong detonation or weak deflagration;
6-10
AMCP 706-180
and supersonic behind a lower point, i.e„ a weak detonation or strong deflagration. These conclusions form a part o f Jouguet’s rule.
I f a Rayleigh line intersects the Hugoniot curve at a single point, then the Hugoniot function attains a maximum on the Rayleigh line at the point o f intersection. Consequently, the entropy is a maximum on the Rayleigh line at the point of intersection and
ds— = 0 (6-37)dr
Using Eqs. 6-23, 6-24 and 6-30, we have, at such an intersection,
p (c [ = p V (6-38)
and this relation implies that
1^1 = (6-39)
I f the Rayleigh line intersects the Hugoniot curve at a single point, the state described by such an intersection is a Chapman-Joug j e t state. We have proved that the gas flow relative to the r e a c t io n f r o n t is son ic beh ind a Chapman-Jouguet state. This is the property formulated by Jouguet in 1905, and this conclusion forms another part o f Jpuguet’s rule.
We have noted that the Hugoniot function attains a stationary (maximum) value on the Rayleigh line through a Chapman-Jouguet point at the Chapman-Jouguet point. Along the Hugoniot curve, dH(pl ) = 0. Therefore, the Rayleigh line through the Chapman-Jouguet point is tangent at that point to the Hugoniot curve, i.e.,
m _ f j (M 0 )
dvi vi - %at a Chapman-Jouguet point. Since this Rayleigh line is also tangent to the isentrope passing through the Chapman-Jouguet point, the Hugoniot curve is tangent at a Chapman-Jouguet point to the isentrope through the point. It follows that the entropy attains a stationary va lue on th e H u go n io t curve at a Chapman-Jouguet point. Thus, we have shown that
= - pVdv, *1 1
(6-41)
at a Chapman-Jouguet point, an expression that can be obtained by combining Eqs. 6-38 and6-40, and we have also shown that
* i = 0 (6-42)
on the Hugoniot curve, an expression that can be obtained from Eq. 6-27 with dH(p1 ,v1) = 0 and Eq. 6-40. I f the equation o f the Rayleigh line, Eq. 6-14 is differentiated,
DdD = (^t t ) - p°}du' (6‘43)- - vo Jdpjj
Using Eq. 6-40, we see that
dD = 0 (6-44)
at a Chapman-Jouguet point. We have proved that among the various reactive flows described by the Hugoniot curve, the Tow for a Chapmap-Jouguet point leads to a stationary value fpr the velocity o f ti.e r.action front relative to the unreacted material ' hir is the p ro p e r ty id e n t if ie d by Chapman in 1899.
Along the Hugoniot curve, where dH(pl vv) = 0. Eq. 6-27 is
TjdSj = 'A{px - po)dol - 14(0! - Mo}dpl (6-45)-
The pressure is,given by the equation ofcstate as a function o f specific volume and eniropy. Using Eqs. 6-19, we can write
dpi = - P ^ d vy + (dp/ds)jdsj (6-46)
and transform Eq. 6-45 to
ATr ( i ) = - <’> ? « ! - P > 2) I
( i v vA = 1 + V4(ux - i»D)
1 (6-47)
where we have employed Eq. 6-14 to eliminate the pressure difference p, —po.
Before discussing the implication o f Eq. 6-47, it is necessary to consider the behavior o f the function A. Since 3p/3s > 0 by Eqs. 6-19, this quantity is clearly positive everywhere on the
AM C f 706-1*0
deflagration branch of the Hugoniot curve, where vt > vot and av the point on the d e to n a tion branch fo r constant volume explosion, v1 = v0. Consequently, on the deflagration branch, in view o f Eqs. 6-35,
5 > 0 i f pX > P2D2 (6-48)
i.e., for a weak deflagration; and
5 < o i f(f-49 )
i.e., for a strong deflagration. From Eqs. 6-42 and 6-45 we obtain the relation
DdD = f V° ) T.ds, \vi - V
(6-50)
from which we infer thatdv. dv,—J > 0 o r - ^ < 0 dD dD (6-51)
for a weak or for a strong deflagration,respectively. I f the slope o f the Rayleigh line is increased, so that the velocity D is decreased, we see that the specific volume of the upper (weak deflagration) intersection with the Hugoniot curve decreases arid the specific volume o f the lo w e r (s tron g deflagration) intersection increases. In the lim it o f zero slope and zero velocity,, the upper intersection must coincide with the specific volume for constant pressure combustion since p = p[ > pv The specific volume o f the lower intersection tends toward infinity as the slope of the Rayleigh line tends toward zero because of Eq. 6-14. Conversely, if the slope o f the Rayleigh line is decreased, so that the velocity D is increased, the specific volume o f the upper intersection increases and the specific volume of the lower intersection
eventually coalesce as the slope o f the Rayleigh line continues to decrease. It has been shown that such a single point o f intersection is a Chapman- Jouguet point.
Before applying Eq. 6-47 to the detonation branch o f the Hugoniot curve, we want to show that the coefficient A is positive everywhere on this branch. To do this, we can adapt an analysis due to Becker. Consider any Rayleigh line in te rse c t in g the H u gon io t curve at two points—i.e., (p ' ,v 'j and (p ^ . )—where u' < so
that p\ > pv Each o f these points satisfies the Hugoniot equation, Eq. 6-22. I f ea is eliminated between the two relations obtained when Eq.6 -2 2 is specialized in turn to the two points and i f account is taken o f ,the fact that both points are on. the same Rayleigh line, it is easy to show that
e{Pi,v[) - eQ}^) = Vi(p[ + PjKUj - o ') (6-52)
This relation will be recognized to be the Hugoniot equation centered on (Pj.Uj) for a shock wave in the reaction products, and it is a condition that a shocked state (p',v':) n._st satisfy for given initial state (pv i>,). (Eq. 6-52 coincides with Eq. 6-20 only at the two points o f intersection o f the Rayleigh line with the reaction Hugoniot curve.) Now, we consider p { and Uj to be variables satisfying Eq. 6-52 and obtain, by differentiation at constant p1 and and the use o f Eq. 6-19, the relation
^ ds[ = 14(p' - P1 )du' - 'h(v[ - Vl)dp[ (6-53)
where the prime indicates that the quantity so designated is evaluated at (Pyv!)- We again regard the pressure a function o f entropy and specific volume so the relation equivalent to Eq. 6-46 applies, and Eq. 6-53 becomes
= ( < - ^ [ ( p ; o 2 - p„v J(6-54).
where we have again employed the fact that the two points are on the same Rayleigh line. By Eq.6-35, the right nand member o f Eq. 6-52 is negative. It has been shown, as for example by Courant and Friedrichs, that ds' /du'< 0 for a shock wave described by Eq. 6-52 in a medium whose equation of state conforms to Eqs. 6-19. Therefore . . , ,
1 + 'A (v \ - o,) > 0 (6-55)
The specific volume t>1 o f the lower intersection can be allowed to approach as closely as is desired the initial volume u1 so that px ■* pe as Vi -* v0. Then, it is necessary that p, => as Uj -> u0. From Eq. 6-55, we conclude that A > 0 as
i
ii
}
6-12
AMCP 706-180
the pressure increases indefinitely. We have noted that A > 0 when v , = v0. Since the pressure and temperature, and their derivatives are continuous functions o f the entropy and specific volume; the coefficient A, the derivative ds1/du1, and the right-hand member o f the first o f Eq. 6-47 must be continuous on the Hugoniot curve. Therefore, the coefficient A which has been shown to be positive fo r the maximum and minimum vallies o f u, on the detonation branch o f the Hugoniot curve, is positive everywhere on the detonation branch o f the Hugoniot curve.
From Eq. 6-47, we now conclude that on the detonation btanch o f the Hugoniot curve
o if P\o\ > Py (6-56)
i.e., for a strong detonation; and
^ > 0 if p2 c2 < p V (6-57)
i.e., fo r a weak detonation. Using Eq. 6-50, we infer that
dv. , dv. ^ n < 0 or —* > 0
dD dD (6-58)
fo r a strong or for a weak detonation, respectively. I f the slope o f the Rayleigh line is decreased, so that the velocity D is increased, we see that the specific volume o f the upper (strong detonation) intersection with the Hugoniot curve decreases and the specific volume o f the lower (weak detonation) intersection increases. In the limit o f negatively infinite slope and infinite velocity, the lower intersection must coincide with that fo r constant volume explosion since v', < u, = . The pressure o f theupper intersection tends toward infinity as the slope 'of the Rayleigh line becomes negatively infinite, because o f Eq. 6-14. Conversely, i f the slope o f the Rayleigh line is increased so that the velocity D is decreased, the specific volume o f the upper intersection increases and the specific volume o f the lower intersection decreases. Since i/, < u , , these intersections eventually coalesce as the slope o f the Rayleigh line continues to increase. Such a single point o f in tersection has been shown to be a Chapman-Jouguet point.
The character o f the stationary values o f en trop y and p rop aga tion ve locity at Chapman-Jouguet points can be described
specifically. Differentiating Eq. 6-47 and using Eqs. 6-38 and 6-42, we obtain
= - V4(t), - vo) (6-59)
at a Chapman-Jouguet point. Since d2p/3uJ > 0 by Eqs. 6-19 and since A > 0, we conclude that
d2s, d2Sj— - < 0 or — > 0 (6-60)dvi
fo r a Chapman-Jouguet deflagration or detonation, respectively. From Eq. 6-60 we have
d V
dvt(6-61)
at a Chapman-Jouguet point. Therefore,
d2P 2
do*< 0 or -
dJI >2
da,2> 0 (6-62)
. fo r a Chapman-Jouguet deflagration or detonation, respectively. I t follows that the entropy and propagation velocity are relative maxima at a Chapman-Jouguet deflagration and re la tiv e m in im a at a Chapman-Jouguet detonation. Since die entropy is a maximum at a Chapman-Jduguet. deflagration, there is at most one Chapman-Jouguet point on the deflagration branch o f the Hugoniot curve. We have demonstrated the existence o f one such point separating a region o f strong deflagrations from one o f weak deflagrations, Therefore, the deflagraion branch, consists of tw o sections, the one consisting o f a strong deflagration and the other o f weak deflagrations, separated by a Chapman-Jouguet point. Similarly, we conclude that the detonation branch o f the Hugoniot curve is divided by a Chapman-Jouguet point into an upper section consisting o f strong detonations and a lower section consisting o f w eak detonations. The properties now attributed to the Hugoniot curve require that
dp, d2p— ' < 0 , — > 0 (6-63)do, dv2
and these properties are a direct consequence of
6-13
\
AMCP 706-160
the assumptions regirding the equation o f state that are expressed by Eqs. 6-19.
In order to establish Jouguet’s rule for the state ahead o f the reaction front, we define a Hugoniot function H0 fo r the unreacted material by
H(p,o) = %(p,u) - (6 64)
+ W(P + P1 )(t ' " "x )
where we regard the final state (p1 ,vy) as fixed and where e„ (p,v) is the specific energy function for the unreacted material. The Hugoniot equation, Eq. 6-24, can now be written
H0(P0,vo) = (6-65)
= i f
•where the exothermal nature o f tiie reaction is expressed by the requirement that J(Pi,Vi) > 0. The curve defined by Eq. 6-65 is sketched in Fig. 6-3. It consist o f two branches, one o f which is the locus o f initial states from which the specified final state can be reached when the final state is a detonation, the other being the locus o f initial states when the same final state is a deflagration. An analysis identical to that previously employed demonstrates that the Hugoniot junction and entropy o f the unreacted material attain one and only one stationary value along the Rayleigh line and that this stationary value is, for each function, a maximum. In the present case, a Rayleigh line can have only a single intersection with either branch o f the Hugoniot curve defined by Eq.6-65. I f a second intersection with one o f the branches were to exist, the function Ha , which vanishes at CPp^j, would have the same negative value at each intersection and hence a minimum on the Rayleigh line between the two intersections; this is impossible. Therefore, a second intersection with the same branch o f this curve is impossible. For the present choice o f variables, the Rayleigh line can be represented in terms o f a parameter r„ by
p = px + arB , u = oj + i>r„ I
i (6-66)
0 = P„ - Px , b = u0 - Uj ]
where a/b p„D2 by Eq. 6-14. The expression analogous to Eq. 6-24 for the unreacted material is
Since the entropy attains a maximum on the Rayleigh line at a point between (py ,u1) and (po,0o), it follows that ds0/dr0 •< 0 at (pB,v0) fo r an intersection with either branch. I f we recall that 3s/3p > 0 by Eqs. 0-19, Fqs. 6-66 and 6^7 lead to the result
<M0 - « i ) ( e * - D2) < 0 (6-68)
ThereforeD > c 0 i f u1 >v„ and the final state is a deflagration, and D < ca i f d3 < 0o and the final state is a detonation. We have shown that the flow relative to the reaction front is subsonic ahead o f a deflagration wave and supersonic ahead o f a detonation wave. These statements form part of Jouguet’s rule.
6-4 EXISTENCE AND UNIQUENESS OF FLOWS INVOLVING REACTION WAVES
The Hugoniot equation does not suffice to determine uniquely a reaction st-re and propagation velocity that can be identified with the unique detonation wave that is usually observed experimentally. Therefore, it is necessary to supplement the conservation conditions with additional, information. The source o f this information is the nature o f the entire flow field on each side o f the reaction discontinuity. These flow fields are determined b y the partial differential equations o f hydrodynamics. The equations must be satisfied in any region that is free o f discontinuities and they are to be solved, in the present case o f flow in one dimension, subject to initial' conditions specified on the .r-axis and to boundary conditions specified on the rear boundary. I f the problem is formulated in this manner, the mechanical conditions across the reaction front and the Hugoniot equation are supplementary conditions that must be satisfied on each side o f the discontinuity by the solutions o f the hydrodynamic equations in the continuous regions. They can be thought o f as connecting the solution in one region, that o f the unreacted material, to the solution in the adjacent region, that o f the reaction products. In serving this purpose, they implicitly prescribe the path, e.g.,
6-14
T " mT
'■ w /
x(t), of the reaction wave in the (x,t)-plane. The existence and uniqueness o f solutions o f the hydrodynamic equations in flows involving a reaction front has been discussed in an elegant manner by Courant and Friedrichs, whose treatment is followed in this paragraph.
In par. 2-7, i t is remarked that a curve in the (x.tj-plane on which are specified data to which the hydrodynamic equations are subject is timelike i f the flow relative to the curve is subsonic, and that such a curve is spacelike i f the flow relative to the curve is supersonic. I t is shown that the solution o f a flow problem in a region between two curves is unique in two cases: i f both curves are timelike, one quantity is specified on each curve and two quantities are specified at their intersection; or if one curve is spacelike with two quantities specified.on it, the other curve is timelike with one quantity specified on it. With the aid o f Jouguet’s rule, these principles can be employed to consider the determinacy o f flows involving a detonation wave.
For definiteness, we consider a semi-infinite mass o f explosive, initially at rest with ua = 0, extending from x = 0 to x « and we assume that a reaction propagating in the direction of positive x begins on the plane * = 0 at the time t = 0. Although one is usually concerned with the case where the end x = 0 is completely open or consists o f a rigid wall, it is illuminating to consider the more general problem in which the end is conceived to be a piston which starts to move from the end x = 0 at the time t = 0 with specified constant velocity up .
The path P o f the piston in the (x,t)-plane is timelike since it is identical with that o f the particles adjacent to it. The particle velocity o f the adjacent particles is equal to the piston velocity up so that u.is specified on the path P. The initial values u * ua = 0 and p = p0 are specified on the oe-axis which is to be regarded as spacelike. However, these regions are separated by the unknown path W o f the reaction wave, and it is necessary to consider separately the flow in the two regions into which the (x, fj-plane is divided by W. We may suppose that the propagation velocity o f the wave, i.e., the slope o f W, is arbitrarily fixed and constant.
I f the wave is a detonation, H' is, by Jouguet’s rule, supersonic when observed from the
AMCP 706-1*0
unreacted material. Then, between W and the x-axis, the flow is uniquely determined by the quantities prescribed on the x-axis at f = 0 so that u and p are constant everywhere in that region and equal to u„ and ft ,, respectively. The conservation conditions across the wave front, Eqs. 6-2 and 6-3, then prescribe iq and Pj for the specified value D o f the slope o f W. We may now regard W as an initial curve for the region between P and W on which the quantities u = Uj andp = P i are prescribed.
Mow suppose that W represents a strong detonation. By Jouguet’s rule, F is. timelike when observed from the reaction products, Since P and W are both timelike, their slopes u and D cannot both be arbitrarily specified. This is because the value of u on W, which is fixed by the initial conditions and die velocity D, is also fixed in accordance with the existence rule by the specification o f u on P, o f p on W, and o f u and p at the intersection of P and W. Therefore, for a strong detonation wave o f specified propagation velocity, it is necessary to adjust the piston path P so that up = iq . I t follows that the flow between the piston arid the strong detonation wave is uniform with
P “ Pi# 6 9 )
and that the flow for a strong detonation is completely determined by the piston velocity arid initial conditions. I f the first o f Eqs. 6-2 is combined with Eq. 6-1, then when u0 = 6 we have
J3(l - q ft , ) (6-70)
Differentiating with respect to iq at constant p , we obtain
du,
du- = ( —) — - p„D (3-71)q W rftq °
for a strong detonation, dD/du1 < 0. Therefore du1/dv1 < 0 . I f we denote by u* the particle velocity o f the reaction products for aChapman-Jouguet detonation, we conclude that the velocity of the piston, supporting a strong detonation, is subject to the restriction
«„ > (6-72)
" , u6*15
1
if
!
■ (
■if\x
\ ' tfi
t\
'l
ii
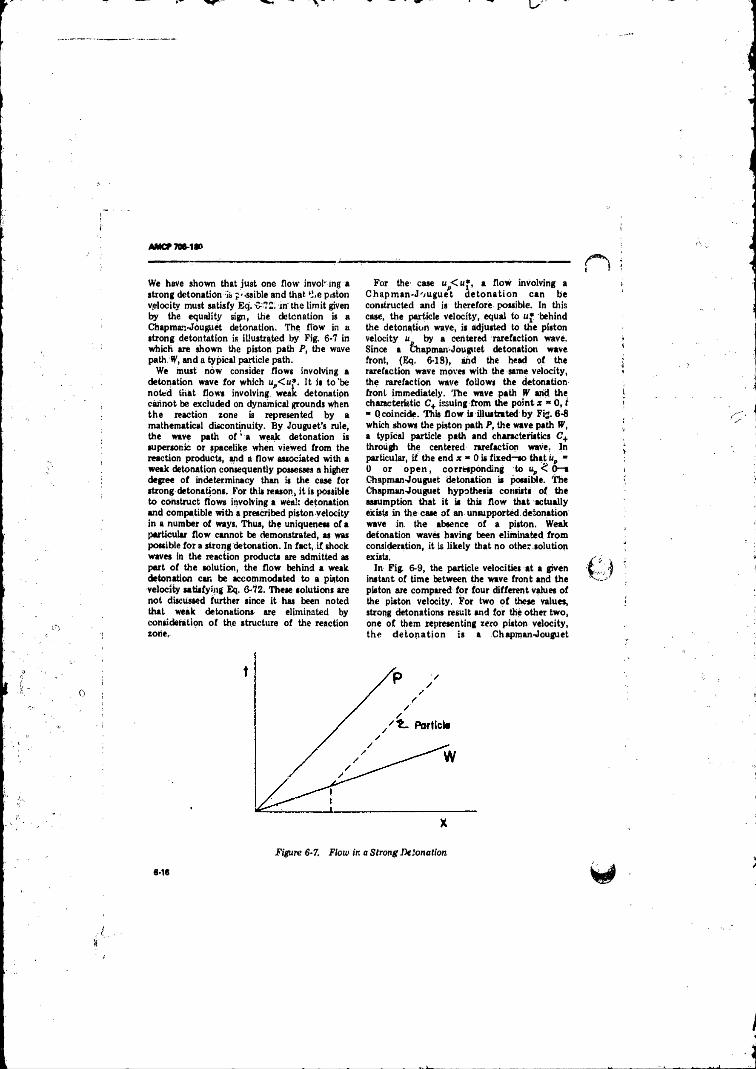
A M C r 706-1»
We have shown that just one flow invoNng a strong detonation » f'-ssible and that he piston velocity must satisfy Eq. 5-72. in' the limit given ivy the equality sign, the detonation is a Chapman-Jouguet detonation. The flow in a strong deputation is illustrated by Fig. 6-7 in which are shown the piston path P, the wave path.W, and a typical particle path.
We must now consider flows involving a detonation wave for which up<u* It is t o ’be noted that flows involving weak detonation cannot be excluded on dynamical grounds when the reaction zone is represented by a mathematical discontinuity. By Jouguet’s rule, the wave path of ’ a weak detonation is supersonic or spacelike when viewed from the reaction products, and a flow associated with a weak detonation consequently possesses a higher degree o f indeterminacy than is the case for strong detonations. For this reason, it is possible to construct flows involving a weal: detonation and compatible with a prescribed piston velocity in a number o f ways. Thus, the uniqueness o f a particular flow cannot be demonstrated, as was possible for a strong detonation. In fact, i f shock waves in the reaction products are admitted as pert o f the solution, the flow behind a weak detonation car. be accommodated to a piston velocity satisfying Eq. 6-72. These solutions are not discussed further since it has been noted that weak detonations are eliminated by consideration o f the structure o f the reaction zone,
For the case up< u » , a flow involving a Chapm an-Jouguet d e ton a tion can be constructed and is therefore possible. In this case, the particle velocity, equal to u* behind the detonation wave, is adjusted to the piston velocity u by a centered rarefaction wave. Since a Chapman-Jouguet detonation wave front, (Eq. 6-18), and the head of the rarefaction wave moves with the same velocity, the rarefaction wave follows the detonation front immediately. The wave path W and. the characteristic C+ issuing from the point r * 0 , i * ((coincide. This flow is illustrated by Fig. 6-8 which shows the piston path P, the wave path IF, a typical particle path and characteristics C’+ through the centered rarefaction wave, In particular, if the end x » 0 is fixed-so that up m 0 or o p e n , corresponding to u, <Z 0 —a Chapman-Jouguet detonation is possible. The Chapman-Jouguet hypothesis consists o f the assumption that it is this flow that actually exists in the case o f an unsupported: detonation wave in the absence o f a piston. Weak detonation waves having been eliminated from consideration, it is likely that no other solution exists.
In F ig 6-9, the particle velocities at a given instant o f time between the wave front and the piston are compared for four different Values o f the piston velocity, For two o f these values, strong detonations result and for the other two, one o f them representing zero piston velocity, the de to n a tion is a Chapman-Jouguet
Figure 6-7. F low in a S tron g D etonation
6-16
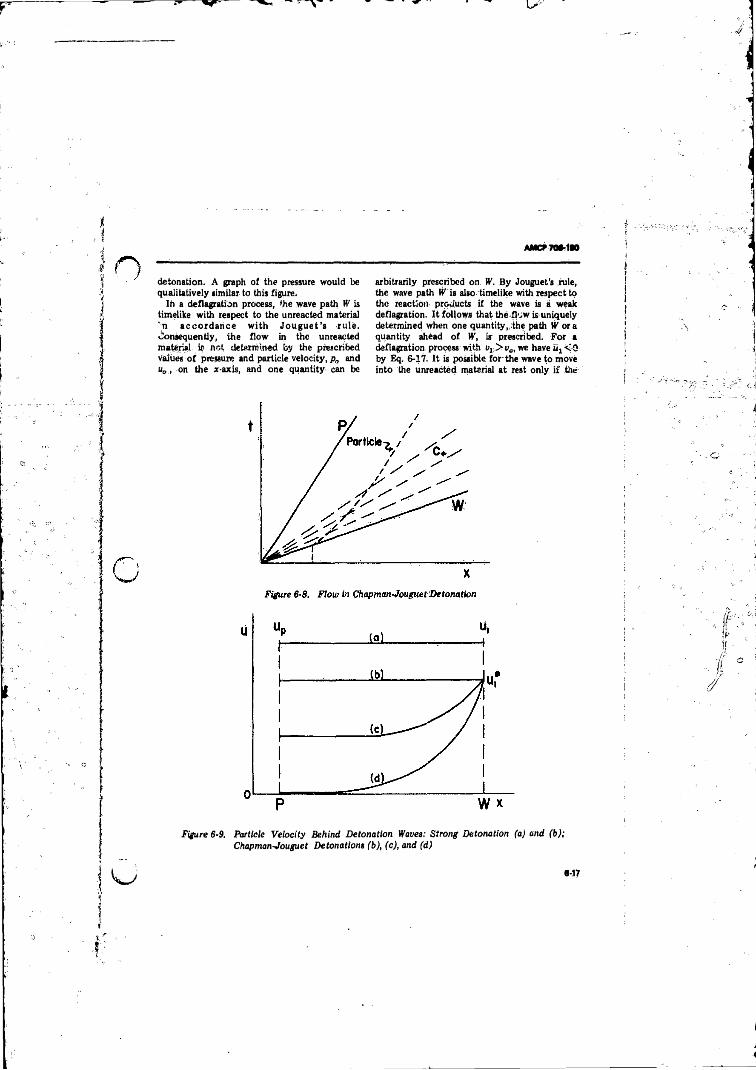
AMCP70C-1I0
detonation. A graph of the pressure would be qualitatively similar to this figure.
lir a deflagration process, the wave path W is timelike with respect to the unreacted material 'n a cco rd an ce w ith Jou gu et's ru le. Consequently, the flow in the unreacted material it> not determined by the prescribed Values o f pressure and particle velocity, p„ arid u„ , on the x-axis, and one quantity can be
arbitrarily prescribed on IK. B y Jouguet's rule, the wave path W is also timelike with respect to the reaction products if the wave is a weak deflagration. I t follows that the flow is uniquely determined when one quantity „ ih e path W ora quantity ahead o f W, is prescribed. For a deflagration process with uJ;> va, we have uj < 0 by Eq. 6-17. It is possible for the wave to move into the unreacted material at rest only i f the
Figure 6-9, Particle Velocity Behind Detonation Waves: Strong Detonation (a) and (b); Chapman-Jouguet Detonations (b), (c), and (d)
8,17
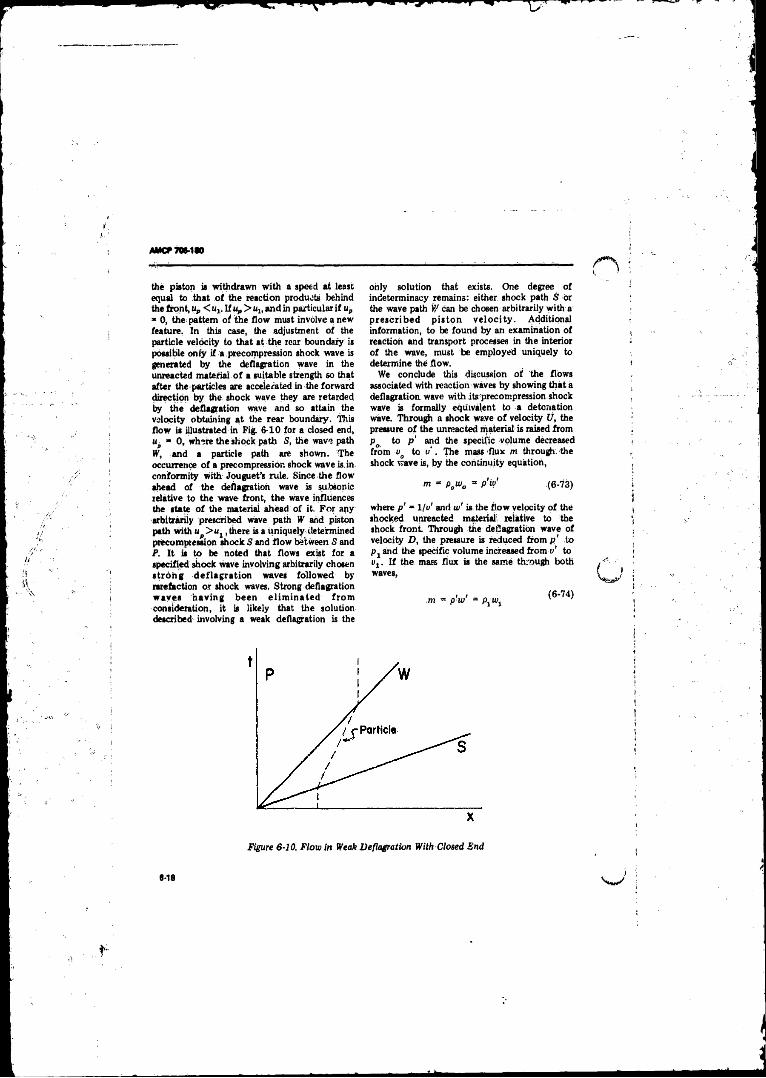
AMCP 706-1M
the piston is withdrawn with a speed at least equal to that o f the reaction products behind the front, u, < Uj, I f u„ > uu and in particular i f u„ * 0, the pattem o f the flow must involve a new feature. In this case, the adjustment o f the particle velocity to that at the rear boundary is possible only if a .precompression shock wave is generated by the deflagration wave in the unreacted material o f a suitable strength so that after the particles are accelerated in the forward direction by the shock wave they are retarded by the deflagration wave and so attain the velocity obtaining at the rear boundary. This flow is illustrated in Fig. 6-10 for a closed end, « p - 0, where the shock path S, the wave path W, and a particle path are shown. The occurrence o f a precompression shock wave is,in conformity with jouguet’s rule. Since the flow ahead o f the deflagration wave is subsonic relative to the wave front, the wave influences the state o f the material ahead o f it. For any arbitrarily prescribed wave path W and piston path with up>u1, there is a Uniquely-determined precompression shock 5 and flow between 5 and P. I t is to be noted that flows exist for a specified shock wave involving arbitrarily chosen s tron g de flagra tion waves followed by rarefaction or shock waves. Strong deflagration w aves having been e lim in a ted from consideration, it is likely that the solution described involving a weak deflagration is the
only solution that exists. One degree o f indeterminacy remains: either shock path S or the wave path ¥/ can be chosen arbitrarily with a prescrib ed p is ton v e lo c ity . Additional information, to be found by an examination of reaction and transport processes in the interior o f the wave, must be employed uniquely to determine the flow.
We conclude this discussion o f the flows associated with reaction waves by showing that a deflagration wave with its'precompression shock wave is formally equivalent to a detonation wave. Through a shock wave o f velocity U, the pressure o f the unreacted material is raised from po to p' and the specific volume decreased from u, to o’ . The mass flux m througv. the shock wave is, by the continuity equation,
m = P0wo = PV (6-73)
where p' “ 1 /o' and w' is the flow velocity o f the shocked unreacted material relative to the shock front. Through the deflagration wave o f velocity D, the pressure is reduced from p ' to P j and the specific volume increased from o' to vl . I f the mass flux is the same through both waves,
Figure 6-10. F lo w in Weak D eflagration With Closed Snd
AMCF 706-110
and therefore
P o % ’ P A i (6-75)
The conservation o f momentum through the shock and deflagration wavesrequires that
P„wl p '(w 'f
Po^l
p - p<
P l - p ' - p V f
so. that, by the elimination o f p[
P i - Po ’ P°wo - P ^ ,
(6-76)
(6-77)
These conservation conditions can be combined to yield
^ . ^ . ^ ^ ( 6 - 7 8 ) v - v„ v - u V - V .
The Hugoniot equations fo r the shock and deflagration waves are
; eo(P iv ) ~ ^ (Po.^o) = V6 (p ' + Po)(v0 - o')
e f P A ) ~ c0 (p',u') » ^ (P j + p ')(u ' - Uj)
(6-79)
respectively* where e0 (p,u) is the specific energy function o f the unreacted material. Eliminating e0(p',v') from these expressions and using Eq.6-78, we obtain
e G W - %iP0'»o)
’ 'HPi + P „ ) K -(6-80)
Eqs. 6-75, 6-77 and 6-80, are identical with Eqs.6-2 and 6-3 for a single reaction process from the state (po, v j to the state (pv v% ).The shock and deflagration waves have the same propagation velocity D » U when the mass flux is the same through each wave and, by Eq. 6-78, the points (p'.v'j and (p^vj lie on the same Rayleigh line. Fig. 6-11, illustrating the Hugoniot curve for the (weak) deflagration and the shock wave, shows that the equivalent single process is a detonation. The curve A' AO is the Hugoniot curve o f the shock wave, centered on (pa,vo), in the unreacted material, given by the first o f Eqs, 6-79. The curve B'B is the deflagration branch o f the reaction Hugoniot curve centered on (p',v')t given by the second
of Eqs. 6-79, and also the detonation branch of the reaction Hugoniot curve centered on (P>>vo), given by Eq; 6-80. The Rayleigh line ABO is drawn tangent to the reaction Hugoniot c u rv e and thus co rresponds to a Chapman-Jouguet detonation centered on (P0 ,v<>) or to a Chapman-Jouguet deflagration centered on (p\ u '). The Rayleigh line A' B.' O corresponds to a strong detonation o f a weak deflagration. I t is evident that a strong detonation is formally ‘equivalent to a weak deflagration preceded, by a shock and a C h a p m a n -J o u g u e t d e to n a tion to a Chapman-Jouguet deflagration preceded by a shock, the mass flux through shock and deflagration waves being identical.
65 THE CHAPMAN-JOUGUET HYPOtHESIS
The Chapman-Jouguet hypothesis states that the detonation wave for which
wt = C, (6-81)
is the one that actually occurs when the reaction wave is unsupported. The assumption that the flow satisfying Eq. 681 is to be identified with the experimentally observed unsupported detonation wave was advanced independently by Chapman and by Jouguet. This hypothesis selects one state from the continuum o f states described by the Hugoniot equation and compatible with the conservation conditions. Consequently, Eq. 6-81-together with the conservation conditions', Eqs. 6-2 and 6-3, and an equation o f state for the reaction products-suffices to determine the detonation velocity, the state o f the reaction products, and their velocity with respect to the detonation front, These relations thus constitute a theory of the detonation wave. It can be used to calculate the detonation properties for particular explosives, and the calculated values can be tested by comparison with experiment.
Support was given to the Chapman-Jouguet hypothesis by the agreement obtained between calculated and observed properties o f the detonation wave for explosives expected to conform to the model o f one-dimensional flow and for which an equation o f state is known. The detonation wave propagating along a pipe filled with an explosive gas mixture appears to
6-19
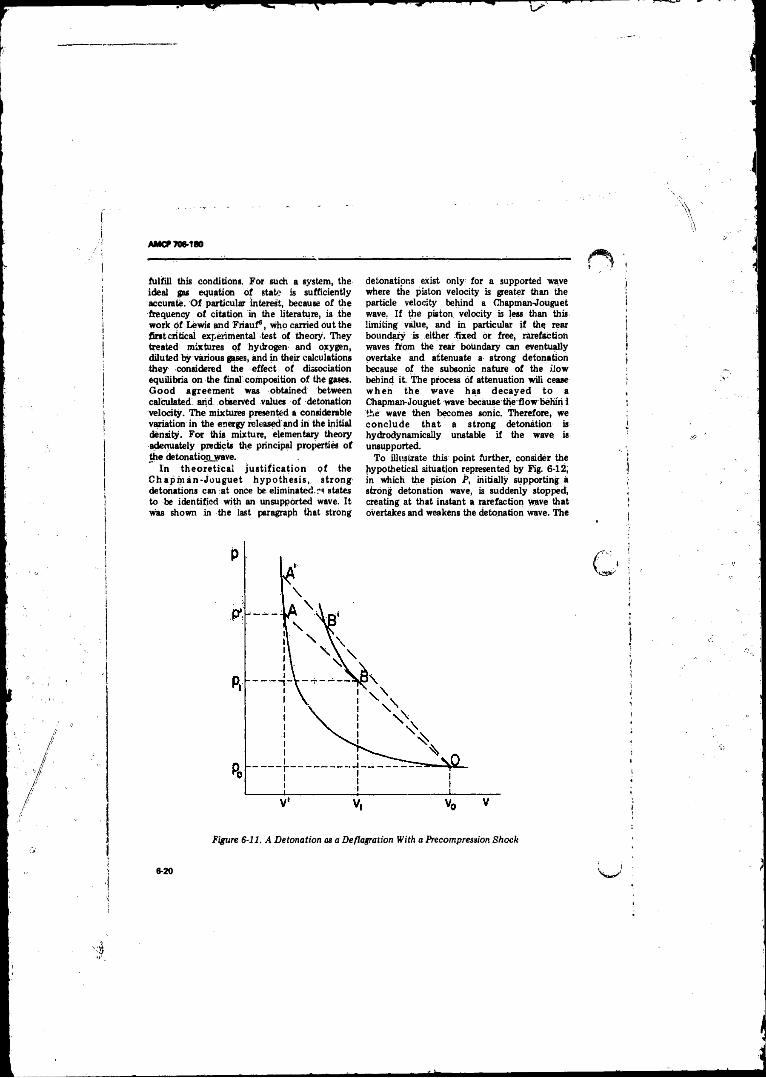
A M C f 706-180
fulfill this conditions. For such a system, the ideal gas equation o f state is sufficiently accurate. O f particular interest, because o f the frequency o f citation in the literature, is the work o f Lewis and Friauf6, who carried out the firstcritical experimental test o f theory. They treated mixtures o f hydrogen' and oxygen, diluted by various gases, and in their calculations they considered the effect o f dissociation equilibria on the final composition o f the gases. G ood agreem ent was obtained between calculated, arid observed values o f detonation velocity. The mixtures presented a considerable variation in the energy released and in the initial density. For this mixture, elementary theory adequately predicts the principal properties o f the detonation wave. .
In th eo re t ic a l ju s t if ic a t io n o f the C h a p m a n -J ou gu e t h ypo th es is , strong detonations can at once be eliminated, rs states to be identified with an unsupported wave. I t was shown in the last paragraph that strong
detonations exist only for a supported wave where the piston velocity is greater than the particle velocity behind a Chapman-Jouguet wave, I f the piston velocity is less than this limiting vtdue, and in particular i f the rear boundary is either fixed or free, rarefaction waves from the rear boundary can eventually overtake and attenuate a strong detonation because o f the subsonic nature o f the ilow behind it. The process o f attenuation wili cease w h en the w ave has d eca yed to a Chapman-Jouguet wave because the flow behiri I the wave then becomes sonic. Therefore, we conclu de that a strong detonation is hydrodynamically unstable i f the wave, is unsupported.
To illustrate this point further, consider the hypothetical situation represented by Fig. 6-12, in which the pision P, initially supporting a strong detonation wave, is suddenly stopped^ creating at that instant a rarefaction wave that overtakes and weakens the detonation wave. The
Figure 6-11. A D e to n a tio n as a D eflagration W ith a Precom pression S hock
8-20
AMCP7W1M
initial straight portion ot u' represents the strong detonation wave, the later straight portion the Chapman-Jouguet wave, and the curved portion a transition region. Two particle paths are shown, one through the strong detonation and th e other through the Chapman-Jouguet detonation.
Prior to about 1940, when the analysis was refined b y consideration o f the finite extent o f the reaction zone, weak detonations were e lim in a ted by unconvincing plausibility arguments. Becker7 showed that the entropy o f a strong detonation state is greater than that o f the weak detonation state with the same propegition velocity and inferred that the forma; state is therefore the more probable. Weak detonations being thermodynamically unstable relative to the corresponding strong detonations and strong detonations being dynamically unstable, he concluded that the Chapman-Jouguet detonation wave is the stable one. Scorah* showed the Helmholtz free energy to be a minimum for the Chapman-Jouguet state. He interpreted this result to mean that the Chapman-Jouguet state corresponds to a
maximum degradation o f energy and is therefore the most probable one. Commenting on the g e n e r a l ly u n s a t is fa c to r y natu re o f therm odynam ic arguments o f this sort, Zeldovich* remarked that an increase in entropy does not guarantee the existence o f a shock; a piston to compress tile gas is also necessary.
Brinkley and Kirkwood10 have treated ,the dynamic stability o f the detonation wave by considering the energy available in the explosive products io support the propagation o f the detonation front and the hydrodynamic conditions operating in the flow behind the fron t Their analysis is developed in the paragraphs which follow.
The propagation o f a detonation front, like the propagation o f an unreactive shock wave, requires a continuous supply o f energy from the rear. The work done by the medium to the rear o f the front on the intact medium ahead o f the front in the time element dt is P^dt, the subscript 1 being used to desipiate conditions immediately to the rear o f the front at an instant of time f j . I f we now fix attention on the total mass o f explosion products initially
Figure 6-12. Attenuation of a Strong Detonation Wave by a Rarefaction Wave
6-21
AMCP7Q8-1W
contained in the region from the rear boundary * o = 0 to the plane x o = Xj for times subsequent to the instant when the wave front reaches * j , we. note that the total work done by this portion o f the medium on the medium ahead of it, designated W(xt ), is
-V (ij) = / pudt (6-82)
hwhere the integral is along the particle path o f the particles initially at the point x , .
The secular behavior o f the integrand pu (fo r a given element o f the medium) has ah important bearing on. the behavior o f the detonation wave when it is in an unsteady state. The proof which follows shows that the sign o f [b{pu)/dt]Xl, determines the sign o f the acceleration o f the wave fron t
Defining for the Lagrangian rate o f change of the quantity pu a time constant p to be evaluated at the shock front, i.e.,
I ____ L (6-83)
" p i “ i L at J - i
we make the arbitrary assumption that p > 0 after external or self-generated initiation effects have d ied ou t and the wave has become self-sustaining.
Although this assumption is made a priori, there is strong reason to accept its validity. It can readily be shown, for example, that this condition follows if there is a rarefaction immediately behind the detonation front, a rarefaction being defined for this purpose by the two conditions
Since—in the absence o f shocks in the flo w -a given element o f matter remains in an isentropic condition, the pressure will decrease when the density decreases. Also, the flow velocity will decrease when the pressure gradient is positive according to the equation o f motion. Therefore the presence o f a rarefaction as so defined is a sufficient condition for p to be positive.
We now proceed to establish a connection between this condition on p and the secular behavior o f an unsteady detonation.
Fpr inviscid flow without heat conduction, the hydrodynamic equations o f continuity and momentum can be written in terms o f a Lagrangian space coordinate (see par. 2-6) for flow in one dimension in the form
The Lagrangian coordinate xo is the position o f the element o f fluid at f “ 0 whose position at time t is x. The time and Lagrangian.coordinate are taken to be independent variables and. the Eulerian coordinate x is regarded a function x(xg,t) with
ubx^ a n d p 0 ( 6-86 )
Eqs. 6-85 are supplemented by the entropy, transport equation, which is not explicitly employed; by initial and boundary conditions; and by the conservation conditions across the reaction discontinuity which implicitly prescribe the path o f the discontinuity in the.(xa ,f)-plane. As has previously been pointed out, the d is co n tin u ity co n d it ion s p rescrib e a one-parameter continuum.of possible detonation states and can be used, when supplemented by an equation o f state, to express all o f the detonation properties as functions o f any ono o f the properties selected as argument. For convenience, the unreacted explosive is assumed to be at rest. The second o f Eqs. 6-2 can then be written
P i “ P 0 = Pou i D (6 ,8 7 )
An operator in which the detonation wave is stationary is defined by
_d = JL + z, J Ldt bt bx0
(6-88)
I f Eqs. 6-85 are specialized to the high pressure side o f the detonation wave and the partial time derivatives eliminated with the aid o f Eq. 6-8 8 , we obtain

AMCP708-180
where- the subscript unity indicates that the quantity so designated is to be evaluated immediately behind: the detonation wave. Since the detonation front is assumed to be a mathematical discontinuity, the conservation conditions across the discontinuity must be satisfied whether or not the state behind the wave is steady. Eq. 6-87 can therefore be differentiated, with the result
dP,
dt
g i -
(6-90)
Also from Eq. 6-S8 and the definition o f p, we can write
l M + l / K \ = D
Pi \dt i ui W Pi
+ R / M . I (6'91)
or, in view o f the first o f Eqs. 6-2
G - i - [(J? - V / c j ’ (6-94)
T o determine the sign o f the denominator o f the term in braces o f Eq. 6-92, the-equation o f the Rayleigh line Eq. 6-14, can be rearranged
P, - Po * P cD \ l - P o V (6-95)
and differentiated with respect to Uj at constant .p„ a n d q ,. The resulting expression connects the derivative dD/dpt with the slope dpt /de, o f the Hugoniot curve. When it is simplified with the aid o f Eq; 6-70 and .the definition- o f g introduced, the expression
is obtained. Since dpAJdv1; < 0, g > 1/2. Therefore, (1 + £)*’ juu ‘Cl g - G )—the latter being equal to g + [poD/fPxCi)]*—are positive and the denominator o f the term in braces o f Eq, 6-92 is positive everywhere on the Hugoniot curve.
In view o f the assumption that p is positive, the sign o f dp1/dt is seen to be opposite to that o f G. Therefore, it follows that
dt< 0 when Pl > p* and D < u1 + e,
dh .dt
0 when p1 = p* and D = ux + cl
Eqs. 6-89, 6-90, and 6-91 can be solved tor dpI /dt in terms o f p and the properties o f the reaction products behind the detonation front. The result can be written,
where
G = 1 - (po r»/(Pl C l) ] 2 (6-93)
— - > 0 when p, < p* and D > u, + c, dt 1 1 ' 1 1
w here p* is the pressure behind a Chapman-Jouguet detonation wave.
This analysis indicates that both strong and weak detonations are dynamically unstable and tend with time to the Chapman-Jouguet state. I t also indicates that the Chapman-Jouguet state is stable since its properties do not change with time. In particular, it is demonstrated that the propagation velocity o f the Chapman-Jouguet detonation is constant, a result that is in accord with experimental observations. The analysis must, however, bo regarded a plausibility argument since it is subject to the basic
6-23
AMCf 706-180
assumption that was made with respect to the nature o f the flow behind the detonation wave. We defer to a later chapter further consideration o f the Chapmari-Jouguet hypothesis and now examine the results that can be obtained with the theory that has been formulated.
D = Uj + Cj (6-100)
Eliminating the particle velocity Uj with the aid o f Eq. 6-97, we obtain an alternative expression
D = P1cl lPa ( 6-101)
6-6 T H E O R Y OF TH E DETONATION V E L O C I T Y A N D O F T H E THERMODYNAMIC STATE OF THE EXPLOSION GAS
When supplemented by an equation o f state of the reaction products and the Chapman-Jouguet hypothesis,, die conservation conditions aciross the detonation wave suffice to determine a unique fin a l state, flow velocity, and propagation velocity when the state o f the unreacted explosive is specified. In this paragraph, we assemble these relations and effect a partial reduction o f the equations. By using thermodynamic relations o f general v a l i d i t y , we fo rm u la te the general one-dimensional theory o f the detonation velocity and detonation properties, We assume, without loss o f generality, that the unreacted explosive is at rest with reference to a stationary origin o f coordinates.
The conservation conditions across the detonation wave have been expressed by Eqs.6-2 and 6-3. For the explosive at rest with if, = 0 , these relations can be written
p0D = px(D - Uj) (6-97)
Px - Po = PolfQ - - PoUl ) (6-98)
et - e„ = 14(px - p0)(v0 - Uj) (6-99)
The first o f these expressions is the equation for the conservation o f mass and is identical with the first o f Eqs. 6-2. The second, which is the same as Eq. 6-95, can be obtained by rearranging the equation o f the Rayleigh line, Eq. 6-14, and is the result o f combining the equations for the conservation o f mass and momentum. The third is the Hugoniot equation, Eq. 6-3, which is the result o f combining the equation for the conservation o f energy with the mechanical conservation conditions.
The Chapman-Jouguet hypothesis results in a supplementary condition, Eq. 6-18,
It is convenient to eliminate the speed o f sound by the introduction of the adiabatic exponent K defined by
K = (3 fin p i3 f h p).(6-102)
in termS-of which the speed o f sound is given by
(6 ’103)
The adiabatic exponent is a function o f the thermodynamic state o f the gas. For an ideal gas, it is equal to the ratio Of the heat capacity at constant pressure to the heat capacity at constant volume. With the aid o f Eq. 6-103, Eq. 6 -1 0 1 can be transformed to
D 1 = K1p1p1/pl
k i = * ( P i A )(6-104)
Eq. 6-104 can be employed to eliminate the detonation velocity from Eq, 6-98. We then obtain the result
1Po_
Pi(6rl05)
We have obtained from Eqs. 6-97 to 6-100 a pair o f expressions, Eqs. 6-97 and 6-104, from which the detonation velocity and particle velocity o f the reaction products can be calculated after the pressure pl and specific volume ux o f the reaction products have been determined, i.e.,
■D = W KiP iP i
Uj = D( 1 - p„u1)(6-106)
and a pair o f expressions, Eqs. 6-99 and 6-105, involving thermodynamic quantities only
V e„ = 14(px + p0)(v0 - Uj)
i - Po/Pj = M p A " D
(6-107)
6-24
AM CP706-1M
that suffice to determine p1 and vx . We must now consider the solution of the latter pair o f equations.
Eqs. 6-107 contain tw o functions o f the state o f the reaction products, the specific energy e1 and the adiabatic exponent K ,, whose dependence on the state variables p , and «1 is made explicit by the introduction o f an equation o f state. As ^practical matter, it is not convenient to express either o f these quantities, either analytically or by means o f tables, directly in terms o f these two state variables. Consequently, the equation o f state introduces an additional state variable—e.g., the entropy or temperature-^and Eqs. 6-107 are then to be solved simultaneously with the equation o f state for the three state variables. Since toe'Hugoniot equation, expresses a condition oii the energy o f the reaction products and since toe energyis toe
characteristic thermodynamic function for systems described in terms o f entropy and volume, it would be consistent to employ an equation o f state having entropy and volume the independent variables. However, again as a practical matter, the thermodynamic data to be employed in the evaluation o f the energy difference - e o are o f such a nature as to require the selection o f temperature as :an independent state variable and toe form of equations o f state for nonideal gases makes appropriate the selection of toe volume as the second, independent state variable. The effect of this choice o f variables, which is am unnatural one from, a thermodynamic viewpoint, is to confer on the resulting set o f equations a degree o f algebraic complexity tout, is not required of the formal presentation o f the theory. A method fo r their solution is presented in Appendix F.
6-25
AM C PW H Oi
REFERENCES
1. R . Courant and K. O. Friedrichs,Superionic Flow and Shock Waves, Interscience Publishers, Inc., N ew York, 1948.. ' ( 7.
2. E. Jouguet, Mechaniques desExplosifs, O.Doin e Fils, Paris (1917). g
3. J. von Neumann, O ffice o f Scientific 'Research and Development, Report No. 549(1942). 9
4. D. L. Chapman, Phil. M ag (5 ) 47, 90(1899).
5. E . Jouguet, J. Math. 347, (1905); Proc. Int. 10.Cong. Appl. Mech., 12-22 (1926).
.6 . B. Lewis and J. B. Friauf, J. Am . Chem.Soc. 52, 3905 (1930). See also B. Lewis
S-M
and G. von Elbe, Combustion, Flames and Explosions o f Gates, 2nd Ed., Academic Press, New York, 1961, pp. 525-527.
R. Becker, Z. Physik 8 , 321 (1922); Z. Elektrochem. 42, 457 (1936).
R. L . Scorah, J. Chem. Phys. 3, 425 (1935).
Y . B. Zeidovich, Z. Eksptl i. Teoret. Fiz. 10, 542 (1940), Transl. N AC A Tech. Mem. 1261 (1950).
S. R. Brinkley, Jr, and J. G. Kirkwood, Third Symposium on Combustion and Flan&and Explosion Phenomena, Williams and Wilkins Co., Baltimore, 1949, p. 586.
AMCP7tt-iaO
CHAPTER 7 APPLICATION OF THEORY TO CONDENSED EXPLOSIVES
7-1 INTRODUCTION .
I t has been noted in Chapter 5 that the detonation velocity o f solid and liquid explosives is observed to be in the range 4000 to 8000 m per sec, and that for a given explosive in cylinders o f large diameter the detonation velocity is very nearly a linear function o f the initial bulk density. Since the pressures and temperatures o f the reaction products at the detonation wave front lie far outside o f the region that can be explored by ordinary experim en ta l methods, the variation of detonation velocity with initial density has constituted the chief experimental fact for determining the pressure, density, and particle velocity. In recent years, this evidence has been supp lem en ted by iso lated experimental determinations o f the detonation pressure. However, it is necessary to employ the theory to evaluate the state o f the detonation products at any point other than that fo r which a direct experimental determination is available.
Since 1940, a large amount o f w ^ k has been done in an effort to formul e , generally applicable equation o f state to supplement the hydrodynamic equations o f the theory o f the detonation wave. The work had the objectives of d e term in in g the physical and chemical properties o f the detonation (ps in sufficient detail so as to make possible the evaluation o f its thermodynamic state behind the detonation front and during its isentropic expansion from the detonation state. The latter information is necessary for the solution o f flow problems when the initial boundary conditions are determined by the detonation wave.
In much o f this work, the theory has been em p loy ed in an in verted form —using experimental values o f the detonation velocity and, when available, o f the detonation pressure—to evaluate the parameters o f an equation o f state o f assumed form. The equation o f state obtained in this way can be employed to evaluate the unknown properties o f the detonation wave in the explosive for which the equation was calibrated. I f the parameters o f tbs> equation can be related to the basic molecular parameters o f the explosive and if the form of the equation is sufficiently general, the theory
can be used to predict the properties o f other explosives.
Attempts have been made to employ theoretical equations o f state, based on molecular models, tot a priori calculations o f the detonation velocity and the properties o f the detonation products. The most interesting o f these efforts has entailed a very substantial degree o f algebraic complexity in the resulting computational procedure. The theoretical approach is o f great interest as a program of basic research in the theory o f the properties o f matter at high temperature and very High density. I t may provide valuable qualitative guidance in the formulation o f empirical equations in relatively simple analytical form that are in at least approximate agreement with the requirements i f basic theory. As a computational procedure to evaluate detonation properties for practical applications, the theoretical approach has been disappointing.
The inverse procedure, involving the calibration o f an equation o f state o f assumed form by experimental values o f the detonation v e lo c ity , has been pursued with much elaboration o f mathematical and numerical detail. The parameters o f the equation Of-state depend upon the composition o f the gas, The latter, i f not assumed a priori on the basis o f a conventional reaction scheme, are determined by the thermodynamic equilibrium conditions which depend on the equation ol' state. Furthermore, it is necessar- to conduct the calculation o f equilibrium composition and evaluation o f the thermodynamic properties o f the gas with the temperature' as an independent variable, even though this state variable is an unnatural choice from the point o f view o f the hydrodynam ic equations themselves. The introduction o f the temperature as a parameter o f the problem leads to a degree o f algebraic complexity that is absent from the fundamental equations. Because the simplifying assumptions employed by different workers have varied, the literature contains a variety o f results on the p rop ert ies o f the detonation products; consequently, a comprehensive review o f the field is impossible within the scope o f this chapter.
AMCT 706-1IC
In seme applications, estimates o f the detonation properties and to first order o f their variation with the parameters o f the system, e.g., the heat or energy o f explosion and the initial density, will suffice. Such calculations do not justify elaborate computational procedures requiring computers and they will usually be based on an a priori specification o f composition by means o f a conventional decomposition scheme. In such calculations, simplicity o f procedures is o f greater importance than full mathematical rigor, and the equation o f state may be o f physically unrealistic form provided the properties o f basic interest are not seriously effected thereby.
In other applications, it may be desired to secure the most precise evaluation o f the detonation properties that is possible. Such calculations will usually, at this time, be conducted on computers. I t will commonly be required that the composition o f the gas satisfy the thermodynamic equilibrium conditions and that the equation o f state have a form that is physically plausible. A computational procedure chat is suitable fo r use on an computer is usually different from one that is suitable fo r desk calculation, in that iterative methods o f solution are extensively employed to reduce the complexity o f the program.
In this chapter several equations o f state suitable for the two types o f application are described. In the case o f the forms that are suitebie fo r rapid estimates, the solution o f the hydrodynamic equations is developed in some algebraic detail. In the more elaborate case, the solution is extremely laborious when conducted by hand, and we pve explicit equations in the form in which they are conveniently utilised in the formulation o f a computer program.
7-2 THE ABEL EQUATION OF STATE
The simplest o f tne various empirical equations that seek to describe the dependence o f the p-esaure o f nonideal gases on temperature and volume is that o f van der Waal’s. In the form, due to Abel, that is appropriate for applications at high temperature, it can be written
“ nRT (7-1)
in which o; is a constant volume correction or covolume for unit weight o f gas, This equation was first employed to solve the Hugoniot and Chapman-Jouguet equations by Taffanel and D'Autriche1 and it has been extensively used in connection with calculations for condensed explosives by Schmidt2 . The Abel equation can be obtained as the low density limiting form of the equation o f state o f a gas at high tem perature composed o f hard spheres. Therefore, it can be expected to describe the nonideal behavior o f gases only i f the specific volume is large compared to the covolume constant. This quantity turns cut to be o f the same order o f m%..i:\ide as the specific volume o f the explosion gases from conventional explosives at customary values o f the initial density. Consequently, a theory o f the detonation velocity based on this equation o f state can be expected to yield accurate results only at initial densities that are much lower than those o f pnctical interest for condensed explosive*. In spite o f this fundamental limitation, such a theory is o f practical value because it yields simple relations giving useful estimates. o f the detonation properties.
Application o f the general relations o f Chapter 2 fo r the nonideal gas correction to the thermodynamic properties o f the explosion gas leads to the result that e(v,T) ■ n°(T), i.e., that the gas It thermodynamically ideal with a specific energy function independent o f the specific volume, a function o f temperature only, ai.d equal to the specific energy function o f the ideal gas at the same temperature. It follows that c * c° and 7 — c /eB - 7 ° for a gas described by tfie A I » I equation o f state, where the superscript zero refers to the ideal gas and cp and cv are the specific heats o f the gas at constant pressure ar.d constant volume, repectively. Furthermore,
h[p,T) - e + pv = h ° (T ) + otp
k - 7 0 v/(v- a)
where h° is the specific enthalpy function for the ideal gas and k is the adiabatic exponent, k
In par. 6-5, it was shown that the detonation pressure pl and detonation specific volume are determined by the solution o f Eqs. 6-107p(u - a)
A M C P7M -1M
"J < P l + PoX"» - Vl ’(7-3)
1 - P jh
When the*c relations have been supplemented by an equation o f state and solved, the detonation velocity D and particle velocity can be evaluated by Eqs. 6-106
D = Vc V * lP lP l
PQ»t)
(7-4)
With a condensed explosive, the pressure p1 is the order o f 10* to ld 6 atm. Therefore, po can be neglected in comparison to px . With this simplification and with the introduction o f the enthalpy function and the heat o f reaction q, defined by Eq. 6-8 , Eqs. 7-3 can be written
V h0(To) - q + | -P 1,(no + u,)
**(/>,«’ , ~ 1 ) " 1 (7' 5)
By use o f Eqs. 7-2 and introduction o f the avenge specific heat at constant pressure c? 7
e; (7 i - T „ ) - h’ (Tx) - h ° (T J (7-6)
Eqs. 7-5 become
'< <rx - To) (7-r,* q + Px (u0 + t1! - 2a)/2
u, - (u0 y ° + “ ) / W + 1) (7-8)
Eq. 7-8 is the desired expression for the specific vo lu m e o f the explosion gas in the Chapman-Jouguet detonation state. When the pressure is eliminated from Eq. 7-7 by means o f the equation o f state and the specific volume ol by means o f Eq. 7-8, we obtain
S J l :T„ |_n*
j J2y »J
(7-9)
T l k
T01 1 * ' , C°
%y°\ nRTa nR (7 ‘10)
where q' - q + nRTo - P 0»0 x q + nJ?T is the energy o f explosion. It w°ill. be noticed that the temperature 7) is a constant independent o f the initial density. Because o f the fo< -n o f the Abel equation o f state, these expressions for the temperature are the same as f hoissthat would be obtained with the ideal gas equation o f state. (In fact; Eq. 7-9 can be obtained-from Eqs; F - l0 b y neglecting po compared to px , as <ve have done here, and substituting the ideal gas equat'on o f state.)
The specific heats and the heat capacity ratio are slowly varying functions o f temperature. Eq.7-9 or 7-10 is easily solved by iteration. The specific heat and the ratio - f are evaluated for an approximate value o f the temperature, an improved value o f the temperature is obtained by. solution o f one or the other o f the equations, .\nd the process is repeated until successive approximations are in satisfactory agreement Application o f the theory based on the Abel equation is-not usually o f sufficient accuracy to ju stify a calculation o f the equilibrium composition o f the explosion gas. I f a special application is-such as to justify this elaboration, the composition may be adjusted at each stage of: the iteration by a calculation o f the equilibrium composition at the approximate values o f the temperature and specific volume o f the detonation state, using the methods described in Chapter 2. The activity coefficients f. that are needed for the calculation are easily shown to be /, ■ v/(v-a), independent o f temperature and composition. It vriu usually suffice to base the application on a conventional composition as described in Chapter 3.
By substitution o f the equation o f state and Eq. 7-8 into Eqs. 7-4 and the second o f Eqs. 7-2, expressions for the detonation velocity, particle velocity, and adiabatic exponent o f the detonation products are obtained.
(7-11)
An alternative form, because e°p = + nR, is = (7 " + «P « )/ ( ! - < % )
7-3
AMCT 706-1M
For an explosion gas described by the Abel equation, the particle velocity u 1 is independent o f the initial density po .
I t is a convenient computational device to d e fin e h yp o th e tic a l “ ideal” detonation properties calculated for the actual explosion gas composition and initial density but with the ideal gas equation o f state. I f such quantities are designated with a superscript zero, expressions for their calculation are obtained at once from Eqs. 7-11 by setting a * 6 . Thus, when the explosion products are described by the Abel equation, T1 ~T^ and U1 « u°, we can write
Uj/Uj = 1 + ap0 /7 °
D/jr - ( i - op, ) ' 1
where
I f - (1 ° + D ^ n R T f ly*
\ ]nRT°h°
(7-12)
(7-13)
and where T-, is obtained by the solution o f Eq.7-9 o f 7-10.
An approximate solution o f Eq. 7-10, sufficiently accurate for estimates o f the detonation properties, can be obtained by factoring the term c°/nR from the coefficient o f ?x /To Mid assuming that the heat capacity is independent o f the temperature in evaluating the remainder. If, in addition, w e neglect compared .to q, we obtain
« i - T » - 2 q '^ / [ ( 7 “ + l ) < ] (7-14)
Substituting this expression into Eqs, 7-1 and7-11 and using Eq. 7-8, we obtain
D ’ ( ^ y J 2 + 1)nR/<
Uj = V 29 '(T ° +
(7-15)
which, together with Eq. 7-8, can be used to furnish estimates o f the detonation properties, if a value o f the covolume ce is known. A useful relation is obtained by eliminating q between the first two o f these equations
which can be used to estimate the detonation pressure from an experimental value o f the detonation velocity i f the covolume or is known
One can estimate the covolume constant by comparison o f an observed detonation velocity with a value calculated by the first o f Eqs. 7-11. This procedure is not strictly consistent with the assumptions on which that equation are based since it will be found that the covolume, assumed in the derivation to be constant.depends upon the initial density. I t does, however provide a simple m e t h o d o f e s t i m a t i n g t h e properties Of the explosion gas when a detonation velocity has been experimentally determined that is superior to a total neglect o f the effects o f gas imperfection. I f the detonation velocity has been measured as a "unction o f the initial density, the quantity go » 1 + dinD/din p can be evaluated from toe experimental data. By differentiation o f the first o f Eqs. 7-11, we obtain the result
a = (g0 - l)l(p0g0) (7-17)
By substitution into Eqs. 7-8, 7-16, and the third of Eqs. 7-11, we obtain the relations
’ * „ (7 ° + 1 ) - 1
that depend only on observed quantities and on the heat capacity ratio fo r which a sufficiently accurate estimate can be made for an approximate composition and on approximate temperature.
T h e application o f these approximate equations can be illustrated by a calculation for Composition B consisting o f 64% RDX, 35%
AMCP 706-1*.
T N I, and 1% wax, by weight. The detonation velocity for this mixture is accurately known and the adiabatic exponent K j has been evaluated experimentally at a single initial density. These data suffice fo r the evaluation o f experimental values o f the detonation pressure, density, and particle velocity at the initial density for which the adiabatic exponent is known. According to Deal’ ,the experimental values o f the detonation velocity can be represen tedby
D = 2639 + 3127po
where J) is in m/sec and p is in g/cc. A t p = 1.714, Deal reports that * 2.77.
We employ the conventional decomposition scheme
Ca.4Hs.7°sN s . .^ 4 -4CO + 1'25Ha+ 1.8H20 + 2.45N2
to define the composition o f the explosion products, according to which the oxygen is considered to react first to form CO and then to the extent possible with hydrogen to form water. This reaction yields 0.0434 mole o f gaseous products per gram o f explosive and an energy o f explosion q “ 1.068 kcal/g a t 25° C. The ratio 7 ° ■ 1.25 between 3400° and 5000° K. The results o f the calculations are summarized in Table 7-1.
The unexpectedly good agreement between the estimates and the experimental values at pg “ 1.714 is unquestionably fortuitous, and it cannot be assumed that equally goOd agreement would extend to lower initial densities, were experimental values to be available. The comparison does imply that very useful estimates can be obtained by simple calculations when experimental values o f the detonation velocity are available.
7-3 D E T E R M I N A T I O N O F T H E D E T O N A T I O N S T A T E F R O M VELOCITY DATA
The usual procedure fo r formulating an equation o f state descriptive o f the detonation products o f condensed explosives has involved the assumption o f an analytical form o f the equation and the evaluation of its parameters from experimental values Of the detonation velocity. It has sometimes been erroneously claimed that the fact that this program can be accomplished implies that the assumed form o f the equation o f state is valid and that the thermodynamic properties calculated with its aid rue accurately evaluated. It turns out that various different, forms Of the equation lead, to approximately the game values o f those variables, that are explicit in the hydrodynamic equations but to widely different values o f those variables, such as the temperature, that appear as parameters ct.ihe problem.
It is instructive to consider the general problem o f determining the thermodynamic state o f detonation gases using the hydrodynamic theory and an experimental curve D ■ fKp J . (5qs. 7-3 and the first o f Eqs. 7-4 can be rearrv.ge.i-io theform
P i - 1 " Po\)
e. - e , ->ADS ( 1 - p ^ f(7-19)
where the Chapman-Jouguet equation is written
Ki = P a l\ K l " P»ui) (7-20)
In these expressions, we have without loss in generality neglected the initial pressure pg compared to the detonation pressure p1. The equation of state is customarily taken to be an expression o f the form
TABLE 7-1 ESTIMATES OF THE DETONATION PROPERTIES OF COMPOSITION B
f>g,t!cc g„ a,cc/g k, p,.g/cc Pr »tm 1\ °KEq. 7-18 Exp. Eq. 7-18 Exp. Eq, 7-18 Exp. Eq. 7-11 Eq. 7-14
1.0 1.543 0.352 2.47 1.404 94.5 4370 40601.25 1.597 0.S02 2.61 1.723 146 4370 40601.5 1.640 0.260 2.69 2.060 216 4370 40601.714 1.670 0.234 2.76 2.77 2.338 2.335 289 , 290 4370 4060
7-5
------ ■' -« * ----■----W - » ----------T
AMCP 70*1*0
p ■= p(v, T, ...,nr ...) (7-21)
expressing the pressure as a function o f the temperature, specific volume, and the mole numbers o f each constituent o f the mixture- of reaction products. The mole numbers n( may be fixed a priori by an assumed composition or determined as functions o f specific volume and temperature by Eq. 7-21 together with the equilibrium conditions. Either case implies the existence o f an.implicjtiy defined function
P - P(v, T) (7-22)
By means o f the laws o f thermodynamics, the entropy o f the detonation products is determined as a function o f specific volume and temperature
> - «(o, T) (7-23)
and Eqs. 7-22 and 7-23 together imply the existence o f an implicitly defined function
P “ P(v, « ) (7-24)
The usual program for determining an equation o f state in the form o f Eq. 7-21, subject either to the equilibrium conditions or to an a priori specification o f the composition, is the formal equivalent o f determining function 7-24 for given values o f p ,e , and D - D(p0) by means o f Eqs. 7-19,° *-20 and the laws ofthermodynamics. By use o f the thermodynamic relations
indeterminate in general, and determinacy requires the introduction o f some restriction having the effect o f specifying the arbitrary function. This is accomplished by assuming a form for the equation o f state but the experimental data provide no criterion for the correctness o f the assumption.
Jones5 has remarked that Eq. 7-22 represents a surface in the p,v,T space and that the maximum amount o f information that can be derived from a D(p ) relation would fix a line of a certain length on this surface. Thus, when one attempts to analyze detonation velocity data by fixing on one surface by the assumption o f an equation o f state, the result is largely arbitrary since there are evidently any number o f surfaces which contain the same line. Jones concludes that very little information about the form o f the equation o f state can be obtained from detonation velocity data but that i f a form is assumed, then the values o f its parameters can in general be determined: It follows that the assumption o f a form o f equation must be guided in the main-by considerations o f physical plausibility.
The first o f Eqs, 7-19 defines a ruled surface in P j , Uj, uo space. The second o f these equations determines a curved surface in tile same space which, according to the Chapman-Jouguet theory, touches the ruled surface along a line p t = p1 (vo), vx “ u (u ) that can be called the Chapman-Jouguet locus. In an investigation of the properties o f gazes.that can be deduced from measurements o f the detonation velocity, Jones has deduced from this geometrical circumstance a relation that is o f great practical value, Eqs.7-19 are written in implicit form
and the definition ^(Pl.l'j.t'o) ” P „ I ? { . 1 ' P a \ ) ~ P i * 0
K “ - (3 fci p/3 Hi. v)t G(Pl'vl>vo) " ei ~ eo ” Wpx ( l - Pa\ ) = O'
Brinkley4 has pointed out that the Jacobian
vanishes at the point (px ,v1) satisfying Eqs.7-19 and 7-20. This means that these equations, the thermodynamic relations, and the observed data can be satisfied together with any arbitrary function s “ i(v ) or T m T(v). The program o f evaluating the thermodynamic state is thus
(7-25)
The condition that the surfaces defined by these equations be in contact is that at any point of contact the direction cosines o f the normals to the two surfaces be equal. This condition leads to two relations
(3J’/3u1 )/(3.F,/3p1) => (bG/dvJHdG/dpJ (72 6 )
(3F/3u0)/(3G/3u0) = (dF/bvJHdG/dvJ
7-6
A M C f 704-180
On evaluation o f the derivatives, the first relation leads to Eq. 7-20 which is ah expression o f the Chapman-Jouguet condition. The second relation leads to a new result. Defining a thermodynamic quantity X by
1 1 fde\
x = ; y p (7-27)and noting the thermodynamic relation
Jones obtained the relations
Px - PoJ02l[g?(2 + X)]
*1 “ 4 ,(2 + X) - 1
from the second o f Eqs. 7-26, together with Eqs.7-19 and 7-20. Furthermore, from the second o f Eqs. 7-4
“ -D/[«>-(2 + X)] (7-30)
In these expressions, g * 1 + d2i D/d9.npo> as defined and employed in the last paragraph.
The utility o f these relations resides in the fact that X contains all o f the thermodynamic information that is required when the detonation velocity is known experimentally and g can be evaluated. Jones shows that this quantity is essentially positive so that Eqs. 7-29 and 7-30 with X - 0 provide upper limits t o p r « t , and Uj and lower limits to e1 and Ki: Furthermore, Jones shows that X is insensitive to the for;n o f the equation o f state and that it lies in the i^ ige 0 < X « 2 . Rather accurate estimates o f X can be made with approximate equations of state, thus making possible the direct evaluation o f those properties o f the detonation products that are o f principal interest in studies o f their subsequent flow. Using available equation o f state data for
nitrogen, Jones estimated that X is not likely to be greater than 0.25.
In par. 7-2, reference was made to the experimental determination by Deal o f the value o f the adiabatic exponent for Composition B at an initial density po ■ 1.714 g/cc. The measurements made in, this investigation permitted the evaluation o f the pressure as a function o f specific volume along the isentrope passing through the Chapman-Jouguet point. The experimental data were quits well represented, particularly in the neighborhood of the Chapman-Jouguet point, by the simple adiabatic law
P, = Px (u/o* f * , i f - 2.77 (7-31)
with constant adiabatic exponent, where p( “ p(v,t{) - p jv ) is the pressure on the isentrope p a s s in g th r o u g h th e exp erim en ta l Chapman-Jouguet point (p{, cj/. Along an isentrope obeying Eq. 7-31, the. specific energy is given, by
e, - e* '+ (p,u - p* v* )/(*?- - 1 ) (7-32)
where e, ■ e(v,sf) and et « v{). (We haveemployed an asterisk to designate properties at the experimental Chapman-Jouguet point for po “ 1.714 g/cc.)
The equation of state o f the detonation products could be determined if, in addition to the known isentrope, the energy were known on a single nonistentropic curve in the same region since the rate o f change o f energy along an isentrope is defined By the first law of thermodynamics and the nonisentropic curve would provide initial data for the integration. Fickett and Wood6 have shown that the isentrope and the Chapman-JOuguet locus passing through the experimental point (p 1,v1) lie close together in the (p,u)-plane. They expand the energy as a Taylor series in the pressure about the point on the isentrope having the same specific volume and assume that the expansion can be terminated after the term of first order. For points near the experimental isentrope, this assumption leads to an equation o f state
e(p, v) = e, + f,.(p - pt)u (7-33)
T --- ^— TU -
AMCP 706-190
where ft( is the value on the experimental isentrope o f the quantity
1 /ie\ v \3p/c
(7-34)
The Chapman-Jouguet locus for varying initial density is completely determined by Eqs. 7-28 to 7-34. Pickett and Wood have obtained-the solution by mr erical methods. The original paper should be consulted fo r details. Their results for the coefficients ft, K, and A are listed for several values o f the initial density in Table7-2; The values o f the other detonation properties can be evaluated at once by means o f the basic hydrodynamic equations previously given.
The results listed in Table 7-2 depend only on the validity o f Eq. 7-33; are independent o f any assumptions regarding the form o f a temperature explicit equation o f state; and did not require evaluation o f the composition o f the product gas. Eq. 7-33 is correct to terms o f first order in the increment (p - pt) and is probably a ve-y good approximation when employed to determine the Chapman-Jouguet locus since that curve lies close to the experimental isentrope. Although the numerical solution of the equation is tedious, this method is probably the best available for the calculation o f p , ,at , and K1 as functions o f po along the Chapman-Jouguet locus. Its application requires the availability o f an experimental Chapman-Jouguet point and, in the absence o f an experimental isentrope, the further assumption that the isentrope etui be represented by equations in the form o f Eqs.7-31 and 7-32. Additionally, the calculations summarized in Table 7-2 can be employed as a criterion fo r the physical plausibility o f assumed analytical forms o f the equation o f state.
7-4 MODIFICATIONS OF THE ABEL EQUATION
When the simple Abel equation o f state with a constant covolume was employed by Schmidt2 and others to describe the detonation products o f condensed explosives, it was found that the covolume, evaluated to secure agreement with experimental detonation velocities, is a function o f the initial density. This theoretical inconsistency should have led the early workers to reappraise the analysis and it has led subsequent workers to remove the inconsistency by adopting less restrictive assumptions. The Abel equation
p(v - a ) - nRT
can be made to describe the state o f any substance i f a is a suitably prescribed function o f two state variables, e.g., a » a (p,u). However, it was shown in the last par. 7-3 that a curve D(po) does not provide sufficient information to evaluate the function a in this generality, and some restriction must be placed upon it. Restrictions that are sufficient, but less restrictive than the specification a = constant employed in par. 7-2, are a= a(u) or « ■ a(p). The first o f these has been employed by Cook7 in extensive calculations. The second has been employed by Jones in calculations for the explosive PETN.
Cook employs a modified Abel equation o f state in the form
p[u oi(u)] = nRT (7-35)
According to this equation
(7-36)
TABLE 7-2 THE DERIVATIVES ft K , AND X ALONG THE CHAPMAN-JOUGUET LOCUS FOR COMPOSITION B
£ K X
1.714 1.77 2.77 0.2561 .6 1.79 2.74 Q;2571.4 1.82 2,67 0.2601 .2 1.8 6 2.59 0.2621 .0 1.91 2.50 0.266
AM CF70C-1M
so that a gas described by Eq. 7-35 can bela id to be thermodynamically ideal with efu.Tj = e°(T), cv = c ” Furthermore, the specific enthalpy h - e + pv - e° + nRT + pa(v) - h " + poi(v) so that cf - c° and y = cp/cv " y°. A t the high density o f the detonation products, one would expect the specific energy function to have a substantial contribution from the energy Of gas imperfection arising from repulsive terms in the intermolecular potential junction. This expectation is confirmed by molecular theories o f the properties o f dense gas, such as that o f Lennard-Jones and Devonshire, which is at least qualitatively correct. The consequence o f Eq.7-35 that is expressed by Eq. 7-36 does not appear, therefore, to be physically plausible.
The adiabatic exponent k can be evaluated by Eq. 7-35 and the relation
We obtain the expression
K [1 - M l (7-38)
where a ' (v) is the derivative o f 6t with respect to v. Eqs. 7-3, with the neglect o f Po compared to , become
<7 » + v / ( r + 1 )
Tx1 .
1 q' c°
To LnE 2rJ nRT0 nR
(7.-39)
where
r = 7j [1 + << („)] (7-40)
and where c ~ - [e ° (5 i ) - e a(TJ]/(T1- T J is an average specific heat at constant volume and q' is the energy o f explosion. I t may be noted that Eqs. 7-39 have the same form as the solutions o f Taffanel and D ’Aufcrkihe1 for the unmodified Abel equation o f state, Eqs. 7-8 and 7-10, with the quantity T replacing the heat capai .ty ratio 7 °. Eqs. 7-4 can be written
D = ( ~ ^ \ j n R T i \1 + apop i 1
I T(7-41)
The adiabatic exponent can be evaluated with
= (r + a p j l d - apo ) (7-42)
Eqs. 7-41 and 7-42 are analogous to Eqs. 7-11 btised on the Abel equation o f state.
Cook has applied Eqs. 7-39 through 7-42 te a large number o f explosives. His method of calculation was iterative, commencing with the solutions based on the Abel equation. A t each state o f the iteration, he calculated the equilibrium composition o f the detonation products. He has in this way determined the function a(v) from the experiment D(po) for the explosives considered. He concludes thatthe function a(v) found in this way is independent o f the composition o f the detonation gas and may be used for the a priori calculation of detonation properties. The function a(v) as determined by Cook is shown in Fig. 7-1. Some o f the results obtained with this equation o f state are listed in Table 7-3.
I f Cook’s equation o f state is to be employed in a forward calculation o f the detonation properties, the calculation must be performed b y s u c c e s s iv e approx im a tion s . Th e Taffanel-D’Autriche1 solutions expressed by Eqs. 7-8 and 7-10 provide a convenient first approximation. I f the calculation is to be elaborated by the assumption that the detonation products are in equilibrium, the compositions can be adjusted at each stage o f the iteration by an equilibrium calculation employing the methods detailed’ in Chapter 2. The activity coefficients ft, appropriate for an equilibrium calculation at specified temperature and specific volume, are given by
(7 4 3 )
and have been tabulated by Cook. These coefficients are independent o f composition and temperature and, as noted in Chapter 2, result in a calculation o f the equilibrium composition that is no more difficult than that fo r an ideal gas.
Jones has employed a modified Abel equation o f state in the form
p[u - or(p)] = nRT« ! - \JnRTjl'
7-9
AMCF 706-180
TABLE 7-3 DETONATION PROPERTIES OF SOME PURE EXPLOSIVES’
Po’ vi ’ nv UX’ P VExplosive g/cm3 cm3/g moles/g °K m/sec 10 3 atm
PETN 1 .0 0.725 0.0352 5350 1540 •85
1 .6 0.478 0.0349 5700 1820 225
EDX 1 .0 0.723 0.0405 5250 1660 95
1 .6 0.469 0.0405 5750 2000 255
TN T 1 .0 0.740 0.0331 3700 1250 601 .6 01505 0.0245 4170 1340 150
Tetryl 1 .0 0.752 0.0370 4200 .1340 75
1 .6 0.485 0.0355 4700 1670 200
and applied it to the explosive PETN. According to this equation
: a (P) (7-45)
so that a gas described by Eq. 7-44 has the specific enthalpy and energy functions
h = h°(T) + / a{p)dp•i,
,P
e = <? (T) + J cc(p)dp - pa(p)
(7-46)
a n d c j Cp, c„ “ c j, y=cp/cllxy0. Since this form o f equation predicts a contribution to the energy from gas imperfection, it appears intuitive,y to be a more plausible form than that employed by Cook.
This equation of state appears to have been applied only to the explosive PETN. For this material, Jones has employed the detonation velocity data o f Friederich* to evaluate the function a(p). For an equation o f state o f the assumed form, the coefficient X, defined by Eq. 7-27, is \ = 7“ (7-47)
and it may be regarded a constant to a good approximation. Then by means o f Eqs. 7-29, the detonation properties can be evaluated directly from the experimental D(pc) curve. Using Eqs. 7-29 and 7-46, Jones shows that Oi(pj can be evaluated by the numerical solution o f
P <*(p)
■ ' W * / M ?
(7-48)
dp
where '5' is a function o f p given parametrically in terms o f po by
(1 + X)\P =D 2
2(2 + X)- X q' (7-49)
together with the first o f Eqs. 7-29, where q' is the energy o f explosion. Jones’ determination o f the function a(p) for PETN is shown in Fig. 7-2. Calculated values o f the detonation properties are listed in Table 7-4. The energy ot gas imperfection resulting from this form o f the equation o f state is shown in the last column o f the table. The quantity increases strongly with increasing initial density and is responsible for the downward trend o f the temperature.
The Jones modification o f the Abel equation o f state does not appear to have been applied to other explosives, and its application at the present time to an a priori calculation would require an assumption thr.t the function a(p) is independent o f composition. I f such an assumption should turn out to be justified, the equation should provide a useful and relatively simple method for the calculation o f detonation products having the desirable feature that the energy o f gas imperfection is not neglected. The analytical form o f the equation is such as not to yield useful expressions by a partial reduction o f the equation, similar to that employed in-our description of the Abel equation or o f Cook’s modification of it. It would be most convenient in this case to conduct the calculation in the general manner described- in par. 6-5, using, if desired, the methods o f Chapter 2 to evaluate the equilibrium composition.
3'D
AMCF7M-1W
Figure 7-2, Couolum e F u n c tio n f o r D e ton a tion P rod u ct» o f P E T N 5
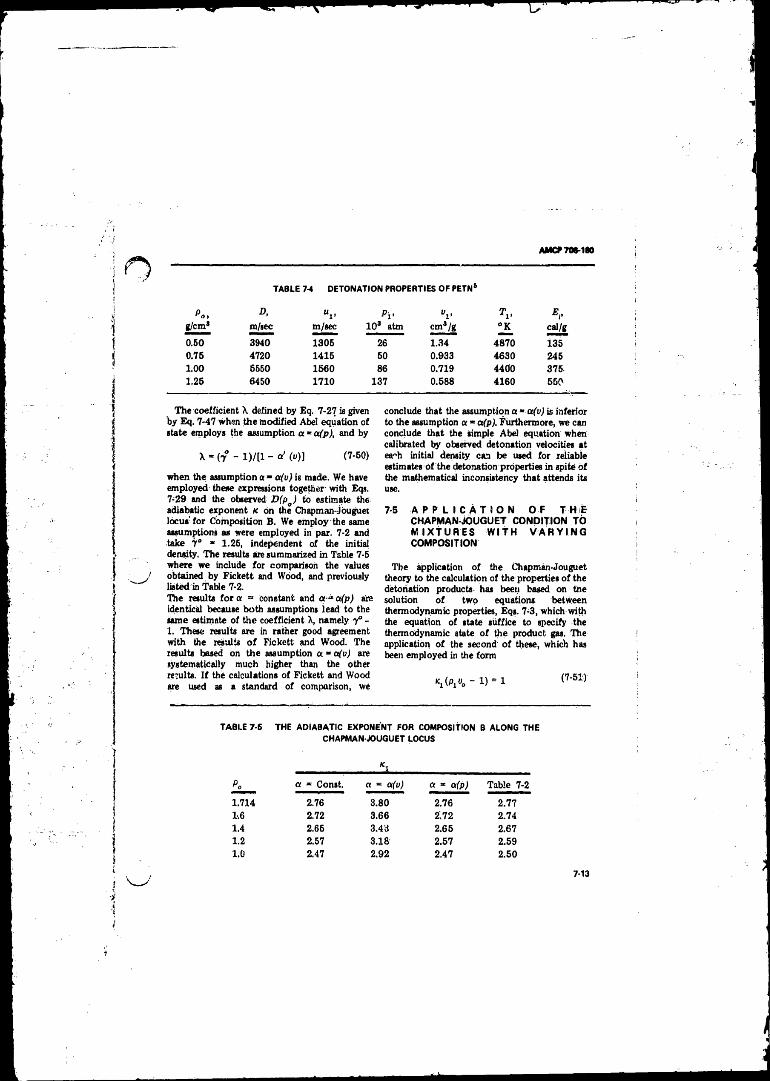
AMCP 706-1S0
TABLE 74 DETONATION PROPERTIES OF PETN6
Po, D, P i’ °v T E,’g/cm8 m/sec m/sec 1 0 3 atm cm Vg ° K cal/g
0.60 3940 1305 26 1.34 4870 1350.75 4720 1415 50 0.933 4630 2451 .0 0 6560 1560 86 0.719 4400 3751.26 6450 1710 137 0.588 4160 560
The coefficient X defined by Eq. 7-27 is given by Eq. 7-47 when the modified Abel equation of state employs the assumption a * a (p), and by
X - (70 - 1)/[1 - o ' (o )] (7-60)
when the assumption a - a(u) is made. We have employed these expressions together with Eqs.7-29 and the observed: D(Pa) to estimate the. adiabatic exponent k on the Chapman-Jouguet locus' for Composition B. We employ the same assumptions as were employed in par. 7-2 and take 7° ■ 1.26, independent of the initial density. The results are summarized in Table 7-5 where we include for comparison the values obtsuned by Fickett and Wood, and previously listed in Table 7-2.The results f o r a = constant and a — ct(p) are identical because both assumptions lead to the same estimate o f the coefficient X, namely y° - 1. These results are in rather good agreement with the results o f Fickctt and Wood. The results based on the assumption a ” o^oj are systematically much higher than the other recults. I f the calculations o f Fickett and Wood are used as a standard o f comparison, we
conclude that the assumption a * a(v) is inferior to the assumption a * a(p). Furthermore, we can conclude that the simple Abel equation when calibrated by observed detonation velocities at ea"h initial density can be used for reliable estimates o f the detonation properties in spite o f the mathematical inconsistency that attends its use.
7-5 A P P L I C A T I O N O F T H E CHAPMAN-JOUGUET CONDITION TO M I X T U R E S W I T H V A R Y I N G COMPOSITION
The application o f the Chapman-Jouguet theory to the calculation of the properties o f the detonation products has been based on the solution o f two equations between thermodynamic properties, Eqs. 7-3, which with the equation o f state suffice to specify the thermodynamic state o f the product gas. The application o f the second' o f these, which has been employed in the form
W o - 1) ■ 1 (7‘ 51)
TABLE 7-6 THE ADIABATIC EXPONENT FOR COMPOSITION B ALONG THE CHAPMAN-JOUGUET LOCUS
Po a * Const. a = a(u) a « a(p) Table 7-2
1.714 2.76 3.80 2.76 2.771 .6 2.72 3.66 2.72 2.741.4 2.65 3.43 2.65 2.671 .2 2.57 3.18 2.57 2.591 .0 2.47 2.92 2.47 2.50
7-13
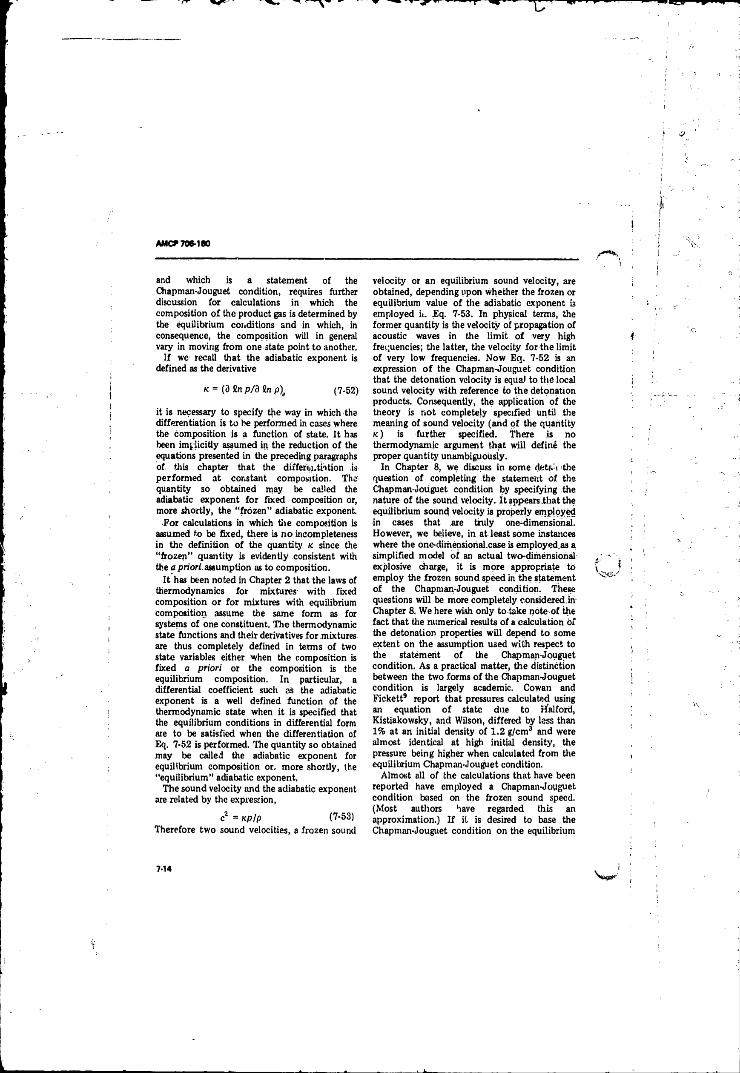
AMCT 706-180
and which is a statement o f the Chapman-Jouguet condition, requires further discussion for calculations in which the composition o f the product gas is determined by the equilibrium conditions and in which, in consequence, the composition will in general vary in moving from one state point to another.
I f we recall that the adiabatic exponent is defined as the derivative
(c = (3 Sn p/3 in p\ (7-52)
it is necessary to specify the way in which the differentiation is to he performed in cases where the composition is a function of state. It has been implicitly assumed in the reduction o f the equations presented in the preceding paragraphs o f this chapter that the differentiation is performed at constant composition. The quantity so obtained may be called the adiabatic exponent fo r fixed composition or, more shortly, the “ frozen" adiabatic exponent.
For calculations in which the composition is assumed to be fixed, there is no incompleteness in the definition o f the quantity K since the “ frozen” quantity is evidently consistent with the a priori, assumption as to composition.
It has been noted in Chapter 2 that the laws of thermodynamics for mixtures with fixed composition or fo r mixtures with equilibrium composition assume the same form as for systems o f one constituent. The thermodynamic state functions and their derivatives fo r mixtures are thus completely defined in terms o f two state variables either when the composition is fixed a priori or the composition is the equilibrium composition. In particular, a differential coefficient such as the adiabatic exponent is a well defined function o f the thermodynamic state when it is specified that the equilibrium conditions in differential form are to be satisfied when the differentiation of Eq. 7-52 is performed. The quantity so obtained may be called the adiabatic exponent for equilibrium composition or. more shortly, the “ equilibrium” adiabatic exponent.
The sound velocity and the adiabatic exponent are related by the expression,
ca = KPlp (7-53)Therefore two sound velocities, a frozen sound
velocity or an equilibrium sound velocity, are obtained, depending upon whether the frozen or equilibrium value o f the adiabatic exponent i3 employed ii. Eq. 7-53. In physical terms, the former quantity is the velocity of propagation of acoustic waves in the lim it o f very high frequencies; the latter, the velocity for the limit o f very low frequencies. Now Eq. 7-52 is an expression o f the Chapman-Jouguet condition that the detonation velocity is equal to the local sound velocity with reference to the detonation products. Consequently, the application o f the theory is not completely specified until the meaning o f sound velocity (and o f the quantity k ) is further specified. There is no thermodynamic argument that will define the proper quantity unambiguously.
In Chapter 8, we discuss in some det&h the question o f completing the statement o f the Chapman-Jouguet condition by specifying the nature o f the sound velocity. I t appears .that the equilibrium sound velocity is properly employed in cases that are truly one-dimensiohal. However, we believe, in at least some instances where the one-dimensiorial.case is employed.as a simplified model o f an actual two-dimensional explosive charge, it is more appropriate to employ the frozen sound speed in the statement o f the Chapman-Jouguet condition. These questions will be more completely considered inChapter 8. We here wish only totake note o f the fact that the numerical results o f a calculation of the detonation properties w ill depend to some extent on the assumption used with respect to the statement o f the Chapman-Jouguet condition. As a practical matter, the distinction between the two forms o f the Chapman-Jouguet condition is largely academic. Cowan and Fickett9 report that pressures calculated using an equation o f state due to Halford, Kistiakowsky, and Wilson, differed by less than 1 % at an initial density o f 1 . 2 g/cm3 and were almost identical at high initial density, the pressure being higher when calculated from the equilibrium Chapman-Jouguet condition.
Almost all o f the calculations that have been reported have employed a Chapman-Jouguet condition based on the frozen sound speed. (Most authors have regarded this an approximation.) I f it is desired to base the Chapman-Jouguet condition on the equilibrium
7-14
AM CF7M -1M
sound speed, two methods ot computation s possible. The Cist, which has been employed by Cowan and Fickett, is to construct the equilibrium Hugoniot curve in the neighborhood o f the Chapman-Jouguet point, using only the first o f Eqs. 7-3. and to determine by trial or by graphical or numerical interpolation the point on the Hugoniot curve resulting in the minimum detonation velocity. This procedure clearly is equivalent to employing the equilibrium sound velocity in the statement o f the Chapman-Jouguet condition. The second, which we prefer because it requires substantially less computation, is to employ the general iterative procedure described in Appendix F which, together with the methods for eva’ -'ating equilibrium composition and equilibrium thermodynamic propertie described in Appendix 5, ie'ads to a direct solution o f the problem.
The frozen composition Chapman-Jouguet condition appears generally to be an entirely adequate approximation. It is much more easily employed. Even Su, the general iterative procedure o f Appendix F remains, in our op in ion , th e m ost straightforward computational approach for any equation o f state except the simple forms suitable fo r order o f magnitude estimates. In Appendix E, we have described computational procedures in detail for evaluating the thermodynamic properties o f equilibrium1 mixtures. The Chapman-Jouguet point is then determined by an iterative procedure involving thermodynamic quantities only. The computational procedure it thus completely prescribed i f the equation o f state is presented in analytical form.
7-6 EXPLOSIVES WHOSE PRODUCTS CONTAIN A SOLID PHASE
The products ot detonation of an explosive may consist not only o f an homogeneous gas mixture but also of a mixture o f gas with various condensed constitu en ts . Nongaseoua constituents may be present in the products because species found in the reaction condense at the prevailing detonation temperature and density. Explosives such as tetryi or TN T have a marked oxygen deficiency and, as a result, free carbon is formed as a reaction product. Some commercial explosives are cor. ounded with chemically inert diluents present m the original
explosive mixture, and these materials form condensed phases in the detonation products.
The first case where some o f the reaction products are condensed can be treated in a direct manner. It is natural to assume that such products are in thermal equilibrium with the gaseous reaction products and completely entrained by them. These assumptions applied to explosives containing inert diluents are more arbitrary in nature and will be the more closely applicable the finer the particle size o f the diluent and the lower its concentration. For the case o f inert diluents, Taylor1 1 has compared calculations in which thermal equilibrium is assumed with calculations in which it is assumed that there is no heat transfer to the diluent Complete entrainment was assumed in each case, and Taylor concludes that the assumption c f thermal equilibrium results in the better theoretical model.
The pressure o f the gas phase is represented by an equation o f state as an expression o f the general form
P ” PO,.T) (V-54)
where vt may be defined as the volume o f the gas phase for unit total weight o f explosion products. Since the volume (if gas and o f condensed phases is additive
« * v, + ", (7-55)
where v is the specific volume o f the mixture as previously defined and u, is the volume o f condensed phases for unit total weight o f products. Furthermore,
v, “condensedphases
(7-56)
where n, is the number o f moles o f the i-t'i condensed species from unit weight o f explosive and V, is the molar volume o f the i-th condensed species. In the case o f an explosive producing solid carbon, such as TNT, this expression is simply
v, = n V c (7-57)
The general form o f the equation o f state for a mixture o f gas and condensed species expressed In terms o f the specific volume o f the mixture, can now be written in the form
7-15
A M O 70*1(0
P mP (» - v , ,T ) (7-58)
where u is, in general, a function - pressure and temperature.
An equation o f state o f the Abel type can be written in the form
p(v - ct) = nRT
t? *= a + vt
(7-59)
where n is the number o f moles o f gas produced by unit weight o f explosive. Thus the quantity a becomes an effective covolume, and the equation has the same form fo r a mixture o f gas and condensed phase as for a gas phase alone. In calculations that are calibrated by observed detonation velocities such as have been described previou.-iy, a may be considered: ( 1 ) an adjustable constant as in the Abel equation,(2 ) a function a(u) as has been done by Cook, or(3 ) a function a(p) as would be appropriate in a calculation employing the Jones modification o f the Abel equation.
In a priori calculations o f the detonation properties using an equation o f state with known parameters, the quantity vf must be evaluated. This requires knowledge o f the concentration o f each condensed species in the detonation products and the molar volume o f each species at the temperature and pressure o f the detonation gas, The former quantity concentration must be based on an initial estimate that is improved as the overall iteration procedure progresses by successively more accurate determinations obtained from the solution o f the equilibrium conditions, The molar volumes o f the condensed species can usually be taken as constants o f the system unless their concentrations are very large. They can be evaluated, when the necessary compressibility and thermal expansion data exist, at a temperature and pressure in the range o f detonation conditions and thereafter held constant. Lacking such data, the molar volume at ambient conditions can be employed as an estimate. The overall precision with which the equation of state o f the gas is known does not appear for most applications to warrant an elaborate equation o i t for condensed species. Furthermore, as a practical matter, the use o f more accurate forms is awkward because
such forms are explicit either in the pressure or in the molar volume o f the solid and they are not easily combined with the equation o f state o f the gas which is explicit;!*! the volume o f the gas. We cite, however, the work o f Cowan and Fickett9 who have quoted an equation o f state fo r carbon (graphite) with parameters that are derived from experimental measurements o f the shock Hugoniot curve in graphite. I t is an accurate but extremely cumbersome equation o f state fo r carbon that could be employed ir calculations if the high accuracy could be justified by comparable accuracy in the other parameters involved.
7-7 THE VIRIAL EQUATION OF STATE
According to the virial theorem, the equation o f state for gases can always be written in the form
P», B(T) C(T)——— = 1 + ------ + ----3—nMT ve v3
| X>(p+ „ (7-60)
where B(T), C(T), D (T)„ . . are the first, second, third, etc., virial coefficients which are functions o f temperature and composition but not o f volume. For molecules with an interaction energy that can be expressed as a function o f the intennolecular distance, the second virial coefficient can be theoretically evaluated. For nonattracting rigid spherical molecules, the virial coefficients are independent o f temperature. For such a gas, the third virial coefficient has been calculated by Boltzmann and Jaget « i d the fourth virial coefficient by Happel and Majumbar12. For the gas o f rigid nonattracting spheres, the virial equation to cubic terms in the density has the form
£ 1nRT
b A (b3 '1 + - + 0 6 2 5 - j )+ 0 .2 8 6 9 b r
\ V V
i (7-61)
A t high temperature, Hirschfelder and Rosevearo1 3 proposed the equation
3 lnRT
1 + — + 0.625[^
+ 0.2869 Fj-W 0.1928 (-y
(7-62)
'•16
AM CP 708-180
where the »econd virial coefficient is calculated according to the theory o f imperfect gases in the limit o f vanishing density and is found at high temperatures to be nearly independent o f temperature. Thus, the second virial coefficient can be evaluated theoretically, and its evaluation makes possible a theoretical evaluation o f the higher virial coefficients for a hard sphere gas which is taken to be a satisfactory model o f a real pis at high temperature. The value o f the fifth virial coefficient in the expression given was chosen to make the equation agree at high density with the free volume theory o f liquids o f Hirschfelder, Stevenson, and Eyring14.
The calculated high temperature second virial coefficients o f some species appearing as explosion products are listed in Table 7-6.The coefficients in Table 7.-6 are fo r pure gases. Rules fo r mixtures having a theoretical justification are quite complex in form. In view o f the approximation, only the simplest combination rule can be justified and the formula
6 > f n,h, (7-63)
has been employed in applications o f Eq. 7-62.Hirschfelder and his coworkers have employed
Eq. 7-62 in extensive calculations o f the thermodynamic properties o f the products o f propellants. Its application to the a priori calculation o f the properties o f the detonation products o f condensed explosives is due to Paterson18. I t is o f the form
pvf = nRT F
so that i f 6 is a constant
0
(7-64)
(7^66)
and c„ = c°, y ” c/c„ “ 7 ° . The equation neglects the energy o f gas imperfection and will, for this *eason, overestimate the temperature o f the e'etonation products. Paterson justifies this neglect by sUting thatit is justified at low initial densities and will affect to only a small extent all properties except temperature at higher initial densities.
Eq.. 7-62 can be written in the Abel form
P l», ~ “ O',)) ” nRT
where
« ( " , ) “ ” , ( I " 1 /*’( * ) ]
x - b/vs
(7-66),
(7-67)
Therefore, the quantity T can be calculated by the relation
and the solution for the Chapmcn-Jouguet ..pint, based on< the frozen Chapman-Jouguet condition, is given by Eqs. 7-39. Thus, the modified Boltzmann *orm o f the virial equation o f state can be employed to obtain an a priori,
TABLE 7-6 HIGH TEMPERATURE SECOND ViRIAL GASEOUS DETONATION PRODUCTS15
COEFFICIENTS
Species f bh cm3 /mole Species i b,, cm3/mole
coa* 37.0 NO 2 1 .2
CO 33.0 Na 34.0
14.0 ch4 37.0
H ,0 7.9 NHa 15.2
30.5
* A t densities where the C 0 2 molecule is assumed not to rotate, A t lower densities, with rotation permitted, thG value o f 6( for CO j is 63.0 cm3/mole.
AM CF7M -1S0
theoretical evaluation ot the function a(uj that was evaluated empirically by Cook.
The results o f some o f Paterson's calculations—using the equation o f state Eq. 7-62, the frozen Chapman-Jouguet condition, and assuming equilibrium composition of the detonation products—are given in Table 7-7. Paterson has also applied .his equation o f state to calculations for a large number o f commercial blasting explosives. ,
In these -calculations all o f the necessary data were determined without reference to detonation experiments. Considering the completely a priori nature o f the calculations, surprisingly good agreement with experimental detonation velocities was obtained, particularly at the lower values o f the initial density.
7-8" ; HALFOROKISTIAKOW SKYW LSONEUJATION OF STATE
An extensive computation o f the detonation state was carried out by Brinkley and Wilson1 7 employing an empirical form o f equation of state that was proposed by Halford, Kistiakowsky, and Wilson10 . The equation is a modified form o f one that was originally employed by Becker to represent an experimental nitrogen isotherm. It was modified by the omission o f terms that are significant only at Ipw temperature and in such a way as to
provide for a contribution due to gas imperfection to the energy content o f the gas. The parameters o f the equation were calibrated in part by the use o f experimental detonation velocity data and in part from theoretical considerations. Since the original work, this equation has had many modifications as new data became available. The most extensive and most recent re.jsion has been carried out by Cowan and Fickett who were able to supplement experimental velocity data with some experimental pressure measurements.
Cowan and Fickett employ an equation o f state in the form
pvf = nRTF(x)
F(x) - 1 + x / '
x - k l t v , (T + e f ]
k - ^ k ,
(7-69)
Here, vt is the volume o f gas from unit weight o f explosive; n, is the number o f moles.of the i-th gaseous constituent from unit weight o f explosive; a , P, and 9 are empirical constants; and the fe( are empirical constants, characteristic of the individual species, having1 the nature o f covolumes. The constant 9 was added to the original form to suppress a spurious minimum that the unmodified form presented in curves o f
t
(Ii
TABLE 7*7 DETONATION PROPERTIES OF SOME CONDENSED EXPLOSIVES1*
Po> UVExplosive Horn? cm3/g
Nitroglycerin 1,60 0.505
PETN 0.50 1.362
1 .0 0 0.760
1.50 0.540
T N T 0.50 1.354
1 .0 0 0.769
1.50 0.550
Tetryl 0.50 1.3G6
1 .0 0 0.770
1.50 0.550
P v " i * D,“ K 1 0 3 atm m/oec tn/seca w
5640 199 1550 8060
5000 21.3 1175 3670
5150 73.8 1340 5560
5340 188 1550 8150
3873 12.4 894 2770
3873 44.2 1 0 1 0 4400
3890 124 1196 6970
4500 15.6 10 0 0 3140
4600 56.9 1150 5000
4790 160 1375 7850
(
7-18
AMCP 706-180
pressure versus temperature at constant volume. Cowan and Fickett have employed the value 0 = 400° K. in all o f their work.
When Eq. 7-69 is employed as the equation of state, the specific energy e( o f gas imperfection, where c= e ° + eh is given by
eJ(nRT) - a ( ~ ^ j (F - 1 ) . (7-70)
which is a rapidly increasing function o f the gas density at constant temperature.
Eqs. 7-69 and 7-70 can be written in an approximate form
e, = ot(pvt - nRT) (7-71)
if we neglect 8/T compared to unity. Now, it can be shown from the virial theorem that if attractive forces are neglected in comparison with repulsive forces in the intermolecular potential function and i f the latter varies inversely as the n-th power o f the intermolecular distance, then
«,* (3 ln)(puf - nRT) (7-72)
Thus, Eq. 7-71 is of the correct form fo r the internal energy o f a gas that is sufficiently dense so that attractive forces can be neglected in comparison with repulsive forces. Furthermore, the parameter a can be identified with the quantity 3/n, where n is the exponent o f the repulsive term in an interiiiplecular potential function o f the Lennard-Jones type. From theoretical considerations, n > 6 so that ot <Vz. Cowan and Fickett found the best overall fit with experimental data with the value a = 'A. The high value o f this coefficient reflects the facij thut attractive forces are not entirely negligible at any gas density. Also, there is now evidence that an inverse power law fo r the repulsive term is too “hard” for dense gases.
The discussion o f th, last paragraph is not, o f course, a complete justification o f the form of the essentially empirical equation of state, Eq. 7-69. It does, however, indicate that this equation takes account o f the energy o f gas imperfection in a way that is physically plausible and in this respect, at least, is superior to the other forms o f equation o f state that have been considered. Unfortunately, its use in routine calculations involves a considerably more
elaborate computational program. It is not conveniently employed fo r desk computations, and it,is most suitably employed in calculations employing a computer fo r which the e ffort o f preparing a computer program can be justified.
We can summarize the values o f the equation o f state parameters adopted by Cowan and Fickett as follows: ,
a = 0.50 P = 0.09 6 = 400 °K
The values o f the are given in Table 7-8.
TABLE 7-8 VALUES OF THE CONSTANTS fe(9
Species ■ k *' Species kt*
HZ 2133 CO 3383
H2L 3636 co2 6407
6267 NO 4148
Table 7-9 contains values o f some detonation properties o f several exploeives calculated with C o w a n and Fickett!.? fo rm o f the Ualford-Kistiakowsky-Wilson equation o f state. Experimental values and some calculated values by Cook and by Paterson axe included for comparison.
Cowan and Fickett conclude that reasonably good agreement between calculated and observed quantities is obtained except for explosives such as T N T with large oxygen deficit. In the case o f T N T the calculated values are unss.tisfactory even though an elaborate equation o f state was used for solid carbon. The cause o f this discrepancy is not understood at the present time.
The equation of state employed by Cowan and Fickett leads to detonation temperatures that decrease with increasing initial density. This behavior follows from the fact that the equation o f state results in a contribution to the energy due to gas imperfections as a strongly increasing function o f density. It will be noted from Table 7-9 that the calculated temperature is
* A more extensive list o f the constants * ! j to the best available explosives' property data, rx c. Tabled in reports by C. Mador, LASL , which have not been published.
7-19
AMCP70S-1S0
substantially lower than fo r equations o f state fo r which the energy o f gas imperfection is zero. Cowan and Fickett conclude that the Halford-Kistiakowsky-Wilson equation o f state is probably fairly reliable i f its use is restricted to explosives which are similar to those that were includediin the determination o f its parameters, and to pressures and volume? t^at are not too
different from those at the Chapman-Jouguet point. There appears to be no justification fo r its use in an extended extrapolation.
We conclude this chapter by remarking that the problem o f formulating a generally adequste equ ation o f state is not solved. The Halford-Kistiakowsky-Wilson equation appears to be the best available.
TABLE 7-9 COMPARISON OF CALCULATED DETONATION PROPERTIES
Pm, D, T, P.ExpioMve Source m/sec iM f„ *K 10* atm \*aaiwBi. » — i i ■PM *<saw»*» mmmm wmmmm
RDX Exparimtntal 1.6 8060 3470 262 2.62 0.32Cowan 4 Fkktftt. 1.6 6037 ?250 2786 266 2.79 0.30Cook 1.6 8040 — 3570 6750 255 3.01 - 0.34
RDX Experimental 1.6 366 3t06:Cowan 4 Pkkatt 1.8 344 i,.
i'NT Experimental 1.6 6640 2800 166 3.44 0.68Cowan 4 Ftckatt 1.6 6694 3120 2715 193 3.88 0.25Cook 1.6 7030 -3660 4170 150 4:20 0.84<Fatcnon 1.6 6790 3310 3900 125 4.81 1.26
TNT Expcriaantal 1.64 175 3.48Cowan 4 Pkkalt 1.64 204 2.91
RDX/TNT, 73/22 ExptrimrmUl 1.765 313 2.82Conn * Jlrtatt 1.755 307 2.90
Comp, fi Experimental 1,716 268 2.79Cowan 4 Pickett 1.718 261 2.89
AMCP706-1W
REFERENCES
1. J. Taffenal and H. D ’Autriche, Compt. Rend. 155,1221 (1912).
2. A . S c h m i d t , Z . G e s . Schiess-u-Sprengstoffw. 30, 364 (1935); 31, 8 (1936).
3. W. E. Deal, Phys. Fluids 1,523 (1958).4. S. R. Brinkley, Jr., Proc, Cohf. Chemistry
arid Physics of Detonation,Office o f Navil Research, Jan. 1951.
5. H. Jones, Third Symposlunt on Combustion and Flame and Explosion Phenomena; M iam i & Wilkins, Baltimore, 1949, p. 590.
6 . W. Fickett and W. W. Wood, F.iys, Fluids 1, 528(1958).
7. M. A . Cook, J. Chem. Phys. 15, 513 (1947); sea also M.' A. Cook, Science of High Explosives, Reinhold Publ. Corp., New York, 1958.
8. W . F r i e d e r i c h , Z . Ges . Schieas-u-Sprenfprtoffw. 28, 2, 51, 80, 113
(1933).9. R, O. Cowan and W. Fic.^tt, J. Chem.
Phys. 24, 932 (1956).10. G. B. Kistiakowsky and E. B. Wilson, Jr.,
OSRD Report No. 114,1941.11. James Taylor; Detonation in Condensed
Explosives, Oxford University Press, Oxford, 1952, Chapters 7 and 8.
12. R. Majumbar, Bull. Calcutta Math. Soc. 21, 107 (1929).
13. j . O. Hirschfdder and W. E. Roseveare, J. Phys. Chem. 43 ,15 (1939).
14- J. O, Hiischfalder, D . F. Stevenson, and H. Eyring, J. Chem. Phys. 5,896 (1957).
15. J, O. Hir?chfe!der, F. G. McC!ure, end C. F. Curtiss, OSRD Report No. 547,1942.
16. S. Paterson, Research .1, 221 (1948); see also Reference l i .
17. S. R. Brinkley, Jr. and E. B, Wilson, Jr., OSRD Report N c. 905,1942.
18. R. Bei r, Z .furPhysik4 , 393 (1921).
AMCF 708-180
CHAPTER 8 STRUCTURE OF THE PLANE DETONATION WAVE: FINITER E A C T S . /ONE
8-1 INTRODUCTION,
The elementary theory o f plane detonation waves, described in Chapter 6 , is based on a model in which the reaction zone is idealized as a mathematical plane, thus implying a detonation reaction o f infinite rate and a reaction zone o f zero thickness. The properties o f the detonation wave are then determined by the expressions for the transport o f mass, momentum, and energy across che discontinuity; by the Chapman-Jouguet condition which provides a sufficient description o f the flow behind the detonation front; and by the equation o f state and thermal properties o f the •detonation products. The properties o f the detonation wave are independent o f the rate o f the detonation reaction according to this
' idealized model.This elementary theory correctly describes the
main features o f the detonation process. In particular, it correctly predicts the detonation velocity and the thermodynamic state o f the detonation products o f cylindrical explosive charges initiated at one end, provided, the diameter o f the charge is not too small. However, extension of the theory to more than one dimension—e.g., to the sphericalcharge—involves mathematical difficulties that result from the over-idealization o f the reaction zone to a mathematical surface. Many details of the detonation prr ;ess in finite charges—e.g., the effect o f charge diameter on the detonation of smalt cylindrical charges—arevdetermined by the structure o f the reaction zone. In this chapter, the consequences o f a more realistic model which takes account o f finite reaction rates are investigated; however, we limit the treatment to plane waves propagating in one direction.
direction o f propagation. We fix the origin of the coordinate system in the moving reaction wave and assume that there exists a region of finite extent in the moving coordinate system within which the flow is steady.
The hydrodynamic equations for inviscid flow without heat conduction or diffusion have been given in par. 2-6. For flow in one dimension, they can be written
In these equations, p is the pressure, p is the density, e is the specific energy, and w is the particle velocity measured with respect to the moving origin o f coordinates, lire operator d/dt is the mobile time derivative, denoting the rate o f change with respect to time as measured by an observer moving with the fluid, i.e.,
i , = A JLdt 9t 3x
(8-2)
For steady one-dimensional flow, partial derivatives with respect to time vanish and Eqs;8-1 become
8-2 CONSERVATION CONDITIONS FOR STEADY REACTION WAVES IN ONE DIMENSION
ds p fdp\dx l? \dx)
We assume the existence o f a wave o f chemical reaction propagating in one direction parallel to the x-axis o f a rectangular coordinate system and assume that the properties o f tire flow are constant on planes perpendicular to the
where, in the steady state, the properties o f the fluid are functions only o f the space coordinate x, measured relative to the moving coordinate system. Eqs. 8-3 can bt integrated, with the result
8*1
AMCP7W -1S0
wp = M = constant
p + M2v = P = constant
e + pv + Hiu2 = 42 = constant
(8 4 )
where v is the specific volume. The hew constants have the following significance: M is the mass current, P is the dynamic pressure, and 42 is the kinetic enthalpy. The three quantities are constants o f the flow in a region where the flow is steady and where the effects o f viscosity, heat, conduction, and diffusion can be neglected.
Eqs. 8-4 are supplemented by the reaction rate equations o f par. 2-6
and by the stoichiometric com. ions given in par. 2-2
? = % (8-6)
where the stoichiometric constant qf is the number o f moles o f the j-th component in unit weight o f a hypothetical mixture consisting o f components only. Without loss o f generality, we can assume that the components are assigned the labels i « 1 , 2 , . . . c, so that constituents that are not components are assigned the labels i = c + 1 , c + 2, , . .$. Eqs. 8-5 and 8-6 can then be written in a more explicit form that takes into account the fact that only the f t (, i “ c + 1 , c + 2 , . . . s, can be independently specified. For the steady state, these expressions are
dn.„ R‘ i » c + 1 , ..
d* pw ’
12 0uRr j * 1, 2, ...c
/ - C + 1dx pw(8-7)
The rates 22, are linear combinations o f the rate expression for the elementary reactions occurring in the region o f reactive flow. These rate expressions depend upon the composition, temperature, and pressure. Therefore
R, » 22,(7', p; n, ... n,) ( 8-8 )
and i f the mechanism o f the reaction is known, the expressions summarized by Eq. 8-8 can, at
s-z
least in principle, be evaluated. Eqs. 8 4 are also supplemented by an equation o f state which we may take to be an expression o f the form
p = pip, T; n,......n ) ( 8-9 )
Now, we suppose that fluid is moving from left to right, i.e .,u )>0 . (This convention is opposite to that employed in Chapter 6 .) Further, we suppose that the material to the le ft o f the plane x - 0 is in the uniform state pa ,po with wo - D and 22, = 0 for.all /. A t the plane x = 0, we consider two cases. First, assume that the properties o f the flow are continuous at this plane. Then the constants o f Eqs. 8-4 are given
M = R„D
P - P„ + ft ( 8-1 0 )
SI = e0 + P „ ft * 'AD2 )■ is the specific energy o f the
nonreacting fluid in the uniform state. Alternatively, assume that the reacting fluid in the region x > 0 is. connected to the uniform nonreacting fluid in the r e g io n x < 0 by a shock wave fixed in the plane x » C, i f the properties o f the shocked fluid at x « 0 are designated by a prime, we have
M = p'w'
P “ p ' + p'iw’f ( 8-11)
42 = e’ + p V + Vi{ui')*Here c ' is the specific energy o f the material at pressure p ' and specific volume v1 having the same composition as die material in the uniform state at po and vo. Assuming that the shock can be represented by a discontinuous transition from the unshocked to the shocked state at constant composition, we may employ conservation conditions o f par, 2-8 and transform Eqs. 8-11 to expressions that are identical with. Eqs. 8-10. Thus Eqs. 8-10 can be employed for the tw o cases under consideration. Combining them with Eqs. 8-4, we obtain
pw = paD
p + pw2 = pQ + | (8 4 2 )
e + pv + lAw2 - e0 + p01’0 + ViD2 )
A M C f 708-1*0
The left-hand members o£ Eqs. 8-12 are evaluated at fixed arbitrary values o f the x-coordinate, x > 0. I f the first o f Eqs. 8-12 is employed to eliminate w from the second, we obtain
p jD 2 - - (p - Po)l(v - vB) C M 3)
I f the first and second o f Eqs. 8-12 are employed to eliminate w and D from the third, we obtain
e - e„ = 'A(p + p0)(vo - v) (8-14)
I f we denote by u “ D - w the particle velocity in the re(pon3t > 0 relative to that o f the uniform state existing in the region x < 0 , the first o f Eqs.8 -12 becomes
p{D - « ) = p0D (8-15)
I f the uniform state is at rest in a laboratory system o f coordinates, u is the particle velocity in a laboratory system o f coordinates.
Examining Eqs. 8-7 and 8-12, we note that we have s + 3 equations connecting the a + 4 variables n(, p, p, u, and D when the uniform state is specified. (The equation o f state and thermal properties o f the explosion products determine the specific energy e as a function o f n(, p, and p.) The indeterminacy corresponds, for detonations, to 'the absence o f the Chapman-Jouguet condition from the equations. Insofar as these equations are concerned, we may regard D as a parameter whose value can be specified. Eqs. 8-7 and S-12 are then in a formal sense determinant, determining each o f the dependent variables as functions o f x and D. Thus, the solutions o f Eqs, 8-7 and 8-12 determine a two parameter sequence o f states through the moving reaction wavo. It is necessary, in principle, to determine the values o f D for which these equations have suitable solutions. For the general case o f multiple simultaneous reactions terminating in an equilibrium state, this presents a formidable problem.
A model that is easily visualized and that provides a useful description o f the reaction wave is obtained by assuming that the reaction proceeds toward a final invariant composition that can be specified a priori independently o f
final prtssu.e and density. A progress variable £ can then be introduced by the relation
e(£) = (P,v) + (1 £k,(P ,u ) (8-16)
where e, is the specific energy Of the products and eo is the specific energy o f the reactants, cash considered a function o f p and v. In this approximation, Eq. 8-14 can be written
SV-P.w) + t1 “ £)co(P.u) ( g ,17)
" e,(p0,va) = !A(p + p„)(u„ - u)
where p and v are to be regarded as functions o f the progress variable £. When £ = 1, Eq. 8-17 is identical with the Hugoniot equation fo r instantaneous reaction. Eq. 8-17 describes a family o f curves in the (p,v)-plane, each member o f which is labeled by a value p f £ with 0 < £ < 1 . For exothermic processes w ithep (p,o,l> e 1 (p,c) this family consists o f nonirlterseeting curves that are concave upward. Eq. 8-13 is the equation for die Rayleigh line. With p and v regarded as functions o f £, the reaction in a steady reaction wave is constrained to states on this line. When we employ die subscript unity to identify properties o f the flow when £ ■ 1, Eqs. &-13 #u"d 8-i7 become identical with the analogous expressions o< Chapter 6 .
8-3 THE STEADY D EFLAGRATION WAVE
The branches o f the family o f curves given by Eq. 8-17 for which p(i-) < p Q describe the states in a steady deflagration wave that, satisfy the conservation equations. These curves are shown in Fig. 8-1, together with a Rayleigh line OABC. This Rayleigh line represents two d if fe re n t processes with the same propagation velocity D. One consists o f a discontinuous tr-msttion in the unreacted material from the state O to the state C, followed by the reaction zone represented by the segment o f the Rayleigh line CB along which £ changes from 0 to 1, terminating in state B which is a strong deflagration. The other consists o f the continuous transition from the state 0 to the state A, which is a weal: deflagration, along the segment o f the Rayleigh line OA for which £ changes torn 0 to 1. It has been noted in par. 2 -8 that a nonreactive rarefaction shock, as in the transition from O to C, docs not exist since it would entail a decrease in entropy and violate
ft-3
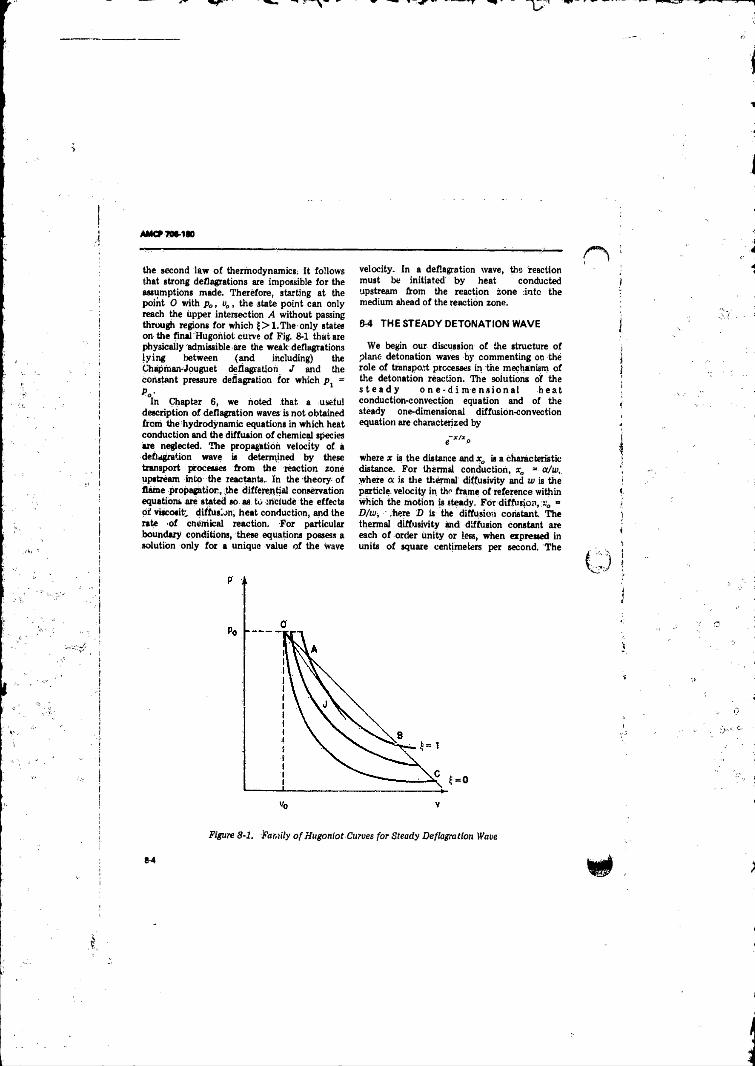
AMCP706-1S0
the second law o f thermodynamics; It follows that strong deflagrations are impossible fo r the assumptions made. Therefore, starting at the point 0 with p0, v0 , the state point can only reach the upper intersection A without passing through regions fo r which j ;> l.T h e only states on the final Hugoniot curve o f Fig. 8-1 that are physically admissible are the weak deflagrations ly in g between (and including) the Chapman-Jouguet deflagration J and the constant pressure deflagration for which p =
PaIn Chapter 6 , we noted that a useful
description o f deflagration waves is not obtained from the bydrodynamic equations in which heat conduction and the diffusion o f chemical species are neglected. The propagation velocity o f a deflagration wave is determined by these transport processes from the reaction zone upstream into the reactants. In the theory o f flame propagation, the differential conservation equations are stated so- as. to include the effects o f viscosity diffusion, heat conduction, and the rate o f chemical reaction. For particular boundary conditions, these equations possess a solution only for a unique value o f the wave
velocity. In a deflagration wave, the ^reaction must be initiated by heat conducted upstream from the reaction zone in to the medium ahead o f the reaction zone.
8-4 THE STEADY DETONATION WAVE
We begin our discussion o f the structure o f plane detonation waves by commenting on the role o f transport processes in the mechanism o f the detonation reaction. The solutions of the s t e a d y o n e - d i me n s i o n a l h e a t conduction-convection equation and o f the steady one-dimensional diffusion-convection equation are characterized by
where x is the distance and xa is a characteristic distance. For thermal conduction, x0 »■ ot/w, where a is the thermal diffusivity and w is the particle, velocity in the frame o f reference within which the motion is steady. For diffusion, = D/w, .here D is the diffusion constant. The thermal diffusivity and diffusion constant are each o f order unity or less, when expressed in units o f square centimeters per second. The
Figure 8-1. Fam ily o f H u gon io t Curves fo r Steady Deflagration Wave
BA
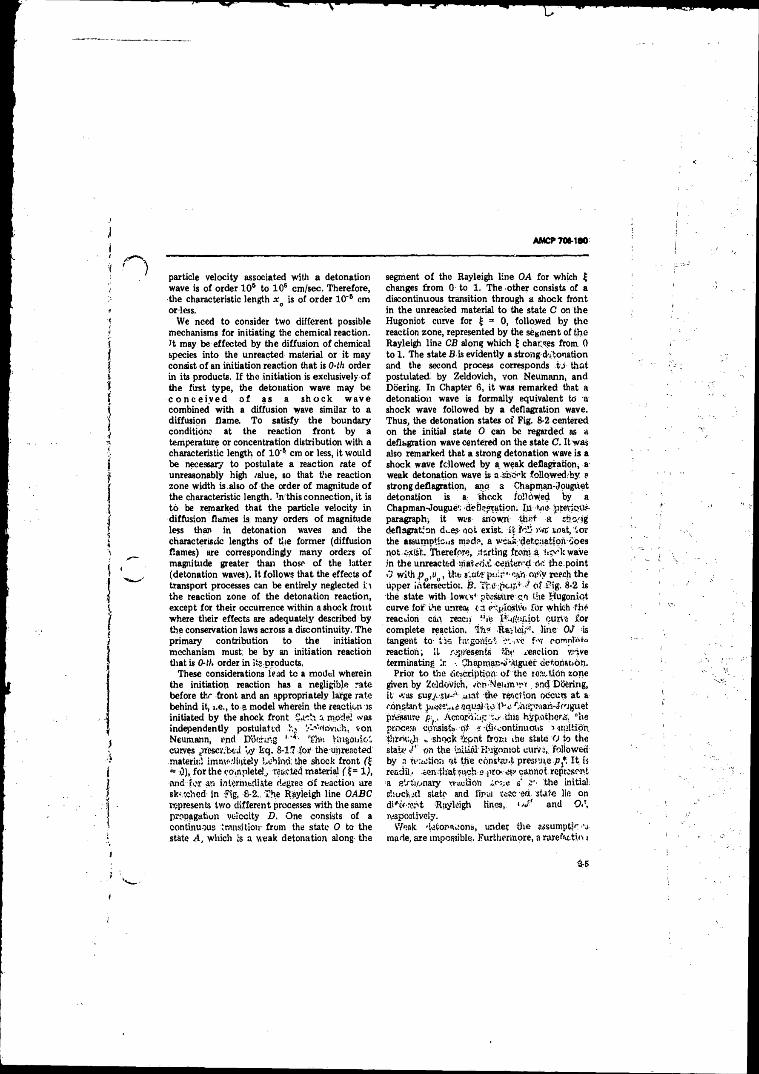
AMCP 706-180
particle velocity associated with a detonation wave is o f order 10s to 106 cm/sec. Therefore, the characteristic length * o is o f order 1 0 '6 cm or-less.
We need to consider two different possible mechanisms for initiating the chemical reaction. It may be effected by the diffusion o f chemical species into the unreacted material or it may consist o f an initiation reaction that is 0-th order in its products. I f the initiation is exclusively o f the first type, the detonation wave may be c o n c e i v e d o f as a s h o c k w a v e combined with a diffusion wave similar to a diffusion flame. To satisfy the boundary conditionr at the reaction front by a temperature or concentration distribution with a characteristic length o f 1 0 ’5 cm or less, it would be necessary to postulate a reaction rate o f unreasonably high /alue, so that the reaction zone width is also o f the order o f magnitude o f the characteristic length. In this connection, it is to be remarked that the particle velocity in diffusion flames is, many orders o f magnitude less than in detonation waves and the characteristic lengths o f the former (diffusion flames) are correspondingly many orders o f magnitude greater than those o f the latter (detonation waves). It follows that the effects o f transport processes can be entirely neglected 1 i the reaction zone o f the detonation reaction, except for their occurrence within a shock front where their effects are adequately described by the conservation iaws across a discontinuity. The primary contribution to the initiation mechanism must: be by an initiation reaction that is 0-th order in Its products,
These considerations lead to a model wherein the initiation reaction has a negligible rate before the front and an appropriately large rate behind it, i.e., to e model wherein the reaction is initiated by the shock front Such a model was independently postulated i".; /-•'■dovich, von Neumann, end D'daring T'hh Vliigoniot curves prescribed Vy t'q . 8-17 fo r the u.breacted materis' imme.'.Hnieiy behind the shock front (£ = *5), fo r the completely reacted material (£ = 1 ), and for an interm.tritete degree o f reaction are sketched in Fig, -8-2., The Rayleigh line OABC represents two different processes with the same propagation velocity D. One consists o f a continuous transition- from the state 0 to the state A, which is a weak detonation along the
segment o f the Rayleigh line OA for which £ changes from 0 to 1. The other consists of a discontinuous transition through a shock front in the unreaefced material to the state C on the Hugoniot curve for £ = 0, followed by the reaction zone, represented by the segment of the Rayleigh line CB along which £ charges from 0 to 1. The state B is evidently a strong-detonation and the second process corresponds td that postulated by Zeldovich, von Neumann, and Doering. In Chapter 6 , it was remarked that a detonation wave is formally equivalent to a shock wave followed by a deflagration wave. Thus, the detonation states o f Fig. 8-2 centered on the initial state 0 can be regarded as a deflagration wave centered on the state C. It was also remarked that a strong detonation wave is a shock wave followed by a weak deflagration, a weak detonation wave is a shock followed hy a strong deflagration, anq a Chapman-Jouguet detonation is a, "shock followed by a Chapman-Jougue'; deflagration. Hi -tne previous paragraph-, it was snowjrv tterf St sit&'ig deflagration dee? not exist, i f JdS vme mat, tor the assumptions nude, a wcak detpaatiph does not exist. Therefore, starting-tews 4 •bpokwaVe in the unreacted materia. ceriiard On d ie point y) with.p , the sfata poir'-cah om'y reach the upper intersection B. o f i?ig. 8-2 isthe state with lowes* pressure on the Hugoniot curve for' ihe unreal * a evplqsiye for which the reaction can reach t*ife jfcigwdot curie fo r complete reaction. Tha -ttajieiT1- lins Of 4s tangent to t ic hugoniot >.•<«* f-'v -rompF™ reaction; it represents the reaction w-ive terminating ir ChaprsiaP'Shuguef deioiiahon.
Prior to the description of the reaction zone given by Zeldovich, veri'Neum'ri and Dciering, it was sug . svi-''- aiat -fee reaction occurs at a constant squal:ip:t'-c-,;h!Sv,r<iah-df'iguetpressure js>, Accordunp V tills hsp*thcr& *he procesfi consists of dkcontmuotiS i-iruitipnthrovuli » -shock 'ipnt from ihe state <) to the state f ' pn the initial rlugonsot curve,, followed by a rertction at the cbnsto.t pressure p*. It, is rcndil, aemthat?u.che pro- e$s> cannot, represent -a girti.wiary reisulaon zone s’ O'- the initial, shuefct'd state and final veac -ed sUte lie on difwre.rit Rayleigh tines, l'J ' and Od,respectively.
Pfeak detonacons, under the assumptir -s made, are impossible. Furthermore, a rarefmtiivt
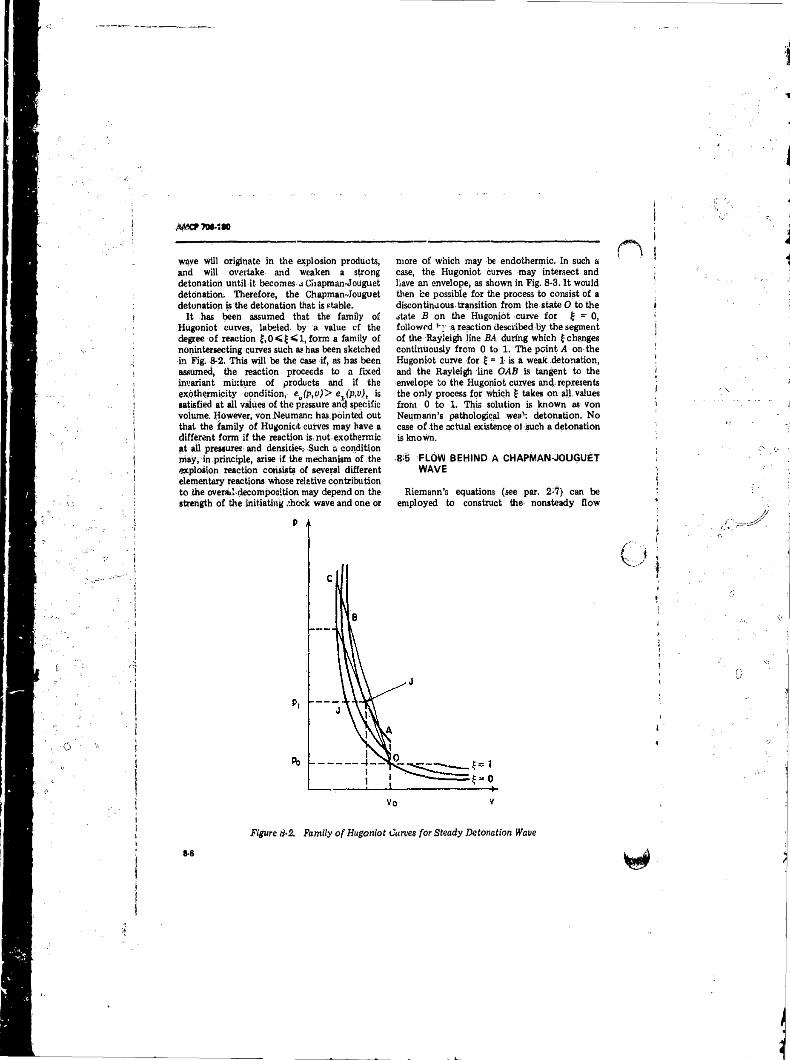
wave will originate in the explosion products, and will overtake and weaken a strong detonation until it becomes a Chapman-JoUguet detonation. Therefore, the Chapman-Jouguet detonation is the detonation that is stable.
I t has been assumed that the: family of Hugoniot curves, labeled by a value c f the degree o f reaction £,0 < £ < 1 , form a family of nonintersecting curves such as has been sketched in Fig. 8-2. This will be the case if, as has been assumed, the reaction proceeds to a fixed invariant mixture o f products and if the exdthermicity condition, e jp ,u )> e (p,v}t is satisfied at ail values o f the pressure and specific volume. However, von Neumann has,pointed out that the famUy o f Hugoniot curves may have a different form if the reaction is not exothermic at ail pressures and densities Such a condition niay, in principle, arise i f the mechanism o f the explosion reaction consists of several different elementary reactions whose relative contribution to the overad decomposition may depend on the strength o f the initiating shock wave and one or
more o f which may be endothermic. In such a case, the Hugoniot curves may intersect and liave an envelope, as shown in Fig. 8-3. I t would then be possible for the process to consist o f a discontinuous, transition from the state O to the state B on the Hugoniot curve fo r £ - 0, followed a reaction described by the segment o f the Rayleigh line BA during which {changes continuously from 0 to 1. The point A on the Hugoniot curve for £ = 1 is a weak detonation, and the Rayleigh line OAB is tangent to the envelope to the Hugoniot curves and. represents the only process fo r which £ takes on all. values from 0 to 1. This solution is known as von Neumann’s pathological weak detonation. N o case o f the actual existence ol such a detonation is knoWn.
8 3 FLOW BEHIND A CHAPMAN-JOUGUET WAVE
Riemann’s equations (see par. 2-7} can be employed to construct the nonsteady flow
Figure ii-2 . Fam ily o f H u gon io t C a m s f o r Steady D eton a tion Wave
8-6
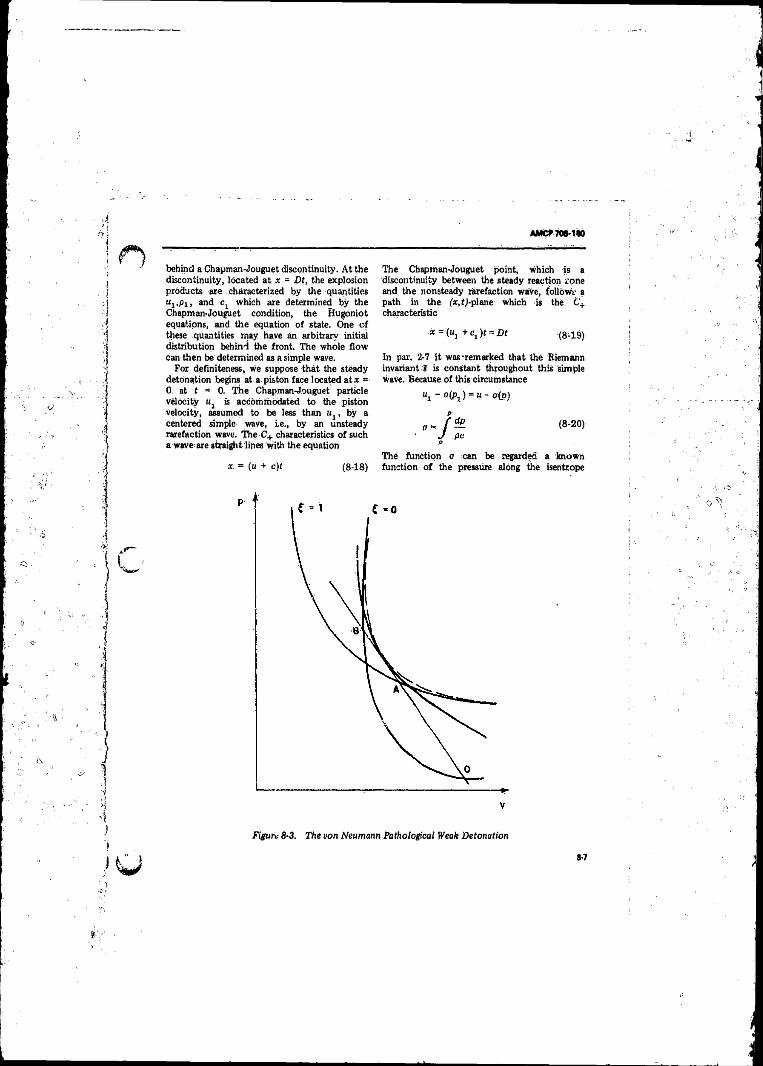
AMCP706-140
behind a Chapman-Jouguet discontinuity. A t the discontinuity, located at x = Dt, the explosion products are characterized by the quantities ul t p i, and cx which are determined by the Chapman-Jouguet condition, the Hugoniot equations, and the equation of state. One o f these quantities may have an arbitrary initial distribution behind the front. The whole flow can then be determined as a simple wave.
For definiteness, we suppose that the steady detonation begins at a piston face located at.x = 0, at t = 0. The Chapman-Jouguet particle velocity u is accommodated to the piston velocity, assumed to be less than ux , by a centered simple wave, ie., by an unsteady rarefaction wave. The C+ characteristics o f such a wave are straight lines with the equation
x = (u + c)t (8-18)
The Chapman-Jouguet point, which is a discontinuity between 1he steady reaction zone and the nonsteady rarefaction wave, follows a path in the (x.tj-plane which is the C'+ characteristic
* = ( “ i + c 1)t = J5f (8-19)
In par. 2-7 it was-remarked that the Riemahn invariant J is constant throughout this simple wave. Because o f this circumstance
u! " o (P j) = u - oQ>)
p-
The function a can be regarded a known function o f the pressure along the isehtrope
F igu re 8-3. The von Neum ann Patholog ica l Weak D eton a tion
8-7
AM S? 706-180
passing through the Chapman-Jouguet state. Therefore, Sq. 8-20 provides one relation between the pressure p and the particle velocity u. Along this isentrope, the acoustic velocity c can also be regarded a known function o f the pressure. Eq. 8-18 thus provides a second relation, connecting the pressure and particle velocity to the reduced distance variable x/Dt
u + c (p ) = (Uj + Cj.l (x/Dt) (8-21)
Eqs. 8-20 and 8-21 determine the particle velocity and pressure in the rarefaction: wave as functions o f the reduced distance x/Dt. For general equations o f state, they can be solved numerically from tables o f c and a versus the pressure. When the pressure distribution through the rarefaction wave is known, the distributions o f the other thermodynamic variables through the wave are determined since these variables depend only oh the pressure along a prescribed isentrope.
I f the explosion products obey a polytropic law, Eqs. 8-20 and 8-21 can be solved explicitly. I f the adiabatic exponent is K, the results can be written in the form
K + 1 U,
c_ _ 2 K - 1 D£ - nt
K + 1 K + 1 D - Uj
p j 2 < K - ! j f -
pi !(K + 1 K + 1 D - ll'j.
£ _ j _ 2 _ | K - l -P f - « r | W - 1
Pj (K + 1 K + 1 D - Ujj
(8-22)
where f = */Dt. It will be noted that the particle velocity and acoustic velocity are linear functions o f the reduced distance f fo r this case. The solution for a polytropic gas was obtained by Taylor, and the unsteady flow behind the Chapman-Jouguet detonation is sometimes called the Taylor wave. Eqs. 8-22 assume a particularly simple form when k = 3, Then
— - 1 m - 1)
Hm - “i D - u.
+ I f
p \d £ - “ .(~ = 1/8 - - --- i - H Pi I D - ui >
(8-23)
p \D£ - u I ■ = 'k -----5 + 1D - u.
In this case, the density is also a linear function o f the reduced distance f . This particular solution is of interest since the explosion products o f condensed explosives obey, approximately, a polytropic law with an adiabatic exponent in the neighborhood o f 3 5,6. It can, therefore, be expected to display qualitatively the features of the flow associated with such explosives.
The transient portion o f the flow is terminated by the straight characteristic along which the particle velocity is equal to the piston velocity. Th ' .haracteristic separates the transient flow from a uniform flow. The uniform flow is found by the solution o f Eqs. 8-20 and 8-21 with u set equal to the piston velocity. The case o f steady detonation initiated at a rigid fixed wall corresponds to a terminal characteristic along which u = 0. In the polytropic casej from the first o f Eqs. 8-22; the uniform state at rest extends from the back wall to a point given by
C = 1 -K + 1
2when u = 0
= 1 - 2(uJD) fo r k = 3
(8-24X
For condensed explosives, the ratio uJD «1 / 4 so that 5 ~ 1/2 when k -■ 3. For this case, the pressure on the back wall can be calculated from the third o f Eqs. 8-23. Using K = 3, f = 1/2, and Uj/D = 1/4, we obtain the order o f magnitude resultp/Pj 8/27.
From these considerations, we see that the reaction zone is followed by a column o f forward-moving explosion products, the length
8-8
AMCP 706-1*0
o f which increases linearly with time. For a solid explosive, the length o f this column is o f the order o f one-half the distance traversed by the detonation wave from its point o f initiation. If initiation is at a rigid wall, the column of forward-moving products is followed by a column o f stationary gas which also increases in length and within which the pressure is constant.
Shear7 has employed numerical methods to solve Eqs. 8-20 and 8-21 fo r the explosive pentolite at a loading density o f 1.65 g/cm3. He employed the equation of state o f Halford, Kistiakowsky, and Wilson to construct the isentrope through the Chapman-Jouguet state and obtained the function a by numerical integration. The particle velocity and pressure through the Taylor wave fo r a detonation originating at a rigid surface as determined by these calculations are shown in Fig. 8-4. It is interesting to note that in Shear’s detailed calculations, u = 0 and p/p1 - 0.295 at J = 0.483. For the polytropic gas with K = 3, D. = 4u , we have obtained the estimate, u = 0 and p/p = 0.296 at f = 0.5.
Suppose that the point x = 0 represents an interface between explosive and air, i.e., that the plane o f initiation is unconfined and that a Chapman-dotiguet detonation is initiated at t - 0 on this interface. There will then result a backward flow o f explosion products in the negative x-direction. This flow is the same as though the piston o f our model is conceived to begin to- move at t = 0 with a constant velocity sufficient to reduce the pressure on the piston to the ambient air pressure. The velocity o f the air-explosion product interface can be determined by solving Eqs. 8-20 and 8-21 with p = po. For „he polytropic case, and neglectingpo compared- to p1, we obtain from Eqs. 8-22 the result
U K. +■ 1
Mj X - 1when p » 0
(8-25)
= 2 - D/u, fo r x = 3
Thus, fo r a condensed explosive with k - 3, D = 4Uj , we obtain the order o f magnitude result chatn/uJ = - 2 .
We have seen that when the rear surface o f the explosive charge is uuconfined, the flow behind the reaction zone consists o f a column of forward-moving explosion products, the length
o f which increases linearly with time, followed by a column o f backward-moving products whose length also increases linearly with time. For a solid explosive, the length of the backward-moving products is o f the order of twice the length o f the forWard-moving products and the negative velocity o f the air-product interface is o f the order o f twice the (forward) particle velocity o f the Chapman-Jouguet state.
Equations o f state o f detonation products 5,6 ,8 have been generated from hydrodynamic properties o f the products measured by impedance mismatch methods9,10 . The early work o f Lawton and Skidmore, and Deal showed that shock compressions and adiabatic expansions- o f the detonation products from- the Chapman-Jouguet state in many high, explosives are consistent with a- polytropic -et/atjon of state. The value o f the polytropic index above 100 kbar is found to be about 3, Further work by Skidmore and Hart11 on overdriven detonation waves in Composition B in the 300 kbar regime indicates that the simple polytropic relationship with a constant indiac appropriate to the Chapman-Jouguet state is adequate for predicting overdriven detonation wave properties, shock compressions, and adiabatic expansions from a given overdriven state. Equations o f state o f detonation products applicable over a wider pressure range below the Chapman-Jouguet state have been generated for many explosives by Wilkins12 and coworkers at the Lawrence Radiation laboratory. The basis o f the method is to use the energy-pressure-volume equation o f state o f the products as a variable in a two-dimensional code for calculating the radial expansion o f a copper vessel containing a detonating explosive. Numerical experiments are performed with a computer until calculated expansions agree with those observed experimentally.
8-6 THE DETONATION WAVE WITH EQUILIBRIUM PRODUCT COMPOSITION
In order to provide an easily visualized model o f the detonation wave reaction zone, we assumed in par, 8-4 that the detonation reaction proceeds to a fixed composition that is known a priori. With this assumption, it was possible to define a “ degree o f reaction” and to employ this parameter to characterize points within tire reaction zone at which the reaction is
8-9
dim
en
sio
nle
ss
AM Cf 706-1SC )
Figure 8-4. Pressure and Particle Velocity Behind an Unsupported Chapman-Jouguet Detonation
8-10
AMCP 706-180
incomplete. The degree o f reaction was thus described by the progress variable £, defined by Eq. 8-16 as the fraction o f the energy of explosion released at the point in the reaction zone characterized by a particular value o f £.
Under these assumptions, Hugoniot curves can be constructed for all points in the reaction zone between the initiating shock wave and the point at which the reaction is complete, each curve being labeled by a value o f £. Within the context o f the model employed, these curves have physical meaning, representing the locus o f all states that are compatible with the conservation conditions and for which the amount, o f energy released is given by Eq. 8-16. Under these assumptions, no ambiguity is encountered in the statement o f the Chapman-Jouguet condition since the Hugoniot curve for complete reaction is a curve fo r constant composition. This curve is tangent to an isentrope along which the composition is constant and whesfe slope is characterized by the frozen sound speed in which the differentiation is performed at constant composition. The Chapman-Jouguet condition can thus be written in the usual way in terms o f the frozen speed o f sound.
However, the final Hugoniot cu.ve is supposed to describe the states that are compatible with the conservation conditions when all o f the reaction rates ft. o f Eqs. 8-7 have vanished, i.e,, wheii the explosion products are in thermodynamic equilibrium. Therefore, the final Hugoniot curve o f Fig. 8-2 does not necessarily represent physically accessible states o f the explosion products and it may, in fact, not even be a good approximation to the states that can actually be reached from different points.on the initial Hugoniot curve.
Suppose that the segment o f the Rayleigh line CB o f Fig. 8-2 represents an actual reaction process, initiated at the state C on the initial Hugoniot curve and terminating at the state B. In general, the Hugoniot curves labeled with different values o f the progress variable £ and drawn for constant composition represent physically real (i.e., accessible) states only at their points o f intersection with this particular Rayleigh line. If a different process—represented by a Rayleigh line from a different point on the initial Hugoniot curve—is considered, the fixed composition Hugoniot curves, drawn for particular values o f the progress variable £, will
not in general coincide with those for the first process. In other words, the sequence o f states between the initial Hugoniot curve and the final (equilibrium) Hugoniot curve, each o f which represents a locus of physically real states, depends not only on the fraction o f energy released but also on the position on the initial Hugoniot eu -;c from which the process starts. Thus, in general, the sequence o f states in the reaction zone o f a detonation wave depends on a progress variable such as £ and an additional parameter which may be the detonation velocity D.
Although it is evident that a single parameter cues not suffice in principle to prescribe- a unique family o f curves o f the von Neumann type (such as those o f Fig. 8-2), descriptive of states within the reaction zone that are reached from aiiy poitic on the initial Hugoniot curve, such a model may provide a useful approximate description. This would be the case i f only one reaction process were to be involved, or alternatively i f all other reactions were to have much faster reaction rates so that a state of quasi-equilibrium, is approximately established at each stage. In practice, a single reaction will hardly ever be sufficient to describe the reaction process, but it may very well happen that one particular step is much slower (ban the rest. Thus, for example, in granular explosives it can frequently be assumed that grain or surface burning determines the rate of release o f energy, and that this process is followed by equilibration among the products at a much faster rate.
It has been customary tacitly to assume that the equilibrium sound speed should be employed in defining the stable velocity o f a detonation wave that is not supported by a piston when the reaction terminates in an equilibrium state. Although many numerical calculations have been conducted in which the frozen sound speed was employed- for this quantity, it has been assumed, either explicitly or implicitly, that this simplification is an approximation, justified by the fact that the two different statements o f the Chapman-Jouguet condition do not lead to very different values of the detonation velocity.
Wood and Kirkwood13 have shown that if a stable Chapm a-Jouguet detonation wave exists, its velocity must be determined by a Chapman-Jouguet condition in which the
8 -1 1
AM CP 706-180
equilibrium sound speed is employed. This implies a physical model in which the reaction is initiated in a shock front and terminates at the leading edge o f a rarefaction wave at which point the reaction is complete and the explosion products are in thermodynamic equilibrium. Consider the reaction pictured in Fig. 8-5 that is initiated at the point C on the initial Hugoniot curve S and during which the state point moves along the Rayleigh line CB' B. Let the point B be an equilibrium state at which the Rayleigh line is tangent to Hugoniot curve F at fixed composition for the composition o f the point B. Let the Hugoniot curve E be the curve for equilibrium states that is also centered on the point (po,vo). This curve evidently passes through the point B. It can be shown by the thermodynamic equilibrium conditions that the curve E lies to the left o f the curve F for pressures greater than the pressure at the point B. The Rayleigh line CB thus has a point of intersection with the equilibrium at a point, say a , that lies between the points C and B. It follows that the predicated process cannot terminate at the state B' but must terminate at the state B' which also an equilibrium state. Now , the wave of minimum velocity that terminates in a point on the equilibrium Hugoniot curve is the wave whose Rayleigh line is tangent to the equilibrium Hugoniot curve. It has besn shown in Chapter 6 that the equilibrium Hugoniot curve is tangent to an equilibrium isentrope at its point o f tangency. to the Rayleigh line. Thus the slope o f the Rayleigh line at this point is characterized by the equilibrium sound speed. Our physical model implies that this is the speed at which the raref- ation wave advances into the explosion products. It is to be noted that this argument does not prove the stability o f the postulated flow.
The curves for the rates of the chemical reactions that occur in the reaction zone as functions o f time must be asymptotic to the time axis for any reasonable rate laws. Therefore, if the reaction terminates in an equilibrium state, the separation distance between the shock front and rarefaction wave must, in the one-dimensional case, be infinite. This formal result is without substantial practical importance fo r two reasons. The first is that even in the theoretical one-dimensional
case, the reaction of substances o f practical interest is substantially complete in a short distance behind the shock front, so that an effective reaction zone thickness exists that is finite but o f somewhat indeterminate extent within which all but an infinitesimal amount of the energy o f reaction is released. The second is that in detonation waves o f explosive charges of finite extent, the position o f the rarefaction wave in the flow is unambiguously fixed by other dynamical considerations. Thus, these considerations o f the nature o f the stability conditions for the one-dimen-slonal detonation wave are mainly o f theoretical interest. Although the matter is not satisfactorily settled, it appears from these considerations to be plausible that a detonation wave with a steady reaction zone terminating at a rarefaction wave in an equilibrium state exists only in an asymptotic'sense.
On this basis, the results are physically reasonable. The isentropes which appear in a theory based on equilibrium Hugoniot curves must necessarily themselves correspond to equilibrium changes. This is physically acceptable since the infinitesimal rarefactions that enter into the Chapman-Jouguet theory are presumably real rarefactions, involving a change in composition when the system is one in which such changes can occur. Since we are here concerned with the asymptotic properties o f a rarefaction wave whose gradient approaches zero with time, it is physically acceptable that the sound speed appearing in the theory be that characteristic for the propagation o f sound in the limit o f zero frequency.
We have shown that a steady reactive flow exists in which the reaction is initiated in a shock wave and terminated at a rarefaction wave advancing into the equilibrium mixture of explosion products with the equilibrium velocity o f sound. (We have not shown that this flow is stable.) We now want to exclude other possibilities. Brinkley and Richardson14 haye supposed that the rarefaction wave is located a finite and fixed distance downstream from the shock wave. They have shown that 3 steady flow exists between the shock wave and the leading edge of the rarefaction wave, and that the propagation velocity o f the rarefaction wave relative to tire explosion products is the frozen «cund speed. They called such Dows subideal
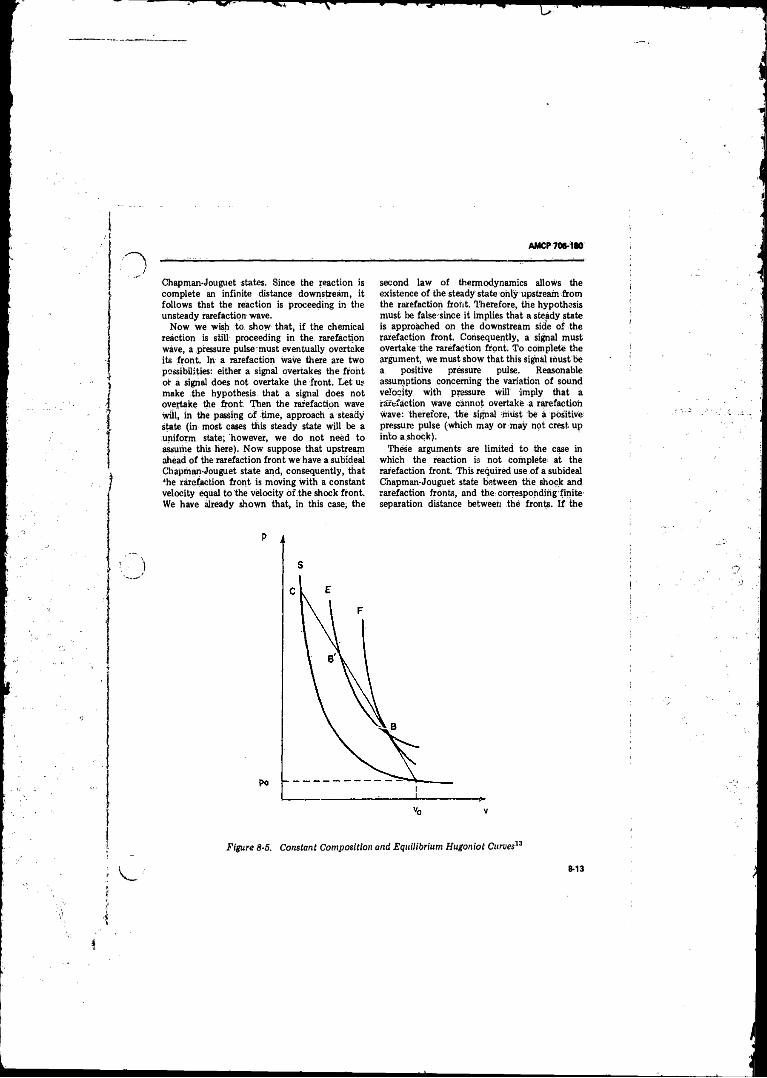
AMCP 706-1*0
Chapman-Jouguet states. Since the reaction is complete an infinite distance downstream, it follows that the reaction is proceeding in the unsteady rarefaction wave.
Now we wish to show that, i f the chemical reaction is still proceeding in the rarefaction wave, a .pressure pulse-must eventually overtake its front. In a rarefaction wave there are two possibilities: either a signal overtakes the front o f a signal does not overtake the front. Let us make the hypothesis that a signal does not overtake the front. Then the rarefaction wave will, in the passing o f time, approach a steady state (in most cases this steady state will be a uniform state; however, we do not need to assume this here). Now suppose that upstream ahead o f the rarefaction front we have a subideal Chapman-Jouguet state and, consequently, that *he rarefaction front is moving with a constant velocity equal to the velocity Of the shock front. We have already shown that, in this case, the
second law o f thermodynamics allows the existence o f the steady state only upstream from the rarefaction front. Therefore, the hypothesis must be false since it implies that a steady state is approached on the downstream side o f the rarefaction front. Consequently, a signal must overtake the rarefaction front: To complete the argument, we must show that this signal must be a positive pressure pulse. Reasonable assumptions concerning the variation o f sound velocity with pressure will imply that a rarefaction wave cannot overtake a rarefaction wave: therefore, the signal must be a positive pressure pulse (which may or may not crest up into a.shock).
These arguments are limited to the case in which the reaction is not complete' at the rarefaction front. This required use o f a subideal Chapman-Jouguet state between the shock and rarefaction fronts, and the correspohdihg finite' separation distance between the fronts. I f the
Figure 8-5. Constant Composition and Equilibrium Hugoniot Curves13
8-13
AM CJ> 706-180 AMC? 706-1B0
reaction is complete at the rarefaction front, the ideal Chapman-Jouguet state will exist between the two fronts, and the rarefaction front will be an infinite distance downstream from the shock front. In this case a rarefaction wave can behave in the usual fashion, with no signals overtaking its front, and can approach a uniform steady state without contradiction since there is now no definite limit downstream for the steady state.
These considerations lead us to the conclusion that, in the one-dimensional case, i f the reaction is not complete at the rarefaction front, the chemical energy will not be lost forever behind the front. A t least a certain fraction o f the energy must eventually be delivered upstream in the form o f a positive pressure pulse. However, in two- or three-dimensional processes a sidewise expansion in the rarefaction wave is possible with the result that signals may never overtake the front, and the total amount o f the chemical energy liberated in the rarefaction may never be delivered upstream.
Brinkley and Richardson erroneously concluded that the propagation velocity, the asymptotic ideal Chapman-Jouguet wave in one-dimension, is defined by the frozen sound speed. We have shown that this cannot be the case and have inferred from arguments o f physical plausibility and from the demonstration o f Wood and Kirkwood that the asymptotic wave, i f it exists, is characterized by the equilibrium sound speed. In an earlier paper, Kirkwood and Wood15 had reached similarly erroneous conclusions. They had noted that when specialized to one-dimensional How, the general equations for reactive flow give a system of hydrodynamic equations which is hyperbolic and irreducible, and for which the characteristic sound speed is the frozen sound speed. This property o f the equations led them to the same conclusion that had beer, reached by Brinkley and Richardson., Subsequently, Wood and Kirkwood presented the elementary proof, that has been summarized, that the frozen Chapman-Jouguet state cannot be reached in a one-dimensional steady detonation.
Wood and Salsburg16 have conducted the most complete theoretical study o f the existence and stability o f steady state supported one-dimensional detonation waves. It is beyond the scope o f our treatment to reproduce their analysis in detail. Their work is, however, the
definitive treatment at this time o f this subject. T h ey consider the possible steady one-dimensional flows that can occur in a medium in which an arbitrary number o f chemical reactions proceed behind an initiating shock wave, and they investigate the stability o f solutions to the chemical rate equations in conjunction with such flows. They show that, under suitable conditions on the chemical rate functions, there are stable solutions resulting in equilibrium final states for detonation velocities equal to or greater than those fo r an equilibrium Chapman-Jouguet condition corresponding to tangency o f the Rayleigh line to the equilibrium Hugoniot curve. They suggest that these solutions correspond to piston-supported detonations after the decay o f initiation transients, and that the equilibrium Chapman-Jouguet detonation is stable with respect to. the removal o f the piston after a sufficiently long time. They also show that the frozen Chapman-Jouguet detonation, in which equilibrium is attained at a point where the flow velocity is sonic in terms of the frozen sound speed, is unstable.
8-7 FINE STRUCTURE OF DETONATION IN GASES AND LIQUIDS
Experimental investigations since the late 1950's have shown that self-sustaining gaseous detonations propagate as three-dimensional nonsteady waves father than as one-dimensional steady-state waves. In view o f this discovery, it is necessary to give a brief discussion o f recent developments in the study o f detonation structure. For more details the reader is referred to the reviews o f Wagner11; Oppenheim, Manson, and Wagner18 ; Schott18 ; Soloukhin20; Shchelkin21 ; van Tiggelen and de Soete22 Strehlow25 ; and Edwards24.
Although Chapman-Jouguet theory predicts gaseous detonation velocities to within a few percent 25 , recent experimental studies 18‘?1' is-28 have led to the conclusion that the one-dimcnssonal model o f the detonation wave is an approximation. Careful examination o f gaseous detonation shows that the detonation front has a fine structure composed o f a system o f unsteady interacting shocks and is not a plane shock. The existence o f such fine structure in self-sustaining gaseous detonation shows the detonation to be a three-dimensional nonsteady
AMCP70S-180
phenomenon that exhibits steady gross characteristics. White20 first associated the fine structure with turbulence in the reaction zone, but it was later identified with Mach interactions27'30 . In a self-sustaining detonation, points at which the forward propagating curved shocks intersect travel across the detonation front as waves25. These transverse waves occur at the detonation front as Mach stems or triple shock intersections o f finite amplitude31'32 . As shown by Oppenheim and Urtiew23, the motion o f the triple points writes the pattern on the smoked surface in studies o f detonation structure nploying the smoke track technique developed Denisov and Troshin33 .
The occurrence and structure o f transverse waves have bet amined extensively by Strehlow and coworkers34'37 . The experimental evidence suggests that transverse waves are an inherent property o f the flow behind a shock that initiates an exothermic reaction. Transverse waves are produced in initiation of detonation in controlled one-dimensional experiments, and are observed repeatedly in self-sustaining, overdriven, and spherical detinations. Examination o f cell patterns on smoke track records shows that transverse waves exhibit a well-regulated spacing in many self-sustaining detonations. The regularity depends on the confining geometry and the nature o f the chemical system supporting the detonation. In rectangular tubes, the characteristic size of a regular patter is dictated by the initial pressure level and the amount o f diluent present in the rea'ctive mixture. A t present, transverse wave spacing is thought to be controlled primarily by induction and recombination zone kinetics, but can be influenced by the tube containing the detonation.
A theoretical treatment o f the stability o f steady one-dimensional detonation waves, based on the assumption of a square wave reaction zone, was started by Shchelkin38 and continued by many workers,. The restrictions imposed by the square wave model have recently been removed by Erpcnbeck39"41 and Strehlow, et al.42-43 who considered a more realistic reaction zone. The studies o f Erper.oeck on the response o f an overdriven discontinuity to a transverse harmonic perturbation in the reaction zone indicate that instability depends on the frequency o f the disturbance, the activation
energy o f the assumed first-order exothermic reaction, and the amount the detonation is overdriven. The stability conditions fo r high frequency transverse waves show systems with sufficiently low activation energy to be stable. The studies o f Strehlow and Fernandes42 and Barthel and Strehlow43 on the behavior of a high frequency coherent transverse acoustic wave in the reaction zone give two important results. The first o f these is that a shock, with exothermic reaction, o f Mach number greater than 3, is unstable to a transverse acoustic disturbance. The second is the possibility o f the wavefront o f a sonic disturbance producing multiple shock contacts which asymptotically approach a regular spacing related to the reaction zone thickness.
Theoretical studies show that hydrodynamic instabilities are to be expected in flows where a shock initiates an exothermic reaction,, and are consequently consistent with experimental observations.
Although the mechanism o f propagation o f a self-sustaining gaseous detonation is qualitatively understood, there is no satisfactory model at the present time fo r calculating quantitative properties o f the Cne structure, It can be concluded that the gaseous detonation wave with steady gross properties contains an intrinsic unsteadiness on a scale some 1 order o f magnitude greater than the one-dimensional reaction zone thickness. The overall motion is sustained by the collisions o f Mach interactions which continually provide new centers o f reaction as the shocks propagating forward attenuate. The detonation front as a whole propagates at very close to Chapman-Jouguet velocity, even though the velocity o f a leading shock in the front varies from a value 10 to 20 percent above to 10 to 20 percent below the Chapm an-Jouguet value. Since the Chapman-Jouguet hypothesis is successful in predicting detonation velocity, it must be o f some significance even though at the present time it cannot be justified on structural and stability considerations.
Experimental investigations o f self-sustaining detonation in liquids have not been as conclusive as those o f self-sustaining detonations in gases. Detonations in liquids are more difficult to study experimentally than detonations in gases because they generate pressures in the 100 kbar
S*15
AMCF 706-180
regime. The experimental observation o f fine structure in the detonation front in nitromefchane and its mixtures with acetone led premin^*"17 to postulate that detonations in;a)l liquids should exhibit fine structure simiiar to
that in gases. However, the detonation fronts in
n i t r o g l y c e r i n , d in itro g ly c e r in , and
tetranitromethane were found48 to be smooth
and to exhibit no fine structure;
8-1B
A M C P70K1M
REFERENCES
1. Y. B. Zeldovich, J. Exp. and Theoret. Physics (USSR) 10, 542 (1940); NACA Tech. Memo. 1261,1950.
2. J. von Neumann, O ffice o f Scientific Research and Development, Report No. 541,1942.
3. W. Doering, Ann. Physik 43, 421 (1943).4. W. Doering and G. I. Burkhardt, Tech.
R '.‘port No. F-TS-1227-1A (GDAM A9-T-46).
5. H. Lawton and I. C. Skidmore, Faraday Soc. Discussions, No. 22,188 (1956).
6. W. E. Deal, Phys, Fluids 1, 523 (1958).7. R. E. Shear, BRL Report No. 1159,
Aberdeen Proving Ground, Md., 1961.8. - W. Fickett and W. W. Wood, Phys. Fluids i ,
528 (1958).9. M. H. Rice, R. G. McQueen, and J. M.
Walsh, “ Compression o f Solids by Strong Shock Waves” , Soil'd Slate Physics, Vol. 6, F. Seitz and D; Turnbull, Eds., Academic Press, New York, 1958.
10. L. V. Altshuler, et al., Soviet Phys. JETP 34, 606 (1958).
11. I. C. Skidmore and S. Hart, Fourth Symposium (International) on Detonation, ACR-126, Office o f Naval Research, Dept, o f the Navy, Washington, D. C., p. 47.
12. M. L. Wilkins, et al., Fourth Symposium (International) on Detonation, ACR-126, O ffice o f Naval Research, Dept, o f the Navy, Washington, D. C., p. 3.
13. W. W. Wood aiid J. G. Kirkwood, J. Chem. Phys. 25,1276 (1S56); 29, 957 (1958).
14. S. R. Brinkley, Jr. and J. M. Richardson, Fourth Symposium (International) on Combustion, Williams and Wilkins Co., Baltimore,.1953, 450-7.
15. J. G. Kirkwood and W. W. Wood, J. Chem. Phys. 22,1915(1954).
18. W. W. Wood and Z. W. Salshurg, Phys. Fluids 3, 549 (1960).
17. H. G. Wagner, Agardograph 41, Fundamental Data Obtained from Shock Tube Experiments, A . A. Ferri, Ed., Pergatnon, New York, 1961, p. 320.
18. A. K. Oppenheim, N. Manson, and H. G. Wagner, A IA A J, 1, 2243 (1963).
19. G. L. Schott, “ Structure, Chemistry andInstability o f Detonation in Homogeneous Low-Density Fluids—Gases” , FourthInternational Symposium on HighExplosive Detonation, White Oak, Maryland, 1964.
20. R. I. Soloukhin, Soviet Physics Uspekhi 6, 523(1964).
21. K. I. Shchelkin, Soviet Physics L.pekhi 9, 780 (1965).
22. A. van Tiggelen and G. Lie Soete, Rev, Inst. Franc. Petrole, Anri; Combust. Liquides 21, 239-84, 455-86, 604-78 (1966).
23. R. A . Strehlow, “ Gas. Phase Detonations: Recent Devlopments” , Combust Flame 1-2, 81 (1968).
24. D. H. Edwards, Twelfth Symposium (International) on Combustion, Th6 Combustion Institute, Pittsburgh, 1969, p. 819.
25. J. Taylor, Detonation in Condensed Explosives, Oxford at the Clarendon Press, 1952, pp. 84-5.
2fi, D. R. White, Phys. Fluids 4,465 (1961).27. H. G. Wegner; Ninth Symposium
(International) on Combustion, Academic Press, New York, 1963, p. 454.
28. K. I. Shchelkin and Y . K . Troshin, Comb, and Flame 7,143 (1963).
29. Y. N. Denisov and Y . K . Troshin, EighthSy mposium ■(International) onCombustion, Williams and Wilkins Co., Baltimore, 1962, p, 600.
30. R. E. Duff, Phys. Fluids 4,1427 (1961).31. V. V. Mitrofanov, V. A . Subbotin, and M.
E. Topchian, Zh. prikl. Mekh. i Tekh. Fiz. 3, 45 (1963).
32. A. A. Borisov and S. M. Kogarko, DoW. Akad. Nank., S.S.S.R. 149, 623 (1963), Translation: Doklady, Phys. Chem., p. 252.
33. Y . H. Denisov and Y. K. Troshin, Doki, Akad. Nank., S.S.S.R. 125, 110 (1959). Translation; Phys. Chem., Sect. 125, 217 (I960).
34. R, A. Strehlow, A IA A J. 2, 784 (1964).35. R. A. Strehlow, R. Liaugminas, R. H.
Watson, and J. R. Eyman, Eleventh
AM CP7M -1M
REFERENCES (Continued)
Sy mpotium (International) on Combuition, Mono Book Corp,, Baltimore, 1% 7, p. 177.
36. R. A. Strehlow, R . Maurer, and S. Rajan, A IA A 3. 7, 323 (1969).
37. R. A. Strehlow and 6. D. Engel, A IA A J. 7, 493 (1969).
38. K. I. Shchelkin, Sov. Rhys. JETP 9-(36), 416 (1959).
39; I. J.Erpenbeck.Phys. Fluids!, 684 (1964);40. J, 3. Eipenbeck, Phys. Fluids 8, 1192
(1965) .41. J. J, Erpenbeck, Phys. Fluids 9, 1293
(1966) .42. R. A . Strehlow, and F. D. Fermndes,
Combust. Flame 9 ,109 (1965).
43. H. 0; Barthel and R. A . Strehlow, Phys. Fluids 9,1896 (1966).
44. A. -N. Dremin, and O. K . Rozanov, Dokl. Akad. Nauk. SSSR 139,. 137.(1931).
45. A . N. Dremin, 0. K , Rozanov, and V. S. Trofimov, Zh. Prikl. Mekh. Tekh.Fiz., No. 1, 130 (1963).
46. A . N. Dremin, 0. K. Rozanov, and V. S. Trofimov, Combust. Flame 7, 2 (1963).
47. S. N. Buravova, A . N . Dremin, 6 . K. Rozanov, and V, S. Trofimov, Zh. Prikl. Mekh. Tekh. Fist (Gazodynamika Goreniya), No. 4,101 (1963).
48. A . N. Dremin and S. D. Savrov, Fiz. Goreniya Vzryaa, No. 1, 36 (i96 6 ).
/ ' " N
AMCP 706-180
CHAPTER 9 DETONATION WAVES OF CYLINDRICAL AND SPHERICALSYMMETRY
9-1 INTRODUCTION
The theoretical development o f the previous chapters has been limited to detonation waves in one dimension in which the wave front is planar and the flow behind the front is parallel. A rather complete description o f this idealized wave is possible, because o f the simple geometry. The theory o f plane detonation waves is strictly applicable only to a semi-infinite mass o f explosive. The treatment becomes a good approximation to charges o f finite size if the dimension o f the charge perpendicular to the direction o f propagation o f the wave is large enough so that edge effects become of negligible importance, and if the dimension in the direction of propagation is large compared to the distance jn which transients arising from the initiation process exist.
Explosive charges o f practical interest are, o f course, o f finite size. One expects the one-dimensional theory to apply to a cylindrical charge o f explosive, initiated at one end and with the wave propagating in the direction o f the axis o f the cylinder if the cylinder is contained in a perfectly rigid casing and if the interaction o f the explosion products with the casing wall has negligible effect on the main flow behind the detonation wave. Such a situation is allowed in the case o f an explosive gas mixture contained in a metal tube i f the tube diameter is not too small.
The pressures; developed in the explosion reaction o f a condensed explosive at the reaction front are o f the order o f 105 atm. A t such pressures, material cannot be completely container} ahd it is impossible to conceive o f a perfectly ' rigid envelope. Consequently, the material velocity o f the product gases has a radial component and the flow cannot be one-dimensional. One expects, therefore, that the one-dimensional theory will have asymptotic velocity, becoming the more realistic the larger the diameter o f the cylindrical chirge. Cylindrical charges o f finite diameter are expected to differ in their behavior from that o f the ideal one-dimensional charge to a degree that depends on the diameter o f the charge and on the nature of tire confining envelope.
In a cylindrical charge of explosive, the flow o f the reaction products must have cylindrical symmetry. The detonation velocity along a finite cylindrical charge is observed, experimentally, to be constant after a short distance in which initiation transients disappear. I t is, therefore, appropriate t o assume that the flow in the reaction zone o f sue}: a charge is stationary (in a coordinate-system moving with the wave). The equations o f hydrodynamics for steady flow with cylindrical symmetry are approximately as tractable as those for plane unsteady Sow. Some progress has been made in the theoretical description o f the flow in steady detonation waves in cylindrical charges, but a theory o f the effect o f finite charge diameter on the detonation velocity in such charges cannot be said to exist.
A further type o f nonparallel flow that has received limited theoretical attention is the flow with spherical symmetry resulting from initiation in a large mass of explosive at a point.
These two instances involving nonparallel flow o f the reaction products are the only ones that have been amenable to even limited theoretical study. I t is thus apparent that the traditional methods o f classical physics have not been employed; to describe the detonation process in any actual explosive charge of two or three physical dimensions. The material o f this chapter is intended to display the limitations o f the one-dimensional theory and to assist in the understanding of the reasons why actual detonations may differ in their properties from the predictions o f the theory. In the present state o f knowledge, the theory cannot provide all o f the design data needed fo r the rational design o f an explosive charge for a particular application.
9-2 THE EFFECT OF CHARGE DIAMETER ON THE DETONATION VELOCITY
Soon after detonating explosives began to be studied, it was observed that the detonation velocity of a cylindrical charge o f explosive, initiated at cue end and with the wave propagating in the direction o f the axis o f the charge, depends upon the diameter o f the charge
9-1
AMCP 706-180
and upon the nature o f the charge confinement. The velocity increases with increasing charge diameter in charges with the same confining envelope and with increasing strength o f confinement at constant finite diameter. A t constant confinement and with increasing diameter, the detonation velocity approaches asymptotically a limiting value which, on physical grounds, we consider to, be that predicted by the one-dimensionai theory. I f D is the observed detonation velocity for charge diameter d (i.e., D = Old)) and D„ the ideal value gi.sn by one-dimensional theory, then
D/D„ -*• 1 as d ■* - (9-1)
This behavior is illustrated in Fig. 9-1, in which the detonation velocity o f RDX at a density o f 0.9 g/cm3 is plotted against the reciprocal o f the cylinder radius. The experimental data are seen to be w ell
represented by a straight line. (Experimental data on the variation o f detonation velocity with charge diameter have been represented in the literature in graphs employing the radius instead o f its reciprocal as abscissa. Since the detonation velocity is expected to approach the ide?J limit asymptotically as the radius goes to infinity, there can be no justification fo r this mode of treatment o f the data, calling as it does for an extrapolation o f infinity.)
It is found experimentally that the slope of curves such as that of Fig. 9-1 depends strongly on the density o f 'the explosive, its chemical nature, and its state of aggregation, The velocity depends on the charge diameter mote strongly fo r explosives at low loading density than for the same explosive at high loading density, for pressed granular explosives than for homogeneous cast explosives, for composite explosives than fo r pure explosive compounds, and fo r explosives o f low energy release than for
Figure 9-1. Effect of Charge Diameter on the Detonation Velocity of RDX, po ” 0.9 (Ref, 1)
9-Z
AMCP 706-180
those o f high energy release. Thus, a high energy explosive such as PETN has a smaller dependence o f velocity on charge diameter tlian does one such as TNT. Cast TNT has a smaller dependence than does pressed TN T at about the same density. The dependence fo r a pressed TN T charge of high density is less than that for a pressed charge at low density. A t low density, the dependence of the velocity on charge diameter is strongly influenced by the particle size of the explosive, being the greater the greater the particle size. The latter observation suggests that the rate o f decomposition o f a granular explosive is controlled by the rate o f a surface reaction o f the individual particles. By contrast, in homogeneous explosives that can be expected to undergo a bulk homogeneous decomposition reaction, only a relatively small dependence o f detonation velocity on charge diameter is observed.
Although the general features o f the dependence of detonation velocity on charge diameter .and the nature o f the confinement have beei studied experimentally fo r many years, attempts to explain the effect in terms o f the hydrodynamics and thermodynamics o f the system were not made until about 1940. Since that time, a qualitative understanding o f the effect has been gained but a satisfactory quantitative theory o f the phenomenon does not exist.
In the one-dimensional case, the Chapman-Jouguet condition has been shown to define a surface scrubs which, energy cannot be transmitted. In the infinite charge o f explosive,
, or alternatively in a finite charge under ideal confinement, the reaction is complete at this surface and this surface lies an infinite distance downstream from the leading edge-the shock wave—of the detonation wave. In the last chapter, it was stated that steady reaction zones can be 3hown to exist between a surface defined by a frozen sound velocity Chapman-Jouguet condition and the shock wave, where this surface is a finite distance from the shock front in a region where the reaction is incomplete, but that such steady flows are unstable. These theoretically steady but unstable configurations o f shock wave and rarefaction front were called subideal Chapman-Jouguet states, I f a cylindrical charge o f explosive is imperfectly confined, the high pressure explosion products will expand
laterally, and this lateral expansion will begin at the intersection between the initiating shock and the boundary- o f the charge. Thus, both in the reaction zone, which we may assume to be a region o f steady flow, and in the expansion wave, which cannot be a region of steady flow, the vector particle velocity o f the explosion products will have a nonvanishing radial as well as axial component. The region of steady flow is followed by a two-dimensional rarefaction wave that is determined by boundary conditions prescribed on the interface between, explosion products and surrounding medium. A s a consequence, the leading edge o f the rarefaction wave, propagating into the explosion products with the local velocity o f sound, must be fixed in space relative to the position, o f the shock front. Shock front and head o f rarefaction wave are surfaces o f revolution about the axis o f the cylindrical charge defining a reaction zone having the shape of a meniscus and a volume characterized by two linear dimensions, of which one is the diameter o f the explosive charge and the other can be taken to be the distance on the axis o f the charges between the shock front and the rarefaction front.
As far as the propagation o f the detonation wave is concerned, the reaction is arrested at an intermediate stage corresponding to only a partial release o f the energy o f explosion. Energy released in the rarefaction wave cannot be transmitted across the sonic surface comprising the head o f the rarefaction wave, and it is expended in partial support o f the lateral expansion o f the gas in the rarefaction wave. Only the energy that is released ahead o f the sonic surface is effective in supporting the propagation o f the detonation wave. The consequence o f the establishment o f a two-dimensional analogue o f the subideal Chapman-Jouguet state that has previously been considered, with on energy deficit caused by incomplete reaction on the sonic surface, is a decrease in the detonation velocity
There is a further mechanical consequence of the lateral expansion o f the reaction products in finite cylinders o f explosive. Work is performed in maintaining the radial component o f particle velocity which, as we have already noted, is nonvanishing in the steady reaction zone. As a consequence, not. all o f the energy released in the region o f steady flow is effective in
9-3
supporting the axial propagation o f the wave, and the detonation velocity is less for diverging flow than for parallel flow with the same energy release.
Divergent flow across a shock front implies a curved shock front and vice versa. Flow crossing an- oblique shock is turned toward the shock. Therefore, the shock front is convex toward the intact explosive and concave toward the reaction zone. The assumptions that have been made in formulating the model that has been described are supported by experimental observations o f the curvature o f the front in cylindrical explosive charges. The observations are made with a streak camera with the axis of the cylinder oriented in the direction o f the camera optical axis and with the wave propagating toward the camera. The detonation wave is observed to emerge first from the explosive charge at the axis.
The curvature o f the shock front, the divergence o f the flow in the reaction zone, and the extent o f the region o f steady flow are determined by the diameter o f the charge and the nature o f the confinement. The theoretical calculation o f the curvature (or, alternatively, o f the flow divergence) would require the solution o f a complex hydrodynamical problem involving the formation o f shock wave or waves in the exterior medium and requiring thedetermination o f the location o f the contact surface between explosion products and exterior medium. In a bare charge, surrounded by air, a cylindrically symmetric shock wave will be propagated outward in the air. I f the charge is cased, a shock wave is propagated into the casing. I f the casing is thin, the problem is further complicated by the subsequent'reflection o f this shock wave at the boundary between casing and air, resulting in a reflected wave and a transmitted wave into the air surrounding the cased charge.
The shape o f the reaction zone may be characterized by the diameter d o f the reaction zone and the axial distance a0 o f separation between shock front and the head of the rarefaction wave. I f the surrounding medium is defined, and the problem o f fully describing its motion could be solved, these two dimensions would fully characterize the region o f steady reaction upon which the propagation o f the wave depends. The only dimensionless combination o f these lengths is the ratio a0/d,
and no other characteristic lengths can occur in the theory. Therefore, from dimensional considerations alone, we can write
D/D_ - F(a0/d) (9-2)
The function F can always be represented by its MacLaurin expansion. Taking into account the asymptotic behavior sumr rized by Eq. 9-1, we can write
D/D„ = 1 + A(aa/d) + .... (9-3)'
where .4 Is a constant and where for small values o f a?/d the higher order terms can be neglected. It will be noticed that the data shown in Fig. 9-1 is well represented by an equation linear in 1Id, It is, in fact, generally true that experimental data for the velocity deficit in finite cylindrical charges can be represented, ifor small values o f the deficit, by Eq. 9-3. The p-oportionality constant Ado is a function of the confinement on the charge for charges o f a given density.
9-3 D I V E R G I N G FLOW W ITH IN A C Y L I N D R I C A L L Y S Y M M E T R I C STEADY REACTION ZONE
When a detonation wave progresses in the direction o f the axis o f a cylindrical charge o f explosive, it is found experimentally that the rat? of propagation is constant and that the leading shock wave is convex in the direction of propagation o f the wave. These observations imply that a steady reaction zone exists arid that the reaction zone has cylindrical symmetry. In order to connect such a flow region with a stationary (in laboratory coordinates) downstream boundary on which the values of the various quantities describing the flow are prescribed, it is necessary to postulate a cylindrically symmetric unsteady expansion wave. Thus, we may consider the flow illustrated schematically by Fig. 9-2, in which the coordinate system is at rest in the wave front, the x-axis being coincident with the axis o f the cylindrical charge o f explosive with origin in the wave front and with the radial coordinate r measuring the distance from the x-axis. The intact explosive moves from right to left with constant velocity = D. To the left o f the wave front, the particle velocity vector has an axial component wx and a radial component wr.
V T 7
O i ’ )
Figure 9-2. CyHndrically Symmetric Flow Through a Detonation Wave8
■ M b
C
AMCP 708-1*0
I f u and co are the axial and radial components, respectively, o f particle velocity relative to laboratory coordinates,
wx ~ D - u
w = u(9-4)
d a 3 3
dt 3 f / 3x 3r
Eq. 9-5 becomes
3X 3X(D - u) — + co t - = R
ox or
for the steady flow under consideration.The differential equations for the conservation
o f mass, momentum, and energy are given in par. 2-6. For cyiindricafly symmetric flow, they are the equation o f continuity
the equations of motion
i (9-8)
and the equation for energy transport
= T + RAF (9-9)
where AF is the change in free energy for the reaction occurring in the reaction zone.
For the postulated steady flow, Wood and Kirkwood2 transform these hydrodynamic equations into the form
Wood and Kirkwood2 have considered the flow illustrated by Fig. 9-2, assuming a single chemical reaction in the steady reaction zone. The progress o f such a reaction can be described by a, progress variable X which has the value 0 at the wave front where the reaction is initiated and the value 1 when the reaction is. complete. The rate equation for such a reaction can be written
T t = R ( 9‘ 5>
where the rate function ft is a function of the instantaneous state o f the system. Since the mobile time derivative is
3u /3u\ 1
(i?- U )3x +C° W =7 U(D
3co IdcJu) — + col—
ox \0r
(9-6)
(D - u)
where c is here the frozen sound speed
c2 = (3p/3p)jk
and o is the quantity1 /3p\
(9-11)
(9-12)
Instead o f attempting a complete solution of these equations, Wood and Kirkwood specialize them to the axis o f symmetry (r = 0) where w = 0, bp/dr = 9 and 3p/3r » Ot When the results are solved for the derivatives of the axial component o f particle velocity and pressure with respect to the coordinate x, there are obtained
„ (9-13)
where
G = 1 - (D - i if lc 2(9-14)
and where the superscript zera indieates that the derivative so/designated is evaluated on the axis, r = 0 .
9-6
AMCP 706-1*0
Now, thepostulated flow has been assumed to consist o f a steady reaction zone that is connected to the rear boundary by an unsteady expansion wave. The surface separating these two regimes must be a weak discontinuity. A t such a surface, the axial derivatives o f pressure and axial component o f particle velocity are discontinuous. I f these quantities are discontinuous on the surface separating the two regions, and in particular i f they are discontinuous at the intersection o f this surface with the x-axis at the point labeled x = a in Fig.9-2, the right-hand side o f the first two o f Eqs.9-13 are indeterminate at x = a . Therefore, a tx
G = 0 o r .D = u + c (9-15)
and3co ,
T r = a R I2 (9-!6)Eq. 9-15 is identical in form to the
Chapman-.Iouguet condition for the plane detonation wave. It is appropriate, therefore, to refer to Ihc surface separating the steady reaction zone and the unsteady expansion wave as the Chapman-Jouguet surface. The relation states that the rarefaction wave advances into the explosion products with the local velocity o f sound. However, from Eq. 9-16 we conclude that the Chapman-Jouguet surface is fixed in space relative to the initiating shock wave. The surface intersects the axis o f symmetry at the point x ~ ao at which, according to Eq. 9-16 the reaction is incomplete; R > 0, if 3co/3r > 0. Therefore, not all o f the energy o f the explosion reaction is released in the steady reaction zone. Furthermore, the Chapman-Jouguet point dofined by Eq. 9-15 is a frozen Chapman-Jouguet point, defined in terms o f the frozen sound speed.
The distance ao is a characteristic length o f the cylindrically symmetric diverging flow and may be employed to characterize the thickness o f the reaction zone.
Eqs. 9-13 can be integrated to yield integral relations analogous to the I-Iugoniot equations for plane, one-dimensional flow through a steady reaction zone, obtained in the last chapter. With the aid o f the conditions on the axis of symmetry relating the state o f the
unshocked explosive to the shocked unreactcd explosive, Wood and Kirkwood obtained the expressions,
f l ( x ) = i
0
In deriving Eqs. 9-17, terms quadratic in (3 « j/3i-)° have been neglected. Eqs. 9-17 are generalized Hugoniot equations fo r cylindrically symmetric diverging flow through a steady reaction zone. They determine the state o f the material in the reaction zone and on the axis in terms o f the state of the intact explosive ahead o f the wave. For parallel flow, 3cu/3r = 0 and Eqs. 9-17 become identical with the Hugoniot equations that, were obtained in the last chapter fo r parallel flow.
When the conservation conditions, as derived by Wood and Kirkwood, are analyzed, it can be seen that they differ from the analogous expressions for parallel flow in an important aspect. As a mechanical consequence o f the divergent flow, the propagation velocity is less than that for parallel How for the same energy release at the Chapman-Jouguet point. A further decrease in propagation velocity is the result, in principle, o f the fact that the reaction is not complete at the Chapman-Jouguet point.
In order to make use o f these expressions, it is necessary to obtain a relation for the radial flow
AM CP7M -1M
divergence 3co/3x on r = 0 as a function of x. To where u(0, 0) is the particle velocity atx = 0, r =do this exactly would require the complete 0. The second radial derivative of the pressure issolution of the flow equations subject to estimated by means of a simplified model of theboundary conditions prescribed on the interface geometry of the reaction zone, shownbetween explosion gases and exterior medium, schematically by Fig. 9-3. It is assumed that theWood and Kirkwood obtain an approximate Cnapman-Jouguet surface is a planerelation by using the law of conservation of perpendicular to die x-axis at x = a Thismementum to relate 3co/3r to 3sp/3r2 and then surface intersects the curved- shock front, as is employing an estimate of the latter quantity, shown. It is further assumed that the portion of.When the second of the equations of motion is the curved shock front ahead of thedifferentiated—specialized to the axis r = 0—and Chapman-Jouguet surface can be representedthen integrated with neglect of terms of order with sufficient prt -ision by a segment of a(du/dr)*', they obtain sphere of radius s. The pressure p far) on the
shock front at a point where the axial coordinate is x can be represented approximately be ah expansion about the pressure on the axis
The quantity (3<o/3r)° at x = 0 can be expressed in terms of the radius of curvature of the shock front at the axis s by
(9-19)
The second term on the right-hand side of this equation vanishes because of the cylindrical symmetry. In approximation r2 = Zsx. If the further approximation is made that the shock
X
r
Figure 9-3, Model o f the Reaction Zone Employed by Wood and Kirkwood
9-8
AMCP 706-180
pressure is constant on the shock surface px = p (0, 0), Eq. 9-20 yields the desired relation in approximate form
(S)° (9‘21)By use of Eqs. 9-18, 9-19, and 9-21, the expression for (3«/3r)° becomes
where higher order terms have again been neglected.
Additional approximations are made to obtain an approximate explicit solution. Wood and Kirxwood assume that the pressure profile on the axis is square with
p = p(0, 0) , x < a 0
where Px is the pressure on the Chapman-Jouguet surface at the axis. Using a free volume equation of state for the explosion products and the typical values P Hp(aofi)\ = 0.7 and po/[p(0,0)] = 0.55, they finally obtain the relation
D/D„ = 1 - 3.5a„/s (9-24)
This relation, although based on an approximate model of the reaction ’.one and with the coefficient evaluated for a particular physical explosive, exhibits the nature of the dependence of the detonation velocity in a finite cylindrical charge on the radius of curvature of the shock front.
9-4 THEORIES OF THE CHARGEDIAMETER EFFECT
Tho analysis by Wood and Kirkwood of the consequences of divergent flow in a steady reaction zone provides a considerable insight, into the conditions that obtain in a cylindrical charge of explosive along the axis of which a detonation wave is propagating with constant velocity. However, not even their approximate result, Eq. 9-24 relating the velocity deficit to
the radius of curvature of the shock front, is a satisfactory theory of the charge diameter effect since the radius of curvature is difficult to measure experimentally and it cannot at present be calculated in terms of the dimensions of the charge. A complete theory of the charge diameter effect would make possible the calculation of the velocity deficit V - U from a knowledge of a characteristic time or length characterizing the chemical reaction, the diameter of the charge, and the properties of the confining media. Several authors have attempted this more elaborate program. In each case, die analysis has been based upon a drastically simplified physical model, the mathematical description of which has involved a variety of mathematical and numerical approximations, together with various self-contradictory initial assumptions. These treatments have had as a common aim the evaluations of the function F(a6/d) of Eq. 9-2.
The resulting theories have always been, employed in an inverted sense. Since kinetic data permitting an a priori calculation of a characteristic reaction time for condensed explosives is, in the maim nonexistent, the theories have been employed to deduce the characteristics of the reaction zone from the experimentally determined dependence of detonation velocity on charge diameter. When expressed in terms of a “reaction zone length” , the various different models yield results differing by a factor of about 2 and thus are in agreement as to order of magnitude. Is view of the arbitrary nature of the underlying assumptions and the approximations entering into the subsequent derivations, there exists considerable uncertainty as to the physical significance to be ascribed to the parameters of the various theories. It is the authors’ opinion that they have little to recommend them over the simple empirical result expressed by Eq. 9-3. In these circumstances, and beca ise detailed treatments are readily available in the literature-, we shall not attempt a detailed exposition of .he different theories but shall limit our discussion to a description of the models and a statement of the results.
Two theoretical treatments of the nonideal detonation velocity in a cylindrical charge of explosive of finite radius have a common basic assumption, namely, of the hydrodynamic
9-9
AMCC 706-180
equations, only the equation of continuity differs from the form for parallel flow due to the expansion in the reaction zone. Both treatments assume that the reaction is complete a finite distance ao behind the shock front and that this parameter is, therefore the thickness of the reaction zone.
The physical model employed by Jones is shown schematically in Fig. 9-4(A). Although the shock front is curved when the flow diverges, near the axis it is plane. Jones assumed that it is plane across the cross section of the charge. He approximated the divergence of the flow near the axis by that of a Prandtl-Meyer expansion around a comer a distance from the axis equal to the original radius of the charge. In addition to the assumption of complete reaction, Jones assumed the one-dimensional form of the Chapman-Jouguet condition (Chapter 9) and he employed the-Abel equation of state with a covolume appropriate for TNT and an adiabatic exponent of 3. The equations resulting from these assumptions are solved graphically and the results are tabulated. They can-be expressed by the relationship
(D/DJ2 = 1 - 0 . 8 (2a0/d)2 (9-25)
Eyring; Powell, Duffey, and Parlin4 adopted a model consisting of curved shock front and a parallel curved surface of complete reaction as shown schematically by Fig. 9-4(B). They assumed that the curved shock front is made up of spherical segments and that the radially divergent flow behind a spherical detonation wave that is described in the next paragraph occurs behind each spherical segment of the curved shock front. The piecewise representation of steady flow in a cylindrical system by spherically divergent flow is self-contradictory since the radius of curvature of a spherical detonation increases with time and, therefore, a spherical detonation is not steady. Eyring and his coworkers obtained relations between the ratio D/D„ and the ratio of the radius of curvature to the reaction zone length ao, assuming that-the reaction is complete at the surface a distance a behind the shock front. Using these results, they performed calculations of the detonation velocity for a typical solid explosive described by an Abel equation of state for given width of reaction zone and charge radius. In these calculations, the
curved front was constructed from connected spherical segments, the spherical radii of which decrease as one moves outward from the axis of the charge. The construction was subject to a requirement that the whole wave have the same constant velocity in the axial direction. For a charge surrounded by air, the wave front was required to reach the surface with an angle of 90 deg between the charge axis and the normal to the final segment. In its detail, the development of this theory is algebraically complex. The results of the calculations were represented by the empirical formula
D/D„ = 1 - ^ Id (9-26)
which is identical in form with Eq. 9-3 and in which the proportionality constant is unity.
Cook has based his treatment of the charge diameter effect on a fundamental assumption different from that employed by Jones arid by Eyring, and their coworkers. rt..„ latter authors have assumed that the reaction is complete on the Chapman-Jouguet surface and have ascribed the velocity deficit in finite cylindrical charges to the mechanical effects of the diverging flow. Cook assumes that (he flow is parallel in the reaction zone up to the Chapman-Jouguet surface and ascribes the velocity deficit to the fact that only a portion of the energy of explosion is released in the region of steady flow, the remainder being dissipated in the expansion wave. He visualizes the steady reaction zone as having.a conical shape of height a? as shown schematically in Fig. 9-4(C). This distance is determined by the miers.^fon with the charge axis of the rarefaction wave moving in from the side, calculated from
a0 = or d' (9-27)
where « is a constant having a value between 0 and 1 and d' is a corrected diameter
d' - d - 0.6 cm (9-28)
Cook assumes that any reaction occurring at x > o0does not effect the steady zone. According to these assumptions, the velocity deficit is due to the fact that ao <ax where a1 is the distance on the axis at which the reaction would be complete. These assumptions imply that D =
9-11
AMCP706-1M
when ao > a1 and that no diameter effect is then observed. This deduction is not consistent with the experimental observation that D approaches D^ asymptotically. Cook made the further assumption that pressure, density, and particle velocity are constant between the shock front and the Chapman-Jouguet plane. With these assumptions, lie deduced the relation,
( W 1 - Jl
DjD_ - 1
3 (* ' Vc„ < c,
. ao * a,
The distance ao is to be calculated from Eq.9-27. The distance <ij can in principle be calculated if a reaction mechanism yielding a finite time to complete the reaction is employed, or it may be treated as an adjustable parameter. Such a mechanism is provided if the surface burning of grains of granular explosive is the step controlling the rate of release of explosion energy. In a homogeneous expiosive’-where the reaction is homogeneous- n, =-, and Eq. 9-30 does not predict a charge diameter effect, which is notin accord with experience.
The assumptions upon which Cook bases his treatment constitute a very substantial oversimplification o£ the flow within the reaction zone. The results deduced from his model are not in particularly good agreement with experiment. In the next paragraph, we show that the curvature of the wave front can be simply described by a treatment that does not require use of arbitrary assumptions.
9-5 THE RELEASE WAVE MODEL
The release wave model is a description of reaction wave geometry that has been developed by Eichelberger* based upon the method of characteristics, for prediction of the impulse imparted to on element of surface area on an explosive charge of arbitrary geometry. Its virtues are simplicity and versatility, but sacrifices of precision are required in order to obtain these advantages.
In principle, the model describes the propagation of isobars in the rarefaction following an idealized detonation wave. The propagation of the detonation front from the initiation source is described by moans of
Huygen’s principle. As the front sweeps the boundary of the explosive charge, it progressively initiates a simple, centered rarefaction. To each isobar, or characteristic surface, in the rarefaction a specific density, pressure, and propagation velocity can be assigned; thus, barring interactions among characteristics initiated from intersecting boundaries or convergence due to complex geometries. Accordingly, Huygen’s principle can be used to describe the propagation of each characteristic.
The special simplifications inherent in a polytropic gas law with k = 3 are exploited in order to salvage the concept; for this specific condition, rarefactions from different sources penetrate without change. Thus, when rarefactions from severa! surfaces affect the impulse delivered at a point on the charge—as is generally the case for real, three-dimensional charges—Fermat’s principle of least time den be used to determine the earliest time of arrival of a characteristic surface identified with a given pressure. Fortunately for the model, the best' measurements of equation of state of explosive products indicate that the polytropic gas lz.r, with a value of k = 3 (actually between 2.8 and 2.9) describes the gases through the entire regior. from the C-J plane to very low pressures.
In applications to date, the reaction zone in the explosive has been neglected, although this is not a necessary feature of the model. A region of constant thickness end pressure distribution, between the detonation front and the rarefaction, could be added without signficant increase in complexity.
The model, then, uses a histogram representation of the pressure behind a one-dimensional pulse, as illustrated in Fig. 9-5, The precision of the results depends upon the number of elements into which the pulse is divided. The values of particle velocity, sound velocity, etc. associated with each finite segment of the pulse arc determined by use of one-dimensional theory. The subsequent procedure can follow either of two directions. The pressure distribution behind the detonation front can be developed by constructing the isobars in the detonation products as illustrated in Fig. 9-6. Alternately, the impulse delivered at a selected point on the surface can be estimated by applying Fermat’s principle, determining the
9-1Z
AMCP 708-190
time o f arrival o f each isobar at the selected point, synthesizing the pressure-time history at the-ielected point, and integrating.
As the ultimate in simplicity, for ease o f calculation, a single square pulse has been used to replace the histogram composed of several dements. For rough approximations, a pulse bounded by the detonation wave and by a "release wave” whose propagation velocity is 0.6 times the detonation rate suffices. The amplitude o f the square pulse is adjusted to make the total impulse equal to that o f the real pulse for a one-dimensional case. In this simplified version, the release wave model very closely resembles the “ detonation head” concept described by Cook; there is no claim o f physical reality In the square pulse version o f the release wave model, however.
Refinements to the model have been developed to permit handling o f confined boundaries, using simple, centered rarefactions with an artificial delay time and displacement o f the boundary.
9-6 THE SPHERICAL DETONATION WAVE INITIATED AT A POINT
The expanding detonation wave with spherical symmetry is the only instance o f a three-dimensional transient wave that has received attention. This case is o f practical interest since it represents the immediateresult o f a localized initiating source embedded: in a mass o f explosive. G. X. Taylor1 has analyzed the dynamics o f spherical detonation from a point and has demonstrated the theoretical existence o f a particular flow, i.e., that the particular flow resulting f m his assumptions is compatible with the conservation equations and therefore a possible flow. His analysis does not prove that such a flow is the actual result o f the point initiation o f a detonating.cxplosive.
Taylor assumed that the reaction is instantaneous, resulting in a wave whose reaction zone is o f zero thickness. The model employed is thus the spherical analogue o f that used in the elementary theory o f plane
Figure 9-5. Typical Histogram Representation o f the Pressure Pulse for Use in “Release Wave’' Calculations Together With the Simplified Square Pulse Approximation
9-13
AMCP 709-150
detonation waves, given in Chapter 6. He examined the possibility o f a flow for which the Chapman-Jouguet condition D = ut + cL is satisfied at a spherical surface expanding with radial velocity D, where D was assumed to be constant. Under these assumptions, all of the properties behind the wave front are easily shown to be functions o f the single variable x = r/i, where r is the radial coordinate, and the flow is said to be seif-similar.
The equations o f continuity and motion for spherically symmetric radial flow are given in par. 2-6. They can be written
= 0
(9-31)
where u is the radial particle velocity. Since the reaction is assumed to be complete at the wave front, the flow behind the front is isentropic, hs/di + uds/dr = 0, and the pressure can be
eliminated from the second o f Eqs. 9-31 by the introduction o f the sound velocity c. The condition that the density and particle velocity depend only on the variable x can be written
Combining Eqs. 9-31 and 9-32, and introducing the sound velocity, we obtain
du c2 /dp\ (u - x) ~r~ + - ( - M
dx j) \dxj= 0
(9-33)
( «dp (du\ 2up
x
Following Taylor, we introduce the variables
f = u/x
'F = u/c
f
INITIATION IN IT IA TIO N INITIATION
Figure 9-6. Illustration o f Progress of Characteristic Surfaces in a Three-dimensional Explosive Charge, as Described in the “Release Wave" Theory
9-14
AMCP 706-180
in terms of which Eqs.. 9-33 become
dinj = S f - (1~- S f V
dtnx (1 - f 2) '! '2 - f
dun* r [2 f - ( i - dinx ( 1 - f 2) '! '2 - J2
(9-35)
where f = 2 (din c/dSnp). T o integrate these equations! it is convenient to employ the quantity <t> ~ c/D = \xl('VD) as independent variable. Employing the relation
^1= _ (9-36)0 y a x
Eqs. 9-35 are transformed io
d » 2? - (1 -
d<t> 0(1 - W f
d t 3 f2 - (1 - n 2* 2 (9-37)d0 = 0(1 - t)*2f
dtnx (1 - £)2* 2 - f
d0 " 0 f (1 - ' n * V
Eqs. 9-37 are integrated numerically inward from the wave front at which point the dependent variables are defined by the Hugoniot equations and the Chapman-Jouguet condition. For the flow behind the wave front, the pressure and density are known functions o f the sound velocity along the isentrope terminating in the Chapman-Jouguet state.
Taylor has performed the integration for explosion products treated as an ideal polytropic gas. Shear* has performed the integration for
the explosion products o f the explosive Pentolite at a loading density o f 1.65 g/cm3. His results are given in Figs. 9-7 and 9-8, where they are compared with his calculations for the plane detonation wave that were cited in Chapter 8. The particle velocity becomes aero at r/(Dt) =0.43 and the gas between this point and the center o f symmetry is at rest. Approximately 93 percent o f the mass o f the explosion products is contained by tire‘region at rest.
In Taylor’s analysis, the radial gradients of particle velocity, pressure, and density are infinite at the wave front. I t is stated that these infinite rates o f change probably would not occur i f account were taken o f the finite reaction time. However, a steady finite reaction zone cannot exist behind a spherically diverging shock front. In connection with the development o f his curved front model fo r the calculation of the charge diameter effect, Eyring deduced fo r spherical reaction zones o f finite width a relation between the radius o f curvature o f the front and the detonation velocity in which the wave velocity increases with radius and approaches the plane wave velocity in the limit. However, Eyring’s analysis is based on the assumption of a stationary reaction zone, which is self-contradictory. I t has to be concluded, therefore, that Taylor’s description o f the Cow behind a spherically diverging detonation wave is an approximation and that more detailed theoretical investigations will be required before the degree to which his model is a useful description of the actual flow can be determined. In particular, it must be emphasized that Taylor’s analysis does not demonstrate that spherical detonation actually occurs with a constant radial propagation velocity equal to that given by the plane wave Chapman-Jouguet condition.
9-15
a/
n
AM CT706-1*0
r/(Dt)
Figure 9-7. Particle V e lo c ity Behind a Spherical D e ton a tion Wave in Pento lite , p o = 1.65
9-16
AMCP7W-1M
r / ( D t )
f ig u re 9-8. Pressure Behind a Spherical D e ton a tion Wave in Pen to lite , po " 1.65
A M C f 706-1W
REFERENCES
1. A. Farisot and P. Lafitte, Compt. rend., 18 me, Congr. Chim, ind., Nancy, 1938, p. 930.
2. W. W. Wood and J. G. Kirkwood, J. Chem. Phys. 22,1920 (1954).
3. H. Jones, Proc. Roy. Soc. (London), A 189, 415 (1947).
4. H. Eyring, R. E. Powell, G. H. Dulfey, andR. B. Parlin, Chem. Rev., 45, 69 (1949).
5. M. A . Cook, The Science of High Explosives, Reinhoid Publishing Corp., New York, 1958, pp. 125-8.
6. M. A . Cook and F. A. Olsen, A . I Ch. E. Journal 1, 391 (1955).
7. G. I. Taylor, Proc. Roy. Soc. (London) A200, 235 (1950). '
8. R. E. Shear, Ballistic Research Laboratories, Report No. 1159,1961.
9. R. J. Eichelberger, “ Predictions o f Shaped Chsurge Performanceffrom the Release Wave Theory” , Fundamentals o f Shaped Charges, Status Report NO. 1, Carnegie Institute o f Technology, January 31,1954. (Originally classified Confidential, declassified January 1966.)
8-18
AMCF7M-1M
F igure 9-8. Pressure B ehind a Spherical D e ton a tion Wave in Pen to liie , p o m 1,85
(M 7
AMCP 706-180
REFERENCES
1. A. Farisot and P. Lafitte, Compt. rend,, 18 me, Congr. Chim. ind., Nancy, 1938, p. 930.
2. W. W. Wood and J. G. Kirkwood, J. Chem. Phys. 22,1920 (1954).
3. H. Jones, Proc. Rcy. Soc. (London), A 189,415(1947).
4. H. Eyring, R. E. Powell, G, H. Duffey, and R. B. Parlin, Chem. Rev., 45, 69 (i949).
5. M. A . .Cook, The Science o f High Explosifm, Reihhold Publishing Corp., New York, 1958, pp. 125-8.
6. M. A . Cook and F. A . Olsen, A . I Ch. E. Journal 1, 391 (1958).
7. G. I. Taylor, Proc. Roy. Soe. (Londoh) A 200,1235 (1950).
8. R. E. Shear, Ballistic Research Laboratories, Report No. 1159,1961.
9. R. J. Eichelberger, “ Predictions o f Shaped Charge Performance from the Release Wave Theory” , Fundamentals of Shaped Charges, Status Report No. 1, Carnegie Institute o f Technology, January 31, 1954, (Originally classified Confidential', declassified Janutuy 1966.)
AMCP 7M -1M
CHAPTER 10 THERMAL EXPLOSION10-1 INTRODUCTION
Thermal explosion is concerned with the effects o f uncontrolled internal heating on explosive systems. Such uncontrolled heating can be initiated by action o f external beat sources on the explosive or simply by “ spontaneous” decomposition o f the explosive itself. Under appropriate (or inappropriate) conditions o f temperature, physical dimension, and thermal insulation, ail explosive materials can undergo a build-up o f chemical reaction leading eventually to firo and/or explosion in the material.
Since thermal explosion concepts have significant application to the safe handling and storage o f explosives as well as to the fundamental understanding o f the mechanisms of initiation andgrowth o f detonation, it will be desirable to describe the thermal explosion process in some detail. Par. 10-2 is devoted to a description o f the important physical processes which give rise to thermal explosions. In par.10-3, the theoretical treatment o f thermal explosions as developed by previous workers such as Semenov1, Frarik-Kamenetskii2, Chambre'3, Zinn and Mader'1, Enig5, and others, is presented. Some specific applications o f the theory are discussed in pars. 10-4 and 10-5. The reader will also find reference to the concepts o f thermal explosion in Chapters 11 and 12.
10-2 DESCRIPTION OF THE THERMAL EXPLOSION PROCESS
The basis for a thermal explosion is the exponential dependence o f chemical reaction rate on temperature, as expressed in the Arrhenius law for the reaction rate proportionality constant kr
kT = Z exp [- E/(RT)) (10-1)
whereZ = pre-exponential factor E - activation energy for the reaction,
cal/iuoleit ~ gas constant, cal/mole-0 K T = absolute temperature,0 K *
In a first-order decomposition reaction, which, is common in high explosive compounds, the reaction rate constant has the dimensions o f (time)'1 and its reciprocal is the characteristic life time o f the explosive molecules at temperature T.
A typical high explosive compound ' see Table10-1) has a pre-exponential factor equal to about 1013 sec'1 and an-activation energy-of the order o f 35,000 cal/gram mole. Table 10-2 shows how the characteristic life time charges with temperature fo r such a material.
The figures in Table 10-2 are illustrative only since the decomposition mechanism may differ in various temperature ranges. In fact, this is common since some o f the larger molecular aggregates found among the low-temperature decomposition products o f explosives disappear at higher temperatures. In some cases the reaction produces molecules that catalyze further decomposition (autocatalytic reaction). However, the general lifetime behavior exemplified in Table 10-2 is characteristic o f virtually all high explosives.
Since the decomposition o f an explosive is exothermic and evolves heat, there is a ten lency for the decomposing material to become warmer and, thus, for the reaction to become, faster and the heat-production rate to increase. Opposing this tendency is the flow and loss o f heat to cooler surroundings. The heat production, rate depends exponentially on temperature, according to Arrhenius’ law, while the rate o f heat loss usually increases in a linear fashion with temperature. The difference in the laws governing heat production and heat loss lead to interesting consequences—depending on circumstances, either the opposing effects come into balance and the temperature at some point ceases to rise, and then gradually recedes as the decomposing material becomes used up; or, the opposing tendencies fail to reach a balance, In the latter case the chemical reaction finally dominates, and tire result is a catastrophic acceleration o f the temperature rise. This is the
*Whi!e system temperatures in this chapter may be Quoted in degrees centigrade, the reader is cautioned that for calculation purposes the temperature must refer to an absolute temperature unit, i.n., degrees Kelvin.
1 0 -1
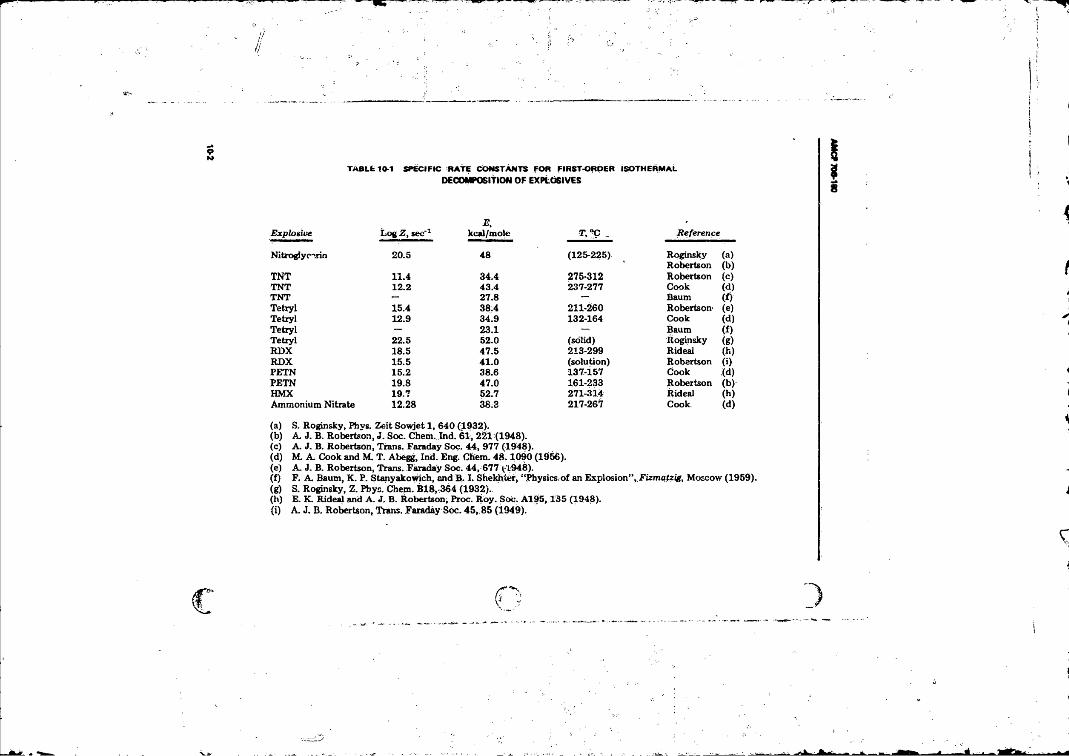
TABLE 10-1 SPECIFIC RATE CONSTANTS FOR FIRST-ORDER ISOTHERMALDECOMPOSITION OF EXPLOSIVES
E,Explosive Log Z , sec’ 1 kcal/mole T , ”C .. Reference
Nitroglycerin 20.5 48 (125-225) Roginsky (a)Robertson (b )
T N T 11.4 34.4 275-312 Robertson (c )T N T 12.2 43.4 237-277 Cook (d )T N T — 27.8 — Baum ( f )Tetryl 15.4 38.4 211-260 Robertson- (e )Tetryl 12.9 34.9 132-164 Cook (d )Tetryl — 23.1 — Baum ( f )te try l 22.5 52.0 (solid) Roginsky (g )R D X 18.5 47.5 213-299 Rideal (h )RD X 15.5 41.0 (solution) Robertson (i )PE TN 15.2 38.6 137-157 Cook ,(d)PE TN 19.8 47.0 161-233 Robertson (b )HMX 19.7 52.7 271-314 Rideal (h )Ammonium Nitrate 12.28 38.3 217-267 Cook. (d )
(a ) S. Roginsky, Phys. Zeit Sow jet 1, 640 (1932).(b ) A. J. B. Robertson, J. Soc. Chem. Ind. 61, 221 (1948).(c ) A . J. B. Robertson, Trans. Faraday Soc. 44, 977 (1948).(d ) M. A . Cook and M. T. Abegg, Ind. Eng. Chem. 48.1090 (1956).(e ) A . J. B. Robertson, Trans. Faraday Soc. 44, 6771-1948).( f ) F. A. Baum, K . P. Stanyakowich, and B. I. Shekhfer, “ Physicsrof an Explosion” , Fizmatzig, Moscow (1959).(g ) S. Roginsky, Z. Pbys. Chem. B18.-364 (1932)..(h ) E. K. Rideal and A . J. B. Robertson; Proc. R oy. Sob. A195,,135 (1948).( i ) A . J. B. Robertson, Trans. Faraday Soc. 45 ,8 5 (1949).
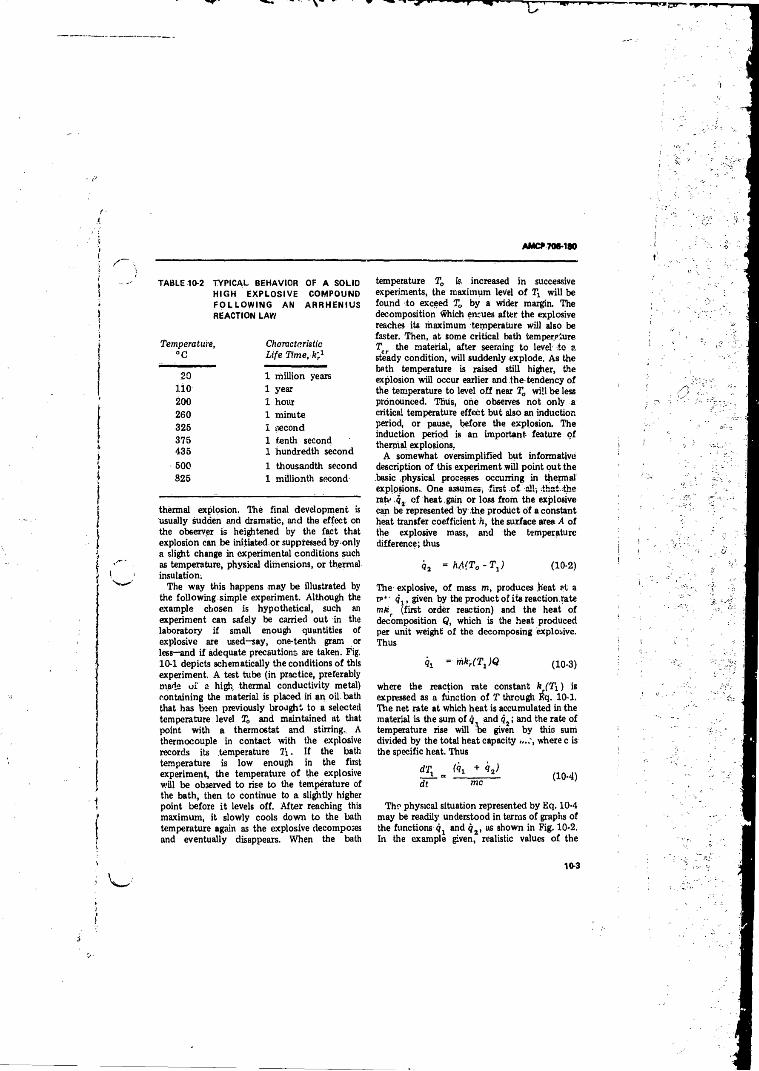
AM CP706*180
TABLE 10-2 TYPICAL, BEHAVIOR OF A SOLID HIGH EXPLOSIVE COMPOUND FOLLOW ING AN ARRHENIUS REACTION LAW
Temperature,°C
Characteristic Life Time, ft;1
20110200260325375435
500825
1 million years 1 year
1 hour 1 minute 1 second 1 tenth second 1 hundredth second
1 thousandth second 1 millionth second
thermal explosion. The final development is usually sudden and dramatic, and the effect on the observer is heightened by the fact that explosion can be initiated or suppressed by only a slight change in experimental conditions such as temperature, physical dimensions, or thermal insulation.
The way this happens may be illustrated by the following simple experiment. Although the example chosen is hypothetical, such an experiment can safely be carried out in the laboratory if small enough quantities of explosive are used-say, one-tenth gram or less—and i f adequate precautions are taken. Fig.10-1 depicts schematically the conditions o f this experiment. A test tube (in practice, preferably made o f a high thermal conductivity metal) containing the material is placed in an oil. bath that has been previously brought to a selected temperature level % and maintained at that point with a thermostat and stirring.. A thermocouple in contact with Ihe explosive records its temperature . If the bath temperature is low enough in the first experiment, the temperature o f the explosive will be observed to rise to the temperature of the bath, then to continue to a slightly higher point before i t levels off. A fter reaching this maximum, it slowly cools down to the bath temperature again as the explosive decomposes and eventually disappears. When the bath
temperature Ta is increased in successive experiments, the maximum level o f Tj will be found to exceed Ta by a wider margin. The decomposition which ensues after the explosive reaches its maximum temperature will also be faster. Then, at some critical bath temperature T the material, after seeming to level to a steady condition, will suddenly explode. As the bath temperature is raised still higher, the explosion will occur earlier and the tendency o f the temperature to level o f f near % will be less pronounced. Thus, one observes not only a critical temperature effect but also an induction period, or pause, before the explosion. The induction period is an important- feature o f thermal explosions,
A somewhat oversimplified but informative description o f this experiment will point out the basic physical processes occurring in thermal explosions. One assumes, first o f all; that the rate q2 o f heat gain or loss ftom the explosive can be represented by the product o f a constant heat transfer coefficient h, the surface area A o f the explosive mass, and the temperature difference; thus
q2 = hA(Ta - T2) (10-2)
The explosive, o f mass m, produces heat at a n**‘ <j1, given by the product o f its reaction.rate mUr (first order reaction) and the heat o f decomposition Q, which is the heat produced per unit weight o f the decomposing explosive. Thus
9i = mkrfT^Q (10-3)
where the reaction rate constant h (Tx ) is expressed as a function o f T through Eq. 10-1. The net rate at which heat is accumulated in the material is the sum o f q and q2; and the rate o f temperature rise will be given by this sum divided by the total heat capacity where c is the specific heat. Thus
dT, _ (kt + k2)di me
(10-4)
The physical situation represented by Eq. 10-4 may be readily understood in terms o f graphs o f the functions and q 2, as shown in Fig. 10-2. In the example given, realistic values o f the
10-3
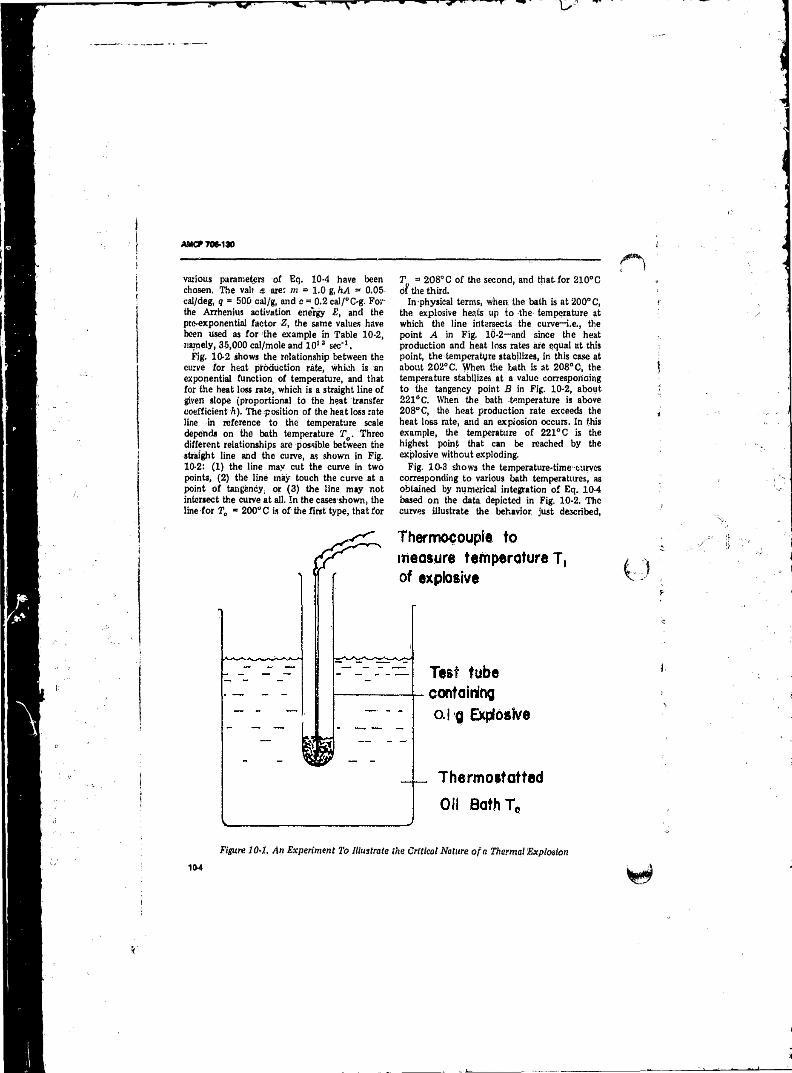
AMCP70C-130
various parameters o f Eq. 10-4 have been chosen. The vali & are: m = 1.0 g, hA => 0.05 cal/deg, q = 500 cal/g, and c = 0.2 cal/°C-g. For the Arrhenius activation energy E, and the pre-exponential factor Z, the same values have been used as fo r the example in Table 10-2, namely, 35,000 cal/mole and 1013 sec"1.
Fig. 10-2 shows the relationship between the curve for heat production rate, which is an exponential function of temperature, and that for the heat loss rate,, which is a straight line o f given slope (proportional to the heat transfer coefficient A ). The position o f the heat loss rate line in reference to the temperature scale depends on the bath temperature To. Three different relationships arc possible between the straight line and the curve, as shown in Fig.10-2: (1 ) the line may cut the curve in two points, (2 ) the line may touch the curve at a point o f tangency, or (3 ) the Sine may not intersect the curve at all. In the cases shown, the line for Ta ■ 200“ C is o f the first type, that for
T = 208°C o f the second, and thafcfor 210°C of the third.
In physical terms, when, the bath is at 200° C, the explosive heats up to the temperature at which the line intersects the curve—i.e., the point A in Fig. 1C-2—and since the heat production and heat loss rates are equal at this point, the temperature stabilizes, in this case at about 202° C. When the bath is at 208“ C, the temperature stabilizes at a value corresponoing to the tangency point B in Fig. 10-2, about 221°C. When the bath temperature is above 208“ C, the heat production rate exceeds the heat loss rate, and an expiosion occurs. In this example, the temperature o f 221° C is the highest point that can be reached by the explosive without exploding.
Fig. 10-3 shows the temperature-time-curves corresponding to various bath temperatures, as obtained by numerical integration o f Eq. 10-4 based on the data depicted in Fig. 10-2. The curves illustrate the behavior, just described,
104
Figure] 0-1. An Experiment To Illustrate the Critical Nature o f a Thermal Explosion
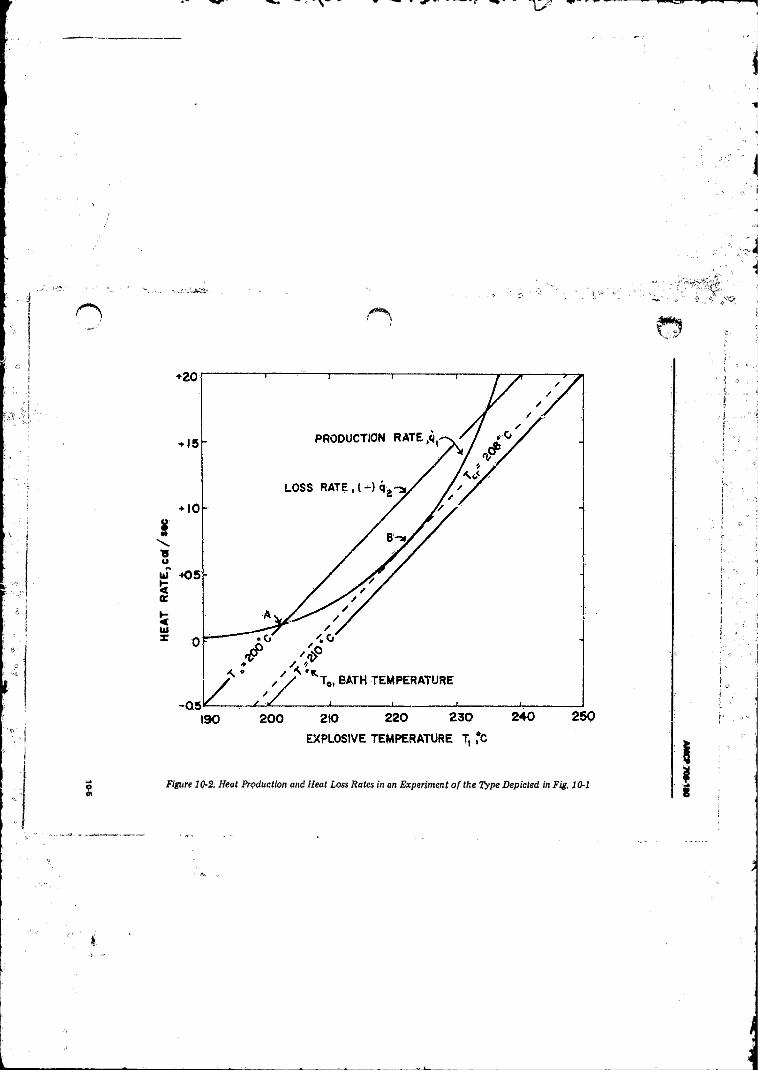
HEA
T
RA
TE
, co
l / «
*c
Figure 10-2, Heat Production and Heat loss Hates in an Expersmen t o f the Type Depicted in Fig. 10-1
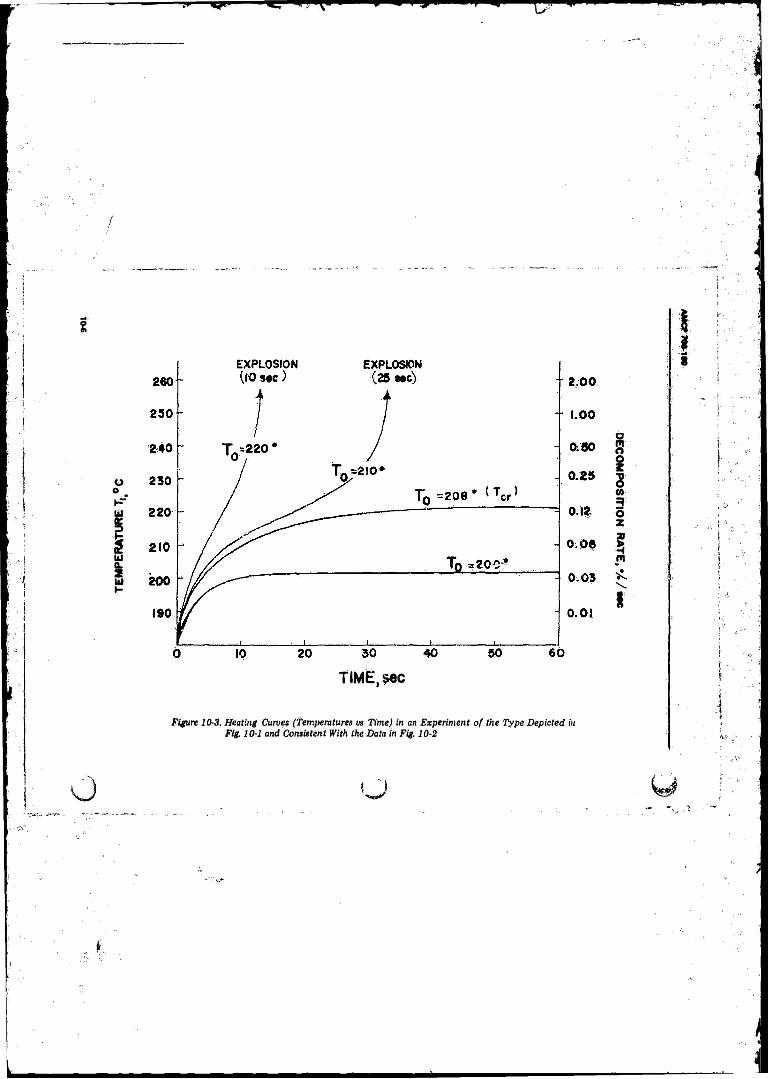
TIME.^ec
Figure 10-3, Heating Curves (Temperatures vs Time) in an Experiment of the Type Depicted in Fig. 10-1 and Consistent With the Data in Fig. 10-2
DE
CO
MPO
SITION
RA
TE, •/£/ M
C
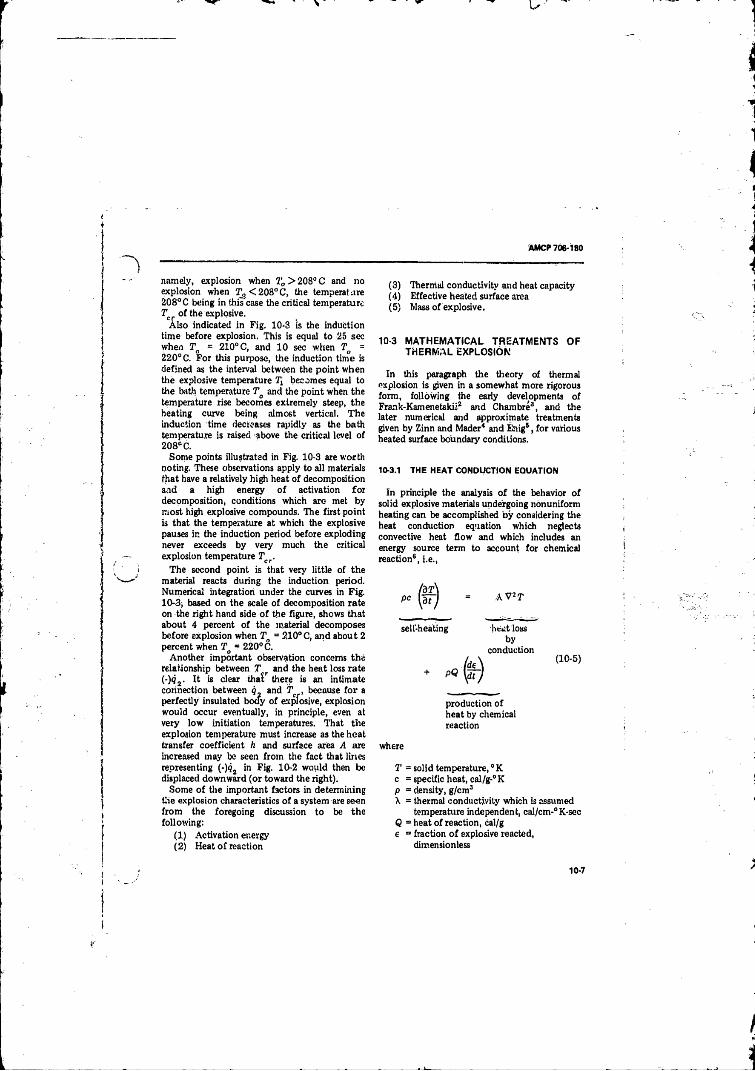
AMCP 706-180
namely, explosion when T„ > 208° C and no explosion when T_c < 208° C, the temperature 208° C being in this'case the critical temperature T o f the explosive.
Also indicated in Fig. 10-3 is the induction time before explosion. This is equal to 25 sec when To = 210° C, and 10 sec when To = 220° G. For this purpose, the induction time is defined as the interval between the point when the explosive temperature 7][ becomes equal to the bath temperature Tq and the point when the temperature rise becomes extremely steep, the heating curve being almost vertical. The induction time decreases rapidly as the bath temperature is raised above the critical level of 208c C.
Some points illustrated in Fig. 10-3 are worth noting. These observations apply to all materials that have a relatively high heat o f decomposition and a high energy o f activation fo r decomposition, conditions which are met by most high explosive compounds. The first point is that the temperature at which the explosive pauses in the induction period before exploding never exceeds by very much the critical explosion temperature Tcr.
The second point is that very little o f the material reacts during the induction period. Numerical integration under the curves in Fig.10-3; based on the scale o f decomposition rate on the right hand side o f the figure, shows that about 4 percent o f the material decomposes before explosion when To = 210° C, and about 2 percent when T# “ 220° C.
Another important observation concerns the relationship between 5T,r and the heat loss rate (-)q2. It is dear that there is an intimate connection between q and T , because fo r a perfectly insulated body o f explosive, explosion would occur eventually, in principle, even at very low initiation temperatures. That the explosion temperature must increase as the heat transfer coefficient k and surface area A are increased may be seen from the fact that lines representing (-)<j2 in Fig. 10-2 would then be displaced downward (or toward the right).
Some o f the important factors in determining the explosion characteristics o f a system are seen from the foregoing discussion to be the following:
(1 ) Activation energy(2 ) Heat o f reaction
(3 ) Thermal conductivity and heat capacity(4 ) Effective heated surface area(5 ) Mass o f explosive.
10-3 MATHEMATICAL TREATMENTS OF THERMAL EXPLOSION
In this paragraph the theory of thermal explosion is given in a somewhat more rigorous form, following the early developments o f Frank-Kamenetskii.2 and Chambre3, and the later numerical and approximate treatments given by Zinn and Madcr* and Enig5, for various heated surface boundary conditions.
10-3.1 THE HEAT CONDUCTION EQUATION
In principle the analysis o f the behavior o f solid explosive materials undergoing nonuniform heating can be accomplished by considering the heat conduction equation which neglects convective heat flow and which includes an energy source term to account for chemicalreaction6, i.e.,
= a v 2r
sell-heating heat lossby
conduction
(de\ (10-5)+ pQ w
production o f heat by chemical reaction
where
T = solid temperature,0 K c = specific heat, cal/g-°K p = density, g/cm3X = thermal conductivity which is assumed
temperature independent, cal/cm-° K-sec Q = heat o f reaction, cal/g e = fraction o f explosive reacted,
dimensionless
10-7
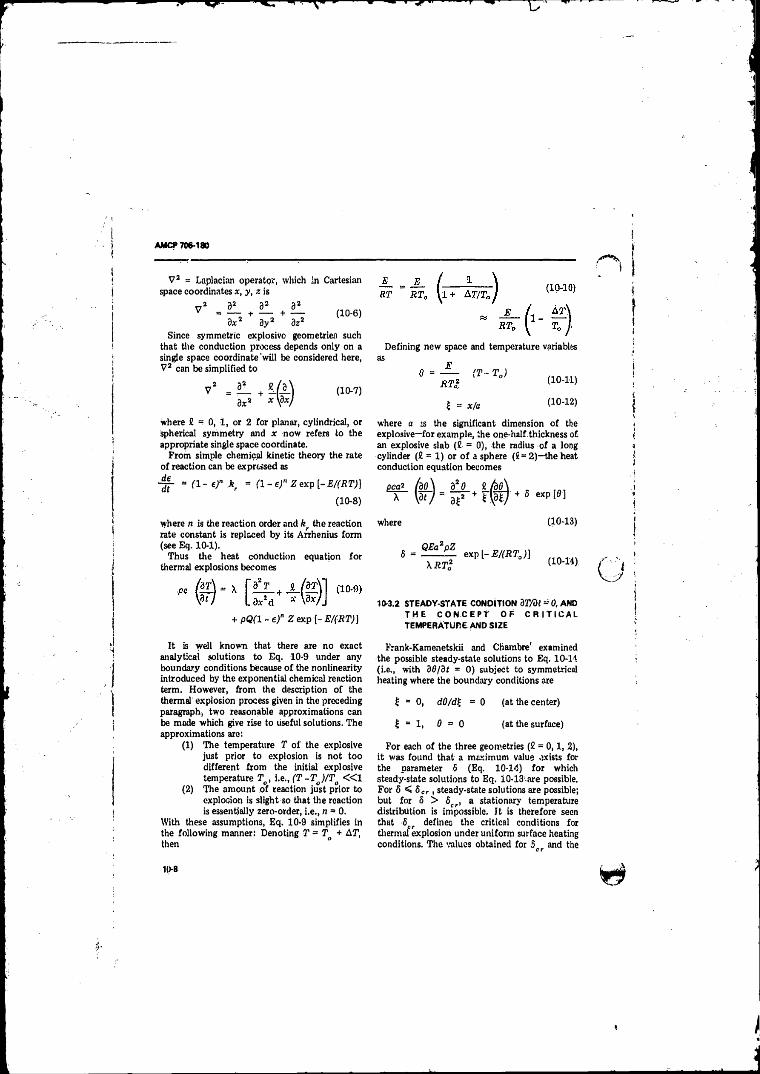
AMCP 706-180
V 2 = Laplacian operator, which In Cartesian space coordinates x, y, z is
32 113y2
( 10-6)dx2 3y2 3z2
Since symmetric explosive geometries such that the conduction process depends only on a single space coordinate'will be considered here, V 2 can be simplified to
V2
l l + - (J Ldx2 +
(10-7)
Defining new space and temperature variablesas
( T - T J
£ = */«
(10-11)
( 10-12)
where 2 = 0, 1, or 2 for planar, cylindrical, or spherical symmetry and x now refers to the appropriate single space coordinate.
From simple chemical kinetic theory the rate o f reaction can be expressed as
- f - - (1 - e)n Mr = a - e ) “ Zexp [-E/ (RT)]
(10-8)
where a is the significant dimension o f the explosive—for example, the one-half thickness of an explosive slab (2 = 0), the radius o f a long cylinder (2 = 1) or o f a sphere (2= 2 )—the heat conduction equation becomes
pea1 IdO X \3f
t ±a£*
+2£ w + 5 ex p [0 ]
where n is the reaction order and fe. the reaction rate constant is replaced by its Arrhenius form (see Eq. 10-1).
Thus the heat conduction equation for thermal explosions becomes
+ pQ(l - e)" Z exp (- E/(KT)]
where (10-13)
QEa2pZ
I R T 2exp l -E/ (R TJ ]
(10-14)
10-3.2 STEADY-STATE CONDITION 3T/Df “ 0, AND T H E C O N C E P T O F C R I T I C A L TEMPERATURE AND SIZE
I t is well known that there are no exact analytical solutions to Eq. 10-9 under any boundary conditions because o f the nonlinearity introduced by the exponential chemical reaction term. However, from the description o f the thermal explosion process given in the preceding paragraph, two reasonable approximations can be made which give rise to useful solutions. The approximations are:
(1) The temperature T o f the explosive just prior to explosion is not too different from the initial explosive temperature To, i.e., (T -T o)/T0 « 1
(2) The amount o f reaction just prior to explosion is slight so that the reaction is essentially zero-order, i.e., n = 0.
With these assumptions, Eq. 10-9 simplifies in the following manner: Denoting T = T + AT, then °
Frank-Kamenetskii and Chambre' examined the possible steady-state solutions to Eq. 10-14 (i.e,, with 30/3t = 0) subject to symmetrical heating where the boundary conditions are
£ = 0, d0/d£ = 0 (at the center)
£ = 1, I) = 0 (at the surface)
For each o f the three geometries (2 = 0,1, 2), it was found that a maximum value exists for the parameter 5 (Eq. 10-14) fo r which steady-state solutions to Eq. 10-13-are possible. For 6 < 8c r , steady-state solutions are possible; but for 5 > 8cf, a stationary temperature distribution is impossible. I t is therefore seen that Sl!r defines the critical conditions for thermal explosion under uniform surface heating conditions. The values obtained for 5 and thecr
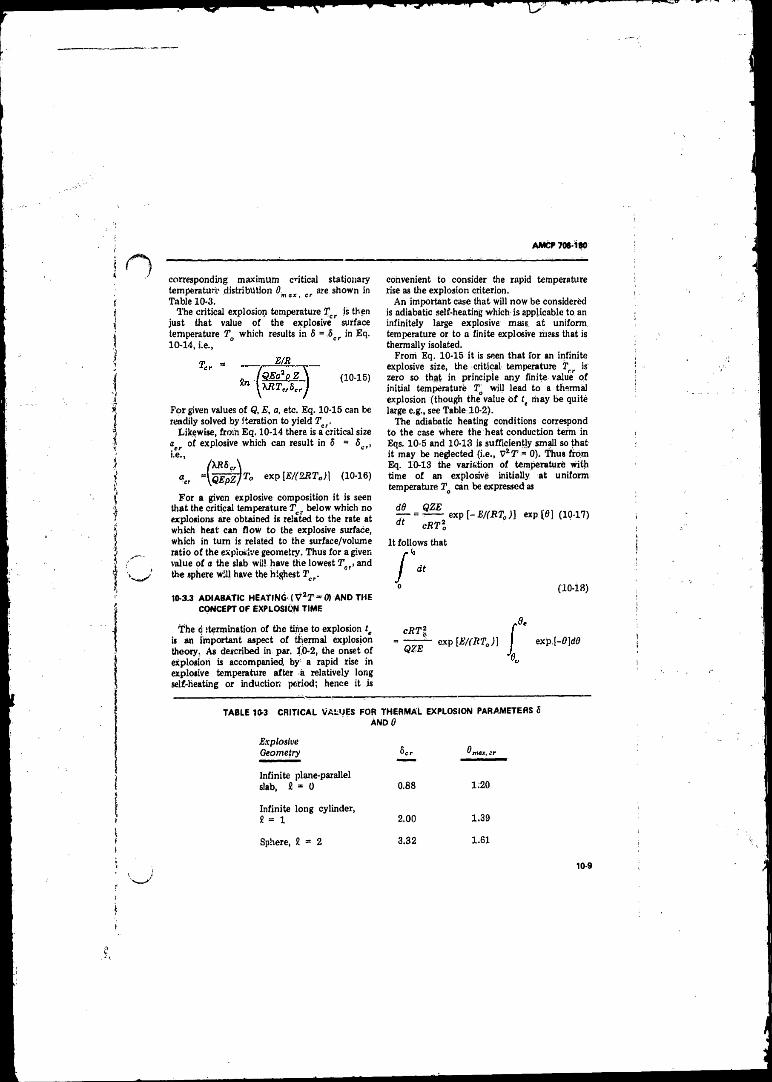
AMCP 706-180
corresponding maximum critical stationary temperature distribution 6 are shown in_ r max , crTable 10-3.
The critical explosion temperature Tcr is then just that value o f the explosive surface temperature T which results in S = &cr in Eq.10-14, i.e.,
For given values o f Q, E, a, etc. Eq. 10-15 can be readily solved by iteration to yield T ,r.
Likewise, from Eq. 10-14 there is a critical size acr o f explosive which can result in 5 = 5cr,
, e ” A Rt>„\« „ =\QEpZJTa exp lE/CZRTJ] (10-16)
For a given explosive composition it is seen that the critical temperature T below which no explosions are obtained is related to the rate at which heat c m flow to the explosive surface, which in turn is related to the surface/volume ratio o f the explosive geometry. Thus for a given value o f a the slab will have the lowest Trr, and the sphere will have the highest Tcr. ’
10-3.3 ADIABATIC HEATING (V 2T “ 0) AND THE CONCEPT OF EXPLOSION TIME
The d (termination of the time to explosion te is ah important aspect o f thermal explosion theory. As described in par. 10-2, the onset o f explosion is accompanied by a rapid rise in explosive temperature after a relatively long self-heating or induction period; hence it is
convenient to consider the rapid temperature rise as the explosion criterion.
An important case that will now be considered is adiabatic self-heating which is applicable to. an infinitely large explosive mass at uniform, temperature or to a finite explosive mess that is thermally isolated.
From Eq. 10-15 it is seen that for an infinite explosive size, the critical temperature T is zero so that in principle any finite value o f initial temperature T0 will lead to a thermal explosion (though the value o f fe may be quite large e.g., see Table 10-2).
The adiabatic heating conditions correspond to the case where the heat conduction term in Eqs. 10-5 and 10-13 is sufficiently small so that it may be neglected (i.e., V25T = 0). Thus from Eq. 10-13 the variation of temperature with time o f an explosive initially at uniform temperature To can be expressed as
^ - = — exp {-E / (R % )] exp [8 ] (10-17) dt cRT%
It follows that
(10-18)
cRT l
QZEexp IE/(RTJ] exjp,[-0]dd
TABLE 10-3 CRITICAL VALUES FOR THERMAL EXPLOSION PARAMETERS 5AND 0
ExplosiveGeometry Scr 0v /fw.r, ci
Infinite plane-parallel slab, JE = 0 0.88 1.20
Infinite long cylinder, 2 = 1 2.00 1.39
Sphere, 2 = 2 3.32 1.61
10-9
AMCF7O0-1B0
or
t.oRTl
QZEexp [E/(RT0)} exp[-fl]
So
%(10-19)
The integration limits on 0 correspond to
t =? 0; 6„ = 0
t = t.; 0' = (* ; - % )
However it may be shown*'3 that within the approximations, used in deriving Eq. 10-13 that 8 * 1. We can, therefore, express the explosion time as
CRTSt, ~ q z e ~ exr>[E/(RT)} (10-20)
It will be seen later in this chapter and in subsequent chapters that experimental data on adiabatic explosion times for many explosives generally fo llow an empirical relationship o f the type
* » t. “ A + | (10-21)
This empirical relationship is consistent with the form o f Eq. 10-20,
10-3.4 APPROXIMATE SOLUTIONS FOR t WITH NONADIABATIC HEATING '
Several investigators5' , , * have presented approximate solutions to Eq. 10-9 for the explosion induction time with nonadiabatic surface heating conditions. Enig6 has approached the problem in a general manner which seems to be applicable to a number of boundary conditions o f practical interest. In those particular cases tested, the approximate solutions to tt yielded values which agreed within «2 0% o f the values calculated by more exact numerical methods.
Enig's approach makes use o f the fact that in many cases the chemical reaction is small up until the time o f explosion, and that the onset
o f explosion, when the surface temperature o f the explosive is much higher than T , is accompanied by a maximum temperature very near to the surface. The approach can be described in the following manner for symmetric semi-infinite geometries.
Introducing the dimensionless variables
RQZtcE
Eq. 10-9 with zero order reaction (n = 0) becomes
h = _ 1 / M + e -,w
3 r 3z* z \3 z )(10-22)
I t will suffice for our purposes to consider only the planar case with 2 = 0. The solution to Eq. 10-22 is
(10-23)
3 ip _ 3 ip I
3 z 3 z I z 3 z |z = o
The explosion criterion is expressed as
= 0 (10-24)2 * 0
and since at 2 = *•, ^!ztr ) the initialtemperature for all t> this leads to
9
9 z
f - e * » ) * . 0 (10’ 25)0 \3 r J
The explosion time ff (or r t ) is just the root o f Eq, 10-25. Whiie exact solutions for <f(z,r) cannot be found which would allow Eq. 10-25 to be solved, the approximation of negligible chemical reaction over the time period 0 < t < te allows us to replace <f(z,r) by f a(z,r) inE q. 10-25, where y>° represents the solution to the “ inert” case o f Eq. 10-32 (i.e., tile case where e '1 W is set to equal zero).
1 0 - 1 0
AM CP7M -1M
This leads to
e '^ 'dz (10-26)
A difficulty arises in evaluating the integral o f Eq. 10-26 due to the negligible amount o f reaction occurring fo r <p° = ip, at z = This makes the integral infinite. T?his difficulty is removed by replacing the integrand by exp[- l/<f>°]- exp [-1 !<p0\, i.e.,
(10-27)
Thus an explicit relationship t can be found for all cases where analytic solutions can be found fo r and where Eq. 10-27 can be integrated-in closed form.
Table 10-4 shows derived expressions for tf for a semi-infinite planar explosive with various boundary conditions. The reader is referred to Enig’s original paper6 for other possible cases.
10-3.6 NUMERICAL METHODS
Numerical methods appear to be the only way of obtaining exact solutions to the heat conduction equation for thermal explosion (Eq. 10-9), and several investigators have carried out such ca lcu la tion s fo r particu la r explosive cases4 For the one-dimensional case, the numerical methods are relatively straightforward arid can be handled on many modem digital computers. In some instances it has been demonstrated that the numerical results for one particular explosive can be generalized to other explosives by simple graphical techniques.
T o solve Eq. 10-9, which is rewritten here as
(10-28)
— - = (1 - e )» Z exp [ - Ef(RT)] (10-29) dt
by numerical methods in the manner o f Zinn and Mader4, the time scale is considered to be
divided into equal increments o f r sec. I t is also considered that no chenilcal reaction occurs during the time r , but at the end o f each time period, the heat produced by chemical reaction can be added to the explosive in the form o f an- instantaneous temperature correction, The heat produced is taken as that given by pQdc/dt assuming a constant temperature T(x,t) during the r time interval. In this manner, Eq. 10-28 is solved with Q = 0 over each interval r but with a different initial temperature distribution f:(x) for each consecutive time period.
The initial distribution will be given by the expressions
Qf i + i (*> “ 2’ (* J f) + j - (Ae; ) (10-30)
Ae, = t [1 - e (xjr) ] “ Z exp
e(xjT) « £ Ae,
(10-31)
(10-32)
This numerical procedure is relatively simple but it does require starting solutions to be available for Eq, iO-28 with <3 “ 0. As an example, we can consider the planar case (2 ■ 0) o f a slab (0 < 2c), i.e.,
pc (10-33)
with boundary conditions f j x ) *» T(x,o) and T(2a,t)=Tt, a constant.
The solution to Eq. 10-33 is given by Carslaw and Jaeger6 as
If f (x) is known at a sufficient number o f values o f x, the integral can be evaluated
1 0 - 1 1
AMCP 708-180
TABLE 104 APPROXIMATE SOLUTIONS FOR EXPLOSION INDUCTION TIMES FOR A SEMI-INFINITE PLANAR EXPLOSIVE5
Surface Condition (atz = a) Dimensionless Explosion Time
Constant surface temperature, ip :
V. > v.V = <fi,
Constant Surface Flux: rc = 1 ( l e -
V, ~ V0 + k r w
e 4 \ o
= Cc(3/2)x]
K, a constant
Heat flux from medium at constant temperature <p with a constant coefficient o f heat transfer h:
o - * [ ^ (0 -T>]
[E/ChpQZR)r\ \
t _ V" ~ v 0' 4 [ ^ - V>0_ V
, - v 0)(vs
numerically arid T(x-,tj'determined. Utilizing Eq, 10-34 for the reactive case involves replacing f (x) by fj(x) and solving for the temperature distribution at each consecutive time period r. The accuracy o f this numerical procedure is limited by how practically small the increments o f r and x can be taken.
Zinri and Mador carried out solutions to Eqs. 10-28 and 10-29 for a number o f explosive compositions and geometries assuming zero-order kinetics, and subject to the boundary conditions o f uniform initial temperature To and constant surface temperature T > T for t> 0 .
Fig. 10-4 shows the results obtained for the temperature distribution in 1-in, spheres o f RDX at various times. Fig. 10-5 depicts the calculated explosion times for one-inch slabs, cylinders, and spheres o f RDX for different surface temperatures T > T cr, In these calculations the values for the physical and kinetic parameters of the explosiye are: p = 1.8 g/cm3, c = 0.5 cal/g-°C, X = 7 X 10’4 cal/0 C-cm-scc,- Q = 500 cal/g, Z = 1018,5sec'1, E = 47500 cal/mole. It also was found that the t calculations for one
explosive composition could be generalized to all other explosives by utilizing a f,vs l/7j relationship o f the form
= p~ - m \ ) (10-35)X
where F is a function which depends only on, the type 'o f geometry (slab, cylinder, or sphere) and the initial temperature Ta , The variation o f F ill terms o f the argument (E/Tc ~ -E/T ) is shown in Fig, 10-6 fo r the three geometries all initially at 25° C. T can be easily obtained from the Frank-kamenetskii expression Eq. 10-15. Therefore, Fig. 10-6 makes it possible to readily determine the explosion times for any material for which the appropriate physical and kinetic parameters are known.
Several pertinent facts can be gathered from these numerical calculations which indicate that previously discussed approximate solutions must always be used with caution. First, for relatively low values o f T > T , the hottest region-prior to explosion is at the center o f the explosive. This implies that the thermal explosion will initiate at the center. The reverse situation occurs when T
1 0 - 1 2
AMCP 706-180
Figure 10-4. Temperature Profiles for Times Near the End of the Induction Period, as Calculated for 1-in. Spheres o f RDX Initially at 2S°C. \jpurve 1: t * 0.90 tt; Curves: t a 0.95 te; Curve 3: t = 0.98 t . Also shown is the steady-state profile at the critical temperature Tcr ( Ref. 4 J.]
AMCP 706-180
is much higher than Ter. Here the temperature near the surface is hottest prior to explosion while the center temperature remains relatively unchanged. Thus approximations based upon a semi-infinite geometry are only applicable for T » T cr. Second, it is seen from Fig. 10-5 that the temperature dependence o f te does not follow an Arrhenius curve (such as Eq. 10-21, which is often used to curve f i t experimental data) over all values o f T . Therefore, one must be cautious in identifying the slope o f such empirical curves with an activation energy for chemical reaction (i.e., £ or E/R). The experimental studies o f Gross and Amster11, which are discussed in Chapter 12, are a good example o f the considerations that must be taken in deriving kinetic parameters from measured explosion times.
Another point that should be considered in connection w ith the Zinn and Mader
calculations, as well as with most o f the available approximate solutions, is the effect o f assuming a zero-order chemical reaction. This assumption applies that the source of chemical energy cannot be used up prior to explosion regardless o f the heat loss fate or the time to explosion. For small explosive masses this may not be valid since the total heat content o f the explosive may be relatively small compared to the effective heat capacity o f the medium immediately surrounding the explosive. This point will be discussed further in die next paragraph.
10-4 T H E R M A L EXPLOSION OF HOT SPOTS
A concept o f great importance fo r the initiation o f detonation in high explosives is that o f “ hot spots” . This topic is discussed in greater detail in Chapter 11. However at this point, it is
•C
Figure 10-5. Explosion Times vs 1/Tt forRDX in Various Geometries, Initially at 25° C (Ref. 4)
10-14
10-15
IVM VW W H , UI*V
cooling o f the sphere in subsequent periods o f time would be represented by the temperature distribution curves in. Fig, 10-7. These are derived from the classical treatment o f the differential equation for heat conduction and may be found in Carslaw and Jaeger6. Time is depicted in terms o f a dimensionless parameter at/ar, where a is the radius of the sphere and a the thermal diffusivity [a = X/fpc}J where X is thermal conductivity, p the density, and c the specific heat).
The sudden creation o f a hot spot by | mechanical action in an explosive material
causes this reaction to occur in the affected region at a measurably higher rate than that in the body o f the explosive, where it may be virtually zero12. However, during most, o f the induction period before explosion the amount o f heat produced by chemical reaction is very small and the cooling behavior is little affc-cied by the fact that reaction is taking place. To state this more exactly: ;ho temperature rise at any point in the hot spot caused by chemical reaction in the induction period is small com pared to the initial difference in temperature between the hot spot and the body o f the explosive; therefore, the temperature gradient that develops at this point, and consequently the flow o f heat during this time, is affected very little by the fact that the material is reactive and not inert. The temperature profiles in Fig. 10-7 are, therefore, „ - - e asmroximation to those that would obtiv'i in an explosive hot spot during the period prior to explosion.
10-16
where f ic. the' induction time. Equating i. ( to ,he adiahatic explosion time given by Eq. 10-liO, allows ope to obtain the criterion in terms o f the props* ties o£-the explosive, i.e.,
x “ P (10'37)
This relationship, Eq. 1.0-37, can be used to calculate typical quant1 •? tor hot spots o f various sixes. Such figines are given in Table 10-5, based on the explosive properties quoted in par, 10-3,4 tor RDX. It is significant that the induction period is in the order o f microseconds for a hot spot in the order o f microns in diameter. This is consistent with the fact that the total time for initiation and reaction in detonating'high explosives is usually in the order o f microseconds. The critical temperature 550"-600° K also falls in a physically plausible range. The fourth column in the table gives the total chemical enerjy pet unit area available for heating the explosive medium just external to the hot spot. It is seen that the values o f q/s are also strongly dependent or, the size o f the hot spot. This points to the possibility that while hot spots may explode, they may have insufficient energy content to ignite the surrounding cooler medium. For the case o f RDX there is evidence from adiabatic gas compression studies (3 msec duration) that the minimum ignition energy is «0 .3 cal/cms {Ref. 13), which is somewhat consistent with a hot spot size o f the order o f microns.
It should be noted that this treatment o f the thermal explosion o f hot spots assumes adiabatic
-O " o.0
c
Figure 10-7. Temperature Distribution During Cooling o f a Spherical Element o f Inert Material That Has Been Raised Initially to a Uniform Temperature Greater Than That o f theSurrounding!
/UUCP 708-180
explosion times and zero-order reaction. Neither o f these assumptions may be valid for the small explosive mass that makes up the hot spot.
Friedman, fo r example, carried out numerical solutions fo r the critical quantities o f a nonadiabatic hot spot which was assumed to be a thin slab14. A good analytical approximation to the numerical value o f the critical one-half slab thickness dcr was found to be
A (T - 7’J 1 f Ed2 -cr _ pZQ eXp[ W o. (10-38)
For conditions o f T0 = 550°K and an ambient environment temperature T * 300° K, the value o f dir for RDX is 220 microns, which is one order o f magnitude greater than the value acr in Tabls 10-5 for the same Tg. Part o f this difference in calculated critical hot-spot size is undoubtedly due to the fact that the two calculations refer to. different geometries (slab and sphere). However it is reasonable to suggest that a significant part o f the difference is actually due to nonadiabatic vs adiabt ;Jc heating conditions.
.Friedman also investigated by numerical calculations the extent o f reaction in the hot spot prior to explosion. Although he states that typically a maximum reaction of 1-8% is indicated, it can be readily calculated from his results that an explosive having the properties E
= 20 kcal/mole, e = 0.25 cal/g-“ C, Q - 250 cal/g, Tg = 800° K , T, = 300°K, will undergo 80% reaction by first order reaction kinetics, The possible effects o f nonzero-order chemical reaction in thermal explosion theory warrants considerable more attention, particularly when application is to be made to small quantities o f explosive.
10-5 THERMAL EXPLOS ON AND SAFETY IN HANDLING HIGli EXPLOSIVES
High explosives are prime examples of materials that can undergo thermal explosion, and it is not suprising that this is an important aspect o f their behavior. The mechanism is most apparent in phenomena; related to initiation and transition to detonation, subjects which are treated in the following and subsequent chapters. The potential fo r seif-heating is also a matter for se, ious consideration in connection with safety in handling and storing explosives.
Several disasters with great loss o f life and property have resulted from the failure to appreciate the possibilities o f self-heating in explosive materials and the suddenness with which a thermal explosion develops when it occurs16. Although numerous severe explosions following fires in dynamite factories and ammunition dumps had warned people o f the hazard o f fighting fire in which high explosives
1
TABLE 10-5 VARIOUS CALCULATED QUANTITIES FOR HOT SPOTS IN RDX
Hot-spot Hot-spot Explosion Total EnergyTemperature T0, Radius a„, Times tM , Available q/S,
eal/cm5*° K microns rnicrosec
450 710 260000 21
50Q 56 . 1600 1.7
550 6.9 25 0.21
600 1.3 0,83 0.C4
700 0.08 0.0036 0.002
800 0.01 0.000066 O.OOf'O
* q/S = (1/3) pQa, the total chemical energy available in the hot spot per
unit o f surface area.
1W
10-18
AMCP703-1W
were involved by the customary method , it was n o t generally appreciated that relatively insensitive materials such as ammonium nitrate and nitromethane have basically the same ten d en cy toward thermal explosion. The catastrophe at Texas City in 1947, in which several million pounds o f ammonium nitrate fertilizer exploded following a fire, drew sharp attention to the critical size phenomenon in this material. This had been overlooked in this case because countless fifes in smaller quantities of the material had occurred and had not resulted in explosion.
One o f the lessons to be learned from these tragic events is that explosives should always be stored in ways that will provide for the maximum- possible dissipation o f heat and never in large consolidated piles i f it can be avoided, it is o f interest in this, connection to calculate the critical diameter at various rface temperatures fo r spherical mass o f RDX, Eq. 10-16, and the adiabatic explosion time fee. various initial uniform tempera' ires, Eq. 10-20. The physical and kinetic parameters considered in these calculations are the same ones used in previous calculations in this chapter. The calculated values are given in Table 10-6.
The values o f explosion time in Table 10:6 refer to the condition in which a mass o f the explosive is at a uniform temperature initially; therefore, these figures do not apply specifically
to the situation in a fire. The actual relationship among surface temperature, geometry, size, and time to explosion can be obtained by the numerical methods described in per. 10-3.5.
In assessing the potential explosion hazards o f an ex p lo s ive mass at elevated surface temperature, useful information can be gained from the temperature distribution just prior to the thermal explosion (theoretically represented by a rapid increase in temperature or rate of reaction at some point in the mass/. I f rapid reaction starts at or near the surface, the reaction will be unconfined and will probably lead, to a less violent surface deflagration. However i f rapid reaction starts in the interior of the explosive mass, the reaction will be confine! and-have a greater probability o f building up. <0 a detonation.
Referring to Fig. 10-4, we see that the temperature distribution varies significantly with the ratio T / T . As this ratio increases above unity, the position o f the maximum temperature (which defines the position o f runaway reaction): moves closer to the surface. In the example shown(1—in .RD X spheres) when T / T ., " 1.05, the explosion starts at a distance o f r/a * 0.7, while for TJTcr » 1 .1 2 it starts at r/a ~ 0.95.
In the particular case where an explosive mass is burning, it can be suggested that TJTtr will not be too much greater than unity. I f the mass is sufficiently large and the burning time
TABLE 10-6 CRITICAL DIAMETER AND ADIABATIC EXPLOSION TIME FOR
Temperature, °C
RDX
CriticalDiameter*
Adiabatic Explosion Time**
50 540 meters 9200 viiars.
75 148 meters 6.8 years
100 41 meters 27 weeks
125 5.8 meters 3.8 days
150 1 meter 3 hours
200 5.6 cm 30 seconds
* Surface o f explosive sphere a t constant temperature.
* * Sphere o f explosive at uniform initial temperature.
AMCP 709*110
sufficiently long, it is reasonable n expect that The application o f these principles to the surface burning will lead to a violent operations involving the heating o f highexplosion. However if the mass is sufficiently exp los ive materials, such as melting insmall, the.surface burning can consume the entire preparation for casting and drying in ovenS,explosive prior to the build-up o f a violent will be obvious. The importance o f goodexplosion. Thus, in disposing ot high explosives it temperature control, in these operations cannotis common to set the material afire but only when be overstressed; and an overriding controlit is dispersed in small chunks on the ground, and should always be provided in addition to anever when it is in large consolidated masses. thermostat to prevent overheating.
10-20
AMCP 708-180
REFERENCES
1. N. N. Semenov, Some Problems in Chemical Kinetics and Reactivity, VOl. 2 (English translation by M. Boudart), Princeton University Press, Princeton, N. J., 1959. '
2. D.. A. Frank-Kamenetskii, Diffusion and Heat Exchange in Chemical Kinetics (Enlist, translation by N, Thon), Princeton University Press, Princeton, N. J., 1955.
3. P. L. Chambrc', J. Chem. Phys. 20,1795 (1952).
4. J. Zinn and C. L. Mader, J. Appl. Phys.31, 323 (1960).
5. J. W. Enig, Proc. Roy. Soc. ,.05A, 205 (1968).
6. H. S. Carslaw and J. C. Jaeger, Conduction of Heat in Solids, Oxford University Press, 1959.
7. M. H. Fried? -omb. and Flame 11, 239 (1967).
8. Y . B. Zeldovicl vviet Phys. Dokl, 8, 461 (1963).
9. G. B. Cook, Proc. Roy. Soc. A246, 154 (1958).
10. E. W. Price, H. H. Bradley, Jr., G. L. Doherity, and M. M. Ibiricu, A IA A Journal 4,1158 (1966).
11. D. Gross and A. B. Amster, Eighth Sym posium ('In te rn a tio n a l) on Combustion, Williams & Wilkins Co., Baltimore, Md., 1962, p. 728.
12. F. P. Bowden and A . D. Y o f fe, Initiation and Growth o f Explosion in Liquids and Solids, Cambridge University Press, 1952.
13. F. P. Bowden and A . D. Yoffe, Fast Reactions in Soiids, Academic Press, New York, 1958, p. 63.
14. M. H. Friedman, Ninth Symposium (International) on Combustion, Academic Press, New York, 1963, p. 294.
15. C. S. Robinson, Explosives, Their Anatomy and Destructiveness, McGraw-Hill, New York, 1944.
10-21
j.
AMCP 706-180
CHAPTER 11 INITIATION OF DETONATION BY SHOCK WAVES11-1 UNDERDRIVEN AND OVERDRIVEN
DETONATION
Steady-state detonation is a self-supporting shock wave in which chemical energy constantly restores the deficit, o f mechanical energy that w ou ld otherwise be created because of dissipation at the shock front (into heat) and external losses. An inert or neutral shock wave without such a source o f energy loses strength a n d u l t i m a t e l y d is a p p e a r s . T h e Chapman-Jouguet (C-J) detonation represents a dynamic “ stable” condition. I f there is a so ht disturbance, such as a small gap in the explosive charge or a narrow region with greater explosive energy, the shock wave (or detonation front) wit veaken or grow stronger temporarily, but will tend to return to the original stable condition when the perturbation is removed. Thus, when the shock at the detonation front is slightly weaker than the C-J wave, the energy supplied by chemical reaction causes the front to accelerate; and when the shock at the detonation front is stronger than the C-J wave, the chemical energy supplied is insufficient to maintain it and the front slows down. This behavior does not depend on whether the rate of chemical energy conversion is sufficient or insufficient per sc, but rather whether the conditions in the flow is such that the released energy is transmitted to the front, i.e., whether the flow near the end o f the reaction zone is supersonic, sonic, or subsonic (see Chapter 8).
In the situation represented in Fig. 11-1, where detonation is transmitted from a “ donor" explosive to an “ acceptor” explosive, there are three possibilities: the shock wave transmit-ed to the acceptor may be stronger than, o f the same strength as, or weaker than the stable C-J wave in the acceptor. The first and last cases m ay be referred to as overdriven and underdrive; detonations, respectively. The degree o f o erdrive and underdrive may be o f any given magnitude, and it is o f interest to determine the consequences o f large departures from the C-J condition on the ultimate fate o f the transmitted shock.
In the case o f an overdriven wave, it is found that the strength always decays until the C-0
condition is reached; but, for an underdilven wave in a given experimental arrangement, there is some limiting shock strength below which the wave decays and does not gain the increased strength needed to reach the C-J condition. The question of interest in this chapter may be stated: “ What conditions are required fo r development o f stable detonation from an underdriven shock wave?” . The answer, obviously, bears on the question o f safety in handling high explosives and materials, such as rocket propellants, that are potential high explosives. I t also relates importantly to the p rob lem o f designing reliable initiating mecham-_Ais in the practical use o f explosives.
11-2 THE GAP TEST
Experimentally, a simple way to determine the sensitivity of an explosive to initiation by shock waves is represented in the gap test. This test comprises a method o f producing u terdriven waves o f variable strength by insert:. '’arying thicknesses o f inert material between lonor and an acceptor charge (Fig. 11-2). Commonly, the inert material consists o f a number o f uniform “ cards” which may be paper or plastic, for example. (An air-filled gap is not desirable because the hot explosive product gases from the donor would impinge directly on the acceptor.)
As in other tests o f critical “ go, no-go” behavior in explosives, the gap test experiments must be interpreted statistically. An efficient way to perform the test is the so-called “ up-and-down” method, whereby, in a sequence o f experiments, the number o f cards is increased or decreased by one in each successive trial (o r by some other standard incremental number) depending on whether the previous trial results in detonation or failure, respectively (see Chapter 12). The result o f such a series o f experiments is usually reported as the number o f cards in the gap that produces, on the average, a 50 percent chance o f detonation.
The gap test has been developed at O e U. S. Naval Ordnance Laboratory into a useful means for comparing the sensitivity or solid rocket propellants1. The standard test assembly is
1 1 - 1
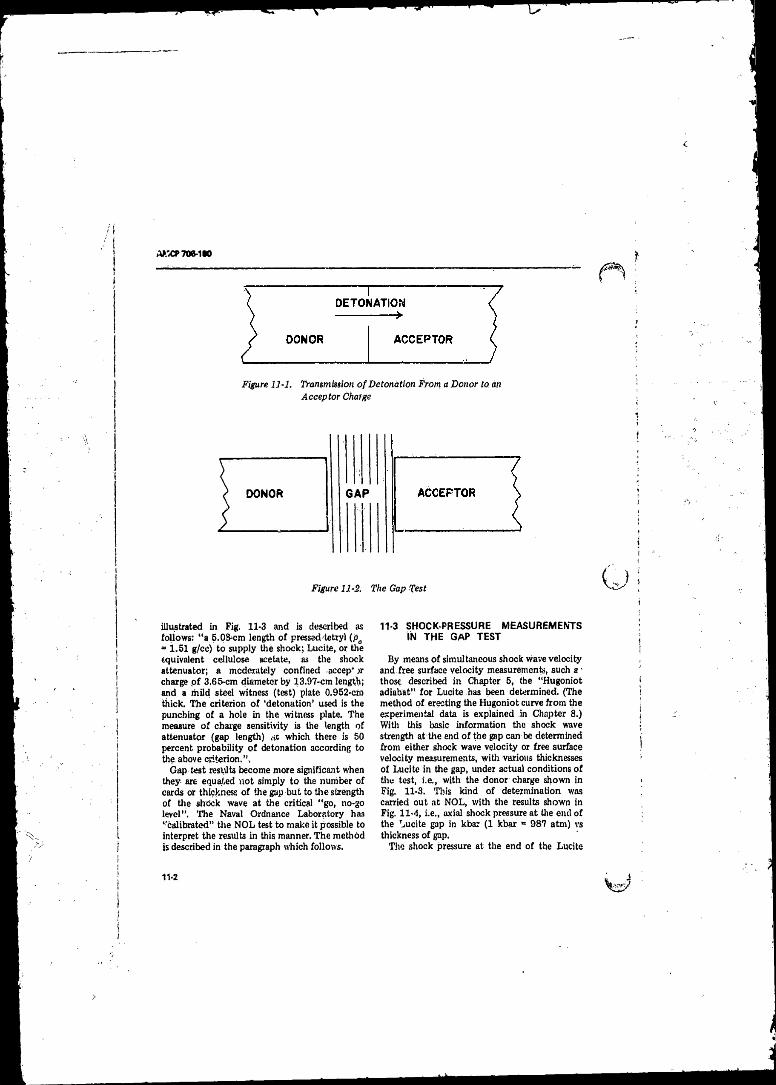
A KC P708-U 0
Figure 11-1. Transmission of Detonation From a Donor to an Acceptor Charge
DONOR GAP
Figure 11-2. The Gap Test
illustrated in Fig. 11-3 and is described as follows: “ a 5.03-cm length o f pressed tetryi (pa * 1.51 g/cc) to supply the shock; Lucite, or the equivalent cellulose acetate, as the shock attenuator; a moderately confined accep' >r charge p f 3,65-cm diameter by 13.97-cm length; and a mild steel witness (test) plate 0.952-cm thick. The criterion o f ‘detonation’ used is the punching of a hole in the witness plate. The measure o f charge sensitivity is the length o f attenuator (gap length) at which there is 50 percent probability o f detonation according to the above criterion.” ,
Gap test results become more significant when they are equal,ed not simply to the number o f cards or thickness o f the gap but to the strength of the shock wave at the critical “ go, no-go level” . The Naval Ordnance Laboratory has ‘"calibrated” the NO L test to make it p ossible to interpret the results in this manner. The method is described in the paragraph which follows.
11-3 SHOCK-PRESSURE MEASUREMENTS IN THE GAP TEST
By means o f simultaneous shock wave velocity and free surface velocity measurements, such a ■ those described in Chapter 5, the “ Hugoniot adiahat” fo r Lucite has been determined. (The method o f erecting the Hugoniot curve from the experimental data is explained in Chapter 8.) With this basic information the shock wave strength at the end o f the gap can be determined from either shock wave velocity or free surface velocity measurements, with various thicknesses o f Lucite in the gap, under actual conditions o f the test, i.e., with the donor charge shown in Fig. 11-3. This kind o f determination was carried out at NOL, with the results shown in Fig. 11-4, i.e,, axial shock pressure at the end o f the Lucite gap in kbar (1 kbar = 987 atm) vs thickness o f gap. '
The shock pressure at the end o f the Lucite
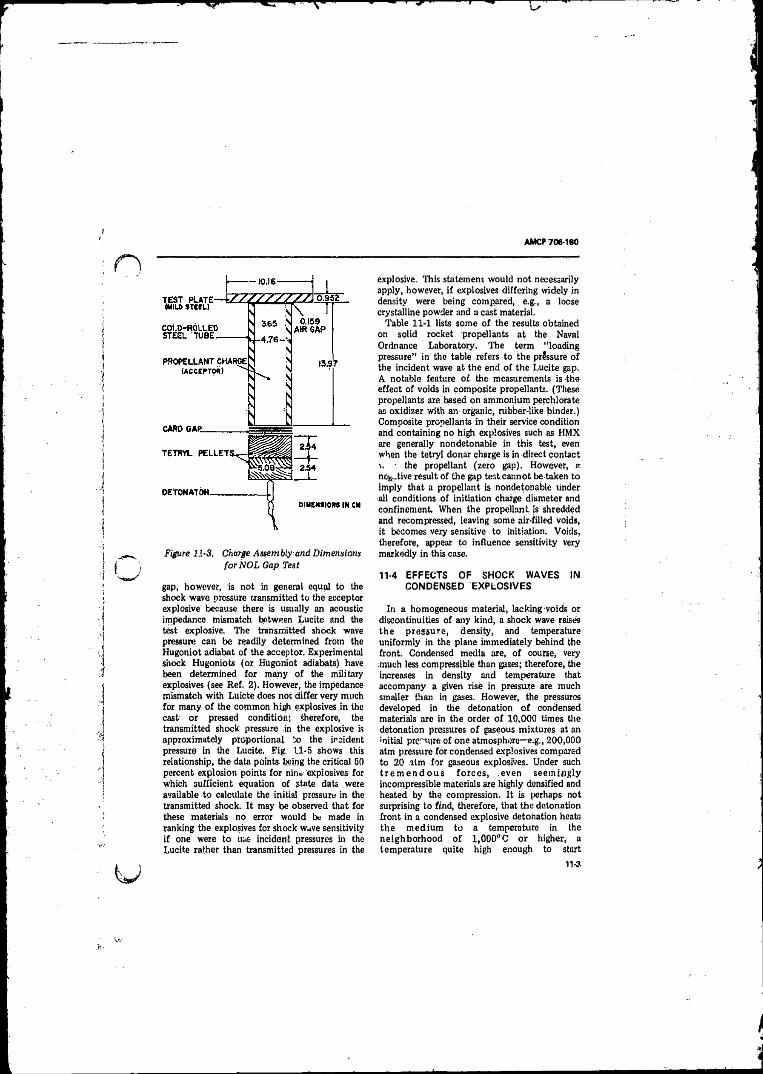
AMCF 706-180
Figure 11-3. Charge Assembly and Dimensions forNOL Gap Test
gap, however, is not in general equal to the shock wave pressure transmitted to the acceptor explosive because there is usually an acoustic impedance mismatch between Lucite and the test explosive. The transmitted shock wave pressure can be readily determined from the Hugoniot adiabat o f the acceptor. Experimental shock Hugoniots (or Hugoniot adiabats) have been determined for many o f the military explosives (see Ref. 2). However, the impedance mismatch with Luicte does nor differ very much for many o f the common high explosives in the cast or pressed condition; therefore, the transmitted shock pressure in the explosive is approximately proportional to the incident pressure in the Lucite. Fig. ll-B shows this relationship, the data paints being the critical 50 percent explosion points fo r nine explosives for which sufficient equation o f state data were available to calculate the initial pressure in the transmitted shock. It may be observed that for these materials no error would be made in ranking the explosives for shock wave sensitivity i f one were to use incident pressures in the Lucite rather than transmitted pressures in the
explosive. This statement would not necessarily apply, however, i f explosives differing widely in density were being compared, e.g., a loose crystalline powder and a cast material.
Table 11-1 lists some o f the results obtained on solid rocket propellants at the Naval Ordnance Laboratory. The term “ loading pressure” in the table refers to the pressure o f the incident wave at the end o f the Lucite gap. A. notable feature of. the measurements is the effect o f voids in composite propellants. (These propellants are based on ammonium perchlorate as oxidizer with an organic, rubber-like binder.) Composite propellants in their service condition and containing no high explosives such as HMX are generally nondetonable in this test, even when the tetryl donar charge is in direct contact v. • the propellant (zero gap). However, k negative result o f the gap test, cannot be taken to imply that a propellant is nondetonable under all conditions o f initiation charge diameter and confinement. When the propellant is shredded and recompressed, leaving some air-filled voids, it becomes very sensitive to initiation. Voids, therefore, appear to influence sensitivity very markedly in this case.
11-4 EFFECTS OF SHOCK WAVES IN CONDENSED EXPLOSIVES
In a homogeneous material, lacking voids or discontinuities o f any kind, a shock wave raises the pressure, density, and temperature uniformly in the plane immediately behind the front. Condensed media are, o f course, very much less compressible than gases; therefore, the increases in density and temperature that accompany a given rise in pressure are much smaller than in gases. However, the pressures developed in the detonation o f condensed materials are in the order o f 10,000 times the detonation pressures o f gaseous mixtures at an initial pressure o f one atmosphere—e.g., 200,000 atm pressure for condensed explosives compared to 20 atm for gaseous explosives. Under such t r e m e n d o u s fo rces , even seem ingly incompressible materials are highly densified and heated by the compression. It is perhaps not surprising to find, therefore, that the detonation front in a condensed explosive detonation heats the medium to a temperature in the neighborhood o f 1,000°C or higher, a temperature quite high enough to start
11-9
AM CP70C -W5K*5*v
THICKNESS OF LUCITE, mm
Figure 11-4, Shock Ware Pressure at the End of t te Lucite Gap in the NOL Gap Test
11-4
AMCP7M-180
PRESSURE AT END OF LUCITE GAP, SHOCK LOADING, KBAR
Figure 11-5. Comparison of Shock Loading at 50 Percent Point With Initial Pressure in Charges
d ecom p os ition a t a r a p id rate. The Zeldovich-von Neumann-Doering model o f detonation is, therefore, equally as plausible when applied to condensed explosives as it is in the case o f gaseous explosives.
There is,, in fact, in the case o f condensed materials a phenomenon that markedly increases their susceptibility to initiation by shock waves. This is the so-called “ hot spot” . An important class o f hot spots is hydrodynamic in origin and results exclusively from the action o f strong shock waves at discontinuities. H ie formation of the hydrodynamic hot spot and its subsequent behavior are,. therefore, o f primary importance ip a discussion of shock initiation o f explosives.
11-5 S H O C K I N I T I A T I O N I N H O M O G E N E O U S A N D NONHOMOGENEOUS EXPLOSIVES
Although much valuable work has been done at several laboratories on initiation of detonation by underdriven shock waves, perhaps
the most decisive experimentation o f this kind has been carried out at the George Washington University Laboratory and the Los Alamos Sciect.'ic Laboratory. This work, largely summarized in Refs. 3-6, established that there is an essential difference between explosives 'hat are completely homogeneous and free from, discontinuities o f any kind, and those winch contain a multitude and a variety o f such discontinuities. The presence o f discontinuities is, o f course, by far the mostcomnvon practical condition, and it is only with extreme care that the number and size o f discontinuities can be reduced to a point where the clearly defined behavior o f a -truly homogeneous material is evident.
The basic requirements for well-controlled experiments on shock wave initiation are:
(1 ) High degree o f planarity in the incident shock wave. This is achieved by a plane-wava generator (Chapter 5).
(2 ) Sufficient run length o f the plane detonation wave in a booster charge so that the decay o f pressure behind the shock front (due to
AMC* 704-1*0
TABLE 11-1 SHOCK SENSITIVITY OF SOLID ROCKET PRC,>, ’ ANTS IN THE NOL GAP TEST
Lot,ilingPressure atPropellant Physical State the 50 percent Point, kbar
various ct mposites service condition;
nonporousno-go
double base service condition;
nonporous80-47
composite with 17-18 percent service condition; 69-58high explosive nonporous
composite shredded and pressed;16-22 percent connected pores
11-7
the Taylor expansion described in Chapter 8) is small for a time period o f some microseconds.
(3 ) Large enough diameter in the donor shock wave production system so that lateral expansion effects (described in Chapter 9) do not seriously a ffect the planarity o f the shock wave or decrease the period o f sustained high pressure behind the front.
(4 ) Variable attenuation o f the donor shock wave. This is produced by inserting between the donor and acceptor charge a gap filled with an inert material o f various composition and thickness.
A number o f different experimental arrangements were used to elucidate various aspects o f the phenomena. These cannot be described in detail here. Typical arrangements —taken from Refs. 5,6—are shown in Fig.11-6(A) and 11-6(15), and illustrate how the various requirements previously enumerated were met in these experiments.
The major aspects o f initiation phenomena in homogeneous and nonhomogeneo vs explo..ivps. as derived from a long series o f experiment’ y ,tb liquid and solid explosives car, be state'! as follows:
(1 ) In Nonhomogeneour Explosives. i f th.. ■ ntering hock wave s above a critical strength, it. begins to- accelerate at the point o f entry, gaining strength relatively slowly at first, but ever more rapidly until steady-state C-J velocity is reached. The development o f
detonation in this case may be described :<a a smooth transition from a shock wave at first only weakly supported by chemical reaction,!..- a fully supported steady detonation, Tfci fins) stages o f acceleration to detonation, in whirr, the greater part o f the increase in shock strength occurs, comprise only a small fraction o f th v total time between the initial entrance o f ;l,e wave and the final aihievement o f iu 'l detonation. Material lyingiin the region betweev the point o f entry o f the shock wave and the region between the point where detonationfiret starts remains essentially unreactec, aud retonaidon (a detonation wave moving back toward the point o f shock entry) lb c >eii observed.
(2 ) In Homogeneous Explosives, The. entering shock behaves as w.v,yld n. c';h>i:'''lcV unsupportedslightly: and- ipsiug speed as itbeca'i?\ oil di&ipatieu. ' JMter aJshiductidu whjeh. Seays r. strongrelationship to (he strength .,1 -Uve eritr-rii,U shock--detonation starts, not at th*' sheer front hfiL at' the entering face o f the , teptdr, 'jihis detonation wave is character,jfic q f die explosive medium in the pre-cq ^pressed1 (and heated) condition created, by, tbs 'pltiiii shock,, and it travels at a hyperveioc. ,y (high?''tiip.r» the C-J velocity at normal density) chate',^fis*ic o f these conditions plus tin; velocity o f forward, motion imparted to the medium by the mit; j
1 1 - 6
AMCP 706-130
A O lT O K t rO K" 1 CQMposITInM |
Figure U-6(A). Arrangement to Measure Shock and Detonation Travel in a N on h om oge neous Solid E: plosive Using the Wedge technique8
shock. This hypervelocity detonation, traveling at a higher speed than the initial shock wave overtakes it, and the combined wave moves from that point as an overdriven detonation the medium ahead. Eventually, the detonation wave decays to the characteristic, steady-state velocity o f the explosive.
The distance-time relationships in these two contrasting situations are depicted in Fig. 11-7. Traces o f essentially this nature were obtained by smear-camera techniques.
The induction time in the initiation o f homogeneous explosives is sensitive to many factors. Indeed, the effects o f various experimental variables are so important that only by taking extreme care is it possible to sort them out. Fig. 11-8, taken from Hef. 5, is a smear record taken from a camera viewing from the top (through a slit) the shock wave which is progressing upward toward the camera from the bottom o f a vessel containing nitromethane. The light in this photograph is self-light from detonation; therefore, the original unreactive shock, starting at a point in time marked F in Fig. 11-8, is not visible. F jr this experiment the Plexiglas attenuator plate which formed the
Figure 11-6(B). Arrangement to Measure Shock and Detonation Travel in a Homogeneous Liquid Explosive (Nitromethane)6
bottom o f the nitromethane vessel (e.g., Fig.11-6(B) was scored over half o f the surface with riangular grooves, 0.020 in deep, spaced 0.025 ,n. apart. The other half o f the surface was polished, smooth. In Fig. 11-8, the scored half o f the plate corresponds to the upper half o f the
' photograph, and the smooth half to the lower: The photograph shows at the time marks .4 and C the sudden appearance o f a faint light. This is light from the detonation when it originates in the precompressed medium at the Plexiglas surface. The time marks B and D, indicating the appearance o f a much brighter front, indicate the points when the detonation in the precompressed medium overtakes the shock front producing an overdriven detonation in the undisturbed fluid. The induction t im e- represented by the distance between F and .4, and F and C in the two regionsHs seen to be about 2pscc on the smooth portion o f the Plexiglas plate and less than one microsecond on the roughened portion. The explanation, presumably, is that the grooves in the Plexiglas produce distortions and interaction on the shock front which result in regions of somewhat higher temperature than that in the undisturbed shock,
11-7
O cv • 0 .
Time offer arrivai of shock at front face
Time offer arrival of _ shock at front face
s9
*8
Figure 11-7, Distance vs Time Behavior in Shock Wave Initiation o f Nonhomogeneous atid Homogeneous Explosives
AMCP 706-180
.F: Shock enters nitromethane. ■
A: Detonation is initiated in compressed nitromethane at interface between nitromethane and grooved attenuator plate.
B: Detonation over grooved plate overtakes shock.
C: Detonation is initated at interface o f nitromethane and smooth attenuator plate.
D\ Detonation over smooth plate overtakes shook.
Induction time, t, , :’ In a
Over grooved plate F - A Over smooth plate F - C
Figure 11-8. Smear Camera Record of Effect o f Rough Shock Wave on Induction Time
AMCP 706-180
with the result that thermal explosion occurs sooner on the roughened plate than it does on the smooth plate.
The induction time in a thermal explosion is very sensitive to temperature (Chapter 10). Therefore, the time for shock initiation o f nitromethane would be expected to depend critically bn shock pressure. That this is so can be readily seen from Fig. 11-9 which is taken from a recent analysis7 o f data reported by three different laboratories3■s'8 . From Fig. 11-9 it also appears that increasing the initial temperature o f the nitromethane causes a decrease in induction time.
The effect o f hot-spot sites in nitromethane was also very nicely deomonstrated in the work described in Ref. 5. This was done by carefully locating air bubbles o f various size at the Plexiglas-nitromethane interface. Other types o f potential hot-spot sites have also been studied, including, for example, tiny rods o f metal and glass that would produce a disturbance in the initiating shock front. A hot spot was usually visible as a flash o f light at the moment o f its creation by the shock wave; then, after a variable delay in time, a detonation was o b s e r v e d t o s p r e a d o u t i n a spherical front from the hot spot. (The hot spot produced no yisible light during the induction period.) The effect is illustrated in Fig. 11-10, taken from Ref. 5. This photograph, taken in the same way as Fig. 11-8, shows the flash o f light created by the interaction o f the shock wave with a bubble at the time mark F. A fter a variable delay, explosions occur at C and D fo r the 1.0-mm and 0.75-mm bubbles, respectively; but.no explosion occurred for the0.5-mm bubble, presumably because the hot-spot temperature was too low or the size too small for an explosion to develop. The delayed homogeneous detonation occurs at the Plexiglas-nitromethane interface at the time mark A in Fig. 11-10, and the catch-up and formation of the overdriven detonation occurs at II. The dependence o f the explosion induction period on the size o f the hot spot site is clearly shown by this experiment. Also evident is a critical-sizo phenomenon in relation to hot spots since the Smallest o f the three bubbles did not produce a detonation.
The variable induction period, the critical “ go, no-go” behavior o f hotspots, and the important influence o f temperature in these experiments
point clearly to the explosion mechanism discussed Chapter 10. This inference h. been
i,investigated by C. L. Mader at the Los Alamos Laboratory10 and Enig and Petrone at the U.S. Naval Ordnance Laboratory11 in a series o f “ computer experiments,” the results o f which are discussed in the paragraph which follows.
11-6 TH ERM AL EXPLO SIO N THEORY APPLIED TO SHOCK INITIATION
11-6.1 HOMOGENEOUS EXPLOSIVES
The experimental phenomena described, in par.11-5 strongly suggest a thermal explosion mechanism in the shock wave initiation o f homogeneous explosives. Detonation starts, not at the shock front but behind it, at the point where the wave entered the explosive and, therefore, where the high temperature: produced by tire shock has existed fo r the longest time. And, as it should in a thermal explosion, the induction period depends very sensitively on the temperature produced at this point, Proof that the phenomenon is indeed a thermal explosion would be provided i f one could predict independently the magnitude o f the induction period from the strength o f the shock wave and the properties o f the.explosive.
The data heeded for this calculation are the shock-Hugoniot properties o f the explosive, a PVT equation o f state and, the kinetic and thermal data fo r the chemical deposition (see Eq. 10-20). Unfortunately, reliable experimental PVT data are unavailable for shocked explosives. However, Mader10 and Enig and Petrone11, utilizing the same shock Hugoniot and kinetic data but different assumed PVT equations o f state, were able to calculate induction times for nitromethane, liquid TNT, and single crystal PETN in reasonable egreament with experiment (see Table 11-2). While these calculations show that a thermal explosion mechanism is consistent with the observed shock initiation process in homogeneous explosives, they do not prove it.
How detonation develops from an underdriven shock wave in nitromethane is shown in the calculated pressure vs distance curves in Fig. 11-11. These curves are taken from Ref. 10. They were plotted by automatic equipment which took its input directly from the computer.
11-10
INDU
CTIO
N TI
ME,
AMCT 708-1*0
80 9 0 I0 0 IIO 120 I30 I40SHOCK PRESSURE IN NITROMETHANE, kbor
Figure 11-9. Shock Initiation Induction Timet in Nitromethane at Different Shock Pressures and at Different Initial Temperatures
1 1 - 1 1
AM CP 706-180
Argon bubbles: 1. 0.75-mm diameter2. 9.50-mm diameter3. 1.0 -mm diameter
F: Shock enters nitromethane. (Flash o f bubbles number 1 and 3 may be seen.)
C: Local detonation starts at 1.0-mrn bubble.
D: Local detonation starts at 0.75-mm bubble.
A : Detonation starts in precompressed nitromethane at interface with attenuator plate.
B: Detonation overtakes shock front.
Figure 11-10. Smear Camera Record ’.mowing Effect of Bubbles in Initiation of Nitromethane
AMCP 706-180
TABLE 11-2 CALCULATED SHOCK INITIATION INDUCTION TIMES IN , HOMOGENEOUS EXPLOSIVES
Shock Temperature, °K Induction Times, MsecShock Pressure, kbar Enig ■£ Petrone Mader Eitig& Petrone Mader Observed
Nitromethane (T n = 300°K)
86 1103 1180 2.31 1.34 ~1 .0170 1560 2100 — — —
201 1662 2472 - —
Liquid T N T (To = 358°K )
125 1154 1132 0.60 6.68 0.7265 1992 2409 — _ —
Single Crystal PETN (To = 29S°K ) - notshown
- 0.337 Q;3
11-6.2 BEHAVIOR OF HOT SPOTS
The power o f modem computer techniques is even more forcefully demonstrated ih the treatment o f hot spots reported by Mader in Ref. 10. Here the behavior is much too complex for analytical description. Even to anticipate what will happen, qualitatively, is difficult.
Mader treats the problem o f describing all events set in motion by creation o f a spherical hot spot, starting with various initial boundary conditions. In general, the following processes may be important:
(1 ) Production of heat by chemical reaction
(2 ) Dispersion o f energy by wave motion(3 ) D ispersion o f energy by heat
conduction.The competition between (1 ) and (3) is treated in par. 10-4, where the following condition, Eq. 10-36, first derived by Zinn1J, is shown to apply:
tlni < 0.04a4/a (11-1)
The characteristic heat flow time on the ri#it-hand side o f the expression is seen to depend on the square o f the radius a. For the “ hydrodynamic” hot spots in nitromethane considered by Mader the size is so large (a = 0.03 to 0.3 cm) that this heat flow time is o f the order o f some thousands o f microseconds. On
the other hand, fluid dynamical energy dispersion (wave motion) occursiri a time o f the order o f a/c, where c is the speed o f sound; Since c is o f the order o f 10s - 10® cm/sec, the time period characteristic o f this mode o f energy transfer is in the range o f 0.01 - 0.1 psec. Heat conduction can, therefore, be. disregarded in this case arid only the first two o f the processes listed need be considered; However, this still poses a task that is impossible without the aid o f a modern high speed, computer.
The computer was programmed to integrate the partial differential equations o f fluid dynamics (Chapter 2) in which the energy transport equation includes a term fo r chemical reaction. In principle, the problem is one o f spherical shock wave propagation as treated in Chapter 13, with the added complication o f variable energy sources at every point in the medium. Special methods, such as the von N eu m ann -R ich tm yer a r t if ic ia l viscosity technique (Chapter 14), are needed to handle the shock wave problem alone.
Figs. 11-12, 11-13, and 11-14 are taken from Mader’s paper10, and the discussion which follows is quoted directly from that source. The m odel discussed here is termed the “ temperature” hot spot—i.e., one in which the temperature is higher than in the surrounding (shocked) medium, but in which the density is the same as that o f the surroundings. The pressure is, therefore, higher in the hot spot than
11-13
AMCP 706-180
•
<5.3
r—SftS
r ~EC
L .
0 .5 9p S fI <
C
•
(1 7 !
1
J— 1 fiSEC
11
J
--------- —
0.69■ 1
:c
.
J
Figure 11-11. Pressure-distance Profiles at Various Times for the Shock Initiation of Nitromethane by a 92-kbar Shock (The ordinate is pressure in scale divisions of 100 kbar and the abscissa is Eulerian distance in scale divisions of 0.1 cm.)
0 rc
- - :
“I
7 ifi *
7 w/“ 156
n5 ‘
1
0.nMfi
nset
■\1
Figure 11-12. Pressure-radius Profiles at Various Timer, for- the Development o f a Detonation in Shocked Nitromethane (94.7 kbar, 12isO°'K') from a Spherical Temperature Hot Spot (1404°K) of0.292-cm Radius (The ordinate is pressure in scale divisions of 100 kbar and the abscissa is Eulerian radius in scale divisions of 0.1 cm.)
in the bulk medium but the pressure difference is o f somewhat minor importance in this case. Mader also treats the “ pressure” hot spot, where density as well as temperature is higher than in tile surroundings. This case will not be described here, The quotation from Ref. 10 follows:
“ Fig. 11-12 shows the pressure-radius profiles for a 0.292-cm radius, temperature hot spot
(1404° K ) in nitromethane which has been shocked to 94.7 kbar. Initially, v.t the boundary between the hot spot and the shocked nitromethane, a small shock is sent into the outer nitromethane and a rarefaction is sent back into the hot spot. A t about 0,03 psec, part o f the hot spot explodes and initiates the remainder o f the hot spot, which has been
11-14
AMCP 708-180
rn>«*A* C
na<
n nm i
P
-non
HL
i0
i i M N p
" V- s
_ L
<r -roip
T "tec
l
oi KC
0.0-—r~u*ec
MOIVS
Figure 11-13. Pressure-radius Profiles at Various Times fo r the Development of a Detonation in Shocked Nitromethane (94.7
' kbar, 1230°K) from a Spherical Temperature Hot Spot (1404° K ) of 0.06-cm Radius (The ordinate is pressure in scale divisions of 100 kbar and the abscissa is Eulerian radius in scale divisions of 0.01 cm.)
cooled by the rarefaction. A strong shock goes into the undetonated nitromethane and a rarefaction goes back into the explosion products. The strongly shocked nitromethane at the hot spot boundary explodes at about 0.06 psec and initiates a detonation which propagates through the rest o f the nitromethane. The detonation propagates at a velocity o f 0.856 cm/gsec, which is the computed equilibrium de to n a tion v e lo c ity o f the shocked nitromethane. The experimental- hypervelocities in shocked nitromethane are approximately 0.8 cm/psec3'6.
“ Fig. 11-13 shows in considerable detail the mechanism of. initiation of detonation from a 0.06-cm radius, temperature hot spot (14G4°K)- Initially, at the hot spot boundary, a small shock is sent into the shocked nitromethane aiid a rarefaction is sen; back into the hot spot. The pressure o f the hot spot increases as a result o f a chemical reaction. A t 0.288 psec, the inner 0.045 cm o f the original hot spot explodes. A t 0.035 psec, the entire hot spot has exploded. A shock is sent into the undetonated explosive and a rarefaction is sent into the explosion products. The undetonated explosive at the hot spot boundary does not explode until 0.08 psec, or after an initial induction period o f 0.045 psec. A t 0.1 psec, the detonation is propagating at full velocity and pressure.
“ Fig. 11-14 shows the pressure-radius profiles for a 0.0292-cm radius, teihperature hot spot (1404°K ) in shocked nitromethane. The initial behavior is essentially the same as for larger hot spots. However, the pressure and temperature o f the undetonated explosive at the hot spot interface decay more rapidly because o f the greater divergence o f the flow, and initiation o f detonation fails to occur.
“ Numerous other calculations were also performed varying the hot spot temperature and the temperature o f the exterior nitromethane. The results can be summarized as follows. Temperature hot spots in shocked ( « 90 kbar) nitromethane o f 0.06-cm radius and. larger will explode before the rarefaction reaches the center o f tire hot spot. Cooler hot spots may explode even after the rarefaction arrives at the center o f the hot spot, since the rarefaction is weak. For example, it was observed that a
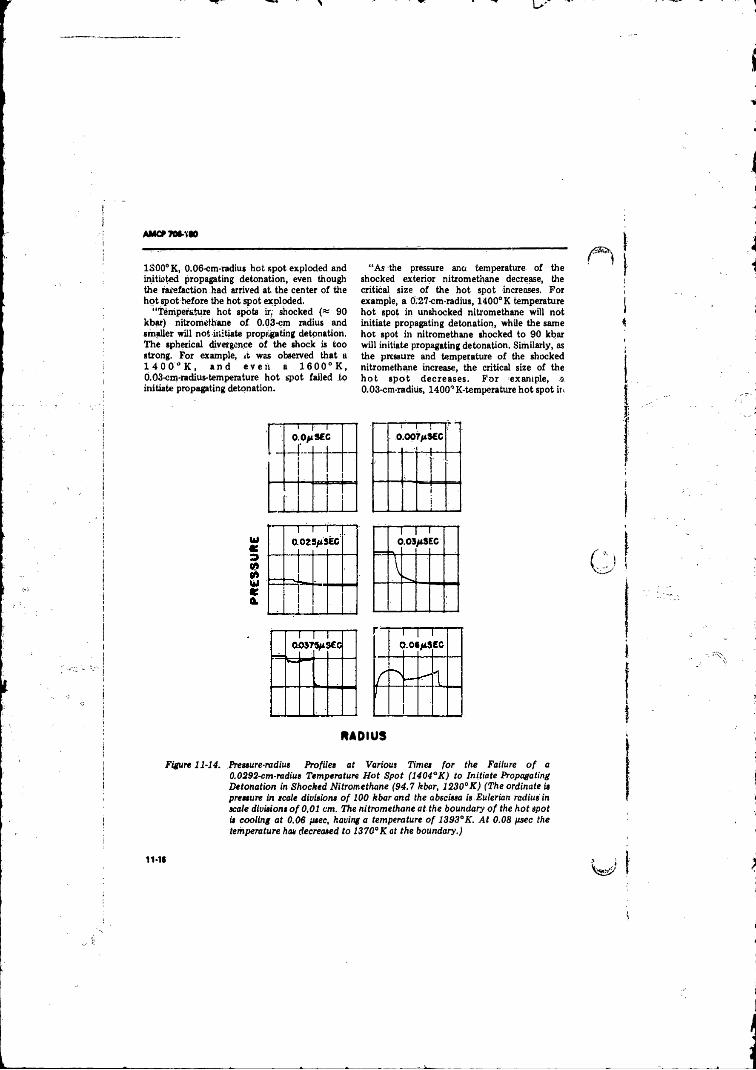
AMCP7Q6-YM
1300° K, 0.06-cm-radius hot spot exploded and initiated propagating detonation, even though the rarefaction had arrived at the center o f the hot spot before the hot spot exploded.
“ Temperature hot spots ir, shocked ( « 90 kbar) nitromethane o f 0.03-cm radius and smaller will not initiate propagating detonation. The spherical divergence o f the shock is too strong. For example, it was observed that a 1 4 0 0 ° K , a n d e v e n a 1 6 0 0 ° K , 0.03-cm-radius-temperature hot spot failed to initiate propagating detonation.
“ As the pressure ana temperature o f the shocked exterior nitromethane decrease, the critical size o f the hot spot increases. For example, a O.'27-cm-radius, 1400° K temperature hot spot in unshocked nitromethane will not initiate propagating detonation, while the same hot spot in nitromethane shocked to 90 kbar will initiate propagating detonation. Similarly, as the pressure and temperature o f the shocked nitromethane increase, the critical size o f the h o t sp o t decreases. F o r example, a 0.03-cm-radius, 1400° K-temperature hot spot in
0—.00
— !— Tft S6C
i|
n, i ,
“ T— 1 0 .0 ft
f
r ~ iset
—
111
J L_L
cn.03
HftS EC
:
RADIUS
Figure 11-14. Pressure-radius Profiles at Various Times for the Failure o f a 0.0292-cm-radius Temperature Hot Spot (1404aK ) to Initiate Propagating Detonation in Shocked Nitromethane (94.7 kbar, 1230°K) (The ordinate is pressure in scale divisions o f 100 kbar and the abscissa is Eulerian radius in scale divisions o f 0,01 cm. The nitromethane at the boundary o f the hotspot is cooling at 0.06 psec, having a temperature of 1393°K. At 0.08 psec the temperature has decreased to 1370°K at the boundary.)
11-16
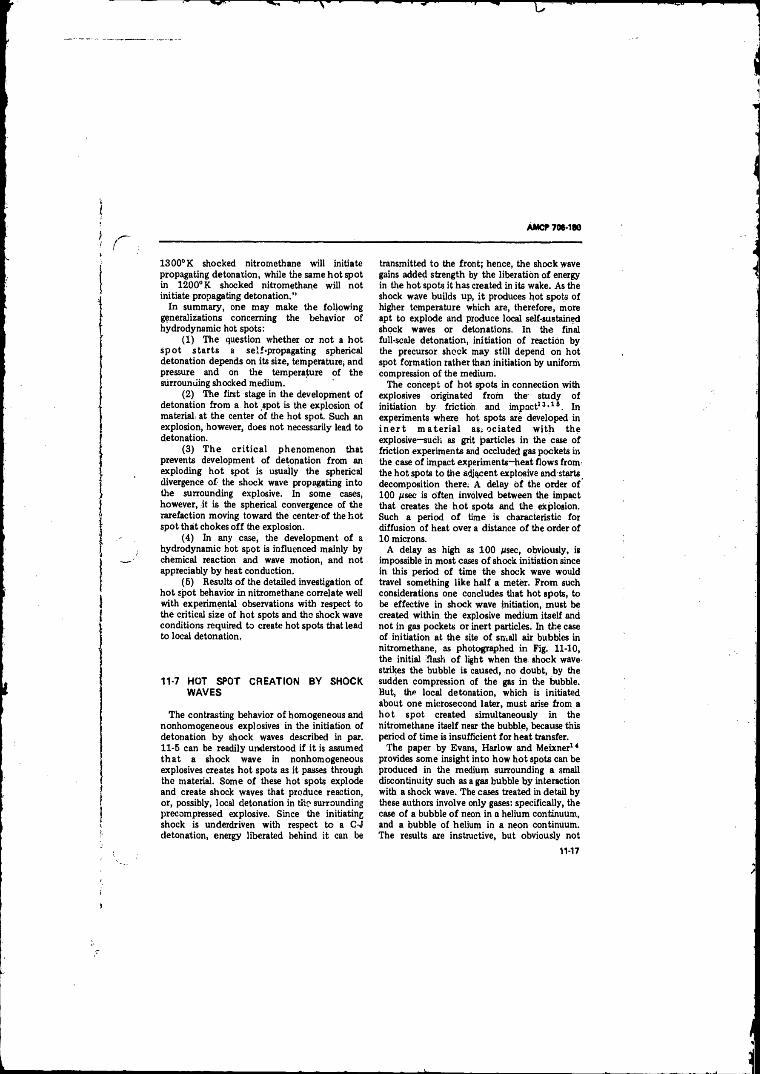
AMCP 706-180
1300°K shocked nitromethane will initiate propagating detonation, while the same hot spot in 1200° K shocked nitromethane will not initiate propagating detonation.”
In summary, one may make the following generalizations concerning the behavior o f hydrodynamic hot spots:
(1 ) The question whether or not a hotsp o t starts a self-propagating spherical detonation depends on its size, temperature, and pressure and on the temperature o f the surrounding shocked medium. '
(2 ) The first stage in the development of detonation from a hot spot is the explosion o f material, at the center o f the hot spot. Such an explosion, however, does not necessarily lead to detonation.
(3 ) T h e c r it ic a l phenomenon that prevents development o f detonation from an exploding hot spot is usually the spherical divergence o f the shock wave propagating into the surrounding explosive. In some cases, however, it is the spherical convergence of the rarefaction moving toward the center o f the hot spot that chokes o f f the explosion.
(4 ) In any case, the development o f a hydrodynamic hot spot is influenced mainly by chemical reaction and wave motion, and not appreciably by heat conduction.
(5 ) Results o f the detailed investigation of hot spot behavior in nitromethane correlate well with experimental observations with respect to the critical size of hot spots and the shock wave conditions required to create hot spots that lead to local detonation,
11-7 HOT SPOT CREATION BY SHOCK WAVES
The contrasting behavior o f homogeneous and nonhomogeneous explosives in the initiation of detonation by shock waves described in par.11-5 can be readily understood i f it is assumed th a t a shock wave in nonhomogeneous explosives creates hot spots as it passes through the material. Some o f these hot spots explode and create shock waves that produce reaction, or, possibly, local detonation in the surrounding precompressed explosive. Since the initiating shock is underdriven with respect to a C-J detonation, energy liberated behind it can be
transmitted to the front; hence, the shock wave gains added strength by the liberation o f energy in the hot spots it has created in its wake. As the shock wave builds up, i t produces hot spots o f higher temperature which are, therefore, more apt to explode and produce local self-sustained shock waves or detonations. In the filial full-scale detonation, initiation o f reaction by the precursor shock may still depend on hot spot formation rather than initiation by uniform compression o f the medium.
The concept o f hot spots in connection with explosives originated from the’ study of initiation by friction, and impact13,16. In experiments where hot spots are developed in i n e r t m a te r ia l as; oc ia ted w ith the explosive—such as grit particles in the case o f friction experiments and occluded gas pockets in the case o f impact experiments—heat flows from, the hot spots to the adjacent explosive and starts decomposition there; A delay o f the order o f 100 psec is often involved between the impact that creates the hot spots and the explosion. Such a period o f time is characteristic for diffusion o f heat over a distance o f the order o f 10 microns.
A delay as high as 100 psec, obviously, is impossible in most cases o f shock initiation since in this period o f time the shock wave would travel something like half a meter. From such considerations one concludes that hot spots, to be effective in shock wave initiation, must be created within the explosive medium itself and not in gas pockets or inert particles. In the case o f initiation at the site o f small air bubbles in nitromethane, as photographed in Fig. 11-10, the initial flash o f light when the shock wave strikes the bubble is caused, no doubt, by the sudden compression o f the gas in the bubble. But, the local detonation, which is initiated about one microsecond later, must arise from a hot spot created simultaneously in the nitromethane itself near the bubble, because this period o f time is insufficient for heat transfer.
The paper by Evans, Harlow and Meixner14 provides some insight into how hot spots can be produced in the medium surrounding a small discontinuity such as a gas bubble by interaction with a shock wave. The cases treated in detail by these authors involve only gases: specifically, the case o f a bubble o f neon in a helium continuum, and a bubble o f helium in a neon continuum. The results are instructive, but obviously not
11-17
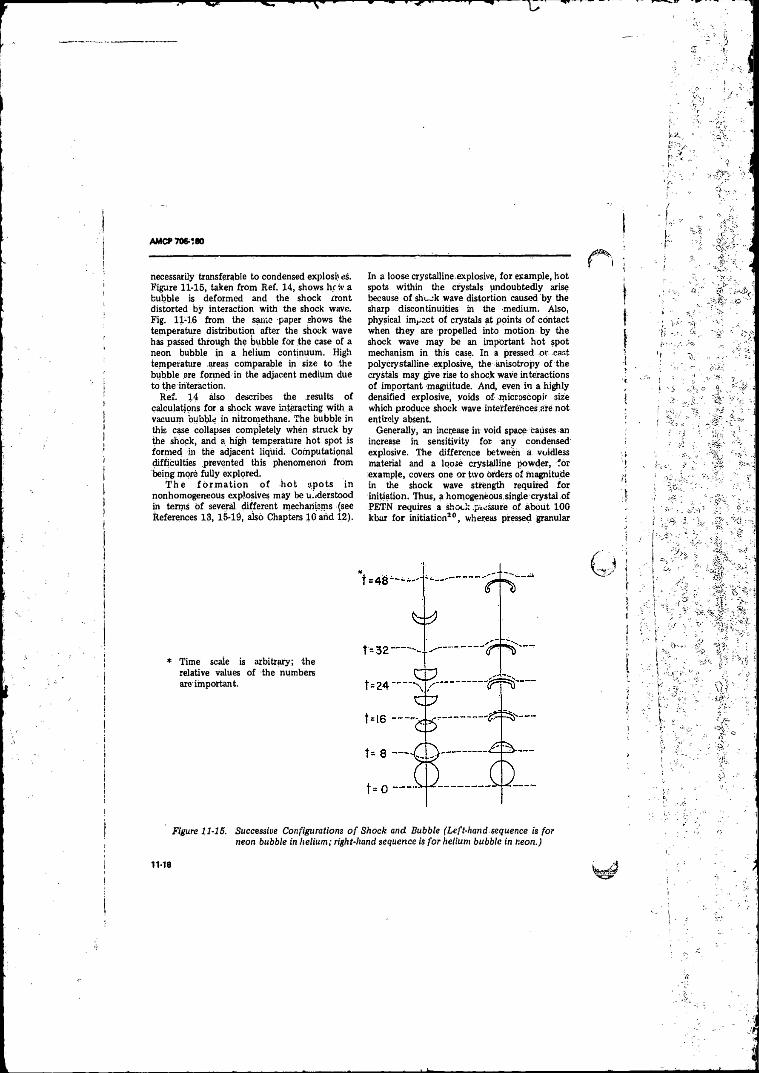
AM CP 706- SO
necessarily transferable to condensed explosi; es. Figure 11-15, taken from Ref. 14, shows hew a bubble is deformed and the shock front distorted by interaction with the shock wave. Fig. 11-16 from the same paper shows the temperature distribution after the shock wave has passed through the bubble for the case of a neon bubble in a helium continuum. High temperature areas comparable in size to the bubble are formed in the adjacent medium due to the interaction.
Ref. 14 also describes the results o f calculations for a shock wave interacting with a vacuum bubble in nitromethane. The bubble in this case collapses completely when struck by the shock, and a high temperature hot spot is formed in the adjacent liquid. Computational difficulties .prevented this phenomenon from being more fully explored.
T h e fo rm a t io n o f h o t spots in nonhomogeneous explosives may be understood in terms o f several different mechanisms (see References 13, 15-19, also Chapters 10 and 12).
In a loose crystallineexplosive, fo r example, hot spots within the crystals undoubtedly arise because o f shock wave distortion caused by the sharp discontinuities in the medium. Also, physical impact o f crystals at points o f contact when they are propelled into motion by the shock wave may be an important hot spot mechanism in this case. In a pressed or cast polycrystalline explosive, the anisotropy o f the crystals may give rise to shock wave interactions o f important magnitude. And, even in a hi^ily densified explosive, voids o f .micrascopk size which produce shock wave interferences are not entirely absent.
Generally, an increase in void space Causes an increase in sensitivity for any condensed explosive. The difference between a voidless material and a loose crystalline powder, for example, covers one o f two orders of magnitude in the shock wave strength required for initiation. Thus, a homogeneous.single-crystal o f PETN requires a shock .pressure o f about 100 kbar for initiation20, whereas pressed granular
* Time scale is arbitrary; the relative values o f the numbers are important.
Figure 11-15. Successive Configurations o f Shock and Bubble (Left-hand-sequence is for neon bubble in helium; right-hand sequence is for helium bubble in neon.)
11-18
AMCP70G-1M
PETN with 40 percent voids (density “ 1.0 g/cm3) requires only 2.5 kbar21.
In the compressed granular explosive approach ing crysta l density, or in a plastic-bonded explosive, for example, hot-spot sites may be few in number and relatively “ inactive” , Such materials might be expected to show “ homogeneous behavior” when initiated by a strong shock. In fact, it is quite possible to have hot-spot initiation and homogeneous initiation proceeding simultaneously, as the photograph in Fig. 11-10 shows.
11-8 SENSITIVITY TO SHOCK INITIATION
In most applications the main explosive charge is initiated by a detonator nap or primer, possibly in conjunction with a booster charge. Such an initiating system often produces an underdriven shock wave; therefore, many o f the principles discussed in this chapter have a bearing on problems connected with the design and performance o f these systems. Also, in the use o f explosives for blasting, it frequently happens that an inert object may fall between two sticks o f dynamite in a borehole, or that an air gap may result from not tamping the sticks in the borehole firmly enough. I t is, therefore, important that explosives used for this purpose be sufficiently sensitive to shock wave initiation .so that detonation will not fail to propagate Under these circumstances.
In principle, one may distinguish between the shock wave sensitivity o f explosives and sensitivity to other stimuli such as impact and friction. Indeed this distinction has been drawn in die division o f subject matter in this handbook, the present chapter dealing with initiation by shock waves, and the next chapter dealing with initiation from thermal sources. Nevertheless, these two subjects have important factorsin common.
The term “ shock wave sensitivity” has been used rather loosely up to now, and it is important to clarify its meaning. One can, o f course, define it arbitrarily In terms o f some standard test, e.g., the gap test. The results o f such a test may be treated in a more or less sophisticated way, by defining the sensitivity either In terms o f the actual shock strength produced in the explosive at the critical, “ go, no-go” threshold, or, more simply, in terms o f
Figure 11-16. Isotherm Plots for the Shock in, Helium Hitting a Neon Bubble (The numbers are 100 times the specific internal energy; behind the initial shock, the value is SO. Dashed lines show the bubble configuration. Cylindrical axis is to the left. Late-time heating at the top is caused by collision with wall, t - 30.)
the critical thickness o f the gap material. But, either way, the point remains that any such definition is arbitrary in some degree because there is at least one other factor that may be important besides cthe.peak pressure in the shock wave. This factor is time, i.e., the duration o f the shock pulse or its characteristic decay time.
The time factor in the initiation o f solid explosives is o f interest, because it could be important in determining shock sensitivity. In a shock sensitivity experiment, such as the gap test, the time period over which the initiating shock can be sustained in the acceptor charge without chemical reaction is limited either by (1 ) the diameter o f the donor charge, (2 ) the length o f the donor charge (i.e., the pulse width o f the incoming shock), or (3 ) the diameter o f the acceptor charge. This arises because
11-19
.k.
AMCV 706-1*0
rare fa ction s (release waves) will always propagate towards the shock front from the charge boundaries (Chapter 9). The release waves are associated with a drop in pressure and temperature, and hence will effectively quench chemical reaction. Therefore, if detonation is to be initiated in an acceptor charge, significant chemical reaction (e,g., thermal explosion) must occur prior to the arrival o f the release waves.
Th is criterion for shock initiation o f detonation can be stated as
r(d*) > t'(P ,) (11-2)
jftwhere t (d ) is the time period available fo r chemical reaction when, the limiting charge dimension is d , and' 't (Pt) is the thermal explosion time for an initiating shock pressure Pr The equality sign in Eq. 11-2 will then define the critical shock pressure (i.e., P = P or) for a “ go or no-go” result in a gap test experiment. Since r can be expected to decrease with decreasing d , and tt to decrease with increasing P, (see Eqs. 10-20 and 10-21), it can, therefore, be inferred^ that Pcr must increase with decreasing d .
This effect on P has been borne out in a series o f gap test experiments carried out by A ero je t-G en era l Corporation with solid composite propellants22. Fig. 11-17 shows the experimental variation in Pcr with acceptor charge diameter for three different propellants . In these gap tests the acceptor was a right cylinder with a diameter greater than the critical diameter dc (i.e., the minimum charge diameter in which a steady-state detonation will propagate). The donor charge in each case was a conical TN T booster that is three base diameters in height with the base diameter equal to the diameter o f the acceptor. The region below each o f the curves defines the “ no-go” region for the propellant, and above the curve, the “ go” regiont.
It is clear from the figure that there are values o f the acceptor diameter, particularly near to rfc,
* Compositions containing ammonium perchlorate, a l u m i n u m , R D X , a n d P B A N b i n d e r (polybuUdiene*acrylonitrile copolymer).
t A “ go” result wai interpreted when detonation was initiated and sustained over the entire length o f the acceptor (2-4 charge diameters).
where a decrease in charge dimension causes an increase :n P . I t can be construed from these results that the acceptor diameter is acting as a limiting dimension d and that its effect becomes lessimportant at larger charge diameters.
Table 11-3 shows the effect o f variations in diameter o f the donor charge on the shook pressure required for initiation o f one o f the propellants from Fig. 11-17 (i.e., propellant A with 9.2% RDX; d = 2.7 in.). Here the cylindrical acceptor charge diameter was kept constant at 6 in. and the donpr charges were cylindrical TN T boosters whose diameters were varied. While the values fo r Pcr are not well defined by these data, it is dear that shocks of higher strength were required fo r a “ go” result when the donor charge diameter was made smaller. This would again indicate that there is a limiting charge dimension d , namely the donor diameter, at least for those cases where the diameter is less than that o f the acceptor. I t is interesting to note from Table 11-3, that a “ go” result can be obtained even when the donor sire is less than the critical diameter o f the acceptor, however the value o f Pcr apparently is greatly increased in this case.
Fig. 11-18 depicts the results o f a shock sensitivity experiment with Propellant A, dc = 2.7 in., using the flyer-plate technique. In this test explosively driven flyer plates (5 sq. in., 1/32 to 1/2 in.) are impacted against the acceptor charge (4 in. diameter). In this manner planar shock waves with varying peak pressure, (proportional to plate velocity) and pulse width (proportional to plate thickness) are introduced into the acceptor. As in the gap-test, a “ go or no-go” result is determined. It is quite evident from Fig. 11-18 that Prr varies quite drastically when the pulse width is less than 1-2 psec, but approaches a constant value at larger pulse widths. Since the pulse width in microseconds is governed by the release wave which moves directly behind and toward the shock front, the data o f Fig. 11-18 can be interpreted as indicating the existence o f a limiting dimension d which would be equivalent to the length o f j donor charge. In this particular case, the d* corresponding to a 2 psec pulse width would be « 7 mm.
One can conclude from these results that the critical shock strength fo r initiation may be controllei.. by factors which are not intrinsic to
Figure 11-17. Normalized Initiation Criteria
Qai-t
tM.4
3MV
}
Figure 11-18. Effect o f Pulse Width on Minimum Initiating Shock Pressure
AMC
PtTM-iaO
AMCP 706-180
TABLE 11-3 EFFECT OF DONOR CHARGE DIAMETER ON SHOCK SENSITIVITY
Acceptor Charge: 6-in. right cylinder (critical diameter = 2.7 in.)
Donor Charge Initial Shock Gap TestDiameter, in, Pressure, kbar Result
T.00 250* No-C-1.50 250 No-Go1.75 150 No-Go1.75 250 Go2.00 125 No-Go2.00 150 Go2.00 250 Go3.00 50 No-Go6.00 “ 3.0 Go
* Maximum shock pressure attainable (i.e., zero-gap).
the explosive composition, in which' case one must be cautious in comparing the experimental results from different test arrangements, and even with the same test arrangements. However, it is also evident that it is possible to minimize the effects o f charge geometry on Pcr by utilizing charge diameters both for the acceptor and donor which are larger than the critical diameter o f the test material.
11-9 T H E O R Y OF SH O C K W AVE INITIATION IN SOLID EXPLOSIVES
The contrasting behavior o f homogeneous and nonhomogeneous explosives when subjected to underdriven shock waves was described in par.11-5. Solid explosives, except fo r single crystals, are nonhomogeneous; and, typically, unless the wave decays without producing detonation, it begins to accelerate immediately, and smoothly deve lops to a steady-state detonation. Acceleration o f the front indicates that reaction is occurring close behind the shock. Electrical resistivity measurements derived by Campbell, Davis, Ransay, and Travis6 tend to confirm this. Their experiments seem to show that the region immediately behind the underdriven shock front is electrically conductive, and that the conductivity in this region increases continually as the wave progresses until steady state
detonation is reached. This indicates that weak chemical reaction occurs behind the entering shock front and becomes strongeras the shock wave builds up. This finding is somewhat at variance, however, with conclusions reported by Gipson and Macek®3, who interpreted their experimental results to mean that the reaction at first lags at a distance behind the shock. They explain the acceleration o f the front as resulting from the action o f compression waves emanating from the reaction zone. In their picture, the reaction catches up to the shock wave only when full detonation is established. The conditions were not the same in the two sets o f experiments: Campbell, et al., employed plane, essentially nondecaying (step-like) shocks, whereas Gipson and Macek used a typical gap-test geometry where neither o f these conditions were fu lly met. Also, the conclusions o f Gipson and Macek are based on an observed difference in location o f a pressure frpnt as detected by pressure collapsing probes and a “ flame front” as detected by a common type o f ionization probe. The pressure detectors were located on the central axis o f the cylindrical charge, and tire ionization detectors at the interface o f the explosive and the steel tube used to co n fin e th e charge. Possibly, the interpretation o f the experimental results could be reconciled in the two cases if the electrical
11-23
A M C f 706-1*0
response characteristics o f the different ionization probes were carefully analyzed, and if the curvature o f the front in the Gipson and Macek experiments were taken into account. The theory o f hot spots as described in the previous paragraphs suggests that initiation takes place within 0.1 Msec or less after passage o f the shock. It is to be expected that ionization will increase with time as the initiation process spreads, and as the reaction becomes general throughout the mass o f the explosive. Therefore, the-somewhat disparate conclusions j £ these two investigations may not be really at variance with this theoretical picture.
Although experimental work has not as yet yielded a clear picture o f the nature o f the reaction that supports a shock wave in the early stages o f the initiation process in solid explosives, it is quite certain that energy release occurs not far behind the initiating front. This is in distinct contrast to the behavior o f hom ogeneous liq u id ex p los ives where detonation develops at the back face where the shock first enters the explosives. Obviously the model o f a simple- first-order, Arrhenius-type r e a c t io n —w hich describes the la tte r phenomenon so well—does not represent the entire behavior o f solid explosives. Indeed, there is little doubt that the actual mechanism involves initiation by hot spots followed by some sort o f surface-erosive deflagration, or grain burning. T h e formulation o f a mathematical model along these lines, however, presents some rather formidable problems not encountered in the homogeneous case.
The general approach to this question has been discussed -by Adams24, who shows that a pressure-dependent burning-law as displayed by solid propellants, i.e.,
r = fcSP n (H -3 )
where r is the linear surface erosion rate; S, the surface area; P, the pressure; and k and n constants, will meet many o f the model requirements provided the reaction is.,supposed to start on all the grain surfaces when the shock advances over them. Warner25 has formulated the equations o f motion for a computer program with this type o f heat release term. As a technical matter, it is necessary to set an arb itra ry pressure le v e l below which
decomposition does not occur to prevent the explosive from decomposing even before the shock passes through it. Essentially this device performs the function o f hot spots in the actual case. Another practical problem is to find an equation o f state that satisfactorily describes the two-phase system representing the surface burning explosive grains and the product gases. In spite o f obvious imperfections, a simple model with a pressure-dependent burning law does show the desired behavior: steady build-up o f the shock front to detonation without overshoot. Some o f the results reported in Ref. 25 are depicted in Fig. il-1 9 and 11-20. These figures illustrate the calculations for an initiating shock o f finite duration applied by means o f p,ston r, .on at the left boundary o f the explosive = 0), the motion o f the piston being adjusted to support the flow at all times as reaction builds up. Full development o f the von Neum ann “ spike” (Chapter 8) to the steady-state condition occurs in this case in about one microsecond.
Boyer and coworkers26 have attempted to simulate the behavior o f hot spots combined with grain burning by a “ two-zone” model. The explosive grains are considered to be enveloped in a thin initiating layer which comprises a fraction F o f the total explosive. This initiating layer behaves as a homogeneous explosive, following a first order Arrhenius law. The activation energy is adjusted to give a suitably short ignition delay time. By means o f this device the grain burning mechanism is brought into action in the second, inner zone. Behavior o f this model is similar to that o f Warner’s model, showing a steady build-up to full detonation at the shock front. Interesting studies can be made in this case by varying the fraction F1, which might be thought o f as the “ hot-spot” fraction. Boyer and Grandey26 have also considered the effect o f varying grain size on the behavior o f the two-zone model. Larger grains lead to a longer reaction zone and a slower build-up to detonation, as expected (cf. Chapter 9),
Boyer, on the basis o f the two-zone model, has investigated some interesting ideas pertaining to the effect o f void spaces, or porosity in the charge. The following remarks are quoted from a discussion in the Ninth Combustion Symposium, p. 551 (Academic Press, 1963): “ An interesting
AMCP 706-180
Figure 11-19. Build-up o f Shock Wave in Solid Explosive to Detonation for a Surface-erosion (grain burning) Law of Heat Release2 6 (The shock enters the explosive a t X - 0 with a pressure of 10,000 atm.)
Figure 11 -20. Peak Pressure and Position, o f the Wave as a Function of Time for the Case in Fig. 11-19'
type o f ignition occurs when there are pores or voids in the charge. It is found that if, upon passage o f ta shock over porous material, the pores are compressed to zero volume, then the energy deposition in excess o f that deposited by a shock of similar intensity in a nonporous material is approximately proportional to the initial pore volum,.. This excess energy represents work done in compressing the pore. It is associated with motion and viscous dissipation, and presumably is deposited in, the vicinity o f the pore. I f the volume o f material so affected is approximately equal to the pore volume, then the temperature rise will bo twice in bulk material. A Hot spot approximately equal to the pore volume is, therefore, created (cf. Ref. 10, 14, and 22); this logically becomes the volume o f the ignition region, and it is concluded that in the initiation o f porous explosives by such a mechanism, the parameter F1 can be taken to be equal to the fractional porosity of the charge. I t is to be noted that the
foregoing arguments do not depend significantly upon the type, or even the presence of occluded gas.
“ This relation between porosity and the ign it io n process p rov ides a resonable interpretation o f many widely observed characteristics o f detonation waves.. I t is first necessary to realize that representation o f the ignition reaction by an Arrhenius function means that the ignition reaction zone is very narrow. Its energy contribution to support o f the wave is, therefore, not seriously degraded by lateral expansions, even at small charge diameters. This will be equally true o f Taylor expansions (Chapter 8) behind thu wave after a very short propagation distance. I t follows that i f a large fraction o f the charge material is consumed in the ignition process, as would be the case, according to the previous argument, with loosely packed, porcus charges (i.e., large -Fj) one would expect a very short wave ry.n up to steady state and a small critical diameter.
AMCP 706-180
With a high density, nonporous charge, the converse would be expected. Such behavior is in general accord with experiment.”
Boyer also makes these remarks concerning the effect o f grain radius Rg . “ The parameter Rt has a similar effect on the surface regressive process. A small Rg provides a thin reaction zone width and, consequently, a short run-up distance and small critical diameter, whereas the converse is true with large Rt . We have observed that computed waves in charges defined to have an Ra combined with a small I'\ (i.e., initiating fraction) will run for large distances.at a velocity o f about 4 mm/;usec before accelerating to a steady value. Since these waves were computed with one-dimensional geometry, the effect of lateral losses could not be ascertained (cf. Chapter 9), but it is believed that had such losses been present, these low velocity waves could h a v e b e e n i n d e f i n i t e l y sta b ilized . Experimentally, it is reported that the condition of large.grain size, high density, and small charge diameter is just that which results in stable low order detonation” (cf. Refs. 27 and.28).
The term “ low-order” detonation is a loosely defined concept referring to reaction waves which travel at velocities much less than that predictable by C-J theory. These processes, which can be considered as intermediate betw een d e fla g ra tion s and detonations, undoubtedly involve a critical balance between energy production by heterogeneous reaction processes and energy loss due to lateral expansion (Chapter 9). Hence the observed reaction wave depends critically on charge diameter, porosity, explosive composition, confinement, etc. A comprehensive review o f this general subject can be found in Ref. 28 which is a U.S. Army Research Office STAR report.
A special case o f “ low-order” detonation is the so-called “ low-velocity detonation wave” (LV D ) which can occur in certain liquids and solids and in charge geometries which can also sustain a “ nonnal” C-J type detonation. This special case is discussed in some detail in par. 11-10.
11-10 LO W -V E LO C IT Y DETONATION (LVD)
The discussions o f shock wave initiation have referred so far primarily to the establishment o f
a “ normal” detonation wave whose velocity is commensurate with that predictable from hydro thermodynamic theory. For many years, however, it has been known that certain solid and liquid explosives (e.g., granular TN T and nitroglycerin) can detonate in two different velocity regimes (see Ref. 28). There is the stab le “ norm al” mode or high-velocity detonation (HVD ) which we have referred to previously, and an apparently stable low-velocity detonation (LV D ) that propagates near the sonic velocity o f the unreacted material. The LVD mode occurs only under special conditions o f charge diameter, confinement, and initiation. This can be seen in Fig. 11-21 whin t presents the detonation velocities found in a typical blasting gelatin29.
The HVD mode is seen to propaga'; essentially at the Chapman-Touguet velocity o f 7500 m/sec, while the LV D mode propagates at 1500-2500 m/sec, which is near sonic in the unreacted blasting gelatin. In this case, either HVD or LV D could be obtained at the same charge diameter simply by changing the initiation source from a high strength Briska detonator to a lower strength fulminate-chlorate detonator. Similar HVD-LVD phenomena have been reported for granular T N T 30.
The different shock strengths required to initiate HVD and LVD is one o f the striking differentiating characteristics o f the two modes o f d e to n a tion . For example, HVD in homogeneous liquid explosives requires shook initiation pressures of 50-100 kbar, whereas an LVD in these same liquids might be initiated with shock pressures one to two orders o f magnitude less. A good example o f this difference can be seen in the gap-test sensitivity data (see Table 11-4) reported by the U. S. B u r e a u o f M i n e s f o r a 5 0 / 5 0 nitroglycerin-ethylene glycol dinitrate explosive mixture (NG-EGDN) and a nitric acid-fuel solution (Cavea B110)31.
The extreme shock sensitivity o f materials to LVD has considerable significance in the safe handling o f liquids which can undergo this mode o f detonation. Accidental explosions have occu rred in n itro g ly c e r in and liquid monopropellant manufacturing facilities as the result o f relatively mild initiation stimuli. This suggests that LVD may have been the responsible factor in the initiation of the explosion.
1 1 - 2 6
AMCP 706-1*0o
CHARGE DIAMETER, in.
Figure 11-21. Propagation Failure in Blasting Gelatin29
11-27
AMCP 706-180
TABLE 11-4 EXPERIMENTAL CARD-GAP TEST RESULTS
SonicConfinement
MaterialVelocity, * m/sec
! P,/P,** Gap Valuesf(in. of Lucite) .
NG-EGDN CavedBHVD-LVD LVD-NI HVD.-LVD LYD-NI
Lucite 1840 1.00 2.2 > 1 2 l - 2 t t -Lead 1190 1.73 1.8 > 1 2 1.5 -
Aluminum 5000 1.73 1.2 > 1 2 . 0,1 3,0
Copper 3810 1.87 1.0 > 12 < 0.1 4;0
Steel 5200 1.90 0.4 > 12 < 0.1 6.0
* Sonic velocity in thin rods of confinement material.
* * Ratio of transmitted to incident pressures from Lucite gap.
f Gap values for HVD-LVD refer to threshold between HVD and LVD.Gap values fo r LVD-Nl refer to threshold between LVD and no initiation (N I).
t t Only HVD observed.
A t the present time there is no adequate theory for LVD initiation and propagation, however, experimental studies at the U. S. Bureau o f Mines31' 33 and Stanford Research Institute34'36 have characterized some o f the properties o f LVD in liquid explosives, These studies suggest that the phenomenon involves comjplex shock interactions between the liquid and the container walls, and the formation o f vapor bubbles by cavitation.
Table 11-5 shows some o f the results found by the U. S. Bureau o f Mines for the stability o f an L V D Wave in NG-EGDN under various conditions o f confinement33. I t is evident that wave stability is enhanced by increased container wall thickness and increased wall sound speed. These results along with high speed photographic evidence o f cavitation in the liquid led Watson, et al.33 to suggest the following four step model fo r LVD initiation and propagation.
In the first step, shocks (precursor waves) moving up through the container walls cause bow waves in the liquid explosive which compress the fluid. In step 2, the compressed liquid is expanded by the rarefaction waves which are associated with a radially outward motion o f the container walls. In step 3, the
liquid cavitates resulting in the formation of large numbers o f gas bubbles. In the final step, the gas bubbles ignite to release the energy required to support the precursor shock wave in the container wall.
The mechanism by which these steps are coupled to yield a steady state reaction wave has yet to be worked out. However,, the model is som ewhat similar to the grain burning mechanism often postulated for granular solid explosives (e .g , .see discussions in previous paragraph). In the solids case the surfaces necessary to support bulk grain burning are associated with the individual grains o f explosive. In the liquids case, the necessary surfaces are formed in situ by cavitation behind the precursor waves.
Amster and coworkers34 at Stanford Research Institute suggested a somewhat different model for LVD propagation. In this model the bow waves in the liquid coalesce to form a high pressure “ Mach disc” which travels with the speed o f the precursor wave. The pressure just behind the “ Mach disc” could be quite high ( * 85 kbar) which would be marginally sufficient to initiate the same type o f reactions that support HVD in the liquid. This model would explain the observations that (1 ) a propagating
1 1 - 2 8
AMCP 706-180
TABLE 11-5 RESULTS OF LOW-VELOCITY DETONATION STABILITY STUDIES, WITH. NG-EGDN
(co = 1.48 mm/psec, p = 1.55 g/cm3)
Wall DetonationThickness, in. Result
Lead Tubes: co = 1.21 mm/psec
Velocity, mm/psec-
1/16 Unstable . . . .
1/8 Unstable —
, 1/4 Unstable
Plexiglas Tubes: co = 1.84 mm/psec
1/16 Unstable _1/8 Stable 2.141/4 Stable 1.84
1/16 Steel Tubes: cn = 5.20-mm/psec
1/16 Stable 1.961/8 Stable 1.881/4 Stable 2.11
Aluminum Tubes: -S.OOmm/psec
1/16 Unstable —
1/4 Stable 2.04
LVD wave often changes in a jump fashion to an HVD wave, (2 ) an LVD wave is more stable in cy lin d r ica l con ta iners (wall shocks in noncylindrical containers will not give rise to a “ Mach disc” ), and (3 ) LVD wave stability is sensitive to wall composition and wall thickness.
However, in subsequent studies'Woolf oik and A m ste r36 observed an apparent LVD propagation with 1,2 difluoraminopropane (1 ,2-D P) in cylindrical lead and square aluminum containers (see Table 11-6). This is inconsistent with the “ Mach disc” model because with lead having a sound speed (q, = 1.2 mm/psec) just slightly above that o f 1,2-DP (co = 0.96 mm/psec) a high pressure “ Mach disc”
would not be expected to form in the liquid. Also, a well defined “ Mach disc” is not expected to be formed when the liquid is contained in a noncylindrical geometry.
Indirect evidence in support o f a cavitation typ e m odel com es from an extensive experimental study by Stanford Research Institute (SR I) o f the sensitivity o f an isomeric series o f difliioramino propanes (1,2-DP; 2,2-DP; 1,3-DP)'16. These liquid explosives consistently exhibit an LVD o f * 1 mm/psec in charges o f less than » 9 mm diameter and an HVD o f » 6 mm/psec at larger charge diameters. In some cases the LVD wave can be initiated by extremely weak shocks as can be seen from the
11-26
AMCP 706-180
TABLE 11-6 LVD GAP TEST FOR 1,2-DP: DEFECT OF CONFINEMENT GEOMETRY AND SONIC VELOCITY
Sonic Velocity, Dimensions 50% Gap, cmTube Material mm/psec Geometry ID, cm Wall, cm of PlexiglasA lu m in u m 5.2 Cylinder 1.27 0:23 > 214
A lu m in u m 5.2 Square 1.27 0.318 > 6 1 ' - < 9 i . 5
Brass 3.7 C ylinder 1.27 0.23 > 9 5 - < i 2 2
Steel 5.1 C ylinder 1.27 0.63 > S I '- < 1 2 6
Lead 1.2 C ylinder 1.27 0.63 > 9 5 .0 t
t N o fu rther test was m ade above this gap because th eaveragepropagation ve lo c ity had becom e subsonic.
positive gap test result for 1,2-DP with a 214 cm gap (see Table 11-6).
I t was found by the SRI group that the order o f increasing shock initiation sensitivity for the difhiprammopropanes is just that order which would be expected on the basis o f increasing gas-phase reaction rates (see Table 11-7); In addition, the drop weight and spark sensitivities for the compounds follow the same order. On the other hand the order o f HVD shock sensitivity as deduced from measured shock initiation induction times (see par. 11-5) is exactly opposite to that for LVD. These results suggest the following: (1 ) the controlling chemical reactions in LVD are gas-phase
decompoisitons (i.e., in gas bubbles formed by cavitation o f the liquid), and (2) the controlling chemical reaction step in LVD is not the same as that in HVD, at least for the two compounds shown in Table 11-7. The first suggestion is consistent with a cavitation type model for LVD, while the second suggestion is inconsistent with the “ Mach disc” model
The various observations o f LVD in liquids indicate that a quantitative understanding o f the phenomena cannot be obtained by application o f the Chapman-Jouguet theory. Consideration must be given to the multiple shock wave interactions that occur and to heterogeneous bulk bu-hing in the liquid.
TABLE 11-7 CORRELATION OF SENSITIVITY TESTS WITH REACTION RATES
Gas-Phase Reaction Rate
Sensitivity Test Reaction Time HVD GapLVD Gap Drop Weight Spark
2,2-DP A * 2,2-DP , i 2,2-DP t 2,2-DPA 2,2-DP 1 * *
1,2-Dp T 1,2-DP 1,2-DP 1,2-Dp T 1,2-DP 1
1,3-DP' . . . 1,3-DP „ . 1 ... t
+ t = increasing sensitivity or reactivity.
* * 4 = increasing reactivity.
AM CP7M -180
REFERENCES
1. Donna Price, and I. Jaffe, Am, Rocket Soc. Joum. 31, 595 (1961).
2. Fourth Symposium (International) on Detonation, Sponsored by the V. S. Naval Ordnance Laboratory and the Office o f Naval Research, O ffice o f Naval Research Report ACR-126 (1965).
3. R , F . Chaiken, Eighth Symposium (International) on Combustion, Williams and Wilkins Co., Baltimore, Md., 1962, o. 759.
4. R. F. Chaiken, J. Chem. Phys. 33, 760(1960) .
5. A. W. Campbell, W. C. Davis, and J. R. Travis, Phys. of. Fluids, 4,498 (1961).
6. A. W. Campbell, W. C. Davis, J. B: Ramsay, and j . R. Travis, Phys. o f Fluids, 4, 511(1961) .
7. R. F. Chaiken, Unpublished work at Stanford Research Institute, Menlo Park, Calif., 1969.
8. J. Berke, L. B. Seely, D. Tegg, and R. Shaw, Unpublished work at Stanford Research Institute, Menlo Park, Calif., 1969.
9. J. R. Travis, Reference 2, p. 386.10. C. L. Mader, Phys. o f Fluids 6, 375
(1963).11. J. W. Enig and F. J. Petrone, Phys. o f
Fluids 9, 398 (1966).12. J. Zinn, J. Chem. Phys. 36,1949 (1962).13. F. F, Bowden and A. D, Yoffc, Initiation
and Growth of Explosion in Liquids and Solids, Cambridge University Press, 1952.
14. M. W Evans, F. H. Harlow, and B. D. Meixner, Phys. o f Fluids 5, 651 (1962).
15. F. P. Bowden and A . D, Y o ffe , Fast Reactions in Solids, Academic. Press, Now York, 1958.
16. M. A . Cook, The Science o f High Explosiues, Reinhold Publishing Co., New York, 1958.
17. Proceedings o f the International Conference on Sensitivity and Hazards of Explosives, London, October 1963, sponsored by the Explosives Research and Development Establishment, Ministry of Aviation, Watham Abbey, Essex, England.
18. Ninth Symposium (I< temational) on Combustion, Academic Press, New York, 1963.
19. C. E. Melton, D, F. Strenzwilk, and P. D. Yedinak, Microscopic Theory of Detonation in Solids, BRL TN 1715, Aberdeen Proving Ground, Md., April 1969.
20. T. E. Holland, A . W. Campbell and M E. Malin, J. Appl. Phys. 28,1217 (1967).
21. G.E. Seay and L. B. Seely, Jr., “ Initiationo f a Low-Density PETN Pressing by a Plane Shock Wave” , Third Symposium on D'-.L nation, p. 562, Vol. 2, 1960,published by Office o f Naval Research.
22. Large Solid Propellant Boosters Explosive Hazards Study Program (Project SOPHY), Technical Documentary Report Nos. A F R P L - T R - 6 5 - i l , N o v . 1965 and AFRPL-TR-87-211, August 1967.
23. R. W. Gipson, and A . Macck, “ Flame. Fronts and Compressions Waves During Transition from Deflagration to Detonation in S o lid s ” , Eigth Symposium on Combustion, Williams and Wilkins, Baltimore, Md,, 1962, p. 847.
24. G. K. Adams, Reference 18, p. 545.25. F. J. Warner, Reference 18, p. 53626. M. H. Boyer and R. Grandey, “ Theoretical
Treatment o i the Detonation Behavior o f Solid Propellants", Symposium of Amer. Rocket Soc. on Detonation and Two Phase Flow, April 26-28, 1961. Published by Academic Press, 1962, S.S. Penner and F .A . Williams, Eds., 75. See also disscus3ions by M. H. Boyer, Reference 18, pp. 543 and 551, and additional paper in Reference 17.
27. A. Maeek, “ Sensitivity o f Explosives” , Chem. Rev. 62,41 (1962).
28. J. A. Brown .met M. Collins, Explosion Phenomena Intermediate Between Deflagration and Detonations, Esso Research and Engineering Co. Report on Contract No. DA-49-092-ARO-140, Oct. 1967, AD-662 778.
29. J. Taylor, Detonation in Condensed Explosives, Oxford University Press, 1952.
11-31
AMCP 706-180
REFERENCE (Cont'd).
30. E. Jones and L. C. Cumming, Second Detonation Symposium, sponsored by the ' Office o f Naval R search, 195E, p. 483.
31. R. W. Van Dolah, R. W. Watson, F. C. Gibson, G. M, .Mason and <J? Slbdvicfi, ’Reference 17.
32. F. Ci Givson, C. R. Summers, C. M. Mason and R. W. Van Dolah, Third Symposium on Detonation, ONE Symposium Report ACR-52, Vol. 2, 1960,;p 436.
33. R. W. Watson, C. R. Summers, F. C. Gibson, and R. W. Van Dolah, Reference 2, p. 117..
.34. A . B. Amster, D. M. McEachern, Jr„ and’Z. Pressman, Reference 2, p. 126.
35, R. Vi. Woolfolk, and A . B. Amster, Twelfth Symposium (International) on Detonation, The Combustion Institute, Pittsburgh, Pa., 1969, p. 731.
36. Stanfc ' Research Institute, Sensitivity Fundu,..entals, Reports on Contract NONR-3760(G0); Annual Report No. 66-2, March 1966.
11-32
CHAPTER 12 INITIATION AND GROWTH OF DETONATION FROM IMPACT, FRICTION, AND THERMAL SOURCES
12-1 SENSITIVITY TO IMPACT AND FRICTION
Safety is, o f course, a constant concern in handling explosives; from the beginning of their development, methods were sought to test the “ sensitivity” o f explosives to various types of stimuli. Explosives that are more sensitive to impact and friction are not necessarily more powerful; therefore, it should be quite possible in principle to produce explosives that are just as effective or more effective than those now in use and which, at the same time, are safer to handle and use. This has been the reason for much of the work on this subject. A t the same time attempts have been made to interpret the sensitivity behavior in terms o f properties that are better characterized and better understood:
The difficulty o f ’ the sensitivity problem stems, indeed, just from the fact that it is so poorly understood and, therefore, so poorly defined. Even at the present time there are no standards in this field; tests results from one laboratory may not entirely concur with those from another. In the United States there are perhaps three nonofficial “ standard” impact test machines—one at the Bureau o f Mines, Bruceton, Pennsylvania; one at Picatinny Arsenal; and one at the Naval Ordnance Laboratory (NO L). Because there are no guiding principles in this area, the design and dimensions o f each o f these devices was quite arbitrarily arrived at. However, to obtain meaningful and consistent results, great pains must be taken to control conditions in the test whatever they are arbitrarily established to be. The painstaking nature o f this work is illustrated by the following description o f the apparatus and methods presently in use at the Bureau o f Mines, a typical piece o f apparatus.
The Bureau o f Mines impact apparatus shown in Fig. 12-1 is essentially a device in which a sample o f explosive is subjected to an impact of a free-falling drop-hammer of 5-kg weight. It consists o f a framework o f steel T-beams which rise vertically from a massive steel base resting on a concrete pier. The drop-hammer and the yoke move between the steel beams which are
12.5 ft in height. The yoke is provided with an electromagnet so that it can be magnetized. It is raised or lowered by means o f a windlass located at the base o f the machine. When the yoke is magnetized, it attracts and holds the drop-hammer which may be raised to any desired height up to 330 cm. When the yoke is demagnetized, it releases the steel hammer: A recording device attached to the windlass measures the height from which the hammer is released. The anvil assembly is mounted on the base o f the machine and consists o f a hardened steel anvil and a plunger, 1.25 in. in diameter and 6 in. in length, machined to give a sliding fit through a steel guide ring. The drop-hammer, when relee-ed, strikes the plunger which transmits the forces developed on impact to a small striking pin that fits into a steel cup containing the test sample.
The striking pins—0.5-in. diameter by 0.75-in. length-are of type 440-C stainless steel, hardened to 55-50 on the Rockwell scale, and ground and polished to give a snug, freely sliding fit in the sample cup. The sample cups are approximately 0.5-in. in diameter and 0.25-in. in depth, and are o f type 302 stainless steel with a w ill thickness o f 0.007-in.
The test sample o f approximately 35 mg is placed in the stainless steel sample cup, and the striking pin is gently pressed down upon the sample. This assembly is then centered on the anvil by a shallow socket at the lower end o f the plunger. The hammer is raised to a given height and then allowed to drop on the plunger. I f no explosion or reaction occurs, the hammer is raised to successively greater heights and the test repeated with a fresh charge until a reaction occurs or until the maximum range o f the equipment is reached. I f a reaction does occur, fresh samples are tested at successively lower initial heights o f fall until a point o f no reaction is reached. Once the initial height is determined, a sample will be tested at a given increment below the level at which the previous sample was tested i f that sample reacted, and a given increment above the level at which the previous one was tested i f it did not react. By using this “ up-and-down” method and analyzing the data
AMCT 706-180
Figure 12-1. Impact Apparatus Showing Anvil-striking Pin Assembly
AMCF7W-U0
statistically, a height fo r 50-percent ignition probability is attained;
The determination o f an “ explosion or reaction” is based on visual and aural o b s e r v a t i o n . A n y in d ica tion o f decomposition—explosion, bumingj flash,smoke, or charring—isconsidered a “ go” .
One difference between the Bureau o f Mines test and that at NOL is the use at NOL o f a piece of sandpaper placed under the sample on the test anvil. This possibly has the effect o f more nearly standardizing the mechanism by which the mechanical: energy o f the falling
weight is converted to heat in the explosive sample.
Other differences are present in the tooling, drop weight, size and criteria forjudging a “ go” ; All differences combine to give different 50-percent drop height values for the same explosives; however, in general, when properly determined on adequate equipment, tlu. results have a differentia! validity in> thatthey correctly order explosives with respect to impact sensitivity.
Friction testing o f explosive has not been as common as impact testing. However, interesting
Solid explosive
Figure 12-2, Illustration of Apparatus Used for Determining the Friction Sensitivity of Solid Explosives
1Z-3
AM C f 706-1*0
results have been obtained by Bowden1 and coworkers using friction apparatus such as that illustrated in Fig. 12-2. Some o f the results are described in par. 12-3. The device in Fig. 12-2 is designed so that a thin layer o f solid explosive is subjected to rapid shear while held under a known load.
12-2 DESIGN AND ANALYSIS OF SENSITIVITY EXPERIMENTS
Explosive sensitivity tests are among the few examples, o f what might be described as one-shot, “ go or no-go” experiments. Certain types o f biological tests, e.g., lethal dosage, also fall into this category. In experiments o f this nature, only a single trial can be performed on each specimen because it is so altered by the test, regardless o f outcome, that it cannot be subjected to further testing. Thus, it is not possible to determine the critical level o f the independent variable-e.g., the drop height o f the impact test—in t..is case fo r each specimen and, therefore, an element o f indeterminacy is inherent in each trial result. One consequence o f this situation is that more tests are-necessary to determine the sample mean and standard deviation with given precision than in experiments where a definite critical threshold value can be assigned as a result o f each trial. Another consequence is that a certain method o f testing, the so-called “ up and down” method, is considerably more efficient than other methods in deriving this information.
The up-and-down method was developed by the Explosives Research Laboratory, Bruceton, Pa., and the statistical analysis appropriate to it was developed by the Statistical Research Group at Princeton University during World War II. A full treatment o f the subject may be found in Ref. 2; the essentials are given in the following discussion which refers specifically to the drop-weight impact sensitivity test.
In performing a test on a given sample o f explosive, one first o f all fixes certain points on the height scale at which trials will be made. Individual trials are then made by setting the drop hammer at one o f these points, never at intermediate positions. The fixed points, which we designate by the general symbol ft, to indicate the i-th point on the scale, are separated by equal intervals d on a normalized scale. The
normalized scale is defined as that scale function o f height on which the actual critical drop heights—if these coi.ld be determined—of an infinite number o f specimens o f the explosive/ would be normally -distributed (in the statistical sense). Experience indicates that the normalized scale in the impact test is the logarithm o f the drop height; therefore, the intervals should be equal increments o f log height. I f equal linear intervals on the height scale are used, it would 1-sd, in principle, to errors in the application o f the statistics. (A test for normality o f scale is described in Ref. 2.) Ideally, the interval d should be chosen, equal to the standard deviation is. Obviously, since o is not known in advance, the magnitude o f d had to be selected on the basis o f experience. A choice o f interval either larger or smaller than a simply makes the test less efficient but does not invalidate the results.
The “ up-and-down” test is carried out in a sequential manner, the choice o f test level fo r the drop hammer in each trial being dictated by the result o f the trial just preceding it. The drop hammer is raised by one interval d to the next higher point h,41 if the preceding trial at ft, was “ no-go” and is lowered by one interval d to the next lower point ft, i f the preceding trial was “ go” . This procedure results in a nearly equal number of “ go’s” and “ no-go’s” , and guarantees that a great majority o f trials is grouped around the mean. An example o f an actual lest involving 100 trials is shown in Fig.12-3. In this type o f testing, 100 or more trials are considered necessary if reasonably good estimates are to be maue o f the mean height.
The formula for calculation o f the mean height (or mean log height if the log scale is used) follows. The computation is based either on die “ no-go’s” (zeros) or the “ go’s” (x ’s), depending upon which is least in number; i f the number o f each is the same, either may be used. When the numbering o f the fixed points starts with zero at the lowest level at which tests were made, the mean level m is given by
m = c + d I— — Sin (o ) + Vi (12-la)w > ) ' J
where c refers to the normalized scale value at the zero level—e.g., the value o f ft in Fig.12-3;-N(o) refers to the total number o f zeros, or “ no-go’s” ; / is the number o f the level; and
12-4
/
K -
h , ~
h r
h , -
h 0 -
■ X • .
• X x X, X O X X
■ J C X O X X X O X X .X X X X X X X X X X x< X X X O O X X O X X X X x o X * X X, X X X
>6 0 0 X 0 O 0 0 0 O 6 X X X 0 O 0 0 6 0 0 O 6,0 X 0 0 X 0 O: o 6 o o X X 6 o o o p Q 6
• 0 O O O O O 0 0
Figure.12‘3. Example of a Sensitivity Test Result Comprising 100 Trials Following the Up-and-down Method (x indicates “go”, and o indicates uno-go” )
s
AMCP 706-180
nt(o) the number o f zeros at that level, the sum being taken over all levels above the zero level. A similar formula applies if one counts the “ go’s” or x ’s, as follows:
m = a + d | j ^ S< «,(*) - (12-lb)
where N(x) refers to the tot:.’, number of x ’s, and the other symbols are defined consistently with those previously given. Eqs. 12-la and 12:lb are, of course,, identical with usual formulas fo r calculating the mean, except for the com ction ± 1/2, which lakes account o f the fact that the independent variable is not continuous, but “ quantized” .
Calculation o f the standard deviation a is not so direct. One first calculates a number M defined by
JWN
( 12-2)
where N and n, refer to either the zeros or the x the choice being o f the one for which N is the smaller i f N is not the same for both. I f M > 0.40, a number s is calculated from it by the approximate formula
s = 1.60 (M + 0.04) (12-3)
I f M < 0.40, the curves in Fig. 12-4 are used to find s. The actual curve to be used depends on how close the mean value m is to the nearest test point h. Interpolation can be made between the curves in Fig. 12-4 when the difference m -h does not correspond to a value for which a curve is given. When s has been evaluated, the estimated standard deviation 0 is calculated by the formula
0 = sd (12-4)
These formulas, o f course, give estimated values for m and a based on tests on a finite sized sample. The standard error of the estimates depends, as in ordinary statistics, on 1/ yiT where n is the total number o f trials. It also depends on the relative size of d and a, and on where m happens to fall within an interval on the .height seme. For the formulas used to compute standard errors o f various estimates, the reader is referred to the original publications2. However,
it should be n.. ted that Martin anc’ Sanders3 compared the analysis o f the Bruceton method to that o f large sample theory employing the results on as many as 150,000 trials obtained in a simulated computer experiment. They concluded that for a sample size, o f 100, the Bruceton type o f test will give a good estimate o f the mean m, but a relatively poor estimate of the standard deviation a. With a sample size of 25, the spread in m becomes excessive.
12-3 THEORY OF IMPACT SENSITIVITY
I t is now widely accepted that initiation in all the-common sensitivity tests depends on thermal explosion. Usually, the temperature . rise produced by the test stimulus is not uniform throughout the mass o f explosive; instead, heat is concentrated in one or more small-volume elements, i.e., hot spots, created by the stimulus. Explosion occurs in these areas and spreads into the mass by the action o f hot gases or of compression waves, or o f both. A complete theory o f the phenomena in any given type experiment would have to treat the following aspects: (1 ) process by which heat is produced in a hot spot as a result o f the initial stimulus, (2) distribution o f size and temperature level among the hot spots as a function o f intensity of the initial stimulus, (3 ) temporal behavior o f a hot spot after it is formed as a function o f size and initial temperature, and (4 ) spread of reaction to the bulk explosive following explosion o f the hot spots.
Because o f the obvious complexity o f the problem, a complete theory such as this has never been formulated, but considerable attention has been given to the problem (see Chapters 10 and 11). The types o f processes by which hot spots are produced as a result o f impact and friction have been the subject o f much artful research by Bowden, Y o ffe , and coworkers1. This work has demonstrated that there are a number o f mechanisms by which part o f the mechanical energy may appear as heat concentrated in a number o f small volume elements or hot spots in the explosive mass. These findings are as yet only semi-quantitative, and in no instance is it possible to calculate with certainty the size or temperature o f a hot spot that is produced, for example, by some given impact. Neither is anything yet known about the
12-6
12-7
AMCt> 706-180
distribution o f temperature and size among the hot spots produced, or how these distributions affect the behavior o f the explosive. The theory o f thermal explosion was applied to hot spot behavior by Rideal and Robertson4 and their work has been extended by several others, including Gross and Amster6, Boddingtons and Friedman7. The final growth of the explosion following decomposition o f the hot spot'has not been specifically treated. What has evolved to the present time, then, is a partially complete and still largely qualitative model. Comparison between theory and experiment consist in correlation rather than quantitative calculation.
Bowden1 has listed the possible effects o f impact or shock as follows:
(1 ) Adiabatic heating o f compressed gas spaces
(2 ) Frictional hot spot on the confining surface or on a grit particle
(3 ) Intercrystalline friction o f the explosive itself
(4 ) Viscous heating o f the explosive flowing under high rates o f shear
(5 ) Heating o f a sharp point when it is deformed plastically
(6 ) Mutual reinforcement by interference o f shock waves.
The adiabatic heating o f compressed gas bubbles proves to be an important source o f hot spots in liquid explosives like nitroglycerin. The importance o f this effect is illustrated by the fo llow in g experimental finding. With nitroglycerin, when a bubble as small as 5 x 10'3 cm in radius is present, an explosion efficiency of 100 percent may be obtained with a 40-g weight falling 10 cm; but, when no gas bubble is present something like 5 kg falling through one meter may be needed to initiate explosion. Nitroglycerin can be initiated when a 40-g striker falls a distance o f only 0.5 cm with the apparatus depicted in Fig. 12-5, (Fig. 12-5 is taken from Ref. 1.) Trapped air pockets may also be the source o f hot spots in the impact testing o f granular solid explosives but this is not so readily demonstrated.
A fact overlooked in early speculations on tile effect o f trapped bubbles on impact is that the heat made available by the compression o f the air in a small bubble does not flow rapidly enough into the surrounding liquid explosive to heat it to a temperature necessary fo r explosion. Evidence has been adduced by Johannson and
coworkers8 to show that impact on a liquid containing a gas bubble causes a fine spray or foam inside the bubble. The tiny particles explode when heated by the hot compressed gas in the bubble, and the heat in these explosion products is then communicated to the bulk. Because o f this mechanism, therefore, a compressed bubble is actually a much more potent source o f heat than a simple calculation based on the gas alone would indicate. Similar effects, caused by fracturing and splintering o f crystals, may occur in the impact test on solids.
ih the frictional mechanism of hot spot formation; melting point, thermal conductivity, and viscous flow play an important role. Melting point is significant because a low-melting material subjected to a given impact stimulus may take up so much heat by melting, (latent heat) that it is prevented from reaching the explosion temperature. A convincing series o f experiments on this point has been performed by Bowden and coworkers1 who added various kinds of grit to an explosive and subjected it to a given stimulus, either friction or impact. Typical results are given in Table 12-1 which lists the hardness as well as the melting point o f the various grit materials used. While there is apparently no correlation between test results and the hardness o f the grit particles, there is a very significant relationship o f the behavior to the melting point. Clearly, there is a sharp threshold effect when the melting point o f the grit particles lies in the region o f 400° C or higher.
It is interesting to note that fo r some primary explosives, like lead azide, lead styphnate, and mercury fulminate—and secondary explosives, like PETN and TNT—that the secondary explosives melt at a temperature below the point at which they normally explode, whereas the pr imary explos i ves explode below the temperature at which they melt. This may help to explain the marked difference in sensitivity between the two types o f explosive. However, melting point alone cannot explain the differences in sensitivity of pure secondary explsives; for example, PETN (m.p. = 142° C; 50 percent impact height » 25 cm) and RDX (m.p. = 204° C; 50 r :ent impact height * 25 cm). Chaiken and Cheselske9 suggested that in these cases the rate o f heating by friction (and impact) may be controlled by surface rate processes involving viscous melt flow. Quantitative
1 2 - 8
AMCP706-190
Figure 12-5. Cavity Striker, Showing Small Air Bubble Inside Cavity
measurements o f the rates o f viscous melt flow for PETNj RJDX, .tetryl, and TN T under surface heating conditions showedthat at a given energy input the observed melt temperatures fo llow the same order as the sensitivity, i.e., PETN > R D X > tetryl > TNT. These studies indicate the possible importance o f endothermic rate process''* in determining the sensitivity o f explosives to external stimuli.
A simplified derivation o f the relationship between hot-spot size and temperature at the critical conditions fo r explosion was given in par. 10-4, which is
I “-M0.04 QEa]r
oi2cR(12-5)
where.a,r is the critical radius o f a hot spot that has a temperature T (o r vice versa). The attempts at correlating thermal explosion theory with impact sensitivity data have usually started with the assumption that hot spots o f the same size (i.e„ same value acr) are produced in various explosives by the impact machine, and proceeded to calculate from fin-equation like Eq.12-5 the critical temperature Tcr. This involves the use o f kinetic decomposition data (see Table 10-1). The temperatures! so calculated are then correlated with the critical heights in the drop-weight test.
O f the several papers that have treated this kind o f correlation, the one by Gross and Amster6 is o f special interest because o f the uniquely appropriate way in which decomposition data for the explosives w o e obtained. Most decomposition kinetics studies
TABLE 1 INITIATION OF EXPLOSION OF PETN IN THE PRESENCE OF GRIT
GritHardness, Moh scale
Melting Pt., °C
Friction Explosion Efficiency, %
Impact Explosion Efficiency, %
N iUpurePETN ) 2 141 0 2
A gN 0 3 2-3 210 0 3
k n o 3 2-3 334 0 0
K 2Cr20 , 2-3 398 0 0
AgBr 2-3 434 50 6
A g l 2-3 550 100 -
Glass 7 800 100 100
Galena 2-3 1114 100 60
12-9
AMCC 706-180
on explosives have used the evolution o f gas (build-up of pressure) to fo llow the course of reaction. Chemical analysis o f the gas and identification o f the decomposition products permit one to calculate the heat o f reaction, and thus to infer the rate o f heat release from the measured reaction rate. Measurements over a range o f temperature give the activation energy (cf. Fig. 4-2); with this and the absolute rate determination, the frequency factor Z is calculated (Eq. 4-5). There are several reasons why information derived in this somewhat roundabout manner may lead to erroneous results when applied to self-heating calculations. In the method employed by Gross.and Amster6, however, heat release rates are inferred directly from experiments involving self-heating under adiabatic conditions. The method is outlined in the paragraphs which follow.
I f no heat escapes from a body o f explosive that is decomposing according to a first order law, the temperature rises according to the differential equation
dT qZ— = — exp [ - EJ(RT)] (12-6) dt c
where c and q are the specific- heat and heat of decomposition per gram, respectively. The equation strictly applies only to instantaneous conditions at the start o f the reaction but-provided the decomposition does not proceed very far during an experiment, i.e., approximately zero-order reaction—the equation can be applied to the behavior o f a body o f explosive that is decomposing over a period of time under adiabatic conditions. Therefore, if the T vs t curve is measured at several points in such an experiment, one should find that in (dT/dt) plotted against l'/T is a straight line.
The experiments o f Gross and Amster were carried out in a special furnace designed to supply heat automatically to a Vessel enclosing an explosive sample, the heat being supplied at such a rate as to maintain the vessel at all times virtually at the same temperature as the self-heating sample, thus preventing any exchange of heat with the surroundings. The sample was initially in the form of a solid right cylinder 2 in. X 2 in., and was contained in a stainless steel cup. The sample was heated slowly under manual control to a temperature at which self-heating became noticeable; then the device
was switched to automatic control which maintained the adiabatic condition. In some cases, c.g., with TNT, the explosive was in the liquid state during the self-heating stage o f the experiment; in others, e.g., KDX, the melting point was not reached. Thus, in the extrapolation o f some of Gross and AmsterV data to higher temperature, a change from solid to liquid is involved which has an unknown effect on the reaction kinetics. Two figures showing the adiabatic self-heating data fo r several explosive materials are reproduced in Fig.12-6(A) and 12-6(B). The data points in Fig.12-6 generally fall on a straight line as predicted by Eq. 12-6. From the slope o f the line the activation energy E was calculated. The specific heat was measured in independent experiments;, thus the quantity qZ was obtained from the data. The values computed for these derived quantities are given in Table 12-2. (The value o f qZ for Propellant C, given in Ref. 3 appears to be in error; this has been corrected in Table12-2.) Gross and Amster have also included some conventional kinetic measurements in -the table for comparison.
For Explosive Q two values of E are given in Table 12-2 dong with corresponding values o f qZ, the- ;i .-f value o f E being the one used by Gross and ^iinster. The data points for Explosive Q in Fig. 12-6(A) show an abrupt change o f slope in the dT/dt vs 1 IT curve near the high temperature end. However, the authors used the points at low temperatures as a basis fo r evaluating E. Since the value o f E is to be used in extrapolating the behavior to higher temperatures than those at which experimental data were obtained, it seems more appropriate to choose the points at high temperatures as the basis. The values given in parentheses in Table12-2 are, therefore, based on a line o f lower slope, as drawn through the high temperature points for the Explosive Q in Fig. I2 -6 (A ).
With the adiabatic furnace data o f Gross and Amster as a basis, the critical explosion temperatures fo r hot spots in the various explosives have been calculated from Eq. 12-5. These are given in Table 12-3, based on tliiee values for the hot-spot radius—10'3 , 10 's , and 10'1 cm. Similar calculations based on the conventional kinetic data of Table 12-2 are also given. The two different types o f data give generally consistent results. (An average value,
12-10
AMCP 700*180-
Figure 12-6. Explosive Decomposition Data From the Adiabatic Furnace3
10's cm2/sec, was used for the thermal diffuuivity a tor all the calculations in Tablei2-3.)
In order to select from Table 12-2 a set o f temperatures for correlation with sensitivity test data, a choice has to be made o f some “ standard” hot-spot sire op which to base the comparison. Although this choice is in a degree arbitrary, there is reason to believe that a radius o f about 10"’ cm (10/0 is fairly representative for hot spots produced in impact experiments. One line o f evidence comes from data such as those in Table 12-1 which show that the critical hot-spot temperatures for relatively sensitive explosives like PETN arJ RDX lie in the region o f 400° C (670°K ). To judge from the temperatures listed in Tabic 12-3, this would indicate that the hot-spot radius is in uie neighborhood o f 10’ ’ cm, or perhaps somewhat less.
Another argument for this choice o f hot spot size may be based on the induction time measurement? o f Rideal and Robertson4, In their experiments the interval was measured between the instant o f impact o f the drop weight and the time when the explosion was recorded by a microphone placed as close us possible to the edge o f the sample. In various
ways the authors demonstrated that this time interval was mainly due to an induction or lag period, and not to the t o e required for explosion to propagate through the explosive. (Indeed, in some of their experiments the explosion probably started on the edge of the sample near the microphone but in no case~although there h the usual random scatter in the data-did they ever find:a delay time less than about loOpscc.) The average time interval increased as the energy o f the impact (height o f fall) was reduced toward the critical level required for ignition. The induction period measured by Rideal and Robertson fo r PETN, RDX, and tetryl was found to lie in the range from 200 to 500,ysec when the drop height was near the critical value. According to the theory o f thermal explosions, the critical induction period is o f the order o f 0.1 a1/a (cf. Eq. 10-36). Thus with a ~ 10'3 cm and with a => 10 '3 cm2/sec the induction period should be o f the order o f 100 psec; but i f a were 10'2 cm, for example, it would, be o f the order o f 10,000 psec, This points to 10p as the conect magnitude (see Table 10-4).
An empirical correlation o f hot-spot explosion temperature in °C and wi'.h the logarithm o f the 50 percent drop hoight (cm ) is shown in Fig.
1 1 - 1 1
AMCP7W -1S0
TABLE 12-2 KINETIC PROPERTIES OF EXPLOSIVE MATERIALS FROM ADIABATIC SELF-HEATING EXPERIMENTS
Adiabatic Furnace Data Conventional Kinetic DataTemp. Range Activation Temp. Range Activation
Exploiive*and State,
°ctEnergy E, ;kcal/mol
*z -eal/sec-g
and State,°ct
Energy E, keal/mol
qz,cal/sec-g
TN T 2510-260; L 37 5 X 10¹³ 275-310; L 34 1 X 1014238-277; L 43 5 X 101*
RDX 170-200; S 57 2 X 10s* 213-299;L 48 3 X 10?1Comp.B 155-180; L 44 6 X 101*DINA 130-175; L 36 2 X 101S 166-189; L 50 5 X 1033
Q 250-270; S 66 4 X 10*?'(39) (7 X 1 0 " )
AP 205-270; S 41 1 X o Os 215-240; S 28240-270; S 19
Prop. A 100-170; S 39 4 X 101*Prop. B 190-242; S 49 9 X 1 0 "Prop. C 165:235; S 29 1 X 10¹³
* Comp. B (or Cyclotol) is KDX/TNT, 60/40.
D INA is diethyinitramjne dihitrate,
Explosive Q is a high-meltiog CHNO explosive.
Propellant, A is a double-base (nitrocellulose-nitroglycerin-type)
propellant.
Propellant B is a composite propellant containing ammonium perchlorate
(AP), aluminum, and, polyvinyl chloride.
Propellant C is a composite containing AP, aluminum, and polyurethane,
f L * Liquid
S “ Solid
12-12
AMCP 706-180
TABLE 12-3 HOT-SPOT EXPLOSION TEMPERATURES CALCULATED ON BASIS OF DATA IN TABLE 12-2
Critical Explosion Temperature ,°K
Adiabatic Furnace Data Conventional Xinetic Data
Explosive o = 10'3cm a ^ 10' "cm a = 10-1cm a - 10‘3cm a » 10'acm a “ 10"! cm
TN T 900 710 590 780 640 540
930 770 65C
RDX 610 550 510 600 530 490
Comp. B 660 580 510
DINA 650 560 480 550 500 460
Q. 740 670 610
(105G) (830) (690)
AP 770 660 570
Prop .A 590 520 460
Prop.B 670 600 580
Prop. C 750 600 500
12-7. The explosion temperatures (converted to °C ) are taken from the first column o f Table12-3 (for a = 10'3 cm), and the sensitivity data from the paper o f Gross and Amsier, (The explosion temperature used fo r Explosive Q in locating the point in Fig. 12-7 is that given in parentheses in Table 12-3, i.e., the figure predicted on the lower value of E in Table 12-2.) It is evident from trie data points that the hot-spot temperature increases with increasing impact insensitivity or decreasing sensitivity. The overall correlation (represented by the heavy line in Fig. 12-7) is apparently improved when the data are grouped into the two “ families” o f points joined by the dashed lines in Fig, 12-7. One o f these families consists o f TNT, RDX, and the mixture o f these, Comp. B; the other, o f ammonium perchlorate (AP) and the two composite propellants based on it (B and C), While these results are consistent with a thermal explosion theory o f initiation, it should be pointed out that other factors—e.g., endothermic surface rate processes—may be involved in determining impact sensitivity.
12-4 TRANSITION OF DEFLAGRATION TO DETONATION
in deflagration or simple burning, asexemplified in ordinary flames and solid propellants, fresh material is caused to react as a result o f heat transfer from the flame zone and diffusion o': matter back and forth between intact and burning regions. In detonation, on the other hand, reaction is initiated in successive layers by the advance o f a shock wave, and transfer processes play little i f any part.Compared on the basis o f either mass reaction rate or propagation velocity, detonation is 103-10* times as fast as deflagration. The change from the deflagration regime to the detonation regime, when it occurs, is almost always extremely sudden and unpredictable (or nonreproduciblo). For this reason thephenomenon has been difficult to studyexperimentally, and little understandir , o f it has been obtained until quite recently.
Detonation almost invariably starts at some distance ahead o f the burning front. The
12-13
12-14
Figure 12-7. Correlation P lot o f 5i) Percent Explosion Drop Height in the Sensitivity Test vs Critical Explosion Temperature for Hot Spot of Radius lOp. (Calculations based on adiabatic furnace, measurements ofGross and Amsters.)
AMCP 706-180
detonation wave moves forward from the point o f initiation, and a “ retonation” wave is sometimes observed to travel back into the undecomposed material between that point and the Dame front. The explanation o f this behavior seems quite straightforward: (1) a compression wave builds up, emanating from the deflagration zone, (2) the rise in pressure accelerates the-decomposition and the pressure, therefore, increases exponentially, and (3) the compression front changes into a shock; when this reaches critical.strength, it initiate; reaction at hot spots and quickly develops to detonation.
Initiation o f detonation after a strong shock front forms follows the mechanisms described in Chapter 11. The new phenomenon here is the development o f a compression wave from a deflagration zone. The treatment o f this subject is drawn mainly from the papers o f Macek and his coworkers10-13.
According to this mechanism, the transition will not occur unless the explosive is confined because a shock pressure o f Die order o f several kilobars is required to initiate detonation. This fact is well known in practice. For example, a common method o f disposing o f high explosives without producing detonation is simply to bum them in the open. On the other hand, heavy-cased explosive projectiles and bombs often detonate when involved in fire. The strength and weight of confinement needed to cause deflagration to change to detonation depends on several properties o f the explosive: state of aggregation, bulk density, burning rate (in deflagration), and shock sensitivity. It also depends on the size o f the charge. A large mass o f finely powdered, granular explosive requires little if any confinement because o f the large burning surface available and the ease with which deflagration can spread from grain to grain. If such a mass o f explosive is ignited in the middle, it may detonate with only the self-confinement provided by the inertia o f the outer layers. A cast or plastic-bonded explosive, on 'the other hand, is much less prone to detonate when ignited and may require very heavy confinement. Both the strength and inertia o f the walls confining an explosive charge are important because the pressure development is slow in the early stages; when the walls burst and relieve the internal pressure, the transition to detonation may be stopped. On the other
hand, since the final pressures produced during the transition are much higher than any vessel can withstand without bursting, rupture will usually occur before detonation starts; at this stage, the inertia o f the walls is the factor that limits the rate o f the expansion. The quantity o f explosive is also important, both because o f the effect o f the mass in seif-confinement and because o f the time and distance available for compression waves to build up. Some materials, such as primary explosives, have such a high intrinsic burning rate and high sensitivity to shock initiation that the transition occur,, even with small quantities and very little confinement. The effect o f these various factors may be inferred from the discussion which follows o f experimental studies on this problem.
The deflagration to detonation transition experiments o f Macek and coworkers10 at the Naval Ordnance Laboratory were performed with cast explosives, namely: DINA, Pentolite (PETN/TNT), and TNT. The first two explosives detonated readily in these experiments but, under the same conditions, TN T did not. This illustrates the combined effect o f burning rate and sensitivity since TN T is notably more sluggish than the other two. (See, for example, the positions o f TN T and D INA on the sensitivity curve in Fig. 12-7.) The explosives were confined in a heavy-walled steel tube, as shown in Fig. 12-8. They were ignited by an electrically-heated nichrome wire, retained by a threaded plug at one end o f the cylinder. The pressure produced in the deflagrating zone was measured by a strain gage on the outside o f the steel tube, as shown in Fig. 12-8, Several ionization probes (Chapter 5) were used to detect the detonation wave and locate the approximate point at which detonation was established. The description of results in the paragraphs which follow refers to experiments with D INA. Quite similar results were obtained with Pentolite.
Although the pressure build-up ir. the deflagration zone was not identical from one experiment to the next—presumably, because o f random variations in minute details o f the ignition process—the general form was always approximately exponential
P = Po exp [fct] (12-7)
12-15
AMCP 706-1 BO
Figure 12-8. Charge Arrangement Used by Macek10 to Study Deflagration to Detonation Txmsition (Three other ionization probes were located at regular intervals in addition to the one shown.)
12-16
AMCP 706-180
the time constant k having a value in the range0.10-0.12 Msec"1. The point o f origin o f the detonation wave was variable but usually was located a distance o f 10-15 cm from the igniter. Pressures o f several kilobars magnitude were recorded by the strain gage; higher pressures were undoubtedly reached after the strain wire broke. The bursting strength o f the tube was in the neighborhood o f 5-10 kbar but inertial confinement allowed the pressure in the deflagration zone to reach higher values. This can be appreciated from the calculations which follow o f the expansion that would occur in the tube if only inertial forces were involved, i.e., under the assumption of zero strength. As a basis for the calculations we take from Ref. 10 a typical pressure-time relation recorded by the strain gage, p » 0.08 exp [0.1 f] where p is measured in kbars and t in Msec. The strain gage registered pressures in some cases as high as 10 kbar. Under the assumption that this relationship continues to apply as the pressure rises bevond this point, the following figures shew the pressure and percent expansion o f the tube at various times:
Time, Msec: 30 40 50 60 70Pressure, kbar: 1.6 4.5 12 33 90Expansion, %: 4 10 29 86 266
On the basis o f these calculations, one may guess that the pressure will actually rise to a maximum in tiie neighborhood of, perhaps, 30-40 kbar. Such a shock wave pressure should easily produce detonation in cast explosives like D INA and Pentolite. Although direct measurements are not available. Jacobs, Liddiard and Drimmer14 report a pressure o f 20 kbar as the threshold shock strength needed to initiate Composition B-3, a less sensitive explosive than DINA. These calculations, therefore, show that the proposed explanation o f the transition is quite reasonable. More convincing evidence is obtained by the analysis which follows of the build-up o f the compression wave, based on a calculation of characteristics (Chapter 2). This analysis is also due to Macek10.
In the analysis, the pressure produced at the deflagration surface is considered to act as a piston which creates motion at that surface and produces a compression wave traveling ahead into the explosive. The generating pressure at
the deflagration surface is assumea to be given, fo r a certain period o f time at least, by an extrapolation o f the pressure-time function indicated by the strain gage (Eq. 12-7). The diagram o f positive (C+) characteristics is shown in Fig. 12-9 and, based on this, the compression wave development is represented in Fig. 12-10. For the purpose o f this figure, it is assumed that the pressure-time function is unaffected by expansion o f the tube until the pressure reaches about 30 kbar. Beyond that, it is assumed that the pressure levels o f f and eventually begins to fall. The lower part o f the pressure curve, on the assumption that the deflagration pressure is known, is indicated by solid lines; the upper part, based only on conjecture, by broken lines. The position o f the deflagration boundary—i.e. the “ piston” —is indicated by the vertical line terminating the pressure curve on the left. (This line is not meant to indicate that the pressure drops to zero at this point.) The shaded areas in Fig, 12-10, therefore, represent at various times the pressure in that portion o f the intact explosive affected by the compression wave.
Fig. 12-10 shows the expected steepening o f the compression wave front, the high pressure portion o f which develops into a shock at a distance o f about 12-14 cm from the igniter and at a time about 90-100 Msec after ignition, (see Fig. 12-9). This result comports quite well with the experimental findings. Other calculations reported by Macek, based on pressure-time curves from several different experiments, giye similar results.
The basis for these characteristics calculations, as outlined by Macek, follows. The equation o f state o f the solid, explosive under adiabatic restraint is assumed to have the form
P = <>l(P/Po? ~ 1] <12"8>
where a is a constant with dimensions of pressure. This is a modification o f the Tait equation, The constant a is evaluated from the value o f the sound velocity cc in the explosive, the sound velocity c being given in general by
c = v^dp/dp).
= c„(P/Po)
12-17
140
120
100 -
VICINITY OFSHOCK FORMATION
+
DEFLAGRATION
(GAS-SOLD)BOUNDARY
6 8 10
DISTANCE, cm
Figure 12-9. Characteristics Diagram (C+J for the Development o f u Compression Wave From Deflagration inaSigidly Confined High Explosive10
AMCC706-180
n y
Figure 12-10. Development o f Compression Wave From Deflagration as Transposed From the Characteristics Diagram in Fig. 12-9 (The left boundary of the shaded area represents the position of the deflagration surface.)
12-19
AMCP 706-180
The Riemann quantity a, defined by
a =J (c/p)dp (12-10)
is thus readily shown to be given by
a = c - c„ (12-11)
i f the lower limit o f integration in Eq. 12-10 is taken to be po . Since the C_ characteristics originate on the * ” 0 axis—where the particle velocity u equals zero and where <7 = 0 also, and since on any Cv characteristic u - a is constant-it follows that u « o everywhere, i.e.,
u = c - ca
The calculation o f the characteristics diagram proceeds as follows. Eq. 12-7, in which the constants Po and k have been experimentally evaluated, gives the relationship o f pressure to time at the deflagration boundary. Combination o f Eq. 12-7 and Eq. 12-8 then gives the p, (-relationship at the boundary. Evaluation o f the integral udt, using Eq. 12-i2, then
describes the motion of this boundary. Each point on the boundary terminates a C+
characteristic on vhich the state properties p,p and c, and the velocity u are constant. The terminal values of these quantities at the boundary can be evaluated through Eqs. 12-7,12-8, 12-9, and 12-12, and since the slope o f the C+ characteristic is given by u + c, which is constant, the C+ lines can be plotted and the properties determined everywhere to the right of the boundary in the *,(-domain. The analysis can be extended along any characteristic C+ line only to he point where it crosses another C+ line, which is interpreted: to he the point at which * a llow becomes discontinuous, i.e., the point ai. which a shock develops. The pressurerdistance curves in Pig. 12-10 are reccjjy obtained by transposing from Fig. 12-9, where the characteristics are labeled according to the pressure.
Macek10 also shows that the observed exponential rise in pressure agrees quite well with the behavior o f a model based on “ cigarette-type” burning at the deflagration boundary (with constant burning area), perfectly rigid cylindrical walls, and a pressure exponent unity in the erosive burning law (cf. Eq. l i - 3 ) . This demonstration completes the rationalization o f the observed behavior in these experiments.
12-20
AMCP 706-180
REFERENCES
1. F. P. Bowden and A . D. Yo ffe , Initiation and Growth of Explosion in Liquids and Solids, Cambridge University Press, Cambridge, England, 1952.
2. Statistical Research Group, Princeton University, Statistical Analysis for a New Procedure in Sensitivity Experiments, report to Applied Mathematics Panel, NDRC, AMP Rep. No. 101.1R, SRG-P No. 40, (1944); also see W. J. Dixon and J. Mood, Amer. Statistical Assn. 43, 109 (1948); W, J. Dixon and F J. Massey, Jr., Introduction to Statistical Analysis, McGraw-Hill, New York, 2nd Ed., 1957, pp. 318-327.
3. J. W. Martin and J. Saunders, Proceedings of the International Conference of Sensitivity and Hazards of Explosives, Session 6, London, October 1963.
4. E-. K Rideal and A . J. B. Robertson, Proc. Roy. See; A 195,135 (1948).
5. D. Gross and A . B. Amster, EighthSymposium I.Internationa.,) onCombustion, Williams arid Wilkins, Baltimorei.Md., 1962Lp. 728. _____
6. T. Boddington, Ninth ~ Symposium
(International) on Combustion, Acadeinie Press, New York, 1963, p. 287.
7. M. H. Friedman, Ninth Symposium (International) on Combustion, Academic Press, New York, 1963,.p 294.
8. C. H. Johansson* Proc. Roy. Soc. A 246, 160 (1958).
9. R. F. Chaikeri andiF. J. Cheselske, Ji Chem. Phys. 43, 3228 (1965).
10. A. Macek, J. Chem. Phys. 31,162 (1959),11. R. W. Gipsori, and A. Macek, Eighth
Sy mposium (International) on Combustion, Williams and Wilkins Co., Baltimore, Md. 1962, p. 847.
12. C. T. Zovko and A. Macek, “ A Computational Treatment o f the Transition from Deflagration to Detonation in Solids” , Third Symposium on Detonation, Princeton University, Sept, i960, published by Office o f Na''al Research, Rep. No. ACR-52, Vol. 2, p. 606.
13. A. Macek, Chem. Rev. 62,41 (lu62).14. S. J. Jacobs, T. P. Liddiard, Jr., and B. E.
P r i m m e r , N in t h Symposium (International) on Combustion, Academic Press, New York, 1963, p. 517.
1 2 - 2 1
AMCP 706-180
CHAPTER 13 SHOCK WAVES FROM EXPLOSIVE CHARGES13-1 INTRODUCTION
Spherically-symmetric blast waves resulting from explosions in air, wafer, and solid media are considered in this chapter. Explosions in air and water are dealt with in detail; references to blast waves in scilid media are given.
Compared to the durai:on o f its after-effects in air the decomposition o f an explosive charge by a detonation is very rapidly completed. I f the detonation process is considered to occupy one unit o f time, for example, the shock wave in air is capable o f inflicting serious damage to structures at points some 200 charge radii distant from the center and at times in the order o f 3500 o f these time units later. For some purposes, therefore, the detonation process can be considered instantaneous. In cases involving dense media, however, the detonation time may be o f the order o f the damage times in the media.
Passage o f the detonation wave leaves the explosive product gases at an extremely high pressure and in a state o f motion. However, neither the pressure nor the particle velocity is uniform throughout the volume of the explosive gases. The simplest geometry results i f the charge is spherical and initiated at the center so that the detonation wave reaches the boundaries o f the charge everywhere at the same instant. In this case, the velocity o f outward motion o f the explosion products is the highest at the boundary and decreases toward the center, at which point material must remain motionless. Pressure and density are also at a maximum at the boundary, and at a minimum at the center. For any geometry o f a finite, three-dimensional charge other than the centrally initiated sphere, interaction with the external medium begins before detonation is everywhere complete within the charge, giving rise to a much more complex flow o f the explosion products.
As the explosion products begin to expand, the pressure at the interface separating them from the exterior medium fulls rapidly. An intense pressure wave is propagated uutward in the exterior medium and an outward flow o f the medium results. In Chapter 2, it was mentioned that a compression wave o f finite amplitude
alway- p:_pag;fes as a shock wave at a velocity that is greater than the velocity o f sound in the undisturbed medium and which depends upon, the amplitude o f the wave. The shock is characterized by a very rapid increase in pressure that may—as a very good approximation-be considered instantaneous, so that the leading edge o f the shook wave can be regarded a mathematical discontinuity. The shock wave.iii air generated by an explosive charge is often called the blast wave. The initial shock front pressure o f the shock wave generated in air at atmospheric pressure by conventional explosives is o f the order o f 103 atm. In water the initial shock front pressure is o f the order o f 10'* atm, and in metals is of the order cf 106 atm. The shock front pressure is often called the peak pressure.
As the shock wave propagates away from the generating explosive charge, its peak pressure decreases, .tiie shock wave decay can be attributed to two causes. I f the shock wave is not planar, tl.\e decay is due to geometrical divergence. Also, because o f the finite entropy increment across tire shock front, the decay is due to progressive dissipation o f energy in the shocked air in accord with the requirement r 1' the second law o f thermodynamics. The decay o f shock waves because o f the dissipation o f energy leads to a decay more rapid than would’ be expected from geometrical considerations alone.
For the purpose o f discussion, we may consider a cylindrical charge o f explosive in air, initiated at one end. The development o f the shock wave in the surrounding medium is shown qualitatively in Fig. 13-1, for three times after the instant of initiation. As the detonation wave progresses down the charge, the laterally expanding products generate a shock wave that has cylindrical symmetry For definiteness, suppose that the origin o f cylindrical coordinates is fixed at the point o f initiation with the detonation wave moving in the positive direction of the axial coordinate. Then the profile o f the shock wave at any instant and the flow behind the shock front depend only on the axial and radial coordinates relative to this fixed origin and are determined by the hydrodynamic
13-1
AMCP 706-180
equations for cylindrically symmetric flow. A t points in space with positive axial coordinates greater than about one or two charge radii and less than the length o f the charge, the shock wave is, to a good approximation, the same as would be ge'-eiated by an infinitely long explosive charge. A t smaller positive values of the axial coordinate and all negative values, the flow is more complicated because of end effects connected with the finite- length o f the charge. When the detonation wave reaches the end of the charge, a shock wave is generated o f f the end which is connected discor.tinuously with the shock wave that has been propagating laterally. Although the shock wave profile and the flow hehind the shock front retain cylindrical symmetry, the flow becomes very complicated after the detonation wave has progressed through the charge and it has "not been analyzed in detail.
figure 13-1. Development of Shock Wave About Cylindrical Explode, Charge Initiated at One End
As the oek wave continues to propagate, the effects o f charge geometry arid o f the initiating, detonation wave become progressively less important in comparison with the effects of radial divergence. The shock wave profile becomes progressively more spherical. A t distances that are several times the largest linear dimension o f the charge, the shock wave can be considered spherical to a good degree o f approximation. The approximation is the better the more nearly the ratio o f charge length to charge diameter is unity. A t such distancu, a model that is amenable to theoretical analysis is obtained by consideration o f a spherical charge o f explosive o f the same weight as the charge o f inter'st, in which the detonation wave is initiat‘d at the center. The shock wave profile from such a charge is spherical and the flow behind the shriek front depends only on the time and tbe radial coordinate o f a spherical coordinate i ysirm.
Further simplifications may be justified for the sake o f theoretical simplidiy. One further step in this direction is to consider the globe of explosion formed by detonation o f a spherical chiege to be uniform in pressure and density, and at a stave of rest. This is the result o f hypothetical, homogeneous, instantaneous constant-volume explosion.
Asymptotically, at distances that are large compared to the radius o f the equivalent sphere o f explosive, an even simpler model is obtained by considering a point source in which the energy o f explosion o f the charge o f interest is instantaneously released.
In this chapter, we shell restrietthe discussion to shock waves in one-dimension with radial symmetry, i.e., those from a spherically symmetric explosion. This is not only the case that has been »»udied in greatest detail but also the case that provides a simple model that is approximately descriptive o f actual explosive charges, We shall further limit the discussion to the shock wave in an infinite isotropic medhun, regarding as outside o f the scope o f this handbook such topics as shock wave reflection at rigid or free surfaces and shock wave interactions with structures o f various types. A nonsuperficial treatment o f these topics cannot be undertaken in a chapter o f reasonable length. Each treatment requires a knowledge o f the parameters o f the incident wave and it is with these parameters that this chapter is concerned.
13-7
AMC8708-18O
13-2 EXPANSION OF THE EXPLOSION PRODUCTS
Given a spherical globe o f gaa at an extremely high pressure, there follows immediately as it begins to expand the establishment o f a shook front running outward into tne medium and a rarefaction moving in toward the center o f the sphere. There is a boundary requirement that the particle velocity normal to the surface and pressure be continuous across the contact surface between the explosion product gases and the external medium. The flow is somewhat similar to that occurring in a shock tube. However, the spherical divergence o f the flow introduces complications for a theoretical treatment that are not encountered in the plane case. The pressure at the shock front, instead of being constant as in the shock tube, fills rapidly as the front moves out. This changes the terminal condition for the rarefaction. The characteristics of the solution o f the partial differential equations are not straight lines; neither are the integrals o f the morion along these characteristic lines simple functions as in the plane case. For a considerable period o f time after the expansion begir.1, therefore, the temporal change; in pressure, density, and particle velocity occurring at any point depend on the configuration o f the entire flow field from the center out to the shock front. A complex numerical integration is required to obtain an accurate description o f the motion.
T o make certain order-of-magnitude assessments, one may simplify the actual process and consider that the explosive gas globe expends uniformly, the boundary coming to rest at a radius rm when the pressure within the g o be has dropped to the ambient pressure o f the medium po . Acutally, the distance moved by the boundary and the velocity o f its motion depend on the original size o f the gas globe, the conditions and properties o f the gases inside it, and on the properties o f the external medium. Motion within the globe is not uniform; when the boundary first comes to rest, there are still pressure, density, and motion gradients within
the sphere. However, i f the expansion is considered to be quasi-static and isentropic, and the explosive products are treated as a polytropic gas, the final volume Vm will be related to the initial volume V .. by tile relation
*5, - v.te jp . )t f*
(13-1)
where k is the average or effective value o f the adiabetiic exponent k during the expansion process. (In fact, the gas glebe does not remain isentropic because o f the inward-facing shock as described in the discussion which follows.) I f the total expansion energy available in the gas globe, which for a polytropic gas would be equal to
P t V J ( K - 1), is equated to the energy pf the explosion £ ( , one obtains from Eq. 13-1 an approximate expression fo r the rpaximum expansion radius rm o f the gas globe in tepni of a characteristic length (E,/p o ) ' as follows:
W / P j1*
3(ic -
4w \>J(13-2)
The expression on the right side of Eq. 13-2 is not very sensitive to the value assumed for E; and, i f pa and pt are given values of 1 stm and 10s atm, respectively, and E a value o f 1,4 (its value fo r an ideal pis), rm in terms o f the unit (E0 /p0 )1,JvTsuraes a value c f about 0.15.
‘The velocity o f the contact surface in the expansion o f the gss globe depends on the properties o f the explosion gases and the properties o f the medium. For an explosion in air where the resistance to expansion is relatively small, the initial motion will approach the velocity u for escape into a vacuum, given approximately by the equation
where c< is the initial acoustic v"'ocity in the gas globe and Kt the adiabatic exponent at the constant volume explosion state. For explosives, c ( is equal approximately to 0.8 times the detonation velocity D, and the effective value o f
13-3
AMCP 706-180
Ks is about three*. By equating the average value o! the boundary velocity during the expansion to one-half the initial velocity, one obtains, to on order o f magnitude, the time t required for the gas globe to deliver substantially all o f its energy to the pressure wave
tm, 0-4 ( W 1' 3
0.40 ~ D(13-4)
Putting this time in terms o f units (E to ) 1,*/c , where c is the acoustic velocity in the medium, one obtains-
< W
0-4 co
D(13-5)
Substituting the value o f c0 for air and a typical value for B o f a high explosive, one obtains for rm the approximate value 0.025. On the other hand, in terms o f the same dimensionless units, the total time o f interest for the air blast wave at sea level—i.e., the time in which i t is able to inflict serious damage on structures—is o f order unity.
The main interest in the air blast wave at sea level is, therefore, in the period after the explosive has passed on essentially all the available energy to the blast wave. The hydrodynamic laws governing the wave propagation are such that the influence of details in. the process by which *he wave was formed tends to diminish with the passage of time. This explains why the point-energy release model gives a fairly good description o f the air blast from explosions at sea level.
* The appropriate value o f ICf to be used in Eq, 13-3 ia different In principle from the value o f E that is appropriate to Eq, 13-2. By use o f Eq. 13-3, we wish to estimate the initial flow velocity which Is a characteristic o f the initial state o f the gas; whereas by Eq. 13-2 we want to calculate the final expansion volume which depends in large degree on the properties o f the gas at luw pressure. The work o f Deal1 and that o f Fickett and W ood2 shows that in isentropic expansion from the detonation state, where the pressure is in the order o f IQ5 atm, down to a pressure o f about 103 atm the explosive products behave nearly as a polytropic gas with a K-value o f 3.0. A t much lower pressures—below, e.g., 100 atm—the gases assume more normal properties and the effective K becomes something less than 1 ,4 . It is wher the gases are at a relatively low pressure level, o f course, that they undergo the greater- part o f the Increase m volume.
It is o f interest to examine the effect of, altitude (lower ambient pressures) in.the light o f this analysis. To do this it is first necessary to consider briefly the potential o f an explosion to inflict damage on a target at a distance. For some targets, such as window glass, the energy involved in the destruction is small. For these, it is the level o f overpressure in the blast wave that mainly determines whetner or not destruction o f the target occuiv However, for most structures substantial amounts o f energy are required to cause the displacements and deformations that constitute damage. F o r such typical targets the total energy flux per unit area o f the blast wave provides in first order approximation a criterion for the damaging effectiveness. On this basis one can conclude that, for a given target and a given explosive source with energy Ee, there must be some absolute limiting distance r ( where the quantity Et/ (iw j) is just sufficient to inflict critical damage**. This absolute distance lim it is independent o f the nature o f the medium intervening between the explosion and the target.
I t is apparent from Eq. 13-2 that when the ambient pressure po is reduced, the maximum radius reached by the expanding gas cloud increases. In the lim it o f perfect vacuum, o f course, the expansion continues indefinitely. Consideration o f the blast effects o f explosives at various aPtrades, therefore, shows that although the details o f the expansion process play a relatively minor role at sea level, they become increasingly important at lower ambient pressures and,, in vacuum, constitute the entire phenomenon.
For an explosive fired under water, the expansion o f the gas globs assumes a key role in the development o f the shock wave. Nothing analogous to the point-energy release model seems to be possible for this case. Because o f the relative incompressibility o f water, the sound velocity is much higher and the flow velocities smaller for water than fo r air. The motion o f the gas-water interface is very slow relative to the outward movement o f the shock wave, For many applications the strength o f the
* * T h c energy criterion ot damage effectiveness necessary but obviously not aufflcicnt. Therefore, r, an upper lim it to the radius o f damage effect. The actual radius may be considerably smaller and will depend on what pressure or impulse levels may be required to perform the destructive effects.
5* K
*
AMCP 706-180
underwater shook wave deca;, s belov; a level of interest before the gas bubble reaches its maximum extension. The theoretical treatment o f underwater explosions depends, therefore, critically on the behavior o f the gas globe as well as on the propagation o f the shock wave in water.
The interaction of detonation products with solid materials w ill be discussed in more detail in subsequent paragraphs.
13-3 ENERGY TRANSPORT BY SHOCK WAVE PROPAGATION
The foregoing considerations show that the problem.of air Mast from high explosives fired at sea level and up to certain altitudes can be considered largely as the problem o f shock wave propagation. T1'® input energy from the explosion defc fines the scale o f thephenomenon. The shock wave provides a mechanism for the outward transmission and dissipation o f this energy (in the sense o f the second law o f thermodynamics). The shock wave plays a similar role fo r explosives fired under water or underground. Other mechanisms are heat conduction and radiation. These various means fo r the diffusion o f energy do notinteract to an appreciable extent for thechemical high explosives. For nuclear explosives, however, the three mechanisms do interact importantly for a short period in the beginning, after which shock wave transmissior oecomes dominant.
I t is o f interest to consider what information thermodynamics can yield about the transfer of energy via the shock wave. Designating the rate at which mechanical work is performed per unit area at the shock front when it has reached a radius it as w(R), we note that*
iu{R) = p, Uj (13-6)
where px and are the pressure and particle velocity, respectively, immediately behind the front. This work serves to raise the internal energy of, and impart kinetic energy to, the adjacent layer in the medium which is being enveloped by the shock front, i.a.,
* H ie notation “ subscript on e " denotes values at or immediately behind the shock front.
rn(it) = p. U{R) [(e , - e0) + u“ /2] (W - ’ )
where U(R) is the velocity o f the shock wave at i f , and Cj and so the specific energy, immediately behind and in front o f the shock, respectively. (We assume the medium is initially, at rest, i.e., uo = 0.)
Par. o f the energy change represented by (e1 - e ) is irreversible in the sense that, after shock wave compression, subsequent expansion of the medium tack to ambient pressure P0 does not yield an amount o f work equivalent to (e1 - e o ), but a' quantity, which is less by an amount which we will designate 6 e [t jra)]. This notation signifies A e to be the “ irreversible” increment of energy connected with the entropy rise in the shock and Sjfr ) denotes that this particular entropy state is associated with the element of the medium (originally) at the Lagnrigian coordinate ro . Quantitatively, A e[«1 ( r j ] is given by
W l = e(P0.« , ) - e (PDiio) (13-8)
The significance o f this “ retained” energy is illustrated graphically in Fjg. 13-2.
I f no other shock waves or irreversible processes occur behind the initial shock front,
represents the ultimate legacy o f the explosion to this element o f the medium. Thus, the total energy released by the explosive in going from the initial state to the final state o f the explosion products at. po can be equated to the total o f such residual energy in the medium plus the net work done by expansion of the explosion products and the shock-heated medium
-E(Po) ' £,(P<,) 13 / W P3Ae[Sl,(r„)]dr0 0o
P o t a t o ) - ^ (P o )) +
Po P o W o .s , W l
°o 1
- Vo
where £e(P0) and 15 (po ) are the total energy o f the intact explosive and the explosive products
13-8
AMCP 706-180
at pressure po, respectively; V J p J and V (p ) are the corresponding total volumes; v[p? , s (r o)} is the specific volume o f the medium in the state represented by (P0,s1)i vo is the specific volume o f the medium initially; and ao is the initial radius o f the explosive charge. By rearrangement o f ’ terms, Eq. 13-9 can be written
W,(P0) - ^ ( P 0) - f W f t , Ah[s, ,(r0)]dr0 (13-10)
where H (p- ) and H (pa) are the total enthalpy o f the intact explosive and the explosive products at p , respectively, and the quantity Ah[* (ro) ) is defined, like■ Ae[* (r0) ] ; thus,
- * [ f t ]
Eq. 13-10 expresses the thermodynamic requirement that for the total system, explosive and medium, enthalpy is conserved in the explosion process.
Eq. 13-10 is based on division o f the total system into two parts separated by the boundary between the explosive and. the medium. The surface o f such division is arbitrary. Therefore, one may equally well define a spherical boundary in Lagrangian coordinates that includes not only the explosive
but also a portion o f the medium out to radius R in one part,, and the rest o f the medium from R to infinity in the other. Then, one can write on the basis o f arguments identical to those which led to Eq. 13-10
He(R) - HSR) = J 4x r; p „ A h [Sl(r0 ) ]d r 0
R(i3-ii)
where H0(R) and BUR) represent the total enthalpy in the explosive plus the medium out to Lagrangian coordinate ro - R initially and at infinite time, respectively. The change in enthalpy can be equated to the change in energy plus the change in pV and, since the pressure is equal to pc in both the initial and final states, we can write
HSR) ~ HSR) = E0(R) - RJR)
where E (S ) and E J R ) are the total energy in the initial and final states, respectively, and A V is the total change o f volume. The latter quantity can be computed from the movement o f the boundary at r„ = R ; thus
Figure 13-2. thematic Illustration of the Energy Retention Resulting From the Entropy Increase at ,the Shook Front \The area under the cum between the initial and final states represents the energy change In both the shock compression (upward arrow) and isentropic expansion back to p0 (downward arrow) ]
13-6
AMCP 706-180
A V = (r0 « B) j 4 ttr2 udt (13-13)
UR)where the notation in front o f the integral sign is meant to signify that the integral is along the particle path ro = jR, u is the particle velocity, an-1 t(R ) is the time at which the shock wave reaches R and at which u, therefore, takes on a va ue different from zero. From the first 1iaw of thermodynamics, the change in energy may be equated to ihe work done on the medium external to it ; thus
E0(R ) - EJR) = (r0 = R) f to fp u d t
< (* )
(13-14)
Combini” JEqs. 13*11, 13-12, 13-13, and 13-14 we ma:
E(R) a = R) f 4nr2 (p - p j udt
= / W Po Ah (Sj (!■<.)]*„
n
where we have defined E(R) to represent the integral for total work involving the overpressure p -pa along the particle path r„ = R. It w ill be noted that E(R) = Ii0(R ) -H J R ), and, in particular , E(a„ ) = Ht (p„ ) -Hp (pa).
By differentiating Eq. 13-15, we derive the differential equation for the total transport o f enthalpy associated with transmission o f a spherical shock wave; thus
4irit2 p0A h [Sl( f l ) ) (13-16)
It should be noted that Eq. 13-16 contains no information not implicit in the Hugoniot relations since they take full account o f the conservation o f energy. When the Hugoniot relations are combined with an equation of state, all the basic information it is possible to derive from thermodynamics in this connection is implicitly contained. However, the concept o f total enthalpy transport expressed in Eq. 13-16, which was first derived by Kirkwood and
Brinkley3, provides an insight not immediately given by the Hugoniot relations alone.
13-4 B L A ST W AVES IN A IR FROM EXPLOSIVE CHARGES
Before considering the quantitative analysis of the shock wave in air generated by an explosive charge, it is desirable to describe the qualitative features o f the wave. We lim it the discussion to the spherical wave with a center o f symmetry, propagating radially outward from the center o f the explosion in a space free o f obstacles.
As the blast wave in air travels away from the source, the peak pressure steadily decreases- and the pressure behind the front falls o ff in a regular manner. A fter the shock front has propagated a certain distance, the pressure behind the shock front falls below the original ambient pressure o f the atmosphere, creating a suction phase of negative overpressures. The pressure as a function o f distance from the center o f explosion is shown schematically in Fig. 13-3 for several successive times, increasing as the wave propagates from left to right. I t may be noted that the suction phase o f the blast wave is a consequence o f the geometrical divergence o f the wave. Waves propagating without divergence do not exhibit a suction phase.
I t will be recalled from Chapter 2 that the Hugoniot equations, expressing the conservation laws across the shock discontinuity, prescribe all o f the shock front variables in terms o f any one o f them. Thus, if the peak pressure is chosen as the independent variable, (he shock front particle velocity is a monotonic function o f the peak pressure so that it decreases during propagation o f the wave in a manner determined by tile instantaneous value o f the peak pressure througi the Hugoniot equation. The particle velocity decreases behind the shock front in a manner that is determined by the pressure distribution through the hydrodynamic equations. The particle velocity is shown as a function o f distance from the center of explosion schematically in Fig. 13-4 for several successive times as the wave propagates from left to right. The particle velocity changes direction in consequence of the suction phase o f the blast wave,
AMCP 706*180
Figure 13-3. Pressure-distance Cuives for Blast Wanes in Air.at Successive Times
Qualitatively similar curves are obtained i f the pressure or particle velocity is plotted as functions o f time at a fixed distance from the center o f the explosion. Such curves are called the Eulerian pressure-time o f particle velocity-time curve because the position is taken as fixed in a laboratory system o f coordinates. Pressure-time curves at two distances, R% and jR2> f i j , are shown schematically in Fig. 13-5. A t ^ , the blast wave does not exhibit a suctioi. phase. A t the greater distance J?2, the suction phase exhibited in the pressure-distance curves is reproduced by the pressure-time curve.
A t distances close enough to the explosion so that the blast wave is o f the form as shown to the left in Fig 13-5, it may be represented by the empirical equation*
* The notation "subscript prime” is used only with pressure and refers to shock fron t pressure above atmospheric pressure.
P(t) = P, c - , ,e (13-17)-
where p is the pressure in excess o f the ambient pressure po, i.e., the excess pressure or the overpressure; p, is the peak value o f the excess pressure at the shock front, i.e., p ( “ p, -p o ; t is the time measured from the instant o f arrival o f the shock wave; and 6 is called Eulerian time constant o f the pressure-time curve. I t is the time required for the overpressure to fall to a value 1/e o f its peak value. It can be calculated by the relation
1 l M
• ’ P| W « , - o(13-18)
where the partial derivative is formed at constant radial coordinate R and evaluated at the time o f arrival o f the shock front at E. Asymptotically, at large distances and low overpressures, it has been shown by Kirkwood
13-8
Port
fcto
AM CP70e-^ 0
Figure 13-4. Particle Velocity-distance Curves for Blast Waves in Air at Successive Times
13-9
•*— Tmw
Figure 13-5, Pressure-time Cu-ves for Blast Waves in Air
AM CP 70*-180
and Bethe* that the positive portion of the pressure-time curve is the straight line
p (t ) = p , ( l - t/6 ), t > 6 (13-19)
For the asymptotic pressure-time curve, 0 is the duration o f the positive portion o f the wave. It satisfies the definition o f Eq. 13-18. A t intermediate distances and peak pressures, the pressure-time curve cannot be represented by a simple, one-parameter, empirical equation.
The properties o f the shock front, expressed as functions o f the peak pressure, can be calculated by the use o f the Hugoniot equations supplemented by an equation o f state for the air.. Fig. 13-6 has been constructed on the assumption that air is polytropic with 7 = 1.4. This assumption is adequate fo r shock eves whose peak pressure is relatively low. A t h ,er amplitudes, the high temperature o f the shock wave causes' extensive dissociation and the polytropic assumption is no longer valid. Hugoniot curves, fo r air in which dissociation is taken into account have been constructed Hilsenrath and Beckett’ .
The. dynamic pressure ir is defined as the quantity
Jr = pu! /2 (13-20)
This property o f the shock wave determines the aerodynamic drag forces to which a structure is exposed. The' dynamic pressure is characterized by a peak value at the shock front, determined through the Hugoniot equations by the peak pressure, and a decaying dynamic pressure-time curve. The peak dynamic pressure is shown as a function o f shock front pressure in Fig. 13-6. A peak approximation, similar in form to Eq.13-17, is appropriate to describe the variation o f dynamic pressure with time at points near the explosion. Asymptotically, at large distances and low overpressures, Kirkwood and Bethe* have shown that the portion o f the dynamic pressure corresponding to the positive part o f the wave is represented by the qi’ dratic expression
jr(t) = TjC l - t/0)2, t > 0 (13-21)
This expression involves the same constant 0 as Eq. 13-19 because the durations o f positive pressure and forward facing particle velocity are asymptotically equal.
The impluse delivered to unit area by the positive portion o f the shock wave is the area under the positive portion o f the pressure-time curve. For the pressure-time curve o f Eq. 13-1
*P = P ,e (13-22)
which is valid close to the explosion.Asymptotically, when Eq. 13-19 applies, then
f = >4p , 0 (13-23)
I f the peak approximation for the dynamic pressure is written in terms o f a time constant $'
(13-24)
analogously to Eq, 13-18, tire dynamic impulse per unit area is given by an.expression similar to Eq. 13-22
/ = 7r18' (13-25)
which is valid close to the explosion. Asymptotically, when Eq. 13-21 applies, the dynamic impulse for the positive phase o f the wave is given by
/„ = 2/37^0 (13-26)
These simple expressions for the impulses require a knowledge only o f two parameters o f the shock wave, each o f which are evaluated at the shock front. A t intermediate distances and shock wave amplitudes, the evaluation o f pressure impulse or dynamic impulse requires either additional information on the structure of the wave or an interpolation procedure between the expressions resulting from the peak approximation and those resulting from the asymptotic equations.
13-5 R E S U L T S OF N U M E R I C A L I N T E G R A T I O N OF T H E HYDRODYNAMIC EQUATIONS FOR BLAST WAVES IN AIR
A complete theoretical development o f the consequences o f a simple model such as the spherical shock wave from a centrally initiated spherical charge is attended by considerable
Ffeok
Dy
rtom
ic FV
e**u
re,
psi
AMCP 706-1*0
Peak Overpreeeure, pel
Figure 13-6. Hugoriiot Properties of the Shock Wave for Ideal Poly tropic Air
13-11
AMCP 706180
difficulty. In principle, the theoretical analysis is to be based on the partial differential equations o f hydrodynamics. They are to be solved subject to the Hugoniot equaitons which express the conservation laws across the discontinuous shock front and which implicitly prescribe the path o f the shock front in space as a function o f time. The solutions depend upon initial and boundary conditions that are prescribed on the interface separating explosion products and air. The, latter themselves pose a difficult problem since the position o f the surface and the conditions on it depend on the flow o f the detonation products at all times subsequent to the passage o f the detonation wave. Now, when the detonation wave reaches the surface o f the explosive and generates the initial shock wave in the surrounding medium, a wave is reflected back into the explosion products. In the spherical case, this wave is again reflected at the center and on reaching the interface between explosion products and air modifies both the position o f the interface and the properties on it. As the motion develops, a complex set o f waves is generated, both in the explosion products and in the air, and these have to be followed in detail in order to construct an exact solution, even for the spherical model.
The point source model o f a spherical shock \vave is much easier to exploit since the complicated conditions on the interface between explosion products and air are replaced by a single condition specifying the total energy released by the explosion. There is theoretical and experimental evidence that this model reproduces the main features o f the explos! rely generated shock wave, especially at large distances from the explosion, and it provides a useful basis upon which to continue our description o f the properties o f blast waves in sir. A more exact treatment taking into account the motion o f the explosion products can be considered as adding a kind o f “ fine structure" to the picture obtained from the simpler considerations, The point o f view appears to be valid in the present instance for two reasons, namely: (1 ) at distances where measurements o f shock wave parameters are normally made experimentally, and where their magnitudes are important for practical problems such as specification o f critical damage radii, the so-called fine structure is not resolved by the
instrumentation employed, and ( 2 ) at distances nearer to the explosion where the so-called fine structure is more important, the assumption o f spherical symmetry is an increasingly poor approximation to charge configurations usually employed.
Brode6'7 has obtained the numerical solutions o f the differential equations o f hydrodynamics for the point source model o f the spherical blast wave in air. The computational method employed is due to von Neumann and Richtmyer10 in which an artificial viscosity is introduced into the equations as a mechanism for avoiding shock front discontinuities. The artificial viscosity is defined in such a way as to replace the shock front with steep but finite gradients in the properties o f the flow, across which the Hugoniot equations are satisfied. Simultaneously, as defined, it has negligible effect on the flow in all other regions. The integrating process then consists o f the step-wise solution o f difference equations which approximate the differential equations o f motion o f the gas.
For the point source model, one can define a characteristic length X and time r
X = (£/po)1,3, r = X/e0 (13-27)
where £ is the total energy transmitted by the explosion to the shock wave, and po and co are file pressure and sound velocity, respectively, in the undisturbed air. Then, it is easy to show that the solutions o f the hydrodynamic equations are similar, i.e., that scaling is preserved, i f distances are expressed in units o f length X and times in units o f the characteristic time T. Thus, the point source solutions are independent o f the nature o f the explosive, so long as the energy released to the shook wave is properly employed in evaluating the seeding parameters X and r .
The solid line of Fig. 13-7, which is taken from Brode’s paper, shows the variation o f peak pressure with distance for a point explosion in an ideal gas in which it is assumed that the heat capacity ratio 7 is constant and equal to 1.4. The effect o f the assumption o f ideality is shown by comparison with the dashed curve o f the same figure, which results from calculations in which the thermodynamic properties o f real air were employed and in which account was taken o f the dissociation o f air at the high
13-12
AMCP 706-130
temperatures associated with strong shocks. The curves axe qualitatively similar but show the importance o f the equation o f state in the actual shock amplitude at a given distance. This figure also shows fo r comparison experimental values fo r TNT.
These calculations afford a complete description o f the flow associated with the shoo': wave. Brode presents the results in his paper by means o f graphs and by empirical equations fitted to the various curves. The results axe too voluminous fo r inclusion in this chapter and for them reference is made to the original reports. For later reference, however, we reproduce in Fig. 13-8 the instantaneous pressure-distance curves calculated fo r isotropic air with the point source model. The curves for real air are o f similar form.
In the point source approximation, the explosion is described by a single parameter, i.e., the energy transmitted to the shock wave. The results o f the calculation are thus independent o f size, density, or chemical nature o f the explosive, and, when scaled by a characteristic length and characteristic v.me determined by the energy o f explosion, the results are.applicable to any explosive. The effect o f the parameters o f the explosive that are neglected by the point source approximation is revealed by consideration o f a numerical integration, carried out by Brode, in which the integration is continued from the spherical detonation wave o f Taylor o f the case o f TN T at initial density o f 1.5 g/cm3. It was carried out using the artificial viscosity technique o f von Neumann and Richtmyer. This calculation ij substantially more involved than that o f the point source model, and it does not appear to have been repeated fo r other explosive charges. Unfortunately, obsolete ’ quation o f state data for the explosion products and an incorrect energy o f explosion were employed, so that the numerical results are likely to be sen * c hat in error, However, this calculation .provides the- most complete and detailed, description (hq air shock wave that is in. exisce ice. I t '»as „pecial value in providing, a test oi tee validity o f simplified models.
’.VJhcn a spheriau shock wave is generated by a sphere o f gas o f finite volume at high pressure, the establishment o f continuity ot pressure and radial particle velocity across ins contact surface
between explosion products and air results in a rarefaction wave moving toward the center in the explosion products. ( I f the explosion products are generated by a spherical detonation wave o f the type described by Taylor, the rarefaction wave moves into and modifies the structure o f Taylor wave.) In general, as Brode points out, when a spherical shock wave o f finite volume is backed up to an inward moving rarefaction wave, the negative pressure gradient o f the rarefaction joins the positive gradient o f the shock through a compression which grows as a shock as the rarefaction develops. N o such condition exists fo r a plane wave in a shock tube. Thus, in the numerical calculations, a shock wave is seen to fo llow the rarefaction wave into the explosion gases. It starts with zero strength and grows as i t moves inward through these gases. The gases themselves are expanding radially at a velocity that is initially high, w-vUre this shock is swept outward in space hintil the- expansion o f the explosion products is nearly complete. Then i t implodes on the dngm audis' reflected outward to the contact -.urface. A t the time o f reaching this surface, tteexp ibaon gas-ts are denser and cooler than fiu % outside. Therefore, on passing through the urfa-e t ic wave establishes a. second shock wf’,vein the'aif and a new inward rarefaction wai'e wlii'ch,'•■.irq the initial rarefaction wave, is fo llow ed by' a shock wave moving inward. This sir-,v ffinDloassi: on the origin, reflects, and propagates outward in the wake o f the earlier shocks. The jucceseiap, o f shocks continues in this maousr until tV- residual energy o f the exr'bsiori prod ,cfc jf dissipated. -
A rather complicated series- pi shock Waves and rarefactions thus develops, whiclj-sj&ei; the mouori o f the contact surface- Jnqtead ot moving ir-onytordcally fra * t?. qsSiiiy-rtidius-f'f the-explr aive to trie ratlins ai-whicH. %«
at rest, a series o| .dhinpetl p ' ‘b lu e ts are oba- iV«d. Fig.I3-G, which is tqten ftqm/EiiVd-j’B paper, shows the pt»'8C 'pries, o t fh e “hook waves and o f the contact surface.
By neglecting she ’ ■ waves pi the expi'sipn products, the specific energy of'-«.p!asics;.<;l'iu i» been defined as
9 ' " ■ cG-V.^1 (13-23)
where eo is the specific energy content o f the intact explosive, and tire ^ppciili. energy content
AMCP 706-180
f '1
.01 Oi 10
R a d u o td d M o n c a r / X
Figure 13-7. Peak Pressure-distance Curves for Shock Waves in Air Calculated With the Point Source Model (Brode)
( ' ?V _-- '
13-14
at
AMCP 706-180
e o f the explosion products is evaluated at ambient pressure po and the entropy s, o f the Chapman-Jouguet detonation state. However, the final entropy is greater than s1 by the increments across all o f the shocks in the explosion products, so that Eq. 13-28 is an overestimate o f the energy transmitted to the air. I t may be retained as a reasonable approximation since the energy dissipated across the shock waves is a small fraction o f the total energy released by the explosion. The dissipation assumption employed in par. 13-3 is that all o f the energy o f the explosion is dissipated in the air as a result o f the entropy increment across the initial shock. This assumption, also, is not strictly correct because o f the entropy increments associated with each o f the later shocks. These increments are small compared to that across the primary shock and consequently the description o f energy
propagation that takes account only o ' the primary shock wave is a good approximation.
These subsidiary shocks, as is shown by Big.13-10, fo llow the main shock at such a time and distance as to be behind the minimum of the negative phase. The pressure-distance curves of this figure are to be compared with those of Fig.13-8, which results from the point source model. They show how the structure o f the waive is affected by the finite size o f the explosive charge. Since the subsidiary shocks are located in the negative phase o f the primary shock wave, they cannot overtake and merge with the primary shock. It will be noted that the shape of the positive portion o f the pressure-time curve as calculated from the point source model is qualitatively quite similar to that from the finite charge.
The variation o f peak pressure with distance as calculated for the finite charge o f TN T is
Figure 13-8. Pressure in Atmospheres as a Function of the Lagrange or Mass Position fcr the Point Source Solution at Times Indicated (The position is in arbitrary units ofK/1627.2 and the time is in units o f T.) (11 rode)
13-15
AMCP 706-180
Reduced dietonce, R/X
Figure 13-9, Space-time Diagram (or Shocks and Contact Surface for 'INT Blast in Air (Brode) '
13-16
Exce
ss P
eak
Pres
sure
,
7
O
Figure 13-10. Pressure-distappe Curvet at Successive• Times for TNT Blast Waves in Air (Brode)
&
O
mi I
AMCP 708-180
AM CP7M -180
Riduced dittanot, R/XAFigure 13-11, Peak Pressure-distance Curve for T A T Blast Waves il. Air (Erode)
13-11
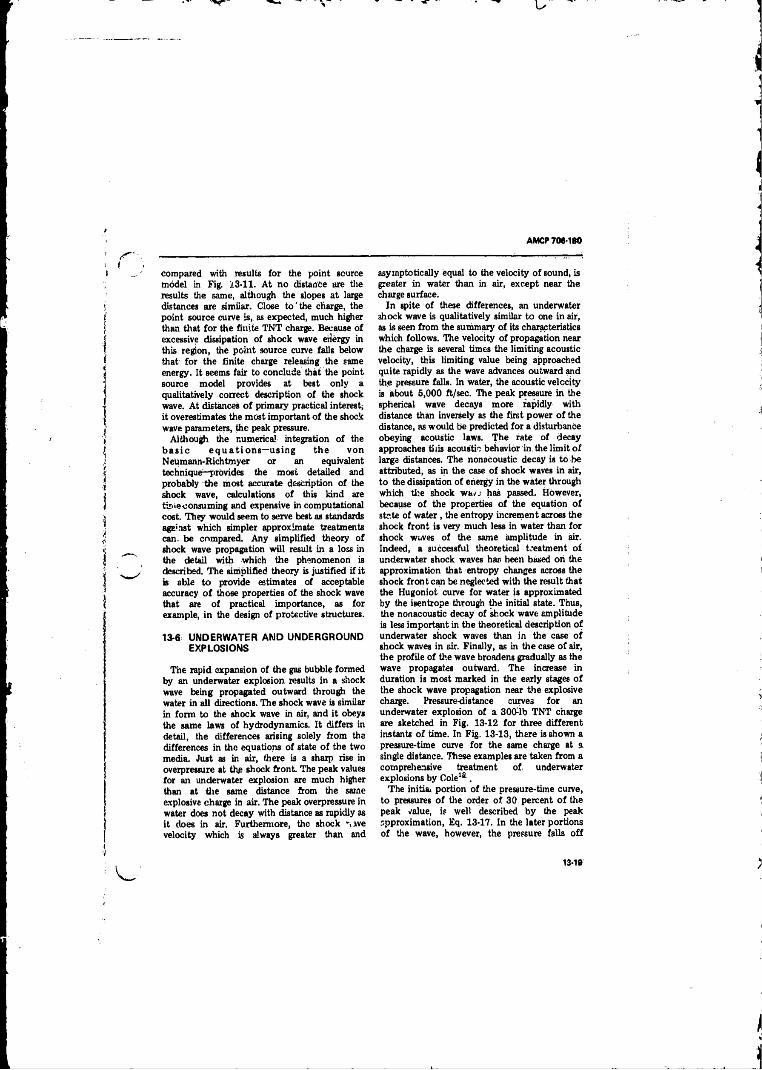
AMCP 706-180
compared with results for the point source model in Fig. 13-11. A t no distance are the results the same, although the slopes at large distances are simiiar. Close to 'th e charge, the point source curve is, as expected, much higher than that fo r the finite T N T charge. Because o f excessive dissipation o f shock wave eriergy in this region, the point source curve falls helow that for the finite charge releasing the same energy. It seems fair to conclude that the point source model provides at best only a qualitatively correct description o f the shock wave. A t distances o f primary practical interest; it overestimates the most important o f the shock wave parameters, the peak pressure.
Although the numerical integration o f the b a s ic e q u a t io n s —using th e vonNeumann-Rich tmyer or an equivalenttec hnique—-provides the most detailed and probably the most accurate description o f the shock wave, calculations o f this kind are tir-ieconsuming and expensive in computational cost. They would seem to serve best as standards age’ nst which simpler approximate treatments can. be compared. Any simplified theory o f shock wave propagation will result in a loss in the detail with which the phenomenon is described. The simplified theory is justified if it is able to provide estimates o f acceptable accuracy o f those properties o f the shock wave that are o f practical importance, as for example, in the design o f protective structures.
13-6 UNDERWATER AND UNDERGROUND EXPLOSIONS
The rapid expansion of the gas bubble formed by an underwater explosion results in a shock wave being propagated outward through the water in all directions. The shock wave is similar in form to the shock wave in air, and it obeys the same laws o f hydrodynamics. It differs in detail, the differences arising solely from the differences in the equations o f state o f the two media. Just as in air, there is a sharp rise in overpressure at the shock front. The peak values for an underwater explosion are much higher than at d ie same distance *om the same explosive charge in air. The peak overpressure in water does not decay with distance as rapidly as it does in air, Furthermore, the shock ", sve velocity which is always greater than and
asymptotically equal to the velocity o f sound, is greater in water than in air, except near the charge surface.
In spite o f these differences, an underwater 3hock wave is qualitatively similar to one in air, as is seen from the summary o f its characteristics which follows. The velocity o f propagation near the charge is several times the limiting acoustic velocity, this limiting value being approached quite rapidly as the wave advances outward and ihe pressure falls. In water, the acoustic velocity is about 5,000 ft/sec. The peak pressure in the spherical wave decays more rapidly with distance than inversely as the first power o f the distance, as would be predicted for a disturbance obeying acoustic laws. The rate o f decay approaches this acoustic behavior in. the limit o f large distances. The nonaCoustic decay is to be attributed, as in the case o f shock waves in air, to the dissipation o f energy in the water through which tiie shock wave has passed. However, because o f the properties o f the equation o f str.te o f water , the entropy increment across the shock front is very much less in water than for shock waves o f the same amplitude in air. Indeed, a successful theoretical treatment o f underwater shock waves has been based oh the approximation that entropy changes across the shock front can be neglected with the result that the Hugoniot curve for water is approximated by the isentrope through the initial state. Thus, the nonacoustic decay o f shock wave amplitude is less important in the theoretical description o f underwater shock waves than in the case o f shock waves in air. Finally, as in the case o f air, the profile o f the wave broadens gradually as the wave propagates outward. The increase in duration is most marked in the early stages o f the shock wave propagation near the explosive charge. Pressure-distance curves fo r an underwater explosion o f a 300Tb TN T charge are sketched in Fig. 13-12 for three different instants o f time. In Fig. 13-13, there is shown a pressure-time curve for the same charge at a single distance. These examples are taken from a comprehensive treatment o f underwater explosions by Cole1®-,
The initial portion o f the pressure-time curve, to pressures o f the order o f 30 percent o f the peak value, is well described by the peak approximation, Eq. 13-17. In the later portions o f the wave, however, the pressure falls o f f
13-19
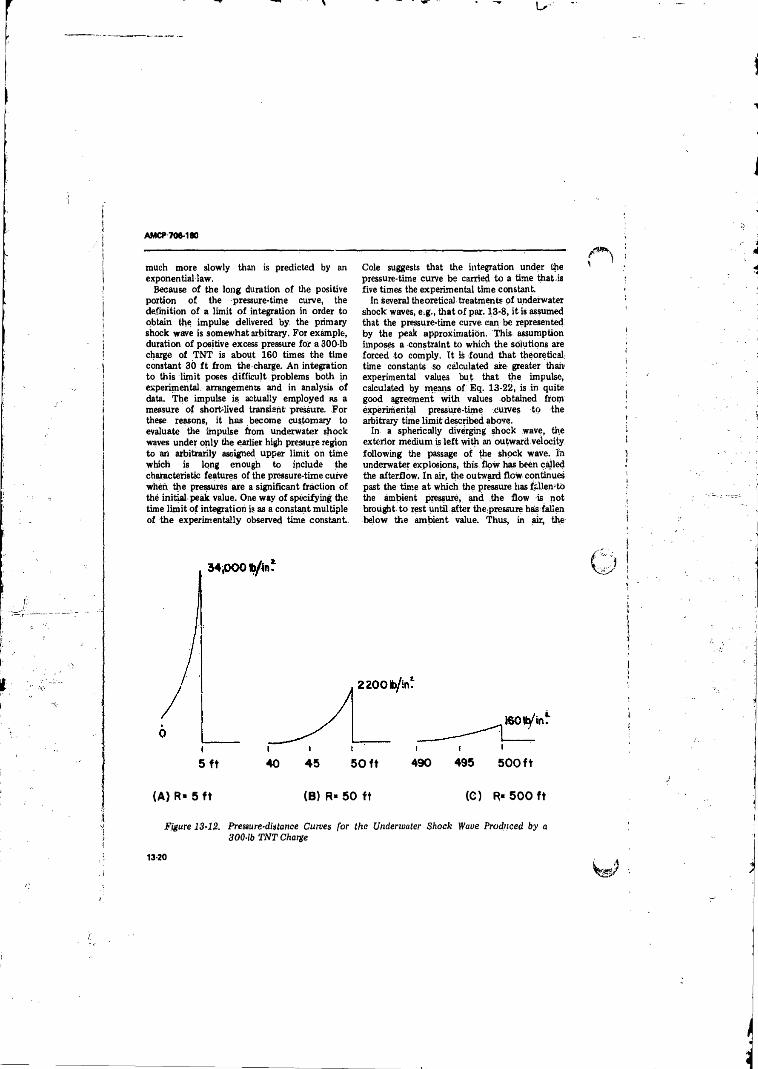
AMCP 706-180
much more slowly than is predicted by an exponential law.
Because o f the long duration o f the positive portion o f the pressure-time curve, the definition o f a limit o f integration in order to obtain the impulse delivered by the primary shock wave is somewhat arbitrary. For example, duration o f positive excess pressure for a 300-lb charge o f T N T is about 160 times the time constant 30 f t from the charge. An integration to this limit poses difficult problems both in experimental arrangements and in analysis o f data. The impulse is actually employed as a measure o f shortlived transient pressure. For these reasons, it has become customary to evaluate the impulse from underwater shock waves under only the earlier high pressure region to an arbitrarily assigned upper limit on time which is long enough to include the characteristic features o f the pressure-time curve when the pressures are a significant fraction o f the initial peak value. One way o f specifying the time lim it o f integration is as a constant multiple of the experimentally observed time constant
Cole suggests that the integration under the pressure-time curve be carried to a time that is five times the experimental time constant.
In several theoretical treatments o f underwater shock waves, e.g., that o f par. 13-8, it is assumed that the pressure-time curve can be represented by the peak approximation. This assumption imposes a constraint to which the solutions are forced to comply. Tt is found that theoretical: time constants so calculated are greater than' experimental values but that the impulse, calculated by means o f Eq. 13-22, is in quite good agreement with values obtained from experimental pressure-time Curves to the arbitrary time lim it described above.
In a spherically diverging shock wave, the exterior medium is le ft with an outward velocity following the passage o f the shock wave. In underwater explosions, this flow has been called the afterflow. In air, the outward flow continues past the time at which the pressure has fallen to the ambient pressure, and the flow is not brought to rest until after thepressure has fallen below the ambient value. Thus, in air, the
5 f t 40 4 5 5 0 f t 490 495 5 0 0 f t
(A) R m 5 f t (B) R» 5 0 ft (0) R* 5 0 0 f t
Figure 13-12. Pressure-distance Curves for the Underwater Shock Wave Produced by a 300-lb TNT Charge
13-20
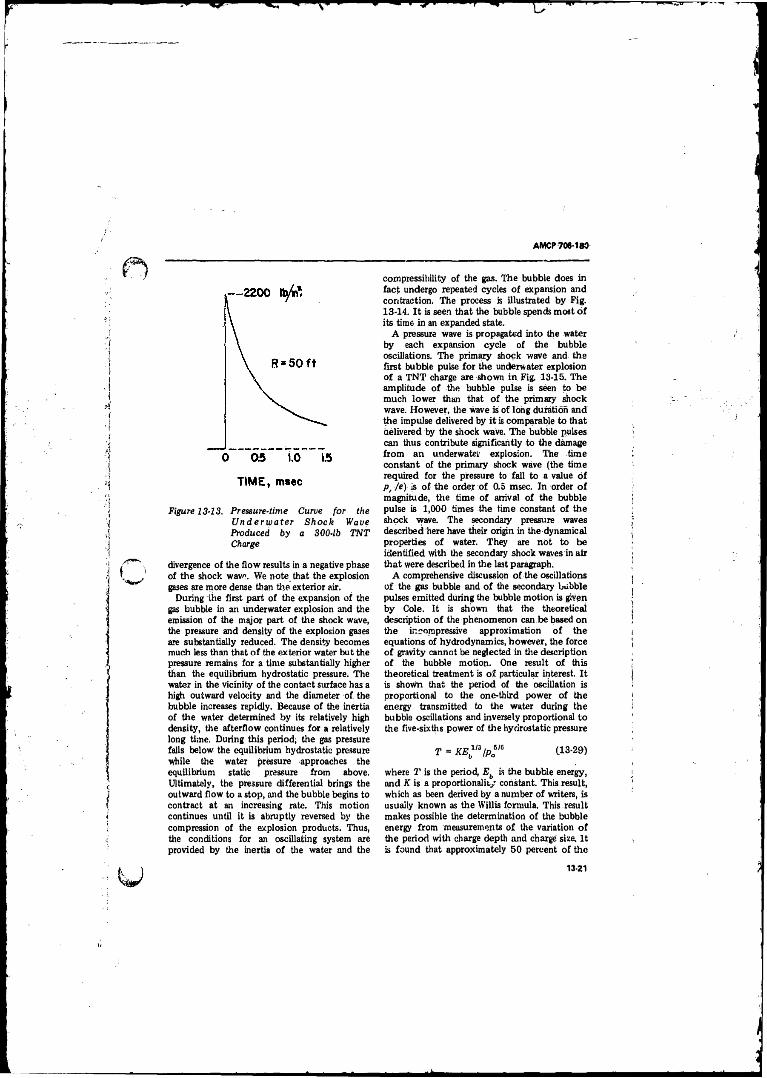
AMCP 706-180
Figure 13-13. Pressure-time Curve for the Underwater Shock Wave Produced by a 300-lb TNT Charge
divergence o f the flow results in a negative phase o f the shock wave. We note that the explosion gases are more dense than the exterior air.
During the first part o f the expansion o f the gas bubble in an underwater explosion and the emission o f the major part o f the shock wave, the pressure and density o f the explosion gases are substantially reduced. The density becomes much less than that o f the exterior water but the pressure remains for a time substantially higher than the equilibrium hydrostatic pressure. The water in the vicinity o f the contact surface has a high outward velocity and the diameter o f the bubble increases rapidly. Because o f the inertia o f the water determined by its relatively high density, the afterflow continues for a relatively long time. During this period; the gas pressure falls below the equilibrium hydrostatic pressure while the water pressure approaches the equilibrium static pressure from above. Ultimately, the pressure differential brings the outward flow to a stop, and the bubble begins to contract at an increasing rate. This motion continues until it is abruptly reversed by the compression o f the explosion products. Thus, the conditions for an oscillating system are provided by the inertia o f the water and the
compressibility o f the gas. The bubble does in fact undergo repeated cycles o f expansion and contraction. The process is illustrated by Fig.13-14. I t is seen that the bubble spends most o f its time in an expanded state.
A pressure wave is propagated into the water by each expansion cycle of the bubble oscillations. The primary shock wave and the first bubble pulse fo r the underwater explosion o f a T N T charge are shown in F ig 13-15. The amplitude o f the bubble pulse is seen to be much lower than that o f the primary shock wave. However, the wave is o f long duration and the impulse delivered by it is comparable to that delivered by the shock wave. The bubble pulses can thus contribute significantly to the damage from an underwater explosion. The time constant of the primary shock wave (the time required for the pressure to fall to a value o f pr /e) is o f the order o f 0.5 msec. In order o f magnitude, the time o f arrival o f the bubble pulse is 1,000 times the time constant o f the shock wave. The secondary pressure waves described here have their origin in the dynamical properties o f water. They are not to be identified with (he secondary shock waves in air that were described in the last paragraph.
A comprehensive discussion o f the oscillations o f the gas bubble and o f the secondary bubble pulses emitted during the bubble motion is given by Cole. It is shown that the theoretical description o f the phenomenon can .be based on the incompressive approximation o f the equations of hydrodynamics, however, the force o f gravity cannot be neglected in the description o f the bubble motion. One result o f this theoretical treatment is o f particular interest. I t is shown that the period of the oscillation is proportional to the one-third power o f the energy transmitted to the water during the bubble oscillations and inversely proportional to the five-sixths power of the hydrostatic pressure
T = K E ™ lp™ 113-29)
where 2’ is the period, Eb is the bubble energy, and K is a proportionality constant. This.result, which as been derived by a number o f writers, is usually known as the Willis formula. This result makes possible the determination o f the bubble energy from measurements o f the variation o f the period with charge depth and charge size. I t is found that approximately 50 percent o f the
13-21
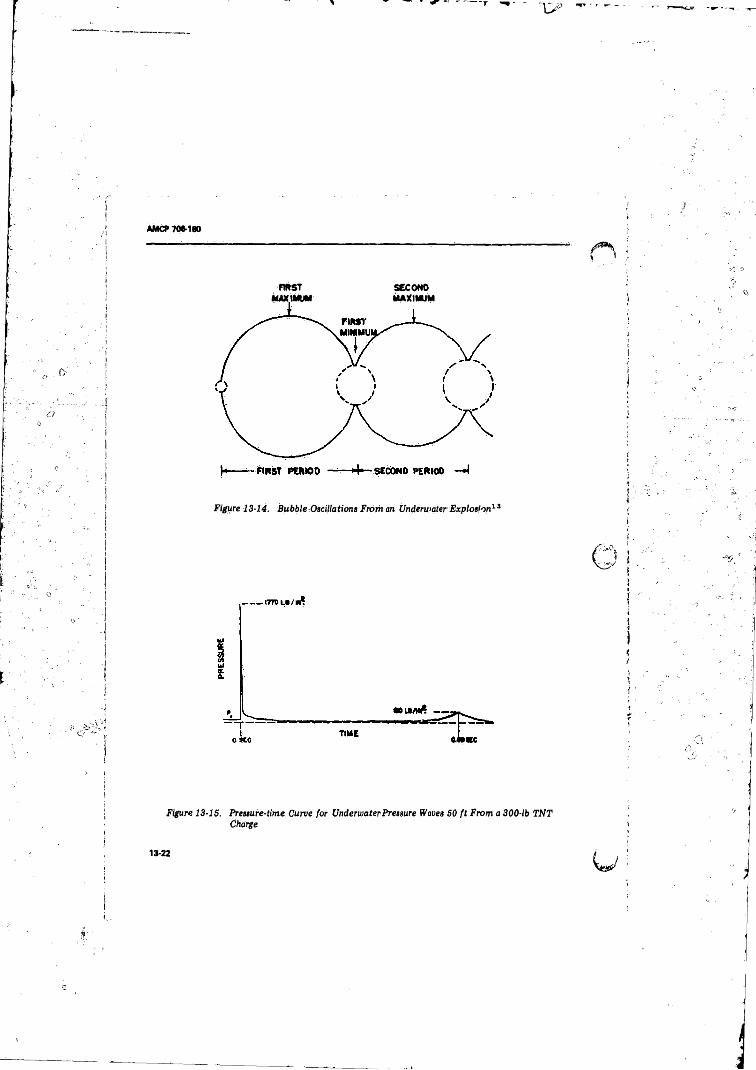
AMCP 706-100
FIRST SEC0N0MAXIMUM MAXIMUM
Figure 13-14. Bubble Oscillations From an Underwater Explosion13
Figure 13-15, Pressure-time Curve for Underwater Pressure Waues 50 ft From a 300-lb TNTCharge
13-22
X
AMCP 706-180
energy o f explosion is transmitted during the primary shock wave*, the remainder being dissipated during the oscillations o f the gas bubble. The most precise data are available for the underwater explosion o f TNT, for which the energy o f explosion has been evaluated as 1060 cal/g. From the observed period o f oscillation of the gas bubble, a bubble energy o f 480 cal/g is calculated. The difference, 580 cal/g, is the energy o f the initial shock wave.
In water, as in air, all o f the properties at the shock front are determined as functions o f the peak pressure by the Hugoniot equations and an equation o f state. The Tait equation o f state is an expression o f simple form that, gives a good representation ” T data. Along an isentrope, it can be written
p = BUplp0f - 1] (13-30)
The exponent k is taken to be 7.15 fo r sea water. The quantity B is a slowly varyingfunction o f entropy. For sea water at 20° C, it has been assigned the value 3.047 kbars. It will be noted that Eq. 13-30 has a form similar to that for a polytropic gas. Richardson, Arons, and Halverson11 have employed Eq. 13-30 to evaluate the properties o f sea water along the Hugoniot curve. The shock wave velocity and the particle and sound velocities at the shock front are shown as functions o f peak pressure by Fig. 13-16.
As in the case o f shock waves in air, a straightforward mathematical approach to the theoretical description o f the shock wave from underwater explosions can be based on the numerical integration o f the equations of hydrodynamics. A calculation o f this nature has been performed by Penney and Dasgupts12 for TNT. The integration was continued from the spherical detonation wave described by Taylor. The peak pressure-distance curve obtained by this procedure is shown in Fig. 13-17 which also shows some experimental values. A t distances for which experimental data are available, the rate o f decay o f the theoretical curve is closely similar to that for the experimental curve. The
* N o t all o f the energy transmitted by the primary shock wave appears in the shock wave at moderate distances from the charge, A portion o f the energy ; dissipated as heat in the fluid through which the shock wave has progressed (sec par. 4-8).
low values obtained by calculation are to be attributed to the low energy release that was assumed in the calculation of the initial conditions. I t seems reasonable to assume that a revision and extension of these calculations, employing the more accurate value o f the energy o f explosion that is now available, would give results in good agreement with experiment.
The principal commercial application o f explosives has been to blasting with the explosive detonated underground. An underground explosion is very difficult to describe q'. antitatively, and the present state o f knowledge in this area is very limited. In practical cases, the terrain is rarely even approximately uniform over any considerable distance from the charge. Even where uniform, the exterior medium cannot be described by any simple equation o f state. Fipaliy, the explosion in a medium o f infinite extent, to which we have elected to lim it the treatment o f this chapter, does not correspond to the geometry o f any blasting application of practical interest. On the other hand, more recent problems involving underground storage o f ammunition, and simulation o f underground nuclear bursts, have led to experimental and theoretical work on underground detonations in “ infinite” media20’25.
In an underground explosion, the pressure wave transmitted to the exterior medium is, o f course, affected by the mechanical properties of the medium. I f the medium is an elastic solid, such as rock, there is a region o f plastic deformation and permanent displacement in the region close to the charge where the pressure is greater than the elastic limit o f the material. A t greater distances, both transverse andlongitudinal elastic waves are generated by the explosion which travel, in general, at different velocities and which are modified on reflection at free surfaces, such as the ground level or a pit face, and on passing from material at one density to material at another. In general, it can be stated that most of the energy o f explosion is dissipated close to the explosion in the region o f permanent displacement, and that the amount o f energy transmitted by elastic or seismic waves is at most a few percent o f the energy of explosion. I f the solid is elastic, it most commonly fractures under tension as the result o f the tension wave produced on reflection o f a compression wave at a free surface.
13-23
AMCP 706-180
0 to 40 to- 00PRESSURE, KBARS
Figure 13-16. Hugoniot Properties for Shock Waves in Sea Water11
60
4 0
<#L.o5 20
aa.a 10
8
6I 2 4 6 8 10 20 4 0
Reduced D istance, R /a0
Figure 13-17. Peak Pressure-distance Curve for the Underwater Explosion o f TNT as Calculated by Penney and Dasgupta11
V\\\\\\ \
'
Remy-Oa
\ s v,igupta
1 .
13-74
AMCP 706-180
A considerable amount o f empirical information has been compiled on the behavior o f explosives in varying terrains. The selection o f an explosive and its arrangements for a particular blasting job are, as a practical matter, entirely dictated by experience. It seems fair to state that blasting is at the present time an art almost completely without a quantitative scientific basis.
The solution for the propagation o f shock waves should, o f course, be based on a continuation o f the solution for the spherical detonation wave, described in Chapter 9. I f we here designate by pd the pressure o f the detonation wave front and by urf the corresponding value o f the particle velocity, Eqs.13-32 can be written
%(.“„) + n(p*) = ud, ( 1 3 .3 3 )
13-7 T H E I N I T I A L S H O C K W A V E PRESSURES
A t the contact surface between explosion products and exterior medium, the pressure and normal component o f the particle velocity :are equal on each side o f the surface a t all times. In particular, fo r a spherical explosive charge o f initial radius a , these conditions can be expressed by
P, (a„) = P *(«„), " j ( a , ) = “ * ( « , ) (13-31)
where p f (ao) is the initial excess peak pressure in the exterior medium, p * (ao ) is the pressure in excess o f the initial pressure pg o f the explosion products on the surface It = a , it (e ) is the initial radial shock front particle velocity, and u# Cao ) is. the radial particle velocity o f the explosion products on the contact surface. When these conditions are established, a shock wave advances into the exterior medium and a rarefaction wave recedes into the explosion products. The rarefaction wave is initially characterized by the fact that the Riemann r function (see Chapter 2) is an invariant on a particle path, i.e., on. the surface R - ao . This condition can be stated in the form
where M oo l p ) - J fa (13-34)
>>dUsing Eqs. 13-31, the Riemann condition can be written in the form
« t ( « „ ) + °(P ,) = % (13-35)
The cr-function is to_ be evaluated using an equation o f state for the explosion products. It is necessary to calculate the detonation state; to construct the isentrope through this state; to evaluate the integrand o f Eq. 13-34 along the isentrope; and, finally, to evaluate the o-functior. by quadrature. Methods fo r the construction of the isentrope are described in Chapter 2.
The shock front in the exterior medium must satisfy the Hugonipt conservation equations (see Chapter 2;. The-" can be written
P, “ P0« r U
“ i = U(1 - P0U\)
\ - ha = p, (it, + e,)/2
(13-36)
r = u + a - constant
P+Po
The constant in Eq. 13-32 is fixed when the difinition o f the o-function is completed by specificatioi o f a lower limit o f integration. The integral defining the o-function is along a path o f constant entropy (which because o f tire entropy transport equation is also a particle path).
in terms of the excess peak pressure p, , where U is the velocity o f propagation o f the shock wave. These equations are supplemented by an equation o f state for the exterior medium. They make it possible to express each o f the shock front properties as functions o f any one o f them (usually in tabular form ) for given values o f the properties o f the undisturbed medium. In particular, it is possible to express the shock front particle velocity as a function o f the peak excess pressure
= i‘ i ( P , ) (1 3 -3 7 )
13-25
AM CP 706-180
Thus, Eqs. 13-35 Bad 13-36 imply a relation
(P, ) + <r(P,) = ud (13-36)
which can be solved for the initial excess shock front pressure p, by numerical or graphical methods.
Kirkwood and Bethe* have constructed a theory o f the propagation of shock waves in water in which it is shown that the function
G « r(w + u212}
propagates according to a relation that can be written
G(r,t) - Gb(t ) (13-40)
where Gt is the value o f the function G on the contact surface at a time r. I f G(r,t) is known everywhere in the (V,t)-plane, all o f the properties o f the shock wave can be deduced in a straightforward manner. Eq. 13-40 states that the function G(r,t) is equal to the value o f the^ same function on the contact surface at a time t " which is a function r(r,t). Kirkwood and Bethe give a prescription for evaluating GJt) and r(r, ;), and they have thus formulated a theory o f propagation o f the shock wave. We do not wish to describe this theory in further detail but only to comment on an implication o f Eq.13-40. Kirkwood and Bethe show that the time r is an increasing function o f time for any constant value o f r. This means that the properties o f the shock wave, including those at the shock front, are determined by properties on the - untact surface at times that increase as the shock front propagates. We may, therefore, picture modification of the wave during its propagation as the result o f a process in which the wave front is continually destroyed by dissipation in response to the finite entropy increment across the shock front and in which the properties of the wave as it propagates are determined by properties on the contact surface at successively later times. The process is illustrated schematically by the pressure-time profiles at two distances o f Fig. 13-18, in which the dashed curve o f the curve at the greater
distance is intended to represent the portion o f the earlier wave that has been destroyed by dissipation. The Kirkwood-Bethe theory is based on an assumption that the flow behind the shock front can be considered to be isentropic, as assumption that is valid in water but not in air. The picture that it affords o f the dissipation mechanism, is however, qualitatively true for shv-ck wt res in air, where the dissipation o f ener. /is more rapid than in water.
I t can be concluded on the basis o f the insight afforded by the analysis o f Kirkwood and Bethe that simpler models o f the initial state o f the explosion products can be employed to calculate the initial shock wave pressure, provided the energy o f the explosion is correctly specified. The shock wave parameters are seen to be relatively insensitive to the initial shock wave pressure. I t is, therefore, frequently assumed th a t the explosion can be adequately approximated by assuming that it takes place instantaneously at constant volume. One then defines the o-fUnction by
j> + po
o(P) % (13-4D
ft
where pt is the pressure o f the constant volume explosion state. The constant o f Eq. 13-32 is then zero and the expression corresponding to Eq. 13-38 is
“ i (P, )■ + o (p ,) - 0 (13-42)
which can be solved fo r the initial excess shock front pressure by numerical or graphical methods,
13-8 AN APPROXIMATE THEORY OF SHOCK WAVE PROPAGATION
In the analysis o f damage to structures by blast waves in air or underwater explosion waves, and in the establishment o f an order o f merit among explosives with respect to dtunage power, the pressure-time curves and peak pressure-distance curves o f the shock waves produced by the explosives are 6 i primary importance. While experimental techniques have been sufficiently developed so as to lead to the accumulation o f a large body o f reliable data,
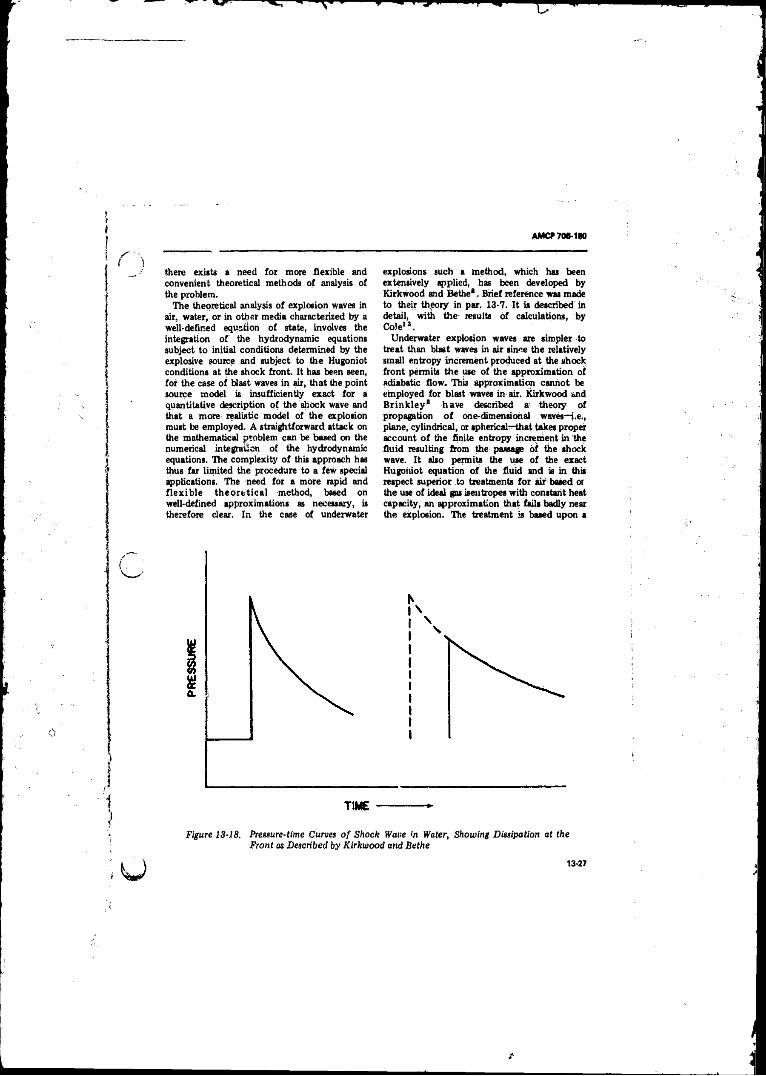
A M C f 706-180
there exists a need for more flexible and convenient theoretical methods o f analysis of the problem.
The theoretical analysis o f explosion waves in air, water, or in other media characterized by a well-defined equation o f state, involves the integration o f the hydrodynamic equations subject to initial conditions determined by the explosive source and subject to the Hugoniot conditions at the shock front. It haB been seen, for the case o f blast waves in air, that the point source model is insufficiently exact for a quantitative description o f the shock wave and that a more realistic model of the explosion must be employed. A straightforward attack on the mathematical problem can be based on the numerical integration o f the hydrodynamic equations. The complexity o f this approach has thus far limited the procedure to a few special applications. The need for a more rapid and f le x ib le th eo re tic a l method, based on well-defined approximations as necessary, is therefore dear. In the case of underwater
explosions such a method, which has been extensively applied, has been developed by Kirkwood and Be the®. Brief reference was made to their theory in par. 13-7. It is described in detail, with the results o f calculations, by CoJe13.
Underwater explosion waves are simpler to treat than blast waves in air since the relatively small entropy increment produced at the shock front permits the use o f the approximation of adiabatic flow. Thi3 approximation cannot be employed for blast waves in air. Kirkwood and Brinkley® have described a theory of propagation o f one-dimensional waves—i.e., plane, cylindrical, or spherical—that takes proper account o f the finite entropy increment in the fluid resulting from the passage o f the shock wave. It also permits the use o f the exact Hugoiiiot equation o f the fluid and is in this respect superior to treatments fo r air based or the use o f ideal gas isentropes with constant heat capacity, an approximation that fails badly near the explosion. The treatment is based upon a
Figure 13-18, Pressure-time Curves o f Shock Wave in Water, Showing Dissipation at the Front as Described by Kirkwood and Be the
13-27
AMCP 706-180
s im ila r ity res tra in t imposed upon the energy-time curve o f the wave. The theory results in the formulation o f a pair o f ordinary differential equations which can easily be integrated by numerical procedures. A similar approach has been employed by Kirkwood arid Brinkley3 for the shock wave generated in an infinitely, long cylindrical charge with a detonation wave progressing at constant velocity in the axial direction. In this paragraph the theory will be described for the spherical wave.
The equations o f hydrodynamics fo r radialflow in the absence o f viscosity or heatconduction can be written in the usual Eulerianform /j \ 3 . o.1 jdp\ du 2 u_1 du
,d t ) 3r
du _1 /3p\
dt p \dr)
(13-43)
1 M p frAdu
Pc2 \8t/+ Po
l i i + / J L .W . = n3f [Pofydro
2k 1 ■r
(13-47)
where we now understand the independent variables to be ro and f. Eqs, 13-47 are o f hybrid form in that the Eulerian form of the equation o f continuity is retained. They are supplemented by the entropy transport equation and by the equation o f state o f the fluid, and they are to be solved subject to initial and boundary conditions specified on a curve in the fo.fj-pTane and to the Hugoniot conditions, Eqs-13-36
P, = Po ui u
u1 = U ( l - p 0u1) (13-48)
where p is the excess pressure, u is the particle velocity, p is the density, and r is the radial space coordinate whose origin is at the center o f the explosion. The sound velocity c is defined by c2 = (hpj'dp)'. These equations are supplemented by the entropy transport equation which we do not employ explicitly. The conservation o f mass for radial flow requires that
r(r0, ti
^WoPo = 4tt f p (r ',t )(r f dr' (13-44)
rto.tl
where r(ro,t) is the Eulerian space coordinate o f the material particle whose Eulerian coordinate was r , at t = 0, and where po is the constant density o f the fluid at t = 0. Differentiating Eq. 13-44 with respect to ro at constant f, we obtain the Lagrangian equation o f continuity for spherical symmetry
= - ( - y(13-45)
Vo/ j 9 w
Also, by definitionA)r\
u (13-46)W / rr0
In terms o f the Lagrangian space coordinate r0 ,Eqs. 13-43 can be written
ft, - fto = (P,/2)(v„ + >\)
(p is the pressure in excess o f the pressure p0 o f the undisturbed fluid) which are to be satisfied at the shock front. Eqs. 13-48 are compatible with Eqs. 13-47 and specified boundary conditions only i f the shock front follows an implicitly prescribed curve R (tj in the (r0 ,t)-plane.
We denote a derivative in which the shock front is stationary by
d_dR u W
(13-4S)' 1 “ v v i
where the subscript unity means that the quantity so designated is to be. evaluated at the shock front. I f this operator . applied to the first o f Eqs. 13-48, one, otains the relation
+ U\
n dux p, du■ p U — . =s 1 - --’ ---0 dp, Udp,
(13-50)
where the partial derivatives are to be evaluated at the shock front and where the function g is to be calculated from the Hugoniot relations.
When specialized to the shock front r = ro = jR, Eqs. 13-47 become
13-28
AMCP 706-160
pi fHu\ + 1 /3p\ _ 2ui
Eqs. 13-50 and 13-51 provide three relations between the four partial derivatives ~p/dt, dp/dr, 3u/dt, and du/dr—all evaluated at the shock front, with coefficients that can be expressed as functions o f excess peak pressure alone for given ambient conditions, by means o f the Hugoniot equations and the equation o f state o f the fluid. I f they could be supplemented by a fourth independent relation, it would be possible to solve algebraically for each o f the partial derivatives as a function o f p and S and, with the aid o f Eq. 13-19, to formulate an ordinary differential equation
dR'dp,3r
_1 /3p\
+ V W j= F(p,R) (13-52)
for the peak pressure p y o f the shock wave as a function o f the distance R and also to obtain the initial scope o f the Eu ler pressure-time curve o f the wave.
It is, o f course, futile to seek such a fourth relation that does not itself involve an integral o f Eqs. 13-47. I t is possible, however, to formulate a relation of the desired type that requires only a knowledge o f the form o f the energy-time curve o f the shock induced flow and that is insensitive to changes in form attending the propagation o f the wave. By imposing a similarity restraint on the energy-lime curve, an approximate theory of propagation is obtained.
The physical basis for the supplementary relation derives from the fact that the nonacoustic decay o f waves o f finite amplitude is closely associated with the finite entropy increment experienced by the fluid in passing through the shock front and the resulting dissipation o f energy. As the shock wave propagates through the fluid, it leaves in its path a residual internal energy increment determined by the entropy increment produced in it by the passage o f the shock wave. In consequence, the energy propagated ahead by the shock wave decreases as the distance it has traveled from the source increases.
In par. 13-3, it was shown that the shock wave energy E(R), defined by Eq. 13-15
E(R) = 47r J r2pudt (13-53)rom
(in this paragraph p denotes the excess pressure) is related to the Hugoniot properties at the shock front by the ordinary differential equation
dD 2 .— = -4xB '1ppAh(p1) (13-54)
where Ah(p ) is the specific enthalpy dissipated at a shock front whose peak pressure is p . The integral o f the energy-time curve is expressible through Eq. 13-54 in terms o f the peak pressure-distance curve o f the shock wave for distances beyond R by Eq. 13-54. The d issipation assumption does not violate conservation o f momentum since, through spreading o f the wave, the total momentum can remain finite while the particle velocity everywhere and the total kinetic energy tend to zero. The dissipation assumption breaks down if the first shock wave can be overtaken by secondary shocks built up in its wake. This will not occur i f the pressure-time curve is initially monotonically-decreasing with asymptotic value pa. I f the excess pressure has a negative phase, second shocks may develop in the negative portion o f the wave but they cannot overtake the initial positive shock. In this case, the theory will apply to the positive portion of the wave if the line integral o f Eq. 13-53 is extended to the time at which the excess pressure vanishes, instead o f to infinity.
The energy-time curve can now be expressed in reduced form as follows:
B(R) - -UK P, u, ;jc
a let ■<„(«>
A M . A AA _ ^ p, W i ux W i R
■ / *
[ ( -
HIl.r) " r*pu/(l iJp,
HR, r)dt
' [ ( - < • (« )] IP
(13-55)
13-29
AMCP 706-180
T h e function f (R j ) is the energy-time integrand, normalized by its peak value at the shock front, expressed as a function o f R and a reduced time which normalizes its initial slope to -1, i f p does not vanish, i.e.,
W , 0) = 1
(3/y3r)T„0 = - 1
We assume f to be a monotonically-decreasing function of r . Elimination o f p between the first tw o o f Eqs. 13-55 yields the desired supplementary relation between the partial derivatives a t the shock front. It, o f course, involves integrals o f Eqs. 13-47 for a knowledge o f the reduced energy-time function. However, i f f(ao ,r )-un is initial charge radius—is initially a monotonically-decreasing function o f r, f(R',r) will remain so and will, at large R, become asymptotically a quadratic function o f r corresponding to the linear form o f the pressure-time curve shown by Kirkwood and Bethe® to be asymptotically stable. This means that e is a slowly varying' function o f it for which a sufficiently accurate estimate can be made without explicit integration o f the equations o f hydrodynamics.
The initial pressure-time curve and energy-time curves of an explosion wave are rapidly decreasing. A n expansion o f the logarithm o f the function in a linear Taylor series in the time, the peak approximation, is appropriate fo r an initial estimate Of e. This corresponds to an exponential f(r ), independent o f,R
f = e~T, e = 1
For the asymptotic energy-time curve o f quadratic form corresponding to a linear positive portion o f the pressure-time curve
f = <1 -r/2 )2, T < 2
f = 0,r > 2, e = 2/3
As an empirical interpolation formula between these two limiting values, Kirkwood and Brinkley3 have employed the relation
e(p) = 1 - 1 exp[- p/p„ ] (13-56)3
When the four relations expressed by Eqs. 13-50, 13-51, and 13-55 between the four
partial derivatives dp/dt, dp/dr, du/dt, and3u/3r, all at the shock front, are combined- with jEq. 13-52; we obtain an ordinary differential equation
dp,dr
+ j m(p,) = - i i r ^ p ? n(p,)eR2D
where
m(p,)
n(p,)
(13-57)
2G(1 - p 0/pi.l + 4p„/pi
2(1 + e'i ~G
G( 1 ~ Pol P i)2(1 + g) - G
G = 1 - (p0U/plC l)2
which is to be solved simultaneously with Eq. 13-54. The constants o f integration are -the initial value o f the peak pressure, the evaluation o f which is discussed in par. 13-7, and the energy E(oo) delivered to the shockwave, For a shock wave in air, this quantity may be taken equal to the energy o f explosion since substantially all o f the explosion energy is dissipated by the shock wave. For an underwater shock wave, it can be .assumed for a priori calculations that 50 percent o f the energy o f explosion is transferred to the initial shock wave, the remainder being transmitted as secondary pulses by the oscillation o f the bubble. These equations can also be employed to e x tra p o la te an experim enta l peak pressure-distance curve to distances nearer io or farther, from the explosion than those covered by the experiments. In this application, the constants o f integration are chosen from experimental Values o f p, and o f dp, HR at some value off?.
The Eulerian time constant 8 o f the pressure-time curve is
18
3tn p 31
(13-50)1 [ip \ U i/pA (hp\
M at } i p\ p° ) v r h
Using Eqs. 13-50, 13-51, and 13-55, we obtain
1
82»iR “(P,) + 4ir
e-R2 P,“ i D
b(p,j (13-59)
13-30
AMCF7W-1M
where where
a(P,) = b(Pl)f<£> = M l-
* 7ol+l [_£r * l
2(p0/p1) - 1 w j 2(1 + g) - G j
(1 - Po/P i)[2 (l + g) - G]
b(p,) . (P l/ P o )(l + g) - (Pi/Po - 1)G2 (1 + g) - G J
For the peak approximation, the positive impulse I is given by Eq. ±3-22
I = p,6 (13-60)
and where we have already defined
■2G(1 - PolPi) +. 4pp/Ptm(£) =
2(1 + g) - G
For the asymptotic linear pressure-time curve, the positive impulse / is given by Eq, 13-23
I = \ p ,6 (±3-61)
Kirkwood and Brinkley3 have interpolated between these limiting values by means o f the empirical formula
/ = | l - Y exp [- p ,/ p „ ]jp ,0 (13-62)
an expression that hus no theoretical justification and o f which the form was chosen to give agreement with experimental values o f the positive impulse.
It is convenient for shock waves in air toexpress the excess peak /pressure in units of p o arid the distance in units o f the initial charge radius a . Therefore, we.defineQ ’
£ = P/P.o
£ = R'Mc(13-53)
We also define a reduced energy variable Q by
h r * (13184)
where co and 7 o are the sound-velocity and heat capacity ratio, respectively, o f the undisturbed air With these definitions, Eqs. 13-64 and 13-57 can be written
F(p) (13-65)
f = -
with din Vdinp,
G 1 -'Po u y
The normalization o f these functions has been so arranged that
Em (£ -* 0) m (£) ■ 1 I
Em ( £ - 0 ) F(£) - 3/2 j (13-66)
E m <£ - 0) f(£) - .1 J
For shock waves in water, it is convenient toretain the definition o f the reduced distance £ but to define
£ - P,/B
3ks I D \ir(x + 1) \c? Po)
(13-67)
where B and k are parameters o f the Tait equation o f state
p = [B (p tpJ - l ]
With these definitions, Eqs; 13-54 and 13-57 reduce to Eqs. 13-65 with the quantity yo replaced by the quantity K. In this form, the normalization leading to Eqs. 13-66 is preserved.
The propagation equations can be stated in another reduced form that is particularly useful fo r the discussion o f scaling. We have defined a
13-31
AMCP 706-180
characteristic length X by Eq. 13-27, which w e In view o f Eqs. 13-66, and recalling that e-2/3 write in the form asp < 0, the asymptotic form o f Eqs. 13-73 is
X = ( Wq'/pa)113 (13-68)
where VP is the weight o f the explosive charge and q' is the energy released by unit weight o f explosive. We also define a new reduced energy variable K by
K3->», (D \
k(7„ + 1) \W,9/(13-69)
dPdx Q
Their solution can be written
P = P, lU iR IR ,)]'111
(13-74)
In terms o f a reduced distance Z = R/k, the propagation equations can be written
d Z + f = ‘ K F(t>(13-70)
For the shock wave in air, where all o f the energy o f explosion may be assumed to. -be dissipated in the shock wave, the initial value o f K can be calculated with D/(Wq') « 1. For ,an underwater shock wave, an approximate initial value can be obtained D/(Wq') = 1/2 (and with yo replaced by ft).
For numerical integration, it is convenient tolet O r ,x « trig
P = R g
<3 = D/(Rp)
x “ in Z
(13-71)
P - } (13-72)
Q = KHZ2 ) j
Then both Eqs, 13-65 and Eqs. 13-70 can be written
dStnPdx
P2= 1 - m(£) - — c-P(£)
(13-73'
dinQ P1 f 1- m(p) - i + — | e j ^ - j .
Q = 2Pf
where R, and P, are constants These results are in accord w i th those obtained by Kirkwood and Bethe' fo r the asymptotic nonacousticai decay o f spherical waves-of finite amplitude.
In terms o f the reduced distance f l and the reduced energy variable U, the first o f Eqs. 13-59 can be written
i f e ) =\ M2> (13'75)where
A(£) - (u1/c0)a(£)
B(R> = ( ~ T ^ f u' /c b(£ }
In terms o f the reduced distance Z and the reduced energy variable X , the same equation has the form
where r is the characteristic time that has been defined by Eq. 13-27 . These expressions are applicable to shock waves in water i f the heat capacity ratio yc is replaced by the exponent k.
Kirkwood and Brinkley’ , in a calculation cited by Cole13, have employed the propagation theory described in this paragraph to extrapolate the experimental peak pressure-distance curve, shown in Fig. 13-17, for die underwater explosion o f TNT, to distances closer to the charge. The results o f the calculation are shown in Fig. 13-19. The calculated peak pressures are, as is to be expected, in good agreement with the experimental values, although i t is significant
13-32
AMCP 706-160
that the theory is able to reproduce the experimentally observed rate o f decay o f peak pressure over the whole experimental range. The extrapolated value o f the shock wave energy at the surface o f the explosive is 561 cal/g, which is in excellent agreement with the experimental value o f 580 cal/g and which constitutes a significant test of the reliability o f the theory fo r underwater shock waves.
Kirkwood and Brinkley3 and Makino15 have employed the theory to carry out a complete o priori calculation o f the shock wave parameters fo r the blast waves produced by T N T and Pentolite. Their calculations employed a Hugoniot curve for air that has been made obsolete by more accurate thermodynamic data and, in consequence, their results are somewhat inaccurate. The calculations have been repeated by Shear and Wright16, using- an accurate Hugoniot curve fo r air. Unfortunately, these a u th o r s e v a lu a t e d o n ly the peak pressure-distance curve and do not report values o f the impulse. In Figs. 13-20 and 13-21, we reproduce the peak pressure-distance curves for TN T and Pentolite that were calculated by Shear and Wright16.- For illustrative purposes, we reproduce the impulse-distance curve o f Makino15 fo r Penolite, Fig. 13-22, even though the experimental data shown in that figure are
not the la tes t values and the theoretical curve is not based on the same Hugoniot curve as that employed by Shear , and Wright. These curves have not been adjusted in any way by the experimental data and the good agreement between experiment and the theory indicates that the approximate propagation theory provides a description o f the shock wave that is o f acceptable accuracy.
13-9 SHOCK WAVE SCALING
Three different-types o f scaling procedures are involved in the application o f theoretical or experimental determinations o f s'.-.'". wave parameters to the prediction o f >hc actual effects o f explosives. These involve scaling as to the size o f the explosive charge, as to the ambient conditions o f the undisturbed medium, and as to the nature of the explosive. Rules for the first are easily derived from the fundamental hydrodynamic equations. Rules for the second- end third can \ot be deduced apart from a description o f the explosion. I f it can be assumed that the approximate propagation theory is o f adequate accuracy, the discussion is simplified since the propagation theory defines the information that is required about the explosion. In this paragraph, we assume it to
I 2 4 6 B 10 20 4 0Reduced Distance, R /a 0
Figure 13-19, Peak Pressure-distance Curve for the Underwater Explosion of TNT as Calculated by Kirkwood and Brinkley
13-33
AMCP 706-180
Figure 13-20, Peak Excess Pressure Ratio us Distance in Charge Radii for TNT at a Loading Density of 1.5 g/cm3 (Experimental values of Ref. 17 are for small charges in free air. Experimental values of Ref. 18 are from the surface explosion of a 20-ton charge uncorrected for surface reflection.) (Shear and Wright)
"1
i*•
I
*
L
l/tf
, lb
*ms«
e /l
b,/3
-ln
r
k-
KEY: O EXPERIMENTAL --------- THEORETICAL
£— |---------- C> ■
oC
E- '
‘ S, -N O
— . " s - s n—
— i
ILLl.
l> 4 6 ' J ^>
r ' X O
TT
iT
o N
5-c 9 \ \
O '
E-
O
/
o
Q11111111 r
' ■ " l u l l ■ ' 1111 [ II x m J jiu J iX L M l! 1 | _ L n u l l ' l l i " i I nn j . u i l n i i
o
m i l m iI IS 2 3 -« S * T a ■ » io IS 20 30 40
R/W!/3. ft/Jbl/3
F ig u re 1 3 -2 2 . P o s it iv e Im p u ls e -d is ta n c e C urve f o r P e n to l i t e (M ak in o )
AMCP 706-180
AMCP 706-180
have been established that the point source model o f the explosion is insufficiently accurate
i fo r shock waves generated by chemical explosives and that the approximate propagation theory described in the preceding paragraph provides a description o f the shock wave that is sufficiently accurate fog practical purposes.
The solution o f Eqs. 13-65 and 13-75 can be represented by the expressions
P, = Pof,[ f i fa J , U. (a0);p 0,T0 ]
these solutions can be symbolized by the simplified expressions
P ,= FJR/aJ = G(R/W113)
D = a3F2(R/a„) = WGfR/W1'3) (1g .g l )
6 = a0F3(R/a0) = W1'3 G(R/W113 )
I = a0F4(R/aJ = W1'3 G<R/W113)
d = o| f2[& ;£ ( «e),-U M ;Po ,T '> ) (i3-77)
0 - a0fjU L ;£ (a 0),H (a 0);p a,Ta]
and it follows that the impulse is o f the form,
/ = a .P 0/4[f l ; j2 fa J ,£ fa ,; ;/ > o ,2 ’0] (13-78)
where f., f2, etc., are functions whose form is determined by th e . actual solution o f the equ ations , and where we indicate the dependence o f the shock wave parameters on (1 ) the reduced distance fl = R/ao ; (2 ) the constants o f integration* the initial reduced excess peak pressure £ fao ), and reduced shock wave energy £ fa ); and (3) the ambient conditions o f the medium which we describe by the ambient pressure po and temperature T . Alternatively, the solutions o f Eqs. 13-70 and 13-76 can be symbolized by
P,~ Pc gx[Z ;£.(«<,);Po,T„]
F> = Wq' g2[Z ;£ (a 0);p 0,T0]
8 = <W/Po)vs Co1 S3[Z ; £ ( a „ ) ; p 0, T 0 ]
and it follows that the impulse is o f the form
M W ? 1)313 pV3 c? g4[ Z ; £ faJ,-po, r o ](13-S0)
where g j , g,v etc., are also functions whose form is determined by the actual solution of the equation, but where we need to indicate their dependence only on the integration constant £ fa o), since the initial value o f the reduced energy variable K can be taken to be a constant.
For shock waves from explosive charges o f different -ize but o f the same explosive in the same medium at the same ambient conditions,
■ (13-79)
Eqs. 13-81 are a statement o f the usual rules for geometrical scaling. They state that the quantities p ( , D/a3 , 6/a , and I/a are similar when presented as functions o f Ihe reduced distance R/a , or alternatively that the quantities p , ° D/W, 8/W113, and I/W113 are similar when presented as functions o f the distance variable R/Wtl3 .
The functions on the Hugoniot curve in the integrands o f Eqs. 13-70 and those defined in connection with Eq. 13-76 are functions riot only o f the reduced excess peak pressure £ , but also, in general, o f the ambient state o f the medium which we have designated by po and Ta . I f the medium is a poly tropic gas or if i t can be described by an equation of the form o f the Ta it equation, as is the case for water, it is easy t o show that the functions on the Hugoniot curve o f Eqs. 13-70 and 13-76 are universal functions o f the reduced excess peak pressure p and do hot depend explicitly on the ambient state o f the medium. Tn this event, Eqs. 13-79 and.13-80 can be simplified to
P, = Po Si [Z !JZ fa J ]
D = Wq'gtlZ ;jr<aj\
e = (Wq'/pJ113 c? g3[Z ;j> (a„ j]
I = (Wq')ll3p 313 c2gt [ Z ;£ (a 0)}
Since the Tait equation provides a satisfactory equation o f state for water, the scaling implied by Eqs. 13-82 can evidently be employed for shock waves in water. It has been shown by actua l calculation that the propagation equations fo r shock waves in air can, as a good approximation, employ a polytropic equation of state to evaluate the functions appearing in Eqs. 13-79 and 13-80, provi-’ i the evaluation o f the constant o f integration ^fa0) is based on the
L
AMCP 706-180
actual Hugoniot curve for air. This result, which can properly be termed a "numerical accident” , means that the scaling implied by Eqs. 13-82 is a good approximation for shock waves in air.
I t is a widely adopted practice to represent the shock wave parameters fo r some particular explosive by defining an “ equivalent weight” o f a reference explosive, usually TN T . I t is then assumed that the shock wave parameters o f the explosion o f interest are those for the explosion o f the equivalent weight o f the reference explosive, in the same medium at the same ambient conditions. I f peak pressures are shown fo r the explosion o f interest, the equivalent weight may be evaluated by matching such pressures with those for a fixed weight o f the reference explosive. The equivalent weight is properly defined by energy considerations based on Eqs. 13-82.
The description o f the shock wave from an explosion by the statement that it can be represented by the shock wave from an equivalent weight of a reference explosion assumes that Eqs. 13-82 can be approximated by
the relatively smaller dissipation o f energy at the shock front. The range o f utility o f the concept of a weight equivalent o f another explosive is correspondingly more limited.
Sachs1* has based a procedure for scaling shock waves in air to different ambient conditions on the assumption that the blast wave parameters depend dominantly on the energy o f explosion. This scaling procedure is also implied by Eqs. 13-83. However, the initial shock wave pressure j>(ua ) is not, even approximately, independent o f ihe ambient conditions, and Eqs. 13-83 are not, strictly, a good approximation to Eqs. 13-82 fo r scaling explosions with the same explosive as to changes in the ambient conditions of the medium.
In spite o f this conclusion, Sachs scaling is experimentally verified as a procedure having asymptotic validity. This asymptotic validity is the result o f the insensitivity o f the shock wave parameters to the initial shock wave pressure. A t points close to the explosion, deviations must be anticipated from the predictions o f the Sachs scaling procedure.
P, = PoSi ( Z )
D = W q 'g i (Z )
6 » (Wq'/pJ1'3 c? g i(Z )
l = (Wq')1'3 pV3 c? g i(Z )
(13-83)
This approximation is valid i f the valuej>(a ) is the same for both explosions or if the shock wave parameters are insensitive to this constant o f integration. Because o f the phenomenon o f dissipation at the front, discussed in par. 13-7, it turns out that the parameters o f the shock wave in air lor shock waves o f equal energy are quite insensitive to the value o f the initial shock wave pressure. Eqs. 13-82 are thus a reasonably good approximation to Eqs. 14-82 provided the initial shock wave pressure o f the explosions being compared are o f the same order o f magnitude. For such cases, the description of the effect o f the explosion by that o f an equivalent weight o f a reference explosive is then a valid procedure. The procedure becomes invalid for widely different values o f the initial shock wave pressure. For shock waves in water, the shock wave parameters are much more sensitive than in air to the initial shock wave pressure because o f
13-10 EXPLOSIVELY-PRODUCED SHOCK WAVES IN SOLIDS
There is an extensive literature covering the response of solids to explosive loading. Reviews have been gven by Duvall2® and by McQueen27. In most o f the work the explosive has simply been used as a tool to provide loading o f the solid at high stresses and high strain rates. The development o f explosive plane wave generators has made it possible to produce plane detonation waves in solid explosives, and these plane detonation waves have been used to produce shock waves in solid samples under conditions o f uniaxial strain. When the explosive is in direct contact with the solid, shock wave pressures o f the order of 105 atm and strain rates o f the order o f 10s sec"1 are typically produced in a solid. The simple uniaxial strain conditions make it relatively easy to calculate the developing shock waves and flow fields, using the standard computational techniques discussed earlier and in Chapter 14, e.g., the artificial viscosity method o f von Neumann and Richtmyer10.
The detailed response o f a solid to explosive loading is, o f course, a function o f the material
A M C P 706-180
/?■(*
properties. In general, the constitutive equation lor the material must be known, and this depends in turn on the microscopic properties ol the material. For example, in a metal the stress history due to explosive loading with a given explosive w ill depend on i .c t things as the stress
dependence o l the mobile dislocation, density and mobility1’ .
Thus, explosively-produced shock waves are currently serving as productive tools lor investigating both macroscopic and microscopic behavior o f solids undergoing rapid loading.
1 !M
u 13-39
AM CP 706-180 AMCP 706-180
REFERENCES
1. W. E. Deal, Phys. o f Fluids 1, 523 (1958).2. W. Fickett and W. W. Wood, Phys. o f
Fluids 1, 528 (1958).3. J. G. Kirkwood and S. R. Brinkley, Jr.,
OSRD Report No. 4814; 1945.4. S. R. Brinkley, Jr. and J. G. Kirkwood,
Phys. Rev. 71,606 (1947).5. H. L . Brode, J. Appl. Phys. 26, 766 (1955).6. H. L. Brode, Rand Corporation Research
Memorandum RM -1824,1956.7. H, L. Brode, Phys. o f Fluids 2; 217 (1959).8. J. G. Kirkwood and H. Be the, OSRD
Report, No. 588,1942.9. J. Hilsenrath and C. W. Beckett, National
Bureau o f Standards Report No. 3991, 1955.
10. J. von Neumann and R . D. Richtmyer, J. Appl. Phys. 21, 232 (1950).
11. J. M. Richardson, A. B. Arons, and R. R. Halverson, J. Chem. Phys. 15, 785 (1947).
12. W. G. Penney and H. K. Dasgupta, British Report RC-333,1942.
13. R . H. Cole, Underwater Explosions, Princeton University Press, Princeton, N.J., 1948.
14. R. G. Sachs, BRL Report No. 466, Aberdeen Proving Ground, Md., 1944.
15. R . Makino, BRL Report No. 750, Aberdeen Proving Ground, Md., 1951.
16. R. E. Shear and E. Q. Wright, BRL Memorandum Report No. 1423, Aberdeen Proving Ground, Md., 1962.
17. E. M. Fisher and J. F. Pittman, NAVORD Report 2890, U. S. Naval Ordnance Laboratory, 1953.
18. Suffield Experimental Station, Ralston, Alberta, Canada, Canadian Observations on 20-ton TNT Explosion, 1961, cited by Reference 16.
19. H. Goodman, BRL Report No. 1092, Aberdeen Proving Ground, Md., 1960.
20. A. J. Chabai and R. C. Bass, Measurements
on a Spherical Shock Wave in a Granite Medium, Sandia Corporation, S.C.-4741 (R R ).
21. H. L. Brode and B. R . Parkin, “ Calculation o f the Blast and dose-In Elastic Response o f the Cavity Explosion in the Cowboy Program” , Journal o f Geophysical Research 68, No. 9 , 2761-2789 (1963).
22. R. H. Bishop, “ SphericalShock Waves from Underground Explosions” , Section 4, Close-In Phenomena of Buried Explosions, Sandia Corporation SC-4907 (R R ).
23. P. C. Loken, Calculation and Observation of the Ground Shook from Underground Detonations in Rock, Int. Rpt., X-112, N o r w e g i a n D e fe n s e R e s e a r c h Establishment, Kjeller, Norway, May 1966.
24. “ Prevention o f and Protection against Accidental Explosion o f Munitions, Fuels, and Other Hazardous Mixtures” , Annals.of the New York Academy of Sciences 152, Art. 1,1-913 (1968).
25. J. T. Cherry, “ Computer Calculations o f Explosion-Produced Craters” , Int. J. Rock Mech. Min. Sci. 4,1-22 (1967).
26. G. E. Duvall, “ Some Properties and Applications o f Shock Waves” , Response o f Metals to High Velocity Deformation, P. G. Sherman and V . F. Zackay, Eds., Interscience Publishers, New York, 1961.
27. R. G. McQueen, “ Laboratory Techniques fo r Very High Pressures and tne Behavior o f Metals under Dynamic Loading” , Metallurgy at High Pressures and High Temperatures, K. A . Gschneidner, Jr., M.T. Hepworth, and N. A , D. Pariee, Eds., Gordon and Breach Science Publishers, New York, 1964,
28. J. N. Johnson, and L. M, Barker, “ Dislocation Dynamics and Steady Plastic Wave Profiles in 6061-T6 Aluminum", J. Appl. Phys. 40 ,11 , 4321 (1969).
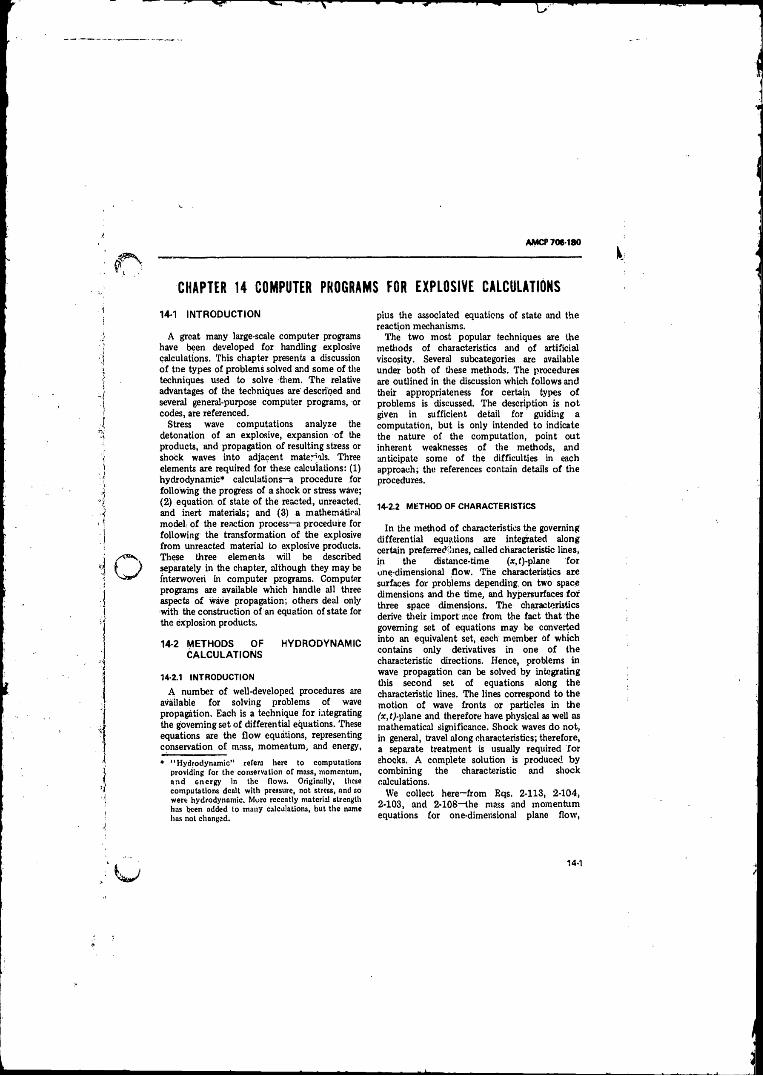
AMCC 706-180
CHAPTER 14 COMPUTER PROGRAMS FOR EXPLOSIVE CALCULATIONS14-1 INTRODUCTION
A great many large-scale computer programs have been developed for handling explosive calculations. This chapter presents a discussion o f tne types o f problems solved and some o f the techniques used to solve them. The relative advantages o f the techniques are' described and several general-purpose computer programs, or codes, are referenced.
Stress wave computations analyze the detonation o f an explosive, expansion o f the products, and propagation o f resulting stress or shock waves into adjacent materials. Three elements are required for these calculations: (1) hydrodynamic* calculations—a procedure for following the progress o f a shock or stress wave;(2 ) equation o f state o f the reacted, unreacted, and inert materials; and (3) a mathematical model, o f the reaction process—a procedure for following the transformation o f the explosive from unreacted material to explosive products. These three elements will be described separately in the chapter, although they may be interwoven in computer programs. Computer programs are available which handle all three aspects o f wave propagation; others deal only with the construction o f an equation of state for the explosion products.
14-2 METHODS OF HYDRODYNAMIC CALCULATIONS
14-2.1 INTRODUCTIONA number o f well-developed procedures are
available for solving problems o f wave propagation. Each is a technique for integrating the governing set o f differential equations. These equations are the flow equations, representing conservation o f mass, momentum, and energy,
* "Hydrodynam ic” refers here to computations providing for the conservation o f mass, momentum, and energy in the flows. Originally, these computations dealt with pressure, not stress, and so were hydrodynamic. Mure recently material strength has been added to many calculations, but the name has not changed.
pius the associated equations o f state and the reaction mechanisms.
The two most popular techniques are the methods o f characteristics and o f artificial viscosity. Several subcategories are available under both o f these methods. The procedures are outlined in the discussion which follows and their appropriateness for certain types o f problems is discussed. The description is not given in sufficient detail for guiding a computation, but is only intended to indicate the nature o f the computation, point out inherent weaknesses o f the methods, and anticipate some o f the difficulties in each approach; the references contain details o f the procedures.
14-2.2 METHOD OF CHARACTERISTICS
In the method o f characteristics the governing differential equations are integrated along certain preferred-lines, called characteristic lines, in the distance-time (x,f)-plane for one-dimensional flow. The characteristics are surfaces fo r problems depending on two space dimensions and the time, and hypersurfaces fo r three space dimensions. The characteristics derive their import mce from the fact that the governing set o f equations may be converted into an equivalent set, each member of which contains only derivatives in one o f the characteristic directions. Hence, problems in wave propagation can be solved by integrating this second set of equations along the characteristic lines. The lines correspond to the motion o f wave fronts or particles in the fx,fj-plane and therefore have physical as well as mathematical significance. Shock waves do not, in general, travel along characteristics; therefore, a separate treatment is usually required fo r shocks. A complete solution is produced by combining the characteristic and shock calculations.
We collect here—from Eqs. 2-113, 2-104, 2-103, and 2-108—the mass and momentum equations for one-dimerisional plane flow,
14-1
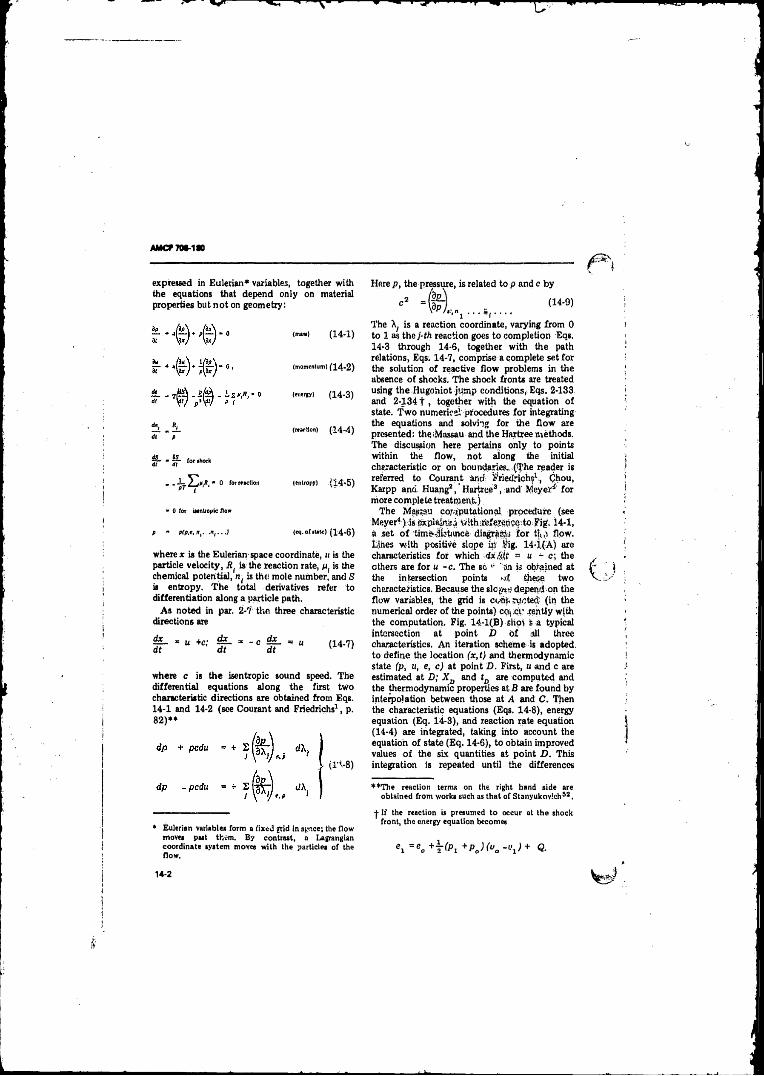
AMC? 708-1*0
expressed in Eulerian* variables, together with the equations that depend only on material properties but not on geometry:
Z2. n-L (ft p
. / jU /t. " 0 for reactionPT*-f ‘ •
• 0 for iwnboplc flow
P " pfp,
<ma») (14-1)
(momentum) ( 14-2)
(mercy) (14-3)
(reaction) (-14-4)
lentrapyl ( 14-5)
{eq.otinte) ( 14-6)
where* is the Eulerian space coordinate, u is the particle velocity, Rf is the reaction rate, p( is the chemical potential, n( is the! mole number, and S is entropy. The total derivatives refer to differentiation along a particle path.
A s noted in par. 2-7 the three characteristic directions are
- u +c; - - c = «i t dt dt ( 14-7)
where c is the isentropic sound speed. The differential equations along the first two characteristic directions are obtained from Eqs.14-1 and 14-2 (see Courant and Friedrichs1, p. 82 )**
* Eulerian variable! form a fixed grid in space; the flow moves pu t them. By contrast, a Lagrangian coordinate system movea with the particles o f the flow.
Here p, the pressure, is related to p and e by
c ’ = ( | ) , (14-9)
The Xy is a reaction coordinate, varying from 0 to 1 as the j-th reaction goes to completion Eqs.14-3 through 14-6, together with the path relations, Eqs; 14-7, comprise a complete set for the solution o f reactive flow problems in the absence o f shocks. The shock fronts are treated using the Hugohiot jump conditions, Eqs. 2-133. and 2-1341 , together with the equation of state. Tw o numerical procedures fo r integrating the equations and solving for the flow are presented: theMassau and the Hartree methods. The discussion here pertains only to points within the flow, not along the initial characteristic or on boundaries .(The reader is referred to Courant and Friedrichs1, Chou, Karpp and. Huang2, Hartree3 , and Meyer* for more complete treatment.)
The Majsau computational procedure (see Meyer4 ■). is explains i with irefejence^to. f ig, 1.4-1, a set o f time-distance diagrams fo r t|,.,i flow. Elites W/ith positive slope ip fig . 14-1(A) are characteristics for which dx'dt = u ~ c; the others are fo r u -c. The so " tin is obtained at the intersection points **£ these two characteristics. Because the slogve depend.on the flow variables, the grid is ewife runted (in the numerical order o f the points) cmci" rentiy with the computation. Fig. 14-1(B) slio> s a typical intersection at point D o f all three characteristics. An iteration scheme is adopted, to define the location (x,t) and thermodynamic state (p, u, e, c) at point D. First, u and c are estimated at D; XD and tD are computed and the thermodynamic properties at B are found by interpolation between those at A and C. Then the characteristic equations (Eqs. 14-8), energy equation (Eq. 14-8), and reaction rate equation (14-4) are integrated, taking into account the equation o f state (Eq. 14-6), to obtain improved values o f the six quantities at point D. This integration is repeated until the differences
* *T h e reaction terms on the right hand side are obtained from works such as that o f Stanyukovich52.
■j* i f the reaction is presumed to occur at the shock front, the energy equation become*
e 1 = e 0 + | - ( P i + P 0 J (u o -i>i ; + Q.
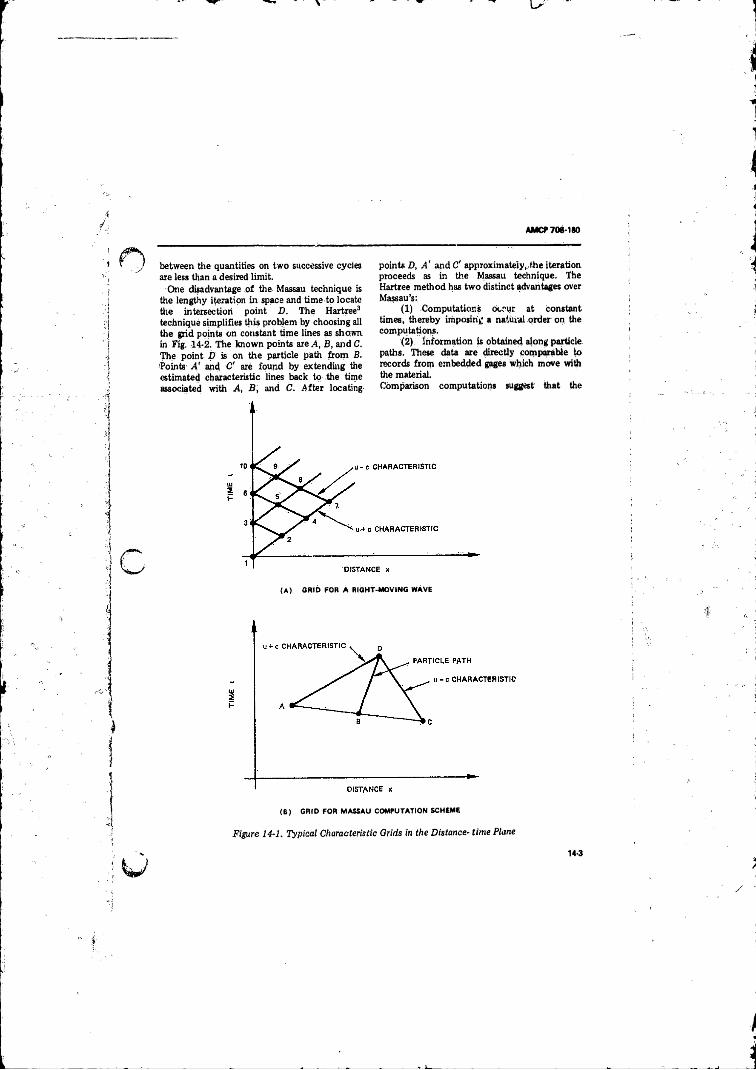
AMCC 706-180
between the quantities on two successive cycles are less than a desired limit.
One disadvantage o f the Massau technique is the lengthy iteration in space and time to locate die intersection point D. The Hartree3 technique simplifies this problem by choosing all the grid points on constant time lines as shown in Fig. 14-2. The known points are A, B, and C. The point D is on the particle path from B. Points A' and C' are found by extending the estimated characteristic lines back to the time associated with A, B, and C. A fter locating
points D, A ' and C' approximateiy, the iteration proceeds as in the Massau technique. The Hartree method has tw o distinct advantages over Massau’s:
(1) Computations Occur at constant times, thereby imposing a natural order on the computations.
(2 ) information is obtained along particle paths. These data are directly comparable to records from embedded gages which move with the material.Comparison computations suggest that the
(A ) GRID FOR A RIGHT-MOVING WAVE
<B) GRID FOR M ASSAU COMPUTATION SCHEME
F igure 14-1. Typica l Characteristic Grids in the D istance- tim e Plane
14-3
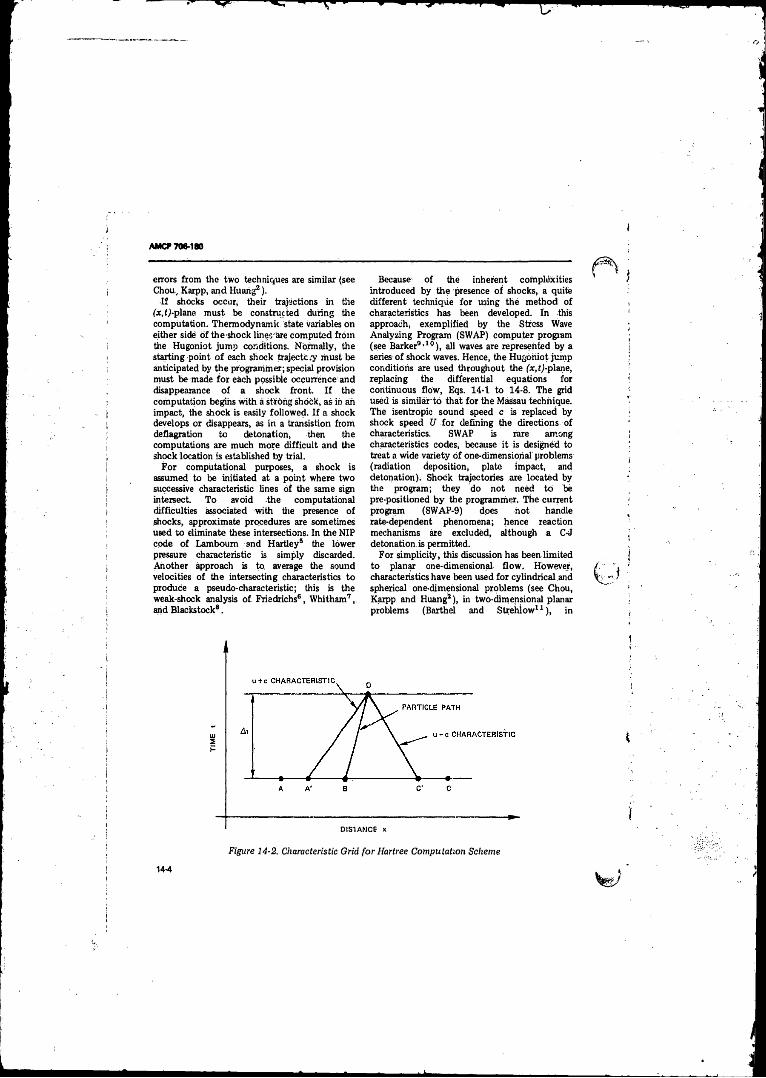
AMCP 706-180
errors from the two techniques are similar (see Chou, Karpp, and Huang2).
I f shocks occur, their trajections in the (*,t.)-plane must be constructed during the computation. Thermodynamic state variables on either side o f the shock linesare computed from the Hugoniot jump conditions. Normally, the starting point o f each shock trajectory must be anticipated by the programmer; special provision must be made fo r each possible occurrence and disappearance o f a shock front. I f the computation begins with a strong shock, as in ail impact, the shock is easily followed. I f a shock develops or disappears, as in a transistion from deflagration to detonation, then the computations are much more difficult and the shock location is established by trial.
For computational purposes, a shock is assumed to be initiated at a point where two successive characteristic lines Of the same sign intersect. To avoid the computational difficulties associated with the presence o f shocks, approximate procedures are sometimes used to eliminate these intersections. In the NIP Code o f Lamboum and Hartley6 the lower pressure characteristic is simply discarded. Another approach is to average the sound velocities o f the intersecting characteristics to produce a pseudo-characteristic; this is the weak-shock analysis o f Friedrichs6, Whitham7, arid Blackstock8 .
Because o f the inherent complexitiesintroduced by the presence o f shocks, a quite different technique for using the method of characteristics has been developed. In this approach, exemplified by the Stress Wave Analyzing Program (SWAP) computer program (see Barker3’10), all waves are represented by a series o f shock waves. Hence, the Hugoniot jump conditions are used throughout the fotj-plane, replacing the differential equations forcontinuous flow, Eqs. 14-1 to 14-8. The grid used is sim ilarto that for the Massau technique. The isentropic sound speed a is replaced by shock speed U for defining the directions of characteristics. SWAP is rare among characteristics codes, because it is designed to treat a wide variety o f one-dimensional problems (radiation deposition, plate impact, and detonation). Shock trajectories are located by the program; they do not need to be pre-positioned by the programmer. The current program (SWAP-9) does h o t handle rate-dependent phenomena; hence reaction mechanisms are excluded, although a C-d detonation is permitted.
For simplicity, this discussion has been.limited to planar one-dimensional flow . However, characteristics have been used for cylindrical and spherical one-dimensional problems (see Chou, Karpp and Huang2), in two-dimensional planar problems (Barthel and Strehiow11), in
DISTANCE x
Figure 14-2. Characteristic G rid fo rH a rtre e C om putation Scheme
14-4
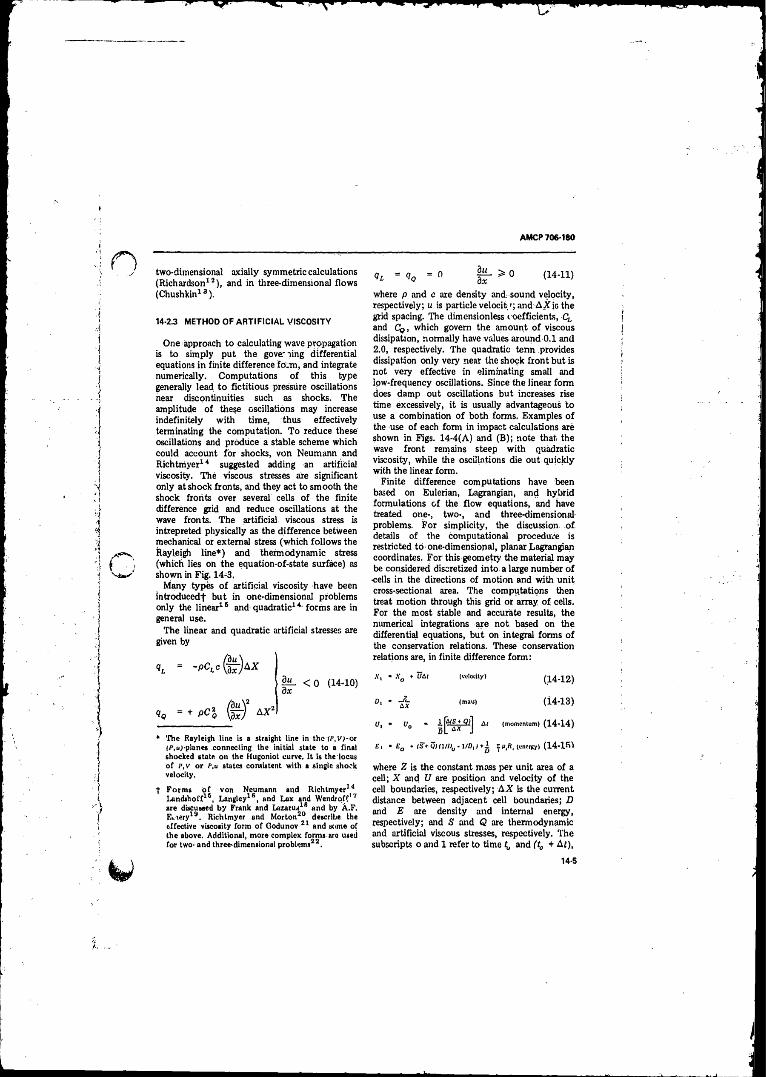
AMCP 706-180
two-dimensional axially symmetric calculations (Richardson12), and in three-dimensional flows (Chushkin13).
14-2.3 METHOD OF ARTIFICIAL VISCOSITY
One approach to calculating wave propagation is to simply put the governing differential equations in finite difference form, and integrate numerically. Computations o f this type generally lead to fictitious pressure oscillations hear discontinuities such as shocks. The amplitude o f these oscillations may increase indefinitely with time, thus effectively terminating the computation. To reduce these oscillations and produce a stable scheme which could account for shocks, von Neumann and Richtmyer14 suggested adding an artificial viscosity. The viscous stresses are significant only at shock fronts, and they act to smooth the shock fronts over several cells o f the finite difference grid and reduce oscillations at the wave fronts. The artificial viscous stress is intrepreted physically as the difference between mechanical or external stress (which follows the Rayleigh line*) and thermodynamic stress (which lies on the equation-of-state surface) as shown in Fig. 14-3.
Many types o f artificial viscosity have been introducedf but in one-dimensional problems only the linear16 and quadratic14 forms are in general use.
The linear and quadratic artificial stresses aregiven by
„ /3i
= - p c t c t a $ A X j
?JL < 0 (14-10) 1 dx
«<, = + PC% (|r l a x 2'
* The Rayleigh line is a straight line in theY/’ .v j-o r {/\u;-planes connecting the initial state to a final shocked state on the Hugoniot curve. It is the locus o f P ,v or P.u states consistent with a single shook velocity.
| Form s o f von Neumann and Richtmyer14 Landthoff16, Langley16, and Lax and W endroff1 / are discussed by Frank and Lazarus16 and by A.F. Ei,tery13. Richtmyer and Morton20 describe the effective viscosity form o f Godunov 21 and some of the above. Additional, more complex forms.are used for two- and three-dimensional problems22.
= % - n | f - > 0 (M -U )
where p and c are density and: sound velocity, respectively; u is particle velocity; and A X is the grid spacing. The dimensionless coefficients, Ch and Q ,, which govern the amount o f viscous dissipation, normally have values around 0.1 and 2.0, respectively. The quadratic term provides dissipation only very near the shock front but is not very effective in eliminating small and low-frequency oscillations. Since the linear form does damp out oscillations but increases rise time excessively, it is usually advantageous to use a combination o f both forms. Examples o f the use o f each form in impact calculations are shown in Figs. 14-4(A) and (B ); note that the wave front remains steep with quadratic viscosity, while the oscillations die out quicldy with the linear form.
Finite difference computations have been based on Eulerian, Lagrangian, and hybrid formulations o f the flow equations, and have treated one-, two-, and three-dimensional- problems. For simplicity, the discussion o f details o f the computational procedure is restricted to one-dimensional, planar Lagrangian coordinates. For this geometry the material may be considered discretized into a large number o f ■cells in the directions o f motion and with unit cross-sectional area. The computations then treat motion through this grid or array o f cells. For the most stable and accurate results, the numerical integrations are not based on the differential equations, but on integral forms o f the conservation relations. These conservation relations are, in finite difference form:
,V, Xa f uai lvelocity) ( 14-12)
D, - ~ ~ (mass) ( i 4-13)
U, *> U0 - (momentum) ( 14-14)
E, * E0 * (S*Q)tW>u -l/D,>+i Ijltfi, (uno:gy) (14-151
where Z is the constant mass per unit area o f a cell; X and U are position and velocity o f the cell boundaries, respectively; A X is the current distance between adjacent cell boundaries; D and E are density and internal energy, respectively; and S and Q are thermodynamic and artificial viscous stresses, respectively. The subscripts o and 1 refer to time ta and (t0 + At),
14-5
AM CP 706-180
Figure 14-3. Paths Traversed by Thermodynamic and Mechanical Stress Through a Shock Front; Definition of Artificial Viscous Stress
respectively. The quantities used for U, D, S, and Q, AS, A Q, and A t are chosen to provide ah accurate representation o f the conservation laws; the differences between methods lie in these choices.
The progress o f computation is illustrated in the distance-time plane in Fig. 14-5 which shows coordinate points (iabeled C and 0 ) and other points (labeled H and A ). The flow and thermodynamic variables are computed at some or all o f these points. Calculations proceed from left to right, one coordinate (set o f A, C, H points) at a time, updating X, V, D, etc., to the new time, io + At. When the right boundary is reached, computations begin again at the le ft for the next time increment. The simplest computation scheme is the leapfrog method of von Neumann and Richtmyer14 in which density, energy, and stresses are computed at H points, particle velocity at coordinate C points, and X at A points. With this layout, the computed velocity equals U (the average velocity between times associated with Xo and X , ) in Eq. 14-12, the two derivatives in Eq,14-14 [3(7/91 and d(S + Q)/dX] are centered at the same point, and the density calculation o f Eq. 14-13 is exact. The stress quantities in Eq.14-15 are averages at two i f points for successive
times, hence the stress at (t + A t) must be known to integrate Eq. 14-15. For equations o f state in which density is linearly related to energy, Eq. i4-15 can be solved simultaneously with the equation o f states For more complex equations o f state, E and D are found by iteration (see Brodie2 3 fo r an example).
Another integration procedure is typified by the two-step Lax-Wendroff method o f Richtmyer and Morton20. In that, all flow and thermodynamic quantities are computed for both C and 77 points. The H points are treated as subsidiary, so the difference equations (Eqs.14-12 to 14-15) for those points are not required to be centered. The energy equation (Eq. 14-15) is directly integrable because (S + Q)-term is taken as the average o f the stresses one-half time step earlier, and these are known at the time o f integration. Hence, fo r complex equations o f state, this two-step method has an advantage over the leapfrog method. Because there are twice as many hydrodynamic computations in the two-step as in the leapfrog method, the computing titne is longer for simple equations o f state.
Besides the leapfrog and two-step Lax-Wendroff integration schemes, there are several others which have been used successfully.
14-6
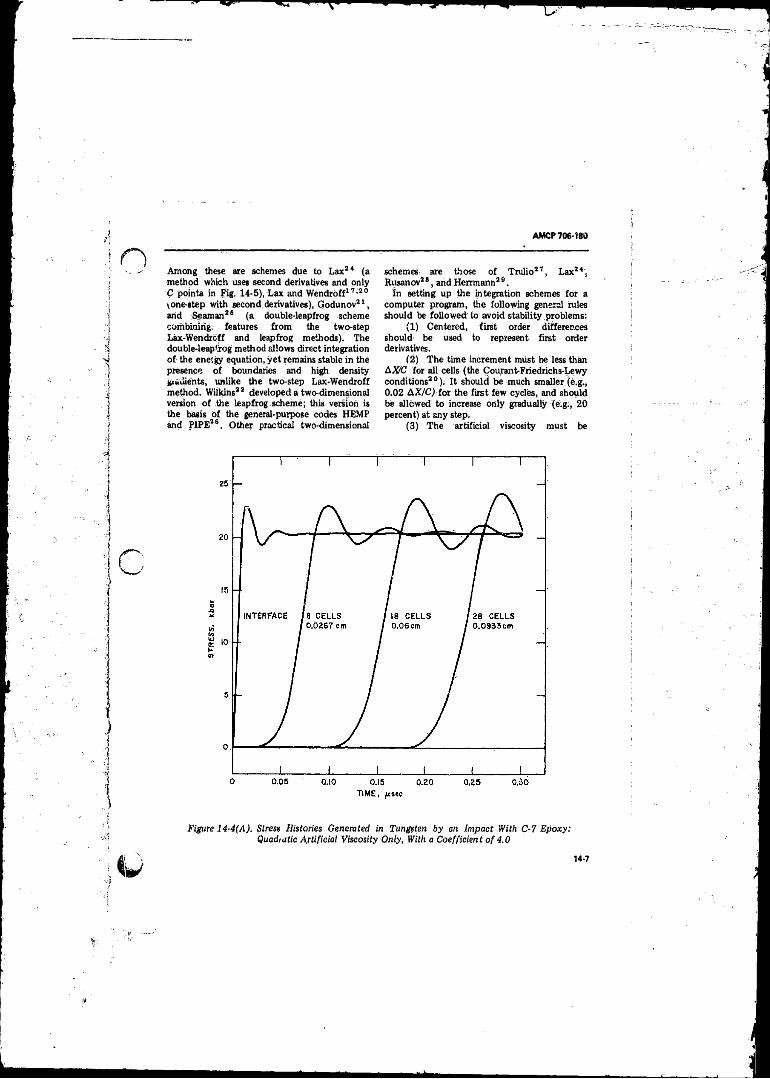
AMCP 706-180
Among these are schemes due to Lax24 (a method which uses second derivatives and only C points in fig . 14-5), Lax and Wendroff17,20 V one-step with second derivatives), Godunov21, arid Seaman26 (a double-leapfrog scheme combining; features from the two-step Lax-Wendrcff and leapfrog methods). The double-leapfrog method allows direct integration o f the ene'.gy equation, yet remains stable in the presence o f boundaries and high density giauients, unlike the two-step Lax-Wendroff method. Wilkins22 developed a two-dimensional version o f the leapfrog scheme; this version is the basis o f the general-purpose codes HEMP and PIPE26, Other practical two-dimensional
schemes are those o f Trulio27, Lax24, Rusanov28, arid Herrmann26.
In setting up the integration schemes for a computer program, the following general rules should be followed to avoid stability problems:
(1 ) Centered, first order differences should be used to represent first order derivatives.
(2 ) The time increment must be less than AX/C for all cells (the Courant-Friedrichs-Lewy conditions20); It should be much smaller (e.g., 0.02 AX/C) for the first few cycles, and should be allowed to increase only gradually (e.g., 20 percent) at any step.
(3 ) The artificial viscosity must be
Figure 14-4(A). Stress Histories Generated in Tungsten by an impact With C-7 Epoxy: Quadiatic Artificial Viscosity Only, With a Coefficient of 4,0
14-7
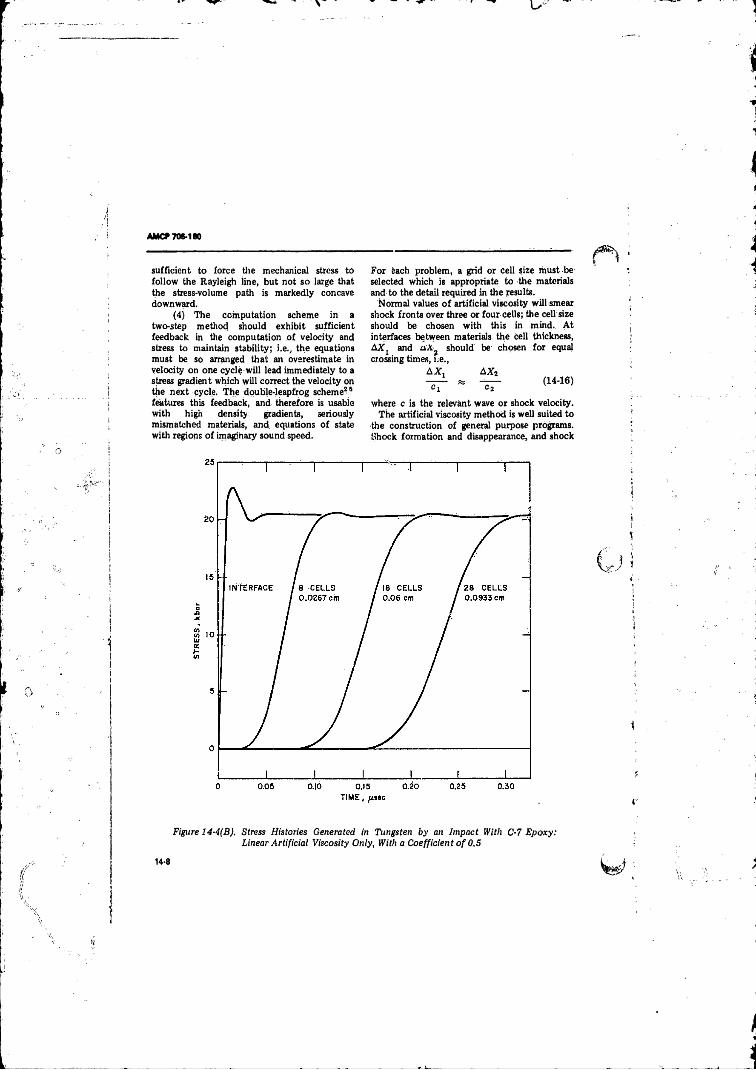
AM C? 706-180
sufficient to force tiie mechanical stress to fo llow the Rayleigh line, but not so large that the stress-volume path is markedly concave downward.
(4) The computation scheme in a two-step method should exhibit sufficient feedback in the computation o f velocity and stress to maintain stability; i.e., the equations must be so arranged that an overestimate in velocity on one cycle will lead immediately to a stress gradient which will correct the velocity on the next cycle. The double-leapfrog scheme*5 features this feedback, and therefore is usable with high density gradients, seriously mismatched materials, and equations o f state with regions o f imaginary sound speed.
For each problem, a grid or cell size must be selected which is appropriate to the materials and to the detail required in the results.
Normal values o f artificial viscosity will smear shock fronts over three or four cells; the cell size should be chosen with this in mind. A t interfaces between materials the cell thickness, A X j and should be chosen fo r equalcrossing times, ne.,
A X j
T T
AXjc 2
(14-16)
where c is the relevant wave or shock velocity.The artificial viscosity method is well suited to
the construction o f general purpose programs. Shock formation and disappearance, and shock
14-8
Figure 14-4(B). Stress Histories Generated in Tungsten by an Impact With C-7 Epoxy: Linear Artificial Viscosity Only, With a Coefficient of 0.5
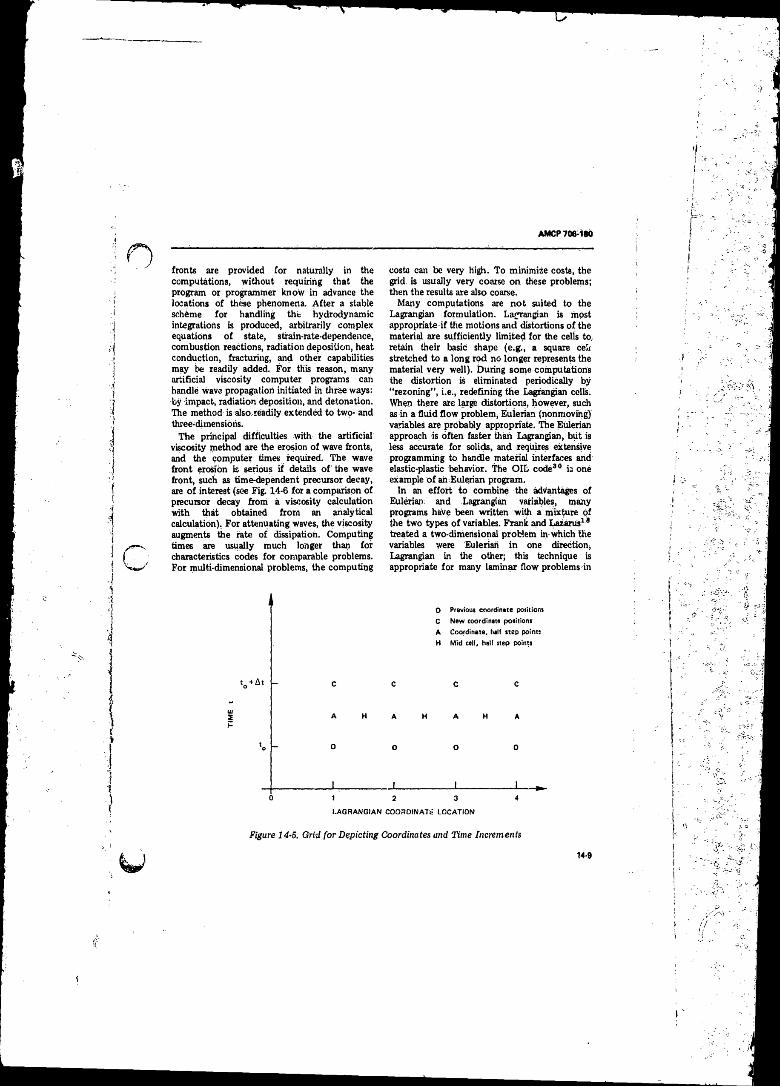
AMCP 706-180
fronts axe provided for naturally in the computations, without requiring that the program or programmer know in advance the locations o f these phenomena. A fter a stable scheme for handling the hydrodynamic integrations is produced, arbitrarily complex equations o f state, strain-rate-dependence, combustion reactions, radiation deposition, heat conduction, fracturing, and other capabilities may be readily added. For this reason, many artificial viscosity computer programs can handle wave propagation initiated in three ways: by impact, radiation deposition, and detonation. The method is also readily extended to two- and three-dimensions.
The principal difficulties with the artificial viscosity method are the erosion o f wave ftonts, and the computer times required. The wave front erosion is serious if details o f the wave front, such as time-dependent precursor decay, are o f interest (see F ig 14-6 for a comparison of precursor decay from a viscosity calculation with that obtained from an analytical calculation). For attenuating waves, the viscosity augments the rate o f dissipation. Computing times are usually much longer than for characteristics codes for comparable problems. For multi-dimensional problems, the computing
costa can be very high. To minimize costs, the grid is usually very coarse on these problems; then the results are also coarse.
Many computations are not suited to the Lagrangian formulation. Lanrangian is most appropriate i f the motions and distortions o f the material are sufficiently limited for the cells to, retain their basic shape (e.g., a square cell stretched to a long rod no longer represents the material very well). During some computations the distortion is eliminated periodically by “ rezoning” , i.e., redefining the Lagrangian cells: When there are large distortions, however, such as in a fluid flow problem, Euierian (nonmoving) variables are probably appropriate. The Euierian approach is often faster than Lagrangian, but is less accurate for solids, and requires extensive programming to handle material interfaces and elastic-plastic behavior. The O IL code30 is one example o f ail Euierian program.
In an effort to combine the advantages o f Euierian and Lagrangian variables, many programs have been written with a mixture of the two types o f variables. Frank and Lazarus13 treated a two-dimensional problem in-which the variables were Euierian in one direction* Lagrangian in the other; this technique is appropriate for many laminar flow problems in
0 Previous coordinate positions C New coordinate positionsA Coordinate, half step points H M id cell, half step points
to + At c c c c
uisb
A H A H A H A
to O O O 0
_____________ L ___________ I____________ I____________ L0 1 2 3 4
LAGRANGIAN COORDINATE LOCATION
Figure 14-5. G rid f o r D ep ic tin g Coordinates and T im e Increm ents
14*9
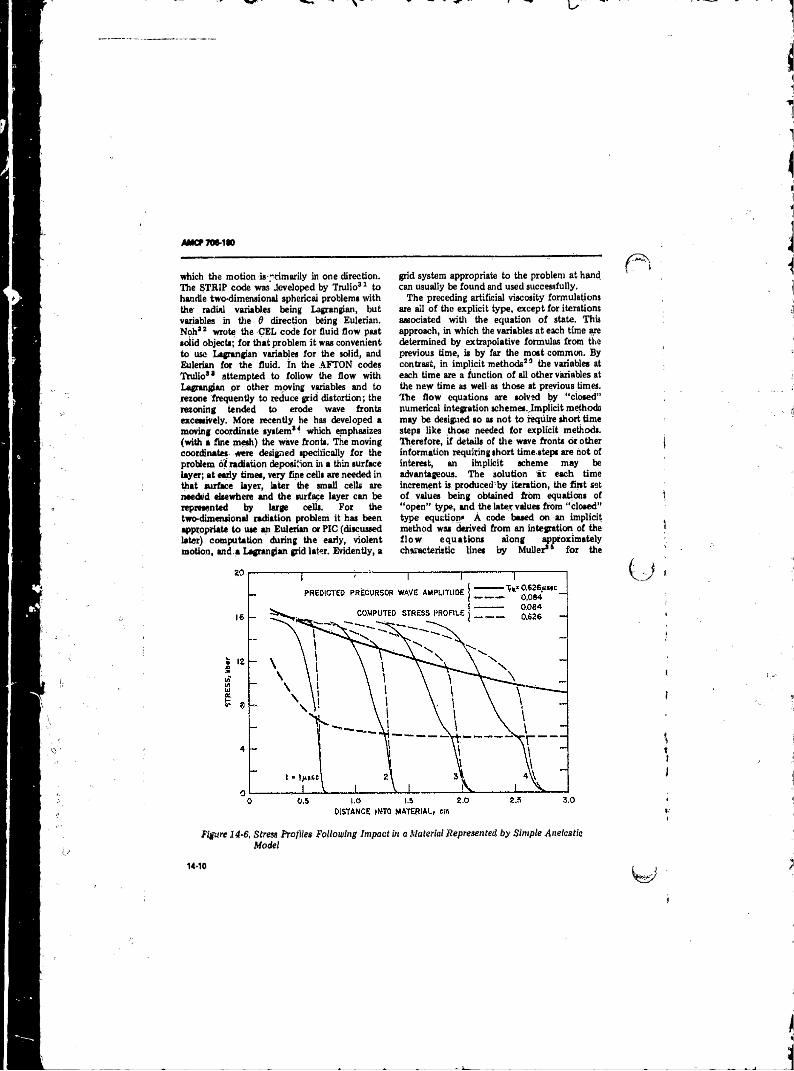
AMCP7W -100
which the motion is-.-Timarily in one direction. The STRIP code was developed by Trulio31 to handle two-dimensional spherical problems with the- radial variables being Lagrangian, but variables in tile 0 direction being Eulerian. NohS2 wrote the CEL code fo r fluid flow past solid objects; for that problem it was convenient to use Lagrangian variables fo r the solid, and Eulerian for the fluid, in the AFTO N codes Trulio3* attempted to fo llow the flow with Lagrangian or other moving variables and to rezone frequently to reduce grid distortion; the rezoning tended to erode wave fronts excessively. More recently he has developed a moving coordinate system** which emphasizes (with a fine mesh) the wave fronts. The moving coordinates were designed specifically fo r the problem o f radiation deposition in a thin surface layer; at early times, very fine cells are needed in that surface layer, later the small cells are needed elsewhere and the surface layer can be represented by large cells. For the taro-dimensional radiation problem it has been appropriate to use an Eulerian or PIC (discussed later) computation during the early, violent motion, and,a Lagrangian grid later. Evidently, a
grid system appropriate to the problem at hand can usually be found and used successfully.
The preceding artificial viscosity formulations are all o f the explicit type, except for iterations associated with the equation o f state. This approach, in which the variables at each time are determined by extrapolative formulas from the previous time, is by far the most common. By contrast, in implicit methods39 the variables at each time are a function o f all other variables at the new time as well as those at previous times. The flow equations are solved by “ closed” numerical integration schemes. Implicit methods may be designed so as not to require short time steps like those needed fo r explicit methods. Therefore, i f details of the wave fronts or other information requiring short time steps are hot of interest, an itnplicit scheme may be advantageous. The solution at each time increment is produced by iteration, the first set o f values being obtained from equations of “ open” type, and the later values from “ closed” type equation* A code based on an implicit method was derived from an integration of the f lo w equations along approximately characteristic lines by Muller*3 fo r the
Figure 14-6, Stress Profiles Following Impact in a Material Represented by Simple Anelastie Model
14-10
AMCP 706-180
computation o f nonlinear acoustic flow without shocks.
14-2.4 PARTICLE-IN-CELL METHu.1
The particle-in-cell (PIC) methoo3 6-3 7 is a mixture o f Lagrangian and Eulerian techniques, and generally requires a computer wiih both a large memory and high speed. I t is especially useful fo r problems in which there are large distortions. The fluid may be visualized as discretized into small Lagrangian particles with mass, velocity, and energy, but no shape. During the computation, these cells are passed through a fixed Eulerian grid. During each time step, two types o f calculations occur: a computation o f pressure and energy in the Eulerism cell based on the number o f particles in the cell, then a determination o f the motion o f each Lagrangian particle from the pressure gradients on the particle, The stability o f the computations arises, according to Harlow’ ®, from an artificial viscosity introduced unintentionally in the averaging process. Some o f the disadvantages o f the method are its high computing cost36, the jumps in pressure associated with quantized changes in density, and difficulty in handling elastic-plastic properties. Harlow presented figures from two-dimensional PIC computations o f a crater formed by the explosion o f a spherical charge on the surface o f the ground; this exemplifies well the ia je distortions treated in PIC problems.
14-3 EQUATION-OF-STATECOMPUTATIONS
An equation o f state is a relationship between thermodynamic variables which describe equilibrium states o f a material. The relationship can be visualized as a multidimensional surface whose coordinates are the thermodynamic variables. In an equilibrium process, the material state moves across the surface; in a shock or reaction process, the end points are on tire surface but intermediate points may be o ff the surface. An example o f Hugoniot curves on equation-of-state surfaces is shown in Fig. 14-7, In the shock front the material state follows the Rayleigh line from 0 to A. In the subsequent reaction, the state follows the Rayleigh lii from A to the C-J point.
In this paragraph, computer codes ate discussed which develop the equation-of-state
relationships for reaction products, given the equations o f state o f each constituent; i.e., these codes could be used to develop the upper curve in Fig. 14-7. The computations generally fo llow the analyses in Chapter 2 and Appendices A , E, and D . Examples o f these codes are the STRETCH, BKW3* , RU B Y” , and TIGER40. The TIG E R code was constructed with the aid o f experience gained from the earlier two; its characteristics are described in the paragraphs which follow.
The TIGER computer code calculates the composition and thermodynamic variables associated with equilibrium states o f reaction products. The user supplies the chemical formula (o r formulas, for a mixture) o f the condensed explosive and specifies the state points o f interest State ooints which are obtainable are the C-J point, the constant volume explosion point, a series o f Hugoniot points, a series o f points on an isentrope, or any arbitrary point fo r which two thermodynamic variables are specified. The program uses the analysis o f Chapter 2 to satisfy the stoichiometric and chemical equilibrium conditions, and the equations o f state o f each constituent-combined with the Hugoniot, isentropic, and C-J conditions—to find the state. The printed output, fo r each state point includes the constituents, the thermodynamic variables, and derivatives—such as the specific heat, the thermal expansion coefficient, and the adiabatic exponent. For each point the constituents may be represented by either a perfect gas law or a Becker-Kistiakowsky-Wilson equation o f state. The resulting states are equilibrium states and, therefore, do not represent a reaction process. T o be able to estimate properties o f nonequilibrium states, points may be computed with the constituents either frozen to those o f a prior equilibrium state, or free to assume a new equilibrium configuration. The transient state may be presumed to He between these two states.
Within the TIGER program there is a basic thermodynamics routine (THERM O) which solves for equilibrium composition given two equation-of-state variables. Within THERMO the basic variables are the n( (mole numbers for dll gas phase constituent!.), ijk (parameters related to chemical poten ials—oneperelementpresent), temperature T, and a pressure-related variable Px. Because o f the hi'Jily nonlinear relations
14-11
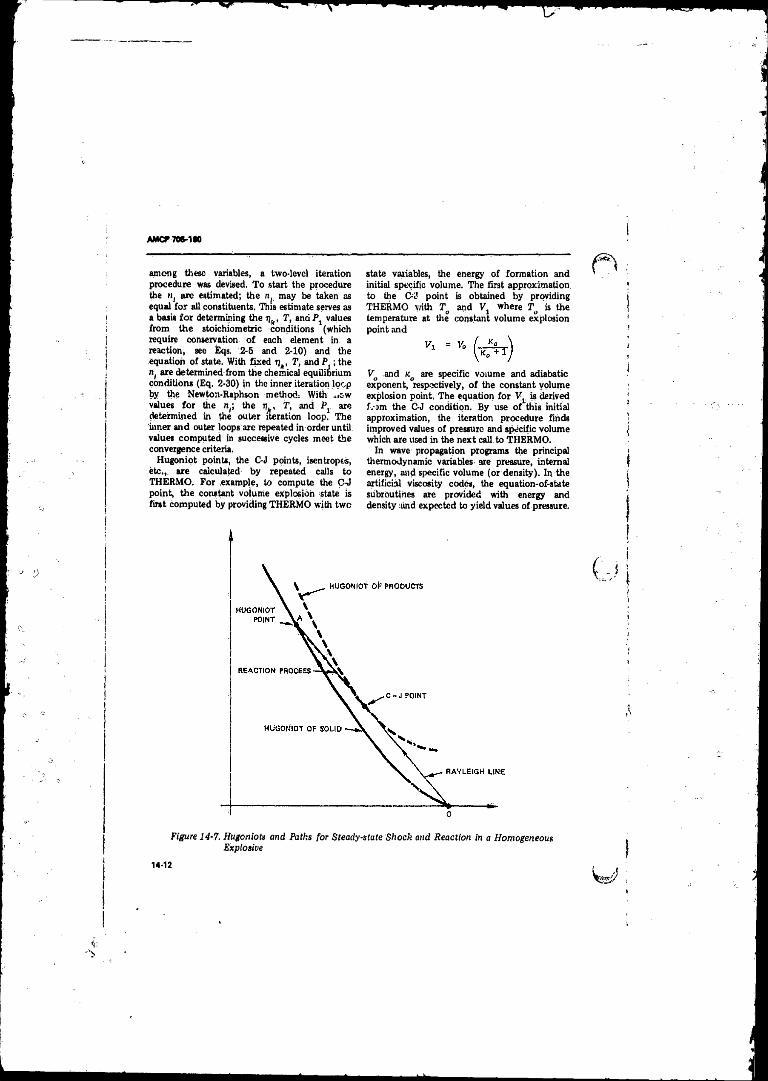
AMCP70S-1M
among these variables, a two-level iteration procedure was devised. T o start the procedure the Hj are estimated; the nf may be taken as equal fo r all constituents. This estimate serves as a basis fo r determining the q , T, and P values from the stoichiometric conditions (which require conservation o f each element in a reaction, see Eqa. 2-5 and 2-10) and the equation o f state. With fixed t)4, T, and P ; the n, are determined from the chemical equilibrium conditions (Eq. 2-30) in the inner iteration loop by the Newton-Raphson method: With „c w values fo r the n-, the i}., T, and P1 are determined in the outer iteration loop. The inner and outer loops are repeated in order until values computed in successive cycles meet the convergence criteria.
Hugoniot points, the C-J points, isentropos, etc,, are calculated by repeated calls to THERMO. For .example, to compute the C-J point, the constant volume explosion state is first computed by providing THERMO with two
state variables, the energy o f formation and initial specific volume. The first approximation to the C-J point is obtained by providing THERMO with To and V1 where To is the temperature at the constant volume explosion point and
Va and x are specific volume and adiabatic exponent, respectively, o f the constant volume explosion point. The equation fo r Vj, is derived f.-am the C-J condition. By use o f this initial approximation, the iteration procedure finds improved values o f pressure and specific volume which are used in the next call to THERMO.
In wave propagation programs the principal thermodynamic variables are pressure, internal energy, and specific volume (or density). Ip the artificial viscosity codes, the equation-of-state subroutines are provided with energy and density and expected to yield values of pressure.
Figure 14-7. Hugoniots and Paths for Steady-state Shock and Reaction in a Homogeneous Explosive
14-12
AMCP 706-180
Therefore, for use in wave propagation calculations, the most convenient equation of state is one in which pressure is an explicit function o f energy and density. An example o f the transformation which may be required to put an equation o f state in tractable form is given by Zemow, eta l.41. Initially, they used the equation o f state to compute pressure for a grid o f points in (.E,p)-space, and then interpolated in this grid for the wave propagation calculation.
14-4 REACTION ' MECHANISMS FOR COMPUTATIONS
The reaction mechanism is the process by which the unreactcd material bums or detonates to become the reaction product. I f the reaction process is not of interest, then a very simple computational scheme can be used. However, for a study directed toward determining the induction time, initiation and fadeout o f detonation, and other phenomena governed by the reaction zone; the reaction process is modeled more carefully. For a homogeneous explosive the Arrhenius equation for the reacted fraction/is used41, 4 2 - 43
3 7 = A ( l - l f exp E*/(ET^ (14-17)
where A is the frequency factor, E* is the activation energy, R is the gas constant, and X is the order o f the reaction (either X = 0 or 1 is used). While the material is reacting, part o f the material is obeying the product equation of state and part the explosive equation o f state. The products are in pressure equilibrium but not necessarily in thermal equilibrium. Possible computational treatments o f this two-phase problem are given by Peirone4 2 and by Zemow, et al41.
For an inhomogeneous (condensed) explosive Warner44 and Boyer43 have suggested methods for describing the hot-spot initiation, burning o f adjacent material, and detonation. Warner let X - 2/3, corresponding to a process depending on surface area rather than volume, and made T the temperature o f the reacted gas. Boyer4 4 considered the condensed explosive to consist o f two phases, one o f which would detonate by an Arrhenius law (the hot-spot part), and the other would bum by a law like Warner’s with X = 2/3. Both Warner’s and Boyer’s methods were able to
model an underdriven detonation, with subsequent build up of. reaction and production o f a steady C-J wave front.
Where details o f the reaction process are unimportant, simple reaction mechanisms have been employed, fo r example, an instantaneous conversion to the G-J state o f the explosive at the front o f the detonation: wave, This mechanism, available in TOODY 39 and in N IP46 may be adequate when the explosive propels a flyer plate, and only the terminal velocity o f the plate is o f interest. For a little more fidelity to the reaction process, Wilkins2 2 has suggested two computational mechanisms:
(1 ) The detonation is required to travel at the known detonation velocity D, and the time o f arrival o f the wave at each.cell is calculated in advance. When the detonation time is reached at a cell, the heat o f reaction is added to the internal, energy o f the cell over several time increments. As with the simpler mechanism previously described, the detonation wave is forced to reach the C-J velocity and achieve the C J pressure.
(2 ) An alternate possibility is to set the burn fraction f to
1 - V/Va
where 7, VCJ, Vo are the current, C-J, and initial specific volume, respectively. With this mechanism, the detonation wave is allowed tc establish itself.Wilkins has found that the second mechanism does not establish a steady state very rapidly. T o eliminate this problem and also to allow for an overdriven wave, he recommends computing f as the maximum from the two mechanisms.
14-5 SUMMARY OF CALCULATIONS OF WAVE PROPAGATION WITH REACTIVE MECHANISMS
The preceding paragraphs have contained descriptions o f the three basic elements o f wave propagation in reactive flow : hydrodynamics, equations o f state, and reactive mechanisms. Here, some o f the ways in which these elements have been combined are mentioned, and the nature o f the resulting solutions are discussed.
One example o f a method o f characteristics calculation with reactive flow is that o f Barthel
14-13
AMCP7M -1S0
and Strehlow11 to study the effect o f transverse waves on one-dimensional flow. Another is the study o f Osborn41 on the thermal decomposition, induction, and burning o f propellants.
Unsteady aspects o f detonation waves have been considered by Warner with artificial viscosity computations. The initiation, induction, and gradual build up to the steady state, instability, and fadeout were treated from a coritinuum mechanics viewpoint. The details o f hot-spot and bubble collapse mechanisms for initiation have been studied by Mader4 8,4 9-50 who treated the hot spot in detail.
Without treating the reaction process in detail, Wilkins51 has performed multiple detonation computations to determine the equation o f state o f reactant products. The equation o f state was altered and the calculations were repeated until there was satisfactory agreement between computed and measured motion o f the explosive casing. The preceding references only hint at the variety o f problems which have been tackled with wave propagation codes.
Before constructing a code for wave propagation calculations, it is well to decide on the nature o f the results desired, whether the code must be general-purpose, etc. Some of these code characteristics have been discussed previously; three more will be mentioned here.
First, the code should be easy for the user to understand and even modify. Normally, this requirement lengthens the program and extends running time somewhat, but it saves programmer time and encourages people to use the code. I f possible, the code should be modular, i.e., with
separate routines for hydrodynamics, equations o f state, reaction mechanisms, input and output; this simplifies code modification.
Second, an estimate o f the number o f computations required in a given project depends strongly on the role that the computations are to play. I f the observed detonation velocity or fracture lines are pre-planned for the computation, the computed results serve mainly to correlate the experimental data. Then there may be one o f two computations per experiment. On the other hand, i f the computed detonation velocity is the result o f hydrodynamic and reaction rate calculations, then it is properly termed a theoretical prediction. With such a code, a variation o f parameters is usually helpful, this will require a large number o f computations.
The third item is accuracy. With all computations there will be some errors and, in wave propagation, these tend to grow with time. One aspect o f accuracy has been discussed, namely, the comparison o f computed results with an exact analytical prediction. Normally, this type o f error is o f less interest (and smaller) than those associated with uncertainties in the parameters o f the reaction process and the equations of state. In most o f the foregoing computations these parameters are not known closely so that the computed results are primarily o f a semi-quantitative nature, although the results may be relied upon to indicate the relative importance o f input parameters. In spite o f this drawback, the computations are useful fo r extending our understanding o f the detonation process.
14-14
m
AMCP 706-180
REFERENCES
1. R. Courant and K. O. Friedrichs, Supersonic Flow and Shock Waves, Jnterscience Publishers, Inc., New York, 1948.
2. Pei Chi Chou, Robert R. Karpp, and Shih Lien Huang, “ Numerical Calculation of Blast Waves b y the Method of Characteristics” , Amer. Inst, o f Aero. & Astro Journal, 5, No. 4, 618 (1967).
3. D. R. Hartree, Numerical Analysis, 2nd Edition, Oxford University Press, London, 1968.
4; R. E. Meyer, “ The Method of Characteristics” , Modern Developments in Fluid Dynamics, High Speed Flow, L. Howarth, Ed., Clarendon Press, Oxford, 1953.
5. B. O. Lamboum and J. E. Hartley, “ The Calculation o f the Hydrodynamic Behavior of Plane One-Dimensional Explosive/Metal S y s te m s ” , Fourth Symposium (International) oh Detonation, p. 538, Naval Ordnance Lab., October 1965.
6. K. O. Friedrichs, “ Formation and Decay of Shock Waves” , Comnun. Pure and Appl. Math. 1, 211 (1948).
7. G. B. Whitham, “ The Flow Pattern o f a Supersonic Projectile” , Commun. Pure and Appl. Math. 5, 301 (1952).
8. David T. Blackstock, “ Connectionbetween the Fay and Fubine Solutions for Plane Sound Waves o f Finite Amplitude” , Jour, o f Acoustical Society o f America 39, No. 6; 1019 (1966).
9. L. M. Barker, SHAP-A Computer Program for Shock Wave Analysis, SC-4796 (RR), Sandia Corp., Albuquerque, New Mexico, Oct. 1963.
10 L. M, Barker, SWAPS: An Improved Stress Wave Analyzing Program, SC-RR-69-233, Sandia Laboratories, August 1969.
11. Harold O. Barthel and Roger A. Strehlow, “ Wa’ e Propagation in One-Dimensional Reactive Flows” , The Physics o f Fluids 9, No. 10, 1896 (1966).
12. D. J. Richardson, “ The Solution of T w o -D im e n s io n a l H yd rod yn am ic Equations by the Method of C h a r a c t e r is t i c s ” , Methods in Computational Physics, B. Alder, S.
Fernbach, and M. Rotenberg, Eds., Vol. 3 Fundamental Methods in Hydrodynamics, Academic Press, New York, 1964.
13. P. I. Chushkin, “ Numerical Method of Characteristics for Three-dimensional Superson ic Flows” , Progress in Aeronautical Sciences, D. Kuchemann, Ed., Pergamon Press, Oxford, Vol. 9, 1968, p.41.
14. J. von Neumann-and R . D. Richtmyer, “ A Method for the Numerical Calculation of Hydrodynamic Shocks” , J. Appl. iPhys. 21, 232(1950).
15. R. Landshoff, A Numerical Method for Treating Fluid Flow in the Presence of Shocks, LA SL LA-1930, Los Alamos Scientific Laboratory, New Mexico, 1955.
16. H. J. Longley, Methods of Differencing in Eulerian Hydrodynamics, LAMS-2379, Los Alamos Scientific Laboratory, 1960.
17. P. D. Lax, and B. Wendroff, “ Systems o f Conservation Laws” , Communications on Pure and Applied Mathematics, 13, 217.
18. R. M. Frank and R. B. Lazarus, “MixedEulerian-Lagrangian Method” , Methods in Computational Physics—Advances inResearch and Application, Vol. I ll, Academic Press, New York, 1964, pp. 47-67.
IS . A. F, Emery, An. Evaluation o f Several Differencing Methods for Inviscid Fluid-Flow Problems, Sandia Corporation Monograph SCL-DC-66-78, Albuquerque, New Mexico, March 1967.
20. R. D. Richtmyer and K. W, Morton, Difference Methods for Initial-Value Problems, 2d Ed., Interscience Publishers, New York, 1967.
21. S. K. Godunov, “ Finite Difference Method fo r N um erica l Computatidri o f Discontinuous Solutions of the Equations of-Fluid. Dynamics” , Mat. Sbornik 47 (89), No. 3, 271-306 (1959).
22. Mark L . Wilkins, “ Calculation o f Elastic Plastic Flows” , Methods in Computational Physics, Vol. 3, Berni Alder, Ed., Academic Press, New York, 1964.
23. R. N. Brodie and J. E. Hormuth, The PUFF 66 and P PUFF 66 Computer Programs, Research and Technology Division, A ir
14-15
AM CP 706-180
REFERENCES (Cont'd)
Force Weapons Laboratory, Kirtland Air Force Base, New Mexico, May 1966.
24; P. D. Lax, “ Weak Solutions o f Nonlinear Hyperbolic Equations and Their Numerical Computations” , Communication on Pure and Applied Mathematics 7, 159 (1954).
25. L. Seaman, SRI PUFF 3 Computer Code for Stress Wave Propagation, Stanford Research Institute fo r Air Force Weapons L a b o r a t o r y u n d e r C o n t r a c t F29601-70-C-0001, January 1970.
26. C. S. Godfrey, D. J. Andrews and E. T. Trigg, Prediction Calculations for Free Field Ground Motion, Tech. Doc. Report No. WL-TDR-64-27, Physics International for A ir Force WeaDons Laboratory, May 1964.
27. J. G. Trulio, Theory and Structure of the AFTON Cadet, Tech. Rept. No. AFWL-TR-66-19; Nonronics for Air Force Weapons,Laboratory, June 1966.
28. V. Rusanov, Calculation of Interaction of Non-Steady Shock Waves with Obstacles, National Research Council o f Canada, Translation No. 1027,1962.
29. B. J, Thorne and W. Herrman, TOODY, A ■Computer Program for Calculating Problems of Motion in Two Dimensions, Sandia Laboratories Report No. SC-RR-66-602, Albuquerque, New Mexico, July 1967. See also S. E. Benzley, L. D. Bertholf, and G. E. Clark, TOODY 11-A, Sandia Laboratories Report No. SC-DR-69-516, November 1969.
30. W. E. Johnson, OIL, A Continuous Two-Dimensional Eulerian Hydrodynamic Code, General Atomic Division o f General Dynamics Corporation for Advanced Research Projects Agency under Contract DA-04-495-AMC-116(X), Jan. 1965.
31. John G. Trulio, “ The STRIP Code and the Jetting o f Gas Between Plates” , Methods in Computational Physics, Vol. 3,Berni Alder, Ed., Academic Press, New York, 1964, p. 69.
32. W. F. Noh, “ CEL: A Time-Dependent, Two-Space-Dimensional, Coupled Eulerian Lagrange C o d e ” , Methods in Computational Physics, Vol. 3,Berni Alder, Ed-, Academic Press, New York, 1964, p.
117.33. John G. Trulio, Theory and Structure of
the AFTON Codes, Tech. Rept. No. AFWL-TR-66-19, Nortronics, A Division o f Northrop Corporation, for A ir Force Weapons Laboratory, June 1966.
34. John G. Trulio, William E. Carr, and John B. Muller, PUFF Rezone Development, Tech. Rept. No, AFWL-TR-69-50, Applied Theory, Inc., for A ir Force Weapons Laboratory, October 1969.
35. George M. Muller, Numerical Calculation of the Near Field for Spherically Symmetric Nonlinear Acoustic Flows in an Unbounded Ideal Gas, Stanford Research Institute for A ir Force Systems Command, Wright-Patterson Air Force Base, Ohio, under Contract F33615-67-CG.751, February 1970.
36. Francis H. Harlow, “ The Particle-in-Cell Computing Method fo r Fluid Dynamics” , Methods ir. Computational Physics, Vol. 3, Bemi Alder, Ed., Academic Press, New York, 1964, p. 319.
37. R. Bjork, N. Brooks, and R. Papetti, A Numerical Technique for Solution of Multidimension Hydrodynamic Problems, Memorandum RM-2628-PR o f Rand Corporation fo r U. S. Air Force under Contract A F 49(638)-700s Dec. 1963.
38. C. L. Mader, Detonation Properties of Condensed Explosives Using the Becker-Kistiakowsky-Wilson Equation of State, Los Alamos Scientific Lab Rept. LA-2900,1963.
39. H. B. Levine and R. E. Sharpies, Operator's Manual for RUBY, LR L Rept., (JCRL-6815,1962.
40. W. E. Wiebenson, Jr., W. H. Zwisier, L. B. Seely, and S. R. Brinkley, Jr., TIGER Computer Program Documentation (4 volumes), Stanford Research Institute fo r Ballistic Research Laboratories under C on trac t DA-04-200-AM C-3226(X), November 1968.
41. L. Zernow, E. A . Tkachenko, Nancy B. Brooks, R. L. Laradale, and G. E. Lewis, “ A p p lica tion o f Two-Dimensional Computations to the Study o f Sub-Critical Initiation and Fadeout in a Homogeneous
AMCP 706-180
REFERENCES (Cont'd)
E x p lo s iv e ” , Eleventh Symposium (International) on Combustion, 1957, p. 645.
42. Francis J. Petrone, “ Validity o f the Classical Detonation Wave Structure for Condensed' Explosives” , Phys. o f Fluids 11, 1473 (1968).
43. Charles L. Mader, “ One- and Two-Dimensional Flow Calculations o f the Reaction Zones o f Ideal Gas, N itromethane, ard Liquid TN T D etonations” , Twelfth Symposium (International) on Combustion, The Combustion Institute, 1969, p. 701.
44. F, J. Warner, “ The Initiation o f Detonation in Solid Explosives” , Ninth Symposium (International) on Combustion, The Combustion Institute; 1963.
45. M. H, Boyer, “ Calculation o f the Characteristics o f Detonation Waves in-Real Materials” , J. Appl. Phys 40, 654 (1969).
46. B. D. Eambourn and J. E. Hartley, “ The Calculation o f the Hydro-dynamic Behavior o f Plane One-Dimensional Explosive/Metal S y s te m s ” , Fourth Symposium (International) on Detonation, Naval Ordnance Lab., Oct. 1965„p. 538.
47. J. R. Osborn and G. M. Lehmann, “ On the
Interaction o f a Finite Amplitude Pressure Pulse with a Combustion Region” , Eleventh Symposium (International) on Combustion, 1967, p.739.
48. Charles L Mader, “ Shock and Hot Spot Initiation o f Homogentous Explosives” , Phys. o f Fluids 6, No. 3. 375 (1963).
49. Charles L. Mader, “ Initiation of Detonation by the Interaction o f Shocks with Density Discontinuities” , Phys. of Fluids 6, No. 1G (1965).
50. Charles L. Mader, “ Theoretical Studies o f Shock and Hot Spot Initiation o f Homogeneous Explosives” , Proceedings of the International Conference on Sensitivity and Hazards o f Explosives, Chairman-G. K. Adams, Explosives Res. and Dev. Establishment; Oct. 1963.
51. Mark L. Wilkins, Squier Bailey, and Bertram -Halperin, “ Equation o f State fo r Detonation Products of PBX 9404 and L X 0 4 - 0 1 ” , Tenth Symposium (International) on Combustion, The Combustion Institute, 1965, p. 769.
52. K. P. Stanyukovich, Unsteady Motion of Continuous Media, Translated by Maurice Holt and J. George Adashko, Pergamon Press, London, 1960.
AMCP 706-180
REFERENCES (Cont'd)
E x p lo s iv e ” , Eleventh Symposium (International) on Combustion, 1957, p. 645.
42. Francis J. Petrone, “ Validity o f the Classical Detonation Wave Stmcture for Condensed Explosives” , Phys. o f Fluids 11, •1473 (1968).
43. Charles L. Mader, “ One- andTwo-Dimensional Flow Calculations o f the Reaction Zones o f Ideal Gas,Nitromethane, and Liquid TNT Detonations” , Twelfth Symposium (International) on Combustion, TheCombustion-Institute, 1969, p. 701.
44. F. •). Warner, “ The Initiation o f Detonationin Solid Explosives” , Ninth Symposium (International) on Combustion, TheCombustion Institute, 1963.
45. M. H. Boyer, “ Calculation o f the Characteristics o f Detonation Waves in Real Materials” , <J. Appl. Phys. 40, 654 (1969).
46. B. D. Lambourn and J. E, Hartley, “ TheCalculation o f the Hydro-dynamic Behavior o f Plane One-Dimensional Explosive/Metal S y s te m s ” , Fourth Symposium(International) on Detonation, NavalOrdnance Lab., Oct. 1965, p. 538.
47. J. R. Osborn and G. M. Lehmann, “ On the
Interaction o f a Finite Amplitude Pressure Pulse with a Combustion Region” , Eleventh Symposium (International} on Combustion, 1967, p.739.
48. Charles L Mader, “ Shock and Hot Spot Initiation o f Homogeneous Explosives", Phys. o f Fluids 6 , No. 3, 375 (1963).
49. Charles L. Mader, “ Initiation-of Detonation by the Interaction o f Shocks with Density Discontinuities” , Phys. o f Fluids 6, No. 10 (1965).
50. Charles L. Mader, “ Theoretical Studies of Shock and Hot Spot Initiation of Homogeneous Explosives” ,- Proceedings of the International Conference on Sensitivity and Hazards of Exptosiues,.-Chairman G. K. Adams, Explosives Res. and Dev. Establishment, Oct. 1963.
51. Mark L . Wilkins, Squier Bailey, and Bertram Halperin, “ Equation o f State for Detonation Products o f PBX 9404 and L X 0 4 - 0 1 ” , Tenth Symposium (International) on Combustion, The Combustion Institute, 1965, p. 769.
52. K. P. Stanyukovich, Unsteady Motion of Continuous Media, Translated by Maurice Holt and J. George Adashko, Pergamon Press, London, 1960.
14-17
AMCP 706-180
APPENDIX A EVALUATION OF THE THERMODYNAMIC PROPERTIES
A-1 INTRODUCTION
The thermodynamic relations of general validity, summarized in par. 2-4, provide the basis fo r the evaluation of the thermodynamic properties o f a system. Since it is a characteristic o f these relations that they are in differential form, it is necessary to integrate them in order to obtain expressions that can be employed fo r numerical work. Furthermore, since they are characteristically relations betw een partial derivatives, the integral expression! are most conveniently stated in terms o f l ia integrals. Physically a line integral is a way o f expressing the change in some property during a process between two different states. In the present application, one state is taken to be ihat o f the system o f interest and the other that o f a reference system whose properties are known. I f the reference state is properly defined, the line integrals needed to evaluate the thermodynamic properties of real systems can be made to involve only properties o f tire system that are determined by the equations o f state o f its constituent phases.
In successive paragraphs of this Appendix, expressions are deduced for the thermodynamic properties o f pure condensed phases and of a gas mixture. Relations are then given for the properties o f a general heterogeneous system. It is assumed that the composition o f each phase is given. A procedure fo r die determination o f the composition at equilibrium (which is the only co m p o s it io n u n iqu e ly de term in ed by thermodynamic considerations alone) is given in Appendix B.
A-2 THERMODYNAMIC PROPERTIES OF PURE CONDENSED PHASES
In the interest o f simplicity o f notation, we dispense in this paragraph with the component index that has been employed in Chapter 2 to identify the chemical species of which the phase is composed, and with the prime-notation that has been employed to distinguish a condensed phase from a gaseous phase as in Eq. 2-11.
We assume that the molar volume o f a pure condensed phase is a known function o f pressure
and temperature, V - V(p,T). Writing the second o f Eqs. 2-65 and integrating, we obtain an expression fo r the molar enthalpy H o f the phase
(A-1)
where H* is the molar enthalpy in a reference state at one atmosphere. The quantity i f * is a function o f temperature only, H* * and-the integral is along a path o f constant temperature. The quantity H* is undefined to the extent o f an additive constant, the specification o f which can be arbitrary. The specification o f this constant is equivalent to the selection of a standard state or datum base in terms o f which the enthalpy is to be measured. The standard state is defined by a reference temperature, reference pressure, and reference state (liquid o r solid) o f each element. We select absolute zero and one atmosphere as the reference temperature and pressure. The reference state is the phase which is stable at room temperature and atmospheric pressure. The quantity H* may then -be defined formally by
H* = H,* - H* + AfH*
where (H? - H*) is the enthalpy function in the reference state at temperature T measured relative to the same state at a temperature o f absolute zero and A^H* is the molar heat o f formation o f the materials from the elements at absolute zero and at a pressure o f one atmosphere. The quantities and A fH *are listed in standard tables o f thermodynamic properties1. The standard state here defined is consistent with that employed fo r gas mixtures. The molar energy is obtained from the definition of the enthalpy
E ~ H* - p V + / H dp (A-2)
The heat capacities can be obtained by differentiation of Eq. A-1 and the use o f Eq. 2-69
AMCP 706-180
where a* = dH*/dT = c£(T) is the molar heat capacity at constant pressure in the reference state o f unit pressure. It can be obtained from standard tables o f thermodynamic properties.
The chemical potential (equal fo r a pure phase to the molar Gibbs energy.) is expressed by a relation obtained by integrating the first o f Eqs. 2-67
p = p* + J v d p (A-4)
13* p ~ p*. This approximation is valid for systems in which a condensed phase is in equilibrium with a gas phase if npV/RT < < 1, where n is the number o f moles o f condensed phase per mole o f gas phase. For the explosion products o f a condensed explosive for which—as we shall the density o f the gas phase is o f the order o f the densities o f normal solids—this approximation is not valid even i f it is possible to assume that the condensed phase molarvolumes are constant. __
A second approximation may be obtained by assuming that the coefficient Kp o f isothermal compressibility
and the coefficient KT 61 isobaric thermal expansion
where p* is the chemical potential in the reference state o f unit pressure. This quantity is a function o f temperature only, p* - p'* t?1), that is tabulated in standard tables o f thermodynamic properties. The entropy can be obtained from the relation
are constants independent o f temperate re and pressure. W ith these assumptions the pressure-volume-temperature equation o f state is
V = exp (X .T ] e x p fA y i - p j ]
S = (H - p)IT (A-5)
which results from the definition o f tire Gibbs free energy.
As a first approximation, the molar volume may be assumed to be a constant, independent o f p and T. With this assumption
H = H* + V(p - 1) '
E = E*
_p =p * + ( p - l ) V I
where E* and cjf denote the molar energy and molar heat capacity at constant volume, resp c,lively, in the reference state at 1 atm. A t low pressures, it is possible to simplify these expressions still further by neglecting the product pV compared to E* and p* so that i f ~
where V0 is the molar volume at a temperature o f absolute zero and a pressure o f one atmosphere.. Then Eq. A - l becomes
H = H* + (1 -71KT)|-*|l - exp jj^G -pjJ |(A-7)
where V * = exp [Kt T], and the expression for E follows directly by adding pV to the right hand side. Differentiating Eq. A-7 with respect to temperature at constant pressure and combining the result with Eq. 2-69 gives the following expressions for tire heat capacities,
TW 'V”
’ A'1 - ex|P f c d -P ) ] [ (A -8 )
» C*
For the chemical potential, we obtain the expression
A*2
AMCP 706-180
y * i ■)M =' M + U - exp[Jf (1 - p ) ] ( (A-9)
p ( /
A-3 THERMODYNAMIC PROPERTIES OF A GAS MIXTURE
In this paragraph, we present expressions by means o f which the thermodynamic properties o f a phase consisting o f a gas mixture can be evaluated in terms of certain thermal properties o f its constituents and an equation o f state of the mixture. A comprehensive account of these matters is given in a review by Beattie2.
Our procedure is to define a reference state of the mixture and to calculate the change in the various thermodynamic properties of the mixture during a process that transforms the mixture in the reference state into the mixture in the actual state o f interest. I f the thermodynamic properties o f the mixture in the reference state are known in terms of the properties o f the pure constituents, the properties o f the mixture in the actual state are then known. I t is not necessary that the reference state have physical existence; i t is only necessary that it be possible to. determine its properties and to perform an accurate calculation o f its chapge in the process resulting in the actual state o f interest. The reference state may, therefore, be an hypothetical state and its definition may be arbitrary.
As reference state, w e select the hypothetical perfect gas mixiure o f the same composition at the pressure arid temperature o f the actual system or, alternatively, at the volume and temperature o f the actual system. The data for the mixture are taken to be the thermal properties o f the pure constituents when they are in an hypothetical ideal gas state at a pressure o f one atmosphere. For a constituent i in this state, we let jE° be the molar energy and S? be the molar entropy. By definition, jE? and S/ are functions o f temperature only
E°= E ? m $ = S ? {T )From a knowledge o f the energy states and
structure o f the molecules o f gaseous substances, the methods o f statistical mechanics have been employed to calculate the quantities £ ° - £ ° and S“, for pure substances regarded as ideal gases at atmospheric pressure. E°. and S°. are the molar energy and entropy, respectively, at
absolute temperature T; E° is the molar energy at T = 0 "K ; and the statistically calculated quantity 5 ° = 0 when T = 0.
We may now complete the specification o f the E° and S" by defining
s f = (<£),
(.K - K ) , + ( V O , <A' 10>
where (Ar f f ) l is the heat change of the hypothetical reaction at atmospheric pressure and zero absolute temperature (equal at absolute zero to the energy absorbed) that produces one mole o f substance i from the elements, the elements being assumed to be in the state of a llega tion that is stable at room temperature and atmospheric pressure. More briefly, (A/
# > i is called ihe heat o f formation at zero temperature. Thus, the energy E° is measured relative to a datum base o f standard state consisting o f the elements at absolute zero. The entropy S” is measured relative to the same standard state because, the entropy o f the elements in their standard states is zero. It may be noted that die specification o f a standard state independent o f the composition of the m ixtu re is essential i f changes in the composition are to be considered. The quantities E° - E°, A r I f , and S%, are listed in standard tabulations o f thermodynamic data.
The idea! gas pure components satisfy the equation o f state
p V f = RT (A -T I)
where R is the molar gas constant and V, is the ideal molar volume o f substance i. The ideal molar enthalpy of substance i at one atmosphere pressure is
I ^ = i f + A T = f # T ) (A-12)
and the ideal molar Gibbs free energy (chemical potential) o f substance i at a pressure of one atmosphere is
ix" » - TS; « + RT - TS° = g”(T ) (A-13)
The ideal heat capacities o f substance i at a pressure o f one atmosphere are the functions
A-3
AMCC 706*180
C“ = < / < ! ! • = c ” ( D
(A-14)
Evidently, c j ( _ c°, = B. From Eqs. 2*615. we have
d{ji°/T)m - = - A f/r1 (A-15)
From Eqs. 2*64 and 2-65, written for one mole o f a substance /, we find that fo r a substance obeying Eq. A - l l
(3ff,/3p)r » 0; (3S(/3p)T = - B/p
Integrating these expressions between p " 1 and p * p at constant temperature, we obtain the relations
H,{p, T; ideal) =
S,(p, V; ideal) - S f - B in p(A-16)
and from the definition o f the chemical potential, we obtain the additional relation
P,(P, T; ideal) = p° + RT in p (A-17)
We now define the hypothetical perfect gas mixture as one.for which
pjip, T ) = p" + B T 2n p + i t T Jn x(A18)
.r( * n(/n, n » 2n,
for every constituent i o f the mixture, where we employ an asterisk to designate a property in the reference state, AH o f the properties o f the mixture in th? reference state are deducible from Eq, A-18. In particular, since the chemical potential is tire partial molar Gibbs free energy, the Gibbs free energy g* o f the perfect gas mixture described by the mole numbe? n,. . , n, is given by
2 n,p° + nit fV n p + RTZnf in x( (A*19)
"inca, from Eqs, 2*81, (3g*/3p;Ti„ = r « , the « jCotion o f state o f the perfect gas mixture can *,e obtained by differentiation o f Eq, A-19
p r* - nRT (A-20)
Eq. A-20 is in accord with Dalton’s law of partial pressures.-gallon’s law o f itself does not, however, form a sufficient basis fo r the definition o f the reference state-since Eq. A-18 cannot be deduced from it without an additional assumption that introduces the concept o ' equilibrium between the mixture in the reference state and the pure constituents (as through appropriately defined semi-permeable membranes).
With ihe aid o f Eq. A-20, the Helmholtz free energy f* o f the perfe.it gas mixture can be obtained from Eq. A-19.
f* - g * - p r * ” g * - nRT
= E/i((p" - RT) + nRT in IRT/t)
* RT%n, in h.
(A-31)
Expressions Z ji the other thermodynamic properties o f the m .v ire in the reference state are easily deduced.
The equation o f slate o f the actual mixture Is an expression in one o f the forms
P - p (r , r 1 ,
r = r (p ,r ; nt, - -n )
We assume the equation o f state, expressed in either way, has ihe property that pr/(nRT) 1 as p •* 0 or r •* and further that pr/(nRT) differs from unity by terms o f at least first order in p or 1/r at finite pressures. Thus the actual mixture becomes identicsl with the reference mixture in the lim it as p •* 0 or r ■*
I f the equation o f state is explicit in temperature and volume, we evaluate the Helmholtz free energy o f the actual mixture from that o f ,the perfect grs mixture in a reference state at the same temperature end volume by means o f
t(r, T) - l* (r,T ) - - / * (- ,T ))
+ W ,T ) - n-.T)}where we use the fact tliat f* (-,T ) » f(-,T). From Eqs. £-31, (3)73u)Tin = -p . Therefore
/ v . r ) - f % T ) =
1r t .t ) - n~,v) = - j pdT
I,
I
>
A 4
I
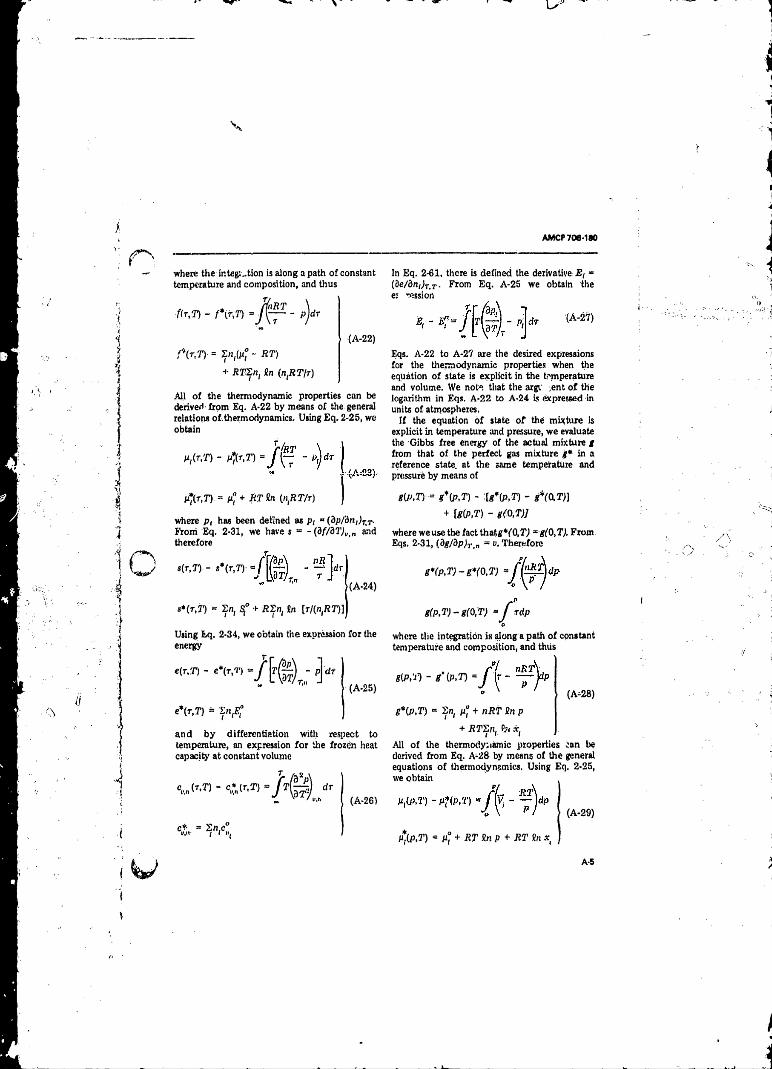
AMCP 706-1*0
where the integs-tion is along a path o f constant temperature and composition, and thus
f(r,T) - - 0 - pjdr
! u ( t , 7 ) = - R T )
+ in (n fiT jr)
(A-22)
A ll o f the thermodynamic properties can be derived from Eq. A-22 by means o f the general relations otthermodynamics. Using Eq. 2-25, we obtain
M,(r.5T) - P*,(r,T) =
In Eq. 2-61, there is defined the derivative J5/ “ (ie/dni)T-T. From Eq. A-25 we obtain the e: ression
Eqs. A-22 to A-27 are the desired expressions for the thermodynamic properties when the equation o f state is explicit in the temperature and volume. We note that the argi ient o f the logarithm in Eqs. A-22 to A-24 is expressed in units o f atmospheres.
I f the equation o f state o f the mixture is explicit in temperature and pressure, w e evaluate the Gibbs free energy of the actual mixture g from that o f the perfect gas mixture g* in a reference state, at the same temperature and pressure by means of
= p " + R T in infiT/r) )
where p ( has been defined as pi » (dp/'dn,)TlT. From Eq. 2-31, we have t - - (3f/327„,„ and therefore
s (t ,T ) - s* ( t,T)-
(A-24)
S iP .n = g*{p,T) - :[g*{p,T) - g*(0,T)]
+ \g(J>,T) - g{0,T)l
where weuse the fact thatg*('0,jT; = g(0,T). From Eqs. 2-31, (3g/3pl-j-,„ = v. Therefore
g*(p ,T )-g*(0 ,T )
s* (r,2 ’) = En, S° + R2nt in M n f iT ) ]
Using Eq. 2-34, we obtain the expression fo r the energy
e(r,T) - e*(r ,T ) =< T, ii
dt
(A-25)
e*(r,T) = t n f i
and b y differentiation with respect to temperature, an expression fo r the frozen heat capacity at constant volume
(A-26)
<&■ =
g (P ,T ) -g (0 ,'T ) = f TripO
where the integration is along a path o f constant temperature and composition, and thus
*(P,2') - g'iP .T )
g*(P,T) = Sn( p“ + nRT in p
(A-28)
+ RTSn, ij< xt
All o f the thermodynamic properties San be derived from Eq. A-28 by means of the general equations o f thermodynamics. Using Eq. 2-25, we obtain
(A-29)
p*(p,T) = m° + RT in P + RT in *
A-5
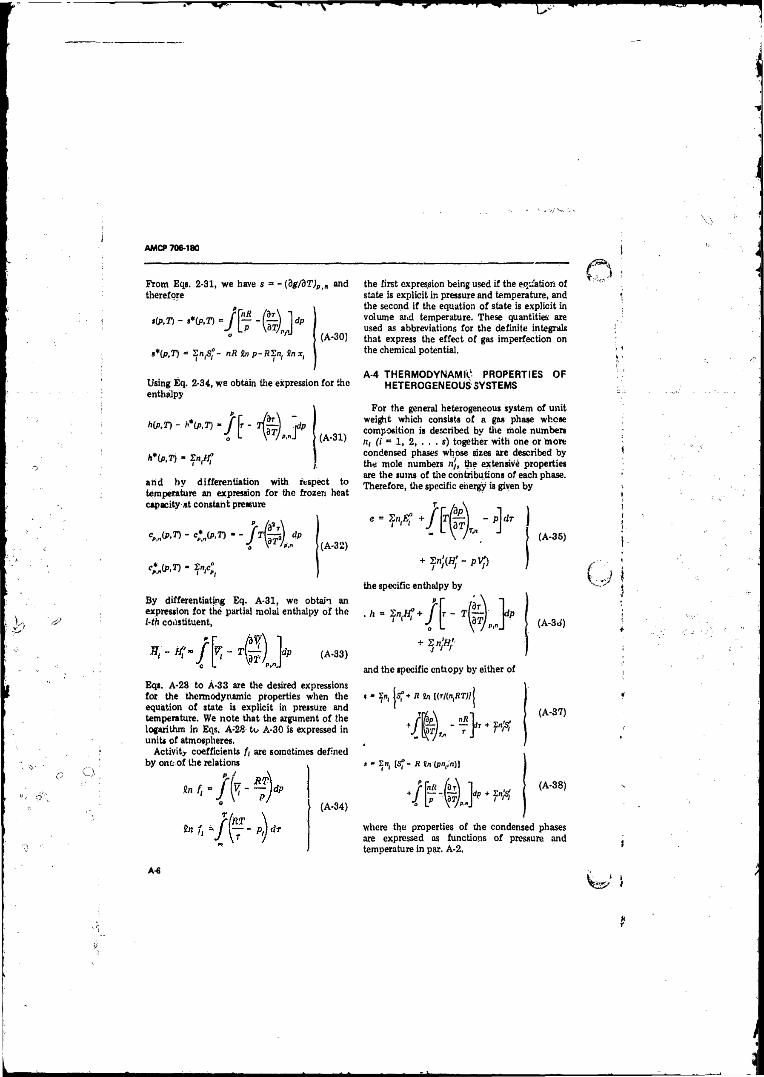
AM CP 706-180
From Eqs. 2-31, we have s = -(3g/dT)Pi„ and therefore
,(p ,n - ,*(p ,T) - / ( j - ' g j ) J O
• v J (A-30)
s*(p,T) « SnfS,°- nfi bi p-H2n, fnx,
Using Eq. 2-34, we obtain the expression for the enthalpy
h(p,T) - h*(p,T)■ I H A - f (A-31)
A*(p,Tj - Zn,/J?
and by differentiation with respect to temperature an expression for the frozen heat capacity at constant pressure
c ,.„(P .D - ■ e* (P .T ) -' - P dp(A-32)
En,c"i i r,
By differentiating Eq. A-31, we obtain an expression fo r the partial molal enthalpy o f the l-th constituent,
(A-33)
Eqs. A-23 to A-33 are the desired expressions for the thermodynamic properties when the equation o f state is explicit in pressure and temperature. We note that the argument o f the logarithm in Eqs. A-28 to- A-30 is expressed in units o f atmospheres.
Activity coefficients ft are sometimes defined by one o f the relations
to/« -/(? ■
the first expression being used i f the equation, o f state is explicit in pressure and temperature, and the second if the equation o f state is explicit in volume ar.d temperature. These quantities are used as abbreviations for the definite integrals that express the effect o f gas imperfection on the chemical potential.
A-4 THERMODYNAMIC PROPERTIES OF HETEROGENEOUS SYSTEMS
For the general heterogeneous system o f unit weight which consists o f a gas phase whose composition is described by the mole numbers n, (i *= i , 2, . . . s) together with one or more condensed phases whose sizes are described by the mole numbers nj, the extensive properties are the sums o f tire contributions o f each phase. Therefore, the specific energy is given by
* * * / f f 4 ■ '] *
+ 2 n f f l - p t y
the specific enthalpy by
. h = s y i ? + / H I } '- w ;
and the specific entropy by either o f
, - Sn, + K Sn ((T/(n(i!iy;|
j - En( [5 f- R Sn (pn,,'n)l
dp + fnfi
(A-35)
(A-3U)
(A-37)
(A-38)
where the properties o f the condensed phases are expressed as functions o f pressure and temperature in par. A-2.
A-6
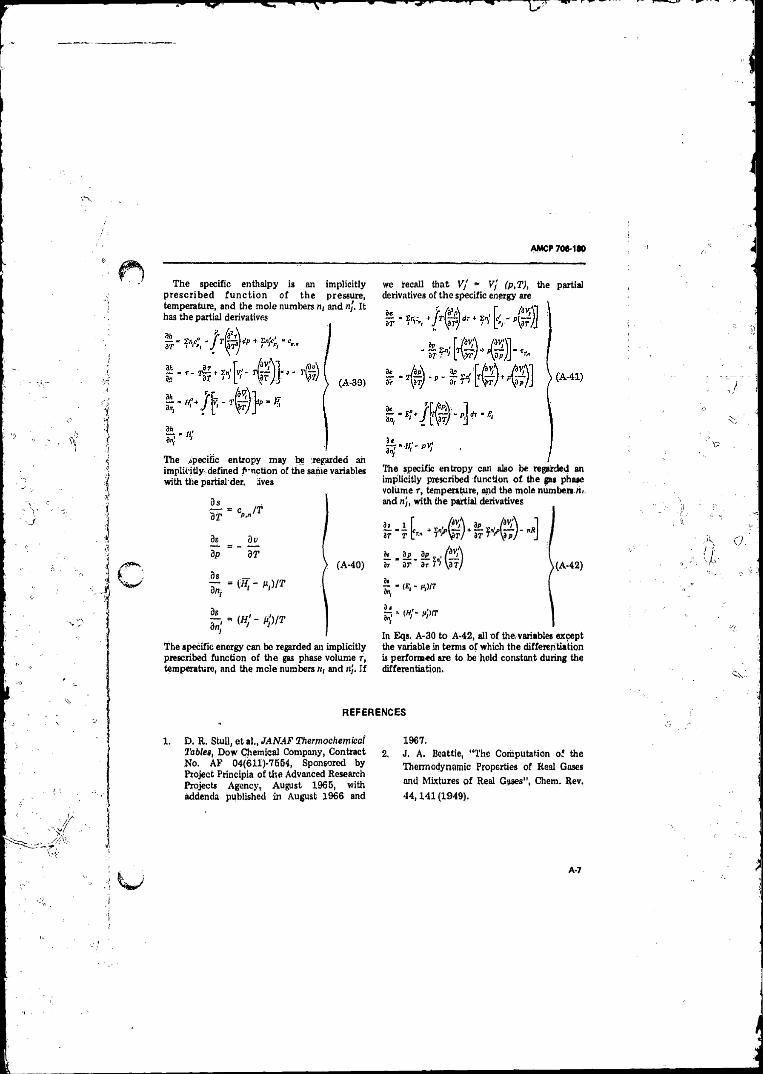
AMCP 706-180
The specific enthalpy is an implicitly prescrib ed fu n c tio n o f the pressure, temperature, and the mole numbers nt and nj. It has the partial derivatives
The specific entropy may be regarded ah implicitly defined function of the same variables with the partial der, lives
3s
3 TIT
3? dv3p 3T
3s
3= ( « , - a,)/T
3s_Bn;
= (H‘r fy lT
} (A-40)
The specific energy can be regarded an implicitly prescribed function o f the gas phase volume r, temperature, and the mole numbers nt and nj. I f
we recall that Vj “ V/ (p,T), the partial derivatives of the specific energy are
The specific entropy can also be regarded an implicitly prescribed function o f the gas phase volume r, temperature, and the mole numbers bland nj, with the partial derivatives
Sr “ 7 [ * * ? " > © + 57 - "*]
Hi. j . i ( i Vl\8r a r" 3r 7 / \ar/
^ - <«/■ ^
>(A-42)
In Eqs. A-30 to A-42, all o f thevarisbies except the variable in terms o f which the differentiation is performed are to be held constant during the differentiation.
REFERENCES
1. D. R. Stull, e t al., JANAF Thermochemicoi Tables, Dow Chemical Company, Contract No. A F 04(611>75B4, Sponsored by Project Principia o f the Advanced Research Projects Agency, August 1965, with addenda published in August 1966 and
1967.
2, J. A. Beattie, “ The Computation o f the
Thermodynamic Properties o f Real Gases
and Mixtures o f Real Gases", Chem. Rev,
44,141 (1949).
A-7
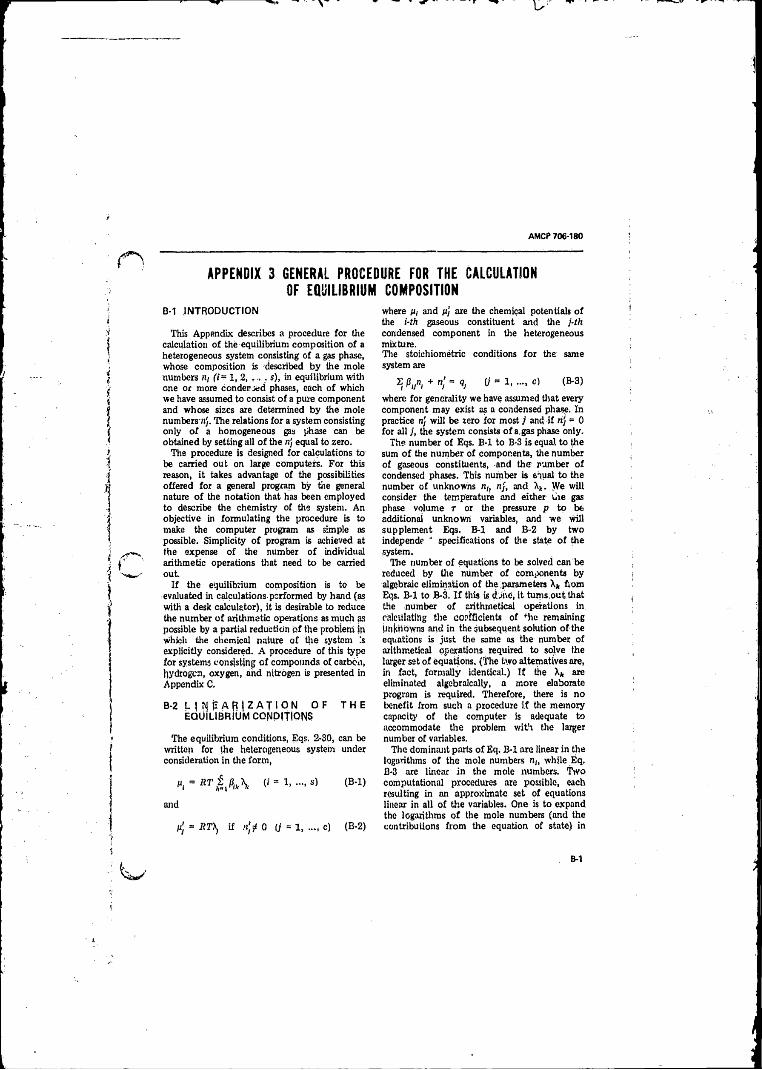
AMCP 706-180
APPENDIX 3 GENERAL PROCEDURE FOR THE CALCULATION OF EQUILIBRIUM COMPOSITION
B-1 INTRODUCTION
This Appendix describes a procedure for the calculation o f the equilibrium composition o f a heterogeneous system consisting o f a gas phase, whose composition is described by the mole numbers nt ( i= 1, 2, . . . , s), in equilibrium with one or more condensed phases, each o f which we have assumed to consist o f a pure component and whose sizes are determined by the mole numbers iiy. The relations for a system consisting only o f a homogeneous gas phase can be obtained by setting all o f the nj equal to zero.
The procedure is designed for calculations to be carried out on large computers. For this reason, it takes advantage o f the possibilities offered for a general program by the general nature o f the notation that has been employed to describe the chemistry of the system. An objective in formulating the procedure is to make the computer program as simple as possible. Simplicity o f program is achieved at the expense o f the number o f individual arithmetic operations that need to be carried ou t
I f the equilibrium composition is to be evaluated in calculations performed by hand (as with a desk calculator), it is desirable to reduce the number o f arithmetic operations as much as possible by a partial reduction o f the problem ip which the chemical nature o f the system !s explicitly considered. A procedure o f this type for systems consisting o f compounds o f carbon, hydrogen, oxygen, and nitrogen is presented in Appendix C.
B-2 L l i ' j i r A f l j Z A J I O N OF T H E EQUILIBRIUM CONDITIONS
The equilibrium conditions, Eqs. 2-30, can be written for the heterogeneous system under consideration in the form,
M, = J ^ , A (i = 1, —, s) (B-1)
and
= liTA, if n jf 0 (j = 1 , ..., c) (B-2)
where p, and p.j Me the chemical potentials at the i-th gaseous constituent and the j-th condensed component in the heterogeneous mixture.The stoichiometric conditions fo r the same system are
2 + nj = 9, (/ = 1, .... c) (B-3)
where for generality we have assumed that every component may exist as a condensed phase. In practice nj will be zero for most j and i f nj = 0 for a l l t h e system consists o f a.gas phase only.
The number o f Eqs. B-1 to B-3 is equal to the sum o f the number o f components, the number o f gaseous constituents, and the number o f condensed phases. This number is equal to the number o f unknowns n,, nj, and X*. We will consider the temperature and either u e gas phase volume r or the pressure p to be additional unknown variables, and we will supplement Eqs. B-1 and B-2 by two independe ‘ specifications o f the state o f the system.
The number o f equations to be solved can be reduced by the number o f components by algebraic elimination o f the .parameters X* to m Eqs. B-1 to B-3. I f this is. done, it tums.outthat the number o f arithmetical operations in calculating the coefficients o f fhe remaining unknowns and in the subsequent solution o f the equations is just the same as the number o f arithmetical operations required to solve the larger set o f equations. (The two alternatives are, in fact, formally identical.) I f the X* are eliminated algebraically, a more elaborate program is required. Therefore, there is no benefit from such a procedure i f the memory capacity o f the computer is adequate to accommodate the problem with the larger number o f variables.
The dominant parts o f Eq. B-1 are linear in the logarithms o f the mole numbers nh while Eq, B-3 are linear in the mole numbers. Two computational procedures are possible, each resulting in an approximate set o f equations linear in all o f the variables. One is to expand the logarithms o f the mole numbers (and the contributions from the equation of state) in
B-1
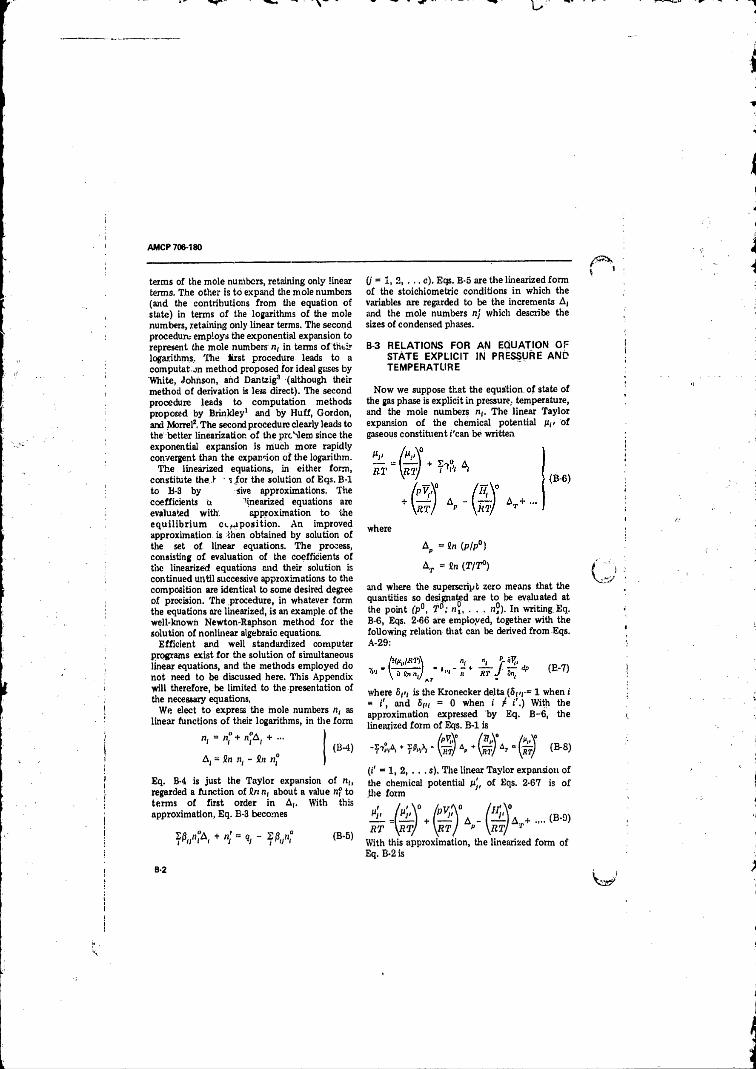
ANICP 706-180
terms o f the mole numbers, retaining only linear terms. The other is to expand the mole numbers (and the contributions from the equation o f state) in terms o f the logarithms o f the mole numbers, retaining only linear terms. The second procedure employs the exponential expansion to represent the mole numbers n, in terms of'their logarithms.. The fast procedure leads to a computat on method proposed for ideal gases by White, Johnson, and Dantzig3 (although their method o f derivation is less direct). The second procedure leads to computation methods proposed by Brinkley1 and by Huff, Gordon, and Morrel1, The second procedure clearly leads to the better linearization o f the problem since the exponential expansion is much more rapidly convergent than the expansion o f the logarithm.
The linearized equations, in either form, constitute the,Y ■ s for the solution o f Eqs. B -l to B-3 by sive approximations. Thecoefficients b. 'inearized equations are evaluated with approximation to the equ ilib riu m com position . An improved approximation is then obtained by solution o f the set o f linear equations. The process, consisting o f evaluation of the coefficients o f the linearized equations and their solution is continued until successive approximations to the composition are identical to some desired degree o f precision. The procedure, in whatever form the equations are linearized, is an example o f the well-known Newton-Raphson method fo r the solution o f nonlinear algebraic equations.
Efficient and well standardized computer programs exist fo r the solution o f simultaneous linear equations, and the methods employed do not need to be discussed here. This Appendix will therefore, be limited to the presentation o f the necessary equations,
We elect to express the mole numbers n, as linear functions o f their logarithms, in tire form
n, = n° + n°A, + ..
A, = in nt - fin n°(B -4 )
Eq. B-4 is just the Taylor expansion o f n,, regarded a function of in nt about a value nf to terms o f first order in A,. With this approximation, Eq. B-3 becomes
+ <B - 5 >
O' = 1, 2, . . . c). Eqs. B-5 are the linearized form o f the stoichiometric conditions in which the variables are regarded to be the increments A, and the mole numbers nj which describe the sizes o f condensed phases.
B-3 RELATIONS FOR AN EQUATION OF STATE EXPLICIT IN PRESSURE AND TEMPERATURE
N ow we suppose that the equation, o f state o f the gas phase is explicit in pressure, temperature, and the mole numbers n(. The linear Taylor expansion o f the chemical potential (q< o f gaseous constituent i'can be written
where
\ = in {p Ip ° )
A , = in {T/T°)
and where the superscript zero means that the quantities so designated are to be evaluated at the point (p°, T ° ; n°, . . . n j). In writing Eq. B-6, Eqs. 2-66 are employed, together with the following relation that can be derived from Eqs. A-29:
where S,>f is the Kronecker delta (5|,r = 1 when i = f', and 5(/j = 0 when i t i ', ) With the approximation expressed by Eq. B-6, the linearized form o f Eqs. B -l is
\ + (B-8)
(i' = 1 , 2 , . . . s). The linear Taylor expansion o f the chemical potential p', o f Eqs. 2-67 is o f .the form
(B-9)
With this approximation, the linearized form o f Eq. B-2 is
B-2
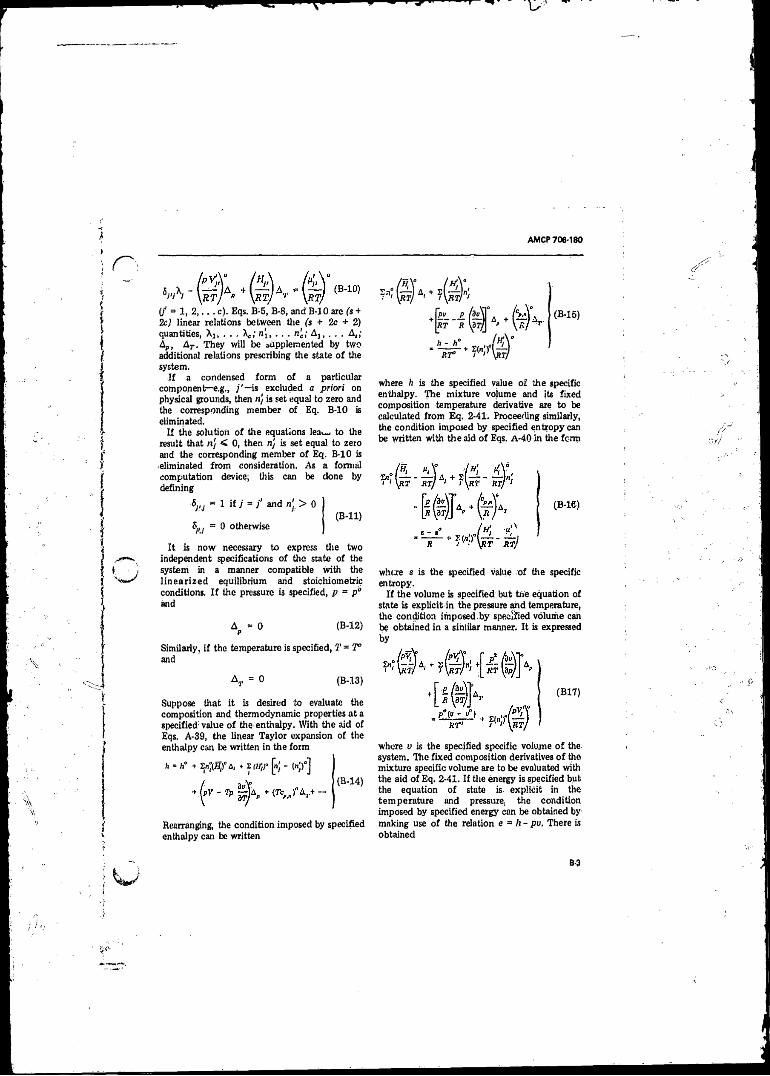
AMCP 706-180
(j1 = 1, 2 , . . . c). Eqs. B-5, B-8, and B-10 are (s + 2c) linear relations between the (s + 2c + 2) quantities, X j, . . . K n 'ly . . . n!c; A J; . . . A,; A„, Ar . They will be supplemented by two additional relations prescribing the state o f the system.
I f a condensed form o f a particular component—e.g., is excluded a priori onphysical grounds, then n) is set equal to zero and the corresponding member o f Eq. B-10 is eliminated.
I f the solution o f the equations lea>— to the result that n] < 0, then n] is set equal to zero and the corresponding member o f Eq. B-10 is eliminated from consideration. As a formal computation device, this can be done by defining
&j,j = 1 i f / = and nj > 0
Bjtj = 0 otherwise(B - l l )
It is now necessary to express the two independent specifications o f the state o f the system in a manner compatible with the lin earized equilibrium arid stoichiometric conditions. I f the pressure i3 specified, p = p° and
Ap = 0 (B-12)
Similarly, i f the temperature is specified, T = T° and
Ay = 0 (B-13)
Suppose that it is desired to evaluate the composition and thermodynamic properties at a specified value o f the enthalpy. With the aid of Eqs, A-39, the linear Taylor expansion o f the enthalpy can be written in the form
a * + 2<tflj)° c, * s M r [«; - («;>-]
Rearranging, the condition imposed by specified enthalpy can be written
Jpy_ £ / M E r " r \a
a. +
' T F ' + ¥ n‘
(B-15)
where h is the specified value o f the specific enthalpy. The mixture volume and its fixed composition temperature derivative are to be calculated from Eq. 2-41. Proceeding similarly, the condition imposed by specified entropy can be written with the aid o f Eqs. a -40 in the form
where s is the specified value o f the specific entropy.
I f the volume is specified but trie equation of state is explicit in the pressure and temperature, the condition impcsed.by specified volume carr be obtained in a similar manner. It is expressed by
where v is the specified specific volume o f the system. The fixed composition derivatives o f the mixture specific volume are to be evaluated with the aid o f Eq. 2-41. I f the energy is specified but the equation o f state is explicit in the temperature and pressure, the condition imposed by specified energy can be obtained by making use o f the relation e =* tr - pv, There is obtained
B-3
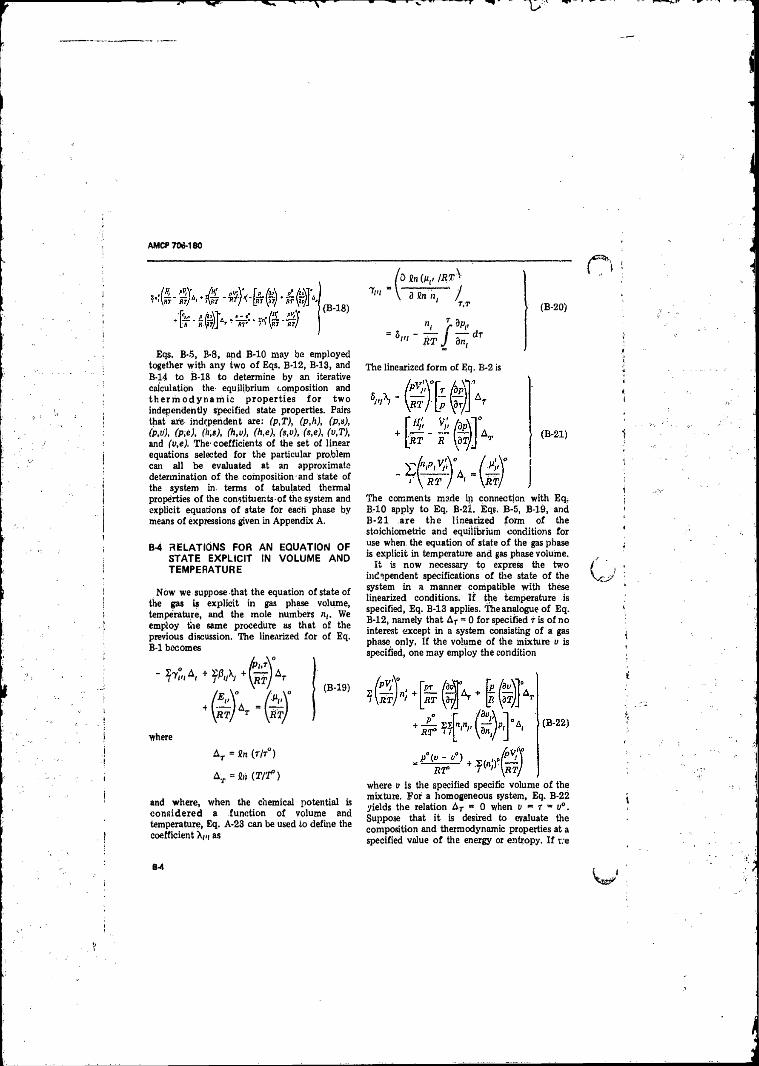
AM CP 706-180
(B-18)
Eqs. B-5, B-8, and B-10 may be employed together with any two o f Eqs. B-12, B-13, and B-14 to B-18 to determine by an iterative calculation the equilibrium composition and th e r m o d y n a m ic p rop erties fo r tw o independently specified state properties. Pairs that are independent are: (p,T), (p,h), (P,s), (p,v), (P,e), (K’ h (h,v), (A,e), (s,u), (s,e), (u,T), and (v,e). The- coefficients o f the set of linear equations selected for the particular problem can all be evaluated at an approximate determination o f the composition and state of the system in terms o f tabulated thermal properties o f the constituents o f the system and explicit equations o f state for each phase by means o f expressions given in Appendix A.
B-4 RELATIONS FOR AN EQUATION OF STATE EXPLICIT IN VOLUME AND TEMPERATURE
Now we suppose that the equation o f state o f the gas is explicit in gas phase volume, temperature, and the mole numbers n,. We employ the same procedure as that o f the previous discussion. The linearized fo r o f Eq. B-l becomes
- + ( ~ ) a t
+ [ r t J A t
(B-19)
where
A t = in ( r lr°)
Aj, - in (T P ? )
and where, when the chemical potential is con s id ered a function o f volume and temperature, Eq. A-23 can be used to define the coefficient Am as
(o in (P ,,/ R T ^
'r" i = \ 3 in n, /* T,T
n, Tf dp,,
= 5"' ~ RT j 3n, dT
(B-20)
The linearized form of Eq. B-2 is
The comments made in connection with Eq; B-10 apply to Eq, B-2l. Eqs. B-5, B-19, and B-21 are th e linearized form o f the stoichiometric and equilibrium conditions for use when, the equation o f state o f the gas phase is explicit in temperature and gas phase volume.
It is now necessary to express the two independent specifications o f the state o f the system in a manner compatible with these linearized conditions. I f the temperature is specified, Eq. B-13 applies. The analogue o f Eq. B-12, namely that A r = 0 fo r specified t is o f no interest except in a system consisting o f a gas phase only, I f the volume o f the mixture v is specified, one may employ the condition
where u is the specified specific volume o f the mixture. For a homogeneous system, Eq. B-22 yields the relation A r = 0 when v = r - v°. Suppose that it is desired to evaluate the composition and thermodynamic properties at a specified value o f the energy or entropy. I f we
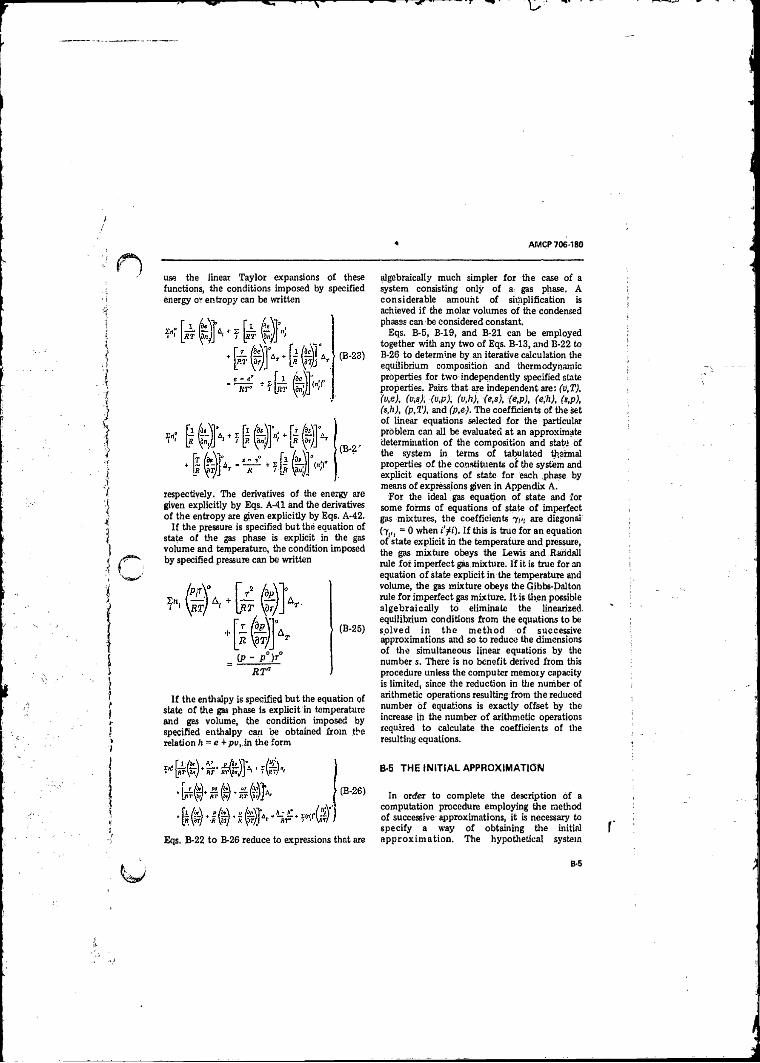
AMCP 706-180
use the linear Taylor expansions oC these functions, the conditions imposed by specified energy o? entropy can be written
respectively. The derivatives o f the energy are given explicitly by Eqs. A-41 and the derivatives o f the entropy are given explicitly by Eqs. A-42.
I f the pressure is specified but the equation o f state o f the gas phase is explicit in the gas volume and temperature, the condition imposed by specified pressure can be written
, 0 , < (P - P )r
R T a
I f the enthalpy is specified but the equation of state o f the gas phase is explicit in temperature and gas volume, the condition imposed by specified enthalpy can be obtained from the relation h - e + pu,.in the form
Eqs. B-22 to B-26 reduce to expressions that are
algebraically much simpler fo r the case o f a system consisting only o f a, gas phase. A considerable amount o f simplification is achieved i f the molar volumes o f the condensed phases can be considered constant.
Eqs. B-5, B-19, and B-21 can be employed together with any two o f Eqs. B-13, and B-22 to B-26 to determine by an iterative calculation the equilibrium composition and thermodynamic properties for two independently specified state properties, Pairs that are independent are: (V,T), (u,e), (v,s), (u,p)i (o,k), (e,s), (e,p), (e,h), (a,p), (s,h), (p,T), and (p,e). The coefficients of the set o f linear equations selected for the particular problem can all be evaluated at an approximate determination o f the composition and state of the system in terms o f tabulated thermal properties o f the constituents o f the system and explicit equations o f state for each phase by means o f expressions given in Appendix A.
For the ideal gas equation o f state and for some forms o f equations o f state o f imperfect gas mixtures, the coefficients 7 ,1- are diagonal (7 i(j = 0 when i'jtf). I f this is true for an equation of state explicit in the temperature and pressure, the gas mixture obeys the Lewis and Randall rule fo r imperfect gas mixture. I f it is true for an equation o f state explicit in the temperature and volume, the gas mixture obeys the Gibbs-Dalton rule fo r imperfect gas mixture. I t is then possible a lgebraically to eliminate the linearized, equilibrium conditions from the equations to be so lved in th e m ethod o f successive approximations and so to reduce the dimensions o f the simultaneous linear equations by the number s. There is no benefit derived from this procedure unless the computer memory capacity is limited, since the reduction in the number of arithmetic operations resulting from the reduced number o f equations is exactly offset by the increase in the number o f arithmetic operations required to calculate the coefficients o f the resulting equations.
B-5 THE INITIAL APPROXIMATION
In order to complete the description o f a computation procedure employing the method o f successive approximations, it is necessary to specify a way o f obtaining the initial approx im ation . The hypothetical system
B-5
AM CP 706-180
consisting o f components only provides a conven ien t initial approximation to the composition. Our procedure requires that the nt must not vanish (although they may be negligibly small). Tins requirement is met if, in the absence o f a better approximation, the initial approximation is takei to be
n° = e if i =£ i(j)
where i(j) is the' constituent label o f the j-th component and e is an arbitrarily chosen constant smaller than the precision with which the equilibrium composition is to be calculated, and
n° — q. i f i = !(/)
and a condensed' phase o f the j-th component is excluded a priori, or
n° = e i f i = 10')
and a condensed phase o f the j-th component may exist, in which case
I f the temperature and pressure or volume o f the system, is not prescribed, initial' estimates o f these quantities can be entirely arbitrary (but preferably o f the correct order of magnitude) or, when available, the results o f some simplified approximate calculation.
The state for which enthalpy and pressure are specified is called the constant pressure combustion state. That for which the energy and volume are specified is called the constant volume explosion state. The latter is frequently employed to describe the reaction products o f a condensed explosive.
B-6 CALCULATION OF THE EQUILIBRIUM PARTIAL DERIVATIVES
T h e equ ilib r iu m derivatives (dv/dT)p, (bv/dp)T, and c„ can be evaluated by means of Eqs. 2-48 and 2-62 i f the partial detwatives o f the mole numbers n( and nj with respect to temperature and pressure in equilibrium mixtures are determined. Expressions for ti:ese quantities can be obtained by differentiating, with respect to temperature and with respect to
pressure, Eqs. B -l to B-3, We obtain for the change in equilibrium composition with respect to temperature at constant pressure the simultaneous linear equations
b fin n\ 3n’
W 3t ) + DT _ 0
/a fin n\ fb&
? 7("\ 3r / ~ ‘ RT~(B-27)
wU>'i \bT,3 lR T1
For the change in equilibrium composition with respect to pressure at constant temperature, we obtain the simultaneous linear equations
(d fin n\ 3n!?S.,n. — -----) + ~ = 0! 11 1 \ dp / ap
3 fin n\ /3>.\ V„
l 3p + p J ~ RT(B-28)
H %dp RT
In Eqs. B-27 and B-28, the coefficients y,i, are defined by Eq. B-7. The coefficients o f the variables o f Eqs. B-27 and B-28,are the same and their matrix is the same as the matrix o f the coefficients o f Eqs. B-5, B-8, and B-10. Since the triangular or inverse form o f the letter is obtained in the course o f the calculation o f the equilibrium composition, the solution o f Eqs. B-27 and B-28 can be economically performed.
The equ ilib riu m derivatives {bp/dT)f , {bp/bo)T , and c„ can be evaluated by the procedure described in par. 2-4 i f the partial derivatives o f the mole numbers n( and nj with respect to temperature and gas phase volume in equ ilib riu m m ixtures are determined, Expressions for these quantities can be obtained by differentiating, with respect to temperature and with respect to gas phase volume, Eqs. B-l to B-3. For the derivatives with respect to temperature at constant r, we obtain
B-6
AMCP 706-180
In Eqs. B-29 and B-30, the confidents 7 (>/ are defined by Eq. B-20. The coefficients o f the variables o f Eqs. B-29 and B-30 are the sameand their matrix is the same as the matrix o f the coefficients o f Eqs. B-B, B-19, and B-21. The triangular or inverse form o f the latter is obtained.in the course o f the calculation o f the equilibrium composition, and thus the solutions o f Eqs. B-29 and B-30 can1 be economically obtained.
For the derivatives with respect to r at constant temperature; we obtain
REFERENCES
1. a. S.R. Brinkley Jr., J, Chem. Phys. 15,107 (1947).b. High Speed Aerodynamics and Jet Propulsion, P r in ceton Uriiv. P ress , Princeton, 1956, Vol. II, pp. 64-97.c. Proa. Conf. on Kinetics, Equilibrium-and Performance o f High Temperature Systems,
Butterworth’s; London, 1960, pp. 74-81.2. V . N. Huff, S. Gordon, and V . E. Morrell,
N a tion a l A d v is o ry Com m ittee for Aeronautics Report 1037,1951.
3. W. B. White, S, M. Johnson and G. B. Dantzig, J. Chem. Phys. 28,751.(1958).
B-7
AMCP 706-1*0
APPENDIX C METHOD FOR THE DESK CALCULATION OF EQUILIBRIUM COMPOSITION OF SYSTEMS CONTAINING COMPOUNDS OF
CARBON, HYDROGEN, OXYGEN, AND NITROGENC-1 INTRODUCTION
In this Appendix, we outline.a simple iterative procedure lor the calculation o f the equilibrium composition o f systems containing compounds o f carbon, hydrogen, oxygen, and nitrogen. The procedure is designed fo r hand computations. It is now well adapted to calculations on computers since convergence .is not guaranteed fo r all possible combinations. This is not an important characteristic fo r hand calculations since the computist can exercise judgment to force convergence by adjusting the approximate solution employed as the basis fo r each iterative step.
We assume ‘hat the calculation is to be p e rfo rm ed w ith independent, variables, temperature and pressure, when an equation of state is explicit in temperature acd pressure; or with independent variables, temperature and gas volume, when the equation o f state is explicit in these variables. I f the state o f the system is specified in another way, it is best—in using these methods—to perform the calculation at several appropriate values o f the independent variables and to interpolate in the resulting table of the thermodynamic properties with respect to the property or properties that are specified.
The procedure described in this Appendix does not lead to an exact calculation o f the equilibrium derivatives, such as the heat capacity. I f these quantities are required, they must be evaluated either by the exact methods described in Appendix B, using the ’.omposition calculated by the method of this Appendix C, or by numerical differentiation in a sable o f the appropriate property prepared by performing the calculations at several values o f the independent variables.
Tire chemical species considered i t this Appendix, together with the label assigned to each species, are listed
Spp-aes c-(-) GO C 02 h 2 H20 N2
i or j X 2 s 4 5 6
Species 0 2 0 OB B hJO N
i or j r 8 9 10 11 12
Elemental carbon, i f present, is assumed to be solid.
We define a quantity tpt for each constituent by the following scheme:
¥>, = ^Z(R 'l') (C-1)
where Mr is the chemical potential o f solid carbon, to be evaluated by Eq. A-4, and
V, = H,!(RT) - « , ,/ =* 2 , 3 , . . . 12 (C-2)
where p, is the chemical potential o f the i-th gaseous constituent, <pt is the same quantity less the leading concentration term, and n; v, die number o f moles o fth e i-fh constituent m a unit weight o f mixture. The quantity is io be evaluated with the aid o f Eq A-29 i f the equation o f stale is explicit in temperature pressure, or with the aid or Eq. A-23 i f ‘ha equation o f state is explicit in temperature and gas phase volume. \i'c define equilibriirva constant k, fo r the t4h species ny the relation
log10fc( = 0.43429(2/1,,¥> - * ; ) ( '- -4
Tables o f the coefficients fly are givei/in tables which follow.
The method is based on the fact that, •yitSvone exception receiving, special treatment, ;be-fit as calculated by Eq. C-3 for the particular values of the j3(/ employed here are all much lets than unity at the pressures >>f in ts> }t. ‘ . description o f the ejiylqsioiv piwdticta o f condensed explosives,
GeasraHy olid- earboir is :ki6 eroduced illsyEteftjB c-qrttaming oxygen than required fo r qchaplste ,oxidation o f the carfeh ($d hydrogen. Usually, it is rieCecsajy to- ddtMpiinc Vie equilibrium composition on ’he aasumy-tiorv that solid carbon is present, V> tills calyuiatioji results in a negative amount Of edrlnirs, the calculation is then repeated wdh tlse iznpwledge that solid carbon is absent
We denote by qc , ? « , <to- -in tha liutihar o f gram atoms o f carbon, hydrogen, oxygen, and: nitrogen, respectively, that are preset^ in one gram o f mixture. We a ffix a supmscrjyt zero to
AMCP706180
the symbol nj to denote that the symbol so designated is an approximation to the composition o f the system, and to the symbol k, to denote that the equilibrium constant so designated is to be calculated with the approximation n®, . . . n?2 to the composition o fth e system.
C-2 SYSTEMS WITH SOLID CARBON
The equilibrium constants kt are calculated with the aid o f the following table o f the |3y for each value o f i'for which entries are given:
Steps in the calculation are:(1 ) ms, n4, and n6 are calculated from the
conservation relationships for oxygen, hydrogen, and nitrogen atoms:
"a -
"s = t y * » 4
", = k°A= * ; » 2
" io ' C / " * .
" l l " * l l " 2V \
ni2= k°nV^s
\
(C-5)
(3) Steps (1 ) and (2 ) are repeated in sequence until successive Iterations give the same values o f na, nt , and ns. The amount o f solid carbon is then calculated from
" i = % - " 2 " " s (C -6 )
The Calculations for n j < 0 are given in the next paragraphs,
C-3 R IC H SYSTE M W ITH O U T SOLID CARBON, < 2 qc
The equilibrium constants kt are calculated with the aid o f the following table o f the ft; for each value o f i for which entries are given:
n, - C0 - A - nl - 2n» - j
* -i,,, " "s ” " ^ " lo /(C""1)
n, « - WnJj - VinJ, j
Initially, all o f the n f ’in these relationships can be taken to be zero:(2 ) The remaining mole numbers ore calculated
with the equilibrium conditions:
ft/ CO H 2 H )0 N;
j ’ 2 4 5 6
C O i
i3 1 -1 1 0
o 2 7 0 -2 2 0
0 8 0 -1 1 0O H 9 0 •1/2 1 0
H 10 0 1/2 r0 0
N O 11 0 -1 1 1/2
N 12 0 0 0 1/2
C-2
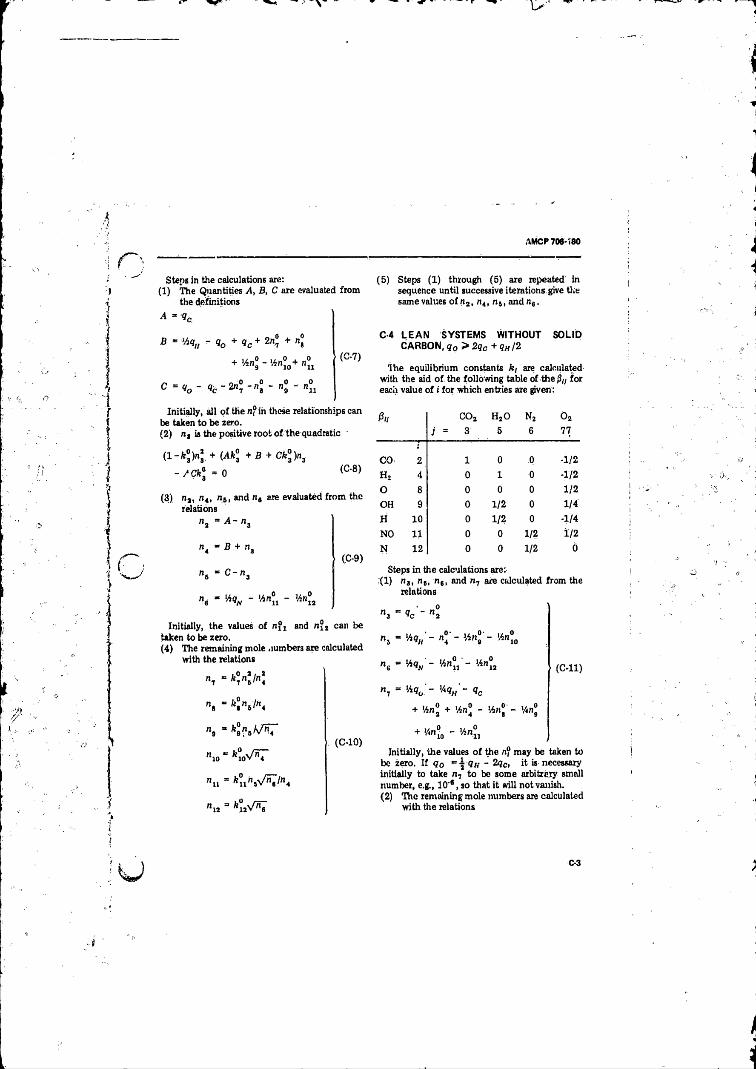
AMCP 706-180
,4
\ Qi
is
f
r .
}*
•ii•i!
Steps in the calculations are:(1 ) The Quantities A, B, C are evaluated from
the definitions
A =
(5 ) Steps (1 ) through (5 ) are repeated' in sequence until successive iterations give the same values o f na, nit n5, and n6.
B = Mq„ - qa + qc + 2n,® + nj
+ Mb® ' »°u(C-7)
C - « o “ 9 c -2 "? -ns - "a - »°u
C-4 LEA N SYSTEMS WITHOUT SOLID CARBON, g0 > 2qc + qH/2
The equilibrium constants fe, are calculated •with the aid o f the following table of the (3W for each value o f i for which entries are given:
Initially, all o f the n® in these relationships can be taken to be zero.(2 ) R j is the positive root o f the quadratic ■
(1 + + B + cfc> s
-/C fc® = 0 (C '8)
(3 ) n2, n4, n6, and b , are evaluated from the relations
n , « B + n,
ns “ c - " s
(C-9)
n« “ - 'An* - Mb®
Initially, the values o f b21 and bJj can be taken to be zero.(4 ) The remaining mole .lumbers are calculated
with the relations
n, - k °n\ln\ '
n , - fe,n8/«4
"s = fta ? 6 V n 7
" i e “ fc?oV ^ T
" u = fcu n5V/V n4
” i2 =
(C-10)
ft f c o 2
j = 3
H jO
5
n 2
6
o 2
77
CO 2 1 0 o -1/2
h 2 4 0 1 0 -1/2
o 8 0 0 0 1/2
OH 9 0 1/2 0 1/4
H 10 0 1/2 0 -1/4
NO 11 0 0 1/2 1/2
N 12 0 0 1/2 6
Steps in (he calculations are:(1) na, n5, n6, and b7 are calculated from the
relations
= 9C' - n z
" , = MqN - M»® ■- Mb®,
b, = Mq0 - M q „ '- qc
+ Mb ® + Mb® - Mb , - Mb,
+ ‘K - lK
(C-ll)
Initially, the values o f the n® may be taken to be zero. I f q0 <3k - 2qc, it is necessary initially to take n , to be some arbitrary small number, e.g., 10's , so that it will not vanish.(2 ) The remaining mole numbers are calculated
with the relations
C-3
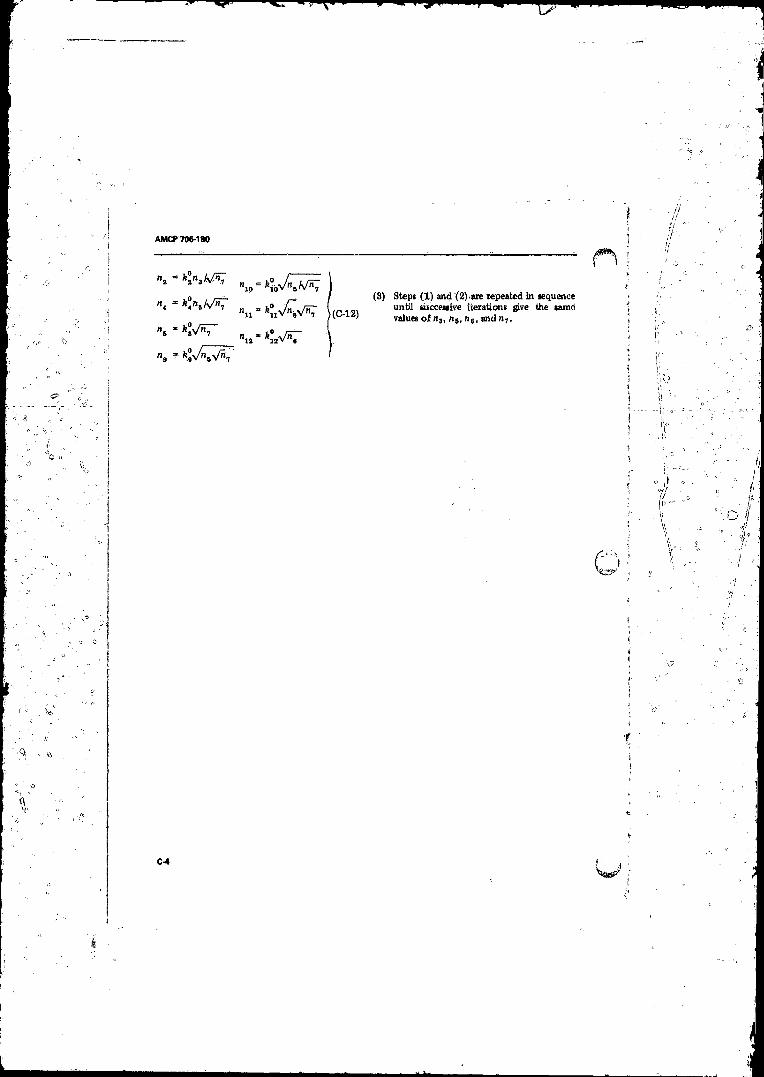
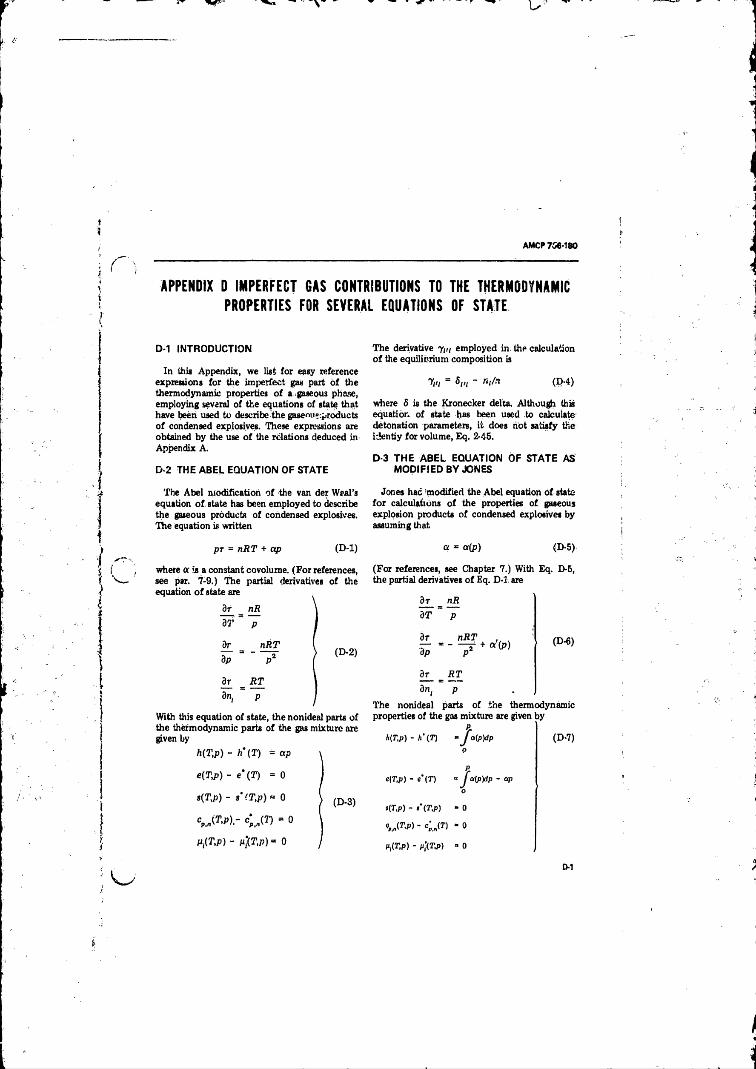
AMCP7S6-180
( \ -------------------------------------------'------------------------------ '---------- 'APPENDIX D IMPERFECT GAS CONTRIBUTIONS TO THE THERMODYNAMIC
PROPERTIES FOR SEVERAL EQUATIONS OF STATE
D-1 INTRODUCTION
In this Appendix, we list for easy reference expressions for the imperfect gas part o f the thermodynamic properties o f a .gaseous phase, employing several o f the equations of state that have been used to describe the gasenu°:products o f condensed explosives. These expressions are obtained by the use o f the relations deduced in Appendix A.
D-2 THE ABEL EQUATION OF STATE
The derivative ym employed in the calculation o f the equilibrium composition is
%n = " k ,/.i (D-4)
where S is the Kronecker delta. Although this equation, o f state has been used to calculate detonation parameters, it does riot satisfy the identiy for volume, Eq. 2-45.
D-3 THE ABEL EQUATION OF STATE AS MODIFIED BY JONES
The Abel nlodificatioh o f the van der Waal’s equation o f state has been employed to describe the gaseous products o f condensed explosives. The equation is written
Jones had modified the Abel equation o f state fo r calculations o f the properties o f gaseous explosion products o f condensed explosives by assuming that
pr - nRT + ap (D-1)
dr
3 T
3r dp
3r
dn,
nR
P
nRT„2 (D-2)
RT_
P
a = a(p) (D-5)
where a is a constant covolume. (F or references, see par. 7-9.) The partial derivatives o f the equation o f state are
(For references, see Chapter 7.) With Eq. D-5, the partial derivatives o f Eq. D-1. are
3r
~dTnR
P
3t nRT ,, ,— ------ r + a (p )dp P*
ordn,
F T
P
(D-6)
With this equation o f state, the nonideal parts o fThe nonideal parts o f the thermodynamic properties o f the gas mixture are given by
(D '7)the thermodynamic parts o f the gas mixture are given by
. prh(T,p) - h'(T) “ J a(p)dp
h(T,p) - ft’ (T ) = ap \ O
e (T , p ) - e * ( T ) = 0 l e(T.P) - • (T ) - J alpyip -
s(T,p) - s‘ !T,p) = 0 \ p . 3)o
*{T.p) - « ’ (T ,p ) - 0
% JT,P ).- cpn(T) = 0 lV'JT.p) ' K J T> " °
Pf,T,p) - p'fT,p)= 0 / V-f.T,p) - p\(T.p) ■ 0
D-1
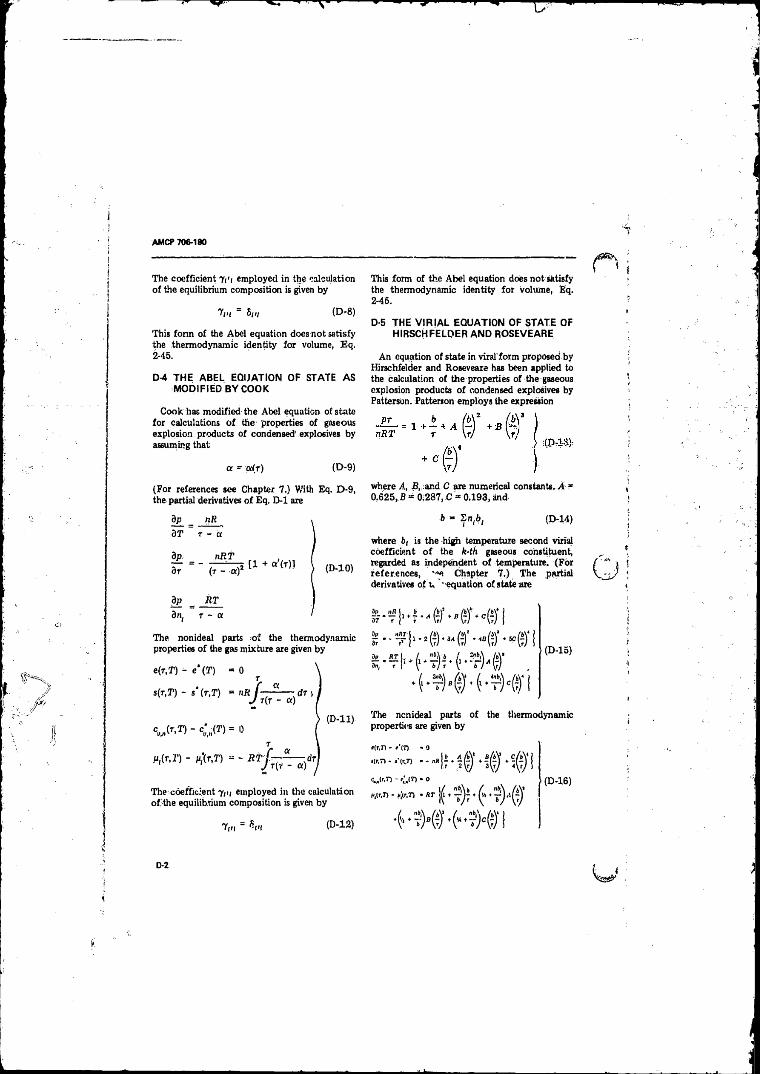
AMCP 706-180
The coefficient 7i'i employed in the calculation o f the equilibrium composition is given by
7 ,„ = 5m (D -8)
This fonn of the Abel equation does not satisfy the thermodynamic identity for volume, Eq. 2-45.
D-4 THE ABEL EQUATION OF STATE AS MODIFIED BY COOK
Cook has modified the Abel equation of state for calculations o f the properties of gaseous explosion products o f condensed'explosives by assuming that
a - a (j) (D-9)
(For references see Chapter 7.) With Eq. D-9, the partial derivatives o f Eq. D -l are
This form o f the Abel equation does not satisfy the thermodynamic identity fo r volume, Eq. 2-45.
D-5 THE V IR IA L EQUATION OF STATE OF HIRSCWFELDER AND ROSEVEARE
An equation of state in viral form proposed by Hirschfelder and Roseveare has been applied to the calculation of the properties o f the gaseous explosion products o f condensed explosives by Patterson. Patterson employs the expression
where A, B, ar.d C are numerical constants. A =■ 0,625, B = 0;287, C = 0.193, and
9p nR9 T r - a
dp nRTdr (t - a)
dp HTd n( r - ot
5 ( 1 + a '(r ) l { (d _10 )
CM (r ' T > - < n ( T ) = 0T
P,(r,T ) - p'(r,T) - - R T f ~ ~ d r j
The coefficient 7 m employed in the calculation of,the equilibrium composition is given by
7„, = (D-12)
b = 2 n,&( 1 11 (D-14)
where bt is the high temperature second virial coefficient o f the k-th gaseous constituent, regarded as independent o f temperature. (For references, ' “ a Chapter 7.) The partial derivatives o f u ' -equation o f state are
3p nit 1 br - ■ — \ 1 * * + ar r ) r
The nonideal parts o f the thermodynamic properties o f the gas mixture are given by
e(r,T ) - e * (T ) - 0r
s ( t , T ) - s*(r ,T ) = nR — -d r 1J r(r - a)
(D -l 5)
(D -ll) The ncnideal parts o f the thermodynamic properties are given by
hen - • 0<(T,71 - *’ (nT) • - nR
CjhTi • ‘ 0
P,(r,T} - *L(r,T) • R T
(D-16)
D-2
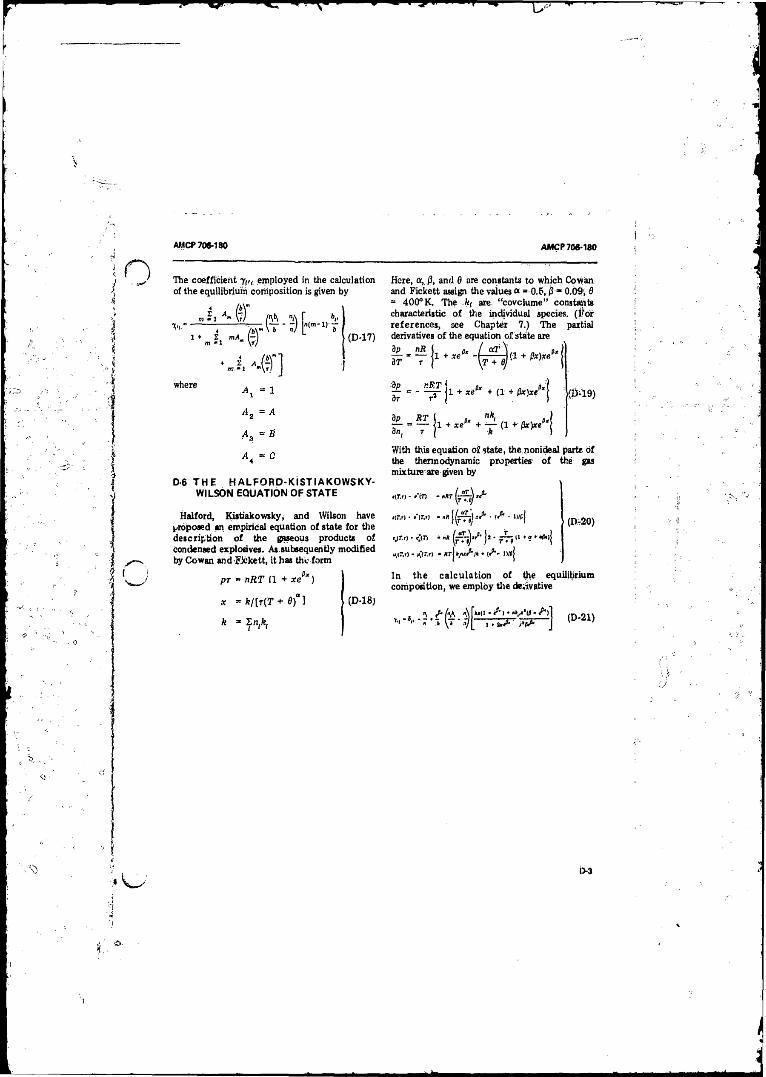
AMCP 706-180 AMCP 706-180
The coefficient j fll. employed in the calculation of the equiUbriurh composition is given by
■Vi.'f
4X mAM
m - 1 * r4
+ 2nr- ■ 1
M " A f ,
(D-17)
Here, a, ft, and 0 are constants to which Cowan and Fickett assign the vaiues a. = 0.5, ft =* 0.09; 0 = 400° K. The .ft, are “ covolume” constants characteristic o f the individual species. (For references, see Chapter 7.) The partial derivatives o f the equation o f state are
where
D-6 T H E H A L F O R D -K iS T IA K O W S K Y - WILSON EQUATION OF STATE
Halford, Kiatiakowsky, and Wilson have proposed an empirical equation o f state for the description o f the gaseous products o f condensed explosives. As subsequently modified by Cowan and Sekett, it has the form
pr = nRT (1 + xef‘ )
x » f e / [ r ( T + 0 ) “ l
ft = In,ft,i 1 '
(D-1S)
■dp3r
+ (1 + Px)xJ*\
3p_
3n(
RT|l + xe0*
nk{+ ~ ~ (1 +‘ 0x)xe
k0*1
0-19 )
With this equation o f state, the nonideal parte 6f the thermodynamic properties o f the gas mixture are given by
• iw - ' ’ in - « st
nr.r) - - nn j - J ' • ■ n/cj
sir.') - Cm " «* ( f T j ) " 1’' js ‘ rTT11" ? ''•‘‘"j«,tr.r> - r j r .,1 . x r j k/v f-ih * ,/•- ivsj
(D,20)
In the ca lcu lation o f the equilibrium composition, we employ tire derivative
», Wn,*, f*ii|I -/ ‘ I t xljf’lp- y‘i ■*“ " " iy [ i . a .> r Jv?:
(D-21)
i>3
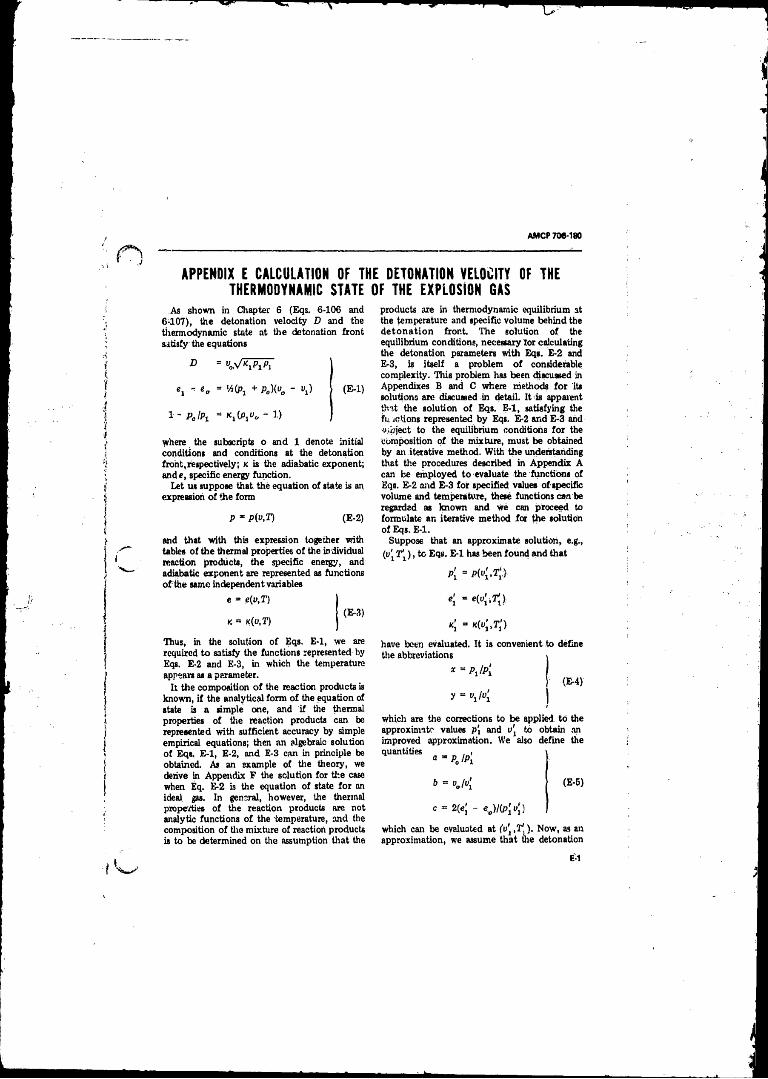
AMCP 706-180
APPENDIX E CALCULATION OF THE DETONATION VELOCITY OF THE THERMODYNAMIC STATE OF THE EXPLOSION GAS
As shown in Chapter 6 (Eqs. 6-106 and 6-107), the detonation velocity D and the thermodynamic state at the detonation front satisfy the equations
D =
ei ~ eo ~ VS(Pj + Pa)(vo - Uj)
1 ' P 0 IPt = K jtP jO ,, - 1 )
(E -l)
where the subscripts o and 1 denote initial conditions and conditions at the detonation front,respectively; k is the adiabatic exponent; ande, specific energy function.
Let us suppose that the equation o f state is an expression o f the form
P - P(v,T) (E-2)
and that with this expression together with tables o f the thermal properties o f the in dividual reaction products, tire specific energy, and adiabatic exponent are represented as functions o f the same independent variables
e = e(u,T)
(E-3)K = K(V,T)
products are in thermodynamic equilibrium at the temperature and specific volume behind the de ton a tion front. The solution o f the equilibrium conditions, necessary for calculating the detonation parameters with Eqs. E-2 and E-3, is itself a problem o f considerable complexity. This problem has been discussed in Appendixes B and C where methods fo r its solutions are discussed in detail. It is apparent that the solution o f Eqs. E -l, satisfying the fu jcrtions represented by Eqs. E-2 and E-3 and ob jec t to the equilibrium conditions fo r the composition o f the mixture, must be obtained by an iterative method. With the understanding that the procedures described in Appendix A can be employed to evaluate the functions of Eqs. E-2 and E-3 for specified values o f specific volume and temperature, these functions can be regarded as known and we can proceed to formulate an iterative method for the solution o f Eqs. E-l.
Suppose that an approximate solution, e.g.,
(Uj ) , to Eqs. E -l has been found and that
p[ = p K . t ;;-
= e K i lJ ) :
Thus, in the solution o f Eqs. E-l, we are required to satisfy the functions represented by Eqs. E-2 and E-3, in which the temperature appears as a parameter.
It the composition o f the reaction products is known, if the analytical form o f the equation of state is a simple one, and if the thermal properties o f the reaction products can be represented with sufficient accuracy by ample empirical equations; then an algebraic solution o f Eqs. E -l, E-2, and E-3 can in principle be obtained. As an example of the theory, we derive in Appendix F the solution for the case when Eq. E-2 is the equation o f state fo r an ideal gas. In general, however, the thermal properties o f the reaction products are not analytic functions o f the temperature, and the composition o f tire mixture o f reaction products is to be determined on the assumption that the
have been evaluated. It is convenient to define the abbreviations i
* = pJ P ‘i
y = V 4
(E-4)
which are the corrections to be applied to the approximate values p i and i>j to obtain an improved approximation. We also define the qu entities . i 1
a ~PolPx ,
b = v jv [ (E-5)
« = 2(ej " e J I ( P ' i )
which can be evaluated at fu '.T ! ) . Now, as an approximation, we assume that the detonation
E-1
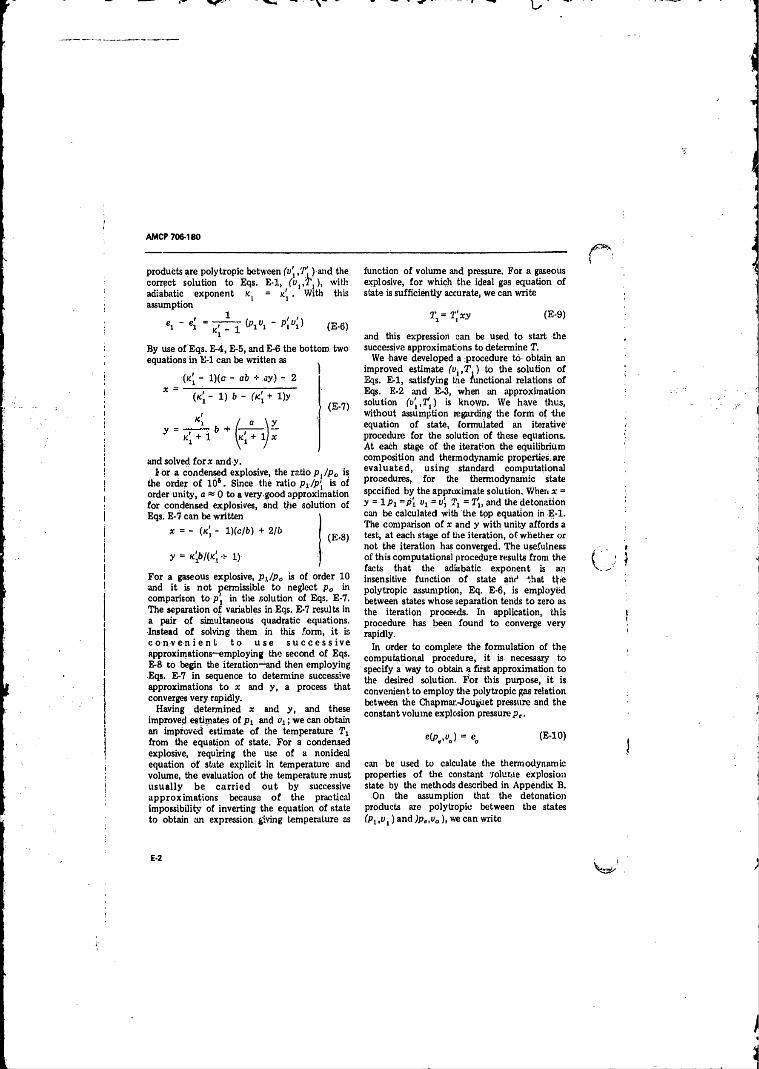
AMCP 706-180
products are polytropic between (v1 ,T ' ) and the correct solution to Eqs. E -l, fi>1,2’1), with adiabatic exponent K( = x, . With this assumption
. e- (piV i . p| „ ') (E .6)
By use o f Eqs. E-4, E-5, and E-6 the bottom two equations in E -l can be written as
(x , - l ) ( c - ab + ay) - 2
( < - 1 ) b - (■ «;+ i )y
i L £ _ \ y
(E-7)
and solved fo r * andy.1 or a condensed explosive, the ratio px/p0 is
the order o f 10s . Since the ratio P\lp\ is of order unity, a « 0 to a very good approximation for condensed explosives, and the solution of Eqs. E-7 can be written
* = - ( « ; - 1)(c/6) + 2lb
y = x£/ (x , -i- 1) ;
For a gaseous explosive, Px/p0 is o f order 10 and it is not permissible to neglect pa in comparison to p', in the solution of Eqs. E-7. The separation o f variables in Eqs. E-7 results in a pair o f simultaneous quadratic equations. Instead o f solving them in this form, it is c o n v e n i e n t t o u s e s u c c e s s i v e approximations—employing the second o f Eqs. E-8 to begin the iteration—and then employing •Eqs. E-7 in sequence to determine successive approximations to x and y, a process that converges very rapidly.
Having determined x and y , and these improved estimates o f px and i q ; we can obtain an improved estimate o f the temperature T , from the equation o f state. For a condensed explosive, requiring the use o f a nonideal equation o f state explicit in temperature and volume, the evaluation of the temperature must usually be ca rr ied ou t by successive approximations because o f the practical impossibility of inverting the equation o f state to obtain an expression giving temperature as
function o f volume and pressure. For a gaseous explosive, fo r which the ideal gas equation o f state is sufficiently accurate, we can write
T ,= f[xy (E-9)
and this expression can be used to start the successive approximations to determine T,
We have developed a procedure to obtain an improved estimate (vJtT ) to the solution o f Eqs. E-l, satisfying the functional relations o f Eqs. E-2 and E-3, when an approximation solution (u '.T 'j) is known. We have thus, without assumption regarding the form of the equation o f state, formulated an iterative' procedure for the solution o f these equations. A t each stage o f the iteration the equilibrium composition and thermodynamic properties.are evaluated, using standard computational procedures,, for the thermodynamic state specified by the approximate solution. When x - y = l P i =p[ i>i - v'i 7i = T i, and the detonation can be calculated with the top equation in E -l. The comparison o f x and y with unity affords a test, at each stage o f the iteration, o f whether or not the iteration has converged. The usefulness o f this computational procedure results from the facts that the adiabatic exponent is an insensitive function o f state and that the poly tropic assumption, Eq. E-6, is employed between states whose separation tends to zero as the iteration proceeds. In application, this procedure has been found to converge very rapidly.
In order to complete the formulation o f the computational procedure, it is necessary to specify a way to obtain a first approximation to tile desired solution. For this purpose, it is convenient to employ the polytropic gas relation between the Chapman-Jouguet pressure and the constant volume explosion pressurepe.
e(pe,v j = e (E-10)
can be used to calculate the thermodynamic properties o f the constant volume explosion state by the methods described in Appendix B.
On the assumption that the detonation products are polytropio between the states (p, ,u ,) and )pe,f0), we can write
E-2
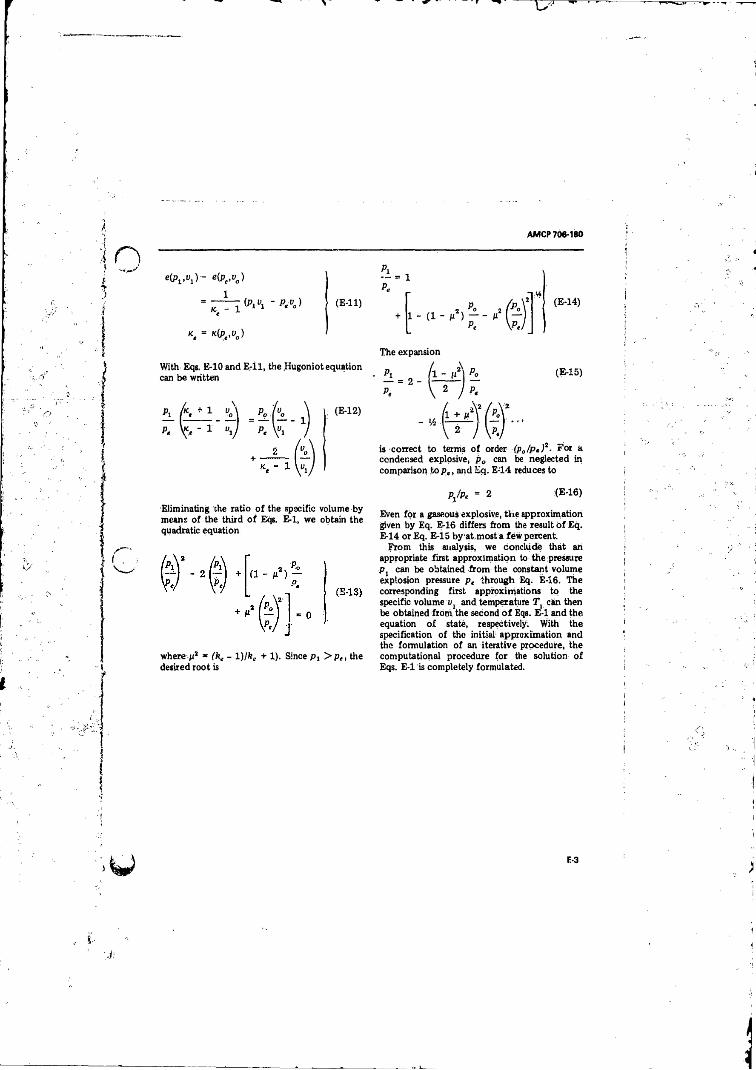
AMCP 706*180
• K p ^ ) - e(pe,vo)
= T T i (PlVl ‘ P‘ °
K. = K^ - Uo)
(E - l l )
With Eqs. E-10 and E - l l , the .Hugoniot equation can be written
P i fa + 1 "A 1 (’■p, 1 H
i
■ J p .
(E-12)
2 l - ip.
2 2 H o(E-14)
The expansion
1 +
(E-15)
+is correct to terms o f order (p0/pt)'1- For a condensed explosive, p0 can be neglected in comparison to pe, and Eq. E;14 reduces to
Eliminating the ratio o f the specific volume by means o f the third o f Eqs. E-l, we obtain the quadratic equation
where p* * (k„ - 1 )lkc + 1). Since Pi > p , , the desired root is
P/Pe = 2 (E-16)
Even for a gaseous explosive, the approximation given by Eq. E-16 differs from the result Of Eq. E-14 or Eq. E-i5 by ’at.most a few percent.
From this analysis, we conclude that an appropriate first approximation to the pressure p , can be obtained from the constant volume explosion pressure p„ through Eq. E-16. The corresponding first approximations to the specific volume Uj and temperature T , can then be obtained from the second o f Eqs. E -l and the equation o f state, respectively; With the specification o f the initial approximation and the formulation o f an iterative procedure, the computational procedure for the solution o f Eqs. E -l is completely formulated.
E-3
AMCP7M-1S0
APPENDIX F CALCULATION OF THE DETONATION VELOCITY FOR IDEAL GASESAs shown in Chapter 6 the detonation pressure
P, and the detonation specific volume u, are determined by solving the equations .
e , - e2 = '/4(p, + p j ( u 0 - U j)
1 - P j P c M V o " D
(F - l )
and the solution requires the introduction o f an equation of state. When i t has been obtained, the detonation velocity D and the particle velocity Uj can be evaluated using the equations
D = •oV tP P l (F-2)
ui = - P0\ )
As an example o f the application o f the theory, we derive in this Appendix the solution o f Eqs. F -l fo r the case where the explosion products are described with sufficient accuracy by the idee! gas equation o f state
exp los ion products at pressure p „ and temperature T0. For an ideal gas, the enthalpy is independent o f the pressure and a function o f the temperature only. Therefore, theleft-hand side o f Eq. F-4 can be written ,
K - h{po,T0) = A ° (T ,) - h°(To) j (P-5)
= oJtT, - Ta) jwhere ti(T) - h(T, p = 1 atm) is the ideal gas specific enthalpy o f the> explosion products and c j is the average specific heat o f the explosion products between temperatures T0 and Tx . When this expression is substituted into Eq. F-4 and the temperature eliminated by means o f Eq. F-3, we obtain
= q + t4(p} - + u0 )
pv = nRT (F-3)
where n is the number o f moles o f gas produced by unit weight o f explosive. We also assume that the composition o f the explosion gas is frozen and is known. In order to calculate the detonation velocity and detonation properties o f ' a gaseous detonation, to which case the ideal gas equation o f state is accurately applicable, the results o f this Appendix can be employed iteratively with the procedure for the calculation o f the equilibrium composition that has been described in Chapter 2. The results also provide a basis for approximate relations that are o f practical interest fo r the estimation of the explosion properties o f condensed explosives.
It is convenient to transform Eq. F-X by the introduction o f the specific enthalpy h = e +pv and o f the specific heat o f explosion, defined by Eq. 6-8. When this is done, we obtain
= c, + 'A(px - p„)(vx + u„) (F-4)
where li(pa, T „ ) is the specific enthalpy o f the
When the abbreviations x= vi /va, y = p, /p0, a “ 2 c%MR, b » 2 (g + eg TJ/(p0v0) are introduced, Eq. F-6 becomes
(a - 1 pey + x ~ y * ‘ b - l (p-7 )
In the special case that the average specific heat <5 is a constant, Eq. F-7 describes a rectangular hyperbola.
For an ideal gas, the adiabatic exponent k is equal to the ratio o f the heat capacity at constant pressure to that at constant volume,
* = “ 7 ° <F-8>
By using the abbreviations x and y, the second o f Eqs. F -l can be transformed to the expression
{y° + l )x y - x - y°y = 0 (P-9)
Eqs. F-7 and F-9 are to be solved simultaneously for at andy,
Upon separation o f the variables, a pair o f quadratic equations is obtained
F-1
AMCP 706*180
(%° + a)x2- (y “ + l)bx + y ° (b - l) = 0 j
[7i°(o - 1) - 7° - 1 ]7 2 (P-10)
- (7 ° + 1)(6 - 2 )y + 6 - 1 = 0 '
These equations can be solved with the aid o f the usual formula fo r the roots of a quadratic equation. Each has two real roots. The Chapman-Jouguet detonation, which is here the solution o f interest, corresponds to the pair for which x < 1, y > 1. (The pair fo r which x > 1, y < 1 corresponds to a Chapman-Jouguet deflagration.) A fter x and y have been obtained,
and Pi can be evaluated and the temperature o f the Chapman-Jouguet state can be
evaulated with the=aid o f the equation o f state, Eq. P-3.
Both the. average specific heat and the heat capacity ratio are functions o f temperature, although the temperature dependence is not very strong. I f an attempt is made to include the temperature dependence explicitly by expanding these quantities as a pov/er series o f the temperature, the expressions replacing Eqs. F-10 become o f order higher than the second and their solution becomes awkward. It seems better, therefore, if precise results are desired, to conduct the calculations iteratively. The average specific heat and ratio y° are evaluated at an approximate temperature. The solution o f Eqs. F-10 and F-3 will then yield an improved value o f the temperature, upon which a second solution can be based. I f it is desired to elaborate the calculation to the -extent o f requiring that the explosion products be in thermodynamic equilibrium, the composition o f the products can be adjusted at each stage o f the ite ra t ion by calculating the equilibrium composition at the approximate temperature and pressure o f the particular iteration. Whether the equilibrium calculation is performed or not, the successive approximations will be found to converge rapidly.
As a useful approximation to obtain estimates of the detonation properties, one can assume that the explosion gas is polytropic with a constant heat capacity. Then
„ = 2 7 " /(7 0 - 1 )
b = — [<? + y°nRT0l(y° - 1 )]?oVo
'
(F - l l )
In this approximation, Eqs. F -ld can be written
llb *
2 h - A
I T ~ IV+ I-1;------ 1 (6 - i ) = 0
,7° + 1/
y - (7 - 1)(6 - 2 )y
+ ' t t y ) (6 - U - 0
(F 12)
In the polytropic approximation, 7 ° is a known constant, independent o f the temperature. Therefore, Eqs. F-12 can be solved at once and an iterative-calculation is not required.
Relations that are convenient for order of m agn itude estimates o f the detonation properties can be obtained ficom a further approximation to Eqs. F-12. On the detonation branch o f the Hugoniot curve, x is o f order unity, and y and b are largo compared to unity. As a first approximation, the roots o f Eqs. F-12 co rresp on d in g to the Chapman-Jouguet detonation can be written
* = 7°/(7° + 1)(F-13)
y = (7 ° - D 6
Futhermore, q is much greater than c“ T „. Therefore, Eqs. F-13 result in the approximate relati ms,
- v0 y ° l { y ° + i) ](P-14)
pt - 2 9 (7 ° - 1 ) ! « 0 1
Th e corresponding approximation to the d e to n a tion temperature is obtained by substitution in the equation o f state
m 7° (7 ° - 1)
1 W / 7° + 1(P-15)
F-2
AMCP 706-180
and the corresponding approximations to the detonation velocity and particle velocity are obtained by substitution in Eqs. 6-56
D = */2q(y° + 1 )(7 ° - 1)(F-16)
\ = s/2q(yc ~ l)/ (7 ° + 1 )
In order to estimate the accuracy o f the approximate relations, Eqs. F-14, we may use the formula for the roots of a quadratic to write the exact, solutions .of Eqs. F-12. I f this is done and the resulting radical expanded in powers o f 1/b, the result to terms of order 1/6 can be written
(y ° f1 + 'A -----
i + Jy° + 1
(7V ~ 16
r i ^1y = (7 - i)!> i - 2 +----:----.
. (f")2 - 1.
(F-i7)-
Thus, the approximations expressed by Eqs. F-14 differ from the exact solutions of Eqs; F:12 by terms in the quantity 1/6 o f first and higher orders.
AM CP7M -1M
INDEX
A
Abel 7-2equation o f state 9-10, D-l
Accidents 11-26 Accuracy 14-14Activation energy 4-1,4-3, Table 4-1,10-1 Activity coefficient; 7-3, A-6 Adams 11-24 Adiabat, Hugoniot 11-2
exponent 2-14,2-16, 7-2, 7-9, Table 7-6,14-11, E-1
heating 10-9 Aerodynamic drag 13-10 A F T O N 14-10 Air-blast 3-6 Amatol Tabic 1-2 Ammonium
nitrate Table 1-1 dynamite Table 1-2
perchlorate Table 1-1 picrate Table 1-1 salts 4-16
Amster 11-28A N See: Ammonium nitrate Andreev 4-6A P See: Ammonium perchlorate Argon
flash 5-3 gap method 5-15
Arrhenius equation 10-2,12-10, Fig. 12-6, Table12-2,14-13
Avrami and Erofeev 4-2
B
Ballast, thermal 1-3function o f in explosives, commercial 1-3
Ballistic Mortar test 3-7, Table 3-11, 5-26 Baratol, composition o f Table 1-2 Barium nitrate, in baratol Table 1-3 Barker 14-4Barthei and Strehlow 8-15, 14-4, 14-13, 14-14 Beattie A-3 Becker 6-21, 7-13Becker-Kistiakowiky-Wilson See: BKW code Berthelot
and Vieille 1-1 detonation, theory o f 1-1
Bikini gage 5-19
Bircumshaw 4-16Bis (2,2-dinitro-2-fluoroethyl) formal See;
FEFOBis (N, N'-trinitromethyl), urea See: BTNEU BKW code 14-11Black powder, constituents o f 1-1Blackstock 14-4Blast
pressure 5-19,18-1 propagation theory 1-3 wave,13-1,13-7,13-10
Blasting caps 1-9,-1-4 gelatin Table 1-2,11-26
Boddington 12-8 ,Boltzmann and Jgger 7-16 Bowden 12-4,12-6,12-8
and Y o ffe 12-6 Boyer 11-24,14-13
and Grandey 11-24 Bridgman 510 Brinkley B-2
and Kirkwood 6-21,13-7,13-30,13-31,13-32 and Bichardson 8-12 and Wilson 7-18 stoichiometric conditions 2-8
Briianee 5-24,5-25 Brode 13-12,13-13 Brodie 14-6 BTNEU Table 1-1 Bubble pulse 5-19 Burning law 11-24,12-20
C
Camera framing 5-3 image dissection 5-3rotating-mirror or -drum 5-1, 5-2, Fig. 5-1 “ streak camera 1-2,5-1 See; Photography, high-speed
Campbell, Davis, Bansay, and Travis 11-23 Cartlaw and lager 10-11,10-16 CEL 14-10Chaiker, and Cheaelske 12-8 Chambre’ , 1 W , 10-7 Chapman and Jouguet 1-1,6-1
Ses: C-JCharacteristics, mettiod o f 2-21,14-1
1-1
AMCP 706-180
Chargecylindrical 8-1,13-1diameter, effect on detonation velocity 9-1,
9-9spherical 8-1 ,13-i
Chemical kinetics 1-2Chemical potential 2-7,14-11, A-2, A-4, A-5,
B-2, B-4, C-l, D -l, D-2, D-3 definition o f % i
Chemical reaction 1-1 j4 “ tonation wave 1-1,1-2,14-2,14-4
Chou, Karpp, and Huang 14-2,14-4 Chushkin 14-5 C-J
detonation F-2 hypothesis 6-19 parsmetefsTable 3-5, 3-6 point* 14-11 state
detonation velocity F-3 energy 7-7 particle velocity F-3 pressure 5-9, 7-4,7-7, E-2, F-2 solution fo r 6-24 subideal 8-12,9-3 temperature 7-3, 7-4, F-2 volume F-2
theory 1-1 Code
B K W 14-11Eulerian-Lagrangian 14-9,14-19 modular 14-14
Codes, computer See: Computer codes (o r programs)
Coefficient activity 7-3, A-6 thermal expansion A-2
Cole 13-19,13-21,13-27,13-32 Components, definition o f 2-2 Composition, theoretical description 2-1 Composition B Table 1-2, 5-23 Compressibility, isothermal A-2 Computer codes (or programs)
AFTQ N 14-10 CEL 14-10explosion phenomena, use in 1-2 HEMP 14-7hydrodynamic, time dependent 1-3,14-1NIP 14-4,1413O IL 14-9PIC 14-10PIPE 14-7
RUBY 14-11STRETCH 14-11STRIP 14-10SWAP 14-4THERMO 14-11thermodynamic, equilibrium 1-3TIGER 14-11T O O D Y 14-13See: Chapter 14
Conductivity, as measurable parameter 5-1, 5-4, 5-22
Conservationequations 2-18, 2-1,9, 5-7,8-1 shock front 2-28,51-29
Constants Gurney Table 3-8 Rydberg 4-9 stoichiometric 2-2
Constant volume explosion point 14-11 Constituent, definition o f 2-1 Conventional decomposition equation See:
Decomposition, equation Cook 5-5, 7-8, 7-9,9-10 Courant
and Friedrichs 2-29,6-15,14-2 -Friedrichs-Lewy conditions 14-7
Courtney-Pratt, J. S: 5-4 Covolume 7-2, D -l, SD-2, D-3 Cowan and Fickett 7-14,7-16,7-18, D-3 ‘Cyclotetramethylenei tetranihramine Sec: HMX Cyclotol, composition o f Table 1-2 Cyclotrimethylene trinitramine See: RDX Cylindrical charge 13-1
D
Dalton’s law A-4 DATNB Table 1-1 D ’Autriche method 6-6 Deal 5-18, 7-5, 8-9,13-4 Deb 4-9 Decomposition
covalent explosives 4-3 data from adiabatic furnace Fig. 12-6 equation 2-1, 2-3 heat o f 4-1 ionic solids 4-6 mechanisms 4-3 o f azides 4-6 o f nitrates 4-14 products 2-3
o f T N I ’ 2-4
1-2
AM CP7M -1M
Decomposition (cont.) rale o f 4-1reaction 4-5, 4-6,4-16,4-18,10-1 spontaneous 10-1 thermal 4-1, Table 4-2
Deflagration 6-3 propagation o f 1-3,1-6,1-8 strong 8-3transition to detonation 12-10 wave 8-3
Denisov and Troshin 8-15 Densitometry, flash X-ray 5-7 Dependence, domain o f 2-23 Detonation
energy 1-2,1-3 fadeout o f 14-13 hypervelocity 11-17 in liquid 8-16 initiation of 14-13 low-order 11-26 low-velocity 11-26,11-28
stability 11-26, Table 11-5 overdriven 11-1parameters, measurement o f 5-4 pressure 5-5, 5-9properties Table 7-3, Table 7-4, Table 7-5,
Table 7-7solids and liquids 7-1 theoretical/experimenlal comparison
Table 7-9 productscomposition o f 3-2, 3-3, Table 3-4,
7-13equation o f state 3-3
stablility of 6-21, 8-6 strong 6-4, 8-10 temperature 5-21 theories o f 1-1underdriven 11-1,11-10,11-17, Fig. 11-11 velocity 5-1, 5-8, F - l
charge effect on 9-2,9-9 equation fo r 3-6, 6-14, 7-3, 7-4 low, initiation process 11-26,
wavescylindrical 9-1 definition o f 1-8 elementary theory o f 6-1 front o f 1-1 planar 1-2 plane 8-1 spherical 9-13 steady 8-4
weak 6-4
Dewey 5-19Diaminotrinitrobenzene See: DATNB Diaphragm gage 5-19 Diethylnitramine dinitrate See: D INA D IN A Table 1-1,12-15 Doering 5-18, 8-5
and Burkhardt 5-18 Drag, aerodynamic 13-10 Dremin 8-16D u ff and Houston 5-9, 5-10 Duvall 13-38 Dynamic pressure 13-10 Dynamite 1-1, Table 5-2
ammonium nitrate type Table 1-2 coinirierical 1-3 composition o f Table 1-2 nitroglycerin-based 1-1 ■N obe ll-1See: Explosive, secondary
E
EDGN Table 1-1 EDNA Table 1-1, Table 5-2 Edwards 8-14 E ffect
See:Faraday effect See:Kerr:effect See:Magneto-optic effect
Eichelberger 9-12Electrical systems, ionization probes 6-4Emery 14-5Energy
activation 10-1, Table 10-1 as property o f explosive 1-3, 3-1 as thermodynamic property 2-10 free 3-2internal A - l, A-S, A-5, A-6, D -l, D-2, D-3,
E -lo f detonation 1-2,1-3 o f explosion 13-23 o f explosive 3-1specific internal, o f C-J state 7-7
Enig 10-1,10-7,10-10 and Petxone 11-10
Enthalpy 2-7, 2-9,13-6, A - l, A-3, A-6 B -3,F-las thermodynamic property 2-10 definition o f 2-7
Entropy A-2, A-3, A-5, A-6, D -l, D-2, D-3, function o f
mole number 2-9
1-3
AMCC 706,180
Entropy (cont.)
temperature 2-9 volume 2-9
in reversible process 2-8 in thermodynamics, second law 2-5
EquationSee: Arrhenius equation See: Conservation equations See: Decomposition equation See: Euletian equations o f motion See: Hyperbolic equations See: Xtankine-Hugoniot equation See: Stoichiometric equations
Equation o f state 3-3, 3-6, 5-1, 5-22, 8-2, A-2, A-3, A -4, B-2, B-3, B-5, C-l, D -l, D-2, D-3, F - l Abel’s 7-2, 9-10, D -las requirement for stress wav. calculations14-1Becker-Kistiakowsky-Wilson 14-11 caloric 2-10 Cook’ s 7-8definition o f 2-10,14-11 Fickettand Wood 7-7, Table 7-2 fo r solid or liquid explosives 7-1 general derivation 7-5Halford, Kistiakowsky, and Wilson 8-9, D-3 Jones’ 7-9modified Abel 7-8, 7-16
by Jones 7-9, D -l by Cook 7-8, D-2
o f condensed species 7-16 o f products 8-9 Tait 12-17,13-30,13-37 van der Waal D -l virial 7-16, D-2
table o f coefficients, Table 7-6 Equilibrium
composition 14-11, B-1,.3-6, C -l, D -l conditions B-4, C-2 general conditions for 2-8 mechanical, chemical, and thermal 2-8, 2-9
Equivalent weight, Table 3-9, Table 3-10,5-25,13-38,3-5
Erpenbcck 8-15Ethylenedinitramine See: EDNA Ethylene glycol dinitrate See: EGDN Eulerian
equations o f motion 2-16, 2-18, 2-20 variables 14-1,14-9
Eulerian-Lagrangian code 14-9,14-10 Erying 9-15
and Powell, Duffey, and Pariin 9-10
1-4
Experimental technique 5-1 Exploding wire 5-3 Explosion
description o f 1-2 energy o f 14-27 pomt, constant volume 14-11 pressure, constant 6-3 products 1-4, 2-1
in thermodynamic equilibrium 2-3 thermal 1-3,1-8,10-1
critical temperature for 10-9, Table 10«3, Table 10-4
dependence on sensitivity tests 12-6 o f cylinders Fig. 10-5 o f slabs Fig. 10-5o f spheres 10-12, Fig. 10-4, Fig. 10-5,
Table 10-6shock initiation o f 11-10 stability 10-3time 10-9,10-12, Fig. 10-4, F g . 10-5, Fig.10-6,10-19, Table 10-6
underground 12-19,13-23 underwater 13-4,13-19 volume, constant 6-3, E-3 work o f 3-6, Table 3-11
Explosiveacceptor 11-1,11-20 commercial 1-3 condensed 14-13 covalent 4-4damage from 13-4,13-26 definition o f 1-2,1-4,3-1 donor 11-1,11-20homogeneous 11-5, ll-1 0 j 11-17,11-23 Hugoniot adiabat 11-2 inhomogeneous 14-13 lens 5-9nonhomogeneous 11-17,11-23 performance 1-2
evaluation o f 1-3 primary 1-4,12-8,12-15 processes of 1-2 products 5-1 secondary 1-4,12-8 size, critical 10-9
Explosive D See: Ammor..:im picratc
F
Faraday effect 5-4 fo il 5-16
FEFO Table 1-1, Table 3-1
AMCP 706-180
Fermat’s principle 9-12 Fickett Table 3-5
and Wood 7-7,7-13,13-4 Figure o f merit 5-25 Formula vector 2-2
o f components 2-3 o f constituents 2-2,2-3
Flash,argon 5-3 Flash X-ray, densitometry 5-7 Fragments, velocities o f 3-4 Frank and Lazarus 14-5,14-9 Frank Kamenetskii 10-1,10-7 Free energy function, Table 3-3 Friedman 12-8, 3-2 Friederich 7-10 Friederich 14-4‘ Frozen" composition, o f mixture 2-1 Fuel, types Table 3-1
G
GageBikini 5-19 diaphragm 5-19 in-material 5-10, 5-13 manganih 1-2, 5-10, 5-13 piezoelectric 5-10 piezoresistive 5-10, 5-13 polarization 5-14 quartz 5-10
'sulfur 5-15Galwey and Jacobs 4-18 Gap test 11-1,11-20, 11-26, Table 11-3, Table
11-4argon 5-15pressure measurement in l i - 2
Gasimperfect, properties o f D -l polytropic 13-23,13-37, E-2
Geometry, spherical 13-1,13-2,13-12 Gibbs-Dalton rule B-5 Gibbs free energy 2-7, A-2, A-3, A-5
in standard state 2-9 specific 2-9
Gibson 5-21, 5-22 Gipson and Macek 11-23 Godunov 14-5,14-7 Goranson 5-8 Gray 4-4
and Williams 4-4Gross and Amstcr 12-8,12-9,12-10 Gross composition, specification o f 2-2
Gurneyconstants, Table 3-8 comparison o f with Q, Table 3-8 formula, definition 3-5
H
Haleite See: EDNAHalford, Kistiakowiiky, and Wilson 7-18, 8-9,
D-3equation o f state sjJ-9, D-3
Happel and Majumliar 7-16 Harlow 14-11 Hartree method 14-2,14-3 Hat 5-23 He
cap acity A - l, A-3, A-5, A-6 conduction 10-7, J0-8,13-5 o f formation A-3 radiation o f 13-5release 3-1, Table 3-6, Table 3-7, 6-2
computation 3-5 equation fo r Hens’ law-3-1 in detonation 3-1 sample values Table 3-2
specific 2-10, 2-12, 7-3, 14-11, D -l, D-2, D-3„ F -l
transport, cause ofi detonation 1-3 Helmholtz free energy 2-17, A-4
in standard state 2-9 HEMP 14-7 Herrmann 14-7 Hess' law 3-1Heterogeneous explosives See: Explosive,
nonhomogeneous Heterogeneous system B-l Hilsenrsth and Becke tt 13-10 Hirschfelder
and Roseveare 7-16, D-2 Stevenson, and Eyring 7-17
HMX Table 1-1, Table 1-2 Homogeneous explosives See: Explosive,
homogeneous
Hotspots 10-22, Table 10-5,11-5,11-10,11-13, 11-17,14-13,14-14,11-24,12-6,12-9,, 12-11 critical 12-11 pressure 11-14temperature 11-14,11-15,11-16,
Table 12-3See: Explosion, thermal
Huff, Gordon, and Morrell B-2
IS
AMCP 708-180
Hugoniot 2-29,13-7 adiabat 11-2 and Rankine 1-1 curve 2-29, 5-10, 6-3, Fig. 6-2 definition fo r an explosion 8-11 equations, cylindrically symmetric flow 9-7 jump conditions 14-2 o f explosive 11-2 points 14-11 relations 8-6 shock front 1-1
Hiiygen’s principle 9-12 Hydrodynamics
cause b f detonation 1-3 conservation equations 1-1 definition 14-1equations 2-18, 2-20, 8-1,14-2
Eulerian equation o f 13-28 explosion phenomena o f 1-1,1-6,2-1 for point source model 13-12 of reacting continua 2-16 theoretical development 2-1
Hyperbolic equations 2-27
Illumination 5-3 Image-converter tube 5-4 Image dissection 5-3 Impact
sensitivity 1-8 tests 12-1
Implicit methods 14-10 Impulse, positive, as parameter o f shock wave
5*19Induction time 10-6,10-12,10- .6, Table 10-5,
11-7,11-30, Fig. 11-8, Table 12-11, 14:13
Inerts as ballast 1-3 Inhomogeneous explosives See: F,y ’
inhomogeneous Initiating mechanisms 11-1 Initiation 11-1,14-13
air bubbles effect 11-10,11-17, by friction 11-17,12-1,12-14,3 o, 12-8 by impact 11-17,12-1,12-6 cavitation model 11-28,11-29 confinement effect 12-15 diameter, critical 11-20, Table 11-3 duration o f shock pulse effect l l - i 9 grain size effect 11-24 in gas bubble 12-8
inhomogeneities effect 11-5 Mach disc model 11-28 porosity effect 11-3,11-18 process o f low-velocity detonation 11-26,
11-28thermal 12-1,12-6 time, critical 11-20
Initiator, types o f mechanical shock 1-4 thermal source 1-4
In-material gage 5-10, 5-13 interferometer, laser 5-16 Inviscid motion 2-17 Ionic solids 4-6 Ionization probes 5-4 Irreversibility 13-5Irreversible process 2-7, 2-18, 2-19, 2-28 Isentrope, properties o f 2-16
J
Jacobs, Liddiard, and Drimmer 1217Jameson 5-23Johannson 1?-SJones 5-8, 5-18, 5-21,7-6, 9-10Jouquet rule 6-6, 6-7, 6-11, 6-14
K
Kerr effect 5-3 Kinetics, chemical 1-2 Kirkwood
and Be the 13-8, 13-10, 13-26, 13-27, 13-30,13-32
arid B rink ley! 3-7, 13-27,.13-38 and Wood 8-1-1,8-14
L
Lagrangian 14-5,14-9 equations o f motion 2-16, 2-20
Lamboum and Hartley 14-4 Landau and Lifshitz 3-5 Landshoff 14-6 Langley 14-5 Laser interferometer 5-16 Law
See .'Arrhenius equation See: Burning law See: Conservation equations See: Dalton’s law See: Hess' law
1-6
AMCP 706-180
Law (cont.)See: Perfect gas law See: Planck’s distribution law See: Wien displacement law
Lawton and'Skidmore 8-9 Lax 14-7
and Wendroff 14-5,14-7 Lax-Wendro£f 14-6 Lead azide Table 1-1 Lead block test 5-25 Lead styphnate Table 1-1 Leapfrogl4-6
double 14-7Le Chatelier See: Mallard, detonation, theory o fLens, plane wave 5-9Lewis
and Friauf 6-20 and Randall rule B-5
Lucite wedge 5-15
M
Macek 12-15,12-17,12-20 Mader Table 3-5, l lr lO , 14-14 Magneto-optic effect 5-4 Makino 13-33 MakOvsky
and Gruenwald 4-6 and Lenji 4-5
Mallard, detonation, theory o f 1-1 Manganin gage 1-2, 5-10, 5-13 Massau 14-2,14-3 Martin and Saunders 12-6 McQueen 13-38Measurement o f detonation parameters 5-1Mercury fulminate Table 1-1Method
See: Argon gap method See: Characterisitics, method of See: D’Autriche method See: Hartree method See: Implicit method See: Method o f characteristics See: Newton-Raphson method See: Up-and-down method
Method o f characteristics 14-1 Meyer 14k2 Microballoons 5-15 Mixture
composition o f 2-1 constant composition o f 2-10 constituents o f 2-4 heterogeneous 2-10
Mitchell 4-9 Modular codes 14-14 Mole number 14-11 Muller 14-10
N
Newton-Raphson method B-2 Nicholson 4-6 N IP 14-4,14-13 Nitrobenzene 5-3Nitroglycerin 1-1, Table 1-1, Table 1-2, Table
5-2,5-22,11-26,12-8 ,Nitromethane Table l-1, Tabie-b-2, 5-23, Table
11-2,11-7,11-10, 11-13,11-14, l i - 1 5 ,11-16, 11-17
NG See: Nitroglycerin NM See: Nitromethane Nobel 1-1 Noh 14-10Nonequj'ibrium states 14-11 Nuclear tests 5-10
0
O IL 14-9 'Oppenheim
and Urtiew 8-14 Mai,son, and Wagner 8-14
Omellas 3-2 Osborn 14-14 Oxidizer
in explosives 1-3 types Table 3-1
Oxygen balance Table 3-6
P
Particle-in-cell 14-10,14-11 Particle velocity 5-7, 5-15, F -l
equation for 6-24, 7-3,7-4, 7-7 Paterson 7-17PBX 9404, composition o f Table 1-2 Penney and Dasgupta 13-23 Pentaerythritol tetranitrate See: PETN Pentolite 13-33
composition o f Table 1-2 Perfect gas law 14-11 PETN Tables 1-1,1-2, 5-2; 5-22
as homogeneous explosive 11-10, Table 11-2 charge diameter 9-3
Petrone 14-13
1-7
AMCP 706-180
Phasecondensed, in mixture 2-1,2-3,2-10 gas in mixture 2-1, 2-3 rule 2-3
PHERMEX 5-18 Photography
argon flash 5-3 Deal 5-18 Dewey 5-1?Doering aim Burkhardt 5-18 exploding wire 5-3 framing 5-3 high-speed 5-1 illumination 5-3 image dissection 5-3 VHERMEX 5-18 Schall 5-18 spark discharge 5-3 See: Camera
Photo-optical systems 5-4 PIC See: Particle-in-cell Picric acid TaWe 1-1 Piezoelectric gage 5-10 Piezoresistive gage 5-10, 5-13 Pin technique 5-15 PIPE 14-7Planck’s.distribution law 5-21 Plane wave lens 5-9 Plate-dent test 5-25 Point source model 13-12,13-27 Polarization 5-14 Polytropic gas 13-23,13-37 Power o f an explosive 5-24 Pressure
as propertyo f explosive 1-3,1-4 o f homogeneous phase 2-4, 2-5 thermodynamic 2-10
blast 5-19C-J, equation fo r 3-6 dynamic 13-10 in reversible process 2-8 o f detonation 5-5, 5-9 o f reaction 1-2 transducer 5-10
Price 3-5 Principle
See: Fermat’s principle See: Huygen’s principle
Probes, ionization 5-4 Process
equations for 2-9
infinitesimal 2-5, 2-7, 2-8 irreversible 2-5, 2-7 natural 2-5of isolated system 2-8, 2-8 reversible 2-5, 2-7 thermodynamic 2-5 unnatural 2-5
Propagationblast See: Blast, propagation theory velocity, de hnition o f 1-6
Propellant 1-3,11-3,11-20,11-26 Prout and Tompkins 4-2
Q
Quartz gage 5-10
R
Radiation damage 4-18 o f heat 13-5
Rankine 2-29shock front, discontinuous 1-1
Rankine-Hugoniot equation 2-29,6-1 Rarefaction 13-3
wave 2-24 Rayleigh
line 6-3,14-5,14-8 shock waves 1-1
RDX Table 1-1, Table i-2, Table 5-2, 5-22 Reaction
decomposition 1-2, 2-2, 4-5 heat o f 6-2 initiation 8-5 order o f 10-8 process 14-1,14-13
progress variable for 8-3 products Table 3-1rate 2-17, 2-18,10-1, Table l f l . l , 10-3
equation 8-2,10-8 water-gas 3-2 waves
boundary rigid 8-9 free 8-9
general 8-6 polytropic gas 8r8 stability 8-12,8-14,8-15
zone 8-1,11-23 cylindrical charge 9-3, 9-4, 9-9 diverging flow 9-4
AMCP 706-180
Reaction Zone (Cont.)
fine structure 8-14 length 9-9Mach interactions 8-15 mechanisms 11-24 turbulence 8-15
Release wave model 9-12 Retonation 12-15Reversible process 2i7, 2-18, 2-19, 2-28 Rezoning.14-9Richardson, Arons, and Halverson 13-23 Richtmyer and Morton 14-5,14-6 Rideal and Robertson 12-8,12-11 Riemann
function 13-25 invariants 2-22 shock waves 1-1
RUBY 14-11 Rule
See: Gibbs-Dalton rule See: Jququet's rule See: Lewis and Randall rule See: Phase, rule
Rusanov 14-7 Rydberg constant 4-9
S
Sachs 13-38Safety in handling 4-1,10-1,10-18,11-1,11-26,
12-1Schall 5-18 Schmidt 7-2, 7-8 Schott 8-14 Scoiah 6-21 Seaman 14-7 Secco 4-16 Seismic waves 13-23 Self-heating 4-1 Semenov io - lSensitivity 11-26, Table 11-7, 12-1, 12-4, 12-6,12-8o f explosive 1‘8relation to .melting temperature 12-9
Shchelkin 8-14,8-15 Shear 8-9, 9-15
and Wright 13-33 Shock
front 13-3 velocity 5-7 wave 2-25
chemical reaction 1-1
detonation 1-1from explosive charge 13-1in solids 13-38line 14-4nonreactive 1-1propagaton o f 1-3,13-5,13-26 properties o f 1-1 scaling o f 13-33,13-37 stability 1-29
weak 14-4 Shuster 1-1
detonation wave 1-1 Simple waves 2-23 Skidmore and Hart 8-9 Smith and Calvert 4-6 Smoke trails 5-21 Soloukhin 8-14 Sombrero 1-1 Sonic 2-19
subsonic 2-19 supersonic 2-19
Sound velocity 2-14 equilibrium7-14 frozen 7-14,8-12
Spacelike 2-22 Spark
as external initiating stimuli 1-3 discharge 5-3 types o f 1-3
Specific heat See: Heat, specific Sphcncal geometry 13-1,13-2,13-12 Standard state 2-9 Steady-state
detonationcharge diameter effect bn 1-3 theory o f 1-1
o f wave 1-6 Stimuli, initiating
See: Heat See: Impact See: Shock See: Spark
Stoichiometric conditions B-l, B-2, B-4 mathematical expressions o f 2-3, 2-8 constants 2-2 equations 8-2
Strehlow 8-14,8-15 and Fernandes 8-15
STRETCH 14-11 STRIP 2-19 Subsonic 2-19
1-9
AMCP 706-180
Sulfur gage 5-15 Supersonic 2-19 SWAP 14-4 Systems
See: Electrical systems See: Heterogeneous system
T
Taffanel and D'Autriche 7-2,7-9Tait equation o f state 13-23,13-31,13-37Target 13-4faylor 715,13-13,13-23
wave 5-10, 8-8,13-13 Taylor, G. I. 9-13 Technique
See: Experimental technique See: Fin technique
Temperature as property
o f homogeneous phase 2-4 thermodynamic 1-10, A - l, A-3
in equation o f state relation 2-10 in reversible process 2-8
TestSee: Ballistic Mortar test See: Gap test See: Impact tests See: Lead block test See: Nuclear tests See: Place-dent test
Tetranitromethane See: TNM Tetryl Table 1-1, Table 5-2 Thermal expansion coefficient 14-11, A-2 THERMO 14-11Thermochemical data on explosives Table 3;1 Thermodynamic(s)
cause o f detonation 1-3 first law o f 2-5, 2-7, 2-7 process, definition 2-5 properties 2-10, A-5, A-6, D -l
gas mixture -A-l, A-3 heterogeneous systems A-6 pure condensed phase A - l
second law o f 2-5, 2-7 state E -l theory o f 1-2, 2-4
TheorySee: Berthelot, detonation, theory of See: Blast, propagation theory
1-10
See: C-J theory See: Detonation, theories of See: Mallard, detonation, theory o f See: Thermodynamics, theory of See: TNT, propagation theory
TIGER i 4 - l l Timelike 2-22 TNETB Table 1-1 TNM Table 1-1 TN T Table 1-1, Table 1-2
as equivalent weight 13-38 as homogeneous explosive 11-10, Table 11-2 burning rate and sensitivity 12-15 charge diameter 9-3conductivity profile in detonation zone 5-23decomposition equation o f 2-1energy .of explosion o f 13-23"equivalent” 1-3finite charge o f 13-15granular 11-26pressure-distance curves fo r 13-19 pressure ratio vs charge radii Fig. 13-20 pressure-time curve for 13-19 propagation theory 13-32
TOODY 14-13 Transducer, pressure 5-10 Transfer
electron 4-18 proton 4-18
Triniirophenyl methylnitramiric See; Tetryl Trinitrotoluene See: TN T Trulio 14-7,14-10
U
Underwater performance 3-5 Up-and-down method 12-1,12-4
statistical analysis o f 12-4
V
van der Waal D -l van Tiggelen and de Soete 8-14 Velocity
deflagation 1-8 particle 5-7,5-15, F -l
equation fo r 6-24, 7-3, 7-4, 7-7 shock 5-7See: Detonation, velocity See: Sound velocity
Vicilie See: Berthelot
i
f
)f,
I
!
!
i
*
K
I
\
▼ 11 7 ™
i
Viscosity, artificial 13-12,13-13,14-1,14-5 linear 14-5 other forma 14-5 quadratic 14-5
Volumeaa property o f homogeneous phage 2-4 in reversible process 2-8 molar A - i specific 2-9o f C-J state 8-3, 7-7,7-9
Von Neumann 8-5, 8-6 and Richtmyer 13-12,13-13,14-5,14-6 spike 5-9
W
Wagner 6-14Warner 11-24, i4 -1 3 ,14-14 Wave 1-1
blast 13-1,13-7,13-10 deflagration 8-3 detonation 1-1,1-8 propagation 14-1
multidimensional 14-4,14-5 rarefaction 2-24 reaction 1-1 retonation 12-15 seismic 13-23 shock 7-25,13-38
AMCP 7G6-180
simple 2-23 stability 2-29 steady-state o f 1-6 three-dimensional 8-14 See: Taylor, wave
Welding 1-2 White 8-15
Johnson, and Dantzig B-2 Whitham 14-4 Wien displacement law 5-21 Wilkins 3-9,14-7,14-13 Willis formula 13-21 Wood
and Kiritwood 8-12, 8-14, 9-6, 9-9 and Salsburg 8-14
Woolfolk and Amster 11-29
X-ray, flash 1-2 densitometry 57 photography 518
Z
Zeldovich 6-21, 9 5 Zemovir 14-13Zinn and Mader 10-1,30-7,1912 Zubarev Table 3-5
:; uj
' 4 ■: '/