characterization of polymorphic ampicillin forms
TRANSCRIPT

C
Ca
b
c
a
ARRAA
KAFRDXT
1
dgfdmomipp
(
h0
Journal of Pharmaceutical and Biomedical Analysis 100 (2014) 329–340
Contents lists available at ScienceDirect
Journal of Pharmaceutical and Biomedical Analysis
j o ur na l ho mepage: www.elsev ier .com/ locate / jpba
haracterization of polymorphic ampicillin forms
. Baraldia, A. Tintib, S. Ottanic, M.C. Gamberinia,∗
Department of Life Sciences, University of Modena and Reggio Emilia, via Campi n.183, 41125 Modena, ItalyDepartment of Biomedical and Neuromotor Sciences, University of Bologna, via Belmeloro 8/2, 40126 Bologna, ItalyIstituto per la Sintesi Organica e la Fotoreattività, ISOF-CNR, via P. Gobetti 101, 40129 Bologna, Italy
r t i c l e i n f o
rticle history:eceived 19 May 2014eceived in revised form 12 August 2014ccepted 15 August 2014vailable online 26 August 2014
eywords:mpicillinTIR/ATR spectroscopyaman microscopyFT calculations-ray powder diffractionhermal analysis
a b s t r a c t
In this work polymorphs of �-aminobenzylpenicillin (ampicillin), a �-lactamic antibiotic, were preparedand investigated by several experimental and theoretical methods. Amorphous monohydrate and threecrystalline forms, the trihydrate, the crystal form I and the crystal form II, were investigated by FT-IRand micro-Raman. Also data obtained by differential scanning calorimetry (DSC), thermogravimetricanalysis (TGA), X-ray powder diffraction (XRPD) and hot-stage Raman spectroscopy are reported. Finally,quantum mechanical calculations were performed by density functional theory (DFT) to assist the assign-ment of spectroscopic experimental bands. For the first time, the ampicillin molecule in its zwitterionicform was studied at the B3LYP/aug-cc-pVDZ level and the corresponding theoretical vibrational spectrawere computed. In fact, ampicillin in the crystal is in zwitterionic form and concentrations of this sameform are quite relevant in solutions at physiological pH. Experimental and theoretical results allowedidentification of specific features for polymorph characterization. Bands typical of the different poly-morphs are identified both in IR and Raman spectra: in particular in the NH stretching region (IR), inthe amide I + �NH region (both techniques), in the 1520–1490 cm−1 region (IR), in the 1320–1300 cm−1
and 1280–1220 cm−1 (IR), in the 1200–1170 cm−1 (Raman), in the amide V region (IR), and, finally,in the 715–640 cm−1 and 220–200 cm−1 (Raman). Interconversion among different polymorphs was
investigated by hot-stage Raman spectroscopy and thermal analysis, clarifying the complex pattern oftransformations undergone as a function of temperature and heating rate. In particular, DSC scans showhow the trihydrate crystals transform into anhydrous forms on heating. Finally, stability tests demon-strated, after a two years period, that no transformation or degradation of the polymorphs occurred.© 2014 Elsevier B.V. All rights reserved.
. Introduction
Several active pharmaceutical ingredients (APIs) crystallize inifferent forms (polymorphs) or with solvent molecules as inte-ral part of their structures (pseudopolymorphs). Pharmaceuticalormulations of these compounds may prove challenging, sinceifferences in the solid state phase of the active ingredient may dra-atically alter the final effects of the drug, with marked influence
n its bioavailability. Moreover, differences in crystal packing play aajor role on drug stability, especially as temperature and humid-
ty effects are concerned. Usually, crystalline forms are stronglyreferred for their stability and reproducibility; higher degree ofurification can be achieved, as compared to amorphous solids and
∗ Corresponding author. Tel.: +39 59 205 5157; fax: +39 59 205 5131.E-mail addresses: [email protected], [email protected]
M.C. Gamberini).
ttp://dx.doi.org/10.1016/j.jpba.2014.08.021731-7085/© 2014 Elsevier B.V. All rights reserved.
solid solutions. Thus, the requirement that in pharmaceutical for-mulations of APIs only a single crystalline form be present, rises aset of problems related to clinical protocols and legal and regula-tory issues. The unpredictability (i.e. lack of obviousness) of crystalstructures and physical properties may rise legal issues and chal-lenges in terms of obtaining and maintaining patent protection foran API. Among the substances affected by this kind of problems,an important case is provided by ampicillin, a molecule which hasobtained new attention in antibiotic therapeutic practices.
Ampicillin or �-aminobenzylpenicillin or 6-[d(-)�-aminophenylacetamido] penicillanic acid (Fig. 1) is a penicillinclass antibiotic with betalactamic structure. Literature reportsthat ampicillin may exist in two anhydrous polymorphic forms (�form also named B or I; � form also named II) and hydrate forms
(trihydrate; monohydrate or form A) [1–3]. The trihydrate andanhydrous form I have been the most studied forms, while themonohydrate and anhydrous form II did not receive analogousattention. In particular, Shefter et al. [1] refer the existence of form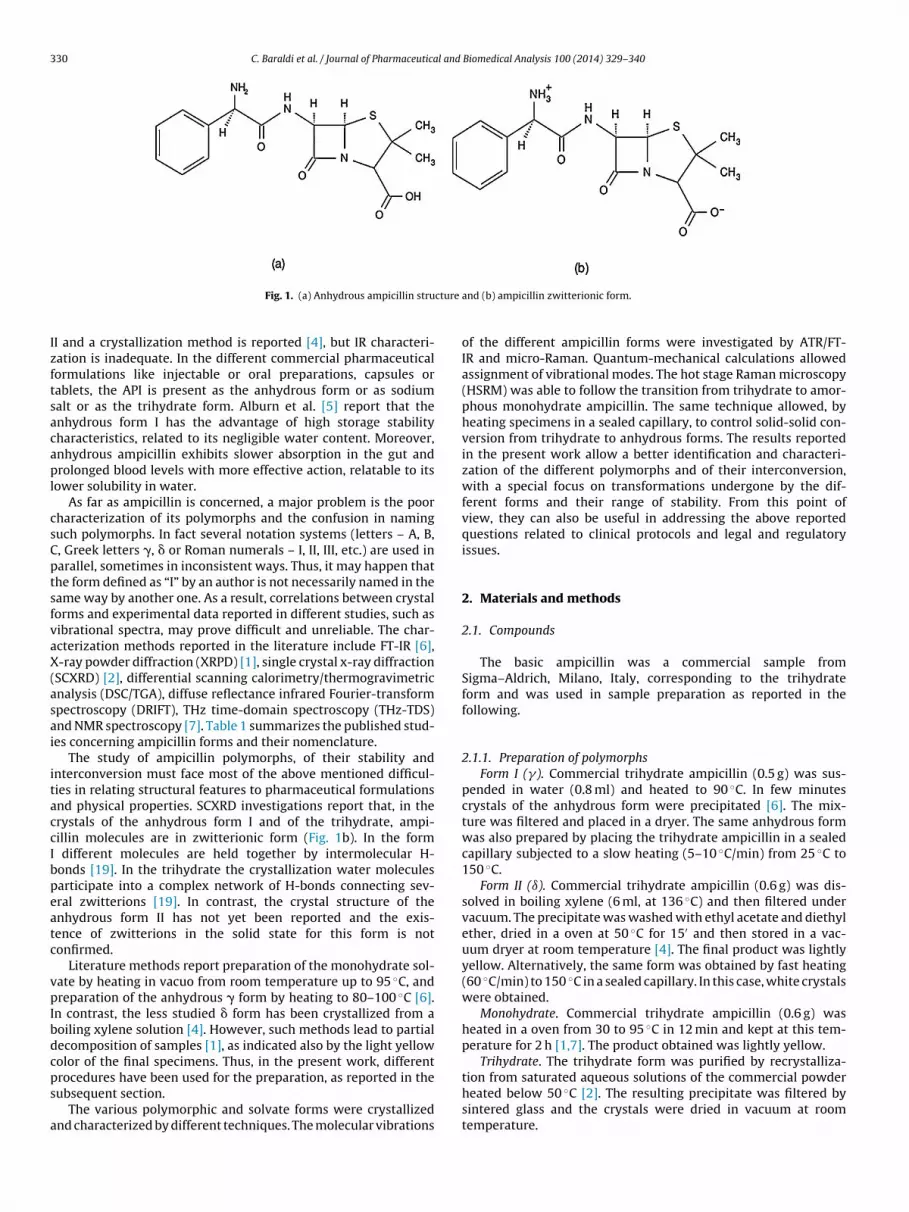
330 C. Baraldi et al. / Journal of Pharmaceutical and Biomedical Analysis 100 (2014) 329–340
cture
Izftsacapl
csCptsfvaX(asai
itaccIbpeatc
vpIbdcps
a
Fig. 1. (a) Anhydrous ampicillin stru
I and a crystallization method is reported [4], but IR characteri-ation is inadequate. In the different commercial pharmaceuticalormulations like injectable or oral preparations, capsules orablets, the API is present as the anhydrous form or as sodiumalt or as the trihydrate form. Alburn et al. [5] report that thenhydrous form I has the advantage of high storage stabilityharacteristics, related to its negligible water content. Moreover,nhydrous ampicillin exhibits slower absorption in the gut androlonged blood levels with more effective action, relatable to its
ower solubility in water.As far as ampicillin is concerned, a major problem is the poor
haracterization of its polymorphs and the confusion in naminguch polymorphs. In fact several notation systems (letters – A, B,, Greek letters �, � or Roman numerals – I, II, III, etc.) are used inarallel, sometimes in inconsistent ways. Thus, it may happen thathe form defined as “I” by an author is not necessarily named in theame way by another one. As a result, correlations between crystalorms and experimental data reported in different studies, such asibrational spectra, may prove difficult and unreliable. The char-cterization methods reported in the literature include FT-IR [6],-ray powder diffraction (XRPD) [1], single crystal x-ray diffraction
SCXRD) [2], differential scanning calorimetry/thermogravimetricnalysis (DSC/TGA), diffuse reflectance infrared Fourier-transformpectroscopy (DRIFT), THz time-domain spectroscopy (THz-TDS)nd NMR spectroscopy [7]. Table 1 summarizes the published stud-es concerning ampicillin forms and their nomenclature.
The study of ampicillin polymorphs, of their stability andnterconversion must face most of the above mentioned difficul-ies in relating structural features to pharmaceutical formulationsnd physical properties. SCXRD investigations report that, in therystals of the anhydrous form I and of the trihydrate, ampi-illin molecules are in zwitterionic form (Fig. 1b). In the form
different molecules are held together by intermolecular H-onds [19]. In the trihydrate the crystallization water moleculesarticipate into a complex network of H-bonds connecting sev-ral zwitterions [19]. In contrast, the crystal structure of thenhydrous form II has not yet been reported and the exis-ence of zwitterions in the solid state for this form is notonfirmed.
Literature methods report preparation of the monohydrate sol-ate by heating in vacuo from room temperature up to 95 ◦C, andreparation of the anhydrous � form by heating to 80–100 ◦C [6].
n contrast, the less studied � form has been crystallized from aoiling xylene solution [4]. However, such methods lead to partialecomposition of samples [1], as indicated also by the light yellowolor of the final specimens. Thus, in the present work, different
rocedures have been used for the preparation, as reported in theubsequent section.The various polymorphic and solvate forms were crystallizednd characterized by different techniques. The molecular vibrations
and (b) ampicillin zwitterionic form.
of the different ampicillin forms were investigated by ATR/FT-IR and micro-Raman. Quantum-mechanical calculations allowedassignment of vibrational modes. The hot stage Raman microscopy(HSRM) was able to follow the transition from trihydrate to amor-phous monohydrate ampicillin. The same technique allowed, byheating specimens in a sealed capillary, to control solid-solid con-version from trihydrate to anhydrous forms. The results reportedin the present work allow a better identification and characteri-zation of the different polymorphs and of their interconversion,with a special focus on transformations undergone by the dif-ferent forms and their range of stability. From this point ofview, they can also be useful in addressing the above reportedquestions related to clinical protocols and legal and regulatoryissues.
2. Materials and methods
2.1. Compounds
The basic ampicillin was a commercial sample fromSigma–Aldrich, Milano, Italy, corresponding to the trihydrateform and was used in sample preparation as reported in thefollowing.
2.1.1. Preparation of polymorphsForm I (�). Commercial trihydrate ampicillin (0.5 g) was sus-
pended in water (0.8 ml) and heated to 90 ◦C. In few minutescrystals of the anhydrous form were precipitated [6]. The mix-ture was filtered and placed in a dryer. The same anhydrous formwas also prepared by placing the trihydrate ampicillin in a sealedcapillary subjected to a slow heating (5–10 ◦C/min) from 25 ◦C to150 ◦C.
Form II (ı). Commercial trihydrate ampicillin (0.6 g) was dis-solved in boiling xylene (6 ml, at 136 ◦C) and then filtered undervacuum. The precipitate was washed with ethyl acetate and diethylether, dried in a oven at 50 ◦C for 15′ and then stored in a vac-uum dryer at room temperature [4]. The final product was lightlyyellow. Alternatively, the same form was obtained by fast heating(60 ◦C/min) to 150 ◦C in a sealed capillary. In this case, white crystalswere obtained.
Monohydrate. Commercial trihydrate ampicillin (0.6 g) washeated in a oven from 30 to 95 ◦C in 12 min and kept at this tem-perature for 2 h [1,7]. The product obtained was lightly yellow.
Trihydrate. The trihydrate form was purified by recrystalliza-
tion from saturated aqueous solutions of the commercial powderheated below 50 ◦C [2]. The resulting precipitate was filtered bysintered glass and the crystals were dried in vacuum at roomtemperature.
C. Baraldi et al. / Journal of Pharmaceutical and Biomedical Analysis 100 (2014) 329–340 331
Table 1Existing studies and notation systems concerning ampicillin forms.
References and analyticalmethod
Form I Form II Trihydrate Monohydrate
Ref. [1]: XRPD X“form 1”
X“form 2”
X X“amorphous anhydrousstate”
Ref. [2]: single crystal X“anhydrous”
X
Ref. [3]: IR, XRPD X“anhydrous”
X
Ref. [4]: IR (nujol), XRPD X“anhydrous, B,�”
X“new or �”
X
Ref. [5]: IR X“anhydrous”
X X
Ref. [6]: IR X X X“other form”
Ref. [7]: DSC, TGA, XRPD, FTIR,NMR
X “anhydrous” X
Ref. [8]: DSC XRef. [9]: IR X
“anhydrous”X
Ref. [10]: IR X“B”
X“A”
Ref. [11]: XRPD, SEM X X“amorphous state”
Ref. [12]: XRPD, FTIR, stabilitytest
X
Ref. [13]: XRPD under heatingin open/sealed holder, DSCunder pressure
X“anhydrous”
X“newanhydrous”
X
Ref. [14]: FTIR X“form II”
X“form I”
Ref. [15]: XRPD X“anhydrous”
X
Ref. [16]: XRPD, DSC, TGA X “anhydrous” X“amorphous form”
Ref. [17]: THz–TDS X“anhydrous”
X
Ref. [18]: DRIFT X“anhydrous”
X
2
2
awasbw
2
coenLoawtAcut
Ref. [19]: SCXRD X“anhydrous”
.2. Methods
.2.1. X-ray powder diffraction (XRPD)Powder diffractograms were recorded by the X’PERT PRO celer-
tor Panalytical diffractometer (Panalytical, Almelo, Netherlands)ith the following experimental settings: Ni filtered Cu K� radi-
tion (� = 1.5418 A); voltage 40 kV; tube current 40 mA; angularpeed 0.040◦ (2�) min−1; divergence and anti-scatter slits 0.5◦;eam mask 15 mm; angular range 4◦ <2� < 30◦. The application soft-are version was X’Pert Date collector.
.2.2. Computational methods (DFT calculations)Quantum mechanical calculations were performed on the ampi-
illin molecule by the Gaussian09 program [20] in the frameworkf the density functional theory (DFT). The B3LYP functional wasmployed, which includes the Becke’s three parameters (local,onlocal, Hartree–Fock) hybrid exchange functional [21] with theee–Yang–Parr correlation functional [22]. Molecular orbitals werebtained by a mixed basis set: the correlation-consistent polarizedugmented basis set, aug-cc-pVDZ [23], was used for all atoms,hereas for sulphur the aug-cc-pV(D+d)Z was selected. Geome-
ry optimization was carried on in redundant internal coordinates.
ccording to the implementation in Gaussian09, the convergenceriterion was met when maximum and root-mean square val-es of forces and next-step displacements were below predefinedhresholds.X
Theoretical Raman and IR spectra were obtained by frequencycalculations on the optimized geometries. Frequencies were com-puted in the limit of the harmonic approximation, using the samebasis sets and method as in the geometry optimization steps. Allcomputed frequencies were positive, confirming that optimizedgeometries correspond to minima on the Potential energy surface.
2.2.3. IR with attenuated total reflection (FT-IR/ATR)The spectra were recorded by a VERTEX 70 (Bruker Optics,
Ettlingen, Germany) FT-IR spectrophotometer, equipped with adeuterium triglycine sulphate (DTGS) detector. Setting parame-ters: resolution 4 cm−1; apodization weak. The spectral range was4000–600 cm−1 with 32 scans for each spectrum. The ATR spectrawere recorded using the Golden-Gate accessory.
2.2.4. Raman microscopy and hot stage Raman microscopy(HSRM)
The Raman spectra were recorded with a confocal Labraminstrument (Horiba Jobin Yvon, Longjumeau Cedex, France)equipped with a He–Ne laser at 632.8 nm and a CCD detector(254 × 1024), cooled by the Peltier effect. The spectra were recordedin backscattering after focalization in several positions within a
small area (ca.100 �m × 100 �m) of the sample. The maximumlaser power employed was 5 mW and the recording time for goodsignal-to-noise ratio was 100–200 s. GRAMS/AI 7.02 was used forthe elaboration of the spectra.
3 l and Biomedical Analysis 100 (2014) 329–340
o
2t
Ldaiawe
3
3
3
rtttoambmftteu
iihter
fihaP2dv[av
a
3
bio(ccusc
32 C. Baraldi et al. / Journal of Pharmaceutica
The hot-stage Raman analysis was carried out by direct couplingf the Raman microscope with a hot stage.
.2.5. Differential scanning calorimetry (DSC) andhermogravimetric analysis (TGA)
The thermal behavior of samples was studied with a SETARAM-ABSYS TG-DTA/DSC instrument (Setaram, Caluire, France) usingry nitrogen as purge gas over the temperature range 35–220 ◦C at
scanning rate of 10 ◦C/min. The instrument was calibrated with anndium sample (99.99% purity), having a melting point of 156.6 ◦Cnd a melting enthalpy of 28.45 J/g. The SETSOFT 2000 softwareas used to extrapolate onset value temperatures for each thermal
vent.
. Results and discussion
.1. Characterization of polymorphic and solvate forms
.1.1. X-ray powder diffraction (XRPD)Results of X-ray diffraction investigations have been previously
eported for single crystals of the anhydrous form I [19] and of therihydrate form [19]. Atomic coordinates support the conclusionhat in both polymorphs molecules are in zwitterionic form andhe NH3
+ and COO− groups participate to an infinite networkf H-bonds. However, it must be noted that the positions of H-toms were not refined, but rather obtained by Fourier differenceaps. Oscillations around these positions (<.01 nm), as induced
y thermal treatments, may change the zwitterionic character ofolecules in the crystals. Moreover, a single crystal structure of
orm II has never been reported, therefore a definite experimen-al evidence of the existence of a zwitterion in the solid state forhis form has not been assessed. In subsequent sections data fromxperimental and theoretical spectra are reported, providing someseful insight on this question.
Another point of interest is the chain of structural changesnduced by thermal treatments on the trihydrate form. Actually,t has been reported [19] that differences of the anhydrous and tri-ydrate structures are too important to allow direct conversion inhe solid state between these polymorphs. However, depending onxperimental conditions, a different process of fusion and partialecrystallization might be possible.
As a first step toward this type of investigations, in order to con-rm the polymorphs identity, X-ray powder diffraction patternsave been recorded (Fig. 4). Form I and trihydrate XRPD patternsre in agreement with data published by Ivashkiv and James [2,3].olymorph I displays a X-ray pattern with characteristic peaks at� = 8.10 vs, 16.4 vs, 20.3m, 21.7s, 22.9s, 25.4m, while the trihy-rate form shows peaks at 2� = 7.4m, 12.3 vs, 15.1m, 18.1 vs, 19.5s, 22.2s, 23.4s, 23.7s, 25.7m, 26.9 vs, 29.2s, 29.5m (00-029-15462]). In contrast, the XRPD pattern of ampicillin form II shows char-cteristic strong diffraction peaks at: 2� = 6.9 vs, 13.4m, 15.7 vs, 16.5s, 17.0s, 18.6s, 19.9m, 26.8mw.
The monohydrate form presents the diffraction spectrum char-cteristic of an amorphous substance (Fig. 2).
.1.2. Computational resultsVibrational spectra of the crystalline forms were approximated
y DFT quantum mechanical calculations on the isolated moleculen vacuum. Atomic coordinates for the initial stage of geometryptimization were taken from the Cambridge Structural DatabaseCSD) [24]. Preliminary results showed the presence of small forceonstants and low frequency vibrational modes. Thus, the tight
onvergence criteria on an ultra-fine DFT integration grid wassed in the geometry optimization to ensure reliable results in theubsequent frequency computation step. In fact, the zwitterionicharacter of the anhydrous form I, as obtained from the CSD, wasFig. 2. X-ray diffraction patterns of ampicillin forms: I, II, trihydrate and monohy-drate forms (from the top).
retained throughout the whole geometry optimization. The finaloptimized geometry of the isolated molecule is close, but not iden-tical to the coordinates in the crystal structure. Probably, the mostsignificant difference is a slight increase of the curvature along themolecular axis of the optimized geometry.
Comparisons between theoretical and experimental spectrashow differences attributable to several factors. First, experimentsare performed on the solid phase, while calculations refer to theisolated molecule in vacuum. Thus, computed frequencies do notaccount for effects stemming from intermolecular interactions inthe crystals. Additional differences may arise also from anharmoniceffects and from experimental peak broadening, that cannot besatisfactorily reproduced in the computed spectra.
Anharmonic effects can be reduced by a scaling procedure [25].Linear fitting of the theoretical frequencies to the experimentalones was performed by the SPESCA program [26]. Scaled frequen-cies were computed as �scaled = b × �calc + a. For the crystal formI, the corresponding equations were: �scaled = 0.9502 × �calc + 12.46for the IR spectrum and �scaled = 0.9493 × �calc + 10.72 for the Ramanspectrum. As expected for the used functional, values of b closeto 0.95 were obtained. Interpretation of the theoretical frequencyspectra was performed by the potential energy distribution (PED)analysis of the fundamental vibrations modes. The procedure wascarried on by the program VEDA4 [26], allowing the identificationof the stretching, bending and torsion local modes for each com-puted line. In the additional materials PED results are summarizedin the corresponding Tables, one for each frequency calculation.
Additional computations were performed, aimed to simulateeffects of intermolecular interactions on the vibrational spectradue to crystal packing. The initial geometry was a molecular dimer
taken from the CSD structure of form I. In this model the twomolecules are bound together by two H-bonds, each one betweenthe NH3+ of a molecule and the COO− group of the other one.However, for this larger system, a different basis set, 6-311++G(d,p)
l and
wasHHr3aaitfy
3
amar
ceae3amsa3d
sttNotpogiafisCsot
2smiHel2aatoiT
C. Baraldi et al. / Journal of Pharmaceutica
as used, allowing to keep computation time within reason-ble limits. Optimized geometries obtained by these computationshowed that the NH3
+ group looses the hydrogen involved in the-bond toward the COO− group of the other molecule. Thus, the-bonds are retained but the zwitterionic character is lost. The cor-
esponding IR spectrum shows two distinct features at 2870 and135 cm−1 (not scaled values) related to the O H stretching of thetoms involved in the two intermolecular H-bonds. These featuresre not detected in the IR spectra of the polymorphs. This results consistent with the presence of zwitterions in form I and in therihydrate, but it is of special relevance in the case of the anhydrousorm II, suggesting that zwitterions may be present also in its notet determined crystalline structure.
.1.3. Infrared and Raman spectraFig. 3 shows the experimental FT-IR/ATR spectra of different
mpicillin forms recorded at room temperature. A detailed assign-ent of the experimental bands of ampicillin is reported in Table 2,
ccording to the results of DFT frequency calculation, as usuallyeported in literature [27].
However, in the range 4000–2600 cm−1 some significant dis-repancies are found. In this range, O H and N H stretching arexpected. The sharp and intense peak at 3332 cm−1 (form I) wasttributable to the N H stretching. For polymorph II, the pres-nce of three sharp and characteristic peaks at 3419, 3334 and287 cm−1 can be observed. These bands are always related tosymmetric and symmetric N H stretching, which for the pri-ary amine group falls in the range 3400–3300 cm−1 and for the
econdary amide group in trans conformation falls between 3330nd 3100 cm−1. The disappearance of the two bands at 3419 and287 cm−1 in the FT-IR spectrum of form I may be attributed to aifferent H-bond scheme in the two forms.
In this spectral range hydrated forms exhibit the OH bondtretching vibrations of water molecules. The trihydrate form spec-rum shows characteristic peaks at 3501 and 3440 cm−1 related tohe crystallization water that establishes hydrogen bonds involving
and O (amide), O (betalactamic ring), COO−, NH3+ [2]. More-
ver, crystal structures of the anhydrous and trihydrate forms showhat ampicillin molecules are in zwitterionic form [19] thanks to theKa = 2.5 ( COOH) and pKa = 7.3 ( NH2) of the acid and basic groupsf the molecule. Thus, the NH3
+ group interacts with the COO−
roup of a second drug molecule. There is no evidence of a NH3+
ntramolecular H-bonding and the presence of a broad shouldert about 2873 cm−1, corresponding to the NH3
+ stretching, con-rms the zwitterionic state. Furthermore, the trihydrate spectrumhows two strong bands at 1604 and 1572 cm−1 related to ionizedOO− and NH3
+ groups deformation, whose bands overlap in thispectral region. In the other forms these bands are weaker, even ifbservable as medium intensity bands at 1641 and 1581 cm−1 inhe spectrum of form I.
The large band at about 2900 cm−1, together with those at742 and 2652 cm−1 (bands A, B and C) indicate the presence of atrong asymmetric H-bond [28] in the trihydrate form. Also in theonohydrate, the large bands at about 3300, 2900 and 2650 cm−1
ndicate the presence of weaker H-bonds. Bands attributable to-bonds are less evident in the spectra of anhydrous forms. Nev-rtheless, the IR spectrum of form I shows the presence of twoarge and not very intense bands with maxima at about 2900 and600 cm−1, while form II spectrum displays maxima at about 3280nd 2950 cm−1, indicating for both polymorphs that the H-bondsre weaker than those of the trihydrate form. Moreover, the respec-
ive H-bonds are weaker in form II than in form I. The absencef the A, B and C bands typical of strong H-bonds, the presencen the IR and Raman spectra of the �as and �sCOO− bands (seeable II), as well as the small difference in the melting temperatureBiomedical Analysis 100 (2014) 329–340 333
(see Section 3.1.4.1), strongly suggests for polymorph II, as for formI, the presence of the zwitterionic form.
The monohydrate form exhibits a general bands enlargement,typical of a compound with a low degree of order (amorphous) andalso the OH (water) stretching bands at about 3501 and 3300 cm−1
are broader, thereby suggesting that water was adsorbed insteadof fixed in crystallization sites and involved in hydrogen-bonds ofvariable geometry.
In the spectral region between 1800 and 1600 cm−1 the vibra-tional modes due to the C O groups stretching occur with highintensity. For the trihydrate form, the C O stretching band at1769 cm−1 attributable to the carbonilic group of the lactamic ringis strong. For the anhydrous forms it drops in intensity and shiftsslightly below at 1765 (form I) and 1763 cm−1 (form II); the mono-hydrate form shows a medium and broader band at 1774 cm−1.
The secondary amide C O stretching, associated with the N Hdeformation mode (amide I), is at lower wavenumbers showingintense peaks at 1692, 1705 with a shoulder at about 1666, 1686 and1663 cm−1 for the four structures, respectively. Such differences, inparticular the red shift of this band for the two solvate forms, can berelated to the increasing involvement of the amide group in hydro-gen bonds. In fact, associated linear amides show a C O stretchingband lying in the 1680–1630 cm−1 region, while non-bondedamides absorptions are at 1700–1650 cm−1 [29]. Similarly, hydro-gen bonded NH stretch is usually reported near 3300 cm−1, whereasnon-bonded NH stretch falls at 3490–3400 cm−1. Considering theC O stretching at higher wavenumbers, it can be hypothesized,relatively to form II, that H-bond involving it become weaker, asunderlined above.
In the region 1650–1500 cm−1 also the �asCOO− and ıNH3+
bands of the zwitterionic form can be observed (form I). The cor-responding �sCOO− can be observed both in the IR and Ramanspectra, with variable intensity, in the 1300 cm−1 region. Themedium-strong bands near 1120 cm−1 are assigned to the COOgroup deformation.
In this region the solvate forms show the OH water deformationband in the 1640–1620 cm−1 range. This is clearly observed in thetrihydrate form at 1621 cm−1, disappearing in case of deuteration(not shown here).
One of the most characteristic bands related to amide group isthe very strong “amide II” vibration near 1500 cm−1 that involvesboth C N stretching and N H in-plane bending (amide II), whilethe stretch open mode mixed with NH deformation (amide III)absorbs more weakly in the IR spectrum in the 1330–1250 cm−1
region. Other important medium-to-strong modes concerning theC N stretching and the N H deformation are reported close to1180–1190 cm−1.
A band associated to C C stretching and C H deformation of thephenyl ring falls at 1581 cm−1 for the I form. The phenyl ring vibra-tions exhibit significant bands for the different forms. Form I andthe trihydrate show intense bands due to C C stretching and C Hdeformation of the phenyl ring falling at 1581, 1455, 1378 cm−1
and 1572, 1457, 1373 cm−1, respectively; instead, form II and themonohydrate form show a shoulder near 1550 cm−1. Both exhibit amedium intensity band at 1458 cm−1. Moreover, other C H defor-mations together with in-plane deformations of the ring give strongpeaks at 1305 and 1234 cm−1 (form I), 1336, 1318 and 1236 cm−1
(form II), 1334, 1307 and 1218 cm−1 (trihydrate) and 1307 and1223 cm−1 (monohydrate). The ring breathing bands are situatedat about 640 cm−1 for all forms. The more significant phenyl ringout-of-plane deformations fall near 870 cm−1, 800 cm−1 and at 751,760–745, 763–736, 758 cm−1 for the titled forms.
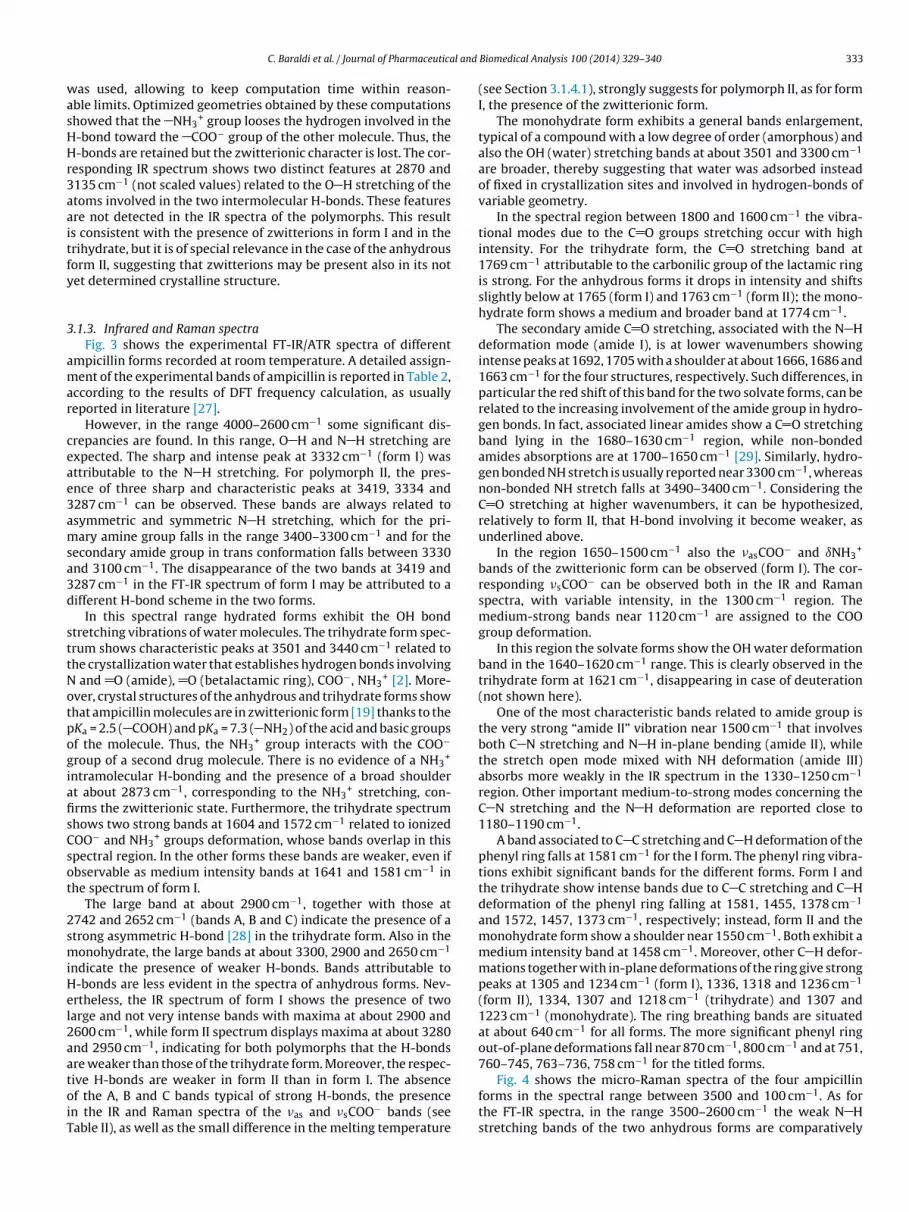
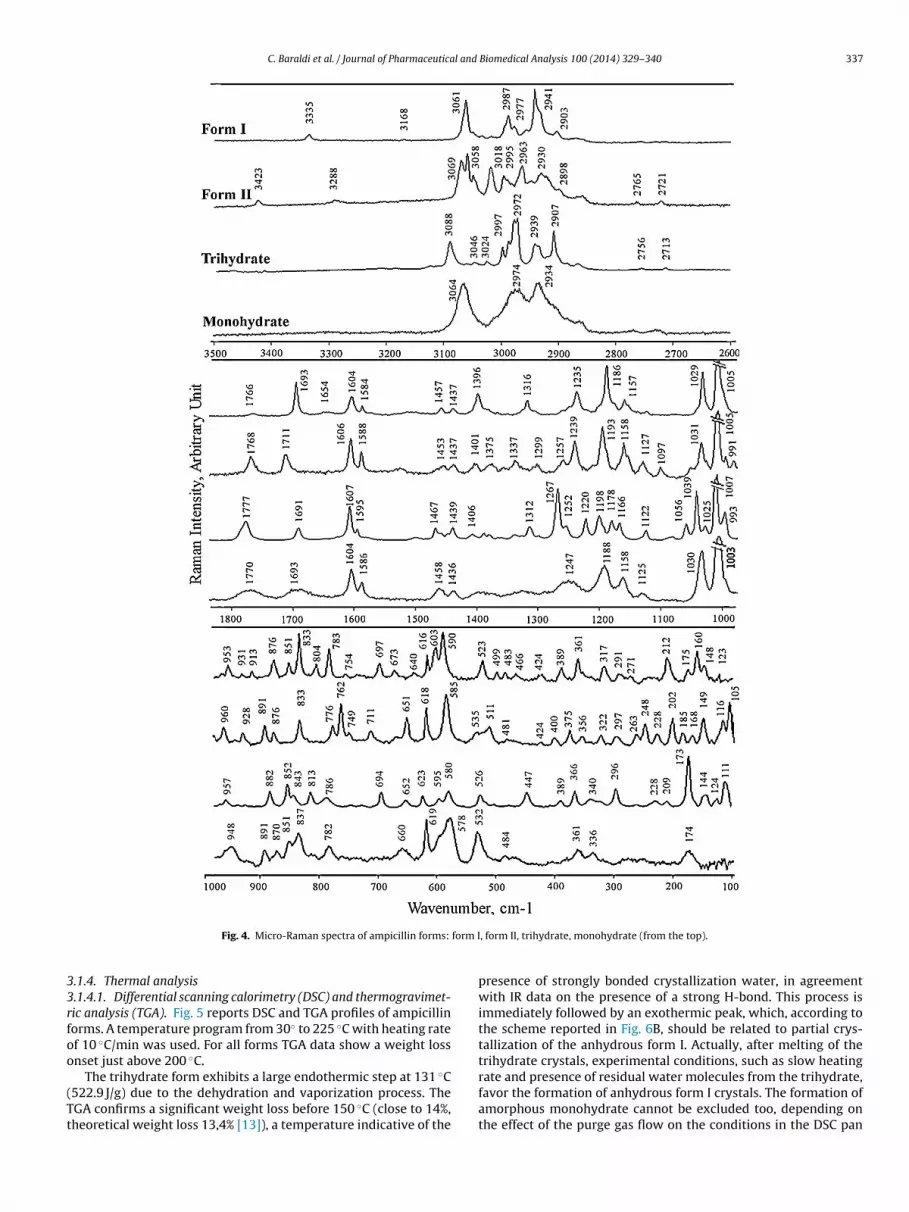
Fig. 4 shows the micro-Raman spectra of the four ampicillinforms in the spectral range between 3500 and 100 cm−1. As forthe FT-IR spectra, in the range 3500–2600 cm−1 the weak N Hstretching bands of the two anhydrous forms are comparatively

334
C. Baraldi
et al.
/ Journal
of Pharm
aceutical and
Biomedical
Analysis
100 (2014)
329–340Table 2Experimentally observed FT-IR and Raman wavenumbers (cm−1) and their attribution for ampicillin forms.
IR anhydrous form I Ramanahydrous formI
IR anhydrousform II
Ramananhydrousform II
IR trihydrate Ramantrihydrate
IRmonohydrate
Ramanmonohydrate
Assignment
3501m 3501w,br �O H (H2O)3440s �O H (H2O) intramolecularly bonded OH (dimeric)a
3419m 3423vvw �N H3332s 3335vvw 3334m 3370sh 3301s,br �N H
�O H (IR) intermolecularly bonded OH (polymeric)a
3170vw 3287s 3288vvw �N H (amide)3061w 3069w-3058w 3088w 3064w �CH (aromatic)[3000–2800] [3000–2800] [3000–2800] [3000–2800] �CH (aliphatic)
2873w �NH3+
1765vs 1766vvw 1763vs 1768m 1769vs 1777w 1774s 1770w,br �C O (lactamic ring)1692vs 1693m 1705s 1711m 1686vs 1691ms 1663vs,br 1693w,br amide I + ıNH1641m 1646w 1654w,sh �asCOO− + amide I
1621m,sh 1624sh ıOH (crystal H2O)a
1581m 1604m1584w
1558sh 1606m1588m
1604s1572s
1607m1595w
1606sh 1604m1586mw
�CC(ph) + ıCH(ph) + ıNH3+
1520vs,sh 1497vs 1515vs1496sh
1492vs 1515vs1500vs
ıCH(ph) + amide II + ıNH3+ + �asCOO−
1455m 1457w1437w
1458m 1453w 1457m 1467w 1458m 1458w,br �CC(ph) + ıCH(ph) + ıCH3/CH2
1390s 1396m 1397m 1401w 1383m 1386vw 1387m 1396vw,br ıCH3 + �sCOO−
1378vs 1362s 1368w,sh 1375w 1373s 1375vvw 1369m ıCH2+ıCH3 + �CC(ph) + ıCH(ph) + ıopCH(CH3) + ıHCC(CH3)
1324vvw 1336m 1337w 1334m 1330w,sh ıipCH (ph) + ıHCC(CH3) + �CN (amide, lactam)1305vs 1316mw 1318m 1310vw,sh
1299vw1307s 1312m 1307m,br �sCOO− + �CC(ph) + ıipCH(ph) + �CN (amide,
lactam) + ıHCC(CH3) + ıHNC(amine) + ıNH3+
1278w,sh 1254w 1258w,sh 1252m 1257w 1261s1250sh
1267ms1252w
1260vw,sh 1247mw,vbr ıHCN(lactam) + �CN(lactam) + ıipCH(ph) + ıHNC(amide,lactam) + ıNH3
+
1234w 1235m 1236m 1239m 1223m,br �CC + ıHNC(NH3+) + ıipCH(ph) + ıHCN(lactam)
1214m 1219 w 1213w,sh 1210w 1218m 1220w ıHCS + �CN(amine) + ˇHNH(amine) + ˇHCS1181m 1186ms
1179w1190w 1193ms 1194w
1171m1198ms1178vw
1191sh 1188m,br ıHNC(lactam, amide) + �CN(amide) + ıHCC + ıNH3+
1157vw- 1146vw 1157mw 1156w 1158ms1152sh
1154m 1166w 1157w 1158m,br ıipHCC(ph) + ıCH + �CC
1123m 1122vw 1126m 1127w 1116m 1122vvw 1126m 1125vw,br ıCH(CH3) + �CC(CH3) + �CN(lactam,amide) + ıHCN(lactam)
1072m 1097m 1076w 1097w 1077m 1074w ıHCC(CH3) + �CN(amine + lactam) + �HCCS + �CC(ph) + ıNH3+
1049vw 1056w �CN (amine) + ıNH3+
1026m 1029ms 1026m 1031ms1023sh
1019m 1039s1025vw
1026m 1030m ıHNC (amine) + �CC(ph) + �CN(amide + lactam) + ıNH3+
1004vw 992vw 1005vs996mw
1006w975w
1005vvs991vw979vw
1000vw990w
1007vs993w
1005vw 1003vs ıipHCC(ph) + ıopCH(ph) + �CC(ph) + ıHCCH(CH3) + ıNH3+
961vw 949vw 953w 954vw 960w941vvw
963vw957vw
948w,br ıCNC(amide,lactam) + �CC(lactam) + ıopCH(ph) + ıHCCH(CH3)
926w 931vvw913vw
924w 928w 931w 931vvw919vvw
920vw �NC(amine) + �CC(CH3, lactam) + ıCH3 + ıopCH(ph)
889w 891m 887vw 891vw �CC(CH3) + �NC(amine) + ıopCH(ph) + ıCH3
873w 876mw 872w 876w 875w 882m 867vw 870vw �CC(aliph) + �NC(amine) + �SC + ıopCH(ph) + COO−
847w 851mw 847vw 847w 852m 850vw 851w �CC(aliph) + ıCCS + COO−
833s 833ms820vvw
843m 837m �CC(aliph) + ıpOCOC + ıCCC (lactam chain) + ıopCH(ph)
802m 804mw 804vw 805w 813w 808vw ıCNC(amine + amide) + ıopCH(ph) + ıip ph + NH3+
778m 783ms 776mw 787w 786m 782w,br ıNCO(lactam) + �CNCO(lactam) + ıip ph

C. Baraldi
et al.
/ Journal
of Pharm
aceutical and
Biomedical
Analysis
100 (2014)
329–340
335
Table 2 (Continued)
IR anhydrous form I Ramanahydrous formI
IR anhydrousform II
Ramananhydrousform II
IR trihydrate Ramantrihydrate
IRmonohydrate
Ramanmonohydrate
Assignment
751m 754vw 760s 762s 763w,br 758m �HNCC lactam + ıopNH(“amideV”) + ıNCO + �CNCO(lactam) + ıop ph
745m 749w 736m 741m �HNCC (lat amide) + ıopNH (“amide V”) + ıop ph728s 729w, sh 711mw 720m 727m ıCOO− + �CC(aliph) + ıop ph692s 697m 696vs 696s 694ms 697vs ıCCO + lactam + skeleton vibration669 m 673w 672vw
663w666vw,br 660w,br 660w,br ıOCO− + Lactamic ring def.
639s 640w 647w 651m 644m 652w ıip ph + �HNCC(lat,amide) + �CC(aliph) + �CNCO(lactam) + ıCOO− + �SC(formII)
616m603ms
609w 618ms 623m595vw
619m609w,sh
�CC(aliph) + �CNCO(lactam) + ıip ph + ıCNC (lactam,amide) + �CS + ıCOO−(form I)
590s 585s 580ms 578 m,br ıip ph + �CC(aliph) + ıCNC(lactam)523m 535w 526ms 532 m,br ıop ph + �CC +
ıCNCO(amide + lactam) + �SC + ıCCS (ı lactam)499vw 511m 513m �SC + ıop ph + ıCNC (C5-N4-C3)483vw- 481vw 499vw 484vvw ıHCC + ıCCN(lactam) + �CNCO + ıip lactam466vw �SC + “skeletal deformation”424w 424vw 447m ıCCS389w 400w 389vw “C skeletal deformation”.361m 375m 366w 361vw ıCCS353sh 356w ıCCC +�HCNH + ıNH3
+ + �HCCC(CH3)317w 322w 333 vw
320 vw336vw ˇCCC(CH3) + ıNH3 + ıCCN + �HCCC(CH3) + ıop ph
291vw271 vw
297w263 w
296m �CH3 + �CNCO + ıCCS
248m228w
228vw �CH3 + ıCCC
212m 202m 209vw ıCCN (amine) + �HCCC + ˇCCC175w 185w 173m 174vw ıCCC + ıCCS160ms148w
168w149m
144w ıCCN (amine) + �HCCC + ıCCC
123vw 116m-105s 124vw111m
Lattice vibrations
a Ref. [30].

336 C. Baraldi et al. / Journal of Pharmaceutical and Biomedical Analysis 100 (2014) 329–340
m I, fo
dtaaIrstfOtimvf
i3
(oMlrsi
afd
R1f3
Fig. 3. FTIR/ATR spectra of ampicillin forms: for
ifferent from the hydrated samples. Also in this case, the spec-rum of form II shows two bands at 3423 and 3288 cm−1 (�sN Hnd �N H of the amide group) while form I displays only one bandt 3335 cm−1. These bands well correspond to those observed in theR spectra. The presence of these differences in the N H stretchingegion, together with the X-ray diffraction and calorimetric results,uggests a looser packing of crystal form II, with a possible dis-ortion of the H-bond system, corresponding to these vibrationaleatures. Moreover, as regards hydrated forms, the bands due to
H stretching vibrations are stronger in IR than in Raman spec-ra. When carboxylic group forms hydrogen bonding, the results a broad band centered at 3100–2900 cm−1, overlapped by the
uch stronger C H stretching bands. This broad band is clearlyisible both in the IR and Raman spectra of the monohydrateorm.
Characteristic features are the C H stretching bands involv-ng the benzene ring carbons, falling for the four forms at 3061,069–3058, 3088 and 3064 cm−1, respectively.
Two C O stretching vibrations are expected, one in-phasesymmetric stretching vibration) is Raman active and the other,ut-of-phase (antisymmetric stretching vibration), is IR active.edium-to-weak Raman bands are observed, that can be corre-
ated with these polar groups. The C O stretching band (lactamicing) for the various forms is located around 1770 cm−1 with a slighthift to 1777 cm−1 for the trihydrate form, due to the carboxyl groupnvolvement in an intermolecular bonding.
The carbonyl stretching of the amide group shows a band atbout 1693 cm−1 for the anhydrous form I and the two hydratedorms, while the peak is blue-shifted to 1711 cm−1 for the anhy-rous form II, as noted in the infrared spectrum.
The NH3+ deformation modes are found as medium intensity
aman bands observed at about 1605 cm−1 (all forms) and at 1584,588, 1595 and 1586 cm−1 for I, II, trihydrate and monohydrateorms, respectively. Moreover, in the Raman spectra weak bands at53 and 317 cm−1 for I form (similar values for the II form) can also
rm II, trihydrate, monohydrate (from the top).
be assigned to the NH3+ deformation mode, while for solvates this
feature is observed at 333–320 and 336 cm−1.Unlike in the IR spectra, the amide II band is not normally
observed in Raman.The total symmetric vibration (breathing) of the benzene ring
appears as a medium band at 640 and 651 cm−1 for the anhydrousforms I and II, respectively, while for the trihydrate form it falls at652 cm−1 and for the monohydrate at 660 cm−1. Other significantbands associated to the benzene ring are those at 1584, 1316, 1157and 1005 cm−1, referred to C C stretching vibrations and to theC H bending deformation for form I. The other forms show slightlydifferent values at 1588, 1299, 1158, 1005 cm−1 (form II), 1595,1312, 1166, 1007 (trihydrate) and 1586, 1158, 1003 (monohydrate).
In the lower wavenumber region of the Raman spectra, the C Sstretching vibration is observed between 650 and 610 cm−1 andaround 500 cm−1. The variable wavenumbers and relative intensityof these bands indicate different conformations of the pentatomicring, in particular as regards I and II forms. Furthermore, the C C Sbending and umbrella deformation modes appear as characteris-tic bands in the Raman spectra. The first mode corresponds to amedium band at 447 cm−1 for the trihydrate form, whereas theother forms display very weak bands at lower values. Instead,the umbrella mode shows medium bands at 361, 375, 366 and361 cm−1 for the four forms, respectively.
In the range of the lattice vibrations, the bands are characteristicand different for the two anhydrous forms. As regards the solvatedforms, the trihydrate spectrum displays strong and well resolvedbands, whereas the monohydrate shows broader bands with van-ishing lattice vibrations. This behavior, as well as the broadening ofthe main IR bands, suggests that water is not present as hydratedmolecules, but it is rather adsorbed.
In Table 2, for both IR and Raman spectra, the distinctive spec-tral features for the various forms are printed in bold. Both IR andRaman spectra display some peaks distinctive of the different poly-morphs and are useful to differentiate them.
C. Baraldi et al. / Journal of Pharmaceutical and Biomedical Analysis 100 (2014) 329–340 337
form I
33rfoo
(Tt
Fig. 4. Micro-Raman spectra of ampicillin forms:
.1.4. Thermal analysis
.1.4.1. Differential scanning calorimetry (DSC) and thermogravimet-ic analysis (TGA). Fig. 5 reports DSC and TGA profiles of ampicillinorms. A temperature program from 30◦ to 225 ◦C with heating ratef 10 ◦C/min was used. For all forms TGA data show a weight lossnset just above 200 ◦C.
The trihydrate form exhibits a large endothermic step at 131 ◦C522.9 J/g) due to the dehydration and vaporization process. TheGA confirms a significant weight loss before 150 ◦C (close to 14%,heoretical weight loss 13,4% [13]), a temperature indicative of the
, form II, trihydrate, monohydrate (from the top).
presence of strongly bonded crystallization water, in agreementwith IR data on the presence of a strong H-bond. This process isimmediately followed by an exothermic peak, which, according tothe scheme reported in Fig. 6B, should be related to partial crys-tallization of the anhydrous form I. Actually, after melting of thetrihydrate crystals, experimental conditions, such as slow heating
rate and presence of residual water molecules from the trihydrate,favor the formation of anhydrous form I crystals. The formation ofamorphous monohydrate cannot be excluded too, depending onthe effect of the purge gas flow on the conditions in the DSC pan
338 C. Baraldi et al. / Journal of Pharmaceutical and Biomedical Analysis 100 (2014) 329–340
Fig. 5. DSC and TGA profiles (10 ◦C/min) of ampicillin forms.
Fig. 6. Crystal form transformations upon heat treatment: (A) Raman spectra of the trihydrate form at room temperature and during heating at 60 ◦C, 75 ◦C, 90 ◦C and 100 ◦C(from the top). (B) Conversion of the trihydrate form to monohydrate and anhydrous forms I (slow heating) and II (fast heating).

l and
(t1map(w
feiaatclwt(
empea1wbeaIpwI
bhftivbr
3spcOt9isbs
u(wog
at6
C. Baraldi et al. / Journal of Pharmaceutica
see Fig. 6B). Unfortunately, uncertainties in the identification ofhe baseline make quite difficult to analyze the DSC profile above90 ◦C. However, a comparison with the traces of the other poly-orphs shows several similarities confirming the presence of the
nhydrous form I and possibly of the monohydrate in this tem-erature range. A final endothermic peak is detected at 216 ◦C44.2 J/g), in agreement with published data [7], caused by meltingith decomposition.
The thermograms of the monohydrate amorphous form, per-ormed with the same temperature program, show a largendothermic peak corresponding to a water loss at 68 ◦C (55.4 J/g),ndicative of weakly bound water molecules. The dehydration waslso confirmed by TGA data: weight loss of about 8% between 30nd 150 ◦C, theoretical weight loss 4.5%. The discrepancy betweenhese values is attributable to adsorption water not stoichiometri-ally bonded. Even anhydrous forms show 2.5% and 3.3% weightoss, as reported by Grant et al. [10]. A second very broad and
eak endothermic peak is detected at 190 ◦C (28.3 J/g). Finally,he ampicillin monohydrate melts with decomposition at 209 ◦C19.9 J/g).
The DSC profile of the anhydrous form I shows a broad and weakxothermic peak near 206 ◦C (18.5 J/g) [7], followed by endother-ic melting at 218 ◦C (72.7 J/g). The form II thermogram, not
reviously reported in the literature, exhibits a sharp exothermicvent at about 200 ◦C (1.9 J/g), immediately followed by meltingt 212 ◦C (23.1 J/g). For both these forms the DSC patterns above80 ◦C display trends consistent with a loss of residual absorbedater and a possible melting of less perfect crystals followed
y a crystallization process of residual amorphous material (thexothermic peak) immediately before the final melting. However,s reported in a previous section and in Fig. 6B, formation of formI by fast heating is likely to produce less stable crystals as com-ared to form I. Thus, the exothermic peak at 200 ◦C might asell correspond to a solid state conversion of form II into form
.As regards thermal analysis, the melting temperatures obtained
y DSC are: 216 ◦C, 209 ◦C, 218 ◦C and 212 ◦C for trihydrate, mono-ydrate, forms I and II, respectively, with different enthalphy of
usion (44.2 J/g, 19.9 J/g, 72.7 J/g, 23.1 J/g). However, the above men-ioned difficulties in the unambiguous identification of the baselinentroduce important uncertainties in the measurement of theseariables. Thus, discrimination of the different polymorphs onlyy thermal parameters is questionable and should be supported byesults from other techniques.
.1.4.2. Hot-stage Raman spectroscopy (HSRM). Hot-stage mea-urements were carried out with the same DSC temperaturerogram (10 ◦C/min; 32–225 ◦C temperature range). A specificharacterization of DSC events is possible by this technique.n heating from 35 ◦C to 90 ◦C, the micro-Raman spectra of
he trihydrate form is completely preserved, whereas, above0 ◦C, the conversion of trihydrate into monohydrate form
s complete (Fig. 6A) and followed by melting. Thus, HSRMhows that, even if spectral changes are detected, heatingelow 90 ◦C does not produce modifications in the crystaltructures.
In contrast, when specimens are slowly heated (5–10 ◦C/min)p to 150 ◦C in sealed capillaries, anhydrous form I is producedFig. 6B). On fast heating in sealed capillary (60 ◦C/min until 150 ◦C),hite crystals of form II are obtained (Fig. 6B). It is possible to
bserve these events through the capillary, by focusing beyond thelass wall.
Raman spectra show that, as temperature is increased, a notice-ble decrease in intensity is observed for bands at 1777 (C O ofhe �-lactamic ring), 1267, and 1120 cm−1 (already decreasing at0 ◦C) related to the carboxylic group. Also the bands at 882 and
Biomedical Analysis 100 (2014) 329–340 339
447 cm−1, related to deformation of betalactamic ring, decrease.The sharp band at 173 cm−1 due to the five member ring breath-ing displays a sudden intensity decrease as the temperature isincreased. These results may well correspond to an increasing dis-order of the crystal lattice above 70 ◦C, especially in the structure ofthe sensitive �-lactams. Such instability was already hypothesizedby Austin et al. [6].
3.2. Stability tests with time
In order to test the stability of ampicillin with time, the XRPD,Raman and FT-IR spectra of raw polymorphs and solvates in powderform were recorded with a time interval of 2 years. The spectra oftablets containing 25% (w/w) ampicillin were also recorded shortlyafter their manufacture and after 2 years. In both cases, and in orderto simulate a real life scenario, in the interim period the powderswere placed in a laboratory box for protection against the lightbut neither the temperature nor the moisture were controlled. Nodifference was observed between the two sets of data, thereby indi-cating that no transformation or degradation of the active form aftera period of 2 years had occurred.
4. Conclusions
For the first time, the four ampicillin polymorphs have beencharacterized by a large set of different techniques: FT-IR, Raman,XRPD, hot stage Raman microscopy and thermal analysis havebeen employed with the aim to investigate problems related tothe characterization and the stability of the crystal forms of thesepolymorphs. In this respect particular attention has been paid tovariables affecting interconversion of polymorphs as induced bydifferent processing methods. Pharmaceutical formulations of APIsrequire that only a single crystalline form be present. Thus, reliablemethods to characterize polymorphs are of great importance espe-cially when clinical protocols and legal and regulatory issues areconcerned.
All the above mentioned techniques are relatively able to iden-tify the different polymorphs: IR and Raman by some characteristicbands, as well as XRPD by the assignment of specific diffrac-tion peaks to different crystalline forms or by their absence as inthe amorphous. Thermal analysis can discriminate polymorphs bytheir melting temperatures and enthalphy of fusion. Moreover, thisstudy has confirmed the efficiency of vibrational spectroscopies,in particular Raman techniques, to distinguish, for an API, differ-ent polymorphs and solvate forms and to monitor the transitionsamong them as temperature is changed. For the first time, theRaman spectra of the four solid ampicillin forms are reported andthe bands typical of the different polymorphs are identified both inIR and Raman spectra. Also, for the first time, DFT quantum mechan-ical calculations have been performed for the zwitterionic formof ampicillin at the B3LYP/aug-cc-pVDZ level. Theoretical IR andRaman spectra have been obtained and compared to the experi-mental ones by the aid of the potential energy distribution (PED)analysis. Several data reported in this work emphasize the impor-tance of the zwitterionic form for ampicillin. Actually, solvatedzwitterionic ampicillin at physiological pH is present in significantconcentrations, increasing as the pH is decreased. In the crystalsof the trihydrate and anhydrous form I, ampicillin zwitterions arestabilized by a complex network of H-bonds involving the NH3
+
group. In contrast, the theoretical DFT IR spectrum of an isolateddimer shows that, in this case, ampicillin molecules are not in zwit-
terionic forms. Thus, the presence of zwitterions in the solid statemust be related to their stabilization by effect of crystal packing.A comparison of vibrational spectra of the crystal forms I and IIsupports this conclusion, suggesting that ampicillin zwitterions are
3 l and
ps
aasisac“m
y
A
t
R
[[
[
[
[[
[
[
[
[
[
[
[
[
[
[
[
[
[
[Infrared and Raman Characteristic Frequencies of Organic Molecules, Academic
40 C. Baraldi et al. / Journal of Pharmaceutica
resent also in form II, whose structure, however, has not beenolved yet.
From the collected data, the monohydrate form appears to bemorphous, though it has the appearance of crystals (50 × 100 �mpproximately); experimental results show that water is nottoichiometrically bonded, but rather adsorbed in the solid. Bynterpolating the analytical data here reported, it can be demon-trated that the forms cited as monohydrate in certain articles ands amorphous in other articles, coincide. As far as form I is con-erned, it should be noted that, generally, the literature cites ananhydrous form” that, by comparison with our data, almost alwaysatches the form I.Finally, the stability of the polymorphs with time, after a two
ears period, has been demonstrated.
ppendix A. Supplementary data
Supplementary data associated with this article can be found, inhe online version, at http://dx.doi.org/10.1016/j.jpba.2014.08.021.
eferences
[1] E. Shefter, H. Fung, O. Mok, Dehydration of crystalline theophylline monohy-drate and ampicillin trihydrate, J. Pharm. Sci. 62 (1973) 791–794.
[2] M.N.G. James, D. Hall, Crystalline modifications of ampicillin I: the trihydrate,Nature 220 (1968) 168–170.
[3] E. Ivashkiv, Ampicillin, in: K. Florey (Ed.), Analytical Profiles of Drug Substances,vol. 2, Academic Press, New York, 1973, pp. 1–61.
[4] A.C. Parker, S.E. Staniforth, US Patent, 3,933,796 (1976).[5] H.E. Alburn, W. Chester, N.H. Grant, process for the preparation of 6-(alpha-
aminoacylamino)penicillanic acids, US Patent Office 3,299,046 (1967).[6] K.W.B. Austin, A.C. Marshall, H. Smith, Crystalline modifications of ampicillin,
Nature 208 (1965) 999–1000.[7] H.G. Brittain, D.E. Bugay, S.J. Bogdanowich, J. DeVincentis, Spectral methods for
determination of water, Drug. Dev. Ind. Pharm. 14 (1988) 2029–2046.[8] Y. Takahashi, K. Nakashima, H. Nakagawa, I. Sugimoto, Effects of grinding and
drying on the solid-state stability of ampicillin trihydrate, Chem. Pharm. Bull.32 (1984) 4963–4970.
[9] N.H. Grant, H.E. Alburn, Peptide hydrates: influence of the hydration state onthe properties of �-aminobenzylpenicillin, Nature 207 (1965) 645–646.
10] N.H. Grant, H.E. Alburn, US Patent Office 3,144,445 (1964).11] K. Moribe, A. Wongmekiat, Y. Hyakutake, Y. Tozuka, T. Oguchi, K. Yamamoto,
Influence of dehydration temperature on water vapor adsorption, dissolutionbehavior and surface property of ampicillin, Int. J. Pharm. 288 (2005) 245–252.
12] S. Nojavan, A. Ghassempour, Y. Bashour, M.K. Darbandi, S.H. Ahmadi, Deter-
mination of residual solvents and investigation of their effect on ampicillintrihydrate crystal structure, J. Pharm. Biomed. Anal. 36 (2005) 983–988.13] J. Han, S. Gupte, R. Suryanarayanan, Applications of pressure differentialscanning calorimetry in the study of pharmaceutical hydrates. II. Ampicillintrihydrate, Int. J. Pharm. 170 (1998) 63–72.
[
Biomedical Analysis 100 (2014) 329–340
14] H.H. Silvestri, D.A. Johnson, US Patent 3,941,773 (1976).15] N.V. Phadnis, R.K. Cavatur, R. Suryanarayanan, Identification of drugs in phar-
maceutical dosage forms by X-ray powder diffractometry, J. Pharm. Biomed.Anal. 15 (1997) 929–943.
16] H. Zhu, D.J.W. Grant, Influence of water activity in organic solvent + water mix-tures on the nature of the crystallizing drug phase. 2. Ampicillin, Int. J. Pharm.139 (1996) 33–43.
17] H. Liu, Y. Chen, X. Zhang, Characterization of anhydrous and hydrate pharma-ceutical materials with THz time-domain spectroscopy, J. Pharm. Sci. 96 (2007)927–934.
18] T. Kojima, Y. Yamauchi, S. Onoue, Y. Tsuda, Evaluation of hydrate formation ofa pharmaceutical solid by using diffuse reflectance infrared Fourier-transformspectroscopy, J. Pharm. Biomed. Anal. 46 (2008) 788–791.
19] M.O. Boles, R.J. Girven, The structures of ampicillin: a comparison of the anhy-drate and trihydrate forms, Acta Crystallogr. B 32 (1976) 2279–2284.
20] M.J. Frisch, G.W. Trucks, H.B. Schlegel, G.E. Scuseria, M.A. Robb, J.R. Cheeseman,G. Scalmani, V. Barone, B. Mennucci, G.A. Petersson, H. Nakatsuji, M. Caricato,X. Li, H.P. Hratchian, A.F. Izmaylov, J. Bloino, G. Zheng, J.L. Sonnenberg, M. Hada,M. Ehara, K. Toyota, R. Fukuda, J. Hasegawa, M. Ishida, T. Nakajima, Y. Honda,O. Kitao, H. Nakai, T. Vreven, J.A. Montgomery Jr., J.E. Peralta, F. Ogliaro, M.Bearpark, J.J. Heyd, E. Brothers, K.N. Kudin, V.N. Staroverov, R. Kobayashi, J. Nor-mand, K. Raghavachari, A. Rendell, J.C. Burant, S.S. Iyengar, J. Tomasi, M. Cossi, N.Rega, J.M. Millam, M. Klene, J.E. Knox, J.B. Cross, V. Bakken, C. Adamo, J. Jaramillo,R. Gomperts, R.E. Stratmann, O. Yazyev, A.J. Austin, R. Cammi, C. Pomelli, J.W.Ochterski, R.L. Martin, K. Morokuma, V.G. Zakrzewski, G.A. Voth, P. Salvador,J.J. Dannenberg, S. Dapprich, A.D. Daniels, Ö. Farkas, J.B. Foresman, J.V. Ortiz, J.Cioslowski, D.J. Fox, Gaussian 09, Revision A.1, Gaussian, Inc., Wallingford CT,2009.
21] A.D. Becke, Density-functional thermochemistry. III. The role of exact exchange,J. Chem. Phys. 98 (1993) 5648–5652.
22] C.T. Lee, W.T. Yang, R.G. Parr, Development of the Colle–Salvetti correlation-energy formula into a functional of the electron density, Phys. Rev. B 37 (1988)785–789.
23] T.H. Dunning Jr., Gaussian basis sets for use in correlated molecular calcula-tions. I. The atoms boron through neon and hydrogen, J. Chem. Phys. 90 (1989)1007–1023.
24] F.H. Allen, The Cambridge structural database: a quarter of a million crystalstructures and rising, Acta Crystallogr. B 58 (2002) 380–388.
25] J.P. Merrick, D. Moran, L. Radom, An evaluation of harmonic vibrational fre-quency scale factors, J. Phys. Chem. A 111 (2007) 11683–11700.
26] M.H. Jamróz, J.C. Dobrowolski, R. Brzozowski, Vibrational modes of 2,6-,2,7-,and 2,3-diisopropylnaphthalene. A DFT study, J. Mol. Struct. 787 (2006)172–183.
27] R. Mishra, A. Srivastava, A. Sharma, P. Tandon, C. Baraldi, M.C. Gamberini,Structural electronic, thermodynamical and charge transfer properties of chlor-amphenicol palmitate using vibrational spectroscopy and DFT calculations,Spectrochim. Acta: A 101 (2013) 335–342.
28] D. Hadzi, S. Bratos, in: P. Schuster, G. Zundel, C. Sandorfy (Eds.), The HydrogenBond, Structure and Spectroscopy, vol. 2, North Holland, Amsterdam, 1976, pp.565–611.
29] N.B. Daimay Lin-Vien, W.G. Colthup, J. Fatelet, G. Grasselli, The Handbook of
Press, Inc./Harcourt Brace Jovanovich Publishers, Boston/San Diego/New York,1991.
30] G. Socrates, Infrared Characteristic Group Frequency. Tables and Charts, 2nded., Wiley, Chichester, 1997.