chapter- i introduction - dspace at tribhuvan university
TRANSCRIPT
1
Chapter- I
INTRODUCTION
1.1 General Background
Dividend refers that portion of firm’s net earning, which is paid to the shareholders. It is
the payment made to the common stock holder out of the firm’s earning instead of their
investment on equity share of the firm. In other words, dividend refers that form of
return which is distributed to the stockholders after retaining firm’s profit for its
expansion. A company decides to declare its dividend to its equity shareholder as a part
of return on their investment only of the financial report of the company shows net
profit during the financial year. The popular forms of dividend are cash and stock
dividend. How much cash and stock dividend is to be distributed to the common
stockholders is decided by the board of directors. The common stockholders are real
owners of the business but they are least in the priority of the disbursement of the profit.
Before the distribution of the dividend to the common stockholder, interest to
bondholder, preferred dividend to the preferred stockholder and revenue to the
government must be paid. Dividend is the most inspiring aspect for the investment in
the shares of various companies for an investor, so to attract the new investors; dividend
should be paid to the shareholder in an effective way.
Dividend policy is defined as the decision regarding the separation of net earning
between distribution to shareholders as dividend and retention within the firm to meet its
further financial requirement. Dividend policy decision is a major decision of a firm,
which determines the division of earning between payment to stockholders and
reinvestment in the firm. There is no uniformity in the distribution of dividend in Nepal.
Firm may choose one of the many combinations between two extremes is, distribution of
zero to hundred percent as cash dividend. Dividend policy has strong effect on the stock
price of the firm. Thus, it is one to the major decision that may contribute to maximize
the value of the firm. There is conceptual conflict about whether cash dividend should be
2
paid or retain in company for the purpose of internal financing. Both alternatives leave
their own impact on the growth of a company. Retained earnings are the most significant
internal source of financing the growth of the firm; on the other hand dividends are
desirable from shareholder’s point of view, as it tends to increase their current wealth.
Dividend policy is a crucial area of financial management of a firm. The important
aspect of dividend policy is to determine the amount of earning to be distributed to
shareholders and the amount to be retained in the firm. There is inverse relationship
between retained earnings and cash dividend. If more retained earning is made, the
amount of dividend would be less and in the case of less retained the investor would be
able to enjoy more dividend. The objective of a dividend policy should be to maximize
shareholder’s return so that the value of his investment is maximized. Shareholder’s
return consists of two components, dividend and capital gains. Dividend policy has
direct influence on these two components of return. If the firm adopts the policy of
retained earning for the purpose of expansion of its business in the long run capital gain
would be the result. Dividend payment to shareholders will obviously reduce the capital
gain but it will increase their current wealth and plug them back into the business.
After the adaptation of liberal economy policy by Nepalese Government, joint venture
and national investors are encouraged to invest in different private sector, which results
Nepalese capital market under the stage of the developing during the decade of 90’s.
People are attracting to invest in the organizational profitable securities. Scattered money
is taking its shape into an organized capital market of Nepal though it is suffering from
the numerous hurdles. This is human nature that he wants a smart return from his
investment. When someone is considering to invest in any organization as the form of
equity share his first attempt would be to wards gathering information about firm’s
present position and profitability, which can be reveal through the dividend policy of the
firm. So, the study of the dividend policy is very important as well as challenging task in
the field of financial decision making. An optimum dividend policy is a major tool to
attract a potential investor to invest for the expansion of the capital position and business
operation of the firm.
3
This research includes the study of four companies from different sectors. Each sample
consists of banking, finance, insurance and manufacturing and processing sector. The
focus of my study is on the relevant factors regarding of dividend policy and practices of
the above mentioned samples. Before starting the study, the review on the history of
Nepalese financial market could be beneficial. Following paragraph contains a brief
description of the history of related sectors of the study.
Banks
In Nepal, banking in true sense of term started with the inception of Nepal Bank Ltd,
which is the first commercial band in Nepal. Established in 1937 AD (1994 B.S), Nepal
Bank Ltd. Carried out the functions of a commercial bank. It collected the deposits and
provided loans to the needy people. This bank played a major role in Nepalese economy
at that period. After the establishment of Nepal Bank Limited, banking transaction was
flourished, which was an initial step towards the structure of the capital market. Having
felt the need of a central bank, Nepal Rastra Bank was established in 2013 B.S under the
central Bank Act 2012. To fulfill the adequate services for increasing commercial
activities in the country, Rastriya Banija Bank (R.B.B) was established in 2022 B.S as a
fully government owned commercial bank. Despite these efforts of the government,
financial sector was found sluggish. Banking services to the satisfaction of customers
was a far cry. In the meantime, when government permitted establishment of foreign
Joint Venture Banks (JVB’s), the inspection of Nepal Arab Bank Limited (NABIL) in
1984 AD as a first joint venture bank proved to be milestone in the history of banking.
Following NABIL, Nepal Indosusez Bank Ltd. And Nepal Grindlays Bank Ltd. (now
Standard Chartered Bank Limited) was established as joint venture banks. After
restoration of the multiparty democracy, the newly elected government adopted the
liberal market oriented economic policy, as the result Nepalese capital market has
jumped a step upward by establishing remarkable number of banks in collaboration with
joint ventures and Nepalese promoters.
4
Financial Institutions
Financial institutions are the organizations that are engaged in any type of the financial
transactions. Financial Institutions accepts deposits as well as provide loans to the needy
persons, business or industries. According to NRB Act 2012 article 2(7a), “The financial
institution in Nepal refers to any institutions, established with the objective of providing
loan to agriculture, cooperative, industry or any other specific economic sector or
accepting deposit from the public. The term also refers to any other institution called
financial institution by Government of Nepal by publishing a notice in gazette. However
the term doesn’t signify Commercial Banks”. Finance companies are one of the forms of
the financial institutions. In Nepal the finance company act 2042 governs finance
companies. Besides providing banking facilities, it performs agency function i.e.
transferring of money, underwriting shares and debentures. Finance company also deals
in stocks and bond issued by government as well as provides brokerage and
underwriting service to non-governmental organization.
Insurance
Insurance is a way of providing security to the property as well as person against any
particular risk. It is means of shifting the risk to insurer in consider action of nominal
cost. Insurance provides financial protection against any specific risk. Insurance business
act 2042 states insurance as, “A contract made by person/persons paying certain amount
based on estimated life and he or his representative gets the amount based on estimated
life of the policy period”
Insurance has two functions:
1. Primary Function: Primary function of insurance includes act of assessing risk and
minimizing financial risk using remedial measures to protect from loss
immediately.
2. Secondary Function: Secondary function consist of capital mobilization and also it
helps to maintain financial stability against and numerous of hazards in the world
of business.
5
Manufacturing and Processing Industries:
Manufacturing Industries refers to those Industries, which produces goods by utilizing or
processing raw materials, semi processed materials, by products or waste products, or
any other goods. Manufacturing and processing Industries produces such products,
which are very familiar among the consumers. The regular consumable products are
main focus of these types of the Industries.
Brief Profile of Samples
In this study, due to time consistency and reliability of the data available, only four
companies are selected as sample among 48 ‘A-category’ enlisted companies of NEPSE.
Following are the brief introduction of them.
1. Nepal Investment Bank Ltd.
Nepal Investment Bank Limited, one of the A-category enlisted banks of NEPSE offers a
wide range of services. Some of them are Trade finance, deposits, fund transfer,
remittances, export credit, bills purchase, loans and advances, locker facilities, ATM
with any branch banking 365 days banking etc. Nepal Investment Bank Limited,
formerly Nepal Indosuez Bank Limited was established in 1986 as a joint venture
between Nepalese and French partners. The French partner holding 50% of the capital of
NIBL was credit Agricole Indosuez, a subsidiary of one of the largest banking group in
the world. On April 2002, Agricole Indosuez withdrew its 50% share from NIBL and a
group of companies consisting of Bankers, Professionals, Industrialists and Businessman
has acquired those 50% of shares. The name of the bank has changed as Nepal
Investment Bank Limited on approval of its annual general meeting. Following are the
shareholding structure of NIBL:
A group of companies holding 50% of capital
Rashtriya Banijya Bank holding 15% of capital
Rashtriya Beema Sansthan holding 15% of capital
Remaining 20% shares are hold by general public
6
2. National Finance Company Ltd.
It was established in 1992 under the company act 1964 with an objective of mobilizing
scattered saving through various schemes and deploys them in different sectors of
economy for the economic development of the country. The company commenced its
operation on May 1993 in accordance with finance company act 1985. Besides accepting
deposits and providing loans and advance the company undertook the job of market
making for listed corporate securities issue management underwriting and other capital
market activities as a market maker till December 1996 but in January 1997 the
securities dealer (primary market) gibing up the market making functions. The total
authorized capital was Rs.60m and paid up capital was Rs.30millions.
3. Everest Insurance Company Ltd
Nepalese finance market has remarkable contrition from insurance sector i.e., insurance
companies. Among numerous insurance companies, Everest Insurance Company has its
own identity as ‘A-category’ enlisted insurance companies of NEPSE. Everest Insurance
Company Ltd. commenced its insurance business in 1994A.D after receiving an
insurance license from Beema Samiti after privatization of Insurance Business in Nepal.
Everest Insurance Company has promoted by leading Industrial and Business houses of
Nepal. The share structure of Everest Insurance Company reveals that the company has
40% of its total capital with the general public. Everest Insurance Company was the first
company to declare with successful in developing relationship with the best reinsure
throughout the world. Providing various insurance services form last twelve years, the
company has established itself as one of the leading insurance companies in Nepal.
4. Nepal Lever Limited (Unilever Nepal Limited)
With the purpose of meeting the every day need of everywhere, Nepal Lever Ltd. Was
established in 1992 under company Act of Nepal1964 as a subsidiary body of Hindustan
Lever Ltd. The Hindustan Lever Limited has invested Rs.73.7 millions in equity as 80%
ownership in Unilever Nepal Limited. Similarly Sibkrim Land and industrial Co. Ltd.
Has invested Rs.49.03 millions in equity as 5% ownership in Unilever Nepal Limited.
Rest 15% on equity has been issued as public preference share. However, the company
7
Unilever Nepal Limited is firstly established as the name of Nepal Lever Limited. Later
on after the great success of 10th AGM, the company’s name is changed into Unilever
Nepal Limited. Nepal Lever Ltd. (Unilever Nepal Limited) is providing various
consumable home appliances as well as cosmetic goods to its costumers either b
producing itself or importing them from other countries. The product of Unilever Nepal
Limited is quite popular among the Nepalese people because it has brought its wealth of
knowledge and international expertise to the service of local consumers. Due to its
smooth operation, NLL is able to remain only one ‘A-category’ enlisted company from
manufacturing and processing sector. Believing hat to succeed it requires higher
standard of corporate behavior towards employees, consumers, society and the world in
which we live, NLL is moving a head in the path of sustainable and profitable growth,
which is assisting creation of long term value for its investors as well as employees.
1.2 Statement of the Problem
Dividend decision is the crucial decision in financial analysis of a firm. It is a
fundamental but still a controversial area of managerial finance. The relationship
between the dividend payment and market price of the share is a subject of long standing
argument. Some assume that dividend and stock price has positive relationship however
others belief there is a negative relationship between dividend and stock price. In the
developed capital market, many empirical studies have been carried out to analyze the
relationship between dividend and stock prices like Linter (1956), Modigliani and Miller
(1961), Gordon (1962), Friend and Puckett (1964), Walter (1966), Van Horne and Mc
Donald (1971), Chawla and Shrinivasan (1987). However, there is still a controversy
concerning the effect of dividend policy on the corporation’s market value or market
value of share.
Dividend is desirable form the stockholder’s point of view. It is the most stimulating
factor for the investment on the shares of the company. Payment of dividend makes the
investors happy but for the expansion of the firm and get the opportunity of investment
in profitable securities, the firm should have an optimum amount of retained earnings.
Earnings are also treated as financing sources of the firms. If firm retains its earnings as
the source of internal financing, the amount of dividend would be less. In the case of less
8
retained the investor would be able to enjoy more dividend, but this will hamper the
growth of the firm. Therefore, there are many dimensions to be considered on dividend
theories, policies and practices.
.
The capital market is an important part of corporate development of a country. Even if
capital market is in early stage of development in Nepal, Nepalese investors have
heavily made investment in newly established companies, especially in the financial
sector. This trend will remain to continue until the investors are satisfied by the decision
made by the management of these companies. Dividend is the most inspiring aspect for
the investment in the shares of various companies for an investor. Even if dividends
affect the firm’s value unless management knows exactly how they affect value, there is
not much that they can do to increase the shareholder’s wealth. So it is necessary for the
management to understand how the dividend policy effects the market valuation of the
firm. In Nepalese context, different companies paying dividend adopting different
dividend policies. Some companies are paying dividend on regular basis but, no
companies following a single convincing policy. Dividend is paid in different forms such
as cash dividend, stock dividend that are widely popular among Nepalese companies
The major problems that have been identified for the purpose of this study are
1. What is the relationship between the dividend policy and the valuation of the
firm?
2. What are the factors that affect the dividend and valuation of the firms?
3. Does the market price of share affected by the dividend policy?
1.3 Objectives of the Study
Main objective of this study is to trace the impact of dividend policy adopted by the firm
on the market price of the share as well as the overall value of the firm. Dividend refers
to “an amount to the profit that a company pays to people who owns shares in the
company” (A.S. Hornby:2000:P230) which means that dividend serve as return on
investment. For the management of any organization, examination of the relationship
between dividend and market price of share may become an important guideline in
setting suitable dividend policy. The major objective of the study is to obtain in-depth
9
knowledge about thee impact of dividend policy adopted by the firm to its market price
of shares as well as the overall valuation of the firm.
Some of the important objectives of this study can be pointed as follows.
1. To study the dividend policy of the organizations under study.
2. To evaluate the current practices of the dividend policy.
3. To examine the impact of dividend on share price.
4. To study the relationship between dividend policy and other financial indicators.
5. To provide applicable suggestions, which might be helpful to the formulation of
an optimal dividend policy and maximize the stock price.
1.4 Significance of the Study
Decision relating to the dividend policy is very important decision regarding financial
performance of the company. If the market does not receive its expected dosage, stock
price will suffer. Dividend announcement also help to solve symmetric information
problem between management and shareholders. Besides this, shareholders usually think
that dividend is less risky than capital gain and they use the announcement of changes in
dividend payment in assessing the value of a security.
The dividend is most sensitive element in the area of investment in the common stock.
Now a day people are attracted to invest in share for the purpose of getting more return
as well as to maximize their wealth. So the dividend policy has become an effective way
to attract new investors, to keep present investors happy and to maintain goodwill of the
company. When a new company floats shares in the capital market, very big
congregation gathers to apply for owner’s certificate. It indicates people’s expectation on
higher return of investment in shares. The study may be helpful to investors in
identifying the productivity of their investment and justify the rational of their
investment decision.
In Nepalese context, dividend distribution is inconsistent and fluctuating. This research
may be helpful to the policymakers to formulate an optimum dividend policy in
10
accordance with international standard and this research may try point out the loopholes
and suggest the remedies about the appropriate dividend policy.
1.5 Limitations of the Study
When analyzing the study, this research also couldn’t be untouched from the boundaries
of limitations. Some of these limitations may refer inadequate time, lacking of the
experience in research work and reliability of the applied statistical tools. Although we
have 48 companies enlisted in ‘A-category’ due to limited time and quality of the
research, only four samples have been used for the analysis. Besides these, some other
limitations are discussed below.
1. This study is based specially on secondary data like annual reports of the companies,
journals, related materials from various websites and the outcomes may depend on
reliability of data of such nature
2. Only cash dividend is referring as dividend at the time of the study.
3. Due to time consistency, only limited number of companies has been considered as
samples.
4. Among the limited samples, some samples are not interested in providing the
necessary report of their activities.
5. Due to lack of experience in research work, there may be lack of detailed
information required for research.
1.6 Organization of the Study
This research consists of five chapters, each chapter is concerned with the dividend
policy and practices followed by the four samples. The chapters are very carefully
planned to make a simple and meaningful methodology approach. Organization of the
chapters and content of each chapter are discussed in following way:
11
Chapter One: Introduction
This chapter deals with the introductory part of the research. This chapter covers general
background, Statement of problems, Objectives of the study, Significance of the study,
research methodology and Organization of the study.
Chapter Two: Review of Literature
This chapter includes theoretical analysis as well as brief review of related literatures.
This chapter is divided into conceptual framework and review of related major studies.
Chapter Three: Research Methodology
This chapter deals with the nature and sources of the data, research design, data
collection and processing procedures, methods of analysis of statistical tools.
Chapter Four: Data Analysis and Presentation
This chapter consists of presentation and analysis of data by applying statistical and non-
statistical tools to indicate the quantitative factor on dividend policy and practice as well
as the major findings are also shown in this chapter.
Chapter Five: Summary, Conclusion and Recommendations
This chapter includes the summary of the study and presents the conclusion which has
been found as the outcome of the research with a suggestive package of
recommendations.
Besides these, bibliography and appendices have been included at the end of the Thesis
Report.
12
CAPTER II
REVIEW OF LITERATURE
In this chapter, concerned literatures relevant to the dividend policy are reviewed. While
reviewing the literature, different books, studies of magazines, articles, Journals and
unpublished dissertation of seniors have been used. This chapter is divided into two
groups. First is conceptual framework and another is review of related studies.
2.1 Conceptual Framework
By dividend, we mean the portion of earning made by the firm that is distributed to the
firm that is distributed to the shareholders in return of their investment in shares. Profit
maximization is the main objective of the entire firm. While making the profit the firm
has two alternatives, the first alternative related to determine how much amount of profit
to be retained in the firm for business expansion and other alternative tells the amount of
the money distributed to its investors (shareholders). Most of the firms try to make
balance between these two alternatives. For this they retain certain percentage of profit
in business and rest is distributed to the stockholders. The distributed income is simply
called dividend. “Dividend refers to that portion of a firm’s net earning, which are paid
out to the shareholders.”(Khan & Jain: 1999: P.13.3)
Paying dividend to the shareholders is an effective way to attract the new investors. But
it is not an easy task to decide how much should be paid to the shareholders, as the firm
needs more fund to expand its operation. An effective dividend policy can solve the
problem of how much amount should be retained and how much should be paid to the
shareholders. The dividend policy includes all aspects related to the payment of
dividend. Dividend policy is the policy of any firm/company regarding the division of its
profit between shareholders as dividend and retention of the profit for making
investment. “Dividend Policy determines the division of earnings between payments to
stockholders and reinvestment in the firm. Retained earnings are one of the most
13
significant sources of funds for financing corporate growth, but dividends constitute the
cash flows that accrue to stockholders”. (Weston, & Copeland: 1990: P.657)
The policy of a company in segmentation of its earning as dividend and as retention for
its investment is known to be dividend policy. Dividend policy may consider as one of
the essential decision to maximize the value of common stock as it directly affects the
structure of the firm, the flow of funds, corporate liquidity and investor’s attitude. It
determines the ratio of earning to be retained and payout. As the dividend payment and
retained earning have inverse relationship, the entire problem relating dividend payment
and retention of earning is closely examined before applying appropriate dividend
policy. Higher dividend payout reduces the retention amount, which affects the internal
financing, in other hand lower dividend payment affects the market price of the stock.
The decision of dividend payment is closely related to the objective of the firm. The
form pays higher dividend in wealth maximization objective but in the objective of the
expansion of the firm, the principle of lower payout should be adopted. “Most of the
investors expect to continue in each year as well as to receive price when they sell the
stock.”(Weston & Brigham: 1989: P.228) The expected final stock price includes the
return of original investment plus a capital gain. If the stock is actually sold at price
above its purchase price, the investor will receive capital gain; as such the shareholders
expect increase in market value of the common stock over time. At the same time, they
also expect firm’s earning in the form of dividend or capital gain. “Financial Manager is
therefore concerned with the activities of the corporation that affects the well being of
stockholders. That well being partially measures by dividend received but a more
accurate measure is the market value of the stock.” (Dean: 1973: P.1) In the view of the
shareholders, dividend is less risky than capital gain. “Since dividends would be more
attractive to the shareholders, one might think that there would be a tendency for
corporation to increase the distribution of dividend. But one might equally pressure that
gross dividend would be reduced somewhat, with an increase in net after tax dividends
still available to stockholders, and increase in retained earning for the corporation.”
(Throp: 1977: PP. 90-91)
14
Dividend serves as simple comprehensive signal of management interpretation of the
firm’s recent performance and its future prospects. Some companies may pay whole
earning as dividend at the beginning to create good image in financial sector but later,
they may change their policy and announce a certain percent of dividend pay out term.
Dividend policy should be concerned with the well being of the shareholder, which can
be partially measured by dividend received but more accurately measured in terms of the
market value of the stock. “The dividend policy must be formulated with the basic
objectives of maximizing the wealth of the firm’s owners and providing for the sufficient
financing. These objectives are not mutually exclusive but rather interrelated”
(Lawrance: 1994: P.696)
Thus dividend decision is one of the central and major decision area related to the
policies seeking to maximize the value of firm’s common stock as well as the wealth of
the shareholders.
2.1.1 Major Forms of Dividend
Dividend refers to left out of earnings. The portion of dividend payout will fluctuate
from period to period by making support in the amount of acceptable investment
opportunity available to the firm. Dividend can be paid to the shareholders in various
forms depending upon the objectives and policies implemented by a firm. A firm must
ensure the smooth growth of the firm as well as satisfy the expectation of the
shareholders before adopting any dividend policy. The corporations in Nepal are in the
early stage of development due to which they need to pay extensive concentration in the
dividend policy. In Nepalese context, cash dividend and stock dividend and are the most
popular form of dividend payment. When the firm doesn’t have sufficient cash, it pays
different forms of dividend to its investors. Besides cash and stock dividend, scrip
dividend, property dividend, bond dividend can also be paid as the return of the investors
(Shareholders).
15
I. Cash Dividend
By its name, cash dividend refers to the portion of earning paid to the investors in the
form of cash in proportion to their share investment in the company. In context of Nepal,
cash dividend is the most popular form of dividend and is mostly adopted by many
companies/forms/financial institutions. When cash dividend is paid, the cash account
and the reserve account of a company will be reduced, thus both the total assets and the
net worth of the company are reduced as well when cash dividend is distributed. A
company must arrange sufficient cash at the time of dividend payment in cash. “When a
company follows a stable dividend payment policy, it should prepare cash budget for a
coming period to indicate the necessary funds which would be needed to meet regular
dividend payment of the company”(Pandy: 1999: P.782)
II. Stock Dividend and Stock Split
“A stock dividend is paid in additional shares of the stock instead of in cash and simply
involves a book keeping transfer from retained earning to the capital stock account.”
(Weston & Copeland: 1990: P.980) In other words, stock dividend refers to issuing of
additional shares to existing shareholders instead of cash. Stock dividend increases
number of shares outstanding of the company as result EPS, DPS and MPS of the shares
decreases. The shares are distributed proportionately so the shareholder retains his
proportionate ownership of the company. The declaration of shares dividend will
increase the paid-up share capital and reduce the retained earning (reserve and surplus)
of the company but the total net worth is not affected by the bonus share issue.
“With the stock split, the number of shares is increased through a proportional reduction
in the par value of the stock” (Van Horne: 1988: P.373) A stock split is a method to
increase the number of outstanding shares through a proportional reduction in the par
value of the share. A stock split affects only the par value and the number of outstanding
shares. The shareholder’s total fund remains unaffected. Some of the joint venture
companies of Nepal have adopted the policy of paying cash along with stock dividend.
16
III Scrip Dividend
Scrip refers to promissory notes, when company doesn’t have sufficient cash to pay its
shareholders or the company’s cash position is temporarily weak and does not permit
cash dividend, the company may issue promissory note stating that dividend would be
paid within the maturity period. Scrip dividend could be interest bearing and non-interest
bearing. The dividend would be paid to shareholders when the company has sufficient
amount of cash. Script dividends are justified only when the company has really earned
profit and have only to wait for the conversion of other current assets into cash in the
course of operation.
IV Property Dividend
By property dividend, we mean payment of dividend in the form of property or assets
instead of cash. Usually this form of dividend is paid when the company has useless or
unnecessary property or assets at the time of operation. This excess of property is to be
distributed among its equity shareholders as the form of return to their investment
V Bond Dividend
With the view of reserving cash flow, the company pays the dividend in the form of its
own bond. When the company generates more profit for a long time, they issue the bond
with the view of avoiding cash outflows. The issue of bond dividend increases the long
term obligation of the company’s current liability.
VI Special Dividend
Companies with wasting assets may declare this kind of dividend, by those wishing to
retrench operations and by those winding up their corporate existence. Cash dividends,
in such cases are considered as a return of capital in gradual stages.
VII Optional Dividend
Optional dividends are payable in cash or stock at the option of stockholders. Sometimes
cash dividends are applied towards the purchase of new stock unless the stockholder
expresses his/her desire to have cash.
17
VIII Depression Dividend
Depression dividends may arise from reduction in stated capital. A corporation thus
wipes out its deficits and creates surpluses in order to keep up dividend payments.
Unintelligent and indifferent stock holders lend their approval to such hocus-pocus.
IX Dividends from Appreciation
When assets are disposed of for more than the book value, dividends may be paid out of
the realized appreciation.
X Liquidation Dividend
Liquidation dividends represent the distribution of assets as a result of the failure of a
company or on its dissolution. They are paid out of properties that are surrendered for
cash or some other form of wealth. Liquidation dividends may be paid to bond-holders
as well as to stockholders.
2.1.2 Theories of the Dividend
The firm would be well advised to use the net profits for paying dividend to the
shareholders if the payment will lead to the maximization of wealth of the owners. If not,
the firm should rather return them to finance its investment programme. The relationship
between dividends and value of the firm should, therefore, be the decision criterion.
There are, however, conflicting opinions regarding the impact of dividends on the
valuation of a firm. Modigliani and Miller (MM) think “under a perfect market situation,
the dividend policy of a firm is irrelevant, as it does not affect the value of the firm” (
Miller & Modigliani: 1961: PP.411-433). On the other hand Professor James E. Walter
argues that “the choice of dividend policies almost always affect the value of the firm” (
Walter: 1963: PP.280-291). For the convenience of the study dividend theory can be
divided into two groups which is as follows.
a) Residual Theory of Dividend
b) Stability of Dividend
18
a) Residual Theory of Dividend
According to this theory, “the dividend is distributed if there exists a balance earning
after paying fixed obligations and investment opportunities.” (Pandey: 1999: P.537) This
theory tells only left after earnings should be distributed to the shareholders in the form
of dividend after accepting all the profitable investments opportunities in accordance
with the firm’s investment policy. The firm must invest in such project, which have
greater than required and only residual amount of earning should be distributed to the
stockholders as the form of cash dividend.
Dividend amount wouldn’t remain constant in every time because the firm usually gets
investment opportunity in profitable securities. It must prefer retained earning instead of
external funding because external funding is quite expensive in comparison with internal
funding due to flotation cost and others. When the firm uses huge amount of earning for
its expansion, the dividend payout to its stockholders would certainly be bit lower.
“Although the residual theory of the dividend appears to make further analysis of the
dividend policy unnecessary, it is not clear that dividends are solely a means of
disbursing excess funds” (Rao: 1992: P.458)
In a bird’s eye view, we can conclude that dividend amount of the firm can be
determined by investment opportunity as well as availability of the internally generated
fund of a firm.
b) Stability of Dividend
This theory refers to regularity in dividend payout even the amount fluctuates from time
to time. Stability of dividend is considered as a desirable policy by the management of
most companies. Shareholders also generally favor this policy and value of stable
dividend is higher than the fluctuating ones. “All the other things being the same, stable
dividend have a positive impact of the market price of the share”. (Pandey: 1999: P.778)
Under this theory, three different forms of dividend was developed which are as follows:
19
i. Constant Dividend per Share
In this policy, a fixed amount per share as dividend each year is to be paid to its
stockholders. Respective to the fluctuation in the earning, when the earning of the
firm is stable, it is easy to follow this policy but if the earnings are fluctuating, the
company may face many difficulties. With the earning fluctuating year to year, it is
essential for the company which wants to adopt this policy, to build up surpluses in
year of higher than average earning to maintain dividend in years of below average
income.
This policy doesn’t imply that the dividend per share will never be increased. When
the company reaches new level and expect to maintain it, the annual dividend per
share may be increased. If the income is expected to be temporary, the annual
dividend per share is not changed and remains at the existing level.
This policy generally preferred by those persons and Institutions that depends upon
the dividend income to meet their living and operating expenses. “Increase or
decrease in market value may even be of little concern to these investors, and this
condition tends to produce a steady long run demand that automatically stabilizes the
market value of the shares.” (Brandt: 1972: P.447)
ii. Constant Dividend Payout Ratio
Some company follows constant dividend payout ratio. The policy refers to paying a
fixed percent of net earning every year. With this policy, the amount of dividend will
fluctuate in direct proportion of earning and are likely to be highly volatile in the
wake of wide fluctuations in the earnings of the company. Management may support
this type of policy because it is related to the company’s ability to pay dividends. It
ensures that dividends are paid when profits are earned and at the time of losses, no
dividend shall be paid regardless of the desire of the shareholders. “One of the most
appealing features of this policy to some extent is its conservation and its guarantee
against over or under payment, since it doesn’t allow management to pay dividend if
20
profit are not earned in current year, and it does not allow management to for go
dividend, if profits are earned.” (Brandt: 1972: PP.448-449)
iii. Low cost Dividend Per Share Plus Extra Dividend
Under this policy, a small amount of dividend is fixed to reduce the possibility of
ever missing of dividend payment. In the period of prosperity, extra dividend is paid
to prevent investors form expecting that the dividend represent an increase in the
established dividend amount. “This type of policy enables a company to pay constant
amount of dividend regularly without a default and allows a great deal of flexibility
for company’s earning higher than the usual without committing itself to make larger
payment as a part of the fixed dividend.” (Pandey: 1999: P.780) This policy is
preferable to some shareholders because of certain amount of dividend with extra
dividends.
2.1.3 Constraints on Dividend Payment
The decision regarding distribution of earnings to its shareholders of a company related
to number of factors. Many internal as well as external factors may influence the
payment of dividend. Management has to consider economic and non -economic factors
before establishing any dividend policy. The factor which affects the dividend policy of
a firm, are discussed below.
a) Legal Restriction
Legal restriction is one of the most important constraints in paying dividend of a
company. These constraints can be discussed as follows:
I) Capital impairment rule states that dividend should not be paid out of paid-up
capital, which causes adverse effect on security of creditors and preference
shareholders.
II) The firm should not pay cash dividend greater than the current net profit plus
accumulated balance of retained earning. Accumulated loss should be recouped out
of current earnings. This rule is violated by some of Nepalese companies due to
management intention and government intervention.
21
III) Insolvent firms i.e. liabilities exceeding assets or unable to pay bills are prohibited
for paying cash dividend to protect creditors of the firm.
IV) If the firm has retained earning to provide opportunity to shareholders for capital
gain and thereby evade tax liability of income, under such condition the firm may
be forced to pay dividends.
b) Liquidity Position
Liquidity position or the cash availability of a company is another one of the major
constraints in making dividend decision. The firm must have adequate cash while paying
the dividend. The dividend payment means cash outflow. So the availability of cash of a
firm is important consideration for dividend payment. The greater the cash position and
overall liquidity of a company, the greater is its ability to pay dividend regularly. While
an immature firm faces difficulties in maintaining a sound cash liquidity position
because of the expansion of the business, but a mature company generally have adequate
liquidity and able to pay large amount of dividend with a sound cash position.
c) Access to the capital market
If a company can raises debt or equity in the capital market, it can pay dividend even the
cash position of the firm is insufficient. A firm, which is large and well established and
has a record of profitability and stability of earning, will not find much difficulty in
raising funds in the capital market. Even if the firm is not in liquid position its ability to
pay dividend will be higher because of its ability to raise funds in capital market. In
contrast a small and new firm is riskier for potential investors so its ability to raise equity
or debt funds from capital market is restricted. That’s why small firms must retain more
earnings to finance its investment opportunities. Thus a well established firm has higher
dividend payout ratio than of a new and smaller one.
d) Control
“The objective of maintaining control over the company by the existing management
group or the body of the shareholders can be an important variable in influencing the
company’s dividend policy” (Pandey: 1999: P777) If the company pays access cash
22
dividend, there would be shortage of fund to finance investment opportunities, which
must be fulfilled by issuing new securities. This affects the control position of existing
shareholders. So, they are not desirable to distribute earning as dividend which prevents
them to loose the control position of the company.
e) Investment Opportunity
The dividend policy is greatly influenced by the financial need of the company.
Companies invest its earning to the projects rather paying dividend, if any profitable
project is found. “A growing firm gives precedence to the retention of earning over the
payment of dividend in order to finance its expanding activities. But when the
investment opportunities do not occur continuously but infrequently then the company
may not justify in retaining the earning at least during those period when such
opportunities does not exists.” (Pandey: 1999: P778) When the investment opportunities
occur in frequently, company follows a policy of paying dividend and raises external
funds when the investment opportunities occur.
f) Inflation
Inflation act as one of the constraint in the dividend policy. Cost of replacing assets
increase due to inflation and funds generated by depreciation would be inadequate to
replace the assets. To maintain the capital in act and preserve the earning power of the
firm, earning would be retained. In another words, to maintain the capital in act that
reduces dividend payment, the greater profit retention would be required.
g) Stability of Earning
A company can declare its dividend only when there is stability in its earning. Stable
earning can predict the company’s approximation regarding future earnings. The
company with stable earning can pay out higher percent of earning as dividend than a
firm with fluctuating earnings. A lower dividend will be easier to sustain if a firm is not
certain that in succeeding years the anticipated earnings will be realized. In another
words, if the earning is unstable, the company has to retain higher percentage of earning.
23
h) Restriction in Loan Agreement.
When the firm is experiencing liquidity, restriction on dividend payment may be
employed by the lenders to protect their interests. This could be happen in those
circumstances when a firm aggresses as a part of contract with its lenders that it will
restrict dividend payment to conserve the company’s ability to service debt. Similarly
preferred stock agreements generally state that no cash dividends can be paid on the
common stock until all accrued preferred dividend have been paid. In the period of these
restrictions, the firm is forced to retain earning and have a low payout of dividend.
i) Past Dividend
A firm with record of past dividend payment strive to maintain the same in the future.
Dividends are habit forming. If the market does not receive its expected dosage, the
stock price will suffer. The majority of firms surveyed indicated that they would
maintain their current dividend payments even if they were operating at a net loss for an
interim period.( Jensen & Johnson: 1995: P.32)
j) Tax position of stockholders
The dividend payment of a company is highly influenced by the tax position of its
owners. If a company is closely held by few taxpayers in high income tax brackets then
they will certainly like to get the return of their investment in the form of capital gains
rather than as dividends, which are subject to higher personal income tax rates. On the
other hand, a high dividend payout might be preferred by the stockholders of a large
widely held corporation.
k) Other considerations
The above mentioned things are not sufficient to decide a sound dividend policy. Other
considerations which have to be taken into accounts are; the future growth of the
company, maturity period, government policies, age of the corporation, informational
contents of dividend are a few examples which plays vital role at the time of deciding an
optimum dividend policy.
24
2.1.4 Legal Provision Regarding Dividend Practice in Nepal
In Nepalese context, regarding dividend payment, some provisions are made by Nepal
Company Act 1997. The provisions regarding dividend practices are discussed as
follows:
Section 2 (M) states that bonus shares (stock dividends) means shares issued in the
form of additional shares to share holders by capitalizing the surplus from the
profits or the reserve fund of a company. The term also denotes an increase in the
paid up values of the shares after capitalizing surplus or reserve funds. (Endi
Consultants Research Group: 1997: P.43 )
Section 47 has prohibited company from purchasing is own shares. This section states
that no company shall purchase its own shares or supply loans against the security
of its own shares. (Endi Consultants Research Group: 1997: P.60 )
Section 134 Bonus Shares and Sub Section (1) states that the company must inform the
office before issuing bonus shares. Under Sub Section (1), this may be done only
according to a special resolution passed by the general meeting. (Endi Consultants
Research Group: 1997: P.94 )
Section 140: Dividends and Sub Sections of this Section are as follows; (Ibid, P.94-
95)
Sub Section (1): Except in the following circumstances, dividends shall be
distributed among the shareholders within 45 days from the date of decision
to distribute them.
- In case any law forbids the distribution of dividends.
- In case the right to dividend is disputed.
- In case dividends can not be distributed within the time limit mentioned
above owing to circumstances beyond anyone’s control and without any
fault on the part of the company.
25
Sub Section (2): In case dividends are not distributed within the time limit mentioned
in Sub Section (1), this shall be done by adding interest at the prescribed rate.
Sub Section (3): Only the person whose name stands registered in the register of
existing shareholder at the time the dividend shall be entitled to.
2.2 Review of the Major Studies in General
Various studies have been made concerning the dividends and stock prices. Some of the
major international studies on the relating to dividend are stated as below.
2.2.1 Modigliani and Miller’s StudyAccording to Modigliani and Miller, dividend policy of a firm is irrelevant as it doesn’t
affect the wealth of the shareholders (Miller & Modigliani: 1961: PP.411-433). In other
words, the division of earnings between dividend and retained earning is irrelevant from
shareholders viewpoint. This is the most comprehensive argument for the irrelevant of the
dividend. In their 1961 article, for the first time in the history of finance, Modigliani and
Miller advocated that dividend policy does not affect the value of the firm i.e. dividend
policy has no effect on the share price of the firm. They argued that the value of the form
depends on the firm’s earnings which depend on its investment policy. Therefore there is
no significant relationship between dividend policy and value of firm. In other words a
firm’s value is independent of dividend policy.
The MM approach of irrelevance dividend is based on following assumptions:
a. The firms operate in perfect capital market where all investors are rational and
information is freely available to all. Securities are infinitely divisible and no
investor is large enough to influence the market price of securities.
b. There are no flotation costs. The securities can be purchased and sold without
payment of any commission or brokerage etc.
26
c. Taxes do not exist. Alternatively, there are no differences in tax rates applicable to
capital gains and dividends.
d. The firm has a fixed investment policy, which is not subject to change.
e. Risk of uncertainty does not exist. Investors are also able to forecast future prices
and dividends with certainty, and one discount rate is appropriate for all securities
and all time periods.
The proof of the support of the argument is discussed as below:
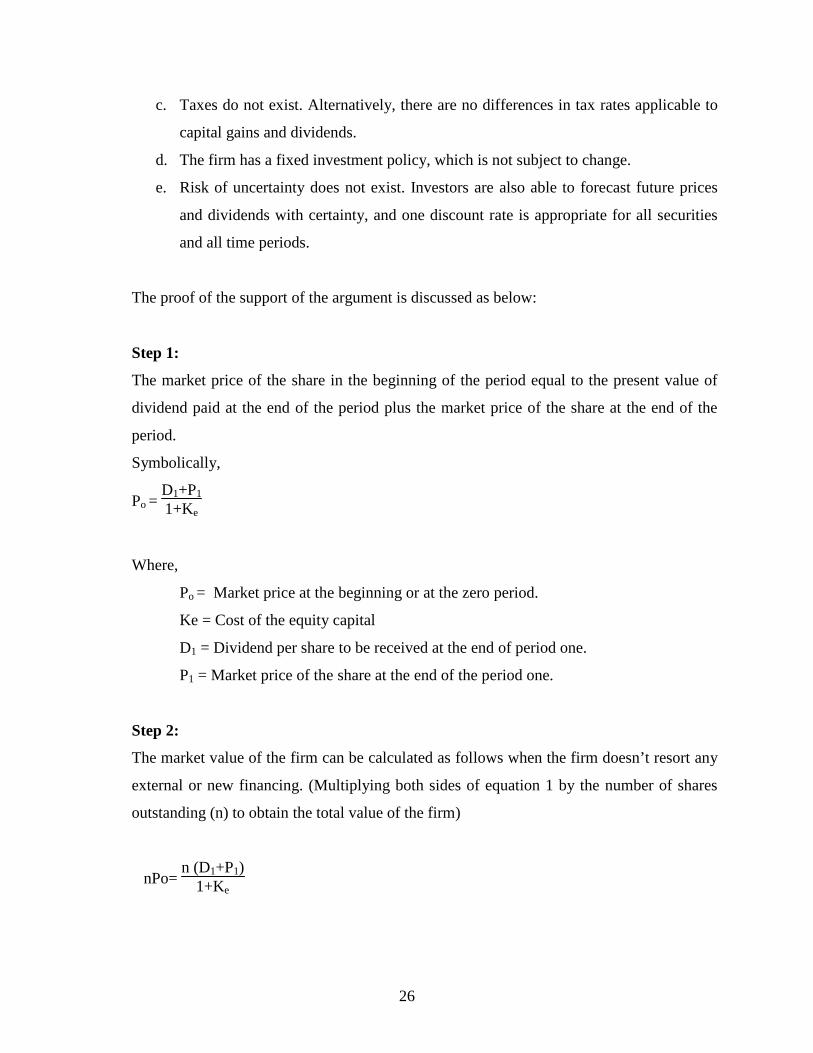
Step 1:
The market price of the share in the beginning of the period equal to the present value of
dividend paid at the end of the period plus the market price of the share at the end of the
period.
Symbolically,
Po =D1+P1
1+Ke
Where,
Po = Market price at the beginning or at the zero period.
Ke = Cost of the equity capital
D1 = Dividend per share to be received at the end of period one.
P1 = Market price of the share at the end of the period one.
Step 2:
The market value of the firm can be calculated as follows when the firm doesn’t resort any
external or new financing. (Multiplying both sides of equation 1 by the number of shares
outstanding (n) to obtain the total value of the firm)
nPo=n (D1+P1)
1+Ke
27
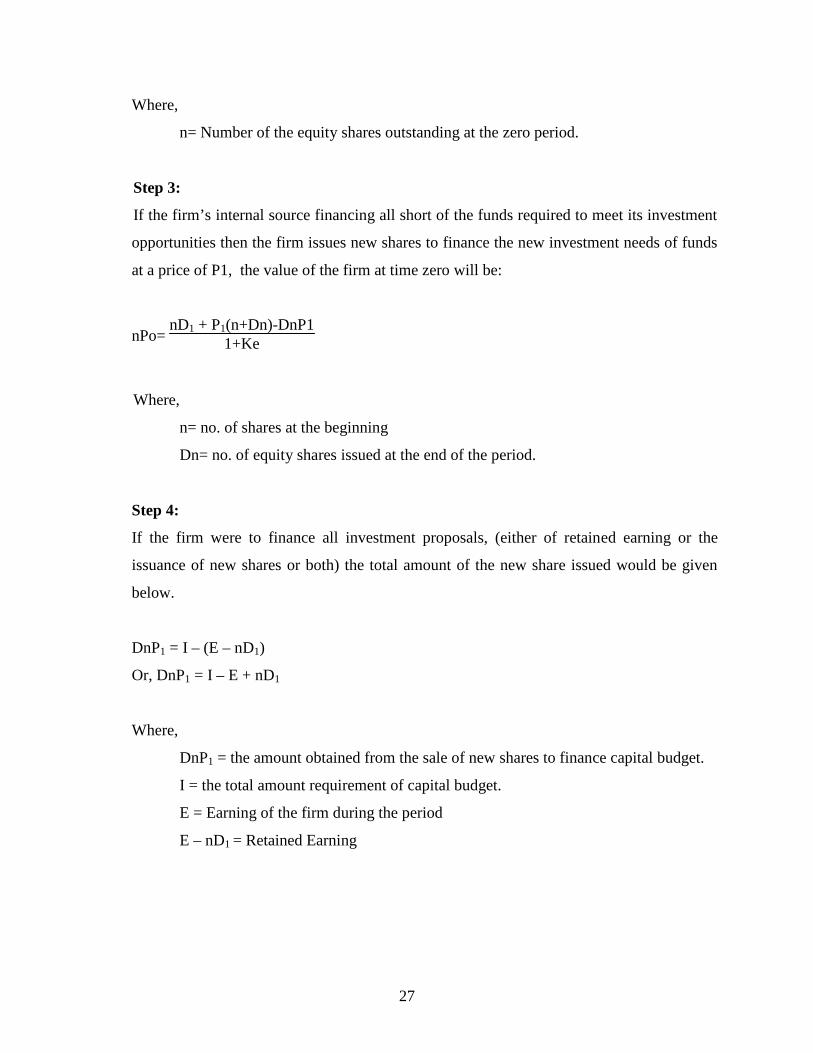
Where,
n= Number of the equity shares outstanding at the zero period.
Step 3:
If the firm’s internal source financing all short of the funds required to meet its investment
opportunities then the firm issues new shares to finance the new investment needs of funds
at a price of P1, the value of the firm at time zero will be:
nPo=nD1 + P1(n+Dn)-DnP1
1+Ke
Where,
n= no. of shares at the beginning
Dn= no. of equity shares issued at the end of the period.
Step 4:
If the firm were to finance all investment proposals, (either of retained earning or the
issuance of new shares or both) the total amount of the new share issued would be given
below.
DnP1 = I – (E – nD1)
Or, DnP1 = I – E + nD1
Where,
DnP1 = the amount obtained from the sale of new shares to finance capital budget.
I = the total amount requirement of capital budget.
E = Earning of the firm during the period
E – nD1 = Retained Earning
28
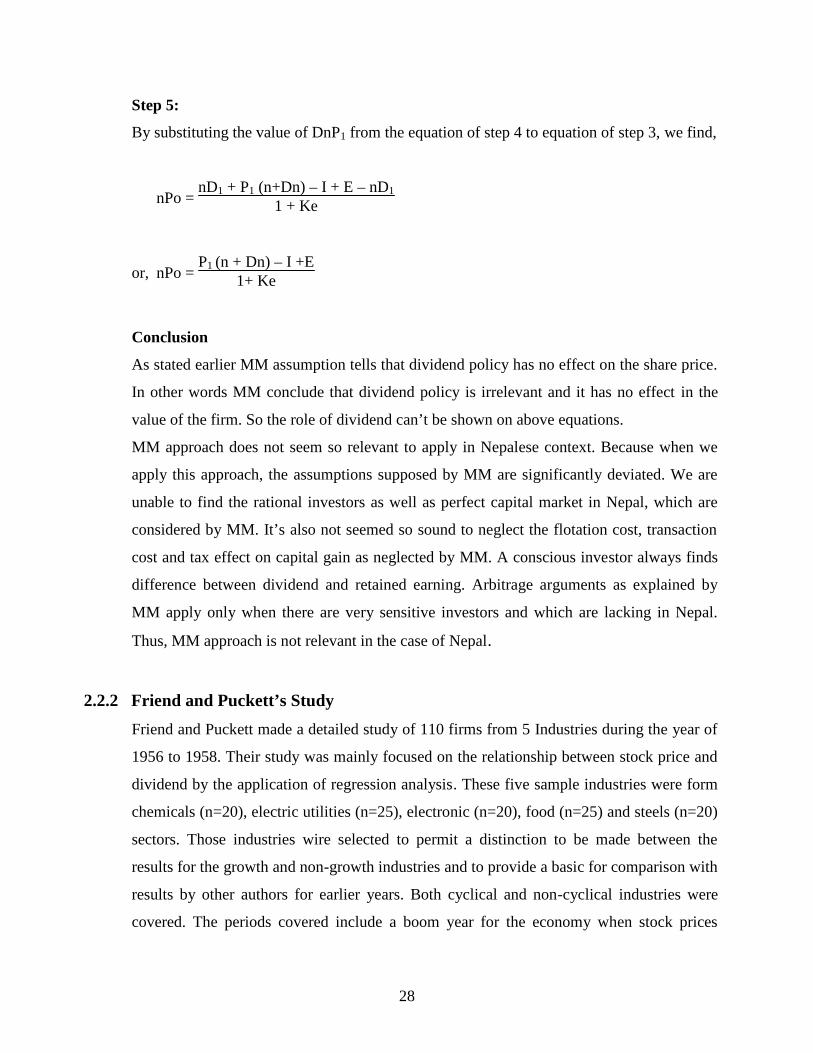
Step 5:
By substituting the value of DnP1 from the equation of step 4 to equation of step 3, we find,
nPo =nD1 + P1 (n+Dn) – I + E – nD1
1 + Ke
or, nPo =P1 (n + Dn) – I +E
1+ Ke
Conclusion
As stated earlier MM assumption tells that dividend policy has no effect on the share price.
In other words MM conclude that dividend policy is irrelevant and it has no effect in the
value of the firm. So the role of dividend can’t be shown on above equations.
MM approach does not seem so relevant to apply in Nepalese context. Because when we
apply this approach, the assumptions supposed by MM are significantly deviated. We are
unable to find the rational investors as well as perfect capital market in Nepal, which are
considered by MM. It’s also not seemed so sound to neglect the flotation cost, transaction
cost and tax effect on capital gain as neglected by MM. A conscious investor always finds
difference between dividend and retained earning. Arbitrage arguments as explained by
MM apply only when there are very sensitive investors and which are lacking in Nepal.
Thus, MM approach is not relevant in the case of Nepal.
2.2.2 Friend and Puckett’s StudyFriend and Puckett made a detailed study of 110 firms from 5 Industries during the year of
1956 to 1958. Their study was mainly focused on the relationship between stock price and
dividend by the application of regression analysis. These five sample industries were form
chemicals (n=20), electric utilities (n=25), electronic (n=20), food (n=25) and steels (n=20)
sectors. Those industries wire selected to permit a distinction to be made between the
results for the growth and non-growth industries and to provide a basic for comparison with
results by other authors for earlier years. Both cyclical and non-cyclical industries were
covered. The periods covered include a boom year for the economy when stock prices
29
leveled off after a substantial rise (1956) and s somewhat depressed year for the economy
when stock prices, however rose strongly (1958).
They used dividend, retained earning, and price earning ratio as independent variable in
their regression model of price function and dividend model acts the role of supply
function. In dividend function, earning, last year’s dividend and price earning ratio are
independent variable. Symbolically, the price function and dividend supply function can be
written as follows:
Price Function
P1 = a + bDt + cRt + n(E/P)t-1
Where,
Pt = Price per share at time‘t’
Dt = Dividends at time‘t’
Rt = Retained earning at time‘t’
E/P)t-1 = Lagged Earning Price Ratio
Dividend supply Function
Dt = e + f Et + g Dt-1 + h (E/P)t-1
Where,
Et = Earning per share at time‘t’
Dt-1 = Last years dividend
The followings are some basic assumptions of their study.
Price doesn’t contain the speculative components
Earning fluctuation may not sum zero over the sample
Dividend reacts year- to- year fluctuation in earnings.
The regression equation of five industries was based on the equation of
P1 = a + bD1+ cR1 presents the usual simple linear relationship between average prices
and dividend and retained earnings to show with the data. They found the customary strong
30
dividend and relatively weak retained earnings effect in three of five industries i.e.,
chemicals, foods and steels.
Again they tested other regression equation by adding lagged earning price ratio to the
earlier equation results the following equation,
Pt = a + bD1 + cR1 + d(E/P)t+1
After testing this equation, they found the result that more than 80% of the variation in
stock price can be explained by three independent variables. Dividends have a predominant
influence of stock price in the three industries among five but they found the differences
between the dividends and retained earning coefficients were not quite so marked as in the
first set of regression. The dividend and retained earning are closer to each other for all the
industries in both year except for steel in 1956, and the correlation are higher, again except
for steels.
The study also shows the calculation of dividend supply equation in the form of Dt = e +
fEt + gDt-1 h (E/P)t-1 and derived price equation for four industry group in 1958. Their
derive price equation shows no significant changes from those obtained from the single
equation approach as explained above. They argued that the stock price, or more accurately
the price earning ratio, does not seem to have significant effect on dividend payout. On the
other hand, they noted that the retained earning effect is increased relatively in the three of
four cases tested. Furthermore, they argued that their result suggested that price effects on
dividend supply are probably not a serious source of bias in the customary derivation of
dividend and retained earnings effects on stock prices, though such a bias might be marked
if the distributing effects of short run income movements are sufficiently great.
Similarly they tested the regression equation of P1 = a + bD1 + cR1 + d(E/P)t-1 by using
normalized earnings again. They obtained normalized retained earnings by subtracting
dividends from normalized earnings. That normalization procedure was based on the period
1950-1961. Again they added prior year’s normalized earning price variable and they
compared the result. Comparing the result, they found that there was significant role of
normalized earning and retained earning but effect of normalized price earning ratio was
31
constant. When they examined later equation, they found that the difference between
dividend and retained earning coefficient disappeared. Finally, they concluded that
management might be able to increase prices somewhat by raising dividend in food and
steel industries.
The conclusion of their study was that the management might be able, at least in some
measure to increase in stock price in no growth industries by raising dividends and in
growth industries by paying low dividends.
2.2.3 Walter’s StudyProfessor Walter conducted a study on dividend policy and common stock prices in 1966,
arguing that dividend policy almost always affects the value of the enterprise. According to
him, the dividend policy of the firm affects the value of the shares, so the dividends are
relevant. In the view of Professor Walter Investment policy and Dividend policy are
correlated to each other. The importance of the relationship between internal rate of return
(R) and its cost of capital (k) in determining the dividend policy is clearly shown in his
study.
Assumptions of this model are as follows:
I. The firm survives in infinite life.
II. Either the firm distributes entire earnings as dividend or immediately reinvested
III. Internal rate of return (r) and cost of capital (k) remain constant.
IV. The value of EPS and DPS are assumed to remain constant forever in determining a
given value.
V. The firm finances all investment through retained earning. There is no need of debt or
new equity shares.
32
Based on above assumptions, Walter has given following formula of valuation of equity
share.
P =DPSKe +
r/ke(EPS-DPS)ke
or P=DPS+r/ke(EPS-DPS)
ke
Where,
P = Market price per share
DPS = Dividend per share
EPS = Earning per share
R = Internal rate of return
Ke = Cost of capital
In the opinion of Walter, optimum relationship between firm’s internal rate of return(r) and
its cost of capital (k) results optimum dividend policy for the firm. Different dividend
policies for the different types of the firms suggested by Walter are discussed below:
a. Growth Firm (r>k)
The firms which expand rapidly are known as growth firms. Because of the ample
investment opportunities, these firms enjoy reinvesting their earning at the rate which is
higher than the rate expected by shareholders. So, firms having r>k is referred as growth
firms which yielding return (r) is higher than the opportunity cost of capital (k). They will
maximize the value per share if they follow a policy of retaining all earnings for internal
investment. For such a firm dividend payout ratio is zero and correlation between dividend
and stock price is negative. The market value per share (P), increases as payout ratio
decreases when r>k.
b. Normal Firm (r=k)
When the firm’s required rate of return and cost of capital are equal, those firms used to be
called normal firm. In such model, market value per share would be unaffected by the
dividend payout ratio; i.e. dividends are indifferent from the stock price. In normal firms,
whether company retains the profit or distributes it as dividend could not make any
difference. The market price of share will remain constant for different dividend payout
33
ratio from zero to 100. Thus there is no unique optimum payout ratio for a normal firm.
One dividend policy is as good as other and the market value per share is not affected by
the payout ratio when r=k.
c. Declining Firm (r<k)
If the firms don’t have any profitable business opportunities, their investment rate would be
less than required rate of return. The investors would expect to get earning as dividend so
that they could spend elsewhere with higher return than declining firm. In these firms, the
relation between dividend and stock price is positive. So, by distributing the entire earnings
as dividend, the value of the share will be at its optimum level. In other words, the market
value per share of a declining firm with r<k will be maximum when it does not retain its
earnings at all. To maximize the value of share, dividend also should be maximized. The
optimum payout ratio for a declining firm is 100% and the market value per share increases
as payout ratio increases when r<k.
Walter’s model concludes that the dividend policy of a firm depends on the availability of
investment opportunities and the relationship between the internal rate of return and cost of
capital of the firm.
This model has the following Limitations:
a) No external financing: Walter’s approach assumes that retained earning finance is
the only investment opportunity of the firm and no external financing debt or equity
is used for the financing. When such a situation exists, either the firm’s investment
or its dividend policy or both will be sub-optimum. This means when the firm’s
earning aren’t adequate to exploit all the investment opportunities having return at
equal or more than cost of capital, this approach doesn’t allow financing the gap by
using other sources.
b) Constant ‘r’ and ‘k’: Walter’s approach is based on assumption that rate of return
(r) and opportunity cost of capital or discount rate (k) are constant. In fact ‘r’
decreases as more investment occurs and ‘k’ changes directly with the firm’s risk.
This model may not be applicable in case of Nepalese companies because of his
other assumption i.e., EPS, DPS etc are constant.
34
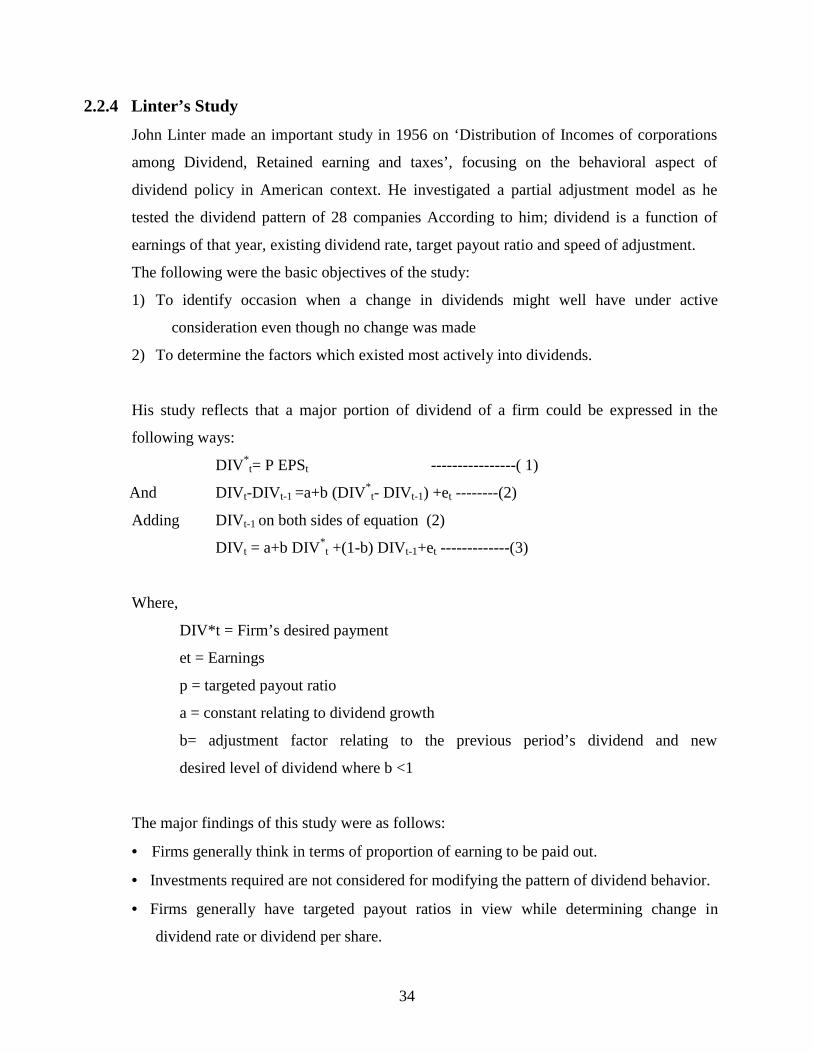
2.2.4 Linter’s StudyJohn Linter made an important study in 1956 on ‘Distribution of Incomes of corporations
among Dividend, Retained earning and taxes’, focusing on the behavioral aspect of
dividend policy in American context. He investigated a partial adjustment model as he
tested the dividend pattern of 28 companies According to him; dividend is a function of
earnings of that year, existing dividend rate, target payout ratio and speed of adjustment.
The following were the basic objectives of the study:
1) To identify occasion when a change in dividends might well have under active
consideration even though no change was made
2) To determine the factors which existed most actively into dividends.
His study reflects that a major portion of dividend of a firm could be expressed in the
following ways:
DIV*t= P EPSt ----------------( 1)
And DIVt-DIVt-1 =a+b (DIV*t- DIVt-1) +et --------(2)
Adding DIVt-1 on both sides of equation (2)
DIVt = a+b DIV*t +(1-b) DIVt-1+et -------------(3)
Where,
DIV*t = Firm’s desired payment
et = Earnings
p = targeted payout ratio
a = constant relating to dividend growth
b= adjustment factor relating to the previous period’s dividend and new
desired level of dividend where b <1
The major findings of this study were as follows:
Firms generally think in terms of proportion of earning to be paid out.
Investments required are not considered for modifying the pattern of dividend behavior.
Firms generally have targeted payout ratios in view while determining change in
dividend rate or dividend per share.
35
2.2.5 Gordon’s ModelMyron Gordon developed a popular and important model on dividend policy, which is
explicitly relating to the market value of the firm. Gordon explaining that inventory are not
indifferent between current dividend and retention of earning with the prospect of future
dividend, capital gain and both. He concludes that dividend policy does affect the value of
share even when the return on investment and required rate of return are equal. Under the
uncertainty period it is assured that inventory have a strong preference for present
dividends more than future capital gain. The expected capital gain is assumed as more risky
then current dividend. His assumption argues that an increase in dividend payout ratio leads
to increase in the stock price for the reason that inventory consider the dividend yield is
less risky than the expected capital gain.
Gordon’s model is also described as”a bird in hand argument”. It supports the argument,
which is popularly known as a bird in hand is worth two is the bush. This model believes
that what is available at present is preferable than what may be available in the future. That
is to say current dividends are considered certain and risk-less. So it is preferred by rational
investors as compared to deferred dividend in future. The future is uncertain. The investors
would naturally like to avoid uncertainty. So the current dividends are given more weight
than expected future dividend by the investors. So the value per share increases if dividend
payout ratio increases. This means there exists positive relationship between the amount of
dividend and stock prices.
Gordon’s model is based on the following assumption:
The firm uses equity capital only.
Internal rate of return ( r) and cost of capital ( ke )are constant.
Not availability of external financing, retained earning would be used to finance for
expansion.
Not existence of corporate taxes. The firm and its stream of earning is perpetual.
‘Ke’ must be greater than g (=br) to get meaningful value.
The retention ratio is once decided upon is constant. Thus growth rate g=br is
constant forever.
36
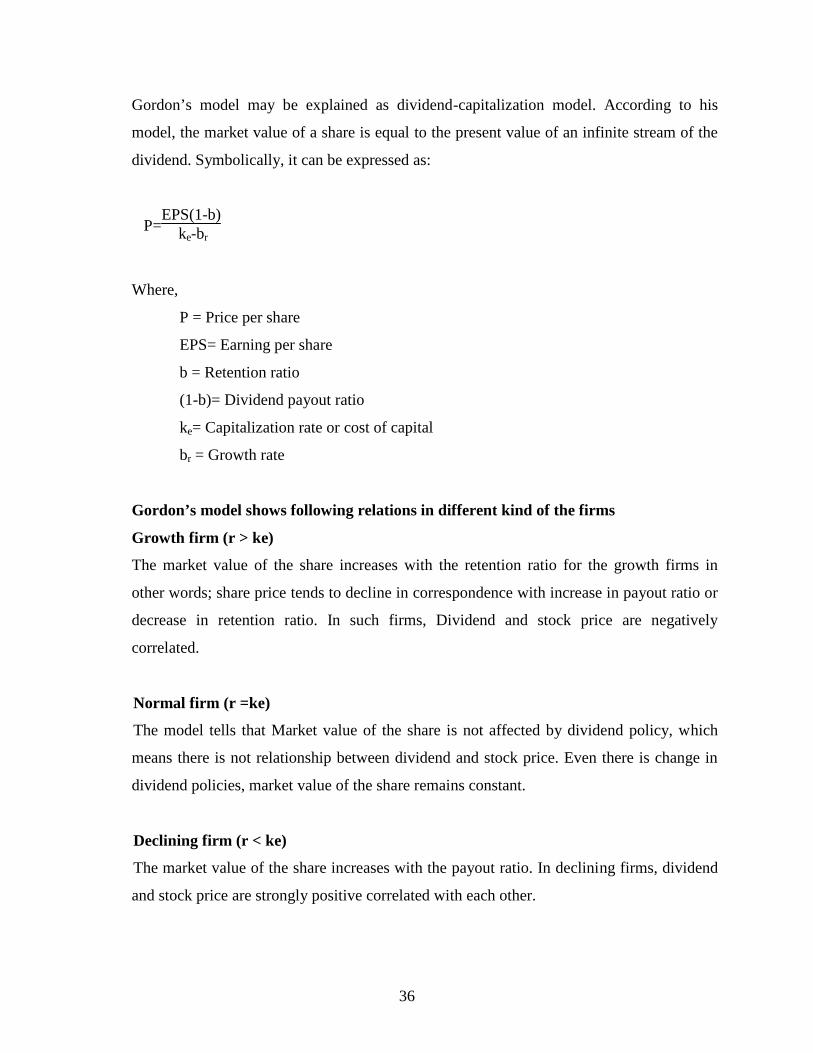
Gordon’s model may be explained as dividend-capitalization model. According to his
model, the market value of a share is equal to the present value of an infinite stream of the
dividend. Symbolically, it can be expressed as:
P=EPS(1-b)
ke-br
Where,
P = Price per share
EPS= Earning per share
b = Retention ratio
(1-b)= Dividend payout ratio
ke= Capitalization rate or cost of capital
br = Growth rate
Gordon’s model shows following relations in different kind of the firms
Growth firm (r > ke)
The market value of the share increases with the retention ratio for the growth firms in
other words; share price tends to decline in correspondence with increase in payout ratio or
decrease in retention ratio. In such firms, Dividend and stock price are negatively
correlated.
Normal firm (r =ke)
The model tells that Market value of the share is not affected by dividend policy, which
means there is not relationship between dividend and stock price. Even there is change in
dividend policies, market value of the share remains constant.
Declining firm (r < ke)
The market value of the share increases with the payout ratio. In declining firms, dividend
and stock price are strongly positive correlated with each other.
37
Because of the similarity in assumptions, Gordon’s model and Walter’s model are quite
alike to each other.
2.2.6 Van Horne and McDonald’s StudyVan Horne and McDonald conducted comprehensive study on dividend policy and new
equity financing. The purpose of this study was to investigate the combined effect of
dividend policy and new equity financing decision on the market value of the firm’s
common stocks.
Empirical tests were performed with year-end 1968 cross sections for two industries, using
a well-known valuation model. For there investigation, they employed two samples of
firms viz. the 86 electric utilities in the continental U.S. which were included on the
COMPUSTAT utility data tape; and companies in the electronics and electric component
industries as listed on the COMPUSTAT industrial data tape in 1968.
They performed empirical study by testing two regressions for the electric utilities and one
regression model for electronics and electronic and electronic components industry.
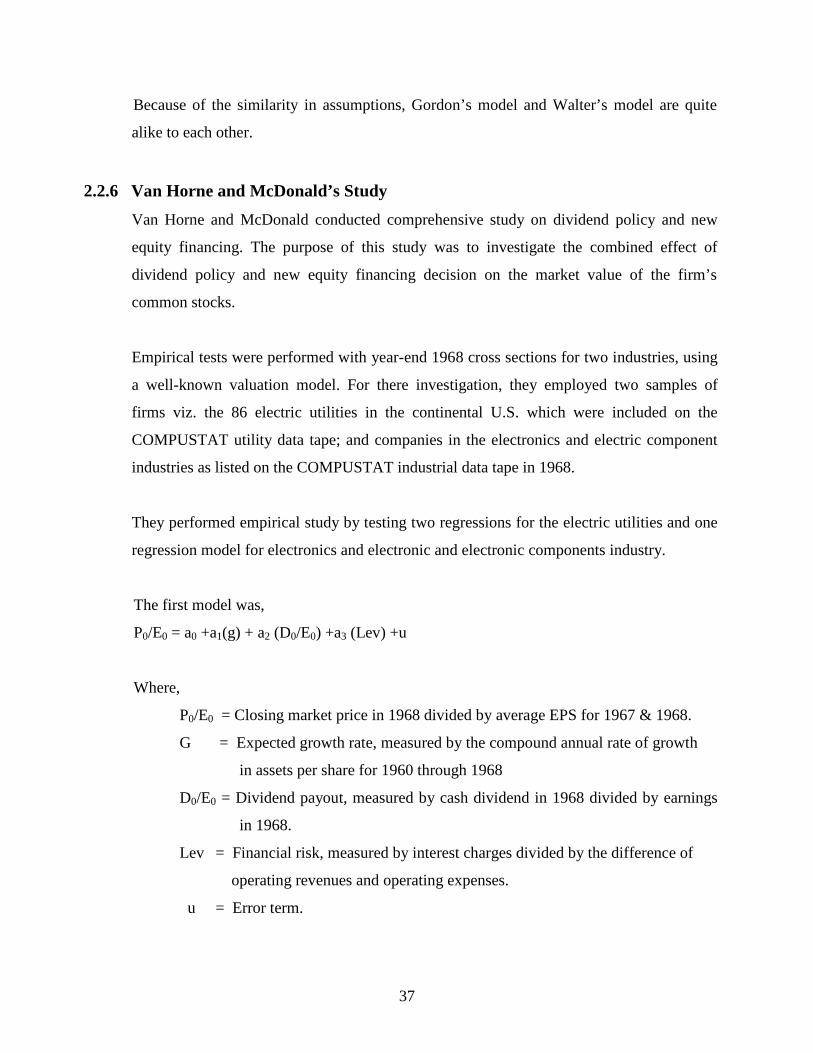
The first model was,
P0/E0 = a0 +a1(g) + a2 (D0/E0) +a3 (Lev) +u
Where,
P0/E0 = Closing market price in 1968 divided by average EPS for 1967 & 1968.
G = Expected growth rate, measured by the compound annual rate of growth
in assets per share for 1960 through 1968
D0/E0 = Dividend payout, measured by cash dividend in 1968 divided by earnings
in 1968.
Lev = Financial risk, measured by interest charges divided by the difference of
operating revenues and operating expenses.
u = Error term.
38
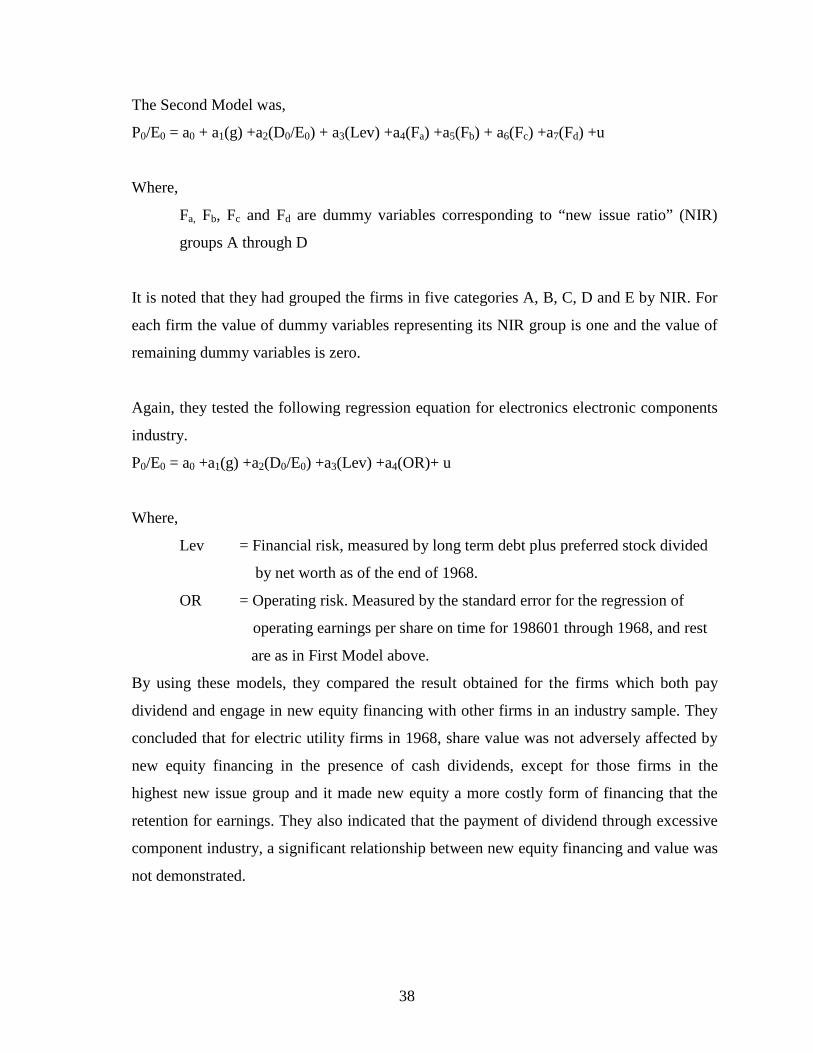
The Second Model was,
P0/E0 = a0 + a1(g) +a2(D0/E0) + a3(Lev) +a4(Fa) +a5(Fb) + a6(Fc) +a7(Fd) +u
Where,
Fa, Fb, Fc and Fd are dummy variables corresponding to “new issue ratio” (NIR)
groups A through D
It is noted that they had grouped the firms in five categories A, B, C, D and E by NIR. For
each firm the value of dummy variables representing its NIR group is one and the value of
remaining dummy variables is zero.
Again, they tested the following regression equation for electronics electronic components
industry.
P0/E0 = a0 +a1(g) +a2(D0/E0) +a3(Lev) +a4(OR)+ u
Where,
Lev = Financial risk, measured by long term debt plus preferred stock divided
by net worth as of the end of 1968.
OR = Operating risk. Measured by the standard error for the regression of
operating earnings per share on time for 198601 through 1968, and rest
are as in First Model above.
By using these models, they compared the result obtained for the firms which both pay
dividend and engage in new equity financing with other firms in an industry sample. They
concluded that for electric utility firms in 1968, share value was not adversely affected by
new equity financing in the presence of cash dividends, except for those firms in the
highest new issue group and it made new equity a more costly form of financing that the
retention for earnings. They also indicated that the payment of dividend through excessive
component industry, a significant relationship between new equity financing and value was
not demonstrated.
39
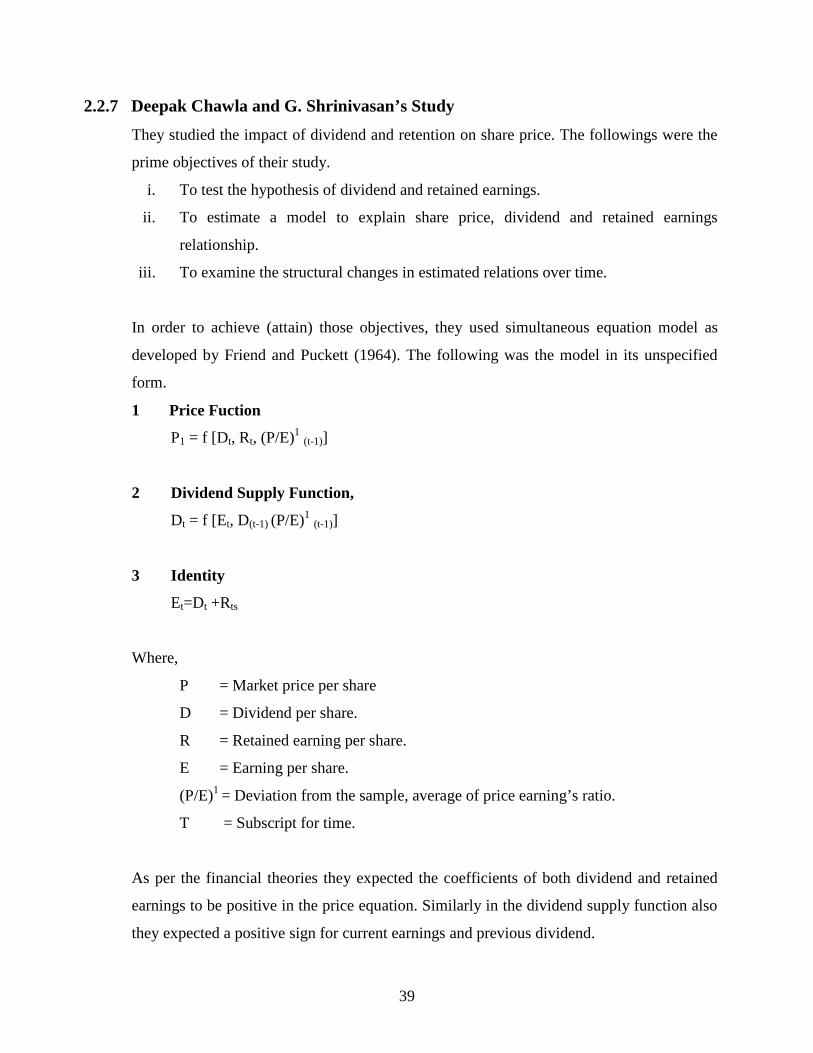
2.2.7 Deepak Chawla and G. Shrinivasan’s StudyThey studied the impact of dividend and retention on share price. The followings were the
prime objectives of their study.
i. To test the hypothesis of dividend and retained earnings.
ii. To estimate a model to explain share price, dividend and retained earnings
relationship.
iii. To examine the structural changes in estimated relations over time.
In order to achieve (attain) those objectives, they used simultaneous equation model as
developed by Friend and Puckett (1964). The following was the model in its unspecified
form.
1 Price Fuction
P1 = f [Dt, Rt, (P/E)1(t-1)]
2 Dividend Supply Function,
Dt = f [Et, D(t-1) (P/E)1(t-1)]
3 Identity
Et=Dt +Rts
Where,
P = Market price per share
D = Dividend per share.
R = Retained earning per share.
E = Earning per share.
(P/E)1 = Deviation from the sample, average of price earning’s ratio.
T = Subscript for time.
As per the financial theories they expected the coefficients of both dividend and retained
earnings to be positive in the price equation. Similarly in the dividend supply function also
they expected a positive sign for current earnings and previous dividend.
40
They selected 18 chemicals and 13 sugar companies and estimated cross-sectional
relationship for the years 1969 and 1973. They collected the required data from the official
directory of Bombay Stock Exchange. They used two stages least square technique for
estimation .They also used lagged, earnings price ratio instead of lagged price earnings
ratio. i.e P/E(t-1).
It was found fro the result of their tow stages least square estimation, that the estimated
coefficients had the correct sign and the coefficients of determination of all the equations
were very high in case of chemical industry. It implies that the stock price and dividend
supply variations can be explained by their independent variables. But in case of sugar
industry, they found that the sign for retained earnings is negative in both years and left for
further analysis of sugar industry. It was observed that the coefficient of dividend was very
high as compared to retained earnings for chemical industry. They also found that
coefficient of dividend was significant ant one percent level in both years whereas
coefficient so retained earnings was significant at ten percent level in 1969 and one percent
level in 1973.
Finally, they concluded that dividend hypothesis holds good in the chemical industry. Both
dividend and retained earnings significantly explain the variation in share price in chemical
industry. They also stressed that the impact of dividend was more pronounced than that of
the retained earnings but the market has started shifting towards more weight for retained
earnings.
41
2.3 Review of Major Studies in Nepal
The review of studies regarding dividend policy can be broadly classified into two
categories.
2.3.1 Review of Previous Thesis
In last few years, prior to his thesis; some students of M.B.S programme have conducted
research about the dividend and its relation with stock prices in various sectors. Some of
them, which are supposed to be relevant for this study have been reviewed and presented in
this section.
a) Bishnu Hari Bhattarai’s Study
The study of the dividend decision and its impact on the stock valuation was carried out by
Bishnu Hari Bhattarai, in 19996 using 10 companies of various sectors. The basic objective
of the study was to identify the relationship between dividend and the stock price. The
major objectives of this study can be stated as follows:
i. Highlight various aspects of dividend policies and practices in Nepal.
ii. Analyze the variables such as profit, dividend, retained earning, growth rate and
relevant variables to how the relationship between the value and other ingredients
affecting it.
iii. Provide feedback to the policy makers and executive working in various companies
chosen for study based on the findings of the analysis.
The major findings of this study are as follows:
i. The companies while paying dividend generally neglect shareholder’s expectations.
ii. Dividends were paid out in profitable years.
iii. In aggregate, there was no stable dividend paid by the companies i.e. instability of
dividend.
iv. There were no criteria to adopt a certain payout ratio. There is haphazard payout ratio
in the companies under study.
v. Cash balance and dividend payment were positively correlated.
vi. Mostly the joint venture companies were paying dividend.
42
vii. There was positive impact of dividend on valuation of shares.
viii. Dividend paid was inadequate to cover the required rate of return of the investors.
ix. Market price considerably higher than actual net worth.
b) Nabaraj Adhikari’s Study
The study has covered the period from 1990 to 1996 with total observations of 47 in
financial sector and 30 non-financial sectors. This study has used both primary and
secondary data. The major objectives of this study were to assess corporate dividend
practices in Nepal. The specific objectives were as follows:
i. To analyze the properties of portfolios formed on dividends.
ii. To examine the relationship between dividends & stock prices.
iii. To survey the opinions of financial executives on corporate dividend practices.
The major conclusions, of this research study were as follows:
It is observed that there are differences in financial position of high dividend paying and
low dividend paying companies. Other things remaining the same, financial position of
high dividend paying companies is comparatively better than that of low dividend paying
companies. Thus ‘Dividends affect the market price of share’ is the major conclusion of
this study.
Likewise, the other findings based on primary data are given below:
i. The price of common stock was induced by dividend payout ratio.
ii. Nepalese shareholders were not really indifferent towards payments or non-payment
of dividend.
iii. The majority of the respondents feel that the major motives to pay cash dividend was
to convey information to shareholders that the company is in good position.
iv. As regards dividend as a residual decision, the majority of the respondents feel that it
was not a residual decision.
43
With respect to factors affecting corporate dividend policy, the majority of the respondents
gave the first priority to ‘earnings’ the second priority to ‘availability of cash ‘ , the third
priority to ‘past dividends’ & fourth priority to ‘concern about maintaining or increasing
stock price’.
c) Bhattarai’s Study
Anjani Raj Bhattarai conducted his study on ‘Share market in Nepal’ in 1990. His study
has following issues related to dividend practices:
The actual percentage dividend was not matching with the expected percentage
dividend. So must of the listed companies declaring less percentage than risk free rate
of return and risk premium are unable to maintain investors psychology in marketing.
Most of the companies are paying less than the expected cash dividend per share to its
investors. Most companies were underwriting the expectation of the investors and
there by resulting the two marketability o shares on trading floor of stock exchange.
There was a huge gap in the percentage of cash dividend paid by the public
companies.
There were mismatch between calculated and quoted price of share observed only one
calculated price of share was near the actual Market price of the share. This reveals
over pricing were guided by technical factors.
The price-earning ratio showing by most of the company is lower.
Bhattarai’s study couldn’t be untouched from limitations but his topic was only focuses on
dividend policy. So discussion on those limitations might be irrelevant here.
d) Gautam’s study
Rishi Raj Gautam has conducted a study on dividend policy in commercial banks a
comparative study of NGBL, NIBL and NABIL in 1995. His study reveals some important
aspects of dividend performance of three samples. Major finding of his studies are as
follows:
Commercial banks represent a robust body of profit earning organization in
comparing with other sectors.
44
Though they have good earning potentials, it doesn’t seem that commercial banks are
guided by clearly defined dividend policy.
Share of the financial institution are actively traded and market price are increasing.
Average EPS and DPS of the concerned banks are satisfactory.
This study indicates there are the largest fluctuation in EPS and DPS, on the other
hand, have relatively more consistency DPS in all samples.
One of the important finding of this study is that none of the sample has defined the
dividend strategy. On the other hand there was significant relationship percentage
between earning and dividend of expansion program.
However Gautam’s study suffers from following limitations:
There are many factors affects dividend policy, those factors are DPS, DPS, MVPS, DPR,
dividend yield, liquidity ratio and profitability ratio. But only has used a few financial
indicators that result the validity of the research is not worthwhile.
In this study, he has selected samples from commercial bank only. It would be perfect
research if he has taken the samples from other sectors and performs while spread analysis
in the variables mentioned above.
e) Khatiwada’s Study
N.P. Khatiwada has conducted a study on ‘Impact of dividend and earning announcement
on shareholder’s return and stock prices in Nepal’ in May 2001, through the data collected
from 053/54 to 055/56 for four joint venture banks viz. Nepal Indosuez Bank Ltd., Nepal
SBI Bank Ltd., Nepal Grindlays Bank Ltd. and Nepal Bangladesh Bank Limited.
The main objectives of the study were as follows:
To analyze the impact of earning and dividend announcement on shareholder’s return.
To see the correlation between the return of the individual securities with market
return.
To identify the quality of systematic and unsystematic system.
45
Major findings of the study are as follows:
Announcement of dividend and earning didn’t affect the shareholders return in
average.
Other banks except Nepal SBI Bank Ltd. having different dividend rates didn’t
provide significant abnormal return to the shareholders.
Shareholders realized the positive abnormal return from NB Bank, SBI Bank and
Grindlays Bank.
f) Katawal’s Study
Y.B. Katawal has conducted a research on ‘A comparative study of dividend policy in
commercial banks’ in July 2001, based on data collected from 1994/95 to 19998/99 for six
commercial banks.
He has conducted the research with following objectives:
To study the current practices of dividend policy in commercial banks.
To find out the impact of dividend on share price.
To analyze the relationship of financial indicators.
To examine either there is any uniformity among DPS, EPS and DPR of the six
sample banks.
The major findings of this study are as follows:
Average EPS and DPS for the period covered by the study of all the concerned banks
are satisfactory.
Analysis of CV indicated that there is largest fluctuation in EPS and DPS and other
are relatively more consistent.
The analysis of DPR shows that none of the sample banks has consistent dividend
policy.
The market value of shares in market is fluctuating in all sample banks.
The most important decision is that no specific dividend payment strategies are
following by these banks. Payment of cash dividend and stock dividend are made
without wise managerial decision due to unstable and adequate dividend and unequal
payout ratio.
46
2.3.2 Review of Articles
I) Review of Books and Journals in Nepalese Perspective
Very few articles relating directly or indirectly with dividend and stock price are
published in Nepal. Some of them, which are significant in this study, are reviewed
in this section.
a) Dr. R.S. Pradhan’s Study
Dr. R.S. Pradhan has conducted a study on small Market Behaviour in A Small Capital
Market: A case of Nepal in 1993. It is pertinent to put forth here because he has analyzed
various ratios related to dividend and market price of shares. The study was based on the
pooled – cross sectional data of 17 enterprises covering the year from 1986 to 1990.
The objectives of this study were as follows:
i. To assess the stock market behavior in Nepal.
ii. To examine the relationship of market equity, market value to book value, price
earning, and dividends with liquidity, profitability, leverage, assets turnover, and
interest coverage.
The following model was employed.
V =b0 +b1 LIQ +b2LEV +b3 EARN +b4TURN +b5 COV +Ui…..
The dependent variable, V chosen for the study has been are specified as under:
- Market equity, number of shares multiplied by market price of shares (ME).
- Market value of equity to its book value (MV/BV)
- Price –earning ratio (PE)
- Dividend per share to market price per share (DPS/MPS)
- Dividend per share to earning per share (DPS /EPS)
The independent variables are specified as:
LIQ = Current Ratio (CR) to Quick / Acid Test Ratio (QR)
LEV = Long –Term Debt to Total Assets(LTD /TA) or Long-Term Debt to Total
Capitalization (LTD /TC ). Total Capitalization is specified as Long-Term Debt
plus Net Worth.
47
EARN = return on Assets, i.e. Earnings Before Tax to Total Assets (ROA ) or Return on
Net Worth, i.e. Earnings Before Tax to Net Worth (RONW).
COV = Interest Coverage Ratio, i.e. Earnings Before Tax to Interest.
TURN =Fixed Assets Turnover, i.e. Sales to Average Fixed Assets (S/FA), or Total
Assets Turnover, i.e. Sales to Average Total Assets (S/ TA)
U = Error Term
Some findings of his study, among others were as follows:
i. Stocks with larger ratio of dividend per share to market price per share have higher
liquidity. Liquidity position of stocks paying lower dividends is also more
inconsistent as compared to stocks paying higher dividends.
ii. Stocks with larger ratio of dividend per share to market price per share have lower
leverage ratios. So, leverage ratios of stocks paying smaller dividends were also more
variable as compared to stocks paying higher dividends.
iii. Stocks with larger ratio of dividend per share to market price per share also have
higher earnings. But these earning ratios of stocks paying larger dividends were also
more variable as compared to stocks paying smaller dividends.
iv. Positive relationship is observed between the ratio of dividend per share to market
price per share and turnover ratios. Stocks with larger ratio of dividend per share to
market price per share also have higher turnover ratios. Turnover ratios of stocks
paying larger dividends are also more variable than that of stocks paying smaller
dividends.
v. There is also a positive relationship between the ratio of dividend per share to a
market price per share and interest coverage. Stocks with higher ratio of dividend per
share to market price per share also have higher interest coverage. Interest coverage
of stocks paying larger dividends were also more variable as compared to stocks
paying smaller dividends.
vi. So, in conclusion, it indicates positive relationship of dividend per share to market
price per share with liquidity, profitability, assets turnover and interest coverage; and
negative relationship with leverage.
48
b) Dr. M.K. Shrestha’s Article
Dr. M.K. Shrestha has written an article about “Public Enterprises; Have They Dividend
Paying Ability?” which was published in the book ‘PRASHASAN’ in March 1981. It
gives short glimpse of the dividend performance of some public enterprises of that time in
Nepal. Dr. Shrestha has highlighted (focused) the following issues in the article.
Government of Nepal wants two things from the public enterprises: (i) they should be in a
position to pay minimum dividend & (ii) Public enterprises should be self-supporting in
financial matters in future years to come.
But these both objectives are not achieved by public enterprises.
1. One reason for this inefficiency is caused by excessive governmental interference
over daily affairs even though there is provision of government interference only for
policy matters. On the other hand, high-ranking officials of Government of Nepal
appointed as directors of board do nothing but simply show their bureaucratic
personalities. Bureaucracy has been the enemy of efficiency and thus led corporation
to face losses. Losing corporations are, therefore, not in a position of paying
dividends to government.
2. Another reason of this is the lack of self-criticism and self-consciousness. Esman33
has pointed out that lack of favorable leadership is one of the biggest constraints to
institution building. Moreover corporate leadership comes, as managers are not ready
to have self-criticisms. In fact, all so called managers of corporations have not been
able to identify themselves regarding what they can contribute as managers of
corporations. So Government of Nepal must be in a position to develop a financial
target on corporate investment by imposing financial obligation on corporations.
3. The articles points out the irony of government biasness that government has not
allowed banks to adopt an independent dividend policy and Government of Nepal is
found to have pressurized on dividend payment in case of Nepal Bank Limited
regardless of profit. But, it has allowed Rastriya Banijya Bank to be relieved from
dividend obligation despite considerable profit.
4. The improvement suggested by authors are:
49
i. Adopt a criteria-guided policy to drain resources from corporations through the
medium of dividend payment.
ii. Realization by managers about cost of equity capital and dividend obligation.
If Government of Nepal wants to tap resources through dividend, the following criteria
should be followed.
i. Proper evaluation of public enterprises interns of capabilities of paying dividend
through corporation coordination committee.
ii. Imposition of fixed rate of dividend by government on financially sound public
enterprises.
iii. Circulating the information about minimum rate of dividend to all public
enterprises.
iv. Specifying performance targets in terms of profit, priorities on timings and plans
and development of strategic plans that bridges the gap between aspiration and
reality.
Identification of corporation objectives in Corporations Act, Company Act or special
charters so as to clarify public enterprise mangers regarding their financial obligation to
pay dividend to Government of Nepal.
II) International Journals and Articles
R. Mehotra’s Study
Rohit Mehotra (2003) conducted a study on ‘Dividend Policy and its Effect on Market
Pricing’, the study is concerned with dividend and its effect on the price fluctuation of the
stock. This study is based on the scenario of Indian stock market, top 50 Indian companies
of Bombay stock exchange has been taken as sample of this study. All the samples are
paying dividend, although some of the samples suffering from losses, they are also paying
nominal dividend using their prior reserves.
His study reveals that market risk of any security depends on its beta (b), which shows the
relationship between the sensex return and security return. It also measures the relative risk
50
associated with the security with respect to market. Higher the beta, greater the risk
associated with the security. If the value of beta is less than one, he security will affected
lesser than the proportion of the market sensex.
This research reflects that some of the renowned companies followed the conservation
policy while others were paying an excellent dividend. Samples representing the companies
like NIIT, Satyam Computers, Glaxo, P &G, Health care, etc., 37% of the sample sizes
have performed as per the SENSEX movement. All of these companies have very good
track record of dividend payment and appreciated by investors. But, since April 2000,
Indian stock market is being victim of continuous chain of national and international
negative sentimental (including the US slowdown to TEHELEKA issue), due to which the
share price has come down drastically.
Samples holding 26% of the total samples, including Hindustan Lever Limited, ITC,
Reliance India Ltd. performed extraordinarily well after debacle of SENSEX. The stock of
these companies are continuously paying handsome dividend and showing positive trend in
the price movement and have never experienced significant downfall in past couple of
years.
Due to some specific factors, 25% of the samples having fluctuation in dividend payment
from last couple of years. Though factors may consist of liberalized economic policy, strict
government policy in certain sectors, economic fluctuations etc. Some samples are
continuously paying certain amount of the dividend from last couple of years, a continuous
dividend payment record find no appreciation along with this, they want smooth
performance of the company so that they can earn some capital gain also.
Rest of companies, representing 11% of the sample size performed negatively. Those
companies were paying dividend on regular basis, the stock price were declining
continuously from last couple of years. This situation reveals that investors are very
rational about their current as well as future earning. They can’t accept any window
dressing.
51
In conclusion, investors make equity investment with the expectation of capital gains
irrespective of whether they are short term or long term investors. Typically there is who
can ensure capital gains to investors without declaring continuous dividend. In other words,
the investors do care about dividends however a small impact on their wealth. It is not only
the investors care about dividend but also growth in dividend and profitability of the
companies in which they made investments. Since the dividends are taxed in the hands of
the companies, but not investors, Indian investors don’t give weightage on tax matter
unlike US market where tax is the major determinants for the investors for accepting
dividends.
Oaktree Research
A recent research on dividend was published on Oaktree (2003) a website relating to
business and finance consist of a deep study on dividend with heading of ‘Dividend:
Relevance or reverence’. This study describes dividend as, dividend represents one of the
most interesting puzzles in corporate finance, knowing that dividend are paid in the face of
tax disadvantage. This study attempts to tell the answer of the following questions:
Why do corporations continue to pay dividends?
What then is the relevance of the dividends?
What does it play the role in corporate finance?
This study wants to describe the role of dividend policy by two schools of thoughts in the
view on whether the dividend adds to the value to the firm.
The first school of thoughts originated by Modigliani and Miller claims that dividend
should have no impact on the value of the firm under the perfect market condition. The
shareholders of the firm are indifferent towards retention of net income and payment of the
dividend, since the dividend policy of a firm doesn’t affect its current price.
In the second school of thought, the imperfect market school begins to relax the unrealistic
assumption that Modigliani and Miller have introduced. They begin to introduce both
dividend and capital gain taxes. If dividends are taxed at a different rate of capital gain, a
52
distinct preference could develop for either dividend income or capital gains. In 1979,
Elton and Gruber found evidence that is consistent with the notion that the investors prefer
capital gain to dividend.
This study considers following factors:
Signaling effects of dividend
In 1984, Easterbrook studied the signaling effect of dividend and its role in reducing
agency cost. He believed that firms that pay high dividend signals the managers intent to
maximize investors wealth and to subject him to capital market monitoring and reduces the
potential for managerial self dealing and thus reduces the agency cost. His study states that
quality firms will signal their strength to investors by passing and sustainable dividend.
Dividend and corporate governance
Easterbook didn’t state about motivation that will drive a firm to pay the dividend in his
research. Investigation on this issue has derived the outcome models and substitute model.
They formulated two hypotheses on the former model:
1. Economies with better investor protection will have higher dividends.
2. Economies with higher investors rights, firms with growth opportunities will retain
earning and invest them, resulting in low dividend payout whereas mature firm will
have low growth opportunities and will have high dividend payout ratios.
Hypothesis of second model is as follows:
1. Economies with weak investor protection will have higher dividends.
2. Firms with better growth prospects in weak investor protection economies will have
higher dividend payout ratio than firms with lower growth opportunities.
The study conducted by Faccio, Long and Young (2001) investigated the link between
dividend and expropriation of minority shareholders. In their study, they found that loosely
controlled firms and those with lower CV paid lower dividend. Efficient capital Markey
requires firms to pay high dividend when agency problem are high. The findings of FLY
study are as follows:
53
Dividend work to constrain agency problem in Europe.
Dividends do not work constrain agency problem in Asia.
Capital structure works to constrain problem in Europe.
Capital structure facilitates agency problem in Asia through cross shareholding and
pyramids.
This study was conducted with that companies paying higher dividend had strong operating
track records and growing profits.
A.K. Saxena’s Study
A study conducted by A.K. Saxena (2003) conducted a study entitled ‘Determinants of
dividend policy: Regulated vs unregulated firms’, where he tries to state the importance of
dividend policy in several reasons for example, using dividend as a mechanism for the
financial signaling to the outsiders regarding growth and stability of the firm, the role of
dividend in capital structure, the dividend decision is key phenomenon in establishment of
investment decisions.
Though there are sufficient literatures in dividend policy, most of the study excludes
regulated firm from their analysis. His study includes several financial variables to explain
the possible differences in the dividend policy of both regulated and unregulated firms.
While comparing regulated and unregulated firms, the study reflects one interesting results.
On average the regulated firms are less risky, has a lower growth rate, has such fewer
insiders holding its common stocks, and has fewer investment opportunities, but pays
higher percentage in dividend.
His study consists of the data randomly drawn from 333 firms. The total sample is split
between 235 unregulated and 98 regulated firms, covering 56 industries. The regulated
samples are taken from commercial banking, saving and loan association, investment and
brokerage services, life and prosperity and causality insurance, electric utilities, gas,
petroleum, telecommunications, railroads, and airlines industries.
The study applied regression equation and hypothesis in order to predict the relationship of
variables (with respect o dividend payout ratio) for regulated and unregulated firms.
54
The study also reflects that the mean dividend payout for regulated firm is significantly
larger than that for unregulated firms. Unregulated firms grew more than regulated ones in
the samples over past years. This probably states the fact that regulated firms are more
matured and have stabilized over times. It might indicate the fact that managers of
regulated firms don’t have as much freedom to make them grew as their counterparts in
unregulated firms.
This model predicts that dividend payout of unregulated firms are inversely related to past
and expected growth, their systematic risk, and the level of holding of common stocks by
the managers, directors and officers. On the other hand, payouts are directly related to the
number of stockholders in unregulated firms. While the results for the regulated subgroup
provide some interesting insights regarding the payout behavior of regulated firms. It seems
that insiders don’t play a significant role in dividend policy of regulated firms. It is
suggested that if a firm is unregulated, the firm’s insiders will act to ‘regulate’ and monitor
the firm’s financial performance in long run. They do not care as much about receiving
dividend today, if they can reinvest these dollars in positive net value projects that will
increase firm’s value, which in turn attract new investors.
The conclusion of this study reflects that a firm’s dividend policy will depend upon its past
growth rate, future growth rate and systematic risk, the percentage of common stock held
by insiders and the number of common stock holders. More importantly, however some of
the determinants of dividend policy are different for regulated and unregulated firms.
Specially, the percentage of common stock held by insiders, and expected future growth
rate, do not play a key role in regulated firm’s payout ratio.
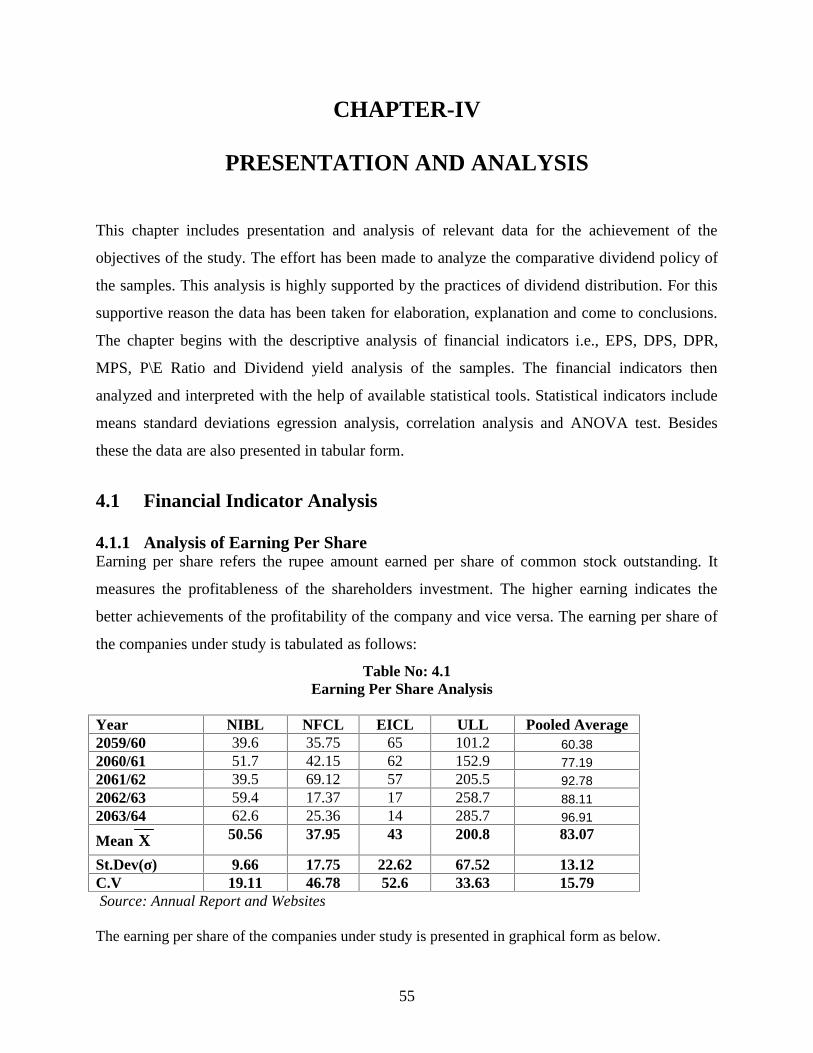
55
CHAPTER-IV
PRESENTATION AND ANALYSIS
This chapter includes presentation and analysis of relevant data for the achievement of the
objectives of the study. The effort has been made to analyze the comparative dividend policy of
the samples. This analysis is highly supported by the practices of dividend distribution. For this
supportive reason the data has been taken for elaboration, explanation and come to conclusions.
The chapter begins with the descriptive analysis of financial indicators i.e., EPS, DPS, DPR,
MPS, P\E Ratio and Dividend yield analysis of the samples. The financial indicators then
analyzed and interpreted with the help of available statistical tools. Statistical indicators include
means standard deviations egression analysis, correlation analysis and ANOVA test. Besides
these the data are also presented in tabular form.
4.1 Financial Indicator Analysis
4.1.1 Analysis of Earning Per ShareEarning per share refers the rupee amount earned per share of common stock outstanding. It
measures the profitableness of the shareholders investment. The higher earning indicates the
better achievements of the profitability of the company and vice versa. The earning per share of
the companies under study is tabulated as follows:
Table No: 4.1Earning Per Share Analysis
Year NIBL NFCL EICL ULL Pooled Average2059/60 39.6 35.75 65 101.2 60.382060/61 51.7 42.15 62 152.9 77.192061/62 39.5 69.12 57 205.5 92.782062/63 59.4 17.37 17 258.7 88.112063/64 62.6 25.36 14 285.7 96.91
Mean X 50.56 37.95 43 200.8 83.07
St.Dev(σ) 9.66 17.75 22.62 67.52 13.12C.V 19.11 46.78 52.6 33.63 15.79Source: Annual Report and Websites
The earning per share of the companies under study is presented in graphical form as below.
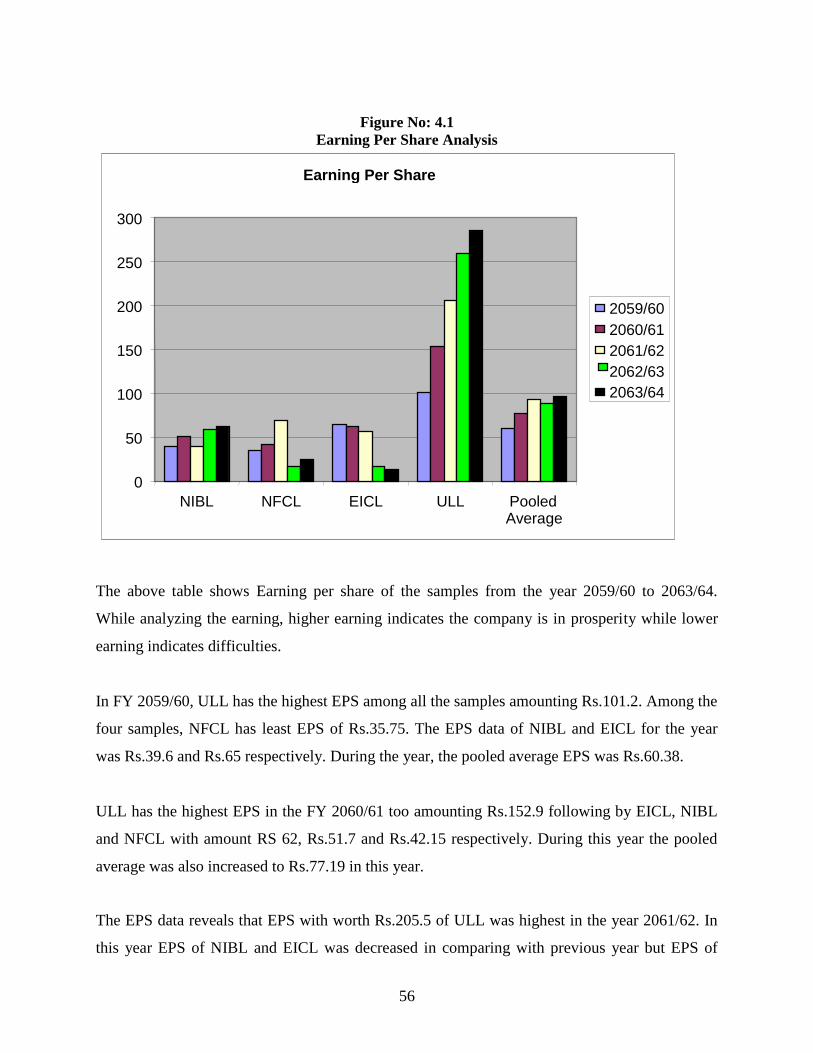
56
Figure No: 4.1Earning Per Share Analysis
The above table shows Earning per share of the samples from the year 2059/60 to 2063/64.
While analyzing the earning, higher earning indicates the company is in prosperity while lower
earning indicates difficulties.
In FY 2059/60, ULL has the highest EPS among all the samples amounting Rs.101.2. Among the
four samples, NFCL has least EPS of Rs.35.75. The EPS data of NIBL and EICL for the year
was Rs.39.6 and Rs.65 respectively. During the year, the pooled average EPS was Rs.60.38.
ULL has the highest EPS in the FY 2060/61 too amounting Rs.152.9 following by EICL, NIBL
and NFCL with amount RS 62, Rs.51.7 and Rs.42.15 respectively. During this year the pooled
average was also increased to Rs.77.19 in this year.
The EPS data reveals that EPS with worth Rs.205.5 of ULL was highest in the year 2061/62. In
this year EPS of NIBL and EICL was decreased in comparing with previous year but EPS of
Earning Per Share
0
50
100
150
200
250
300
NIBL NFCL EICL ULL PooledAverage
2059/602060/612061/622062/632063/64
57
ULL was increased throughout the year and the EPS of NFCL was also increased in comparing
with previous year. The EPS of the remaining samples i.e. NIBL, NFCL and EICL were
Rs.39.5, Rs.69.12 and Rs.57 respectively. The pooled average EPS was Rs.92.78 for the period.
The EPS of ULL was again the highest with Rs.258.7 in the year 2062/63 following by NFCL,
NIBL and EICL with EPS amounting Rs.17.37, Rs.59.4 and Rs.17 respectively. The pooled
average data was decreasing during in comparing with previous year. The pooled average
amount was Rs88.11 for the year.
The analysis of EPS data of the samples in the FY 2063/64 reveals that ULL has the highest EPS
for the period amounting Rs.285.7 while the lowest EPS belongs to EICL with the worth of
Rs.14. In the same period, the EPS of NIBL and NFCL was Rs.62.6 and Rs.25.36 respectively.
The pooled data shows that the EPS amount was increased to 96.91 in the corresponding year.
While going through the average of the samples, the average EPS of ULL has highest among all
the samples of Rs.200.80 following by NIBL, NFCL and EICL with Rs.50.54, Rs.37.95 and
Rs.43 respectively.
S.D. of the samples is 9.66, 17.75, 22.62 and 67.52 for NIBL, NFCL, ELCL and ULL
respectively. The pooled average S.D of EPS is 13.12 respectively. Small S.D represents high
degree of uniformity of the observation as well as homogeneity of the series.
Coefficient of variation (CV) shows the rate of fluctuation. CV of EICL, 52.60% is the highest
among the entire sample, followed by 46.78% of NFCL, 33.63% of ULL and 19.11% of NIBL
respectively. Pooled average of the fluctuation shows 15.79%
Dividend policy can’t be predicted only by the analysis of EPS of the samples. Therefore to give
the true picture of dividend policy it is necessary to measure other necessary financial tools too.
4.1.2 Analysis of Dividend Per Share (DPS)
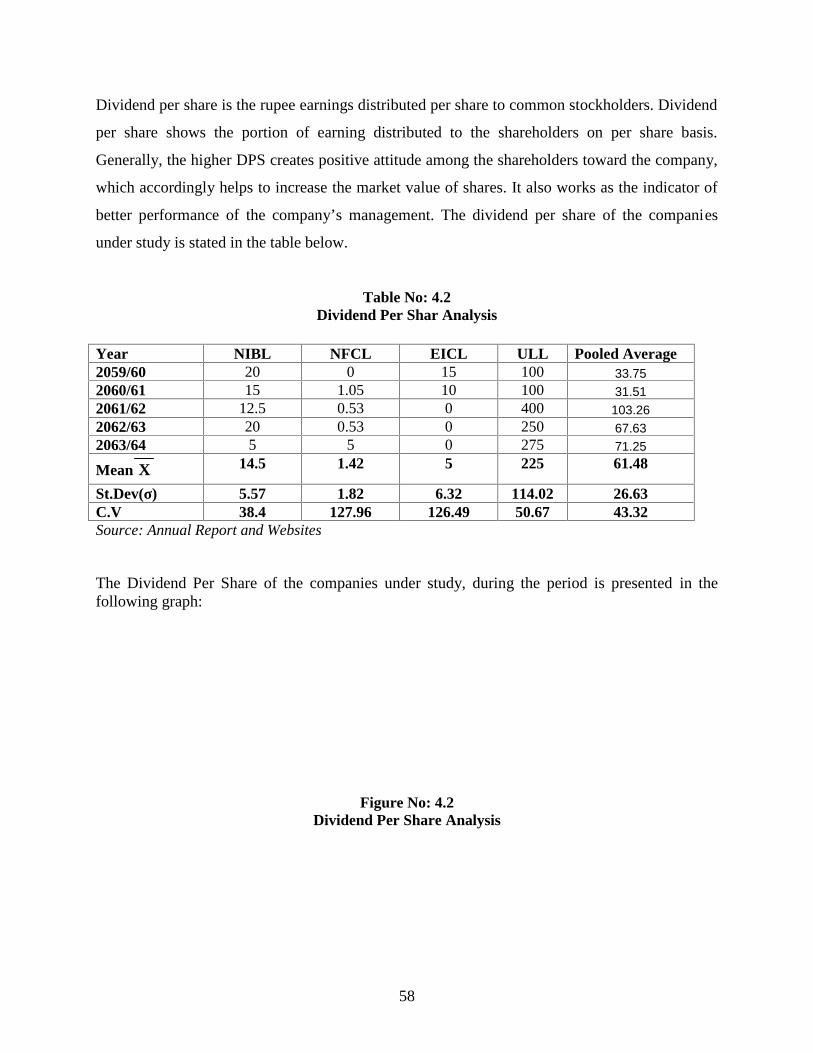
58
Dividend per share is the rupee earnings distributed per share to common stockholders. Dividend
per share shows the portion of earning distributed to the shareholders on per share basis.
Generally, the higher DPS creates positive attitude among the shareholders toward the company,
which accordingly helps to increase the market value of shares. It also works as the indicator of
better performance of the company’s management. The dividend per share of the companies
under study is stated in the table below.
Table No: 4.2Dividend Per Shar Analysis
Year NIBL NFCL EICL ULL Pooled Average2059/60 20 0 15 100 33.752060/61 15 1.05 10 100 31.512061/62 12.5 0.53 0 400 103.262062/63 20 0.53 0 250 67.632063/64 5 5 0 275 71.25
Mean X 14.5 1.42 5 225 61.48
St.Dev(σ) 5.57 1.82 6.32 114.02 26.63C.V 38.4 127.96 126.49 50.67 43.32Source: Annual Report and Websites
The Dividend Per Share of the companies under study, during the period is presented in thefollowing graph:
Figure No: 4.2Dividend Per Share Analysis
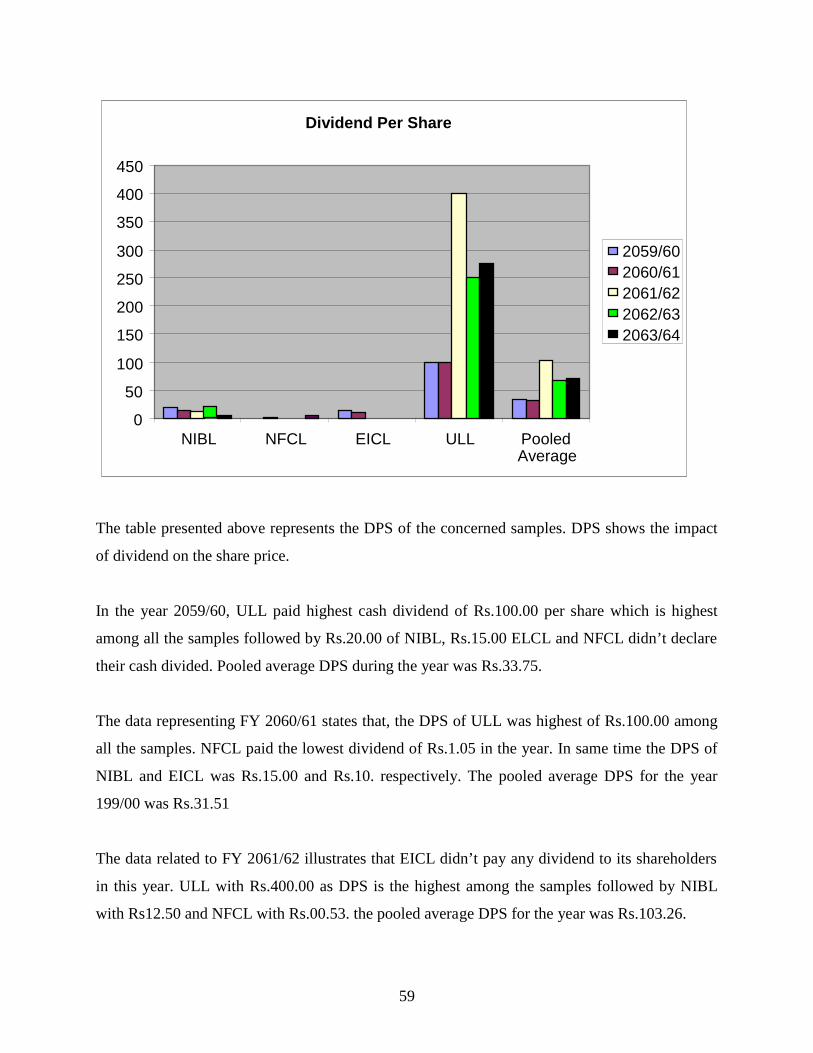
59
The table presented above represents the DPS of the concerned samples. DPS shows the impact
of dividend on the share price.
In the year 2059/60, ULL paid highest cash dividend of Rs.100.00 per share which is highest
among all the samples followed by Rs.20.00 of NIBL, Rs.15.00 ELCL and NFCL didn’t declare
their cash divided. Pooled average DPS during the year was Rs.33.75.
The data representing FY 2060/61 states that, the DPS of ULL was highest of Rs.100.00 among
all the samples. NFCL paid the lowest dividend of Rs.1.05 in the year. In same time the DPS of
NIBL and EICL was Rs.15.00 and Rs.10. respectively. The pooled average DPS for the year
199/00 was Rs.31.51
The data related to FY 2061/62 illustrates that EICL didn’t pay any dividend to its shareholders
in this year. ULL with Rs.400.00 as DPS is the highest among the samples followed by NIBL
with Rs12.50 and NFCL with Rs.00.53. the pooled average DPS for the year was Rs.103.26.
Dividend Per Share
0
50
100
150
200
250
300
350
400
450
NIBL NFCL EICL ULL PooledAverage
2059/602060/612061/622062/632063/64
60
In the FY 2062/63, EICL again didn’t declare their cash dividend. For this year, the DPS of ULL
was Rs.250.00 and for NFCL and NIBL the DPS was worth of Rs.0.53 and 20.00 respectively.
The pooled average DPS for the year was Rs.67.63.
The data representing FY 2063/64 reveals that ULL with DPS of Rs275.00 was the highest
among all the samples. In this year, EICL didn’t pay any cash dividend to its shareholders. Both
NIBL and NFCL paid equal DPS to its shareholders i.e. both paid Rs.5.00 DPS. The pooled
average column of the DPS was increased than previous year amounting Rs.71.25.
On the average, ULL has paid the highest DPS of Rs.225.00 during the period of the study,
followed by NIBL with average DPS of Rs.14.50. EICL has paid dividend to its shareholders
with the average of Rs.5. The lowest average DPS among the samples belongs to NFCL with
Rs.1.42. The pooled average column of the average shows the value of Rs.61.48 for the study
period.
At the time of observing standard deviation, a small S.D measures higher degree of uniformity
and vice versa. Here S.D of ULL is 114.02, NIBL 5.57, EICL 6.32 and NFCL 1.82. The pooled
average S.D of DPS was 26.63 during the period of the study. With the help of CV, we are able
to state the rate of fluctuation. The data reveals that NFCL has highest fluctuation rate in the
payment of dividend with 127.96% followed by EICL with 126.49% and ULL with 50.67%. The
fluctuation rate of NIBL is the lowest among the samples with the rate of 38.40%. The pooled
average column states that the CV of all the samples during the time of the study is 43.32%
which reveals that the samples haven’t followed the consistent dividend policy.
4.1.3 Analysis of Dividend Payout Ratio (DPR)The proportion of earning paid in the form of dividend is called Dividend Payout Ratio (DPR).
This ratio shows what percentage of the profit is distributed as dividend and it is measured in
percentage. The dividend payout ratio of a company depends upon the earnings made by the
company. The DPR of the companies under study are stated in the table and graph as follows:
Table No: 4.3Dividend Payout Ratio Analysis
Year NIBL NFCL EICL ULL Pooled Average
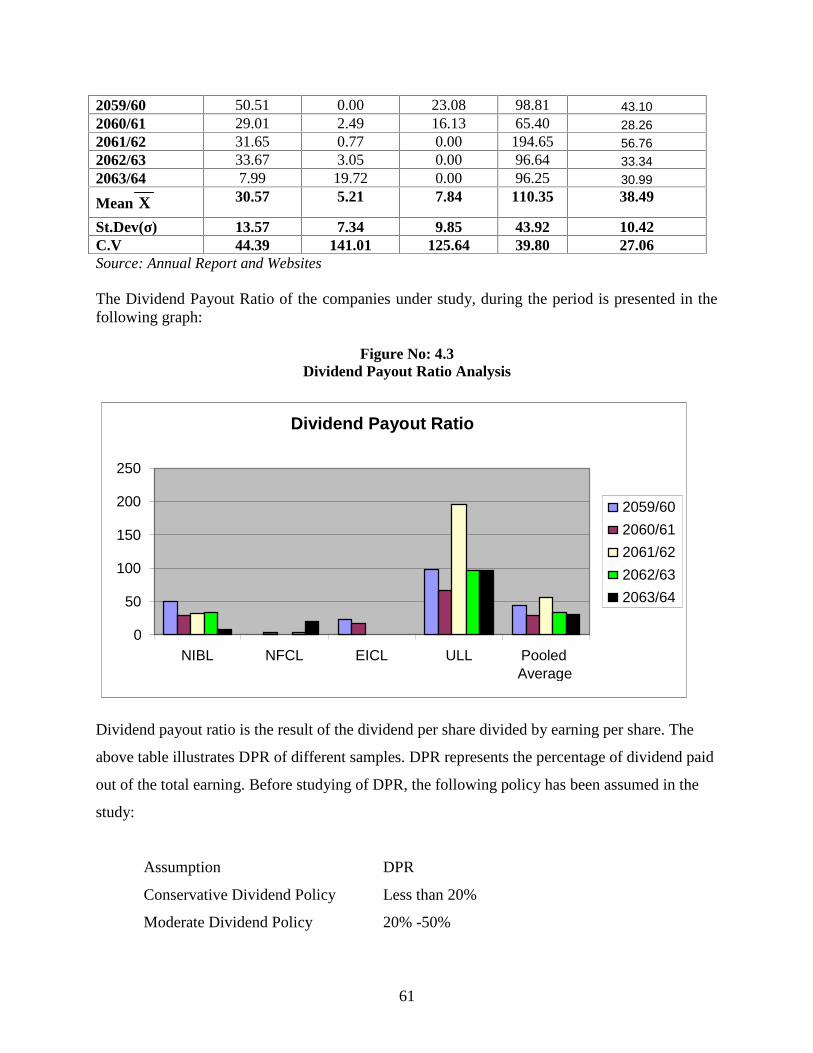
61
2059/60 50.51 0.00 23.08 98.81 43.102060/61 29.01 2.49 16.13 65.40 28.262061/62 31.65 0.77 0.00 194.65 56.762062/63 33.67 3.05 0.00 96.64 33.342063/64 7.99 19.72 0.00 96.25 30.99
Mean X 30.57 5.21 7.84 110.35 38.49
St.Dev(σ) 13.57 7.34 9.85 43.92 10.42C.V 44.39 141.01 125.64 39.80 27.06Source: Annual Report and Websites
The Dividend Payout Ratio of the companies under study, during the period is presented in thefollowing graph:
Figure No: 4.3Dividend Payout Ratio Analysis
Dividend payout ratio is the result of the dividend per share divided by earning per share. The
above table illustrates DPR of different samples. DPR represents the percentage of dividend paid
out of the total earning. Before studying of DPR, the following policy has been assumed in the
study:
Assumption DPR
Conservative Dividend Policy Less than 20%
Moderate Dividend Policy 20% -50%
Dividend Payout Ratio
0
50
100
150
200
250
NIBL NFCL EICL ULL PooledAverage
2059/602060/612061/622062/632063/64
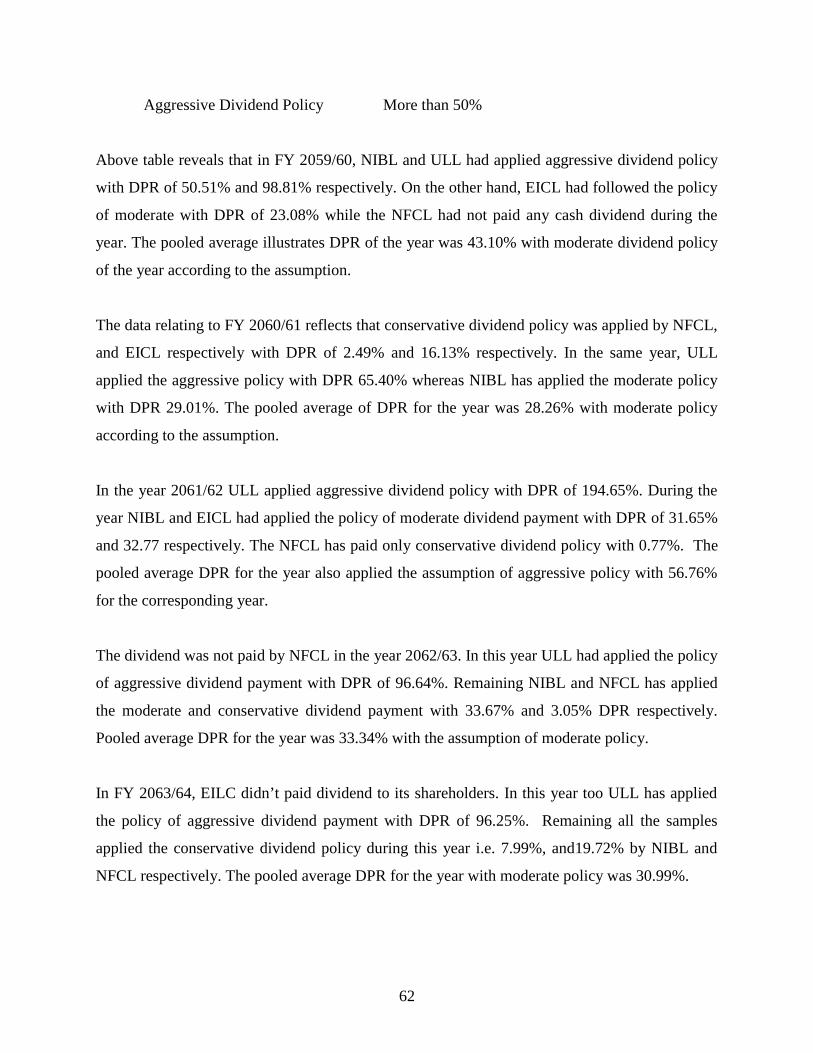
62
Aggressive Dividend Policy More than 50%
Above table reveals that in FY 2059/60, NIBL and ULL had applied aggressive dividend policy
with DPR of 50.51% and 98.81% respectively. On the other hand, EICL had followed the policy
of moderate with DPR of 23.08% while the NFCL had not paid any cash dividend during the
year. The pooled average illustrates DPR of the year was 43.10% with moderate dividend policy
of the year according to the assumption.
The data relating to FY 2060/61 reflects that conservative dividend policy was applied by NFCL,
and EICL respectively with DPR of 2.49% and 16.13% respectively. In the same year, ULL
applied the aggressive policy with DPR 65.40% whereas NIBL has applied the moderate policy
with DPR 29.01%. The pooled average of DPR for the year was 28.26% with moderate policy
according to the assumption.
In the year 2061/62 ULL applied aggressive dividend policy with DPR of 194.65%. During the
year NIBL and EICL had applied the policy of moderate dividend payment with DPR of 31.65%
and 32.77 respectively. The NFCL has paid only conservative dividend policy with 0.77%. The
pooled average DPR for the year also applied the assumption of aggressive policy with 56.76%
for the corresponding year.
The dividend was not paid by NFCL in the year 2062/63. In this year ULL had applied the policy
of aggressive dividend payment with DPR of 96.64%. Remaining NIBL and NFCL has applied
the moderate and conservative dividend payment with 33.67% and 3.05% DPR respectively.
Pooled average DPR for the year was 33.34% with the assumption of moderate policy.
In FY 2063/64, EILC didn’t paid dividend to its shareholders. In this year too ULL has applied
the policy of aggressive dividend payment with DPR of 96.25%. Remaining all the samples
applied the conservative dividend policy during this year i.e. 7.99%, and19.72% by NIBL and
NFCL respectively. The pooled average DPR for the year with moderate policy was 30.99%.
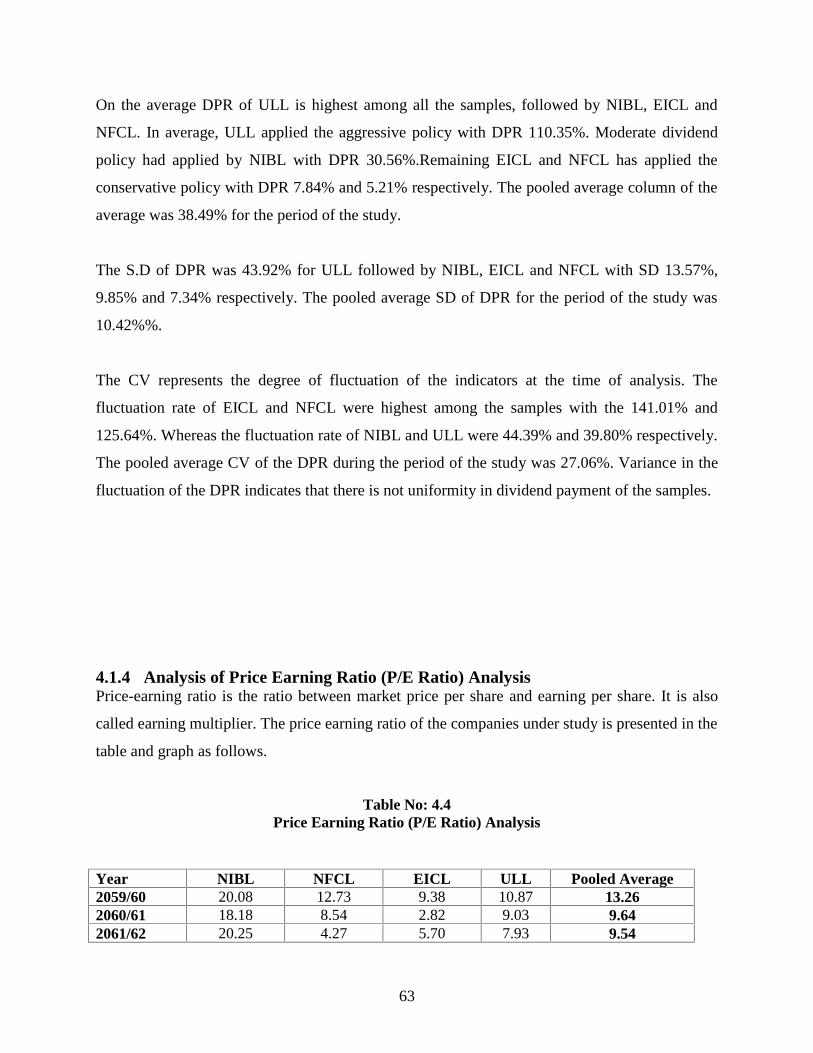
63
On the average DPR of ULL is highest among all the samples, followed by NIBL, EICL and
NFCL. In average, ULL applied the aggressive policy with DPR 110.35%. Moderate dividend
policy had applied by NIBL with DPR 30.56%.Remaining EICL and NFCL has applied the
conservative policy with DPR 7.84% and 5.21% respectively. The pooled average column of the
average was 38.49% for the period of the study.
The S.D of DPR was 43.92% for ULL followed by NIBL, EICL and NFCL with SD 13.57%,
9.85% and 7.34% respectively. The pooled average SD of DPR for the period of the study was
10.42%%.
The CV represents the degree of fluctuation of the indicators at the time of analysis. The
fluctuation rate of EICL and NFCL were highest among the samples with the 141.01% and
125.64%. Whereas the fluctuation rate of NIBL and ULL were 44.39% and 39.80% respectively.
The pooled average CV of the DPR during the period of the study was 27.06%. Variance in the
fluctuation of the DPR indicates that there is not uniformity in dividend payment of the samples.
4.1.4 Analysis of Price Earning Ratio (P/E Ratio) AnalysisPrice-earning ratio is the ratio between market price per share and earning per share. It is also
called earning multiplier. The price earning ratio of the companies under study is presented in the
table and graph as follows.
Table No: 4.4Price Earning Ratio (P/E Ratio) Analysis
Year NIBL NFCL EICL ULL Pooled Average2059/60 20.08 12.73 9.38 10.87 13.262060/61 18.18 8.54 2.82 9.03 9.642061/62 20.25 4.27 5.70 7.93 9.54
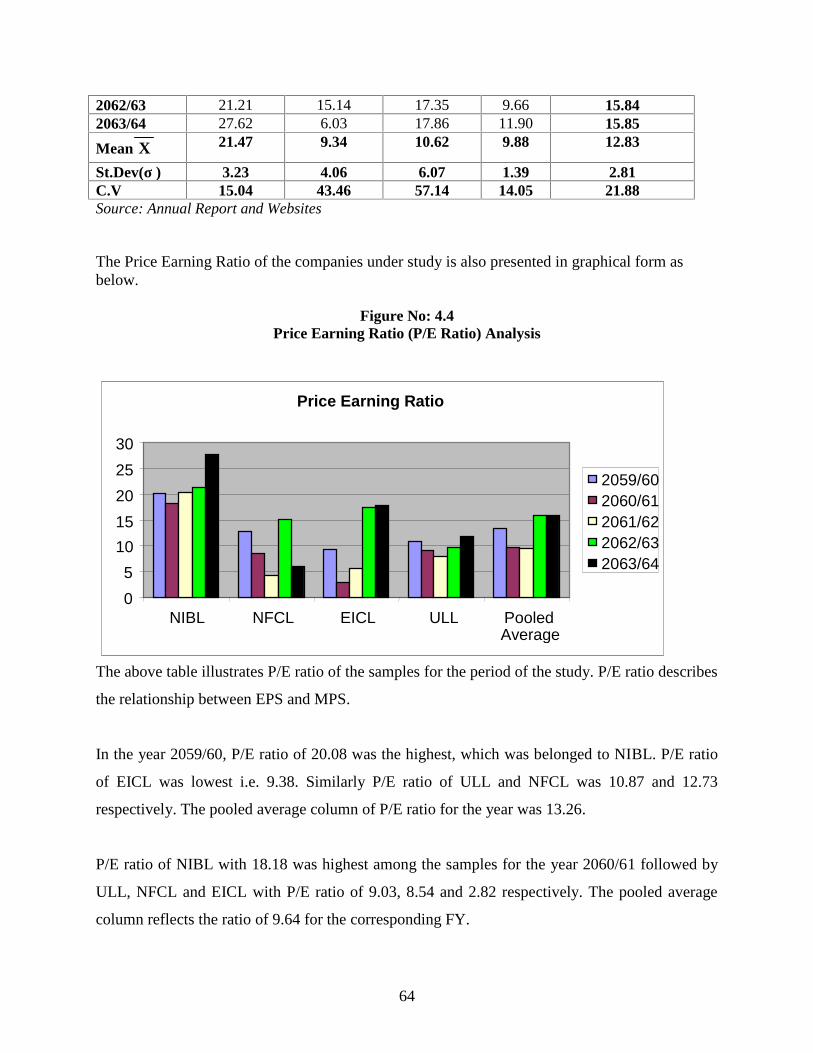
64
2062/63 21.21 15.14 17.35 9.66 15.842063/64 27.62 6.03 17.86 11.90 15.85
Mean X 21.47 9.34 10.62 9.88 12.83
St.Dev(σ ) 3.23 4.06 6.07 1.39 2.81C.V 15.04 43.46 57.14 14.05 21.88Source: Annual Report and Websites
The Price Earning Ratio of the companies under study is also presented in graphical form asbelow.
Figure No: 4.4Price Earning Ratio (P/E Ratio) Analysis
The above table illustrates P/E ratio of the samples for the period of the study. P/E ratio describes
the relationship between EPS and MPS.
In the year 2059/60, P/E ratio of 20.08 was the highest, which was belonged to NIBL. P/E ratio
of EICL was lowest i.e. 9.38. Similarly P/E ratio of ULL and NFCL was 10.87 and 12.73
respectively. The pooled average column of P/E ratio for the year was 13.26.
P/E ratio of NIBL with 18.18 was highest among the samples for the year 2060/61 followed by
ULL, NFCL and EICL with P/E ratio of 9.03, 8.54 and 2.82 respectively. The pooled average
column reflects the ratio of 9.64 for the corresponding FY.
Price Earning Ratio
05
1015202530
NIBL NFCL EICL ULL PooledAverage
2059/602060/612061/622062/632063/64
65
The P/E ratio of the sample is fluctuating in the FY 2061/62. NIBL and EICL have increasing
P/E ratio while NFCL and ULLL have decreasing ratios. The highest P/E ratio was 20.25 of
NIBL while the lowest P/E ratio belonged to NFCL with 4.27. The pooled average P/E ratio for
the year was 9.54.
The data representing to FY 2062/63 also reflects that NIBL has the highest P/E ratio with the
value 21.21 followed by EICL, NFCL, and ULL with 17.35, 15.14 and 9.66 respectively. The
pooled average was increased to 15.84 for the FY 2062/63.
In the year 2063/64, P/E ratio of all the samples excluding NFCL has decreased in comparison
with the P/E ratio of previous FY. In this year NIBL has the highest P/E ratio of 27.62; NFCL
had the lowest P/E ratio of 6.03. The P/E ratio of ULL and EICL was 11.90 and 17.86
respectively. The pooled average P/E ratio was 15.85 for the year.
On the average, NIBL has the highest P/E ratio with 21.47 ULL, ELCL, and NFCL have the
average of 9.88, 10.62 and 9.34 respectively. Pooled average of the average P/E ratio was 12.83
for the period of the study.
As we analyzed the S.D. of P/E ratio of the samples, it can be reflected that the S.D. of NIBL,
NFCL, EICL and ULL are 3.23, 4.06, 6.07 and 1.39 respectively. Pooled average S.D of P/E
ratio was 2.81 for the study period.
While studying the P/E ratio it can be reflect that P/E ratio of NIBL is the highest among the
samples. But the CV analysis shows that ULL is more consistent than other samples. P/E ratio of
EICL is more fluctuating than other samples during the time of the study. The pooled average
column shows that the fluctuation rate of P/E ratio is 21.88% during the period of study.
4.1.5 Analysis of Market Price Per Share (MPS)Market Price Per Share (MPS) is the price of share on which shares are traded in the secondary
market. The average market price per share of the companies under study is presented in table
and in graphical form as follows:
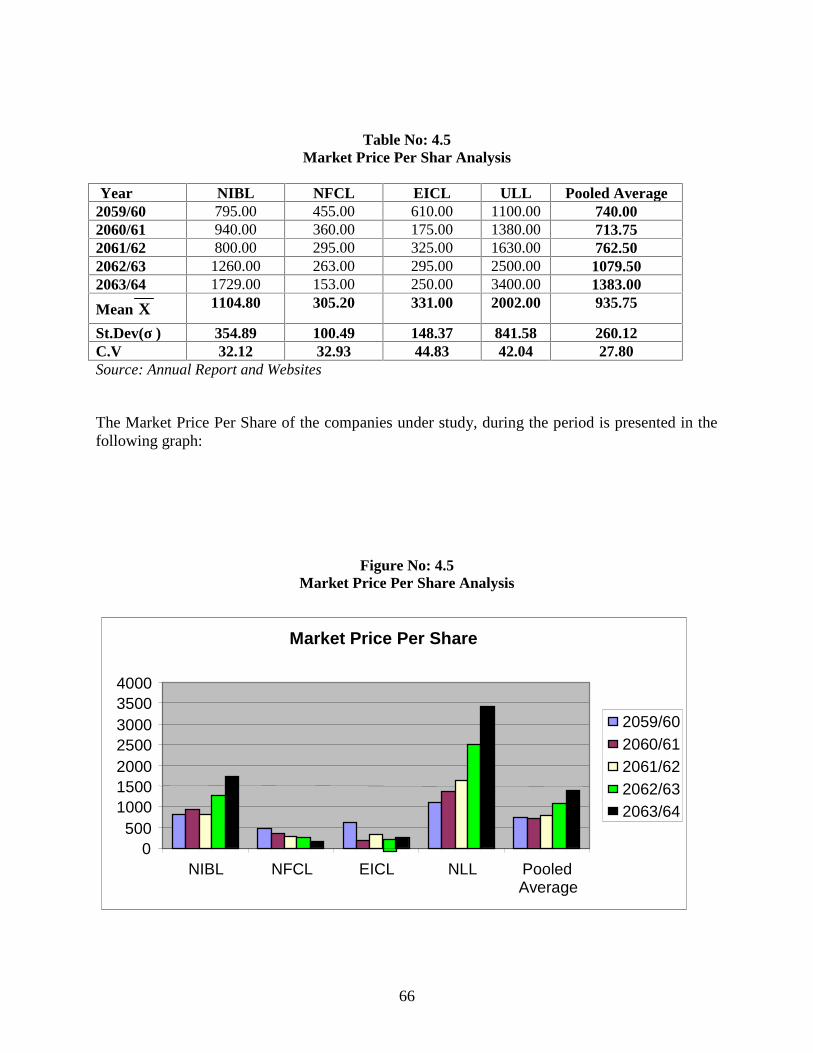
66
Table No: 4.5Market Price Per Shar Analysis
Year NIBL NFCL EICL ULL Pooled Average2059/60 795.00 455.00 610.00 1100.00 740.002060/61 940.00 360.00 175.00 1380.00 713.752061/62 800.00 295.00 325.00 1630.00 762.502062/63 1260.00 263.00 295.00 2500.00 1079.502063/64 1729.00 153.00 250.00 3400.00 1383.00
Mean X 1104.80 305.20 331.00 2002.00 935.75
St.Dev(σ ) 354.89 100.49 148.37 841.58 260.12C.V 32.12 32.93 44.83 42.04 27.80Source: Annual Report and Websites
The Market Price Per Share of the companies under study, during the period is presented in thefollowing graph:
Figure No: 4.5Market Price Per Share Analysis
Market Price Per Share
0500
1000150020002500300035004000
NIBL NFCL EICL NLL PooledAverage
2059/602060/612061/622062/632063/64
67
The table above shows the market value of the shares. The objective to analyze market value is
to evaluate the value of the shares in the market.
In the year 2059/60, the share price off ULL is Rs.1100.00, highest among the samples while
MPS of Rs.455.00 of NFCL is the lowest for the year. The data shows MPS of NIBL and EICL
was Rs.795.00 and Rs.610.00 respectively. The pooled average MPS column shows the value of
Rs.740.00 for the year.
The data of 2060/61 reflects that ULL has the highest MPS with Rs.1380.00, followed by NIBL,
NFCL and EICL with Rs.940.00, Rs.360.00 and RS.175.00 respectively. The pooled average
column shows MPS with Rs.713.75 for the Year.
Again, ULL has the highest MPS of Rs.1630.00 in the FY 2061/62. NFCL has the lowest MPS at
this time with Rs.295.00. the pooled average column of MPS shows the value of Rs.762.50 for
the corresponding year.
The MPS of ULL was the highest for the year 2062/63 while the MPS of NFCL is the lowest for
the period. The pooled average column shows that Rs.1079.50 as per pooled average MPS for
the year.
The data of 2063/64 reflects that there is fluctuation in MPS of all the samples. In the year, MPS
of ULL was Rs.3400.00 followed by NIBL with Rs.1792.00, EICL with Rs.250.00 and NFCL
with Rs.153.00. The pooled average MPS was Rs.1383.00 for the year.
The study of average shows that ULL has highest MPS where as NFCL has the lowest average
MPS during the period of study. The column of pooled average of the average reflects that the
value of Rs.935.75 during the period of the study.
68
While analyzing the S.D of the sample, the S.D. of MPS for the samples is 354.89, 100.49,
148.37 and 841.58 respectively for NIBL, NFCL, EICL and ULL respectively. The pooled
average S.D. of MPS during the study period is 260.12.
The CV reflects the rate of the fluctuation of the samples at the time of the study. While
analyzing the CV, EICL has the highest CV with 44.83% and NIBL has lowest CV of 32.12%.
At the time of the study, the pooled average CV of MPS was 27.80%, which indicates that there
is not uniformity in the calculated of MPS by all the samples.
4.1.6 Analysis of Dividend Yield (DY)Dividend yield is the percentage of DPS on MPS. It measures the dividend in relation to market
value of share. It is the dividend received by the investors as a percentage of market price per
share in the stock market. This ratio highly influences the market price per share because a small
change in dividend per share can bring effective change in the market value of the share. The
dividend yield of the companies under study is presented in the table and graph as below.
Table No: 4.6Dividend Yield Analysis
Year NIBL NFCL EICL ULL Pooled Average2059/60 2.52 0.00 2.46 9.09 3.522060/61 1.60 0.29 5.71 7.25 3.712061/62 1.56 0.18 0.00 24.54 6.572062/63 1.59 0.20 0.00 10.00 2.952063/64 0.29 3.27 0.00 8.09 2.91
Mean X 1.51 0.79 1.63 11.79 3.93
St.Dev(σ ) 0.71 1.24 2.25 6.44 1.36C.V 46.99 157.77 137.72 54.61 34.49
Source: Annual Report and Websites
The Dividend Yield Analysis of the companies under study, during the period is presented in thefollowing graph:
Figure No:4.6Dividend Yield Analysis
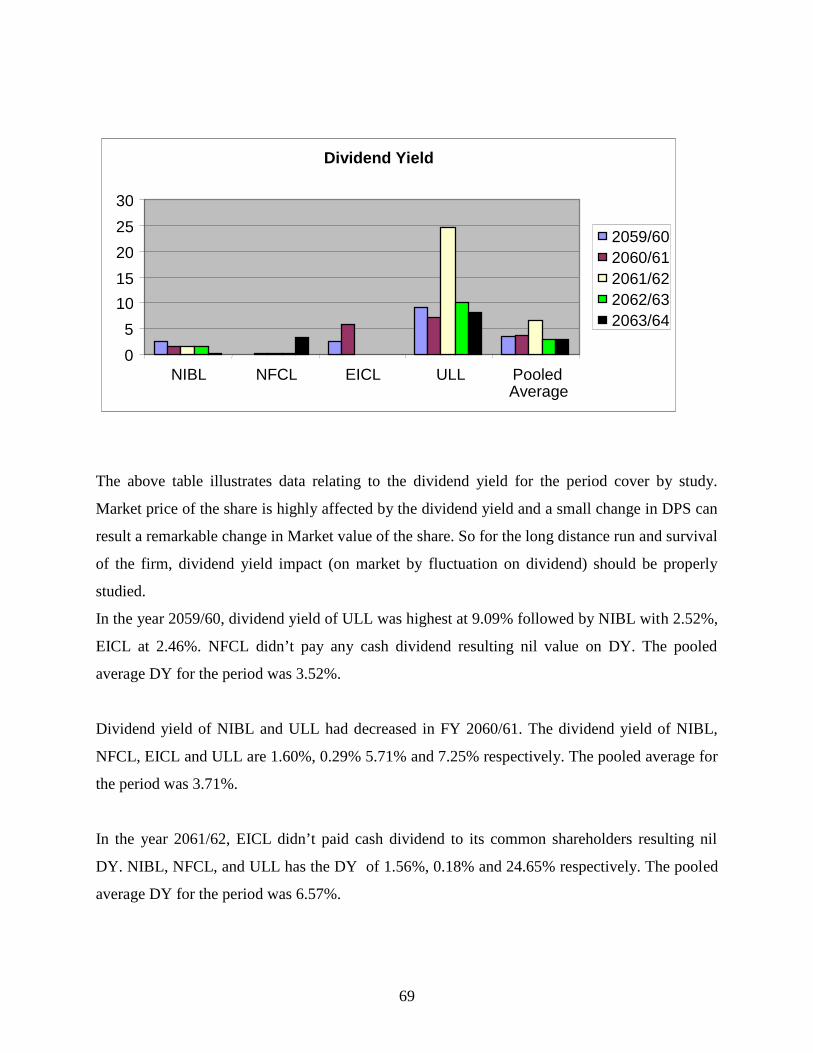
69
The above table illustrates data relating to the dividend yield for the period cover by study.
Market price of the share is highly affected by the dividend yield and a small change in DPS can
result a remarkable change in Market value of the share. So for the long distance run and survival
of the firm, dividend yield impact (on market by fluctuation on dividend) should be properly
studied.
In the year 2059/60, dividend yield of ULL was highest at 9.09% followed by NIBL with 2.52%,
EICL at 2.46%. NFCL didn’t pay any cash dividend resulting nil value on DY. The pooled
average DY for the period was 3.52%.
Dividend yield of NIBL and ULL had decreased in FY 2060/61. The dividend yield of NIBL,
NFCL, EICL and ULL are 1.60%, 0.29% 5.71% and 7.25% respectively. The pooled average for
the period was 3.71%.
In the year 2061/62, EICL didn’t paid cash dividend to its common shareholders resulting nil
DY. NIBL, NFCL, and ULL has the DY of 1.56%, 0.18% and 24.65% respectively. The pooled
average DY for the period was 6.57%.
Dividend Yield
05
1015202530
NIBL NFCL EICL ULL PooledAverage
2059/602060/612061/622062/632063/64
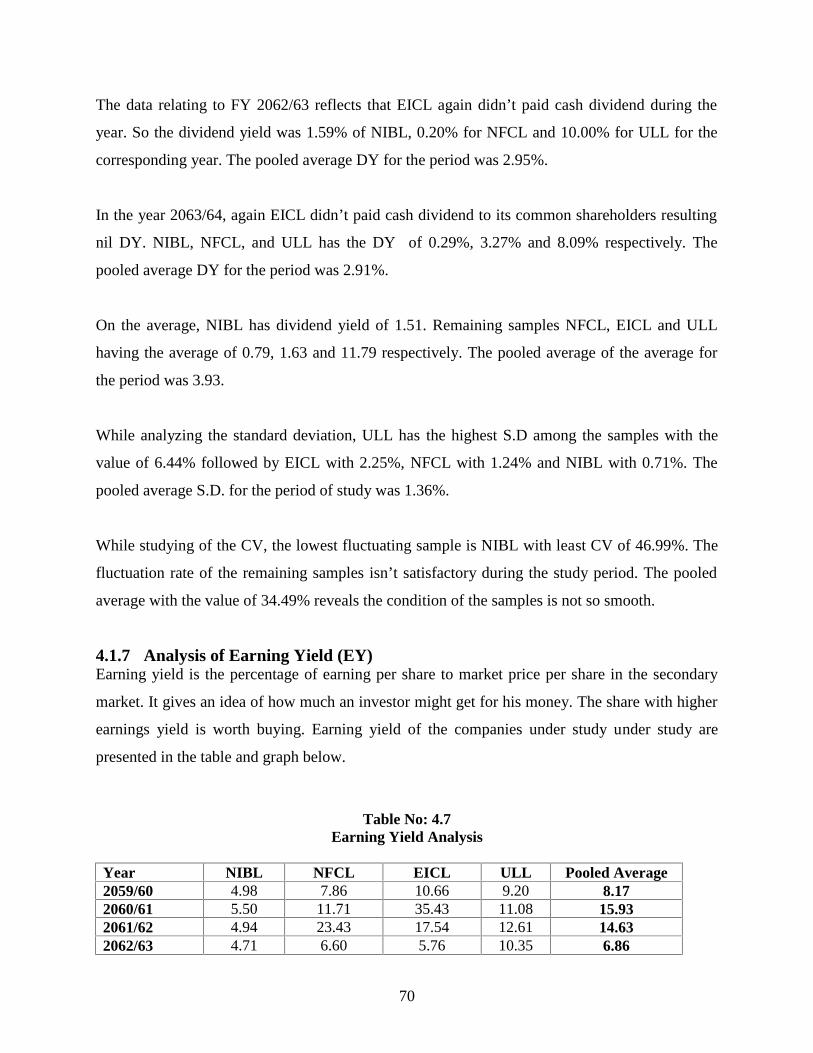
70
The data relating to FY 2062/63 reflects that EICL again didn’t paid cash dividend during the
year. So the dividend yield was 1.59% of NIBL, 0.20% for NFCL and 10.00% for ULL for the
corresponding year. The pooled average DY for the period was 2.95%.
In the year 2063/64, again EICL didn’t paid cash dividend to its common shareholders resulting
nil DY. NIBL, NFCL, and ULL has the DY of 0.29%, 3.27% and 8.09% respectively. The
pooled average DY for the period was 2.91%.
On the average, NIBL has dividend yield of 1.51. Remaining samples NFCL, EICL and ULL
having the average of 0.79, 1.63 and 11.79 respectively. The pooled average of the average for
the period was 3.93.
While analyzing the standard deviation, ULL has the highest S.D among the samples with the
value of 6.44% followed by EICL with 2.25%, NFCL with 1.24% and NIBL with 0.71%. The
pooled average S.D. for the period of study was 1.36%.
While studying of the CV, the lowest fluctuating sample is NIBL with least CV of 46.99%. The
fluctuation rate of the remaining samples isn’t satisfactory during the study period. The pooled
average with the value of 34.49% reveals the condition of the samples is not so smooth.
4.1.7 Analysis of Earning Yield (EY)Earning yield is the percentage of earning per share to market price per share in the secondary
market. It gives an idea of how much an investor might get for his money. The share with higher
earnings yield is worth buying. Earning yield of the companies under study under study are
presented in the table and graph below.
Table No: 4.7Earning Yield Analysis
Year NIBL NFCL EICL ULL Pooled Average2059/60 4.98 7.86 10.66 9.20 8.172060/61 5.50 11.71 35.43 11.08 15.932061/62 4.94 23.43 17.54 12.61 14.632062/63 4.71 6.60 5.76 10.35 6.86
71
2063/64 3.62 16.58 5.60 8.40 8.55
Mean X 4.75 13.24 15.00 10.33 10.83
St.Dev(σ ) 0.62 6.17 11.10 1.47 3.70C.V 13.07 46.62 74.03 14.19 34.18
Source: Annual Report and Websites
The Earning Yield of the companies under study, during the period is presented in the followinggraph:
Figure No: 4.7Earning Yield Analysis
Earning Yield
0
5
10
15
20
25
30
35
40
NIBL NFCL EICL ULL Pooled Average
2059/60
2060/61
2061/62
2062/63
2063/64
72
The above table illustrates data relating to the earning yield for the period cover by study. In the
year 2059/60, dividend yield of EICL was highest at 10.66% followed by ULL with 9.20%,
NFCL at 7.86% and NIBL 4.98. The pooled average EY for the period was 8.17%.
Earning yield of EICL had decreased in FY 2060/61. The dividend yield of NIBL, NFCL, EICL
and ULL are 5.50%, 11.71%, 35.43% and 11.08% respectively. The pooled average for the
period was 15.93%.
In the year 2061/62, earning yield of NIBL, NFCL, EICL and ULL are 4.49%, 23.43%, 17.54%
and 12.61% respectively. The pooled average EY for the period was 14.63%.
The data relating to FY 2062/63 reflects that earning yield of all companies has decreased. The
earning yield was 4.71% of NIBL, 6.60% of NFCL, 5.76 of EICL and 10.35% of ULL for the
corresponding year. The pooled average EY for the period was 6.86%.
In the year 2063/64, again EY of NIBL, EICL and ULL had decreased but the EY of NFCL has
increased in large scale. Earning Yield of NIBL, NFCL, EICL and ULL for this year are 3.62%,
16.58%, 5.60% and 8.40% respectively. The pooled average EY for the period was 8.55%.
On the average, NIBL has earning yield of 4.75. Remaining samples NFCL, EICL and ULL
having the average of 13.24, 15.00 and 10.33 respectively. The pooled average of the average for
the period was 10.83.
While analyzing the standard deviation, EICL has the highest S.D among the samples with the
value of 11.10% followed by NFCL with 6.17%, ULL with 1.47% and NIBL with 0.62%. The
pooled average S.D. for the period of study was 3.70%.
While studying of the CV, the lowest fluctuating sample is NIBL with least CV of 13.07%. The
EY of the remaining samples are 46.62%, 74.03%, and 14.19% of NFCL, EICL and ULL
respectively. The pooled average with the value of 34.18% reveals the condition of the samples
is not so smooth.
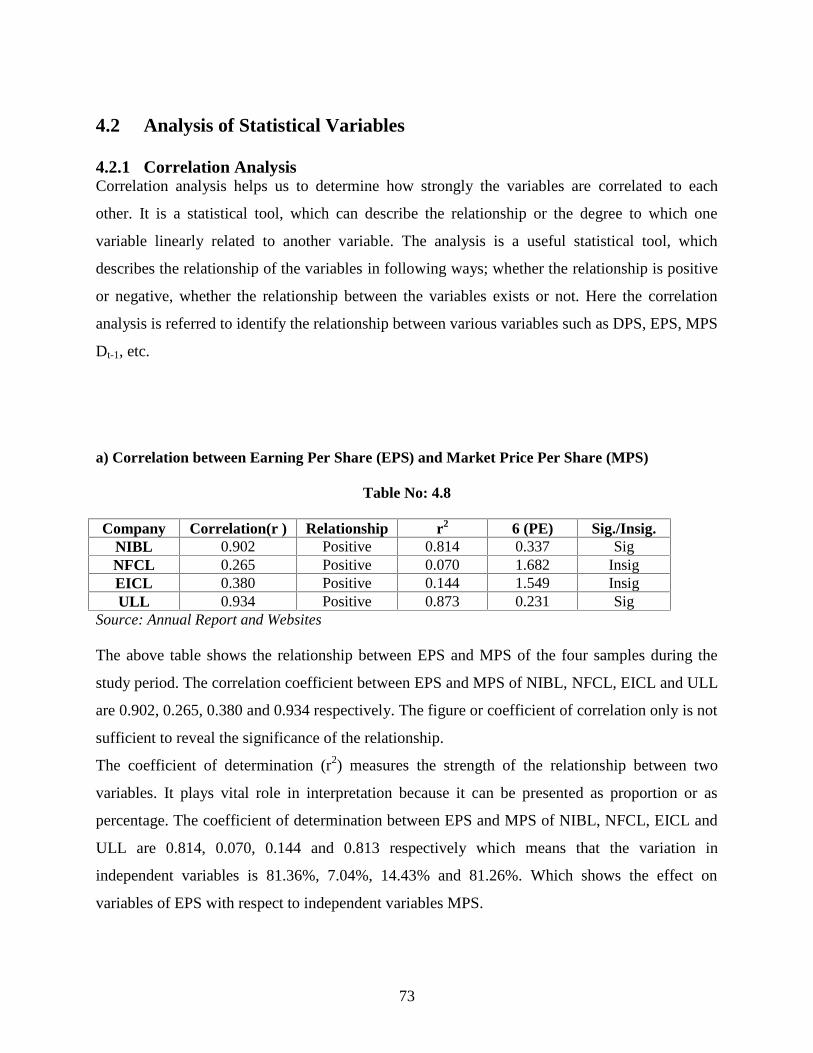
73
4.2 Analysis of Statistical Variables
4.2.1 Correlation AnalysisCorrelation analysis helps us to determine how strongly the variables are correlated to each
other. It is a statistical tool, which can describe the relationship or the degree to which one
variable linearly related to another variable. The analysis is a useful statistical tool, which
describes the relationship of the variables in following ways; whether the relationship is positive
or negative, whether the relationship between the variables exists or not. Here the correlation
analysis is referred to identify the relationship between various variables such as DPS, EPS, MPS
Dt-1, etc.
a) Correlation between Earning Per Share (EPS) and Market Price Per Share (MPS)
Table No: 4.8
Company Correlation(r ) Relationship r2 6 (PE) Sig./Insig.NIBL 0.902 Positive 0.814 0.337 SigNFCL 0.265 Positive 0.070 1.682 InsigEICL 0.380 Positive 0.144 1.549 InsigULL 0.934 Positive 0.873 0.231 Sig
Source: Annual Report and Websites
The above table shows the relationship between EPS and MPS of the four samples during the
study period. The correlation coefficient between EPS and MPS of NIBL, NFCL, EICL and ULL
are 0.902, 0.265, 0.380 and 0.934 respectively. The figure or coefficient of correlation only is not
sufficient to reveal the significance of the relationship.
The coefficient of determination (r2) measures the strength of the relationship between two
variables. It plays vital role in interpretation because it can be presented as proportion or as
percentage. The coefficient of determination between EPS and MPS of NIBL, NFCL, EICL and
ULL are 0.814, 0.070, 0.144 and 0.813 respectively which means that the variation in
independent variables is 81.36%, 7.04%, 14.43% and 81.26%. Which shows the effect on
variables of EPS with respect to independent variables MPS.
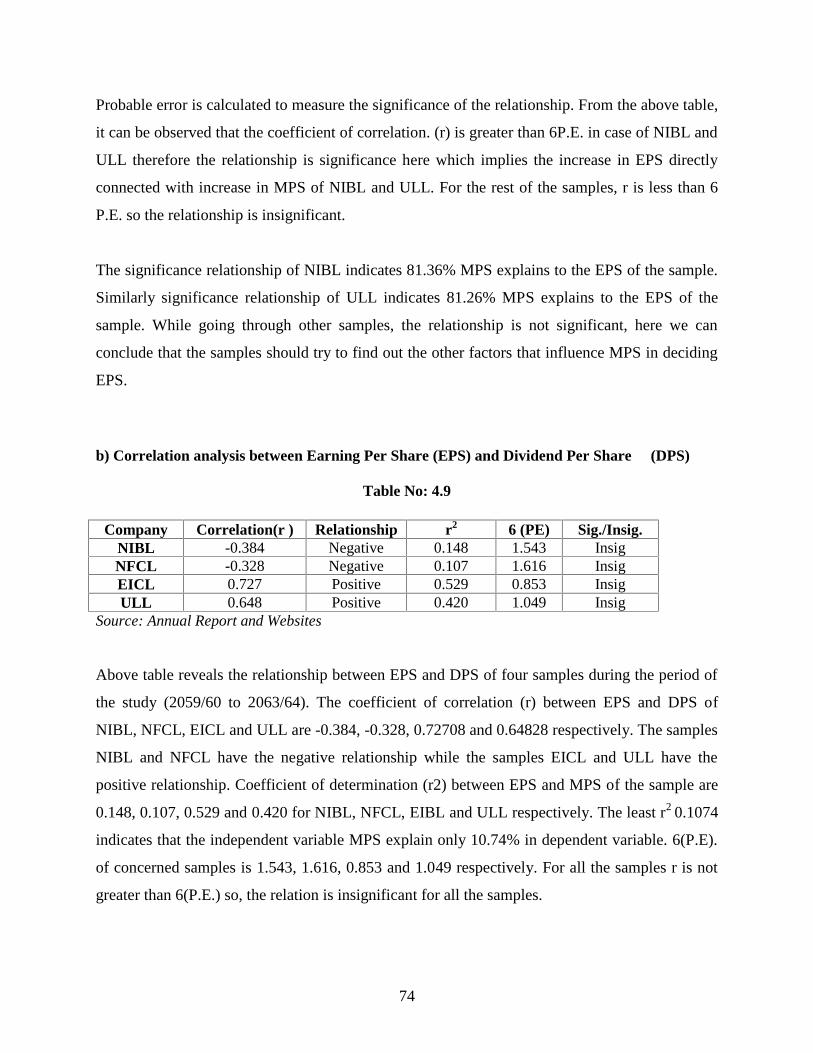
74
Probable error is calculated to measure the significance of the relationship. From the above table,
it can be observed that the coefficient of correlation. (r) is greater than 6P.E. in case of NIBL and
ULL therefore the relationship is significance here which implies the increase in EPS directly
connected with increase in MPS of NIBL and ULL. For the rest of the samples, r is less than 6
P.E. so the relationship is insignificant.
The significance relationship of NIBL indicates 81.36% MPS explains to the EPS of the sample.
Similarly significance relationship of ULL indicates 81.26% MPS explains to the EPS of the
sample. While going through other samples, the relationship is not significant, here we can
conclude that the samples should try to find out the other factors that influence MPS in deciding
EPS.
b) Correlation analysis between Earning Per Share (EPS) and Dividend Per Share (DPS)
Table No: 4.9
Company Correlation(r ) Relationship r2 6 (PE) Sig./Insig.NIBL -0.384 Negative 0.148 1.543 InsigNFCL -0.328 Negative 0.107 1.616 InsigEICL 0.727 Positive 0.529 0.853 InsigULL 0.648 Positive 0.420 1.049 Insig
Source: Annual Report and Websites
Above table reveals the relationship between EPS and DPS of four samples during the period of
the study (2059/60 to 2063/64). The coefficient of correlation (r) between EPS and DPS of
NIBL, NFCL, EICL and ULL are -0.384, -0.328, 0.72708 and 0.64828 respectively. The samples
NIBL and NFCL have the negative relationship while the samples EICL and ULL have the
positive relationship. Coefficient of determination (r2) between EPS and MPS of the sample are
0.148, 0.107, 0.529 and 0.420 for NIBL, NFCL, EIBL and ULL respectively. The least r2 0.1074
indicates that the independent variable MPS explain only 10.74% in dependent variable. 6(P.E).
of concerned samples is 1.543, 1.616, 0.853 and 1.049 respectively. For all the samples r is not
greater than 6(P.E.) so, the relation is insignificant for all the samples.
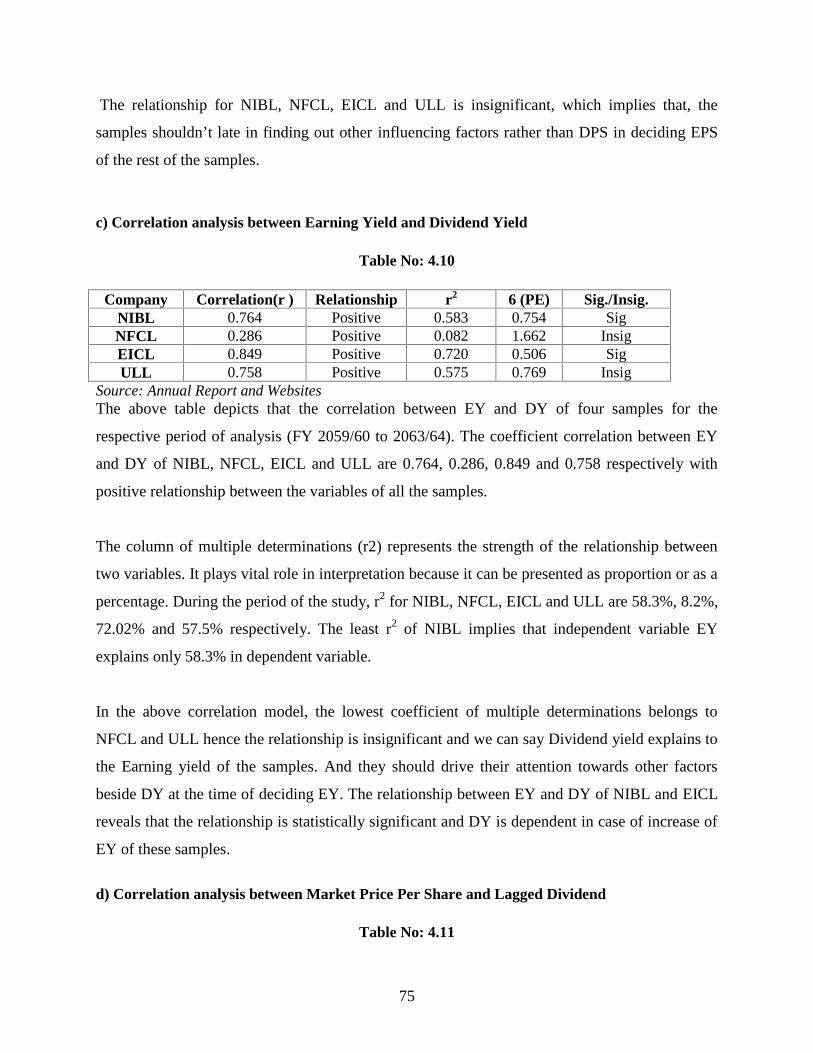
75
The relationship for NIBL, NFCL, EICL and ULL is insignificant, which implies that, the
samples shouldn’t late in finding out other influencing factors rather than DPS in deciding EPS
of the rest of the samples.
c) Correlation analysis between Earning Yield and Dividend Yield
Table No: 4.10
Company Correlation(r ) Relationship r2 6 (PE) Sig./Insig.NIBL 0.764 Positive 0.583 0.754 SigNFCL 0.286 Positive 0.082 1.662 InsigEICL 0.849 Positive 0.720 0.506 SigULL 0.758 Positive 0.575 0.769 Insig
Source: Annual Report and WebsitesThe above table depicts that the correlation between EY and DY of four samples for the
respective period of analysis (FY 2059/60 to 2063/64). The coefficient correlation between EY
and DY of NIBL, NFCL, EICL and ULL are 0.764, 0.286, 0.849 and 0.758 respectively with
positive relationship between the variables of all the samples.
The column of multiple determinations (r2) represents the strength of the relationship between
two variables. It plays vital role in interpretation because it can be presented as proportion or as a
percentage. During the period of the study, r2 for NIBL, NFCL, EICL and ULL are 58.3%, 8.2%,
72.02% and 57.5% respectively. The least r2 of NIBL implies that independent variable EY
explains only 58.3% in dependent variable.
In the above correlation model, the lowest coefficient of multiple determinations belongs to
NFCL and ULL hence the relationship is insignificant and we can say Dividend yield explains to
the Earning yield of the samples. And they should drive their attention towards other factors
beside DY at the time of deciding EY. The relationship between EY and DY of NIBL and EICL
reveals that the relationship is statistically significant and DY is dependent in case of increase of
EY of these samples.
d) Correlation analysis between Market Price Per Share and Lagged Dividend
Table No: 4.11
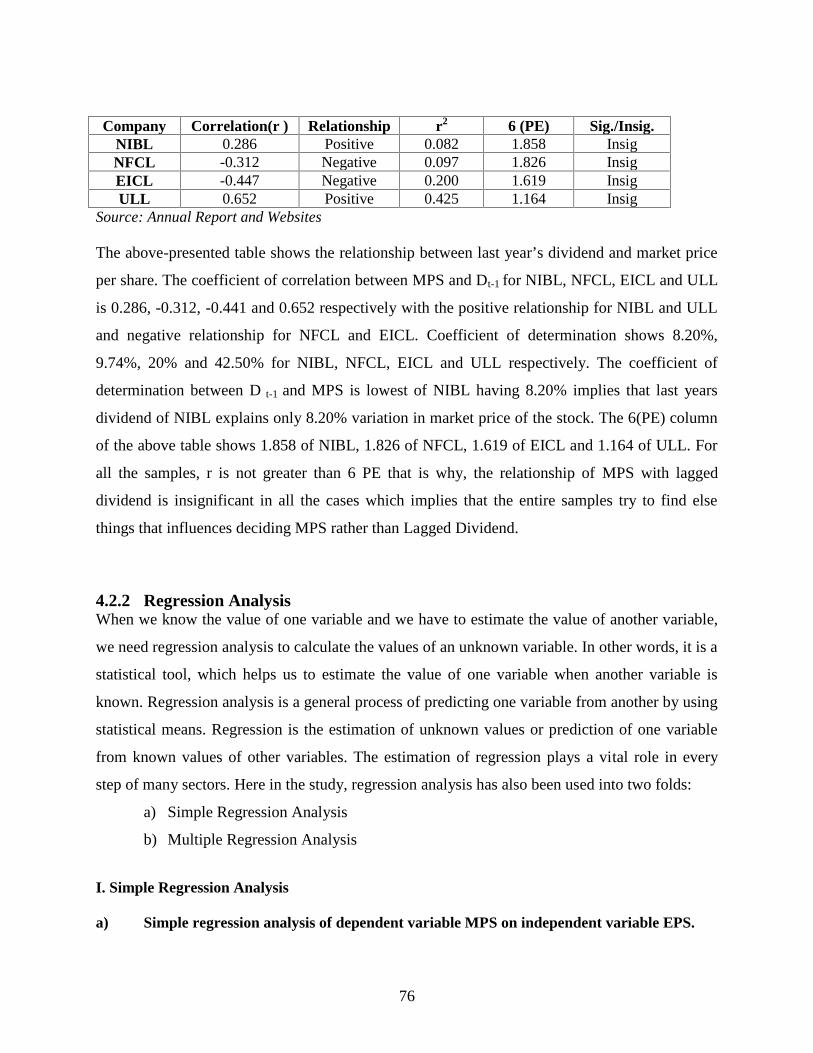
76
Company Correlation(r ) Relationship r2 6 (PE) Sig./Insig.NIBL 0.286 Positive 0.082 1.858 InsigNFCL -0.312 Negative 0.097 1.826 InsigEICL -0.447 Negative 0.200 1.619 InsigULL 0.652 Positive 0.425 1.164 Insig
Source: Annual Report and Websites
The above-presented table shows the relationship between last year’s dividend and market price
per share. The coefficient of correlation between MPS and Dt-1 for NIBL, NFCL, EICL and ULL
is 0.286, -0.312, -0.441 and 0.652 respectively with the positive relationship for NIBL and ULL
and negative relationship for NFCL and EICL. Coefficient of determination shows 8.20%,
9.74%, 20% and 42.50% for NIBL, NFCL, EICL and ULL respectively. The coefficient of
determination between D t-1 and MPS is lowest of NIBL having 8.20% implies that last years
dividend of NIBL explains only 8.20% variation in market price of the stock. The 6(PE) column
of the above table shows 1.858 of NIBL, 1.826 of NFCL, 1.619 of EICL and 1.164 of ULL. For
all the samples, r is not greater than 6 PE that is why, the relationship of MPS with lagged
dividend is insignificant in all the cases which implies that the entire samples try to find else
things that influences deciding MPS rather than Lagged Dividend.
4.2.2 Regression AnalysisWhen we know the value of one variable and we have to estimate the value of another variable,
we need regression analysis to calculate the values of an unknown variable. In other words, it is a
statistical tool, which helps us to estimate the value of one variable when another variable is
known. Regression analysis is a general process of predicting one variable from another by using
statistical means. Regression is the estimation of unknown values or prediction of one variable
from known values of other variables. The estimation of regression plays a vital role in every
step of many sectors. Here in the study, regression analysis has also been used into two folds:
a) Simple Regression Analysis
b) Multiple Regression Analysis
I. Simple Regression Analysis
a) Simple regression analysis of dependent variable MPS on independent variable EPS.
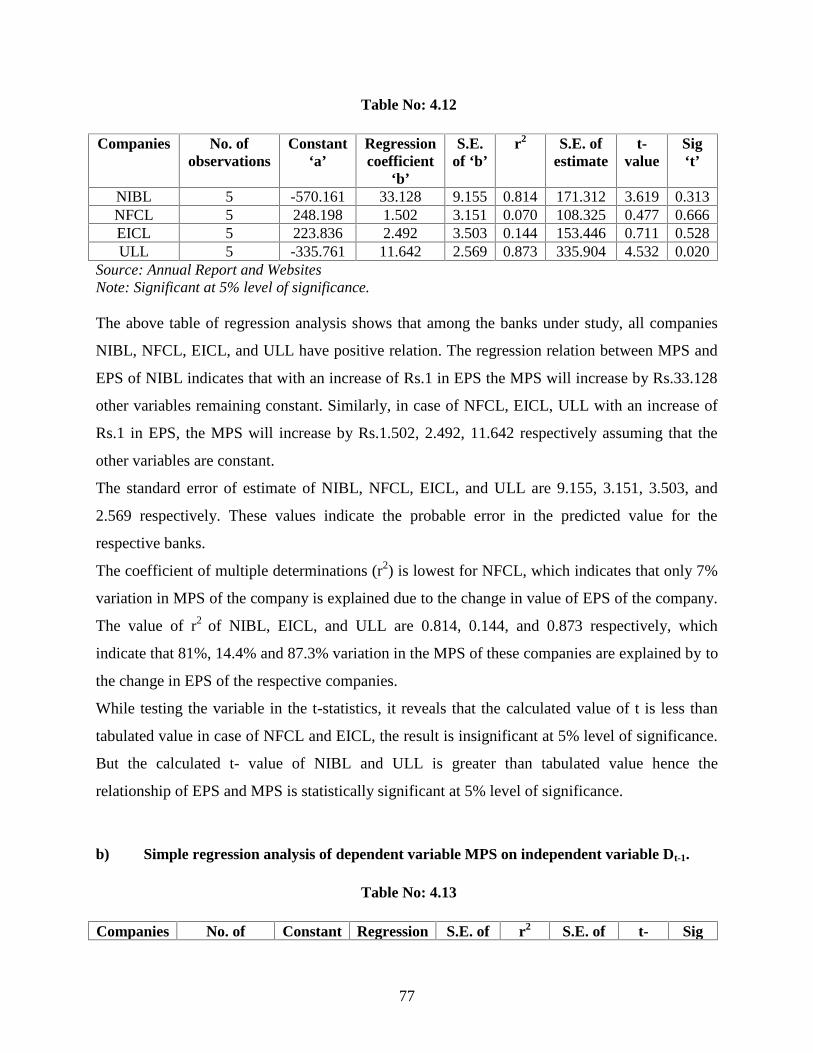
77
Table No: 4.12
Companies No. ofobservations
Constant‘a’
Regressioncoefficient
‘b’
S.E.of ‘b’
r2 S.E. ofestimate
t-value
Sig‘t’
NIBL 5 -570.161 33.128 9.155 0.814 171.312 3.619 0.313NFCL 5 248.198 1.502 3.151 0.070 108.325 0.477 0.666EICL 5 223.836 2.492 3.503 0.144 153.446 0.711 0.528ULL 5 -335.761 11.642 2.569 0.873 335.904 4.532 0.020
Source: Annual Report and WebsitesNote: Significant at 5% level of significance.
The above table of regression analysis shows that among the banks under study, all companies
NIBL, NFCL, EICL, and ULL have positive relation. The regression relation between MPS and
EPS of NIBL indicates that with an increase of Rs.1 in EPS the MPS will increase by Rs.33.128
other variables remaining constant. Similarly, in case of NFCL, EICL, ULL with an increase of
Rs.1 in EPS, the MPS will increase by Rs.1.502, 2.492, 11.642 respectively assuming that the
other variables are constant.
The standard error of estimate of NIBL, NFCL, EICL, and ULL are 9.155, 3.151, 3.503, and
2.569 respectively. These values indicate the probable error in the predicted value for the
respective banks.
The coefficient of multiple determinations (r2) is lowest for NFCL, which indicates that only 7%
variation in MPS of the company is explained due to the change in value of EPS of the company.
The value of r2 of NIBL, EICL, and ULL are 0.814, 0.144, and 0.873 respectively, which
indicate that 81%, 14.4% and 87.3% variation in the MPS of these companies are explained by to
the change in EPS of the respective companies.
While testing the variable in the t-statistics, it reveals that the calculated value of t is less than
tabulated value in case of NFCL and EICL, the result is insignificant at 5% level of significance.
But the calculated t- value of NIBL and ULL is greater than tabulated value hence the
relationship of EPS and MPS is statistically significant at 5% level of significance.
b) Simple regression analysis of dependent variable MPS on independent variable Dt-1.
Table No: 4.13
Companies No. of Constant Regression S.E. of r2 S.E. of t- Sig
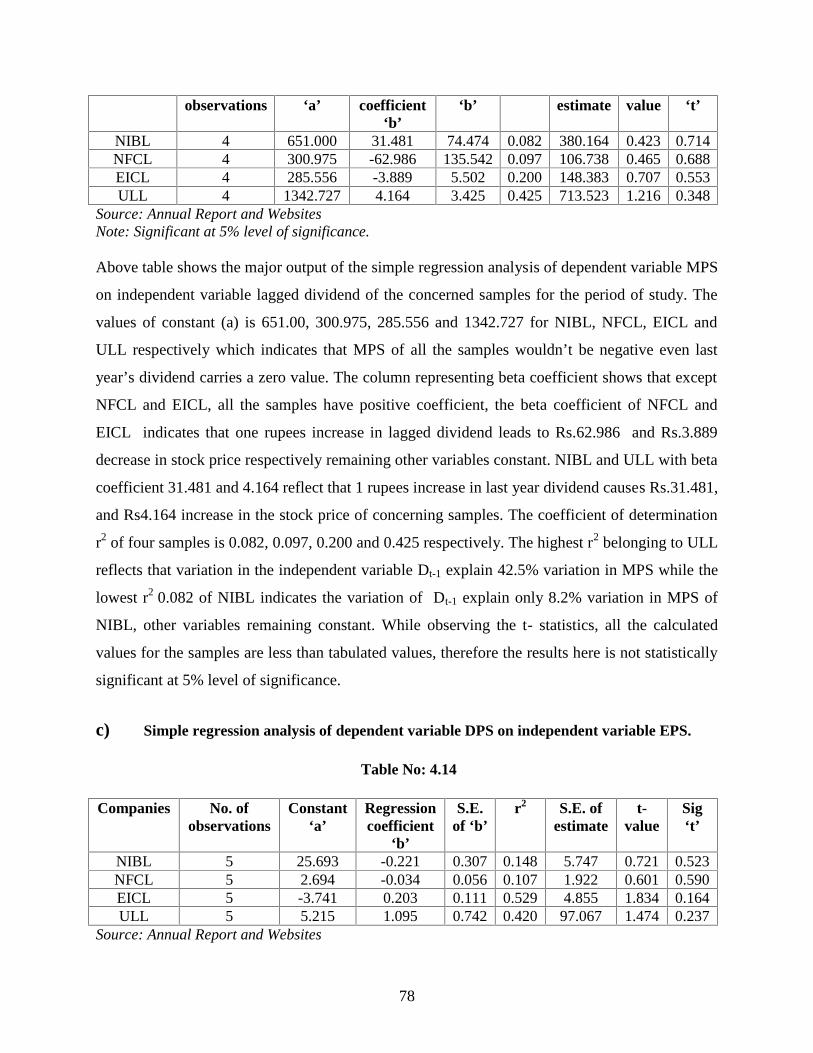
78
observations ‘a’ coefficient‘b’
‘b’ estimate value ‘t’
NIBL 4 651.000 31.481 74.474 0.082 380.164 0.423 0.714NFCL 4 300.975 -62.986 135.542 0.097 106.738 0.465 0.688EICL 4 285.556 -3.889 5.502 0.200 148.383 0.707 0.553ULL 4 1342.727 4.164 3.425 0.425 713.523 1.216 0.348
Source: Annual Report and WebsitesNote: Significant at 5% level of significance.
Above table shows the major output of the simple regression analysis of dependent variable MPS
on independent variable lagged dividend of the concerned samples for the period of study. The
values of constant (a) is 651.00, 300.975, 285.556 and 1342.727 for NIBL, NFCL, EICL and
ULL respectively which indicates that MPS of all the samples wouldn’t be negative even last
year’s dividend carries a zero value. The column representing beta coefficient shows that except
NFCL and EICL, all the samples have positive coefficient, the beta coefficient of NFCL and
EICL indicates that one rupees increase in lagged dividend leads to Rs.62.986 and Rs.3.889
decrease in stock price respectively remaining other variables constant. NIBL and ULL with beta
coefficient 31.481 and 4.164 reflect that 1 rupees increase in last year dividend causes Rs.31.481,
and Rs4.164 increase in the stock price of concerning samples. The coefficient of determination
r2 of four samples is 0.082, 0.097, 0.200 and 0.425 respectively. The highest r2 belonging to ULL
reflects that variation in the independent variable Dt-1 explain 42.5% variation in MPS while the
lowest r2 0.082 of NIBL indicates the variation of Dt-1 explain only 8.2% variation in MPS of
NIBL, other variables remaining constant. While observing the t- statistics, all the calculated
values for the samples are less than tabulated values, therefore the results here is not statistically
significant at 5% level of significance.
c) Simple regression analysis of dependent variable DPS on independent variable EPS.
Table No: 4.14
Companies No. ofobservations
Constant‘a’
Regressioncoefficient
‘b’
S.E.of ‘b’
r2 S.E. ofestimate
t-value
Sig‘t’
NIBL 5 25.693 -0.221 0.307 0.148 5.747 0.721 0.523NFCL 5 2.694 -0.034 0.056 0.107 1.922 0.601 0.590EICL 5 -3.741 0.203 0.111 0.529 4.855 1.834 0.164ULL 5 5.215 1.095 0.742 0.420 97.067 1.474 0.237
Source: Annual Report and Websites
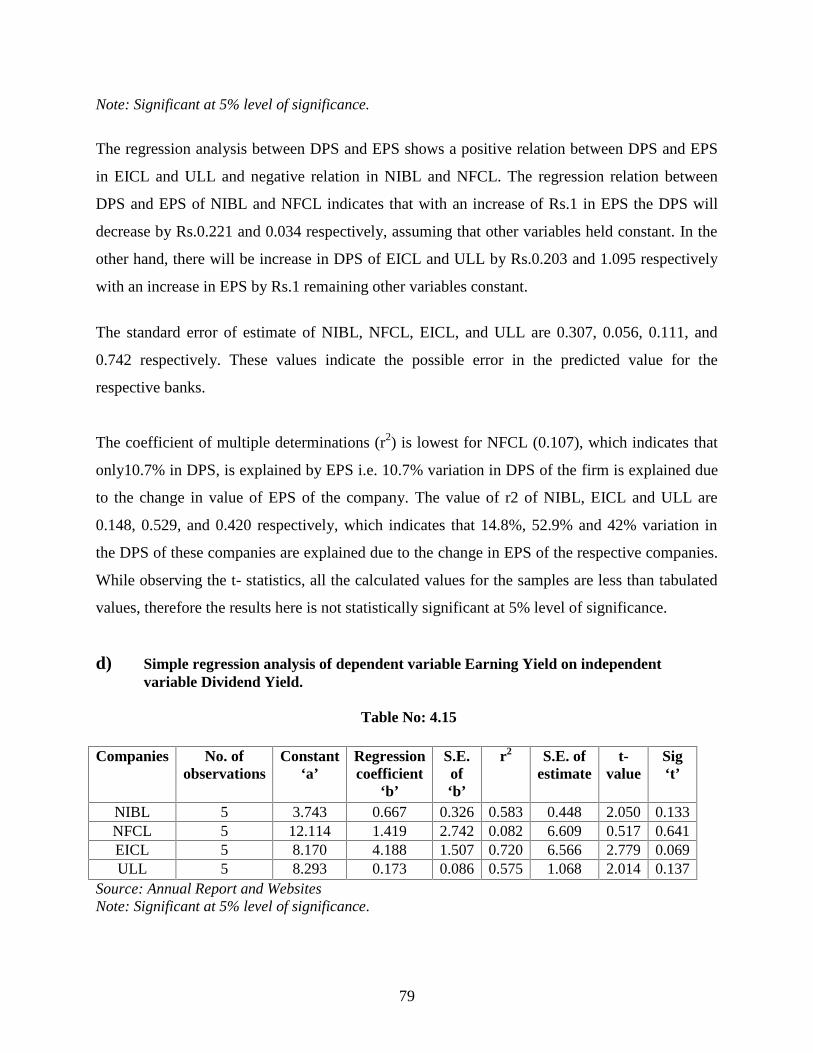
79
Note: Significant at 5% level of significance.
The regression analysis between DPS and EPS shows a positive relation between DPS and EPS
in EICL and ULL and negative relation in NIBL and NFCL. The regression relation between
DPS and EPS of NIBL and NFCL indicates that with an increase of Rs.1 in EPS the DPS will
decrease by Rs.0.221 and 0.034 respectively, assuming that other variables held constant. In the
other hand, there will be increase in DPS of EICL and ULL by Rs.0.203 and 1.095 respectively
with an increase in EPS by Rs.1 remaining other variables constant.
The standard error of estimate of NIBL, NFCL, EICL, and ULL are 0.307, 0.056, 0.111, and
0.742 respectively. These values indicate the possible error in the predicted value for the
respective banks.
The coefficient of multiple determinations (r2) is lowest for NFCL (0.107), which indicates that
only10.7% in DPS, is explained by EPS i.e. 10.7% variation in DPS of the firm is explained due
to the change in value of EPS of the company. The value of r2 of NIBL, EICL and ULL are
0.148, 0.529, and 0.420 respectively, which indicates that 14.8%, 52.9% and 42% variation in
the DPS of these companies are explained due to the change in EPS of the respective companies.
While observing the t- statistics, all the calculated values for the samples are less than tabulated
values, therefore the results here is not statistically significant at 5% level of significance.
d) Simple regression analysis of dependent variable Earning Yield on independentvariable Dividend Yield.
Table No: 4.15
Companies No. ofobservations
Constant‘a’
Regressioncoefficient
‘b’
S.E.of‘b’
r2 S.E. ofestimate
t-value
Sig‘t’
NIBL 5 3.743 0.667 0.326 0.583 0.448 2.050 0.133NFCL 5 12.114 1.419 2.742 0.082 6.609 0.517 0.641EICL 5 8.170 4.188 1.507 0.720 6.566 2.779 0.069ULL 5 8.293 0.173 0.086 0.575 1.068 2.014 0.137
Source: Annual Report and WebsitesNote: Significant at 5% level of significance.
80
Above table depicts simple regression analysis of dependent variable earning yield on
independent variable dividend yield of the concerning samples representing FY 2059/60 to
2063/64. While analyzing the constant ‘a’, the value is positive in all the cases. Regression
coefficients (beta coefficient) of corresponding samples are 0.667, 1.419, 4.188 and 0.173 for
NIBL, NFCL, EICL and ULL respectively. Positive beta coefficient shows that one rupees
increase in dividend yield tends to Rs.0.667, Rs.1.419, Rs.4.188 and Rs.0.173 increase in earning
yield of NIBL, NFCL, EICL and ULL respectively. The coefficient of determination r2 for the
sample companies is 0.583, 0.082, 0.720 and 0.575 for NIBL, NFCL, EICL and ULL
respectively. Among them higher r2 concerning to EICL represents that variation in independent
variable dividend yield explain 0.720 of dependent variable earning yield of EICL. While going
through the t value of the samples, calculated t- value for NIBL, NFCL, EICL and ULL is 2.050,
0.517, 2.779 and 2.014 respectively, which is less than the tabulated value of ‘t’ at 5% level of
significance. The t- statistic reveals that the calculated value of t is less than tabulated value in
case of NFCL and ULL, the result is insignificant at 5% level of significance. But the calculated
t-value of NIBL and EICL is greater than tabulated value hence the relationship between earning
yield and dividend yield is statistically significant at 5% level of significance.
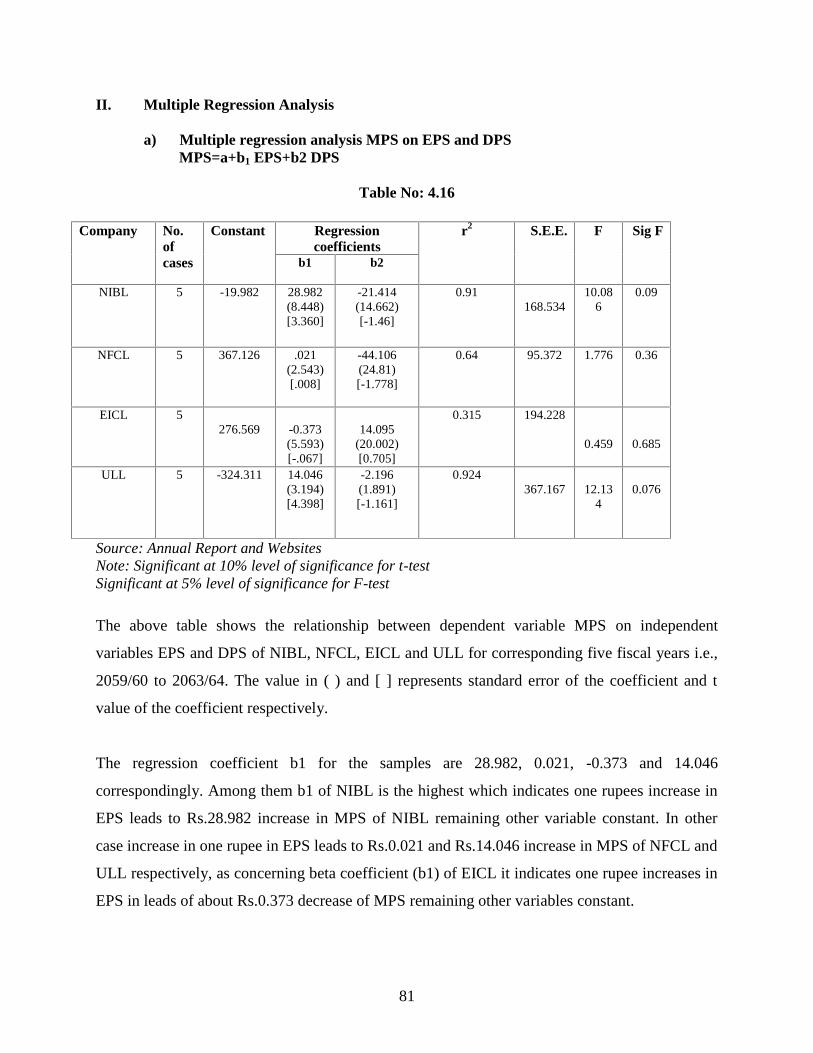
81
II. Multiple Regression Analysis
a) Multiple regression analysis MPS on EPS and DPSMPS=a+b1 EPS+b2 DPS
Table No: 4.16
Company No.ofcases
Constant Regressioncoefficients
r2 S.E.E. F Sig F
b1 b2
NIBL 5 -19.982 28.982(8.448)[3.360]
-21.414(14.662)[-1.46]
0.91168.534
10.086
0.09
NFCL 5 367.126 .021(2.543)[.008]
-44.106(24.81)[-1.778]
0.64 95.372 1.776 0.36
EICL 5276.569 -0.373
(5.593)[-.067]
14.095(20.002)[0.705]
0.315 194.228
0.459 0.685
ULL 5 -324.311 14.046(3.194)[4.398]
-2.196(1.891)[-1.161]
0.924367.167 12.13
40.076
Source: Annual Report and WebsitesNote: Significant at 10% level of significance for t-testSignificant at 5% level of significance for F-test
The above table shows the relationship between dependent variable MPS on independent
variables EPS and DPS of NIBL, NFCL, EICL and ULL for corresponding five fiscal years i.e.,
2059/60 to 2063/64. The value in ( ) and [ ] represents standard error of the coefficient and t
value of the coefficient respectively.
The regression coefficient b1 for the samples are 28.982, 0.021, -0.373 and 14.046
correspondingly. Among them b1 of NIBL is the highest which indicates one rupees increase in
EPS leads to Rs.28.982 increase in MPS of NIBL remaining other variable constant. In other
case increase in one rupee in EPS leads to Rs.0.021 and Rs.14.046 increase in MPS of NFCL and
ULL respectively, as concerning beta coefficient (b1) of EICL it indicates one rupee increases in
EPS in leads of about Rs.0.373 decrease of MPS remaining other variables constant.
82
The beta coefficient b2 representing the relationship between MPS and dividend per share
reflects the value for NIBL, NFCL, EICL and ULL are -21.414, -44.106, 14.095 and -2.196
respectively. Here the lowest b2 concerning to NFCL reflects that Rs. one increase in last years
dividend of EICL leads to in average Rs.44.106 decrease in MPS remaining other variables
constant.
The column representing coefficient of determination (r2) shows the value representing NIBL,
NFCL, EICL and ULL are 0.91, 0.64, 0.315 and 0.924 respectively. The highest r2 representing
ULL reflects that 92.4% variation in MPS explained by variation in EPS and DPS. While
observing t-statistics of the coefficients, t value relating to the variables of EPS and DPS are
greater than the tabulated value of‘t’ at 10% level of significance so the relationship is
statistically significant in all of the cases.
The F-statistics of the samples reveals that the calculated value of ‘F’ at 5% level of significance
is greater than the tabulated value of F statistic for NIBL and ULL, therefore the relationship is
significant while going through EICL and NFCL, the calculated value of F is less than tabulated
value, the relationship is insignificant in these cases.
b) Multiple regression analysis MPS on P/E ratio and DPR
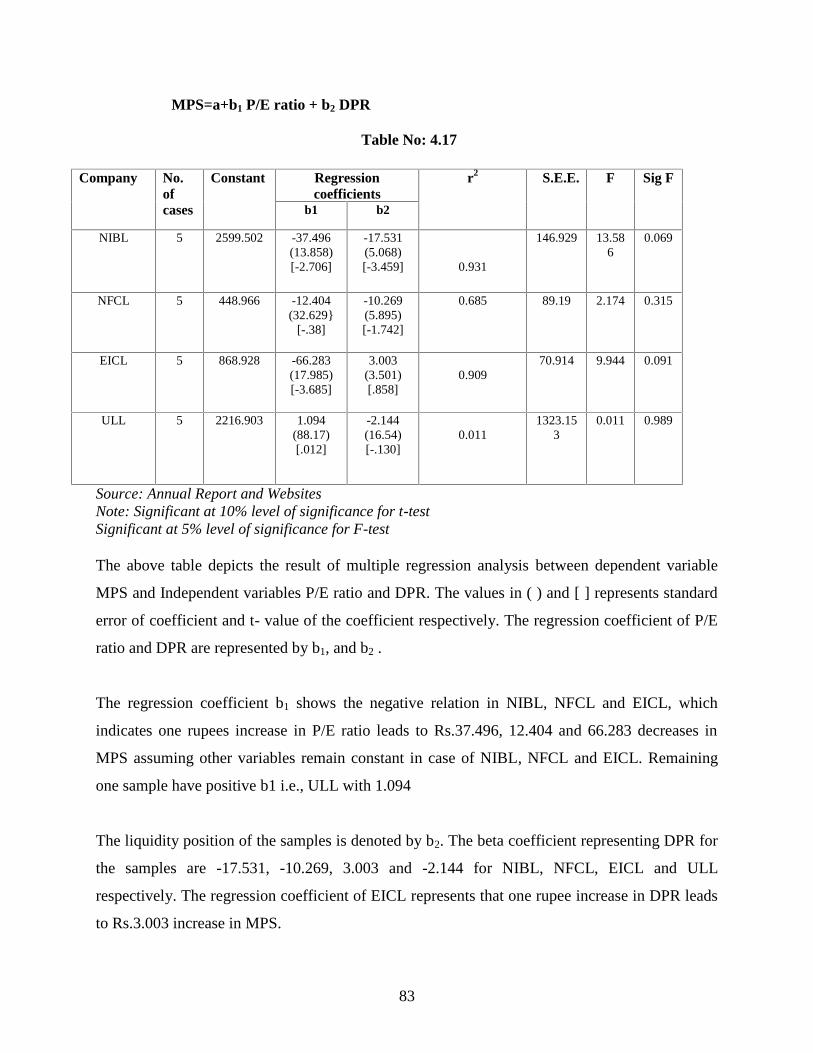
83
MPS=a+b1 P/E ratio + b2 DPR
Table No: 4.17
Company No.ofcases
Constant Regressioncoefficients
r2 S.E.E. F Sig F
b1 b2
NIBL 5 2599.502 -37.496(13.858)[-2.706]
-17.531(5.068)[-3.459] 0.931
146.929 13.586
0.069
NFCL 5 448.966 -12.404(32.629}
[-.38]
-10.269(5.895)[-1.742]
0.685 89.19 2.174 0.315
EICL 5 868.928 -66.283(17.985)[-3.685]
3.003(3.501)[.858]
0.90970.914 9.944 0.091
ULL 5 2216.903 1.094(88.17)[.012]
-2.144(16.54)[-.130]
0.0111323.15
30.011 0.989
Source: Annual Report and WebsitesNote: Significant at 10% level of significance for t-testSignificant at 5% level of significance for F-test
The above table depicts the result of multiple regression analysis between dependent variable
MPS and Independent variables P/E ratio and DPR. The values in ( ) and [ ] represents standard
error of coefficient and t- value of the coefficient respectively. The regression coefficient of P/E
ratio and DPR are represented by b1, and b2 .
The regression coefficient b1 shows the negative relation in NIBL, NFCL and EICL, which
indicates one rupees increase in P/E ratio leads to Rs.37.496, 12.404 and 66.283 decreases in
MPS assuming other variables remain constant in case of NIBL, NFCL and EICL. Remaining
one sample have positive b1 i.e., ULL with 1.094
The liquidity position of the samples is denoted by b2. The beta coefficient representing DPR for
the samples are -17.531, -10.269, 3.003 and -2.144 for NIBL, NFCL, EICL and ULL
respectively. The regression coefficient of EICL represents that one rupee increase in DPR leads
to Rs.3.003 increase in MPS.
84
The coefficients of multiple determinations (r2) of the samples are 0.931, 0.685, 0.909 and 0.011
for NIBL, NFCL, EICL and ULL respectively. Which means for instant, for ULL r2 is 0.011 that
indicates 1.10% variation in MPS is explain by variation in P/E ratio and DPR.
The t-value of regression coefficient b1 is insignificant in all case, all samples has calculated‘t’
less than tabulated value of ‘t. Statistic at 10% level of significance, the relation isn’t significant.
While observing‘t’ value of b2, the result is insignificant for all of the samples, hence the
relationship is insignificant for all the samples.
The column representing to ‘F- test ‘ reveals that the calculated value of ‘F’ at 5% level of
significance is greater than the tabulated value of F statistic for NIBL and EICL, therefore the
relationship is significant while going through NFCL and ULL, the calculated value of F is less
than tabulated value, the relationship is insignificant in these cases.
4.3 Test of HypothesisHypothesis is a procedure to assess the significance of a statistic or different between two
independent statistics is known as test of significance. The truth or falsity of a statistical
hypothesis is based in the information contained in the samples which may be consistent or
inconsistent with the hypothesis and accordingly, the hypothesis may be accepted or rejected.
Normally two complementary hypotheses are set up at a time. If one hypothesis is accepted, then
other is rejected and vice versa. Following hypothesis has been set up for the convenience of the
study.
a) First Hypothesis:Null hypothesis HO: μ1= μ2= μ3= μ4
i.e. there is not significant difference in EPS of NIBL, NFCL, EICL and ULL.
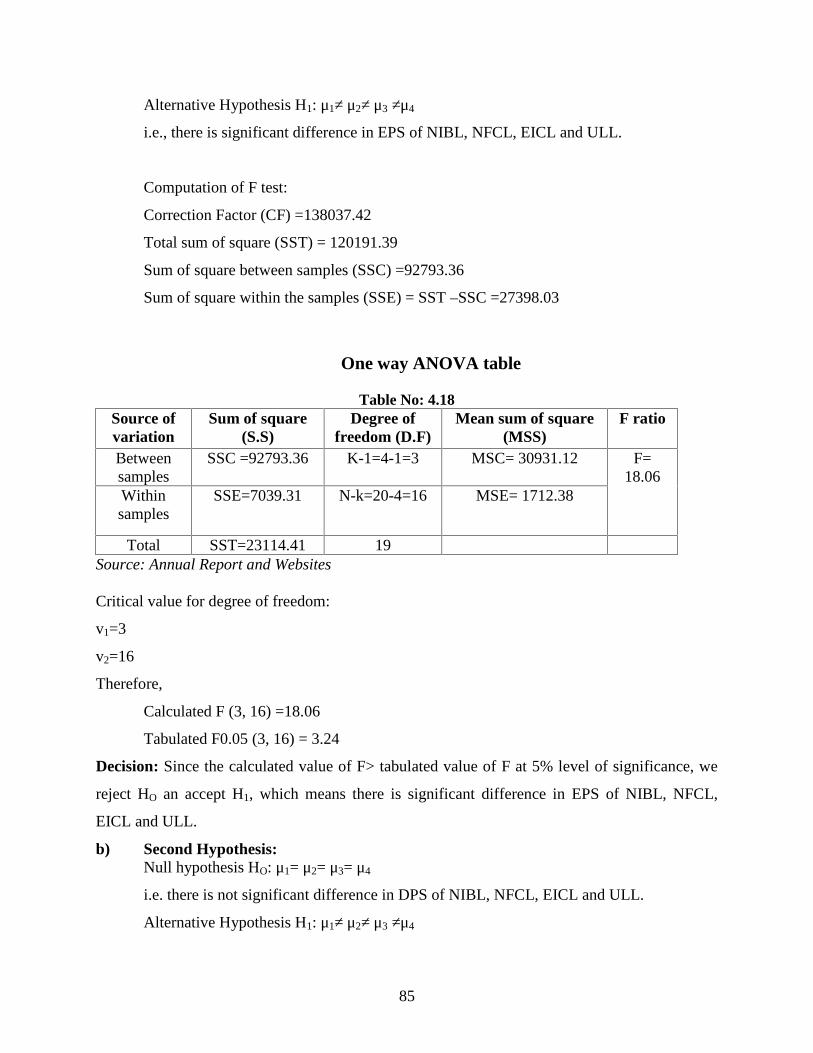
85
Alternative Hypothesis H1: μ1≠ μ2≠ μ3 ≠μ4
i.e., there is significant difference in EPS of NIBL, NFCL, EICL and ULL.
Computation of F test:
Correction Factor (CF) =138037.42
Total sum of square (SST) = 120191.39
Sum of square between samples (SSC) =92793.36
Sum of square within the samples (SSE) = SST –SSC =27398.03
One way ANOVA table
Table No: 4.18Source ofvariation
Sum of square(S.S)
Degree offreedom (D.F)
Mean sum of square(MSS)
F ratio
Betweensamples
SSC =92793.36 K-1=4-1=3 MSC= 30931.12 F=18.06
Withinsamples
SSE=7039.31 N-k=20-4=16 MSE= 1712.38
Total SST=23114.41 19Source: Annual Report and Websites
Critical value for degree of freedom:
v1=3
v2=16
Therefore,
Calculated F (3, 16) =18.06
Tabulated F0.05 (3, 16) = 3.24
Decision: Since the calculated value of F> tabulated value of F at 5% level of significance, we
reject HO an accept H1, which means there is significant difference in EPS of NIBL, NFCL,
EICL and ULL.
b) Second Hypothesis:Null hypothesis HO: μ1= μ2= μ3= μ4
i.e. there is not significant difference in DPS of NIBL, NFCL, EICL and ULL.
Alternative Hypothesis H1: μ1≠ μ2≠ μ3 ≠μ4
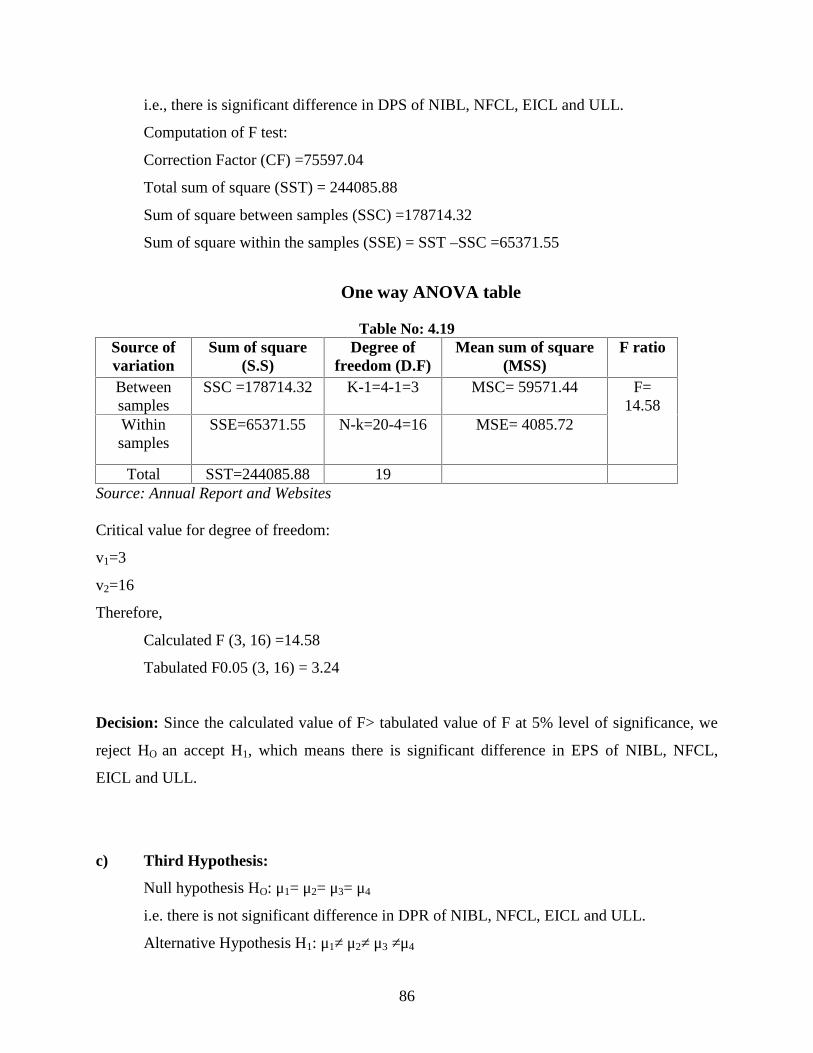
86
i.e., there is significant difference in DPS of NIBL, NFCL, EICL and ULL.
Computation of F test:
Correction Factor (CF) =75597.04
Total sum of square (SST) = 244085.88
Sum of square between samples (SSC) =178714.32
Sum of square within the samples (SSE) = SST –SSC =65371.55
One way ANOVA table
Table No: 4.19Source ofvariation
Sum of square(S.S)
Degree offreedom (D.F)
Mean sum of square(MSS)
F ratio
Betweensamples
SSC =178714.32 K-1=4-1=3 MSC= 59571.44 F=14.58
Withinsamples
SSE=65371.55 N-k=20-4=16 MSE= 4085.72
Total SST=244085.88 19Source: Annual Report and Websites
Critical value for degree of freedom:
v1=3
v2=16
Therefore,
Calculated F (3, 16) =14.58
Tabulated F0.05 (3, 16) = 3.24
Decision: Since the calculated value of F> tabulated value of F at 5% level of significance, we
reject HO an accept H1, which means there is significant difference in EPS of NIBL, NFCL,
EICL and ULL.
c) Third Hypothesis:
Null hypothesis HO: μ1= μ2= μ3= μ4
i.e. there is not significant difference in DPR of NIBL, NFCL, EICL and ULL.
Alternative Hypothesis H1: μ1≠ μ2≠ μ3 ≠μ4
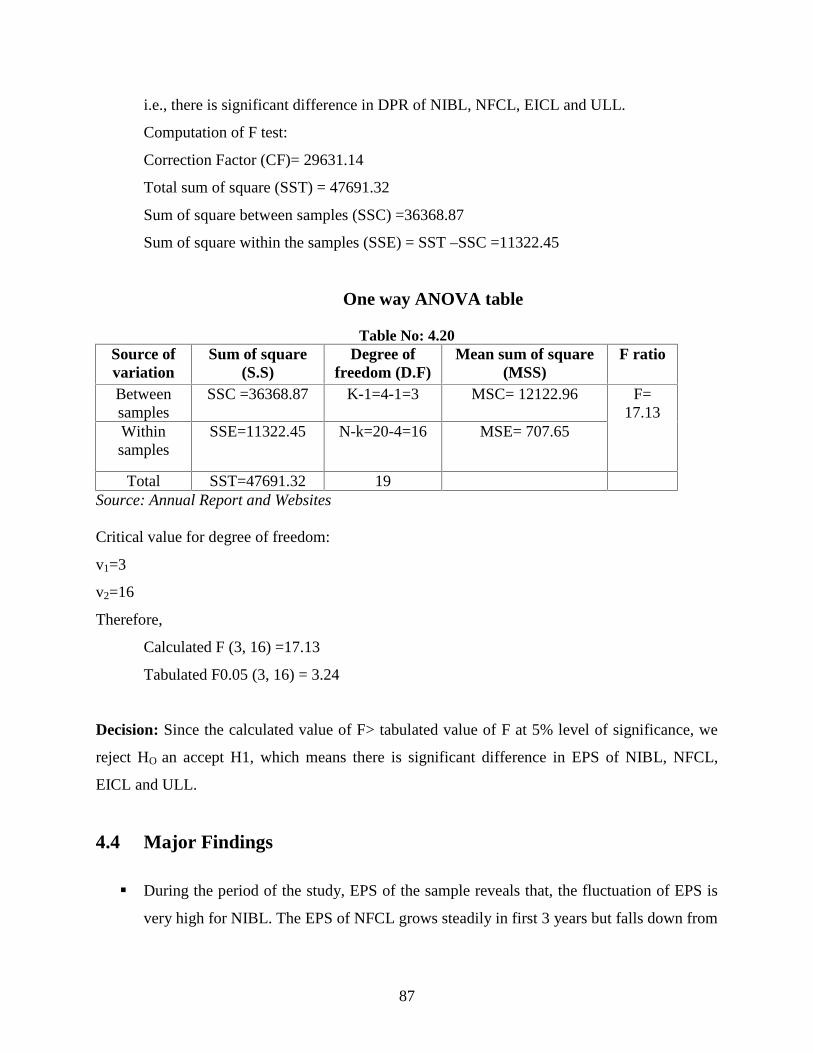
87
i.e., there is significant difference in DPR of NIBL, NFCL, EICL and ULL.
Computation of F test:
Correction Factor (CF)= 29631.14
Total sum of square (SST) = 47691.32
Sum of square between samples (SSC) =36368.87
Sum of square within the samples (SSE) = SST –SSC =11322.45
One way ANOVA table
Table No: 4.20Source ofvariation
Sum of square(S.S)
Degree offreedom (D.F)
Mean sum of square(MSS)
F ratio
Betweensamples
SSC =36368.87 K-1=4-1=3 MSC= 12122.96 F=17.13
Withinsamples
SSE=11322.45 N-k=20-4=16 MSE= 707.65
Total SST=47691.32 19Source: Annual Report and Websites
Critical value for degree of freedom:
v1=3
v2=16
Therefore,
Calculated F (3, 16) =17.13
Tabulated F0.05 (3, 16) = 3.24
Decision: Since the calculated value of F> tabulated value of F at 5% level of significance, we
reject HO an accept H1, which means there is significant difference in EPS of NIBL, NFCL,
EICL and ULL.
4.4 Major Findings
During the period of the study, EPS of the sample reveals that, the fluctuation of EPS is
very high for NIBL. The EPS of NFCL grows steadily in first 3 years but falls down from
88
fourth year. EPS of EICL also falls down during the study period. The highest EPS
during the period of study belongs to ULL and it also grows steadily.
While analyzing DPS, the trend of dividend payment seems constant in case of NIBL and
ULL only. This indicates that the sign is satisfactory for the forthcoming days. Though
there is fluctuation in dividend payment of ULL, it has highest pooling average dividend
payment among the samples. The cash dividend is not being regularly paid by NFCL and
EICL during the period of study.
The analysis of DPR revels that ULL has the highest DPR of 110.35%, which means
ULL has followed the policy of aggressive dividend payment. The analysis also shows
that NIBL has followed moderate dividend policy. On the other hand, NFCL and EICL
have been following conservative dividend payment policy. The pooled average DPR
during the study period was 38.49%. The most consistency in dividend payment is
grabbed by ULL. The pooled average fluctuation regarding DPR for the study period was
27.06%,
The analysis of P/E ratio reflects that highest P/E ratio belongs to NIBL followed by
EICL, ULL and NFCL. Pooled average P/E ratio was 12.83%. The most consistent P/E
ratio is 14.05% of ULL during the study period.
The pooled average of MPS is Rs.935.75. While analyzing the CV, the position doesn’t
seem consistent for all the samples.
The dividend analysis reveals that the pooled average is 3.93%. At the time, the analysis
of CV shows the dividend yield doesn’t seem consistent for all the samples.
The earning analysis reveals that the pooled average is 10.83%. At the time , the analysis
of CV shows the earning yield of NIBL and ULL is only consistent and for remaining
samples, it is inconsistent.
At the time of determining correlation analysis between EPS and MPS, it is revealed that
correlation is positive for all the samples. The significant relationship can be seen in the
case of NIBL and ULL, for remaining samples, the relationship is insignificant.
The correlation between EPS and DPS reveals that the relationship is positive for EICL
and ULL and the relationship is negative for NIBL and NFCL. The relationship between
EPS and DPS is insignificant for all the samples of this study.
89
It can be reflected that the correlation between earning yield and dividend yield is
positive in all case. The relationship is significant in case of NIBL and EICL only. For
rest of the samples, relationship between EY and DY in insignificant.
The correlation between MPS and Lagged dividend is positive for NIBL and ULL, but
negative for NFCL and EICL. While going through the relationship, it is insignificant for
all the samples.
While analyzing the correlations, it is reflected that most of the relationship for the
samples were insignificant which indicates that the samples should consider other factors
also while deciding impact on explained variables to the independent variables. In the
same time, dependent significance relationship indicates that the variables are correlated
to each other and dependent variable is influencing on independent variable.
The simple regression MPS on EPS reflects that, constant ‘b’ is positive in all of the
cases, hence we can conclude that there is positive relationship between EPS and MPS.
With the increase in EPS, MPS also increases and vice versa.
In other regression relating to MPS on lagged dividend, the constant ‘b’ is positive for
NIBL and ULL which indicates that MPS and lagged dividend has positive relationship
for these samples. But, in the case of NFCL and EICL, constant ‘b’ is negative which
shows that with increase in lagged dividend, MPS decreases.
The simple regression analysis DPS on EPS reveals that constant ’b’ is negative in the
case of NIBL and NFCL which shows negative relation between DPS and EPS. In the
case of EICL and ULL, constant ‘b’ is positive which revels positive relation between
DPS and EPS.
The regression equation of MPS on EPS shows that the relationship is significant only in
case of NIBL and ULL, at 5% level of significance while in case of remaining samples,
the relationship is insignificant. For regression equation MPS on lagged dividend, the
relationship is insignificant for all the samples. Also regression equation DPS on EPS, the
relationship is insignificant for all the samples. Similarly, the regression analysis of
earning yield on dividend yield reflects that the relationship is insignificant in the case of
NFCL and ULL, for the rest of the samples the relationship is significant.
The dependency in variable is explained by coefficient of determination (r2), the
dependency of NPS and EPS is highest in case of ULL. Similarly, the dependency of
90
MPS on lagged dividend reflects that the dependency rate is higher again in case of ULL.
For another regression equation, DPS on EPS and earning yield on dividend yield, the
rate of dependency is higher in case of EICL only.
The multiple regression analysis MPS on EPS and DPS reflects value of F at 5% level of
significant. Here, the relationship is statistically significant in case of NIBL and ULL. For
the remaining samples, the F-value is less than tabulated value, hence the relationship is
insignificant.
The multiple regression analysis, MPS on P/E ratio and DPR reflects that value of F at
5% level of significant is significance for NIBL and EICL which means calculated value
of ‘F’ is greater than tabulated value of ‘F’ for NIBL and EICL. That indicates that
regression equation provides statistically significant explanation of variation in MPS due
to P/E ratio and DPR for these samples.
91
CHAPTER – V
SUMMARY, CONCLUSION AND RECOMMENDATIONS
5.1 Summary and ConclusionThe term dividend refers to earnings, which is distributed to common stockholders of the
company in return of their investment. The analysis of dividend represents present status as
well as future prospects of the company. Paying dividend is an effective way to attract
prospective investors to invest in the common stock of the company. With the help of
dividend, the actual financial figure of the company can be reflected.
The financial indicators such as earning, liquidity position, net worth, etc of the company
may be affected by the decision of the dividend. These factors indicate the financial position
of a company. If a firm has a strong financial position, the firm will able to provide parts
regarding dividend policy have already been presented in the chapter of introduction.
The main objective of this study is to find out the financial relationship between dividend and
other financial indicators. The key focus of the study is to find out the appropriated dividend
policy of different companies representing different sectors.
The study has been conducted on the basis of secondary data of the concerning samples. The
companies enlisted in ‘A’ – category by NEPSE have been taken as samples. Each sample
represents different sectors of its own. The samples are NIBL from banking sector, NFCL
from finance sector, EICL from insurance sector and ULL from manufacturing and
processing sector.
Various statistical as well as non-statistical tools have been adopted to make this study
reliable. The consistency regarding the distribution of dividend of different companies has
also been analyzed by using different statistical tools.
92
The major finding that are mentioned in previous chapter led this study conclude that there is
no uniformity in paying dividend by all the samples. The earning of ULL is highest among
all the samples. The fluctuation in the payment of DPS can also be revealed at the time of
conducting research. The DPS of rest of the samples are quite lower in comparison with DPS
of ULL. The DPR analysis shows that ULL is following aggressive dividend, NIBL is
following moderate policy while rest of the samples adopting the policy of conservative
dividend payment. Analysis of coefficient of correlation depicts that the market price of the
share of the company is not affected by the dividend and earning of the samples.
Because of uncertainty in paying dividend, the credibility of the companies are loosing in
Nepalese capital market. But the study shows that most of the samples are paying dividend
on regular basis during last couple of tears. Although the financial sector of the nation is
affected by the adverse situation of the nation, the payment of dividend is satisfactory by
analyzing different financial indicators of the samples. The situation would be convenience
for all the samples if they pay dividend regularly by adopting optimum dividend payment
policy, according to the interest, expectation and welfare of the common stockholder. In
other words, to win the credibility or the confidence of their investors, payment to existing
investors is most important to attract potential investors.
At the time of declaring dividend, the company mustn’t neglect the important factors like
liquidity position and earning position of the firm. While conducting the study, it seems that
above mentioned factors are not considering by the firms at the time of declaring the
dividend. The company must pay its attention towards these important factors while paying
dividend.
This study includes analyzing and examining dividend policy and practices of four samples
representing different four sectors for the period of five years from 2059/60 to 2063/64. If
more samples are taken, the research may accurate and statistically reliable but due to time
consistency and other numerous constraints, only limited number of the samples has been
taken into consideration. So, dividend policy may be subject for further study, which can be
more appropriate.
93
From the analysis of financial variables using statistical tools mean, standard deviation and
coefficient of variation, following conclusions have been drawn.
The average earning per share (EPS) of the samples under study shows a positive
result. But the coefficient of variation indicates that the EPS of the samples are not
stable. The CV ranges between 52.06% and 15.79%. Among the sample under study,
ULL has the highest average EPS and NFCL has the least with high degree of
fluctuation.
The average DPS shows that there is no regularity in payment of dividend. The DPS
is quite fluctuating. The CV of DPS ranges between 127.96% and 38.4%. The ULL
has the highest average DPS and the most regular to pay dividend to its shareholders.
Among the samples under study, EICL has the lowest average DPS and also the
highest fluctuation in DPS. Since the paid up capital per share is Rs. 100, the analysis
of dividend percent also depicts the same result as that of DPS.
The analysis of DPR also shows that the DPR of the samples are not stable. The
fluctuation ranges between 141.01% and 39.80%. Among the samples under study,
ULL has highest average DPR and least fluctuation in the DPR. The result also shows
that, NFCL has the lowest average DPR but highest fluctuation as indicated by
highest CV.
The average Price Earning ration of EICL among the samples under study is the
highest and also highly unstable. The ration of remaining samples is satisfactory and
quite stable.
The average MPS of the samples indicate quite high level of fluctuation .ULL has the
highest average MPS while NFCL has the lowest. Among the samples under study,
the MPS of EICL is highly fluctuating and that of NIBL is the most stable.
The average dividend yields of the samples are very low ranging between 11.79% and
0.79%. Among the samples ULL has the highest dividend yield and NFCL has the
lowest. Besides the dividend yield being low, there is high fluctuation in the dividend
ranging from 157.77 % to 54.60%.
94
The average earning yield of samples under study indicates that the earning yield is
quite low ranging between 15.00% and 4.75% and the stability of the earning yield is
also low i.e. fluctuation of earning yield range form 74.03% to 13.07%.
Upon using the major statistical tools i.e. correlation and regression, following conclusion
have been drawn.
The correlation between Earning Per Share (EPS) and Market Price Per share (MPS)
of all the four samples: NIBL, NFCL, EICL and ULL is positive.
The correlation analysis between EPS and DPS shows that among the four samples
NIBL and NFCL has negative relationship between EPS and DPS while the samples
EICL and ULL have positive relationship between EPS and DPS.
The correlation between Earning Yield and Dividend Yield of all the four samples is
positive.
The correlation analysis between Market Price Per Share and Lagged Dividend shows
that among the four samples NIBL and ULL has positive relationship between MPS
and Lagged while the samples NFCL and EICL has negative relationship between
MPS and Lagged Dividend.
The regression coefficient (b) of the regression analysis between MPS on EPS is
positive for all samples NIBL, NFCL, EICL and ULL.
The regression analysis between MPS and lagged dividend shows that the regression
coefficient (b) is positive for NIBL and ULL while for NFCL and EICL regression
coefficient is negative.
The regression analysis between DPS on EPS shows that the regression coefficient
(b) is positive for EICL and ULL only while in the case of NIBL and NFCL the
regression coefficient (b) is negative.
The regression analysis between earning yield on dividend yield shows that the
regression coefficient (b) for all samples are positive.
The multiple regression analysis of MPS on EPS and DPS shows that the regression
coefficient b1 for the samples NIBL, NFCL and ULL is positive which shows the
95
positive relation between MPS and EPS. But b1 is negative for EICL. The beta
coefficient b2 representing the relationship between MPS and DPS reflects the value
for NIBL, NFCL and ULL are negative. The beta coefficient b2 for EICL is positive.
The multiple regression analysis of MPS on P\E ratio and DPR shows that the
regression coefficient b1 for all the samples except ULL is negative. The beta
coefficient b2 is also negative for all the samples except EICL which shows the
negative relation between MPS and DPR for the samples except EICL.
After analyzing the financial variables using mean, standard deviation and coefficient of
variation, making analysis of relation between the variables using correlation an regression, the
following conclusions have been drawn.
All the samples under study have not uniform behavior in dividend distribution. Some
pay dividend to their stockholders regularly but some does not, so, there is no
uniformity in dividend payment. Different sample give importance to dividend in
different way and manner.
The market price per share is affected by the dividend related financial variables i.e.
DPS, DPR and Dividend yield either positively or negatively. The nature of effect is
different for different samples. In case of some samples, there exists positive relation
between dividend and market price per share while for other there exists negative
relation. Besides this the market price per share largely depends upon the dividend,
which has been shown by the coefficient of multiple determinations.
Besides dividend, other factors also affect the market price per share e.g.: earning per
share, price earning ratio etc. Their effect is also different for different samples.
The dividend per share is affected by earning per share, retention ratio and net profit
differently in different samples. The extent of effect is also different for each sample.
An analysis of the average DPR of the samples shows that out of the total income
generated, about 38.49% is distributed as dividend in general. If the individual DPR
of the samples are compared to this figure, ULL has the average DPR (110.35%)
above that the average DPR of all samples. The individual average DPR of NIBL
(30.57%) is also near about this figure. On the other hand the average DPR of NFCL
(7.34%) and EICL (7.84%) are quite low as compare to the average of all samples.
96
The coefficients of variation of the average DPR of the samples indicate that the
fluctuation in the payment of dividend is 27.06% which is above moderate level.
Thus it can be concluded that dividend policy of the banks are not uniform. There is
no strategy of calculating growth in the dividends paid by the company, which depicts
that the dividend policy of the companies is not stable and consistent. There is
fluctuation in the dividend payment even if the company is making profit regularly.
The dividend payout ratio also does not show any stability and coordination with
other variables. There is large fluctuation in dividend in each year. There is not
certain criterion for paying dividend. From this we can conclude that there is no long-
term vision regarding the dividend policy.
5.2 RecommendationsAt the end of the research, the research would be incomplete without some suggestions that
came from the basis of the problems. The following would be some recommendations found
from the research work:
The dividend policy isn’t clearly defined by the samples; the fluctuation in dividend
payment is high. The ratio of DPR seems unbalance, which may cause serious
problem among stockholders and other sectors of the samples. For this reason it is
strongly recommended that company should maintain constant dividend payout ratio.
Irregularity in payment of dividend may change the interest of the investors. So, the
samples are suggested to pay regular and attractive dividend to its stockholders.
As we know, DPS is more dependent on earning, it can be observed through the study
that samples are not paying dividend in comparison with their earning. The investors
are more concerned with dividend payment ability as well as the earning of the
company. That is why; EPS should be taken as a considerable factor at the time of
declaring dividend.
From the above analysis it can be revealed that the liquidity position as well as
retained earning has been ignored by the samples at the time of decision making
about dividend. These factors shouldn’t be ignored while declaring the dividend by
the samples.
97
The companies should be able to grasp the better opportunity by creating innovative
ideas, activities and technologies. The greater volume of new activities certainly
increases the earning opportunities of the investors.
While conducting the study, it is observed that, investment in the stock of these
companies are in increasing trend, which means, without considering company’s
financial performance, the investment is made which is irrational. So it can be
suggested that the investor should understand the condition and financial performance
of the company before making investment decision,
The necessary rules and regulation should be introduced by the state and concerning
samples for the convenience in the transaction of the stock at the stock market.
The ordinary shareholders are original owners of the company, so the company
should pay high attention over the investment of their worthwhile shareholders. The
executive committee of the company should always pay its attention about the desire
of the shareholders regarding the forms of dividend (return) on their investment.
The decision relating to the dividend should be in favor of prosperity and in favor of
the company and the investors.
The government or private sectors relating to the blossoming of the stock market for
the betterment and uniformity in paying dividend should conduct the interactions,
meetings, seminars etc. For this reason expertise and consultant relating to financial
performance should be recruited or hired.
The capital market of Nepal is in the growing stage. The capital market should be
perfect and efficient to attract new investors. The price of the stock should be
declared within norms and the values of financial policy and practices of the nation.
There is lack of proper legal provisions regarding the dividend payment. The
government should pay attention in this matter for prescribing certain provision and
rules regarding the percentage of earning as payment of dividend.
The above suggestions further are described as:
Rules and legislation should be implemented as well as evaluated by the
government regarding perfect dividend policy.
98
Company should formulate an effective dividend policy
The investors should know the basic knowledge of finance.
Strengthen and empowered the capacity and boundaries of Nepal Stock
Exchange Limited.
Formulation of shareholders welfare association by the effort of government.
All the information regarding to investment policy, financial performance, etc
should be disclose to the general public.
99
BIBLIOGRAPHY
BooksBaker, H.K. and Philips, Aaron L. (1992), “Management View on Stock Dividends”,Working Paper Series, Jacksonville, Florida.
Brandt, Luis K. (1972), “Analysis for Financial Management” Eaglewoods Cliffs, N.J.,Prentice Hall Inc.
Brealey, Richard A. and Myres, Stewart C.(1998), “Principles of Corporate Finance”New Delhi, Tata Mc Graw-Hill Publishing Co. Ltd.
Endi Consultants Research Group Kathmandu, Nepal, “Nepalese Company Act 1997”,Nepal For Profitable Investment, (Kathmandu, Shree Star Printing Press Baghbazar),
Friend, Irwin and Puckett, Marshall (1964), “Dividend and Stock Prices”, AmericanEconomic Review, Vol. IV, September
Gorden, Myron J. (1962), “The Investment Financing and Valuation of Corporation”,Home Wood III, Richard D, Irwin
Gupta, S.C.(1997), “Statistics”, New Delhi, Himalayan Publishing House,
Gupta, S.P.(1991), “Statistical Methods”, New Delhi, Sultan Chand and Sons Publication
Hasting, P.G.(1996), “The Management of Business Finance,” New York Von NostrandCo.
Hornby, A.S.(2000),”Oxford Advance Learner’s Dictionary”, 6th edition, OxfordUniversity, Great Clarendon Street, Oxford OXZ GDP.
Hunt, Peterson, Wiliam, Charles M. and Govlen, Donald son (1972), “Basic BusinessFinance” Homewood Illinois D. Irwin Inc
Jensen, Gerald R. & Johnson, James M.(1995), “The Dynamics of Corporate DividendReductions”, Financial Management, Vol.24, No.4,
Khan, M.Y. & Jain, P.K.(1999), “Dividend Policy Decision”, Financial Management Textand Problems, Third Edition, (New Delhi, Tata MC Graw-Hill Publishing Company Limited,
Khan, M.Y and Jain P.K.(1992), “Financial Management Text and Problems”, NewDelhi, Tata Mc-Graw Hill Publishing Limited
100
Kothari, C.R.(1992), “Quantitative Techniques”, Vikas Publishing House Pvt. Ltd. NewDelhi
Kuchhal S.C.(1974), “Financial Management”, New Delhi, Chaitanya Publishing HousePvt. Ltd.
Lawrance J. Gitman, (1994) “Principles of Managerial Finance”, 7th Edition, New York,Haper Collins’ College
Levin, Richard I. and Rubin, David S.(1999), “Statistics for Management” New Delhi,Prentice Hall of India Pvt. Ltd
Linter, John (1956), “Distribution of Incomes of Corporations among Dividend, RetainedEarning and Taxes”, American Economic Review, vol. 46
Miller, Merton H. and Modigliani, France (1961), “Dividend Policy, Growth andValuation of the Shares” Journal of Business, XXIV
Miller, M.H. and Modigliani, F. (June 19966) “Some Estimates of the Cost of Capital tothe Electric Utility Industry 1954-57”. American Economic Review.
Pandey, I.M.(1999), “Financial Management” 8th edition. New Delhi, Vikash PublishingHouse P. Ltd.
Pradhan, Radhe S.(1994), “Financial Management Practice in Nepal”, New Delhi,Vikash Publishing House Pbt. Ltd.
Pradhan, Surendra (1992), “Basic Of Financial Management”, Kathmandu, EducationalEnterprises Pvt. Ltd
Rao, Ramesh K., (1992), “The Dividend Policy Decision, Financial Management Conceptand Application”, 2nd Edition, New York Macmillan Publishing Co.
Sharma, Puskar Kumar and Chaudhary, A.K.(2001), “Statistical Methods”, Kathmandu,Khanal Books Prakashan,
Shrestha, Dr. R.B. (1992) “Statistics and Probablity”, Ekta Books Distribution Pvt. 1992Shrestha, Prakash et al. (2008), “Fundamental Principles of Financial Management”Telaju Prakashan.
Soloman, Ezra.(1963), “The Theory of Financial Management”, New York, ColumbiaUniversity Press
101
Throp, Smith Dan (1977, “Relief from Double Taxation of Dividend Income”, HarvardBusiness Review
Walter, James E. (1963) “Dividend Policy: It’s Influence on the Value of the Enterprise”,Journal of Finance
Walter, James E. (1966), “Dividend Policy and Common Stock Prices”, Journal of Finance
Weston, J. Fred. and Brigham Eugene F. (1989), “Managerial Finance”, 9th edition,Chicago. The Dryden Press
Weston, J. Fred & Copeland, Thomas, E. (1990), “Dividend Policy”, Managerial FinanceNinth Edition (USA, The Dryen Press
ThesisAdhikari, Navaraj, “Corporate Dividend Practices in Nepal” a master’s degreedissertation submitted to Tribhuvan University, Central Department of Management 1999
Bhattarai, Bishnu Hari, “Dividend decision and its impact on the stock Valuation”,thesis, T.U., Kirtipur, Kathmandu, 1996
Bhattarai, Anjani Raj, “Share Markets in Nepal”, an unpublished master’s degree thesis,T.U., Kirtipur, Kathmandu, 1990
Gautam, Rishi Raj, “Dividend Policy in Commercial Banks a Comparative Study ofNGBL, NIBL, NABIL”, unpublished Master’s Degree Thesis, SDC, October 1995
Khatiwada, Narayan Prasad, “Impact of Dividend and Earning Announcement onShareholder’s Return and Stock Prices in Nepal”, unpublished Master’s Degree Thesis,Shanker Dev Campus, May 2001
Katawal, Yagaya Bahadur, “A Comparative Study of Dividend Policy in CommercialBanks”, an unpublished Master’s Degree Thesis, Shanker Dev College, July 2001
Internet web sites:Search engines
www.astavista.comwww.google.comwww.msn.comwww.yahoo.com
Related website:www.coolavenues.comwww.eicl.com

102
www.gsb.unichicago.eduwww.heritage.comwww.hepalstock.comwww.nibl.comwww.oaktree.comwww.pldis.orgwww.seeq.com/popuwrapper.jspwww.westqa.edu
103
Questionnaires
Dear Sir/ Madam,
I have been conducting a research on “An Overview Of Corporate Dividend Policy AndPractice In Nepal” as a requirement for the partial fulfillment of the degree of MBS. To fulfillthe objective of the study, the need for first hand solicitation of opinions from the relevantindividuals concerned has led me to develop the questionnaires for distribution to all thoseincluded in the survey. Therefore, I hope that you will help me in this research effort bycompleting these questionnaires and forwarding to me in time.
Please so not hesitate to add detailed comments and suggestions, which you feel, may berelevant to the objective of this study. Your ideas and opinions will be of great value in mystudy.
Thank you for your cooperation on this research effort.
Yours faithfully,Sarita Sahu
Nepal Commerce Campus
Respondents:Name of Respondent:Address:Please tick in the group you belong to:Listed CompanyBroker/ Issue ManagerIndividual Investors
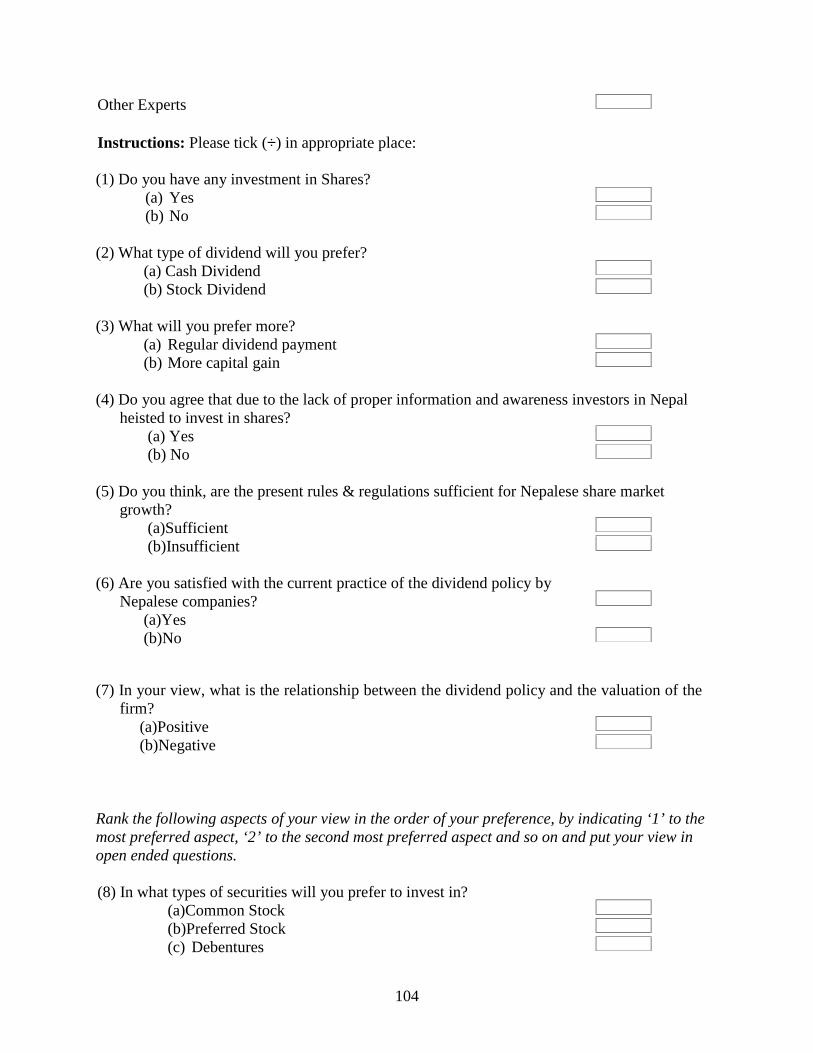
104
Other Experts
Instructions: Please tick () in appropriate place:
(1) Do you have any investment in Shares?(a) Yes(b) No
(2) What type of dividend will you prefer?(a) Cash Dividend(b) Stock Dividend
(3) What will you prefer more?(a) Regular dividend payment(b) More capital gain
(4) Do you agree that due to the lack of proper information and awareness investors in Nepalheisted to invest in shares?
(a) Yes(b) No
(5) Do you think, are the present rules & regulations sufficient for Nepalese share marketgrowth?
(a)Sufficient(b)Insufficient
(6) Are you satisfied with the current practice of the dividend policy byNepalese companies?
(a)Yes(b)No
(7) In your view, what is the relationship between the dividend policy and the valuation of thefirm?
(a)Positive(b)Negative
Rank the following aspects of your view in the order of your preference, by indicating ‘1’ to themost preferred aspect, ‘2’ to the second most preferred aspect and so on and put your view inopen ended questions.
(8) In what types of securities will you prefer to invest in?(a)Common Stock(b)Preferred Stock(c) Debentures
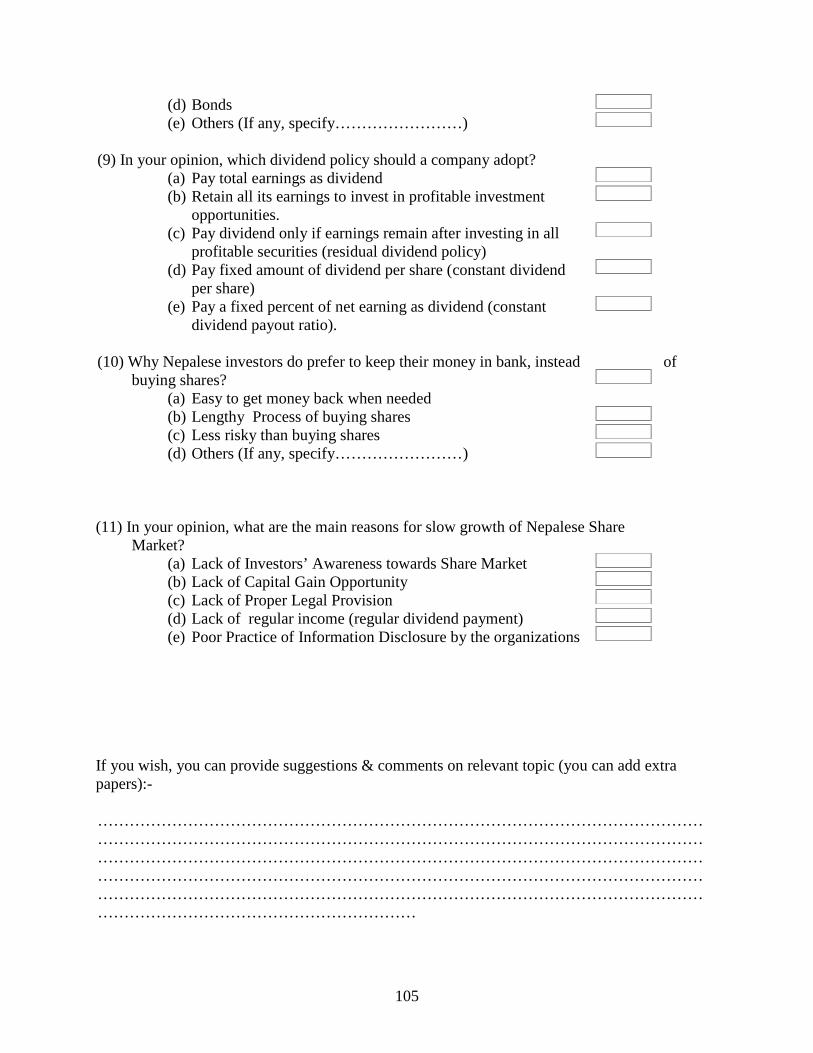
105
(d) Bonds(e) Others (If any, specify……………………)
(9) In your opinion, which dividend policy should a company adopt?(a) Pay total earnings as dividend(b) Retain all its earnings to invest in profitable investment
opportunities.(c) Pay dividend only if earnings remain after investing in all
profitable securities (residual dividend policy)(d) Pay fixed amount of dividend per share (constant dividend
per share)(e) Pay a fixed percent of net earning as dividend (constant
dividend payout ratio).
(10) Why Nepalese investors do prefer to keep their money in bank, instead ofbuying shares?
(a) Easy to get money back when needed(b) Lengthy Process of buying shares(c) Less risky than buying shares(d) Others (If any, specify……………………)
(11) In your opinion, what are the main reasons for slow growth of Nepalese ShareMarket?
(a) Lack of Investors’ Awareness towards Share Market(b) Lack of Capital Gain Opportunity(c) Lack of Proper Legal Provision(d) Lack of regular income (regular dividend payment)(e) Poor Practice of Information Disclosure by the organizations
If you wish, you can provide suggestions & comments on relevant topic (you can add extrapapers):-
………………………………………………………………………………………………………………………………………………………………………………………………………………………………………………………………………………………………………………………………………………………………………………………………………………………………………………………………………………………………………………………………………………………………………………