chapter 9 projection of occupancy and average daily rate
TRANSCRIPT
Downtown Madison Convention Hotel Study Chapter 9 Page 1
CHAPTER 9
PROJECTION OF OCCUPANCY AND AVERAGE DAILY RATE
In this chapter, a penetration model is used to understand how the new hotel will penetrate the competitive set and what occupancy and rate will result.
Competitive Set Supply and Demand Growth
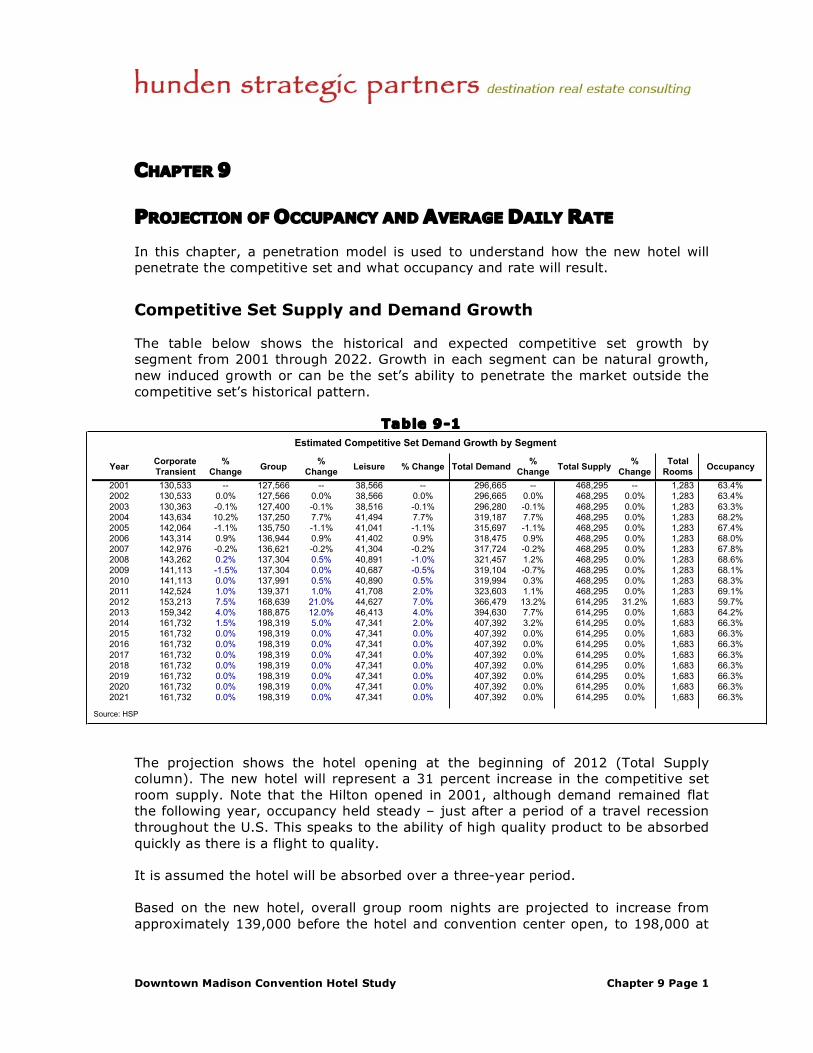
The table below shows the historical and expected competitive set growth by segment from 2001 through 2022. Growth in each segment can be natural growth, new induced growth or can be the set’s ability to penetrate the market outside the competitive set’s historical pattern.
Table 9-1 Estimated Competitive Set Demand Growth by Segment
YearCorporate
Transient
%
Change Group
%
Change Leisure % Change Total Demand
%
Change Total Supply
%
Change
Total
RoomsOccupancy
2001 130,533 -- 127,566 -- 38,566 -- 296,665 -- 468,295 -- 1,283 63.4%
2002 130,533 0.0% 127,566 0.0% 38,566 0.0% 296,665 0.0% 468,295 0.0% 1,283 63.4%
2003 130,363 -0.1% 127,400 -0.1% 38,516 -0.1% 296,280 -0.1% 468,295 0.0% 1,283 63.3%
2004 143,634 10.2% 137,250 7.7% 41,494 7.7% 319,187 7.7% 468,295 0.0% 1,283 68.2%
2005 142,064 -1.1% 135,750 -1.1% 41,041 -1.1% 315,697 -1.1% 468,295 0.0% 1,283 67.4%
2006 143,314 0.9% 136,944 0.9% 41,402 0.9% 318,475 0.9% 468,295 0.0% 1,283 68.0%
2007 142,976 -0.2% 136,621 -0.2% 41,304 -0.2% 317,724 -0.2% 468,295 0.0% 1,283 67.8%
2008 143,262 0.2% 137,304 0.5% 40,891 -1.0% 321,457 1.2% 468,295 0.0% 1,283 68.6%
2009 141,113 -1.5% 137,304 0.0% 40,687 -0.5% 319,104 -0.7% 468,295 0.0% 1,283 68.1%
2010 141,113 0.0% 137,991 0.5% 40,890 0.5% 319,994 0.3% 468,295 0.0% 1,283 68.3%
2011 142,524 1.0% 139,371 1.0% 41,708 2.0% 323,603 1.1% 468,295 0.0% 1,283 69.1%
2012 153,213 7.5% 168,639 21.0% 44,627 7.0% 366,479 13.2% 614,295 31.2% 1,683 59.7%
2013 159,342 4.0% 188,875 12.0% 46,413 4.0% 394,630 7.7% 614,295 0.0% 1,683 64.2%
2014 161,732 1.5% 198,319 5.0% 47,341 2.0% 407,392 3.2% 614,295 0.0% 1,683 66.3%
2015 161,732 0.0% 198,319 0.0% 47,341 0.0% 407,392 0.0% 614,295 0.0% 1,683 66.3%
2016 161,732 0.0% 198,319 0.0% 47,341 0.0% 407,392 0.0% 614,295 0.0% 1,683 66.3%
2017 161,732 0.0% 198,319 0.0% 47,341 0.0% 407,392 0.0% 614,295 0.0% 1,683 66.3%
2018 161,732 0.0% 198,319 0.0% 47,341 0.0% 407,392 0.0% 614,295 0.0% 1,683 66.3%
2019 161,732 0.0% 198,319 0.0% 47,341 0.0% 407,392 0.0% 614,295 0.0% 1,683 66.3%
2020 161,732 0.0% 198,319 0.0% 47,341 0.0% 407,392 0.0% 614,295 0.0% 1,683 66.3%
2021 161,732 0.0% 198,319 0.0% 47,341 0.0% 407,392 0.0% 614,295 0.0% 1,683 66.3%
Source: HSP
The projection shows the hotel opening at the beginning of 2012 (Total Supply column). The new hotel will represent a 31 percent increase in the competitive set room supply. Note that the Hilton opened in 2001, although demand remained flat the following year, occupancy held steady – just after a period of a travel recession throughout the U.S. This speaks to the ability of high quality product to be absorbed quickly as there is a flight to quality.
It is assumed the hotel will be absorbed over a three-year period.
Based on the new hotel, overall group room nights are projected to increase from approximately 139,000 before the hotel and convention center open, to 198,000 at
Downtown Madison Convention Hotel Study Chapter 9 Page 2
stabilization of the property. Much of this is due to the proposed hotel offering a larger room block for the city and the fact that it will have its own meeting space. Overall occupancy is projected to decrease to 60 percent for the competitive set in 2012 and increase to 66 percent by 2015 as it is expected the new rooms will be nearly absorbed within the period. Absorption for the hotel will occur over four years.
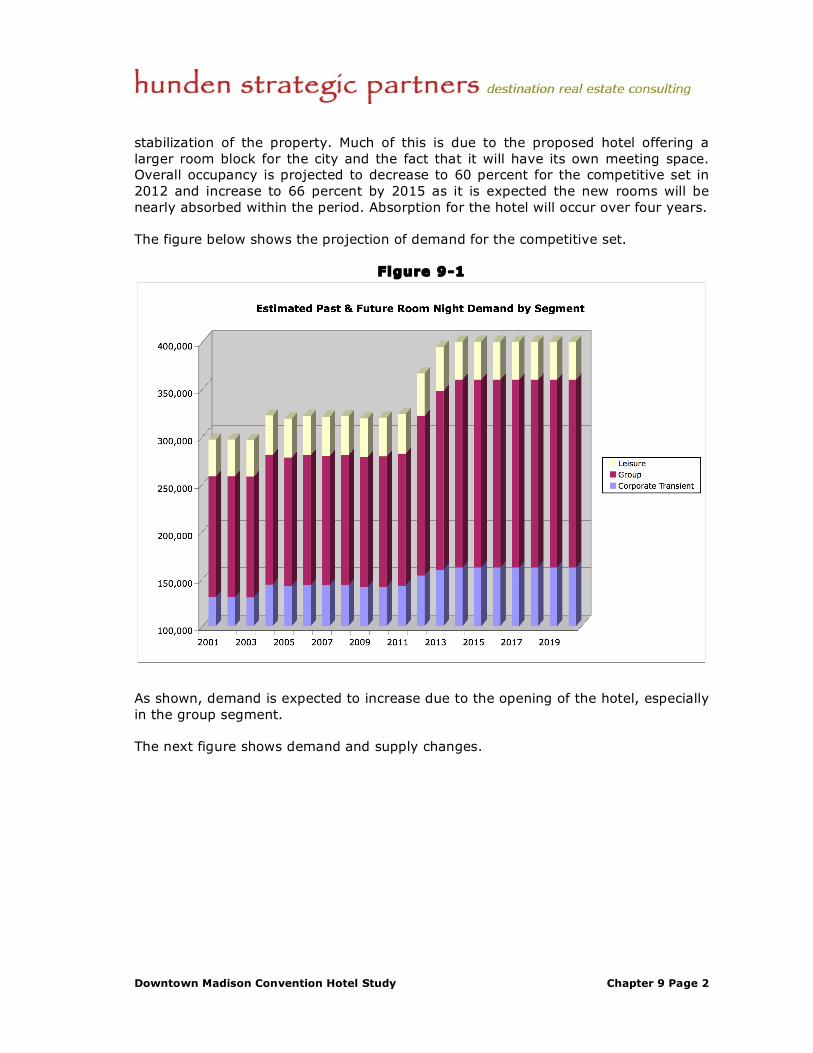
The figure below shows the projection of demand for the competitive set.
Figure 9-1
As shown, demand is expected to increase due to the opening of the hotel, especially in the group segment.
The next figure shows demand and supply changes.
Downtown Madison Convention Hotel Study Chapter 9 Page 3
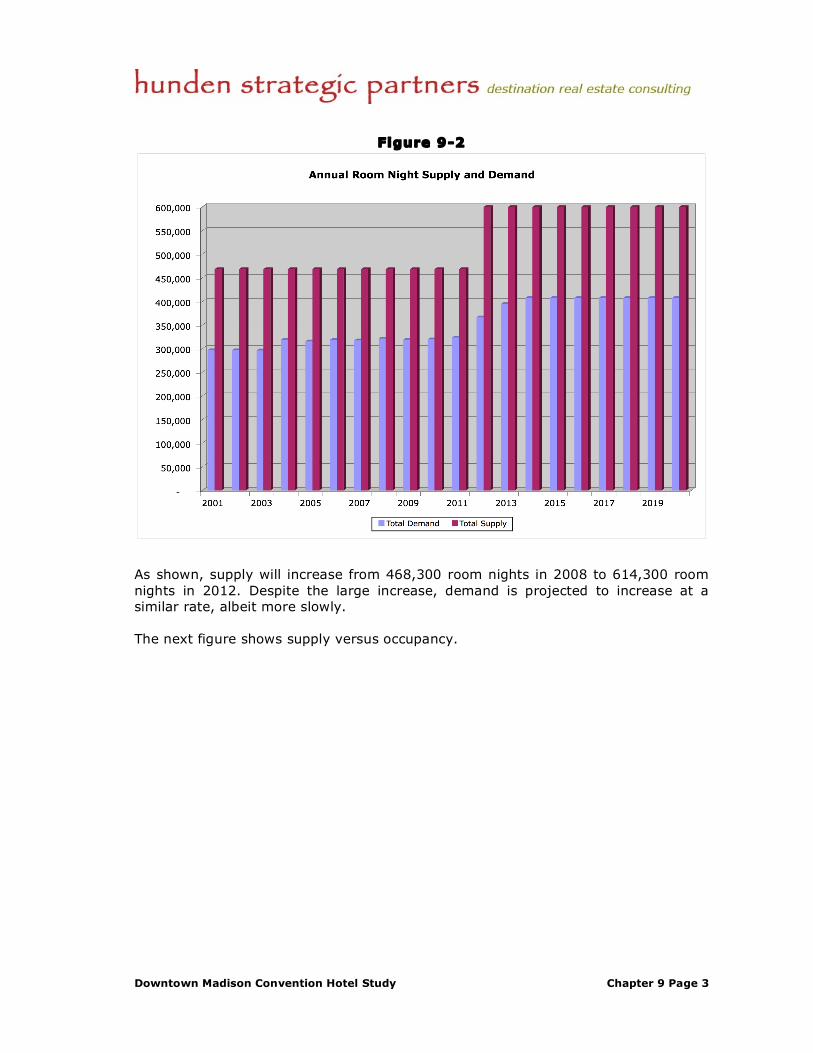
Figure 9-2
As shown, supply will increase from 468,300 room nights in 2008 to 614,300 room nights in 2012. Despite the large increase, demand is projected to increase at a similar rate, albeit more slowly.
The next figure shows supply versus occupancy.
Downtown Madison Convention Hotel Study Chapter 9 Page 4
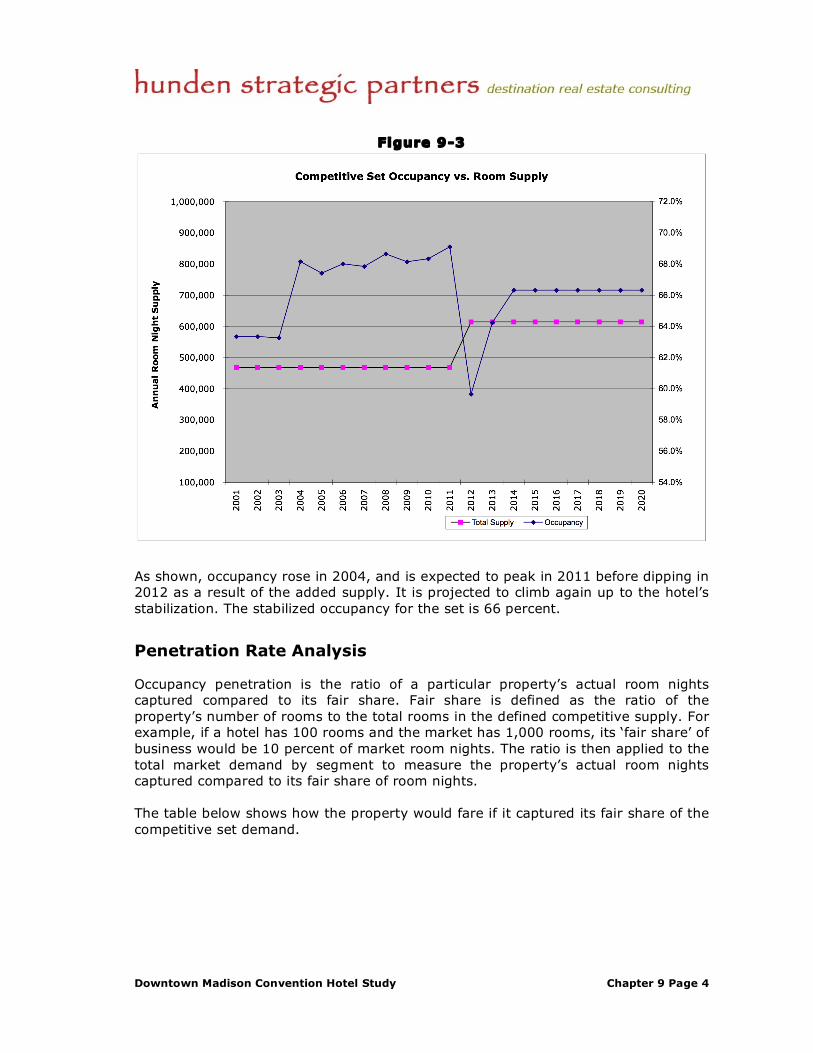
Figure 9-3
As shown, occupancy rose in 2004, and is expected to peak in 2011 before dipping in 2012 as a result of the added supply. It is projected to climb again up to the hotel’s stabilization. The stabilized occupancy for the set is 66 percent.
Penetration Rate Analysis
Occupancy penetration is the ratio of a particular property’s actual room nights captured compared to its fair share. Fair share is defined as the ratio of the property’s number of rooms to the total rooms in the defined competitive supply. For example, if a hotel has 100 rooms and the market has 1,000 rooms, its ‘fair share’ of business would be 10 percent of market room nights. The ratio is then applied to the total market demand by segment to measure the property’s actual room nights captured compared to its fair share of room nights.
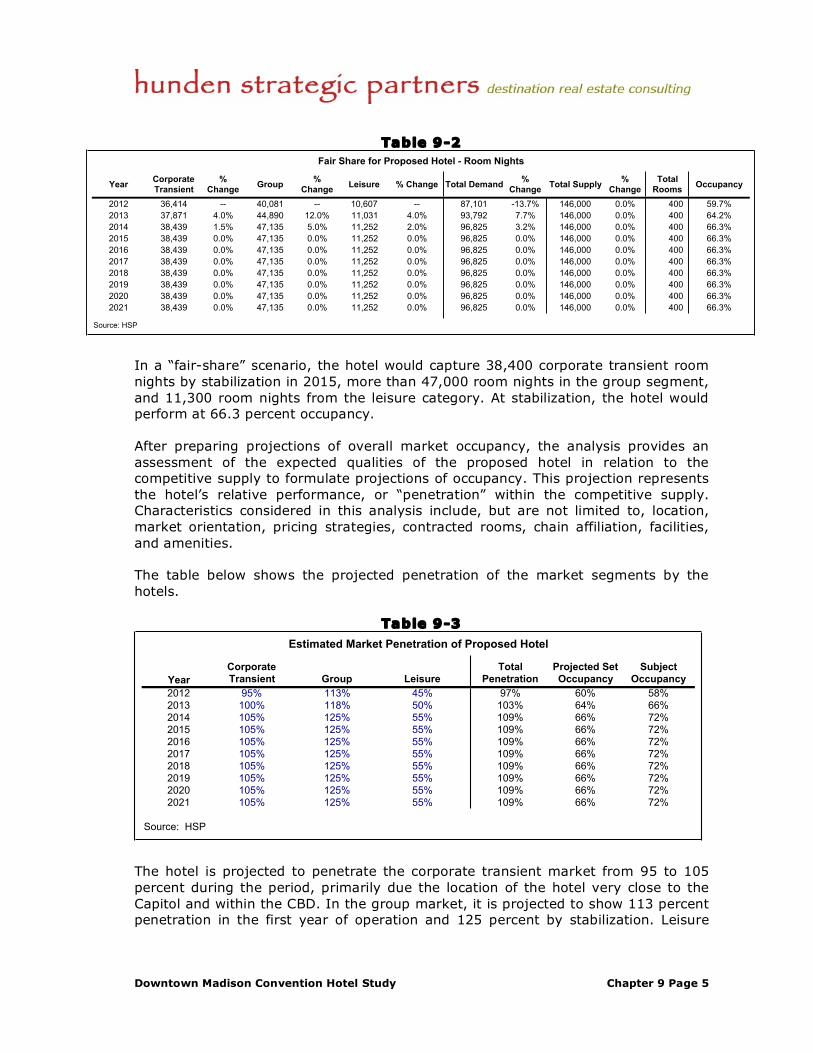
The table below shows how the property would fare if it captured its fair share of the competitive set demand.
Downtown Madison Convention Hotel Study Chapter 9 Page 5
Table 9-2 Fair Share for Proposed Hotel - Room Nights
YearCorporate
Transient
%
Change Group
%
Change Leisure % Change Total Demand
%
Change Total Supply
%
Change
Total
RoomsOccupancy
2012 36,414 -- 40,081 -- 10,607 -- 87,101 -13.7% 146,000 0.0% 400 59.7%
2013 37,871 4.0% 44,890 12.0% 11,031 4.0% 93,792 7.7% 146,000 0.0% 400 64.2%
2014 38,439 1.5% 47,135 5.0% 11,252 2.0% 96,825 3.2% 146,000 0.0% 400 66.3%
2015 38,439 0.0% 47,135 0.0% 11,252 0.0% 96,825 0.0% 146,000 0.0% 400 66.3%
2016 38,439 0.0% 47,135 0.0% 11,252 0.0% 96,825 0.0% 146,000 0.0% 400 66.3%
2017 38,439 0.0% 47,135 0.0% 11,252 0.0% 96,825 0.0% 146,000 0.0% 400 66.3%
2018 38,439 0.0% 47,135 0.0% 11,252 0.0% 96,825 0.0% 146,000 0.0% 400 66.3%
2019 38,439 0.0% 47,135 0.0% 11,252 0.0% 96,825 0.0% 146,000 0.0% 400 66.3%
2020 38,439 0.0% 47,135 0.0% 11,252 0.0% 96,825 0.0% 146,000 0.0% 400 66.3%
2021 38,439 0.0% 47,135 0.0% 11,252 0.0% 96,825 0.0% 146,000 0.0% 400 66.3%
Source: HSP
In a “fair-share” scenario, the hotel would capture 38,400 corporate transient room nights by stabilization in 2015, more than 47,000 room nights in the group segment, and 11,300 room nights from the leisure category. At stabilization, the hotel would perform at 66.3 percent occupancy.
After preparing projections of overall market occupancy, the analysis provides an assessment of the expected qualities of the proposed hotel in relation to the competitive supply to formulate projections of occupancy. This projection represents the hotel’s relative performance, or “penetration” within the competitive supply. Characteristics considered in this analysis include, but are not limited to, location, market orientation, pricing strategies, contracted rooms, chain affiliation, facilities, and amenities.
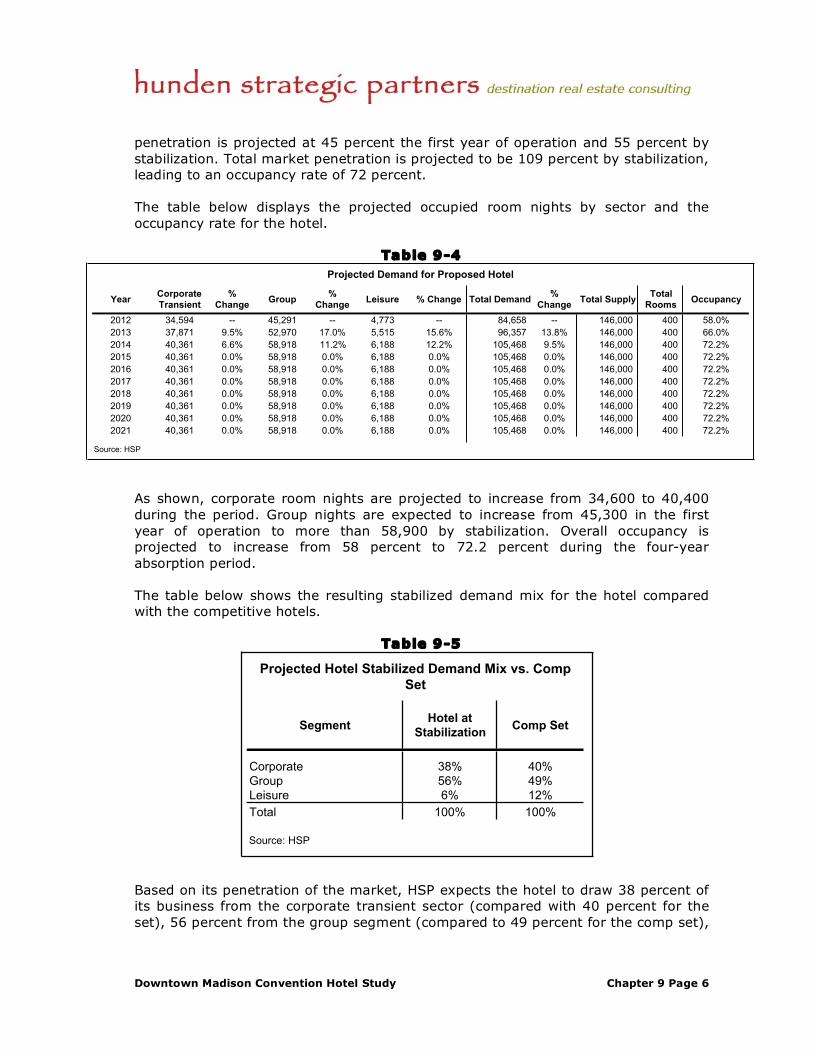
The table below shows the projected penetration of the market segments by the hotels.
Table 9-3 Estimated Market Penetration of Proposed Hotel
Year
Corporate
Transient Group Leisure
Total
Penetration
Projected Set
Occupancy
Subject
Occupancy
2012 95% 113% 45% 97% 60% 58%
2013 100% 118% 50% 103% 64% 66%
2014 105% 125% 55% 109% 66% 72%
2015 105% 125% 55% 109% 66% 72%
2016 105% 125% 55% 109% 66% 72%
2017 105% 125% 55% 109% 66% 72%
2018 105% 125% 55% 109% 66% 72%
2019 105% 125% 55% 109% 66% 72%
2020 105% 125% 55% 109% 66% 72%
2021 105% 125% 55% 109% 66% 72%
Source: HSP
The hotel is projected to penetrate the corporate transient market from 95 to 105 percent during the period, primarily due the location of the hotel very close to the Capitol and within the CBD. In the group market, it is projected to show 113 percent penetration in the first year of operation and 125 percent by stabilization. Leisure
Downtown Madison Convention Hotel Study Chapter 9 Page 6
penetration is projected at 45 percent the first year of operation and 55 percent by stabilization. Total market penetration is projected to be 109 percent by stabilization, leading to an occupancy rate of 72 percent.
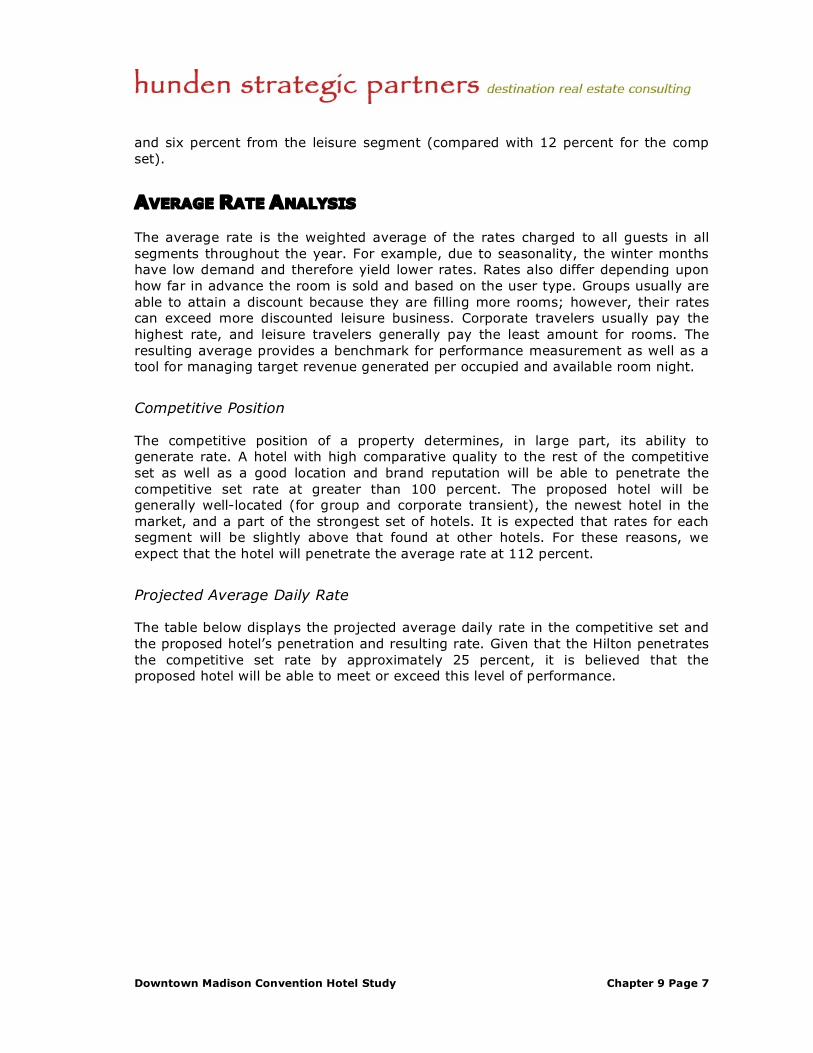
The table below displays the projected occupied room nights by sector and the occupancy rate for the hotel.
Table 9-4 Projected Demand for Proposed Hotel
YearCorporate
Transient
%
Change Group
%
Change Leisure % Change Total Demand
%
Change Total Supply
Total
RoomsOccupancy
2012 34,594 -- 45,291 -- 4,773 -- 84,658 -- 146,000 400 58.0%
2013 37,871 9.5% 52,970 17.0% 5,515 15.6% 96,357 13.8% 146,000 400 66.0%
2014 40,361 6.6% 58,918 11.2% 6,188 12.2% 105,468 9.5% 146,000 400 72.2%
2015 40,361 0.0% 58,918 0.0% 6,188 0.0% 105,468 0.0% 146,000 400 72.2%
2016 40,361 0.0% 58,918 0.0% 6,188 0.0% 105,468 0.0% 146,000 400 72.2%
2017 40,361 0.0% 58,918 0.0% 6,188 0.0% 105,468 0.0% 146,000 400 72.2%
2018 40,361 0.0% 58,918 0.0% 6,188 0.0% 105,468 0.0% 146,000 400 72.2%
2019 40,361 0.0% 58,918 0.0% 6,188 0.0% 105,468 0.0% 146,000 400 72.2%
2020 40,361 0.0% 58,918 0.0% 6,188 0.0% 105,468 0.0% 146,000 400 72.2%
2021 40,361 0.0% 58,918 0.0% 6,188 0.0% 105,468 0.0% 146,000 400 72.2%
Source: HSP
As shown, corporate room nights are projected to increase from 34,600 to 40,400 during the period. Group nights are expected to increase from 45,300 in the first year of operation to more than 58,900 by stabilization. Overall occupancy is projected to increase from 58 percent to 72.2 percent during the four-year absorption period.
The table below shows the resulting stabilized demand mix for the hotel compared with the competitive hotels.
Table 9-5
Projected Hotel Stabilized Demand Mix vs. Comp
Set
SegmentHotel at
StabilizationComp Set
Corporate 38% 40%
Group 56% 49%
Leisure 6% 12%
Total 100% 100%
Source: HSP
Based on its penetration of the market, HSP expects the hotel to draw 38 percent of its business from the corporate transient sector (compared with 40 percent for the set), 56 percent from the group segment (compared to 49 percent for the comp set),
Downtown Madison Convention Hotel Study Chapter 9 Page 7
and six percent from the leisure segment (compared with 12 percent for the comp set).
AVERAGE RATE ANALYSIS
The average rate is the weighted average of the rates charged to all guests in all segments throughout the year. For example, due to seasonality, the winter months have low demand and therefore yield lower rates. Rates also differ depending upon how far in advance the room is sold and based on the user type. Groups usually are able to attain a discount because they are filling more rooms; however, their rates can exceed more discounted leisure business. Corporate travelers usually pay the highest rate, and leisure travelers generally pay the least amount for rooms. The resulting average provides a benchmark for performance measurement as well as a tool for managing target revenue generated per occupied and available room night.
Competitive Position
The competitive position of a property determines, in large part, its ability to generate rate. A hotel with high comparative quality to the rest of the competitive set as well as a good location and brand reputation will be able to penetrate the competitive set rate at greater than 100 percent. The proposed hotel will be generally well-located (for group and corporate transient), the newest hotel in the market, and a part of the strongest set of hotels. It is expected that rates for each segment will be slightly above that found at other hotels. For these reasons, we expect that the hotel will penetrate the average rate at 112 percent.
Projected Average Daily Rate
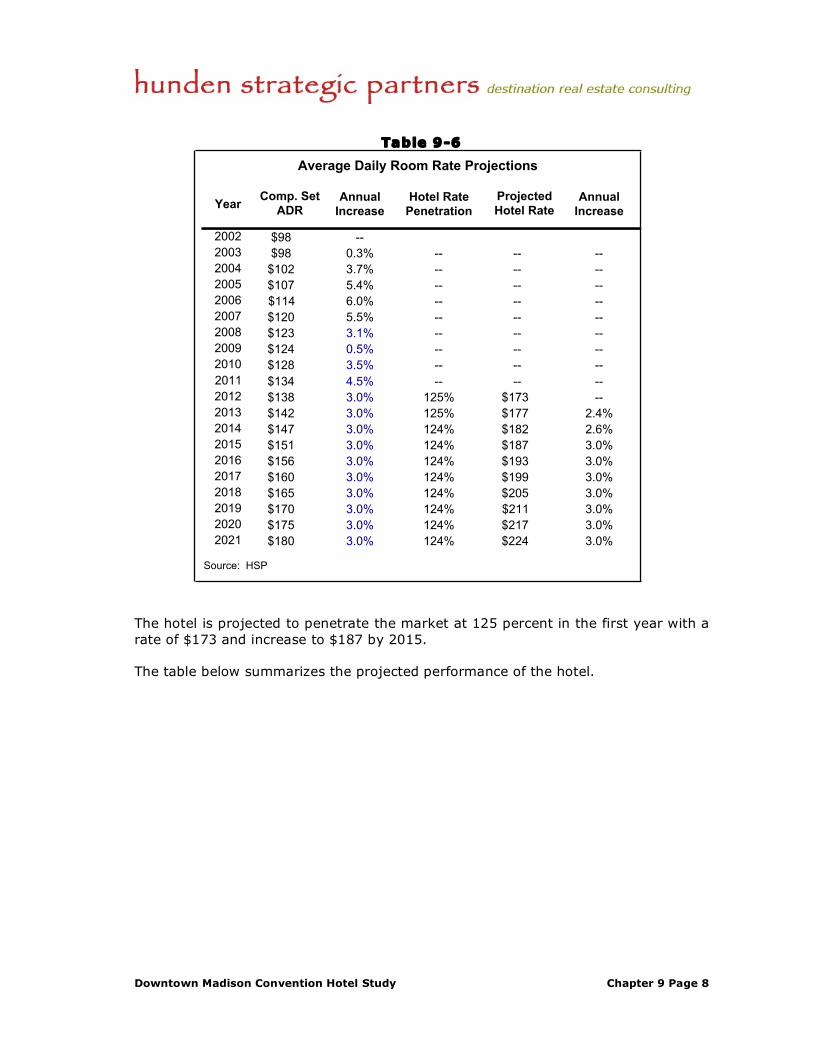
The table below displays the projected average daily rate in the competitive set and the proposed hotel’s penetration and resulting rate. Given that the Hilton penetrates the competitive set rate by approximately 25 percent, it is believed that the proposed hotel will be able to meet or exceed this level of performance.
Downtown Madison Convention Hotel Study Chapter 9 Page 8
Table 9-6
Average Daily Room Rate Projections
YearAnnual
Increase
Hotel Rate
Penetration
Annual
Increase
2002 $98 --
2003 $98 0.3% -- -- --
2004 $102 3.7% -- -- --
2005 $107 5.4% -- -- --
2006 $114 6.0% -- -- --
2007 $120 5.5% -- -- --
2008 $123 3.1% -- -- --
2009 $124 0.5% -- -- --
2010 $128 3.5% -- -- --
2011 $134 4.5% -- -- --
2012 $138 3.0% 125% $173 --
2013 $142 3.0% 125% $177 2.4%
2014 $147 3.0% 124% $182 2.6%
2015 $151 3.0% 124% $187 3.0%
2016 $156 3.0% 124% $193 3.0%
2017 $160 3.0% 124% $199 3.0%
2018 $165 3.0% 124% $205 3.0%
2019 $170 3.0% 124% $211 3.0%
2020 $175 3.0% 124% $217 3.0%
2021 $180 3.0% 124% $224 3.0%
Source: HSP
Projected
Hotel Rate
Comp. Set
ADR
The hotel is projected to penetrate the market at 125 percent in the first year with a rate of $173 and increase to $187 by 2015.
The table below summarizes the projected performance of the hotel.
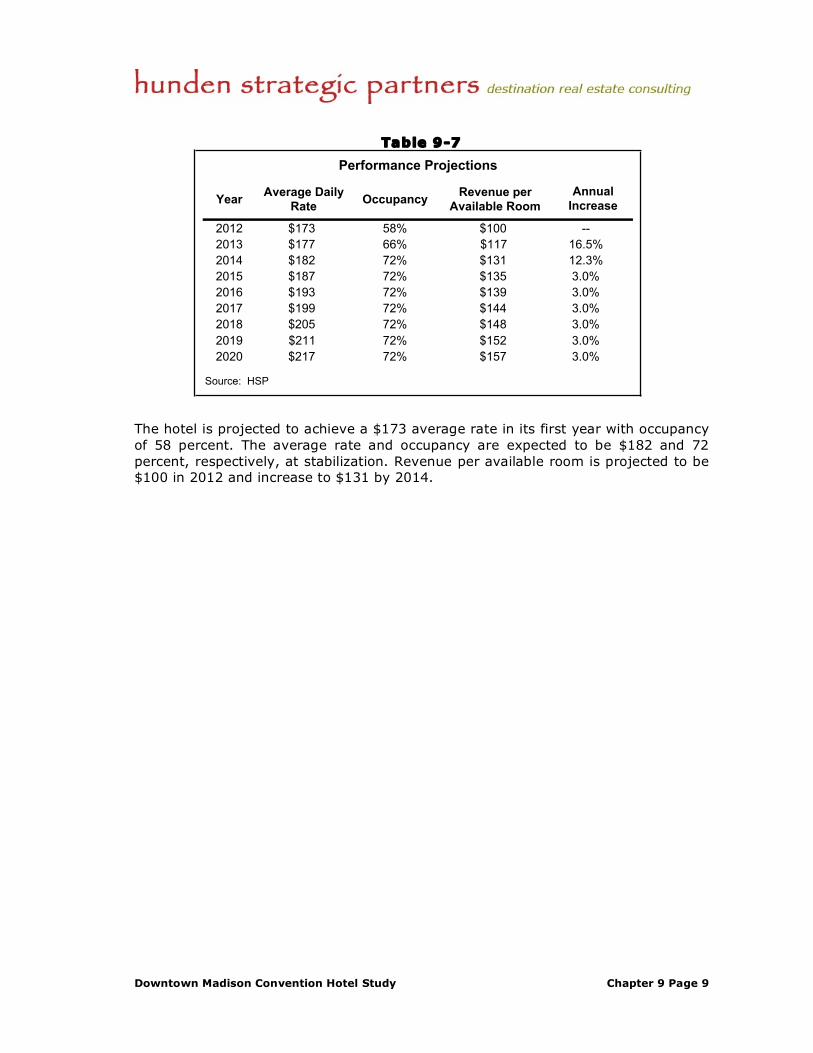
Downtown Madison Convention Hotel Study Chapter 9 Page 9
Table 9-7
YearAverage Daily
RateOccupancy
Revenue per
Available Room
2012 $173 58% $100 --
2013 $177 66% $117 16.5%
2014 $182 72% $131 12.3%
2015 $187 72% $135 3.0%
2016 $193 72% $139 3.0%
2017 $199 72% $144 3.0%
2018 $205 72% $148 3.0%
2019 $211 72% $152 3.0%
2020 $217 72% $157 3.0%
Source: HSP
Performance Projections
Annual
Increase
The hotel is projected to achieve a $173 average rate in its first year with occupancy of 58 percent. The average rate and occupancy are expected to be $182 and 72 percent, respectively, at stabilization. Revenue per available room is projected to be $100 in 2012 and increase to $131 by 2014.