certified internet coordinates
TRANSCRIPT
Certified Internet Coordinates
Mohamed Ali KaafarINRIA Sophia Antipolis, FR
Laurent Mathy∗
Lancaster University, [email protected]
Chadi BarakatINRIA Sophia Antipolis, [email protected]
Kave SalamatianLIP6, FR and EPFL, CH
Thierry TurlettiINRIA Sophia Antipolis, [email protected]
Walid DabbousINRIA Sophia Antipolis, FR
ABSTRACTWe address the issue of asserting the accuracy of Internet co-ordinates advertised by nodes of Internet coordinate systemsduring distance estimations. Indeed, some nodes may evenlie deliberately about their coordinates to mount various at-tacks against applications and overlays.
Our proposed method consists in two steps: 1) establishthe correctness of a node’s claimed coordinate by using theSurveyor infrastructure and malicious embedding neighbordetection proposed in our previous work on securing the co-ordinates embedding phase; and 2) issue a time limited va-lidity certificate for each verified coordinate.
Validity periods are computed based on an analysis of co-ordinate inter-shift times observed by Surveyors. By doingthis, each surveyor can estimate the time until the next shiftand thus, can limit the validity of the certificate it issues toregular nodes for their calculated coordinates. Our methodis illustrated on a trace collected from a Vivaldi system de-ployed on PlanetLab, where inter-shift times are shown tofollow long-tail distribution (lognormal distribution inmostcases, or Weibull distribution otherwise).
We validate the effectiveness of our method by measuringthe impact of a variety of attacks on distance estimates.
1. INTRODUCTIONInternet coordinate systems (e.g. [1, 2, 3, 4, 5, 6, 7]) have
been proposed to allow for distance (Round-Trip Time, shortlyRTT) estimation between nodes, in order to reduce the mea-surement overhead of many applications and overlay net-works. Indeed, by embedding the Internet delay space intoa metric space – an operation that only requires each nodein the system to measure delays to a small set of other nodes(its neighbors), nodes are attributed coordinates that canthenbe used to estimate the RTT between any two nodes, withoutfurther measurements, simply by applying the distance func-tion associated with the chosen metric space to the nodes’coordinates.
The security of the embedding phase, or in other words the
∗L. Mathy was also partly supported by the University of Liege,Belgium.
coordinate computation phase, of Internet coordinate sys-tems has received some attention in the form of either sim-ple mechanisms built into embedding protocols [3, 4] or amore general, embedding protocol-independent cheat detec-tion mechanism based on a Surveyor infrastructure [8]. Allof these mechanisms use distance measurements betweentwo nodes to, one way or an another, assess the plausibilityof the corresponding distance estimation based on the nodes’current coordinates. In cases where the discrepancy betweenthe measured and estimated distances is deemed too impor-tant, the node carrying out the test removes its correspon-dent node from its set of neighbors. By doing this, it avoidsadjusting its coordinate in response to potentially maliciousinformation.
However, ultimately, Internet coordinate systems are usedto estimate distances between nodes, based on their coor-dinates only, even and all the more so if these nodes havenever exchanged a distance measurement probe. Whatevermechanism is used to obtain a node’s coordinate (e.g. directexchange, DNS-like repository, etc.), each node must some-how report its own coordinate computed during the embed-ding phase of the system. This is because, for scalability rea-sons, nodes compute their own coordinates in a distributedway. This, of course, provides a malicious node with anopportunity to strike: in order to achieve some application-dependent goal or advantage (e.g. free-riding, denial-of-service, isolation, ubiquity gift, etc), a node can repeatedlylie about its coordinate. Simply lying about its coordinatecould seriously disrupt the operations of Internet applica-tions relying on coordinate-based systems for distance esti-mation. Several studies have quantified the impact of cheat-ing on topology-aware Internet applications, and have shownthat simple attack strategies can prove to be very effective[9,10, 11]. This paper addresses the question of guaranteeingthe veracity of the coordinates advertised by nodes.
To do so, we propose to leverage the Surveyor infras-tructure and embedding cheat detection test proposed in [8].More precisely, we propose that several Surveyors measuretheir distance to a node in order to verify the correctness ofits claimed coordinate (using the cheat detection test from[8]).If all Surveyors agree that this coordinate is the node’s true
1
coordinate, a time limited validity certificate, includingthecertified coordinate, is issued to the node.
A certificate validity time period is necessary because, dueto dynamic network conditions, nodes’ coordinates vary intime. Upon a coordinate change, an honest node would stopusing its current certificate and seek a certification of its newcoordinate. On the other hand, a malicious node could keepusing a certificate related to a previous position, hence acareful balance between scalability and certificate validityis desirable. To achieve this, one of our contributions is tostudy the coordinate inter-shift time (i.e. the time betweencoordinate changes at a node) as observed for a Vivaldi sys-tem running on PlanetLab. We found that the coordinateinter-shift times at most nodes follow a lognormal distribu-tion, with the rare cases when this distribution is inappropri-ate being accounted for by a Weibull distribution (note theseare both long-tail distributions).
The remainder of the paper is as follows: in section 2,we study and characterize the coordinate inter-shift timesand show that these times observed at Surveyors can ade-quately and statistically model inter-shift times at closebynodes. Section 3 describes the certification procedure indetail, while performance evaluation of our proposal in thecontext of various attacks is presented in section 4; section 5concludes the paper.
2. COORDINATES EVOLUTION MODELOur goal is to characterize and ascertain forward validity
of nodes’ coordinates during the distance estimation phase.We therefore concentrate on tracking the evolution in time ofcoordinates along the different axis of the coordinate spaceby observing their evolution in a clean system (without anymalicious activity).
2.1 Experimental Set-upThe measurement used in this study comes from traces ob-
tained by running the Vivaldi System on 600 planetLab ma-chines through a period of 18-days. These traces were thenacquired in a clean environment with no malicious node. Wealso used live-PlanetLab experiments, as a Vivaldi servicedeployed over a three-weeks period, to demonstrate the va-lidity and effectiveness of our proposal to deal with variousattacks.
In our initial trace, we kept the coordinates of 450 nodes,as several nodes, that have been down for more than oneweek or experienced connectivity troubles, have been fil-tered out. Some of them even do not respond to differentRPC requests sent by the Vivaldi service.
In this trace, Vivaldi is using a 3-dimensional Euclideanspace for the embedding. Each 10 minutes, correspondingto an embedding step, nodes are adjusting their coordinatesbased on a one-to-one interaction with another node, calleda peer node. Finally, Vivaldi nodes are filtering the streamof latency measurements from a remote node and turn theseinto expected latency values, based on a Moving Percentile
(MP) filter, a variant on the Moving Median filter, used tofilter out heavy-tailed errors [12, 13]. This filter acts as alow-pass filter, where anomalies are ignored while a base-line signal passes through. This allows Vivaldi to smoothlyadapt to shifts in the baseline (that BGP route changes causefor example). The goal of the latency filter is to summarizethe measurements, providing a current and stable descrip-tion of the expected latency between any two nodes. Ledlieet al. [12] found that using this simple latency filter with thea size of the history window equal to four observations and apercentile of 25% was a good predictor for the next observedlatency (i.e. consider the minimum value of a four-latencymeasurements stream, for coordinates computation).
The PlanetLab experiments were conducted over a set of280 PlanetLab nodes spread world-wide, running Vivaldi, asa coordinate-embedding service. For the purpose of our ex-perimentations, we slightly modified the logging functionsof the Vivaldi protocol. Each node is running several in-stantiations to allow us experimenting different parametersin similar conditions. Nodes are then updating their coordi-nates as needed, depending on the embedding step definedin each instantiation of the Vivaldi protocol. In the sameway, the dimension of coordinates varies from one instanti-ation to another on the same node1, and a node is acting asa malicious node or as a honest ’normal’ node.
Each node had 20 neighbors (i.e. was attached to 20 springs),10 of which being chosen to be closer than 50 ms. Theconstant fractionCc for the adaptive timestep (see [5] fordetails) is set to 0.25. When needed, Surveyor nodes werechosen that represent8% of the overall population [8].
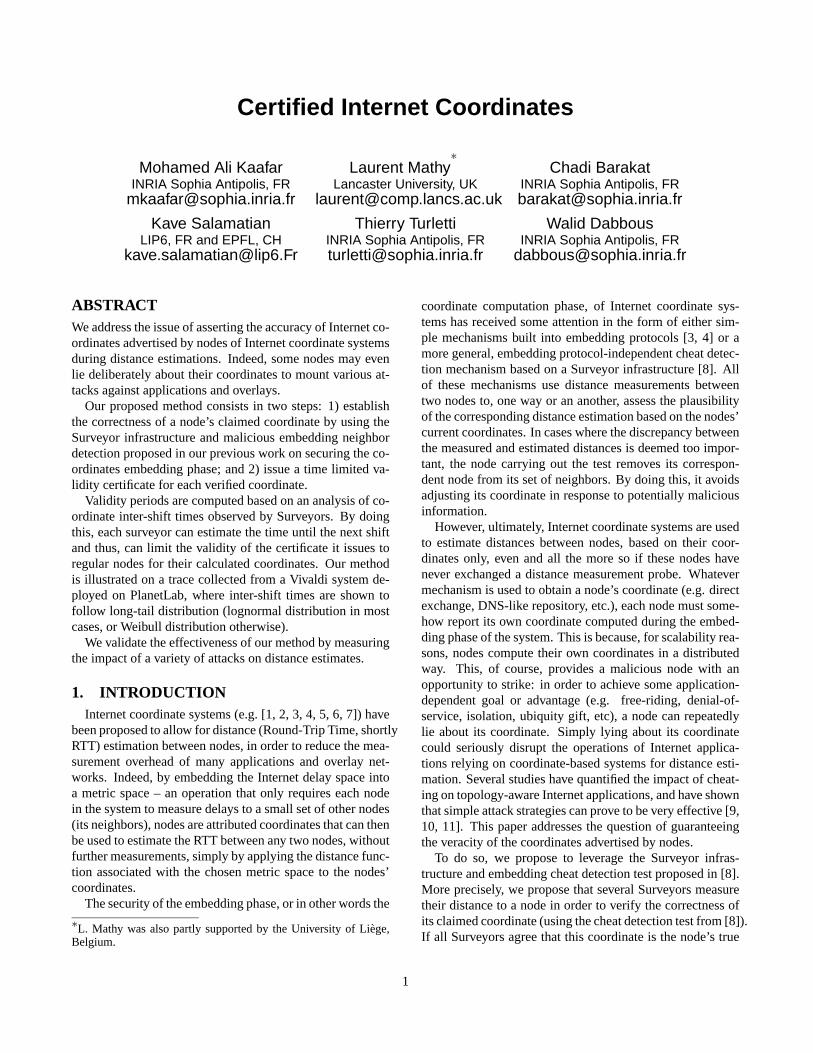
2.2 ObservationsFigure 1 shows a typical evolution of the coordinates of a
Vivaldi node. Each sub-figure depicts the evolution of onecoordinate component along the three axis.
0 500 1000 1500 2000 2500−400
−200
0
200
X C
oord
inat
es
0 500 1000 1500 2000 2500−1000
−500
0
500
Y C
oord
inat
es
0 500 1000 1500 2000 2500−2000
−1000
0
1000
Time (x 10 mn)
Z C
oord
inat
es
Figure 1: Typical Variations of a node’s coordinate in theVivaldi System.
1We experimented with different Euclidean embedding spaces anda 2-dimensional coordinate space augmented with a height vector.
2
We observe that the system after roughly 250 embeddingsteps, reaches a stationary regime, but coordinates continueto fluctuate. Looking further in the entire set of nodes’ co-ordinates, we observe that coordinates steadily variate, mov-ing away from the origin (03) of the coordinate system. Therate of these variations is low enough to allow distance es-timation at the application level, but this prevents us fromcertifying absolute coordinates.
More specifically, because at any instant in time, the RTTthat can be measured between two nodes depends on thestate of the network (e.g. traffic load, state of queues inrouters, etc), the exact value of the RTT varies continuously.However, it has been shown that RTT values in the Internetexhibit some stability in a statistical sense [14], with thesta-tistical properties of RTTs exhibiting no significant changeat timescales of several minutes. It is that property that em-bedding systems exploit to provide good distance estimateswhile only needing to have nodes adjust (recalculate) theircoordinates on a periodic basis. Consequently, the node’scoordinate can be viewed as a discrete stochastic process,embedded at the instants of updates.
Regardless of the dimensionality used by the coordinate-systems, our main goal is to assign to any coordinate givenby a node, a reliability value that is telling the likelihoodthatthis coordinate is still valid and has not changed. For thispurpose we observe for our set of 450 planetlab nodes theinter-shift time distribution, corresponding to the amount oftime (in terms of embedding steps intervals) during which,nodes stick to their positions, i.e. the coordinates do notchange. This distribution is denotedTi for each nodei. Itis important to note that although we observed that in ourtraces, a variation of one coordinate component was syn-onym to the variation of both others, we consider the inter-shift time as the laps of time corresponding to the non varia-tion of all the coordinate components of this node.
Basically, we would like to determine which probabilitydistribution is suitable to describe the inter-shift times. In thefollowing, we will use our empirical data sets of inter-shifttimes to find the probability distribution that best describesthe distribution values of eachTi.
2.3 Inter-shift Time Distribution FittingFor choosing the best suitable distribution, we use a set of
candidate distributions containing lognormal, Weibull, Rayleighand Gamma distributions2.
For each one of the 450 nodes in the dataset, we applya two-step procedure. In the first step, we derive the maxi-mum likelihood estimates of parameters of each distributionin the candidate set. The likelihood is the probability to getthe observed inter-shift times for some hypothetic distribu-tion. The estimates of the distribution parameters are thenthe values that maximize their likelihood.
In a second step, we used goodness of fit tests to evalu-
2The Gaussian distribution was not tested because the empiricaldistribution was not symmetrical around a mean.
ate if the hypothesis that the observed valuesTi come fromthe candidate distribution can be rejected or not. The good-ness of fit evaluation was done using the popular and robustKolmogorov-Smirnov (K-S) test [15], applied at a signifi-cance level of 5%.
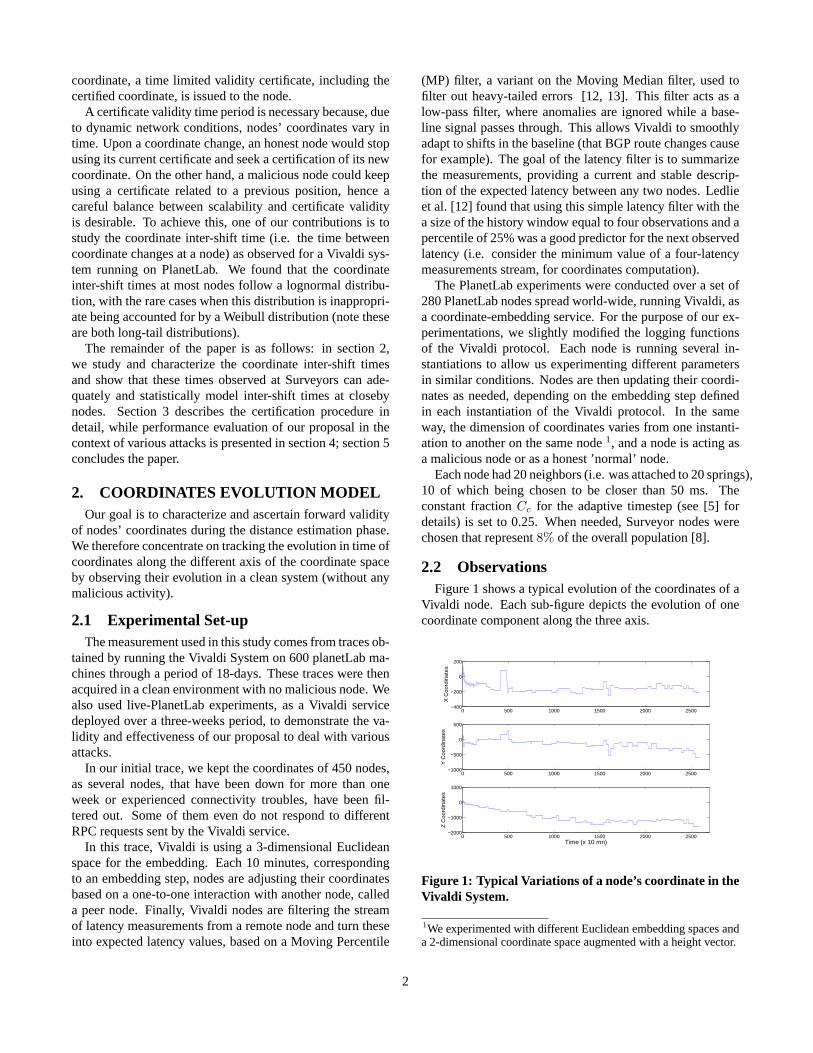
We show in figure 2, the results of the fitting done on one
0 20 40 60 80 100 120 1400
0.005
0.01
0.015
0.02
0.025
Inter−Shift Time (x 10 mn)
Den
sity
PlanetLab dataLog−NormalRayleighWeibullGamma
(a) Histogram of the data andPDF of fitted distributions
20 40 60 80 100 1200
0.1
0.2
0.3
0.4
0.5
0.6
0.7
0.8
0.9
1
Inter−Shift Time (x 10mn)
Cum
ulat
ive
prob
abili
ty
PlanetLab dataLog−NormalRayleighWeibullGamma
(b) Empirical CDF and fittedCDFs
Figure 2: Density plots and CDF of a typical inter-shiftdistribution (Node 181).
of the datasets relative to node 181. Simple inspection byeye shows that the lognormal distribution produces the bestfits among the set of distributions. This is validated by theK-S test that rejects all the candidate distributions but thelognormal.
Using the fitting procedure described above, we tried to fitthe inter-shift datasets. The first interesting result we foundis that all of the empirical distributions examined can be fit-ted to a known distribution. A large majority of distributionscan be fitted into a lognormal distribution. The lognormalhypothesis was rejected for only 5 datasets out of the 450.Looking further in these 5 inter-shift datasets, we observedthat they have a good fit with the Weibull distribution. Ta-ble 1 gives a summary of our findings for the KolmogorovSmirnov goodness of fit tests.
2.4 Correlation between Surveyors and Nodesinter-shift Distributions
Having shown that inter-shift time distribution of our pop-ulation of nodes in the Vivaldi system is compatible with ei-ther a lognormal distribution in most cases or a Weibull dis-tribution otherwise whose parameters can be obtained by amaximum likelihood method, the next question is how wellthe shifts as observed by Surveyor nodes can be used as rep-resentative of the shifts of regular nodes. Basically, if theinter-shift distribution of a node as seen by the surveyors isthe same as the real inter-shift distribution, the former maybe used as a reference to validate the node’s coordinate.
The verification of this hypothesis is done by comparingthe sequence of inter-shift as seen by surveyors and the realinter-shift of a node and asking if the hypothesis that thesetwo sequences come from the same distribution can be re-jected or not. The latter test is done using a two-sampleKolmogorov Smirnov Test (with a significance level of 5%)that precisely gives an answer to the previous question. For
3
Table 1: Results using the Kologorov Smirnov Test for fittingthe inter-shift Times data.Fitted Distributions % of samples that passed the test
log-Normal 445/450
Rayleigh 2/450
Weibull 5/450
Gamma 6/450
each of the 35 surveyor nodes, we applied therefore 415 two-sample K-S test.
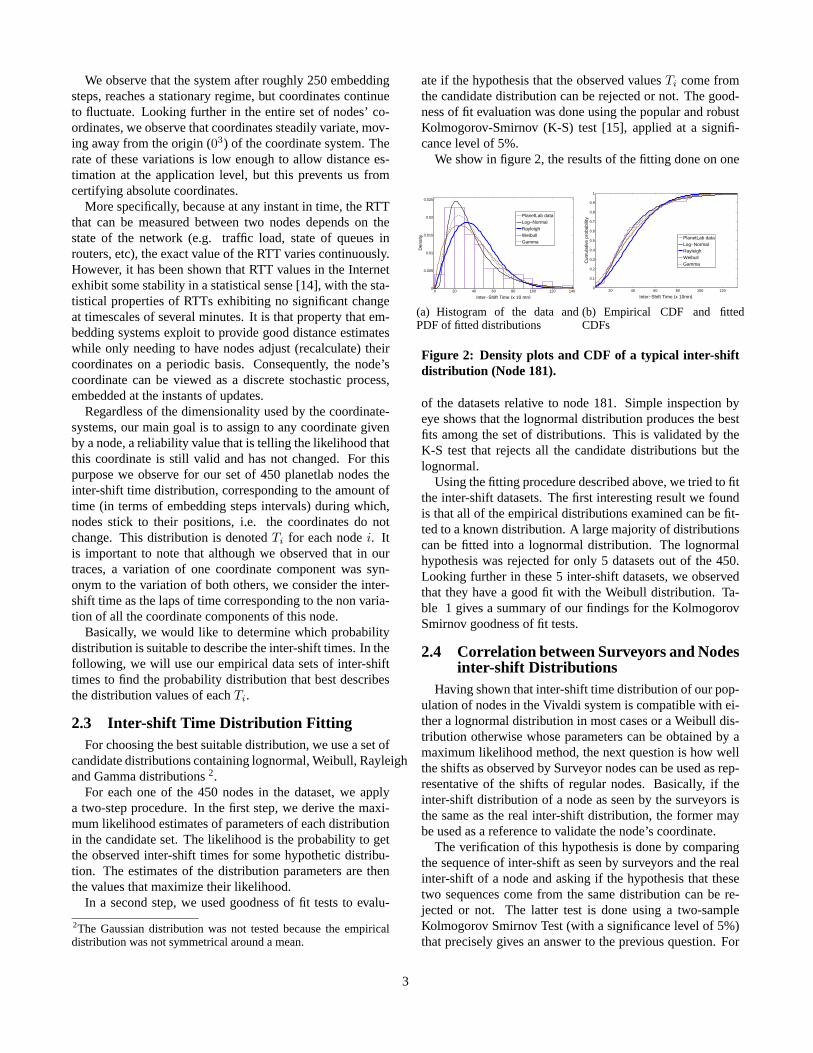
To answer this question, we analyzed for each surveyornodes the likelihood that the two-samples KS-test is rejectedas a function of the distance (measured as an RTT) betweenthe surveyor node and the tested regular node. The likeli-hood is obtained as the ratio between the number of nodeswith a given RTT that reject the test and the overall num-ber of regular nodes. Figure 3 shows this rejection ratiovs.the distance (measured as an RTT) between a node and thecorresponding Surveyor, as observed during the PlanetLabexperiment.
0 100 200 300 400 500 600 700 8000
0.1
0.2
0.3
0.4
0.5
0.6
0.7
0.8
0.9
1
RTTs (ms)
Rej
ectio
n R
atio
Figure 3: Correlation between ’Nodes-Surveyors’ RTTsand the rejection Ratio.
Intuitively, a Surveyor should have tendency to have thesame inter-shift distribution as nodes that are close by interms of RTT, as they are more likely to experience simi-lar dynamics of the coordinate system. Figure 3 validatesthis intuition and shows that better locality between a nodeand its Surveyor yields more accurate fittings.
We therefore apply the following heuristics: the inter-shifttime distribution of the closest Surveyor is used as the repre-sentative distribution for regular nodes.
3. COORDINATE CERTIFICATIONThe method we propose to certify Internet coordinates
consists in two steps:
1. the node coordinate verification test;
2. computation of an estimated validity period for this co-ordinate.
The coordinate verification test leverages the Surveyor in-frastructure and malicious embedding neighbor detection pro-posed in [8], while the validity period estimation is based onthe results presented in section 2.
3.1 Coordinate Verification
3.1.1 Principle
The method for malicious embedding neighbor detectionproposed in [8] is based on a model of the evolution of anodes’s observed relative errors, during embedding steps.These relative errors, defined as|||Xi−Xj ||−RTTij |
RTTij, where
Xi andXj are the nodes’ coordinates andRTTij the mea-sured distance between the nodes, have been shown to betrackable by a Kalman filter in the case of a system withoutmalicious nodes. The idea is thus to have a set of trustednodes (a.k.a Surveyors), well positioned in the network andacting as vantage points, that compute their coordinates byembedding with each other exclusively and thus observe theevolution of their relative errors in a clean system withoutinfluence from malicious nodes. It was also shown that theKalman filters calibrated on such nodes can advantageouslytrack the relative error model at nearby untrusted nodes. EachKalman filter is capable of providing a predicted relative er-ror (based on the history of observed measured errors) aswell as the distribution of its innovation process which isthe deviation between the measured and predicted relativeerrors expected at each embedding step. The basis for themalicious embedding neighbor detection test is then a sim-ple hypothesis test on this innovation process (see [8] fordetails).
It is important to note that this malicious embedding neigh-bor detection test is based on relative errors, and thus simplytests the consistency between the estimated and measureddistances between two nodes. In particular, this test is notable to evaluate the truthfulness of a node’s coordinate. In-deed, if during an embedding step a node fakes its coordi-nate but at the same time delays the measurement probes in away consistent with its faked position in the coordinate space(based on the knowledge of the correspondent’s coordinate,as well as its own true and fake coordinates), then the result-ing relative error measured between the two nodes is reduced(see figure 4). Indeed, if a node at coordinateXi fakes a co-ordinateX ′
i, then its real distance to another node (e.g. a
4
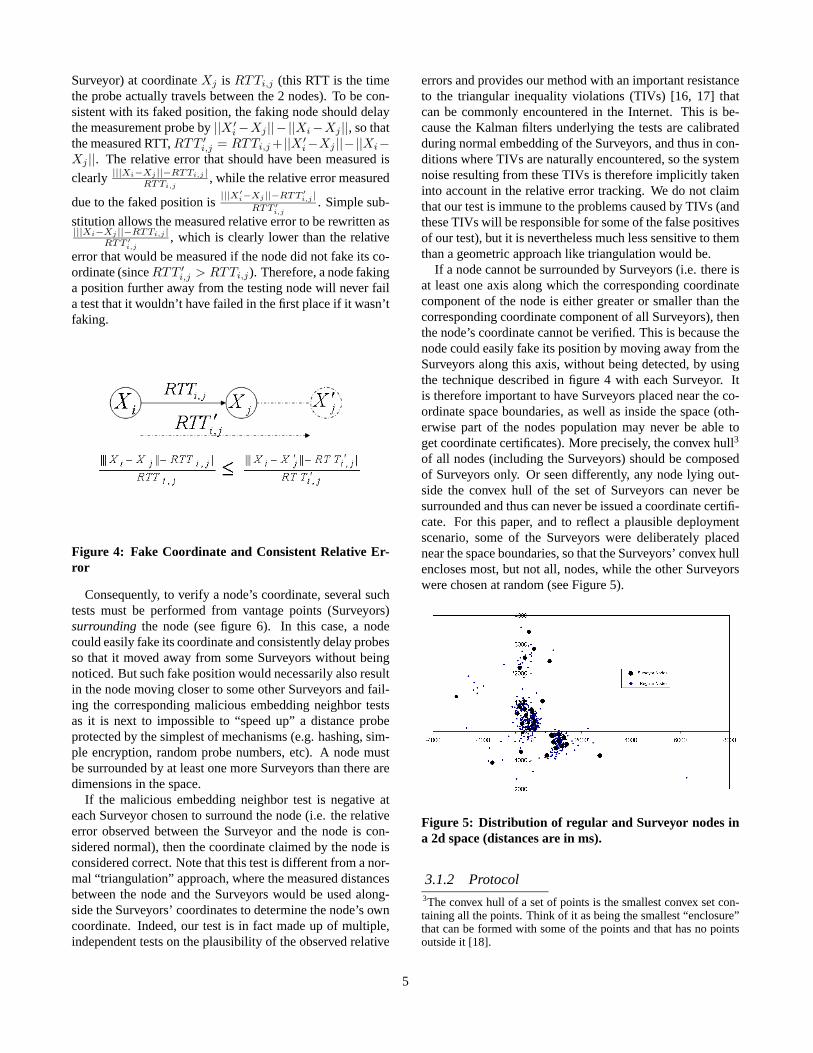
Surveyor) at coordinateXj is RTTi,j (this RTT is the timethe probe actually travels between the 2 nodes). To be con-sistent with its faked position, the faking node should delaythe measurement probe by||X ′
i −Xj ||− ||Xi−Xj ||, so thatthe measured RTT,RTT ′
i,j = RTTi,j +||X ′i−Xj ||−||Xi−
Xj ||. The relative error that should have been measured is
clearly |||Xi−Xj ||−RTTi,j |RTTi,j
, while the relative error measured
due to the faked position is|||X′
i−Xj ||−RTT ′
i,j |
RTT ′
i,j
. Simple sub-
stitution allows the measured relative error to be rewritten as|||Xi−Xj ||−RTTi,j |
RTT ′
i,j
, which is clearly lower than the relative
error that would be measured if the node did not fake its co-ordinate (sinceRTT ′
i,j > RTTi,j). Therefore, a node fakinga position further away from the testing node will never faila test that it wouldn’t have failed in the first place if it wasn’tfaking.
Figure 4: Fake Coordinate and Consistent Relative Er-ror
Consequently, to verify a node’s coordinate, several suchtests must be performed from vantage points (Surveyors)surrounding the node (see figure 6). In this case, a nodecould easily fake its coordinate and consistently delay probesso that it moved away from some Surveyors without beingnoticed. But such fake position would necessarily also resultin the node moving closer to some other Surveyors and fail-ing the corresponding malicious embedding neighbor testsas it is next to impossible to “speed up” a distance probeprotected by the simplest of mechanisms (e.g. hashing, sim-ple encryption, random probe numbers, etc). A node mustbe surrounded by at least one more Surveyors than there aredimensions in the space.
If the malicious embedding neighbor test is negative ateach Surveyor chosen to surround the node (i.e. the relativeerror observed between the Surveyor and the node is con-sidered normal), then the coordinate claimed by the node isconsidered correct. Note that this test is different from a nor-mal “triangulation” approach, where the measured distancesbetween the node and the Surveyors would be used along-side the Surveyors’ coordinates to determine the node’s owncoordinate. Indeed, our test is in fact made up of multiple,independent tests on the plausibility of the observed relative
errors and provides our method with an important resistanceto the triangular inequality violations (TIVs) [16, 17] thatcan be commonly encountered in the Internet. This is be-cause the Kalman filters underlying the tests are calibratedduring normal embedding of the Surveyors, and thus in con-ditions where TIVs are naturally encountered, so the systemnoise resulting from these TIVs is therefore implicitly takeninto account in the relative error tracking. We do not claimthat our test is immune to the problems caused by TIVs (andthese TIVs will be responsible for some of the false positivesof our test), but it is nevertheless much less sensitive to themthan a geometric approach like triangulation would be.
If a node cannot be surrounded by Surveyors (i.e. there isat least one axis along which the corresponding coordinatecomponent of the node is either greater or smaller than thecorresponding coordinate component of all Surveyors), thenthe node’s coordinate cannot be verified. This is because thenode could easily fake its position by moving away from theSurveyors along this axis, without being detected, by usingthe technique described in figure 4 with each Surveyor. Itis therefore important to have Surveyors placed near the co-ordinate space boundaries, as well as inside the space (oth-erwise part of the nodes population may never be able toget coordinate certificates). More precisely, the convex hull3
of all nodes (including the Surveyors) should be composedof Surveyors only. Or seen differently, any node lying out-side the convex hull of the set of Surveyors can never besurrounded and thus can never be issued a coordinate certifi-cate. For this paper, and to reflect a plausible deploymentscenario, some of the Surveyors were deliberately placednear the space boundaries, so that the Surveyors’ convex hullencloses most, but not all, nodes, while the other Surveyorswere chosen at random (see Figure 5).
Figure 5: Distribution of regular and Surveyor nodes ina 2d space (distances are in ms).
3.1.2 Protocol3The convex hull of a set of points is the smallest convex set con-taining all the points. Think of it as being the smallest “enclosure”that can be formed with some of the points and that has no pointsoutside it [18].
5
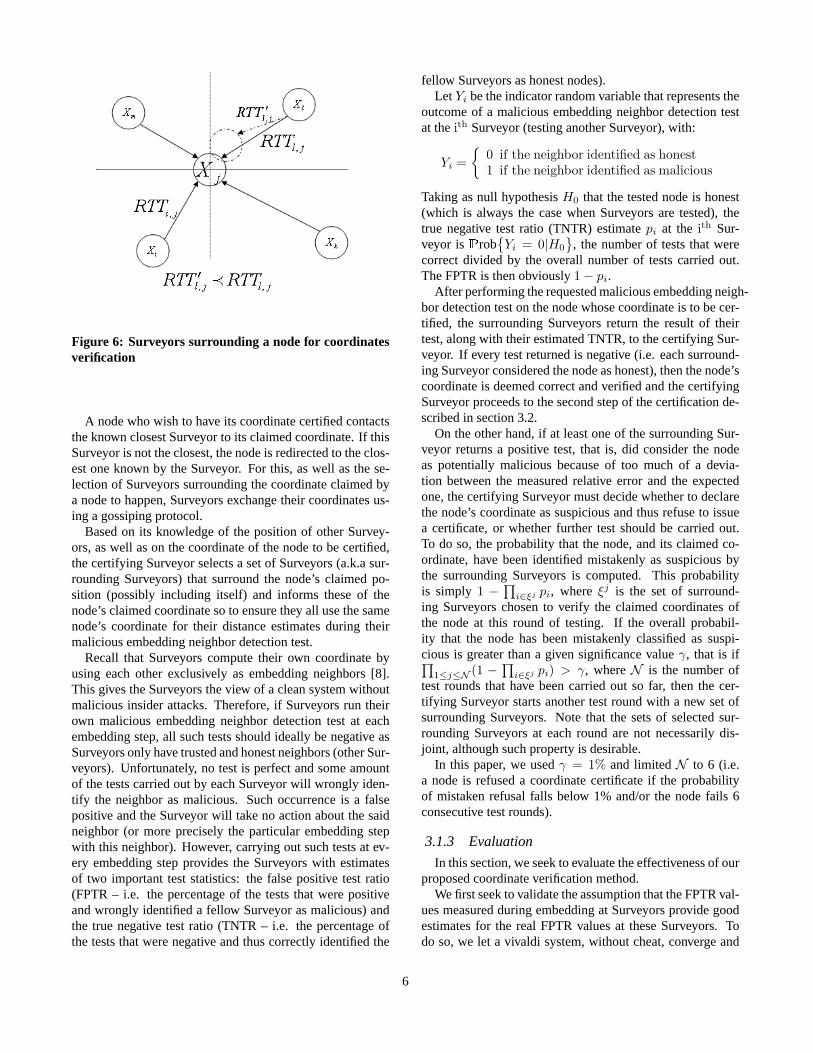
Figure 6: Surveyors surrounding a node for coordinatesverification
A node who wish to have its coordinate certified contactsthe known closest Surveyor to its claimed coordinate. If thisSurveyor is not the closest, the node is redirected to the clos-est one known by the Surveyor. For this, as well as the se-lection of Surveyors surrounding the coordinate claimed bya node to happen, Surveyors exchange their coordinates us-ing a gossiping protocol.
Based on its knowledge of the position of other Survey-ors, as well as on the coordinate of the node to be certified,the certifying Surveyor selects a set of Surveyors (a.k.a sur-rounding Surveyors) that surround the node’s claimed po-sition (possibly including itself) and informs these of thenode’s claimed coordinate so to ensure they all use the samenode’s coordinate for their distance estimates during theirmalicious embedding neighbor detection test.
Recall that Surveyors compute their own coordinate byusing each other exclusively as embedding neighbors [8].This gives the Surveyors the view of a clean system withoutmalicious insider attacks. Therefore, if Surveyors run theirown malicious embedding neighbor detection test at eachembedding step, all such tests should ideally be negative asSurveyors only have trusted and honest neighbors (other Sur-veyors). Unfortunately, no test is perfect and some amountof the tests carried out by each Surveyor will wrongly iden-tify the neighbor as malicious. Such occurrence is a falsepositive and the Surveyor will take no action about the saidneighbor (or more precisely the particular embedding stepwith this neighbor). However, carrying out such tests at ev-ery embedding step provides the Surveyors with estimatesof two important test statistics: the false positive test ratio(FPTR – i.e. the percentage of the tests that were positiveand wrongly identified a fellow Surveyor as malicious) andthe true negative test ratio (TNTR – i.e. the percentage ofthe tests that were negative and thus correctly identified the
fellow Surveyors as honest nodes).Let Yi be the indicator random variable that represents the
outcome of a malicious embedding neighbor detection testat theith Surveyor (testing another Surveyor), with:
Yi =
{
0 if the neighbor identified as honest1 if the neighbor identified as malicious
Taking as null hypothesisH0 that the tested node is honest(which is always the case when Surveyors are tested), thetrue negative test ratio (TNTR) estimatepi at the ith Sur-veyor isProb
{
Yi = 0|H0
}
, the number of tests that werecorrect divided by the overall number of tests carried out.The FPTR is then obviously1 − pi.
After performing the requested malicious embedding neigh-bor detection test on the node whose coordinate is to be cer-tified, the surrounding Surveyors return the result of theirtest, along with their estimated TNTR, to the certifying Sur-veyor. If every test returned is negative (i.e. each surround-ing Surveyor considered the node as honest), then the node’scoordinate is deemed correct and verified and the certifyingSurveyor proceeds to the second step of the certification de-scribed in section 3.2.
On the other hand, if at least one of the surrounding Sur-veyor returns a positive test, that is, did consider the nodeas potentially malicious because of too much of a devia-tion between the measured relative error and the expectedone, the certifying Surveyor must decide whether to declarethe node’s coordinate as suspicious and thus refuse to issuea certificate, or whether further test should be carried out.To do so, the probability that the node, and its claimed co-ordinate, have been identified mistakenly as suspicious bythe surrounding Surveyors is computed. This probabilityis simply 1 −
∏
i∈ξj pi, whereξj is the set of surround-ing Surveyors chosen to verify the claimed coordinates ofthe node at this round of testing. If the overall probabil-ity that the node has been mistakenly classified as suspi-cious is greater than a given significance valueγ, that is if∏
1≤j≤N (1 −∏
i∈ξj pi) > γ, whereN is the number oftest rounds that have been carried out so far, then the cer-tifying Surveyor starts another test round with a new set ofsurrounding Surveyors. Note that the sets of selected sur-rounding Surveyors at each round are not necessarily dis-joint, although such property is desirable.
In this paper, we usedγ = 1% and limitedN to 6 (i.e.a node is refused a coordinate certificate if the probabilityof mistaken refusal falls below 1% and/or the node fails 6consecutive test rounds).
3.1.3 Evaluation
In this section, we seek to evaluate the effectiveness of ourproposed coordinate verification method.
We first seek to validate the assumption that the FPTR val-ues measured during embedding at Surveyors provide goodestimates for the real FPTR values at these Surveyors. Todo so, we let a vivaldi system, without cheat, converge and
6

run on PlanetLab for over 2500 time ticks (i.e. embeddingperiods). the Surveyors measured their estimated FPTR bycarrying out a malicious embedding neighbour detection testat every embedding step. At the end of the experiment,each Surveyor also measured its real FPTR by running amalicious embedding neighbour detection test to every othernodes in the system. Since this system does not have anymalicious node in it, a failed test is a false positive. TheCDF of the differences of these 2 values at each Surveyor isshown in figure 7. We see that the difference between the es-timated and the real FPTR are mostly within less than 1% ofeach other, confirming that our proposed estimation methodyields reliable FPTR estimates. Even in the cases where theFPTR estimates differ more than the real value, these willonly affect the coordinate verification tests in which the cor-responding Surveyors take place: in these cases the coordi-nate verification test will be slightly more aggressive thanitought to (since the FPTR estimate is smaller than the realvalue), favouring security.
−0.05 −0.04 −0.03 −0.02 −0.01 0 0.01 0.020
0.1
0.2
0.3
0.4
0.5
0.6
0.7
0.8
0.9
1
False Postive test Ratio differences
Cum
ulat
ive
Dis
trib
utio
n F
unct
ion
2d
3d
5d
2d + height
Figure 7: CDF of False positive probability differences.
Next, we seek to further understand the behaviour of falsepositive and true negative occurrences. Figure 8(a) is a scat-ter plot of the distance between a node and its Surveyor,whenever the malicious embedding neighbour detection testthrough a false positive at the Surveyor. This figure clearlyindicates that Surveyors hardly ever experience wrong testresults when testing nearby honest nodes. Complementarily,Figure 8(b) shows that Surveyors are much more success-ful at identifying nearby honest nodes correctly. These re-sults indicate that striving to choose surrounding Surveyorsas close as possible to the node whose coordinate are beingverified will increase the effectiveness of the coordinate ver-ification test (by reducing the occurrences of false positivein the multiple test, through reduction of false positive oc-currences in the component tests making this multiple testup). This is therefore the strategy adopted in the rest of thispaper.
To assess the overall effectiveness of the proposed coordi-nate verification method, we then make all nodes try to move
0 200 400 600 800 1000 1200 1400 1600 18000
100
200
300
400
500
600
700
800
900
Node ID
RT
Ts
(a) Correlation between FalsePositives and RTTs
0 200 400 600 800 1000 1200 1400 1600 18000
100
200
300
400
500
600
Node ID
RT
Ts
(b) Correlation between TrueNegatives and RTTs
Figure 8: Correlation between distance and test perfor-mance.
away in all direction, from their position in the convergedsystem. In this experiment, each node varies the direction ofits move one degree at a time. Along each direction, it triesto move a distance drawn at random form the distribution ofthe innovation process computed by the Kalman filter cali-brated at the nearest Surveyor [8], in a bid to outsmart themalicious embedding neighbour detection test. After eachmove, the node requests a re-certification of its coordinate.The displacement achieved by the node until the correspond-ing fake coordinate is declared incorrect by our verificationmethod is then recorded. Figure 9 shows, the average, mini-mum and maximum displacement observed across all nodes,as a function of the direction of movement. Note that this fig-ure only take into account the nodes that are eligible for cer-tification (i.e. the nodes that lie inside the Surveyors convexhull, see section 3.1.1), meaning that 13 nodes are excludedfrom the experiment.
Figure 9: Undetected displacement as a function of di-rection.
We see that the maximum displacement achieved by anynode is below 10 ms, while the average is around 6 ms.Such deviations are of the order of the distance predictionaccuracy (they will not decrease the accuracy of the coordi-nate system in any significant way) and will be acceptable tomany applications.
Finally, we experimented with a simple attack, carried outby a growing malicious node population that has access to
7
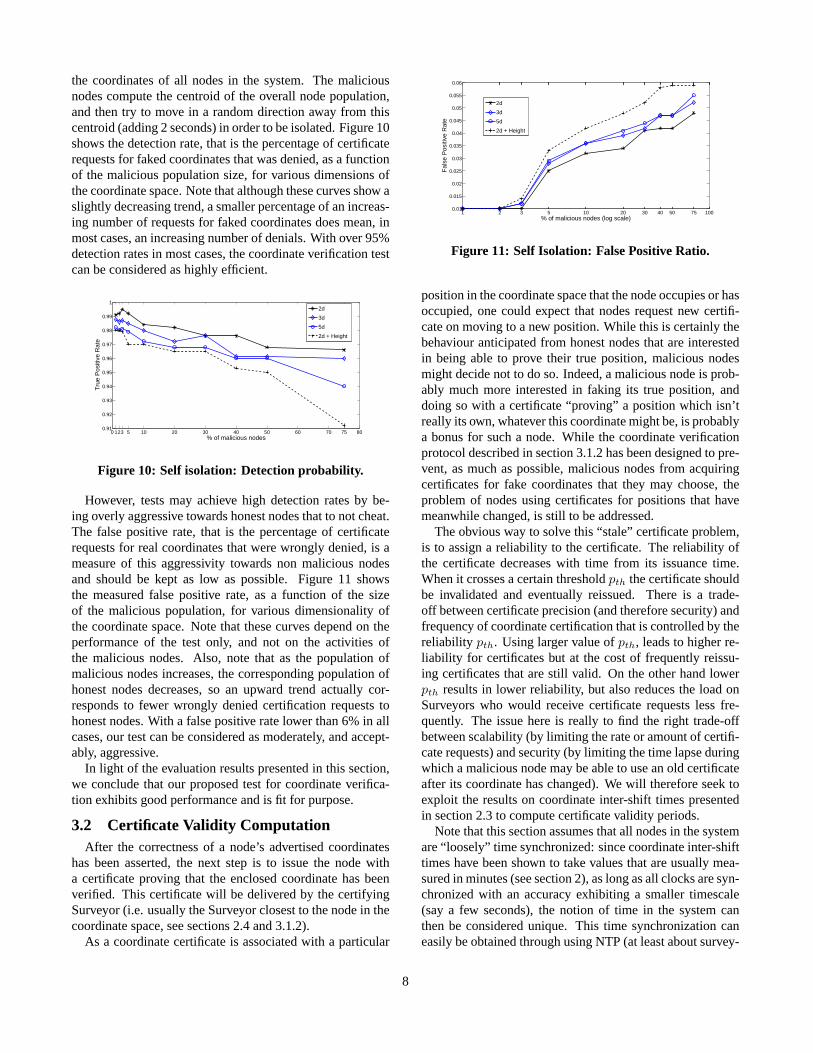
the coordinates of all nodes in the system. The maliciousnodes compute the centroid of the overall node population,and then try to move in a random direction away from thiscentroid (adding 2 seconds) in order to be isolated. Figure 10shows the detection rate, that is the percentage of certificaterequests for faked coordinates that was denied, as a functionof the malicious population size, for various dimensions ofthe coordinate space. Note that although these curves show aslightly decreasing trend, a smaller percentage of an increas-ing number of requests for faked coordinates does mean, inmost cases, an increasing number of denials. With over 95%detection rates in most cases, the coordinate verification testcan be considered as highly efficient.
0 123 5 10 20 30 40 50 60 70 75 800.91
0.92
0.93
0.94
0.95
0.96
0.97
0.98
0.99
1
% of malicious nodes
Tru
e P
ositi
ve R
ate
2d
3d
5d
2d + Height
Figure 10: Self isolation: Detection probability.
However, tests may achieve high detection rates by be-ing overly aggressive towards honest nodes that to not cheat.The false positive rate, that is the percentage of certificaterequests for real coordinates that were wrongly denied, is ameasure of this aggressivity towards non malicious nodesand should be kept as low as possible. Figure 11 showsthe measured false positive rate, as a function of the sizeof the malicious population, for various dimensionality ofthe coordinate space. Note that these curves depend on theperformance of the test only, and not on the activities ofthe malicious nodes. Also, note that as the population ofmalicious nodes increases, the corresponding population ofhonest nodes decreases, so an upward trend actually cor-responds to fewer wrongly denied certification requests tohonest nodes. With a false positive rate lower than 6% in allcases, our test can be considered as moderately, and accept-ably, aggressive.
In light of the evaluation results presented in this section,we conclude that our proposed test for coordinate verifica-tion exhibits good performance and is fit for purpose.
3.2 Certificate Validity ComputationAfter the correctness of a node’s advertised coordinates
has been asserted, the next step is to issue the node witha certificate proving that the enclosed coordinate has beenverified. This certificate will be delivered by the certifyingSurveyor (i.e. usually the Surveyor closest to the node in thecoordinate space, see sections 2.4 and 3.1.2).
As a coordinate certificate is associated with a particular
1 2 3 5 10 20 30 40 50 75 1000.01
0.015
0.02
0.025
0.03
0.035
0.04
0.045
0.05
0.055
0.06
% of malicious nodes (log scale)
Fal
se P
ositi
ve R
ate
2d
3d
5d
2d + Height
Figure 11: Self Isolation: False Positive Ratio.
position in the coordinate space that the node occupies or hasoccupied, one could expect that nodes request new certifi-cate on moving to a new position. While this is certainly thebehaviour anticipated from honest nodes that are interestedin being able to prove their true position, malicious nodesmight decide not to do so. Indeed, a malicious node is prob-ably much more interested in faking its true position, anddoing so with a certificate “proving” a position which isn’treally its own, whatever this coordinate might be, is probablya bonus for such a node. While the coordinate verificationprotocol described in section 3.1.2 has been designed to pre-vent, as much as possible, malicious nodes from acquiringcertificates for fake coordinates that they may choose, theproblem of nodes using certificates for positions that havemeanwhile changed, is still to be addressed.
The obvious way to solve this “stale” certificate problem,is to assign a reliability to the certificate. The reliability ofthe certificate decreases with time from its issuance time.When it crosses a certain thresholdpth the certificate shouldbe invalidated and eventually reissued. There is a trade-off between certificate precision (and therefore security)andfrequency of coordinate certification that is controlled bythereliability pth. Using larger value ofpth, leads to higher re-liability for certificates but at the cost of frequently reissu-ing certificates that are still valid. On the other hand lowerpth results in lower reliability, but also reduces the load onSurveyors who would receive certificate requests less fre-quently. The issue here is really to find the right trade-offbetween scalability (by limiting the rate or amount of certifi-cate requests) and security (by limiting the time lapse duringwhich a malicious node may be able to use an old certificateafter its coordinate has changed). We will therefore seek toexploit the results on coordinate inter-shift times presentedin section 2.3 to compute certificate validity periods.
Note that this section assumes that all nodes in the systemare “loosely” time synchronized: since coordinate inter-shifttimes have been shown to take values that are usually mea-sured in minutes (see section 2), as long as all clocks are syn-chronized with an accuracy exhibiting a smaller timescale(say a few seconds), the notion of time in the system canthen be considered unique. This time synchronization caneasily be obtained through using NTP (at least about survey-
8
ors).
3.2.1 Principle
The problem of computing a validity period for coordi-nate certificates can be formalized through reliability theory.Let’s define the survival function of the coordinate of nodei as the probability,Si
T0(∆) = Prob
{
T i > T i0 + ∆
}
, thatthe next change of coordinate occurs later than∆ time unitsafter the last coordinate change, happening at timeT i
0. Thesurvival function is thus related to the inter-shift time cumu-lative distributionF i(∆) = Prob
{
T i ≤ T i0 + ∆
}
throughSi(∆) = 1 − F i(∆).
Recall from section 2.4, that the inter-shift times observedat a Surveyors are similar to those observed at nearby nodes.Hence, the inter-shift time distribution at a certifying Sur-veyor is the distribution used to compute the validity of thecertificates it issues (since it issues certificates to the nodesthat are closest to it than to any other Surveyors).
The survival function can be used to compute the validityof a certificate, that is the time remaining until the next coor-dinate change. The probability that the next position changeoccurs at or before timeτ + ∆, given that the certificate isbeing issued at timeτ is just:Prob
{
T < τ + ∆|T > τ}
=Prob
{
τ < T < τ + ∆}Prob
{
T > τ}
= 1 −Si(τ + ∆ − T i
0)
Si(τ − T i0)
In fact, we use the above probability, computed at a Sur-veyor whose survival function and last coordinate changetime areSi(∆) and T i
0 respectively, to estimate the lapseof time until the next position change of the node request-ing the certificate. In other words, the assumption here isthat network conditions for nodes that are close to each othershould change in a synchronous way. However, due to theasynchronous nature of embedding steps at different nodes,their respective coordinates will not all change at the sametime, but we take as “reference” time, the moment when theSurveyor is expected to see a change in its coordinate.
In section 2.3, we showed that most nodes follow a log-normal or Weibull distribution. Depending on which distri-bution each surveyor node is observing (computing the like-lihood at each embedding step), the above formula have asimple form for these two distributions.
For lognormal Inter-Shift distribution we will have:
S(∆) = 1 − Φ(ln ∆
σ)Prob
{
T < τ + ∆|T > τ}
= 1 −1 − Φ(
ln(τ+∆−T i0)
σ)
1 − Φ(ln(τ−T i
0)
σ)
where the functionΦ(.) is the complementary error functionandσ is its shape parameter of the lognormal distribution.
For Weibull distributions we will have:
S(∆) = 1 − exp(∆γ)Prob{
T < τ + ∆|T > τ}
= 1 −1 − exp((τ + ∆ − T i
0)γ)
1 − exp((τ − T i0)
γ)
whereγ is the shape parameter of the Weibull distribution.The validity time of a certificate,∆, is then computed by
settingProb{
T < τ + ∆|T > τ}
= pth, wherepth isthe chosen reliability of the estimate (i.e. the long-term pro-portions of validity periods that will expire before the corre-sponding coordinate change).
The certificate then consists in the verified coordinate, thetimestamp of the certificate creation, the validity period∆of the certificate, as well as the identification of the node thecertificate is delivered to (i.e. IP address). The certificate isthen signed by the the certifying Surveyor using appropriatecredentials and encryption keys and issued to the node.
3.2.2 Evaluation
To evaluate the effectiveness of our certificate validity com-putation, we study the over-estimation resulting from eachcertificate: for each certificate issued, if the correspondingnode moves before its current certificate expires, we recordthe residual time left on the certificate. This over-estimationis an important security parameter, as it is the lapse of timea malicious node could use a “stale” certificate.
Figure 12 shows the CDF of over-estimation times whenthe certificates are issued by either the closest Surveyor ora Surveyor chosen at random. We can clearly see that mostcertificates will not outlive their corresponding coordinatesby more than 2 embedding periods in the case where theybare delivered by the closest Surveyor. This is a good result,as many a time, coordinate changes in such timescale willbe “localized” in space. The figure also confirms that theaccuracy of the validity periods, as thus the security of thesystem, is improved if coordinates are certified by nearbySurveyors.
Scalability is also an important factor for any certificationscheme. Although under-estimation of the validity period ofcertificates does not pose any security issue for the system,it does tend to increase the load on the system, and on theSurveyors in particular. Obviously, the higher the probabil-ity threshold used to compute the certificate validity time,the shorter this time will be. We therefore measure the meanvalidity period over all certificates for various values of theprobability threshold. Figure 13 shows the correspondingaverage certification rate, which is the inverse of the meanvalidity period. The average certification rate gives the av-erage number of certification requests that will be issued pernode and per time unit (here the embedding period) to thesystem. This number, multiplied by the number of nodes inthe system, and divided by the number of Surveyors and theembedding period gives a certificate request rate per secondat each Surveyor.
Figure 13 shows that the average certification rate increases
9
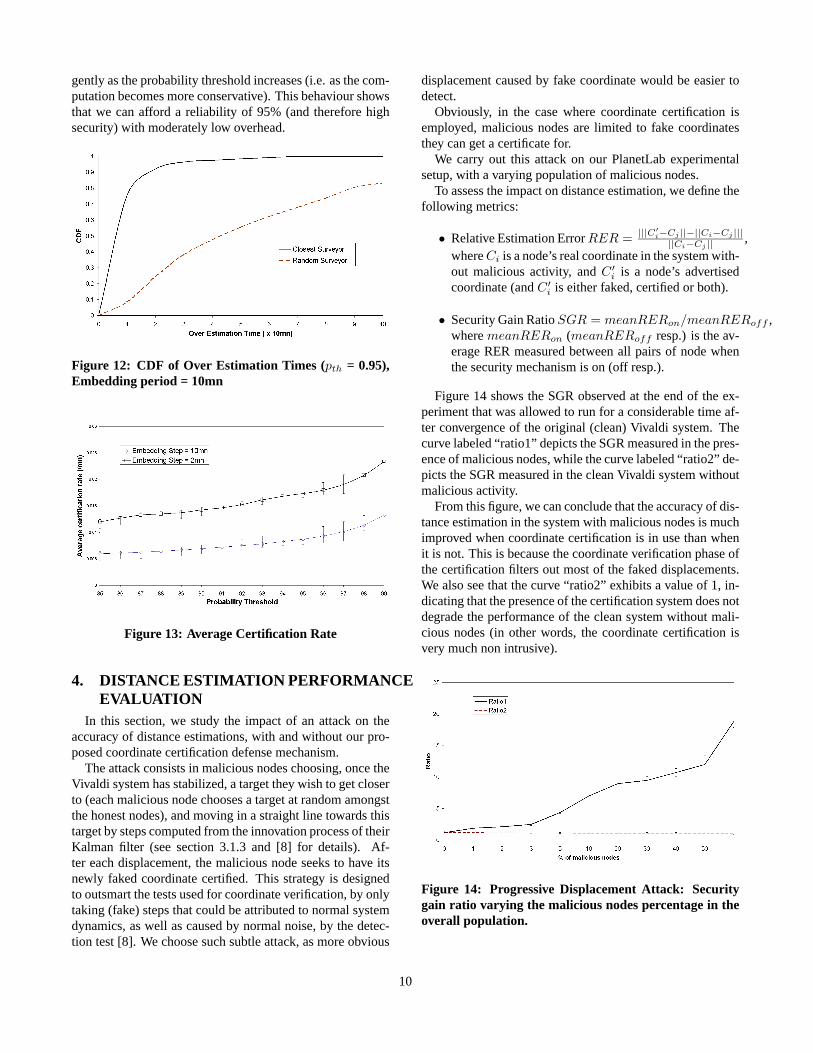
gently as the probability threshold increases (i.e. as the com-putation becomes more conservative). This behaviour showsthat we can afford a reliability of 95% (and therefore highsecurity) with moderately low overhead.
Figure 12: CDF of Over Estimation Times (pth = 0.95),Embedding period = 10mn
Figure 13: Average Certification Rate
4. DISTANCE ESTIMATION PERFORMANCEEVALUATION
In this section, we study the impact of an attack on theaccuracy of distance estimations, with and without our pro-posed coordinate certification defense mechanism.
The attack consists in malicious nodes choosing, once theVivaldi system has stabilized, a target they wish to get closerto (each malicious node chooses a target at random amongstthe honest nodes), and moving in a straight line towards thistarget by steps computed from the innovation process of theirKalman filter (see section 3.1.3 and [8] for details). Af-ter each displacement, the malicious node seeks to have itsnewly faked coordinate certified. This strategy is designedto outsmart the tests used for coordinate verification, by onlytaking (fake) steps that could be attributed to normal systemdynamics, as well as caused by normal noise, by the detec-tion test [8]. We choose such subtle attack, as more obvious
displacement caused by fake coordinate would be easier todetect.
Obviously, in the case where coordinate certification isemployed, malicious nodes are limited to fake coordinatesthey can get a certificate for.
We carry out this attack on our PlanetLab experimentalsetup, with a varying population of malicious nodes.
To assess the impact on distance estimation, we define thefollowing metrics:
• Relative Estimation ErrorRER =|||C′
i−Cj ||−||Ci−Cj |||||Ci−Cj ||
,whereCi is a node’s real coordinate in the system with-out malicious activity, andC ′
i is a node’s advertisedcoordinate (andC ′
i is either faked, certified or both).
• Security Gain RatioSGR = meanRERon/meanRERoff ,wheremeanRERon (meanRERoff resp.) is the av-erage RER measured between all pairs of node whenthe security mechanism is on (off resp.).
Figure 14 shows the SGR observed at the end of the ex-periment that was allowed to run for a considerable time af-ter convergence of the original (clean) Vivaldi system. Thecurve labeled “ratio1” depicts the SGR measured in the pres-ence of malicious nodes, while the curve labeled “ratio2” de-picts the SGR measured in the clean Vivaldi system withoutmalicious activity.
From this figure, we can conclude that the accuracy of dis-tance estimation in the system with malicious nodes is muchimproved when coordinate certification is in use than whenit is not. This is because the coordinate verification phase ofthe certification filters out most of the faked displacements.We also see that the curve “ratio2” exhibits a value of 1, in-dicating that the presence of the certification system does notdegrade the performance of the clean system without mali-cious nodes (in other words, the coordinate certification isvery much non intrusive).
Figure 14: Progressive Displacement Attack: Securitygain ratio varying the malicious nodes percentage in theoverall population.
10

5. CONCLUSIONSIn this paper we have presented a coordinate certification
method to protect the distance estimation phase of InternetCoordinate Systems from nodes lying about their coordinate.This work thus complements our previous work on Coordi-nate System embedding phase security [8].
The proposed certification method is based on a coordi-nate verification method, along with a validity period esti-mation for the corresponding certificate. This method hasbeen shown to be effective, enjoying good verification testperformance (high true positive detection rate with low falsepositive rates), while achieving a very good trade-off be-tween scalability and security. Indeed, the validity periodsof certificates are rarely over-estimated, while they stilldonot trigger too frequent re-certifications.
The reader should note though, that a node knows when itsnext embedding will occur, and thus when its coordinate islikely to change. A malicious node could exploit this knowl-edge to seek to obtain a certificate (for its current coordi-nate) just before performing this embedding, as this couldleave such node in possession of a certificate for a soon tobe outdated coordinate. To palliate this problem, one couldenvisage that Surveyors carry out “spot check” on the valid-ity of a node’s certificate: if the certified coordinate failsanew coordinate verification test, the node is “penalized” forusing an outdated certificate.
Although this paper focused on Vivaldi for measurementsand experimentations, the method proposed for coordinatecertification is independent of the embedding protocol used.This because the malicious embedding neighbour detectiontest that forms the basis of the coordinate verification is it-self independent of the specifics of the embedding protocol,and because the validity period computation only depends onobserved coordinate inter-shift times. Our proposed methodwould then be general enough to be applied in the context ofcoordinates computed by other Internet coordinate systemsthan Vivaldi.
Finally, regardless of the accuracy of Internet coordinatesystems, we believe that securing them is a necessary con-dition to their deployment. Indeed, without security of boththe embedding and distance estimation phases, simple at-tacks have been shown to easily and seriously disrupt thesesystems and reduce their utility to next to nothing. This pa-per thus complements previous work on embedding phasesecurity [8] in this important security mission.
6. REFERENCES[1] T. E. Ng, and H. Zhang,Predicting internet network
distance with coordinates-based approaches, inProceedings of the IEEE INFOCOM, New York, June2002.
[2] M. Pias, J. Crowcroft, S. Wilbur, S. Bhatti, andT. Harris,Lighthouses for Scalable DistributedLocation, in Proceedings of International Workshop onPeer-to-Peer Systems (IPTPS), Berkeley, February
2003.[3] M. Costa, M. Castro, A. Rowstron, and P. Key,
Practical Internet coordinates for distance estimation,in Proceedings of the IEEE International Conference onDistributed Computing Systems (ICDCS), Tokyo,March 2004.
[4] T. E. Ng and H. Zhang,A Network Positioning Systemfor the Internet, in Proceedings of the USENIX annualtechnical conference, Boston, June 2004.
[5] F. Dabek, R. Cox, F. Kaashoek and R. Morris,Vivaldi:A decentralized network coordinate system. InProceedings of the ACM SIGCOMM, Portland,Oregon, August 2004.
[6] Y. Shavitt and T. Tankel,Big-bang simulation forembedding network distances in euclidean space, inProceedings of the IEEE INFOCOM, San Francisco,April 2003.
[7] R. Zhang, Y. C. Hu, X. Lin, and S. Fahmy,AHierarchical Approach to Internet Distance Prediction,In Proceedings of the IEEE International Conference onDistributed Computing Systems (ICDCS), Lisboa, July2006.
[8] M. A. Kaafar, L. Mathy, C. Barakat, K. Salamatian,T. Turletti and W. Dabbous,Securing InternetCoordinates Embedding Systems, in SIGCOMM 2007.
[9] L. Mathy et al.,Impact of Simple Cheating inApplication-Level Multicast, In Proceedings of Infocom2003.
[10] A. Walters, D. Zage and C. Nita-Rotaru,MitigatingAttacks Against Measurement-Based AdaptationMechanisms in Unstructured Multicast OverlayNetworks, In Proceedings of ICNP 2006.
[11] R. Zhang, C. Tang, Y. C. Hu, S. Fahmy and X. Lin,Impact of the Inaccuracy of Distance PredictionAlgorithms on Internet Applications, an Analytical andComparative Study, In proceedings of Infocom 2006,Barcelona, April 2006.
[12] J. Ledlie, P. Gardner, and M. Seltzer,NetworkCoordinates in the Wild, In Proceedings of NSDI,Cambridge, April 2007.
[13] A. W. Moore et al.,Median Filtering for Removal ofLow- Frequency Drift, Analytic Chemistry, pp. 65:188,1993.
[14] Y. Zhang, N. Duffield, V. Paxson, and S. Shenker,Onthe Constancy of Internet Path Properties, inProceedings of ACM SIGCOMM InternetMeasurement Workshop, San Francisco, November2001.
[15] G. R. Shorack and J. A. Wellner,Empirical ProcessesWith Applications to Statistics, John Wiley&Sons Inc,1986, p.976.
[16] H. Zheng, E. K. Lua, M. Pias, and T. Griffin,InternetRouting Policies and Round-Trip Times, in Proceedingsof the Passive Active Measurement (PAM), Boston,March 2005.
11
[17] E. K. Lua, T. griffin, M. Pias, H. Zheng, andJ. Crowcroft,On the accuracy of Embeddings forInternet Coordinate Systems, in Proceedings of InternetMeasurement Conference (IMC), Berkeley, October2005.
[18] M. de Berg, et al.Computational Geometry,Algorithms and Applications, Springer 2000.
12