census of india 1981
TRANSCRIPT
'ifl ~ (1 cfit \lIj r;PI Q,,,,, I 981
CENSUS OF INDIA 1981
1989 'q)I" Q' +1i), ¥ ~ +1«41. ... 1
OCCASIONAL PAPER No.1 of 1989
q f~::C=l1 '( ctr me=t '( d I ,
~ ~ Ql;fl,
~'i1#i ~
.~ il~I<1'4 ~an:t
Household Literacy, Drinking Water,
Electricity and
Toilet Facilities
""'3T~~ ~ ct q~I<f;:;:tf?l{ q:;r ~Cf>~ltI~f~~4
rrt~
DEMOGRAPHY DIVISION OFFICE OF THE REGISTRAR GENERAL, INDIA
MINISTRY OF HOME AFFAIRS NEW DELHI
CONTENTS
Preface
Household Literacy, Drinking Water, Electricity & Toilet Facilities
Annexure-I
Annexure-II
TABLES
Table 1:
Table 2:
Table 3:
Table 4:
TableS:
Table 6:
Table 7:
Tables 8:
Table 9:
Table 10:
Chart-I:
Chart-2:
Chart-3:
Chart-4:
Chart-5:
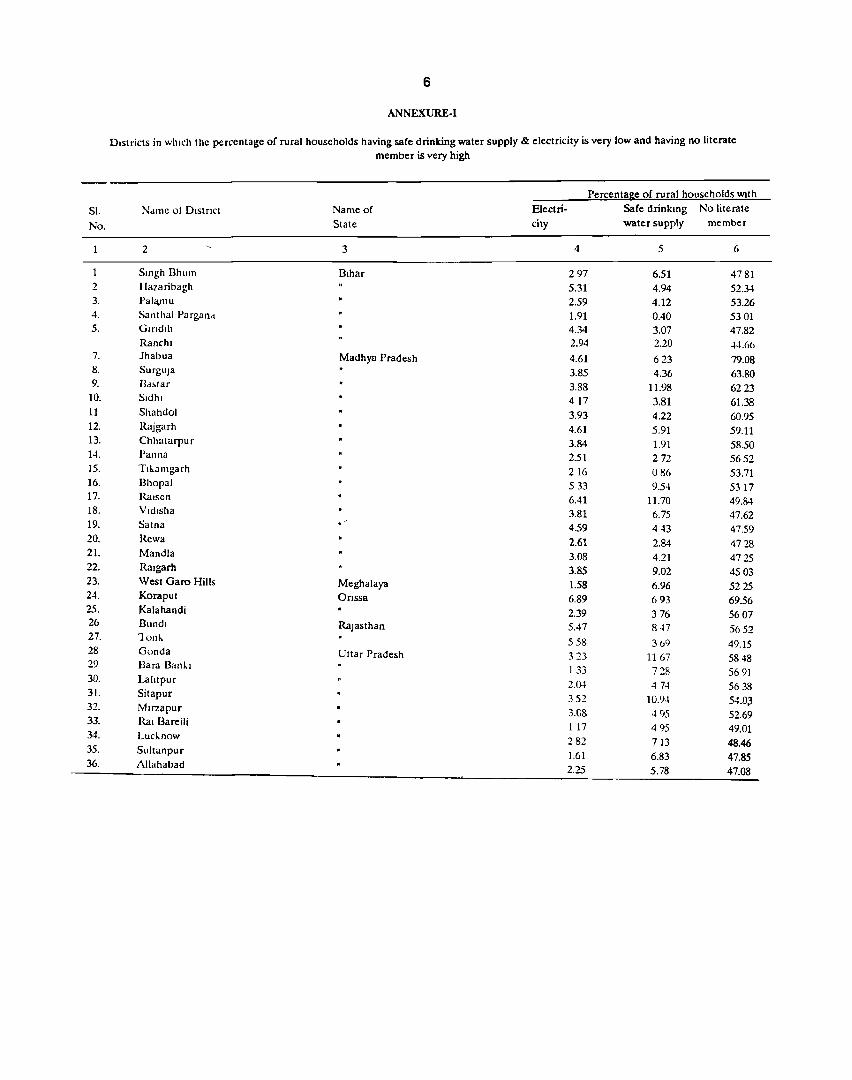
Districts in which the percentage of rural households having safe drinking water supply & electricity is very low and having no literate member is very high.
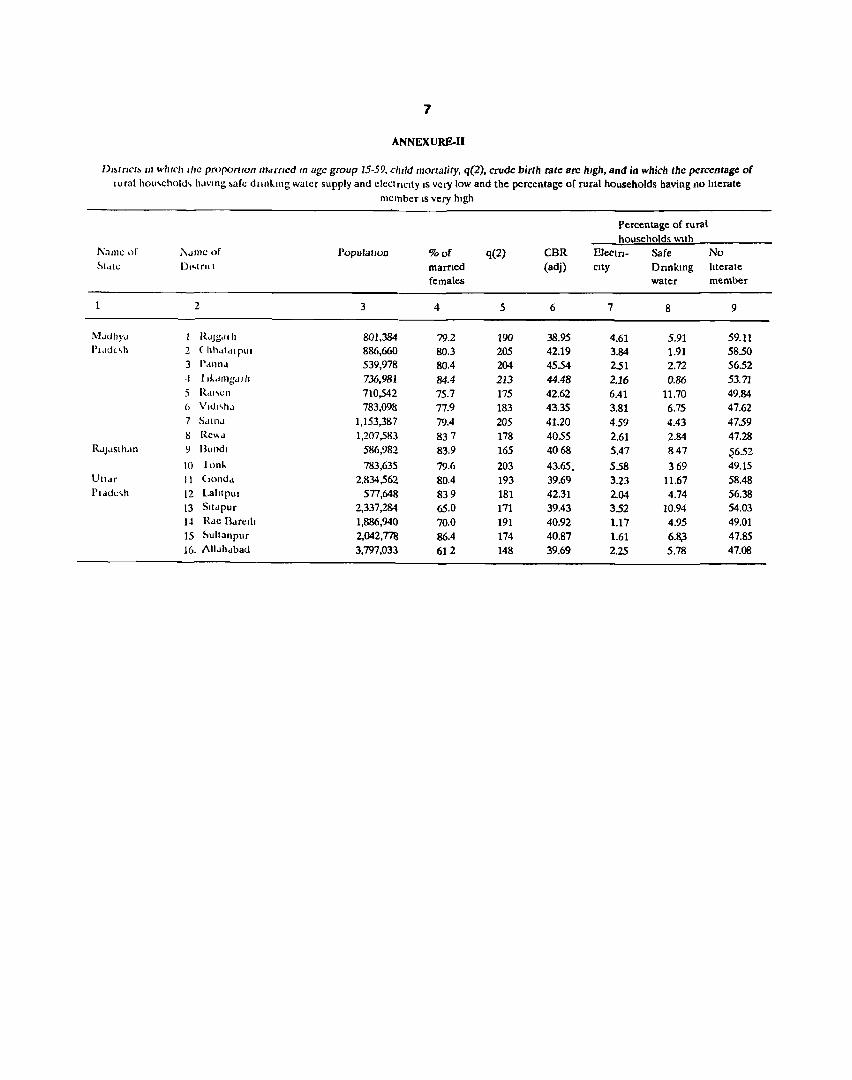
Districtics which the proportion married in age group 15-59, Child mortalitym q(2) .;:rude birth rate are very high, and in which the percentage of rural households having safe drinking water supply and electricity is very low and the percentage of rural households having no literate member is veri: high.
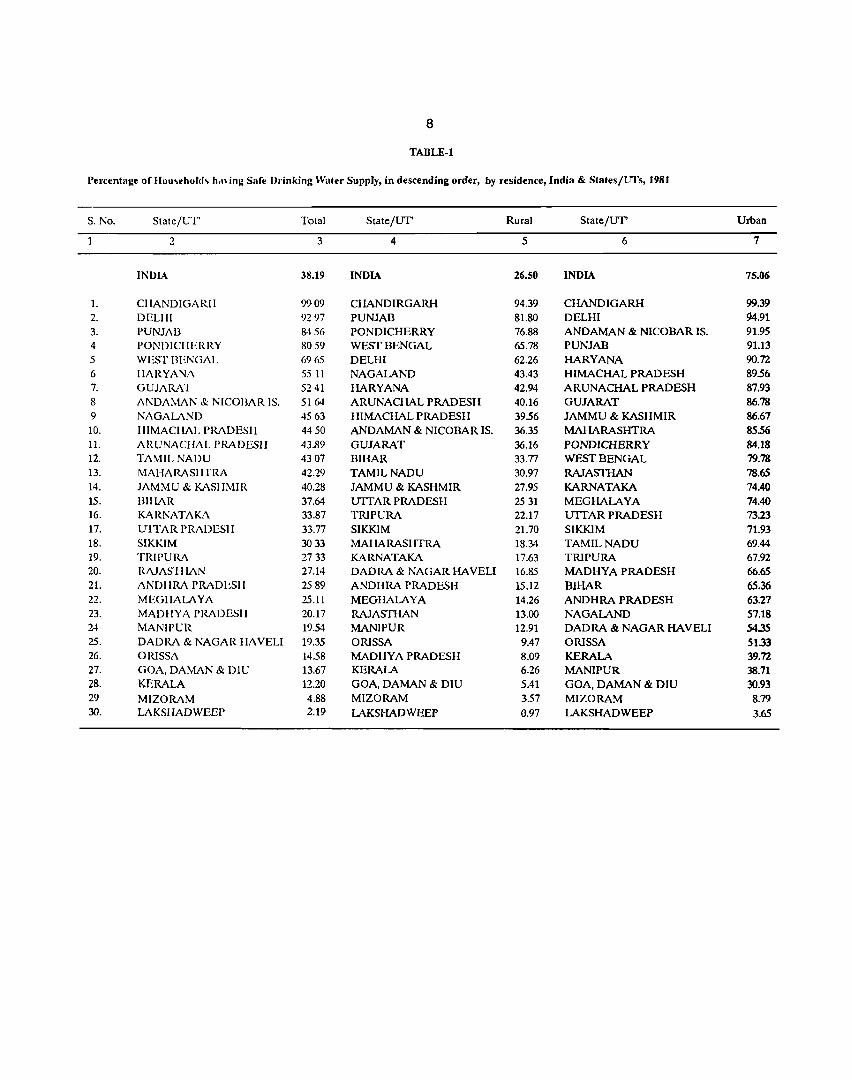
Percentage of households having Safe Drinking Water Supply in descending order, by residence India & States/Union Territories 1981.
Percentage of Households having electricity, in descending order, by residence, India & States/Union Territories 1981.
Percentage of Households having no literate member in descending order, by residence, India & States/Union Territories 1981.
Percentage of Households having Toilet facilities in descending order, in Urban India & State/Union Territories 1981.
Percentage of Households having Electricity, Safe Drinking Water Supply & Toilet facilities and no literate member by State/Union Territories 1981.
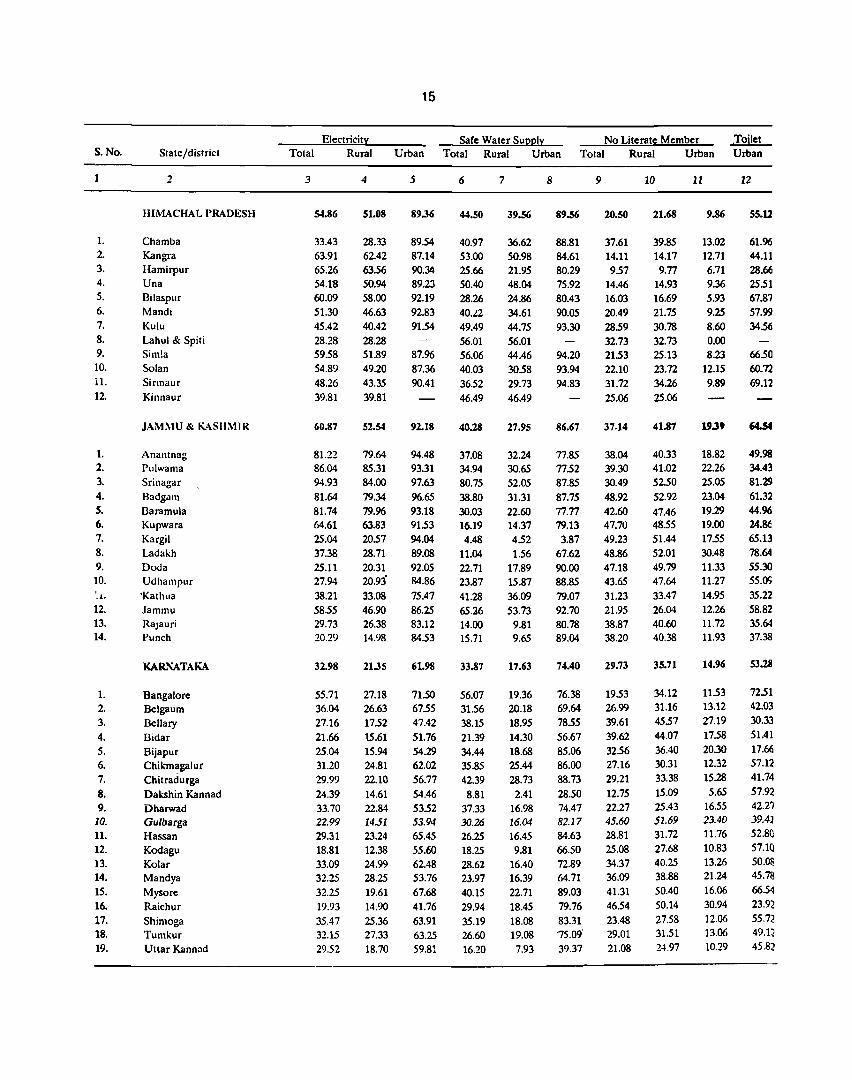
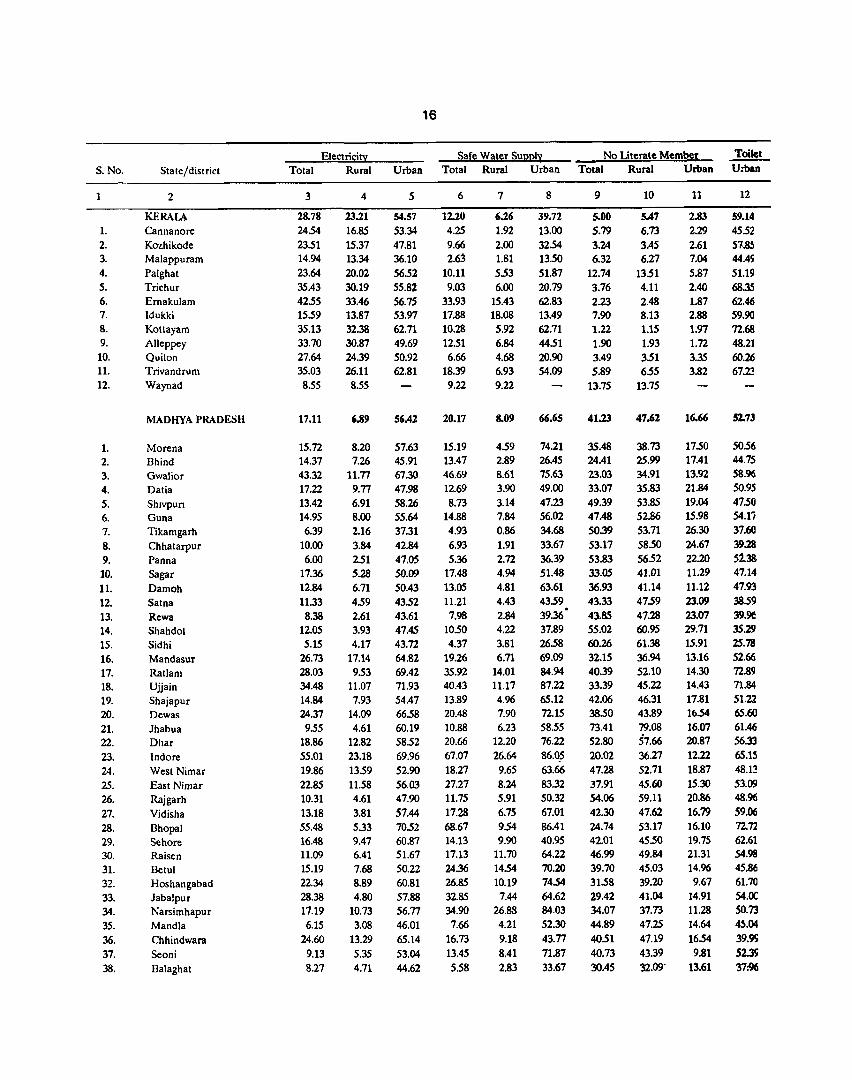
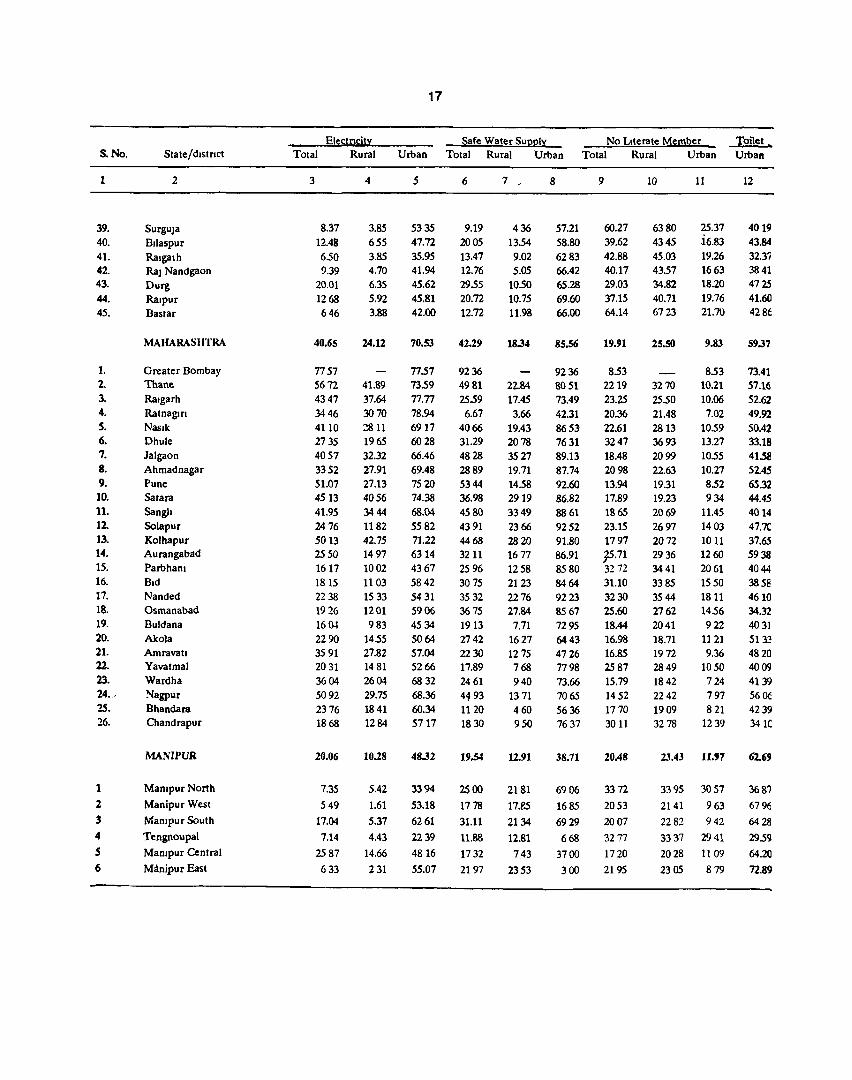
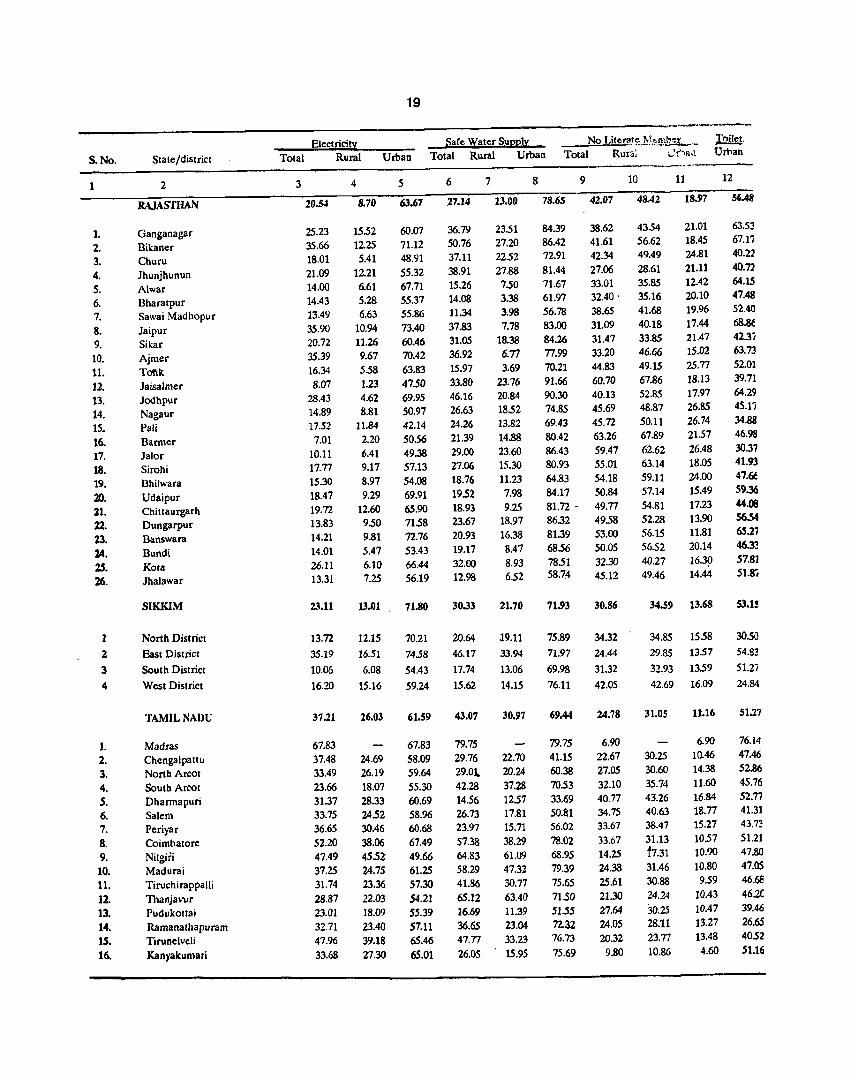
Percentage of Households having Electricity, Safe Drinking Water Supply & Toilet Facilities and No Literate Member by States/Union Territories 1981, districtwlse.
Percentage of Households having Safe Drinking Water Supply, in descending order by district - 1981 - Rural
Percentage of Households having electricity, in descending order, by district Rural.
Percentage of Households having No Literate Member, in descending order by district -Rural.
Percentage of Househo.lds having Toilet facilities, in descending order, by districtUrban.
Source of Drinking Water Supply in ru{al areas-India, 1981.
Percentage of Rural Households having Safe Drinking Water Supply-India and major states, 1981.
Percentage of Rural Households having Electricity-India and major states, 1981.
Percentage of Rural Households having No Literate Member-India and major states, 1981.
Percentage of Urban Households having Toilet Facilities-India and Major States, 1981.
Officers and Staff Associated with this Report.
Pg.
(I)
1-5
6
7
8
9
10
11
12
13-22
23-28
29-34
35-40
41-46
47
48
49
50
51
52
RHflCI"f'
1981 c#it "1'1 'I 01'11 -q- qftcmJ -q- m:cm: ~ -q- qr.ftr> tfI'lT, ~ am: ~ n:qI€1~ ~marr c#it ~am c(; ~ -q \itr'1Cf>1 ~ ~ <tt 7ft ~, l( n:ql <1~ ~m* worrar 11"!f'1'" ~ ~ e)?IT it gr ~ <n:rr ~ I W m ~ ~ CI?T qfum- (11 <fOlm ar~ llfto-6 alh: llfto-7 it ~ f$trr ~ ~ I ~ 'Ell '(ol1m c(; ~ , ~ ~ Ilfto-I I it mcmT CI?T 3l'T<fiT<" 3ftt mm-~ <tiT ~ cf; ~ t;j'fu ~ ~ ~ ~ I ~"'EiT('Uft~"Trf ~ <tiT m f.t 4,1 <1 '11 ~ ~f;r;;it m '4T ~ meR"'1tI~ I ~ 111m
~ 0 •
CR it -:;mt ~ ~ tt ~ 'Ell '11f"'1C13 alh: ~ ~ t fc:rffl CR ~ ~'>f it f$ m<m: -qr.r cf; rt 3l'h" m&r<m ~ar I41WI1I4i1 nr~ q-{ ~ Cif<1" ~ W ~ I qf«m- iql <fOl41lt ~ ~ cf; Tmt ~u ~ ~ w tz<I?m~ fm;rrCR:~~~ I~ ~ ~~cf;~~it~fcf;"llpmT~1 ~<it~~cA-cF~~it~~~1fllT~1 ~'ElI<fOllil cf;m~tz<I? ~ ~ '4T ~ <rt ~ ~ 'El'4RlIIOj_<1if etsiT 1R 'SrcPT!fT m<1T 1fllT ~I 3IT!fTT g f$ <:rg ftqTi ~U(i ~ it ~ ~ t1hr'1r -Rllfur cF ~ ~ ~ fu";g m<ft I
1:fg ftq1i ~ 3f~'l'l111T it ~ m cf; ~ '1C!,(I\i1'1, mnr cF \3q A6J<f\ltf?J( 3l'h" m 3fI1: cF Tfr, "J1rmmF \i1'1'I OI'1I'ct>r.r
mu ~'$t 'lTt~ I w~ 'SrcPTrr.=f q,11Jl i.f>1f\mf~ tf; ~~~ ~~ ~ I ~ ~ fli (f\:ljl~' q:;T ~ if)t:'"1 c!'( 'Cfl:~ rn cf; fuQ: m ~ c(; q,1-!IT<1' ~ ~ m am: -;;IT 'U\i1<1, 3IT!( !Aftl CI3 imT ~ ~ 1Jl1'rnT<tiT '4T ~ 'CI3"<m ~ I '# w f1;iIt it 'Elft:'1f'&i(l
"fRl CI?T ~ ~ cf; ~ ~o* c(; U<T, "J1r '4gl<Mf?l< (~) ct>T '4T 3fT~ ~I II W 'SrcPT!fR <it ~ c(; m~ ~ CRFt *'" ~~ m cf; ~ m oft qr ~, ~ ~ (~) ct>T m 3fT~ ~I ~ ~ ~ m <t&JII'1R: ~, ~ ~ (-u lIT) c(; lOI"r~!ff'1 it ~ aq'l1T1f grn ~ 1fllT I
rrt~ 2~, 1989
(cft'~ ~) \1rof c(; ¥i ~I <fJl fS!1 '(
PREFACE
In the 1981 census, information was collected from the households in the Household Schedule regarding availability of drinking water supply, electricity and toilet facilities. The question on toilet facilities was canvassed in urban areas only. The data thus collected have been presented in Household Tables HH-6 and HH-7. In addition to these tables, Household Table HH-ll cross classifies households by size and number of literate members. From this table, it is possible to work out the number of households in which no member is liter"lte. Together, these 4 indicators are very useful social and economic indicators, particularly in the context of the government's stress on technology missions on drinking water supply and literacy. The data available in the household tables for these indicators have been brought together and presented herein fof all the StatesjUTs and districts. The districts have also been arranged in descending order of these indicators. A short note accompanies these tables highlighting the problem areas. It is hoped that this report will serve a useful purpose for district level planning in the conc~rned areas.
This report has been prepared by Shri K.S. Natarajan, Deputy Registrar General, India, and Shri R.K Puri, Deputy Director of Census Operations in the Demography Division. My thanks are due to them for bringin~\ out this useful publication. I am happy to place on record my appreciation of the efforts put in by Shri H.K. KlU"h;:,l, Investigator and Shri R.G. Rajan, Stenographer in bringing out these tables on the Personal Computer. I am also thankful to Dr. B.K Roy, Deputy Registrar General, India (Map) for preparation of the charts included in this report.
I am thankful to Shri B.P. Jain, Deputy Director of Census Operations, Printing Seclion, for arranging th-: printing of this publication very quickly. The Hindi Translation of this report has been done by the Hindi Divisior. under the guidance of Sh. KN. Pant, Dy. Director.
New Delhi January 2, 1989
(i)
(V.S. VERMA) Registrar General, India
qf.(ql if rtf In"~, ~ CR~, ~ ... \Oft m ~ih .. (ltq ~mtt
1981 cit ",,,,11111"11 ciT11ftcm" ~-q~ "''11101'111jf!f'''1''~ ,*m~-m~~~,*1IT1TI1l~~~-q'~ ~~mrq;t)flR'm-71T! ~I ~ ~((;~~i;.f~cft~((;m-q~~~~v)-I ~~1ffOf9q>T ~!:J (q;)1fr;?tcf;l:fRTcf;~, (l9)~~~:mrr am:(lT)~~-q !!n:qg'lll Wc:n-JTarr~~mrrof;m~ 'IT 1 ~~~ 1981 <t'r '" '" II 01 "11 -q ~ om- m-lfl! ~ I "1fr;?t <J;T l:fRT" ~ m ~~~ '1 t\ 'fCt'! of 1jf!!"if 'IT ~ mcm- irrU 1lTlfTur~-q'
1fr;?t of; l:fRT<t'rWraw~!:J~,*~~~ ~~1l"!J;tl ~ ~-q~~irrU~~~~~ anq;it <J;T fi:w~qol ~ 11m t I ~ ~ of; 'l'I<T II 1l ~ -q' m ~ 64mli,' of; -ant -q'~ ~ ~ ~ <a114i~d ',I ~cf;~m-~<t'r~cf;.m--q"'I'1q;I~~!:Jq;u;t,*~~arrtm:~"~"~atVR<it~<aI(ufJ"I~~ 11m t I Bn'I" tr If 'IlT«f ~ ~ merorr '* ant -q ~ c;fto:J ii1leA fimof cit ~~ * t I ~ ~~ 11m t f<¥ ~ VR ~ irrU ~!:J ~ TIt "'I'1Q;lfI -;m ~ cf; ~ cwtT 'lel'fCt,!uf tmr MI
1fr;?t cf; qr;ft cf; ~ ~Ur 1flf"f <it ~ Wl'll ~ ~ ~ 11m 1flIT ~ f<¥ qftcm: 1fr;?t CR -qr;ft ~ ~ ~ mn 'IT 3f¥ffi:r~ ~'<bTqr;ft~~it~~m~~m~~/~(V!"'"'k)it'lIT~/<W-~m~~'lIT~~W<l~I~~~ ~~PTm'ITf<¥~~CR~~-q~~a-"lTm~cf;~1 r.:.!!~t1olof;~of;~~~*~eft"f<¥~~ cf; ~ q;f am: ts q-P:f /C¥ <h'I" it ~ ~ qr;ft <it tr ~ ~ '<bT ~ lfAT \ill' ~ ~ I ~ amr ~ ~ ~ ~ ~ f<¥ ~ t ~ -q ~arr tr ~ cf; qr;ft '<bT W<1 it ~ ~ f4:ll qQ;< ~ ~ '<br<rr<1T "itT ~ ~ 'IT I ffi of; ~ ~ ri ~ !!1t14>( ~-tt ~ -q itm tr itm t I Cf~, ~ cf; ~ cf; ant.q 3lf)rq; ~~!:J '1' ~ cf; ~ ~ '$ ~<it~~'4>T~~1I'AT 1TliT1 ~h~~~ vnr1'it~~1 ~~<it~~lI"t\"m1TliTf<¥~it~38%tfficrr<T<it~~~ ~~~u~~~~~'$~~u~m~of;~I'1"I'Tfn:r~.q-75%~<it~~~-q' cf;cn;r 26 5% ~ q;'t 1fr;?t CfT ~ ~~!:J 'IT I ~ 3f~ ~ ~3f1'~ ~ ~~ ~ qf'oo-d <it ~ '4>T m:f&«r qy;t ~u '1'tr ~ ~ 11T1ftuT ehT ~ ('I'1T'llT cfr.r :ql~ -qftcrnf <it ~ '4>T ~ ~ ~a-;;gr 'IT I waft ~~~~~ m~it~(991%)mcmr'<bT~'4>T~tf'IOft~a-'IT' ~~~(93.0%)<J;T~'IT1 ~~!:Jif~ '3("~ &'1111 t ~ ~ w.r ~ ('I'lT'llT rrtT ~ ~ ~ t am: ~ ~ 'U'il'uAT ~ t 1 ~ ~ -q' ~ 1f'i1Tiij' if ~ (84.6%) qftcmTq;f~'4>T~~~g "lT1 \3'W.f;~~~(69.7), ~f<lIlijll (55.1), ~(52.4), dfSt('l'1I~(43.1), '1f1I(I~ (42.3), ~ (37 6), ~ (33.9), ~Wu (33.8), ~"1T'1' (27 I), 3{fi'g'tRu (25.9), lfm~ (20.2)~ (14.6) ~ ~(12 2)CfT~3lTffi~1 22~am:w.r~~-q50%tq;;rqftcmJ<it~Cfl~'Wft~a-'lT~8~1Wn ~ it 50% it 3Jftrq; qhqrd ~ lfT;t q;r ~ 'tJ1'<ft ~a- 'IT'
*m ~~q;m\ill'~~, ~ ~1)' ~~:ql~~<it1fr;?tCfT~~~S';;gr "lT1 ~m~* ~ ~ l{ Slil1!!T cf;cn;r 3.6 am: 8 811ftrmqftcmTeN~~ CfT ~rt~S' ''IT I n~.q-t~~~Q:mmRf 'IT ~,rnrt'I<r ~ l{ 50% ~ ~ q;;r ~ (~ 39%) eN tt fr.t '4>T ~ rt~u 'IT 1 <nIT ~ ~ ~ ~ f<¥ ~ of; ~ <it ~ CfT ~ 'tJ1'<ft '1' ~'* ~ ~ eIarr ~ I ~ am-~, ~, 3fIlS1iT'1' am: f;tq,1 "II < ~ q~'i~, ~ ~ elf<1I1 011 cf; 90% it ~ 3Jfuq; '1'l'rtn:r ~ eN ~ CfT ~ rt~!1 "lT1
ri'ur ehT -q ~~ ~ it ~ t I C® ~'flT cfI;:r ~"1Tt tfficrr<T <it 1fr;?t '<bT mf&rn' qr;fi ~ onff ''IT 1 W ~f1.q 16 mRf/w.r ~~ ~ aftmf it ~ ~~ 14 '(f\jlf /w.r~ ~~ 3lhrcr it~ ~ I ~*~qr;fi*~mtT*-ant ~ U ~ <tit ~~ ~ 1jfCff{?fr ~ (81 8), ~ 'G1f1mf (65 8),t<f~:41 011 (43.4), 1fiJ'(Td' (36.2), ~ (33.8), d~Wtl~
1
HOUSEHOLD LITERACY, DRINKING WATER, ELECTRICITY & TOILET FACILITIES.
In the 11)81 CL:nslI'> Hou~chold Schedule, a number of questions pertaining to the household as unit were can\'as~ed in p,u t I of the Household Schedule alongwith the usual census questionaire. Some of the questions in the Hou~ehold Schcduk pcrtdin to the housing conditions in which the households live. Question 9 of the Schedule rclatcd to (a) ~ourcc of drinking water supply, (b) availability of electricity & (c) availability of toilet facilities in the urban areas. Thc~e tlll cc questions were canvassed for the first time in 1981 census. The question on "Drinking Water Supply" wa~ p,uticularly a crucial question because of the special programmes initiated by the government to provide drin\"'ing \,;aler facilities particularly in the rural areas. In this note, an analysis has been made of the data furnished by these questions up to district level. The Household Schedule Part II contained certain selected data on individuals residing in the household. From these, the question on 'literacy' has also been tabulated so as to provide the information regarding the number of members who were illiterate in the households. Recently, the Government of J ndia has set up a Technology Mission on literacy. It is felt that the information provided by this question may be quite important for that purpose.
Drinking Water Supply:
While canvassing the question on the source of drinking water supply, the household was asked to specify the source of drinking water supply to that household; i.e. whether the household got its drinking water supply from a well or a tap or a hand pump/tube well or a river/canal or a tank or any other source. The househgld was also asked whether the drinking water supply was available to it within the premises or outside the premises. FOi purposes of our analysis, it has been assumed that only tap water and water drawn from the hand pump/tube well could be considered to be safe drinking water. It is emphasised that in a number of cases, well water could also be source of safe drinking water, particularly if the well water is unpolluted. This is the case in many parts of the country particularly in states like Kerala. However, due to lack of further details on the condition of well water, this has not been con~idered as safe drinking water. This limitation has to be kept in view throughout. Using this criterion it is found that only 38% of the households in India had access to safe drinking water supply, whether available within the premises or outside the premises. In the urban areas, this percentage was 75%, while in the rural areas it was 26.5% only. That is, one-fourth of the urban households did not have access to safe drinking water, while in the rural areas, roughly three-fourth of the households did not have safe water supply. Considering all areas, the highest percentage of households having safe drinking water supply was in Chandigarh (99.1), followed by Delhi (93.0). It may be mentioned that these Union Territories are almost purely urban areas and are the capital cities. Among the major states, the highest percentage of households with safe drinking water supply is reported from Punjab (84.6) followed by West Bengal (69.7), Haryana (55.1), Gujarat (52.4), Tamil Nadu (43.1), Maharashtra (42.3), Bihar (37.6), Karnataka (33.9), Uttar Pradesh (33.8), Rajasthan (27.1), Andhra Pradesh (25.9), Madhya Pradesh (20.2), Orissa (14.6), and Kerala (12.2). Less than 50% of the house.holds had safe drinking water supply in 22 states and Union Territories, while in 8 states or Union Territories, more than 50% of the households had safe drinking water supply.
As mentioned earlier, even in the urban areas, one-fourth of the households did not have access to safe wdter supply. In Lakshadweep and Mizoram, the percentage of households having safe drinking water supply even In the urban areas was as low as 3.6 and 8.8 respectively. Kerala was the only major state in whose urban areas, Ic~s than 50% of the households (39% to be exact) had safe drinking water supply. It is worth repeating that part of this may be due to non-inclusion of well water as safe drinking water. On the other hand, in Chandigarh, Delhi, Andaman & Nicobar Islands, Punjab and Haryana, more than 90% of the urban households had safe drinking water supply.
In the rural areas, the position is really critical where roughly three-fourth of the households do not have access to safe drinking water supply. 16 states/Union Territories fell below the national average in this regard while 14
2
(31 0), ~~U (253), 4(':'('tSS.! (18 3), ~(17 6), aws"~(15 I), ~~(l3 0), ~(9 5), lfgp;r~·U(8 I),~ ~ (111)1~, 1i9.4~,~, ~?JR', awS"rot,~,4t<'<ItSS.!~~rot<$1I'1'1ftur~cGt~~-q-l!!fUir *1 '5, ~ ~ cf; ~ 3F"lf &h" ~ ~~ <wtT ~ ~, ifilm ~, 111crr, ~ ~~, ~, ~, ~ an (. '11 q. ~, fuf'ctcp4, ~ 3{t{ ~ ~ I
-rrn;TT I 11 ~ 3{t{ ~ /Wl ~ it \3Of ~ q;r ~ ~ 1'i11 -q-1Ifffif ~ lfm t ~ ~ CR ~rt ~!J ~I m11lft6 it~~ am:~~<$~ anq;t~~1f1Z~I~ ~
f'-.13I4't ?tT~~:
1981 -q- \1mf<$ 26 2~~~~~a-~, ~-q-~921l'ft:rm~~-q-~"(f;4"9mmr ~'GPl~~a- ~I n"<f\ilfrcGt ~STilf-q-~~~1lGPR ~ 'I1'ifTGf(60 9), (':f<lI,OIl (51 5),~(44 8), 4g'(ItSS.!
(406), dl1i<i1"1'~ (37 2), ~ (33 0), ~ (288), "I1~1I~0:s (26 I), awa-rot (21 4), ~GflIT<i1" (21 I), ~?JR'(20 5), ~(17 8), lfafrl"U(J71), ~~(129)~~(9 2)1 ~~-q-lft~625~~'GPltt~ ~a- ~ I ~it~ 96 4% 3{t{~1t~Cf>lf 48 3 ~qftcmT'GPl~~a-~I n~cGt ~Ji1f-q ~'Jftr~m~ ~ (85 4), (':f<lI,oll (82 2), ~(74 4), 4(':'(I~ (70 5), ~?JR'(63 7), ~(62 O),df1:l<i1i1'~(61 6),
~~ (579), 1iW~ (564), ~rot (546), ~(54 6), awa-rot(52 2), ~(51 7) ~~(50.1)1
c:mr afn"~ 14 7%~m<mt'GPl~~a-~~~it~88 0~~'GPl3{t{~1t~ <f"1i 3 5 mm~'GPl iT~~a- ~I ~cGt~mrr<$ ~STilfitn~cGt~~~1lGPR ~ ~(50 6), (':f~lIloll (410) tpr<Rr (30 8), dl1i<i1""~ (26 0), ~ (24 I), ~(23 2), ~(21 4), ~(13 0), awa~(l2 5),
~~ (8 7) qf!0fJ1 ~ (7 0) lfmRU (6 9), ~RU (4 0) 3{t{~ (35), ~,~~, lfa:r~, ~~ ~ ~~ <$ ~ ehT cGt ~~ q'ffif<f it it ~ t ~ 90% -« lft ~ qftcmT 'GPl ~ cGt ~m ~a-~ ~I
~ 2 it ~ 3{t{~/~~ <$~\3Of~ q;r~m ~1'i11it~~lfmt~~~a~ I ~ 6 it ~ 3f<i11T -3f<i11T ~/Wl ~ <$ ~ 1lGPR <$ ~ anq;t ~ ~ ~ ~I
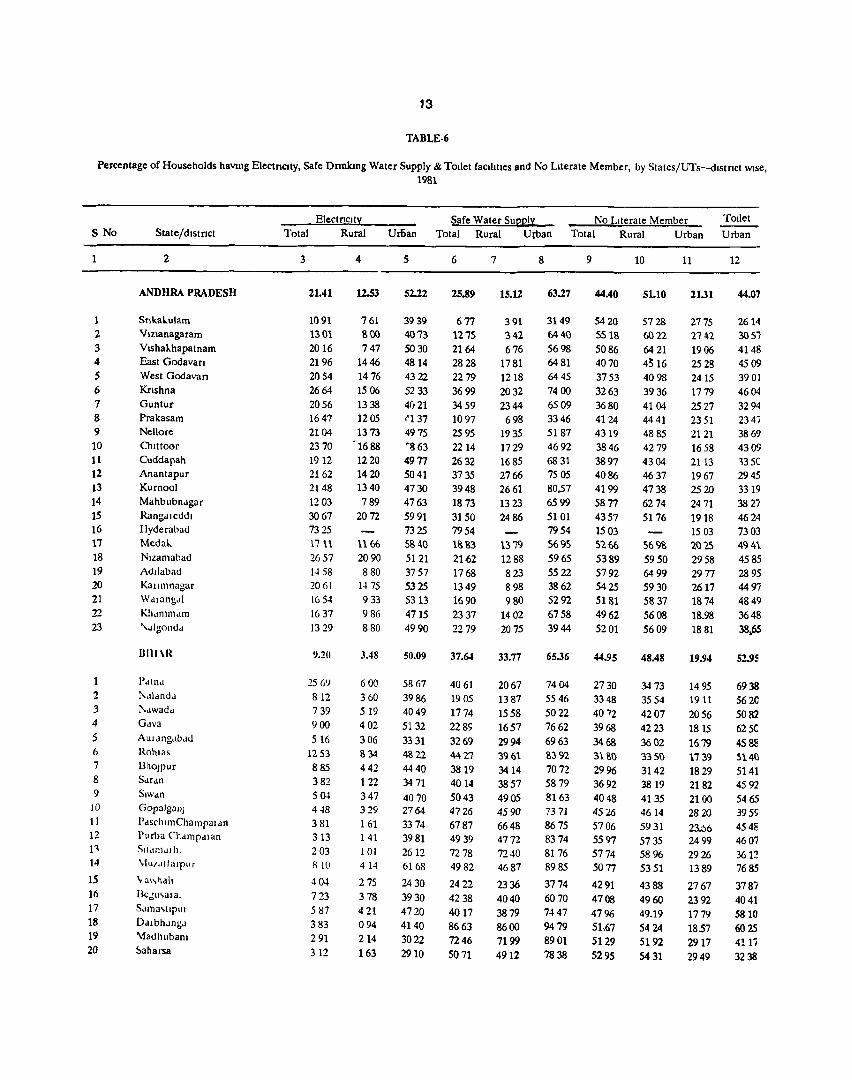
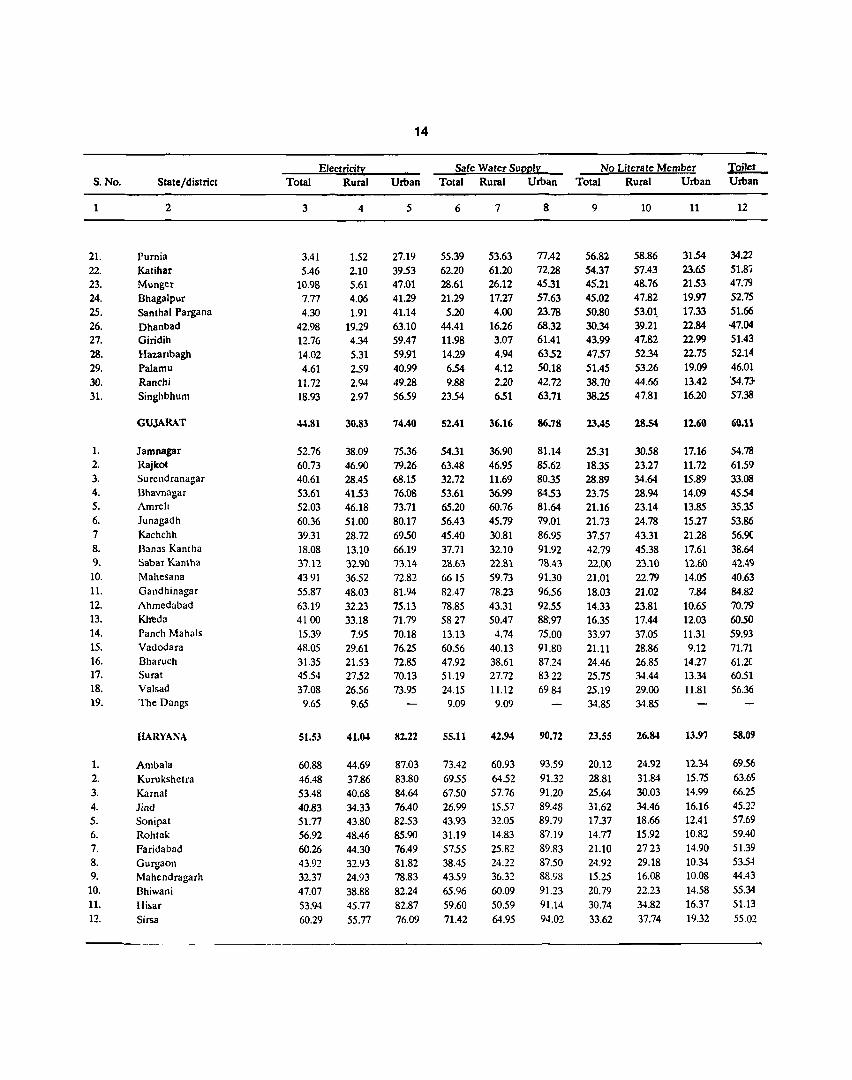
1981 cGt 'JI"IIIO,"I, cGtqftcm-~,(fUl41 cGtm<"Oftmo-I 111'ftcm"CR ~ 3{t{mm:~cGt~<$ anq;t~~tl ~ ~ it ~ 'GPl\3Ofitmm: Ulf1ffi41 cGt ~ <$ ~~~ lfm t I ~~ -«\3Of~cGt ~ CR~:t ~qlJ, f<Fm lflIT t ~ m lft ~ mm: ~ 'IT ~ ~ cGt ~ ~ 'GPl ~ \iIT ~ I
1981 it ~<$'GP'<i1"~<$33%1:fftcm11t~lft~mm:;;ft'IT1 "1"'I'rtTzr ~1t~~ 15 63 'ttl 3j~01l""<i1~ it52%it~~itq;Ttlft~men-;;ft'IT~~itl"ft<"~~5%'tTln~it~~lftmm:~ "Itt 'IT, r:fficmT<$ ~ STilfT1~~1lGPR 'IT ~(45 0), awarot (44 4), "<T'if"f?JR'(42 I), lf9f~(41 2), ~ rRU (40 0) ~ (35 2), ~~ (31 2), ~(29 7), dl1i<i1""~(24 8), ~(24 8), (':f<1I1 1J1l (23 6), 1['iI'mf(23 4), Jig, <I",? (19 9) 3{t{ ~ (5 0), OJ ~01l""<i1~,~, awa~, ~ 3{t{~~, ~~, lfm~, \1m~,~, ~ 3{t{ ~ 3{t{ ~ *it ~ /Wl ~ <$ ~ ~ -« lft 3IfacI; 1:fftcm1-q- q;W lft mm: ~ ~ 'ttl
2
states/Union Territories werc above Lhe national avcrage. The position of the major states, in respect of availability of safe waLer ~upply, is as follows: Punjab (81:8), West Bengal, (65.8), Haryana (43.4), Gujarat (36.2), Bihar (33.8), T dmil Nadu (31.0), Uttar Pradesh (25.3), Maharashtra (18.3), Karnataka (17.6), Andhra Pradesh (15.1), Raja~than (13.0), Ori~~a (9.5), Madhya Pradesh (8.1) and Kerala' (6.3). The position is really bad in the rural areas of Kerc!ld, Madhya Prade~h, Orissa, Rajasthan, Andhra Pradesh, Karnataka, MaharashLra and Uttar Pradesh. Besides these major stales, the other areas with a critical situation are Mizoram, Goa Daman & Diu, Manipur, Meghalaya, Dadra & Nagar Haveli, Sikkim, Tripura and Lakshadweep in that order.
Table 1 presents the percentage of households having safe drinking water supply, in descending order, by residence for India and the various states/Union Territories. Table 6 presents the district-wise data for all the states and Union Territories.
Availability of Electricity:
26.2 percent of the households in India had electricity in 1981, the highest percent being 92 in Lakshadweep and the lowest being 9 in Bihar. The position of the major states, in descending order, was: Punjab (60.9), Haryana (51.5), Gujarat (44.8), Maharashtra (40.6), Tamil Nadu (37.2), Karnataka (33.0), Kerala (28.8), Nagaland (26.]), Andhra Pradesh (21.4), West Bengal (21.1), Rajasthan (20.5), Orissa (17.8), Madbya Pradesh (17.1), UUar Pradesh (12.9) and Bihar (9.2). Even in the urban areas, only 62.5 per cent of the households had electricity available to them, the highest percentage being 96.4 for Lakshadweep and lowest being 48.3 for Manipur. The position of the major states, in descending order, is as follows: Punjab (85.4), Haryana (82.2), Gujarat (74.4), Maharashtra (70.5), Rajasthan (63.7), Karnataka (62.0), Tamil Nadu (61.6), West Bengal (57.9), Madhya Pradesh (56.4), Uttar Pradesh (54.6), Kcrala (54.6), Andhra Pradesh (52.2), Orissa (51.7) and Bihar (50.1).
On the other hand, only 14.7% of the rural households had electricity available to them, the highest percentage being (88.0) for Lakshadweep and the lowest_percentage for Bihar (3.5). The major states, in descending order of availability of electricity, were Punjab (50.6), Haryana (41.0), Gujarat (30.8), Tamil Nadu (26.0), Maharashtra (24.1), Kerala (23.2), Karnataka (21.4), Orissa (13.0), Andhra Pradesh (12.5), Rajasthan (8.7), West Bengal (7.0), Madhya Pradesh (6.9), Uttar Pradesh (4.0) and Bihar (3.5). The position was really critical in the rural areas of Bihar, Uttar Pradesh, Madhya Pradesh, West Bengal and Rajasthan where more than 90% of the households did not have the facility of electricity.
Table 2 presents the percentage of households having electricity, in descending order, by residence for India and states/UTs for 1981. Table 6 presents similar data separately for all the states/UTs, district-wise.
Literacy:
Table HH-ll of the Household Tables of 1981 Census presents data of households by size and number of literate members. In this table, households are classified by the number of literate persons in the household. This note confines itself to the analysis of those households only in which nO person was literate so as to emphasize the total illiteracy in the households.
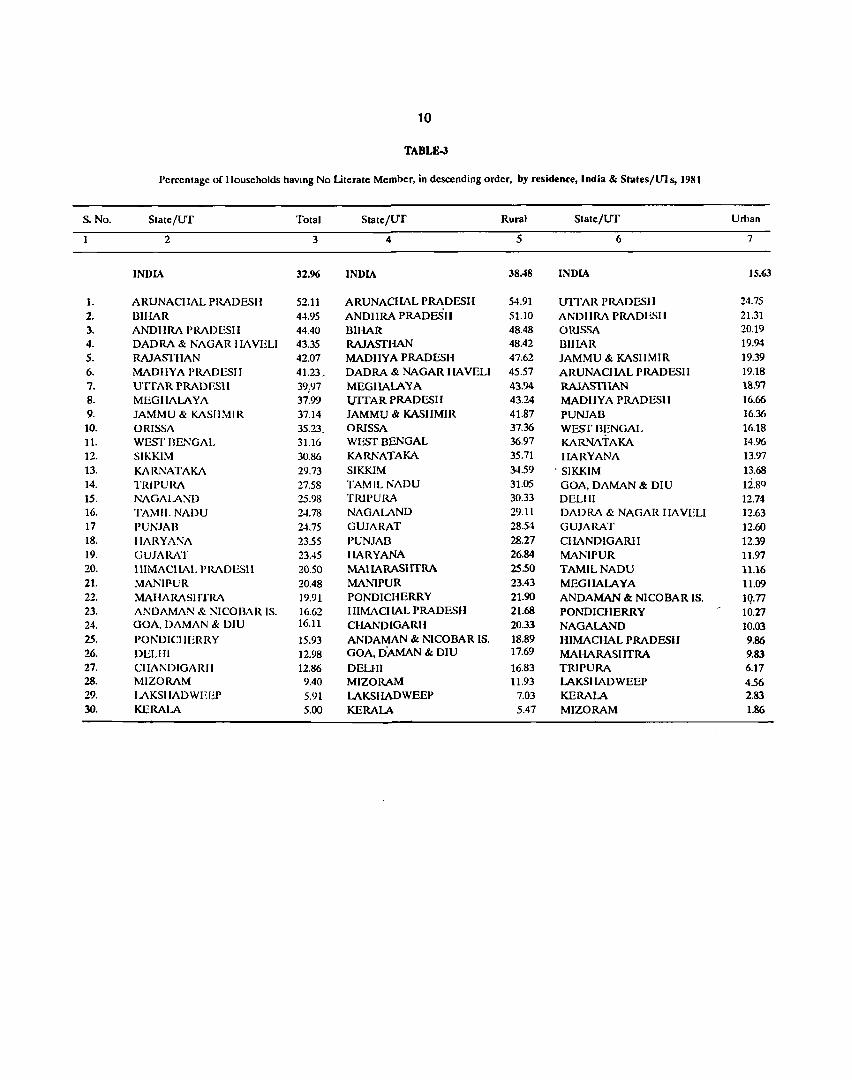
In 1981, 33% of the total households in India did not have any literate member. In the urban areas, it. was 15.63. In Arunachal Pradesh, more than 52% of the households did not have any literate member while in Kerala only 5 percent of the households did not have any literate members. Among the major states, the percentage of households having no literate member was, in descending order, as under: Bihar (45.0), Andhra Pradesh (44.4), Rajasthan (42.1), Madhya Pradesh (41.2), Uttar Pradesh (40.0), Orissa (35.2), West Bengal (31.2), Karnataka (29.7), Tamil Nadu (248), Punjab (24.8), Haryana (23.6), Gujarat (23.4), Maharashtra (19.9) and Kerala (5.0). More than one-third of the households did not have any literate member in the states/Union Territories of Arunachal Pradesh, Bihar, Andhra Pradesh, Dadra & Nagar Haveli, Rajasthan, Madhya Pradesh, Uttar Pradesh, Meghalaya, Jammu & Kashmir and Orissa.

3
~~, awa-~a:fh:~<f;~~1l20~'lIT~qftcm]'1l~.qr~~~'U~~aft" ~lltW~ 3 -«q;JT ~ I ~ ~llm&R'lftcm:lq;r~ ~1iIftrm 31«,011 '4'-'1 rtu (59.9) 1l 'U a:fh:~q;JT ~ ~(5.47)if~1 ~ 3ltmr 38.5% -«~~if~~~~~ ~~llw~~: awa-rtu(51.1 ~ (48.5), ~~R (48.4), 1191 ~ (47.6) am: ~ ~ (43.2)1
~ 3 if 1981 if mm am:~/~~ifR<mr$ ~~~~~~ll~fumlflrr~~<ir. ~mm~~ ~I ~ 6"#~ 3R1T-~~/Wq~$~~<f;~ ~~~lfI:!;~1
.1CI~')Q ~ it 'ffn'i:lI~Q ~ai1:t:
!!M'4I'-'1lj m-m -« ~acJ ~ ~ ~ ~ if tT ~ lflrr ~ 1 ~ 1l ~ 58% tff1::cm1 $ '!ffif tT lfi1'4I'-'1l1 ~m ~a-~I ~if~~(95.7)~~¥tTam:~(24.5)if~q;JT¥tT~~1l~~if~~qftr~ lTcW::" -«~: ~ ~ (77.7), ~ (64.8), ~~ (62.1), ~ (60.1),'H;I'lI~ (59.4), ~ (59.1), 6f{ l lioll (58.1), ~~ (56.5), ~(53.3), ~(53.0), lfv:r~(52.7), dfltWOII't(5J.3), 3fFa-~l44.1 )am:~(41.9)1 ~~ -«~ crrcf~/Wq'U~:rw.nTfi'a~,~, 6f{lil oll, fE;4i1'4'-'1~, ~,lfgf~,~, 'l1'iH"\!fA", ~I\¢+i, dil1'-'1'1I~, ~,am:~~,~, ~am:<ftq,~, ~am:qlfOs~{I ~I ~am:~~~~ll.qr~ft:qftr~ ~ ~ ~I ~ <f; 32% ~ 'lftcm:l am: ~ $ ~'llT 22% qftcmJ 1l lfi1'4lw~ ~ar ~a- rrtT ~I
~ 4 if m-«f am:~~ /WJ;~"* ~ ~if~qftcmJq;r ~ Sfilfifmmfumlflrr~~ lfi1'4''-'14 <tit~m~g~1
~ 5 if~/Wq ~~ $ ~~ ~q;r~ ~ fum lflrr~~~, ~q;r~rt('f~ vf!! ilb'4=1 '-'1rrrlj <tit ~m11: ~g ~ 3l'h" ~ ~ ~ mm ~ ~ ¥tT I ~ 6 if ~ "iffil ~ e(; ft;ro: 3R1T -3R1T ~ /'fi'q ~ <f; ~~)ffiffi ~~~ I ~ 7,8 am: 9 ifm+fraT W-rr$ ~qftcmJq;r ~ ~if~~fG'lITlflrr~ ftr;rItqr.rq;r~'l"f;ft, ~~g ~~~m ~mm~~ ¥tTl ~ loif~ ~if~~q;r ~ ~ if ~ fum lflrr ~ ~ !!i1:qI~lj c$r ~m11: ~g ~I
m+ftur ~if~$mfucf'l"f;ft<tit arrmt<tT~mrr$~if 1981 ifmif~4tT~~~~90%~if~ $~'l"f;ft<tT arrmtcfim-m~tT ~I m-«cft;r~~~if am:~¥tT~~if¥tT1 21 ~~~~ 75%-«~~<Ft~$mfu(:rqr;ft*rmf.lT~g~1 m-« IO~~~ll~1 ~if,~cf;82%~ mcmT if ~ <f; mfmT rt <tT 3ITmt <tT ~~ ~ ~ 3lfuq; mm ~ ~ q;r (88.52%) ¥tT am:~~~q;r ~ q;Jf~(56.24%) ¥tTl ~fq;~~lflrrtfq;~$ 12 ~if~ 10f:;n;ITif75o/c-«3lfuq;~1lqr.r$~qRt ctiT~m~g ~I
~!!T <f; 67 f:.;p:jt if 50% -« 3Jfuq; vnfror ~ if~ $~rt <tT ~<tT ~~ ~ I ~ ~ if, 335 f:.;p:jt if 50% t 3lfuq; VIlfi1rr -cri1:cm:T if ~ <f; ~ qRtc$r ~<tTm-m~g~ ~ I ~q;JT~~ ~$~fu'ldtqt aft"< lffJ.f rttPf; ~ l1q; q;r ~ ~ ~ m:<mr if t~ ~~it ~q;JT<Ft~e(;~1:l"RrctiT~f<nlT~g ~ I me(; 125 ~cf; 90% -« 3Jfuq; ttftcm:T if ~ <f; mfucf qr;ft- <tT 3fT11ftt ~tT .,gr ?ft I ~ 125 ~ if lffJ.f ~ cf; 33 f:;r# ~ ~ $ 17 ~ ~~am:~if-« ~$II-II ~,~e(; 10~, awa~<fn~am:~('f¥tT'l61'l1~$6-6~~I~~ lfT;tcr;rtcf?r ~q;r~tTt~!!Tct~~if~~if~:~ft:~~mTOf~1 ~ ~<f;~~t-;;Jr~ 3Tf1rq;g~~'-'1dl:mftJrcr~~1 ~~$13~ifit 11 ~if~~~$12~ifitlO~if~~~t!fUGf ~ I ~ lItnT ~ qr;ft c$r ~ ~ ~ ~ ~ if -« ~ '4t ~tl ~~ifCltarrqr.r$ qr;ftq;r ~ ~~I
3
In the urban areas, 28% or more of the households did not have any literate member in Uttar Pradesh, Andhra Pradesh and Orissa, while in Mizoram and Kerala, this percentage was less than 3. In the rural areas, the highest percentage of hou§e-holds with no literate member was in Arunachal Pradesh (54.9) and lowest in Kerala (5.47). In descending order the major states with percentage of households above the national average (in rural areas) of 38.5% were: Andhra Pradesh (51.1), Bihar (48.5), Rajasthan (48.4), Madhya Pradesh (47.6) and Uttar Pradesh (4~.2). /
Table 3 pn;~ent~ the percentage of households having no literate member, in descending order, by residence for India, Statcs/U nion Terrilorie~ for 1981. Table 6 presents similar data for individual states/Union Territories alongwith their di~tricts.
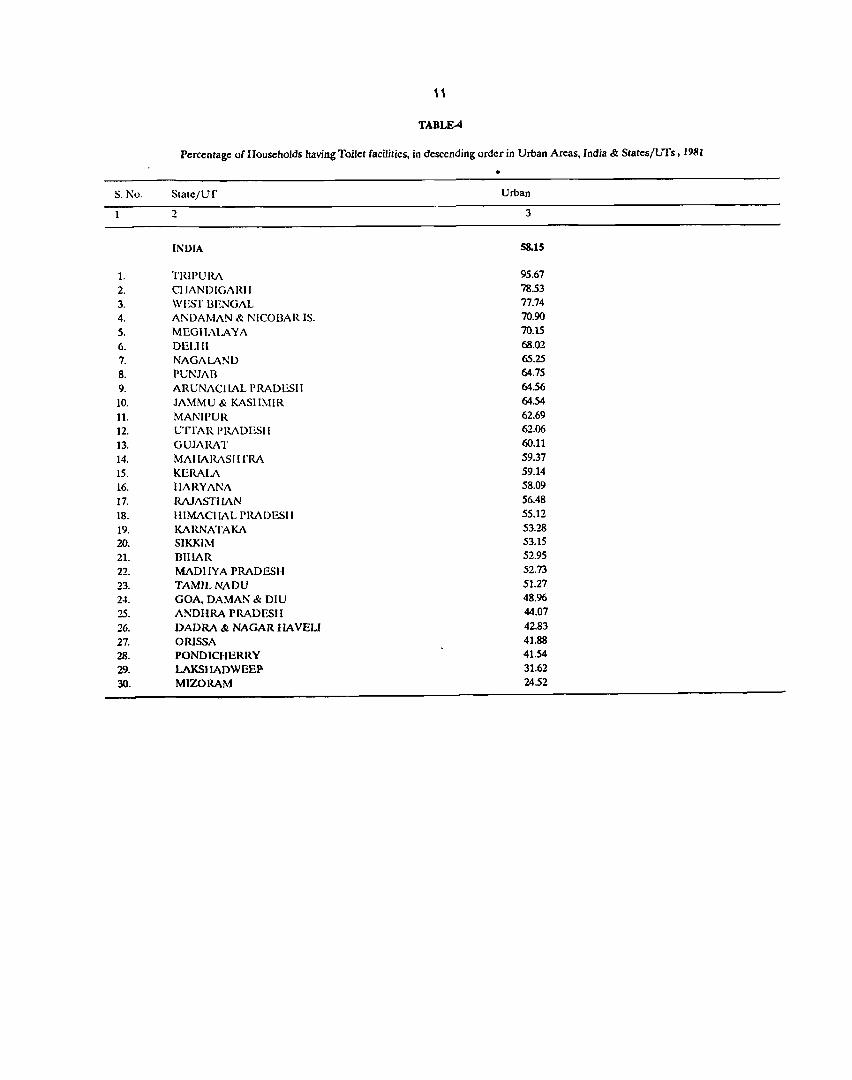
Toilet Facilities in Urban Areas: A question relating to toilet facility was canvassed in the urban areas only. Only 58% of the urban households
had access to toilet facilities. This percentage was the highest for Tripura (95.7) and the lowest in"Mizoram (24.5). The position of major states, in descending order, wa~: West Bengal (77.7), Punjab (64.8), Uttar Pradesh (62.1), Gujarat l60.1), Maharashtra (59.4), Kerala (59.1), Haryana (58.1), Rajasthan (56.5), Karnataka (53.3), Bihar (53.0), Madhya Pradesh (52.7), Tamil Nadu (51.3), Andhra Pradesh (44.1) and Orissa (41.9). The States/Union Territories below the national average were Andhra Pradesh, Bihar, Haryana, Himachal Pradesh, Karnataka, Madhya Pradesh, Orissa, Rajasthan, Sikkim, Tamil Nadu, Dadra & Nagar Haveli, Goa Daman & Diu, Lakshadweep, Mizoram and Pondicherry. Even among the city·states like Delhi and Chandigarh, the position was not ~o good. 32% of the urban households in Delhi and roughly 22% of the households in Chandigarh did not enjoy the facility of toilet.
Table 4 presents the percentage of households having access to toilet facilities in urban areas, in descending order, for India and various States/Union Territories.
Table 5 provides a consolidated picture of the percentage of households having electricity, safe drinking water supply and toilet facilitie~, and households with no literate member by States/UTs. Table 6 presents the di~lriclwise data for the individual states and Union Territories for all the four indicators. Tables 7, 8 & 9 present the percentage of households having safe drinking water supply, electricity and no literate member respeclively, in descending order, by district in the rural areas only, while Table 10 presents the percentage of households having toilet facilities in urban areas, in descending order, by district.
District-wise analysis Regarding availability of safe drinking water supply in the rural areas (Table 7), there were 4 dislricts in the
country in 1981 in which more than 90% of the households in the rural areas had access to safe drinking waler supply. Three of these d.istricts were in West Bengal and the 4th was Chandigarh. There were 21 districts in which more than 75% of the households had ~afe drinking water supply; 10 of these districts were in Punjab state. In fact, in Punjab, 82% of the rural households had access to safe drinking water supply, the highest percentage; being 88.52% for Ludhiana district and the lowest being 56.24% for Rupnagar district. As already mentioned, in 10 of the 12 districts of Punjab, more than 75% of the households had safe drinking water supply.
In 62 districts of the country, more than 50% of the rural households had safe drinking water supply. In olher words, in 335 districts, more than 50% of the rural households did not have access to safe drinking waler &upply. At the lowest end of the scale, with less than 1% of the households baving access to safe drinking water .supply, were Lakshadweep, Chhimtuipui district of Mizoram and Tikamgarh district of Madhya Pradesh. In 125 districts of the country, more than 90% of the households did not have access to safe drinking water supply. Of these 125 districts, 33 are in Madhya Pradesh, 17 in Uttar Pradesh, 11 each in Rajasthan & Orissa, 10 in Kerala, 7 in Andhra Pradesh and six each in Bihar and Maharashtra. That is, in so far as drinking .water supply is concerned, the position is really bad in an exceedingly large number of districts in the country as a whole. Orissa and Kerala are the two most worst affected states as in 11 out of 13 districts in Orissa and 10 out of 12 districts of Kerala, the position was very bad. Kerala seems to be one of the worst affected states regarding potable safe water supply.
4
«1¥t1;;qd":~"U\ilf.q~~~qrn~~~~tT~t~'(;p:~31l~~1Fm'~-;;mrrtl~~~qRT* m~~~~m '4T~~.q~ ~~.q~~rt<A'~<A'ff~ ~~~tl ~~1flZ~.q ~ ~ .q ~ ~ ~ 1:fAt <A' ~ (~3lT ~) ~ ~a- .q qftcmJ q;r ~ ~ lflrr tl
~ -mq'.q ~ * ~ qr;ft ~ (lI!3W mw) ~ ~ q~"iU lfl1' ~
~-mq'
I~ 2 rmfim 3. fjl<1IQ'! ("I
4~
5.~ 6 3i4ii'lICf.<1"1
7~' z; C'1»;:;ZI4"1
9~ 10 ~ II~ 12 Cf11AlS
~
2
8943
89.49 959J 96.07 9304 9302 9531 67.36 9020 7493 9245 9355 5656
1J1'1ft"Gr ~
3 4
8799 9607
8706 9859 9503 9853 9502 9575 9243 9864 9220 96 18 9545 9') 11
66.44 87.77 8946 9757 72 57 8821 9180 97 12 9251 96 78 5656
~~ll~"$'r~mTI~~lltftqr.~am:~~~~~~$T~~m~~~ll 93(;c qftcmT cir ~"$'r ~m ~a- ?ft ~ ~~!fr ~~f;;ffl<Np.rrOf~~ amrrt I ~~ eh""$ ~ 0.78('( qf«rrit cir ~ ~g ~ I W ~ ~ 26 ~ ~ ~ ~ lJI1ftlJf ~ "$ 50% ~ arfa<ii qftcmT cir far~~g m I 101 ~ it 25q it arfgq; mcmr ~ qrn ~ <f;'r ~m ~g m I ~ cn:q;~!fr"$ 181 fm;it # I Oll" ~ q;l1 ~ ~"$ qrn~<f;'r~m ml ~itm~m~!fr"$WT~ 101 fm;it# 5o/r~q;l1qftcmT<f;qrn~<f;'r~m~gm~ 101 ~itit~~!IT~~rt!fr.lftlP*~3fh:~"$itl ~ 101 fm1Titit40~~,*!fr"$. 25hr#~<f;~ 17 ~ lfC1l~!IT "$?ll ~ ~"$ 3 48 mm, ~~!IT ~ 3 9 3itt l{~:~nttu"$ 6 89t;{fuWPlTlfi"QTtITtcm-"$ qrn~riT ~m~1
~~.qme:rorr$~.q(~-9) 3I~UII:q~ ~~q<ff~~it~qftcm}q;r~~~(79.52)m ~~ ~~~~ m~~~~~~~~~~~(1.15) ml m~85 ~.q50%~.qr ~ ~ qftcmJ q;r Cl>Tt.qr ~ ~ o;tt ml ~$ 100~.q ~ ~.q~ .qr~~o;tt m, 17/ 17 ~ ~~ afR~¥fR.q, 16~l{s:r~.q, 15~~#~ 13~3Wa-~1l~1
~ m, ~ ~ t):m ~ ~ ~ ~ tT q;l1 tTit qfrcw it :~ riti '4T ~ mm- ;fflT ~ I ~"$ ~ 3lh" -qn;rqrc: tT m rtir ~ it ~ ~ ~"$ I oq it mgq; 'fficmT #~ '4T men-~;fflT ~ I ~ iTm ~ -~ 1ffi:r~TIf iilrlIT 13 75 a.rt. 13 5 I m!1"Ff ~ I ~"$ Ci>1 ?clll '"' ~ it rtir r.rfn:rrit q;r m!!T<'f ~ q;l1 ~ ~ m '4T ~ mW;fflT ~ I ~
<TT"?" ~ ~* ~ ~ <N~ amrrt I Ci>l?clll q m;:f;~ 1 15 m~TIf ~'1f«rrrmr it~ <itt m~ mm~ ?tTl
4
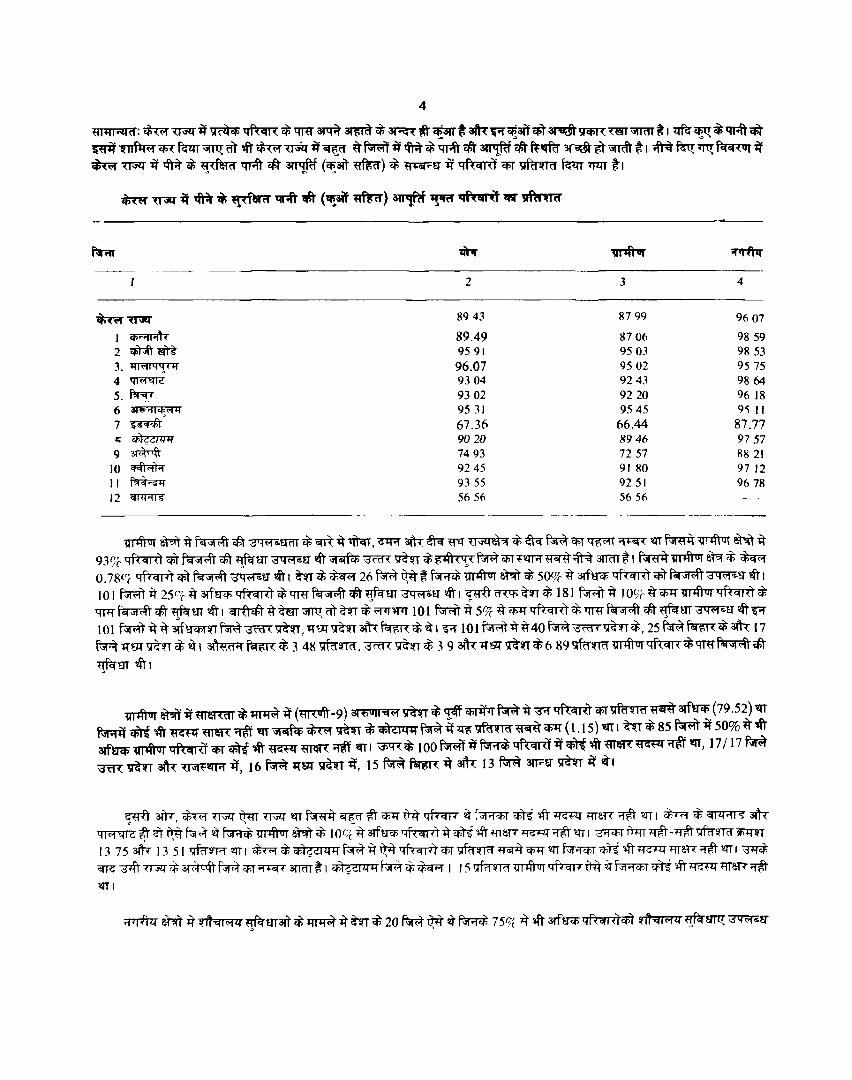
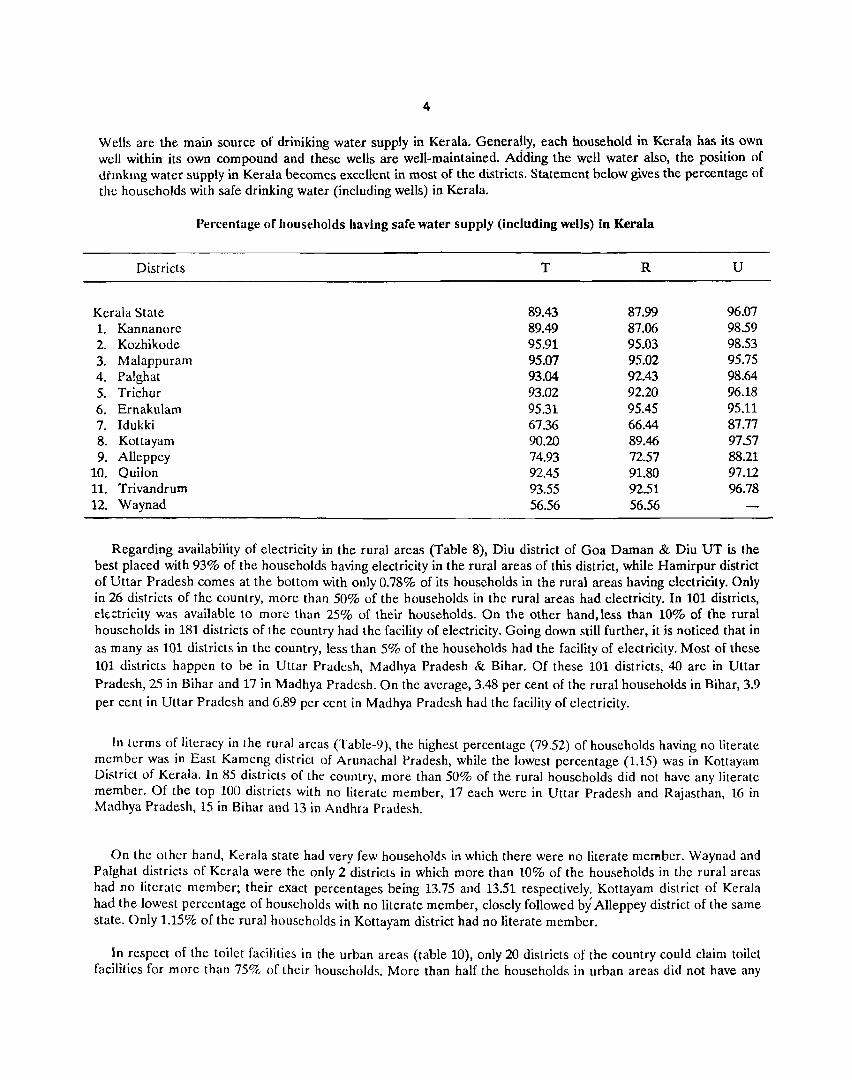
Wells are the main source of driniking water supply in Kerala. Genera~ly, each household in Kerala has its own well within its own compound and these wells are well-maintained. Adding the well water also, the position of dhnkmg water supply in Kerala becomes excellent in most of the districts. Statement below gives the percentage of the households with safe drinking water (including wells) in Kerala.
Percentage of households having safe water supply (including wells) in Kerala
Districts T R U
Kerala State 89.43 87.99 96.07 1. Kannanore 89.49 87.06 98.59 2. Kozhikodc 95.91 95.03 98.53 3. Malappuram 95.07 95.02 95.75 4. Palghat 93.04 92.43 98.64 5. Trichur 93.02 92.20 96.18 6. Ernakulam 95.31 95.45 95.11 7. Idukki 67.36 66.44 87.77 8. Kottayam 90.20 89.46 97.57 9. AUeppey 74.93 72.57 88.21
10. Quilon 92.45 91.80 97.12 11. Trivandrum 93.55 92.51 96.78 12. Waynad 56.56 56.56
Regarding availability of electricity in the rural areas (Table 8), Diu district of Goa Daman & Diu UT is the best placed with 93% of the households having electricity in the rural areas of this district, while Hamirpur district of Uttar Pradesh comes at the bottom with only 0.78% of its households in the rural areas having electricity. Only in 26 districts of the country, more than 50% of the households in the rural areas had electricity. In 101 districts, ek::tricity was available to more than 25% of their households. On the other hand. less than 10% of tbc rural households in 181 districts of the country had the facility of electricity. Going down still further, it is noticed that in as many as 101 districts in the country, less than 5% of the households had the facility of electricity. Most of these 101 districts happen to be in Uttar Pradesh, Madhya Pradesh & Bihar. Of these 101 districts, 40 are in Uttar Pradesh, 25 in Bihar and 17 in Madhya Pradesh. On the average, 3.48 per cent of the rural households in Bihar, 3.9 per cent in Uttar Pradesh and 6.89 per cent in Madhya Pradesh had the facility of electricity.
In terms of literacy in the rural areas (Table-9), the highest percentage (79.52) of households having no literate member was in East Kameng district of Arunachal Pradesh, while the lowest percentage (1.15) was in Kottayam District of Kerala. In 85 districts of the country, more than 50% of the rural households did not have any literate member. Of the top 100 districts with no literate member, 17 each were in Uttar Pradesh and Rajasthan, 16 in Madhya Pradesh, 15 in Bihar and 13 in Andhra Pradesh.
On the other hand, Kerala state had very few households in which there were no literate member. Waynad and Palghat districts of Kerala were the only 2 districts in which more than 10% of the households in the rural areas had no literate member; their exact percentages being 13.75 and 13.51 respectively. Kottayam district of Kerala had the lowest percentage of households with no literate member, closely followed by Alleppey district of the same state. Only 1.15% of the rural hOllseholds in Kottayam district had no literate member.
In respect of the toilet facilities in the urban areas (table 10), only 20 districts of the country could claim toilet facilities for more than 75% of their households. More than half the households in urban areas did not have any
5
tfTl m~ 177~~~~it3{Ta-~liT ~~q;T :&ql~4$mt(~~a-~tfTl ~q;r~~(l7.7) am-~ q;r ~ ~ (8.6) tt ~ <it ~ ~ ~ 20% it liT q;li mcrrU q;T :&':IIW~ $~ ~a- ~I
ri1IT ~ <f ~ ~ ~ cf;rt aft<:~*~~q;Tm~~m~~lR~qm~t~~it 36 ~~~ ~f~t<mp~itMEft~ ~Eftq;lT~a-tl w~«;~~~m«;m~cml 133 ~lRfcRR~1lm tl ~~<f~~, ~~"ll"lZcmuIT<f~~cf;~q;Tmfl1<;r~~ll<rrtl ~36~if44.66~~liT atfaq; ~ ~ it ~ mm: ~ 'itt t I 12 ~m it.qr q;+f lJllfM ~ q;T ~ q;r mfam w.fr ~g 'fT\jfGJ~ 6.89 ~mit~q;lfq;T~ctT~m~a-tfTl ~36f;;n;it~it, 16-;r~~,9\ffir{~,6~,2~~,2~3{tt1 ~~tl ~ 36f;;n;itctT~~3t1""'''1q;-1 it~~tl ~ 36~itit30~~~~40'CJftrm"llT~liTq;li~ qftcm:l it ~n"<lI""'4 ~anz ~a- 'itt tfTl
\3'ffi36~,~~er.rrif~~.~afRmerorrcf;~it~~~<ro:~ifit16~if~ql~d~arr ~1#rm~lffl!~ aft<: ~~~ liT~~~1 ~16 ~it~,8-;rm~,67ffiR~,aft<:2~'fr.fif~1 ~ 16 f;;n;it ctT ~ ~ ~ .. 311""'''1$-2 if ~ ~ tl
~ v:rr;:r ~ f$ 3fWT ~ q5t W fi;r~ it 3f(11T un 1T"lIT ~ Cflitfq; 198 I ~ crgr 'if '1-1 01 '11 '1'tr * ~ I
I. 'ffi Cfq; qf;fcf; qr;frctT ~q;r ~a-~, 7 5 ~ ~mcrrU q5t ~ 2611firm vnfiur ~q;T1ft;t~~rt ctT m~nn ~g tfT I q;;'IlOf, ~~, '<I Oil-Ii?, q lfo:s~ €I 3t'h ~ ~ /~ ~ q;T ~ 50 11ftrm it liT 3ff1A; ~~q;)-qr;lt*$m~g'itT~I~,~, 3tT"grt~, ~'qTii,~, -;r~rt~ 3{tt~if~:~ ~?ffu ~ tfT, ~ CfW 75 ~ it ~ ~ ~~q;)qf;fcf;~qy;ft*~m~a-'itT ~I ""'1'T'q1T 125 ~ cf; 90 mm it ~ ~ vnftur mmr q5t qf;f cf; ~ qAt * ~m ~a-~ ?ft I
2. ~~it#63~m3t'tt~mcnuitit 151#rmmcrruq;)~ctT~m~g~,~, ~ ~~, ~ 3t'h qi~ 3!'tt ~ ~ ~ q;T ~ 50 ~mit ~ 3l'fuq;vnfiurmcmTq;):~<tr-w.rar~a-;nff ~ I art ~ ~it~. ~,~~,~: 3W!:I~~. ~~, ~~, lfmvffi, \ffir{~, ~~, *75~ vr4Tormcmtq;T~ctT~m~a-~ tfTl ~,~'-*~, lfm~ aft\~~if~~~aft\~~tftl 179 f;;n;it~90mr~it~ma-q;~mcmJq;T~ctT~m~g;rtTtfT~lOO~cf;95~~~q;r~ ~m~g~tfTl
3. 16m~TO~~~ 38"S1f\;!ffifri1lT~it~.qrmm:~~mI3llr!:Irtu~3t~o\l'<l"",rtucf;50 11firm it ~ 3lftrq; "IDlfruT ~ ~ ~ mer< ~ ~ ~ I ~"$ 85 f;;n;it it it 50 ~ it '1ft 3lfuq; vnftur m:cn-uif it <itt ~ mer< m ~ I 3tT"!:I ~!IT. f.lm. lfUl' ~~. ~'qTii attt ~ ~~"$ ~ it ~ ~ ~ ft~ ~ tr 1T'fu: tfTl
4. ~ ~!ITctcf;qc;; 58mrm~qfu:mJq;)9n"<lI~4m'qanz~g~~~attt~~it 1/3~it~ 3l'fuq; ~ qfrcmT q;) 9 n '<II &1101 manz ~g ~ tfT ~ 177 f;;n;it ~ 3{Tg it liT maq; ~ ttf'tcmT q;T ~ n "<II w(~f.nmt ~g~tfTl
5
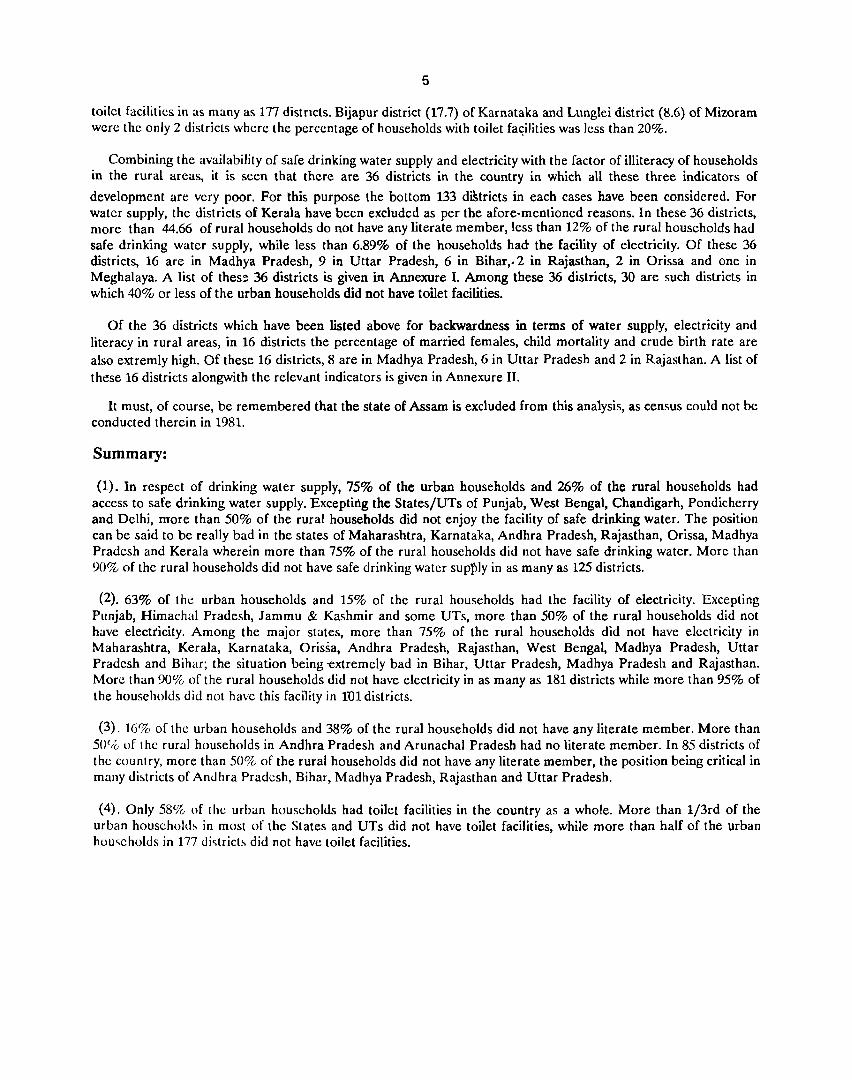
toilet facilities in as many as 177 distncts. Bijapur district (17.7) of Karnataka and Lunglei district (8.6) of Mizoram were the only 2 districts where the percentage of households with toilet fa~ilities was less than 20%.
Combining the availability of safe drinking water supply and electricity with the factor of illiteracy of households in the rural areas, it is seen that there are 36 districts in the country in which all these three indicators of
development are very poor. For this purpose the bottom 133 districts in each cases have been considered. For water supply, the districts of Kerala have been excluded as per the afore-mentioned reasons. In these 36 districts, more than 44.66 of rural households do not have any literate member, less than 12% of the rural households had safe drinking water supply, while less than 6.89% of the households had the facility of electricity. Of these 36 districts, 16 are in Madhya Pradesh, 9 in Uttar Pradesh, 6 in Bihar,.2 in Rajasthan, 2 in Orissa and one in Meghalaya. A list of thes: 36 districts is given in Annexure I. Among these 36 districts, 30 are such districts in which 40% or less of the urban households did not have toilet facilities.
Of the 36 districts which have been listed above for backwardness in terms of water sup-ply, electricity and literacy in rural areas, in 16 districts the percentage of married females, child mortality and crude birth rate are also extremly high. Of these 16 districts, 8 are in Madhya Pradesh, 6 in Uttar Pradesh and 2 in Rajasthan. A list of these 16 districts alongwith the relevdnt indicators is given in Annexure II.
It must, of course, be remembered that the state of Assam is excluded from this analysis, as census could not be conducted therein in 1981.
Summary:
(1). In respect of drinking water supply, 75% of the urban households and 26% of the rural households had access to safe drinking water supply. Excepting the States/UTs of Punjab, West Bengal, Chandigarh, Pondicherry and Delhi, more than 50% of the rural households did not enjoy the facility of safe drinking water. The position can be said to be really bad in the states of Maharashtra, Karnataka, Andhra Pradesh, Rajasthan, Orissa, Madhya Pradesh and Kerala wherein more than 75% of the rural households did not have safe drinking water. More than 90% of the rural households did not have safe drinking water supf>ly in as many as 125 districts.
(2). 63% of the urban households and 15% of the rural households had the facility of electricity. Excepting Punjab, Himachal Pradesh, Jammu & Kashmir and some UTs, more than 50% of the rural households did not have electticity. Among the major states, more than 75% of the rural households did not have electricity in Maharashtra, Kerala, Karnataka, Orissa, Andhra Pradesh, Rajasthan, West Bengal, Madhya Pradesh, Uttar Pradesh and Bihar; the situation being -extremely bad in Bihar, Uttar Pradesh, Madhya Pradesh and Rajasthan. More than 90% of the rural households did not have electricity in as many as 181 districts while more than 95% of the households did not have this facility in lUI districts.
(3). 16% of the urban households and 38% of the rural households did not have any literate member. More than 5WIc, of the rural households in Andhra Pradesh and Arunachal Pradesh had no literate member. In 85 districts of the country, more than 50% of the rural households did not have any literate member, the position being critical in many di!>tricts of Andhra Pradesh, Bihar, Madhya Pradesh, Rajasthan and Uttar Pradesh.
(4). Only 58% of the urban households had toilet facilities in the country as a whole. More than 1/3rd of the urban houschold~ in most of the States and UTs did not have toilet facilities, while more than half of the urban hou~cholds in 177 di'itrict~ did not have toilet facilities.
6
ANNEXURE-I
DIstricts in whIch the percentage of rural households having safe drinking water supply & electricity is very low and having no literate member is very high
SI.
No.
Ndl11e oj Dlstnct
2
Smgh Bhllm 2 lIa7aribagh 3. Pal~llu
4. Santhal Pargand 5. Glflolh
Ranchl 7. Jhabua 8. SurgliJa 9. Bd~tar
10. Slohl 11 Shahdol 12. Rajgarh 13. Chhatarpllr 14. Panna 15. Tlkall1garh 16. I3hopal 17. Ralsen 18. Vldlsha 19. Satn3 20. Rewa 21. Mandla 22. 23. 24. 25. 26 27. 28
Ralgarh West Garo Hills Koraput Kalahandi Bundl 1 on I-. Gonda
29 Bara l3an"l 30. Lahtpur 31. Sitapur 32. MlfZapur 33. Ral Bareili 34. Lucknow 35. Sliltanpur 36. Allahabad
Name of State
3
BIhar
Madhya Pradesh
Meghalaya Qnssa
Rajasthan
Uttar Pradesh
Electri-city
Percentage of rural hOllseholds WIth Safe drinkmg No literate water supply member
4 5 6
297 6.51 4781 5.31 4.94 52.3-t 2.59 4.12 53.26 1.91 0.40 5301 4.34 3.07 47.82 2.94 2.20 -1-1.66
4.61 623 79.08 3.85 4.36 63.80 3.88 11.98 6223 417 3.81 61.38 3.93 4.22 60.95 4.61 5.91 59.11 3.84 1.91 58.50 2.51 272 5652 216 086 53.71 533 9.54 5317 6.41 11.70 49.84 3.81 6.75 47.62 4.59 443 47.59 2.61 2.84 4728 3.08 4.21 4725 3.85 9.02 4503 1.58 6.96 5225 6.89 693 69.56 2.39 376 5607 5.47 847 5652 558 369 49.15 323 1167 5848 133 728 5691 2m 474 5638 352 lO.94 54.0~ 3.08 495 52.69 1 17 495 49.01 282 713 48.46 1.61 6.83 47.85 2.25 5.78 47.08
7
ANNEXURE·II
DI~trlcl!> In w/rlchl/le proporllOIl IIIMncd In age group 15-59, chIld mortality, q(2), crudc birth rate arc hIgh, and in which the percentage of III ral hou,>chol<h h<.lvlIlg ~afe dunking; water supply and clectnclly IS very low and the percentage of rural households having no literate
member IS very high
Percentage of rural households WIth
Name of l\JIl1C of Populallon %of q(2) CBR Electrl- Safe No ~tdtC DI~t rtll married (adi) city Drlnktng literate
females water member
2 3 4 5 6 7 8 9
M .. "jhycl Rcl_lg.llh 801,384 79.2 190 38.95 4.61 5.91 59.11 I'I .. H.k~h 2 ( hhdtdlPlil 886,660 80.3 205 42.19 3.84 1.1}1 58.50
3 I' .lIlllo.l 539,978 80.4 204 45.54 2.51 2.72 56.52 -l llLullgdJ h 736.981 84.4 213 44.48 2.16 0.86 53.71 5 Rdl"CIl 710,542 75.7 175 42.62 6.41 11.70 49.84 (, VIUl\h .. 1 783,098 77.9 183 43.35 3.81 6.75 47.62 7 S.t(Il...t 1,153,387 79.4 205 41.20 4.59 4.43 47.59 8 RC"d 1,207,583 837 178 40.55 2.61 2.84 47.28
R...tj,ISth,1Il 9 BUlldl 586,982 83.9 165 4068 5.47 847 ~6.52
10 lOll).. 783,635 79.6 203 43.65, 5.58 369 49.15 Uttdf 11 (,olldd 2.834,562 80.4 193 39.69 3.23 11.67 58.48 Plduc~h 12 Lahtplil 5n,648 839 181 42.31 2.04 4.74 56.38
13 SII...tpur 2,337,2&4 65.0 171 39.43 3.52 10.94 54.03 l-l Rde Barclh 1,886,940 70.0 191 40.92 1.17 4.95 49.01 15 ~ultal1p\lf 2,042,718 86.4 174 40.87 1.61 6.8,3 47.85 16. I\lldhdbad 3,797,033 612 148 39.69 2.25 5.78 47.08
8
TABLE-l
Percentage of Houwhord~ h.i> ing Saf~ Drinking Watel' Supply, in descending order, by residence, India & States/l1Ts, 1981
S. No. Statc/UT Total State/UT' Rural State/UT' Urban
2 3 4 5 6 7
INOlA 38.19 INDIA 26_50 INDIA 75.06
1. CIIANDIGARII 9909 CIIANDIRGARH 94.39 CHANDIGARH 99.39 2. DELIIl 9297 PUNJAB 81.80 DELHI 94.91 3. PUNJAB 84 56 PONDICHERRY 76.88 ANDAMAN & NICOBAR IS. 91.95 4 I'ONDICIlERRY 8059 WEST BENGAL 65.78 PUNJAB 91.13 5 WEST BENGAL 6965 DELHI 62.26 HARYANA 90.72 6 IIARYANA 5511 NAGALAND 43.43 HIMACHAL PRADESH 89.56 7. GUJARAI 5241 IlARYANA 42.94 ARUNACHAL PRADESH 87.93 8 ANDA~1AN & NICOBAR IS. 5164 ARUNACHAL PRADESH 40.16 GUJARAT 86.78 9 NAGALAND 4563 HIMACHAL PRADESH 39.56 JAMMU & KASHMIR 86.67 10. lIIMACIIAL PRADESH 4450 ANDAMAN & NICOBAR IS. 36.35 MAl-IARASHTRA 85.56 11. ARUNACIIAL I'RADESII 43..89 GUJARAT 36.16 PONDICHERRY 84.18 12. TAMILNADU 4307 BIHAR 33.77 WEST BENGAL 79.78 13. MAHARASII l'RA 42.29 TAMILNADU 30.97 RAJASTHAN 78.65 14. JAMMU & KASHMIR 40.28 JAMMU & KASHMIR 27.95 KARNATAKA 74.40 15. IlIIIAR 37.64 UTTAR PRADESH 25 31 MEGHALAYA 74.40 16. KARNATAKA 33.87 TlUPURA 22.17 UTTAR PRADESH 73.23 17. UTTAR I'RADESII 33.77 SIKKIM 21.70 SIKKIM 71.93 18. SIKKIM 3033 MAl lARASI ITRA 18.34 TAMILNADU 69.44 19. TIUPURA 2733 KARNATAKA 17.63 TlUrURA 67.92 20. IWASI I IAN 27.14 DADRA & NAGAR HA VELl 16.85 MADHYA PRADESH 66.65 21. ANDIlRA PRADl:SIl 2589 ANDHRA PRADESH 15.12 BIHAR 65.36 22. MEGIIALAYA 25.11 MEGJIALAYA 14.26 ANDHRA PRADESH 63.27 23. MADHYA PRADESII 20.17 RAJASfl-IAN 13.00 NAGALAND 57.18 2-1 MANIPUR 19.54 MANIPUR 12.91 DADRA & NAGAR HA VELI 54.35 25. DADRA & NAGAR llAVELI 19.35 OIUSSA 9.47 OIUSSA SI.33 26. ORISSA 14.58 MADHYA PRADESH 8.09 KERALA 39.72 27. GOA, DAMAN & DIU 13.67 KERALA 6.26 MANIPUR 38.71 28. KERALA 12.20 GOA, DAMAN & DIU 5.41 GOA, DAMAN & DIU 30.93 29 MIZORAM 4.88 MIZORAM 3.57 MIZORAM 8.79 30. LAKSIIADWEEl' 2.19 LAKSHADWEEP 0.97 LAKSHADWEEP 3.65

9
TABLE-2
Percenlage of Ilollseholds haVIng Electricity, in descending order, hy residence, India & States/UTs, 1981
S. No. Statc/UT Tolal State/UT Rural State/UT Urban
2 3 4 5 6 7
INDIA 26.19 INDIA 14.69 INDIA 62.51
1. LAKSIIADWEEP 91.79 LAKSHADWEEP 88.01 LAKSHADWEEP 96.35 2. CIIANDlGARH 84.43 CHANDIGARH 67.85 JAMMU & KASHMIR 92.18 3. DELIII 73.57 GOA, DAMAN & DIU 53.84 TRIPURA 92.10 4. PUNJAB 60.90 JAMMU & KASHMIR 52.54 HIMACHAL PRADESH 89.36 5. JAMMU & KASHMIR 60.87 DELHI 51.68 CHANDIGARH 85.48 6. GOA, DAMAN & DIU 59.49 HIMACHAL PRADESH 51.08 PUNJAB 85.44 7. lIIMACllAL PRADESH 54.86 PUNJAB 50.61 HARYANA 82.22 8. IIARYANA 51.53 HARYANA 41.04 ANDAMAN & NICOBAR IS. 78.22 9. GUJARAT 44.81 GUJARAT 30.83 DELHI 74.94 10. I)ONDICIIERRY 43.79 PONDICHERRY 28.97 GUJARAT 74.40 11. MAIIARASIITRA 40.65 TAMILNADU 26.03 SIKKIM 71.80 12. TAMILNADU 37.21 DADRA & NAGAR HA YELl 25.87 GqA, DAMAN & DIU 71.31 13. ANDAMAN & NICOBAR IS. 35.92 MAHARASHTRA 24.12 MAHARASHTRA 70.53 14. K.ARNATAKA 32.98 KERALA 23.21 DADRA & NAGAR HA VELI 67.66 15. KERALA 28.78 KARNATAKA 21.35 ARUNACHAL PRADESH 64.26 16. DADRA & NAGAR HAVELI 28.66 NAGALAND 19.97 RAJASTHAN 63.67 17. NAGALAND 26.12 ANDAMAN & NICOBAR IS. 19.87 KARNATAKA 61.98 18. TIUPURA 25.05 TRIPURA 16.52 TAMILNADU 61.59 19. SIKKIM 23.11 ORISSA 13.03 MEGHALAYA 59.59 20. ANDHRA PRADESH 21.41 SIKKIM 13.01 NAGALAND 58.43 21. WESTDENGAL 2'1.09 ANDHRA PRADESH 12.53 PONDICHERRY 58.11 22. RAJASTllAN 2054 ARUNACHAL PRADESH 10.99 WESfBENGAL 57.86 '23. MANII'UR 20.06 MANIPUR 10.28 MADHYA PRADESH 56.42 24. OIUSSA 17.75 RAJASTHAN 8.70 U'ITAR PRADESH 54.61 25. MADHYA PRADESH 17.11 MEGHALAYA 7.44 KERALA 54.57 26. MEGllAlAYA 16.84 WEST BENGAL 7.02 ANDHRA PRADESH 52.22 27. MIZORAM 16.27 MADHYA PRADESH 6.89 ORISSA 51.74 28. ARUNACllAL I'RADESH 15.15 MIZORAM 4.96 BIHAR 50.09 29. UTTAR PRADESH 12.91 U'ITAR PRADESH 3.97 MIZORAM 50.06 30. DlHAR 9.20 BIHAR 3.48 MANIPUR 48.32
10
TABLE-J
Percentage of Iiouseholds havmg No Literate Member, in descending order, by residence, India & Srntes/lTI s, 1981
S.No. Slate/UT Total State/Ur Rural Stale/Uf Urban
1 2 3 4 5 6 7
INDIA 32.% INDIA 38.48 INDlA 15.63
1. ARUNACIIAL PRADESII 52.11 ARUNACHAL PRADESH 54.91 U1TAR I'RADESII 24.75
2. BIHAR 44.95 ANDlIRA PRADESII 51.10 ANDIlRA PRADESII 21.31
3. ANDlIRA I'RA))ESlI 44.40 lllHAR 48.48 OIUSSA 20.19
4. DADRA & NAGAR IIAVELI 43.35 RAJASfUAN 48.42 BIlIAR 19.94
S. RAJASTHAN 42.07 MADHYA PRADESH 47.62 JAMMU & KASHMIR 19.39
6. MADHYA PRADESH 41.23, DADRA & NAGARIIAVELI 45.57 ARUNACIIAL PRADESII 19.18
7. UTrAR PRADES1l 39,97 MEGllAl.AYA 43.94 RAJASfllAN 18.91 8. MEGIIALA Y A 37.99 UlTAR PRADESH 43.24 MADHYA PRADESH 16.66
9. JAMMU & KASHMIR 37.14 JAMMU & KASHMIR 41.87 PUNJAB 16.36
10. OruSSA 35.23. OruSSA 37.36 WEST BENGAL 16.18
11. WEST BE1'\GAL 31.16 WEST BENGAL 36.97 KARNATAKA 14.96
12. SIKKIM 30.86 KARNATAKA 35.71 IIARYANA 13.97
13. KARNATAKA 29.73 SIKKIM 34.59 . SIKKIM 13.68 14. TRIPURA 27.58 TAMILNADU 31.05 GOA, DAMAN & DIU 12.8Q
15. NAGAIAND 25.98 TIUPURA 30.33 DELI II 12.74 16. TAMILNADU 24.78 NAGALAND 29.11 DADRA & NAGAR IlAVELI 12.63 17 PUNJAB 24.15 G UJA RAT 28.54 GUJARAT 12.60 18. I1ARYJ\~A 23.55 PUNJAD 28.27 CIlANDIGAIUI 12.39 19. GUJARAT 23.45 IIARYANA 26.84 MANIPUR 11.97 20. IIIMACHAL PRADESH 20.50 MAllARASHTRA 25.50 TAMILNADU 11.16 21. MANIPUR 20.48 MANIPUR 23.43 MEGllALAYA 11.09 22. MAIIARASm'RA 19.91 PONDICHERRY 21.90 ANDAMAN & NICOBAR IS. lQ.n 23. ANDAMAN & l'\ICOBAR IS. 16.62 IIIMACHAL PRADESH 21.68 PONDICHERRY 10.27 24. OOA. DAMAN & DIU 16.11 CI·lANDlGAIUI 20.33 NAGALAND 10.03 25. l'ONDlCllERRY 15.93 ANDAMAN & NICOBAR IS. 18.89 HIMACHAL PRADESH 9.86 26. DELHI 12.98 GOA, DAMAN & DIU 17.69 MAI-lARASIITRA 9.83 27. CHANDIGARII 12.86 DELHI 16.83 TIUPURA 6.17 28. MIZORAM 9.40 MIZORAM 11.93 LAKSI IADWEEP 4.56 29. LAKSIIADWEEP 5.91 LAKSIIADWEEP 7.03 KERALA 2.83 30. KERAI.A 5.00 KERALA 5.47 MIZORAM 1.86
S.l'\u.
l. 2. 3. 4. 5. 6. 7. 8. 9. 10. 11. 12. 13. 14. 15. 16. 17. 18. 19. 20. 21. 22. 23. 2 ...
25. 26. 27. 28. 29. 30.
11
TABLE-4
Percentage of IIouseholds having Toilet facilities, in descending order in Urban Areas, India & States/UTs , 198 I
• StatejUT Urban
2 3
I~DlA S8.1S
l'RII'UIv\ 95.67
CIIANDIGARII 78.53
WEST BENGAL 77.74
AI'\DAMAN & NICOBAR IS. 70.90
MEGIIAl.AYA 70.15
DELlll 68.02
NAGALA!':!) 65.25
I'UN1AB 64.75
ARUNACHAL PRADESH 6456
JAMMU & KASIIMIR 64.54
MANII'UR 62.69
UTrAR PIv\DESII 62.06
GUJARAT 60.11
MAIIARASII rRA 59.37
KERAIA 59.14
IlARYANA 58.09
IV\1A~TI IAN 56.48
llIMACIlAL PRADESH 55.12
KARNATAKl\ 53.28 SIKKIM 53.15
DlllAR 52.95
MADHYA PRADESH 52.73
TAMILNADU 51.27
GOA, DAMAN & DIU 48.96
Al':DIIRA PRADESH 44.07
DADRA & NAGAR HAVELI 42.83
OruSSA 41.88
PONDICHERRY 41.54
LAKSIIADWEEP 31.62
MIZORAM 2452

12
TADLE-5
Percentage of lIoll~cholds having Electricity, Safe D~inking Water Supply &Toilet facilities and No Literate Member by States/UTs, 1981
S. No. State/UT
2
INDIA
1. Al\'DIIRA PRADESH 2. 13 IlIA R 3. GUJARAT 4. IlARYANA 5. IIIMt\CIIAL PRADESH 6. JA\1MU & KAS[lM[R
7. KARl\'ATAKA 8. KERALA
9. MADIIYA PRADESlI 10. MAl lARASIITRA 11. l\1i\l\'IPU R
12. MEGllALAYA 13. l'\i\GALAND 14. ORISSA
15. PUNJAI3 16. RAJA SrI IAN 17. SIKKIM 18. TAMIL NADU 19. TRIPURA
20. UITAR PRADESII 21. WEST BENGAL
22. AN DAMAN & NICOlJAR IS. 23. ARUNACIlAL PRADESII 24. CHANDIGARlI 25. DAIJRA & NAGAR IJAVELI 26. DELlIl
27. GOA, o.MI1AN & DIU 28. LAKSHADWEEP 29. MIZORAM
30. PONDICHERRY
Electricity Total Rural
3
26.19
21.41 9.20
44.81 51.53 54.86
60.!!7 32.98
28.78 17.11 40.65
20.06 16.84 26.12
17.75 60.90 20.54 23.11 37.21
25.05 12.91 21.09 35.92 15.15
84.43 28.66 73.57 59.49 91.79 16.27 43.79
4
14.69
12.53 3.48
30.83 41.04 51.08
5254 21.35 23.21 6.89
24.12 10.28 7.44
19.97
13.03 50.61
8.70 13.01 26.03 16.52 3.97 7.02
19.87
10.99
67.85 25.87
51.68 53.84 88.01 4.96
28.97
Safe Water Supply No Literate Mcmber ..!2iJ!.!_ Urban Total Rural Urban Total Rural Urban Urban
5
62.51
52.22 50.09 74.40 82.22 89.36 92-18 61.98
54.57
56.42 70.53
48.32 59.59 58.43 51.74 85.44 63.67 71.80 61.59 92.10
54.61 57.86 78.22
64.26
85.48 67.66 74.94 71.31 96.35 50.06 58.11
6 7 8 9 10 11 12
38.19 26.50 75.06 32.96 38.48 15.63 58.1~
25.89 37.64
52.41 55.11 44.50
40.28 33.87
12.20 20.17 42.29
19.54 25.11 45.63
14.58 84.56 27.14 30.33 43.07 27.33
33.77 69.65
51.64 43.89
99.09 19.35 92.97 13.67
2.19 4.88
80.59
15.12 33.77 36.16 42.94 39.56 27.95
17.63 6.26 8.09
18.34 12.91
14.26 43.43 9.47
81.80 13.00 21.70 30.97 22.17
25.31 65.78
36.35 40.16
94.39 16.85 62.26 5.41 0.97 3.57
76.88
63.27 65.36 86.78 90.72 89.56 86.67 74.40
39.72 66.65
85.56 38.71 74.40 57.18 51.33
91.13 78.65 71.93 69.44 67.92
73.23 79.78
91.95
87.93 99.39 54.35 94.91 30.93
3.65 8.79
84.18
44.40 44.95
23.45 23.55 20.50 37.14
29.73
5.00 41.23 19.91
20.48 37.99 25.98 35.23 24.75 42.07 30.86 24.78 27.58 39.97 31.16
16.62 52.11
12.86 43.35 12.98
16.11 5.91
9.40
15.93
51.10 48.48 28.54 26.84 21.68 41.87 35.71
5.47 47.62
25.50
23.43
43.94 29.11 37.36
28.27 48.42 34.59 31.05 30.33 43.24 36.97 18.89
54.91
20.33 4557 16.83
17.69 7.03
11.93
21.90
21.31 44.0i 19.94 52.95 12.60 60.11 13.97 58.OS
9.86 55.12
19.39 64.54 14.96 53.28
2.83 59.14 16.66 52.73 9.83 59.3i
11.97 62.6S 11.09 70.15 10.03 6S.2S 20.19 41.88 16.36 64.75
18.97 56.48 13.68 53.15 11.16 51.2i 6:17 95.6;
24.75 62.06 16.18 n.74 10.n 70.9C
19.18 64..56 12.39 7833 12.63 42.83 12.74 68.02 12.89 48.96
4.56 31.62 1.86 2452
10.27 41.54
13
TABLE·6
Percentage of Households haVIng Electnclty, Safe Dnnkmg Water Supply & TOIlet facillhes and No Literate Member, by States/UTs-dlstnct Wise, 1981
S No
1
1 2 3 4 5 6 7 8 9 10 11 12 13 14 15 16 17 18 19 20 21 22 23
1 2 3 4
5 6 7 8 9
10
11 12 1'1 14
15 16 17 18 19 20
State/distrIct
2
ANDHRA PRADESH
Snkal..ulam Vlzlanagaram
Vlshal..hapatnam East GodavarI West Godavan Krishna
Guntur Prakasam Nellore
Chmoor Cuddapah Anantapur Kurnool
Mahbubndgar Rang.llcddl Ilyderabad Medal-. Nlzamabad Adllabad Kaumnagar WdlangJ!
Khdllll11.lIn '\Jlgol1dd
Hill \R
I'dll1.J )\aldnd.J
)\Jwadd
Gdva
AUldllg<lb.Jd
Rohtas
13hoJpur SJrJll
SIWdl1 GopalganJ I'dschll11Chamraldll
l'urba Chdlllpdlan SIIJI11JII11
\ll1/dllal]?"r
" ol,h,,11 BC~lI\alal
S.Jllla\tlplII Ddlbhdllg.J
\1adhllballl ~ahal'sa
Electtlclty
Total Rural
3
21.41
1091 1301 2016 2196 2054 2664 2056 1647 2104 2370 1912 2162 2148 1203 3067 7325 1711 2657 1~58
2061 1654 1(,37
1329
').20
25(,')
812 739 900 516
1253 885 382 504 448 381 313 203 810
404 723
587 383 291 312
4
761 800 747
1446 1476 1506 1338 1205 1373 1688 1220 1420 1340 789
2072
1166 2090 880
1475 933 986 880
3.48
600 360 519 402 306 834 442 122 347 329
161 141 101 414
275
378 421 094 214 163
Safe Water Sueply No Literate Member Uman Total Rural Ufban Total Rural Urban
5
52.22
3939 4073 5030 4814 4322 5233 4021 <"137 4975 ~863
4977 5041 4730 4763 5991 7325 5840 5121 3757 5325 5313
4715 4990
50.09
5867 3986 4049 5132 3331 4822 4440 3471
4070 2764 3374 3981 2612 6168
2430 3930 4720 4140 3022 2910
6
25.89
677 1275 2164 2828 2279 3699 3459 1097 2595
2214 1632 3735 3948 1873 3150 7954 1883 2162 1768 1349 1690 2337 2279
37.64
4061 1905 1774 228> 3269 4427 3819 4014 5043 4726 6787 4939 72 78 4982
2422 4238 40 17 8663 7246 5071
7
15.U
391 342 676
1781 1218 2032 2344 698
1935 1729 1685 2766 2661 1323 2486
1379 1288 823 898 980
1402 2075
33.77
2067 1387 1558 1657 2994 3961 3414 3857 4905 4590 6648 4772 7240 4687
2336 4040 3879 8600 7199 4912
8
63.27
3149 6440 5698 64 81 6445 7400 6509 3346 5187 4692 68 31 7505 80.57 6599 5101 7954 56% 5965 5522 3862 5292 6758 3944
65.36
7404 5546 5022 7662 6963 8392 7072 5879 8163 737I 8675 8374 8176 8985
3774 6070 7447 94 79 8901 7838
9
44.40
5420 5518 5086 4070 3753 3263 3680 4124 4319 3846 3897 4086 4199 58n 4357 1503 5266 5389 5792 5425 5181 4962 5201
44.95
2730 3348 40 72 3968 3468 3180 2996 3692 4048 4526 5706 5597 5774 5077
4291 4708 4796 51.67 5129 5295
10
51.10
5728 6022 64 21 4~ 16 4098 3936 4104 4441 4885 4279 4304 4637 4738 6274 5176
56% 5950 6499 5930 5837 5608 5609
48.48
3473 3554 4207 4223 3602 33 SO 3142 3819 4135 4614 5931 5735 5896 5351
4388 4960 49.19 5424 5192 5431
11
21.31
2775 2742 1906 25 28 2415 1779 25 27 2351 2121 1658 2113 1967 25 20 2471 1918 1503 2025 2958 2977 2617 1874 18.98 1881
19.94
1495 1911 2056 1815 1679 1739 1829 2182 2100 2820
23~6
2499 2926 1389
2767 2392 1779 1857 2917 2949
TOilet
Urban
12
44.07
2614 3051 4148 4509 3901 4604 3294 234, 3869 4309 135C 2945 3319 3827 4624 7303 4941 4585 2895 4497 4849 3648 38,65
52.95
6938 5620 5082 625C 45SS SHU 5141 4592 5465 395> 4548 4607 3613 7685
378; 4041 5810 6025 411; 3238
S.No.
1
21. 22. 23. 24. 25. 26. 27. 28. 29. 30. 3t.
1. 2. 3. 4. 5. 6. 7 8. 9. 10. 11. 12. 13. 14, 15. 16. 17. 18. 19.
1. 2. 3. 4. 5. 6. 7. 8. 9.
10. 11. 12.
State/district
2
Purnia Katihar Munger Bhagalpur Santhal Pargana Dhanbad Giridih Hazanbagh Palamu Ranchi Singhbhum
GUJAAAT
Jamnagar Rajkot Surcndranagar Bhavnagar AmrelJ Junagadh Kachchh Banas Kantha SabaT Kamila Mahesana Gandhinagar Ahmcdabad Klrt:da Panch Mahals Vadodara Bharuch Surat Valsad The Dangs
HARYANA
Ambala Kurukshetra Karnal lind Sonipat Rohtak Faridabad Gurgaon Mahendragarh Dhiwani I-li~ar
Sirsa
Electricity Total Rural
3
3.41 5.46
10.98 7.77 4.30
42.98 12.76 14.02 4.61
11.72 18.93
44.81
52.76 60.73 40.61 53.61 52.03 60.36 39.31 18.08 37.12 4391 55.87 63.19 4100 15.39 48.05 31.35 45.54 37.08
9.65
51.53
60.88 46.48 53.48 40.83 51.77 56.92 60.26 43.92 32.37 47.07 53.94 60.29
4
1.52 2.10 5.61 4.06 1.91
19.29 4.34 5.31 2.59 2.94 2.97
30.83
38.09 46.90 28.45 4153 46.18 51.00 28.72 13.10 32.90 36.52 48.03 32.23 33.18
7.95 29.61 21.53 2752 26.56
9.65
41.04
44.69 37.86 40.68 34.33 43.80 48.46 44.30 32.93 24.93 38.88 45.77 55.77
14
Urban
5
27.19 3953 47.01 41.29 41.14 63.10 59.47 59.91 40.99 49.28 56.59
74.40
75.36 79.26 68.15 76.08 73.71 80.17 6950 66.19 73.14 72.82 81.94 75.13 71.79 70.18 76.25 72.85 70.13 73.95
82.22
87.03 83.80 84.64 76.40 82.53 85.90 76.49 81.82 78.83 82.24 82.87 76.09
Safe Water Supply Total Rural Urban
6
55.39 62.20 28.61 21.29 5.20
44.41 11.98 14.29 654 9.88
23.54
52.41
54.31 63.48 32.72 53.61 65.20 56.43 45.40 37.71 28.63 6615 82.47 78.85 5827 13.13 60.56 47.92 51.19 24.15
9.09
55.11
73.42 69.55 67.50 26.99 43.93 31.19 57.55 38.45 43.59 65.96 59.60 71.42
7
53.63 61.20 26.12 17.27 4.00
16.26 3.07 4.94 4.12 2.20 651
36.16
36.90 46.95 11.69 36.99 60.76 45.79 30.81 32.10 22.81 59.73 78.23 43.31 50.47
4.74 40.13 38.61 27.72 11.12 9.09
42.94
60.93 64.52 57.76 15.57 32.05 14.83 25.82 24.22 36.32 60.09 50.59 64.95
8
77.42 72.28 45.31 57.63 23.78 68.32 61.41 6352 50.18 42.72 63.71
86.78
81.14 85.62 80.35 8453 81.64 '19.01 86.95 91.92 78.43 91.30 96.56 92.55 88'.97 75.00 91.80 87.24 8322 6984
90.72
93.59 91.32 91.20 89.48 89.79 87.19 89.83 87.50 88.98 91.23 91.14 94.02
No Literate Member Toilet Total Rural Urban Urban
9
56.82 54.37 45.21 45.02 50.80 30.34 43.99 47.57 51.45 38.70 38.25
23.45
25.31 18.35 28,89 23.75 21.16 21.73 37.57 42.79 22.00 21.01 18.03 14.33 16.35 33.97 21,11 24.46 25,75 25.19 34.85
23.55
20.12 28.81 25,64 31.62 17.37 14,77 21.10 24.92 15.25 20.79 30.74 33.62
10
58,86 57.43 48.76 47.82 S3.0~
39.21 47.82 52.34 53,26 44.66 47,81
28.54
30.58 23.27 34.64 28.94 23.14 24,78 43.31 45.38 23,10 22.79 21.02 23,81 17.44 37,05 28.86 26.85 34.44 29,00 34.85
26.84
24.92 31.84 30,03
34.46 18.66 15.92 2723 29.18 16.08 22.23 34,82 37,74
11
3154 23,65 2153 19,97 17,33 22,84 22,99 22.75 19.09 13.42 16.20
12.60
17,16 11,72 15,89 14.09 13.85 15,27 21.28 17,61 12,60 14,05 7.84
10,65 12,03 11,31 9.12
14,27 13.34 11.81
13.97
12,34 15,75 14,99 16,16 12.41 10.82 14.90 10.34 to.08
14.58 16,37 19,32
12
34,22 51,8; 47,79 52.75 51.66 47.04 51,43 52,14 46,01 '54.73-57.38
60.11
54.78 61.59 33,08 4554 35.35 53,86 56.9C 38.64 42.49 40.63 84.82 70.79 60.50 59.93 71.71 61.2C 60,51 56.36
58.09
69.56 63.6S 66.25 45.22 57.69 59.40 51.39 53.5~
44.43 55.34 51.13 55.02
S.No.
1
1. 2. 3. 4.
5. 6. 7. 8. 9. 10. 11. 12.
1. 2. 3. 4. S. 6. 7. 8. 9. 10. I. l .
12. 13. 14.
1. 2. 3. 4. 5. 6. 7. 8. 9.
IO. 11. 12. 13. 14. 15. 16. 17. 18. 19.
State/district
2
HIMACHAL I'RADESH
Chamba Kangra Hamirpur Una I3ilaspur Mandl Kulu Lahul & Spiti Simla Solan Sirmaur
Kinnaur
JAMMU & KASIIMIR
Anantnag I'ulwama Srinagar BadgJI11 llaramula Kupwara Kargil Ladakh Doda Udhampur 'Kathua Jammu RaJauri Punch
Bangalore Belgaum llellary nidar Bijapur Chik"l11agalur Chitradurga Dakshin Kannad Dharwad Gulbarga Hassan Kodagu Kolar Mandya
Mysore Raichur
Shimoga Tumkur Uttar Kannnd
Electricity Total Rural
3
54.86
33.43 63.91 65.26 54.1S 60.09 51.30 45.42 28.28 59.58 54.89 48.26 39.81
60.87
81.22 86.04 94.93 81.64 81.74 64.61 25.04 37.38 25.11 27.94 38.21 58.55 29.73 20.29
32.98
55.71 36.04 27.16 21.66 25.04 31.20 29.99 24.39 33.70 22.99 29.31 18.81 33.09 32.25 32.25 19.93 35.47 32.15 29.52
4
51.08
28.33 62.42 63.56 50.94 58.00 46.63 40.42 28.28 51.89 49.20 43.35 39.81
52.54
79.64 SS.31 84.00 79.34 79.96 63.83 20.57 28.71 20.31 20.93 33.08 46.90 26.38 14.98
21.35
27.18 26.63 17.52 15.61 15.94 24.81 22.10 14.61 22.84 14.51 23.24 12.38 24.99 28.25 19.61 14.90 25.36 27.33 18.70
15
Safe Water Supply No Literate Member Urban Total Rural Urban Total Rural Urban
5
89.36
89.54 87.14 90.311 89.23 92.19 92.83 91.54
87.96 87.36 90.41
92.18
94.48 93.31 97.63 96.65 93.18 91.53 94.04 89.08 92.05 84.86 75.47 86.25 83.12 84.53
61.98
71.50 67.55 47.42 51.76 54.29 62.02 56.77 54.46 53.52 53.94
65.45 55.60 62.48 53.76 67.68 41.76 63.91 63.25 59.81
6
44.50
40.97 53.00 25.66 50.40 28.26 40 . ..:2 49.49 56.01 56.06 40.03 36.52 46.49
40.28
37.08 34.94 80.75 38.80 30.03 16.19 4.48
11.04 22.71 23.87 41.28 65.J6 14.00 15.71
33.87
56.07 31.56 38.15 21.39 34.44 35.SS 42.39 8.81
37.33 30.26 26.25 18.25 28.62 23.97 40.15 29.94 35.19 26.60 16.20
7
39.56
36.62 50.98 21.95 48.04 24.86 34.61 44.75 56.01 44.46 30.58 29.73 46.49
27.95
32.24 30.65 52.05 31.31 22.60 14.37 4.52 1.56
17.89 15.87 36.09 53.73
9.81 9.65
17.63
19.36 20.18 18.95 14.30 18.68 25.44 28.73 2.41
16.98 16.04 16.45 9.81
16.40 16.39 22.71 18.45 18.08 19.08 7.93
8
89.56
88.81 84.61 80.29 75.92 80.43 90.05 93.30
94.20 93.94 94.83
86.67
n.SS 77.52 87.SS
87.75 77.77 79.13 3.87
67.62 90.00 88.SS 79.07 92.70 80.78 89.04
74.40
76.38 69.64 78.55 56.67 85.06 86.00 88.73 28.50 74.47 82.17 84.63 66.50 72.89 64.71 89.03 79.76 83.31 75.09' 39.37
9
20.50
37.61 14.11 9.57
14.46 16.03 20.49 28.59 32.73 21.53 22.10 31.72 25.06
37.14
38.04 39.30 30.49 48.92 42.60 47.70 49.23 48.86 47.18 43.65 31.23 21.95 38.87 38.20
29.73
19.53 26.99
39.61 39.62 32.56 27.16 29.21 12.75 22.27 45.60 28.81 25.08 34.37 36.09 41.31 46.54 23.48 29.01 21.08
10
21.68
39.SS 14.17 9.77
14.93 16.69 21.75 30.78 32.73 25.13 23.72 34.26 25.06
41.87
40.33 41.02 52.50 52.92 47.46 48.55 51.44 52.01 49.79 47.64 33.47 26.04 40.60 40.38
35.71
34.12 31.16 45.57 44.07 36.40 30.31 33.38 15.09 25.43 51.69 31.72 27.68 40.25 38.88 50.40 50.14 27.58 31.51 24.97
11
9.86
13.02 12.71 6.71 9.36 5.93 9.25 8.60 0.00 8.23
12.15 9.89
19.39
18.82 22.26 25.05 23.04 19.29 19.00 17.55 30.48 11.33 11.27 14.95 12.26 11.72 11.93
14.96
11.53 13.12 27.19 17.58 20.30 12.32 15.28 5.65
16.55 23.40 11.76 10.83 13.26 21.24 16.06 30.94 12.06 13.06 10.29
Toilet Urban
12
55.12
61.96 44.11 28.66 25.51 67.87 57.99 34.56
66.50 60.72 69.12
49.98 34.43 81.29 61.32 44.96 24.Bf 65.13 78.64 55.30 55.OS 35.22 58.82 35.64 37.38
53.28
72.51 42.03 30.33 51.41 17.66 57.12 41.74 57.92 42.2; 39.4~
52.80 57.10 50.oti 45.7a 66.54 23.9~
55.7~
49.n 45.8:1
S.No.
1
1. 2. 3. 4. 5. 6. 7. 8. 9.
10. 11. 12.
1. 2. 3. 4. 5. 6. 7. 8. 9.
10. 11. 12. 13. 14. 15. 16. 17. 18. 19. 20. 21. 22. 23. 24. 25. 26. 27. 28. 29. 30. 31. 32. 33. 34. 35. 36. 37. 38.
State/district
2
KERALA Canllanore Kozhikode Malappuram Palghat Trichur Ernakulam Idukki Kottayam Alleppey Quilon Trivandrum Waynad
MADHYA PRADESH
Morena Bhind Gwalior Datia Shlvpun Guna Tikamgarh Chhatarpur Panna Sagar Damoh Satna Rewa Shahdol Sidhi Mandasur Ratlam Ujjain Shajapur Dewas Jhabua Dhar Indore West Nimar East Nimar Rajgarh Vidisha Bhopal Sehore Raisen Betul Hoshangabad Jabalpur Narsimhapur Mandla Chhindwara Seoni Balaghat
Electricity Total
3
28.78 24.54 23.51 14.94 23.64 35.43 42.55 15.59 35.13 33.70 27.64 35.03 8.55
17.11
15.72 14.37 43.32 17.22 13.42 14.95 6.39
10.00 6.00
17.36 12.84 11.33 8.38
12.05 5.15
26.73 28.03 34.48 14.84 24.37 9.55
18.86 55.01 19.86 22.85 10.31 13.18 55.48 16.48 11.09 15.19 22.34 28.38 17.19 6.15
24.60 9.13 8.27
Rural
4
23.21 16.85 15.37 13.34 20.02 30.19 33.46 13.87 32.38 30.87 24.39 26.11 8.55
6.89
8.20 7.26
11.77 9.77 6.91 8.00 2.16 3.84 2.51 5.28 6.71 4.59 2.61 3.93 4.17
17.14 9.53
11.07 7.93
14.09 4.61
12.82 23.18 13.59 11.58 4.61 3.81 5.33 9.47 6.41 7.68 8.89 4.80
10.73 3.08
13.29 5.35 4.71
Urban
5
54.57 53.34 47.81 36.10 56.52 55.82 56.75 53.97 62.71 49.69 50.92 62.81
56.42
57.63 45.91 67.30 47.98 58.26 55.64 37.31 42.84 47.05 50.09 50.43 43.52 43.61 47.45 43.72 64.S2 69.42 71.93 54.47 66.58 60.19 58.52 69.96 52.90 56.03 47.90 57.44 70.52 60.87 51.67 50.22 60.81 57.88 56.77 46.01 65.14 53.04 44.62
16
Safe Water SupplX Total Rural Urban
6
12.20 4.25 9.66 2.63
10.11 9.03
33.93 17.88 10.28 12.51 6.66
18.39 9.22
20.17
15.19 13.47 46.69 12.69 8.73
14.88 4.93 6.93 5.36
17.48 13.05 11.21 7.98
10.50 4.37
19.26 35.92 40.43 13.89 20.48 10.88 20.66 67.07 18.27 27.27 11.75 17.28 68.67 14.13 17.13 24.36 26.85 32.85 34.90 7.66
16.73 13.45 5.58
7
6.26 1.92 2.00 1.81 5.53 6.00
15.43 18.08 5.92 6.84 4.68 6.93 9.22
8.09
4.59 2.89 8.61 3.90 3.14 7.84 0.86 1.91 2.72 4.94 4.81 4.43 2.84 4.22 3.81 6.71
14.01 11.17 4.96 7.90 6.23
12.20 26.64
9.65 8.24 5.91 6.75 9.54 9.90
11.70 14.54 10.19 7.44
26.88 4.21 9.18 8.41 2.83
8
39.72 13.00 32.54 13.50 51.87 20.79 62.83 13.49 62.71 44.51 20.90 54.09
66.65
74.21 26.45 75.63 49.00 47.23 56.02 34.68 33.67 36.39 51.48 63.61 43.59 39.36" 37.89 26.58 69.09 84.94 87.22 65.12 72.15 58.55 76.22 86.0;5 63.66 83.32 50.32 67.01 86.41 40.95 64.22 70.20 74.54 64.62 84.03 52.30 43.77 71.87 33.67
No Literate Member Total
9
5.00 5.79 3.24 6.32
12.74 3.76 2.23 7.90 1.22 1.90 3.49 5.89
13.75
41.23
35.48 24.41 23.03 33.07 49.39 47.48 50.39 53.17 53.83 33.05 36.93 43.33 43.85 55.02 60.26 32.15 40.39 33.39 42.06 38.50 73.41 52.80 20.02 47.28 37.91 54.06 42.30 24.74 42.01 46.99 39.70 31.58 29.42 34.07 44.89 40.51 40.73 30.45
Rural Urban
10
5.47 6.73 3.45 6.27
13.51 4.11 2.48 8.13 1.15 1.93 3.51 6.55
13.75
47.62
38.73 25.99 34.91 35.83 53.85 52.86 53.71 58.50 56.52 41.01 41.14 47.59 47.28 60.95 61.38 36.94 52.10 45.22 46.31 43.89 79.08 57.66 36.27 52.71 45.60 59.11 47.62 53.17 45.50 49.84 45.03 39.20 41.04 37.73 47.25 47.19 43.39 32.09'
11
2.83 2.29 2.61 7.04 5.87 2.40 1.87 2.88 1.97 1.72 3.35 3.82
16.66
17.50 17.41 13.92 21.84 19.04 15.98 26.30 24.67 22.20 11.29 11.12 23.09 23.07 29.71 15.91 13.16 14.30 14.43 17.81 Ib.54 16.07 20.87 12.22 18.87 15.30 20.86 16.79 16.10 19.75 21.31 14.96 9.67
14.91 11.28 14.64 16.54 9.81
13.61
..!2!!!L Urban
12
59.14 45.52 51.85 44.45 51.19 68.35 62.46 59.90 72.68 48.21 60.26 67.23
52.73
50.56 44.75 58.96 50.95 47.50 54. Ii 37.60 39.28 52.38 47.14 47.93 38.59 39.9f 35.29 25.78 52.66 72.89 71.84 51.22 65.60 61.46 56.33 65.15 48.1:! 53.09 48.96 59.06 72.72 62.61 54.98 45.86 61.70 54.OC 50.73 45.04 39.95 52.35 37:96
S.No.
1
39. 40. 41. 42. 43.
44. 45.
1. 2. 3. 4. 5. 6. 7. 8. 9. 10. 11. 12. 13. 14. IS. 16. 17. 18. 19. 20. 21. 22. 23. 24./ 25. 26.
1 2 3 4
5 6
State/district
2
SurguJa Bdaspur Ralgalh Raj Nandgaon Durg Ralpur Bastar
MAHARASHTRA
Greater Bombay Thane Ralgarh RatnaglCl Naslk Dhule Jalgaon Ahmadnagar Pune Satata Sangh Solapur Kolhaput Aurangabad Parbham Bid Nanded Osmanabad Buldana Akola Amravatl Yavatmal Wardha !'IIagpur Bhandara Chandrapur
MANIPUR
MaOlpur North
Manipur West
Mampur South
Tengnoupal
MaOlpur Central
Mllnipur East
Electndty Total Rural
3
8.37 12.48 6.50 9.39
20.01 1268 646
40.65
7757 5672 4347 34 46 4110 2735 4057 3352 51.07 4513 41.95 2476 5013 2550 1617 1815 2238 1926 16 ().t
2290 35 91 2031 3604 5092 2376 1868
20.06
7.35
549
17.04
7.14
25 87
(j 33
4
3.85 655 3.85 4.70 6.35 5.92 3.88
24.U
41.89 37.64 3070 ~11
1965 32.32 27.91 27.13 4056 3444 1182 42.75 1497 1002 11 03 1533 1201 983
14.55 27.82 1481 2604 29.75 1841 1284
10.28
5.42
1.61
5.37
4.43
14.66
231
17
Urban
5
5335 47.72 35.95 41.94 45.62 45.81 42.00
70.53
77.57 73.59 nn 78.94 6917 6028 66.46 69.48 7520 74.38 68.04 5582 71.22 6314 4367 5842 5431 5906 4534 5064 57.04 5266 6832 68.36 60.34 5717
48.32
3394
53.18
6261
2239
4816
55.07
Safe Water Supply Total Rural Urban
6
9.19 2005 13.47 12.76 29.55 20.72 12.72
42.29
9236 4981 25.59
6.67 4066 31.29 4828 2889 5344 36.98 4580 4391 4468 3211 2596 3075 3532 3675 1913 2742 2230 17.89 2461 4493 1120 1830
19.54
2500
1718
31.11
11.88
1732
2197
7 _ 8
436 57.21 13.54 58.80 9.02 6283 5.05 66.42
10.50 65.28 10.75 69.60 11.98 66.00
18.34
22.84 17.45 3.66
19.43 2078 3527 19.71 14.58 2919 3349 2366 2820 1677 1258 2123 2276 27.84
7.71 1627 1275 768 940
1371 460 950
U.91
2181
17.es
2134
12.81
743
2353
85.56
9236 8051 73.49 42.31 8653 7631 89.13 87.74 92.60 86.82 8861 9252 91.80 86.91 8580 8464 9223 8567 7295 6443 4726 7798 73.66 7065 5636 7637
38.71
6906
1685
6929
668
3700
300
No Literate Member Total Rural Urban
9
00.27 39.62 42.88 40.17 29.03 37.15 64.14
19.91
8.53 2219 23.25 20.36 22.61 3247 18.48 2098 13.94 17.89 1865 23.15 1797 ]S.71 3272 31.10 3230 25.60 18.44 16.98 16.85 2587 15.79 1452 1770 3011
20.48
3372
2053
2007
3277
1720
2195
10
6380 4345 45.03 43.57 34.82 40.71 6723
25.50
3270 25.50 21.48 2813 3693 2099 22.63 19.31 19.23 2069 2697 2072 2936 3441 3385 3544 2762 2041 18.71 1972 2849 1842 2242 1909 3278
11
25.37 i6.83 19.26 1663 18.20 19.76 21.70
9.83
8.53 10.21 10.06 7.02
10.59 13.27 10.55 10.27 8.52 934
11.45 1403 1011 1260 2061 1550 1811 14.56 922
1121 9.36
1050 724 797 821
1239
23.43 lU7
3395
2141
2282
3337
2028
2305
3057
963
942
2941
11 09
879
Toilet. Urban
12
4019 43.84 32.31 3841 4725 41.60 428t
59.37
73.41 57.16 52.62 49.92 50.42 33.18 41..58 52.45 65.32 44.45 4014 47.7C 37.65 5938 4044 3858 4610 34.32 4031 5133 4820 4009 4139 560<: 4239 341C
62.69
3681
6796
6428
29.59
64.20
72.89

S.No.
1
1
2
3
4
5
1
2
3
4
5 6
7
1. 2. 3. 4 5.
6. 7. 8. 9.
10. 11. 12. 13.
1. 2. 3 4.
5 6
7. 8. 9
10.
11. 12.
State/diM riet
2
MEGHALAYA
Jarntia HIlls
East Khasi Hills
West Khasi Hills
East Garo Hills
West Garo HIlls
NAGALAND
Kohlma
Phek
Wokna
Zunhebbto
Mo)".okchung
Tuensang
Mon
ORISSA
Sambalpur Sundargarh KenduJhar MayurbhanJ Daleshwar Cuttack Dhenkanal Phulbam 13alanglr Kalahandl Koraput
GanJam Purr
PUNJAB
Gurdaspur Amntsar Frrozpur Ludhlana Jdlandhar Kapurthala Hoshlarpur Rupnagar PatJala S,mgrur Dathlllda Fandkot
Electricity Total Rural
3
16.84
12.58
33.89
5.54
2.97
4.36
26.12
31.59
18.58
18.64
22.16
47.63
16.60
9.79
17.75
2220 2567 1062
1161 1467 2350 1502
7.46 13.98 452'
11.51 1662
3133
60.90
56.85 6242 45.80 7498
72.87 7023 6102 6357
64 32 5478 4805
5230
4
7.44
7.49
16.57
4.34
2.41
1.58
19.97
20.18
18.58
13.14
17.91
44.61
13.57
6.20
13.03
18.20 11.76 7.10 9.18
1195 19.23 11.59 5.77
11.29 2.39 6.89
11.84 23.69
50.61
48.09 48.04 35.04 64.75 63.09 62.46 5623 54.68 5269 47.43 38.77 44.30
18
Safe Water Supply Urban Total Rural Urban
5
59.59
71.14
66.20
43.37
17.52
30.32
58.43
6C.97
59.01
54.10
62.88
47.68
44.34
51.74
44.14 54.27 35.45 54.39 43.26 5"1.27 52.80 39.72 41.77 40.29 47.97 46.77 71.45
85.44
85.52 88.76 80.67 87.69 90.02 87.06 8694 &8.92 88.09 78.07 75.69 76.88
6
25.11
15.53
45.93
10.85
9.09
11.44
45.63
43.99
60.71
15.86
33.87
38.10 62.56
45.64
14.58
14.60 25.97 16.48 5.75
45.78 14.34 6.84 5.50 8.41 5.05
10.97 10.78 14.43
84.56
8Q.62 88.04 81.13 90.11 86.95 89.66 71.38 65.51 82.19 87.67 87.41 87.97
7
14.26
14.93
25.79
8.97
8.45
6.96
43.43
36.81
60.71
11.91
32.48
39.96
62.11
41.65
9.47
8.35 8.51
10.93 4.09
43.77 9.62 3.46 4.16 5.73 3.76 6.93 4.31 6.26
81.80
79.48 86.20 86.02 88.52 84.22 88.46 67.79 56.24 77.25 88.18 85.90 87.44
8
74.40
22.27
83.48
70.45
25.82
53.28
57.18
62.45
44.85
44.33
28.70
67.22
83.97
51.33
48.91 61.89 55.56 35.09 66.97 51.74 44.06 31.14 36.11 26.64 42.81 51.61 57.36
91.13
84.37 91.41 90.75 92.09 91.75 92.27 90.88 91.97
92.28 92.38 91.92 89.62
No Uterate Member Total Rural Urban
9
37.99
49.06
29.05
35.56
34.50
48.40
25.98
21.19
25.72
21.87
20.70
13.29
36.55
48.73
35.23
34.94 33.46 38.78 45.10 21.60 18.76 27.43 40.21 42.06 54.48 65.07 38.01 18.57
24.75
19.73 25.82 34.40 17.17 16.28 19.01 14.92 16.31 24.72 36.20 37.85 33.24
10 11
43.94 11.09
52.71
38.98 36.21
35.08
52.25
7.97
10.59
15.21
19.58
12.89
29.11 10.03
25.02 11.53
25.72
24.06 6.41
22.75 5.87
14.66 6.62
39.45 7.24
52.50 16.33
31.36
36.91 40.52 40.22 46.76 21.65 19.24 28.50 41.18 43.115 56.07 69.56 40.88 19.65
28.27
21.56 31.16 39.29 13.58 17.80 20.88 15.81 18.23 29.53 38.99 42.89 36.61
20.19
24.27 19.09 28.77 16.82 21.04 15.08 16.15 11.08 23.75 28.21 30.09 20.17 13.11
16.36
13.74 16.03 18.59 14.17 13.63 15.01 10.18 10.84 14.97 27.35 22.86 21.10
Toitet lirban
12
7M!
6O.:!3
73.26
57.53
50.51
62.10
65.25
67.46
41.62
59.10
SO.3C 50.86
59.65
41..,
37.53 51.47 30.46 37.78 31.18 47.62 44.24 29.72 29.'78 30.60 34.62 35.15 56.06
64.705
62.18 65.4~
58.70 70.62 65.90 59.67 64.13 65.'79 74.1C 55.03 59.80 57.70
19
--------------------------------------------------------------------------------_.~---~-----Electricity Safe Water Supply No Literat!-!.1:l~!I~~.L _ loiret. Total Rural Urban Total Rural Urban Total Rura; L)r"lhl Urhan S.No. State/district --------------------------------------_. __ ._-----
1
1. 2. 3. 4. S. 6. 7. 8. 9.
10. 11. 12. 13. 14. 15. 16. 17. 18. 19. 20. 21. 22. 23. 24. 25. 26.
1 2 3 4
1. 2. 3. 4. S. 6. 7. 8. 9. 10. 11. 12. 13. 14. 15. 16.
2
RAJASfHAN
Ganganagar Bikaner Churu Jhunjhunun Alwar Bharalpur Sawai Madhopur Jaipur Sikar Ajmer TofIk Jaisalmer Jodhpur Nagaur Pali Barmer Jalor Sirohi Bhilwara Udaipur Chittaurgarh Dungarpur Banswara Bundi KOla Jhalawar
SIKKIM
North District East District
South District
West District
'fAMILNADU
Madras Chengalpattu North Areot South Areot Dhamlapuri Salem Periyar Coimbatore Nilgiri Madurai Tiruchirappalli 1l1anjavur I'udukottai Ramanathapuram Tirunelveli Kanyakulllari
3
20.54
25.23 35.66 18.01 21.09 14.00 14.43 13.49 35.90 20.72 35.39 16.34 8.07
28.43 14.89 17.52 7.01
10.11 17.77 15.30 18.47 19.72 13.83 14.21 14.01 26.11 13.31
2.\.11
13.72
35.19
10.06
16.20
67.83 37.48 33.49 23.66 31.37 33.75 36.65 52.20 47.49 37.25 31.74 28.87 23.01 32.71 47.96 33.68
4
8.70
15.52 12.25 5.41
12.21 6.61 5.28 6.63
10.94 11.26 9.67 5.58 1.23 4.62 8.81
11.84 2.20 6.41 9.17 8.97 9.29
12.60 9.50 9.81 5.47 6.10 7.25
13.01
12.15
16.51
6.08
15.16
26.03
24.69 26.19 18.07 28.33 24.52 30.46 38.06 45.52-24.75 23.36 22.03 18.09 23.40 39.18 27.30
5
63.67
60.07 71.12 48.91 55.32 67.71 55.37 55.86 73.40 60.46 70.42 63.83 47.50 69.95 50.97 42.14 50.56 49.38 57.13 54.08 69.91 65.90 71.58 72.76 53.43 66.44 56.19
71.80
70.21
74.58
54.43
59.24
61.59
67.83 58.09 59.64 55.30 60.69 5S.96 60.68 67.49 49.66 61.25 57.30 54.21 55.39 57.11 65.46 65.01
6
27.14
36.79 50.76 37.11 38.91 15.26 14.08 11.34 37.83 31.05 36.92 15.97 33.80 46.16 26.63 24.26 21.39 29.00 27.06 18.76 19.52 18.93 23.67 20.93 19.17 32.00 12.98
30.33
20.64 46.17
17.74
15.62
43.07
79.75 29.76 29.01., 42.28 14.56 26.73 23.97 57.38
64.S3 5S.29 41.86 65.12 16.69 36.65 47.n 26.05
7
13.00
23.51 27.20 22.52 27.88 7.50 3.38 3.98 7.78
18.38 6.77 3.69
23.76 20.84 18.52 13.82 14.88 23.60 15.30 11.23 7.98 9.25
18.97 16.38 8.47 S.93 6.52
21.70
19.11
33.94
13.06
14.15
30.91
22.70 20.24 37.28 12.51 17.81 15.71 38.29 61.09 47.32 30.71 63.40 11.39 23.04 33.23
15.95
8
78.65
84.39 86.42 72.91
81.44 71.67 61.97 56.78 83.00 84.26 77.99 70.21 91.66 90.30 74.85 69.43 80.42 86.43 80.93 64.S3 84.17 81.72 -86.32 81.39 68.56 78.51 58.74
71.93
75.89
71.97
69.98
76.11
69.44
79.75 41.15 60.38 70.53 33.69 50.81 56.02 78.02 68.95 79.39 75.65 71.50 51.55 72.32 76.73
75.69
9
42.07
38.62 41.61 42.34 27.06 33.01 32.40 . 38.65 31.09 31.47 33.20 44.83 60.70 40.13 45.69 45.72 63.26 59.47 55.01 54.18 50.84 49.n 49.58 53.00 50.05 32.30 45.12
30.86
34.32
24.44
31.32
42.05
24.78
6.90 22.67 27.05 32.10 40.77 34.75 33.67 33.67 14.25 24.38 25.61 21.30 27.64 24.05 20.32 9.80
10
48.42
43.54 56.62 49.49 28.61 35.85 35.16 41.68 40.18 33.85 46.66 49.15
67.86 52.85 48.87 50.11 67.89 62.62 63.14 59.11 57.14 54.81 52.28 56.15 56.52 40.27 49.46
11
18.97
21.01 18.45 24.81 21.11 12.42 20.10 19.96 17.44 21.47 15.02 25.77 18.13 17.97 26.85 26.74 21.57 26.48 18.05 24.00 15.49 17.23 13.90 11.81 20.14 16.39 14.44
34.59 13.68
34.85 15.58
29.85 13.57
32.93 13.59
42.69 16.09
31.05
30.25 30.60 35.74 43.26 40.63 38.47
31.13 f7.31 31.46 30.88 24.24 30.25 28.11 23.77 10.86
11.16
6.90 10.46 14.38 11.60 16.84 18.77 15.27 10.57 10.90 10.80 9.59
10.43 10.47 13.27 13.48
4.60
12
56.48
63.53 67.1; 40.22 40.72 64.15 47.48 52.40 68.~
42.31 63.73 52.01 39.71 64.29 45.1; 34.88 46.98 30.31 41.93 47.6f 59.36
44.08 56.54 65.21 46~
57.81 51.8i
53.1!
30.50 54.83
5Ui 24.84
51.27
76.14 47.46 52.86 45.76 52.;; 41.31 43.73 51.21 47.80 47.05 46.68 46.2C 39.46
26.65 40.52 51.16
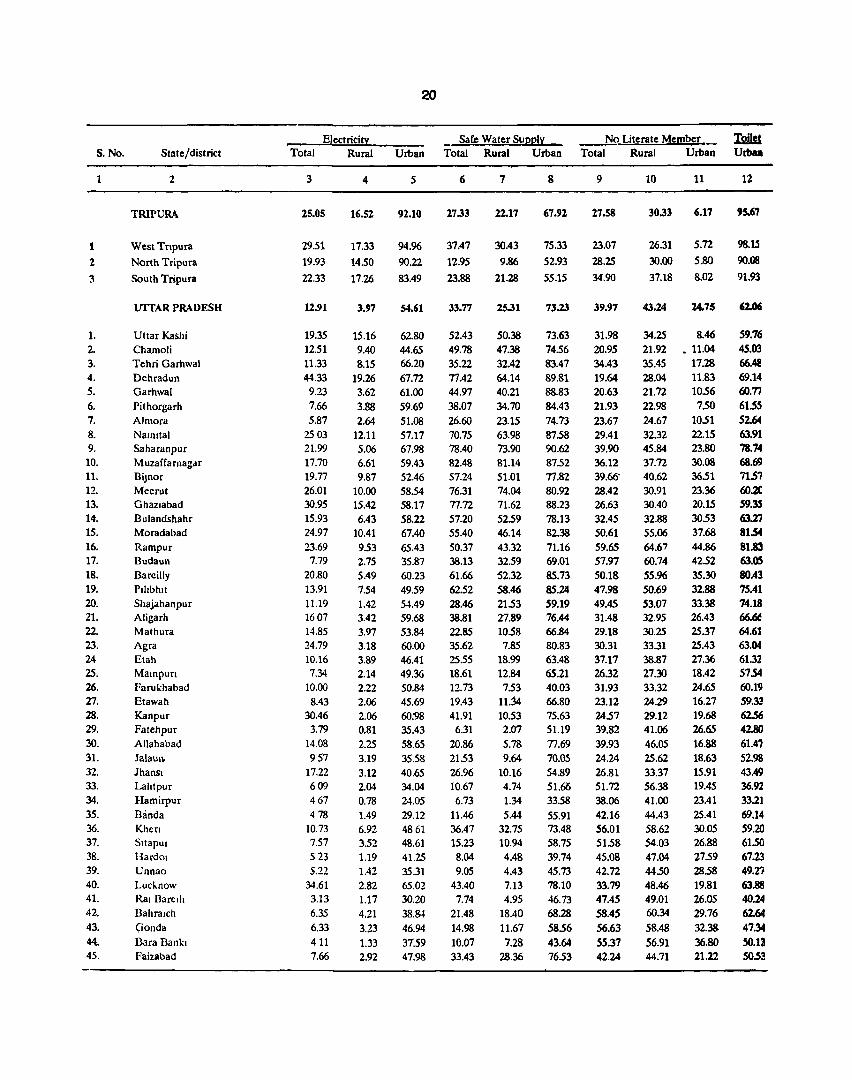
1
2
3
S.No.
1
1. 2. 3. 4. 5. 6. 7. 8. 9.
10. 11. 12. 13. 14. 15. 16. 17. 18. 19. 20. 21. 22. 23. 24 25. 26. 27. 28. 29. 30. 31. 32. 33. 34.
35. 36. 37. 38. 39. 40. 41. 42. 43. 44. 45.
State/district
2
TRIPURA
West Tnpura
North Tripura
South Tripura
UITAR PRADESH
Uttar Kashi Chamoli Tehri Garhwal Dehradun Garhwal
Pilhorgarh Almora Natnllal Saharanpur Muzaffarnag.lr
DiJnor Meerut Ghazlabad Bulandshahr Moradabad Rampur Budaun Bareilly Plllbhlt Shajahanpur Aligarh Mathura Agra Elah Mampun Farukhabad Etawah Kanpur Fatehpur Allahabad Jalau,~
Jhansl Lahtpur Hamirpur
Banda Khen S,tapul Bardo, Unnao Lucknow Ral Dared,
Dahralch (londa
Bara Bankl r··aizabad
Electricity Total Rural
3
25.05
29.51
19.93
22.33
12.91
19.35 12.51 11.33 44.33
9.23 7.66 5.87
2503 21.99 17.70 19.77 26.01 30.95 15.93 24.97 23.69 7.79
20.80 13.91 11.19 1607 14.85 24.79 10.16 7.34
10.00 8.43
30.46 3.79
14.08 957
17.22 609 467 478
10.73 7.57 523 5.22
34.61 3.13 6.35 6.33 411 7.66
4
16.52
17.33
1450
17.26
3.97
15.16 9.40 8.15
19.26 3.62 3.88 2.64
12.11 5.06 6.61 9.87
10.00 15.42 6.43
10.41 9.53 2.75 5.49 7.54 1.42 3.42 3.97 3.18 3.89 2.14 2.22 2.06 2.06 0.81 2.25 3.19 3.12 2.04 0.78 1.49 6.92 3.52 1.19 1.42 2.82 1.17 4.21 3.23 1.33 2.92
20
Urban
5
9l.l0
94.96 90.22
83.49
54.61
62.SO 44.65 66.20 67.72 61.00 59.69 51.08 57.17 67.98 59.43 52.46 58.54 58.17 58.22 67.40 65.43 35.87 60.23 49.59 54.49 59.68 53.84 60.00 46.41 49.36 50.84 45.69 60:98 35.43 58.65 35.58 40.65 34.04 24.05 29.12 4861 48.61 41.25 35.31 65.02 30.20 38.B.t 46.94 37:59 47.98
Safe Water Supply Total Rural Urban
6
27.33
37.47
12.95
23.88
33.77
52.43 49.78 35.22 77.42 44.97 38.07 26.60 70.75 78.40 82.48 57.24 76.31 77.72 57.20 55.40 50.37 38.13 61.66 62.52 28.46 38.81 22.85 35.62 25.55 18.61 12.73 19.43 41.91
6.31 20.86 21.53 26.96 10.67 6.73
11.46 36.47 15.23 8.04 9.05
43.40 7.74
21.48 14.98 10.07 33.43
7
22.17
30.43
9.86
21.28
25.31
50.38 47.38 32.42 64.14 40.21 34.70 23.15 63.98 73.90 81.14 51.01 74.04 71.62 5259 46.14 43.32 32.59 52.32 58.46 21.53 27.89 10.58 7.85
18.99 12.84 7.53
11.34 10.53 2.07 5.78 9.64
10.16 4.74 1.34 5.44
32.75 10.94 4.48 4.43 7.13 4.95
18.40 11.67 7.28
28.36
8
67.92
75.33
52.93
55.15
73.23
73.63 74.56 83.47 89.81 88.83 84.43 74.73 87.58 90.62 87.52 77.82 SO.92 88.23 78.13 82.38 71.16 69.01 85.73 85.24 59.19 76.44 66.84 SO.83 63.48 65.21 40.03 66.80 75.63 51.19 77.69 70.05 54.89 51.6li 33.58 55.91 73.48 58.75 39.74 45.73 78.10 46.73 68.28 58.56 43.64 76.53
~ Literate Member Total Rural Urban
9
27.58
23.07
28.25
34.90
39.97
31.98 20.95 34.43 19.64 20.63 21.93 23.67 29.41 39.90 36.12 39.66' 28.42 26.63 32.45 50.61 59.65 57.97 50.18 47.98 49.45 31.48 29.18 30.31 37.17 26.32 31.93 23.12 24.57 39.82 39.93 24.24 26.81 51.72 38.06 42.16 56.01 51.58 45.08 42.72 33.79 47.45 58.45 56.63 55.37 42.24
10 11
30.33 6.17
26.31 5.72
30.00 5.80
37.18 8.02
43.24
34.25 21.92 35.45 28.04 21.72 22.98 24.67 32.32 45.84 37.72 4Q.62 30.91 30.40 32.88 55.06 64.67 60.74 55.96 50.69 53.07 32.95 30.25 33.31 38.87 27.30 33.32 24.29 29.12 41.06 46.05 25.62 33.37 56.38 41.00 44.43 58.62 54.03 47.04 44.50 48.46 49.01 60.34 58.48 56.91 44.71
24.75
8.46 • 11.04
17.28 11.83 10.56 7.50
10.51 22.15 23.80 30.08 36.51 23.36 20.15 30.53 37.68 44.86 42.52 35.30 32.88 33.38 26.43 25.37 25.43 27.36 18.42 24.65 16.27 19.68 26.65 16.88 18.63 15.91 19.45 23.41 25.41 30.05 26.88 27.59 28.58 19.81 26.05 29.76 32.38 36.80 21.22
12
95.67
98.15 9O.~
91.93
62.06
59.76 45.03 66.~
69.14 60.77 61.55 52.64 63.91 78.74 68.69 71.57 60.2C 59.35 63.27 81.54 81.83 63.05 80.43 75.41 74.18 66.6f 64.61 63.04 61.32 57.54 60.19 59~
62.56 42.80 61.47 52.98 43.49 36.92 33.21 69.14 59.20 61.50 67.23 49.27 63.88 40.24 62.64 47.34 SO.13 50.53

S.No.
1
46. 47. 48. 49.
SO. 51. 52. 53. 54. 55. 56.
1. 2. 3. 4. 5. 6. 7. 8. 9. 10.
11. 12. 13. 14.
15. 16.
1
2
1
2
3 4
5
6
7
8 9
1
State/district
2
Sultan pur Pralapgarh
Dasli Gorakhpur Deoria
Azamgarh Jaunpur DaHia Ghazipur VaranaSI
Minapur
WEST BENGAL
Koch Dibar Jalpaiguri
Darjiling West Dinajpur Maldah Murshidabad Nadia
Twenty four Parganas Calcutta Ham'a Hugli Mcdinipur Dankura Puruliya
Darddhaman Dirbhum
ANDAMAN & NICODAR
ISLANDS Andamans
Nicobars
ARUNACHAL PRADESH
West Kameng
East Kameng
Lower Subansiri
Upper Subansiri
West Siang
EAst Siang
Dibang VaHey
Lohit
Tirap
CIIANDIGARJI
Chandigarh
Electricity Total Rural
3
3.15
3.08
3.65 8.70
5.71 5.09 ~.22
7.88 5.47
20.37
10.05
21.09
7.61 14.01
23.90 8.47
21.64 7.67
15.28 23.06 83.66 26.79 22.86 7.27
14.40 6.73
26.65
14.42
35.92
38.65
17.98
15.15
23.41
4.01
19.27
9.00
p.57
10.55
10.11
13.48
18.02
84.43
84.43
4
1.61 1.63
2.17 4.12
3.78 3.23 ;?4R
4.81 2.84 34 46
3.08
1.02
3.23 9.17
10.10 5.23
19.15 4.35
6.41 4.08
5.69 9.84 3.75
10.47
2.80
11.28 12.23
19.87
20.29
17.98
10.99
20.03
4.01
9.45
9.00
7.97
2.96 10.11
7.50
18.02
67.85
67.85
Urban
5
49.68
33.46
35.23 50.18 32.97 24.84 45.32 38.76 36.32
65.55 53.56
21
57.86
70.99 44.50
60.19 37.33 71.56 38.63 45.54 50.61 83.66 48.95 49.18 44.11 62.46
48.23 59.10
38.08
78.22
78.22
64.26
70.26
69.84
58.40
57.19
60.40
85.48
85.48
Safe Water Supply Total Rural Urban
6
8.83 6.07
22.S3 47.76
53.87 28.10 18.92 31.49 17.09 24.30 13.97
69.65
63.24 35.38 37.04
43.94 54.69 78.81 87.66 90.07 90.92 85.54 90.68 57.59
24.97
11.54 75.57 63.18
51.64
58.00
9.88
43.89
41.32
25.15
48.80
35.60
54.72
51.97
46.36
48.50
36.46
99.09
99.09
7
6.83
4.38
20.35 44.64
51.93 26.37 15.67
28.20 13.80 6.39
4.95
65.78
62.27 35.01 34.64 42.04
53.51 78.15 89.26
92.88
92.57 91.96 57.41
22.80 7.57
79.67 63.69
36.35
42.24
9.88
40.16
38.32
25.15
41.42
35.60
49.97
46.33
46.36
43.07
36.46
94.39
94.39
8
69.18
41.28 68.89 76.04
81.52 46.55
66.42 64.75 55.84 72.15 70.31
79.78
77.31 37.70 43.38 60.84 78.43 84.91 82.19 85.98 90.92 78.15 88.10 59.52 51.57
53.46 66.93
57.72
91.95
91.95
87.93
82.76
86.84
92.77
86.68
91.16
99.39
99.39
No Uterate Member Total Rural Urban
9
46.99
42.99 49.94 42.85 40.08 38.55.
JP.34 33.49 33.16 32.59 48.30
31.16
40.66 42.80 27.90
i5.77 48.59
49.27 33.91 24.28 11.79 20.74 25.07 23.38
~.91
37.07
34.68 42.19
16.62
15.60
23.22
52.11
54.30
79.52
57.43
65.67
40.5.
40.98
45.81
40.37
51.23
1~.86
10
47.85 43.70
51.11 45.25 41.38 39.82 37.38 34.54 34.36 36.17 52.69
36.97
42.52 46.59 32.83
49.17 50.29 51.67 39.42 30.62
23.22 29.10 24.12 36.12 38.86
40.63 43.65
11
20.73
28.38 24.80
21.13 21.81 25.03 20.96 22.92 18.97
23.02 20.98
16.18
14.46 19.26 15.12 15.98 14.78 27.01 15.21 15.17 11.79 18.17 16.93 15.72
20.22
18.35 22.18
26.47
18.89 10.71
17.91 10.77
23.22
54.91 19.18
56.55
79.52
64.94
65.67
43.67
44.29
45.81
43.22
51.23
23.89
18.85
16.68
20.45
17.82
20.33 12.39
20.33 12.39
Toilet Urban
12
52.2e
34.80 34.45 53.77 33.04 36.97 53.76 40.32 37.16 67.35 53.5;
77.14
82.51 62.1E 67.13 70.5C 72.44 47.50
70.66 81.34 92.97 78.43 77.73 57.95 36.66
49.2~ 69.67 41.68
10.90
70.90
64.56
71.34
66.52
58.13
65.38
60.03
18.53
78.53
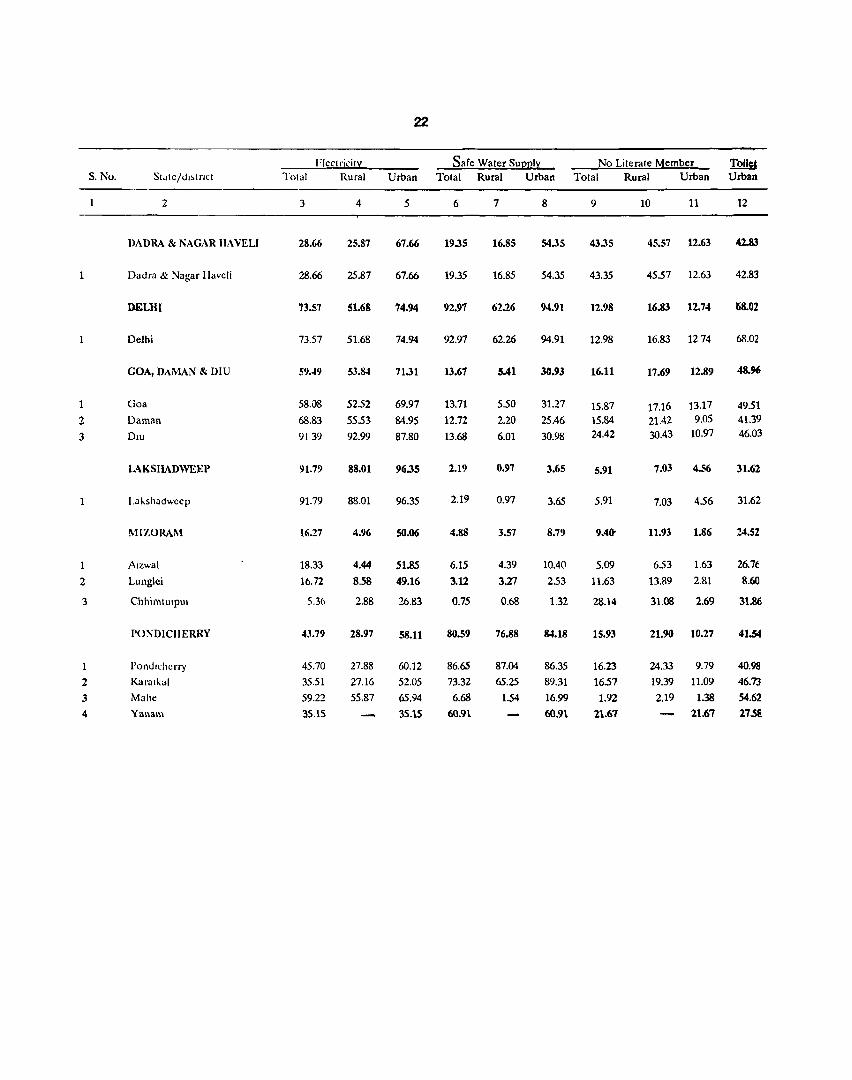
22
Flcet ricit;:L Safe Water SUI2I2I:,: No Literate Member Toilg S. No. St'ltC/UI~tflct Total Rural Urban Total Rural Urban Total Rural Urban Urban
2 3 4 5 6 7 8 9 10 11 12
I>ADRA & l'\AGAR HAVELI 28.66 25.87 67.66 19.35 16.85 54.35 43.35 45.57 12.63 42.83
1 Dadra & Nagar llavcli 28.66 25.87 67.66 19.35 16.85 54.35 43.35 45.57 12.63 42.83
DELHI 73.S7 51.68 74.94 92.91 62.26 94.91 12.98 16.83 12.74 68.02
Delhi 73.57 51.68 74.94 92.97 62.26 94.91 12.98 16.83 1274 68.02
GOA, DAMAN & DIU 59.~9 53.84 71.31 13.61 SAl 30.93 16.11 17.69 12.89 48.96
1 Goa 58.08 52.52 69.97 13.71 5.50 31.27 15.87 17.16 13.17 49.51 2 Daman 68.83 55.53 84.95 12.72 2.20 25.46 15.84 21.42 9.05 41.39
3 DIU 9139 92.99 87.80 13.68 6.01 30.98 24.42 30.43 10.97 46.03
LAKSllADWEEl) 91.79 88.01 96.35 2.19 0.97 3.6S 5.91 7.03 4.56 31.62
La"5h~dwccp 91.79 88.01 96.35 2.19 0.97 3.65 5.91 7.03 4.56 31.62
MIZOlt>\l\1 16.27 4.96 50.06 4.88 3.57 8.79 9.4Qo 11.93 1.86 24.52
Alzwal 18.33 4.44 51.85 6.15 4.39 10.40 5.09 6.53 1.63 26.7f
2 LungJei 16.72 8.58 49.16 3.12 3.27 2.53 11.63 13.89 2.81 8.60
3 Chhimtuipul 5.36 2.88 26.83 0.75 0.68 1.32 28.14 31.08 2.69 31.86
I'O:"lDIClIERRY 43.79 28.97 58.11 80.59 76.88 84.18 15.93 21.90 10.27 41.54
1 l'ondl('hcrry 45.70 27.88 60.12 86.65 87.04 86.35 16.23 24.33 9.79 40.98
2 Karalkal 35.51 27.16 52.05 73.32 65.25 89.31 16.57 19.39 11.09 46.73
3 Mahe 59.22 55.87 65.94 6.68 1.54 16.99 1.92 2.19 1.38 54.62
4 Y.mal\l 35.15 35.15 60.91 60.91 21.67 21.67 27.5@
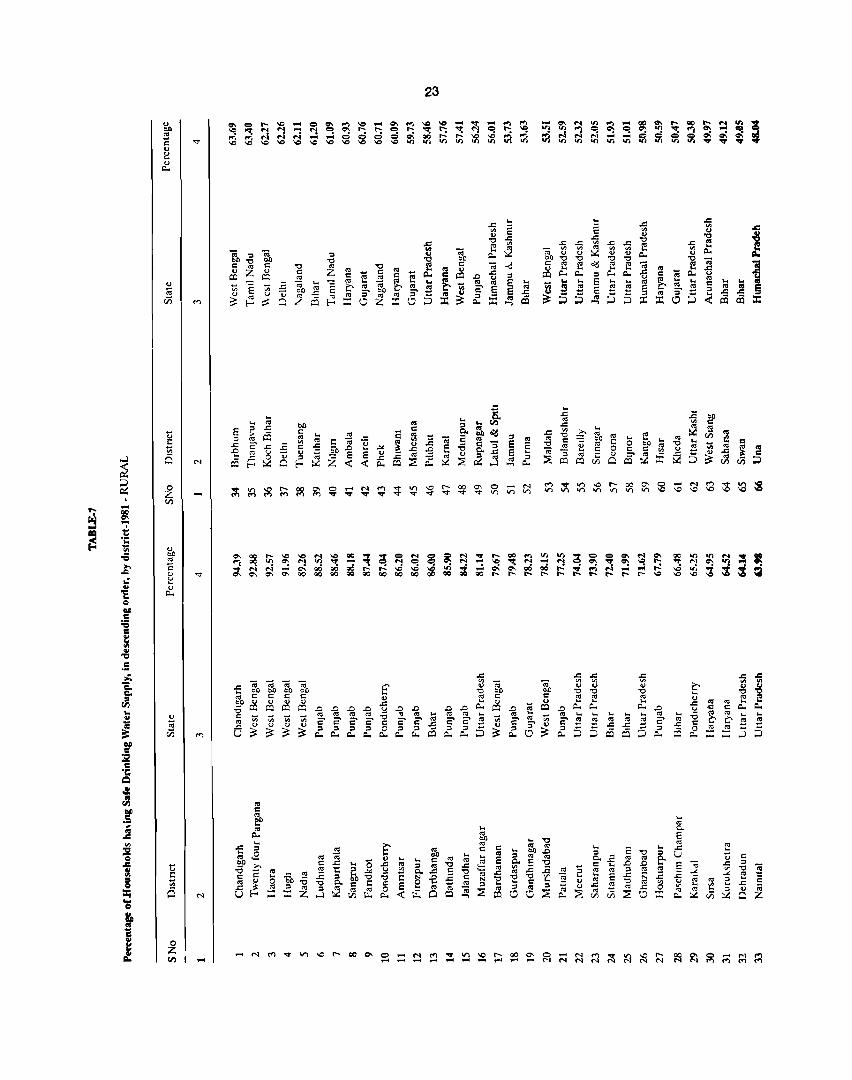
tj
E ~ o
o Z CIl .....
'0 _ C
~ '" ~ ~O :l '" o z
23

N
...,.
c :s
~ III
00 ..... .....
.c '" " £
~ .. C ~ o :3
24
..... N <"l<"l ..... .....
... :s
.9< ..c - <J ~ 2 e ., ~ S
c :s c :s .c ·c :s .c ...
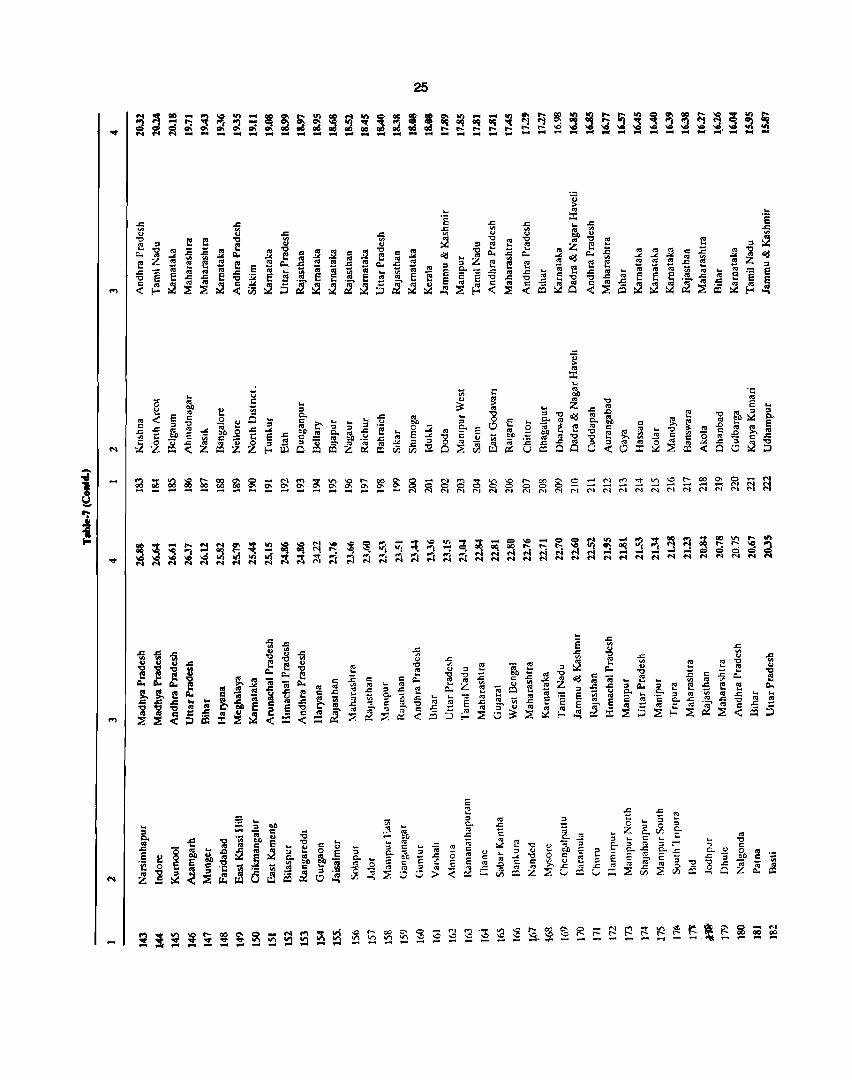
N
.. :..
l
.. a. c g'O c :s o
25
!l'o o e ~
.. :s 0-
~() os .c c::::
.c ~ os '0 '0 :s U
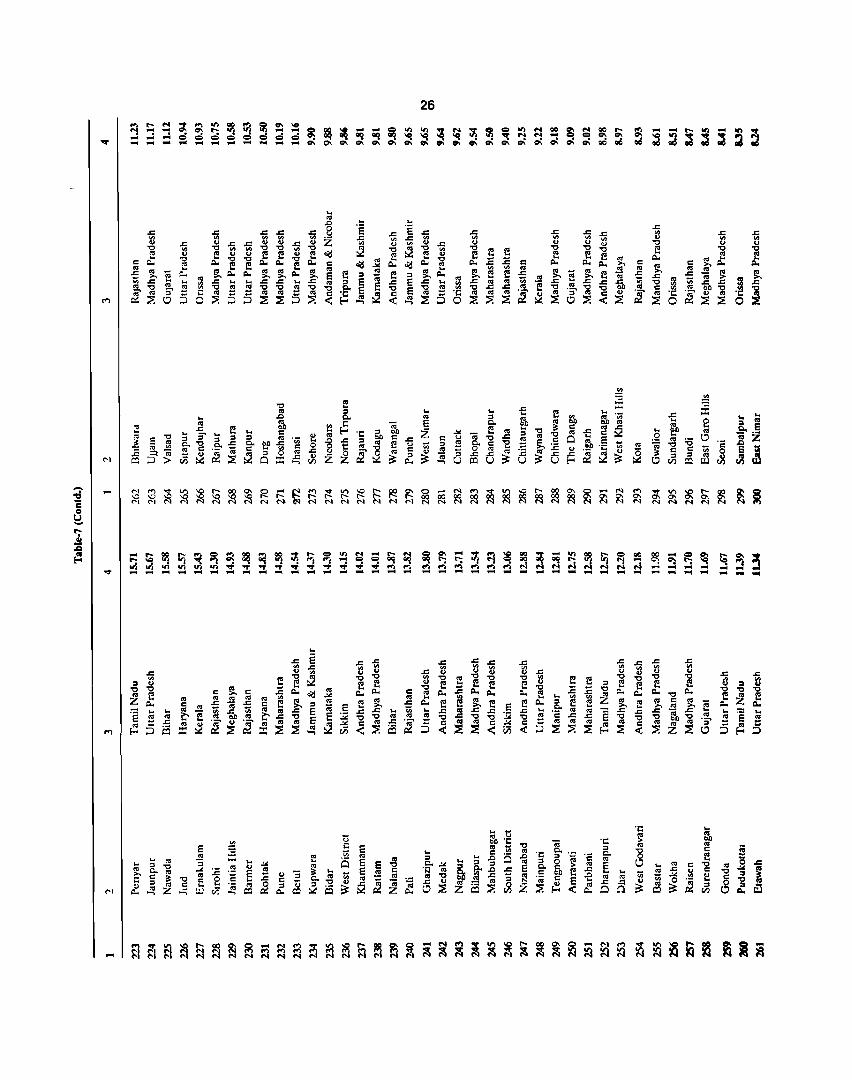
26
.. co E
.c Z u
~~
.. " e-
]..-g o co .c .c III U
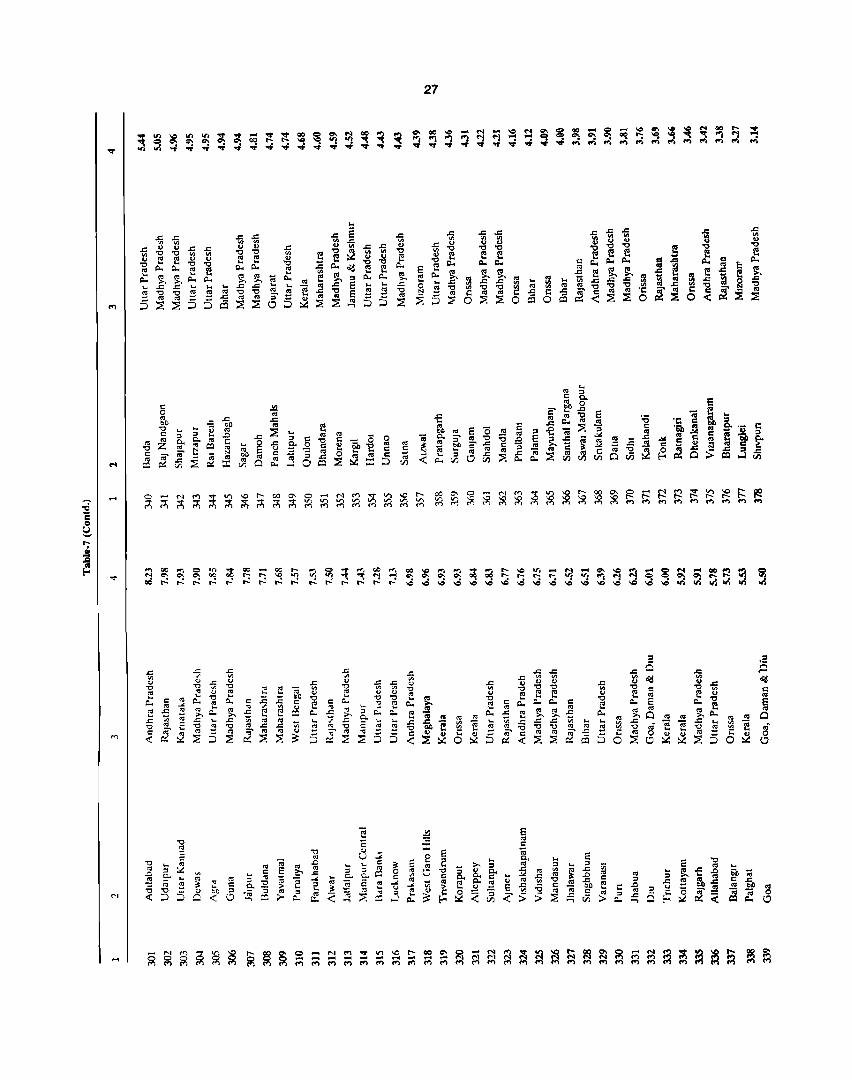
27
~ ~ ~ ~ ~ ~ ~ fn r-- r-.. ,...: r..: r--: r...: r...: r..:
("
s '" c co 0.,
'" .... 3i OJ '" E ~ <>
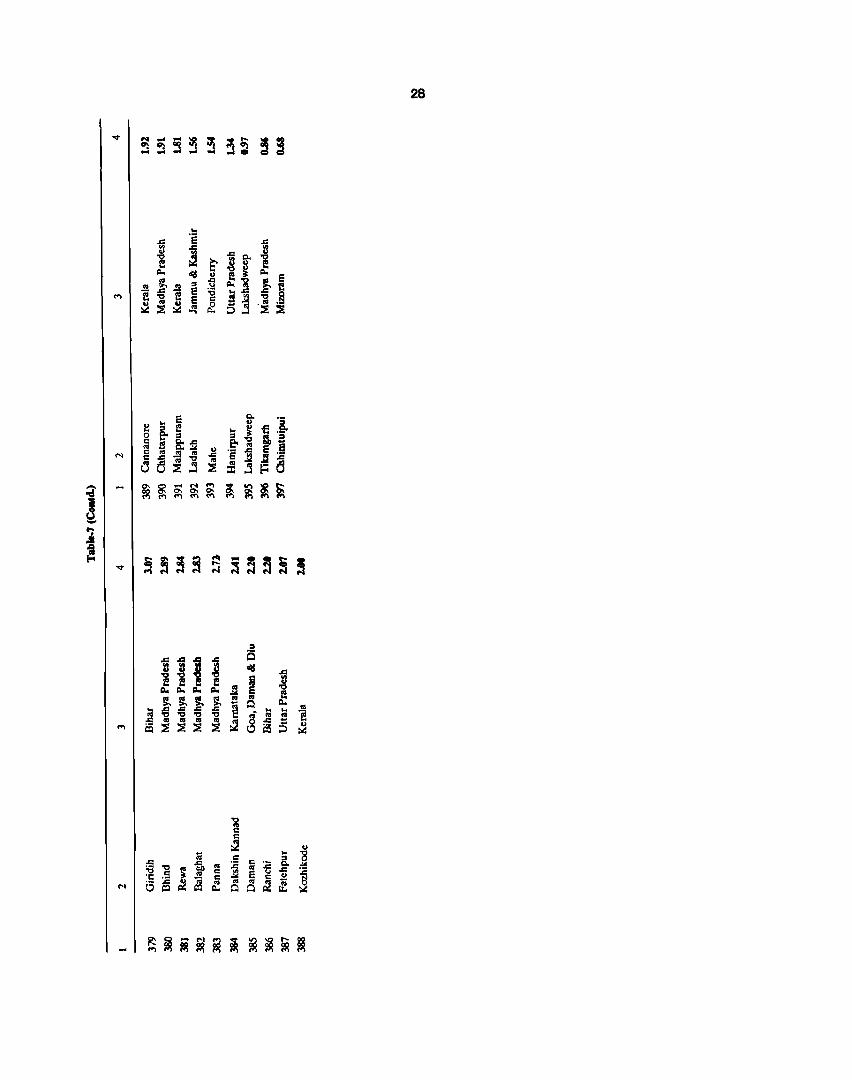
28
::I
~!1 ~ is II'd ..: '0 '0 '0 C .g f f f
!J '" c. c. c. c. E e ~~~~ '" Q
~ c.
S .... ..:..:..: .c .... .... '" '0 '0 '0 '0 8" Oil :! e ..c Oil Oil '" Oil :2 .c: .... is ~ ~ ~ :::2 0 CS :5 ~
'0 .. c c :2 .,
; .... '8 ..c: c c ::I
fa Oil :.c :.c 0- "'" ~ '0 ~
Oil ..c :.c c '" c '" e '" ., 'C
~ ~ c -"= c
~ 0 ~ .. .. .. Q! ~ N C. Q Q
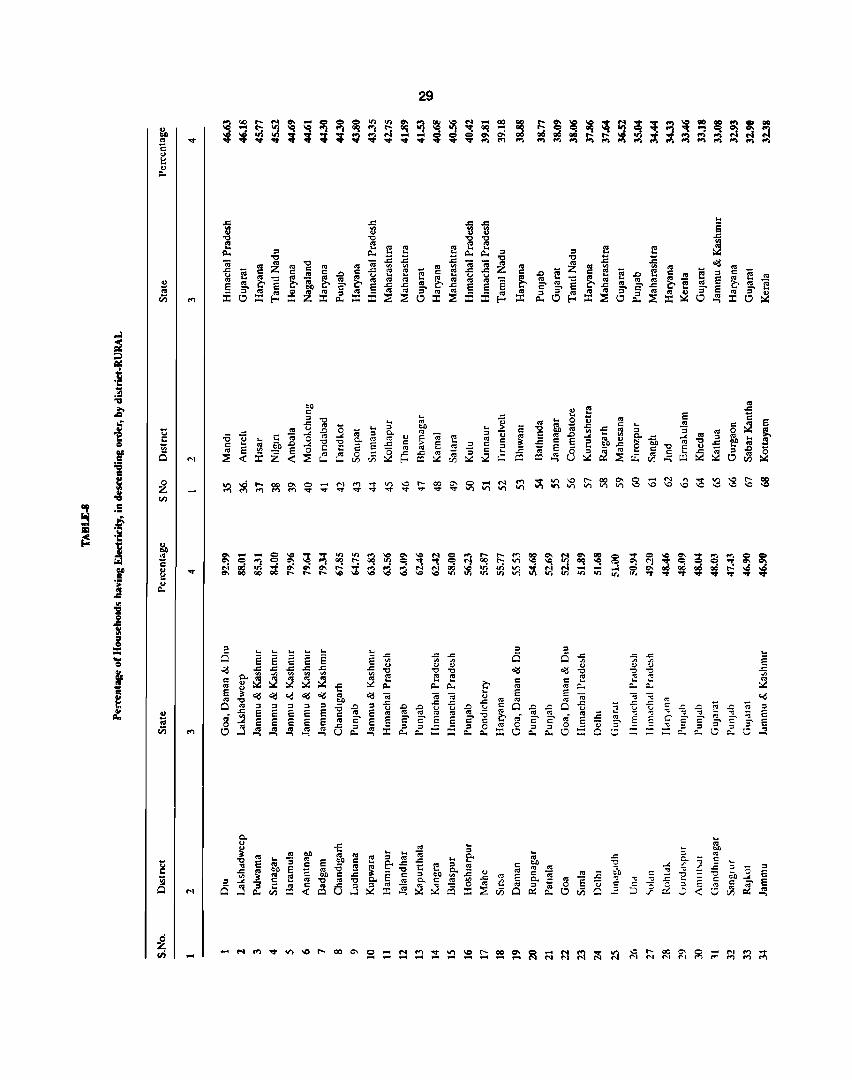
N
.S
....
... ~ ~ C C Vl
of li'o -0 c ~ .c
U
29
.... N N N
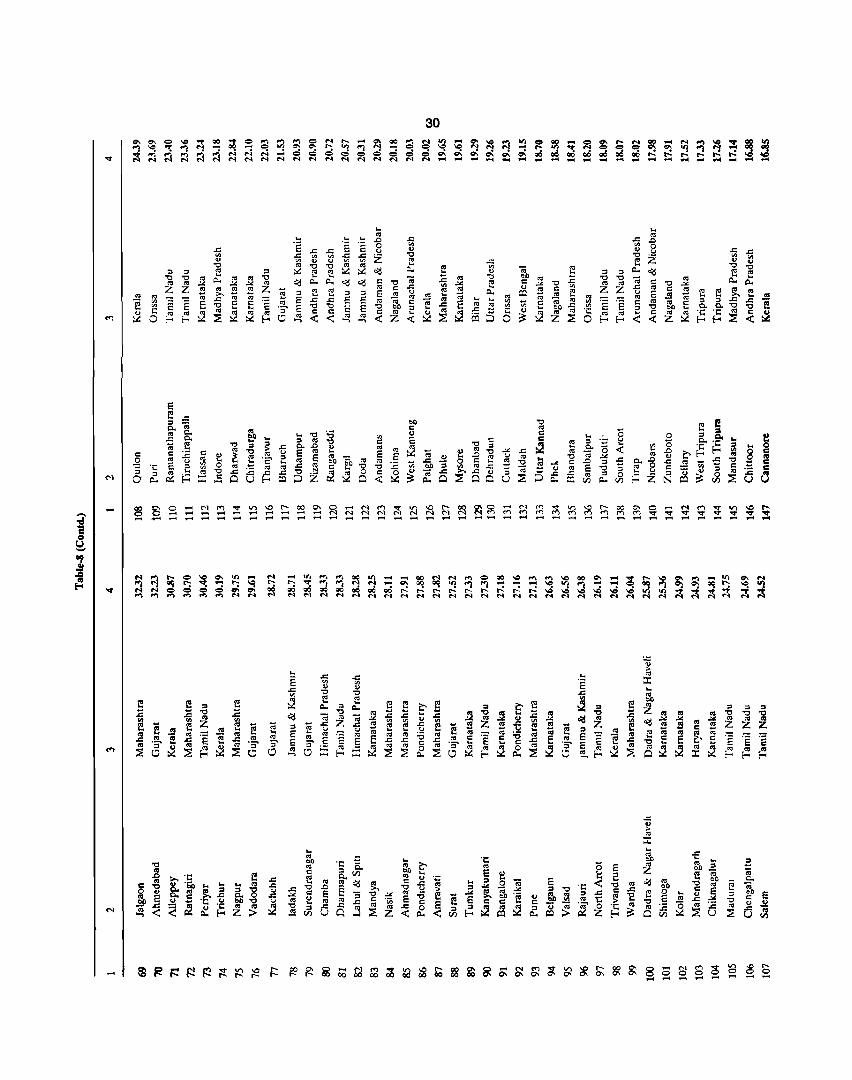
30
....
e co ·s o
"0 C
..\S ~o co Z
8 8 .... ....
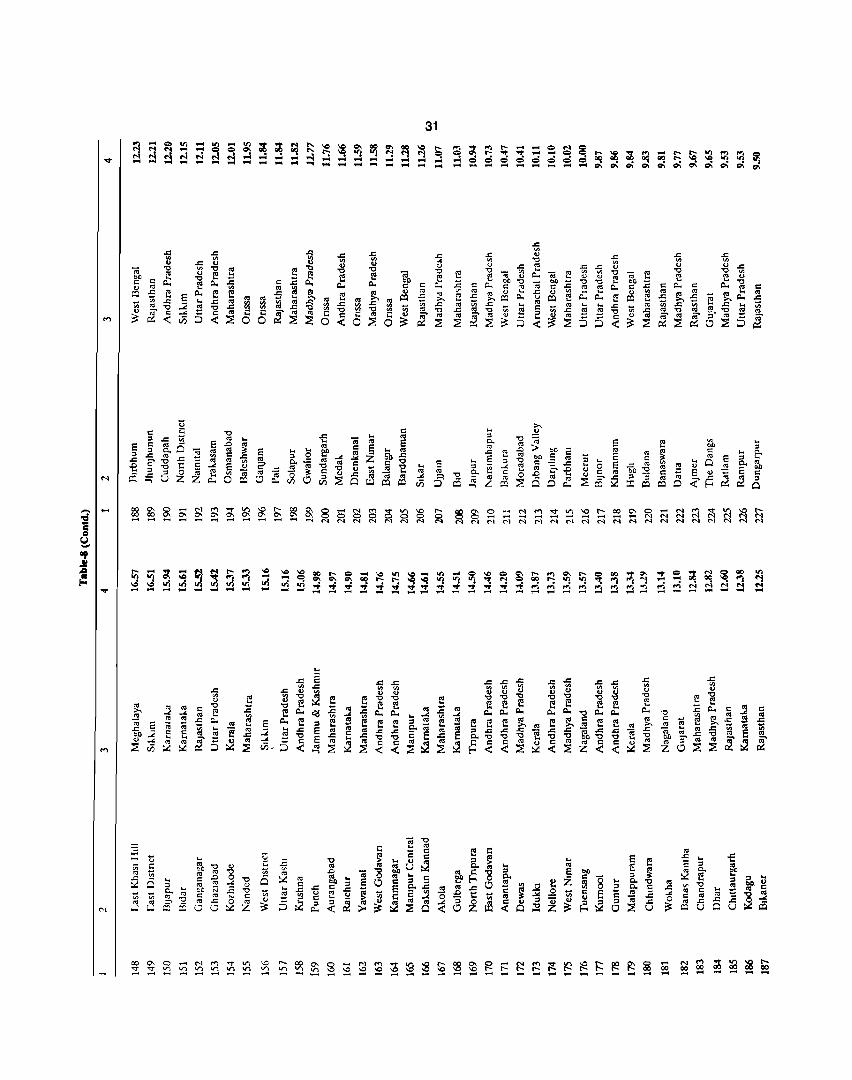
31
<'I
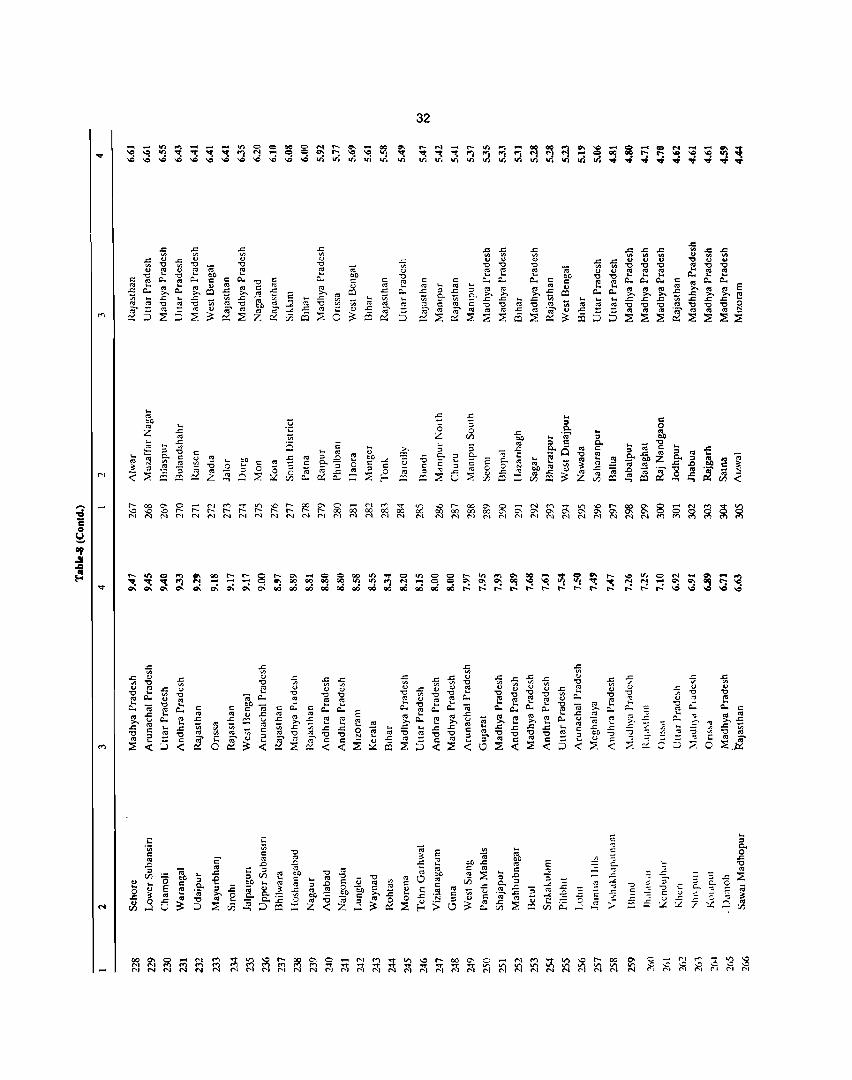
('1
c " ..c 'iii " ~
32
E ~
" '0
" c
'" "N ;;
... ..c '" '" ... " "0 "0
J: t
.... :::> c.. " "CO ..c Vl
.... '" bO
~
c " ..c 'iii
" ~
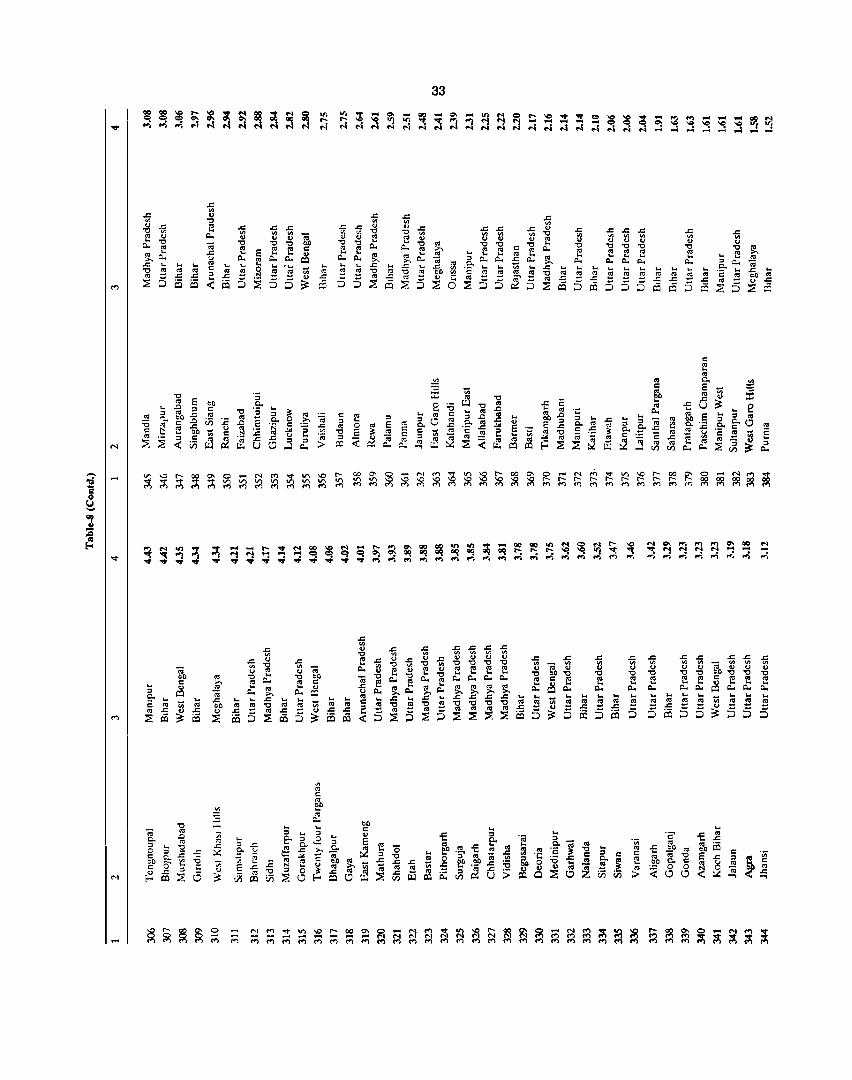
a. '" o e '0 c
.u r"'
~o c .,
Vi :c u
'" C ~ ~
... '" c.. c ~ ....,
33
co .~ ::> en
.. '" c.. c ~
.. '" .go j
~ ~ or. VI () () "0 "0 t: e
l).. l)..
.. '" .9-c .,
::E
... 1: ~
.. '" c.. c ~ "5 en
jo~ j ~J
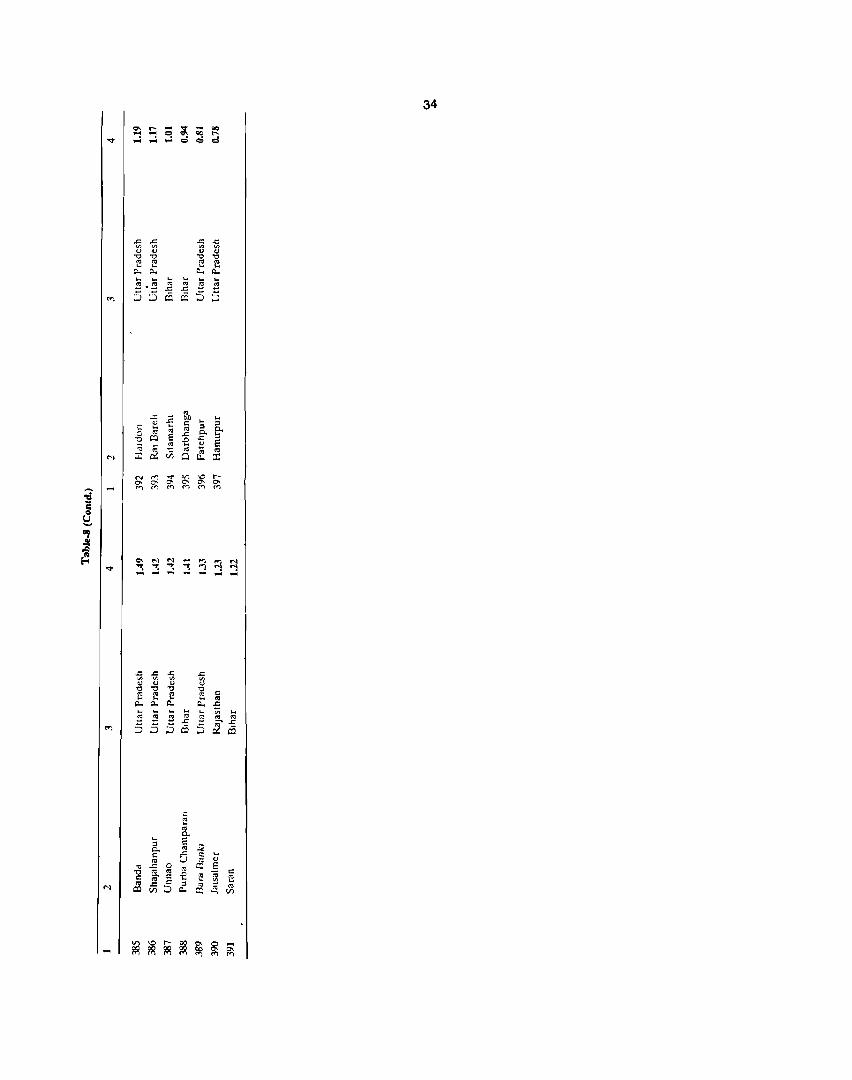
34
.c .c .c: .c: '" '" VI '" <l) <l) <l) ... "0 "0 ." '0
'" '" '" ~ .... .... ... p.., p.., "" "" .... .... .... ... ... .... ~.~ " " '" '" .c ..c :5 :5 ('l :S :S ci5 ci5
., ~ ..c on ... ....
C ::J § ... ., ::J eo '" " ..c Po. '0 ~ e -e ..c a
c2 ~ " "" " tZ '" N ::r:: rJi Q :I:
N <"l -T V) '0 t-
'" '" '" '" '" '" ~
...., ," <'l <'l <'l <'l
~ C? .. :s ~ ~ f'I I'l -.... ~, '" "7 ~ :3 "': :3 ::! "i .... ...; -
..c .c .c .c V) V! II> II> 0) ... <l <l '0 '0 '0 '0 c e ~ !.': " .... " p.., p.., ~ ~ -5 .... .... .... .. .. II> .... ~ ~ ~ " ~ '" '" ..c ff ..c .., :S :S ;5 C5 ;5 ci5
~ '" Po. ....
::J e ~ 0.. " c ..c ~
.... til U ...
'" ..c 0
'" I::i E
'0 " " -e e "'iii c c '"
c ~ C II>
C5 ..c ::J ~ iii '" N til ::J p.., .... til
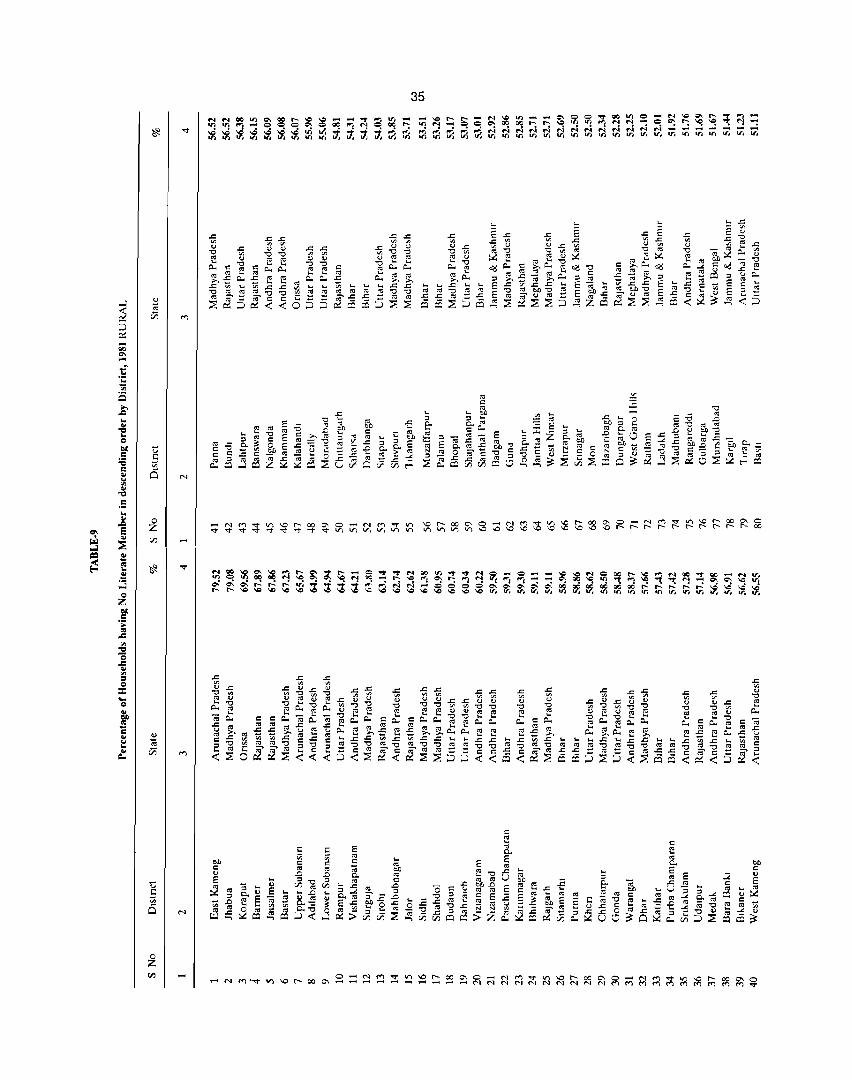
ti ;:: Vi o
... 5 Vl o
'" .; c c c " ~c::
.... 0)
E ....
]j
I..;
~ '" C
.n :l .n ..c '" ~
35
E i:!'O '" '" 0lJ .n '" '" C E ~ '" N N
>2.
~ I..; .....
" ." 0.._ .c -'0 = o '" ..., ...,
I..; I..;
'" '" ..c.c ::3::3
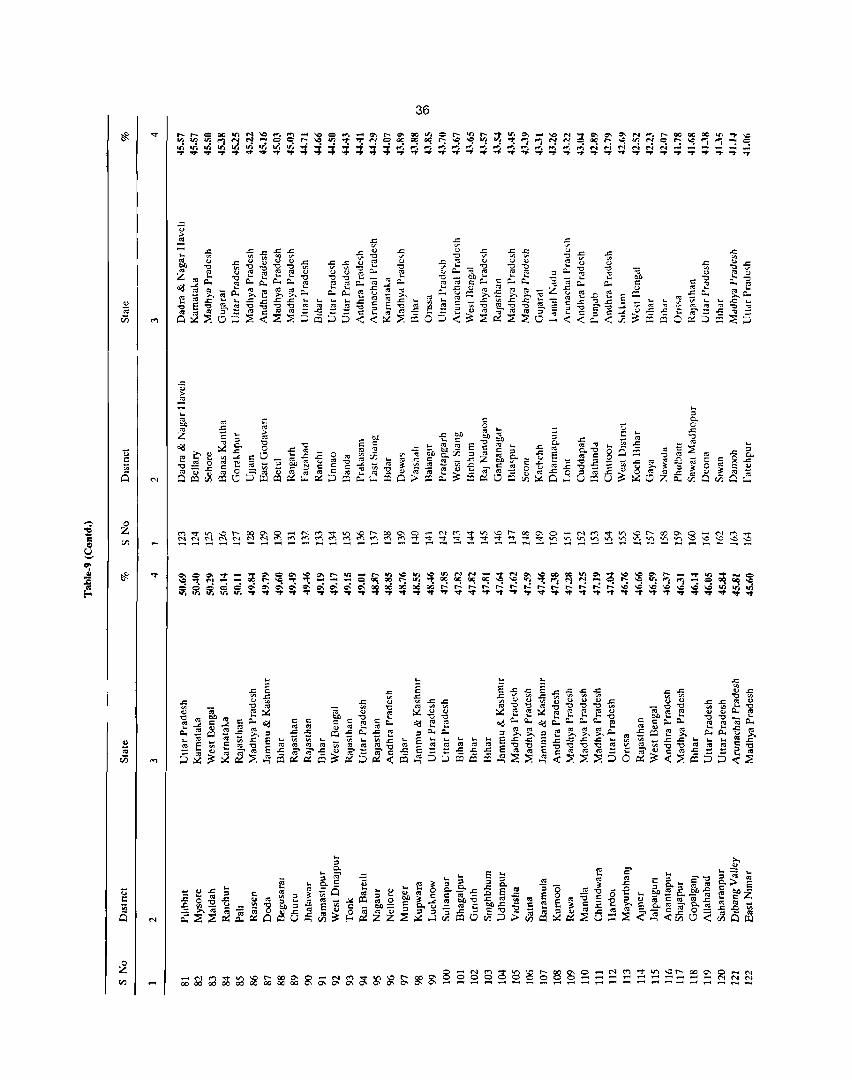
36
t: E '" Ci N
III ;; :ii
t: E '" Ci
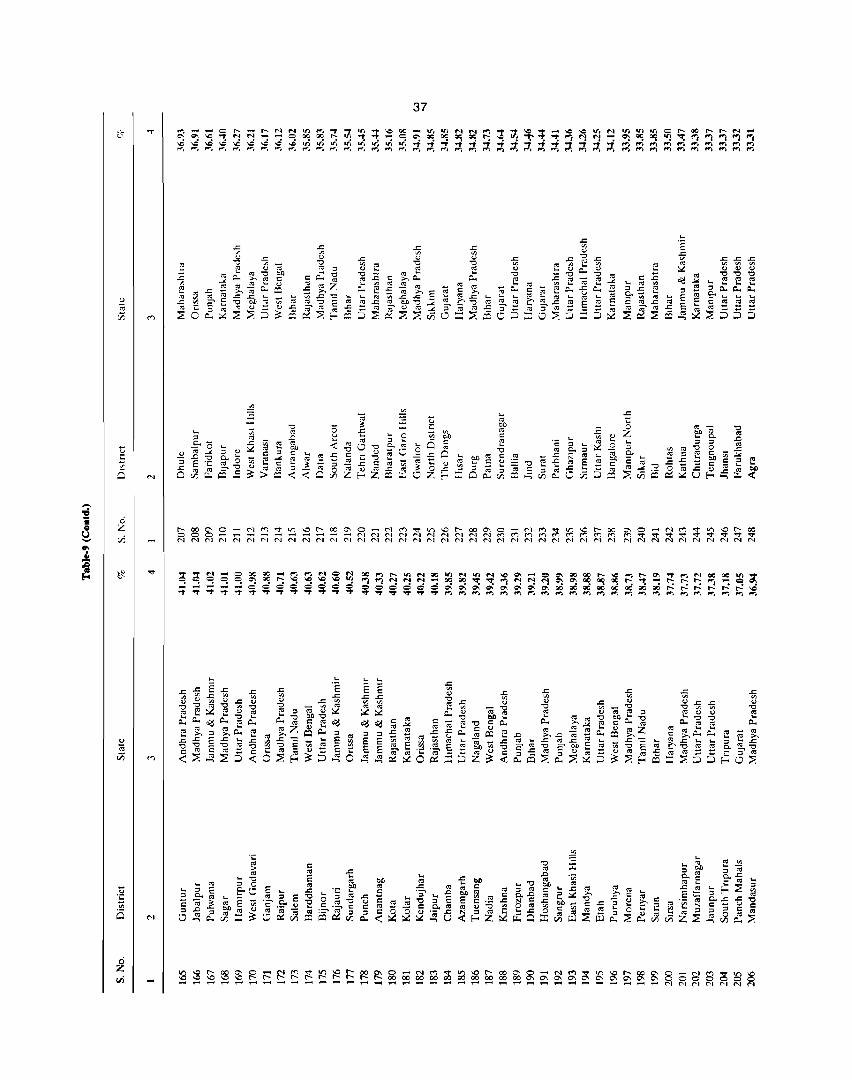
.....
... :;J " a. ... ell 0
g]
t:: :§ ~ t: ...
<;0
... ... E E
..c:..c:
~~ o<lo<l :;J " E E E E ell ell ..., ...,
37
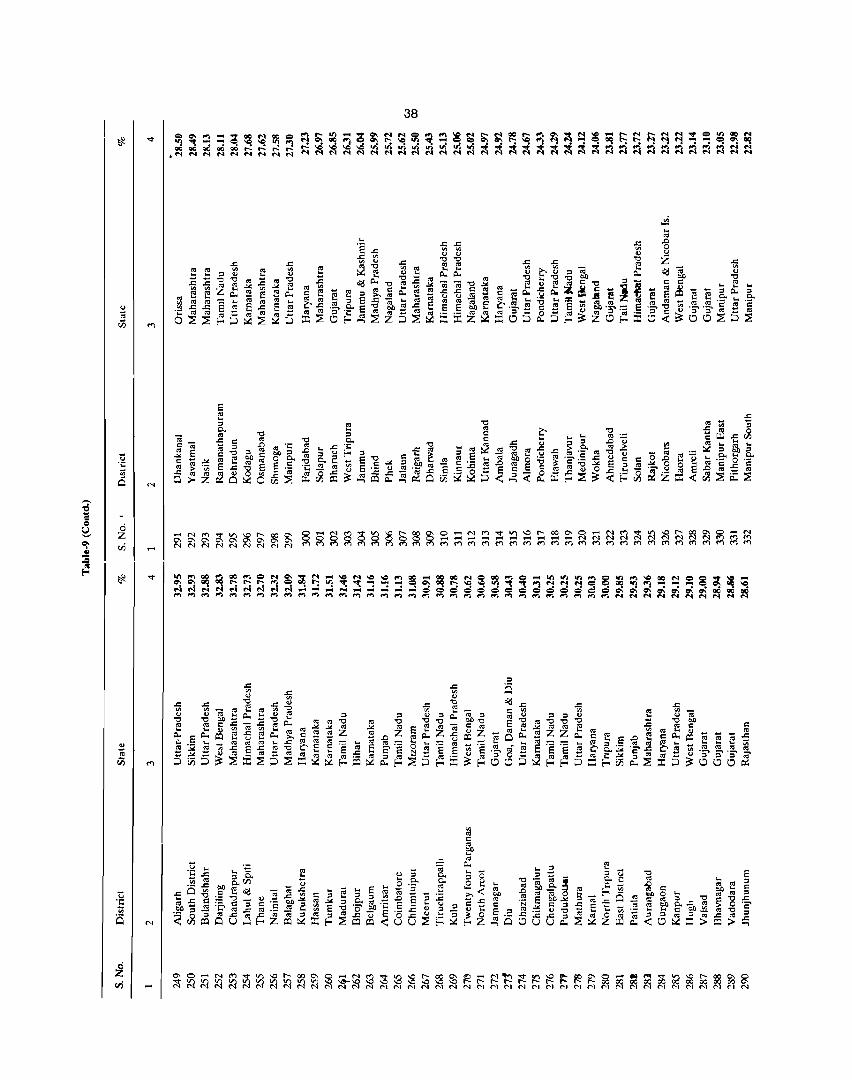
-u '5 '" o
ci Z vi
N
«s 't:; 00'" o 0. E .s - '" 65::E
'" '0
'" oD Z '" .-~E
'" '" ll-oE-<
38
~ :; o 0. ~ '; oD E E ..c 80
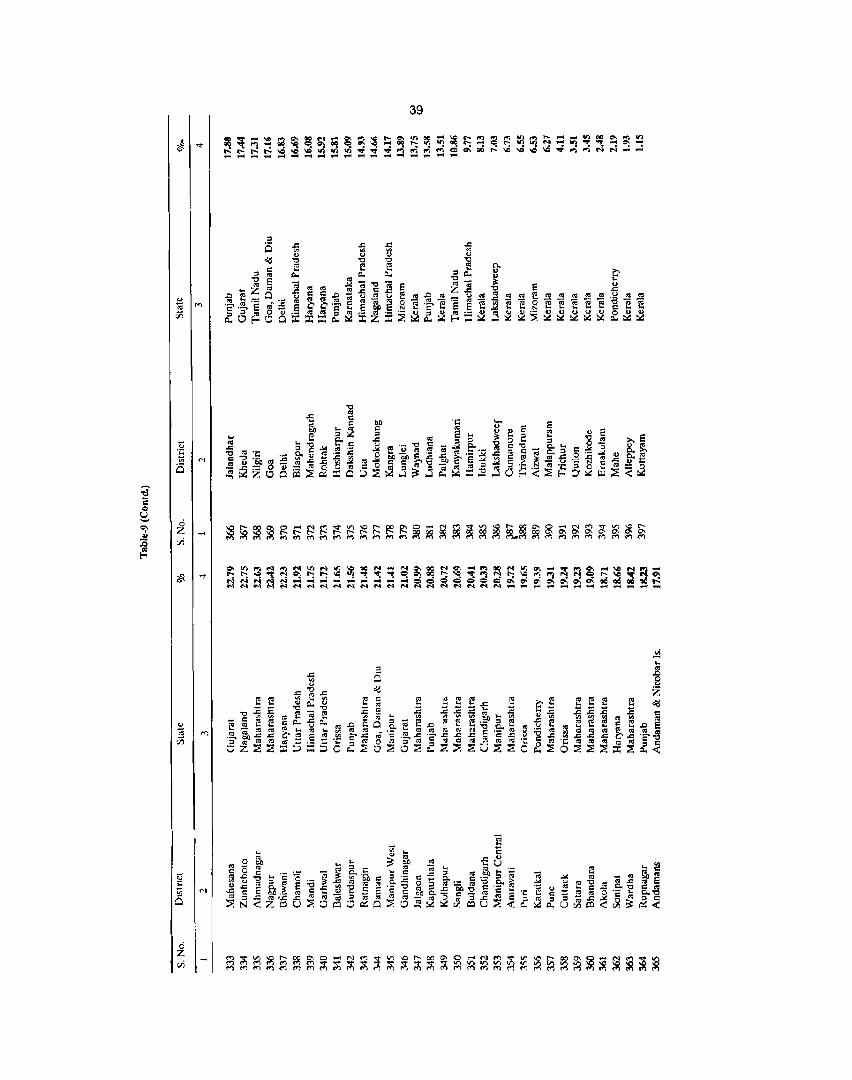
~
o Z :Ii
o z (fj
..,.
'"
,..,
1-
~~ .... .... 9 .... ., ...
~ .... .... ... ...: .... .... .... ... .... .... ~ ;! ... ~
or. 'C ... ~ oc ~ ~ ....
.... iii III ..p '" .... ... ... .... .... ... .... ....
39
on oc ... .... .... '" ~ '" on ~
,.._ ... .. VI oc .... ~
on ,.._ "l "1 ~ ~ ....
~ ~ ~ ... "l "': "': .... ....
..; or. .., ..0 ... .... ..p '" '" N N ... ..; .... ... .... ....

u E III
cS
N
N
"0 c: <)
E ... ~ g III
$~
40
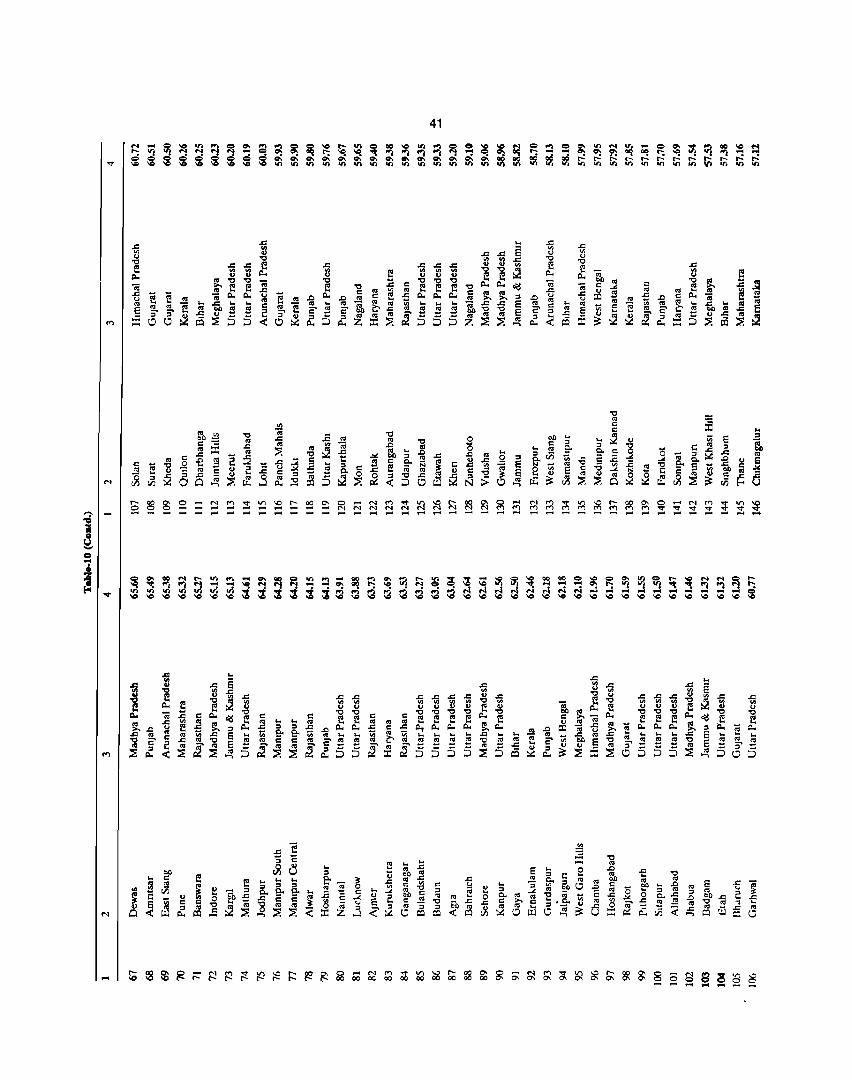
41
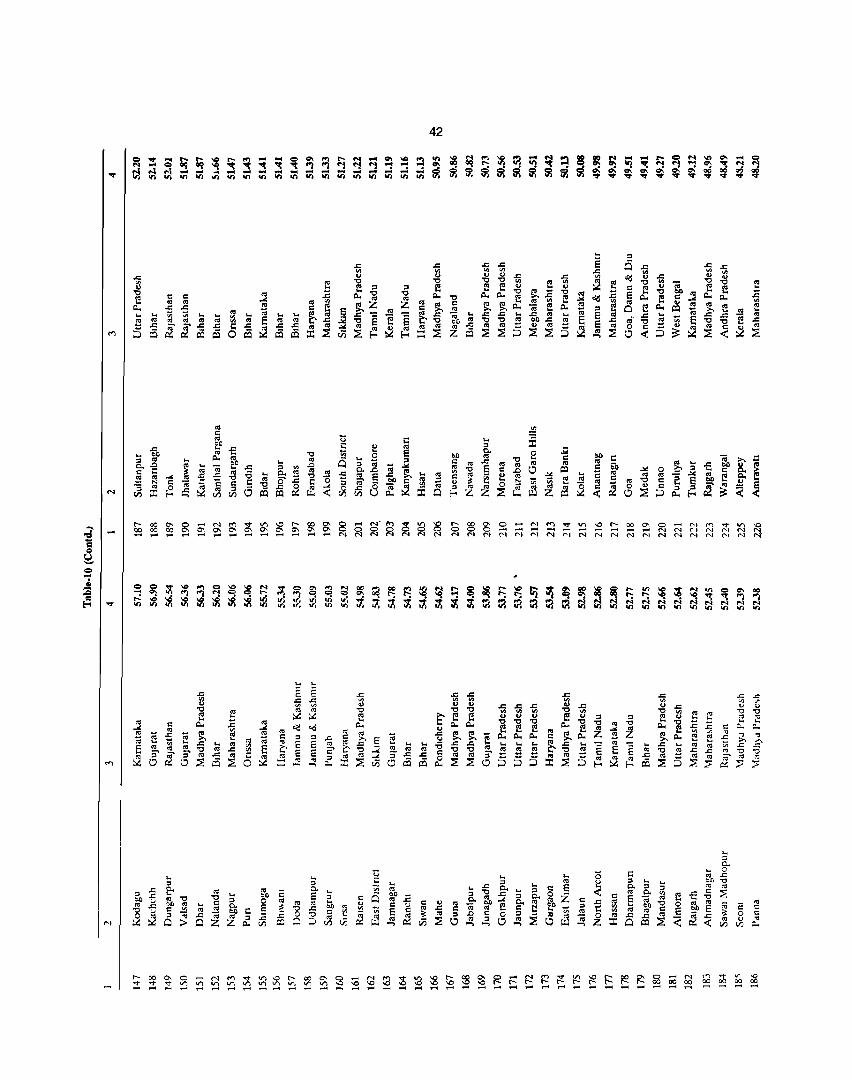
N
1-
.. .... '" '" .c .c cii as
....
.... .... '" '" .c .c
cii cii
g'o co .c c u E C
!; .2
42
~ 0
'" '" '0 C <> C ~ ~
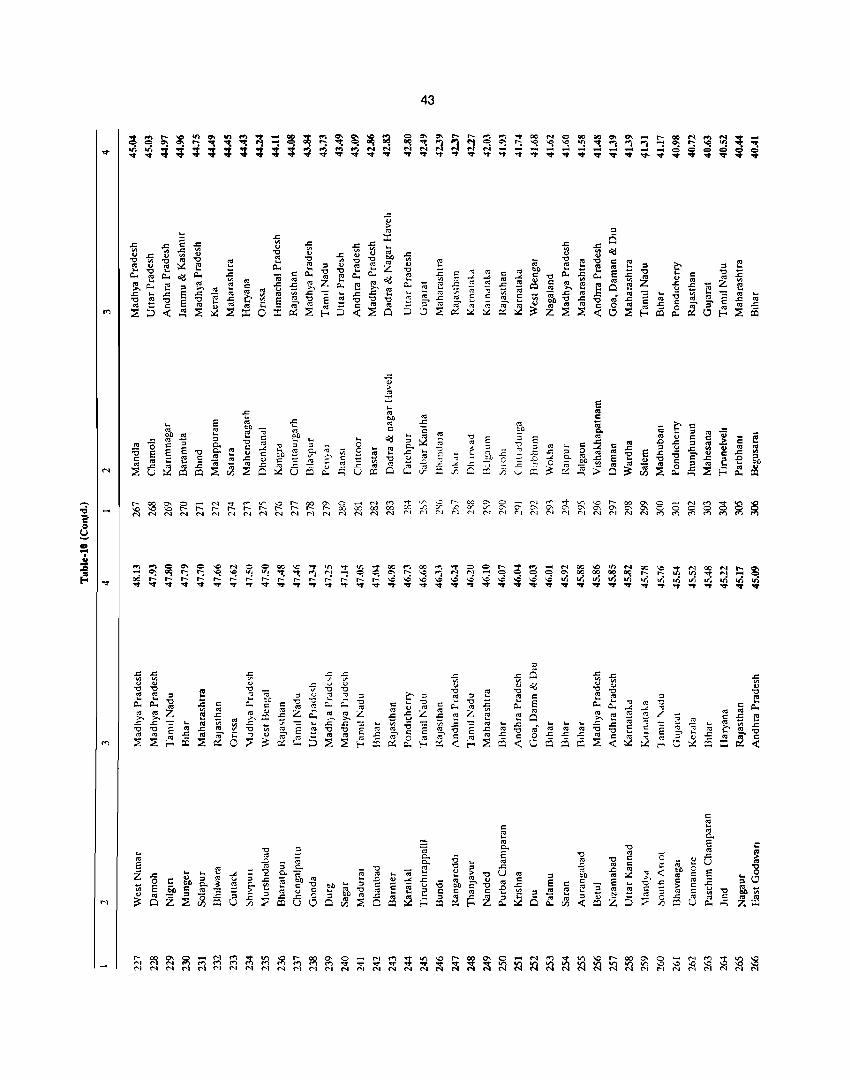
::J ~ ~ ~ ~ ~ ~ ~ ~ ~ ~ ~ ~ ~ ~ ~
01 QC -..: 1.1', ~ ~ .....: r- ,...... ..,. .." .....
::>
:; a ~ ~o '" <> ..c: ..c:
I:Q U
~ " ::: ... " 00
'" c: o<l
43
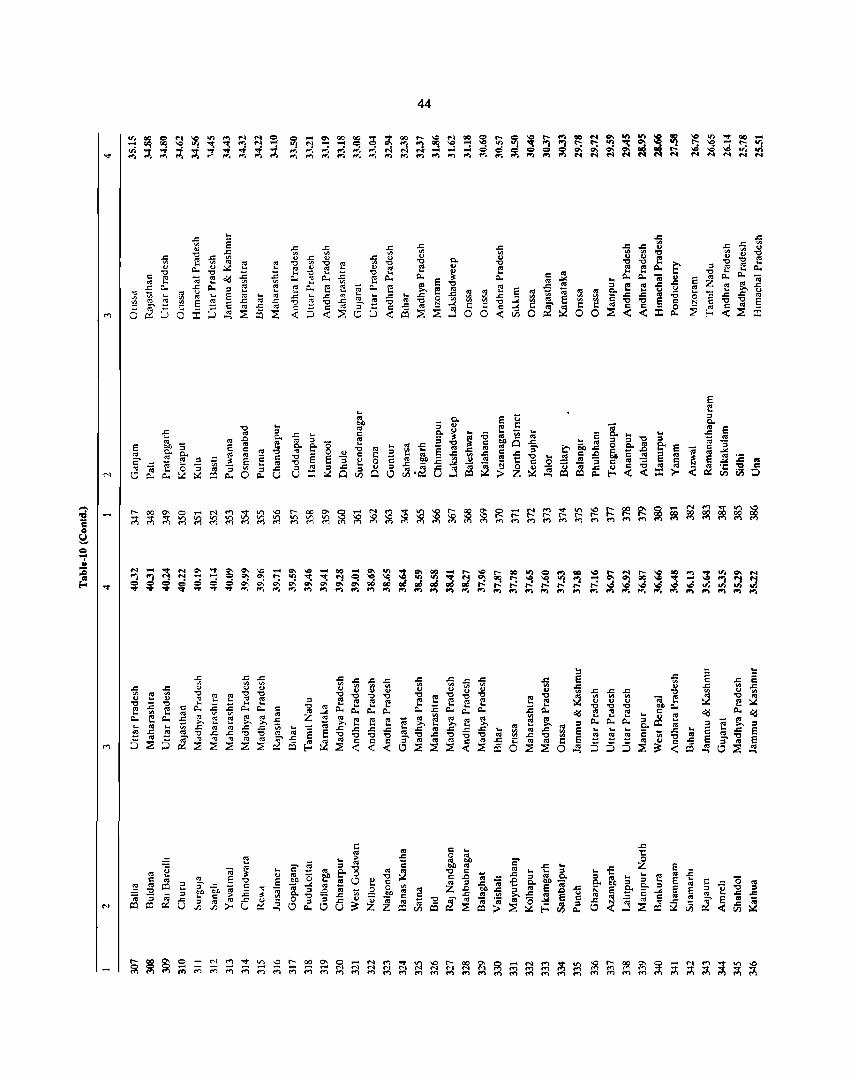
E co 2' '" "
c: co .c ;;; co
ff
44
~ ~ o 0
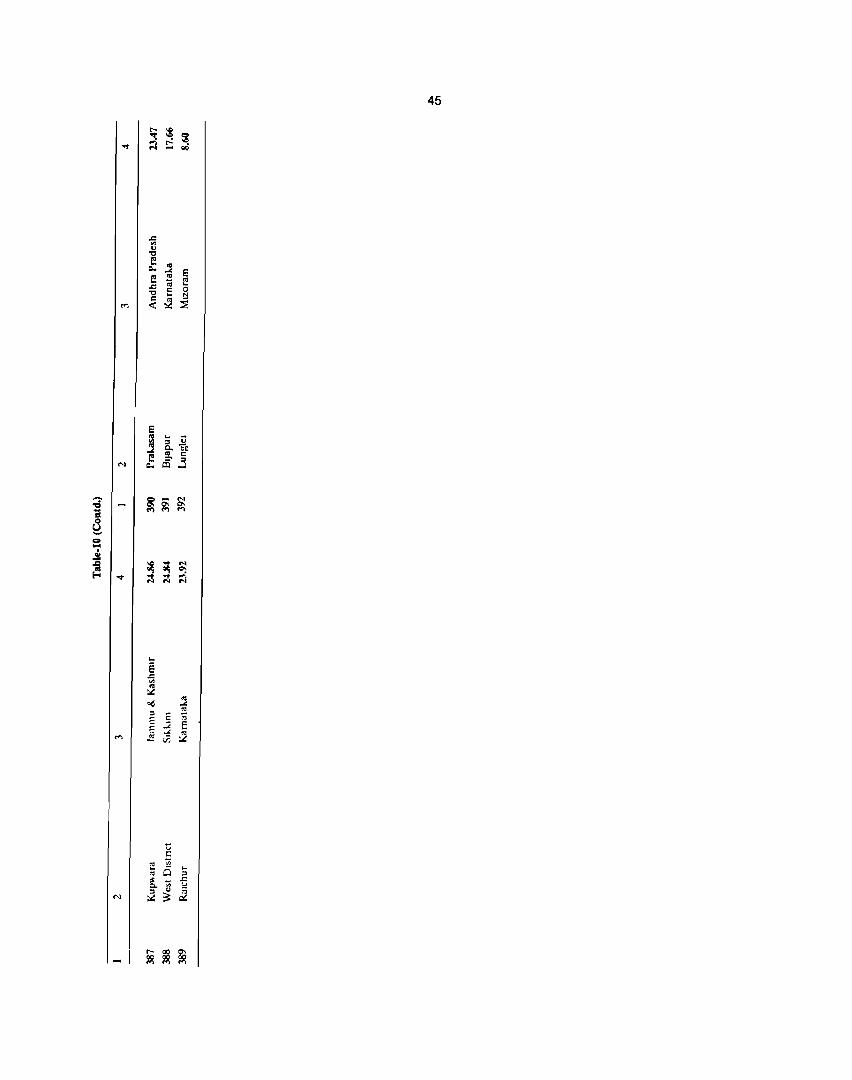
45
.t::
'" ... "0 E
'" ~ ... e E '" .t::
(; E "0 c S .. c '" :E ..... <: ::.:
e ~ .. 41 '" '" Q, ec ... E '" c =- '" N ~ Q:l .....l
:J ~ 0; ~
= .., ....
Q
~ = ~ .!I ~ ~ ;!j ... ~ ~ .... ;:!; .. .... ... ...,
.... E .<: '" '" ::.: o.d
<'IS ... ::I '" E E ;;
~ .:;; E .J. '" ..... Vi ~
t: ;:::
E Vi Ci ....
'" ::I :S Vi
.t:: Q.. <oJ
::I " ~ N ~ ~
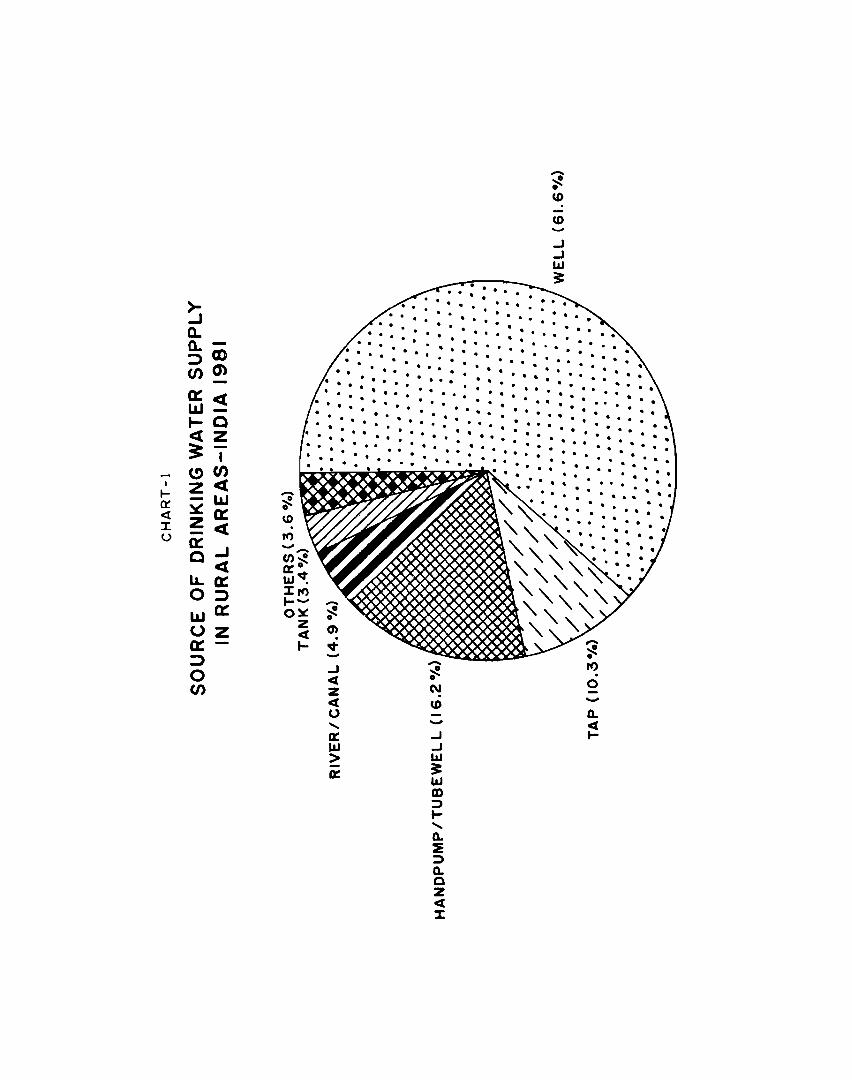
~ Q. Q.CI)
~cn O:::ct LlJ o ~z ~I ~U) zct
LIJ 0::: ct
O:::..J c« LLO::: O:J LlJD::: Uz 0:::-:::> o U)
U) -
. . . . . . . · . . . . . · . . . · . . . . . . · . . . . . . . . . . . . . . . . . . . . . . . . · . . . . . . . . . . . . . . . . . . . . . . · .. . . ... . . . · . . • •
. . · . . . . · . . . . . · . . .. . . . . . · . . · .. . . · . . . . . . ... . . . . . . . · . . · . . · . . . . . . . . . . . . . . . . . . . . . . . . . . .. . . . . . . . . . . · . . . . . · ...
-..J « z « o ..... a: 1&.1 > a:
· .. · . . .. . ..... . . . . . . . . . . . . . . . . . . . .. ..
-..J ..J lIJ ~ lIJ m ::» t..... Q. 2: ::» Q. o Z « :t
. . . . . . . . . . . . . · . · . . . . . . . . . • • . . .
-
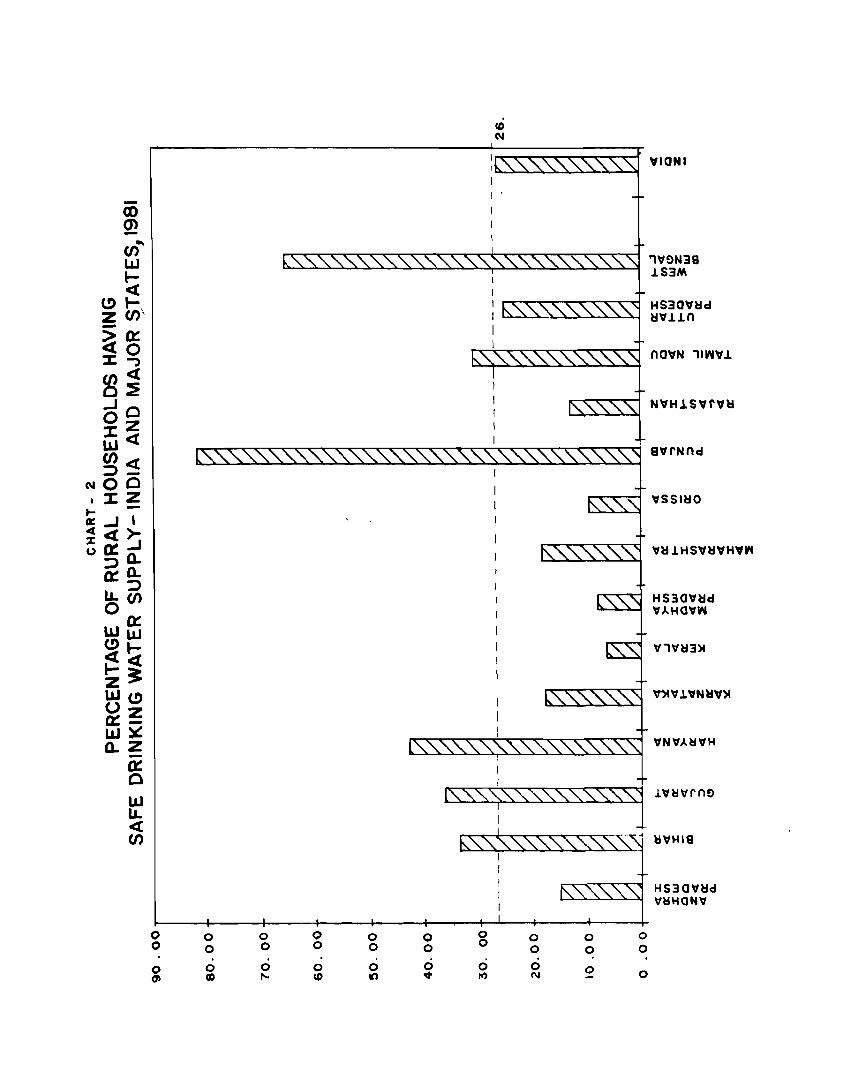
0 0 0 0 0 0 0 0 0 0 0 0
0 0 0 0 0 0 0\ CI) r- CD to ~
0 0
0 It)
CD N
0 0 0 0
0 0 N
0 0
0
'tIONI
HS30'ta:td a:t'tlln
nO'tN 11W'tl
'tSSIa:tO
HS30\ta:td \t).HO'lW
l\ttl\trn!)
l:I'IH18
HS30\ta:td \tl:lHON'I
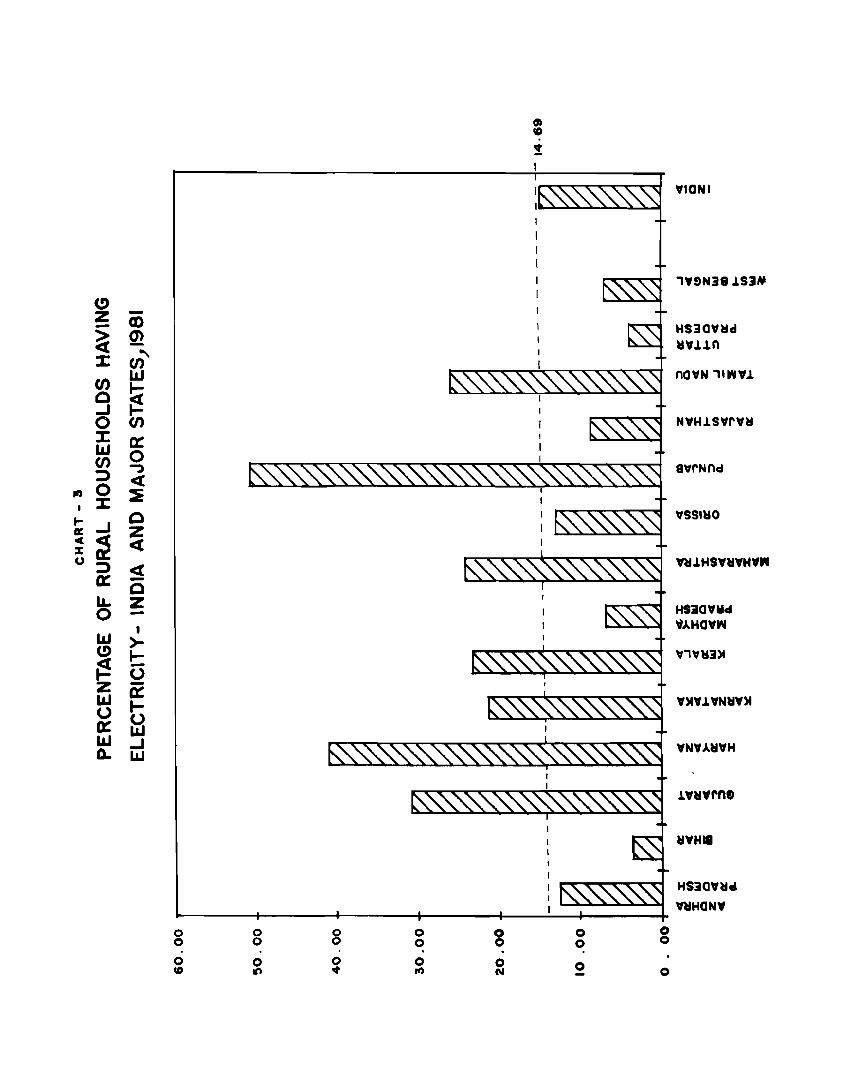
'fIONI
1'f9N38 J.S]N
(!) -Z CD HS30'f~d -~ m ~'fJ..ln
~ ::E: C/) nO'fN 111N'fJ.
C/) 11.1
Q ~ ..J ~
N'fHJ.S'fr'flt 0 C/)
:E: a: 11.1 0 8'frNnd C/) ..,
:;) « If) 0 ~
I X 'fSSI~O ... ..J
Q II: Z C ~ « % 0::
'fltJ.HS'f~'fH'f" u :;) « a:: -Q u.. Z HSlO'f". 0
~AHO'fW I IJJ >-
'f1'f~i)t (!) I-~ -0 z 0:
'f)t'fJ.'fN~'f)l 11.1 I-0 hl a:: 'fN'fAlt'fH 11.1 ..J
0.. 11.1
J.'f~'frn.
It'fH.
HSiO'f~.
WHON'f
8 0 0 0 0 0 0 0 0 0 0 0 0 .
0 0 0 0 0 0 0 U) It) • If) '"
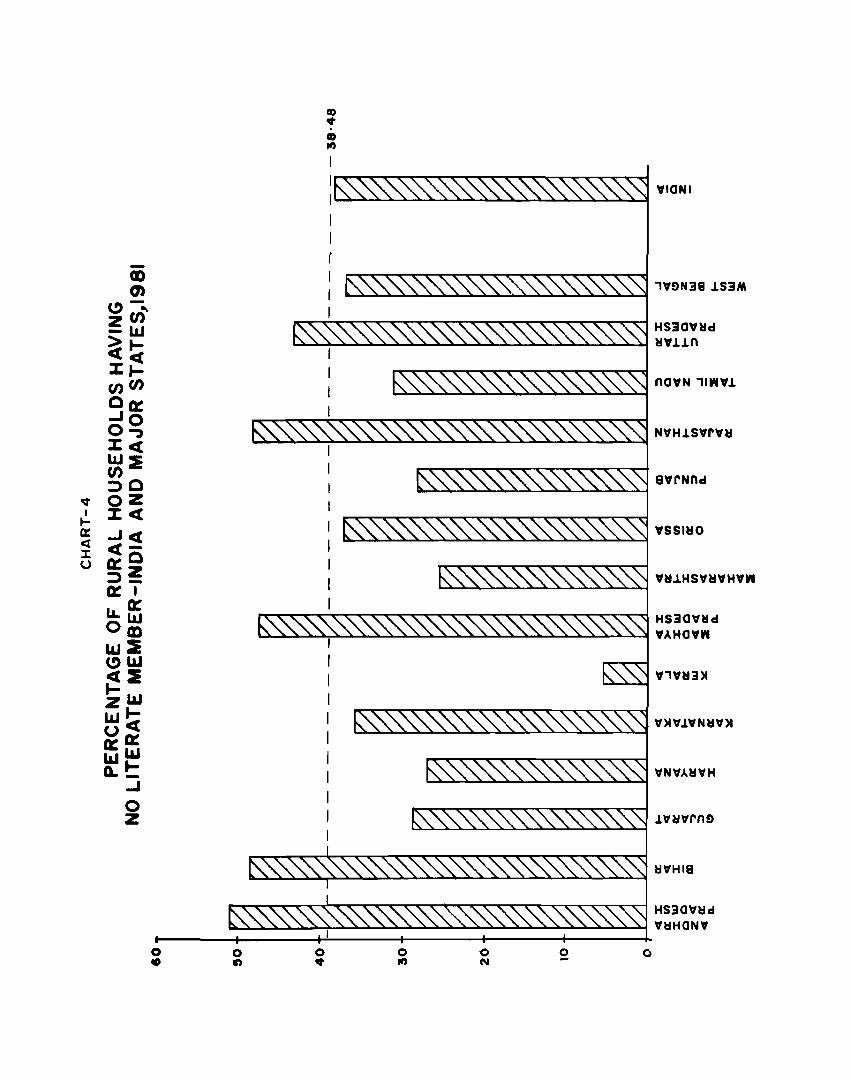
-CO CJ)
C>~ ~W ~ .... :z:~ cnU)
00:: ""0 0, :z:~ W~ V) ::)0
~ OZ I :Z:~ ....
a:: ...J~ <i ~-:t 0::0 u ::)~ 0::. lL,0:: O~ w:i C>~
~:& ZllJ W'" O~ 0::0:: LlJW o.t: ....
0 Z
0 0 0 CO 1ft •
CD •
I , I I I I I I I I
0 If)
''f9N38 .LS3M
nO'fN 'IW'f.L
'fH..LHS'fH'fHYW
HS30'WHd YAHOYW
'W'YH3>1
'W>I 'W.L'W N H'W>I
'WN'WAH'WH
.L'fH'frn9
H'fHI8
HS30'fHd 'fl:lHON'f
0 0 0 N -
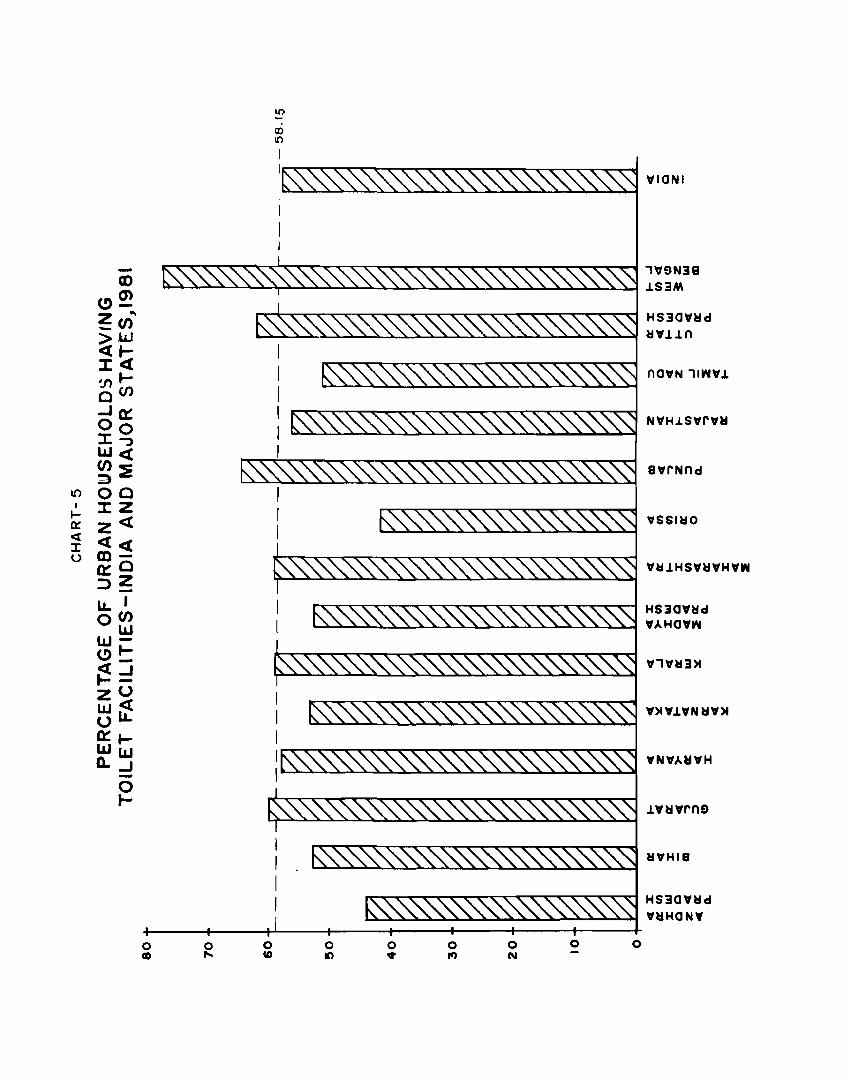
I()
I .... 0:: <t ::I: u
CD (!)~ Z .. _CI)
>1.&.1 «I-J:« ~ .... O(/) -'0::: 00 J:-:) LLJ« (I):;: ::)
00 J:Z z« «« m-o:::O ::>~ LL' oCl)
W LLJ-e>t: ~= zO LLJ~ 0 0::: .... LLJw Q...J -0
I-
o CD
o .... o CD
o In
o ~
o If)
o N
o o
'~f)N39
iS3M
HS3aY~d
~Yiin
nOYN '1,.'11.
NYHiSyry~
aYrNnd
"SSI~O
YI:UHSY~YHYW
HS30Y~d
YAHOY,.
Y'Y~3)4
'1)4 YiYN ~Y)I
YNYA~~H
iY~Yrnf)
OFFICERS AND STAFF ASSOCIATED wrrH THIS REPORT
K.S. Natarajan
Deputy Regi~trar General, India
R...K. Puri
Deputy Di.rector 'Of Census Operations
M.L. Chmora Investigator
H.K. Kallshal Investigator
Mrs. S B. OberOJ Statistical Asstt.
Nal'csh Chand Statistical Asstt.
J.B. Shalma Statistical Asstt.
K.P Gupta Statistical Assu.
Dansl Lal Computor
Mrs. KulJtt Kaur Computor
Mrs. Pushp Lara Computor
Mrs. Nlrmal Bhalla Computor
Mrs. Usha Saxena Computor
Mrs. In<.lll Bhola Assistant Complier
R.G. RaJ.1Il Stenographer
51