cell structure & cell organisation - wicked biology
TRANSCRIPT
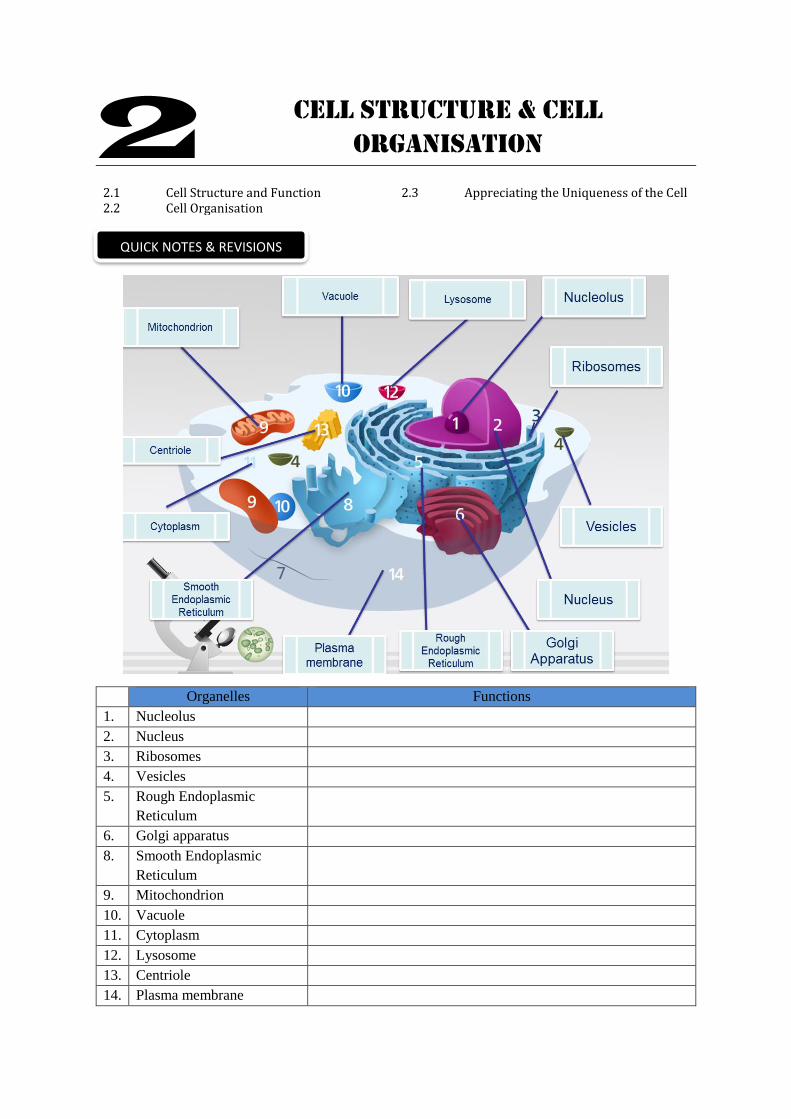
CELL STRUCTURE & CELL
ORGANISATION
2.1 Cell Structure and Function 2.3 Appreciating the Uniqueness of the Cell 2.2 Cell Organisation
Organelles Functions
1. Nucleolus
2. Nucleus
3. Ribosomes
4. Vesicles
5. Rough Endoplasmic
Reticulum
6. Golgi apparatus
8. Smooth Endoplasmic
Reticulum
9. Mitochondrion
10. Vacuole
11. Cytoplasm
12. Lysosome
13. Centriole
14. Plasma membrane
2 QUICK NOTES & REVISIONS
WICKEDBIOLOGY.WORDPRESS.COM 1
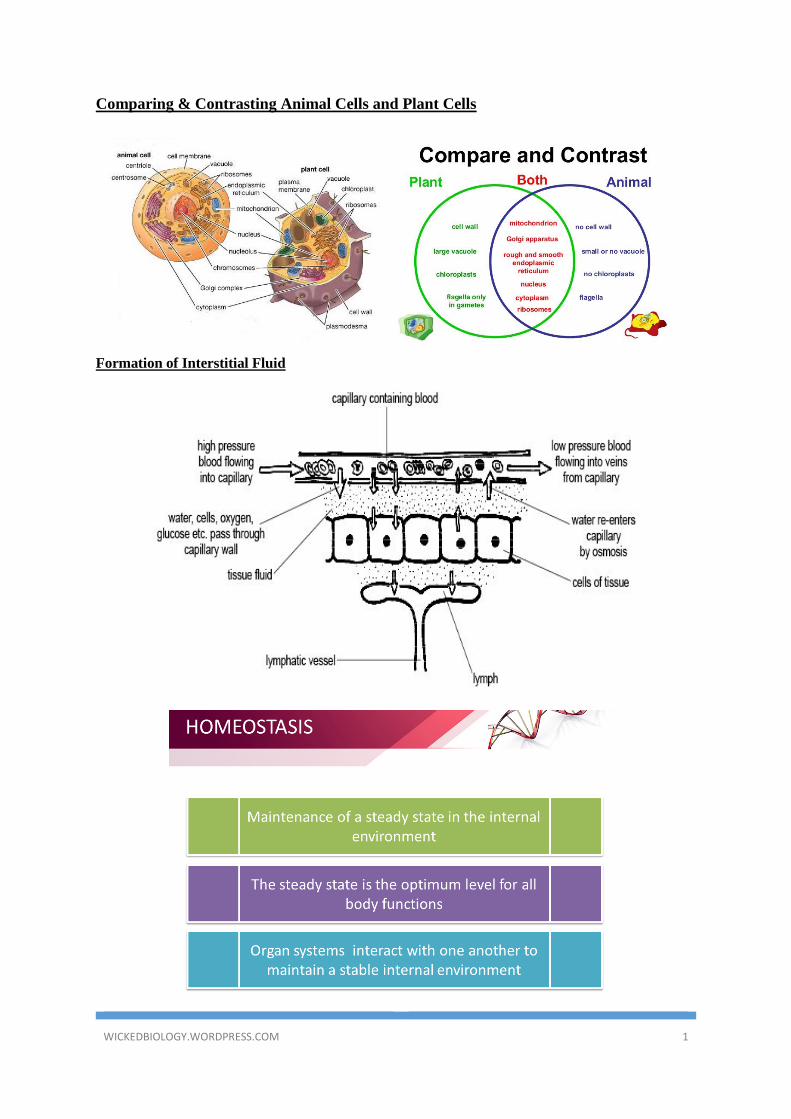
Comparing & Contrasting Animal Cells and Plant Cells
Formation of Interstitial Fluid
WICKEDBIOLOGY.WORDPRESS.COM 2
WICKEDBIOLOGY.WORDPRESS.COM 3
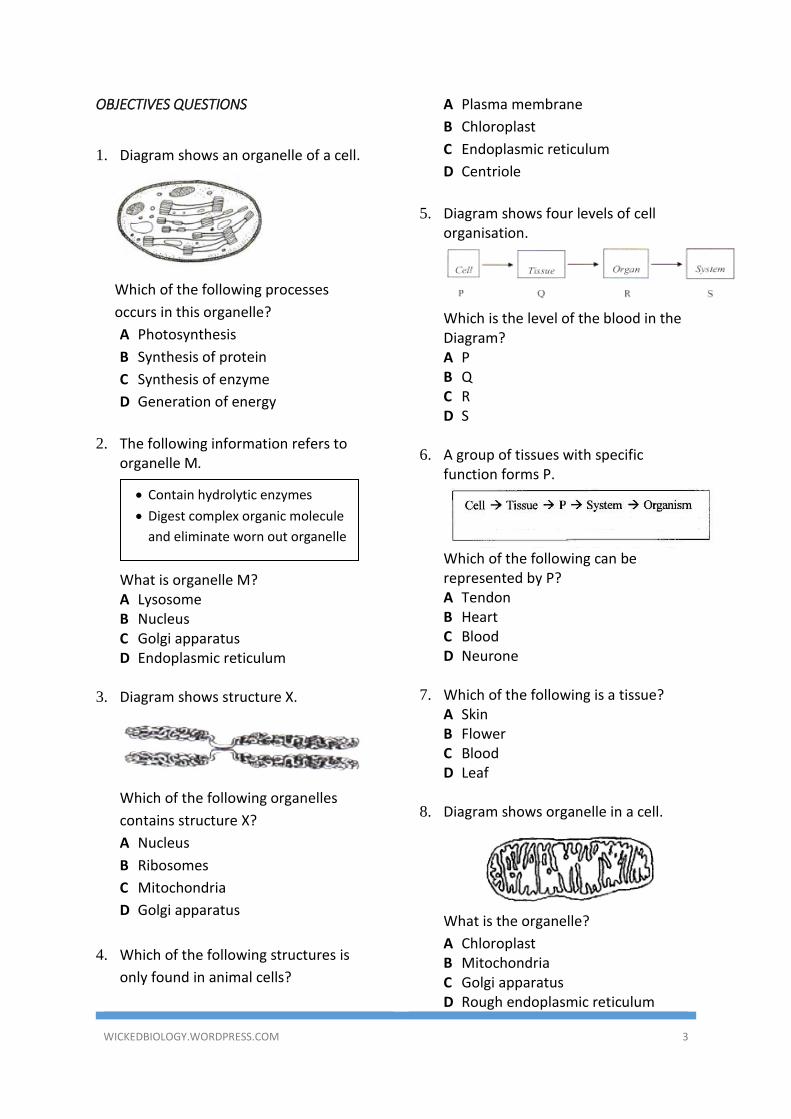
OBJECTIVES QUESTIONS
1. Diagram shows an organelle of a cell.
Which of the following processes
occurs in this organelle?
A Photosynthesis
B Synthesis of protein
C Synthesis of enzyme
D Generation of energy
2. The following information refers to
organelle M.
What is organelle M? A Lysosome B Nucleus C Golgi apparatus D Endoplasmic reticulum
3. Diagram shows structure X.
Which of the following organelles
contains structure X?
A Nucleus
B Ribosomes
C Mitochondria
D Golgi apparatus
4. Which of the following structures is
only found in animal cells?
A Plasma membrane
B Chloroplast
C Endoplasmic reticulum
D Centriole
5. Diagram shows four levels of cell
organisation.
Which is the level of the blood in the Diagram? A P B Q C R D S
6. A group of tissues with specific function forms P.
Which of the following can be represented by P? A Tendon B Heart C Blood D Neurone
7. Which of the following is a tissue?
A Skin B Flower C Blood D Leaf
8. Diagram shows organelle in a cell.
What is the organelle?
A Chloroplast B Mitochondria C Golgi apparatus D Rough endoplasmic reticulum
• Contain hydrolytic enzymes
• Digest complex organic molecule
and eliminate worn out organelle
WICKEDBIOLOGY.WORDPRESS.COM 4
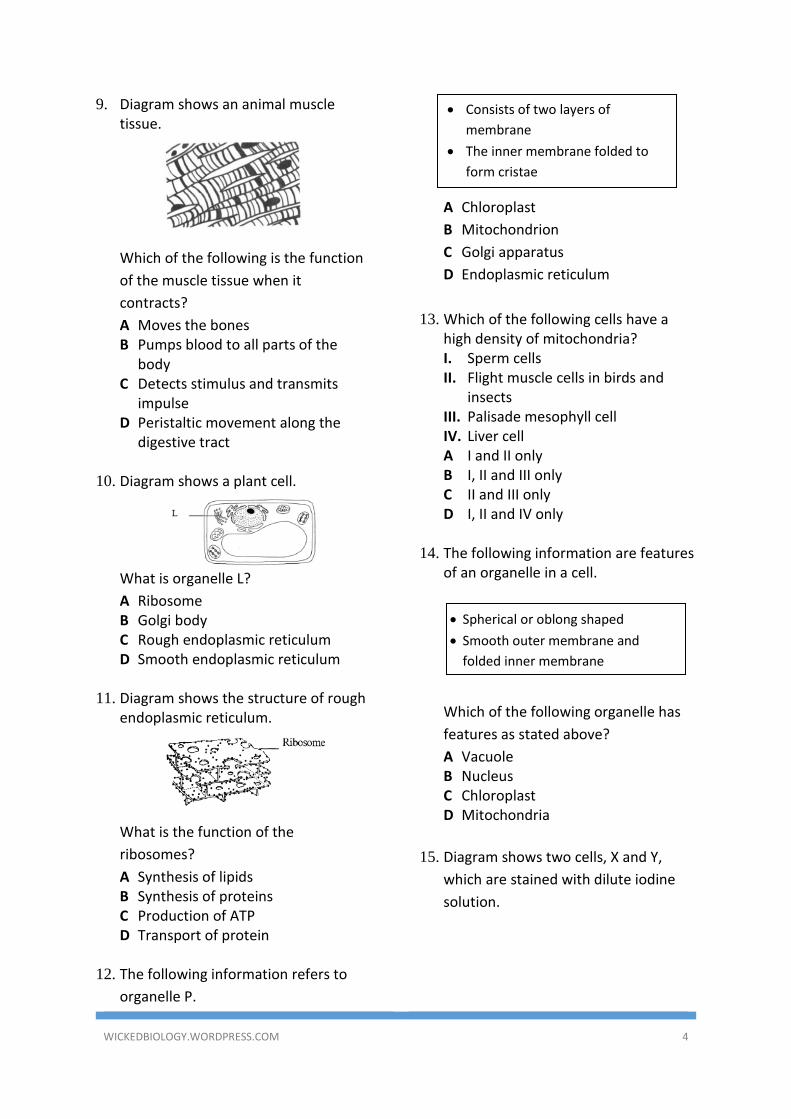
9. Diagram shows an animal muscle tissue.
Which of the following is the function
of the muscle tissue when it
contracts?
A Moves the bones B Pumps blood to all parts of the
body C Detects stimulus and transmits
impulse D Peristaltic movement along the
digestive tract
10. Diagram shows a plant cell.
What is organelle L?
A Ribosome B Golgi body C Rough endoplasmic reticulum D Smooth endoplasmic reticulum
11. Diagram shows the structure of rough endoplasmic reticulum.
What is the function of the
ribosomes?
A Synthesis of lipids B Synthesis of proteins C Production of ATP D Transport of protein
12. The following information refers to
organelle P.
What is organelle P?
A Chloroplast
B Mitochondrion
C Golgi apparatus
D Endoplasmic reticulum
13. Which of the following cells have a high density of mitochondria? I. Sperm cells II. Flight muscle cells in birds and
insects III. Palisade mesophyll cell IV. Liver cell A I and II only B I, II and III only C II and III only D I, II and IV only
14. The following information are features
of an organelle in a cell.
Which of the following organelle has
features as stated above?
A Vacuole B Nucleus C Chloroplast D Mitochondria
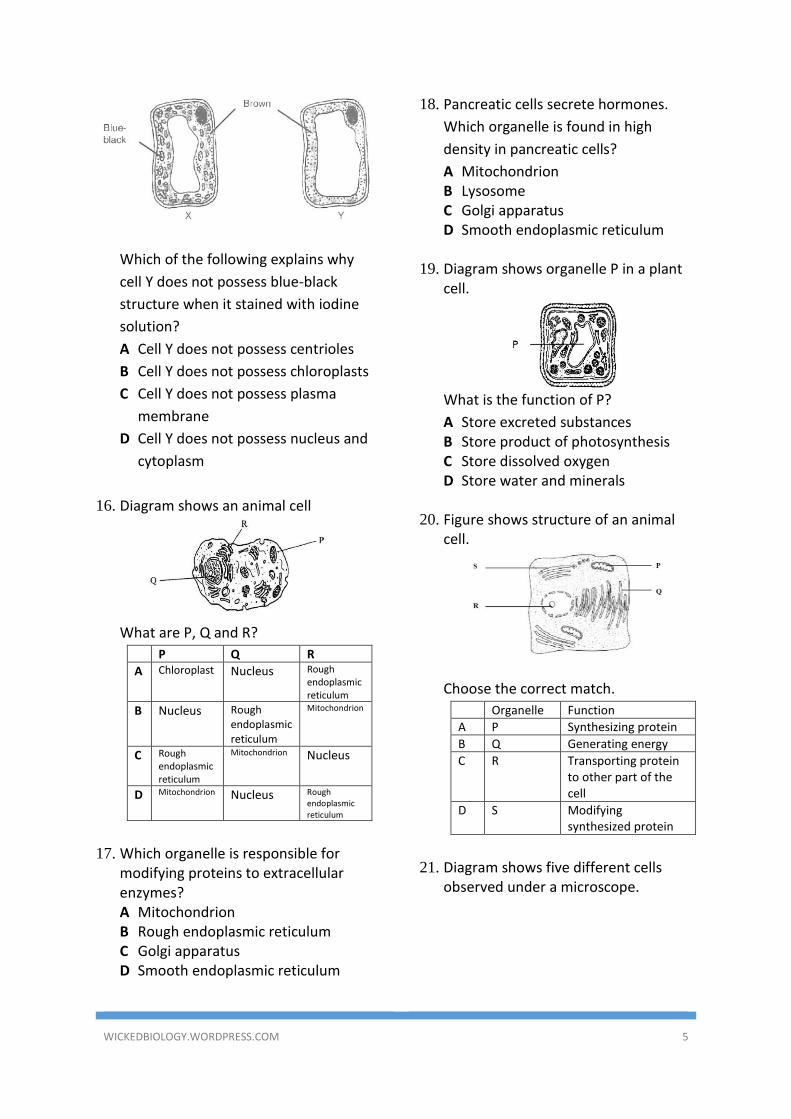
15. Diagram shows two cells, X and Y,
which are stained with dilute iodine
solution.
• Consists of two layers of
membrane
• The inner membrane folded to
form cristae
• Spherical or oblong shaped
• Smooth outer membrane and
folded inner membrane
WICKEDBIOLOGY.WORDPRESS.COM 5
Which of the following explains why
cell Y does not possess blue-black
structure when it stained with iodine
solution?
A Cell Y does not possess centrioles
B Cell Y does not possess chloroplasts
C Cell Y does not possess plasma
membrane
D Cell Y does not possess nucleus and
cytoplasm
16. Diagram shows an animal cell
What are P, Q and R?
P Q R
A Chloroplast Nucleus Rough endoplasmic reticulum
B Nucleus Rough endoplasmic reticulum
Mitochondrion
C Rough endoplasmic reticulum
Mitochondrion Nucleus
D Mitochondrion Nucleus Rough endoplasmic reticulum
17. Which organelle is responsible for modifying proteins to extracellular enzymes? A Mitochondrion B Rough endoplasmic reticulum C Golgi apparatus D Smooth endoplasmic reticulum
18. Pancreatic cells secrete hormones.
Which organelle is found in high
density in pancreatic cells?
A Mitochondrion B Lysosome C Golgi apparatus D Smooth endoplasmic reticulum
19. Diagram shows organelle P in a plant
cell.
What is the function of P?
A Store excreted substances B Store product of photosynthesis C Store dissolved oxygen D Store water and minerals
20. Figure shows structure of an animal cell.
Choose the correct match.
Organelle Function
A P Synthesizing protein
B Q Generating energy
C R Transporting protein to other part of the cell
D S Modifying synthesized protein
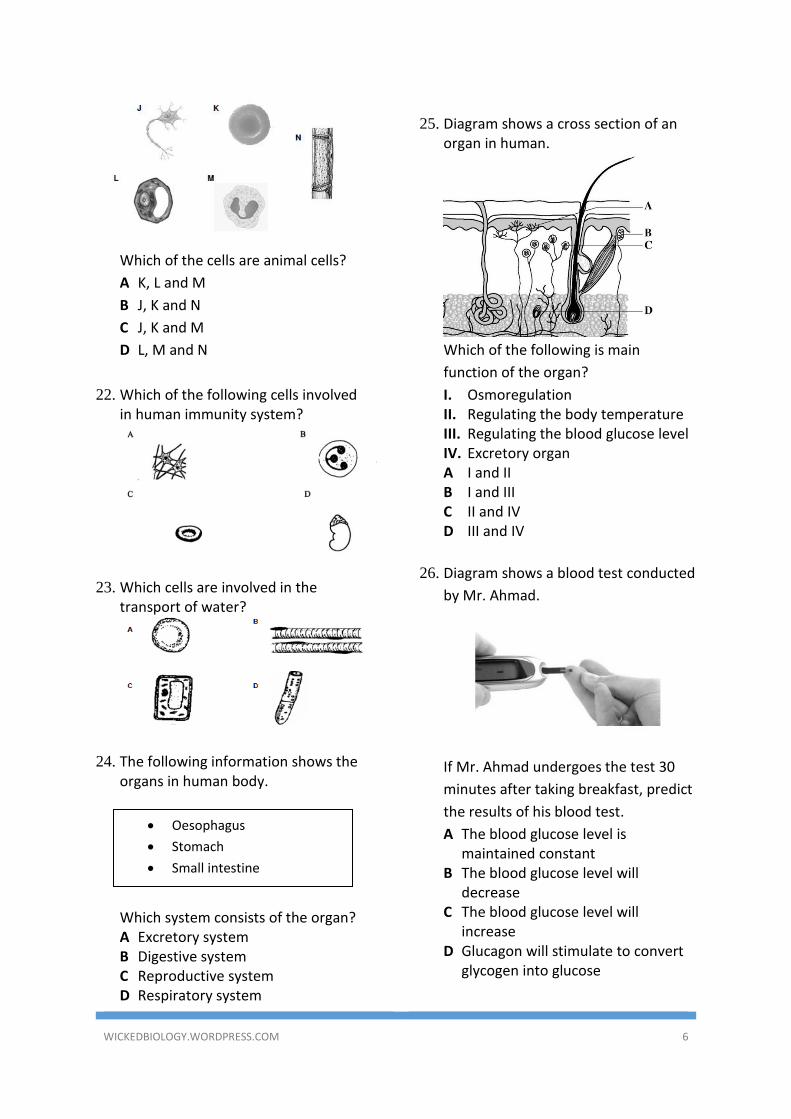
21. Diagram shows five different cells observed under a microscope.
WICKEDBIOLOGY.WORDPRESS.COM 6
Which of the cells are animal cells?
A K, L and M
B J, K and N
C J, K and M
D L, M and N
22. Which of the following cells involved in human immunity system?
23. Which cells are involved in the transport of water?
24. The following information shows the organs in human body. Which system consists of the organ? A Excretory system B Digestive system C Reproductive system D Respiratory system
25. Diagram shows a cross section of an
organ in human.
Which of the following is main
function of the organ?
I. Osmoregulation II. Regulating the body temperature III. Regulating the blood glucose level IV. Excretory organ A I and II B I and III C II and IV D III and IV
26. Diagram shows a blood test conducted
by Mr. Ahmad.
If Mr. Ahmad undergoes the test 30
minutes after taking breakfast, predict
the results of his blood test.
A The blood glucose level is maintained constant
B The blood glucose level will decrease
C The blood glucose level will increase
D Glucagon will stimulate to convert glycogen into glucose
• Oesophagus
• Stomach
• Small intestine
WICKEDBIOLOGY.WORDPRESS.COM 7
STRUCTURE QUESTIONS
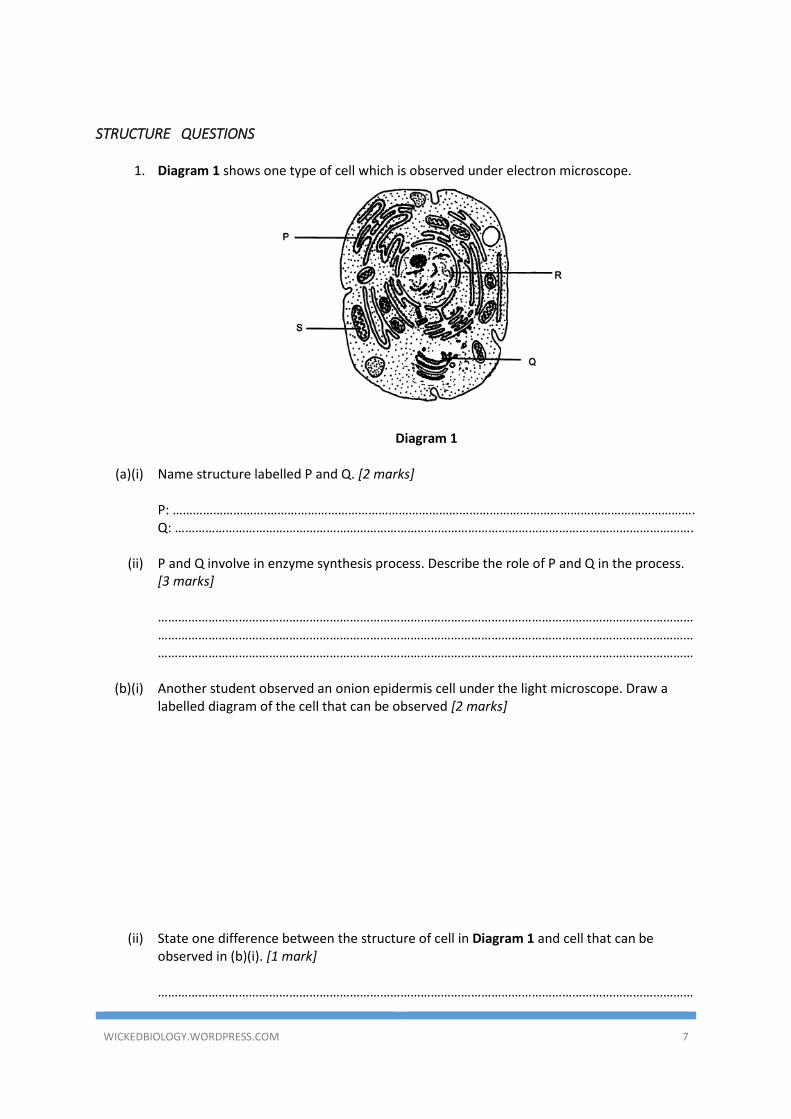
1. Diagram 1 shows one type of cell which is observed under electron microscope.
Diagram 1
(a)(i) Name structure labelled P and Q. [2 marks] P: ……………………….………………………………………………………………………………………………………………. Q: ……………………………………………………………………………………………………………………………………….
(ii) P and Q involve in enzyme synthesis process. Describe the role of P and Q in the process.
[3 marks] ………………………………………………………………………………………………………………………………………………………………………………………………………………………………………………………………………………………………………………………………………………………………………………………………………………………………………
(b)(i) Another student observed an onion epidermis cell under the light microscope. Draw a
labelled diagram of the cell that can be observed [2 marks]
(ii) State one difference between the structure of cell in Diagram 1 and cell that can be
observed in (b)(i). [1 mark]
……………………………………………………………………………………………………………………………………………
WICKEDBIOLOGY.WORDPRESS.COM 8
(c) Structure R is removed from the cell. Explain what happen to the growth of the cell.
[2 marks] …………………………………………………………………………………………………………………………………………………………………………………………………………………………………………………………………………………………
(d) Explain why meristematic cell has abundant of organelle S compare to the cheek cell.
[2 marks] …………………………………………………………………………………………………………………………………………………………………………………………………………………………………………………………………………………………
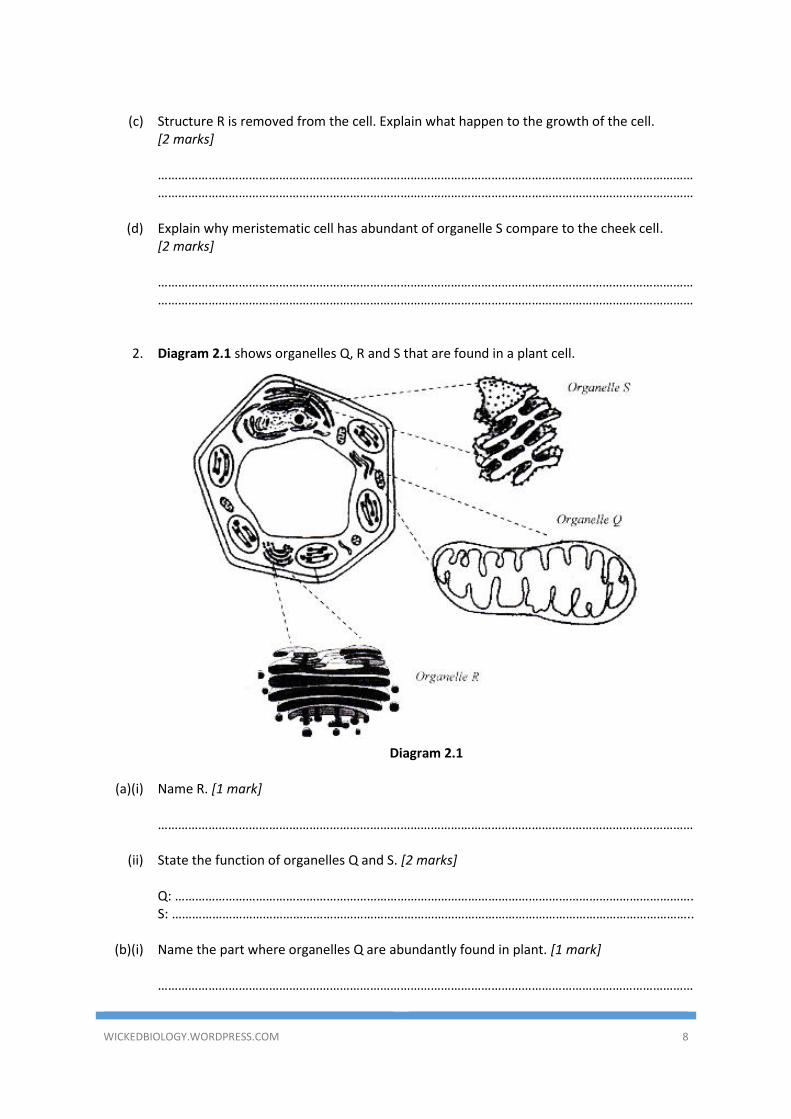
2. Diagram 2.1 shows organelles Q, R and S that are found in a plant cell.
Diagram 2.1
(a)(i) Name R. [1 mark]
……………………………………………………………………………………………………………………………………………
(ii) State the function of organelles Q and S. [2 marks]
Q: ………………………………………………………………………………………………………………………………………. S: ………………………………………………………………………………………………………………………………………..
(b)(i) Name the part where organelles Q are abundantly found in plant. [1 mark]
……………………………………………………………………………………………………………………………………………
WICKEDBIOLOGY.WORDPRESS.COM 9
(ii) Explain the role of organelle Q to the plant. [3 marks] ………………………………………………………………………………………………………………………………………………………………………………………………………………………………………………………………………………………………………………………………………………………………………………………………………………………………………
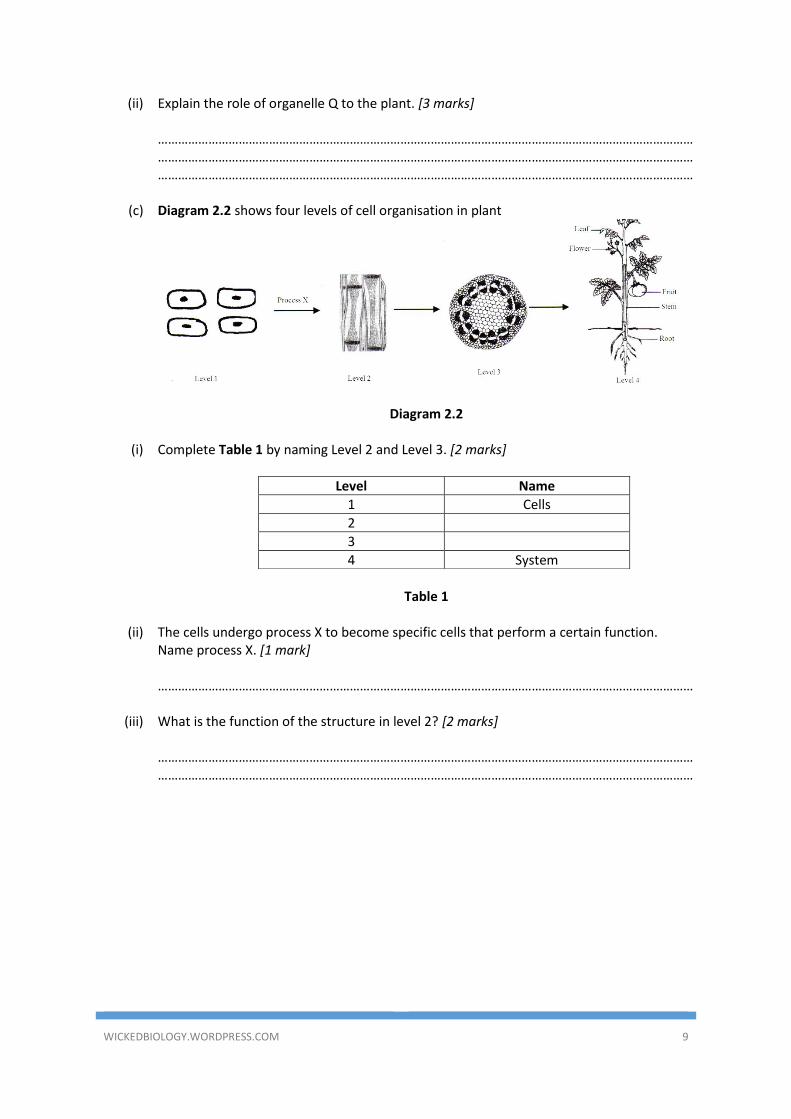
(c) Diagram 2.2 shows four levels of cell organisation in plant
Diagram 2.2
(i) Complete Table 1 by naming Level 2 and Level 3. [2 marks]
Level Name
1 Cells
2
3
4 System
Table 1
(ii) The cells undergo process X to become specific cells that perform a certain function.
Name process X. [1 mark] ……………………………………………………………………………………………………………………………………………
(iii) What is the function of the structure in level 2? [2 marks]
…………………………………………………………………………………………………………………………………………………………………………………………………………………………………………………………………………………………
WICKEDBIOLOGY.WORDPRESS.COM 10
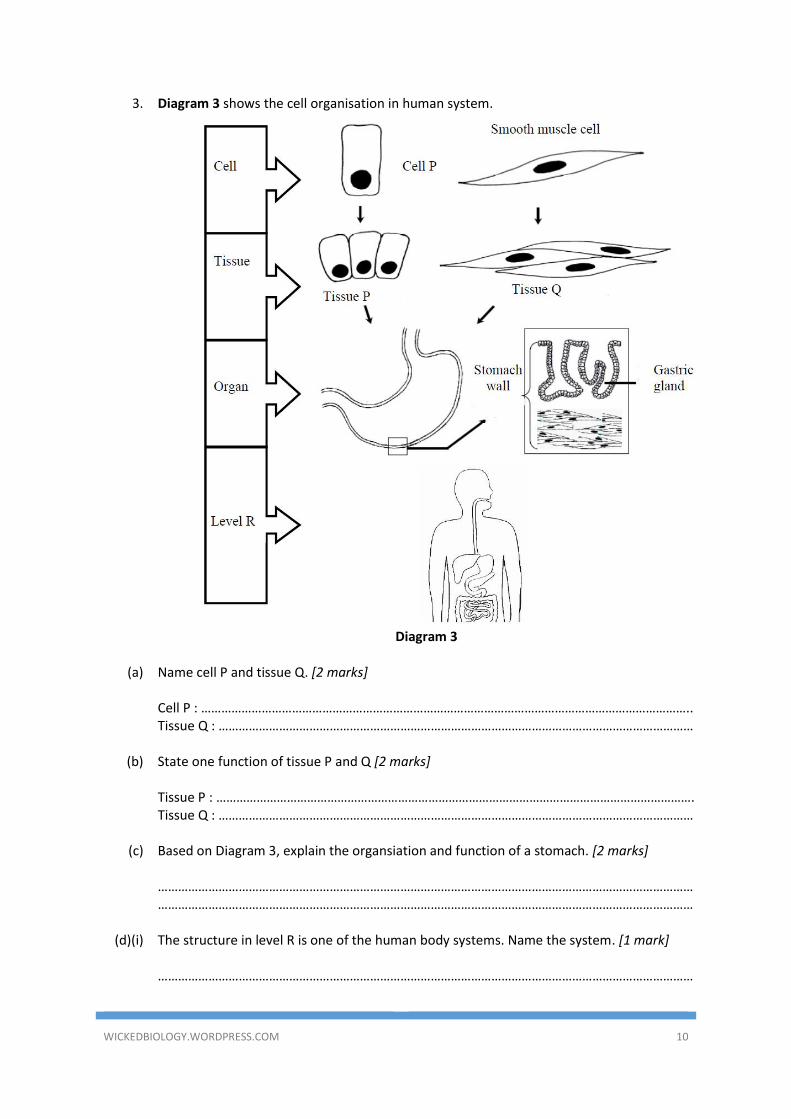
3. Diagram 3 shows the cell organisation in human system.
Diagram 3
(a) Name cell P and tissue Q. [2 marks]
Cell P : ……………………………………………………………………………………………………………………………….. Tissue Q : ……………………………………………………………………………………………………………………………
(b) State one function of tissue P and Q [2 marks]
Tissue P : ……………………………………………………………………………………………………………………………. Tissue Q : ……………………………………………………………………………………………………………………………
(c) Based on Diagram 3, explain the organsiation and function of a stomach. [2 marks]
……………………………………………………………………………………………………………………………………………
……………………………………………………………………………………………………………………………………………
(d)(i) The structure in level R is one of the human body systems. Name the system. [1 mark] ……………………………………………………………………………………………………………………………………………
WICKEDBIOLOGY.WORDPRESS.COM 11
(ii) State one function of the system in 1(d)(i). [1 mark]
……………………………………………………………………………………………………………………………………………
(iii) State two other organs which form the system in level R [2 marks]
……………………………………………………………………………………………………………………………………………
(e) Gastric glands produce hydrochloric acid. Describe the role of hydrochloric acid in the chemical process that occurs in the stomach. [2 marks]
…………………………………………………………………………………………………………………………………………………………………………………………………………………………………………………………………………………………
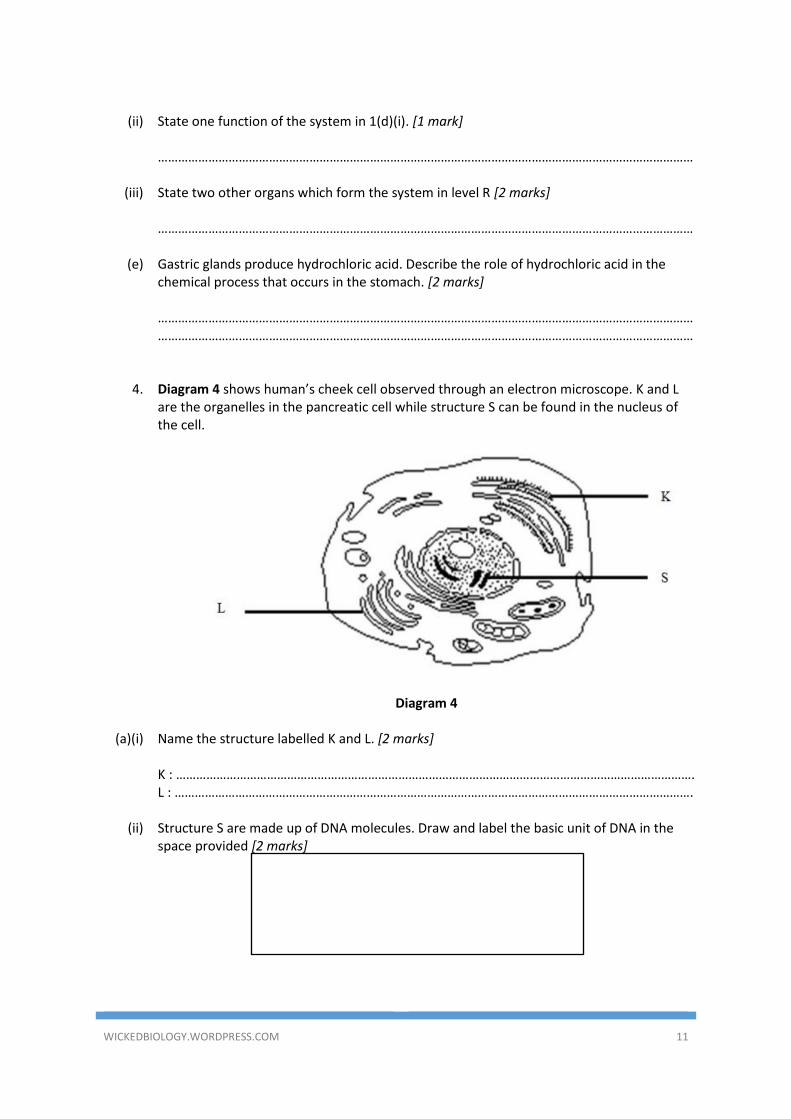
4. Diagram 4 shows human’s cheek cell observed through an electron microscope. K and L are the organelles in the pancreatic cell while structure S can be found in the nucleus of the cell.
Diagram 4
(a)(i) Name the structure labelled K and L. [2 marks] K : ………………………………………………………………………………………………………………………………………. L : ……………………………………………………………………………………………………………………………………….
(ii) Structure S are made up of DNA molecules. Draw and label the basic unit of DNA in the
space provided [2 marks]
WICKEDBIOLOGY.WORDPRESS.COM 12
(iii) Structure S is an important structure that carries genetic information. What is structure S? [1 mark] ……………………………………………………………………………………………………………………………………………
(b) Explain how organelles K and L are involve in synthesising specific extracellular enzyme. [3 marks]
………………………………………………………………………………………………………………………………………………………………………………………………..............................................................................................................................................................................................................................................
(c) Exposure to radiation will cause the gene mutation in the pancreatic cell. Explain how
would this affect the digestion of polypeptide in the duodenum. [3 marks] ………………………………………………………………………………………………………………………………………………………………………………………………………………………………………………………………………………………………………………………………………………………………………………………………………………………………………
WICKEDBIOLOGY.WORDPRESS.COM 13
ESSAY QUESTIONS
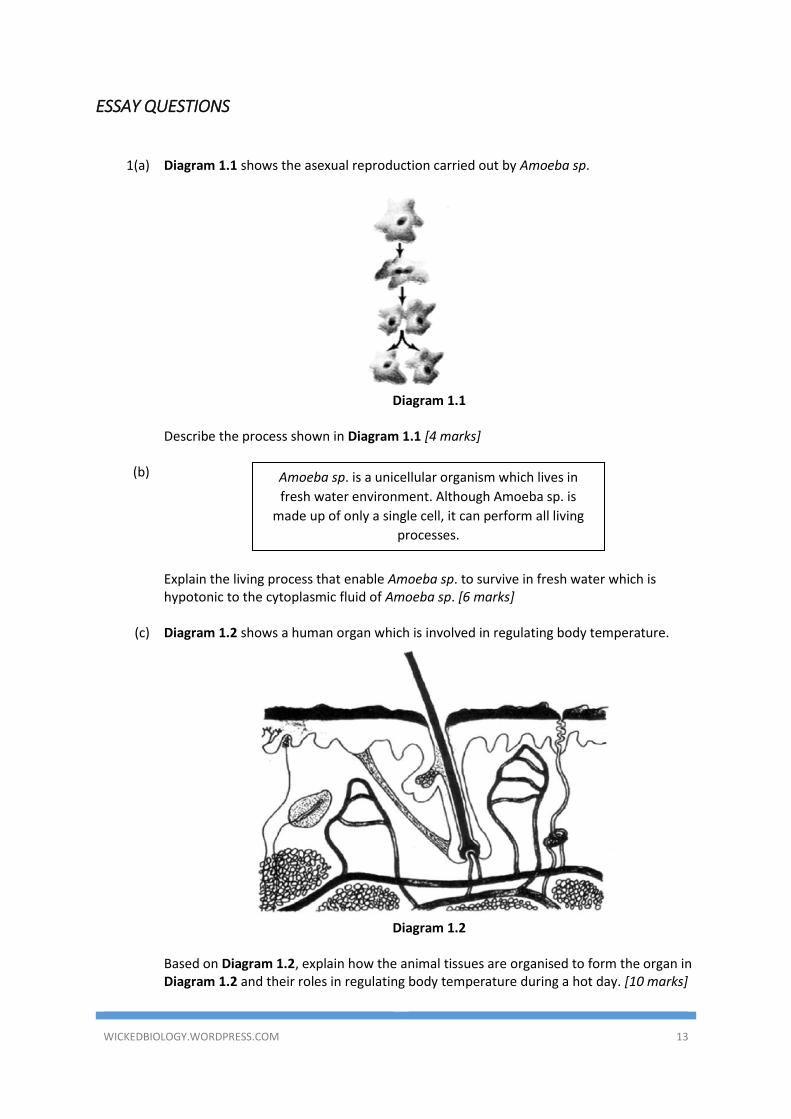
1(a) Diagram 1.1 shows the asexual reproduction carried out by Amoeba sp.
Diagram 1.1
Describe the process shown in Diagram 1.1 [4 marks]
(b)
Explain the living process that enable Amoeba sp. to survive in fresh water which is hypotonic to the cytoplasmic fluid of Amoeba sp. [6 marks]
(c) Diagram 1.2 shows a human organ which is involved in regulating body temperature.
Diagram 1.2
Based on Diagram 1.2, explain how the animal tissues are organised to form the organ in
Diagram 1.2 and their roles in regulating body temperature during a hot day. [10 marks]
Amoeba sp. is a unicellular organism which lives in
fresh water environment. Although Amoeba sp. is
made up of only a single cell, it can perform all living
processes.
WICKEDBIOLOGY.WORDPRESS.COM 14
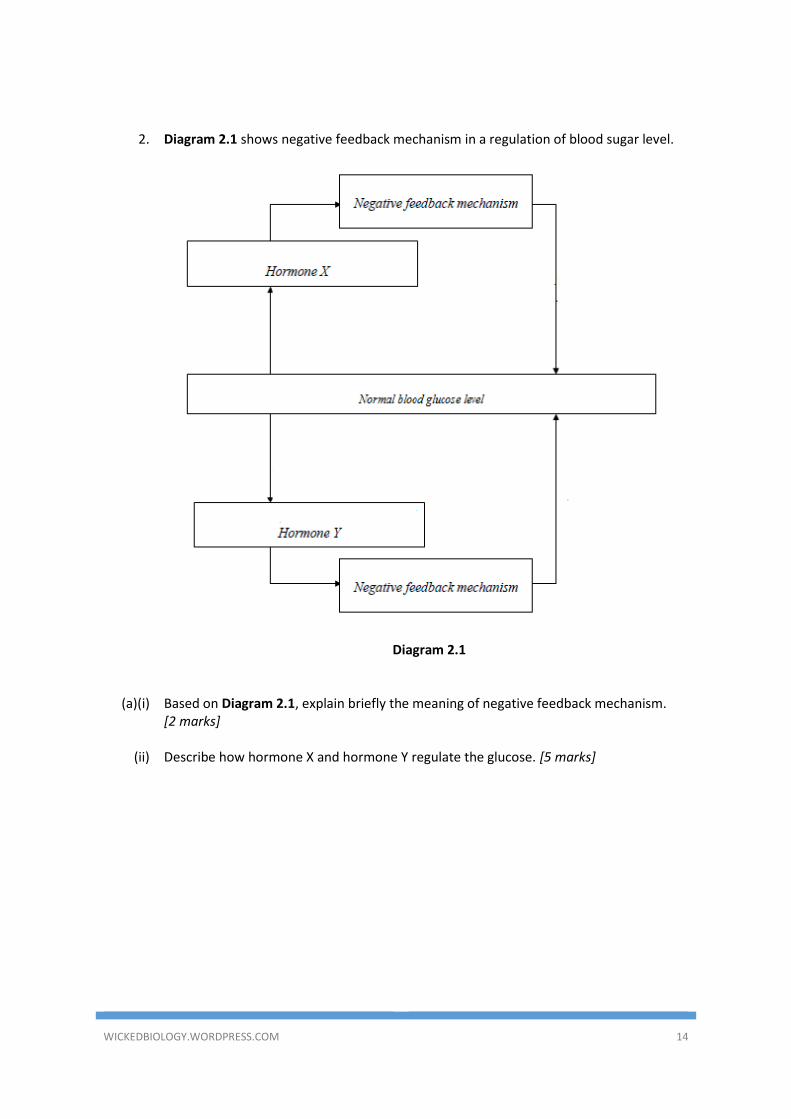
2. Diagram 2.1 shows negative feedback mechanism in a regulation of blood sugar level.
Diagram 2.1
(a)(i) Based on Diagram 2.1, explain briefly the meaning of negative feedback mechanism.
[2 marks]
(ii) Describe how hormone X and hormone Y regulate the glucose. [5 marks]
WICKEDBIOLOGY.WORDPRESS.COM 15
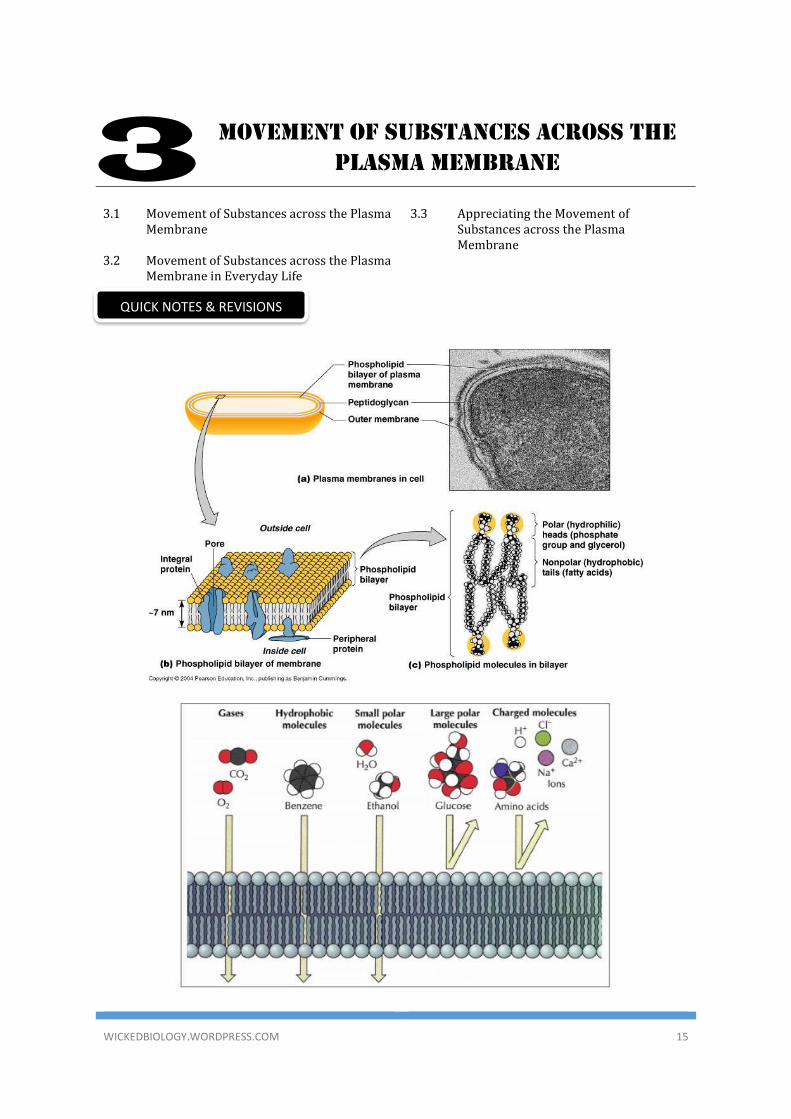
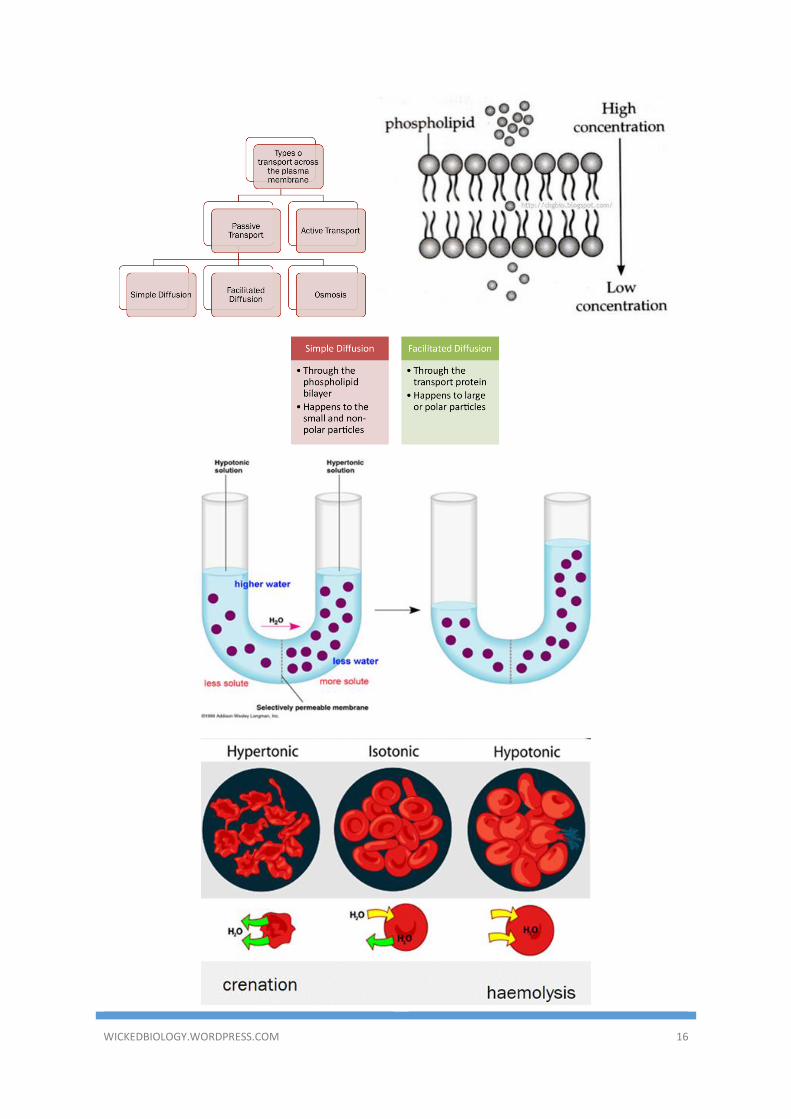
MOVEMENT OF SUBSTANCES ACROSS THE
PLASMA Membrane
3.1 Movement of Substances across the Plasma
Membrane 3.3 Appreciating the Movement of
Substances across the Plasma Membrane
3.2 Movement of Substances across the Plasma Membrane in Everyday Life
3
QUICK NOTES & REVISIONS
WICKEDBIOLOGY.WORDPRESS.COM 16
WICKEDBIOLOGY.WORDPRESS.COM 17
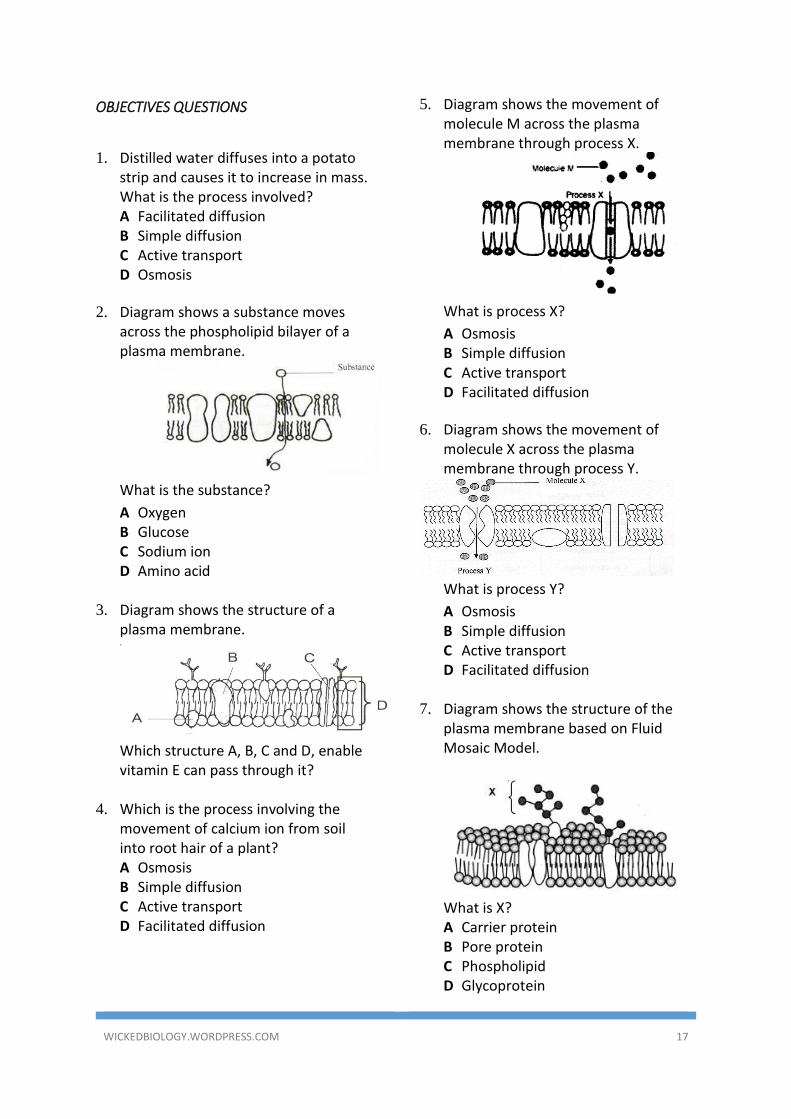
OBJECTIVES QUESTIONS
1. Distilled water diffuses into a potato strip and causes it to increase in mass. What is the process involved? A Facilitated diffusion B Simple diffusion C Active transport D Osmosis
2. Diagram shows a substance moves across the phospholipid bilayer of a plasma membrane.
What is the substance?
A Oxygen B Glucose C Sodium ion D Amino acid
3. Diagram shows the structure of a
plasma membrane.
Which structure A, B, C and D, enable vitamin E can pass through it?
4. Which is the process involving the
movement of calcium ion from soil into root hair of a plant? A Osmosis B Simple diffusion C Active transport D Facilitated diffusion
5. Diagram shows the movement of molecule M across the plasma membrane through process X.
What is process X?
A Osmosis B Simple diffusion C Active transport D Facilitated diffusion
6. Diagram shows the movement of molecule X across the plasma membrane through process Y.
What is process Y?
A Osmosis B Simple diffusion C Active transport D Facilitated diffusion
7. Diagram shows the structure of the plasma membrane based on Fluid Mosaic Model.
What is X? A Carrier protein B Pore protein C Phospholipid D Glycoprotein
WICKEDBIOLOGY.WORDPRESS.COM 18
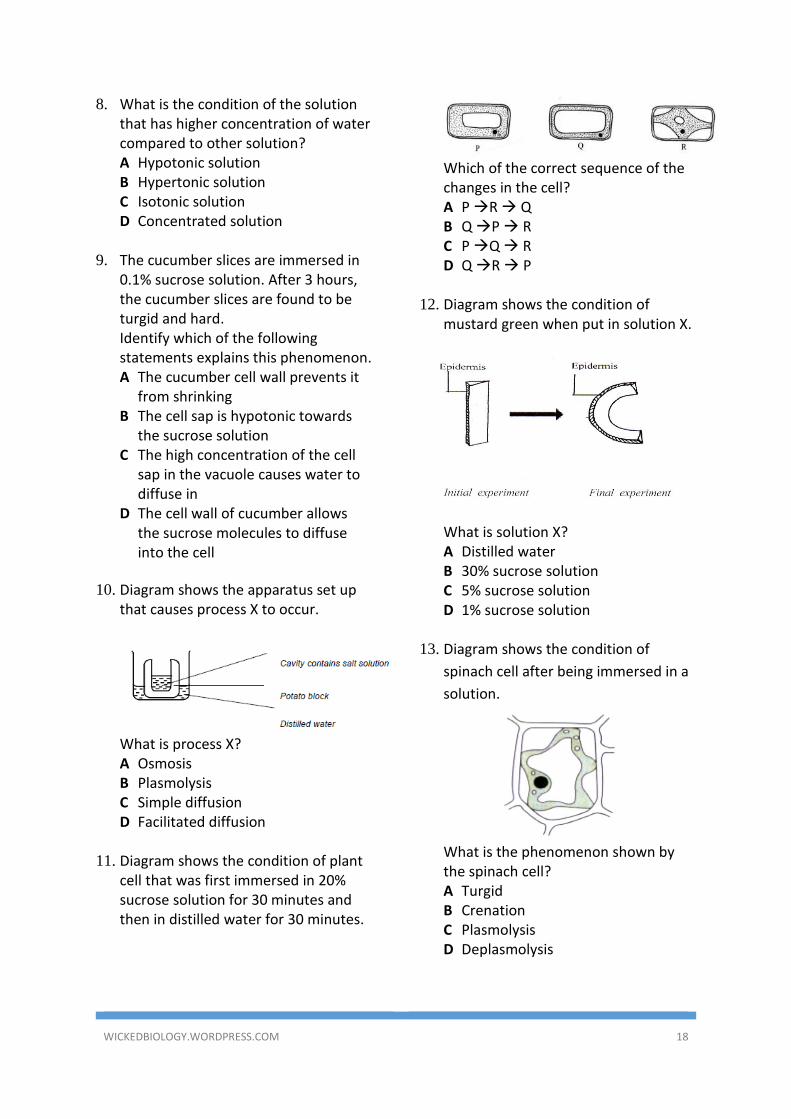
8. What is the condition of the solution that has higher concentration of water compared to other solution? A Hypotonic solution B Hypertonic solution C Isotonic solution D Concentrated solution
9. The cucumber slices are immersed in
0.1% sucrose solution. After 3 hours, the cucumber slices are found to be turgid and hard. Identify which of the following statements explains this phenomenon. A The cucumber cell wall prevents it
from shrinking B The cell sap is hypotonic towards
the sucrose solution C The high concentration of the cell
sap in the vacuole causes water to diffuse in
D The cell wall of cucumber allows the sucrose molecules to diffuse into the cell
10. Diagram shows the apparatus set up that causes process X to occur.
What is process X? A Osmosis B Plasmolysis C Simple diffusion D Facilitated diffusion
11. Diagram shows the condition of plant cell that was first immersed in 20% sucrose solution for 30 minutes and then in distilled water for 30 minutes.
Which of the correct sequence of the changes in the cell? A P R Q B Q P R C P Q R D Q R P
12. Diagram shows the condition of mustard green when put in solution X.
What is solution X? A Distilled water B 30% sucrose solution C 5% sucrose solution D 1% sucrose solution
13. Diagram shows the condition of
spinach cell after being immersed in a
solution.
What is the phenomenon shown by the spinach cell? A Turgid B Crenation C Plasmolysis D Deplasmolysis
WICKEDBIOLOGY.WORDPRESS.COM 19
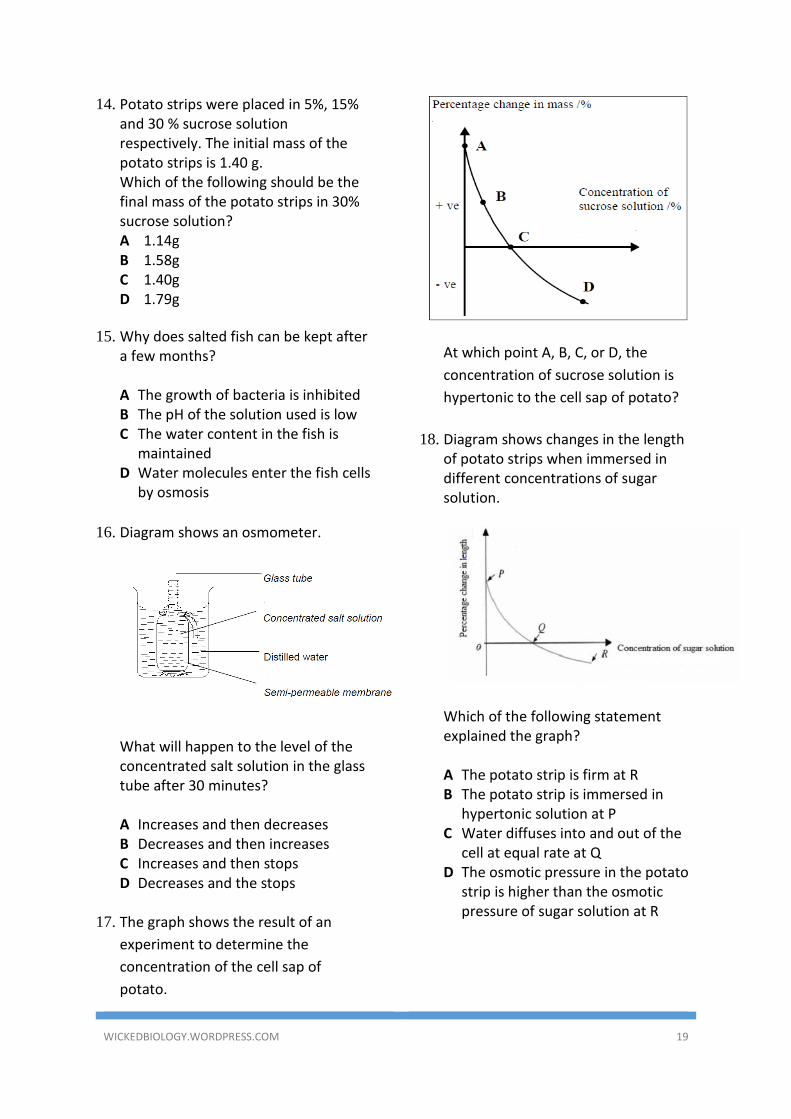
14. Potato strips were placed in 5%, 15% and 30 % sucrose solution respectively. The initial mass of the potato strips is 1.40 g. Which of the following should be the final mass of the potato strips in 30% sucrose solution? A 1.14g B 1.58g C 1.40g D 1.79g
15. Why does salted fish can be kept after a few months? A The growth of bacteria is inhibited B The pH of the solution used is low C The water content in the fish is
maintained D Water molecules enter the fish cells
by osmosis
16. Diagram shows an osmometer.
What will happen to the level of the concentrated salt solution in the glass tube after 30 minutes? A Increases and then decreases B Decreases and then increases C Increases and then stops D Decreases and the stops
17. The graph shows the result of an
experiment to determine the
concentration of the cell sap of
potato.
At which point A, B, C, or D, the
concentration of sucrose solution is
hypertonic to the cell sap of potato?
18. Diagram shows changes in the length
of potato strips when immersed in different concentrations of sugar solution.
Which of the following statement explained the graph? A The potato strip is firm at R B The potato strip is immersed in
hypertonic solution at P C Water diffuses into and out of the
cell at equal rate at Q D The osmotic pressure in the potato
strip is higher than the osmotic pressure of sugar solution at R
WICKEDBIOLOGY.WORDPRESS.COM 20
STRUCTURE QUESTIONS
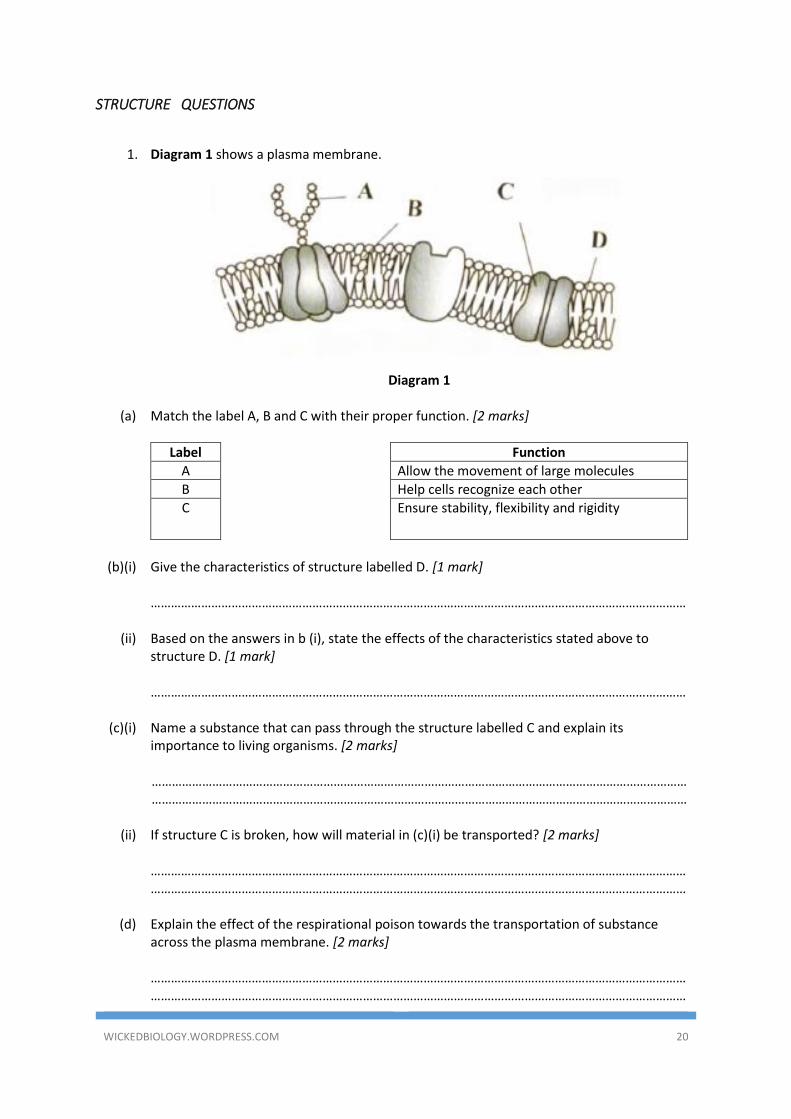
1. Diagram 1 shows a plasma membrane.
Diagram 1
(a) Match the label A, B and C with their proper function. [2 marks]
Label Function
A Allow the movement of large molecules
B Help cells recognize each other
C Ensure stability, flexibility and rigidity
(b)(i) Give the characteristics of structure labelled D. [1 mark]
……………………………………………………………………………………………………………………………………………
(ii) Based on the answers in b (i), state the effects of the characteristics stated above to
structure D. [1 mark] ……………………………………………………………………………………………………………………………………………
(c)(i) Name a substance that can pass through the structure labelled C and explain its
importance to living organisms. [2 marks]
…………………………………………………………………………………………………………………………………………………………………………………………………………………………………………………………………………………………
(ii) If structure C is broken, how will material in (c)(i) be transported? [2 marks]
…………………………………………………………………………………………………………………………………………………………………………………………………………………………………………………………………………………………
(d) Explain the effect of the respirational poison towards the transportation of substance
across the plasma membrane. [2 marks] …………………………………………………………………………………………………………………………………………………………………………………………………………………………………………………………………………………………
WICKEDBIOLOGY.WORDPRESS.COM 21
(e) Explain why the structure of the plasma membrane is considered a fluid mosaic model.
[2 marks] …………………………………………………………………………………………………………………………………………………………………………………………………………………………………………………………………………………………
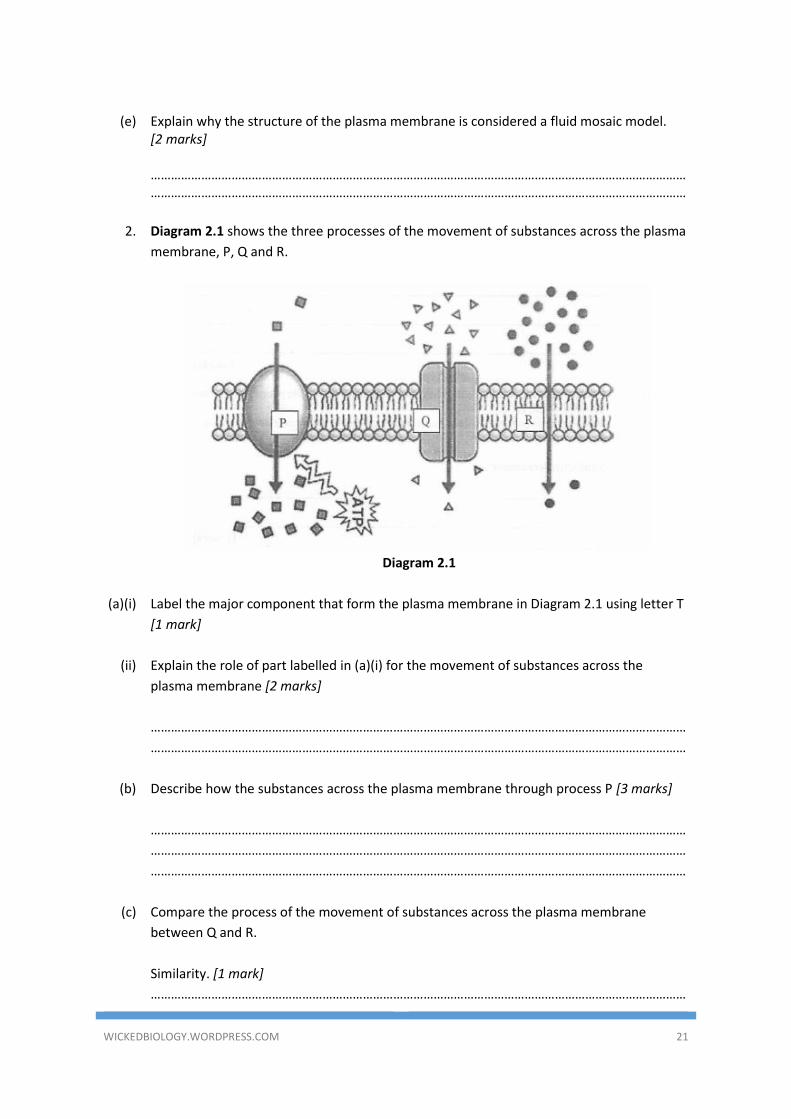
2. Diagram 2.1 shows the three processes of the movement of substances across the plasma
membrane, P, Q and R.
Diagram 2.1
(a)(i) Label the major component that form the plasma membrane in Diagram 2.1 using letter T
[1 mark]
(ii) Explain the role of part labelled in (a)(i) for the movement of substances across the
plasma membrane [2 marks]
……………………………………………………………………………………………………………………………………………
……………………………………………………………………………………………………………………………………………
(b) Describe how the substances across the plasma membrane through process P [3 marks]
……………………………………………………………………………………………………………………………………………
……………………………………………………………………………………………………………………………………………
……………………………………………………………………………………………………………………………………………
(c) Compare the process of the movement of substances across the plasma membrane
between Q and R.
Similarity. [1 mark]
……………………………………………………………………………………………………………………………………………
WICKEDBIOLOGY.WORDPRESS.COM 22
Differences [2 marks]
Q R
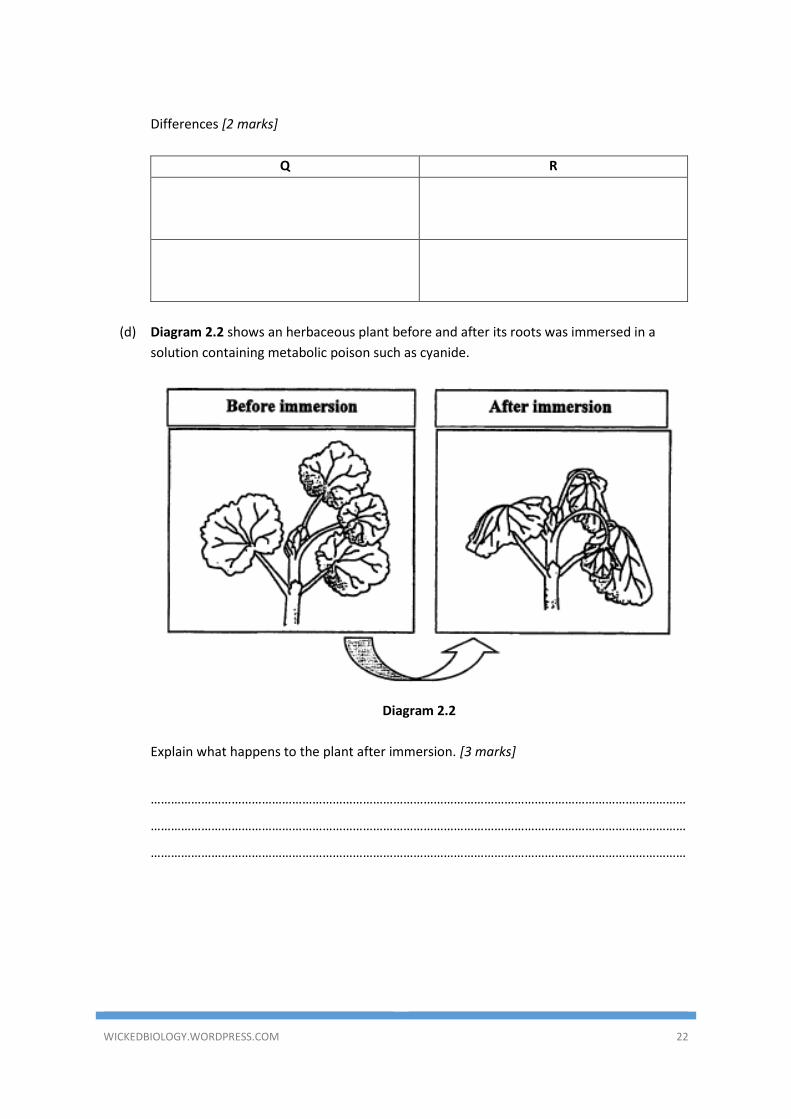
(d) Diagram 2.2 shows an herbaceous plant before and after its roots was immersed in a
solution containing metabolic poison such as cyanide.
Diagram 2.2
Explain what happens to the plant after immersion. [3 marks]
……………………………………………………………………………………………………………………………………………
……………………………………………………………………………………………………………………………………………
……………………………………………………………………………………………………………………………………………
WICKEDBIOLOGY.WORDPRESS.COM 23
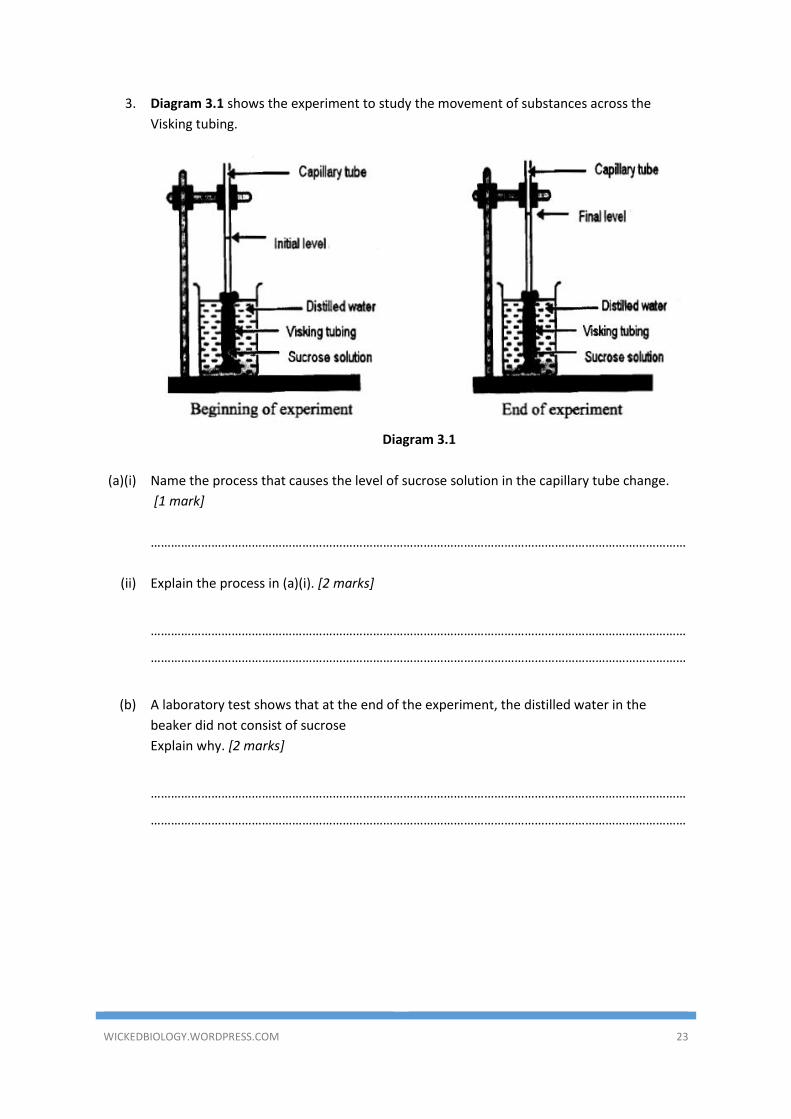
3. Diagram 3.1 shows the experiment to study the movement of substances across the
Visking tubing.
Diagram 3.1
(a)(i) Name the process that causes the level of sucrose solution in the capillary tube change.
[1 mark]
……………………………………………………………………………………………………………………………………………
(ii)
Explain the process in (a)(i). [2 marks]
……………………………………………………………………………………………………………………………………………
……………………………………………………………………………………………………………………………………………
(b) A laboratory test shows that at the end of the experiment, the distilled water in the
beaker did not consist of sucrose
Explain why. [2 marks]
……………………………………………………………………………………………………………………………………………
……………………………………………………………………………………………………………………………………………
WICKEDBIOLOGY.WORDPRESS.COM 24
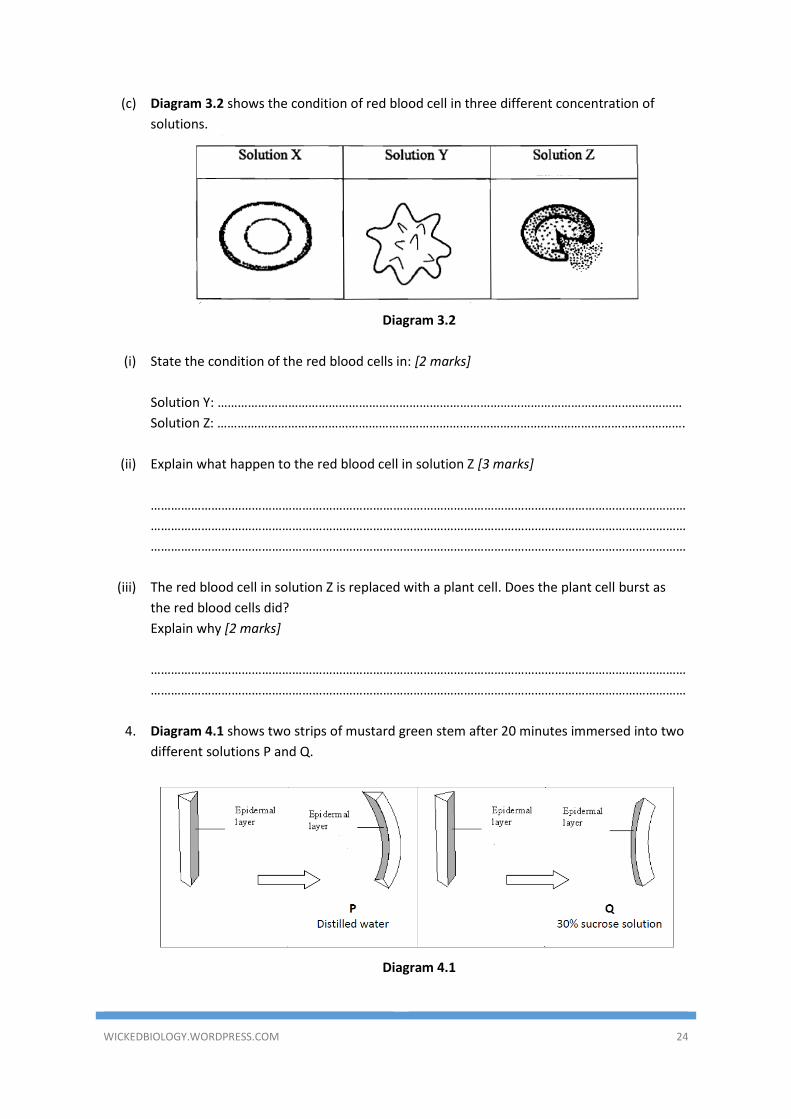
(c) Diagram 3.2 shows the condition of red blood cell in three different concentration of
solutions.
Diagram 3.2
(i) State the condition of the red blood cells in: [2 marks]
Solution Y: …………………………………………………………………………………………………………………………
Solution Z: ………………………………………………………………………………………………………………………….
(ii) Explain what happen to the red blood cell in solution Z [3 marks]
……………………………………………………………………………………………………………………………………………
……………………………………………………………………………………………………………………………………………
……………………………………………………………………………………………………………………………………………
(iii) The red blood cell in solution Z is replaced with a plant cell. Does the plant cell burst as
the red blood cells did?
Explain why [2 marks]
……………………………………………………………………………………………………………………………………………
……………………………………………………………………………………………………………………………………………
4. Diagram 4.1 shows two strips of mustard green stem after 20 minutes immersed into two
different solutions P and Q.
Diagram 4.1
WICKEDBIOLOGY.WORDPRESS.COM 25
Based on Diagram 4.1,
(i) State the type of solution Q. [1 mark]
……………………………………………………………………………………………………………………………………………
(ii) Explain how solution Q affects the condition of the cells in the strip of mustard green.
[2 marks]
……………………………………………………………………………………………………………………………………………
……………………………………………………………………………………………………………………………………………
(iii) If strip from solution Q is transferred into solution P, explain what will happen to the cells
in the strip after 20 minutes. [3 marks]
……………………………………………………………………………………………………………………………………………
……………………………………………………………………………………………………………………………………………
……………………………………………………………………………………………………………………………………………
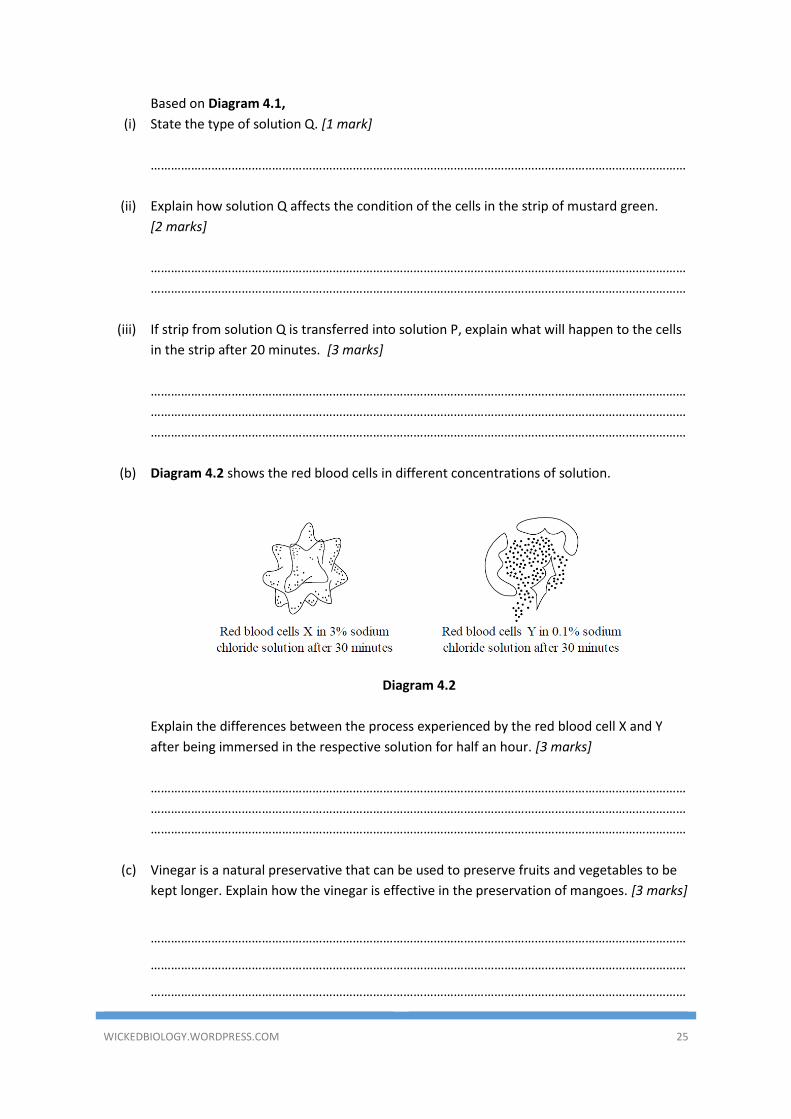
(b) Diagram 4.2 shows the red blood cells in different concentrations of solution.
Diagram 4.2
Explain the differences between the process experienced by the red blood cell X and Y
after being immersed in the respective solution for half an hour. [3 marks]
……………………………………………………………………………………………………………………………………………
……………………………………………………………………………………………………………………………………………
……………………………………………………………………………………………………………………………………………
(c) Vinegar is a natural preservative that can be used to preserve fruits and vegetables to be
kept longer. Explain how the vinegar is effective in the preservation of mangoes. [3 marks]
……………………………………………………………………………………………………………………………………………
……………………………………………………………………………………………………………………………………………
……………………………………………………………………………………………………………………………………………
WICKEDBIOLOGY.WORDPRESS.COM 26
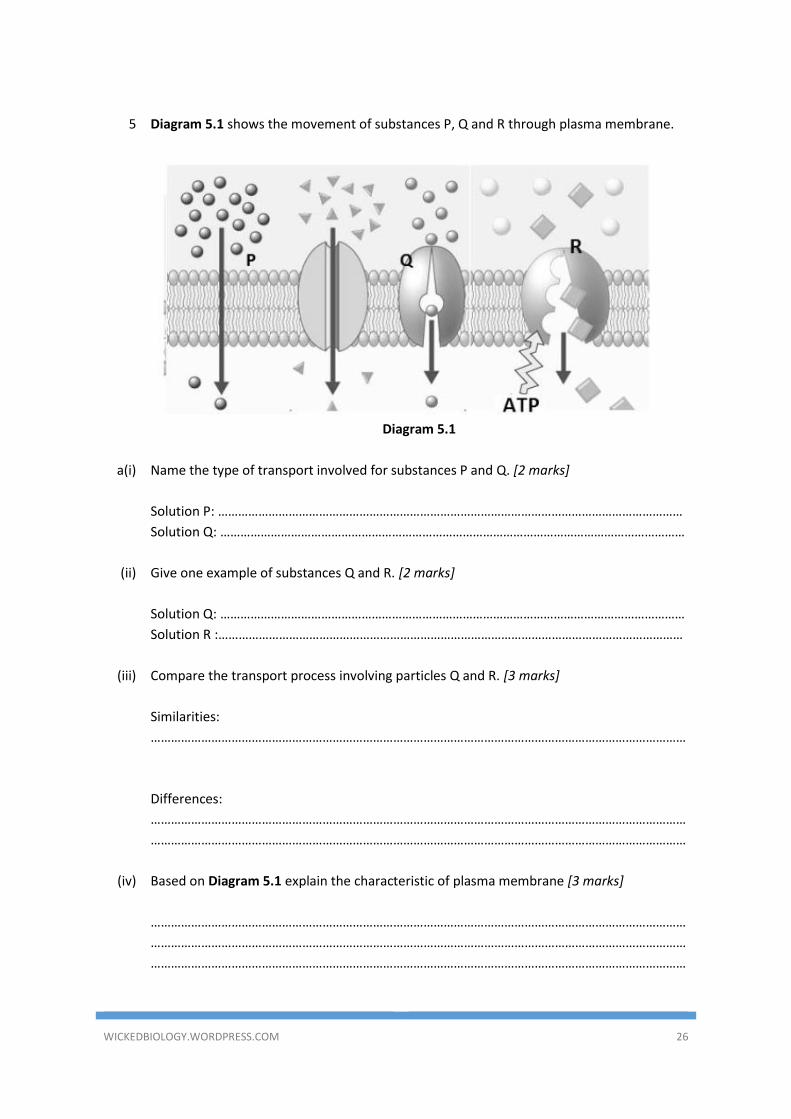
5 Diagram 5.1 shows the movement of substances P, Q and R through plasma membrane.
Diagram 5.1
a(i) Name the type of transport involved for substances P and Q. [2 marks]
Solution P: …………………………………………………………………………………………………………………………
Solution Q: …………………………………………………………………………………………………………………………
(ii) Give one example of substances Q and R. [2 marks]
Solution Q: …………………………………………………………………………………………………………………………
Solution R :…………………………………………………………………………………………………………………………
(iii) Compare the transport process involving particles Q and R. [3 marks]
Similarities:
……………………………………………………………………………………………………………………………………………
Differences:
……………………………………………………………………………………………………………………………………………
……………………………………………………………………………………………………………………………………………
(iv) Based on Diagram 5.1 explain the characteristic of plasma membrane [3 marks]
……………………………………………………………………………………………………………………………………………
……………………………………………………………………………………………………………………………………………
……………………………………………………………………………………………………………………………………………
WICKEDBIOLOGY.WORDPRESS.COM 27
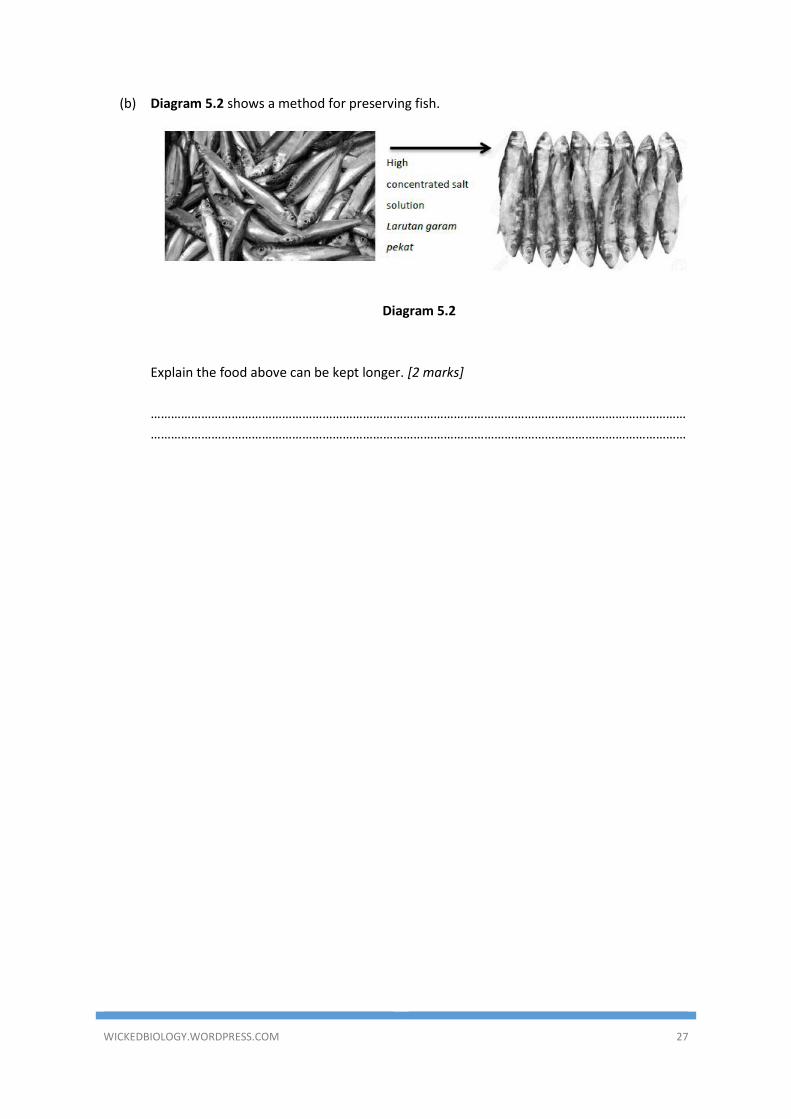
(b) Diagram 5.2 shows a method for preserving fish.
Diagram 5.2
Explain the food above can be kept longer. [2 marks]
……………………………………………………………………………………………………………………………………………
……………………………………………………………………………………………………………………………………………
WICKEDBIOLOGY.WORDPRESS.COM 28
ESSAY QUESTIONS
1.
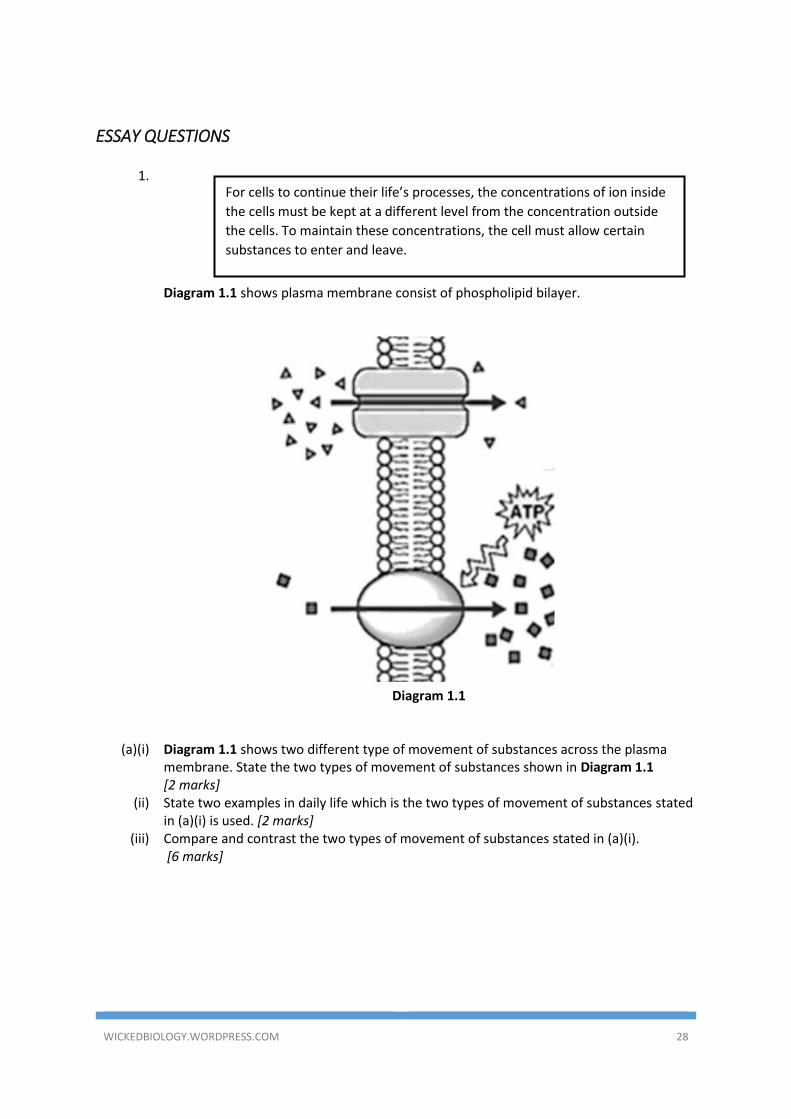
Diagram 1.1 shows plasma membrane consist of phospholipid bilayer.
Diagram 1.1
(a)(i) Diagram 1.1 shows two different type of movement of substances across the plasma membrane. State the two types of movement of substances shown in Diagram 1.1 [2 marks]
(ii) State two examples in daily life which is the two types of movement of substances stated in (a)(i) is used. [2 marks]
(iii) Compare and contrast the two types of movement of substances stated in (a)(i). [6 marks]
For cells to continue their life’s processes, the concentrations of ion inside
the cells must be kept at a different level from the concentration outside
the cells. To maintain these concentrations, the cell must allow certain
substances to enter and leave.
WICKEDBIOLOGY.WORDPRESS.COM 29
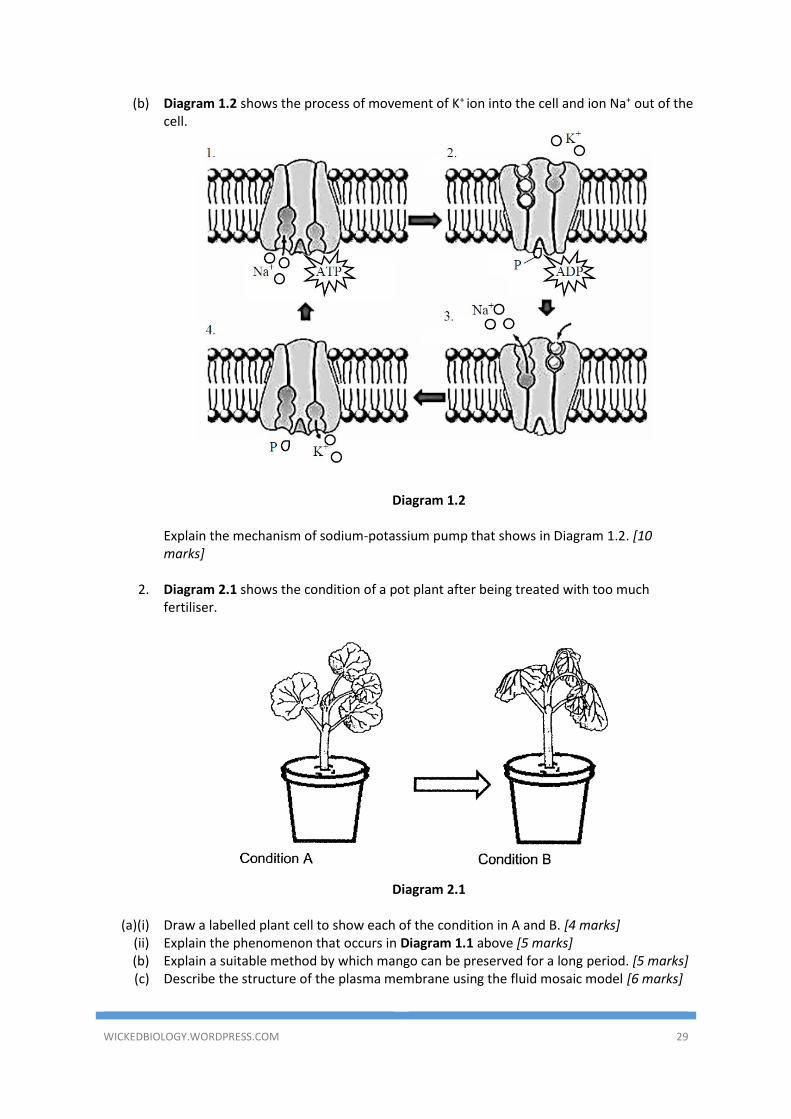
(b) Diagram 1.2 shows the process of movement of K+ ion into the cell and ion Na+ out of the cell.
Diagram 1.2 Explain the mechanism of sodium-potassium pump that shows in Diagram 1.2. [10
marks]
2. Diagram 2.1 shows the condition of a pot plant after being treated with too much fertiliser.
Diagram 2.1
(a)(i) Draw a labelled plant cell to show each of the condition in A and B. [4 marks]
(ii) Explain the phenomenon that occurs in Diagram 1.1 above [5 marks] (b) Explain a suitable method by which mango can be preserved for a long period. [5 marks] (c) Describe the structure of the plasma membrane using the fluid mosaic model [6 marks]
WICKEDBIOLOGY.WORDPRESS.COM 30
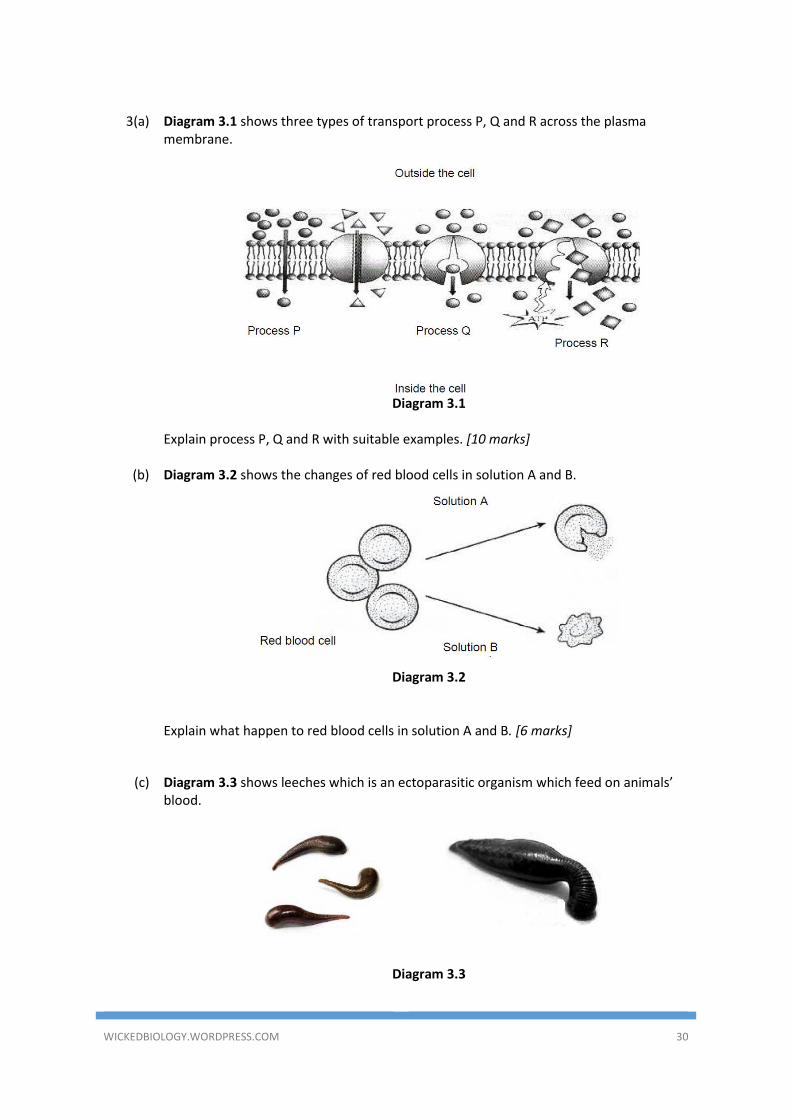
3(a) Diagram 3.1 shows three types of transport process P, Q and R across the plasma
membrane.
Diagram 3.1
Explain process P, Q and R with suitable examples. [10 marks]
(b) Diagram 3.2 shows the changes of red blood cells in solution A and B.
Diagram 3.2
Explain what happen to red blood cells in solution A and B. [6 marks]
(c) Diagram 3.3 shows leeches which is an ectoparasitic organism which feed on animals’ blood.
Diagram 3.3
WICKEDBIOLOGY.WORDPRESS.COM 31
Explain how does table salt can be used to detach leeches from the human skin or to kill the leeches. [4 marks]
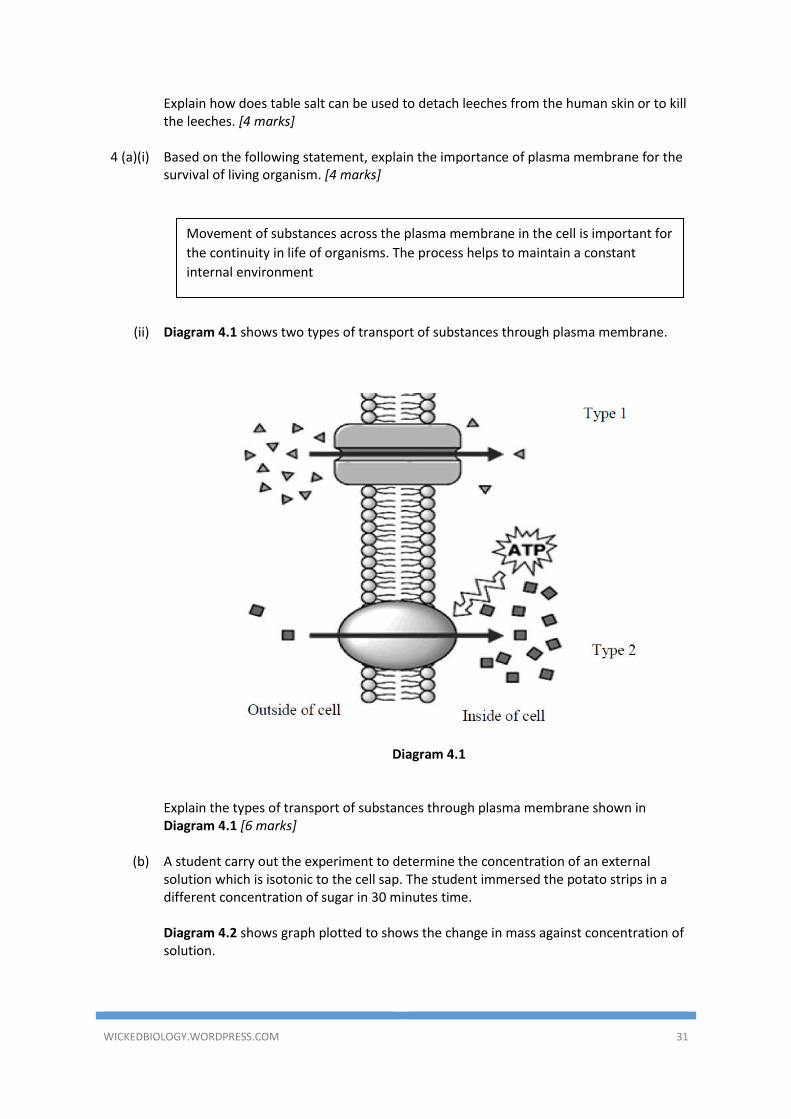
4 (a)(i) Based on the following statement, explain the importance of plasma membrane for the
survival of living organism. [4 marks]
(ii) Diagram 4.1 shows two types of transport of substances through plasma membrane.
Diagram 4.1 Explain the types of transport of substances through plasma membrane shown in Diagram 4.1 [6 marks]
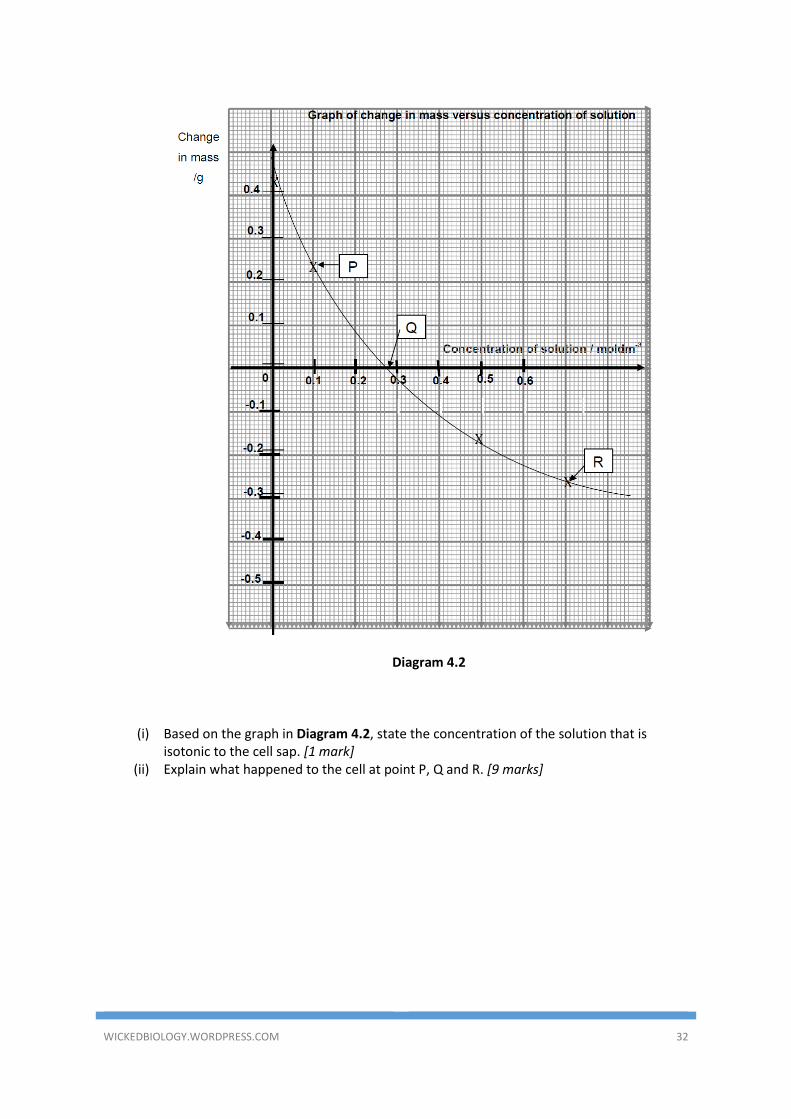
(b) A student carry out the experiment to determine the concentration of an external
solution which is isotonic to the cell sap. The student immersed the potato strips in a different concentration of sugar in 30 minutes time. Diagram 4.2 shows graph plotted to shows the change in mass against concentration of solution.
Movement of substances across the plasma membrane in the cell is important for
the continuity in life of organisms. The process helps to maintain a constant
internal environment
WICKEDBIOLOGY.WORDPRESS.COM 32
Diagram 4.2
(i) Based on the graph in Diagram 4.2, state the concentration of the solution that is isotonic to the cell sap. [1 mark]
(ii) Explain what happened to the cell at point P, Q and R. [9 marks]
WICKEDBIOLOGY.WORDPRESS.COM 33
CHEMICAL COMPOSITION OF THE
CELL
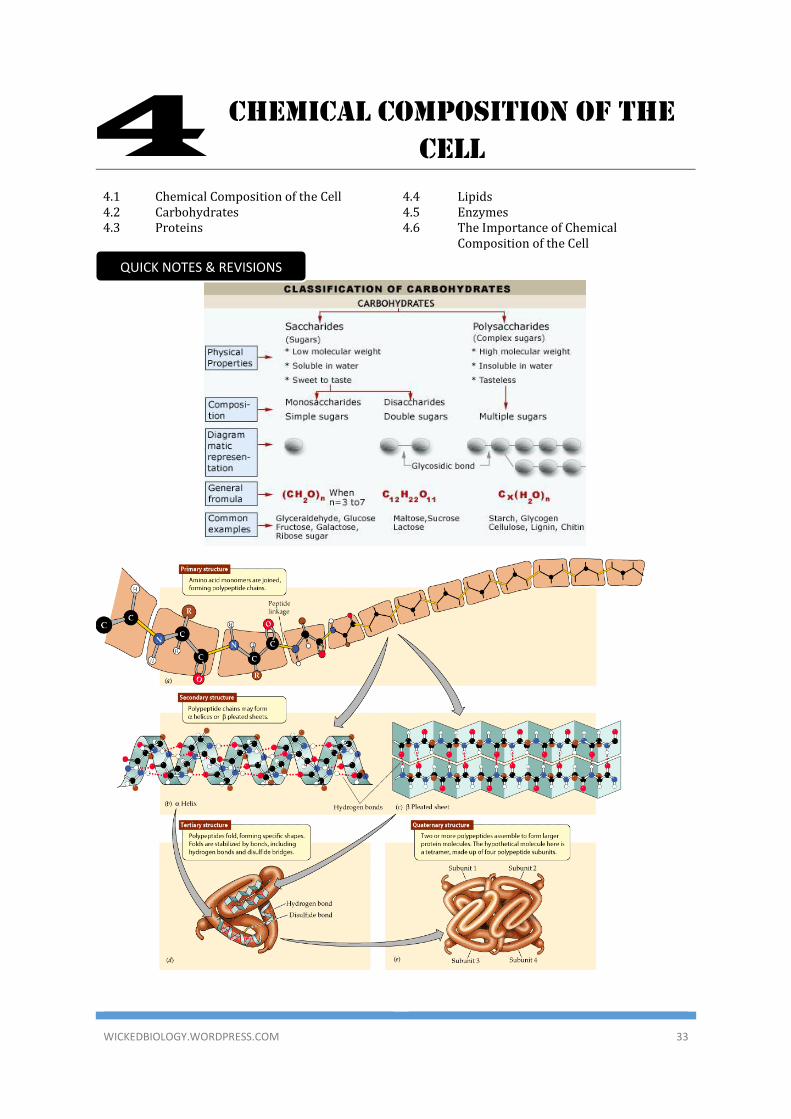
4.1 Chemical Composition of the Cell 4.4 Lipids 4.2 Carbohydrates 4.5 Enzymes 4.3 Proteins 4.6 The Importance of Chemical
Composition of the Cell
4
QUICK NOTES & REVISIONS
WICKEDBIOLOGY.WORDPRESS.COM 34
Gen
eral
Ch
arac
teri
stic
s o
f En
zym
es
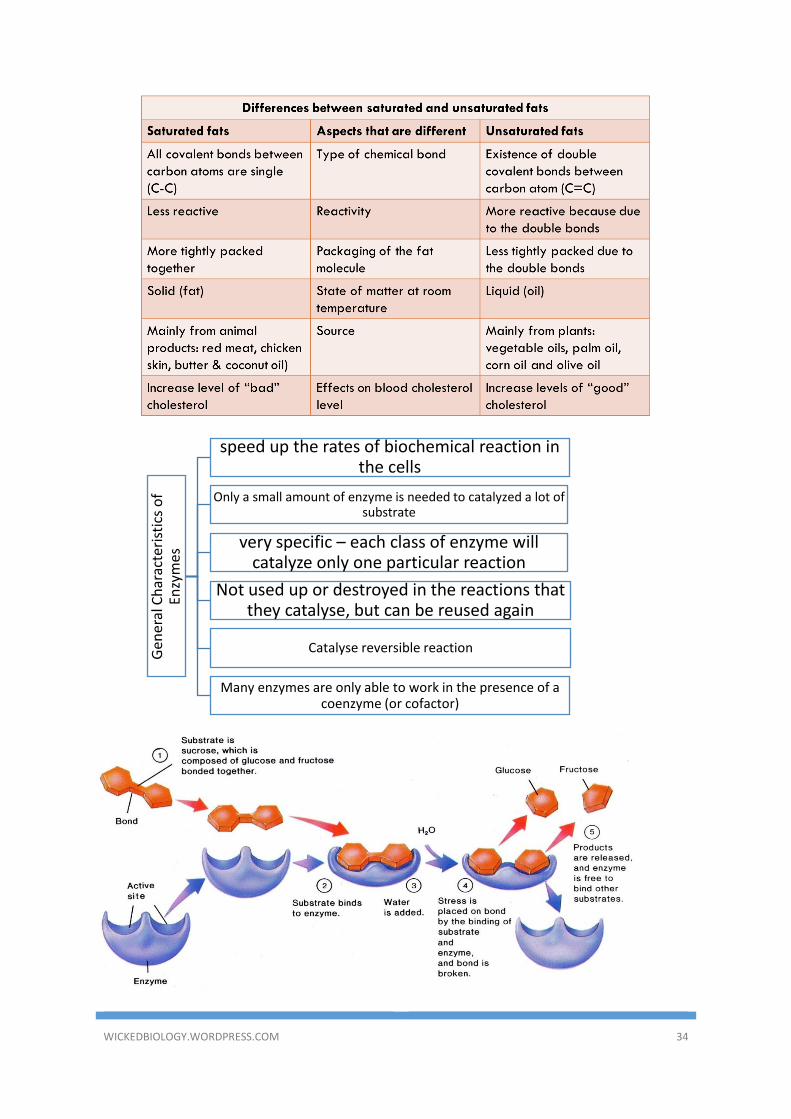
speed up the rates of biochemical reaction in the cells
Only a small amount of enzyme is needed to catalyzed a lot of substrate
very specific – each class of enzyme will catalyze only one particular reaction
Not used up or destroyed in the reactions that they catalyse, but can be reused again
Catalyse reversible reaction
Many enzymes are only able to work in the presence of a coenzyme (or cofactor)
WICKEDBIOLOGY.WORDPRESS.COM 35
OBJECTIVES QUESTIONS
1. Which of the following is organic
compound?
A Protein
B Lipid
C Water
D Nucleic acid
2. Which type of carbohydrate can be
found abundantly in liver cells?
A Starch
B Maltose
C Glucose
D Glycogen
3. Diagram shows a basic unit of a
chemical compound in a living cell.
Which chemical compound has the
unit shown?
A Lipid
B Protein
C Lactic acid
D Nucleic acid
4. Which of these carbohydrates is
insoluble in water?
A Starch
B Maltose
C Glucose
D Galactose
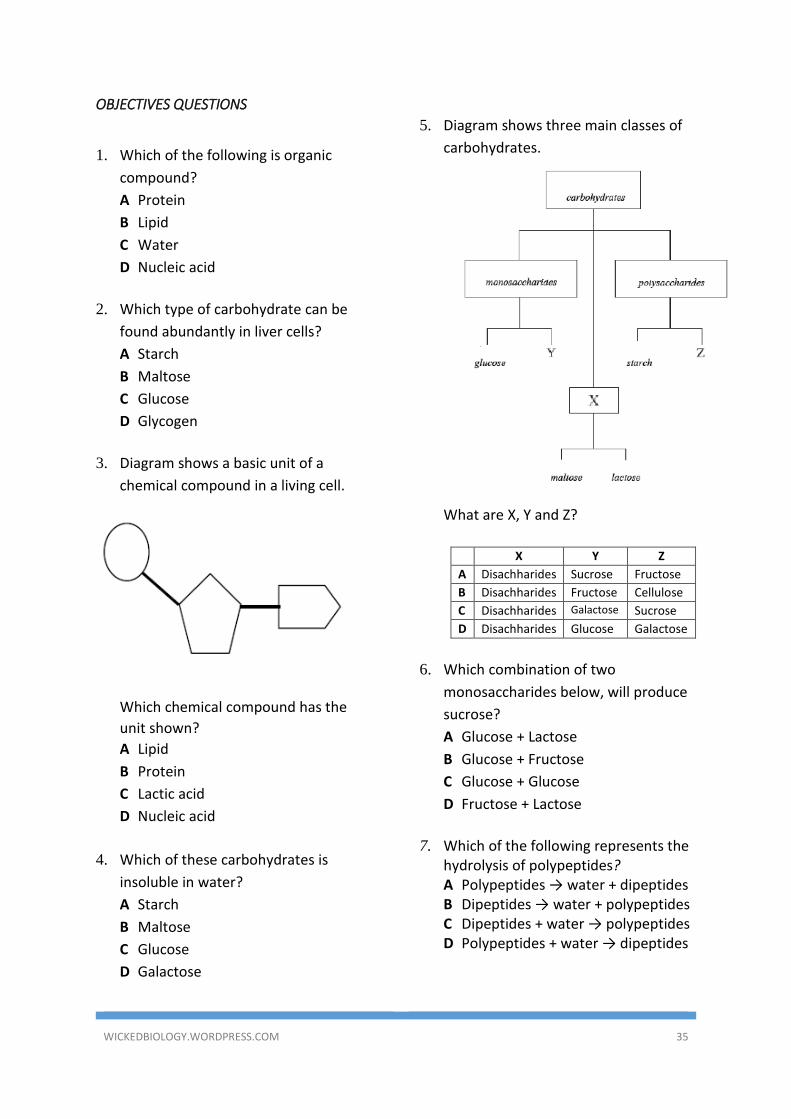
5. Diagram shows three main classes of
carbohydrates.
What are X, Y and Z?
X Y Z
A Disachharides Sucrose Fructose
B Disachharides Fructose Cellulose
C Disachharides Galactose Sucrose
D Disachharides Glucose Galactose
6. Which combination of two
monosaccharides below, will produce
sucrose?
A Glucose + Lactose
B Glucose + Fructose
C Glucose + Glucose
D Fructose + Lactose
7. Which of the following represents the
hydrolysis of polypeptides? A Polypeptides → water + dipeptides B Dipeptides → water + polypeptides C Dipeptides + water → polypeptides D Polypeptides + water → dipeptides
WICKEDBIOLOGY.WORDPRESS.COM 36
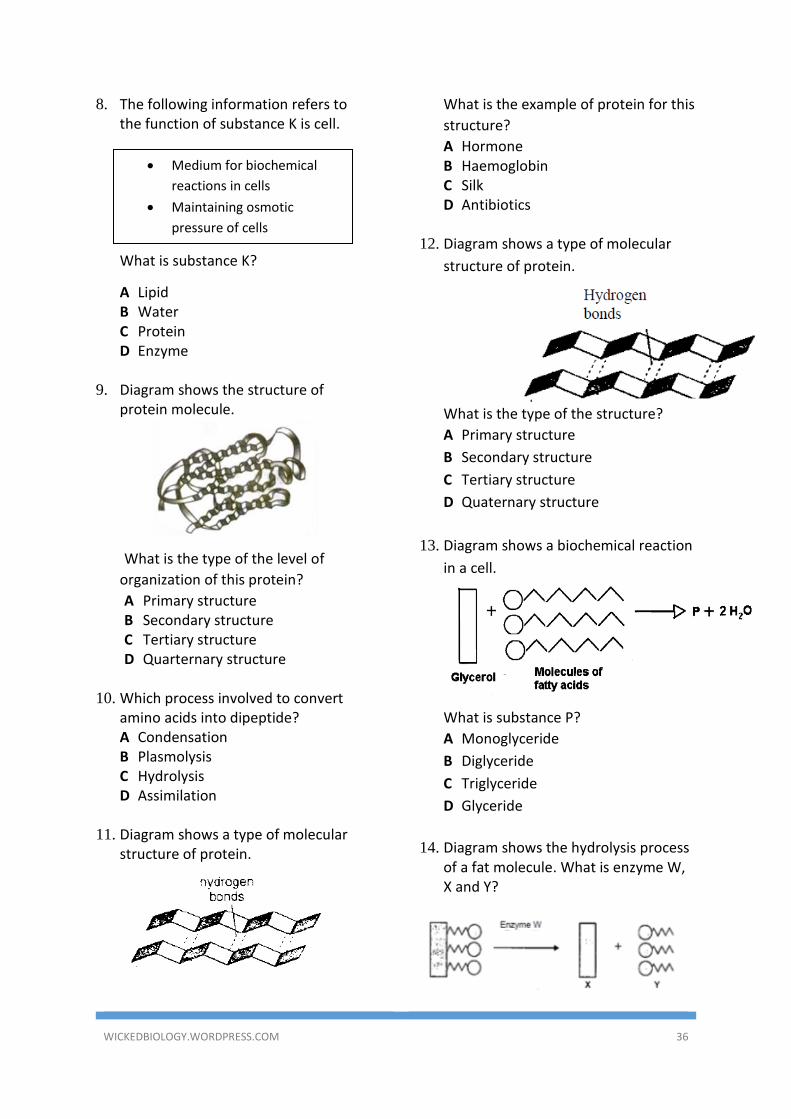
8. The following information refers to the function of substance K is cell.
What is substance K?
A Lipid B Water C Protein D Enzyme
9. Diagram shows the structure of protein molecule.
What is the type of the level of
organization of this protein?
A Primary structure B Secondary structure C Tertiary structure D Quarternary structure
10. Which process involved to convert
amino acids into dipeptide? A Condensation B Plasmolysis C Hydrolysis D Assimilation
11. Diagram shows a type of molecular
structure of protein.
What is the example of protein for this
structure?
A Hormone B Haemoglobin C Silk D Antibiotics
12. Diagram shows a type of molecular
structure of protein.
What is the type of the structure?
A Primary structure
B Secondary structure
C Tertiary structure
D Quaternary structure
13. Diagram shows a biochemical reaction
in a cell.
What is substance P?
A Monoglyceride
B Diglyceride
C Triglyceride
D Glyceride
14. Diagram shows the hydrolysis process
of a fat molecule. What is enzyme W, X and Y?
• Medium for biochemical
reactions in cells
• Maintaining osmotic
pressure of cells
WICKEDBIOLOGY.WORDPRESS.COM 37
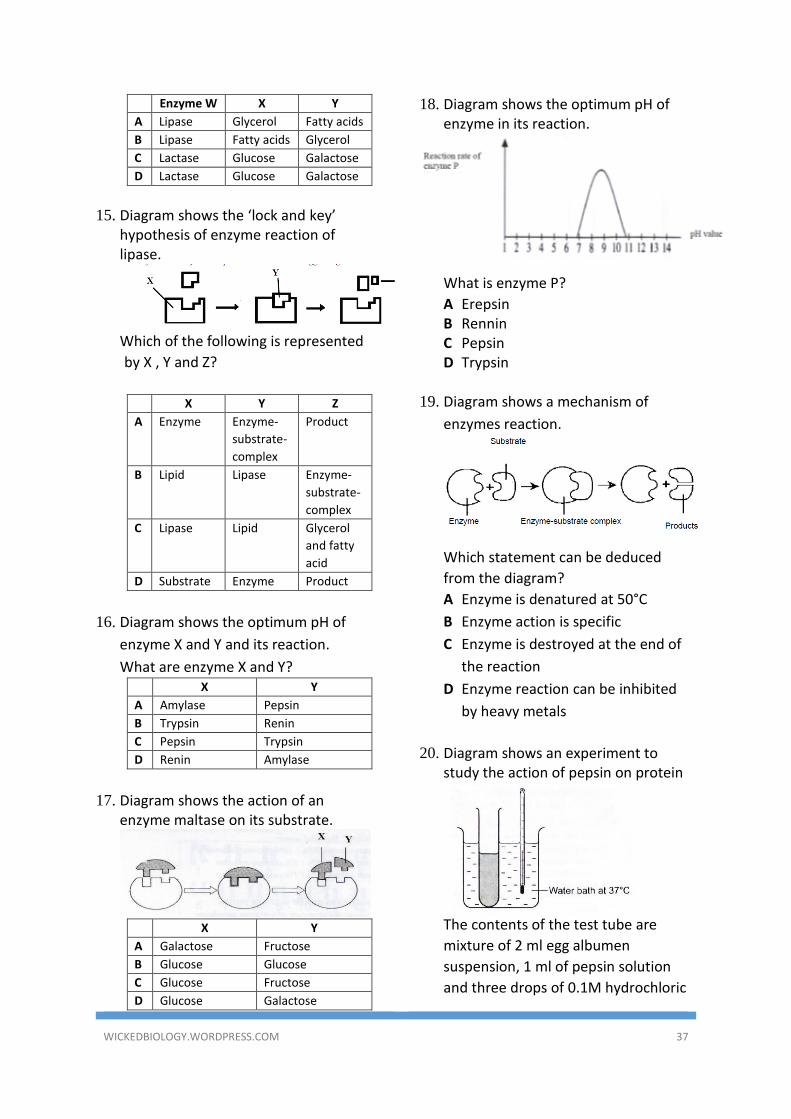
Enzyme W X Y
A Lipase Glycerol Fatty acids
B Lipase Fatty acids Glycerol
C Lactase Glucose Galactose
D Lactase Glucose Galactose
15. Diagram shows the ‘lock and key’
hypothesis of enzyme reaction of lipase.
Which of the following is represented
by X , Y and Z?
X Y Z
A Enzyme Enzyme-
substrate-
complex
Product
B Lipid Lipase Enzyme-
substrate-
complex
C Lipase Lipid Glycerol
and fatty
acid
D Substrate Enzyme Product
16. Diagram shows the optimum pH of
enzyme X and Y and its reaction.
What are enzyme X and Y? X Y
A Amylase Pepsin
B Trypsin Renin
C Pepsin Trypsin
D Renin Amylase
17. Diagram shows the action of an enzyme maltase on its substrate.
X Y
A Galactose Fructose
B Glucose Glucose
C Glucose Fructose
D Glucose Galactose
18. Diagram shows the optimum pH of enzyme in its reaction.
What is enzyme P?
A Erepsin B Rennin C Pepsin D Trypsin
19. Diagram shows a mechanism of
enzymes reaction.
Which statement can be deduced
from the diagram?
A Enzyme is denatured at 50°C
B Enzyme action is specific
C Enzyme is destroyed at the end of
the reaction
D Enzyme reaction can be inhibited
by heavy metals
20. Diagram shows an experiment to
study the action of pepsin on protein
The contents of the test tube are
mixture of 2 ml egg albumen
suspension, 1 ml of pepsin solution
and three drops of 0.1M hydrochloric
WICKEDBIOLOGY.WORDPRESS.COM 38
acid. The albumen suspension turns
clear after 20 minutes.
Which step can reduce the time taken
for the egg albumen suspension to
turn clear?
A Increase the volume of egg albumen suspension to 4 ml
B Increase the volume of 1% pepsin to 2 ml
C Replaced the hydrochloric acid with 0.1M sodium hydroxide
D Increase the temperature of water bath to 45°C
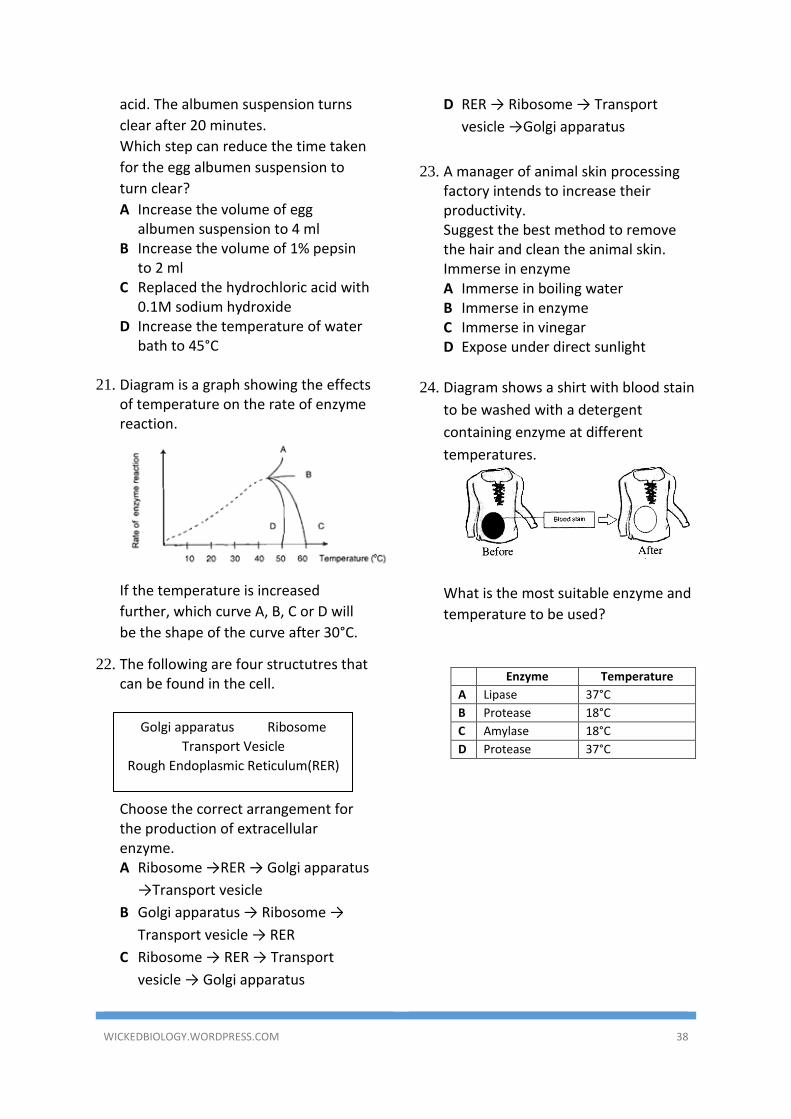
21. Diagram is a graph showing the effects
of temperature on the rate of enzyme reaction.
If the temperature is increased
further, which curve A, B, C or D will
be the shape of the curve after 30°C.
22. The following are four structutres that can be found in the cell.
Choose the correct arrangement for the production of extracellular enzyme. A Ribosome →RER → Golgi apparatus
→Transport vesicle
B Golgi apparatus → Ribosome →
Transport vesicle → RER
C Ribosome → RER → Transport
vesicle → Golgi apparatus
D RER → Ribosome → Transport
vesicle →Golgi apparatus
23. A manager of animal skin processing factory intends to increase their productivity. Suggest the best method to remove the hair and clean the animal skin. Immerse in enzyme A Immerse in boiling water B Immerse in enzyme C Immerse in vinegar D Expose under direct sunlight
24. Diagram shows a shirt with blood stain
to be washed with a detergent
containing enzyme at different
temperatures.
What is the most suitable enzyme and
temperature to be used?
Enzyme Temperature
A Lipase 37°C
B Protease 18°C
C Amylase 18°C
D Protease 37°C
Golgi apparatus Ribosome
Transport Vesicle
Rough Endoplasmic Reticulum(RER)
WICKEDBIOLOGY.WORDPRESS.COM 39
STRUCTURE QUESTIONS
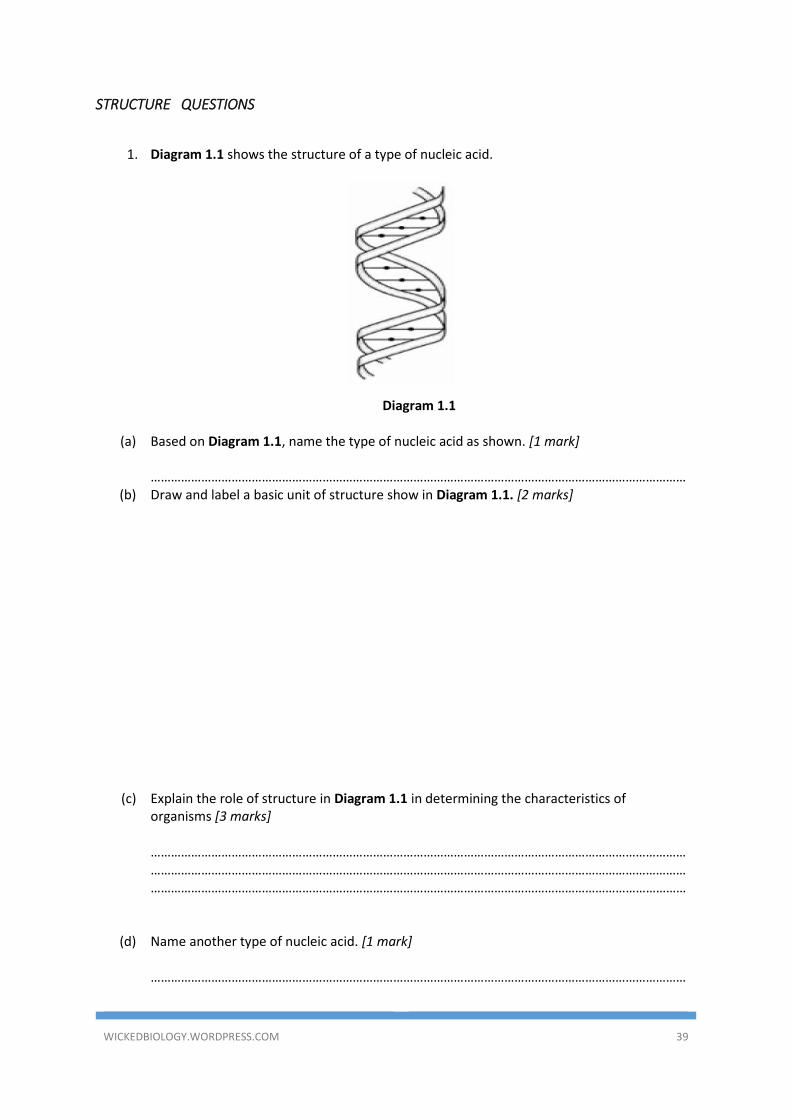
1. Diagram 1.1 shows the structure of a type of nucleic acid.
Diagram 1.1
(a) Based on Diagram 1.1, name the type of nucleic acid as shown. [1 mark]
……………………………………………………………………………………………………………………………………………
(b) Draw and label a basic unit of structure show in Diagram 1.1. [2 marks]
(c) Explain the role of structure in Diagram 1.1 in determining the characteristics of
organisms [3 marks] ………………………………………………………………………………………………………………………………………………………………………………………………………………………………………………………………………………………………………………………………………………………………………………………………………………………………………
(d) Name another type of nucleic acid. [1 mark] ……………………………………………………………………………………………………………………………………………
WICKEDBIOLOGY.WORDPRESS.COM 40
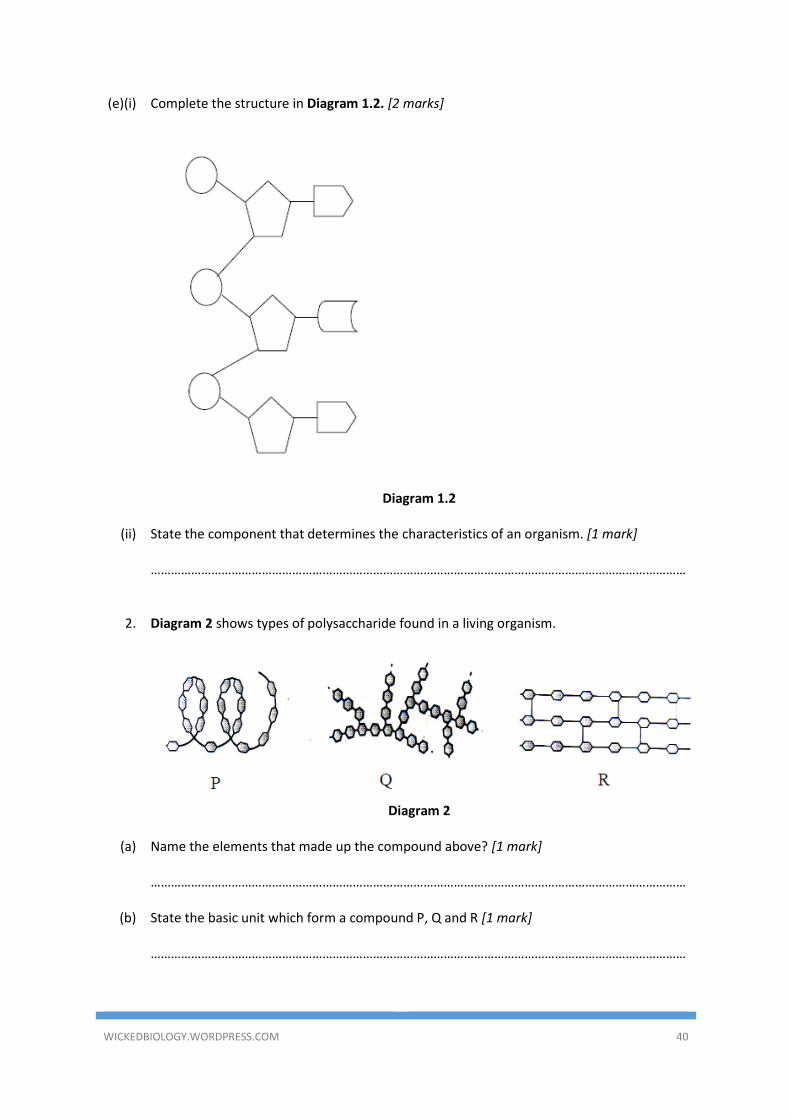
(e)(i) Complete the structure in Diagram 1.2. [2 marks]
Diagram 1.2
(ii) State the component that determines the characteristics of an organism. [1 mark]
……………………………………………………………………………………………………………………………………………
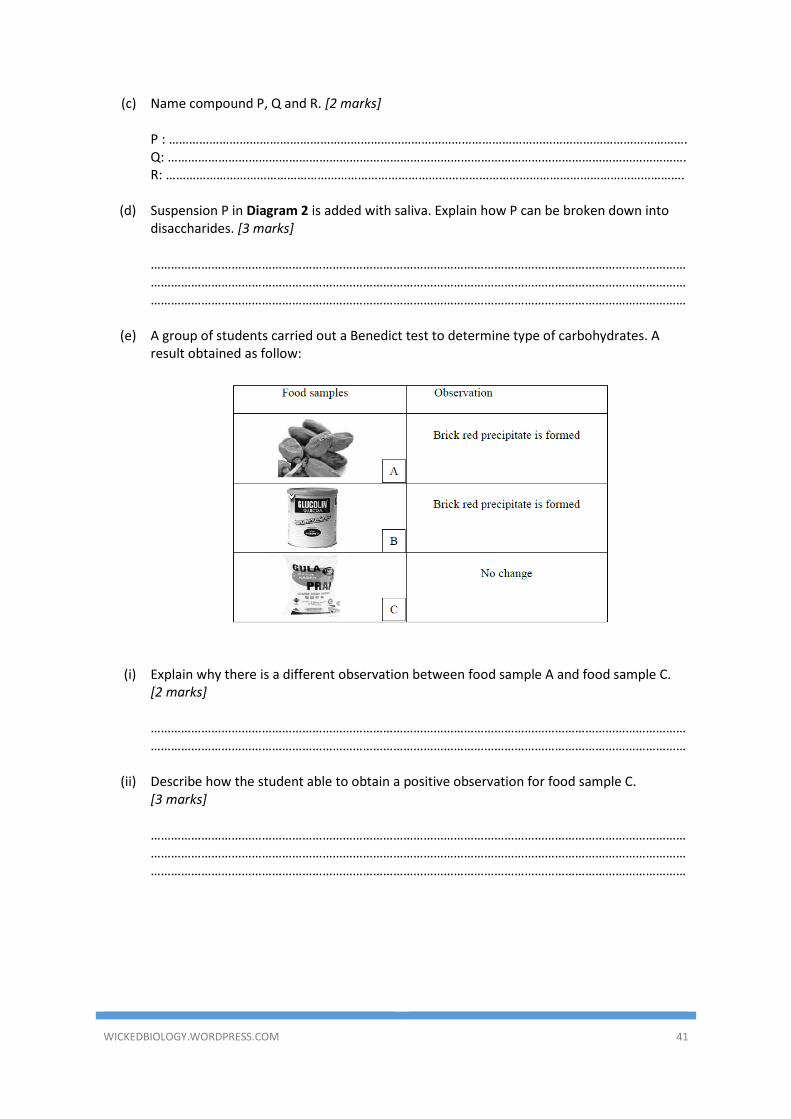
2. Diagram 2 shows types of polysaccharide found in a living organism.
Diagram 2
(a) Name the elements that made up the compound above? [1 mark]
……………………………………………………………………………………………………………………………………………
(b) State the basic unit which form a compound P, Q and R [1 mark]
……………………………………………………………………………………………………………………………………………
WICKEDBIOLOGY.WORDPRESS.COM 41
(c) Name compound P, Q and R. [2 marks] P : ………………………………………………………………………………………………………………………………………. Q: ………………………………………………………………………………………………………………………………………. R: ……………………………………………………………………………………………………………………………………….
(d) Suspension P in Diagram 2 is added with saliva. Explain how P can be broken down into disaccharides. [3 marks] ………………………………………………………………………………………………………………………………………………………………………………………………………………………………………………………………………………………………………………………………………………………………………………………………………………………………………
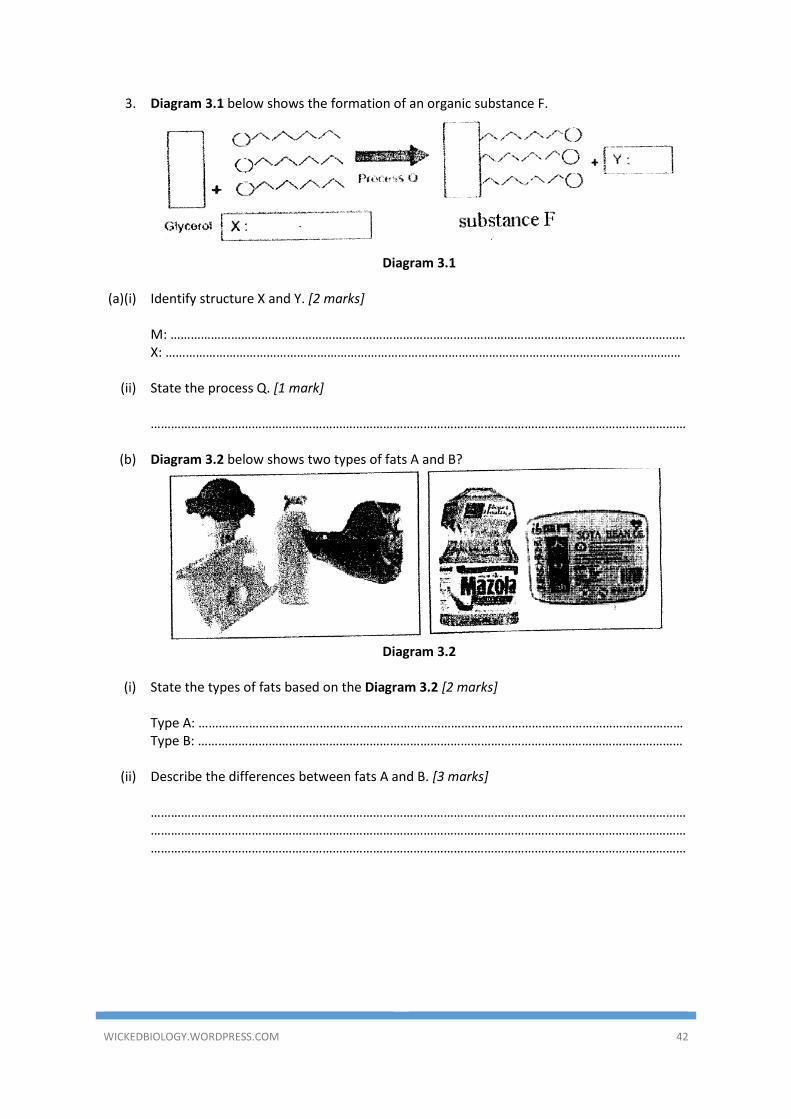
(e) A group of students carried out a Benedict test to determine type of carbohydrates. A
result obtained as follow:
(i) Explain why there is a different observation between food sample A and food sample C. [2 marks] …………………………………………………………………………………………………………………………………………………………………………………………………………………………………………………………………………………………
(ii) Describe how the student able to obtain a positive observation for food sample C.
[3 marks] ………………………………………………………………………………………………………………………………………………………………………………………………………………………………………………………………………………………………………………………………………………………………………………………………………………………………………
WICKEDBIOLOGY.WORDPRESS.COM 42
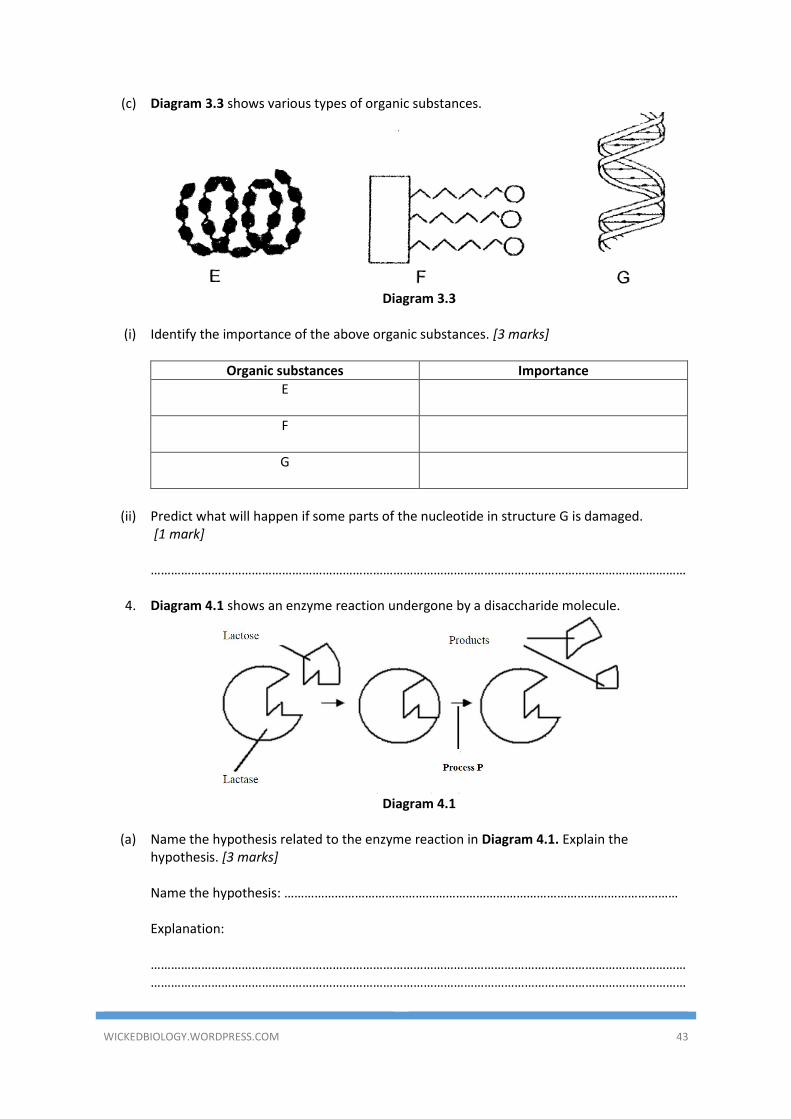
3. Diagram 3.1 below shows the formation of an organic substance F.
Diagram 3.1
(a)(i) Identify structure X and Y. [2 marks]
M: ……………………………………………………………………………………………………………………………………… X: ………………………………………………………………………………………………………………………………………
(ii) State the process Q. [1 mark]
……………………………………………………………………………………………………………………………………………
(b) Diagram 3.2 below shows two types of fats A and B?
Diagram 3.2
(i) State the types of fats based on the Diagram 3.2 [2 marks]
Type A: ……………………………………………………………………………………………………………………………… Type B: ………………………………………………………………………………………………………………………………
(ii) Describe the differences between fats A and B. [3 marks]
………………………………………………………………………………………………………………………………………………………………………………………………………………………………………………………………………………………………………………………………………………………………………………………………………………………………………
WICKEDBIOLOGY.WORDPRESS.COM 43
(c) Diagram 3.3 shows various types of organic substances.
Diagram 3.3
(i) Identify the importance of the above organic substances. [3 marks]
Organic substances Importance
E
F
G
(ii) Predict what will happen if some parts of the nucleotide in structure G is damaged.
[1 mark] ……………………………………………………………………………………………………………………………………………
4. Diagram 4.1 shows an enzyme reaction undergone by a disaccharide molecule.
Diagram 4.1
(a) Name the hypothesis related to the enzyme reaction in Diagram 4.1. Explain the
hypothesis. [3 marks] Name the hypothesis: ……………………………………………………………………………………………………… Explanation: …………………………………………………………………………………………………………………………………………………………………………………………………………………………………………………………………………………………
WICKEDBIOLOGY.WORDPRESS.COM 44
(b) Name the process [1 mark] ……………………………………………………………………………………………………………………………………………
(c) Based on Diagram 4.1, explain process P. [2 marks]
…………………………………………………………………………………………………………………………………………………………………………………………………………………………………………………………………………………………
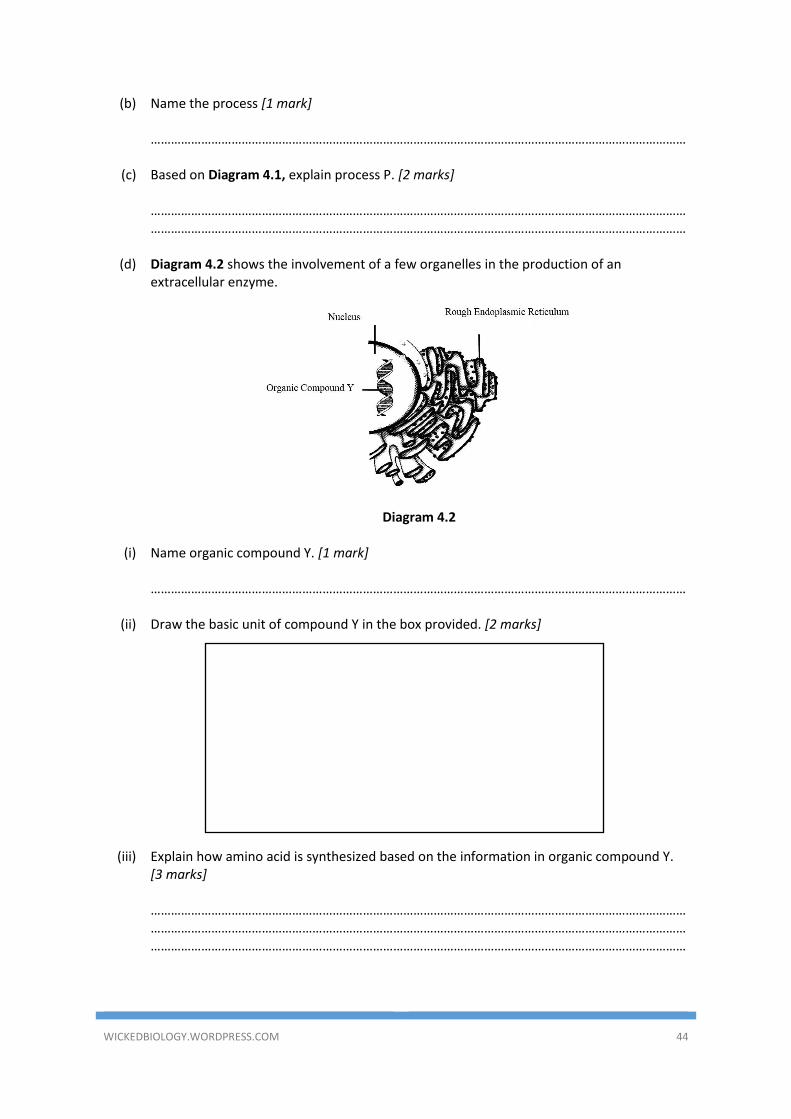
(d) Diagram 4.2 shows the involvement of a few organelles in the production of an
extracellular enzyme.
Diagram 4.2
(i) Name organic compound Y. [1 mark] ……………………………………………………………………………………………………………………………………………
(ii) Draw the basic unit of compound Y in the box provided. [2 marks]
(iii) Explain how amino acid is synthesized based on the information in organic compound Y. [3 marks] ………………………………………………………………………………………………………………………………………………………………………………………………………………………………………………………………………………………………………………………………………………………………………………………………………………………………………
WICKEDBIOLOGY.WORDPRESS.COM 45
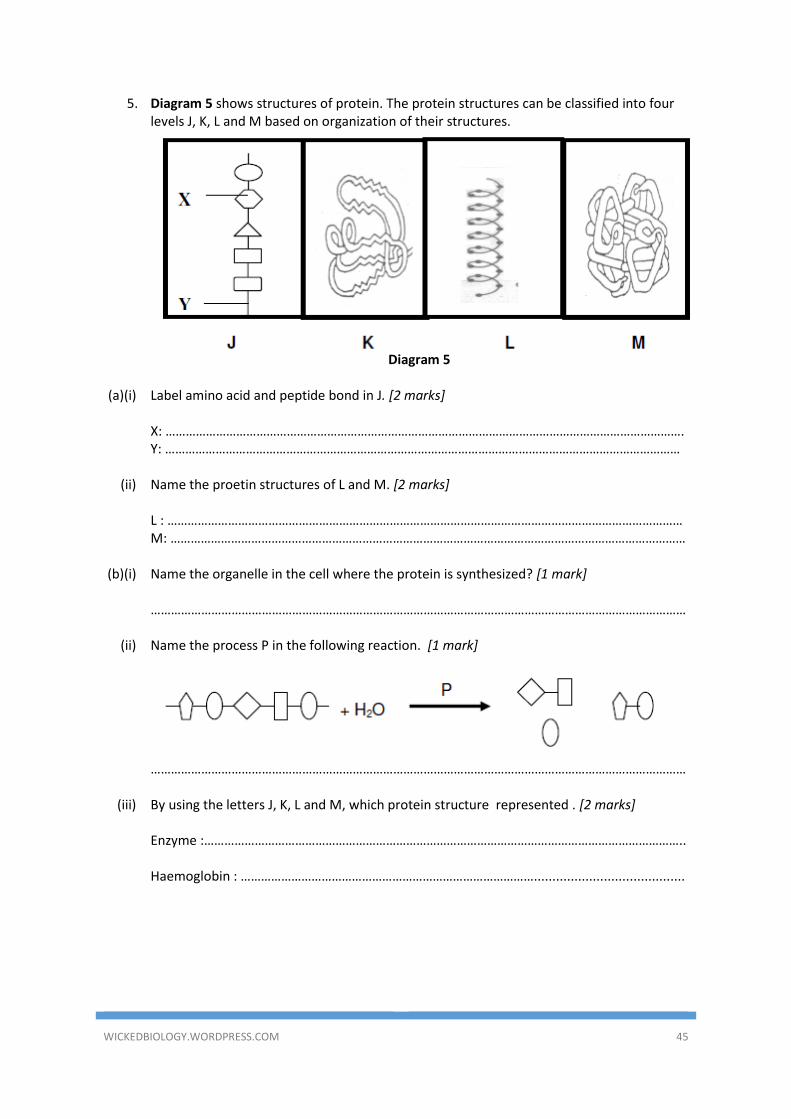
5. Diagram 5 shows structures of protein. The protein structures can be classified into four levels J, K, L and M based on organization of their structures.
Diagram 5
(a)(i) Label amino acid and peptide bond in J. [2 marks]
X: ………………………………………………………………………………………………………………………………………. Y: ………………………………………………………………………………………………………………………………………
(ii) Name the proetin structures of L and M. [2 marks]
L : ……………………………………………………………………………………………………………………………………… M: ………………………………………………………………………………………………………………………………………
(b)(i) Name the organelle in the cell where the protein is synthesized? [1 mark]
……………………………………………………………………………………………………………………………………………
(ii) Name the process P in the following reaction. [1 mark]
……………………………………………………………………………………………………………………………………………
(iii) By using the letters J, K, L and M, which protein structure represented . [2 marks]
Enzyme :…………………………………………………………………………………………………………………………….. Haemoglobin : …………………………………………………………………………….........................................
WICKEDBIOLOGY.WORDPRESS.COM 46
(c) Based on the following statement, explain why food is kept in refrigerator? [3 marks]
……………………………………………………………………………………………………………………………………………
…………………………………………………………………………………………………………………………………………………………………………………………………………………………………………………………………………………………
(d) A branded washing machine is provided with temperature regulator. A housewife uses
the detergent containing enzyme at 40°C to wash the clothes. Using the information given, explain why? [2 marks] …………………………………………………………………………………………………………………………………………………………………………………………………………………………………………………………………………………………
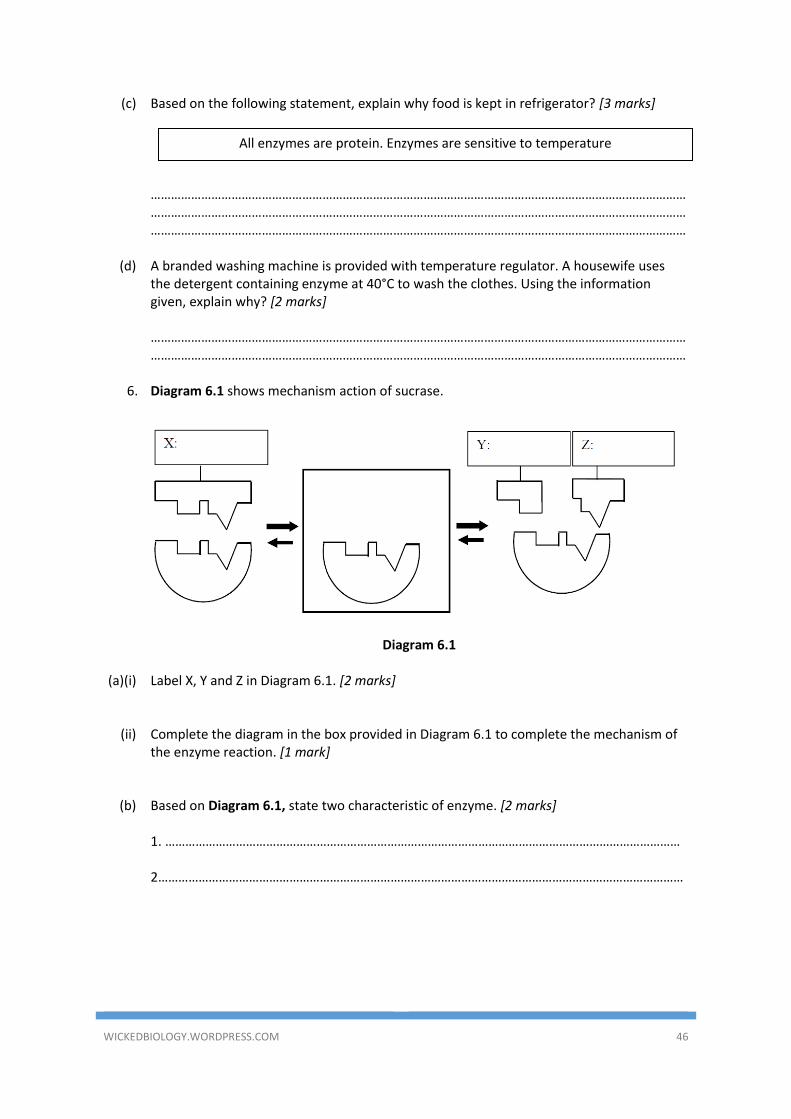
6. Diagram 6.1 shows mechanism action of sucrase.
Diagram 6.1
(a)(i) Label X, Y and Z in Diagram 6.1. [2 marks]
(ii) Complete the diagram in the box provided in Diagram 6.1 to complete the mechanism of the enzyme reaction. [1 mark]
(b) Based on Diagram 6.1, state two characteristic of enzyme. [2 marks]
1. ……………………………………………………………………………………………………………………………………… 2…………………………………………………………………………………………………………………………………………
All enzymes are protein. Enzymes are sensitive to temperature
WICKEDBIOLOGY.WORDPRESS.COM 47
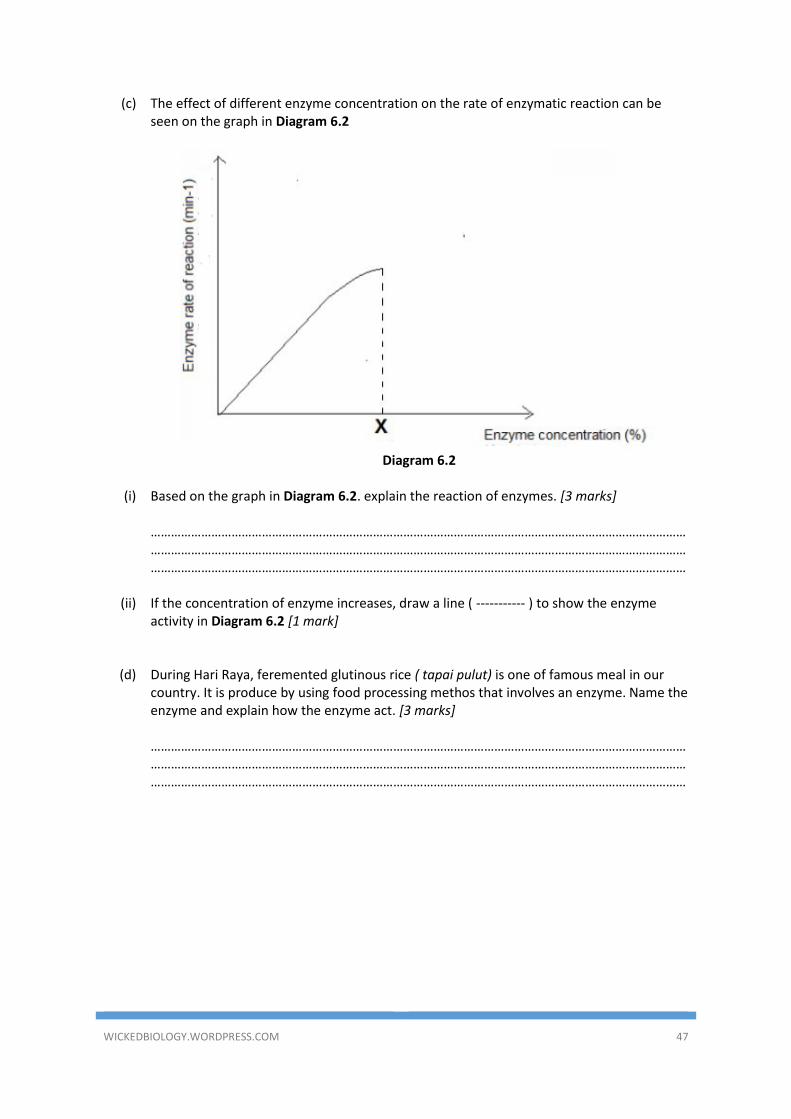
(c) The effect of different enzyme concentration on the rate of enzymatic reaction can be seen on the graph in Diagram 6.2
Diagram 6.2
(i) Based on the graph in Diagram 6.2. explain the reaction of enzymes. [3 marks]
………………………………………………………………………………………………………………………………………………………………………………………………………………………………………………………………………………………………………………………………………………………………………………………………………………………………………
(ii) If the concentration of enzyme increases, draw a line ( ----------- ) to show the enzyme
activity in Diagram 6.2 [1 mark]
(d) During Hari Raya, feremented glutinous rice ( tapai pulut) is one of famous meal in our
country. It is produce by using food processing methos that involves an enzyme. Name the enzyme and explain how the enzyme act. [3 marks] ………………………………………………………………………………………………………………………………………………………………………………………………………………………………………………………………………………………………………………………………………………………………………………………………………………………………………
WICKEDBIOLOGY.WORDPRESS.COM 48
ESSAY QUESTIONS
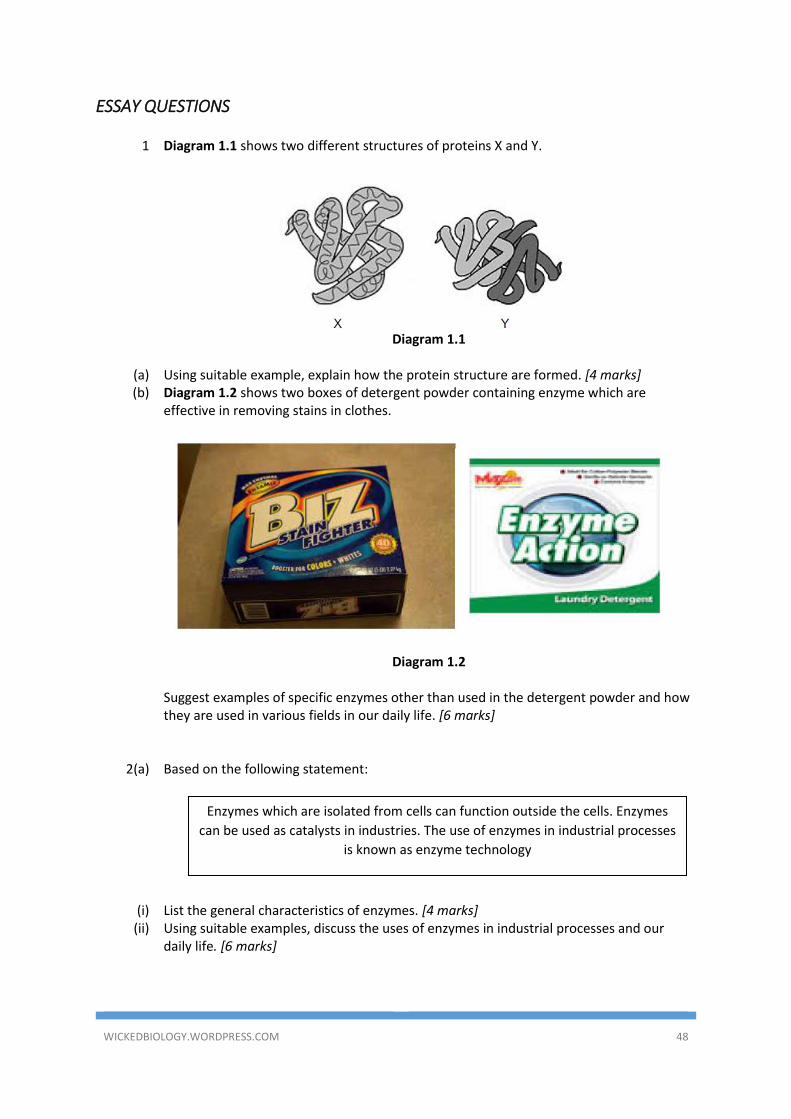
1 Diagram 1.1 shows two different structures of proteins X and Y.
Diagram 1.1
(a) Using suitable example, explain how the protein structure are formed. [4 marks] (b) Diagram 1.2 shows two boxes of detergent powder containing enzyme which are
effective in removing stains in clothes.
Diagram 1.2
Suggest examples of specific enzymes other than used in the detergent powder and how
they are used in various fields in our daily life. [6 marks]
2(a) Based on the following statement:
(i) List the general characteristics of enzymes. [4 marks]
(ii) Using suitable examples, discuss the uses of enzymes in industrial processes and our daily life. [6 marks]
Enzymes which are isolated from cells can function outside the cells. Enzymes
can be used as catalysts in industries. The use of enzymes in industrial processes
is known as enzyme technology

WICKEDBIOLOGY.WORDPRESS.COM 49
(b) Diagram 2 shows the organelles involved during the synthesis and secretion of an enzyme in an animal cell.
Diagram 2
Based on Diagram 2, explain how extracellular enzyme are produced by emphasizing the
role of P, Q, R and S. [10 marks]
3. Diagram 3.1 shows three stages in an enzyme reaction.
Diagram 3.1
(a) Based on digram above, explain the lock and key hypothesis in the mechanism of enzyme reaction. [8 marks]
(b) Diagram 3.2 shows the types of complex molecules.
Diagram 3.2
WICKEDBIOLOGY.WORDPRESS.COM 50
Based on Diagram 3.2, explain [4 marks]
(i) The formation of molecules X (ii) The breakdown of molecule Y
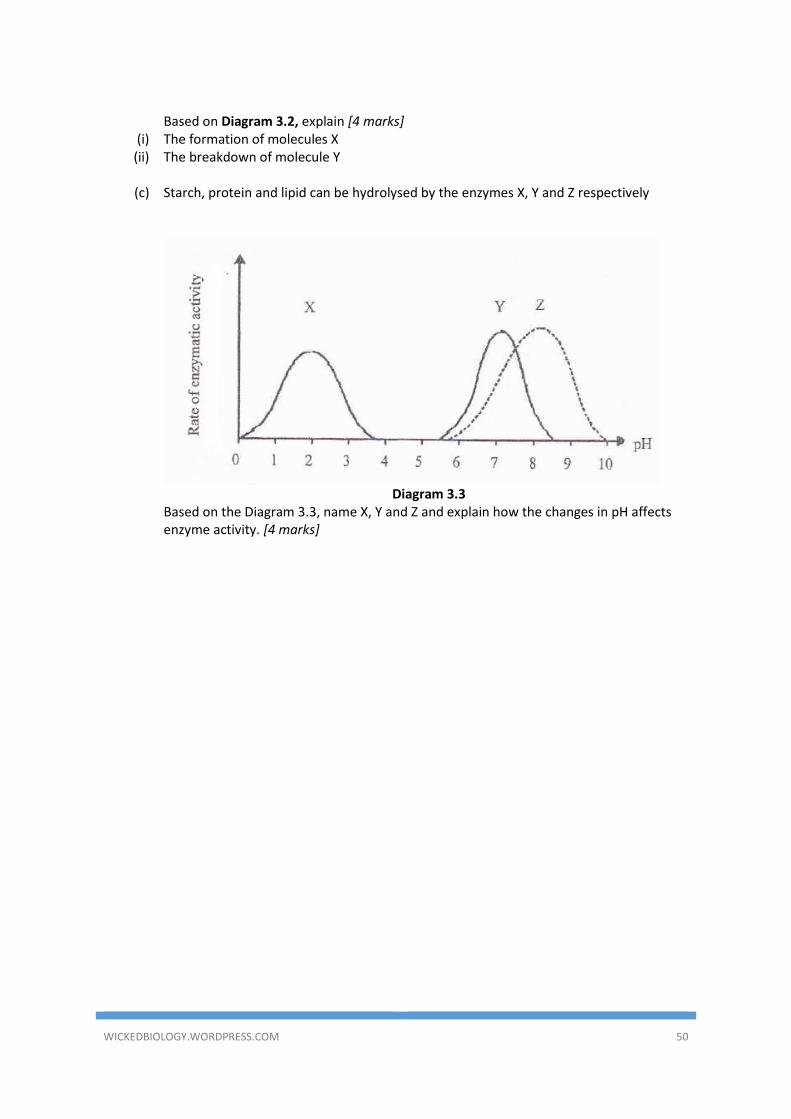
(c) Starch, protein and lipid can be hydrolysed by the enzymes X, Y and Z respectively
Diagram 3.3
Based on the Diagram 3.3, name X, Y and Z and explain how the changes in pH affects enzyme activity. [4 marks]
WICKEDBIOLOGY.WORDPRESS.COM 51
CELL DIVISION
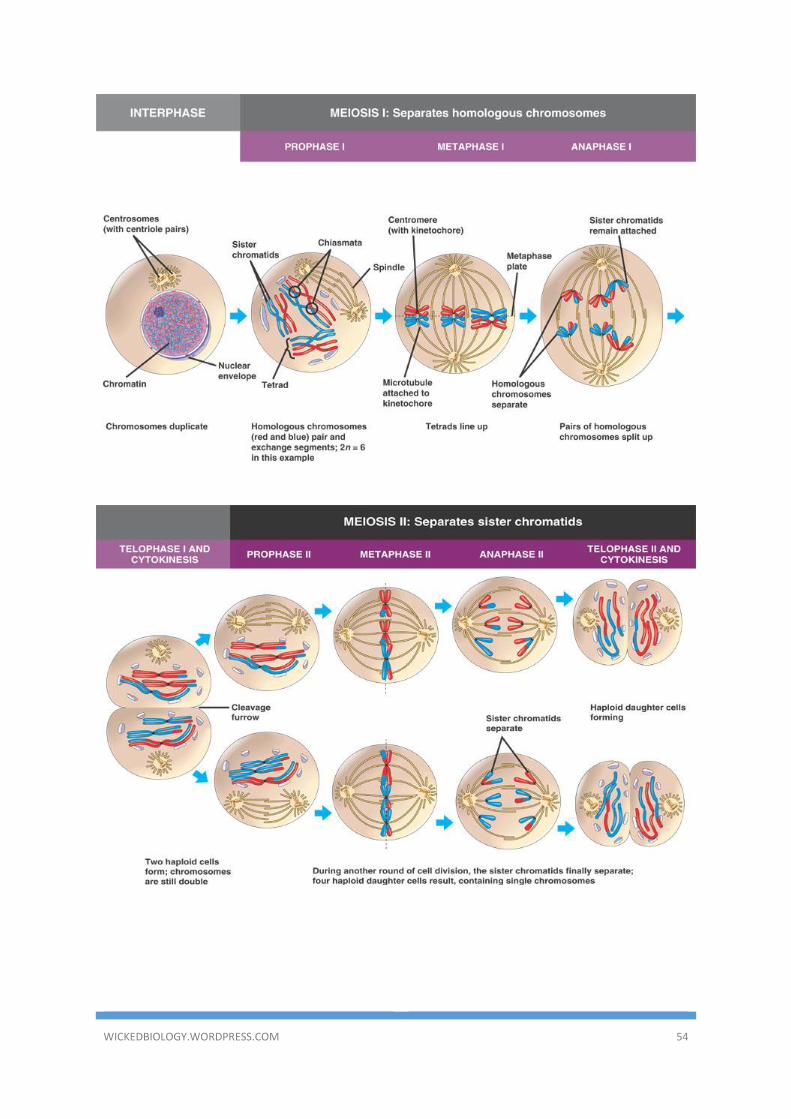
5.1 Mitosis 5.3 Appreciating the Movement of Chromosomes during Mitosis and Meiosis
5.2 Meiosis
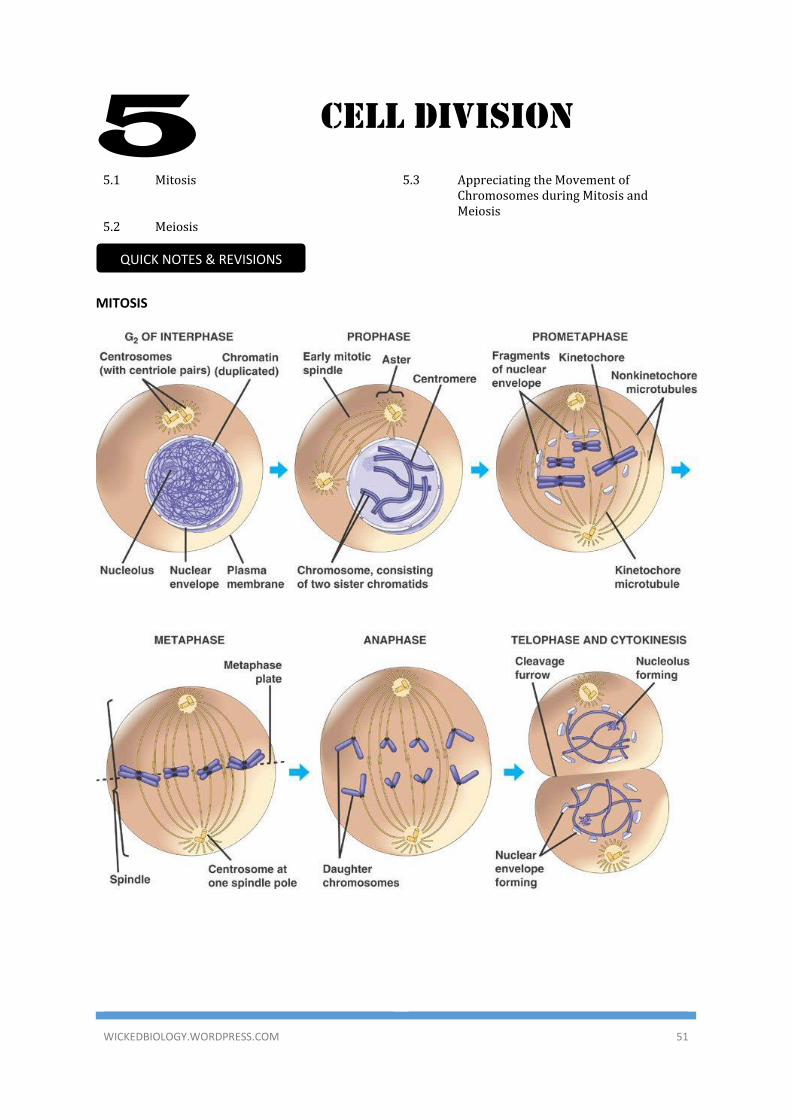
MITOSIS
5
QUICK NOTES & REVISIONS
WICKEDBIOLOGY.WORDPRESS.COM 52
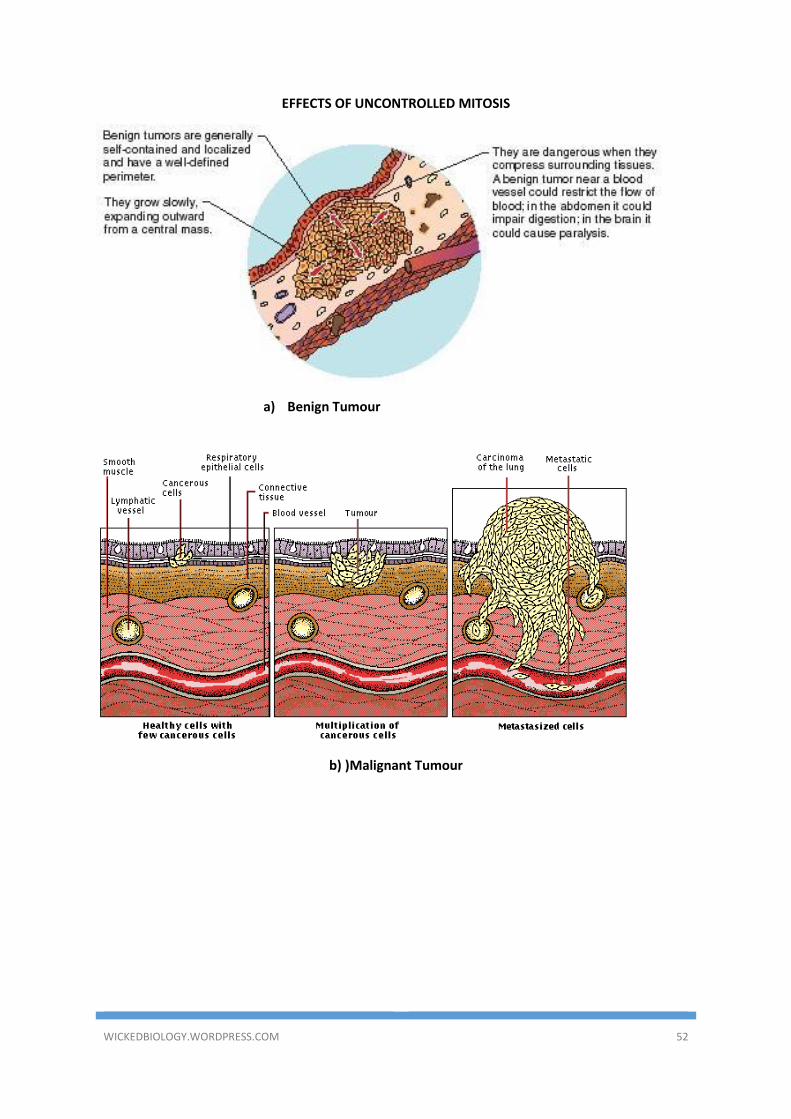
EFFECTS OF UNCONTROLLED MITOSIS
a) Benign Tumour
b) )Malignant Tumour
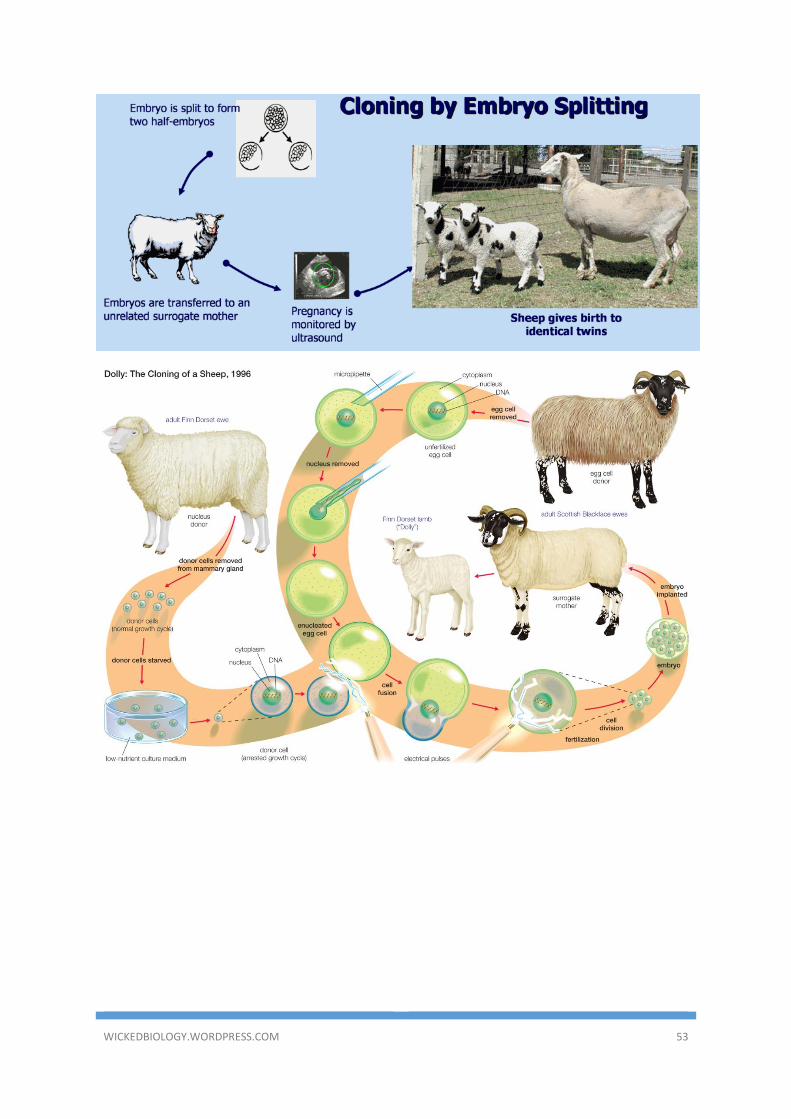
WICKEDBIOLOGY.WORDPRESS.COM 53
WICKEDBIOLOGY.WORDPRESS.COM 54
WICKEDBIOLOGY.WORDPRESS.COM 55
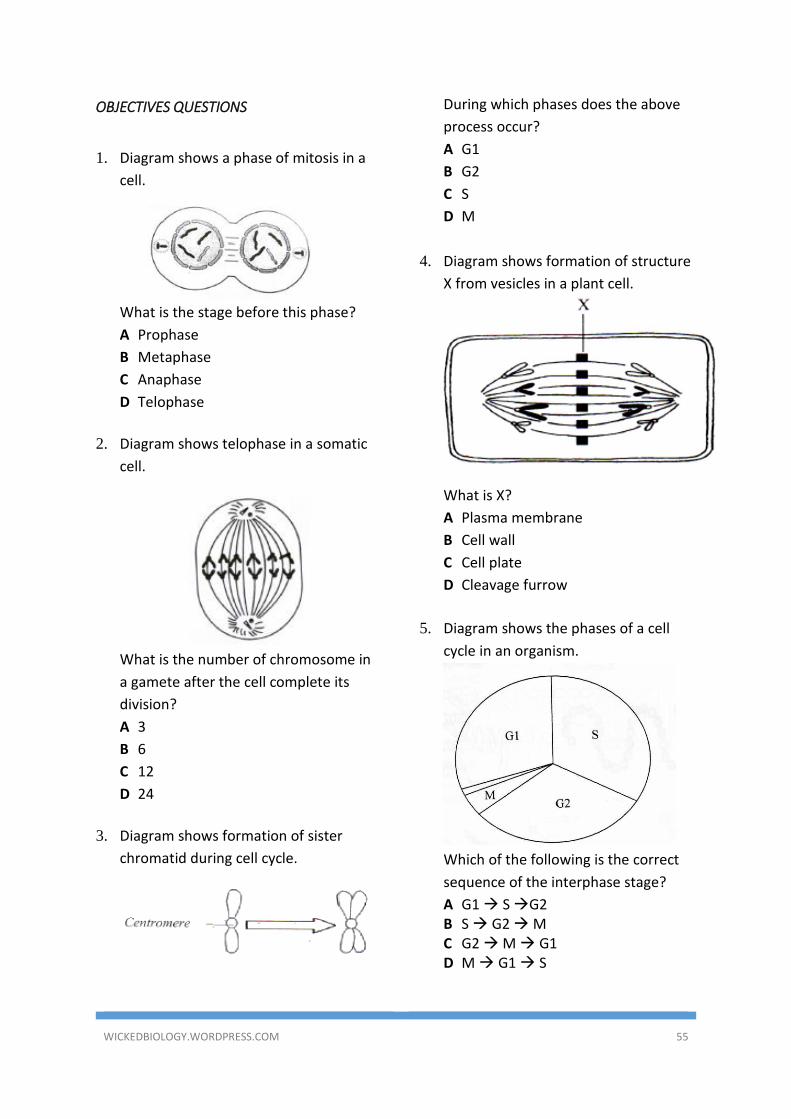
OBJECTIVES QUESTIONS
1. Diagram shows a phase of mitosis in a
cell.
What is the stage before this phase?
A Prophase
B Metaphase
C Anaphase
D Telophase
2. Diagram shows telophase in a somatic
cell.
What is the number of chromosome in
a gamete after the cell complete its
division?
A 3
B 6
C 12
D 24
3. Diagram shows formation of sister
chromatid during cell cycle.
During which phases does the above
process occur?
A G1
B G2
C S
D M
4. Diagram shows formation of structure
X from vesicles in a plant cell.
What is X?
A Plasma membrane
B Cell wall
C Cell plate
D Cleavage furrow
5. Diagram shows the phases of a cell
cycle in an organism.
Which of the following is the correct
sequence of the interphase stage?
A G1 S G2 B S G2 M C G2 M G1 D M G1 S
WICKEDBIOLOGY.WORDPRESS.COM 56
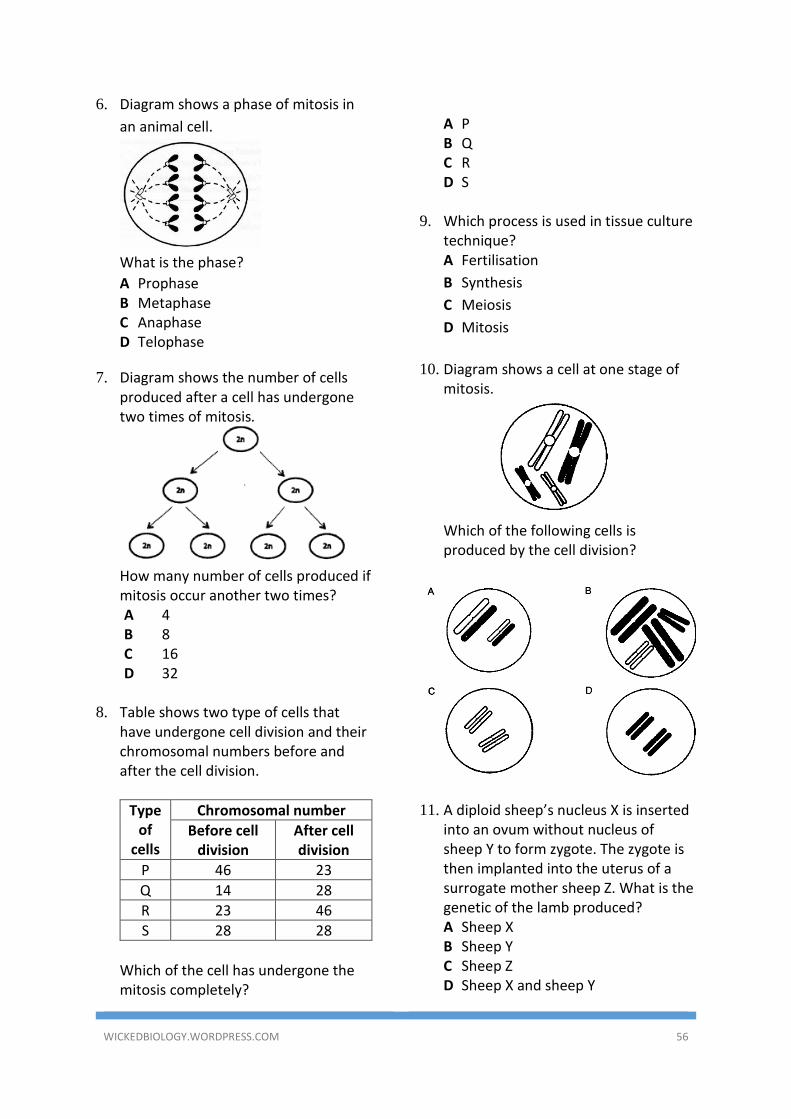
6. Diagram shows a phase of mitosis in
an animal cell.
What is the phase?
A Prophase B Metaphase C Anaphase D Telophase
7. Diagram shows the number of cells produced after a cell has undergone two times of mitosis.
How many number of cells produced if mitosis occur another two times? A 4 B 8 C 16 D 32
8. Table shows two type of cells that
have undergone cell division and their chromosomal numbers before and after the cell division.
Type of
cells
Chromosomal number
Before cell division
After cell division
P 46 23
Q 14 28
R 23 46
S 28 28
Which of the cell has undergone the mitosis completely?
A P B Q C R D S
9. Which process is used in tissue culture
technique? A Fertilisation
B Synthesis
C Meiosis
D Mitosis
10. Diagram shows a cell at one stage of
mitosis.
Which of the following cells is produced by the cell division?
11. A diploid sheep’s nucleus X is inserted
into an ovum without nucleus of sheep Y to form zygote. The zygote is then implanted into the uterus of a surrogate mother sheep Z. What is the genetic of the lamb produced? A Sheep X B Sheep Y C Sheep Z D Sheep X and sheep Y
WICKEDBIOLOGY.WORDPRESS.COM 57
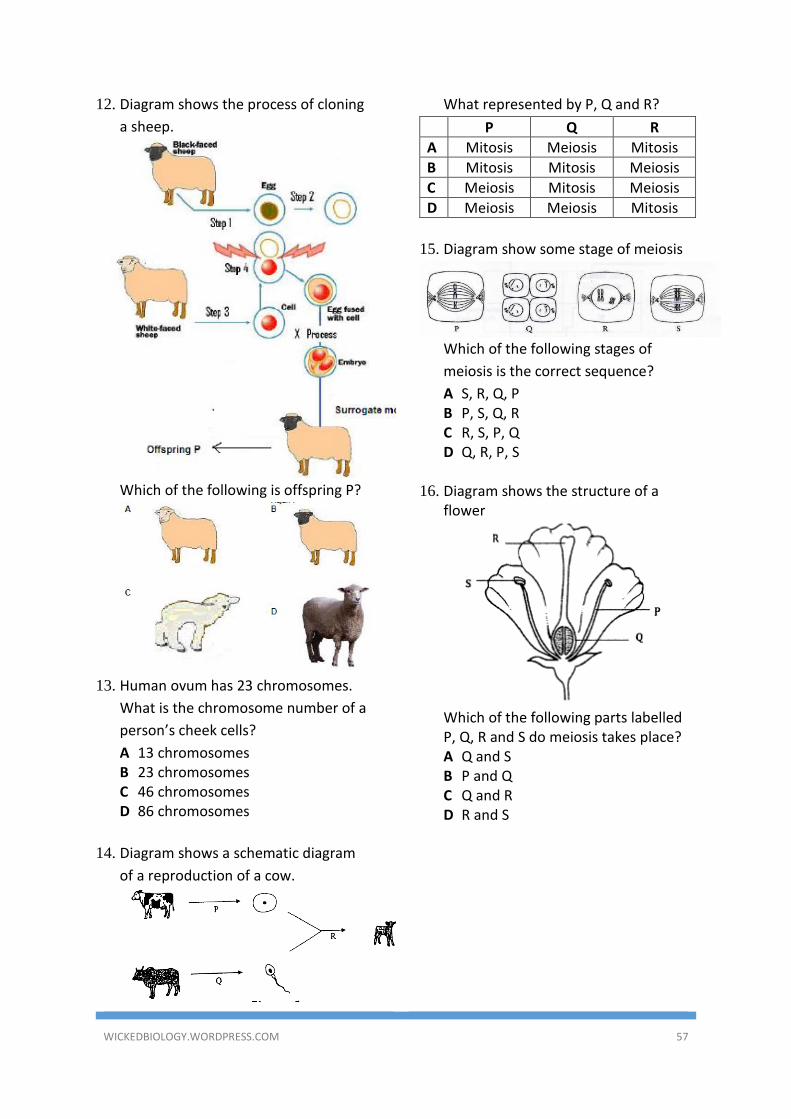
12. Diagram shows the process of cloning
a sheep.
Which of the following is offspring P?
13. Human ovum has 23 chromosomes.
What is the chromosome number of a
person’s cheek cells?
A 13 chromosomes B 23 chromosomes C 46 chromosomes D 86 chromosomes
14. Diagram shows a schematic diagram
of a reproduction of a cow.
What represented by P, Q and R?
P Q R
A Mitosis Meiosis Mitosis
B Mitosis Mitosis Meiosis
C Meiosis Mitosis Meiosis
D Meiosis Meiosis Mitosis
15. Diagram show some stage of meiosis
Which of the following stages of
meiosis is the correct sequence?
A S, R, Q, P B P, S, Q, R C R, S, P, Q D Q, R, P, S
16. Diagram shows the structure of a
flower
Which of the following parts labelled P, Q, R and S do meiosis takes place? A Q and S B P and Q C Q and R D R and S
WICKEDBIOLOGY.WORDPRESS.COM 58
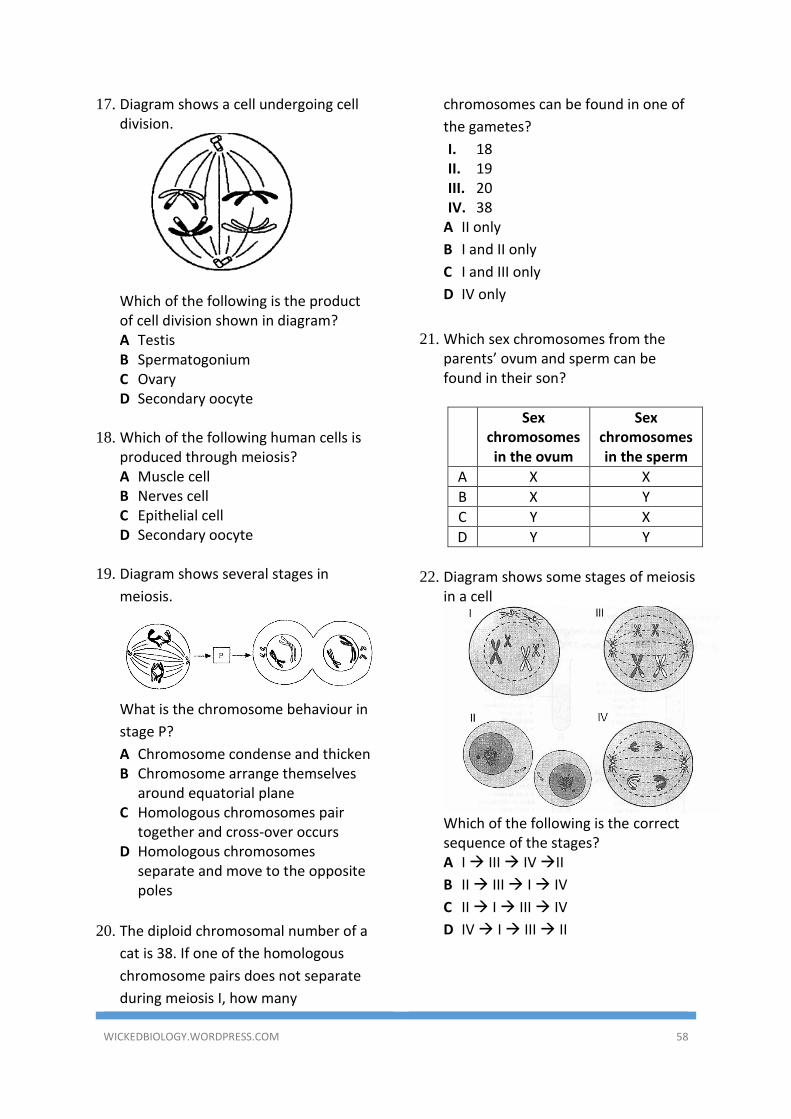
17. Diagram shows a cell undergoing cell division.
Which of the following is the product of cell division shown in diagram? A Testis B Spermatogonium C Ovary D Secondary oocyte
18. Which of the following human cells is
produced through meiosis? A Muscle cell B Nerves cell C Epithelial cell D Secondary oocyte
19. Diagram shows several stages in
meiosis.
What is the chromosome behaviour in
stage P?
A Chromosome condense and thicken B Chromosome arrange themselves
around equatorial plane C Homologous chromosomes pair
together and cross-over occurs D Homologous chromosomes
separate and move to the opposite poles
20. The diploid chromosomal number of a
cat is 38. If one of the homologous
chromosome pairs does not separate
during meiosis I, how many
chromosomes can be found in one of
the gametes?
I. 18 II. 19 III. 20 IV. 38
A II only
B I and II only
C I and III only
D IV only
21. Which sex chromosomes from the parents’ ovum and sperm can be found in their son?
Sex chromosomes in the ovum
Sex chromosomes in the sperm
A X X
B X Y
C Y X
D Y Y
22. Diagram shows some stages of meiosis
in a cell
Which of the following is the correct sequence of the stages? A I III IV II
B II III I IV
C II I III IV
D IV I III II
WICKEDBIOLOGY.WORDPRESS.COM 59
STRUCTURE QUESTIONS
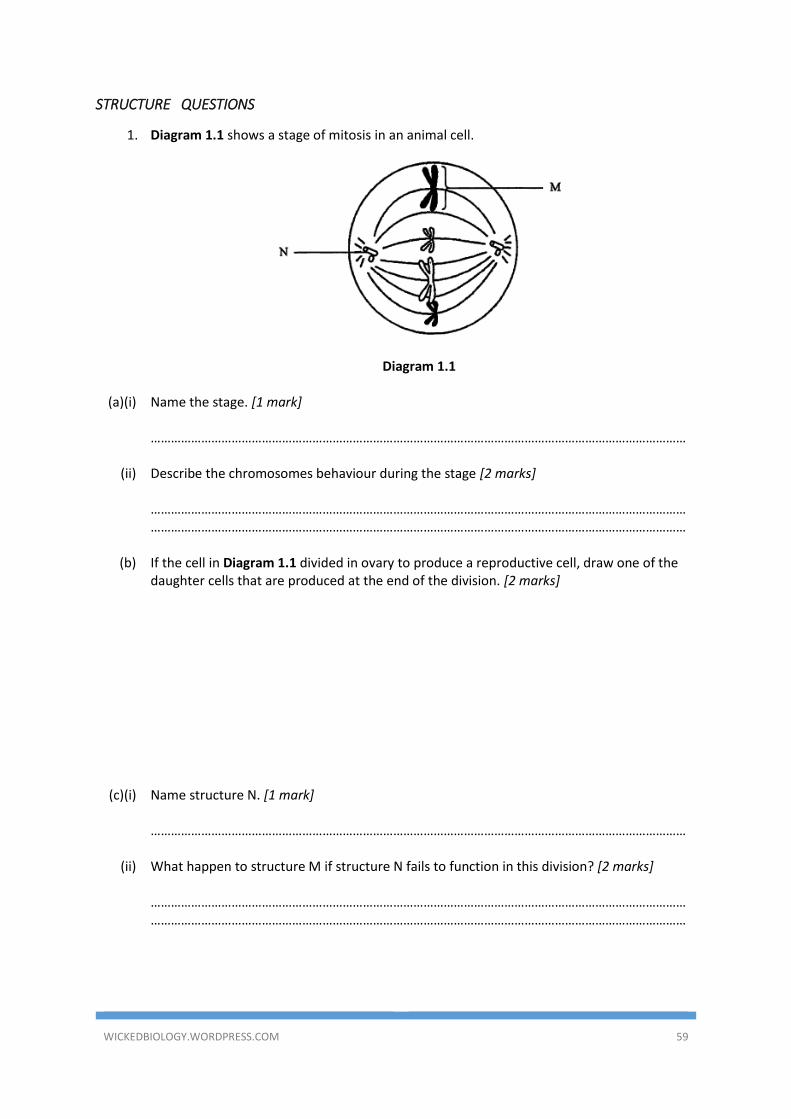
1. Diagram 1.1 shows a stage of mitosis in an animal cell.
Diagram 1.1
(a)(i) Name the stage. [1 mark] ……………………………………………………………………………………………………………………………………………
(ii) Describe the chromosomes behaviour during the stage [2 marks]
…………………………………………………………………………………………………………………………………………………………………………………………………………………………………………………………………………………………
(b) If the cell in Diagram 1.1 divided in ovary to produce a reproductive cell, draw one of the
daughter cells that are produced at the end of the division. [2 marks]
(c)(i) Name structure N. [1 mark]
……………………………………………………………………………………………………………………………………………
(ii) What happen to structure M if structure N fails to function in this division? [2 marks] …………………………………………………………………………………………………………………………………………………………………………………………………………………………………………………………………………………………
WICKEDBIOLOGY.WORDPRESS.COM 60
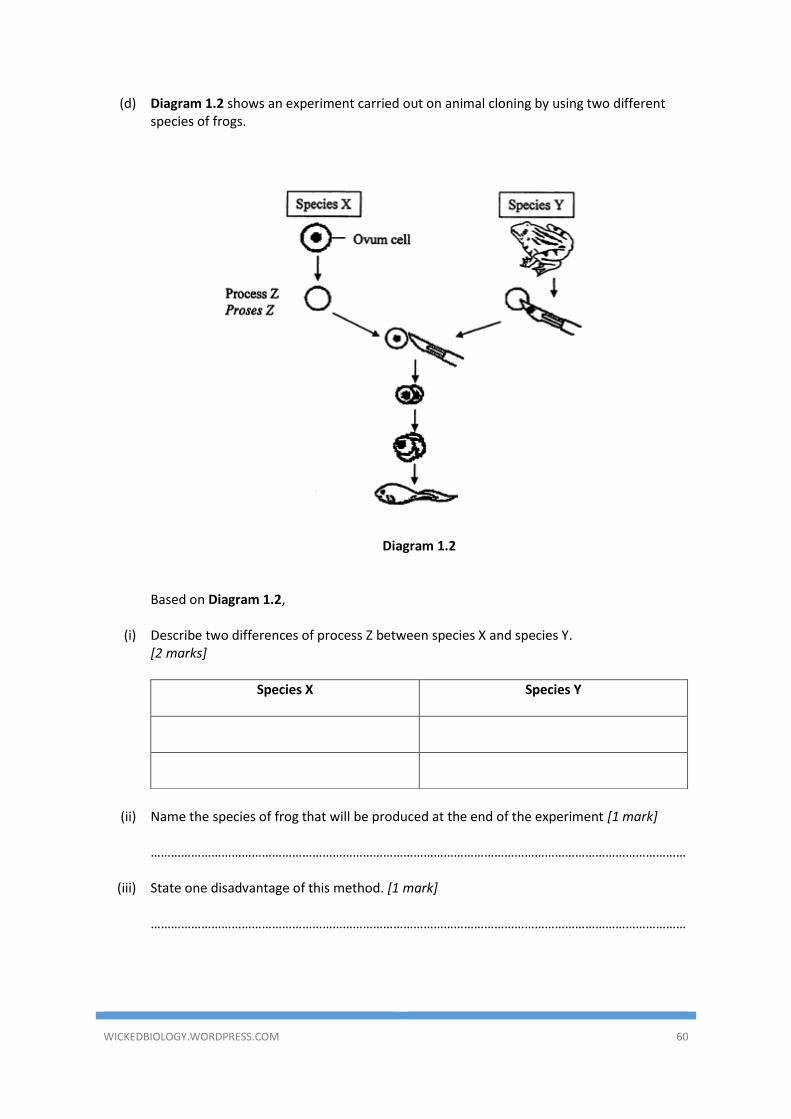
(d) Diagram 1.2 shows an experiment carried out on animal cloning by using two different species of frogs.
Diagram 1.2
Based on Diagram 1.2,
(i) Describe two differences of process Z between species X and species Y.
[2 marks]
Species X
Species Y
(ii) Name the species of frog that will be produced at the end of the experiment [1 mark]
……………………………………………………………………………………………………………………………………………
(iii) State one disadvantage of this method. [1 mark]
……………………………………………………………………………………………………………………………………………
WICKEDBIOLOGY.WORDPRESS.COM 61
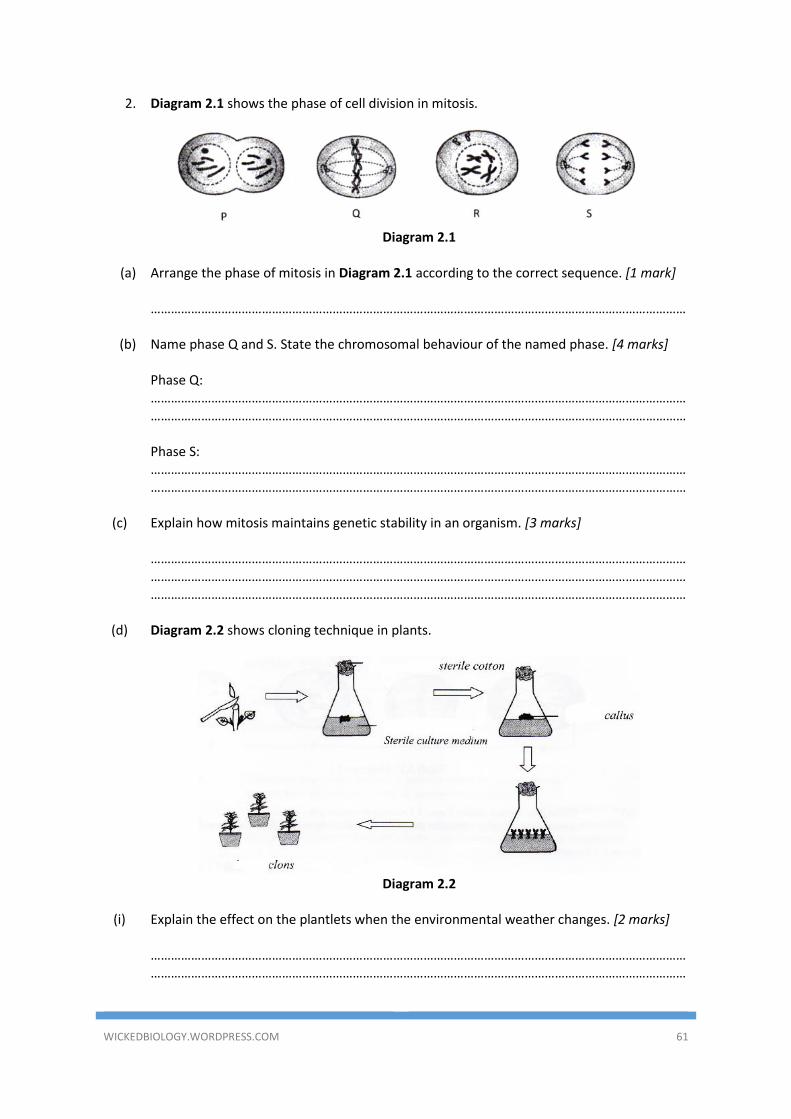
2. Diagram 2.1 shows the phase of cell division in mitosis.
Diagram 2.1
(a) Arrange the phase of mitosis in Diagram 2.1 according to the correct sequence. [1 mark]
……………………………………………………………………………………………………………………………………………
(b) Name phase Q and S. State the chromosomal behaviour of the named phase. [4 marks]
Phase Q:
………………………………………………………………………………………………………………………………………………………………………………………………………………………………………………………………………………………… Phase S: …………………………………………………………………………………………………………………………………………………………………………………………………………………………………………………………………………………………
(c) Explain how mitosis maintains genetic stability in an organism. [3 marks]
………………………………………………………………………………………………………………………………………………………………………………………………………………………………………………………………………………………………………………………………………………………………………………………………………………………………………
(d) Diagram 2.2 shows cloning technique in plants.
Diagram 2.2
(i) Explain the effect on the plantlets when the environmental weather changes. [2 marks]
…………………………………………………………………………………………………………………………………………………………………………………………………………………………………………………………………………………………
WICKEDBIOLOGY.WORDPRESS.COM 62
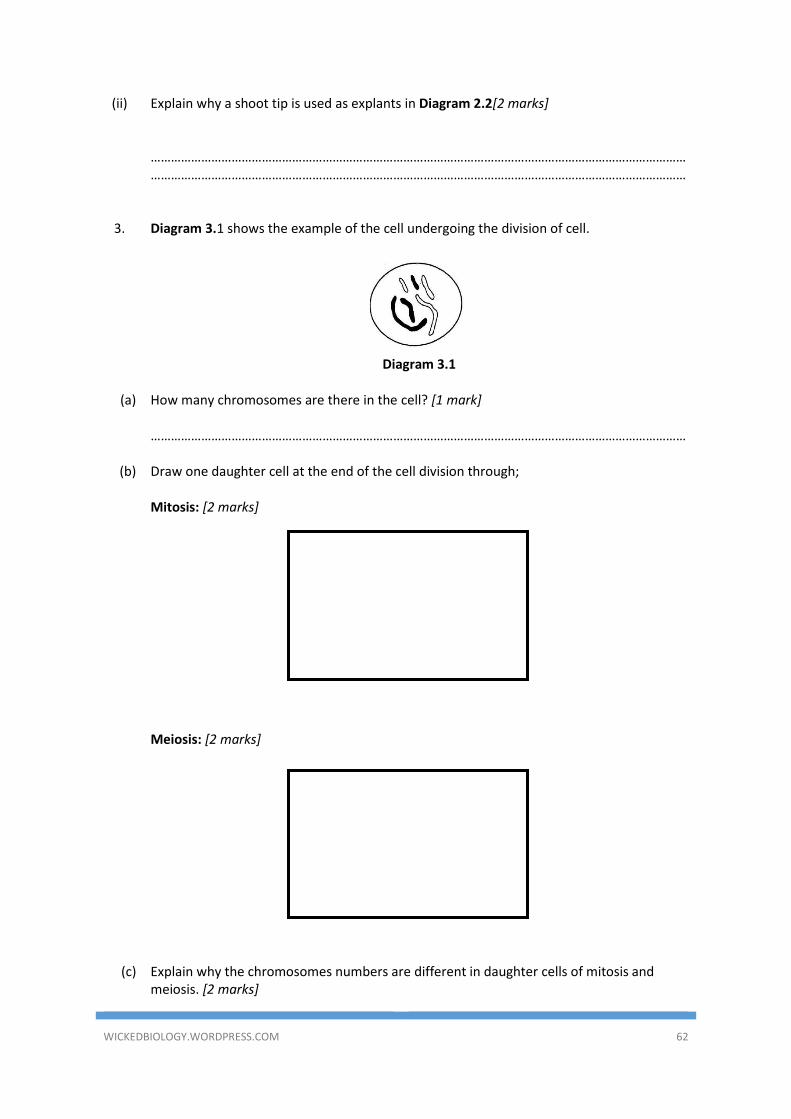
(ii) Explain why a shoot tip is used as explants in Diagram 2.2[2 marks] …………………………………………………………………………………………………………………………………………………………………………………………………………………………………………………………………………………………
3. Diagram 3.1 shows the example of the cell undergoing the division of cell.
Diagram 3.1
(a) How many chromosomes are there in the cell? [1 mark]
……………………………………………………………………………………………………………………………………………
(b) Draw one daughter cell at the end of the cell division through;
Mitosis: [2 marks]
Meiosis: [2 marks]
(c) Explain why the chromosomes numbers are different in daughter cells of mitosis and
meiosis. [2 marks]
WICKEDBIOLOGY.WORDPRESS.COM 63
…………………………………………………………………………………………………………………………………………………………………………………………………………………………………………………………………………………………
(d) Explain one difference of importance of meiosis and mitosis to organisms. [2 marks]
…………………………………………………………………………………………………………………………………………………………………………………………………………………………………………………………………………………………
(e) In a population of buffaloes, there are normal buffaloes and white buffaloes or known as
‘kerbau balar’. Why does it happen? [3 marks] ………………………………………………………………………………………………………………………………………………………………………………………………………………………………………………………………………………………………………………………………………………………………………………………………………………………………………
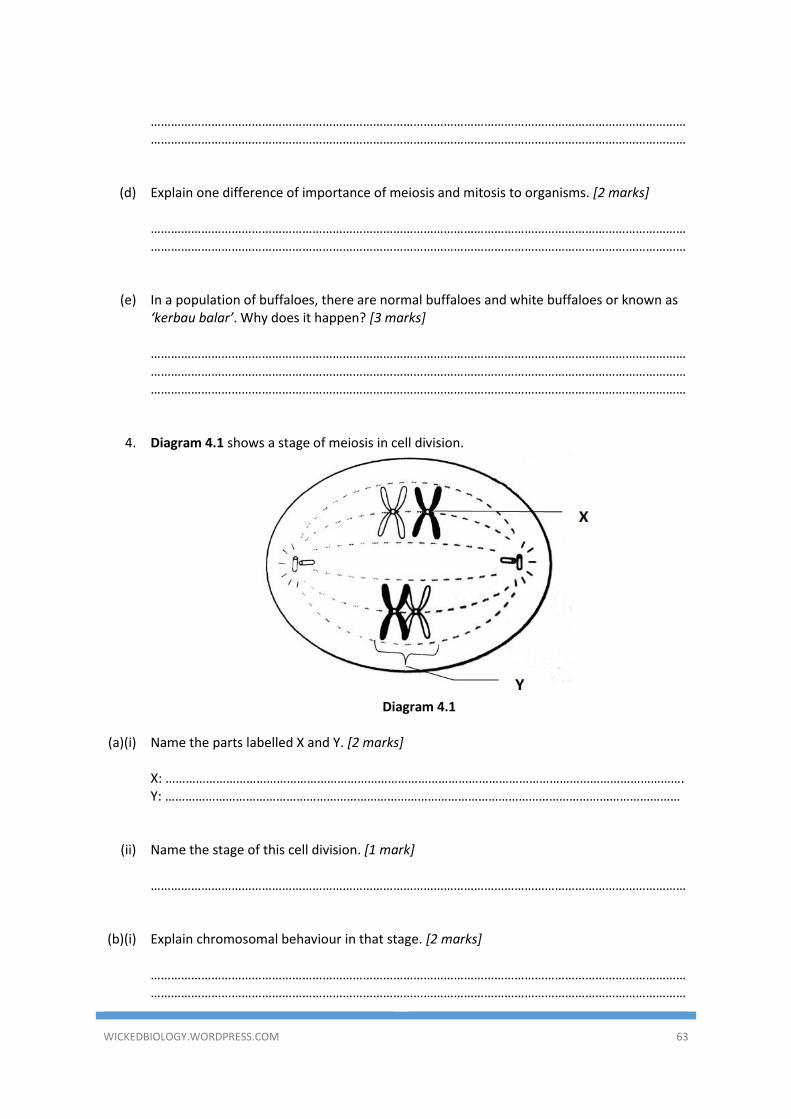
4. Diagram 4.1 shows a stage of meiosis in cell division.
Diagram 4.1
(a)(i) Name the parts labelled X and Y. [2 marks]
X: ………………………………………………………………………………………………………………………………………. Y: ………………………………………………………………………………………………………………………………………
(ii) Name the stage of this cell division. [1 mark]
……………………………………………………………………………………………………………………………………………
(b)(i) Explain chromosomal behaviour in that stage. [2 marks]
…………………………………………………………………………………………………………………………………………………………………………………………………………………………………………………………………………………………
WICKEDBIOLOGY.WORDPRESS.COM 64
(ii) State one importance of the chromosomal behaviour in 4(b)(i). [2 marks]
…………………………………………………………………………………………………………………………………………………………………………………………………………………………………………………………………………………………
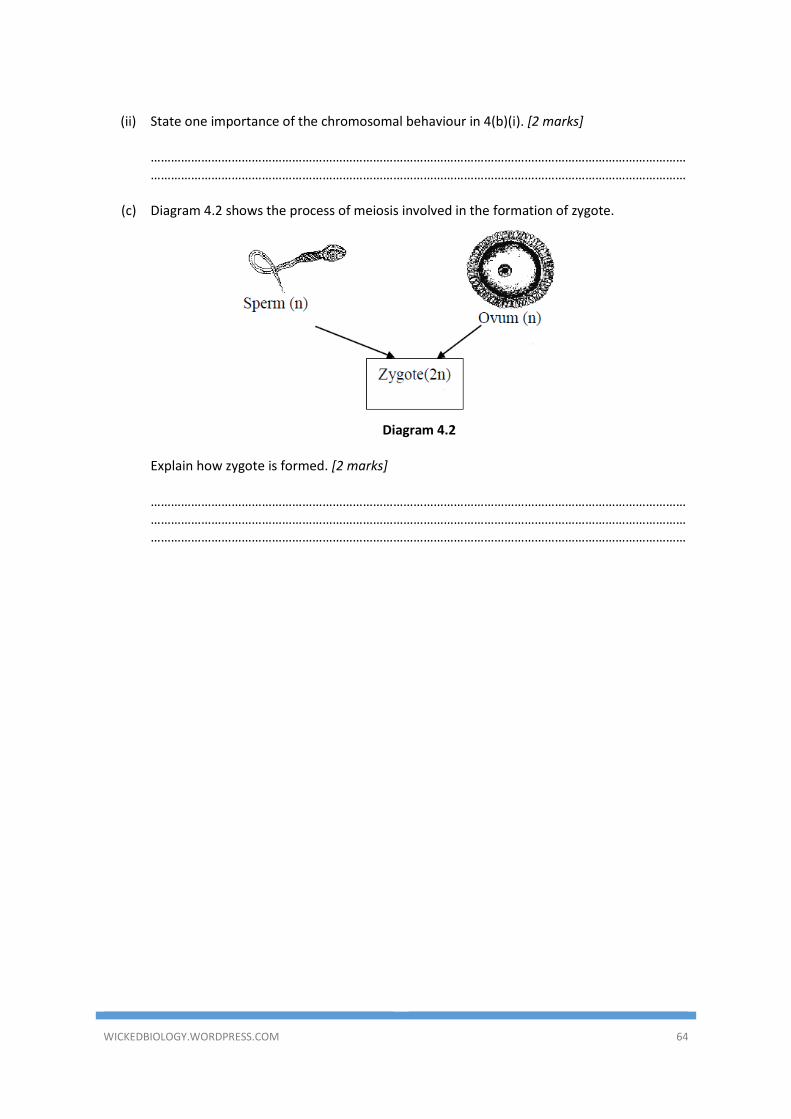
(c) Diagram 4.2 shows the process of meiosis involved in the formation of zygote.
Diagram 4.2
Explain how zygote is formed. [2 marks]
………………………………………………………………………………………………………………………………………………………………………………………………………………………………………………………………………………………………………………………………………………………………………………………………………………………………………
WICKEDBIOLOGY.WORDPRESS.COM 65
ESSAY QUESTIONS
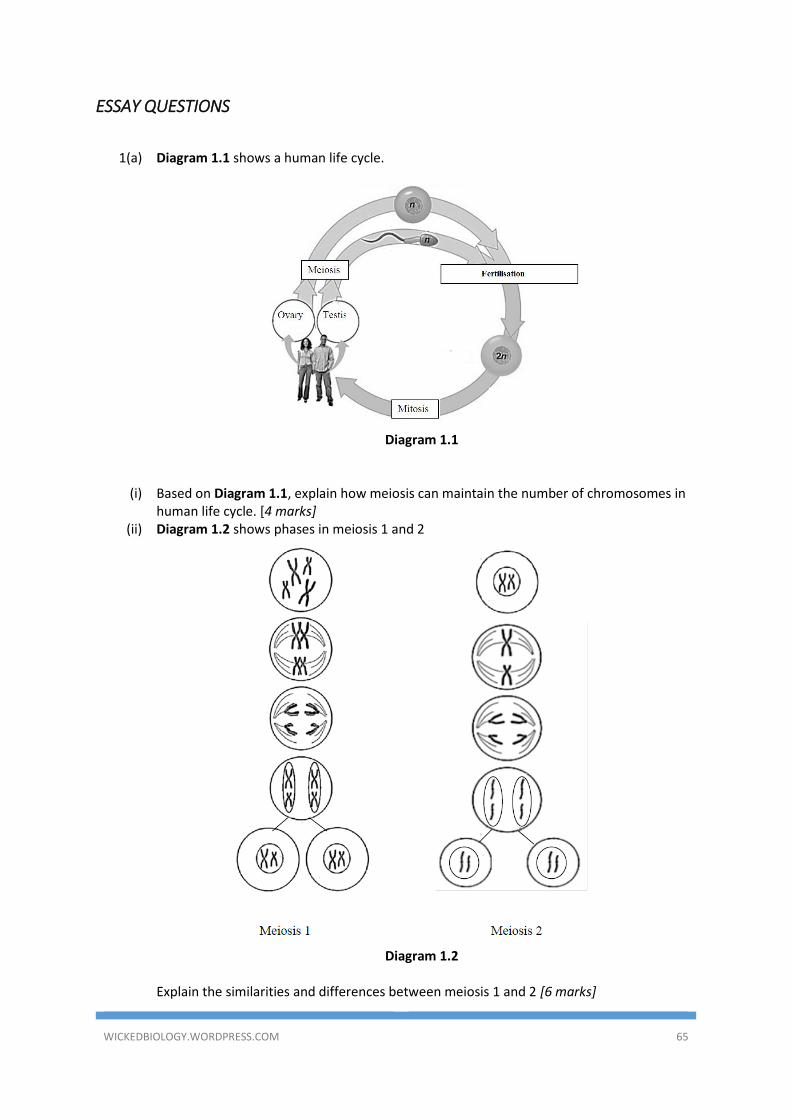
1(a) Diagram 1.1 shows a human life cycle.
Diagram 1.1
(i) Based on Diagram 1.1, explain how meiosis can maintain the number of chromosomes in human life cycle. [4 marks]
(ii) Diagram 1.2 shows phases in meiosis 1 and 2
Diagram 1.2
Explain the similarities and differences between meiosis 1 and 2 [6 marks]
WICKEDBIOLOGY.WORDPRESS.COM 66
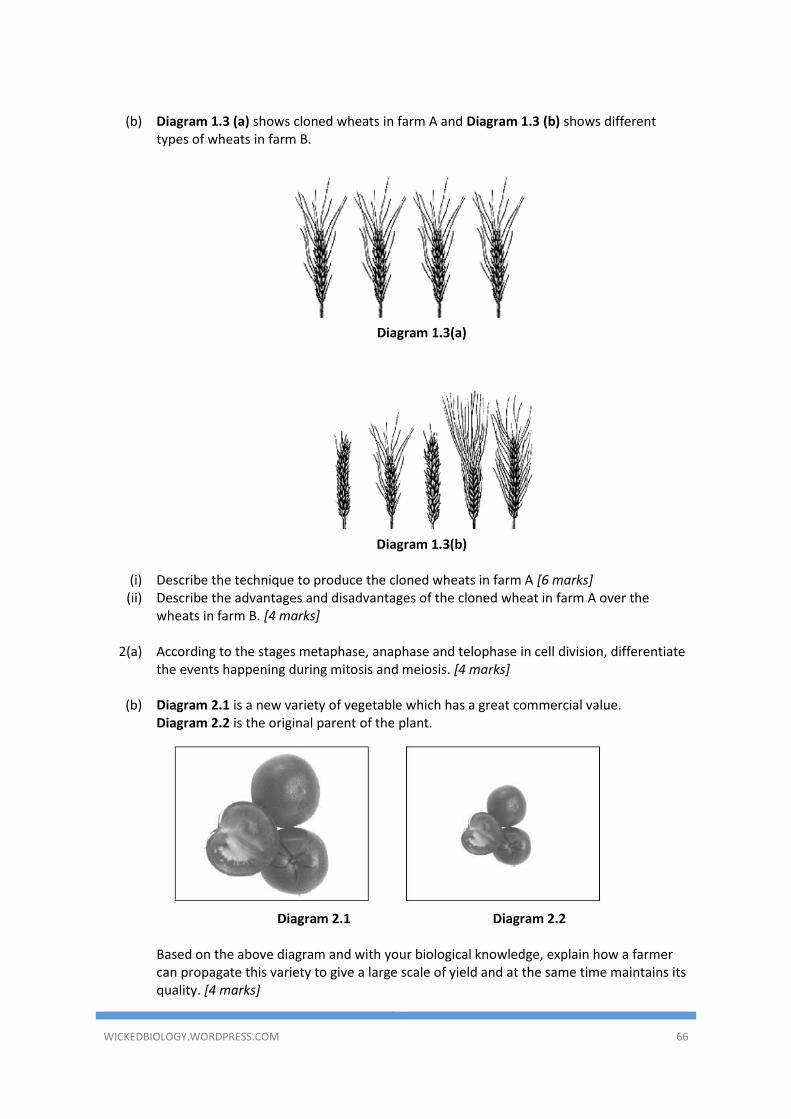
(b) Diagram 1.3 (a) shows cloned wheats in farm A and Diagram 1.3 (b) shows different
types of wheats in farm B.
Diagram 1.3(a)
Diagram 1.3(b)
(i) Describe the technique to produce the cloned wheats in farm A [6 marks]
(ii) Describe the advantages and disadvantages of the cloned wheat in farm A over the wheats in farm B. [4 marks]
2(a) According to the stages metaphase, anaphase and telophase in cell division, differentiate
the events happening during mitosis and meiosis. [4 marks] (b) Diagram 2.1 is a new variety of vegetable which has a great commercial value.
Diagram 2.2 is the original parent of the plant.
Diagram 2.1 Diagram 2.2
Based on the above diagram and with your biological knowledge, explain how a farmer
can propagate this variety to give a large scale of yield and at the same time maintains its quality. [4 marks]
WICKEDBIOLOGY.WORDPRESS.COM 67
(c) Discuss how mutation can lead to the formation of tumour. [10 marks]
3(a)(i) What is meant by cloning? [2 marks]
(ii) Describe one cloning technique to produce a commercial plant of desirable characteristics. [6 marks]
(b) Based on the following information, discuss the benefits of genetic engineering method
in producing products for the society. [6 marks]
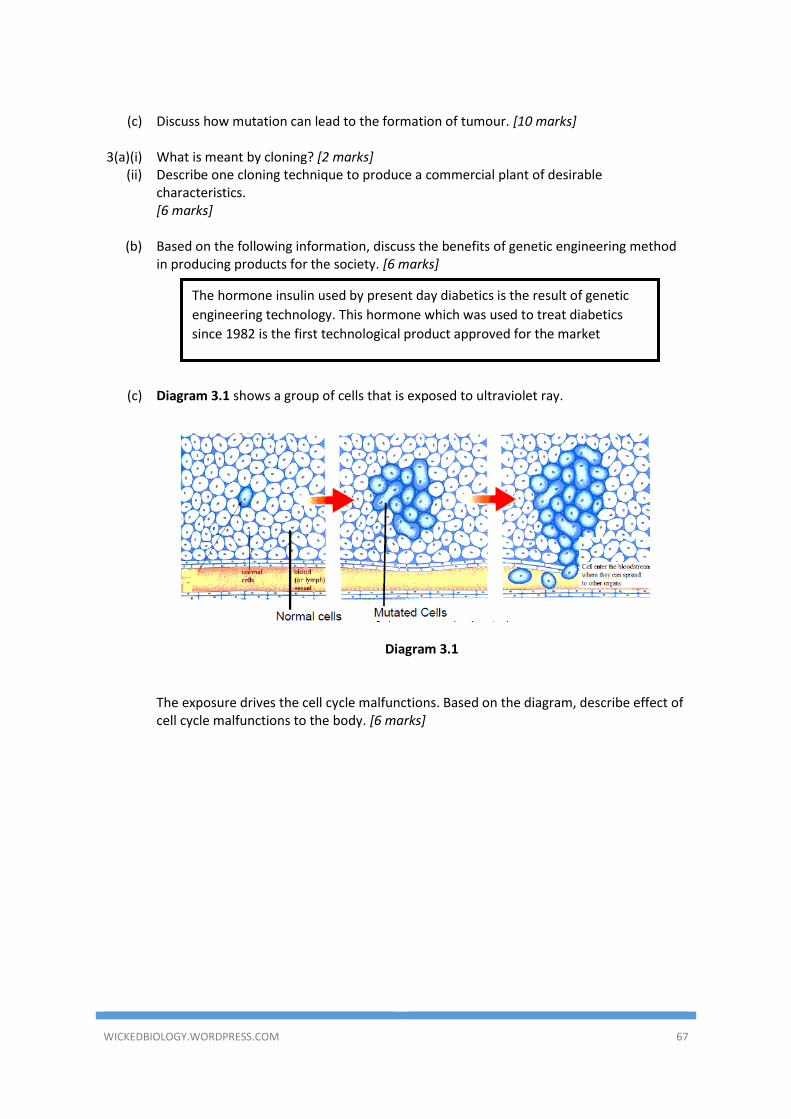
(c) Diagram 3.1 shows a group of cells that is exposed to ultraviolet ray.
Diagram 3.1
The exposure drives the cell cycle malfunctions. Based on the diagram, describe effect of
cell cycle malfunctions to the body. [6 marks]
The hormone insulin used by present day diabetics is the result of genetic
engineering technology. This hormone which was used to treat diabetics
since 1982 is the first technological product approved for the market
WICKEDBIOLOGY.WORDPRESS.COM 68
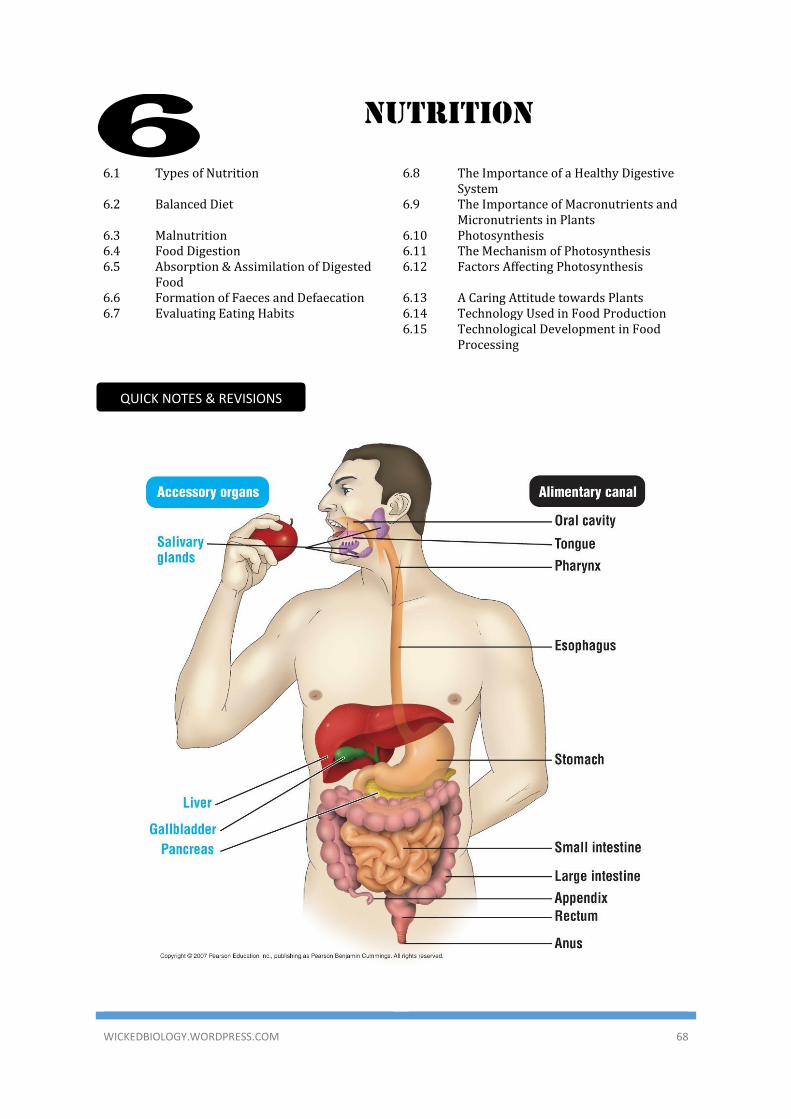
NUTRITION
6.1 Types of Nutrition 6.8 The Importance of a Healthy Digestive System
6.2 Balanced Diet 6.9 The Importance of Macronutrients and Micronutrients in Plants
6.3 Malnutrition 6.10 Photosynthesis 6.4 Food Digestion 6.11 The Mechanism of Photosynthesis 6.5 Absorption & Assimilation of Digested
Food 6.12 Factors Affecting Photosynthesis
6.6 Formation of Faeces and Defaecation 6.13 A Caring Attitude towards Plants 6.7 Evaluating Eating Habits 6.14 Technology Used in Food Production 6.15 Technological Development in Food
Processing
6
QUICK NOTES & REVISIONS
WICKEDBIOLOGY.WORDPRESS.COM 69
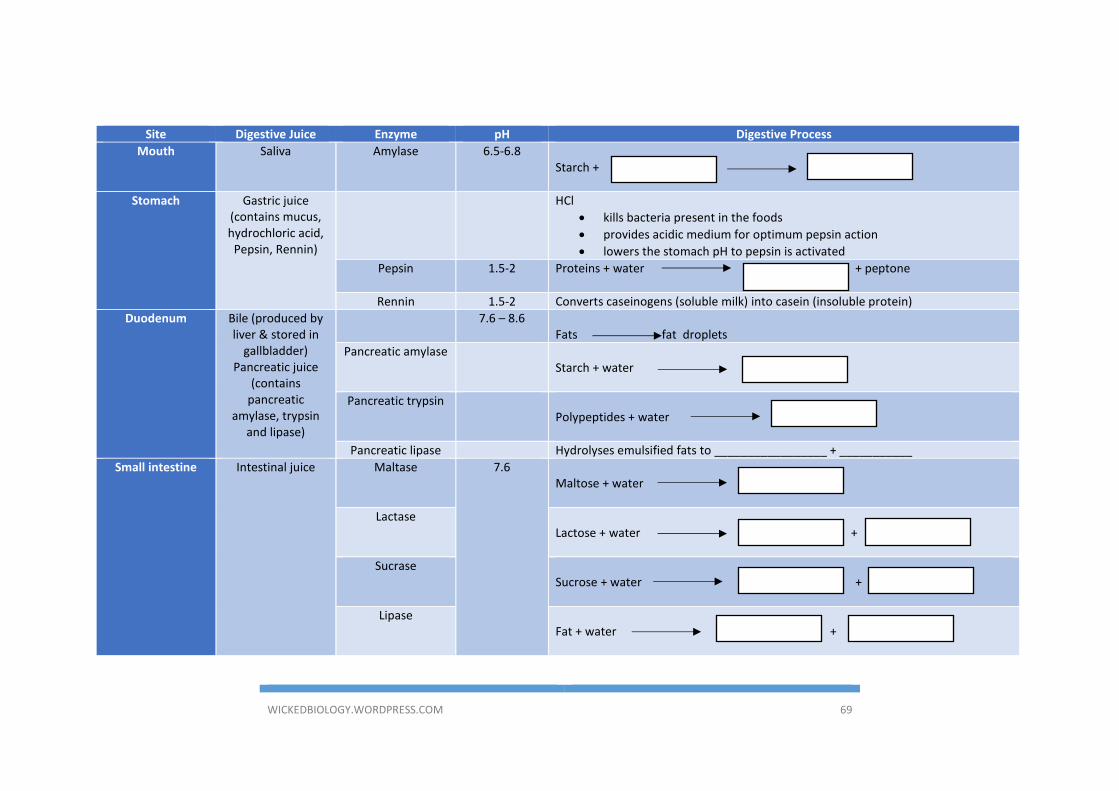
Site Digestive Juice Enzyme pH Digestive Process
Mouth Saliva Amylase 6.5-6.8
Starch +
Stomach Gastric juice (contains mucus, hydrochloric acid,
Pepsin, Rennin)
HCl
• kills bacteria present in the foods
• provides acidic medium for optimum pepsin action
• lowers the stomach pH to pepsin is activated
Pepsin 1.5-2 Proteins + water + peptone
Rennin 1.5-2 Converts caseinogens (soluble milk) into casein (insoluble protein)
Duodenum Bile (produced by liver & stored in
gallbladder) Pancreatic juice
(contains pancreatic
amylase, trypsin and lipase)
7.6 – 8.6 Fats fat droplets
Pancreatic amylase Starch + water
Pancreatic trypsin Polypeptides + water
Pancreatic lipase Hydrolyses emulsified fats to _________________ + ___________
Small intestine Intestinal juice Maltase 7.6 Maltose + water
Lactase Lactose + water +
Sucrase Sucrose + water +
Lipase Fat + water +
WICKEDBIOLOGY.WORDPRESS.COM 70
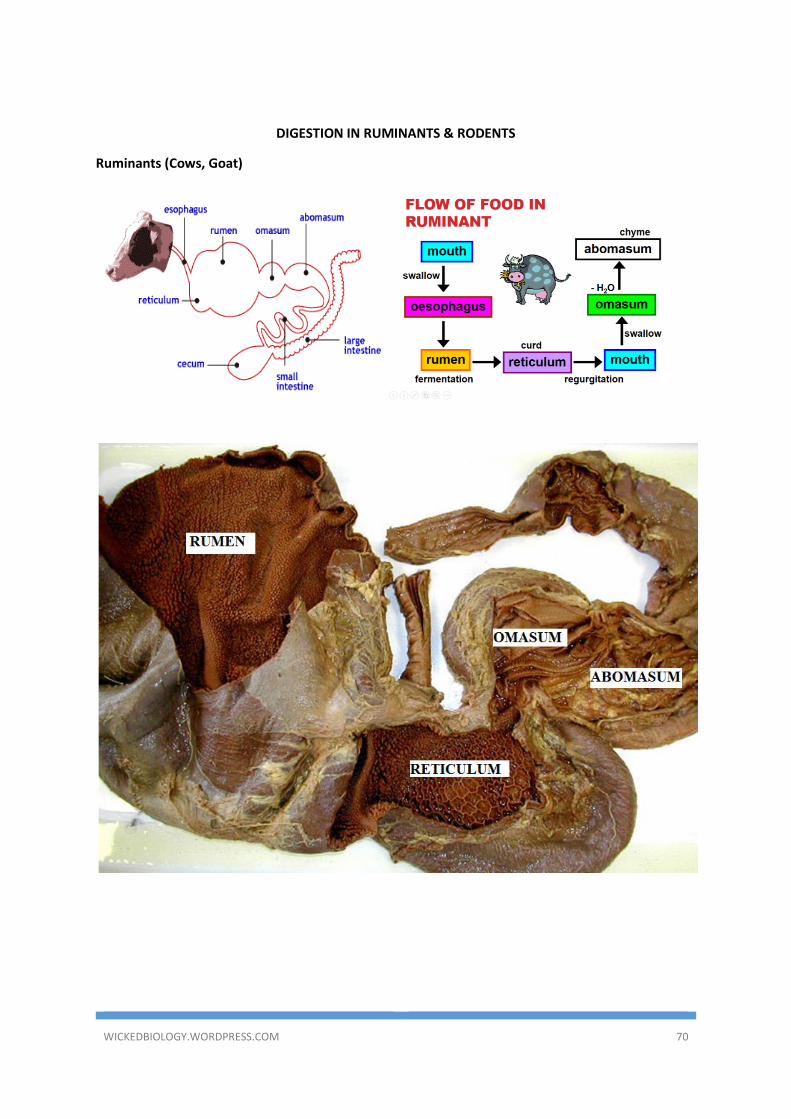
DIGESTION IN RUMINANTS & RODENTS
Ruminants (Cows, Goat)
WICKEDBIOLOGY.WORDPRESS.COM 71
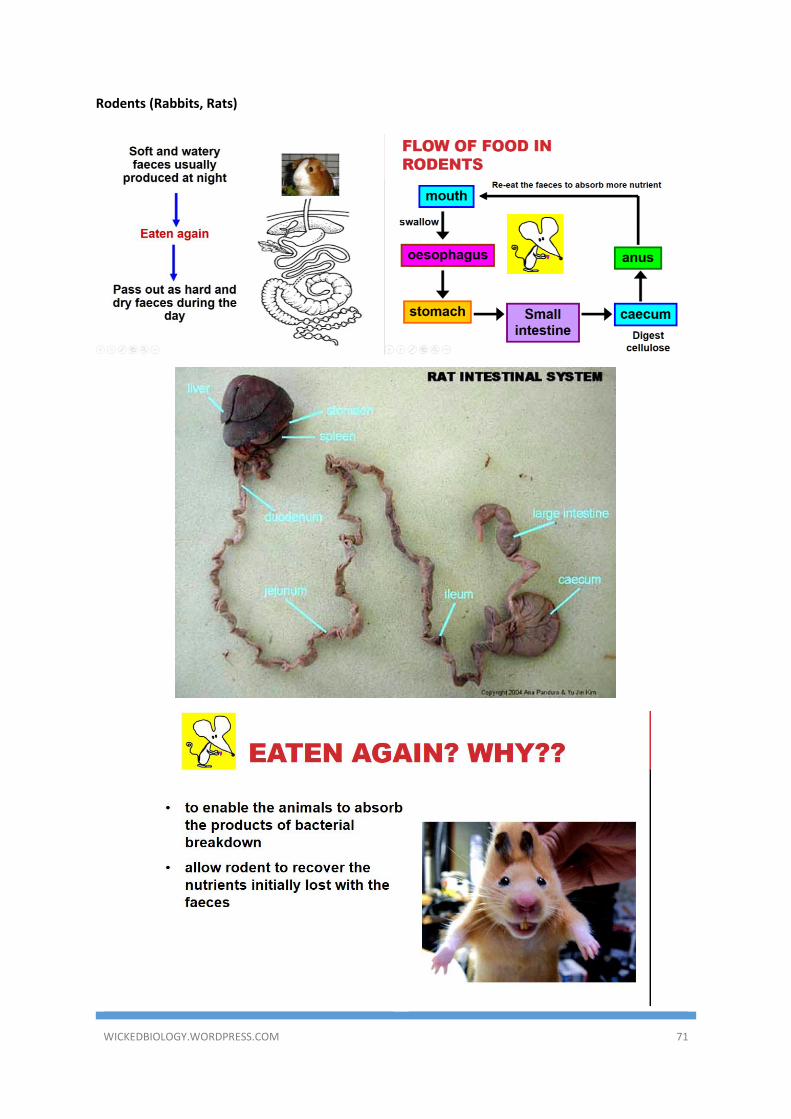
Rodents (Rabbits, Rats)
WICKEDBIOLOGY.WORDPRESS.COM 72
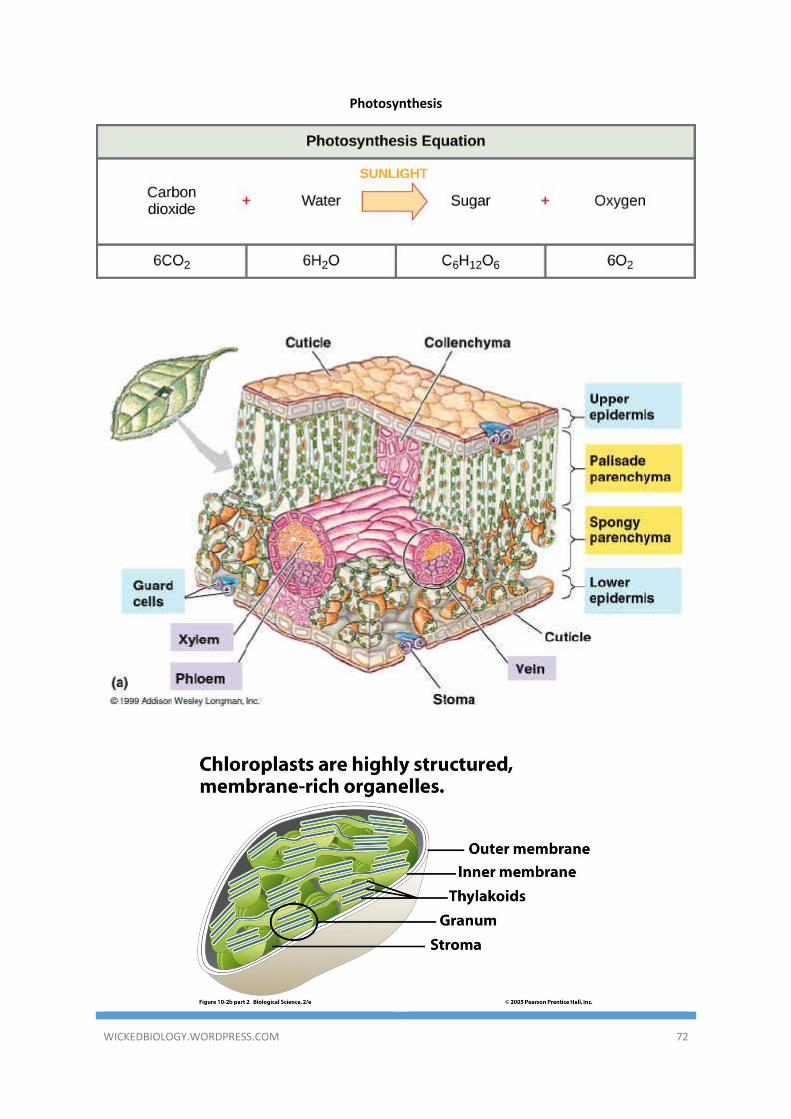
Photosynthesis
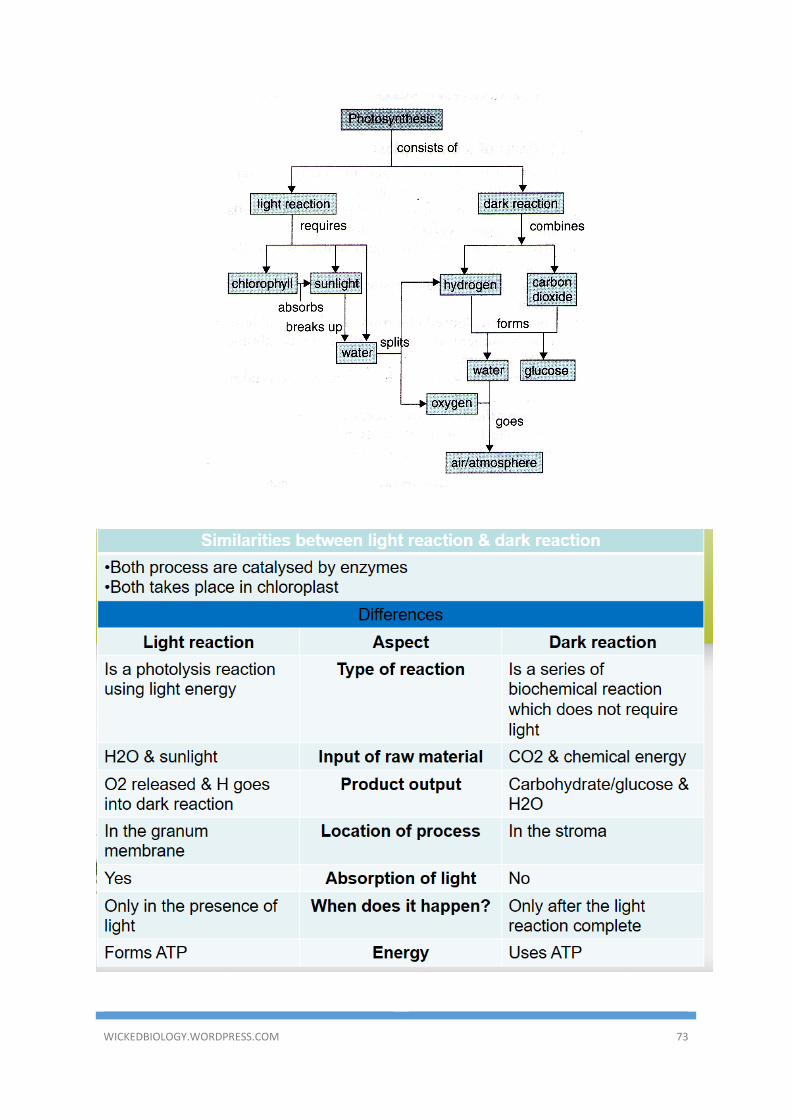
WICKEDBIOLOGY.WORDPRESS.COM 73
WICKEDBIOLOGY.WORDPRESS.COM 74
OBJECTIVES QUESTIONS
1. Living organism can be classified based
on nutritional habits. Which of the
following are correct?
Saprophytic Parasitic
A Green plants Bacteria
B Bacteria Tapeworm
C Tapeworm Lice
D Bacteria Green plants
2. When 0.4 g of groundnut is completely
burnt, the temperature of 20 ml of
water rises from 30 °C to 70°C. The
specific heat capacity of water is 4.2
Jg°C. Calculate the energy value of the
groundnut.
A 1400 Jg-1
B 3400 Jg-1
C 8400 Jg-1
D 7620 Jg-1
3. The following information shows the
results of an experiment to determine
the energy value of cashew nuts.
Calculate the energy value of the
cashew nuts
A 0.1 kJ/g
B 8.0 kJ/g
C 0.84 kJ/g
D 8.4 kJ/g
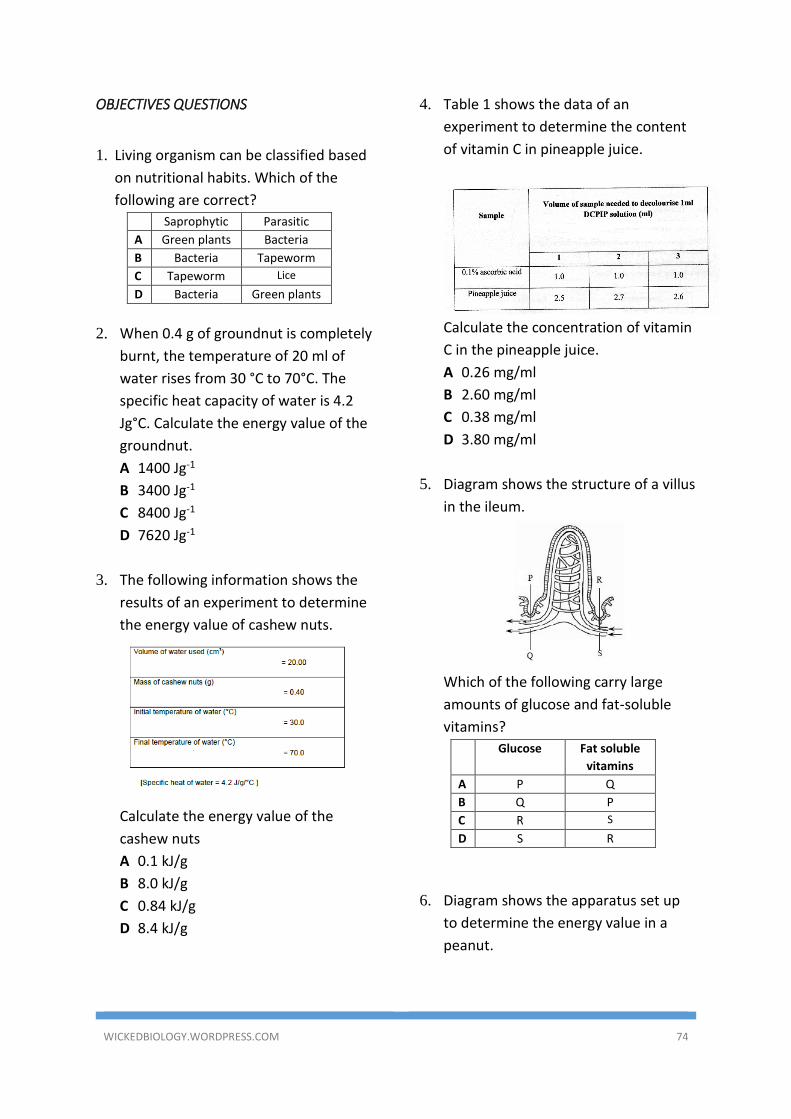
4. Table 1 shows the data of an
experiment to determine the content
of vitamin C in pineapple juice.
Calculate the concentration of vitamin
C in the pineapple juice.
A 0.26 mg/ml
B 2.60 mg/ml
C 0.38 mg/ml
D 3.80 mg/ml
5. Diagram shows the structure of a villus
in the ileum.
Which of the following carry large
amounts of glucose and fat-soluble
vitamins?
Glucose Fat soluble
vitamins
A P Q
B Q P
C R S
D S R
6. Diagram shows the apparatus set up
to determine the energy value in a
peanut.
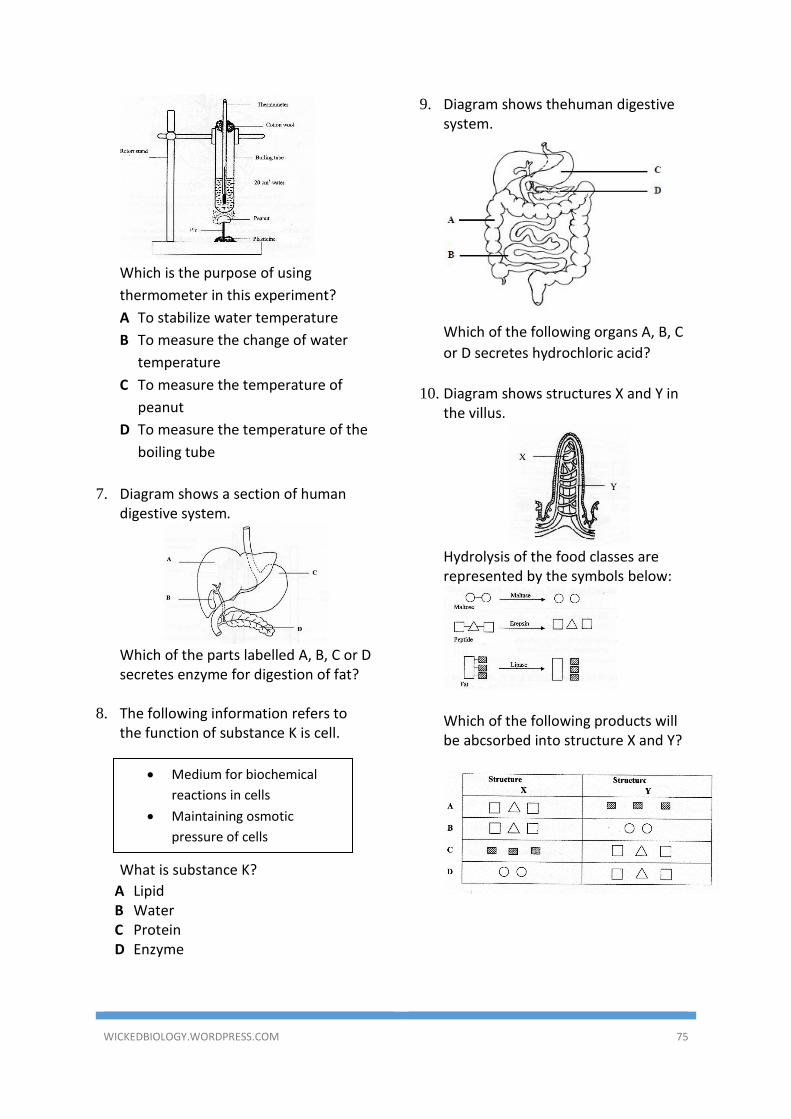
WICKEDBIOLOGY.WORDPRESS.COM 75
Which is the purpose of using
thermometer in this experiment?
A To stabilize water temperature
B To measure the change of water
temperature
C To measure the temperature of
peanut
D To measure the temperature of the
boiling tube
7. Diagram shows a section of human
digestive system.
Which of the parts labelled A, B, C or D secretes enzyme for digestion of fat?
8. The following information refers to
the function of substance K is cell.
What is substance K?
A Lipid B Water C Protein D Enzyme
9. Diagram shows thehuman digestive system.
Which of the following organs A, B, C
or D secretes hydrochloric acid?
10. Diagram shows structures X and Y in
the villus.
Hydrolysis of the food classes are represented by the symbols below:
Which of the following products will be abcsorbed into structure X and Y?
• Medium for biochemical
reactions in cells
• Maintaining osmotic
pressure of cells
WICKEDBIOLOGY.WORDPRESS.COM 76
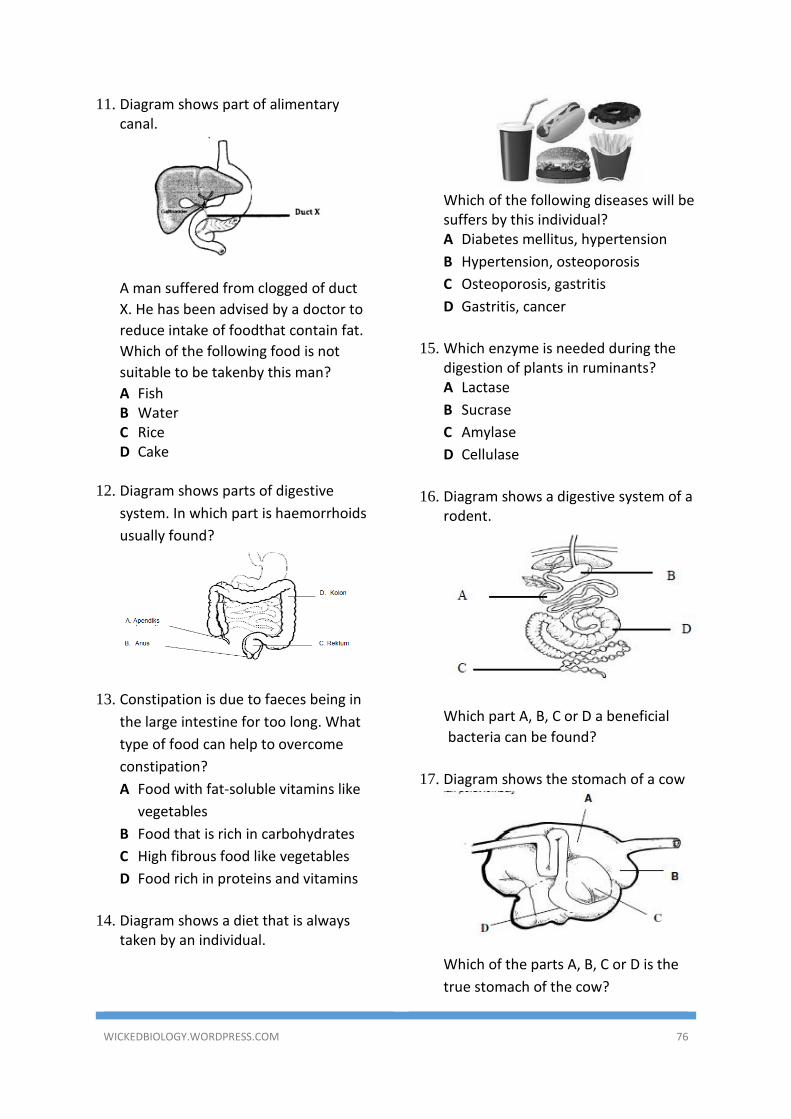
11. Diagram shows part of alimentary canal.
A man suffered from clogged of duct
X. He has been advised by a doctor to
reduce intake of foodthat contain fat.
Which of the following food is not
suitable to be takenby this man?
A Fish B Water C Rice D Cake
12. Diagram shows parts of digestive
system. In which part is haemorrhoids
usually found?
13. Constipation is due to faeces being in
the large intestine for too long. What
type of food can help to overcome
constipation?
A Food with fat-soluble vitamins like
vegetables
B Food that is rich in carbohydrates
C High fibrous food like vegetables
D Food rich in proteins and vitamins
14. Diagram shows a diet that is always
taken by an individual.
Which of the following diseases will be suffers by this individual? A Diabetes mellitus, hypertension
B Hypertension, osteoporosis
C Osteoporosis, gastritis
D Gastritis, cancer
15. Which enzyme is needed during the
digestion of plants in ruminants? A Lactase
B Sucrase
C Amylase
D Cellulase
16. Diagram shows a digestive system of a
rodent.
Which part A, B, C or D a beneficial
bacteria can be found?
17. Diagram shows the stomach of a cow
Which of the parts A, B, C or D is the
true stomach of the cow?
WICKEDBIOLOGY.WORDPRESS.COM 77
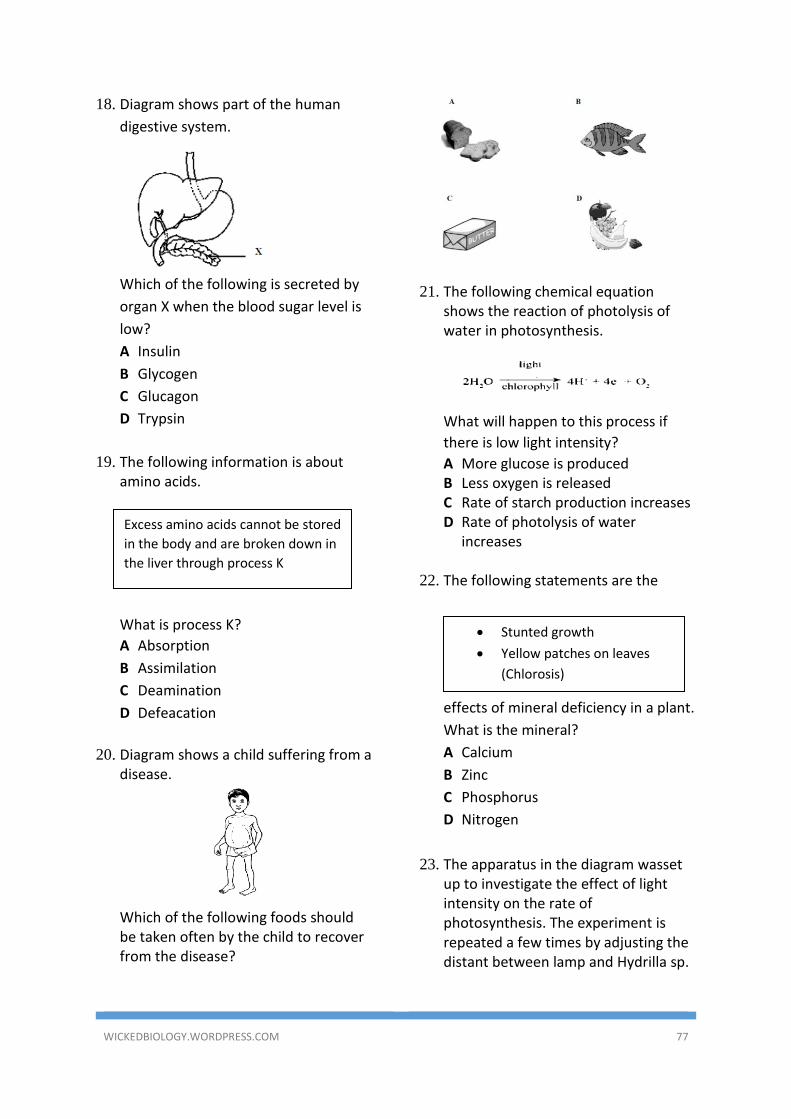
18. Diagram shows part of the human
digestive system.
Which of the following is secreted by
organ X when the blood sugar level is
low?
A Insulin
B Glycogen
C Glucagon
D Trypsin
19. The following information is about amino acids.
What is process K?
A Absorption
B Assimilation
C Deamination
D Defeacation
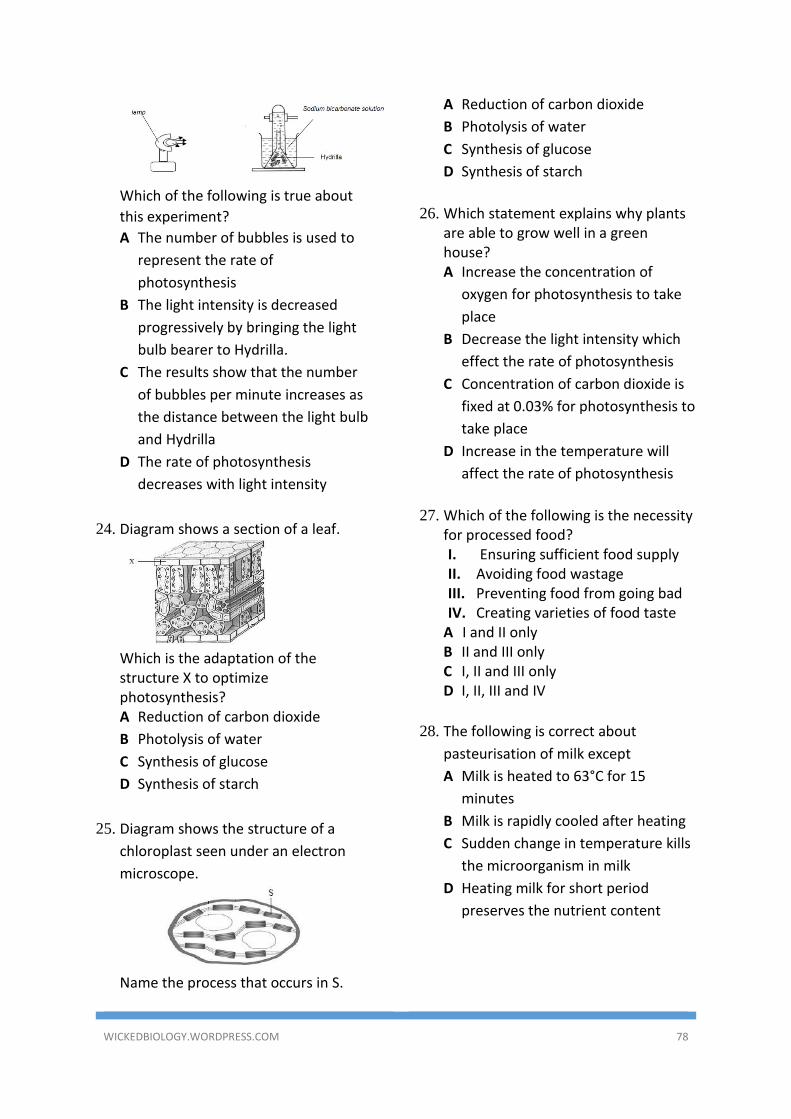
20. Diagram shows a child suffering from a
disease.
Which of the following foods should be taken often by the child to recover from the disease?
21. The following chemical equation shows the reaction of photolysis of water in photosynthesis.
What will happen to this process if
there is low light intensity?
A More glucose is produced B Less oxygen is released C Rate of starch production increases D Rate of photolysis of water
increases
22. The following statements are the
effects of mineral deficiency in a plant.
What is the mineral?
A Calcium
B Zinc
C Phosphorus
D Nitrogen
23. The apparatus in the diagram wasset up to investigate the effect of light intensity on the rate of photosynthesis. The experiment is repeated a few times by adjusting the distant between lamp and Hydrilla sp.
• Stunted growth
• Yellow patches on leaves
(Chlorosis)
Excess amino acids cannot be stored
in the body and are broken down in
the liver through process K
WICKEDBIOLOGY.WORDPRESS.COM 78
Which of the following is true about
this experiment?
A The number of bubbles is used to
represent the rate of
photosynthesis
B The light intensity is decreased
progressively by bringing the light
bulb bearer to Hydrilla.
C The results show that the number
of bubbles per minute increases as
the distance between the light bulb
and Hydrilla
D The rate of photosynthesis
decreases with light intensity
24. Diagram shows a section of a leaf.
Which is the adaptation of the structure X to optimize photosynthesis? A Reduction of carbon dioxide
B Photolysis of water
C Synthesis of glucose
D Synthesis of starch
25. Diagram shows the structure of a
chloroplast seen under an electron
microscope.
Name the process that occurs in S.
A Reduction of carbon dioxide
B Photolysis of water
C Synthesis of glucose
D Synthesis of starch
26. Which statement explains why plants
are able to grow well in a green house? A Increase the concentration of
oxygen for photosynthesis to take
place
B Decrease the light intensity which
effect the rate of photosynthesis
C Concentration of carbon dioxide is
fixed at 0.03% for photosynthesis to
take place
D Increase in the temperature will
affect the rate of photosynthesis
27. Which of the following is the necessity
for processed food? I. Ensuring sufficient food supply II. Avoiding food wastage III. Preventing food from going bad IV. Creating varieties of food taste
A I and II only B II and III only C I, II and III only D I, II, III and IV
28. The following is correct about
pasteurisation of milk except
A Milk is heated to 63°C for 15
minutes
B Milk is rapidly cooled after heating
C Sudden change in temperature kills
the microorganism in milk
D Heating milk for short period
preserves the nutrient content
WICKEDBIOLOGY.WORDPRESS.COM 79
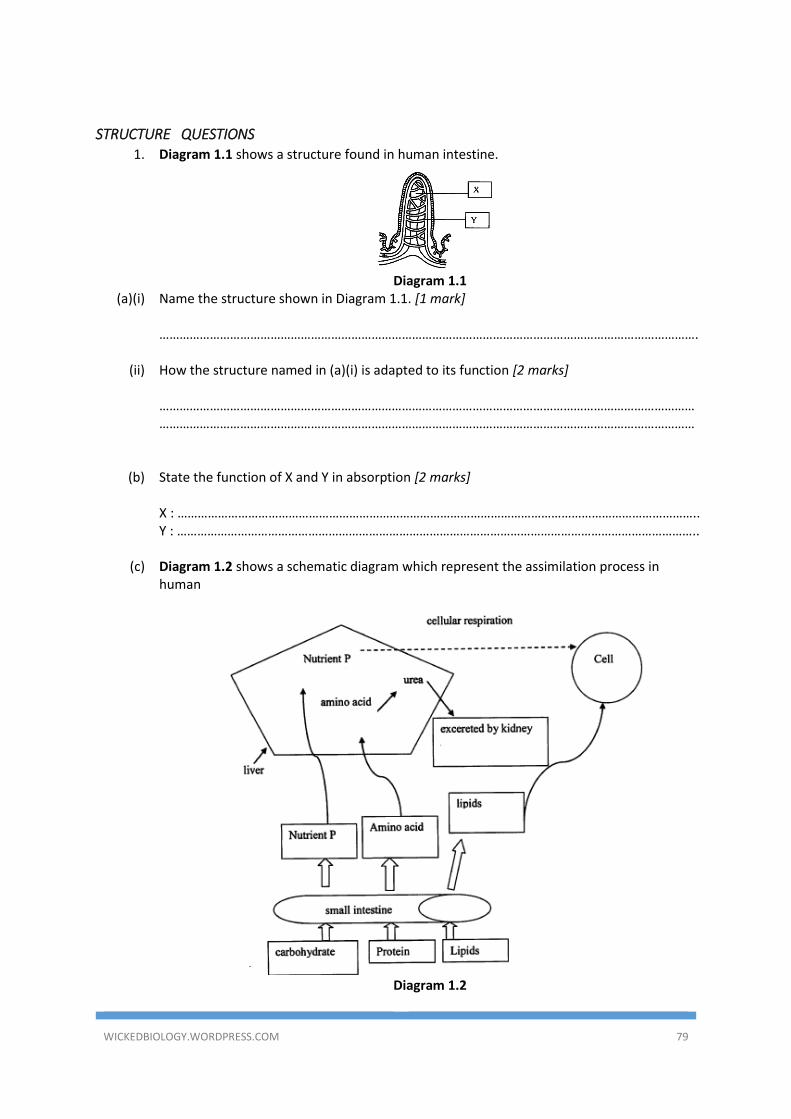
STRUCTURE QUESTIONS 1. Diagram 1.1 shows a structure found in human intestine.
Diagram 1.1
(a)(i) Name the structure shown in Diagram 1.1. [1 mark] …………………………………………………………………………………………………………………………………………….
(ii) How the structure named in (a)(i) is adapted to its function [2 marks]
…………………………………………………………………………………………………………………………………………………………………………………………………………………………………………………………………………………………
(b) State the function of X and Y in absorption [2 marks]
X : ……………………………………………………………………………………………………………………………………….. Y : ………………………………………………………………………………………………………………………………………..
(c) Diagram 1.2 shows a schematic diagram which represent the assimilation process in
human
Diagram 1.2
WICKEDBIOLOGY.WORDPRESS.COM 80
(i) Explain the function of liver in assimilation. [2 marks] …………………………………………………………………………………………………………………………………………………………………………………………………………………………………………………………………………………………
(ii) Based on the diagram, explain the assimilation of nutrient P. [2 marks]
…………………………………………………………………………………………………………………………………………………………………………………………………………………………………………………………………………………………
(iii) Explain why assimilation of lipids do not occur directly in liver. [3 marks]
………………………………………………………………………………………………………………………………………………………………………………………………………………………………………………………………………………………………………………………………………………………………………………………………………………………………………
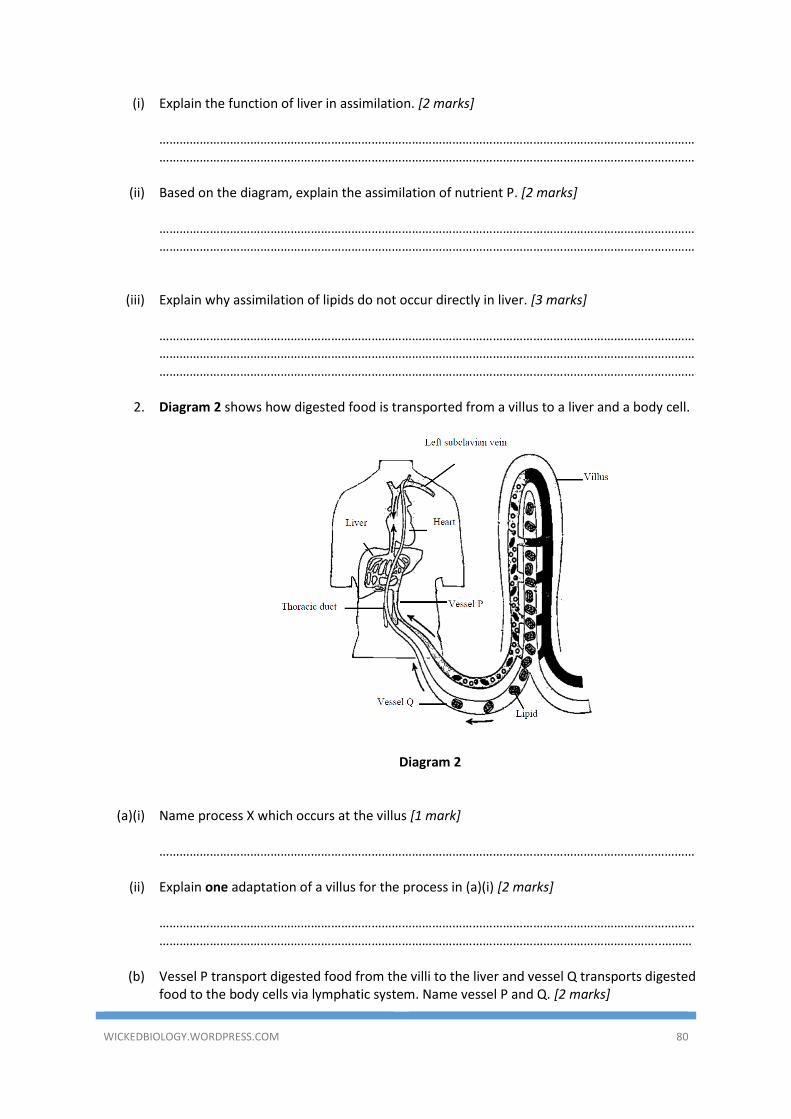
2. Diagram 2 shows how digested food is transported from a villus to a liver and a body cell.
Diagram 2
(a)(i) Name process X which occurs at the villus [1 mark]
……………………………………………………………………………………………………………………………………………
(ii) Explain one adaptation of a villus for the process in (a)(i) [2 marks]
………………………………………………………………………………………………………………………………………………………………………………………………………………………………………………………………………………..………
(b) Vessel P transport digested food from the villi to the liver and vessel Q transports digested
food to the body cells via lymphatic system. Name vessel P and Q. [2 marks]
WICKEDBIOLOGY.WORDPRESS.COM 81
Vessel P :……………………………………………………………………………………………………………………………… Vessel Q :……………………………………………………………………………………………………………………………..
(c) Explain the difference in the concentration of glucose level in vessel P and Q. [2 marks]
…………………………………………………………………………………………………………………………………………………………………………………………………………………………………………………………………………………………
(d) Other than lipid, name one other nutrient that can be found in vessel Q. [1 mark]
……………………………………………………………………………………………………………………………………………
(e) A teenager has taken an excessive amount of protein in his daily diet. Explain how a liver
functions in the regulation of excess protein. [4 marks] ………………………………………………………………………………………………………………………………………………………………………………………………………………………………………………………………………………..…………………………………………………………………………………………………………………………………………………………………………………………………………………………………………………………………………………………………
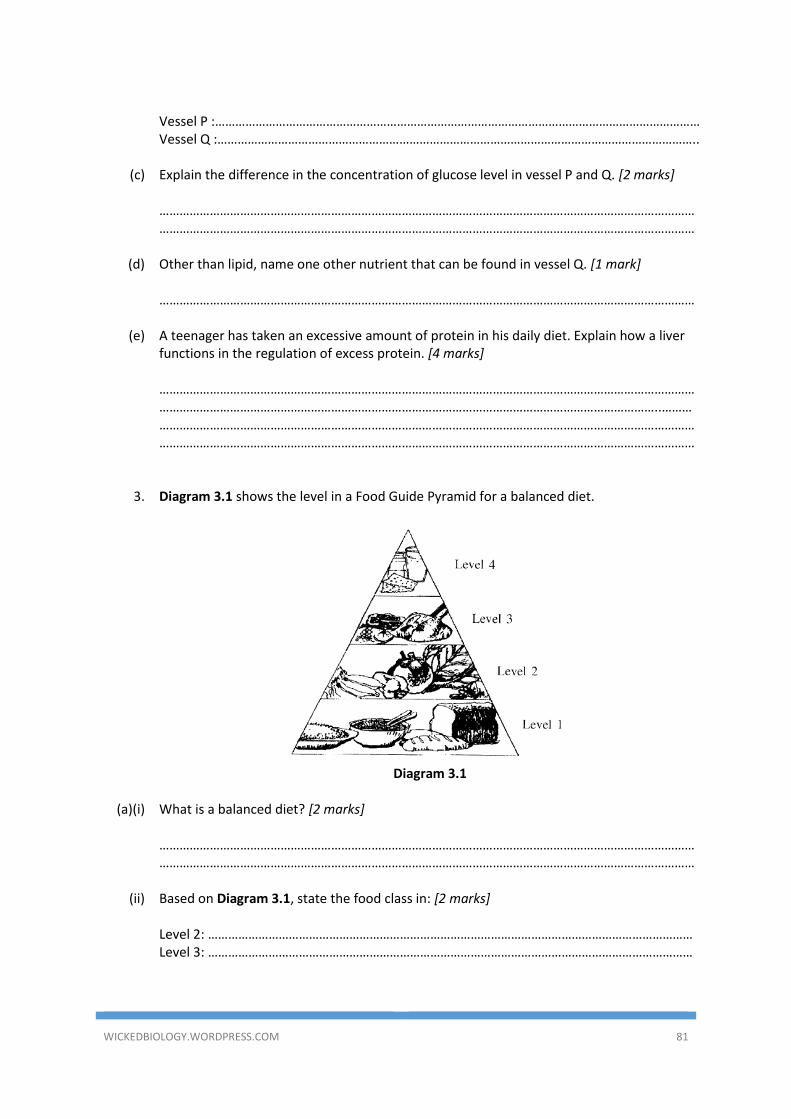
3. Diagram 3.1 shows the level in a Food Guide Pyramid for a balanced diet.
Diagram 3.1
(a)(i) What is a balanced diet? [2 marks]
…………………………………………………………………………………………………………………………………………………………………………………………………………………………………………………………………………………………
(ii) Based on Diagram 3.1, state the food class in: [2 marks]
Level 2: ……………………………………………………………………………………………………………………………… Level 3: ………………………………………………………………………………………………………………………………
WICKEDBIOLOGY.WORDPRESS.COM 82
(iii) The levels in a food pyramid determine the amount of food that should be consumed in a diet. Why food class in level 4 should be taken in small amount? [2 marks] …………………………………………………………………………………………………………………………………………………………………………………………………………………………………………………………………………………………
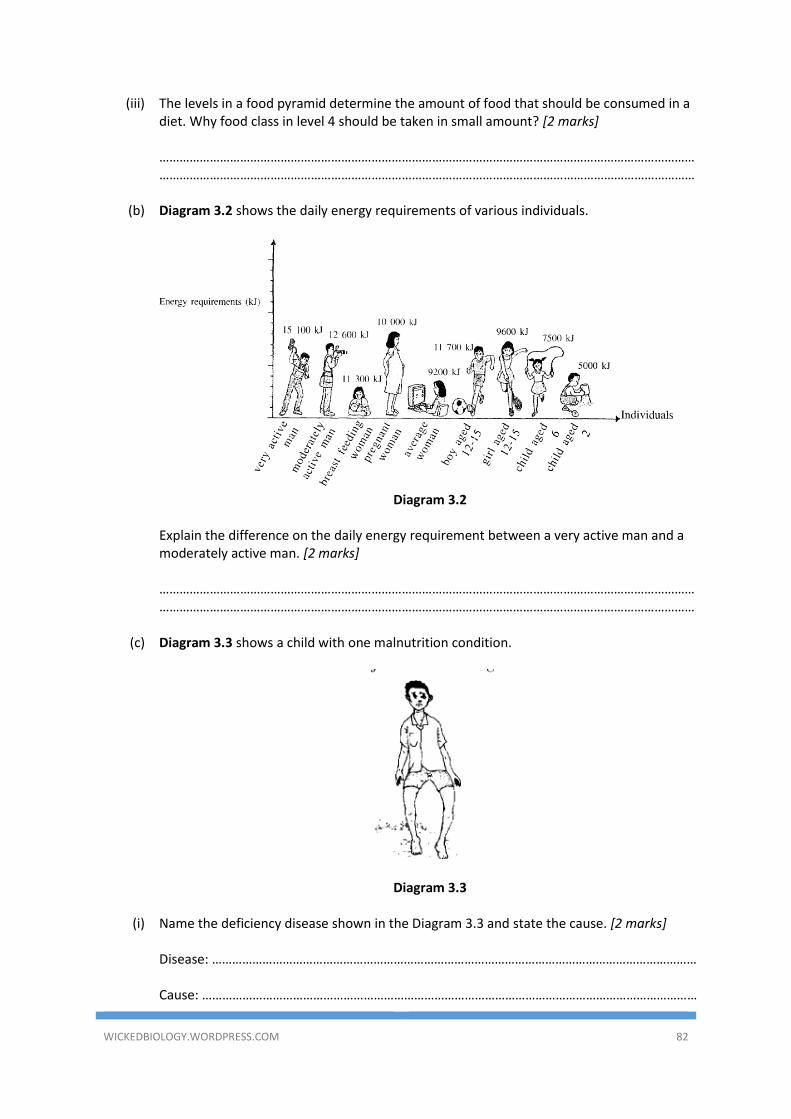
(b) Diagram 3.2 shows the daily energy requirements of various individuals.
Diagram 3.2
Explain the difference on the daily energy requirement between a very active man and a
moderately active man. [2 marks] …………………………………………………………………………………………………………………………………………………………………………………………………………………………………………………………………………………………
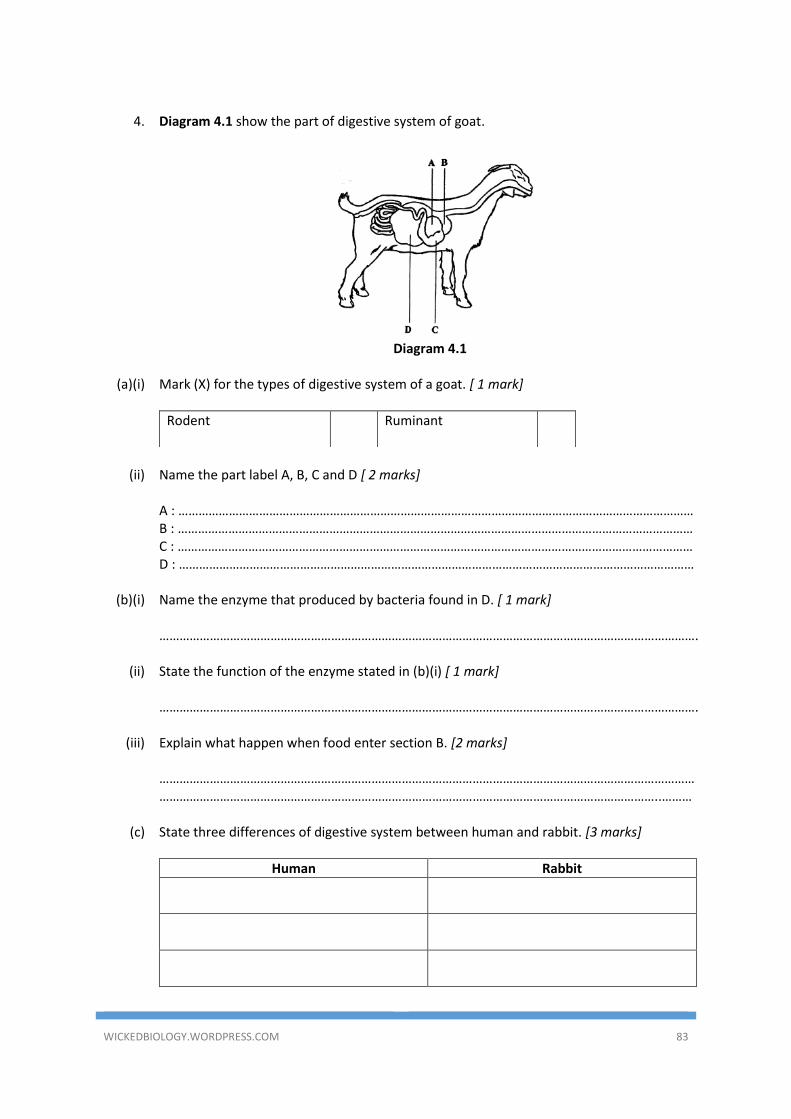
(c) Diagram 3.3 shows a child with one malnutrition condition.
Diagram 3.3
(i) Name the deficiency disease shown in the Diagram 3.3 and state the cause. [2 marks] Disease: ……………………………………………………………………………………………………………………………… Cause: …………………………………………………………………………………………………………………………………
WICKEDBIOLOGY.WORDPRESS.COM 83
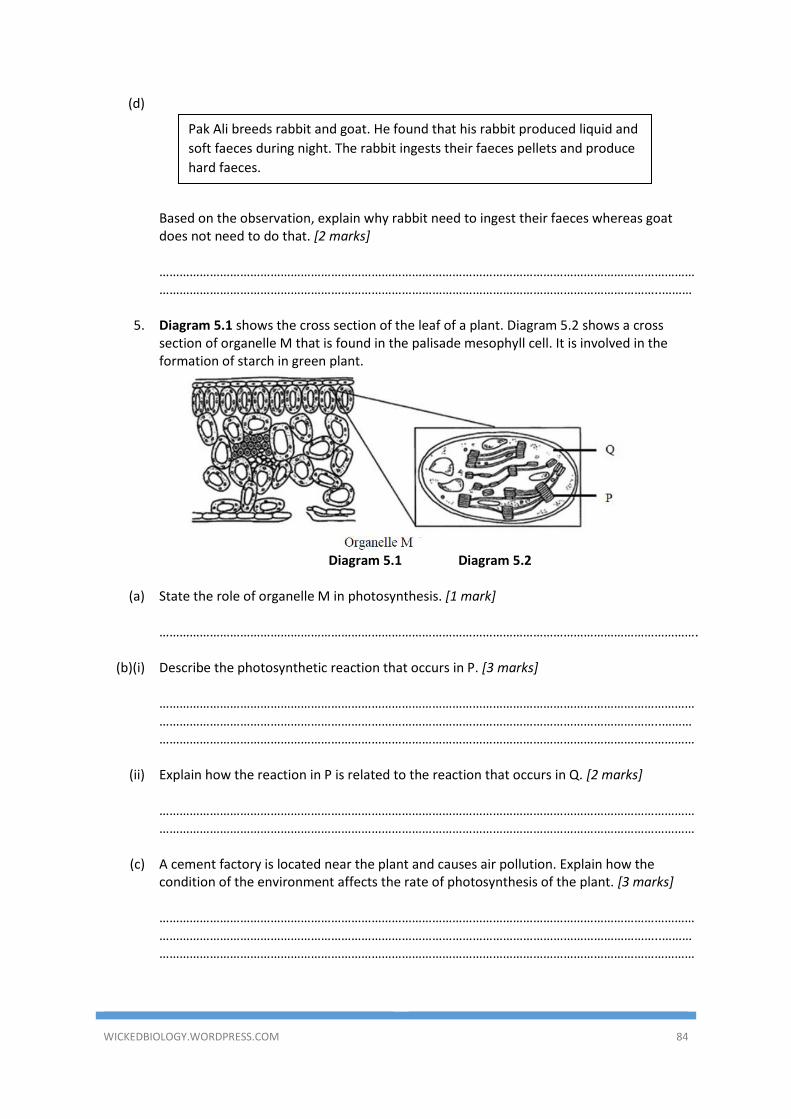
4. Diagram 4.1 show the part of digestive system of goat.
Diagram 4.1
(a)(i) Mark (X) for the types of digestive system of a goat. [ 1 mark]
Rodent Ruminant
(ii) Name the part label A, B, C and D [ 2 marks]
A : ……………………………………………………………………………………………………………………………………… B : ……………………………………………………………………………………………………………………………………… C : ……………………………………………………………………………………………………………………………………… D : ………………………………………………………………………………………………………………………………………
(b)(i) Name the enzyme that produced by bacteria found in D. [ 1 mark]
…………………………………………………………………………………………………………………………………………….
(ii) State the function of the enzyme stated in (b)(i) [ 1 mark]
…………………………………………………………………………………………………………………………………………….
(iii) Explain what happen when food enter section B. [2 marks]
………………………………………………………………………………………………………………………………………………………………………………………………………………………………………………………………………………..………
(c) State three differences of digestive system between human and rabbit. [3 marks]
Human Rabbit
WICKEDBIOLOGY.WORDPRESS.COM 84
(d)
Based on the observation, explain why rabbit need to ingest their faeces whereas goat
does not need to do that. [2 marks] ………………………………………………………………………………………………………………………………………………………………………………………………………………………………………………………………………………..………
5. Diagram 5.1 shows the cross section of the leaf of a plant. Diagram 5.2 shows a cross
section of organelle M that is found in the palisade mesophyll cell. It is involved in the formation of starch in green plant.
Diagram 5.1 Diagram 5.2
(a) State the role of organelle M in photosynthesis. [1 mark]
…………………………………………………………………………………………………………………………………………….
(b)(i) Describe the photosynthetic reaction that occurs in P. [3 marks]
………………………………………………………………………………………………………………………………………………………………………………………………………………………………………………………………………………..……………………………………………………………………………………………………………………………………………………
(ii) Explain how the reaction in P is related to the reaction that occurs in Q. [2 marks]
…………………………………………………………………………………………………………………………………………………………………………………………………………………………………………………………………………………………
(c) A cement factory is located near the plant and causes air pollution. Explain how the
condition of the environment affects the rate of photosynthesis of the plant. [3 marks] ………………………………………………………………………………………………………………………………………………………………………………………………………………………………………………………………………………..……………………………………………………………………………………………………………………………………………………
Pak Ali breeds rabbit and goat. He found that his rabbit produced liquid and
soft faeces during night. The rabbit ingests their faeces pellets and produce
hard faeces.
WICKEDBIOLOGY.WORDPRESS.COM 85
(d) Based on the following statement, explain how this method is carried out during winter to ensure the production of crops throughout the year. [3 marks] ………………………………………………………………………………………………………………………………………………………………………………………………………………………………………………………………………………..……………………………………………………………………………………………………………………………………………………
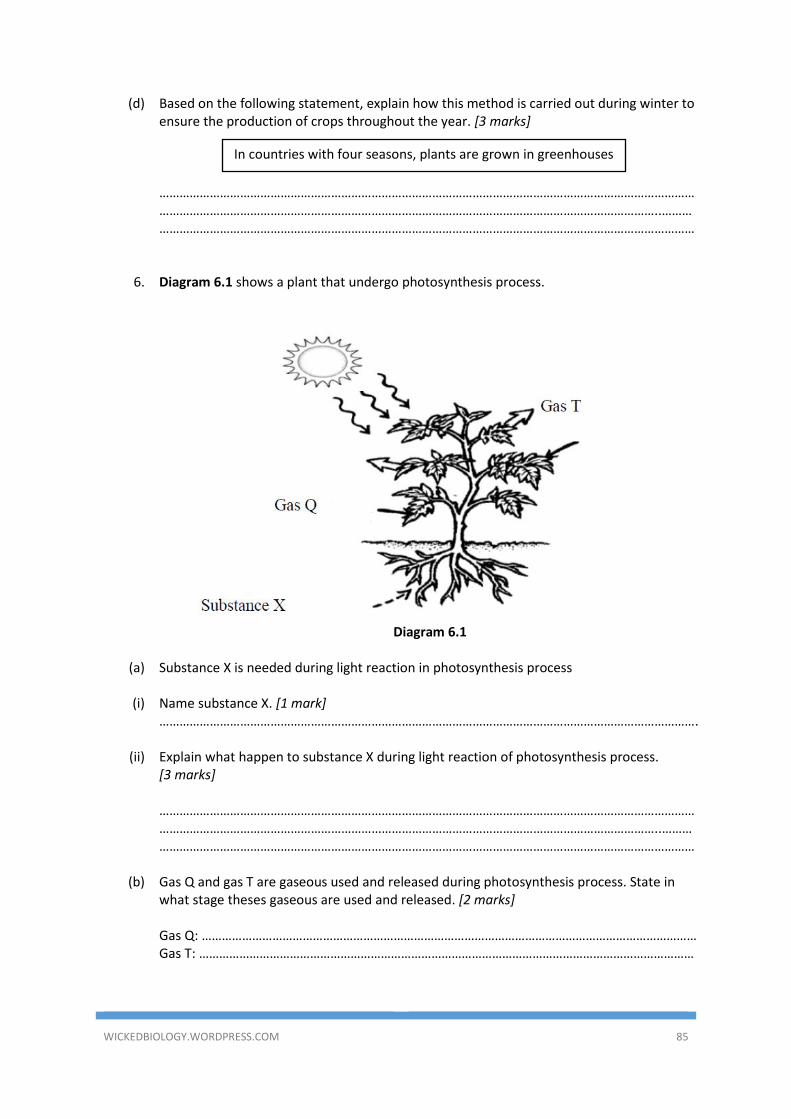
6. Diagram 6.1 shows a plant that undergo photosynthesis process.
Diagram 6.1
(a) Substance X is needed during light reaction in photosynthesis process
(i) Name substance X. [1 mark]
…………………………………………………………………………………………………………………………………………….
(ii) Explain what happen to substance X during light reaction of photosynthesis process. [3 marks]
………………………………………………………………………………………………………………………………………………………………………………………………………………………………………………………………………………..……………………………………………………………………………………………………………………………………………………
(b) Gas Q and gas T are gaseous used and released during photosynthesis process. State in
what stage theses gaseous are used and released. [2 marks] Gas Q: ………………………………………………………………………………………………………………………………… Gas T: …………………………………………………………………………………………………………………………………
In countries with four seasons, plants are grown in greenhouses
WICKEDBIOLOGY.WORDPRESS.COM 86
(c) Different light intensity has different effect on the rate of photosynthesis. The uses of gas Q and production of gas T are also affected by the different light intensity. Explain what will happen if the uses of gas Q and production of gas T are at the same rate? [3 marks] ……………………………………………………………………………………………………………………………………………
………………………………………..………………..…………………………………………………………………………………
……………………………………………………………………………………………………………………………………………
(d) Diagram 6.2 below shows an example of campaign held to preserve green plant. Without
plant, life will not exist on Earth. Through photosynthesis, green plant convert the energy of sunlight into chemical energy stored within organic molecules. State the importance of photosynthesis to living organism. [3 marks]
Diagram 6.2
……………………………………………………………………………………………………………………………………………
………………………………………..…………………………………………………………………………………………………
……………………………………………………………………………………………………………………………………………
WICKEDBIOLOGY.WORDPRESS.COM 87
ESSAY QUESTIONS
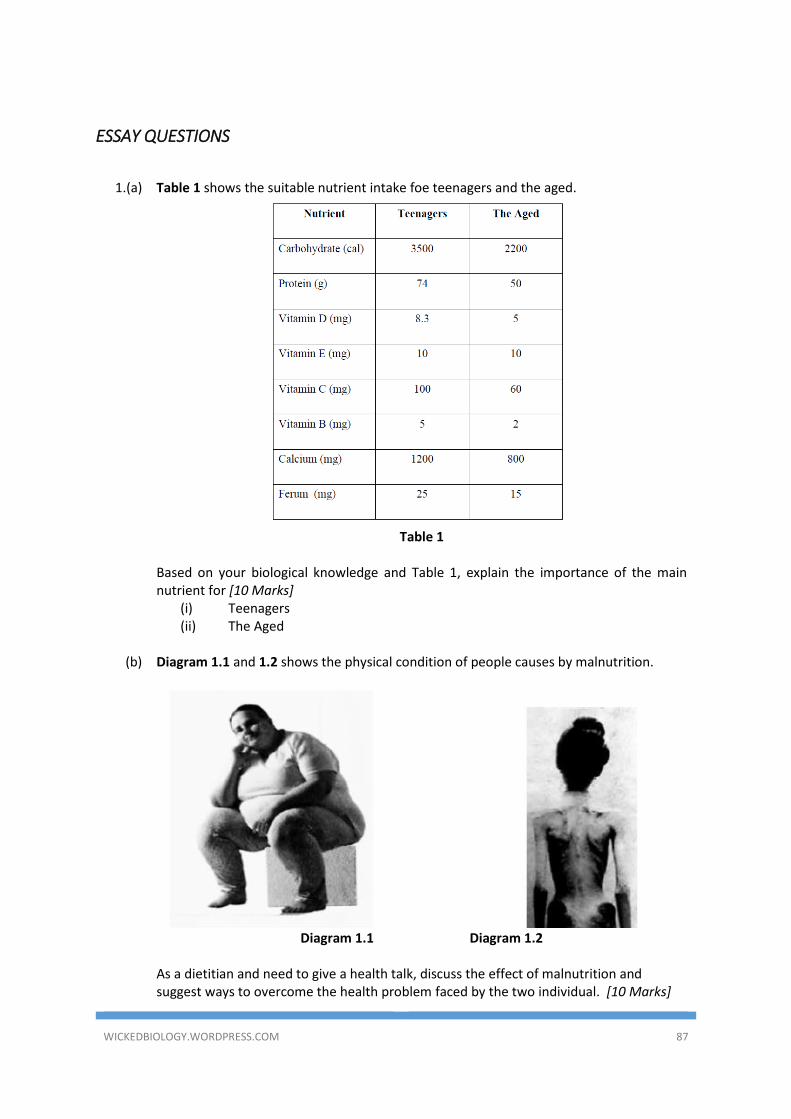
1.(a) Table 1 shows the suitable nutrient intake foe teenagers and the aged.
Table 1
Based on your biological knowledge and Table 1, explain the importance of the main
nutrient for [10 Marks] (i) Teenagers (ii) The Aged
(b) Diagram 1.1 and 1.2 shows the physical condition of people causes by malnutrition.
Diagram 1.1 Diagram 1.2
As a dietitian and need to give a health talk, discuss the effect of malnutrition and
suggest ways to overcome the health problem faced by the two individual. [10 Marks]
WICKEDBIOLOGY.WORDPRESS.COM 88
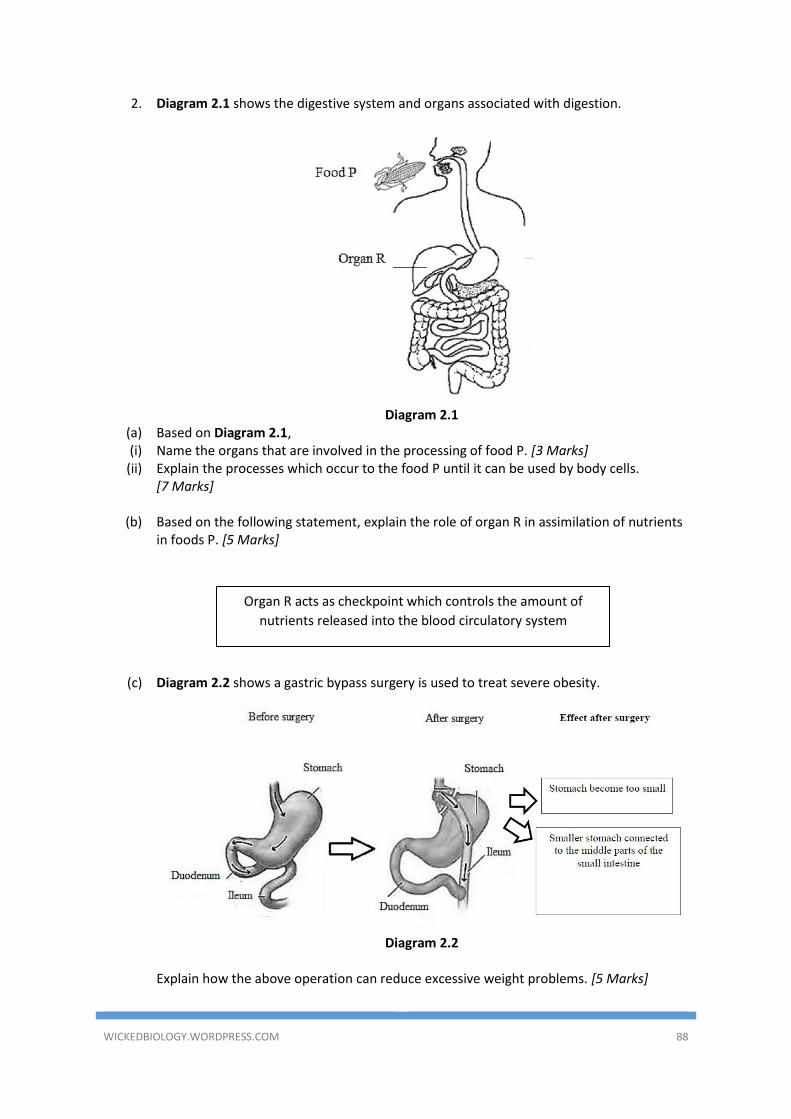
2. Diagram 2.1 shows the digestive system and organs associated with digestion.
Diagram 2.1
(a) Based on Diagram 2.1, (i) Name the organs that are involved in the processing of food P. [3 Marks]
(ii) Explain the processes which occur to the food P until it can be used by body cells. [7 Marks]
(b) Based on the following statement, explain the role of organ R in assimilation of nutrients
in foods P. [5 Marks]
(c) Diagram 2.2 shows a gastric bypass surgery is used to treat severe obesity.
Diagram 2.2
Explain how the above operation can reduce excessive weight problems. [5 Marks]
Organ R acts as checkpoint which controls the amount of
nutrients released into the blood circulatory system
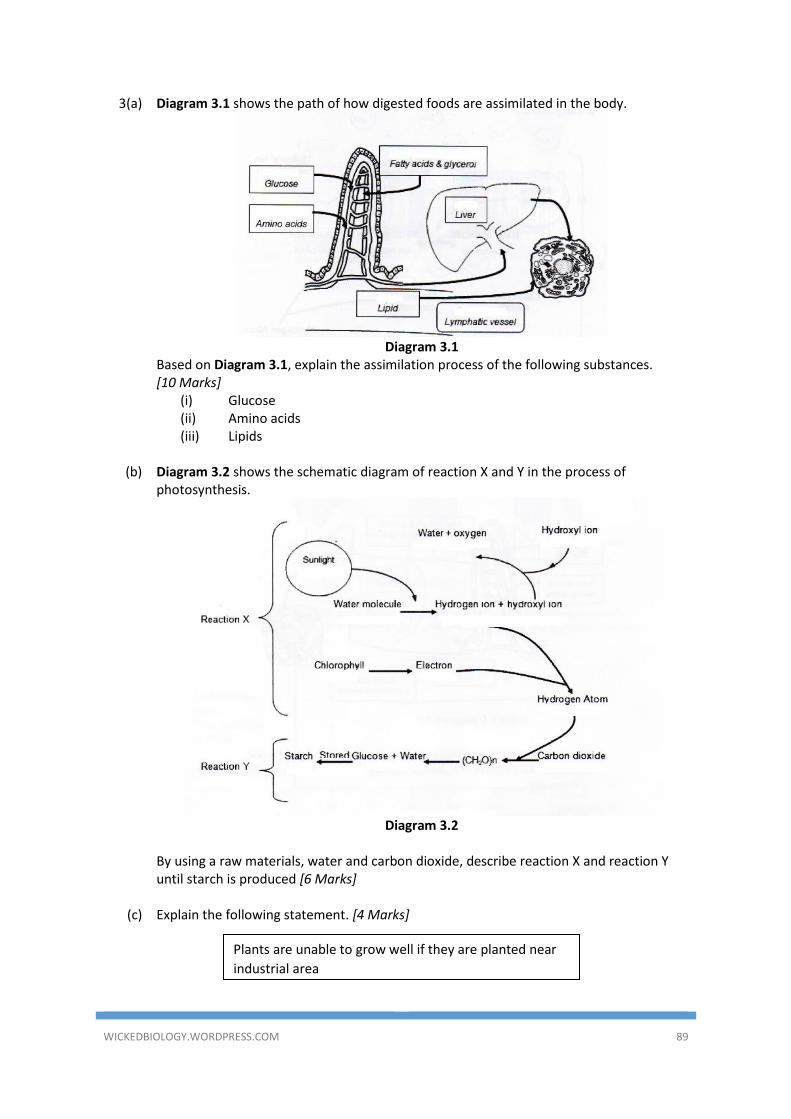
WICKEDBIOLOGY.WORDPRESS.COM 89
3(a) Diagram 3.1 shows the path of how digested foods are assimilated in the body.
Diagram 3.1
Based on Diagram 3.1, explain the assimilation process of the following substances. [10 Marks]
(i) Glucose (ii) Amino acids (iii) Lipids
(b) Diagram 3.2 shows the schematic diagram of reaction X and Y in the process of
photosynthesis.
Diagram 3.2
By using a raw materials, water and carbon dioxide, describe reaction X and reaction Y
until starch is produced [6 Marks]
(c) Explain the following statement. [4 Marks]
Plants are unable to grow well if they are planted near
industrial area
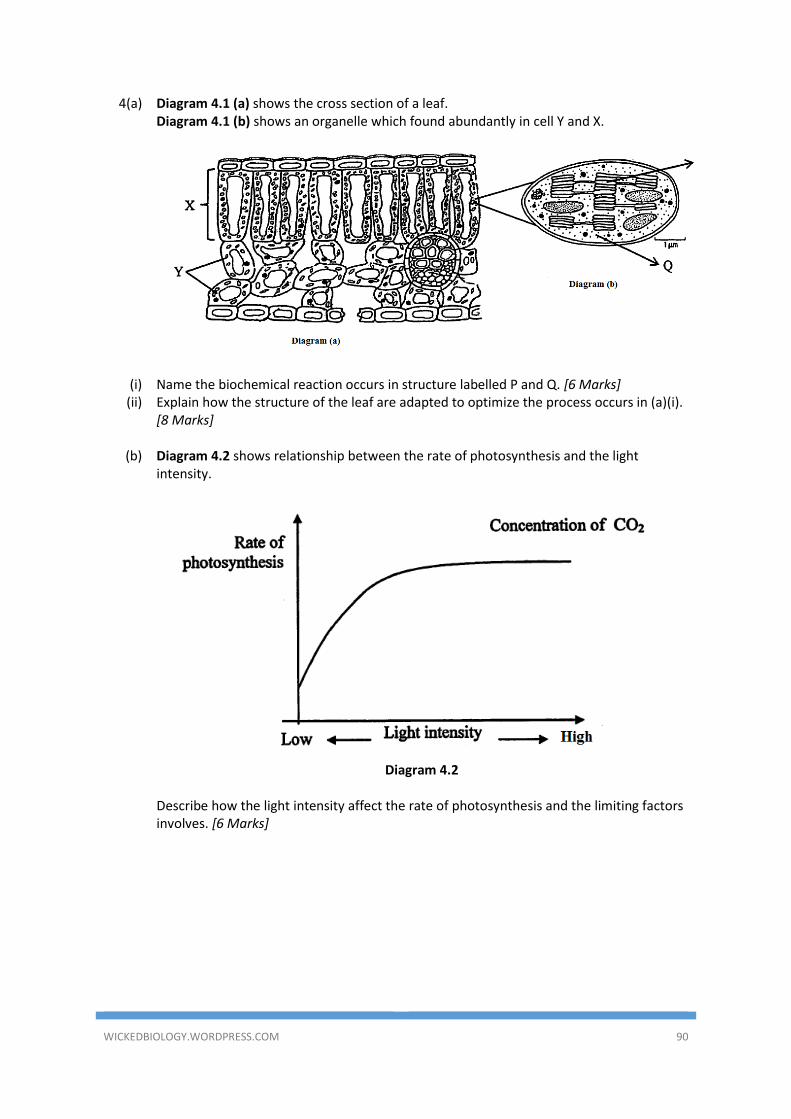
WICKEDBIOLOGY.WORDPRESS.COM 90
4(a) Diagram 4.1 (a) shows the cross section of a leaf. Diagram 4.1 (b) shows an organelle which found abundantly in cell Y and X.
(i) Name the biochemical reaction occurs in structure labelled P and Q. [6 Marks] (ii) Explain how the structure of the leaf are adapted to optimize the process occurs in (a)(i).
[8 Marks]
(b) Diagram 4.2 shows relationship between the rate of photosynthesis and the light intensity.
Diagram 4.2
Describe how the light intensity affect the rate of photosynthesis and the limiting factors
involves. [6 Marks]
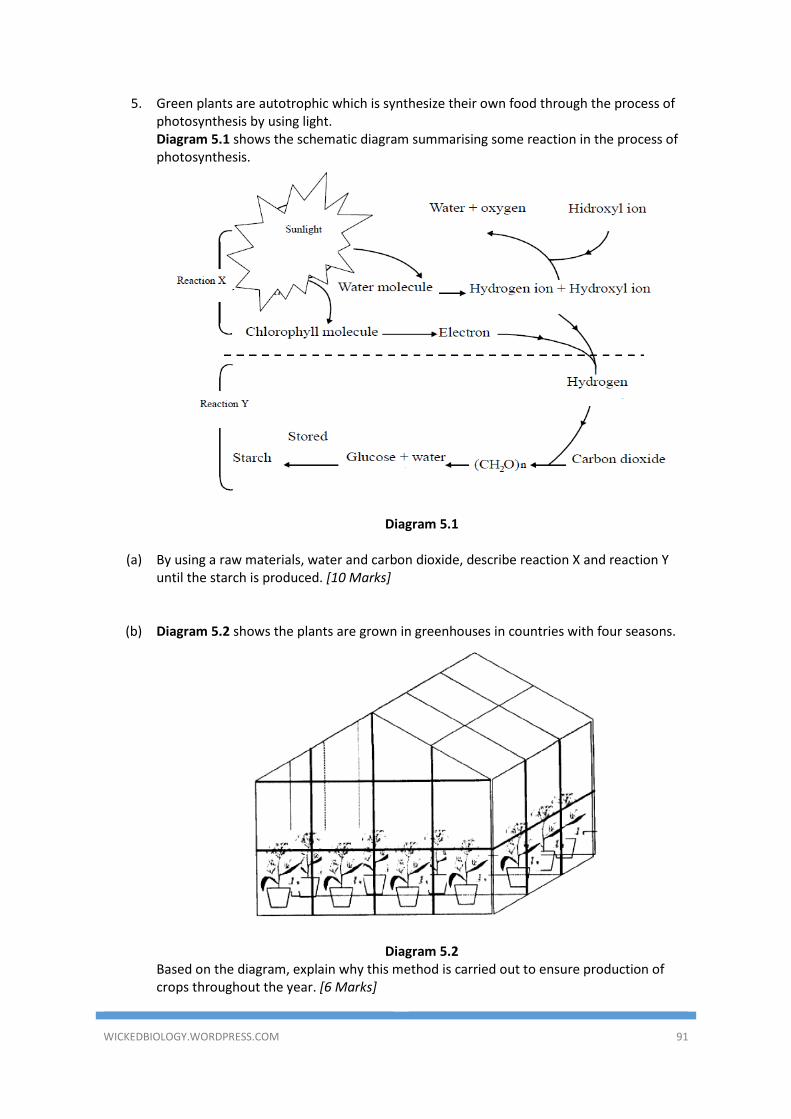
WICKEDBIOLOGY.WORDPRESS.COM 91
5. Green plants are autotrophic which is synthesize their own food through the process of photosynthesis by using light. Diagram 5.1 shows the schematic diagram summarising some reaction in the process of photosynthesis.
Diagram 5.1
(a) By using a raw materials, water and carbon dioxide, describe reaction X and reaction Y
until the starch is produced. [10 Marks]
(b) Diagram 5.2 shows the plants are grown in greenhouses in countries with four seasons.
Diagram 5.2 Based on the diagram, explain why this method is carried out to ensure production of
crops throughout the year. [6 Marks]
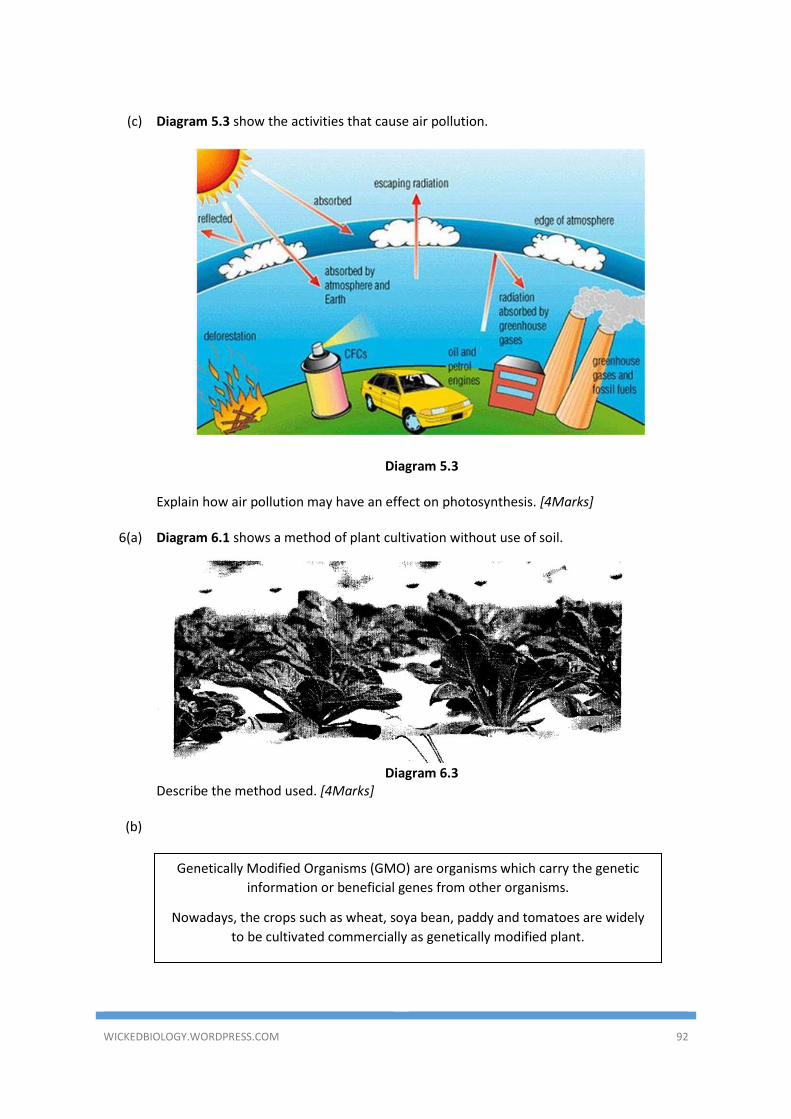
WICKEDBIOLOGY.WORDPRESS.COM 92
(c) Diagram 5.3 show the activities that cause air pollution.
Diagram 5.3
Explain how air pollution may have an effect on photosynthesis. [4Marks]
6(a) Diagram 6.1 shows a method of plant cultivation without use of soil.
Diagram 6.3
Describe the method used. [4Marks]
(b)
Genetically Modified Organisms (GMO) are organisms which carry the genetic
information or beneficial genes from other organisms.
Nowadays, the crops such as wheat, soya bean, paddy and tomatoes are widely
to be cultivated commercially as genetically modified plant.
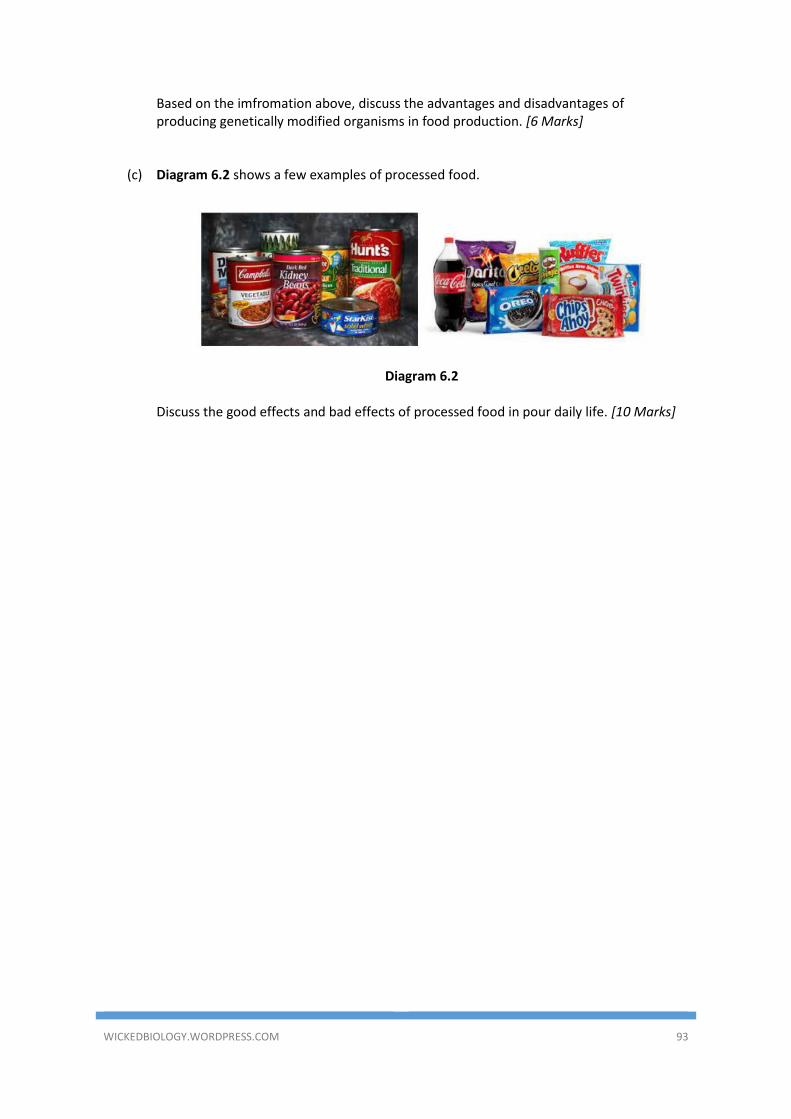
WICKEDBIOLOGY.WORDPRESS.COM 93
Based on the imfromation above, discuss the advantages and disadvantages of producing genetically modified organisms in food production. [6 Marks]
(c) Diagram 6.2 shows a few examples of processed food.
Diagram 6.2
Discuss the good effects and bad effects of processed food in pour daily life. [10 Marks]
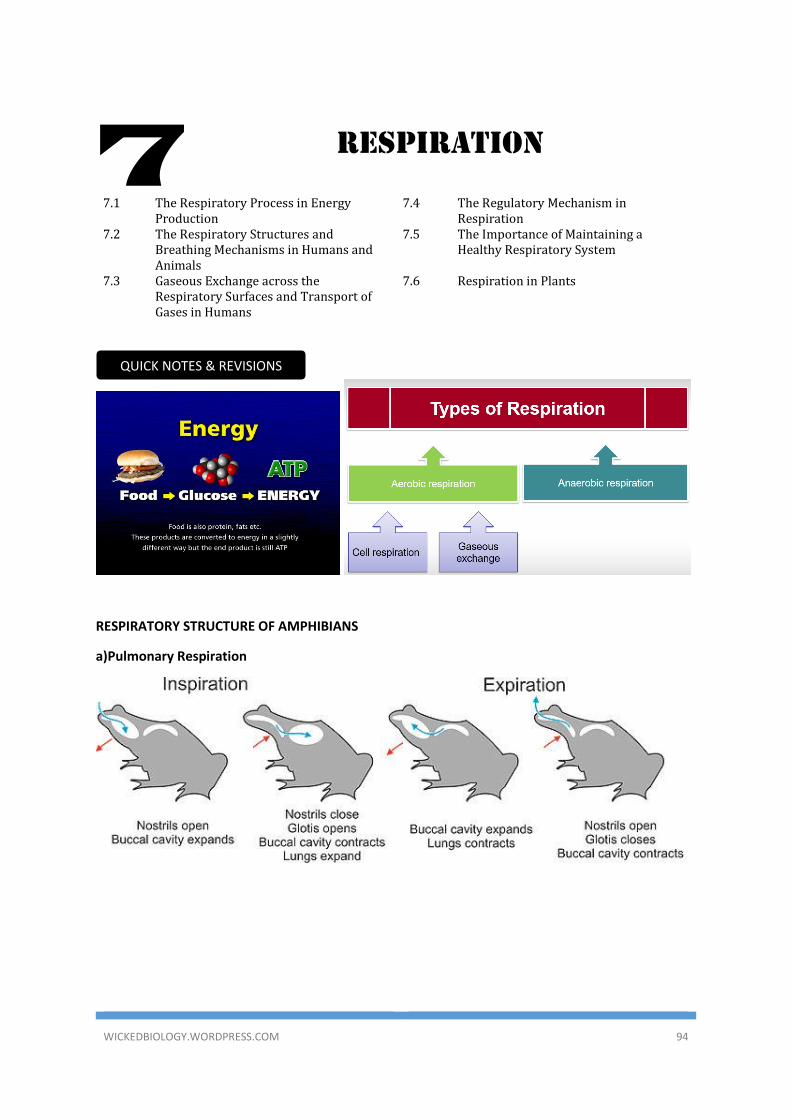
WICKEDBIOLOGY.WORDPRESS.COM 94
RESPIRATION
7.1 The Respiratory Process in Energy Production
7.4 The Regulatory Mechanism in Respiration
7.2 The Respiratory Structures and Breathing Mechanisms in Humans and Animals
7.5 The Importance of Maintaining a Healthy Respiratory System
7.3 Gaseous Exchange across the Respiratory Surfaces and Transport of Gases in Humans
7.6 Respiration in Plants
RESPIRATORY STRUCTURE OF AMPHIBIANS
a)Pulmonary Respiration
7
QUICK NOTES & REVISIONS
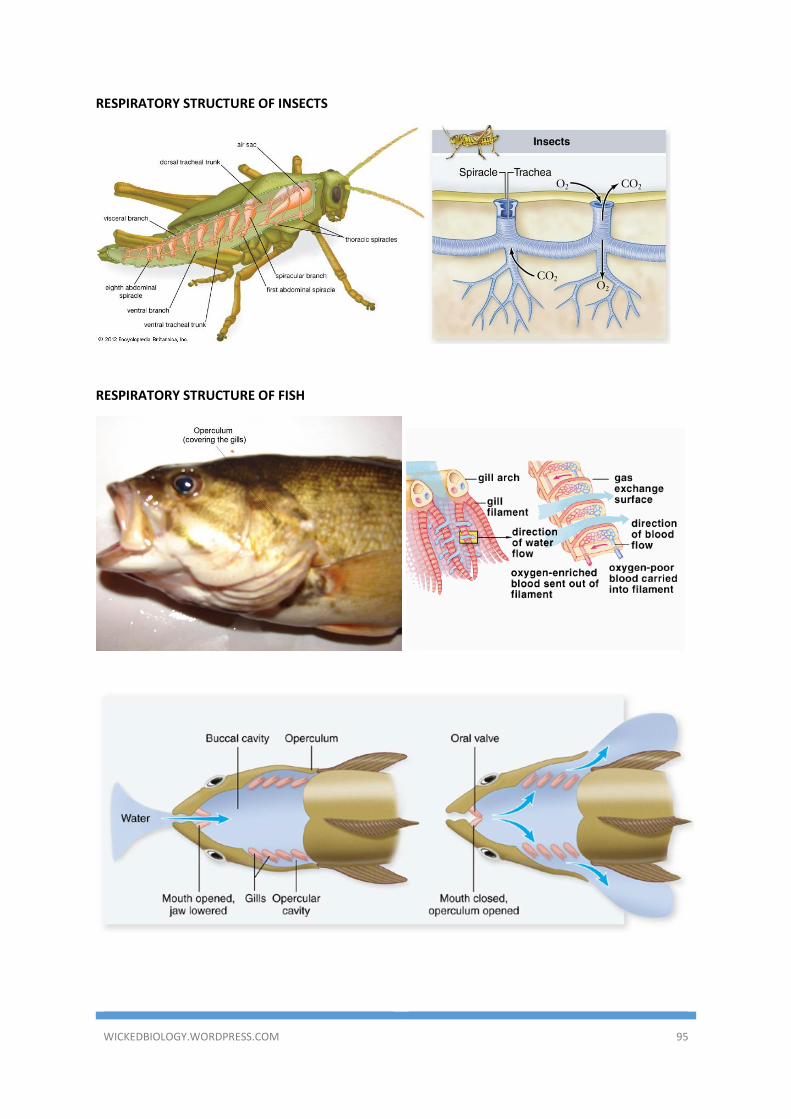
WICKEDBIOLOGY.WORDPRESS.COM 95
RESPIRATORY STRUCTURE OF INSECTS
RESPIRATORY STRUCTURE OF FISH
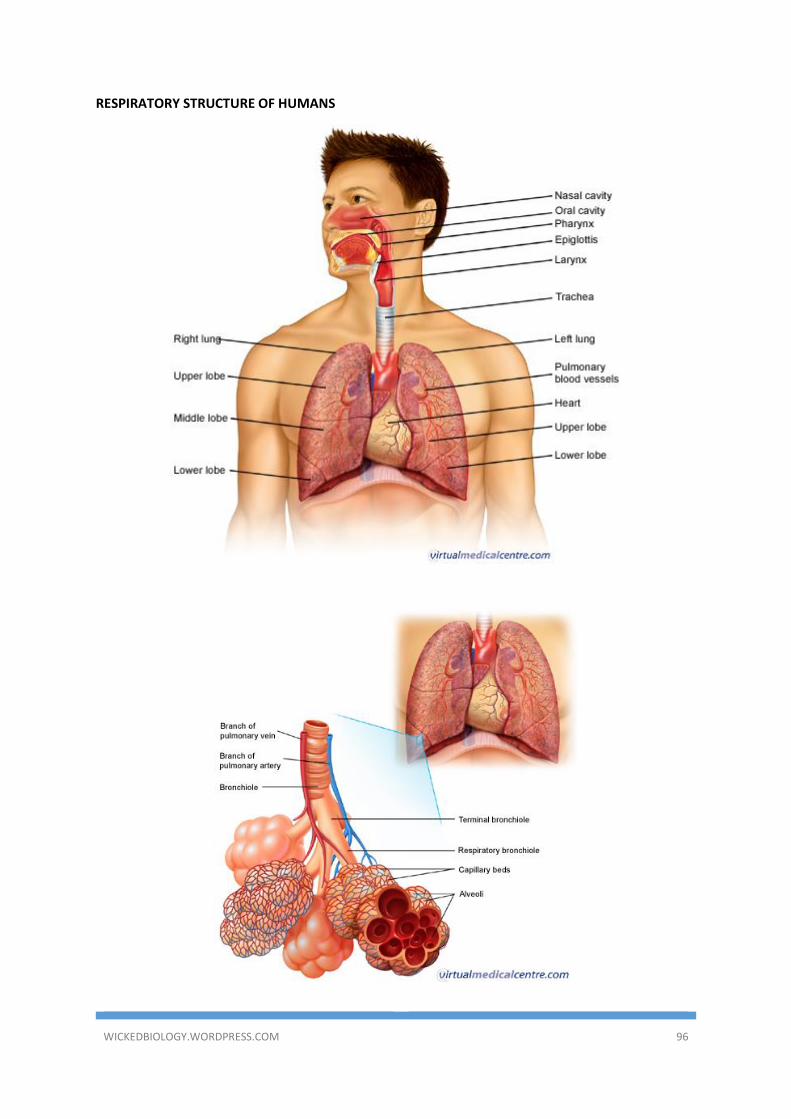
WICKEDBIOLOGY.WORDPRESS.COM 96
RESPIRATORY STRUCTURE OF HUMANS
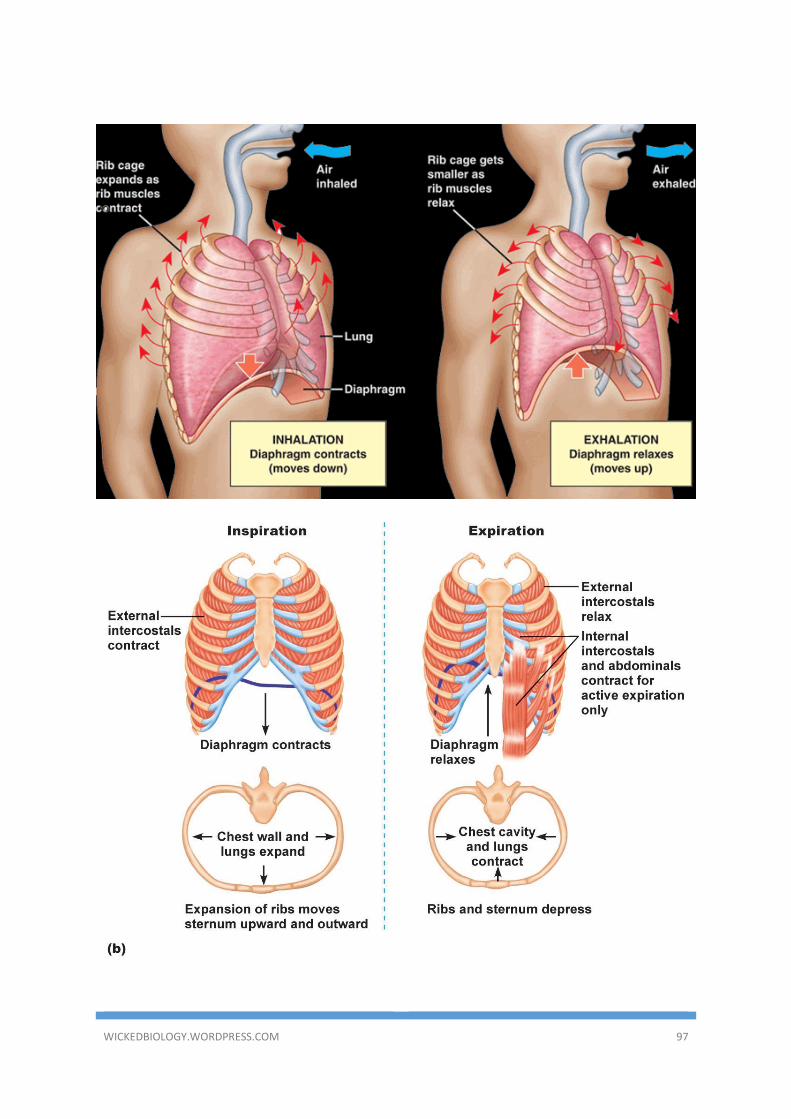
WICKEDBIOLOGY.WORDPRESS.COM 97
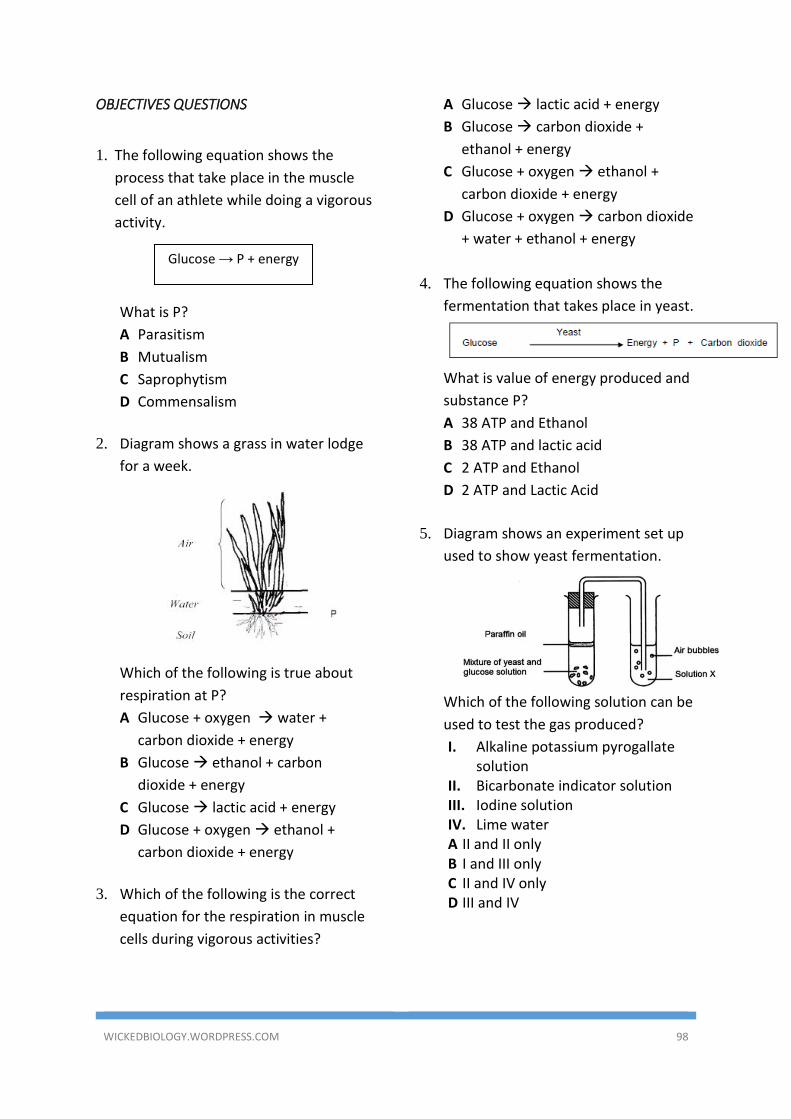
WICKEDBIOLOGY.WORDPRESS.COM 98
OBJECTIVES QUESTIONS
1. The following equation shows the
process that take place in the muscle
cell of an athlete while doing a vigorous
activity.
What is P?
A Parasitism
B Mutualism
C Saprophytism
D Commensalism
2. Diagram shows a grass in water lodge
for a week.
Which of the following is true about
respiration at P?
A Glucose + oxygen water +
carbon dioxide + energy
B Glucose ethanol + carbon
dioxide + energy
C Glucose lactic acid + energy
D Glucose + oxygen ethanol +
carbon dioxide + energy
3. Which of the following is the correct
equation for the respiration in muscle
cells during vigorous activities?
A Glucose lactic acid + energy
B Glucose carbon dioxide +
ethanol + energy
C Glucose + oxygen ethanol +
carbon dioxide + energy
D Glucose + oxygen carbon dioxide
+ water + ethanol + energy
4. The following equation shows the
fermentation that takes place in yeast.
What is value of energy produced and
substance P?
A 38 ATP and Ethanol
B 38 ATP and lactic acid
C 2 ATP and Ethanol
D 2 ATP and Lactic Acid
5. Diagram shows an experiment set up
used to show yeast fermentation.
Which of the following solution can be
used to test the gas produced?
I. Alkaline potassium pyrogallate solution
II. Bicarbonate indicator solution III. Iodine solution IV. Lime water A II and II only B I and III only C II and IV only D III and IV
Glucose → P + energy
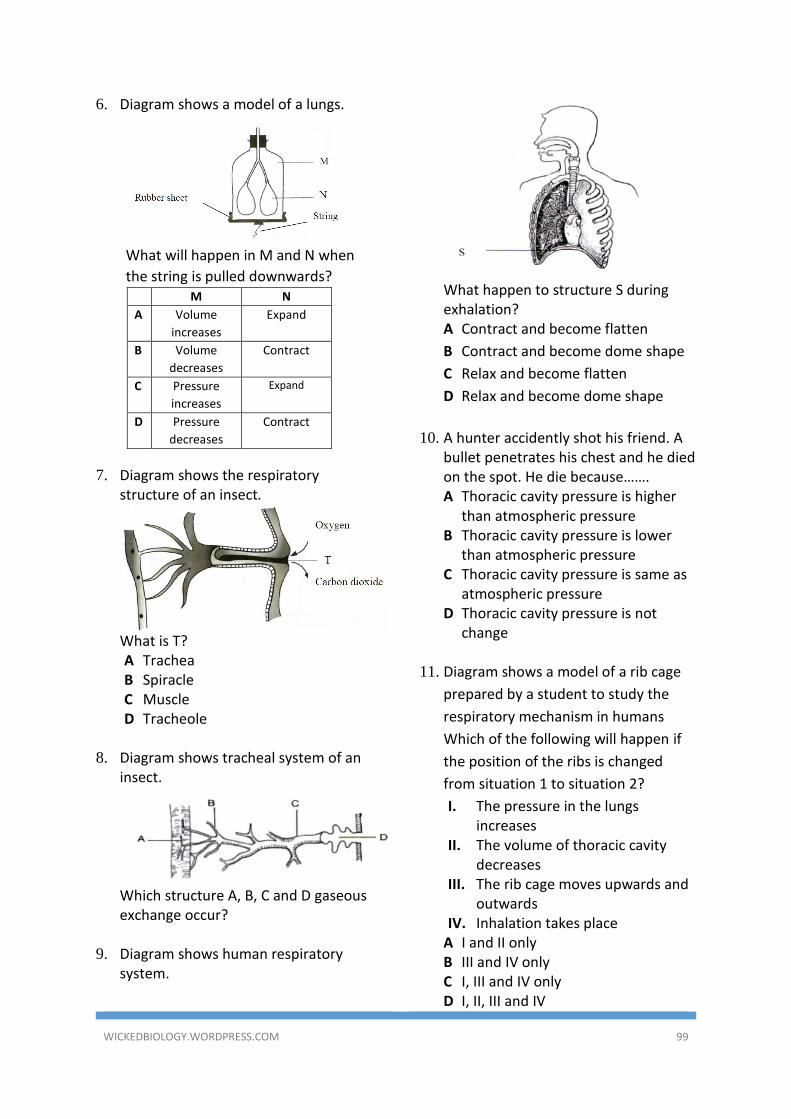
WICKEDBIOLOGY.WORDPRESS.COM 99
6. Diagram shows a model of a lungs.
What will happen in M and N when
the string is pulled downwards? M N
A Volume
increases
Expand
B Volume
decreases
Contract
C Pressure
increases
Expand
D Pressure
decreases
Contract
7. Diagram shows the respiratory structure of an insect.
What is T? A Trachea B Spiracle C Muscle D Tracheole
8. Diagram shows tracheal system of an
insect.
Which structure A, B, C and D gaseous exchange occur?
9. Diagram shows human respiratory
system.
What happen to structure S during exhalation? A Contract and become flatten
B Contract and become dome shape
C Relax and become flatten
D Relax and become dome shape
10. A hunter accidently shot his friend. A
bullet penetrates his chest and he died on the spot. He die because……. A Thoracic cavity pressure is higher
than atmospheric pressure B Thoracic cavity pressure is lower
than atmospheric pressure C Thoracic cavity pressure is same as
atmospheric pressure D Thoracic cavity pressure is not
change 11. Diagram shows a model of a rib cage
prepared by a student to study the
respiratory mechanism in humans
Which of the following will happen if
the position of the ribs is changed
from situation 1 to situation 2?
I. The pressure in the lungs increases
II. The volume of thoracic cavity decreases
III. The rib cage moves upwards and outwards
IV. Inhalation takes place A I and II only B III and IV only C I, III and IV only D I, II, III and IV
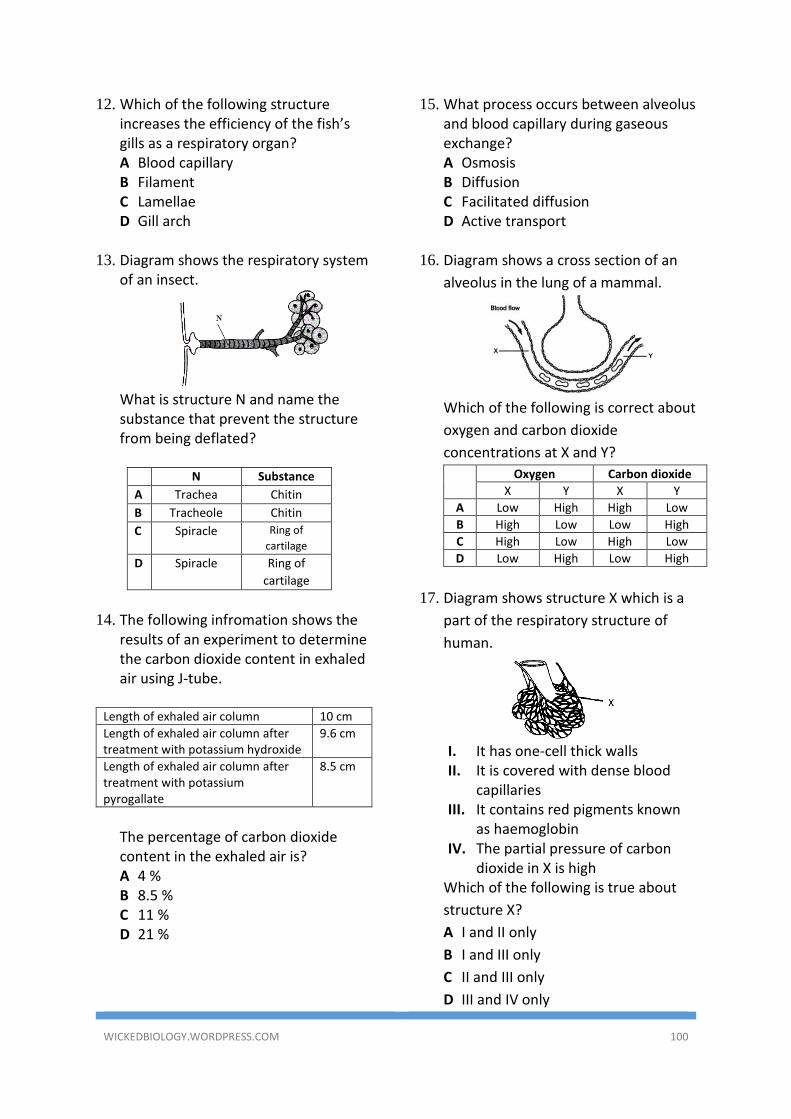
WICKEDBIOLOGY.WORDPRESS.COM 100
12. Which of the following structure increases the efficiency of the fish’s gills as a respiratory organ? A Blood capillary B Filament C Lamellae D Gill arch
13. Diagram shows the respiratory system
of an insect.
What is structure N and name the substance that prevent the structure from being deflated?
N Substance
A Trachea Chitin
B Tracheole Chitin
C Spiracle Ring of
cartilage
D Spiracle Ring of
cartilage
14. The following infromation shows the
results of an experiment to determine the carbon dioxide content in exhaled air using J-tube.
Length of exhaled air column 10 cm
Length of exhaled air column after treatment with potassium hydroxide
9.6 cm
Length of exhaled air column after treatment with potassium pyrogallate
8.5 cm
The percentage of carbon dioxide content in the exhaled air is? A 4 % B 8.5 % C 11 % D 21 %
15. What process occurs between alveolus and blood capillary during gaseous exchange? A Osmosis B Diffusion C Facilitated diffusion D Active transport
16. Diagram shows a cross section of an
alveolus in the lung of a mammal.
Which of the following is correct about
oxygen and carbon dioxide
concentrations at X and Y?
Oxygen Carbon dioxide
X Y X Y
A Low High High Low
B High Low Low High
C High Low High Low
D Low High Low High
17. Diagram shows structure X which is a
part of the respiratory structure of
human.
I. It has one-cell thick walls II. It is covered with dense blood
capillaries III. It contains red pigments known
as haemoglobin IV. The partial pressure of carbon
dioxide in X is high Which of the following is true about
structure X?
A I and II only
B I and III only
C II and III only
D III and IV only
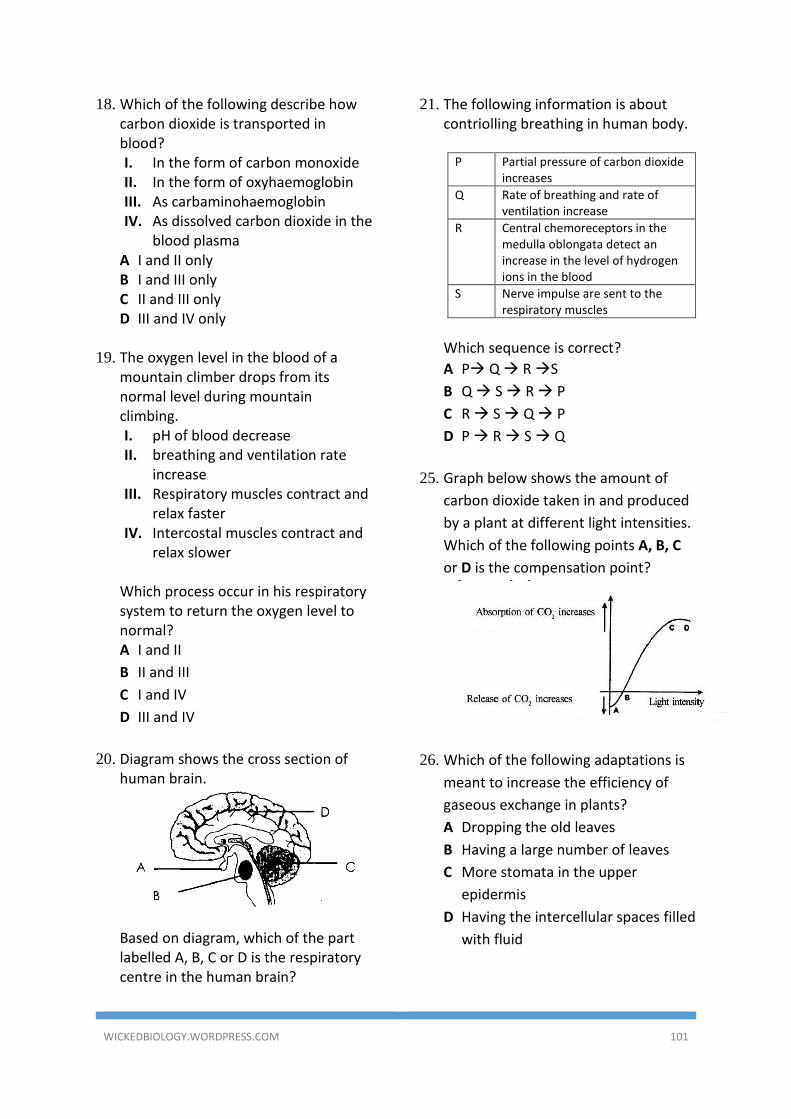
WICKEDBIOLOGY.WORDPRESS.COM 101
18. Which of the following describe how carbon dioxide is transported in blood? I. In the form of carbon monoxide II. In the form of oxyhaemoglobin III. As carbaminohaemoglobin IV. As dissolved carbon dioxide in the
blood plasma A I and II only B I and III only C II and III only D III and IV only
19. The oxygen level in the blood of a
mountain climber drops from its normal level during mountain climbing. I. pH of blood decrease II. breathing and ventilation rate
increase III. Respiratory muscles contract and
relax faster IV. Intercostal muscles contract and
relax slower
Which process occur in his respiratory system to return the oxygen level to normal? A I and II
B II and III
C I and IV
D III and IV
20. Diagram shows the cross section of
human brain.
Based on diagram, which of the part labelled A, B, C or D is the respiratory centre in the human brain?
21. The following information is about contriolling breathing in human body.
P Partial pressure of carbon dioxide increases
Q Rate of breathing and rate of ventilation increase
R Central chemoreceptors in the medulla oblongata detect an increase in the level of hydrogen ions in the blood
S Nerve impulse are sent to the respiratory muscles
Which sequence is correct?
A P Q R S
B Q S R P
C R S Q P
D P R S Q
25. Graph below shows the amount of
carbon dioxide taken in and produced
by a plant at different light intensities.
Which of the following points A, B, C
or D is the compensation point?
26. Which of the following adaptations is
meant to increase the efficiency of
gaseous exchange in plants?
A Dropping the old leaves
B Having a large number of leaves
C More stomata in the upper
epidermis
D Having the intercellular spaces filled
with fluid
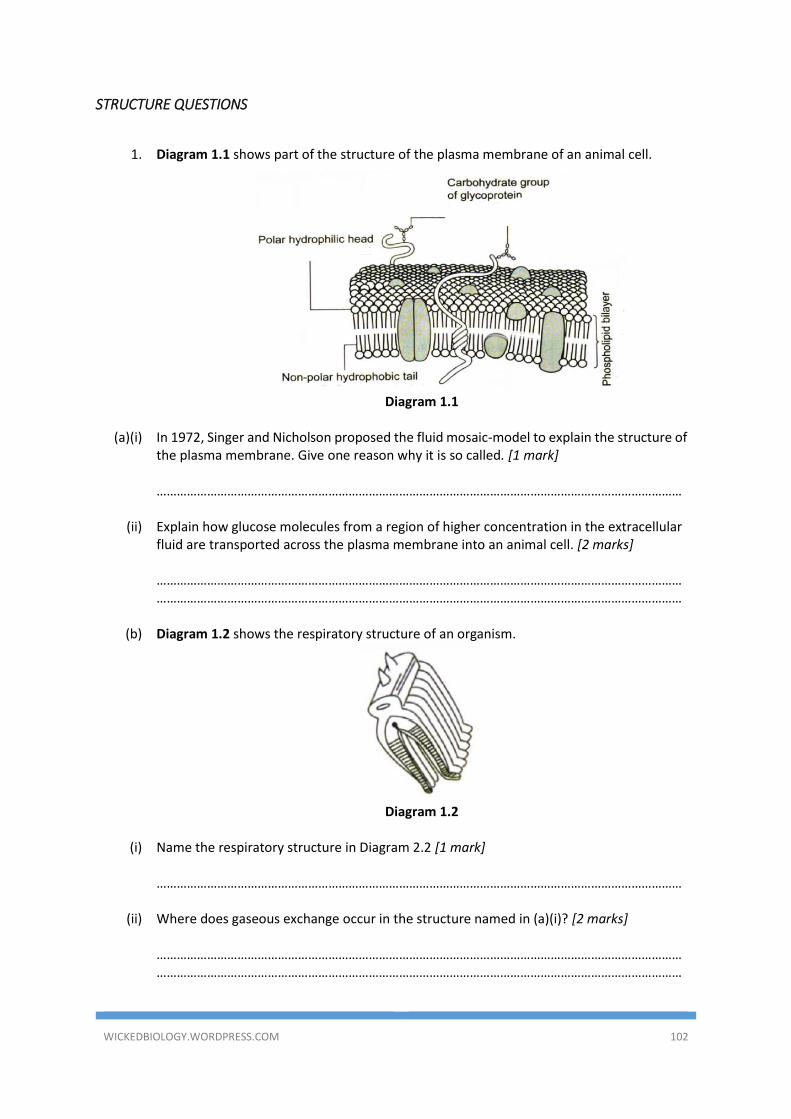
WICKEDBIOLOGY.WORDPRESS.COM 102
STRUCTURE QUESTIONS
1. Diagram 1.1 shows part of the structure of the plasma membrane of an animal cell.
Diagram 1.1
(a)(i) In 1972, Singer and Nicholson proposed the fluid mosaic-model to explain the structure of
the plasma membrane. Give one reason why it is so called. [1 mark] …………………………………………………………………………………………………………………………………………
(ii) Explain how glucose molecules from a region of higher concentration in the extracellular
fluid are transported across the plasma membrane into an animal cell. [2 marks] ……………………………………………………………………………………………………………………………………………………………………………………………………………………………………………………………………………………
(b) Diagram 1.2 shows the respiratory structure of an organism.
Diagram 1.2
(i) Name the respiratory structure in Diagram 2.2 [1 mark]
…………………………………………………………………………………………………………………………………………
(ii) Where does gaseous exchange occur in the structure named in (a)(i)? [2 marks]
……………………………………………………………………………………………………………………………………………………………………………………………………………………………………………………………………………………
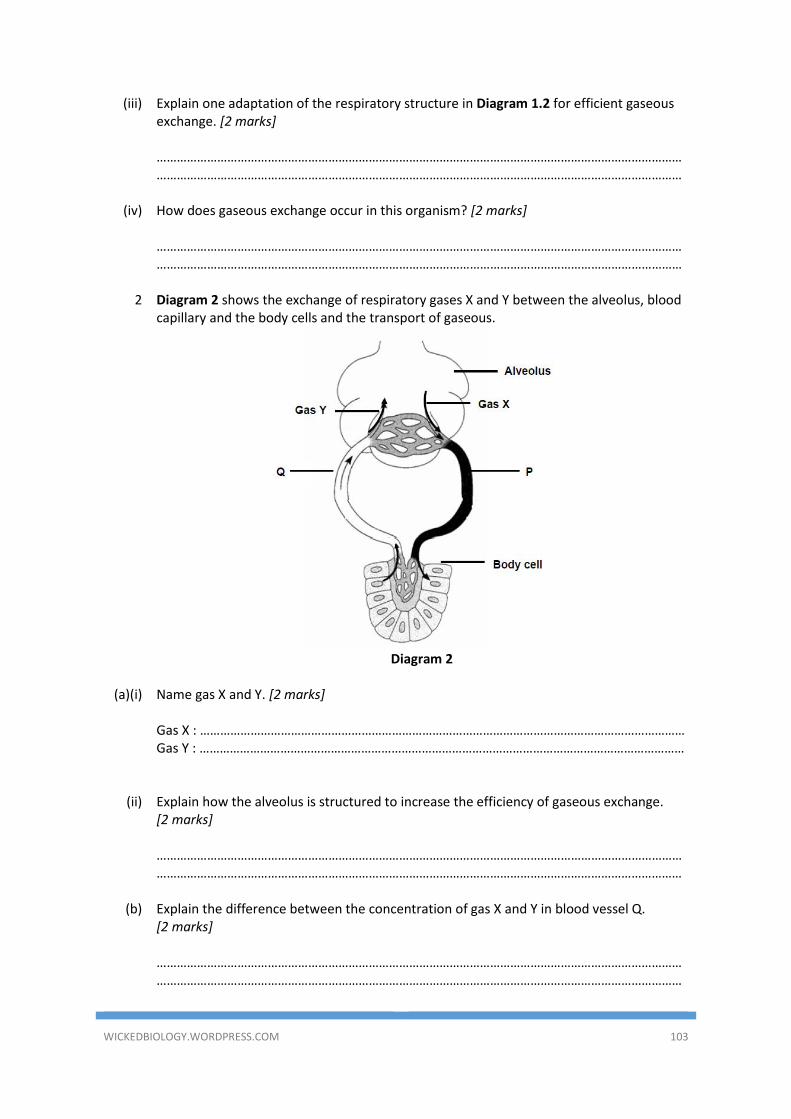
WICKEDBIOLOGY.WORDPRESS.COM 103
(iii) Explain one adaptation of the respiratory structure in Diagram 1.2 for efficient gaseous exchange. [2 marks] ……………………………………………………………………………………………………………………………………………………………………………………………………………………………………………………………………………………
(iv) How does gaseous exchange occur in this organism? [2 marks]
……………………………………………………………………………………………………………………………………………………………………………………………………………………………………………………………………………………
2 Diagram 2 shows the exchange of respiratory gases X and Y between the alveolus, blood
capillary and the body cells and the transport of gaseous.
Diagram 2
(a)(i) Name gas X and Y. [2 marks]
Gas X : ……………………………………………………………………………………………………………………………… Gas Y : ………………………………………………………………………………………………………………………………
(ii) Explain how the alveolus is structured to increase the efficiency of gaseous exchange.
[2 marks] ……………………………………………………………………………………………………………………………………………………………………………………………………………………………………………………………………………………
(b) Explain the difference between the concentration of gas X and Y in blood vessel Q.
[2 marks] ……………………………………………………………………………………………………………………………………………………………………………………………………………………………………………………………………………………
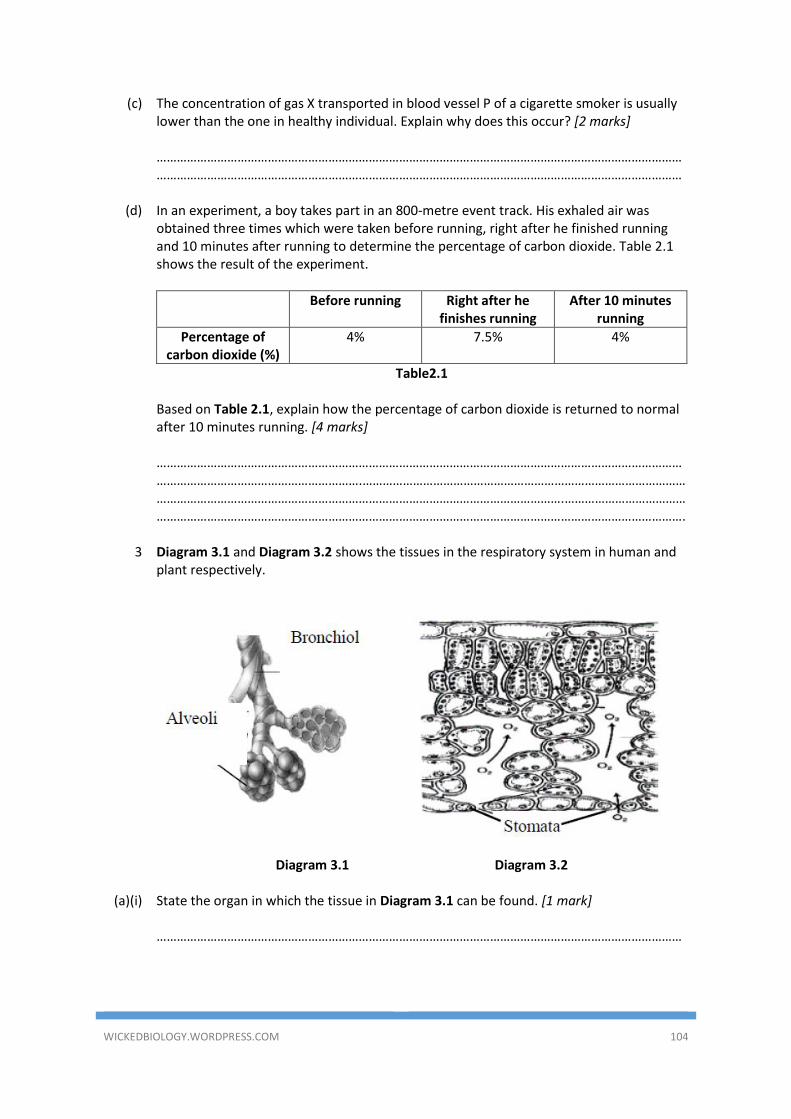
WICKEDBIOLOGY.WORDPRESS.COM 104
(c) The concentration of gas X transported in blood vessel P of a cigarette smoker is usually lower than the one in healthy individual. Explain why does this occur? [2 marks] ……………………………………………………………………………………………………………………………………………………………………………………………………………………………………………………………………………………
(d) In an experiment, a boy takes part in an 800-metre event track. His exhaled air was obtained three times which were taken before running, right after he finished running and 10 minutes after running to determine the percentage of carbon dioxide. Table 2.1 shows the result of the experiment.
Before running Right after he finishes running
After 10 minutes running
Percentage of carbon dioxide (%)
4% 7.5% 4%
Table2.1 Based on Table 2.1, explain how the percentage of carbon dioxide is returned to normal
after 10 minutes running. [4 marks] ……………………………………………………………………………………………………………………………………………………………………………………………….……………………………………………………………………………………………………………………………………………………………………………………………….………………………………………………………………………………………………………………………………………………………………………….
3 Diagram 3.1 and Diagram 3.2 shows the tissues in the respiratory system in human and
plant respectively.
Diagram 3.1 Diagram 3.2
(a)(i) State the organ in which the tissue in Diagram 3.1 can be found. [1 mark] …………………………………………………………………………………………………………………………………………
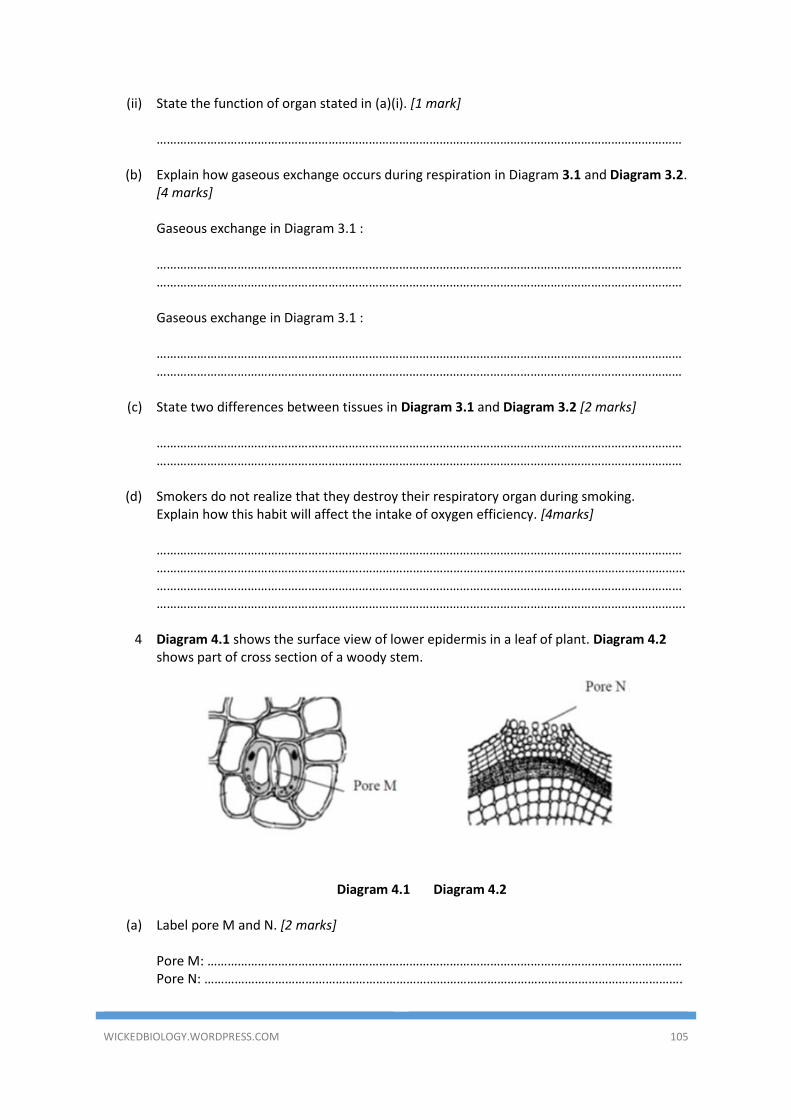
WICKEDBIOLOGY.WORDPRESS.COM 105
(ii) State the function of organ stated in (a)(i). [1 mark] …………………………………………………………………………………………………………………………………………
(b) Explain how gaseous exchange occurs during respiration in Diagram 3.1 and Diagram 3.2.
[4 marks] Gaseous exchange in Diagram 3.1 : …………………………………………………………………………………………………………………………………………………………………………………………………………………………………………………………………………………… Gaseous exchange in Diagram 3.1 : ……………………………………………………………………………………………………………………………………………………………………………………………………………………………………………………………………………………
(c) State two differences between tissues in Diagram 3.1 and Diagram 3.2 [2 marks] ……………………………………………………………………………………………………………………………………………………………………………………………………………………………………………………………………………………
(d) Smokers do not realize that they destroy their respiratory organ during smoking.
Explain how this habit will affect the intake of oxygen efficiency. [4marks] ……………………………………………………………………………………………………………………………………………………………………………………………….………………………………………………………………………………………………………………………………………………………………………………………………………………………………………………………………………………………………………………………………………………………………………….
4 Diagram 4.1 shows the surface view of lower epidermis in a leaf of plant. Diagram 4.2
shows part of cross section of a woody stem.
Diagram 4.1 Diagram 4.2
(a) Label pore M and N. [2 marks]
Pore M: …………………………………………………………………………………………………………………………… Pore N: …………………………………………………………………………………………………………………………….
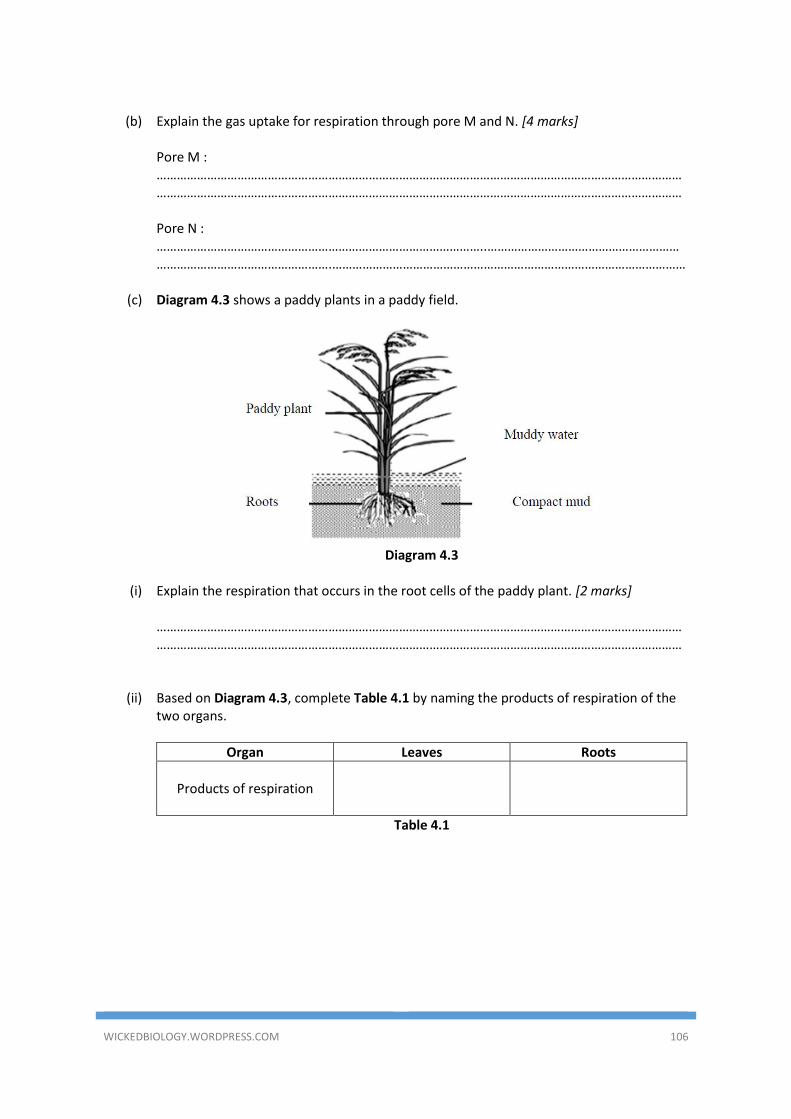
WICKEDBIOLOGY.WORDPRESS.COM 106
(b) Explain the gas uptake for respiration through pore M and N. [4 marks]
Pore M : …………………………………………………………………………………………………………………………………………………………………………………………………………………………………………………………………………………… Pore N : ……………………………………………………………………………………..……………………………………………………………………………………………….……………………………………………………………………………………………
(c) Diagram 4.3 shows a paddy plants in a paddy field.
Diagram 4.3
(i) Explain the respiration that occurs in the root cells of the paddy plant. [2 marks]
……………………………………………………………………………………………………………………………………………………………………………………………………………………………………………………………………………………
(ii) Based on Diagram 4.3, complete Table 4.1 by naming the products of respiration of the
two organs.
Organ Leaves Roots
Products of respiration
Table 4.1
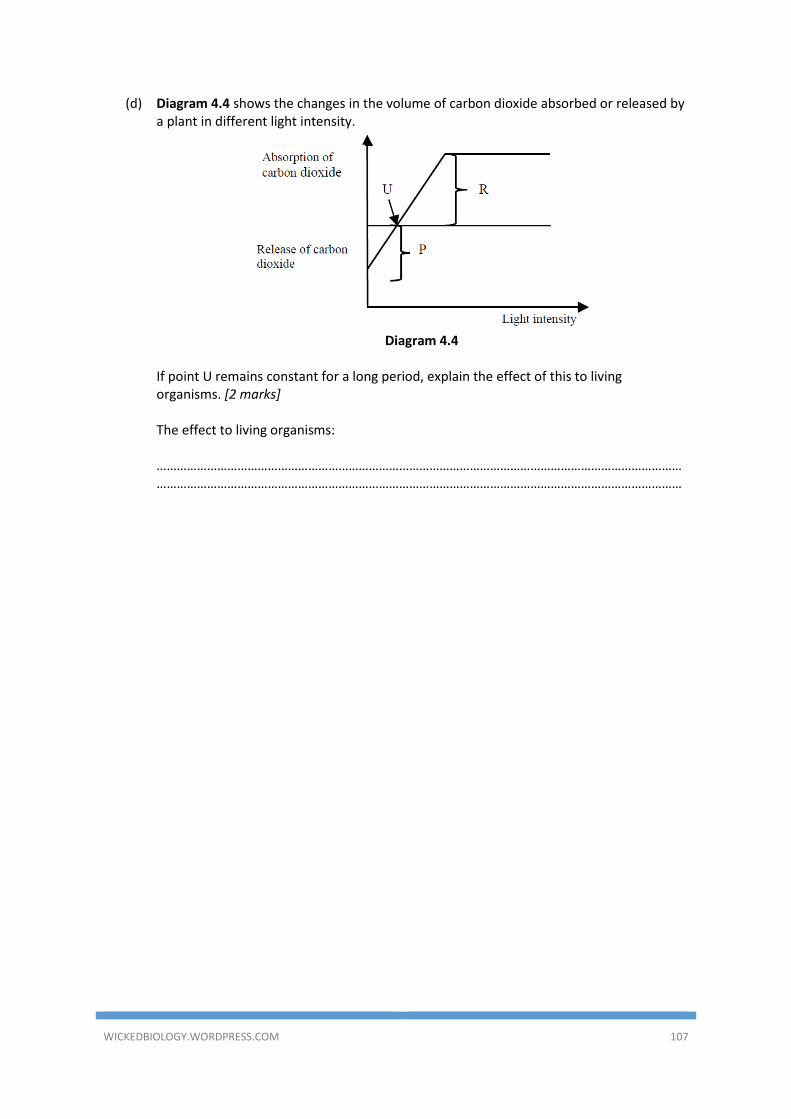
WICKEDBIOLOGY.WORDPRESS.COM 107
(d) Diagram 4.4 shows the changes in the volume of carbon dioxide absorbed or released by a plant in different light intensity.
Diagram 4.4
If point U remains constant for a long period, explain the effect of this to living
organisms. [2 marks] The effect to living organisms: ……………………………………………………………………………………………………………………………………………………………………………………………………………………………………………………………………………………
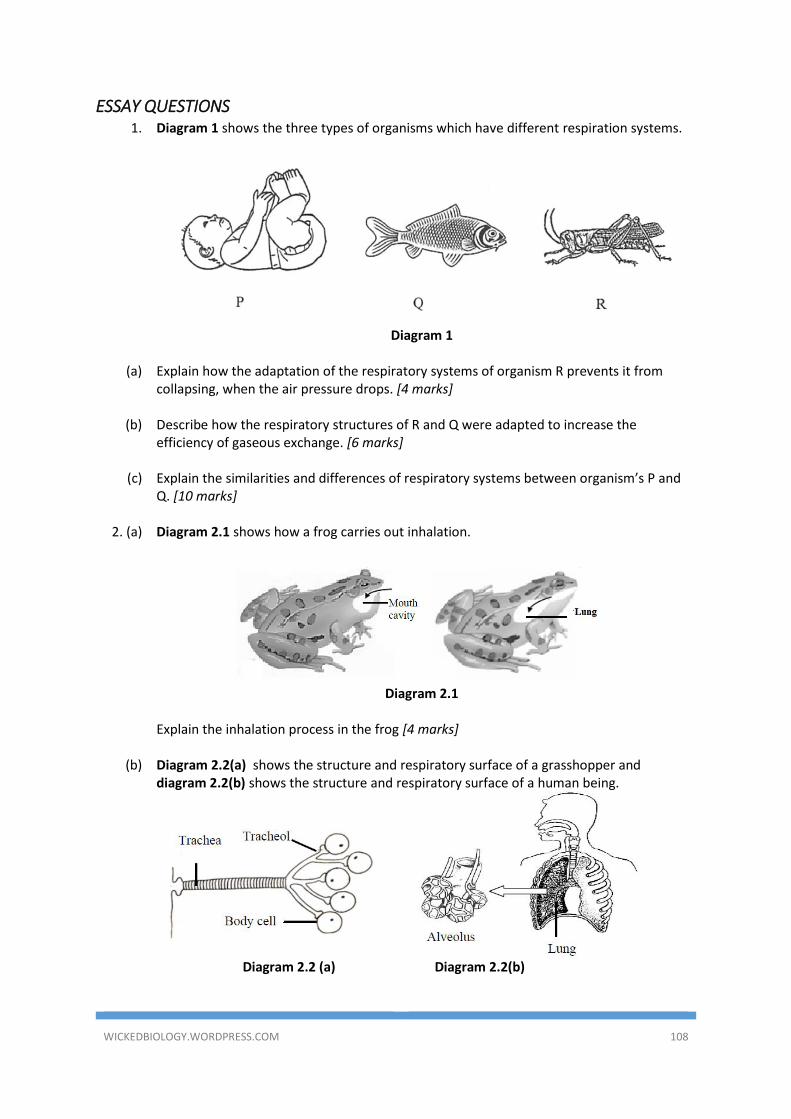
WICKEDBIOLOGY.WORDPRESS.COM 108
ESSAY QUESTIONS 1. Diagram 1 shows the three types of organisms which have different respiration systems.
Diagram 1
(a) Explain how the adaptation of the respiratory systems of organism R prevents it from
collapsing, when the air pressure drops. [4 marks]
(b) Describe how the respiratory structures of R and Q were adapted to increase the efficiency of gaseous exchange. [6 marks]
(c) Explain the similarities and differences of respiratory systems between organism’s P and
Q. [10 marks]
2. (a) Diagram 2.1 shows how a frog carries out inhalation.
Diagram 2.1
Explain the inhalation process in the frog [4 marks]
(b) Diagram 2.2(a) shows the structure and respiratory surface of a grasshopper and
diagram 2.2(b) shows the structure and respiratory surface of a human being.
Diagram 2.2 (a) Diagram 2.2(b)
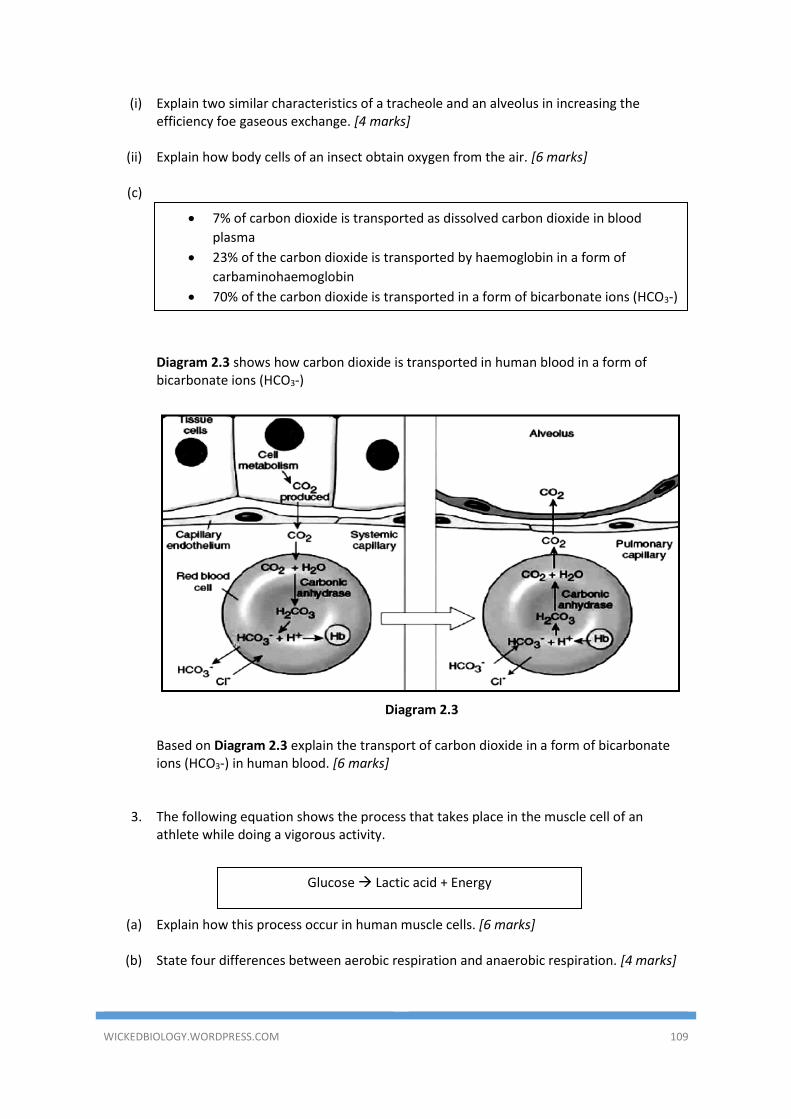
WICKEDBIOLOGY.WORDPRESS.COM 109
(i) Explain two similar characteristics of a tracheole and an alveolus in increasing the efficiency foe gaseous exchange. [4 marks]
(ii) Explain how body cells of an insect obtain oxygen from the air. [6 marks]
(c)
Diagram 2.3 shows how carbon dioxide is transported in human blood in a form of
bicarbonate ions (HCO3-)
Diagram 2.3
Based on Diagram 2.3 explain the transport of carbon dioxide in a form of bicarbonate
ions (HCO3-) in human blood. [6 marks]
3. The following equation shows the process that takes place in the muscle cell of an
athlete while doing a vigorous activity.
(a) Explain how this process occur in human muscle cells. [6 marks]
(b) State four differences between aerobic respiration and anaerobic respiration. [4 marks]
Glucose Lactic acid + Energy
• 7% of carbon dioxide is transported as dissolved carbon dioxide in blood
plasma
• 23% of the carbon dioxide is transported by haemoglobin in a form of
carbaminohaemoglobin
• 70% of the carbon dioxide is transported in a form of bicarbonate ions (HCO3-)
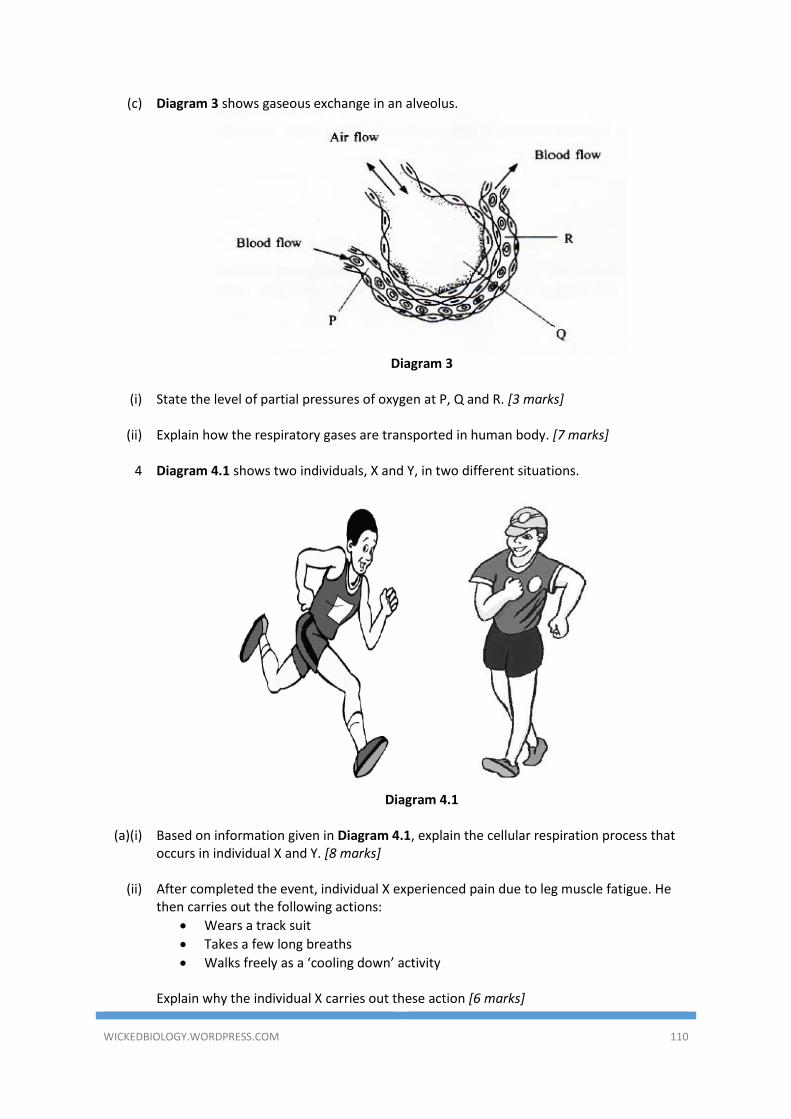
WICKEDBIOLOGY.WORDPRESS.COM 110
(c) Diagram 3 shows gaseous exchange in an alveolus.
Diagram 3
(i) State the level of partial pressures of oxygen at P, Q and R. [3 marks]
(ii) Explain how the respiratory gases are transported in human body. [7 marks]
4 Diagram 4.1 shows two individuals, X and Y, in two different situations.
Diagram 4.1
(a)(i) Based on information given in Diagram 4.1, explain the cellular respiration process that
occurs in individual X and Y. [8 marks]
(ii) After completed the event, individual X experienced pain due to leg muscle fatigue. He then carries out the following actions:
• Wears a track suit
• Takes a few long breaths
• Walks freely as a ‘cooling down’ activity Explain why the individual X carries out these action [6 marks]
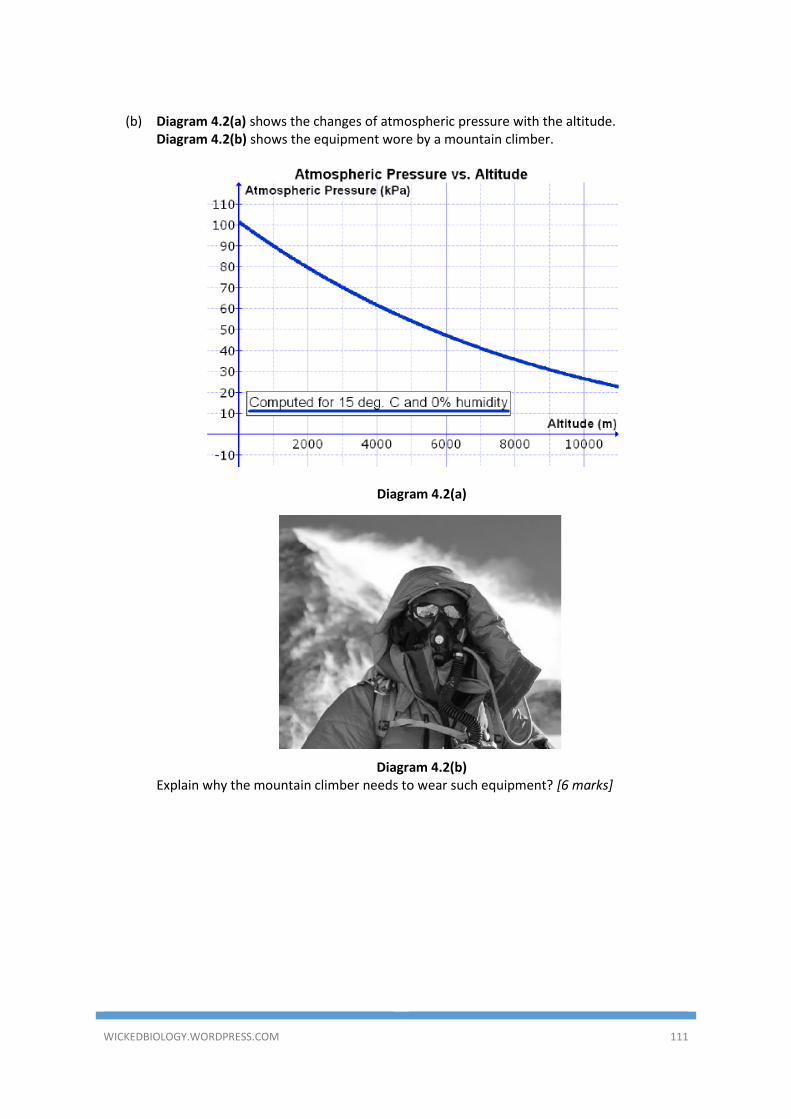
WICKEDBIOLOGY.WORDPRESS.COM 111
(b) Diagram 4.2(a) shows the changes of atmospheric pressure with the altitude.
Diagram 4.2(b) shows the equipment wore by a mountain climber.
Diagram 4.2(a)
Diagram 4.2(b)
Explain why the mountain climber needs to wear such equipment? [6 marks]
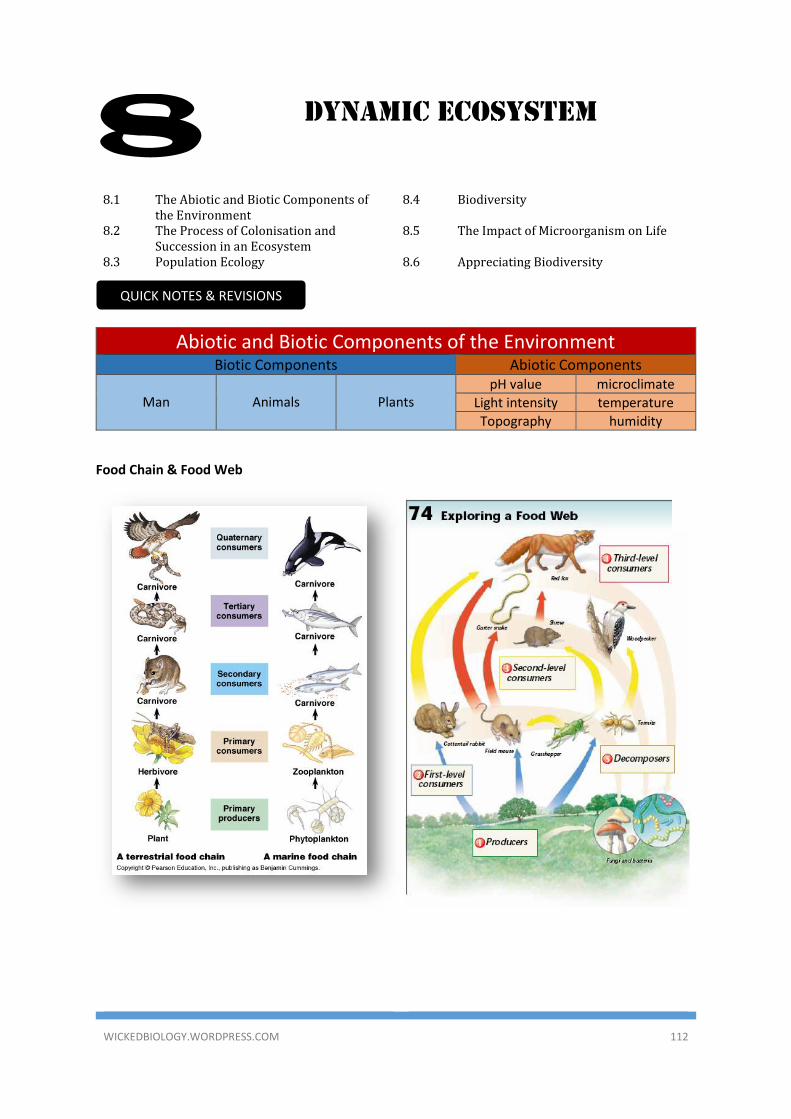
WICKEDBIOLOGY.WORDPRESS.COM 112
DYNAMIC ECOSYSTEM
8.1 The Abiotic and Biotic Components of the Environment
8.4 Biodiversity
8.2 The Process of Colonisation and Succession in an Ecosystem
8.5 The Impact of Microorganism on Life
8.3 Population Ecology 8.6 Appreciating Biodiversity
Abiotic and Biotic Components of the Environment
Biotic Components Abiotic Components
Man
Animals
Plants
pH value microclimate
Light intensity temperature
Topography humidity
Food Chain & Food Web
8
QUICK NOTES & REVISIONS
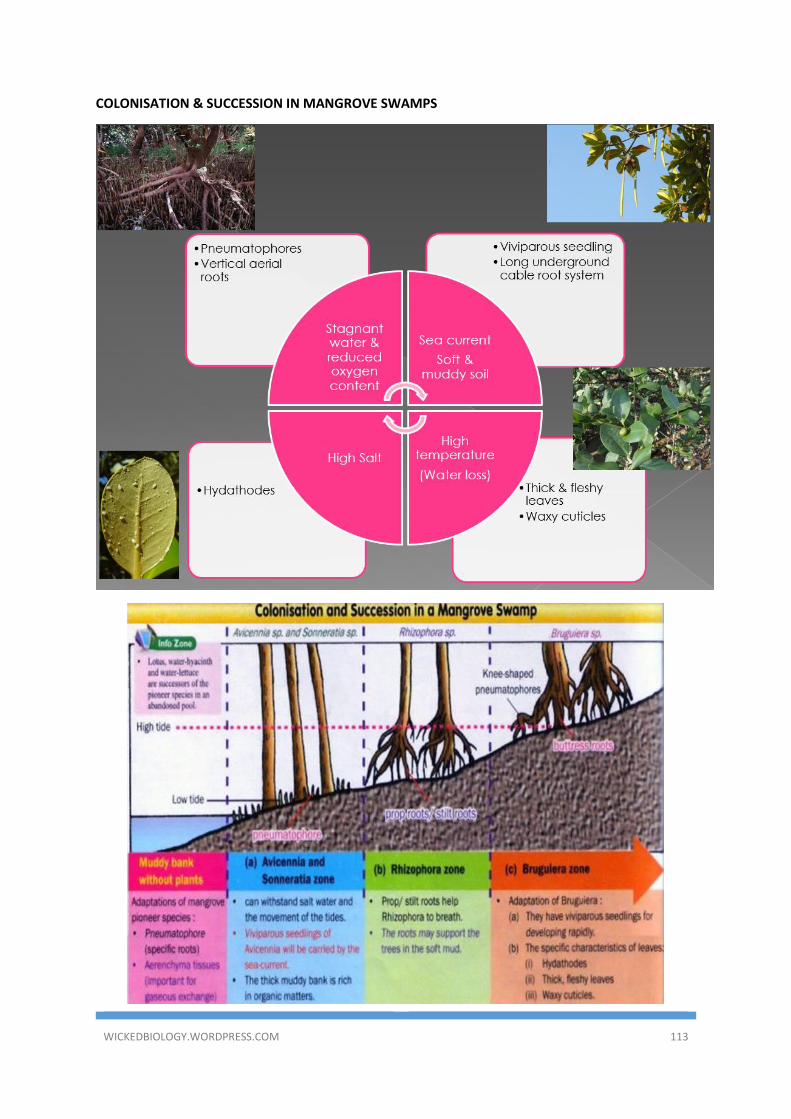
WICKEDBIOLOGY.WORDPRESS.COM 113
COLONISATION & SUCCESSION IN MANGROVE SWAMPS
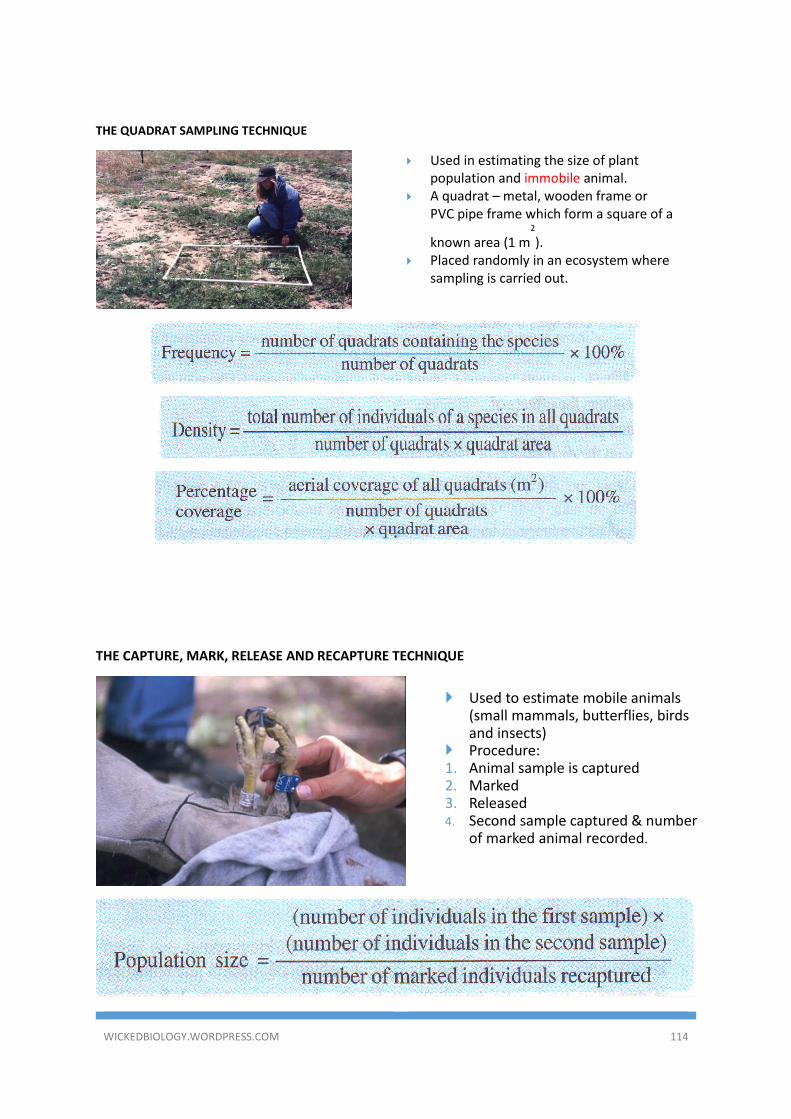
WICKEDBIOLOGY.WORDPRESS.COM 114
THE QUADRAT SAMPLING TECHNIQUE
THE CAPTURE, MARK, RELEASE AND RECAPTURE TECHNIQUE
Used in estimating the size of plant population and immobile animal.
A quadrat – metal, wooden frame or PVC pipe frame which form a square of a
known area (1 m2
). Placed randomly in an ecosystem where
sampling is carried out.
Used to estimate mobile animals (small mammals, butterflies, birds and insects)
Procedure: 1. Animal sample is captured 2. Marked 3. Released 4. Second sample captured & number
of marked animal recorded.
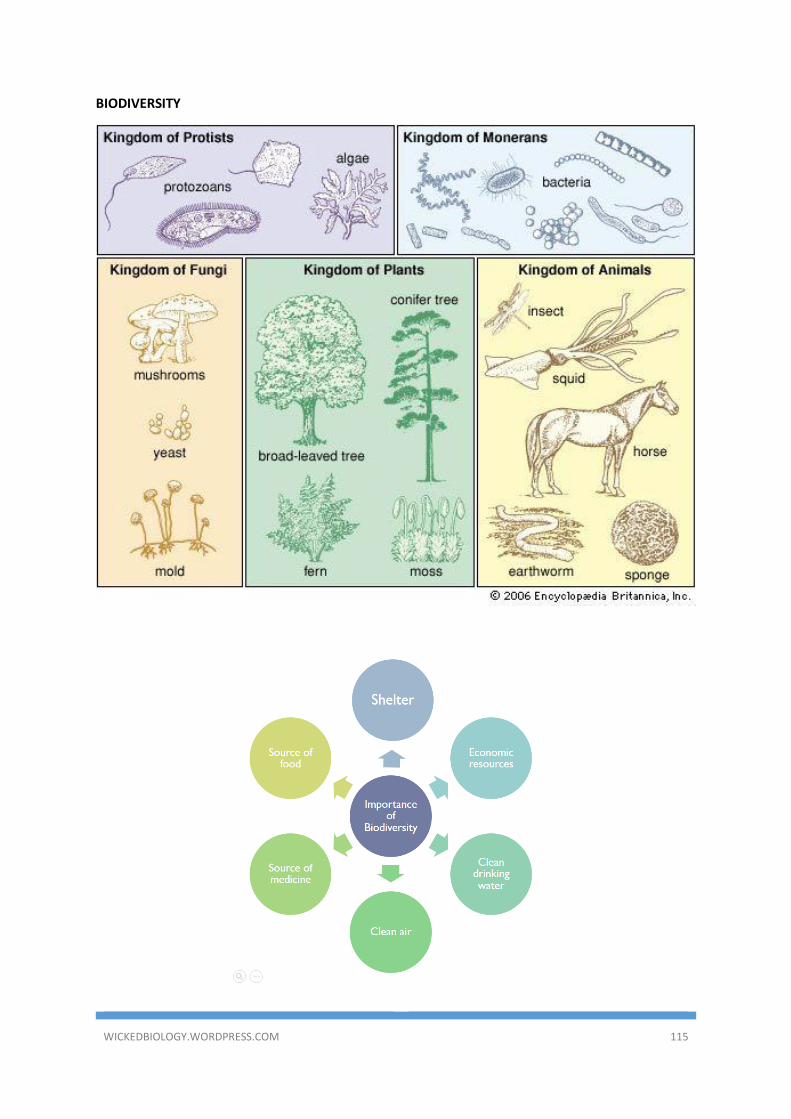
WICKEDBIOLOGY.WORDPRESS.COM 115
BIODIVERSITY
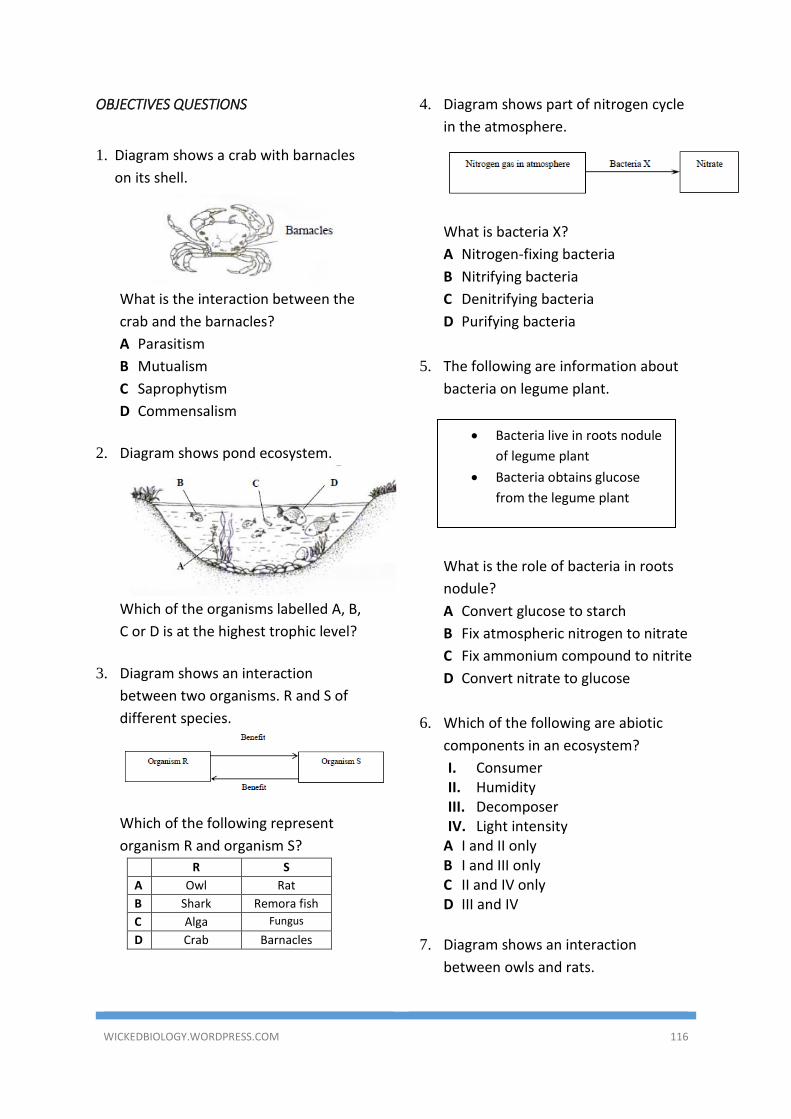
WICKEDBIOLOGY.WORDPRESS.COM 116
OBJECTIVES QUESTIONS
1. Diagram shows a crab with barnacles
on its shell.
What is the interaction between the
crab and the barnacles?
A Parasitism
B Mutualism
C Saprophytism
D Commensalism
2. Diagram shows pond ecosystem.
Which of the organisms labelled A, B,
C or D is at the highest trophic level?
3. Diagram shows an interaction
between two organisms. R and S of
different species.
Which of the following represent
organism R and organism S?
R S
A Owl Rat
B Shark Remora fish
C Alga Fungus
D Crab Barnacles
4. Diagram shows part of nitrogen cycle
in the atmosphere.
What is bacteria X?
A Nitrogen-fixing bacteria
B Nitrifying bacteria
C Denitrifying bacteria
D Purifying bacteria
5. The following are information about
bacteria on legume plant.
What is the role of bacteria in roots
nodule?
A Convert glucose to starch
B Fix atmospheric nitrogen to nitrate
C Fix ammonium compound to nitrite
D Convert nitrate to glucose
6. Which of the following are abiotic
components in an ecosystem?
I. Consumer II. Humidity III. Decomposer IV. Light intensity
A I and II only B I and III only C II and IV only D III and IV
7. Diagram shows an interaction
between owls and rats.
• Bacteria live in roots nodule
of legume plant
• Bacteria obtains glucose
from the legume plant
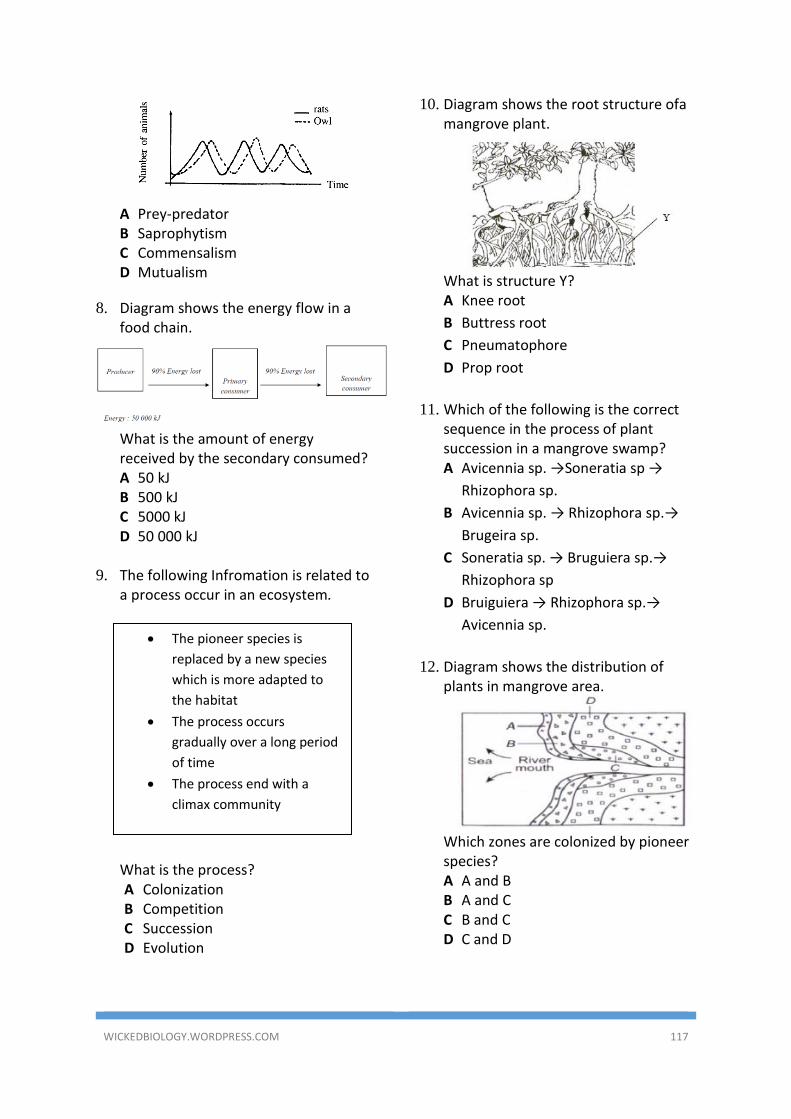
WICKEDBIOLOGY.WORDPRESS.COM 117
A Prey-predator B Saprophytism C Commensalism D Mutualism
8. Diagram shows the energy flow in a food chain.
What is the amount of energy received by the secondary consumed? A 50 kJ B 500 kJ C 5000 kJ D 50 000 kJ
9. The following Infromation is related to
a process occur in an ecosystem.
What is the process? A Colonization B Competition C Succession D Evolution
10. Diagram shows the root structure ofa mangrove plant.
What is structure Y? A Knee root
B Buttress root
C Pneumatophore
D Prop root
11. Which of the following is the correct
sequence in the process of plant succession in a mangrove swamp? A Avicennia sp. →Soneratia sp →
Rhizophora sp.
B Avicennia sp. → Rhizophora sp.→
Brugeira sp.
C Soneratia sp. → Bruguiera sp.→
Rhizophora sp
D Bruiguiera → Rhizophora sp.→
Avicennia sp.
12. Diagram shows the distribution of
plants in mangrove area.
Which zones are colonized by pioneer species? A A and B B A and C C B and C D C and D
• The pioneer species is
replaced by a new species
which is more adapted to
the habitat
• The process occurs
gradually over a long period
of time
• The process end with a
climax community
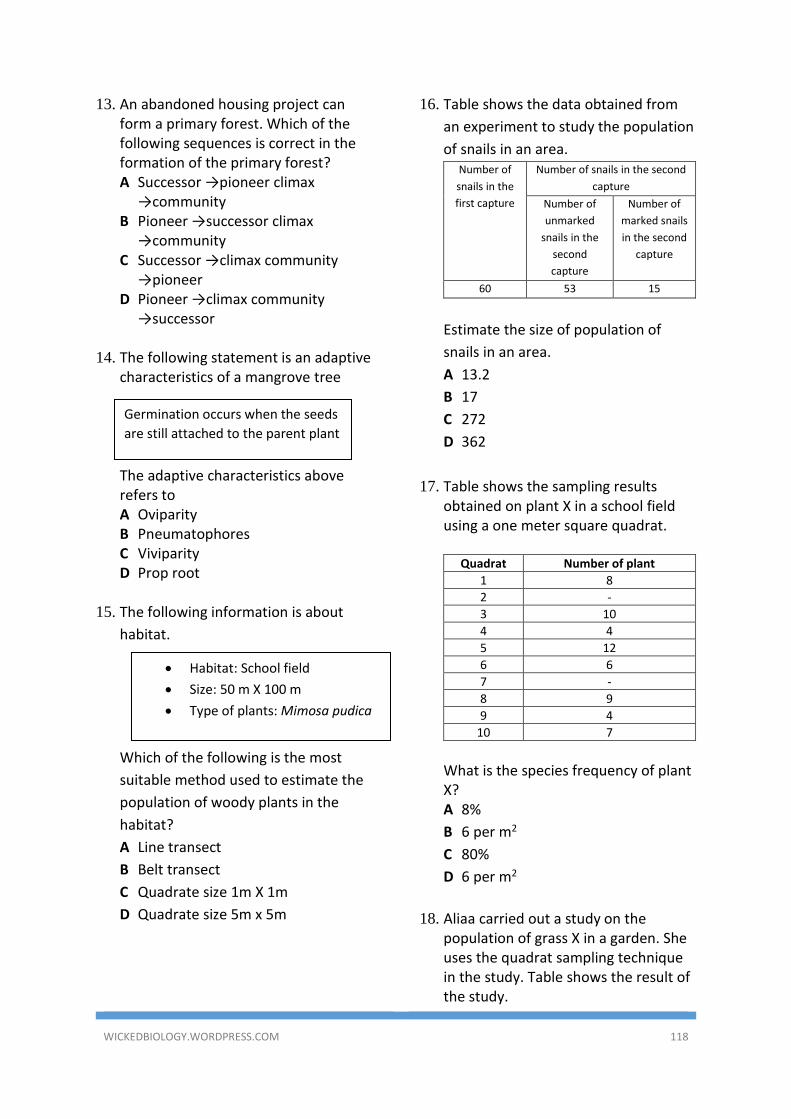
WICKEDBIOLOGY.WORDPRESS.COM 118
13. An abandoned housing project can form a primary forest. Which of the following sequences is correct in the formation of the primary forest? A Successor →pioneer climax
→community B Pioneer →successor climax
→community C Successor →climax community
→pioneer D Pioneer →climax community
→successor 14. The following statement is an adaptive
characteristics of a mangrove tree
The adaptive characteristics above refers to A Oviparity B Pneumatophores C Viviparity D Prop root
15. The following information is about
habitat.
Which of the following is the most
suitable method used to estimate the
population of woody plants in the
habitat?
A Line transect
B Belt transect
C Quadrate size 1m X 1m
D Quadrate size 5m x 5m
16. Table shows the data obtained from
an experiment to study the population
of snails in an area. Number of
snails in the
first capture
Number of snails in the second
capture
Number of
unmarked
snails in the
second
capture
Number of
marked snails
in the second
capture
60 53 15
Estimate the size of population of
snails in an area.
A 13.2
B 17
C 272
D 362
17. Table shows the sampling results obtained on plant X in a school field using a one meter square quadrat.
Quadrat Number of plant
1 8
2 -
3 10
4 4
5 12
6 6
7 -
8 9
9 4
10 7
What is the species frequency of plant X? A 8%
B 6 per m2
C 80%
D 6 per m2
18. Aliaa carried out a study on the
population of grass X in a garden. She uses the quadrat sampling technique in the study. Table shows the result of the study.
Germination occurs when the seeds
are still attached to the parent plant
• Habitat: School field
• Size: 50 m X 100 m
• Type of plants: Mimosa pudica
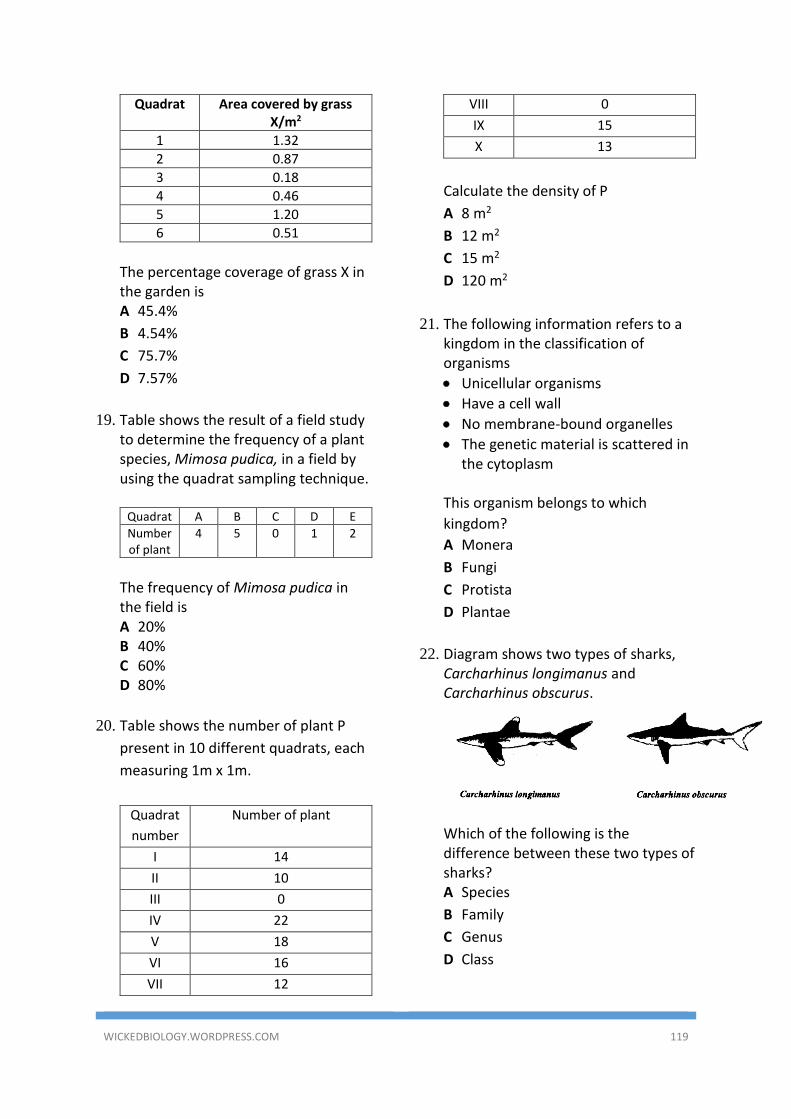
WICKEDBIOLOGY.WORDPRESS.COM 119
Quadrat Area covered by grass X/m2
1 1.32
2 0.87
3 0.18
4 0.46
5 1.20
6 0.51
The percentage coverage of grass X in the garden is A 45.4%
B 4.54%
C 75.7%
D 7.57%
19. Table shows the result of a field study
to determine the frequency of a plant species, Mimosa pudica, in a field by using the quadrat sampling technique.
Quadrat A B C D E
Number of plant
4 5 0 1 2
The frequency of Mimosa pudica in the field is A 20% B 40% C 60% D 80%
20. Table shows the number of plant P
present in 10 different quadrats, each
measuring 1m x 1m.
Quadrat
number
Number of plant
I 14
II 10
III 0
IV 22
V 18
VI 16
VII 12
VIII 0
IX 15
X 13
Calculate the density of P
A 8 m2
B 12 m2
C 15 m2
D 120 m2
21. The following information refers to a kingdom in the classification of organisms
• Unicellular organisms
• Have a cell wall
• No membrane-bound organelles
• The genetic material is scattered in the cytoplasm
This organism belongs to which
kingdom?
A Monera
B Fungi
C Protista
D Plantae
22. Diagram shows two types of sharks,
Carcharhinus longimanus and Carcharhinus obscurus.
Which of the following is the difference between these two types of sharks? A Species
B Family
C Genus
D Class
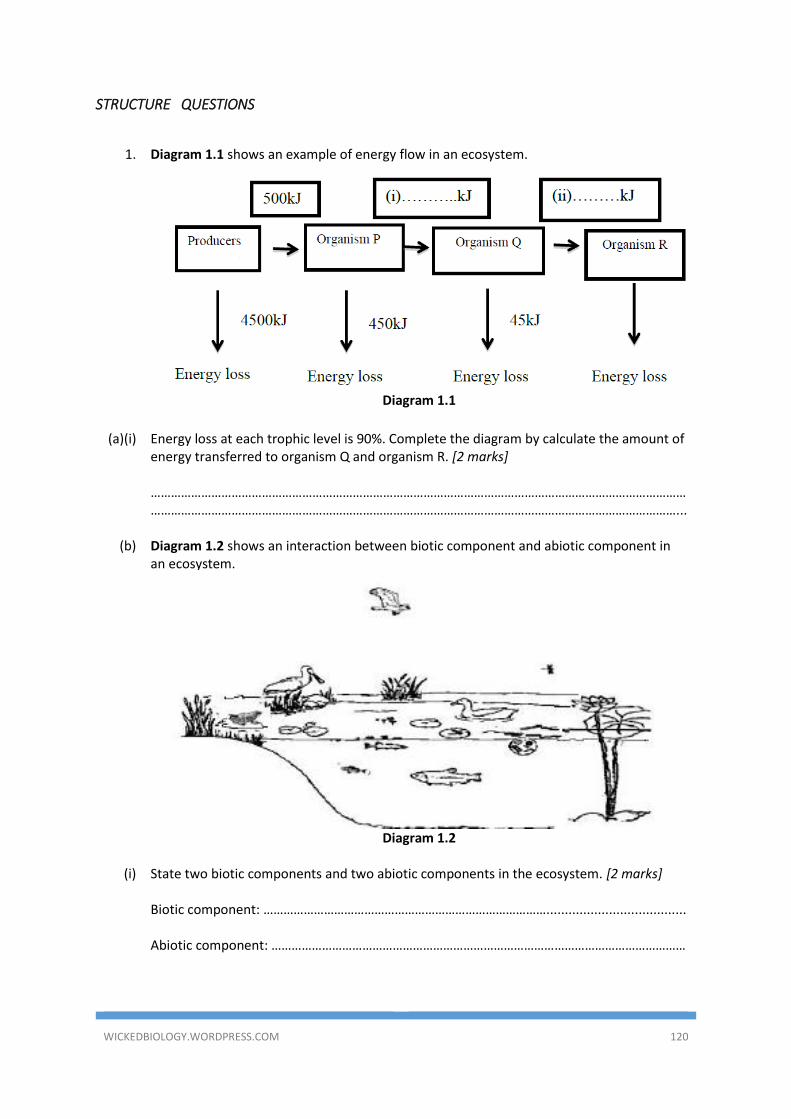
WICKEDBIOLOGY.WORDPRESS.COM 120
STRUCTURE QUESTIONS
1. Diagram 1.1 shows an example of energy flow in an ecosystem.
Diagram 1.1
(a)(i) Energy loss at each trophic level is 90%. Complete the diagram by calculate the amount of energy transferred to organism Q and organism R. [2 marks] ………………………………………………………………………………………………………………………………………………………………………………………………………………………………………………………………………………………...
(b) Diagram 1.2 shows an interaction between biotic component and abiotic component in
an ecosystem.
Diagram 1.2
(i) State two biotic components and two abiotic components in the ecosystem. [2 marks]
Biotic component: …………………………………………………………………………...................................... Abiotic component: ……………………………………………………………………………………………………………
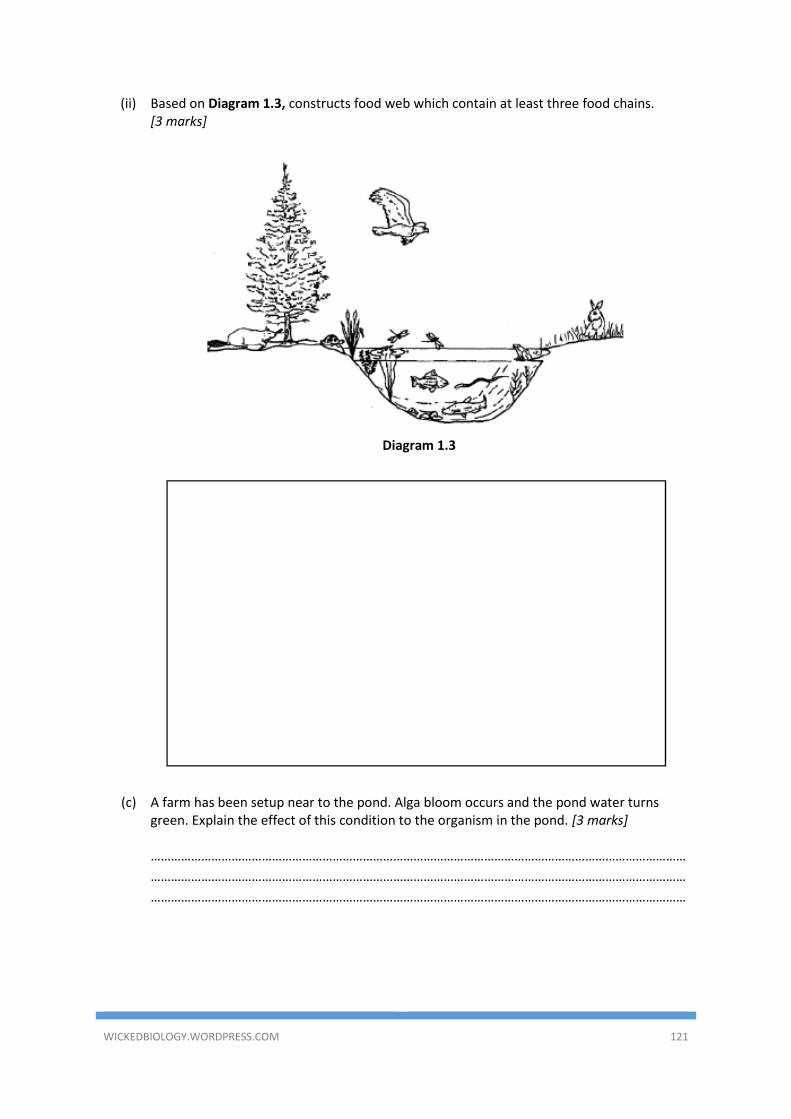
WICKEDBIOLOGY.WORDPRESS.COM 121
(ii) Based on Diagram 1.3, constructs food web which contain at least three food chains. [3 marks]
Diagram 1.3
(c) A farm has been setup near to the pond. Alga bloom occurs and the pond water turns green. Explain the effect of this condition to the organism in the pond. [3 marks] ……………………………………………………………………………………………………………………………………………
……………………………………………………………………………………………………………………………………………
……………………………………………………………………………………………………………………………………………
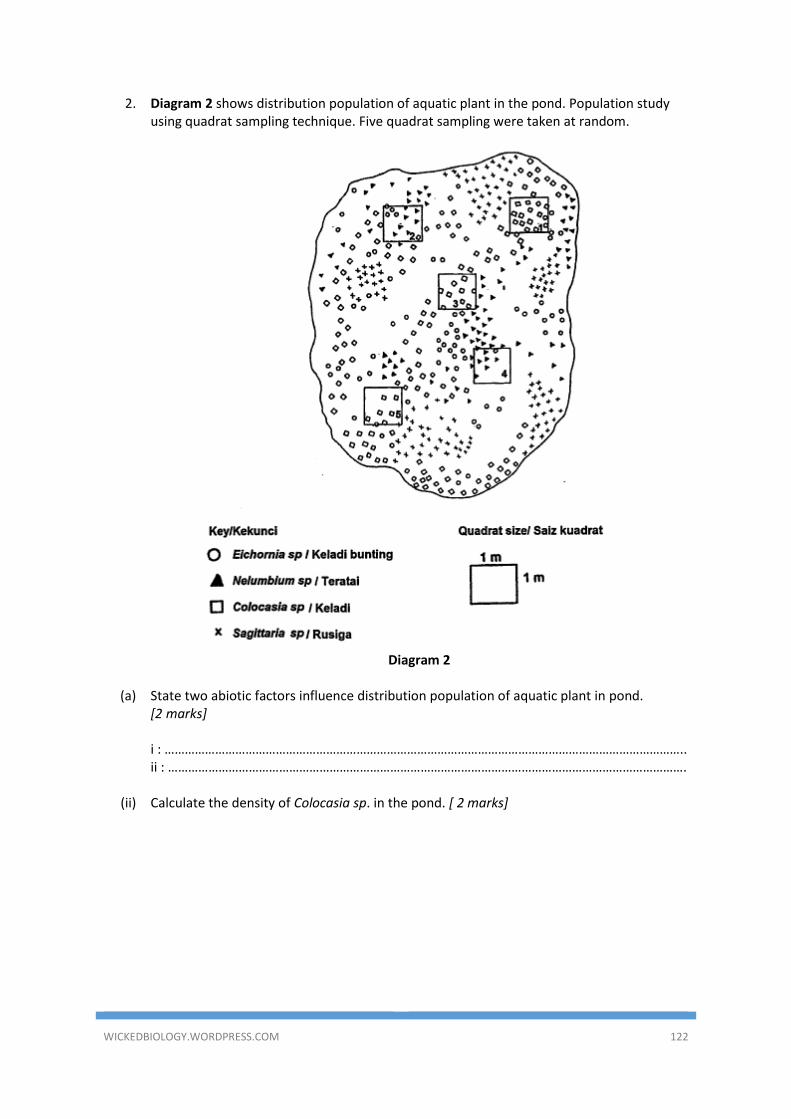
WICKEDBIOLOGY.WORDPRESS.COM 122
2. Diagram 2 shows distribution population of aquatic plant in the pond. Population study using quadrat sampling technique. Five quadrat sampling were taken at random.
Diagram 2
(a) State two abiotic factors influence distribution population of aquatic plant in pond.
[2 marks] i : ……………………………………………………………………………………………………………………………………….. ii : ……………………………………………………………………………………………………………………………………….
(ii) Calculate the density of Colocasia sp. in the pond. [ 2 marks]
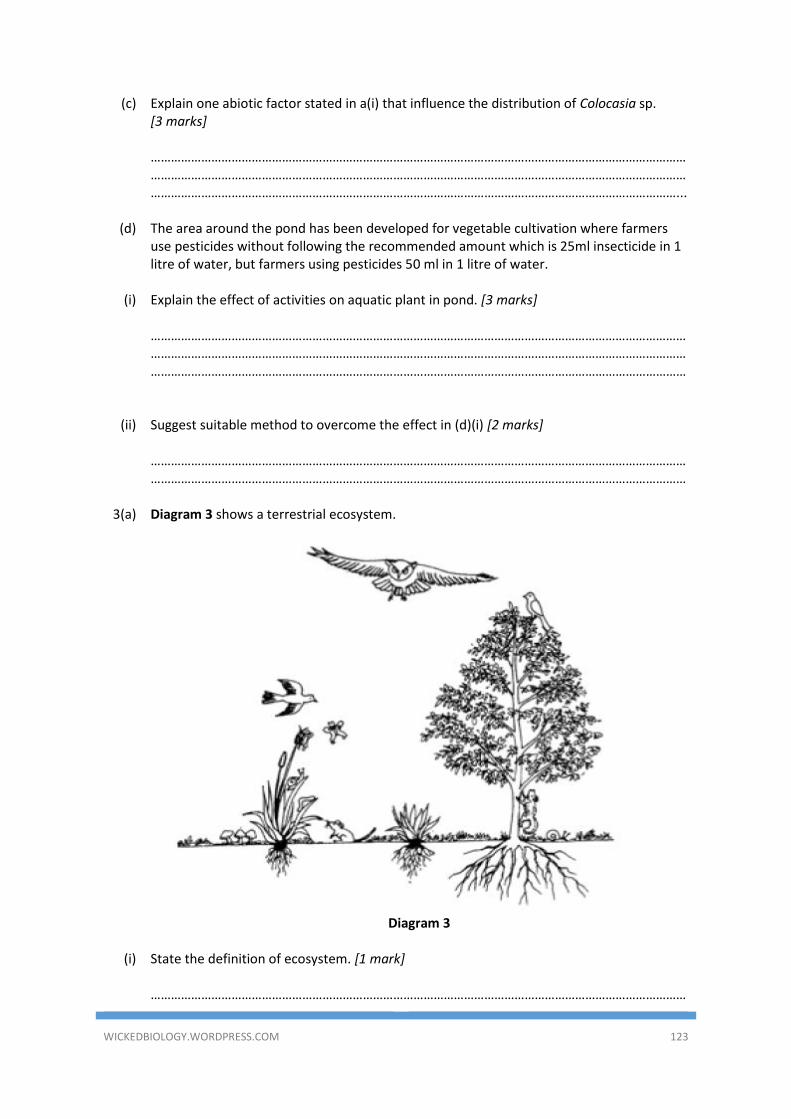
WICKEDBIOLOGY.WORDPRESS.COM 123
(c) Explain one abiotic factor stated in a(i) that influence the distribution of Colocasia sp. [3 marks] ……………………………………………………………………………………………………………………………………………………………………………………………………………………………………………………………………………………………………………………………………………………………………………………………………………………………………...
(d) The area around the pond has been developed for vegetable cultivation where farmers
use pesticides without following the recommended amount which is 25ml insecticide in 1 litre of water, but farmers using pesticides 50 ml in 1 litre of water.
(i) Explain the effect of activities on aquatic plant in pond. [3 marks]
………………………………………………………………………………………………………………………………………………………………………………………………………………………………………………………………………………………………………………………………………………………………………………………………………………………………………
(ii) Suggest suitable method to overcome the effect in (d)(i) [2 marks]
…………………………………………………………………………………………………………………………………………………………………………………………………………………………………………………………………………………………
3(a) Diagram 3 shows a terrestrial ecosystem.
Diagram 3
(i) State the definition of ecosystem. [1 mark] ……………………………………………………………………………………………………………………………………………
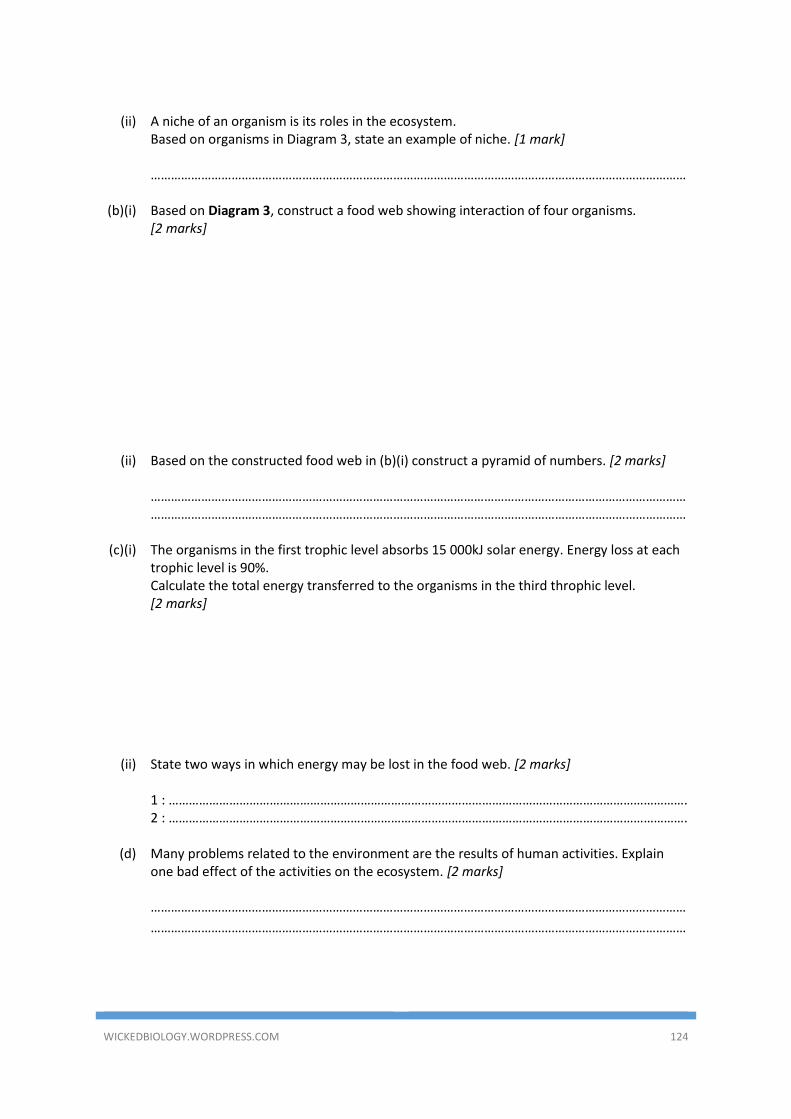
WICKEDBIOLOGY.WORDPRESS.COM 124
(ii) A niche of an organism is its roles in the ecosystem.
Based on organisms in Diagram 3, state an example of niche. [1 mark] ……………………………………………………………………………………………………………………………………………
(b)(i) Based on Diagram 3, construct a food web showing interaction of four organisms.
[2 marks]
(ii) Based on the constructed food web in (b)(i) construct a pyramid of numbers. [2 marks]
…………………………………………………………………………………………………………………………………………………………………………………………………………………………………………………………………………………………
(c)(i) The organisms in the first trophic level absorbs 15 000kJ solar energy. Energy loss at each
trophic level is 90%. Calculate the total energy transferred to the organisms in the third throphic level. [2 marks]
(ii) State two ways in which energy may be lost in the food web. [2 marks]
1 : ………………………………………………………………………………………………………………………………………. 2 : ……………………………………………………………………………………………………………………………………….
(d) Many problems related to the environment are the results of human activities. Explain
one bad effect of the activities on the ecosystem. [2 marks] ……………………………………………………………………………………………………………………………………………
……………………………………………………………………………………………………………………………………………
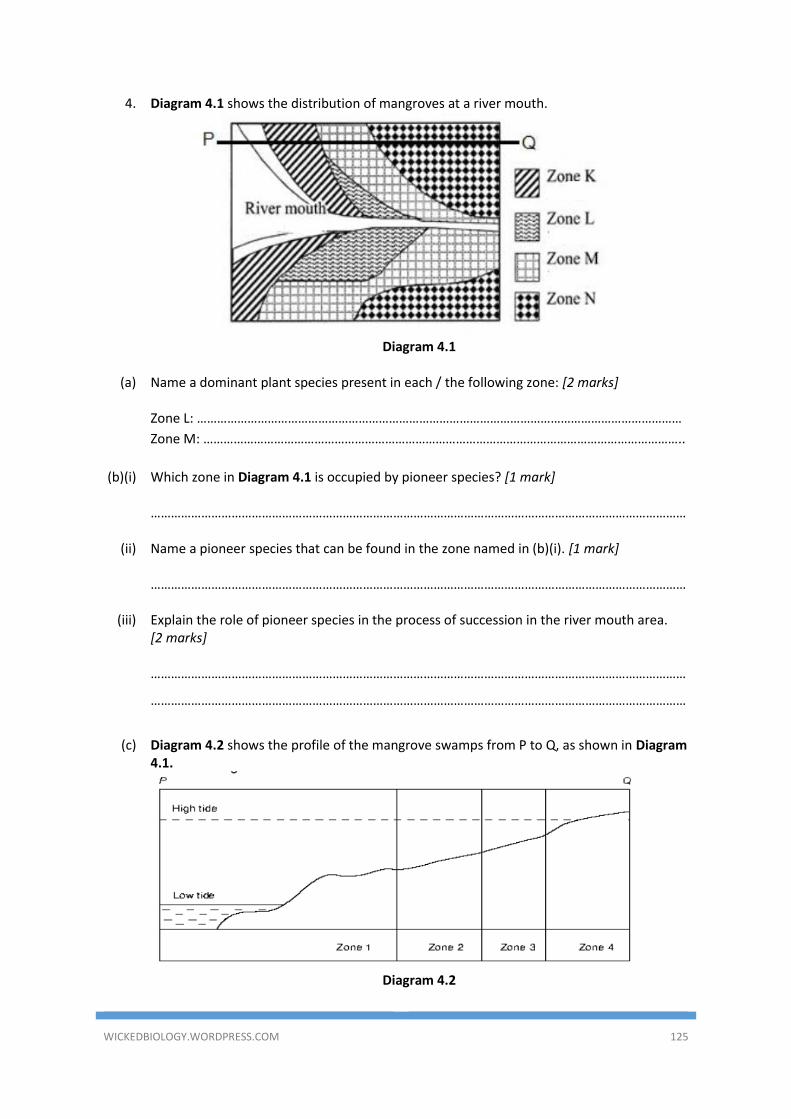
WICKEDBIOLOGY.WORDPRESS.COM 125
4. Diagram 4.1 shows the distribution of mangroves at a river mouth.
Diagram 4.1
(a) Name a dominant plant species present in each / the following zone: [2 marks]
Zone L: ………………………………………………………………………………………………………………………………
Zone M: ……………………………………………………………………………………………………………………………..
(b)(i) Which zone in Diagram 4.1 is occupied by pioneer species? [1 mark]
……………………………………………………………………………………………………………………………………………
(ii) Name a pioneer species that can be found in the zone named in (b)(i). [1 mark]
……………………………………………………………………………………………………………………………………………
(iii) Explain the role of pioneer species in the process of succession in the river mouth area.
[2 marks] ……………………………………………………………………………………………………………………………………………
……………………………………………………………………………………………………………………………………………
(c) Diagram 4.2 shows the profile of the mangrove swamps from P to Q, as shown in Diagram
4.1.
Diagram 4.2
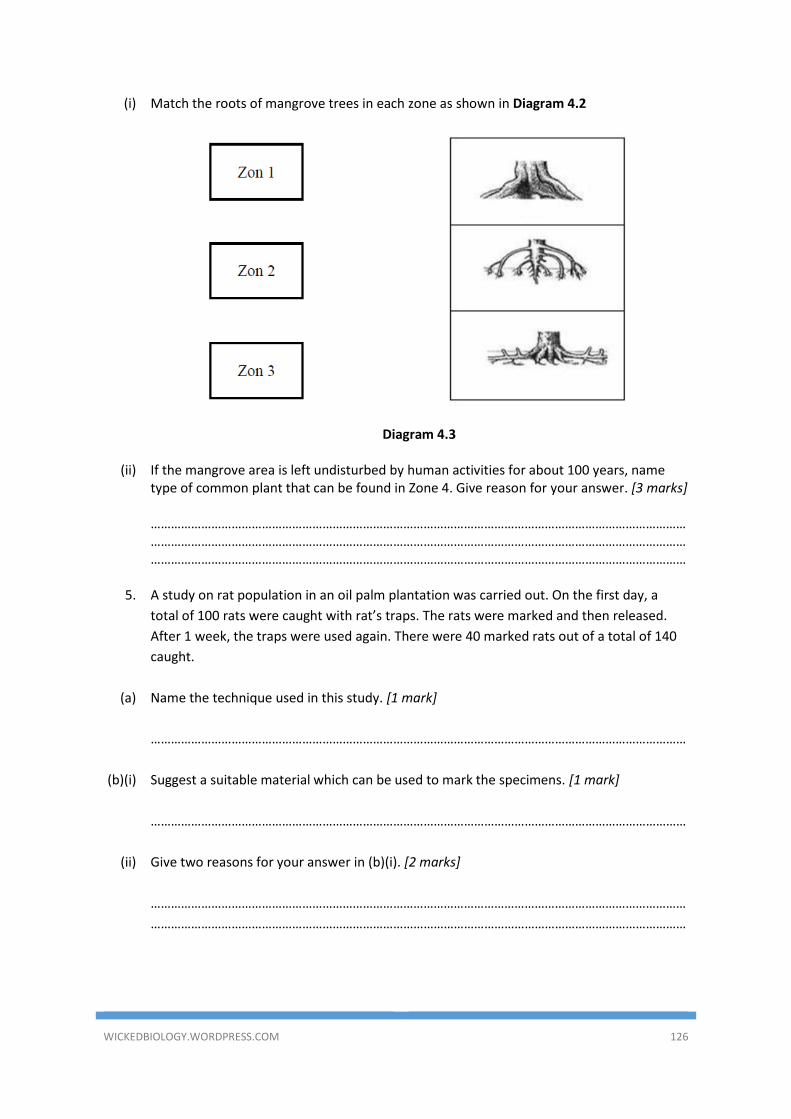
WICKEDBIOLOGY.WORDPRESS.COM 126
(i) Match the roots of mangrove trees in each zone as shown in Diagram 4.2
Diagram 4.3
(ii) If the mangrove area is left undisturbed by human activities for about 100 years, name type of common plant that can be found in Zone 4. Give reason for your answer. [3 marks] ………………………………………………………………………………………………………………………………………………………………………………………………………………………………………………………………………………………………………………………………………………………………………………………………………………………………………
5. A study on rat population in an oil palm plantation was carried out. On the first day, a
total of 100 rats were caught with rat’s traps. The rats were marked and then released.
After 1 week, the traps were used again. There were 40 marked rats out of a total of 140
caught.
(a) Name the technique used in this study. [1 mark]
……………………………………………………………………………………………………………………………………………
(b)(i) Suggest a suitable material which can be used to mark the specimens. [1 mark]
……………………………………………………………………………………………………………………………………………
(ii) Give two reasons for your answer in (b)(i). [2 marks]
……………………………………………………………………………………………………………………………………………
……………………………………………………………………………………………………………………………………………
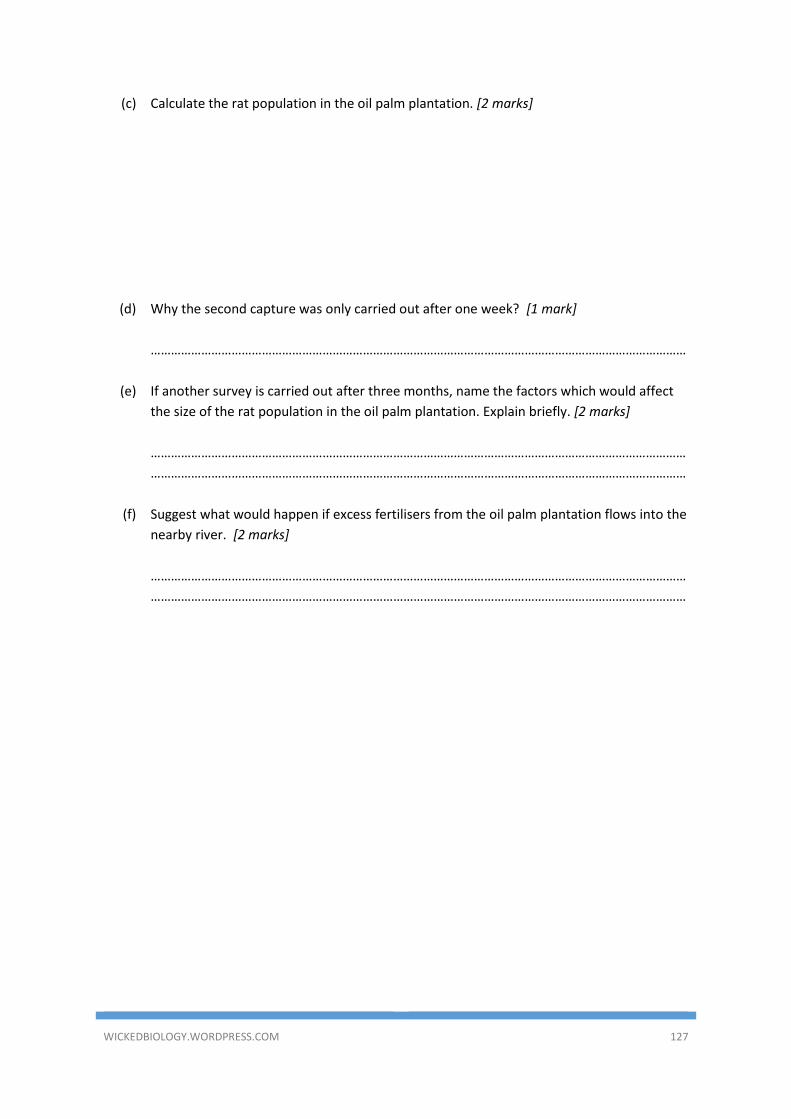
WICKEDBIOLOGY.WORDPRESS.COM 127
(c) Calculate the rat population in the oil palm plantation. [2 marks]
(d) Why the second capture was only carried out after one week? [1 mark]
……………………………………………………………………………………………………………………………………………
(e) If another survey is carried out after three months, name the factors which would affect
the size of the rat population in the oil palm plantation. Explain briefly. [2 marks]
……………………………………………………………………………………………………………………………………………
……………………………………………………………………………………………………………………………………………
(f) Suggest what would happen if excess fertilisers from the oil palm plantation flows into the
nearby river. [2 marks]
……………………………………………………………………………………………………………………………………………
……………………………………………………………………………………………………………………………………………
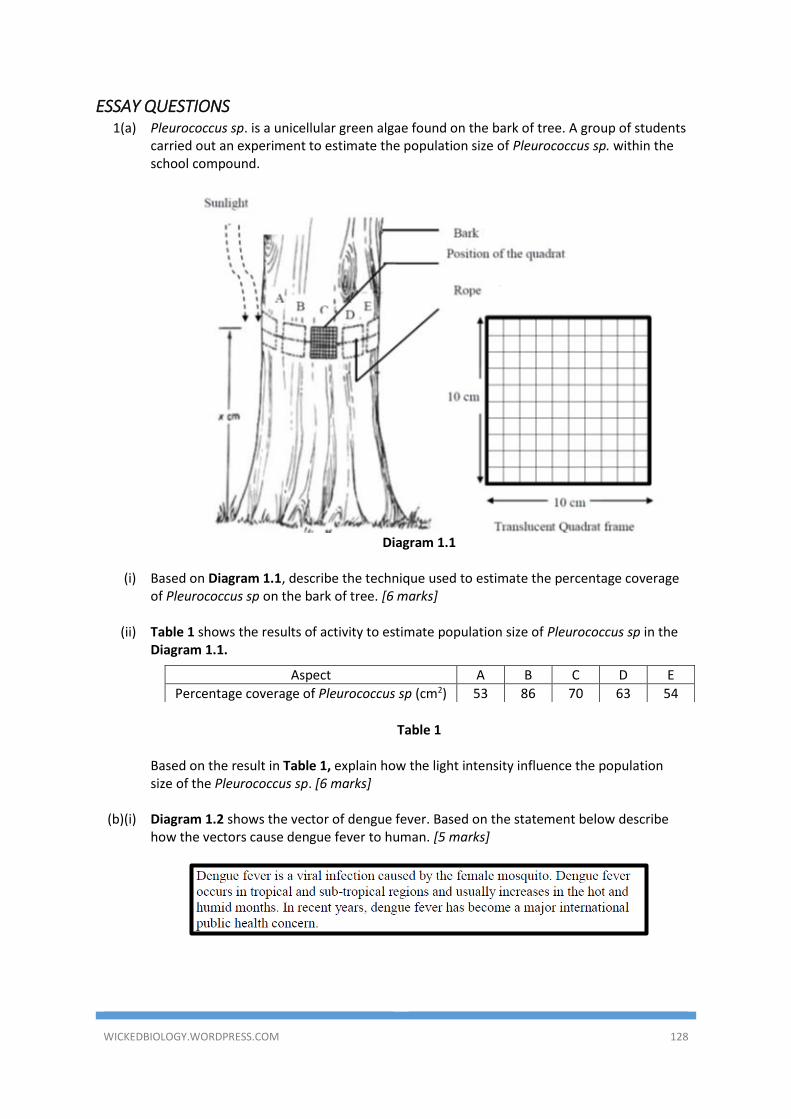
WICKEDBIOLOGY.WORDPRESS.COM 128
ESSAY QUESTIONS 1(a) Pleurococcus sp. is a unicellular green algae found on the bark of tree. A group of students
carried out an experiment to estimate the population size of Pleurococcus sp. within the school compound.
Diagram 1.1
(i) Based on Diagram 1.1, describe the technique used to estimate the percentage coverage
of Pleurococcus sp on the bark of tree. [6 marks]
(ii) Table 1 shows the results of activity to estimate population size of Pleurococcus sp in the Diagram 1.1.
Table 1
Aspect A B C D E
Percentage coverage of Pleurococcus sp (cm2) 53 86 70 63 54
Based on the result in Table 1, explain how the light intensity influence the population
size of the Pleurococcus sp. [6 marks]
(b)(i) Diagram 1.2 shows the vector of dengue fever. Based on the statement below describe how the vectors cause dengue fever to human. [5 marks]
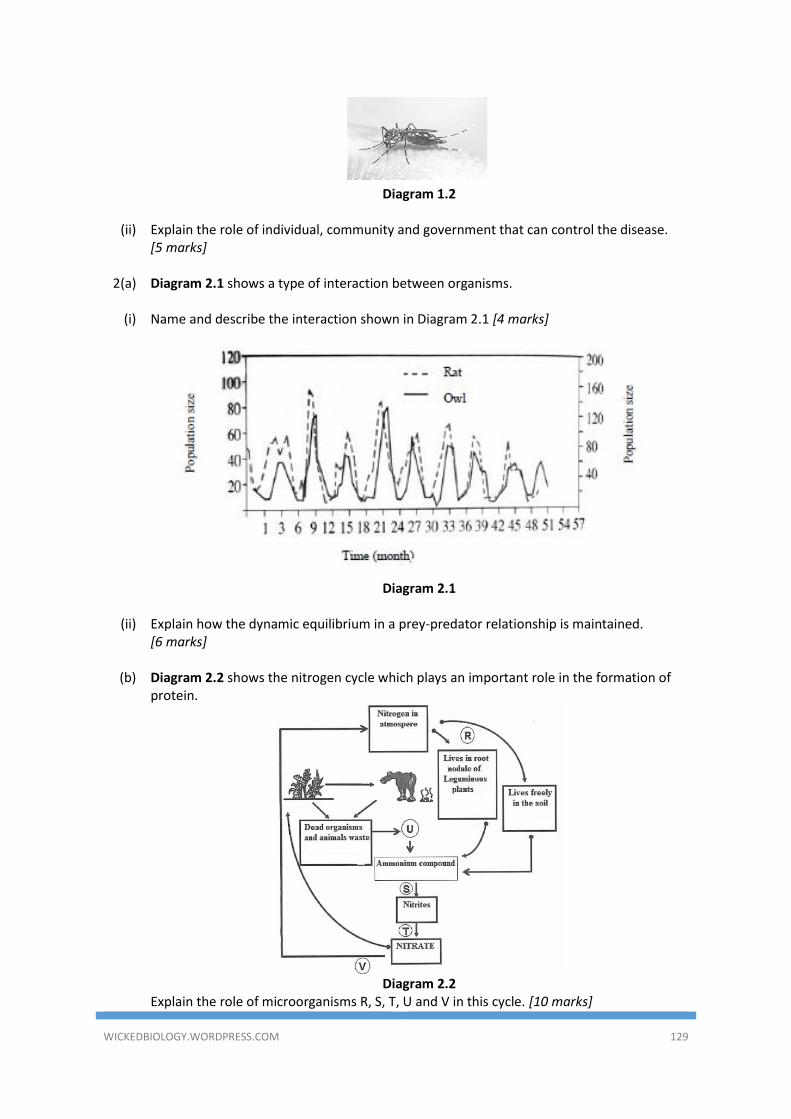
WICKEDBIOLOGY.WORDPRESS.COM 129
Diagram 1.2
(ii) Explain the role of individual, community and government that can control the disease.
[5 marks]
2(a) Diagram 2.1 shows a type of interaction between organisms.
(i) Name and describe the interaction shown in Diagram 2.1 [4 marks]
Diagram 2.1
(ii) Explain how the dynamic equilibrium in a prey-predator relationship is maintained.
[6 marks]
(b) Diagram 2.2 shows the nitrogen cycle which plays an important role in the formation of protein.
Diagram 2.2 Explain the role of microorganisms R, S, T, U and V in this cycle. [10 marks]
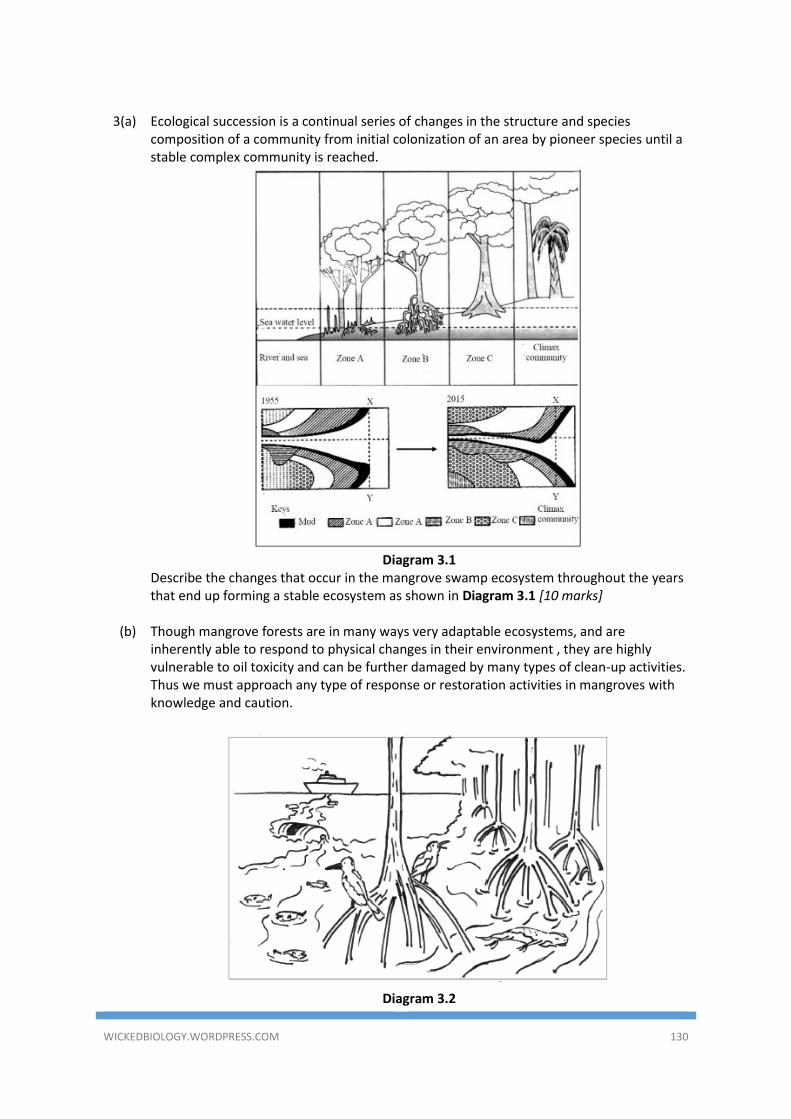
WICKEDBIOLOGY.WORDPRESS.COM 130
3(a) Ecological succession is a continual series of changes in the structure and species
composition of a community from initial colonization of an area by pioneer species until a stable complex community is reached.
Diagram 3.1 Describe the changes that occur in the mangrove swamp ecosystem throughout the years
that end up forming a stable ecosystem as shown in Diagram 3.1 [10 marks]
(b) Though mangrove forests are in many ways very adaptable ecosystems, and are inherently able to respond to physical changes in their environment , they are highly vulnerable to oil toxicity and can be further damaged by many types of clean-up activities. Thus we must approach any type of response or restoration activities in mangroves with knowledge and caution.
Diagram 3.2
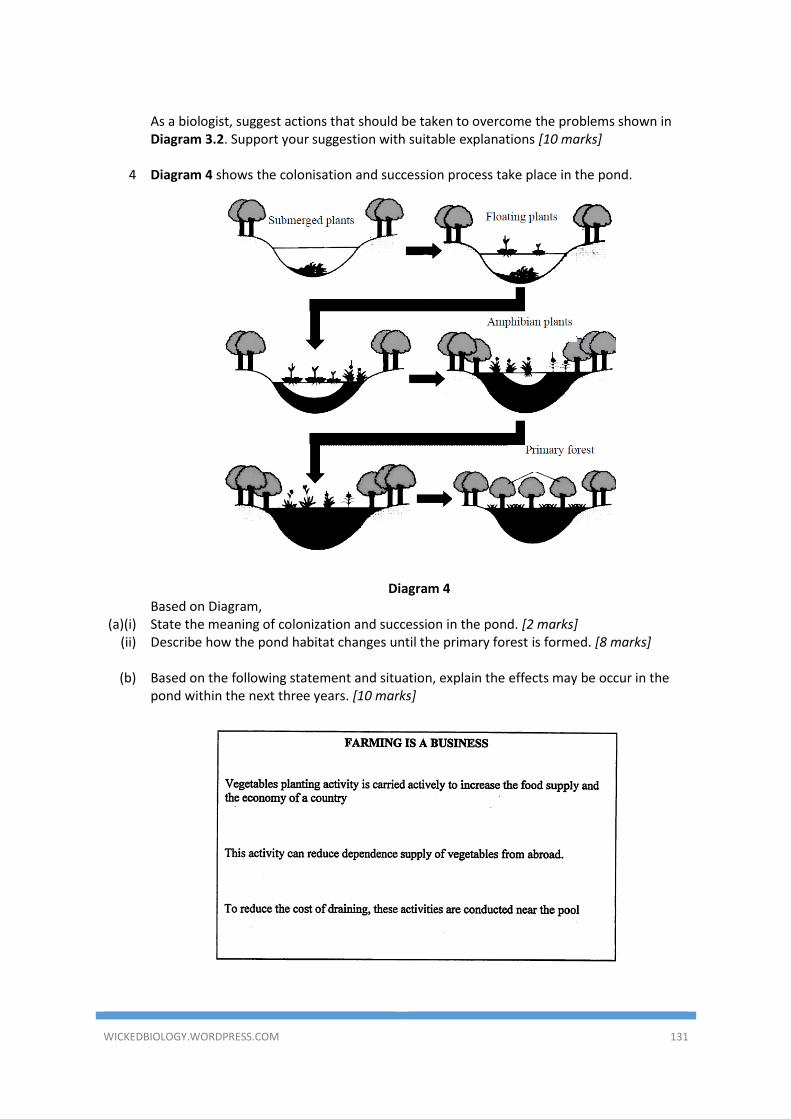
WICKEDBIOLOGY.WORDPRESS.COM 131
As a biologist, suggest actions that should be taken to overcome the problems shown in
Diagram 3.2. Support your suggestion with suitable explanations [10 marks]
4 Diagram 4 shows the colonisation and succession process take place in the pond.
Diagram 4 Based on Diagram,
(a)(i) State the meaning of colonization and succession in the pond. [2 marks] (ii) Describe how the pond habitat changes until the primary forest is formed. [8 marks]
(b) Based on the following statement and situation, explain the effects may be occur in the
pond within the next three years. [10 marks]
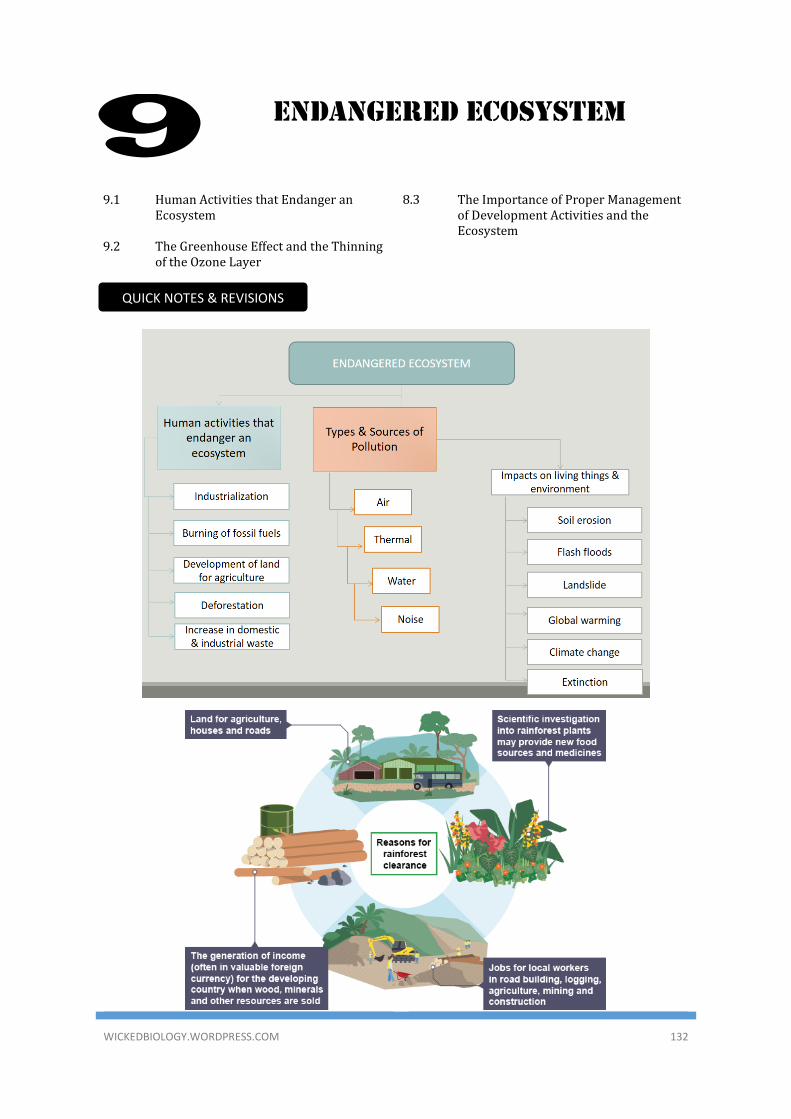
WICKEDBIOLOGY.WORDPRESS.COM 132
ENDANGERED ECOSYSTEM
9.1 Human Activities that Endanger an Ecosystem
8.3 The Importance of Proper Management of Development Activities and the Ecosystem
9.2 The Greenhouse Effect and the Thinning of the Ozone Layer
9
QUICK NOTES & REVISIONS
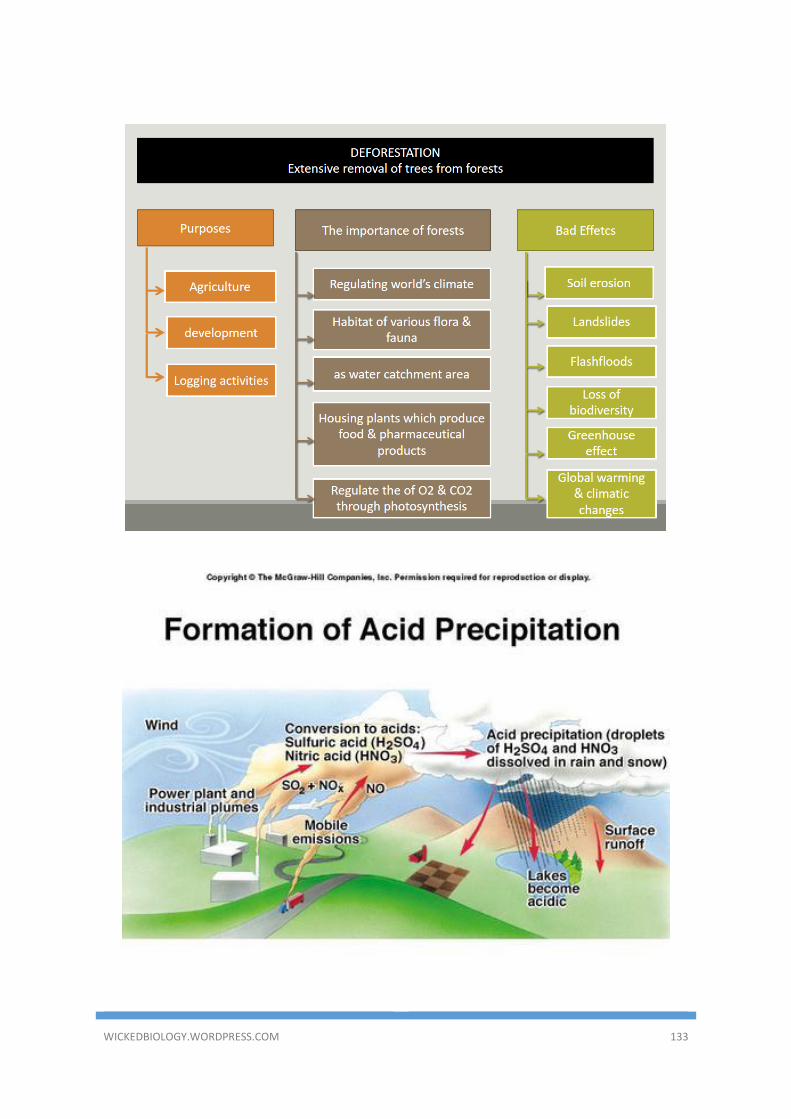
WICKEDBIOLOGY.WORDPRESS.COM 133
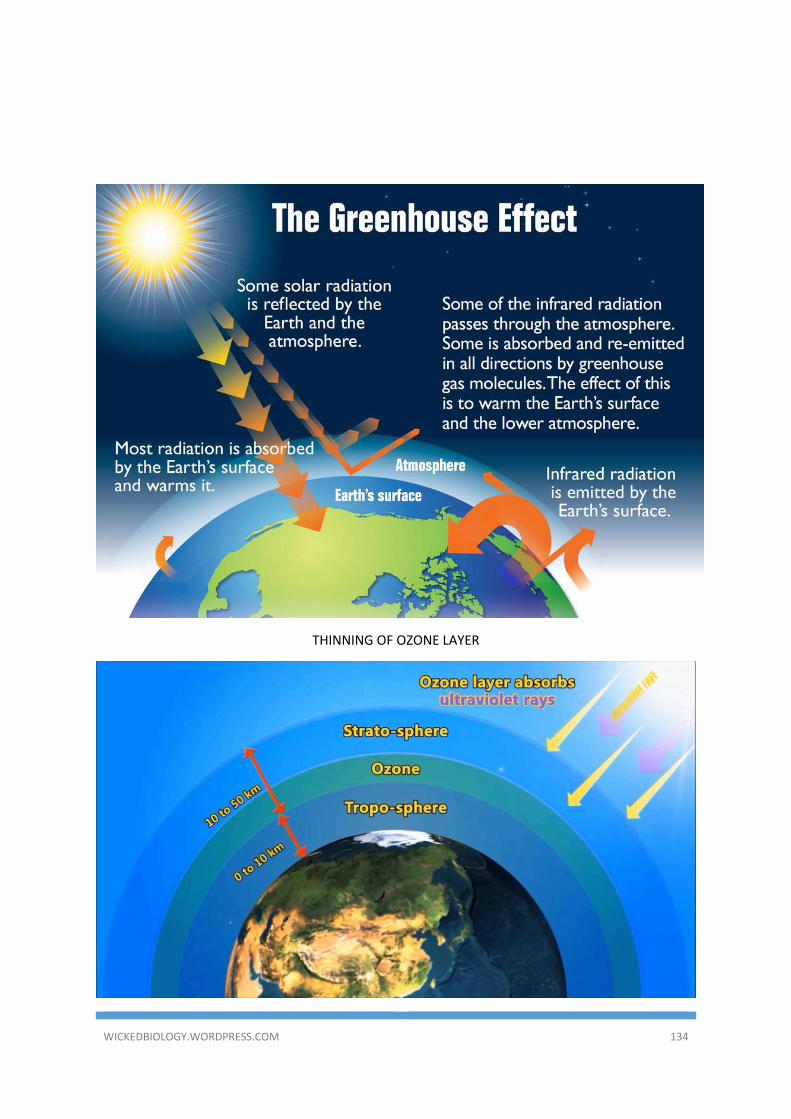
WICKEDBIOLOGY.WORDPRESS.COM 134
THINNING OF OZONE LAYER
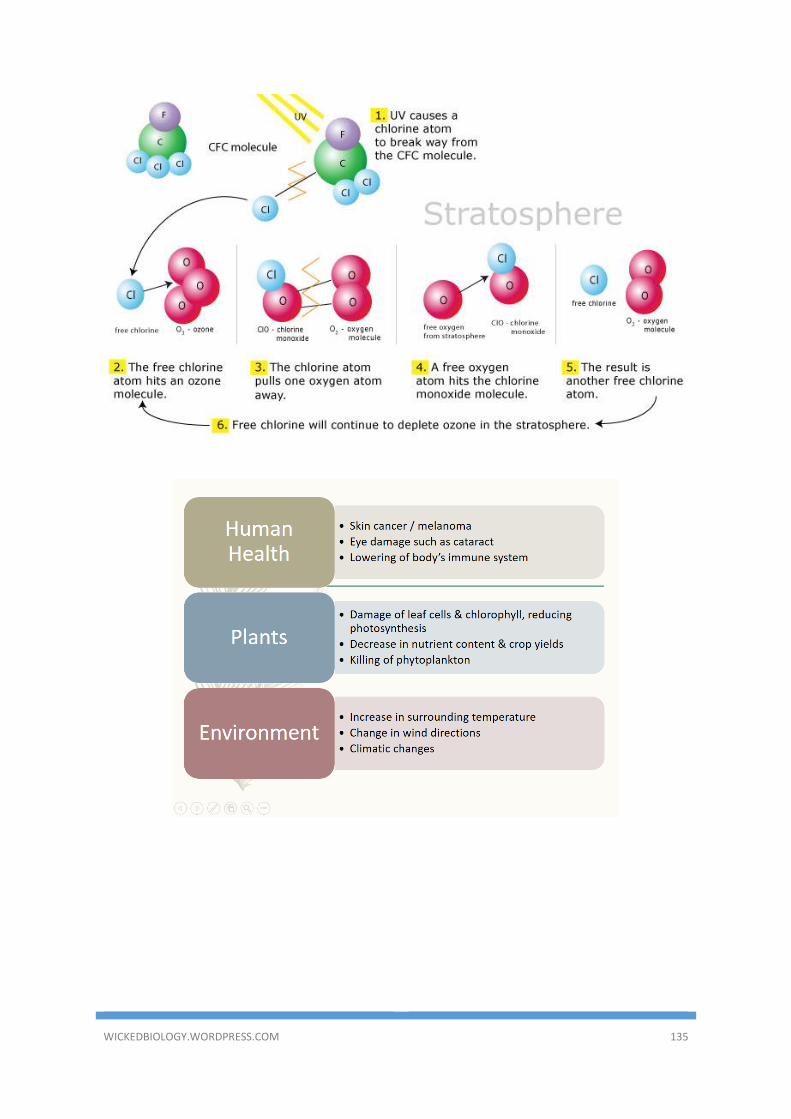
WICKEDBIOLOGY.WORDPRESS.COM 135

WICKEDBIOLOGY.WORDPRESS.COM 136
OBJECTIVES QUESTIONS
1. The information below shows the
impacts of phenomenon S
What is phenomenon S?
A Greenhouse effect
B Ozone depletion
C Thermal pollution
D Global warming
2. Diagram shows logging activity.
Which of the following is the effect of
the activity?
A Eutrophication
B Increase of biodiversity
C Air pollution
D Soil erosion
3. Diagram shows an environmental
phenomenon.
Which of the following is correctly
matched?
Unplanned
development
Impact
A Excessive use
of inorganic
fertilisers
Eutrophication
B Glass building Air pollution
C Excessive
mining
Greenhouse
effect
D Dumping of
domestic
waste
Soil erosion
4. Diagram shows the emission of
various gases by a chemical factory in
an industrial area.
Which of the following is the effect of
this activity?
A Reduce BOD value of water
B Increase the humidity of
atmosphere
C Increase the acidity of the water
D Reduce the vision distance
problems
5. Diagram shows two type of aquatic
organism which live in a pond.
Which of the following is true
regarding the relationship between
the level of BOD in the water, the
populations od R and the population
of S?
• Increase in the earth’s
temperature
• Change in climate zone
• Decline in the yields of
crops
• Melting of polar ice and
glaciers causing rise in sea
level
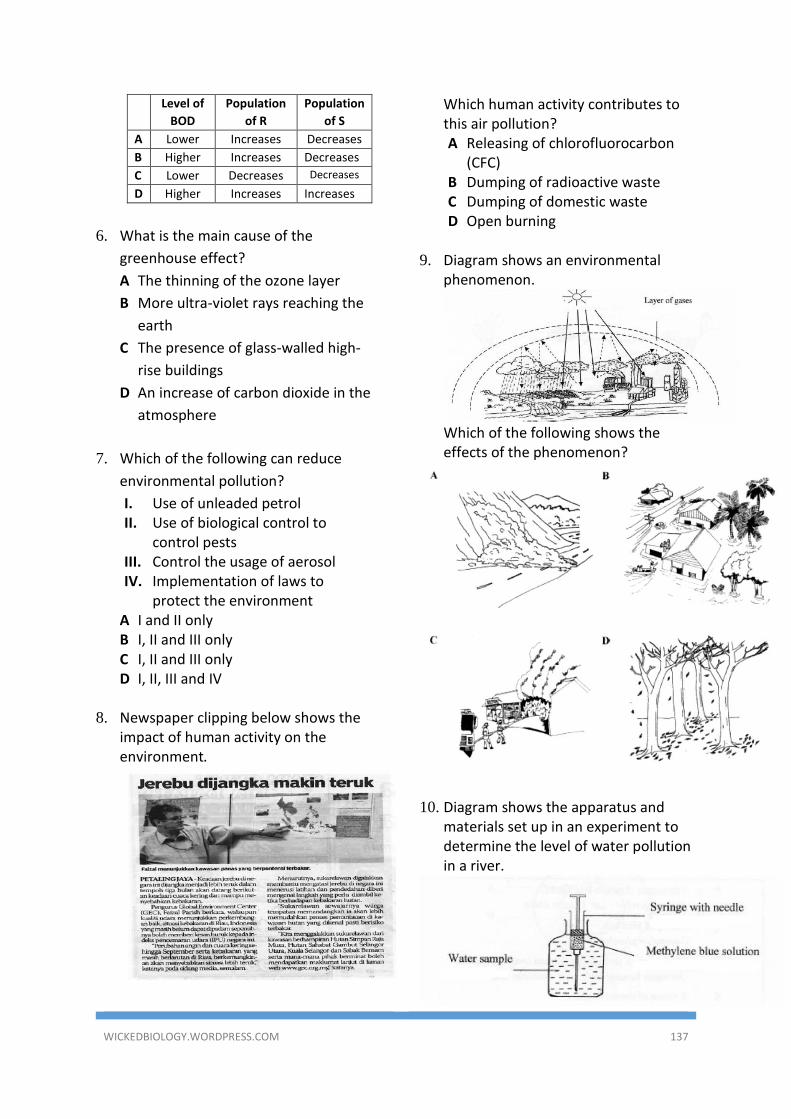
WICKEDBIOLOGY.WORDPRESS.COM 137
Level of
BOD
Population
of R
Population
of S
A Lower Increases Decreases
B Higher Increases Decreases
C Lower Decreases Decreases
D Higher Increases Increases
6. What is the main cause of the
greenhouse effect?
A The thinning of the ozone layer
B More ultra-violet rays reaching the
earth
C The presence of glass-walled high-
rise buildings
D An increase of carbon dioxide in the
atmosphere
7. Which of the following can reduce
environmental pollution?
I. Use of unleaded petrol II. Use of biological control to
control pests III. Control the usage of aerosol IV. Implementation of laws to
protect the environment A I and II only B I, II and III only C I, II and III only D I, II, III and IV
8. Newspaper clipping below shows the impact of human activity on the environment.
Which human activity contributes to this air pollution? A Releasing of chlorofluorocarbon
(CFC) B Dumping of radioactive waste C Dumping of domestic waste D Open burning
9. Diagram shows an environmental
phenomenon.
Which of the following shows the effects of the phenomenon?
10. Diagram shows the apparatus and materials set up in an experiment to determine the level of water pollution in a river.
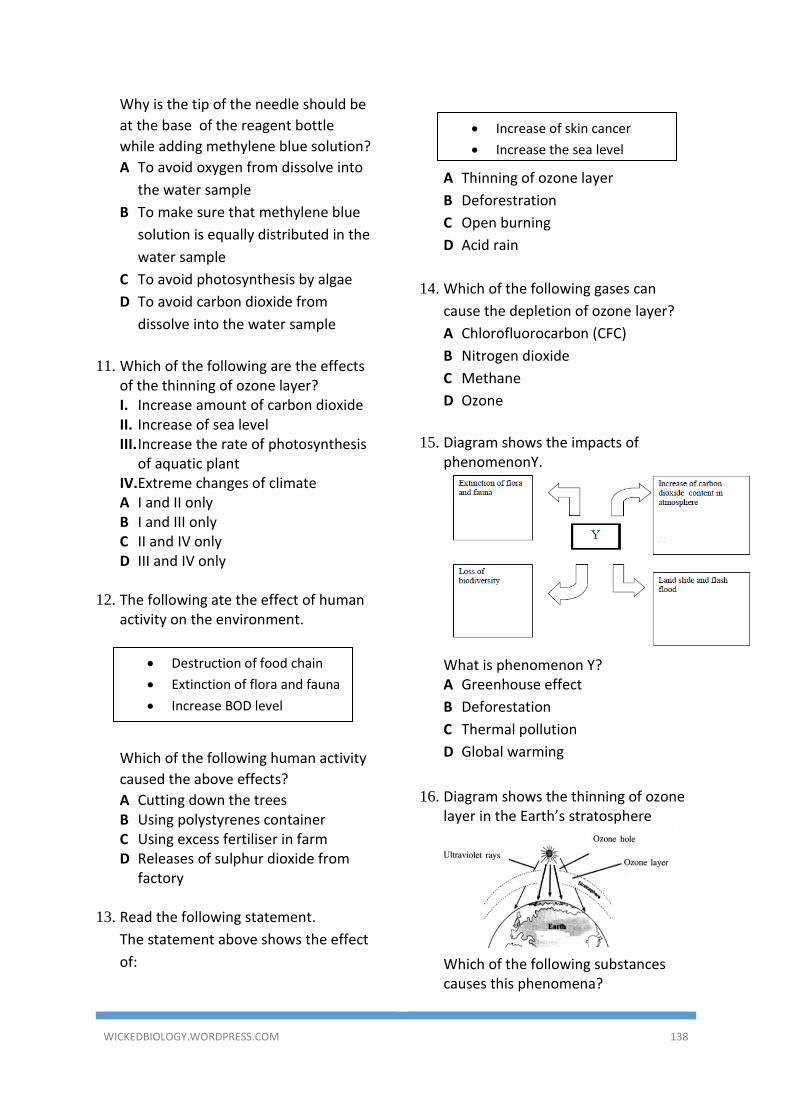
WICKEDBIOLOGY.WORDPRESS.COM 138
Why is the tip of the needle should be
at the base of the reagent bottle
while adding methylene blue solution?
A To avoid oxygen from dissolve into
the water sample
B To make sure that methylene blue
solution is equally distributed in the
water sample
C To avoid photosynthesis by algae
D To avoid carbon dioxide from
dissolve into the water sample
11. Which of the following are the effects
of the thinning of ozone layer? I. Increase amount of carbon dioxide II. Increase of sea level III. Increase the rate of photosynthesis
of aquatic plant IV.Extreme changes of climate A I and II only B I and III only C II and IV only D III and IV only
12. The following ate the effect of human
activity on the environment.
Which of the following human activity
caused the above effects?
A Cutting down the trees B Using polystyrenes container C Using excess fertiliser in farm D Releases of sulphur dioxide from
factory 13. Read the following statement.
The statement above shows the effect
of:
A Thinning of ozone layer
B Deforestration
C Open burning
D Acid rain
14. Which of the following gases can
cause the depletion of ozone layer?
A Chlorofluorocarbon (CFC)
B Nitrogen dioxide
C Methane
D Ozone
15. Diagram shows the impacts of
phenomenonY.
What is phenomenon Y? A Greenhouse effect
B Deforestation
C Thermal pollution
D Global warming
16. Diagram shows the thinning of ozone layer in the Earth’s stratosphere
Which of the following substances causes this phenomena?
• Destruction of food chain
• Extinction of flora and fauna
• Increase BOD level
• Increase of skin cancer
• Increase the sea level
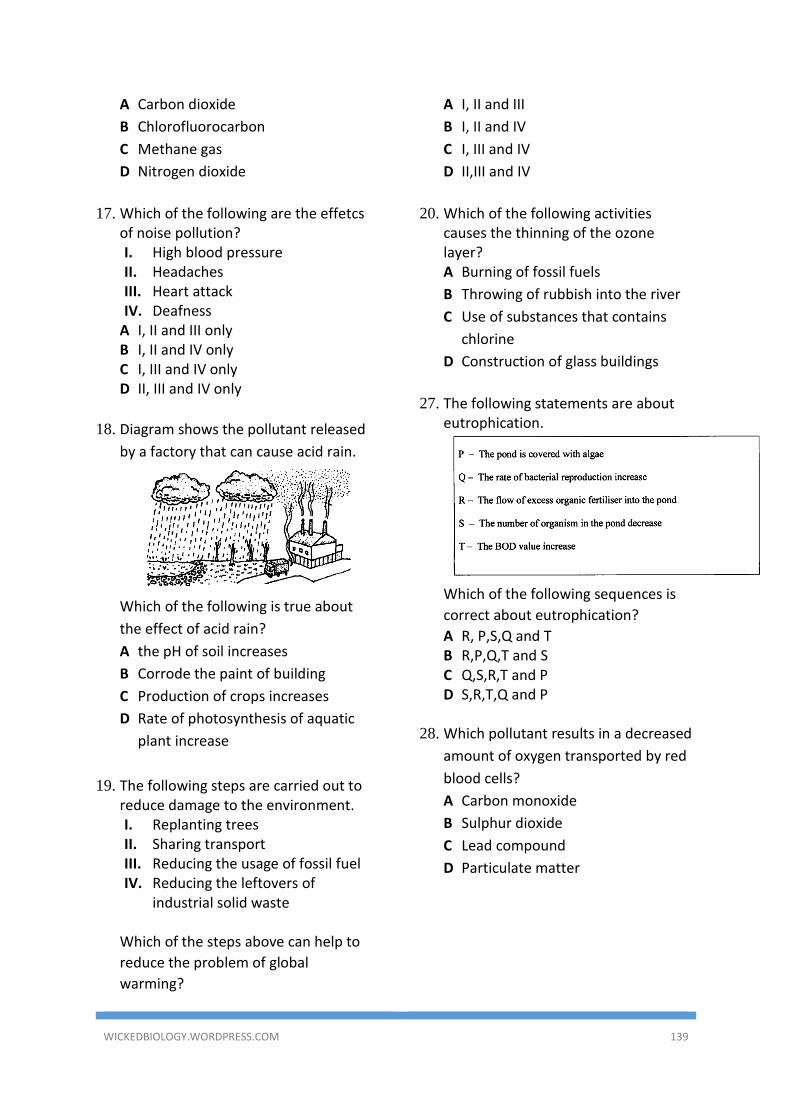
WICKEDBIOLOGY.WORDPRESS.COM 139
A Carbon dioxide
B Chlorofluorocarbon
C Methane gas
D Nitrogen dioxide
17. Which of the following are the effetcs
of noise pollution? I. High blood pressure II. Headaches III. Heart attack IV. Deafness
A I, II and III only B I, II and IV only C I, III and IV only D II, III and IV only
18. Diagram shows the pollutant released
by a factory that can cause acid rain.
Which of the following is true about
the effect of acid rain?
A the pH of soil increases
B Corrode the paint of building
C Production of crops increases
D Rate of photosynthesis of aquatic
plant increase
19. The following steps are carried out to reduce damage to the environment. I. Replanting trees II. Sharing transport III. Reducing the usage of fossil fuel IV. Reducing the leftovers of
industrial solid waste
Which of the steps above can help to
reduce the problem of global
warming?
A I, II and III
B I, II and IV
C I, III and IV
D II,III and IV
20. Which of the following activities
causes the thinning of the ozone layer? A Burning of fossil fuels
B Throwing of rubbish into the river
C Use of substances that contains
chlorine
D Construction of glass buildings
27. The following statements are about
eutrophication.
Which of the following sequences is
correct about eutrophication?
A R, P,S,Q and T B R,P,Q,T and S C Q,S,R,T and P D S,R,T,Q and P
28. Which pollutant results in a decreased
amount of oxygen transported by red
blood cells?
A Carbon monoxide
B Sulphur dioxide
C Lead compound
D Particulate matter
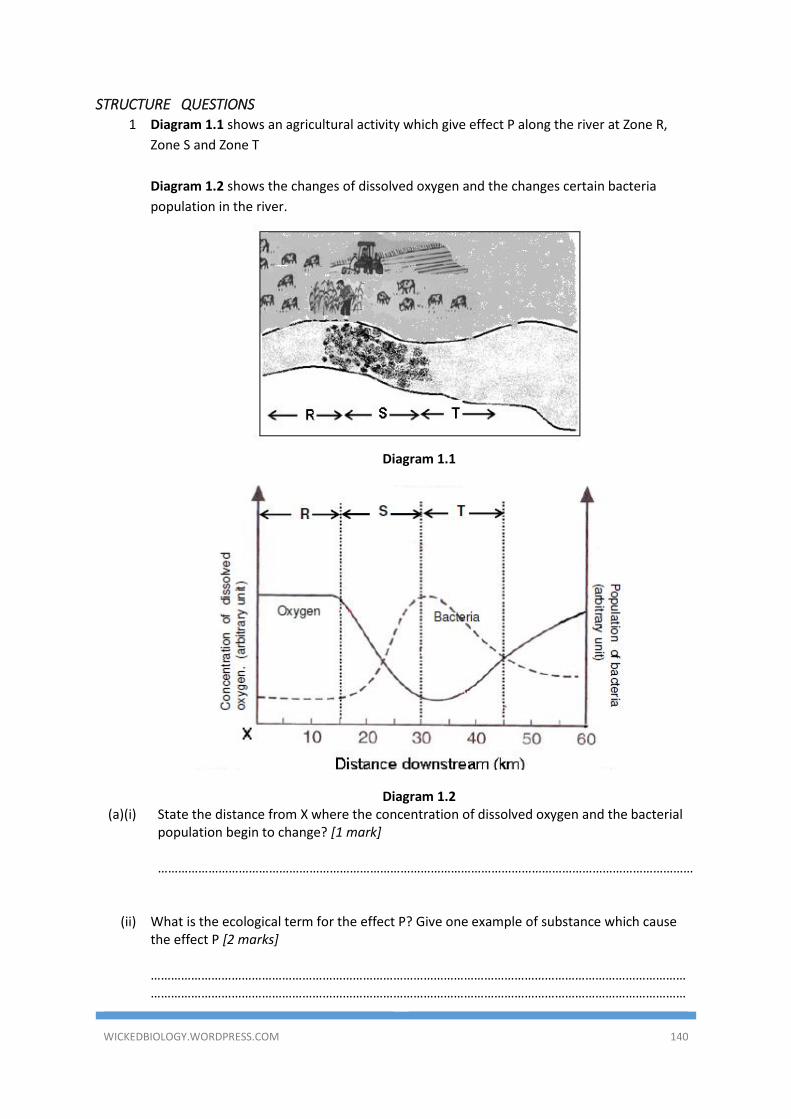
WICKEDBIOLOGY.WORDPRESS.COM 140
STRUCTURE QUESTIONS 1 Diagram 1.1 shows an agricultural activity which give effect P along the river at Zone R,
Zone S and Zone T
Diagram 1.2 shows the changes of dissolved oxygen and the changes certain bacteria
population in the river.
Diagram 1.1
Diagram 1.2
(a)(i) State the distance from X where the concentration of dissolved oxygen and the bacterial population begin to change? [1 mark] ……………………………………………………………………………………………………………………………………………
(ii) What is the ecological term for the effect P? Give one example of substance which cause
the effect P [2 marks] …………………………………………………………………………………………………………………………………………………………………………………………………………………………………………………………………………………………
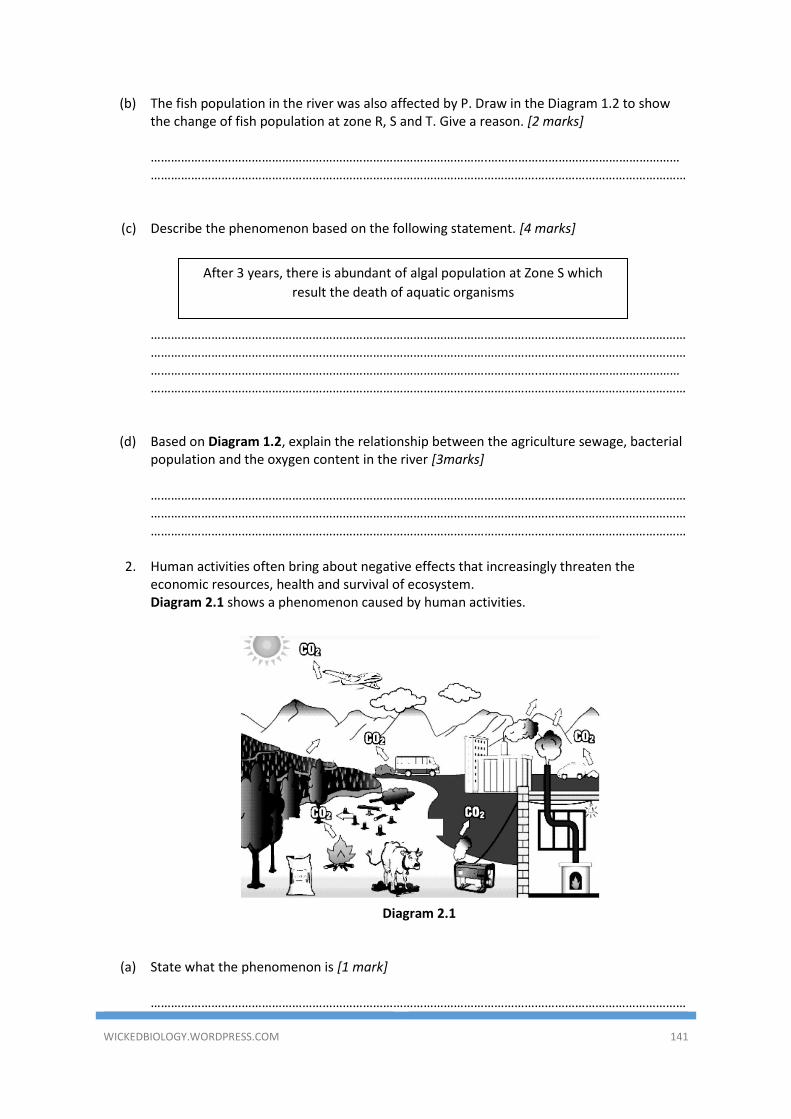
WICKEDBIOLOGY.WORDPRESS.COM 141
(b) The fish population in the river was also affected by P. Draw in the Diagram 1.2 to show the change of fish population at zone R, S and T. Give a reason. [2 marks] ……………………………………………………………………………………….………………………………………………………………………………………………………………………………………………………………………………………………
(c) Describe the phenomenon based on the following statement. [4 marks]
……………………………………………………………………………………………………………………………………………………………………………………………………………………………………………………………………………………………………………………………………………………………………………………………….…………………………………………………………………………………………………………………………………………………………………………………
(d) Based on Diagram 1.2, explain the relationship between the agriculture sewage, bacterial
population and the oxygen content in the river [3marks] ………………………………………………………………………………………………………………………………………………………………………………………………………………………………………………………………………………………………………………………………………………………………………………………………………………………………………
2. Human activities often bring about negative effects that increasingly threaten the
economic resources, health and survival of ecosystem. Diagram 2.1 shows a phenomenon caused by human activities.
Diagram 2.1
(a) State what the phenomenon is [1 mark] ……………………………………………………………………………………………………………………………………………
After 3 years, there is abundant of algal population at Zone S which
result the death of aquatic organisms
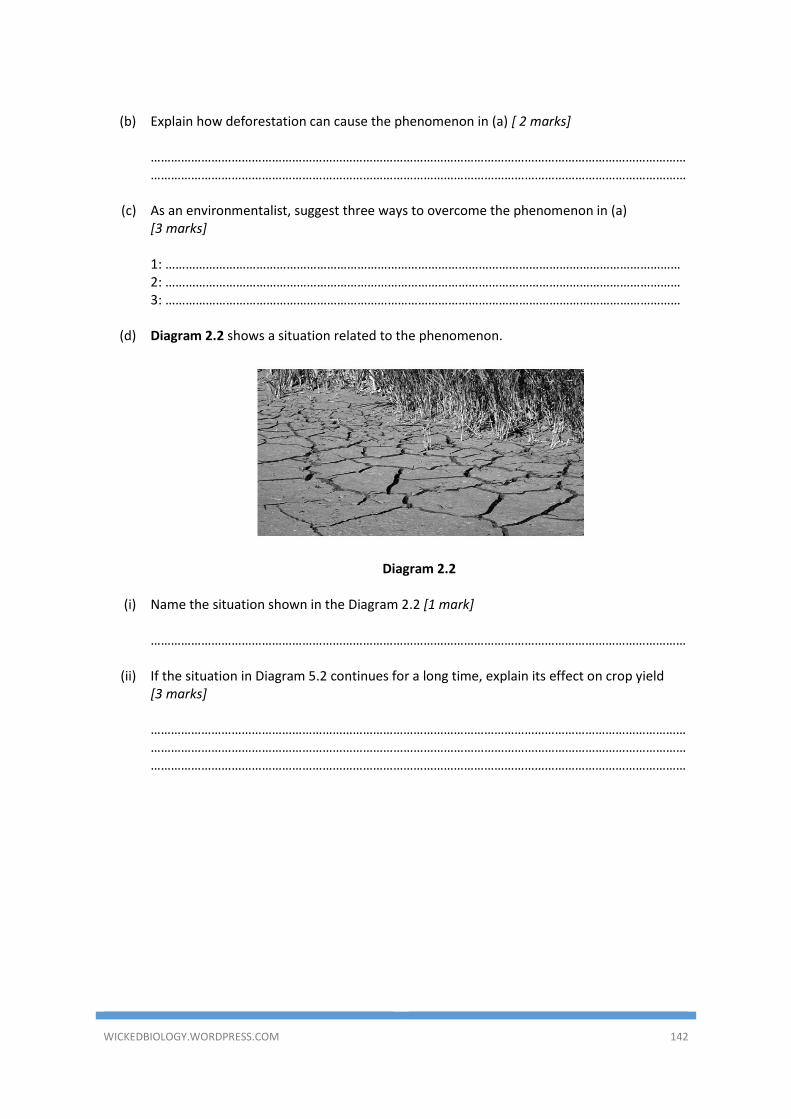
WICKEDBIOLOGY.WORDPRESS.COM 142
(b) Explain how deforestation can cause the phenomenon in (a) [ 2 marks]
…………………………………………………………………………………………………………………………………………………………………………………………………………………………………………………………………………………………
(c) As an environmentalist, suggest three ways to overcome the phenomenon in (a) [3 marks] 1: ……………………………………………………………………………………………………………………………………… 2: ……………………………………………………………………………………………………………………………………… 3: ………………………………………………………………………………………………………………………………………
(d) Diagram 2.2 shows a situation related to the phenomenon.
Diagram 2.2
(i) Name the situation shown in the Diagram 2.2 [1 mark] ……………………………………………………………………………………………………………………………………………
(ii) If the situation in Diagram 5.2 continues for a long time, explain its effect on crop yield
[3 marks] ………………………………………………………………………………………………………………………………………………………………………………………………………………………………………………………………………………………………………………………………………………………………………………………………………………………………………
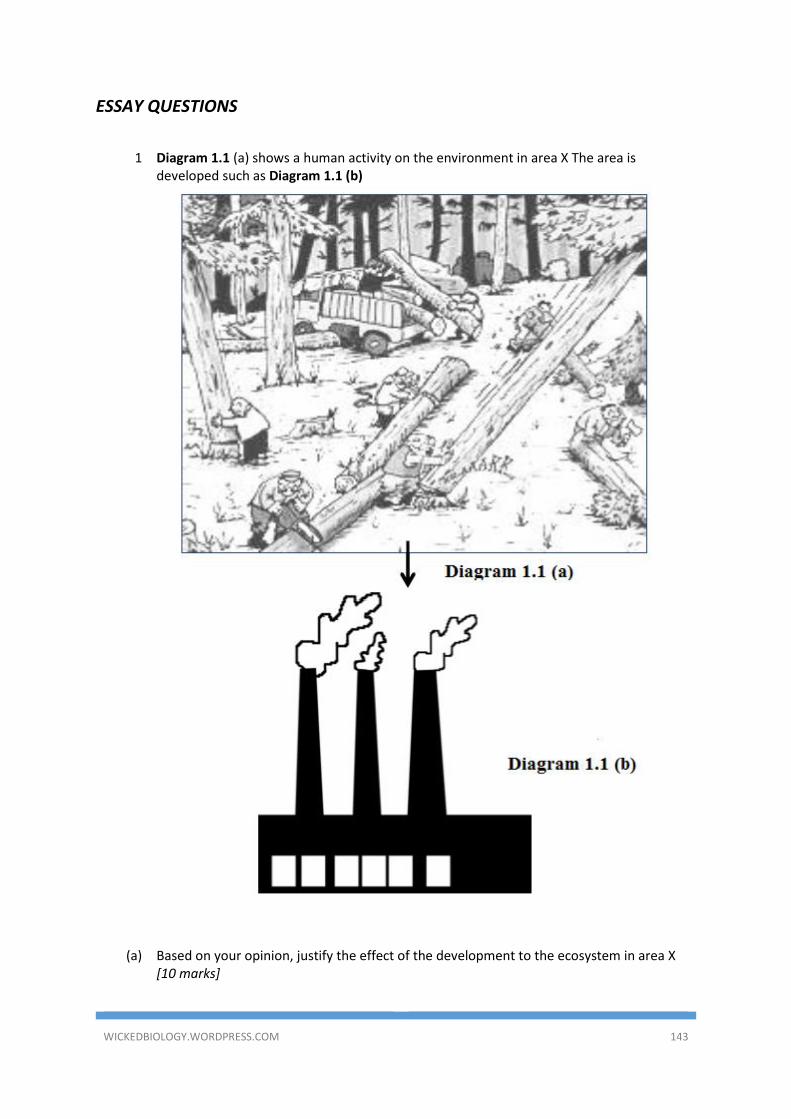
WICKEDBIOLOGY.WORDPRESS.COM 143
ESSAY QUESTIONS
1 Diagram 1.1 (a) shows a human activity on the environment in area X The area is developed such as Diagram 1.1 (b)
(a) Based on your opinion, justify the effect of the development to the ecosystem in area X
[10 marks]
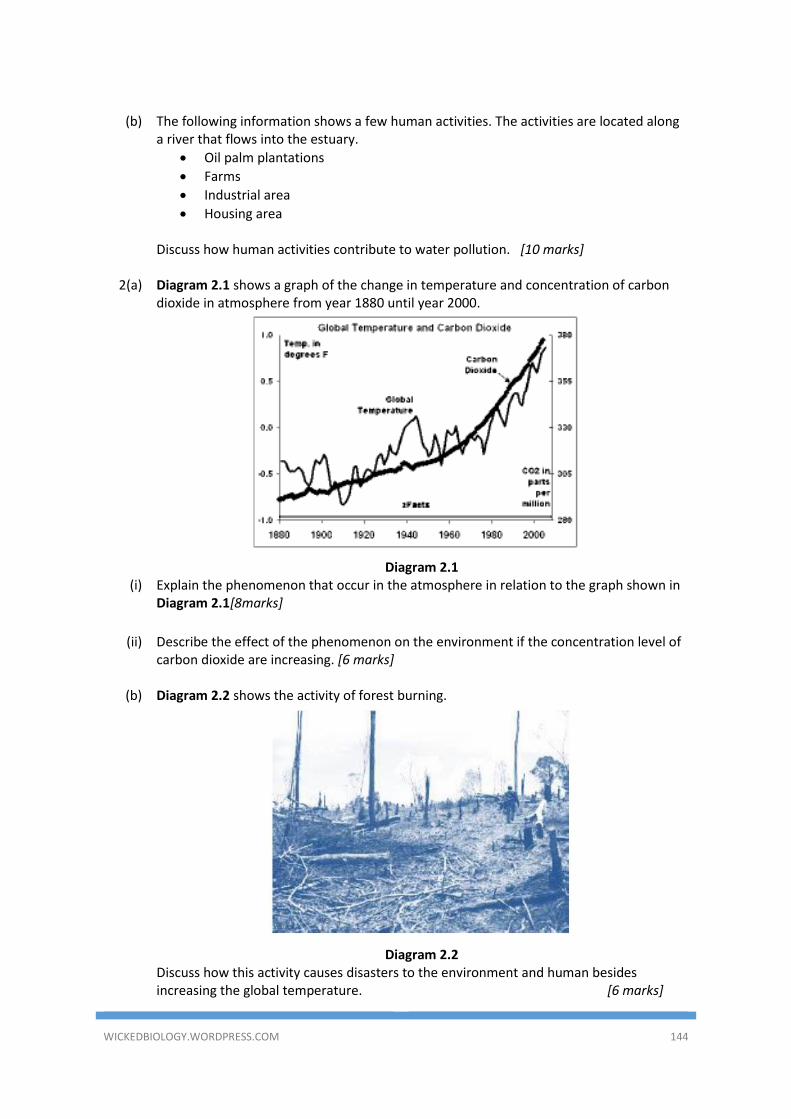
WICKEDBIOLOGY.WORDPRESS.COM 144
(b) The following information shows a few human activities. The activities are located along
a river that flows into the estuary.
• Oil palm plantations
• Farms
• Industrial area
• Housing area
Discuss how human activities contribute to water pollution. [10 marks]
2(a) Diagram 2.1 shows a graph of the change in temperature and concentration of carbon dioxide in atmosphere from year 1880 until year 2000.
Diagram 2.1
(i) Explain the phenomenon that occur in the atmosphere in relation to the graph shown in Diagram 2.1[8marks]
(ii) Describe the effect of the phenomenon on the environment if the concentration level of carbon dioxide are increasing. [6 marks]
(b) Diagram 2.2 shows the activity of forest burning.
Diagram 2.2
Discuss how this activity causes disasters to the environment and human besides increasing the global temperature. [6 marks]
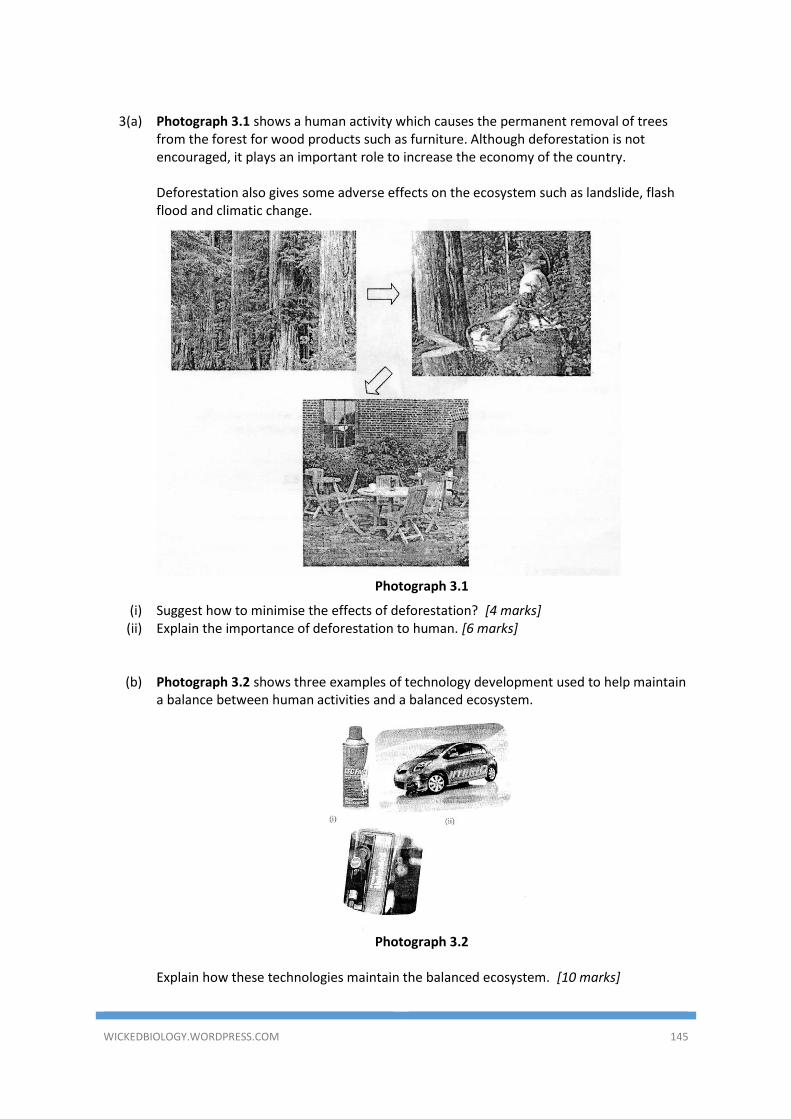
WICKEDBIOLOGY.WORDPRESS.COM 145
3(a) Photograph 3.1 shows a human activity which causes the permanent removal of trees
from the forest for wood products such as furniture. Although deforestation is not encouraged, it plays an important role to increase the economy of the country. Deforestation also gives some adverse effects on the ecosystem such as landslide, flash flood and climatic change.
(
Photograph 3.1
(i) Suggest how to minimise the effects of deforestation? [4 marks] (ii) Explain the importance of deforestation to human. [6 marks]
(b) Photograph 3.2 shows three examples of technology development used to help maintain a balance between human activities and a balanced ecosystem.
Photograph 3.2
Explain how these technologies maintain the balanced ecosystem. [10 marks]
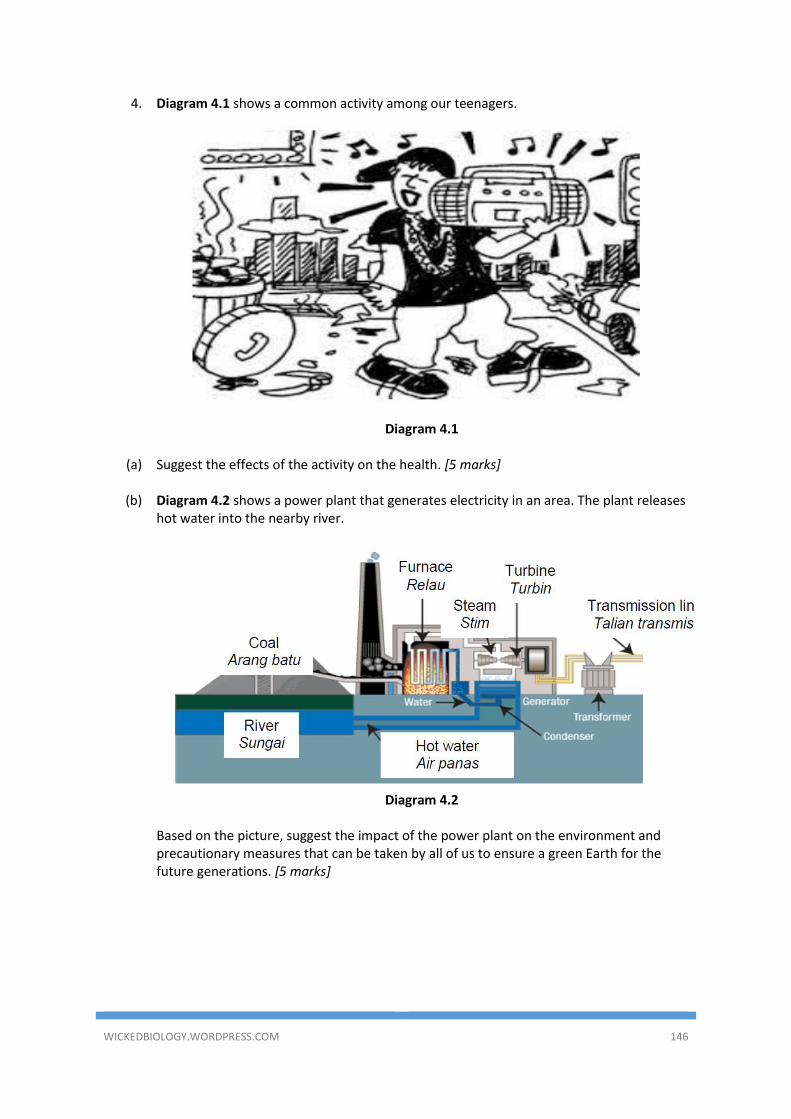
WICKEDBIOLOGY.WORDPRESS.COM 146
4. Diagram 4.1 shows a common activity among our teenagers.
Diagram 4.1
(a) Suggest the effects of the activity on the health. [5 marks]
(b) Diagram 4.2 shows a power plant that generates electricity in an area. The plant releases
hot water into the nearby river.
Diagram 4.2 Based on the picture, suggest the impact of the power plant on the environment and
precautionary measures that can be taken by all of us to ensure a green Earth for the future generations. [5 marks]
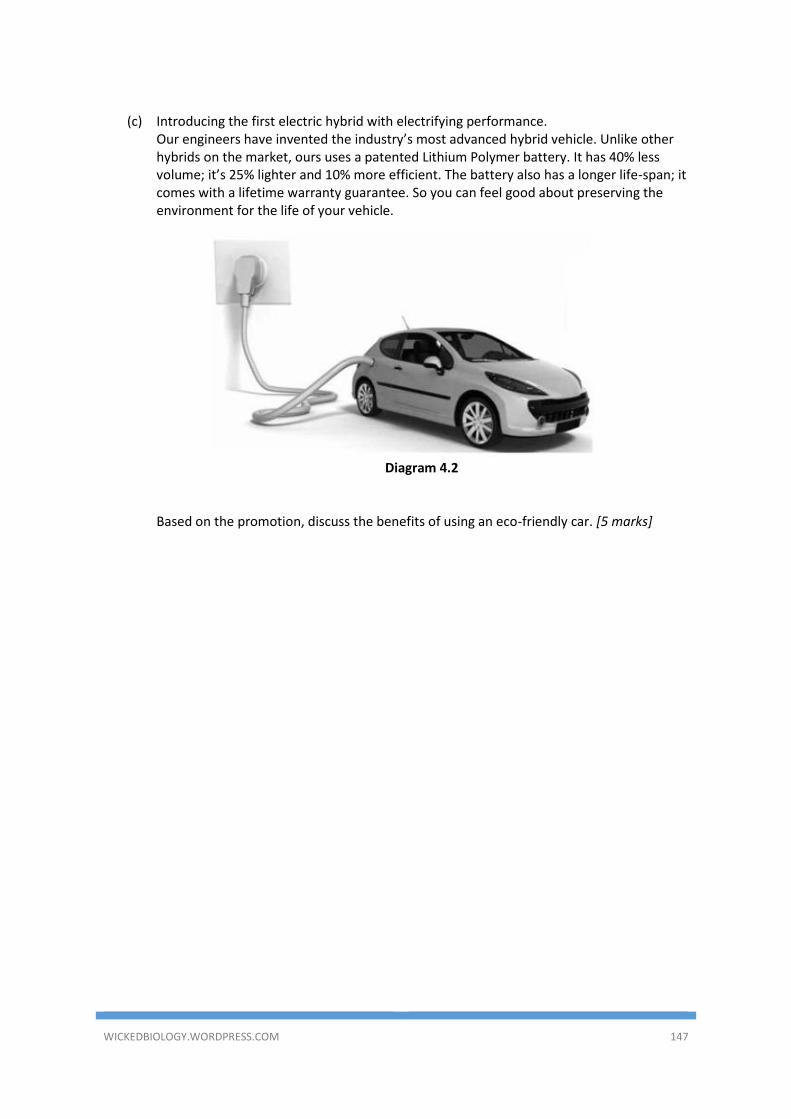
WICKEDBIOLOGY.WORDPRESS.COM 147
(c) Introducing the first electric hybrid with electrifying performance.
Our engineers have invented the industry’s most advanced hybrid vehicle. Unlike other hybrids on the market, ours uses a patented Lithium Polymer battery. It has 40% less volume; it’s 25% lighter and 10% more efficient. The battery also has a longer life-span; it comes with a lifetime warranty guarantee. So you can feel good about preserving the environment for the life of your vehicle.
Diagram 4.2
Based on the promotion, discuss the benefits of using an eco-friendly car. [5 marks]