cashew nut shell liquid as a green alternative to ... - pantheon ufrj
TRANSCRIPT
CASHEW NUT SHELL LIQUID AS A GREEN ALTERNATIVE TO FUNCTIONALIZE
POLYMERS: EXPERIMENTAL AND MODELING INVESTIGATION
Laura Pires da Mata Costa
Dissertação de Mestrado apresentada ao
Programa de Pós-graduação em Engenharia
Química, COPPE, da Universidade Federal
do Rio de Janeiro, como parte dos requisitos
necessários à obtenção do título de Mestre em
Engenharia Química.
Orientadores: José Carlos Costa da Silva Pinto
Amanda Lemette Teixeira
Brandão
Márcio Nele de Souza
Rio de Janeiro
Fevereiro de 2019
CASHEW NUT SHELL LIQUID AS A GREEN ALTERNATIVE TO FUNCTIONALIZE
POLYMERS: EXPERIMENTAL AND MODELING INVESTIGATION
Laura Pires da Mata Costa
DISSERTAÇÃO SUBMETIDA AO CORPO DOCENTE DO INSTITUTO ALBERTO LUIZ
COIMBRA DE PÓS-GRADUAÇÃO E PESQUISA DE ENGENHARIA (COPPE) DA
UNIVERSIDADE FEDERAL DO RIO DE JANEIRO COMO PARTE DOS REQUISITOS
NECESSÁRIOS PARA A OBTENÇÃO DO GRAU DE MESTRE EM CIÊNCIAS EM
ENGENHARIA QUÍMICA.
Examinada por:
Prof. Fernando Gomes de Souza Jr, D.Sc.
Prof. Marina Damião Besteti, D.Sc.
Dr. Bruno Francisco Oeschler, D.Sc.
Prof. José Carlos Costa da Silva Pinto, D.Sc.
Prof. Amanda Lemette Teixeira Brandão, D.Sc.
RIO DE JANEIRO, RJ – BRASIL
FEVEREIRO DE 2019
Pires da Mata Costa, Laura
Cashew Nut Shell Liquid as a Green Alternative to
Functionalize Polymers: Experimental and Modeling
Investigation/Laura Pires da Mata Costa. – Rio de Janeiro:
UFRJ/COPPE, 2019.
XVIII, 159 p.: il.; 29,7cm.
Orientadores: José Carlos Costa da Silva Pinto
Amanda Lemette Teixeira Brandão
Márcio Nele de Souza
Dissertação (mestrado) – UFRJ/COPPE/Programa de
Engenharia Química, 2019.
Referências Bibliográficas: p. 150 – 158.
1. LCC. 2. Cardanol. 3. Ácido anacárdico. 4.
Copolímero. I. Costa da Silva Pinto, José Carlos et al. II.
Universidade Federal do Rio de Janeiro, COPPE, Programa
de Engenharia Química. III. Título.
iii

I dedicate ...
iv

Acknowledgments
I am thankful ...
v
Resumo da Dissertação apresentada à COPPE/UFRJ como parte dos requisitos
necessários para a obtenção do grau de Mestre em Ciências (M.Sc.)
LÍQUIDO DA CASTANHA DE CAJU COMO UMA ALTERNATIVA VERDE PARA
FUNCIONALIZAR POLÍMEROS: INVESTIGAÇÃO EXPERIMENTAL E TEÓRICA
Laura Pires da Mata Costa
Fevereiro/2019
Orientadores: José Carlos Costa da Silva Pinto
Amanda Lemette Teixeira Brandão
Márcio Nele de Souza
Programa: Engenharia Química
O líquido da castanha de caju (LCC) é um sub-produto da indústria de produção de
castanha de caju. Apesar disto, ele é riquissímo em compostos fenólicos que podem
ser utilizados como comonômeros na funcionalização de polímeros. No presente
trabalho, é estudada a polimerização radicalar desses materiais. Inicialmente, a
copolimerização em massa do cardanol ou LCC natural com estireno, metacrilato
de metila, acetato de vinila ou ácido acrílico foi estudada cineticamente e diversas
análises foram realizadas para caracterizar os copolímeros formados. Algumas
vantagem obtidas na copolimerização foi o aumento da estabilidade térmica e redução
da temperatura vítrea dos polímeros. Assim, um mecanismo cinético foi proposto e
um modelo matemático derivado para que fossem estimados parâmetros cinéticos
que permitiram a descrição apropriada de conversão dos monômeros, massas molares
médias e composição dos copolímeros. É detectado que os monômeros renováveis
exercem forte efeito inibitório nas polimerizações, fazendo com que a incorporação
deles nas cadeias copoliméricas seja difícil, mas não impossível. Com tais resultados,
polimerizações em suspensão foram realizadas com as condições que obtiveram
melhor desempenho em massa. Polímeros antes hidrofóbicos, se tornaram mais
hidrofílicos e a adição de cardanol nessas polimerizações se mostrou uma ótima
alternativa para controlar tamanho de partículas e manter suspensões estáveis por
longos períodos de tempo.
vi
Abstract of Dissertation presented to COPPE/UFRJ as a partial fulfillment of the
requirements for the degree of Master of Science (M.Sc.)
CASHEW NUT SHELL LIQUID AS A GREEN ALTERNATIVE TO FUNCTIONALIZE
POLYMERS: EXPERIMENTAL AND MODELING INVESTIGATION
Laura Pires da Mata Costa
February/2019
Advisors: José Carlos Costa da Silva Pinto
Amanda Lemette Teixeira Brandão
Márcio Nele de Souza
Department: Chemical Engineering
Cashew nut shell liquid (CNSL) is a by-product of cashew nut industry. Despite
this, it is rich in phenolic compounds that can be used as comonomers in the
functionalization of polymers. In the present study, the radical polymerization of these
materials is investigated. Inittialy, the bulk copolymerization of cardanol or natural
CNSL with styrene, methyl methacrylate, vinyl acetate or acrylic acid was studied
kinetically and several analyzes were carried out to characterize the copolymers
formed. Some advantages obtained in the copolymerization were the increase in
thermal stability and reduction of the glass temperature of the polymers. Thus, a
kinetic mechanism was proposed and a mathematical model derived to estimate
kinetic paramers that allowed proper description of monomer conversion, average
molecular weights, and composition of the copolymers. It is detected that the
renewable monomers exert a strong inhibition effect on the polymerizations, making
the incorporation of them into the copolymer chains difficult, but not impossible. With
these results, suspension polymerizations were performed with the conditions that
obtained the best results in bulk polymerization. Polymers previously hydrophobics
became more hydrophilic; and the addition of cardanol in such polymerization
has proved to be an excellent alternative for particle size control and to stabilize
suspensions for long periods of time.
vii
Contents
Acknowledgments v
List of Figures xi
List of Tables xvii
1 Introduction 1
1.1 Motivation . . . . . . . . . . . . . . . . . . . . . . . . . . . . . . . . . . . . . . 2
2 Theoretical Foundation About Polymers 3
2.1 Introduction . . . . . . . . . . . . . . . . . . . . . . . . . . . . . . . . . . . . . 3
2.2 Types of Polymerization . . . . . . . . . . . . . . . . . . . . . . . . . . . . . . 3
2.3 Polymerization methods . . . . . . . . . . . . . . . . . . . . . . . . . . . . . . 12
2.3.1 Bulk Polymerization . . . . . . . . . . . . . . . . . . . . . . . . . . . . 12
2.3.2 Solution Polymerization . . . . . . . . . . . . . . . . . . . . . . . . . . 12
2.3.3 Suspension Polymerization . . . . . . . . . . . . . . . . . . . . . . . . 13
2.3.4 Emulsion Polymerization . . . . . . . . . . . . . . . . . . . . . . . . . 13
2.4 Molecular Weight Distribution (MWD) . . . . . . . . . . . . . . . . . . . . . 13
3 Cashew Nut Shell Liquid – A Literature Review 16
3.1 Introduction . . . . . . . . . . . . . . . . . . . . . . . . . . . . . . . . . . . . . 16
3.2 Cashew Nut Shell Liquid (CNSL) . . . . . . . . . . . . . . . . . . . . . . . . . 18
3.3 Synthesis of polymers using CNSL . . . . . . . . . . . . . . . . . . . . . . . . 24
3.4 Polymer Functionalization . . . . . . . . . . . . . . . . . . . . . . . . . . . . 37
3.5 Concluding Remarks . . . . . . . . . . . . . . . . . . . . . . . . . . . . . . . . 38
Kinetic Study of Bulk Copolymerization 39
4 Bulk Copolimerization: Methodology 40
4.1 Materials . . . . . . . . . . . . . . . . . . . . . . . . . . . . . . . . . . . . . . . 40
4.2 Set up for bulk polymerizaion . . . . . . . . . . . . . . . . . . . . . . . . . . . 40
4.3 Kinetic Experiments . . . . . . . . . . . . . . . . . . . . . . . . . . . . . . . . 41
4.4 Gravimetric Analysis . . . . . . . . . . . . . . . . . . . . . . . . . . . . . . . . 42
viii
4.5 Characterizations . . . . . . . . . . . . . . . . . . . . . . . . . . . . . . . . . . 43
4.5.1 Gel Permeation Chromatography (GPC) . . . . . . . . . . . . . . . . 43
4.5.2 Nuclear Magnetic Resonance (NMR) . . . . . . . . . . . . . . . . . . 43
4.5.3 Fourier-transform infrared spectroscopy (FTIR) . . . . . . . . . . . . 44
4.5.4 Thermogravimetric analysis (TGA) . . . . . . . . . . . . . . . . . . . 44
4.5.5 Differential Scanning Calorimetry (DSC) . . . . . . . . . . . . . . . . 44
5 Bulk Copolymerization: Experimental Results 46
5.1 Introduction . . . . . . . . . . . . . . . . . . . . . . . . . . . . . . . . . . . . . 46
5.2 Homopolymerization of cardanol and anacardic acid . . . . . . . . . . . . . 47
5.3 Copolymerization of cardanol and styrene . . . . . . . . . . . . . . . . . . . 55
5.4 Copolymerization of cardanol and methyl methacrylate . . . . . . . . . . . 67
5.5 Copolymerization of natural CNSL and methyl methacrylate . . . . . . . . 74
5.6 Copolymerization of cardanol and vinyl acetate . . . . . . . . . . . . . . . . 78
5.7 Copolymerization of cardanol and acrylic acid . . . . . . . . . . . . . . . . . 82
5.8 Concluding Remarks . . . . . . . . . . . . . . . . . . . . . . . . . . . . . . . . 86
6 Bulk Copolymerization: Modeling 87
6.1 Introduction . . . . . . . . . . . . . . . . . . . . . . . . . . . . . . . . . . . . . 87
6.2 Kinetic Mechanism . . . . . . . . . . . . . . . . . . . . . . . . . . . . . . . . . 88
6.3 Material Balances . . . . . . . . . . . . . . . . . . . . . . . . . . . . . . . . . . 91
6.4 Methodology and Numerical Solution . . . . . . . . . . . . . . . . . . . . . . 95
6.5 Parameters for homopolymerization . . . . . . . . . . . . . . . . . . . . . . 99
6.6 Parameter estimation . . . . . . . . . . . . . . . . . . . . . . . . . . . . . . . 102
6.7 Simulations . . . . . . . . . . . . . . . . . . . . . . . . . . . . . . . . . . . . . 103
6.7.1 Styrene Homopolymerization . . . . . . . . . . . . . . . . . . . . . . 105
6.7.2 Styrene/Cardanol Copolymerizations at 110°C . . . . . . . . . . . . 107
6.7.3 Styrene/Cardanol Copolymerizations at 85°C . . . . . . . . . . . . . 110
6.7.4 Styrene/Cardanol Copolymerizations at 110°C for 10wt % . . . . . . 114
6.7.5 Methyl Methacrylate/Cardanol Copolymerizations at 85°C . . . . . 115
6.7.6 Methyl Methacrylate/Cardanol Copolymerizations at 110°C . . . . . 124
6.8 Concluding Remarks . . . . . . . . . . . . . . . . . . . . . . . . . . . . . . . . 126
Kinetic Study of Suspension Copolymerization 128
7 Suspension Copolimerization: Methodology 129
7.1 Materials . . . . . . . . . . . . . . . . . . . . . . . . . . . . . . . . . . . . . . . 129
7.2 Set Up . . . . . . . . . . . . . . . . . . . . . . . . . . . . . . . . . . . . . . . . . 129
7.3 Kinetic Experiments . . . . . . . . . . . . . . . . . . . . . . . . . . . . . . . . 129
7.4 Gravimetric Analysis . . . . . . . . . . . . . . . . . . . . . . . . . . . . . . . . 131
7.5 Characterizations . . . . . . . . . . . . . . . . . . . . . . . . . . . . . . . . . . 132
ix
7.5.1 Contact Angle . . . . . . . . . . . . . . . . . . . . . . . . . . . . . . . . 132
7.5.2 Interfacial tension . . . . . . . . . . . . . . . . . . . . . . . . . . . . . 132
7.5.3 Particles Size . . . . . . . . . . . . . . . . . . . . . . . . . . . . . . . . . 132
7.5.4 MEV . . . . . . . . . . . . . . . . . . . . . . . . . . . . . . . . . . . . . . 132
7.5.5 Optical Microscopy (OM) . . . . . . . . . . . . . . . . . . . . . . . . . 133
8 Suspension Copolimerization: Results 134
8.1 Introduction . . . . . . . . . . . . . . . . . . . . . . . . . . . . . . . . . . . . . 134
8.2 Styrene-Cardanol Copolymer Particles . . . . . . . . . . . . . . . . . . . . . 134
8.3 Methyl Methacrylate-Cardanol Copolymer Particles . . . . . . . . . . . . . 137
8.4 Concluding Remarks . . . . . . . . . . . . . . . . . . . . . . . . . . . . . . . . 145
9 Conclusions 147
Bibliography 150
x
List of Figures
1.1 Logo from COPPETEX . . . . . . . . . . . . . . . . . . . . . . . . . . . . . . . . 2
2.1 Some Ways to Classify a Polymer . . . . . . . . . . . . . . . . . . . . . . . . . 4
2.2 Free Radical Polymerization: Initiation . . . . . . . . . . . . . . . . . . . . . 5
2.3 Homolytic scission of BPO followed by the initiation of styrene polymer-
ization . . . . . . . . . . . . . . . . . . . . . . . . . . . . . . . . . . . . . . . . 5
2.4 Thermal initiation of styrene . . . . . . . . . . . . . . . . . . . . . . . . . . . 5
2.5 Free Radical Polymerization: Propagation . . . . . . . . . . . . . . . . . . . 6
2.6 Propagation of poly(styrene) . . . . . . . . . . . . . . . . . . . . . . . . . . . 6
2.7 Free Radical Polymerization: Termination (Disproportionation or Cou-
pling) . . . . . . . . . . . . . . . . . . . . . . . . . . . . . . . . . . . . . . . . . 6
2.8 Termination of poly(styrene) . . . . . . . . . . . . . . . . . . . . . . . . . . . 7
2.9 Synthesis of Nylon 66, a step-growth polymerization . . . . . . . . . . . . . 7
2.10 Decomposition of BPO (a) and AIBN (b) . . . . . . . . . . . . . . . . . . . . 8
2.11 Last model applied for copolymerization . . . . . . . . . . . . . . . . . . . . 10
2.12 Penultimate model . . . . . . . . . . . . . . . . . . . . . . . . . . . . . . . . . 11
3.1 Cashew . . . . . . . . . . . . . . . . . . . . . . . . . . . . . . . . . . . . . . . . 17
3.2 An Example of Beneficiation process for Cashew Nut . . . . . . . . . . . . . 18
3.3 Cashew nut: the shell and the almond (adapted from Sistemas de Pro-
dução, EMBRAPA). . . . . . . . . . . . . . . . . . . . . . . . . . . . . . . . . . 19
3.4 Products obtained from cashew (adapted from AgroIndúsria do Caju no
Nordeste, ETENE/BNB, 1973). . . . . . . . . . . . . . . . . . . . . . . . . . . 19
3.5 Production of Cashew Nut between the years of 2006 and 2018
(IBGE/CEPAGRO) . . . . . . . . . . . . . . . . . . . . . . . . . . . . . . . . . . 20
3.6 Components of the CNSL . . . . . . . . . . . . . . . . . . . . . . . . . . . . . 20
3.7 Advantages arising from functional groups of cardanol and anacardic acid 21
3.8 Decarboxylation of anacardic acid . . . . . . . . . . . . . . . . . . . . . . . . 21
3.9 Thermal Polymerization of cardanol. (OLIVEIRA, LINCOLN DAVI M. DE
, 2007) . . . . . . . . . . . . . . . . . . . . . . . . . . . . . . . . . . . . . . . . . 22
xi
3.10 Anacardic Acid: (i) 1-hydroxy-2-carboxy-3-pentadecyl benzene, (ii)
1-hydroxy-2-carboxy-3-(8-penta-decenyl)benzene, (iii) 1-hydroxy-
2-carboxy-3-(8,11-pentadecadienyl)benzene, and (iv) 1-hydroxy-2-
carboxy-3-(8,11,14 pentadecatrienyl)benzene. . . . . . . . . . . . . . . . . . 24
3.11 Chemical Transformations of Cardanol (BALGUDE and SABNIS, 2014) . . 25
3.12 Oxidative Polymerization of Cardanol using Fe-Salen as a catalyst (IKEDA
et al., 2000a) . . . . . . . . . . . . . . . . . . . . . . . . . . . . . . . . . . . . . 26
3.13 Structure of Fe-salen complex . . . . . . . . . . . . . . . . . . . . . . . . . . 26
3.14 Cationic Polymerization of Cardanol . . . . . . . . . . . . . . . . . . . . . . . 27
3.15 Synthesis of poly(cardanyl acrylate) and its film (MANJULA et al., 1992) . . 28
3.16 An epoxy novolac resin structure sold by Cardolite . . . . . . . . . . . . . . 32
3.17 Reaction scheme of anacardic acid polymerization catalyzed by peroxi-
dase (adapted from CHELIKANI et al. (2009)) . . . . . . . . . . . . . . . . . 36
3.18 Synthesis of anacardanyl acrylate (a) and anacardanyl methacrylate (b)
(adapted from PHILIP et al. (2007)) . . . . . . . . . . . . . . . . . . . . . . . 36
4.1 Set Up for Bulk Copolymerization . . . . . . . . . . . . . . . . . . . . . . . . 41
5.1 Reactive sites of cardanol . . . . . . . . . . . . . . . . . . . . . . . . . . . . . 46
5.2 GPC of cardanol oligomers at 85°C (a) and 110°C (b) . . . . . . . . . . . . . 48
5.3 GPC of natural CNSL oligomers at 85°C (a) and 110°C (b) . . . . . . . . . . 49
5.4 1H NMR of cardanol . . . . . . . . . . . . . . . . . . . . . . . . . . . . . . . . 50
5.5 1H NMR of the reaction mixture for synthesize polycardanol by radical
polymerization using BPO after 4 hours . . . . . . . . . . . . . . . . . . . . . 50
5.6 1H NMR of cardanol after 8h for reaction with BPO . . . . . . . . . . . . . . 51
5.7 1H NMR of CNSL . . . . . . . . . . . . . . . . . . . . . . . . . . . . . . . . . . 52
5.8 1H NMR of CNSL after 8h of reaction . . . . . . . . . . . . . . . . . . . . . . 53
5.9 FTIR for cardanol after 4 and 8 hours of reaction . . . . . . . . . . . . . . . . 54
5.10 Inhibition Mechanism for Cardanol . . . . . . . . . . . . . . . . . . . . . . . 54
5.11 TGA and DTG analysis for cardanol and natural cashew nut shell liquid . . 55
5.12 Chemical structure of polystyrene . . . . . . . . . . . . . . . . . . . . . . . . 56
5.13 Photo for synthesized polystyrene or poly(styrene-co-cardanol) at 110°C . 56
5.14 Conversion and molecular weights for poly(Sty-co-C), 85°C . . . . . . . . . 57
5.15 Conversion and molecular weights for poly(Sty-co-C), 110°C . . . . . . . . 58
5.16 TGA and DTG curves for poly(Sty-co-C), 85°C . . . . . . . . . . . . . . . . . 59
5.17 TGA and DTG curves for poly(Sty-co-C), 110°C . . . . . . . . . . . . . . . . 59
5.18 1H-NMR spectrum of poly(styrene-co-cardanol) prepared with 5 wt% of
cardanol at 110°C . . . . . . . . . . . . . . . . . . . . . . . . . . . . . . . . . . . 61
5.19 FTIR spectrum of poly(styrene-co-cardanol) prepared with at 85°C . . . . . 63
5.20 FTIR spectrum of poly(styrene-co-cardanol) at 110°C . . . . . . . . . . . . . 64
xii
5.21 FTIR spectrum of poly(styrene-co-cardanol) at condition 2.5wt % and 85°C . 65
5.22 FTIR spectrum of poly(styrene-co-cardanol) at condition 2.5wt % and
110°C . . . . . . . . . . . . . . . . . . . . . . . . . . . . . . . . . . . . . . . . . . 66
5.23 FTIR spectrum of poly(styrene-co-cardanol) at condition 10wt % and
110°C . . . . . . . . . . . . . . . . . . . . . . . . . . . . . . . . . . . . . . . . . . 66
5.24 Methyl methacrylate, MMA, structure . . . . . . . . . . . . . . . . . . . . . . 67
5.25 Conversion and molecular weights for P(MMA-co-C), 85°C . . . . . . . . . 68
5.26 Conversion and molecular weights for P(MMA-co-C), 110°C . . . . . . . . . 68
5.27 TGA and DTG curves for P(MMA-co-C), 85°C . . . . . . . . . . . . . . . . . . 70
5.28 TGA and DTG curves for P(MMA-co-C), 110°C . . . . . . . . . . . . . . . . . 70
5.29 FTIR analysis for P(MMA-co-C), 85°C . . . . . . . . . . . . . . . . . . . . . . 71
5.30 FTIR analysis for P(MMA-co-C), 110°C . . . . . . . . . . . . . . . . . . . . . 72
5.31 NMR spectrum for P(MMA-co-C), 5% w/w, 110°C . . . . . . . . . . . . . . . 74
5.32 Conversion for P(MMA-co-CNSL), 85 and 110°C . . . . . . . . . . . . . . . . 75
5.33 Conversion for P(MMA-co-CNSL) and P(MMA-co-C), 85°C . . . . . . . . . 75
5.34 Conversion for P(MMA-co-CNSL) and P(MMA-co-C), 110°C . . . . . . . . . 76
5.35 TGA and DTG curves for P(MMA-co-CNSL) and P(MMA-co-C), 85°C . . . . 77
5.36 TGA and DTG curves for P(MMA-co-CNSL) and P(MMA-co-C), 110°C . . . 77
5.37 Structure of poly(vinyl acetate), PVAc . . . . . . . . . . . . . . . . . . . . . . 78
5.38 Conversion and molecular weight for P(VAc-co-C), 85°C . . . . . . . . . . . 79
5.39 1H NMR for P(VAc-co-C), 5% w/w, 85°C . . . . . . . . . . . . . . . . . . . . . 80
5.40 TGA and DTG curves for P(VAc-co-C), 85°C . . . . . . . . . . . . . . . . . . . 81
5.41 FTIR for P(VAc-co-C), 85°C . . . . . . . . . . . . . . . . . . . . . . . . . . . . 82
5.42 Polyacrylic acid, PAA . . . . . . . . . . . . . . . . . . . . . . . . . . . . . . . . 82
5.43 Conversion for P(AA-co-C) at 85°C . . . . . . . . . . . . . . . . . . . . . . . . 84
5.44 TGA curves for for P(AA-co-C) at 85°C . . . . . . . . . . . . . . . . . . . . . . 85
6.1 Employed parameter estimation procedure (BRANDÃO (2017)) . . . . . . . 102
6.2 Predicted and experimental results for styrene homopolymerization at
90°C (condition A5). (MCI = model confidence interval; MP = model pre-
dictions and ED = experimental data). . . . . . . . . . . . . . . . . . . . . . . 106
6.3 Predicted and experimental results for styrene homopolymerization at
110°C (condition A6). (MCI = model confidence interval; MP = model
predictions and ED = experimental data). . . . . . . . . . . . . . . . . . . . . 106
6.4 Joint confidence region for parameters r1,2 and r2,1 when parameter fi nh
was fixed at 0.731. The red center dot is the estimated values of r1,2 and
r2,1 (1.628, 0.026). . . . . . . . . . . . . . . . . . . . . . . . . . . . . . . . . . . 107
xiii
6.5 Predicted and experimental results for styrene/cardanol copolymeriza-
tion at condition A1. (MCI = model confidence interval; MP = model pre-
dictions and ED = experimental data). . . . . . . . . . . . . . . . . . . . . . . 108
6.6 Predicted and experimental results for styrene/cardanol copolymeriza-
tion at condition A2. (MCI = model confidence interval; MP = model pre-
dictions and ED = experimental data). . . . . . . . . . . . . . . . . . . . . . . 109
6.7 Predicted and experimental results for cardanol compositions at condi-
tions A1 and A2. (MP = model predictions and ED = experimental data). . 110
6.8 Joint confidence region for parameters r1,2 and r2,1 when parameter fi nh
was fixed at 0.628. The red center dot is the estimated values of r1,2 and
r2,1 (3.172, 0.015). . . . . . . . . . . . . . . . . . . . . . . . . . . . . . . . . . . 111
6.9 Predicted and experimental results for styrene/cardanol copolymeriza-
tion at condition A3. (MCI = model confidence interval; MP = model pre-
dictions and ED = experimental data). . . . . . . . . . . . . . . . . . . . . . . 112
6.10 Predicted and experimental results for styrene/cardanol copolymeriza-
tion at condition A4. (MCI = model confidence interval; MP = model pre-
dictions and ED = experimental data). . . . . . . . . . . . . . . . . . . . . . . 113
6.11 Predicted and experimental results for cardanol compositions at condi-
tions A3 and A4 (MP = model predictions). . . . . . . . . . . . . . . . . . . . 113
6.12 Predicted and experimental results for cardanol copolymerization at
110°C for 10wt % (MP = model predictions). . . . . . . . . . . . . . . . . . . 114
6.13 Predicted and experimental results for cardanol compositions at 110°C
for 10wt % (MP = model predictions). . . . . . . . . . . . . . . . . . . . . . . 115
6.14 Predicted and experimental results for MMA/cardanol copolymer con-
version and molecular weights at conditions 2.5 wt % (MP = model pre-
dictions). . . . . . . . . . . . . . . . . . . . . . . . . . . . . . . . . . . . . . . . 117
6.15 Predicted and experimental results for cardanol composition in a
MMA/cardanol copolymer at 85°C and 2.5wt % (MP = model predictions). 117
6.16 Predicted and experimental results for MMA/cardanol copolymer con-
version and molecular weights at conditions 5 wt % (MP = model predic-
tions). . . . . . . . . . . . . . . . . . . . . . . . . . . . . . . . . . . . . . . . . . 117
6.17 Predicted and experimental results for cardanol composition in a
MMA/cardanol copolymer at 85°C and 5wt % (MP = model predictions). . 118
6.18 Predicted and experimental results for MMA/cardanol copolymer con-
version and molecular weights at conditions 10wt % (MP = model pre-
dictions). . . . . . . . . . . . . . . . . . . . . . . . . . . . . . . . . . . . . . . . 118
6.19 Predicted and experimental results for cardanol composition in a
MMA/cardanol copolymer at 85°C and 10wt % (MP = model predictions). 118
xiv
6.20 Predicted and experimental results for MMA/cardanol copolymer con-
version and molecular weights at conditions 2.5 wt % considering a 4th
parameter, t1,2 (MP = model predictions). . . . . . . . . . . . . . . . . . . . . 121
6.21 Predicted and experimental results for cardanol composition in a
MMA/cardanol copolymer at 85°C and 2.5wt % considering a 4th param-
eter, t1,2 (MP = model predictions). . . . . . . . . . . . . . . . . . . . . . . . . 121
6.22 Predicted and experimental results for MMA/cardanol copolymer con-
version and molecular weights at conditions 5 wt % considering a 4th pa-
rameter, t1,2 (MP = model predictions). . . . . . . . . . . . . . . . . . . . . . 122
6.23 Predicted and experimental results for cardanol composition in a
MMA/cardanol copolymer at 85°C and 5wt % considering a 4th parame-
ter, t1,2 (MP = model predictions). . . . . . . . . . . . . . . . . . . . . . . . . 122
6.24 Predicted and experimental results for MMA/cardanol copolymer con-
version and molecular weights at conditions 10wt % considering a 4th
parameter, t1,2 (MP = model predictions). . . . . . . . . . . . . . . . . . . . . 123
6.25 Predicted and experimental results for cardanol composition in a
MMA/cardanol copolymer at 85°C and 10wt % considering a 4th param-
eter, t1,2 (MP = model predictions). . . . . . . . . . . . . . . . . . . . . . . . . 123
6.26 Predicted and experimental results for MMA/cardanol copolymer con-
version and molecular weights at 110°C and 2.5 wt % considering a 4th
parameter, t1,2 (MP = model predictions). . . . . . . . . . . . . . . . . . . . . 125
6.27 Predicted and experimental results for cardanol composition in a
MMA/cardanol copolymer at 110°C and 2.5wt % considering a 4th pa-
rameter, t1,2 (MP = model predictions). . . . . . . . . . . . . . . . . . . . . . 125
6.28 Predicted and experimental results for MMA/cardanol copolymer con-
version and molecular weights at 110°C and 10wt % considering a 4th
parameter, t1,2 (MP = model predictions). . . . . . . . . . . . . . . . . . . . . 126
6.29 Predicted and experimental results for cardanol composition in a
MMA/cardanol copolymer at 110°C and 10wt % considering a 4th param-
eter, t1,2 (MP = model predictions). . . . . . . . . . . . . . . . . . . . . . . . . 126
7.1 Set Up for Suspension Polymerizations . . . . . . . . . . . . . . . . . . . . . 130
8.1 Photos of pendant upward drop tensiometry used for some non-reported
interfacial tension calculations. (a) was the test for cardanol-water and
(b) for styrene + cardanol in water. . . . . . . . . . . . . . . . . . . . . . . . . 136
8.2 Conversion values for styrene-cardanol suspension polymerizations . . . 136
8.3 Conversion values for methyl methacrylate-cardanol suspension poly-
merizations with 1wt% of BPO . . . . . . . . . . . . . . . . . . . . . . . . . . 137
xv
8.4 SEM photo for methyl methacrylate-cardanol particles produced with
10wt% of cardanol and 1wt% of BPO after 6 hours of polymerization . . . 138
8.5 SEM photo for methyl methacrylate-cardanol particles produced with
5wt% of cardanol and 1wt% of BPO after 4 hours of polymerization . . . . 139
8.6 Particle size distribution for copolymer particles produced with 1wt% of
BPO . . . . . . . . . . . . . . . . . . . . . . . . . . . . . . . . . . . . . . . . . . 140
8.7 Photo of a becker contaning the reaction mixture of methyl methacrylate
and 5wt% of cardanol one day after the reaction . . . . . . . . . . . . . . . . 141
8.8 Optical microscopy images for the center (a) and bottom (b) for methyl
methacrylate-cardanol copolymer particles . . . . . . . . . . . . . . . . . . 141
8.9 Conversion values for methyl methacrylate-cardanol suspension poly-
merizations with 5wt% of cardanol and 1 or 3wt% of BPO . . . . . . . . . . 142
8.10 Particle size distribution for PMMA or copolymer particles made with 1
or 3wt% of BPO respectively . . . . . . . . . . . . . . . . . . . . . . . . . . . . 142
8.11 Conversion data for methyl methacrylate-cardanol suspension polymer-
izations with 5wt% (a) or 10wt% (b) of cardanol and 1wt% of AIBN . . . . . 143
8.12 Particle size distribution for 5wt% cardanol copolymer particles made
with 1wt% of BPO or AIBN . . . . . . . . . . . . . . . . . . . . . . . . . . . . . 143
8.13 Experimental set up for PMMA-water contact angle measure . . . . . . . . 144
8.14 Photos taken while a contact angle analysis was being performed for a
copolymer of MMA and cardanol . . . . . . . . . . . . . . . . . . . . . . . . . 145
xvi
List of Tables
3.1 Difference between natural and technical CNSL (adapted from
MAZZETTO et al. (2009)) . . . . . . . . . . . . . . . . . . . . . . . . . . . . . . 23
3.2 Composition of natural CNSL measured by gas chromatography and
mass spectroscopy (GC-MS) (adapted from MAZZETTO et al. (2009)) . . . 23
3.3 Properties of cardanol and anacardic acid. . . . . . . . . . . . . . . . . . . . 23
3.4 Patents using cardanol as a reactive molecule . . . . . . . . . . . . . . . . . 29
3.5 Patents using cardanol to produce polyurethanes . . . . . . . . . . . . . . . 33
4.1 Kinetic Experiments Done . . . . . . . . . . . . . . . . . . . . . . . . . . . . . 42
5.1 Conversion for homopolymerization of cardanol with 1% w/w of BPO . . . 47
5.2 Conversion for homopolymerization of natural cashew nut shell liquid
with 1% w/w of BPO . . . . . . . . . . . . . . . . . . . . . . . . . . . . . . . . 48
5.3 Glass transition temperatures for P(STy-co-C) . . . . . . . . . . . . . . . . . 60
5.4 Cardanol contents of copolymer samples (wt%) for P(STy-co-C) . . . . . . 62
5.5 DSC analysis for P(MMA-co-C) . . . . . . . . . . . . . . . . . . . . . . . . . . 69
5.6 Copolymer composition for P(MMA-co-C), 85°C . . . . . . . . . . . . . . . 73
5.7 Copolymer composition for P(MMA-co-C), 110°C . . . . . . . . . . . . . . . 73
5.8 DSC analysis for P(MMA-co-CNSL) . . . . . . . . . . . . . . . . . . . . . . . 78
5.9 Copolymer composition for P(VAc-co-C), 85°C . . . . . . . . . . . . . . . . . 79
6.1 Parameter used for benzoyl peroxide, BPO . . . . . . . . . . . . . . . . . . . 99
6.2 Parameters for styrene . . . . . . . . . . . . . . . . . . . . . . . . . . . . . . . 100
6.3 Parameters for methyl methacrylate, MMA . . . . . . . . . . . . . . . . . . . 101
6.4 Equations for gel and glass effects for methyl methacrylate, MMA . . . . . 101
6.5 Experimental conditions used for parameter estimation . . . . . . . . . . . 103
6.6 Parameters used for cardanol . . . . . . . . . . . . . . . . . . . . . . . . . . . 104
6.7 Estimated model parameters for styrene homopolymerization reactions. . 105
6.8 Estimated model parameters for cardanol/styrene copolymerization re-
actions performed at 110°C . . . . . . . . . . . . . . . . . . . . . . . . . . . . . 107
6.9 Estimated model parameters for cardanol/styrene copolymerization re-
actions performed at 90°. . . . . . . . . . . . . . . . . . . . . . . . . . . . . . 110
xvii
6.10 Estimated model parameters for cardanol/styrene copolymerization re-
actions performed with 10wt % at 110°. . . . . . . . . . . . . . . . . . . . . . 114
6.11 Estimated model parameters for cardanol/MMA copolymerization reac-
tions, 85°C . . . . . . . . . . . . . . . . . . . . . . . . . . . . . . . . . . . . . . . 116
6.12 Boundaries for estimated model parameters considering ktm12. . . . . . . 119
6.13 Estimated model parameters for cardanol/MMA copolymerization reac-
tions considering ktm12, 85°C . . . . . . . . . . . . . . . . . . . . . . . . . . . 120
6.14 Estimated model parameters (without the exponentials) for car-
danol/MMA copolymerization reactions considering ktm12, 85°C . . . . . . 120
6.15 Estimated model parameters for cardanol/MMA copolymerization reac-
tions considering ktm12, 110°C . . . . . . . . . . . . . . . . . . . . . . . . . . . 124
6.16 Estimated model parameters (without exponentials) for cardanol/MMA
copolymerization reactions considering ktm12, 110°C . . . . . . . . . . . . . 125
7.1 Conditions for Suspension Polymerizations . . . . . . . . . . . . . . . . . . 131
8.1 Interfacial tension between styrene or styrene-cardanol with distilled water135
8.2 Interfacial tension between styrene or styrene-cardanol with distilled water137
xviii
Chapter 1
Introduction
Due to an increase on environmental concerns, green chemistry and waste manage-
ment are topics that have been discussed and studied in the 21th century. Thus, many
renewable sources are being used, mainly those that are derivatives by-products or
wastes are gaining a new presentation. In the polymerization industry, most of the
polymers are still petroleum-derived and it has been suffering harsh criticism due to
environment impact. Consequently, alternative sources of monomers have been in-
vestigated. One of them is cashew nut shell liquid (CNSL) which is a mixture of pheno-
lic compounds obtained from the fruit of cashew tree.
Although many people think that the fruit is the cashew apple, the actual fruit is
the nut with a kidney-shaped seed hidden within, the cashew kernel. Hence, the CNSL
is found inside of the cashew nut shells. It can be extracted by thermal, solvent or by
mechanical means. And depending on the method, it can be classified as natural and
technical. Natural CNSL is rich in anacardic acid, while technical CNSL is rich in car-
danol. Cardanol is a salicylic acid with a long side chain, while anacardic acid also has
a carboxylic acid group. The side chain varies in the number of unsaturation rang-
ing from 0 to 3. Both compounds are amphiphilic and, truly, are a mixture of several
closely related organic compounds. (LUBI and THACHIL (2000), LOCHAB et al. (2014),
OTSUKA et al. (2017)).
Thus, although the funcionalities of CNSL are large, it is still considered a by-
product of the cashew almond industry, being normally released to the environment
and discarded as waste. Besides biological applications (as anticancer, antioxidant and
antibacterial agent), it has been applied on many industrial applications like brake lin-
ings, surface coating, paints and varnishes. But it can undergo many polymerization
reactions because all compounds from CNSL contain at least a phenolic group (poly-
condensation) and a meta-substituted unsaturated long aliphatic chain (C15) (polyad-
dition). Mainly with cardanol, due to the hydroxyl group, polycondensation reactions
with formaldehyde (or a less toxic alternative) are well studied. However, very few is
1
known about how they react on radical addition polymerization (BHUNIA et al. (1999),
BALGUDE and SABNIS (2014), MUBOFU and MGAYA (2018)).
Finally, the worldwide annual production of raw cashew nuts stands at approxi-
mately 2.1 million tons. Knowing that 25wt%. of the total cashew fruit is the nut, and
30-35 wt%. of the shell is CNSL, depending on the method of extraction, million tons of
CNSL is produced and obtained annually. However, it does not have this demand, and
is even used as furnace fuel to consume it. Therefore, the aim of this study is the use
of CNSL, or its derivatives (e.g. cardanol) as a co-monomer to functionalize polymers
via free radical polymerization, proposing to be an alternative waste disposal of CNSL.
Then, consequently, the functionalization may happen due to the presence of carboxyl
and hydroxyl groups presented in the cashew nut compounds (TIAN et al. (2012)).
Firstly, bulk copolymerization of cardanol/natural CNSL with styrene, methyl
methacrylate or vinyl acetate is studied – kinetics experiments were done for conver-
sion data; GPC, NMR, FTIR, DSC and TG analysis are interpreted; and, after proposing
a model, some kinetic parameters are estimated. Because of the long side chain, steric
hindrance is expected. Also, inhibitory effects can happen due the phenolic moiety
and appearance of stable radicals.
Then, as suspension polymerization kinetics is similar to the bulk polymerization
in kinetic aspects, new experiments were done is suspension based on those already
obtained. In this case, functionalized particles are made, and the porosity, hydropho-
bicity and size are studied. These particles can be used for bioconjugation, immobi-
lization of enzymes, as a drug carrier and other uses.
Figure 1.1: Logo from COPPETEX
1.1 Motivation
2
Chapter 2
Theoretical Foundation About Polymers
2.1 Introduction
In this chapter, a brief theoretical introduction about polymers is discussed. Poly-
mers are macromolecules formed by joining together repeating units (monomers),
building a long molecule with high molecular mass. However, there are several ways
of building them. First, the kinetic scheme can be chain or step-growth polymeriza-
tion. You can use more than one monomer, enabling the formation of a copolymer,
terpolymer and so on. Also, a single monomer can form more than one bond, cre-
ating a network; or a catalyst or a chain transfer agent can be added to control the
polymerization. And you can do all of this in bulk, solution, suspension or emulsion
polymerization. Every single aspect changes the final characteristics of the polymer
made. Therefore, it is important to understand each process. Figure ?? shows ways to
classify a polymer.
2.2 Types of Polymerization
Polymerization is the process that small units known as monomers are joined by
covalent bonds, building high-molecular-weight polymers. This can be done by two
processes: chain-growth polymerization and step-growth polymerization. If the reac-
tion is started by a reactive site (a cation, an anion, or a radical), then a chain-growth
polymerization occurs. However, if more than one monomer is used and they have
a complementary chemical function, enabling the occurrence of a chemical reaction,
then a step-growth polymerization happens.
3
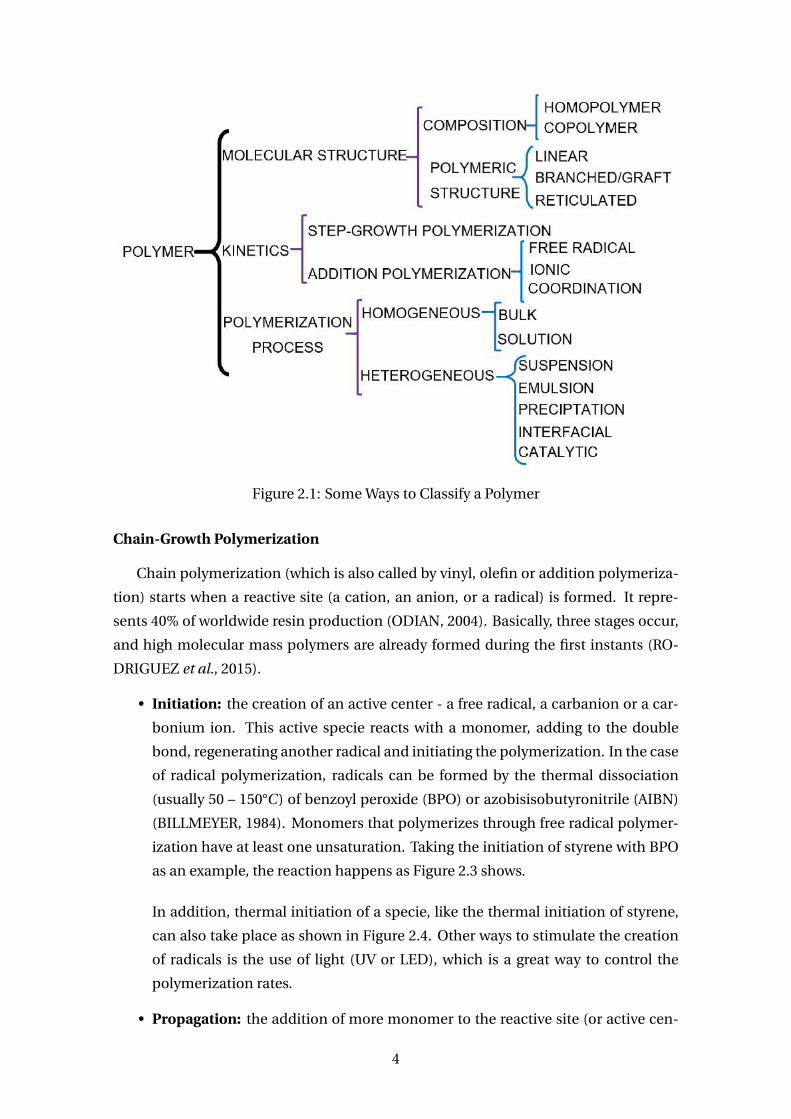
Figure 2.1: Some Ways to Classify a Polymer
Chain-Growth Polymerization
Chain polymerization (which is also called by vinyl, olefin or addition polymeriza-
tion) starts when a reactive site (a cation, an anion, or a radical) is formed. It repre-
sents 40% of worldwide resin production (ODIAN, 2004). Basically, three stages occur,
and high molecular mass polymers are already formed during the first instants (RO-
DRIGUEZ et al., 2015).
• Initiation: the creation of an active center - a free radical, a carbanion or a car-
bonium ion. This active specie reacts with a monomer, adding to the double
bond, regenerating another radical and initiating the polymerization. In the case
of radical polymerization, radicals can be formed by the thermal dissociation
(usually 50 – 150°C ) of benzoyl peroxide (BPO) or azobisisobutyronitrile (AIBN)
(BILLMEYER, 1984). Monomers that polymerizes through free radical polymer-
ization have at least one unsaturation. Taking the initiation of styrene with BPO
as an example, the reaction happens as Figure 2.3 shows.
In addition, thermal initiation of a specie, like the thermal initiation of styrene,
can also take place as shown in Figure 2.4. Other ways to stimulate the creation
of radicals is the use of light (UV or LED), which is a great way to control the
polymerization rates.
• Propagation: the addition of more monomer to the reactive site (or active cen-
4
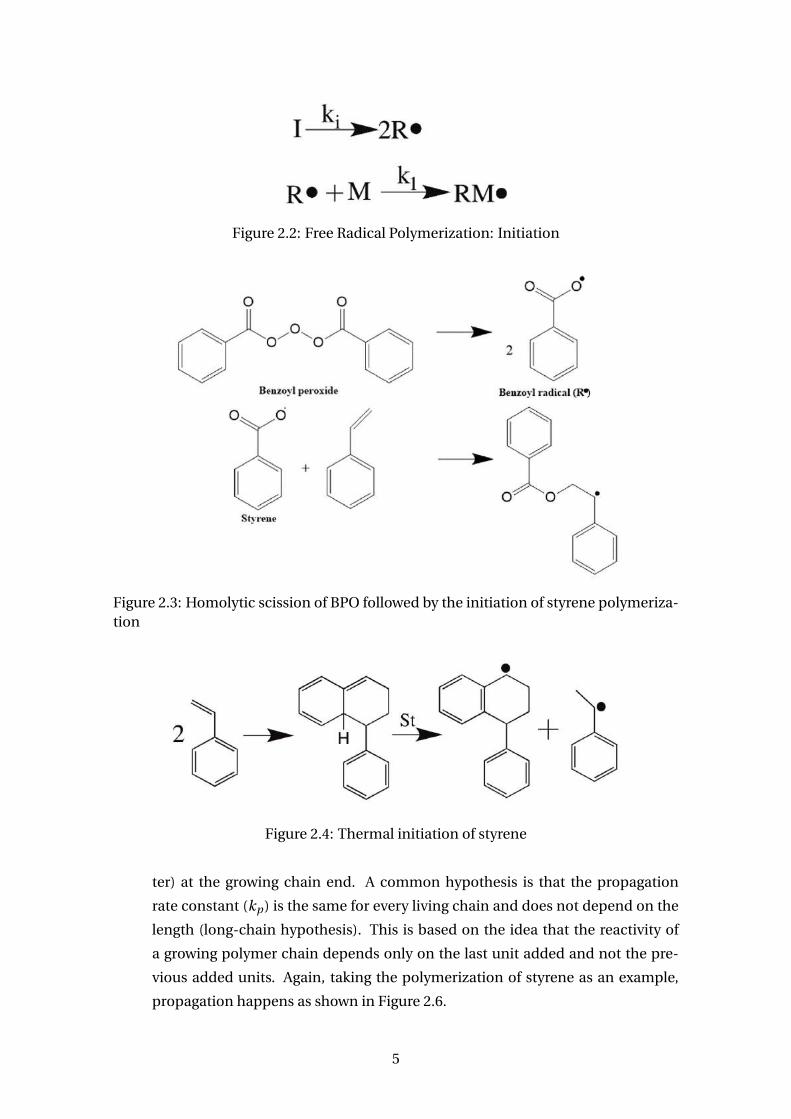
Figure 2.2: Free Radical Polymerization: Initiation
Figure 2.3: Homolytic scission of BPO followed by the initiation of styrene polymeriza-tion
Figure 2.4: Thermal initiation of styrene
ter) at the growing chain end. A common hypothesis is that the propagation
rate constant (kp ) is the same for every living chain and does not depend on the
length (long-chain hypothesis). This is based on the idea that the reactivity of
a growing polymer chain depends only on the last unit added and not the pre-
vious added units. Again, taking the polymerization of styrene as an example,
propagation happens as shown in Figure 2.6.
5
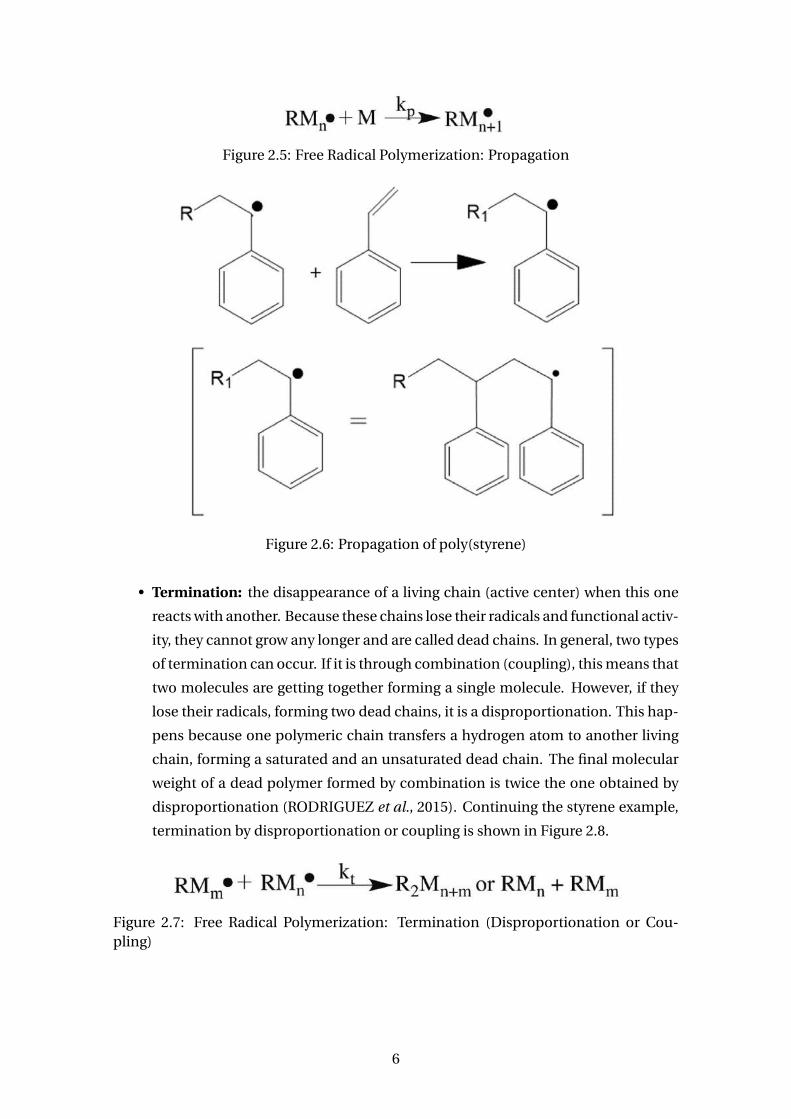
Figure 2.5: Free Radical Polymerization: Propagation
Figure 2.6: Propagation of poly(styrene)
• Termination: the disappearance of a living chain (active center) when this one
reacts with another. Because these chains lose their radicals and functional activ-
ity, they cannot grow any longer and are called dead chains. In general, two types
of termination can occur. If it is through combination (coupling), this means that
two molecules are getting together forming a single molecule. However, if they
lose their radicals, forming two dead chains, it is a disproportionation. This hap-
pens because one polymeric chain transfers a hydrogen atom to another living
chain, forming a saturated and an unsaturated dead chain. The final molecular
weight of a dead polymer formed by combination is twice the one obtained by
disproportionation (RODRIGUEZ et al., 2015). Continuing the styrene example,
termination by disproportionation or coupling is shown in Figure 2.8.
Figure 2.7: Free Radical Polymerization: Termination (Disproportionation or Cou-pling)
6
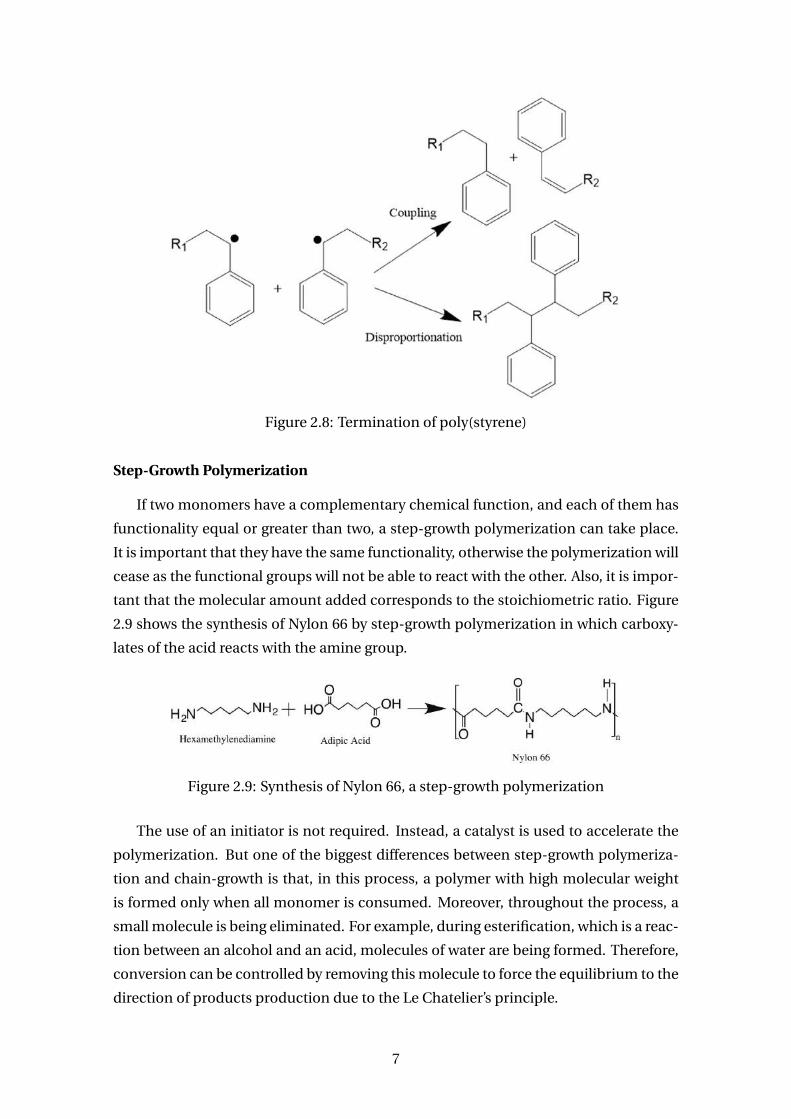
Figure 2.8: Termination of poly(styrene)
Step-Growth Polymerization
If two monomers have a complementary chemical function, and each of them has
functionality equal or greater than two, a step-growth polymerization can take place.
It is important that they have the same functionality, otherwise the polymerization will
cease as the functional groups will not be able to react with the other. Also, it is impor-
tant that the molecular amount added corresponds to the stoichiometric ratio. Figure
2.9 shows the synthesis of Nylon 66 by step-growth polymerization in which carboxy-
lates of the acid reacts with the amine group.
Figure 2.9: Synthesis of Nylon 66, a step-growth polymerization
The use of an initiator is not required. Instead, a catalyst is used to accelerate the
polymerization. But one of the biggest differences between step-growth polymeriza-
tion and chain-growth is that, in this process, a polymer with high molecular weight
is formed only when all monomer is consumed. Moreover, throughout the process, a
small molecule is being eliminated. For example, during esterification, which is a reac-
tion between an alcohol and an acid, molecules of water are being formed. Therefore,
conversion can be controlled by removing this molecule to force the equilibrium to the
direction of products production due to the Le Chatelier’s principle.
7
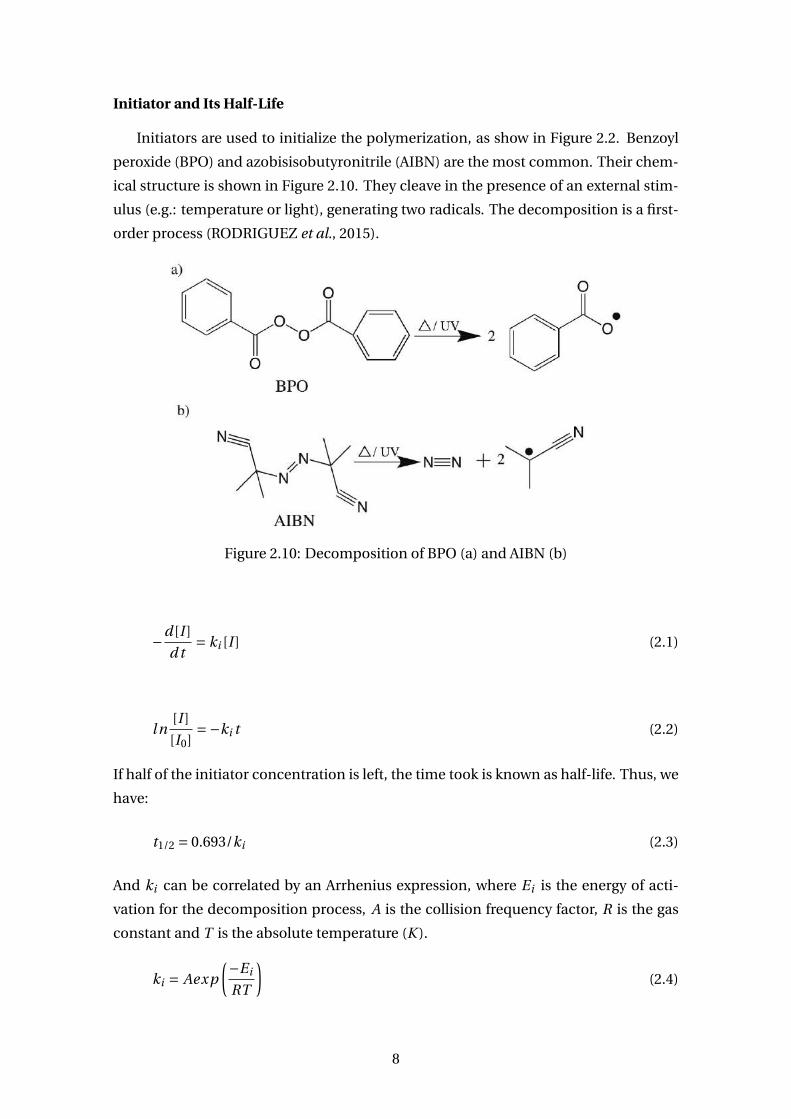
Initiator and Its Half-Life
Initiators are used to initialize the polymerization, as show in Figure 2.2. Benzoyl
peroxide (BPO) and azobisisobutyronitrile (AIBN) are the most common. Their chem-
ical structure is shown in Figure 2.10. They cleave in the presence of an external stim-
ulus (e.g.: temperature or light), generating two radicals. The decomposition is a first-
order process (RODRIGUEZ et al., 2015).
Figure 2.10: Decomposition of BPO (a) and AIBN (b)
−d [I ]
d t= ki [I ] (2.1)
l n[I ]
[I0]=−ki t (2.2)
If half of the initiator concentration is left, the time took is known as half-life. Thus, we
have:
t1/2 = 0.693/ki (2.3)
And ki can be correlated by an Arrhenius expression, where Ei is the energy of acti-
vation for the decomposition process, A is the collision frequency factor, R is the gas
constant and T is the absolute temperature (K ).
ki = Aexp
(−Ei
RT
)(2.4)
8
However, not every molecule of initiator dissociates generating two radicals and suc-
cessfully reacting with monomer. Therefore, it is said that only a certain fraction f of
initiator is successful. Equation 2.5 shows how to obtain f , being n the number of mols
formed by the decomposition of 1 mol of initiator and, thus, n = 2 for BPO or AIBN. In
general, it is used a value in the range of 0.8±0.2 (RODRIGUEZ et al., 2015). However,
f decays as the viscosity increases and monomer concentration decreases (ODIAN,
2004).
f = i ni t i at i on r ate
n ∗ i ni t i at i or decomposi t i on r ate(2.5)
Chain Transfer
Sometimes, the molecular weight is smaller than excepted. A reason for this may be
chain transfer. Some species present during polymerization can act as chain transfer
agents (CTAs): solvent, initiator, monomer, impurities, or polymer. They capture, in an
irreversible manner, the polymeric radical by some weakly bound atom (normally, a
hydrogen atom), resulting in a dead chain, but initiating a new one (RODRIGUEZ et al.,
2015). Transfer to monomer with subsequent polymerization of the double bond lead
to the formation of branched molecules, changing the molecular weight distribution
(BILLMEYER, 1984).
Inhibition and Retardation
A retarder is a substance (e.g. an impurity) that can react with a radical to form
products incapable of adding monomer. If the retarder is very effective, it becomes
an inhibitor. Therefore, inhibitors are species that reacts with radicals to give stable
species and, therefore, reducing the polymerization rate or ceasing it. Thus, the length
of the polymer chains gets smaller too. Hydroquinone and diphenylamine are fre-
quently used to prevent undesired polymerization or to stop it. Oxygen also acts as
an inhibitor, and total removal of it can be a key to allow some polymerizations sys-
tems (e.g.: living radical polymerization). "Induction period" is the time that takes to
normalize the reaction rate (without retarders).
Gel and Glass Effects
A controlled or theoretical polymerization (with initiation, propagation and termi-
nation steps) proceeds by first-order kinetics if the initiator concentration does not
vary largely and its efficiency is independent of monomer concentration. This means
that the polymerization rate is proportional to monomer concentration so that, in gen-
eral, it is detected a first-order kinetics. However, at high concentrations, the overall re-
action rate decreases with time as monomer and initiator are being consumed. How-
9
ever, mainly in bulk polymerizations, a deviation from first-order kinetics happens,
increasing the reaction rate and the molecular weight. This behavior is known as gel
effect (or autoaccelaration or Trommsdorff effect).
This effect happens because, as the conversion increases, viscosity also increases,
thereby decreasing the rate at which polymer molecules diffuse through the medium
as termination is diffusion controlled for most liquid-phase polymerizations. There-
fore, molecules cannot find each other and terminate, increasing their lifetime
(BILLMEYER, 1984).
Also, as living chains cannot move around freely to react with monomers due to
their size, steric hindrance and a viscous medium; the propagation rate is affected.
This is known as glass effect.
Homo- and co-polymerization
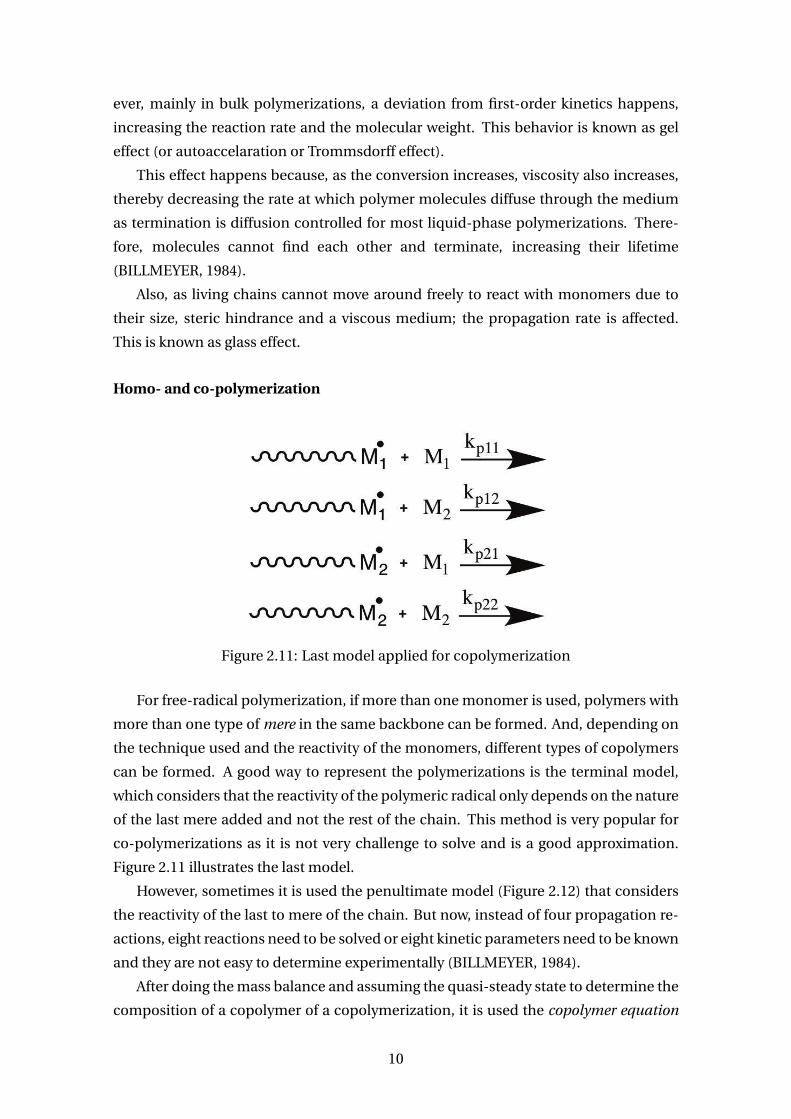
Figure 2.11: Last model applied for copolymerization
For free-radical polymerization, if more than one monomer is used, polymers with
more than one type of mere in the same backbone can be formed. And, depending on
the technique used and the reactivity of the monomers, different types of copolymers
can be formed. A good way to represent the polymerizations is the terminal model,
which considers that the reactivity of the polymeric radical only depends on the nature
of the last mere added and not the rest of the chain. This method is very popular for
co-polymerizations as it is not very challenge to solve and is a good approximation.
Figure 2.11 illustrates the last model.
However, sometimes it is used the penultimate model (Figure 2.12) that considers
the reactivity of the last to mere of the chain. But now, instead of four propagation re-
actions, eight reactions need to be solved or eight kinetic parameters need to be known
and they are not easy to determine experimentally (BILLMEYER, 1984).
After doing the mass balance and assuming the quasi-steady state to determine the
composition of a copolymer of a copolymerization, it is used the copolymer equation
10
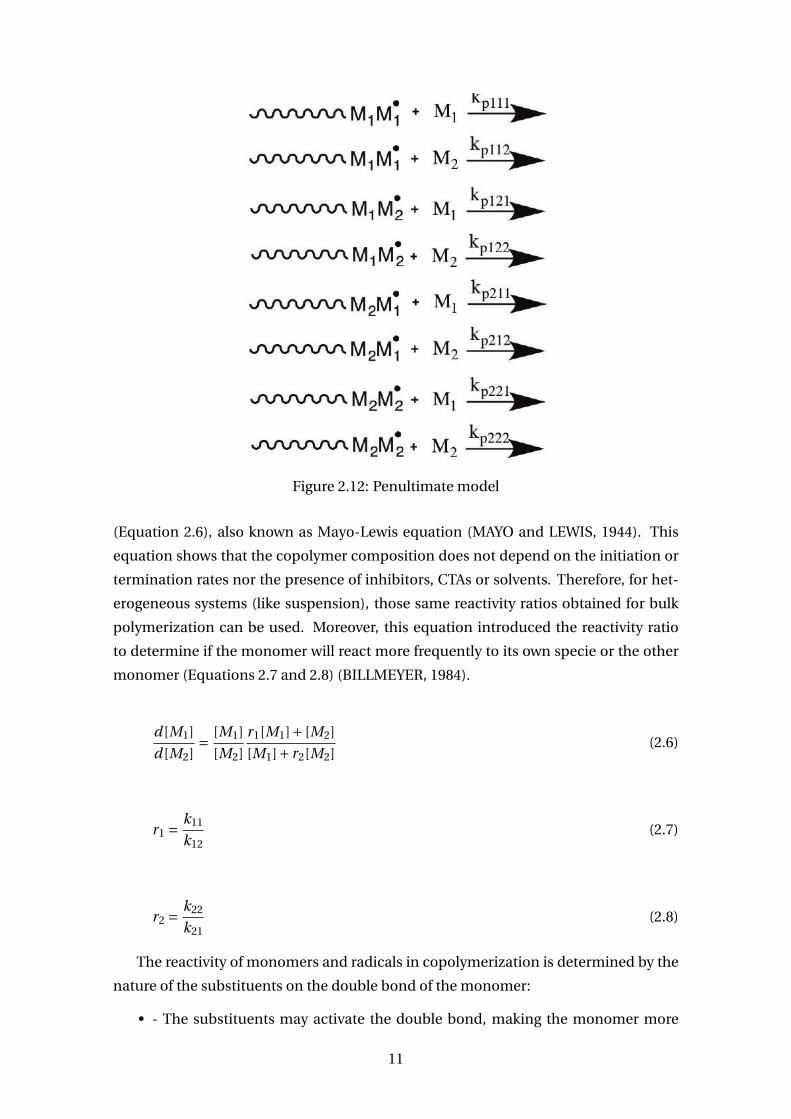
Figure 2.12: Penultimate model
(Equation 2.6), also known as Mayo-Lewis equation (MAYO and LEWIS, 1944). This
equation shows that the copolymer composition does not depend on the initiation or
termination rates nor the presence of inhibitors, CTAs or solvents. Therefore, for het-
erogeneous systems (like suspension), those same reactivity ratios obtained for bulk
polymerization can be used. Moreover, this equation introduced the reactivity ratio
to determine if the monomer will react more frequently to its own specie or the other
monomer (Equations 2.7 and 2.8) (BILLMEYER, 1984).
d [M1]
d [M2]= [M1]
[M2]
r1[M1]+ [M2]
[M1]+ r2[M2](2.6)
r1 = k11
k12(2.7)
r2 = k22
k21(2.8)
The reactivity of monomers and radicals in copolymerization is determined by the
nature of the substituents on the double bond of the monomer:
• - The substituents may activate the double bond, making the monomer more
11
reactive;
• - They may stabilize the resulting radical by resonance;
• - They may provide steric hindrance at the reaction site.
Besides the Mayo-Lewis equation, other methods used to calculate the reactivity
ratios are: KELEN and TÜDOS (1974), TIDWELL and MORTIMER (1965), and FINE-
MAN and ROSS (1950). These methods can give discrepancies between the values
TIDWELL and MORTIMER (1970). Also, experimental design and the technique used
to analyze the data can influence in the precision of experimentally determined reac-
tivity ratios (ZALDÍVAR et al., 1998).
2.3 Polymerization methods
Depending on the final application of the polymer, they can be obtained using sev-
eral polymerization methods. If they occur in only one phase, they are called homo-
geneous – like the bulk and solution polymerization. If not, it is a heterogeneous poly-
merization – suspension and emulsion polymerizations. In this dissertation, only the
bulk and suspension polymerization are used so they will be explored deeply.
2.3.1 Bulk Polymerization
Using for free radical polymerization, the advantage of a bulk polymerization is
that anything besides the monomer and the initiator is required. Therefore, the final
polymer has a high purity. However, as the polymerization is an exothermic reaction
and viscosity increases, control this system is difficult. Heat removal is impeded by
high viscosity and low thermal conductivity. Also, the removal of traces of unreacted
monomer from the final product gets difficult because of low diffusion rates and low
surface-to-volume ratio, compromising the purification of the final product. Conver-
sion of all monomer is complicated for the same reason (RODRIGUEZ et al., 2015).
2.3.2 Solution Polymerization
Using a solvent can be very beneficial because it can help with the temperature
and viscosity control of the system. The reaction happens with full miscibility of the
monomer and initiator in solvent. The kinetics is like the one of bulk polymerization.
However, sometimes, depending on the solvent being used, undesired chemical inter-
actions can happen between the species and the solvent. Besides it, purification and
recirculation of the solvent increases the cost of the polymer production, and the pro-
ductivity decays (CANEVAROLO JR., 2006).
12
2.3.3 Suspension Polymerization
If the monomer is insoluble in water, bulk polymerization can occur inside of sus-
pended droplets of polymer in water, which acts like the heat transfer medium. How-
ever, although the viscosity within the beads rises, increasing reaction rate, the vis-
cosity of the continuous phase (water) almost does not change, improving the heat
transfer. To avoid coalescence, an suspension agent is used, commonly poly(vinyl al-
cohol) (PVA). Moreover, polymer particles produced through suspension can get from
10 to 1000 µm diameter. A way to control them is by changing the concentration of
suspending agent and the stirring rate.
A typical suspension procedure is the following: a reactor is filled with water con-
taining PVA (0.25% w/w in relation to H2O), this solution is heated up to the reac-
tion temperature and stirring happens throughout the whole polymerization. Then
the mixture of monomer and initiator is added to the reactor. After a certain amount
of time, when the conversion is close to 100%, the heat bath and the stirring can be
turned off. Finally, the suspension can be filtrated to obtain pearl-like beads of poly-
mer (RODRIGUEZ et al., 2015).
2.3.4 Emulsion Polymerization
As it happens on suspension polymerization, the monomer is dispersed on a con-
tinuous phase. Frequently, water is used as the continuous phase, but emulsion inver-
sion occurs using an oil. It also uses an emulsifying (surfactant) agent, which is present
in form of micelles – hydrophobic tails oriented inward and hydrophilic heads out-
ward. These micelles appear when the concentration is higher than the critical micelle
concentration (CMC). However, the initiator is hydrophilic and, because the micelles
are smaller than droplets, the surface area is much greater, enabling to capture free
radicals generated in the aqueous phase. Therefore, in emulsion polymerization, the
system consists of monomer-swollen polymer particles and droplets of monomer that
keeps getting into the old micelles. Particles between 50nm and 5µm can be obtained
by this method (RODRIGUEZ et al., 2015).
2.4 Molecular Weight Distribution (MWD)
Even for a homo-polymerization, there are infinite reactions happening at the same
time. You can’t know for sure if a living chain is going to propagate or terminate, but
there is a probability to each effect. Therefore, some of them propagate more while
others are losing their radicals “prematurely”. Thus, each reaction produces a mix-
ture of polymers with the same composition, but different degrees of polymerization.
13
Chain length distribution is a property that relates each chain with size i with the fre-
quency of the chain with the same i present, Pi . With mass basis, it becomes:
Wi = Pi i M M (2.9)
Experimentally, the distribution is determined by use of techniques such as high-
pressure liquid chromatography (HPLC) or size-exclusion chromatography (SEC). The
frequency of each size/molar is frequently normalized, enabling comparison between
different distributions. Therefore, it is possible to have a probability density function
(PDF) that treats the size of polymeric chain as a random variable with a certain prob-
ability to exist or not (LEMOS, 2014).
P nor mi = Pi∑∞
i=1 Pi(2.10)
W nor mi = Wi∑∞
i=1 Wi(2.11)
There is a chain size distribution known as Most Probable Distribution, or Schulz-
Flory Distribution, that is frequently found on polymeric systems (Equation 2.12). q is
the probability of propagation and Ptot is the total amount of chains (?).
Pi = Ptot q i−1(1−q) (2.12)
To simplify the distribution, although they might me ambiguous, it is highly com-
mon to represent the distribution by distribution moments. The medium average
length in a numeric base in and the medium size in mass base iw are:
in =∑∞
i=1 i Pi∑∞i=1 Pi
(2.13)
iw =∑∞
i=1 iWi∑∞i=1 Wi
(2.14)
And the number average molar mass Mn and mass average molar mass Mw are calcu-
lated by:
Mn =∑∞
i=1 Mi Ni∑∞i=1 Ni
= in M M (2.15)
14
Mw =∑∞
i=1 M 2i Ni∑∞
i=1 Mi Ni= iw M M (2.16)
Also, polydispersity index (PI) is a measure of the variance of the chain size distribu-
tion, defined by Equation 2.17, being σ2 the variance of the distribution.
PD I = Mw
Mn
= iw
in
= 1+ σ2
in2 (2.17)
15
Chapter 3
Cashew Nut Shell Liquid – A Literature
Review
3.1 Introduction
The cashew tree is a plant native to the Brazilian northeast, which was taken in
the 16th and 17th centuries to India, Africa and other tropical countries. It belongs
to the family Anacardiaceae, in which the specie Anacardium occidentale is the most
explored variation. From it, one obtains the pseudo fruit (popularly known as cashew
apple) and the cashew (the almond), two products of high economic interest. For il-
lustration purposes, Figure 3.1 shows the combination of the cashew nut (true fruit)
and the peduncle (pseudo fruit), in which is consumed as fruit in nature or to produce
juices (e.g. cajuína), sweets and others.
Therefore, to obtain the cashew nut, it needs to undergo a process of beneficiation
in order to remove the shell (pericarp) that surrounds it. In Brazil, this process is about
90% mechanized. An example of this process is shown in Figure 3.2. However, mainly
in the northeast interior, the artisan process is still very used.
Figure 3.3 is a picture of the cashew nut - formed by the shell and the almond.
The shell is constituted by the epicarp (outer layer), endocarp (inner layer) and the
mesocarp (middle layer). It is in the mesocarp that the cashew nut shell liquid (CNSL)
is found. Truly, this is an oil composed of several phenolic lipids, among them the
anacardic acid and the cardanol.
Figure 3.4 revels the richness and diversity of products that can be obtained from
cashew. Looking at the cashew nut ramification, followed by the shell, many CNSL
applications are show. However, while CNSL has the potential to be a valuable raw
16
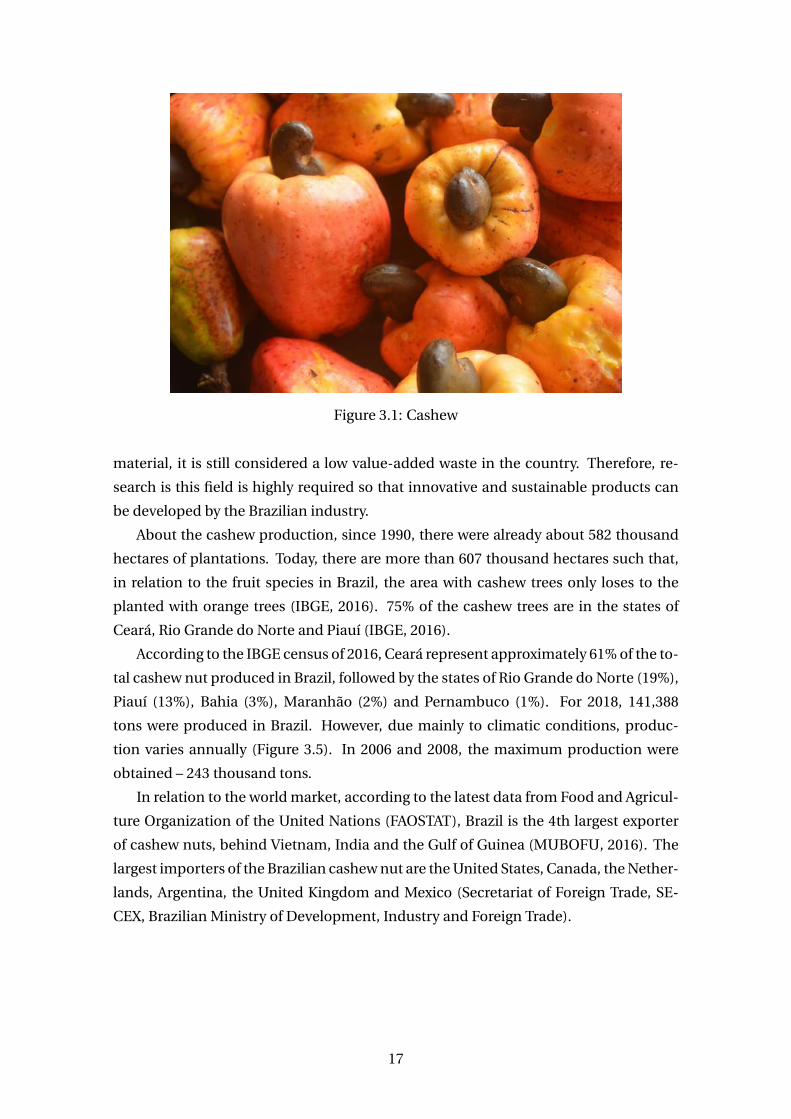
Figure 3.1: Cashew
material, it is still considered a low value-added waste in the country. Therefore, re-
search is this field is highly required so that innovative and sustainable products can
be developed by the Brazilian industry.
About the cashew production, since 1990, there were already about 582 thousand
hectares of plantations. Today, there are more than 607 thousand hectares such that,
in relation to the fruit species in Brazil, the area with cashew trees only loses to the
planted with orange trees (IBGE, 2016). 75% of the cashew trees are in the states of
Ceará, Rio Grande do Norte and Piauí (IBGE, 2016).
According to the IBGE census of 2016, Ceará represent approximately 61% of the to-
tal cashew nut produced in Brazil, followed by the states of Rio Grande do Norte (19%),
Piauí (13%), Bahia (3%), Maranhão (2%) and Pernambuco (1%). For 2018, 141,388
tons were produced in Brazil. However, due mainly to climatic conditions, produc-
tion varies annually (Figure 3.5). In 2006 and 2008, the maximum production were
obtained – 243 thousand tons.
In relation to the world market, according to the latest data from Food and Agricul-
ture Organization of the United Nations (FAOSTAT), Brazil is the 4th largest exporter
of cashew nuts, behind Vietnam, India and the Gulf of Guinea (MUBOFU, 2016). The
largest importers of the Brazilian cashew nut are the United States, Canada, the Nether-
lands, Argentina, the United Kingdom and Mexico (Secretariat of Foreign Trade, SE-
CEX, Brazilian Ministry of Development, Industry and Foreign Trade).
17
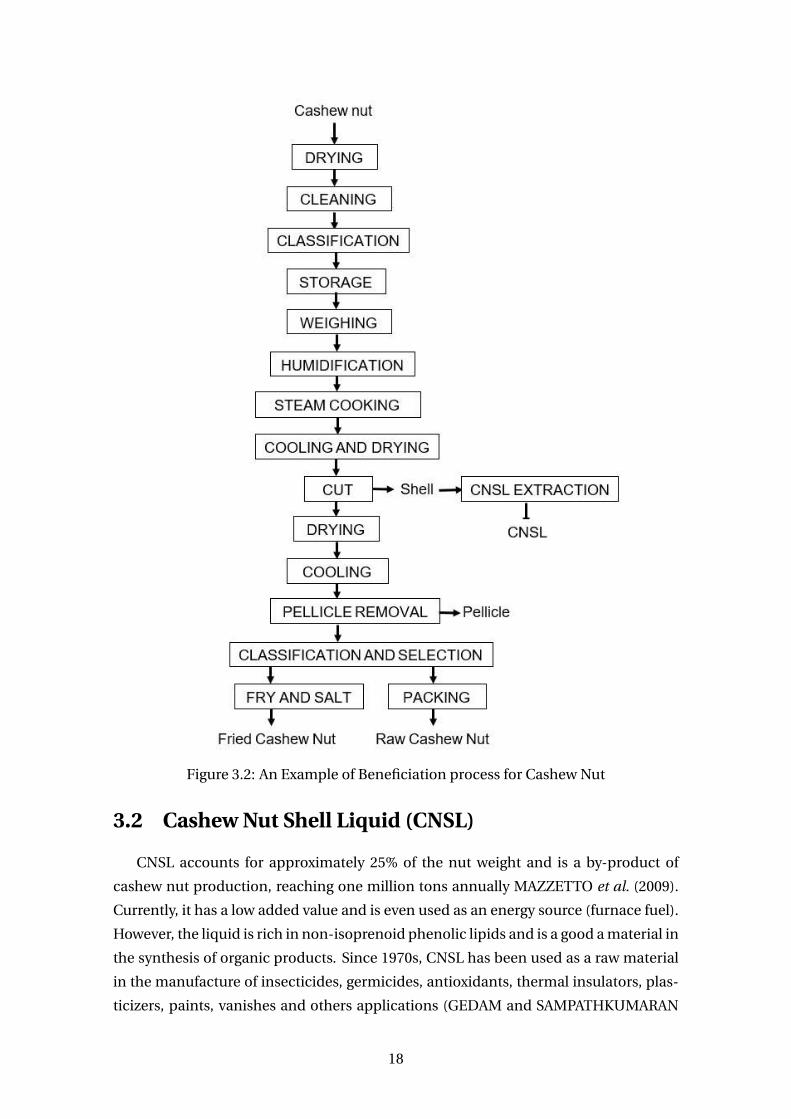
Figure 3.2: An Example of Beneficiation process for Cashew Nut
3.2 Cashew Nut Shell Liquid (CNSL)
CNSL accounts for approximately 25% of the nut weight and is a by-product of
cashew nut production, reaching one million tons annually MAZZETTO et al. (2009).
Currently, it has a low added value and is even used as an energy source (furnace fuel).
However, the liquid is rich in non-isoprenoid phenolic lipids and is a good a material in
the synthesis of organic products. Since 1970s, CNSL has been used as a raw material
in the manufacture of insecticides, germicides, antioxidants, thermal insulators, plas-
ticizers, paints, vanishes and others applications (GEDAM and SAMPATHKUMARAN
18
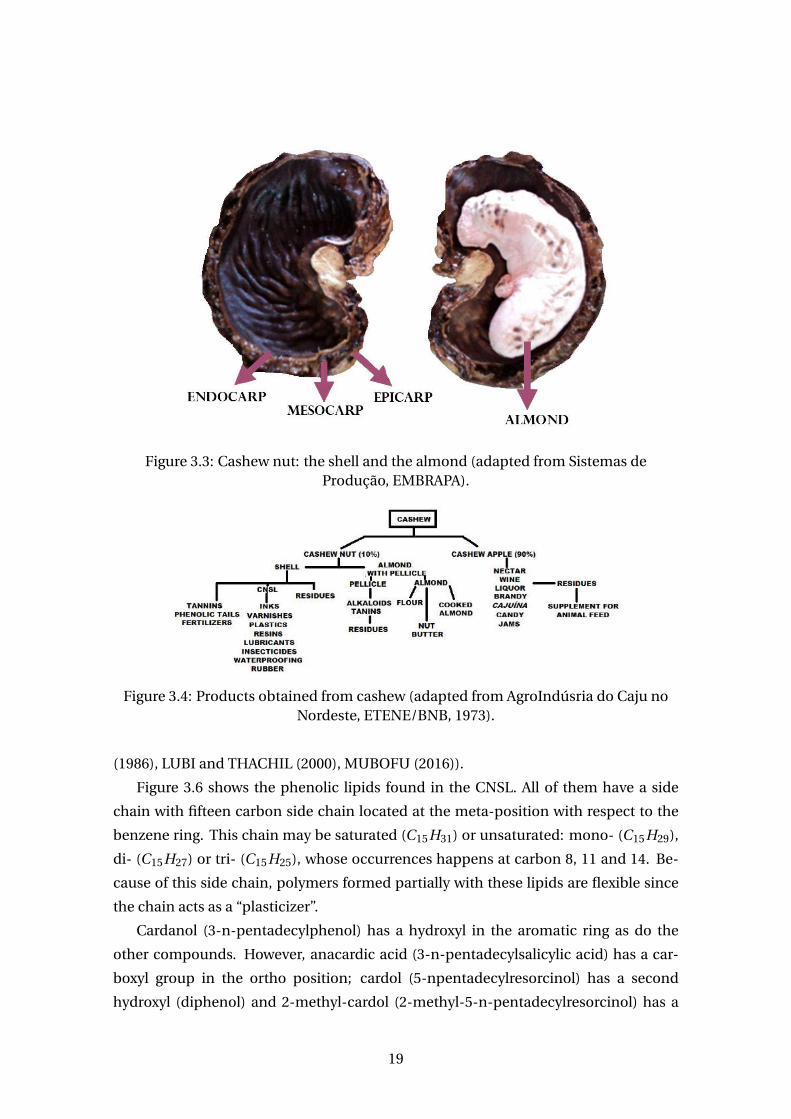
Figure 3.3: Cashew nut: the shell and the almond (adapted from Sistemas deProdução, EMBRAPA).
Figure 3.4: Products obtained from cashew (adapted from AgroIndúsria do Caju noNordeste, ETENE/BNB, 1973).
(1986), LUBI and THACHIL (2000), MUBOFU (2016)).
Figure 3.6 shows the phenolic lipids found in the CNSL. All of them have a side
chain with fifteen carbon side chain located at the meta-position with respect to the
benzene ring. This chain may be saturated (C15H31) or unsaturated: mono- (C15H29),
di- (C15H27) or tri- (C15H25), whose occurrences happens at carbon 8, 11 and 14. Be-
cause of this side chain, polymers formed partially with these lipids are flexible since
the chain acts as a “plasticizer”.
Cardanol (3-n-pentadecylphenol) has a hydroxyl in the aromatic ring as do the
other compounds. However, anacardic acid (3-n-pentadecylsalicylic acid) has a car-
boxyl group in the ortho position; cardol (5-npentadecylresorcinol) has a second
hydroxyl (diphenol) and 2-methyl-cardol (2-methyl-5-n-pentadecylresorcinol) has a
19
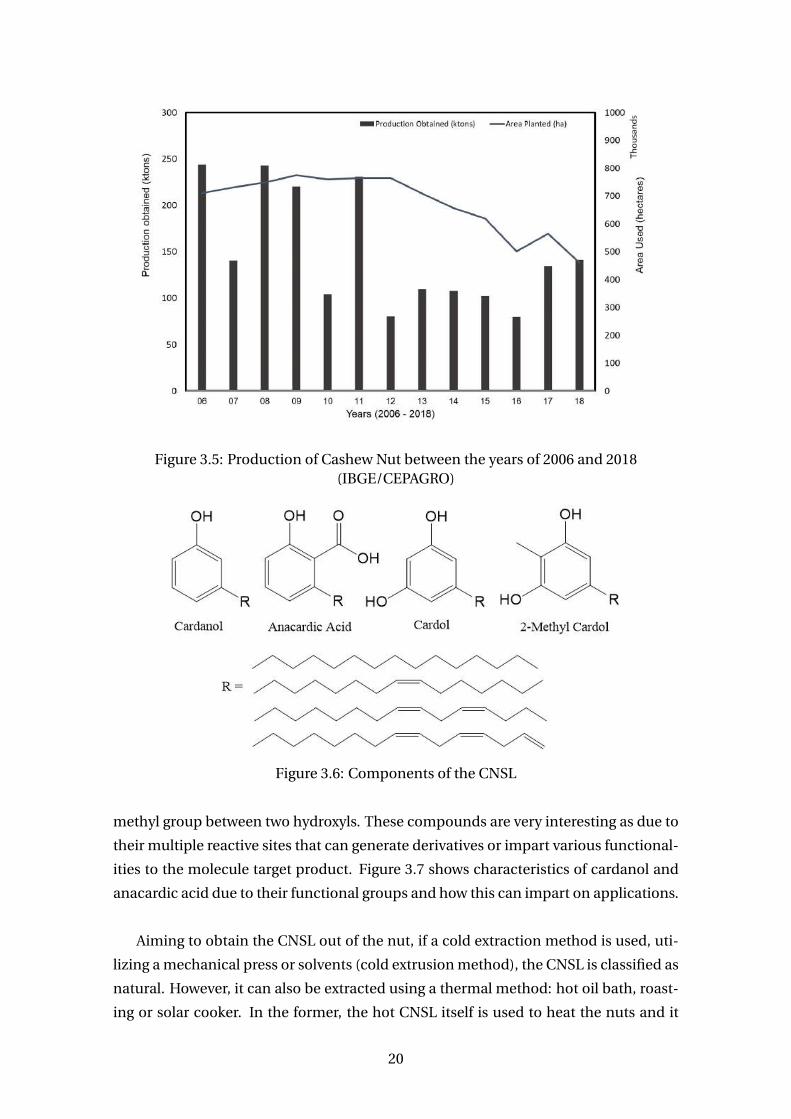
Figure 3.5: Production of Cashew Nut between the years of 2006 and 2018(IBGE/CEPAGRO)
Figure 3.6: Components of the CNSL
methyl group between two hydroxyls. These compounds are very interesting as due to
their multiple reactive sites that can generate derivatives or impart various functional-
ities to the molecule target product. Figure 3.7 shows characteristics of cardanol and
anacardic acid due to their functional groups and how this can impart on applications.
Aiming to obtain the CNSL out of the nut, if a cold extraction method is used, uti-
lizing a mechanical press or solvents (cold extrusion method), the CNSL is classified as
natural. However, it can also be extracted using a thermal method: hot oil bath, roast-
ing or solar cooker. In the former, the hot CNSL itself is used to heat the nuts and it
20
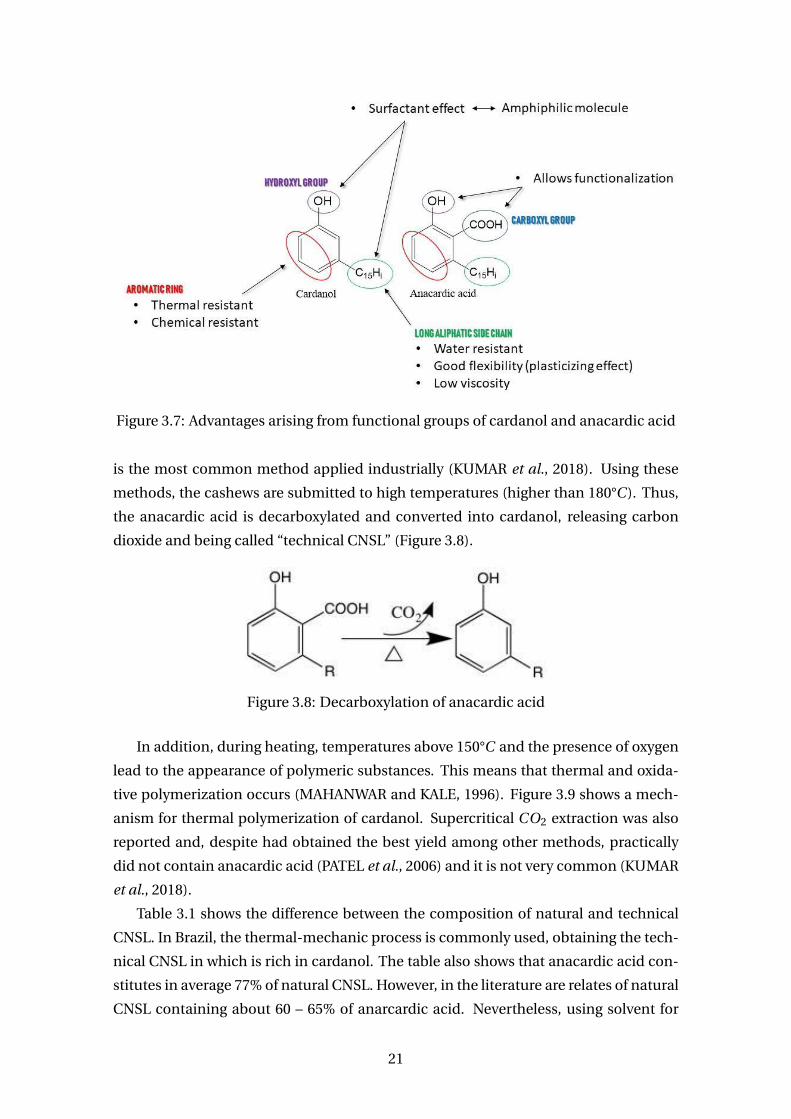
Figure 3.7: Advantages arising from functional groups of cardanol and anacardic acid
is the most common method applied industrially (KUMAR et al., 2018). Using these
methods, the cashews are submitted to high temperatures (higher than 180°C ). Thus,
the anacardic acid is decarboxylated and converted into cardanol, releasing carbon
dioxide and being called “technical CNSL” (Figure 3.8).
Figure 3.8: Decarboxylation of anacardic acid
In addition, during heating, temperatures above 150°C and the presence of oxygen
lead to the appearance of polymeric substances. This means that thermal and oxida-
tive polymerization occurs (MAHANWAR and KALE, 1996). Figure 3.9 shows a mech-
anism for thermal polymerization of cardanol. Supercritical CO2 extraction was also
reported and, despite had obtained the best yield among other methods, practically
did not contain anacardic acid (PATEL et al., 2006) and it is not very common (KUMAR
et al., 2018).
Table 3.1 shows the difference between the composition of natural and technical
CNSL. In Brazil, the thermal-mechanic process is commonly used, obtaining the tech-
nical CNSL in which is rich in cardanol. The table also shows that anacardic acid con-
stitutes in average 77% of natural CNSL. However, in the literature are relates of natural
CNSL containing about 60 – 65% of anarcardic acid. Nevertheless, using solvent for
21
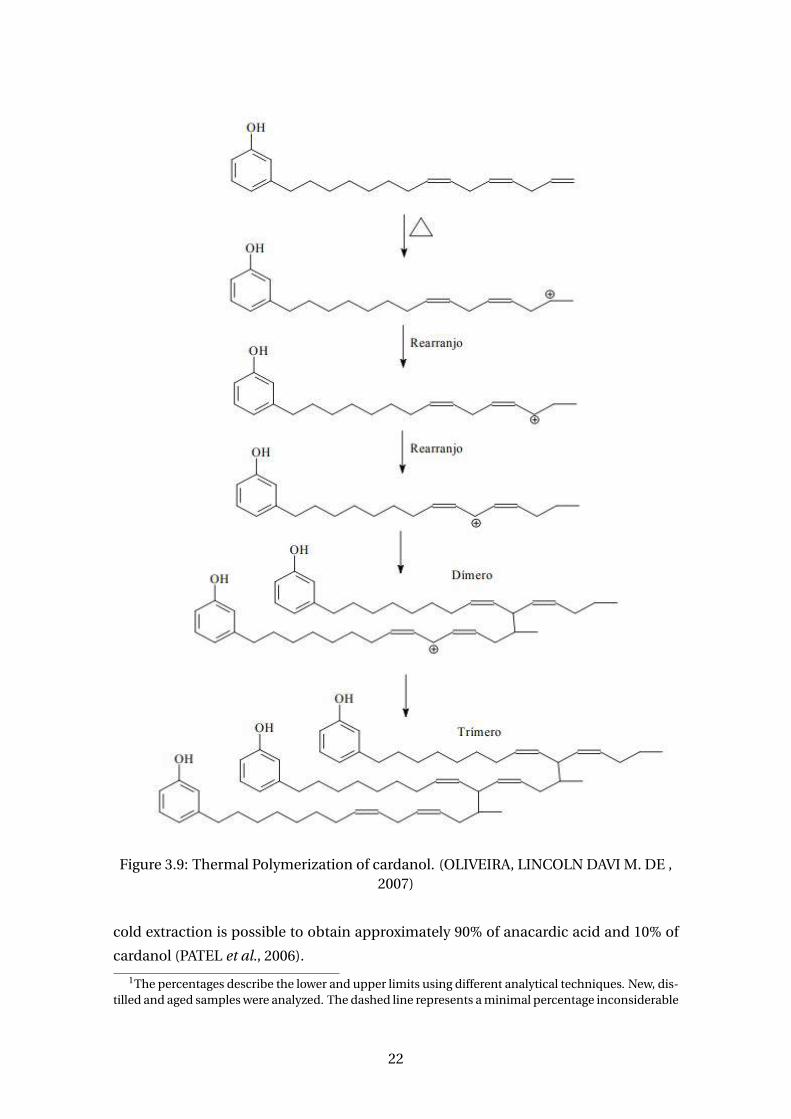
Figure 3.9: Thermal Polymerization of cardanol. (OLIVEIRA, LINCOLN DAVI M. DE ,2007)
cold extraction is possible to obtain approximately 90% of anacardic acid and 10% of
cardanol (PATEL et al., 2006).
1The percentages describe the lower and upper limits using different analytical techniques. New, dis-tilled and aged samples were analyzed. The dashed line represents a minimal percentage inconsiderable
22
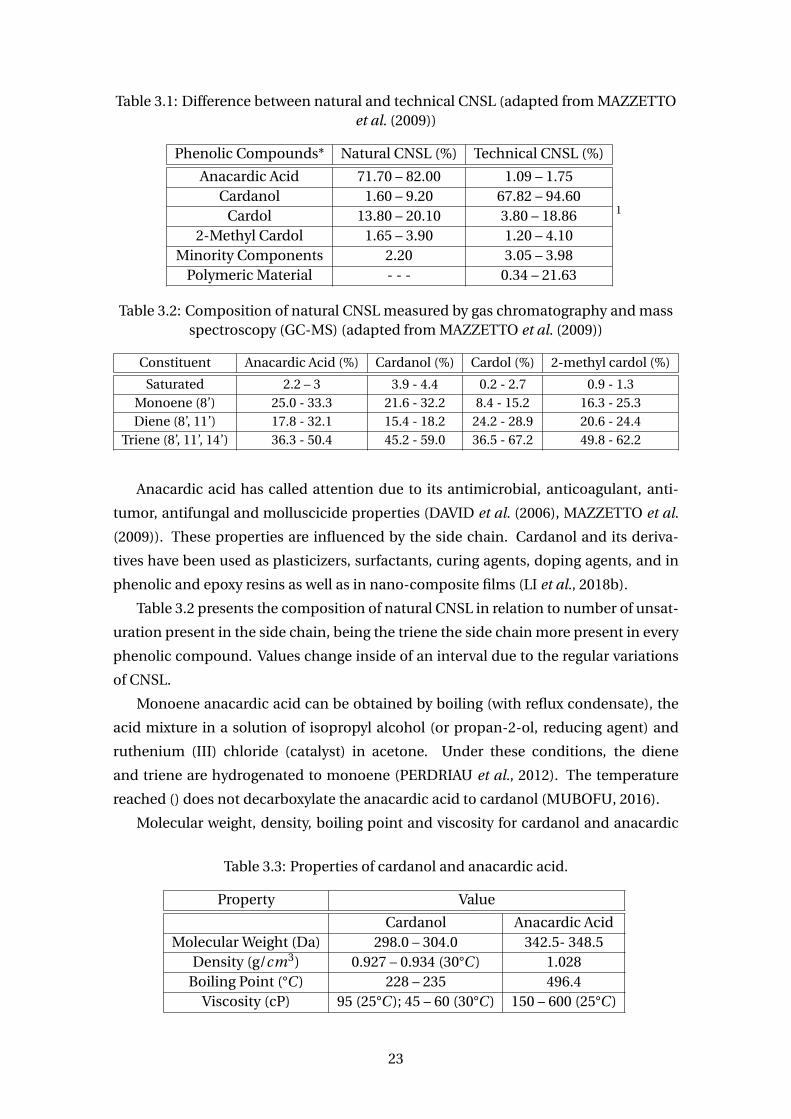
Table 3.1: Difference between natural and technical CNSL (adapted from MAZZETTOet al. (2009))
Phenolic Compounds* Natural CNSL (%) Technical CNSL (%)
Anacardic Acid 71.70 – 82.00 1.09 – 1.75Cardanol 1.60 – 9.20 67.82 – 94.60
Cardol 13.80 – 20.10 3.80 – 18.862-Methyl Cardol 1.65 – 3.90 1.20 – 4.10
Minority Components 2.20 3.05 – 3.98Polymeric Material - - - 0.34 – 21.63
1
Table 3.2: Composition of natural CNSL measured by gas chromatography and massspectroscopy (GC-MS) (adapted from MAZZETTO et al. (2009))
Constituent Anacardic Acid (%) Cardanol (%) Cardol (%) 2-methyl cardol (%)
Saturated 2.2 – 3 3.9 - 4.4 0.2 - 2.7 0.9 - 1.3Monoene (8’) 25.0 - 33.3 21.6 - 32.2 8.4 - 15.2 16.3 - 25.3Diene (8’, 11’) 17.8 - 32.1 15.4 - 18.2 24.2 - 28.9 20.6 - 24.4
Triene (8’, 11’, 14’) 36.3 - 50.4 45.2 - 59.0 36.5 - 67.2 49.8 - 62.2
Anacardic acid has called attention due to its antimicrobial, anticoagulant, anti-
tumor, antifungal and molluscicide properties (DAVID et al. (2006), MAZZETTO et al.
(2009)). These properties are influenced by the side chain. Cardanol and its deriva-
tives have been used as plasticizers, surfactants, curing agents, doping agents, and in
phenolic and epoxy resins as well as in nano-composite films (LI et al., 2018b).
Table 3.2 presents the composition of natural CNSL in relation to number of unsat-
uration present in the side chain, being the triene the side chain more present in every
phenolic compound. Values change inside of an interval due to the regular variations
of CNSL.
Monoene anacardic acid can be obtained by boiling (with reflux condensate), the
acid mixture in a solution of isopropyl alcohol (or propan-2-ol, reducing agent) and
ruthenium (III) chloride (catalyst) in acetone. Under these conditions, the diene
and triene are hydrogenated to monoene (PERDRIAU et al., 2012). The temperature
reached () does not decarboxylate the anacardic acid to cardanol (MUBOFU, 2016).
Molecular weight, density, boiling point and viscosity for cardanol and anacardic
Table 3.3: Properties of cardanol and anacardic acid.
Property Value
Cardanol Anacardic AcidMolecular Weight (Da) 298.0 – 304.0 342.5- 348.5
Density (g/cm3) 0.927 – 0.934 (30°C ) 1.028Boiling Point (°C ) 228 – 235 496.4
Viscosity (cP) 95 (25°C ); 45 – 60 (30°C ) 150 – 600 (25°C )
23
Figure 3.10: Anacardic Acid: (i) 1-hydroxy-2-carboxy-3-pentadecyl benzene,(ii) 1-hydroxy-2-carboxy-3-(8-penta-decenyl)benzene,
(iii) 1-hydroxy-2-carboxy-3-(8,11-pentadecadienyl)benzene, and(iv) 1-hydroxy-2-carboxy-3-(8,11,14 pentadecatrienyl)benzene.
acid are presented in Table 3.3 (RODRIGUES et al. (2011), MAZZETTO et al. (2009).
3.3 Synthesis of polymers using CNSL
In the literature, there are reports of polymer synthesis from CNSL mainly by con-
densation with electrophilic agents (e.g. formaldehyde), polymerization of the side
chains using acid catalysts, or by the functionalization of the hydroxyl group to obtain
an oligomer as functionalized prepolymer (BALGUDE and SABNIS, 2014). The poly-
mers derived from the CNSL are known to have good flexibility because of the long
aliphatic chain, low wear, high resistance to friction and impact. LUBI and THACHIL
(2000) reviewed most of the reactions (including polymerizations) and applications
made with the CNSL until the late 90s.
However, instead of using the mixture of compounds (CNSL), isolated cardanol has
been the most studied and used substance obtained from the CNSL in polymer sci-
ence. In the literature, there are reports of oxidative (using acid catalysts), cationic, in
stages (polycondensation) and enzymatic polymerizations (IKEDA et al. (2000b), KIM
24
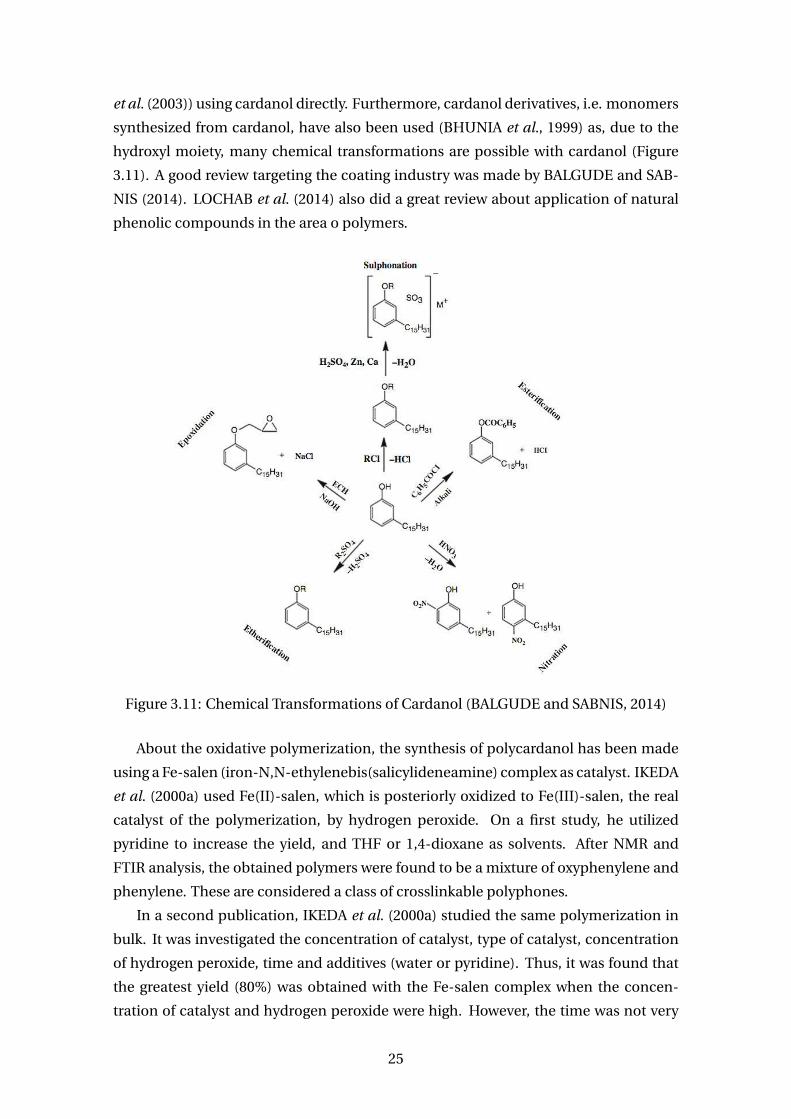
et al. (2003)) using cardanol directly. Furthermore, cardanol derivatives, i.e. monomers
synthesized from cardanol, have also been used (BHUNIA et al., 1999) as, due to the
hydroxyl moiety, many chemical transformations are possible with cardanol (Figure
3.11). A good review targeting the coating industry was made by BALGUDE and SAB-
NIS (2014). LOCHAB et al. (2014) also did a great review about application of natural
phenolic compounds in the area o polymers.
Figure 3.11: Chemical Transformations of Cardanol (BALGUDE and SABNIS, 2014)
About the oxidative polymerization, the synthesis of polycardanol has been made
using a Fe-salen (iron-N,N-ethylenebis(salicylideneamine) complex as catalyst. IKEDA
et al. (2000a) used Fe(II)-salen, which is posteriorly oxidized to Fe(III)-salen, the real
catalyst of the polymerization, by hydrogen peroxide. On a first study, he utilized
pyridine to increase the yield, and THF or 1,4-dioxane as solvents. After NMR and
FTIR analysis, the obtained polymers were found to be a mixture of oxyphenylene and
phenylene. These are considered a class of crosslinkable polyphones.
In a second publication, IKEDA et al. (2000a) studied the same polymerization in
bulk. It was investigated the concentration of catalyst, type of catalyst, concentration
of hydrogen peroxide, time and additives (water or pyridine). Thus, it was found that
the greatest yield (80%) was obtained with the Fe-salen complex when the concen-
tration of catalyst and hydrogen peroxide were high. However, the time was not very
25
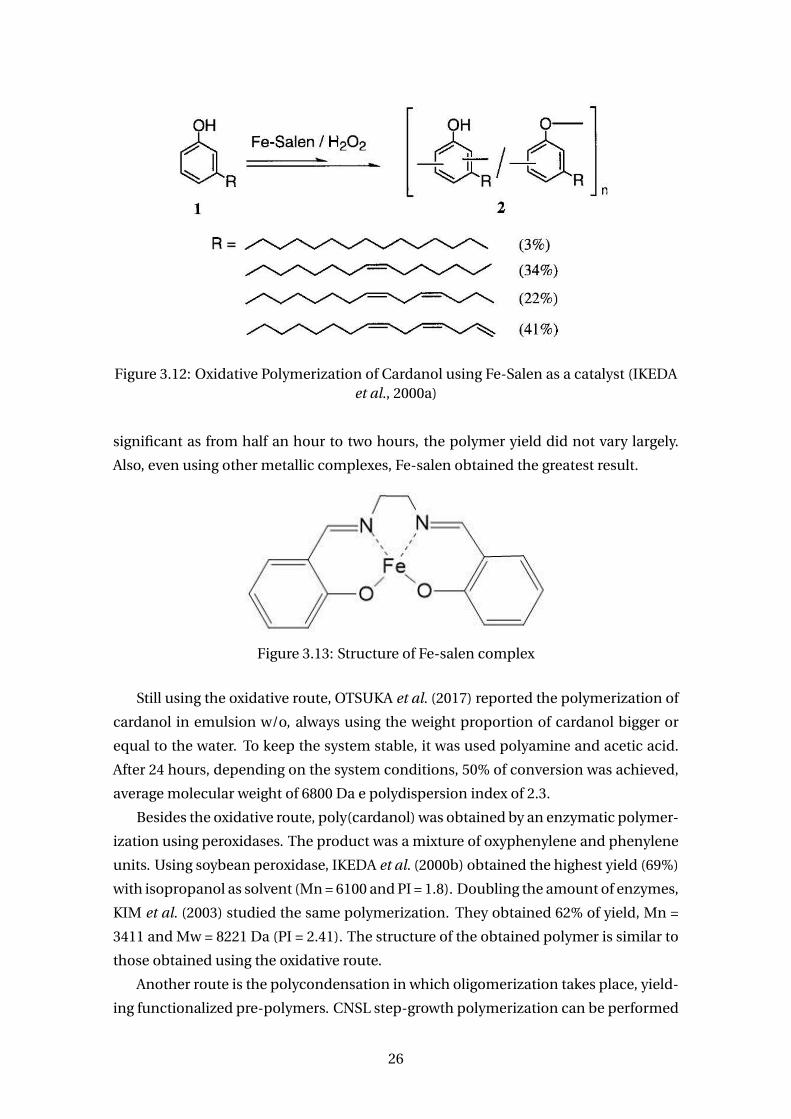
Figure 3.12: Oxidative Polymerization of Cardanol using Fe-Salen as a catalyst (IKEDAet al., 2000a)
significant as from half an hour to two hours, the polymer yield did not vary largely.
Also, even using other metallic complexes, Fe-salen obtained the greatest result.
Figure 3.13: Structure of Fe-salen complex
Still using the oxidative route, OTSUKA et al. (2017) reported the polymerization of
cardanol in emulsion w/o, always using the weight proportion of cardanol bigger or
equal to the water. To keep the system stable, it was used polyamine and acetic acid.
After 24 hours, depending on the system conditions, 50% of conversion was achieved,
average molecular weight of 6800 Da e polydispersion index of 2.3.
Besides the oxidative route, poly(cardanol) was obtained by an enzymatic polymer-
ization using peroxidases. The product was a mixture of oxyphenylene and phenylene
units. Using soybean peroxidase, IKEDA et al. (2000b) obtained the highest yield (69%)
with isopropanol as solvent (Mn = 6100 and PI = 1.8). Doubling the amount of enzymes,
KIM et al. (2003) studied the same polymerization. They obtained 62% of yield, Mn =
3411 and Mw = 8221 Da (PI = 2.41). The structure of the obtained polymer is similar to
those obtained using the oxidative route.
Another route is the polycondensation in which oligomerization takes place, yield-
ing functionalized pre-polymers. CNSL step-growth polymerization can be performed
26
with electrophiles for reactions with hydroxyl group or, very commonly, an aldehyde
(formaldehyde) is used. In the last, it is obtained a formaldehyde-cardanol resin, form-
ing a phenolic thermosetting resin. For example, MISRA and PANDEY (1984) (or MISRA
and PANDEY (1985)) studied the polymerization using a alkaline catalysis (NaOH).
Moreover, BISANDA and ANSELL (1992) evaluated that this composited have adequate
strength for roofing applications.
In general, these resins are more flexible and soluble in organic solvents relative to
others. In addition, they are hydrophobic and have better resistance to acids and bases.
However, they have lower tensile strength and thermal stability than the traditional
phenol-formaldehyde resin (PF) (LOCHAB et al., 2014). This may be attributed to the
side chain that imparts steric hindrance and reduction in intermolecular interactions.
Thus, an optimum percentage replacement of phenol by cardanol is required. For ex-
ample, phenolic resins containing less than 15 wt% cardanol have distinctly improved
chemical resistance and mechanical properties compared to neat phenolic resins.
Moreover, polycondensation using acid catalysis has been reported using oxalic,
succinic, citric and other acids (SATHIYALEKSHMI (1993), YADAV and SRIVASTAVA
(2007a), LOUREIRO et al. (2017)). For example, SOUZA JR. et al. (2008a) prepared the
resin one step with H2SO4. FTIR and XPS confirmed the polymerization. It was also
noticed the presence of sulfur in the polymer, which influences its acidity and is advan-
tageous for mixtures with polyaniline (conductive polymer). In another work, SOUZA
JR. et al. (2008b) used the cationic route to produce the same resin applying H2SO4.
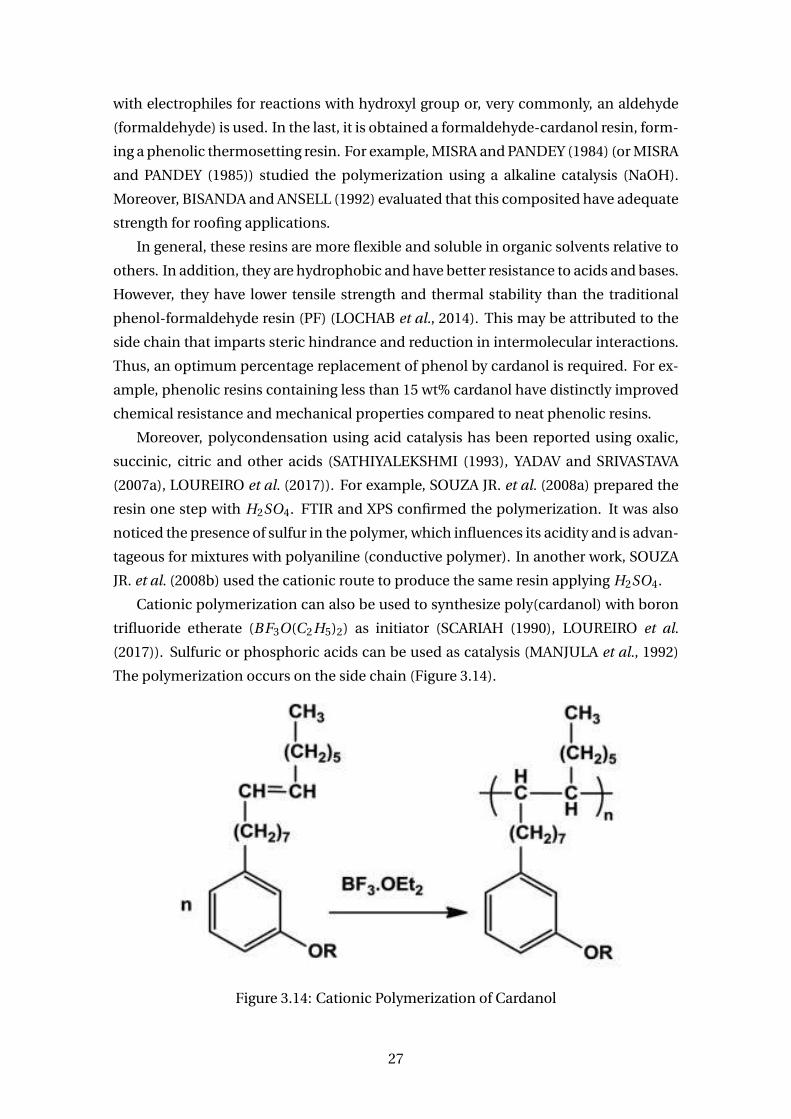
Cationic polymerization can also be used to synthesize poly(cardanol) with boron
trifluoride etherate (BF3O(C2H5)2) as initiator (SCARIAH (1990), LOUREIRO et al.
(2017)). Sulfuric or phosphoric acids can be used as catalysis (MANJULA et al., 1992)
The polymerization occurs on the side chain (Figure 3.14).
Figure 3.14: Cationic Polymerization of Cardanol
27
BESTETI et al. (2014) and GALVÃO (2016) studied the direct use of cardanol as
comonomer using several polymerization methodologies – bulk, solution, suspension
and emulsion. However, due to the poor reactivity of the C15 unsaturations, conver-
sion did not get very high, but their products have shown to be attractive for some
applications, inspiring the present study.
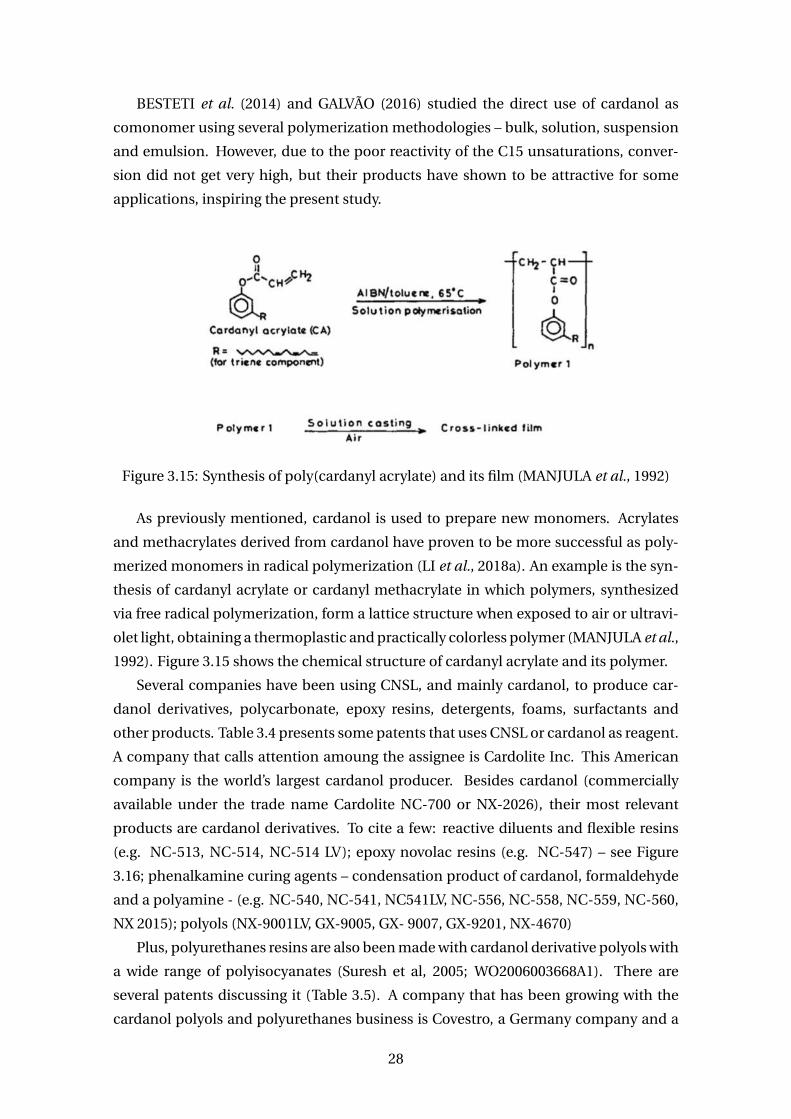
Figure 3.15: Synthesis of poly(cardanyl acrylate) and its film (MANJULA et al., 1992)
As previously mentioned, cardanol is used to prepare new monomers. Acrylates
and methacrylates derived from cardanol have proven to be more successful as poly-
merized monomers in radical polymerization (LI et al., 2018a). An example is the syn-
thesis of cardanyl acrylate or cardanyl methacrylate in which polymers, synthesized
via free radical polymerization, form a lattice structure when exposed to air or ultravi-
olet light, obtaining a thermoplastic and practically colorless polymer (MANJULA et al.,
1992). Figure 3.15 shows the chemical structure of cardanyl acrylate and its polymer.
Several companies have been using CNSL, and mainly cardanol, to produce car-
danol derivatives, polycarbonate, epoxy resins, detergents, foams, surfactants and
other products. Table 3.4 presents some patents that uses CNSL or cardanol as reagent.
A company that calls attention amoung the assignee is Cardolite Inc. This American
company is the world’s largest cardanol producer. Besides cardanol (commercially
available under the trade name Cardolite NC-700 or NX-2026), their most relevant
products are cardanol derivatives. To cite a few: reactive diluents and flexible resins
(e.g. NC-513, NC-514, NC-514 LV); epoxy novolac resins (e.g. NC-547) – see Figure
3.16; phenalkamine curing agents – condensation product of cardanol, formaldehyde
and a polyamine - (e.g. NC-540, NC-541, NC541LV, NC-556, NC-558, NC-559, NC-560,
NX 2015); polyols (NX-9001LV, GX-9005, GX- 9007, GX-9201, NX-4670)
Plus, polyurethanes resins are also been made with cardanol derivative polyols with
a wide range of polyisocyanates (Suresh et al, 2005; WO2006003668A1). There are
several patents discussing it (Table 3.5). A company that has been growing with the
cardanol polyols and polyurethanes business is Covestro, a Germany company and a
28
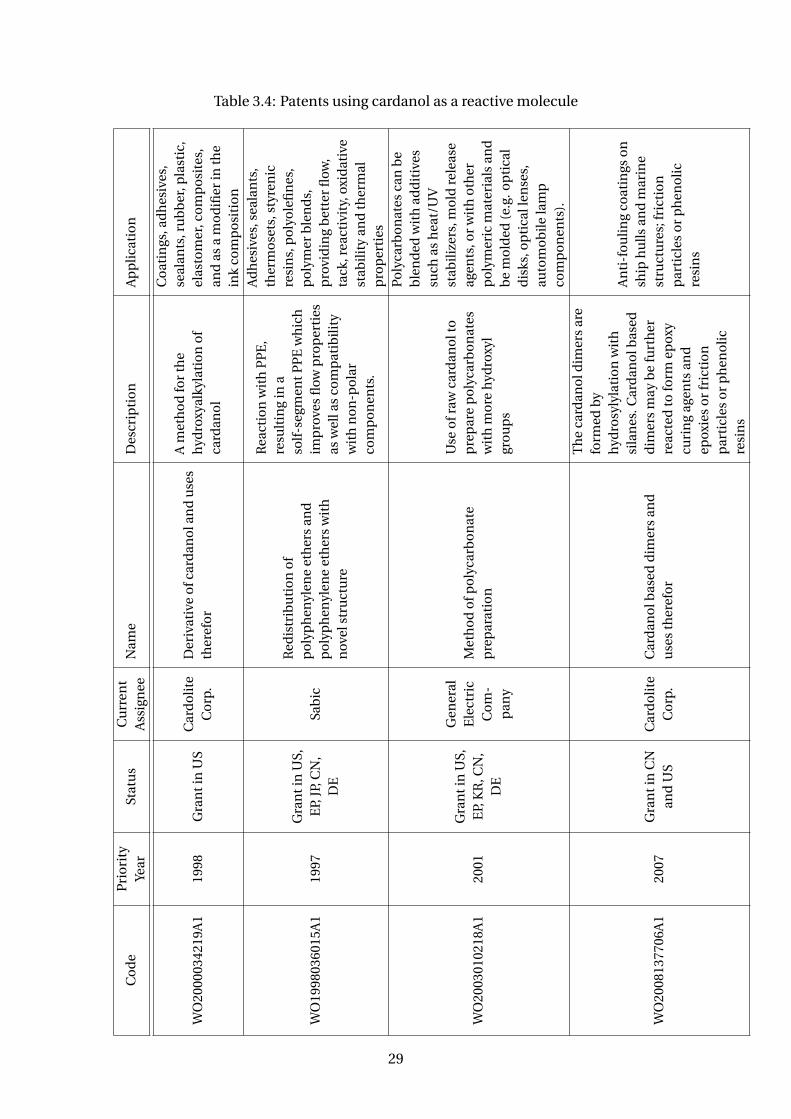
Table 3.4: Patents using cardanol as a reactive molecule
Co
de
Pri
ori
tyYe
arSt
atu
sC
urr
ent
Ass
ign
eeN
ame
Des
crip
tio
nA
pp
licat
ion
WO
2000
0342
19A
119
98G
ran
tin
US
Car
do
lite
Co
rp.
Der
ivat
ive
ofc
ard
ano
lan
du
ses
ther
efo
r
Am
eth
od
for
the
hyd
roxy
alky
lati
on
of
card
ano
l
Co
atin
gs,a
dh
esiv
es,
seal
ants
,ru
bb
er,p
last
ic,
elas
tom
er,c
om
po
site
s,an
das
am
od
ifier
inth
ein
kco
mp
osi
tio
n
WO
1998
0360
15A
119
97G
ran
tin
US,
EP,
JP,C
N,
DE
Sab
ic
Red
istr
ibu
tio
no
fp
oly
ph
enyl
ene
eth
ers
and
po
lyp
hen
ylen
eet
her
sw
ith
nov
elst
ruct
ure
Rea
ctio
nw
ith
PP
E,
resu
ltin
gin
aso
lf-s
egm
entP
PE
wh
ich
imp
rove
sfl
owp
rop
erti
esas
wel
las
com
pat
ibil
ity
wit
hn
on
-po
lar
com
po
nen
ts.
Ad
hes
ives
,sea
lan
ts,
ther
mo
sets
,sty
ren
icre
sin
s,p
oly
ole
fin
es,
po
lym
erb
len
ds,
pro
vid
ing
bet
ter
flow
,ta
ck,r
eact
ivit
y,ox
idat
ive
stab
ilit
yan
dth
erm
alp
rop
erti
es
WO
2003
0102
18A
120
01G
ran
tin
US,
EP,
KR
,CN
,D
E
Gen
eral
Ele
ctri
cC
om
-p
any
Met
ho
do
fpo
lyca
rbo
nat
ep
rep
arat
ion
Use
ofr
awca
rdan
olt
op
rep
are
po
lyca
rbo
nat
esw
ith
mo
reh
ydro
xyl
gro
up
s
Po
lyca
rbo
nat
esca
nb
eb
len
ded
wit
had
dit
ives
such
ash
eat/
UV
stab
iliz
ers,
mo
ldre
leas
eag
ents
,or
wit
ho
ther
po
lym
eric
mat
eria
lsan
db
em
old
ed(e
.g.o
pti
cal
dis
ks,o
pti
call
ense
s,au
tom
ob
ile
lam
pco
mp
on
ents
).
WO
2008
1377
06A
120
07G
ran
tin
CN
and
US
Car
do
lite
Co
rp.
Car
dan
olb
ased
dim
ers
and
use
sth
eref
or
Th
eca
rdan
old
imer
sar
efo
rmed
by
hyd
rosy
lyla
tio
nw
ith
sila
nes
.Car
dan
olb
ased
dim
ers
may
be
furt
her
reac
ted
tofo
rmep
oxy
curi
ng
agen
tsan
dep
oxie
so
rfr
icti
on
par
ticl
eso
rp
hen
oli
cre
sin
s
An
ti-f
ou
ling
coat
ings
on
ship
hu
llsan
dm
arin
est
ruct
ure
s;fr
icti
on
par
ticl
eso
rp
hen
oli
cre
sin
s
29
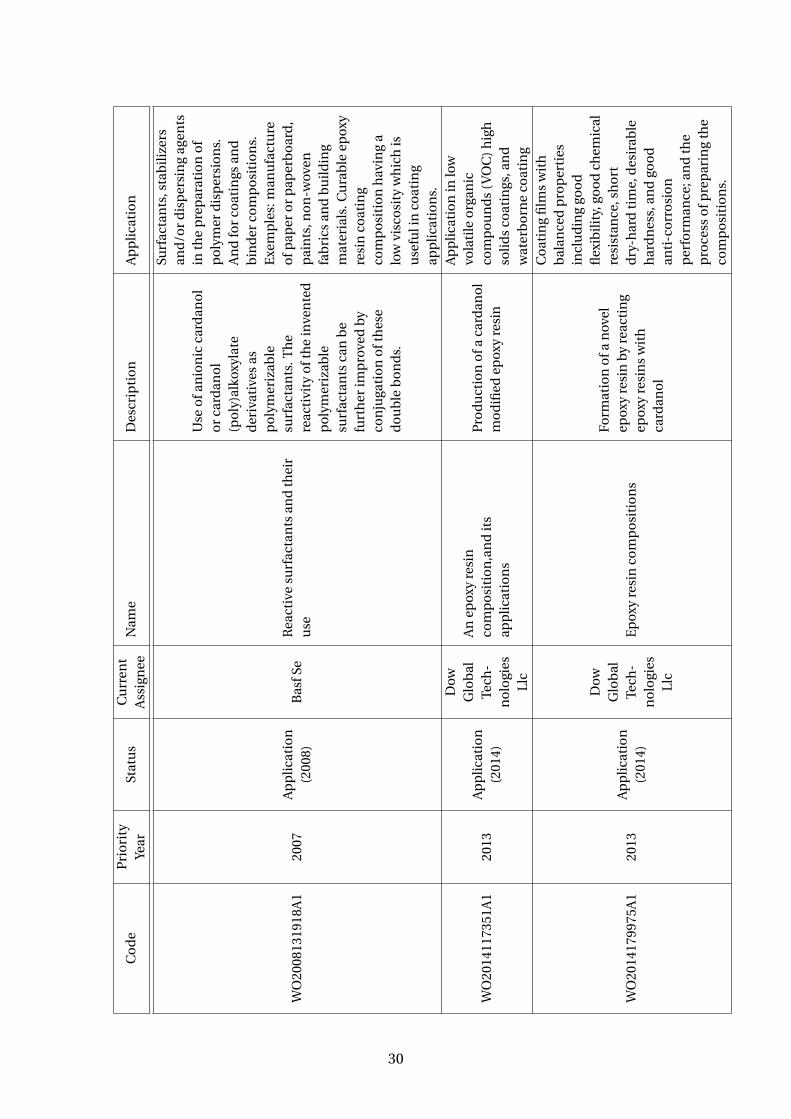
Co
de
Pri
ori
tyYe
arSt
atu
sC
urr
ent
Ass
ign
eeN
ame
Des
crip
tio
nA
pp
lica
tio
n
WO
2008
1319
18A
120
07A
pp
licat
ion
(200
8)B
asfS
eR
eact
ive
surf
acta
nts
and
thei
ru
se
Use
ofa
nio
nic
card
ano
lo
rca
rdan
ol
(po
ly)a
lkox
ylat
ed
eriv
ativ
esas
po
lym
eriz
able
surf
acta
nts
.Th
ere
acti
vity
oft
he
inve
nte
dp
oly
mer
izab
lesu
rfac
tan
tsca
nb
efu
rth
erim
pro
ved
by
con
juga
tio
no
fth
ese
do
ub
leb
on
ds.
Surf
acta
nts
,sta
bil
izer
san
d/o
rd
isp
ersi
ng
agen
tsin
the
pre
par
atio
no
fp
oly
mer
dis
per
sio
ns.
An
dfo
rco
atin
gsan
db
ind
erco
mp
osi
tio
ns.
Exe
mp
les:
man
ufa
ctu
reo
fpap
ero
rp
aper
bo
ard
,p
ain
ts,n
on
-wov
enfa
bri
csan
db
uil
din
gm
ater
ials
.Cu
rab
leep
oxy
resi
nco
atin
gco
mp
osi
tio
nh
avin
ga
low
visc
osi
tyw
hic
his
use
fuli
nco
atin
gap
pli
cati
on
s.
WO
2014
1173
51A
120
13A
pp
licat
ion
(201
4)
Dow
Glo
bal
Tech
-n
olo
gies
Llc
An
epox
yre
sin
com
po
siti
on
,an
dit
sap
pli
cati
on
s
Pro
du
ctio
no
faca
rdan
ol
mo
difi
edep
oxy
resi
n
Ap
pli
cati
on
inlo
wvo
lati
leo
rgan
icco
mp
ou
nd
s(V
OC
)h
igh
soli
ds
coat
ings
,an
dw
ater
bo
rne
coat
ing
WO
2014
1799
75A
120
13A
pp
licat
ion
(201
4)
Dow
Glo
bal
Tech
-n
olo
gies
Llc
Ep
oxy
resi
nco
mp
osi
tio
ns
Form
atio
no
fan
ovel
epox
yre
sin
by
reac
tin
gep
oxy
resi
ns
wit
hca
rdan
ol
Co
atin
gfi
lms
wit
hb
alan
ced
pro
per
ties
incl
ud
ing
goo
dfl
exib
ilit
y,go
od
chem
ical
resi
stan
ce,s
ho
rtd
ry-h
ard
tim
e,d
esir
able
har
dn
ess,
and
goo
dan
ti-c
orr
osi
on
per
form
ance
;an
dth
ep
roce
sso
fpre
par
ing
the
com
po
siti
on
s.
30
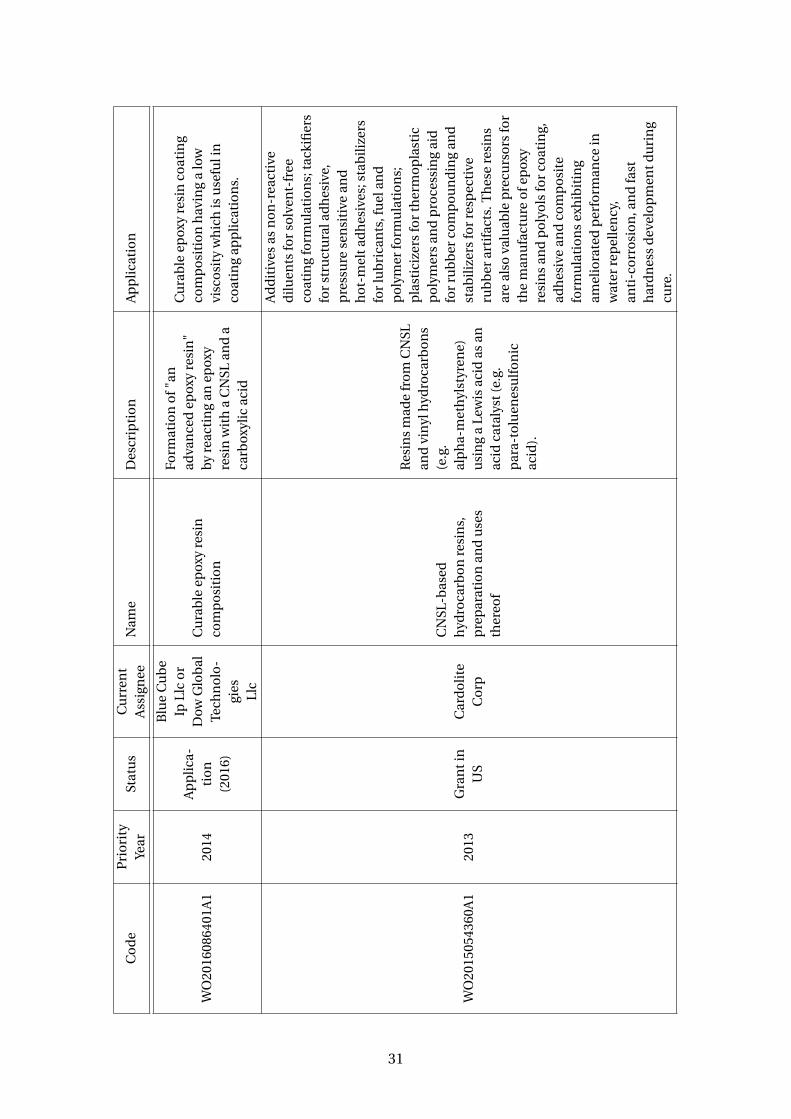
Co
de
Pri
ori
tyYe
arSt
atu
sC
urr
ent
Ass
ign
eeN
ame
Des
crip
tio
nA
pp
lica
tio
n
WO
2016
0864
01A
120
14A
pp
lica
-ti
on
(201
6)
Blu
eC
ub
eIp
Llc
or
Dow
Glo
bal
Tech
no
lo-
gies
Llc
Cu
rab
leep
oxy
resi
nco
mp
osi
tio
n
Form
atio
no
f"an
adva
nce
dep
oxy
resi
n"
by
reac
tin
gan
epox
yre
sin
wit
ha
CN
SLan
da
carb
oxyl
icac
id
Cu
rab
leep
oxy
resi
nco
atin
gco
mp
osi
tio
nh
avin
ga
low
visc
osi
tyw
hic
his
use
fuli
nco
atin
gap
pli
cati
on
s.
WO
2015
0543
60A
120
13G
ran
tin
US
Car
do
lite
Co
rp
CN
SL-b
ased
hyd
roca
rbo
nre
sin
s,p
rep
arat
ion
and
use
sth
ereo
f
Res
ins
mad
efr
om
CN
SLan
dvi
nyl
hyd
roca
rbo
ns
(e.g
.al
ph
a-m
eth
ylst
yren
e)u
sin
ga
Lew
isac
idas
anac
idca
taly
st(e
.g.
par
a-to
luen
esu
lfo
nic
acid
).
Ad
dit
ives
asn
on
-rea
ctiv
ed
ilu
ents
for
solv
ent-
free
coat
ing
form
ula
tio
ns;
tack
ifier
sfo
rst
ruct
ura
lad
hes
ive,
pre
ssu
rese
nsi
tive
and
ho
t-m
elta
dh
esiv
es;s
tab
iliz
ers
for
lub
rica
nts
,fu
elan
dp
oly
mer
form
ula
tio
ns;
pla
stic
izer
sfo
rth
erm
op
last
icp
oly
mer
san
dp
roce
ssin
gai
dfo
rru
bb
erco
mp
ou
nd
ing
and
stab
iliz
ers
for
resp
ecti
veru
bb
erar
tifa
cts.
Th
ese
resi
ns
are
also
valu
able
pre
curs
ors
for
the
man
ufa
ctu
reo
fep
oxy
resi
ns
and
po
lyo
lsfo
rco
atin
g,ad
hes
ive
and
com
po
site
form
ula
tio
ns
exh
ibit
ing
amel
iora
ted
per
form
ance
inw
ater
rep
elle
ncy
,an
ti-c
orr
osi
on
,an
dfa
sth
ard
nes
sd
evel
op
men
tdu
rin
gcu
re.
31
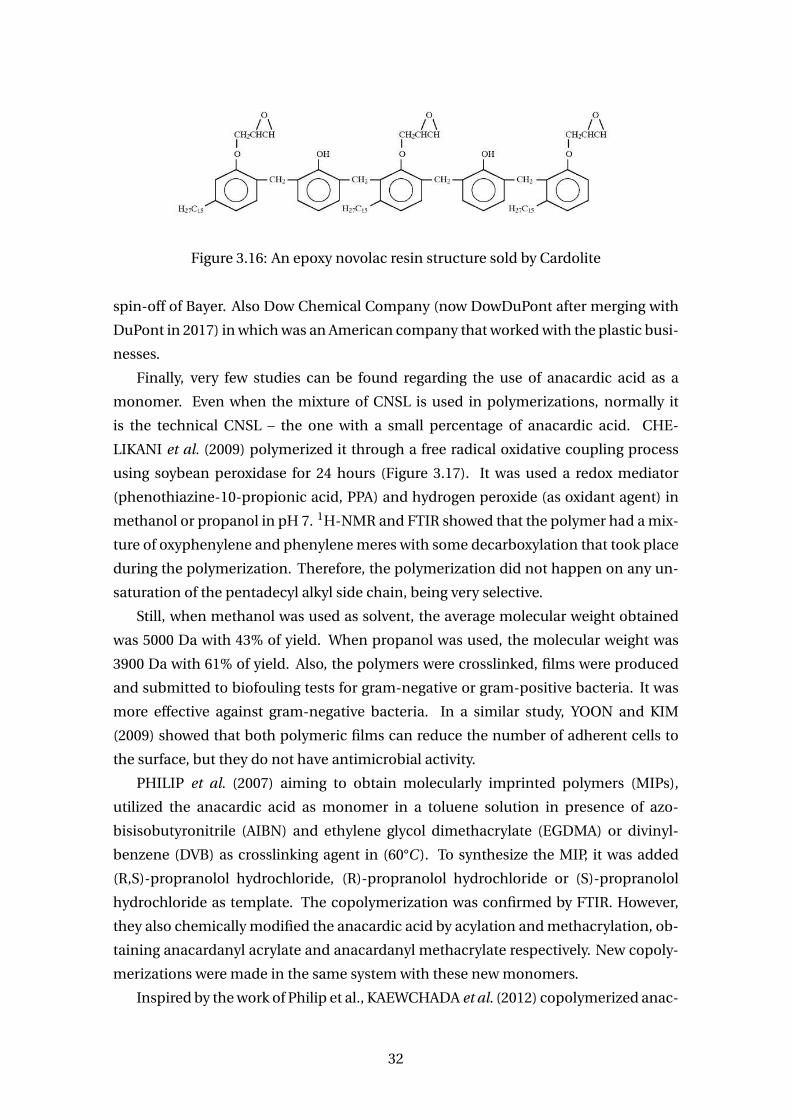
Figure 3.16: An epoxy novolac resin structure sold by Cardolite
spin-off of Bayer. Also Dow Chemical Company (now DowDuPont after merging with
DuPont in 2017) in which was an American company that worked with the plastic busi-
nesses.
Finally, very few studies can be found regarding the use of anacardic acid as a
monomer. Even when the mixture of CNSL is used in polymerizations, normally it
is the technical CNSL – the one with a small percentage of anacardic acid. CHE-
LIKANI et al. (2009) polymerized it through a free radical oxidative coupling process
using soybean peroxidase for 24 hours (Figure 3.17). It was used a redox mediator
(phenothiazine-10-propionic acid, PPA) and hydrogen peroxide (as oxidant agent) in
methanol or propanol in pH 7. 1H-NMR and FTIR showed that the polymer had a mix-
ture of oxyphenylene and phenylene meres with some decarboxylation that took place
during the polymerization. Therefore, the polymerization did not happen on any un-
saturation of the pentadecyl alkyl side chain, being very selective.
Still, when methanol was used as solvent, the average molecular weight obtained
was 5000 Da with 43% of yield. When propanol was used, the molecular weight was
3900 Da with 61% of yield. Also, the polymers were crosslinked, films were produced
and submitted to biofouling tests for gram-negative or gram-positive bacteria. It was
more effective against gram-negative bacteria. In a similar study, YOON and KIM
(2009) showed that both polymeric films can reduce the number of adherent cells to
the surface, but they do not have antimicrobial activity.
PHILIP et al. (2007) aiming to obtain molecularly imprinted polymers (MIPs),
utilized the anacardic acid as monomer in a toluene solution in presence of azo-
bisisobutyronitrile (AIBN) and ethylene glycol dimethacrylate (EGDMA) or divinyl-
benzene (DVB) as crosslinking agent in (60°C ). To synthesize the MIP, it was added
(R,S)-propranolol hydrochloride, (R)-propranolol hydrochloride or (S)-propranolol
hydrochloride as template. The copolymerization was confirmed by FTIR. However,
they also chemically modified the anacardic acid by acylation and methacrylation, ob-
taining anacardanyl acrylate and anacardanyl methacrylate respectively. New copoly-
merizations were made in the same system with these new monomers.
Inspired by the work of Philip et al., KAEWCHADA et al. (2012) copolymerized anac-
32
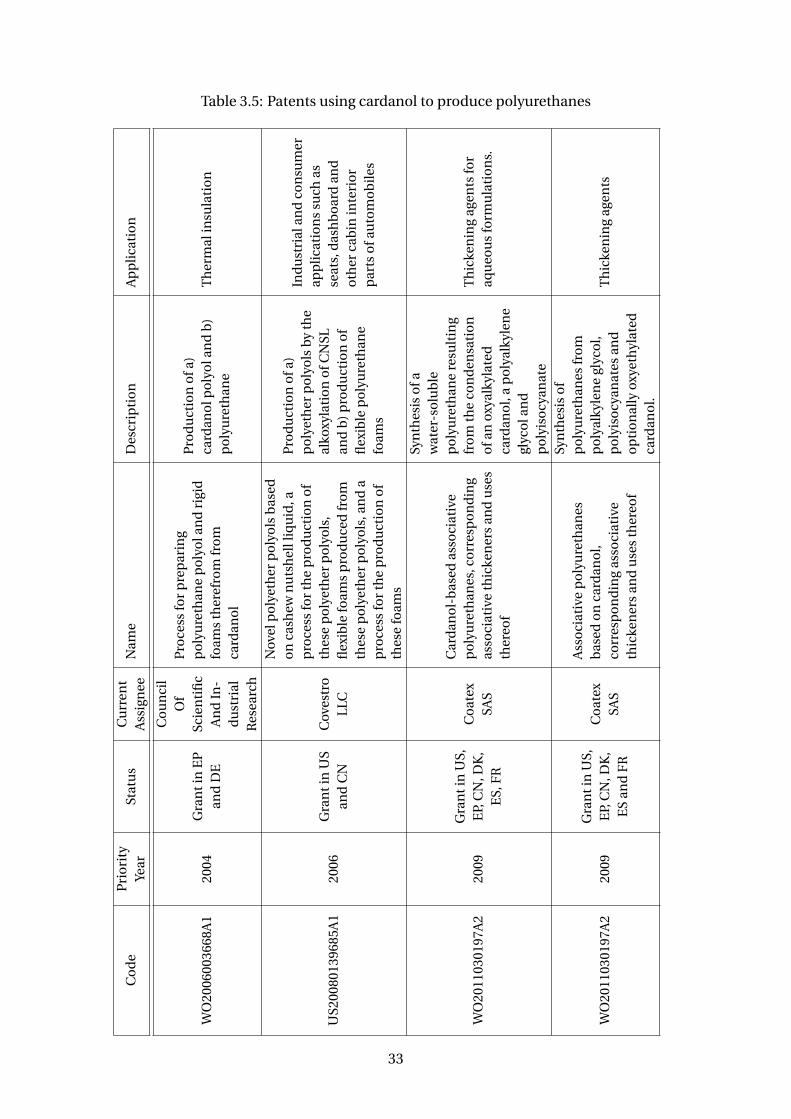
Table 3.5: Patents using cardanol to produce polyurethanes
Co
de
Pri
ori
tyYe
arSt
atu
sC
urr
ent
Ass
ign
eeN
ame
Des
crip
tio
nA
pp
lica
tio
n
WO
2006
0036
68A
120
04G
ran
tin
EP
and
DE
Co
un
cil
Of
Scie
nti
fic
An
dIn
-d
ust
rial
Res
earc
h
Pro
cess
for
pre
par
ing
po
lyu
reth
ane
po
lyo
lan
dri
gid
foam
sth
eref
rom
fro
mca
rdan
ol
Pro
du
ctio
no
fa)
card
ano
lpo
lyo
lan
db
)p
oly
ure
than
eT
her
mal
insu
lati
on
US2
0080
1396
85A
120
06G
ran
tin
US
and
CN
Cov
estr
oLL
C
Nov
elp
oly
eth
erp
oly
ols
bas
edo
nca
shew
nu
tsh
elll
iqu
id,a
pro
cess
for
the
pro
du
ctio
no
fth
ese
po
lyet
her
po
lyo
ls,
flex
ible
foam
sp
rod
uce
dfr
om
thes
ep
oly
eth
erp
oly
ols
,an
da
pro
cess
for
the
pro
du
ctio
no
fth
ese
foam
s
Pro
du
ctio
no
fa)
po
lyet
her
po
lyo
lsb
yth
eal
koxy
lati
on
ofC
NSL
and
b)
pro
du
ctio
no
ffl
exib
lep
oly
ure
than
efo
ams
Ind
ust
rial
and
con
sum
erap
pli
cati
on
ssu
chas
seat
s,d
ash
bo
ard
and
oth
erca
bin
inte
rio
rp
arts
ofa
uto
mo
bil
es
WO
2011
0301
97A
220
09G
ran
tin
US,
EP,
CN
,DK
,E
S,F
R
Co
atex
SAS
Car
dan
ol-
bas
edas
soci
ativ
ep
oly
ure
than
es,c
orr
esp
on
din
gas
soci
ativ
eth
icke
ner
san
du
ses
ther
eof
Syn
thes
iso
faw
ater
-so
lub
lep
oly
ure
than
ere
sult
ing
fro
mth
eco
nd
ensa
tio
no
fan
oxya
lkyl
ated
card
ano
l,a
po
lyal
kyle
ne
glyc
ola
nd
po
lyis
ocy
anat
e
Th
icke
nin
gag
ents
for
aqu
eou
sfo
rmu
lati
on
s.
WO
2011
0301
97A
220
09G
ran
tin
US,
EP,
CN
,DK
,E
San
dF
R
Co
atex
SAS
Ass
oci
ativ
ep
oly
ure
than
esb
ased
on
card
ano
l,co
rres
po
nd
ing
asso
ciat
ive
thic
ken
ers
and
use
sth
ereo
f
Syn
thes
iso
fp
oly
ure
than
esfr
om
po
lyal
kyle
ne
glyc
ol,
po
lyis
ocy
anat
esan
do
pti
on
ally
oxye
thyl
ated
card
ano
l.
Th
icke
nin
gag
ents
33
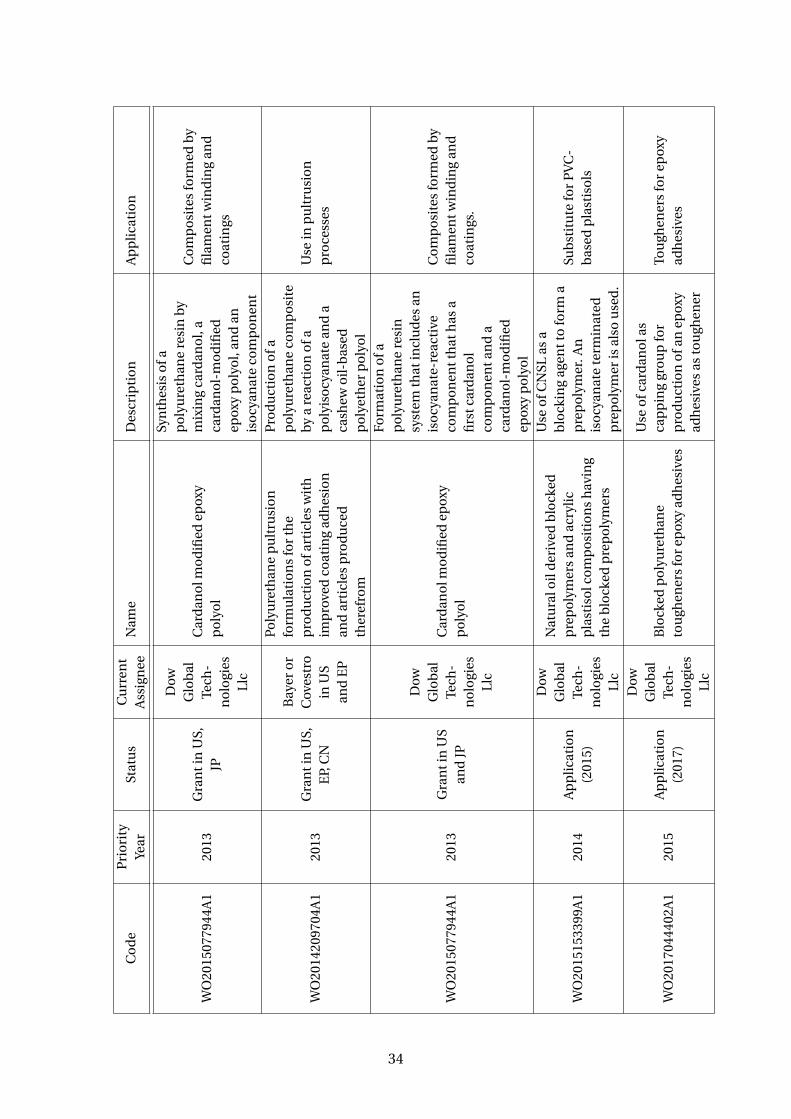
Co
de
Pri
ori
tyYe
arSt
atu
sC
urr
ent
Ass
ign
eeN
ame
Des
crip
tio
nA
pp
lica
tio
n
WO
2015
0779
44A
120
13G
ran
tin
US,
JP
Dow
Glo
bal
Tech
-n
olo
gies
Llc
Car
dan
olm
od
ified
epox
yp
oly
ol
Syn
thes
iso
fap
oly
ure
than
ere
sin
by
mix
ing
card
ano
l,a
card
ano
l-m
od
ified
epox
yp
oly
ol,
and
anis
ocy
anat
eco
mp
on
ent
Co
mp
osi
tes
form
edb
yfi
lam
entw
ind
ing
and
coat
ings
WO
2014
2097
04A
120
13G
ran
tin
US,
EP,
CN
Bay
ero
rC
oves
tro
inU
San
dE
P
Po
lyu
reth
ane
pu
ltru
sio
nfo
rmu
lati
on
sfo
rth
ep
rod
uct
ion
ofa
rtic
les
wit
him
pro
ved
coat
ing
adh
esio
nan
dar
ticl
esp
rod
uce
dth
eref
rom
Pro
du
ctio
no
fap
oly
ure
than
eco
mp
osi
teb
ya
reac
tio
no
fap
oly
iso
cyan
ate
and
aca
shew
oil
-bas
edp
oly
eth
erp
oly
ol
Use
inp
ult
rusi
on
pro
cess
es
WO
2015
0779
44A
120
13G
ran
tin
US
and
JP
Dow
Glo
bal
Tech
-n
olo
gies
Llc
Car
dan
olm
od
ified
epox
yp
oly
ol
Form
atio
no
fap
oly
ure
than
ere
sin
syst
emth
atin
clu
des
anis
ocy
anat
e-re
acti
veco
mp
on
entt
hat
has
afi
rstc
ard
ano
lco
mp
on
enta
nd
aca
rdan
ol-
mo
difi
edep
oxy
po
lyo
l
Co
mp
osi
tes
form
edb
yfi
lam
entw
ind
ing
and
coat
ings
.
WO
2015
1533
99A
120
14A
pp
lica
tio
n(2
015)
Dow
Glo
bal
Tech
-n
olo
gies
Llc
Nat
ura
loil
der
ived
blo
cked
pre
po
lym
ers
and
acry
lic
pla
stis
olc
om
po
siti
on
sh
avin
gth
eb
lock
edp
rep
oly
mer
s
Use
ofC
NSL
asa
blo
ckin
gag
entt
ofo
rma
pre
po
lym
er.A
nis
ocy
anat
ete
rmin
ated
pre
po
lym
eris
also
use
d.
Sub
stit
ute
for
PV
C-
bas
edp
last
iso
ls
WO
2017
0444
02A
120
15A
pp
lica
tio
n(2
017)
Dow
Glo
bal
Tech
-n
olo
gies
Llc
Blo
cked
po
lyu
reth
ane
tou
ghen
ers
for
epox
yad
hes
ives
Use
ofc
ard
ano
las
cap
pin
ggr
ou
pfo
rp
rod
uct
ion
ofa
nep
oxy
adh
esiv
esas
tou
ghen
er
Tou
ghen
ers
for
epox
yad
hes
ives
34
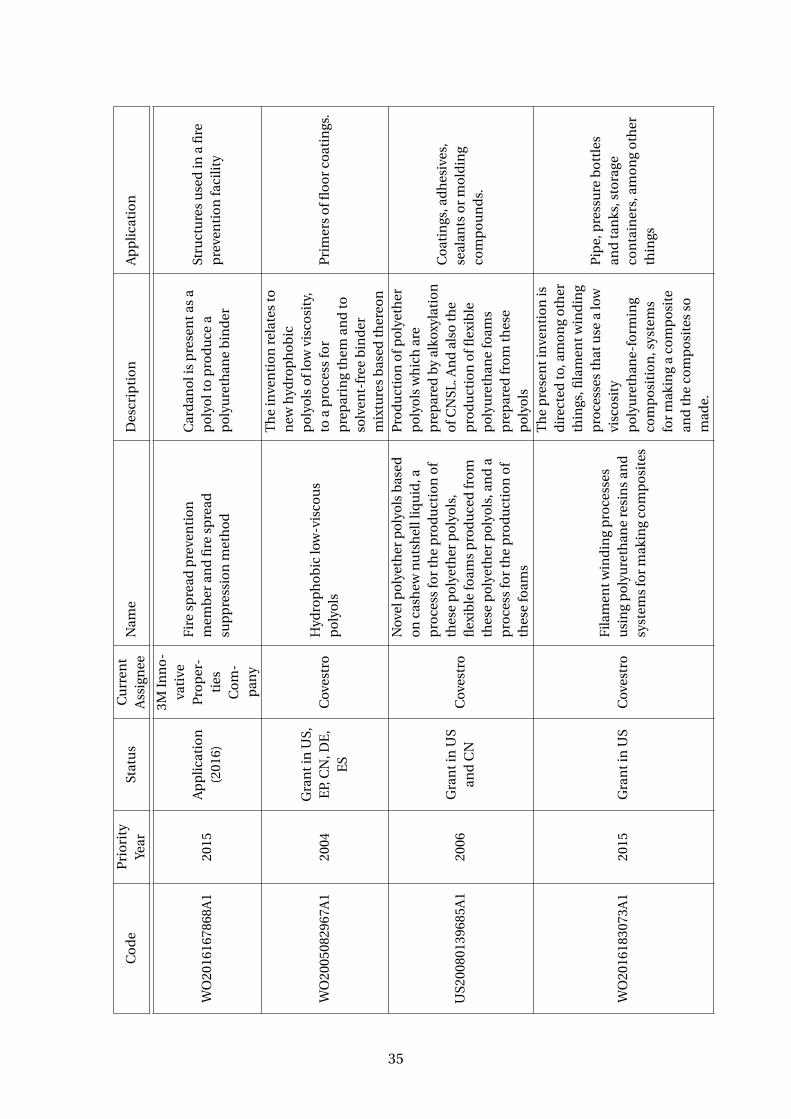
Co
de
Pri
ori
tyYe
arSt
atu
sC
urr
ent
Ass
ign
eeN
ame
Des
crip
tio
nA
pp
licat
ion
WO
2016
1678
68A
120
15A
pp
lica
tio
n(2
016)
3MIn
no
-va
tive
Pro
per
-ti
esC
om
-p
any
Fir
esp
read
pre
ven
tio
nm
emb
eran
dfi
resp
read
sup
pre
ssio
nm
eth
od
Car
dan
oli
sp
rese
nta
sa
po
lyo
lto
pro
du
cea
po
lyu
reth
ane
bin
der
Stru
ctu
res
use
din
afi
rep
reve
nti
on
faci
lity
WO
2005
0829
67A
120
04G
ran
tin
US,
EP,
CN
,DE
,E
SC
oves
tro
Hyd
rop
ho
bic
low
-vis
cou
sp
oly
ols
Th
ein
ven
tio
nre
late
sto
new
hyd
rop
ho
bic
po
lyo
lso
flow
visc
osi
ty,
toa
pro
cess
for
pre
par
ing
them
and
toso
lven
t-fr
eeb
ind
erm
ixtu
res
bas
edth
ereo
n
Pri
mer
so
fflo
or
coat
ings
.
US2
0080
1396
85A
120
06G
ran
tin
US
and
CN
Cov
estr
o
Nov
elp
oly
eth
erp
oly
ols
bas
edo
nca
shew
nu
tsh
elll
iqu
id,a
pro
cess
for
the
pro
du
ctio
no
fth
ese
po
lyet
her
po
lyo
ls,
flex
ible
foam
sp
rod
uce
dfr
om
thes
ep
oly
eth
erp
oly
ols
,an
da
pro
cess
for
the
pro
du
ctio
no
fth
ese
foam
s
Pro
du
ctio
no
fpo
lyet
her
po
lyo
lsw
hic
har
ep
rep
ared
by
alko
xyla
tio
no
fCN
SL.A
nd
also
the
pro
du
ctio
no
fflex
ible
po
lyu
reth
ane
foam
sp
rep
ared
fro
mth
ese
po
lyo
ls
Co
atin
gs,a
dh
esiv
es,
seal
ants
or
mo
ldin
gco
mp
ou
nd
s.
WO
2016
1830
73A
120
15G
ran
tin
US
Cov
estr
oF
ilam
entw
ind
ing
pro
cess
esu
sin
gp
oly
ure
than
ere
sin
san
dsy
stem
sfo
rm
akin
gco
mp
osi
tes
Th
ep
rese
nti
nve
nti
on
isd
irec
ted
to,a
mo
ng
oth
erth
ings
,fila
men
twin
din
gp
roce
sses
that
use
alo
wvi
sco
sity
po
lyu
reth
ane-
form
ing
com
po
siti
on
,sys
tem
sfo
rm
akin
ga
com
po
site
and
the
com
po
site
sso
mad
e.
Pip
e,p
ress
ure
bo
ttle
san
dta
nks
,sto
rage
con
tain
ers,
amo
ng
oth
erth
ings
35
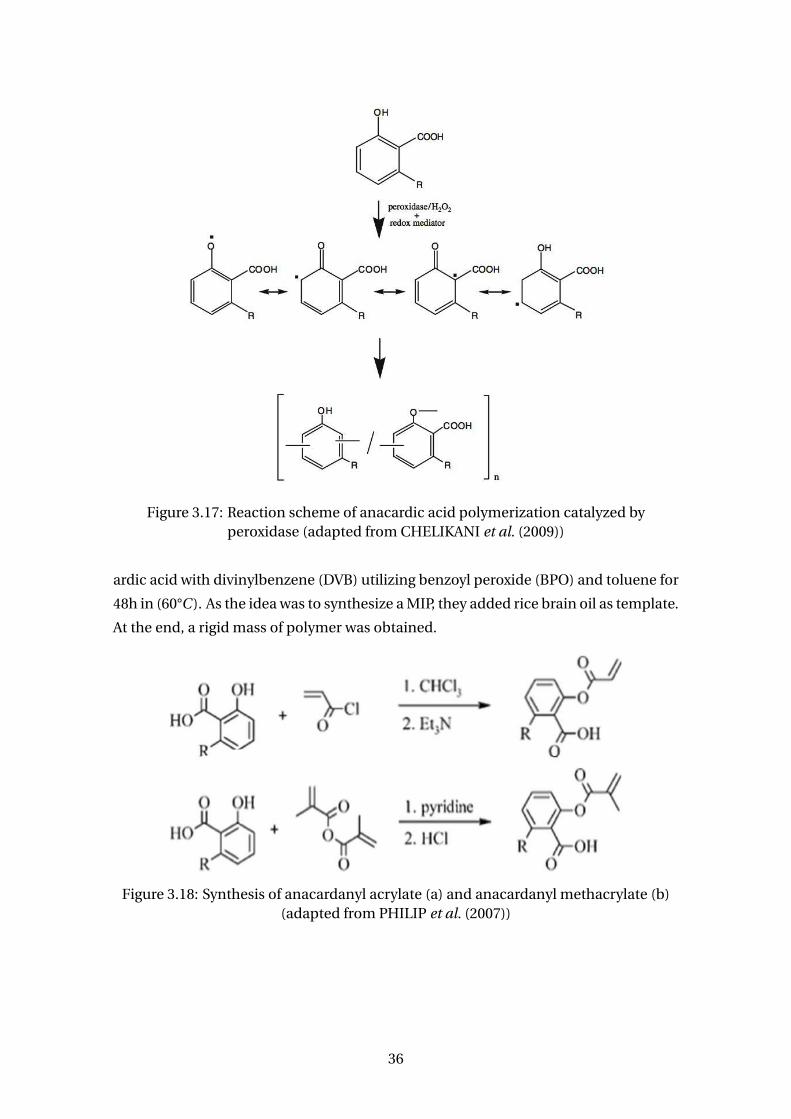
Figure 3.17: Reaction scheme of anacardic acid polymerization catalyzed byperoxidase (adapted from CHELIKANI et al. (2009))
ardic acid with divinylbenzene (DVB) utilizing benzoyl peroxide (BPO) and toluene for
48h in (60°C ). As the idea was to synthesize a MIP, they added rice brain oil as template.
At the end, a rigid mass of polymer was obtained.
Figure 3.18: Synthesis of anacardanyl acrylate (a) and anacardanyl methacrylate (b)(adapted from PHILIP et al. (2007))
36
3.4 Polymer Functionalization
Functionalization of polymers means the introduction of desired functional groups
in its structure to create specific chemical, physical, biological, pharmacological, or
other properties. The functionalization is important to enable further reactions, like
bioconjugation, or to enable selective binding of particular species; transport of drugs;
catalytic activity and other applications (PICHOT (2004), TIAN et al. (2012)). These
interactions happen due to physical adsorption by hydrophobic, hydrophilic or elec-
trostatic interactions and hydrogen and Van der Walls bounds. But, it can also be done
due to covalent coupling by the presence of chemical groups in the biomolecules like
amine, thiol, carboxyl and hydroxyl groups.
The non-specific (physical) adsorption is the weakest one since the molecule can
be easily desorbed by changes in medium conditions like pH, temperature and ionic
strength (WELSCH et al., 2013). The conjugation by means of covalent attachment is
attractive since it provides a route for the formation if a biofunctional layer, being the
molecule irreversibly and stable bounded (RAMOS, 2018).
Therefore, as defined by IUPAC, a functional polymer is one that:
• Bears specified chemical groups or;
• Has specified physical, chemical, biological, pharmacological, or other uses
which depend on specific chemical groups.
PICHOT (2004) specified the most used methods for fabrication of functionalized par-
ticles. Two of them are:
• Heterogenous polymerization: usually in aqueous medium and initialized by
free-radical polymerization. This enables the synthesis of dispersions of parti-
cles with a wide size range depending on the technique used.
• Self-organization of block or grafted copolymers by means of molecular or elec-
trostatic interactions.
HERMANSON (2013) confirms that reactive or functional groups can be created
at the surface of particles for the subsequent coupling of binders with the aid of the
monomer mixture in the polymerization. Moreover, multiple factors, such as size and
curvature of the particle surface and the chemical nature of the surface and the parti-
cle’s nucleus, determine the arrangement of the biomolecules MAHON et al. (2012).
PEIXOTO (2013) studied the functionalization of poly(methyl methacrylate) parti-
cles by copolymerizing it with acrylic acid, methacrylic acid, 2-dimethylamino ethyl
methacrylate and 2-hydroxyethyl methacrylate. She observed that the co-monomers
were concentrated in the particle surface due to their affinity be the aqueous medium,
37
functionalizing the particles. Absorption tests with bovine serum albumin (BSA) indi-
cated that from 15 to 35% of the protein was immobilized.
WAY (2017) studied the click chemistry. Successful reactions were the thiol-ene re-
action between styrene and 3-mercaptopropionic acid and between maleimide and
functionalized polymers produced by RAFT polymerization. She detected that the use
of copolymer systems can lead to cell uptakes of nanoparticles of bioconjugated poly-
mers up to 8 times higher, constituting promising alternatives for use in targeted drug
delivery application.
Thus, in this study, suspension polymerization, in which is a polymerization
in heterogeneous medium, is used to functionalize polymer particles. Besides the
use of cardanol, employment of anacardic acid is interesting due to the carboxyl
group as it can react with an amine group of the biomolecule, forming a pep-
tide bound. This can be easily done using a carbodiimide, such as 1-ethyl-3-(3-
dimethylaminopropyl)carbodiimide (EDC), in parallel with N-hydroxysuccinimide
(NHS). The formation of a amide group can be detected by FTIR (RAMOS, 2018).
3.5 Concluding Remarks
Based on the literature review, there isn’t a detailed study about the free-radical
polymerization of cardanol or acid anacardic. GALVÃO (2016) started investigating
the copolymerization kinetics of cardanol with styrene in homogenous and heteroge-
neous systems, confirming that cardanol can be incorporated into the polymeric chain
through the one of the unsaturations. Also, cardanol seemed to be a great stabilizer for
suspension polymerization. However, it also inhibits the polymerization, reducing the
overall polymerization rate. Another work was the investigation of copolymerization
in suspension by ?. She produced a core-shell polymer particle containing cardanol
by semibatch combined suspension-emulsion polymerization aiming enzyme immo-
bilization with good characteristics. However, she was not successful copolymerizing
cardanol and styrene in usual suspension conditions.
Regarding anacardic acid, anything besides the synthesis of MIPs (cited in sec-
tion 3.3) have been reported about its use as monomer in free radical polymerization.
Therefore, it is exciting to see how it is going to behavior and the differences between its
kinetics and those of cardanol as the only thing that they have different is the addition
of the carboxyl group.
Moreover, the use of any of these renewable monomers for polymer functional-
ization is very interesting as, if attached successfully to the particle surfaces, they will
introduce the long aliphatic side chain – perhaps with one or two unsaturations, en-
abling further polymerizations -, and the reactive groups hydroxyl and carboxyl.
38
Kinetic Study of Bulk Copolymerization
1st Section
39
Chapter 4
Bulk Copolimerization: Methodology
4.1 Materials
Cardanol (Taian Health Chemical, minimum purity of de 99.5% m/m, Tai’an,
China), natural CNSL (donated by Embrapa, Brazilian Agricultural Research Corpora-
tion), acrylic acid (AA) (VETEC, Rio de Janeiro – Brazil, minimum purit of 99%), methyl
methacrylate (MMA) (VETEC, Rio de Janeiro – Brazil, minimum purity of 99.5%),
styrene (STy) (Sigma-Aldrich, Rio de Janeiro – Brazil, minimum purity 99%) and vinyl
acetate (VAc) were used as monomers. Hydroquinone (Tedia, Rio de Janeiro – Brazil,
minimum purity of 99%) was used to cease the polymerization in a solution of ethanol
(VETEC, Rio de Janeiro – Brazil, minimum purity 99.8%). Benzoyl peroxide (BPO)
(VETEC, Rio de Janeiro – Brazil, minimum purity of 99%, containing 25% of humidity)
was used as a initiator for the polymerizations. Tetrahydrofuran (THF) (Tedia, Rio de
Janeiro – Brazil, minimum purity of 99%) was used as a solvent for gel permeation chro-
matography analyzes. Deuterated chloroform (Cambridge Isotope Laboratoies Inc.,
United States, minimum purity 99.8%) was used for NMR analysis.
4.2 Set up for bulk polymerizaion
Reactions were performed in glass tubes. The reaction mixture was purged with ni-
trogen for one minute and placed on a silicone bath kept under constant stirring at the
desired reaction temperature. The sample on time zero was taken when the tempera-
ture of the reaction mixture (measured by a thermometer inside of the tube) reached
the desired one. At specified sampling times, tubes were removed, cooled quickly and
the reaction was ceased by adding a solution of hydroquinone (1wt %).
40
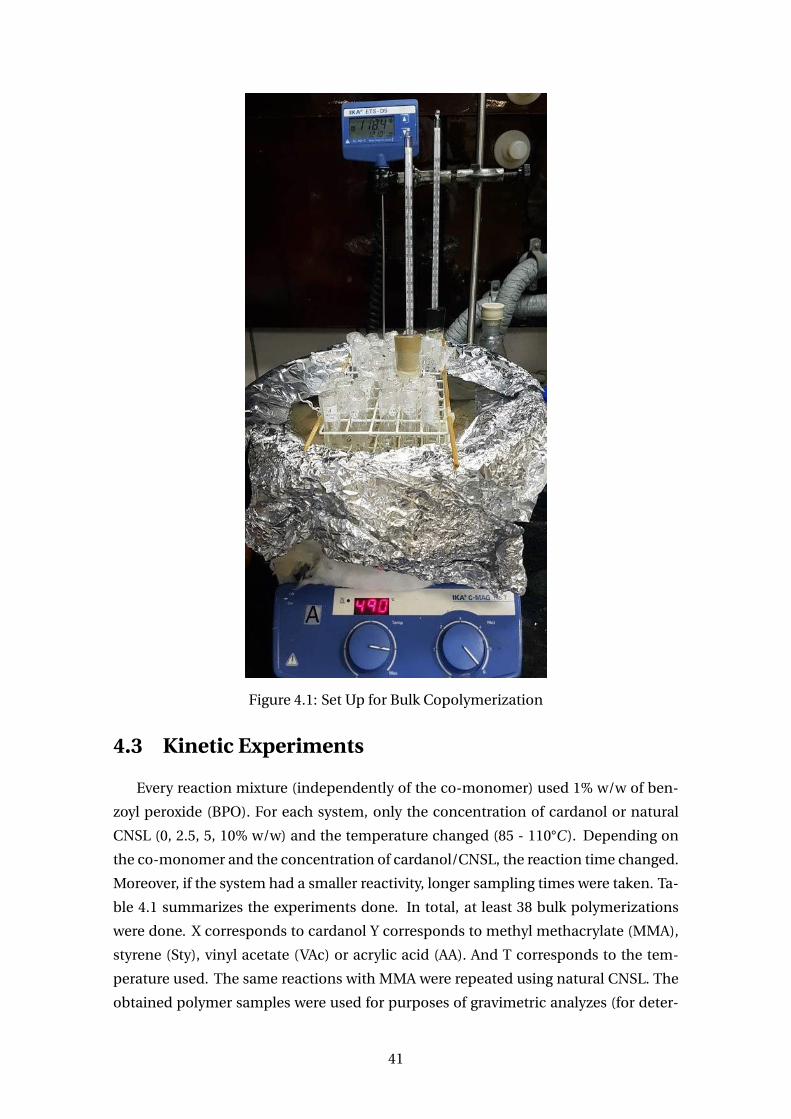
Figure 4.1: Set Up for Bulk Copolymerization
4.3 Kinetic Experiments
Every reaction mixture (independently of the co-monomer) used 1% w/w of ben-
zoyl peroxide (BPO). For each system, only the concentration of cardanol or natural
CNSL (0, 2.5, 5, 10% w/w) and the temperature changed (85 - 110°C ). Depending on
the co-monomer and the concentration of cardanol/CNSL, the reaction time changed.
Moreover, if the system had a smaller reactivity, longer sampling times were taken. Ta-
ble 4.1 summarizes the experiments done. In total, at least 38 bulk polymerizations
were done. X corresponds to cardanol Y corresponds to methyl methacrylate (MMA),
styrene (Sty), vinyl acetate (VAc) or acrylic acid (AA). And T corresponds to the tem-
perature used. The same reactions with MMA were repeated using natural CNSL. The
obtained polymer samples were used for purposes of gravimetric analyzes (for deter-
41
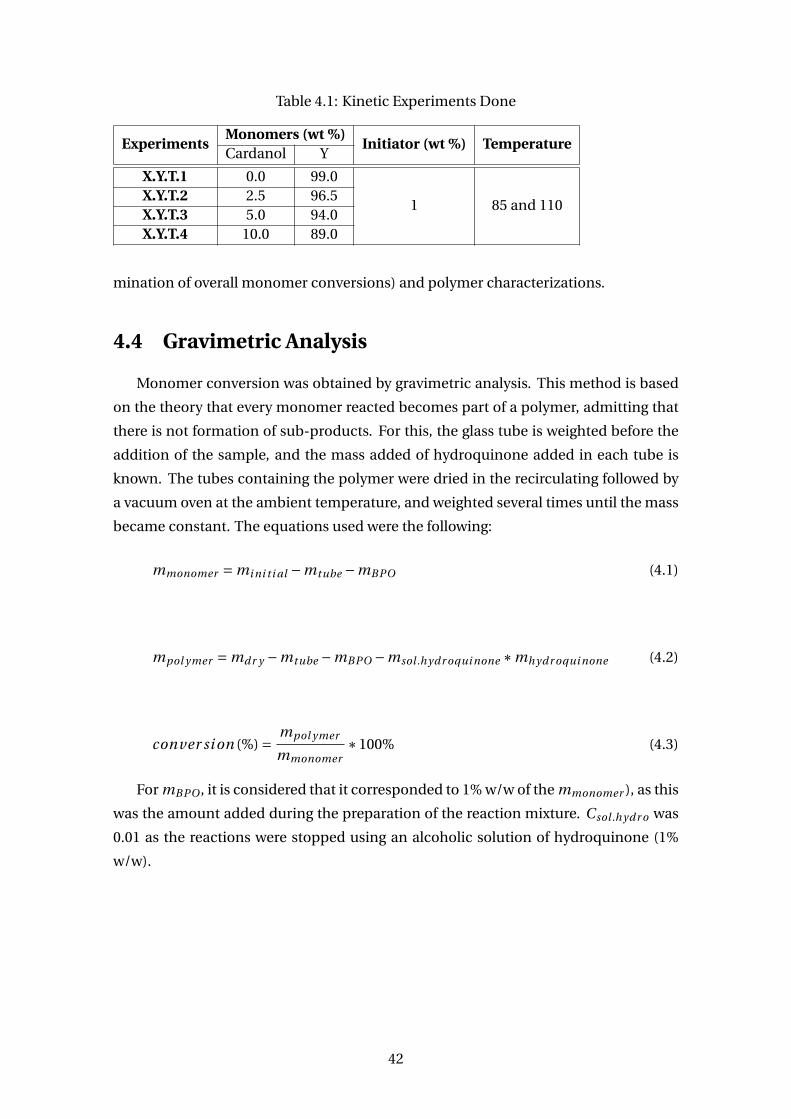
Table 4.1: Kinetic Experiments Done
ExperimentsMonomers (wt %)
Initiator (wt %) TemperatureCardanol Y
X.Y.T.1 0.0 99.0
1 85 and 110X.Y.T.2 2.5 96.5X.Y.T.3 5.0 94.0X.Y.T.4 10.0 89.0
mination of overall monomer conversions) and polymer characterizations.
4.4 Gravimetric Analysis
Monomer conversion was obtained by gravimetric analysis. This method is based
on the theory that every monomer reacted becomes part of a polymer, admitting that
there is not formation of sub-products. For this, the glass tube is weighted before the
addition of the sample, and the mass added of hydroquinone added in each tube is
known. The tubes containing the polymer were dried in the recirculating followed by
a vacuum oven at the ambient temperature, and weighted several times until the mass
became constant. The equations used were the following:
mmonomer = mi ni t i al −mtube −mBPO (4.1)
mpol ymer = mdr y −mtube −mBPO −msol .hydr oqui none ∗mhydr oqui none (4.2)
conver si on (%) = mpol ymer
mmonomer∗100% (4.3)
For mBPO , it is considered that it corresponded to 1% w/w of the mmonomer ), as this
was the amount added during the preparation of the reaction mixture. Csol .hydr o was
0.01 as the reactions were stopped using an alcoholic solution of hydroquinone (1%
w/w).
42
4.5 Characterizations
4.5.1 Gel Permeation Chromatography (GPC)
Gel permeation chromatography (GPC) was used to determine the molecular
weight distribution and average molecular weight of polymers. The sample is dis-
solved on a solvent (tetrahydrofuran, THF) and injected in a porous column filled with
a polymer. Smaller molecules take longer times to leave the column as they penetrate
the interior of the gel phase pores. Bigger molecules are detected first at the end be-
cause they do not percolate the pores. As the column is calibrated with a standard
with known molecular weight, it is possible to the determine molecular weight of the
polymer to be analyzed depending on its retention time inside the column,
The analysis were done in EngePOL using a GPC chromatograph (Viscotek GPC-
max, Malvern, Malvern, United Kingdom) equipped with a Shodex GPC HFIP-803,
Shodex GPC HFIP-804 and Shodex GPC HFIP-805 (Showa Denko, Tokyo, Japan) plus
Viscotek refractive detector model VE3580 and Viscotek model 2500 UV detector, set
to 255 ηm and equipped with deuterium lamp. The equipment was calibrated with
polystyrene standards having molecular weight ranging from 500 and 1.8 ∗ 106 Da.
Sample preparation consisted of solubilizing about 5 mg of the polymer in about 5
mL of THF. The solution obtained was filtered through a Teflon filter with 0.45 µm
pores. This filtered solution was then injected into the chromatograph. The temper-
ature of the columns was 40°C . It was injected 200 µl with a volumetric flow rate of 1
mL/minute.
GPC data were also used to analyze the conversion for homopolymers of cardanol
or natural cashew nut shell liquid. The monomer spectrum was used to compare to
those of the copolymers. When a should appeared in the direction of higher molec-
ular weight, indicating formation of oligomers or small polymers, the mass fraction
reported by the GPC of that fraction is said to correspond to the conversion. However,
as cardanol or natural cashew nut shell liquid are not purified, they also contain higher
molecules, creating a little shoulder. So, this mass fraction was also used subtracting
the value of the copolymer from this one.
4.5.2 Nuclear Magnetic Resonance (NMR)
The chemical structure of a material can be detected by nuclear magnetic reso-
nance. This technique is based that an energy absorption occurs at discrete frequen-
cies when a compound is placed in a strong magnetic field and irradiated with a radio-
frequency signal. The frequency is very sensitive to the atomic environment of the
proton.
Samples for 1H-NMR were prepared solubilizing 15mg in 0.8 mL of deuterated
43
chloroform. Analysis were done in the Chemistry Institute of Federal University of
Rio de Janeiro at room temperature in a Varian Mercury, model VX300, 300.2 MHz
of frequency and 5 mm of probe. Other analysis were done in LAMAR - Laboratório
Multiusuários de Análises por RMN in the Centro de Ciências da Saúde of Universi-
dade Federal do Rio de Janeiro. In addition, for same samples (when announced in
the discussion), the dry polymer material was redissolved in toluene, reprecipitated in
methanol, filtered and dried a second time in drying oven under vacuum at 50°C until
it reached constant weight again.
4.5.3 Fourier-transform infrared spectroscopy (FTIR)
Fourier-transform infrared spectroscopy (FTIR) is based on the fact that atoms vi-
brate in specific frequencies of the electromagnetic spectra depending on their chem-
ical structure. The vibration changes in relation to the atom neighborhood. This tech-
nique is used to detected chemical compounds and detect the appearance or disap-
pearance of functional groups.
FTIR analysis were done in the Chemistry Institute of Federal University of Rio de
Janeiro in the range of 4000 – 400 cm−1, with resolution of 4 cm−1, in a Thermo equip-
ment, model Nicolet 6700 equipped with a ATR Smart Orbit in reflectance mode, that
ensures application of a constant pressure in the samples and dispensing the prepara-
tion of KBr pellets.
4.5.4 Thermogravimetric analysis (TGA)
Thermogravimetric analysis (TGA) is a destructive analysis used to determine the
thermal stability of polymeric samples in an inert or not environment. It can also be
used to evaluate presence of solvent, residual monomer or any other volatile com-
pound present. During the analysis, temperature increases in a predefined rate and
the mass of the sample decreases along the whole time. Then, the equipment gives a
mass graph (thermogram) as a function of the temperature.
Thus, analysis were done in EngePOL, laboratory of polymerization of Federal Uni-
versity of Rio de Janeiro. Each sample had roughly 10 mg. It was used a Perkin Elmer
STA 600 equipment ((Massachusetts, United States) with temperature ranging from 30
to 700°C with a heating rate of 10°C /min under inert nitrogen atmosphere.
4.5.5 Differential Scanning Calorimetry (DSC)
For Differential Scanning Calorimetry (DSC) analyzes, polymer samples of 5 mg
were placed in aluminum pans under nitrogen atmosphere. Analyzes were performed
in the range from 0 to 280°C at heating rate of 10°C .min−1. As usual, the second heating
44
scan was used to record thermal transition temperatures in order to erase the thermal
history of the sample.
45
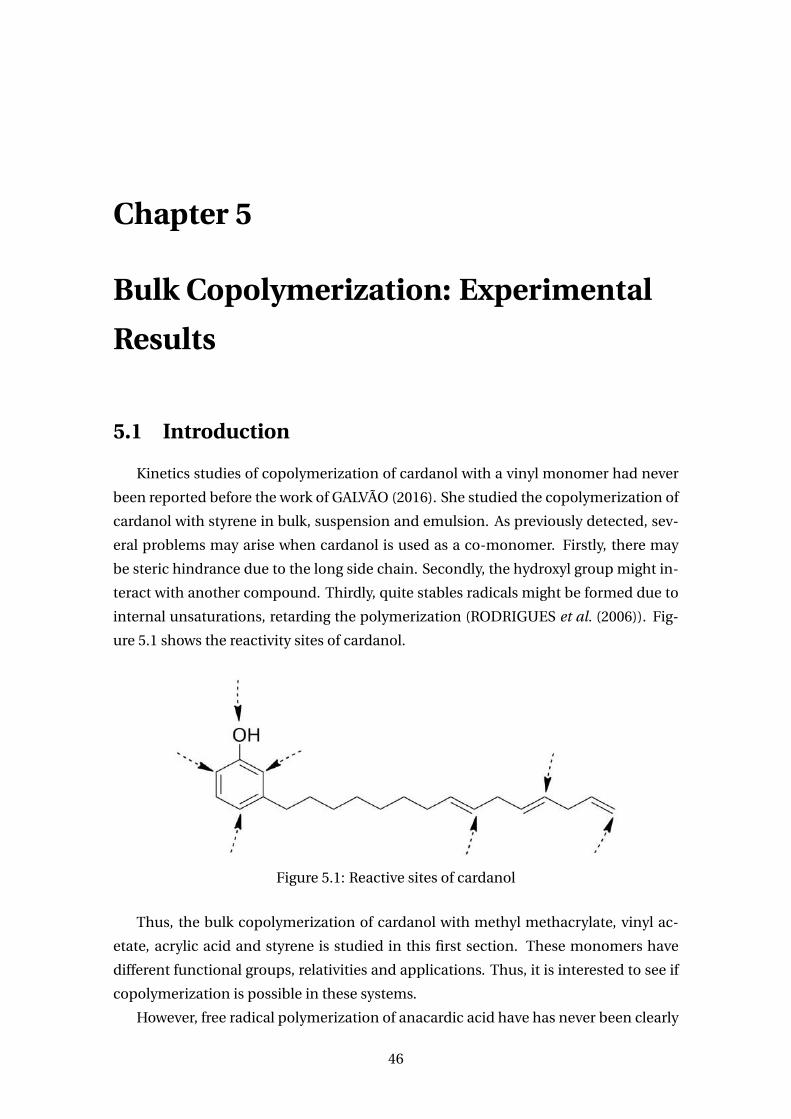
Chapter 5
Bulk Copolymerization: Experimental
Results
5.1 Introduction
Kinetics studies of copolymerization of cardanol with a vinyl monomer had never
been reported before the work of GALVÃO (2016). She studied the copolymerization of
cardanol with styrene in bulk, suspension and emulsion. As previously detected, sev-
eral problems may arise when cardanol is used as a co-monomer. Firstly, there may
be steric hindrance due to the long side chain. Secondly, the hydroxyl group might in-
teract with another compound. Thirdly, quite stables radicals might be formed due to
internal unsaturations, retarding the polymerization (RODRIGUES et al. (2006)). Fig-
ure 5.1 shows the reactivity sites of cardanol.
Figure 5.1: Reactive sites of cardanol
Thus, the bulk copolymerization of cardanol with methyl methacrylate, vinyl ac-
etate, acrylic acid and styrene is studied in this first section. These monomers have
different functional groups, relativities and applications. Thus, it is interested to see if
copolymerization is possible in these systems.
However, free radical polymerization of anacardic acid have has never been clearly
46
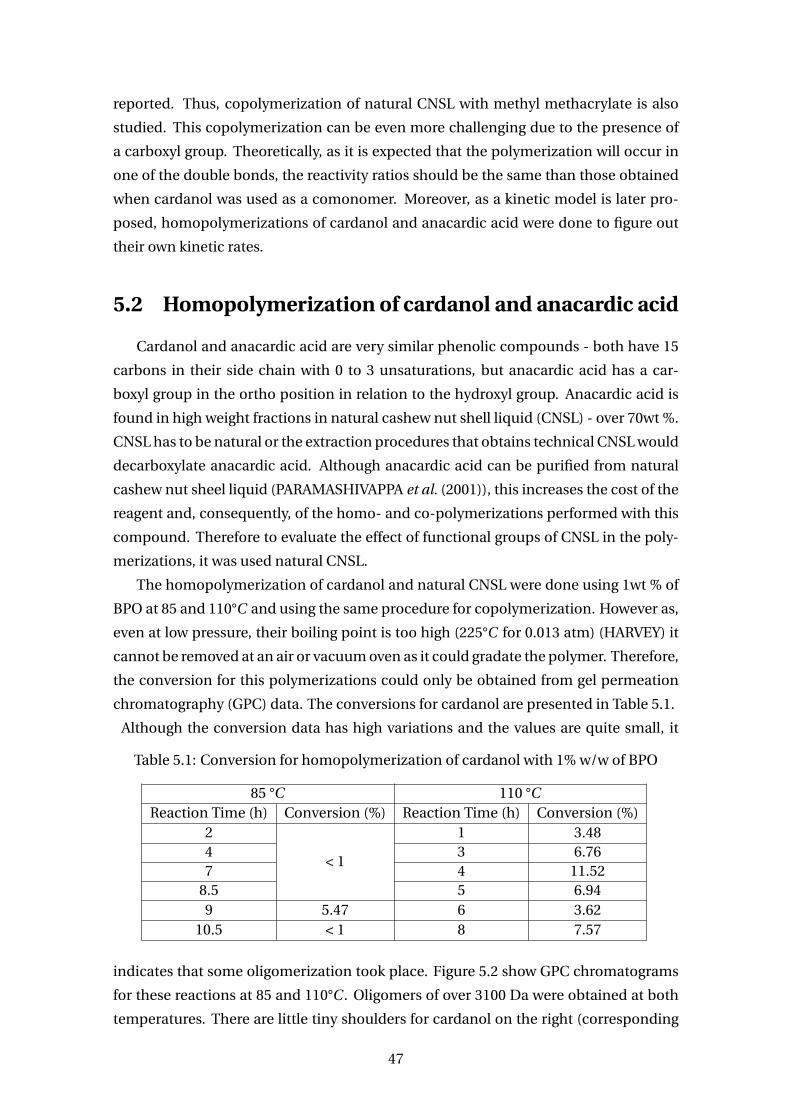
reported. Thus, copolymerization of natural CNSL with methyl methacrylate is also
studied. This copolymerization can be even more challenging due to the presence of
a carboxyl group. Theoretically, as it is expected that the polymerization will occur in
one of the double bonds, the reactivity ratios should be the same than those obtained
when cardanol was used as a comonomer. Moreover, as a kinetic model is later pro-
posed, homopolymerizations of cardanol and anacardic acid were done to figure out
their own kinetic rates.
5.2 Homopolymerization of cardanol and anacardic acid
Cardanol and anacardic acid are very similar phenolic compounds - both have 15
carbons in their side chain with 0 to 3 unsaturations, but anacardic acid has a car-
boxyl group in the ortho position in relation to the hydroxyl group. Anacardic acid is
found in high weight fractions in natural cashew nut shell liquid (CNSL) - over 70wt %.
CNSL has to be natural or the extraction procedures that obtains technical CNSL would
decarboxylate anacardic acid. Although anacardic acid can be purified from natural
cashew nut sheel liquid (PARAMASHIVAPPA et al. (2001)), this increases the cost of the
reagent and, consequently, of the homo- and co-polymerizations performed with this
compound. Therefore to evaluate the effect of functional groups of CNSL in the poly-
merizations, it was used natural CNSL.
The homopolymerization of cardanol and natural CNSL were done using 1wt % of
BPO at 85 and 110°C and using the same procedure for copolymerization. However as,
even at low pressure, their boiling point is too high (225°C for 0.013 atm) (HARVEY) it
cannot be removed at an air or vacuum oven as it could gradate the polymer. Therefore,
the conversion for this polymerizations could only be obtained from gel permeation
chromatography (GPC) data. The conversions for cardanol are presented in Table 5.1.
Although the conversion data has high variations and the values are quite small, it
Table 5.1: Conversion for homopolymerization of cardanol with 1% w/w of BPO
85 °C 110 °CReaction Time (h) Conversion (%) Reaction Time (h) Conversion (%)
2
< 1
1 3.484 3 6.767 4 11.52
8.5 5 6.949 5.47 6 3.62
10.5 < 1 8 7.57
indicates that some oligomerization took place. Figure 5.2 show GPC chromatograms
for these reactions at 85 and 110°C . Oligomers of over 3100 Da were obtained at both
temperatures. There are little tiny shoulders for cardanol on the right (corresponding
47
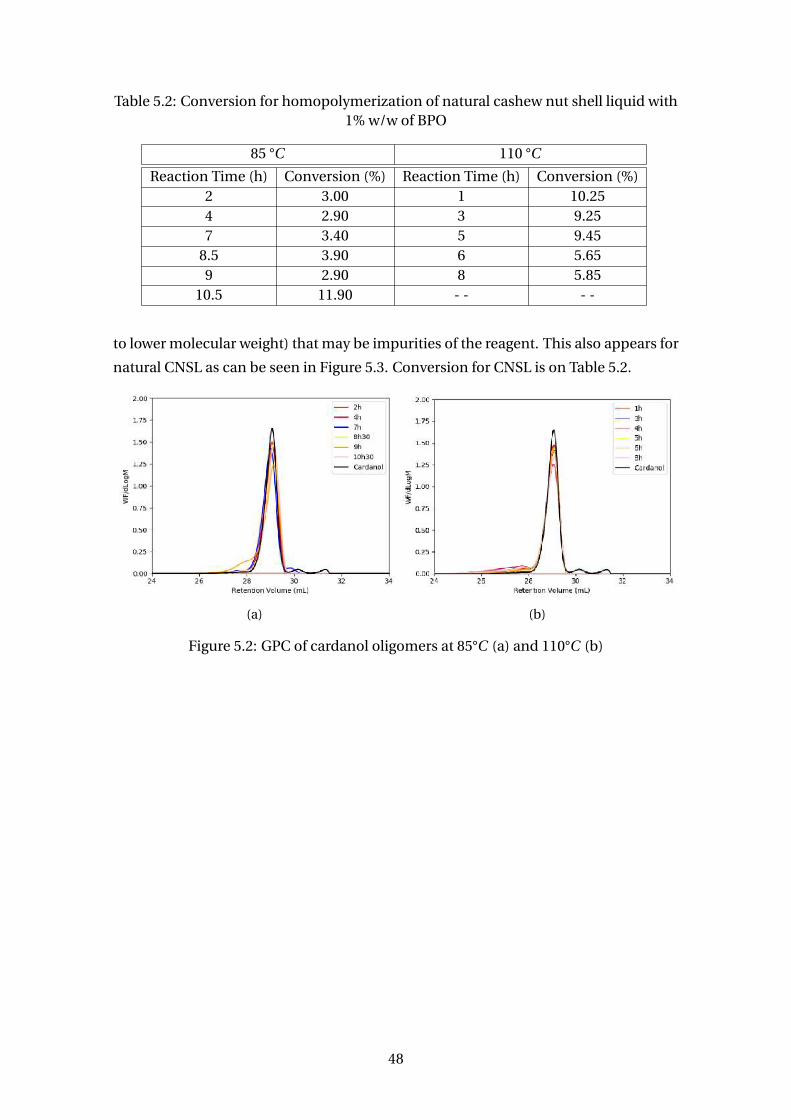
Table 5.2: Conversion for homopolymerization of natural cashew nut shell liquid with1% w/w of BPO
85 °C 110 °C
Reaction Time (h) Conversion (%) Reaction Time (h) Conversion (%)2 3.00 1 10.254 2.90 3 9.257 3.40 5 9.45
8.5 3.90 6 5.659 2.90 8 5.85
10.5 11.90 - - - -
to lower molecular weight) that may be impurities of the reagent. This also appears for
natural CNSL as can be seen in Figure 5.3. Conversion for CNSL is on Table 5.2.
(a) (b)
Figure 5.2: GPC of cardanol oligomers at 85°C (a) and 110°C (b)
48
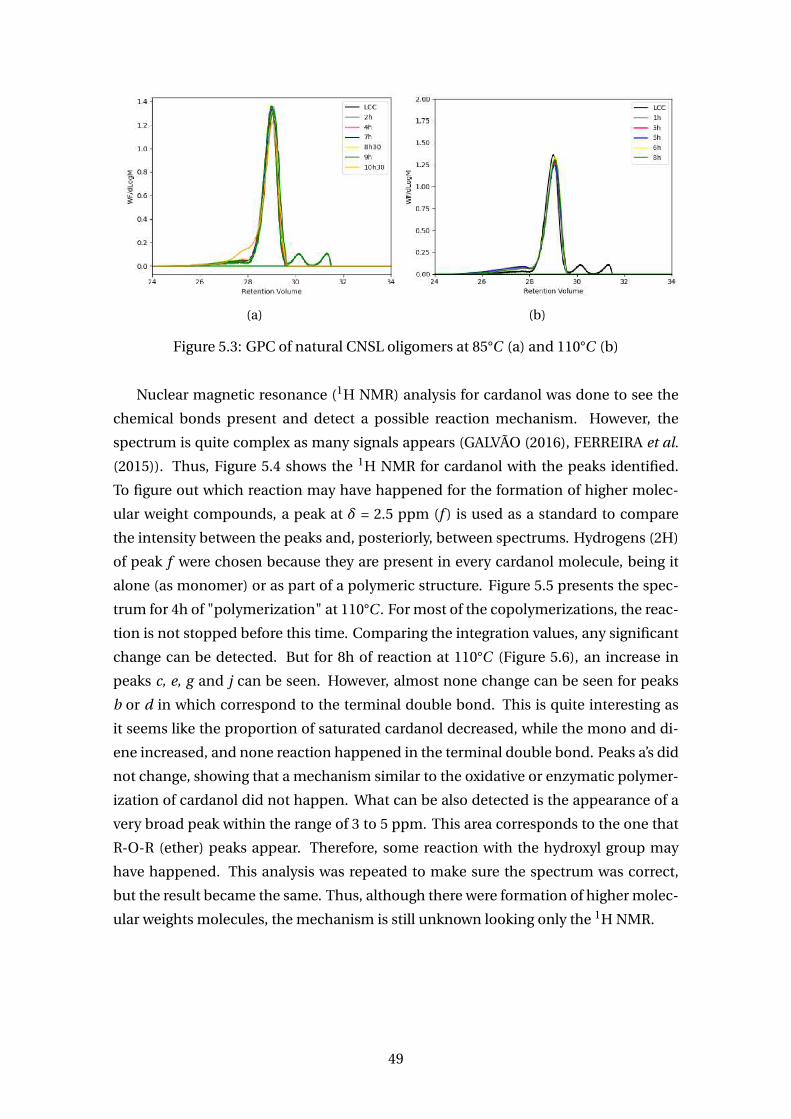
(a) (b)
Figure 5.3: GPC of natural CNSL oligomers at 85°C (a) and 110°C (b)
Nuclear magnetic resonance (1H NMR) analysis for cardanol was done to see the
chemical bonds present and detect a possible reaction mechanism. However, the
spectrum is quite complex as many signals appears (GALVÃO (2016), FERREIRA et al.
(2015)). Thus, Figure 5.4 shows the 1H NMR for cardanol with the peaks identified.
To figure out which reaction may have happened for the formation of higher molec-
ular weight compounds, a peak at δ = 2.5 ppm (f ) is used as a standard to compare
the intensity between the peaks and, posteriorly, between spectrums. Hydrogens (2H)
of peak f were chosen because they are present in every cardanol molecule, being it
alone (as monomer) or as part of a polymeric structure. Figure 5.5 presents the spec-
trum for 4h of "polymerization" at 110°C . For most of the copolymerizations, the reac-
tion is not stopped before this time. Comparing the integration values, any significant
change can be detected. But for 8h of reaction at 110°C (Figure 5.6), an increase in
peaks c, e, g and j can be seen. However, almost none change can be seen for peaks
b or d in which correspond to the terminal double bond. This is quite interesting as
it seems like the proportion of saturated cardanol decreased, while the mono and di-
ene increased, and none reaction happened in the terminal double bond. Peaks a’s did
not change, showing that a mechanism similar to the oxidative or enzymatic polymer-
ization of cardanol did not happen. What can be also detected is the appearance of a
very broad peak within the range of 3 to 5 ppm. This area corresponds to the one that
R-O-R (ether) peaks appear. Therefore, some reaction with the hydroxyl group may
have happened. This analysis was repeated to make sure the spectrum was correct,
but the result became the same. Thus, although there were formation of higher molec-
ular weights molecules, the mechanism is still unknown looking only the 1H NMR.
49
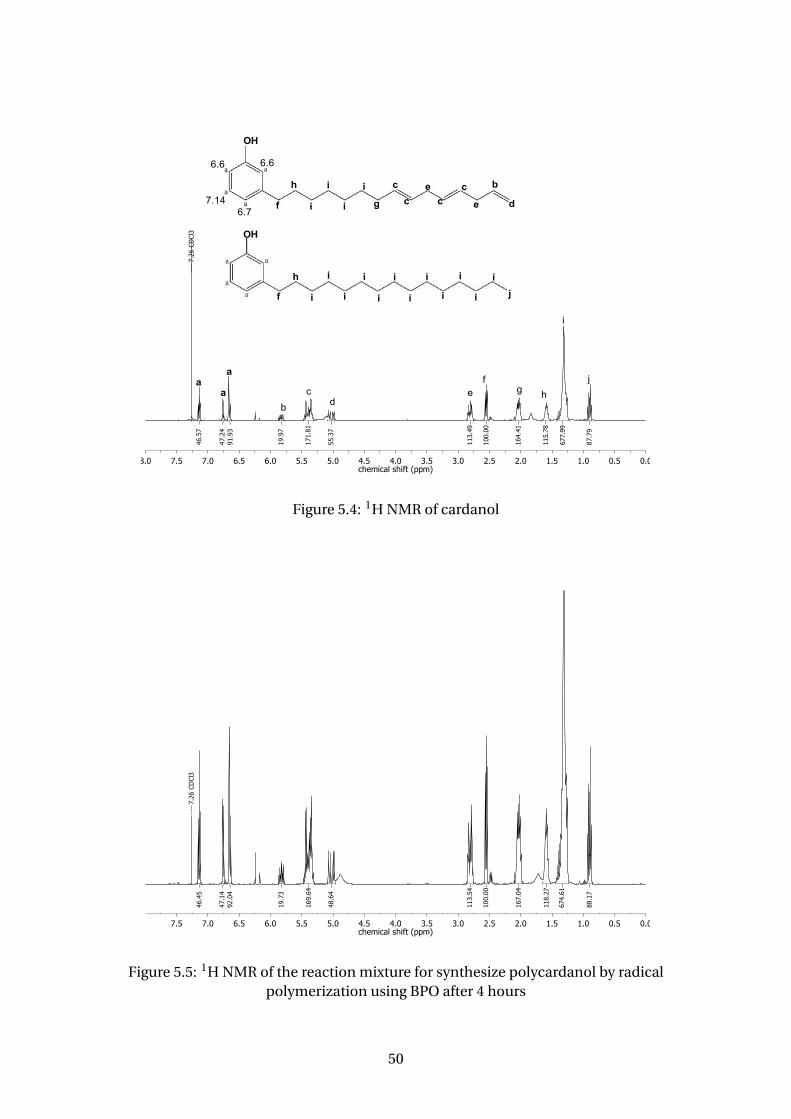
0.00.51.01.52.02.53.03.54.04.55.05.56.06.57.07.58.0chemical shift (ppm)
87.7
9
677.
99
115.
78
164.
41
100.
00
113.
49
55.3
7
171.
81
19.9
7
91.9
347
.24
46.5
77.
26 C
DCl
3
b
cd
ef
g h
i
j
6.6 6.6
7.146.7
h
f i
i
i
i
g
c
c cce
e
b
d
f i
h i
i
i
i
i
i
i
i
i
i
i
j
OH
OH
aa
a
Figure 5.4: 1H NMR of cardanol
0.00.51.01.52.02.53.03.54.04.55.05.56.06.57.07.5chemical shift (ppm)
88.1
7
674.
61
118.
27
167.
04
100.
00
113.
54
48.6
4
169.
64
19.7
3
92.0
447
.14
46.4
57.
26 C
DCl
3
Figure 5.5: 1H NMR of the reaction mixture for synthesize polycardanol by radicalpolymerization using BPO after 4 hours
50
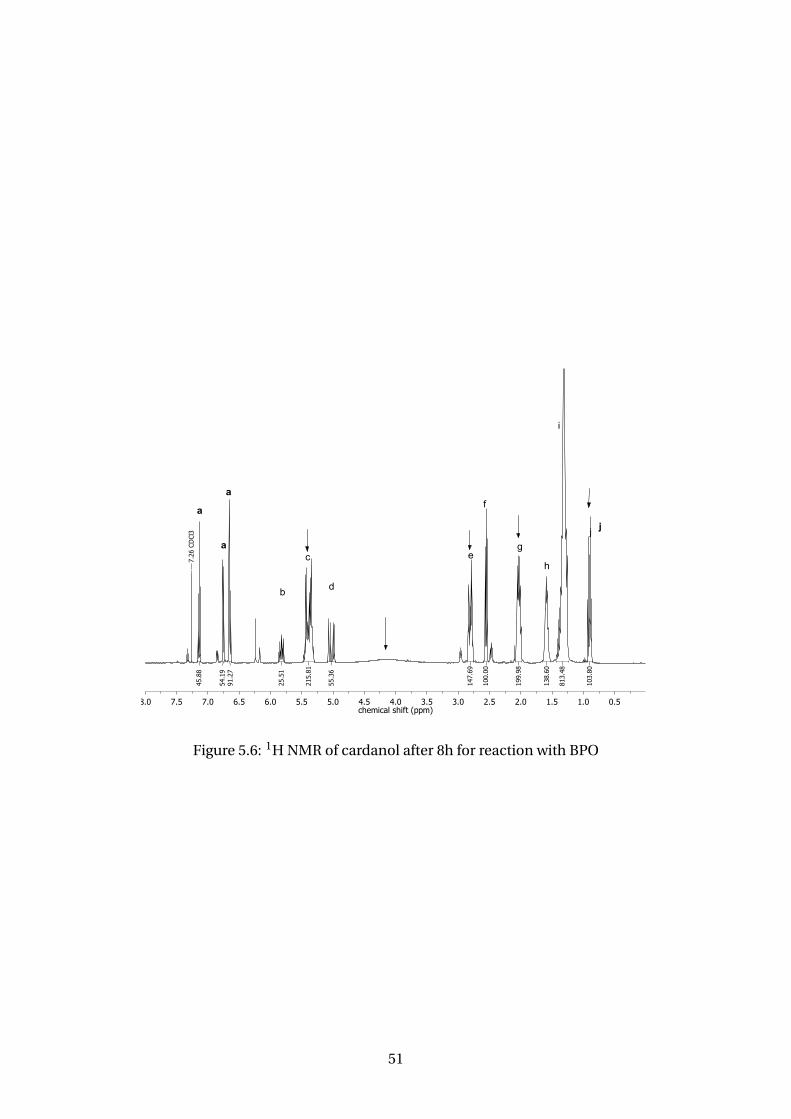
0.51.01.52.02.53.03.54.04.55.05.56.06.57.07.58.0chemical shift (ppm)
103.
80
813.
48
138.
60
199.
98
100.
00
147.
69
55.3
6
215.
81
25.5
1
91.2
754
.19
45.8
87.
26 C
DCl
3
a
a
a
b
c
d
e
f
g
h
i
j j
Figure 5.6: 1H NMR of cardanol after 8h for reaction with BPO
51
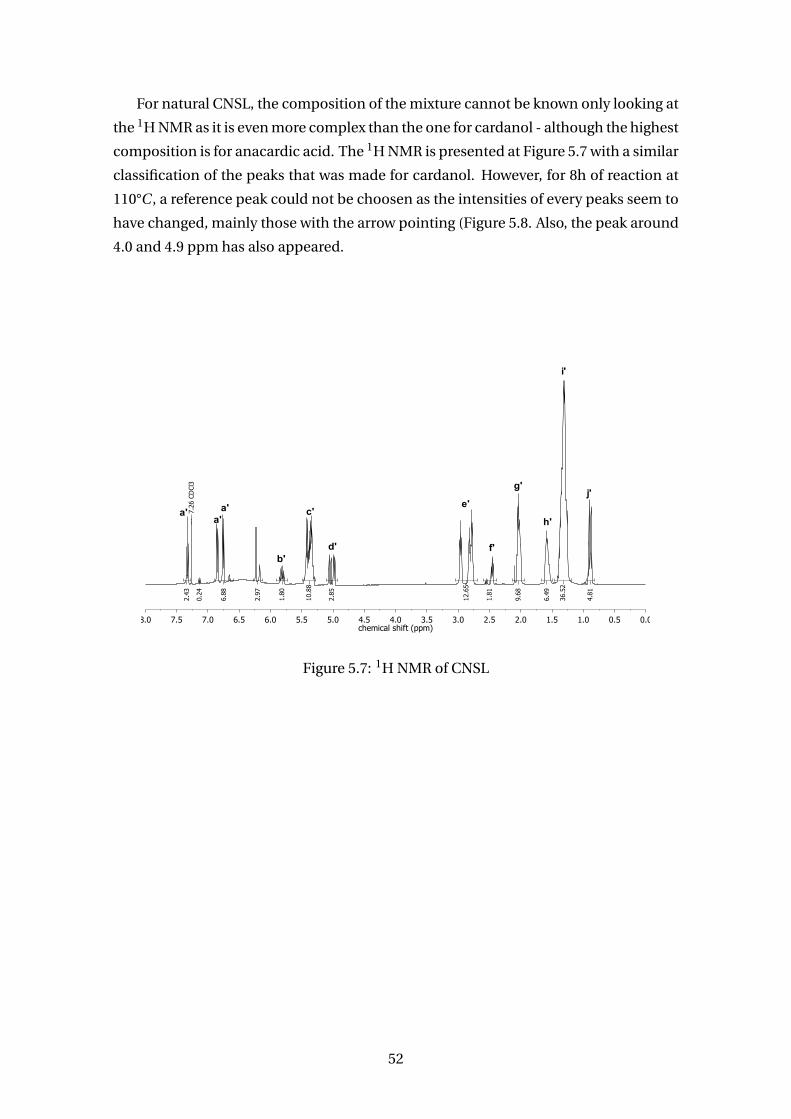
For natural CNSL, the composition of the mixture cannot be known only looking at
the 1H NMR as it is even more complex than the one for cardanol - although the highest
composition is for anacardic acid. The 1H NMR is presented at Figure 5.7 with a similar
classification of the peaks that was made for cardanol. However, for 8h of reaction at
110°C , a reference peak could not be choosen as the intensities of every peaks seem to
have changed, mainly those with the arrow pointing (Figure 5.8. Also, the peak around
4.0 and 4.9 ppm has also appeared.
0.00.51.01.52.02.53.03.54.04.55.05.56.06.57.07.58.0chemical shift (ppm)
4.81
36.5
2
6.49
9.68
1.81
12.6
5
2.85
10.8
8
1.80
2.97
6.88
0.24
2.43
7.26
CD
Cl3
j'
i'
h'
g'
f'
a'a'
a'e'
b'
c'
d'
Figure 5.7: 1H NMR of CNSL
52
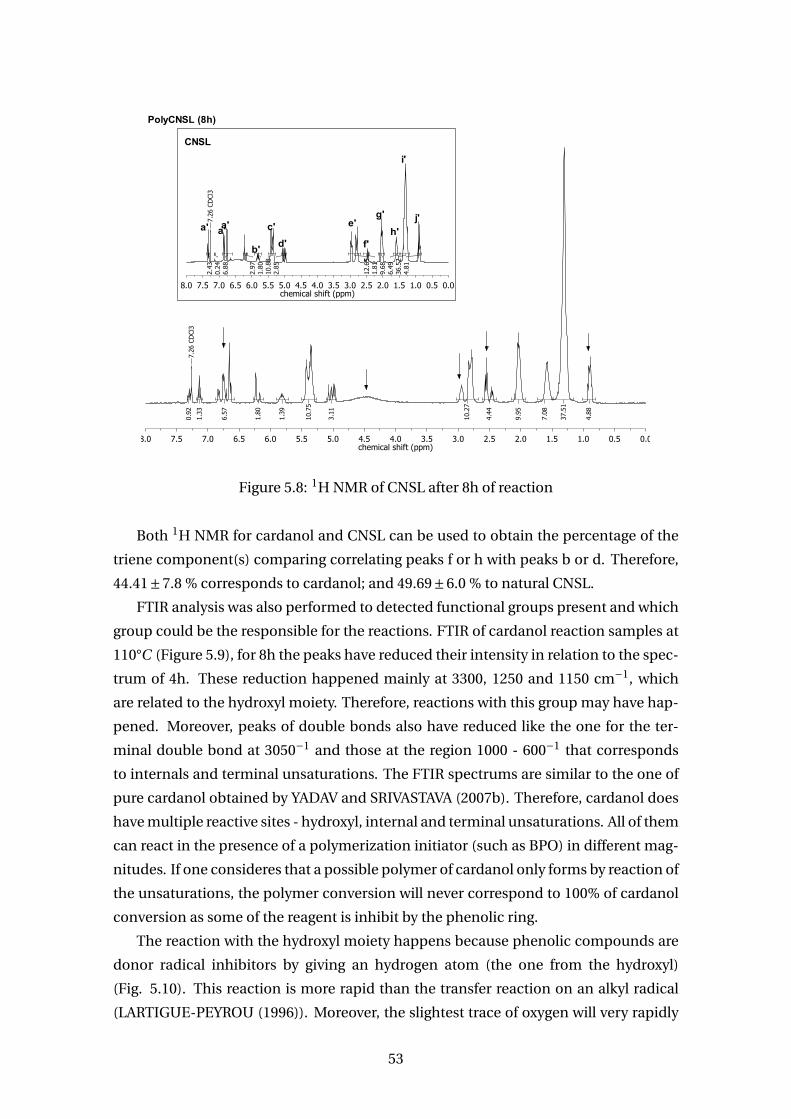
0.00.51.01.52.02.53.03.54.04.55.05.56.06.57.07.58.0chemical shift (ppm)
4.88
37.5
1
7.08
9.95
4.44
10.2
7
3.11
10.7
5
1.39
1.80
6.57
1.33
0.92
7.26
CD
Cl3
0.00.51.01.52.02.53.03.54.04.55.05.56.06.57.07.58.0chemical shift (ppm)
4.81
36.5
26.
499.
681.
8112
.65
2.85
10.8
81.
802.
97
6.88
0.24
2.43
7.26
CD
Cl3
j'
i'
h'
g'
f'
a'a'e'a'
b'
c'
d'
CNSL
PolyCNSL (8h)
Figure 5.8: 1H NMR of CNSL after 8h of reaction
Both 1H NMR for cardanol and CNSL can be used to obtain the percentage of the
triene component(s) comparing correlating peaks f or h with peaks b or d. Therefore,
44.41±7.8 % corresponds to cardanol; and 49.69±6.0 % to natural CNSL.
FTIR analysis was also performed to detected functional groups present and which
group could be the responsible for the reactions. FTIR of cardanol reaction samples at
110°C (Figure 5.9), for 8h the peaks have reduced their intensity in relation to the spec-
trum of 4h. These reduction happened mainly at 3300, 1250 and 1150 cm−1, which
are related to the hydroxyl moiety. Therefore, reactions with this group may have hap-
pened. Moreover, peaks of double bonds also have reduced like the one for the ter-
minal double bond at 3050−1 and those at the region 1000 - 600−1 that corresponds
to internals and terminal unsaturations. The FTIR spectrums are similar to the one of
pure cardanol obtained by YADAV and SRIVASTAVA (2007b). Therefore, cardanol does
have multiple reactive sites - hydroxyl, internal and terminal unsaturations. All of them
can react in the presence of a polymerization initiator (such as BPO) in different mag-
nitudes. If one consideres that a possible polymer of cardanol only forms by reaction of
the unsaturations, the polymer conversion will never correspond to 100% of cardanol
conversion as some of the reagent is inhibit by the phenolic ring.
The reaction with the hydroxyl moiety happens because phenolic compounds are
donor radical inhibitors by giving an hydrogen atom (the one from the hydroxyl)
(Fig. 5.10). This reaction is more rapid than the transfer reaction on an alkyl radical
(LARTIGUE-PEYROU (1996)). Moreover, the slightest trace of oxygen will very rapidly
53
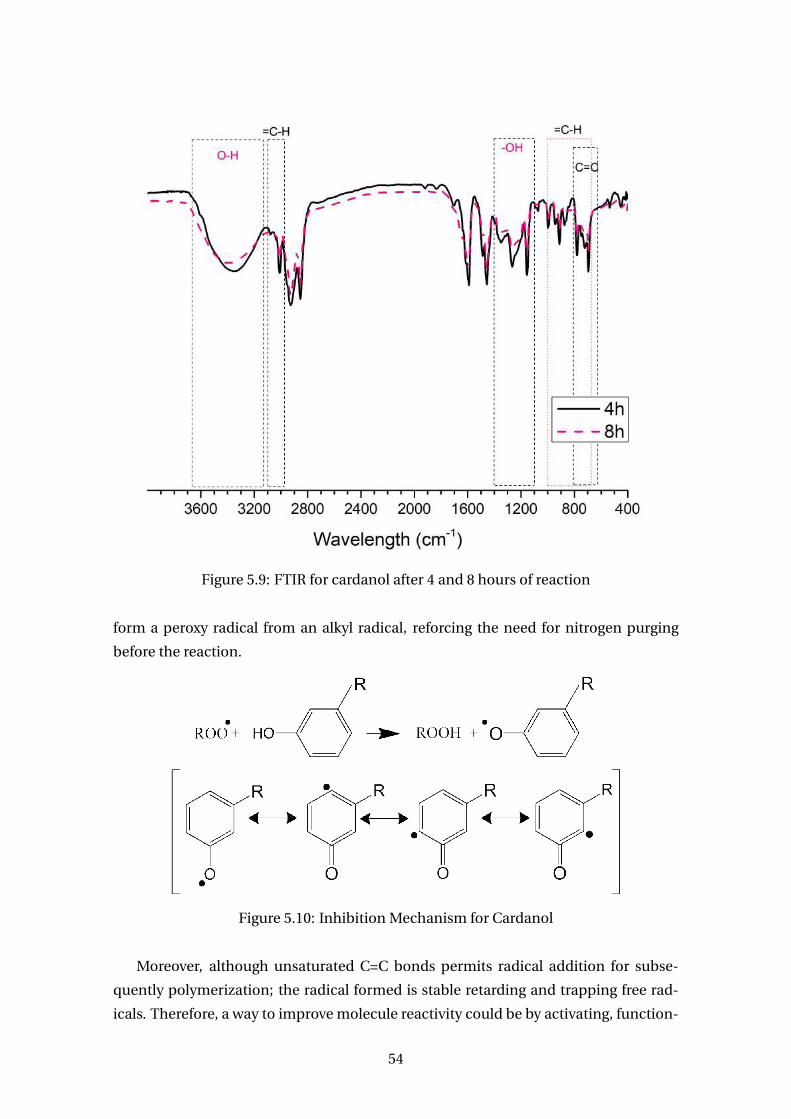
Figure 5.9: FTIR for cardanol after 4 and 8 hours of reaction
form a peroxy radical from an alkyl radical, reforcing the need for nitrogen purging
before the reaction.
Figure 5.10: Inhibition Mechanism for Cardanol
Moreover, although unsaturated C=C bonds permits radical addition for subse-
quently polymerization; the radical formed is stable retarding and trapping free rad-
icals. Therefore, a way to improve molecule reactivity could be by activating, function-
54
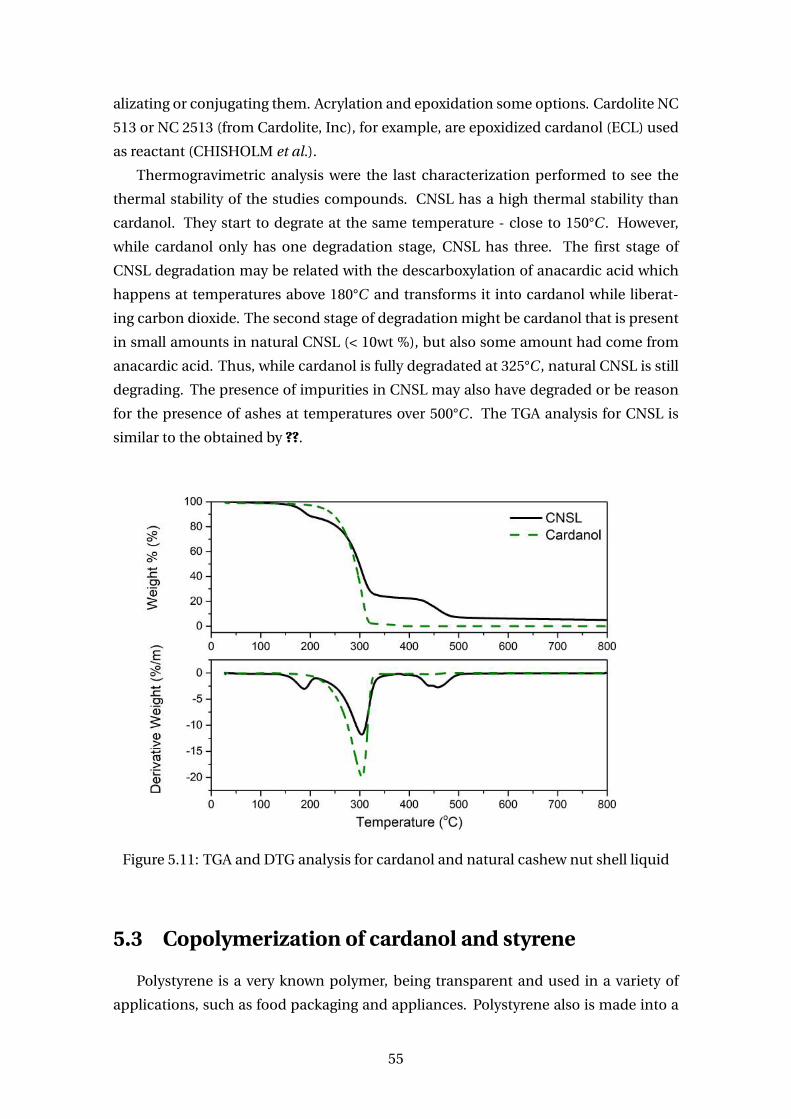
alizating or conjugating them. Acrylation and epoxidation some options. Cardolite NC
513 or NC 2513 (from Cardolite, Inc), for example, are epoxidized cardanol (ECL) used
as reactant (CHISHOLM et al.).
Thermogravimetric analysis were the last characterization performed to see the
thermal stability of the studies compounds. CNSL has a high thermal stability than
cardanol. They start to degrate at the same temperature - close to 150°C . However,
while cardanol only has one degradation stage, CNSL has three. The first stage of
CNSL degradation may be related with the descarboxylation of anacardic acid which
happens at temperatures above 180°C and transforms it into cardanol while liberat-
ing carbon dioxide. The second stage of degradation might be cardanol that is present
in small amounts in natural CNSL (< 10wt %), but also some amount had come from
anacardic acid. Thus, while cardanol is fully degradated at 325°C , natural CNSL is still
degrading. The presence of impurities in CNSL may also have degraded or be reason
for the presence of ashes at temperatures over 500°C . The TGA analysis for CNSL is
similar to the obtained by ??.
Figure 5.11: TGA and DTG analysis for cardanol and natural cashew nut shell liquid
5.3 Copolymerization of cardanol and styrene
Polystyrene is a very known polymer, being transparent and used in a variety of
applications, such as food packaging and appliances. Polystyrene also is made into a
55
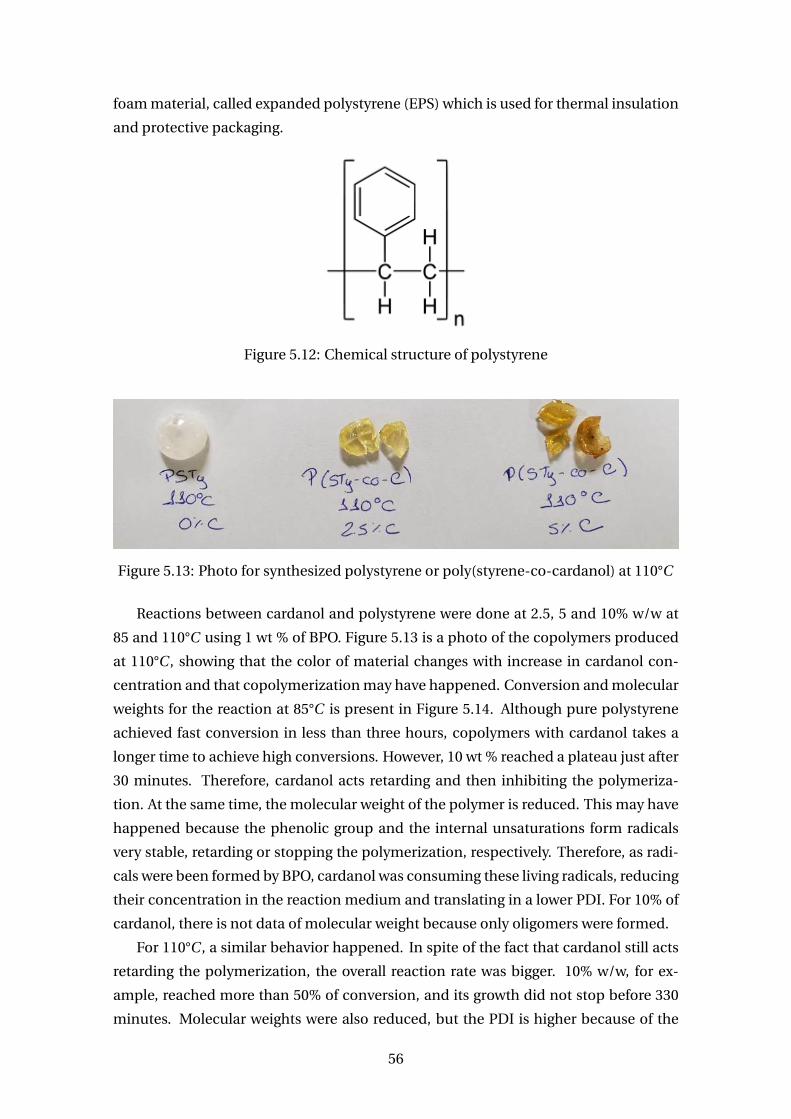
foam material, called expanded polystyrene (EPS) which is used for thermal insulation
and protective packaging.
Figure 5.12: Chemical structure of polystyrene
Figure 5.13: Photo for synthesized polystyrene or poly(styrene-co-cardanol) at 110°C
Reactions between cardanol and polystyrene were done at 2.5, 5 and 10% w/w at
85 and 110°C using 1 wt % of BPO. Figure 5.13 is a photo of the copolymers produced
at 110°C , showing that the color of material changes with increase in cardanol con-
centration and that copolymerization may have happened. Conversion and molecular
weights for the reaction at 85°C is present in Figure 5.14. Although pure polystyrene
achieved fast conversion in less than three hours, copolymers with cardanol takes a
longer time to achieve high conversions. However, 10 wt % reached a plateau just after
30 minutes. Therefore, cardanol acts retarding and then inhibiting the polymeriza-
tion. At the same time, the molecular weight of the polymer is reduced. This may have
happened because the phenolic group and the internal unsaturations form radicals
very stable, retarding or stopping the polymerization, respectively. Therefore, as radi-
cals were been formed by BPO, cardanol was consuming these living radicals, reducing
their concentration in the reaction medium and translating in a lower PDI. For 10% of
cardanol, there is not data of molecular weight because only oligomers were formed.
For 110°C , a similar behavior happened. In spite of the fact that cardanol still acts
retarding the polymerization, the overall reaction rate was bigger. 10% w/w, for ex-
ample, reached more than 50% of conversion, and its growth did not stop before 330
minutes. Molecular weights were also reduced, but the PDI is higher because of the
56
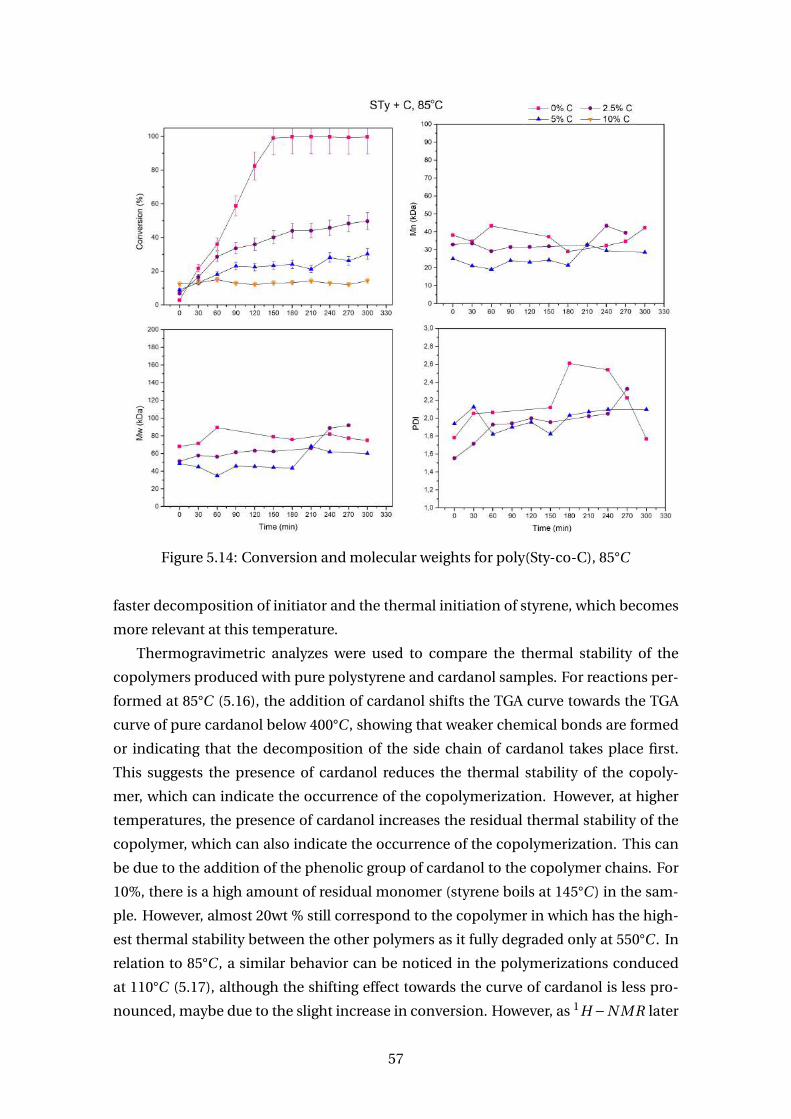
Figure 5.14: Conversion and molecular weights for poly(Sty-co-C), 85°C
faster decomposition of initiator and the thermal initiation of styrene, which becomes
more relevant at this temperature.
Thermogravimetric analyzes were used to compare the thermal stability of the
copolymers produced with pure polystyrene and cardanol samples. For reactions per-
formed at 85°C (5.16), the addition of cardanol shifts the TGA curve towards the TGA
curve of pure cardanol below 400°C , showing that weaker chemical bonds are formed
or indicating that the decomposition of the side chain of cardanol takes place first.
This suggests the presence of cardanol reduces the thermal stability of the copoly-
mer, which can indicate the occurrence of the copolymerization. However, at higher
temperatures, the presence of cardanol increases the residual thermal stability of the
copolymer, which can also indicate the occurrence of the copolymerization. This can
be due to the addition of the phenolic group of cardanol to the copolymer chains. For
10%, there is a high amount of residual monomer (styrene boils at 145°C ) in the sam-
ple. However, almost 20wt % still correspond to the copolymer in which has the high-
est thermal stability between the other polymers as it fully degraded only at 550°C . In
relation to 85°C , a similar behavior can be noticed in the polymerizations conduced
at 110°C (5.17), although the shifting effect towards the curve of cardanol is less pro-
nounced, maybe due to the slight increase in conversion. However, as 1H −N MR later
57
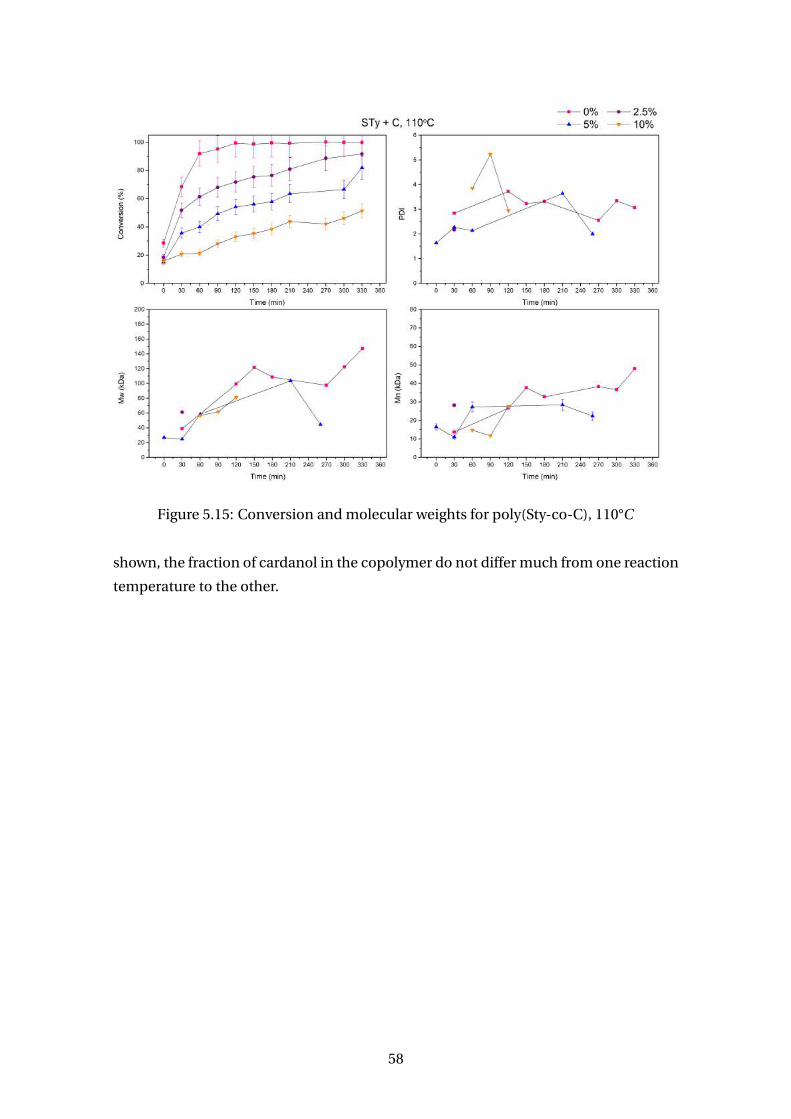
Figure 5.15: Conversion and molecular weights for poly(Sty-co-C), 110°C
shown, the fraction of cardanol in the copolymer do not differ much from one reaction
temperature to the other.
58
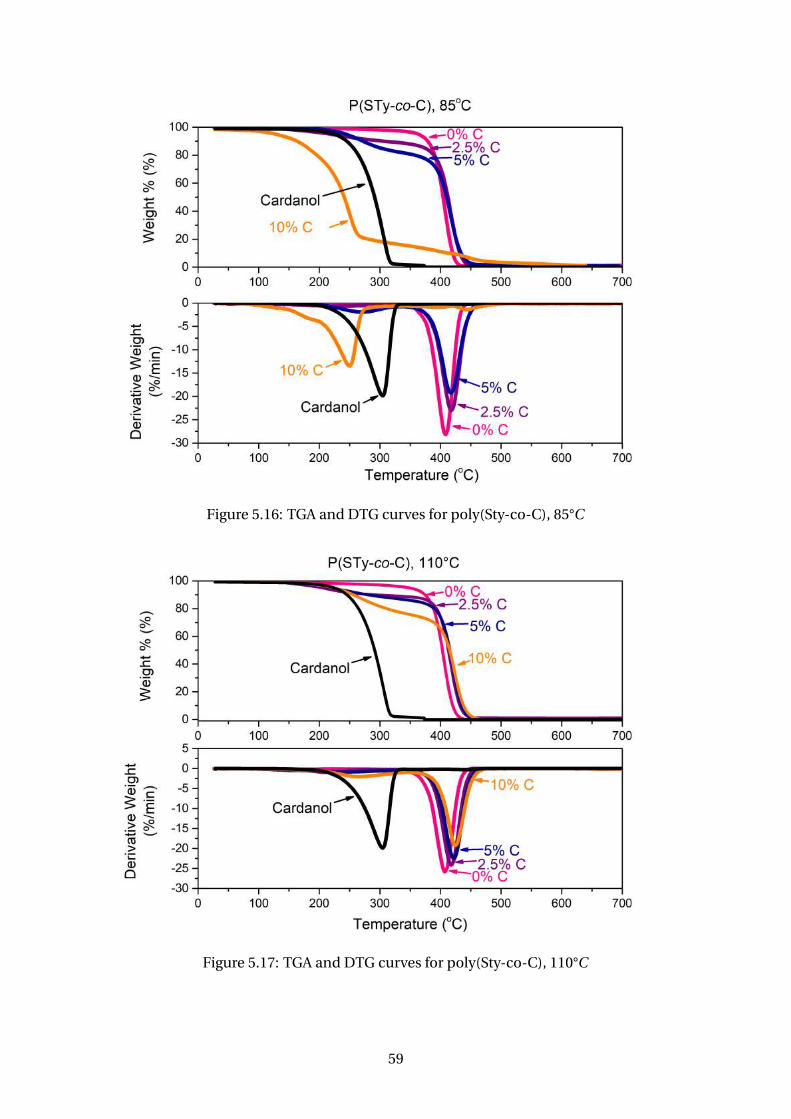
Figure 5.16: TGA and DTG curves for poly(Sty-co-C), 85°C
Figure 5.17: TGA and DTG curves for poly(Sty-co-C), 110°C
59
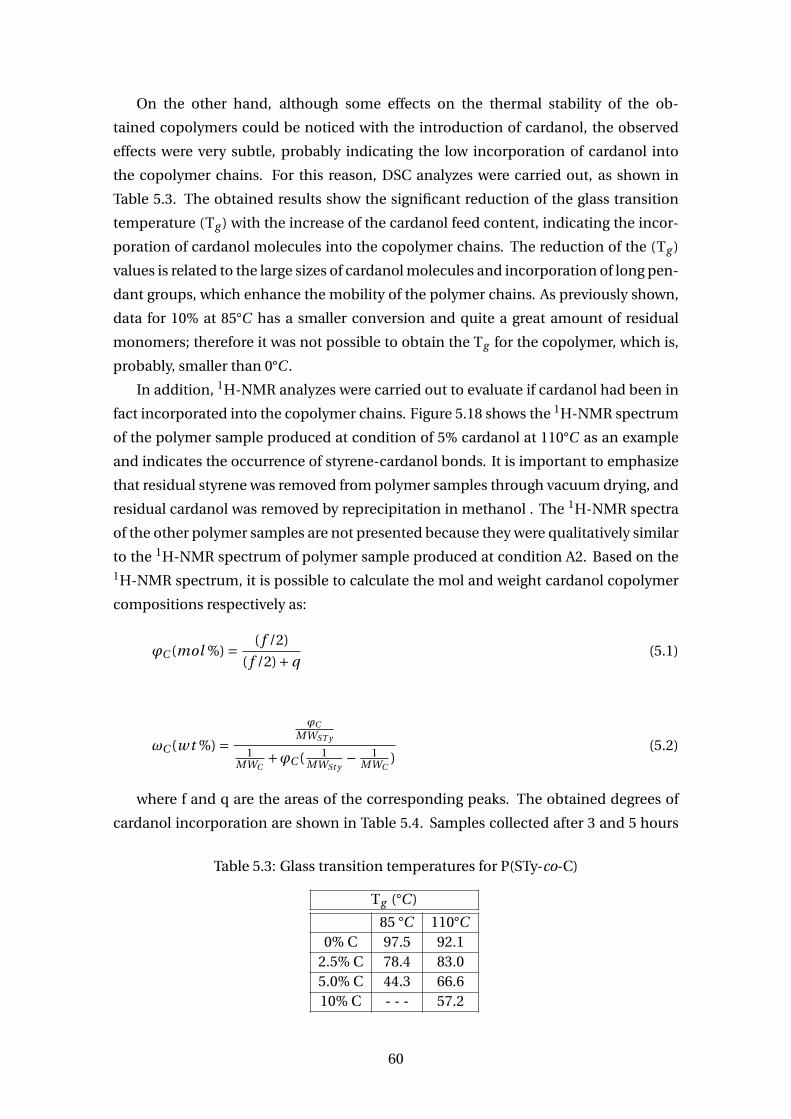
On the other hand, although some effects on the thermal stability of the ob-
tained copolymers could be noticed with the introduction of cardanol, the observed
effects were very subtle, probably indicating the low incorporation of cardanol into
the copolymer chains. For this reason, DSC analyzes were carried out, as shown in
Table 5.3. The obtained results show the significant reduction of the glass transition
temperature (Tg ) with the increase of the cardanol feed content, indicating the incor-
poration of cardanol molecules into the copolymer chains. The reduction of the (Tg )
values is related to the large sizes of cardanol molecules and incorporation of long pen-
dant groups, which enhance the mobility of the polymer chains. As previously shown,
data for 10% at 85°C has a smaller conversion and quite a great amount of residual
monomers; therefore it was not possible to obtain the Tg for the copolymer, which is,
probably, smaller than 0°C .
In addition, 1H-NMR analyzes were carried out to evaluate if cardanol had been in
fact incorporated into the copolymer chains. Figure 5.18 shows the 1H-NMR spectrum
of the polymer sample produced at condition of 5% cardanol at 110°C as an example
and indicates the occurrence of styrene-cardanol bonds. It is important to emphasize
that residual styrene was removed from polymer samples through vacuum drying, and
residual cardanol was removed by reprecipitation in methanol . The 1H-NMR spectra
of the other polymer samples are not presented because they were qualitatively similar
to the 1H-NMR spectrum of polymer sample produced at condition A2. Based on the1H-NMR spectrum, it is possible to calculate the mol and weight cardanol copolymer
compositions respectively as:
ϕC (mol %) = ( f /2)
( f /2)+q(5.1)
ωC (w t %) =ϕC
MWST y
1MWC
+ϕC ( 1MWSt y
− 1MWC
)(5.2)
where f and q are the areas of the corresponding peaks. The obtained degrees of
cardanol incorporation are shown in Table 5.4. Samples collected after 3 and 5 hours
Table 5.3: Glass transition temperatures for P(STy-co-C)
Tg (°C )
85 °C 110°C0% C 97.5 92.1
2.5% C 78.4 83.05.0% C 44.3 66.610% C - - - 57.2
60
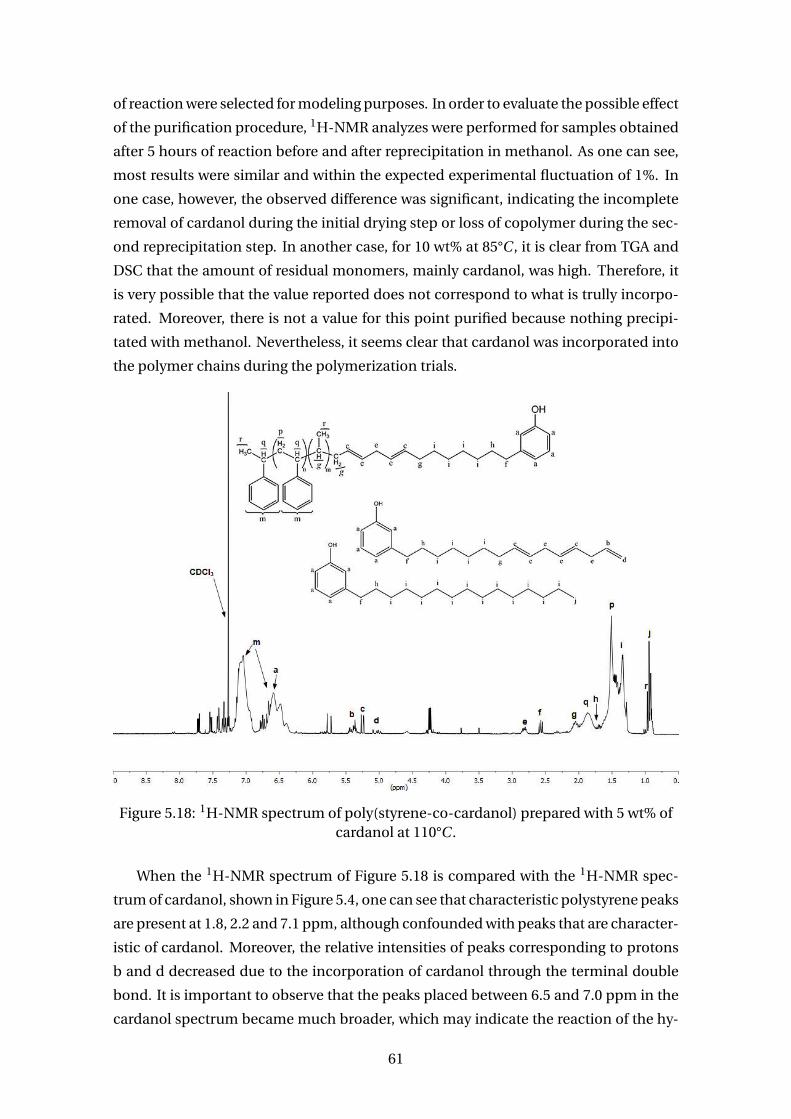
of reaction were selected for modeling purposes. In order to evaluate the possible effect
of the purification procedure, 1H-NMR analyzes were performed for samples obtained
after 5 hours of reaction before and after reprecipitation in methanol. As one can see,
most results were similar and within the expected experimental fluctuation of 1%. In
one case, however, the observed difference was significant, indicating the incomplete
removal of cardanol during the initial drying step or loss of copolymer during the sec-
ond reprecipitation step. In another case, for 10 wt% at 85°C , it is clear from TGA and
DSC that the amount of residual monomers, mainly cardanol, was high. Therefore, it
is very possible that the value reported does not correspond to what is trully incorpo-
rated. Moreover, there is not a value for this point purified because nothing precipi-
tated with methanol. Nevertheless, it seems clear that cardanol was incorporated into
the polymer chains during the polymerization trials.
Figure 5.18: 1H-NMR spectrum of poly(styrene-co-cardanol) prepared with 5 wt% ofcardanol at 110°C .
When the 1H-NMR spectrum of Figure 5.18 is compared with the 1H-NMR spec-
trum of cardanol, shown in Figure 5.4, one can see that characteristic polystyrene peaks
are present at 1.8, 2.2 and 7.1 ppm, although confounded with peaks that are character-
istic of cardanol. Moreover, the relative intensities of peaks corresponding to protons
b and d decreased due to the incorporation of cardanol through the terminal double
bond. It is important to observe that the peaks placed between 6.5 and 7.0 ppm in the
cardanol spectrum became much broader, which may indicate the reaction of the hy-
61
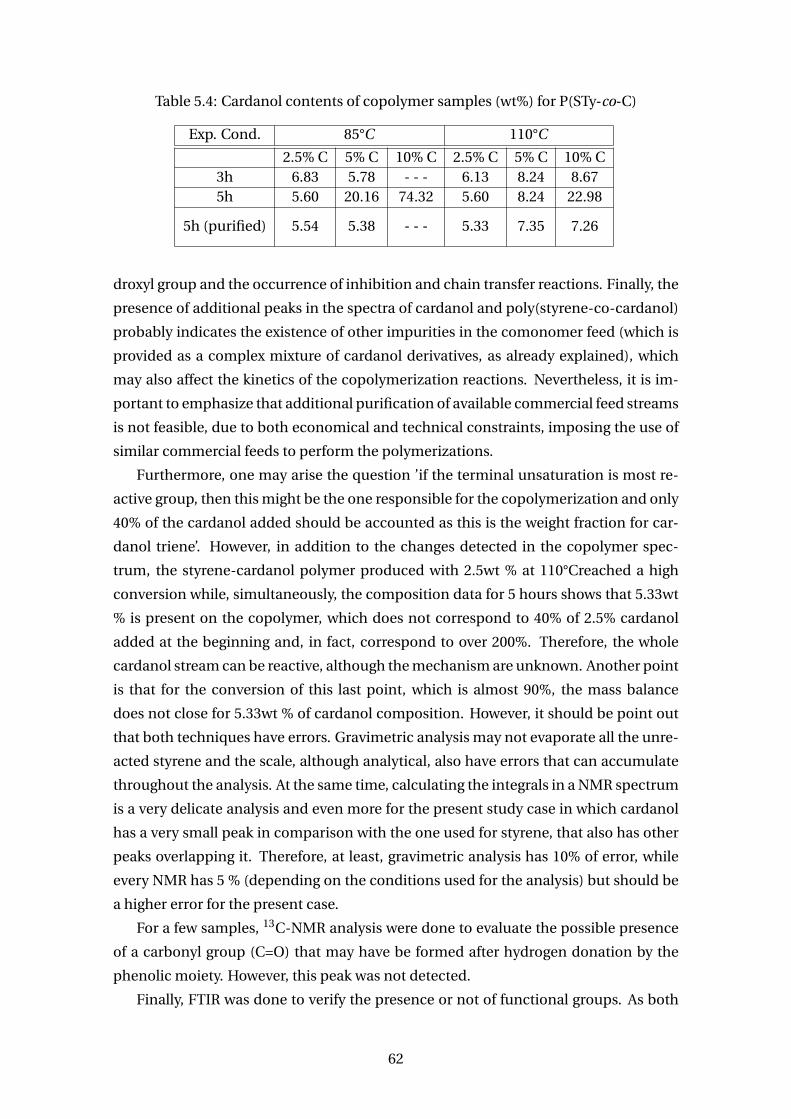
Table 5.4: Cardanol contents of copolymer samples (wt%) for P(STy-co-C)
Exp. Cond. 85°C 110°C
2.5% C 5% C 10% C 2.5% C 5% C 10% C3h 6.83 5.78 - - - 6.13 8.24 8.675h 5.60 20.16 74.32 5.60 8.24 22.98
5h (purified) 5.54 5.38 - - - 5.33 7.35 7.26
droxyl group and the occurrence of inhibition and chain transfer reactions. Finally, the
presence of additional peaks in the spectra of cardanol and poly(styrene-co-cardanol)
probably indicates the existence of other impurities in the comonomer feed (which is
provided as a complex mixture of cardanol derivatives, as already explained), which
may also affect the kinetics of the copolymerization reactions. Nevertheless, it is im-
portant to emphasize that additional purification of available commercial feed streams
is not feasible, due to both economical and technical constraints, imposing the use of
similar commercial feeds to perform the polymerizations.
Furthermore, one may arise the question ’if the terminal unsaturation is most re-
active group, then this might be the one responsible for the copolymerization and only
40% of the cardanol added should be accounted as this is the weight fraction for car-
danol triene’. However, in addition to the changes detected in the copolymer spec-
trum, the styrene-cardanol polymer produced with 2.5wt % at 110°Creached a high
conversion while, simultaneously, the composition data for 5 hours shows that 5.33wt
% is present on the copolymer, which does not correspond to 40% of 2.5% cardanol
added at the beginning and, in fact, correspond to over 200%. Therefore, the whole
cardanol stream can be reactive, although the mechanism are unknown. Another point
is that for the conversion of this last point, which is almost 90%, the mass balance
does not close for 5.33wt % of cardanol composition. However, it should be point out
that both techniques have errors. Gravimetric analysis may not evaporate all the unre-
acted styrene and the scale, although analytical, also have errors that can accumulate
throughout the analysis. At the same time, calculating the integrals in a NMR spectrum
is a very delicate analysis and even more for the present study case in which cardanol
has a very small peak in comparison with the one used for styrene, that also has other
peaks overlapping it. Therefore, at least, gravimetric analysis has 10% of error, while
every NMR has 5 % (depending on the conditions used for the analysis) but should be
a higher error for the present case.
For a few samples, 13C-NMR analysis were done to evaluate the possible presence
of a carbonyl group (C=O) that may have be formed after hydrogen donation by the
phenolic moiety. However, this peak was not detected.
Finally, FTIR was done to verify the presence or not of functional groups. As both
62
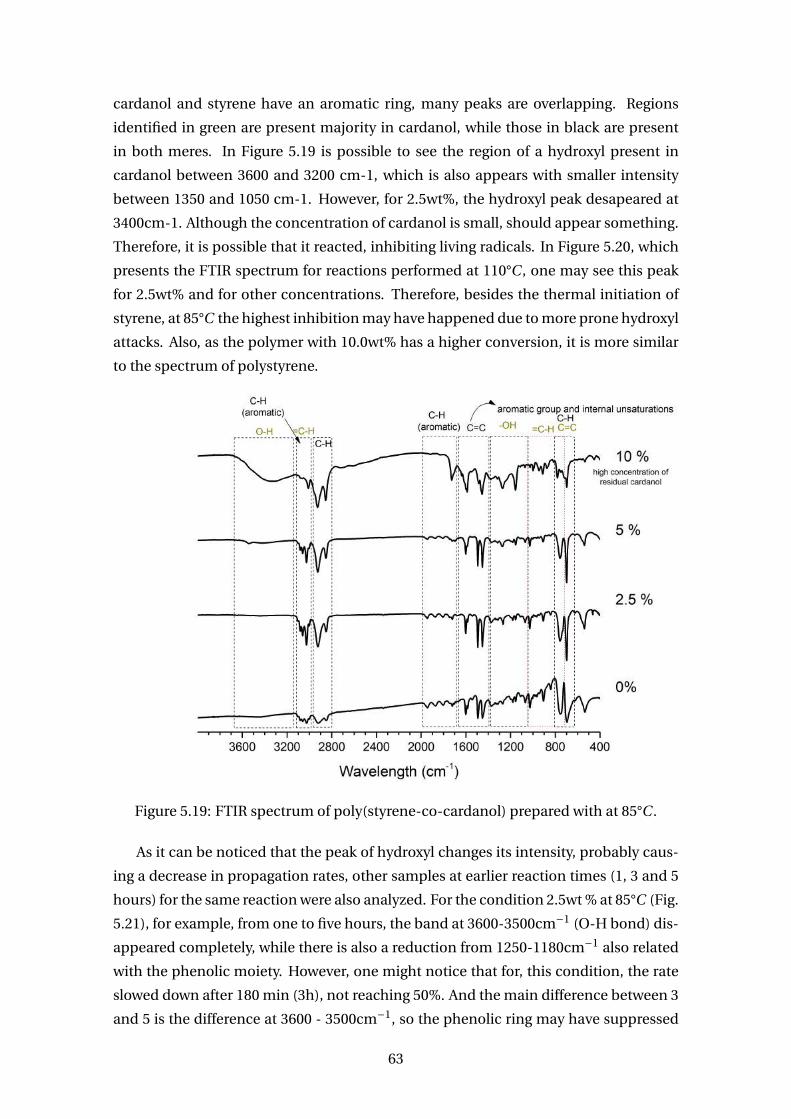
cardanol and styrene have an aromatic ring, many peaks are overlapping. Regions
identified in green are present majority in cardanol, while those in black are present
in both meres. In Figure 5.19 is possible to see the region of a hydroxyl present in
cardanol between 3600 and 3200 cm-1, which is also appears with smaller intensity
between 1350 and 1050 cm-1. However, for 2.5wt%, the hydroxyl peak desapeared at
3400cm-1. Although the concentration of cardanol is small, should appear something.
Therefore, it is possible that it reacted, inhibiting living radicals. In Figure 5.20, which
presents the FTIR spectrum for reactions performed at 110°C , one may see this peak
for 2.5wt% and for other concentrations. Therefore, besides the thermal initiation of
styrene, at 85°C the highest inhibition may have happened due to more prone hydroxyl
attacks. Also, as the polymer with 10.0wt% has a higher conversion, it is more similar
to the spectrum of polystyrene.
Figure 5.19: FTIR spectrum of poly(styrene-co-cardanol) prepared with at 85°C .
As it can be noticed that the peak of hydroxyl changes its intensity, probably caus-
ing a decrease in propagation rates, other samples at earlier reaction times (1, 3 and 5
hours) for the same reaction were also analyzed. For the condition 2.5wt % at 85°C (Fig.
5.21), for example, from one to five hours, the band at 3600-3500cm−1 (O-H bond) dis-
appeared completely, while there is also a reduction from 1250-1180cm−1 also related
with the phenolic moiety. However, one might notice that for, this condition, the rate
slowed down after 180 min (3h), not reaching 50%. And the main difference between 3
and 5 is the difference at 3600 - 3500cm−1, so the phenolic ring may have suppressed
63
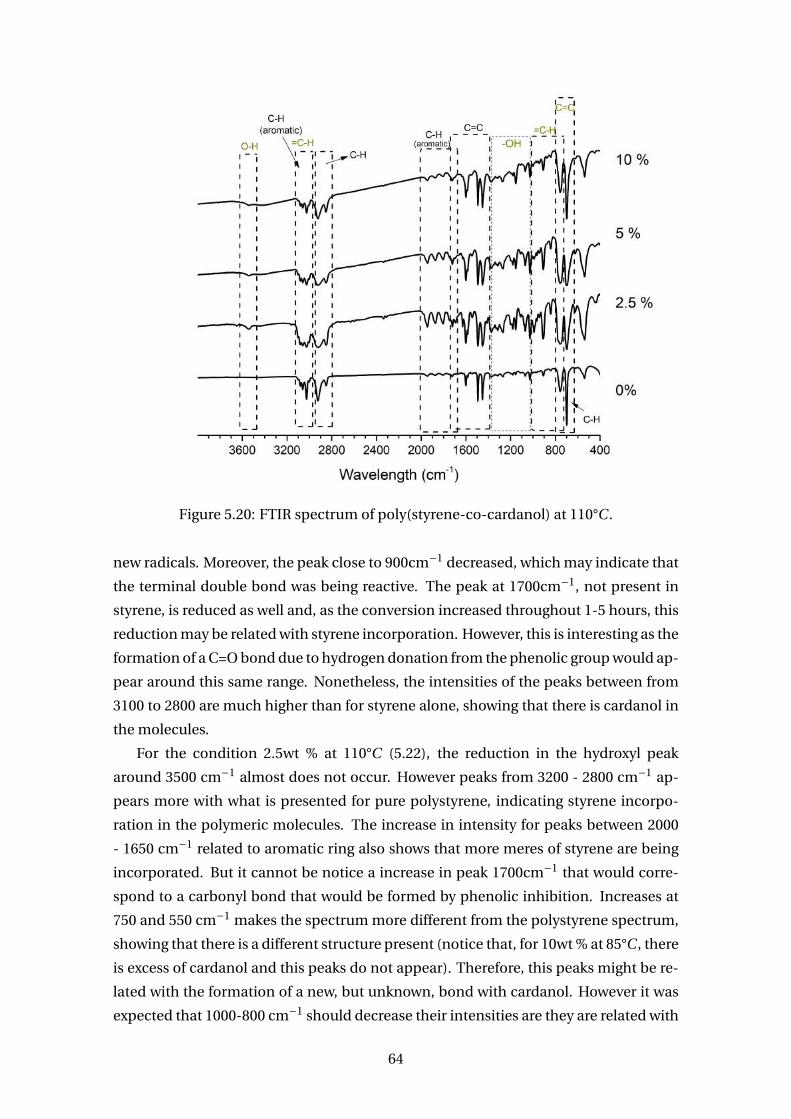
Figure 5.20: FTIR spectrum of poly(styrene-co-cardanol) at 110°C .
new radicals. Moreover, the peak close to 900cm−1 decreased, which may indicate that
the terminal double bond was being reactive. The peak at 1700cm−1, not present in
styrene, is reduced as well and, as the conversion increased throughout 1-5 hours, this
reduction may be related with styrene incorporation. However, this is interesting as the
formation of a C=O bond due to hydrogen donation from the phenolic group would ap-
pear around this same range. Nonetheless, the intensities of the peaks between from
3100 to 2800 are much higher than for styrene alone, showing that there is cardanol in
the molecules.
For the condition 2.5wt % at 110°C (5.22), the reduction in the hydroxyl peak
around 3500 cm−1 almost does not occur. However peaks from 3200 - 2800 cm−1 ap-
pears more with what is presented for pure polystyrene, indicating styrene incorpo-
ration in the polymeric molecules. The increase in intensity for peaks between 2000
- 1650 cm−1 related to aromatic ring also shows that more meres of styrene are being
incorporated. But it cannot be notice a increase in peak 1700cm−1 that would corre-
spond to a carbonyl bond that would be formed by phenolic inhibition. Increases at
750 and 550 cm−1 makes the spectrum more different from the polystyrene spectrum,
showing that there is a different structure present (notice that, for 10wt % at 85°C , there
is excess of cardanol and this peaks do not appear). Therefore, this peaks might be re-
lated with the formation of a new, but unknown, bond with cardanol. However it was
expected that 1000-800 cm−1 should decrease their intensities are they are related with
64
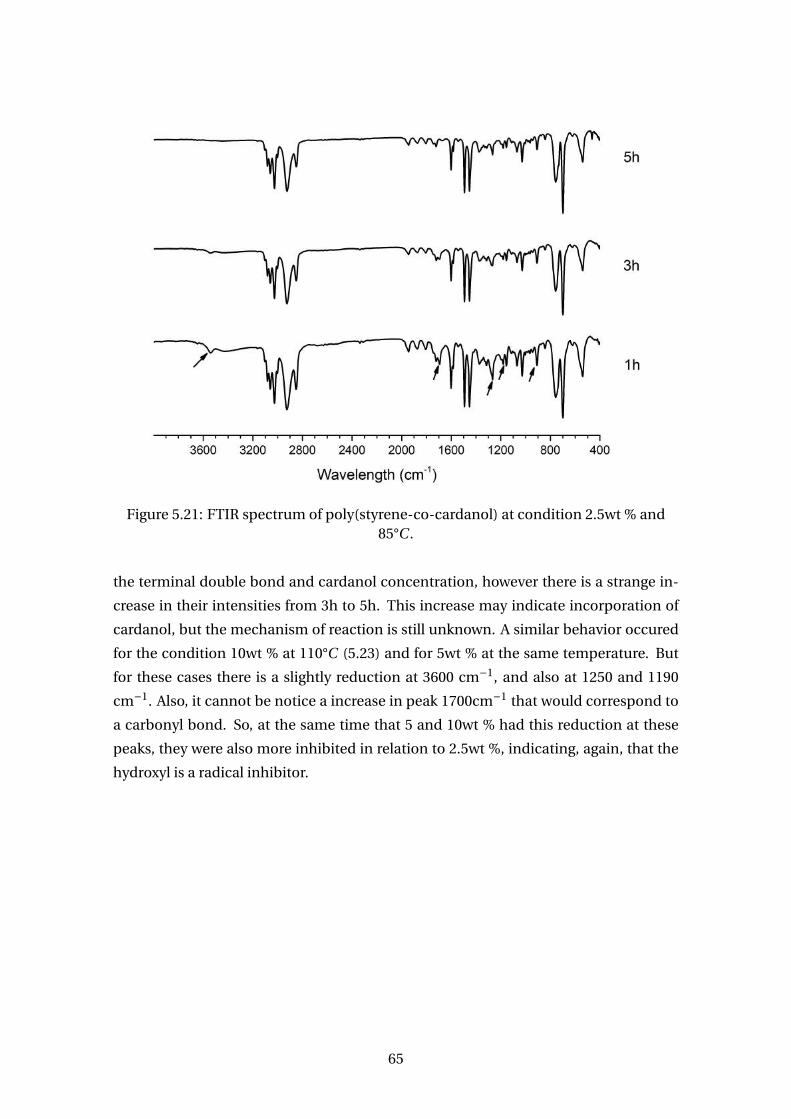
Figure 5.21: FTIR spectrum of poly(styrene-co-cardanol) at condition 2.5wt % and85°C .
the terminal double bond and cardanol concentration, however there is a strange in-
crease in their intensities from 3h to 5h. This increase may indicate incorporation of
cardanol, but the mechanism of reaction is still unknown. A similar behavior occured
for the condition 10wt % at 110°C (5.23) and for 5wt % at the same temperature. But
for these cases there is a slightly reduction at 3600 cm−1, and also at 1250 and 1190
cm−1. Also, it cannot be notice a increase in peak 1700cm−1 that would correspond to
a carbonyl bond. So, at the same time that 5 and 10wt % had this reduction at these
peaks, they were also more inhibited in relation to 2.5wt %, indicating, again, that the
hydroxyl is a radical inhibitor.
65
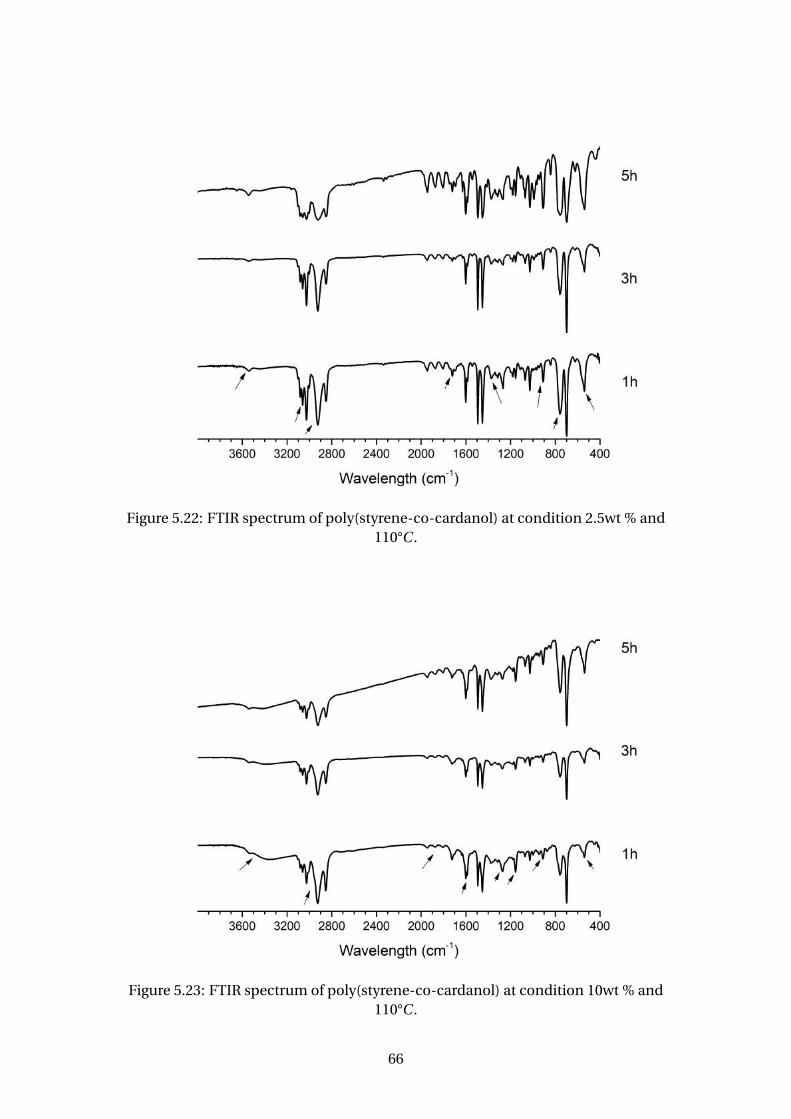
Figure 5.22: FTIR spectrum of poly(styrene-co-cardanol) at condition 2.5wt % and110°C .
Figure 5.23: FTIR spectrum of poly(styrene-co-cardanol) at condition 10wt % and110°C .
66
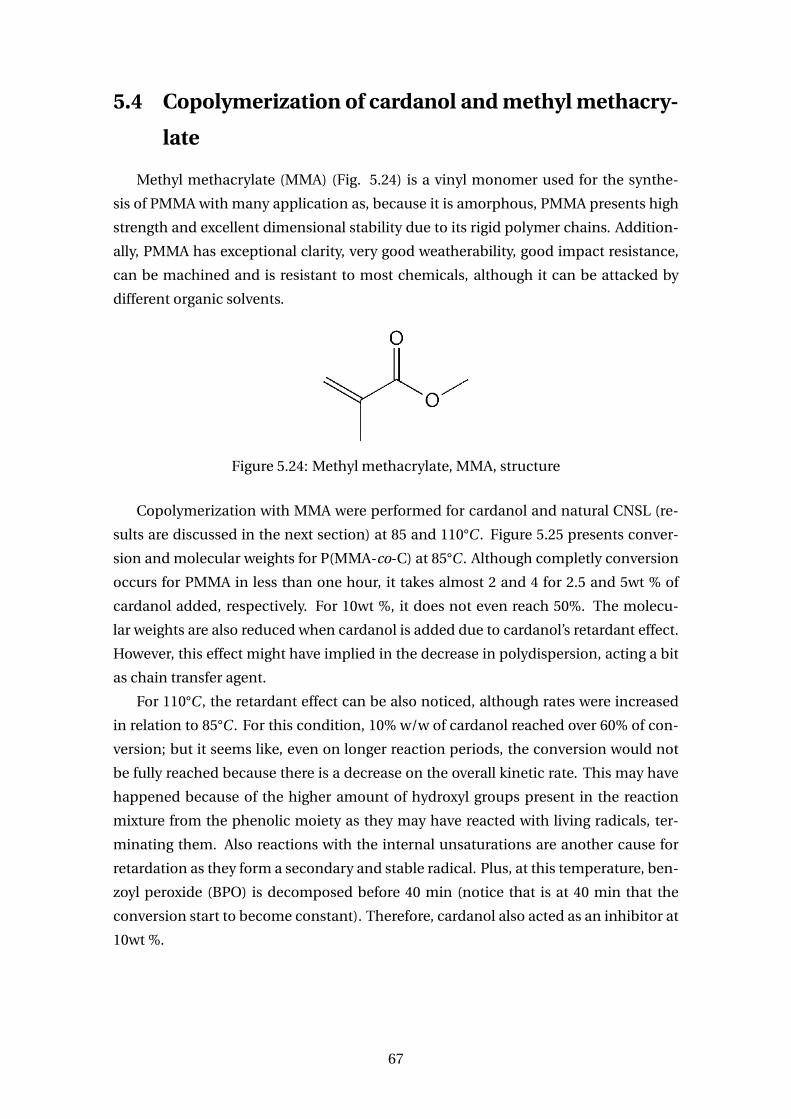
5.4 Copolymerization of cardanol and methyl methacry-
late
Methyl methacrylate (MMA) (Fig. 5.24) is a vinyl monomer used for the synthe-
sis of PMMA with many application as, because it is amorphous, PMMA presents high
strength and excellent dimensional stability due to its rigid polymer chains. Addition-
ally, PMMA has exceptional clarity, very good weatherability, good impact resistance,
can be machined and is resistant to most chemicals, although it can be attacked by
different organic solvents.
Figure 5.24: Methyl methacrylate, MMA, structure
Copolymerization with MMA were performed for cardanol and natural CNSL (re-
sults are discussed in the next section) at 85 and 110°C . Figure 5.25 presents conver-
sion and molecular weights for P(MMA-co-C) at 85°C . Although completly conversion
occurs for PMMA in less than one hour, it takes almost 2 and 4 for 2.5 and 5wt % of
cardanol added, respectively. For 10wt %, it does not even reach 50%. The molecu-
lar weights are also reduced when cardanol is added due to cardanol’s retardant effect.
However, this effect might have implied in the decrease in polydispersion, acting a bit
as chain transfer agent.
For 110°C , the retardant effect can be also noticed, although rates were increased
in relation to 85°C . For this condition, 10% w/w of cardanol reached over 60% of con-
version; but it seems like, even on longer reaction periods, the conversion would not
be fully reached because there is a decrease on the overall kinetic rate. This may have
happened because of the higher amount of hydroxyl groups present in the reaction
mixture from the phenolic moiety as they may have reacted with living radicals, ter-
minating them. Also reactions with the internal unsaturations are another cause for
retardation as they form a secondary and stable radical. Plus, at this temperature, ben-
zoyl peroxide (BPO) is decomposed before 40 min (notice that is at 40 min that the
conversion start to become constant). Therefore, cardanol also acted as an inhibitor at
10wt %.
67
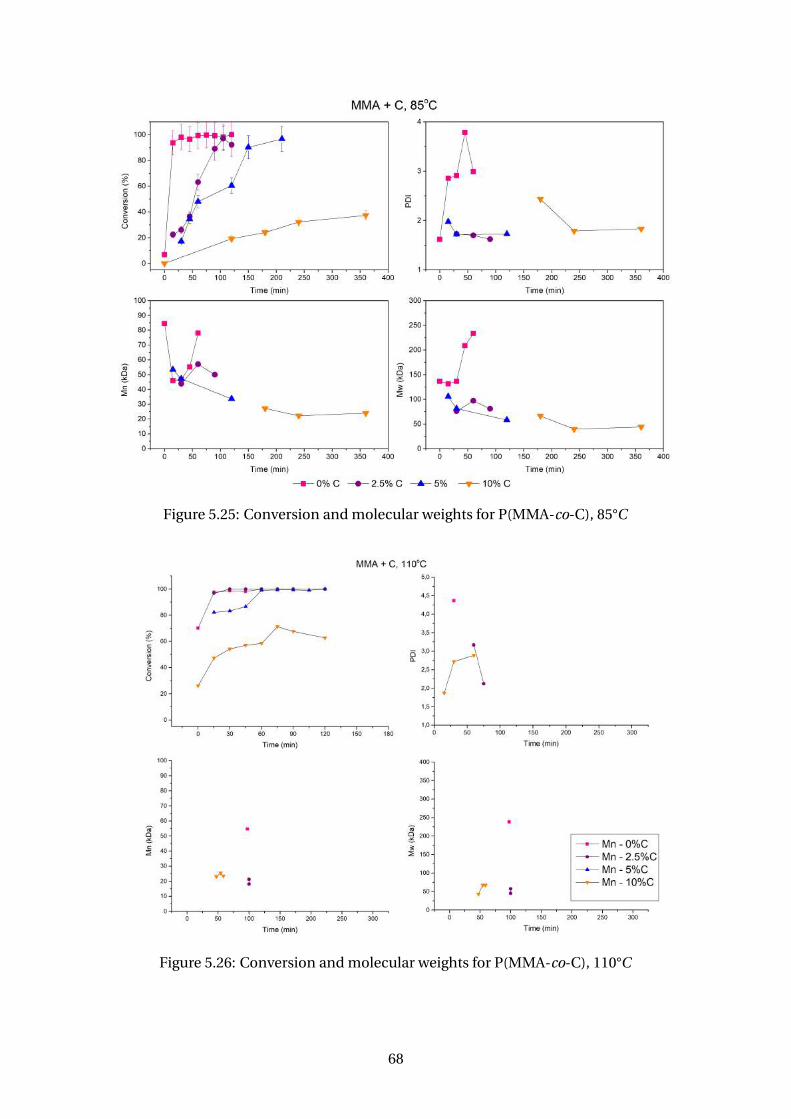
Figure 5.25: Conversion and molecular weights for P(MMA-co-C), 85°C
Figure 5.26: Conversion and molecular weights for P(MMA-co-C), 110°C
68
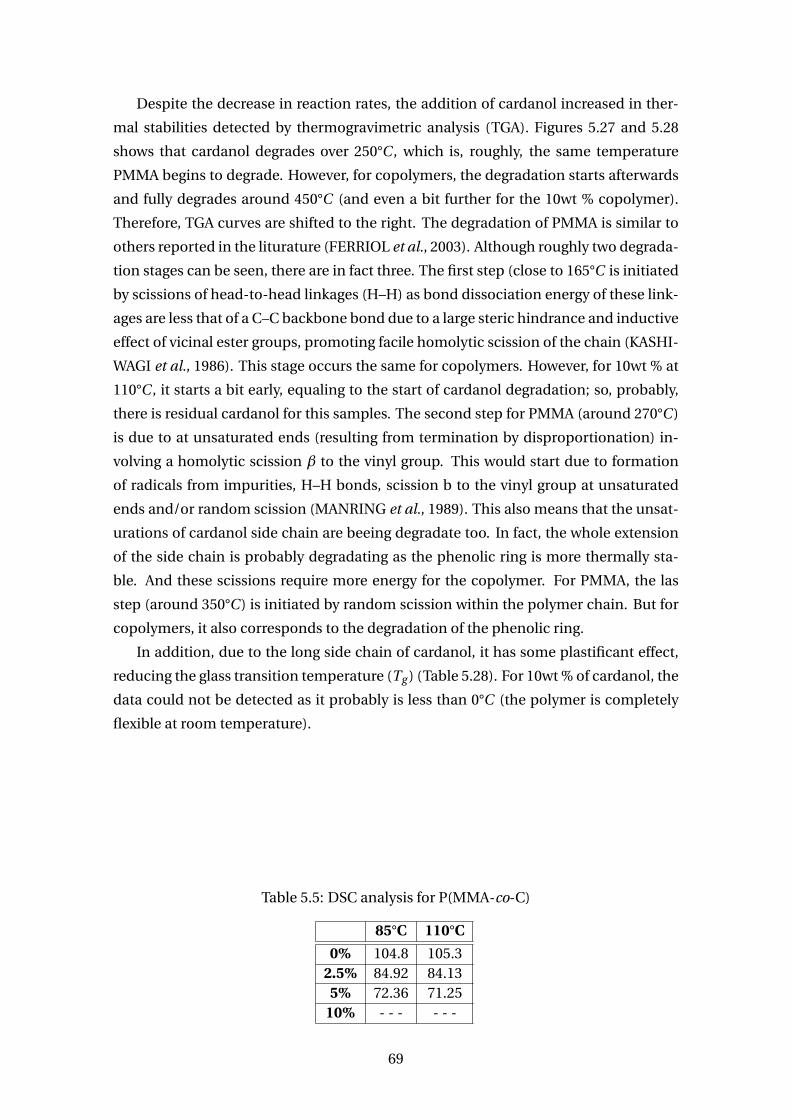
Despite the decrease in reaction rates, the addition of cardanol increased in ther-
mal stabilities detected by thermogravimetric analysis (TGA). Figures 5.27 and 5.28
shows that cardanol degrades over 250°C , which is, roughly, the same temperature
PMMA begins to degrade. However, for copolymers, the degradation starts afterwards
and fully degrades around 450°C (and even a bit further for the 10wt % copolymer).
Therefore, TGA curves are shifted to the right. The degradation of PMMA is similar to
others reported in the liturature (FERRIOL et al., 2003). Although roughly two degrada-
tion stages can be seen, there are in fact three. The first step (close to 165°C is initiated
by scissions of head-to-head linkages (H–H) as bond dissociation energy of these link-
ages are less that of a C–C backbone bond due to a large steric hindrance and inductive
effect of vicinal ester groups, promoting facile homolytic scission of the chain (KASHI-
WAGI et al., 1986). This stage occurs the same for copolymers. However, for 10wt % at
110°C , it starts a bit early, equaling to the start of cardanol degradation; so, probably,
there is residual cardanol for this samples. The second step for PMMA (around 270°C )
is due to at unsaturated ends (resulting from termination by disproportionation) in-
volving a homolytic scission β to the vinyl group. This would start due to formation
of radicals from impurities, H–H bonds, scission b to the vinyl group at unsaturated
ends and/or random scission (MANRING et al., 1989). This also means that the unsat-
urations of cardanol side chain are beeing degradate too. In fact, the whole extension
of the side chain is probably degradating as the phenolic ring is more thermally sta-
ble. And these scissions require more energy for the copolymer. For PMMA, the las
step (around 350°C ) is initiated by random scission within the polymer chain. But for
copolymers, it also corresponds to the degradation of the phenolic ring.
In addition, due to the long side chain of cardanol, it has some plastificant effect,
reducing the glass transition temperature (Tg ) (Table 5.28). For 10wt % of cardanol, the
data could not be detected as it probably is less than 0°C (the polymer is completely
flexible at room temperature).
Table 5.5: DSC analysis for P(MMA-co-C)
85°C 110°C
0% 104.8 105.32.5% 84.92 84.13
5% 72.36 71.2510% - - - - - -
69
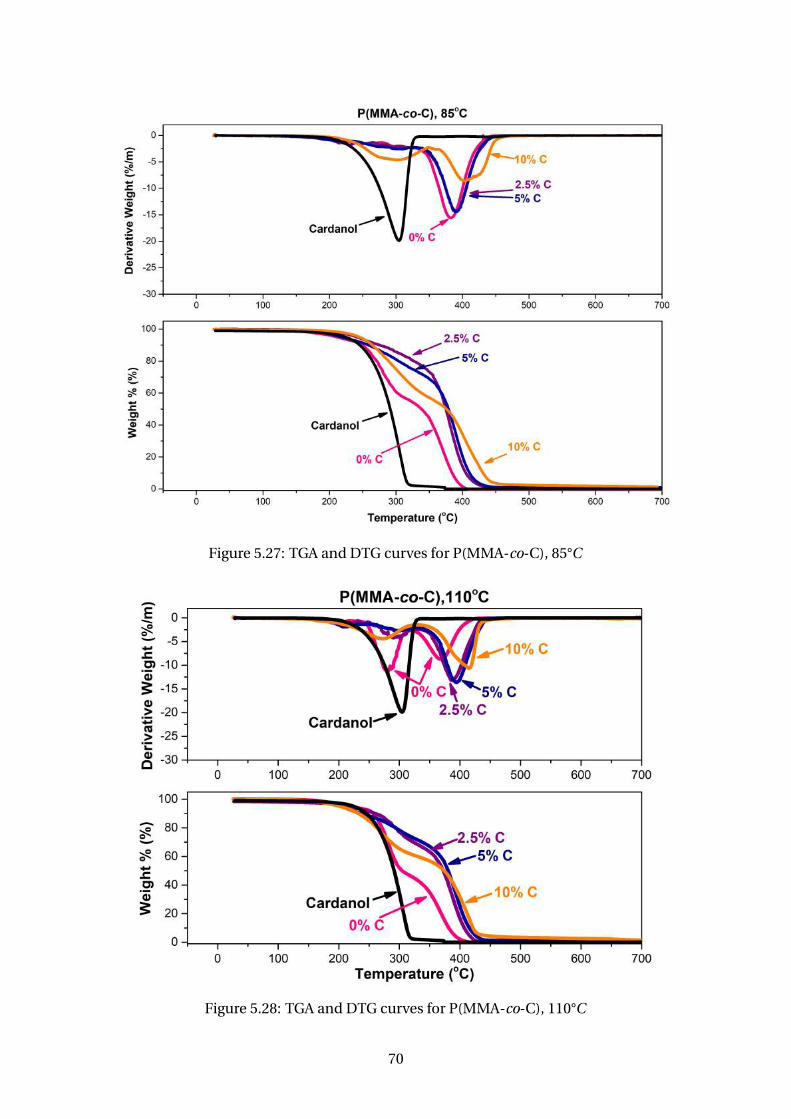
Figure 5.27: TGA and DTG curves for P(MMA-co-C), 85°C
Figure 5.28: TGA and DTG curves for P(MMA-co-C), 110°C
70
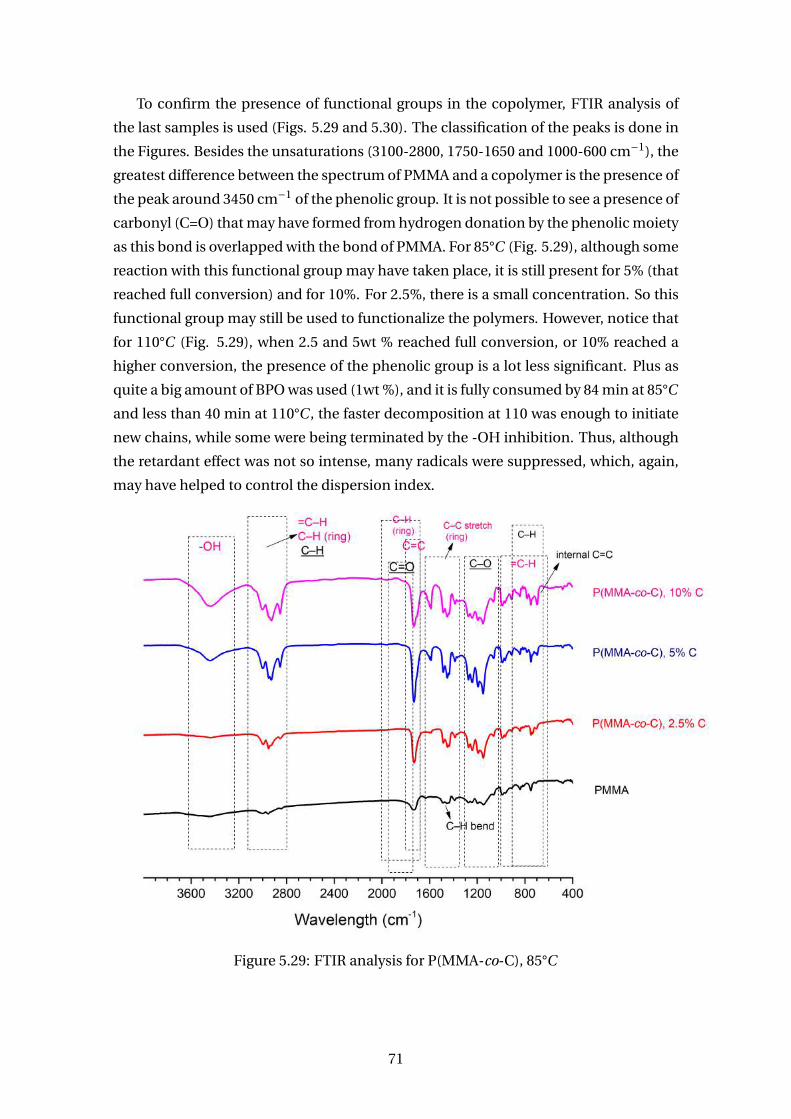
To confirm the presence of functional groups in the copolymer, FTIR analysis of
the last samples is used (Figs. 5.29 and 5.30). The classification of the peaks is done in
the Figures. Besides the unsaturations (3100-2800, 1750-1650 and 1000-600 cm−1), the
greatest difference between the spectrum of PMMA and a copolymer is the presence of
the peak around 3450 cm−1 of the phenolic group. It is not possible to see a presence of
carbonyl (C=O) that may have formed from hydrogen donation by the phenolic moiety
as this bond is overlapped with the bond of PMMA. For 85°C (Fig. 5.29), although some
reaction with this functional group may have taken place, it is still present for 5% (that
reached full conversion) and for 10%. For 2.5%, there is a small concentration. So this
functional group may still be used to functionalize the polymers. However, notice that
for 110°C (Fig. 5.29), when 2.5 and 5wt % reached full conversion, or 10% reached a
higher conversion, the presence of the phenolic group is a lot less significant. Plus as
quite a big amount of BPO was used (1wt %), and it is fully consumed by 84 min at 85°C
and less than 40 min at 110°C , the faster decomposition at 110 was enough to initiate
new chains, while some were being terminated by the -OH inhibition. Thus, although
the retardant effect was not so intense, many radicals were suppressed, which, again,
may have helped to control the dispersion index.
Figure 5.29: FTIR analysis for P(MMA-co-C), 85°C
71
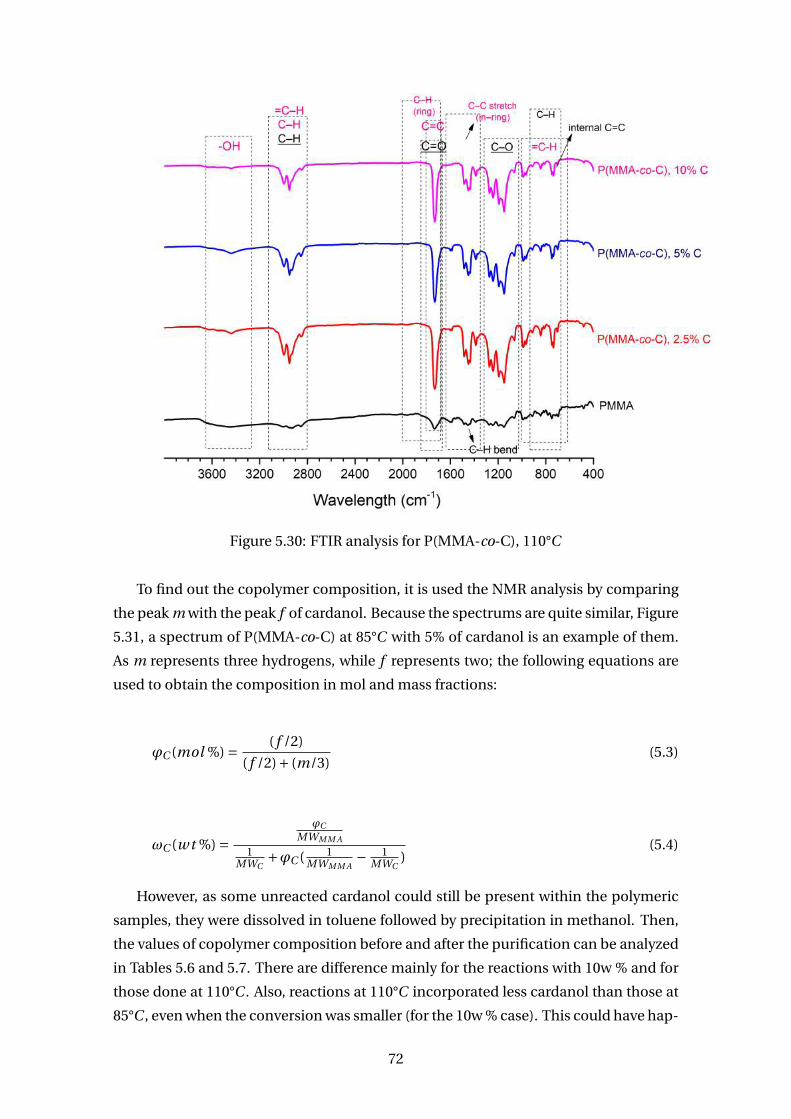
Figure 5.30: FTIR analysis for P(MMA-co-C), 110°C
To find out the copolymer composition, it is used the NMR analysis by comparing
the peak m with the peak f of cardanol. Because the spectrums are quite similar, Figure
5.31, a spectrum of P(MMA-co-C) at 85°C with 5% of cardanol is an example of them.
As m represents three hydrogens, while f represents two; the following equations are
used to obtain the composition in mol and mass fractions:
ϕC (mol %) = ( f /2)
( f /2)+ (m/3)(5.3)
ωC (w t %) =ϕC
MWM M A
1MWC
+ϕC ( 1MWM M A
− 1MWC
)(5.4)
However, as some unreacted cardanol could still be present within the polymeric
samples, they were dissolved in toluene followed by precipitation in methanol. Then,
the values of copolymer composition before and after the purification can be analyzed
in Tables 5.6 and 5.7. There are difference mainly for the reactions with 10w % and for
those done at 110°C . Also, reactions at 110°C incorporated less cardanol than those at
85°C , even when the conversion was smaller (for the 10w % case). This could have hap-
72
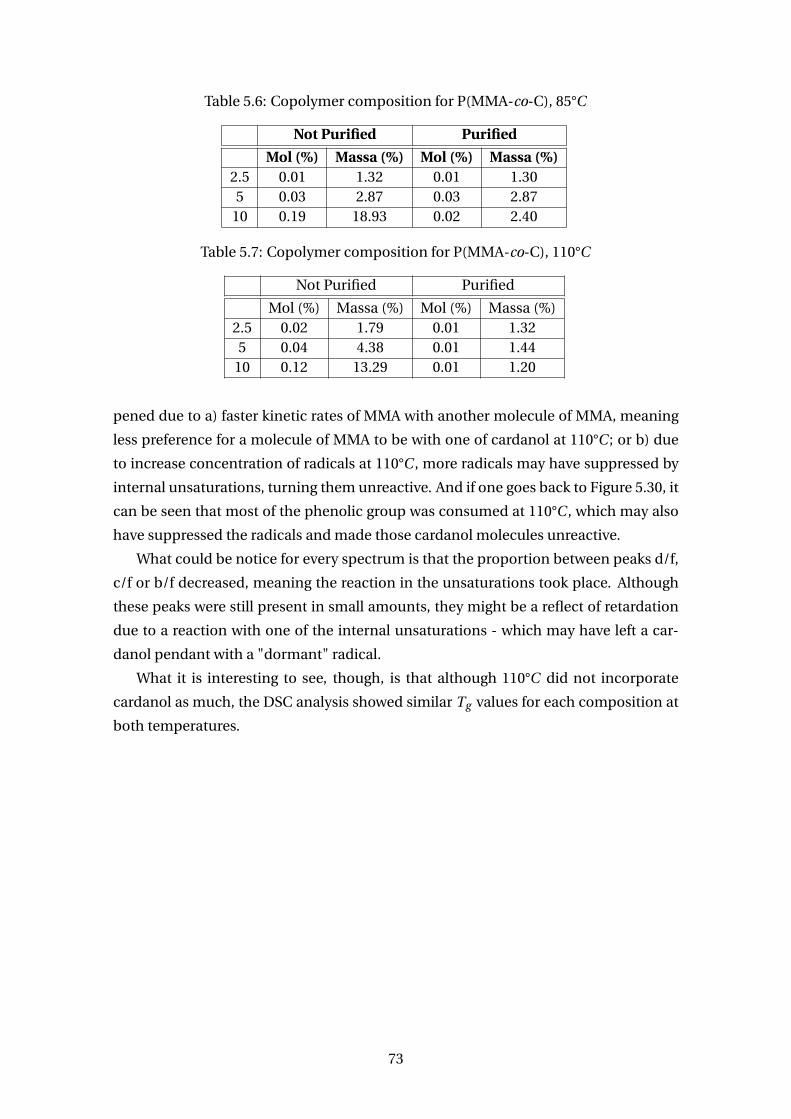
Table 5.6: Copolymer composition for P(MMA-co-C), 85°C
Not Purified Purified
Mol (%) Massa (%) Mol (%) Massa (%)2.5 0.01 1.32 0.01 1.305 0.03 2.87 0.03 2.87
10 0.19 18.93 0.02 2.40
Table 5.7: Copolymer composition for P(MMA-co-C), 110°C
Not Purified Purified
Mol (%) Massa (%) Mol (%) Massa (%)2.5 0.02 1.79 0.01 1.325 0.04 4.38 0.01 1.44
10 0.12 13.29 0.01 1.20
pened due to a) faster kinetic rates of MMA with another molecule of MMA, meaning
less preference for a molecule of MMA to be with one of cardanol at 110°C ; or b) due
to increase concentration of radicals at 110°C , more radicals may have suppressed by
internal unsaturations, turning them unreactive. And if one goes back to Figure 5.30, it
can be seen that most of the phenolic group was consumed at 110°C , which may also
have suppressed the radicals and made those cardanol molecules unreactive.
What could be notice for every spectrum is that the proportion between peaks d/f,
c/f or b/f decreased, meaning the reaction in the unsaturations took place. Although
these peaks were still present in small amounts, they might be a reflect of retardation
due to a reaction with one of the internal unsaturations - which may have left a car-
danol pendant with a "dormant" radical.
What it is interesting to see, though, is that although 110°C did not incorporate
cardanol as much, the DSC analysis showed similar Tg values for each composition at
both temperatures.
73
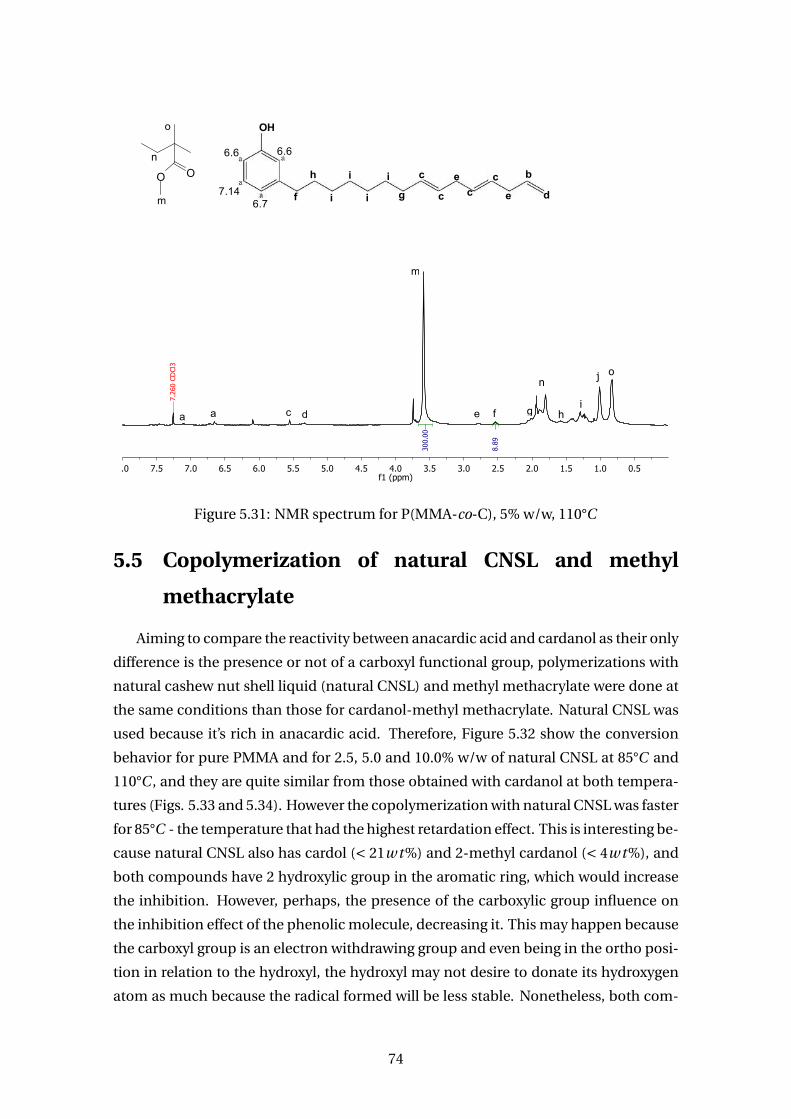
0.51.01.52.02.53.03.54.04.55.05.56.06.57.07.58.0f1 (ppm)
8.89
300.
00
7.26
0 CD
Cl3
no
O On 6.6 6.6
7.146.7
h
f i
i
i
i
g
c
c cce
e
b
d
OH
m
o
m
aa dc e f g hi
j
Figure 5.31: NMR spectrum for P(MMA-co-C), 5% w/w, 110°C
5.5 Copolymerization of natural CNSL and methyl
methacrylate
Aiming to compare the reactivity between anacardic acid and cardanol as their only
difference is the presence or not of a carboxyl functional group, polymerizations with
natural cashew nut shell liquid (natural CNSL) and methyl methacrylate were done at
the same conditions than those for cardanol-methyl methacrylate. Natural CNSL was
used because it’s rich in anacardic acid. Therefore, Figure 5.32 show the conversion
behavior for pure PMMA and for 2.5, 5.0 and 10.0% w/w of natural CNSL at 85°C and
110°C , and they are quite similar from those obtained with cardanol at both tempera-
tures (Figs. 5.33 and 5.34). However the copolymerization with natural CNSL was faster
for 85°C - the temperature that had the highest retardation effect. This is interesting be-
cause natural CNSL also has cardol (< 21w t%) and 2-methyl cardanol (< 4w t%), and
both compounds have 2 hydroxylic group in the aromatic ring, which would increase
the inhibition. However, perhaps, the presence of the carboxylic group influence on
the inhibition effect of the phenolic molecule, decreasing it. This may happen because
the carboxyl group is an electron withdrawing group and even being in the ortho posi-
tion in relation to the hydroxyl, the hydroxyl may not desire to donate its hydroxygen
atom as much because the radical formed will be less stable. Nonetheless, both com-
74
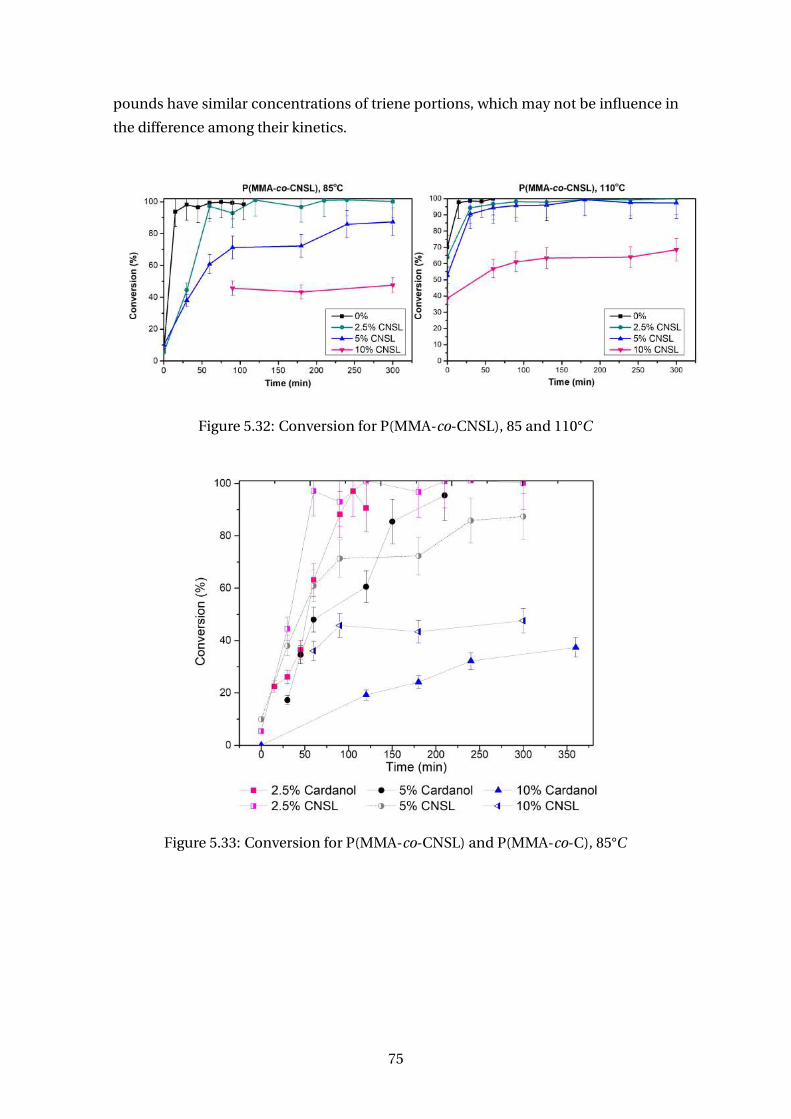
pounds have similar concentrations of triene portions, which may not be influence in
the difference among their kinetics.
Figure 5.32: Conversion for P(MMA-co-CNSL), 85 and 110°C
Figure 5.33: Conversion for P(MMA-co-CNSL) and P(MMA-co-C), 85°C
75
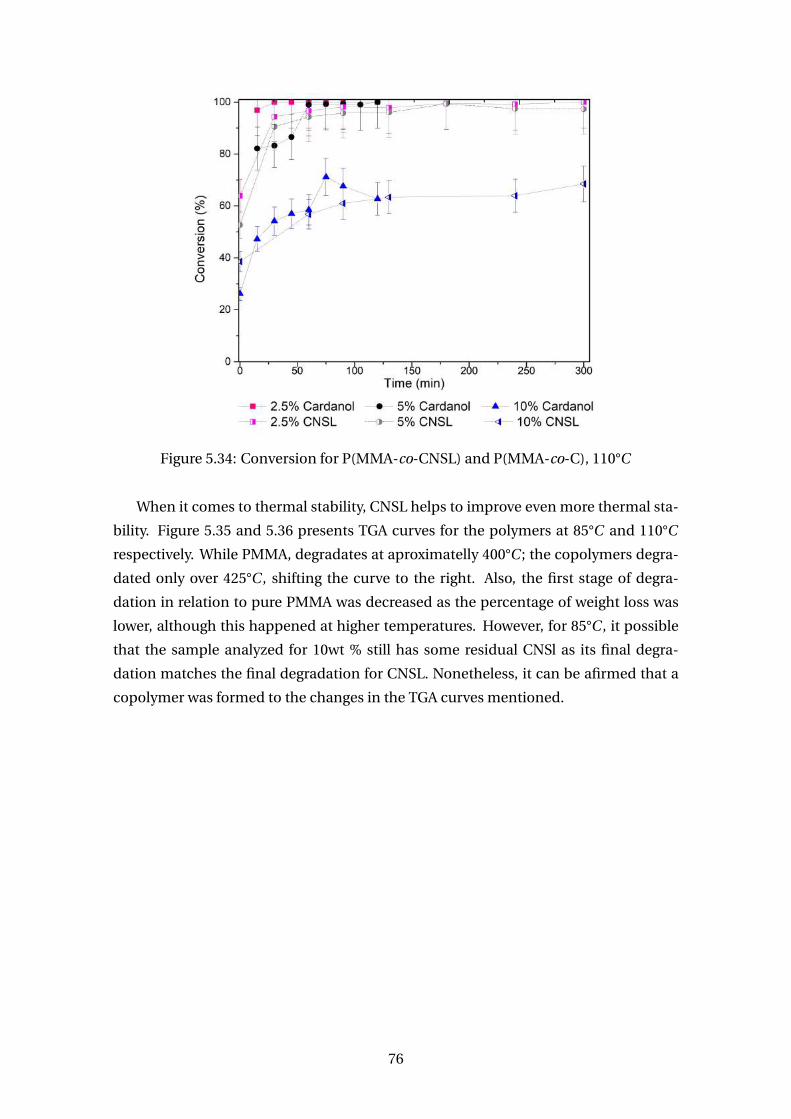
Figure 5.34: Conversion for P(MMA-co-CNSL) and P(MMA-co-C), 110°C
When it comes to thermal stability, CNSL helps to improve even more thermal sta-
bility. Figure 5.35 and 5.36 presents TGA curves for the polymers at 85°C and 110°C
respectively. While PMMA, degradates at aproximatelly 400°C ; the copolymers degra-
dated only over 425°C , shifting the curve to the right. Also, the first stage of degra-
dation in relation to pure PMMA was decreased as the percentage of weight loss was
lower, although this happened at higher temperatures. However, for 85°C , it possible
that the sample analyzed for 10wt % still has some residual CNSl as its final degra-
dation matches the final degradation for CNSL. Nonetheless, it can be afirmed that a
copolymer was formed to the changes in the TGA curves mentioned.
76
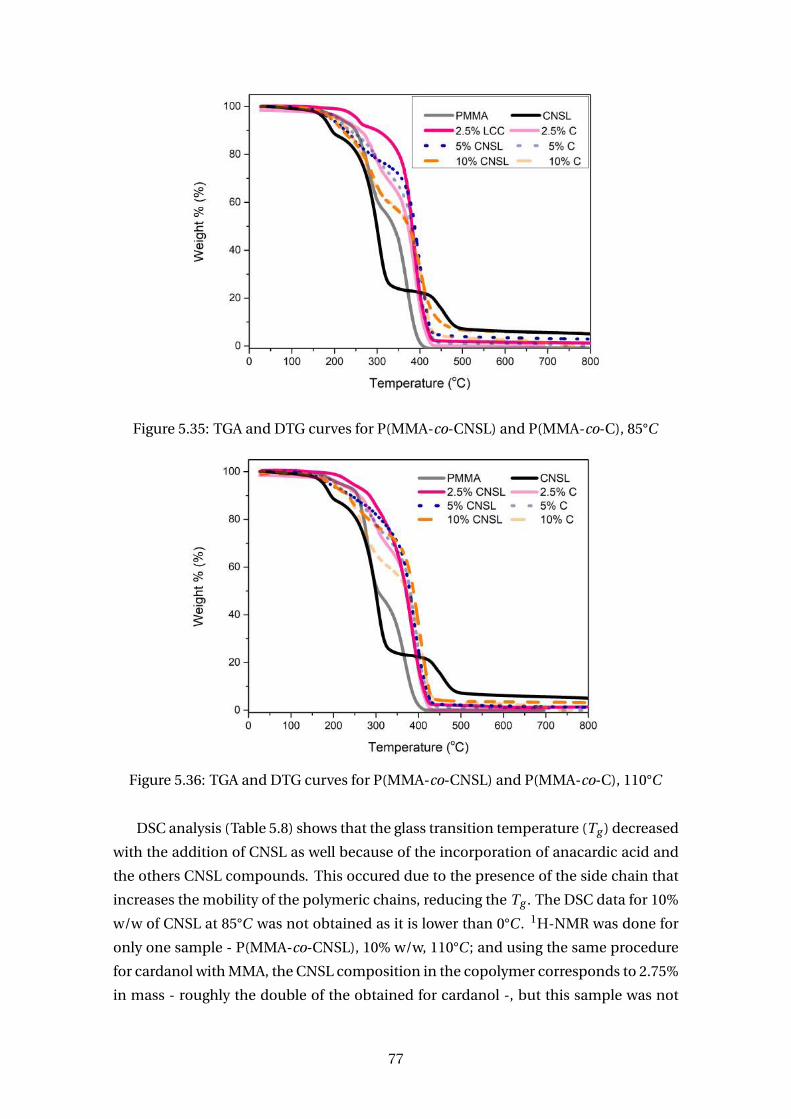
Figure 5.35: TGA and DTG curves for P(MMA-co-CNSL) and P(MMA-co-C), 85°C
Figure 5.36: TGA and DTG curves for P(MMA-co-CNSL) and P(MMA-co-C), 110°C
DSC analysis (Table 5.8) shows that the glass transition temperature (Tg ) decreased
with the addition of CNSL as well because of the incorporation of anacardic acid and
the others CNSL compounds. This occured due to the presence of the side chain that
increases the mobility of the polymeric chains, reducing the Tg . The DSC data for 10%
w/w of CNSL at 85°C was not obtained as it is lower than 0°C . 1H-NMR was done for
only one sample - P(MMA-co-CNSL), 10% w/w, 110°C ; and using the same procedure
for cardanol with MMA, the CNSL composition in the copolymer corresponds to 2.75%
in mass - roughly the double of the obtained for cardanol -, but this sample was not
77
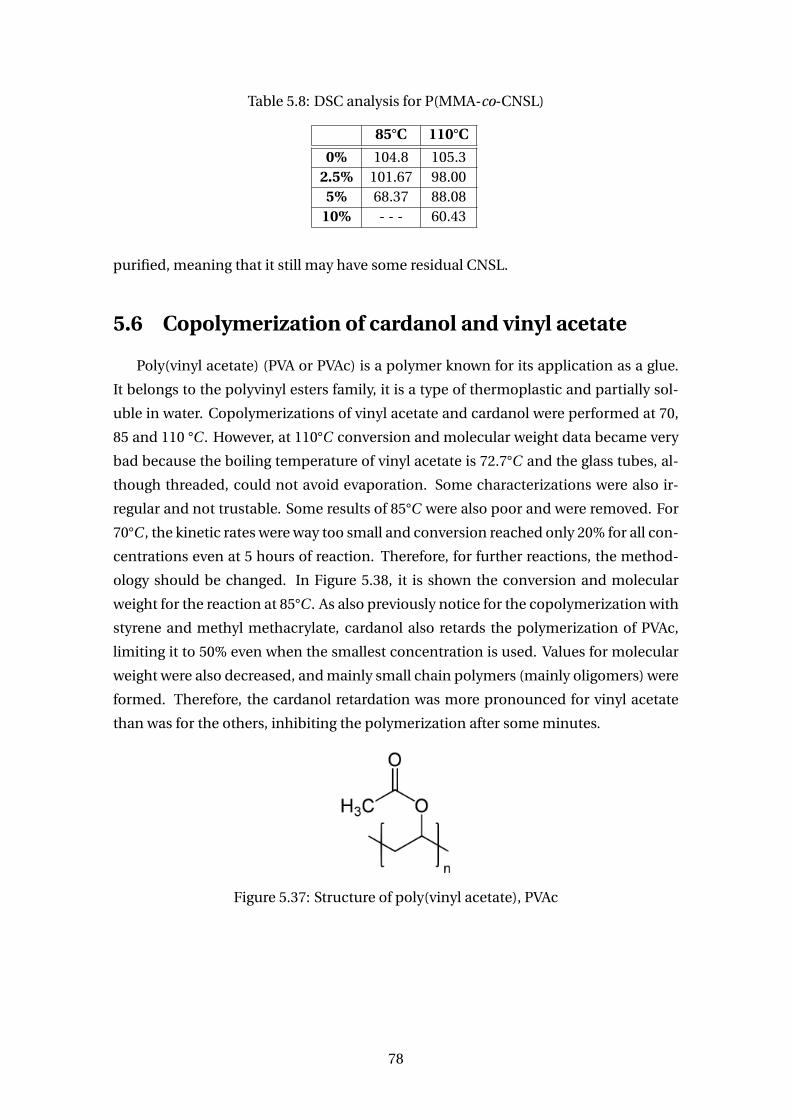
Table 5.8: DSC analysis for P(MMA-co-CNSL)
85°C 110°C
0% 104.8 105.32.5% 101.67 98.00
5% 68.37 88.0810% - - - 60.43
purified, meaning that it still may have some residual CNSL.
5.6 Copolymerization of cardanol and vinyl acetate
Poly(vinyl acetate) (PVA or PVAc) is a polymer known for its application as a glue.
It belongs to the polyvinyl esters family, it is a type of thermoplastic and partially sol-
uble in water. Copolymerizations of vinyl acetate and cardanol were performed at 70,
85 and 110 °C . However, at 110°C conversion and molecular weight data became very
bad because the boiling temperature of vinyl acetate is 72.7°C and the glass tubes, al-
though threaded, could not avoid evaporation. Some characterizations were also ir-
regular and not trustable. Some results of 85°C were also poor and were removed. For
70°C , the kinetic rates were way too small and conversion reached only 20% for all con-
centrations even at 5 hours of reaction. Therefore, for further reactions, the method-
ology should be changed. In Figure 5.38, it is shown the conversion and molecular
weight for the reaction at 85°C . As also previously notice for the copolymerization with
styrene and methyl methacrylate, cardanol also retards the polymerization of PVAc,
limiting it to 50% even when the smallest concentration is used. Values for molecular
weight were also decreased, and mainly small chain polymers (mainly oligomers) were
formed. Therefore, the cardanol retardation was more pronounced for vinyl acetate
than was for the others, inhibiting the polymerization after some minutes.
Figure 5.37: Structure of poly(vinyl acetate), PVAc
78
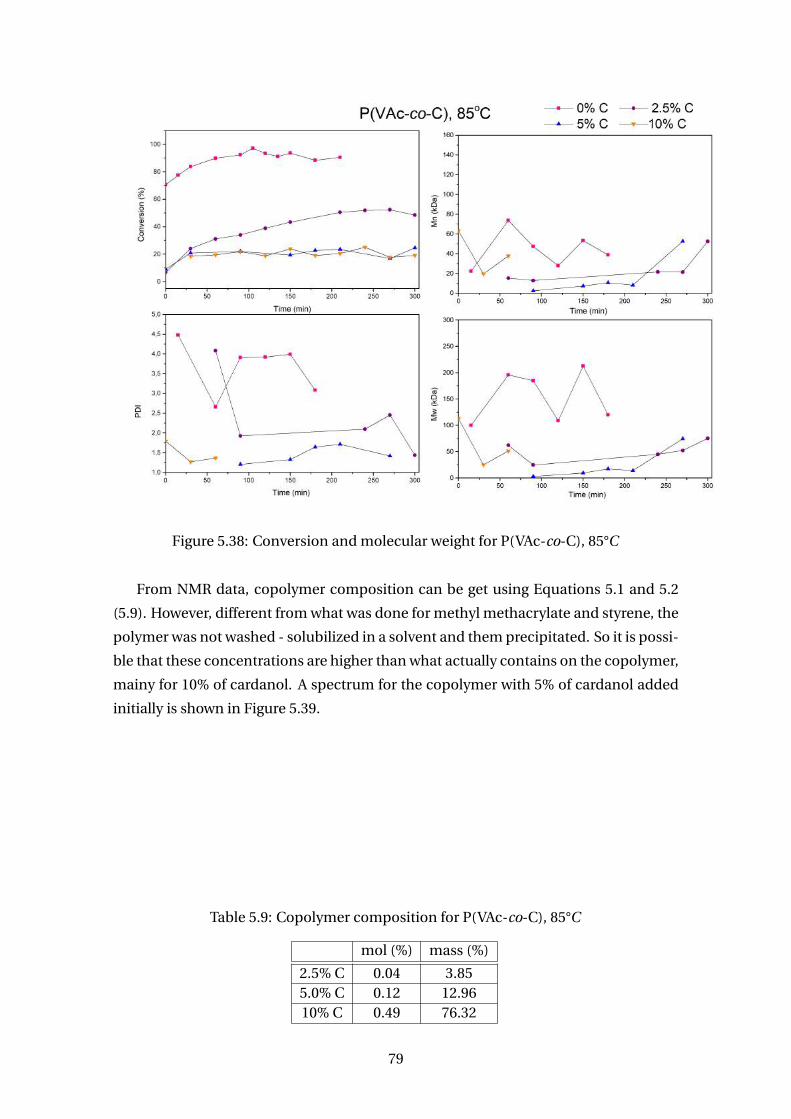
Figure 5.38: Conversion and molecular weight for P(VAc-co-C), 85°C
From NMR data, copolymer composition can be get using Equations 5.1 and 5.2
(5.9). However, different from what was done for methyl methacrylate and styrene, the
polymer was not washed - solubilized in a solvent and them precipitated. So it is possi-
ble that these concentrations are higher than what actually contains on the copolymer,
mainy for 10% of cardanol. A spectrum for the copolymer with 5% of cardanol added
initially is shown in Figure 5.39.
Table 5.9: Copolymer composition for P(VAc-co-C), 85°C
mol (%) mass (%)
2.5% C 0.04 3.855.0% C 0.12 12.9610% C 0.49 76.32
79
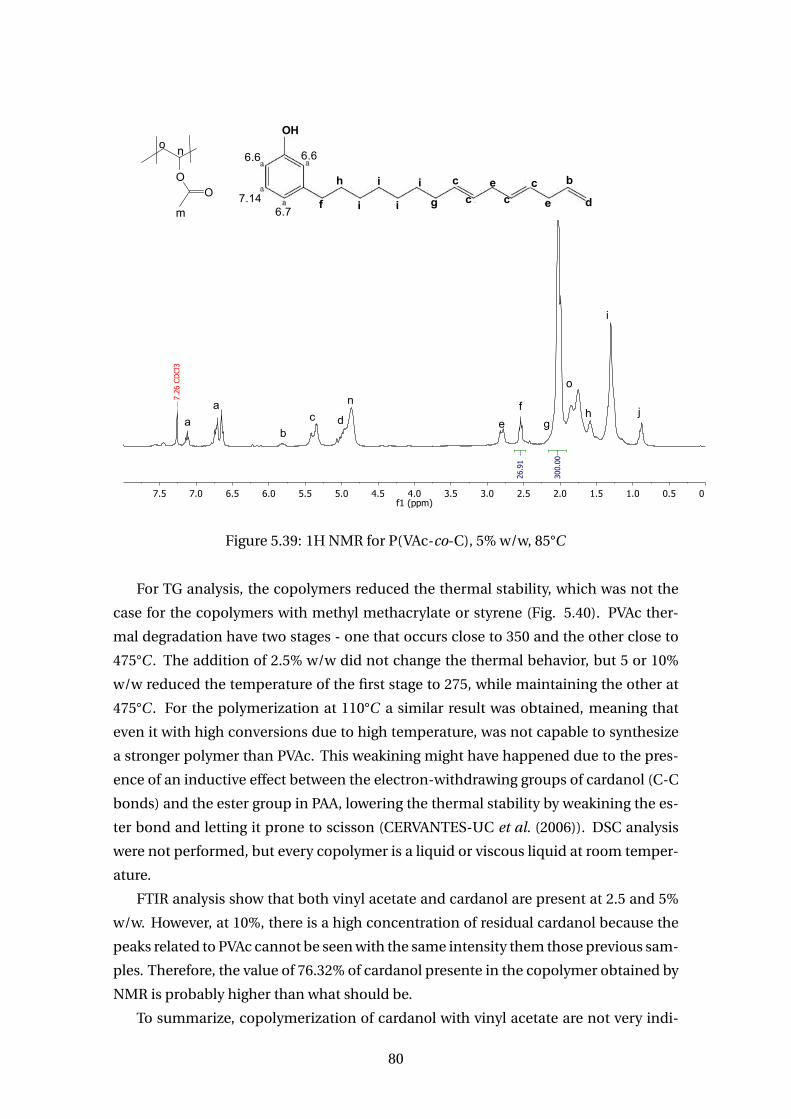
0.00.51.01.52.02.53.03.54.04.55.05.56.06.57.07.5f1 (ppm)
300.
00
26.9
1
7.26
CD
Cl3
OO
no
m
o
m
n
aa
bc d
f
e gh
i
j
6.6 6.6
7.146.7
h
f i
i
i
i
g
c
c cce
e
b
d
OH
Figure 5.39: 1H NMR for P(VAc-co-C), 5% w/w, 85°C
For TG analysis, the copolymers reduced the thermal stability, which was not the
case for the copolymers with methyl methacrylate or styrene (Fig. 5.40). PVAc ther-
mal degradation have two stages - one that occurs close to 350 and the other close to
475°C . The addition of 2.5% w/w did not change the thermal behavior, but 5 or 10%
w/w reduced the temperature of the first stage to 275, while maintaining the other at
475°C . For the polymerization at 110°C a similar result was obtained, meaning that
even it with high conversions due to high temperature, was not capable to synthesize
a stronger polymer than PVAc. This weakining might have happened due to the pres-
ence of an inductive effect between the electron-withdrawing groups of cardanol (C-C
bonds) and the ester group in PAA, lowering the thermal stability by weakining the es-
ter bond and letting it prone to scisson (CERVANTES-UC et al. (2006)). DSC analysis
were not performed, but every copolymer is a liquid or viscous liquid at room temper-
ature.
FTIR analysis show that both vinyl acetate and cardanol are present at 2.5 and 5%
w/w. However, at 10%, there is a high concentration of residual cardanol because the
peaks related to PVAc cannot be seen with the same intensity them those previous sam-
ples. Therefore, the value of 76.32% of cardanol presente in the copolymer obtained by
NMR is probably higher than what should be.
To summarize, copolymerization of cardanol with vinyl acetate are not very indi-
80
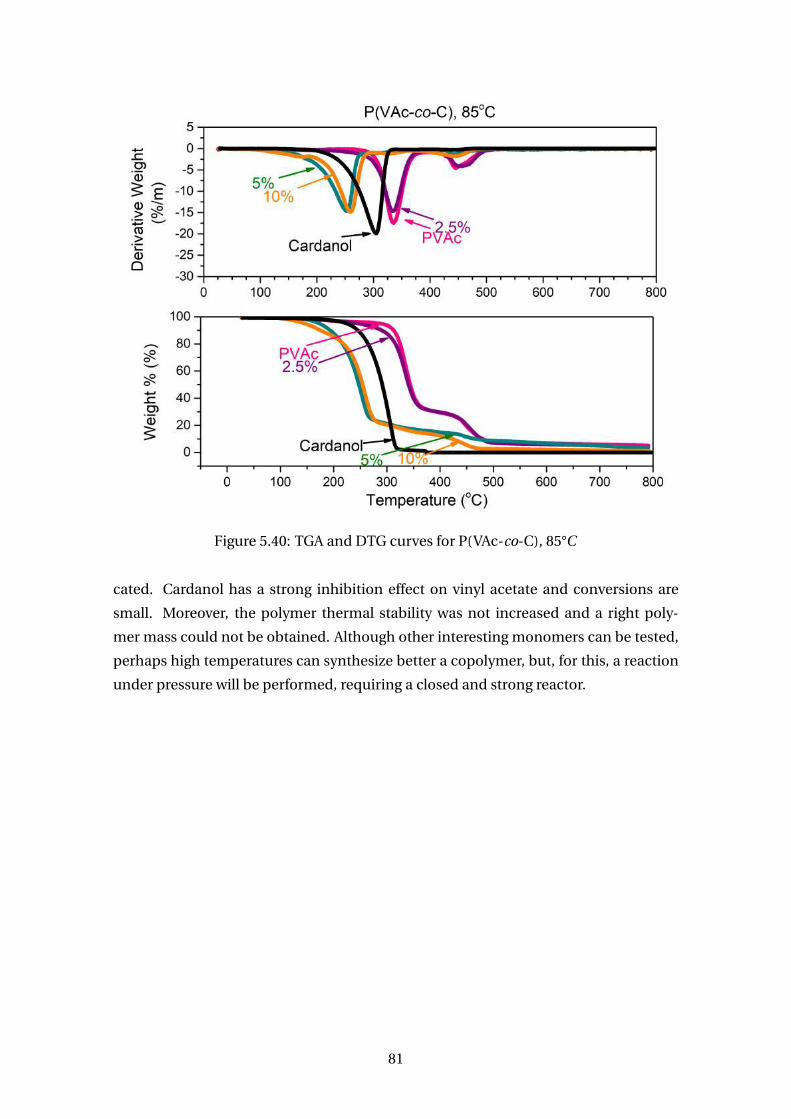
Figure 5.40: TGA and DTG curves for P(VAc-co-C), 85°C
cated. Cardanol has a strong inhibition effect on vinyl acetate and conversions are
small. Moreover, the polymer thermal stability was not increased and a right poly-
mer mass could not be obtained. Although other interesting monomers can be tested,
perhaps high temperatures can synthesize better a copolymer, but, for this, a reaction
under pressure will be performed, requiring a closed and strong reactor.
81
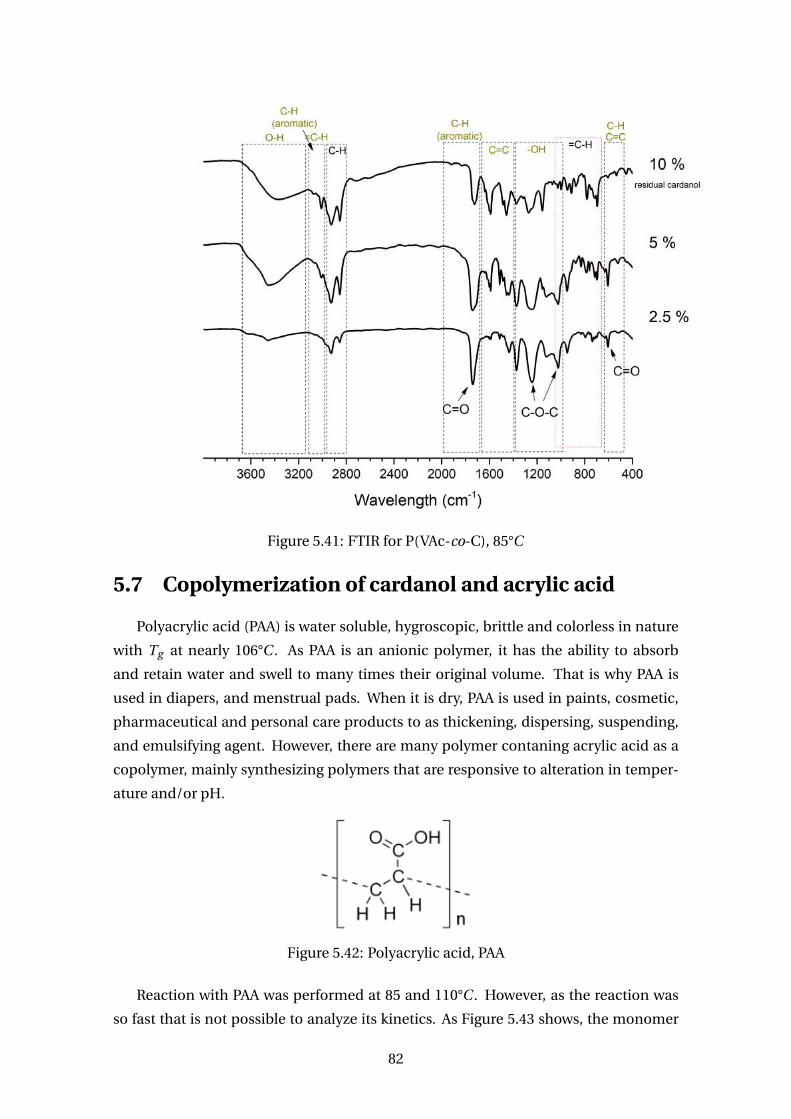
Figure 5.41: FTIR for P(VAc-co-C), 85°C
5.7 Copolymerization of cardanol and acrylic acid
Polyacrylic acid (PAA) is water soluble, hygroscopic, brittle and colorless in nature
with Tg at nearly 106°C . As PAA is an anionic polymer, it has the ability to absorb
and retain water and swell to many times their original volume. That is why PAA is
used in diapers, and menstrual pads. When it is dry, PAA is used in paints, cosmetic,
pharmaceutical and personal care products to as thickening, dispersing, suspending,
and emulsifying agent. However, there are many polymer contaning acrylic acid as a
copolymer, mainly synthesizing polymers that are responsive to alteration in temper-
ature and/or pH.
Figure 5.42: Polyacrylic acid, PAA
Reaction with PAA was performed at 85 and 110°C . However, as the reaction was
so fast that is not possible to analyze its kinetics. As Figure 5.43 shows, the monomer
82
is practically completely consumed instantaneously even when 10wt % cardanol was
added. Experimentally, the reaction mixture, just a few seconds after added in the hot
bath, starts to polymerize so fast that it seems like it is boiling. Besides TGA, there is
not characterization analysis for this copolymer. Therefore, Figure 5.44 presents TGA
curves for the copolymer acrylic acid-cardanol. As can be seen, the addition of car-
danol shifts a the curves of the copolymer to the left in direction of pure cardanol.
Therefore, cardanol does not increase the thermal stability of the polymer. Plus, it
seems like there are three degradation stages for the copolymers. The beginning of
the first stage matches with the boiling point of acrylic acid, which is 139°C . So this
first stage seems to be the loss of residual acrylic acid. The second stage matches with
the cardanol curve, suggesting that it corresponded to residual cardanol. And the third
stage is similar to PAA curve and might be the degradation of pure PAA without high
concentrations of cardanol. So, even at high conversions, perharps cardanol incorpo-
ration was not high.
Moreover, as the reaction was really fast even for 85°C , another reaction was per-
formed at 60°C . However, as the initiator decomposition rate also decreases, the ki-
netic became a lot slower, and the copolymer conversion reached was of roughly 40%
after 6h and stopped. Therefore, some how, the slower kinetics makes the inhibition
of cardanol more likely and significant. In addition, very little is found in the literature
about the polymerization of acrylic acid in bulk to understand how fast its kinetics is.
Therefore, perhaps, for further reactions, the polymerization of acrylic acid with car-
danol should be done in heterogeneous medium as this method is more commonly
used and there is more data.
83
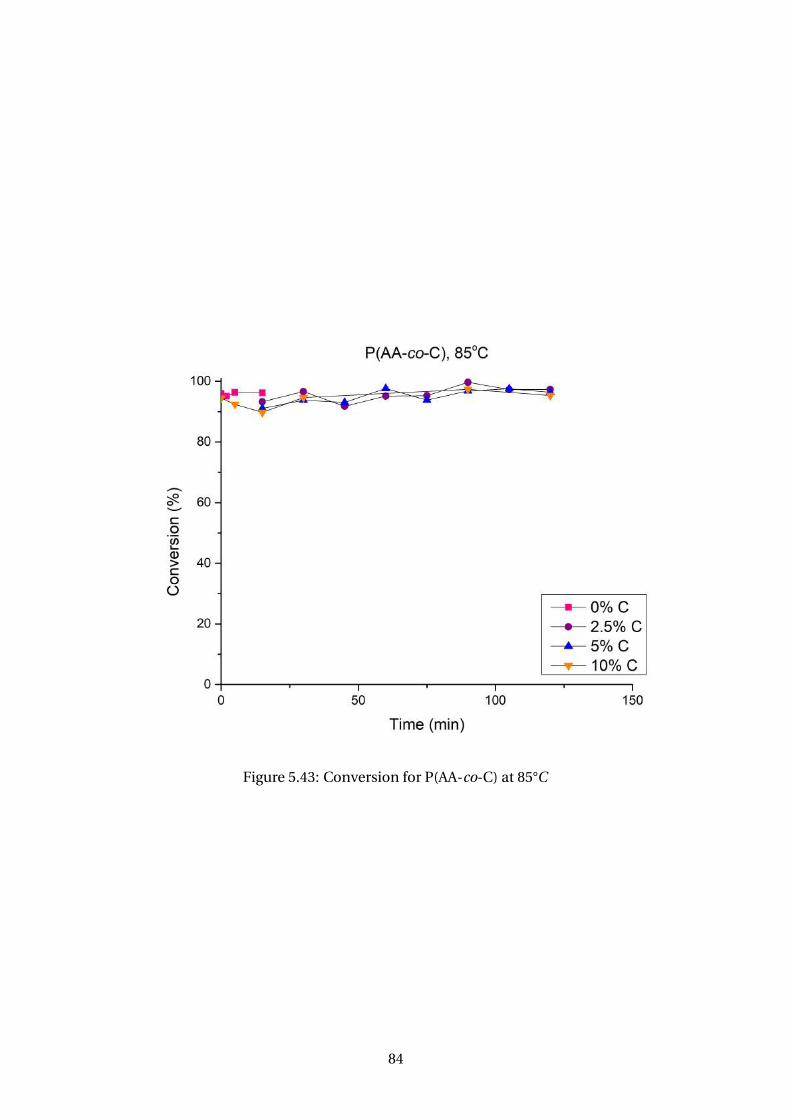
Figure 5.43: Conversion for P(AA-co-C) at 85°C
84
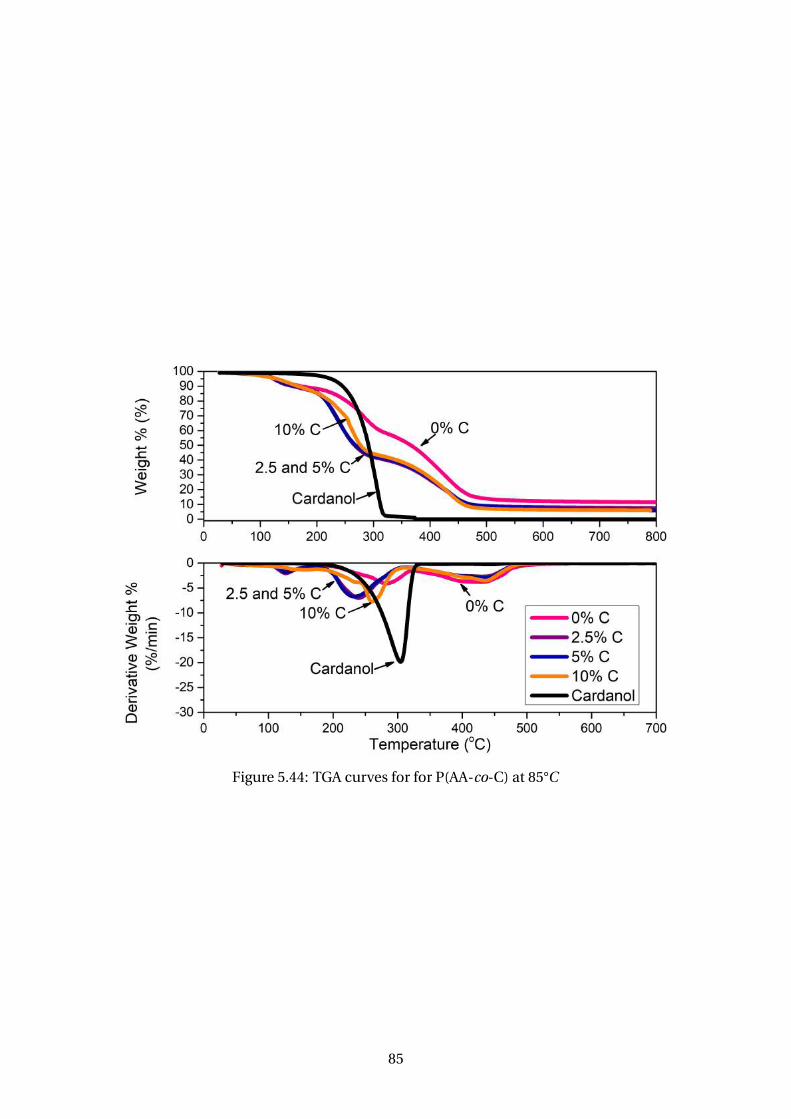
Figure 5.44: TGA curves for for P(AA-co-C) at 85°C
85
5.8 Concluding Remarks
In this chapter, it was shown that cardanol and other compounds of cashew nut
shell liquid truly reacts via free radicals polymerize. For the case of homopolymer-
ization of these compounds, they are very slow and reached very small conversions.
However, 1H-NMR, FTIR and TG analysis proved that there are differences between
the reaction product after 8 or 10 hours and the "raw" compound. However, they re-
tard and, most of the times (mainly at lower temperatures and high concentrations),
inhibits the polymerization. Nonetheless, besides the use of the synthesized copoly-
mers for functionalization of the molecules, the addition of cardanol or natural CNSL
can be also used to decrease the Tg or increase the thermal stability when required.
However, the copolymerization experiments with vinyl acetate was not satisfactory,
and cardanol does not increase the thermal stability of PAA.
Moreover, increasing the temperature of reaction does increase conversion, but
this does not translate in high differences in cardanol composition in the copolymer.
In fact, the composition remains almost the same or even smaller. Polymerization of
MMA with natural CNSL was very satisfactory, meaning that it obtained slight high
conversions and in thermal stabilities. Therefore, further tests with it may be interest-
ing.
Therefore, to summarize, copolymerization with cardanol or natural cashew nut
shell liquid happened with four different monomers. These phenolic compounds were
able to react with free radical through several reactive sites. The hydroxyl group was re-
sponsible for inhibition as its concentration was detected in FTIR analysis, forming a
carbonyl group. The last could not be seen in FTIR spectrums due to peak over leaping,
and it was not detected in 13C -NMR. Though not likely, the extra radical in the oxygen
atom (which was stabilized by the aromatic ring) might have formed an ether bond
if it propagated or terminated. Internal unsaturations, although had some steric hin-
drance, probably were attacked too. Due to the generation of a stable secondary radi-
cal, propagation or termination were not frequently. However, reduction in their inten-
sities were detected by 1H-NMR and FTIR analysis. The terminal unsaturation was the
functional group most likely to continue propagation and incorporate cardanol/ nat-
ural CNSL in polymeric chains. Although they are present in less than 50% in phenolic
lumps, it is considered that the whole lump is reactive because the compounds have
many reactive sites. The carboxylic group of anacardic acid in relation to cardanol did
not influence intensively on polymerization kinetics. On the contrary, it seems like the
carboxylic moiety helped decreasing the inhibition for 85°C. And although cardanol
or natural CNSL are provided as a complex mixture of natural compounds, possibly
including small amounts of other inhibitors, one must consider that it is not econom-
ically feasible to purify this natural stream any further prior to use.
86
Chapter 6
Bulk Copolymerization: Modeling
6.1 Introduction
In this chapter, it is proposed a mathematical dynamic model for the copolymer-
ization in bulk via free radical polymerization. It is used the terminal model and quasi-
steady state assumption. Based on experimental results, model parameters are esti-
mated to allow for appropriate description of monomer conversions, average molec-
ular weights and copolymer compositions of the produced copolymer. For methyl
methacrylate or styrene, classical thermal-kinetic parameters for the literate was used.
As cardanol behaved similar to natural CNSL, with the experimental data available the
result would also be similar. Therefore, along the chapter, the parameter estimation
will be referring to cardanol, but it can be valid for both. Regarding the parameters
related to cardanol, these parameters are not available in the literature, and either for
copolymerization. Plus, it was shown that those phenolic compounds exerts strong
inhibitory effects on polymerizations and this effect must be take into account. There-
fore it is estimated a parameter ( fi nh) that reduces the concentration of free living rad-
icals in the system.
Given the fact that other molecules may be eventually present in the naturally oc-
curring cardanol stream and that different reactive sites (such as the phenolic group)
can take part in the reaction mechanism, the whole cardanol stream was treated as
a lumped monomer stream for purposes of kinetic modeling. However, as cardanol
polymerizes at slow rates and only produces oligomers at the analyzed reaction con-
ditions through free-radical polymerizations, as observed experimentally; for the sake
of simplicity, some model parameters were initially assumed to be either null or equal
to the styrene polymerization parameters. Thus, the parameter estimation happened
using the computation package ESTIMA, implemented in Fortran, which combines
particle swarm optimization (PSO) and Gauss-Newton algorithms (SCHWAAB et al.,
2008). One hundred particles were used and two thousand iterations were carried out
87
with statistical confidence level of 95 %.
6.2 Kinetic Mechanism
The dynamic model proposed describe the copolymerization in bulk via free rad-
ical polymerization. For this, it uses the terminal model assuming that only the last
specie added to a living chain represents the reactivity of whole molecule that it be-
longs to. Therefore, the step of propagation is extended to represent the different reac-
tions between monomers and the reactive macro-radicals presented in the reactional
medium. Similarly, other steps including the reaction of a living species with another
molecule are also extended – termination, transfer to monomer, etc.
Every free radical polymerization initiated thermally by an initiator (BPO or AIBN),
includes the steps of initiation, propagation and termination. Depending on the
monomer used, thermal initiation may take place and should be included. Chain
transfer reactions (to one of the monomers or to impurities) do not influence largely
on the conversion; however, it changes the average molar mass. Therefore, a generic
kinetic mechanism is represented below by 19 equations. However, notice that the
thermal initiation is represented as it happens for styrene (Eq. 6.4).
Initiation:
Ikd−→ 2R (6.1)
R +M1kr1−−→ P1,0 (6.2)
R +M2kr2−−→Q0,1 (6.3)
3M1kdm−−−→ 2P∗
1,0 (6.4)
Propagation:
Pi , j +M1kp11−−→ Pi+1, j (6.5)
Pi , j +M2kp12−−→Qi , j+1 (6.6)
Qi , j +M1kp21−−→ Pi+1, j (6.7)
Qi , j +M2kp22−−→Qi , j+1 (6.8)
88
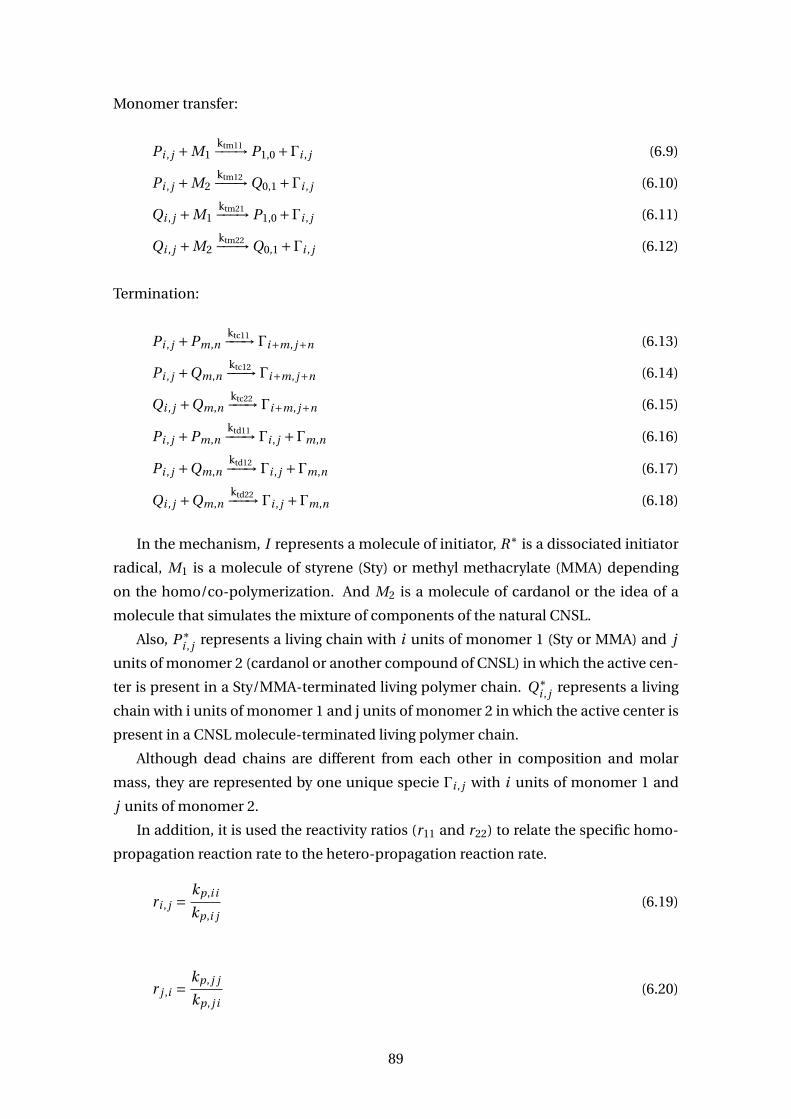
Monomer transfer:
Pi , j +M1ktm11−−−→ P1,0 +Γi , j (6.9)
Pi , j +M2ktm12−−−→Q0,1 +Γi , j (6.10)
Qi , j +M1ktm21−−−→ P1,0 +Γi , j (6.11)
Qi , j +M2ktm22−−−→Q0,1 +Γi , j (6.12)
Termination:
Pi , j +Pm,nktc11−−−→ Γi+m, j+n (6.13)
Pi , j +Qm,nktc12−−−→ Γi+m, j+n (6.14)
Qi , j +Qm,nktc22−−−→ Γi+m, j+n (6.15)
Pi , j +Pm,nktd11−−−→ Γi , j +Γm,n (6.16)
Pi , j +Qm,nktd12−−−→ Γi , j +Γm,n (6.17)
Qi , j +Qm,nktd22−−−→ Γi , j +Γm,n (6.18)
In the mechanism, I represents a molecule of initiator, R∗ is a dissociated initiator
radical, M1 is a molecule of styrene (Sty) or methyl methacrylate (MMA) depending
on the homo/co-polymerization. And M2 is a molecule of cardanol or the idea of a
molecule that simulates the mixture of components of the natural CNSL.
Also, P∗i , j represents a living chain with i units of monomer 1 (Sty or MMA) and j
units of monomer 2 (cardanol or another compound of CNSL) in which the active cen-
ter is present in a Sty/MMA-terminated living polymer chain. Q∗i , j represents a living
chain with i units of monomer 1 and j units of monomer 2 in which the active center is
present in a CNSL molecule-terminated living polymer chain.
Although dead chains are different from each other in composition and molar
mass, they are represented by one unique specie Γi , j with i units of monomer 1 and
j units of monomer 2.
In addition, it is used the reactivity ratios (r11 and r22) to relate the specific homo-
propagation reaction rate to the hetero-propagation reaction rate.
ri , j =kp,i i
kp,i j(6.19)
r j ,i =kp, j j
kp, j i(6.20)
89
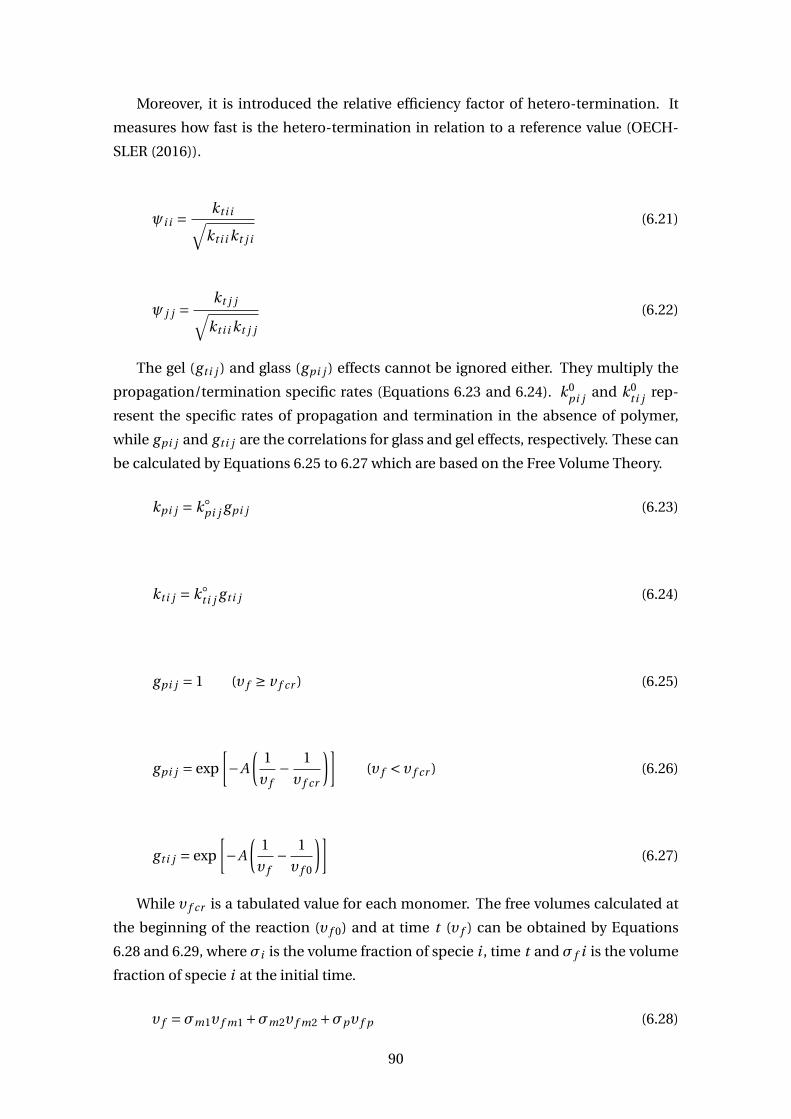
Moreover, it is introduced the relative efficiency factor of hetero-termination. It
measures how fast is the hetero-termination in relation to a reference value (OECH-
SLER (2016)).
ψi i = kt i i√kt i i kt j i
(6.21)
ψ j j =kt j j√
kt i i kt j j
(6.22)
The gel (g t i j ) and glass (gpi j ) effects cannot be ignored either. They multiply the
propagation/termination specific rates (Equations 6.23 and 6.24). k0pi j and k0
t i j rep-
resent the specific rates of propagation and termination in the absence of polymer,
while gpi j and g t i j are the correlations for glass and gel effects, respectively. These can
be calculated by Equations 6.25 to 6.27 which are based on the Free Volume Theory.
kpi j = kpi j gpi j (6.23)
kt i j = kt i j g t i j (6.24)
gpi j = 1 (υ f ≥ v f cr ) (6.25)
gpi j = exp
[−A
(1
υ f− 1
υ f cr
)](υ f < υ f cr ) (6.26)
g t i j = exp
[−A
(1
υ f− 1
υ f 0
)](6.27)
While υ f cr is a tabulated value for each monomer. The free volumes calculated at
the beginning of the reaction (υ f 0) and at time t (υ f ) can be obtained by Equations
6.28 and 6.29, where σi is the volume fraction of specie i , time t and σ f i is the volume
fraction of specie i at the initial time.
υ f =σm1υ f m1 +σm2υ f m2 +σpυ f p (6.28)
90
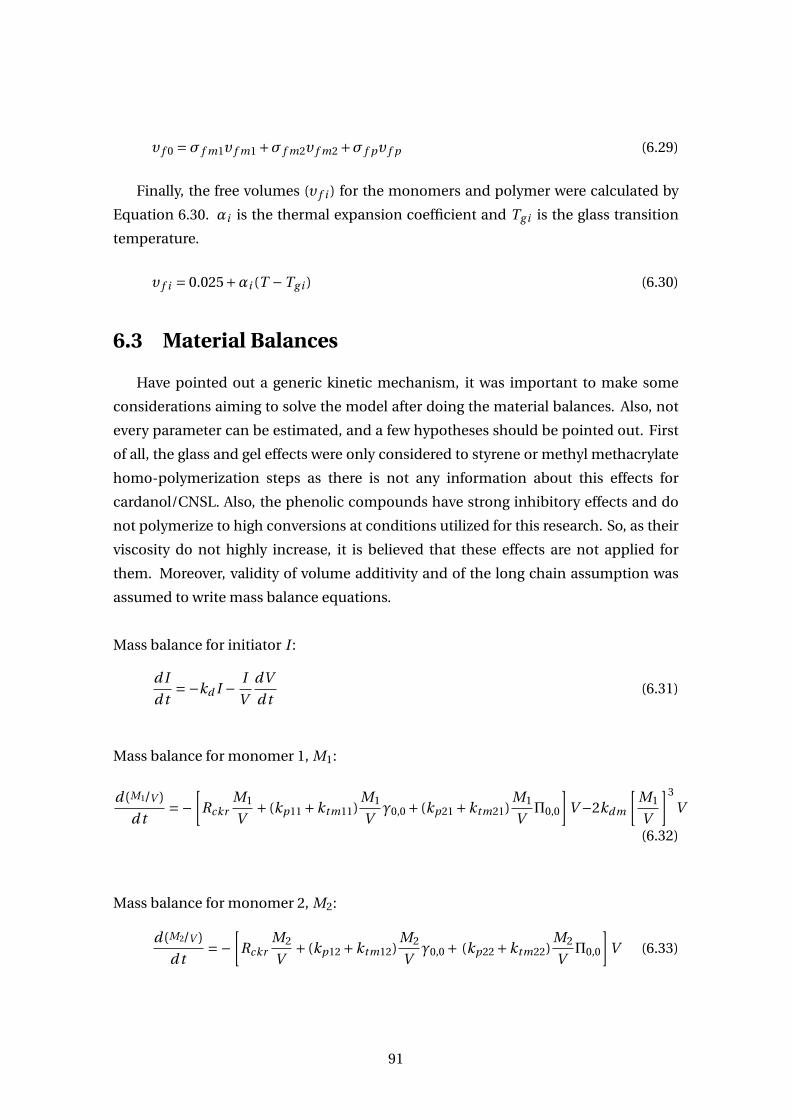
υ f 0 =σ f m1υ f m1 +σ f m2υ f m2 +σ f pυ f p (6.29)
Finally, the free volumes (υ f i ) for the monomers and polymer were calculated by
Equation 6.30. αi is the thermal expansion coefficient and Tg i is the glass transition
temperature.
υ f i = 0.025+αi (T −Tg i ) (6.30)
6.3 Material Balances
Have pointed out a generic kinetic mechanism, it was important to make some
considerations aiming to solve the model after doing the material balances. Also, not
every parameter can be estimated, and a few hypotheses should be pointed out. First
of all, the glass and gel effects were only considered to styrene or methyl methacrylate
homo-polymerization steps as there is not any information about this effects for
cardanol/CNSL. Also, the phenolic compounds have strong inhibitory effects and do
not polymerize to high conversions at conditions utilized for this research. So, as their
viscosity do not highly increase, it is believed that these effects are not applied for
them. Moreover, validity of volume additivity and of the long chain assumption was
assumed to write mass balance equations.
Mass balance for initiator I :
d I
d t=−kd I − I
V
dV
d t(6.31)
Mass balance for monomer 1, M1:
d(M1/V )
d t=−
[Rckr
M1
V+ (kp11 +ktm11)
M1
Vγ0,0 + (kp21 +ktm21)
M1
VΠ0,0
]V −2kdm
[M1
V
]3
V
(6.32)
Mass balance for monomer 2, M2:
d(M2/V )
d t=−
[Rckr
M2
V+ (kp12 +ktm12)
M2
Vγ0,0 + (kp22 +ktm22)
M2
VΠ0,0
]V (6.33)
91
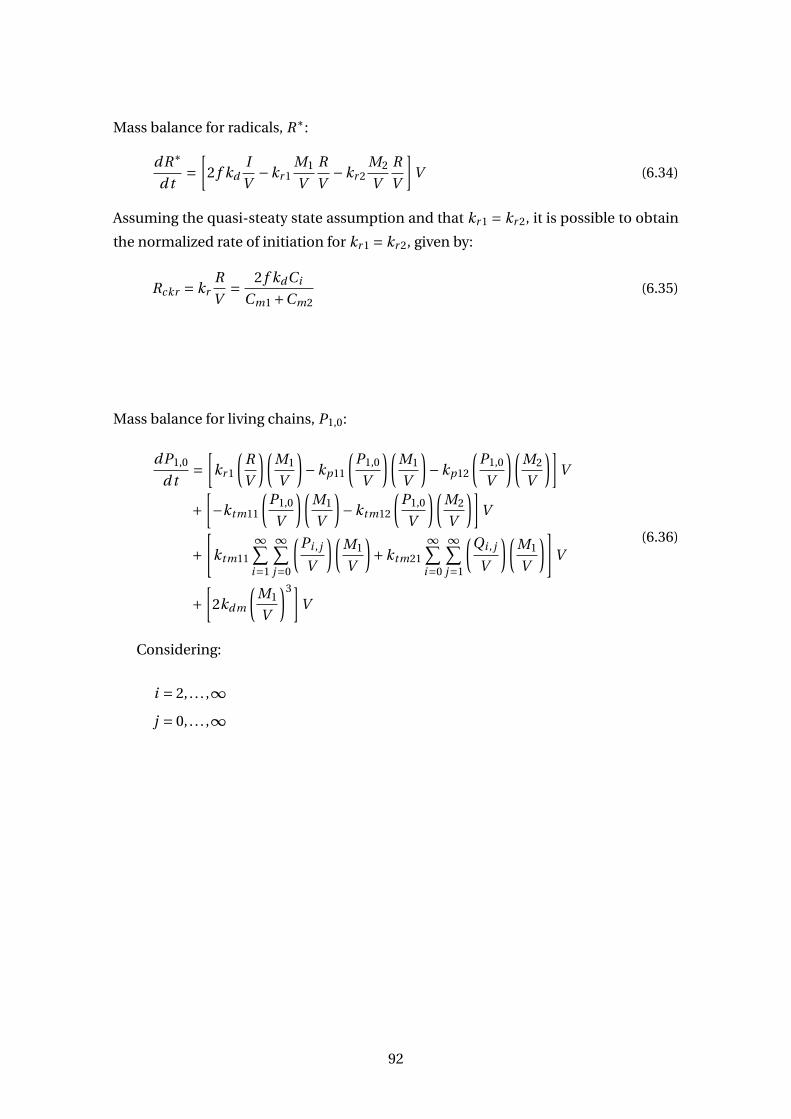
Mass balance for radicals, R∗:
dR∗
d t=
[2 f kd
I
V−kr 1
M1
V
R
V−kr 2
M2
V
R
V
]V (6.34)
Assuming the quasi-steaty state assumption and that kr 1 = kr 2, it is possible to obtain
the normalized rate of initiation for kr 1 = kr 2, given by:
Rckr = krR
V= 2 f kdCi
Cm1 +Cm2(6.35)
Mass balance for living chains, P1,0:
dP1,0
d t=
[kr 1
(R
V
)(M1
V
)−kp11
(P1,0
V
)(M1
V
)−kp12
(P1,0
V
)(M2
V
)]V
+[−ktm11
(P1,0
V
)(M1
V
)−ktm12
(P1,0
V
)(M2
V
)]V
+[
ktm11
∞∑i=1
∞∑j=0
(Pi , j
V
)(M1
V
)+ktm21
∞∑i=0
∞∑j=1
(Qi , j
V
)(M1
V
)]V
+[
2kdm
(M1
V
)3]V
(6.36)
Considering:
i = 2, . . . ,∞j = 0, . . . ,∞
92
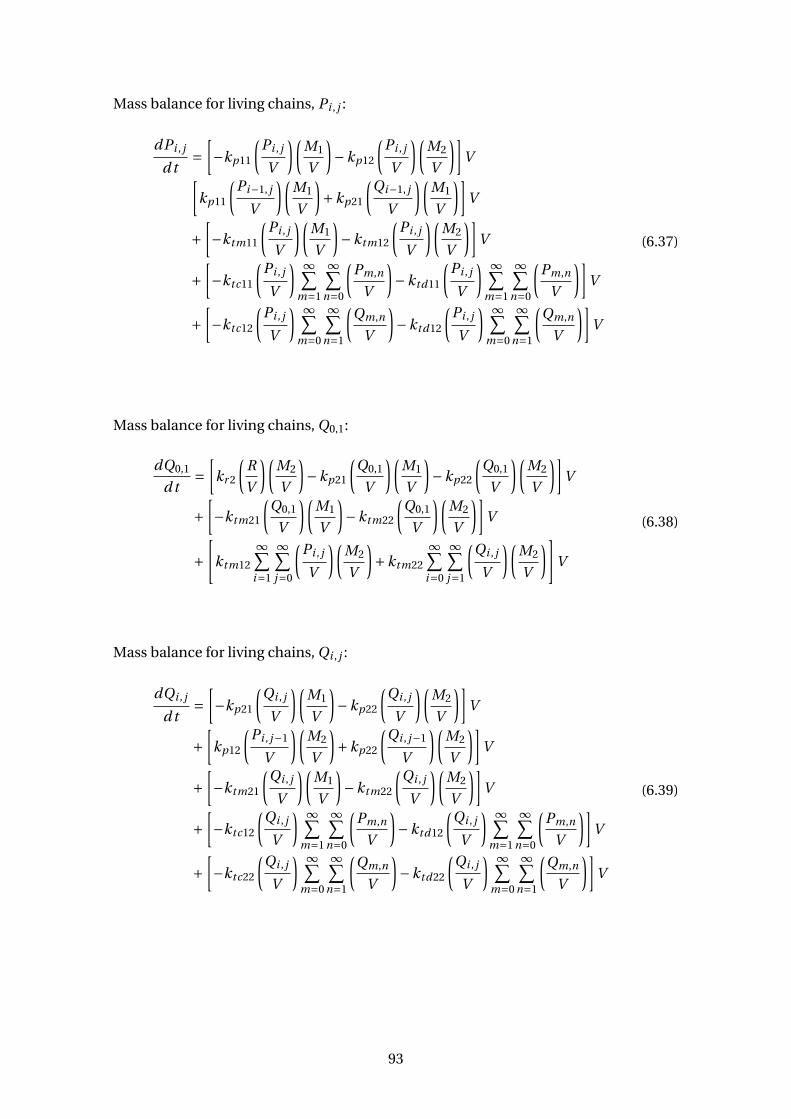
Mass balance for living chains, Pi , j :
dPi , j
d t=
[−kp11
(Pi , j
V
)(M1
V
)−kp12
(Pi , j
V
)(M2
V
)]V[
kp11
(Pi−1, j
V
)(M1
V
)+kp21
(Qi−1, j
V
)(M1
V
)]V
+[−ktm11
(Pi , j
V
)(M1
V
)−ktm12
(Pi , j
V
)(M2
V
)]V
+[−ktc11
(Pi , j
V
) ∞∑m=1
∞∑n=0
(Pm,n
V
)−ktd11
(Pi , j
V
) ∞∑m=1
∞∑n=0
(Pm,n
V
)]V
+[−ktc12
(Pi , j
V
) ∞∑m=0
∞∑n=1
(Qm,n
V
)−ktd12
(Pi , j
V
) ∞∑m=0
∞∑n=1
(Qm,n
V
)]V
(6.37)
Mass balance for living chains, Q0,1:
dQ0,1
d t=
[kr 2
(R
V
)(M2
V
)−kp21
(Q0,1
V
)(M1
V
)−kp22
(Q0,1
V
)(M2
V
)]V
+[−ktm21
(Q0,1
V
)(M1
V
)−ktm22
(Q0,1
V
)(M2
V
)]V
+[
ktm12
∞∑i=1
∞∑j=0
(Pi , j
V
)(M2
V
)+ktm22
∞∑i=0
∞∑j=1
(Qi , j
V
)(M2
V
)]V
(6.38)
Mass balance for living chains, Qi , j :
dQi , j
d t=
[−kp21
(Qi , j
V
)(M1
V
)−kp22
(Qi , j
V
)(M2
V
)]V
+[
kp12
(Pi , j−1
V
)(M2
V
)+kp22
(Qi , j−1
V
)(M2
V
)]V
+[−ktm21
(Qi , j
V
)(M1
V
)−ktm22
(Qi , j
V
)(M2
V
)]V
+[−ktc12
(Qi , j
V
) ∞∑m=1
∞∑n=0
(Pm,n
V
)−ktd12
(Qi , j
V
) ∞∑m=1
∞∑n=0
(Pm,n
V
)]V
+[−ktc22
(Qi , j
V
) ∞∑m=0
∞∑n=1
(Qm,n
V
)−ktd22
(Qi , j
V
) ∞∑m=0
∞∑n=1
(Qm,n
V
)]V
(6.39)
93
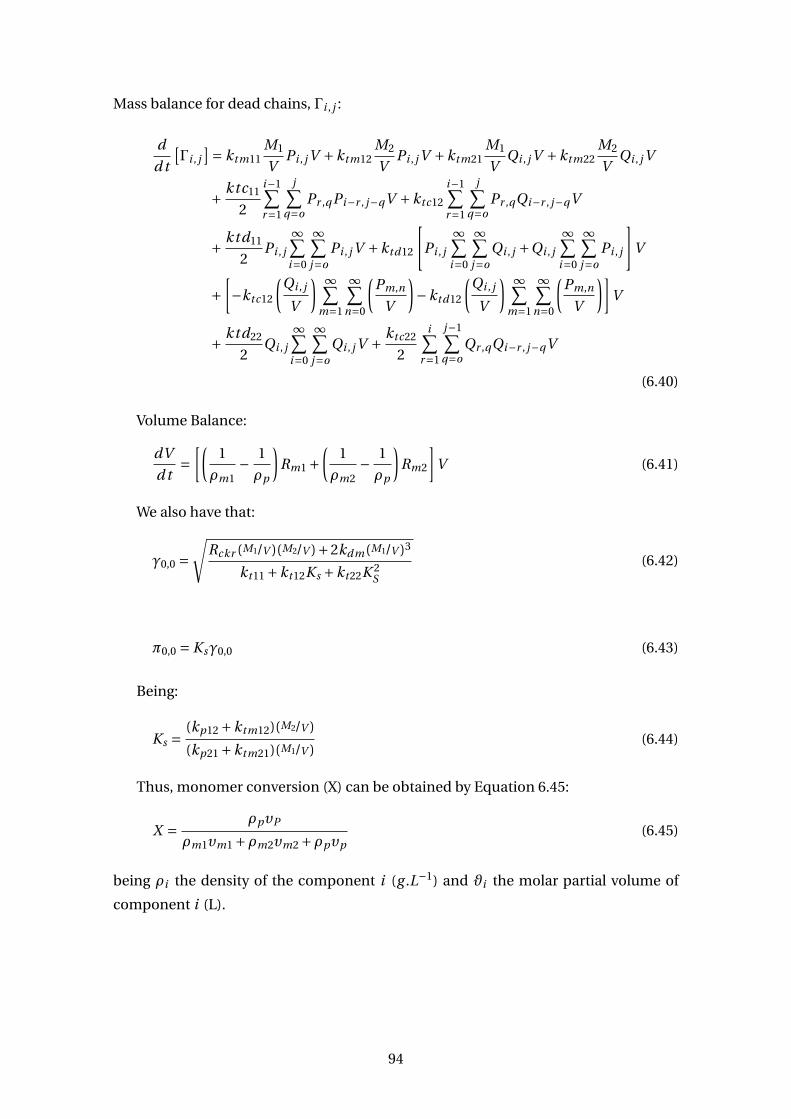
Mass balance for dead chains, Γi , j :
d
d t
[Γi , j
]= ktm11M1
VPi , j V +ktm12
M2
VPi , j V +ktm21
M1
VQi , j V +ktm22
M2
VQi , j V
+ ktc11
2
i−1∑r=1
j∑q=o
Pr ,q Pi−r , j−qV +ktc12
i−1∑r=1
j∑q=o
Pr ,qQi−r , j−qV
+ ktd11
2Pi , j
∞∑i=0
∞∑j=o
Pi , j V +ktd12
[Pi , j
∞∑i=0
∞∑j=o
Qi , j +Qi , j
∞∑i=0
∞∑j=o
Pi , j
]V
+[−ktc12
(Qi , j
V
) ∞∑m=1
∞∑n=0
(Pm,n
V
)−ktd12
(Qi , j
V
) ∞∑m=1
∞∑n=0
(Pm,n
V
)]V
+ ktd22
2Qi , j
∞∑i=0
∞∑j=o
Qi , j V + ktc22
2
i∑r=1
j−1∑q=o
Qr ,qQi−r , j−qV
(6.40)
Volume Balance:
dV
d t=
[(1
ρm1− 1
ρp
)Rm1 +
(1
ρm2− 1
ρp
)Rm2
]V (6.41)
We also have that:
γ0,0 =√
Rckr (M1/V )(M2/V )+2kdm(M1/V )3
kt11 +kt12Ks +kt22K 2S
(6.42)
π0,0 = Ksγ0,0 (6.43)
Being:
Ks =(kp12 +ktm12)(M2/V )
(kp21 +ktm21)(M1/V )(6.44)
Thus, monomer conversion (X) can be obtained by Equation 6.45:
X = ρpυP
ρm1υm1 +ρm2υm2 +ρpυp(6.45)
being ρi the density of the component i (g .L−1) and ϑi the molar partial volume of
component i (L).
94
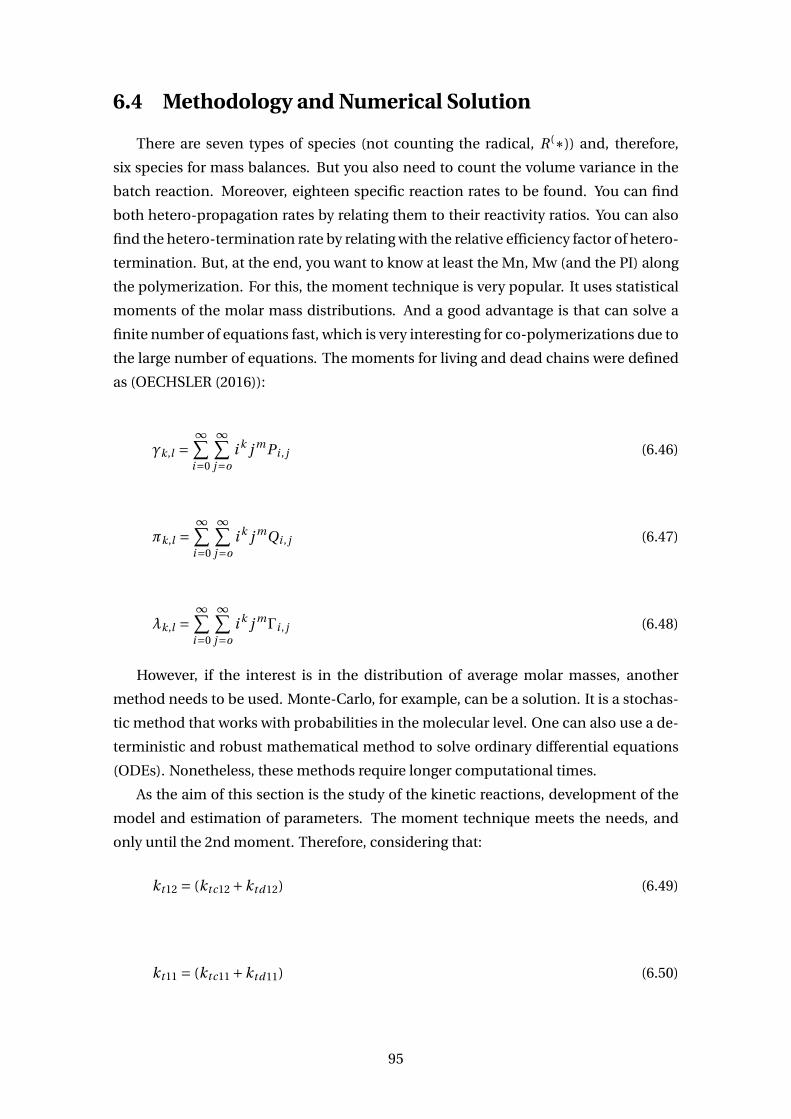
6.4 Methodology and Numerical Solution
There are seven types of species (not counting the radical, R(∗)) and, therefore,
six species for mass balances. But you also need to count the volume variance in the
batch reaction. Moreover, eighteen specific reaction rates to be found. You can find
both hetero-propagation rates by relating them to their reactivity ratios. You can also
find the hetero-termination rate by relating with the relative efficiency factor of hetero-
termination. But, at the end, you want to know at least the Mn, Mw (and the PI) along
the polymerization. For this, the moment technique is very popular. It uses statistical
moments of the molar mass distributions. And a good advantage is that can solve a
finite number of equations fast, which is very interesting for co-polymerizations due to
the large number of equations. The moments for living and dead chains were defined
as (OECHSLER (2016)):
γk,l =∞∑
i=0
∞∑j=o
i k j mPi , j (6.46)
πk,l =∞∑
i=0
∞∑j=o
i k j mQi , j (6.47)
λk,l =∞∑
i=0
∞∑j=o
i k j mΓi , j (6.48)
However, if the interest is in the distribution of average molar masses, another
method needs to be used. Monte-Carlo, for example, can be a solution. It is a stochas-
tic method that works with probabilities in the molecular level. One can also use a de-
terministic and robust mathematical method to solve ordinary differential equations
(ODEs). Nonetheless, these methods require longer computational times.
As the aim of this section is the study of the kinetic reactions, development of the
model and estimation of parameters. The moment technique meets the needs, and
only until the 2nd moment. Therefore, considering that:
kt12 = (ktc12 +ktd12) (6.49)
kt11 = (ktc11 +ktd11) (6.50)
95
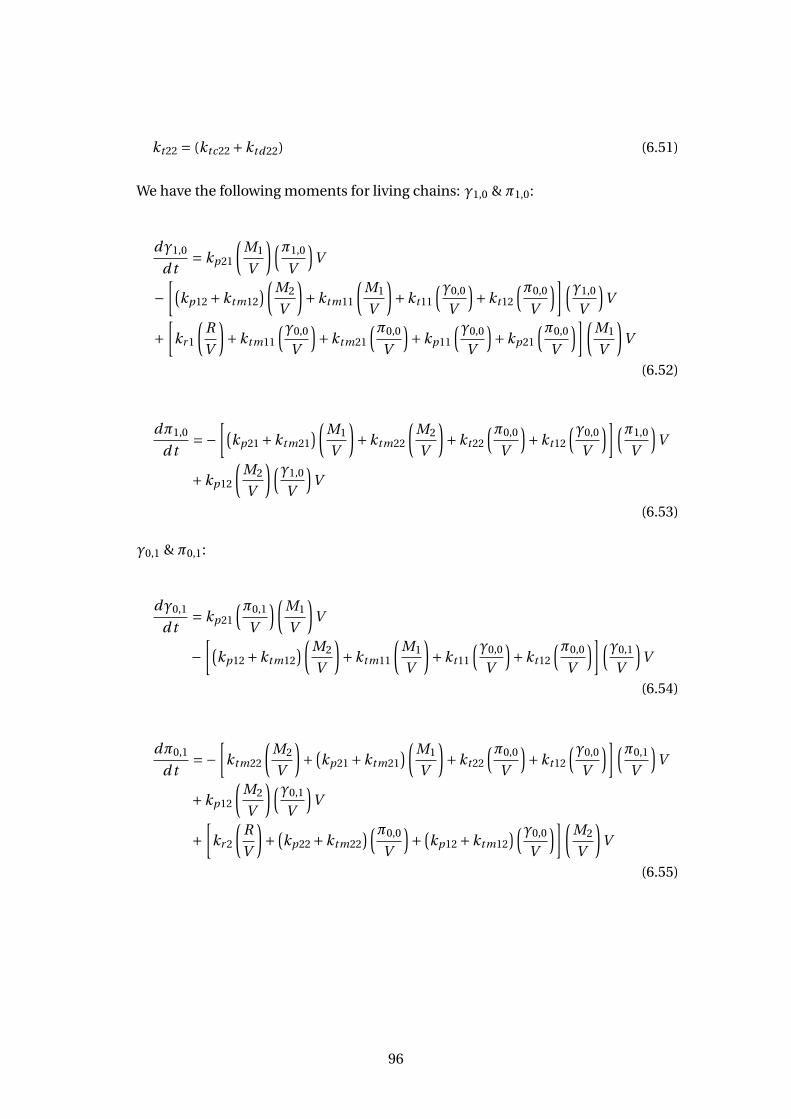
kt22 = (ktc22 +ktd22) (6.51)
We have the following moments for living chains: γ1,0 & π1,0:
dγ1,0
d t= kp21
(M1
V
)(π1,0
V
)V
−[(
kp12 +ktm12)(M2
V
)+ktm11
(M1
V
)+kt11
(γ0,0
V
)+kt12
(π0,0
V
)](γ1,0
V
)V
+[
kr 1
(R
V
)+ktm11
(γ0,0
V
)+ktm21
(π0,0
V
)+kp11
(γ0,0
V
)+kp21
(π0,0
V
)](M1
V
)V
(6.52)
dπ1,0
d t=−
[(kp21 +ktm21
)(M1
V
)+ktm22
(M2
V
)+kt22
(π0,0
V
)+kt12
(γ0,0
V
)](π1,0
V
)V
+kp12
(M2
V
)(γ1,0
V
)V
(6.53)
γ0,1 & π0,1:
dγ0,1
d t= kp21
(π0,1
V
)(M1
V
)V
−[(
kp12 +ktm12)(M2
V
)+ktm11
(M1
V
)+kt11
(γ0,0
V
)+kt12
(π0,0
V
)](γ0,1
V
)V
(6.54)
dπ0,1
d t=−
[ktm22
(M2
V
)+ (
kp21 +ktm21)(M1
V
)+kt22
(π0,0
V
)+kt12
(γ0,0
V
)](π0,1
V
)V
+kp12
(M2
V
)(γ0,1
V
)V
+[
kr 2
(R
V
)+ (
kp22 +ktm22)(π0,0
V
)+ (
kp12 +ktm12)(γ0,0
V
)](M2
V
)V
(6.55)
96
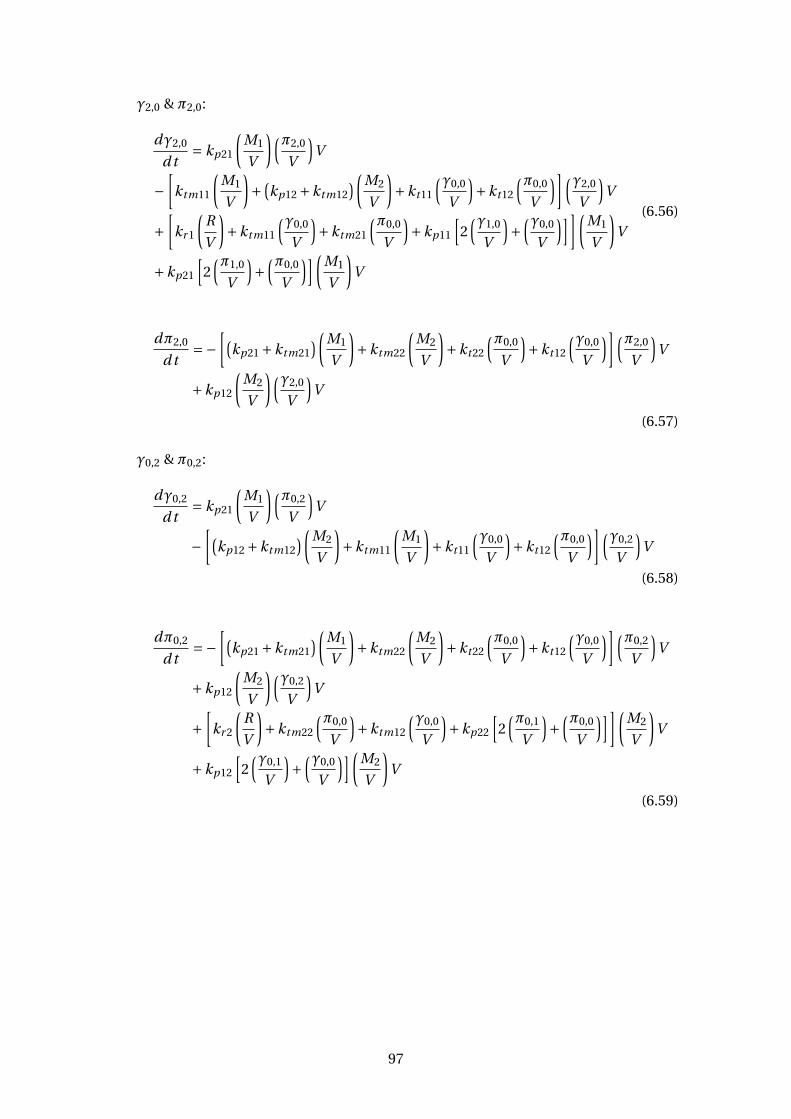
γ2,0 & π2,0:
dγ2,0
d t= kp21
(M1
V
)(π2,0
V
)V
−[
ktm11
(M1
V
)+ (
kp12 +ktm12)(M2
V
)+kt11
(γ0,0
V
)+kt12
(π0,0
V
)](γ2,0
V
)V
+[
kr 1
(R
V
)+ktm11
(γ0,0
V
)+ktm21
(π0,0
V
)+kp11
[2(γ1,0
V
)+
(γ0,0
V
)]](M1
V
)V
+kp21
[2(π1,0
V
)+
(π0,0
V
)](M1
V
)V
(6.56)
dπ2,0
d t=−
[(kp21 +ktm21
)(M1
V
)+ktm22
(M2
V
)+kt22
(π0,0
V
)+kt12
(γ0,0
V
)](π2,0
V
)V
+kp12
(M2
V
)(γ2,0
V
)V
(6.57)
γ0,2 & π0,2:
dγ0,2
d t= kp21
(M1
V
)(π0,2
V
)V
−[(
kp12 +ktm12)(M2
V
)+ktm11
(M1
V
)+kt11
(γ0,0
V
)+kt12
(π0,0
V
)](γ0,2
V
)V
(6.58)
dπ0,2
d t=−
[(kp21 +ktm21
)(M1
V
)+ktm22
(M2
V
)+kt22
(π0,0
V
)+kt12
(γ0,0
V
)](π0,2
V
)V
+kp12
(M2
V
)(γ0,2
V
)V
+[
kr 2
(R
V
)+ktm22
(π0,0
V
)+ktm12
(γ0,0
V
)+kp22
[2(π0,1
V
)+
(π0,0
V
)]](M2
V
)V
+kp12
[2(γ0,1
V
)+
(γ0,0
V
)](M2
V
)V
(6.59)
97
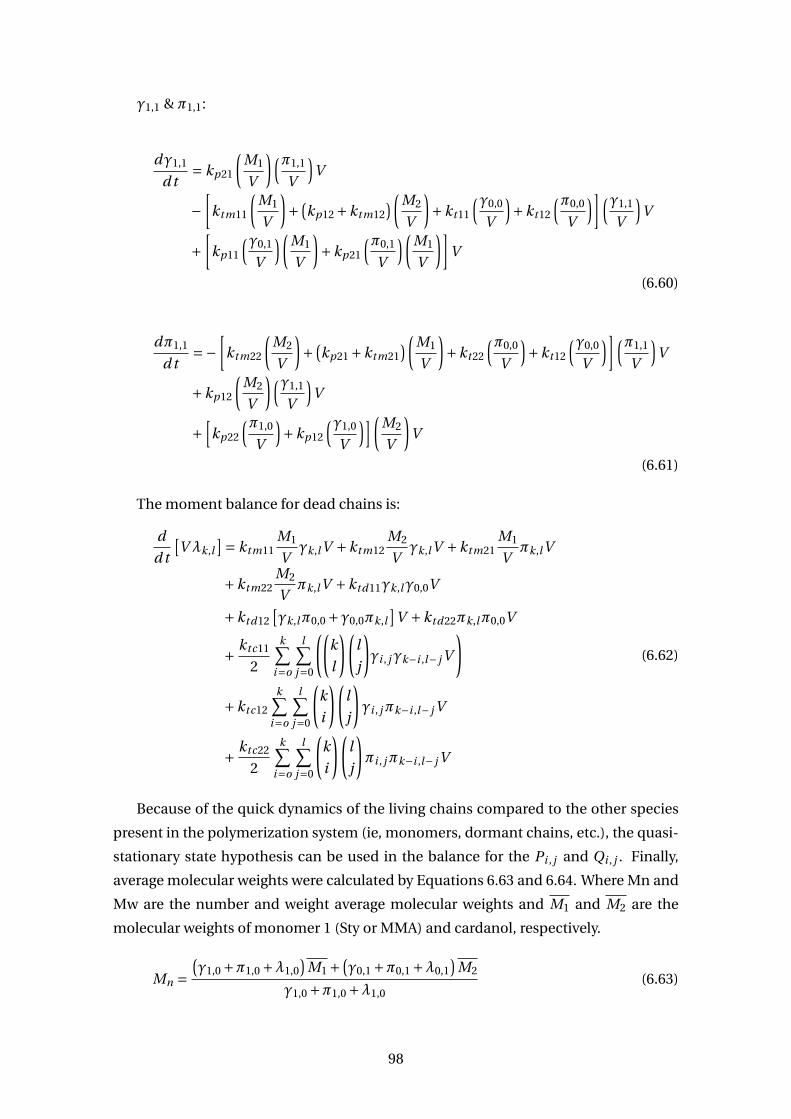
γ1,1 & π1,1:
dγ1,1
d t= kp21
(M1
V
)(π1,1
V
)V
−[
ktm11
(M1
V
)+ (
kp12 +ktm12)(M2
V
)+kt11
(γ0,0
V
)+kt12
(π0,0
V
)](γ1,1
V
)V
+[
kp11
(γ0,1
V
)(M1
V
)+kp21
(π0,1
V
)(M1
V
)]V
(6.60)
dπ1,1
d t=−
[ktm22
(M2
V
)+ (
kp21 +ktm21)(M1
V
)+kt22
(π0,0
V
)+kt12
(γ0,0
V
)](π1,1
V
)V
+kp12
(M2
V
)(γ1,1
V
)V
+[
kp22
(π1,0
V
)+kp12
(γ1,0
V
)](M2
V
)V
(6.61)
The moment balance for dead chains is:
d
d t
[V λk,l
]= ktm11M1
Vγk,l V +ktm12
M2
Vγk,l V +ktm21
M1
Vπk,l V
+ktm22M2
Vπk,l V +ktd11γk,lγ0,0V
+ktd12[γk,lπ0,0 +γ0,0πk,l
]V +ktd22πk,lπ0,0V
+ ktc11
2
k∑i=o
l∑j=0
((k
l
)(l
j
)γi , jγk−i ,l− j V
)
+ktc12
k∑i=o
l∑j=0
(k
i
)(l
j
)γi , jπk−i ,l− j V
+ ktc22
2
k∑i=o
l∑j=0
(k
i
)(l
j
)πi , jπk−i ,l− j V
(6.62)
Because of the quick dynamics of the living chains compared to the other species
present in the polymerization system (ie, monomers, dormant chains, etc.), the quasi-
stationary state hypothesis can be used in the balance for the Pi , j and Qi , j . Finally,
average molecular weights were calculated by Equations 6.63 and 6.64. Where Mn and
Mw are the number and weight average molecular weights and M1 and M2 are the
molecular weights of monomer 1 (Sty or MMA) and cardanol, respectively.
Mn =(γ1,0 +π1,0 +λ1,0
)M1 +
(γ0,1 +π0,1 +λ0,1
)M2
γ1,0 +π1,0 +λ1,0(6.63)
98
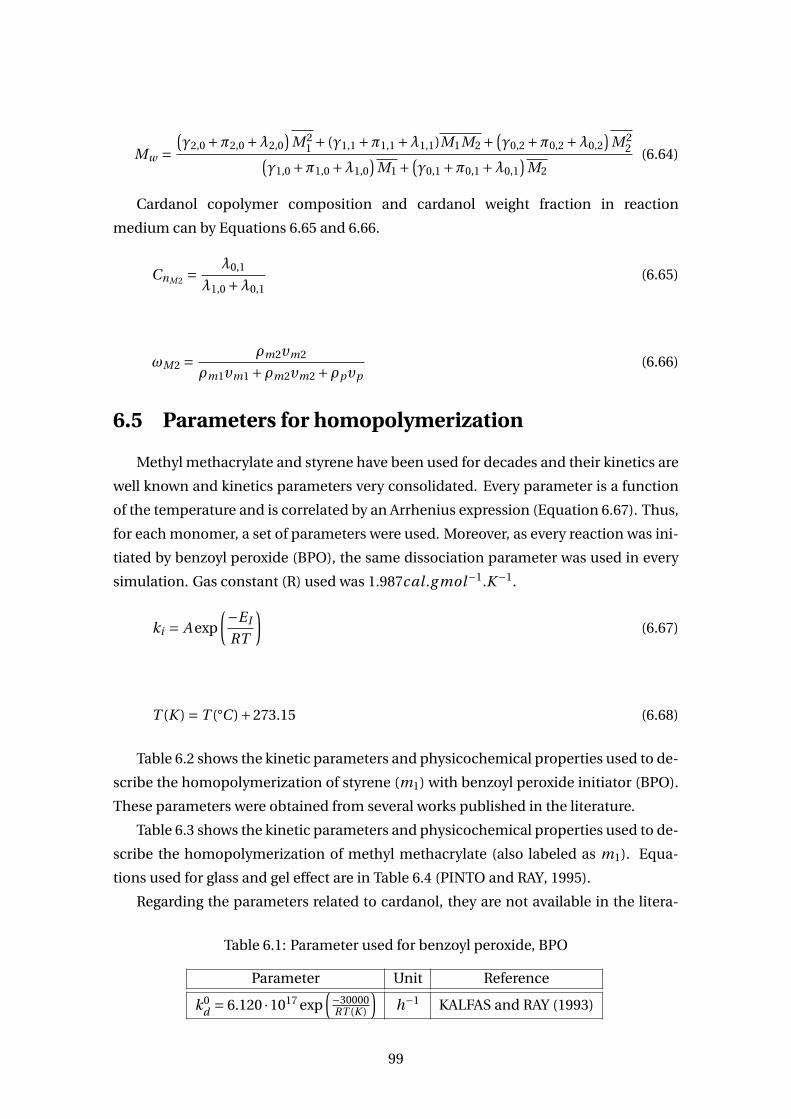
Mw =(γ2,0 +π2,0 +λ2,0
)M 2
1 + (γ1,1 +π1,1 +λ1,1)M1M2 +(γ0,2 +π0,2 +λ0,2
)M 2
2(γ1,0 +π1,0 +λ1,0
)M1 +
(γ0,1 +π0,1 +λ0,1
)M2
(6.64)
Cardanol copolymer composition and cardanol weight fraction in reaction
medium can by Equations 6.65 and 6.66.
CnM2 =λ0,1
λ1,0 +λ0,1(6.65)
ωM2 = ρm2υm2
ρm1υm1 +ρm2υm2 +ρpυp(6.66)
6.5 Parameters for homopolymerization
Methyl methacrylate and styrene have been used for decades and their kinetics are
well known and kinetics parameters very consolidated. Every parameter is a function
of the temperature and is correlated by an Arrhenius expression (Equation 6.67). Thus,
for each monomer, a set of parameters were used. Moreover, as every reaction was ini-
tiated by benzoyl peroxide (BPO), the same dissociation parameter was used in every
simulation. Gas constant (R) used was 1.987cal .g mol−1.K −1.
ki = A exp
(−E I
RT
)(6.67)
T (K ) = T (°C )+273.15 (6.68)
Table 6.2 shows the kinetic parameters and physicochemical properties used to de-
scribe the homopolymerization of styrene (m1) with benzoyl peroxide initiator (BPO).
These parameters were obtained from several works published in the literature.
Table 6.3 shows the kinetic parameters and physicochemical properties used to de-
scribe the homopolymerization of methyl methacrylate (also labeled as m1). Equa-
tions used for glass and gel effect are in Table 6.4 (PINTO and RAY, 1995).
Regarding the parameters related to cardanol, they are not available in the litera-
Table 6.1: Parameter used for benzoyl peroxide, BPO
Parameter Unit Reference
k0d = 6.120 ·1017 exp
(−30000RT (K )
)h−1 KALFAS and RAY (1993)
99
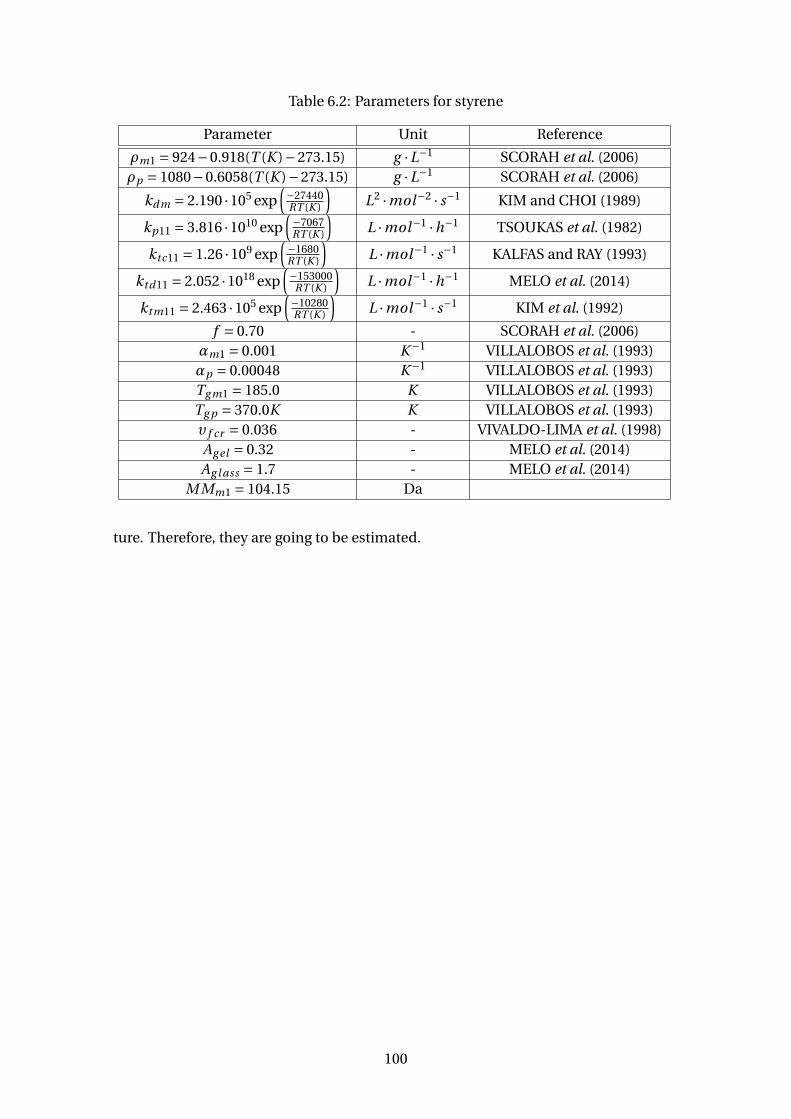
Table 6.2: Parameters for styrene
Parameter Unit Reference
ρm1 = 924−0.918(T (K )−273.15) g ·L−1 SCORAH et al. (2006)ρp = 1080−0.6058(T (K )−273.15) g ·L−1 SCORAH et al. (2006)
kdm = 2.190 ·105 exp(−27440RT (K )
)L2 ·mol−2 · s−1 KIM and CHOI (1989)
kp11 = 3.816 ·1010 exp(−7067RT (K )
)L ·mol−1 ·h−1 TSOUKAS et al. (1982)
ktc11 = 1.26 ·109 exp(−1680RT (K )
)L ·mol−1 · s−1 KALFAS and RAY (1993)
ktd11 = 2.052 ·1018 exp(−153000
RT (K )
)L ·mol−1 ·h−1 MELO et al. (2014)
ktm11 = 2.463 ·105 exp(−10280RT (K )
)L ·mol−1 · s−1 KIM et al. (1992)
f = 0.70 - SCORAH et al. (2006)αm1 = 0.001 K −1 VILLALOBOS et al. (1993)αp = 0.00048 K −1 VILLALOBOS et al. (1993)Tg m1 = 185.0 K VILLALOBOS et al. (1993)Tg p = 370.0K K VILLALOBOS et al. (1993)υ f cr = 0.036 - VIVALDO-LIMA et al. (1998)Ag el = 0.32 - MELO et al. (2014)Ag l ass = 1.7 - MELO et al. (2014)
M Mm1 = 104.15 Da
ture. Therefore, they are going to be estimated.
100
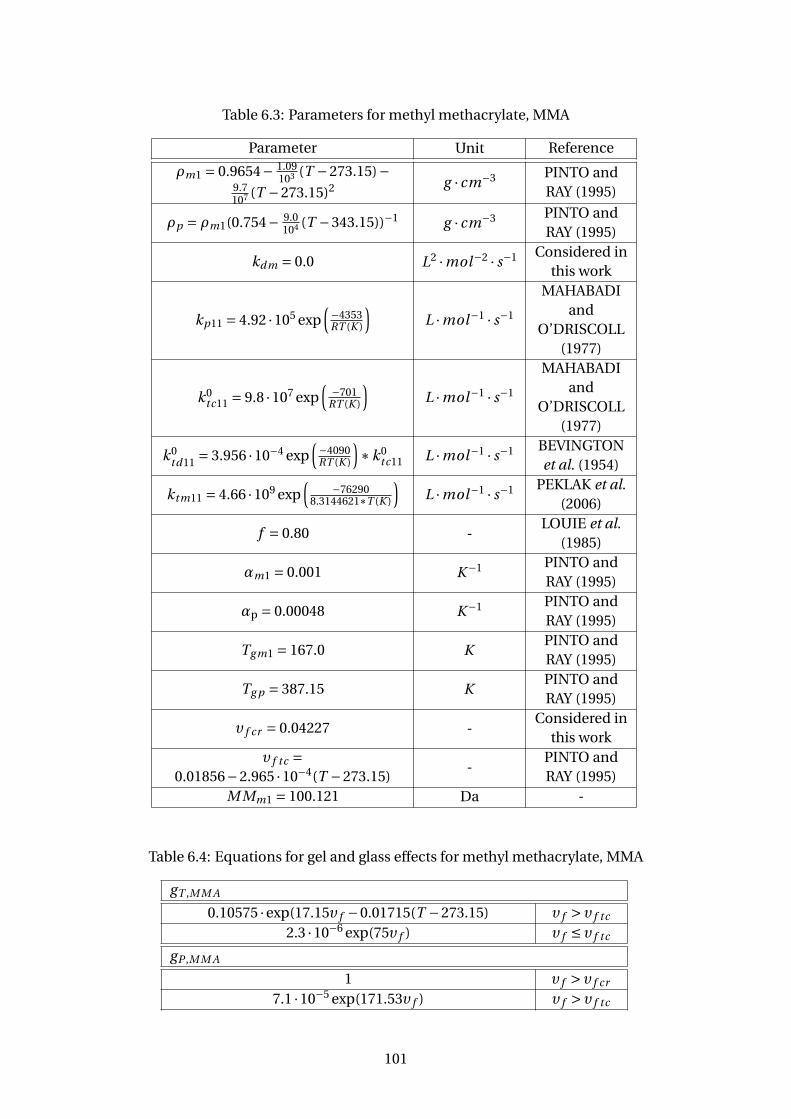
Table 6.3: Parameters for methyl methacrylate, MMA
Parameter Unit Reference
ρm1 = 0.9654− 1.09103 (T −273.15)−
9.7107 (T −273.15)2 g · cm−3 PINTO and
RAY (1995)
ρp = ρm1(0.754− 9.0104 (T −343.15))−1 g · cm−3 PINTO and
RAY (1995)
kdm = 0.0 L2 ·mol−2 · s−1 Considered inthis work
kp11 = 4.92 ·105 exp(−4353RT (K )
)L ·mol−1 · s−1
MAHABADIand
O’DRISCOLL(1977)
k0tc11 = 9.8 ·107 exp
(−701
RT (K )
)L ·mol−1 · s−1
MAHABADIand
O’DRISCOLL(1977)
k0td11 = 3.956 ·10−4 exp
(−4090RT (K )
)∗k0
tc11 L ·mol−1 · s−1 BEVINGTONet al. (1954)
ktm11 = 4.66 ·109 exp(
−762908.3144621∗T (K )
)L ·mol−1 · s−1 PEKLAK et al.
(2006)
f = 0.80 -LOUIE et al.
(1985)
αm1 = 0.001 K −1 PINTO andRAY (1995)
αp = 0.00048 K −1 PINTO andRAY (1995)
Tg m1 = 167.0 KPINTO andRAY (1995)
Tg p = 387.15 KPINTO andRAY (1995)
υ f cr = 0.04227 -Considered in
this workυ f tc =
0.01856−2.965 ·10−4(T −273.15)-
PINTO andRAY (1995)
M Mm1 = 100.121 Da -
Table 6.4: Equations for gel and glass effects for methyl methacrylate, MMA
gT ,M M A
0.10575 ·exp(17.15υ f −0.01715(T −273.15) υ f > υ f tc
2.3 ·10−6 exp(75υ f ) υ f ≤ υ f tc
gP ,M M A
1 υ f > υ f cr
7.1 ·10−5 exp(171.53υ f ) υ f > υ f tc
101
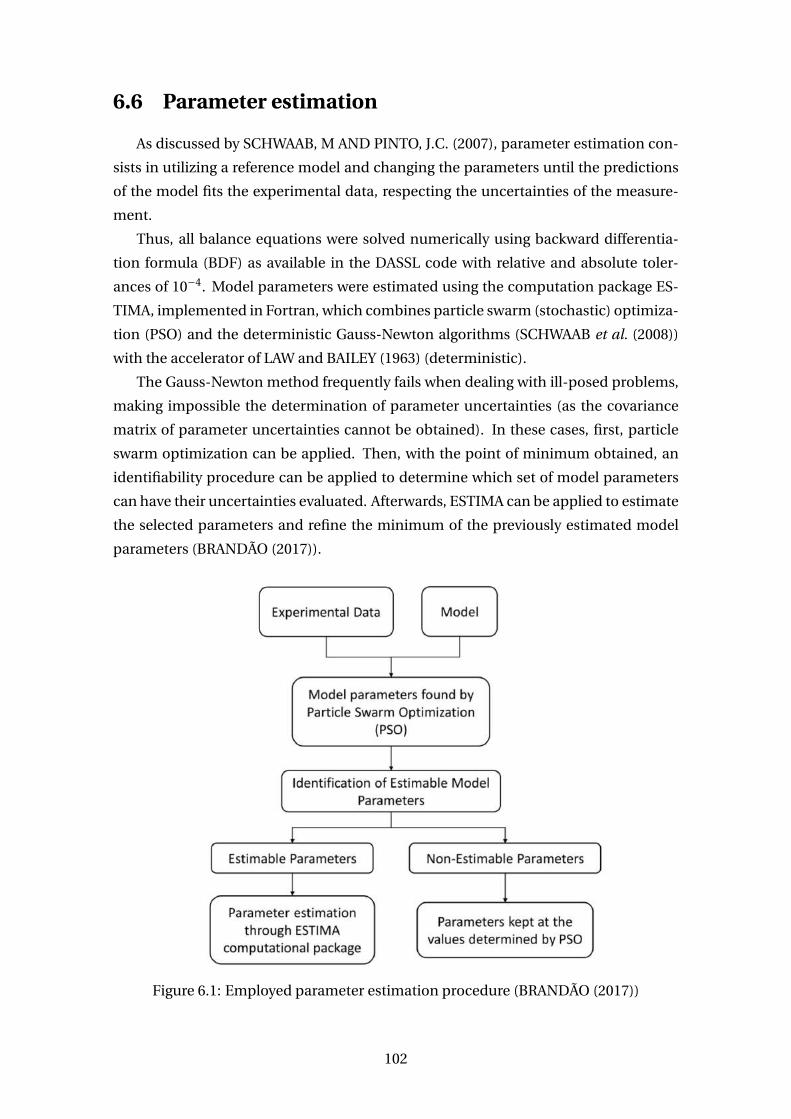
6.6 Parameter estimation
As discussed by SCHWAAB, M AND PINTO, J.C. (2007), parameter estimation con-
sists in utilizing a reference model and changing the parameters until the predictions
of the model fits the experimental data, respecting the uncertainties of the measure-
ment.
Thus, all balance equations were solved numerically using backward differentia-
tion formula (BDF) as available in the DASSL code with relative and absolute toler-
ances of 10−4. Model parameters were estimated using the computation package ES-
TIMA, implemented in Fortran, which combines particle swarm (stochastic) optimiza-
tion (PSO) and the deterministic Gauss-Newton algorithms (SCHWAAB et al. (2008))
with the accelerator of LAW and BAILEY (1963) (deterministic).
The Gauss-Newton method frequently fails when dealing with ill-posed problems,
making impossible the determination of parameter uncertainties (as the covariance
matrix of parameter uncertainties cannot be obtained). In these cases, first, particle
swarm optimization can be applied. Then, with the point of minimum obtained, an
identifiability procedure can be applied to determine which set of model parameters
can have their uncertainties evaluated. Afterwards, ESTIMA can be applied to estimate
the selected parameters and refine the minimum of the previously estimated model
parameters (BRANDÃO (2017)).
Figure 6.1: Employed parameter estimation procedure (BRANDÃO (2017))
102
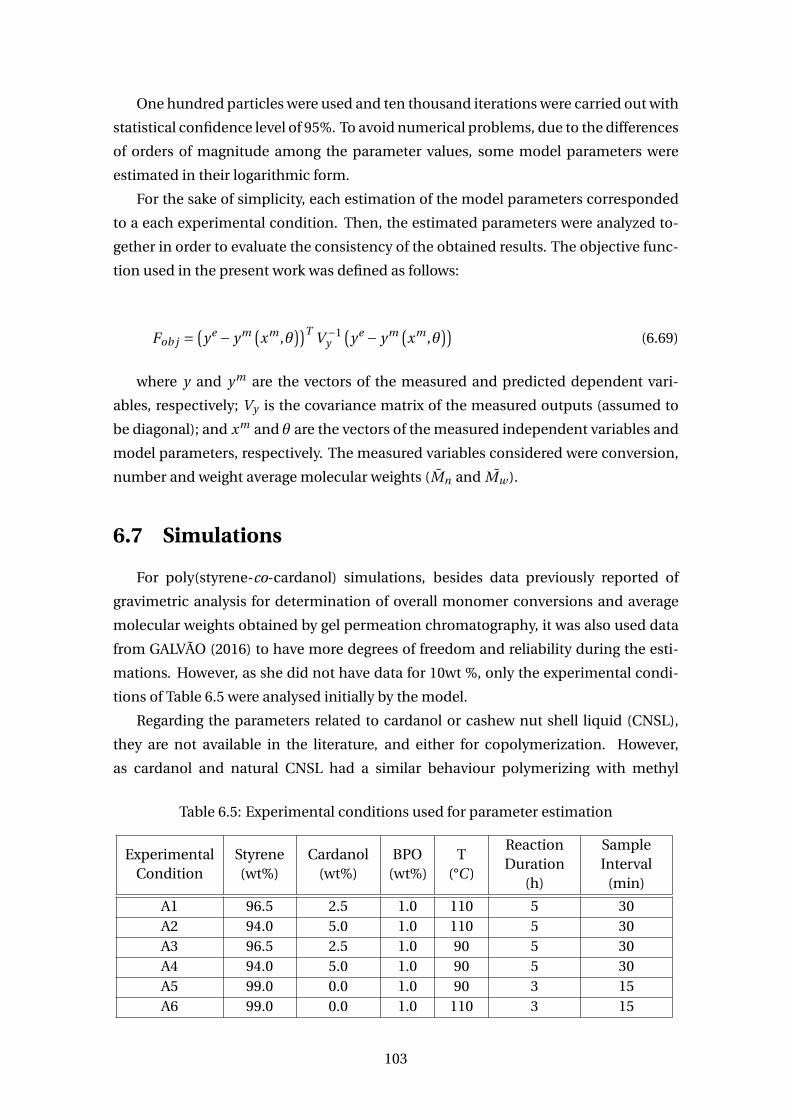
One hundred particles were used and ten thousand iterations were carried out with
statistical confidence level of 95%. To avoid numerical problems, due to the differences
of orders of magnitude among the parameter values, some model parameters were
estimated in their logarithmic form.
For the sake of simplicity, each estimation of the model parameters corresponded
to a each experimental condition. Then, the estimated parameters were analyzed to-
gether in order to evaluate the consistency of the obtained results. The objective func-
tion used in the present work was defined as follows:
Fob j =(ye − ym (
xm ,θ))T V −1
y
(ye − ym (
xm ,θ))
(6.69)
where y and ym are the vectors of the measured and predicted dependent vari-
ables, respectively; Vy is the covariance matrix of the measured outputs (assumed to
be diagonal); and xm and θ are the vectors of the measured independent variables and
model parameters, respectively. The measured variables considered were conversion,
number and weight average molecular weights (Mn and Mw ).
6.7 Simulations
For poly(styrene-co-cardanol) simulations, besides data previously reported of
gravimetric analysis for determination of overall monomer conversions and average
molecular weights obtained by gel permeation chromatography, it was also used data
from GALVÃO (2016) to have more degrees of freedom and reliability during the esti-
mations. However, as she did not have data for 10wt %, only the experimental condi-
tions of Table 6.5 were analysed initially by the model.
Regarding the parameters related to cardanol or cashew nut shell liquid (CNSL),
they are not available in the literature, and either for copolymerization. However,
as cardanol and natural CNSL had a similar behaviour polymerizing with methyl
Table 6.5: Experimental conditions used for parameter estimation
ExperimentalCondition
Styrene(wt%)
Cardanol(wt%)
BPO(wt%)
T(°C )
ReactionDuration
(h)
SampleInterval
(min)
A1 96.5 2.5 1.0 110 5 30A2 94.0 5.0 1.0 110 5 30A3 96.5 2.5 1.0 90 5 30A4 94.0 5.0 1.0 90 5 30A5 99.0 0.0 1.0 90 3 15A6 99.0 0.0 1.0 110 3 15
103
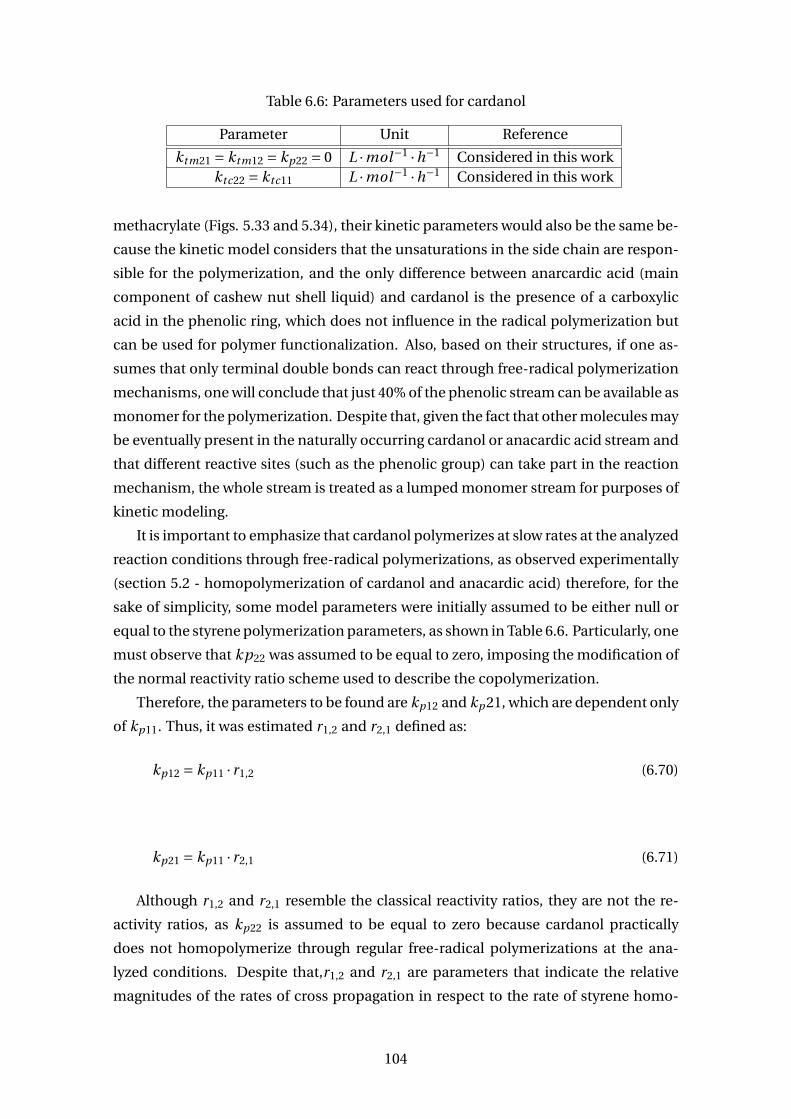
Table 6.6: Parameters used for cardanol
Parameter Unit Reference
ktm21 = ktm12 = kp22 = 0 L ·mol−1 ·h−1 Considered in this workktc22 = ktc11 L ·mol−1 ·h−1 Considered in this work
methacrylate (Figs. 5.33 and 5.34), their kinetic parameters would also be the same be-
cause the kinetic model considers that the unsaturations in the side chain are respon-
sible for the polymerization, and the only difference between anarcardic acid (main
component of cashew nut shell liquid) and cardanol is the presence of a carboxylic
acid in the phenolic ring, which does not influence in the radical polymerization but
can be used for polymer functionalization. Also, based on their structures, if one as-
sumes that only terminal double bonds can react through free-radical polymerization
mechanisms, one will conclude that just 40% of the phenolic stream can be available as
monomer for the polymerization. Despite that, given the fact that other molecules may
be eventually present in the naturally occurring cardanol or anacardic acid stream and
that different reactive sites (such as the phenolic group) can take part in the reaction
mechanism, the whole stream is treated as a lumped monomer stream for purposes of
kinetic modeling.
It is important to emphasize that cardanol polymerizes at slow rates at the analyzed
reaction conditions through free-radical polymerizations, as observed experimentally
(section 5.2 - homopolymerization of cardanol and anacardic acid) therefore, for the
sake of simplicity, some model parameters were initially assumed to be either null or
equal to the styrene polymerization parameters, as shown in Table 6.6. Particularly, one
must observe that kp22 was assumed to be equal to zero, imposing the modification of
the normal reactivity ratio scheme used to describe the copolymerization.
Therefore, the parameters to be found are kp12 and kp 21, which are dependent only
of kp11. Thus, it was estimated r1,2 and r2,1 defined as:
kp12 = kp11 · r1,2 (6.70)
kp21 = kp11 · r2,1 (6.71)
Although r1,2 and r2,1 resemble the classical reactivity ratios, they are not the re-
activity ratios, as kp22 is assumed to be equal to zero because cardanol practically
does not homopolymerize through regular free-radical polymerizations at the ana-
lyzed conditions. Despite that,r1,2 and r2,1 are parameters that indicate the relative
magnitudes of the rates of cross propagation in respect to the rate of styrene homo-
104
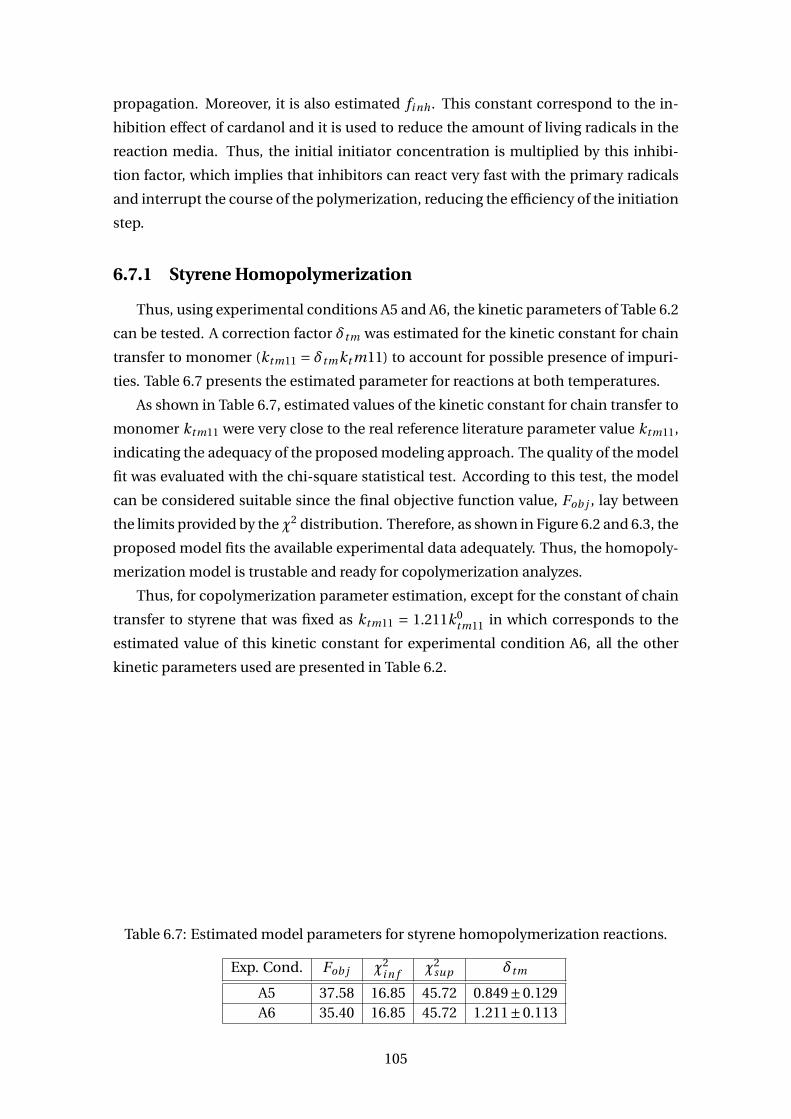
propagation. Moreover, it is also estimated fi nh . This constant correspond to the in-
hibition effect of cardanol and it is used to reduce the amount of living radicals in the
reaction media. Thus, the initial initiator concentration is multiplied by this inhibi-
tion factor, which implies that inhibitors can react very fast with the primary radicals
and interrupt the course of the polymerization, reducing the efficiency of the initiation
step.
6.7.1 Styrene Homopolymerization
Thus, using experimental conditions A5 and A6, the kinetic parameters of Table 6.2
can be tested. A correction factor δtm was estimated for the kinetic constant for chain
transfer to monomer (ktm11 = δtmkt m11) to account for possible presence of impuri-
ties. Table 6.7 presents the estimated parameter for reactions at both temperatures.
As shown in Table 6.7, estimated values of the kinetic constant for chain transfer to
monomer ktm11 were very close to the real reference literature parameter value ktm11,
indicating the adequacy of the proposed modeling approach. The quality of the model
fit was evaluated with the chi-square statistical test. According to this test, the model
can be considered suitable since the final objective function value, Fob j , lay between
the limits provided by the χ2 distribution. Therefore, as shown in Figure 6.2 and 6.3, the
proposed model fits the available experimental data adequately. Thus, the homopoly-
merization model is trustable and ready for copolymerization analyzes.
Thus, for copolymerization parameter estimation, except for the constant of chain
transfer to styrene that was fixed as ktm11 = 1.211k0tm11 in which corresponds to the
estimated value of this kinetic constant for experimental condition A6, all the other
kinetic parameters used are presented in Table 6.2.
Table 6.7: Estimated model parameters for styrene homopolymerization reactions.
Exp. Cond. Fob j χ2i n f χ2
sup δtm
A5 37.58 16.85 45.72 0.849±0.129A6 35.40 16.85 45.72 1.211±0.113
105
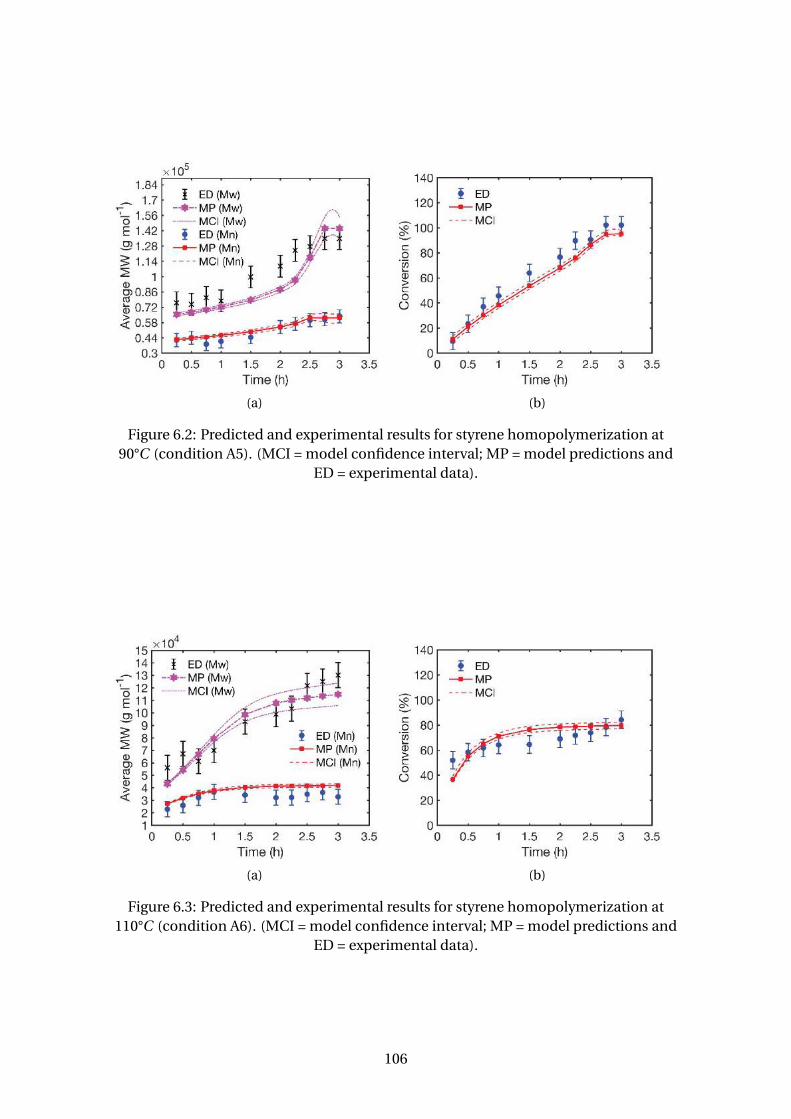
(a) (b)
Figure 6.2: Predicted and experimental results for styrene homopolymerization at90°C (condition A5). (MCI = model confidence interval; MP = model predictions and
ED = experimental data).
(a) (b)
Figure 6.3: Predicted and experimental results for styrene homopolymerization at110°C (condition A6). (MCI = model confidence interval; MP = model predictions and
ED = experimental data).
106
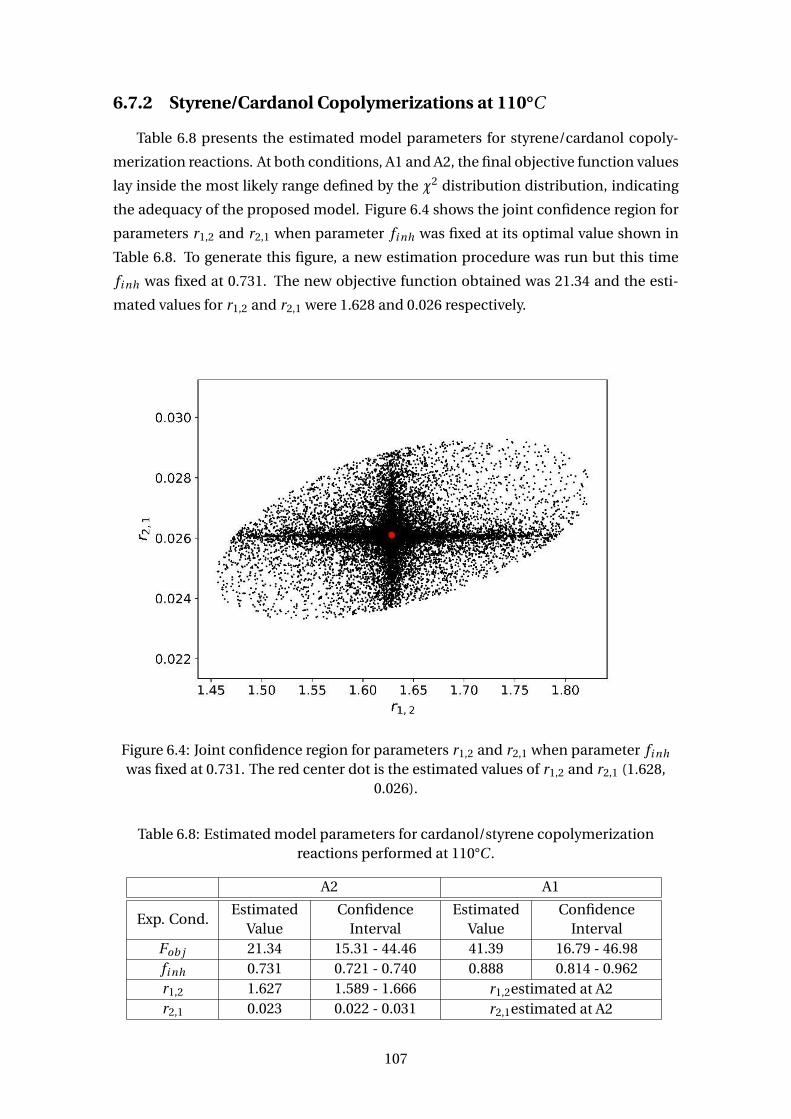
6.7.2 Styrene/Cardanol Copolymerizations at 110°C
Table 6.8 presents the estimated model parameters for styrene/cardanol copoly-
merization reactions. At both conditions, A1 and A2, the final objective function values
lay inside the most likely range defined by the χ2 distribution distribution, indicating
the adequacy of the proposed model. Figure 6.4 shows the joint confidence region for
parameters r1,2 and r2,1 when parameter fi nh was fixed at its optimal value shown in
Table 6.8. To generate this figure, a new estimation procedure was run but this time
fi nh was fixed at 0.731. The new objective function obtained was 21.34 and the esti-
mated values for r1,2 and r2,1 were 1.628 and 0.026 respectively.
Figure 6.4: Joint confidence region for parameters r1,2 and r2,1 when parameter fi nh
was fixed at 0.731. The red center dot is the estimated values of r1,2 and r2,1 (1.628,0.026).
Table 6.8: Estimated model parameters for cardanol/styrene copolymerizationreactions performed at 110°C .
A2 A1
Exp. Cond.Estimated
ValueConfidence
IntervalEstimated
ValueConfidence
IntervalFob j 21.34 15.31 - 44.46 41.39 16.79 - 46.98fi nh 0.731 0.721 - 0.740 0.888 0.814 - 0.962r1,2 1.627 1.589 - 1.666 r1,2estimated at A2r2,1 0.023 0.022 - 0.031 r2,1estimated at A2
107
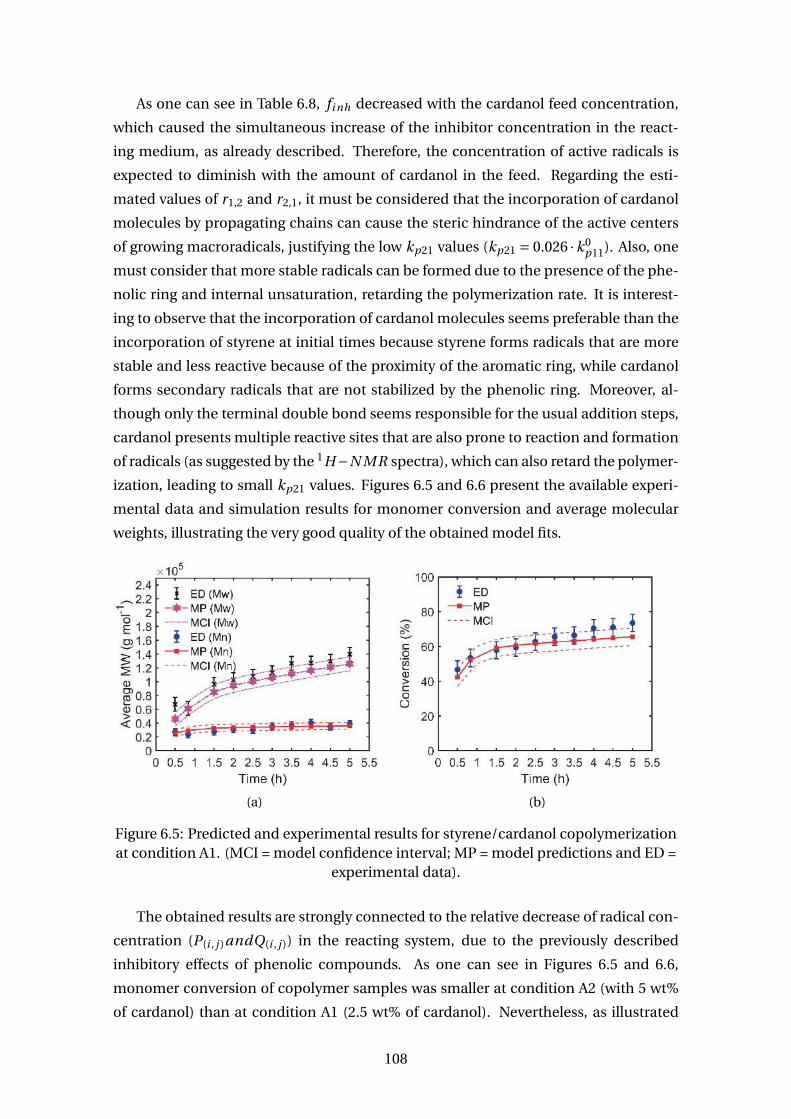
As one can see in Table 6.8, fi nh decreased with the cardanol feed concentration,
which caused the simultaneous increase of the inhibitor concentration in the react-
ing medium, as already described. Therefore, the concentration of active radicals is
expected to diminish with the amount of cardanol in the feed. Regarding the esti-
mated values of r1,2 and r2,1, it must be considered that the incorporation of cardanol
molecules by propagating chains can cause the steric hindrance of the active centers
of growing macroradicals, justifying the low kp21 values (kp21 = 0.026 ·k0p11). Also, one
must consider that more stable radicals can be formed due to the presence of the phe-
nolic ring and internal unsaturation, retarding the polymerization rate. It is interest-
ing to observe that the incorporation of cardanol molecules seems preferable than the
incorporation of styrene at initial times because styrene forms radicals that are more
stable and less reactive because of the proximity of the aromatic ring, while cardanol
forms secondary radicals that are not stabilized by the phenolic ring. Moreover, al-
though only the terminal double bond seems responsible for the usual addition steps,
cardanol presents multiple reactive sites that are also prone to reaction and formation
of radicals (as suggested by the 1H−N MR spectra), which can also retard the polymer-
ization, leading to small kp21 values. Figures 6.5 and 6.6 present the available experi-
mental data and simulation results for monomer conversion and average molecular
weights, illustrating the very good quality of the obtained model fits.
(a) (b)
Figure 6.5: Predicted and experimental results for styrene/cardanol copolymerizationat condition A1. (MCI = model confidence interval; MP = model predictions and ED =
experimental data).
The obtained results are strongly connected to the relative decrease of radical con-
centration (P(i , j )andQ(i , j )) in the reacting system, due to the previously described
inhibitory effects of phenolic compounds. As one can see in Figures 6.5 and 6.6,
monomer conversion of copolymer samples was smaller at condition A2 (with 5 wt%
of cardanol) than at condition A1 (2.5 wt% of cardanol). Nevertheless, as illustrated
108
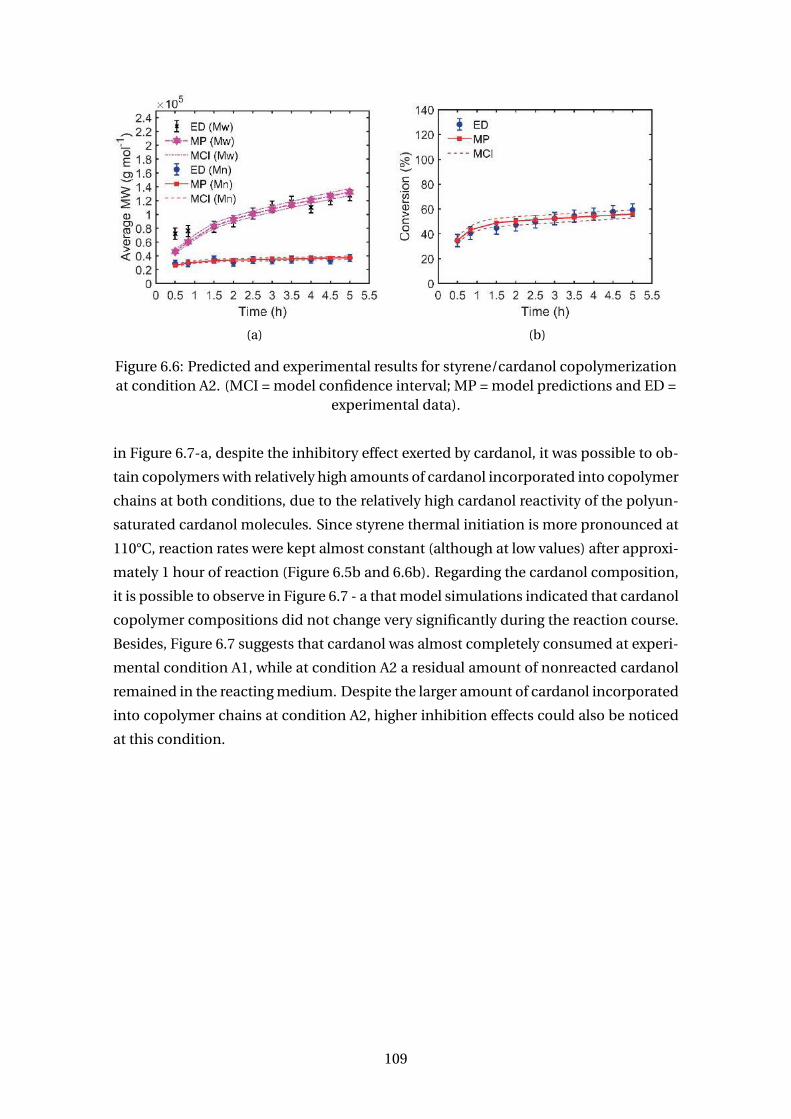
(a) (b)
Figure 6.6: Predicted and experimental results for styrene/cardanol copolymerizationat condition A2. (MCI = model confidence interval; MP = model predictions and ED =
experimental data).
in Figure 6.7-a, despite the inhibitory effect exerted by cardanol, it was possible to ob-
tain copolymers with relatively high amounts of cardanol incorporated into copolymer
chains at both conditions, due to the relatively high cardanol reactivity of the polyun-
saturated cardanol molecules. Since styrene thermal initiation is more pronounced at
110°C, reaction rates were kept almost constant (although at low values) after approxi-
mately 1 hour of reaction (Figure 6.5b and 6.6b). Regarding the cardanol composition,
it is possible to observe in Figure 6.7 - a that model simulations indicated that cardanol
copolymer compositions did not change very significantly during the reaction course.
Besides, Figure 6.7 suggests that cardanol was almost completely consumed at experi-
mental condition A1, while at condition A2 a residual amount of nonreacted cardanol
remained in the reacting medium. Despite the larger amount of cardanol incorporated
into copolymer chains at condition A2, higher inhibition effects could also be noticed
at this condition.
109
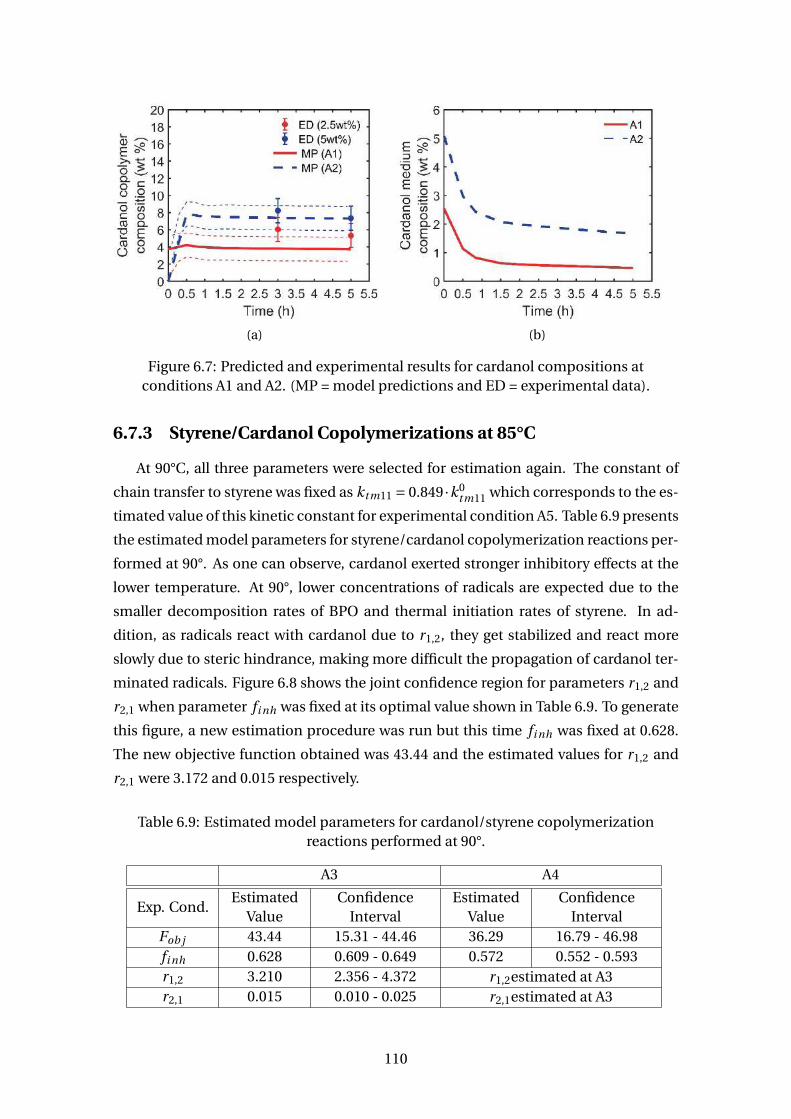
(a) (b)
Figure 6.7: Predicted and experimental results for cardanol compositions atconditions A1 and A2. (MP = model predictions and ED = experimental data).
6.7.3 Styrene/Cardanol Copolymerizations at 85°C
At 90°C, all three parameters were selected for estimation again. The constant of
chain transfer to styrene was fixed as ktm11 = 0.849 ·k0tm11 which corresponds to the es-
timated value of this kinetic constant for experimental condition A5. Table 6.9 presents
the estimated model parameters for styrene/cardanol copolymerization reactions per-
formed at 90°. As one can observe, cardanol exerted stronger inhibitory effects at the
lower temperature. At 90°, lower concentrations of radicals are expected due to the
smaller decomposition rates of BPO and thermal initiation rates of styrene. In ad-
dition, as radicals react with cardanol due to r1,2, they get stabilized and react more
slowly due to steric hindrance, making more difficult the propagation of cardanol ter-
minated radicals. Figure 6.8 shows the joint confidence region for parameters r1,2 and
r2,1 when parameter fi nh was fixed at its optimal value shown in Table 6.9. To generate
this figure, a new estimation procedure was run but this time fi nh was fixed at 0.628.
The new objective function obtained was 43.44 and the estimated values for r1,2 and
r2,1 were 3.172 and 0.015 respectively.
Table 6.9: Estimated model parameters for cardanol/styrene copolymerizationreactions performed at 90°.
A3 A4
Exp. Cond.Estimated
ValueConfidence
IntervalEstimated
ValueConfidence
IntervalFob j 43.44 15.31 - 44.46 36.29 16.79 - 46.98fi nh 0.628 0.609 - 0.649 0.572 0.552 - 0.593r1,2 3.210 2.356 - 4.372 r1,2estimated at A3r2,1 0.015 0.010 - 0.025 r2,1estimated at A3
110
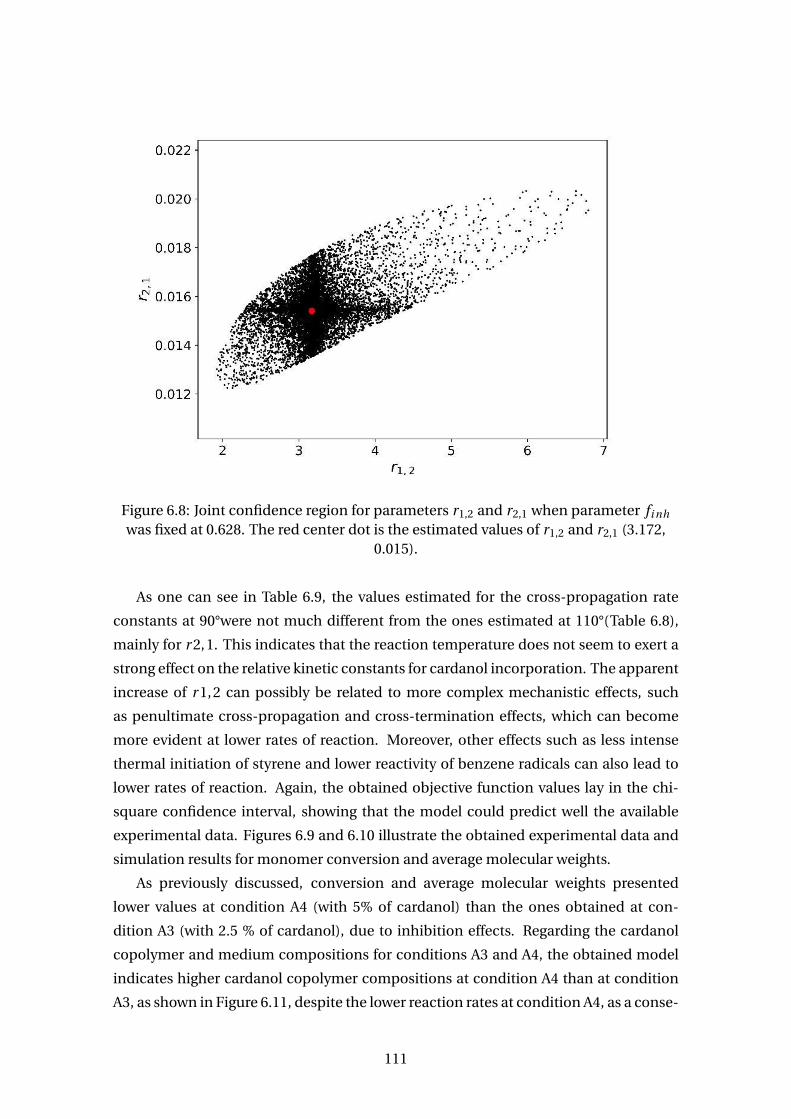
Figure 6.8: Joint confidence region for parameters r1,2 and r2,1 when parameter fi nh
was fixed at 0.628. The red center dot is the estimated values of r1,2 and r2,1 (3.172,0.015).
As one can see in Table 6.9, the values estimated for the cross-propagation rate
constants at 90°were not much different from the ones estimated at 110°(Table 6.8),
mainly for r 2,1. This indicates that the reaction temperature does not seem to exert a
strong effect on the relative kinetic constants for cardanol incorporation. The apparent
increase of r 1,2 can possibly be related to more complex mechanistic effects, such
as penultimate cross-propagation and cross-termination effects, which can become
more evident at lower rates of reaction. Moreover, other effects such as less intense
thermal initiation of styrene and lower reactivity of benzene radicals can also lead to
lower rates of reaction. Again, the obtained objective function values lay in the chi-
square confidence interval, showing that the model could predict well the available
experimental data. Figures 6.9 and 6.10 illustrate the obtained experimental data and
simulation results for monomer conversion and average molecular weights.
As previously discussed, conversion and average molecular weights presented
lower values at condition A4 (with 5% of cardanol) than the ones obtained at con-
dition A3 (with 2.5 % of cardanol), due to inhibition effects. Regarding the cardanol
copolymer and medium compositions for conditions A3 and A4, the obtained model
indicates higher cardanol copolymer compositions at condition A4 than at condition
A3, as shown in Figure 6.11, despite the lower reaction rates at condition A4, as a conse-
111
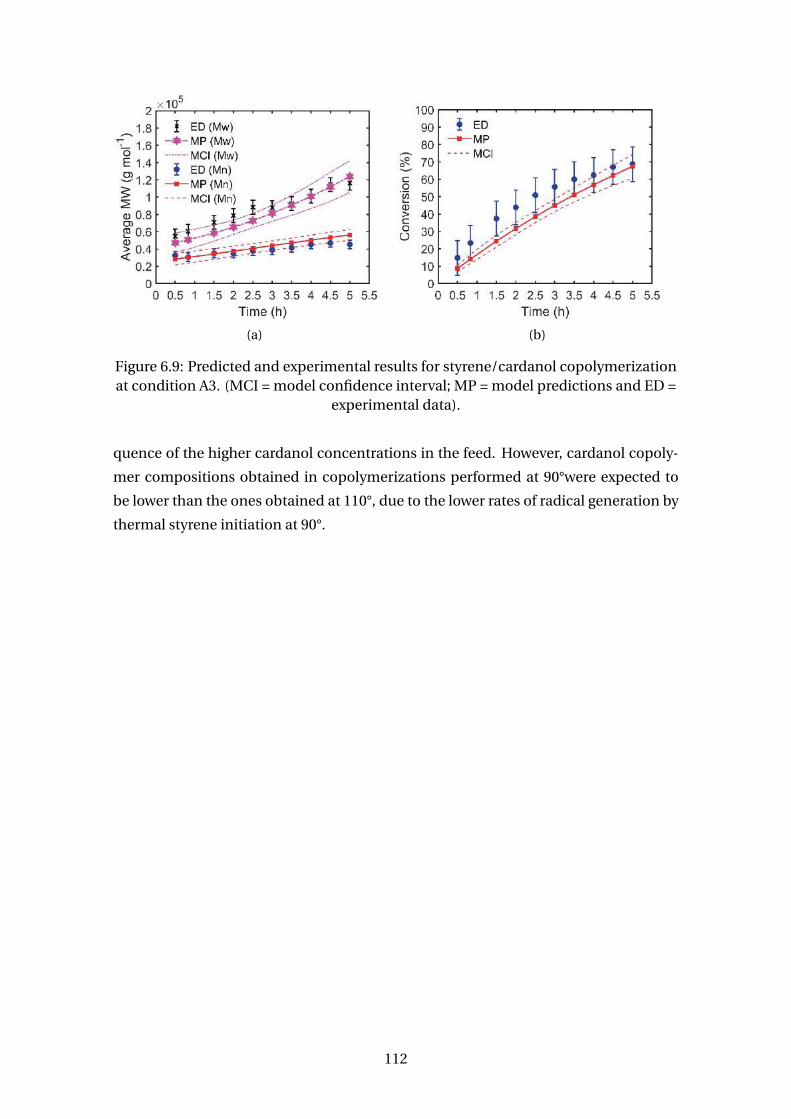
(a) (b)
Figure 6.9: Predicted and experimental results for styrene/cardanol copolymerizationat condition A3. (MCI = model confidence interval; MP = model predictions and ED =
experimental data).
quence of the higher cardanol concentrations in the feed. However, cardanol copoly-
mer compositions obtained in copolymerizations performed at 90°were expected to
be lower than the ones obtained at 110°, due to the lower rates of radical generation by
thermal styrene initiation at 90°.
112
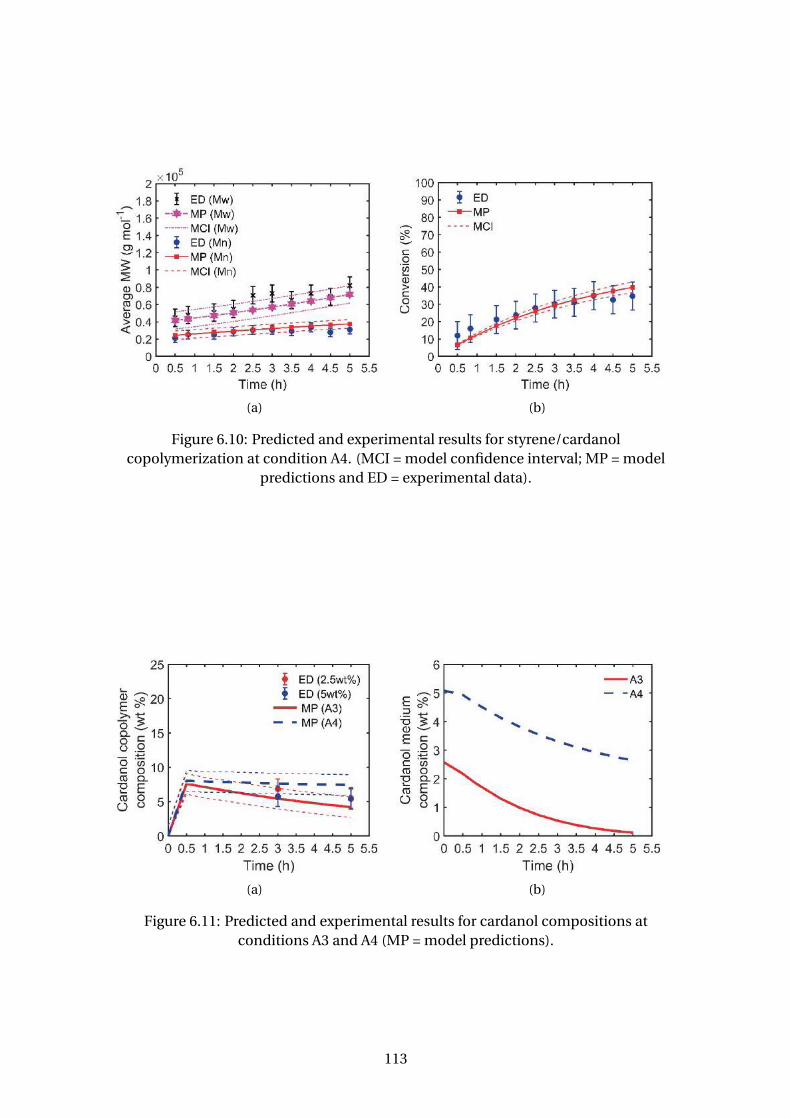
(a) (b)
Figure 6.10: Predicted and experimental results for styrene/cardanolcopolymerization at condition A4. (MCI = model confidence interval; MP = model
predictions and ED = experimental data).
(a) (b)
Figure 6.11: Predicted and experimental results for cardanol compositions atconditions A3 and A4 (MP = model predictions).
113
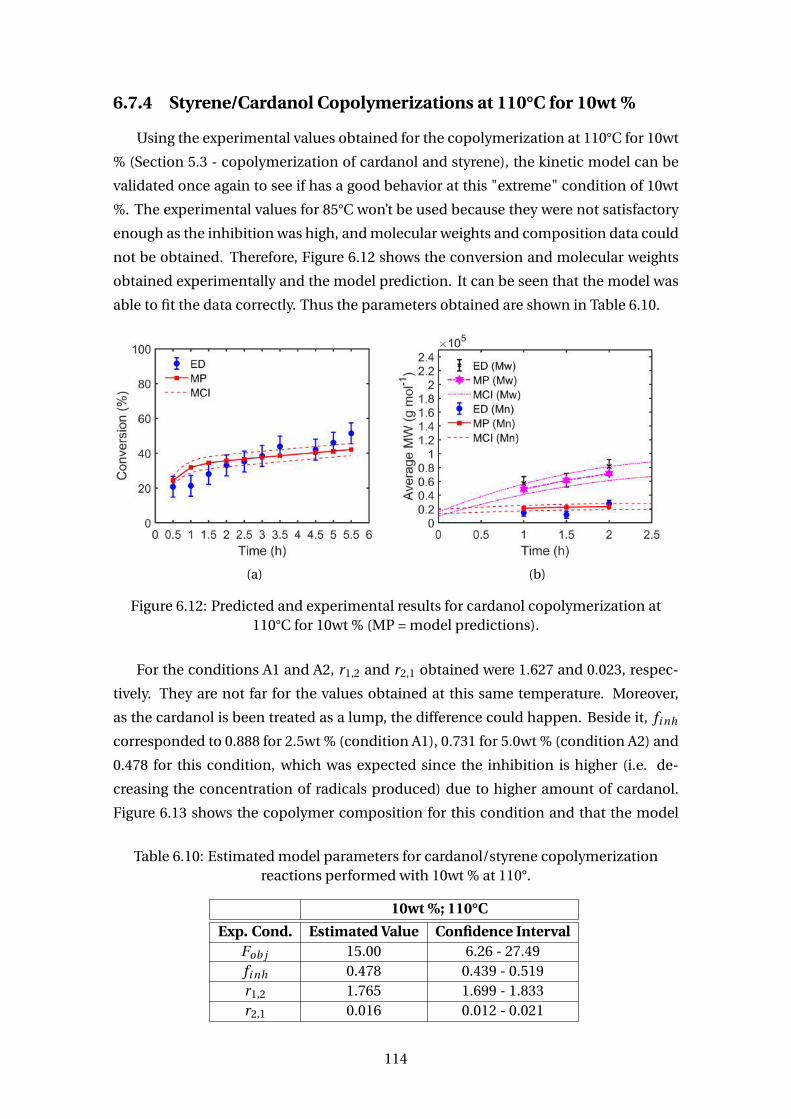
6.7.4 Styrene/Cardanol Copolymerizations at 110°C for 10wt %
Using the experimental values obtained for the copolymerization at 110°C for 10wt
% (Section 5.3 - copolymerization of cardanol and styrene), the kinetic model can be
validated once again to see if has a good behavior at this "extreme" condition of 10wt
%. The experimental values for 85°C won’t be used because they were not satisfactory
enough as the inhibition was high, and molecular weights and composition data could
not be obtained. Therefore, Figure 6.12 shows the conversion and molecular weights
obtained experimentally and the model prediction. It can be seen that the model was
able to fit the data correctly. Thus the parameters obtained are shown in Table 6.10.
(a) (b)
Figure 6.12: Predicted and experimental results for cardanol copolymerization at110°C for 10wt % (MP = model predictions).
For the conditions A1 and A2, r1,2 and r2,1 obtained were 1.627 and 0.023, respec-
tively. They are not far for the values obtained at this same temperature. Moreover,
as the cardanol is been treated as a lump, the difference could happen. Beside it, fi nh
corresponded to 0.888 for 2.5wt % (condition A1), 0.731 for 5.0wt % (condition A2) and
0.478 for this condition, which was expected since the inhibition is higher (i.e. de-
creasing the concentration of radicals produced) due to higher amount of cardanol.
Figure 6.13 shows the copolymer composition for this condition and that the model
Table 6.10: Estimated model parameters for cardanol/styrene copolymerizationreactions performed with 10wt % at 110°.
10wt %; 110°C
Exp. Cond. Estimated Value Confidence IntervalFob j 15.00 6.26 - 27.49fi nh 0.478 0.439 - 0.519r1,2 1.765 1.699 - 1.833r2,1 0.016 0.012 - 0.021
114
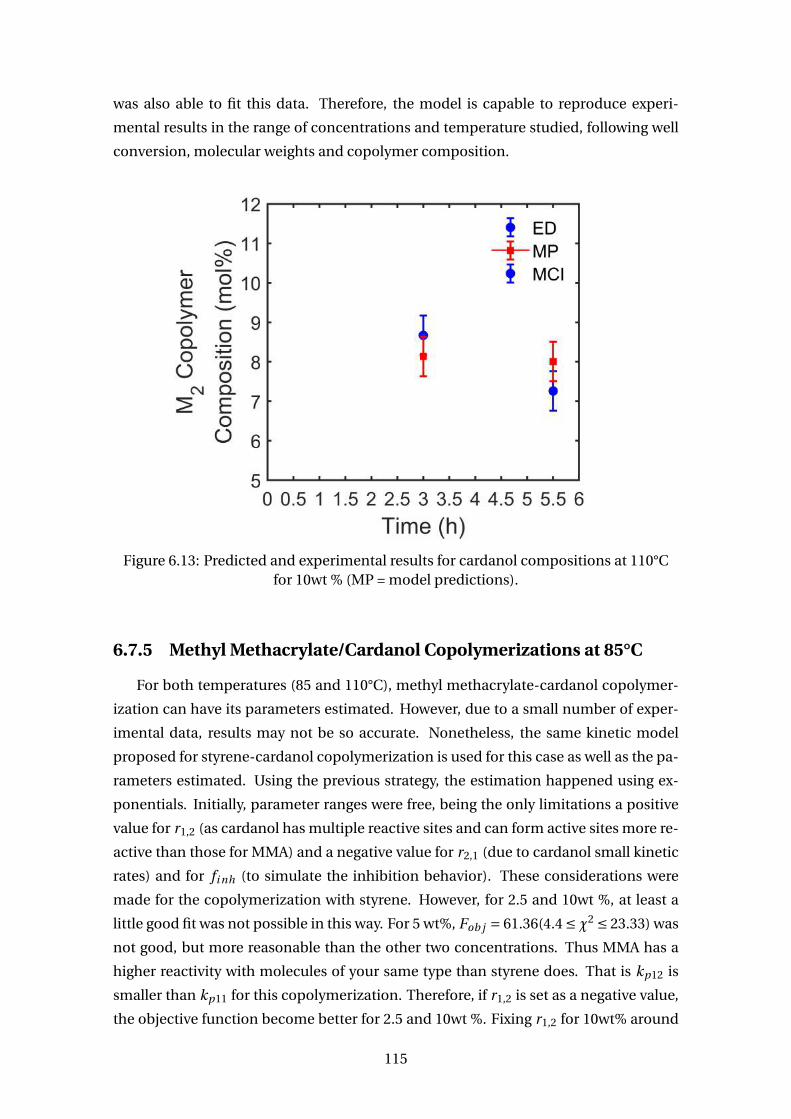
was also able to fit this data. Therefore, the model is capable to reproduce experi-
mental results in the range of concentrations and temperature studied, following well
conversion, molecular weights and copolymer composition.
Figure 6.13: Predicted and experimental results for cardanol compositions at 110°Cfor 10wt % (MP = model predictions).
6.7.5 Methyl Methacrylate/Cardanol Copolymerizations at 85°C
For both temperatures (85 and 110°C), methyl methacrylate-cardanol copolymer-
ization can have its parameters estimated. However, due to a small number of exper-
imental data, results may not be so accurate. Nonetheless, the same kinetic model
proposed for styrene-cardanol copolymerization is used for this case as well as the pa-
rameters estimated. Using the previous strategy, the estimation happened using ex-
ponentials. Initially, parameter ranges were free, being the only limitations a positive
value for r1,2 (as cardanol has multiple reactive sites and can form active sites more re-
active than those for MMA) and a negative value for r2,1 (due to cardanol small kinetic
rates) and for fi nh (to simulate the inhibition behavior). These considerations were
made for the copolymerization with styrene. However, for 2.5 and 10wt %, at least a
little good fit was not possible in this way. For 5 wt%, Fob j = 61.36(4.4 ≤χ2 ≤ 23.33) was
not good, but more reasonable than the other two concentrations. Thus MMA has a
higher reactivity with molecules of your same type than styrene does. That is kp12 is
smaller than kp11 for this copolymerization. Therefore, if r1,2 is set as a negative value,
the objective function become better for 2.5 and 10wt %. Fixing r1,2 for 10wt% around
115
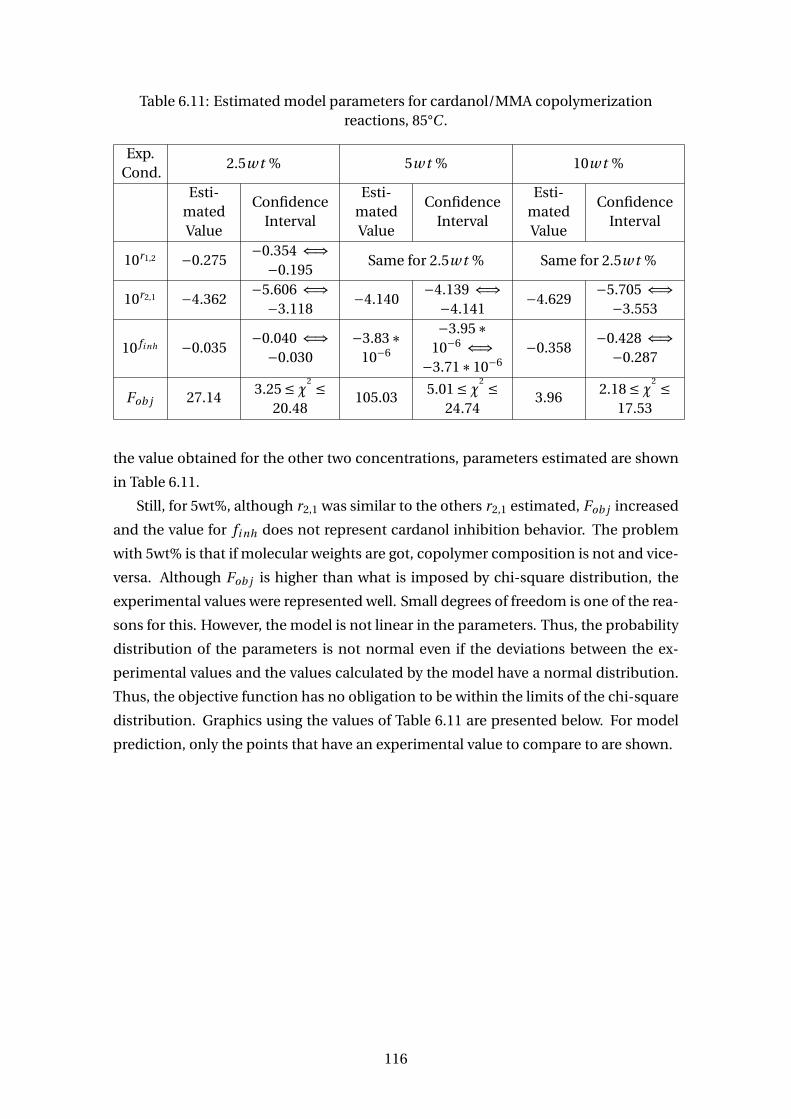
Table 6.11: Estimated model parameters for cardanol/MMA copolymerizationreactions, 85°C .
Exp.Cond.
2.5w t % 5w t % 10w t %
Esti-matedValue
ConfidenceInterval
Esti-matedValue
ConfidenceInterval
Esti-matedValue
ConfidenceInterval
10r1,2 −0.275−0.354 ⇐⇒
−0.195Same for 2.5w t % Same for 2.5w t %
10r2,1 −4.362−5.606 ⇐⇒
−3.118−4.140
−4.139 ⇐⇒−4.141
−4.629−5.705 ⇐⇒
−3.553
10 fi nh −0.035−0.040 ⇐⇒
−0.030−3.83∗
10−6
−3.95∗10−6 ⇐⇒
−3.71∗10−6−0.358
−0.428 ⇐⇒−0.287
Fob j 27.143.25 ≤χ
2 ≤20.48
105.035.01 ≤χ
2 ≤24.74
3.962.18 ≤χ
2 ≤17.53
the value obtained for the other two concentrations, parameters estimated are shown
in Table 6.11.
Still, for 5wt%, although r2,1 was similar to the others r2,1 estimated, Fob j increased
and the value for fi nh does not represent cardanol inhibition behavior. The problem
with 5wt% is that if molecular weights are got, copolymer composition is not and vice-
versa. Although Fob j is higher than what is imposed by chi-square distribution, the
experimental values were represented well. Small degrees of freedom is one of the rea-
sons for this. However, the model is not linear in the parameters. Thus, the probability
distribution of the parameters is not normal even if the deviations between the ex-
perimental values and the values calculated by the model have a normal distribution.
Thus, the objective function has no obligation to be within the limits of the chi-square
distribution. Graphics using the values of Table 6.11 are presented below. For model
prediction, only the points that have an experimental value to compare to are shown.
116
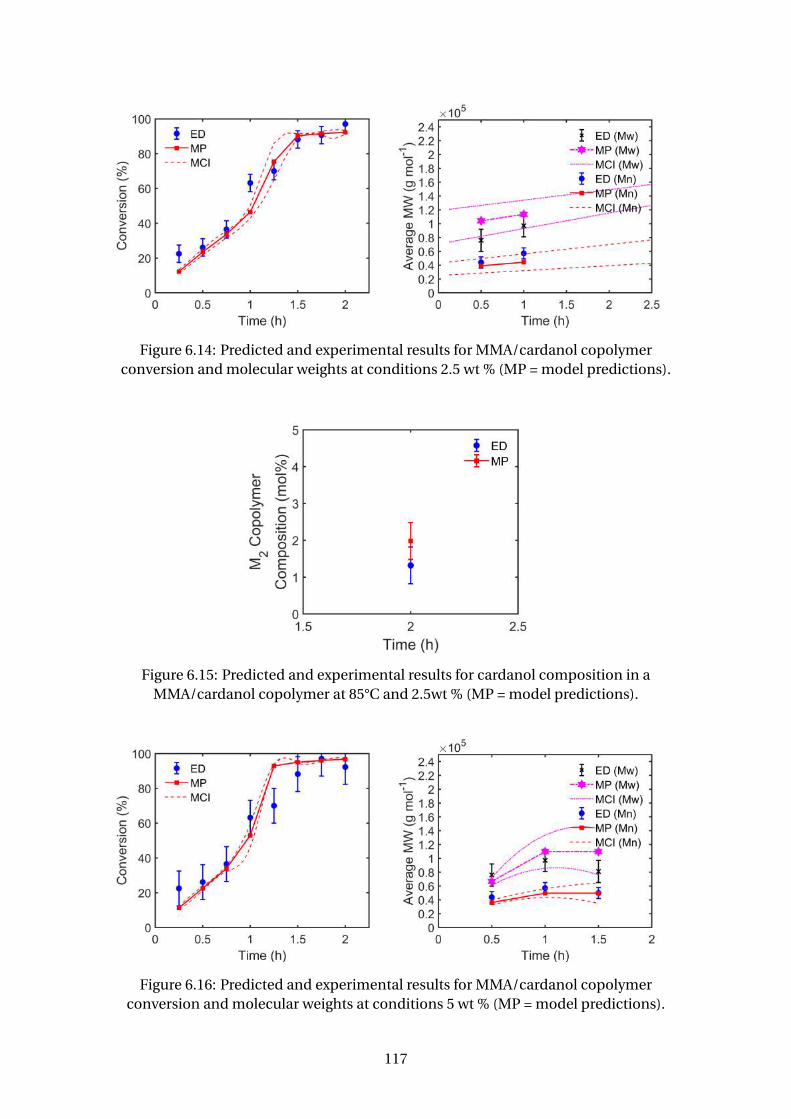
Figure 6.14: Predicted and experimental results for MMA/cardanol copolymerconversion and molecular weights at conditions 2.5 wt % (MP = model predictions).
Figure 6.15: Predicted and experimental results for cardanol composition in aMMA/cardanol copolymer at 85°C and 2.5wt % (MP = model predictions).
Figure 6.16: Predicted and experimental results for MMA/cardanol copolymerconversion and molecular weights at conditions 5 wt % (MP = model predictions).
117
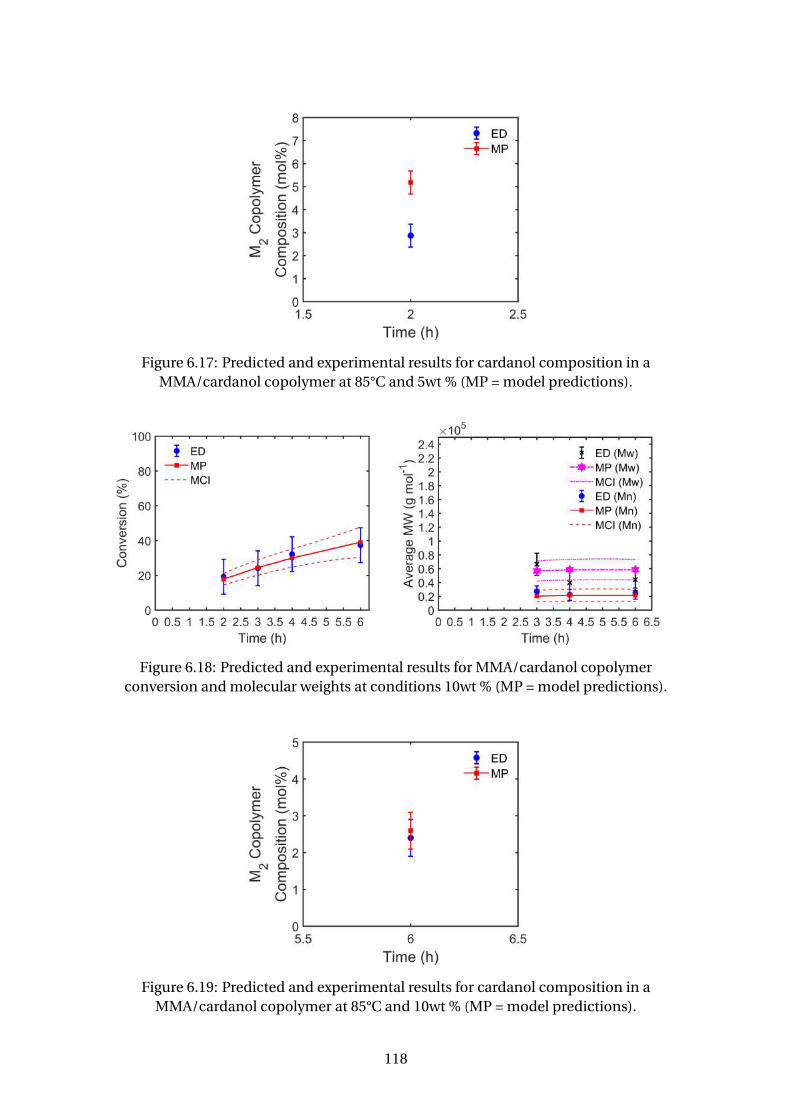
Figure 6.17: Predicted and experimental results for cardanol composition in aMMA/cardanol copolymer at 85°C and 5wt % (MP = model predictions).
Figure 6.18: Predicted and experimental results for MMA/cardanol copolymerconversion and molecular weights at conditions 10wt % (MP = model predictions).
Figure 6.19: Predicted and experimental results for cardanol composition in aMMA/cardanol copolymer at 85°C and 10wt % (MP = model predictions).
118
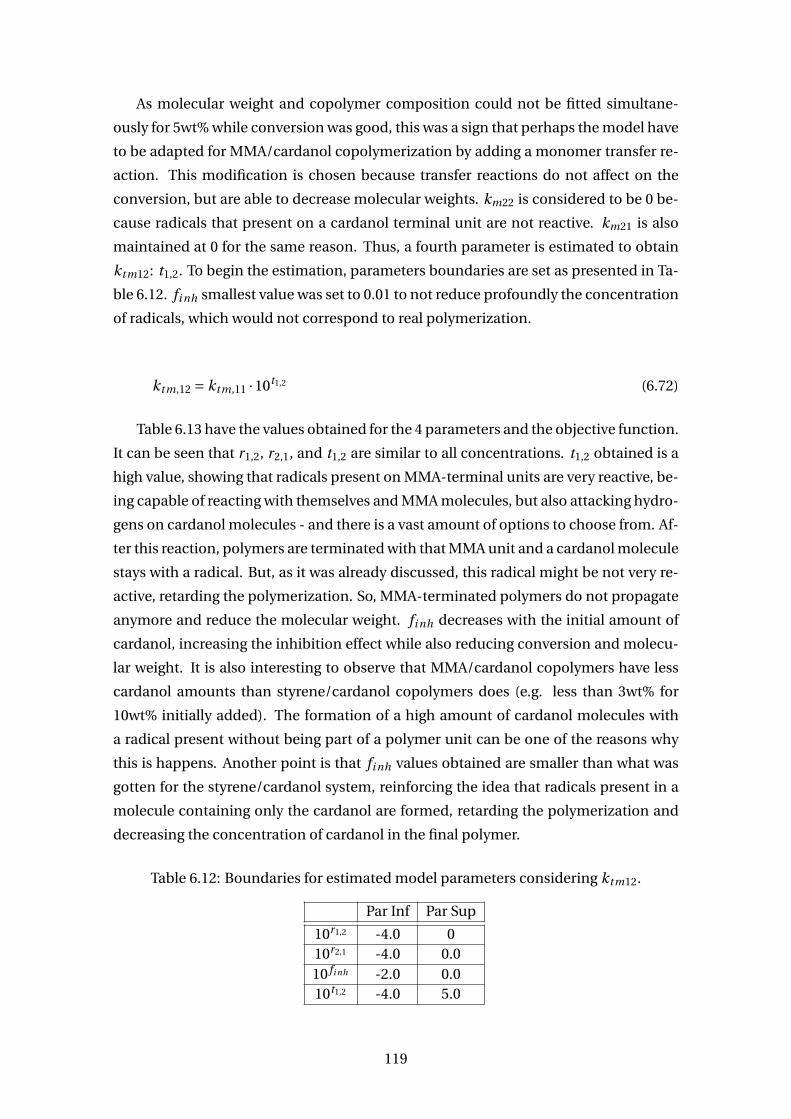
As molecular weight and copolymer composition could not be fitted simultane-
ously for 5wt% while conversion was good, this was a sign that perhaps the model have
to be adapted for MMA/cardanol copolymerization by adding a monomer transfer re-
action. This modification is chosen because transfer reactions do not affect on the
conversion, but are able to decrease molecular weights. km22 is considered to be 0 be-
cause radicals that present on a cardanol terminal unit are not reactive. km21 is also
maintained at 0 for the same reason. Thus, a fourth parameter is estimated to obtain
ktm12: t1,2. To begin the estimation, parameters boundaries are set as presented in Ta-
ble 6.12. fi nh smallest value was set to 0.01 to not reduce profoundly the concentration
of radicals, which would not correspond to real polymerization.
ktm,12 = ktm,11 ·10t1,2 (6.72)
Table 6.13 have the values obtained for the 4 parameters and the objective function.
It can be seen that r1,2, r2,1, and t1,2 are similar to all concentrations. t1,2 obtained is a
high value, showing that radicals present on MMA-terminal units are very reactive, be-
ing capable of reacting with themselves and MMA molecules, but also attacking hydro-
gens on cardanol molecules - and there is a vast amount of options to choose from. Af-
ter this reaction, polymers are terminated with that MMA unit and a cardanol molecule
stays with a radical. But, as it was already discussed, this radical might be not very re-
active, retarding the polymerization. So, MMA-terminated polymers do not propagate
anymore and reduce the molecular weight. fi nh decreases with the initial amount of
cardanol, increasing the inhibition effect while also reducing conversion and molecu-
lar weight. It is also interesting to observe that MMA/cardanol copolymers have less
cardanol amounts than styrene/cardanol copolymers does (e.g. less than 3wt% for
10wt% initially added). The formation of a high amount of cardanol molecules with
a radical present without being part of a polymer unit can be one of the reasons why
this is happens. Another point is that fi nh values obtained are smaller than what was
gotten for the styrene/cardanol system, reinforcing the idea that radicals present in a
molecule containing only the cardanol are formed, retarding the polymerization and
decreasing the concentration of cardanol in the final polymer.
Table 6.12: Boundaries for estimated model parameters considering ktm12.
Par Inf Par Sup
10r1,2 -4.0 010r2,1 -4.0 0.010 fi nh -2.0 0.010t1,2 -4.0 5.0
119
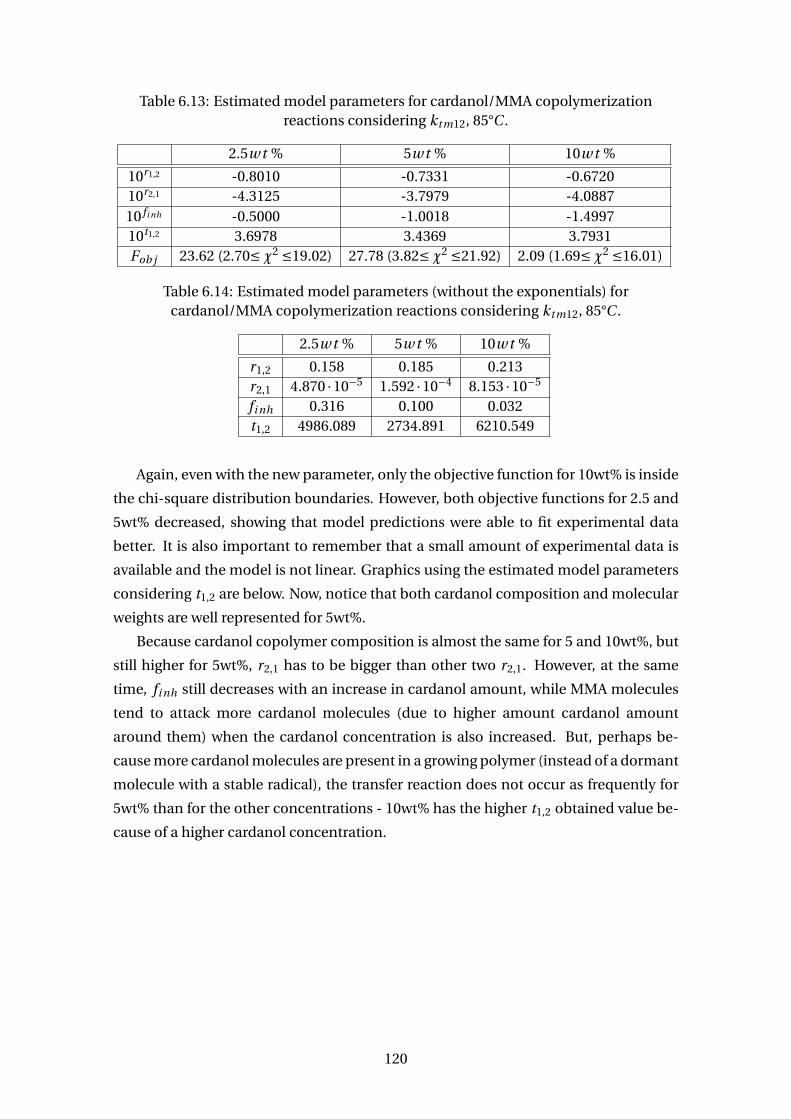
Table 6.13: Estimated model parameters for cardanol/MMA copolymerizationreactions considering ktm12, 85°C .
2.5w t % 5w t % 10w t %
10r1,2 -0.8010 -0.7331 -0.672010r2,1 -4.3125 -3.7979 -4.088710 fi nh -0.5000 -1.0018 -1.499710t1,2 3.6978 3.4369 3.7931Fob j 23.62 (2.70≤χ2 ≤19.02) 27.78 (3.82≤χ2 ≤21.92) 2.09 (1.69≤χ2 ≤16.01)
Table 6.14: Estimated model parameters (without the exponentials) forcardanol/MMA copolymerization reactions considering ktm12, 85°C .
2.5w t % 5w t % 10w t %
r1,2 0.158 0.185 0.213r2,1 4.870 ·10−5 1.592 ·10−4 8.153 ·10−5
fi nh 0.316 0.100 0.032t1,2 4986.089 2734.891 6210.549
Again, even with the new parameter, only the objective function for 10wt% is inside
the chi-square distribution boundaries. However, both objective functions for 2.5 and
5wt% decreased, showing that model predictions were able to fit experimental data
better. It is also important to remember that a small amount of experimental data is
available and the model is not linear. Graphics using the estimated model parameters
considering t1,2 are below. Now, notice that both cardanol composition and molecular
weights are well represented for 5wt%.
Because cardanol copolymer composition is almost the same for 5 and 10wt%, but
still higher for 5wt%, r2,1 has to be bigger than other two r2,1. However, at the same
time, fi nh still decreases with an increase in cardanol amount, while MMA molecules
tend to attack more cardanol molecules (due to higher amount cardanol amount
around them) when the cardanol concentration is also increased. But, perhaps be-
cause more cardanol molecules are present in a growing polymer (instead of a dormant
molecule with a stable radical), the transfer reaction does not occur as frequently for
5wt% than for the other concentrations - 10wt% has the higher t1,2 obtained value be-
cause of a higher cardanol concentration.
120
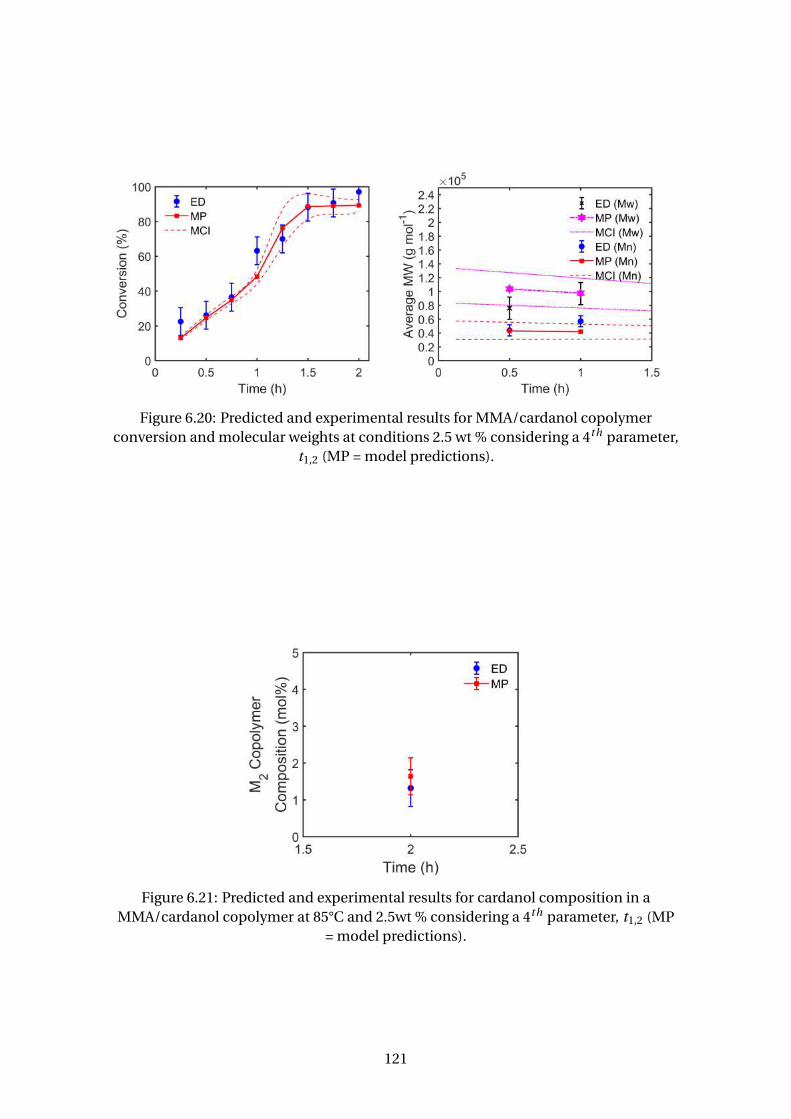
Figure 6.20: Predicted and experimental results for MMA/cardanol copolymerconversion and molecular weights at conditions 2.5 wt % considering a 4th parameter,
t1,2 (MP = model predictions).
Figure 6.21: Predicted and experimental results for cardanol composition in aMMA/cardanol copolymer at 85°C and 2.5wt % considering a 4th parameter, t1,2 (MP
= model predictions).
121
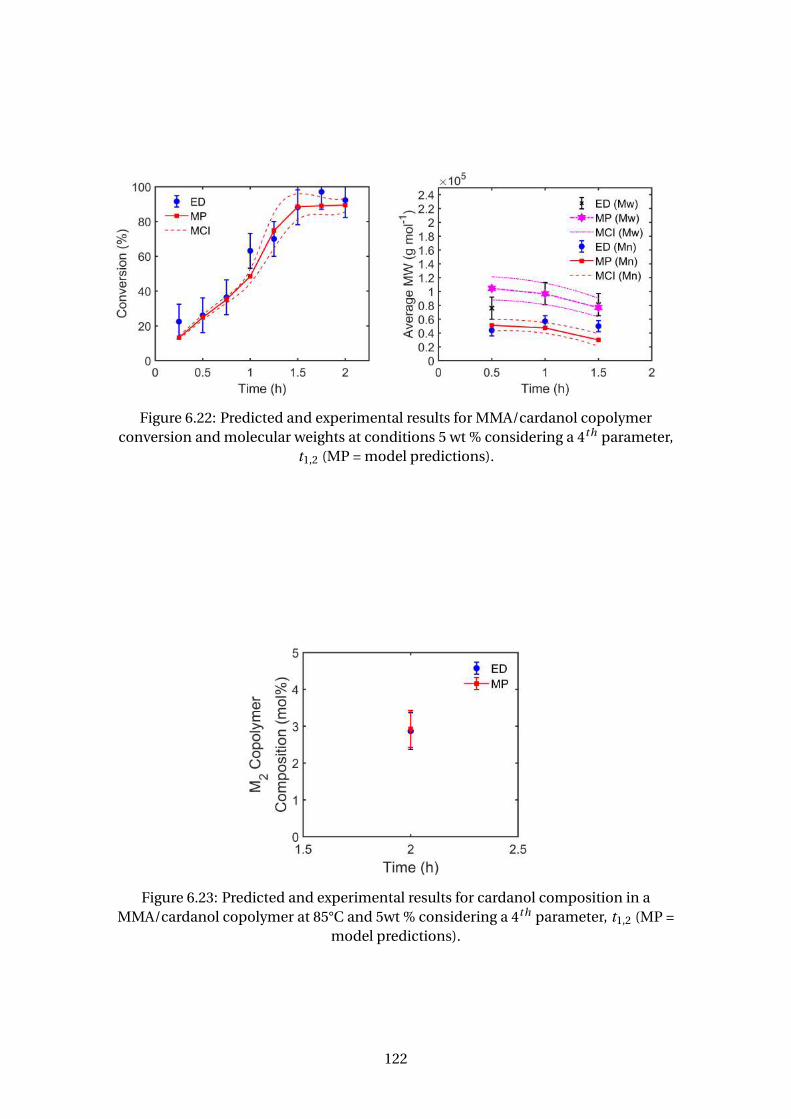
Figure 6.22: Predicted and experimental results for MMA/cardanol copolymerconversion and molecular weights at conditions 5 wt % considering a 4th parameter,
t1,2 (MP = model predictions).
Figure 6.23: Predicted and experimental results for cardanol composition in aMMA/cardanol copolymer at 85°C and 5wt % considering a 4th parameter, t1,2 (MP =
model predictions).
122
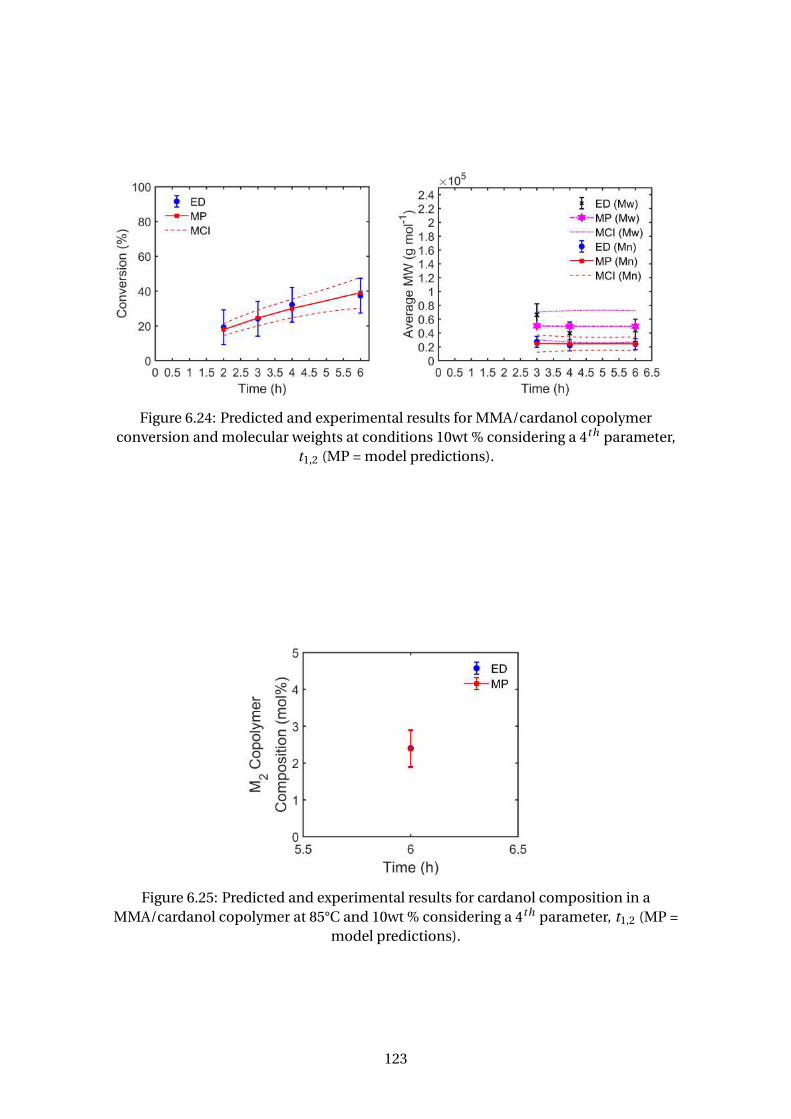
Figure 6.24: Predicted and experimental results for MMA/cardanol copolymerconversion and molecular weights at conditions 10wt % considering a 4th parameter,
t1,2 (MP = model predictions).
Figure 6.25: Predicted and experimental results for cardanol composition in aMMA/cardanol copolymer at 85°C and 10wt % considering a 4th parameter, t1,2 (MP =
model predictions).
123
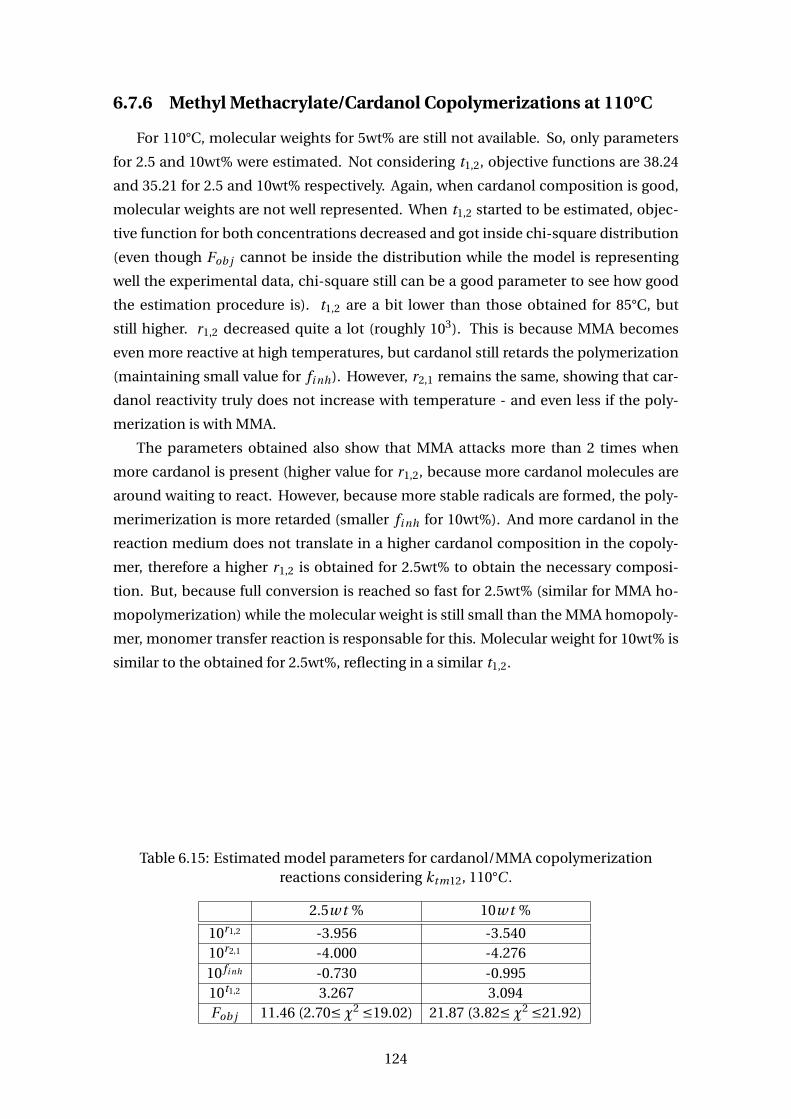
6.7.6 Methyl Methacrylate/Cardanol Copolymerizations at 110°C
For 110°C, molecular weights for 5wt% are still not available. So, only parameters
for 2.5 and 10wt% were estimated. Not considering t1,2, objective functions are 38.24
and 35.21 for 2.5 and 10wt% respectively. Again, when cardanol composition is good,
molecular weights are not well represented. When t1,2 started to be estimated, objec-
tive function for both concentrations decreased and got inside chi-square distribution
(even though Fob j cannot be inside the distribution while the model is representing
well the experimental data, chi-square still can be a good parameter to see how good
the estimation procedure is). t1,2 are a bit lower than those obtained for 85°C, but
still higher. r1,2 decreased quite a lot (roughly 103). This is because MMA becomes
even more reactive at high temperatures, but cardanol still retards the polymerization
(maintaining small value for fi nh). However, r2,1 remains the same, showing that car-
danol reactivity truly does not increase with temperature - and even less if the poly-
merization is with MMA.
The parameters obtained also show that MMA attacks more than 2 times when
more cardanol is present (higher value for r1,2, because more cardanol molecules are
around waiting to react. However, because more stable radicals are formed, the poly-
merimerization is more retarded (smaller fi nh for 10wt%). And more cardanol in the
reaction medium does not translate in a higher cardanol composition in the copoly-
mer, therefore a higher r1,2 is obtained for 2.5wt% to obtain the necessary composi-
tion. But, because full conversion is reached so fast for 2.5wt% (similar for MMA ho-
mopolymerization) while the molecular weight is still small than the MMA homopoly-
mer, monomer transfer reaction is responsable for this. Molecular weight for 10wt% is
similar to the obtained for 2.5wt%, reflecting in a similar t1,2.
Table 6.15: Estimated model parameters for cardanol/MMA copolymerizationreactions considering ktm12, 110°C .
2.5w t % 10w t %
10r1,2 -3.956 -3.54010r2,1 -4.000 -4.27610 fi nh -0.730 -0.99510t1,2 3.267 3.094Fob j 11.46 (2.70≤χ2 ≤19.02) 21.87 (3.82≤χ2 ≤21.92)
124
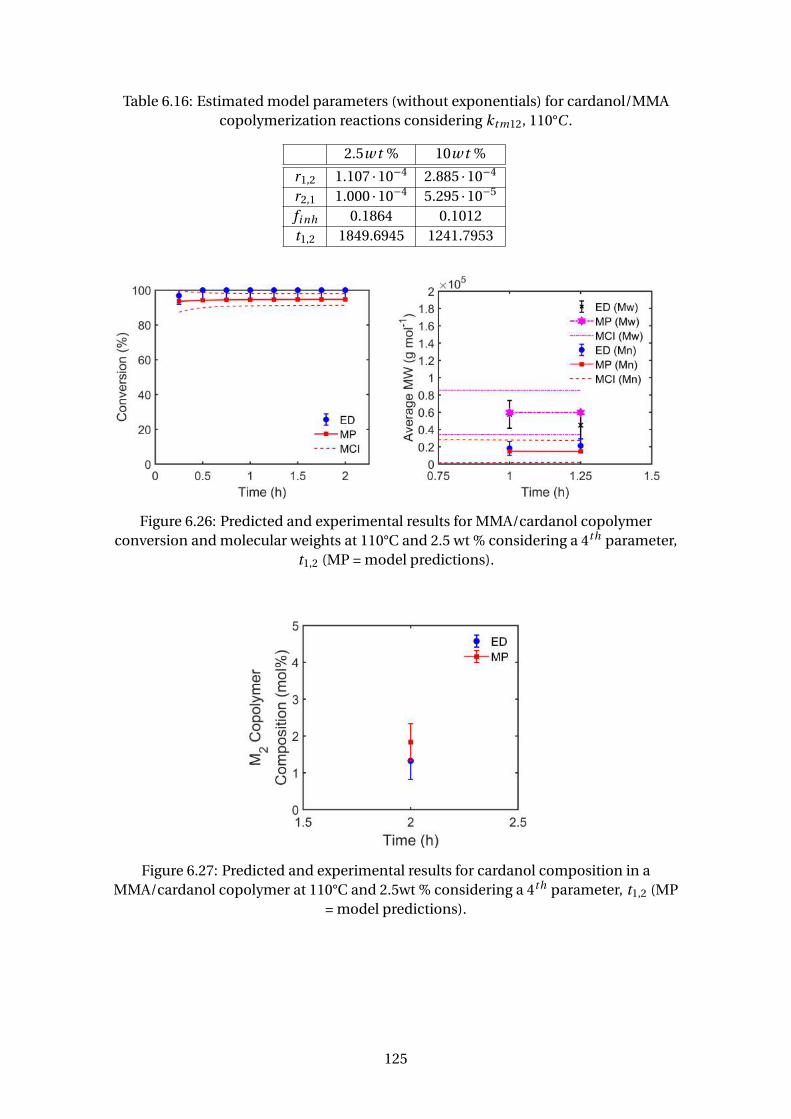
Table 6.16: Estimated model parameters (without exponentials) for cardanol/MMAcopolymerization reactions considering ktm12, 110°C .
2.5w t % 10w t %
r1,2 1.107 ·10−4 2.885 ·10−4
r2,1 1.000 ·10−4 5.295 ·10−5
fi nh 0.1864 0.1012t1,2 1849.6945 1241.7953
Figure 6.26: Predicted and experimental results for MMA/cardanol copolymerconversion and molecular weights at 110°C and 2.5 wt % considering a 4th parameter,
t1,2 (MP = model predictions).
Figure 6.27: Predicted and experimental results for cardanol composition in aMMA/cardanol copolymer at 110°C and 2.5wt % considering a 4th parameter, t1,2 (MP
= model predictions).
125
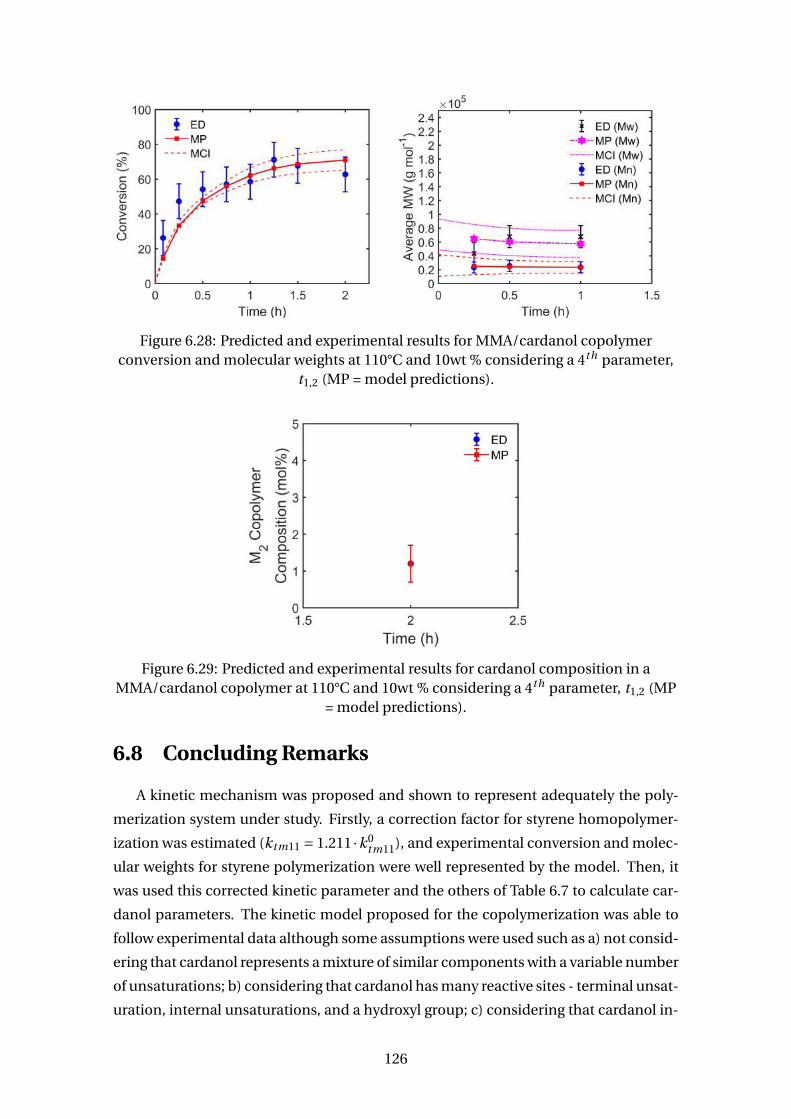
Figure 6.28: Predicted and experimental results for MMA/cardanol copolymerconversion and molecular weights at 110°C and 10wt % considering a 4th parameter,
t1,2 (MP = model predictions).
Figure 6.29: Predicted and experimental results for cardanol composition in aMMA/cardanol copolymer at 110°C and 10wt % considering a 4th parameter, t1,2 (MP
= model predictions).
6.8 Concluding Remarks
A kinetic mechanism was proposed and shown to represent adequately the poly-
merization system under study. Firstly, a correction factor for styrene homopolymer-
ization was estimated (ktm11 = 1.211 ·k0tm11), and experimental conversion and molec-
ular weights for styrene polymerization were well represented by the model. Then, it
was used this corrected kinetic parameter and the others of Table 6.7 to calculate car-
danol parameters. The kinetic model proposed for the copolymerization was able to
follow experimental data although some assumptions were used such as a) not consid-
ering that cardanol represents a mixture of similar components with a variable number
of unsaturations; b) considering that cardanol has many reactive sites - terminal unsat-
uration, internal unsaturations, and a hydroxyl group; c) considering that cardanol in-
126
hibits the polymerization due to its internal unsaturations and hydroxyl group, which
required the estimation of fi nh parameter to decrease the concentration of initiator;
d) considering that cardanol does not homopolymerize and it has a propagation con-
stant (kp22) equal to zero; e) considering that the living polymeric chains ending in
cardanol also terminates with the same rate of polystyrene; f) considering the quasi-
state hypothesis and the terminal model for the polymerization; g) considering that the
polymerization takes place at the external double bond; h) considering that kinetic ex-
periments were performed at truly constant temperature; i) considering that cardanol
does not have impurities.
Moreover, transfer reactions, although possible (mainly due to steric hindrance and
great availability of hydrogens), were not considered for the cardanol mixture. Also,
The terminal unsaturation was the functional group most likely to continue propa-
gation and incorporate cardanol. But, although cardanol only has less than 50% of
compounds with terminal unsaturation, it was considered that the whole lump was
reactive in the kinetic model proposed because, as explained, the compounds have
many reactive sites. Nonetheless, the copolymerization parameters r1,2 and r2,1 were
shown to depend little on the reaction temperature in the analyzed experimental range
and to be equal to 1.627 - 3.210 and 0.015 - 0.026, respectively. As detecting experimen-
tally, the inhibition of cardanol at 90°C is more intense than at 110°. This reflected in a
lower value for fi nh obtained for 90°C (0.628) than for 110°C (0.731), meaning that it re-
duced the concentration of available radical molecules more the last condition. From1H −N MR analysis, it was possible to obtain copolymer composition and, therefore,
predict cardanol compositions in the copolymer and in the reaction medium. For the
conditions studied, cardanol is incorporated at the begging quite fast (r1,2 > 1.0) during
early reaction times due to its multiple reactive sites.
For MMA/cardanol copolymerizations, without the monomer transfer reaction (a
MMA-ended living chain attacking a cardanol’s hydrogen), the model could not repre-
sent correctly experimental data. MMA is much more reactive than styrene, therefore
r1,2 became lower than 1.0. The parameter for chain transfer reaction (t1,2) turned out
to be quite high to represent correctly molecular weights while still maintaining car-
danol composition in the copolymer. With this adapted model in relation to the one for
styrene, for MMA copolymerization, the model was able to follow experimental data at
every studied composition (2.5, 5 and 10wt%) and temperature.
127
Kinetic Study of Suspension
Copolymerization
2nd Section
128
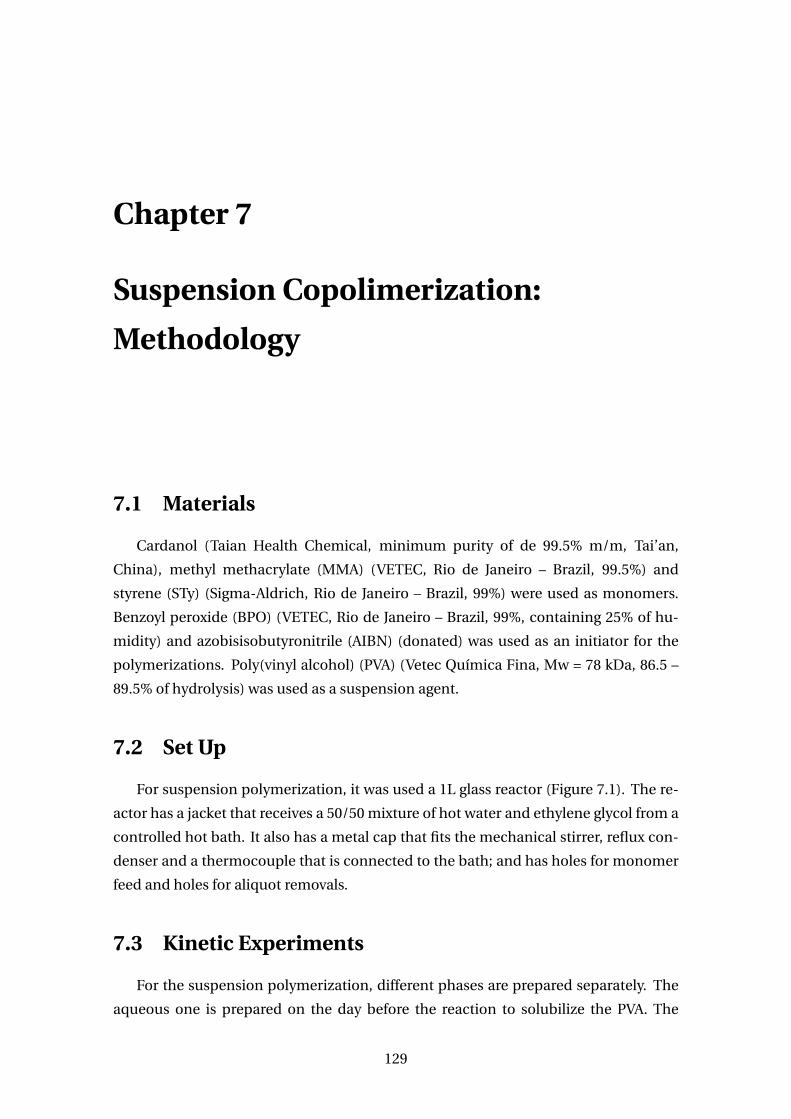
Chapter 7
Suspension Copolimerization:
Methodology
7.1 Materials
Cardanol (Taian Health Chemical, minimum purity of de 99.5% m/m, Tai’an,
China), methyl methacrylate (MMA) (VETEC, Rio de Janeiro – Brazil, 99.5%) and
styrene (STy) (Sigma-Aldrich, Rio de Janeiro – Brazil, 99%) were used as monomers.
Benzoyl peroxide (BPO) (VETEC, Rio de Janeiro – Brazil, 99%, containing 25% of hu-
midity) and azobisisobutyronitrile (AIBN) (donated) was used as an initiator for the
polymerizations. Poly(vinyl alcohol) (PVA) (Vetec Química Fina, Mw = 78 kDa, 86.5 –
89.5% of hydrolysis) was used as a suspension agent.
7.2 Set Up
For suspension polymerization, it was used a 1L glass reactor (Figure 7.1). The re-
actor has a jacket that receives a 50/50 mixture of hot water and ethylene glycol from a
controlled hot bath. It also has a metal cap that fits the mechanical stirrer, reflux con-
denser and a thermocouple that is connected to the bath; and has holes for monomer
feed and holes for aliquot removals.
7.3 Kinetic Experiments
For the suspension polymerization, different phases are prepared separately. The
aqueous one is prepared on the day before the reaction to solubilize the PVA. The
129
Figure 7.1: Set Up for Suspension Polymerizations
organic is prepared by mixing the monomer with the initiator only instants before
the polymerization starts. Every reaction was conducted at 85°C with agitation of
850 ± 50r pm. For methyl methacrylate polymerizations, samples were taken for 2
hours. For styrene for 4 hours. Each aliquot was every 15/30 minutes.
On the reaction day, the following procedure happened: (1) heating bath was
turned on with 85°C as set point; (2) PVA solution was added to the reactor; (3) stir-
ring was turned on and kept around 500 rpm; (4) when the temperature of the PVA
solution reached the desired one, the monomer was mixed with the initiator; (5) the
monomer mixture was added to the reactor and the stirring rate was changed to 850
rpm; (6) samples were taken in specifics intervals and a solution of hydroquinone was
added to stop the polymerization; (7) the heating bath was turned off after the planned
reaction time; (8) after cooling, some reaction samples were filtered under vacuum, but
other had very tiny particles that could not be filtered; (9) the samples were left at the
recirculating and vacuum oven until dry or were dried by freeze-drying.
Conditions for the suspension polymerizations are summarized in Table 7.1. Con-
centrations are presented in weight fraction. X stands for cardanol and Y for styrene
(Sty) or methyl methacrylate (MMA). Moreover, 1 wt% or 3 wt% of BPO was added
in relation to the total mass of monomer. Sometimes, BPO was substituted by AIBN.
Thus, for reactions in a 1 L reactor, the follow masses were the real values used: 180g of
monomer, 418.32g of water and 1.68g of PVA.
130
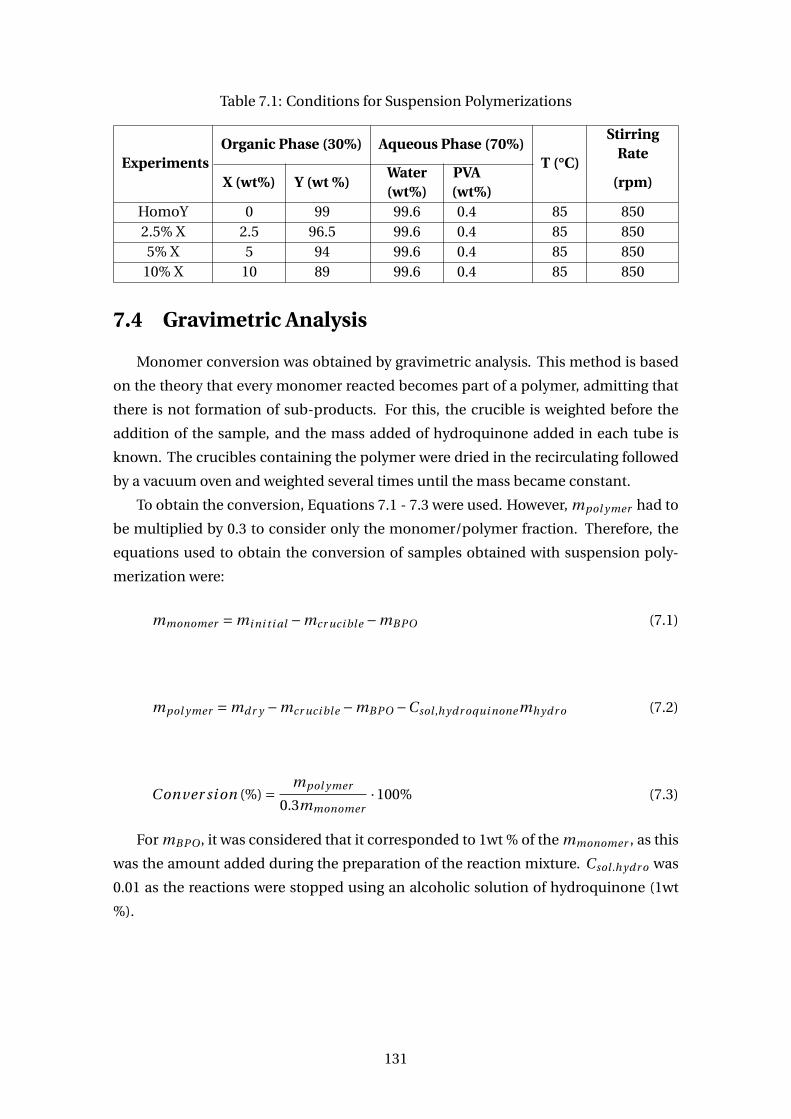
Table 7.1: Conditions for Suspension Polymerizations
ExperimentsOrganic Phase (30%) Aqueous Phase (70%)
T (°C)
StirringRate
X (wt%) Y (wt %)Water(wt%)
PVA(wt%)
(rpm)
HomoY 0 99 99.6 0.4 85 8502.5% X 2.5 96.5 99.6 0.4 85 8505% X 5 94 99.6 0.4 85 850
10% X 10 89 99.6 0.4 85 850
7.4 Gravimetric Analysis
Monomer conversion was obtained by gravimetric analysis. This method is based
on the theory that every monomer reacted becomes part of a polymer, admitting that
there is not formation of sub-products. For this, the crucible is weighted before the
addition of the sample, and the mass added of hydroquinone added in each tube is
known. The crucibles containing the polymer were dried in the recirculating followed
by a vacuum oven and weighted several times until the mass became constant.
To obtain the conversion, Equations 7.1 - 7.3 were used. However, mpol ymer had to
be multiplied by 0.3 to consider only the monomer/polymer fraction. Therefore, the
equations used to obtain the conversion of samples obtained with suspension poly-
merization were:
mmonomer = mi ni t i al −mcr uci bl e −mBPO (7.1)
mpol ymer = mdr y −mcr uci bl e −mBPO −Csol ,hydr oqui none mhydr o (7.2)
Conver si on (%) = mpol ymer
0.3mmonomer·100% (7.3)
For mBPO , it was considered that it corresponded to 1wt % of the mmonomer , as this
was the amount added during the preparation of the reaction mixture. Csol .hydr o was
0.01 as the reactions were stopped using an alcoholic solution of hydroquinone (1wt
%).
131
7.5 Characterizations
7.5.1 Contact Angle
To determine the degree of hydrophobicity of the polymeric materials produced, a
tensiometer Teclis was used. Initially, the particles were compressed in a disk model
using a press, forming tablets. Each sample was placed over a acrylic superficie, and
a drop of water as placed over to obtain contact angle between the surfaces under at-
mospheric conditions at 25°C using the equipment’s software. Such an angle is used as
an inference of the degree of hydrophobicity of the polymeric particles. The analyzes
were made in triplicate.
7.5.2 Interfacial tension
The interfacial tension was calculated between the organic phase (containing only
monomers, without BPO) and water (without PVA) at 25 and 85°C . This analysis were
performed to see the influence of cardanol as an suspension agent. Analysis were done
with pure MMA, MMA with cardanol, styrene, and styrene with cardanol. For this,
it was used a tensiometer (Kruss Process, model K100) and using a plaque that was
conected to equipment’s balance. Analysis occurred until the interfacial tension was
constant. Data points were obtained every 30 seconds.
7.5.3 Particles Size
Particle size distribution was obtained by a light scattering technique caused by
the presence of the polymer particles in aqueous medium. The equipment used was
the particle size analyzer Master Sizer Hydro 2000S (Malvern, United Kingdom). The
equipment has a detector system for front, side and back light scattering. The source
is a helium neon laser whose characteristic wavelength is 632.8 ηm. Its detection limit
ranges from 0.01 to 3000 µm. The samples were prepared dispersing roughly 200 - 500
mg of sample in an aqueous solution of ethanol. The dispersion medium used does
not dissolve the particles. Analyzes were done at room temperature.
7.5.4 MEV
The detailed visualization of the surface of the particles produced was possible with
the aid of SEM technique (Quanta 250, Fei Company, 30kV) using vacuum and sec-
ondary electrons for image construction. The photomicrographs were processed in an
image analyzer from the same manufacturer.
132
7.5.5 Optical Microscopy (OM)
Morphology of the particles produced by suspension were determined by optical
microscopy. The micrographs were obtained using the optical microscope Axiovert 40
MAT equipped with a 1.4 megapixel camera, model Axiocam MRc, both from manu-
facturer Carl Zeiss (Oberkochen, Germany), using the dark field technique.The micro-
scope is associated with a computer that has the Axiovision software version 4.8.1 from
the same manufacturer. This software enables acquisition of images, provides scales
and other measures.
133
Chapter 8
Suspension Copolimerization: Results
8.1 Introduction
As one of the main objectives of this study is the immobilization of enzymes and
functionalization of polymers using natural CNSL or cardanol, the synthesis of these
copolymers by a heterogeneous medium is interesting (PAIVA et al. (2018), CAMPOS
et al. (2016), MENDES et al. (2012)). Suspension, for instance, is a good choice be-
cause it has many advantages, including easy separation of the polymer particles, easy
removal of the heat of reaction, easy temperature control, and low levels of impuri-
ties and additives in the final polymer resin.Therefore, it is suitable for production of
polymer resins intended for many distinct applications, including biotechnological,
medical, and dental applications (PINTO et al., 2002).
Therefore, copolymer synthesis by suspension was done using only cardanol with
methyl methacrylate or styrene as they had the best results in bulk polymerizations.
The same procedure for natural cashew nut shell liquid may result in similar outcomes.
For initiator, benzoyl peroxide (BPO) was used in two different concentrations - 1wt
% and 3wt %. However, some polymerizations used azobisisobutyronitrile (AIBN) in-
stead. Although, molecular weights and copolymer compositions were not obtained,
other aspects of this reaction and its products are studied. An interesting aspect is that
after the reaction, the reaction mixtures were stable even when they were kept resting
for several weaks. Thus the addition of cardanol resulted in an increase in suspension
particles stability due to reduction of interfacial tension and combination of electrical
and geometric effects.
8.2 Styrene-Cardanol Copolymer Particles
First of all, the interfacial tension between the organic phase (styrene and 10wt %)
was studied to see if cardanol would interfere in particle sizes, and if some conditions
134
Table 8.1: Interfacial tension between styrene or styrene-cardanol with distilled water
Average Value [mN/m] Standard Deviation [mN/m]
Sty 18.0977 6.2072Sty + 10%C 11.0678 0.4502
for suspension polymerization should be changed such as PVA concentration and stir-
ring rate. In table 8.1, values for interfacial tension verify that the addition of cardanol
truly reduces the interfacial tension. This occurs because cardanol is an amphiphilic
molecule, thereby increasing the iteration between the organic phase and the aque-
ous one. However, the reduction is not as high as what happens with the addition
of PVA in the aqueous phase that corresponds to roughly 5 mN/m with 1wt% of PVA
(CARVALHO, 2011). GALVÃO (2016) obtained higher values for both styrene or styrene
with cardanol organic phases, but the addition of cardanol also decreased the interfa-
cial tension. As an example for the roughly good interaction between cardanol-water,
when the interfacial tension between cardanol and water tried to be measured by pen-
dant drop tensiometry, this could not be done due to high relation between the two
phases as cardanol was carried by the water phase - not remaining in the drop (Fig-
ure 8.1-a). For measures between styrene (or methyl methacrylate) and water by this
method, they remained in the drop, being this one with a perfect shape. It also likely
that cardanol moves to the interface leaving styrene in the nucleus of the particle or the
bottom of the crucible used to measure the interfacial tension (DE MARIA et al., 2005).
However this is a good aspect as cardanol deposition on the surfaces allows surface
modification through the functional groups, rendering the particles compatible with
different mediums and with the potential for various kinds of applications (BOHARA
et al. (2016)). Figure 8.1-b is a photo for a drop in which its interfacial tension was been
measured and there is a "snake" of cardanol running away.
Styrene-cardanol copolymers were synthesized using 5wt % of cardanol with 1 or
3wt %; and using 10wt % of cardanol with 1wt % of AIBN (Figure 8.2). The data for
2.5wt% with 1wt% BPO was obtained from GALVÃO (2016) for comparative purposes.
Polystyrene reached 100% of conversion around 200 min for 1wt% of BPO. However,
as was detected and discussed in the 1st section, cardanol inhibits the polymerization,
reaching only 53% for 2.5wt% (after 540 minutes) and 7 for 5wt% (GALVÃO (2016) ob-
tained 13.4% after 300min). Therefore, the kinetics was slower when the reaction was
performed in suspension due to differences in mass and heat transfers. But because
nitrogen purging did not occur for these reactions, this can also have an influence in
hydrogen donation by the phenolic group (LARTIGUE-PEYROU, 1996). Then, chang-
ing the initiator for AIBN, monomer conversion was improved extremely. For 5wt %,
conversion reached over 80%; and, for 10wt %, 45% was obtained - almost the value
got for 2.5wt% with BPO. GALVÃO (2016) obtained total conversion with 2.5wt % using
135
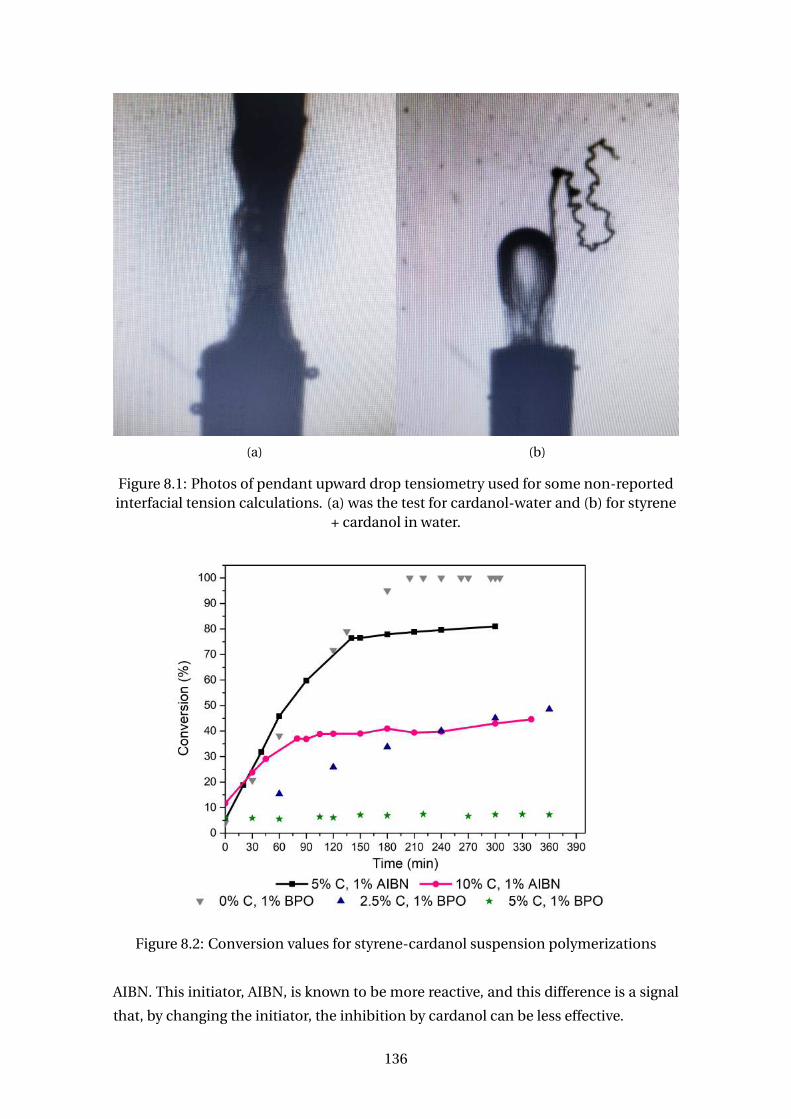
(a) (b)
Figure 8.1: Photos of pendant upward drop tensiometry used for some non-reportedinterfacial tension calculations. (a) was the test for cardanol-water and (b) for styrene
+ cardanol in water.
Figure 8.2: Conversion values for styrene-cardanol suspension polymerizations
AIBN. This initiator, AIBN, is known to be more reactive, and this difference is a signal
that, by changing the initiator, the inhibition by cardanol can be less effective.
136
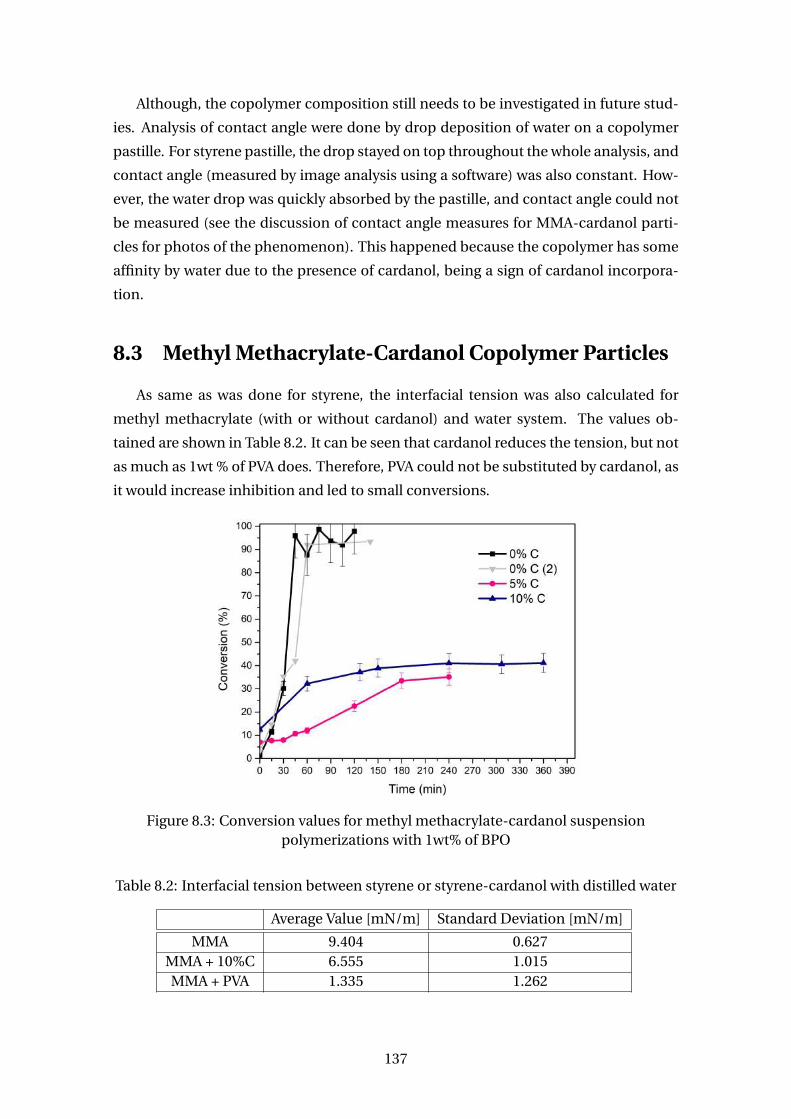
Although, the copolymer composition still needs to be investigated in future stud-
ies. Analysis of contact angle were done by drop deposition of water on a copolymer
pastille. For styrene pastille, the drop stayed on top throughout the whole analysis, and
contact angle (measured by image analysis using a software) was also constant. How-
ever, the water drop was quickly absorbed by the pastille, and contact angle could not
be measured (see the discussion of contact angle measures for MMA-cardanol parti-
cles for photos of the phenomenon). This happened because the copolymer has some
affinity by water due to the presence of cardanol, being a sign of cardanol incorpora-
tion.
8.3 Methyl Methacrylate-Cardanol Copolymer Particles
As same as was done for styrene, the interfacial tension was also calculated for
methyl methacrylate (with or without cardanol) and water system. The values ob-
tained are shown in Table 8.2. It can be seen that cardanol reduces the tension, but not
as much as 1wt % of PVA does. Therefore, PVA could not be substituted by cardanol, as
it would increase inhibition and led to small conversions.
Figure 8.3: Conversion values for methyl methacrylate-cardanol suspensionpolymerizations with 1wt% of BPO
Table 8.2: Interfacial tension between styrene or styrene-cardanol with distilled water
Average Value [mN/m] Standard Deviation [mN/m]
MMA 9.404 0.627MMA + 10%C 6.555 1.015MMA + PVA 1.335 1.262
137
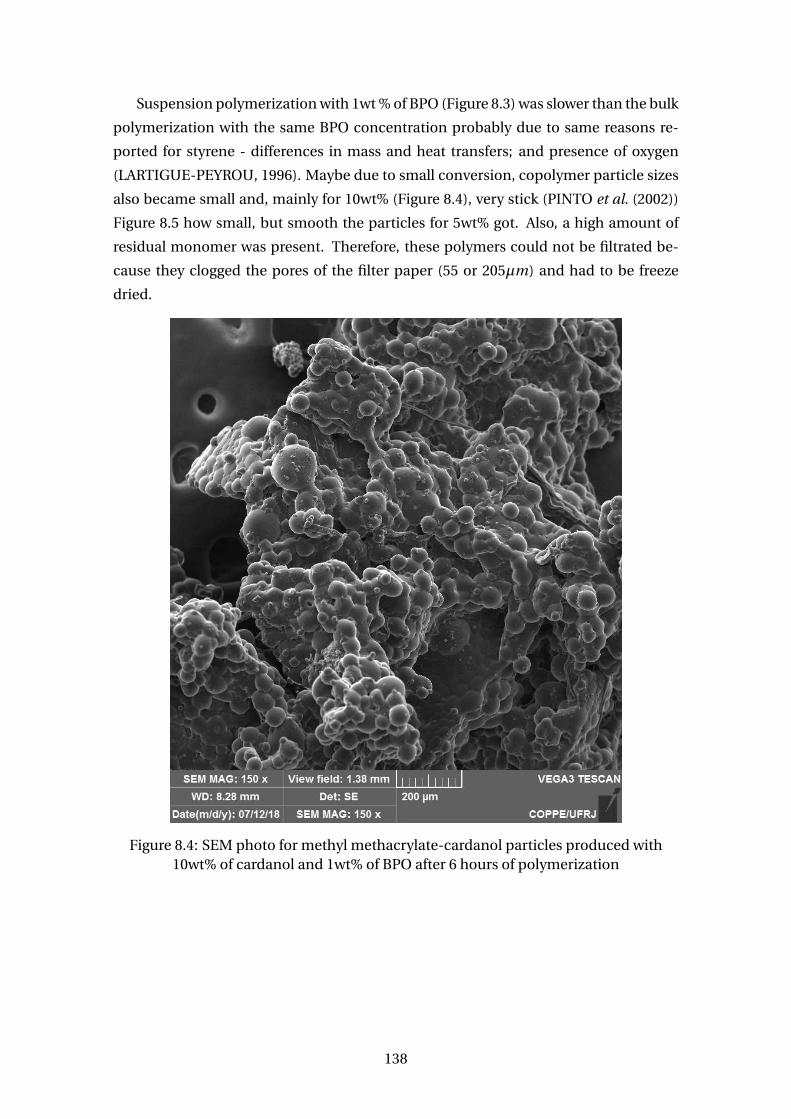
Suspension polymerization with 1wt % of BPO (Figure 8.3) was slower than the bulk
polymerization with the same BPO concentration probably due to same reasons re-
ported for styrene - differences in mass and heat transfers; and presence of oxygen
(LARTIGUE-PEYROU, 1996). Maybe due to small conversion, copolymer particle sizes
also became small and, mainly for 10wt% (Figure 8.4), very stick (PINTO et al. (2002))
Figure 8.5 how small, but smooth the particles for 5wt% got. Also, a high amount of
residual monomer was present. Therefore, these polymers could not be filtrated be-
cause they clogged the pores of the filter paper (55 or 205µm) and had to be freeze
dried.
Figure 8.4: SEM photo for methyl methacrylate-cardanol particles produced with10wt% of cardanol and 1wt% of BPO after 6 hours of polymerization
138
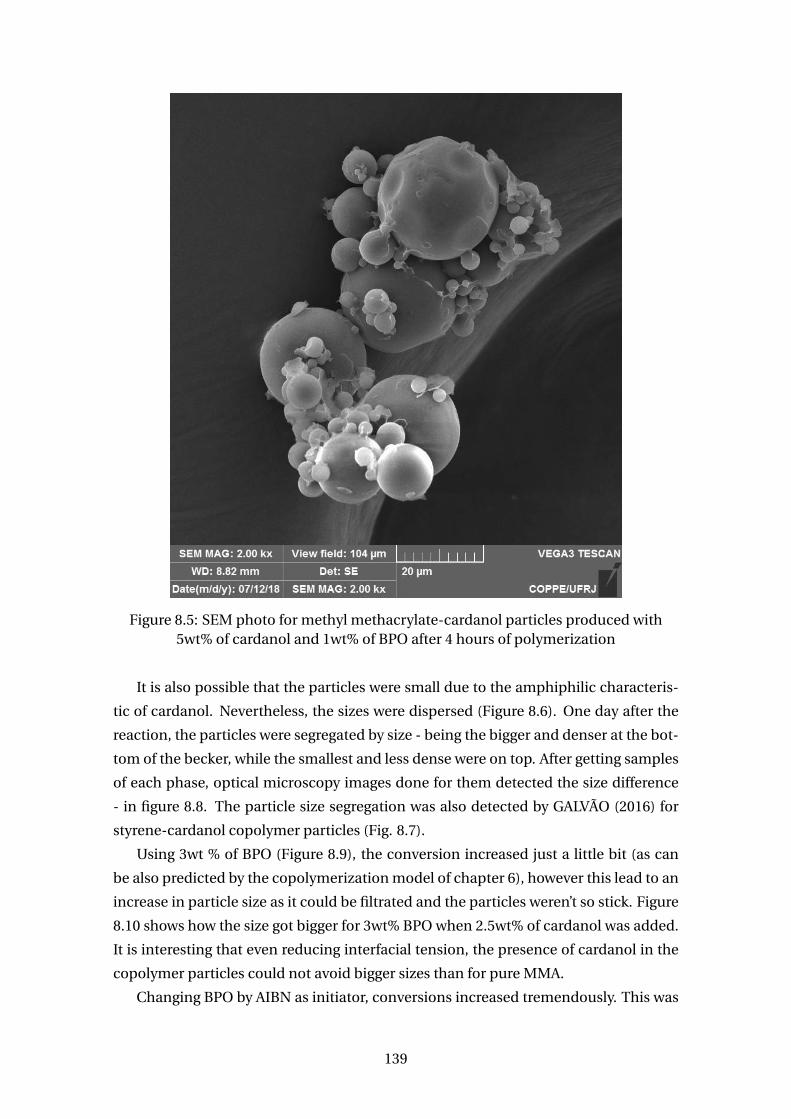
Figure 8.5: SEM photo for methyl methacrylate-cardanol particles produced with5wt% of cardanol and 1wt% of BPO after 4 hours of polymerization
It is also possible that the particles were small due to the amphiphilic characteris-
tic of cardanol. Nevertheless, the sizes were dispersed (Figure 8.6). One day after the
reaction, the particles were segregated by size - being the bigger and denser at the bot-
tom of the becker, while the smallest and less dense were on top. After getting samples
of each phase, optical microscopy images done for them detected the size difference
- in figure 8.8. The particle size segregation was also detected by GALVÃO (2016) for
styrene-cardanol copolymer particles (Fig. 8.7).
Using 3wt % of BPO (Figure 8.9), the conversion increased just a little bit (as can
be also predicted by the copolymerization model of chapter 6), however this lead to an
increase in particle size as it could be filtrated and the particles weren’t so stick. Figure
8.10 shows how the size got bigger for 3wt% BPO when 2.5wt% of cardanol was added.
It is interesting that even reducing interfacial tension, the presence of cardanol in the
copolymer particles could not avoid bigger sizes than for pure MMA.
Changing BPO by AIBN as initiator, conversions increased tremendously. This was
139
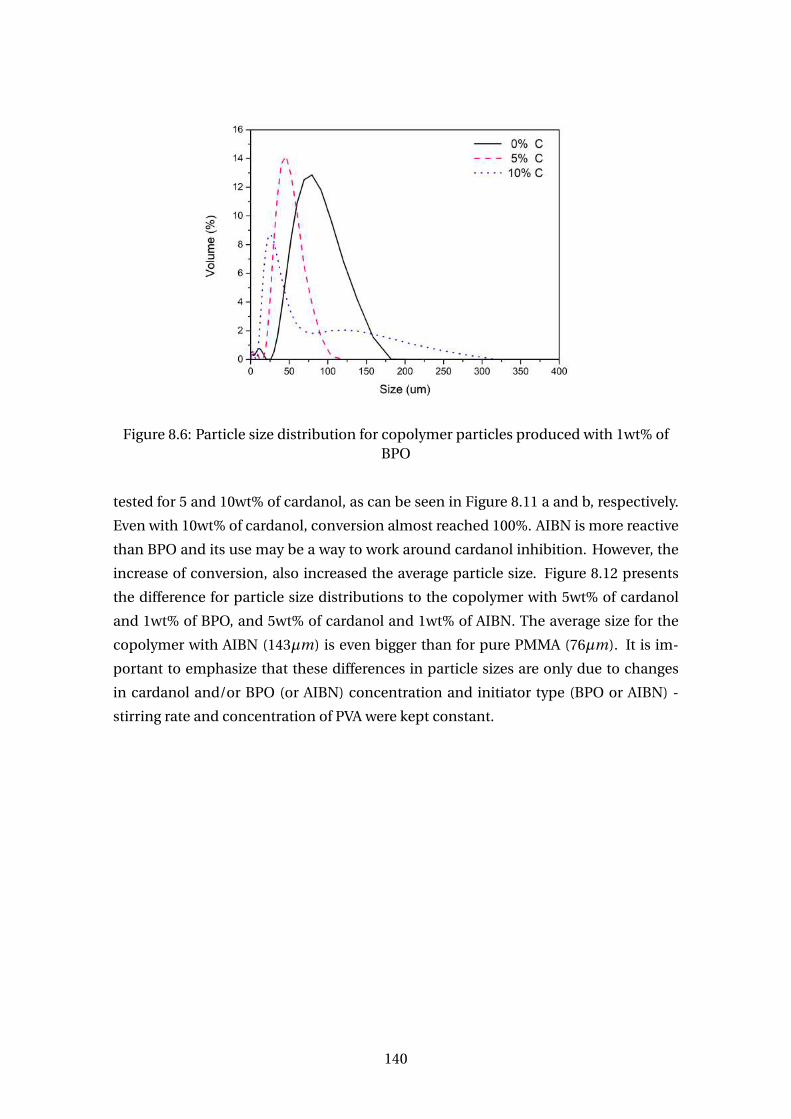
Figure 8.6: Particle size distribution for copolymer particles produced with 1wt% ofBPO
tested for 5 and 10wt% of cardanol, as can be seen in Figure 8.11 a and b, respectively.
Even with 10wt% of cardanol, conversion almost reached 100%. AIBN is more reactive
than BPO and its use may be a way to work around cardanol inhibition. However, the
increase of conversion, also increased the average particle size. Figure 8.12 presents
the difference for particle size distributions to the copolymer with 5wt% of cardanol
and 1wt% of BPO, and 5wt% of cardanol and 1wt% of AIBN. The average size for the
copolymer with AIBN (143µm) is even bigger than for pure PMMA (76µm). It is im-
portant to emphasize that these differences in particle sizes are only due to changes
in cardanol and/or BPO (or AIBN) concentration and initiator type (BPO or AIBN) -
stirring rate and concentration of PVA were kept constant.
140
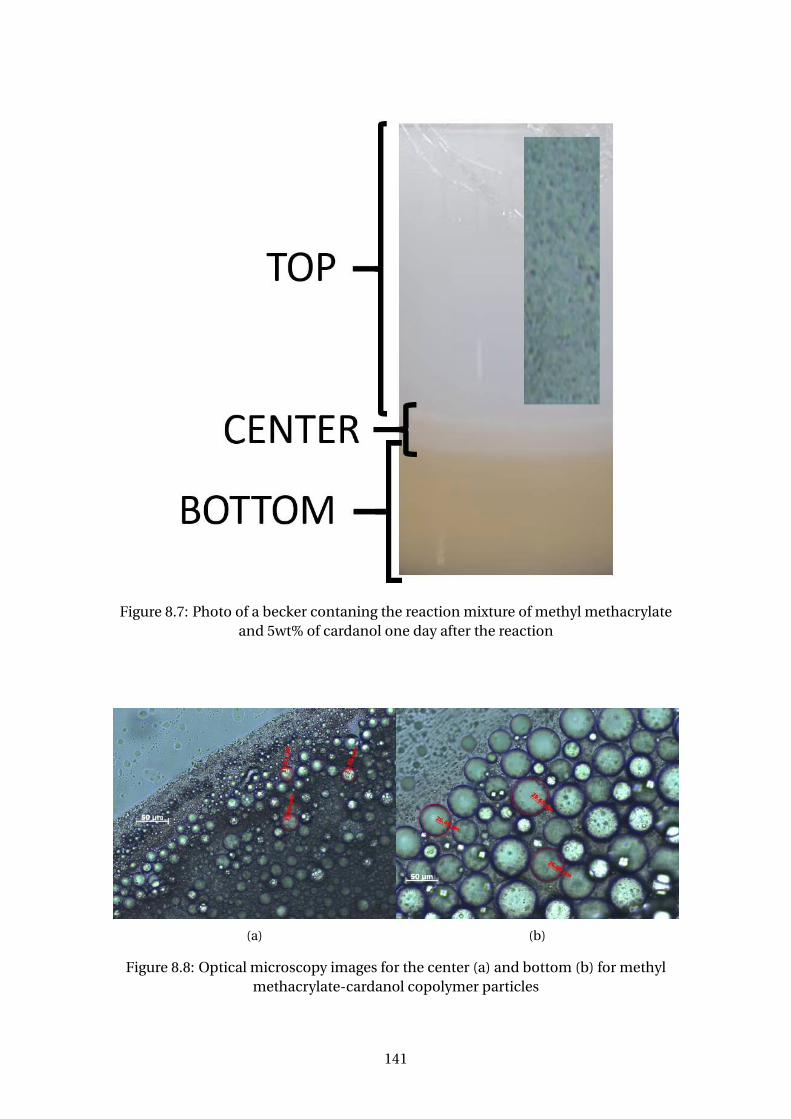
Figure 8.7: Photo of a becker contaning the reaction mixture of methyl methacrylateand 5wt% of cardanol one day after the reaction
(a) (b)
Figure 8.8: Optical microscopy images for the center (a) and bottom (b) for methylmethacrylate-cardanol copolymer particles
141
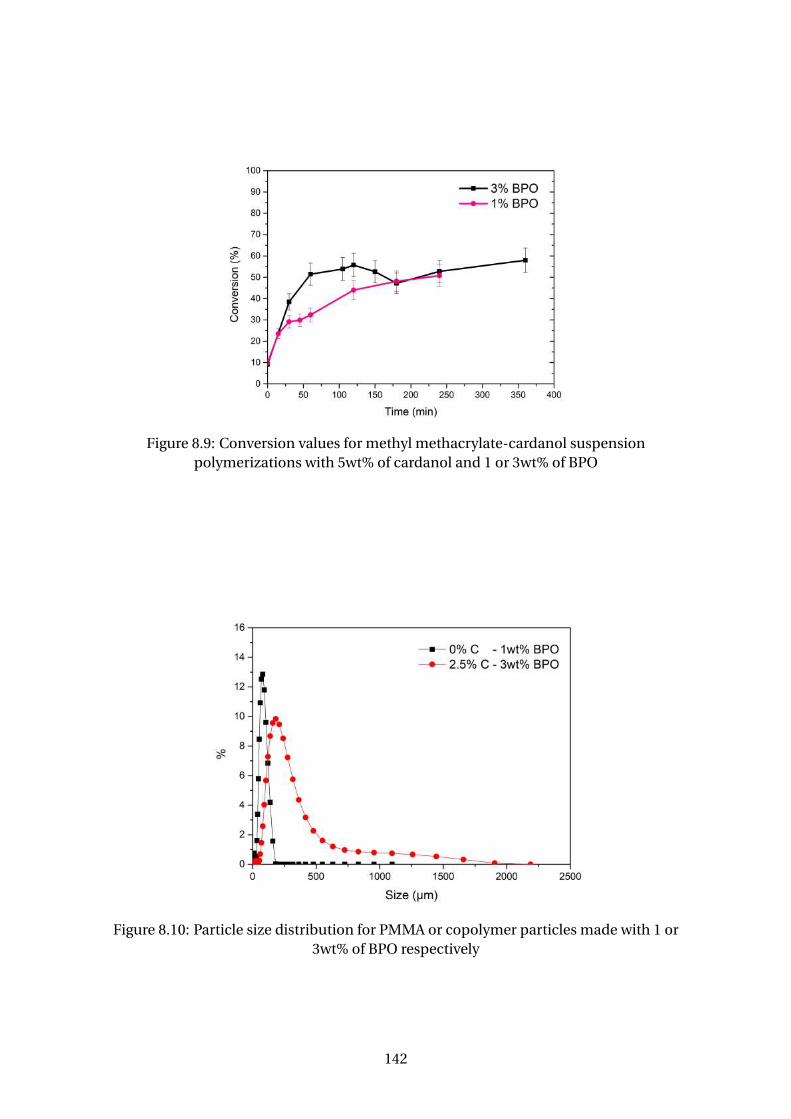
Figure 8.9: Conversion values for methyl methacrylate-cardanol suspensionpolymerizations with 5wt% of cardanol and 1 or 3wt% of BPO
Figure 8.10: Particle size distribution for PMMA or copolymer particles made with 1 or3wt% of BPO respectively
142
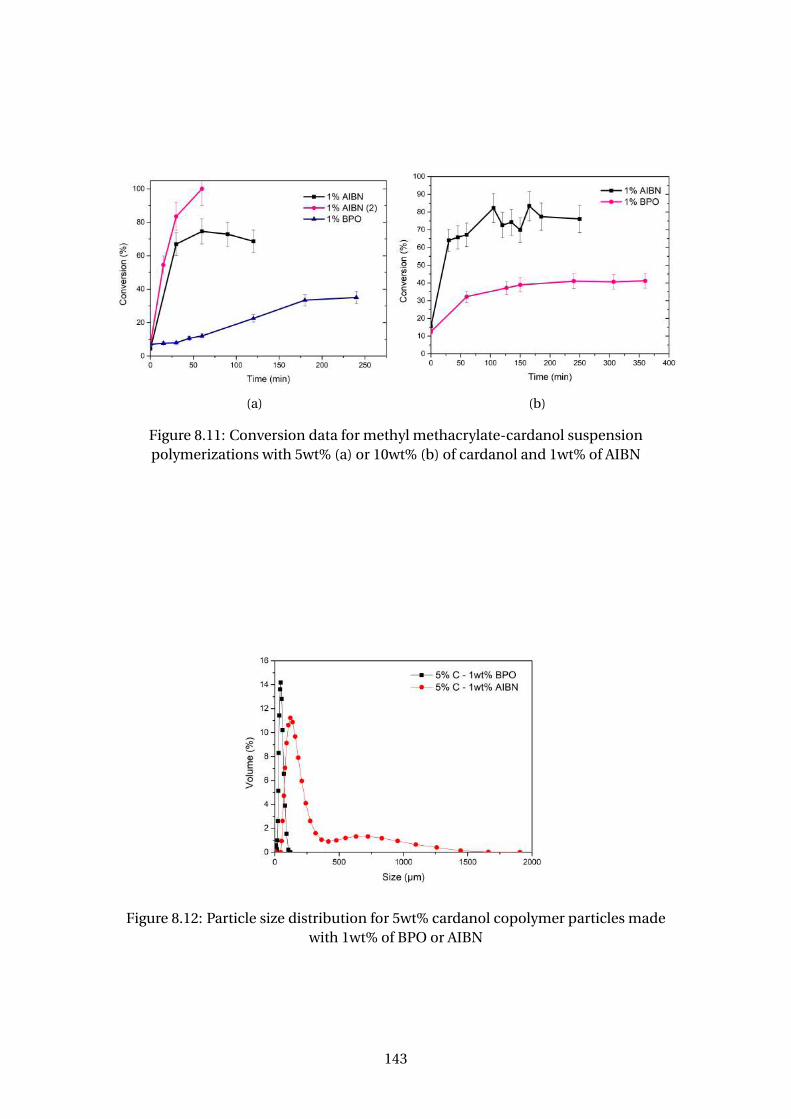
(a) (b)
Figure 8.11: Conversion data for methyl methacrylate-cardanol suspensionpolymerizations with 5wt% (a) or 10wt% (b) of cardanol and 1wt% of AIBN
Figure 8.12: Particle size distribution for 5wt% cardanol copolymer particles madewith 1wt% of BPO or AIBN
143
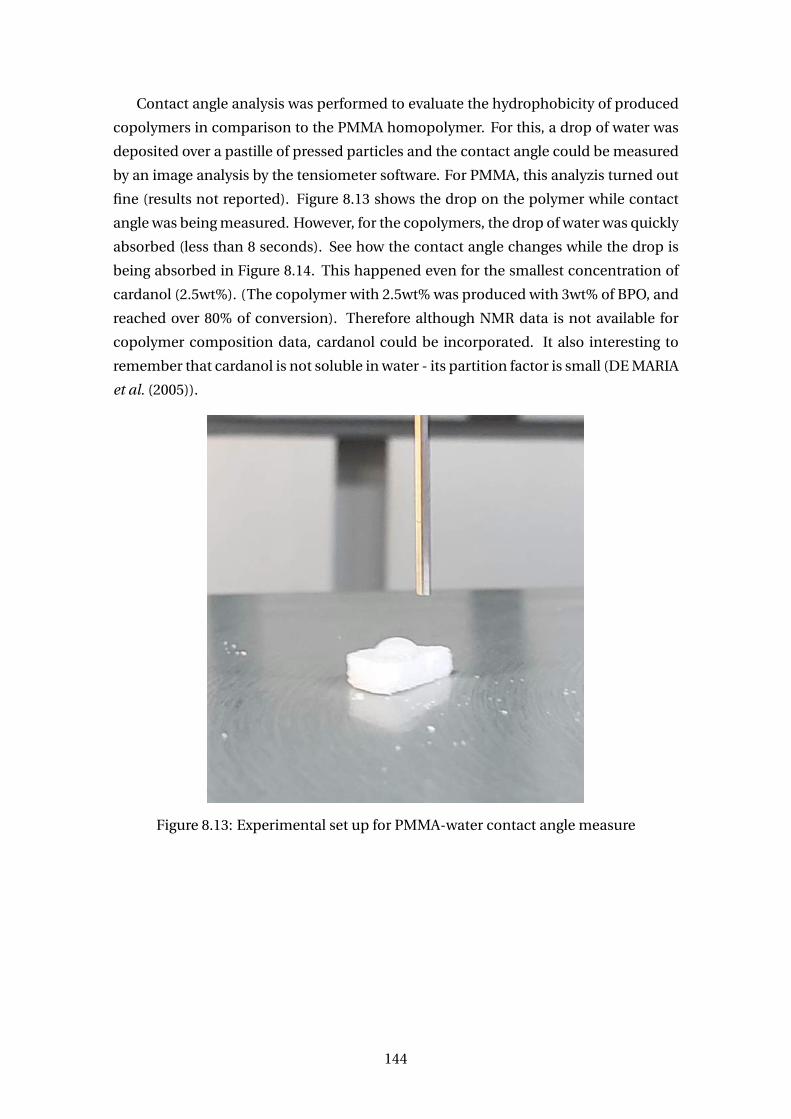
Contact angle analysis was performed to evaluate the hydrophobicity of produced
copolymers in comparison to the PMMA homopolymer. For this, a drop of water was
deposited over a pastille of pressed particles and the contact angle could be measured
by an image analysis by the tensiometer software. For PMMA, this analyzis turned out
fine (results not reported). Figure 8.13 shows the drop on the polymer while contact
angle was being measured. However, for the copolymers, the drop of water was quickly
absorbed (less than 8 seconds). See how the contact angle changes while the drop is
being absorbed in Figure 8.14. This happened even for the smallest concentration of
cardanol (2.5wt%). (The copolymer with 2.5wt% was produced with 3wt% of BPO, and
reached over 80% of conversion). Therefore although NMR data is not available for
copolymer composition data, cardanol could be incorporated. It also interesting to
remember that cardanol is not soluble in water - its partition factor is small (DE MARIA
et al. (2005)).
Figure 8.13: Experimental set up for PMMA-water contact angle measure
144
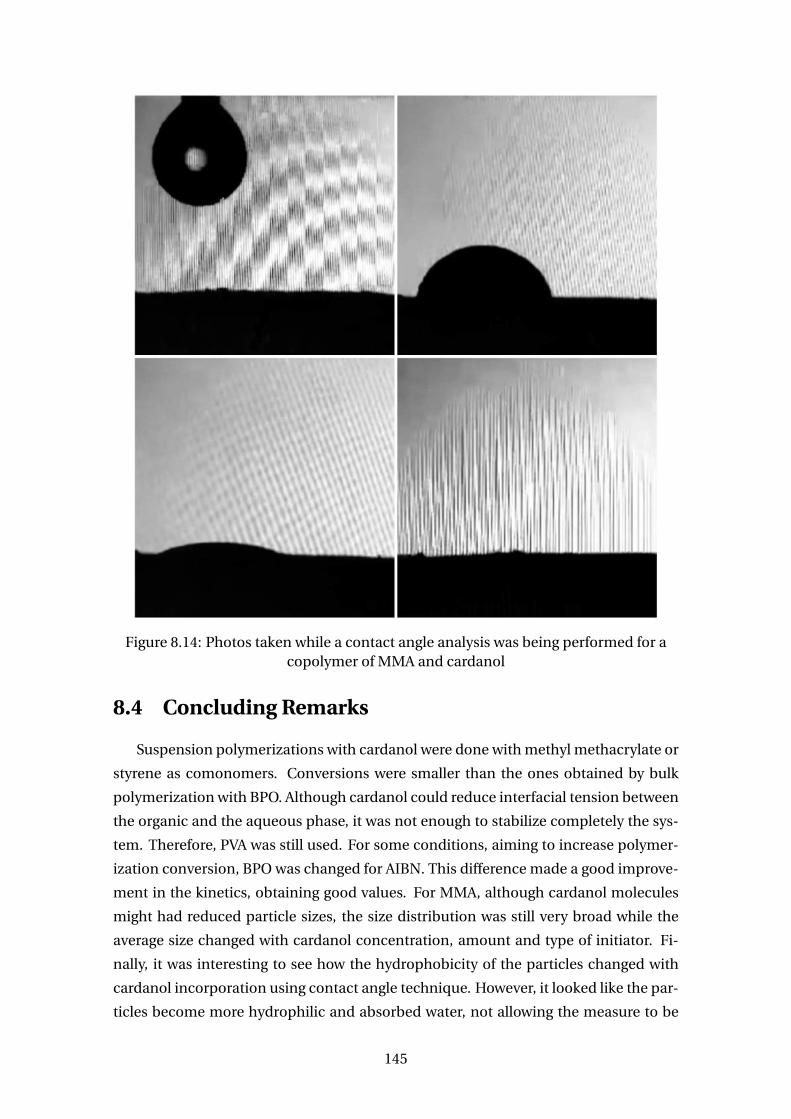
Figure 8.14: Photos taken while a contact angle analysis was being performed for acopolymer of MMA and cardanol
8.4 Concluding Remarks
Suspension polymerizations with cardanol were done with methyl methacrylate or
styrene as comonomers. Conversions were smaller than the ones obtained by bulk
polymerization with BPO. Although cardanol could reduce interfacial tension between
the organic and the aqueous phase, it was not enough to stabilize completely the sys-
tem. Therefore, PVA was still used. For some conditions, aiming to increase polymer-
ization conversion, BPO was changed for AIBN. This difference made a good improve-
ment in the kinetics, obtaining good values. For MMA, although cardanol molecules
might had reduced particle sizes, the size distribution was still very broad while the
average size changed with cardanol concentration, amount and type of initiator. Fi-
nally, it was interesting to see how the hydrophobicity of the particles changed with
cardanol incorporation using contact angle technique. However, it looked like the par-
ticles become more hydrophilic and absorbed water, not allowing the measure to be
145
completed. Therefore for applications that require water-soluble polymers, the ob-
tained particles may be a good option. Nonetheless, the synthesis of these particles in
the heterogeneous medium show that a broad range of applications for them is avail-
able, e.g. core-shell particles of cardanol-styrene or cardanol-MMA (BESTETI et al.,
2014).
146
Chapter 9
Conclusions
Although there is not any kinetic study verifying that CNSL does not polymerize via
free radicals, it is common to found in the literature claims that says that it cannot.
However, bulk polymerizations of cardanol and natural cashew nut shell liquid (CNSL)
showed that polymeric chains with more than 10 meres can be formed. The strong
limitations to maximize conversions arise from steric hindrance; addition of radical to
any of the internal unsaturations of the side chain, forming a stable radical that tends
to not propagate; and donation of a hydrogen by the phenolic group, remaining a free
radical in the oxygen atom that is stabilized by the aromatic ring due to resonance
structures. Despite this, bulk copolymerization of cardanol/natural CNSL with methyl
methacrylate, styrene, vinyl acetate and acrid acid occurred. The best results were ob-
tained by the first two cited monomers, although inhibitory effects and lower reactions
rates were still present. Their copolymers did not have high cardanol contents, but
even 1% was enough to improve thermal stability and had their glass transition tem-
perature reduced. Also, because the phenolic compounds have many reactive sites and
functional groups, analysis of FTIR and 1H-NMR could be more complex with peaks
overleaping each other, but bonds for both compounds were detected and it is clear
that phenolic unsaturations are reactive, i.e. their corresponding peaks decrease in in-
tensity. Nonetheless, cardanol content in the copolymers was determined by 1H-NMR.
For vinyl acetate, cardanol acted as a strong inhibitor and, even worse, its presence
in VAc polymeric chains decreased its strength and, thereby, decreasing thermal sta-
bility. For acrylic acid, practically instant copolymerization happened. But, because
of this, deep kinetic investigations could not be performed. Further reactions with
acrylic acid should be done in heterogeneous medium to have a better control of poly-
merization, as bulk kinetic parameters for PAA polymerization is hard to find to study
its kinetics.
Moreover, only mildly differences from cardanol kinetics to CNSL ones could be de-
tected. For homopolymerizations, CNSL had higher conversions, but considering the
high deviations of the obtained values, their oligomerization happened basically the
147
same. For MMA-CNSL copolymerization, the biggest gap between its conversion and
MMA-cardanol copolymerization conversion happened for the lowest temperature (85
°C). Therefore, CNSL had a lesser inhibition effect, but still a present one. This could
have happened due to induction effect between the carboxyl and hydroxyl around the
aromatic ring, decreasing the possibility of phenolic inhibition. However, even with
this slightly difference, they are both lump mixtures and can their kinetics can be con-
sidered the same. Furthermore, using CNSL, decreases one purification step to obtain
cardanol, reducing process costs.
Therefore, based on the bulk results, one may expect to face strong limitations to
maximize the cardanol/CNSL content of the copolymers. Despite that, for future stud-
ies, the production of copolymers with high CNSL compositions should be performed
at much higher temperatures as was shown that the increase in temperature led to a
decrease in CNSL retardation effect on kinetics. However, this might not translate in
high CNSL copolymer compositions. Other possibility is using alternative processes,
mainly polymerization under pressure to avoid traces of oxygen that can increase rad-
ical inhibition by the phenolics. This may lead to overall high conversions. Nonethe-
less, changing the initiator to a more reactive one, such as AIBN, can obtain high con-
version. A good start for this future studies was the validation of a proposed kinetic
model in which kinetic parameters for cardanol copolymerizations with styrene were
estimated (r1,2 and r2,1). To characterize the inhibition, an inhibition factor responsi-
ble for reducing the concentration of free radicals was also estimated. These constants
could be obtained for the studied range of cardanol concentrations and temperatures
used with low objective functions. Thus, even with many hypothesis, the proposed
model was able to follow monomer conversions, molecular weights and copolymer
compositions in a good range of conditions.
As polymerization in heterogeneous medium is more interesting for biomedical
and other noble applications, MMA/cardanol or styrene/cardanol copolymerization
were performed in suspension. Although worse rates for monomer conversion were
obtained using the same mass fractions of reactants in the organic phase, the intro-
duction of small amounts of cardanol into the copolymer backbone (below 2.5 wt%)
is sufficient to modify the hydrophobicity of the final polymer product, which can be
advantageous for biotechnological applications. From SEM photographies, the parti-
cles did not have a high porosity, and, in fact, their surface were smooth. Nonetheless,
cardanol concentration reduces the interfacial tension, but not as much to substitute
PVA in the aqueous phase. However, its amphiphilic characteristic affected the average
particle size, reducing it from the average size of 76µm for pure PMMA to 30~45µm for
10 or 5wt% of cardanol respectively. But particle sizes were influenced by differences in
initiator concentration and type - as well as monomer conversion. Finally, the addition
of chemical functionals groups on the polymeric chains (and mainly on the surface of
148
polymeric particles), renders them compatible and with the potential for various kind
of applications.
149
Bibliography
BALGUDE, D., SABNIS, A. S., 2014, “CNSL: an environment friendly alternative for
the modern coating industry”, Journal of Coatings Technology and Research,
v. 11, n. 2, pp. 169–183. doi: <10.1007/s11998-013-9521-3>. Availability:
<http://link.springer.com/10.1007/s11998-013-9521-3>.
BESTETI, M. D., SOUZA JR, F. G., FREIRE, D. M., et al., 2014, “Production of core-
shell polymer particles-containing cardanol by semibatch combined sus-
pension/emulsion polymerization”, Polymer Engineering & Science, v. 54,
n. 5, pp. 1222–1229.
BEVINGTON, J., MELVILLE, H., TAYLOR, R., 1954, “The termination reaction in radi-
cal polymerizations. Polymerizations of methyl methacrylate and styrene at
25°”, Journal of Polymer Science, v. 12, n. 1, pp. 449–459.
BHUNIA, H. P., NANDO, G. B., BASAK, A., et al., 1999, “Synthesis and characterization
of polymers from cashewnut shell liquid (CNSL), a renewable resource III.
Synthesis of a polyether”, European Polymer Journal, v. 35, n. 9, pp. 1713–
1722. doi: <http://dx.doi.org/10.1016/S0014-3057(98)00244-4>.
Availability: <http://www.sciencedirect.com/science/article/pii/
S0014305798002444>.
BILLMEYER, F. W., 1984, Textbook of Polymer Science. 3rd ed. United States of America,
John Wiley & Sons.
BISANDA, E. T. N., ANSELL, M. P., 1992, “Properties of sisal-CNSL composites”,
Journal of Materials Science, v. 27, n. 6, pp. 1690–1700. doi: <10.1007/
BF00542934>.
BOHARA, R. A., THORAT, N. D., PAWAR, S. H., 2016, “Role of functionalization: strate-
gies to explore potential nano-bio applications of magnetic nanoparticles”,
RSC Advances, v. 6, n. 50, pp. 43989–44012.
BRANDÃO, A., 2017, Mathematical modeling of chain branching reactions in olefin
coordination polymerizations. Tese de doutorado, Programa de Engenharia
Química (PEQ) - Universidade Federal do Rio de Janeiro.
150
CAMPOS, I. M., FERRAZ, H. C., PINTO, J. C., 2016, “Production and Functionaliza-
tion of P (MMA-co-AA) Nanoparticles by Miniemulsion Polymerization”. In:
Macromolecular Symposia, v. 368, pp. 70–77. Wiley Online Library.
CANEVAROLO JR., S., 2006, Ciência dos Polímeros. 2nd ed. São Paulo, Artliber Editora.
CARVALHO, E. P., 2011, Uso do persulfato de amônio para estabilização da polimeriza-
ção em suspensão do estireno. Tese de mestrado, Programa de Engenharia
Química (PEQ) - Universidade Federal do Rio de Janeiro.
CERVANTES-UC, J., CAUICH-RODRÍGUEZ, J., VÁZQUEZ-TORRES, H., et al., 2006,
“TGA/FTIR study on thermal degradation of polymethacrylates containing
carboxylic groups”, Polymer degradation and stability, v. 91, n. 12, pp. 3312–
3321.
CHELIKANI, R., KIM, Y. H., YOON, D. Y., et al., 2009, “Enzymatic polymerization
of natural anacardic acid and antibiofouling effects of polyanacardic acid
coatings”, Applied Biochemistry and Biotechnology, v. 157, n. 2, pp. 263–277.
doi: <10.1007/s12010-008-8284-2>.
CHISHOLM, B. J., ALAM, S., KALITA, H., et al. “Monomers and polymers derived from
natural phenols (W O2014197041A2)”. .
DAVID, J. P., FARMÁCIA, F. D., FEDERAL, U., et al., 2006, “Metabólitos Secundários de
Espécies de Anacardiaceae”, Quim. Nova, v. 29, n. 6, pp. 1287–1300.
DE MARIA, P., FILIPPONE, P., FONTANA, A., et al., 2005, “Cardanol as a replacement
for cholesterol into the lipid bilayer of POPC liposomes”, Colloids and Sur-
faces B: Biointerfaces, v. 40, n. 1, pp. 11–18.
FERREIRA, S. R., LOUZADA, H. F., DIP, R. M. M., et al., 2015, “Influence of the ar-
chitecture of additives on the stabilization of asphaltene and water-in-oil
emulsion separation”, Energy & Fuels, v. 29, n. 11, pp. 7213–7220.
FERRIOL, M., GENTILHOMME, A., COCHEZ, M., et al., 2003, “Thermal degradation
of poly (methyl methacrylate)(PMMA): modelling of DTG and TG curves”,
Polymer degradation and stability, v. 79, n. 2, pp. 271–281.
FINEMAN, M., ROSS, S. D., 1950, “Linear method for determining monomer reactivity
ratios in copolymerization”, Journal of Polymer Science, v. 5, n. 2, pp. 259–
262.
GALVÃO, L. D. A., 2016, Estudo da Copolimerização de Estireno e Cardanol em Meios
Homogêneo e Heterogêneo. Msc dissertation, Programa de Engenharia
Química (PEQ) - Federal University of Rio de Janeiro.
151
GEDAM, P., SAMPATHKUMARAN, P., 1986, “Cashew nut shell liquid: extraction,
chemistry and applications”, Progress in Organic Coatings, v. 14, n. 2,
pp. 115–157.
HARVEY, M. T. “Process of destructively distilling cashew nut shell liquid
(U S2098824)”. .
HERMANSON, G. T., 2013, Bioconjugate techniques. Academic press.
IKEDA, R., TANAKA, H., UYAMA, H., et al., 2000a, “Enzymatic Synthesis and Curing of
Poly(cardanol)”, Polymer Journal, v. 32, n. 7, pp. 589–593.
IKEDA, R., TANAKA, H., UYAMA, H., et al., 2000b, “New crosslinkable polyphenol
from renewable resource”, American Chemical Society, Polymer Preprints,
Division of Polymer Chemistry, v. 41, n. 1, pp. 83–84. doi: <10.1002/(SICI)
1521-3927(20000501)21:8<496::AID-MARC496>3.0.CO;2-G>.
KAEWCHADA, A., BORVORNPONGSAKUL, C., JAREE, A., 2012, “Synthesis of molec-
ularly imprinted polymers from AnAc for the separation of γ-oryzanol”, Ko-
rean Journal of Chemical Engineering, v. 29, n. 9 (sep), pp. 1279–1284. doi:
<10.1007/s11814-012-0021-4>. Availability: <http://link.springer.
com/10.1007/s11814-012-0021-4>.
KALFAS, G., RAY, W. H., 1993, “Modeling and experimental studies of aqueous sus-
pension polymerization processes. 1. Modeling and simulations”, Industrial
& engineering chemistry research, v. 32, n. 9, pp. 1822–1830.
KASHIWAGI, T., INABA, A., BROWN, J. E., et al., 1986, “Effects of weak linkages on the
thermal and oxidative degradation of poly (methyl methacrylates)”, Macro-
molecules, v. 19, n. 8, pp. 2160–2168.
KELEN, T., TÜDOS, F., 1974, “A new improved linear graphical method for determing
copolymerization reactivity ratios”, Reaction Kinetics and Catalysis Letters,
v. 1, n. 4, pp. 487–492.
KIM, K. J., CHOI, K. Y., ALEXANDER, J. C., 1992, “Dynamics of a continuous stirred
tank reactor for styrene polymerization initiated by a binary initiator mix-
ture. II: Effect of viscosity dependent heat transfer coefficient”, Polymer En-
gineering & Science, v. 32, n. 7, pp. 494–505.
KIM, K., CHOI, K., 1989, “Modeling of free radical polymerization of styrene cat-
alyzed by unsymmetrical bifunctional initiators”, Chemical engineering sci-
ence, v. 44, n. 2, pp. 297–312.
152
KIM, Y. H., AN, E. S., SONG, B. K., et al., 2003, “Polymerization of cardanol using soy-
bean peroxidase and its potential application as anti-biofilm coating mate-
rial”, Biotechnology Letters, v. 25, n. 18, pp. 1521–1524. doi: <10.1023/A:
1025486617312>.
KUMAR, S., DINESHA, P., ROSEN, M. A., 2018, “Cashew Nut Shell Liquid as a Fuel for
Compression Ignition Engines: A Comprehensive Review”, Energy and Fu-
els, v. 32, n. 7, pp. 7237–7244. doi: <10.1021/acs.energyfuels.8b00579>.
LARTIGUE-PEYROU, F., 1996, “The use of phenolic compounds as free-radical poly-
merization inhibitors”. In: Industrial Chemistry Library, v. 8, Elsevier, pp.
489–505.
LEMOS, T. S. M., 2014, Modelagem Estocástica da Formação de Produtos Copoliméri-
cos com Microestrutura Controlada em Reatores Contínuos. Ph.D. The-
sis, Programa de Engenharia Química (PEQ) - Federal University of Rio de
Janeiro.
LI, W. S. J., NEGRELL, C., LADMIRAL, V., et al., 2018a, “Cardanol-based polymer latex
by radical aqueous miniemulsion polymerization”, Polymer Chemistry, v. 9,
n. 18, pp. 2468–2477. doi: <10.1039/C8PY00167G>. Availability: <http:
//xlink.rsc.org/?DOI=C8PY00167G>.
LI, W. S. J., NEGRELL, C., LADMIRAL, V., et al., 2018b, “Cardanol-based polymer latex
by radical aqueous miniemulsion polymerization”, Polymer Chemistry, v. 9,
n. 18, pp. 2468–2477.
LOCHAB, B., SHUKLA, S., VARMA, I. K., 2014, “Naturally occurring phenolic sources:
monomers and polymers”, RSC Adv., v. 4, n. 42, pp. 21712–21752. doi:
<10.1039/C4RA00181H>. Availability: <http://xlink.rsc.org/?DOI=
C4RA00181H>.
LOUIE, B. M., CARRATT, G. M., SOONG, D. S., 1985, “Modeling the free radical so-
lution and bulk polymerization of methyl methacrylate”, Journal of applied
polymer science, v. 30, n. 10, pp. 3985–4012.
LOUREIRO, T., DIP, R. M. M., LUCAS, E., et al., 2017, “Cardanol Polymerization Un-
der Acid Conditions By Addition And Condensation Reactions”, Journal
of Polymers and the Environment, v. 0, n. 0, pp. 1–12. doi: <10.1007/
s10924-017-0969-6>.
LUBI, M. C., THACHIL, E. T., 2000, “Cashew nut shell liquid (CNSL) - a versatile
monomer for polymer synthesis”, Designed Monomers & Polymers, v. 3, n. 2,
153
pp. 123–153. doi: <10.1163/156855500300142834>. Availability: <http:
//www.tandfonline.com/doi/full/10.1163/156855500300142834>.
MAHABADI, H. K., O’DRISCOLL, K., 1977, “Absolute rate constants in free-radical
polymerization. III. Determination of propagation and termination rate
constants for styrene and methyl methacrylate”, Journal of Macromolecular
Science—Chemistry, v. 11, n. 5, pp. 967–976.
MAHANWAR, P. A., KALE, D. D., 1996, “Effect of processing parameters on refining of
CNSL”, Indian Journal of Chemical Technology, v. 3, n. July, pp. 191–193.
MAHON, E., SALVATI, A., BOMBELLI, F. B., et al., 2012, “Designing the nanoparticle–
biomolecule interface for “targeting and therapeutic delivery””, Journal of
Controlled Release, v. 161, n. 2, pp. 164–174.
MANJULA, S., KUMAR, V. G., PILLAI, C. K., 1992, “Kinetics and mechanism of
oligomerization of cardanol using acid catalysts”, Journal of Applied Polymer
Science, v. 45, n. 2, pp. 309–315. doi: <10.1002/app.1992.070450213>.
MANRING, L. E., SOGAH, D. Y., COHEN, G. M., 1989, “Thermal degradation of
poly (methyl methacrylate). 3. Polymer with head-to-head linkages”, Macro-
molecules, v. 22, n. 12, pp. 4652–4654.
MAYO, F. R., LEWIS, F. M., 1944, “Copolymerization. I. A basis for comparing the be-
havior of monomers in copolymerization; the copolymerization of styrene
and methyl methacrylate”, Journal of the American Chemical Society, v. 66,
n. 9, pp. 1594–1601.
MAZZETTO, S. E., LOMONACO, D., MELE, G., 2009, “Óleo da Castanha de Caju: Opor-
tunidades e Desafios no Contexto do Desenvolvimento e Sustentabilidade
Industrial”, Quim. Nova, v. 32, n. 3, pp. 732–741.
MELO, C. K., SOARES, M., CASTOR, C. A., et al., 2014, “In Situ Incorporation of Recy-
cled Polystyrene in Styrene Suspension Polymerizations”, Macromolecular
Reaction Engineering, v. 8, n. 1, pp. 46–60.
MENDES, A. N., HUBBER, I., SIQUEIRA, M., et al., 2012, “Preparation and cytotoxic-
ity of poly (methyl methacrylate) nanoparticles for drug encapsulation”. In:
Macromolecular Symposia, v. 319, pp. 34–40. Wiley Online Library.
MISRA, A. K., PANDEY, G. N., 1984, “Kinetics of alkaline-catalyzed car-
danol–formaldehyde reaction. I”, Journal of Applied Polymer Science,
v. 29, n. 1 (jan), pp. 361–372. doi: <10.1002/app.1984.070290134>.
Availability: <http://doi.wiley.com/10.1002/app.1984.070290134>.
154
MISRA, A. K., PANDEY, G. N., 1985, “Kinetics of alkaline-catalyzed car-
danol–formaldehyde reaction. II. Mechanism of the reaction”, Jour-
nal of Applied Polymer Science, v. 30, n. 3, pp. 969–977. doi:
<10.1002/app.1985.070300307>.
MUBOFU, E. B., MGAYA, J. E., 2018, “Chemical Valorization of Cashew Nut Shell
Waste”, Topics in Current Chemistry, v. 376, n. 2, pp. 1–15. doi: <10.
1007/s41061-017-0177-9>. Availability: <https://doi.org/10.1007/
s41061-017-0177-9>.
MUBOFU, E. B., 2016, “From cashew nut shell wastes to high value chemicals”,
Pure and Applied Chemistry, v. 88, n. 1-2, pp. 17–27. doi: <10.1515/
pac-2015-0603>.
ODIAN, G., 2004, Principles of Polymerization. 4th ed. New York, John Wiley & Sons,
Inc.
OECHSLER, B. F., 2016, “Análise Dinâmica de Modelos de Mistura Imperfeita em
Reatores de Polimerização via Radicais-livres em Solução”, p. 317.
OLIVEIRA, LINCOLN DAVI M. DE , 2007, Síntese, Caracterização e Funcionalidade de
Aditivos de Lubricidade, Derivados do LCC. Tese de mestrado, Universidade
Federal do Ceará.
OTSUKA, T., FUJIKAWA, S. I., YAMANE, H., et al., 2017, “Green polymer chemistry:
The biomimetic oxidative polymerization of cardanol for a synthetic ap-
proach to ’artificial urushi’”, Polymer Journal, v. 49, n. 3, pp. 335–343. doi:
<10.1038/pj.2016.118>. Availability: <http://dx.doi.org/10.1038/
pj.2016.118>.
PAIVA, T., VIEIRA, L., MELO, P., et al., 2018, “In Situ Incorporation of Praziquantel in
Polymer Microparticles through Suspension Polymerization for Treatment
of Schistosomiasis”, Macromolecular Reaction Engineering, p. 1800064.
PARAMASHIVAPPA, R., KUMAR, P. P., VITHAYATHIL, P., et al., 2001, “Novel method
for isolation of major phenolic constituents from cashew (Anacardium oc-
cidentale L.) nut shell liquid”, Journal of Agricultural and Food Chemistry,
v. 49, n. 5, pp. 2548–2551.
PATEL, R. N., BANDYOPADHYAY, S., GANESH, A., 2006, “Extraction of cashew (Anac-
ardium occidentale) nut shell liquid using supercritical carbon dioxide”,
Bioresource Technology, v. 97, n. 6, pp. 847–853.
155
PEIXOTO, A. C. B., 2013, Funcionalização de Nanopartículas Poliméricas para Liber-
ação de Medicamentos Sítio-Dirigida. Ph.D. Thesis, Programa de Engen-
haria Química (PEQ) - Federal University of Rio de Janeiro.
PEKLAK, A. D., BUTTÉ, A., STORTI, G., et al., 2006, “Gel effect in the bulk reversible
addition–fragmentation chain transfer polymerization of methyl methacry-
late: Modeling and experiments”, Journal of Polymer Science Part A: Polymer
Chemistry, v. 44, n. 3, pp. 1071–1085.
PERDRIAU, S., HARDER, S., HEERES, H. J., et al., 2012, “Selective conversion of
polyenes to monoenes by RuCl3-catalyzed transfer hydrogenation: The case
of cashew nutshell liquid”, ChemSusChem, v. 5, n. 12, pp. 2427–2434. doi:
<10.1002/cssc.201200503>.
PHILIP, J. Y., BUCHWEISHAIJA, J., MKAYULA, L. L., et al., 2007, “Preparation of molec-
ularly imprinted polymers using anacardic acid monomers derived from
cashew nut shell liquid”, Journal of Agricultural and Food Chemistry, v. 55,
n. 22, pp. 8870–8876. doi: <10.1021/jf0718289>.
PICHOT, C., 2004, “Surface-functionalized latexes for biotechnological applications”,
Current Opinion in Colloid & Interface Science, v. 9, n. 3-4 (nov), pp. 213–
221. doi: <10.1016/j.cocis.2004.07.001>. Availability: <http://
linkinghub.elsevier.com/retrieve/pii/S1359029404000688>.
PINTO, J., RAY, W., 1995, “The dynamic behavior of continuous solution polymer-
ization reactors—VII. Experimental study of a copolymerization reactor”,
Chemical engineering science, v. 50, n. 4, pp. 715–736.
PINTO, M. C., SANTOS JR, J. G., MACHADO, F., et al., 2002, “Suspension polymeriza-
tion processes”, Encyclopedia of Polymer Science and Technology.
RAMOS, I. M. F. C., 2018, Nanopartículas Poliméricas Funcionalizadas para Liberação
de Fármaco no Sistema Nervoso Central. Ph.D. Thesis, Universidade Federal
do Rio de Janeiro (UFRJ).
RODRIGUES, F. H. A., FRANÇA, F. C. F., SOUZA, J. R. R., et al., 2011,
“Comparison between physico-chemical properties of the tech-
nical Cashew Nut Shell Liquid (CNSL) and those natural ex-
tracted from solvent and pressing”, Polímeros, v. 21, n. 2, pp. 156–
160. doi: <10.1590/S0104-14282011005000028>. Availability:
<http://www.scielo.br/scielo.php?script=sci_arttext&pid=
S0104-14282011000200016&lng=en&tlng=en>.
156
RODRIGUES, F. H. A., FEITOSA, J., RICARDO, N. M., et al., 2006, “Antioxidant activity
of cashew nut shell liquid (CNSL) derivatives on the thermal oxidation of
synthetic cis-1, 4-polyisoprene”, Journal of the Brazilian Chemical Society,
v. 17, n. 2, pp. 265–271.
RODRIGUEZ, F., COHEN, C., OBER, C. K., et al., 2015, Principles of Polymer Systems.
6th ed. New York, Taylor & Francis Group.
SATHIYALEKSHMI, K., 1993, “Studies on structure and properties of CNSL novolac
resins prepared with succinic acid catalyst”, Bulletin of Materials Science,
v. 16, n. 2, pp. 137–150. doi: <10.1007/BF02745329>.
SCARIAH, K. J., 1990, “GPC Studies on the Cationic Polymerization of Cardanol Initi-
ated by”, v. 41, pp. 1765–1775.
SCHWAAB, M., BISCAIA JR, E. C., MONTEIRO, J. L., et al., 2008, “Nonlinear parame-
ter estimation through particle swarm optimization”, Chemical Engineering
Science, v. 63, n. 6, pp. 1542–1552.
SCHWAAB, M AND PINTO, J.C., 2007, Análise de Dados Experimentais: I. Fundamen-
tos de Estatística e Estimação de Parâmetros.
SCORAH, M., DHIB, R., PENLIDIS, A., 2006, “Modelling of free radical polymerization
of styrene and methyl methacrylate by a tetrafunctional initiator”, Chemical
engineering science, v. 61, n. 15, pp. 4827–4859.
SOUZA JR., F. G., PINTO, J. C., RODRIGUES, M. V., et al., 2008a, “New polyani-
line/polycardanol conductive blends characterized by FTIR, NIR, and XPS”,
Polymer Engineering & Science, v. 48, n. 10 (oct), pp. 1947–1952. doi:
<10.1002/pen.21047>. Availability: <http://doi.wiley.com/10.1002/
pen.20921http://doi.wiley.com/10.1002/pen.21047>.
SOUZA JR., F. G., RICHA, P., DE SIERVO, A., et al., 2008b, “New in situ blends of
polyaniline and cardanol bio-resins”, Macromolecular Materials and Engi-
neering, v. 293, n. 8, pp. 675–683. doi: <10.1002/mame.200800077>.
TIAN, H., TANG, Z., ZHUANG, X., et al., 2012, “Biodegradable synthetic poly-
mers: Preparation, functionalization and biomedical application”, Progress
in Polymer Science (Oxford), v. 37, n. 2, pp. 237–280. doi: <10.1016/
j.progpolymsci.2011.06.004>. Availability: <http://dx.doi.org/10.
1016/j.progpolymsci.2011.06.004>.
157
TIDWELL, P. W., MORTIMER, G. A., 1965, “An improved method of calculating copoly-
merization reactivity ratios”, Journal of Polymer Science Part A: General Pa-
pers, v. 3, n. 1, pp. 369–387.
TIDWELL, P. W., MORTIMER, G. A., 1970, “Science of determining copolymerization
reactivity ratios”, Journal of Macromolecular Science—Reviews in Macro-
molecular Chemistry, v. 4, n. 2, pp. 281–312.
TSOUKAS, A., TIRRELL, M., STEPHANOPOULOS, G., 1982, “Multiobjective dynamic
optimization of semibatch copolymerization reactors”, Chemical Engineer-
ing Science, v. 37, n. 12, pp. 1785–1795.
VILLALOBOS, M. A., HAMIELEC, A. E., WOOD, P. E., 1993, “Bulk and suspension poly-
merization of styrene in the presence of n-pentane. An evaluation of mono-
functional and bifunctional initiation”, Journal of applied polymer science,
v. 50, n. 2, pp. 327–343.
VIVALDO-LIMA, E., WOOD, P. E., HAMIELEC, A. E., et al., 1998, “Kinetic model-
based experimental design of the polymerization conditions in suspension
copolymerization of styrene/divinylbenzene”, Journal of Polymer Science
Part A: Polymer Chemistry, v. 36, n. 12, pp. 2081–2094.
WAY, D. V., 2017, Uso de Click Chemistry para a Bioconjugação de Polímeros Visando ao
Tratamento do Câncer. Phd thesis, Programa de Engenharia Química (PEQ)
- Universidade Federal do Rio de Janeiro.
WELSCH, N., LU, Y., DZUBIELLA, J., et al., 2013, Adsorption of proteins to functional
polymeric nanoparticles. Ph.D. Thesis. Availability: <http://dx.doi.org/
10.1016/j.polymer.2013.03.027>.
YADAV, R., SRIVASTAVA, D., 2007a, “Kinetics of the acid-catalyzed cardanol-
formaldehyde reactions”, Materials Chemistry and Physics, v. 106, n. 1,
pp. 74–81. doi: <10.1016/j.matchemphys.2007.05.020>.
YADAV, R., SRIVASTAVA, D., 2007b, “Kinetics of the acid-catalyzed cardanol–
formaldehyde reactions”, Materials Chemistry and Physics, v. 106, n. 1,
pp. 74–81.
YOON, D. Y., KIM, D. S., 2009, “Molecular design of anti-biofouling materials from nat-
ural phenolic compounds”, Korean Journal of Chemical Engineering, v. 26,
n. 2, pp. 433–437. doi: <10.1007/s11814-009-0073-2>.
158
ZALDÍVAR, C., DEL SOL, O., IGLESIAS, G. D., 1998, “On the preparation of acrylic
acid/vinyl acetate copolymers with constant composition—1. copolymer-
ization reactivity ratios”, Polymer, v. 39, n. 1, pp. 245–246.
159