cartoons influence towards violence and aggression in
TRANSCRIPT

Cartoons Influence towards Violence and Aggression
in School Age Children in Nigeria
Elizabeth Ibukunoluwa Odukomaiya
Submitted to the
Institute of Graduate Studies and Research
in partial fulfilment of the requirements for the Degree of
Master of Arts
in
Communication and Media Studies
Eastern Mediterranean University
July, 2014
Gazimağusa, North Cyprus

Approval of the Institute of Graduate Studies and Research
__________________________
Prof. Dr. Elvan Yılmaz
Director
I certify that this thesis satisfies the requirements as a thesis for the degree of Master
of Arts in Communication and Media Studies.
____________________________________________
Prof. Dr. Süleyman İrvan
Chair, Faculty of Communication and Media Studies
We certify that we have read this thesis and that in our opinion it is fully adequate in
scope and quality as a thesis for the degree of Master of Arts in Communication and
Media Studies.
__________________________
Assoc. Prof. Dr. Bahire Özad
Supervisor
Examining Committee
1. Assoc. Prof. Dr. Agah Gümüş __________________________
2. Assoc. Prof. Dr. Bahire Özad __________________________
3. Asst. Prof. Dr. Metin Ersoy __________________________

iii
ABSTRACT
The aim of this study is to explore how violence and aggression in cartoon affects
school age children in Nigeria. The reason for embarking on this research is to know
whether and to what extent cartoon on television makes school age children (both
male and female) violent and aggressive. Children are exposed to cartoon at their
tender age (4-12). Though it serves as a means of entertainment to them, children
learn faster than adults, and their re-enactment of media messages is unrivalled.
Since most children programmes are presented in entertainment form especially
cartoons, it is important to measure the amount of influence these cartoons have on
children. Consequently, this study is motivated by children’s reaction to the violent
contents in the programmes they watch.
This study sets out to explore the children attitudes towards cartoons among Nigerian
children in Saint International Nursery and Primary School and Apostolic Church
Grammar School in 2013 and 2014 academic year spring term. The study seeks to
explore whether or not cartoon violence and aggression affect the children in a long
period. Also, this study sets out to investigate whether there is statistically significant
difference between the children’s attitudes.
In this present study, data have been collected through a questionnaire comprising of
two sections. In the first section of the questionnaire 20 questions are asked in order
to collect data about demographic information of the children and information about
their cartoon uses. The second part of the questionnaire is designed according to the
5 point Likert scale and sought to measure children’s attitudes towards cartoon use

iv
and addiction. Also, in order to explore whether statistically any significance there is
between the responses of the children, chi-square test is run.
The findings of the study indicate that there is statistically significant difference
between the responses of the school age children in some topics. However, no
addictive behaviour has been detected with respect to cartoon use. The most
important finding is that female children tend to be more violent and aggressive than
the male children in Nigerian Results point out that, female children should be more
monitored.
Keywords: Aggressiveness, Cartoon, Children, Gender and Violence.

v
ÖZ
Bu çalışmanın amacı şiddet ve saldırganlık içeren çizgi filmlerin Nijerya’da, okul
çağındaki çocukları nasıl etkilediğini araştırmaktır. Bu araştırmaya başlama nedeni
okul çağındaki erkek ve kız çocukların televizyondaki çizgi filmlerden, ne ölçüde
agresiflik ve şiddet öğrendiklerini belirlemektir. Çocuklar 4-12 yaşları arasında bir
eğlence aracı olarak çizgi film izlemeye maruz bırakılmaktadır. Ancak televizyonun
çocuklar için bir eğlence aracı olmasına karşın yetişkinlerden daha hızlı
öğrenmektedirler ve medyadan aldıkları mesajları canlandırmaktadırlar. Birçok
çocuk programı, çizgi filmler dahil, eğlence şeklinde sunulmaktadır ve özellikle çizgi
filmlerin çocuklar üzerindeki etkilerini ölçmek çok önemlidir. Sonuç olarak, bu
çalışmayı güdüleyen, çocukların izlediklesi şiddet içerikli programlara karşı
tepkilerini ölçmektir.
Bu çalışma, Nijerya’daki Saint International Kreşindeki, İlköğretim Okulu’ndaki ve
Apostolic Church Grammar Okulu’ndaki 2013-2014 akademik yılı Bahar
Dönemindeki çocukların çizgi filmler ile ilgili tutumlarını ortaya çıkarmak için
yapılmıştır. Çalışmanın amaçı çizgi filmlerin çocukların şiddet ve agresif tavırlarını
etkileyip etkilemediginı göstermektir. Ayrıca bu çalışmada, çocukların tutumları
arasında istatistiksel olarak anlamlı bir fark olup olmadığı da araştırılmıştır.
Bu çalışmada veriler iki bölümden oluşan bir anket yoluyla toplanmıştır. Birinci
kısımda, anket sorularından 20’si, katılımcılar hakkında demografik sorular ve
çocukların çizgi film izlemeleri hakkında bilgiler toplamak amacıyla sorulmuştur.
İkinci kısımda ise, beş dereceli Likert ölçeği kullanılmıştır ve bu kısımda sorular,

vi
çizgi film izleme ve bağımlılığına karşı çocukların tutumlarını ölçmek için
sorulmuştur. Ayrıca, çocukların yanıtları arasında istatistiksel önem olupolmadığı
konusund bilgi edinmek için ki- kare testi yapılmıştır.
Çalışmanın bulguları, bazı konularda okul çağındaki çocukların yanıtları arasında
istatistiksel olarak anlamlı farklılıklar olduğunu göstermektedir. Ancak, çizgi film
izlemek ile ilgili herhangi bir bağımlılık tespit edilmemiştir. Bulgular arasında en
önemli olan, Nijerya’daki kız çocukların erkek çocuklarına göre, daha sert ve
saldlrgan olma eğiliminde olmalarıdır. Sonuçlar, kız çocukların daha yakından
izlenmesi, gerektiğine işaret etmektedir.
Anahtar Kelimeler: Saldırganlık, Çizgi Film, Çocuk, Cinsiyet ve Şiddet

vii
DEDICATION
DEDICATION
Dedicated to My Parents

viii
ACKNOWLEDGMENT
I want to say a big thank you to my Father in heaven, the Author and Finisher of
my faith. Thank you for the wisdom and understanding. Thank you for all the
accomplishments in my life; it has always been you Lord.
My sincere appreciation goes to my wonderful supervisor, Assoc. Prof. Dr,
Bahire Özad, you have been more of a mother to me than a lecturer. Thank you
for your love and support during my stay in North Cyprus. God bless you ma.
Mr. Anthony Olushole Odukomaiya, daddy thank you for helping me achieve
this great goal in my life. I will always be grateful; you hold a special place in
my heart. I love you so much.
My love goes to my in measurable siblings, Mrs. E. O. Ajiboye, thank you for
everything. Mrs. V. E. Hounfoun, I’m grateful. Mr. M. O. Odukomaiya, thank
you so much. Mr. S. O. Odukomaiya I appreciate you. Mrs. M. O. Kola-dalton.
May God continues to keep you and your family, thank you a million times for
your support throughout my stay away from home.
To my adorable husband, Taiwo Oladotun Aponmade my love for you will
always grow. I love you. Thanks to all my friends Opeyemi Banjo, Omobolanle
Thomas, Adeola Adepoju, Kikelomo Shofela, Damilola Ogunleye, Mesole
Folasayo and everyone that made my stay pleasant God bless you all.

ix
TABLE OF CONTENTS
ABSTRACT ................................................................................................................ iii
ÖZ ................................................................................................................................ v
DEDICATION ........................................................................................................... vii
ACKNOWLEDGMENT ........................................................................................... viii
LIST OF TABLLES .................................................................................................. xii
LIST OF FIGURES .................................................................................................. xvi
1 INTRODUCTION .................................................................................................... 1
1.1 Background of Media on Children ..................................................................... 1
1.2 Motivation for the Study .................................................................................... 2
1.3 Aims of the Study ............................................................................................... 4
1.4 Research Questions ............................................................................................ 5
1.5 Limitations of the Study ..................................................................................... 5
1.6 Definition of Terms ............................................................................................ 6
2 LITERATURE REVIEW ......................................................................................... 8
2.1 Research on Television ...................................................................................... 8
2.2 Cultivation Theory ........................................................................................... 12
2.2.1 Heavy Viewers........................................................................................... 14
2.2.2 Light Viewers ............................................................................................ 16
2.2.3 The Major Concept of Cultivation Theory ................................................ 16
2.2.4 Hypothesis of Cultivation Theory ............................................................. 16
2.3 Children As Television Audience .................................................................... 17
2.3.1 Negative Effect of Television on Children ................................................ 18
2.3.2 Positive Effect of Television on Children ................................................. 18
2.4 Cartoons ........................................................................................................... 19

x
2.5 Effect of Television on Children ...................................................................... 21
2.5.1 Children Aggression and Violence in Media ............................................ 22
2.6 Research into Cartoon Violence on Nigerian Children .................................... 24
3 METHODOLOGY ................................................................................................. 25
3.1 Research Methodology ..................................................................................... 25
3.2 Research Design ............................................................................................... 26
3.3 Research Context .............................................................................................. 27
3.4 Data Collection Instrument .............................................................................. 27
3.5 Population and Sample of the Study ................................................................ 28
3.5.1 Population and Sample for Pilot Study ...................................................... 29
3.6 Validity and Reliability of Data Collection Instrument ................................... 29
3.7 Data Collection and Analysis Procedures ........................................................ 31
4 ANALYSIS AND FINDINGS ............................................................................... 32
4.1 Analysis of Demographic Variables of the Participants .................................. 32
4.2 Descriptive Analysis of Question Related to Television Usage ...................... 34
4.3 Analysis of the Attitude Scale Statements ....................................................... 56
4.3.1 Means and Attitudes of Respondents on Cartoon ..................................... 56
4.3.2 Means and Attitudes of Respondents Physical Aggression Subscale ....... 60
4.3.3 Means and Attitudes of Respondents on Difference between Possible and
Impossible Act .................................................................................................... 63
4.3.4 Means and Attitudes of Respondents Verbal Aggression Items ............... 67
4.4 Chi-Square Test Results ................................................................................... 69
5 CONCLUSION ....................................................................................................... 73
5.1 Summary of the Study ...................................................................................... 73
5.2 Conclusions Drawn from the Study ................................................................. 78

xi
5.3 Suggestions for Further Research .................................................................... 81
REFERENCES .......................................................................................................... 82
APPENDIX ................................................................................................................ 92

xii
LIST OF TABLLES
Table 1: School gender cross tabulation ....................................................................33
Table 2: School age cross tabulation .........................................................................33
Table 3: School class cross tabulation .......................................................................34
Table 4: How many hours do you spend in school? ..................................................34
Table 5: School how many hours do you spend in school?........................................34
Table 6: Gender how many hours do you spend in school?......................................35
Table 7: How many hours do your parents spend with you in a day?........................35
Table 8: School how many hours do your parents spend with you in a day?............36
Table 9: Gender how many hours do your parents spend with you in a day?............36
Table 10: Do you watch television?............................................................................37
Table 11:School do you watch television? ............................................................... 37
Table 12: Gender do you watch television?................................................................37
Table 13: How many hours do you watch television?................................................38
Table 14: School how many hours do you watch television?.....................................38
Table 15: Gender how many hours do you watch television?....................................39
Table 16: Do you watch cartoons?..............................................................................39
Table 17: School do you watch cartoons?..................................................................40
Table 18: Gender do you you watch cartoons?..........................................................40
Table 19: Do you watch only cartoon?.......................................................................41
Table 20: School do you watch only cartoon?............................................................41
Table 21: Gender do you watch only cartoon?...........................................................41
Table 22: What kind of cartoon do you watch?..........................................................42
Table 23: School what kind of cartoon do you watch?...............................................42

xiii
Table 24: Gender what kind of cartoon do you watch?..............................................42
Table 25: How many hours do you watch cartoon during the day?...........................43
Table 26: School how many hours do you watch cartoon during the day?................43
Table 27: Gender how many hours do you watch cartoon during the day?...............44
Table 28: How many hours do you watch cartoons in a weekend? .......................... 44
Table 29: School how many hours do you watch cartoons in a weekend?................45
Table 30: Gender how many hours do you watch cartoons in a weekend?................45
Table 31: What means do you watch cartoons? .........................................................46
Table 32: School what means do you watch cartoons?..............................................46
Table 33:Gender what means do you watch cartoons?...............................................46
Table 34: What job does your parents do? .................................................................47
Table 35: School what job does your parents do?......................................................47
Table 36: Gender what job does your parents do?......................................................48
Table 37:How many television set do you have in your house?.................................48
Table 38: School how many television set do you have in your house?....................48
Table 39: Gender how many television set do you have in your house?....................49
Table 40: Do you have a room to yourself? ...............................................................49
Table 41: School do you have a room to yourself?....................................................49
Table 42: Gender do you have a room to yourself?....................................................50
Table 43: Do you have a television in your room?.....................................................50
Table 44: School do you have a television in your room?.........................................50
Table 45: Gender do you have a television in your room?.........................................51
Table 46: Do you have a laptop? .............................................................................. 51
Table 47: Where do you watch cartoons?...................................................................51
Table 48: School where do you watch cartoons?........................................................52

xiv
Table 49: Gender where do you watch cartoons?.......................................................52
Table 50: Which cartoon do you watch most? Please specify? .................................53
Table 51: Means and attitudes of respondents towards cartoons................................54
Table 52: I like watching cartoons..............................................................................55
Table 53: School I like watching cartoons………………………………..…...…….55
Table 54: Gender I like watching cartoons………………………………...…..……55
Table 55: I like action cartoons...................................................................................56
Table 56: School I like action cartoons…………………….………………………..56
Table 57: Gender I like action cartoons…………………….………………….....…56
Table 58: Mean and attitude of respondents physical aggression subscale...............57
Table 59: I like to kick, hit or punch my friends just how you watch it in cartoon....58
Table 60: School I like to kick, hit or punch my friends just how you watch it in
cartoon…………………………………………………………………………..…...58
Table 61: Gender I like to kick, hit or punch my friends just how you watch it in
cartoon…………………………………………………………………………….…58
Table 62: I like to see a flying character.....................................................................59
Table 63: Gender I like to see a flying character……………………...……….…....59
Table 64: Means and attitudes of respondents on difference between possible and
impossible act..............................................................................................................60
Table 65: I like to fly................................................................................................. 61
Table 66: School I like to fly……………………………………….…..…..……….61
Table 67: Gender I like to fly…………………………………………...………..….61
Table 68: I like to climb the walls ............................................................................ 62
Table 69: School I like to climb the walls……………………………..……….…...62
Table 70:Gender I like to climb the walls………………………………..….……....62

xv
Table 71: Means and attitudes of respondencts verbal aggression items ................. 63
Table 72: I like insulting other peers .........................................................................63
Table 73: School I like insulting other peers…………………………….…..……...64
Table 74: I like been insulted..................................................................................... 64
Table 75: School I like been insulted……………………………..………………....64
Table 76: Chi square test results.................................................................................65
Table 77: Chi square test result where statistically significant difference is
found………………………………………………………………………….……..66
Table 78: I like watching cartoons…………………………………….…………….72
Table 79: Gender I like watching cartoons…………………………….……………72
Table 80: Group statistics……………………………………………….…………..73

xvi
LIST OF FIGURES
Figure 1: Cultivation theory model.......................................................................... 13
Figure 2: Cultivation theory model.......................................................................... 17

1
Chapter 1
1 INTRODUCTION
After the first half of the 20th
century, television widely spread to the world. In
communication and media studies, the influence of media violence and aggression on
children has been widely scrutinized (American Academy Of Pediatrics. 2001).
With the development of technology, animation gained popularity and its target was
the children. In time, some researchers proved that cartoon in television influences
children. The present study seeks to investigate to what extent do the cartoons
influence and lead to violence and aggression.
1.1 Background of Media on Children
Media is a major medium of dissipation of information that exists in our world
today; either deliberately or indeliberately, we are affected by it because we are
living in a media concentrated society. As a result, children who have easy access to
television media want to inculcate all that is shown on the television. Media is one of
the tools used for creating and maintaining culture in the society.
Access to media is very pervasive in the society today, children are continuosly
exposed to various media such as television, videos, movies, comic books, internet,
music lyrics and computer games. They get attracted to the colour, excitement and
the graphical images the media displays.

2
In the present media dispensation, television has become a tool for sharing
information among the teenagers. Television serves as a source of entertainment,
educational tool that can assist children intellectually. Children learn skills from
popular culture which determine their behavioural patterns, their needs socially,
mentally and emotionally. Television is one of the major agents in the socialization
process along with other socialization agents such as the family, schools, peers
groups (Bandura, 1986). Indeed, television really has numerous roles in a child’s
development.
Media is observed and understood differently by the children unlike the adults. The
literate adults have a deeper understanding about the media and what it represents,
while the children see it only as entertainment. Children develop skills in watching
television gradually, along side mental and physiological development. In the
process, a number of negative behaviours are being inculcated at their age and
linguistic maturity, which determines how a child will respond and engage with
television. Such behaviours include using sharp object on themselves on their mates,
being bully to their classmate, using indecent, inappropriate language among
themselves and at home.
Due to their level of understanding, they misinterpret the message the media is
passing out, children nowadays are eager to learn and interpret anything they see the
way it has been shown.
1.2 Motivation for the Study
Violence is becoming widespread across different regions of the world. It is also
increasingly cutting across different ages and genders. Humans are influenced by the

3
media content they consume and they often re-enact the actions seen or heard in the
media (Gerbner, 1977). Children learn faster than adults, and their re-enactment of
media messages is unrivalled. Since most children programmes are presented in
entertainment form especially in the format of cartoons, it is important to measure
the amount of influence these cartoons have on children. Consequently, this study is
motivated by children’s reaction to the violent contents of the programme they
watch.
I believe, that the amount of things shown on television as cartoons, home video, and
other media contents, have a way of influencing the behaviours of children. But we
think when its animated, some things have been blocked, but through the cartoons
such as (Ben10, Tom and Jerry, Sumarai x, Teenage Mutant Ninja Turtles), they send
numerous negative signal. Lots of imagination go into their brains and they become
more violent and aggressive. George Gerbner (1986) states that “when one is
exposed to too much of television one begins to see it as our reality”. So children see
the media contents they are exposed to as the reality of life and they often go on to
emulate or replicate these realities.
Children do not perceive what they see on television in the same way that adults do
and understand. Although not all what they view influence them negatively, some of
the media contents offer powerful tools for learning and entertainment which build
them up mentally and socially. Due to their age, they think what they see as reality.
This particular research was carried out in both the government and the private
schools in Lagos State, Nigeria during the spring semester break, 2014.

4
1.3 Aims of the Study
Children are exposed to cartoons at their tender ages (4-12). Although cartoons serve
as a means of entertainment to them, the messages sent and received from cartoons,
are mostly dangerous for children. They are often violent and such themes could lead
children to believe that violence is the only way to resolve conflicts. This pattern of
thought occurs in children because they are too young to distinguish between “good”
and “bad”.
The reason for embarking on this research is to know whether and to what extent
cartoons make school age children violent and aggressive. This is to know if the
effect of cartoons is more on male or female children. Cartoons show and in return
make them display some gender roles which may include male kids displaying a high
level of masculine characteristics at a very tender age while the female kids become
afraid and timid because female characters in cartoons and movies are generally
timid, soft, and helpless (e.g. Cinderella). Consequently, it is assumed that female
children tend to accept and expect the aggression exhibited by male children instead
of fighting back.
Cartoons affect the social and moral development of children in their journeys
towards becoming full-fledged members of their societies, in other words in their
socialization process. Cartoons determine the level to which violence and aggression
is induced. After watching cartoons for a long period of time during their early stage
of life, children mistake some characters as role models ( Kochanska G,1993).
Against this background, this study aims at examining the viewing pattern of
children with an eye on the influence of the cartoons as exhibited in their imitation of

5
what they watch. Thus, the present study seeks to explore influence of most popular
cartoons on Nigerian television on school children in Nigeria in 2014.
1.4 Research Questions
This research study was carried out among Nigerian children in February 2014; and
was divided into various categories, the level of a child attitude towards cartoons,
their physical aggression in their daily activities, the difference between possible and
impossible act and their verbal aggression towards their mates. The following
questions are been researched on with respect to Nigerian primary school children in
Spring 2014.
RQ1 To what extent do kids watch cartoons that have violence and aggression in it?
RQ2 What is the influence of cartoon violence and aggression on children?
RQ3 To what extent do children take cartoon characters as their role model?
RQ4 How much do children re-exact what they watch on cartoon programs?
1.5 Limitations of the Study
The present study is limited to children in private and government primary schools in
Nigeria in February 2014 within the age of 4-12. Nigeria is a big country, and the
capital is Abuja. It comprises of so many States and Local Governments. The study
was limited to just one state and local government which is Lagos state.
Some Nigerian parents do not really confide in other people, they believe that when
they talk about their children, it creates wrong impressions about their families to
other people. So this research focuses on teachers (of basic schools), the children and
some few parents alone. In Nigeria not all the children are opportuned to go to school
but directly or indirectly they have access to television.

6
1.6 Definition of Terms
For the purpose of this study, the following words are the key terms in this research:
Cartoon: This simply means a drawing used to illustrate a film or programs which
are mostly used in entertaining children through television, comic books and
magazines.
Children: This is a term used to classify a male or female that is between the time of
birth and the age of 12.
Culture: This is the way of life of a particular set of people. It’s the norms and
values that are inherited from one generation to another generation. Some behaviours
are being developed through the knowledge of the way of life of a certain people and
their action/reaction which later become part of the people.
Cultivation Theory: It is one of the effects in media studies. It is a theory which
was proposed by George Gerbner. The theory suggests that television viewing for a
longer period will make the audience see what is shown as a reality in their
perception.
Media: It is a tool that disseminates information and uses news, entertainment,
education, data, or promotional messages as a medium to communicate with the
general public. Media includes every broadcasting and narrowcasting medium such
as newspapers, magazines, TV, radio, billboards, direct mail, telephone, fax, and
internet.

7
Television: This is an electronic device which receives signal and transform it in
order display moving images. In the study, television is used interchangeably with
television program.

8
Chapter 2
2 LITERATURE REVIEW
The influence of television on children has been a popular topic for the researchers,
particularly cartoons which are meant to be for children are researched throughout
the world (Gerbner, 1976). The information included in this chapter aims to review
the related literature. To this end, it covers; research on television, cultivation theory,
heavy viewers, light viewers, the major concept of cultivation theory, hypothesis of
cultivation theory, children as television audience, negative effect of television,
positive effect of television, cartoons, effect of television on children, children
aggression and violence in media and research into cartoon violence on Nigeria
children.
2.1 Research on Television
Mass media are instruments which are used in telling stories (Gerbner et al., 1978).
In the era of mass society theory in 1850-1940, the theories begins with the
scrutinization of the early ideologies of media. The increase in media technology
innovations in the late 19th century led to the development of more ideas (Baran,
2008). Most of the authors exhibited positive approach towards new technology,
while others displayed a level of negativity (Brantlinger, 1983). The development of
industrial technology was said to have cause the disruption of peace, people were
being forced to live in the urban areas by the rural communities because they can be
useful as a workforce in large factories, mines or bureaucracies. In present time, the
hereby propagated by both the pundits and supporters of technology are superficial.

9
The assumption of the society overestimated the capability of media to sabotage
social order (Baran & Meyer, 1974). The potentials of media which lies in the way
and patten by which audiences use media, was not considered by the ideas of the
theorist. Supporters of technology advocates have indiscreate and so fell short in
recognising the consequences of the administration of technology without knowing
the repercaution.
Stanley J. Baran (2000) provided a frame work classifying the mass media theory.
All mass communication theory has to do with human construction because it was
built at the time of social and political periods, especially with technological and
media contexts. Mass communication theory is the outcome of the four eras of
development.
The first era which consist of the influence of media, sucessfully generated
unneccessary fear on the less priviledge people. Over the years with the
introduction of technology, the urban elites who happen to take over
capitalism from the previous elites (social & cultural elites) used the media to
dictate and control the environmnt. Majorly forgetting that the power of the
communication is in what its used for by the people.
As at the second era, the development of scientific concept led to the limited
effects to serve the clients commercialization and to save the people from the
propaganda treat. The limited effect theories started that people could resist
media power and were influenced by the socialization factors like their
friends and family.
In third era, the concept that projects media as having a large cultural
influence on people was discovered. The cultural theorists of europe holding

10
into their assumption concerning neo-marxistism, directed mass
communication towards critical and cultural studies.
Lastly, the fouth era in which we are now, is charactered with the coming into
existence of meaningful objectives in mass communication theory.
A number of arguments and theories raised that media has limted effects on its
audience (DeFlueur & Ball-Rockeach, 1989). George Gebner says that media does
have effect on its audience but its not an immediate thing but after a prolonged
exposure on it. Gerbner (1986) nowadays people depend on media for source of
information for the society.
According to Gerbner, Gross, Morgan, Signorielli, & Shanahan (2002) argued that
media does have effects on its audience, which it can be related to Gerbner’s theory
of assumption that media does have a long term effect on it audience due to the long
term exposure of television viewing. In the process of watching television one is
been exposed to different contents in media and if one is a heavy viewer then, the
probability of you accepting what is shown in television as reality is very high
(Meyer, 1989).
The impact of television can be classified into two: the way it takes place of other
activities and by it content (Williams, 1986). The influence of media on children
cannot be ascertained as mainly the amount of time spent watching television but
also the type of content that the children are attracted to (Willson. J. B. 2008).
In recent times, children have made television their daily routine. Television is
dangerous for some children under some circumstance, so as for some children

11
television is profitable to them but in some children is either dangerous or profitable
(Schramm, Lyle & Parker, 1961). The level of violence shown on television has the
ability to create aggressive behaviour, instantly and over a period of time on children
(Joy, Kimball & Zabrack, 1986).
Albert Bandura in his social learning theory presumes that children are able to
acquire aggressive behaviour from watching characters on the television. His theory
propose that human has the ability of acquiring behaviour in a right way and effects
behaviour, through their real life and what they see on the mass media (Bandura,
1986).
The programs shown on television are full of violence in one way or the other such
as news, cartoon programs, films, video games e.t.c. Gerbner’s claims that television
has become the main source of storytelling in today's society. Some set of people are
been divided into two groups, the heavy viewers and the light viewers.
According to Aletha Huston and her colleagues who stated after lot of scientific
research on television viewing and aggression:
The accumulated research clearly demonstrates a correlation between
viewing violence and aggressive behaviour that is; heavy viewers behave
more aggressively than light viewers. Both experimental and longitudinal
studies support the hypothesis that viewing violence is causally
associated with aggression. Field (naturalistic) experiments with
preschool children and adolescents found heightened aggression among
viewers assigned to watch violent television or film under some
conditions (Huston et al., 1992, pp.54-55).

12
2.2 Cultivation Theory
Cultivation theory falls into the category of limited media effect. According to
George Gerbner who is the founder of cultivation in the 1970s and 1980s predicted
that when audience are exposed to a prolonged viewing of TV, it does have long
term effects on its audience (Gerbner, 1986). Impact of the television on audience
has been mass communication researcher’s studies.
The first modern of mass communication theorist and researcher Haroid Lasswell,
(1927) projected that, people receive and interpret media messages in a similar way.
So, mass media influence people’s thoughts and behaviours immediately and
effectively. The assumption of the magic bullet theory has been misrepresented by so
many people.
Cultivation theory is one of the major theories that deals with the effect of media on
people which was developed in the 1960’s by George Gerbner who elaborate more
on the cumulative model of media effects which pertains to all aspects of the
television message. This means that those who watch cartoon are likely to accept
what they view which speculate that the more time people spend watching television,
the more likely their conceptions of reality will reflect on what they see on television.
Gerbner describes cultivation as “the independent contribution television viewing
makes to viewer’s conceptions of social reality” (Gerbner, 1998, p.180). The theory’s
effect is broken down into two different levels which are first orders effect and
second other effect. First order effect is our general view and opinion about the world
and the second order talks about personal attitude and belief about the world. Morgan
& Shanahan (2010) observed that people “often construct their judgments on

13
probability of occurrence on the basis of attributes of the information they retrieve
from memory” (Morgan & Shanahan, 2010 p.189). When people listen, read, watch
or see things over and over again, it automatically stores in the memory. The phrase
“heuristic processing” suggests that human memory is accessible and doesn’t need to
be searched for systematically and people often constructed their judgment through
the information that is been retrieved from their memory (Shrum, 2009).
First-Order Effect: it’s the relationship between prolonged television
exposure and quantitative estimates of frequency or probability of events or
occurrences in our social reality which is our general view and opinion about
the world (Hawkins and Pingree, 1983).
Second-Order Effect: the relationship between television exposure and
personal beliefs or value judgments of the state of a certain society (Rössler
& Brosius, 2001).
Figure 2.1: Cultivation theory model Hawkins and Pingree (1983)
Cultivation theory aims to explain the influence of television and the audience.
Television viewers are classified into three different categories; firstly we get
information of how things work, the stories of what is going on today which is called

14
news and also the story of what exactly to do, these things are what develop and
create our way of living (culture) (Shanahan & Morgan, 1999).
According to (Gerbner, 1978) and (Bandura, 1986) who stated that over-
representation of violence on television constitutes a symbolic message
(Livingstone, 1990). Viewing television for so many hours every day has long-term
effects it might be small, gradual, directly or indirect and it has to deal with heuristic
that is monitoring the human brain and later on it becomes our reality (Gerbner,
1976).
Cultivation is a media effect that is explained by the cumulative model of media
effects. Cultivation theory starting point is violence on media, and the result is on the
attitude not on the behaviour of the child. Violence is far more common on television
than in reality (Perse, 2001).
2.2.1 Heavy Viewers
Children are especially unique viewers because they lack the knowledge base and
experiences of most adults; as a result, they may more likely believe what they see
on the television (Strasburger, Wilson, and Jordan, 2009). The time youngsters spend
on this pervasive medium grows continually. Recent study from the Kaiser Family
Foundation (Rideout, Foeher, and Roberts, 2010), reports that, children at their
tender age watch television for 4 hours and 29 minutes a day, on numerous platforms
including traditional television sets, computers, cell phones, and other devices. When
considering multitasking, overall this youngster consumes nearly 11 hours of media a
day. Those who watch four or more hours a day are labelled heavy television viewers
Gerbner (1976). What we see on media is like seeds the media planted in our minds,

15
when the seed grows at the long run it becomes pessimistic. Television creates a
mainstream idea that the world is a small place to live in.
According to Morgan, Shanahan, and Signorielli (2009) claim that those who spend
more time watching television are more likely to perceive the real world in ways that
reflect the most common and recurrent messages of the television world, compared
to those who watch less television but are otherwise comparable in terms of
important demographic characteristics (p. 34). The assumption of the theory states
that the more television people watch, the more likely they are to hold a view of
reality that is closer to television's depiction of reality (Gerbner et al). Heavy viewers
are exposed to more violence and therefore are affected by the Mean World
Syndrome, an idea that the world is worse than it actually is. The overuse of
television is creating a homogeneous and fearful populace (Gerbner, G. & Gross, L.,
1976).
The theory also predicts a difference in the social reality of heavy television viewers
as opposed to light viewers. It claims that the cumulative effect of television is to
create a synthetic world that heavy viewers come to see as reality (Reber & Chang,
2000). In other words, heavy viewers, compared to light viewers, will perceive the
“real” world in a way closer to the “reality” suggested by television, and if television
presents stereotypes or a distorted picture of reality, then those who are heavy
viewers will have an inaccurate conception of actual reality and those who view less
than four hours per day, according to Gerbner (1976) are light viewers.

16
2.2.2 Light Viewers
Children who spent less than 4 hours per day, according to Gerbner (1976) are light
viewers. They are optimistic on what they see on media because they don’t see it as
the reality. As time goes on they realise that it is not all what media tells them is real.
2.2.3 The Major Concept of Cultivation Theory
Cultivation theory posits that television is a primary contributor to children
conceptions of social reality, that it tells a certain cohesive and cumulative story over
time, and that it should be studied as a collective symbolic environment with an
underlying formulaic structure (Gerbner, 1998). Moreover, these stories cut across all
programs, and the viewing of television “cultivates” conceptions of reality (Gerbner,
1998). The theory assumes that uniformed messages of different genre are passed to
the audience through television. This means that television has become a centralized
system of telling stories, those who view television watch non-selectively by this
they get exposed to uniformed messages from different genre and also that heavy
viewers accept what its being showed or said in television as their reality (Gerbner,
Gross, Morgan, Signorielli, & Shanahan, 2002).
2.2.4 Hypothesis of Cultivation Theory
Morgan, Shanahan, and Signorielli (2009) “is that those who spend more time
watching television are more likely to perceive the real world in ways that reflect the
most common and recurrent messages of the television world, compared to those
who watch less television but are otherwise comparable in terms of important
demographic characteristics” (p. 34). The theory predicts a difference in the social
reality of heavy television viewers as opposed to light viewers. The cultivation
hypothesis states that the more television people watch, the more likely they are to

17
hold a view of reality that is closer to television's depiction of reality (Gerbner,
Gross, Morgan, Signorielli, & Shanahan, 2002).
Figure 2.2: Cultivation theory model Hawkins and Pingree (1983)
2.3 Children As Television Audience
Television carries some effect to the extreme with the combinations of images,
sound, immediacy, and bringing into the home (Postman 1985, p.78). Television
images replace reality, manipulate and showmanship in the replacement of leadership
(Postman 1985, p.97). People who are expose to television programs such as the
news, entertainment shows, commercials are being socialized into a variety of
expectation about reality. For example a child who has seen violence in the news,
films and cartoon shows believes that the best way to solve problem is by been
aggressive or violent.

18
There are mainly two opposing ideas as to children who watch television. One of the
ideas is that television is good; children learn positive things from it. On the other it
has a bad influence on them.
2.3.1 Negative Effect of Television on Children
According Neil Postman, the brain is to the mind as the technology is to a medium.
A technology is merely a machine while a medium is the social and intellectual
environment a machine has created (Postman, 1985). Television has no doubt of
having effect on children but at times it is really difficult to distinguish the direct
connection between media effects & children. According to Philips (1998), he said
television are like watching rainfall on a pond and trying to figure out which drop
causes which ripple. But much assurance is that the ripple is there because of
television.
2.3.2 Positive Effect of Television on Children
There are many positive effects of mass media in a child’s life. According to (Rice,
1983) claims that television viewing and the language learning has a correlation with
the child growth. Television dialogue should as a source of new words for
preschoolers. Television stimulates imagination as long as the child does not depend
on it for imaginative activity (Singer & Singer, 1986) and it can be used to increase
creativity and tolerance (Rosenkoetter, Houston & Wright, 1990). These shows that
media has both positive as well as negative impact on children development.
In television different event are viewed such as drama, music video, news. The
quantity of time people use watching television is surprising. On average, persons in
the developed world watch about 21 hours per week, which translates into nine years
in front of the tube in a regular lifetime (Shrum, Burroughs & Rindfleisch, 2003).

19
Strong evidence from experiments, surveys and longitudinal studies suggested that
viewing violent television program contribute a long term aggression and violence
behaviour on children (Barlow.B. & Lindsay, 2003). To younger children it might
not be high cause they can’t display it yet but an older children are primed to act
aggressively after viewing violent cartoon cause the will want to practice what they
have seen (Bandura.A & Ross, 1961). As Gerbner (1976) recognized the 3 Bs on
television, the blends which blends with reality, and it makes people more aggressive
and they become more nervous to attack.
In violent cartoon shows it is seen has humorous and the consequences are seldom
shown (Potter, 1998). To the male children the cartoon make them see themselves
has hero’s at the detriment of their life, naturally male are more punitive while
female children are scared of the world around them but it teaches them how to
gossip, fashion (Coccaro. E., 1992). Aggression is an impulsive act which children
don’t know about (Coccaro & Kavoussi, 1997; New et al., 2002).
2.4 Cartoons
Cartoon serves as a means of entertainment and at the same time it misinforms the
children in real life. Clearly cartoon shows are lucrative market for advertisers. From
observation, the most channels for kids like The Disney Channel, Nickelodeon, and
The Cartoon Network create programming to attract children (Becker, 2004), with
programs like Ben 10, Avengers, Hannah Montana, Zooey 101, and the Suite life of
Zack and Cody. Disney ex-President, Rich Ross, explained why Disney produces
shows for children-aged kids, but the shows feature older teen-aged kids in order to
create aspirations for the viewers (Romano, 2004). Gary Marsh, the present Disney

20
Channel Worldwide president of entertainment explains that Disney XD was
revamped to improve tween boy viewership (Umstead, 2009).
Children purchasing power it is obvious why programming, which includes
advertising for products, is created with this group of children in mind. Many
cartoon programs has shown violence and aggression in a way that the perpetrators
are attractive and heroic characters rather as a villain, also most of the bad act does
not have consequences, no pain or suffering by the victims or survivors and to the
children, that is how they perceive the world they are into. Albert Bandura talked of
observational learning called modelling (Bandura, et al., 1961).
Models can be physical and involve real people, symbolic and involve verbal, audio,
or visual representations, or a combination of these. Modelling is a very powerful
medium for transferring attitudes, values, behavioural and thought patterns.
According to modelling theory, children can remember what they have heard and
seen, and then they can imitate that behaviour (Bandura, 1977).
Albert Bandura believed that aggression is learned through a process called
behaviour modelling. He believed that children do not actually inherit violent
tendencies, but they modelled them after three principles (Bandura, 1976: p.204).
Albert Bandura argued that individuals, especially children learn aggressive
behaviour from observing others, either personally or through the media and
environment.

21
According to Bandura, people believe that aggression will produce reinforcements.
The reaction of the reinforcements can formulate into reduction of tension, gaining
financial rewards, or gaining the praise of others, or building self-esteem.
When children are exposed to media violence that portrays the characters as heroes
and also attractive, they can not only be negatively affected, but also they can
reproduce the violent behaviours seen on television (Siegel, 1992: p.171).
2.5 Effect of Television on Children
According to Huesman and Eron (1986), most children television station it has being
rated high of violent crime in it, which is not surprising that the scape goat has been
the television. In all the mass media, television portrals high violence in it with
greater potential for a long term effect on children.
Ling and Thomas (1986) made research children who were shown two videotapes of
aggressive and non-aggressive play behaviour. Only the children who viewed the
aggressive video exhibited an increase in the amount of aggressive play. Film, rock
music, and even the Internet amplify and reinforce the damaging content television
pours into our consciousness (Medved & Medved, 1998).
One of the important concepts of cultivation theory is the idea of “resonance.” This is
the idea that certain issues or messages from television may resonate with audience
members whose “real” environment includes similar issues and messages. According
to Gerbner et al., (1980),
When what people see on television is most congruent with everyday
reality (or even perceived reality), the combination may result in a

22
coherent and powerful “double dose” of the television messages and
significantly boost cultivation. Thus, the congruence of the television
world and real-life circumstances may “resonate” and lead to markedly
amplified cultivation patterns (p. 15).
2.5.1 Children Aggression and Violence in Media
Countless of studies have been carried out on children aggressiveness and violence in
media. In psychology, aggression is a well-defined scientific concept. Human
aggression researchers define aggression as:
(a) A behaviour that is intended to harm another individual (Anderson, 1997)
(b) The behaviour is expected by the perpetrator to have some chance of actually
harming that individual (Berkowitz, 1990)
(c) The perpetrator believes that the target individual is motivated to avoid the harm
(Anderson & Bushman, 2002b; Baron & Richardson, 1994; Berkowitz, 1993; Geen,
2001).
Media violence refers to media depictions of aggressive and violent behaviour
directed at characters in the media story. Those characters can be human or
nonhuman, cartoonish or visually realistic. Fictional, unrealistic, or animated
violence is still considered violence if it meets the above definitions (Gentile,
Saleem, & Anderson, 2007).
According to Mwema (2011), the early years are a crucial time for brain
development; Children need time for activities that are critical for healthy mental and
physical development. For some children under some conditions some television is
harmful. For other children under other conditions it may be beneficial. For most

23
children under most conditions most TV is probably neither particularly harmful nor
particularly beneficial (Schramm, Lyle & Parker, 1961).
Unfortunately cartoon shows and prime-time programming glorify the use of guns
and violence as acceptable, justifiable solutions to complex problems (Dietz &
Strasburger, 1991).
Media can contribute to long-term fear through cultivation. According to cultivation
theory, people who watch a great deal of television will come to perceive the real
world as being consistent with what they see on the screen (Gerbner, 1976).
Children inculcate aggressive behaviours after viewing a violent cartoon. Although
the violent act in the cartoon may be short lived, but it effect on a child is a long term
thing (Huesman L.R., 1986). To some child it is an immediate effect like showing it
on the playground or at the day-care centre the next day. Other child it is attached to
their thoughts and feeling before they implement what was learnt in childhood age. A
longer-term study shows even more disturbing information (Wilson, B.J.et al., 1987).
Over the last decade, the role of mass media, in particular television, in daily life has
increased (Hagenah & Meulemann, 2006). Violence call for much awareness in
media effect like such as: movies, video-games, musical video, cartoon. There are
believed that much violence and aggression which are harmful to children and
society are portrayed in the media today (Anderson, 2003).
There have been extensive debates among scholars on the impact of television
programs on society (Zajonc, 1968, Tan et al., 2001, Mastro & Tropp, 2004). Some

24
of these debates seem to question the negative impact of television viewing habits on
society, in terms of influencing the mind-set, attitudes, behaviour and over all
lifestyle of the viewers, especially among teenagers and younger viewers. In this
case, according to (Osman & Nizam, 2010) the content of television programs is seen
to be capable of shaping the overall mind set and behaviour of the viewers.
2.6 Research into Cartoon Violence on Nigerian Children
According to CNN, August 26, 2013 -- Updated 1201 GMT (2001 HKT), an 8-year-
old Louisiana boy intentionally shot and killed his elderly caregiver after playing a
violent video game, authorities say. Marie Smothers was pronounced dead at the
scene with a gunshot wound in the head in a mobile home park in Slaughter,
Louisiana, the East Feliciana Parish Sheriff's Department said in a prepared
statement. Slaughter is about 20 miles north of Baton Rouge.
Authorities identified the woman as the boy's "caregiver," without stating whether
she is a relative. But CNN affiliate WBRZ reported that the woman was the boy's
grandmother.
As at the period the research was conducted, no attempt has been made by any
scholar to explore the influence of violence in cartoons on Nigeria children.

25
Chapter 3
3 METHODOLOGY
This chapter lays down the details of how research for the present study has been
tackled. Based on this, the present chapter includes: Research Methodology,
Research Design and Context, Data Collection Instrument, Population and Sample of
the Study, Population and Sample for the Pilot Study, Validity and Reliability of
Data Collection Instrument, Research Procedures, Data Collection and Analysis
Procedures.
3.1 Research Methodology
The present study has been designed as a piece of quantitative research methodology.
As it has been mentioned earlier, the aim of the research is to know how violence
cartoons influence children.
According to Bouma & Atkinson (1995), quantitative research is “structural, logical,
measured and wide” (p. 208). This method of quantitative research gives opportunity
for data to be collected effectively and increase the accuracy in the respondents
answer.
“Quantitative methods are those which are based on numerical information or
quantities, and they are typically associated with statistical analyses” (Stokes, 2003,
p.2). Quantitative method is a useful method for finding out about individual
opinions, attitudes, behavior and so on towards a whole range of topics and issues

26
(Cottle, Hansen, Negrine, & Newbold, 1998, p.225). The quantitative research
methodology which was carried out among the school age children includes a survey
research which is used to calculate the information about the cartoon violence and
aggression on children. Questionnaires are used in order to get information from a
large number of respondents.
An in-home questionnaire was used to conduct the research among Nigerian school
age children in the 2nd
term of their academic school year in February, 2014.
3.2 Research Design
In this present study, a questionnaire was conducted as a case study of Nigerian
children. A survey was prepared, piloted among school age children, their teachers
and parents in two schools called: The Saint International Nursery and Primary
School alongside The Apostolic Church Grammar School during academic year
2013-2014.
The present study provides the description of attitudes of Nigerian children towards
violence and aggression in cartoon. The present research aimed at finding out to what
extent kids watch cartoons that have violence and aggression and the extent to which
they are influenced from this violence.
In this study, participants were group into two: children with high economic status
and children that come from average income families. The high economic status
children attend private schools, they are the children who attend the Saint
International Nursery and Primary School while the other groups are considered as
the children of average income families and they attend Apostolic Church Grammar
School. The study is a case study.
27
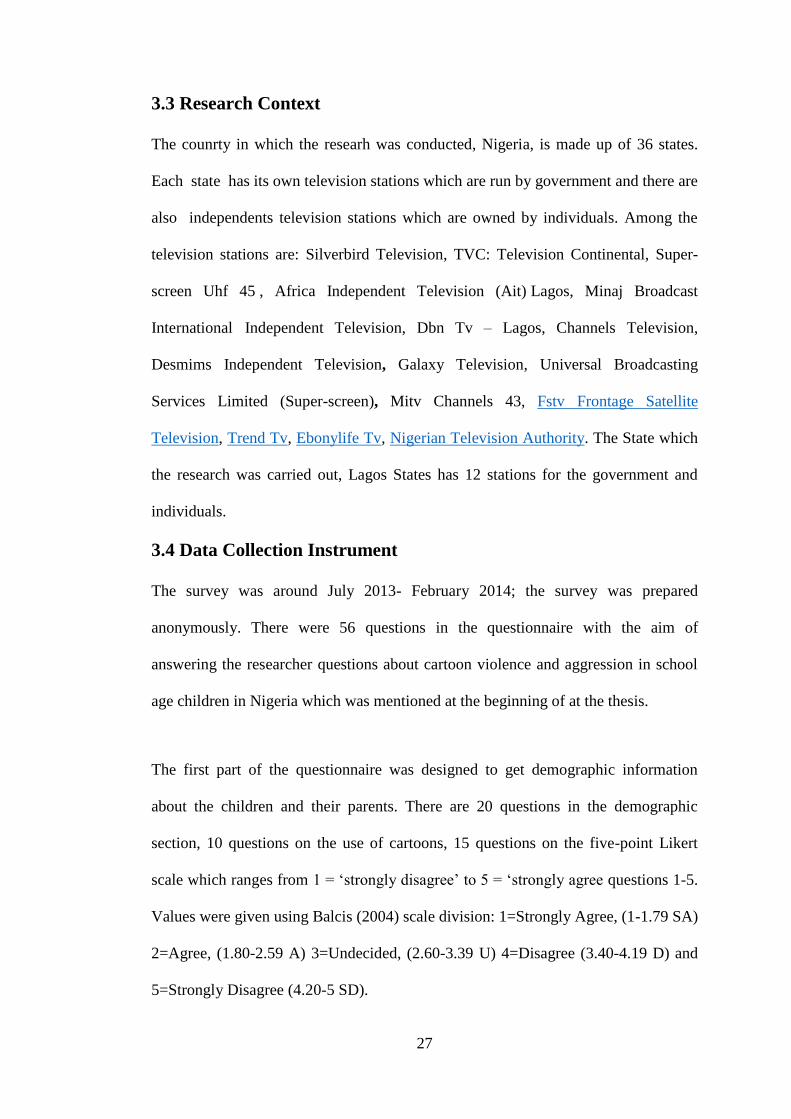
3.3 Research Context
The counrty in which the researh was conducted, Nigeria, is made up of 36 states.
Each state has its own television stations which are run by government and there are
also independents television stations which are owned by individuals. Among the
television stations are: Silverbird Television, TVC: Television Continental, Super-
screen Uhf 45 , Africa Independent Television (Ait) Lagos, Minaj Broadcast
International Independent Television, Dbn Tv – Lagos, Channels Television,
Desmims Independent Television, Galaxy Television, Universal Broadcasting
Services Limited (Super-screen), Mitv Channels 43, Fstv Frontage Satellite
Television, Trend Tv, Ebonylife Tv, Nigerian Television Authority. The State which
the research was carried out, Lagos States has 12 stations for the government and
individuals.
3.4 Data Collection Instrument
The survey was around July 2013- February 2014; the survey was prepared
anonymously. There were 56 questions in the questionnaire with the aim of
answering the researcher questions about cartoon violence and aggression in school
age children in Nigeria which was mentioned at the beginning of at the thesis.
The first part of the questionnaire was designed to get demographic information
about the children and their parents. There are 20 questions in the demographic
section, 10 questions on the use of cartoons, 15 questions on the five-point Likert
scale which ranges from 1 = ‘strongly disagree’ to 5 = ‘strongly agree questions 1-5.
Values were given using Balcis (2004) scale division: 1=Strongly Agree, (1-1.79 SA)
2=Agree, (1.80-2.59 A) 3=Undecided, (2.60-3.39 U) 4=Disagree (3.40-4.19 D) and
5=Strongly Disagree (4.20-5 SD).

28
The Likert scale questions on the questionnaire consist of sub-sections. The first sub-
section is talking about the children attitude towards cartoon. These statement aims
to reveal how children respond to cartoon after they watch it. The second sub-
section is looking at their physical aggressiveness subscale towards their fellow peer,
the difference between possible and impossible action. At these stages the researcher
aimed to reveal the purpose at which cartoon violence and aggressiveness have
impact on them and their play mate. There are 15 statements in this pact.
The third section is self-report survey on media habit, what they imitate in the
cartoon. This category of statement aimed to reveal how children both the rich and
poor children respond to what they see in the cartoon and how they try to practicalize
it in their real life. There are 7 statements in this part. The fourth part is about their
verbal aggression items which is analyzing their peer nomination measure of
aggressiveness and pre social behavior in their day to day activities among people.
Four questions were asked in that part.
The children’s classroom teachers, administrating the children self-report surveys.
The questionnaires were administered on consecutive days. The class room teachers
also administered one survey for each participating child in the school, and teacher
gives report on the children’s aggression and pre social behaviors. The children
parents were asked to fill the survey to know if they really know the level at which
their child watch cartoon and their responds to what they watch.
3.5 Population and Sample of the Study
The population of the study was schools in Nigeria. Two schools were chosen from
over 500 hundred private and public schools in Lagos States Nigeria. Nigeria

29
comprises of 36 states and each of the states has a capital. Within the states there are
774 local government areas in it. Lagos state has 20 local governments but just one
local government was used as the population sample of the study which is Ikorodu
Local Government.
The entire samples were selected from the primary schools in Lagos State Nigeria
both in public and private school. A sample is one of the major steps in knowing the
accuracy of the result collected (Bouma, 1995). The total number of children in each
of the school is 650 pupils. The present study took place in the 2nd
term of the
academic year.
In the same academic year, the pupil that participated were 300 students (50%)
student from the private school (Saint International Nursery and Primary school) and
(50%) from the public school: the (Apostolic Church Grammar School).
3.5.1 Population and Sample for Pilot Study
The pilot study was conducted among Nigerian students. The study was done among
15 Africa students in Eastern Mediterranean University during Fall Semester 2014.
Oral interview was done for the children to ascertain their choice of interest.
3.6 Validity and Reliability of Data Collection Instrument
Before administering the questionnaire to the school children, permission was taken
from the school principals and for personal information a verbal consent where taken
from the children parents during the P.T.A (Parent Teachers Association).
Permission was gotten from the principals of the schools used in the research and
also from the parents of the children that attend the schools. The permission was
given verbally and not in written form.

30
As it has been mentioned above, a pilot study was done among 35 Africa students,
parents, teachers, aunties and uncles. This was done to test the validity and reliability
of the survey. The data collection was done through questionnaires and the first
factor was analysis which was done.
Case Processing Summary
No %
Cases Valid 198 92,1
Excludeda 17 7,9
Total 215 100,0
a. List wise deletion based on all variables in the procedure.
Reliability Statistics
Cronbach's Alpha No of Items
,922 36
For the sustainability of the whole sample, a factor analysis is done for all Likert-
Scale type questions (36 in number) comprised by the questionnaire. The alpha
coefficient of reliability level for the whole questionnaire is 0.922 showing perfect
reliability of the data collection instrument (Nunally, 1967).
Items for each subscale were subjected to reliability analysis. The alpha coefficient
for the total scale was 0.93 and 0.85, 0.89, 0.89, 0.88 respectively for tangibles,
reliability, assurance and empathy. Usually a reliability coefficient above 0.70 is
considered sufficient for exploratory studies (Nunally, 1967).

31
3.7 Data Collection and Analysis Procedures
Data collected with the use of questionnaires will be entered into SPSS (Statistical
Package for Social Sciences) program and properly analysed. The first part of the
questionnaire was a self-report survey of media and demographic data which was
asked. The statements were analyzed with Likert scale type question. Cross tab and
Chi-square test will be done to reveal whether there is any statistically significant
difference between the cartoon violence and aggression between the government and
the private school children.

32
Chapter 4
4 ANALYSIS AND FINDINGS
The present chapter seeks to present the analysis of the data collected for the study
and findings drawn from them. As mentioned earlier in Chapter 3, in the present
study, quantitative methodology is used. A questionnaire was used as the data
collection instrument and findings were obtained through statistical analysis. In other
words, this chapter presents findings obtained from the research which was carried
out among school age children in Nigeria. The analyses that are applied are:
Descriptive statistics cross-tabulations and chi-square-test. Firstly, analysis of
demographical characteristics of the participants will be presented. Secondly the
means of statements designed according to five-point Likert Scale will be given and
compared in relation among the level of violence and aggression in school age
children by using descriptive statistic. Lastly the Chi- square test results will be
presented.
4.1 Analysis of Demographic Variables of the Participants
Out of 300 questionnaires that were distributed, 215 questionnaires were usable from
The Saint International Nursery and Primary school (private school) and The
Apostolic Church Grammar School (government school). 86 pupils responded which
is 40% from the private school and 60% (129 pupils) were from the government
school. In total, the male pupils were 118 (54.9%) while females were 97 (45.1%).
The age of the school age students were 4-6 years: 47 (21.9%), 7-9 years: 69 (32.1%)
while age 10-12: 99 (46.0%). The classes of the school age children were class 1: 8
33
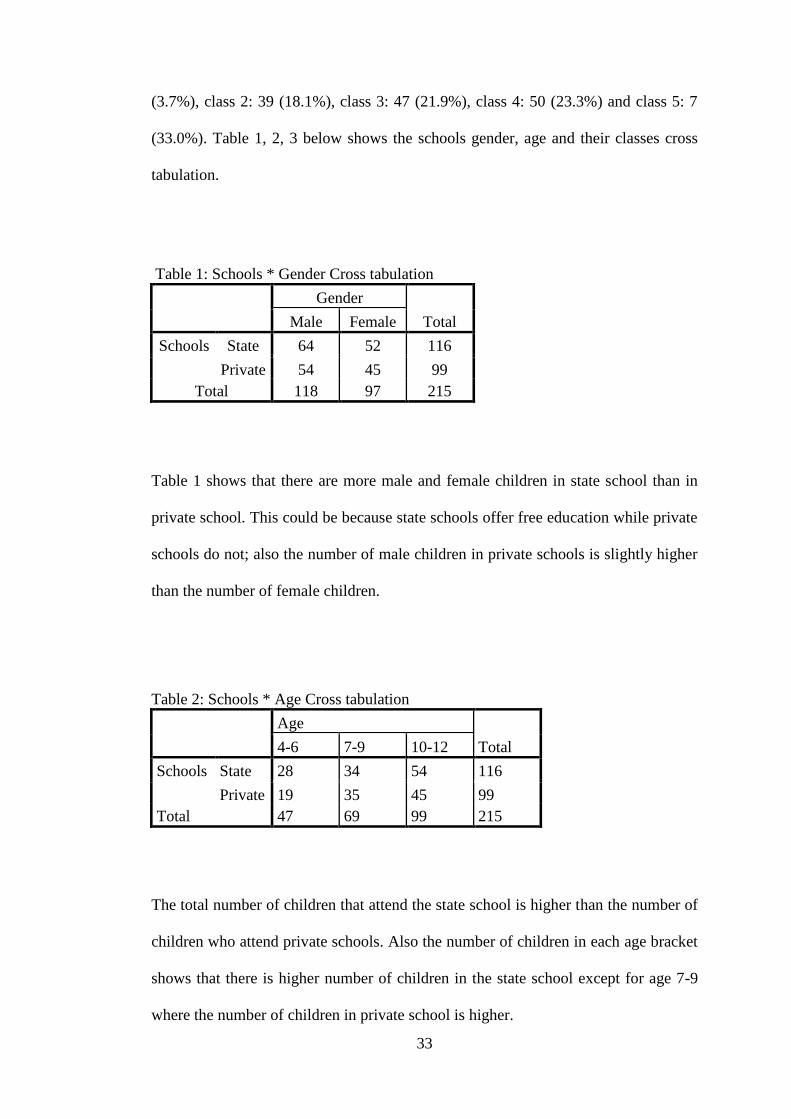
(3.7%), class 2: 39 (18.1%), class 3: 47 (21.9%), class 4: 50 (23.3%) and class 5: 7
(33.0%). Table 1, 2, 3 below shows the schools gender, age and their classes cross
tabulation.
Table 1: Schools * Gender Cross tabulation
Gender
Total Male Female
Schools State 64 52 116
Private 54 45 99
Total 118 97 215
Table 1 shows that there are more male and female children in state school than in
private school. This could be because state schools offer free education while private
schools do not; also the number of male children in private schools is slightly higher
than the number of female children.
Table 2: Schools * Age Cross tabulation
Age
Total 4-6 7-9 10-12
Schools State 28 34 54 116
Private 19 35 45 99
Total 47 69 99 215
The total number of children that attend the state school is higher than the number of
children who attend private schools. Also the number of children in each age bracket
shows that there is higher number of children in the state school except for age 7-9
where the number of children in private school is higher.

34
Table 3: Schools * Class Cross tabulation
Class
Total Class1 Class 2 Class 3 Class 4 Class 5
Schools State 6 23 25 27 35 116
Private 2 16 22 23 36 99
Total 8 39 47 50 71 215
The table 3 above shows the number of the children in the state and private school.
The state school has a larger population due to the fact that it’s a government owned
school which is affordable for most parents. The private school has lower population
because it’s privately owned and quit expensive for most parents.
4.2 Descriptive Analysis of Question Related to Television Usage
Questions from 4-20 were related to the research participants in television usage.
Table 4: How many hours do you spend in school?
The hours spent in school by the children 5-7 hours that is 65.1% that is the normal
school hours without any school lesson, while 8-11 hours (34.9%) is with school
lesson. The senior class children are given the opportunity for extra lessons in school
then the lower class children they spend less time in school.

35
Table 5: Schools * How many hours do you spend in school? Cross
tabulation
How many hours do you
spend in school?
Total 5-7 hours 8-11 hours
Schools State 76 40 116
Private 64 35 99
Total 140 75 215
Table 5 shows the number of hours spent in a day by the children in private and state
schools. State school children spend 5-7 hours with a frequency of 76 in school while
the private school children spend 8-11 hours, frequency of 64. The children spend
more hours in school.
Table 6: Gender Profile
How many hours do you
spend in school?
Total 5-7 hours 8-11 hours
Gender Male 87 31 118
Female 53 44 97
Total 140 75 215
Table 6 shows the amount of hours spent in school in a day by each gender. The
male children spend 5-7 hours with the frequency of 87 which is more than the
female children with the frequency of 53.

36
Table 7: How many hours do your parents spend with you in a day?
Frequency Percent Valid Percent Cumulative Percent
Valid 2-4 hours 91 42.3 42.3 42.3
5-7 hours 111 51.6 51.6 94.0
please specify 13 6.0 6.0 100.0
Total 215 100.0 100.0
The hours the children spend with their parents is used to determine how much the
parents know the extent to which their children watch cartoon in a day. Those parents
that spend 2-4 hours with percentage of 42.3, they might not know more of their
children while the parents that spend 5-7 hours with the percentage of 51.6 can
monitor their children.
Table 8: Schools * How many hours do your parents spend with you in a
day? Cross tabulation
How many hours do your parents spend
with you in a day?
Total 2-4 hours 5-7 hours
please
specify
Schools State 52 54 10 116
Private 39 57 3 99
Total 91 111 13 215
Most of the children that attend state school spend more time with their parents
because it is either their parents teach in the school they are or their mother is a full
house wife. Children that attend private school spend fewer hours with their parent
only during weekend because most of the parents are always busy at work.

37
Table 10: Do you watch television?
Frequency Percent Valid Percent Cumulative Percent
Valid Every Day 136 63,3 63,3 63,3
Once a week 33 15,3 15,3 78,6
Twice a week 31 14,4 14,4 93,0
Every month 14 6,5 6,5 99,5
Never 1 ,5 ,5 100,0
Total 215 100,0 100,0
Children like watching television. The aim of asking these questions is to know how
much they spend watching television. Everyday has 63.3 percentage, once a week
has 15.3 percentage, twice a week has 14.4 percentage, every month has 6.5
percentage while never has 0.5 percentage. These results indicate the significance of
television in children’s lives.
Table 11: Schools * Do you watch television? Cross tabulation
Do you watch television?
Total
Every
Day
Once a
week
Twice a
week
Every
week Never
Schools State 79 20 9 8 0 116
Private 57 13 22 6 1 99
Total 136 33 31 14 1 215
State school children watch television more than the private school children because
state school children have more time for fun than the private school children. State
school has frequency of 79 while private school has 57 frequencies. States school
children always watch television.

38
Table 12: Gender * Do you watch television? Cross tabulation
Do you watch television?
Total
Every
Day
Once a
week
Twice a
week
Every
week Never
Gender Male 75 16 12 7 1 118
Female 61 17 19 7 0 97
Total 136 33 31 14 1 215
Table 12 shows that male children watch television every day with the frequency of
75 and female children watch television with the frequency of 61. Male children
watch television more than the female children.
Table 13: How many hours do you spend watching television?
Frequency Percent Valid Percent Cumulative Percent
Valid 1-2 hours 85 39,5 39,5 39,5
3-4 hours 77 35,8 35,8 75,3
5-6 hours 49 22,8 22,8 98,1
Others 4 1,9 1,9 100,0
Total 215 100,0 100,0
The aim of the research is to know how many hours the children both in state and
private schools spend in watching television. The highest hours the children spend in
watching television is 1-2 hours with a frequency of 85. The hours the children spend
in watching television in a day and the percentage was 3-4 hours: 77(35.8%). 1.9%
children watches television more with the frequency of 4. Most of the children spend
more time in schools so they don’t really have time to watch television.

39
Table 14: Schools * How many hours do you spend watching television? Cross
tabulation
How many hours do you spend watching
television?
Total 1-2 hours 3-4 hours 5-6 hours
please
specify
Schools State 41 49 25 1 116
Private 44 28 24 3 99
Total 85 77 49 4 215
The state school children spent more hours watching television than the private
school children, the state school children spend 3-4 hours watching television while
the private school children spend 1-2 hours watching television. These might be
because of the financial status of their home.
Table 15: Gender * How many hours do you spend watching television? Cross
tabulation
How many hours do you spend watching
television?
Total 1-2 hours 3-4 hours 5-6 hours
please
specify
Gender Male 41 38 18 4 101
Female 44 39 31 0 114
Total 85 77 49 4 215
With respect to light viewers, gender does not make much indiffences yet in heavy
viewers. The table 15 above shows that female children spend more hours watching
television than the male children. The female children spend 1-2 hours with the
frequency of 44 and the male children spend 1-2 hours with the frequency of 41. This
means during the day the children spend not less than 4 hours watching television in
a day.

40
Table 16: Do you watch cartoons?
Frequency Percent Valid Percent Cumulative Percent
Valid Every Day 107 49.8 49.8 49.8
Once a week 44 20.5 20.5 70.2
Twice a week 50 23.3 23.3 93.5
Every month 12 5.6 5.6 99.1
Never 2 .9 .9 100.0
Total 215 100.0 100.0
The children where ask if they watch cartoon daily. Most of the children watch
television every day with a frequency of 107 and a percentage of 49.8. Children are
more attracted to the cartoon programs if they find it interesting and more educative.
Table 17: Schools * Do you watch cartoons? Cross tabulation
Do you watch cartoons?
Total
Every
Day
Once a
week
Twice a
week
Every
month Never
Schools State 60 27 22 7 0 116
Private 47 17 28 5 2 99
Total 107 44 50 12 2 215
The state school children watch cartoons more than the private school children; the
state school children watch cartoons every day with the frequency of 60 while the
private school children frequency is 47. They all watch cartoon every day.
Table 18: Gender * Do you watch cartoons? Cross tabulation
Do you watch cartoons?
Total
Every
Day
Once a
week
Twice a
week
Every
month Never
Gender Male 59 24 28 5 2 118
Female 48 20 22 7 0 97
Total 107 44 50 12 2 215

41
Table 18 shows that male children watch cartoon programs more than the female
children. The percentage shows that the children watch cartoons everyday with the
percentage of 107 (49.8%). Just 9% children have never watched cartoons. The
children said their parents don’t allow them watch cartoons. Most of the children’s
parents are media literate; they understand the danger of exposing their children to
media at an early stage in their life, so they prevent them from watching it every day.
But some parents allow them to watch it. Some children watch it once a week with
the frequency of 44 and 20.5%, some twice a week 50 frequencies with 23-3%, every
month with frequency 12 and 5.6%.
Table 19: Do you watch only cartoon?
Frequency Percent Valid Percent Cumulative Percent
Valid Yes 85 39.5 39.5 39.5
No 130 60.5 60.5 100.0
Total 215 100.0 100.0
The children where ask if they watch only cartoon but they all said No with a
frequency of 130 and a percentage of 60.5 and few of the children said Yes with the
frequency of 85 (39.5) because they watch other programs too.
Table 20: Schools * Do you watch only cartoon? Cross tabulation
Do you watch only
cartoon?
Total Yes No
Schools State 44 72 116
Private 41 58 99
Total 85 130 215

42
The state school children said No with a frequency of 72 that they don’t watch only
cartoon they watch other programs. The private school children too said No with a
frequency of 58 that they don’t watch cartoon program alone.
Table 21: Gender * Do you watch only cartoon? Cross tabulation
Do you watch only
cartoon?
Total Yes No
Gender Male 40 78 118
Female 45 52 97
Total 85 130 215
The frequency shows that the children do not watch only cartoon programs they also
watch other programs. The male children disagree with the frequency of 78 and the
female children disagree with a frequency of 52. Cartoon is a child’s favourite
program. Almost all children in the world like watching cartoon at their tender age
because it seems so real to them at their age. For some children, they watch other
programs with their parents or their elder ones.
Table 22: What kind of cartoon do you watch?
Frequency Percent Valid Percent
Cumulative
Percent
Valid Action 86 40.0 40.0 40.0
Comedy 48 22.3 22.3 62.3
Fantasy 48 22.3 22.3 84.7
Science Fiction 25 11.6 11.6 96.3
Horror 8 3.7 3.7 100.0
Total 215 100.0 100.0

43
The kind of cartoon the children like to watch is action cartoons which is the highest
frequency of 86 (40.0%) while comedy has 48 (22.3%), fantasy has 48 (22.3%),
science fiction 25 (11.6%), horror 8 (3.7%). Action has lot of fighting in it which
shows that the children like watching it, the comedy cartoons make them laugh and
the find it interesting, the fantasy cartoons makes the children imagine life with a
happy ending, for the female children it boost their romantic imagination while the
male want to be a handsome boy. The science fiction cartoons make them
experiment and know more of science while the horror makes them scared.
Table 23: Schools * What kind of cartoon do you watch? Cross tabulation
What kind of cartoon do you watch?
Total Action Comedy Fantasy
Science
Fiction Horror
Schools State 44 30 24 14 4 116
Private 42 18 24 11 4 99
Total 86 48 48 25 8 215
The state school children like action cartoon more than the private school children.
Action cartoon in state school has the frequency of 44 while private school has the
frequency of 42.
Table 24: Gender * What kind of cartoon do you watch? Cross tabulation
What kind of cartoon do you watch?
Total Action Comedy Fantasy
Science
Fiction Horror
Gender Male 28 16 19 18 4 85
Female 58 32 29 7 4 130
Total 86 48 48 25 8 215

44
Female children like action cartoons with the frequency of 58 while the male
children like action cartoons with the frequency of 28. The female children love the
activity displayed in action cartoon.
The hours the children spend in watching cartoon during the day is used in
determining how much of cartoon they watch and the level at which they can be
exposed to the content. 1-2 hours 121 (56.3), 3-4 hours 75(34.9), 5-6 hours 14(6.5)
and 6 or more 5(2.3).
Table 26: Schools * How many hours do you watch cartoon in a day? Cross
tabulation
How many hours do you watch cartoon in a
day?
Total 1-2 hours 3-4 hours 5-6 hours
please
specify
Schools State 68 38 6 4 116
Private 53 37 8 1 99
Total 121 75 14 5 215
The state school children spend much time in watching cartoon than the private
school children. The state school children spend 1-2 hours which was the highest
frequency 121 with the percentage of (56.3%), 3-4 hours has frequency of 75 with
34.9% and 5-6 hours has 14 frequencies with 6.5%. While other children that spend 6
Table 25: How many hours do you watch cartoon during day?
Frequency Percent Valid Percent Cumulative Percent
Valid 1-2 hours 121 56.3 56.3 56.3
3-4 hours 75 34.9 34.9 91.2
5-6 hours 14 6.5 6.5 97.7
6 or more 5 2.3 2.3 100.0
Total 215 100.0 100.0
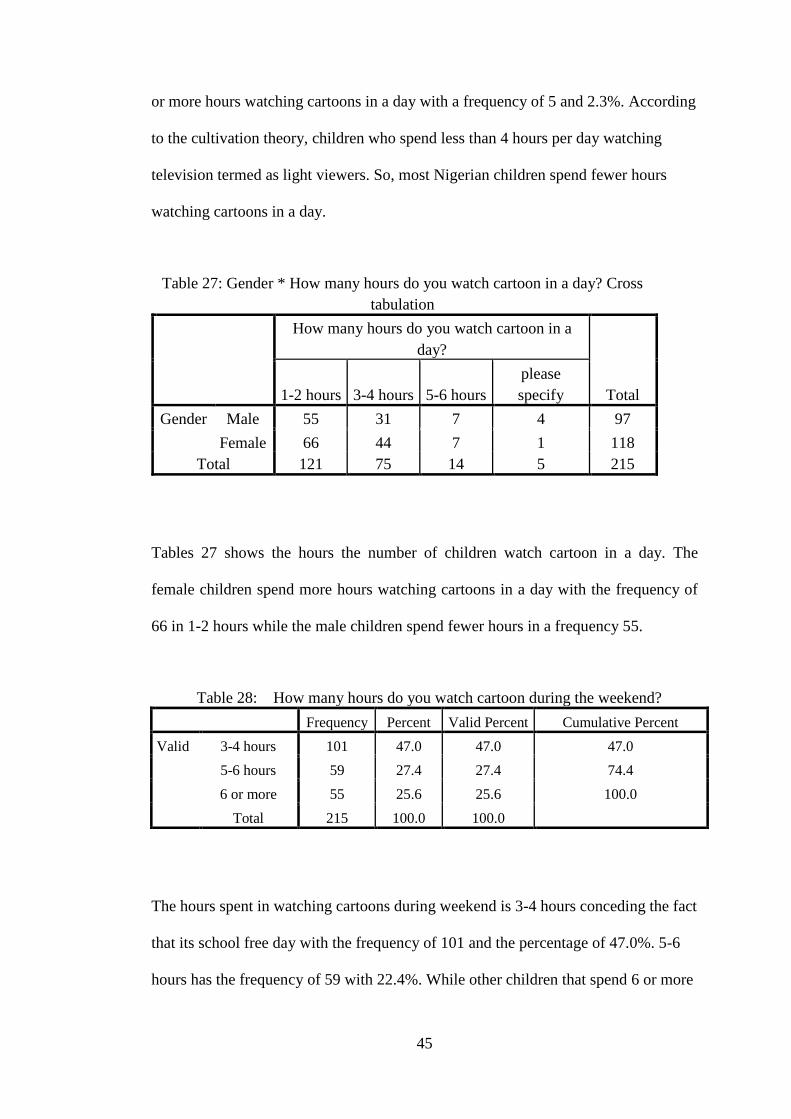
45
or more hours watching cartoons in a day with a frequency of 5 and 2.3%. According
to the cultivation theory, children who spend less than 4 hours per day watching
television termed as light viewers. So, most Nigerian children spend fewer hours
watching cartoons in a day.
Table 27: Gender * How many hours do you watch cartoon in a day? Cross
tabulation
How many hours do you watch cartoon in a
day?
Total 1-2 hours 3-4 hours 5-6 hours
please
specify
Gender Male 55 31 7 4 97
Female 66 44 7 1 118
Total 121 75 14 5 215
Tables 27 shows the hours the number of children watch cartoon in a day. The
female children spend more hours watching cartoons in a day with the frequency of
66 in 1-2 hours while the male children spend fewer hours in a frequency 55.
Table 28: How many hours do you watch cartoon during the weekend?
Frequency Percent Valid Percent Cumulative Percent
Valid 3-4 hours 101 47.0 47.0 47.0
5-6 hours 59 27.4 27.4 74.4
6 or more 55 25.6 25.6 100.0
Total 215 100.0 100.0
The hours spent in watching cartoons during weekend is 3-4 hours conceding the fact
that its school free day with the frequency of 101 and the percentage of 47.0%. 5-6
hours has the frequency of 59 with 22.4%. While other children that spend 6 or more
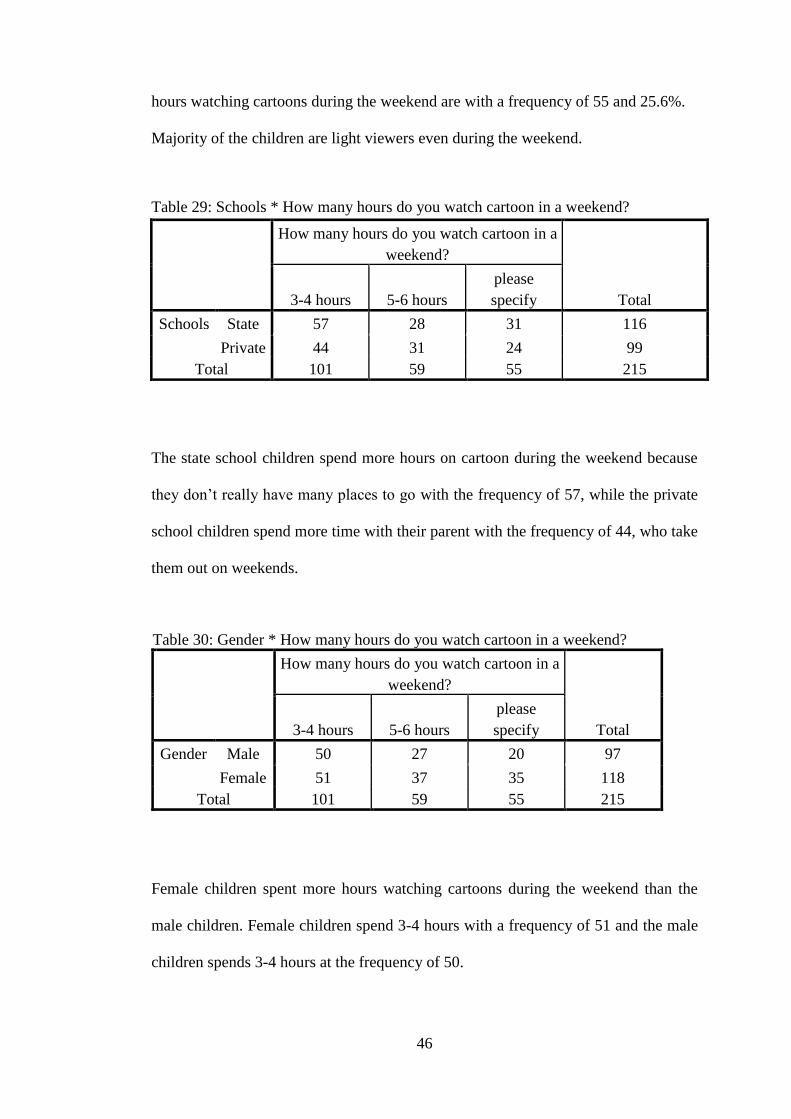
46
hours watching cartoons during the weekend are with a frequency of 55 and 25.6%.
Majority of the children are light viewers even during the weekend.
Table 29: Schools * How many hours do you watch cartoon in a weekend?
How many hours do you watch cartoon in a
weekend?
Total 3-4 hours 5-6 hours
please
specify
Schools State 57 28 31 116
Private 44 31 24 99
Total 101 59 55 215
The state school children spend more hours on cartoon during the weekend because
they don’t really have many places to go with the frequency of 57, while the private
school children spend more time with their parent with the frequency of 44, who take
them out on weekends.
Table 30: Gender * How many hours do you watch cartoon in a weekend?
How many hours do you watch cartoon in a
weekend?
Total 3-4 hours 5-6 hours
please
specify
Gender Male 50 27 20 97
Female 51 37 35 118
Total 101 59 55 215
Female children spent more hours watching cartoons during the weekend than the
male children. Female children spend 3-4 hours with a frequency of 51 and the male
children spends 3-4 hours at the frequency of 50.

47
Table 31: What means do you watch cartoons?
Frequency Percent Valid Percent Cumulative Percent
Valid Laptop 43 20.0 20.0 20.0
Television 146 67.9 67.9 87.9
Cinema 26 12.1 12.1 100.0
Total 215 100.0 100.0
The means by which children watch cartoons is shown above which is; television
with the frequency of 146 and the percentage of 67.9%. Because most of the time,
television is what they have access to, their parent doesn’t have time to take them to
the cinema and they don’t have much access to a laptop.
Table 32: Schools * What means do you watch cartoons? Cross tabulation
What means do you watch
cartoons?
Total Laptop Television Cinema
Schools States 26 75 15 116
Private 17 71 11 99
Total 43 146 26 215
Both state and private school children watch their cartoon on television than on
laptop or cinema. State school has a frequency of 75 and private has 71.
Table 33: Gender * What means do you watch cartoons? Cross tabulation
What means do you watch
cartoons?
Total Laptop
Televisio
n Cinema
Gender Male 13 89 16 118
Female 30 57 10 97
Total 43 146 26 215

48
Both male and female children watches cartoon mostly through television than
another means. Television has the highest frequency than other means of watching
cartoon program.
Table 34: What job does your parent do?
Frequency Percent Valid Percent Cumulative Percent
Valid Teacher 49 22.8 22.8 22.8
Office worker 104 48.4 48.4 71.2
Business 60 27.9 27.9 99.1
Others 2 .9 .9 100.0
Total 215 100.0 100.0
The job of the children parents was consider just to know the level at which the
parent spend time with the children and the level of the parent income, but the result
shows that the office worker has the highest frequency with 104 and 48.4%. The
teacher has 49 with 22.8%, and the business parent has 60 with 27.9%. 2 (9%) for
other, their parent has two occupations. They can be an office worker and a business
woman.
Table 35: Schools * What job does your parent do? Cross tabulation
What job does your parent do?
Total Teacher
Office
worker Business
Please
specify
Schools State 26 58 31 1 116
Private 23 46 29 1 99
Total 49 104 60 2 215

49
The state school parents are more occupied than the private school parents. The state
school parents are mostly office worker, business woman and teacher they have the
highest frequency.
Table 36: Gender * What job does your parent do? Cross tabulation
What job does your parent do?
Total Teacher
Office
worker Business
Please
specify
Gender Male 33 58 25 2 118
Female 16 46 35 0 97
Total 49 104 60 2 215
The male children parents are more of the working class then the female children
parent. Office worker has the highest frequency of 58 than the female children with
the frequency of 46.
Table 37: How many television sets do you have in your house?
Frequency Percent Valid Percent Cumulative Percent
Valid 1 79 36.7 36.7 36.7
2 80 37.2 37.2 74.0
3 43 20.0 20.0 94.0
Others 13 6.0 6.0 100.0
Total 215 100.0 100.0
A home with higher income ought to have 2 or more television set at home which
was corresponded in this result with the frequency of 2 percentages of 37.2% while
13 (6.0%) specified that they have more than 3 televisions in their homes. Other
which is frequency is 13 and 6% depict that some of them has more than enough
television sets in their homes.

50
Table 38: Schools * How many television sets do you have in your house?
How many television sets do you have in your
house?
Total 1 2 3 Please specify
Schools State 36 33 19 4 99
Private 43 47 24 9 116
Total 79 80 43 13 215
The private school children have more television set in their house than the state
school children with the frequency of 47 than the state school children with the
frequency of 33.
Table 39: Gender * How many television sets do you have in your house? Cross
How many television sets do you have in your
house?
Total 1 2 3
Please
specify
Gender Male 33 38 17 8 96
Female 46 42 26 5 119
Total 79 80 43 13 215
The female children have more television sets in their house than the male children.
The female school children have the frequency of 42 and the state school children
have the frequency of 38.
Table 40: Do you have a room to yourself?
Frequency Percent Valid Percent Cumulative Percent
Valid Yes 151 70.2 70.2 70.2
No 64 29.8 29.8 100.0
Total 215 100.0 100.0

51
The level of the parent income determines their standard of living. The buoyant
children have the highest frequency with 151 of having a room to themselves at the
percentage of 70.2%. Most of the parents are scared to leave their child alone in the
room sometimes because of their age and maybe because the room is not enough in
their homes.
Table 41: Schools * Do you have a room to yourself? Cross tabulation
Do you have a room to
yourself?
Total Yes No
Schools States 64 35 116
Private 87 29 99
Total 151 64 215
The private school children have a room to themselves more than the state school
children. The state school children said Yes that they have a room to them self with
the frequency of 64 and the private school children has the highest frequency of 87.
Table 42: Gender * Do you have a room to yourself? Cross tabulation
Do you have a room to
yourself?
Total Yes No
Gender Male 64 33 97
Female 87 31 118
Total 151 64 215
The female children have a room to themselves than the male children. The female
children said Yes with the frequency of 87 while the state school children have the
frequency of 64.

52
Table 43: Do you have a television in your room?
Frequency Percent Valid Percent Cumulative Percent
Valid Yes 91 42.3 42.3 42.3
No 124 57.7 57.7 100.0
Total 215 100.0 100.0
Most of the children do not have a television set to themselves which number has the
highest frequency of 124 and percentage of 57.7%. It is in the rich homes that their
children are given access to television set in their rooms because they are scare of
them damaging it and due to the money they got it they won’t want anything to
happen to the television. So do those that have it in their homes have a higher level
of income and they are more exposed.
Table 44: Schools * Do you have a television in your room? Cross tabulation
Do you have a television in
your room?
Total Yes No
Schools State 50 66 116
Private 41 58 99
Total 91 124 215
The state school children have television in their rooms more than the private school
children. The state school children have the highest frequency of 50 and the private
school children have the frequency of 41.

53
Table 45: Gender * Do you have a television in your room?
Do you have a television in your
room?
Total Yes No
Gender Male 45 52 97
Female 46 72 118
Total 91 124 215
The female children have television in their rooms more than the male children. The
female children have the frequency of 46 and the male have 45.
Table 46: Do you have a laptop?
Frequency Percent Valid Percent Cumulative Percent
Valid Yes 81 37.7 37.7 37.7
No 134 62.3 62.3 100.0
Total 215 100.0 100.0
The table shows that most of the children do not have a laptop with the frequency of
134 and 62.3%. Access to technology is minimal in Nigeria because not everyone
can afford it. Most of the Nigeria parents even believe the children can destroy or
damage it due to their age, so it is not something common among the children.
Table 47: Where do you watch cartoons?
Frequency Percent Valid Percent Cumulative Percent
Valid Living room 172 80,0 80,0 80,0
Bedroom 41 19,1 19,1 99,1
Others 2 ,9 ,9 100,0
Total 215 100,0 100,0

54
Most of the children watch their cartoons in the living room with the frequency of
172 and 80.0%. 9% of the children specified that they either watch cartoon in their
living room or bed room. 41 children watch their cartoons in their bed rooms with
19.1%. Others said anywhere they feel like watching with 2 frequencies and 9%.
Table 48: Schools * Where do you watch cartoons? Cross tabulation
Where do you watch cartoons?
Total
Living
room
Bedroo
m
Please
specify
Schools States 92 23 1 116
Privat
e
80 18 1 99
Total 172 41 2 215
The state school children said they watch their cartoon in the living with the
frequency of 92 likewise the private school children have the frequency of 80.
Table 49: Gender * Where do you watch cartoons?
Where do you watch cartoons?
Total
Living
room Bedroom
Please
specify
Gender Male 75 22 0 97
Female 97 19 2 118
Total 172 41 2 215
The female children say they watch their carton in the living room, with the
frequency of 92 while the male children say the like watching their carton in the
bedroom with the frequency of 75.

55
Table 50: Which cartoon do you watch most?
Frequency Percent Valid Percent Cumulative Percent
Valid Powder-Puff Girls 4 1.9 1.9 1.9
Snow White 3 1.4 1.4 3.3
Lion King 4 1.9 1.9 5.1
Bat Man 9 4.2 4.2 9.3
Kung Fu Panda 6 2.8 2.8 12.1
South Park 11 5.1 5.1 17.2
Fantastic 4 11 5.1 5.1 22.3
Ninja Turtles 21 9.8 9.8 32.1
Cinderella 5 2.3 2.3 34.4
Spiderman 16 7.4 7.4 41.9
Ice Man 5 2.3 2.3 44.2
Barbie 7 3.3 3.3 47.4
Superman 15 7.0 7.0 54.4
Ben 10 62 28.8 28.8 83.3
X-Men 5 2.3 2.3 85.6
Any Kind 1 .5 .5 86.0
Baby First 1 .5 .5 86.5
Beauty and The
Beast
5 2.3 2.3 88.8
Fantasia 2 .9 .9 89.8
Ice Age 2 .9 .9 90.7
Maiden 1 .5 .5 91.2
Power Rangers 9 4.2 4.2 95.3
Simba 1 .5 .5 95.8
Simpsons 7 3.3 3.3 99.1
Winnie the Pooh 2 .9 .9 100.0
Total 215 100.0 100.0
The cartoon watched most by the children was Ben10 with the frequency of 62 and
the percentage of 28.0%. Ben 10 cartoon comprises of action, comedy, fantasy,
science fiction and horror, Ninja Turtles which compares of lot of violence and
aggression has 21 (9.8%), Spiderman 16 (7.4%), Superman 15 (7.0%) while Barbie
which comprises of fashion and romantic characters has 7 (3.3%).

56
4.3 Analysis of the Attitude Scale Statements
In the current study, investigations were made to find out how respondents are
affected by the cartoon they watch. In the study, values attached to the choices of
attitude scale questions are as follows: 1=Strongly Agree, 2= Agree, 3=Undecided,
4=Disagree, 5= Strongly Disagree. For the scale division, Balcı (2004)
recommendation has been followed. Balcı (2004) suggests that the division for the
five-point Likert Scale would be as follows: (1-1.79) Strongly Agree; (1.80- 2.59)
Agree; (2.60- 3.39) Undecided; (3.40- 4.19) Disagree; (4.20- 5.0) Strongly Disagree.
Using five point Likert scale, subjects were asked whether they agreed with the
statements or not.
4.3.1 Means and Attitudes of Respondents on Cartoon
The first section is on: Attitudes of respondents towards cartoon which are shown
below:
Table 51: Means and Attitudes of Respondents towards Cartoon
Statement Means Attitude
I like watching cartoons 1.45 SA
I like action cartoons 2.06 A
I enjoy myself while watching cartoons. 1.71 SA
I prefer watching cartoons to doing my homework 2.98 A
I like cartoons with lots of guns. 2.62 A
I like cartoons with lots of fight in it. 2.55 A
I see the characters like heroes 2.33 A

57
I wish to be like them. 2.71 A
I practice what I watch. 2.44 A
I like cartoons because they are real. 2.78 A
Table 51 reveals that the means and attitudes of the children towards cartoon are
really high. They strongly agree that they like watching cartoons, they agree that they
like action cartoons, they strongly agree that they enjoy themselves watching
cartoons, they agree that they prefer watching cartoons to doing their homework’s,
the children agree that they like cartoons with lots of guns, they agree that they like
cartoons with lots of fighting in it, they strongly agree that they see the characters
like their heroes, they agree that they practices what they watch, they also agree that
they like cartoons because they believe they are real.
Table 52: I like watching cartoons
Frequency Percent Valid Percent Cumulative Percent
Valid Strongly Agree 146 67.9 67.9 67.9
Agree 50 23.3 23.3 91.2
Undecided 14 6.5 6.5 97.7
Strongly disagree 5 2.3 2.3 100.0
Total 215 100.0 100.0
The total percentage of students who strongly agree and agree is 67.9% and 23.3%
students agree that “I like watching cartoons”. This table shows that the children are
really conversant with cartoon programs and the like watching it.

58
Table 53: Schools * I like watching cartoons Cross tabulation
I like watching cartoons
Total
Strongly
Agree Agree Undecided
Strongly
disagree
Schools State 81 28 5 2 116
Private 65 22 9 3 99
Total 146 50 14 5 215
The state school children like watching cartoons more than the private school
children. The state’s school children strongly agree with the frequency of 81 and
agree with the frequency of 28 and 2 frequency of strongly disagree.
Table 54: Gender * I like watching cartoons Cross tabulation
I like watching cartoons
Total
Strongly
Agree Agree Undecided
Strongly
disagree
Gender Male 70 17 9 1 97
Female 76 33 5 4 118
Total 146 50 14 5 215
The female children like watching cartoons more than the male children, the female
children strongly agree to the question with the frequency of 76 and 33 agree and 4
strongly disagree.
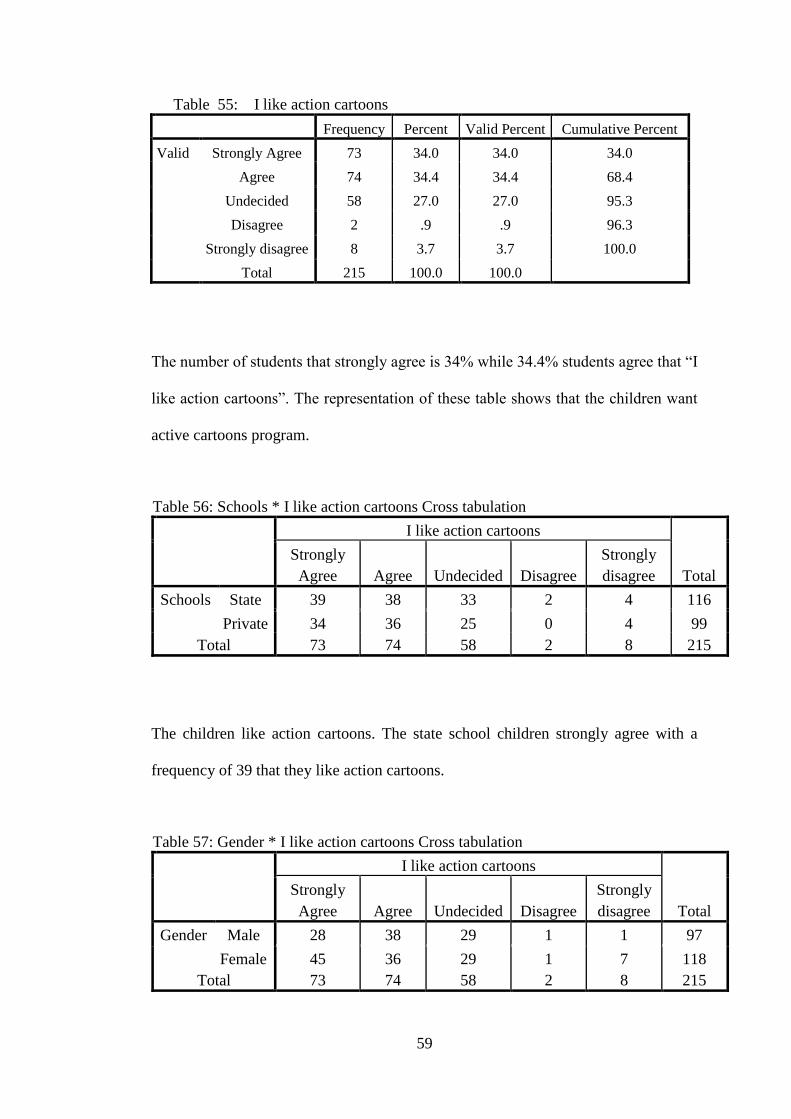
59
Table 55: I like action cartoons
Frequency Percent Valid Percent Cumulative Percent
Valid Strongly Agree 73 34.0 34.0 34.0
Agree 74 34.4 34.4 68.4
Undecided 58 27.0 27.0 95.3
Disagree 2 .9 .9 96.3
Strongly disagree 8 3.7 3.7 100.0
Total 215 100.0 100.0
The number of students that strongly agree is 34% while 34.4% students agree that “I
like action cartoons”. The representation of these table shows that the children want
active cartoons program.
Table 56: Schools * I like action cartoons Cross tabulation
I like action cartoons
Total
Strongly
Agree Agree Undecided Disagree
Strongly
disagree
Schools State 39 38 33 2 4 116
Private 34 36 25 0 4 99
Total 73 74 58 2 8 215
The children like action cartoons. The state school children strongly agree with a
frequency of 39 that they like action cartoons.
Table 57: Gender * I like action cartoons Cross tabulation
I like action cartoons
Total
Strongly
Agree Agree Undecided Disagree
Strongly
disagree
Gender Male 28 38 29 1 1 97
Female 45 36 29 1 7 118
Total 73 74 58 2 8 215

60
The female children strongly agree that they like action cartoon more than the male
children with a frequency of 45 to 28.
4.3.2 Means and Attitudes of Respondents Physical Aggression Subscale
The second section represents the physical aggression subscale of the children which
the means and attitude is shown below:
Table 58: Means and Attitudes of Respondents; Physical Aggression Subscale
Statement Means Attitude
I like to kick, hit or punch your friends just how you watch it in the
cartoon.
2.89 U
I want to kick, hit or punch your friends just how you watch it in the
cartoon.
3.18 U
I try kicking, hitting or punching my friends just how i watch it in the
cartoon.
3.26 U
I like pushing and shoving other kids around just Tom and Jerry. 3.45 D
I want to push and shove other kids around just Tom and Jerry. 3.18 U
I try pushing and shoving other kids around just Tom and Jerry. 3.57 D
I like to get into fights with your peers. 3.34 U
I want to get into fights with your peers. 3.76 D
I try to getting into fights with your peers. 3.51 D
I like threatening other kids. 3.70 D
I want to threaten other kids. 3.39 U
I try to threaten other kids. 3.38 U
I like to see a flying character. 2.49 A
I want to see a flying character 2.57 A
I try to see a flying character. 2.63 A

61
They agree that they like to see a flying character they disagree that they like pushing and
shoving other kids around just like Tom and Jerry. I want to threatening other kids was
undecided.
The table 58 shows that the mean and attitude of the physical aggression subscale of
the children. The children are not sure that they like to kick, hit or punch their friends
just as how they watch it in the cartoon program, they are undecided that they want
to kick, hit or punch their friends just as how they watch it in the cartoon program,
they are also not sure that they want to push and shove other kids around just like
Tom and Jerry, they disagreed that they want to see a flying character, they agree
they want to see a flying character, the children also agree that they try seeing a
flying character. As the cultivation theory states, the effects of media consumption
on its audience is not immediate, but a gradual process.
Table 59: I like to kick, hit or punch my friends just how you watch it in cartoons
Frequency Percent Valid Percent Cumulative Percent
Valid Strongly Agree 49 22.8 22.8 22.8
Agree 51 23.7 23.7 46.5
Undecided 38 17.7 17.7 64.2
Disagree 27 12.6 12.6 76.7
Strongly disagree 50 23.3 23.3 100.0
Total 215 100.0 100.0
The table shows that the children “like to kick, hit or punch your friends just how
you watch it in cartons”. The percentage of agree is 23.8% while the strongly agree
is 22.8%.
Table 60: Schools * I like to kick, hit or punch your friends just how you watch it in
cartoons.

62
I like to kick, hit or punch your friends just how you
watch it in cartoons.
Total
Strongly
Agree Agree Undecided Disagree
Strongly
disagree
Schools State 22 16 18 14 29 99
Private 27 35 20 13 21 116
Total 49 51 38 27 50 215
The state school children strongly disagree that they don’t like to kick, hit or punch
your friends just how you watch it in cartoons but the private school children
strongly agree with a frequency of 27 and agree 35 with just a frequency of 21.
Table 61: Gender * I like to kick, hit or punch your friends just how you watch it in
cartoons. Cross tabulation
I like to kick, hit or punch your friends just how you
watch it in cartoons.
Total
Strongly
Agree Agree Undecided Disagree
Strongly
disagree
Gender Male 20 21 21 9 26 97
Female 29 30 17 18 24 118
Total 49 51 38 27 50 215
The male children strongly disagree that they to kick, hit or punch your friends just
how you watch it in cartoons but the female children strongly agree.
Table 62: I like to see a flying character
Frequency Percent Valid Percent Cumulative Percent
Valid Strongly Agree 72 33.5 33.5 33.5
Agree 44 20.5 20.5 54.0
Undecided 53 24.7 24.7 78.6
Disagree 11 5.1 5.1 83.7
Strongly disagree 35 16.3 16.3 100.0
Total 215 100.0 100.0

63
With the percentage of 33.5 % in the strongly agree and 20.5% for agree. The
children “I like to see a flying character”.
Table 63: Gender * I try to see a flying character. Cross tabulation
I try to see a flying character.
Total
Strongly
Agree Agree Undecided Disagree
Strongly
disagree
Gender Male 25 21 16 11 24 97
Female 33 30 34 11 10 118
Total 58 51 50 22 34 215
The female children strongly agree that they like to see a flying character more than
the male children.
4.3.3 Means and Attitudes of Respondents on Difference between Possible and
Impossible Act
The section three of represents the difference between possible and impossible act of
the children, the means and attitudes of participants are presented in the Table 27
below:
Table 64: Possible and Impossible act
Statement Means Attitude
I like to fly. 2.17 A
I like to climb the walls. 2.47 A
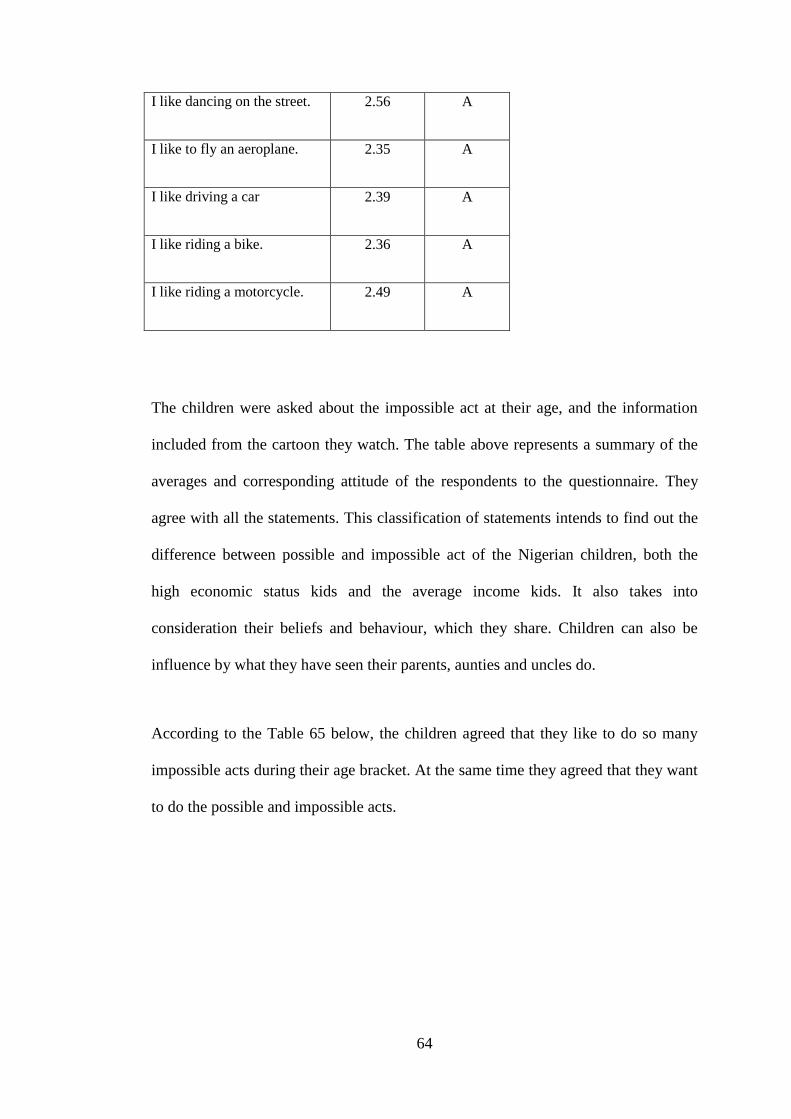
64
I like dancing on the street. 2.56 A
I like to fly an aeroplane. 2.35 A
I like driving a car 2.39 A
I like riding a bike. 2.36 A
I like riding a motorcycle. 2.49 A
The children were asked about the impossible act at their age, and the information
included from the cartoon they watch. The table above represents a summary of the
averages and corresponding attitude of the respondents to the questionnaire. They
agree with all the statements. This classification of statements intends to find out the
difference between possible and impossible act of the Nigerian children, both the
high economic status kids and the average income kids. It also takes into
consideration their beliefs and behaviour, which they share. Children can also be
influence by what they have seen their parents, aunties and uncles do.
According to the Table 65 below, the children agreed that they like to do so many
impossible acts during their age bracket. At the same time they agreed that they want
to do the possible and impossible acts.

65
Table 65: I like to fly
Frequency Percent
Valid
Percent Cumulative Percent
Valid Strongly Agree 91 42.3 42.3 42.3
Agree 57 26.5 26.5 68.8
Undecided 28 13.0 13.0 81.9
Disagree 16 7.4 7.4 89.3
Strongly
disagree
23 10.7 10.7 100.0
Total 215 100.0 100.0
The percentage of strongly agree is 42.3% and agree is 26.5%., the children “like to
fly” which is not possible. The impossible act is very high this table represents that.
Table 66: Schools * I like to fly Cross tabulation
I like to fly
Total
Strongly
Agree Agree Undecided Disagree
Strongly
disagree
Schools State 46 29 19 10 12 116
Private 45 28 9 6 11 99
Total 91 57 28 16 23 215
The children both from the state school and private school strongly agree that they
like to fly.
Table 67: Gender * I like to fly Cross tabulation
I like to fly
Total
Strongly
Agree Agree Undecided Disagree
Strongly
disagree
Gender Male 40 21 11 8 17 97
Female 51 36 17 8 6 118
Total 91 57 28 16 23 215

66
The female children strongly agree with a frequency of 51 and agree of 36 with 6
strongly agree more than the male children that the like to fly. So the female children
like to fly.
Table 68: I like to climb the walls
Frequency Percent Valid Percent Cumulative Percent
Valid Strongly Agree 60 27.9 27.9 27.9
Agree 60 27.9 27.9 55.8
Undecided 52 24.2 24.2 80.0
Disagree 18 8.4 8.4 88.4
Strongly disagree 25 11.6 11.6 100.0
Total 215 100.0 100.0
The percentage of strongly agree and agree is equal which is 27.9% that is the level
of the impossible act and reality is clear. The percentage of the undecided is 24.2 and
a frequency of 52 which shows that the children like to climb the walls.
Table 69: Schools * I like to climb the walls. Cross tabulation
I like to climb the walls.
Total
Strongly
Agree Agree Undecided Disagree
Strongly
disagree
Schools States 30 29 33 11 13 116
Private 30 31 19 7 12 99
Total 60 60 52 18 25 215
Both states and private school children don’t like to climb the walls they strongly
disagree to it.

67
Table 70: Gender * I like to climb the walls. Cross tabulation
I like to climb the walls.
Total
Strongly
Agree Agree Undecided Disagree
Strongly
disagree
Gender Male 36 28 38 7 9 118
Female 24 32 14 11 16 97
Total 60 60 52 18 25 215
Male children strongly agree with the frequency of 36 and agree of 28 that they like
climbing walls but the female children strongly disagree to it with a frequency of 16
and frequency disagree of 11.
4.3.4 Means and Attitudes of Respondents Verbal Aggression Items
The fourth section is on respondents’ Verbal Aggression Items. Means and attitudes
of participants are presented in the Table 30 below:
Table 71: Verbal Aggression Items
Statement Means Attitude
I like insulting other peers. 3.66 D
I like being insulted. 3.70 D
When I’m insulted, I like
retaliating.
3.16 D
I like yelling at people. 3.68 D
According to the results, all the children have the same attitude. The children
generally disagreed to the verbal aggression items. Also from the results it could be
deduced that children do not engage in verbal aggression with their peer.

68
Table 72: I like insulting other peers
Frequency Percent Valid Percent
Cumulative
Percent
Valid Strongly Agree 40 18.6 18.6 18.6
Agree 18 8.4 8.4 27.0
Undecided 28 13.0 13.0 40.0
Disagree 19 8.8 8.8 48.8
Strongly disagree 110 51.2 51.2 100.0
Total 215 100.0 100.0
The table shows that the strongly disagree is 51.2% and strongly agree is 18.8%
which mean the children do not like to insult other peer mates.
Table 73: Schools * I like insulting other peers Cross tabulation
I like insulting other peers
Total
Strongly
Agree Agree Undecided Disagree
Strongly
disagree
Schools States 20 7 13 13 63 116
Private 20 11 15 6 47 99
Total 40 18 28 19 110 215
The school children strongly disagree that they like insulting their peers, both states
and private school children.

69
Table 74: I like being insulted
Frequency Percent Valid Percent Cumulative Percent
Valid Strongly Agree 27 12.6 12.6 12.6
Agree 26 12.1 12.1 24.7
Undecided 36 16.7 16.7 41.4
Disagree 22 10.2 10.2 51.6
Strongly disagree 104 48.4 48.4 100.0
Total 215 100.0 100.0
The table 74 shows the percentage of “I like being insulted” as 48.4% which is
strongly disagrees. The children do not like being insulted by anyone.
Table 75: Schools * I like being insulted. Cross tabulation
I like being insulted.
Total
Strongly
Agree Agree Undecided Disagree
Strongly
disagree
Schools States 13 12 17 14 60 116
Private 14 14 19 8 44 99
Total 27 26 36 22 104 215
The state school children strongly disagree that they don’t like to be insulted likewise
private school children too.
4.4 Chi-Square Test Results
A chi-square test is conducted for the investigation, to know if there are marked
differences in children attitude and physical aggression of the private school children
and the government school children. Table 76 below shows level of the significance.

70
Table 76: Chi-Square Test Results
Value Df Asymp. Sig.
Pearson Chi-Square 272,716a 142 ,000
Likelihood Ratio 300,625 142 ,000
Linear-by-Linear
Association
,715 1 ,398
N of Valid Cases 198
a. 216 cells (100, 0%) have expected count less than 5. The minimum expected count
is, 21.
A chi square test is conducted for 36 questions in order to explore whether there is
statistically significant difference between cartoon violence and aggression towards
the children’s gender and school. The Table 77 shows the significance levels. Out of
36 Likert scale questions only 16 questions, indicate statistically significant value.
Table 77: Chi-square test results where statistically significant differences were
found in state and private schools and also between the gender of the children.
Section and statements
Significance
Section: Attitude towards cartoons
I like action cartoons.
I like watching cartoons.
I enjoy myself while watching
cartoons.
I prefer watching cartoons to doing
my homework.
I like cartoons with lots of guns.
I like cartoons with lots of fight in
it
I see the characters like heroes.
I wish to be like them.
I practice what I watch.
.000
.097
.281
.445
.006
.055
.650

71
I like cartoons because they are
real.
.003
.051
.442
Section: Physical Aggression Subscale.
I like to kick, hit or punch your
friends just how you watch it in
the cartoon.
I want to kick, hit or punch your
friends just how you watch it in
the cartoon.
I try kicking, hitting or punching my
friends just how i watch it in the
cartoon.
I like pushing and shoving other kids
around just Tom and Jerry.
I want to push and shove other kids
around just Tom and Jerry.
I try pushing and shoving other kids
around just Tom and Jerry.
I like to get into fights with your
peers.
I want to get into fights with your
peers.
I try to getting into fights with
your peers.
I like threatening other kids. I want
to threaten other kids.
I try to threaten other kids.
I like to see a flying character.
I want to see a flying character
.000
.000
.315
.564
.075
.314
.004
.004
.004
.080
.004
.049

72
I try to see a flying character. .002
.149
Section: Difference between possible and
impossible act.
I like to climb the walls.
I like to Fly
I like dancing on the street.
I like to fly an aeroplane.
I like driving a car
I like riding a bike.
I like riding a motorcycle.
.043
.056
.011
.043
.005
.079
.017
Section: verbal aggression items
I like insulting other peers.
I like being insulted.
When I’m insulted, I like retaliating.
I like yelling at people.
.167
.184
.119
.145
In other words as the result of the chi-square test run, found out that there are some
statistically significant differences between the responses of the children with respect
to the statements presented in Table 33. For 16 items in the questionnaire, it is found
that there is statistically significant difference between the responses of the children
with respect to p< 0.05

73
Chapter 5
5 CONCLUSION
This chapter aims to pull the strings of the study together. Firstly, a thorough
summary of the study is given. Then, research questions are revisited and
conclusions are drawn from the study. Lastly, suggestions for further research are
made.
5.1 Summary of the Study
Cartoons serve as a means of entertainment and at the same time it misinforms
children about real life. There are many harmful effects in it which has not been
understood by the children. Media entertainment plays a major role in dominating a
child identity, socialization, attitudes, style and behavior after consuming many
images through media (Kellner, 1995).
According to Mittelli (2003) cartoons were not majorly designed just for children.
Children were just considered to be the primary audience in the late 1950’s, the
reason for that was the crude quality of the early cartoons, but now it is taken another
form. As at the 19th
century, cartoons were mostly low-budgeted, but with the help of
Disney Cartoons which had cultural prestige and cinematic reputation, things were
turned around (Mittell, 2003).
Children enjoy cartoons in order to satisfy their needs, unconsciously to them, they
become conversant with what is projected by the media. The violent content on

74
television has been in existence since the beginning of the era of television.
Measuring the quality and degree of violence on television has become the major
point of interest for the researchers because “there is a strong agreement among
social scientists that extensive exposure to media violence can contribute to
aggressiveness in individuals” (Strasburger et al, 2009, p. 156). According to
research results, the level of aggressiveness is greatly enhanced by exposure to
television violence which is projected in the lives of the children due to their level of
understanding.
Joy, Kimball, and Zabrack (1986) found out that the introduction of television into a
community in Canada brought about a spike in the level of aggressive behavior
displayed by the children. Cultivation theory elaborates on other repercussions as a
result of exposure to television violence. Morgan (1982) states, “the underlying
premise of cultivation theory is that the more time people spend watching television,
the more likely they are to perceive the world in ways that reflect the patterns found
in television drama” (p.948).
Previous results obtained by some researchers on cultivation theory on children,
shows that those who spend more time watching violence on television tend to see
the world as an unsafe environment unlike those that spend less time watching
violence on television. This is said to be a phenomenon called “mean world
syndrome,” by cultivation theorists. However this notion depicts that heavy viewers
of television with violent content, view the world as an insecure and dangerous place
(Gerbner, 1998).

75
Van Evra (1998) mentioned that, the age of the children from 9 to 12 years, are very
crucial stages in a child’s life because they begin to change their ideology about
watching violence programs. At a certain point at age 12, they are not likely to watch
those programs that contain negative violence in it even when the violence and
aggression behavior is not closely linked to them (Van der Voort, 1986, p. 61).
This study was a case study on cartoon violence and aggression on school age
children, focusing on gender, school, attitudes on cartoon, physical aggression
subscale, difference between possible and impossible act, verbal aggression.
Cultivation theory was used as the theoretical foundation. The analysis was aimed at
children with high economic status and children that come from average income
families.
This present study is aimed at investigating how and to what extent cartoon make
school age children violent and aggressive with respect to both male and female
children in Nigeria. It also scrutinizes how children are easily influenced by being
exposed to television. Subsequently, the study uses the children’s attitudes on
cartoon, their physical aggression subscale, difference between possible and
impossible act and also their verbal aggression items to compare the aims which
were mentioned earlier. Finally, it was aimed at investigating the differences between
the responses of the male children and that of the female children.
Data have been collected through a questionnaire that contains two sections. The first
section was used to explore demographic characteristics of the children and some
basic uses of television. The second section is designed according to five-point Likert

76
scale and seeks to collect data on the children attitudes towards cartoon and its
addictive potential.
Chi-square test has been done to reveal whether there are any statistically significant
differences between the responses of the children gender.
For the present study, 215 children were selected randomly. The 215 children that
participated in this research are from The Saint International Nursery and primary
school and also The Apostolic Church Grammar School in Nigeria. Data are
analyzed by SPSS (Statistical Package for Social Sciences).
Table 78: I like watching cartoons
Frequency Percent Valid Percent Cumulative Percent
Valid Strongly Agree 146 67.9 67.9 67.9
Agree 50 23.3 23.3 91.2
Undecided 14 6.5 6.5 97.7
Strongly disagree 5 2.3 2.3 100.0
Total 215 100.0 100.0
Table 79: Gender * I like watching cartoons Cross tabulation
I like watching cartoons
Total
Strongly
Agree Agree Undecided
Strongly
disagree
Gender Male 70 17 9 1 97
Female 76 33 5 4 118
Total 146 50 14 5 215
The present study reveals that there is statistically significant difference between the
responses of two genders. In the attitude scale statements, the children were asked

77
how much they like cartoons. The results of the findings state that the kids enjoy
watching cartoon.
Table 80: Group Statistics
Gender
N Mean
Std.
Deviation
Std. Error
Mean
aggression Male 111 98,8198 25,25873 2,39745
Female 87 107,4598 27,22038 2,91833
The cartoon the children like watching most is Ben 10, which has action, comedy,
fantasy, science fiction and horror in it.
Cartoon characters are being portrayed differently whether in action cartoon
programs or adventure programs. Male and female children are twice portrayed as
having very attractive bodies in continuing action and adventure programs compared
to teen scene programs. Cartoon characters are always wearing provocative clothing
in most of the cartoon programs shown. Most of the actions displayed by the
characters in the action cartoon programs are imitated by the children. The children
tend to imitate after viewing such, like they wish to fly like superman, they want to
climb the wall and which all these acts is impossible for them. According to the
result of the research, the female children tend to have high violence and
aggressiveness in them due to their level of independence, assertiveness, athleticism,
maturity, or leadership.
Data collected for the present study reveals that there is difference between the
demographic information gotten from the children in private and government schools
in Nigeria, their gender, age and class. 17 people did not fill some certain questions.

78
Chi-square test was administered to check whether there is any statistically
significant difference between the attitudes of the children. The chi-square test
results indicate that there is statistically significant difference between the means and
attitudes of the children’s gender and school at the p ‗< 0.05 level with respect to
questionnaire items: 21,22,31,43,46,47,53, 54; which shows that there are significant
differences in the children’s attitude towards cartoon, violence and aggression in
Nigeria.
5.2 Conclusions Drawn from the Study
The present study was carried out in order to know whether there is any difference in
the attitude of children both male and female towards violence and aggression
cartoons. The research questions were investigating how the Nigerian primary school
children get affected by the cartoons they watch in spring 2014.
RQ1 To what extent do kids watch cartoons that have violence and aggression in it?
According to the data collected through questionnaires, most children like action
cartoons. Action cartoons contain a degree of violence and aggression and the
children are influenced by this. Most of the Nigerian children love watching cartoons
such as Ben 10, Ninja Turtles, Spiderman, Superman, and they all have project
violence and aggression.
RQ2 What is the influence of cartoon violence and aggression on children?
With the result of the data collected, violence and aggression in cartoons influences
the children. Statistically, female children are more likely to display evidence of
violence and aggression than the male children in Nigeria. The children are
undecided on their physical actions.

79
RQ3 To what extent do children take cartoon character as their role model?
The children show a high level in interest in cartoon characters and so, they want to
be like the cartoon characters and do what they do. This might also be related to their
daily activities as they tend to believe cartoon characters as their role models also
believe them to be their reality.
RQ4 How much do children imitate what they watch on cartoon programs?
Most children want to reenact what is being shown on television; they presume that
whatever is shown in the cartoon can be done in reality. By so doing, they get
themselves in trouble and it might lead to them being hurt by their inability to do
what they watch in cartoons.
It was predicted that due to the enjoyment the children derive from cartoon they
inculcate numerous bad habits which make them dependent on them. Previous
chapters stated that cartoon serves as a means of entertainment and that at the same
time it misinforms the children in real life.
Cartoons affect the social and moral sense of children in the developmental stages of
their lives. It determines the level to which violence and aggression is induced, after
watching cartoons for a long period of time during their early stage of life.
The amount of time a parent spends with their children in a day determines the rate at
which the kids are been monitored. The results show that the highest time a parent
spends with children is 5-7 hours every day. These show the hours the children spend
in watching television in a day and the average was 3-4 hours: 77(35.8%). The
percentage shows that the children watch cartoons everyday with the percentage of

80
49.8% (107). The kind of cartoon the children like to watch is action cartoon which
has the highest frequency of 86 (40.0%). The result shows the hours the children
watches cartoon in a day. 1-2 hours was the highest frequency 121 with the
percentage of (56.3%). The job of the children parents was consider just to know the
level at which the parent spend much time and the level of the parent income, but the
result shows that the office worker has the highest frequency with 104 and 48.4%.
The cartoon watched most by the children was Ben10 with the frequency of 62 and
the percentage of 28.0%. Ben 10 cartoon comprises of action, comedy, fantasy,
science fiction and horror.
A chi-square test is conducted for 36 questions in order to explore whether there is
statistically significant difference between the attitudes of the children towards
violence and aggression among school age children. The Table 32 shows the
significance levels. According to the responses given by the children at the respect of
their attitude of violence and aggression towards cartoon, out of 36 Likert scale
questions only 8 questions indicate statistically significant value.
The first category of the Likert-scale questions aimed to reveal the children’s
attitudes towards cartoons. Also it seeks to explore why they like cartoons and
factors that motivate them to watch them.
The second category of Likert-scale questions aims to reveal the physical aggression
subscale of the children, which factors affect their decision; in the other words how
they react and socialize with their peers.

81
The third category of Likert-scale questions aims at reveal the difference between
possible and impossible act of the children. The children were asked about the
impossible act for their age and information included in the things they watch on
cartoons program the table above presents a summary of the averages and
corresponding attitude of the respondents to the questionnaire items. This
classification of statements intends to find out the difference between possible and
impossible act of the Nigerian children both the higher level kids and the lower level
kids which they share, similar beliefs and behaviours.
The last category aims to reveal the verbal aggression items of the children towards
cartoon and their addictive potentials among their peers. According to the answers
the statements in Likert scale questions, children have symptoms of verbal
aggression addiction after spending much time watching cartoon, they will want to
imitate what and how the cartoon characters speaks.
5.3 Suggestions for Further Research
The present study was conducted in Nigeria in spring 2014. Further research can be a
long term study on university students who are in Nigeria and aboard, because they
are more exposed to media. Further research can also be a long term study on high
school students who are younger and at the stage of understanding media. Qualitative
research with in-depth interviews and observations could be used in order to
investigate the violence and aggression caused by media with violent content, could
be conducted.

82
REFERENCES
American Academy of Pediatrics,Committee on Communication. (1995).
ChildreAdolescents and Television. Pediatrics, 96,786–787.
American Academy of Pediatrics. 2001. "Media Violence." Pediatrics 108,1222-
1226
Anderson, A. (2003). The Influence of Media Violence on Youth. Psychological
Science in the Public Interest. December, 4-110.
Anderson, C., & Bushman, B. (2002). The General Aggression Model. An Integrated
Social-Cognitive Model of Human Aggression. Ann Rev Psychology, 53,27–
51.
Anderson, C.A. (1997). Effects of Violent Movies and Trait Irritability on Hostile
feelings and Aggressive Thoughts. Aggressive Behaviour, 23:161–78.
Balci, A. (1986). Social Foundations of Thought and Action. A Social Cognitive
Theory, Upper Saddle.
Bandura., A. (1977). Social Learning Theory. Englewood Cliffs , NJ: Prentice-Hall.
Bandura.A, & Ross, D. (1961). Transmission of Aggression Through Imitation of
Aggressive Models. Journal of Abnormal and Social Psychology, 63, 575-
582.

83
Baran, S. J (2008). Introduction to Mass Communication:Media Literacy and
Culture. NewYork: McGraw-Hill.
Baran, S. J, & Meyer, T. (1974). "Imitation and Identification: Two Compatible
Approaches to Social Media". AV Communication Review, 22, 167-179.
Barbara Wilson.et.al. (2002). 'Violence in Children's Television Programming.
Assessing the Risks," Journal of Communication 52. 1, 5-35.
Barbara, J., & Wilson, B. (2008). Media and Children's Aggression, Fear, and
Altruism. The Future of Children. Children and Electronic Media, 87-118.
Barlow.B., D. K., & Lindsay, J. (2003). The Proliferation of Media Violence and its
Economic Underpinnings In D.A. (Ed.). Media Violence and Children
Westport, CT: Praeger Publishers, 1-18.
Bouma, G. D. (1995). A Handbook of Social Science Research. New York: Oxford
University Press.
Brantilinger, P. (1983). Bread and Circuses: Theories of Mass Culture as Social
Decry. New York: Cornell University Press.
Chang, Y., & Reber, B. (2000). Assessing Cultivation Theory and Public Health
Model for Crime Reporting. Newspaper Research Journal, 21, 1-13 .
84
Coccaro, E., & Kavoussi, R. (1997). Fluoxetine and Impulsiveaggressive Behavior in
Personality-Disordered Subjects. Archive of General Psychiatry, 54, 1081-
1088.
Coccaro. E. (1992). Impulsive Aggression and Central Serotonergic System Function
in Humans: An Example of a Dimensional Brain–behavior Relationship.
International Clinical Psychopharmacology, 7, 3–12.
Comstock, G. C., & Katzman, N. M. (1978). Television and Human Behavior. New
York: Columbia University Press.
Comstock, G. P. (1991). Television and the American Child. San Diego: CA:
Academic.
DeFlueur, M. L., & Ball-Rockeach, S. (1989). Theories of Mass Communication.
White Plains: NY: Longman.
Dietz, V., & Strasburger, W. (1991). Children, Adolescents, and Television. Curry
Problem Pediatrics, 21,8–31.
Eron. L. D., & R., H. L. (1986). The Development of Aggression in American
Children as a Consequence of Television Violence Viewing. In L. Huesmann
(Ed.). Television and the Aggressive Child: A Cross-National Comparison.
Hillsdale NJ: LA, 46-78.
Fleck, A. (2014). Mental Effects of a Fast Food Diet. Houston: Texas.

85
Forge, K., & Phemister, S. (1987). The Effect of Prosocial Cartoon on Preschool
Children. Child Study Journal, 10-16.
George Gerbner.et.al. (2002). "Growing Up with Television: Cultivation Processes"
in Media Effects. Advances in Theory and Research, edited by Jennings
Bryant and Dolf Zillmann Mahwah, N.J: Lawrence Erlbaum Associates.
Gerbner, G. (1967). Mass Media and Human Communication Theory. New York:
Holt: Rinehart and Winston.
Gerbner, G. L., & Morgan M. Signorielli, S. (2002). Growing Up With Television:
Cultivation Processes. In J. Bryant & D. Zillman (Eds.). Media Effects:
Advances in Theory and Research. Mahwah, NJ: Lawrence Erlbaum
Associates, 43-67.
Gerbner, G., & Gross L. (1976). Living with Television: The Violence Profile.
Journal of Communication, 26, 173-199.
Gerbner, G., & Gross L. (1976). The Scary World of TV's Heavy Viewer.
Psychology Today, 9, 41-45, 89.
Hanson, E. R. ( 2011). Mass Communication: Living in a Media World Third edition.
CQ Press.
Hawkins R.P & Pingree, S. (1983). Television Influence on Social Reality. IN:
Wartella.

86
Huesman, L. (1986). The Development of Aggression in American Children as a
Consequence of Television Violence Viewing. Television and an Aggressive
Child, Lawrence Erlbaum Associates.
Huesman, R. E. (1984). The Stability of Aggression Over Time and Generations.
Developmental Psychology, 20, 1120-1134.
Huesmann, L. R. (1986). Psychological Processes Promoting the Relation Between
Exposure to Media Violence and Aggressive Behavior by the Viewer.
Journal of Social Issues, 42, 125-139.
Huesmann, L. R., & Eron, L. D. (1986). The Development of Aggression in
American Children as a Consequence of Television Violence Viewing. In L.
Huesmann (Ed.), Lawrence the Aggressive Child: A Cross-National
Comparison. Hillsdale NJ: Erlbaum Associates, 46-78.
Joy, K. M., & Zabrack, M. (1986). Television and Children's Aggressive Behavior.
In T.M.Williams (Ed.), The Impact of Television: A Natural Experimentin
Three Communities. Orlando, FL: Academic, 303-360.
Kochanska G. ( 1993) Toward A Synthesis Of Parental Socialization And Child
Temperament In Early Development Of Conscience. Child Development. 64,
325–347.
Liebert, R., & Sprafkin, J. (1988). The Early Window: Effects of Teleision on
Children and Youth. New York: Peragamon.

87
Medved. D, & Medved .M. (1998). Saving Childhood: Protecting Our Children
From the National Assault of Innocence. New York: Harper Collins
Publishers.
Meyer, T. P. (1989). Reflection on Cultivation Theory and Consumer Behaviour in
NA. Advanced in Consumer Research, 786-789.
Morgan, M., & Shanahan, J. (2010). The State of Cultivation. Journal of
Broadcasting & Electronic Media, 54, 337-355.
Morgan, S., & Signorielli, N. (2009). Growing up With Television:Cultivation
Processes In Bryant, J., & Oliver, M.B. (Eds.). Media Effects:Advances In
Theory and Research (3rd). Hillsdale, NJ: Erlbaum, 34-49.
Murray .J. (1995). Children and Television Violence. Kansas Journal of Law and
Public Policy, 4, 7-14.
Mwema, A. (2011, Sep/ Oct Vol. 27 Issue 9/10). Effects of Media Violence on
Children. Pediatrics for Parents, p. 6.
Nunnally, J. (1967). Psychometric Theory (1st Ed). New York: McGraw-Hill.
Osman, S. & Nizam, M. (2010). The Impact Of Television Programme On The
Mindset And Attitudes Of Youths In The Rural Areas1. Human
Communication. A Publication of the Pacific and Asian Communication, 217
– 232.

88
Perse, E. (2001). Media Effects and Society. Mahwah, NJ: Lawrence Erlbaum
Associates.
Potter, J. (1998). Humor as a Camouflage of Televised Violence. Journal of
Communication, 48, 40-57.
Potts, H., & Wright.J.C. (1986). The Effects of Television for and Violent Content
on Boys' Attention and Social Behaviour. Journal of Experimental Child
Psychology, 41,1-17.
Rice, H. A., & Truglio, W. (1990). Words from Sesame Street: Learning Vocabulary
While Viewing. Developmental Psychology, 26, 421-428.
Rideout, F. U., & Roberts, D. F. (2010). Generation M2: Media in the Lives of 8 to
18 year olds. Menlo Park, CA: The Henry J. Kaiser Family Foundation.
Rössler, P., & Brosius, H.-B. (2001). Do Talk Shows Cultivate Adolescents’ Views
of the World? A Prolonged Exposure Experiment. Journal of
Communication, 143-163.
Schramm, W. L. (1961). Television in the Lives of Our Children. Standford, CA:
Standford University Press.
Shanahan, J., & Morgan.M. (1999). Television and its Viewers. Cultivation Theory
and Research. London: Cambridge University Press.

89
Showers, H. (1995). Prosocial Programming by the Media can be Effective. Violence
in the Media.
Shrum, L. J. (2005). Television's Cultivation of Material Values. Journal of
Consumer Research, 32, 473-79.
Shrum, L. J. (2009). Television Viewing and Social Reality: Effects and Underlying
Processes, in M. Wänke (Ed.) New York. Social Psychology of Consumer
Behavior, 241-272.
Singer M, S. K., & Frierson, T. Y. P. (1998). Viewing Preferences Symptoms of
Psychological Trauma and Volent Behaviors Among Children Who Watch
Television. J Am Acad Child Adolesc Psychiatry, 37: 1041–1048.
Singer, D. & Feshback, S. (1971). Television and Aggression. California: Jossey-
Bass.
Singer, D. G. (1983). A Time to Reexamine the Role of Television in Our Lives.
American Psychologist, 38, 815–816.
Singer, D., & Singer ,.J. L. (1983). Learning How to Be Intelligent Consumers of
Television.In M.J Howe(ED) Learning from Television. Psychological and
Education Research. London Academic Press, 203-22.

90
Sonia, L. (1990). Making Sense of Television: The Psychology of Audience
Interpretation. Oxford: Pergamon Press 226 pp. Reprinted Twice in
Paperback by Butterworth Heinemann, 1995.
Stokes, J. (2003). How to do Media and Cultural Studies. London: Sage.
Strasburger, V. D. (1999). Children Adolescents and Media Issuses Solution.
Prediatrics, 103, 129-139.
Strasburger, W. B., & Jordan, A. (2009). Children, Adolescents, and the Media, 2nd
edition. Los Angeles, CA: Sage Publications.
Tan, A. F., & Tan, G. (2001). Changing Negative Racial Stereotypes: The Influence
of Normative Peer Information. The Howard Journal of Communication, in
Journal of Human Communication, 12, 171-180.
Umstead, T. (2009, February 9). Where the Boys are: Rebranded Action Net Disney
XDtakes am at Tween Male. Multichannel News, p. 6.
Williams, T. (1986). The Impact of Television. A Natural Experiments in Three
Communities, Orlando FL: Academic.
Wilson, J. B. (2008). Media and Children's Aggression, Fear, and Altruism. The
Future of Children, Vol. 18, No. 1, Children and Electronic Media, 87-118.

91
Wilson, H. C., & Cantor, J. (1987). Children's Perceptions of the Effectiveness of
Techniques to Reduce Fear From Mass Media. Journal of Applied
Developmental Psychology, 8, 39-52.
Zajonc, R. B. (1968). Attitudinal Effects of Mere Exposure (Monograph). Journal of
Personality and Social Psychology, 9, 1-27.

92
APPENDIX

93
Appendix: Questionnaire
PLEASE fill in the following questions as best as you can. The survey is
ANONYMOUS and the findings of the research will be helpful to my course work.
1. Gender: (a) Male (b) Female
2. Age: (a) 4-6 (b) 7-9 (c) 10-12
3. Class: (a) Class 1 (b) Class 2 (c) Class 3 (d) Class 4
(e) Class 5
4. How many hours do you spend in school? (a) 5-7 Hours (b) 8-11 Hours (c)
Please specify ……
5. How many hours do your parents spend with you in a day? (a) 2-4 hours (b) 5-7
hours (c) Please specify……………
6. Do you watch television? (a) Every Day (b) Once a week (c) Twice a week (d)
Every week (e) Never
7. How many hours do you spend watching television? (a) 1-2 Hours (b) 3-4
Hours (c) 5-6 Hours (d) Please Specify …………….
8. Do you watch cartoons? (a) Every Day (b) Once a week (c) Twice a week (d)
Every week (e) Never
9. Do you watch only cartoons? (a)Yes (b) No
10. What kind of cartoon do you watch? (a) Action (b) Comedy (c) Fantasy (d)
Science Fiction (e) Horror
11. How many hours do you watch cartoon in a day? (a) 1-2 Hours (b) 3-4 Hours (c)
Please specify……….
12. How many hours do you watch cartoon in a weekend? (a) 3-4 Hours (b) 5-6
Hours (c) 7-8 Hours (d) Please specify………….
13. What means do you watch cartoons? (You can mark more than one option)
(a) Laptop (b) Television (c) Cinema
14. What job does your parent do? (a) Teacher (b) Office worker (c) Business
(d) Please specify ………..
15. How many television sets do you have in your house? (a) 1 (b) 2 (c) 3
(d) Please specify………..
16. Do you have a room to yourself? (a) Yes (b) No

94
17. Do you have a television in your room? (a) Yes (b) No
18. Do you have a laptop? (a) Yes (b) No
19. Where do you watch cartoons? (a) Kitchen (b) Living room (c)
Bedroom (d) Please specify ………..
20. Which cartoon do you watch most? Please specify……………………….
STRONGLY AGREE - 5 AGREE - 4 UNDECIDED - 3 DISAGREE - 2
STRONGLY DISAGREE - 1
SA A U D SD
I like watching cartoons.
I like action cartoons.
I enjoy myself while
watching cartoons.
I prefer watching cartoons
to doing my homework.
I like cartoons with lots of
guns.
I like cartoons with lots of
fight in it
I see the characters like
heroes
I wish to be like them.
I practice what I watch.
I like cartoons because they
are real.

95
SA A U D SD
I like to kick, hit
or punch your
friends just how
you watch it in
the cartoon.
I want to kick,
hit or punch
your friends just
how you watch
it in the cartoon.
I try kicking,
hitting or
punching my
friends just how
i watch it in the
cartoon.
I like pushing
and shoving
other kids
around just Tom
and Jerry.
I want to push
and shove other
kids around just
Tom and Jerry.
I try pushing
and shoving
other kids
around just Tom
and Jerry.
I like to get into
fights with your
peers.
I want to get
into fights with
your peers.

96
SA A U D SD
I like to fly.
I like to climb the
walls.
I like dancing on the
street.
I like to fly an
aeroplane.
I like driving a car
I like riding a bike.
I try to getting
into fights with
your peers.
I like
threatening other
kids.
I want to
threaten other
kids.
I try to threaten
other kids.
I like to see a
flying character.
I want to see a
flying character
I try to see a
flying character.

97
I like riding a
motorcycle.
SA A U D SD
I like insulting
other peers.
I like being
insulted.
When I’m
insulted, I like
retaliating.
I like yelling
at people.