carbon nanotubes: measuring dispersion and length
TRANSCRIPT
www.advmat.dewww.MaterialsViews.com
PRO
GRES
S R
EPO
RT
338
Carbon Nanotubes: Measuring Dispersion and Length
Jeffrey A. Fagan , * Barry J. Bauer , Erik K. Hobbie , Matthew L. Becker , Angela R. Hight Walker , Jeffrey R. Simpson , Jaehun Chun , Jan Obrzut , Vardhan Bajpai , Fred R. Phelan , Daneesh Simien , Ji Yeon Huh , and Kalman B. Migler
cotpasti
Advanced technological uses of single-walled carbon nanotubes (SWCNTs) rely on the production of single length and chirality populations that are cur-rently only available through liquid-phase post processing. The foundation of all of these processing steps is the attainment of individualized nanotube dispersions in solution. An understanding of the colloidal properties of the dispersed SWCNTs can then be used to design appropriate conditions for separations. In many instances nanotube size, particularly length, is espe-cially active in determining the properties achievable in a given population, and, thus, there is a critical need for measurement technologies for both length distribution and effective separation techniques. In this Progress Report, the current state of the art for measuring dispersion and length populations, including separations, is documented, and examples are used to demonstrate the desirability of addressing these parameters.
1. Introduction
Single-walled carbon nanotubes (SWCNTs) are among the most promising nanomaterials, with projected uses in electronics, com-posites, sensor, and biomedical applications. Hindering the tech-nological development and commerce of SWCNTS has been the fact that SWCNT properties vary signifi cantly with the distribution of lengths, wrapping vectors, and dispersion state within a given
© 2011 WILEY-VCH Verlag GmbH & Co. KGaA, Weinheiwileyonlinelibrary.com
tosmntlcr(ss
tumfCfgpd DOI: 10.1002/adma.201001756
Dr. J. A. Fagan , Dr. B. J. Bauer , Dr. E. K. Hobbie , Dr. M. L. Becker[+] , Dr. J. R. Simpson ,[†] Dr. J. Chun ,[‡] Dr. J. Obrzut , Dr. V. Bajpai ,[¥] Dr. F. R. Phelan , Dr. D. Simien ,[§] Dr. J. Y. Huh , K. B. Migler Polymers Division National Institute of Standards and Technology Gaithersburg, MD 20899, USA E-mail: [email protected] Dr. A. R. Hight Walker Optical Technology Division National Institute of Standards and TechnologyGaithersburg, MD 20899, USA [ + ] Present Address: Department of Polymer Science University of Akron, Akron, Ohio 44325, USA [ † ] Present Address: Physics Department, Towson University, Towson, MD 21252, USA [ ‡ ] Present Address: Pacifi c Northwest National Lab 902 Battelle Blvd., P.O. Box 999, Richland, WA 99352, USA [¥] Present Address: Seldon Technologies Inc. Windsor, VT 05089, USA [§] Present Address: Mechanical and Aerospace Engineering Department West Virginia University, Morgantown, WV 26506, USA
sample, and the diffi culty in measuring these parameters. Thus, to fully realize the benefi ts of using SWCNTs in an advanced technology, it is highly desirable to carefully control the type and number of nanotubes needed for a specifi c application. Reaching this goal requires both the methods to sepa-rate the desired materials from a given lot and the measurement science to direct intel-ligent efforts in producing them. Beginning in 2004, researchers at the National Institute of Standards and Technology (NIST) have focused on separating SWCNTs by factors such as dispersion, length, and diameter, and then refi ning the measurement science of SWCNTs through characterization of those improved populations.
Much of the diffi culty in measuring arbon nanotubes comes from the wide number of possible nan-tube types, with approximately several hundred single-walled ubes thought to be structurally stable at room temperature and ressure, as well as the innumerable varieties of double-walled nd multiwalled nanotubes, each of which may be valuable for a pecifi c use. To keep track of the different species of nanotubes he notation (n,m) is used, in which n and m describe the vector n hexagonal elements for rolling up a sheet of graphene to form he cylindrical nanotube. In accordance with the wide range f possibilities, many different methods for directing SWCNT ynthesis have been pursued, resulting in a large number of anufacturers bringing a wide variety of diffi cult to compare
anotube soots onto the market. Unfortunately for characteriza-ion purposes, these SWCNT soots have often had notoriously ow overall quality, with highly variable properties and signifi -ant impurity contents. Moreover, application of these soot mate-ials to address issues such as environmental, health, and safety EHS) concerns has led to signifi cant uncertainty regarding their uitability for commercial use, and the kinds of controls neces-ary for harnessing SWCNTs in technological applications.
To combat the problem of polydispersity and the uncer-ainty in the measurement science, we decided to focus on sing established techniques from the polymers, colloids, and aterial science fi elds to separate different SWCNT soots into
ractionated populations through liquid-phase processing. haracterization of the fractionated populations is then used as
eedback for the measurement science and separation technolo-ies in a continuous cycle of improvement. The key to a liquid hase processing approach is the achievement of individualized ispersion of the nanotubes.
m Adv. Mater. 2011, 23, 338–348
www.advmat.dewww.MaterialsViews.com P
RO
GRES
S R
EPO
RT
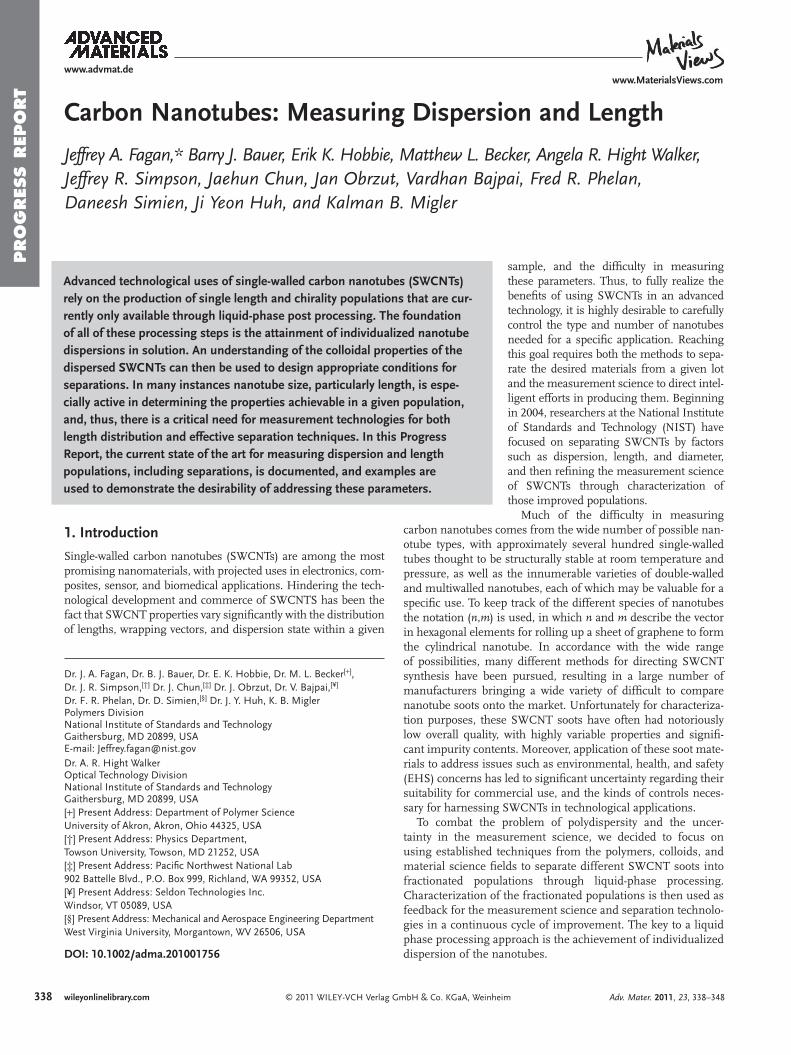
Jeffrey A. Fagan is the project leader for single-walled carbon nanotubes research at the National Institute of Standards and Technology (NIST) in Gaithersburg, Maryland. He earned his BS degree in chemical engineering from the Johns Hopkins University in 2000, and his PhD in chemical engi-neering from Carnegie Mellon
University in 2005. Afterwards, he was a National Research Council postdoctoral fellow at NIST from 2005 to 2007.
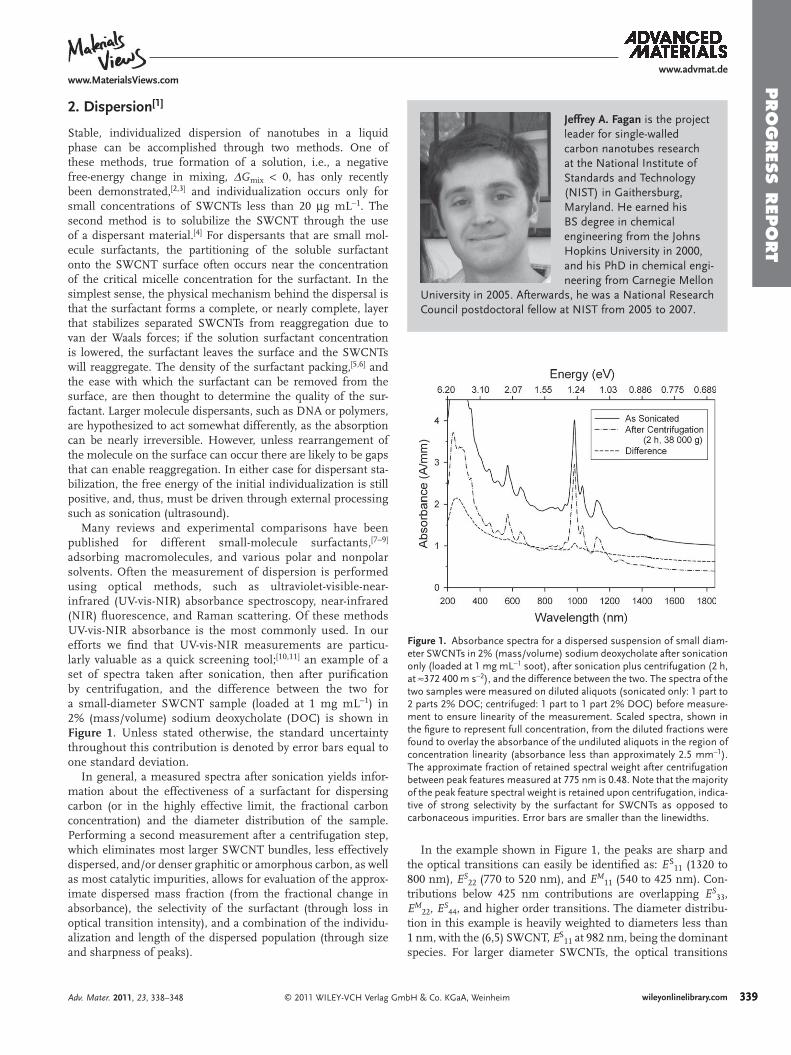
Figure 1 . Absorbance spectra for a dispersed suspension of small diam-eter SWCNTs in 2% (mass/volume) sodium deoxycholate after sonication only (loaded at 1 mg mL − 1 soot), after sonication plus centrifugation (2 h, at ≈ 372 400 m s − 2 ), and the difference between the two. The spectra of the two samples were measured on diluted aliquots (sonicated only: 1 part to 2 parts 2% DOC; centrifuged: 1 part to 1 part 2% DOC) before measure-ment to ensure linearity of the measurement. Scaled spectra, shown in the fi gure to represent full concentration, from the diluted fractions were found to overlay the absorbance of the undiluted aliquots in the region of concentration linearity (absorbance less than approximately 2.5 mm − 1 ). The approximate fraction of retained spectral weight after centrifugation between peak features measured at 775 nm is 0.48. Note that the majority of the peak feature spectral weight is retained upon centrifugation, indica-tive of strong selectivity by the surfactant for SWCNTs as opposed to carbonaceous impurities. Error bars are smaller than the linewidths.
2. Dispersion [ 1 ]
Stable, individualized dispersion of nanotubes in a liquid phase can be accomplished through two methods. One of these methods, true formation of a solution, i.e., a negative free-energy change in mixing, Δ G mix < 0, has only recently been demonstrated, [ 2 , 3 ] and individualization occurs only for small concentrations of SWCNTs less than 20 μ g mL − 1 . The second method is to solubilize the SWCNT through the use of a dispersant material. [ 4 ] For dispersants that are small mol-ecule surfactants, the partitioning of the soluble surfactant onto the SWCNT surface often occurs near the concentration of the critical micelle concentration for the surfactant. In the simplest sense, the physical mechanism behind the dispersal is that the surfactant forms a complete, or nearly complete, layer that stabilizes separated SWCNTs from reaggregation due to van der Waals forces; if the solution surfactant concentration is lowered, the surfactant leaves the surface and the SWCNTs will reaggregate. The density of the surfactant packing, [ 5 , 6 ] and the ease with which the surfactant can be removed from the surface, are then thought to determine the quality of the sur-factant. Larger molecule dispersants, such as DNA or polymers, are hypothesized to act somewhat differently, as the absorption can be nearly irreversible. However, unless rearrangement of the molecule on the surface can occur there are likely to be gaps that can enable reaggregation. In either case for dispersant sta-bilization, the free energy of the initial individualization is still positive, and, thus, must be driven through external processing such as sonication (ultrasound).
Many reviews and experimental comparisons have been published for different small-molecule surfactants, [ 7–9 ] adsorbing macromolecules, and various polar and nonpolar solvents. Often the measurement of dispersion is performed using optical methods, such as ultraviolet-visible-near-infrared (UV-vis-NIR) absorbance spectroscopy, near-infrared (NIR) fl uorescence, and Raman scattering. Of these methods UV-vis-NIR absorbance is the most commonly used. In our efforts we fi nd that UV-vis-NIR measurements are particu-larly valuable as a quick screening tool; [ 10 , 11 ] an example of a set of spectra taken after sonication, then after purifi cation by centrifugation, and the difference between the two for a small-diameter SWCNT sample (loaded at 1 mg mL − 1 ) in 2% (mass/volume) sodium deoxycholate (DOC) is shown in Figure 1 . Unless stated otherwise, the standard uncertainty throughout this contribution is denoted by error bars equal to one standard deviation.
In general, a measured spectra after sonication yields infor-mation about the effectiveness of a surfactant for dispersing carbon (or in the highly effective limit, the fractional carbon concentration) and the diameter distribution of the sample. Performing a second measurement after a centrifugation step, which eliminates most larger SWCNT bundles, less effectively dispersed, and/or denser graphitic or amorphous carbon, as well as most catalytic impurities, allows for evaluation of the approx-imate dispersed mass fraction (from the fractional change in absorbance), the selectivity of the surfactant (through loss in optical transition intensity), and a combination of the individu-alization and length of the dispersed population (through size and sharpness of peaks).
© 2011 WILEY-VCH Verlag GmAdv. Mater. 2011, 23, 338–348
In the example shown in Figure 1 , the peaks are sharp and the optical transitions can easily be identifi ed as: E S 11 (1320 to 800 nm), E S 22 (770 to 520 nm), and E M 11 (540 to 425 nm). Con-tributions below 425 nm contributions are overlapping E S 33 , E M 22 , E S 44 , and higher order transitions. The diameter distribu-tion in this example is heavily weighted to diameters less than 1 nm, with the (6,5) SWCNT, E S 11 at 982 nm, being the dominant species. For larger diameter SWCNTs, the optical transitions
339bH & Co. KGaA, Weinheim wileyonlinelibrary.com 339
www.advmat.dewww.MaterialsViews.com
PRO
GRES
S R
EPO
RT
340
shift to lower energies (longer wavelengths), approximately inversely proportionional to the SWCNT diameter. Comparison of the spectra before and after centrifugation shows that ≈ 40% of the nonpeak absorbance is retained and ≈ 95% of the peak absorbance is retained. Although many manufacturers claim high-percentage carbon purity as SWCNT, an apparent per-centage of 48% via this metric is above average for the batches we have tested. For a sample that was less well-dispersed, the total absorbance would be remarkably reduced, and the inten-sity of the peaks would be smaller. However, as full dispersion is approached, the resolution of transmittance as a metric for dispersion decreases. This is because different surfactant spe-cies provide different homogeneities of dielectric environments, which can broaden the spectral features even in the limit of full individualization.
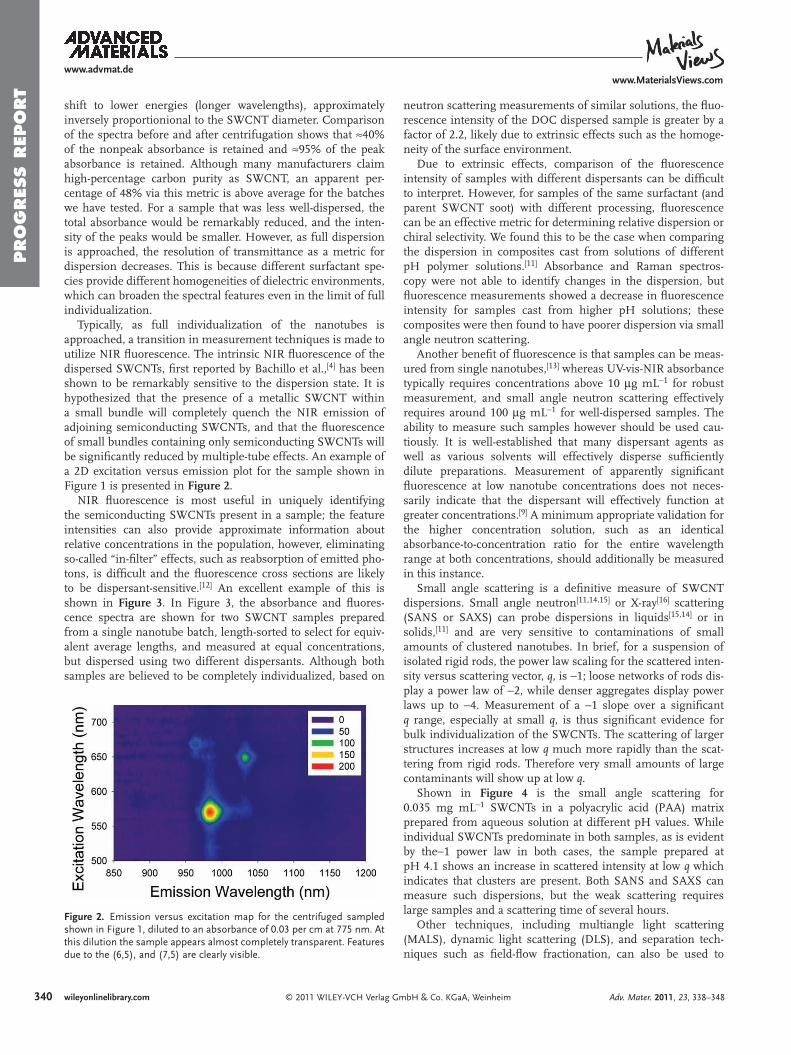
Typically, as full individualization of the nanotubes is approached, a transition in measurement techniques is made to utilize NIR fl uorescence. The intrinsic NIR fl uorescence of the dispersed SWCNTs, fi rst reported by Bachillo et al., [ 4 ] has been shown to be remarkably sensitive to the dispersion state. It is hypothesized that the presence of a metallic SWCNT within a small bundle will completely quench the NIR emission of adjoining semiconducting SWCNTs, and that the fl uorescence of small bundles containing only semiconducting SWCNTs will be signifi cantly reduced by multiple-tube effects. An example of a 2D excitation versus emission plot for the sample shown in Figure 1 is presented in Figure 2 .
NIR fl uorescence is most useful in uniquely identifying the semiconducting SWCNTs present in a sample; the feature intensities can also provide approximate information about relative concentrations in the population, however, eliminating so-called “in-fi lter” effects, such as reabsorption of emitted pho-tons, is diffi cult and the fl uorescence cross sections are likely to be dispersant-sensitive. [ 12 ] An excellent example of this is shown in Figure 3 . In Figure 3 , the absorbance and fl uores-cence spectra are shown for two SWCNT samples prepared from a single nanotube batch, length-sorted to select for equiv-alent average lengths, and measured at equal concentrations, but dispersed using two different dispersants. Although both samples are believed to be completely individualized, based on
© 2011 WILEY-VCH Verlag Gmwileyonlinelibrary.com
Figure 2 . Emission versus excitation map for the centrifuged sampled shown in Figure 1 , diluted to an absorbance of 0.03 per cm at 775 nm. At this dilution the sample appears almost completely transparent. Features due to the (6,5), and (7,5) are clearly visible.
neutron scattering measurements of similar solutions, the fl uo-rescence intensity of the DOC dispersed sample is greater by a factor of 2.2, likely due to extrinsic effects such as the homoge-neity of the surface environment.
Due to extrinsic effects, comparison of the fl uorescence intensity of samples with different dispersants can be diffi cult to interpret. However, for samples of the same surfactant (and parent SWCNT soot) with different processing, fl uorescence can be an effective metric for determining relative dispersion or chiral selectivity. We found this to be the case when comparing the dispersion in composites cast from solutions of different pH polymer solutions. [ 11 ] Absorbance and Raman spectros-copy were not able to identify changes in the dispersion, but fl uorescence measurements showed a decrease in fl uorescence intensity for samples cast from higher pH solutions; these composites were then found to have poorer dispersion via small angle neutron scattering.
Another benefi t of fl uorescence is that samples can be meas-ured from single nanotubes, [ 13 ] whereas UV-vis-NIR absorbance typically requires concentrations above 10 μ g mL − 1 for robust measurement, and small angle neutron scattering effectively requires around 100 μ g mL − 1 for well-dispersed samples. The ability to measure such samples however should be used cau-tiously. It is well-established that many dispersant agents as well as various solvents will effectively disperse suffi ciently dilute preparations. Measurement of apparently signifi cant fl uorescence at low nanotube concentrations does not neces-sarily indicate that the dispersant will effectively function at greater concentrations. [ 9 ] A minimum appropriate validation for the higher concentration solution, such as an identical absorbance-to-concentration ratio for the entire wavelength range at both concentrations, should additionally be measured in this instance.
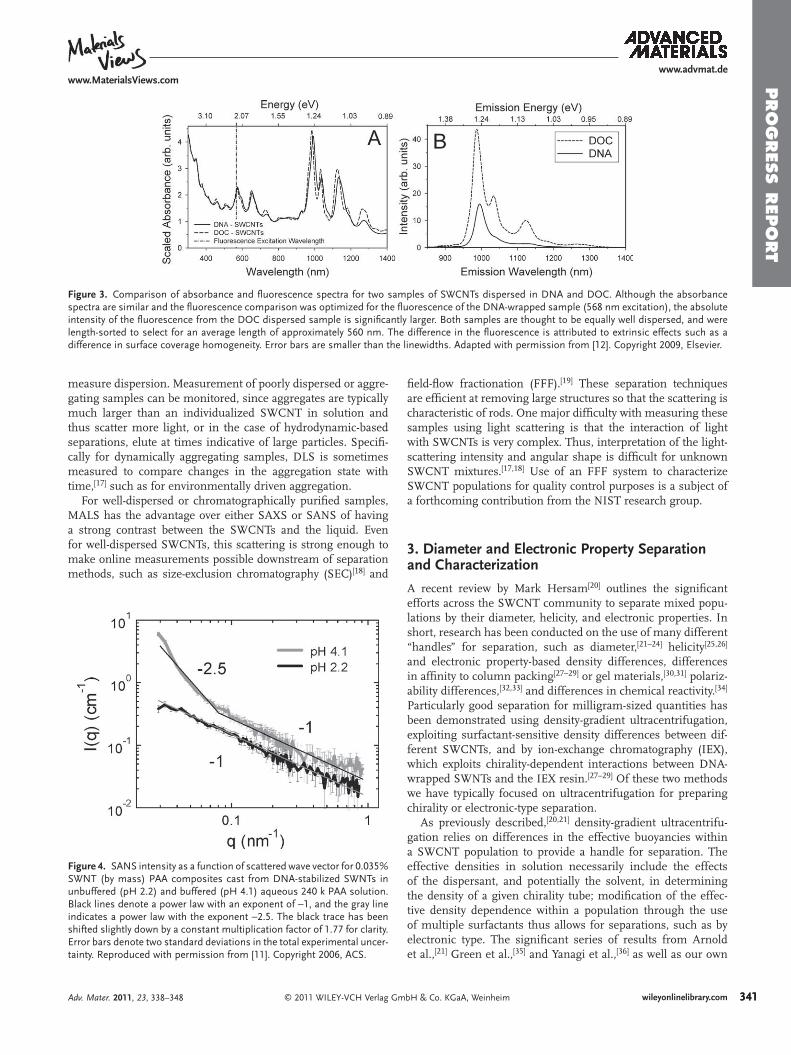
Small angle scattering is a defi nitive measure of SWCNT dispersions. Small angle neutron [ 11 , 14 , 15 ] or X-ray [ 16 ] scattering (SANS or SAXS) can probe dispersions in liquids [ 15 , 14 ] or in solids, [ 11 ] and are very sensitive to contaminations of small amounts of clustered nanotubes. In brief, for a suspension of isolated rigid rods, the power law scaling for the scattered inten-sity versus scattering vector, q , is − 1; loose networks of rods dis-play a power law of − 2, while denser aggregates display power laws up to − 4. Measurement of a − 1 slope over a signifi cant q range, especially at small q , is thus signifi cant evidence for bulk individualization of the SWCNTs. The scattering of larger structures increases at low q much more rapidly than the scat-tering from rigid rods. Therefore very small amounts of large contaminants will show up at low q .
Shown in Figure 4 is the small angle scattering for 0.035 mg mL − 1 SWCNTs in a polyacrylic acid (PAA) matrix prepared from aqueous solution at different pH values. While individual SWCNTs predominate in both samples, as is evident by the − 1 power law in both cases, the sample prepared at pH 4.1 shows an increase in scattered intensity at low q which indicates that clusters are present. Both SANS and SAXS can measure such dispersions, but the weak scattering requires large samples and a scattering time of several hours.
Other techniques, including multiangle light scattering (MALS), dynamic light scattering (DLS), and separation tech-niques such as fi eld-fl ow fractionation, can also be used to
bH & Co. KGaA, Weinheim Adv. Mater. 2011, 23, 338–348
www.advmat.dewww.MaterialsViews.com P
RO
GRES
S R
EPO
RT
fiacswsSSa
3a
Figure 3 . Comparison of absorbance and fl uorescence spectra for two samples of SWCNTs dispersed in DNA and DOC. Although the absorbance spectra are similar and the fl uorescence comparison was optimized for the fl uorescence of the DNA-wrapped sample (568 nm excitation), the absolute intensity of the fl uorescence from the DOC dispersed sample is signifi cantly larger. Both samples are thought to be equally well dispersed, and were length-sorted to select for an average length of approximately 560 nm. The difference in the fl uorescence is attributed to extrinsic effects such as a difference in surface coverage homogeneity. Error bars are smaller than the linewidths. Adapted with permission from [12]. Copyright 2009, Elsevier.
measure dispersion. Measurement of poorly dispersed or aggre-gating samples can be monitored, since aggregates are typically much larger than an individualized SWCNT in solution and thus scatter more light, or in the case of hydrodynamic-based separations, elute at times indicative of large particles. Specifi -cally for dynamically aggregating samples, DLS is sometimes measured to compare changes in the aggregation state with time, [ 17 ] such as for environmentally driven aggregation.
For well-dispersed or chromatographically purifi ed samples, MALS has the advantage over either SAXS or SANS of having a strong contrast between the SWCNTs and the liquid. Even for well-dispersed SWCNTs, this scattering is strong enough to make online measurements possible downstream of separation methods, such as size-exclusion chromatography (SEC) [ 18 ] and
© 2011 WILEY-VCH Verlag GmbAdv. Mater. 2011, 23, 338–348
Aels“aiaPbefwwwc
gaeottoee
Figure 4 . SANS intensity as a function of scattered wave vector for 0.035% SWNT (by mass) PAA composites cast from DNA-stabilized SWNTs in unbuffered (pH 2.2) and buffered (pH 4.1) aqueous 240 k PAA solution. Black lines denote a power law with an exponent of − 1, and the gray line indicates a power law with the exponent − 2.5. The black trace has been shifted slightly down by a constant multiplication factor of 1.77 for clarity. Error bars denote two standard deviations in the total experimental uncer-tainty. Reproduced with permission from [11]. Copyright 2006, ACS.
eld-fl ow fractionation (FFF). [ 19 ] These separation techniques re effi cient at removing large structures so that the scattering is haracteristic of rods. One major diffi culty with measuring these amples using light scattering is that the interaction of light ith SWCNTs is very complex. Thus, interpretation of the light-
cattering intensity and angular shape is diffi cult for unknown WCNT mixtures. [ 17 , 18 ] Use of an FFF system to characterize WCNT populations for quality control purposes is a subject of forthcoming contribution from the NIST research group.
. Diameter and Electronic Property Separation nd Characterization
recent review by Mark Hersam [ 20 ] outlines the signifi cant fforts across the SWCNT community to separate mixed popu-ations by their diameter, helicity, and electronic properties. In hort, research has been conducted on the use of many different handles” for separation, such as diameter, [ 21–24 ] helicity [ 25 , 26 ] nd electronic property-based density differences, differences n affi nity to column packing [ 27–29 ] or gel materials, [ 30 , 31 ] polariz-bility differences, [ 32 , 33 ] and differences in chemical reactivity. [ 34 ] articularly good separation for milligram-sized quantities has een demonstrated using density-gradient ultracentrifugation, xploiting surfactant-sensitive density differences between dif-erent SWCNTs, and by ion-exchange chromatography (IEX), hich exploits chirality-dependent interactions between DNA-rapped SWNTs and the IEX resin. [ 27–29 ] Of these two methods e have typically focused on ultracentrifugation for preparing
hirality or electronic-type separation. As previously described, [ 20 , 21 ] density-gradient ultracentrifu-
ation relies on differences in the effective buoyancies within SWCNT population to provide a handle for separation. The ffective densities in solution necessarily include the effects f the dispersant, and potentially the solvent, in determining he density of a given chirality tube; modifi cation of the effec-ive density dependence within a population through the use f multiple surfactants thus allows for separations, such as by lectronic type. The signifi cant series of results from Arnold t al., [ 21 ] Green et al., [ 35 ] and Yanagi et al., [ 36 ] as well as our own
341H & Co. KGaA, Weinheim wileyonlinelibrary.com 341
www.advmat.dewww.MaterialsViews.com
PRO
GRES
S R
EPO
RT
342
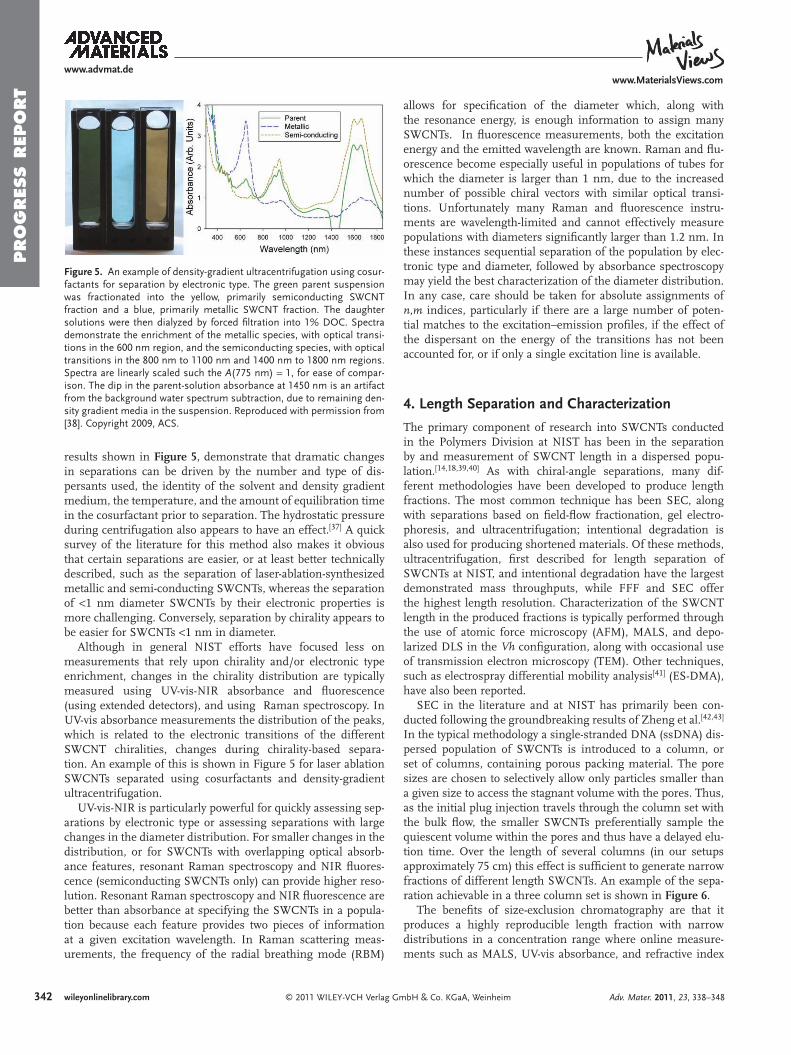
Figure 5 . An example of density-gradient ultracentrifugation using cosur-factants for separation by electronic type. The green parent suspension was fractionated into the yellow, primarily semiconducting SWCNT fraction and a blue, primarily metallic SWCNT fraction. The daughter solutions were then dialyzed by forced fi ltration into 1% DOC. Spectra demonstrate the enrichment of the metallic species, with optical transi-tions in the 600 nm region, and the semiconducting species, with optical transitions in the 800 nm to 1100 nm and 1400 nm to 1800 nm regions. Spectra are linearly scaled such the A (775 nm) = 1, for ease of compar-ison. The dip in the parent-solution absorbance at 1450 nm is an artifact from the background water spectrum subtraction, due to remaining den-sity gradient media in the suspension. Reproduced with permission from [38]. Copyright 2009, ACS.
results shown in Figure 5 , demonstrate that dramatic changes in separations can be driven by the number and type of dis-persants used, the identity of the solvent and density gradient medium, the temperature, and the amount of equilibration time in the cosurfactant prior to separation. The hydrostatic pressure during centrifugation also appears to have an effect. [ 37 ] A quick survey of the literature for this method also makes it obvious that certain separations are easier, or at least better technically described, such as the separation of laser-ablation-synthesized metallic and semi-conducting SWCNTs, whereas the separation of < 1 nm diameter SWCNTs by their electronic properties is more challenging. Conversely, separation by chirality appears to be easier for SWCNTs < 1 nm in diameter.
Although in general NIST efforts have focused less on measurements that rely upon chirality and/or electronic type enrichment, changes in the chirality distribution are typically measured using UV-vis-NIR absorbance and fl uorescence (using extended detectors), and using Raman spectroscopy. In UV-vis absorbance measurements the distribution of the peaks, which is related to the electronic transitions of the different SWCNT chiralities, changes during chirality-based separa-tion. An example of this is shown in Figure 5 for laser ablation SWCNTs separated using cosurfactants and density-gradient ultracentrifugation.
UV-vis-NIR is particularly powerful for quickly assessing sep-arations by electronic type or assessing separations with large changes in the diameter distribution. For smaller changes in the distribution, or for SWCNTs with overlapping optical absorb-ance features, resonant Raman spectroscopy and NIR fl uores-cence (semiconducting SWCNTs only) can provide higher reso-lution. Resonant Raman spectroscopy and NIR fl uorescence are better than absorbance at specifying the SWCNTs in a popula-tion because each feature provides two pieces of information at a given excitation wavelength. In Raman scattering meas-urements, the frequency of the radial breathing mode (RBM)
© 2011 WILEY-VCH Verlag Gmwileyonlinelibrary.com
allows for specifi cation of the diameter which, along with the resonance energy, is enough information to assign many SWCNTs. In fl uorescence measurements, both the excitation energy and the emitted wavelength are known. Raman and fl u-orescence become especially useful in populations of tubes for which the diameter is larger than 1 nm, due to the increased number of possible chiral vectors with similar optical transi-tions. Unfortunately many Raman and fl uorescence instru-ments are wavelength-limited and cannot effectively measure populations with diameters signifi cantly larger than 1.2 nm. In these instances sequential separation of the population by elec-tronic type and diameter, followed by absorbance spectroscopy may yield the best characterization of the diameter distribution. In any case, care should be taken for absolute assignments of n , m indices, particularly if there are a large number of poten-tial matches to the excitation–emission profi les, if the effect of the dispersant on the energy of the transitions has not been accounted for, or if only a single excitation line is available.
4. Length Separation and Characterization
The primary component of research into SWCNTs conducted in the Polymers Division at NIST has been in the separation by and measurement of SWCNT length in a dispersed popu-lation. [ 14 , 18 , 39 , 40 ] As with chiral-angle separations, many dif-ferent methodologies have been developed to produce length fractions. The most common technique has been SEC, along with separations based on fi eld-fl ow fractionation, gel electro-phoresis, and ultracentrifugation; intentional degradation is also used for producing shortened materials. Of these methods, ultracentrifugation, fi rst described for length separation of SWCNTs at NIST, and intentional degradation have the largest demonstrated mass throughputs, while FFF and SEC offer the highest length resolution. Characterization of the SWCNT length in the produced fractions is typically performed through the use of atomic force microscopy (AFM), MALS, and depo-larized DLS in the Vh confi guration, along with occasional use of transmission electron microscopy (TEM). Other techniques, such as electrospray differential mobility analysis [ 41 ] (ES-DMA), have also been reported.
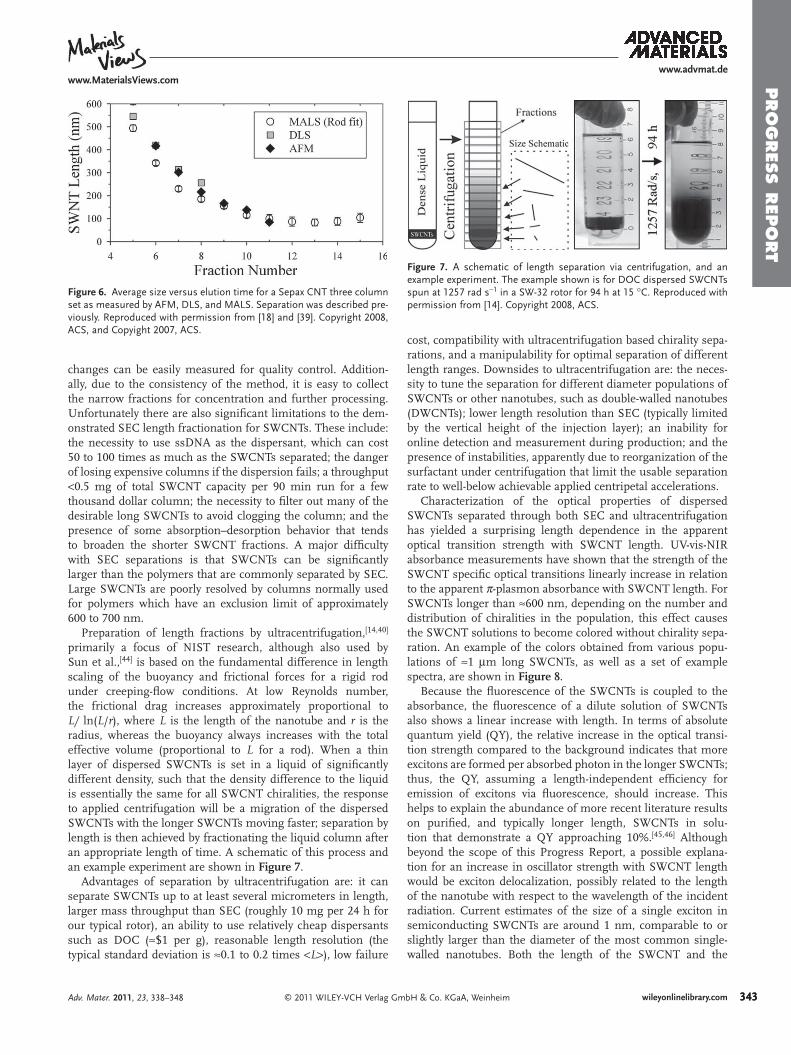
SEC in the literature and at NIST has primarily been con-ducted following the groundbreaking results of Zheng et al. [ 42 , 43 ] In the typical methodology a single-stranded DNA (ssDNA) dis-persed population of SWCNTs is introduced to a column, or set of columns, containing porous packing material. The pore sizes are chosen to selectively allow only particles smaller than a given size to access the stagnant volume with the pores. Thus, as the initial plug injection travels through the column set with the bulk fl ow, the smaller SWCNTs preferentially sample the quiescent volume within the pores and thus have a delayed elu-tion time. Over the length of several columns (in our setups approximately 75 cm) this effect is suffi cient to generate narrow fractions of different length SWCNTs. An example of the sepa-ration achievable in a three column set is shown in Figure 6 .
The benefi ts of size-exclusion chromatography are that it produces a highly reproducible length fraction with narrow distributions in a concentration range where online measure-ments such as MALS, UV-vis absorbance, and refractive index
bH & Co. KGaA, Weinheim Adv. Mater. 2011, 23, 338–348
www.advmat.dewww.MaterialsViews.com P
RO
GRES
S R
EPO
RT
Figure 6 . Average size versus elution time for a Sepax CNT three column set as measured by AFM, DLS, and MALS. Separation was described pre-viously. Reproduced with permission from [18] and [39]. Copyright 2008, ACS, and Copyight 2007, ACS.
Figure 7 . A schematic of length separation via centrifugation, and an example experiment. The example shown is for DOC dispersed SWCNTs spun at 1257 rad s − 1 in a SW-32 rotor for 94 h at 15 ° C. Reproduced with permission from [14]. Copyright 2008, ACS.
changes can be easily measured for quality control. Addition-ally, due to the consistency of the method, it is easy to collect the narrow fractions for concentration and further processing. Unfortunately there are also signifi cant limitations to the dem-onstrated SEC length fractionation for SWCNTs. These include: the necessity to use ssDNA as the dispersant, which can cost 50 to 100 times as much as the SWCNTs separated; the danger of losing expensive columns if the dispersion fails; a throughput < 0.5 mg of total SWCNT capacity per 90 min run for a few thousand dollar column; the necessity to fi lter out many of the desirable long SWCNTs to avoid clogging the column; and the presence of some absorption–desorption behavior that tends to broaden the shorter SWCNT fractions. A major diffi culty with SEC separations is that SWCNTs can be signifi cantly larger than the polymers that are commonly separated by SEC. Large SWCNTs are poorly resolved by columns normally used for polymers which have an exclusion limit of approximately 600 to 700 nm.
Preparation of length fractions by ultracentrifugation, [ 14,40 ] primarily a focus of NIST research, although also used by Sun et al., [ 44 ] is based on the fundamental difference in length scaling of the buoyancy and frictional forces for a rigid rod under creeping-fl ow conditions. At low Reynolds number, the frictional drag increases approximately proportional to L/ ln( L / r ), where L is the length of the nanotube and r is the radius, whereas the buoyancy always increases with the total effective volume (proportional to L for a rod). When a thin layer of dispersed SWCNTs is set in a liquid of signifi cantly different density, such that the density difference to the liquid is essentially the same for all SWCNT chiralities, the response to applied centrifugation will be a migration of the dispersed SWCNTs with the longer SWCNTs moving faster; separation by length is then achieved by fractionating the liquid column after an appropriate length of time. A schematic of this process and an example experiment are shown in Figure 7 .
Advantages of separation by ultracentrifugation are: it can separate SWCNTs up to at least several micrometers in length, larger mass throughput than SEC (roughly 10 mg per 24 h for our typical rotor), an ability to use relatively cheap dispersants such as DOC ( ≈ $1 per g), reasonable length resolution (the typical standard deviation is ≈ 0.1 to 0.2 times < L > ), low failure
© 2011 WILEY-VCH Verlag GmAdv. Mater. 2011, 23, 338–348
cost, compatibility with ultracentrifugation based chirality sepa-rations, and a manipulability for optimal separation of different length ranges. Downsides to ultracentrifugation are: the neces-sity to tune the separation for different diameter populations of SWCNTs or other nanotubes, such as double-walled nanotubes (DWCNTs); lower length resolution than SEC (typically limited by the vertical height of the injection layer); an inability for online detection and measurement during production; and the presence of instabilities, apparently due to reorganization of the surfactant under centrifugation that limit the usable separation rate to well-below achievable applied centripetal accelerations.
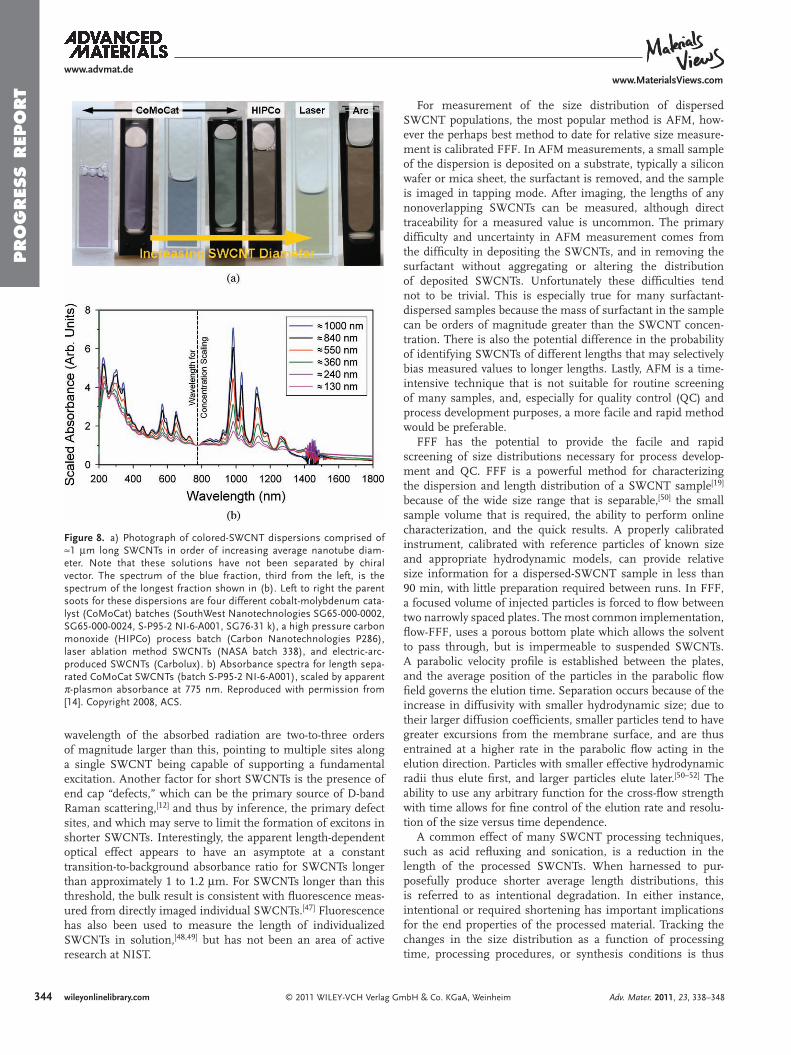
Characterization of the optical properties of dispersed SWCNTs separated through both SEC and ultracentrifugation has yielded a surprising length dependence in the apparent optical transition strength with SWCNT length. UV-vis-NIR absorbance measurements have shown that the strength of the SWCNT specifi c optical transitions linearly increase in relation to the apparent π -plasmon absorbance with SWCNT length. For SWCNTs longer than ≈ 600 nm, depending on the number and distribution of chiralities in the population, this effect causes the SWCNT solutions to become colored without chirality sepa-ration. An example of the colors obtained from various popu-lations of ≈ 1 μ m long SWCNTs, as well as a set of example spectra, are shown in Figure 8 .
Because the fl uorescence of the SWCNTs is coupled to the absorbance, the fl uorescence of a dilute solution of SWCNTs also shows a linear increase with length. In terms of absolute quantum yield (QY), the relative increase in the optical transi-tion strength compared to the background indicates that more excitons are formed per absorbed photon in the longer SWCNTs; thus, the QY, assuming a length-independent effi ciency for emission of excitons via fl uorescence, should increase. This helps to explain the abundance of more recent literature results on purifi ed, and typically longer length, SWCNTs in solu-tion that demonstrate a QY approaching 10%. [ 45 , 46 ] Although beyond the scope of this Progress Report, a possible explana-tion for an increase in oscillator strength with SWCNT length would be exciton delocalization, possibly related to the length of the nanotube with respect to the wavelength of the incident radiation. Current estimates of the size of a single exciton in semiconducting SWCNTs are around 1 nm, comparable to or slightly larger than the diameter of the most common single-walled nanotubes. Both the length of the SWCNT and the
343bH & Co. KGaA, Weinheim wileyonlinelibrary.com 343
www.advmat.dewww.MaterialsViews.com
PRO
GRES
S R
EPO
RT
344
Figure 8 . a) Photograph of colored-SWCNT dispersions comprised of ≈ 1 μ m long SWCNTs in order of increasing average nanotube diam-eter. Note that these solutions have not been separated by chiral vector. The spectrum of the blue fraction, third from the left, is the spectrum of the longest fraction shown in (b). Left to right the parent soots for these dispersions are four different cobalt-molybdenum cata-lyst (CoMoCat) batches (SouthWest Nanotechnologies SG65-000-0002, SG65-000-0024, S-P95-2 NI-6-A001, SG76-31 k), a high pressure carbon monoxide (HIPCo) process batch (Carbon Nanotechnologies P286), laser ablation method SWCNTs (NASA batch 338), and electric-arc-produced SWCNTs (Carbolux). b) Absorbance spectra for length sepa-rated CoMoCat SWCNTs (batch S-P95-2 NI-6-A001), scaled by apparent π -plasmon absorbance at 775 nm. Reproduced with permission from [14]. Copyright 2008, ACS.
wavelength of the absorbed radiation are two-to-three ordersof magnitude larger than this, pointing to multiple sites alonga single SWCNT being capable of supporting a fundamentalexcitation. Another factor for short SWCNTs is the presence ofend cap “defects,” which can be the primary source of D-bandRaman scattering, [ 12 ] and thus by inference, the primary defectsites, and which may serve to limit the formation of excitons inshorter SWCNTs. Interestingly, the apparent length-dependentoptical effect appears to have an asymptote at a constanttransition-to-background absorbance ratio for SWCNTs longerthan approximately 1 to 1.2 μ m. For SWCNTs longer than thisthreshold, the bulk result is consistent with fl uorescence meas-ured from directly imaged individual SWCNTs. [ 47 ] Fluorescencehas also been used to measure the length of individualizedSWCNTs in solution, [ 48 , 49 ] but has not been an area of activeresearch at NIST.
© 2011 WILEY-VCH Verlag Gmwileyonlinelibrary.com
For measurement of the size distribution of dispersed SWCNT populations, the most popular method is AFM, how-ever the perhaps best method to date for relative size measure-ment is calibrated FFF. In AFM measurements, a small sample of the dispersion is deposited on a substrate, typically a silicon wafer or mica sheet, the surfactant is removed, and the sample is imaged in tapping mode. After imaging, the lengths of any nonoverlapping SWCNTs can be measured, although direct traceability for a measured value is uncommon. The primary diffi culty and uncertainty in AFM measurement comes from the diffi culty in depositing the SWCNTs, and in removing the surfactant without aggregating or altering the distribution of deposited SWCNTs. Unfortunately these diffi culties tend not to be trivial. This is especially true for many surfactant-dispersed samples because the mass of surfactant in the sample can be orders of magnitude greater than the SWCNT concen-tration. There is also the potential difference in the probability of identifying SWCNTs of different lengths that may selectively bias measured values to longer lengths. Lastly, AFM is a time-intensive technique that is not suitable for routine screening of many samples, and, especially for quality control (QC) and process development purposes, a more facile and rapid method would be preferable.
FFF has the potential to provide the facile and rapid screening of size distributions necessary for process develop-ment and QC. FFF is a powerful method for characterizing the dispersion and length distribution of a SWCNT sample [ 19 ] because of the wide size range that is separable, [ 50 ] the small sample volume that is required, the ability to perform online characterization, and the quick results. A properly calibrated instrument, calibrated with reference particles of known size and appropriate hydrodynamic models, can provide relative size information for a dispersed-SWCNT sample in less than 90 min, with little preparation required between runs. In FFF, a focused volume of injected particles is forced to fl ow between two narrowly spaced plates. The most common implementation, fl ow-FFF, uses a porous bottom plate which allows the solvent to pass through, but is impermeable to suspended SWCNTs. A parabolic velocity profi le is established between the plates, and the average position of the particles in the parabolic fl ow fi eld governs the elution time. Separation occurs because of the increase in diffusivity with smaller hydrodynamic size; due to their larger diffusion coeffi cients, smaller particles tend to have greater excursions from the membrane surface, and are thus entrained at a higher rate in the parabolic fl ow acting in the elution direction. Particles with smaller effective hydrodynamic radii thus elute fi rst, and larger particles elute later. [ 5 0–5 2 ] The ability to use any arbitrary function for the cross-fl ow strength with time allows for fi ne control of the elution rate and resolu-tion of the size versus time dependence.
A common effect of many SWCNT processing techniques, such as acid refl uxing and sonication, is a reduction in the length of the processed SWCNTs. When harnessed to pur-posefully produce shorter average length distributions, this is referred to as intentional degradation. In either instance, intentional or required shortening has important implications for the end properties of the processed material. Tracking the changes in the size distribution as a function of processing time, processing procedures, or synthesis conditions is thus
bH & Co. KGaA, Weinheim Adv. Mater. 2011, 23, 338–348
www.advmat.dewww.MaterialsViews.com P
RO
GRES
S R
EPO
RT
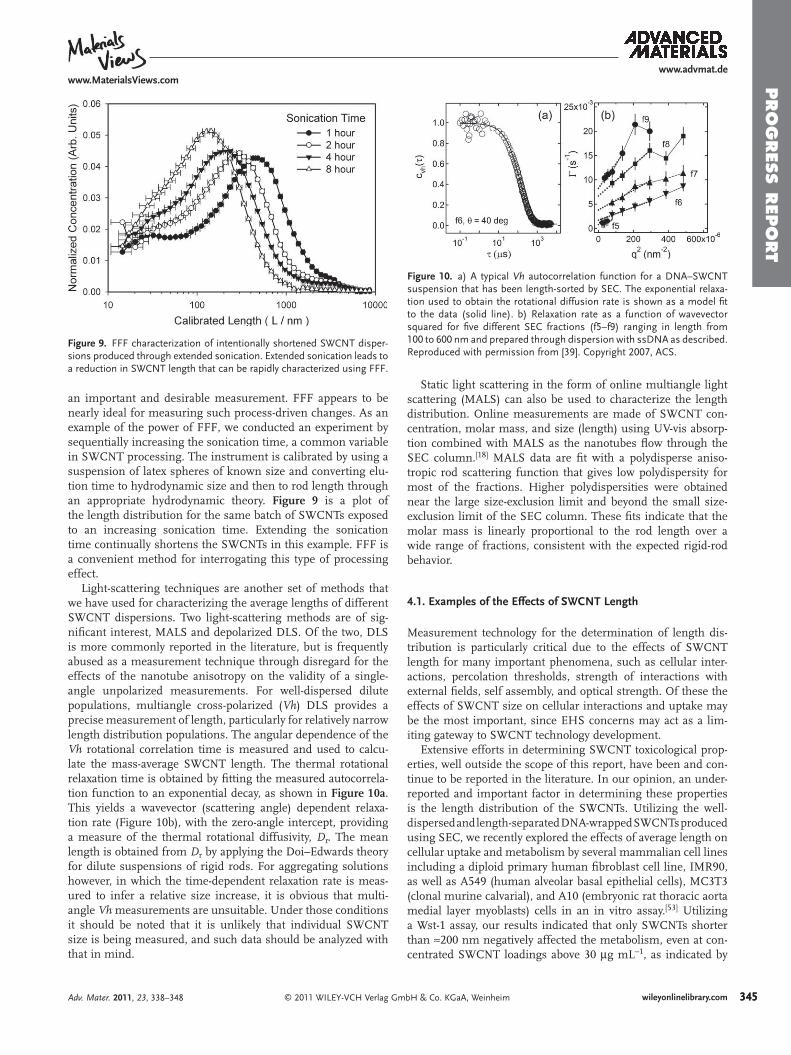
Figure 9 . FFF characterization of intentionally shortened SWCNT disper-sions produced through extended sonication. Extended sonication leads to a reduction in SWCNT length that can be rapidly characterized using FFF.
Figure 10 . a) A typical Vh autocorrelation function for a DNA–SWCNT suspension that has been length-sorted by SEC. The exponential relaxa-tion used to obtain the rotational diffusion rate is shown as a model fi t to the data (solid line). b) Relaxation rate as a function of wavevector squared for fi ve different SEC fractions (f5–f9) ranging in length from 100 to 600 nm and prepared through dispersion with ssDNA as described. Reproduced with permission from [39]. Copyright 2007, ACS.
an important and desirable measurement. FFF appears to be nearly ideal for measuring such process-driven changes. As an example of the power of FFF, we conducted an experiment by sequentially increasing the sonication time, a common variable in SWCNT processing. The instrument is calibrated by using a suspension of latex spheres of known size and converting elu-tion time to hydrodynamic size and then to rod length through an appropriate hydrodynamic theory. Figure 9 is a plot of the length distribution for the same batch of SWCNTs exposed to an increasing sonication time. Extending the sonication time continually shortens the SWCNTs in this example. FFF is a convenient method for interrogating this type of processing effect.
Light-scattering techniques are another set of methods that we have used for characterizing the average lengths of different SWCNT dispersions. Two light-scattering methods are of sig-nifi cant interest, MALS and depolarized DLS. Of the two, DLS is more commonly reported in the literature, but is frequently abused as a measurement technique through disregard for the effects of the nanotube anisotropy on the validity of a single-angle unpolarized measurements. For well-dispersed dilute populations, multiangle cross-polarized ( Vh ) DLS provides a precise measurement of length, particularly for relatively narrow length distribution populations. The angular dependence of the Vh rotational correlation time is measured and used to calcu-late the mass-average SWCNT length. The thermal rotational relaxation time is obtained by fi tting the measured autocorrela-tion function to an exponential decay, as shown in Figure 10a . This yields a wavevector (scattering angle) dependent relaxa-tion rate (Figure 10 b), with the zero-angle intercept, providing a measure of the thermal rotational diffusivity, D r . The mean length is obtained from D r by applying the Doi–Edwards theory for dilute suspensions of rigid rods. For aggregating solutions however, in which the time-dependent relaxation rate is meas-ured to infer a relative size increase, it is obvious that multi-angle Vh measurements are unsuitable. Under those conditions it should be noted that it is unlikely that individual SWCNT size is being measured, and such data should be analyzed with that in mind.
© 2011 WILEY-VCH Verlag GmAdv. Mater. 2011, 23, 338–348
Static light scattering in the form of online multiangle light scattering (MALS) can also be used to characterize the length distribution. Online measurements are made of SWCNT con-centration, molar mass, and size (length) using UV-vis absorp-tion combined with MALS as the nanotubes fl ow through the SEC column. [ 18 ] MALS data are fi t with a polydisperse aniso-tropic rod scattering function that gives low polydispersity for most of the fractions. Higher polydispersities were obtained near the large size-exclusion limit and beyond the small size-exclusion limit of the SEC column. These fi ts indicate that the molar mass is linearly proportional to the rod length over a wide range of fractions, consistent with the expected rigid-rod behavior.
4.1. Examples of the Effects of SWCNT Length
Measurement technology for the determination of length dis-tribution is particularly critical due to the effects of SWCNT length for many important phenomena, such as cellular inter-actions, percolation thresholds, strength of interactions with external fi elds, self assembly, and optical strength. Of these the effects of SWCNT size on cellular interactions and uptake may be the most important, since EHS concerns may act as a lim-iting gateway to SWCNT technology development.
Extensive efforts in determining SWCNT toxicological prop-erties, well outside the scope of this report, have been and con-tinue to be reported in the literature. In our opinion, an under-reported and important factor in determining these properties is the length distribution of the SWCNTs. Utilizing the well-dispersed and length-separated DNA-wrapped SWCNTs produced using SEC, we recently explored the effects of average length on cellular uptake and metabolism by several mammalian cell lines including a diploid primary human fi broblast cell line, IMR90, as well as A549 (human alveolar basal epithelial cells), MC3T3 (clonal murine calvarial), and A10 (embryonic rat thoracic aorta medial layer myoblasts) cells in an in vitro assay. [ 53 ] Utilizing a Wst-1 assay, our results indicated that only SWCNTs shorter than ≈ 200 nm negatively affected the metabolism, even at con-centrated SWCNT loadings above 30 μ g mL − 1 , as indicated by
345bH & Co. KGaA, Weinheim wileyonlinelibrary.com 345
www.advmat.dewww.MaterialsViews.com
PRO
GRES
S R
EPO
RT
346
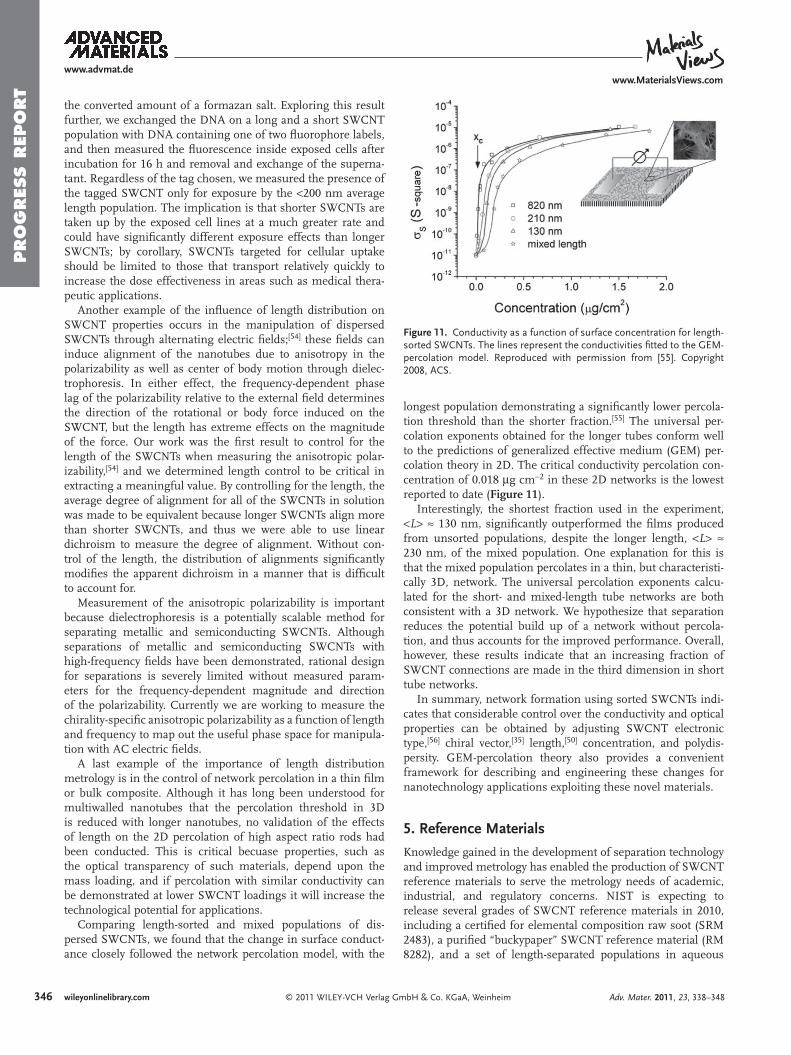
Figure 11 . Conductivity as a function of surface concentration for length-sorted SWCNTs. The lines represent the conductivities fi tted to the GEM-percolation model. Reproduced with permission from [55]. Copyright 2008, ACS.
the converted amount of a formazan salt. Exploring this result further, we exchanged the DNA on a long and a short SWCNT population with DNA containing one of two fl uorophore labels, and then measured the fl uorescence inside exposed cells after incubation for 16 h and removal and exchange of the superna-tant. Regardless of the tag chosen, we measured the presence of the tagged SWCNT only for exposure by the < 200 nm average length population. The implication is that shorter SWCNTs are taken up by the exposed cell lines at a much greater rate and could have signifi cantly different exposure effects than longer SWCNTs; by corollary, SWCNTs targeted for cellular uptake should be limited to those that transport relatively quickly to increase the dose effectiveness in areas such as medical thera-peutic applications.
Another example of the infl uence of length distribution on SWCNT properties occurs in the manipulation of dispersed SWCNTs through alternating electric fi elds; [ 54 ] these fi elds can induce alignment of the nanotubes due to anisotropy in the polarizability as well as center of body motion through dielec-trophoresis. In either effect, the frequency-dependent phase lag of the polarizability relative to the external fi eld determines the direction of the rotational or body force induced on the SWCNT, but the length has extreme effects on the magnitude of the force. Our work was the fi rst result to control for the length of the SWCNTs when measuring the anisotropic polar-izability, [ 54 ] and we determined length control to be critical in extracting a meaningful value. By controlling for the length, the average degree of alignment for all of the SWCNTs in solution was made to be equivalent because longer SWCNTs align more than shorter SWCNTs, and thus we were able to use linear dichroism to measure the degree of alignment. Without con-trol of the length, the distribution of alignments signifi cantly modifi es the apparent dichroism in a manner that is diffi cult to account for.
Measurement of the anisotropic polarizability is important because dielectrophoresis is a potentially scalable method for separating metallic and semiconducting SWCNTs. Although separations of metallic and semiconducting SWCNTs with high-frequency fi elds have been demonstrated, rational design for separations is severely limited without measured param-eters for the frequency-dependent magnitude and direction of the polarizability. Currently we are working to measure the chirality-specifi c anisotropic polarizability as a function of length and frequency to map out the useful phase space for manipula-tion with AC electric fi elds.
A last example of the importance of length distribution metrology is in the control of network percolation in a thin fi lm or bulk composite. Although it has long been understood for multiwalled nanotubes that the percolation threshold in 3D is reduced with longer nanotubes, no validation of the effects of length on the 2D percolation of high aspect ratio rods had been conducted. This is critical becuase properties, such as the optical transparency of such materials, depend upon the mass loading, and if percolation with similar conductivity can be demonstrated at lower SWCNT loadings it will increase the technological potential for applications.
Comparing length-sorted and mixed populations of dis-persed SWCNTs, we found that the change in surface conduct-ance closely followed the network percolation model, with the
© 2011 WILEY-VCH Verlag Gwileyonlinelibrary.com
longest population demonstrating a signifi cantly lower percola-tion threshold than the shorter fraction. [ 55 ] The universal per-colation exponents obtained for the longer tubes conform well to the predictions of generalized effective medium (GEM) per-colation theory in 2D. The critical conductivity percolation con-centration of 0.018 μ g cm − 2 in these 2D networks is the lowest reported to date ( Figure 11 ).
Interestingly, the shortest fraction used in the experiment, < L > ≈ 130 nm, signifi cantly outperformed the fi lms produced from unsorted populations, despite the longer length, < L > ≈ 230 nm, of the mixed population. One explanation for this is that the mixed population percolates in a thin, but characteristi-cally 3D, network. The universal percolation exponents calcu-lated for the short- and mixed-length tube networks are both consistent with a 3D network. We hypothesize that separation reduces the potential build up of a network without percola-tion, and thus accounts for the improved performance. Overall, however, these results indicate that an increasing fraction of SWCNT connections are made in the third dimension in short tube networks.
In summary, network formation using sorted SWCNTs indi-cates that considerable control over the conductivity and optical properties can be obtained by adjusting SWCNT electronic type, [ 56 ] chiral vector, [ 35 ] length, [ 50 ] concentration, and polydis-persity. GEM-percolation theory also provides a convenient framework for describing and engineering these changes for nanotechnology applications exploiting these novel materials.
5. Reference Materials
Knowledge gained in the development of separation technology and improved metrology has enabled the production of SWCNT reference materials to serve the metrology needs of academic, industrial, and regulatory concerns. NIST is expecting to release several grades of SWCNT reference materials in 2010, including a certifi ed for elemental composition raw soot (SRM 2483), a purifi ed “buckypaper” SWCNT reference material (RM 8282), and a set of length-separated populations in aqueous
mbH & Co. KGaA, Weinheim Adv. Mater. 2011, 23, 338–348
www.advmat.dewww.MaterialsViews.com P
RO
GRES
S R
EPO
RT
[
[
[
[
[
[
[
[
[
[
[ [ [
[
[
[
[ [
[ [ [
[
[
dispersions (RM 8281). The characterization of these materials is informed by the knowledge gained through the characteriza-tion of factors such as the dispersion and length distribution detailed above, and should be a valuable resource to each of the different SWCNT user communities.
6. Summary and Outlook
The dispersion state and the length distribution of a SWCNT population are key parameters that determine the achievable properties from a given sample. Measurement technologies for and separation methodologies by these attributes are thus necessary to improve the commercial development of SWCNT technologies. The particular development of these technologies and methodologies at NIST has been the focus of this contri-bution, however several other organizations, including interna-tional bodies, such as the International Standards Organization (ISO) and the Versailles Project on Advanced Materials and Standards (VAMAS), as well as many academic and govern-mental research groups, are constantly improving the scien-tifi c understanding of SWCNT properties and processing. It is our view that the technological development of nanotubes has reached a point where the truly desirable fundamental proper-ties of the nanotubes can be accessed through processing and characterization for high-value commercial applications. The release of well-characterized reference materials, standard pro-tocols, and documentary standards is an additional enabling milestone that is rapidly approaching. Furthermore, ongoing research to facilitate more effi cient and more selective isolation of desired SWCNT lengths and chiral vectors is likely to only accelerate the development of SWCNT materials into applica-tions. In brief, the future of SWCNT materials appears to be bright and improving.
Acknowledgements We acknowledge the support of the National Institute of Standards and Technology in providing the neutron research facilities referred to in this work, as well as initiative funding of the nanotube research. Additionally, many entities, including Southwest Nanotechnologies, Rice University, NanoPower Research, and NASA, among many others, have donated time and/or materials that have been gratefully received and contributed substantially to the course of this work. J.A.F. also gratefully acknowledges the support of a NIST National Research Council postdoctoral fellowship from 2005 to 2007. Offi cial contribution of the National Institute of Standards and Technology; not subject to copyright in the United States. This article is part of a Special Issue on Materials Science at the National Institute of Standards and Technology (NIST).
Received: May 12, 2010 Published online: August 26, 2010
[ 1 ] Certain equipment, instruments, or materials are identifi ed in this paper in order to adequately specify the experimental details. Such identifi cation does not imply recommendation by the National Insti-tute of Standards and Technology nor does it imply the materials are necessarily the best available for the purpose.
[ 2 ] S. D. Bergin , V. Nicolosi , P. V. Streich , S. Giordani , Z. Sun , A. H. Windle , P. Ryan , N. P. P. Niraj , Z. T. Wang , L. Carpenter ,
© 2011 WILEY-VCH Verlag GmbAdv. Mater. 2011, 23, 338–348
W. J. Blau , J. J. Boland , J. P. Hamilton , J. N. Coleman , Adv. Mater. 2008 , 20 , 1876 .
[ 3 ] S. Giordani , S. D. Bergin , V. Nicolosi , S. Lebedkin , M. M. Kappes , W. J. Blau , J. N. Coleman , J. Phys. Chem. B 2006 , 110 , 15708 .
[ 4 ] S. M. Bachilo , M. S. Strano , C. Kittrell , R. H. Hauge , R. E. Smalley , R. B. Weisman , Science 2002 , 298 , 2361 .
[ 5 ] D. A. Tsyboulski , E. L. Bakota , L. S. Witus , J. D. R. Rocha , J. D. Hartgerink , R. B. Weisman , J. Am. Chem. Soc. 2008 , 130 , 17134 .
[ 6 ] H. Cathcart , V. Nicolosi , J. M. Hughes , W. J. Blau , J. M. Kelly , S. J. Quinn , J. N. Coleman , J. Am. Chem. Soc. 2008 , 130 , 12734 .
[ 7 ] M. F. Islam , E. Rojas , D. M. Bergey , A. T. Johnson , A. G. Yodh , Nano Lett. 2003 , 3 , 269 .
[ 8 ] W. Wenseleers , I. I. Vlasov , E. Goovaerts , E. Obraztsova , A. S. Lobach , A. Bouwen , Adv. Funct. Mater. 2004 , 14 , 1105 .
[ 9 ] R. Haggenmueller , S. S. Rahatekar , J. A. Fagan , J. Chun , M. L. Becker , R. R. Naik , T.Krauss , L. Carlson J. F. Kadla , P. C. Trulove , D. F. Fox , H. C. DeLong , Z. Fang , S. O. Kelley , J. W. Gilman , Langmuir 2008 , 24 , 5070 .
10 ] T. Kashiwagi , J. A. Fagan , J. F. Douglas , K. Yamamoto , A. N. Heckert , S. D. Leigh , J. Obrzut , F. Du , S. Lin-Gibson , M. Mu , K. I. Winey , R. Haggenmueller , Polymer 2007 , 48 , 4855 .
11 ] J. A. Fagan , B. J. Landi , I. Mandelbaum , J. R. Simpson , V. Bajpai , B. J. Bauer , K. Migler , A. R. H. Walker , R.Raffaelle , E. K. Hobbie , J. Phys. Chem. B 2006 , 110 , 23801 .
12 ] J. R. Simpson , J. A. Fagan , M. L. Becker , E. K. Hobbie , A. R. H. Walker , Carbon 2009 , 47 , 3238 .
13 ] D. A. Tsyboulski , S. M. Bachilo , R. B. Weisman , Nano Lett. 2005 , 5 , 975 .
14 ] J. A. Fagan , M. L. Becker , J. Chun , P. Nie , B. J. Bauer , J. R. Simpson , A. R. Hight Walker , E. K. Hobbie , Langmuir 2008 , 24 , 13880 .
15 ] B. J. Bauer , M. L. Becker , V. Bajpai , J. A. Fagan , E. K. Hobbie , K. Migler , C. M. Guttman , W. R. Blair , J. Phys. Chem. C 2007 , 111 , 17914 .
16 ] J. A. Fagan , J. R. Simpson , B. J. Landi , L. J. Richter , I. Mandelbaum , V. Bajpai , D. L. Ho , R. Raffaelle , A. R. Hight Walker , B. J. Bauer , E. K. Hobbie , Phys. Rev. Lett. 2007 , 98 , 147402 .
17 ] B. A. Smith , K. Wepasnick , K. E. Schrote , A. R. Bertele , W. P. Ball , C. O’Melia , D. H. Fairbrother , Environ. Sci. Technol. 2009 , 43 , 819 .
18 ] B. J. Bauer , J. A. Fagan , E. K. Hobbie , J. Chun , V. Bajpai , J. Phys. Chem. C 2008 , 112 , 1842 .
19 ] J. Chun , J. A. Fagan , E. K. Hobbie , B. J. Bauer , Anal. Chem. 2008 , 80 , 2514 .
20 ] M. C. Hersam , Nat. Nanotechnol. 2008 , 3 , 387 . 21 ] M. S. Arnold , S. I. Stupp , M. C. Hersam , Nano Lett. 2005 , 5 , 713 . 22 ] M. S. Arnold , A. A. Green , J. F. Hulvat , S. I. Stupp , M. C. Hersam ,
Nat. Nanotechnol. 2006 , 1 , 60 . 23 ] F. Hennrich , S. Lebedkin , M. M. Kappes , Phys. Status Solidi B 2008 ,
245 , 1951 . 24 ] N. Stürzl , F. Hennrich , S. Lebedkin , M. M. Kappes , J. Phys. Chem. C
2009 , 113 , 14628 . 25 ] X. Peng , N. Komatsu , S. Bhattacharya , T. Shimawaki , S. Aonuma ,
T. Kimura , A. Osuka , Nat. Nanotechnol. 2007 , 2 , 361 . 26 ] A. A. Green , M. C. Duch , M. C. Hersam , Nano Res. 2009 , 2 , 69 . 27 ] M. Zheng , A. Jagota , M. S. Strano , A. P. Santos , P. Barone ,
S. G. Chou , B. A. Diner , M. S. Dresselhaus , R. S. McLean , G. B. Onoa , G. G. Samsonidze , E. D. Semke , M. Usrey , D. J. Walls , Science 2003 , 302 , 1545 .
28 ] M. Zheng , E. D. Semke , J. Am. Chem. Soc. 2007 , 129 , 6084 . 29 ] X. Tu , M. Zheng , Nano Res. 2008 , 1 , 185 . 30 ] D. A. Heller , R. M. Mayrhofer , S. Baik , Y. V. Grinkova , M. L. Usrey ,
M. S. Strano , J. Am. Chem. Soc. 2004 , 126 , 14567 . 31 ] T. Tanaka , H. Jin , Y. Miyata , S. Fujii , H. Suga , Y. Naitoh , T. Minari ,
T. Miyadera , K. Tsukagoshi , H. Kataura , Nano Lett. 2009 , 9 , 1497 . 32 ] R. Krupke , F. Hennrich , M. M. Kappes , H. v. Lóhneysen , Nano Lett.
2004 , 4 , 1395 .
347H & Co. KGaA, Weinheim wileyonlinelibrary.com 347
www.advmat.dewww.MaterialsViews.com
PRO
GRES
S R
EPO
RT
348
[ 33 ] D. H. Shin , J. Kim , H. C. Shim , J. Song , J. Yoon , J. Kim , S. Jeong , J. Kang , S. Baik , C Han , Nano Lett. 2008 , 8 , 4380 .
[ 34 ] S. Ghosh , C. N. R. Rao , Nano Res. 2009 , 2 , 183 . [ 35 ] A. A. Green , M , C. Hersam , Nano Lett. 2008 , 8 , 1417 . [ 36 ] K. Yanagi , Y. Miyata , H. Kataura , Appl. Phys. Express 2008 , 1 ,
034003 . [ 37 ] N. Nair , W. Kim , R. D. Braatz , M. S. Strano , Langmuir 2008 , 24 , 1790 . [ 38 ] E. K. Hobbie , J. A. Fagan , J. Obrzut , S. D. Hudson , ACS Appl. Mat.
Interfaces 2009 , 1 , 1561. [ 39 ] J. A. Fagan , J. R. Simpson , B. J. Bauer , S. Lacerda , M. L. Becker ,
J. Chun , K. B. Migler , A. R. Hight Walker , E. K. Hobbie , J. Am. Chem. Soc. 2007 , 129 , 10607 .
[ 40 ] J. A. Fagan , M. L. Becker , J. Chun , E. K. Hobbie , Adv. Mater. 2008 , 20 , 1609 .
[ 41 ] L. F. Pease , D. Tsai , J. A. Fagan , B. J. Bauer , R. A. Zangmeister , M. J. Tarlov , M. R. Zachariah , Small 2009 , 5 , 2894 .
[ 42 ] M. Zheng , A. Jagota , E. D. Semke , B. A. Diner , R. S. McLean , S. R.Lustig , R. E. Richardson , N. G. Tassi , Nat. Mater. 2003 , 2 , 338 .
[ 43 ] X. Y. Huang , R. S. McLean , M. Zheng , Anal. Chem. 2005 , 77 , 6225 . [ 44 ] X. Sun , S. Zaric , D. Daranciang , K. Welsher , Y. Lu , X. Li , H. Dai ,
J. Am. Chem. Soc. 2008 , 130 , 6551 . [ 45 ] J. Lefebvre , D. G. Austing , J. Bond , P. Finnie , Nano Lett. 2006 , 6 ,
1603 .
© 2011 WILEY-VCH Verlag Gmwileyonlinelibrary.com
[ 46 ] S. Ju , W. P. Kopcha , F. Papadimitrakopoulos , Science 2009 , 323 , 1319 .
[ 47 ] R. B. Weisman , “Quantitative Analysis of Bulk SWNT Samples using NIR-Fluorimetry”, Materials Research Society Presentation , Boston, MA, November 2008 .
[ 48 ] D. A. Tsyboulski , S. M. Bachilo , A. B. Kolomeisky , R. B. Weisman , ACS Nano 2008 , 2 , 1770 .
[ 49 ] J. P. Casey , S. M. Bachilo , C. H. Moran , R. B. Weisman , ACS Nano 2008 , 2 , 1738 .
[ 50 ] F. R. Phelan , B. J. Bauer , Chem. Eng. Sci. 2007 , 62 , 4620 . [ 51 ] F. R. Phelan , B. J. Bauer , Chem. Eng. Sci. 2009 , 64 , 1747 . [ 52 ] M. Schimpf , K. Caldwell , J. C. Giddings , Field-Flow Fraction Hand-
book , Wiley-Interscience Publication , New York 2000 . [ 53 ] M. L. Becker , J. A. Fagan , N. D. Gallant , B. J. Bauer , V. Bajpai ,
E. K. Hobbie , S. H. Lacerda , K. B. Migler , J. P. Jakupciak , Adv. Mater. 2007 , 19 , 939 .
[ 54 ] J. A. Fagan , V. Bajpai , B. J. Bauer , E. K. Hobbie , Appl. Phys. Lett. 2007 , 91 , 213105 .
[ 55 ] D. Simien , J. A. Fagan , W. Luo , J. F. Douglas , K. Migler , J. Obrzut , ACS Nano 2008 , 2 , 1879 .
[ 56 ] J. L. Blackburn , T. M. Barnes , M. C. Beard , Y. H. Kim , R. C. Tenent , J. McDonald , B. To , T. J. Coutts , M. J. Heben , ACS Nano 2008 , 2 , 1266 .
bH & Co. KGaA, Weinheim Adv. Mater. 2011, 23, 338–348