capacity management of nursing staff as a vehicle for organizational improvement
TRANSCRIPT

BioMed CentralBMC Health Services Research
ss
Open AcceResearch articleCapacity management of nursing staff as a vehicle for organizational improvementSylvia G Elkhuizen*1, Gert Bor1, Marjolein Smeenk1, Niek S Klazinga2 and Piet JM Bakker1Address: 1Department of Innovation and Process Management, Academic Medical Center/University of Amsterdam, Amsterdam, The Netherlands and 2Department of Social Medicine, Academic Medical Center/University of Amsterdam, Amsterdam, The Netherlands
Email: Sylvia G Elkhuizen* - [email protected]; Gert Bor - [email protected]; Marjolein Smeenk - [email protected]; Niek S Klazinga - [email protected]; Piet JM Bakker - [email protected]
* Corresponding author
AbstractBackground: Capacity management systems create insight into required resources like staff andequipment. For inpatient hospital care, capacity management requires information on beds andnursing staff capacity, on a daily as well as annual basis. This paper presents a comprehensivecapacity model that gives insight into required nursing staff capacity and opportunities to improvecapacity utilization on a ward level.
Methods: A capacity model was developed to calculate required nursing staff capacity. The modelused historical bed utilization, nurse-patient ratios, and parameters concerning contract hours tocalculate beds and nursing staff needed per shift and the number of nurses needed on an annualbasis in a ward. The model was applied to three different capacity management problems on threeseparate groups of hospital wards. The problems entailed operational, tactical, and strategicmanagement issues: optimizing working processes on pediatric wards, predicting the consequencesof reducing length of stay on nursing staff required on a cardiology ward, and calculating the nursingstaff consequences of merging two internal medicine wards.
Results: It was possible to build a model based on easily available data that calculate the nursingstaff capacity needed daily and annually and that accommodate organizational improvements.Organizational improvement processes were initiated in three different groups of wards. For twopediatric wards, the most important improvements were found to be improving working processesso that the agreed nurse-patient ratios could be attained. In the second case, for a cardiology ward,what-if analyses with the model showed that workload could be substantially lowered by reducinglength of stay. The third case demonstrated the possible savings in capacity that could be achievedby merging two small internal medicine wards.
Conclusion: A comprehensive capacity model was developed and successfully applied to supportcapacity decisions on operational, tactical, and strategic levels. It appeared to be a useful tool forsupporting discussions between wards and hospital management by giving objective andquantitative insight into staff and bed requirements. Moreover, the model was applied to initiateorganizational improvements, which resulted in more efficient capacity utilization.
Published: 30 November 2007
BMC Health Services Research 2007, 7:196 doi:10.1186/1472-6963-7-196
Received: 27 April 2007Accepted: 30 November 2007
This article is available from: http://www.biomedcentral.com/1472-6963/7/196
© 2007 Elkhuizen et al; licensee BioMed Central Ltd. This is an Open Access article distributed under the terms of the Creative Commons Attribution License (http://creativecommons.org/licenses/by/2.0), which permits unrestricted use, distribution, and reproduction in any medium, provided the original work is properly cited.
Page 1 of 10(page number not for citation purposes)
BMC Health Services Research 2007, 7:196 http://www.biomedcentral.com/1472-6963/7/196
BackgroundMarket changes, labor shortages, and the introduction ofa form of activity-based costing (diagnosis treatment com-bination (DTC) financing policy) in the Netherlands haveprovided an impetus for hospitals to reorganize care proc-esses to improve efficiency. Establishing a form of capacitymanagement with regard to agreed service levels of qualityof care is essential to gaining insight into the balancebetween available and required resources, like staff andequipment. For inpatient care facilities in a hospital, thisrequires information on bed capacity and nursing staffcapacity, on a daily as well as annual basis. Quantitativemodels can be used to calculate capacity needs for differ-ent planning purposes and for short, medium and longterm planning issues. Although several useful models aredescribed in the international literature [1-3] many ofthem are difficult to apply in practice because they requirea great deal of data and clerical work [1].
To be able to apply capacity management in practice,models must fulfill different functions: "annual staff plan-ning," "roster scheduling support," and "daily assignmentof nurses to wards [4-6]." In addition, "strategic deci-sions" are sometimes mentioned as a separate planninglevel [3,7,8]. Models based on mathematical optimizationtechniques from operations research are generally focusedon short-term scheduling [3,9-11]. Models that do inte-grate different planning horizons (daily, periodical (1–2months), and annual) are for example described by Aber-nathy et al.[7] and Wright et al.[11]. These models containconnected models for periodical staff planning and dailyscheduling. However, models incorporating operationalplanning issues with tactical and strategic decisions oroperational scheduling support with annual staff plan-ning were not found in the literature. For accurate capacitymanagement, operational planning issues (like thenumber of nurses on each shift) should be handledtogether with tactical planning issues (like annual nursestaffing).
In general, capacity models are aimed at calculating thenumber of nurses needed, whereas capacity managementmodels should ideally also give insight into opportunitiesfor improving capacity usage. In the Academic MedicalCenter (AMC) in Amsterdam, the Netherlands, we aimedto create a capacity model that could be used for calculat-ing the number of nurses needed in a hospital ward andthat would also provide a projection on how to utilizestaff more efficiently. This model has to support decisionson three levels:
- At operational level, the most relevant topic is whetherthe organization of nursing activities is such that appro-priate and efficient care can be provided.
- Questions at a tactical decision level that should be sup-ported with a capacity management model concern capac-ity consequences of changes in length of stay (LOS),number of admissions, and patient acuity.
- Relevant strategic issues are the optimal number of bedsper ward and potential savings in nursing staff capacity byusing small flexible nursing pools shared by related wards.
Ideally, capacity management would support discussionbetween management and staff on all these issues andpromote improvements.
This paper describes a comprehensive capacity manage-ment model that gives insight into:
- the number of nurses needed for a hospital ward, and
- opportunities to improve capacity utilization on a ward.
Three cases will be used to demonstrate how this modelcan be applied to support issues at operational, tactical,and strategic levels.
MethodsAn outline of the model is given in Figure 1. In this para-graph, first the core data will be described, followed by aparagraph about the model and finishing with thedescription of how the model is applied in three case stud-ies.
Core dataThe basis of the model is formed by historical bed utiliza-tion and nurse-patient ratios. Historical bed utilizationgives the number of beds used on a daily basis and wasavailable for all wards on an hourly basis from January2005. For an inpatient department, quality of nursing careis directly related to direct nursing hours per patient [12].Available direct nursing hours per patient depends onnurse-patient ratios and indirect activities. So, an appro-priate nurse-patient ratio can be determined by using astandard for both indirect activities and direct nursinghours. For example, when each patient needs an averageof 1.2 hours of direct care and a nurse spends two hourson indirect activities during each shift, each nurse canhandle five patients in an 8 hour shift – the nurse-patientratio can then be set at 1:5. During evening and nightshifts, fewer care hours per patient are needed, so ratioscan be set at a somewhat higher level (more patients pernurse), for example 1:6 or 1:8. Guidelines for nurse-patient ratios can be derived from the international litera-ture. In two countries – USA (California) and Australia(Victoria) – legal minimums for nurse-patient ratios wereset for general medical and surgical wards [13]. Theseminimum ratios were 1:5 in California and vary between
Page 2 of 10(page number not for citation purposes)

BMC Health Services Research 2007, 7:196 http://www.biomedcentral.com/1472-6963/7/196
1:4 and 1:6 in Victoria for day shifts. Research on the rela-tionship between patient outcomes and nurse-patientratios has shown that the higher the ratios, the moreadverse events occurred [14,15]. Because of this, we advo-cate setting nurse-patient ratios at around 1:4–5 for earlyshifts, 1:6–7 for late shifts, and 1:8–10 for night shifts. Theratios applied in the AMC differ somewhat betweenwards.
To transform direct nursing care hours into the full-timeequivalents (FTEs) needed annually, data were used fromagreements on working conditions for all university hos-pitals in the Netherlands (such as contract hours, holidayhours, and time allotted for professional development).
To perform tactical what-if analyses (changing parame-ters, and comparing effects) the number of admissionsand total number of admission days was included. Aver-age LOS can be calculated by dividing total admissiondays by the number of admissions.
ModelOperational output of the model is the number of nursesthat need to be scheduled for each shift. For the tactical
level, the model provides the number of FTEs neededannually for direct care on a ward. To be able to analyzethe strategic issue of the possibilities for flexible nursingstaff, the number of nurses needed for average bed utiliza-tion and the extra number needed in peak periods are sep-arated. The strategic issue of ward size can be analyzed bycomparing model results for separate wards with modelresults using aggregated data for several wards.
The calculated model results can be compared with thecurrent number of nurses. To make a fair comparison,only nurses available for direct patient care were included.Additional staff, as the ward manager, are not included inthe model and in the comparison between model resultsand actual situation. This means that differences were pre-sumed to be rooted in a variety of possible causes at dif-ferent decision levels:
Operational issues- Working methods are not efficient enough to meet theagreed nurse-patient ratio with current nursing staff capac-ity. An effective way to explore this further is to have a rel-ative outsider observe the working processes, for example
Outline of modelFigure 1Outline of model.
OUTPUTINPUT
Length of stay
Historical bed utilization (per hour)
Parameters:- number of weekdays- number of weekend days/ public holidays - working time: contract hours, holiday hours, professional development hours
MODEL
Admission days
Nurse-patient ratios
Number of admissions
number of nurses needed on each shift
(eary, late, night) for average bed
utilization
number of nurses needed on each shift (eary, late, night) for peak bed utilization
number of FTEs needed on a ward on an annual
basis
Page 3 of 10(page number not for citation purposes)
BMC Health Services Research 2007, 7:196 http://www.biomedcentral.com/1472-6963/7/196
someone from a comparable department that does meetthe ratios.
- Sick leave (including maternity leave) in the ward differssubstantially from the standard 4% level.
Tactical issues- Applied nurse-patient ratios are not in accordance withaverage patient acuity levels on the ward. To investigatethis in more detail for a specific ward, acuity levels can beanalyzed for a sample of patients.
- Bed utilization is considerable with respect to currentproduction. This could be caused by a lack of efficientadmission and discharge processes, which lead to unnec-essarily long LOS.
- The ward has nursing staff capacity shortage or surplus.
Strategic issues- Wards are too small, which results in efficiency losses,especially during night shifts.
- A great deal of fluctuation in bed utilization can lead toinefficiency. Introducing a flexible nursing pool could bean option.
All input parameters can be used for what-if analyses.These analyses were checked by comparing the resultsusing bed utilization in 2006 as input with the resultsusing historical bed utilization for 2005, combined withchanges in admissions LOS from 2005 to 2006.
Model applicationThe model was applied to three different capacity man-agement problems on three separate groups of hospitalwards. The problems entailed operational, tactical, andstrategic management issues: optimizing working proc-esses on pediatric wards, predicting consequences of LOSreduction on required nursing staff on a cardiology ward,and calculating the nursing staff consequences of mergingtwo internal medicine wards. Nurse-patient ratios wereagreed upon. For historical bed utilization, the number ofbeds and nurses needed for every shift and on an annualbasis were calculated. What-if analyses were performedand further examinations of working processes were car-ried out.
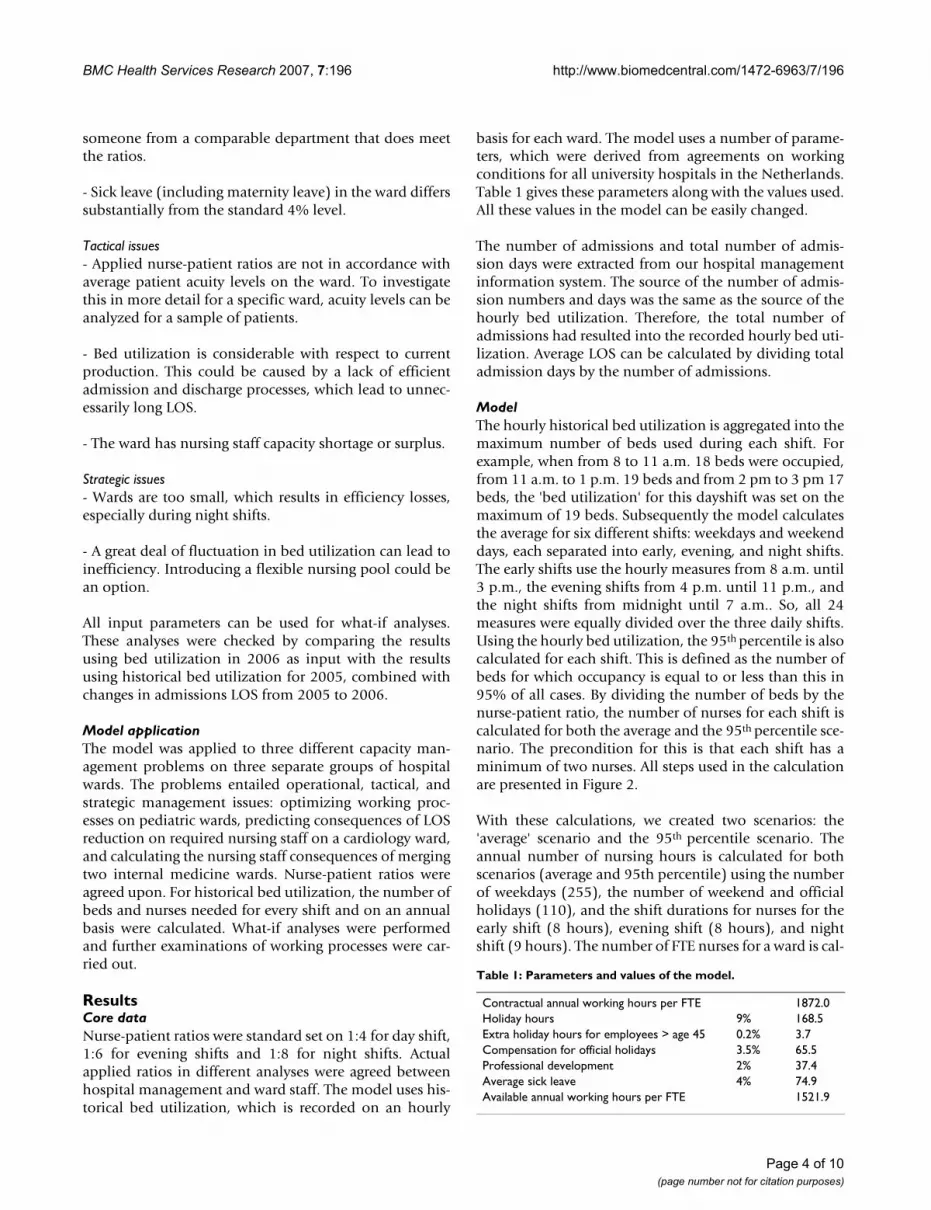
ResultsCore dataNurse-patient ratios were standard set on 1:4 for day shift,1:6 for evening shifts and 1:8 for night shifts. Actualapplied ratios in different analyses were agreed betweenhospital management and ward staff. The model uses his-torical bed utilization, which is recorded on an hourly
basis for each ward. The model uses a number of parame-ters, which were derived from agreements on workingconditions for all university hospitals in the Netherlands.Table 1 gives these parameters along with the values used.All these values in the model can be easily changed.
The number of admissions and total number of admis-sion days were extracted from our hospital managementinformation system. The source of the number of admis-sion numbers and days was the same as the source of thehourly bed utilization. Therefore, the total number ofadmissions had resulted into the recorded hourly bed uti-lization. Average LOS can be calculated by dividing totaladmission days by the number of admissions.
ModelThe hourly historical bed utilization is aggregated into themaximum number of beds used during each shift. Forexample, when from 8 to 11 a.m. 18 beds were occupied,from 11 a.m. to 1 p.m. 19 beds and from 2 pm to 3 pm 17beds, the 'bed utilization' for this dayshift was set on themaximum of 19 beds. Subsequently the model calculatesthe average for six different shifts: weekdays and weekenddays, each separated into early, evening, and night shifts.The early shifts use the hourly measures from 8 a.m. until3 p.m., the evening shifts from 4 p.m. until 11 p.m., andthe night shifts from midnight until 7 a.m.. So, all 24measures were equally divided over the three daily shifts.Using the hourly bed utilization, the 95th percentile is alsocalculated for each shift. This is defined as the number ofbeds for which occupancy is equal to or less than this in95% of all cases. By dividing the number of beds by thenurse-patient ratio, the number of nurses for each shift iscalculated for both the average and the 95th percentile sce-nario. The precondition for this is that each shift has aminimum of two nurses. All steps used in the calculationare presented in Figure 2.
With these calculations, we created two scenarios: the'average' scenario and the 95th percentile scenario. Theannual number of nursing hours is calculated for bothscenarios (average and 95th percentile) using the numberof weekdays (255), the number of weekend and officialholidays (110), and the shift durations for nurses for theearly shift (8 hours), evening shift (8 hours), and nightshift (9 hours). The number of FTE nurses for a ward is cal-
Table 1: Parameters and values of the model.
Contractual annual working hours per FTE 1872.0Holiday hours 9% 168.5Extra holiday hours for employees > age 45 0.2% 3.7Compensation for official holidays 3.5% 65.5Professional development 2% 37.4Average sick leave 4% 74.9Available annual working hours per FTE 1521.9
Page 4 of 10(page number not for citation purposes)

BMC Health Services Research 2007, 7:196 http://www.biomedcentral.com/1472-6963/7/196
culated by dividing this by annual availability (see Table1). This is the number of FTEs needed for direct patientcare. The 95th percentile scenario gives the number ofnurses needed for patient care. This implies that 5% of thetime, nurses have to handle a few more beds than the ratioindicates which corresponds with current practice. Provid-ing all wards with enough nurses in all cases (100%)would result in a great deal of overcapacity. The averagescenario is calculated to gain some understanding into thedifference between average and peak load in that specificward. Another idea is that the number of additionalnurses needed between the average and the 95% scenariocould possibly be shared by similar wards. This wouldmean that a small pool of nurses could be formed to workon two or three related wards, where the nature of patientcare is comparable. Because in general, nurses are not con-tracted to work on a specific ward, changing betweenwards should be possible. Perhaps, not all employees arewilling to change between wards. However, for experi-enced nurses it can offer an opportunity to broaden their
work field and flexibility can be rewarded to motivateemployees [16].
Apart from the model, the number of overhead and sup-porting functions have to be determined. These are inde-pendent of bed utilization. For analysis purposes,historical production data with regard to number ofadmissions and patient days are added into the model.
The what-if analyses were checked for an internal medi-cine ward; results are given in Table 2. First, we applied themodel with historical bed utilization data for 2005. Next,a what-if analysis was performed using the growth for thisward in 2006. This resulted in a change in the number ofadmissions, from 1,290 in 2005 to 1,345 in 2006 (+4%),and the LOS increased from 6.5 in 2005 to 6.7. This led tosuggesting the addition of one nurse to the early weekdayshifts while keeping all other shifts unchanged. Theannual number of FTEs have to increase from 25.7 to 27.
Using historical bed utilization to calculate the number of nurses needed per shiftFigure 2Using historical bed utilization to calculate the number of nurses needed per shift.
aggregation to shifts
95th
per
cent
ile p
er s
hift
aver
age
per
shi
ft
calc
ulat
ion
# nu
rses
calc
ulat
ion
# nu
rses
weekdays weekend daysearly evening night early evening night
18 20 19
21 23 2324 24 2121 22 2120 23 1919 19 19
17 19 1716 19 16
18 20 2222 22 2325 25 2523 26 2122 22 17
18 22 1717 18 15
16 19 1818 19 1818 18 14
18 20 20
early shift evening shift night shiftoccupied beds 0:00 � 7:00 8:00 9:00 10:00 11:00 12:00 13:00 14:00 15:00 16:00 � 23:00Sat Jan 01, 2005 18 18 20 20 19 19 18 19 18 18 18 19
�
Mon Jan 10, 20051 20 21 21 21 21 21 21 21 23 23 23 22Tue Jan 11, 2005 22 24 24 23 23 23 20 20 20 20 21 21Wed Jan 12, 2005 21 21 21 21 21 20 21 22 22 21 21 20Thu Jan 13, 2005 20 20 20 20 22 23 23 22 21 19 19 18Fri Jan 14, 2005 19 19 18 19 19 19 19 18 17 17 17 19Sat Jan 15, 2005 17 17 18 19 19 19 17 17 17 17 17 17Sun Jan 16, 2005 16 16 16 17 17 17 16 15 16 15 15 16Mon Jan 17, 2005 16 18 18 18 18 18 19 19 19 20 20 22Tue Jan 18, 2005 22 22 22 22 21 21 21 21 21 21 21 23Wed Jan 19, 2005 24 25 25 25 25 25 25 24 25 24 25 23Thu Jan 20, 2005 23 23 23 23 25 26 25 22 20 19 19 21Fri Jan 21, 2005 21 22 22 22 21 19 17 17 17 17 17 17Sat Jan 22, 2005 18 18 18 17 16 15 15 15 15 15 15 17Sun Jan 23, 2005 17 17 16 16 16 17 17 17 17 15 15 15Mon Jan 24, 2005 16 16 16 17 17 18 19 18 19 18 17 18Tue Jan 25, 2005 18 18 18 18 18 17 19 19 19 18 18 18Wed Jan 26, 2005 18 18 18 18 18 18 16 15 15 13 13 14
�
Sat Dec 31, 2005 18 18 20 20 20 20 19 19 19 19 18 20
weekdays weekend daysearly evening night early evening night
number of beds 24 25 23 18 20 19nurse- patient ratios 5 7 10 5 7 10nurses needed 5 4 2 4 3 2
weekdays weekend daysearly evening night early evening night
number of beds 21 22 20 17 20 17nurse- patient ratios 5 7 10 5 7 10nurses needed 4 3 2 3 3 2
weekdays weekend daysearly evening night early evening night
21 22 20 17 20 17
weekdays weekend daysearly eveving night early evening night
24 25 23 18 20 19
Page 5 of 10(page number not for citation purposes)

BMC Health Services Research 2007, 7:196 http://www.biomedcentral.com/1472-6963/7/196
This corresponds exactly to the model results using histor-ical bed utilization for 2006.
Model applicationCase: Operational changes in pediatric wardsFive pediatric wards lacked transparency in capacityrequirements. Also, their staff planning was based on a sit-uation that arose over time, with many inexplicable differ-ences between wards. The model was applied to evaluatecurrent numbers of nurses per shift in order to provide afoundation for the need for more efficient working prac-tices, and to calculate budgets for nurses. The modelresults for the pediatric wards are presented in Table 3.The model gives the number of nurses that have to beplanned for each shift and the number of nurses needed
annually for this planning. For all wards except one (teen-agers), the applied nurse-patient ratios were low com-pared with ratios in other wards. In this case, mostattention was given to investigating what working proc-esses could be improved to increase nurse-patient ratios.The main conclusions were that even with the relativelylow ratios there is a surplus of nurses and that inexplicabledifferences between the wards must be corrected. For thefive pediatric wards, a total of 5.1 FTE can be saved annu-ally. With a yearly cost per FTE of €45.000 (including allcosts and bonuses), this leads to a saving of more than200.000. Working processes were observed over severalweeks in two wards (infants and children) that did notmeet the agreed nurse-patient ratios. For the observations,structured sheets were used on which the observers noted
Table 3: Model results for five pediatric wards.
Weekdays Weekend/holidays No of nurses according to
model (yearly FTE)
Actual number of nurses in 2005
(yearly FTE)
Difference
Ward Available beds
Early Evening Night Early Evening Night
Infants (0 years)
19 Number of beds 16 16 16 15 15 15 22.6 26.7 -4.1
Nurse-patient ratios
3.5 4.5 5.5 3.5 4.5 5.5
Nurses needed 5 4 3 4 3 3Children (1–9 years)
24 Number of beds 21 20 20 14 14 15 23.2 25.5 -2.2
Nurse-patient ratios
3.5 5 6.5 3.5 5 6.5
Nurses needed 6 4 3 4 3 2Teenagers (10–17) years
24 Number of beds 23 22 22 19 19 20 24.5 22.4 2.1
Nurse-patient ratios
4 6 8 4 6 8
Nurses needed 6 4 3 5 3 3Oncolgy 13–19 Number of beds 18 15 15 14 13 13 26.4 26.9 -0.5
Nurse-patient ratios
2.5 4 5 2.5 4 5
Nurses needed 7 4 3 6 3 3Surgery 8 Number of beds 8 8 8 8 7 8 9.8 10.2 -0.4
Nurse-patient ratios
3.5 4.5 5.5 3.5 4.5 5.5
Nurses needed 2 2 1 2 2 1
Table 2: Comparison of what-if analysis applied to the 2005 model with growth for 2006 and model results for 2006.
Model results Weekdays Weekend/holidays FTEs
Early Evening Night Early Evening Night
With historical data 2005 6 4 3 6 4 3 25.72005 +what-if scenario with growth for 2006 7 4 3 6 4 3 27.0
With historical data 2006 7 4 3 6 4 3 27.0
Page 6 of 10(page number not for citation purposes)

BMC Health Services Research 2007, 7:196 http://www.biomedcentral.com/1472-6963/7/196
activities and contacts of the observed employees. Weobserved not only nurses, but also receptionists and phy-sicians, since they also influence nurses efficiency. Eachfunction was observed several days by different observers.Qualitative and quantitative observations were collectedand put together to find the bottlenecks. The main causesfor inefficiency appeared to be disorganized physicianrounds and uncertainty about admission and dischargeplanning. For both wards, suggestions for improvementwere made to the ward management. The benefit of usingthe model before observing bottlenecks was that thewards presenting the greatest challenges could be selected,quantitative insight could be provided for inefficiencies,and other possible causes could be excluded. The modelresults were incorporated into the budgets for 2007.
Case: Tactical decisions on a cardiology wardFor cardiology, the model was applied to gain insight intothe possibilities for decreasing the experienced workload.The focus here was to decrease nurse-patient ratiostogether with reducing the LOS, which are both tacticaldecision levels. The model results for the cardiology wardare presented in Table 4. The first conclusion was that theavailable nurses exceeded the model results. However, thenurse-patient ratios this ward adopted seemed to be highfor their patients. Re-applying the model with the ratios1:4, 1:6, and 1:8 for early, evening, and night shiftsrevealed that 29.8 nurses were needed. So, the experi-enced workload was confirmed by the model results. Withthe nurse-patient ratios used (which seemed appropriatefor the patient mix in this ward), a shortage of nursesappeared. However, in this case, production data revealeda relatively long average LOS of 12 days. What-if scenariosshowed that a LOS reduction of two calendar days led tonurse requirements of 25.1 FTEs, which meets currentcapacity. So, in this case the same production in numbersof admissions could be done with current capacity andreduced workload by LOS reduction. A main contributionto LOS reduction was made by starting earlier with prepa-ration for discharge. When the department should decideto use the free fallen capacity by increasing the number ofadmissions, again a shortage of nurses will result, whichcould be quantified by a what-if analyses concerning pro-
duction numbers. However, the department had no inten-tion to increase their admissions.
Case: Strategic improvements in internal medicine wardsThe model was applied to two small internal medicinewards to investigate the possible savings of merging smallwards. A drawback of small wards is that fluctuations inutilization are relatively large and require more capacity.Moreover, due to the requirement that a minimum of twonurses be available during each shift, the capacity neededcan become unrelated to bed utilization and ratios. Ananalysis was made of possible savings resulting frommerging these small wards. The results of this are given inTable 5. This merging could reduce required staff by 3.2FTEs. This leads to a 144000 euros cost saving annually.However, the internal medicine department is investigat-ing the possibility of concentrating nighttime admissionsin one ward, thereby increasing the ratio to 1:10 in nightshifts on other wards. Merging these two wards wouldthen save one nurse each night, or 2.2 FTEs annually.Moreover, merging small wards saves on overhead stafffunctions such as department staff and receptionists.
DiscussionA comprehensive model for capacity planning was devel-oped. In many Dutch hospitals, as is the case in othercountries, nurse staffing is historically-based. The modeloffers the opportunity to calculate staffing requirementsfor wards based, on recent ward-specific data. With themodel, required capacity can be calculated on an annualbasis and for each shift. Decision support for operational,tactical, and strategic levels is possible with the model:efficiency of working processes can be evaluated, wardscan be compared, capacity needed can be compared withstaff budgets, consequences of changing LOS and produc-tion targets (number of admissions) can be calculated,and ward sizes can be evaluated in terms of required nurs-ing staff capacity. It appeared to be a useful tool for sup-porting discussions regarding capacity management issuesbetween wards and hospital management by giving objec-tive and quantitative insight into staff and bed require-ments.
Table 4: Model results for cardiology.
Weekdays Weekend/holidays
Early Evening Night Early Evening Night No of nurses according to
model
Actual number of nurses in
2005
Difference
Number of beds* 29 28 28 24 26 24 22.4 25.8 -3.4Nurse-patient ratios 5 7.5 15 5 7.5 15Nurses needed 7 5 4 6 4 3
*Available beds: 32
Page 7 of 10(page number not for citation purposes)

BMC Health Services Research 2007, 7:196 http://www.biomedcentral.com/1472-6963/7/196
In three cases, it was shown that the model offered differ-ent ideas for the best way to improve capacity utilization.For pediatrics, opportunities for improvement were foundat the operational level in the organization of workingprocesses. With more efficient physician rounds andstandardized admission and discharge procedures, thenurse-patient ratios agreed with the wards were attainable.This calculated annual nursing staff was adopted in the2007 budget, and the existing inexplicable differencesbetween wards were removed. For the cardiology depart-ment, the key to reducing workload was to reduce LOS, bykeeping the same number of admissions. Finally, for twointernal medicine wards, possible savings were calculatedin nursing staff capacity by merging the wards, a strategiclevel decision. In all cases, the model was applied as partof a larger project.
The model goes beyond efficiency and cost reduction[17]. It offers insight into opportunities to improve work-ing processes and reduce workload, which makes thenurses' work easier. Employing an adequate number ofnurses is beneficial for patients and for nurses themselves[18,19]. One of the strong points of the model is the useof historical utilization data rather than available beds.This means both annual production and fluctuation inutilization are taken into account and provides a more faircomparison between wards and between current and cal-culated numbers of staff. In the AMC, the hourly bed uti-lization data are regularly recorded and are easilyaccessible for use in the model. The model is also applica-ble with less detailed data like maximum or average bedutilization per shift. For the observation at the pediatricwards, structured observations were used. Limitation wasthat no inter-observer consistency was calculated.
The model has not the aim to replace integrated hospitaland patient planning methods (see for example [20,21]).Our model had the aim to support capacity managementdecisions on ward level, by calculating staffing needs fordifferent planning levels. Apart form hospital wide plan-ning, a lot of capacity improvements can be attained bycarefully analyzing capacity utilization on single hospitalunits. With our model alternative possibilities forimprovement can be determined by what-if analyses.
Daily staff scheduling is not incorporated in the model.For the scheduling of nurses, several solutions are availa-ble in literature (see for example [11]). Other models con-cern the short term adaptation of schedules (see forexample [22,23]). Our model adds a possibility to pro-vide a quick insight in capacity needs and opportunities toimprove capacity usage.
The model could potentially be criticized for not consid-ering patient acuity. In the literature, there is some criti-cism of the application of nurse-patient ratios [24,25].However, alternative models are much more complicatedand many aspects of patient acuity and organization ofcare can be incorporated into nurse-patient ratios. Differ-ences in patient care needs between wards can be takeninto account by adjusting the nurse-patient ratios. Weused the US and Australian ratios as guideline in our dis-cussions with department staff. However, in all case stud-ies, we applied ward-specific ratios that take the Dutchsituation and ward specific patient needs into account. Forexample, as can be seen in Table 3, we applied differentratios for each pediatric ward. These ratios were set bymutual agreement between hospital management anddepartment staff of the pediatric wards. For the levels of
Table 5: Model results for two internal medicine wards.
Ward Available regular beds
Weekdays Weekend/holidays No of nurses according to model
Early Evening Night Early Evening Night
Internal Medicine
18 Number of beds 18 17 17 16 16 16 19.1
(F6ZU) Nurse-patient ratios 4 6 8 4 6 8Nurses needed 5 3 2 4 3 2
Internal Medicine
16 Number of beds 16 15 15 15 15 15 17.7
(F7NO) Nurse-patient ratios 4 6 8 4 6 8Nurses needed 4 3 2 4 3 2
Total 34 Number of beds 34 32 32 31 31 31 36.8Nurse-patient ratios 4 6 8 4 6 8Nurses needed 9 6 4 8 6 4
One ward 34 Number of beds 33 32 31 31 31 31 33.6F6ZU+ F7NO Nurse-patient ratios 4 6 8 4 6 8
Nurses needed 8 5 4 8 5 4Difference 1 1 1 1 3.2
Page 8 of 10(page number not for citation purposes)

BMC Health Services Research 2007, 7:196 http://www.biomedcentral.com/1472-6963/7/196
analysis in this model, it is sufficient to apply an averagenurse patient ratio per ward. This will be sufficient to cal-culate the number of nurses needed in each shift andyearly, and to perform the what-if analyses. To measurethe acuity for patients on a specific ward for a period oftime the AUKUH Acuity/Dependency tool developed forthe NHS may be useful [26]. This tool supports the meas-urement of acuity and dependency across a range of wardsand specialties. For detailed adaptation of daily nursingstaff, daily measurement of patient acuity could berequired, due to variety in admitted patients at a moment[22,23,27]. However, in our cases, we checked the acuitymix of patients to investigate the stability of the numberof needed nurses in each shift. The patient mix for a sam-ple of weekdays was analyzed for the pediatric and cardi-ology wards. Each day on each ward there appeared to bea balanced patient mix of mostly "average" patients, a fewpatients with lower care needs, and even fewer patientswith relatively high care needs. Therefore, we are con-vinced that the calculated number of nurses for each shiftis appropriate for safe and adequate patient care. Whenthis is not the case, for example for very small wards, dailyadjustment of staffing numbers may be needed. Thesmaller the number of patients, the larger the variety innumber of patients as well as acuity mix will be [28].These short term adaptation are, however, beyond thescope of this model, that is developed for planning pur-poses on operational, tactical and strategic level, and notfor daily scheduling.
Nursing mix by training levels is not an explicit part of themodel. The literature shows that deploying highly edu-cated nurses is cost-effective compared with lower edu-cated nurses [3,29,30]. Due to increasing patientcomplexity, there is an increasing need for RegisteredNurses compared to lower educated staff [3,17]. Themodel calculates the total number of nurses needed dur-ing each shift. In Dutch hospitals, the majority of those innursing teams are certified nurses. It was assumed that ineach shift a sufficient number of qualified nurses wouldbe scheduled. The actual allocation of nurses, and there-fore the skill-mix available in a shift is more a schedulingissue which is outside the scope of the model. A futuremodel extension could be the incorporation of differentskills in the staffing needs to overcome this limitation.
Two research areas were explored to extend research withthe model. First, the application of flexible resource poolswill be studied. A model option is to separate averagecapacity needed per shift and the extra capacity needed inpeak periods. This peak capacity could possibly be sharedby two or more related wards. Second, the model appearsto be suitable for benchmarking resource utilizationbetween comparable wards in different hospitals. Bench-
marking projects were started with two other academichospitals in the Netherlands.
ConclusionA comprehensive model could be developed that coversboth capacity planning for nursing staff and improvingcapacity utilization in hospital wards. The model wasapplied successfully in supporting capacity decisions onoperational, tactical, and strategic levels. For two pediatricwards, improvements were made by improving workingprocesses so that the agreed nurse-patient ratios could beattained. In a second case, for a cardiology ward, what-ifanalyses with the model showed that the workload couldbe substantially decreased by reducing LOS. The third casedemonstrated possible savings in capacity by merging twosmall internal medicine wards. The model appeared to beuseful in calculating capacity needed and in initiatingorganizational improvements, resulting in more efficientcapacity utilization.
Competing interestsThe author(s) declare that they have no competing inter-ests.
Authors' contributionsSG developed and applied the model, collected the dataand wrote the manuscript. GB and MS participated inmodel development, data collection and model applica-tion. NS participated in writing the manuscript. PJB partic-ipated in model development and application and inwriting the manuscript. All authors approved the final ver-sion of the manuscript.
References1. Hurst K: Selecting and Applying Methods for Estimating the
Size and Mix of Nursing Teams. Leeds, Nuffield Institute forHealth; 2003:1-19.
2. Halloran EJ, Vermeersch PEH: Variability in nurse staffingresearch... data collection and the method of reporting. Jour-nal of Nursing Administration 1987, 17:26-34.
3. Siferd SP, Benton WC: Workforce Staffing and Scheduling -Hospital Nursing Specific Models. Eur J Oper Res 1992,60:233-246.
4. Brusco MJ, Futch J, Showalter MJ: Nurse staff planning under con-ditions of a nursing shortage. J Nurs Adm 1993, 23:58-64.
5. Kao EPC, Tung GG: Aggregate nursing requirement planningin a public health care delivery system. Socioecon Plann Sci 1981,15:119-127.
6. Warner DM: Nurse staffing, scheduling, and reallocation inthe hospital. Hosp Health Serv Adm 1976, 21:77-90.
7. Abernathy WJ, Baloff N, Hershey JC, Wandel S: A three-stagemanpower planning and scheduling model-A service sectorexample. Oper Res 1973, 21:693-711.
8. Brown LE, Lewin BA: Supplemental staffing agencies: friend ...or foe? Nurs Manage 1982, 13:37-47.
9. Bordoloi SK, Weatherby EJ: Managerial implications of calculat-ing optimum nurse staffing in medical units. Health Care Man-age Rev 1999, 24:35-44.
10. Burns RN, Carter MW: Work Force Size and Single ShiftSchedules with Variable Demands. Manage Sci 1985,31:599-607.
Page 9 of 10(page number not for citation purposes)
BMC Health Services Research 2007, 7:196 http://www.biomedcentral.com/1472-6963/7/196
Publish with BioMed Central and every scientist can read your work free of charge
"BioMed Central will be the most significant development for disseminating the results of biomedical research in our lifetime."
Sir Paul Nurse, Cancer Research UK
Your research papers will be:
available free of charge to the entire biomedical community
peer reviewed and published immediately upon acceptance
cited in PubMed and archived on PubMed Central
yours — you keep the copyright
Submit your manuscript here:http://www.biomedcentral.com/info/publishing_adv.asp
BioMedcentral
11. Wright PD, Bretthauer KM, Cote MJ: Reexamining the nursescheduling problem: Staffing ratios and nursing shortages.Decision Sciences 2006, 37:39-70.
12. Shullanberger G: Nurse staffing decisions: An integrativereview of the literature. Nurs Econ 2000, 18:124-148.
13. Nurses IC: Fact Sheet. Nurse: Patient Ratios. 2003 [http://www.icn.ch/matters_rnptratio.htm].
14. Aiken LH, Clarke SP, Sloane DM, Sochalski J, Silber JH: Hospitalnurse staffing and patient mortality, nurse burnout, and jobdissatisfaction. J Am Med Assoc 2002, 28:1987-1993.
15. Lang TA, Hodge M, Olson V, Romano PS, Kravitz RL: Nurse-patientratios: a systematic review on the effects of nurse staffing onpatient, nurse employee, and hospital outcomes. J Nurs Adm2004, 34:326-337.
16. Hollabaugh S, Kendrick S: Staffing: the five-level pyramid. NursManage 1998, 29:34-36.
17. Sochalski J, Aiken LH, Fagin CM: Hospital restructuring in theUnited States, Canada, and Western Europe - An outcomesresearch agenda. Med Care 1997, 35:OS13-OS25.
18. Adams A, Bond S: Staffing in acute hospital wards: part 1. Therelationship between number of nurses and ward organiza-tional environment. J Nurs Manag 2003, 11:287-292.
19. Adams A, Bond S: Staffing in acute hospital wards: part 2. Rela-tionships between grade mix, staff stability and features ofward organizational environment. J Nurs Manag 2003,11:293-298.
20. Vissers J, Beech R: Health operations Management. Patient flow logisticsin health care Edited by: Vissers J and Beech R. London, United King-dom, Routledge; 2005.
21. Van Merode GG, Groothuis S, Hasman A: Enterprise resourceplanning for hospitals. Int J Med Inform 2004, 73:493-501.
22. Siferd SP, Benton WC: A Decision Model for Shift Scheduling ofNurses. Eur J of Oper Res 1994, 74:519-527.
23. Wyatt M, Healey K: Managing capacity and workload in chil-dren's services. Paediatr Nurs 2005, 17:31-34.
24. Seago JA: The California experiment - Alternatives for mini-mum nurse-to-patient ratios. J Nurs Adm 2002, 32:48-58.
25. Forster DA, McLachlan HL, Yelland J, Rayner J, Lumley J, Davey MA:Staffing in postnatal units: is it adequate for the provision ofquality care? Staff perspectives from a state-wide review ofpostnatal care in Victoria, Australia. BMC Health Serv Res 2006,6:83.
26. Nisbet E: Acuity Dependence Tool Implementation ResourcePack. 2006 [http://www.selwdc.nhs.uk/document_information.php?PID=0000000305&DID=00000000000000000805]. South East London Workforce Development Confedera-tion
27. Walker D: A "bottom-line" approach to nurse staffing. NursManage 1996, 27:31-32.
28. De Bruin A, Nijman B, Caljouw R, Visser M, Koole G: Improvingbed utilization [In Dutch: bedden beter bezet]. Zorgvisie 2007.
29. McCue M, Mark BA, Harless D: Nurse staffing, quality, and finan-cial performance. J Health Care Finance 2003, 29:54-76.
30. Hall-McGillis L, Doran D: Nurse staffing, care delivery model,and patient care quality. J Nurs Care Qual 2004, 19:27-33.
Pre-publication historyThe pre-publication history for this paper can be accessedhere:
http://www.biomedcentral.com/1472-6963/7/196/prepub
Page 10 of 10(page number not for citation purposes)