cannabinoids delivery systems based on supramolecular
TRANSCRIPT
HAL Id: tel-00935588https://tel.archives-ouvertes.fr/tel-00935588
Submitted on 23 Jan 2014
HAL is a multi-disciplinary open accessarchive for the deposit and dissemination of sci-entific research documents, whether they are pub-lished or not. The documents may come fromteaching and research institutions in France orabroad, or from public or private research centers.
L’archive ouverte pluridisciplinaire HAL, estdestinée au dépôt et à la diffusion de documentsscientifiques de niveau recherche, publiés ou non,émanant des établissements d’enseignement et derecherche français ou étrangers, des laboratoirespublics ou privés.
Cannabinoids delivery systems based on supramolecularinclusion complexes and polymeric nanocapsules for
treatment of neuropathic painFanny Astruc-Diaz
To cite this version:Fanny Astruc-Diaz. Cannabinoids delivery systems based on supramolecular inclusion complexes andpolymeric nanocapsules for treatment of neuropathic pain. Human health and pathology. UniversitéClaude Bernard - Lyon I, 2012. English. �NNT : 2012LYO10099�. �tel-00935588�
- 1 - | P a g e
N° d’ordre : 99-2012 Année 2012
THESE DE L‘UNIVERSITE DE LYON
Délivrée par
L’UNIVERSITE CLAUDE BERNARD LYON 1
ECOLE DOCTORALE DE CHIMIE
DIPLOME DE DOCTORAT (arrêté du 7 août 2006)
soutenue publiquement le 9 Juillet 2012
par
Mme. ASTRUC-DIAZ Fanny
CANNABINOIDS DELIVERY SYSTEMS BASED ON SUPRAMOLECULAR INCLUSION
COMPLEXES AND POLYMERIC NANOCAPSULES FOR TREATMENT OF NEUROPATHIC
PAIN
Jury Mme. DUCKI Sylvie Rapporteur
M. VIERLING Pierre Rapporteur
M. DUTASTA Jean-Pierre Examinateur
M. PAROLA Stéphane Directeur de thèse
M. THOMPSON Charles Examinateur

- 2 - | P a g e
gÉ `tààxÉ tÇw `tå|Åx?
gÉ c{|Ä|ÑÑx?

- 3 - | P a g e
ACKNOWLEGEMENTS
I would like to give my sincere gratitude to my advisor, Dr. Stephane Parola, for his
confidence and for giving me the opportunity of conducting this Ph.D research.
I wish to give my profoundness appreciation to Dr. Philippe Diaz for his excellence
guidance, patience, caring and time to complete this work.
I would like to thank Dr. Charles Thompson for generously giving me the time and the
support to achieve this project.
I would also like to thank my Jury members for their time to review my dissertation.
I am appreciative of the help I've received from my colleagues at the University of
Montana, Steven McDaniel for the cyclodextrin molecular modeling, Dr. James Driver for
conducting the nanocapsules morphological studies, Dr. Christopher Palmer for his
guidance with the use of the GC-MS, Dr. Ravil Petrov for his help and practical
experience in the laboratory, and Dr. Nicolas Guilloteau and Dr. Yamina Belabassi for
their warm words of encouragement. I am also appreciative for my co-workers at MD
Anderson Cancer Center and Dr. Mohamed Naguib for giving me the opportunity to work
in his laboratory, Dr. Gabriel Lopez-Berestein for teaching me how to make non ionic
liposomes and Dr. Pablo Vivas-Mejia for his help preparing them. I would like to give my
gratitude to Dr. Jon Nagy and Ryan Holly for hosting me in their laboratory and assisting
me with particle sizing studies.
Finally, I would like to thank my friend, Agnes, and my family, my mum and my sister
Melanie for their unconditional trust and support through all this difficult and rewarding
experience, and my dad who passed away before the completion of this thesis. I am
gratefuI to my parents in law, Nelly and Mario for their gentleness and their help taking
care of my sons while I was busy preparing my seminar. I would also like to thank my
sons for their love and patience even when I was frustrated and not available for them.
Most of all, I would like to thank my husband who loved me when I deserved it the least
but when I needed the most.
- 4 - | P a g e
TABLE OF CONTENTS
LIST OF ABBREVIATIONS.……………….………………………………………..- 10 -
INTRODUCTION AND OBJECTIVES.…………………………………………...- 15 -
CHAPTER I: BIBLIOGRAPHY.………………………………………..……….......- 17 -
1. Cannabis. .......................................................................................................... - 17 -
2. Endocannabinoid system. .................................................................................. - 18 -
3. Cannabinoid receptors. ..................................................................................... - 20 -
4. Endocannabinoids.............................................................................................. - 21 -
5. Enzymes. ........................................................................................................... - 23 -
6. Cannabinoid receptor-mediated intracellular signal pathways. .......................... - 26 -
7. Interactions of cannabinoids with some other receptor systems. ....................... - 28 -
8. Drug of abuse..................................................................................................... - 30 -
9. Therapeutic cannabinoid derivatives on the market. .......................................... - 31 -
10. Phytocannabinoids. ............................................................................................ - 32 -
11. Pain. ................................................................................................................... - 34 -
11.1. Physiological pain............................................................................................ - 34 -
11.2. Neuropathic pain. ............................................................................................ - 37 -
12. CB2 receptors: a target for Neuropathic Pain treatment? .................................. - 42 -
13 References. ........................................................................................................ - 44 -
CHAPTER II EARLY FORMULATION AND ENABLING DRUG DELIVERY SYSTEMS DESIGN.............................................................................................. - 62 -
1 Introduction. ................................................................................................ ……- 62 -
1.2 Cyclodextrins. .................................................................................................. - 65 -
1.2.1 Cyclodextrins and complexation. ............................................................................... - 67 -
1.3 Liposomes. ...................................................................................................... - 78 -
1.4 Micelles. .......................................................................................................... - 82 -
- 5 - | P a g e
1.5 Oral Self-Emulsifying Drug Delivery System (SEDDS). ……………………….- 87 -
2 Development of enabling Drug Delivery Systems for the in vivo administration of a
series of lipophilic synthetic cannabinoids. ......................................................... - 89 -
2.1 MDA7. ............................................................................................................. - 91 -
2.2 MDA7 physico-chemical properties. ................................................................ - 91 -
2.3 In vitro characterization of MDA7. ................................................................... - 92 -
2.4 Enabling Drug Delivery System design and development. .............................. - 94 -
2.4.1 Preformulation studies. .............................................................................................. - 95 -
2.4.2 MDA7 enabling DDS design and development. ................................................... - 97 -
2.5 In vivo characterization of MDA7. .................................................................. - 130 -
2.5.1 Pharmacokinetic study. ................................................................................... - 130 -
2.5.2 Influence of the DDS selected on MDA7 in vivo efficacy. .................................... - 132 -
2.5.3 Effect of MDA7 administered intraperitoneally on models of nociception in rats. ….- 135 -2.5.4 Effects of MDA7 on tactile allodynia in the spinal nerve ligation model of neuropathic pain. ……………………………………………………………………………………….- 136 -2.5.5 Effects of MDA7 on tactile allodynia in a paclitaxel-induced neuropathic pain model.
…………………………………………………………………………………………… - 139 -
2.5.6 Open-field chamber testing...................................................................................... - 140 -
2.6 Other cannabinoids evaluated in vivo............................................................ - 141 -
3 Summary and Conclusion. ............................................................................... - 144 -
4 References. ...................................................................................................... - 146 -
CHAPTER III CATIONIC POLYMERIC NANOCAPSULES.…......………- 159 -
1 Review. ............................................................................................................ - 159 -
1.1 Structure of drug-loaded nanoparticles. ........................................................ - 159 -
2 Applications of drug-loaded polymeric nanoparticles. ...................................... - 160 -
3 Nanoparticles uptake in cells............................................................................ - 161 -
4 Drug-loaded nanoparticles composition and bioadhesion. ............................... - 161 -
5 Methods of preparation of polymeric drug-loaded nanoparticles. ..................... - 162 -
6 Nanoprecipitation of preformed polymer. ......................................................... - 163 -
- 6 - | P a g e
7 Nanoparticles and oral delivery. ....................................................................... - 164 -
8 Concepts of the study. ..................................................................................... - 165 -
8.1 Theragnostic drug-loaded polymeric nanocapsules. ..................................... - 165 -
8.2 Bioadhesive polymeric nanocapsules for oral delivery of a lipophilic drug. ... - 170 -
9 Polymer materials selected. ............................................................................. - 170 -
10 Beta-caryophyllene as a model drug. ............................................................... - 172 -
11 Objectives of the study. .................................................................................... - 173 -
12 Results and discussion. ................................................................................... - 175 -
12.1 (E)-BCP. ........................................................................................................ - 175 -
12.1.1 Purification ............................................................................................................... - 175 -
12.1.2 Stability. ................................................................................................................... - 175 -
12.2 GC-MS method development for the determination of (E)-BCP entrapment
efficiency and stability in drug-loaded nanocapsules..................................... - 176 -
12.2.1 Calibration and recovery. ......................................................................................... - 176 -
12.2.2 (E)-BCP extraction method. ..................................................................................... - 181 -
13 Drug-loaded nanocapsules preparation. .......................................................... - 182 -
14 Selection of the organic solvent. ...................................................................... - 183 -
15 Preliminary results............................................................................................ - 184 -
15.1 Freeze-drying and cryoprotectants selection. ................................................ - 185 -
15.2 Solvent removal conditions and monitoring. .................................................. - 186 -
15.3 Optimization of solvent phase addition flow-rate. .......................................... - 189 -
16 Physicochemical parameters associated with NCs formation. ......................... - 189 -
16.1 Influence of polymer to solvent phase ratio. .................................................. - 190 -
16.2 Influence of drug to polymer ratio. ................................................................. - 193 -
16.3 Influence of polymer-to-solvent phase ratio on drug-loaded NCs. ................. - 195 -
16.4 Influence of solvent phase nature and ratio on drug-loaded NCs. ................. - 197 -
16.5 Influence of solvent-to-non-solvent ratio on drug-loaded NCs by changing the
volume of the continuous phase. ................................................................... - 200 -
- 7 - | P a g e
16.6 Influence of stabilizing agents on drug-loaded NCs. ..................................... - 202 -
16.7 Influence of type of polymer on drug-loaded NCs. ........................................ - 204 -
16.8 Influence of the incorporation of a fluorescent probe on drug-loaded NCs… - 206 -
16.9 Influence of macrocycles- drug-loaded NCs supramolecular assemblies on drug-
loaded NCs physicochemical characteristics. ............................................... - 207 -
16.10 Chemical stability of (E)-BCP encapsulated in polymeric nanocapsules. ..... - 211 -
17 Summary and Conclusion. ............................................................................... - 211 -
18 References. ...................................................................................................... - 213 -
CHAPTER IV EXPERIMENTAL.…………….…………………………………... - 224 -
1 MDA7 purity determination. .............................................................................. - 225 -
1.1 LC-UV-MS. .................................................................................................... - 225 -
1.1.1 Sample Preparation. ................................................................................................ - 225 -
1.1.2 LC-UV-MS Methodology. ......................................................................................... - 225 -
1.2 Results. ......................................................................................................... - 226 -
1.3 1H NMR. ........................................................................................................ - 228 -
2 MDA7 solubility determination. ......................................................................... - 229 -
3 In vitro MDA7 pharmacological characterization. ............................................. - 230 -
3.1 Materials. ....................................................................................................... - 230 -
3.2 In vitro receptor radioligand binding studies. ................................................. - 230 -
3.2.1 Human CB1 and CB2 binding studies....................................................................... - 230 -
3.2.2 Rat CB1 and CB2 receptor-binding studies. ............................................................ - 231 -
3.2.3 GTP [35
S] functional assays. ................................................................................... - 232 -
4 Enabling Drug Delivery System Design and Development. ............................. - 233 -
4.1 Materials. ....................................................................................................... - 233 -
4.2 Preformulation studies................................................................................... - 234 -
4.2.1 Kinetic solubility procedure adapted from Li et al.… ........................................... - 234 -
4.3 Micellar system.............................................................................................. - 234 -
4.3.1 Preparation. ............................................................................................................. - 234 -
- 8 - | P a g e
4.3.2 In vitro static serial dilution method.......................................................................... - 234 -
4.3.3 Microscopic observation. ......................................................................................... - 235 -
4.3.4 Particle size measurement. ..................................................................................... - 235 -
4.3.5 MDA7 chemical stability by 1H-NMR. ...................................................................... - 236 -
4.3.6 MDA7 chemical stability by UPLC-MS.. ............................................................ - 238 -
4.4 Oral Self-emulsifying Drug delivery System (SEDDS)................................... - 241 -
4.4.1 Preparation. ............................................................................................................. - 241 -
4.4.2 Microscopic observation. ......................................................................................... - 241 -
4.4.3 Particle size measurement. ..................................................................................... - 241 -
4.4.4 MDA7 chemical stability assessment by UPLC-MS. ............................................... - 242 -
4.5 Liposomes. .................................................................................................... - 242 -
4.5.1 Preparation. ............................................................................................................. - 242 -
4.5.2 Morphology. ............................................................................................................. - 242 -
4.5.3 Microscopic observation. ......................................................................................... - 243 -
4.5.4 MDA7 chemical stability assessment by 1H NMR.................................................... - 243 -
4.5.5 Particle size measurement. ..................................................................................... - 244 -
4.6 Cyclodextrins. ................................................................................................ - 245 -
4.6.1 Preparation of complexes. ....................................................................................... - 245 -
4.6.2 NMR spectroscopy. ................................................................................................. - 245 -
4.6.3 Phase solubility studies. .......................................................................................... - 246 -
4.6.4 Differential scanning calorimetry (DSC)................................................................... - 247 -
4.6.5 ESI-MS analysis. ..................................................................................................... - 247 -
4.6.6 Continuous variation method (Job’s plots)............................................................... - 248 -
4.6.7 Enantiomeric recognition. ........................................................................................ - 249 -
4.6.8 Molecular modeling.................................................................................................. - 250 -
4.6.9 Transmission electron microscopy (TEM). .............................................................. - 251 -
4.6.10 Particle size measurement. ..................................................................................... - 251 -
4.6.11 MDA7 chemical stability assessment by UPLC-MS. ............................................... - 253 -
4.6.12 MDA7 chemical stability assessment by 1H NMR.................................................... - 253 -
5 In vivo characterization of MDA7...................................................................... - 255 -
5.1 Pharmacokinetic study. ................................................................................. - 255 -
- 9 - | P a g e
5.2 Influence of the DDS selected on MDA7 in vivo efficacy. .............................. - 256 -
5.2.1 Drug administration......................................................................................... - 256 -
5.2.2 Assessment of mechanical withdrawal thresholds. ………………………………..- 256 -
5.3 In vivo MDA7 effect administered i.p. in different models of nociception in rats.
...................................................................................................................... - 257 -
5.3.1 Compounds and dosing solutions............................................................................ - 257 -
5.3.2 Animals. ................................................................................................................... - 257 -
5.3.3 Assessment of mechanical withdrawal thresholds.............................................. - 258 -
5.3.4 Spinal nerve (L5/6) ligation model of neuropathic pain............................................ - 258 -
5.3.5 Paclitaxel-induced neuropathy model. ..................................................................... - 258 -
5.3.6 Assessment of mechanical withdrawal thresholds. ................................................. - 259 -
5.3.7 Assessment of paw withdrawal latencies in response to noxious heat. .................. - 259 -
5.3.8 Open-field chamber testing...................................................................................... - 260 -
5.3.9 Data analysis. .......................................................................................................... - 260 -
6 Nanocapsules. ................................................................................................. - 261 -
6.1 Materials. ....................................................................................................... - 261 -
6.2 (E)-BCP Purification. ..................................................................................... - 261 -
6.3 (E)-BCP entrapment efficiency, drug loading and stability in nanoacapsules. - 262 -
6.3.1 Equipment and instrumentation. .............................................................................. - 262 -
6.3.2 Standards preparation. ............................................................................................ - 262 -
6.3.3 Samples preparation. ...................................................................................... - 262 -
6.4 Preparations of EBCP nanoparticles. ............................................................ - 263 -
6.5 Particle size measurement. ........................................................................... - 264 -
6.5.1 Morphological analysis. ........................................................................................... - 271 -
7 References. ...................................................................................................... - 273 -
CONCLUSION.…………………….…………………………………..……………… - 275 -
- 10 - | P a g e
LIST OF ABBREVIATIONS
AAC Adenylate cyclase AEA Anandamine 2-AG 2-arachidonylglycerol AIDS Acquired immunodeficiency syndrome AUC Area under curve BBCS Biopharmaceutics Classification System BSA Bovine serum albumin BSCB Blood-spinal cord barrier CCBD CannabidiolCBs Cannabinoids CB1 Cannabinoid receptor 1 CB2 Cannabinoid receptor 2 CCI Chronic constriction nerve injury CDs Cyclodextrins CE Complexation efficiency CIPN Chemotherapy-induced peripheral neuropathy CMC Critical micelle concentration CNS Central Nervous System CrELP Cremophor™ ELP CB[n] Cucurbituril CV Coefficient of variation DDDS Drug delivery system DLS Dynamic Light Scattering DMF Drug master file dPN Diabetic peripheral neuropathy DMSO Dimethyl sulfoxide DMPC Dimyristoylphosphatidyl choline DPN Distal peripheral neuropathy DRG Dorsal root ganglia DSE Depolarization-Induced Suppression of Excitation
- 11 - | P a g e
DSI Depolarization-Induced Suppression of Inhibition E(E)-BCP Beta-caryophyllene
Dielectric constant EC50 Half maximal effective concentration ECs Endocannbinoids system eCBs Endocannabinoids EE Entrapment efficiency EMEA European Medicines Agency EMT Enzyme membrane transporter EPR Enhanced Permeability and Retention ERK1/2 Extracellular signal-regulated kinase-1 and -2 ESI-MS Electrospray mass spectrometry EtOH Ethanol Eud Eudragit FFAAH Fatty acid amide hydrolase FLAT FAAH-like anandamide transporter FDA Food and Drug Administration FTIR Fourier transform infrared spectroscopy GGALT Gut-associated lymphoid tissue
Hildebrand solubility parameter GRAS Generally regarded as safe GC-MS Gas chromatography–mass spectrometry GDP Guanosine diphosphate GI Gastrointestinal GIRK Inwardly rectifying potassium channels GIT Gastrointestinal tract Gln Glutamine Glu Glutamate GTP Guanosine triphosphate HHLB Hydrophilic lipophylic balance (5-HT)3 Serotonin receptor HP CD Hydroxypropyl- -cyclodextrin HP CD Hydroxypropyl- -cyclodextrin
- 12 - | P a g e
HPLC High performance liquid chromatographyIIC50 Median inhibition concentration IENF Intraepidermal nerve fibers IIG Inactive Ingredient Guide i.m. Intramuscular i.p. Intraperitoneal i.v. Intravenous JJNK c-Jun N terminal kinase KKI Inhibition constant LLC/MS/MS liquid chromatography/tandem mass spectrometric LD50 Half lethal dose Log P Partition Coefficient MMA Maleic acid MAGL Monoacylglycerol lipase MAPK Mitogen-activated protein kinases MeOH Methanol MLVs Multilamellar vesicles MS Multiple sclerosis MPS Mononuclear Phagocytic System NnACh Acetylcholine Receptor NADA N-Arachidonoyldopamine NAGly N-arachidonylglycine NAPE N-acyl-phosphatidylethanolamine NAPE-PLD N-acyl-phosphatidylethanolamine hydrolyzing phospholipase D NCE New chemical entity NMDA N-Methyl-D-aspartate receptor NMP N-methyl-2-pyrrolidone NMR Nuclear magnetic resonance NO Nitric oxide NOESY Nuclear Overhauser effect spectroscopyNP Neuropathic pain
- 13 - | P a g e
NPs Nanoparticles NS Nanosuspension OOEA N-oleoylethanolamine OLVs Oligolamellar vesicles OR Ostwald ripening PP80 Polysorbate 80 PAA N-palmitoylethanolamine-preferring acid amidase PBS Phosphate buffer saline PC Phosphatidylcholine pCBs PhytocannabinoidsPCS Photon Correlation Spectroscopy PD Pharmacodynamy PDA Photo diode array PDI Polydispersity index PEA N-palmitoylethanolamine PEG Polyethylene glycol PG Propylene glycol PI3K Phosphoinositide 3-kinase PIN Paclitaxel-induced neuropathy PK Pharmacokinetic PLA Poly(lactic acid) PLGA Poly(lactic-co-glycolic acid) PNS Peripheral nervous system pol/ solv. Polymer to solvent ratio PPAR Peroxisome proliferator-activated receptors
Solvent/non-solvent interaction parameter RRES ReticuloEndothelial System Rf Retention factor RM CD Randomly methylated -cyclodextrinROESY Rotating-frame NOE spectroscopy SSBE CD Sulfobutylether- -cyclodextrin sodium salt SEDDS Self-Emulsifying Drug Delivery System s.c. Subcutaneous
- 14 - | P a g e
SEM Scanning Electron microscopy SNL Spinal nerve ligation TTBOA DL-threo- -benzyloxyaspartate TEM Transmission Electron Miscroscopy THC Tetrahydrocannabinol THF Tetrahydrofuran TLC Thin layer chromatography TRPV1 Transient Receptor Potential Vanilloid type-1 UUNODC United Nations Office on Drugs and Crimes USP Pharmacopeia of the United States ZZ-average Mean diameter of particles
- 15 - | P a g e
INTRODUCTION AND OBJECTIVES
Up to 8%5 of the European population and approximately 3.8 million individuals in the
United States6 are affected by Neuropathic pain (NP). NP is generally chronic and
disabling and challenging to treat with only 40-60% of patients achieving partial relief7.
Neuropathic pain may arise as a consequence of a lesion or disease affecting the
somatosensory system and could be CNS or PNS related8. The management of patients
with chronic NP is complex and response to existing treatments often inadequate9.
Common therapeutics include antidepressants, antiepileptic, opioids and tramadol. The
therapeutic potential of cannabinoids has recently been investigated following the
discovery of the endocannabinoid system and is gaining clinical acceptance to improve
NP outcomes, particularly for CB2 receptors agonists which have shown to produce
antinociception without psychotropic effect10-14. Synthetic and natural cannabinoids
compounds are generally lipophilic in nature and evidence indicates that lipophilicity may
be of importance for potentializing their therapeutic activity15-16. Furthermore,
pharmacological activity of a drug is the result of affinity and interaction with its biological
target but also optimum and reliable exposure at the target site. Appropriate drug delivery
system (DDS) are thereby required to deliver the drug at a sufficient concentration to the
site of action. The goals of this research project were 1) to design, develop and study an
early drug delivery system allowing in vivo PK and PD studies of a selective CB2 agonist
recently synthesized in our laboratory, 2) to design and elaborate a DDS based on
cationic nanocapsules for a highly lipophilic natural CB2 agonist for future theragnostic
applications.
Chapter I is a bibliography review defining the endocannabinoid system i.e. receptors,
endocannabinoids, enzymes, transporters and its signaling pathway as well as an
overview of the family of synthetic and natural cannabinnoid compounds and their
therapeutical use. Finally, pain and neuropathic pain mechanisms are approached and
their potential treatment using CB2 agonists discussed.
- 16 - | P a g e
In Chapter II, we designed and characterized different DDS for CB2 agonists
synthesized in our laboratory namely, co-solvent/surfactant micellar system, self-
emulsifying drug delivery system (SEDDS), cyclodextrin inclusion complexes and
liposomal suspension, to support in vivo PK/PD studies. We also compared their
influence on the activity of our lead compound MDA7 on a model of neuropathic pain in
rats. A thorough investigation of MDA7-hydroxypropyl cyclodextrin complexes formation
has been conducted to afford a better understanding of this promising and efficient DDS
for the delivery of lipophilic cannabinoids.
In Chapter III, we designed and characterized cationic drug-loaded polymeric
nanocapsules obtained by a nanoprecipitation method, for the delivery of a model drug, a
natural CB2 agonist, beta-caryophyllene [(E)-BCP]. We investigated the impact of
various factors and operating conditions on the formation of nanocapsules, and optimize
their size, size distribution and drug entrapment efficiency. The aim was to develop a
protective and mucoadhesive colloidal carrier for the oral delivery of the oxidation
sensitive (E)-BCP, applicable to other cannabinoids for in vivo administration.
Using the well characterized cationic nanocapsules developed, we generated
preliminary results on the feasibility and characterization of macrocycles-nanocapsules
complexes formation, based on host-guest/electrostatic interactions and counterionic
condensation with respectively cucurbituril and sulfobutyl ether-beta-cyclodextrins.
Fluorescent dye has also been incorporated in order to further use these complexes as
sensitive and highly-specific probes providing a unique concept of theragnostic
combining diagnostic/imaging to assess the efficiency of drug delivery and possible
mechanisms of nanocapsules bioabsorption, and therapeutic activity.
- 17 - | P a g e
CHAPTER I BIBLIOGRAPHY
1. Cannabis.
Cannabinoids have been used as therapeutic agent for more than 4000 years in China
and across many ancient cultures. The two most referenced cannabinoids preparations,
named differently depending on the culture, are marijuana and hashish. Both
preparations are derived from the hemp plant Cannabis sativa L., (Cannabaceae).
Hashish is composed of cannabis resin secreted by glands called Trichomes. The
ethymology of this word is still debated and associated from the Middle ages with a chiite
sect called hashishins. In India, Hashish has been used for centuries for religious and
medicinal purpose and is called Charas. Marijuana is dried leaves and female flower
heads. Cannabis was included in the earliest Chinese Pharmacopeia Shen-nung pen
ts’ao ching (divine Husbandman’s material medica)17.
Innumerable indications for cannabis therapeutic uses have been reported such
as analgesic, anticonvulsant, hypnotic, tranquilizer, anesthetic, anti-inflammatory,
antibiotic, antiparasite, antispasmodic, digestive, appetite stimulant, diuretic, aphrodisiac
or anaphrodisiac, antitussive, expectorant and others18. The introduction of cannabis in
European medicine and then in North America occurred in the midst of the 19th century.
Pharmaceuticals laboratories (i.e. Merck, Bristol-Meyers, Eli Lilly) commercialized
cannabis extracts or tinctures.
From the early 20th century to the current phase III clinical trial in USA or the recent
approval in Europe and Canada of Sativex (GW Pharmaceuticals), the use of cannabis
derivatives as medicinal agent has been the subject of controversy. Despite its
therapeutic potential, cannabis is today considered as a potential drug of abuse which
has been hampering the development of new cannabinoids derivatives as therapeutics.
Potential side effects are discussed in section 8.
Cannabis extracts contains more than 460 compounds of which around 70 are
considered as phytocannabinoids19. The primary psychoactive phytocannabinoid of
cannabis is delta-9-tetrahydrocannabinol, commonly known as 9-THC, and scheduled I
by the DEA. Despite early intense use, medicinal cannabis use declined likely because of
- 18 - | P a g e
readily available aspirin and opioids treatments and cannabis criminalization (i.e.1937 in
the United States, 1970 in France, 1971 in UK).
2. Endocannabinoid system.
In recent years, several endogenous lipids, named endocannabinoids (eCBs), have been
shown to activate cannabinoid receptors (CBs), which are also the molecular targets of
phytocannabinoids such as the 9-THC. The identification of an endogenous
cannabinoids system (ECs) renewed in the late 20th century the interest for
cannabinoids as potential therapeutics. The ECs is defined as the signaling system
consisting of eCBs together with their target receptors, the presumed endocannabinoid
membrane transporters and the enzymes and other proteins regulating the tissue levels
of eCBs. The ECs plays a key role in mediating and modulating numerous fundamental
physiological processes involving CNS and autonomic nervous system, immune,
endocrine, reproductive and cardiovascular activity20-22. Imbalance in the ECs results in
the impairment of various processes including neuroinflammation, immunomodulation
and food control. Because of the modulation of these processes, ECs has been involved
in different pathologies such as Alzheimer disease23-24, multiple sclerosis25-26, Parkinson
disease,27 chronic and inflammatory pain11,28-32, cancer33-34, nausea vomiting35, obesity36-
37, epilepsy38 ,glaucoma39 ,asthma40, mood disorders41-42.
- 19 - | P a g e
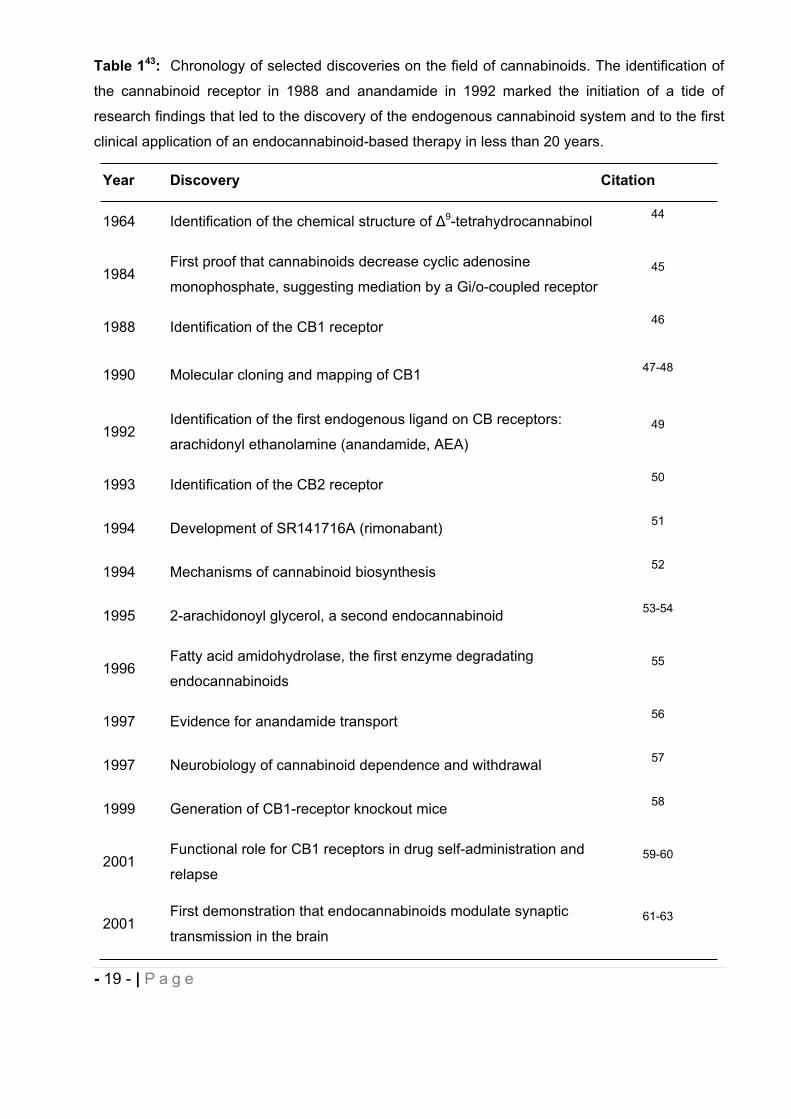
Table 143: Chronology of selected discoveries on the field of cannabinoids. The identification of
the cannabinoid receptor in 1988 and anandamide in 1992 marked the initiation of a tide of
research findings that led to the discovery of the endogenous cannabinoid system and to the first
clinical application of an endocannabinoid-based therapy in less than 20 years.
Year Discovery Citation
1964 Identification of the chemical structure of 9-tetrahydrocannabinol 44
1984First proof that cannabinoids decrease cyclic adenosine
monophosphate, suggesting mediation by a Gi/o-coupled receptor45
1988 Identification of the CB1 receptor 46
1990 Molecular cloning and mapping of CB1 47-48
1992Identification of the first endogenous ligand on CB receptors:
arachidonyl ethanolamine (anandamide, AEA)49
1993 Identification of the CB2 receptor 50
1994 Development of SR141716A (rimonabant) 51
1994 Mechanisms of cannabinoid biosynthesis 52
1995 2-arachidonoyl glycerol, a second endocannabinoid 53-54
1996Fatty acid amidohydrolase, the first enzyme degradating
endocannabinoids55
1997 Evidence for anandamide transport 56
1997 Neurobiology of cannabinoid dependence and withdrawal 57
1999 Generation of CB1-receptor knockout mice 58
2001Functional role for CB1 receptors in drug self-administration and
relapse59-60
2001First demonstration that endocannabinoids modulate synaptic
transmission in the brain61-63
- 20 - | P a g e
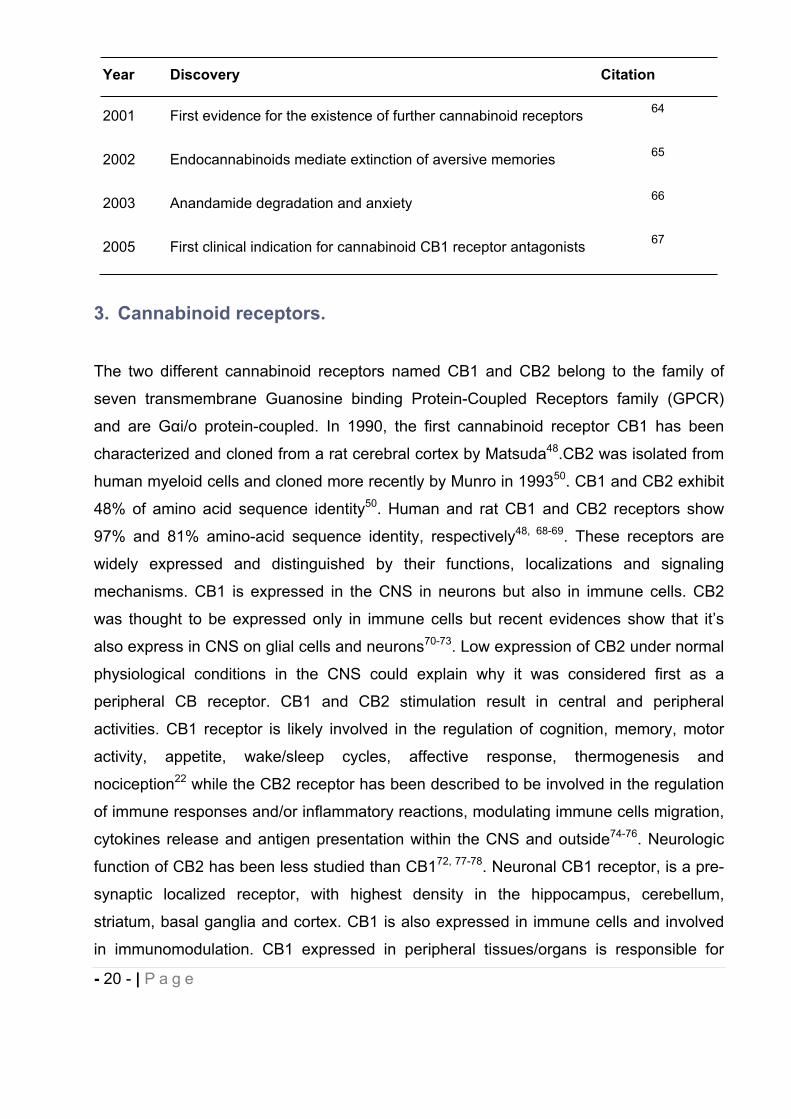
Year Discovery Citation
2001 First evidence for the existence of further cannabinoid receptors 64
2002 Endocannabinoids mediate extinction of aversive memories 65
2003 Anandamide degradation and anxiety 66
2005 First clinical indication for cannabinoid CB1 receptor antagonists 67
3. Cannabinoid receptors.
The two different cannabinoid receptors named CB1 and CB2 belong to the family of
seven transmembrane Guanosine binding Protein-Coupled Receptors family (GPCR)
and are G i/o protein-coupled. In 1990, the first cannabinoid receptor CB1 has been
characterized and cloned from a rat cerebral cortex by Matsuda48.CB2 was isolated from
human myeloid cells and cloned more recently by Munro in 199350. CB1 and CB2 exhibit
48% of amino acid sequence identity50. Human and rat CB1 and CB2 receptors show
97% and 81% amino-acid sequence identity, respectively48, 68-69. These receptors are
widely expressed and distinguished by their functions, localizations and signaling
mechanisms. CB1 is expressed in the CNS in neurons but also in immune cells. CB2
was thought to be expressed only in immune cells but recent evidences show that it’s
also express in CNS on glial cells and neurons70-73. Low expression of CB2 under normal
physiological conditions in the CNS could explain why it was considered first as a
peripheral CB receptor. CB1 and CB2 stimulation result in central and peripheral
activities. CB1 receptor is likely involved in the regulation of cognition, memory, motor
activity, appetite, wake/sleep cycles, affective response, thermogenesis and
nociception22 while the CB2 receptor has been described to be involved in the regulation
of immune responses and/or inflammatory reactions, modulating immune cells migration,
cytokines release and antigen presentation within the CNS and outside74-76. Neurologic
function of CB2 has been less studied than CB172, 77-78. Neuronal CB1 receptor, is a pre-
synaptic localized receptor, with highest density in the hippocampus, cerebellum,
striatum, basal ganglia and cortex. CB1 is also expressed in immune cells and involved
in immunomodulation. CB1 expressed in peripheral tissues/organs is responsible for
- 21 - | P a g e
energy metabolism such as in liver, gastrointestinal tract, pancreas, white and brown
adipose tissue or skeletal muscle79-80. In less extent CB1 is present in adrenal gland,
bone marrow, heart, lung, prostate and testicles/ovaries81.
CB2 receptors are expressed mainly on immune tissues and cells such as spleen,
tonsils, monocytes, and B and T lymphocytes, macrophages, natural killer cells, but also
in skeletal muscle. Importantly, CB2 is expressed in the CNS immune cells, microglia82,
cerebromicrovascular endothelial cells83 and possibly astrocytes84 and its expression is
increased after inflammation. Onaivi was one of the pioneers85 to demonstrate that CB2
receptors and their gene transcripts are also widely distributed in the CNS under normal
physiologic conditions. The expression of CB2 receptors in glial but also neuronal cells in
the brain suggests that CB2 receptors may play broader roles in the CNS than previously
appreciated71-72,86-88. CB2 has been subject to less investigation than CB1 and since it
has no or less severe psychoactive effect, it is emerging as a new phamocological target
for the treatment of schizophrenia89-90 or addiction91.
These two receptors are capable of binding a variety of endogenous and exogenous
chemical ligands acting as agonist or antagonist which arise new development strategies
for treatment of diseases.
4. Endocannabinoids.
The best studied and the most active eCBs as yet described are anandamide (AEA)49 an
ethanolamide derivative of arachidonic acid derived from sanskrit word ananda meaning
bliss, and 2-arachidonylglycerol (2-AG)53-54 (Fig. 1 ). AEA and 2-AG and eCBs in general
are ligands at both of CB1 and CB2 with higher affinity for CB192. AEA is also described
as a partial agonist at CB193, a weak CB2 agonist and can activate the non CB
capsaicin/vanilloid receptor named transient receptor potential vanilloid type-1 (TRPV1)
channel. 2-AG is a full agonist at both CB1 and CB2 receptors, more efficacious and 170
to 1000-fold more concentrated than AEA in the brain54,94-95. Due to their lipophilic nature,
eCBs are local mediators, biosynthetized on-demand and released immediately from
cells. In the CNS, eCBs act as retrograde neuromodulators, released from post-synaptic
neurons and acting at CB1 on pre-synaptic axon terminals96, modulating the release or
reuptake of neurotransmitters to prevent the development of excessive neuronal activity.
- 22 - | P a g e
Thereby, eCBs maintain homeostasis in the CNS under physiological and pathological
conditions97.
CB2 activation in brain microglial cells82, 98-99, astrocytes100 and oligodendrocytes101-102
regulate neuroinflammation and provide neuroprotection by attenuating proinflammatory
agents release such IL-1 , TNF or nitric oxide (NO) as well as inhibiting other
inflammatory mediators23, 103-104. CB2 cell distribution has remained controversial due to
uncertainty of experimental approaches used or specificity of some methodological tools
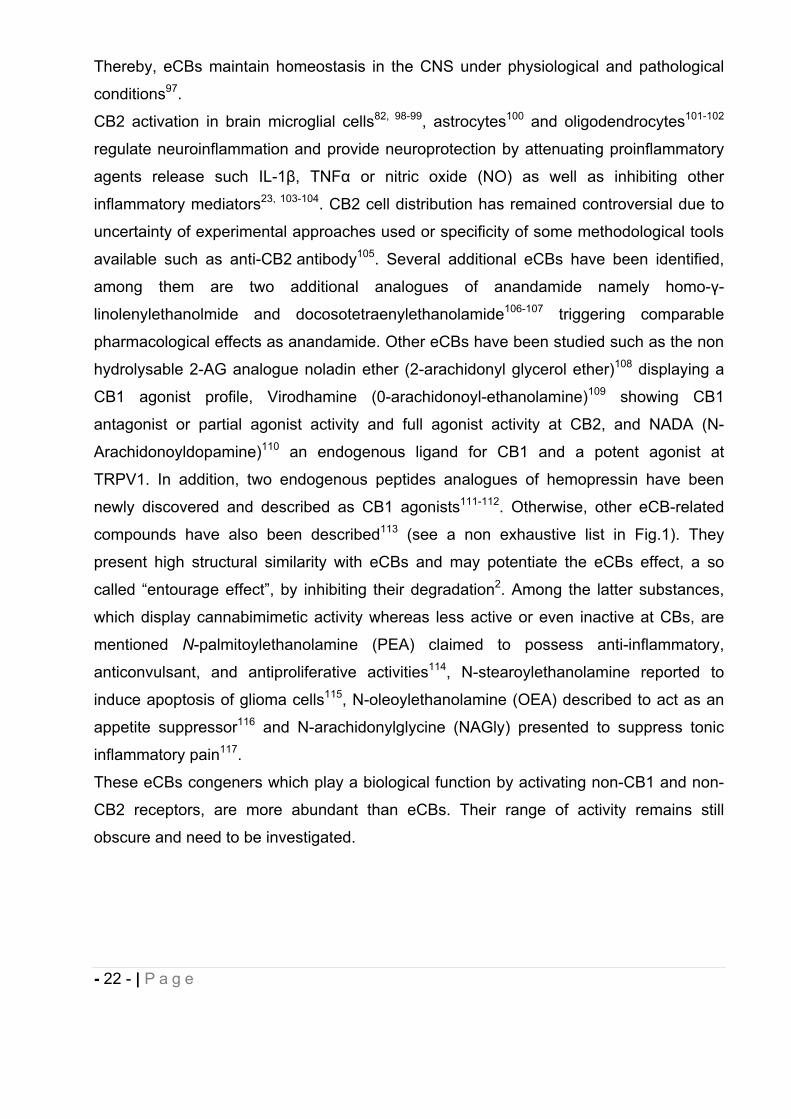
available such as anti-CB2 antibody105. Several additional eCBs have been identified,
among them are two additional analogues of anandamide namely homo- -
linolenylethanolmide and docosotetraenylethanolamide106-107 triggering comparable
pharmacological effects as anandamide. Other eCBs have been studied such as the non
hydrolysable 2-AG analogue noladin ether (2-arachidonyl glycerol ether)108 displaying a
CB1 agonist profile, Virodhamine (0-arachidonoyl-ethanolamine)109 showing CB1
antagonist or partial agonist activity and full agonist activity at CB2, and NADA (N-
Arachidonoyldopamine)110 an endogenous ligand for CB1 and a potent agonist at
TRPV1. In addition, two endogenous peptides analogues of hemopressin have been
newly discovered and described as CB1 agonists111-112. Otherwise, other eCB-related
compounds have also been described113 (see a non exhaustive list in Fig.1). They
present high structural similarity with eCBs and may potentiate the eCBs effect, a so
called “entourage effect”, by inhibiting their degradation2. Among the latter substances,
which display cannabimimetic activity whereas less active or even inactive at CBs, are
mentioned N-palmitoylethanolamine (PEA) claimed to possess anti-inflammatory,
anticonvulsant, and antiproliferative activities114, N-stearoylethanolamine reported to
induce apoptosis of glioma cells115, N-oleoylethanolamine (OEA) described to act as an
appetite suppressor116 and N-arachidonylglycine (NAGly) presented to suppress tonic
inflammatory pain117.
These eCBs congeners which play a biological function by activating non-CB1 and non-
CB2 receptors, are more abundant than eCBs. Their range of activity remains still
obscure and need to be investigated.
- 23 - | P a g e
5. Enzymes
The enzymes responsible for catabolic and the biosynthetic pathways of AEA and 2-AG
have been an attractive target for the synthetic chemists. Drugs that interfere with these
enzymes can pharmacologically regulate the eCBs levels and thereby the CB receptors
without interacting with them. AEA and 2-AG are produced on demand through multiple
biosynthetic pathways, which encompasses N-acyl-phosphatidylethanolamine (NAPE)-
hydrolyzing phospholipase D (NAPE-PLD) for AEA,118 and sn-1-specific diacylglycerol
lipase and phospholipase C for 2-AG119. The degradation of eCBs occurs through
different pathways including the major hydrolytic enzymes fatty acid amide hydrolase
(FAAH) for AEA. Although 2-AG also acts as a substrate for FAAH, monoacylglycerol
lipase (MAGL) is considered the primary enzyme of 2-AG degradation120. To a lesser
extent other intracellular enzymes have a role in the AEA and 2-AG degradation
including N-palmitoylethanolamine-preferring acid amidase (PAA), cyclooxygenase-2,
lipoxygenases and cytochrome P450. Recently, two additional enzymes have been
described to be responsible of a portion of 2-AG hydrolysis, ABHD6121, and ABHD12.
MAGL, ABHD6 and ABHD12 collectively account for at least 98% of the total 2-AG
hydrolase activity in brain but each enzyme exhibits a distinct subcellular distribution,
suggesting that they may regulate distinct pools of 2-AG in the nervous system122. These
enzymes are intracellular and require the reuptake of eCBs implying a putative
Figure 1: Endocannabinoid-related compounds. SEA: steroylethanolamide; OEA:oleoylethanolamide; 2-OG: 2-oleoylglycerol; PEA:palmitoyethanolamide; 2-PG: 2-palmitoylglycerol; LEA: linoleoyethanolamide; 2-LG: 2-linoleoylglycerol.
O
NH
OHO
OOH
OH
OOH
OH O
ON
O
NH
OH
O
NH2
O
NH
OH
O
NH
OH
O
O
OH
O
OOH
OH O
NH
OHO
OOH
OH
O
NH
OH
O
NH
OH
O
NH
O
NH
O O
OH
O O
OH
2-AG AEA NOLADINE VIRHODAMINE
SEA OLEAMIDEOEA 2-OG
PEA 2-PG LEA 2-LG
N-ARACHIDONOYLGLICINE N-ARACHIDONOYLALANINE N-ARACHIDONOYL GAMMA AMINOBUTYRIC ACID
N-ARACHIDONOYLSERINE
- 24 - | P a g e
transporter (EMT)123-125 for metabolism. A variant of the anandamide-degrading enzyme
fatty acid amide hydrolase (FAAH), termed FAAH-like anandamide transporter (FLAT),
that lacked amidase activity but bound anandamide with low micromolar affinity and
facilitated its translocation into cells has been recently identified as the first EMT126.
These biosynthetic or degradative enzymes allow metabolic control of the endogenous
tone of eCBs, and hence they regulate the biological activities of these substances.
The number of members of ECs is still increasing and might soon include non-CB1 non-
CB2 receptors for endocannabinoids, endocannabinoid-related molecules with little
activity at CB1 and CB2 receptors, and new enzymes for the biosynthesis and
degradation of these molecules. The ECs can be described as a pleiotropic and locally
acting pro-homeostatic signaling system activated ‘on demand’ following perturbation of
cell homeostasis2.
- 25 - | P a g e
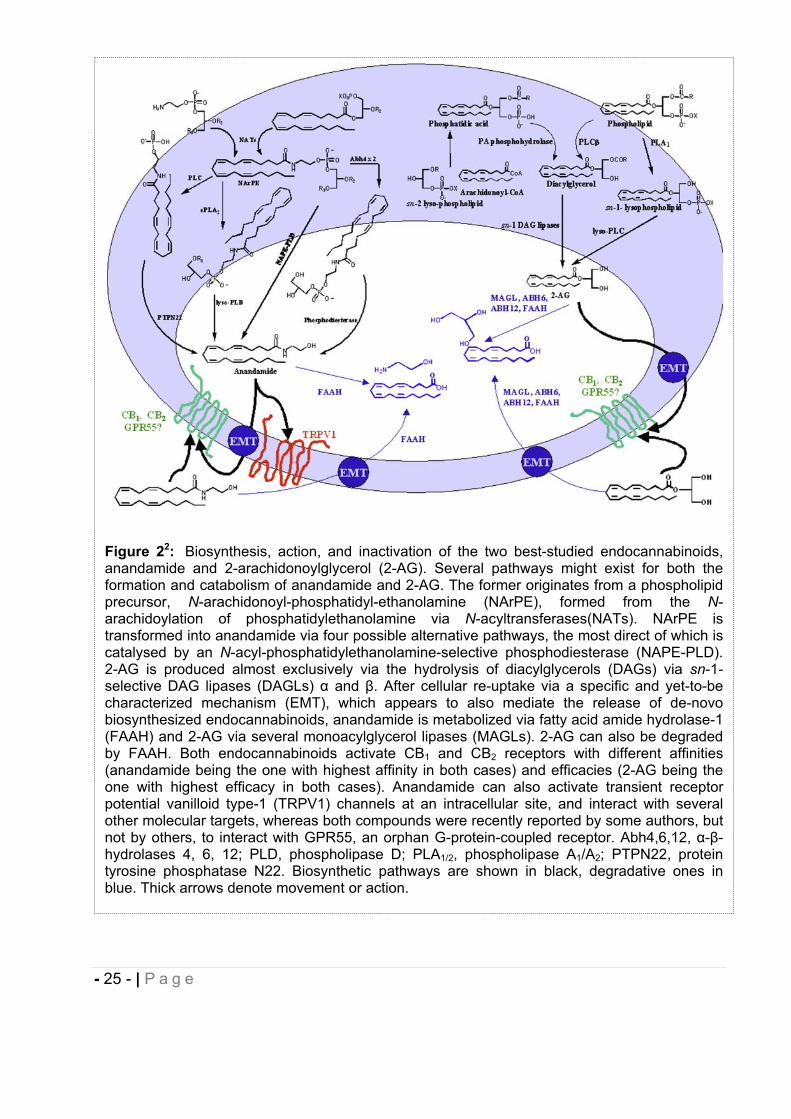
Figure 22: Biosynthesis, action, and inactivation of the two best-studied endocannabinoids, anandamide and 2-arachidonoylglycerol (2-AG). Several pathways might exist for both the formation and catabolism of anandamide and 2-AG. The former originates from a phospholipid precursor, N-arachidonoyl-phosphatidyl-ethanolamine (NArPE), formed from the N-arachidoylation of phosphatidylethanolamine via N-acyltransferases(NATs). NArPE is transformed into anandamide via four possible alternative pathways, the most direct of which is catalysed by an N-acyl-phosphatidylethanolamine-selective phosphodiesterase (NAPE-PLD). 2-AG is produced almost exclusively via the hydrolysis of diacylglycerols (DAGs) via sn-1-selective DAG lipases (DAGLs) and . After cellular re-uptake via a specific and yet-to-be characterized mechanism (EMT), which appears to also mediate the release of de-novo biosynthesized endocannabinoids, anandamide is metabolized via fatty acid amide hydrolase-1 (FAAH) and 2-AG via several monoacylglycerol lipases (MAGLs). 2-AG can also be degraded by FAAH. Both endocannabinoids activate CB1 and CB2 receptors with different affinities (anandamide being the one with highest affinity in both cases) and efficacies (2-AG being the one with highest efficacy in both cases). Anandamide can also activate transient receptor potential vanilloid type-1 (TRPV1) channels at an intracellular site, and interact with several other molecular targets, whereas both compounds were recently reported by some authors, but not by others, to interact with GPR55, an orphan G-protein-coupled receptor. Abh4,6,12, - -hydrolases 4, 6, 12; PLD, phospholipase D; PLA1/2, phospholipase A1/A2; PTPN22, protein tyrosine phosphatase N22. Biosynthetic pathways are shown in black, degradative ones in blue. Thick arrows denote movement or action.
- 26 - | P a g e
6. Cannabinoid receptor-mediated intracellular signal pathways.
Depolarization and subsequent calcium influx triggers the biosynthesis and the release of
eCBs that can act as fast retrograde signaling molecules that activate presynaptic CB1
receptors. Activation of these receptors can transiently inhibit the release of
neurotransmitters such as GABA or glutamate in processes termed depolarization-
induced suppression of inhibition (DSI) or excitation (DSE). Activation of CB receptors
promotes their interaction with G proteins, resulting in guanosine diphosphate
(GDP)/guanosine triphosphate (GTP) exchange and subsequent dissociation of the
and subunits. These units regulate the activity of multiple effector proteins which
induce biological functions127. When both CB1 and CB2 receptors are engaged, multiple
intracellular signal transduction pathways are activated. It is well established that CB1
and CB2 activation regulate multiple effectors through both G-protein-dependent and G-
protein-independent signal transduction pathways128. GPCRs are capable of adopting
more than one active conformation, in which each active state is capable of stimulating
an overlapping yet distinct group of downstream effectors129-130. This may allow signaling
through the receptor to be directed through one pathway over the others through either
strength-of-signal or biased agonism (also called functional selectivity) effects131.
The most referred pathway is the coupling with Gi/o proteins (Fig. 3) which results
in inhibition of adenylate cyclase (AC) and subsequent cAMP response, and in activation
of mitogen-activated protein kinases (MAPK), phosphoinositide 3-kinase (PI3K)-Akt
pathways132-134.
Activation of mitogen-activated protein kinases (MAPK) cascade i.e. c-Jun N terminal
kinase (JNK), p38 MAPK and extracellular signal-regulated kinase-1 and -2 (ERK1/2),
also leads to changes in phosphorylation and so in the function of many cellular
molecules, including several transcription factors, cell proliferation, survival/death and
glucose metabolism regulation. CB1 also inhibits voltage-gated calcium channels in
neurons and modulate A-type and inwardly rectifying potassium channels (GIRK),
causing a reduced neurotransmitter release through reduced intra-cellular Ca2+ and a
hyperpolarized membrane potential resulting in a higher depolarizing stimulus. This is the
mechanism by which eCBs can serve as retrograde neuromodulators in both short-term
and long-term forms of synaptic plasticity, including DSI and DSE, long term potentiation
and depression, and long-term depression of inhibition that suppresses neurotransmitter
- 27 - | P a g e
release for extended duration21,135-138. Besides, CB1 may occasionally signal through
stimulatory Gs protein to increase AC and Gq protein to increase intracellular Ca2+ but
some additional studies are needed to determine the physiological significance of this
dual coupling139-140.
Since both CB1 and CB2 are GPCRs, the type of signaling pathway modulated by CB
receptors activation appears to depend on the type of agonist under study as well as the
tissue or organ involved. 2-AG preferentially activates the MAPK-ERK pathway, while
noladin and the synthetic cannabinoid CP-55,940 preferentially inhibits adenylyl cyclase.
Like noladin, the synthetic ligand CP-55,940 has also been shown to preferentially
inhibits adenylyl cyclase in CB2 receptors141. Together, these results support the
emerging concept of agonist-directed trafficking at the cannabinoid receptors.
In addition to the effects of G proteins and downstream effectors, it has been found that
most GPCRs form homodimers and heterodimers with other GPCRs (i.e. D2 dopamine
receptor, the -, - and -opioid receptors, the orexin-1 receptor, the A2A adenosine
receptor and the 2AR) and that these interactions influence many aspects of receptor
function142. In response to prolonged activation, CB receptor signaling is subject to
regulation via receptor desensitization and internalization. Internalized receptors are
subsequently recycled to the plasma membrane or degraded.
Thus even though the overall effect of activating a GPCR which is coupled to a Gi/o
protein can impact different signaling pathways depending on the ligand, the overall
effect of activating CB receptors, is to apply a biochemical “brake” to the functions of the
cell.
- 28 - | P a g e
7. Interactions of cannabinoids with some other receptor systems.
Endogenous and exogenous cannabinoids or cannabinoids-like compounds can activate
different signaling pathways engaging non-CB1 and non-CB2 receptors. Some of the
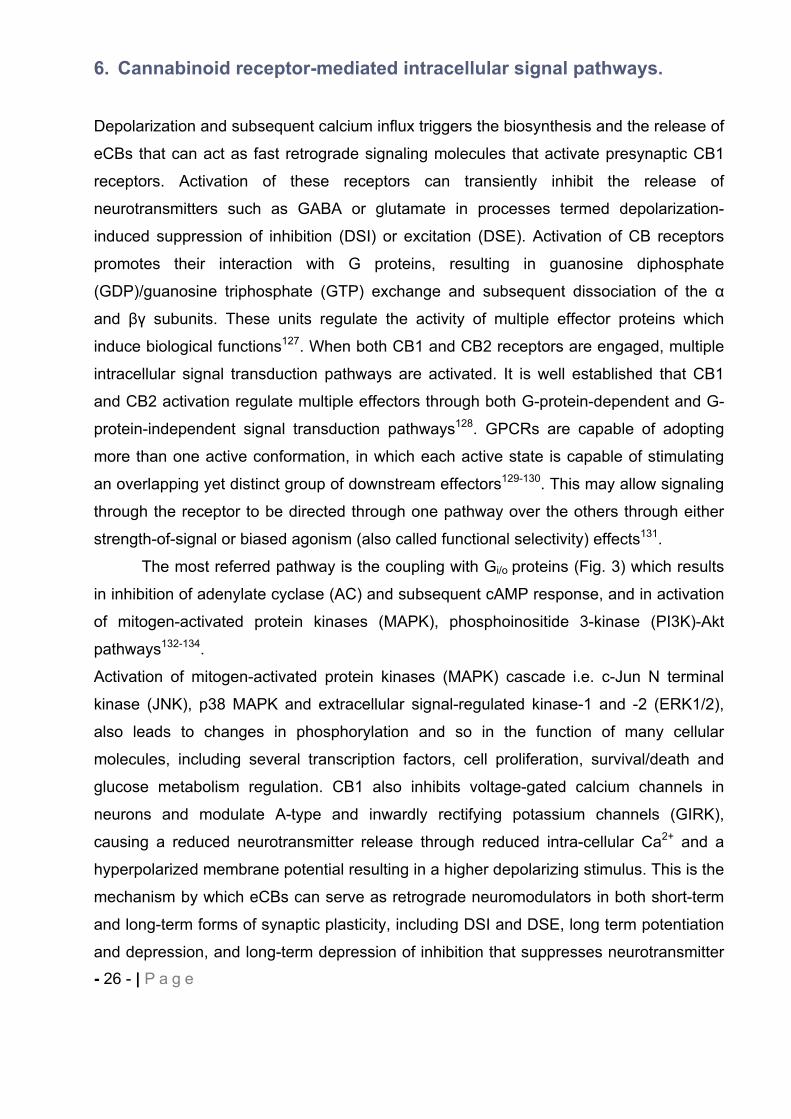
Figure 31: Complexity at cannabinoid receptor signalling. Both CB1 and CB2 cannabinoid receptors are associated with G i/o-dependent inhibition of adenylyl cyclase activity and G -dependent activation of the different MAPK cascades (a). In addition, the CB1 cannabinoid receptor negatively regulates voltage-gated Ca2+ channels and positively regulates inwardly rectifying K+ channels. Finally, the CB1 receptor induces elevation of intracellular free Ca2+ through G -dependent activation of PLC. Cross-talks between signalling pathways are illustrated by the variety of responses requiring cannabinoid-mediated inhibition of PKA. Reduction of PKA activity is related to a reduction of gene expression through decreasing cAMP response element (CRE) activity. In addition, reduction of PKA activity leads to a decrease in constitutive inhibitory phosphorylation of c-Raf and a consecutive activation of ERK1/2. Similarly, reduction of voltage-dependent K+ A channel and focal-adhesion kinase (pp125 FAK and FRNK) phosphorylations through inhibition of PKA lead to activation of these different effectors. Several of these signalling pathways are directly related to the variety of functions regulated by cannabinoid receptors. Besides, it is now demonstrated that activation of CB1 cannabinoid receptors also leads to activation or Gs and Gq proteins (B). In addition the CB1 cannabinoid receptor also signals trough non-G protein partners such as the adaptor protein FAN. Preferential activation of different intracellular effectors by each G protein contributes to diversity and selectivity of responses regulated by cannabinoid receptors.
- 29 - | P a g e
behavioural effects of cannabinoids may occur through other receptors or a synergic
action of CB receptors with these other receptors. The most established non-CB1 non-
CB2 receptor mediating some of the pharmacological effects of AEA, NADA and THC110
is the transient receptor potential vanilloid type-1 (TRPV1) receptor, a non selective
cation channel. TRPV1 is the natural target of capsaicin and is also activated by noxious
heat and acidic pH. Distributed in the peripheral and central terminals of the sensory
neurons143, TRPV1 has been suggested as a potential target for the development of
antinociceptive, antiinflammatory144-145 and antiepileptogenesis agents146.
The deorphanized G protein-coupled receptor GPR55 first discovered by Sawzdargo et
al.147 shares low sequence homology, respectively 13.5% and 14.4% to CB1 and CB2148.
GPR55 has recently been suggested as a third additional member of the cannabinoid
receptor family since several cannabinoid receptor ligands also bind GPR55148-153.
Cannabidiol (CBD), the main non-psychoactive component of Cannabis sativa, appears
to be an antagonist of this receptor151,154 and OEA an agonist. AEA and 2-AG show no
activation of GPR55152, 155. It is thought to be involved in pain signaling156 and to produce
anti-inflammatory effects in microglia157, in obesity in humans158, in breast cancer cells
migration159. In addition, GPR55 -/- mice have been shown to experience less pain in
different models of neuropathic pain validating this receptor as a promising therapeutic
target156.
Additional targets of eCBs and some of their metabolites are the peroxisome proliferator-
activated receptors (PPAR)- ,- , , a class of nuclear receptors that control the
expression of several genes involved particularly in lipid and glucose metabolism160 and
immune/inflammatory responses161. It is thought that 2-AG, AEA, PEA, CBD mediate part
of their pharmacological activity through various isotypes of PPARs162.
Abnormal cannabiniol vasodilatory effect is mediated by an endothelial receptor called
abnormal cannabidiol receptor. Recent investigations support the hypothesis that GPR18
also named N-arachidonoyl glycine (NAGly) receptor, is the putative molecular target in
the CNS of abnormal cannabiniol and NAGly a metabolite of AEA. Through activation,
GPR18 initiates microglial migration163.
- 30 - | P a g e
GPR119 has been suggested to be stimulated by oleylethanolamide (OEA) and be, at
least in part, implied in reducing food intake and body weight gain, a hypothesis that is
supported by the localization of the receptor in brain, pancreas, and gastrointestinal
tract164.
T-type Ca2+ channels presents in nerves, heart, smooth and skeletal muscles and
endocrine tissues165 have been suggested as interesting target in the regulation of
sleep166, nociception167, epilepsy168-169 pain170-171 and neuropathic pain172-173.
Interestingly, several endocannabinoids such as AEA174, phytocannabinoids ( 9-THC,
CBD)175 and synthetic cannabinoids171 can directly block T-type calcium channels.
Cannabinoids have also been suggested as modulators of for others receptors133 such
as serotonin receptor (5-HT)3176-177, acetylcholine receptor (nACh)178, glutamate receptor
(NMDA)179, TASK-1 channel180 and Na+ channel181.
8. Drug of abuse.
Hashish or marijuana are the most world used illicit drugs according to the U.S. National
Institute on Drug Abuse and UNODC (United Nations Office on Drugs and Crimes)
http://www.unodc.org/unodc/en/data-and-analysis/WDR-2010.html. Even though
cannabis derivatives exhibited a very high LD50, long term and high frequency of
cannabis use might result in various side effects. Cannabinoid literature has mainly
focused on the CB1 receptor and its pharmacological responses. The complex array of
behavioral effects exhibited by the cannabinoids acting at the CB1 receptor have been
characterized in numerous animal species, including human. Drug discrimination tests,
dog static ataxia, mouse tetrad models and many others have been used in order to
demonstrate the psychoactive effects of the CB1 cannabinoids. Cannabis consumption is
associated with a variety of possible impairment of mental and bodily functions including
memory and concentration, movement coordination, pleasure, pain tolerance, appetite
and induction of psychiatric illness182-183 such as Schizophrenia. Although the association
between cannabis and Schizophrenia is still controversial, many authors have
emphasized that cannabis abuse may influence the development of schizophrenic
- 31 - | P a g e
psychosis in predisposed people or the neurodevelopment of normal brain during
adolescence leading to Schizophrenia184-188.
Different synthetic cannabinoid derivatives are now commercially available and
increasingly popular recreational drugs. Labelled “Herbal incense”, Spice®, K2® and
others have been intentionally adulterated with synthetic cannabinoids to produce effects
similar to cannabis while circumventing drug legislation. JWH-018189-190 one of the most
commonly use of these synthetic compounds is a potent full agonist at CB1 and CB2 with
higher binding affinities at CB receptors than 9–THC. Little is known about its
pharmacology and toxicology in humans. Recent reports seem to correlate its use with
an increased risk of psychosis191 and abuse192. These aversive effects are putatively
attenuated with cannabis which contains phytocannabinoids which could be CB2
antagonists such as CBD191. CBD has been ascribed to inhibit the metabolism of 9–
THC to the more psychoactive 11-OH- 9–THC193 and/or to antagonize 9–THC in vivo
side effects194-196. Despite contradictory findings regarding the interactions between CBD
and 9–THC197-198, this discovery allowed scientists to compare the effect of a full
CB1/CB2 agonist with cannabis derivatives which includes CB1 partial agonist like 9–
THC but also potential CB2 antagonists such as CBD.
9. Therapeutic cannabinoid derivatives on the market.
Only few cannabinoids-based pharmaceutical products have reached the market.
Sativex®, a (1:1) 9–THC and CBD mixture, developed by GW Pharmaceuticals is the
first cannabis-based prescription medicine in UK, Spain, Czech Republic, Canada,
Germany, Denmark and New Zealand as a treatment of Multiple Sclerosis (MS)
spasticity. The product is also in Phase III clinical development for treatment of cancer
pain (Canada). In addition, GW Pharmaceuticals has submitted an application under the
European Mutual Recognition Procedure to seek marketing authorization for Sativex® in
other selected European member states, including France. In the US, Sativex® is still an
investigational drug (Phase IIIb) being developed as an adjunctive analgesic treatment
for patients with advanced cancer.
There are currently two synthetic CB1 agonists marketed, Marinol® (Dronabinol, synthetic 9–THC) and Cesamet® (Nabilone, synthetic analog of 9–THC) manufactured
respectively by Solvay Pharmaceuticals and Valeant Pharmaceuticals International,
- 32 - | P a g e
respectively. Dronabinol is used as an appetite stimulant in acquired immunodeficiency
syndrome (AIDS) patients and for nausea and vomiting associated with cancer
chemotherapy. Nabilone is used as an anti-emetic drug against nausea and vomiting
caused by cancer chemotherapy199.
Rimonabant® (Sanofi-Aventis) was the first selective CB1 receptor antagonist developed
as an appetite suppressant and anti-obesity agent. Never approved in the US, it has
been officially withdrawn by the EMEA (European Medicines Agency) in 2009 because of
severe depression and anxiety side effects200-201.
10. Phytocannabinoids.
The term phytocannabinoid (pCB) promiscuously refers to lipophilic molecules naturally
occurring in the cannabis sativa L. with similar chemical structures as 9–THC19,202-203.
More than 70 of these compounds have been isolated and just a few of them have the
ECs as a pharmacological target. Recently several plant natural products have been
described as CB receptors ligands and/or exhibiting cannabimimetic effects. It might be
more accurate to define the pCBs as “any plant-derived natural product capable of either
directly interacting with CB receptors on orthosteric or allosteric sites and/or indirectly
modulating eCBs enzymes and subsequently eCBs levels204-205. Whereas 9–THC is still
the most prevalent pCB studied, its psychotropic activity, subserved pharmacology and
potential therapeutic effect investigations of other pCBs206-208. The most common
described pCBs which have been reported to interact with the eCbs are 9–THC and its
analogs such as Cannabidiol (CBD), cannabigerol (CBG), 9–tetrahydrocannabivarin
( 9-THCV), cannabidavirin (CBDV) and cannabinol (CBN). They have particularly shown
interesting in vivo activity in models of CNS disorders202. CBD is currently the only pCB
other than 9–THC that has been investigated for anticonvulsant effects in humans,202 in
addition to its reported effects as alleviating the unwanted side effects from 9–THC (i.e.
sativex®). Promising evidence support further investigations for CBD as a main or
adjunctive therapeutic agent. Other “herbal cannabimimetics”, N-alkylamides (alkamides)
from Echinacea spp. (E. purpurea, E. pallida and E. angustifolia), have been proved to
interact functionally with high affinity to the human CB2 receptor209 and to show some
anti-inflammatory activity210. The main alkamides are the isomeric dodeca-2E,4E,8Z,
10E/Z-tetraenoic acid isobutylamides (see Table 2)204.
- 33 - | P a g e
-caryophyllene [(E)-BCP] (see Table 2), a bicyclic sesquiterpene, is a predominant
volatile constituent of numerous of essential oils, especially cloves Syzygium
aromaticum211 and cannabis212 and contributes also to the spiciness of black pepper
Piper Nigrum213. This FDA approved food additive214 has been shown to selectively
target the CB2 receptor at nanomolar concentrations (Ki= 155 nM) and to act as a full
agonist215. Although (E)-BCP pharmacokinetic and toxicity profiles need further
investigations, (E)-BCP has been evidenced to exert significant cannabimimetic activity
including anti-inflammatory215-217, local anaesthetic211, anti-carcinogenic activity218-220 and
to reduce neuropathic pain204. No psychotropic effect has been ascribed to (E)-BCP
which doesn’t bind to CB1 receptor. (E)-BCP is an attractive candidate for clinical trials
targeting the CB2 receptor.
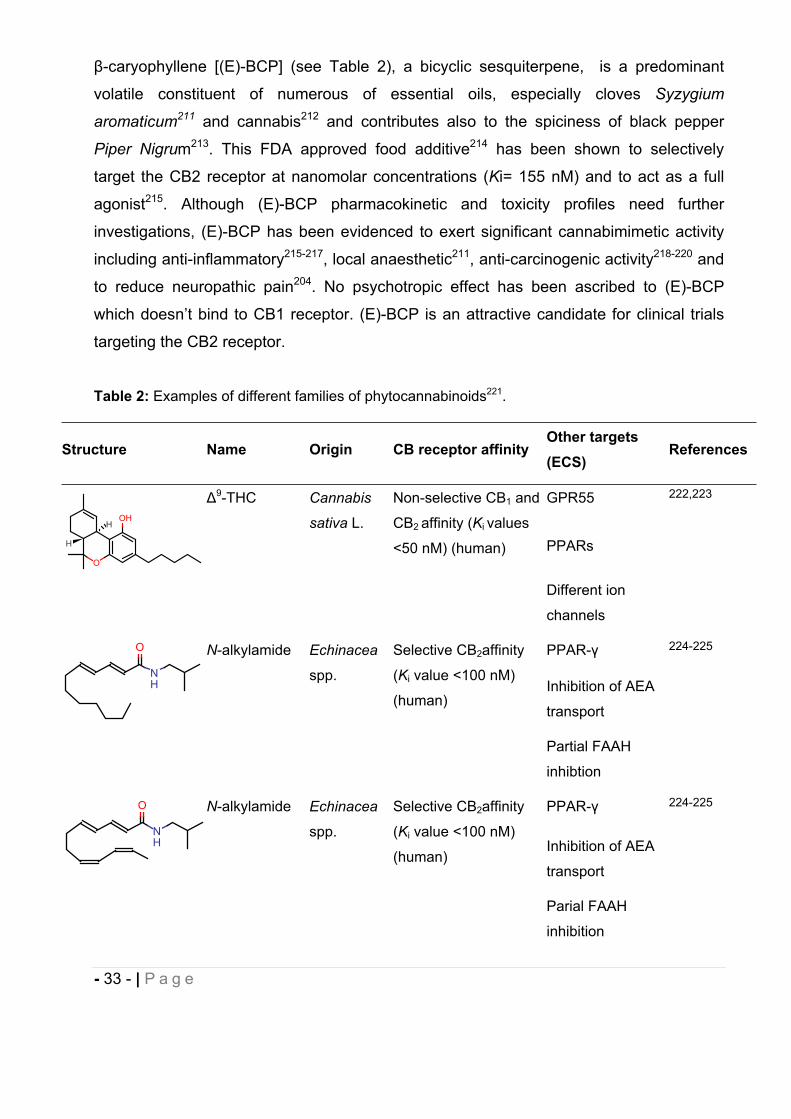
Table 2: Examples of different families of phytocannabinoids221.
Structure Name Origin CB receptor affinityOther targets (ECS)
References
9-THC Cannabis
sativa L.
Non-selective CB1 and
CB2 affinity (Ki values
<50 nM) (human)
GPR55 222,223
PPARs
Different ion
channels
N-alkylamide Echinacea
spp.
Selective CB2affinity
(Ki value <100 nM)
(human)
PPAR- 224-225
Inhibition of AEA
transport
Partial FAAH
inhibtion
N-alkylamide Echinacea
spp.
Selective CB2affinity
(Ki value <100 nM)
(human)
PPAR- 224-225
Inhibition of AEA
transport
Parial FAAH
inhibition
O
OHH
H
NH
O
NH
O
- 34 - | P a g e
Structure Name Origin CB receptor affinityOther targets (ECS)
References
-
caryophyllene
Widespread
in plants
Selective CB2affinity
(Ki value<200 nM)
(human)
No data 221
11. Pain. 11.1. Physiological pain.
Pain is defined as an unpleasant sensory and emotional experience associated with
tissue damage or described in terms of such damage, by the International Association for
the Study of Pain. Pain is essential to warn living organism to a damaging stimulus even
H
H
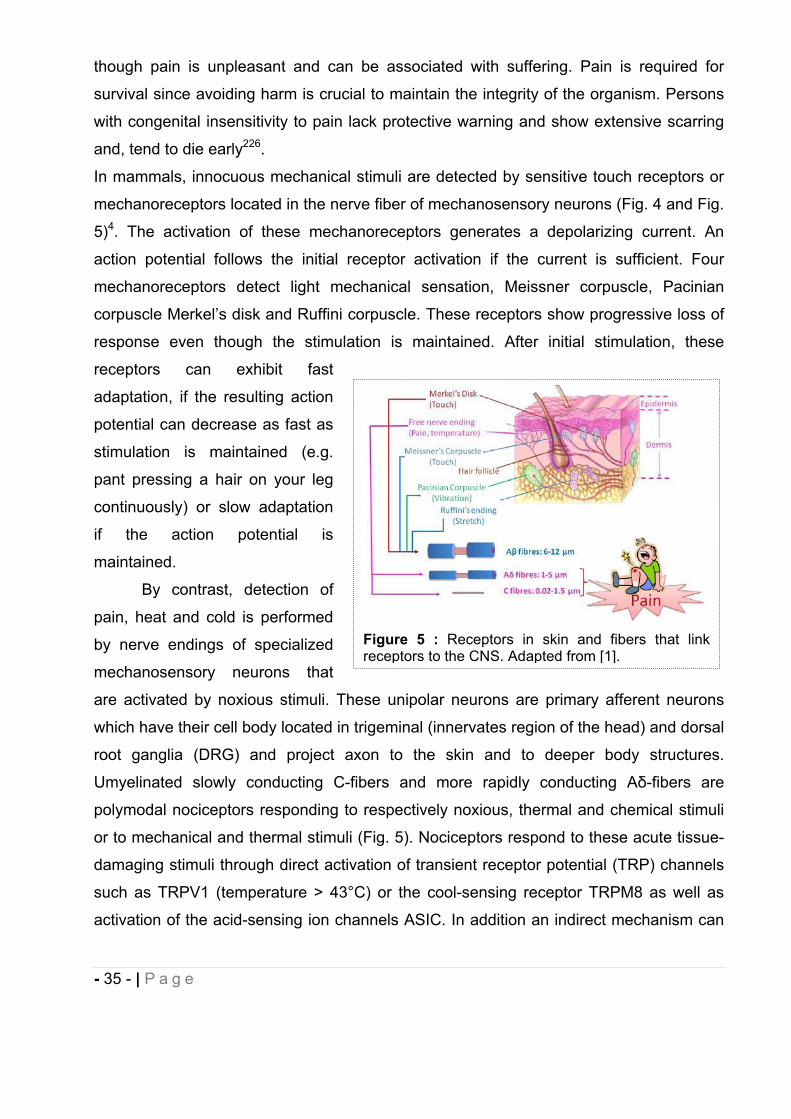
Figure 4: Cutaneous mechanosensory neurons differentiate into many functionally distinct
subtypes — with specific threshold sensitivities and encoding capabilities — each of which
is thought to transduce specific kinds of mechanical stimuli. Rapid adaptation (RA), slow
adaptation (SA), low threshold (LT), high threshold (HT)4.
- 35 - | P a g e
though pain is unpleasant and can be associated with suffering. Pain is required for
survival since avoiding harm is crucial to maintain the integrity of the organism. Persons
with congenital insensitivity to pain lack protective warning and show extensive scarring
and, tend to die early226.
In mammals, innocuous mechanical stimuli are detected by sensitive touch receptors or
mechanoreceptors located in the nerve fiber of mechanosensory neurons (Fig. 4 and Fig.
5)4. The activation of these mechanoreceptors generates a depolarizing current. An
action potential follows the initial receptor activation if the current is sufficient. Four
mechanoreceptors detect light mechanical sensation, Meissner corpuscle, Pacinian
corpuscle Merkel’s disk and Ruffini corpuscle. These receptors show progressive loss of
response even though the stimulation is maintained. After initial stimulation, these
receptors can exhibit fast
adaptation, if the resulting action
potential can decrease as fast as
stimulation is maintained (e.g.
pant pressing a hair on your leg
continuously) or slow adaptation
if the action potential is
maintained.
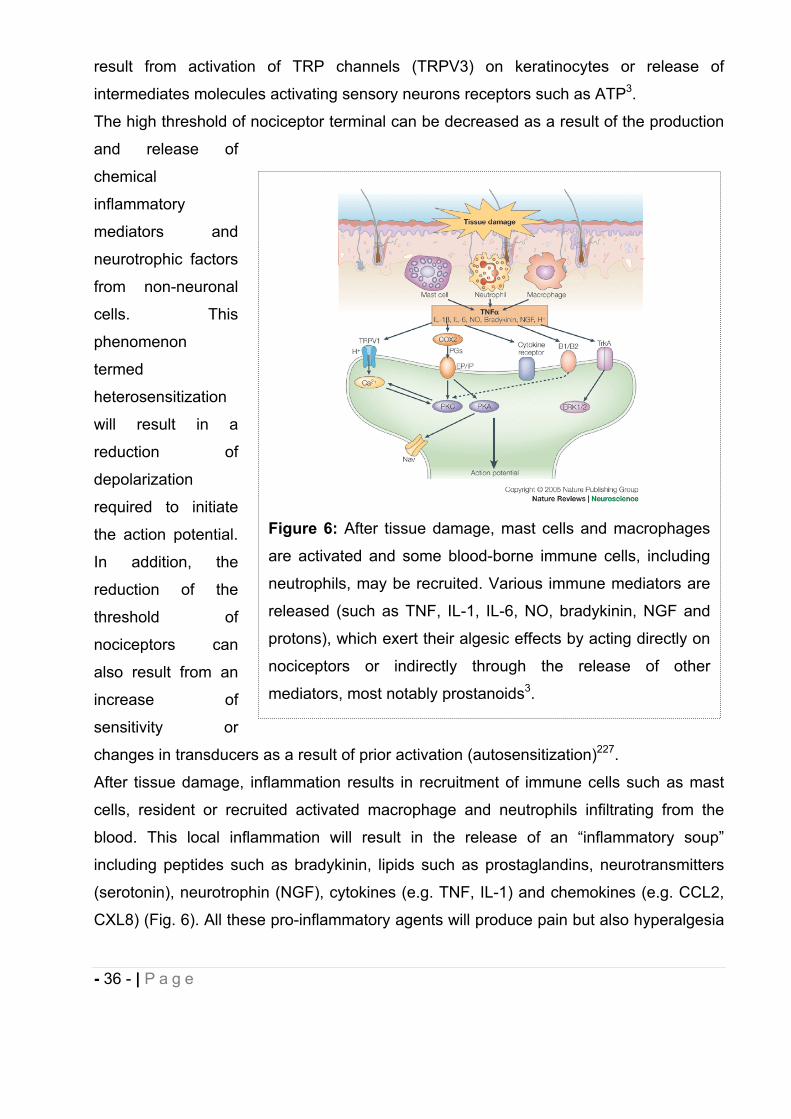
By contrast, detection of
pain, heat and cold is performed
by nerve endings of specialized
mechanosensory neurons that
are activated by noxious stimuli. These unipolar neurons are primary afferent neurons
which have their cell body located in trigeminal (innervates region of the head) and dorsal
root ganglia (DRG) and project axon to the skin and to deeper body structures.
Umyelinated slowly conducting C-fibers and more rapidly conducting A -fibers are
polymodal nociceptors responding to respectively noxious, thermal and chemical stimuli
or to mechanical and thermal stimuli (Fig. 5). Nociceptors respond to these acute tissue-
damaging stimuli through direct activation of transient receptor potential (TRP) channels
such as TRPV1 (temperature > 43°C) or the cool-sensing receptor TRPM8 as well as
activation of the acid-sensing ion channels ASIC. In addition an indirect mechanism can
Figure 5 : Receptors in skin and fibers that link receptors to the CNS. Adapted from [1].
- 36 - | P a g e
result from activation of TRP channels (TRPV3) on keratinocytes or release of
intermediates molecules activating sensory neurons receptors such as ATP3.
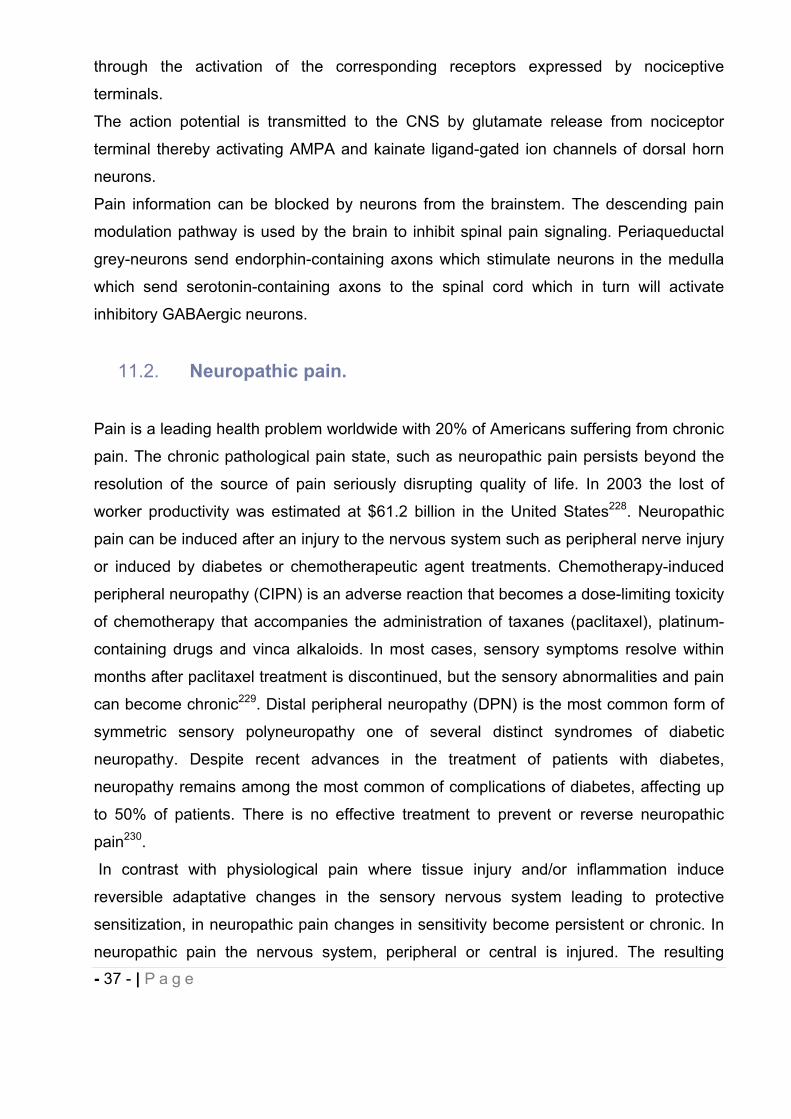
The high threshold of nociceptor terminal can be decreased as a result of the production
and release of
chemical
inflammatory
mediators and
neurotrophic factors
from non-neuronal
cells. This
phenomenon
termed
heterosensitization
will result in a
reduction of
depolarization
required to initiate
the action potential.
In addition, the
reduction of the
threshold of
nociceptors can
also result from an
increase of
sensitivity or
changes in transducers as a result of prior activation (autosensitization)227.
After tissue damage, inflammation results in recruitment of immune cells such as mast
cells, resident or recruited activated macrophage and neutrophils infiltrating from the
blood. This local inflammation will result in the release of an “inflammatory soup”
including peptides such as bradykinin, lipids such as prostaglandins, neurotransmitters
(serotonin), neurotrophin (NGF), cytokines (e.g. TNF, IL-1) and chemokines (e.g. CCL2,
CXL8) (Fig. 6). All these pro-inflammatory agents will produce pain but also hyperalgesia
Figure 6: After tissue damage, mast cells and macrophages
are activated and some blood-borne immune cells, including
neutrophils, may be recruited. Various immune mediators are
released (such as TNF, IL-1, IL-6, NO, bradykinin, NGF and
protons), which exert their algesic effects by acting directly on
nociceptors or indirectly through the release of other
mediators, most notably prostanoids3.
- 37 - | P a g e
through the activation of the corresponding receptors expressed by nociceptive
terminals.
The action potential is transmitted to the CNS by glutamate release from nociceptor
terminal thereby activating AMPA and kainate ligand-gated ion channels of dorsal horn
neurons.
Pain information can be blocked by neurons from the brainstem. The descending pain
modulation pathway is used by the brain to inhibit spinal pain signaling. Periaqueductal
grey-neurons send endorphin-containing axons which stimulate neurons in the medulla
which send serotonin-containing axons to the spinal cord which in turn will activate
inhibitory GABAergic neurons.
11.2. Neuropathic pain.
Pain is a leading health problem worldwide with 20% of Americans suffering from chronic
pain. The chronic pathological pain state, such as neuropathic pain persists beyond the
resolution of the source of pain seriously disrupting quality of life. In 2003 the lost of
worker productivity was estimated at $61.2 billion in the United States228. Neuropathic
pain can be induced after an injury to the nervous system such as peripheral nerve injury
or induced by diabetes or chemotherapeutic agent treatments. Chemotherapy-induced
peripheral neuropathy (CIPN) is an adverse reaction that becomes a dose-limiting toxicity
of chemotherapy that accompanies the administration of taxanes (paclitaxel), platinum-
containing drugs and vinca alkaloids. In most cases, sensory symptoms resolve within
months after paclitaxel treatment is discontinued, but the sensory abnormalities and pain
can become chronic229. Distal peripheral neuropathy (DPN) is the most common form of
symmetric sensory polyneuropathy one of several distinct syndromes of diabetic
neuropathy. Despite recent advances in the treatment of patients with diabetes,
neuropathy remains among the most common of complications of diabetes, affecting up
to 50% of patients. There is no effective treatment to prevent or reverse neuropathic
pain230.
In contrast with physiological pain where tissue injury and/or inflammation induce
reversible adaptative changes in the sensory nervous system leading to protective
sensitization, in neuropathic pain changes in sensitivity become persistent or chronic. In
neuropathic pain the nervous system, peripheral or central is injured. The resulting
- 38 - | P a g e
changes in pain processing can occur spontaneously or as a result of exposure to mildly
painful stimuli (hyperalgesia) or stimuli not normally perceived as painful (allodynia).
Neuropathic pain management is currently aimed only at reducing symptoms. The
treatment of chronic pain remains an unmet clinical need, with only half of patients
receiving adequate pain relief using drugs with adverse central nervous system (CNS)
side effects. Comorbidities such as sleep disorders, depression and anxiety compromise
the quality of life of neuropathic pain patients231.
Dynamic changes in the neural matrix and in the peripheral nervous system induced by
the release of cytokines, chemokines and neurotrophic factors occur over several
temporal scales. Negative symptoms such as numbness or elevated heat threshold are
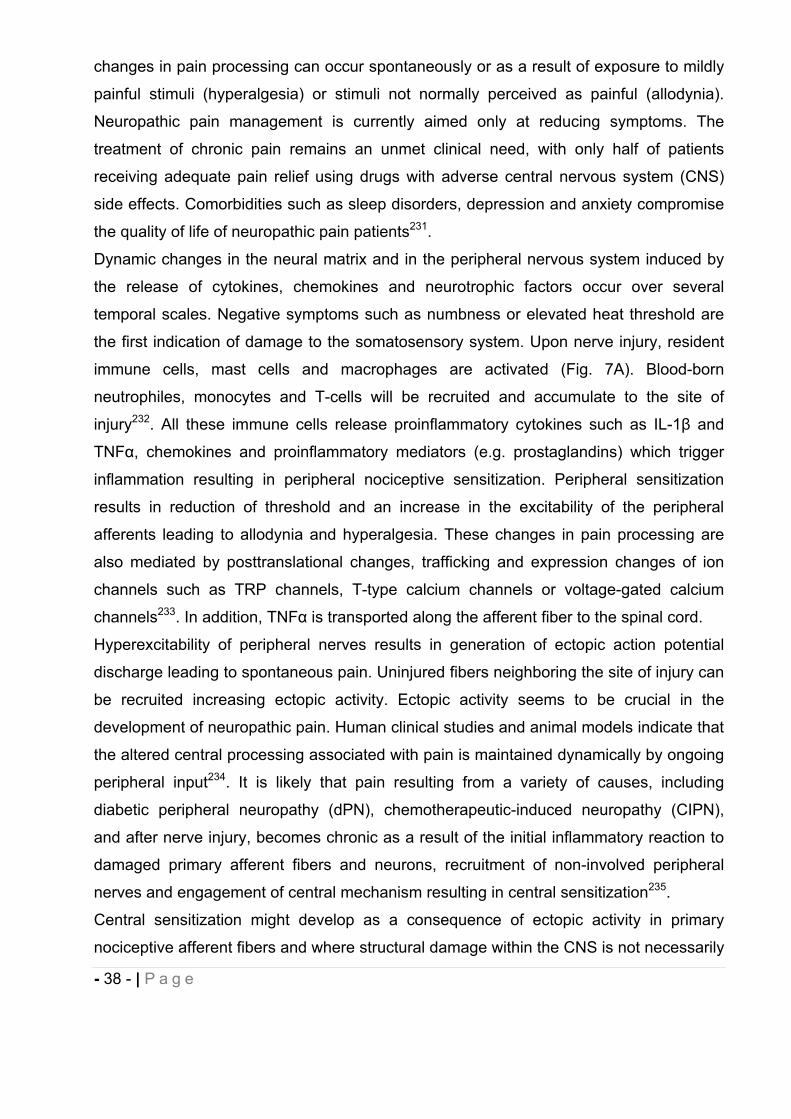
the first indication of damage to the somatosensory system. Upon nerve injury, resident
immune cells, mast cells and macrophages are activated (Fig. 7A). Blood-born
neutrophiles, monocytes and T-cells will be recruited and accumulate to the site of
injury232. All these immune cells release proinflammatory cytokines such as IL-1 and
TNF , chemokines and proinflammatory mediators (e.g. prostaglandins) which trigger
inflammation resulting in peripheral nociceptive sensitization. Peripheral sensitization
results in reduction of threshold and an increase in the excitability of the peripheral
afferents leading to allodynia and hyperalgesia. These changes in pain processing are
also mediated by posttranslational changes, trafficking and expression changes of ion
channels such as TRP channels, T-type calcium channels or voltage-gated calcium
channels233. In addition, TNF is transported along the afferent fiber to the spinal cord.
Hyperexcitability of peripheral nerves results in generation of ectopic action potential
discharge leading to spontaneous pain. Uninjured fibers neighboring the site of injury can
be recruited increasing ectopic activity. Ectopic activity seems to be crucial in the
development of neuropathic pain. Human clinical studies and animal models indicate that
the altered central processing associated with pain is maintained dynamically by ongoing
peripheral input234. It is likely that pain resulting from a variety of causes, including
diabetic peripheral neuropathy (dPN), chemotherapeutic-induced neuropathy (CIPN),
and after nerve injury, becomes chronic as a result of the initial inflammatory reaction to
damaged primary afferent fibers and neurons, recruitment of non-involved peripheral
nerves and engagement of central mechanism resulting in central sensitization235.
Central sensitization might develop as a consequence of ectopic activity in primary
nociceptive afferent fibers and where structural damage within the CNS is not necessarily
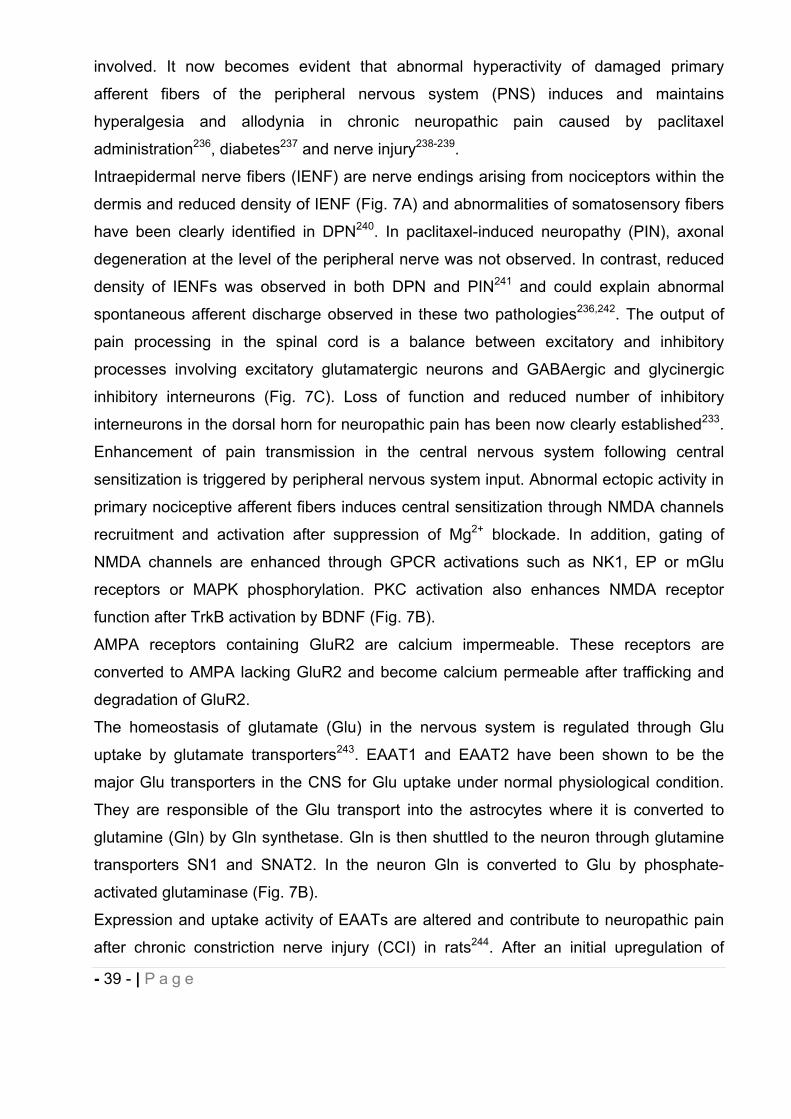
- 39 - | P a g e
involved. It now becomes evident that abnormal hyperactivity of damaged primary
afferent fibers of the peripheral nervous system (PNS) induces and maintains
hyperalgesia and allodynia in chronic neuropathic pain caused by paclitaxel
administration236, diabetes237 and nerve injury238-239.
Intraepidermal nerve fibers (IENF) are nerve endings arising from nociceptors within the
dermis and reduced density of IENF (Fig. 7A) and abnormalities of somatosensory fibers
have been clearly identified in DPN240. In paclitaxel-induced neuropathy (PIN), axonal
degeneration at the level of the peripheral nerve was not observed. In contrast, reduced
density of IENFs was observed in both DPN and PIN241 and could explain abnormal
spontaneous afferent discharge observed in these two pathologies236,242. The output of
pain processing in the spinal cord is a balance between excitatory and inhibitory
processes involving excitatory glutamatergic neurons and GABAergic and glycinergic
inhibitory interneurons (Fig. 7C). Loss of function and reduced number of inhibitory
interneurons in the dorsal horn for neuropathic pain has been now clearly established233.
Enhancement of pain transmission in the central nervous system following central
sensitization is triggered by peripheral nervous system input. Abnormal ectopic activity in
primary nociceptive afferent fibers induces central sensitization through NMDA channels
recruitment and activation after suppression of Mg2+ blockade. In addition, gating of
NMDA channels are enhanced through GPCR activations such as NK1, EP or mGlu
receptors or MAPK phosphorylation. PKC activation also enhances NMDA receptor
function after TrkB activation by BDNF (Fig. 7B).
AMPA receptors containing GluR2 are calcium impermeable. These receptors are
converted to AMPA lacking GluR2 and become calcium permeable after trafficking and
degradation of GluR2.
The homeostasis of glutamate (Glu) in the nervous system is regulated through Glu
uptake by glutamate transporters243. EAAT1 and EAAT2 have been shown to be the
major Glu transporters in the CNS for Glu uptake under normal physiological condition.
They are responsible of the Glu transport into the astrocytes where it is converted to
glutamine (Gln) by Gln synthetase. Gln is then shuttled to the neuron through glutamine
transporters SN1 and SNAT2. In the neuron Gln is converted to Glu by phosphate-
activated glutaminase (Fig. 7B).
Expression and uptake activity of EAATs are altered and contribute to neuropathic pain
after chronic constriction nerve injury (CCI) in rats244. After an initial upregulation of
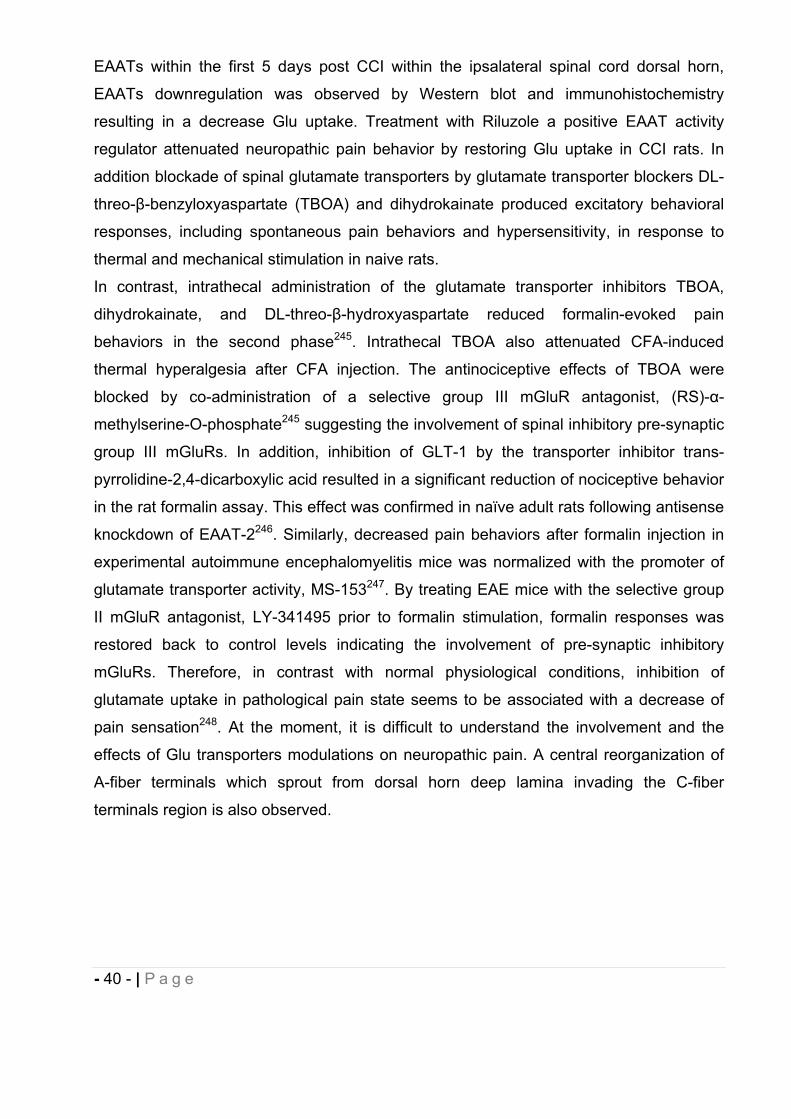
- 40 - | P a g e
EAATs within the first 5 days post CCI within the ipsalateral spinal cord dorsal horn,
EAATs downregulation was observed by Western blot and immunohistochemistry
resulting in a decrease Glu uptake. Treatment with Riluzole a positive EAAT activity
regulator attenuated neuropathic pain behavior by restoring Glu uptake in CCI rats. In
addition blockade of spinal glutamate transporters by glutamate transporter blockers DL-
threo- -benzyloxyaspartate (TBOA) and dihydrokainate produced excitatory behavioral
responses, including spontaneous pain behaviors and hypersensitivity, in response to
thermal and mechanical stimulation in naive rats.
In contrast, intrathecal administration of the glutamate transporter inhibitors TBOA,
dihydrokainate, and DL-threo- -hydroxyaspartate reduced formalin-evoked pain
behaviors in the second phase245. Intrathecal TBOA also attenuated CFA-induced
thermal hyperalgesia after CFA injection. The antinociceptive effects of TBOA were
blocked by co-administration of a selective group III mGluR antagonist, (RS)- -
methylserine-O-phosphate245 suggesting the involvement of spinal inhibitory pre-synaptic
group III mGluRs. In addition, inhibition of GLT-1 by the transporter inhibitor trans-
pyrrolidine-2,4-dicarboxylic acid resulted in a significant reduction of nociceptive behavior
in the rat formalin assay. This effect was confirmed in naïve adult rats following antisense
knockdown of EAAT-2246. Similarly, decreased pain behaviors after formalin injection in
experimental autoimmune encephalomyelitis mice was normalized with the promoter of
glutamate transporter activity, MS-153247. By treating EAE mice with the selective group
II mGluR antagonist, LY-341495 prior to formalin stimulation, formalin responses was
restored back to control levels indicating the involvement of pre-synaptic inhibitory
mGluRs. Therefore, in contrast with normal physiological conditions, inhibition of
glutamate uptake in pathological pain state seems to be associated with a decrease of
pain sensation248. At the moment, it is difficult to understand the involvement and the
effects of Glu transporters modulations on neuropathic pain. A central reorganization of
A-fiber terminals which sprout from dorsal horn deep lamina invading the C-fiber
terminals region is also observed.
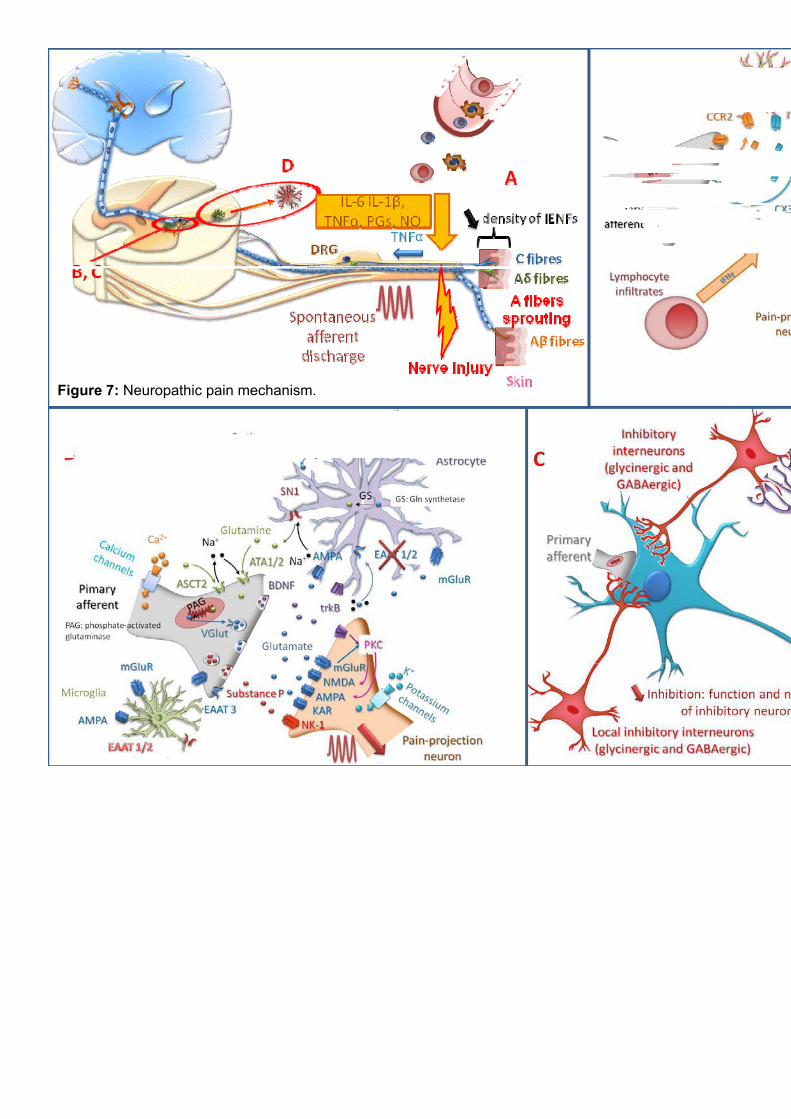
Figure 7: Neuropathic pain mechanism.
- 42 - | P a g e
Chemokines CX3CL1 and CCL2 and their cognate receptors CX3CR1 and CCR2 are the
most studied chemokines and receptors in neuropathic pain. After Glu stimulation,
CX3L1 is expressed and released by neurons thereby activating CX3CR1 receptors
expressed in glial cells (Fig. 7D). CX3R1 activation results in activation and chemotaxis
activity of glial cells249. Similarly, microglia CCR2 activation by CCL2 possibly released
by afferent nerve terminal induces microglia activation. CCR2 appears to be expressed
by astrocytes and primary afferent terminal as well as pain-projection neurons. Therefore
the effect of CCL2 after activating CCR2 is still a debate.
12. CB2 receptors: a target for Neuropathic Pain treatment?
Selective CB2 agonists have shown considerable efficacy in a variety of animal models
of neuropathic pain14,30,250-252 without evidence of psychoactivity. Different strategies
have been attempted to investigate the role of CB2 receptor in pain modulation using
non-selective CB1/CB2 agonists, or selective CB2 agonists and inhibitors of enzymes
that degrade endocannabinoids253. Results from these studies support the potential development of selective CB2 receptor agonists for the treatment of both acute and neuropathic pain254. Mechanisms involved in the antinociceptive activity of CB2
agonists and distribution of CB2 receptors are still controversial and under investigation.
CB2 receptors are primary described to be expressed in immune cells50,255-256 of both
PNS and CNS257 and it is well accepted that CB2 is present in microglia during
neuroinflammation. There is also evidence for their expression in human primary afferent
nociceptors which are critical for pain modulation77,253,258. CB2 receptors have a
chemotactic effect on immune cells modulating their migration, antigen presentation and
release of inflammation mediators75 (i.e. NGF, cytokines, chemokines, ATP, histamine,
prostanoids, etc.) which can be of importance upon peripheral injury, and subsequent
primary afferent sensitization. In case of neuropathic pain resulting from nerve injury,
CB2 agonists may reduce neuroinflammation and sensitization at the peripheral nerve.
CB2 located in CNS may also play a role259 possibly acting on the microglia activation260
or by a direct neuronal action on pain neurotransmitter77 thereby decreasing central
sensitization. Effect of CB2 agonists within the CNS on microglia activation and
migration, or the activity of the glial derived and deleterious substances such as
- 43 - | P a g e
proinflamatory cytokines (e.g.IL- , IL-6, TNF- ) and other cytotoxic agents74,260, can
result in a decrease of neuropathic pain symptoms. However, 2-AG, a full CB1/CB2
endocannabinoid agonist triggers microglial migration while synthetic CB2 ligands
whether agonist or antagonist, inhibit 2-AG-induced chemotaxis75, 260. CB2 agonist has
been shown to either increase or decrease cell migration, and be either pro- or anti-
inflammatory75 depending on the animal model, the cell type261 or the class of CB2 ligand
involved. Different classes of CB2 ligands can produce diverse physiological effects due
to activation of distinct signaling pathways or to functional selectivity141,262, emphasizing
that each CB2 ligand needs to be separately evaluated for therapeutic efficacy. At a
cellular level, CB2 agonists act differently on internalization and desensitization
processes and a greater understanding of the cellular compensations that occur during
chronic drug administration will also be necessary257 to fully understand the therapeutic
benefits of CB2 agonists.
Recently, the selectivity of CB2 agonists reported in the literature and tested in models of
analgesia has been questioned. In the majority of these studies, some weak but
measurable CB1 activity28 may have conducted to a synergistic effect of CB1/CB2
activities, since even weak CB1 binding was ascribed to produce substantial agonism263.
Other group such as Sain et al.264 demonstrated that non-selective CB1/CB2 agonists
produced antinociceptive activity in different models of inflammatory and neuropathic
pain which was abolished in CB1 knockout mice but not in CB2 knockout mice. It should
be noted that the doses used for this study were low, possibly favoring CB1 agonist
activity. It is extremely difficult to conclusively establish if CB2 or off-target activity of
compounds which were claimed to be CB2 agonist (or antagonist) were responsible of
their effect in in vivo models of neuropathic pain73 since endocannabinoids and
phytocannabinoids have been shown to modulate different receptors and ion channels.
Despite CB2 agonists show considerable efficacy in various preclinical models, further
pharmacological investigations are yet needed to be conducted on their peculiar
signaling pathways and potential polypharmacology, in order to successfully develop
efficacious drugs with reduced side effects for the treatment of neuropathic pain or others
neurodegenerative diseases.
- 44 - | P a g e
9 REFERENCES.
1. Bosier, B.; Muccioli, G. G.; Hermans, E.; Lambert, D. M., Functionally selective cannabinoid receptor signalling: Therapeutic implications and opportunities. Biochemical Pharmacology 2010, 80, (1), 1-12.
2. De Petrocellis, L.; Di Marzo, V., An introduction to the endocannabinoid system: from the early to the latest concepts. Best Pract. Res. Clin. Endoc. Metab. 2009,23, (1), 1-15.
3. Marchand, F.; Perretti, M.; McMahon, S. B., Role of the Immune system in chronic pain. Nat Rev Neurosci 2005, 6, (7), 521-532.
4. Delmas, P.; Hao, J.; Rodat-Despoix, L., Molecular mechanisms of mechanotransduction in mammalian sensory neurons. Nat Rev Neurosci 2011,12, (3), 139-153.
5. Bouhassira, D.; Lantéri-Minet, M.; Attal, N.; Laurent, B.; Touboul, C., Prevalence of chronic pain with neuropathic characteristics in the general population. Pain 2008, 136, (3), 380-387.
6. Galluzzi, K. E., Managing Neuropathic Pain. JAOA: Journal of the American Osteopathic Association 2007, 107, (suppl 6), ES39-ES48.
7. Dworkin, R. H.; O'Connor, A. B.; Backonja, M.; Farrar, J. T.; Finnerup, N. B.; Jensen, T. S.; Kalso, E. A.; Loeser, J. D.; Miaskowski, C.; Nurmikko, T. J.; Portenoy, R. K.; Rice, A. S.; Stacey, B. R.; Treede, R. D.; Turk, D. C.; Wallace, M. S., Pharmacologic management of neuropathic pain: evidence-based recommendations. Pain 2007, 132, (3), 237-51.
8. Treede, R. D.; Jensen, T. S.; Campbell, J. N.; Cruccu, G.; Dostrovsky, J. O.; Griffin, J. W.; Hansson, P.; Hughes, R.; Nurmikko, T.; Serra, J., Neuropathic pain: redefinition and a grading system for clinical and research purposes. Neurology 2008, 70, (18), 1630-5.
9. Dworkin, R. H.; O’Connor, A. B.; Backonja, M.; Farrar, J. T.; Finnerup, N. B.; Jensen, T. S.; Kalso, E. A.; Loeser, J. D.; Miaskowski, C.; Nurmikko, T. J.; Portenoy, R. K.; Rice, A. S. C.; Stacey, B. R.; Treede, R.-D.; Turk, D. C.; Wallace, M. S., Pharmacologic management of neuropathic pain: Evidence-based recommendations. Pain 2007, 132, (3), 237-251.
10. Yamamoto, W.; Mikami, T.; Iwamura, H., Involvement of central cannabinoid CB2 receptor in reducing mechanical allodynia in a mouse model of neuropathic pain. Eur J Pharmacol 2008, 583, (1), 56-61.
11. Diaz, P.; Phatak, S. S.; Xu, J. J.; Fronczek, F. R.; Astruc-Diaz, F.; Thompson, C. M.; Cavasotto, C. N.; Naguib, M., 2,3-Dihydro-1-Benzofuran Derivatives as a Series of Potent Selective Cannabinoid Receptor 2 Agonists: Design, Synthesis, and Binding Mode Prediction through Ligand-Steered Modeling. ChemMedChem 2009, 4, (10), 1615-1629.
12. Naguib, M.; Diaz, P.; Xu, J. J.; Astruc-Diaz, F.; Craig, S.; Vivas-Mejia, P.; Brown, D. L., MDA7: a novel selective agonist for CB2 receptors that prevents allodynia in rat neuropathic pain models. British Journal of Pharmacology 2008, 155, (7), 1104-16.
13. Toth, C. C.; Jedrzejewski, N. M.; Ellis, C. L.; Frey, W. H., 2nd, Cannabinoid-mediated modulation of neuropathic pain and microglial accumulation in a model of murine type I diabetic peripheral neuropathic pain. Mol Pain 2010, 6, 16.
- 45 - | P a g e
14. Ibrahim, M. M.; Deng, H.; Zvonok, A.; Cockayne, D. A.; Kwan, J.; Mata, H. P.; Vanderah, T. W.; Lai, J.; Porreca, F.; Makriyannis, A.; Malan, T. P., Jr., Activation of CB2 cannabinoid receptors by AM1241 inhibits experimental neuropathic pain: pain inhibition by receptors not present in the CNS. Proc Natl Acad Sci U S A 2003, 100, (18), 10529-33.
15. Lichtman, A. H.; Smith, P. B.; Martin, B. R., The antinociceptive effects of intrathecally administered cannabinoids are influenced by lipophilicity. Pain 1992,51, (1), 19-26.
16. Paton, R. G. P. D. T. W. D. M., The general pharmacology of cannabinoids.Oxford University Press: London, 1972; p 50-75.
17. Medicine, U. S. N. L. o. Classics of Traditional Chinese Medicine: from the History of Medicine Division National Library of Medicine. http://www.nlm.nih.gov/exhibition/chinesemedicine/emperors.html
18. Zuardi, A. W., History of cannabis as a medicine: a review. Rev Bras Psiquiatr 2006, 28, (2), 153-7.
19. Elsohly, M. A.; Slade, D., Chemical constituents of marijuana: the complex mixture of natural cannabinoids. Life Sci 2005, 78, (5), 539-48.
20. Di Marzo, V., Endocannabinoid System. In eLS, John Wiley & Sons, Ltd: 2001. 21. Piomelli, D., The molecular logic of endocannabinoid signalling. Nat Rev Neurosci
2003, 4, (11), 873-84. 22. Mackie, K., Cannabinoid Receptors: Where They are and What They do. Journal
of Neuroendocrinology 2008, 20, 10-14. 23. Benito, C.; Romero, J. P.; Tolon, R. M.; Clemente, D.; Docagne, F.; Hillard, C. J.;
Guaza, C.; Romero, J., Cannabinoid CB1 and CB2 receptors and fatty acid amide hydrolase are specific markers of plaque cell subtypes in human multiple sclerosis. J Neurosci 2007, 27, (9), 2396-402.
24. Tolon, R. M.; Nunez, E.; Pazos, M. R.; Benito, C.; Castillo, A. I.; Martinez-Orgado, J. A.; Romero, J., The activation of cannabinoid CB2 receptors stimulates in situ and in vitro beta-amyloid removal by human macrophages. Brain Res 2009, 1283, 148-54.
25. Zajicek, J. P.; Apostu, V. I., Role of cannabinoids in multiple sclerosis. Cns Drugs 2011, 25, (3), 187-201.
26. Sanchez, A. J.; Garcia-Merino, A., Neuroprotective agents: cannabinoids. ClinImmunol 2012, 142, (1), 57-67.
27. Garcia-Arencibia, M.; Garcia, C.; Fernandez-Ruiz, J., Cannabinoids and Parkinson's disease. CNS Neurol Disord Drug Targets 2009, 8, (6), 432-9.
28. Beltramo, M., [The cannabinoid system and pain: towards new drugs?]. J Soc Biol 2009, 203, (1), 99-106.
29. Manzanares, J.; Julian, M.; Carrascosa, A., Role of the cannabinoid system in pain control and therapeutic implications for the management of acute and chronic pain episodes. Curr Neuropharmacol 2006, 4, (3), 239-57.
30. Naguib, M.; Diaz, P.; Xu, J. J.; Astruc-Diaz, F.; Craig, S.; Vivas-Mejia, P.; Brown, D. L., MDA7: a novel selective agonist for CB2 receptors that prevents allodynia in rat neuropathic pain models. Br J Pharmacol 2008, 155, (7), 1104-16.
31. Diaz, P.; Phatak, S. S.; Xu, J.; Astruc-Diaz, F.; Cavasotto, C. N.; Naguib, M., 6-Methoxy-N-alkyl isatin acylhydrazone derivatives as a novel series of potent selective cannabinoid receptor 2 inverse agonists: design, synthesis, and binding mode prediction. J Med Chem 2009, 52, (2), 433-44.
- 46 - | P a g e
32. Diaz, P.; Xu, J. J.; Astruc-Diaz, F.; Pan, H. M.; Brown, D. L.; Naguib, M., Design and synthesis of a novel series of N-alkyl isatin acylhydrazone derivatives that act as selective cannabinoid receptor 2 agonists for the treatment of neuropathic pain. Journal of Medicinal Chemistry 2008, 51, (16), 4932-4947.
33. Proto, M. C.; Gazzerro, P.; Di Croce, L.; Santoro, A.; Malfitano, A. M.; Pisanti, S.; Laezza, C.; Bifulco, M., Interaction of endocannabinoid system and steroid hormones in the control of colon cancer cell growth. J Cell Physiol 2012, 227, (1), 250-8.
34. Malfitano, A. M.; Ciaglia, E.; Gangemi, G.; Gazzerro, P.; Laezza, C.; Bifulco, M., Update on the endocannabinoid system as an anticancer target. Expert Opin Ther Targets 2011, 15, (3), 297-308.
35. Parker, L. A.; Rock, E. M.; Limebeer, C. L., Regulation of nausea and vomiting by cannabinoids. Br J Pharmacol 2011, 163, (7), 1411-22.
36. Engeli, S., Central and peripheral cannabinoid receptors as therapeutic targets in the control of food intake and body weight. Handb Exp Pharmacol 2012, 209, 357-81.
37. Valenzuela, C.; Aguirre, C.; Castillo, V.; Ronco, A. M.; Llanos, M., [A role for the endocannabinoid system in obesity]. Rev Med Chil 2010, 138, (5), 621-9.
38. Hofmann, M. E.; Frazier, C. J., Marijuana, endocannabinoids, and epilepsy: Potential and challenges for improved therapeutic intervention. Exp Neurol 2011.
39. Nucci, C.; Bari, M.; Spano, A.; Corasaniti, M.; Bagetta, G.; Maccarrone, M.; Morrone, L. A., Potential roles of (endo)cannabinoids in the treatment of glaucoma: from intraocular pressure control to neuroprotection. Prog Brain Res 2008, 173, 451-64.
40. Braun, A.; Engel, T.; Aguilar-Pimentel, J. A.; Zimmer, A.; Jakob, T.; Behrendt, H.; Mempel, M., Beneficial effects of cannabinoids (CB) in a murine model of allergen-induced airway inflammation: Role of CB(1)/CB(2) receptors. Immunobiology2011, 216, (4), 466-476.
41. Ashton, C. H.; Moore, P. B., Endocannabinoid system dysfunction in mood and related disorders. Acta Psychiatr Scand 2011, 124, (4), 250-61.
42. Esteban, S.; Garcia-Sevilla, J. A., Effects induced by cannabinoids on monoaminergic systems in the brain and their implications for psychiatric disorders. Prog Neuropsychopharmacol Biol Psychiatry 2011.
43. Rodriguez De Fonseca, F.; Schneider, M., GUEST EDITORIAL: The endogenous cannabinoid system and drug addiction: 20 years after the discovery of the CB1 receptor. Addiction Biology 2008, 13, (2), 143-146.
44. Gaoni, Y.; Mechoulam, R., Isolation, Structure, and Partial Synthesis of an Active Constituent of Hashish. Journal of the American Chemical Society 1964, 86, (8), 1646-1647.
45. Howlett, A. C.; Fleming, R. M., Cannabinoid inhibition of adenylate cyclase. Pharmacology of the response in neuroblastoma cell membranes. Mol Pharmacol 1984, 26, (3), 532-8.
46. Devane, W. A.; Dysarz, F. A., 3rd; Johnson, M. R.; Melvin, L. S.; Howlett, A. C., Determination and characterization of a cannabinoid receptor in rat brain. Mol Pharmacol 1988, 34, (5), 605-13.
47. Herkenham, M.; Lynn, A. B.; Little, M. D.; Johnson, M. R.; Melvin, L. S.; de Costa, B. R.; Rice, K. C., Cannabinoid receptor localization in brain. Proc Natl Acad Sci U S A 1990, 87, (5), 1932-6.
- 47 - | P a g e
48. Matsuda, L. A.; Lolait, S. J.; Brownstein, M. J.; Young, A. C.; Bonner, T. I., Structure of a cannabinoid receptor and functional expression of the cloned cDNA. Nature 1990, 346, (6284), 561-564.
49. Devane, W. A.; Hanus, L.; Breuer, A.; Pertwee, R. G.; Stevenson, L. A.; Griffin, G.; Gibson, D.; Mandelbaum, A.; Etinger, A.; Mechoulam, R., Isolation and structure of a brain constituent that binds to the cannabinoid receptor. Science 1992, 258, (5090), 1946-9.
50. Munro, S.; Thomas, K. L.; Abushaar, M., Molecular Characterization of a Peripheral Receptor for Cannabinoids. Nature 1993, 365, (6441), 61-65.
51. Rinaldi-Carmona, M.; Barth, F.; Heaulme, M.; Shire, D.; Calandra, B.; Congy, C.; Martinez, S.; Maruani, J.; Neliat, G.; Caput, D.; et al., SR141716A, a potent and selective antagonist of the brain cannabinoid receptor. FEBS Lett 1994, 350, (2-3), 240-4.
52. Di Marzo, V.; Fontana, A.; Cadas, H.; Schinelli, S.; Cimino, G.; Schwartz, J.-C.; Piomelli, D., Formation and inactivation of endogenous cannabinoid anandamide in central neurons. Nature 1994, 372, (6507), 686-691.
53. Mechoulam, R.; Ben-Shabat, S.; Hanus, L.; Ligumsky, M.; Kaminski, N. E.; Schatz, A. R.; Gopher, A.; Almog, S.; Martin, B. R.; Compton, D. R.; Pertwee, R. G.; Griffin, G.; Bayewitch, M.; Barg, J.; Vogel, Z., Identification of an endogenous 2-monoglyceride, present in canine gut, that binds to cannabinoid receptors. Biochemical Pharmacology 1995, 50, (1), 83-90.
54. Sugiura, T.; Kondo, S.; Sukagawa, A.; Nakane, S.; Shinoda, A.; Itoh, K.; Yamashita, A.; Waku, K., 2-Arachidonoylglycerol: a possible endogenous cannabinoid receptor ligand in brain. Biochem Biophys Res Commun 1995, 215, (1), 89-97.
55. Cravatt, B. F.; Giang, D. K.; Mayfield, S. P.; Boger, D. L.; Lerner, R. A.; Gilula, N. B., Molecular characterization of an enzyme that degrades neuromodulatory fatty-acid amides. Nature 1996, 384, (6604), 83-87.
56. Beltramo, M.; Stella, N.; Calignano, A.; Lin, S. Y.; Makriyannis, A.; Piomelli, D., Functional role of high-affinity anandamide transport, as revealed by selective inhibition. Science 1997, 277, (5329), 1094-1097.
57. Rodriguez de Fonseca, F.; Carrera, M. R.; Navarro, M.; Koob, G. F.; Weiss, F., Activation of corticotropin-releasing factor in the limbic system during cannabinoid withdrawal. Science 1997, 276, (5321), 2050-4.
58. Ledent, C.; Valverde, O.; Cossu, G.; Petitet, F.; Aubert, J. F.; Beslot, F.; Bohme, G. A.; Imperato, A.; Pedrazzini, T.; Roques, B. P.; Vassart, G.; Fratta, W.; Parmentier, M., Unresponsiveness to cannabinoids and reduced addictive effects of opiates in CB1 receptor knockout mice. Science 1999, 283, (5400), 401-4.
59. De Vries, T. J.; Shaham, Y.; Homberg, J. R.; Crombag, H.; Schuurman, K.; Dieben, J.; Vanderschuren, L. J.; Schoffelmeer, A. N., A cannabinoid mechanism in relapse to cocaine seeking. Nat Med 2001, 7, (10), 1151-4.
60. Navarro, M.; Carrera, M. R. A.; Fratta, W.; Valverde, O.; Cossu, G.; Fattore, L.; Chowen, J. A.; Gomez, R.; del Arco, I.; Villanua, M. A.; Maldonado, R.; Koob, G. F.; de Fonseca, F. R., Functional interaction between opioid and cannabinoid receptors in drug self-administration. Journal of Neuroscience 2001, 21, (14), 5344-5350.
61. Kreitzer, A. C.; Regehr, W. G., Retrograde Inhibition of Presynaptic Calcium Influx by Endogenous Cannabinoids at Excitatory Synapses onto Purkinje Cells. Neuron2001, 29, (3), 717-727.
- 48 - | P a g e
62. Ohno-Shosaku, T.; Maejima, T.; Kano, M., Endogenous Cannabinoids Mediate Retrograde Signals from Depolarized Postsynaptic Neurons to Presynaptic Terminals. Neuron 2001, 29, (3), 729-738.
63. Wilson, R. I.; Nicoll, R. A., Endogenous cannabinoids mediate retrograde signalling at hippocampal synapses. Nature 2001, 410, (6828), 588-592.
64. Hájos, N.; Ledent, C.; Freund, T. F., Novel cannabinoid-sensitive receptor mediates inhibition of glutamatergic synaptic transmission in the hippocampus. Neuroscience 2001, 106, (1), 1-4.
65. Marsicano, G.; Wotjak, C. T.; Azad, S. C.; Bisogno, T.; Rammes, G.; Cascio, M. G.; Hermann, H.; Tang, J.; Hofmann, C.; Zieglgansberger, W.; Di Marzo, V.; Lutz, B., The endogenous cannabinoid system controls extinction of aversive memories. Nature 2002, 418, (6897), 530-534.
66. Kathuria, S.; Gaetani, S.; Fegley, D.; Valino, F.; Duranti, A.; Tontini, A.; Mor, M.; Tarzia, G.; La Rana, G.; Calignano, A.; Giustino, A.; Tattoli, M.; Palmery, M.; Cuomo, V.; Piomelli, D., Modulation of anxiety through blockade of anandamide hydrolysis. Nature Medicine 2003, 9, (1), 76-81.
67. Van Gaal, L. F.; Rissanen, A. M.; Scheen, A. J.; Ziegler, O.; Rössner, S., Effects of the cannabinoid-1 receptor blocker rimonabant on weight reduction and cardiovascular risk factors in overweight patients: 1-year experience from the RIO-Europe study. The Lancet 2005, 365, (9468), 1389-1397.
68. Reggio, P. H., Pharmacophores for ligand recognition and activation/inactivation of the cannabinoid receptors. Curr Pharm Des 2003, 9, (20), 1607-33.
69. Gerard, C. M.; Mollereau, C.; Vassart, G.; Parmentier, M., Molecular cloning of a human cannabinoid receptor which is also expressed in testis. Biochem J 1991,279 ( Pt 1), 129-34.
70. Zhang, J.; Hoffert, C.; Vu, H. K.; Groblewski, T.; Ahmad, S.; O'Donnell, D., Induction of CB2 receptor expression in the rat spinal cord of neuropathic but not inflammatory chronic pain models. European Journal of Neuroscience 2003, 17, (12), 2750-2754.
71. Van Sickle, M. D.; Duncan, M.; Kingsley, P. J.; Mouihate, A.; Urbani, P.; Mackie, K.; Stella, N.; Makriyannis, A.; Piomelli, D.; Davison, J. S.; Marnett, L. J.; Di Marzo, V.; Pittman, Q. J.; Patel, K. D.; Sharkey, K. A., Identification and functional characterization of brainstem cannabinoid CB2 receptors. Science 2005, 310, (5746), 329-32.
72. Gong, J. P.; Onaivi, E. S.; Ishiguro, H.; Liu, Q. R.; Tagliaferro, P. A.; Brusco, A.; Uhl, G. R., Cannabinoid CB2 receptors: immunohistochemical localization in rat brain. Brain Res 2006, 1071, (1), 10-23.
73. Atwood, B. K.; Mackie, K., CB2: a cannabinoid receptor with an identity crisis. British Journal of Pharmacology 2010, 160, (3), 467-479.
74. Ashton, J. C.; Glass, M., The cannabinoid CB2 receptor as a target for inflammation-dependent neurodegeneration. Current Neuropharmacology 2007, 5, (2), 73-80.
75. Miller, A. M.; Stella, N., CB2 receptor-mediated migration of immune cells: it can go either way. British Journal of Pharmacology 2008, 153, (2), 299-308.
76. Cabral, G. A.; Griffin-Thomas, L., Emerging role of the cannabinoid receptor CB2 in immune regulation: therapeutic prospects for neuroinflammation. Expert Rev Mol Med 2009, 11, e3.
- 49 - | P a g e
77. Beltramo, M.; Bernardini, N.; Bertorelli, R.; Campanella, M.; Nicolussi, E.; Fredduzzi, S.; Reggiani, A., CB2 receptor-mediated antihyperalgesia: possible direct involvement of neural mechanisms. Eur J Neurosci 2006, 23, (6), 1530-8.
78. Baek, J. H.; Zheng, Y.; Darlington, C. L.; Smith, P. F., Cannabinoid CB2 receptor expression in the rat brainstem cochlear and vestibular nuclei. Acta Otolaryngol 2008, 128, (9), 961-7.
79. Path, M. E., Rehashing endocannabinoid antagonists: can we selectively target the periphery to safely treat obesity and type 2 diabetes? Journal of Clinical Investigation 2010, 120, (8), 2646-2648.
80. Pang, Z.; Wu, N. N.; Zhao, W.; Chain, D. C.; Schaffer, E.; Zhang, X.; Yamdagni, P.; Palejwala, V. A.; Fan, C.; Favara, S. G.; Dressler, H. M.; Economides, K. D.; Weinstock, D.; Cavallo, J. S.; Naimi, S.; Galzin, A. M.; Guillot, E.; Pruniaux, M. P.; Tocci, M. J.; Polites, H. G., The central cannabinoid CB1 receptor is required for diet-induced obesity and rimonabant's antiobesity effects in mice. Obesity (Silver Spring) 2011, 19, (10), 1923-34.
81. Pertwee, R. G., Pharmacology of cannabinoid CB1 and CB2 receptors. PharmacolTher 1997, 74, (2), 129-80.
82. Nunez, E.; Benito, C.; Pazos, M. R.; Barbachano, A.; Fajardo, O.; Gonzalez, S.; Tolon, R. M.; Romero, J., Cannabinoid CB2 receptors are expressed by perivascular microglial cells in the human brain: an immunohistochemical study. Synapse 2004, 53, (4), 208-13.
83. Golech, S. A.; McCarron, R. M.; Chen, Y.; Bembry, J.; Lenz, F.; Mechoulam, R.; Shohami, E.; Spatz, M., Human brain endothelium: coexpression and function of vanilloid and endocannabinoid receptors. Mol Brain Res 2004, 132, (1), 87-92.
84. Rivers, J. R.; Ashton, J. C., The development of cannabinoid CBII receptor agonists for the treatment of central neuropathies. Cent Nerv Syst Agents Med Chem 2010, 10, (1), 47-64.
85. Onaivi, E. S.; Leonard, C. M.; Ishiguro, H.; Zhang, P. W.; Lin, Z.; Akinshola, B. E.; Uhl, G. R., Endocannabinoids and cannabinoid receptor genetics. Prog Neurobiol 2002, 66, (5), 307-44.
86. Brusco, A.; Tagliaferro, P. A.; Saez, T.; Onaivi, E. S., Ultrastructural localization of neuronal brain CB2 cannabinoid receptors. Ann N Y Acad Sci 2008, 1139, 450-7.
87. Hsieh, G. C.; Pai, M.; Chandran, P.; Hooker, B. A.; Zhu, C. Z.; Salyers, A. K.; Wensink, E. J.; Zhan, C.; Carroll, W. A.; Dart, M. J.; Yao, B. B.; Honore, P.; Meyer, M. D., Central and peripheral sites of action for CB2 receptor mediated analgesic activity in chronic inflammatory and neuropathic pain models in rats. British Journal of Pharmacology 2011, 162, (2), 428-440.
88. Onaivi, E. S.; Carpio, O.; Ishiguro, H.; Schanz, N.; Uhl, G. R.; Benno, R., Behavioral Effects of CB2 Cannabinoid Receptor Activation and Its Influence on Food and Alcohol Consumption. Annals of the New York Academy of Sciences 2008, 1139, (1), 426-433.
89. Ishiguro, H.; Horiuchi, Y.; Ishikawa, M.; Koga, M.; Imai, K.; Suzuki, Y.; Morikawa, M.; Inada, T.; Watanabe, Y.; Takahashi, M.; Someya, T.; Ujike, H.; Iwata, N.; Ozaki, N.; Onaivi, E. S.; Kunugi, H.; Sasaki, T.; Itokawa, M.; Arai, M.; Niizato, K.; Iritani, S.; Naka, I.; Ohashi, J.; Kakita, A.; Takahashi, H.; Nawa, H.; Arinami, T., Brain cannabinoid CB2 receptor in schizophrenia. Biol Psychiatry 2010, 67, (10), 974-82.
- 50 - | P a g e
90. Ortega-Alvaro, A.; Aracil-Fernandez, A.; Garcia-Gutierrez, M. S.; Navarrete, F.; Manzanares, J., Deletion of CB2 Cannabinoid Receptor Induces Schizophrenia-Related Behaviors in Mice. Neuropsychopharmacology 2011, 36, (7), 1489-1504.
91. Xi, Z.-X.; Peng, X.-Q.; Li, X.; Song, R.; Zhang, H.-Y.; Liu, Q.-R.; Yang, H.-J.; Bi, G.-H.; Li, J.; Gardner, E. L., Brain cannabinoid CB2 receptors modulate cocaine's actions in mice. Nat Neurosci 2011, 14, (9), 1160-1166.
92. Pertwee, R. G.; Howlett, A. C.; Abood, M. E.; Alexander, S. P. H.; Di Marzo, V.; Elphick, M. R.; Greasley, P. J.; Hansen, H. S.; Kunos, G.; Mackie, K.; Mechoulam, R.; Ross, R. A., International Union of Basic and Clinical Pharmacology. LXXIX. Cannabinoid Receptors and Their Ligands: Beyond CB(1) and CB(2). Pharmacol Rev 2010, 62, (4), 588-631.
93. Howlett, A. C., The cannabinoid receptors. Prostaglandins Other Lipid Mediat 2002, 68-69, 619-31.
94. Stella, N.; Schweitzer, P.; Piomelli, D., A second endogenous cannabinoid that modulates long-term potentiation. Nature 1997, 388, (6644), 773-778.
95. Sugiura, T.; Waku, K., 2-Arachidonoylglycerol and the cannabinoid receptors. Chem Phys Lipids 2000, 108, (1-2), 89-106.
96. Katona, I.; Freund, T. F., Endocannabinoid signaling as a synaptic circuit breaker in neurological disease. Nature Medicine 2008, 14, (9), 923-930.
97. Pertwee, R. G., Ligands that target cannabinoid receptors in the brain: from THC to anandamide and beyond. Addict Biol 2008, 13, (2), 147-59.
98. Maresz, K.; Carrier, E. J.; Ponomarev, E. D.; Hillard, C. J.; Dittel, B. N., Modulation of the cannabinoid CB2 receptor in microglial cells in response to inflammatory stimuli. Journal of Neurochemistry 2005, 95, (2), 437-445.
99. Stella, N., Cannabinoid signaling in glial cells. Glia 2004, 48, (4), 267-277. 100. Fernández-Ruiz, J.; Pazos, M. R.; García-Arencibia, M.; Sagredo, O.; Ramos, J.
A., Role of CB2 receptors in neuroprotective effects of cannabinoids. Molecularand Cellular Endocrinology 2008, 286, (1–2, Supplement 1), S91-S96.
101. Gomez, O.; Sanchez-Rodriguez, A.; Le, M.; Sanchez-Caro, C.; Molina-Holgado, F.; Molina-Holgado, E., Cannabinoid receptor agonists modulate oligodendrocyte differentiation by activating PI3K/Akt and the mammalian target of rapamycin (mTOR) pathways. Br J Pharmacol 2011, 163, (7), 1520-32.
102. Molina-Holgado, E.; Vela, J. M.; Arevalo-Martin, A.; Almazan, G.; Molina-Holgado, F.; Borrell, J.; Guaza, C., Cannabinoids promote oligodendrocyte progenitor survival: involvement of cannabinoid receptors and phosphatidylinositol-3kinase/Akt signaling. J Neurosci 2002, 22, (22), 9742-53.
103. Ehrhart, J.; Obregon, D.; Mori, T.; Hou, H.; Sun, N.; Bai, Y.; Klein, T.; Fernandez, F.; Tan, J.; Shytle, R. D., Stimulation of cannabinoid receptor 2 (CB2) suppresses microglial activation. J Neuroinflammation 2005, 2, 29.
104. Ramirez, B. G.; Blazquez, C.; Gomez del Pulgar, T.; Guzman, M.; de Ceballos, M. L., Prevention of Alzheimer's disease pathology by cannabinoids: neuroprotection mediated by blockade of microglial activation. J Neurosci 2005, 25, (8), 1904-13.
105. Brownjohn, P. W.; Ashton, J. C., Spinal cannabinoid CB2 receptors as a target for neuropathic pain: an investigation using chronic constriction injury. Neuroscience2012, 203, 180-93.
106. Hanus, L.; Gopher, A.; Almog, S.; Mechoulam, R., Two new unsaturated fatty acid ethanolamides in brain that bind to the cannabinoid receptor. J Med Chem 1993,36, (20), 3032-4.
- 51 - | P a g e
107. Pertwee, R.; Griffin, G.; Hanus, L.; Mechoulam, R., Effects of two endogenous fatty acid ethanolamides on mouse vasa deferentia. Eur J Pharmacol 1994, 259, (2), 115-20.
108. Hanuš, L.; Abu-Lafi, S.; Fride, E.; Breuer, A.; Vogel, Z.; Shalev, D. E.; Kustanovich, I.; Mechoulam, R., 2-Arachidonyl glyceryl ether, an endogenous agonist of the cannabinoid CB1 receptor. Proceedings of the National Academy of Sciences 2001, 98, (7), 3662-3665.
109. Porter, A. C.; Sauer, J.-M.; Knierman, M. D.; Becker, G. W.; Berna, M. J.; Bao, J.; Nomikos, G. G.; Carter, P.; Bymaster, F. P.; Leese, A. B.; Felder, C. C., Characterization of a Novel Endocannabinoid, Virodhamine, with Antagonist Activity at the CB1 Receptor. Journal of Pharmacology and Experimental Therapeutics 2002, 301, (3), 1020-1024.
110. Huang, S. M.; Bisogno, T.; Trevisani, M.; Al-Hayani, A.; De Petrocellis, L.; Fezza, F.; Tognetto, M.; Petros, T. J.; Krey, J. F.; Chu, C. J.; Miller, J. D.; Davies, S. N.; Geppetti, P.; Walker, J. M.; Di Marzo, V., An endogenous capsaicin-like substance with high potency at recombinant and native vanilloid VR1 receptors. Proceedings of the National Academy of Sciences 2002, 99, (12), 8400-8405.
111. Gomes, I.; Grushko, J. S.; Golebiewska, U.; Hoogendoorn, S.; Gupta, A.; Heimann, A. S.; Ferro, E. S.; Scarlata, S.; Fricker, L. D.; Devi, L. A., Novel endogenous peptide agonists of cannabinoid receptors. FASEB J 2009, 23, (9), 3020-9.
112. Richter, F.; Meurers, B. H.; Zhu, C.; Medvedeva, V. P.; Chesselet, M. F., Neurons express hemoglobin alpha- and beta-chains in rat and human brains. J Comp Neurol 2009, 515, (5), 538-47.
113. Kogan, N. M.; Mechoulam, R., The chemistry of endocannabinoids. J Endocrinol Invest 2006, 29, (3 Suppl), 3-14.
114. Lambert, D. M.; Vandevoorde, S.; Diependaele, G.; Govaerts, S. J.; Robert, A. R., Anticonvulsant activity of N-palmitoylethanolamide, a putative endocannabinoid, in mice. Epilepsia 2001, 42, (3), 321-7.
115. Maccarrone, M.; Pauselli, R.; Di Rienzo, M.; Finazzi-Agro, A., Binding, degradation and apoptotic activity of stearoylethanolamide in rat C6 glioma cells. Biochem J 2002, 366, (Pt 1), 137-44.
116. Fu, J.; Kim, J.; Oveisi, F.; Astarita, G.; Piomelli, D., Targeted enhancement of oleoylethanolamide production in proximal small intestine induces across-meal satiety in rats. Am J Physiol Regul Integr Comp Physiol 2008, 295, (1), R45-50.
117. Huang, S. M.; Bisogno, T.; Petros, T. J.; Chang, S. Y.; Zavitsanos, P. A.; Zipkin, R. E.; Sivakumar, R.; Coop, A.; Maeda, D. Y.; De Petrocellis, L.; Burstein, S.; Di Marzo, V.; Walker, J. M., Identification of a new class of molecules, the arachidonyl amino acids, and characterization of one member that inhibits pain. JBiol Chem 2001, 276, (46), 42639-44.
118. Okamoto, Y.; Morishita, J.; Tsuboi, K.; Tonai, T.; Ueda, N., Molecular characterization of a phospholipase D generating anandamide and its congeners. J Biol Chem 2004, 279, (7), 5298-305.
119. Bisogno, T.; Howell, F.; Williams, G.; Minassi, A.; Cascio, M. G.; Ligresti, A.; Matias, I.; Schiano-Moriello, A.; Paul, P.; Williams, E. J.; Gangadharan, U.; Hobbs, C.; Di Marzo, V.; Doherty, P., Cloning of the first sn1-DAG lipases points to the spatial and temporal regulation of endocannabinoid signaling in the brain. J Cell Biol 2003, 163, (3), 463-8.
- 52 - | P a g e
120. Ahn, K.; McKinney, M. K.; Cravatt, B. F., Enzymatic pathways that regulate endocannabinoid signaling in the nervous system. Chemical Reviews 2008, 108, (5), 1687-1707.
121. Marrs, W. R.; Blankman, J. L.; Horne, E. A.; Thomazeau, A.; Lin, Y. H.; Coy, J.; Bodor, A. L.; Muccioli, G. G.; Hu, S. S.-J.; Woodruff, G.; Fung, S.; Lafourcade, M.; Alexander, J. P.; Long, J. Z.; Li, W.; Xu, C.; Moller, T.; Mackie, K.; Manzoni, O. J.; Cravatt, B. F.; Stella, N., The serine hydrolase ABHD6 controls the accumulation and efficacy of 2-AG at cannabinoid receptors. Nat Neurosci 2010, 13, (8), 951-957.
122. Blankman, J. L.; Simon, G. M.; Cravatt, B. F., A comprehensive profile of brain enzymes that hydrolyze the endocannabinoid 2-arachidonoylglycerol. Chemistry & Biology 2007, 14, (12), 1347-1356.
123. Reggio, P. H.; Traore, H., Conformational requirements for endocannabinoid interaction with the cannabinoid receptors, the anandamide transporter and fatty acid amidohydrolase. Chem Phys Lipids 2000, 108, (1-2), 15-35.
124. Lopez-Rodriguez, M. L.; Viso, A.; Ortega-Gutierrez, S.; Lastres-Becker, I.; Gonzalez, S.; Fernandez-Ruiz, J.; Ramos, J. A., Design, synthesis and biological evaluation of novel arachidonic acid derivatives as highly potent and selective endocannabinoid transporter inhibitors. J Med Chem 2001, 44, (26), 4505-8.
125. Glaser, S. T.; Kaczocha, M.; Deutsch, D. G., Anandamide transport: A critical review. Life Sciences 2005, 77, (14), 1584-1604.
126. Wu, X.; Han, L.; Zhang, X.; Li, L.; Jiang, C.; Qiu, Y.; Huang, R.; Xie, B.; Lin, Z.; Ren, J.; Fu, J., Alteration of endocannabinoid system in human gliomas. JNeurochem 2012, 120, (5), 842-9.
127. Basavarajappa, B. S., Neuropharmacology of the endocannabinoid signaling system-molecular mechanisms, biological actions and synaptic plasticity. Current Neuropharmacology 2007, 5, (2), 81-97.
128. Varga, E. V.; Georgieva, T.; Tumati, S.; Alves, I.; Salamon, Z.; Tollin, G.; Yamamura, H. I.; Roeske, W. R., Functional selectivity in cannabinoid signaling. Curr Mol Pharmacol 2008, 1, (3), 273-84.
129. Berg, K. A.; Maayani, S.; Goldfarb, J.; Scaramellini, C.; Leff, P.; Clarke, W. P., Effector pathway-dependent relative efficacy at serotonin type 2A and 2C receptors: Evidence for agonist-directed trafficking of receptor stimulus. Molecular Pharmacology 1998, 54, (1), 94-104.
130. Kenakin, T., Inverse, protean, and ligand-selective agonism: matters of receptor conformation. FASEB J 2001, 15, (3), 598-611.
131. Kenakin, T., Agonist-receptor efficacy. II. Agonist trafficking of receptor signals. Trends Pharmacol Sci 1995, 16, (7), 232-8.
132. Howlett, A. C., Cannabinoid receptor signaling. Handb Exp Pharmacol 2005,(168), 53-79.
133. Demuth, D. G.; Molleman, A., Cannabinoid signalling. Life Sciences 2006, 78, (6), 549-563.
134. Di Marzo, V.; De Petrocellis, L., Plant, synthetic, and endogenous cannabinoids in medicine. Annual Review of Medicine 2006, 57, 553-574.
135. Wilson, R. I.; Nicoll, R. A., Endocannabinoid signaling in the brain. Science 2002,296, (5568), 678-82.
136. Chevaleyre, V.; Takahashi, K. A.; Castillo, P. E., Endocannabinoid-mediated synaptic plasticity in the CNS. Annu Rev Neurosci 2006, 29, 37-76.
- 53 - | P a g e
137. Lovinger, D. M., Presynaptic modulation by endocannabinoids. Handb Exp Pharmacol 2008, (184), 435-77.
138. Dalton, G. D.; Bass, C. E.; Van Horn, C. G.; Howlett, A. C., Signal transduction via cannabinoid receptors. CNS Neurol Disord Drug Targets 2009, 8, (6), 422-31.
139. Glass, M.; Felder, C. C., Concurrent stimulation of cannabinoid CB1 and dopamine D2 receptors augments cAMP accumulation in striatal neurons: evidence for a Gs linkage to the CB1 receptor. J Neurosci 1997, 17, (14), 5327-33.
140. Kearn, C. S.; Blake-Palmer, K.; Daniel, E.; Mackie, K.; Glass, M., Concurrent stimulation of cannabinoid CB1 and dopamine D2 receptors enhances heterodimer formation: a mechanism for receptor cross-talk? Mol Pharmacol 2005, 67, (5), 1697-704.
141. Shoemaker, J. L.; Ruckle, M. B.; Mayeux, P. R.; Prather, P. L., Agonist-directed trafficking of response by endocannabinoids acting at CB2 receptors. Journal of Pharmacology and Experimental Therapeutics 2005, 315, (2), 828-838.
142. Hudson, B. D.; Hébert, T. E.; M. Kelly, M. E., Ligand- and Heterodimer-Directed Signaling of the CB1 Cannabinoid Receptor. Molecular Pharmacology 2010, 77, (1), 1-9.
143. Marinelli, S.; Di Marzo, V.; Berretta, N.; Matias, I.; Maccarrone, M.; Bernardi, G.; Mercuri, N. B., Presynaptic facilitation of glutamatergic synapses to dopaminergic neurons of the rat substantia nigra by endogenous stimulation of vanilloid receptors. Journal of Neuroscience 2003, 23, (8), 3136-3144.
144. Premkumar, L. S.; Sikand, P., TRPV1: A target for next generation analgesics. Current Neuropharmacology 2008, 6, (2), 151-163.
145. Park, C. K.; Lu, N.; Xu, Z. Z.; Liu, T.; Serhan, C. N.; Ji, R. R., Resolving TRPV1-and TNF-alpha-Mediated Spinal Cord Synaptic Plasticity and Inflammatory Pain with Neuroprotectin D1. Journal of Neuroscience 2011, 31, (42), 15072-15085.
146. Fu, M.; Xie, Z.; Zuo, H., TRPV1: A potential target for antiepileptogenesis. MedicalHypotheses 2009, 73, (1), 100-102.
147. Sawzdargo, M.; Nguyen, T.; Lee, D. K.; Lynch, K. R.; Cheng, R.; Heng, H. H. Q.; George, S. R.; O'Dowd, B. F., Identification and cloning of three novel human G protein-coupled receptor genes GPR52, GPR53 and GPR55: GPR55 is extensively expressed in human brain. Mol Brain Res 1999, 64, (2), 193-198.
148. Baker, D.; Pryce, G.; Davies, W. L.; Hiley, C. R., In silico patent searching reveals a new cannabinoid receptor. Trends in Pharmacological Sciences 2006, 27, (1), 1-4.
149. Drmota, E.; Greasley, P.; Groblewski, T. Screening assays for cannabinoid-ligand type modulators. 2004.
150. Johns, D. G.; Behm, D. J.; Ao, Z. H.; Walker, D.; Parsons, M.; Senadhi, S.; T Goserud, M.; Daniels, D. A.; Riddick, M.; Staton, P. C.; Green, P.; Bao, W.; Aiyar, N.; Yue, T. L.; Brown, A. J.; Morrison, A. D.; Douglas, S. A., The novel cannabinoid receptor GPR55 binds atypical cannabinoids but does not mediate their vasodilatory effects. Hypertension 2006, 48, (4), E86-E86.
151. Ryberg, E.; Larsson, N.; Sjogren, S.; Hjorth, S.; Hermansson, N. O.; Leonova, J.; Elebring, T.; Nilsson, K.; Drmota, T.; Geasley, P. J., The orphan receptor GPR55 is a novel cannabinoid receptor. British Journal of Pharmacology 2007, 152, (7), 1092-1101.
- 54 - | P a g e
152. Lauckner, J. E.; Jensen, J. B.; Chen, H. Y.; Lu, H. C.; Hille, B.; Mackie, K., GPR55 is a cannabinoid receptor that increases intracellular calcium and inhibits M current. P Natl Acad Sci USA 2008, 105, (7), 2699-2704.
153. Ross, R. A., The enigmatic pharmacology of GPR55. Trends Pharmacol Sci 2009,30, (3), 156-63.
154. Whyte, L. S.; Ryberg, E.; Sims, N. A.; Ridge, S. A.; Mackie, K.; Greasley, P. J.; Ross, R. A.; Rogers, M. J., The putative cannabinoid receptor GPR55 affects osteoclast function in vitro and bone mass in vivo. Proceedings of the National Academy of Sciences 2009, 106, (38), 16511-16516.
155. Oka, S.; Nakajima, K.; Yamashita, A.; Kishimoto, S.; Sugiura, T., Identification of GPR55 as a lysophosphatidylinositol receptor. Biochem Bioph Res Co 2007, 362, (4), 928-934.
156. Staton, P. C.; Hatcher, J. P.; Walker, D. J.; Morrison, A. D.; Shapland, E. M.; Hughes, J. P.; Chong, E.; Mander, P. K.; Green, P. J.; Billinton, A.; Fulleylove, M.; Lancaster, H. C.; Smith, J. C.; Bailey, L. T.; Wise, A.; Brown, A. J.; Richardson, J. C.; Chessell, I. P., The putative cannabinoid receptor GPR55 plays a role in mechanical hyperalgesia associated with inflammatory and neuropathic pain. Pain 2008, 139, (1), 225-236.
157. Pietr, M.; Kozela, E.; Levy, R.; Rimmerman, N.; Lin, Y. H.; Stella, N.; Vogel, Z.; Juknat, A., Differential changes in GPR55 during microglial cell activation. FEBSLetters 2009, 583, (12), 2071-2076.
158. Moreno-Navarrete, J. M.; Catalan, V.; Whyte, L.; Diaz-Arteaga, A.; Vazquez-Martinez, R.; Rotellar, F.; Guzman, R.; Gomez-Ambrosi, J.; Pulido, M. R.; Russell, W. R.; Imbernon, M.; Ross, R. A.; Malagon, M. M.; Dieguez, C.; Fernandez-Real, J. M.; Fruhbeck, G.; Nogueiras, R., The L-alpha-Lysophosphatidylinositol/GPR55 System and Its Potential Role in Human Obesity. Diabetes 2011.
159. Ford, L. A.; Roelofs, A. J.; Anavi-Goffer, S.; Mowat, L.; Simpson, D. G.; Irving, A. J.; Rogers, M. J.; Rajnicek, A. M.; Ross, R. A., A role for L-alpha-lysophosphatidylinositol and GPR55 in the modulation of migration, orientation and polarization of human breast cancer cells. Br J Pharmacol 2010, 160, (3), 762-71.
160. Jay, M. A.; Ren, J., Peroxisome proliferator-activated receptor (PPAR) in metabolic syndrome and type 2 diabetes mellitus. Curr Diabetes Rev 2007, 3, (1), 33-9.
161. Clark, R. B., The role of PPARs in inflammation and immunity. Journal of Leukocyte Biology 2002, 71, (3), 388-400.
162. Stella, N., Cannabinoid and cannabinoid-like receptors in microglia, astrocytes, and astrocytomas. Glia 2010, 58, (9), 1017-30.
163. McHugh, D.; Hu, S. S. J.; Rimmerman, N.; Juknat, A.; Vogel, Z.; Walker, J. M.; Bradshaw, H. B., N-arachidonoyl glycine, an abundant endogenous lipid, potently drives directed cellular migration through GPR18, the putative abnormal cannabidiol receptor. Bmc Neuroscience 2010, 11.
164. Overton, H. A.; Fyfe, M. C. T.; Reynet, C., GPR119, a novel G protein-coupled receptor target for the treatment of type 2 diabetes and obesity. British Journal of Pharmacology 2008, 153, S76-S81.
165. Perez-Reyes, E., Molecular physiology of low-voltage-activated T-type calcium channels. Physiol Rev 2003, 83, (1), 117-161.
- 55 - | P a g e
166. Anderson, M. P.; Mochizuki, T.; Xie, J.; Fischler, W.; Manger, J. P.; Talley, E. M.; Scammell, T. E.; Tonegawa, S., Thalamic Cav3.1 T-type Ca2+ channel plays a crucial role in stabilizing sleep. Proc Natl Acad Sci U S A 2005, 102, (5), 1743-8.
167. Kim, D., Thalamic control of visceral nociception mediated by T-type Ca2+ channels (vol 302, pg 117, 2003). Science 2004, 303, (5664), 1612-1612.
168. Tsakiridou, E.; Bertollini, L.; Decurtis, M.; Avanzini, G.; Pape, H. C., Selective Increase in T-Type Calcium Conductance of Reticular Thalamic Neurons in a Rat Model of Absence Epilepsy. Journal of Neuroscience 1995, 15, (4), 3110-3117.
169. Vitko, I.; Chen, Y. C.; Arias, J. M.; Shen, Y.; Wu, X. R.; Perez-Reyes, E., Functional characterization and neuronal modeling of the effects of childhood absence epilepsy variants of CACNA1H, a T-type calcium channel. Journal of Neuroscience 2005, 25, (19), 4844-4855.
170. Barbara, G.; Alloui, A.; Nargeot, J.; Lory, P.; Eschalier, A.; Bourinet, E.; Chemin, J., T-Type Calcium Channel Inhibition Underlies the Analgesic Effects of the Endogenous Lipoamino Acids. Journal of Neuroscience 2009, 29, (42), 13106-13114.
171. You, H.; Gadotti, V. M.; Petrov, R. R.; Zamponi, G. W.; Diaz, P., Functional characterization and analgesic effects of mixed cannabinoid receptor/T-type channel ligands. Mol Pain 2011, 7, 89.
172. McCallum, J. B.; Kwok, W. M.; Mynlieff, M.; Bosnjak, Z. J.; Hogan, Q. H., Loss of T-type calcium current in sensory neurons of rats with neuropathic pain. Anesthesiology 2003, 98, (1), 209-216.
173. Flatters, S. J. L., T-type calcium channels: a potential target for the treatment of chronic pain. Drug Future 2005, 30, (6), 573-580.
174. Chemin, J.; Monteil, A.; Perez-Reyes, E.; Nargeot, J.; Lory, P., Direct inhibition of T-type calcium channels by the endogenous cannabinoid anandamide. EMBO J 2001, 20, (24), 7033-7040.
175. Ross, H. R.; Napier, I.; Connor, M., Inhibition of Recombinant Human T-type Calcium Channels by 9-Tetrahydrocannabinol and Cannabidiol. Journal of Biological Chemistry 2008, 283, (23), 16124-16134.
176. Fan, P., Cannabinoid agonists inhibit the activation of 5-HT3 receptors in rat nodose ganglion neurons. J Neurophysiol 1995, 73, (2), 907-10.
177. Barann, M.; Molderings, G.; Brüss, M.; Bönisch, H.; Urban, B. W.; Göthert, M., Direct inhibition by cannabinoids of human 5-HT3A receptors: probable involvement of an allosteric modulatory site. British Journal of Pharmacology 2002, 137, (5), 589-596.
178. Oz, M.; Zhang, L.; Ravindran, A.; Morales, M.; Lupica, C. R., Differential Effects of Endogenous and Synthetic Cannabinoids on 7-Nicotinic Acetylcholine Receptor-Mediated Responses in Xenopus Oocytes. Journal of Pharmacology and Experimental Therapeutics 2004, 310, (3), 1152-1160.
179. Hampson, A. J.; Bornheim, L. M.; Scanziani, M.; Yost, C. S.; Gray, A. T.; Hansen, B. M.; Leonoudakis, D. J.; Bickler, P. E., Dual effects of anandamide on NMDA receptor-mediated responses and neurotransmission. J Neurochem 1998, 70, (2), 671-6.
180. Maingret, F.; Patel, A. J.; Lazdunski, M.; Honore, E., The endocannabinoid anandamide is a direct and selective blocker of the background K(+) channel TASK-1. EMBO J 2001, 20, (1-2), 47-54.
- 56 - | P a g e
181. Nicholson, R. A.; Liao, C.; Zheng, J.; David, L. S.; Coyne, L.; Errington, A. C.; Singh, G.; Lees, G., Sodium channel inhibition by anandamide and synthetic cannabimimetics in brain. Brain Research 2003, 978, (1–2), 194-204.
182. Ameri, A., The effects of cannabinoids on the brain. Prog Neurobiol 1999, 58, (4), 315-48.
183. Grant, J. E.; Chamberlain, S. R.; Schreiber, L.; Odlaug, B. L., Neuropsychological deficits associated with cannabis use in young adults. Drug Alcohol Depend 2012,121, (1-2), 159-62.
184. Arseneault, L.; Cannon, M.; Witton, J.; Murray, R. M., Causal association between cannabis and psychosis: examination of the evidence. Brit J Psychiat 2004, 184, 110-117.
185. D'Souza, D. C.; Perry, E.; MacDougall, L.; Ammerman, Y.; Cooper, T.; Wu, Y. T.; Braley, G.; Gueorguieva, R.; Krystal, J. H., The psychotomimetic effects of intravenous delta-9-tetrahydrocannabinol in healthy individuals: implications for psychosis. Neuropsychopharmacology 2004, 29, (8), 1558-72.
186. Hall, W.; Degnhardt, L., Cannabis use and the risk of developing a psychotic disorder. World Psychiatry 2008, 7, (2), 68-71.
187. Caspi, A.; Moffitt, T. E.; Cannon, M.; McClay, J.; Murray, R.; Harrington, H.; Taylor, A.; Arseneault, L.; Williams, B.; Braithwaite, A.; Poulton, R.; Craig, I. W., Moderation of the effect of adolescent-onset cannabis use on adult psychosis by a functional polymorphism in the catechol-O-methyltransferase gene: Longitudinal evidence of a gene X environment interaction. Biol Psychiat 2005, 57, (10), 1117-1127.
188. Fernandez-Espejo, E.; Viveros, M. P.; Nunez, L.; Ellenbroek, B. A.; Rodriguez de Fonseca, F., Role of cannabis and endocannabinoids in the genesis of schizophrenia. Psychopharmacology (Berl) 2009, 206, (4), 531-49.
189. Aung, M. M.; Griffin, G.; Huffman, J. W.; Wu, M.-J.; Keel, C.; Yang, B.; Showalter, V. M.; Abood, M. E.; Martin, B. R., Influence of the N-1 alkyl chain length of cannabimimetic indoles upon CB1 and CB2 receptor binding. Drug and Alcohol Dependence 2000, 60, (2), 133-140.
190. Huffman, J. W.; Dai, D.; Martin, B. R.; Compton, D. R., Design, Synthesis and Pharmacology of Cannabimimetic Indoles. Bioorganic & Medicinal Chemistry Letters 1994, 4, (4), 563-566.
191. Every-Palmer, S., Synthetic cannabinoid JWH-018 and psychosis: an explorative study. Drug Alcohol Depend 2011, 117, (2-3), 152-7.
192. Ginsburg, B. C.; Schulze, D. R.; Hruba, L.; McMahon, L. R., JWH-018 and JWH-073: Delta-tetrahydrocannabinol-like discriminative stimulus effects in monkeys. JPharmacol Exp Ther 2012, 340, (1), 37-45.
193. Bornheim, L. M.; Grillo, M. P., Characterization of cytochrome P450 3A inactivation by cannabidiol: possible involvement of cannabidiol-hydroxyquinoneas a P450 inactivator. Chem Res Toxicol 1998, 11, (10), 1209-16.
194. Russo, E.; Guy, G. W., A tale of two cannabinoids: the therapeutic rationale for combining tetrahydrocannabinol and cannabidiol. Med Hypotheses 2006, 66, (2), 234-46.
195. Vann, R. E.; Gamage, T. F.; Warner, J. A.; Marshall, E. M.; Taylor, N. L.; Martin, B. R.; Wiley, J. L., Divergent effects of cannabidiol on the discriminative stimulus and place conditioning effects of Delta(9)-tetrahydrocannabinol. Drug Alcohol Depend 2008, 94, (1-3), 191-8.
- 57 - | P a g e
196. Bhattacharyya, S.; Morrison, P. D.; Fusar-Poli, P.; Martin-Santos, R.; Borgwardt, S.; Winton-Brown, T.; Nosarti, C.; CM, O. C.; Seal, M.; Allen, P.; Mehta, M. A.; Stone, J. M.; Tunstall, N.; Giampietro, V.; Kapur, S.; Murray, R. M.; Zuardi, A. W.; Crippa, J. A.; Atakan, Z.; McGuire, P. K., Opposite effects of delta-9-tetrahydrocannabinol and cannabidiol on human brain function and psychopathology. Neuropsychopharmacology 2010, 35, (3), 764-74.
197. Zuardi, A. W.; Hallak, J. E.; Crippa, J. A., Interaction between cannabidiol (CBD) and (9)-tetrahydrocannabinol (THC): influence of administration interval and dose ratio between the cannabinoids. Psychopharmacology (Berl) 2012, 219, (1), 247-9.
198. Klein, C.; Karanges, E.; Spiro, A.; Wong, A.; Spencer, J.; Huynh, T.; Gunasekaran, N.; Karl, T.; Long, L. E.; Huang, X. F.; Liu, K.; Arnold, J. C.; McGregor, I. S., Cannabidiol potentiates Delta-tetrahydrocannabinol (THC) behavioural effects and alters THC pharmacokinetics during acute and chronic treatment in adolescent rats. Psychopharmacology (Berl) 2011, 218, (2), 443-57.
199. Mohamed, B. A., Cannabinoids in medicine: A review of their therapeutic potential. Journal of Ethnopharmacology 2006, 105, (1–2), 1-25.
200. Sink, K. S.; Segovia, K. N.; Sink, J.; Randall, P. A.; Collins, L. E.; Correa, M.; Markus, E. J.; Vemuri, V. K.; Makriyannis, A.; Salamone, J. D., Potential anxiogenic effects of cannabinoid CB1 receptor antagonists/inverse agonists in rats: Comparisons between AM4113, AM251, and the benzodiazepine inverse agonist FG-7142. Eur Neuropsychopharm 2010, 20, (2), 112-122.
201. Christensen, R.; Kristensen, P. K.; Bartels, E. M.; Bliddal, H.; Astrup, A., Efficacy and safety of the weight-loss drug rimonabant: a meta-analysis of randomised trials. Lancet 2007, 370, (9600), 1706-13.
202. Hill, A. J.; Williams, C. M.; Whalley, B. J.; Stephens, G. J., Phytocannabinoids as novel therapeutic agents in CNS disorders. Pharmacology & Therapeutics 2012, 133, (1), 79-97.
203. Russo, E. B., Taming THC: potential cannabis synergy and phytocannabinoid-terpenoid entourage effects. British Journal of Pharmacology 2011, 163, (7), 1344-1364.
204. Gertsch, J.; Pertwee, R. G.; Di Marzo, V., Phytocannabinoids beyond the Cannabis plant - do they exist? Br J Pharmacol 2010, 160, (3), 523-9.
205. Woelkart, K.; Salo-Ahen, O. M. H.; Bauer, R., CB receptor ligands from plants. Curr Top Med Chem 2008, 8, (3), 173-186.
206. Pertwee, R. G.; Thomas, A.; Stevenson, L. A.; Ross, R. A.; Varvel, S. A.; Lichtman, A. H.; Martin, B. R.; Razdan, R. K., The psychoactive plant cannabinoid, Delta9-tetrahydrocannabinol, is antagonized by Delta8- and Delta9-tetrahydrocannabivarin in mice in vivo. Br J Pharmacol 2007, 150, (5), 586-94.
207. Izzo, A. A.; Borrelli, F.; Capasso, R.; Di Marzo, V.; Mechoulam, R., Non-psychotropic plant cannabinoids: new therapeutic opportunities from an ancient herb. Trends Pharmacol Sci 2009, 30, (10), 515-27.
208. De Petrocellis, L.; Di Marzo, V., Non-CB1, Non-CB2 Receptors for Endocannabinoids, Plant Cannabinoids, and Synthetic Cannabimimetics: Focus on G-protein-coupled Receptors and Transient Receptor Potential Channels. Journal of Neuroimmune Pharmacology 2010, 5, (1), 103-121.
209. Gertsch, J.; Raduner, S.; Altmann, K. H., Review - New natural noncannabinoid ligands for cannabinoid type-2 (CB2) receptors. J Recept Sig Transd 2006, 26, (5-6), 709-730.
- 58 - | P a g e
210. Raduner, S.; Majewska, A.; Chen, J. Z.; Xie, X. Q.; Hamon, J.; Faller, B.; Altmann, K. H.; Gertsch, J., Alkylamides from Echinacea are a new class of cannabinomimetics - Cannabinoid type 2 receptor-dependent and -independent immunomodulatory effects. Journal of Biological Chemistry 2006, 281, (20), 14192-14206.
211. Ghelardini, C.; Galeotti, N.; Di Cesare Mannelli, L.; Mazzanti, G.; Bartolini, A., Local anaesthetic activity of beta-caryophyllene. Farmaco 2001, 56, (5-7), 387-9.
212. Fournier, G.; Lenicque, P. M.; Paris, M. R., [Toxic effects of essential oil of Cannabis sativa L. and main constituents on planarian (Dugesia tigrina) (author's transl)]. Toxicol Eur Res 1978, 1, (6), 385-9.
213. Politeo, O.; Jukic, M.; Milos, M., Chemical composition and antioxidant activity of essential oils of twelve spice plants. Croat Chem Acta 2006, 79, (4), 545-552.
214. FDA, Everything Added to Food in the United States (EAFUS). In 2012. 215. Gertsch, J.; Leonti, M.; Raduner, S.; Racz, I.; Chen, J. Z.; Xie, X. Q.; Altmann, K.
H.; Karsak, M.; Zimmer, A., Beta-caryophyllene is a dietary cannabinoid. P Natl Acad Sci USA 2008, 105, (26), 9099-9104.
216. Bento, A. F.; Marcon, R.; Dutra, R. C.; Claudino, R. F.; Cola, M.; Pereira Leite, D. F.; Calixto, J. B., -Caryophyllene Inhibits Dextran Sulfate Sodium-Induced Colitis in Mice through CB2 Receptor Activation and PPAR Pathway. The American Journal of Pathology 2011, 178, (3), 1153-1166.
217. Cho, J. Y.; Chang, H. J.; Lee, S. K.; Kim, H. J.; Hwang, J. K.; Chun, H. S., Amelioration of dextran sulfate sodium-induced colitis in mice by oral administration of beta-caryophyllene, a sesquiterpene. Life Sci 2007, 80, (10), 932-9.
218. Legault, J.; Pichette, A., Potentiating effect of beta-caryophyllene on anticancer activity of alpha-humulene, isocaryophyllene and paclitaxel. Journal of Pharmacy and Pharmacology 2007, 59, (12), 1643-1647.
219. Lima, S. R. M.; Veiga, V. F.; Christo, H. B.; Pinto, A. C.; Fernandes, P. D., In vivo and in vitro studies on the anticancer activity of Copaifera multijuga Hayne and its fractions. Phytotherapy Research 2003, 17, (9), 1048-1053.
220. Di Sotto, A.; Evandri, M. G.; Mazzanti, G., Antimutagenic and mutagenic activities of some terpenes in the bacterial reverse mutation assay. Mutation Research/Genetic Toxicology and Environmental Mutagenesis 2008, 653, (1-2), 130-133.
221. Gertsch, J.; Pertwee, R. G.; Di Marzo, V., Phytocannabinoids beyond the Cannabis plant – do they exist? British Journal of Pharmacology 2010, 160, (3), 523-529.
222. Mechoulam, R., Interview with Prof. Raphael Mechoulam, codiscoverer of THC.. Interview by Stanley Einstein. Int J Addict 1986, 21, (4-5), 579-87.
223. Pertwee, R. G., Cannabinoid pharmacology: the first 66 years. British Journal of Pharmacology 2006, 147, (S1), S163-S171.
224. Raduner, S.; Majewska, A.; Chen, J.-Z.; Xie, X.-Q.; Hamon, J.; Faller, B.; Altmann, K.-H.; Gertsch, J., Alkylamides from Echinacea Are a New Class of Cannabinomimetics. Journal of Biological Chemistry 2006, 281, (20), 14192-14206.
225. Chicca, A.; Raduner, S.; Pellati, F.; Strompen, T.; Altmann, K.-H.; Schoop, R.; Gertsch, J., Synergistic immunomopharmacological effects of N-alkylamides in Echinacea purpurea herbal extracts. International Immunopharmacology 2009, 9, (7–8), 850-858.
- 59 - | P a g e
226. Zimmerman, C., Life without pain unites friends from afar. The Daily News 2010.227. Woolf, C. J.; Salter, M. W., Neuronal Plasticity: Increasing the Gain in Pain.
Science 2000, 288, (5472), 1765-1768. 228. Stewart, W. F.; Ricci, J. A.; Chee, E.; Morganstein, D.; Lipton, R., Lost Productive
Time and Cost Due to Common Pain Conditions in the US Workforce. JAMA: The Journal of the American Medical Association 2003, 290, (18), 2443-2454.
229. Stokowski, L. A. Managing Relentless Pain in Cancer Survivors. http://www.medscape.com/viewarticle/737345
230. Finnerup, N. B.; Sindrup, S. r. H.; Jensen, T. S., The evidence for pharmacological treatment of neuropathic pain. Pain 2010, 150, (3), 573-581.
231. Turk, D. C.; Audette, J.; Levy, R. M.; Mackey, S. C.; Stanos, S., Assessment and Treatment of Psychosocial Comorbidities in Patients With Neuropathic Pain. MayoClinic proceedings. Mayo Clinic 2010, 85, (3), S42-S50.
232. Ren, K.; Dubner, R., Interactions between the immune and nervous systems in pain. Nat Med 2010, 16, (11), 1267-1276.
233. von Hehn, Christian A.; Baron, R.; Woolf, Clifford J., Deconstructing the Neuropathic Pain Phenotype to Reveal Neural Mechanisms. Neuron 2012, 73, (4), 638-652.
234. Gracely, R. H.; Lynch, S. A.; Bennett, G. J., Painful neuropathy: altered central processing maintained dynamically by peripheral input. Pain 1992, 51, (2), 175-194.
235. Devor, M., Ectopic discharge in A afferents as a source of neuropathic pain. Experimental Brain Research 2009, 196, (1), 115-128.
236. Xiao, W. H.; Bennett, G. J., Chemotherapy-evoked neuropathic pain: Abnormal spontaneous discharge in A-fiber and C-fiber primary afferent neurons and its suppression by acetyl-l-carnitine. Pain 2008, 135, (3), 262-270.
237. Burchiel, K. J.; Russell, L. C.; Lee, R. P.; Sima, A. A., Spontaneous activity of primary afferent neurons in diabetic BB/Wistar rats. A possible mechanism of chronic diabetic neuropathic pain. Diabetes 1985, 34, (11), 1210-1213.
238. King, T.; Qu, C.; Okun, A.; Mercado, R.; Ren, J.; Brion, T.; Lai, J.; Porreca, F., Contribution of afferent pathways to nerve injury-induced spontaneous pain and evoked hypersensitivity. Pain 2011, 152, (9), 1997-2005.
239. Amir, R.; Kocsis, J. D.; Devor, M., Multiple Interacting Sites of Ectopic Spike Electrogenesis in Primary Sensory Neurons. The Journal of Neuroscience 2005,25, (10), 2576-2585.
240. Løseth, S.; Mellgren, S. I.; Jorde, R.; Lindal, S.; Stålberg, E., Polyneuropathy in type 1 and type 2 diabetes: comparison of nerve conduction studies, thermal perception thresholds and intraepidermal nerve fibre densities. Diabetes/Metabolism Research and Reviews 2010, 26, (2), 100-106.
241. Siau, C.; Xiao, W.; Bennett, G. J., Paclitaxel- and vincristine-evoked painful peripheral neuropathies: Loss of epidermal innervation and activation of Langerhans cells. Experimental Neurology 2006, 201, (2), 507-514.
242. Boyette-Davis, J.; Xin, W.; Zhang, H.; Dougherty, P. M., Intraepidermal nerve fiber loss corresponds to the development of Taxol-induced hyperalgesia and can be prevented by treatment with minocycline. Pain 2011, 152, (2), 308-313.
243. Danbolt, N. C., Glutamate uptake. Prog Neurobiol 2001, 65, (1), 1-105. 244. Sung, B.; Lim, G.; Mao, J., Altered expression and uptake activity of spinal
glutamate transporters after nerve injury contribute to the pathogenesis of neuropathic pain in rats. J Neurosci 2003, 23, (7), 2899-910.
- 60 - | P a g e
245. Yaster, M.; Guan, X.; Petralia, R. S.; Rothstein, J. D.; Lu, W.; Tao, Y.-X., Effect of Inhibition of Spinal Cord Glutamate Transporters on Inflammatory Pain Induced by Formalin and Complete Freund's Adjuvant. Anesthesiology 2011, 114, (2), 412-423 10.1097/ALN.0b013e318205df50.
246. Niederberger, E.; Schmidtko, A.; Rothstein, J. D.; Geisslinger, G.; Tegeder, I., Modulation of spinal nociceptive processing through the glutamate transporter GLT-1. Neuroscience 2003, 116, (1), 81-87.
247. Olechowski, C. J.; Parmar, A.; Miller, B.; Stephan, J.; Tenorio, G.; Tran, K.; Leighton, J.; Kerr, B. J., A diminished response to formalin stimulation reveals a role for the glutamate transporters in the altered pain sensitivity of mice with experimental autoimmune encephalomyelitis (EAE). Pain 2010, 149, (3), 565-72.
248. Tao, Y.-X.; Gu, J.; Stephens, R., Role of spinal cord glutamate transporter during normal sensory transmission and pathological pain states. Mol Pain 2005, 1, (1), 30.
249. Gao, Y.-J.; Ji, R.-R., Chemokines, neuronal–glial interactions, and central processing of neuropathic pain. Pharmacology & Therapeutics 2010, 126, (1), 56-68.
250. Brownjohn, P. W.; Ashton, J. C., Novel targets in pain research: The case for CB2 receptors as a biorational pain target. Current Anaesthesia & Critical Care 2009, 20, (5–6), 198-203.
251. Bridges, D.; Ahmad, K.; Rice, A. S., The synthetic cannabinoid WIN55,212-2 attenuates hyperalgesia and allodynia in a rat model of neuropathic pain. Br J Pharmacol 2001, 133, (4), 586-94.
252. Scott, D. A.; Wright, C. E.; Angus, J. A., Evidence that CB-1 and CB-2 cannabinoid receptors mediate antinociception in neuropathic pain in the rat. Pain 2004, 109, (1-2), 124-31.
253. Whiteside, G. T.; Lee, G. P.; Valenzano, K. J., The role of the cannabinoid CB2 receptor in pain transmission and therapeutic potential of small molecule CB2 receptor agonists. Curr Med Chem 2007, 14, (8), 917-36.
254. Anand, P.; Whiteside, G.; Fowler, C. J.; Hohmann, A. G., Targeting CB2 receptors and the endocannabinoid system for the treatment of pain. Brain Res Rev 2009,60, (1), 255-66.
255. Galiègue, S.; Mary, S.; Marchand, J.; Dussossoy, D.; Carrière, D.; Carayon, P.; Bouaboula, M.; Shire, D.; Le Fur, G.; Casellas, P., Expression of Central and Peripheral Cannabinoid Receptors in Human Immune Tissues and Leukocyte Subpopulations. European Journal of Biochemistry 1995, 232, (1), 54-61.
256. Carlisle, S. J.; Marciano-Cabral, F.; Staab, A.; Ludwick, C.; Cabral, G. A., Differential expression of the CB2 cannabinoid receptor by rodent macrophages and macrophage-like cells in relation to cell activation. International Immunopharmacology 2002, 2, (1), 69-82.
257. Atwood, B. K.; Wager-Miller, J.; Haskins, C.; Straiker, A.; Mackie, K., Functional Selectivity in CB2 Cannabinoid Receptor Signaling and Regulation: Implications for the Therapeutic Potential of CB2 Ligands. Mol Pharmacol 2012, 81, (2), 250-63.
258. Malan Jr, T. P.; Ibrahim, M. M.; Lai, J.; Vanderah, T. W.; Makriyannis, A.; Porreca, F., CB2 cannabinoid receptor agonists: pain relief without psychoactive effects? Current Opinion in Pharmacology 2003, 3, (1), 62-67.
259. Gin C Hsieh, M. P., Prasant Chandran, Bradley A Hooker, Chang Z Zhu, Anita K Salyers, Erica J Wensink, CenChen Zhan, William A Carroll, Michael J Dart, Betty
- 61 - | P a g e
B Yao, Prisca Honore, and Michael D Meyer, Central and peripheral sites of action for CB2 receptor mediated analgesic activity in chronic inflammatory and neuropathic pain models in rats. British Journal of Pharmacology 2010, 162, (2), 428-440.
260. Walter, L.; Franklin, A.; Witting, A.; Wade, C.; Xie, Y.; Kunos, G.; Mackie, K.; Stella, N., Nonpsychotropic Cannabinoid Receptors Regulate Microglial Cell Migration. The Journal of Neuroscience 2003, 23, (4), 1398-1405.
261. Bingham, B.; Jones, P. G.; Uveges, A. J.; Kotnis, S.; Lu, P.; Smith, V. A.; Sun, S. C.; Resnick, L.; Chlenov, M.; He, Y.; Strassle, B. W.; Cummons, T. A.; Piesla, M. J.; Harrison, J. E.; Whiteside, G. T.; Kennedy, J. D., Species-specific in vitro pharmacological effects of the cannabinoid receptor 2 (CB2) selective ligand AM1241 and its resolved enantiomers. Br J Pharmacol 2007, 151, (7), 1061-70.
262. Urban, J. D.; Clarke, W. P.; von Zastrow, M.; Nichols, D. E.; Kobilka, B.; Weinstein, H.; Javitch, J. A.; Roth, B. L.; Christopoulos, A.; Sexton, P. M.; Miller, K. J.; Spedding, M.; Mailman, R. B., Functional Selectivity and Classical Concepts of Quantitative Pharmacology. Journal of Pharmacology and Experimental Therapeutics 2007, 320, (1), 1-13.
263. Trotter, B. W.; Nanda, K. K.; Burgey, C. S.; Potteiger, C. M.; Deng, J. Z.; Green, A. I.; Hartnett, J. C.; Kett, N. R.; Wu, Z.; Henze, D. A.; Della Penna, K.; Desai, R.; Leitl, M. D.; Lemaire, W.; White, R. B.; Yeh, S.; Urban, M. O.; Kane, S. A.; Hartman, G. D.; Bilodeau, M. T., Imidazopyridine CB2 agonists: optimization of CB2/CB1 selectivity and implications for in vivo analgesic efficacy. Bioorg Med Chem Lett 2011, 21, (8), 2354-8.
264. Sain, N. M.; Liang, A.; Kane, S. A.; Urban, M. O., Antinociceptive effects of the non-selective cannabinoid receptor agonist CP 55,940 are absent in CB1(-/-) and not CB2(-/-) mice in models of acute and persistent pain. Neuropharmacology 2009, 57, (3), 235-41.
- 62 - | P a g e
CHAPTER II EARLY FORMULATION AND ENABLING DRUG DELIVERY SYSTEMS DESIGN
1 Introduction.
Recent progress in parallel chemistry and high-throughput screening has resulted in an
increase of poorly soluble drug candidates. New Chemical Entities (NCE) characteristics
differ dramatically in term of physicochemical properties [e.g. chemical structure
(planarity, chirality), polymorphism form, particle size, hydrophilicity/lipophilicity balance,
(logD), pKa, polar surface area (PSA)] and potency. The pharmacological activity of a
drug is the result of affinity and interaction with the biological target but also optimum
exposure at the target site. It is therefore necessary for the drug to reach the site of
action following administration (i.e. oral, intravenous, transdermal etc.) at sufficient
concentrations. In addition, accurate and reproducible dosing is a prerequisite to study
dose-response activity. The pharmaceutical area dealing with these challenges is the
early formulation. Early formulation is an integral part of drug discovery and drug
development. Design of a stable drug delivery system (DDS) during the early formulation
stage should allow drug escalation studies in different animal models using different
routes of administration. Early formulation has mainly the following aim: “to deliver the
drug at the right place, at the right concentration for the right period of time”18.
Formulation of sparingly water- soluble drugs is a common issue for the formulators (i.e.
solubilization and/or particle engineering) especially when a controlled-release drug
profile is required for an optimum therapeutic index or to compensate a poor stability. In
addition, the search for suitable DDS often takes place under little compound availability,
incomplete physicochemical property characterization and time constraints. Enabling
formulation approaches may allow the selection of NCE showing not ideal drug-like
profile to be evaluated for in vitro/in vivo testing to validate a target and/or a therapeutic
strategy at the early phase of drug discovery. For these drugs, the absorption and
bioavailability could be influenced by their intrinsic solubility and dissolution rate in
- 63 - | P a g e
biological fluids. There are many DDS development strategies to enhance the solubility
of lipophilic drugs and subsequently the delivery of these drugs The commonly used
strategies in marketed products include salt formation (i.e. pH adjustment), cosolvency
(e.g. ethanol, propylene glycol, PEG400 etc.), micellization (e.g. polysorbate 80,
cremophor ELP etc.), (nano)- (micro)- emulsification, complexation (e.g. cyclodextrins),
encapsulation in lipid-based formulation (e.g. liposomes) or nanoparticles (NPs) DDS20-
23. Combination of two or more of these techniques may produce synergistic effect in
solubilization24-26. In addition to the solubility and the physicochemical stability of the drug
in DDS and in biological fluids, the biodistribution and the
pharmacokinetic/pharmacodynamic (PK/PD) properties of pharmacologically active drug
candidate can also be altered. When nano- drug carriers are used, the following
characteristics will be usually also requested: lack of long-term host accumulation, non-
toxicity and immunoginecity along with acceptable encapsulation and targeting ability
(passive or active), prolonged plasma circulation, and controlled release. Overall, the
development and selection of a suitable DDS will aim to enhance the therapeutic effect
(i.e. bioavailability) and tolerance of drugs, in a reproducible way and in a case-to-case
manner to compensate for “non drug-like” properties of a drug candidate.
During this thesis, we set up an early formulation strategy (Fig. 8) for rapid evaluation of
NCE on a broad range of in vitro and in vivo assays, such as pharmacodynamic,
pharmacokinetic, toxicology or pharmacology studies. Despite the differences in
objectives, sufficient exposure of the selected organism to the early-stage candidate as
well as dose accuracy and tolerability, are necessary to obtain reliable results from these
studies27. Starting from the orange box, the different excipients used for preformulation
studies are selected according to the NCE solubility and permeability using the
Biopharmaceutics Classification System BCS28 and also according to the route of
administration, the biological target and the animal species to be dosed. From a
regulatory aspect, the excipients chosen are published in the official pharmacopeia of the
United States (USP) or their safety ratio is listed in the Inactive Ingredient Guide (IIG) for
FDA approved drugs (i.e. excipients used in marketed pharmaceutical products). At the
least a Drug Master File (DMF) submitted to the FDA is required for the excipient to be
retained and tested. Scientific articles and technical brochures from the suppliers are
thoroughly consulted for information related to the material toxicity/safety. In addition,
excipients are endowed with intrinsic properties i.e. absorption/dissolution enhancer,
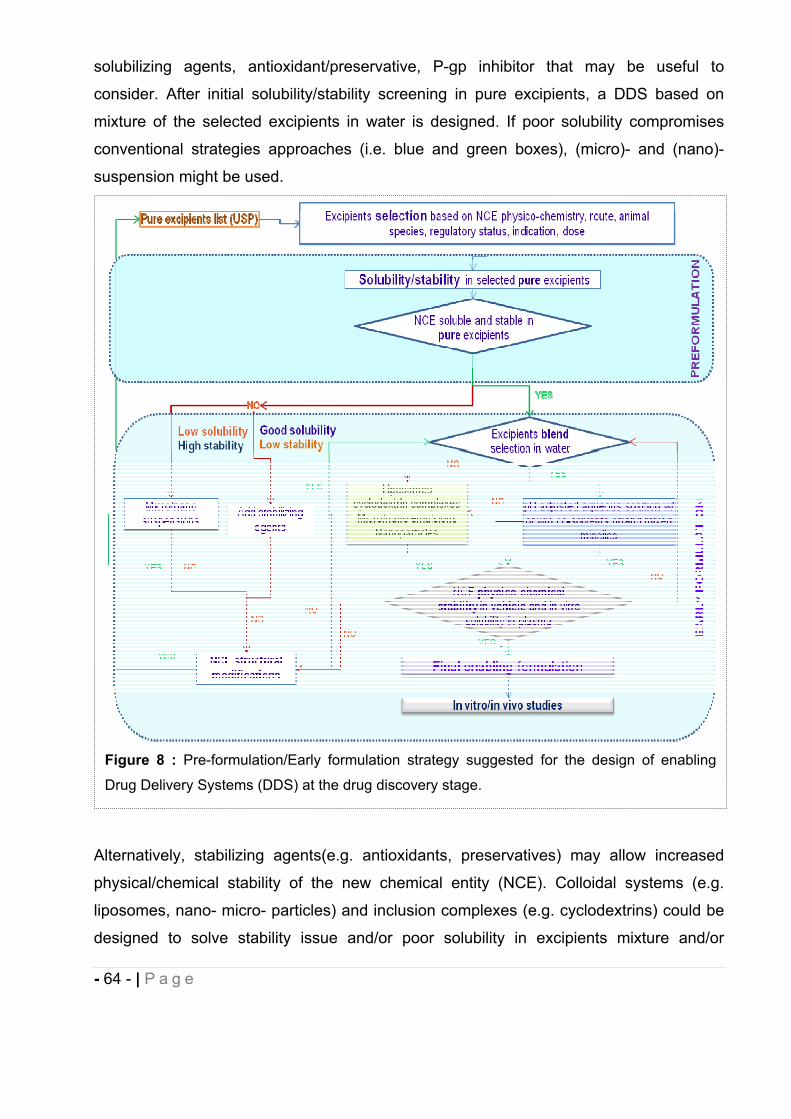
- 64 - | P a g e
solubilizing agents, antioxidant/preservative, P-gp inhibitor that may be useful to
consider. After initial solubility/stability screening in pure excipients, a DDS based on
mixture of the selected excipients in water is designed. If poor solubility compromises
conventional strategies approaches (i.e. blue and green boxes), (micro)- and (nano)-
suspension might be used.
Alternatively, stabilizing agents(e.g. antioxidants, preservatives) may allow increased
physical/chemical stability of the new chemical entity (NCE). Colloidal systems (e.g.
liposomes, nano- micro- particles) and inclusion complexes (e.g. cyclodextrins) could be
designed to solve stability issue and/or poor solubility in excipients mixture and/or
Figure 8 : Pre-formulation/Early formulation strategy suggested for the design of enabling
Drug Delivery Systems (DDS) at the drug discovery stage.
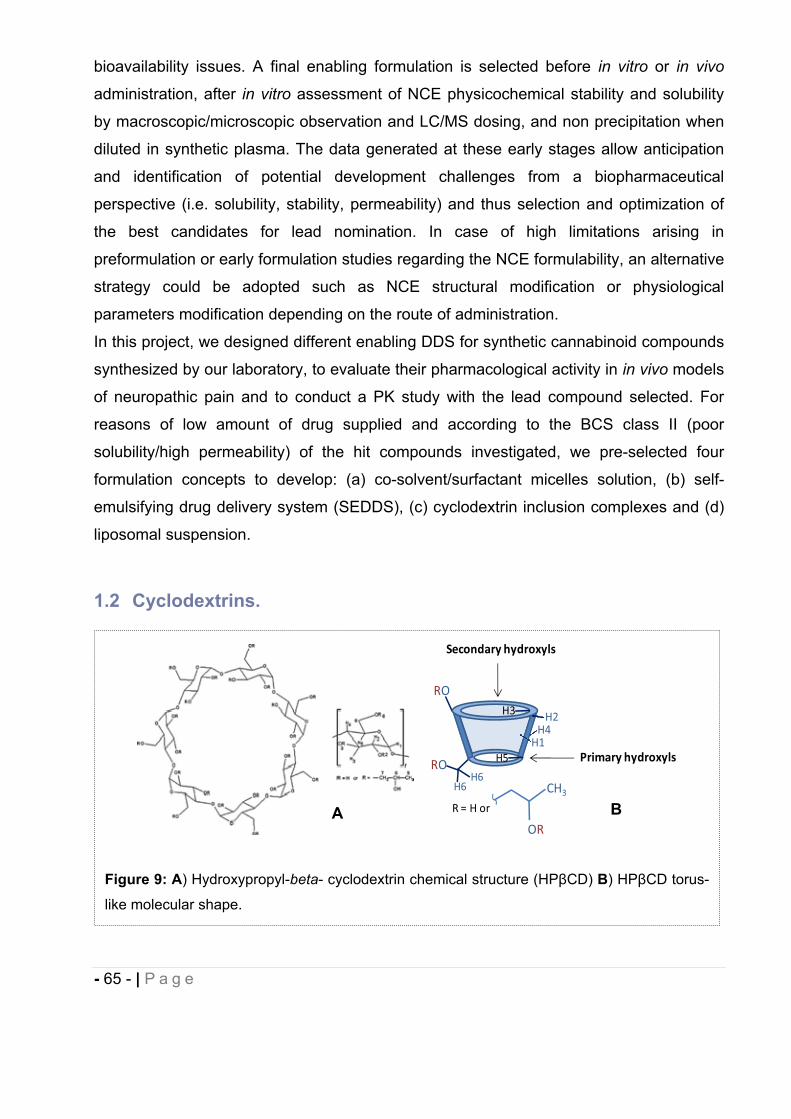
- 65 - | P a g e
bioavailability issues. A final enabling formulation is selected before in vitro or in vivo
administration, after in vitro assessment of NCE physicochemical stability and solubility
by macroscopic/microscopic observation and LC/MS dosing, and non precipitation when
diluted in synthetic plasma. The data generated at these early stages allow anticipation
and identification of potential development challenges from a biopharmaceutical
perspective (i.e. solubility, stability, permeability) and thus selection and optimization of
the best candidates for lead nomination. In case of high limitations arising in
preformulation or early formulation studies regarding the NCE formulability, an alternative
strategy could be adopted such as NCE structural modification or physiological
parameters modification depending on the route of administration.
In this project, we designed different enabling DDS for synthetic cannabinoid compounds
synthesized by our laboratory, to evaluate their pharmacological activity in in vivo models
of neuropathic pain and to conduct a PK study with the lead compound selected. For
reasons of low amount of drug supplied and according to the BCS class II (poor
solubility/high permeability) of the hit compounds investigated, we pre-selected four
formulation concepts to develop: (a) co-solvent/surfactant micelles solution, (b) self-
emulsifying drug delivery system (SEDDS), (c) cyclodextrin inclusion complexes and (d)
liposomal suspension.
1.2 Cyclodextrins.
Figure 9: A) Hydroxypropyl-beta- cyclodextrin chemical structure (HP CD) B) HP CD torus-
like molecular shape.
RO
RO
H2
H1H4
H6H6
H5
H3
R = H or
OR
CH3
HP CD
Secondary hydroxyls
Primary hydroxyls
A B
- 66 - | P a g e
Cyclodextrins (CDs) are a group of cyclic oligosaccharides derived from the enzymatic
degradation of the starch with a torus-like molecular shape (Fig. 9B). These cyclic
oligosaccharides containing six, seven, eight, or more ( -1,4-)-linked d-glucopyranose
units respectively , , cyclodextrins, consist of a relatively hydrophobic inner cavity
and a hydrophilic outer surface. One of their interesting attributes is their ability to form
host-guest inclusion complexes with a variety of lipophilic compounds which can be
partially or totally included in the hydrophobic internal cavity, the hydrophilic outer surface
being exposed to the solvent. In addition, CDs are not restricted to host-guest
interactions and that more complex interactions like non-inclusion complexes or
nanostructures formation do exist in aqueous cyclodextrin solutions29-31. These versatile
nanocarriers are widely used to solve physicochemical and pharmaceutical issues of
administered drugs to increase the aqueous solubility of poorly water-soluble drugs, to
stabilize compounds to chemical and enzyme degradation and to enhance
bioavailability32-36. CDs have also enabled improvement of drug bioavailability by
affecting permeability through biological membrane37-38 and by controlling the rate and/or
time profile of drug release39-41. CDs are reported to be relatively well tolerated at low to
moderate oral and intravenous doses42-43 and have been used to reduce or prevent
gastrointestinal or ocular irritation, for smells or tastes masking, to prevent drug-drug or
drug-additive interactions, to lower compound volatility, or even to convert oils and liquid
drugs into microcrystalline or amorphous powders44-45. The non functionalized natural -,
-, - CDs (Table 3)31 show limited aqueous solubility, especially for the -CDs, ascribed
to the intramolecular ring of hydrogen bonds form between the C2-OH and C3-OH group
of glucopyranosides along with the secondary hydroxyls on the outside the CD. This
complete secondary belt enhances the rigidity of -CD46. By functionalizing the external
hydroxyl groups of natural CDs, aggregates formation through hydrogen bond interaction
are likely reduced increasing aqueous solubility. Water-soluble CDs derivatives of more
pharmaceutical relevance have been developed with the aim to provide versatile delivery
systems for hydrophilic and hydrophobic drugs. Among the most used functionalized
CDs in the pharmaceutical field are found the hydroxypropyl derivatives of -CD
(HP CD) and -CD (HP CD), the randomly methylated -cyclodextrin (RM CD), and
sulfobutylether -cyclodextrin sodium salt (SBE CD). CDs and derivatives have been
investigated for oral, rectal, sublingual, ocular, nasal, pulmonary, and dermal delivery.
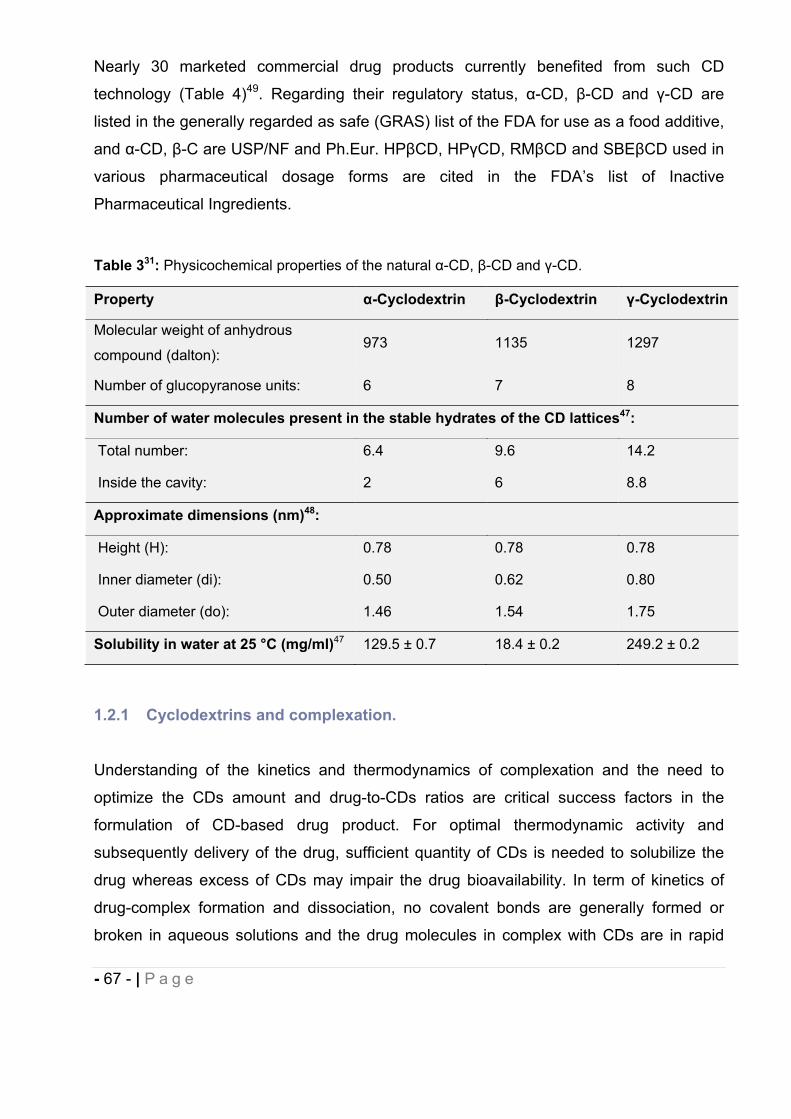
- 67 - | P a g e
Nearly 30 marketed commercial drug products currently benefited from such CD
technology (Table 4)49. Regarding their regulatory status, -CD, -CD and -CD are
listed in the generally regarded as safe (GRAS) list of the FDA for use as a food additive,
and -CD, -C are USP/NF and Ph.Eur. HP CD, HP CD, RM CD and SBE CD used in
various pharmaceutical dosage forms are cited in the FDA’s list of Inactive
Pharmaceutical Ingredients.
Table 331: Physicochemical properties of the natural -CD, -CD and -CD.
Property -Cyclodextrin -Cyclodextrin -Cyclodextrin
Molecular weight of anhydrous
compound (dalton):973 1135 1297
Number of glucopyranose units: 6 7 8
Number of water molecules present in the stable hydrates of the CD lattices47:
Total number: 6.4 9.6 14.2
Inside the cavity: 2 6 8.8
Approximate dimensions (nm)48:
Height (H): 0.78 0.78 0.78
Inner diameter (di): 0.50 0.62 0.80
Outer diameter (do): 1.46 1.54 1.75
Solubility in water at 25 °C (mg/ml)47 129.5 ± 0.7 18.4 ± 0.2 249.2 ± 0.2
1.2.1 Cyclodextrins and complexation.
Understanding of the kinetics and thermodynamics of complexation and the need to
optimize the CDs amount and drug-to-CDs ratios are critical success factors in the
formulation of CD-based drug product. For optimal thermodynamic activity and
subsequently delivery of the drug, sufficient quantity of CDs is needed to solubilize the
drug whereas excess of CDs may impair the drug bioavailability. In term of kinetics of
drug-complex formation and dissociation, no covalent bonds are generally formed or
broken in aqueous solutions and the drug molecules in complex with CDs are in rapid
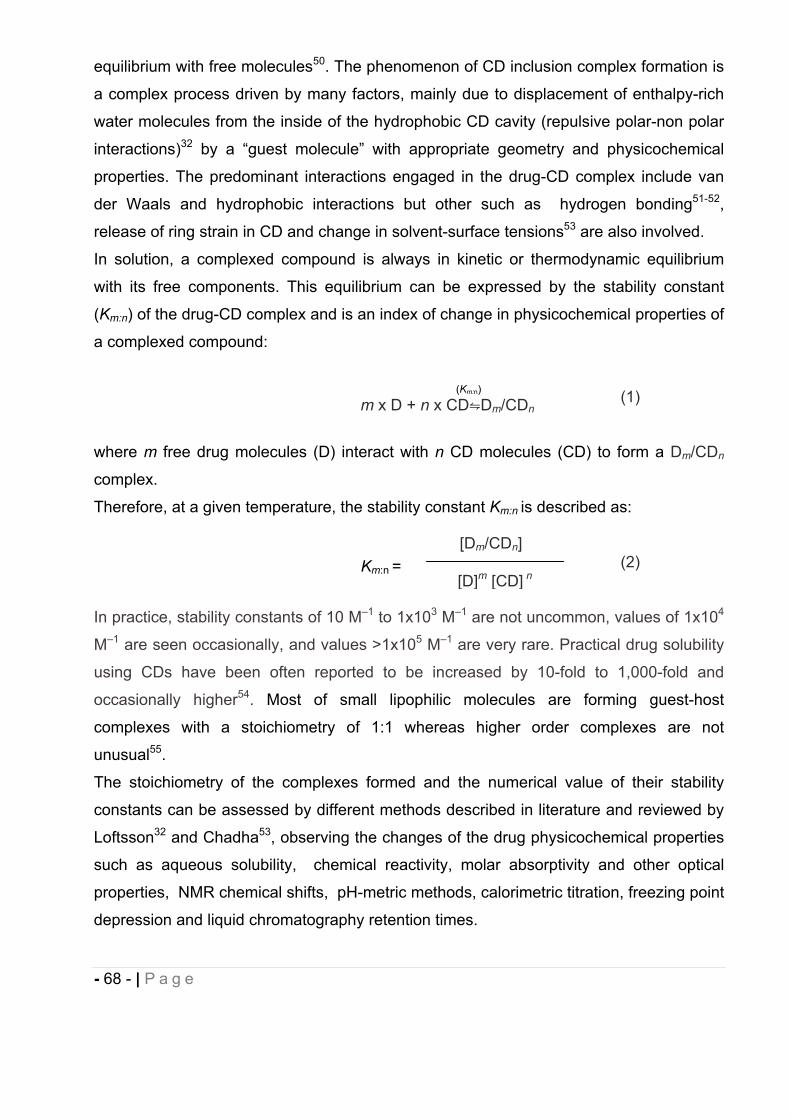
- 68 - | P a g e
equilibrium with free molecules50. The phenomenon of CD inclusion complex formation is
a complex process driven by many factors, mainly due to displacement of enthalpy-rich
water molecules from the inside of the hydrophobic CD cavity (repulsive polar-non polar
interactions)32 by a “guest molecule” with appropriate geometry and physicochemical
properties. The predominant interactions engaged in the drug-CD complex include van
der Waals and hydrophobic interactions but other such as hydrogen bonding51-52,
release of ring strain in CD and change in solvent-surface tensions53 are also involved.
In solution, a complexed compound is always in kinetic or thermodynamic equilibrium
with its free components. This equilibrium can be expressed by the stability constant
(Km:n) of the drug-CD complex and is an index of change in physicochemical properties of
a complexed compound:
(1)
where m free drug molecules (D) interact with n CD molecules (CD) to form a Dm/CDn
complex.
Therefore, at a given temperature, the stability constant Km:n is described as:
(2)
In practice, stability constants of 10 M–1 to 1x10³ M–1 are not uncommon, values of 1x10⁴
M–1 are seen occasionally, and values >1x10⁵ M–1 are very rare. Practical drug solubility
using CDs have been often reported to be increased by 10-fold to 1,000-fold and
occasionally higher54. Most of small lipophilic molecules are forming guest-host
complexes with a stoichiometry of 1:1 whereas higher order complexes are not
unusual55.
The stoichiometry of the complexes formed and the numerical value of their stability
constants can be assessed by different methods described in literature and reviewed by
Loftsson32 and Chadha53, observing the changes of the drug physicochemical properties
such as aqueous solubility, chemical reactivity, molar absorptivity and other optical
properties, NMR chemical shifts, pH-metric methods, calorimetric titration, freezing point
depression and liquid chromatography retention times.
Km:n =[Dm/CDn]
[D]m [CD] n
(Km:n)m x D + n x CD Dm/CDn
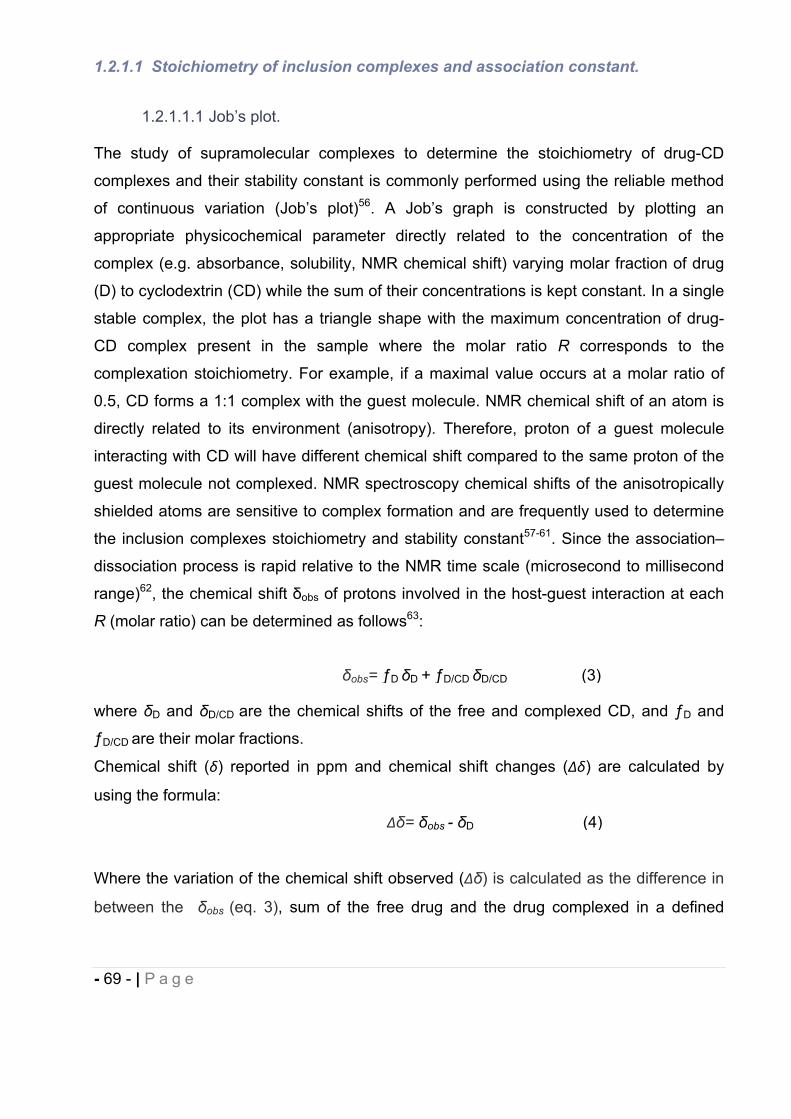
- 69 - | P a g e
1.2.1.1 Stoichiometry of inclusion complexes and association constant.
1.2.1.1.1 Job’s plot.
The study of supramolecular complexes to determine the stoichiometry of drug-CD
complexes and their stability constant is commonly performed using the reliable method
of continuous variation (Job’s plot)56. A Job’s graph is constructed by plotting an
appropriate physicochemical parameter directly related to the concentration of the
complex (e.g. absorbance, solubility, NMR chemical shift) varying molar fraction of drug
(D) to cyclodextrin (CD) while the sum of their concentrations is kept constant. In a single
stable complex, the plot has a triangle shape with the maximum concentration of drug-
CD complex present in the sample where the molar ratio R corresponds to the
complexation stoichiometry. For example, if a maximal value occurs at a molar ratio of
0.5, CD forms a 1:1 complex with the guest molecule. NMR chemical shift of an atom is
directly related to its environment (anisotropy). Therefore, proton of a guest molecule
interacting with CD will have different chemical shift compared to the same proton of the
guest molecule not complexed. NMR spectroscopy chemical shifts of the anisotropically
shielded atoms are sensitive to complex formation and are frequently used to determine
the inclusion complexes stoichiometry and stability constant57-61. Since the association–
dissociation process is rapid relative to the NMR time scale (microsecond to millisecond
range)62, the chemical shift obs of protons involved in the host-guest interaction at each
R (molar ratio) can be determined as follows63:
where D and D/CD are the chemical shifts of the free and complexed CD, and ƒD and
ƒD/CD are their molar fractions.
Chemical shift ( ) reported in ppm and chemical shift changes ( ) are calculated by
using the formula:
Where the variation of the chemical shift observed ( ) is calculated as the difference in
between the obs (eq. 3), sum of the free drug and the drug complexed in a defined
obs= ƒD D + ƒD/CD D/CD (3)
= obs - D (4)
- 70 - | P a g e
system of solvent(s), and D, the chemical shift of the free drug only in the same system
of solvent(s), formula adapted from64-65.
1.2.1.1.2 Mass spectrometry analysis.
Electrospray mass spectrometry (ESI-MS) has been used to investigate noncovalent
complexes of different classes of compounds66. The ESI-MS allows detecting non-
covalent interactions of the supramolecular inclusion host-guest complexes with various
molecules in the gas phase. Electrospray provides a faithful image of the composition of
the complex formed in solution and subsequently its stoichiometry in the range of
concentrations used for in vivo studies67, provided that all species are kinetically stable
enough to reach the detector intact66. However it has been suggested that to avoid non
specific aggregation occurring upon droplet evaporation, analyzed sample should be
diluted and the electrospray flow rate decreased66-68.
In this work we will focus on identifying stable noncovalent interactions formed between
selected synthetic cannabinoids and HP CD in the gas phase using ESI-MS, considering
the parameters mentioned above, in concentrated and diluted solutions.
1.2.1.1.3 Phase solubility analysis.
The study of supramolecular complexes to determine the stoichiometry of drug-CD
complexes and their stability constant is commonly performed using the reliable method
of Phase solubility analysis which also allow the evaluation of the effect of CD
complexation on the drug solubility.
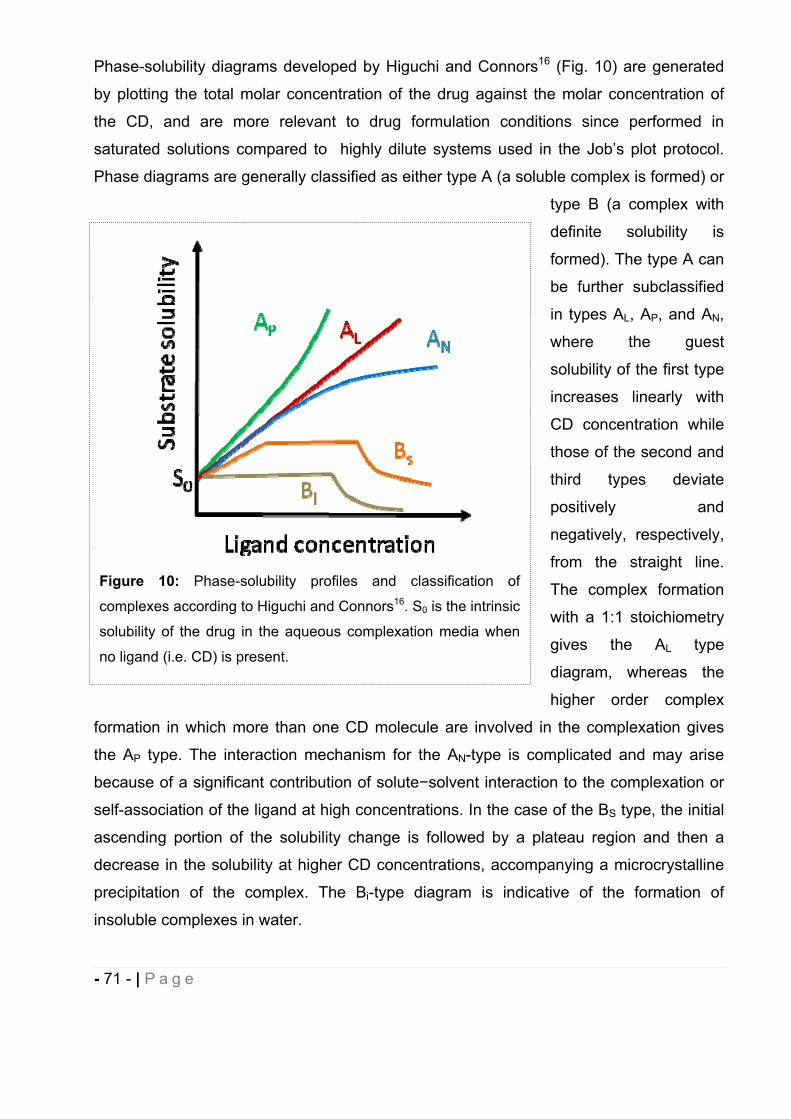
- 71 - | P a g e
Phase-solubility diagrams developed by Higuchi and Connors16 (Fig. 10) are generated
by plotting the total molar concentration of the drug against the molar concentration of
the CD, and are more relevant to drug formulation conditions since performed in
saturated solutions compared to highly dilute systems used in the Job’s plot protocol.
Phase diagrams are generally classified as either type A (a soluble complex is formed) or
type B (a complex with
definite solubility is
formed). The type A can
be further subclassified
in types AL, AP, and AN,
where the guest
solubility of the first type
increases linearly with
CD concentration while
those of the second and
third types deviate
positively and
negatively, respectively,
from the straight line.
The complex formation
with a 1:1 stoichiometry
gives the AL type
diagram, whereas the
higher order complex
formation in which more than one CD molecule are involved in the complexation gives
the AP type. The interaction mechanism for the AN-type is complicated and may arise
because of a significant contribution of solute solvent interaction to the complexation or
self-association of the ligand at high concentrations. In the case of the BS type, the initial
ascending portion of the solubility change is followed by a plateau region and then a
decrease in the solubility at higher CD concentrations, accompanying a microcrystalline
precipitation of the complex. The Bi-type diagram is indicative of the formation of
insoluble complexes in water.
Figure 10: Phase-solubility profiles and classification of
complexes according to Higuchi and Connors16. S0 is the intrinsic
solubility of the drug in the aqueous complexation media when
no ligand (i.e. CD) is present.
- 72 - | P a g e
Interestingly, the phase-solubility diagram allows not only quality assessment of the
stoichiometry of the drug-CD complex but also the derivation of the stability constant
(Km:n). Under the conditions of AL type linear phase solubility diagram when 1 molecule of
drug interacts with 1 molecule of CD, the stability constant (K1:1) with units of M-1 doesn’t
change over the range of CD studied and can be calculated from the slope and the
intrinsic solubility (S0) of the drug in the aqueous complexation medium.
(2)
In equation (2), given that: [D]=S0 and Dtot= S0+m[Dm/CDn] and CDtot= [CD]+ n[Dm/CDn]
With S0 is the intrinsic solubility or equilibrium solubility of the drug i.e. in the absence of
solubilizer, Dtot is the total concentration of the drug (D), free and complexed, and CDtot is
the total concentration of CD.
Then (5)
And (6)
For phase-solubility system that are first order with respect to the CD (n=1), the following
equation can be derived:
(7)
A plot of [Dtot] in mM function of [CD]tot in mM should give a straight line with a slope less
than the unity with y-intercept representing S0 and the slope being:
(8)
[Dm/CDn]=[Dtot -S0]
m
[CD]= [CDtot] - n[Dm/CDn]
Dtot=mK S0
m [CDtot]
1 + K S0m
+S0
Km:n =[Dm/CDn]
[D]m [CD] n
Slope=mK S0
m
1 + K S0m
- 73 - | P a g e
The stability constant (K1:1) of the complex can be calculated from the slope and the
intrinsic solubility (S0) of the drug in the aqueous complexation medium.
(9)
Stability constant of higher order drug-CD complex can be determined but it won’t be the
focus of this work (for review see49).
However the K 1:1 value determined by Eq. (9) is strongly affected by the S0 value which
is usually very inaccurate for compounds with S0< 0.1 mg/mL55 and K 1:1, obtained from
phase-solubility diagrams is frequently used to compare the solubilizing effect of different
CDs on a specific drug which is dependent on the composition of the complexation
medium (i.e. presence of co-solvents or polymer). A more reliable method for evaluation
of CDs and their solubilizing potentials for poorly water soluble compounds is to
determine the Complexation Efficiency (CE), which is equal to the complex to free CD
concentration ratio and can be obtained from the slope of their phase-solubility profile69.
(10)
The CE may remain rather low to solubilise amount of lipophilic drug required for in vivo
dosing and instead of increasing the amount of CDs, numerous pharmaceutical additives
such as polymer, organic solvents, buffer salts, surfactants, preservatives have been
investigated to enhance S0 or/and K and subsequently CE69. One should take into
account that although additives (e.g. surfactants, cosolvents) can be successfully used to
increase S0, they also may decrease K by competing with the drug for the CD, resulting in
less complexation efficiency69.
Overall, when selecting cyclodextrin complexation as an approach to increase the drug
solubility in drug formulation design, solutions with high concentration of CDs (i.e. 20-
30% w/w) are often investigated. This high CD concentration can promote aggregates
and eventually higher than 1:1 drug-CD complex formation30, 49, 70-71. Recently, the
CE =[D/CD]
[CD]S0 . K 1:1 =
slope
(1-slope)=
K1:1=slope
S0 (1-slope)
- 74 - | P a g e
positive effect of CDs on physicochemical properties of drug has been ascribed to
nanoparticulate aggregations (i.e. micelles-like structure) in addition to the formation of
drug-CD inclusion complexes31. Self-aggregation of cyclodextrins (CDs) in water,
frequently in the range of several hundred nanometers31, is an aspect that is still not
completely understood and which vary considerably with the type of CD involved31, 72.
This phenomenon can be characterized by techniques such as Transmission Electron
Miscroscopy (TEM), Scanning Electron microscopy (SEM) or Dynamic Light Scattering
(DLS) and is also observed when phase-solubility diagram is linear and of A(L)-type.
1.2.1.2 Preparation of inclusion complexes.
Several methods have been developed to prepare solid inclusion complexes32, 73.
including spray-drying, co-precipitation, kneading, solid phase complexation, freeze-
drying and recently by supercritical fluids (SCF)74-76. Generally, the drug and the CDs are
combined in a varying proportion of water according to the method used prior to the solid
complex obtention.
1.2.1.3 If drugs bind to cyclodextrins, how is the drug released in vivo?
After oral or parental administration, even the drugs with high range stability constant (i.e.
104 M-1) appear to be rapidly and quantitatively released from CD inclusion complexes.
Dilution in the biological fluids is the predominant mechanism involved in drug release
from the drug-CD complex which continuously forms and dissociates with lifetimes in the
range of milliseconds or less. Many others parameters may contribute to availability of
the drug for target of interest such as competitive displacement, protein binding, change
in ionic strength and temperature, drug uptake by tissues or cyclodextrin renal
clearance50, 77.
1.2.1.4 Cyclodextrins safety considerations.
- 75 - | P a g e
We will mainly focus on reviewing HP CD safety data since it has been selected to
evaluate the in vivo effect of our synthetic cannabinoids on rat pain models. CDs due to
their physicochemical properties do not cross biological membranes easily and cause
only limited toxicity following oral administration, especially for HP CD where the main
adverse effect observed is diarrhoea78. The oral bioavailability of HP CD in humans, due
to passive diffusion, was estimated to be less than 1% following administration of HP CD
in an oral solution of itraconazole79-80 whereas bioavailability of the guest is improved by
increase of water solubility. When drugs are administered by injection CDs have very
limited bioavailability and distribute among extracellular compartments on absorption54.
Following i.v. administration, HP CD, contained in Sporanox® (Itraconazole), undergoes
rapid renal clearance (short half-life of 1 to 2 hours) and demonstrates no accumulation
following successive daily doses81.
Compared to the parent CDs, - - and , which have shown renal toxicity, HP CD and
SBE CD have been extensively studied with regard to their parenteral safety in several
animal species and humans78, 82-83 and are currently used in at least six Food and Drug
Administration (FDA)-approved products (four for SBE CD and two for HP CD. See
Table 4 with commercial products).
The lethal dose 50 (LD50) after single injection of HP CD to rats has been determined to
be 10 g/Kg44 and no adverse clinical effect has been observed when a dose of 1
g/Kg/day was injected to rats1, 82. In addition, HP CD does not cause irritation due to its
low surface tension and is generally regarded as a safe excipient84. Based on the toxicity
studies available in literature on natural CDs and derivatives, and since our cannabinoid
compounds are non ionic, HP CD had the best balance of enhanced aqueous solubility
and capability to form stable complexes with a large range of structurally diverse
analogues. In addition, HPBCD are very soluble in water, greater than 500 mg/ml at
room temperature compared to 18 mg/ml for CD and can be incorporated in DDS for
clinical applications.
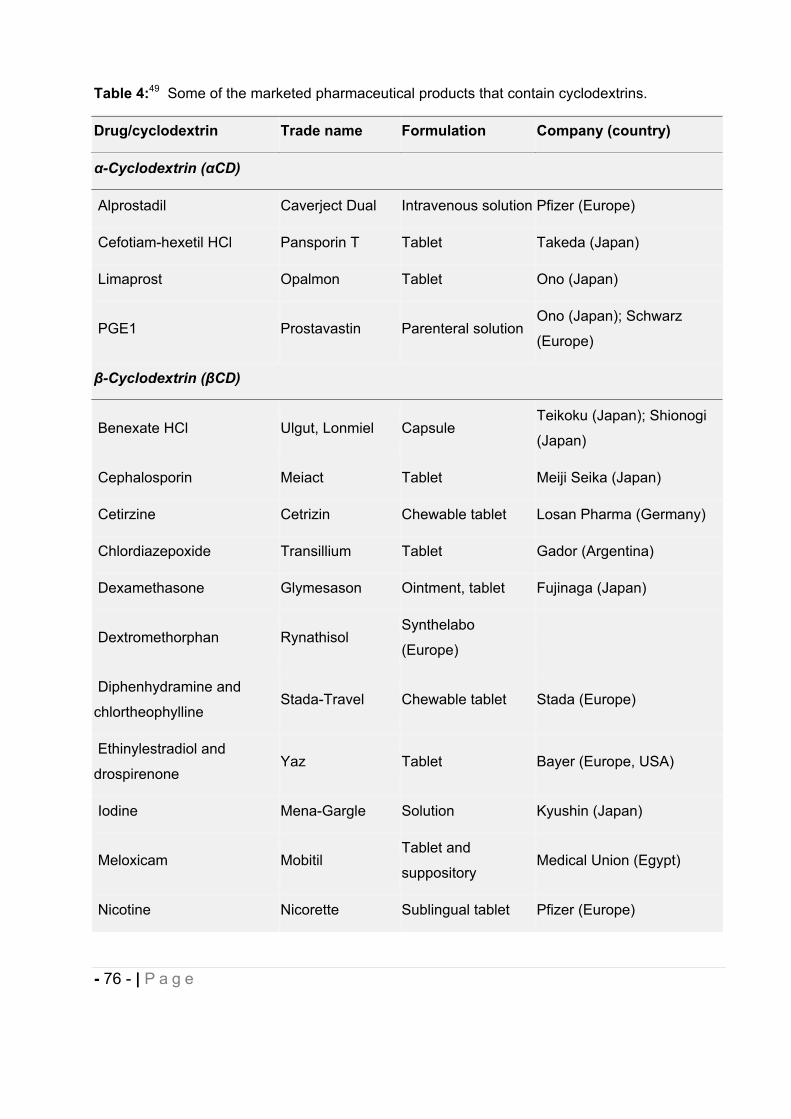
- 76 - | P a g e
Table 4:49 Some of the marketed pharmaceutical products that contain cyclodextrins.
Drug/cyclodextrin Trade name Formulation Company (country)
-Cyclodextrin ( CD)
Alprostadil Caverject Dual Intravenous solution Pfizer (Europe)
Cefotiam-hexetil HCl Pansporin T Tablet Takeda (Japan)
Limaprost Opalmon Tablet Ono (Japan)
PGE1 Prostavastin Parenteral solutionOno (Japan); Schwarz
(Europe)
-Cyclodextrin ( CD)
Benexate HCl Ulgut, Lonmiel CapsuleTeikoku (Japan); Shionogi
(Japan)
Cephalosporin Meiact Tablet Meiji Seika (Japan)
Cetirzine Cetrizin Chewable tablet Losan Pharma (Germany)
Chlordiazepoxide Transillium Tablet Gador (Argentina)
Dexamethasone Glymesason Ointment, tablet Fujinaga (Japan)
Dextromethorphan RynathisolSynthelabo
(Europe)
Diphenhydramine and
chlortheophyllineStada-Travel Chewable tablet Stada (Europe)
Ethinylestradiol and
drospirenoneYaz Tablet Bayer (Europe, USA)
Iodine Mena-Gargle Solution Kyushin (Japan)
Meloxicam MobitilTablet and
suppositoryMedical Union (Egypt)
Nicotine Nicorette Sublingual tablet Pfizer (Europe)
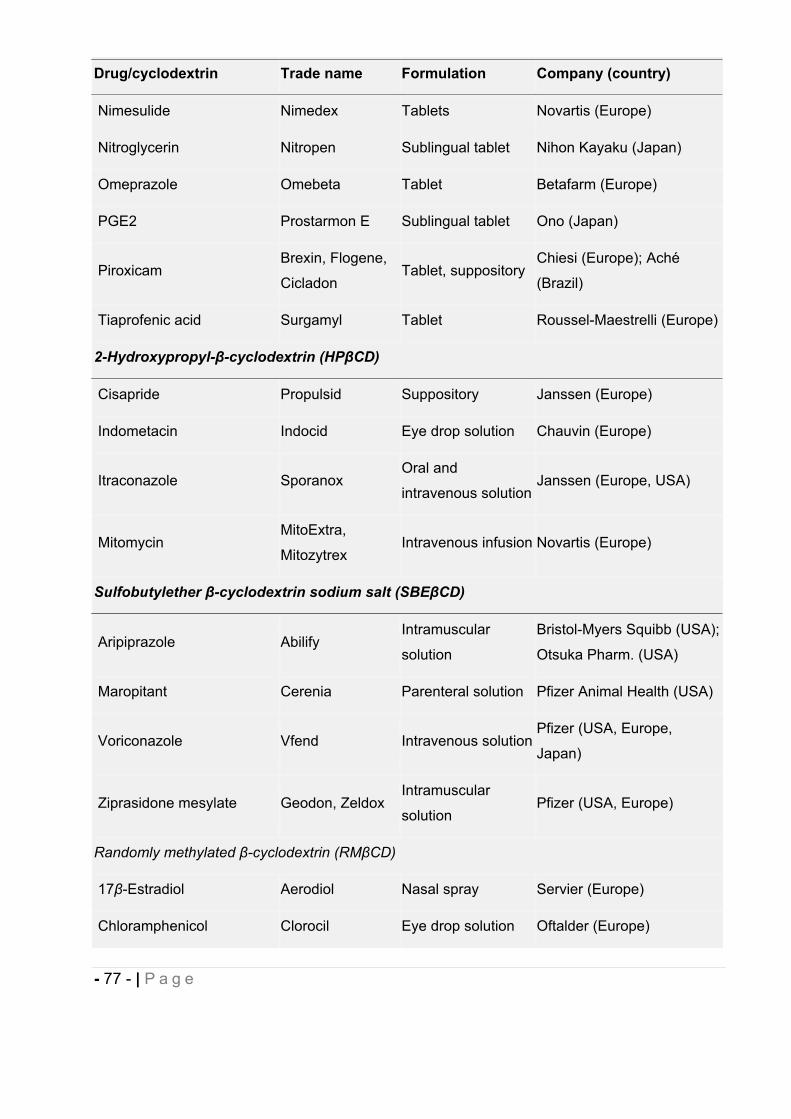
- 77 - | P a g e
Drug/cyclodextrin Trade name Formulation Company (country)
Nimesulide Nimedex Tablets Novartis (Europe)
Nitroglycerin Nitropen Sublingual tablet Nihon Kayaku (Japan)
Omeprazole Omebeta Tablet Betafarm (Europe)
PGE2 Prostarmon E Sublingual tablet Ono (Japan)
PiroxicamBrexin, Flogene,
CicladonTablet, suppository
Chiesi (Europe); Aché
(Brazil)
Tiaprofenic acid Surgamyl Tablet Roussel-Maestrelli (Europe)
2-Hydroxypropyl- -cyclodextrin (HP CD)
Cisapride Propulsid Suppository Janssen (Europe)
Indometacin Indocid Eye drop solution Chauvin (Europe)
Itraconazole SporanoxOral and
intravenous solutionJanssen (Europe, USA)
MitomycinMitoExtra,
MitozytrexIntravenous infusion Novartis (Europe)
Sulfobutylether -cyclodextrin sodium salt (SBE CD)
Aripiprazole AbilifyIntramuscular
solution
Bristol-Myers Squibb (USA);
Otsuka Pharm. (USA)
Maropitant Cerenia Parenteral solution Pfizer Animal Health (USA)
Voriconazole Vfend Intravenous solutionPfizer (USA, Europe,
Japan)
Ziprasidone mesylate Geodon, ZeldoxIntramuscular
solutionPfizer (USA, Europe)
Randomly methylated -cyclodextrin (RM CD)
17 -Estradiol Aerodiol Nasal spray Servier (Europe)
Chloramphenicol Clorocil Eye drop solution Oftalder (Europe)
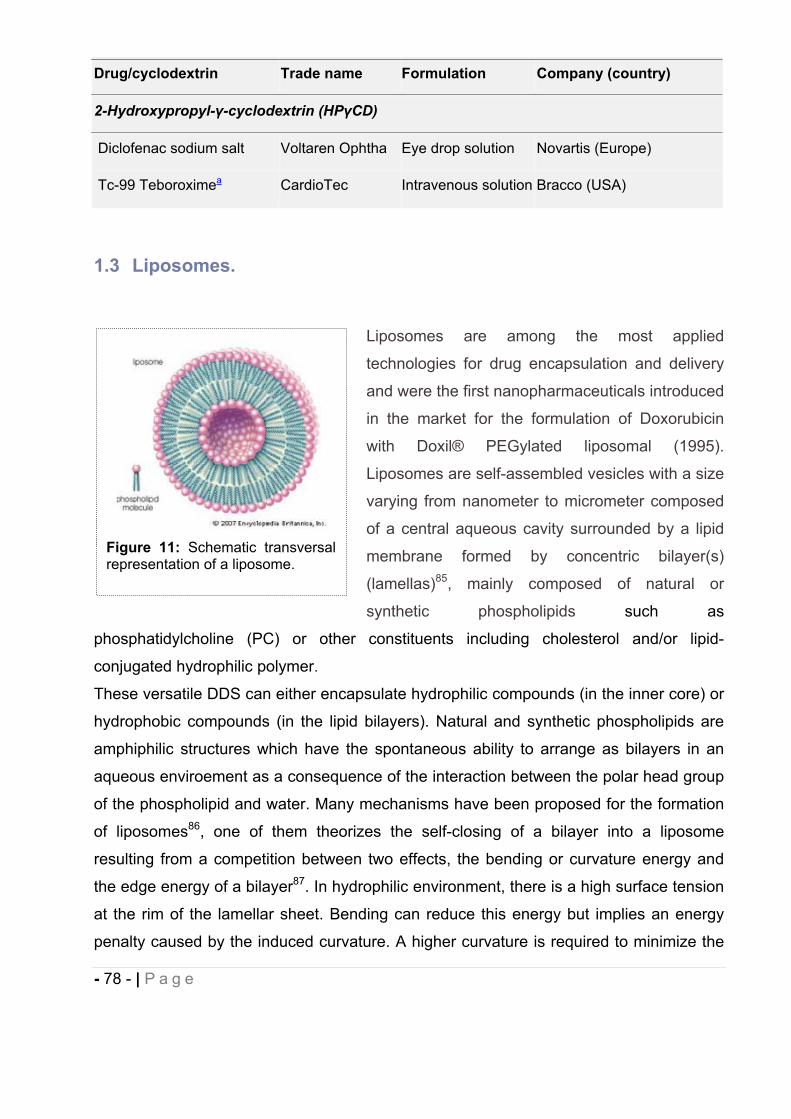
- 78 - | P a g e
Drug/cyclodextrin Trade name Formulation Company (country)
2-Hydroxypropyl- -cyclodextrin (HP CD)
Diclofenac sodium salt Voltaren Ophtha Eye drop solution Novartis (Europe)
Tc-99 Teboroximea CardioTec Intravenous solution Bracco (USA)
1.3 Liposomes.
Liposomes are among the most applied
technologies for drug encapsulation and delivery
and were the first nanopharmaceuticals introduced
in the market for the formulation of Doxorubicin
with Doxil® PEGylated liposomal (1995).
Liposomes are self-assembled vesicles with a size
varying from nanometer to micrometer composed
of a central aqueous cavity surrounded by a lipid
membrane formed by concentric bilayer(s)
(lamellas)85, mainly composed of natural or
synthetic phospholipids such as
phosphatidylcholine (PC) or other constituents including cholesterol and/or lipid-
conjugated hydrophilic polymer.
These versatile DDS can either encapsulate hydrophilic compounds (in the inner core) or
hydrophobic compounds (in the lipid bilayers). Natural and synthetic phospholipids are
amphiphilic structures which have the spontaneous ability to arrange as bilayers in an
aqueous enviroement as a consequence of the interaction between the polar head group
of the phospholipid and water. Many mechanisms have been proposed for the formation
of liposomes86, one of them theorizes the self-closing of a bilayer into a liposome
resulting from a competition between two effects, the bending or curvature energy and
the edge energy of a bilayer87. In hydrophilic environment, there is a high surface tension
at the rim of the lamellar sheet. Bending can reduce this energy but implies an energy
penalty caused by the induced curvature. A higher curvature is required to minimize the
Figure 8: Schematic transversalrepresentation of a liposome. Figure 11: Schematic transversal
representation of a liposome.
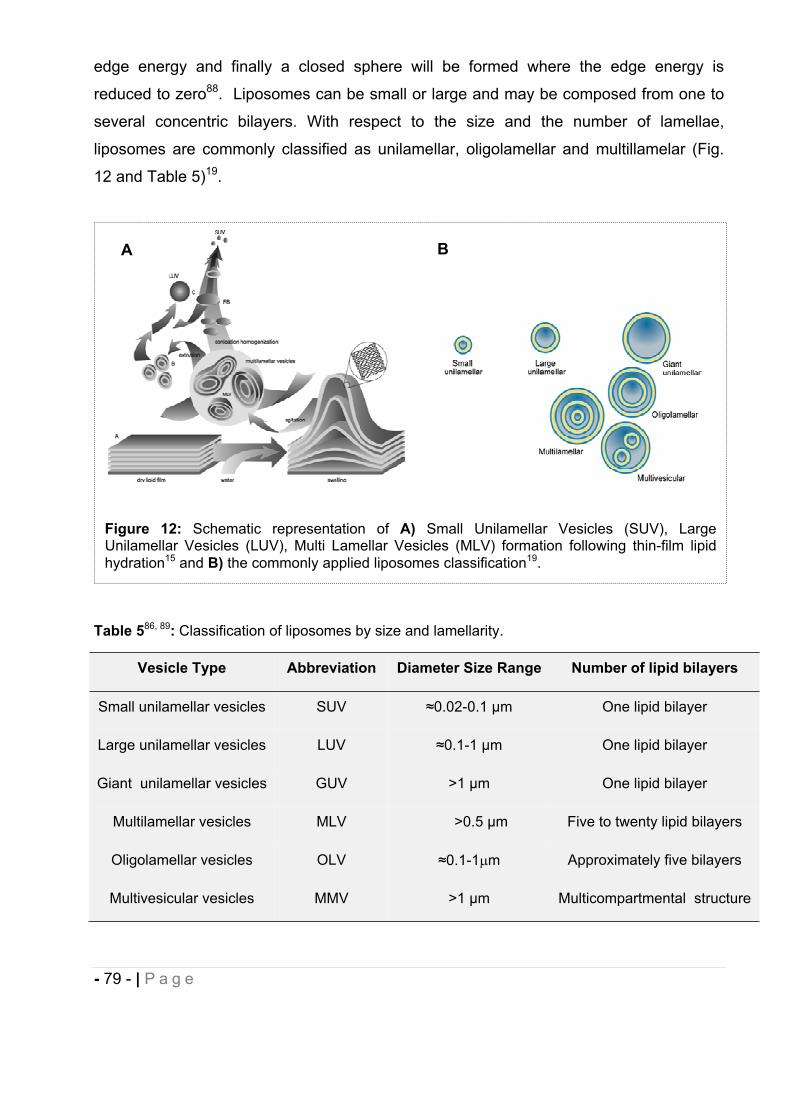
- 79 - | P a g e
edge energy and finally a closed sphere will be formed where the edge energy is
reduced to zero88. Liposomes can be small or large and may be composed from one to
several concentric bilayers. With respect to the size and the number of lamellae,
liposomes are commonly classified as unilamellar, oligolamellar and multillamelar (Fig.
12 and Table 5)19.
Table 586, 89: Classification of liposomes by size and lamellarity.
Vesicle Type Abbreviation Diameter Size Range Number of lipid bilayers
Small unilamellar vesicles SUV 0.02-0.1 m One lipid bilayer
Large unilamellar vesicles LUV 0.1-1 m One lipid bilayer
Giant unilamellar vesicles GUV >1 m One lipid bilayer
Multilamellar vesicles MLV >0.5 m Five to twenty lipid bilayers
Oligolamellar vesicles OLV 0.1-1 m Approximately five bilayers
Multivesicular vesicles MMV >1 m Multicompartmental structure
Figure 12: Schematic representation of A) Small Unilamellar Vesicles (SUV), Large Unilamellar Vesicles (LUV), Multi Lamellar Vesicles (MLV) formation following thin-film lipid hydration15 and B) the commonly applied liposomes classification19.
BA
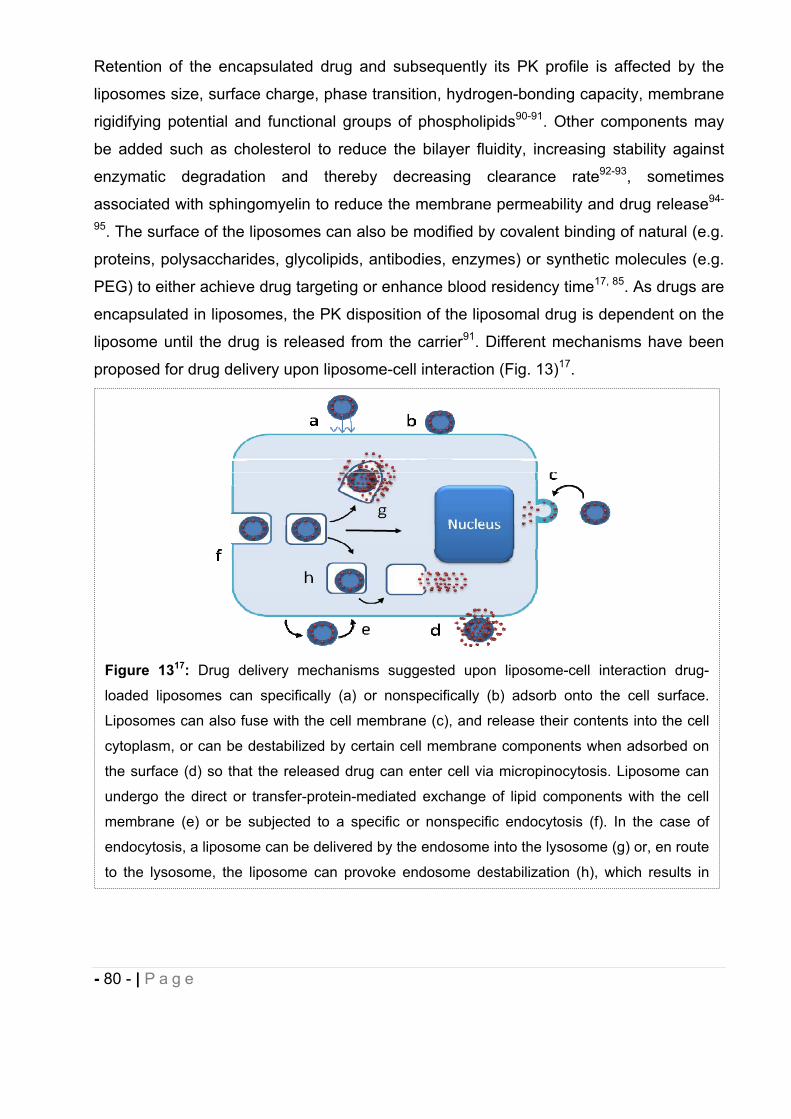
- 80 - | P a g e
Retention of the encapsulated drug and subsequently its PK profile is affected by the
liposomes size, surface charge, phase transition, hydrogen-bonding capacity, membrane
rigidifying potential and functional groups of phospholipids90-91. Other components may
be added such as cholesterol to reduce the bilayer fluidity, increasing stability against
enzymatic degradation and thereby decreasing clearance rate92-93, sometimes
associated with sphingomyelin to reduce the membrane permeability and drug release94-
95. The surface of the liposomes can also be modified by covalent binding of natural (e.g.
proteins, polysaccharides, glycolipids, antibodies, enzymes) or synthetic molecules (e.g.
PEG) to either achieve drug targeting or enhance blood residency time17, 85. As drugs are
encapsulated in liposomes, the PK disposition of the liposomal drug is dependent on the
liposome until the drug is released from the carrier91. Different mechanisms have been
proposed for drug delivery upon liposome-cell interaction (Fig. 13)17.
Figure 1317: Drug delivery mechanisms suggested upon liposome-cell interaction drug-
loaded liposomes can specifically (a) or nonspecifically (b) adsorb onto the cell surface.
Liposomes can also fuse with the cell membrane (c), and release their contents into the cell
cytoplasm, or can be destabilized by certain cell membrane components when adsorbed on
the surface (d) so that the released drug can enter cell via micropinocytosis. Liposome can
undergo the direct or transfer-protein-mediated exchange of lipid components with the cell
membrane (e) or be subjected to a specific or nonspecific endocytosis (f). In the case of
endocytosis, a liposome can be delivered by the endosome into the lysosome (g) or, en route
to the lysosome, the liposome can provoke endosome destabilization (h), which results in
- 81 - | P a g e
Several physicochemical properties have been attributed to these lipidic nanocarriers
including permeability of their membrane to different drugs of various polarities,
enhancing their solubility and stability, and providing sustained delivery of entrapped
drugs through biological membranes. Through encapsulation in liposomes, side effects
can be minimized in result of targeting of specific cells, owing reduced off-target and
change in the volume of biodistribution of the drug retained in the carrier, reducing the
accumulation of otherwise toxic drugs in sensitive organs like heart, kidney, lung and
muscle96. Conventional liposomes distribute preferentially to organ and tissues involved
in the Mononuclear Phagocytic System (MPS) or ReticuloEndothelial System (RES)17, 97-
98 including spleen as well as tumors with impaired microvasculature due to the
Enhanced Permeability and Retention (EPR) effect. When the target of interest is extra
MPS-tissues/organ, designing coated surface liposomes is a more suitable strategy to
enhance blood residency time and vesicles stability (e.g. PEGylated liposomes) and to
achieve active targeting (e.g. growth factors, antibodies, proteins)91. All these factors
have contributed to the increased therapeutic index observed with liposomal formulations
of chemotherapeutic agents (e.g. doxorubicin)90, 99 and triggered numerous
pharmaceutical applications for the administration of chemotherapeutic agents, vaccines,
radiopharmaceuticals and nucleic-acid based therapeutics (Table 6).
Liposomes can be prepared by various techniques, the most commonly used are thin-
film, ultrasonication, detergent depletion, reverse-phase evaporation and ether/ethanol
injection methods100.
Liposome size can then be modified by several techniques such as dehydration-
rehydration and freeze-thaw extrusion methods101. The liposomes may need to undergo
purification procedure (e.g. column filtration, centrifugation) depending on the
manufacturing process selected. Numerous analytical methods have been developed to
characterize the resulting liposomes in term of size and/or morphology by freeze-fracture
electron microscopy and negative staining electron microscopy (i.e. TEM, SEM), and
Photon Correlation Spectroscopy (PCS). Lamellarity behaviors analysis by 31P NMR and
drug release have also been conducted102. For more detail Information on the
composition, characterization, and production of liposomes the reader is directed to a
review “Liposomes: a practical approach”103.

- 82 - | P a g e
Table 6: Some of the marketed liposomal drugs.
DrugProductname
Indications Company
DaunorubicinDaunoXome
®
Acute lymphocytic leukemia, acute non
lymphocytic leukemia Kaposi’s
sarcoma
Gilead Scientific
Doxorubicin Myocet®Combinational therapy of recurrent
breast cancerElan
PEG-liposomes
Doxorubicin
Doxil®
Caelyx®
Refractory Kaposi’s sarcoma, ovarian
cancer, recurrent breast cancer
Johnson&Johnson
Janssen
Amphotericin B AmBisome® Fungal infectionsGilead Scientific/
Fujisawa Healthcare
Cytarabine DepoCyt® Lymphomatous meningitisEnzon
Pharmaceutiicals Inc.
Amphotericin B Albecet® Fungal infectionsEnzon
Pharmaceutiicals
1.4 Micelles.
The use of certain micelle-forming amphiphilic compounds in formulations of sparingly
soluble pharmaceuticals is a conventional approach especially at the early stage of the
drug development to support the in vitro and in vivo studies. Micelles have many
Figure 1414: Schematic representation of a monomer
surfactant and micelle.
- 83 - | P a g e
advantageous characteristics as carriers of hydrophobic drugs including hydrophobic-
core-hydrophilic-shell structure allowing water solubilization of poor-soluble drugs,
hydrophilic shells minimizing uptake by RES or MPS, size that prevents renal excretion,
accumulation of micelle-incorporated drugs in tumors because of the EPR effect104-107.
Micelles are thermodynamically stable colloidal dispersions (with a particle size ranging
normally within 5 to 100 nm) that form spontaneously, under certain concentration and
temperature, from amphiphilic molecules or surface active agents (surfactants),
molecules of which consist of two distinct regions, an hydrophobic “tail” and an
hydrophilic “head”, with opposite affinities toward a given solvent such as water108. At low
concentrations, surfactants exist as monomers in the aqueous solution. As their
concentration increase, amphiphilic molecules self-assemble above the so-called critical
micelle concentration (CMC) into aggregates of well-defined shapes, such as spherical or
cylindrical micelles, usually containing from 60 to 100 surfactants molecules (i.e.
aggregation number)109-111. This average number of surfactant monomers in each micelle
is approximately constant in range up to 100-fold the CMC, with the number of micelles
varying112. The CMC can be detected as an inflection point when physicochemical
properties such as surface tension, conductivity, particle size, fluorescence113 are plotted
as a function of concentration. The formation of micelles is driven by the decrease of
free energy and the entropy increase in the system because of the removal of
hydrophobic “tails” from the aqueous environment and the loss of the order structure of
the water molecules around this region of the molecule. Then, the hydrophilic “heads”
are exposed to the solvent and hydrogen bond network in water are re-established108, 114.
Micelles formed in non aqueous solvent (reverse or inverted micelles) have a core
composed of the hydrophilic groups surrounded by a layer composed of the hydrocarbon
chains and are usually not of a common pharmaceutical interest since they are
hydrophobic. Thermodynamic and structural features of the aggregation process depend
on the chemical structure of the surfactant and its concentration, solvent type, presence
of salt, pH and temperature114-116.
Micelles have been characterized on their size, shape, aggregation number,
polydispersity, enthalpy using various methods such as PCS, Small Angle Neutron
Scattering (SANS), fluorescence quenching, FTIR, calorimetry, NMR109. However,
micelles do not possess a well-defined structure (i.e. fluid) and no detailed high-
resolution picture using TEM or SEM is available109. Micelles have been extensively
- 84 - | P a g e
studied as DDS since lipophilic and poorly soluble drugs can be solubilized within the
inner core of assembled hydrophobic “tails” while more polar compounds can be either
adsorbed on the micelle surface or distributed along the surfactant molecules in
intermediate positions23. Besides the increase of drug solubilization and prevention of
precipitation through micellization, these nanostructures may improve the stability of
labile drugs, reduce the toxicity caused by administration of neat drugs, and decrease the
variability of absorption of poorly-soluble drugs23. Because of their small size, micelles
can gradually and selectively accumulate (passive targeting) in areas such as tumors
and infarcts with discontinuous endothelium through EPR effect108. Interestingly, some
surfactants commonly used in micellar DDS such as Cremophor™ ELP (Polyoxyl-35
Castor Oil) or Tween™ 80 (polysorbate 80) can increase the absorption of drugs by
either a direct inhibition of P-glycoprotein-mediated drug efflux117-119 and/or by interfering
with gastrointestinal epithelial membrane to enhance the permeability of drug120-122.
There are four categories of conventional surfactants, anionic, cationic, zwitterionic and
non ionic. Generally, nonionic surfactants have the least toxicity profile with very much
lower CMC values and higher aggregation numbers than their ionic counterparts with
similar hydrocarbon chains, and thus are the major class of surfactants used in
pharmaceutical system through both oral and parenteral routes123 ( Table 7).
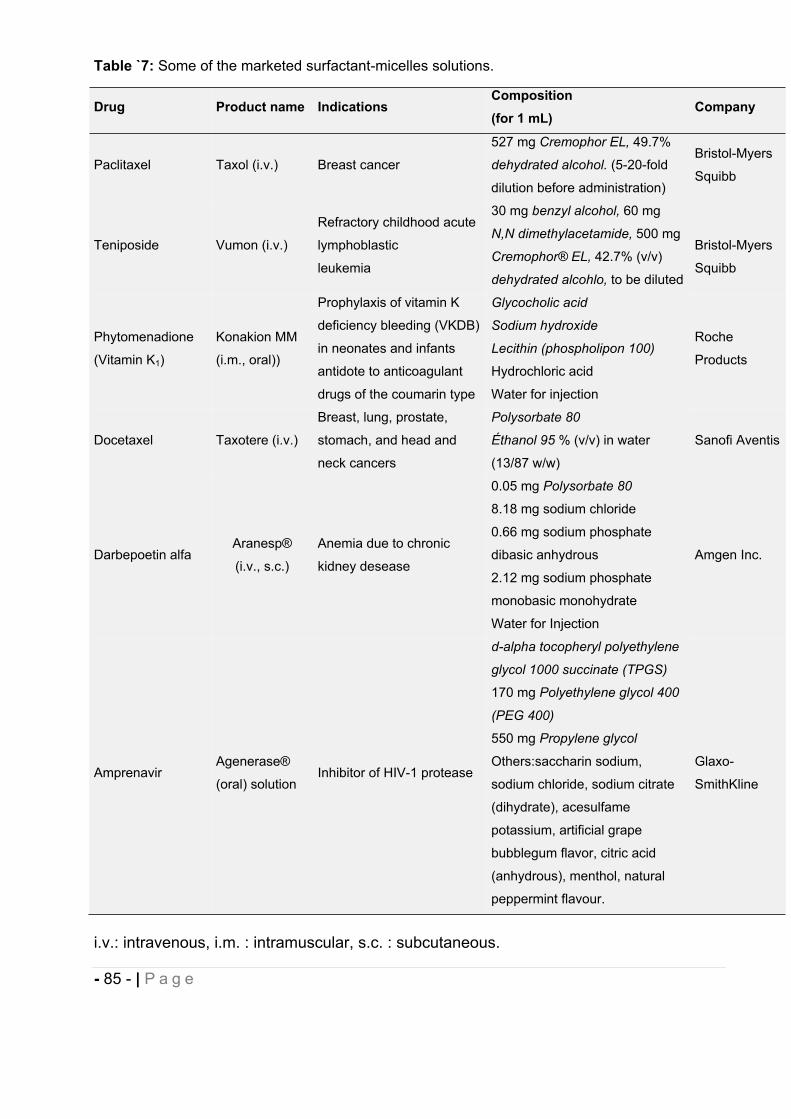
- 85 - | P a g e
Table `7: Some of the marketed surfactant-micelles solutions.
Drug Product name Indications Composition (for 1 mL)
Company
Paclitaxel Taxol (i.v.) Breast cancer
527 mg Cremophor EL, 49.7%
dehydrated alcohol. (5-20-fold
dilution before administration)
Bristol-Myers
Squibb
Teniposide Vumon (i.v.)
Refractory childhood acute
lymphoblastic
leukemia
30 mg benzyl alcohol, 60 mg
N,N dimethylacetamide, 500 mg
Cremophor® EL, 42.7% (v/v)
dehydrated alcohlo, to be diluted
Bristol-Myers
Squibb
Phytomenadione
(Vitamin K1)
Konakion MM
(i.m., oral))
Prophylaxis of vitamin K
deficiency bleeding (VKDB)
in neonates and infants
antidote to anticoagulant
drugs of the coumarin type
Glycocholic acid
Sodium hydroxide
Lecithin (phospholipon 100)
Hydrochloric acid
Water for injection
Roche
Products
Docetaxel Taxotere (i.v.)
Breast, lung, prostate,
stomach, and head and
neck cancers
Polysorbate 80
Éthanol 95 % (v/v) in water
(13/87 w/w)
Sanofi Aventis
Darbepoetin alfa Aranesp®
(i.v., s.c.)
Anemia due to chronic
kidney desease
0.05 mg Polysorbate 80
8.18 mg sodium chloride
0.66 mg sodium phosphate
dibasic anhydrous
2.12 mg sodium phosphate
monobasic monohydrate
Water for Injection
Amgen Inc.
Amprenavir Agenerase®
(oral) solution Inhibitor of HIV-1 protease
d-alpha tocopheryl polyethylene
glycol 1000 succinate (TPGS)
170 mg Polyethylene glycol 400
(PEG 400)
550 mg Propylene glycol
Others:saccharin sodium,
sodium chloride, sodium citrate
(dihydrate), acesulfame
potassium, artificial grape
bubblegum flavor, citric acid
(anhydrous), menthol, natural
peppermint flavour.
Glaxo-
SmithKline
i.v.: intravenous, i.m. : intramuscular, s.c. : subcutaneous.
- 86 - | P a g e
From the pharmacological perspective, the lower CMC value of non ionic surfactants is
beneficial in improving the physicochemical stability of the drug incorporated micelles.
When injected intravenously, the large volume of blood causes dilution of the
administered solution and only micelles of surfactants with very low CMC value can exist,
while micelles of surfactants with high CMC value may dissociate into monomers and
their content may precipitate in the blood113. Although well-tolerated, non ionic
surfactants are not usually incorporated at concentration above 5-20 % (w/v)23 in
parenteral formulations because of their potential haemolytic activity and/or toxicity
profile. In formulation design of sparingly soluble compounds, organic cosolvents are
almost always added to micellar solutions to enhance drug solubilization and achieve
therapeutic dose. This approach is particularly widespread during the screening of NCE
where a library of potential drug candidates needs to be brought into solution to be tested
for biological activity. Among the most frequently water-soluble cosolvents evaluated in
oral and injectable formulations are propylene glycol, ethanol, polyethylene glycol
(i.e.PEG 400), glycerol, N-methyl pyrrolidone (NMP), dimethyl sulfoxide (DMSO) and
dimethylacetamide (DMA)21. The solubilizing effect of cosolvents can be expressed by
the log-linear model established by Yalkowsky124-125 or by the Jouyban-Acree126 model.
The solubilization capacity by surfactants has been described, in pure water-surfactant
systems, by different authors using molar solubilization capacity and the micelle-water
partition coefficient127-128 and in a combination of water-surfactant-cosolvent system26. It
remains however complicated to predict how cosolvents addition will affect surfactant
micelles formation. Addition of cosolvents to the surfactant(s) solution may have a
positive effect regarding the drug solubility enhancement while improving the intrinsic
solubility of the drug or change in the solution properties (i.e. dielectric constant, surface
tension), but may also compete with the drug for the inner core of the micelle or change
its physicochemical properties resulting in a decrease in the solubilization capacity of the
micelles129-131. In our project the solubilization capacity of different cosolvents and
surfactant combinations over different cannabinoid compounds has been determined
experimentally. The effect of dilution of the micellar preparation on the NCE precipitation
was also investigated in vitro in order to prevent in vivo issues. The PK profile of drug
delivered from micelles has been quite extensively studied. The kinetics of association
and disassociation of surfactants forming a micelle are usually very rapid. The
- 87 - | P a g e
characteristic time for the surfactant monomers moving in and out of micelle is typically in
the range of 10-8 to 10-3s132. This brings a practical issue of possible precipitation of
solute among dilution of surfactants at a concentration below CMC that could affect drug
performance. In the absence of drug carriers, drug molecules mostly enter cells by
diffusion out of the micelle and through the cell membrane133-134. When micelles remain
stable in the systemic circulation, the endocytic pathway is the mechanism suggested for
the (polymeric) drug-loaded micelle entering the cell104, 135 and advantageously
bypassing efflux pumps.
1.5 Oral Self-Emulsifying Drug Delivery System (SEDDS).
The efficiency of drug absorption from the gastrointestinal (GI) tract (GIT) is affected by
many factors. These include physicochemical factors (e.g., pKa, solubility, stability,
lipophilicity, polar surface area, hydrogen bonding, crystalline form and size),
physiological factors (e.g., GI pH, blood flow and transit time, gastric emptying,
absorption mechanisms), and factors related to the dosage form (e.g., tablet, capsule,
solution, suspension, emulsion)136. Otherwise complex, Amidon et al.3 demonstrated that
rate and extent of oral drug absorption are strongly influenced and correlated to the drug
solubility/dissolution in GIT and permeability through the GIT. The oral absorption of
poorly water soluble compounds when presented in the crystalline state to the GIT is
typically dissolution rate-limited. Some proposed mechanisms of enhancing oral
bioavailability include to increase the dissolution rate and/or to maintain the drug in
solution through the GIT in a supersaturated state137-140. The rate and extent of
absorption of such compounds is then highly dependent on the performance of the
formulated product141-142. Among many such delivery options, like incorporation of drugs
in oils, surfactant dispersion, emulsions and liposomes, one of the most popular
approaches are the Self-Emulsifying Drug Delivery Systems (SEDDSs)143. The
preclinical and clinical usefulness of the SEDDS have gained considerable interest for
their ability to increase solubility and oral bioavailability of poorly soluble drugs after the
commercial success of Sandimmune® Neoral (Cyclosporin A), Fortovase® (Saquinavir)
and Norvir® (Ritonavir)144. SEDDSs are isotropic mixtures of naturals or synthetic oils and
surfactants, sometimes containing cosolvents, and can be used for the design of
- 88 - | P a g e
formulations in order to improve the oral absorption of highly lipophilic compounds.
SEDDSs emulsify spontaneously to produce fine oil-in-water emulsions or
microemulsions when introduced into an aqueous phase (i.e. GI fluids) under gentle
agitation145. Self-emulsifying formulations spread readily in the GIT, and the digestive
motility of the stomach and the intestine provide the agitation necessary for self-
emulsification. The spontaneous formation of emulsion advantageously presents the
drug in a dissolved form, and the resultant small droplets size provides a large interfacial
surface area for the drug absorption. SEDDSs typically produce dispersion with an
optically clear-to-turbid appearance depending on the droplet size, generally between
100–300 nm146. According to Reiss147, self-emulsification occurs when the entropy
change that favors dispersion is greater than the energy required to increase the surface
area of the dispersion. The efficiency of self-emulsification is usually estimated by
determining the rate of emulsification and droplet size distribution. Turbidity
measurements can be performed to determine the rapid equilibrium reached by the
dispersion and the reproducibility of this phenomenon146, 148. Additionally, the
components used in SEDDS such as surfactants (e.g. Labrasol®, Cremophor ELP,
Polysorbate 80) and oils (e.g. Labrafil 1944 CS®, long chain triglycerides) have been
reported to improve lipophilic drug oral bioavailability by mechanisms including
membrane fluidity to facilitate transcellular absorption, opening tight junction to allow
paracellular transport, inhibiting P-gp and/or Cytochrome P450 (CYP450) enzymes to
increase intracellular concentration and residence time, stimulating
lipoprotein/chylomicron production by lipid and promotion of intestinal lymphatic transport
(i.e. reduction of first pass metabolism) or alterations in gastric transit time149-152,153.
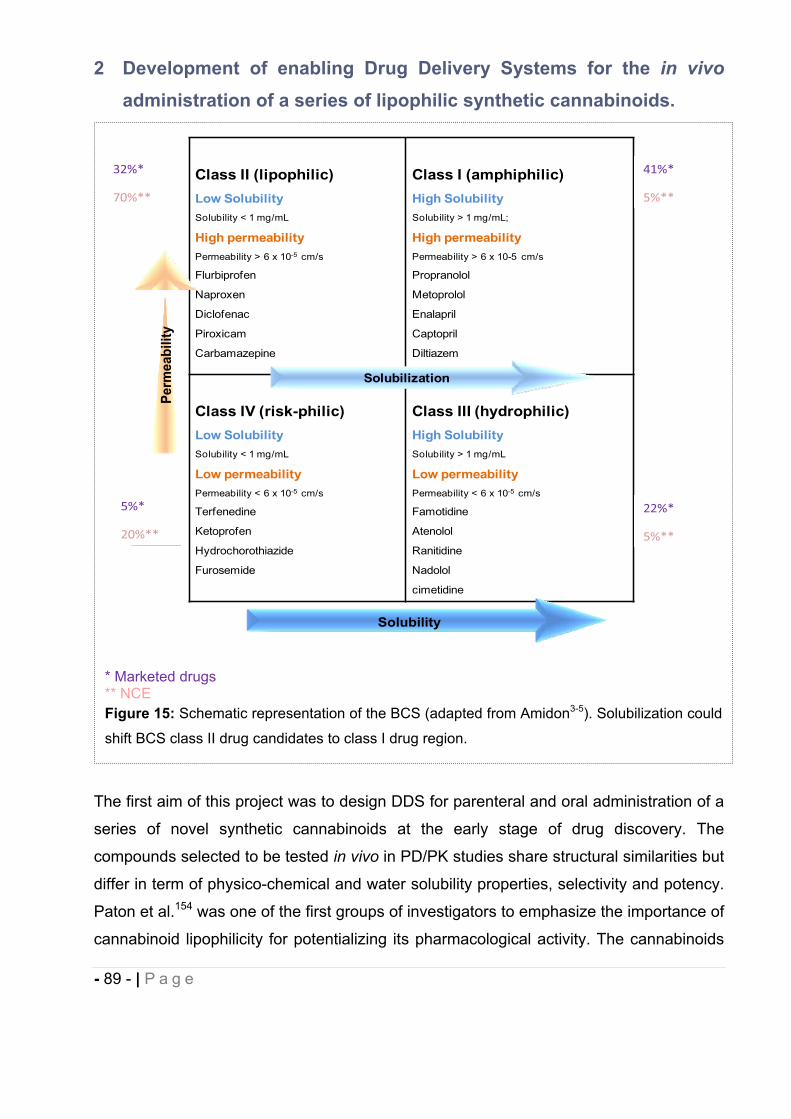
- 89 - | P a g e
2 Development of enabling Drug Delivery Systems for the in vivo
administration of a series of lipophilic synthetic cannabinoids.
The first aim of this project was to design DDS for parenteral and oral administration of a
series of novel synthetic cannabinoids at the early stage of drug discovery. The
compounds selected to be tested in vivo in PD/PK studies share structural similarities but
differ in term of physico-chemical and water solubility properties, selectivity and potency.
Paton et al.154 was one of the first groups of investigators to emphasize the importance of
cannabinoid lipophilicity for potentializing its pharmacological activity. The cannabinoids
* Marketed drugs ** NCE Figure 15: Schematic representation of the BCS (adapted from Amidon3-5). Solubilization could
shift BCS class II drug candidates to class I drug region.
Class II (lipophilic)Low SolubilitySolubility < 1 mg/mL
High permeabilityPermeability > 6 x 10⁻⁵ cm/s
Flurbiprofen
Naproxen
Diclofenac
Piroxicam
Carbamazepine
Class I (amphiphilic)High SolubilitySolubility > 1 mg/mL;
High permeabilityPermeability > 6 x 10⁻⁵ cm/s
Propranolol
Metoprolol
Enalapril
Captopril
Diltiazem
Class IV (risk-philic)Low SolubilitySolubility < 1 mg/mL
Low permeabilityPermeability < 6 x 10⁻⁵ cm/s
Terfenedine
Ketoprofen
Hydrochorothiazide
Furosemide
Class III (hydrophilic)High SolubilitySolubility > 1 mg/mL
Low permeabilityPermeability < 6 x 10⁻⁵ cm/s
Famotidine
Atenolol
Ranitidine
Nadolol
cimetidine
5%*
20%**
22%*
5%**
32%*
70%**
Solubility
Perm
eabi
lity
Solubilization
41%*
5%**
- 90 - | P a g e
we synthesized and evaluated for their therapeutic activity are hydrophobic in nature.
Solubility plays an essential role in drug disposition, since the maximum rate of passive
drug transport across a biological membrane, the main pathway for drug absorption, is
the product of permeability and solubility. A Biopharmaceutics Classification System
(BCS) provided by the FDA and established by Amidon3 has been developed to
categorize compounds based on their aqueous solubility and gastrointestinal
permeability, ascribed to be the most important parameters affecting drug
bioavailability155. A large number of poorly water-soluble drugs belong to classes II and
IV of the BCS and only 8% of the NCE have high permeability and solubility156.
According to the FDA, in the BCS, a drug substance is considered “highly permeable”
when the extent of absorption in humans is determined to be 90% or more of an
administered dose, and a drug substance is considered “highly soluble” when the highest
dose strength is soluble in 250 mL or less of aqueous media over the pH range of 1–7.5
at 37 °C157.
Poor solubility has been identified as the cause of numerous drug development
failures158. The delivery of this poor-water soluble compound has always been
challenging for formulators since inadequate aqueous solubility can affect in vitro
screening assays and the ability to achieve optimum, reproducible and reliable exposure
in animals. Various formulation techniques are applied for solubilization of poorly soluble
drugs and the selection of a DDS depends on the physicochemical properties and the
stability of the drug, the biocompatibility of the vehicle/excipients for a given delivery
route and animal species (or the biological system tested) and the frequency of dosage
(i.e. acute, chronic). In addition to the ability of enhancing solubilization of drugs, suitable
DDS may also alter the physicochemical stability of the drug in the vehicle and in
biological fluids (i.e. metabolic stability), the biodistribution and the tolerance of the drug,
and deliver the drug at a controlled rate to its site of action. Overall, DDS are used to
improve the PK/PD properties of drug with the aim of increasing its therapeutic efficacy.
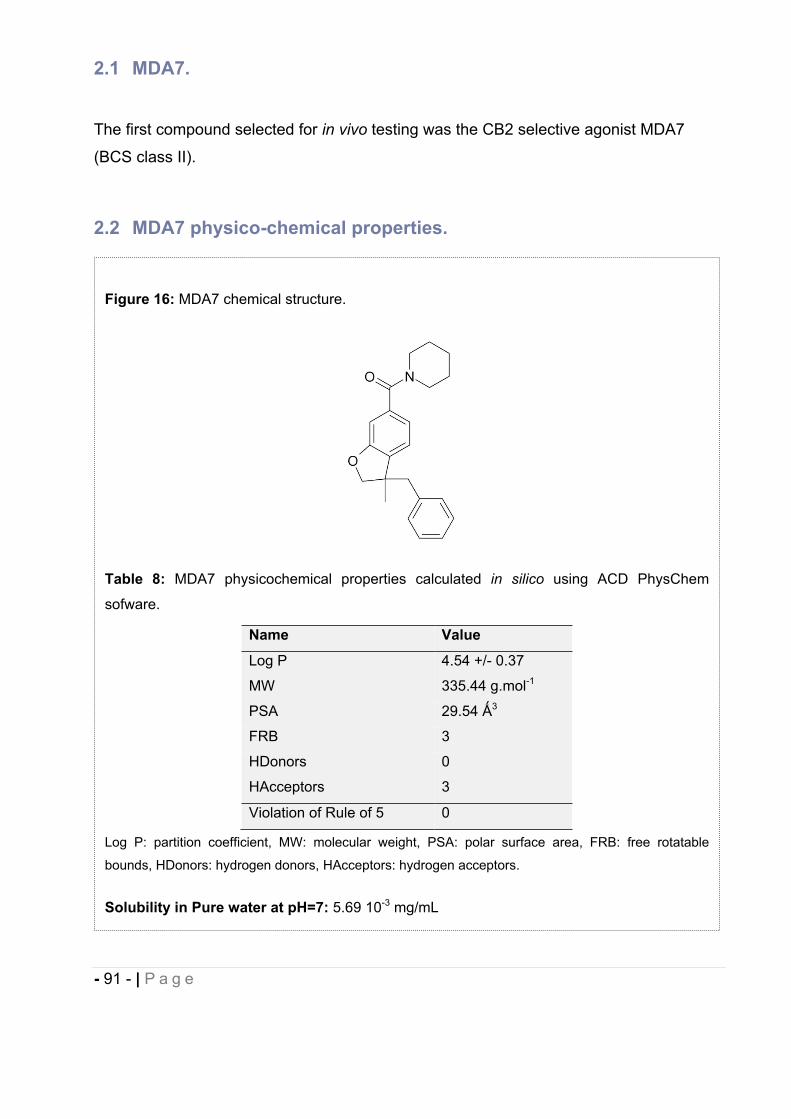
- 91 - | P a g e
2.1 MDA7.
The first compound selected for in vivo testing was the CB2 selective agonist MDA7
(BCS class II).
2.2 MDA7 physico-chemical properties.
Figure 16: MDA7 chemical structure.
Table 8: MDA7 physicochemical properties calculated in silico using ACD PhysChem
sofware.
Name Value
Log P 4.54 +/- 0.37
MW 335.44 g.mol-1
PSA 29.54 3
FRB 3
HDonors 0
HAcceptors 3
Violation of Rule of 5 0
Log P: partition coefficient, MW: molecular weight, PSA: polar surface area, FRB: free rotatable
bounds, HDonors: hydrogen donors, HAcceptors: hydrogen acceptors.
Solubility in Pure water at pH=7: 5.69 10-3 mg/mL
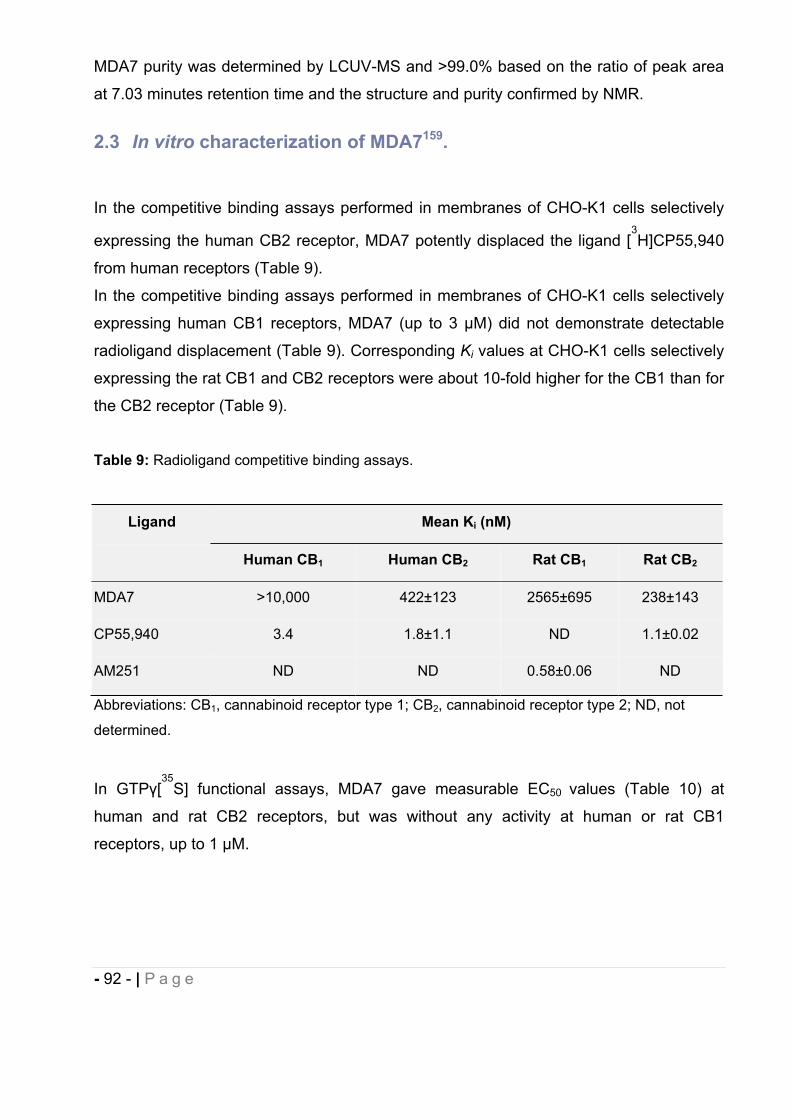
- 92 - | P a g e
MDA7 purity was determined by LCUV-MS and >99.0% based on the ratio of peak area
at 7.03 minutes retention time and the structure and purity confirmed by NMR.
2.3 In vitro characterization of MDA7159.
In the competitive binding assays performed in membranes of CHO-K1 cells selectively
expressing the human CB2 receptor, MDA7 potently displaced the ligand [3H]CP55,940
from human receptors (Table 9).
In the competitive binding assays performed in membranes of CHO-K1 cells selectively
expressing human CB1 receptors, MDA7 (up to 3 μM) did not demonstrate detectable
radioligand displacement (Table 9). Corresponding Ki values at CHO-K1 cells selectively
expressing the rat CB1 and CB2 receptors were about 10-fold higher for the CB1 than for
the CB2 receptor (Table 9).
Table 9: Radioligand competitive binding assays.
Ligand Mean Ki (nM)
Human CB1 Human CB2 Rat CB1 Rat CB2
MDA7 >10,000 422±123 2565±695 238±143
CP55,940 3.4 1.8±1.1 ND 1.1±0.02
AM251 ND ND 0.58±0.06 ND
Abbreviations: CB1, cannabinoid receptor type 1; CB2, cannabinoid receptor type 2; ND, not
determined.
In GTP [35
S] functional assays, MDA7 gave measurable EC50 values (Table 10) at
human and rat CB2 receptors, but was without any activity at human or rat CB1
receptors, up to 1 μM.
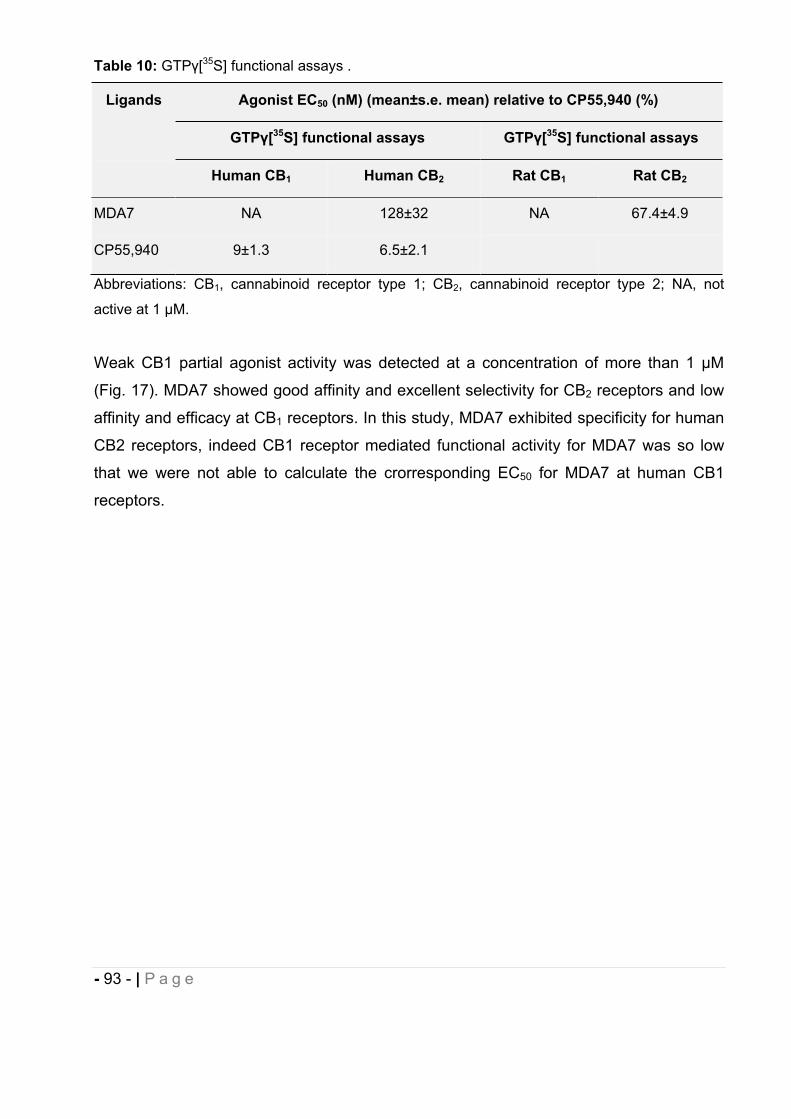
- 93 - | P a g e
Table 10: GTP [35S] functional assays .
Ligands Agonist EC50 (nM) (mean±s.e. mean) relative to CP55,940 (%)
GTP [35S] functional assays GTP [35S] functional assays
Human CB1 Human CB2 Rat CB1 Rat CB2
MDA7 NA 128±32 NA 67.4±4.9
CP55,940 9±1.3 6.5±2.1
Abbreviations: CB1, cannabinoid receptor type 1; CB2, cannabinoid receptor type 2; NA, not
active at 1 M.
Weak CB1 partial agonist activity was detected at a concentration of more than 1 μM
(Fig. 17). MDA7 showed good affinity and excellent selectivity for CB2 receptors and low
affinity and efficacy at CB1 receptors. In this study, MDA7 exhibited specificity for human
CB2 receptors, indeed CB1 receptor mediated functional activity for MDA7 was so low
that we were not able to calculate the crorresponding EC50 for MDA7 at human CB1
receptors.
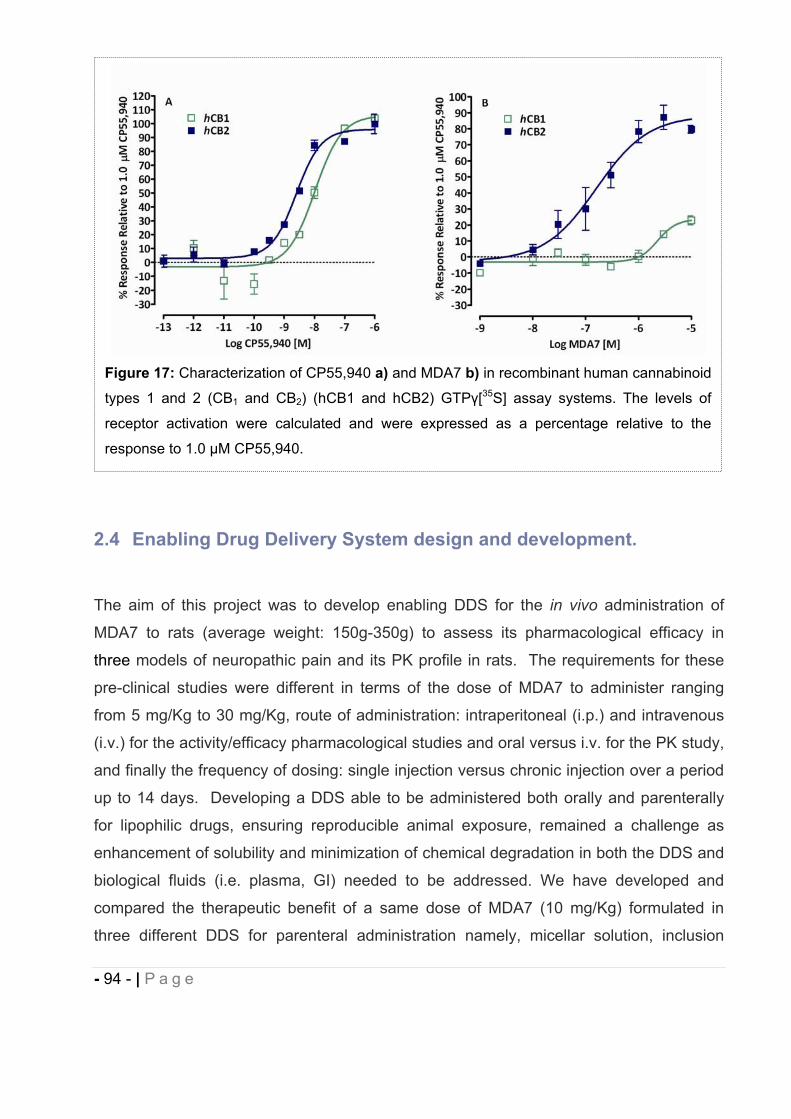
- 94 - | P a g e
2.4 Enabling Drug Delivery System design and development.
The aim of this project was to develop enabling DDS for the in vivo administration of
MDA7 to rats (average weight: 150g-350g) to assess its pharmacological efficacy in
three models of neuropathic pain and its PK profile in rats. The requirements for these
pre-clinical studies were different in terms of the dose of MDA7 to administer ranging
from 5 mg/Kg to 30 mg/Kg, route of administration: intraperitoneal (i.p.) and intravenous
(i.v.) for the activity/efficacy pharmacological studies and oral versus i.v. for the PK study,
and finally the frequency of dosing: single injection versus chronic injection over a period
up to 14 days. Developing a DDS able to be administered both orally and parenterally
for lipophilic drugs, ensuring reproducible animal exposure, remained a challenge as
enhancement of solubility and minimization of chemical degradation in both the DDS and
biological fluids (i.e. plasma, GI) needed to be addressed. We have developed and
compared the therapeutic benefit of a same dose of MDA7 (10 mg/Kg) formulated in
three different DDS for parenteral administration namely, micellar solution, inclusion
Figure 17: Characterization of CP55,940 a) and MDA7 b) in recombinant human cannabinoid
types 1 and 2 (CB1 and CB2) (hCB1 and hCB2) GTP [35S] assay systems. The levels of
receptor activation were calculated and were expressed as a percentage relative to the
response to 1.0 M CP55,940.
- 95 - | P a g e
complexes and liposomes. A PK study was also conducted with the micellar solution
after i.v. administration and compared to SEDDS after oral administration. In order to
bypass potential issues of inconsistent drug absorption related to solubility (i.e. non-ideal
NCE: variable crystallinity and purity) and limited dissolution rate, preformulation and
early formulation studies were conducted with dissolved NCE.
2.4.1 Preformulation studies.
Before the formulation of a drug substance into a dosage form, it must be chemically and
physically characterized. Preformulation studies supply the information needed to define
the physicochemical properties of the drug substance, its solubility and stability in
selected and compendial solvents. This information is then used as the framework for the
drug's combination with pharmaceutical ingredients in the design of DDS.
2.4.1.1 MDA7 kinetic solubility and stability in pure excipients.
Kinetic solubility provides useful information even though it is not as robust as
thermodynamic solubility (i.e. equilibrium solubility). The measurement is rapid (e.g. a
few hours), involves no use of high performance liquid chromatography (HPLC) or other
instrumentation and provides much-needed solubility data in a variety of
solvents/excipients and vehicles with small amount of drug. Kinetic solubility can be
broadly used in developing formulations containing cosolvents, surfactants,
cyclodextrins, lipids, and polymer. The kinetic solubility of MDA7 was studied following a
detailed procedure described by Li et al.22 in hydrophilic, amphiphilic and lipophilic
excipients for the selection of a suitable enabling formulation (Table 11). The solubility of
the drug was assessed by serial addition of a known amount of solvent to a known
amount of drug.
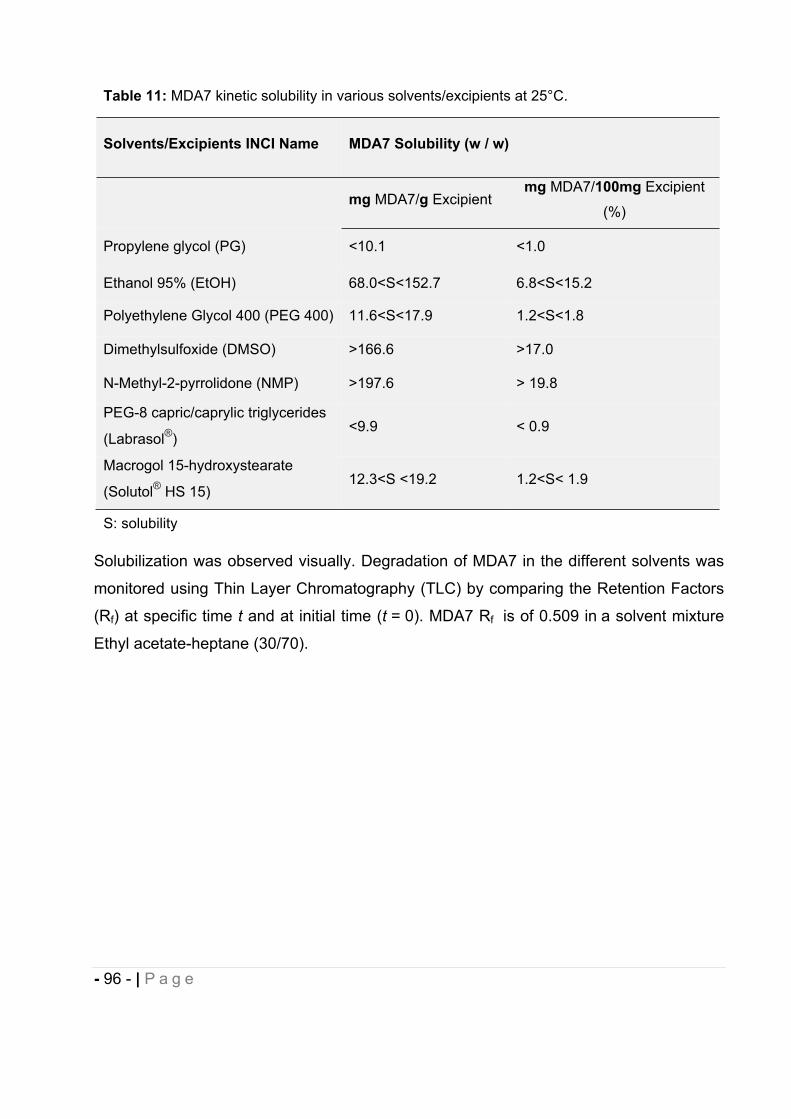
- 96 - | P a g e
Solubilization was observed visually. Degradation of MDA7 in the different solvents was
monitored using Thin Layer Chromatography (TLC) by comparing the Retention Factors
(Rf) at specific time t and at initial time (t = 0). MDA7 Rf is of 0.509 in a solvent mixture
Ethyl acetate-heptane (30/70).
Table 11: MDA7 kinetic solubility in various solvents/excipients at 25°C.
Solvents/Excipients INCI Name MDA7 Solubility (w / w)
mg MDA7/g Excipientmg MDA7/100mg Excipient
(%)
Propylene glycol (PG) <10.1 <1.0
Ethanol 95% (EtOH) 68.0<S<152.7 6.8<S<15.2
Polyethylene Glycol 400 (PEG 400) 11.6<S<17.9 1.2<S<1.8
Dimethylsulfoxide (DMSO) >166.6 >17.0
N-Methyl-2-pyrrolidone (NMP) >197.6 > 19.8
PEG-8 capric/caprylic triglycerides
(Labrasol®)<9.9 < 0.9
Macrogol 15-hydroxystearate
(Solutol® HS 15)12.3<S <19.2 1.2<S< 1.9
S: solubility
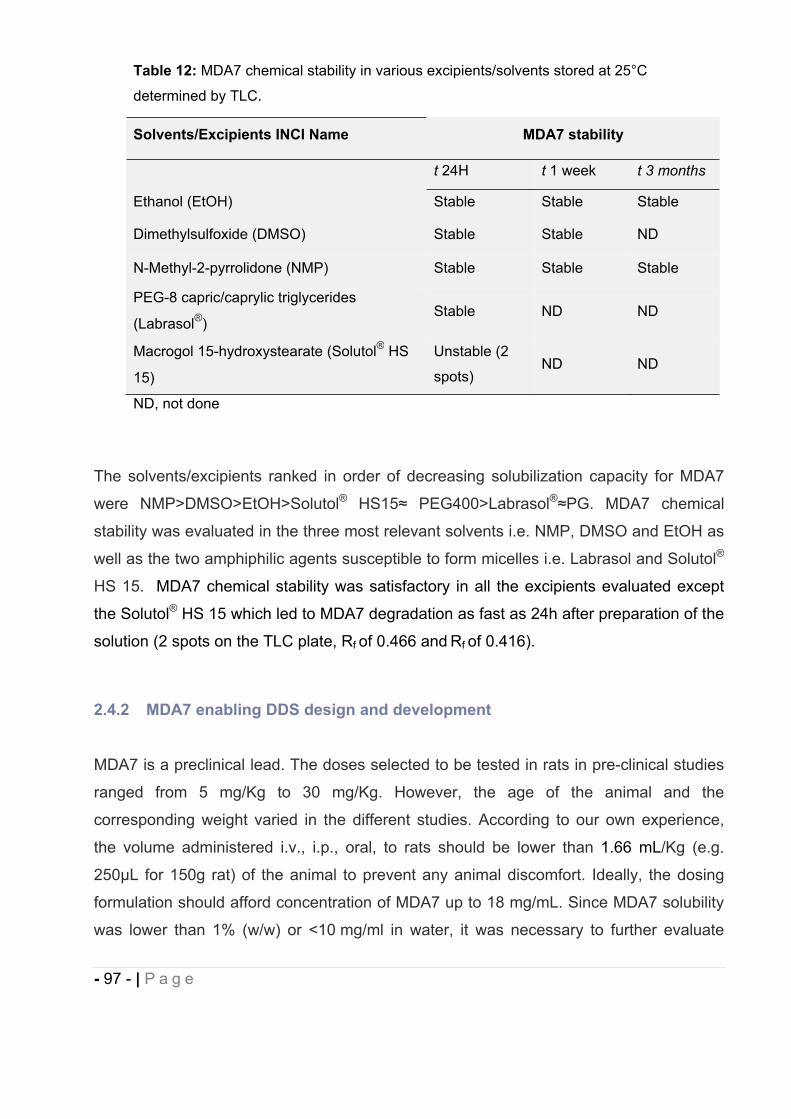
- 97 - | P a g e
The solvents/excipients ranked in order of decreasing solubilization capacity for MDA7
were NMP>DMSO>EtOH>Solutol® HS15 PEG400>Labrasol® PG. MDA7 chemical
stability was evaluated in the three most relevant solvents i.e. NMP, DMSO and EtOH as
well as the two amphiphilic agents susceptible to form micelles i.e. Labrasol and Solutol®
HS 15. MDA7 chemical stability was satisfactory in all the excipients evaluated except
the Solutol® HS 15 which led to MDA7 degradation as fast as 24h after preparation of the
solution (2 spots on the TLC plate, Rf of 0.466 and Rf of 0.416).
2.4.2 MDA7 enabling DDS design and development
MDA7 is a preclinical lead. The doses selected to be tested in rats in pre-clinical studies
ranged from 5 mg/Kg to 30 mg/Kg. However, the age of the animal and the
corresponding weight varied in the different studies. According to our own experience,
the volume administered i.v., i.p., oral, to rats should be lower than 1.66 mL/Kg (e.g.
250μL for 150g rat) of the animal to prevent any animal discomfort. Ideally, the dosing
formulation should afford concentration of MDA7 up to 18 mg/mL. Since MDA7 solubility
was lower than 1% (w/w) or <10 mg/ml in water, it was necessary to further evaluate
Table 12: MDA7 chemical stability in various excipients/solvents stored at 25°C
determined by TLC.
Solvents/Excipients INCI Name MDA7 stability
t 24H t 1 week t 3 months
Ethanol (EtOH) Stable Stable Stable
Dimethylsulfoxide (DMSO) Stable Stable ND
N-Methyl-2-pyrrolidone (NMP) Stable Stable Stable
PEG-8 capric/caprylic triglycerides
(Labrasol®)Stable ND ND
Macrogol 15-hydroxystearate (Solutol® HS
15)
Unstable (2
spots)ND ND
ND, not done
- 98 - | P a g e
solubility in pharmaceutical excipients and vehicles22 to design a suitable formulation for
in vivo testing.
2.4.2.1 i.v./ i.p. cosolvents-surfactant micelles solution.
2.4.2.1.1 Design and development.
According to the results shown in Table 11, the cosolvents approach was seemingly
promising since about approximately 10% (w/w) or 166 mg/Kg (e.g. 250μL for 150g rat)
of the major excipient, NMP or DMSO, would allow solubilizing 18 mg/mL of MDA7, with
EtOH possibly used as a cosolvent. This dose of excipient (i.e. NMP or DMSO) is
acceptable in term of tolerability (see Table 13). Indeed 166 mg/Kg of NMP represents
15-fold safety factor compared to its LD50 reported to be of 2.4 g/Kg, and more than 30-
fold safety factor for DMSO compared to its LD50 of 5.2 g/Kg. Animals tolerate single
administration of high concentration of cosolvents but it is recommended to keep this
concentration lower than 60% (w/w) in the dosing solution160.
Should we have to increase the dose of MDA7 to support toxicological studies and
subsequently the solubilizing agent, we didn’t select DMSO first since a solution of higher
than 15% (w/v) DMSO injected to rats in a volume of 5 mL/kg showed behavior or
neurotoxical effects161 and putative analgesic properties162. NMP was selected as the
main excipient based on the good solubility of MDA7. PEG400 and PG were used as
cosolvent to decrease a potential toxic effect induced by NMP.
Addition of surfactants and cosurfactant was then evaluated for the use in the
cosolvent(s) formulation in order to form micelles resulting in a decrease of potential in
vivo drug precipitation. The in vitro static serial dilution method described by Ping Li et
al.22 was used as a guiding tool for the screening process and select DDS showing the
best potential to prevent drug crystallization. The rate and extent of NCE precipitation
can vary, both of which are important indicators in predicting potential drug precipitation
in vivo upon injection. If the precipitation is not to occur within a short time period (e.g. a
few minutes), the formulation is considered less likely to precipitate in vivo due to rapid
physiological dilution by blood flow.
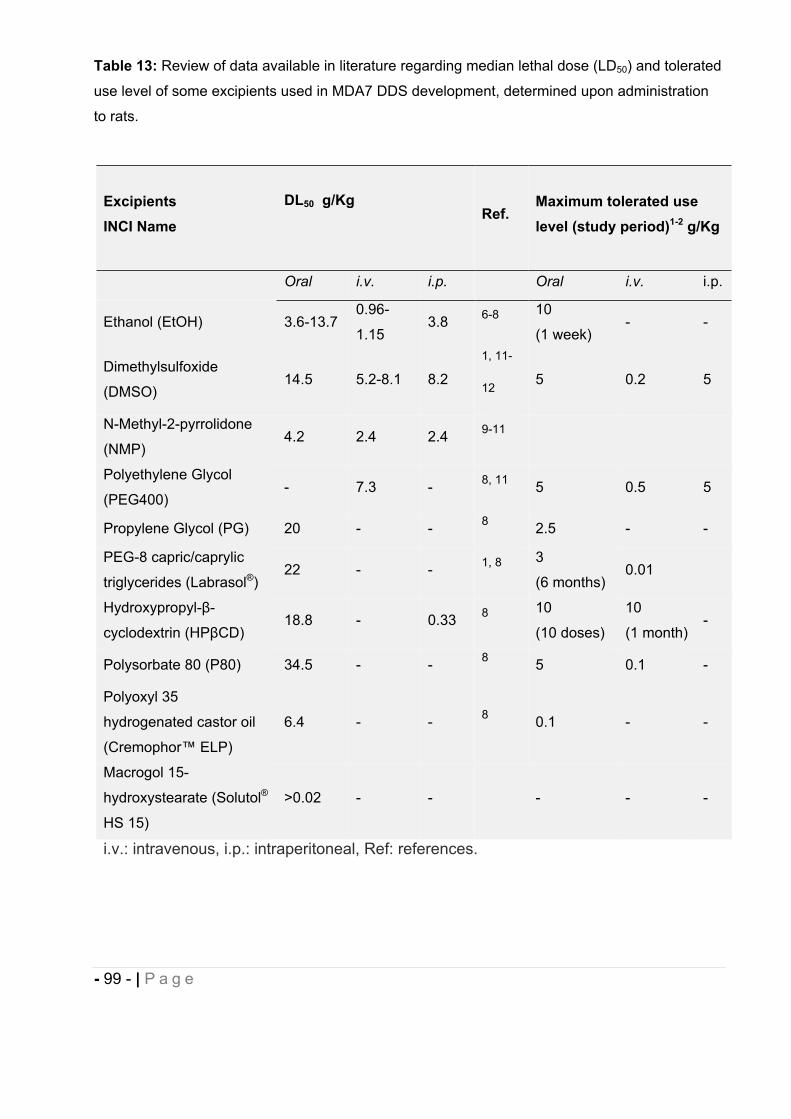
- 99 - | P a g e
Table 13: Review of data available in literature regarding median lethal dose (LD50) and tolerated
use level of some excipients used in MDA7 DDS development, determined upon administration
to rats.
ExcipientsINCI Name
DL50 g/KgRef.
Maximum tolerated use level (study period)1-2 g/Kg
Oral i.v. i.p. Oral i.v. i.p.
Ethanol (EtOH) 3.6-13.70.96-
1.153.8 6-8 10
(1 week)- -
Dimethylsulfoxide
(DMSO)14.5 5.2-8.1 8.2
1, 11-
12 5 0.2 5
N-Methyl-2-pyrrolidone
(NMP)4.2 2.4 2.4 9-11
Polyethylene Glycol
(PEG400)- 7.3 - 8, 11 5 0.5 5
Propylene Glycol (PG) 20 - - 8 2.5 - -
PEG-8 capric/caprylic
triglycerides (Labrasol®)22 - - 1, 8 3
(6 months)0.01
Hydroxypropyl- -
cyclodextrin (HP CD)18.8 - 0.33 8 10
(10 doses)
10
(1 month)-
Polysorbate 80 (P80) 34.5 - - 8 5 0.1 -
Polyoxyl 35
hydrogenated castor oil
(Cremophor™ ELP)
6.4 - - 8 0.1 - -
Macrogol 15-
hydroxystearate (Solutol®
HS 15)
>0.02 - - - - -
i.v.: intravenous, i.p.: intraperitoneal, Ref: references.
- 100 - | P a g e
Li et al. had compared the in vitro static serial dilution with other in vitro precipitation
methods (i.e. dynamic injection method, dropwise addition method) and it is the most
effective in quantifying the amount of precipitation and more descriptive of the formation
and dissolution of the precipitate methods163.
To begin the DDS design, we arbitrary fixed the maximum concentration of the major
solubilizing agent to 40% w/w or 400 mg/mL for safety concern. This amount of NMP
enabled to solubilize MDA7 in concentration up to 11.3 mg/mL but as expected with a
lipophilic compound, even a concentration of MDA7 at 6 mg/mL triggered a massive
crystallization upon dilution with Phosphate Buffer Saline (PBS) (entries A, B in Table
14). Nevertheless NMP was the best solubilizing agent and this system was identified for
further testing with surfactants. Use of surfactant can induce formation of micelles
containing MDA7 solubilized in the excipients resulting in increased water solubility. P80
one of the most commonly used surfactant for parenteral pharmaceuticals (Table 7), was
the first evaluated (entries C, D, E in Table 14) in the above system but concentration up
to 100 mg/mL did not prevent MDA7 crystallization. A cosolvent, PEG400 was then
added for potential synergistic interactions with NMP to increase drug solubility and
decrease excipient-related toxicity. Amount of cosolvents (NMP/PEG400) was then
increased to 60% (w/w) or 600 mg/mL, affording solubilization up to 25 mg/mL of MDA7
(entries G, H in Table 14). No precipitation of the drug was observed (microscopic
observation: no crystal) in DDS containing P80 but the solution was opalescent due to a
poor cosolvents miscibility (the vehicle was opalescent even without MDA7 incorporated:
data not shown). We then evaluated, another widely used surfactant (Table 7),
Cremophor™ ELP (CrELP) since it had a better solubilization capacity with a lower CMC
value (0.032mM) compared to P80 (0.05mM)164 (entry I Table 14). Only slight
improvement was observed about keeping MDA7 into solution. PG was then evaluated
as a cosolvent, even though it showed a poor solubilizing capacity as a pure excipient, it
had a better miscibility with NMP. The system NMP/PG/CrELP (25%/25%/10% w/w) led
to a transparent solution physically stable (t=48h), longer than over the study period (i.e.
few hours), with MDA7 being “less likely to precipitate” according to in vitro testing for
drug precipitation (entry J in Table 14). Increasing MDA7 dose in the previous DDS
(entries K, L in Table 14) provided limited physical stability with crystallization occurring
1h and 3h after preparation. MDA7 showed a good solubility in pure EtOH. However,
EtOH cannot be used at high concentration because of toxicity and potential neurological
- 101 - | P a g e
effects. EtOH was evaluated as a cosolvent/cosurfactant on the MDA7 solubilization and
stabilization in the DDS developed (NMP/PG/CrELP/EtOH: 25%/25%/10%/10% w/w).
EtOH is considered as a cosurfactant since it can intercalate in between the surfactant
hydrophilic moieties at the surface of the micelles. EtOH afforded a clear solution
containing MDA7 at concentration of 18 mg/mL (entry M in Table 14) physically stable for
more than 1 month (microscopic observation: no crystal), “unlikely to precipitate” upon
administration to animals according to in vitro serial dilution results. After >10 rounds of
testing using different cosolvents, surfactants, and different concentrations, the final
composition (entry N in Table 14), in the formulation selected for in vivo studies (i.e.
pharmacological and PK, see section 2.5) was 30% NMP+ 30%PG + 10% CrELP + 10%
EtOH in quantum satis (QS) 100% PBS (w/w). This vehicle allows MDA7 to be
administered at doses up to 30 mg/Kg (e.g. 250μL for 150g rat) that did not precipitate
upon mixing with PBS containing 1% (w/v) Bovine Serum Albumin (BSA), the buffer
mimicking blood physiological dilution in the in vitro serial dilution model. The pH of the
formulation is 7.4. The chemical stability of the final enabling DDS was determined by
LC-MS (Table 15) and by 1H-NMR (Table 16). MDA7 formulated in the former system is
physically (no crystallization, Table 14) and chemically (no degradation, Tables 15 and
16) stable stored at room temperature, for at least 1 month. Entries J and M in Table 14
were also compliant with the specifications since no crystallization of the drug in the
vehicle at least for 1H after preparation and in the in vitro serial dilution testing, was
observed. However, we decided to select one versatile DDS enabling the administration
of a series of structurally diverse synthetic cannabinoids (i.e. MDA19165, MDA42
Compound 19 in166 in vivo to obviate any “vehicle effect”. Indeed, animal systemic
exposure can be erratically affected by the solvents and DDS used167 and can pose
significant problems for the liquid chromatography/tandem mass spectrometric
(LC/MS/MS) analysis of incurred samples168.
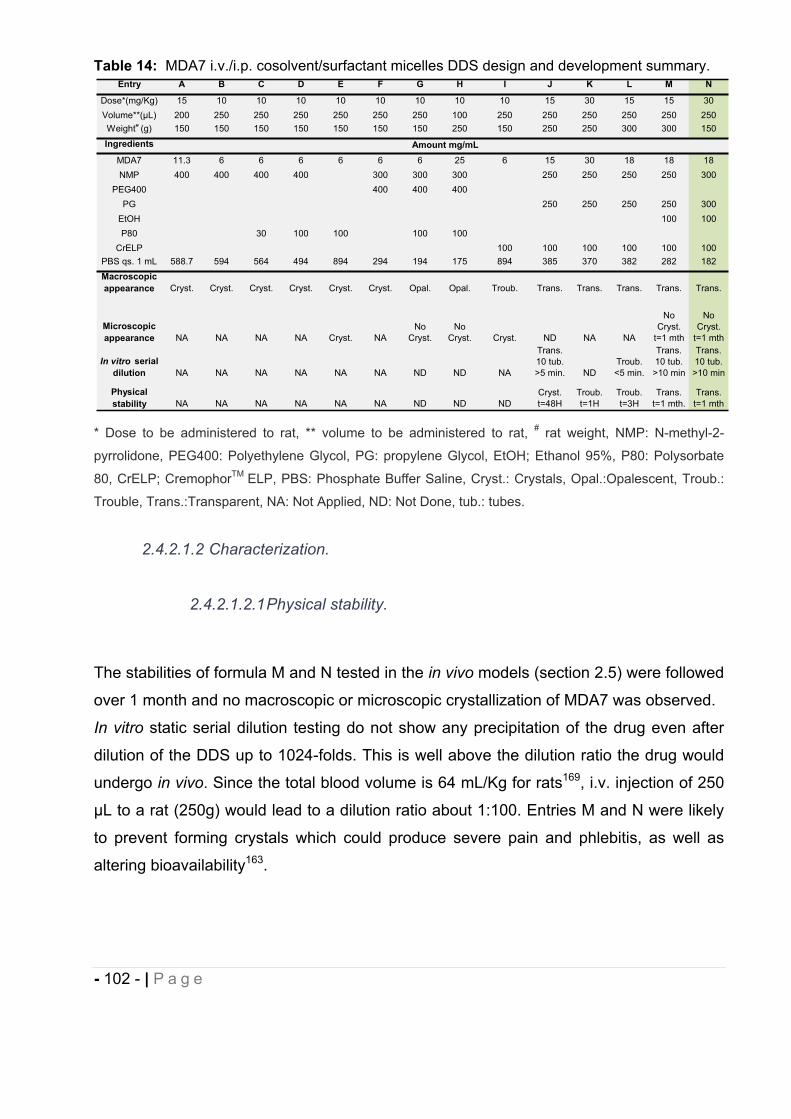
- 102 - | P a g e
Table 14: MDA7 i.v./i.p. cosolvent/surfactant micelles DDS design and development summary.
* Dose to be administered to rat, ** volume to be administered to rat, # rat weight, NMP: N-methyl-2-
pyrrolidone, PEG400: Polyethylene Glycol, PG: propylene Glycol, EtOH; Ethanol 95%, P80: Polysorbate
80, CrELP; CremophorTM ELP, PBS: Phosphate Buffer Saline, Cryst.: Crystals, Opal.:Opalescent, Troub.:
Trouble, Trans.:Transparent, NA: Not Applied, ND: Not Done, tub.: tubes.
2.4.2.1.2 Characterization.
2.4.2.1.2.1 Physical stability.
The stabilities of formula M and N tested in the in vivo models (section 2.5) were followed
over 1 month and no macroscopic or microscopic crystallization of MDA7 was observed.
In vitro static serial dilution testing do not show any precipitation of the drug even after
dilution of the DDS up to 1024-folds. This is well above the dilution ratio the drug would
undergo in vivo. Since the total blood volume is 64 mL/Kg for rats169, i.v. injection of 250
μL to a rat (250g) would lead to a dilution ratio about 1:100. Entries M and N were likely
to prevent forming crystals which could produce severe pain and phlebitis, as well as
altering bioavailability163.
Entry A B C D E F G H I J K L M N
Dose*(mg/Kg) 15 10 10 10 10 10 10 10 10 15 30 15 15 30Volume**(μL) 200 250 250 250 250 250 250 100 250 250 250 250 250 250Weight# (g) 150 150 150 150 150 150 150 250 150 250 250 300 300 150
Ingredients
MDA7 11.3 6 6 6 6 6 6 25 6 15 30 18 18 18NMP 400 400 400 400 300 300 300 250 250 250 250 300
PEG400 400 400 400PG 250 250 250 250 300
EtOH 100 100P80 30 100 100 100 100
CrELP 100 100 100 100 100 100PBS qs. 1 mL 588.7 594 564 494 894 294 194 175 894 385 370 382 282 182Macroscopic appearance Cryst. Cryst. Cryst. Cryst. Cryst. Cryst. Opal. Opal. Troub. Trans. Trans. Trans. Trans. Trans.
In vitro serial dilution NA NA NA NA NA NA ND ND NA
Trans. 10 tub. >5 min. ND
Troub. <5 min.
Trans. 10 tub. >10 min
Trans. 10 tub. >10 min
NoCryst.
t=1 mth
No Cryst.
t=1 mth
Amount mg/mL
Microscopic appearance NA NA NA NA Cryst. NA
No Cryst.
NoCryst.
NA
Cryst. ND NA NA
Physical stability NA NA NA NA
Troub. t=3H
Trans. t=1 mth.
Trans. t=1 mthNA ND ND ND
Cryst. t=48H
Troub. t=1H
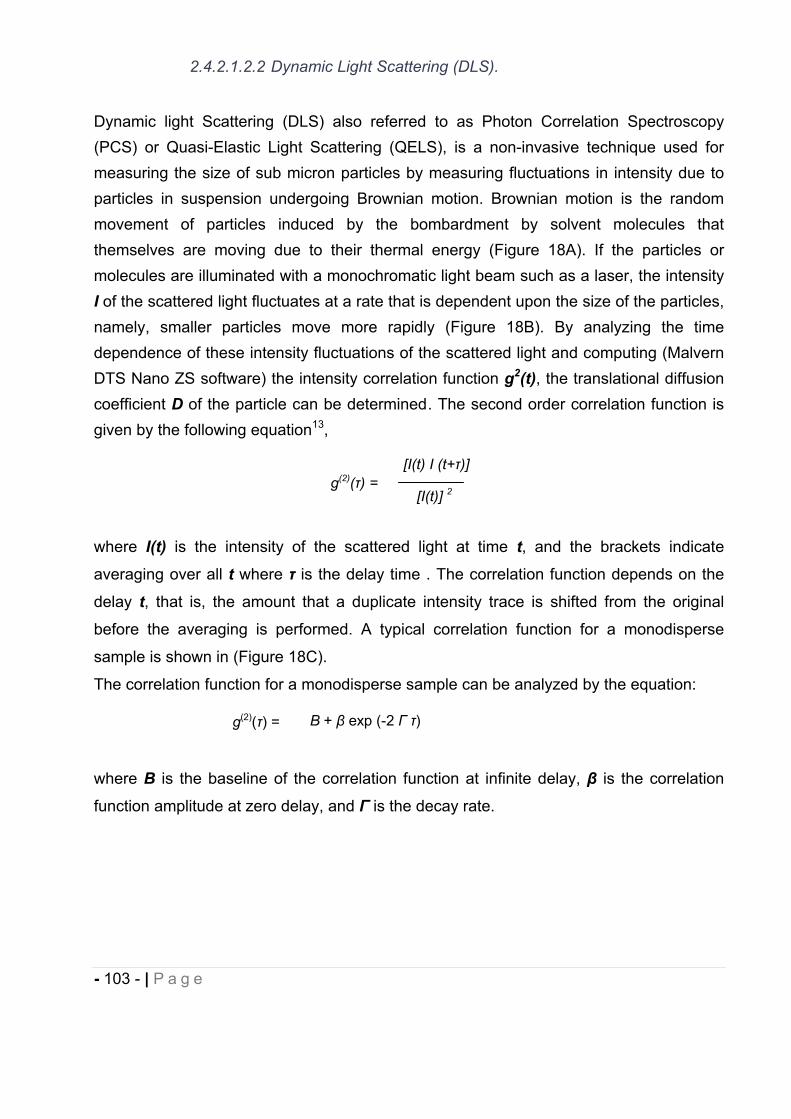
- 103 - | P a g e
2.4.2.1.2.2 Dynamic Light Scattering (DLS).
Dynamic light Scattering (DLS) also referred to as Photon Correlation Spectroscopy (PCS) or Quasi-Elastic Light Scattering (QELS), is a non-invasive technique used for measuring the size of sub micron particles by measuring fluctuations in intensity due to particles in suspension undergoing Brownian motion. Brownian motion is the random movement of particles induced by the bombardment by solvent molecules that themselves are moving due to their thermal energy (Figure 18A). If the particles or molecules are illuminated with a monochromatic light beam such as a laser, the intensity I of the scattered light fluctuates at a rate that is dependent upon the size of the particles, namely, smaller particles move more rapidly (Figure 18B). By analyzing the time dependence of these intensity fluctuations of the scattered light and computing (Malvern DTS Nano ZS software) the intensity correlation function g2(t), the translational diffusion coefficient D of the particle can be determined. The second order correlation function is given by the following equation13,
where I(t) is the intensity of the scattered light at time t, and the brackets indicate
averaging over all t where is the delay time . The correlation function depends on the
delay t, that is, the amount that a duplicate intensity trace is shifted from the original
before the averaging is performed. A typical correlation function for a monodisperse
sample is shown in (Figure 18C).
The correlation function for a monodisperse sample can be analyzed by the equation:
where B is the baseline of the correlation function at infinite delay, is the correlation
function amplitude at zero delay, and is the decay rate.
g(2)( ) = + exp (-2 )
g(2)( ) = [I(t) I (t+ )]
[I(t)] 2
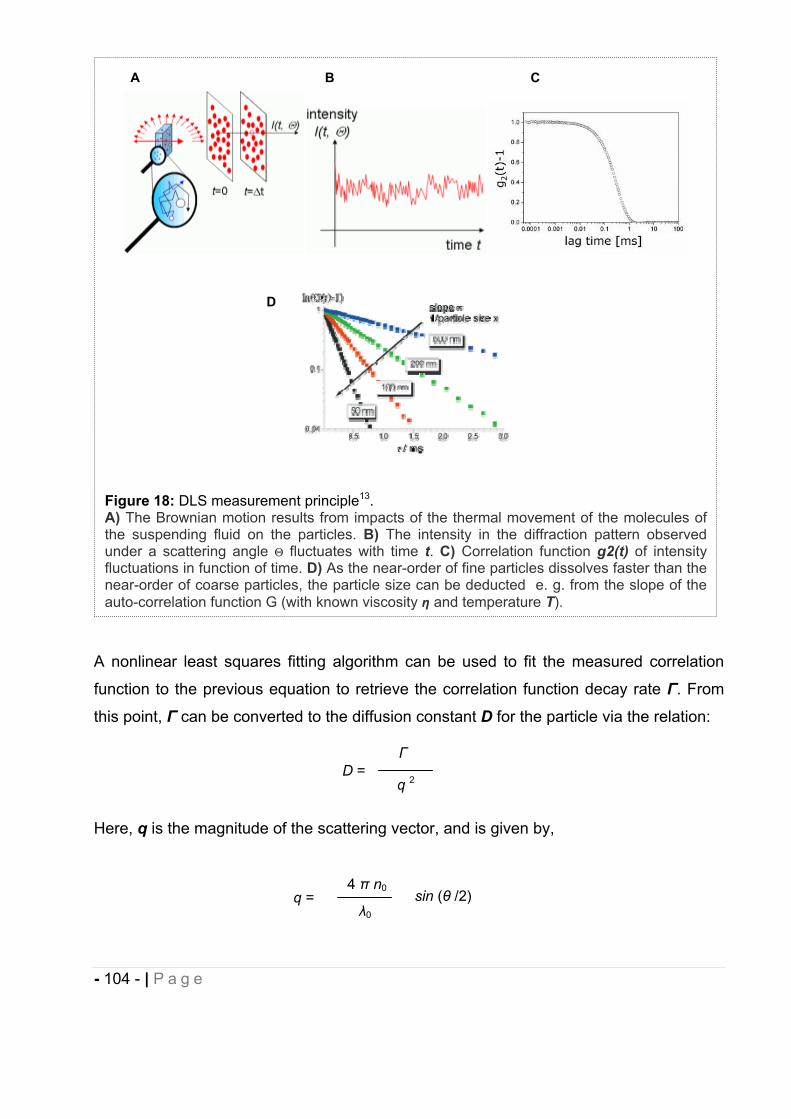
- 104 - | P a g e
A nonlinear least squares fitting algorithm can be used to fit the measured correlation
function to the previous equation to retrieve the correlation function decay rate . From
this point, can be converted to the diffusion constant D for the particle via the relation:
Here, q is the magnitude of the scattering vector, and is given by,
D = q 2
Figure 18: DLS measurement principle13.A) The Brownian motion results from impacts of the thermal movement of the molecules of the suspending fluid on the particles. B) The intensity in the diffraction pattern observed under a scattering angle fluctuates with time t. C) Correlation function g2(t) of intensity fluctuations in function of time. D) As the near-order of fine particles dissolves faster than the near-order of coarse particles, the particle size can be deducted e. g. from the slope of the auto-correlation function G (with known viscosity and temperature T).
A B C
q = 4 n0
0
sin ( /2)
D
- 105 - | P a g e
where n0 is the solvent index of refraction, 0 is the vacuum laser wavelength of the
incident light, and is the scattering angle.
The diffusion coefficient D is then related to the hydrodynamic radius R for a spherical
particle by means of the Stokes-Einstein equation in (Figure 18D).
where R is the hydrodynamic diameter, D is the translational diffusion coefficient, K is
Boltzmann’s constant, T is thermodynamic temperature, is dynamic viscosity.
An accurately known and constant temperature is necessary since knowledge of the
viscosity of the suspending fluid for the estimation of the average particle size and its
distribution function (and for volume fractions the refractive index n) is required. For a
given particle the lower the solvent viscosity (or the temperature higher), the greater the
Brownian motion will be.
PCS yields the mean diameter of the bulk population (z-average, measuring range: 3 nm
– 10 m) and a polydispersity index (PDI) as measure for the width of the size
distribution. The PI ranges from zero (monodisperse particles) to 0.5 (broad distribution),
values above 0.5 do not allow allocation of a logarithmic normal distribution to the PI.
The average mean diameter of the micelles bulk population formed in the
cosolvents/surfactant DDS entry N in Table 14 was assessed using a Malvern Nano ZS.
Monodisperse micelles exhibited an average size of 15 nm (PDI 0.11).
2.4.2.1.2.3 MDA7 chemical stability by 1H-NMR
Lin et al.170 have described a simple and reliable 1H-NMR-based method for determining
a suitable formulation (i.e. drug solubility, stability) for discovery compounds in support of
early in vivo studies. NMR is a powerful technique for solution sample analysis. It
provides detailed information of each component in the solution and can also be used for
quantitative analysis. Quantitation can be carried out using an external standard without
a calibration curve, which makes using NMR for quantitation convenient and provides a
time saving over the HPLC-UV method. In this study, Maleic Acid (MA) was used as the
D = k T
6 R
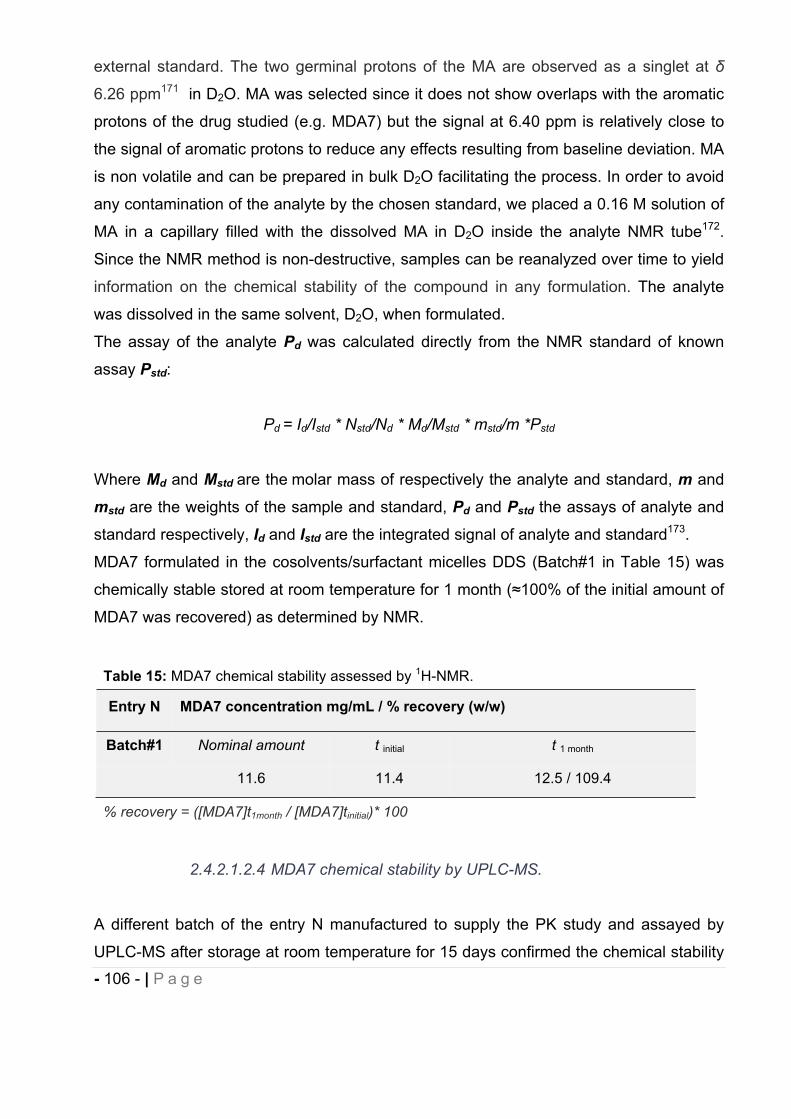
- 106 - | P a g e
external standard. The two germinal protons of the MA are observed as a singlet at
6.26 ppm171 in D2O. MA was selected since it does not show overlaps with the aromatic
protons of the drug studied (e.g. MDA7) but the signal at 6.40 ppm is relatively close to
the signal of aromatic protons to reduce any effects resulting from baseline deviation. MA
is non volatile and can be prepared in bulk D2O facilitating the process. In order to avoid
any contamination of the analyte by the chosen standard, we placed a 0.16 M solution of
MA in a capillary filled with the dissolved MA in D2O inside the analyte NMR tube172.
Since the NMR method is non-destructive, samples can be reanalyzed over time to yield
information on the chemical stability of the compound in any formulation. The analyte
was dissolved in the same solvent, D2O, when formulated.
The assay of the analyte Pd was calculated directly from the NMR standard of known
assay Pstd:
Pd = Id/Istd * Nstd/Nd * Md/Mstd * mstd/m *Pstd
Where Md and Mstd are the molar mass of respectively the analyte and standard, m and
mstd are the weights of the sample and standard, Pd and Pstd the assays of analyte and
standard respectively, Id and Istd are the integrated signal of analyte and standard173.
MDA7 formulated in the cosolvents/surfactant micelles DDS (Batch#1 in Table 15) was
chemically stable stored at room temperature for 1 month ( 100% of the initial amount of
MDA7 was recovered) as determined by NMR.
2.4.2.1.2.4 MDA7 chemical stability by UPLC-MS.
A different batch of the entry N manufactured to supply the PK study and assayed by
UPLC-MS after storage at room temperature for 15 days confirmed the chemical stability
Table 15: MDA7 chemical stability assessed by 1H-NMR.
Entry N MDA7 concentration mg/mL / % recovery (w/w)
Batch#1 Nominal amount t initial t 1 month
11.6 11.4 12.5 / 109.4
% recovery = ([MDA7]t1month / [MDA7]tinitial)* 100
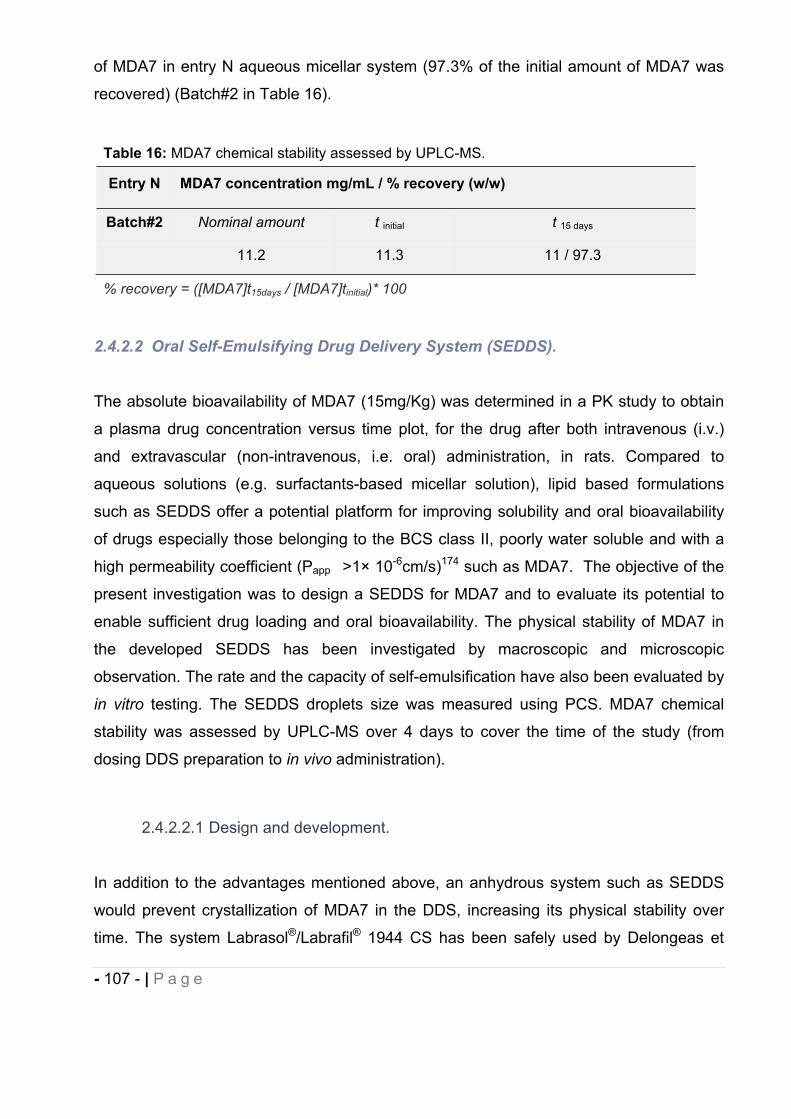
- 107 - | P a g e
of MDA7 in entry N aqueous micellar system (97.3% of the initial amount of MDA7 was
recovered) (Batch#2 in Table 16).
2.4.2.2 Oral Self-Emulsifying Drug Delivery System (SEDDS).
The absolute bioavailability of MDA7 (15mg/Kg) was determined in a PK study to obtain
a plasma drug concentration versus time plot, for the drug after both intravenous (i.v.)
and extravascular (non-intravenous, i.e. oral) administration, in rats. Compared to
aqueous solutions (e.g. surfactants-based micellar solution), lipid based formulations
such as SEDDS offer a potential platform for improving solubility and oral bioavailability
of drugs especially those belonging to the BCS class II, poorly water soluble and with a
high permeability coefficient (Papp >1× 10⁻⁶cm/s)174 such as MDA7. The objective of the
present investigation was to design a SEDDS for MDA7 and to evaluate its potential to
enable sufficient drug loading and oral bioavailability. The physical stability of MDA7 in
the developed SEDDS has been investigated by macroscopic and microscopic
observation. The rate and the capacity of self-emulsification have also been evaluated by
in vitro testing. The SEDDS droplets size was measured using PCS. MDA7 chemical
stability was assessed by UPLC-MS over 4 days to cover the time of the study (from
dosing DDS preparation to in vivo administration).
2.4.2.2.1 Design and development.
In addition to the advantages mentioned above, an anhydrous system such as SEDDS
would prevent crystallization of MDA7 in the DDS, increasing its physical stability over
time. The system Labrasol®/Labrafil® 1944 CS has been safely used by Delongeas et
Table 16: MDA7 chemical stability assessed by UPLC-MS.
Entry N MDA7 concentration mg/mL / % recovery (w/w)
Batch#2 Nominal amount t initial t 15 days
11.2 11.3 11 / 97.3
% recovery = ([MDA7]t15days / [MDA7]tinitial)* 100
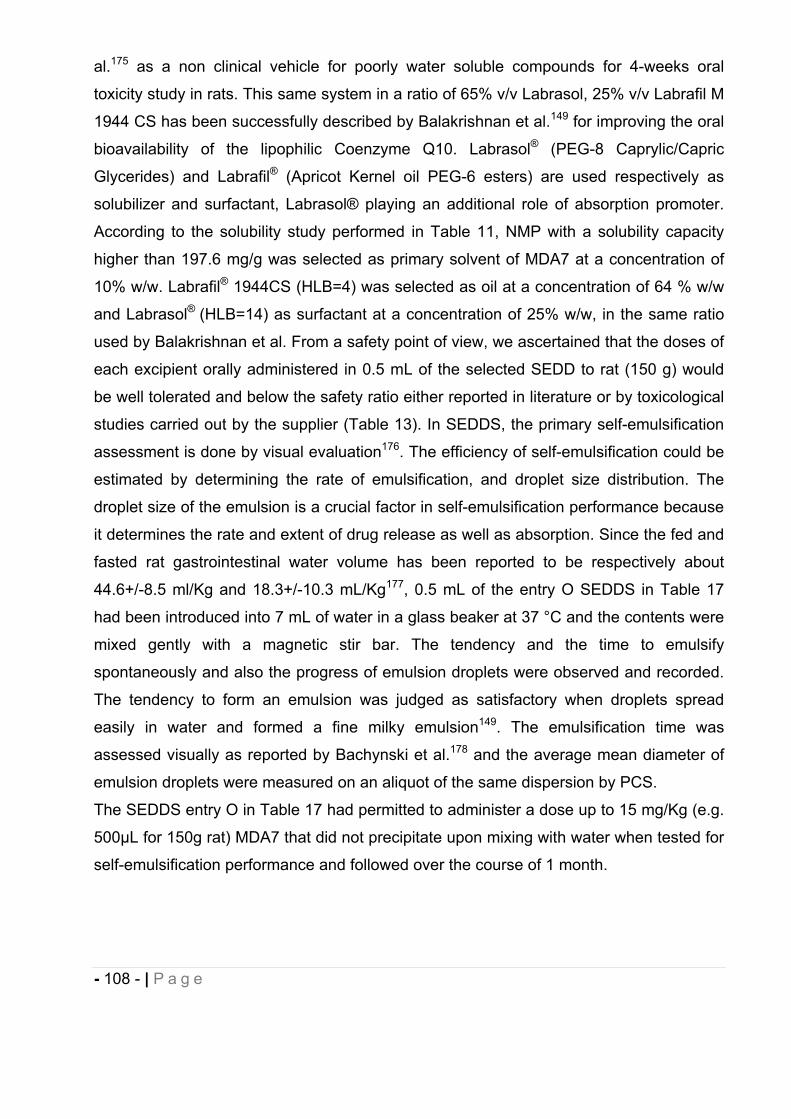
- 108 - | P a g e
al.175 as a non clinical vehicle for poorly water soluble compounds for 4-weeks oral
toxicity study in rats. This same system in a ratio of 65% v/v Labrasol, 25% v/v Labrafil M
1944 CS has been successfully described by Balakrishnan et al.149 for improving the oral
bioavailability of the lipophilic Coenzyme Q10. Labrasol® (PEG-8 Caprylic/Capric
Glycerides) and Labrafil® (Apricot Kernel oil PEG-6 esters) are used respectively as
solubilizer and surfactant, Labrasol® playing an additional role of absorption promoter.
According to the solubility study performed in Table 11, NMP with a solubility capacity
higher than 197.6 mg/g was selected as primary solvent of MDA7 at a concentration of
10% w/w. Labrafil® 1944CS (HLB=4) was selected as oil at a concentration of 64 % w/w
and Labrasol® (HLB=14) as surfactant at a concentration of 25% w/w, in the same ratio
used by Balakrishnan et al. From a safety point of view, we ascertained that the doses of
each excipient orally administered in 0.5 mL of the selected SEDD to rat (150 g) would
be well tolerated and below the safety ratio either reported in literature or by toxicological
studies carried out by the supplier (Table 13). In SEDDS, the primary self-emulsification
assessment is done by visual evaluation176. The efficiency of self-emulsification could be
estimated by determining the rate of emulsification, and droplet size distribution. The
droplet size of the emulsion is a crucial factor in self-emulsification performance because
it determines the rate and extent of drug release as well as absorption. Since the fed and
fasted rat gastrointestinal water volume has been reported to be respectively about
44.6+/-8.5 ml/Kg and 18.3+/-10.3 mL/Kg177, 0.5 mL of the entry O SEDDS in Table 17
had been introduced into 7 mL of water in a glass beaker at 37 °C and the contents were
mixed gently with a magnetic stir bar. The tendency and the time to emulsify
spontaneously and also the progress of emulsion droplets were observed and recorded.
The tendency to form an emulsion was judged as satisfactory when droplets spread
easily in water and formed a fine milky emulsion149. The emulsification time was
assessed visually as reported by Bachynski et al.178 and the average mean diameter of
emulsion droplets were measured on an aliquot of the same dispersion by PCS.
The SEDDS entry O in Table 17 had permitted to administer a dose up to 15 mg/Kg (e.g.
500μL for 150g rat) MDA7 that did not precipitate upon mixing with water when tested for
self-emulsification performance and followed over the course of 1 month.
- 109 - | P a g e
2.4.2.2.2 Characterization.
2.4.2.2.2.1 Physical stability.
As shown in Table 17 the physical stability of the enabling SEDDS entry O tested in in
vivo (see section 2.5) was followed over 1 month at room temperature and no
macroscopic or microscopic crystallization of MDA7 was observed. The results in the in
vitro self-emulsification testing didn’t show any precipitation of the drug nor emulsion
droplets coalescence when subjected to aqueous dilution ratio mimicking the in vivo
dilution undergone by MDA7 in GI juice (fed) after oral administration to rat. The
emulsification time study showed that the formulation used in the PK study could
spontaneously emulsify in time lower than 20 s. in aqueous environment which is in
accordance with previous results reported by several authors149, 179-180 which have used
Table 17: MDA7 oral Self-Emulsifying Drug Delivery System.
Entry O
Dose*(mg/Kg) 15Volume**(μL) 500Rat Weight# (g) 150
Ingredients (mg/mL)Doseadministered(mg/Kg)
Safety ratio
MDA7 4.5 15 ND
NMP 100 333 LD50 4.2 G/KG9-11
Labrasol® 250 833NOAEL 3.0 G/KG/DAY
(TOX AND SAFETY OVERVIEWGATTEFOSSE)
Labrafil 1944® CS 645.5 (650.0 in placebo) 2166 LD0>20ML/KG (TOX AND SAFETY
OVERVIEW GATTEFOSSE)
Macroscopic appearance
Transparent viscous solution
Microscopic appearance No crystal
Self emulsification Spontaneousand immediate
Physical stability Transparent t=1month
- 110 - | P a g e
SEDDS. In the process of spontaneous emulsification, surfactants form a layer around
the emulsion droplets and reduce the interfacial energy as well as providing a
mechanical barrier to coalescence179. The referred SEDDS didn’t show any demixion nor
crystallization of MDA7 when stored at room temperature and observed macroscopically
over 1 month.
2.4.2.2.2.2 DLS
The average mean diameter of the emulsion droplets formed in the SEDDS entry O was
assessed using a Malvern Nano ZS. Since the SEDDS droplets distribution was
polydisperse (PDI>0.5) the instrument was not able to give reliable Z-average value by
the method of Cumulants. However, the Nano ZS is routinely used to describe individual
peaks in particle size distributions derived from multi-modal correlogram fitting algorithms
such as CONTIN and NNLS (non negative least squares)181. As verified by the
distribution results derived from the NNLS analysis of the correlogram, the sample is
composed of a mixture of approximately 260 nm and 30 nm size droplets representing
respectively around 93% and 7% of the total droplets distribution, with low dispersity for
both droplets families (PDI<0.02). SEDDS typically produce emulsions with a droplet size
between 100 and 300 nm146. The droplet size of the emulsion is a crucial factor in self-
emulsification performance because it determines the rate and extent of drug release
and absorption146, 182-183. For example in the two formulations containing the
immunosuppressive agent Cyclosporine A, Neoral® was shown to elicit increased
bioavailability compared to Sandimmune®184. The more efficient SEDDS, Neoral® is
characterized by droplets size ranging from 100 nm to 250 nm whereas Sandimmune®
have droplets ranging from few nanometers to several micrometers185. Our results
indicate the ability of the SEDDS developed to produce a nanoemulsion (droplets size
<300 nm) that offers larger interfacial surface area required for drug absorption146, 148-149.
2.4.2.2.2.3 MDA7 chemical stability by UPLC-MS.
MDA7 chemical stability was investigated on two batches (see Table 18) of entry P.
Batch#1 was manufactured to generate preliminary stability results and Batch#2 was
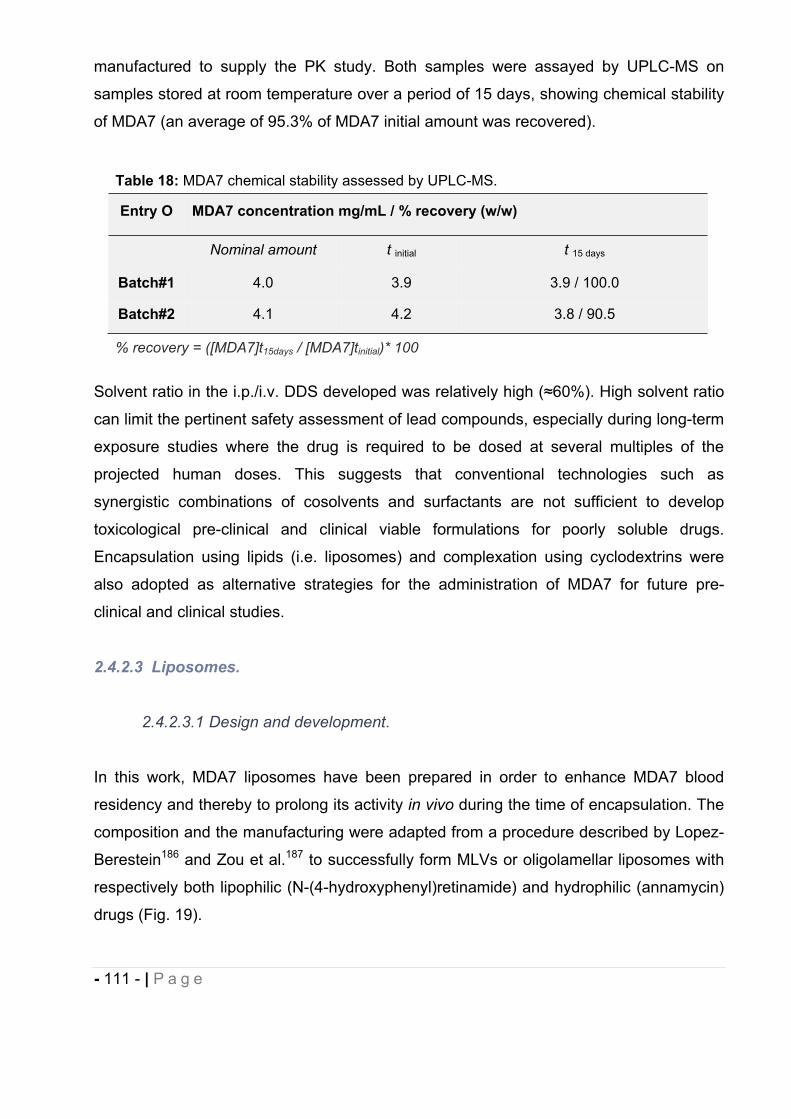
- 111 - | P a g e
manufactured to supply the PK study. Both samples were assayed by UPLC-MS on
samples stored at room temperature over a period of 15 days, showing chemical stability
of MDA7 (an average of 95.3% of MDA7 initial amount was recovered).
Solvent ratio in the i.p./i.v. DDS developed was relatively high ( 60%). High solvent ratio
can limit the pertinent safety assessment of lead compounds, especially during long-term
exposure studies where the drug is required to be dosed at several multiples of the
projected human doses. This suggests that conventional technologies such as
synergistic combinations of cosolvents and surfactants are not sufficient to develop
toxicological pre-clinical and clinical viable formulations for poorly soluble drugs.
Encapsulation using lipids (i.e. liposomes) and complexation using cyclodextrins were
also adopted as alternative strategies for the administration of MDA7 for future pre-
clinical and clinical studies.
2.4.2.3 Liposomes.
2.4.2.3.1 Design and development.
In this work, MDA7 liposomes have been prepared in order to enhance MDA7 blood
residency and thereby to prolong its activity in vivo during the time of encapsulation. The
composition and the manufacturing were adapted from a procedure described by Lopez-
Berestein186 and Zou et al.187 to successfully form MLVs or oligolamellar liposomes with
respectively both lipophilic (N-(4-hydroxyphenyl)retinamide) and hydrophilic (annamycin)
drugs (Fig. 19).
Table 18: MDA7 chemical stability assessed by UPLC-MS.
Entry O MDA7 concentration mg/mL / % recovery (w/w)
Nominal amount t initial t 15 days
Batch#1 4.0 3.9 3.9 / 100.0
Batch#2 4.1 4.2 3.8 / 90.5
% recovery = ([MDA7]t15days / [MDA7]tinitial)* 100
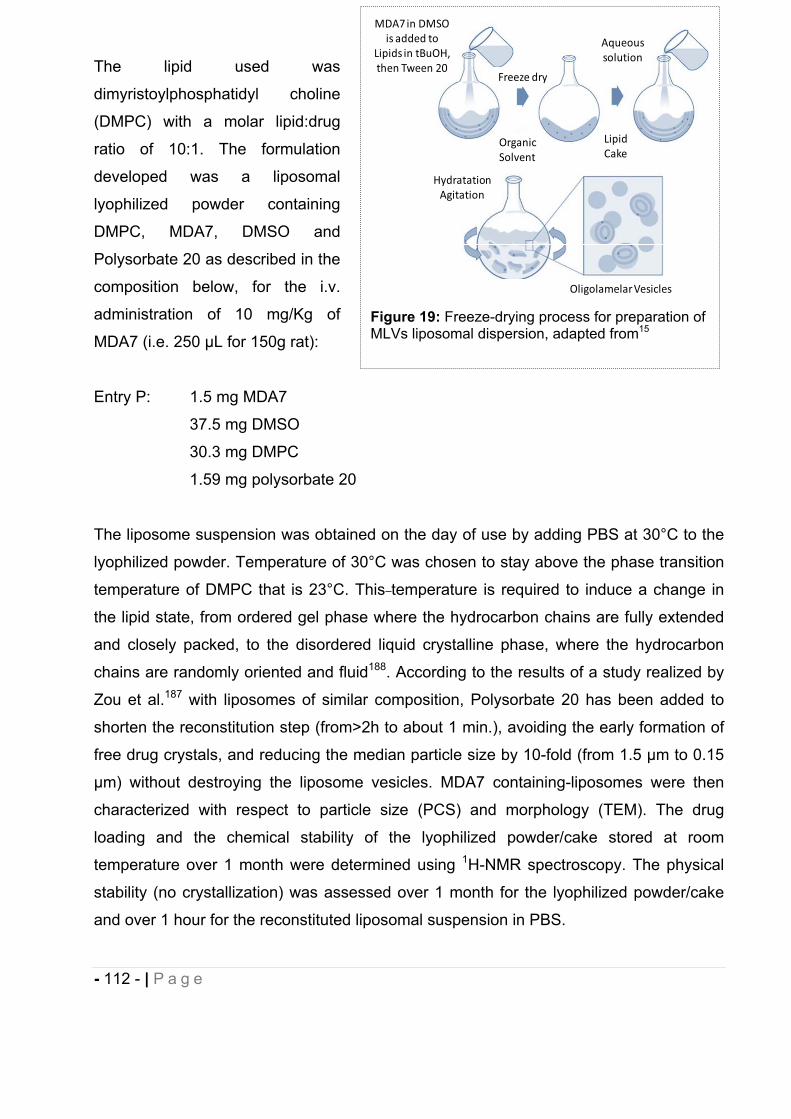
- 112 - | P a g e
The lipid used was
dimyristoylphosphatidyl choline
(DMPC) with a molar lipid:drug
ratio of 10:1. The formulation
developed was a liposomal
lyophilized powder containing
DMPC, MDA7, DMSO and
Polysorbate 20 as described in the
composition below, for the i.v.
administration of 10 mg/Kg of
MDA7 (i.e. 250 μL for 150g rat):
Entry P: 1.5 mg MDA7
37.5 mg DMSO
30.3 mg DMPC
1.59 mg polysorbate 20
The liposome suspension was obtained on the day of use by adding PBS at 30°C to the
lyophilized powder. Temperature of 30°C was chosen to stay above the phase transition
temperature of DMPC that is 23°C. This temperature is required to induce a change in
the lipid state, from ordered gel phase where the hydrocarbon chains are fully extended
and closely packed, to the disordered liquid crystalline phase, where the hydrocarbon
chains are randomly oriented and fluid188. According to the results of a study realized by
Zou et al.187 with liposomes of similar composition, Polysorbate 20 has been added to
shorten the reconstitution step (from>2h to about 1 min.), avoiding the early formation of
free drug crystals, and reducing the median particle size by 10-fold (from 1.5 μm to 0.15
μm) without destroying the liposome vesicles. MDA7 containing-liposomes were then
characterized with respect to particle size (PCS) and morphology (TEM). The drug
loading and the chemical stability of the lyophilized powder/cake stored at room
temperature over 1 month were determined using 1H-NMR spectroscopy. The physical
stability (no crystallization) was assessed over 1 month for the lyophilized powder/cake
and over 1 hour for the reconstituted liposomal suspension in PBS.
Figure 19: Freeze-drying process for preparation of MLVs liposomal dispersion, adapted from15
HydratationAgitation
OligolamelarVesicles
LipidCake
Aqueoussolution
Freeze dry
OrganicSolvent
MDA7in DMSOis added to
Lipids in tBuOH,then Tween 20
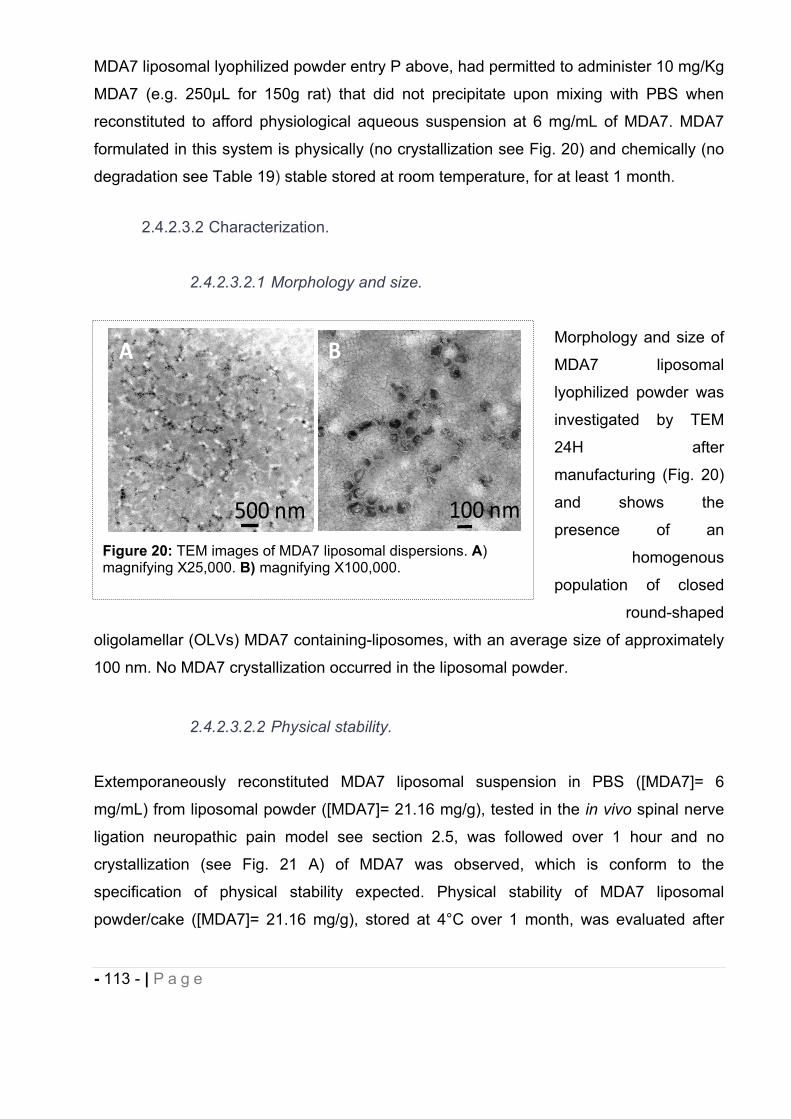
- 113 - | P a g e
MDA7 liposomal lyophilized powder entry P above, had permitted to administer 10 mg/Kg
MDA7 (e.g. 250μL for 150g rat) that did not precipitate upon mixing with PBS when
reconstituted to afford physiological aqueous suspension at 6 mg/mL of MDA7. MDA7
formulated in this system is physically (no crystallization see Fig. 20) and chemically (no
degradation see Table 19) stable stored at room temperature, for at least 1 month.
2.4.2.3.2 Characterization.
2.4.2.3.2.1 Morphology and size.
Morphology and size of
MDA7 liposomal
lyophilized powder was
investigated by TEM
24H after
manufacturing (Fig. 20)
and shows the
presence of an
homogenous
population of closed
round-shaped
oligolamellar (OLVs) MDA7 containing-liposomes, with an average size of approximately
100 nm. No MDA7 crystallization occurred in the liposomal powder.
2.4.2.3.2.2 Physical stability.
Extemporaneously reconstituted MDA7 liposomal suspension in PBS ([MDA7]= 6
mg/mL) from liposomal powder ([MDA7]= 21.16 mg/g), tested in the in vivo spinal nerve
ligation neuropathic pain model see section 2.5, was followed over 1 hour and no
crystallization (see Fig. 21 A) of MDA7 was observed, which is conform to the
specification of physical stability expected. Physical stability of MDA7 liposomal
powder/cake ([MDA7]= 21.16 mg/g), stored at 4°C over 1 month, was evaluated after
Figure 20: TEM images of MDA7 liposomal dispersions. A)magnifying X25,000. B) magnifying X100,000.
A B
100 nm500 nm
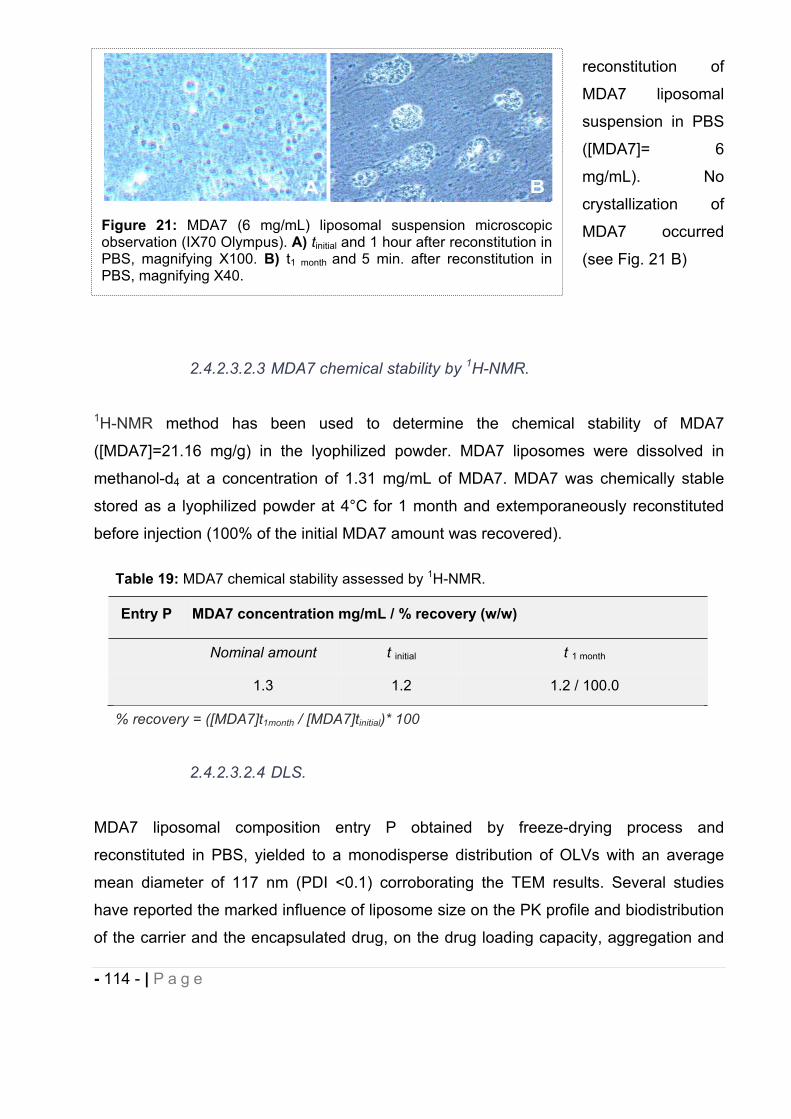
- 114 - | P a g e
reconstitution of
MDA7 liposomal
suspension in PBS
([MDA7]= 6
mg/mL). No
crystallization of
MDA7 occurred
(see Fig. 21 B)
2.4.2.3.2.3 MDA7 chemical stability by 1H-NMR.
1H-NMR method has been used to determine the chemical stability of MDA7
([MDA7]=21.16 mg/g) in the lyophilized powder. MDA7 liposomes were dissolved in
methanol-d4 at a concentration of 1.31 mg/mL of MDA7. MDA7 was chemically stable
stored as a lyophilized powder at 4°C for 1 month and extemporaneously reconstituted
before injection (100% of the initial MDA7 amount was recovered).
2.4.2.3.2.4 DLS.
MDA7 liposomal composition entry P obtained by freeze-drying process and
reconstituted in PBS, yielded to a monodisperse distribution of OLVs with an average
mean diameter of 117 nm (PDI <0.1) corroborating the TEM results. Several studies
have reported the marked influence of liposome size on the PK profile and biodistribution
of the carrier and the encapsulated drug, on the drug loading capacity, aggregation and
Table 19: MDA7 chemical stability assessed by 1H-NMR.
Entry P MDA7 concentration mg/mL / % recovery (w/w)
Nominal amount t initial t 1 month
1.3 1.2 1.2 / 100.0
% recovery = ([MDA7]t1month / [MDA7]tinitial)* 100
Figure 21: MDA7 (6 mg/mL) liposomal suspension microscopic observation (IX70 Olympus). A) tinitial and 1 hour after reconstitution in PBS, magnifying X100. B) t1 month and 5 min. after reconstitution in PBS, magnifying X40.
- 115 - | P a g e
sedimentation189-190 after i.v. administration. It is generally known that liposomes with a
size in the range of 100-200 nm show better physical stability and a longer circulating
time compared to smaller (e.g. 50 nm) or larger (e.g.>300nm) which respectively undergo
reduced interaction with plasma protein and higher recognition/uptake by macrophages
of the ReticuloEndothelial System (RES)189, 191. Studies examining i.v. injected liposomes
demonstrate a diameter of about 100 nm as the optimal size for accumulation because of
the enhanced permeability retention (EPR) found in tumor90, 190. In tumor tissue, the
vasculature is discontinuous, and pore sizes vary from 100 to 780 nm. By comparison
pore size in normal vascular endothelium is <2 nm in most tissues, 6 nm in postcapillary
venules, 40–60 nm for the kidney glomerulus, and up to 150 nm for sinusoidal epithelium
of the liver and spleen192. The size of liposomes for Doxil® drug is between 80-100 nm
and the size of liposomes for Myocet® is around 150 nm193. The liposomal forms of
Doxorubicin Doxil® and Myocet® are both very effective drugs. Besides, peripheral nerve
permeability change may occur after Spinal Nerve Ligation (SNL)194-195 as well as
disruption of the blood-spinal cord barrier (BSCB), associated with breakdown of
microvascular permeability196-197. Since we were going to test the developed MDA7
liposomes in an in vivo model of SNL, we hypothesized that the same size of liposomes
that have been shown to be efficient in tumors models with discontinuous vasculature
may be suitable for this particular in vivo neuropathic pain model.
2.4.2.4 Cyclodextrins.
Cyclodextrins (CDs) are one of the most used drug-carriers because they are able to
form inclusion complexes (host-guest complexes) with a wide variety of small lipophilic
molecules. Inclusion complexes are water soluble and furthermore complexation can
increase the stability (e.g. metabolic) of the guest molecule. The FDA-approved and
chemically modified cyclodextrins, 2-hydroxypropyl- -cyclodextrins (HP CD) have
attracted growing interest based on their low toxicity, water solubility and complexation
potential. Considering the advantages of HP CD and in the aim of developing a
formulation appropriate for further human use, we prepared MDA7 inclusion complexes
to increase its aqueous solubility and metabolic stability. We tested i.v. administration of
MDA7 inclusion complexes at 10 mg/Kg dose (i.e. 250 μL for 150g rat) using a rat model
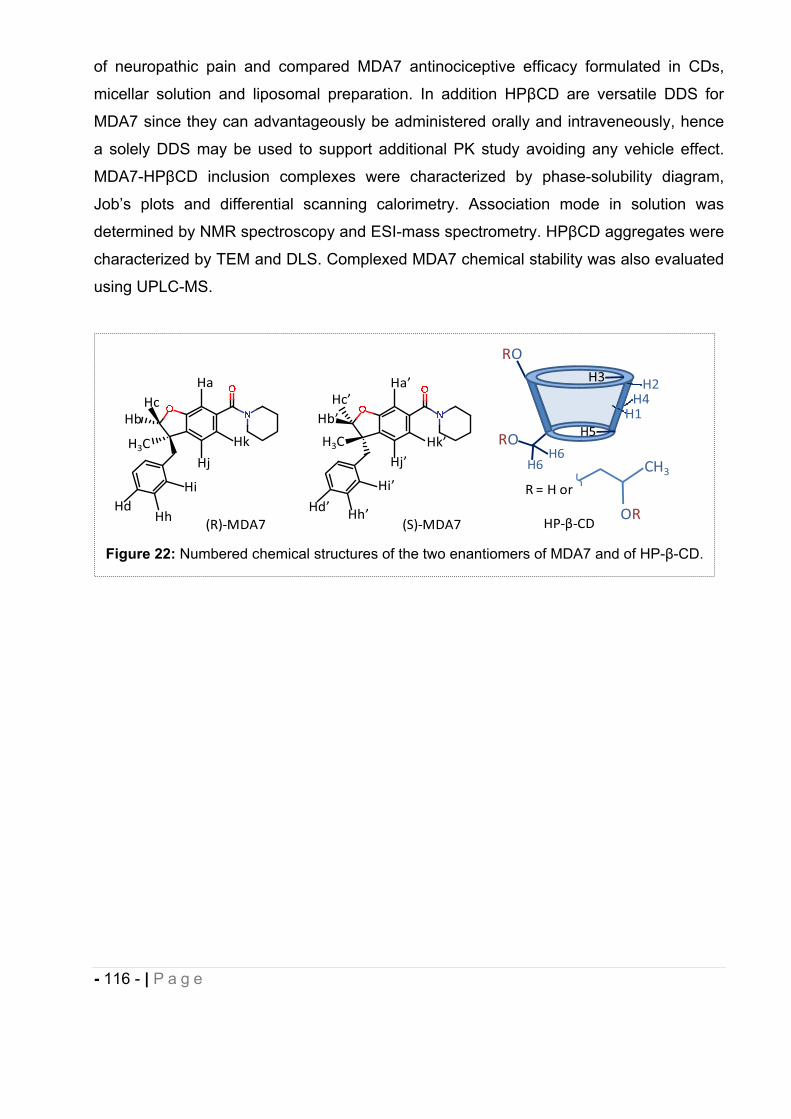
- 116 - | P a g e
of neuropathic pain and compared MDA7 antinociceptive efficacy formulated in CDs,
micellar solution and liposomal preparation. In addition HP CD are versatile DDS for
MDA7 since they can advantageously be administered orally and intraveneously, hence
a solely DDS may be used to support additional PK study avoiding any vehicle effect.
MDA7-HP CD inclusion complexes were characterized by phase-solubility diagram,
Job’s plots and differential scanning calorimetry. Association mode in solution was
determined by NMR spectroscopy and ESI-mass spectrometry. HP CD aggregates were
characterized by TEM and DLS. Complexed MDA7 chemical stability was also evaluated
using UPLC-MS.
Figure 22: Numbered chemical structures of the two enantiomers of MDA7 and of HP- -CD.
(R) MDA7 (S) MDA7
Ha Ha’
H3C H3C
HcHb
Hc’Hb’
Hd’HdHh Hh’
Hi’Hi
Hj Hj’Hk’Hk
RO
RO
H2
H1H4
H6H6
H5
H3
R = H or
OR
CH3
HP CD
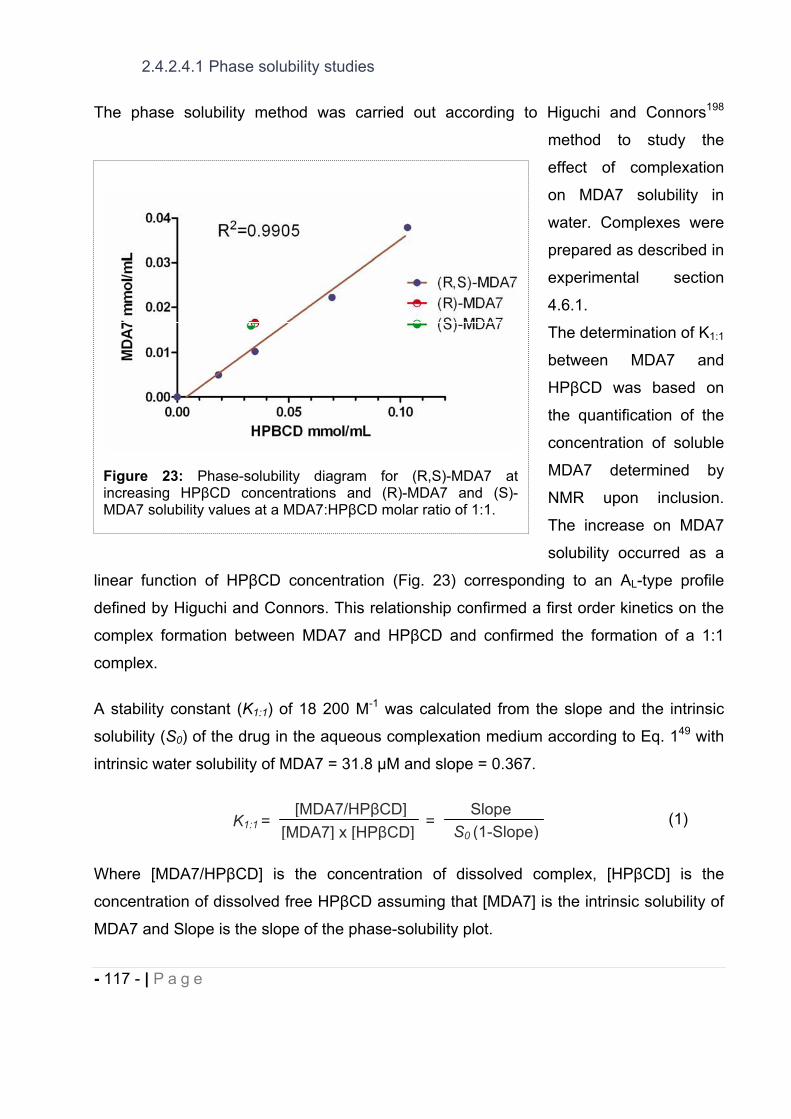
- 117 - | P a g e
2.4.2.4.1 Phase solubility studies
The phase solubility method was carried out according to Higuchi and Connors198
method to study the
effect of complexation
on MDA7 solubility in
water. Complexes were
prepared as described in
experimental section
4.6.1.
The determination of K1:1
between MDA7 and
HP CD was based on
the quantification of the
concentration of soluble
MDA7 determined by
NMR upon inclusion.
The increase on MDA7
solubility occurred as a
linear function of HP CD concentration (Fig. 23) corresponding to an AL-type profile
defined by Higuchi and Connors. This relationship confirmed a first order kinetics on the
complex formation between MDA7 and HP CD and confirmed the formation of a 1:1
complex.
A stability constant (K1:1) of 18 200 M-1 was calculated from the slope and the intrinsic
solubility (S0) of the drug in the aqueous complexation medium according to Eq. 149 with
intrinsic water solubility of MDA7 = 31.8 M and slope = 0.367.
(1)
Where [MDA7/HP CD] is the concentration of dissolved complex, [HP CD] is the
concentration of dissolved free HP CD assuming that [MDA7] is the intrinsic solubility of
MDA7 and Slope is the slope of the phase-solubility plot.
S0 (1-Slope)[MDA7] x [HP CD]Slope
K1:1 =[MDA7/HP CD]
=
Figure 23: Phase-solubility diagram for (R,S)-MDA7 at increasing HP CD concentrations and (R)-MDA7 and (S)-MDA7 solubility values at a MDA7:HP CD molar ratio of 1:1.
- 118 - | P a g e
Intrinsic solubility (S0) of a drug is expected to be determined by the intercept with Y axis.
In the case of MDA7 the Y-intercept is -0.001475 mol/mL. However, MDA7 is a highly
lipophilic molecule which is poorly water soluble. An intrinsic solubility of 31.8 M was
previously determined using the shake flask method199. In this case a more accurate
method to determine the solubilizing effect of HP CD is to determine the complexation
efficiency (CE). CE is the concentration ratio between free HP CD and HP CD
complexing MDA7. CE is independent of both S0 and the intercept and is more reliable
for poorly soluble guest. A CE of 0.58 was determined according to Eq. 2200.
(2)
The drug:cyclodextrin molar ratio in water saturated with MDA7 can be determined
according to Eq. 3.
(3)
MDA7:HP CD ratio has a value of 1:2.7 indicating that, on a 1:1 MDA7:HP CD
complexation, just one out of approximately 3 HP CD molecules is forming an inclusion
complex with MDA7. Since HP CD is a mixture of randomly hydroxypropylated CDs with
different molecular weights, MDA7:HP CD ratio is similar to the experimental
MDA7:HP CD ratio determined to solubilized MDA7 with a value between 3 and 4. In
addition we compared the solubilisation of (R)-MDA7 and (S)-MDA7 with (R,S)-MDA7 at
MDA7:HP CD molar ratio of 1:1. Both enantiomers exhibited a comparable water
solubility value after complexation with HP CD with the racemic mixture (Fig. 23).
2.4.2.4.2 Differential scanning calorimetry.
DSC curves (Fig. 24) of the inclusion complexes were compared with physical mixture.
MDA7 showed an endothermic peak at 108°C corresponding to melting point. HP CD
exhibited two broad endothermic peaks in the range of 50-150°C and 300-350°C201. The
first endothermic event assigned to loss of water and the second one to thermal
decomposition202. The DSC curve of MDA7/HP CD physical mixture showed the
endoterms corresponding to HP CD (50-150°C and 300-350°C) and the melting peak of
(1-Slope)[HP CD]Slope
CE = S0 x K1:1 =[MDA7/HP CD]
=
(CE + 1)
CEMDA7: HP CD molar ratio =
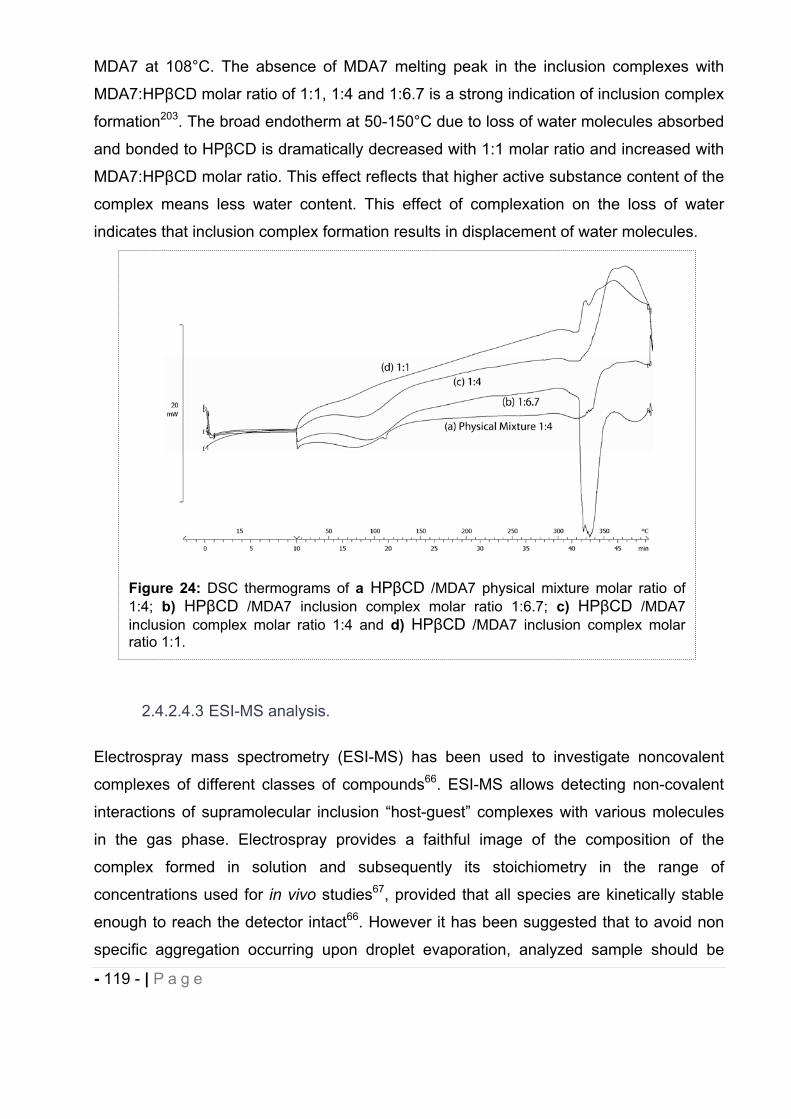
- 119 - | P a g e
MDA7 at 108°C. The absence of MDA7 melting peak in the inclusion complexes with
MDA7:HP CD molar ratio of 1:1, 1:4 and 1:6.7 is a strong indication of inclusion complex
formation203. The broad endotherm at 50-150°C due to loss of water molecules absorbed
and bonded to HP CD is dramatically decreased with 1:1 molar ratio and increased with
MDA7:HP CD molar ratio. This effect reflects that higher active substance content of the
complex means less water content. This effect of complexation on the loss of water
indicates that inclusion complex formation results in displacement of water molecules.
2.4.2.4.3 ESI-MS analysis.
Electrospray mass spectrometry (ESI-MS) has been used to investigate noncovalent
complexes of different classes of compounds66. ESI-MS allows detecting non-covalent
interactions of supramolecular inclusion “host-guest” complexes with various molecules
in the gas phase. Electrospray provides a faithful image of the composition of the
complex formed in solution and subsequently its stoichiometry in the range of
concentrations used for in vivo studies67, provided that all species are kinetically stable
enough to reach the detector intact66. However it has been suggested that to avoid non
specific aggregation occurring upon droplet evaporation, analyzed sample should be
Figure 24: DSC thermograms of a HP CD /MDA7 physical mixture molar ratio of 1:4; b) HP CD /MDA7 inclusion complex molar ratio 1:6.7; c) HP CD /MDA7 inclusion complex molar ratio 1:4 and d) HP CD /MDA7 inclusion complex molar ratio 1:1.
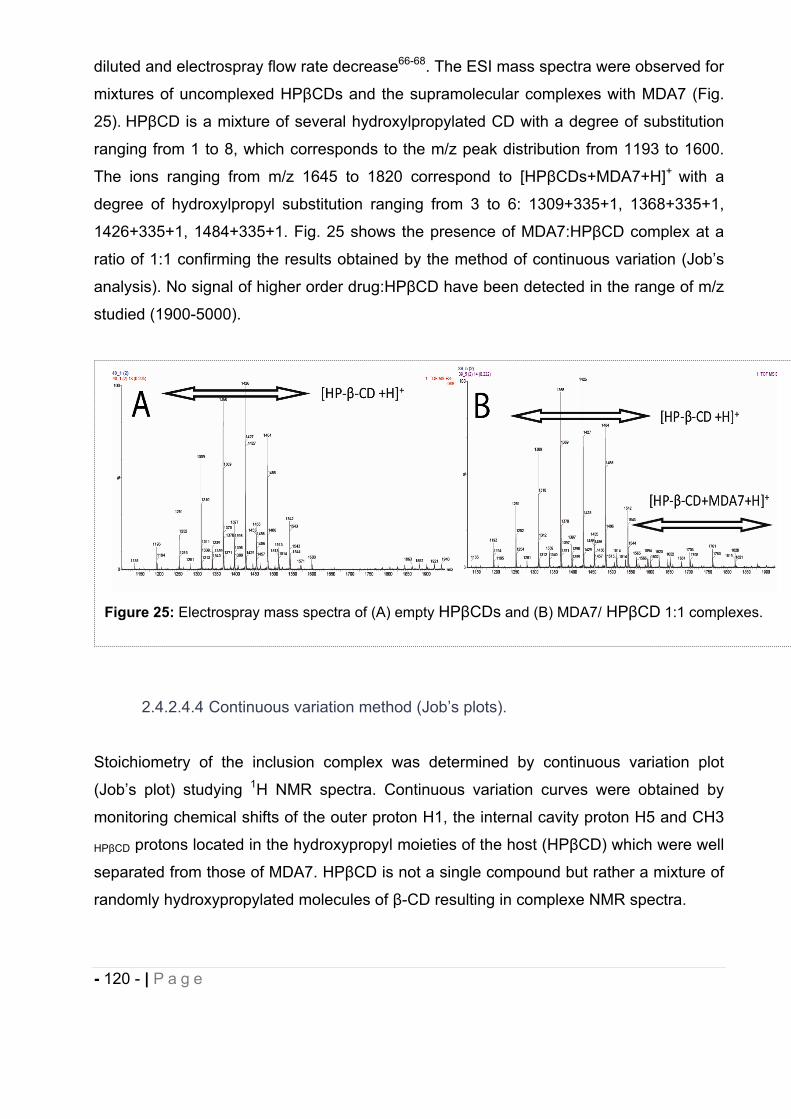
- 120 - | P a g e
diluted and electrospray flow rate decrease66-68. The ESI mass spectra were observed for
mixtures of uncomplexed HP CDs and the supramolecular complexes with MDA7 (Fig.
25). HP CD is a mixture of several hydroxylpropylated CD with a degree of substitution
ranging from 1 to 8, which corresponds to the m/z peak distribution from 1193 to 1600.
The ions ranging from m/z 1645 to 1820 correspond to [HP CDs+MDA7+H]+ with a
degree of hydroxylpropyl substitution ranging from 3 to 6: 1309+335+1, 1368+335+1,
1426+335+1, 1484+335+1. Fig. 25 shows the presence of MDA7:HP CD complex at a
ratio of 1:1 confirming the results obtained by the method of continuous variation (Job’s
analysis). No signal of higher order drug:HP CD have been detected in the range of m/z
studied (1900-5000).
2.4.2.4.4 Continuous variation method (Job’s plots).
Stoichiometry of the inclusion complex was determined by continuous variation plot
(Job’s plot) studying 1H NMR spectra. Continuous variation curves were obtained by
monitoring chemical shifts of the outer proton H1, the internal cavity proton H5 and CH3
HP CD protons located in the hydroxypropyl moieties of the host (HP CD) which were well
separated from those of MDA7. HP CD is not a single compound but rather a mixture of
randomly hydroxypropylated molecules of -CD resulting in complexe NMR spectra.
Figure 25: Electrospray mass spectra of (A) empty HP CDs and (B) MDA7/ HP CD 1:1 complexes.
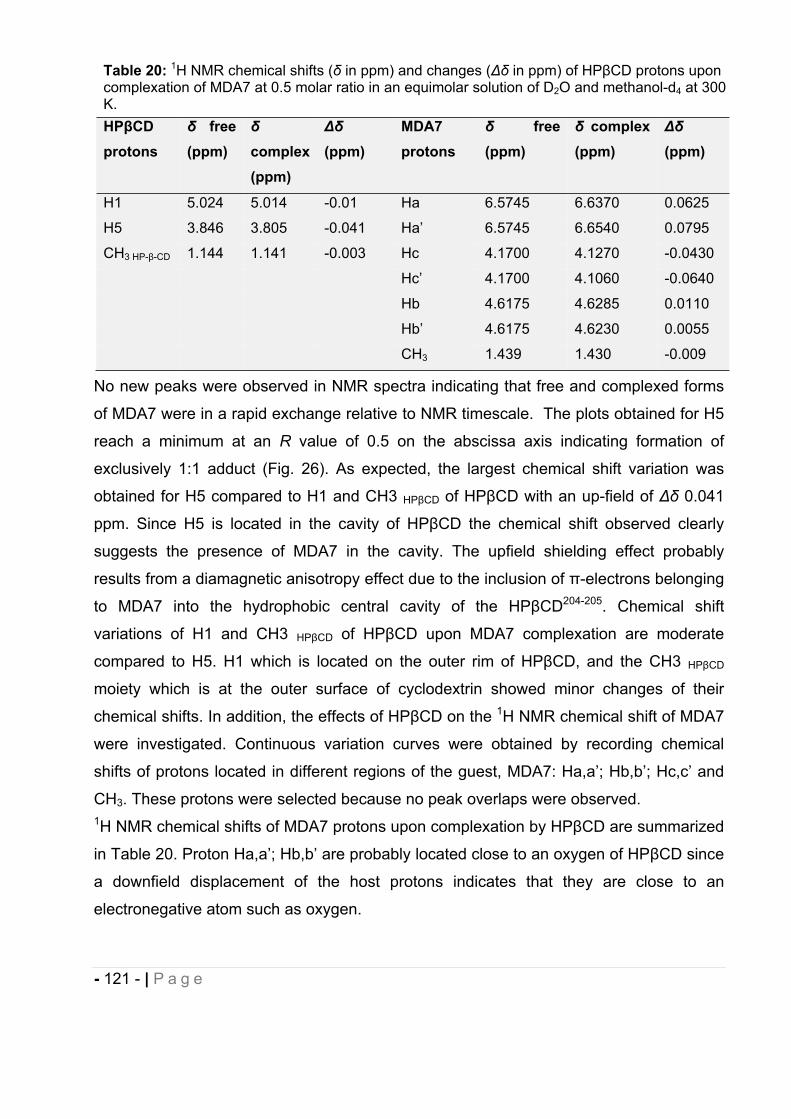
- 121 - | P a g e
No new peaks were observed in NMR spectra indicating that free and complexed forms
of MDA7 were in a rapid exchange relative to NMR timescale. The plots obtained for H5
reach a minimum at an R value of 0.5 on the abscissa axis indicating formation of
exclusively 1:1 adduct (Fig. 26). As expected, the largest chemical shift variation was
obtained for H5 compared to H1 and CH3 HP CD of HP CD with an up-field of 0.041
ppm. Since H5 is located in the cavity of HP CD the chemical shift observed clearly
suggests the presence of MDA7 in the cavity. The upfield shielding effect probably
results from a diamagnetic anisotropy effect due to the inclusion of -electrons belonging
to MDA7 into the hydrophobic central cavity of the HP CD204-205. Chemical shift
variations of H1 and CH3 HP CD of HP CD upon MDA7 complexation are moderate
compared to H5. H1 which is located on the outer rim of HP CD, and the CH3 HP CD
moiety which is at the outer surface of cyclodextrin showed minor changes of their
chemical shifts. In addition, the effects of HP CD on the 1H NMR chemical shift of MDA7
were investigated. Continuous variation curves were obtained by recording chemical
shifts of protons located in different regions of the guest, MDA7: Ha,a’; Hb,b’; Hc,c’ and
CH3. These protons were selected because no peak overlaps were observed. 1H NMR chemical shifts of MDA7 protons upon complexation by HP CD are summarized
in Table 20. Proton Ha,a’; Hb,b’ are probably located close to an oxygen of HP CD since
a downfield displacement of the host protons indicates that they are close to an
electronegative atom such as oxygen.
Table 20: 1H NMR chemical shifts ( in ppm) and changes ( in ppm) of HP CD protons upon complexation of MDA7 at 0.5 molar ratio in an equimolar solution of D2O and methanol-d4 at 300 K.HP CDprotons
free (ppm) complex
(ppm)(ppm)
MDA7protons
free (ppm)
complex (ppm) (ppm)
H1 5.024 5.014 -0.01 Ha 6.5745 6.6370 0.0625
H5 3.846 3.805 -0.041 Ha’ 6.5745 6.6540 0.0795
CH3 HP- -CD 1.144 1.141 -0.003 Hc 4.1700 4.1270 -0.0430
Hc’ 4.1700 4.1060 -0.0640
Hb 4.6175 4.6285 0.0110
Hb’ 4.6175 4.6230 0.0055
CH3 1.439 1.430 -0.009
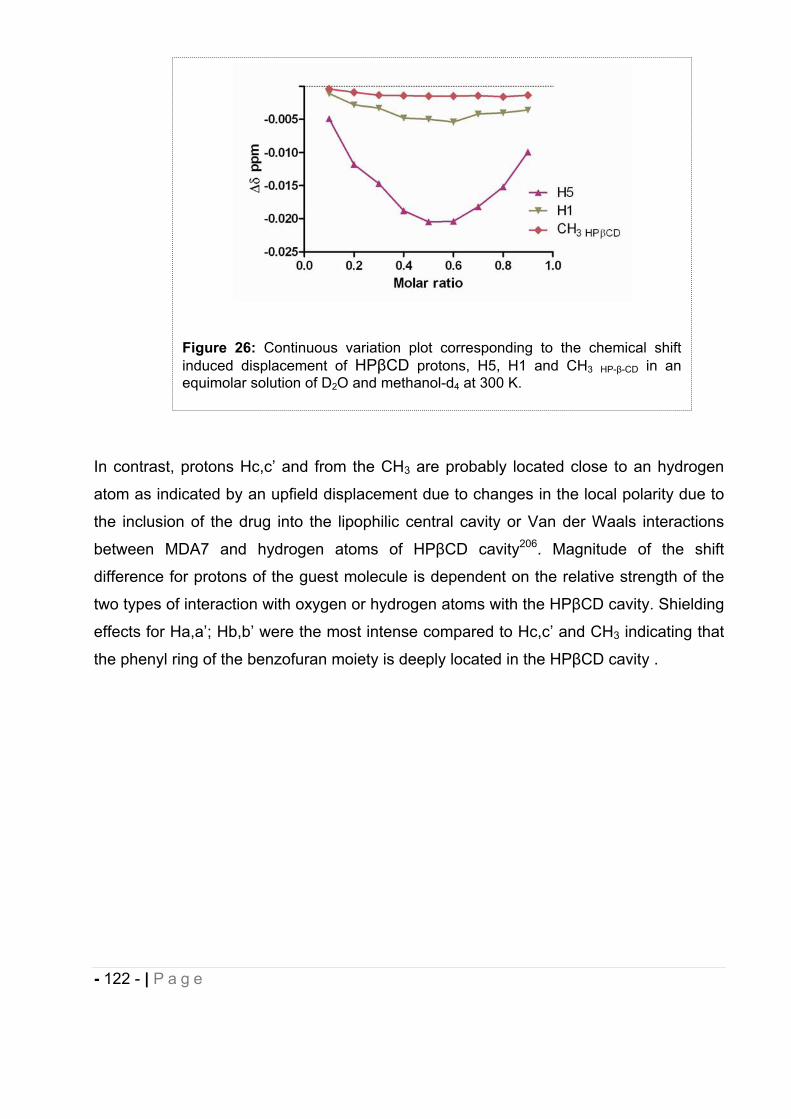
- 122 - | P a g e
In contrast, protons Hc,c’ and from the CH3 are probably located close to an hydrogen
atom as indicated by an upfield displacement due to changes in the local polarity due to
the inclusion of the drug into the lipophilic central cavity or Van der Waals interactions
between MDA7 and hydrogen atoms of HP CD cavity206. Magnitude of the shift
difference for protons of the guest molecule is dependent on the relative strength of the
two types of interaction with oxygen or hydrogen atoms with the HP CD cavity. Shielding
effects for Ha,a’; Hb,b’ were the most intense compared to Hc,c’ and CH3 indicating that
the phenyl ring of the benzofuran moiety is deeply located in the HP CD cavity .
Figure 26: Continuous variation plot corresponding to the chemical shift induced displacement of HP CD protons, H5, H1 and CH3 HP- -CD in an equimolar solution of D2O and methanol-d4 at 300 K.
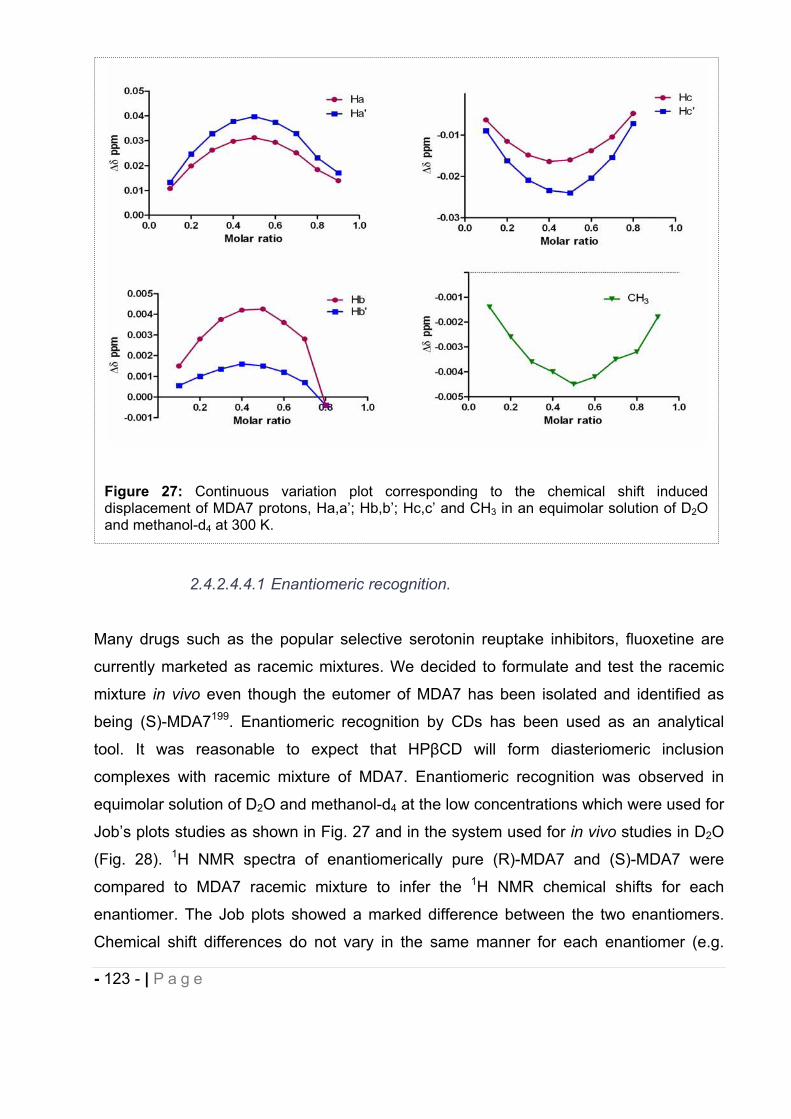
- 123 - | P a g e
2.4.2.4.4.1 Enantiomeric recognition.
Many drugs such as the popular selective serotonin reuptake inhibitors, fluoxetine are
currently marketed as racemic mixtures. We decided to formulate and test the racemic
mixture in vivo even though the eutomer of MDA7 has been isolated and identified as
being (S)-MDA7199. Enantiomeric recognition by CDs has been used as an analytical
tool. It was reasonable to expect that HP CD will form diasteriomeric inclusion
complexes with racemic mixture of MDA7. Enantiomeric recognition was observed in
equimolar solution of D2O and methanol-d4 at the low concentrations which were used for
Job’s plots studies as shown in Fig. 27 and in the system used for in vivo studies in D2O
(Fig. 28). 1H NMR spectra of enantiomerically pure (R)-MDA7 and (S)-MDA7 were
compared to MDA7 racemic mixture to infer the 1H NMR chemical shifts for each
enantiomer. The Job plots showed a marked difference between the two enantiomers.
Chemical shift differences do not vary in the same manner for each enantiomer (e.g.
Figure 27: Continuous variation plot corresponding to the chemical shift induced displacement of MDA7 protons, Ha,a’; Hb,b’; Hc,c’ and CH3 in an equimolar solution of D2Oand methanol-d4 at 300 K.
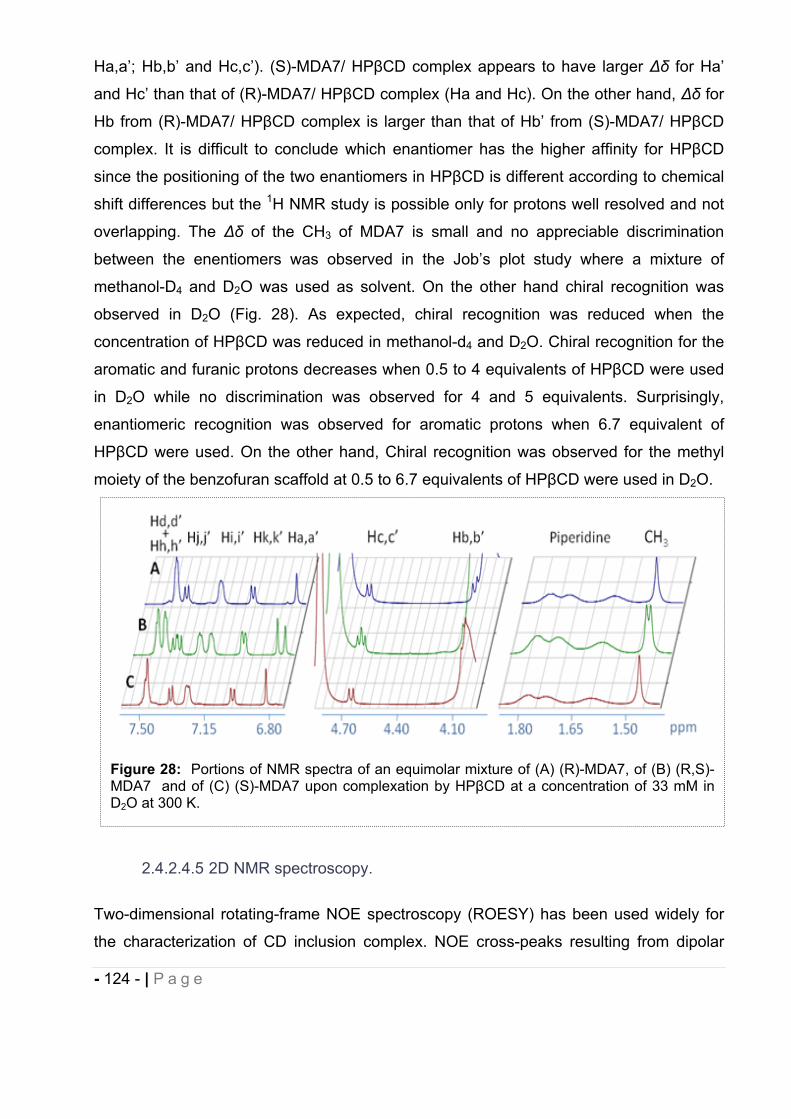
- 124 - | P a g e
Ha,a’; Hb,b’ and Hc,c’). (S)-MDA7/ HP CD complex appears to have larger for Ha’
and Hc’ than that of (R)-MDA7/ HP CD complex (Ha and Hc). On the other hand, for
Hb from (R)-MDA7/ HP CD complex is larger than that of Hb’ from (S)-MDA7/ HP CD
complex. It is difficult to conclude which enantiomer has the higher affinity for HP CD
since the positioning of the two enantiomers in HP CD is different according to chemical
shift differences but the 1H NMR study is possible only for protons well resolved and not
overlapping. The of the CH3 of MDA7 is small and no appreciable discrimination
between the enentiomers was observed in the Job’s plot study where a mixture of
methanol-D4 and D2O was used as solvent. On the other hand chiral recognition was
observed in D2O (Fig. 28). As expected, chiral recognition was reduced when the
concentration of HP CD was reduced in methanol-d4 and D2O. Chiral recognition for the
aromatic and furanic protons decreases when 0.5 to 4 equivalents of HP CD were used
in D2O while no discrimination was observed for 4 and 5 equivalents. Surprisingly,
enantiomeric recognition was observed for aromatic protons when 6.7 equivalent of
HP CD were used. On the other hand, Chiral recognition was observed for the methyl
moiety of the benzofuran scaffold at 0.5 to 6.7 equivalents of HP CD were used in D2O.
2.4.2.4.5 2D NMR spectroscopy.
Two-dimensional rotating-frame NOE spectroscopy (ROESY) has been used widely for
the characterization of CD inclusion complex. NOE cross-peaks resulting from dipolar
Figure 28: Portions of NMR spectra of an equimolar mixture of (A) (R)-MDA7, of (B) (R,S)-MDA7 and of (C) (S)-MDA7 upon complexation by HP CD at a concentration of 33 mM in D2O at 300 K.
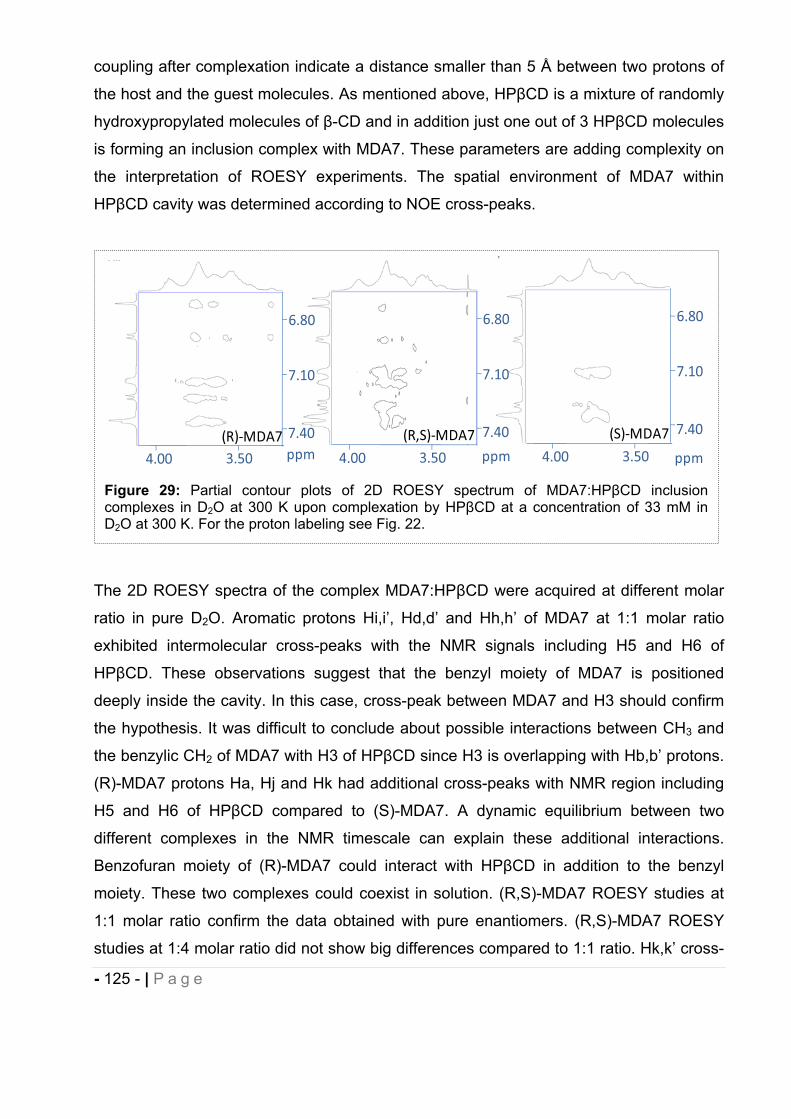
- 125 - | P a g e
coupling after complexation indicate a distance smaller than 5 Å between two protons of
the host and the guest molecules. As mentioned above, HP CD is a mixture of randomly
hydroxypropylated molecules of -CD and in addition just one out of 3 HP CD molecules
is forming an inclusion complex with MDA7. These parameters are adding complexity on
the interpretation of ROESY experiments. The spatial environment of MDA7 within
HP CD cavity was determined according to NOE cross-peaks.
The 2D ROESY spectra of the complex MDA7:HP CD were acquired at different molar
ratio in pure D2O. Aromatic protons Hi,i’, Hd,d’ and Hh,h’ of MDA7 at 1:1 molar ratio
exhibited intermolecular cross-peaks with the NMR signals including H5 and H6 of
HP CD. These observations suggest that the benzyl moiety of MDA7 is positioned
deeply inside the cavity. In this case, cross-peak between MDA7 and H3 should confirm
the hypothesis. It was difficult to conclude about possible interactions between CH3 and
the benzylic CH2 of MDA7 with H3 of HP CD since H3 is overlapping with Hb,b’ protons.
(R)-MDA7 protons Ha, Hj and Hk had additional cross-peaks with NMR region including
H5 and H6 of HP CD compared to (S)-MDA7. A dynamic equilibrium between two
different complexes in the NMR timescale can explain these additional interactions.
Benzofuran moiety of (R)-MDA7 could interact with HP CD in addition to the benzyl
moiety. These two complexes could coexist in solution. (R,S)-MDA7 ROESY studies at
1:1 molar ratio confirm the data obtained with pure enantiomers. (R,S)-MDA7 ROESY
studies at 1:4 molar ratio did not show big differences compared to 1:1 ratio. Hk,k’ cross-
Figure 29: Partial contour plots of 2D ROESY spectrum of MDA7:HP CD inclusion complexes in D2O at 300 K upon complexation by HP CD at a concentration of 33 mM in D2O at 300 K. For the proton labeling see Fig. 22.
4.00 3.50 4.00 3.50 4.00 3.50
7.10
7.40
6.80
7.10
7.40
6.80
7.10
7.40
6.80
ppm ppm ppm
(R,S) MDA7 (S) MDA7(R) MDA7
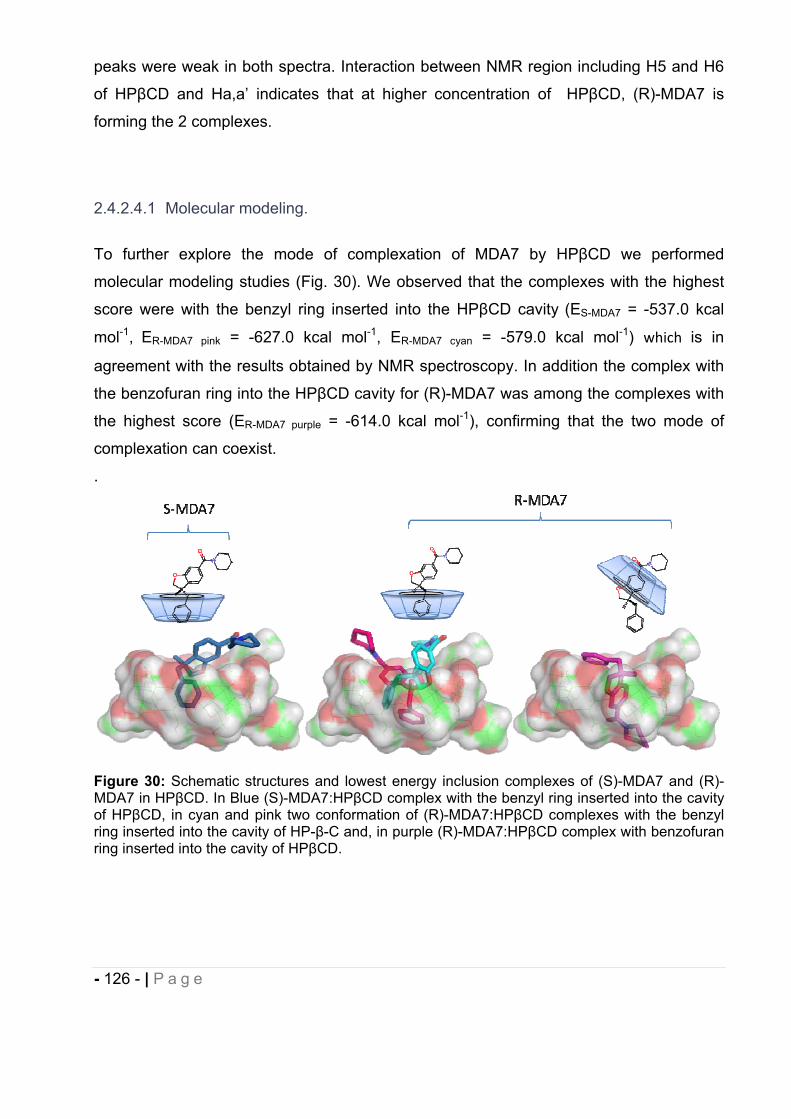
- 126 - | P a g e
peaks were weak in both spectra. Interaction between NMR region including H5 and H6
of HP CD and Ha,a’ indicates that at higher concentration of HP CD, (R)-MDA7 is
forming the 2 complexes.
2.4.2.4.1 Molecular modeling.
To further explore the mode of complexation of MDA7 by HP CD we performed
molecular modeling studies (Fig. 30). We observed that the complexes with the highest
score were with the benzyl ring inserted into the HP CD cavity (ES-MDA7 = -537.0 kcal
mol-1, ER-MDA7 pink = -627.0 kcal mol-1, ER-MDA7 cyan = -579.0 kcal mol-1) which is in
agreement with the results obtained by NMR spectroscopy. In addition the complex with
the benzofuran ring into the HP CD cavity for (R)-MDA7 was among the complexes with
the highest score (ER-MDA7 purple = -614.0 kcal mol-1), confirming that the two mode of
complexation can coexist.
.
Figure 30: Schematic structures and lowest energy inclusion complexes of (S)-MDA7 and (R)-MDA7 in HP CD. In Blue (S)-MDA7:HP CD complex with the benzyl ring inserted into the cavity of HP CD, in cyan and pink two conformation of (R)-MDA7:HP CD complexes with the benzyl ring inserted into the cavity of HP- -C and, in purple (R)-MDA7:HP CD complex with benzofuran ring inserted into the cavity of HP CD.
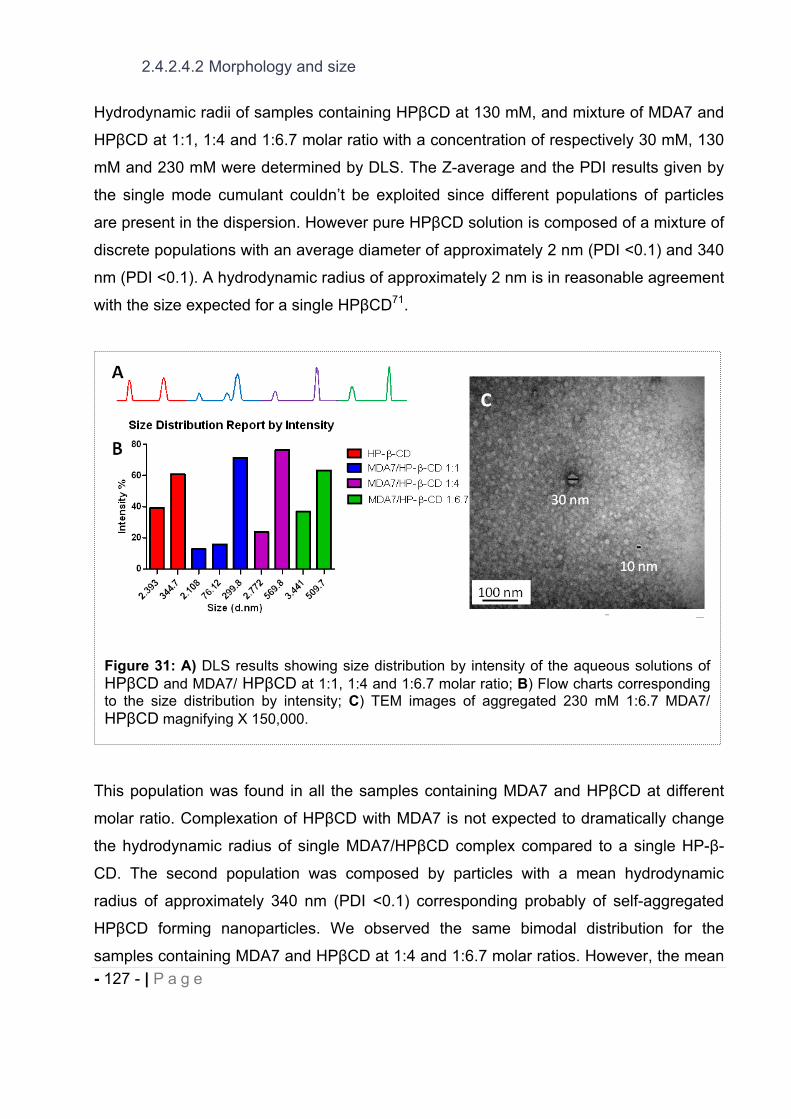
- 127 - | P a g e
2.4.2.4.2 Morphology and size
Hydrodynamic radii of samples containing HP CD at 130 mM, and mixture of MDA7 and
HP CD at 1:1, 1:4 and 1:6.7 molar ratio with a concentration of respectively 30 mM, 130
mM and 230 mM were determined by DLS. The Z-average and the PDI results given by
the single mode cumulant couldn’t be exploited since different populations of particles
are present in the dispersion. However pure HP CD solution is composed of a mixture of
discrete populations with an average diameter of approximately 2 nm (PDI <0.1) and 340
nm (PDI <0.1). A hydrodynamic radius of approximately 2 nm is in reasonable agreement
with the size expected for a single HP CD71.
This population was found in all the samples containing MDA7 and HP CD at different
molar ratio. Complexation of HP CD with MDA7 is not expected to dramatically change
the hydrodynamic radius of single MDA7/HP CD complex compared to a single HP- -
CD. The second population was composed by particles with a mean hydrodynamic
radius of approximately 340 nm (PDI <0.1) corresponding probably of self-aggregated
HP CD forming nanoparticles. We observed the same bimodal distribution for the
samples containing MDA7 and HP CD at 1:4 and 1:6.7 molar ratios. However, the mean
Figure 31: A) DLS results showing size distribution by intensity of the aqueous solutions of HP CD and MDA7/ HP CD at 1:1, 1:4 and 1:6.7 molar ratio; B) Flow charts corresponding to the size distribution by intensity; C) TEM images of aggregated 230 mM 1:6.7 MDA7/HP CD magnifying X 150,000.
- 128 - | P a g e
hydrodynamic radii corresponding to self-aggregated HP CD were larger for samples
containing MDA7 and HP CD than in the sample containing pure HP- -CD. MDA7 can
affect the size of the self-aggregated HP CD inducing formation of larger aggregates200.
Surprisingly, a third population with a mean hydrodynamic radius of approximately 76 nm
(PDI <0.1) was identified in the sample with MDA7/HP CD at a molar ratio of 1:1.
Furthermore the mean diameter of the larger population was similar than for pure HP- -
CD. The lower concentration of HP CD in the former sample compared to the sample
with pure HP CD could explain the differences in term of distribution and diameter. The
aggregation and the size of the aggregates increase with increasing cyclodextrin
concentration200. The morphology and the size of self-aggregates of HP CD were also
analyzed by TEM. Two populations of spherical aggregates of HP CD with diameter of
5-10 nm and 30 nm were observed (Fig. 31C). These results were not in agreement with
DLS experiments but sample preparation can affect the size of the aggregates observed
by TEM. Nevertheless, TEM results confirm that spherical aggregates of different sizes
are present in aqueous MDA7/HP CD solutions as previously shown with other host
molecules207.
2.4.2.4.3 Physicochemical stability
We evaluated the physicochemical stability of the MDA7:HP CD inclusion complex used
in vivo with a molar ratio 1:6.7 ([MDA7]= 6 mg/mL) respectively over a period of 15 days
and 1 month, to correlate with the in vivo model testing of spinal nerve ligation see
section 2.5. This DDS has been selected for in vivo studies with a concentration in CDs
above the solubility determined (between molar ratio 1:3 and 1:4) as to prevent in vivo
crystallization with a safety margin. In addition, this DDS brings some flexibility if higher
concentration of MDA7 has to be tested in vivo. We ascertained that the dose of CDs
(30% w/v or 500 mg/Kg) is safe for i.v. and oral administration to rats. Excellent reviews
of toxicological data concerning HP CD are published and concentration up to 10g/Kg
delivered acute or subchronic, oral or i.v., to rats have been reported to be not toxic1-2.
Sporanox® a marketed product for i.v. administration of itraconazole contains this
excipient at concentrations of up to 40%21.
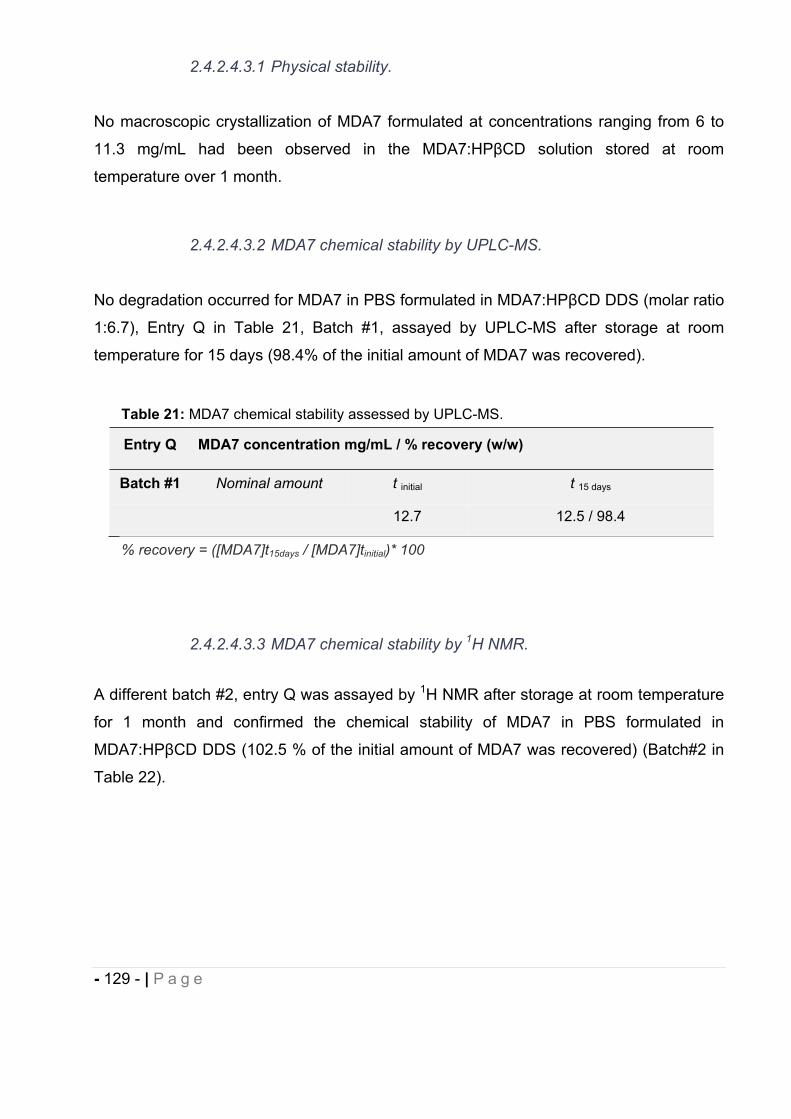
- 129 - | P a g e
2.4.2.4.3.1 Physical stability.
No macroscopic crystallization of MDA7 formulated at concentrations ranging from 6 to
11.3 mg/mL had been observed in the MDA7:HP CD solution stored at room
temperature over 1 month.
2.4.2.4.3.2 MDA7 chemical stability by UPLC-MS.
No degradation occurred for MDA7 in PBS formulated in MDA7:HP CD DDS (molar ratio
1:6.7), Entry Q in Table 21, Batch #1, assayed by UPLC-MS after storage at room
temperature for 15 days (98.4% of the initial amount of MDA7 was recovered).
2.4.2.4.3.3 MDA7 chemical stability by 1H NMR.
A different batch #2, entry Q was assayed by 1H NMR after storage at room temperature
for 1 month and confirmed the chemical stability of MDA7 in PBS formulated in
MDA7:HP CD DDS (102.5 % of the initial amount of MDA7 was recovered) (Batch#2 in
Table 22).
Table 21: MDA7 chemical stability assessed by UPLC-MS.
Entry Q MDA7 concentration mg/mL / % recovery (w/w)
Batch #1 Nominal amount t initial t 15 days
12.7 12.5 / 98.4
% recovery = ([MDA7]t15days / [MDA7]tinitial)* 100
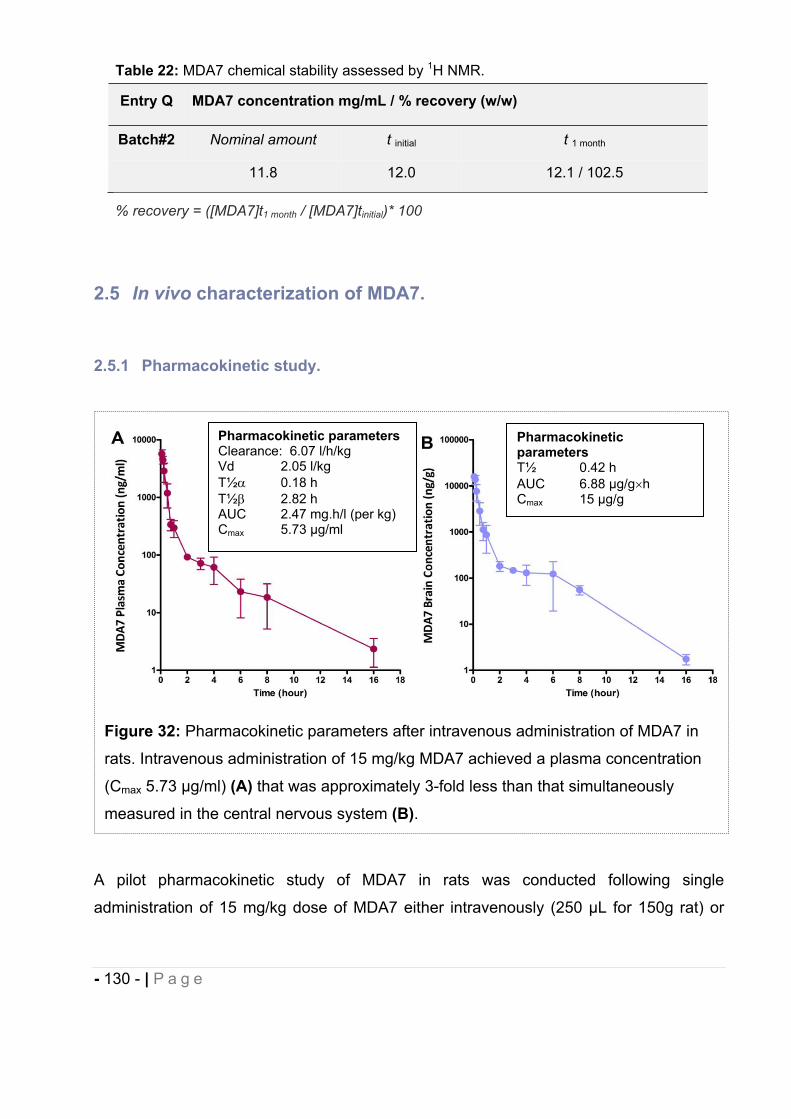
- 130 - | P a g e
2.5 In vivo characterization of MDA7.
2.5.1 Pharmacokinetic study.
A pilot pharmacokinetic study of MDA7 in rats was conducted following single
administration of 15 mg/kg dose of MDA7 either intravenously (250 μL for 150g rat) or
Figure 32: Pharmacokinetic parameters after intravenous administration of MDA7 in
rats. Intravenous administration of 15 mg/kg MDA7 achieved a plasma concentration
(Cmax 5.73 μg/ml) (A) that was approximately 3-fold less than that simultaneously
measured in the central nervous system (B).
Table 22: MDA7 chemical stability assessed by 1H NMR.
Entry Q MDA7 concentration mg/mL / % recovery (w/w)
Batch#2 Nominal amount t initial t 1 month
11.8 12.0 12.1 / 102.5
% recovery = ([MDA7]t1 month / [MDA7]tinitial)* 100
Pharmacokinetic parameters Clearance: 6.07 l/h/kg Vd 2.05 l/kg T½ 0.18 h T½ 2.82 h AUC 2.47 mg.h/l (per kg) Cmax 5.73 μg/ml
Pharmacokinetic parametersT½ 0.42 h AUC 6.88 μg/g hCmax 15 μg/g
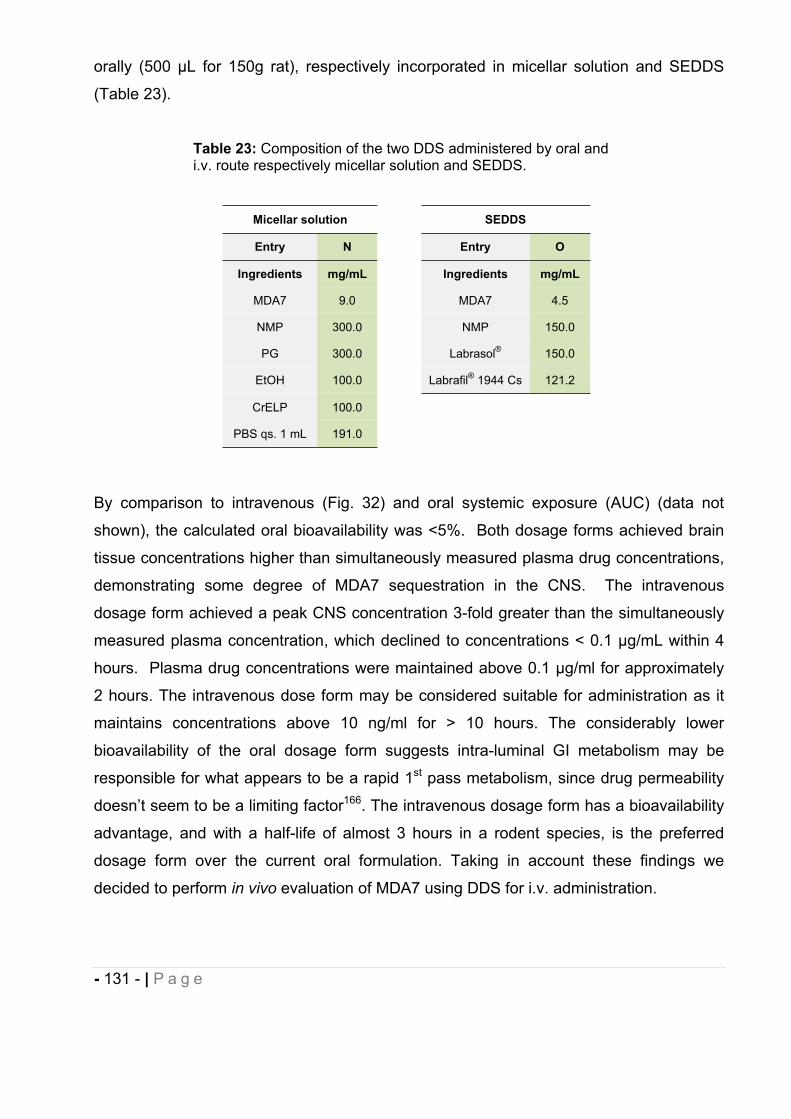
- 131 - | P a g e
orally (500 μL for 150g rat), respectively incorporated in micellar solution and SEDDS
(Table 23).
By comparison to intravenous (Fig. 32) and oral systemic exposure (AUC) (data not
shown), the calculated oral bioavailability was <5%. Both dosage forms achieved brain
tissue concentrations higher than simultaneously measured plasma drug concentrations,
demonstrating some degree of MDA7 sequestration in the CNS. The intravenous
dosage form achieved a peak CNS concentration 3-fold greater than the simultaneously
measured plasma concentration, which declined to concentrations < 0.1 μg/mL within 4
hours. Plasma drug concentrations were maintained above 0.1 μg/ml for approximately
2 hours. The intravenous dose form may be considered suitable for administration as it
maintains concentrations above 10 ng/ml for > 10 hours. The considerably lower
bioavailability of the oral dosage form suggests intra-luminal GI metabolism may be
responsible for what appears to be a rapid 1st pass metabolism, since drug permeability
doesn’t seem to be a limiting factor166. The intravenous dosage form has a bioavailability
advantage, and with a half-life of almost 3 hours in a rodent species, is the preferred
dosage form over the current oral formulation. Taking in account these findings we
decided to perform in vivo evaluation of MDA7 using DDS for i.v. administration.
Table 23: Composition of the two DDS administered by oral and i.v. route respectively micellar solution and SEDDS.
Micellar solution SEDDS
Entry N Entry O
Ingredients mg/mL Ingredients mg/mL
MDA7 9.0 MDA7 4.5
NMP 300.0 NMP 150.0
PG 300.0 Labrasol® 150.0
EtOH 100.0 Labrafil® 1944 Cs 121.2
CrELP 100.0
PBS qs. 1 mL 191.0
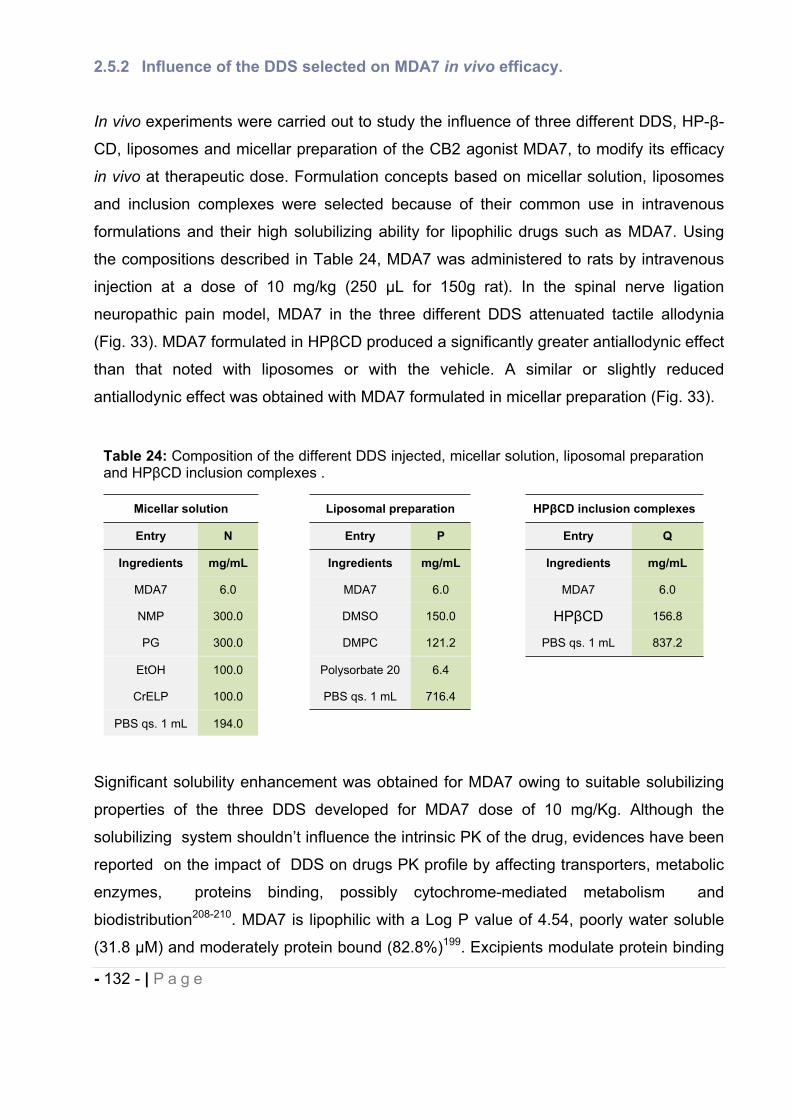
- 132 - | P a g e
2.5.2 Influence of the DDS selected on MDA7 in vivo efficacy.
In vivo experiments were carried out to study the influence of three different DDS, HP- -
CD, liposomes and micellar preparation of the CB2 agonist MDA7, to modify its efficacy
in vivo at therapeutic dose. Formulation concepts based on micellar solution, liposomes
and inclusion complexes were selected because of their common use in intravenous
formulations and their high solubilizing ability for lipophilic drugs such as MDA7. Using
the compositions described in Table 24, MDA7 was administered to rats by intravenous
injection at a dose of 10 mg/kg (250 μL for 150g rat). In the spinal nerve ligation
neuropathic pain model, MDA7 in the three different DDS attenuated tactile allodynia
(Fig. 33). MDA7 formulated in HP CD produced a significantly greater antiallodynic effect
than that noted with liposomes or with the vehicle. A similar or slightly reduced
antiallodynic effect was obtained with MDA7 formulated in micellar preparation (Fig. 33).
Significant solubility enhancement was obtained for MDA7 owing to suitable solubilizing
properties of the three DDS developed for MDA7 dose of 10 mg/Kg. Although the
solubilizing system shouldn’t influence the intrinsic PK of the drug, evidences have been
reported on the impact of DDS on drugs PK profile by affecting transporters, metabolic
enzymes, proteins binding, possibly cytochrome-mediated metabolism and
biodistribution208-210. MDA7 is lipophilic with a Log P value of 4.54, poorly water soluble
(31.8 M) and moderately protein bound (82.8%)199. Excipients modulate protein binding
Table 24: Composition of the different DDS injected, micellar solution, liposomal preparation and HP CD inclusion complexes .
Micellar solution Liposomal preparation HP CD inclusion complexes
Entry N Entry P Entry Q
Ingredients mg/mL Ingredients mg/mL Ingredients mg/mL
MDA7 6.0 MDA7 6.0 MDA7 6.0
NMP 300.0 DMSO 150.0 HP CD 156.8
PG 300.0 DMPC 121.2 PBS qs. 1 mL 837.2
EtOH 100.0 Polysorbate 20 6.4
CrELP 100.0 PBS qs. 1 mL 716.4
PBS qs. 1 mL 194.0
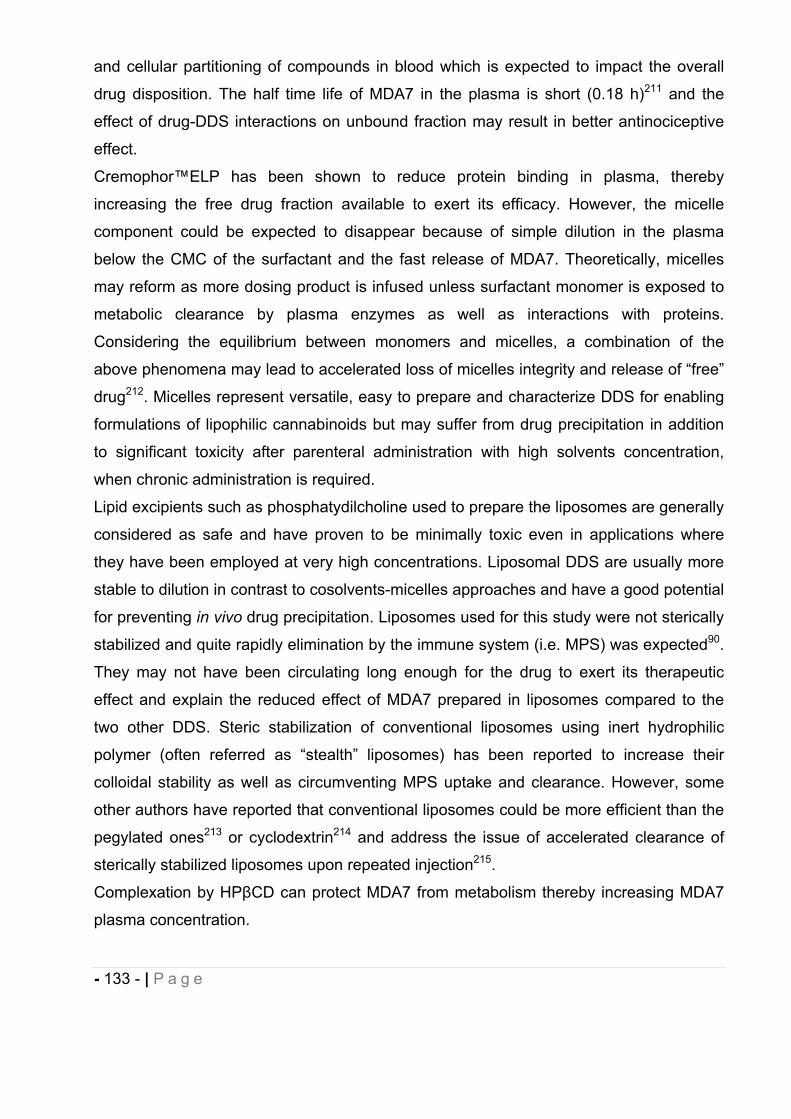
- 133 - | P a g e
and cellular partitioning of compounds in blood which is expected to impact the overall
drug disposition. The half time life of MDA7 in the plasma is short (0.18 h)211 and the
effect of drug-DDS interactions on unbound fraction may result in better antinociceptive
effect.
Cremophor™ELP has been shown to reduce protein binding in plasma, thereby
increasing the free drug fraction available to exert its efficacy. However, the micelle
component could be expected to disappear because of simple dilution in the plasma
below the CMC of the surfactant and the fast release of MDA7. Theoretically, micelles
may reform as more dosing product is infused unless surfactant monomer is exposed to
metabolic clearance by plasma enzymes as well as interactions with proteins.
Considering the equilibrium between monomers and micelles, a combination of the
above phenomena may lead to accelerated loss of micelles integrity and release of “free”
drug212. Micelles represent versatile, easy to prepare and characterize DDS for enabling
formulations of lipophilic cannabinoids but may suffer from drug precipitation in addition
to significant toxicity after parenteral administration with high solvents concentration,
when chronic administration is required.
Lipid excipients such as phosphatydilcholine used to prepare the liposomes are generally
considered as safe and have proven to be minimally toxic even in applications where
they have been employed at very high concentrations. Liposomal DDS are usually more
stable to dilution in contrast to cosolvents-micelles approaches and have a good potential
for preventing in vivo drug precipitation. Liposomes used for this study were not sterically
stabilized and quite rapidly elimination by the immune system (i.e. MPS) was expected90.
They may not have been circulating long enough for the drug to exert its therapeutic
effect and explain the reduced effect of MDA7 prepared in liposomes compared to the
two other DDS. Steric stabilization of conventional liposomes using inert hydrophilic
polymer (often referred as “stealth” liposomes) has been reported to increase their
colloidal stability as well as circumventing MPS uptake and clearance. However, some
other authors have reported that conventional liposomes could be more efficient than the
pegylated ones213 or cyclodextrin214 and address the issue of accelerated clearance of
sterically stabilized liposomes upon repeated injection215.
Complexation by HP CD can protect MDA7 from metabolism thereby increasing MDA7
plasma concentration.
- 134 - | P a g e
MDA7 exhibited a high affinity constant (K1:1= 18 200 M-1) for HP CD. After parental
administration, drugs appear to be rapidly and quantitatively released from CDs inclusion
complexes, particularly for K value < 105 M–1 and dilution in the biological fluids. This is a
predominant mechanism involved in drug release from the drug-CD complex that
continuously forms and dissociates with lifetimes in the range of milliseconds or less50.
Complexation by HP CD and aggregates formation, can decrease MDA7 metabolism
and renal excretion of the complexes, thereby increasing MDA7 plasma concentration.
Our study has shown that through inclusion complexation and possibly formation of
aggregates, HP CD can enhance the aqueous solubility of lipophilic drugs without
compromising their intrinsic ability to permeate biological membranes. Enabling
formulation using HP CD improved antiallodynic effect of the CB2 agonist MDA7 in
comparison to incorporation in micellar preparation or liposomes. Biopharmaceutics
Classification System (BCS) Class II preclinical drug candidates to treat neuropathic pain
such as MDA7 could behave as BCS Class I drug candidates by using HP CD based
Figure 33: Effects of MDA7 formulated in HP CD, liposomes and micellar preparation administered by i.v. injection on tactile allodynia in a spinal nerve ligation neuropathic pain model at a dose of 10 mg/kg. MDA7 effects were greatest in HP CD>liposomes>micellarpreparations at increasing the paw withdrawal threshold of the nerve-injured paw. **P<0.01, *P<0.05 versus corresponding vehicle. +P<0.05 versus MDA7 in HP CD or in micellar preparations (two-way analysis of variance followed by Student-Newman-Keuls multiple comparisons test).
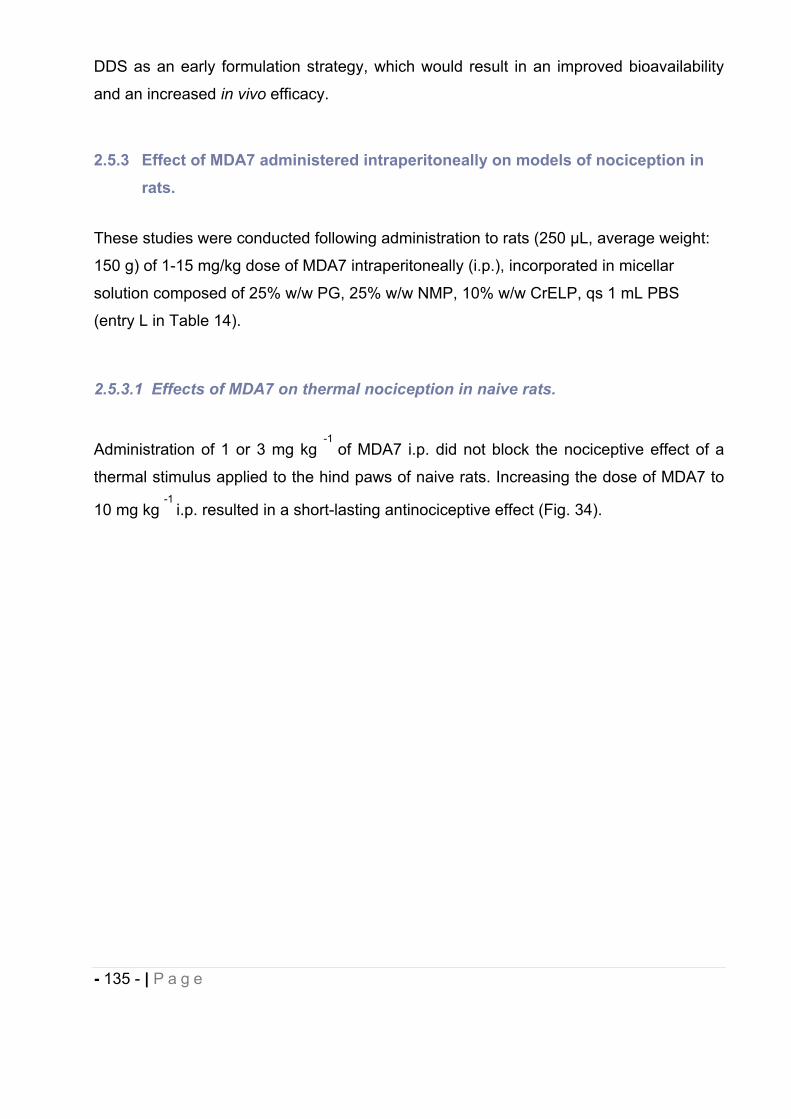
- 135 - | P a g e
DDS as an early formulation strategy, which would result in an improved bioavailability
and an increased in vivo efficacy.
2.5.3 Effect of MDA7 administered intraperitoneally on models of nociception in rats.
These studies were conducted following administration to rats (250 μL, average weight:
150 g) of 1-15 mg/kg dose of MDA7 intraperitoneally (i.p.), incorporated in micellar
solution composed of 25% w/w PG, 25% w/w NMP, 10% w/w CrELP, qs 1 mL PBS
(entry L in Table 14).
2.5.3.1 Effects of MDA7 on thermal nociception in naive rats.
Administration of 1 or 3 mg kg -1
of MDA7 i.p. did not block the nociceptive effect of a
thermal stimulus applied to the hind paws of naive rats. Increasing the dose of MDA7 to
10 mg kg -1
i.p. resulted in a short-lasting antinociceptive effect (Fig. 34).
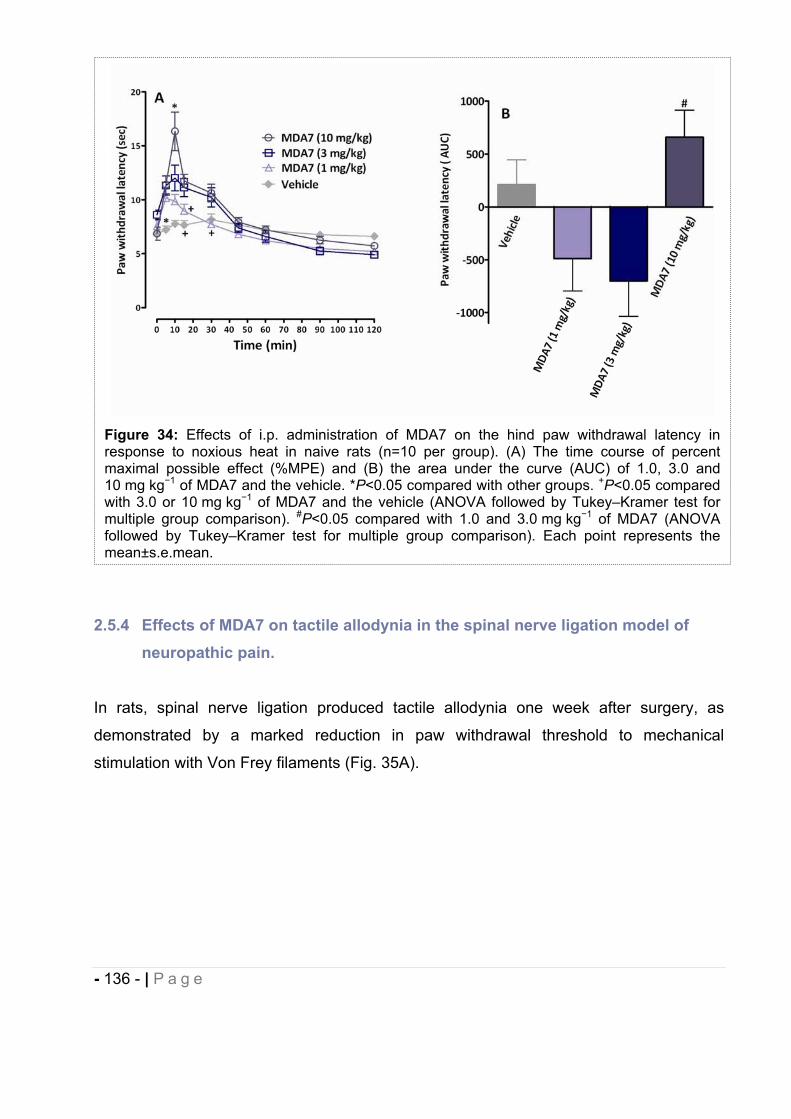
- 136 - | P a g e
2.5.4 Effects of MDA7 on tactile allodynia in the spinal nerve ligation model of neuropathic pain.
In rats, spinal nerve ligation produced tactile allodynia one week after surgery, as
demonstrated by a marked reduction in paw withdrawal threshold to mechanical
stimulation with Von Frey filaments (Fig. 35A).
Figure 34: Effects of i.p. administration of MDA7 on the hind paw withdrawal latency in response to noxious heat in naive rats (n=10 per group). (A) The time course of percent maximal possible effect (%MPE) and (B) the area under the curve (AUC) of 1.0, 3.0 and 10 mg kg 1 of MDA7 and the vehicle. *P<0.05 compared with other groups. +P<0.05 compared with 3.0 or 10 mg kg 1 of MDA7 and the vehicle (ANOVA followed by Tukey–Kramer test for multiple group comparison). #P<0.05 compared with 1.0 and 3.0 mg kg 1 of MDA7 (ANOVA followed by Tukey–Kramer test for multiple group comparison). Each point represents the mean±s.e.mean.
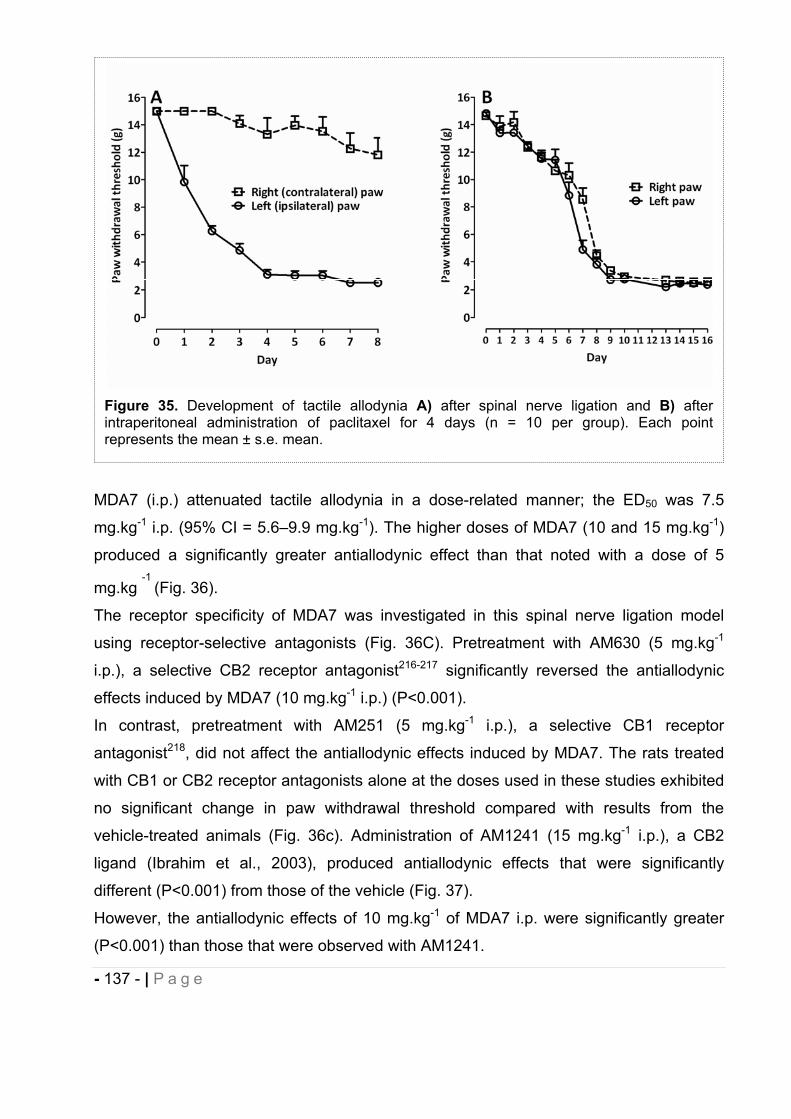
- 137 - | P a g e
MDA7 (i.p.) attenuated tactile allodynia in a dose-related manner; the ED50 was 7.5
mg.kg-1 i.p. (95% CI = 5.6–9.9 mg.kg-1). The higher doses of MDA7 (10 and 15 mg.kg-1)
produced a significantly greater antiallodynic effect than that noted with a dose of 5
mg.kg-1
(Fig. 36).
The receptor specificity of MDA7 was investigated in this spinal nerve ligation model
using receptor-selective antagonists (Fig. 36C). Pretreatment with AM630 (5 mg.kg-1
i.p.), a selective CB2 receptor antagonist216-217 significantly reversed the antiallodynic
effects induced by MDA7 (10 mg.kg-1 i.p.) (P<0.001).
In contrast, pretreatment with AM251 (5 mg.kg-1 i.p.), a selective CB1 receptor
antagonist218, did not affect the antiallodynic effects induced by MDA7. The rats treated
with CB1 or CB2 receptor antagonists alone at the doses used in these studies exhibited
no significant change in paw withdrawal threshold compared with results from the
vehicle-treated animals (Fig. 36c). Administration of AM1241 (15 mg.kg-1 i.p.), a CB2
ligand (Ibrahim et al., 2003), produced antiallodynic effects that were significantly
different (P<0.001) from those of the vehicle (Fig. 37).
However, the antiallodynic effects of 10 mg.kg-1 of MDA7 i.p. were significantly greater
(P<0.001) than those that were observed with AM1241.
Figure 35. Development of tactile allodynia A) after spinal nerve ligation and B) after intraperitoneal administration of paclitaxel for 4 days (n = 10 per group). Each point represents the mean ± s.e. mean.
- 138 - | P a g e
The antinociceptive effects of AM1241 have been shown to involve the μ-opioid receptor
system and -endorphin, and to be blocked by administration of the opioid receptor
antagonist naloxone or antiserum to b-endorphin219. In this study, rats subjected to spinal
Figure 36. Effects of intraperitoneal administration of MDA7 on hind paw withdrawal latency in response to noxious heat in naïve rats (n = 10 per group). (A) The time course of percent maximal possible effect (%MPE) and (B) the area under the curve (AUC) of 1.0, 3.0, and 10 mg/kg of MDA7 and the vehicle. c) Effects of selective antagonists for CB1 and CB2 receptors on the antiallodynic effects of 10 mgkg 1 of MDA7, shown as AUC (n=6 per group). *P<0.05 compared with other groups. +P<0.05 compared with 3.0 or 10 mg/kg of MDA7 and the vehicle (ANOVA). #P<0.05 compared with 1.0 and 3.0 mg/kg of MDA7. Each point represents the mean ± s.e. mean.
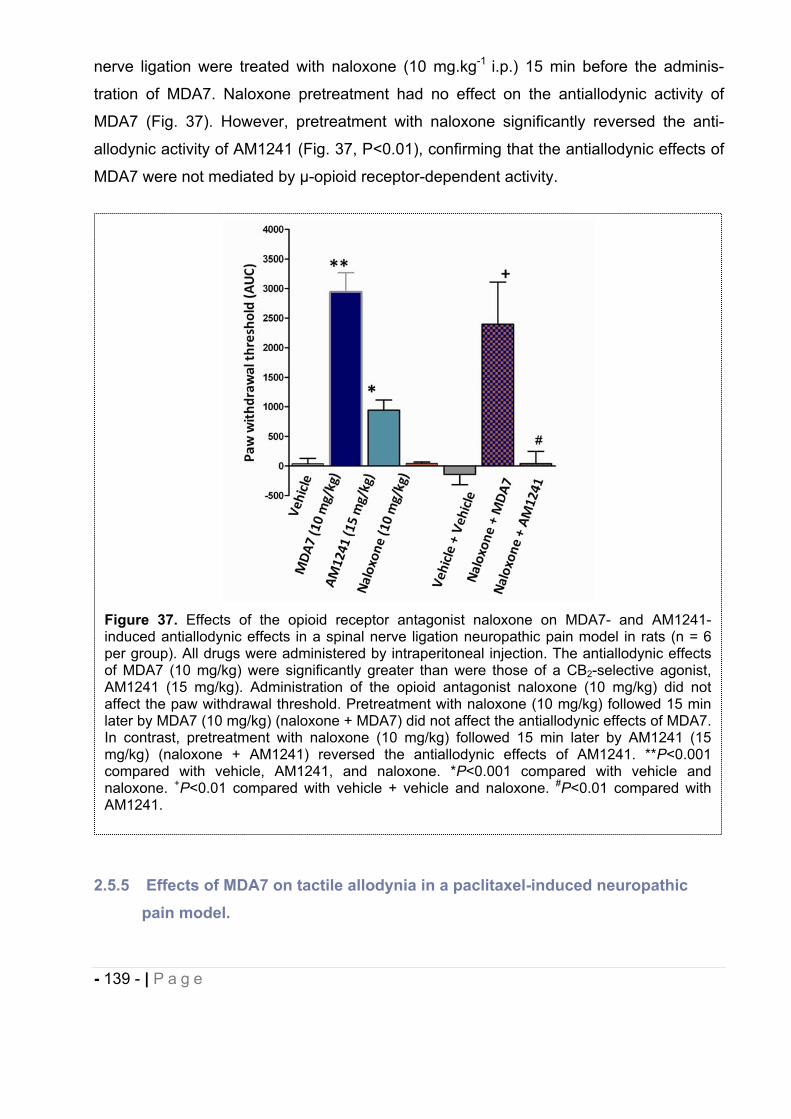
- 139 - | P a g e
nerve ligation were treated with naloxone (10 mg.kg-1 i.p.) 15 min before the adminis-
tration of MDA7. Naloxone pretreatment had no effect on the antiallodynic activity of
MDA7 (Fig. 37). However, pretreatment with naloxone significantly reversed the anti-
allodynic activity of AM1241 (Fig. 37, P<0.01), confirming that the antiallodynic effects of
MDA7 were not mediated by μ-opioid receptor-dependent activity.
2.5.5 Effects of MDA7 on tactile allodynia in a paclitaxel-induced neuropathic pain model.
Figure 37. Effects of the opioid receptor antagonist naloxone on MDA7- and AM1241-induced antiallodynic effects in a spinal nerve ligation neuropathic pain model in rats (n = 6 per group). All drugs were administered by intraperitoneal injection. The antiallodynic effects of MDA7 (10 mg/kg) were significantly greater than were those of a CB2-selective agonist, AM1241 (15 mg/kg). Administration of the opioid antagonist naloxone (10 mg/kg) did not affect the paw withdrawal threshold. Pretreatment with naloxone (10 mg/kg) followed 15 min later by MDA7 (10 mg/kg) (naloxone + MDA7) did not affect the antiallodynic effects of MDA7. In contrast, pretreatment with naloxone (10 mg/kg) followed 15 min later by AM1241 (15 mg/kg) (naloxone + AM1241) reversed the antiallodynic effects of AM1241. **P<0.001compared with vehicle, AM1241, and naloxone. *P<0.001 compared with vehicle and naloxone. +P<0.01 compared with vehicle + vehicle and naloxone. #P<0.01 compared with AM1241.
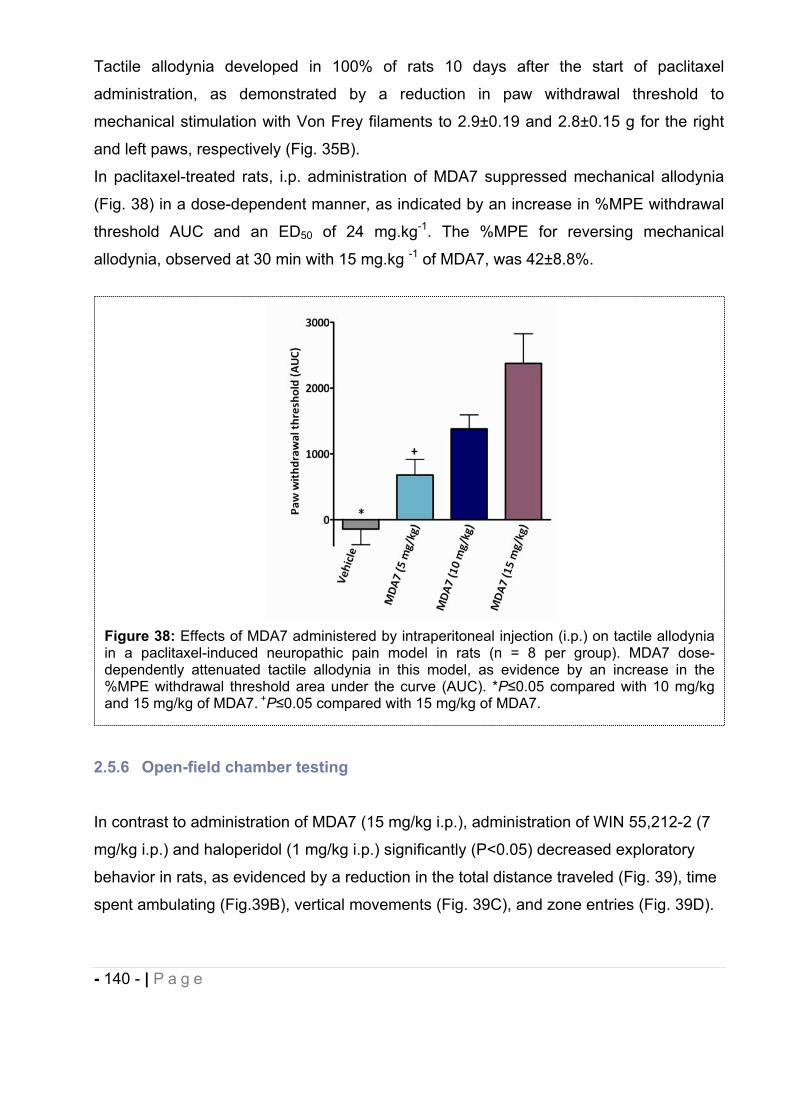
- 140 - | P a g e
Tactile allodynia developed in 100% of rats 10 days after the start of paclitaxel
administration, as demonstrated by a reduction in paw withdrawal threshold to
mechanical stimulation with Von Frey filaments to 2.9±0.19 and 2.8±0.15 g for the right
and left paws, respectively (Fig. 35B).
In paclitaxel-treated rats, i.p. administration of MDA7 suppressed mechanical allodynia
(Fig. 38) in a dose-dependent manner, as indicated by an increase in %MPE withdrawal
threshold AUC and an ED50 of 24 mg.kg-1. The %MPE for reversing mechanical
allodynia, observed at 30 min with 15 mg.kg -1 of MDA7, was 42±8.8%.
2.5.6 Open-field chamber testing
In contrast to administration of MDA7 (15 mg/kg i.p.), administration of WIN 55,212-2 (7
mg/kg i.p.) and haloperidol (1 mg/kg i.p.) significantly (P<0.05) decreased exploratory
behavior in rats, as evidenced by a reduction in the total distance traveled (Fig. 39), time
spent ambulating (Fig.39B), vertical movements (Fig. 39C), and zone entries (Fig. 39D).
Figure 38: Effects of MDA7 administered by intraperitoneal injection (i.p.) on tactile allodynia in a paclitaxel-induced neuropathic pain model in rats (n = 8 per group). MDA7 dose-dependently attenuated tactile allodynia in this model, as evidence by an increase in the %MPE withdrawal threshold area under the curve (AUC). *P 0.05 compared with 10 mg/kg and 15 mg/kg of MDA7. +P 0.05 compared with 15 mg/kg of MDA7.
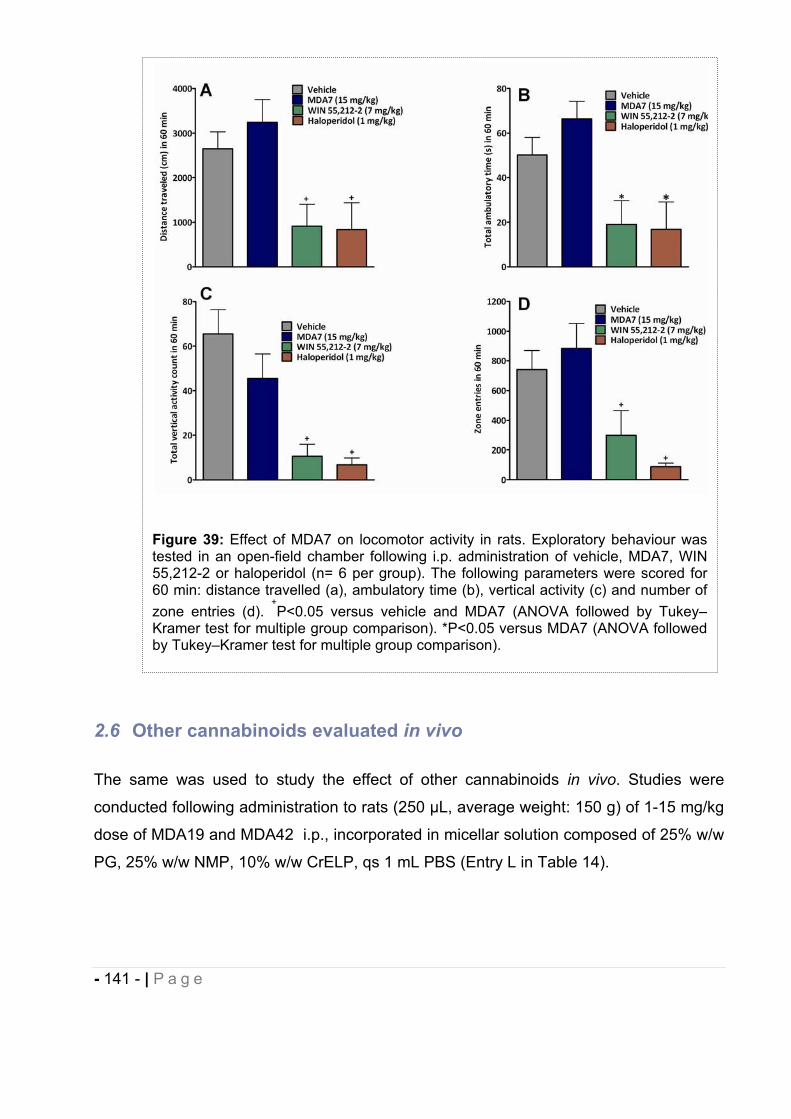
- 141 - | P a g e
2.6 Other cannabinoids evaluated in vivo
The same was used to study the effect of other cannabinoids in vivo. Studies were
conducted following administration to rats (250 μL, average weight: 150 g) of 1-15 mg/kg
dose of MDA19 and MDA42 i.p., incorporated in micellar solution composed of 25% w/w
PG, 25% w/w NMP, 10% w/w CrELP, qs 1 mL PBS (Entry L in Table 14).
Figure 39: Effect of MDA7 on locomotor activity in rats. Exploratory behaviour was tested in an open-field chamber following i.p. administration of vehicle, MDA7, WIN 55,212-2 or haloperidol (n= 6 per group). The following parameters were scored for 60 min: distance travelled (a), ambulatory time (b), vertical activity (c) and number of zone entries (d).
+P<0.05 versus vehicle and MDA7 (ANOVA followed by Tukey–
Kramer test for multiple group comparison). *P<0.05 versus MDA7 (ANOVA followed by Tukey–Kramer test for multiple group comparison).
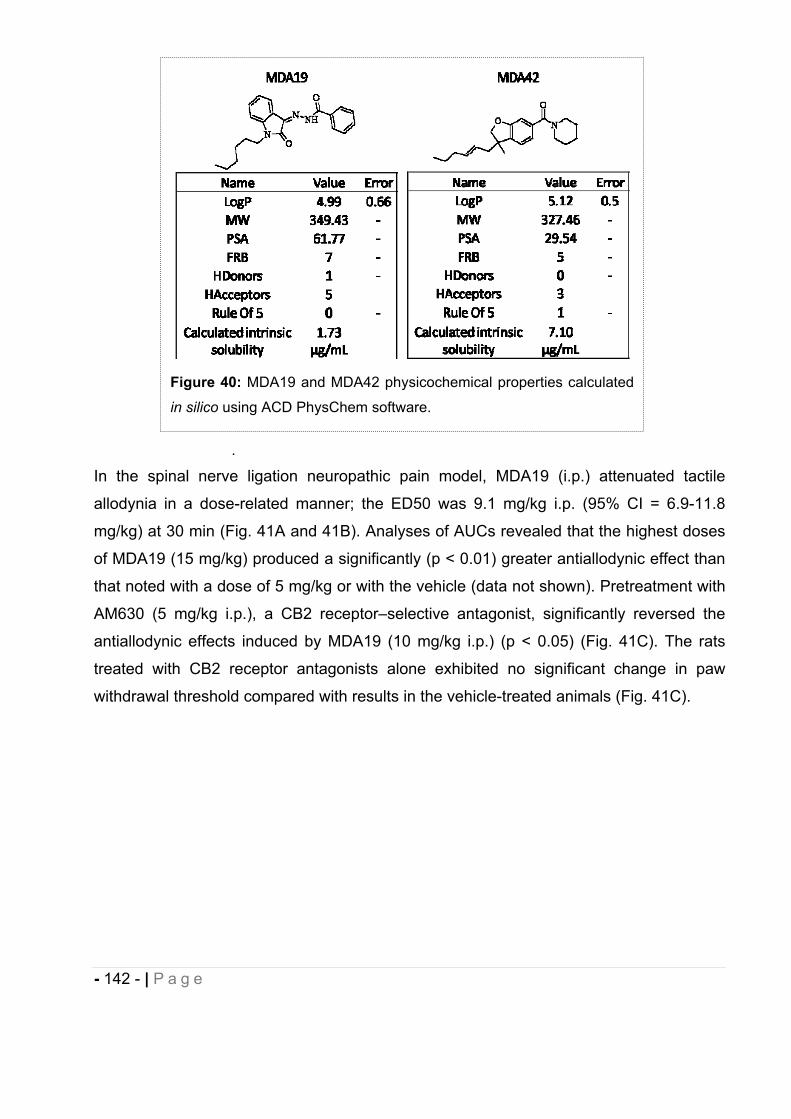
- 142 - | P a g e
.
In the spinal nerve ligation neuropathic pain model, MDA19 (i.p.) attenuated tactile
allodynia in a dose-related manner; the ED50 was 9.1 mg/kg i.p. (95% CI = 6.9-11.8
mg/kg) at 30 min (Fig. 41A and 41B). Analyses of AUCs revealed that the highest doses
of MDA19 (15 mg/kg) produced a significantly (p < 0.01) greater antiallodynic effect than
that noted with a dose of 5 mg/kg or with the vehicle (data not shown). Pretreatment with
AM630 (5 mg/kg i.p.), a CB2 receptor–selective antagonist, significantly reversed the
antiallodynic effects induced by MDA19 (10 mg/kg i.p.) (p < 0.05) (Fig. 41C). The rats
treated with CB2 receptor antagonists alone exhibited no significant change in paw
withdrawal threshold compared with results in the vehicle-treated animals (Fig. 41C).
Figure 40: MDA19 and MDA42 physicochemical properties calculated
in silico using ACD PhysChem software.
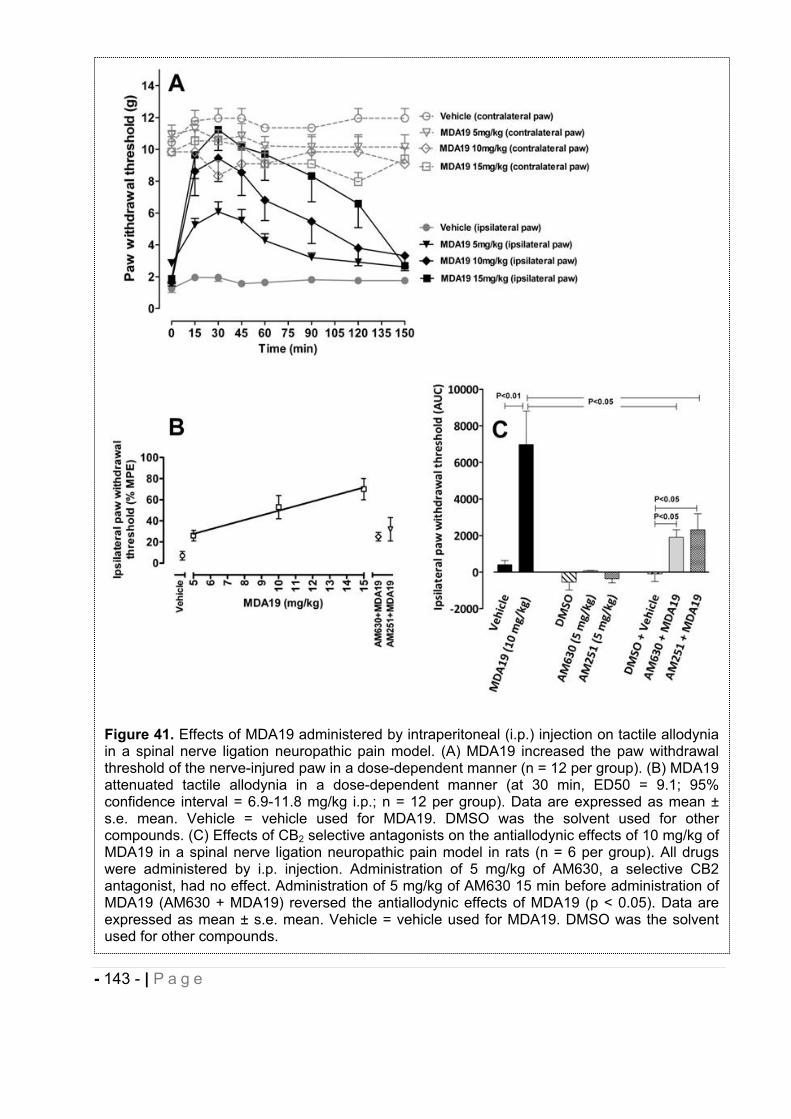
- 143 - | P a g e
Figure 41. Effects of MDA19 administered by intraperitoneal (i.p.) injection on tactile allodynia in a spinal nerve ligation neuropathic pain model. (A) MDA19 increased the paw withdrawal threshold of the nerve-injured paw in a dose-dependent manner (n = 12 per group). (B) MDA19 attenuated tactile allodynia in a dose-dependent manner (at 30 min, ED50 = 9.1; 95% confidence interval = 6.9-11.8 mg/kg i.p.; n = 12 per group). Data are expressed as mean ± s.e. mean. Vehicle = vehicle used for MDA19. DMSO was the solvent used for other compounds. (C) Effects of CB2 selective antagonists on the antiallodynic effects of 10 mg/kg of MDA19 in a spinal nerve ligation neuropathic pain model in rats (n = 6 per group). All drugs were administered by i.p. injection. Administration of 5 mg/kg of AM630, a selective CB2 antagonist, had no effect. Administration of 5 mg/kg of AM630 15 min before administration of MDA19 (AM630 + MDA19) reversed the antiallodynic effects of MDA19 (p < 0.05). Data are expressed as mean ± s.e. mean. Vehicle = vehicle used for MDA19. DMSO was the solvent used for other compounds.
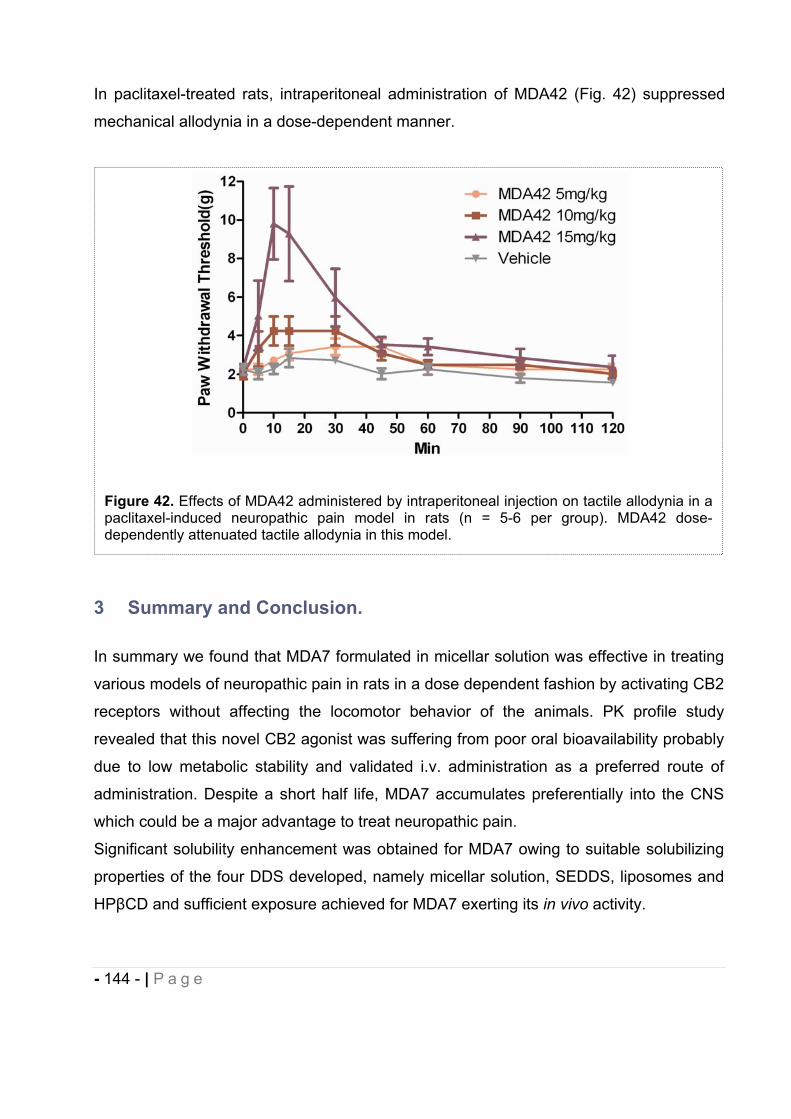
- 144 - | P a g e
In paclitaxel-treated rats, intraperitoneal administration of MDA42 (Fig. 42) suppressed
mechanical allodynia in a dose-dependent manner.
3 Summary and Conclusion.
In summary we found that MDA7 formulated in micellar solution was effective in treating
various models of neuropathic pain in rats in a dose dependent fashion by activating CB2
receptors without affecting the locomotor behavior of the animals. PK profile study
revealed that this novel CB2 agonist was suffering from poor oral bioavailability probably
due to low metabolic stability and validated i.v. administration as a preferred route of
administration. Despite a short half life, MDA7 accumulates preferentially into the CNS
which could be a major advantage to treat neuropathic pain.
Significant solubility enhancement was obtained for MDA7 owing to suitable solubilizing
properties of the four DDS developed, namely micellar solution, SEDDS, liposomes and
HP CD and sufficient exposure achieved for MDA7 exerting its in vivo activity.
Figure 42. Effects of MDA42 administered by intraperitoneal injection on tactile allodynia in a paclitaxel-induced neuropathic pain model in rats (n = 5-6 per group). MDA42 dose-dependently attenuated tactile allodynia in this model.
- 145 - | P a g e
In our specific study comparing the influence of the DDS used on the drug efficacy, we
evidenced that DDS alter not only the physicochemical properties of the drug (e.g.
solubility, stability) but also its pharmacokinetics (e.g. elimination, metabolic stability).
Concepts of enabling formulation and the excipients themselves participate to this effect
and their selection should be considered on case by case basis during the process of
NCE development. Through inclusion complexation and possibly formation of
aggregates, HP CD improved greatly antiallodynic effect of the CB2 agonist in
comparison to incorporation in micellar preparation or liposomes. Biopharmaceutics
Classification System (BCS) Class II preclinical drug candidates to treat neuropathic pain
such as MDA7 could behave as BCS Class I drug candidates by using HP CD based
DDS as an early formulation strategy, which will results in an improved bioavailability and
an increased in vivo efficacy. In addition HP CD DDS are transformable into clinical
formulations. Further studies with fluorescent dyes incorporated in the nanocarriers may
help evaluating their in vivo fate (e.g. integrity, elimination) and subsequently address
and overcome in vivo delivery of the drug.
In addition, the DDS based on micellar preparation allow us to test different molecules
MDA19 and MDA42 in vivo with high lipophilicity (>4). They both showed efficacy in in
vivo model of neuropathic pain confirming the versatility of this vehicle for lipophilic
molecules such as cannabinoid ligands. Even though MDA19 and MDA42 exhibit a high
lipophilicity, their corresponding PSA values are significantly different. In addition,
MDA19 is a planar molecule and MDA42 has a quaternary carbon resulting in a non
planar structure. Thus this micellar preparation can be used with molecules exhibiting
different chemical architecture.
- 146 - | P a g e
4 REFERENCES
1. Gad, S. C.; Cassidy, C. D.; Aubert, N.; Spainhour, B.; Robbe, H., Nonclinical vehicle use in studies by multiple routes in multiple species. International Journal of Toxicology 2006, 25, (6), 499-521.
2. Gad, S. Vehicles for animal studies. http://www.gadconsulting.com/vehicles.htm3. Amidon, G. L.; Lennernäs, H.; Shah, V. P.; Crison, J. R., A Theoretical Basis for a
Biopharmaceutic Drug Classification: The Correlation of in vitro Drug Product Dissolution and in vivo Bioavailability. Pharmaceutical Research 1995, 12, (3), 413-420.
4. Altan, S. Issues in Non-Clinical Statistics; Rutgers university: New Jersey, 2009. 5. Kerns, L. D. a. E. H. Optimizing the Physicochemical Properties of Clinical
Candidates During Drug Discovery; 2009. 6. Ash, M. a. I., Handbook of preservatives. Synapse Information Resources, Inc: NY,
2004.7. FDA, APPENDIX 6. TOXICOLOGICAL DATA FOR CLASS 3 SOLVENTS. In. 8. Shah, A. K.; Agnihotri, S. A., Recent advances and novel strategies in pre-clinical
formulation development: an overview. J Control Release 2011, 156, (3), 281-96. 9. ISP Pharmasolve (N-Methyl-2-Pyrrolidone); International Specialty Products: 2000. 10. WHO, W. H. O.-. N-methyl-2-pyrrolidone - Concise International Chemical
Assessment Document 35; Geneva, 2001. 11. Mottu, F.; Laurent, A.; Rufenacht, D. A.; Doelker, E., Organic solvents for
pharmaceutical parenterals and embolic liquids: a review of toxicity data. PDA J Pharm Sci Technol 2000, 54, (6), 456-69.
12. Pestel, S.; Martin, H.-J.; Maier, G.-M.; Guth, B., Effect of commonly used vehicles on gastrointestinal, renal, and liver function in rats. Journal of pharmacological and toxicological methods 2006, 54, (2), 200-14.
13. GmbH, S. Photon Correlation Spectroscopy. http://www.sympatec.com/EN/PCCS/PCS.html
14. University_Waterloo Research overview - Surfactants. http://science.uwaterloo.ca/~wettig/Research/overview.html
15. Lasic, D. D., Liposomes in Gene delivery. Boca Raton, 1997. 16. Higuchi, I., Phase-Solubility Techniques. Advances in analytical chemistry and
instrumentation 1965, 4, (117). 17. Torchilin, V. P., Recent advances with liposomes as pharmaceutical carriers. Nature
Reviews Drug Discovery 2005, 4, (2), 145-160. 18. Sattler, K. D., Handbook of Nanophysics: Nanomedicine and Nanorobotics. CRC
Press: Boca Raton, 2011. 19. Jesorka, A.; Orwar, O., Liposomes: technologies and analytical applications. Annu
Rev Anal Chem (Palo Alto Calif) 2008, 1, 801-32. 20. Yalkowsky, S. H., Solubility and Solubilization in Aqueous Media. Oxford University
Press: New York 1999. 21. Strickley, R. G., Solubilizing excipients in oral and injectable formulations. Pharm
Res 2004, 21, (2), 201-30. 22. Li, P.; Zhao, L., Developing early formulations: Practice and perspective.
International Journal of Pharmaceutics 2007, 341, (1–2), 1-19. 23. Liu, R., Water-insoluble drug formulation. Second edition ed.; CRC Press: Boca
Raton, 2008.
- 147 - | P a g e
24. Li, P.; Zhao, L.; Yalkowsky, S. H., Combined effect of cosolvent and cyclodextrin on solubilization of nonpolar drugs. J Pharm Sci 1999, 88, (11), 1107-11.
25. Chang, R. K.; Shojaei, A. H., Effect of hydroxypropyl beta-cyclodextrin on drug solubility in water-propylene glycol mixtures. Drug Dev Ind Pharm 2004, 30, (3), 297-302.
26. Kawakami, K.; Miyoshi, K.; Ida, Y., Solubilization behavior of poorly soluble drugs with combined use of Gelucire 44/14 and cosolvent. Journal of Pharmaceutical Sciences 2004, 93, (6), 1471-1479.
27. Maas, J.; Kamm, W.; Hauck, G., An integrated early formulation strategy--from hit evaluation to preclinical candidate profiling. Eur J Pharm Biopharm 2007, 66, (1), 1-10.
28. Sun, D. X.; Yu, L. X.; Hussain, M. A.; Wall, D. A.; Smith, R. L.; Amidon, G. L., In vitro testing of drug absorption for drug 'developability' assessment: Forming an interface between in vitro preclinical data and clinical outcome. Curr Opin Drug Disc 2004, 7, (1), 75-85.
29. Loftsson, T.; Magnusdottir, A.; Masson, M.; Sigurjonsdottir, J. F., Self-association and cyclodextrin solubilization of drugs. J Pharm Sci 2002, 91, (11), 2307-16.
30. Loftsson, T.; Masson, M.; Brewster, M. E., Self-association of cyclodextrins and cyclodextrin complexes. J Pharm Sci 2004, 93, (5), 1091-9.
31. Messner, M.; Kurkov, S. V.; Jansook, P.; Loftsson, T., Self-assembled cyclodextrin aggregates and nanoparticles. Int J Pharm 2010, 387, (1-2), 199-208.
32. Loftsson, T.; Brewster, M. E., Pharmaceutical applications of cyclodextrins. 1. Drug solubilization and stabilization. J Pharm Sci 1996, 85, (10), 1017-25.
33. Ozdemir, N.; Erkin, J., Enhancement of dissolution rate and bioavailability of sulfamethoxazole by complexation with beta-cyclodextrin. Drug Dev Ind Pharm 2012, 38, (3), 331-40.
34. Bouquet, W.; Ceelen, W.; Adriaens, E.; Almeida, A.; Quinten, T.; De Vos, F.; Pattyn, P.; Peeters, M.; Remon, J. P.; Vervaet, C., In vivo toxicity and bioavailability of Taxol and a paclitaxel/beta-cyclodextrin formulation in a rat model during HIPEC. Ann Surg Oncol 2010, 17, (9), 2510-7.
35. Abosehmah-Albidy, A. Z.; York, P.; Wong, V.; Losowsky, M. S.; Chrystyn, H., Improved bioavailability and clinical response in patients with chronic liver disease following the administration of a spironolactone: beta-cyclodextrin complex. Br J Clin Pharmacol 1997, 44, (1), 35-9.
36. Ricevuti, G.; Mazzone, A.; Pasotti, D.; Uccelli, E.; Pasquali, F.; Gazzani, G.; Fregnan, G. B., Pharmacokinetics of dipyridamole-beta-cyclodextrin complex in healthy volunteers after single and multiple doses. Eur J Drug Metab Pharmacokinet 1991, 16, (3), 197-201.
37. Shulman, M.; Cohen, M.; Soto-Gutierrez, A.; Yagi, H.; Wang, H.; Goldwasser, J.; Lee-Parsons, C. W.; Benny-Ratsaby, O.; Yarmush, M. L.; Nahmias, Y., Enhancement of naringenin bioavailability by complexation with hydroxypropoyl-beta-cyclodextrin. PLoS One 2011, 6, (4), e18033.
38. Loftsson, T.; Brewster, M. E., Pharmaceutical applications of cyclodextrins: effects on drug permeation through biological membranes. J Pharm Pharmacol 2011, 63, (9), 1119-35.
39. Nakanishi, K.; Masukawa, T.; Nadai, T.; Yoshii, K.; Okada, S.; Miyajima, K., Sustained release of flufenamic acid from a drug-triacetyl-beta-cyclodextrincomplex. Biological & Pharmaceutical Bulletin 1997, 20, (1), 66-70.
- 148 - | P a g e
40. Palem, C. R.; Battu, S. K.; Gannu, R.; Yamsani, V. V.; Repka, M. A.; Yamsani, M. R., Role of cyclodextrin complexation in felodipine-sustained release matrix tablets intended for oral transmucosal delivery: In vitro and ex vivo characterization. PharmDev Technol 2011.
41. Hirayama, F.; Hirashima, N.; Abe, K.; Uekama, K.; Ijitsu, T.; Ueno, M., Utilization of diethyl-beta-cyclodextrin as a sustained-release carrier for isosorbide dinitrate. JPharm Sci 1988, 77, (3), 233-6.
42. Park, J. H.; Choi, K. H.; Kwak, H. S., Single- and 14-Day Repeat-Dose Toxicity of Cross-Linked beta-Cyclodextrin in Rats. Int J Toxicol 2011, 30, (6), 700-6.
43. Lina, B. A.; Bar, A., Subchronic oral toxicity studies with alpha-cyclodextrin in rats. Regul Toxicol Pharmacol 2004, 39 Suppl 1, S14-26.
44. Brewster, M. E.; Loftsson, T., Cyclodextrins as pharmaceutical solubilizers. Advanced Drug Delivery Reviews 2007, 59, (7), 645-66.
45. Ribeiro-Rama, A. C.; Figueiredo, I. V.; Veiga, F.; Castel-Branco, M. M.; Cabrita, A. M.; Caramona, M. M., Evaluation of gastric toxicity of indomethacin acid, salt form and complexed forms with hydroxypropyl-beta-cyclodextrin on Wistar rats: histopathologic analysis. Fundam Clin Pharmacol 2009, 23, (6), 747-55.
46. Szejtli, J., Medicinal applications of cyclodextrins. Med Res Rev 1994, 14, (3), 353-86.
47. Sabadini, E.; Cosgrove, T.; Egidio Fdo, C., Solubility of cyclomaltooligosaccharides (cyclodextrins) in H2O and D2O: a comparative study. Carbohydr Res 2006, 341, (2), 270-4.
48. Dodziuk, H., Cyclodextrins and their complexes: chemistry, analytical methods, applications. Wiley-VCH: 2006.
49. Loftsson, T.; Brewster, M. E., Pharmaceutical applications of cyclodextrins: basic science and product development. Journal of Pharmacy and Pharmacology 2010, 62, (11), 1607-1621.
50. Stella, V. J.; Rao, V. M.; Zannou, E. A.; Zia, V., Mechanisms of drug release from cyclodextrin complexes. Advanced Drug Delivery Reviews 1999, 36, (1), 3-16.
51. Tabushi, I., Cyclodextrin Catalysis as a Model for Enzyme Action. Accounts Chem Res 1982, 15, (3), 66-72.
52. Szejtli, J., Cyclodextrin Technology. Kluwer: Dordrecht, 1988. 53. Chadha, R.; Kashid, N.; Saini, A., Account of analytical techniques employed for the
determination of thermodynamics of inclusion complexation of drugs with cyclodextrins. J Sci Ind Res India 2004, 63, (3), 211-229.
54. Stella, V. J.; He, Q., Cyclodextrins. Toxicologic Pathology 2008, 36, (1), 30-42. 55. Loftsson, T.; Hreinsdóttir, D.; Másson, M., Evaluation of cyclodextrin solubilization of
drugs. International Journal of Pharmaceutics 2005, 302, (1–2), 18-28. 56. Job, P., Formation and stability of inorganic complexes in solution. Annali di
Chimica Applicata 1928, (9), 113-203 57. Cabrer, P. R.; Azvarez-Parrilla, E.; Meijide, F.; Seijas, J. A.; Nunez, E. R.; Tato, J.
V., Complexation of sodium cholate and sodium deoxycholate by beta-cyclodextrin and derivatives. Langmuir 1999, 15, (17), 5489-5495.
58. Ramstad, T.; Hadden, C. E.; Martin, G. E.; Speaker, S. M.; Teagarden, D. L.; Thamann, T. J., Determination by NMR of the binding constant for the molecular complex between alprostadil and alpha-cyclodextrin. Implications for a freeze-dried formulation. Int J Pharm 2005, 296, (1-2), 55-63.
- 149 - | P a g e
59. Steffan, B.; Fischer, W.; Cordes, G.; Habon, I.; Muller, R., 1H-nuclear magnetic resonance (NMR) studies on the inclusion complex of prostaglandin E1 (PGE1) with alpha-cyclodextrin. Pharmaceutical Research 1992, 9, (4), 575-7.
60. Fielding, L.; McKellar, S. C.; Florence, A. J., Precision studies in supramolecular chemistry: a 1H NMR study of hydroxymethoxyacetophenone/beta-cyclodextrincomplexes. Magn Reson Chem 2011, 49, (7), 405-12.
61. Bernini, A.; Spiga, O.; Ciutti, A.; Scarselli, M.; Bottoni, G.; Mascagni, P.; Niccolai, N., NMR studies of the inclusion complex between beta-cyclodextrin and paroxetine. Eur J Pharm Sci 2004, 22, (5), 445-50.
62. Cramer, F.; Saenger, W.; Spatz, H. C., Inclusion Compounds. XIX.1a The Formation of Inclusion Compounds of -Cyclodextrin in Aqueous Solutions. Thermodynamics and Kinetics. Journal of the American Chemical Society 1967, 89, (1), 14-20.
63. Connors, K. A., Binding Constants. The Measurements of Molecular Complex stability. Wiley: New York, 1987; p 189-192.
64. Figueiras, A.; Sarraguça, J.; Carvalho, R.; Pais, A.; Veiga, F., Interaction of Omeprazole with a Methylated Derivative of -Cyclodextrin: Phase Solubility, NMR Spectroscopy and Molecular Simulation. Pharmaceutical Research 2007, 24, (2), 377-389.
65. Hazekamp, A.; Verpoorte, R., Structure elucidation of the tetrahydrocannabinol complex with randomly methylated -cyclodextrin. European Journal of Pharmaceutical Sciences 2006, 29, (5), 340-347.
66. Gabelica, V.; Galic, N.; De Pauw, E., On the specificity of cyclodextrin complexes detected by electrospray mass spectrometry. J Am Soc Mass Spectrom 2002, 13, (8), 946-53.
67. Smith, R. D.; Light-Wahl, K. J., The observation of non-covalent interactions in solution by electrospray ionization mass spectrometry: Promise, pitfalls and prognosis. Biological Mass Spectrometry 1993, 22, (9), 493-501.
68. Schalley, C. A., Supramolecular chemistry goes gas phase: the mass spectrometric examination of noncovalent interactions in host–guest chemistry and molecular recognition. International Journal of Mass Spectrometry 2000, 194, (1), 11-39.
69. Loftsson, T.; Masson, M.; Sigurjonsdottir, J. F., Methods to enhance the complexation efficiency of cyclodextrins. Stp Pharma Sci 1999, 9, (3), 237-242.
70. Jansook, P.; Kurkov, S. V.; Loftsson, T., Cyclodextrins as solubilizers: Formation of complex aggregates. Journal of Pharmaceutical Sciences 2010, 99, (2), 719-729.
71. He, Y.; Fu, P.; Shen, X.; Gao, H., Cyclodextrin-based aggregates and characterization by microscopy. Micron 2008, 39, (5), 495-516.
72. Ghosh, P.; Maity, A.; Das, T.; Dash, J.; Purkayastha, P., Modulation of Small Molecule Induced Architecture of Cyclodextrin Aggregation by Guest Structure and Host Size. The Journal of Physical Chemistry C 2011, 115, (43), 20970-20977.
73. Ghosh, A.; Biswas, S.; Ghosh, T., Preparation and Evaluation of Silymarin beta-cyclodextrin Molecular Inclusion Complexes. J Young Pharm 2011, 3, (3), 205-10.
74. Van Hees, T.; Piel, G.; Evrard, B.; Otte, X.; Thunus, L.; Delattre, L., Application of supercritical carbon dioxide for the preparation of a piroxicam-beta-cyclodextrininclusion compound. Pharm Res 1999, 16, (12), 1864-70.
75. Charoenchaitrakool, M.; Dehghani, F.; Foster, N. R., Utilization of supercritical carbon dioxide for complex formation of ibuprofen and methyl-beta-cyclodextrin. IntJ Pharm 2002, 239, (1-2), 103-12.
- 150 - | P a g e
76. Hussein, K.; Turk, M.; Wahl, M. A., Comparative evaluation of ibuprofen/beta-cyclodextrin complexes obtained by supercritical carbon dioxide and other conventional methods. Pharmaceutical Research 2007, 24, (3), 585-592.
77. Shimpi, S.; Chauhan, B.; Shimpi, P., Cyclodextrins: application in different routes of drug administration. Acta Pharm 2005, 55, (2), 139-56.
78. Gould, S.; Scott, R. C., 2-hydroxypropyl-beta-cyclodextrin (HP-beta-CD): A toxicology review. Food and Chemical Toxicology 2005, 43, (10), 1451-1459.
79. de Repentigny, L.; Ratelle, J.; Leclerc, J.-M.; Cornu, G.; Sokal, É. M.; Jacqmin, P.; de Beule, K., Repeated-Dose Pharmacokinetics of an Oral Solution of Itraconazole in Infants and Children. Antimicrobial Agents and Chemotherapy 1998, 42, (2), 404-408.
80. Stevens, D. A., Itraconazole in cyclodextrin solution. Pharmacotherapy 1999, 19, (5), 603-611.
81. Janssen-Cilag Sporanox I.V. 10 mg/ml concentrate and solvent for solution for infusion.
82. Irie, T.; Uekama, K., Pharmaceutical applications of cyclodextrins .3. Toxicological issues and safety evaluation. Journal of Pharmaceutical Sciences 1997, 86, (2), 147-162.
83. Thompson, D. O., Cyclodextrins--enabling excipients: their present and future use in pharmaceuticals. Crit Rev Ther Drug Carrier Syst 1997, 14, (1), 1-104.
84. Challa, R.; Ahuja, A.; Ali, J.; Khar, R. K., Cyclodextrins in drug delivery: an updated review. Aaps Pharmscitech 2005, 6, (2), E329-57.
85. Irache, J. M.; Esparza, I.; Gamazo, C.; Agueros, M.; Espuelas, S., Nanomedicine: novel approaches in human and veterinary therapeutics. Vet Parasitol 2011, 180, (1-2), 47-71.
86. Lasic, D. D., The mechanism of vesicle formation. Biochem J 1988, 256, (1), 1-11. 87. Lasic, D. D., A General-Model of Vesicle Formation. Journal of Theoretical Biology
1987, 124, (1), 35-41. 88. Fromherz, P., Lipid-Vesicle Structure - Size Control by Edge-Active Agents. Chem
Phys Lett 1983, 94, (3), 259-266. 89. Hickey, H. D. C. S. A. J., Controlled Pulmonary Delivery. In Controlled Release
Society: 2011. 90. Drummond, D. C.; Meyer, O.; Hong, K.; Kirpotin, D. B.; Papahadjopoulos, D.,
Optimizing liposomes for delivery of chemotherapeutic agents to solid tumors. Pharmacol Rev 1999, 51, (4), 691-743.
91. Song, G.; Wu, H.; Yoshino, K.; Zamboni, W. C., Factors affecting the pharmacokinetics and pharmacodynamics of liposomal drugs. Journal of Liposome Research 2012, 0, (0), 1-16.
92. Vemuri, S.; Rhodes, C. T., Preparation and characterization of liposomes as therapeutic delivery systems: a review. Pharmaceutica acta Helvetiae 1995, 70, (2), 95-111.
93. Weiner, N.; Martin, F.; Riaz, M., Liposomes as a Drug Delivery System. Drug Development and Industrial Pharmacy 1989, 15, (10), 1523-1554.
94. Saito, H.; Shinoda, W., Cholesterol Effect on Water Permeability through DPPC and PSM Lipid Bilayers: A Molecular Dynamics Study. The Journal of Physical Chemistry B 2011, 115, (51), 15241-15250.
95. Webb, M. S.; Harasym, T. O.; Masin, D.; Bally, M. B.; Mayer, L. D., Sphingomyelin-cholesterol liposomes significantly enhance the pharmacokinetic and therapeutic
- 151 - | P a g e
properties of vincristine in murine and human tumour models. Br J Cancer 1995, 72, (4), 896-904.
96. Bista, R. K.; Bruch, R. F., Near-infrared spectroscopy of newly developed PEGylated lipids. Spectrochim Acta A Mol Biomol Spectrosc 2008, 71, (2), 410-6.
97. Maeda, H.; Bharate, G. Y.; Daruwalla, J., Polymeric drugs for efficient tumor-targeted drug delivery based on EPR-effect. Eur J Pharm Biopharm 2009, 71, (3), 409-19.
98. Gabizon, A. A., Pegylated liposomal doxorubicin: Metamorphosis of an old drug into a new form of chemotherapy. Cancer Investigation 2001, 19, (4), 424-436.
99. Gabizon, A.; Catane, R.; Uziely, B.; Kaufman, B.; Safra, T.; Cohen, R.; Martin, F.; Huang, A.; Barenholz, Y., Prolonged circulation time and enhanced accumulation in malignant exudates of doxorubicin encapsulated in polyethylene-glycol coated liposomes. Cancer Res 1994, 54, (4), 987-92.
100. Meure, L. A.; Foster, N. R.; Dehghani, F., Conventional and dense gas techniques for the production of liposomes: a review. Aaps Pharmscitech 2008, 9, (3), 798-809.
101. Samad, A.; Sultana, Y.; Aqil, M., Liposomal drug delivery systems: an update review. Curr Drug Deliv 2007, 4, (4), 297-305.
102. Berger, N.; Sachse, A.; Bender, J.; Schubert, R.; Brandl, M., Filter extrusion of liposomes using different devices: comparison of liposome size, encapsulation efficiency, and process characteristics. International Journal of Pharmaceutics 2001, 223, (1-2), 55-68.
103. Torchilin, V. P., Liposomes : a practical approach. Oxford University Press: Oxford, 2003.
104. Jones, M. C.; Leroux, J. C., Polymeric micelles - a new generation of colloidal drug carriers. Eur J Pharm Biopharm 1999, 48, (2), 101-111.
105. Matsumura, Y., Micelle carrier system in clinical trial. Nihon Rinsho 2006, 64, (2), 316-21.
106. Kim, S.; Shi, Y.; Kim, J. Y.; Park, K.; Cheng, J. X., Overcoming the barriers in micellar drug delivery: loading efficiency, in vivo stability, and micelle-cell interaction. Expert Opin Drug Deliv 2010, 7, (1), 49-62.
107. Sakai, H.; Aikawa, S.; Matsuda, W.; Ohmori, T.; Fukukita, Y.; Tezuka, Y.; Matsumura, A.; Torigoe, K.; Tsuchiya, K.; Arimitsu, K.; Sakamoto, K.; Sakai, K.; Abe, M., A cinnamic acid-type photo-cleavable surfactant. J Colloid Interface Sci 2012, 376, (1), 160-4.
108. Torchilin, V. P., Micellar nanocarriers: pharmaceutical perspectives. Pharm Res 2007, 24, (1), 1-16.
109. Lazaridis, T.; Mallik, B.; Chen, Y., Implicit solvent simulations of DPC micelle formation. J Phys Chem B 2005, 109, (31), 15098-106.
110. Moroi, Y.; Matuura, R., Thermodynamics of Solubilization into Surfactant Micelles - Effect of Hydrophobicity of Both Solubilizate and Surfactant Molecules. J Colloid Interf Sci 1988, 125, (2), 456-462.
111. Velinova, M.; Sengupta, D.; Tadjer, A. V.; Marrink, S. J., Sphere-to-rod transitions of nonionic surfactant micelles in aqueous solution modeled by molecular dynamics simulations. Langmuir 2011, 27, (23), 14071-7.
112. Rangel-Yagui, C. O.; Pessoa, A., Jr.; Tavares, L. C., Micellar solubilization of drugs. J Pharm Pharm Sci 2005, 8, (2), 147-65.
113. Vladimir P, T., Structure and design of polymeric surfactant-based drug delivery systems. Journal of Controlled Release 2001, 73, (2–3), 137-172.
- 152 - | P a g e
114. Jusufi, A.; Sanders, S.; Klein, M. L.; Panagiotopoulos, A. Z., Implicit-Solvent Models for Micellization: Nonionic Surfactants and Temperature-Dependent Properties. The Journal of Physical Chemistry B 2011, 115, (5), 990-1001.
115. Schick, M. J., Effect of temperature on the critical micelle concentration of nonionic detergents. Thermodynamic of micelle formation 1. The Journal of Physical Chemistry 1963, 67, (9), 1796-1799.
116. Becher, P.; Trifiletti, S. E., Nonionic surface-active agents: XII. The effect of solvent on the thermodynamics of micellization. J Colloid Interf Sci 1973, 43, (2), 485-490.
117. Shono, Y.; Nishihara, H.; Matsuda, Y.; Furukawa, S.; Okada, N.; Fujita, T.; Yamamoto, A., Modulation of intestinal P-glycoprotein function by cremophor EL and other surfactants by an in vitro diffusion chamber method using the isolated rat intestinal membranes. Journal of Pharmaceutical Sciences 2004, 93, (4), 877-885.
118. Webster, L. K.; Cosson, E. J.; Stokes, K. H.; Millward, M. J., Effect of the paclitaxel vehicle, Cremophor EL, on the pharmacokinetics of doxorubicin and doxorubicinol in mice. Br J Cancer 1996, 73, (4), 522-4.
119. Hugger, E. D.; Novak, B. L.; Burton, P. S.; Audus, K. L.; Borchardt, R. T., A comparison of commonly used polyethoxylated pharmaceutical excipients on their ability to inhibit P-glycoprotein activity in vitro. Journal of Pharmaceutical Sciences 2002, 91, (9), 1991-2002.
120. Sinicrope, F. A.; Dudeja, P. K.; Bissonnette, B. M.; Safa, A. R.; Brasitus, T. A., Modulation of P-Glycoprotein-Mediated Drug Transport by Alterations in Lipid Fluidity of Rat-Liver Canalicular Membrane-Vesicles. Journal of Biological Chemistry 1992, 267, (35), 24995-25002.
121. Chervinsky, D. S.; Brecher, M. L.; Baker, R. M.; Hoelcle, M. J.; Tebbi, C. K., Reversal of C1300 murine neuroblastoma multidrug resistance by cremophorEL, a solvent for cyclosporin A. Cancer Biother 1993, 8, (1), 67-75.
122. Whitehead, K.; Mitragotri, S., Mechanistic analysis of chemical permeation enhancers for oral drug delivery. Pharmaceutical Research 2008, 25, (6), 1412-1419.
123. Narang, A. S.; Delmarre, D.; Gao, D., Stable drug encapsulation in micelles and microemulsions. Int J Pharm 2007, 345, (1-2), 9-25.
124. Li, A.; Yalkowsky, S. H., Predicting cosolvency based on the log-linear module. Abstr Pap Am Chem S 1998, 216, U805-U805.
125. Miyako, Y.; Khalef, N.; Matsuzaki, K.; Pinal, R., Solubility enhancement of hydrophobic compounds by cosolvents: role of solute hydrophobicity on the solubilization effect. Int J Pharm 2010, 393, (1-2), 48-54.
126. Jouyban, A., Review of the cosolvency models for predicting solubility of drugs in water-cosolvent mixtures. J Pharm Pharm Sci 2008, 11, (1), 32-58.
127. Alvarez-Nunez, F. A.; Yalkowsky, S. H., Relationship between Polysorbate 80 solubilization descriptors and octanol-water partition coefficients of drugs. International Journal of Pharmaceutics 2000, 200, (2), 217-222.
128. Atwood D., F. A. T., Surfactants systems: Their chemistry, pharmacy and biology.Chapman and Hall: New York, 1983.
129. Kawakami, K.; Oda, N.; Miyoshi, K.; Funaki, T.; Ida, Y., Solubilization behavior of a poorly soluble drug under combined use of surfactants and cosolvents. EuropeanJournal of Pharmaceutical Sciences 2006, 28, (1–2), 7-14.
130. Sarkar, B.; Lam, S.; Alexandridis, P., Micellization of Alkyl-Propoxy-Ethoxylate Surfactants in Water Polar Organic Solvent Mixtures. Langmuir 2010, 26, (13), 10532-10540.
- 153 - | P a g e
131. D'Errico, G.; Ciccarelli, D.; Ortona, O., Effect of glycerol on micelle formation by ionic and nonionic surfactants at 25 °C. J Colloid Interf Sci 2005, 286, (2), 747-754.
132. Lindman, W., Micelles, amphiphile aggregation in aqueous solution. Topics in Current Chemistry. 1980, 87, 1-83.
133. Christie, R. J.; Grainger, D. W., Design strategies to improve soluble macromolecular delivery constructs. Adv Drug Deliv Rev 2003, 55, (3), 421-37.
134. Hubbell, J. A., Materials science. Enhancing drug function. Science 2003, 300, (5619), 595-6.
135. Hillaireau, H.; Couvreur, P., Nanocarriers' entry into the cell: relevance to drug delivery. Cellular and Molecular Life Sciences 2009, 66, (17), 2873-2896.
136. Dahan, A.; Miller, J. M.; Amidon, G. L., Prediction of Solubility and Permeability Class Membership: Provisional BCS Classification of the World's Top Oral Drugs. Aaps Journal 2009, 11, (4), 740-746.
137. Wang, Y.; Sun, J.; Zhang, T.; Liu, H.; He, F.; He, Z., Enhanced oral bioavailability of tacrolimus in rats by self-microemulsifying drug delivery systems. Drug Dev Ind Pharm 2011, 37, (10), 1225-30.
138. Mohsin, K.; Long, M. A.; Pouton, C. W., Design of Lipid-Based Formulations for Oral Administration of Poorly Water-Soluble Drugs: Precipitation of Drug after Dispersion of Formulations in Aqueous Solution. Journal of Pharmaceutical Sciences 2009, 98, (10), 3582-3595.
139. Patel, J.; Patel, A.; Raval, M.; Sheth, N., Formulation and development of a self-nanoemulsifying drug delivery system of irbesartan. J Adv Pharm Technol Res 2011, 2, (1), 9-16.
140. Venkatesh, G.; Majid, M. I.; Mansor, S. M.; Nair, N. K.; Croft, S. L.; Navaratnam, V., In vitro and in vivo evaluation of self-microemulsifying drug delivery system of buparvaquone. Drug Dev Ind Pharm 2010, 36, (6), 735-45.
141. Pouton, C. W., Formulation of poorly water-soluble drugs for oral administration: Physicochemical and physiological issues and the lipid formulation classification system. European Journal of Pharmaceutical Sciences 2006, 29, (3–4), 278-287.
142. Pouton, C. W.; Porter, C. J. H., Formulation of lipid-based delivery systems for oral administration: Materials, methods and strategies. Advanced Drug Delivery Reviews 2008, 60, (6), 625-637.
143. Ritesh B. Patel, R. P. P., Madhabhai M. Patel, Self-Emulsifying Drug Delivery Systems. In Pharmaceutical Technology, Advanstar Communications, Inc. : 2008.
144. Pouton, C. W., Lipid formulations for oral administration of drugs: non-emulsifying, self-emulsifying and ‘self-microemulsifying’ drug delivery systems. European Journal of Pharmaceutical Sciences 2000, 11, Supplement 2, (0), S93-S98.
145. Hetal, K. V.; Vasant, K. D., A review on self emulsifying drug delivery system. International Journal of Pharmaceutical and Chemical Sciences 2012, 1, (1), 353-359.
146. Gursoy, R. N.; Benita, S., Self-emulsifying drug delivery systems (SEDDS) for improved oral delivery of lipophilic drugs. Biomed Pharmacother 2004, 58, (3), 173-82.
147. Reiss, H., Entropy-Induced Dispersion of Bulk Liquids. J Colloid Interf Sci 1975, 53, (1), 61-70.
148. Ajay, K.; Surabhi, S.; Ravindra, K., Self emulsifying drug delivery system (SEDDS): Future aspects. International Journal of Pharmacy and Pharmaceutical Sciences 2010, 2, (4).
- 154 - | P a g e
149. Balakrishnan, P.; Lee, B. J.; Oh, D. H.; Kim, J. O.; Lee, Y. I.; Kim, D. D.; Jee, J. P.; Lee, Y. B.; Woo, J. S.; Yong, C. S.; Choi, H. G., Enhanced oral bioavailability of Coenzyme Q10 by self-emulsifying drug delivery systems. Int J Pharm 2009, 374, (1-2), 66-72.
150. Fatouros, D. G.; Karpf, D. M.; Nielsen, F. S.; Mullertz, A., Clinical studies with oral lipid based formulations of poorly soluble compounds. Ther Clin Risk Manag 2007, 3, (4), 591-604.
151. Sha, X.; Yan, G.; Wu, Y.; Li, J.; Fang, X., Effect of self-microemulsifying drug delivery systems containing Labrasol on tight junctions in Caco-2 cells. EuropeanJournal of Pharmaceutical Sciences 2005, 24, (5), 477-486.
152. Cornaire, G.; Woodley, J.; Hermann, P.; Cloarec, A.; Arellano, C.; Houin, G., Impact of excipients on the absorption of P-glycoprotein substrates in vitro and in vivo. International Journal of Pharmaceutics 2004, 278, (1), 119-131.
153. Kale, A. A.; Patravale, V. B., Design and evaluation of self-emulsifying drug delivery systems (SEDDS) of nimodipine. Aaps Pharmscitech 2008, 9, (1), 191-6.
154. Paton, R. G. P. D. T. W. D. M., The general pharmacology of cannabinoids. Oxford University Press: London, 1972; p 50-75.
155. Faller, B.; Ertl, P., Computational approaches to determine drug solubility. Advanced Drug Delivery Reviews 2007, 59, (7), 533-545.
156. Basavaraj K. Nanjwade*, G. K. D., Hiren M. Bechra, Veerendra K. Nanjwade and F.V. Manvi, Design and Characterization of Nanocrystals of Lovastatin for Solubility and Dissolution Enhancement. J Nanomedic Nanotechnol 2011, 2, (107).
157. FDA, Guidance for Industry, Waiver of in vivo bioavailability and bioequivalence studies for immediate-release solid oral dosage forms based on a biopharmaceutics classification system. In 2000.
158. Yan, B., Analysis and Purification Methods in Combinatorial Chemistry. Wiley-Intersciences: New Jersey, 2004.
159. Diaz, P.; Phatak, S. S.; Xu, J. J.; Fronczek, F. R.; Astruc-Diaz, F.; Thompson, C. M.; Cavasotto, C. N.; Naguib, M., 2,3-Dihydro-1-Benzofuran Derivatives as a Series of Potent Selective Cannabinoid Receptor 2 Agonists: Design, Synthesis, and Binding Mode Prediction through Ligand-Steered Modeling. ChemMedChem 2009, 4, (10), 1615-1629.
160. Lee, Y.-C.; Zocharski, P. D.; Samas, B., An intravenous formulation decision tree for discovery compound formulation development. International Journal of Pharmaceutics 2003, 253, (1–2), 111-119.
161. Cavas, M.; Beltran, D.; Navarro, J. F., Behavioural effects of dimethyl sulfoxide (DMSO): changes in sleep architecture in rats. Toxicol Lett 2005, 157, (3), 221-32.
162. M. Steven Evans, a., Kenneth H. Reid,b, and James B. Sharp Jr.c, Dimethyl Sulfoxide (DMSO) Blocks Conduction in Peripheral Nerve C Fibers: a Possible Mechanism of Analgesia Neuroscience Letters 1993, 150, 145-148.
163. Li, P.; Vishnuvajjala, R.; Tabibi, S. E.; Yalkowsky, S. H., Evaluation of in vitro precipitation methods. Journal of Pharmaceutical Sciences 1998, 87, (2), 196-199.
164. Balakrishnan, A.; Rege, B. D.; Amidon, G. L.; Polli, J. E., Surfactant-mediated dissolution: Contributions of solubility enhancement and relatively low micelle diffusivity. Journal of Pharmaceutical Sciences 2004, 93, (8), 2064-2075.
165. Xu, J. J.; Diaz, P.; Astruc-Diaz, F.; Craig, S.; Munoz, E.; Naguib, M., Pharmacological characterization of a novel cannabinoid ligand, MDA19, for treatment of neuropathic pain. Anesth Analg 2010, 111, (1), 99-109.
- 155 - | P a g e
166. Diaz, P.; Phatak, S. S.; Xu, J.; Fronczek, F. R.; Astruc-Diaz, F.; Thompson, C. M.; Cavasotto, C. N.; Naguib, M., 2,3-Dihydro-1-Benzofuran Derivatives as a Series of Potent Selective Cannabinoid Receptor 2 Agonists: Design, Synthesis, and Binding Mode Prediction through Ligand-Steered Modeling. ChemMedChem 2009, 4, (10), 1615-1629.
167. Marty, M. S.; Domoradzki, J. Y.; Hansen, S. C.; Timchalk, C.; Bartels, M. J.; Mattsson, J. L., The Effect of Route, Vehicle, and Divided Doses on the Pharmacokinetics of Chlorpyrifos and Its Metabolite Trichloropyridinol in Neonatal Sprague-Dawley Rats. Toxicological Sciences 2007, 100, (2), 360-373.
168. Shou, W. Z.; Naidong, W., Post-column infusion study of the 'dosing vehicle effect' in the liquid chromatography/tandem mass spectrometric analysis of discovery pharmacokinetic samples. Rapid Commun Mass Spectrom 2003, 17, (6), 589-97.
169. Heiser, A., Rat Jugular Vein and Carotid Artery Catheterization for Acute Survival Studies. In Springer: West Roxbury, 2007.
170. Lin, M.; Tesconi, M.; Tischler, M., Use of 1H NMR to facilitate solubility measurement for drug discovery compounds. International Journal of Pharmaceutics 2009, 369, (1–2), 47-52.
171. Walker, G. S.; Ryder, T. F.; Sharma, R.; Smith, E. B.; Freund, A., Validation of Isolated Metabolites from Drug Metabolism Studies as Analytical Standards by Quantitative NMR. Drug Metabolism and Disposition 2011, 39, (3), 433-440.
172. Holzgrabe, U.; Wawer, I.; Diehl, B., NMR Spectroscopy in Pharmaceutical Analysis.Elsevier B. V.: Oxford (UK), 2008.
173. Diehl, B. W. K. M., Frank; Holzgrabe, Ulrike Quantitative NMR spectroscopy in the quality evaluation of active pharmaceutical ingredients and excipients. . Spectroscopy Europe 2007, 19, (5).
174. Le Ferrec, E.; Chesne, C.; Artusson, P.; Brayden, D.; Fabre, G.; Gires, P.; Guillou, F.; Rousset, M.; Rubas, W.; Scarino, M. L., In vitro models of the intestinal barrier. The report and recommendations of ECVAM Workshop 46. European Centre for the Validation of Alternative methods. Altern Lab Anim 2001, 29, (6), 649-68.
175. Delongeas, J. L.; de Conchard, G. V.; Beamonte, A.; Bertheux, H.; Spire, C.; Maisonneuve, C.; Becourt-Lhote, N.; Goldfain-Blanc, F.; Claude, N., Assessment of Labrasol®/Labrafil®/Transcutol® (4/4/2, v/v/v) as a non-clinical vehicle for poorly water-soluble compounds after 4-week oral toxicity study in Wistar rats. Regul Toxicol Pharm 2010, 57, (2–3), 284-290.
176. Shah, N. H.; Carvajal, M. T.; Patel, C. I.; Infeld, M. H.; Malick, A. W., Self-Emulsifying Drug-Delivery Systems (Sedds) with Polyglycolyzed Glycerides for Improving in-Vitro Dissolution and Oral Absorption of Lipophilic Drugs. International Journal of Pharmaceutics 1994, 106, (1), 15-23.
177. McConnell, E. L.; Basit, A. W.; Murdan, S., Measurements of rat and mouse gastrointestinal pH, fluid and lymphoid tissue, and implications for in-vivo experiments. J Pharm Pharmacol 2008, 60, (1), 63-70.
178. Bachynsky, M. O.; Shah, N. H.; Patel, C. I.; Malick, A. W., Factors affecting the efficiency of a self-emulsifying oral delivery system. Drug Development and Industrial Pharmacy 1997, 23, (8), 809-816.
179. Craig, D. Q. M.; Barker, S. A.; Banning, D.; Booth, S. W., An Investigation into the Mechanisms of Self-Emulsification Using Particle-Size Analysis and Low-Frequency Dielectric-Spectroscopy. International Journal of Pharmaceutics 1995, 114, (1), 103-110.
- 156 - | P a g e
180. Rahman, M. A.; Hussain, A.; Hussain, M. S.; Mirza, M. A.; Iqbal, Z., Role of excipients in successful development of self-emulsifying/microemulsifying drug delivery system (SEDDS/SMEDDS). Drug Development and Industrial Pharmacy 2012, 0, (0), 1-19.
181. Malvern What does polydispersity mean?; 2011. 182. Constantinides, P. P.; Scalart, J. P.; Lancaster, C.; Marcello, J.; Marks, G.; Ellens,
H.; Smith, P. L., Formulation and intestinal absorption enhancement evaluation of water-in-oil microemulsions incorporating medium-chain glycerides. Pharm Res 1994, 11, (10), 1385-90.
183. Gershanik, T.; Benita, S., Self-dispersing lipid formulations for improving oral absorption of lipophilic drugs. Eur J Pharm Biopharm 2000, 50, (1), 179-188.
184. Rossi, G.; Reggiani, P.; Regazzi, M. B.; Gatti, S.; Ceccherelli, F.; Prato, P.; Galmarini, D.; Fassati, L. R., Neoral increases bioavailability versus oral sandimmune after porcine small bowel transplantation. Transplant P 1998, 30, (6), 2654-2656.
185. Taher Boukhris, M. L-S., Mohamed Skiba, Novel oral formulation of cyclosporine-spray-dried dispersion using cyclodextrin copolymer. Digest Journal of Nanomaterials and Biostructures 2012, 7, (1), 143-154.
186. Gabriel Lopez-Berestein, A. M. T., Soo-Jeong Lim Method to incorporate N-(4-hydroxyphenyl) retinamide in liposomes. 2002.
187. Zou, Y.; Priebe, W.; Perez-Soler, R., Lyophilized preliposomal formulation of the non-cross-resistant anthracycline annamycin: effect of surfactant on liposome formation, stability and size. Cancer Chemother Pharmacol 1996, 39, (1-2), 103-8.
188. Small, D. M., Handbook of Lipid Research: The Physical Chemistry of Lipids, From Alkanes to Phospholipid. Plenum Press: New York, 1986.
189. Litzinger, D. C.; Buiting, A. M. J.; van Rooijen, N.; Huang, L., Effect of liposome size on the circulation time and intraorgan distribution of amphipathic poly(ethylene glycol)-containing liposomes. Biochimica et Biophysica Acta (BBA) - Biomembranes 1994, 1190, (1), 99-107.
190. Uchiyama, K.; Nagayasu, A.; Yamagiwa, Y.; Nishida, T.; Harashima, H.; Kiwada, H., Effects of the size and fluidity of liposomes on their accumulation in tumors: A presumption of their interaction with tumors. International Journal of Pharmaceutics 1995, 121, (2), 195-203.
191. Nagayasu, A.; Uchiyama, K.; Kiwada, H., The size of liposomes: a factor which affects their targeting efficiency to tumors and therapeutic activity of liposomal antitumor drugs. Advanced Drug Delivery Reviews 1999, 40, (1–2), 75-87.
192. Siwak, D. R.; Tari, A. M.; Lopez-Berestein, G., The Potential of Drug-carrying Immunoliposomes as Anticancer Agents. Clinical Cancer Research 2002, 8, (4), 955-956.
193. Zhigaltsev, I. V.; Belliveau, N.; Hafez, I.; Leung, A. K.; Huft, J.; Hansen, C.; Cullis, P. R., Bottom-up design and synthesis of limit size lipid nanoparticle systems with aqueous and triglyceride cores using millisecond microfluidic mixing. Langmuir 2012, 28, (7), 3633-40.
194. Abram, S. E.; Yi, J.; Fuchs, A.; Hogan, Q. H., Permeability of injured and intact peripheral nerves and dorsal root ganglia. Anesthesiology 2006, 105, (1), 146-53.
195. Stein, C.; Machelska, H., Modulation of Peripheral Sensory Neurons by the Immune System: Implications for Pain Therapy. Pharmacol Rev 2011, 63, (4), 860-881.
- 157 - | P a g e
196. Gordh, T.; Sharma, H. S., Chronic spinal nerve ligation induces microvascular permeability disturbances, astrocytic reaction, and structural changes in the rat spinal cord. Acta Neurochir Suppl 2006, 96, 335-40.
197. Echeverry, S.; Shi, X. Q.; Rivest, S.; Zhang, J., Peripheral Nerve Injury Alters Blood-Spinal Cord Barrier Functional and Molecular Integrity through a Selective Inflammatory Pathway. Journal of Neuroscience 2011, 31, (30), 10819-10828.
198. Higuchi, T.; Connors, K. A., Advances in Analytical Chemistry and Instrumentation. Chapter 4. Phase Solubility Studies 1965, 117-212.
199. Diaz, P.; Phatak, S. S.; Xu, J.; Astruc-Diaz, F.; Cavasotto, C. N.; Naguib, M., 6-Methoxy-N-alkyl isatin acylhydrazone derivatives as a novel series of potent selective cannabinoid receptor 2 inverse agonists: design, synthesis, and binding mode prediction. J Med Chem 2009, 52, (2), 433-44.
200. Loftsson, T.; Brewster, M. E., Cyclodextrins as functional excipients: Methods to enhance complexation efficiency. Journal of Pharmaceutical Sciences 2012, Epub ahead of print.
201. Veiga, M. D.; Merino, M.; Fernandez, D.; Lozano, R., Characterization of some cyclodextrin derivatives by thermal analysis. J. Therm. Anal. Calorim. 2002, 68, 511-516.
202. de Araújo, M. r. V. G.; Vieira, E. K. B.; Lázaro, G. S.; de Souza Conegero, L.; Ferreira, O. P.; Almeida, L. E.; Barreto, L. S.; da Costa Jr, N. B.; Gimenez, I. F., Inclusion complexes of pyrimethamine in 2-hydroxypropyl- -cyclodextrin:Characterization, phase solubility and molecular modelling. Bioorganic & Medicinal Chemistry 2007, 15, (17), 5752-5759.
203. Orgoványi, J.; Pöppl, L.; H-Otta, K.; Lovas, G. A., Characterization of some cyclodextrin derivatives by thermal analysis. J Therm Anal Calorim 2005, 81, 261-266.
204. Djedaïni, F.; Lin, S. Z.; Perly, B.; Wouessidjewe, D., High-field nuclear magnetic resonance techniques for the investigation of a -cyclodextrin:indomethacininclusion complex. Journal of Pharmaceutical Sciences 1990, 79, (7), 643-646.
205. Loftsson, T.; Olafsdottir, B. J.; Frioriksdottir, H.; Jonsdottir, S., Cyclodextrin complexation of NSAIDSs: physicochemical characteristics. European Journal of Pharmaceutical Sciences 1993, 1, (2), 95-101.
206. Zornoza, A.; Martin, C.; Sanchez, M.; Velaz, I.; Piquer, A., Inclusion complexation of glisentide with -, - and -cyclodextrins. International Journal of Pharmaceutics 1998, 169, (2), 239-244.
207. Messner, M.; Kurkov, S. V.; Brewster, M. E.; Jansook, P.; Loftsson, T., Self-assembly of cyclodextrin complexes: Aggregation of hydrocortisone/cyclodextrincomplexes. International Journal of Pharmaceutics 2011, 407, (1-2), 174-183.
208. Bittner, B.; Mountfield, R. J., Intravenous administration of poorly soluble new drug entities in early drug discovery: the potential impact of formulation on pharmacokinetic parameters. Curr Opin Drug Discov Devel 2002, 5, (1), 59-71.
209. Egger-Heigold, B. The effect of excipients on pharmacokinetic parameters of parenteral drugs. Basel University, Basel, 2005.
210. Dhanikula, A. B.; Singh, D. R.; Panchagnula, R., In vivo pharmacokinetic and tissue distribution studies in mice of alternative formulations for local and systemic delivery of Paclitaxel: gel, film, prodrug, liposomes and micelles. Curr Drug Deliv 2005, 2, (1), 35-44.
211. Naguib, M.; Xu, J. J.; Diaz, P.; Brown, D. L.; Cogdell, D.; Bie, B.; Hu, J.; Craig, S.; Hittelman, W. N., Prevention of Paclitaxel-Induced Neuropathy Through Activation
- 158 - | P a g e
of the Central Cannabinoid Type 2 Receptor System. Anesthesia & Analgesia 2012, 114, (5), 1104-1120.
212. Agency, E. M. Reflection paper on the pharmaceutical development of intravenous medicinal products containing active substances solubilised in micellar systems. http://www.ema.europa.eu/docs/en_GB/document_library/Scientific_guideline/2012/03/WC500124410.pdf
213. Rouf, M. A. Development of Rapamycin drug delivery systems, their characterization and investigaqtion of the antiproliferative effect on cell cultures. Hacettepe University, Ankara, 2007.
214. Bruzell, E. M.; Morisbak, E.; Tonnesen, H. H., Studies on curcumin and curcuminoids. XXIX. Photoinduced cytotoxicity of curcumin in selected aqueous preparations. Photoch Photobio Sci 2005, 4, (7), 523-530.
215. Ishida, T.; Harashima, H.; Kiwada, H., Liposome clearance. Biosci Rep 2002, 22, (2), 197-224.
216. Hosohata, Y.; Quock, R. M.; Hosohata, K.; Makriyannis, A.; Consroe, P.; Roeske, W. R.; Yamamura, H. I., AM630 antagonism of cannabinoid-stimulated [35S]GTP gamma S binding in the mouse brain. Eur J Pharmacol 1997, 321, (1), R1-3.
217. Ross, R. A.; Brockie, H. C.; Stevenson, L. A.; Murphy, V. L.; Templeton, F.; Makriyannis, A.; Pertwee, R. G., Agonist-inverse agonist characterization at CB1 and CB2 cannabinoid receptors of L759633, L759656, and AM630. Br J Pharmacol 1999, 126, (3), 665-72.
218. Gatley, S. J.; Gifford, A. N.; Volkow, N. D.; Lan, R.; Makriyannis, A., 123I-labeled AM251: a radioiodinated ligand which binds in vivo to mouse brain cannabinoid CB1 receptors. Eur J Pharmacol 1996, 307, (3), 331-8.
219. Ibrahim, M. M.; Porreca, F.; Lai, J.; Albrecht, P. J.; Rice, F. L.; Khodorova, A.; Davar, G.; Makriyannis, A.; Vanderah, T. W.; Mata, H. P.; Malan, T. P., Jr., CB2 cannabinoid receptor activation produces antinociception by stimulating peripheral release of endogenous opioids. Proc Natl Acad Sci U S A 2005, 102, (8), 3093-8.
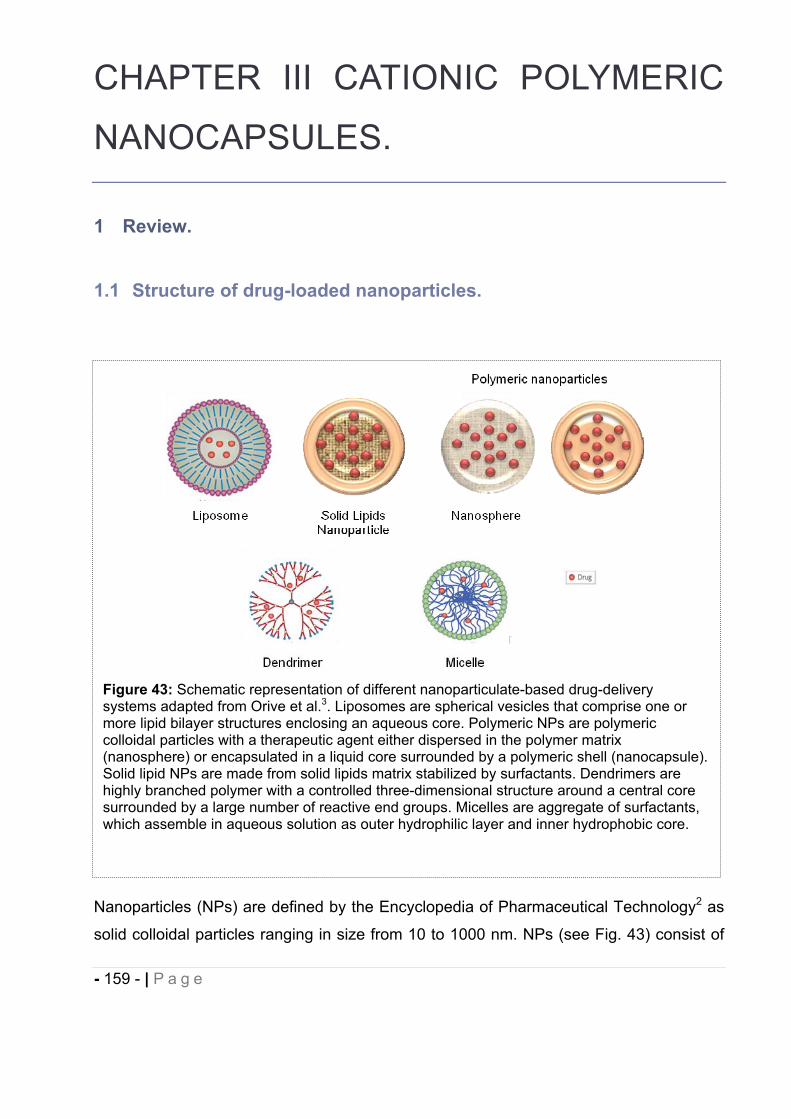
- 159 - | P a g e
CHAPTER III CATIONIC POLYMERIC
NANOCAPSULES.
1 Review.
1.1 Structure of drug-loaded nanoparticles.
Nanoparticles (NPs) are defined by the Encyclopedia of Pharmaceutical Technology2 as
solid colloidal particles ranging in size from 10 to 1000 nm. NPs (see Fig. 43) consist of
Figure 43: Schematic representation of different nanoparticulate-based drug-delivery systems adapted from Orive et al.3. Liposomes are spherical vesicles that comprise one or more lipid bilayer structures enclosing an aqueous core. Polymeric NPs are polymeric colloidal particles with a therapeutic agent either dispersed in the polymer matrix (nanosphere) or encapsulated in a liquid core surrounded by a polymeric shell (nanocapsule). Solid lipid NPs are made from solid lipids matrix stabilized by surfactants. Dendrimers are highly branched polymer with a controlled three-dimensional structure around a central core surrounded by a large number of reactive end groups. Micelles are aggregate of surfactants, which assemble in aqueous solution as outer hydrophilic layer and inner hydrophobic core.
- 160 - | P a g e
macromolecular materials and can be used therapeutically as drug carriers, in which the
active principle is dissolved, entrapped, encapsulated or to which the drug is adsorbed or
covalently conjugated.
2 Applications of drug-loaded polymeric nanoparticles.
NPs have been explored in various applications including biological markers, imaging,
pharmaceuticals and diagnosis6-11 and to deliver lipophilic drugs, proteins, peptides and
genes through parenteral but also per oral/mucosal route of administration for local
diseases treatment or systemic absorption6, 12-14. Polymeric NPs are divided into two
categories: nanocapsules and nanospheres. The former are vesicular systems with a
polymeric shell and an inner core (hydrophobic or hydrophilic) in which the drug is
confined. The latter consist in continuous polymeric matrix inside which the drug is
generally uniformly dispersed15-16. Depending on nanocapsules and nanospheres
physicochemical properties and composition, the drug may also adsorb onto the
surface17. Compared with conventional DDS, polymeric NPs present the advantages of
high stability in biological fluids, high drug loading capacity, small number and amount of
excipients, easy-to-manufacture process, and ability of incorporation of hydrophilic and
lipophilic active compounds achieving controlled (sustained) drug release6 which may be
more suitable to treat chronic diseases15. NPs are considered as effective tools for the
intracellular (i.e. nanometric size) delivery of practically insoluble and sensitive drugs to
degradation, metabolism, plasma binding and multiple drug resistance. NPs properties
can alter the incorporated drug pharmacokinetics, biodistribution and bioavailability
promoting absorption through biological barrier17-22. Their surface physicochemical
properties modification by altering their composition and/or charge and/or by addition of
targeting moieties (e.g. antibodies, peptides, nucleic acids or receptor ligands) can allow
selective and controlled delivery of therapeutic agents and offer interesting
imaging/diagnosis additive properties6-7, 23 with generally reduced toxicity24. In the past
two decades, there has been a progressive increase in the number of commercially
available nanoparticulate-based therapeutic products with two dominant classes,
liposomes and polymer-drug conjugates. Despite the number of patents for nano drug
delivery, commercialization is still at its early stage. This is probably due to the fact that
- 161 - | P a g e
most of the research studies in nanocarriers are carried out by researchers in academia,
the lack of regulatory guidelines, the challenges of scaling up and the fate of NPs in the
body that still needs to be addressed. However, it is envisioned that with the expiration
of more patents and market loss, as well as the undeniable ability of these versatile
colloidal systems to increase therapeutic index, more pharmaceutical industries will take
up the production of nanocarriers to compete favorably25. Drug-loaded polymeric NPs at
the preclinical stages have been shown to greatly increase therapeutic effects of
anticancer drugs i.e. doxorubicin26-28, genistein29 and paclitaxel32, antiparasitic agent i.e.
quinine30, viral antigen i.e. rotavirus31. Fluorescent tagged NPs have also demonstrated
their efficacy in cell imaging using rhodamine B33.
3 Nanoparticles uptake in cells.
As it has been reviewed by Mailander et al.34, NPs are taken up by a variety of cells. For
particles in the range of a few to several hundred nanometers, mechanisms of uptake
involve several possible mechanisms like pinocytosis, nonspecific endocytosis, receptor-
mediated endocytosis, and, for larger particles, phagocytosis. Uptake process of NPs
can be influenced and enhanced by several factors like size i.e. optimal in the range of
50 200 nm, surface properties i.e. positive or negative charge, nature of the polymer i.e.
increased with polymer hydrophobicity, surface groups e.g. amphiphilic polymer
physically adsorbed on NPs surface as transfection agent35.
4 Drug-loaded nanoparticles composition and bioadhesion.
Polymeric NPs are generally composed of natural or synthetic, and biodegradable or
biocompatible polymer. The nature of the polymer influences the size and the release
profile of encapsulated drugs, natural polymer generally trigger immediate drug release
while synthetic polymer enable more extended drug release36. Polymer used for the
formulation of NPs include synthetic (poly(lactic acids) (PLA), poly(lactic-co-glycolic
acids) (PLGA), poly( -caprolactone) (PCL), poly(methyl methacrylates), and poly(alkyl
- 162 - | P a g e
cyanoacrylates)) or natural polymer (albumin, gelatin, alginate, collagen or chitosan).
Biodegradable and biocompatible polyesters polymer, PLGA37-43 and PLA are the most
commonly used for the formulation of NPs. Interestingly, bioadhesive nanoparticles have
been shown to be very advantageous over others carriers by providing prolonged
retention at the site of application and a controlled rate of drug release for improved
therapeutic outcome21, 36, 44-46. The presence of cationic polymer on the surface of NPs
(i.e. chitosan, quaternary ammonium-containing polymethacrylates Eudragit®)36, 47-50 can
promote mucoadhesion by electrostatic interaction of their amino groups with the sialic
groups of mucin, and increase internalization by epithelial cells which are also negatively
charged at physiological pH51-52. These polymer are also known to increase transcellular
and paracellular transport through interactions between the negatively-charged cell
membrane and the positive charges of the polymer, or by complexing Ca2+ involved in
the structure of tight junctions across mucosal epithelium, which is further indicative of
their potential in oral delivery36, 46, 52-58. In addition to mucoadhesive properties, unlike
particles with hydrophobic surface properties are rapidly removed from blood circulation
by macrophages, cationic nanoparticles are less recognized by macrophages and remain
in the circulation for a longer time59.
5 Methods of preparation of polymeric drug-loaded nanoparticles.
Polymeric NPs can be obtained by polymerization in situ from monomers or preformed
polymer. Six different methods are generally described for the preparation of
nanocapsules from preformed polymer: nanoprecipitation, emulsion-diffusion, double
emulsification, emulsion-coacervation, polymer-coating and layer-by-layer4 (see Fig. 44).
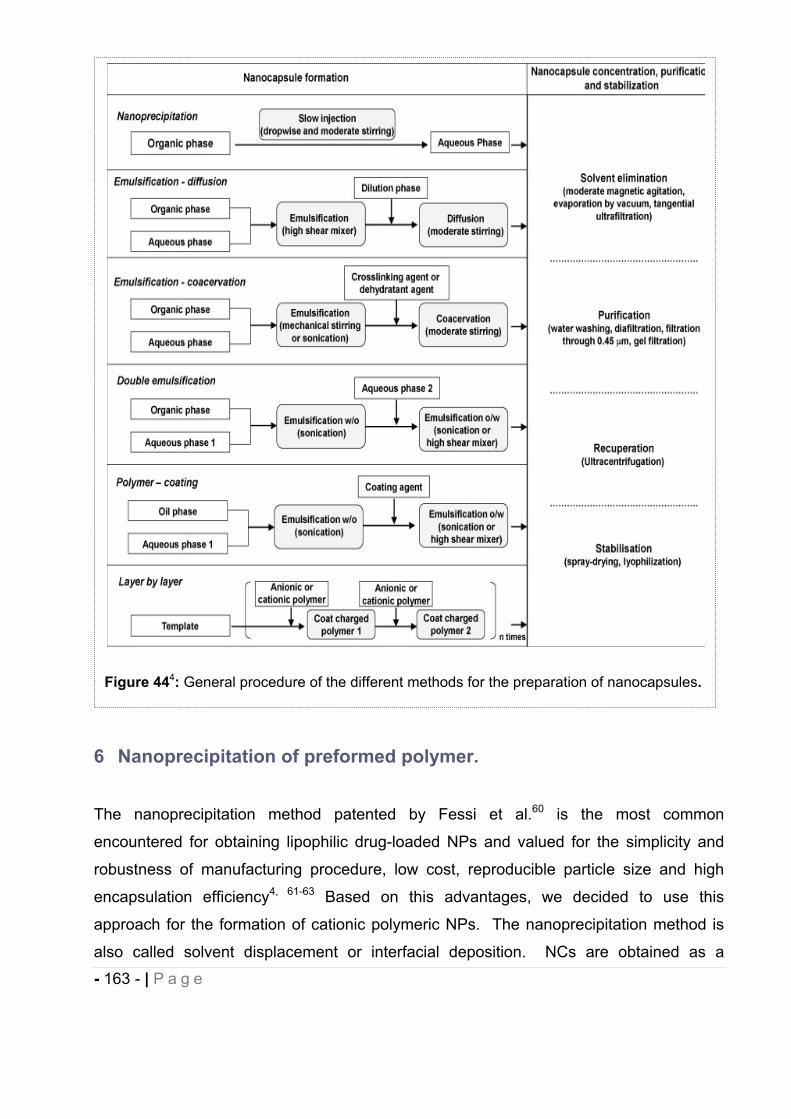
- 163 - | P a g e
6 Nanoprecipitation of preformed polymer.
The nanoprecipitation method patented by Fessi et al.60 is the most common
encountered for obtaining lipophilic drug-loaded NPs and valued for the simplicity and
robustness of manufacturing procedure, low cost, reproducible particle size and high
encapsulation efficiency4, 61-63 Based on this advantages, we decided to use this
approach for the formation of cationic polymeric NPs. The nanoprecipitation method is
also called solvent displacement or interfacial deposition. NCs are obtained as a
Figure 444: General procedure of the different methods for the preparation of nanocapsules.
- 164 - | P a g e
colloidal suspension when a solution of polymer, drug and oil in a semi-polar and water
miscible organic phase (e.g. acetone, ethanol, methylene chloride) is injected slowly and
with moderate stirring into an aqueous solution (being a non-solvent or antisolvent for
drug and polymer) possibly containing an hydrophilic stabilizer (e.g. Poloxamer 188).
NCs are instantaneously formed by rapid diffusion of the solvent into the aqueous phase
and simultaneous interfacial deposition of preformed polymer. The organic solvent
phase is then removed under reduced pressure4, 60, 64-65. Disagreement exists regarding
the molecular mechanism leading to the instantaneous formation of NCs. The first
hypothesis referred to the Gibbs-Marangoni effect as the driving force of
nanoprecipitation process caused by interfacial turbulences and thermal inequities
between two liquid phases66-70. According to this theory, NCs formation is due to polymer
aggregation in stabilized emulsion droplets4. In contrast, recent publications promoted
the “ouzo effect”66, 71-72 for the physical phenomenon of spontaneous emulsification,
observed when water is added to Ouzo (Greek liquor) or Pastis (French liquor) forming a
milky and highly stable oil-in-water microemulsion. The “ouzo effect” occurs when a
hydrophobic solute (i.e. polymer) is rapidly brought into the metastable region (“ouzo
effect”) between the binodal (miscibility-limit curve) and spinodal (stability-limit curve)
boundaries in a ternary phase diagram composed of hydrophobic solute, solvent, and
non-solvent. Local supersaturation of hydrophobic solute molecules leads to
spontaneous nucleation in the form of small nuclei, larger than a critical size, that grow
with time by capturing other solute molecules due to Ostwald ripening (i.e. nucleation and
growth process)66, 71. In intimate contact with the non-solvent, the polymer precipitation is
initiated and the final solidification is completed by a slow evaporation of the organic
solvent.
7 Nanoparticles and oral delivery.
Oral route is the preferred route for the delivery of drugs. It is simple for self-
administration, painless and it improves patient compliance particularly for chronic
therapy such as neuropathic pain. However, oral absorption is limited by various
physiological barriers (e.g. acidity, enzymes, mucus, and motility) and remains a
scientific challenge. Nanometric-sized drug delivery systems including polymeric or lipid-
based carriers (i.e. liposomes, micelles, dendrimers, nanoparticles) are being extensively
- 165 - | P a g e
studied to enhance the bioavailability or the targeting of drug after oral administration52.
As mentioned, polymeric nanoparticles offer significant advantages over other
nanocarriers such as high drug loading and stability of encapsulated drug which can be
protected from degradation along the gastro-intestinal tract (GIT) until the particles
release their cargo (i.e. after erosion, degradation, swelling) and/or diffusion of the drug.
The particles can be designed as site-specific delivery systems, with polymer dissolving
at defined values of pH (corresponding to the pH of specific parts of the GIT) or at time-
controlled delivery, with polymer swelling independently of the pH. The use of various
polymeric materials enable the modulation of physicochemical characteristics (e.g.
hydrophobicity, zeta potential), drug release properties (e.g. delayed, prolonged,
triggered), and biological behavior (e.g. targeting, bioadhesion, permeation enhancing
effect, inhibition of proteolytic enzymes) of nanoparticles36, 46, 73-76. Several mechanisms
for gastrointestinal absorption of nanoparticles in their native structure and translocation
from the intestinal mucosa to the systemic circulation have been reported, involving the
M-cells in the Peyer's patches and the isolated follicles of the gut-associated lymphoid
tissue (GALT), transcellular pathways through normal intestinal enterocytes and to a
lesser extent paracellular pathways (also known as persorption)77-87. Factors affecting
uptake include particle size, surface charge and hydrophobicity, the presence or absence
of surface ligands, length of administration and the dose of particles and methods used
to quantify particulate absorption88-89. Bioadhesive polymeric NPs have the potential to
successfully address the issues related to oral drug delivery, retention and absorption
and are considered potential candidates to carry drugs to the desired site of therapeutic
action.
8 Concepts of the study.
8.1 Theragnostic drug-loaded polymeric nanocapsules.
The first aspect of this project was to design detectable polymeric NPs using cationic
polymer in order to trace the particles in vivo90-91. Aqueous dispersion of cationic polymer
have the unique property to yield a high proportion of counterionic condensation in the
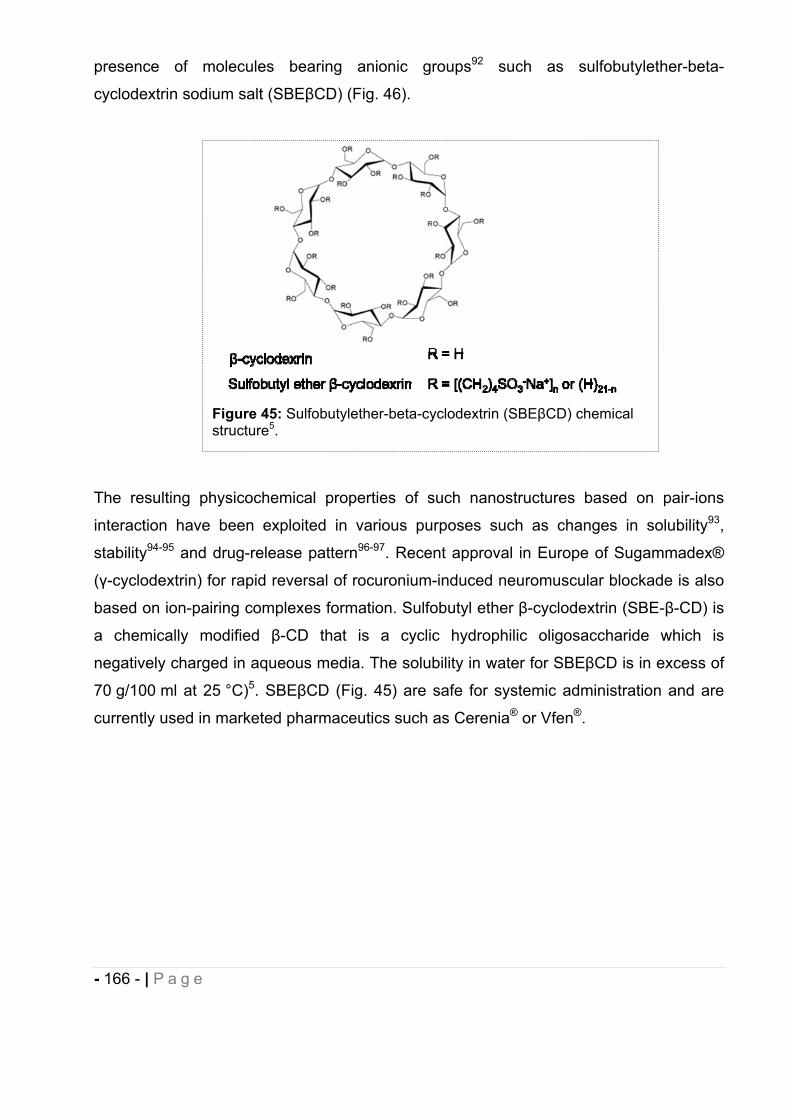
- 166 - | P a g e
presence of molecules bearing anionic groups92 such as sulfobutylether-beta-
cyclodextrin sodium salt (SBE CD) (Fig. 46).
The resulting physicochemical properties of such nanostructures based on pair-ions
interaction have been exploited in various purposes such as changes in solubility93,
stability94-95 and drug-release pattern96-97. Recent approval in Europe of Sugammadex®
( -cyclodextrin) for rapid reversal of rocuronium-induced neuromuscular blockade is also
based on ion-pairing complexes formation. Sulfobutyl ether -cyclodextrin (SBE- -CD) is
a chemically modified -CD that is a cyclic hydrophilic oligosaccharide which is
negatively charged in aqueous media. The solubility in water for SBE CD is in excess of
70 g/100 ml at 25 °C)5. SBE CD (Fig. 45) are safe for systemic administration and are
currently used in marketed pharmaceutics such as Cerenia® or Vfen®.
Figure 45: Sulfobutylether-beta-cyclodextrin (SBE CD) chemical structure5.
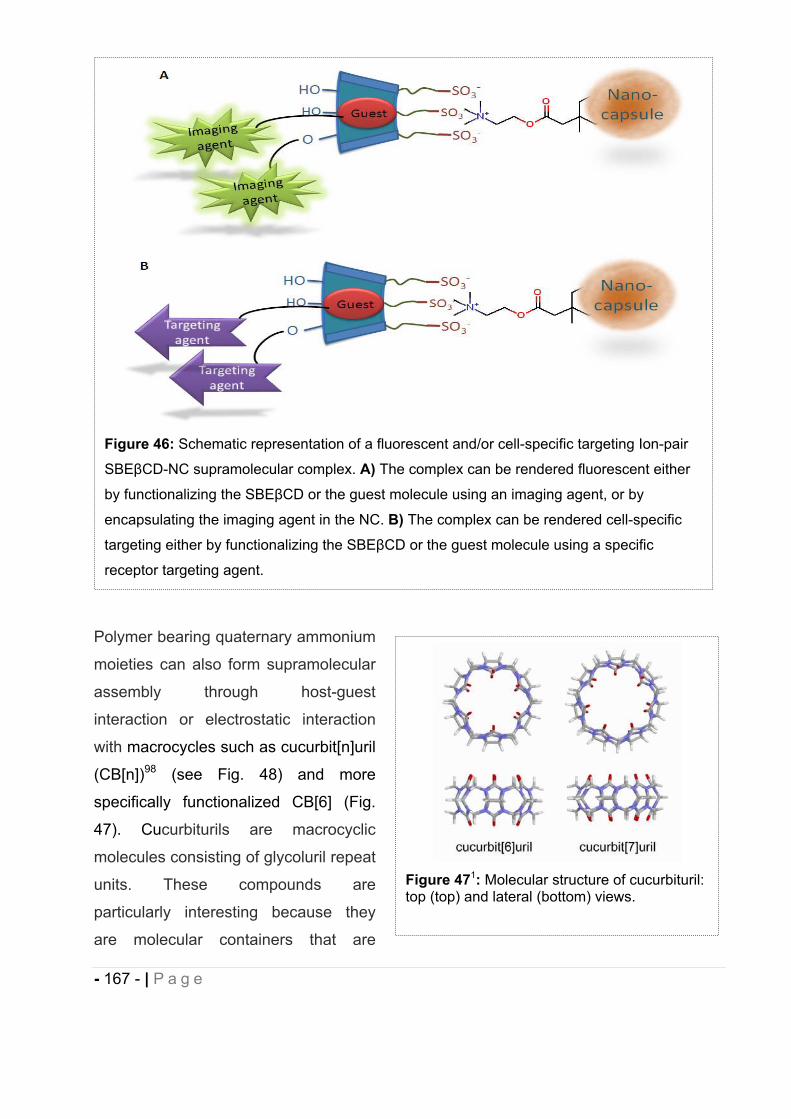
- 167 - | P a g e
Polymer bearing quaternary ammonium
moieties can also form supramolecular
assembly through host-guest
interaction or electrostatic interaction
with macrocycles such as cucurbit[n]uril
(CB[n])98 (see Fig. 48) and more
specifically functionalized CB[6] (Fig.
47). Cucurbiturils are macrocyclic
molecules consisting of glycoluril repeat
units. These compounds are
particularly interesting because they
are molecular containers that are
Figure 46: Schematic representation of a fluorescent and/or cell-specific targeting Ion-pair
SBE CD-NC supramolecular complex. A) The complex can be rendered fluorescent either
by functionalizing the SBE CD or the guest molecule using an imaging agent, or by
encapsulating the imaging agent in the NC. B) The complex can be rendered cell-specific
targeting either by functionalizing the SBE CD or the guest molecule using a specific
receptor targeting agent.
Figure 471: Molecular structure of cucurbituril: top (top) and lateral (bottom) views.
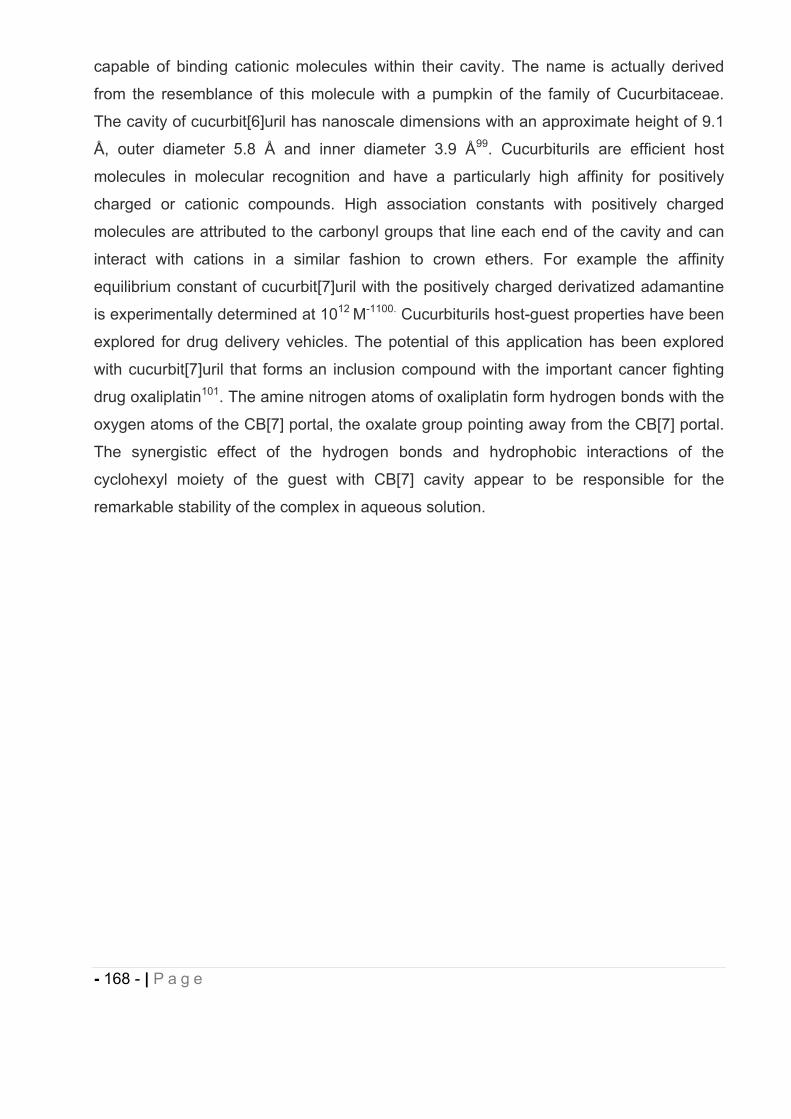
- 168 - | P a g e
capable of binding cationic molecules within their cavity. The name is actually derived
from the resemblance of this molecule with a pumpkin of the family of Cucurbitaceae.
The cavity of cucurbit[6]uril has nanoscale dimensions with an approximate height of 9.1
Å, outer diameter 5.8 Å and inner diameter 3.9 Å99. Cucurbiturils are efficient host
molecules in molecular recognition and have a particularly high affinity for positively
charged or cationic compounds. High association constants with positively charged
molecules are attributed to the carbonyl groups that line each end of the cavity and can
interact with cations in a similar fashion to crown ethers. For example the affinity
equilibrium constant of cucurbit[7]uril with the positively charged derivatized adamantine
is experimentally determined at 1012 M-1100. Cucurbiturils host-guest properties have been
explored for drug delivery vehicles. The potential of this application has been explored
with cucurbit[7]uril that forms an inclusion compound with the important cancer fighting
drug oxaliplatin101. The amine nitrogen atoms of oxaliplatin form hydrogen bonds with the
oxygen atoms of the CB[7] portal, the oxalate group pointing away from the CB[7] portal.
The synergistic effect of the hydrogen bonds and hydrophobic interactions of the
cyclohexyl moiety of the guest with CB[7] cavity appear to be responsible for the
remarkable stability of the complex in aqueous solution.
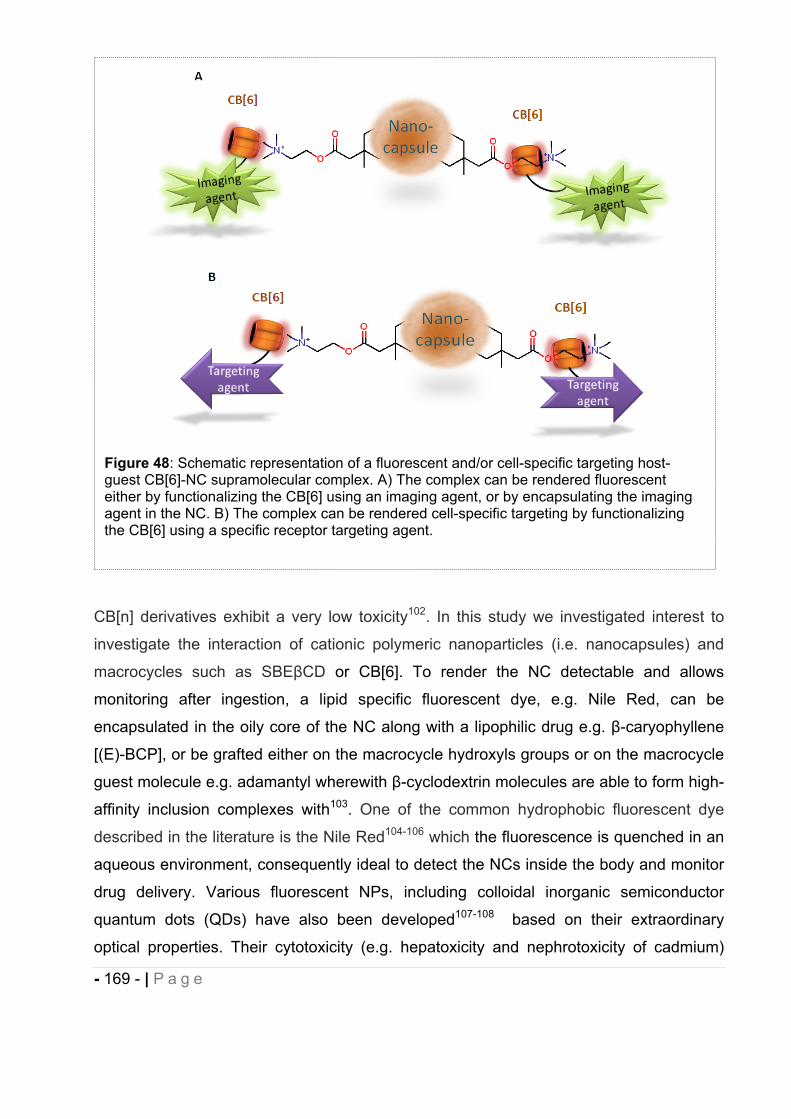
- 169 - | P a g e
CB[n] derivatives exhibit a very low toxicity102. In this study we investigated interest to
investigate the interaction of cationic polymeric nanoparticles (i.e. nanocapsules) and
macrocycles such as SBE CD or CB[6]. To render the NC detectable and allows
monitoring after ingestion, a lipid specific fluorescent dye, e.g. Nile Red, can be
encapsulated in the oily core of the NC along with a lipophilic drug e.g. -caryophyllene
[(E)-BCP], or be grafted either on the macrocycle hydroxyls groups or on the macrocycle
guest molecule e.g. adamantyl wherewith -cyclodextrin molecules are able to form high-
affinity inclusion complexes with103. One of the common hydrophobic fluorescent dye
described in the literature is the Nile Red104-106 which the fluorescence is quenched in an
aqueous environment, consequently ideal to detect the NCs inside the body and monitor
drug delivery. Various fluorescent NPs, including colloidal inorganic semiconductor
quantum dots (QDs) have also been developed107-108 based on their extraordinary
optical properties. Their cytotoxicity (e.g. hepatoxicity and nephrotoxicity of cadmium)
Figure 48: Schematic representation of a fluorescent and/or cell-specific targeting host-guest CB[6]-NC supramolecular complex. A) The complex can be rendered fluorescent either by functionalizing the CB[6] using an imaging agent, or by encapsulating the imaging agent in the NC. B) The complex can be rendered cell-specific targeting by functionalizing the CB[6] using a specific receptor targeting agent.
- 170 - | P a g e
can be a critical concern upon in vitro/in vivo studies since QDs are complexes of heavy
metals9 and encapsulation in polymeric NCs may render them more biocompatible. The
NCs we have developed may be of great interest for this purpose. Commercial contrast
agents like Resovist® and Feridex® IV are available on the market but can be used as a
dual efficient system for drug delivery and imaging10. In addition, the guest molecule
complexed with SBE CD or the macrocycles SBE CD and CB[6] could be
biofunctionalized on the hydroxyls groups with specific cell- targeting ligands offering the
potential for delivery of therapeutic-loaded NPs to a particular site (e.g. brain, spinal cord)
or specific cell type (e.g. tumor cells, immune cells) in the body9, 109-110. These cell/organ
specific and/or fluorescent macrocycle-NCs based on counterionic condensation or host-
guest complexion/electrostatic interaction, can be used as sensitive and highly-specific
probes providing a unique concept of theragnostic combining diagnostic/imaging to
assess the efficiency of drug delivery and possible mechanisms of NCs bioabsorption,
and therapeutic activity.
8.2 Bioadhesive polymeric nanocapsules for oral delivery of a lipophilic drug.
The second aspect of this project was to investigate whether or not the sole cationic
polymeric NPs developed (without macrocycle association) may serve as a suitable drug
delivery system (DDS) for oral administration of lipophilic drug such as the natural dietary
cannabinoid (E)-BCP. The GI sets a variety of morphological and physiological barriers
that can limit intestinal absorption of the therapeutic agent, especially for (E)-BCP, a non
drug-like compound for oral bioavailability, highly lipophilic and sensitive to oxidation and
acidity. Strategy for oral administration of (E)-BCP with sufficient bioavailability (solubility,
stability, intestinal targeting, blood residence, immunogenicity) would be its encapsulation
in protective and mucoadhesive colloidal carriers, such as cationic NCs, which can also
deliver it in a controlled manner.
9 Polymer materials selected.
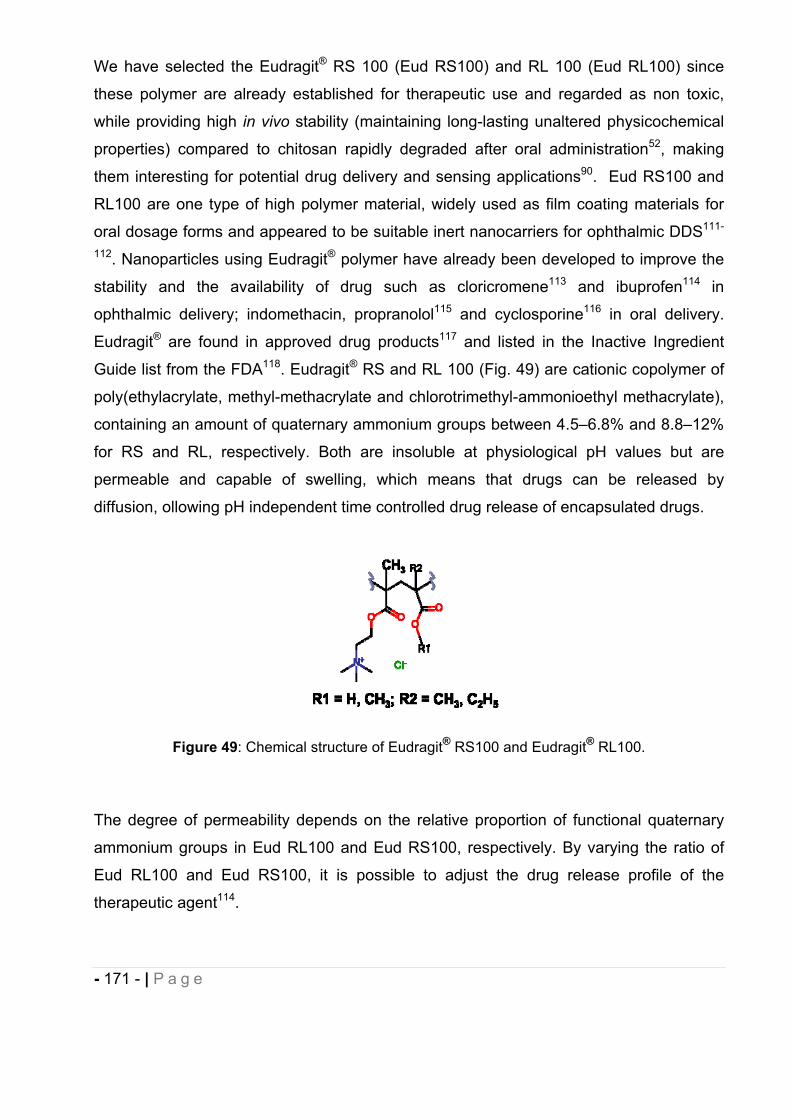
- 171 - | P a g e
We have selected the Eudragit® RS 100 (Eud RS100) and RL 100 (Eud RL100) since
these polymer are already established for therapeutic use and regarded as non toxic,
while providing high in vivo stability (maintaining long-lasting unaltered physicochemical
properties) compared to chitosan rapidly degraded after oral administration52, making
them interesting for potential drug delivery and sensing applications90. Eud RS100 and
RL100 are one type of high polymer material, widely used as film coating materials for
oral dosage forms and appeared to be suitable inert nanocarriers for ophthalmic DDS111-
112. Nanoparticles using Eudragit® polymer have already been developed to improve the
stability and the availability of drug such as cloricromene113 and ibuprofen114 in
ophthalmic delivery; indomethacin, propranolol115 and cyclosporine116 in oral delivery.
Eudragit® are found in approved drug products117 and listed in the Inactive Ingredient
Guide list from the FDA118. Eudragit® RS and RL 100 (Fig. 49) are cationic copolymer of
poly(ethylacrylate, methyl-methacrylate and chlorotrimethyl-ammonioethyl methacrylate),
containing an amount of quaternary ammonium groups between 4.5–6.8% and 8.8–12%
for RS and RL, respectively. Both are insoluble at physiological pH values but are
permeable and capable of swelling, which means that drugs can be released by
diffusion, ollowing pH independent time controlled drug release of encapsulated drugs.
Figure 49: Chemical structure of Eudragit® RS100 and Eudragit® RL100.
The degree of permeability depends on the relative proportion of functional quaternary
ammonium groups in Eud RL100 and Eud RS100, respectively. By varying the ratio of
Eud RL100 and Eud RS100, it is possible to adjust the drug release profile of the
therapeutic agent114.
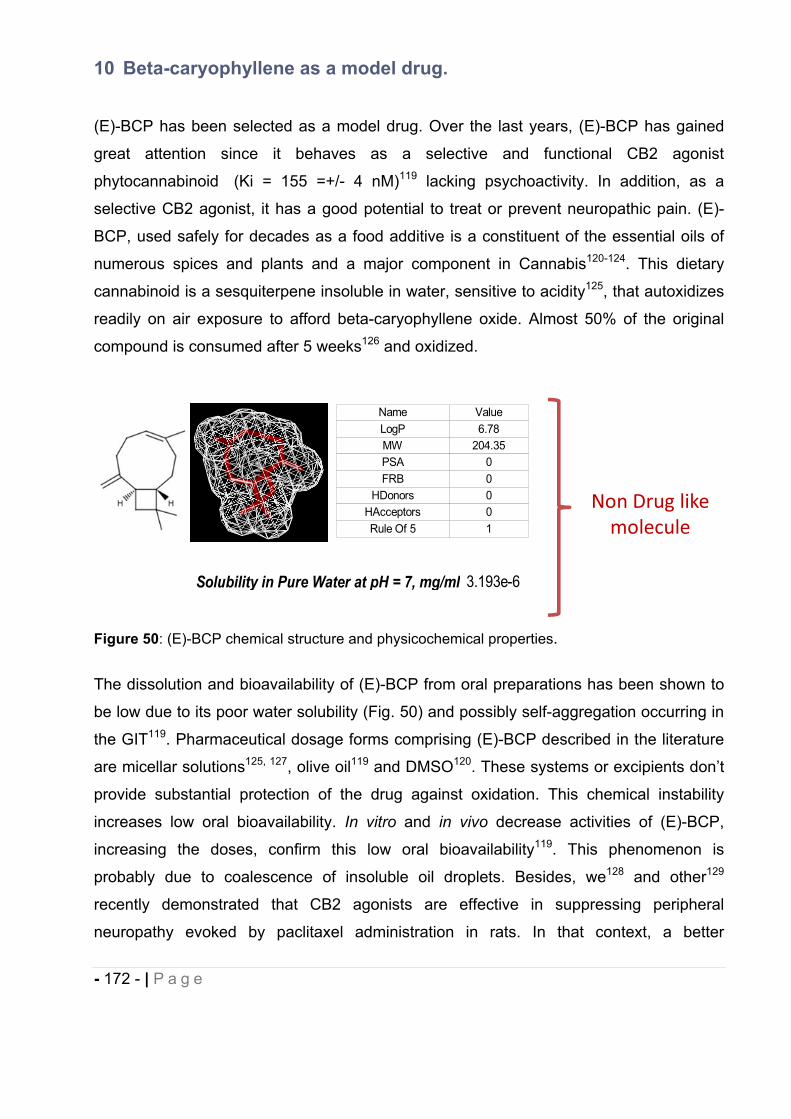
- 172 - | P a g e
10 Beta-caryophyllene as a model drug.
(E)-BCP has been selected as a model drug. Over the last years, (E)-BCP has gained
great attention since it behaves as a selective and functional CB2 agonist
phytocannabinoid (Ki = 155 =+/- 4 nM)119 lacking psychoactivity. In addition, as a
selective CB2 agonist, it has a good potential to treat or prevent neuropathic pain. (E)-
BCP, used safely for decades as a food additive is a constituent of the essential oils of
numerous spices and plants and a major component in Cannabis120-124. This dietary
cannabinoid is a sesquiterpene insoluble in water, sensitive to acidity125, that autoxidizes
readily on air exposure to afford beta-caryophyllene oxide. Almost 50% of the original
compound is consumed after 5 weeks126 and oxidized.
Figure 50: (E)-BCP chemical structure and physicochemical properties.
The dissolution and bioavailability of (E)-BCP from oral preparations has been shown to
be low due to its poor water solubility (Fig. 50) and possibly self-aggregation occurring in
the GIT119. Pharmaceutical dosage forms comprising (E)-BCP described in the literature
are micellar solutions125, 127, olive oil119 and DMSO120. These systems or excipients don’t
provide substantial protection of the drug against oxidation. This chemical instability
increases low oral bioavailability. In vitro and in vivo decrease activities of (E)-BCP,
increasing the doses, confirm this low oral bioavailability119. This phenomenon is
probably due to coalescence of insoluble oil droplets. Besides, we128 and other129
recently demonstrated that CB2 agonists are effective in suppressing peripheral
neuropathy evoked by paclitaxel administration in rats. In that context, a better
Solubility in Pure Water at pH = 7, mg/ml 3.193e-6
Non Drug likemolecule
Name ValueLogP 6.78MW 204.35PSA 0FRB 0
HDonors 0HAcceptors 0Rule Of 5 1
- 173 - | P a g e
understanding of formulation of potential therapeutic agents could result in the
development of better treatment for neuropathic pain and a good alternative for patients
using medical marijuana, avoiding misuse and addiction issues. Fluorescent NCs may
also allow the monitoring of (E)-BCP biodistribution providing new insight in regards with
the peripheral or central target of neuropathic pain. The results from this research are
expected to open a new area in the treatment of paclitaxel-induced neuropathic pain,
which could possibly be extrapolated as a more general control mechanism of
neuropathic pain. Altogether, (E)-BCP with its poor biopharmaceutical and
pharmacokinetics properties represents an ideal drug as a model to investigate the
efficiency of theragnostic polymeric NCs in controlled drug delivery and possible
mechanisms of NCs bioabsorption.
11 Objectives of the study.
In the first stage of this project we focused our research on the preparation of
bioadhesive polymeric NCs for the delivery of the lipophilic model drug (E)-BCP. A
nanoprecipitation procedure was investigated for the preparation of NCs yielding to the
following specifications:
- A loading capacity that can ensure therapeutic doses (10-20 mg/Kg, oral) for in
vivo testing in rats.
- A monodisperse NCs population distribution with a nanometric size for a good
drug bioavailability.
- An improved chemical stability of the encapsulated drug after storage 1 month at
room temperature.
- A process allowing reproducibility in term of particle size and size distribution, drug
loading/entrapment efficiency.
Studies were undertaken to evaluate the influence of different parameters on NCs
formation prepared by nanoprecipitation: drug-to-polymer ratio, solvent phase-to-non
solvent phase ratio, polymer-to-organic solvent ratio, nature and amount of surfactant,
organic solvent nature, organic phase injection flow-rate, polymer (Eudragit® RS or RL)
nature (Table 25). As preliminary data, we also investigated on a non optimized system
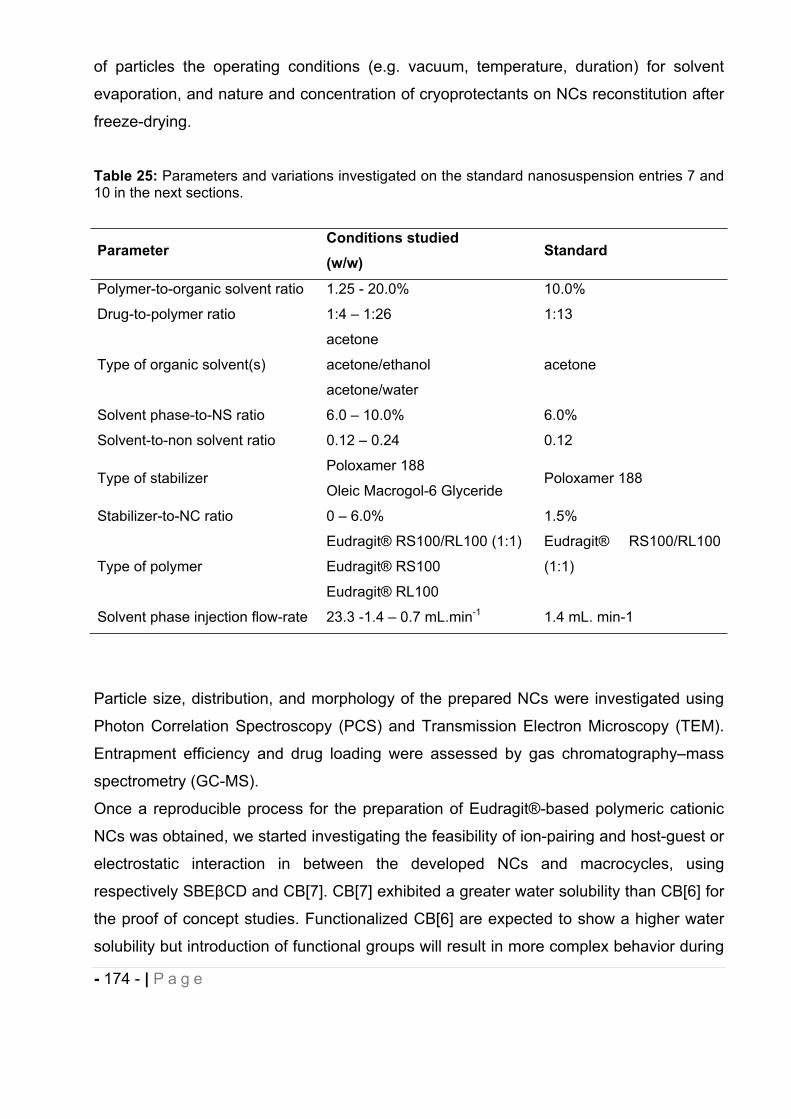
- 174 - | P a g e
of particles the operating conditions (e.g. vacuum, temperature, duration) for solvent
evaporation, and nature and concentration of cryoprotectants on NCs reconstitution after
freeze-drying.
Table 25: Parameters and variations investigated on the standard nanosuspension entries 7 and 10 in the next sections.
ParameterConditions studied (w/w)
Standard
Polymer-to-organic solvent ratio 1.25 - 20.0% 10.0%
Drug-to-polymer ratio 1:4 – 1:26 1:13
Type of organic solvent(s)
acetone
acetone/ethanol
acetone/water
acetone
Solvent phase-to-NS ratio 6.0 – 10.0% 6.0%
Solvent-to-non solvent ratio 0.12 – 0.24 0.12
Type of stabilizer Poloxamer 188
Oleic Macrogol-6 Glyceride Poloxamer 188
Stabilizer-to-NC ratio 0 – 6.0% 1.5%
Type of polymer
Eudragit® RS100/RL100 (1:1)
Eudragit® RS100
Eudragit® RL100
Eudragit® RS100/RL100
(1:1)
Solvent phase injection flow-rate 23.3 -1.4 – 0.7 mL.min-1 1.4 mL. min-1
Particle size, distribution, and morphology of the prepared NCs were investigated using
Photon Correlation Spectroscopy (PCS) and Transmission Electron Microscopy (TEM).
Entrapment efficiency and drug loading were assessed by gas chromatography–mass
spectrometry (GC-MS).
Once a reproducible process for the preparation of Eudragit®-based polymeric cationic
NCs was obtained, we started investigating the feasibility of ion-pairing and host-guest or
electrostatic interaction in between the developed NCs and macrocycles, using
respectively SBE CD and CB[7]. CB[7] exhibited a greater water solubility than CB[6] for
the proof of concept studies. Functionalized CB[6] are expected to show a higher water
solubility but introduction of functional groups will result in more complex behavior during
- 175 - | P a g e
complexion. Particle size, distribution, and morphology of the prepared modified NCs
were investigated using PCS and TEM. Finally, entrapment efficiency and drug loading
were assessed by Gas chromatography–mass spectrometry (GC-MS) on the CB[7]-NCs
developed.
12 Results and discussion.
12.1 (E)-BCP.
12.1.1 Purification
The purity of the (E)-BCP purchased from Sigma Aldrich was only 80%. In order to
prevent any potential side effects due to unidentified impurities, we have developed a
purification method using the Biotage (Medium pressure chromatography) for (E)-BCP to
be incorporated in formulation studies. Analytical parameters such as Rf, solvent flow,
column volume, injected volume, column equilibration have been optimized as described
in the experimental section 6.2 with the aims of maximizing the purification yield and the
resolution, and identifying the impurities. We collected very pure (assessed by NMR,
GC/MS and TLC) (E)-BCP as compared with an analytical standard bought from
Chromadex. TLC was used to follow the separation of (E)-BCP from the impurities. The
solvent was removed using a rotary-evaporator and purity of the fraction containing (E)-
BCP was assessed by 1H-NMR. Besides, we have identified in the fractions containing
the impurities -humulene (also known as -caryophyllene) and -caryophyllene oxide in
the commercial batch of (E)-BCP.
12.1.2 Stability.
(E)-BCP chemical stability was monitored by Gas Chromatography Mass Spectrometry
(GC-MS) using the method described in the experimental part section 12.2 and section
6.3 (Experimental). Purified (E)-BCP and each of the impurities isolated from the
commercial batch have been analyzed to enable further identification of degradation
products/impurities over the course of the use of the compound. When entrapment
- 176 - | P a g e
efficiency of NCs was evaluated, a standard curve with the purified (E)-BCP was freshly
prepared, allowing in addition the monitoring of pure (E)-BCP chemical stability. (E)-BCP
easily auto oxidizes affording 50% of (E)-BCP oxide after 5 weeks126. We have
evidenced by qualitative TLC and NMR that a batch of (E)-BCP stored 7 months at 4°C
under light protection had undergone some degradation to form (E)-BCP oxide and
determined that packaging under nitrogen and in a air-tight container was required.
Storage under appropriate conditions (N2, air-tight container, 4°C), has extended the use
of purified (E)-BCP batches to 18 months.
12.2 GC-MS method development for the determination of (E)-BCP entrapment efficiency and stability in drug-loaded nanocapsules.
The primary objective of this study was to develop a useful and accurate method for
detection and identification of the volatile compound (E)-BCP and its possible
degradation products in the cationic nanocapsules prepared. Gas chromatography/mass
spectrometry (GC/MS) is a common sensitive analytical technique used to identify
volatile analytes such as (E)-BCP130-134. Traditional methods often involve solvent
extraction of the drug prior to direct injection into the GC135. GC-MS analyses were
performed on an Agilent 6890N Gas Chromatograph with an Agilent 5973 Mass
Spectrometer and analysis conditions are reported in experimental section 6.3.
12.2.1 Calibration and recovery.
For accuracy purposes, five calibration standards of pure (E)-BCP in the range of
approximately 0-100 ppm were freshly prepared on each day of samples analysis. To
limit the potential variations in instrument response (e.g. gas or liquid flow-rate, volume of
sample solution injected) or in quantity of sample analyzed (e.g. sample loss occurring
during sample preparation) that may be expected from run to run, a fixed concentration
of -pinene at a concentration of 100 ppm was incorporated as an internal standard.
Standards curve samples were analyzed three times each to access the reproducibility of
the method.
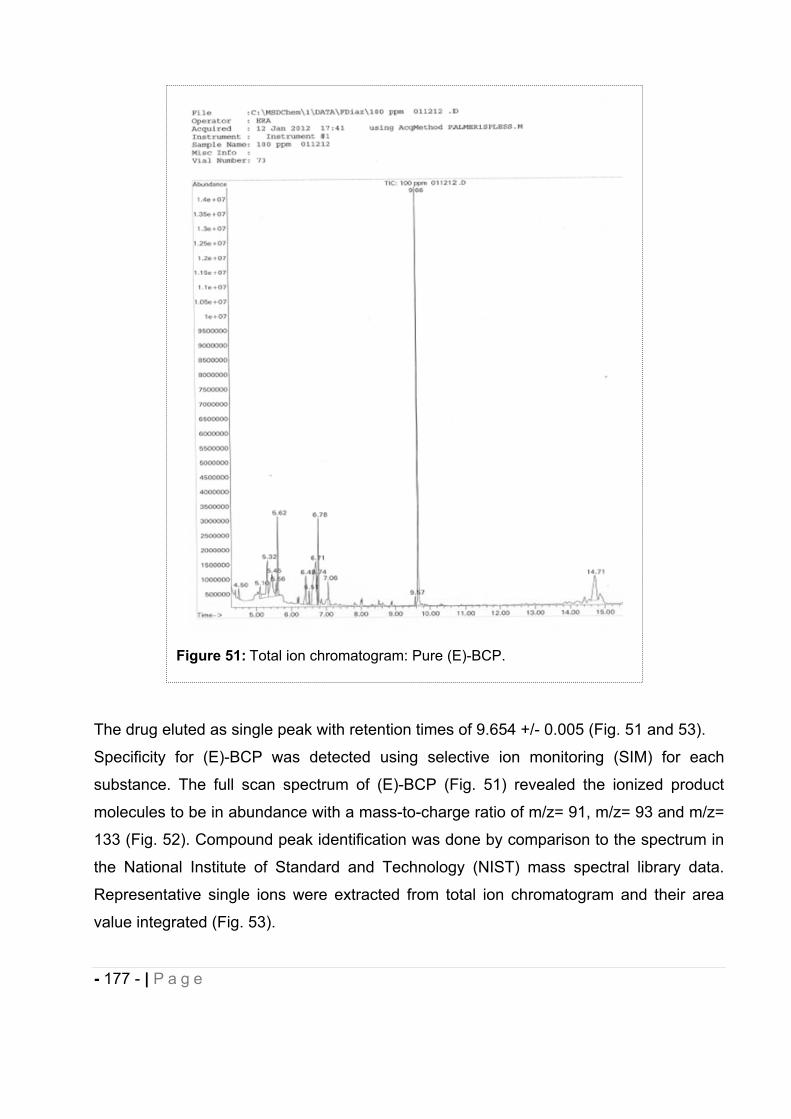
- 177 - | P a g e
The drug eluted as single peak with retention times of 9.654 +/- 0.005 (Fig. 51 and 53).
Specificity for (E)-BCP was detected using selective ion monitoring (SIM) for each
substance. The full scan spectrum of (E)-BCP (Fig. 51) revealed the ionized product
molecules to be in abundance with a mass-to-charge ratio of m/z= 91, m/z= 93 and m/z=
133 (Fig. 52). Compound peak identification was done by comparison to the spectrum in
the National Institute of Standard and Technology (NIST) mass spectral library data.
Representative single ions were extracted from total ion chromatogram and their area
value integrated (Fig. 53).
Figure 51: Total ion chromatogram: Pure (E)-BCP.
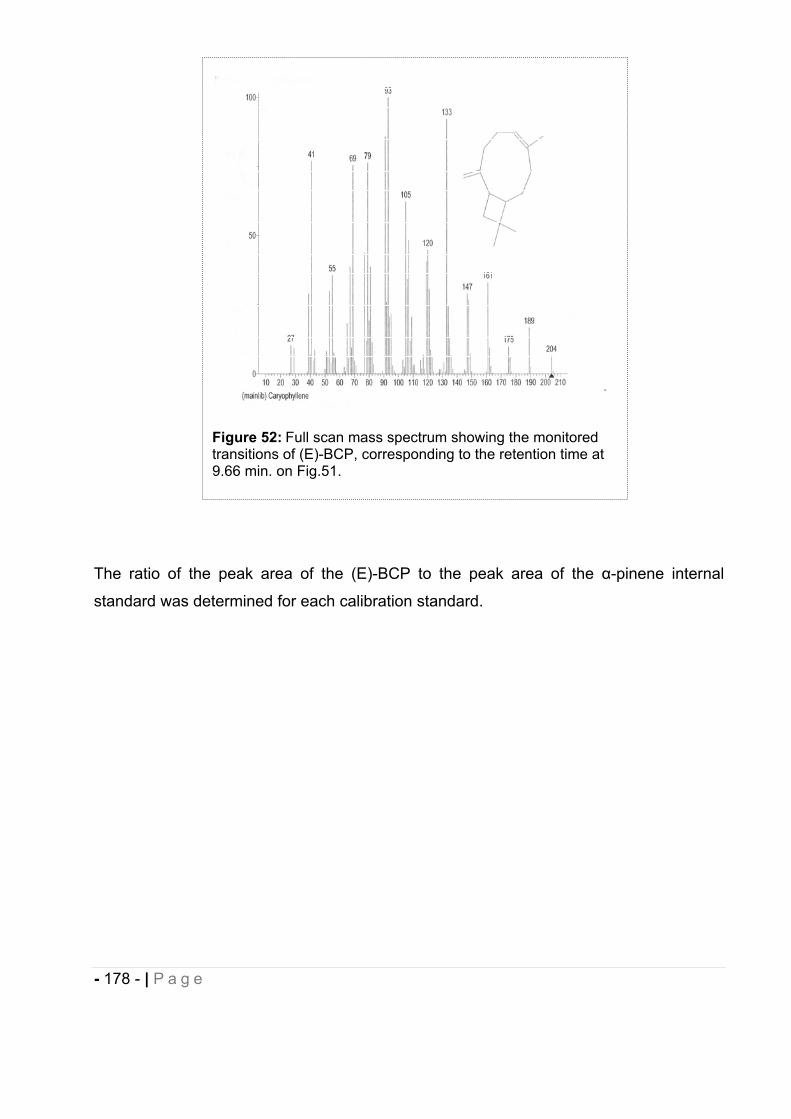
- 178 - | P a g e
The ratio of the peak area of the (E)-BCP to the peak area of the -pinene internal
standard was determined for each calibration standard.
Figure 52: Full scan mass spectrum showing the monitored transitions of (E)-BCP, corresponding to the retention time at 9.66 min. on Fig.51.
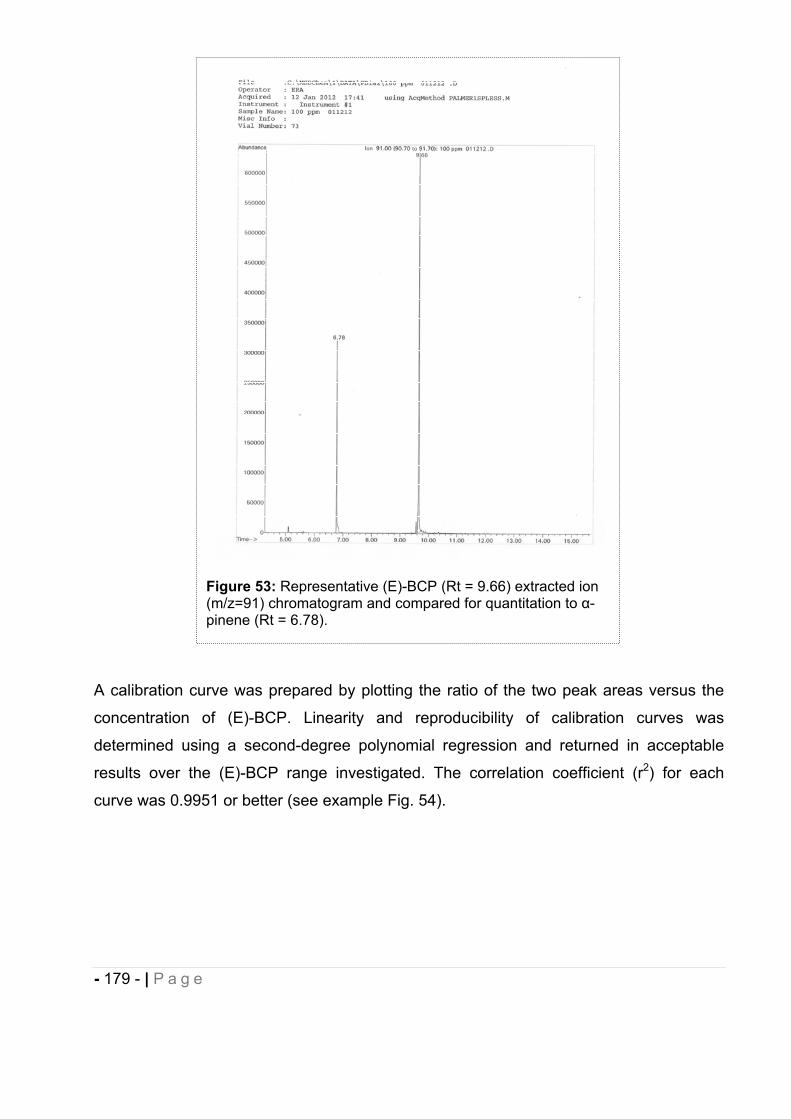
- 179 - | P a g e
A calibration curve was prepared by plotting the ratio of the two peak areas versus the
concentration of (E)-BCP. Linearity and reproducibility of calibration curves was
determined using a second-degree polynomial regression and returned in acceptable
results over the (E)-BCP range investigated. The correlation coefficient (r2) for each
curve was 0.9951 or better (see example Fig. 54).
Figure 53: Representative (E)-BCP (Rt = 9.66) extracted ion (m/z=91) chromatogram and compared for quantitation to -pinene (Rt = 6.78).
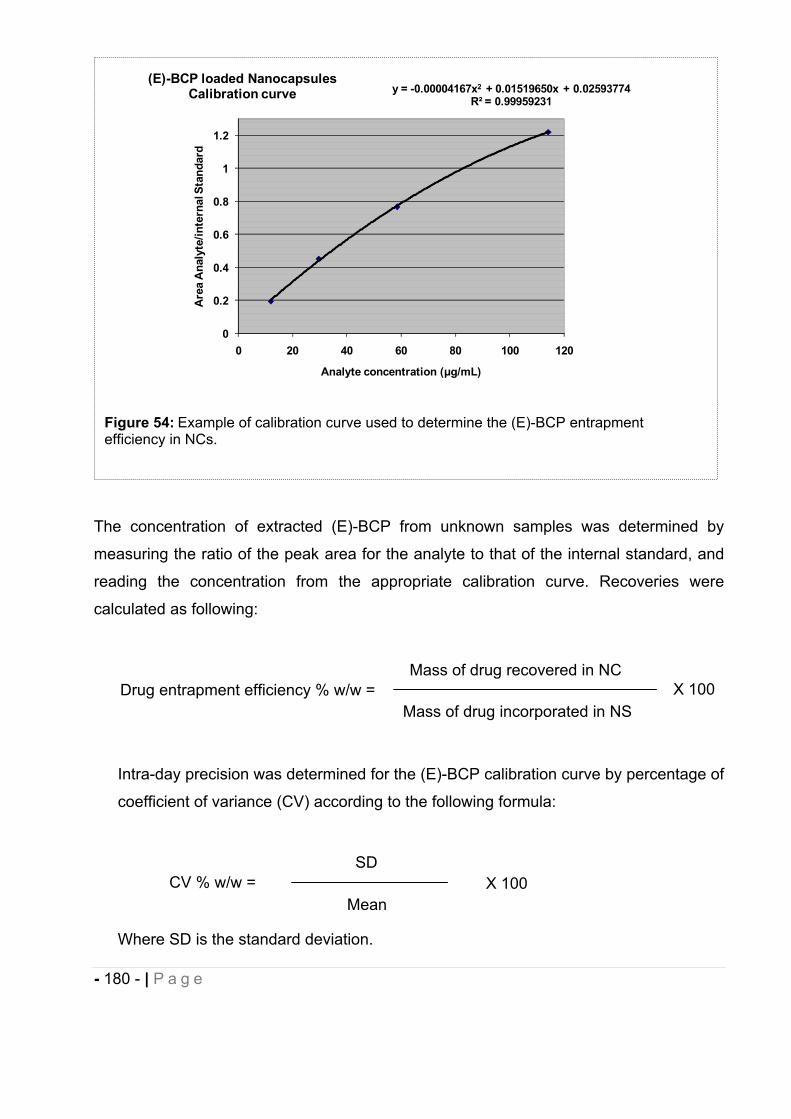
- 180 - | P a g e
The concentration of extracted (E)-BCP from unknown samples was determined by
measuring the ratio of the peak area for the analyte to that of the internal standard, and
reading the concentration from the appropriate calibration curve. Recoveries were
calculated as following:
Intra-day precision was determined for the (E)-BCP calibration curve by percentage of
coefficient of variance (CV) according to the following formula:
Where SD is the standard deviation.
Figure 54: Example of calibration curve used to determine the (E)-BCP entrapment efficiency in NCs.
y = -0.00004167x2 + 0.01519650x + 0.02593774R² = 0.99959231
0
0.2
0.4
0.6
0.8
1
1.2
0 20 40 60 80 100 120
Are
a A
naly
te/in
tern
al S
tand
ard
Analyte concentration ( g/mL)
(E)-BCP loaded Nanocapsules Calibration curve
Mass of drug incorporated in NS Drug entrapment efficiency % w/w =
Mass of drug recovered in NC X 100
MeanCV % w/w =
SDX 100
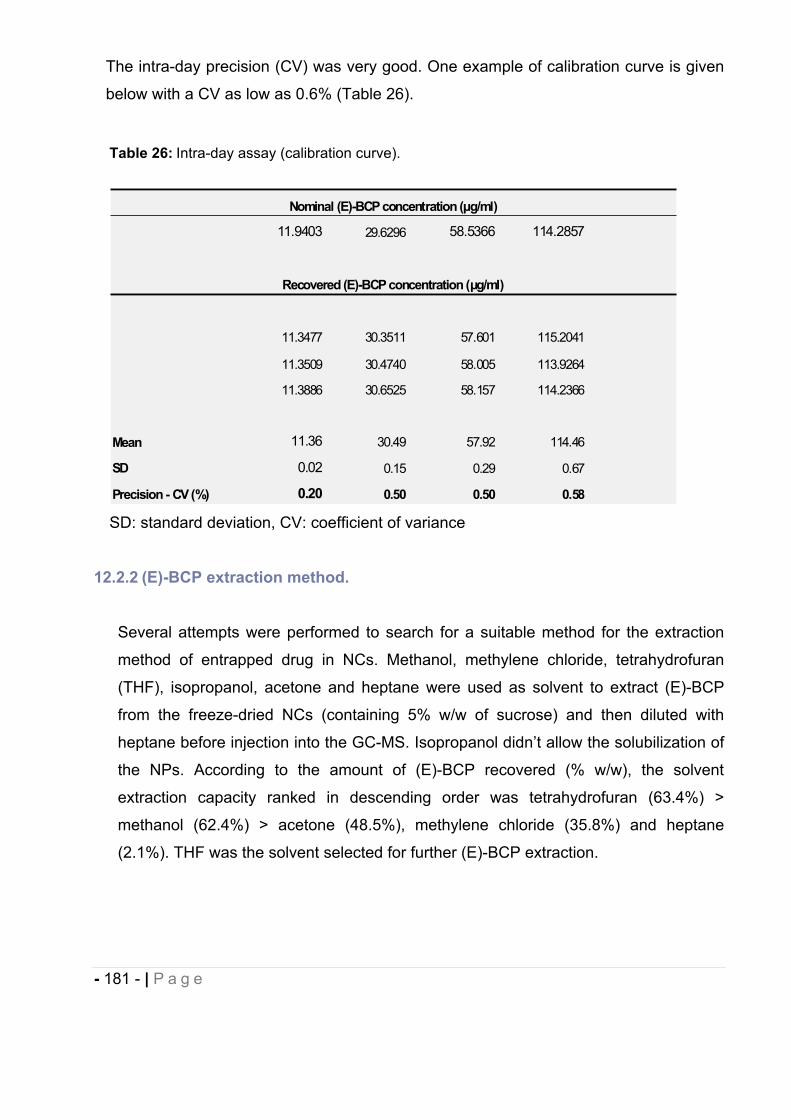
- 181 - | P a g e
The intra-day precision (CV) was very good. One example of calibration curve is given
below with a CV as low as 0.6% (Table 26).
12.2.2 (E)-BCP extraction method.
Several attempts were performed to search for a suitable method for the extraction
method of entrapped drug in NCs. Methanol, methylene chloride, tetrahydrofuran
(THF), isopropanol, acetone and heptane were used as solvent to extract (E)-BCP
from the freeze-dried NCs (containing 5% w/w of sucrose) and then diluted with
heptane before injection into the GC-MS. Isopropanol didn’t allow the solubilization of
the NPs. According to the amount of (E)-BCP recovered (% w/w), the solvent
extraction capacity ranked in descending order was tetrahydrofuran (63.4%) >
methanol (62.4%) > acetone (48.5%), methylene chloride (35.8%) and heptane
(2.1%). THF was the solvent selected for further (E)-BCP extraction.
Table 26: Intra-day assay (calibration curve).
SD: standard deviation, CV: coefficient of variance
11.9403 29.6296 58.5366 114.2857
11.3477 30.3511 57.601 115.2041
11.3509 30.4740 58.005 113.9264
11.3886 30.6525 58.157 114.2366
Mean 11.36 30.49 57.92 114.46
SD 0.02 0.15 0.29 0.67
Precision - CV (%) 0.20 0.50 0.50 0.58
Nominal (E)-BCP concentration ( g/ml)
Recovered (E)-BCP concentration ( g/ml)
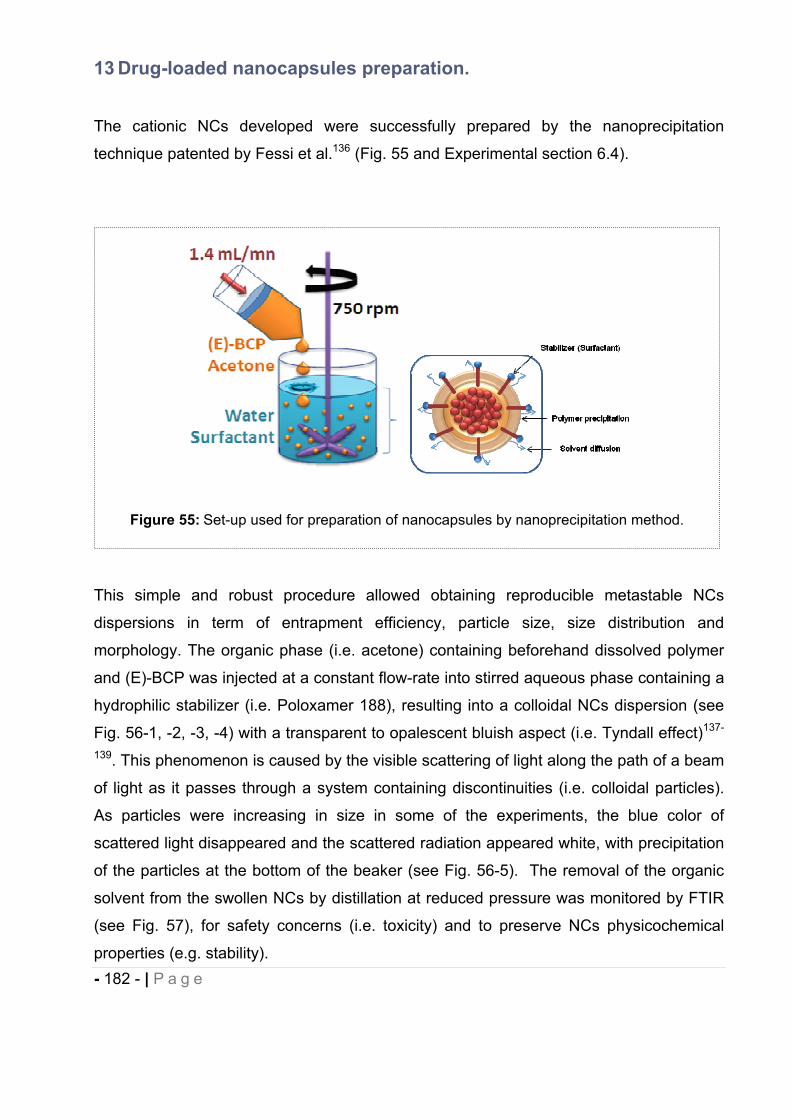
- 182 - | P a g e
13 Drug-loaded nanocapsules preparation.
The cationic NCs developed were successfully prepared by the nanoprecipitation
technique patented by Fessi et al.136 (Fig. 55 and Experimental section 6.4).
This simple and robust procedure allowed obtaining reproducible metastable NCs
dispersions in term of entrapment efficiency, particle size, size distribution and
morphology. The organic phase (i.e. acetone) containing beforehand dissolved polymer
and (E)-BCP was injected at a constant flow-rate into stirred aqueous phase containing a
hydrophilic stabilizer (i.e. Poloxamer 188), resulting into a colloidal NCs dispersion (see
Fig. 56-1, -2, -3, -4) with a transparent to opalescent bluish aspect (i.e. Tyndall effect)137-
139. This phenomenon is caused by the visible scattering of light along the path of a beam
of light as it passes through a system containing discontinuities (i.e. colloidal particles).
As particles were increasing in size in some of the experiments, the blue color of
scattered light disappeared and the scattered radiation appeared white, with precipitation
of the particles at the bottom of the beaker (see Fig. 56-5). The removal of the organic
solvent from the swollen NCs by distillation at reduced pressure was monitored by FTIR
(see Fig. 57), for safety concerns (i.e. toxicity) and to preserve NCs physicochemical
properties (e.g. stability).
Figure 55: Set-up used for preparation of nanocapsules by nanoprecipitation method.
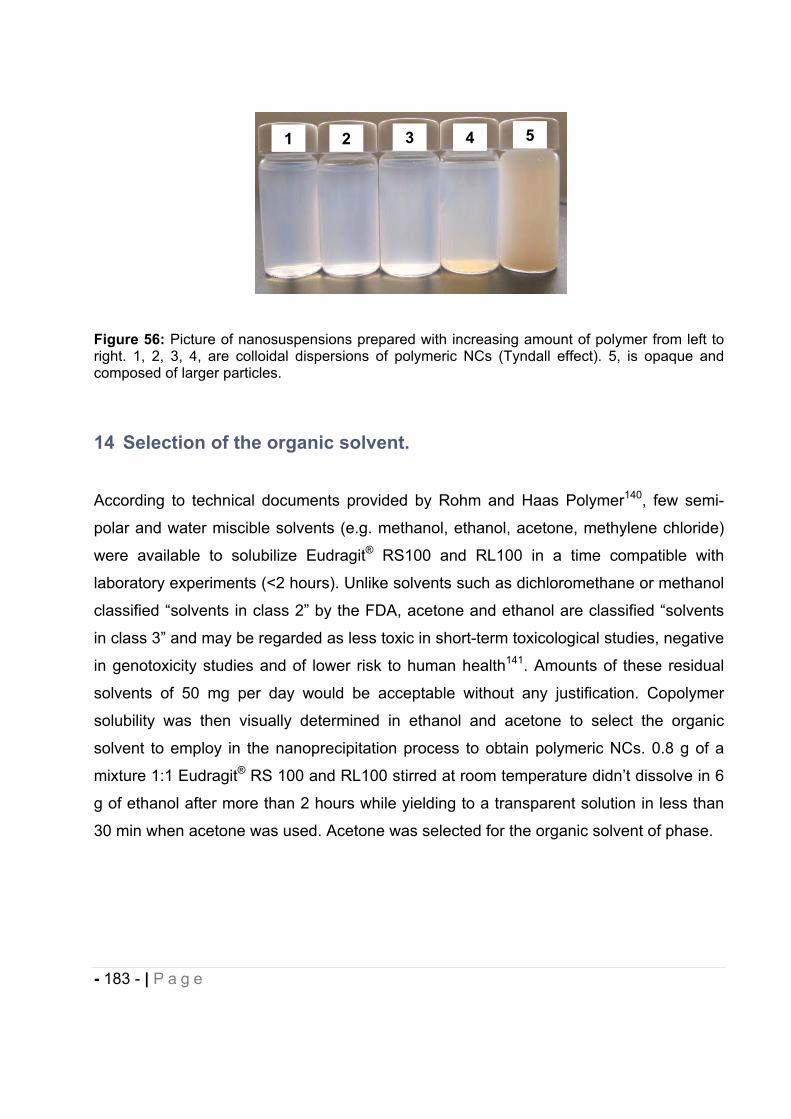
- 183 - | P a g e
Figure 56: Picture of nanosuspensions prepared with increasing amount of polymer from left to right. 1, 2, 3, 4, are colloidal dispersions of polymeric NCs (Tyndall effect). 5, is opaque and composed of larger particles.
14 Selection of the organic solvent.
According to technical documents provided by Rohm and Haas Polymer140, few semi-
polar and water miscible solvents (e.g. methanol, ethanol, acetone, methylene chloride)
were available to solubilize Eudragit® RS100 and RL100 in a time compatible with
laboratory experiments (<2 hours). Unlike solvents such as dichloromethane or methanol
classified “solvents in class 2” by the FDA, acetone and ethanol are classified “solvents
in class 3” and may be regarded as less toxic in short-term toxicological studies, negative
in genotoxicity studies and of lower risk to human health141. Amounts of these residual
solvents of 50 mg per day would be acceptable without any justification. Copolymer
solubility was then visually determined in ethanol and acetone to select the organic
solvent to employ in the nanoprecipitation process to obtain polymeric NCs. 0.8 g of a
mixture 1:1 Eudragit® RS 100 and RL100 stirred at room temperature didn’t dissolve in 6
g of ethanol after more than 2 hours while yielding to a transparent solution in less than
30 min when acetone was used. Acetone was selected for the organic solvent of phase.
54321
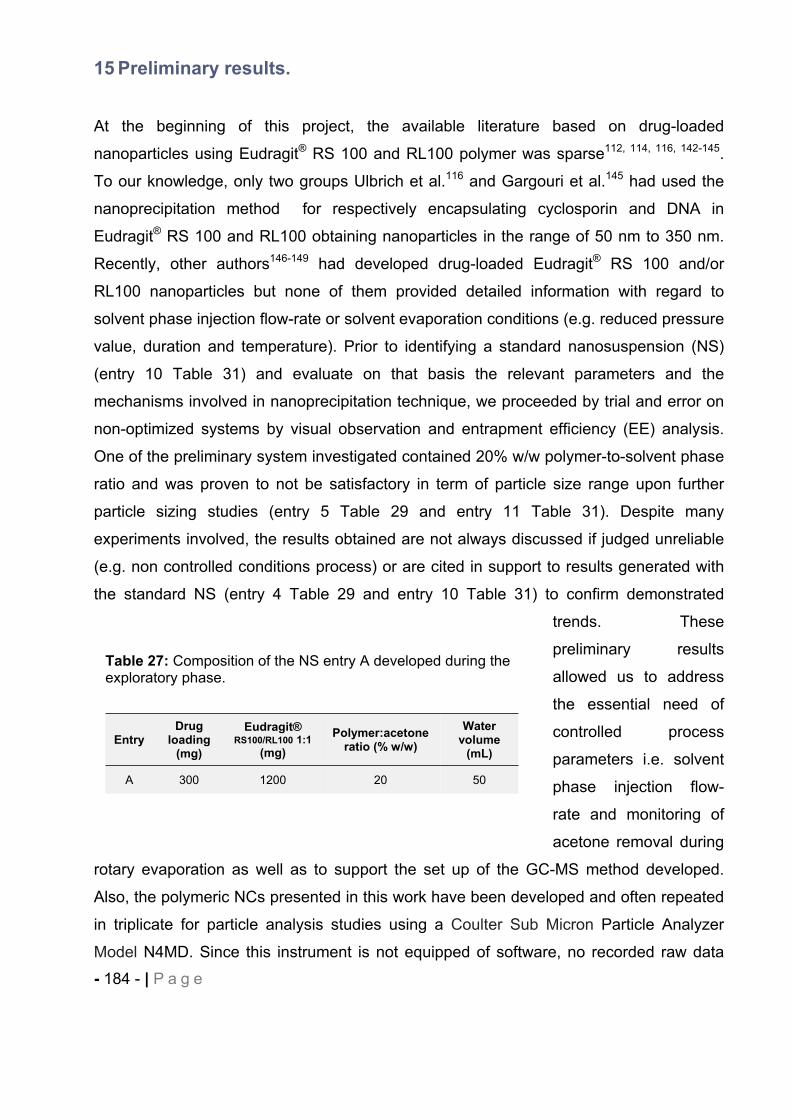
- 184 - | P a g e
15 Preliminary results.
At the beginning of this project, the available literature based on drug-loaded
nanoparticles using Eudragit® RS 100 and RL100 polymer was sparse112, 114, 116, 142-145.
To our knowledge, only two groups Ulbrich et al.116 and Gargouri et al.145 had used the
nanoprecipitation method for respectively encapsulating cyclosporin and DNA in
Eudragit® RS 100 and RL100 obtaining nanoparticles in the range of 50 nm to 350 nm.
Recently, other authors146-149 had developed drug-loaded Eudragit® RS 100 and/or
RL100 nanoparticles but none of them provided detailed information with regard to
solvent phase injection flow-rate or solvent evaporation conditions (e.g. reduced pressure
value, duration and temperature). Prior to identifying a standard nanosuspension (NS)
(entry 10 Table 31) and evaluate on that basis the relevant parameters and the
mechanisms involved in nanoprecipitation technique, we proceeded by trial and error on
non-optimized systems by visual observation and entrapment efficiency (EE) analysis.
One of the preliminary system investigated contained 20% w/w polymer-to-solvent phase
ratio and was proven to not be satisfactory in term of particle size range upon further
particle sizing studies (entry 5 Table 29 and entry 11 Table 31). Despite many
experiments involved, the results obtained are not always discussed if judged unreliable
(e.g. non controlled conditions process) or are cited in support to results generated with
the standard NS (entry 4 Table 29 and entry 10 Table 31) to confirm demonstrated
trends. These
preliminary results
allowed us to address
the essential need of
controlled process
parameters i.e. solvent
phase injection flow-
rate and monitoring of
acetone removal during
rotary evaporation as well as to support the set up of the GC-MS method developed.
Also, the polymeric NCs presented in this work have been developed and often repeated
in triplicate for particle analysis studies using a Coulter Sub Micron Particle Analyzer
Model N4MD. Since this instrument is not equipped of software, no recorded raw data
Table 27: Composition of the NS entry A developed during the exploratory phase.
EntryDrug
loading (mg)
Eudragit® RS100/RL100 1:1
(mg)Polymer:acetone
ratio (% w/w) Water
volume (mL)
A 300 1200 20 50
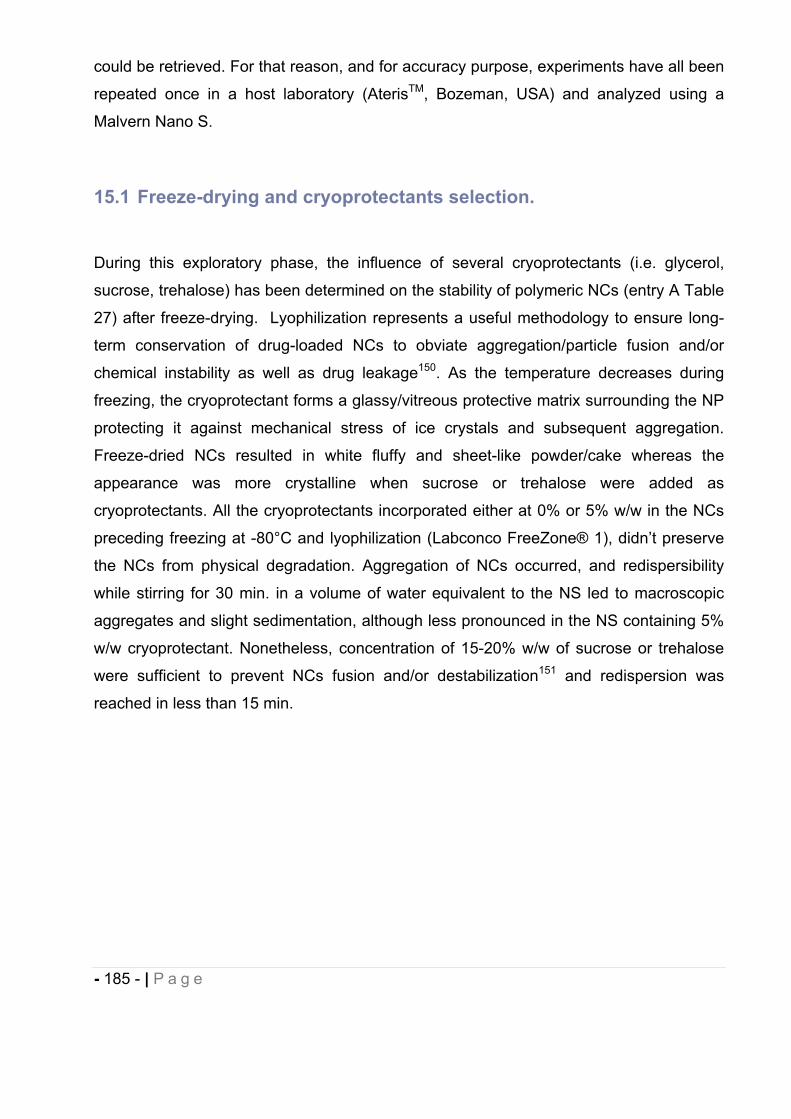
- 185 - | P a g e
could be retrieved. For that reason, and for accuracy purpose, experiments have all been
repeated once in a host laboratory (AterisTM, Bozeman, USA) and analyzed using a
Malvern Nano S.
15.1 Freeze-drying and cryoprotectants selection.
During this exploratory phase, the influence of several cryoprotectants (i.e. glycerol,
sucrose, trehalose) has been determined on the stability of polymeric NCs (entry A Table
27) after freeze-drying. Lyophilization represents a useful methodology to ensure long-
term conservation of drug-loaded NCs to obviate aggregation/particle fusion and/or
chemical instability as well as drug leakage150. As the temperature decreases during
freezing, the cryoprotectant forms a glassy/vitreous protective matrix surrounding the NP
protecting it against mechanical stress of ice crystals and subsequent aggregation.
Freeze-dried NCs resulted in white fluffy and sheet-like powder/cake whereas the
appearance was more crystalline when sucrose or trehalose were added as
cryoprotectants. All the cryoprotectants incorporated either at 0% or 5% w/w in the NCs
preceding freezing at -80°C and lyophilization (Labconco FreeZone® 1), didn’t preserve
the NCs from physical degradation. Aggregation of NCs occurred, and redispersibility
while stirring for 30 min. in a volume of water equivalent to the NS led to macroscopic
aggregates and slight sedimentation, although less pronounced in the NS containing 5%
w/w cryoprotectant. Nonetheless, concentration of 15-20% w/w of sucrose or trehalose
were sufficient to prevent NCs fusion and/or destabilization151 and redispersion was
reached in less than 15 min.
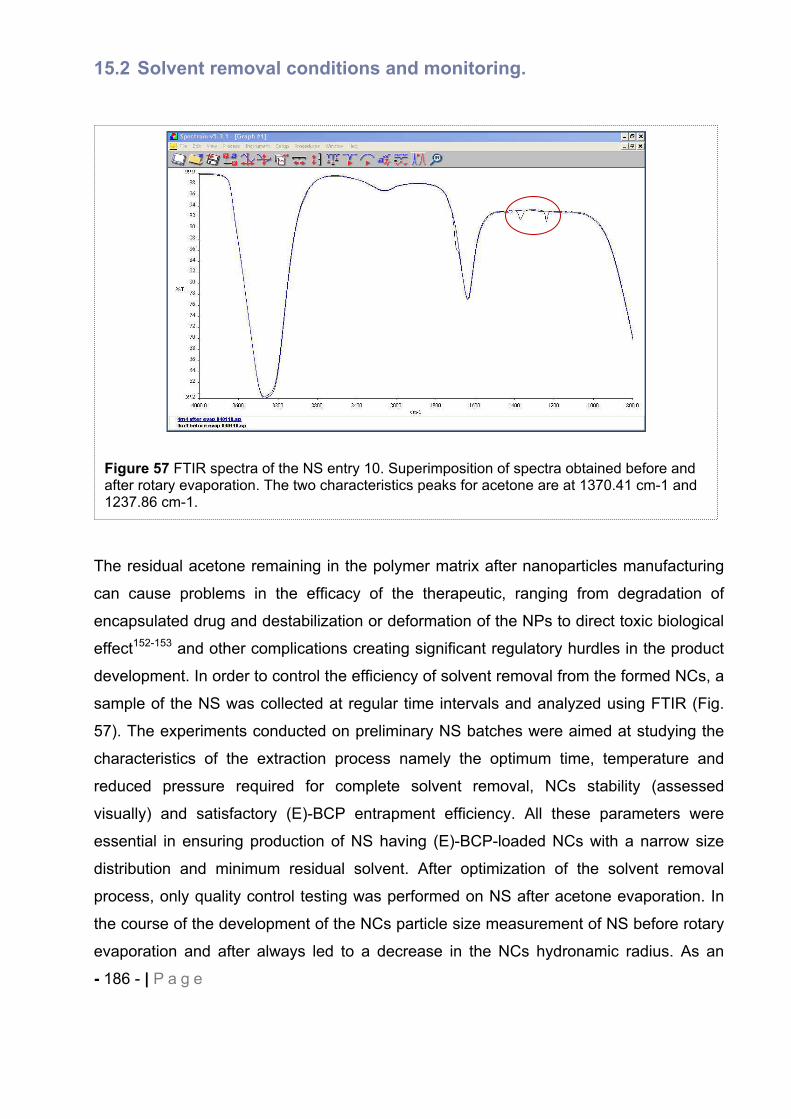
- 186 - | P a g e
15.2 Solvent removal conditions and monitoring.
The residual acetone remaining in the polymer matrix after nanoparticles manufacturing
can cause problems in the efficacy of the therapeutic, ranging from degradation of
encapsulated drug and destabilization or deformation of the NPs to direct toxic biological
effect152-153 and other complications creating significant regulatory hurdles in the product
development. In order to control the efficiency of solvent removal from the formed NCs, a
sample of the NS was collected at regular time intervals and analyzed using FTIR (Fig.
57). The experiments conducted on preliminary NS batches were aimed at studying the
characteristics of the extraction process namely the optimum time, temperature and
reduced pressure required for complete solvent removal, NCs stability (assessed
visually) and satisfactory (E)-BCP entrapment efficiency. All these parameters were
essential in ensuring production of NS having (E)-BCP-loaded NCs with a narrow size
distribution and minimum residual solvent. After optimization of the solvent removal
process, only quality control testing was performed on NS after acetone evaporation. In
the course of the development of the NCs particle size measurement of NS before rotary
evaporation and after always led to a decrease in the NCs hydronamic radius. As an
Figure 57 FTIR spectra of the NS entry 10. Superimposition of spectra obtained before and after rotary evaporation. The two characteristics peaks for acetone are at 1370.41 cm-1 and 1237.86 cm-1.
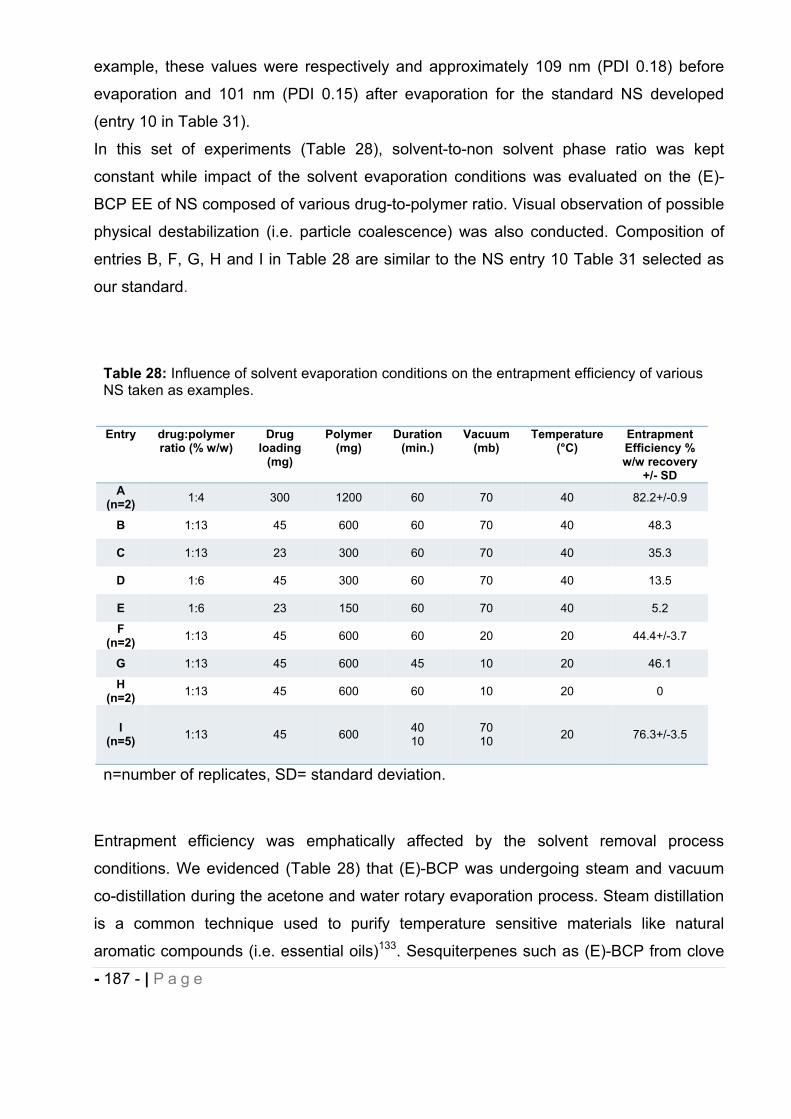
- 187 - | P a g e
example, these values were respectively and approximately 109 nm (PDI 0.18) before
evaporation and 101 nm (PDI 0.15) after evaporation for the standard NS developed
(entry 10 in Table 31).
In this set of experiments (Table 28), solvent-to-non solvent phase ratio was kept
constant while impact of the solvent evaporation conditions was evaluated on the (E)-
BCP EE of NS composed of various drug-to-polymer ratio. Visual observation of possible
physical destabilization (i.e. particle coalescence) was also conducted. Composition of
entries B, F, G, H and I in Table 28 are similar to the NS entry 10 Table 31 selected as
our standard.
Entrapment efficiency was emphatically affected by the solvent removal process
conditions. We evidenced (Table 28) that (E)-BCP was undergoing steam and vacuum
co-distillation during the acetone and water rotary evaporation process. Steam distillation
is a common technique used to purify temperature sensitive materials like natural
aromatic compounds (i.e. essential oils)133. Sesquiterpenes such as (E)-BCP from clove
Table 28: Influence of solvent evaporation conditions on the entrapment efficiency of various NS taken as examples.
Entry drug:polymerratio (% w/w)
Drugloading
(mg)
Polymer(mg)
Duration (min.)
Vacuum (mb)
Temperature (°C)
EntrapmentEfficiency % w/w recovery
+/- SD A
(n=2) 1:4 300 1200 60 70 40 82.2+/-0.9
B 1:13 45 600 60 70 40 48.3
C 1:13 23 300 60 70 40 35.3
D 1:6 45 300 60 70 40 13.5
E 1:6 23 150 60 70 40 5.2
F(n=2) 1:13 45 600 60 20 20 44.4+/-3.7
G 1:13 45 600 45 10 20 46.1
H(n=2) 1:13 45 600 60 10 20 0
I(n=5) 1:13 45 600 40
10 70 10 20 76.3+/-3.5
n=number of replicates, SD= standard deviation.
- 188 - | P a g e
oil123, 154 can be separated and isolated using this method. All the protocols reported in
Table 28 allowed successful removal of acetone from the polymeric NCs as assessed by
FTIR. For acetone evaporation, boiling point of 40°C is normally required at pressure
condition of 556 mb. According to our results, conditions of 40 min/40°C/70 mb (entries A
to E) or 40 min/20°C/70 mb followed by a second phase of 10 min/20°C/10 mb (entry I)
were the minimal requirement to eliminate the acetone from our system. It is also
necessary to take account of Raoult’s law which states that the boiling temperature of a
mixture (e.g acetone/water) rises as the concentration of its low-boiling component (e.g.
acetone) decreases155 in addition to the fact that the acetone distillation may be
hampered by acetone-polymer interactions. Several attempts have been made to
concentrate the (E)-BCP in the NS, evaporating water down to 1/10th of the initial NS
volume (entries F, G and H). The aim was to facilitate in vivo administration of fresh NS
(10-20 mg/Kg) with reduced “gavage” volume.
Among the NS prepared, only solvent removal conditions applied to entries A and I were
satisfactory in term of EE (Entrapment Efficiency) with 82.2% and 76.3% of drug
recovered respectively. It seems obvious than the composition of the NCs, and
particularly the polymer content and the drug-to-polymer ratio, alter significantly the NCs
drug loading. For NS manufactured following identical pressure conditions (entries A-E)
i.e. 40 min/40°C/70 mb the trend observed was that the lower the polymer content, the
lower the EE (entries E< C< D< B < A). Keeping the same ratio of drug-to-polymer, with
decreased polymer content (e.g. entries E< D or C<B) confirmed this observation.
According to different authors, the NC shell thickness could be increased with higher
polymer concentration and may affect the drug release156-159 or the propensity of (E)-BCP
towards steam distillation. When vacuum was reaching values of 10 mb or 20 mb, the
drug distillation was enhanced (entries F, G, H) since at 40 mb the water boiling point is
lower (13.4°C) than the temperature we set up (20°C). Loss of the entire (E)-BCP
entrapped was noticed under the conditions undergone by the NS entry H. The pressure
conditions described for the entry I selected as a standard for further investigations were
optimal considering the high and reproducible EE achieved (76.3%) over five replicated
NS, allowing reliable acetone removal without any physical NCs destabilization i.e
opalescent and bluish dispersions. In addition this EE was even improved upon formation
of macrocycles-NCs complexes (see section 16.9).
- 189 - | P a g e
15.3 Optimization of solvent phase addition flow-rate.
A programmable syringe pump was used to inject the organic solution into the aqueous
phase through a syringe (10 mL) at a constant flow-rate of 1.4 mL.min-1 in order to
ensure reproducibility of the process. Some authors reported that a preferred way to
prepare NPs using nanoprecipitation method is to rapidly inject the organic phase into
the aqueous phase66, 136, 160 to reduce mean size of the resulting NCs. We investigated
three different flow-rates of 0.7, 1.4 mL.min-1 and 23.3 mL.min-1 on one batch of the
standard NS entry 10 Table 31. Flow-rate of 0.7 mL.min-1 didn’t produce any colloidal
system formation since precipitation of polymer occurred at the aperture of the syringe
because of acetone evaporation before mixing with aqueous phase. With flow-rates of
1.4 mL.min-1 and 23.3 mL.min-1 the particles were not significantly different in mean
diameter, respectively 105 (PDI 0.21) and 115 (PDI 0.41), although the NCs size was
more homogeneous with slower rate. However the EE was fairly impacted and
decreased by faster mixing of organic phase and aqueous phase, 65.6% w/w recovered,
compared to 74.8% w/w recovered using a flow-rate of 1.4 mL.min-1. As described by
Beck-Broichsitter et al.66, one of the critical parameter in NCs formation is the velocity of
diffusion of the polymer containing-organic phase. Higher diffusion rates are usually
thought to favour homogeneous dispersion of polymer/acetone/drug droplets in the
aqueous phase, lower local acetone concentration and higher velocity diffusion, resulting
in smaller particles. However the flow-rates reported are generally no greater than 10
mL.min-1. Higher flow-rate may provoke too high local supersaturation in
polymer/acetone/drug reducing solvent diffusion thereby yielding to polymer aggregation,
increased NCs polydispersity and poor drug entrapment efficiency. An appropriate flow-
rate needs to be set up in order to circumvent polymer aggregation and favour organic
solute nucleation and growth owing to homogeneous high supersaturation. Flow-rates of
1.4 mL.min-1 yielded to relatively monodisperse NCs and satisfactory (E)-BCP loading.
16 Physicochemical parameters associated with NCs formation.
In order to design suitable nanocapsules with predictable performance and reliable
process, understanding of the relationships between composition, process parameters,
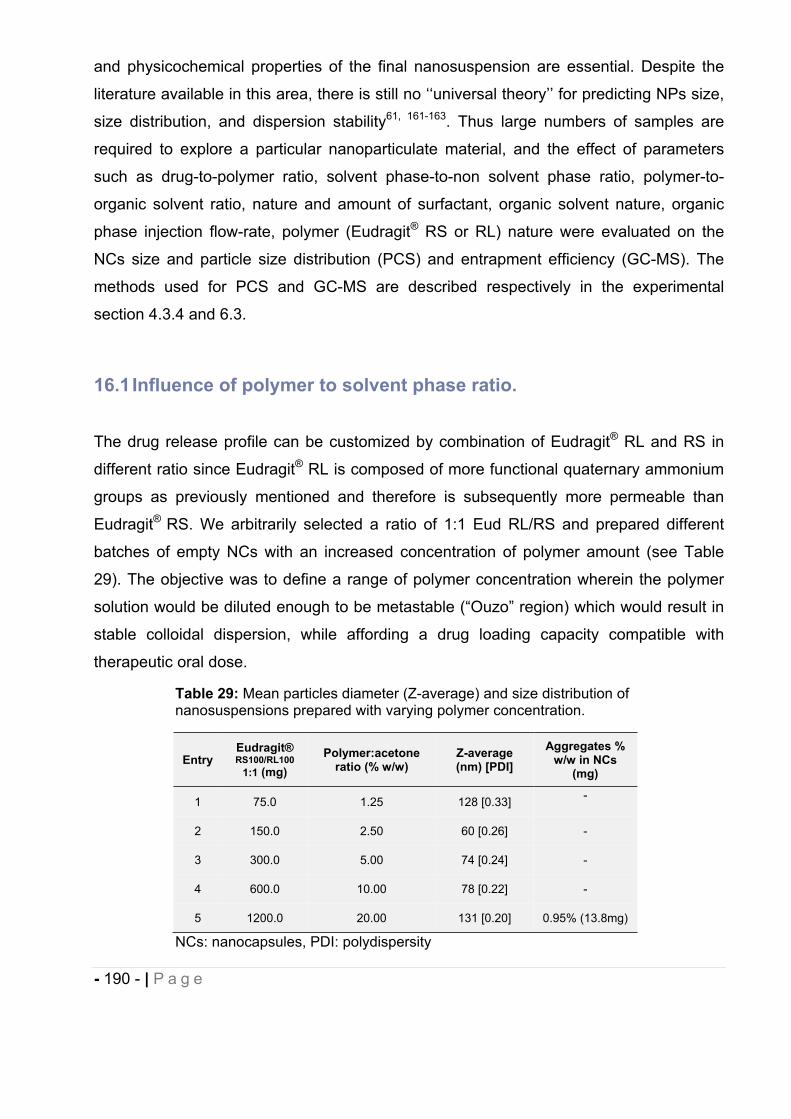
- 190 - | P a g e
and physicochemical properties of the final nanosuspension are essential. Despite the
literature available in this area, there is still no ‘‘universal theory’’ for predicting NPs size,
size distribution, and dispersion stability61, 161-163. Thus large numbers of samples are
required to explore a particular nanoparticulate material, and the effect of parameters
such as drug-to-polymer ratio, solvent phase-to-non solvent phase ratio, polymer-to-
organic solvent ratio, nature and amount of surfactant, organic solvent nature, organic
phase injection flow-rate, polymer (Eudragit® RS or RL) nature were evaluated on the
NCs size and particle size distribution (PCS) and entrapment efficiency (GC-MS). The
methods used for PCS and GC-MS are described respectively in the experimental
section 4.3.4 and 6.3.
16.1 Influence of polymer to solvent phase ratio.
The drug release profile can be customized by combination of Eudragit® RL and RS in
different ratio since Eudragit® RL is composed of more functional quaternary ammonium
groups as previously mentioned and therefore is subsequently more permeable than
Eudragit® RS. We arbitrarily selected a ratio of 1:1 Eud RL/RS and prepared different
batches of empty NCs with an increased concentration of polymer amount (see Table
29). The objective was to define a range of polymer concentration wherein the polymer
solution would be diluted enough to be metastable (“Ouzo” region) which would result in
stable colloidal dispersion, while affording a drug loading capacity compatible with
therapeutic oral dose.
Table 29: Mean particles diameter (Z-average) and size distribution of nanosuspensions prepared with varying polymer concentration.
EntryEudragit® RS100/RL100
1:1 (mg) Polymer:acetone
ratio (% w/w) Z-average (nm) [PDI]
Aggregates % w/w in NCs
(mg)
1 75.0 1.25 128 [0.33] -
2 150.0 2.50 60 [0.26] -
3 300.0 5.00 74 [0.24] -
4 600.0 10.00 78 [0.22] -
5 1200.0 20.00 131 [0.20] 0.95% (13.8mg)
NCs: nanocapsules, PDI: polydispersity
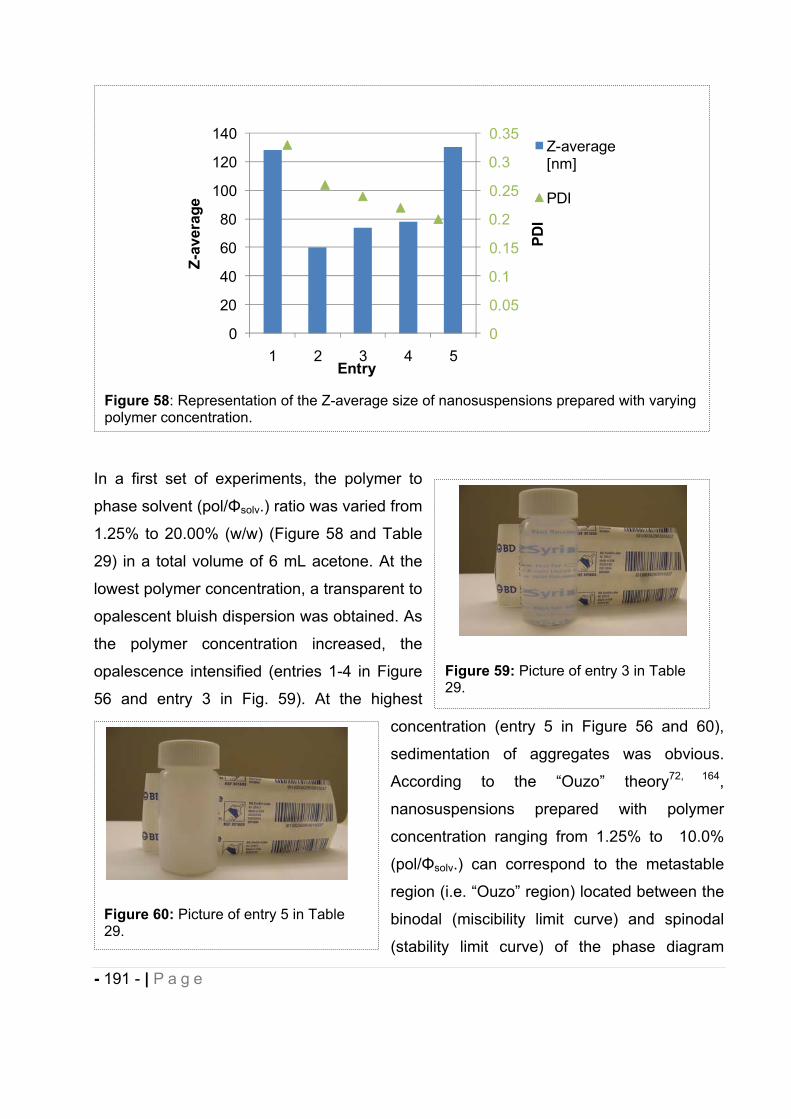
- 191 - | P a g e
In a first set of experiments, the polymer to
phase solvent (pol/ solv.) ratio was varied from
1.25% to 20.00% (w/w) (Figure 58 and Table
29) in a total volume of 6 mL acetone. At the
lowest polymer concentration, a transparent to
opalescent bluish dispersion was obtained. As
the polymer concentration increased, the
opalescence intensified (entries 1-4 in Figure
56 and entry 3 in Fig. 59). At the highest
concentration (entry 5 in Figure 56 and 60),
sedimentation of aggregates was obvious.
According to the “Ouzo” theory72, 164,
nanosuspensions prepared with polymer
concentration ranging from 1.25% to 10.0%
(pol/ solv.) can correspond to the metastable
region (i.e. “Ouzo” region) located between the
binodal (miscibility limit curve) and spinodal
(stability limit curve) of the phase diagram
Figure 58: Representation of the Z-average size of nanosuspensions prepared with varying polymer concentration.
0
0.05
0.1
0.15
0.2
0.25
0.3
0.35
0
20
40
60
80
100
120
140
1 2 3 4 5
PDI
Z-av
erag
e
Entry
Z-average [nm]
PDI
Figure 59: Picture of entry 3 in Table 29.
Figure 60: Picture of entry 5 in Table 29.
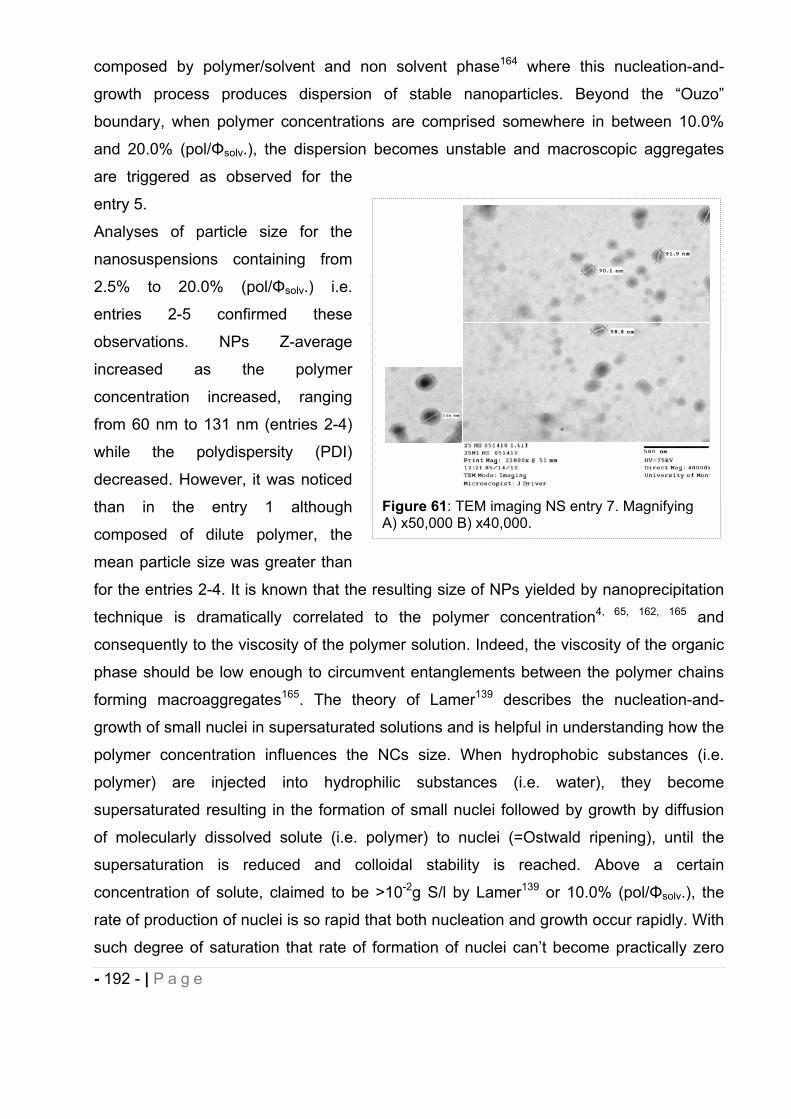
- 192 - | P a g e
composed by polymer/solvent and non solvent phase164 where this nucleation-and-
growth process produces dispersion of stable nanoparticles. Beyond the “Ouzo”
boundary, when polymer concentrations are comprised somewhere in between 10.0%
and 20.0% (pol/ solv.), the dispersion becomes unstable and macroscopic aggregates
are triggered as observed for the
entry 5.
Analyses of particle size for the
nanosuspensions containing from
2.5% to 20.0% (pol/ solv.) i.e.
entries 2-5 confirmed these
observations. NPs Z-average
increased as the polymer
concentration increased, ranging
from 60 nm to 131 nm (entries 2-4)
while the polydispersity (PDI)
decreased. However, it was noticed
than in the entry 1 although
composed of dilute polymer, the
mean particle size was greater than
for the entries 2-4. It is known that the resulting size of NPs yielded by nanoprecipitation
technique is dramatically correlated to the polymer concentration4, 65, 162, 165 and
consequently to the viscosity of the polymer solution. Indeed, the viscosity of the organic
phase should be low enough to circumvent entanglements between the polymer chains
forming macroaggregates165. The theory of Lamer139 describes the nucleation-and-
growth of small nuclei in supersaturated solutions and is helpful in understanding how the
polymer concentration influences the NCs size. When hydrophobic substances (i.e.
polymer) are injected into hydrophilic substances (i.e. water), they become
supersaturated resulting in the formation of small nuclei followed by growth by diffusion
of molecularly dissolved solute (i.e. polymer) to nuclei (=Ostwald ripening), until the
supersaturation is reduced and colloidal stability is reached. Above a certain
concentration of solute, claimed to be >10-2g S/l by Lamer139 or 10.0% (pol/ solv.), the
rate of production of nuclei is so rapid that both nucleation and growth occur rapidly. With
such degree of saturation that rate of formation of nuclei can’t become practically zero
Figure 61: TEM imaging NS entry 7. Magnifying A) x50,000 B) x40,000.
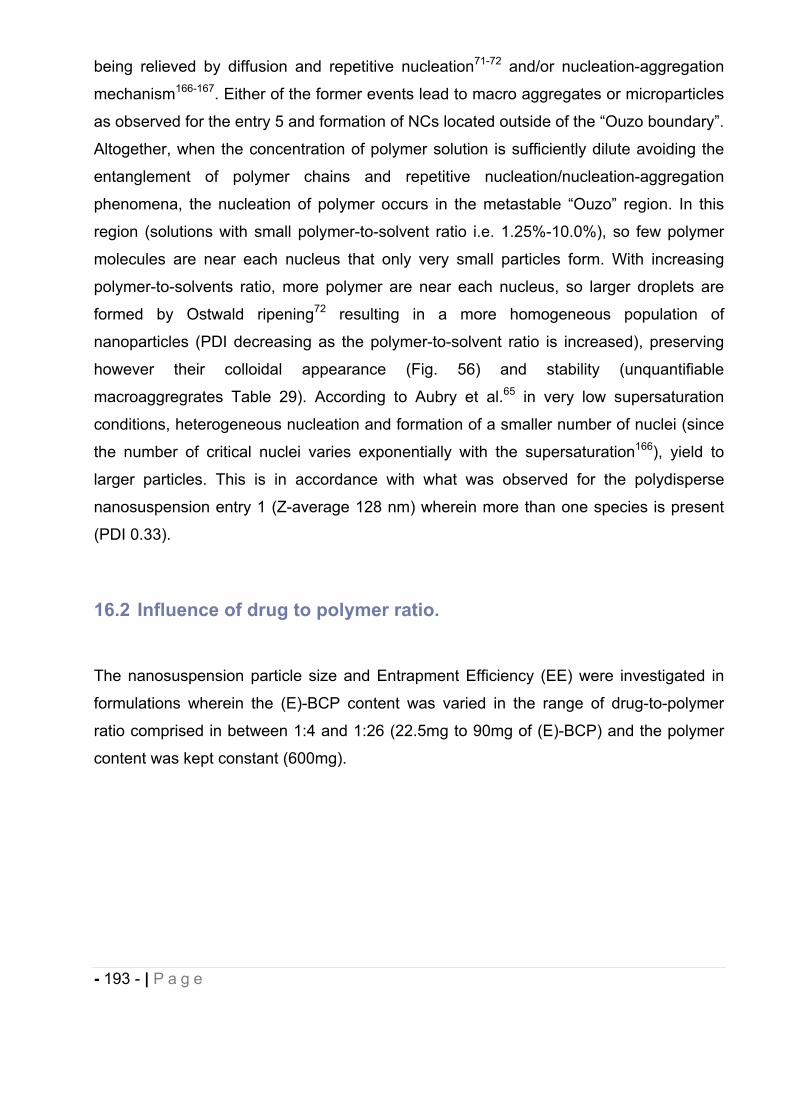
- 193 - | P a g e
being relieved by diffusion and repetitive nucleation71-72 and/or nucleation-aggregation
mechanism166-167. Either of the former events lead to macro aggregates or microparticles
as observed for the entry 5 and formation of NCs located outside of the “Ouzo boundary”.
Altogether, when the concentration of polymer solution is sufficiently dilute avoiding the
entanglement of polymer chains and repetitive nucleation/nucleation-aggregation
phenomena, the nucleation of polymer occurs in the metastable “Ouzo” region. In this
region (solutions with small polymer-to-solvent ratio i.e. 1.25%-10.0%), so few polymer
molecules are near each nucleus that only very small particles form. With increasing
polymer-to-solvents ratio, more polymer are near each nucleus, so larger droplets are
formed by Ostwald ripening72 resulting in a more homogeneous population of
nanoparticles (PDI decreasing as the polymer-to-solvent ratio is increased), preserving
however their colloidal appearance (Fig. 56) and stability (unquantifiable
macroaggregrates Table 29). According to Aubry et al.65 in very low supersaturation
conditions, heterogeneous nucleation and formation of a smaller number of nuclei (since
the number of critical nuclei varies exponentially with the supersaturation166), yield to
larger particles. This is in accordance with what was observed for the polydisperse
nanosuspension entry 1 (Z-average 128 nm) wherein more than one species is present
(PDI 0.33).
16.2 Influence of drug to polymer ratio.
The nanosuspension particle size and Entrapment Efficiency (EE) were investigated in
formulations wherein the (E)-BCP content was varied in the range of drug-to-polymer
ratio comprised in between 1:4 and 1:26 (22.5mg to 90mg of (E)-BCP) and the polymer
content was kept constant (600mg).
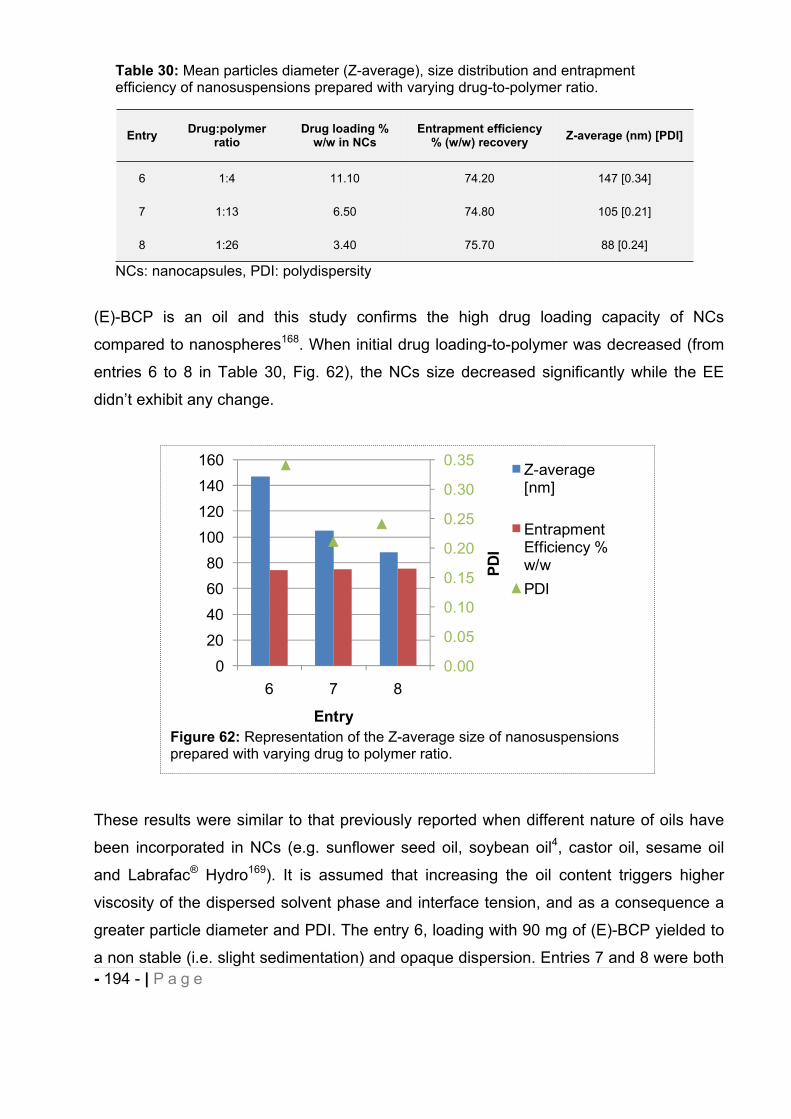
- 194 - | P a g e
(E)-BCP is an oil and this study confirms the high drug loading capacity of NCs
compared to nanospheres168. When initial drug loading-to-polymer was decreased (from
entries 6 to 8 in Table 30, Fig. 62), the NCs size decreased significantly while the EE
didn’t exhibit any change.
These results were similar to that previously reported when different nature of oils have
been incorporated in NCs (e.g. sunflower seed oil, soybean oil4, castor oil, sesame oil
and Labrafac® Hydro169). It is assumed that increasing the oil content triggers higher
viscosity of the dispersed solvent phase and interface tension, and as a consequence a
greater particle diameter and PDI. The entry 6, loading with 90 mg of (E)-BCP yielded to
a non stable (i.e. slight sedimentation) and opaque dispersion. Entries 7 and 8 were both
Figure 62: Representation of the Z-average size of nanosuspensions prepared with varying drug to polymer ratio.
0.00
0.05
0.10
0.15
0.20
0.25
0.30
0.35
0
20
40
6080
100
120
140
160
6 7 8
PDI
Entry
Z-average [nm]
Entrapment Efficiency % w/wPDI
Table 30: Mean particles diameter (Z-average), size distribution and entrapment efficiency of nanosuspensions prepared with varying drug-to-polymer ratio.
Entry Drug:polymer ratio
Drug loading % w/w in NCs
Entrapment efficiency % (w/w) recovery Z-average (nm) [PDI]
6 1:4 11.10 74.20 147 [0.34]
7 1:13 6.50 74.80 105 [0.21]
8 1:26 3.40 75.70 88 [0.24]
NCs: nanocapsules, PDI: polydispersity
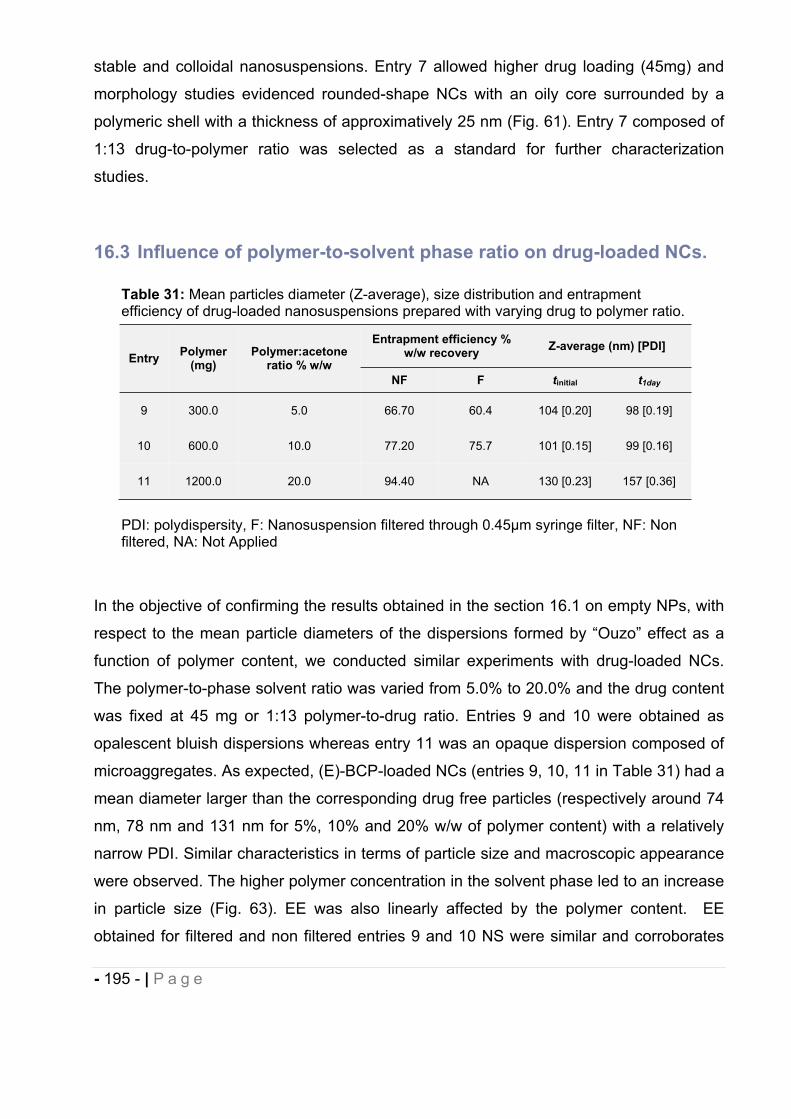
- 195 - | P a g e
stable and colloidal nanosuspensions. Entry 7 allowed higher drug loading (45mg) and
morphology studies evidenced rounded-shape NCs with an oily core surrounded by a
polymeric shell with a thickness of approximatively 25 nm (Fig. 61). Entry 7 composed of
1:13 drug-to-polymer ratio was selected as a standard for further characterization
studies.
16.3 Influence of polymer-to-solvent phase ratio on drug-loaded NCs.
In the objective of confirming the results obtained in the section 16.1 on empty NPs, with
respect to the mean particle diameters of the dispersions formed by “Ouzo” effect as a
function of polymer content, we conducted similar experiments with drug-loaded NCs.
The polymer-to-phase solvent ratio was varied from 5.0% to 20.0% and the drug content
was fixed at 45 mg or 1:13 polymer-to-drug ratio. Entries 9 and 10 were obtained as
opalescent bluish dispersions whereas entry 11 was an opaque dispersion composed of
microaggregates. As expected, (E)-BCP-loaded NCs (entries 9, 10, 11 in Table 31) had a
mean diameter larger than the corresponding drug free particles (respectively around 74
nm, 78 nm and 131 nm for 5%, 10% and 20% w/w of polymer content) with a relatively
narrow PDI. Similar characteristics in terms of particle size and macroscopic appearance
were observed. The higher polymer concentration in the solvent phase led to an increase
in particle size (Fig. 63). EE was also linearly affected by the polymer content. EE
obtained for filtered and non filtered entries 9 and 10 NS were similar and corroborates
Table 31: Mean particles diameter (Z-average), size distribution and entrapment efficiency of drug-loaded nanosuspensions prepared with varying drug to polymer ratio.
Entry Polymer (mg)
Polymer:acetone ratio % w/w
Entrapment efficiency % w/w recovery Z-average (nm) [PDI]
NF F tinitial t1day
9 300.0 5.0 66.70 60.4 104 [0.20] 98 [0.19]
10 600.0 10.0 77.20 75.7 101 [0.15] 99 [0.16]
11 1200.0 20.0 94.40 NA 130 [0.23] 157 [0.36]
PDI: polydispersity, F: Nanosuspension filtered through 0.45μm syringe filter, NF: Non filtered, NA: Not Applied
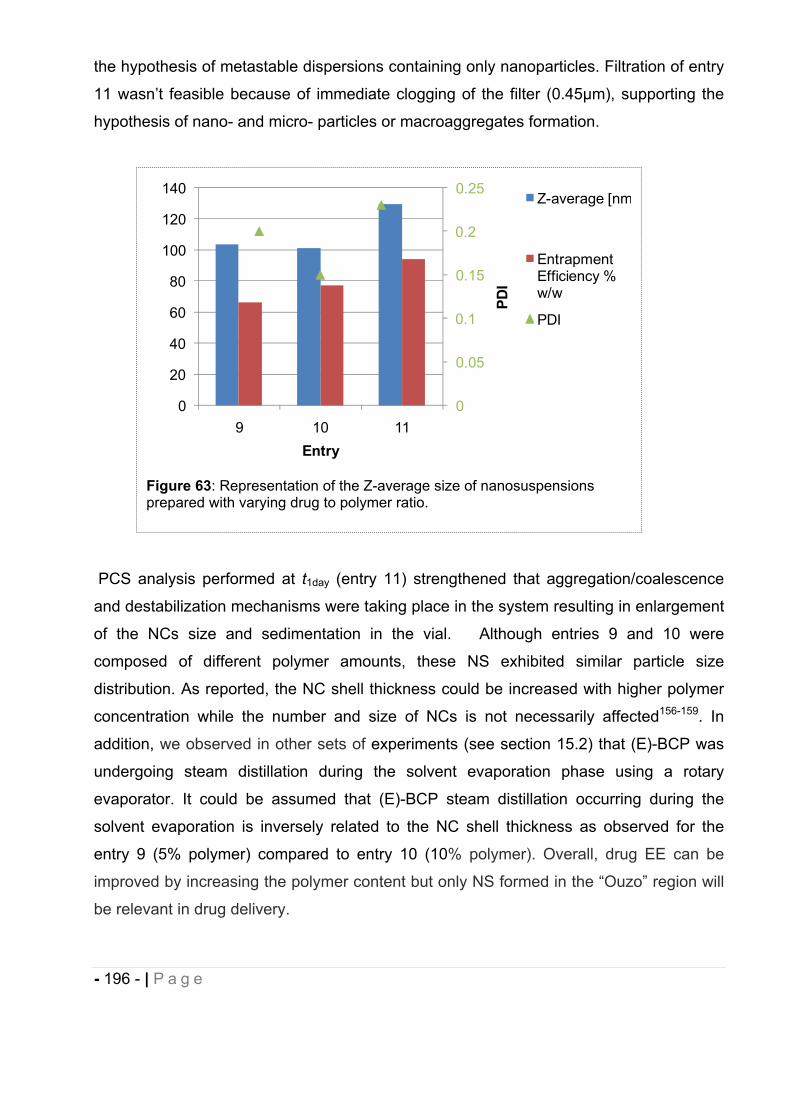
- 196 - | P a g e
the hypothesis of metastable dispersions containing only nanoparticles. Filtration of entry
11 wasn’t feasible because of immediate clogging of the filter (0.45μm), supporting the
hypothesis of nano- and micro- particles or macroaggregates formation.
PCS analysis performed at t1day (entry 11) strengthened that aggregation/coalescence
and destabilization mechanisms were taking place in the system resulting in enlargement
of the NCs size and sedimentation in the vial. Although entries 9 and 10 were
composed of different polymer amounts, these NS exhibited similar particle size
distribution. As reported, the NC shell thickness could be increased with higher polymer
concentration while the number and size of NCs is not necessarily affected156-159. In
addition, we observed in other sets of experiments (see section 15.2) that (E)-BCP was
undergoing steam distillation during the solvent evaporation phase using a rotary
evaporator. It could be assumed that (E)-BCP steam distillation occurring during the
solvent evaporation is inversely related to the NC shell thickness as observed for the
entry 9 (5% polymer) compared to entry 10 (10% polymer). Overall, drug EE can be
improved by increasing the polymer content but only NS formed in the “Ouzo” region will
be relevant in drug delivery.
Figure 63: Representation of the Z-average size of nanosuspensions prepared with varying drug to polymer ratio.
0
0.05
0.1
0.15
0.2
0.25
0
20
40
60
80
100
120
140
9 10 11
PDI
Entry
Z-average [nm
Entrapment Efficiency % w/w
PDI
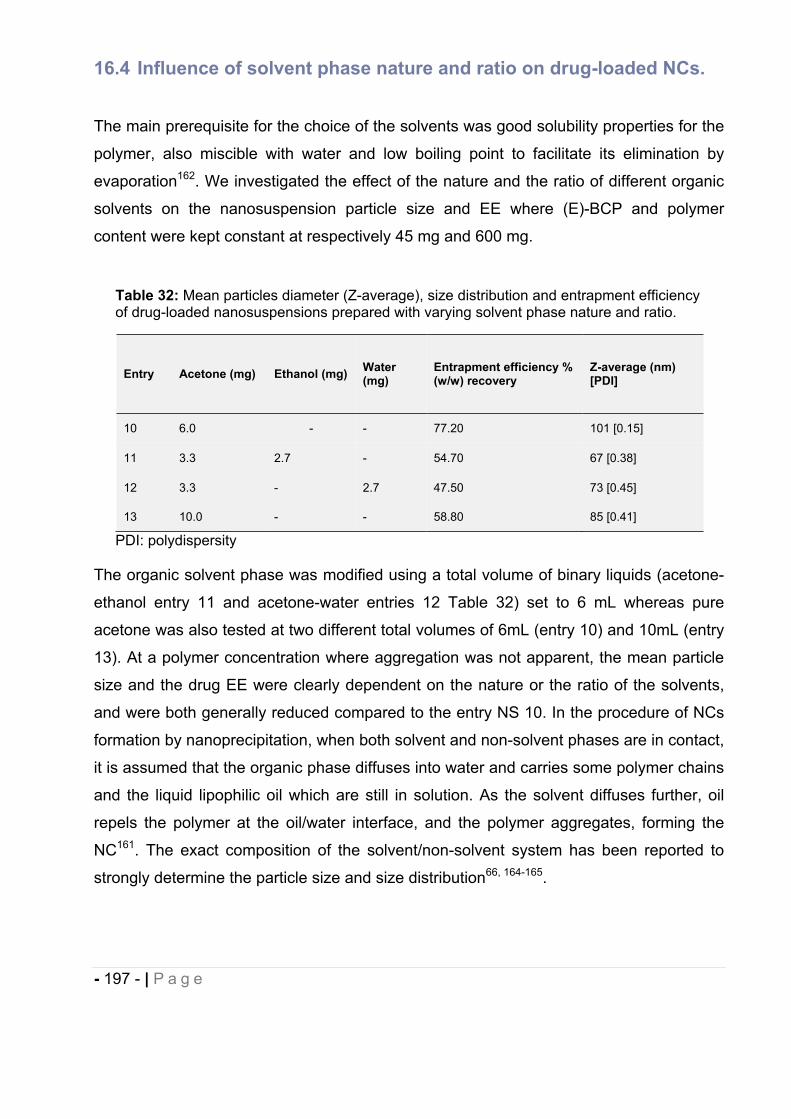
- 197 - | P a g e
16.4 Influence of solvent phase nature and ratio on drug-loaded NCs.
The main prerequisite for the choice of the solvents was good solubility properties for the
polymer, also miscible with water and low boiling point to facilitate its elimination by
evaporation162. We investigated the effect of the nature and the ratio of different organic
solvents on the nanosuspension particle size and EE where (E)-BCP and polymer
content were kept constant at respectively 45 mg and 600 mg.
The organic solvent phase was modified using a total volume of binary liquids (acetone-
ethanol entry 11 and acetone-water entries 12 Table 32) set to 6 mL whereas pure
acetone was also tested at two different total volumes of 6mL (entry 10) and 10mL (entry
13). At a polymer concentration where aggregation was not apparent, the mean particle
size and the drug EE were clearly dependent on the nature or the ratio of the solvents,
and were both generally reduced compared to the entry NS 10. In the procedure of NCs
formation by nanoprecipitation, when both solvent and non-solvent phases are in contact,
it is assumed that the organic phase diffuses into water and carries some polymer chains
and the liquid lipophilic oil which are still in solution. As the solvent diffuses further, oil
repels the polymer at the oil/water interface, and the polymer aggregates, forming the
NC161. The exact composition of the solvent/non-solvent system has been reported to
strongly determine the particle size and size distribution66, 164-165.
Table 32: Mean particles diameter (Z-average), size distribution and entrapment efficiency of drug-loaded nanosuspensions prepared with varying solvent phase nature and ratio.
Entry Acetone (mg) Ethanol (mg) Water (mg)
Entrapment efficiency % (w/w) recovery
Z-average (nm) [PDI]
10 6.0 - - 77.20 101 [0.15]
11 3.3 2.7 - 54.70 67 [0.38]
12 3.3 - 2.7 47.50 73 [0.45]
13 10.0 - - 58.80 85 [0.41]
PDI: polydispersity
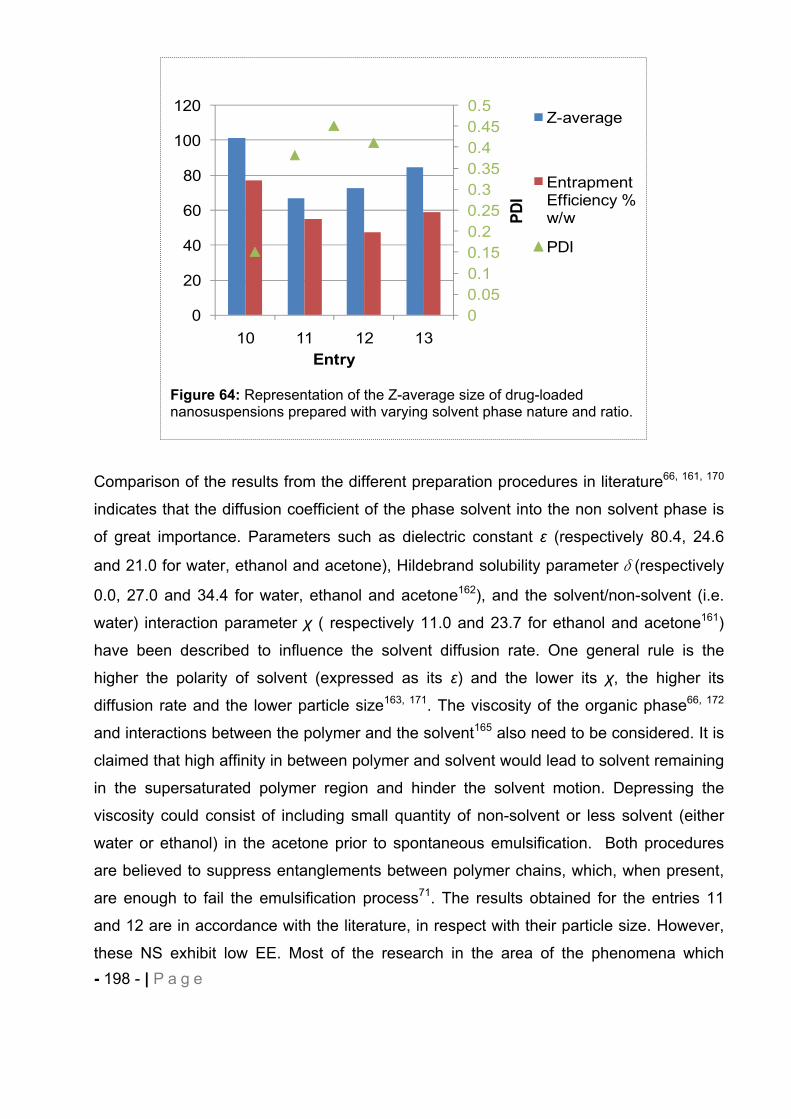
- 198 - | P a g e
Comparison of the results from the different preparation procedures in literature66, 161, 170
indicates that the diffusion coefficient of the phase solvent into the non solvent phase is
of great importance. Parameters such as dielectric constant (respectively 80.4, 24.6
and 21.0 for water, ethanol and acetone), Hildebrand solubility parameter (respectively
0.0, 27.0 and 34.4 for water, ethanol and acetone162), and the solvent/non-solvent (i.e.
water) interaction parameter ( respectively 11.0 and 23.7 for ethanol and acetone161)
have been described to influence the solvent diffusion rate. One general rule is the
higher the polarity of solvent (expressed as its ) and the lower its , the higher its
diffusion rate and the lower particle size163, 171. The viscosity of the organic phase66, 172
and interactions between the polymer and the solvent165 also need to be considered. It is
claimed that high affinity in between polymer and solvent would lead to solvent remaining
in the supersaturated polymer region and hinder the solvent motion. Depressing the
viscosity could consist of including small quantity of non-solvent or less solvent (either
water or ethanol) in the acetone prior to spontaneous emulsification. Both procedures
are believed to suppress entanglements between polymer chains, which, when present,
are enough to fail the emulsification process71. The results obtained for the entries 11
and 12 are in accordance with the literature, in respect with their particle size. However,
these NS exhibit low EE. Most of the research in the area of the phenomena which
Figure 64: Representation of the Z-average size of drug-loaded nanosuspensions prepared with varying solvent phase nature and ratio.
00.050.10.150.20.250.30.350.40.450.5
0
20
40
60
80
100
120
10 11 12 13
PDI
Entry
Z-average
Entrapment Efficiency %w/w
PDI
- 199 - | P a g e
govern nanoprecipitation are mostly performed without drug incorporated in the
nanosystems and few arguments are available in this regard. One should expect that
smaller particles are yielded by higher number of nuclei generated by the supersaturation
phenomenon164 and subsequent thinner NCs shell thickness159. In addition, the polymer
and (E)-BCP solubility has been dramatically reduced in entries 11 and 12 solvents
binary systems, particularly for entry 12 where the organic phase appearance was turbid.
Under these conditions, polymer chain entanglements may occur leading to the formation
of microparticles or polymer macroaggregates, as supported by the large particle
distribution (PDI>0.35). As mentioned in the previous paragraph, steam distillation of (E)-
BCP has been evidenced upon solvent evaporation and should be expected to be
greater with thinner NCs wall or entrapment of (E)-BCP in non discrete nanoparticles.
Otherwise, similar trend as for the above NS has been observed with the entry 13 (10mL
of acetone) with regard to NCs size, size distribution and EE. The role of the polymer-
polymer interactions may be involved since the polymer chains are independent and no
overlapping of the coils may occur. Furthermore, in a more dilute regime than for the
entry 10 (6mL of acetone), the solvent viscosity is reduced providing lower mass transfer
resistance and increase of the organic phase diffusion rate, favoring an overall smaller
NPs formation with potential higher polydispersity caused by heterogeneous
nucleation164. The combination on the final NCs of decreased shell thickness (for the low
range particle size) and higher polymer solvation may render it more porous and a
greater amount of (E)-BCP could be lost during solvent evaporation. Also, with a higher
amount of acetone, the supersaturation is less and (E)-BCP may lie longer in a solvated
state, and propensity of polymer chains to aggregate in encapsulating (E)-BCP is less
likely. Altogether, the solvent phase selected was 6 mL of acetone (entry 10), since a
good EE and suitable particle size for oral delivery was reached.
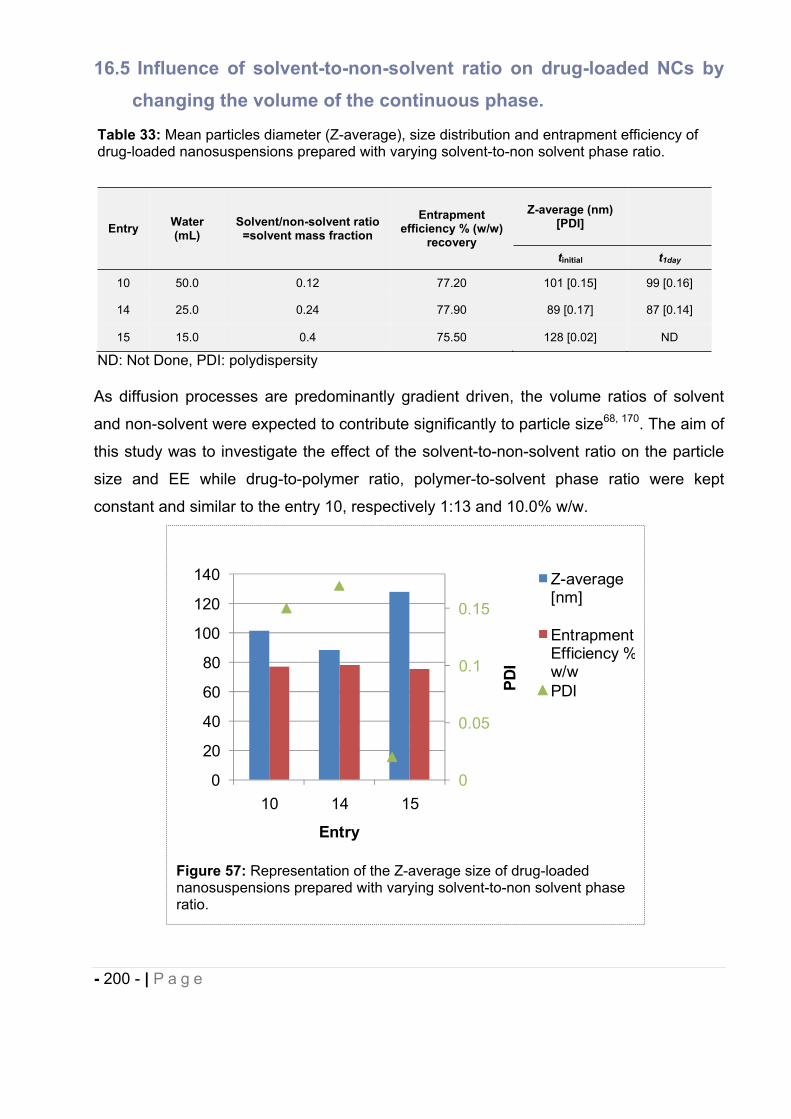
- 200 - | P a g e
16.5 Influence of solvent-to-non-solvent ratio on drug-loaded NCs by changing the volume of the continuous phase.
As diffusion processes are predominantly gradient driven, the volume ratios of solvent
and non-solvent were expected to contribute significantly to particle size68, 170. The aim of
this study was to investigate the effect of the solvent-to-non-solvent ratio on the particle
size and EE while drug-to-polymer ratio, polymer-to-solvent phase ratio were kept
constant and similar to the entry 10, respectively 1:13 and 10.0% w/w.
Figure 57: Representation of the Z-average size of drug-loaded nanosuspensions prepared with varying solvent-to-non solvent phase ratio.
0
0.05
0.1
0.15
0
20
40
60
80
100
120
140
10 14 15
PDI
Entry
Z-average [nm]
Entrapment Efficiency %w/wPDI
Table 33: Mean particles diameter (Z-average), size distribution and entrapment efficiency of drug-loaded nanosuspensions prepared with varying solvent-to-non solvent phase ratio.
Entry Water (mL)
Solvent/non-solvent ratio =solvent mass fraction
Entrapmentefficiency % (w/w)
recovery
Z-average (nm) [PDI]
tinitial t1day
10 50.0 0.12 77.20 101 [0.15] 99 [0.16]
14 25.0 0.24 77.90 89 [0.17] 87 [0.14]
15 15.0 0.4 75.50 128 [0.02] ND
ND: Not Done, PDI: polydispersity
- 201 - | P a g e
Variations of the volume of water phase down to 15 mL didn’t trigger any different
behavior in terms of EE but was of significant influence for the NCs formed (i.e. size and
size distribution) and appearance since the NS entry 15 (Table 33) was opaque whereas
entries 10 and 14 were transparent to opalescent bluish dispersions. Aubry et al.164 also
showed that polymethylmethacrylate (PMMA) -based final dispersions size was
predominantly affected by the solvent mass fraction in specific regions of the “Ouzo”
boundary, when the solvent mass fraction was 0.25. For equivalent amount of polymer
(entries 10, 14, 15) and small additions of water (acetone mass fraction 0.24), we
observed the same trend as Aubry et al. since the variation of the mean NCs diameter
was less impacted by the solvent mass fraction for values near 0.25 (entry 14) compared
to mean NCs diameter and PDI obtained when the solvent mass fraction was
dramatically increased up to 0.4 (entry 15). Considering the PDI values, the entries 10
and 14 don’t exhibit fundamental dissimilarity. As discussed previously, during the
nanoprecipitation procedure, a transient solvent concentration gradient is created across
the non-solvent phase leading to further oil nanodroplets formation with aggregation of
polymer on its surface. Smaller volume of continuous phase (i.e. water) may result in
slower precipitation of the polymer chains and as suggested by Choi et al172, larger
nanoparticles will be formed by the solvent loss from the surface of the NC. Sirnikova et
al.173 demonstrated than the formation of nuclei (timescale in the range of milliseconds or
faster)174 is accompanied by further growth due to molecular diffusion known as Ostwald
ripening (seconds or longer)174. This process occurs when the smallest droplets dissolve,
since the polymer and oil concentration has dropped to below the supersaturation (i.e.
nucleation ceased), and the larger ones grow by diffusion of oil and polymer into the
already nucleated droplets, since their saturation is smaller and thermodynamically
favored. Nucleation is a random process, so initially the droplets not uniformly distributed
may tend to show an increased average size and a more evenly distribution. Ostwald
ripening (OR) occurs slowly because dissolution rates are very small and the diffusion
rates of the molecules are minimized as the droplets become fewer and thus farther from
each other174-175. Combination of slow OR event and slow rigidification of the NC shell in
the referred system (entry 15), may support the result incurred which is the production of
large monodisperse NCs. In addition, some technical issues (i.e reproducible stirring)
have been encountered because of low volume of continuous phase. Either the NS entry
10 or 14 could be selected from this batch of experiments in regards with the NCs size,
- 202 - | P a g e
size distribution, EE and physical stability of the NCs after storage at room temperature
for one day.
16.6 Influence of stabilizing agents on drug-loaded NCs.
Previous publications investigated the use of hydrophilic and polymeric surfactants in
order to decrease the interfacial energy between water and polymer suggested to be
involved when the Marangoni effect is claimed to be the driving force for NPs formation66,
176. Use of surfactants has been shown to improve oral absorption177-179 and reduce
uptake by the RES due to their steric barrier properties and subsequent longer systemic
residency time180. Lipophilic stabilizers have also been incorporated to control drug
release and reduce the interfacial tension in the system181-182.
The effect of non-ionic hydrophilic (i.e. poloxamer 188, HLB>29), and lipophilic (i.e. oleic
macrogol-6 glycerides, HLB=4) surfactants have been evaluated, after being incorporated
in the aqueous phase and the solvent phase (Table 34). The poloxamer 188 was selected
as a standard, prior to any investigations and was added in proportion below the critical
micelle concentration179 at a concentration of 1.5% (w/w) of total NP weight or 0.02%
(w/w) in NS. Variation in concentrations (0%-5% w/w) of this difunctional block copolymer
surfactant terminating with primary hydroxyl groups didn’t alter the particle size and size
Table 34: Mean particles diameter (Z-average), size distribution and entrapment efficiency of drug-loaded nanosuspensions prepared with varying concentration in stabilizers.
EntryHydrophilic
stabilizer%(w/w) in NS
Poloxamer 188
Lipophilic stabilizer
%(w/w) in NSOleic Macrogol-
6 Glyceride
Entrapment efficiency % (w/w) recovery
Z-average (nm) [PDI]
tinitial t1day
16 5.0 - 70.3 95 [0.18] 94 [0.18]
10 1.5 - 77.2 101 [0.15] 99 [0.16]
17 - - 77.1 104 [0.18] 101 [0.15]
18 - 3.00 69.1 112 [0.16] ND
19 1.5 6.00 45.7 ND(opaque) ND
NS: nanosuspension, PDI: polidispersity, ND: not done.
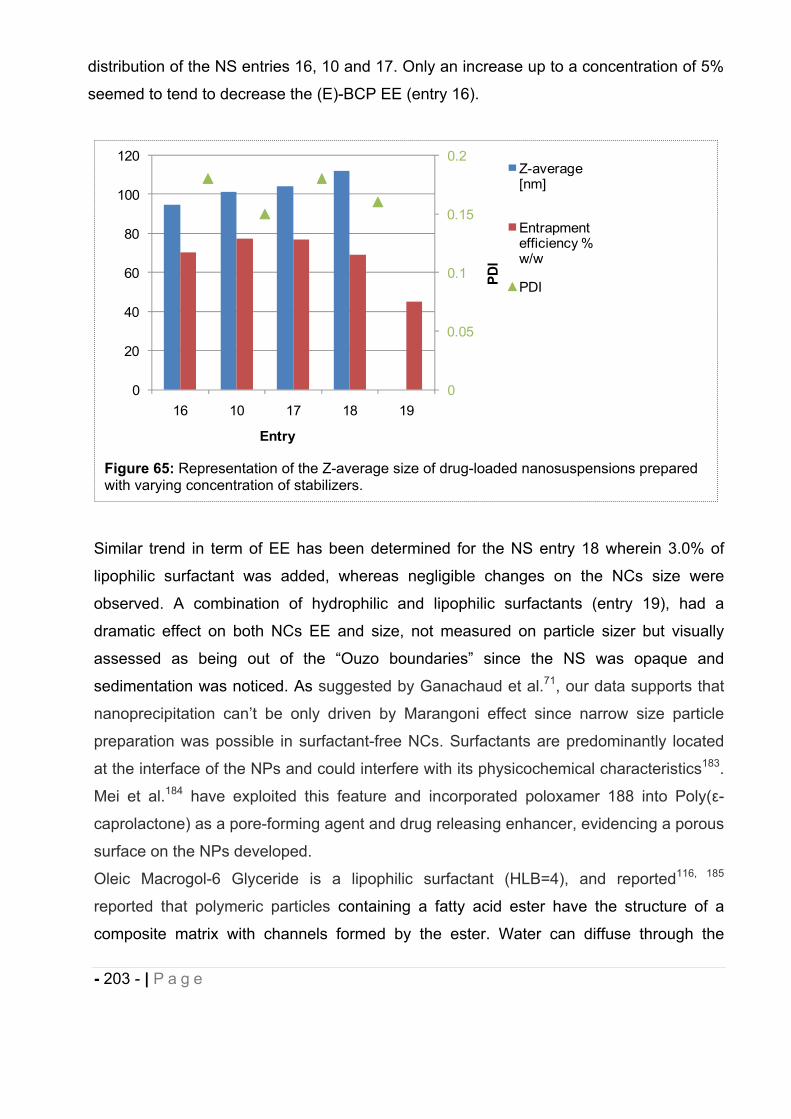
- 203 - | P a g e
distribution of the NS entries 16, 10 and 17. Only an increase up to a concentration of 5%
seemed to tend to decrease the (E)-BCP EE (entry 16).
Similar trend in term of EE has been determined for the NS entry 18 wherein 3.0% of
lipophilic surfactant was added, whereas negligible changes on the NCs size were
observed. A combination of hydrophilic and lipophilic surfactants (entry 19), had a
dramatic effect on both NCs EE and size, not measured on particle sizer but visually
assessed as being out of the “Ouzo boundaries” since the NS was opaque and
sedimentation was noticed. As suggested by Ganachaud et al.71, our data supports that
nanoprecipitation can’t be only driven by Marangoni effect since narrow size particle
preparation was possible in surfactant-free NCs. Surfactants are predominantly located
at the interface of the NPs and could interfere with its physicochemical characteristics183.
Mei et al.184 have exploited this feature and incorporated poloxamer 188 into Poly( -
caprolactone) as a pore-forming agent and drug releasing enhancer, evidencing a porous
surface on the NPs developed.
Oleic Macrogol-6 Glyceride is a lipophilic surfactant (HLB=4), and reported116, 185
reported that polymeric particles containing a fatty acid ester have the structure of a
composite matrix with channels formed by the ester. Water can diffuse through the
Figure 65: Representation of the Z-average size of drug-loaded nanosuspensions prepared with varying concentration of stabilizers.
0
0.05
0.1
0.15
0.2
0
20
40
60
80
100
120
16 10 17 18 19
PDI
Entry
Z-average [nm]
Entrapment efficiency % w/w
PDI
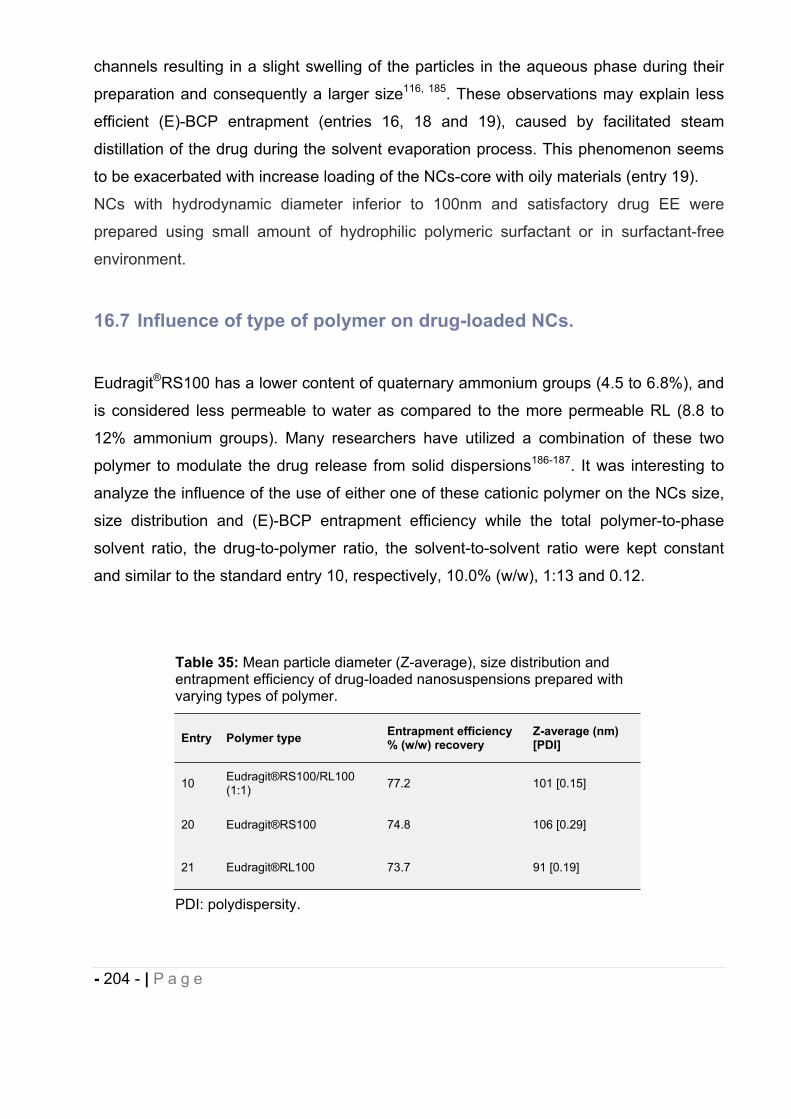
- 204 - | P a g e
channels resulting in a slight swelling of the particles in the aqueous phase during their
preparation and consequently a larger size116, 185. These observations may explain less
efficient (E)-BCP entrapment (entries 16, 18 and 19), caused by facilitated steam
distillation of the drug during the solvent evaporation process. This phenomenon seems
to be exacerbated with increase loading of the NCs-core with oily materials (entry 19).
NCs with hydrodynamic diameter inferior to 100nm and satisfactory drug EE were
prepared using small amount of hydrophilic polymeric surfactant or in surfactant-free
environment.
16.7 Influence of type of polymer on drug-loaded NCs.
Eudragit®RS100 has a lower content of quaternary ammonium groups (4.5 to 6.8%), and
is considered less permeable to water as compared to the more permeable RL (8.8 to
12% ammonium groups). Many researchers have utilized a combination of these two
polymer to modulate the drug release from solid dispersions186-187. It was interesting to
analyze the influence of the use of either one of these cationic polymer on the NCs size,
size distribution and (E)-BCP entrapment efficiency while the total polymer-to-phase
solvent ratio, the drug-to-polymer ratio, the solvent-to-solvent ratio were kept constant
and similar to the standard entry 10, respectively, 10.0% (w/w), 1:13 and 0.12.
Table 35: Mean particle diameter (Z-average), size distribution and entrapment efficiency of drug-loaded nanosuspensions prepared with varying types of polymer.
Entry Polymer type Entrapment efficiency % (w/w) recovery
Z-average (nm) [PDI]
10 Eudragit®RS100/RL100 (1:1) 77.2 101 [0.15]
20 Eudragit®RS100 74.8 106 [0.29]
21 Eudragit®RL100 73.7 91 [0.19]
PDI: polydispersity.
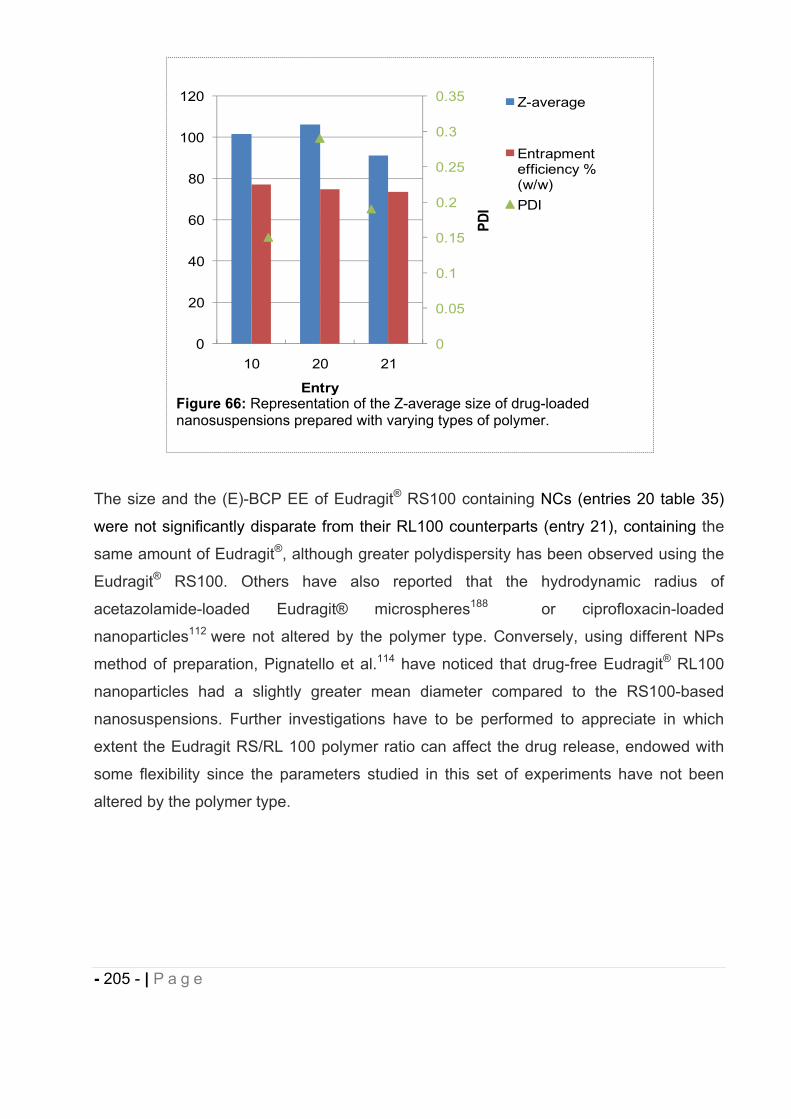
- 205 - | P a g e
The size and the (E)-BCP EE of Eudragit® RS100 containing NCs (entries 20 table 35)
were not significantly disparate from their RL100 counterparts (entry 21), containing the
same amount of Eudragit®, although greater polydispersity has been observed using the
Eudragit® RS100. Others have also reported that the hydrodynamic radius of
acetazolamide-loaded Eudragit® microspheres188 or ciprofloxacin-loaded
nanoparticles112 were not altered by the polymer type. Conversely, using different NPs
method of preparation, Pignatello et al.114 have noticed that drug-free Eudragit® RL100
nanoparticles had a slightly greater mean diameter compared to the RS100-based
nanosuspensions. Further investigations have to be performed to appreciate in which
extent the Eudragit RS/RL 100 polymer ratio can affect the drug release, endowed with
some flexibility since the parameters studied in this set of experiments have not been
altered by the polymer type.
Figure 66: Representation of the Z-average size of drug-loaded nanosuspensions prepared with varying types of polymer.
0
0.05
0.1
0.15
0.2
0.25
0.3
0.35
0
20
40
60
80
100
120
10 20 21
PDI
Entry
Z-average
Entrapment efficiency % (w/w)PDI
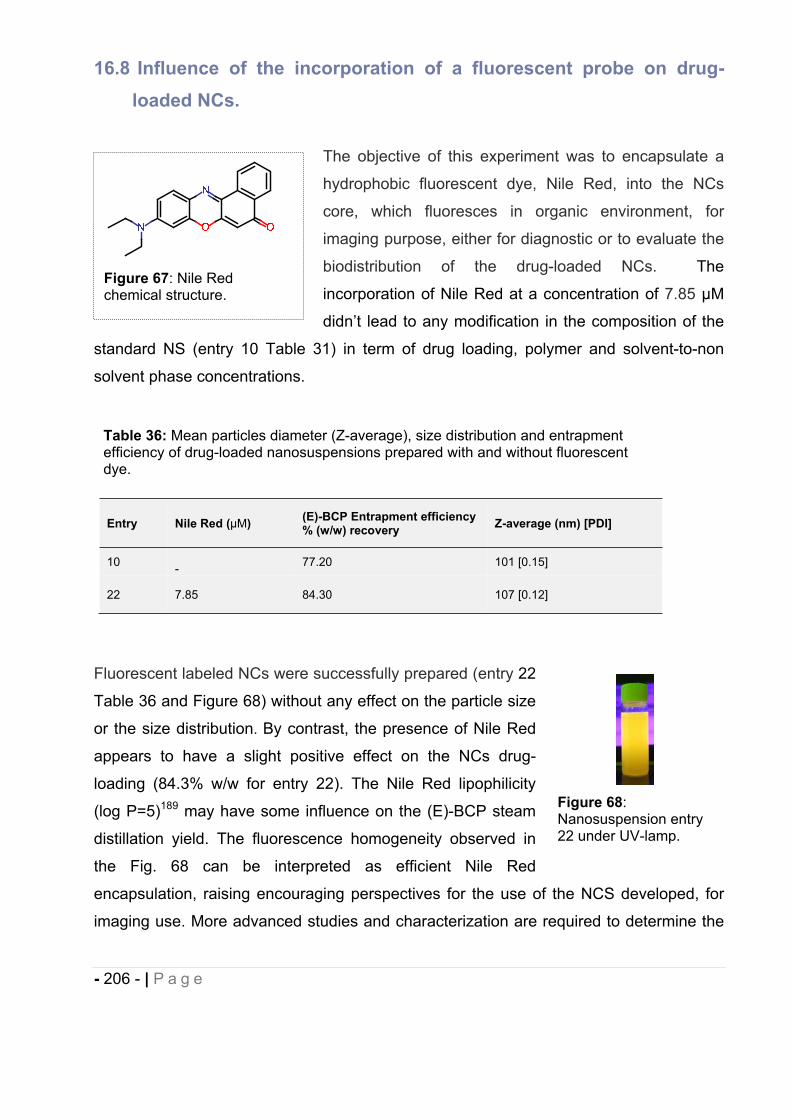
- 206 - | P a g e
16.8 Influence of the incorporation of a fluorescent probe on drug-loaded NCs.
The objective of this experiment was to encapsulate a
hydrophobic fluorescent dye, Nile Red, into the NCs
core, which fluoresces in organic environment, for
imaging purpose, either for diagnostic or to evaluate the
biodistribution of the drug-loaded NCs. The
incorporation of Nile Red at a concentration of 7.85 μM
didn’t lead to any modification in the composition of the
standard NS (entry 10 Table 31) in term of drug loading, polymer and solvent-to-non
solvent phase concentrations.
Fluorescent labeled NCs were successfully prepared (entry 22
Table 36 and Figure 68) without any effect on the particle size
or the size distribution. By contrast, the presence of Nile Red
appears to have a slight positive effect on the NCs drug-
loading (84.3% w/w for entry 22). The Nile Red lipophilicity
(log P=5)189 may have some influence on the (E)-BCP steam
distillation yield. The fluorescence homogeneity observed in
the Fig. 68 can be interpreted as efficient Nile Red
encapsulation, raising encouraging perspectives for the use of the NCS developed, for
imaging use. More advanced studies and characterization are required to determine the
Table 36: Mean particles diameter (Z-average), size distribution and entrapment efficiency of drug-loaded nanosuspensions prepared with and without fluorescent dye.
Entry Nile Red (μM) (E)-BCP Entrapment efficiency % (w/w) recovery Z-average (nm) [PDI]
10 - 77.20 101 [0.15]
22 7.85 84.30 107 [0.12]
Figure 68:Nanosuspension entry 22 under UV-lamp.
Figure 67: Nile Red chemical structure.
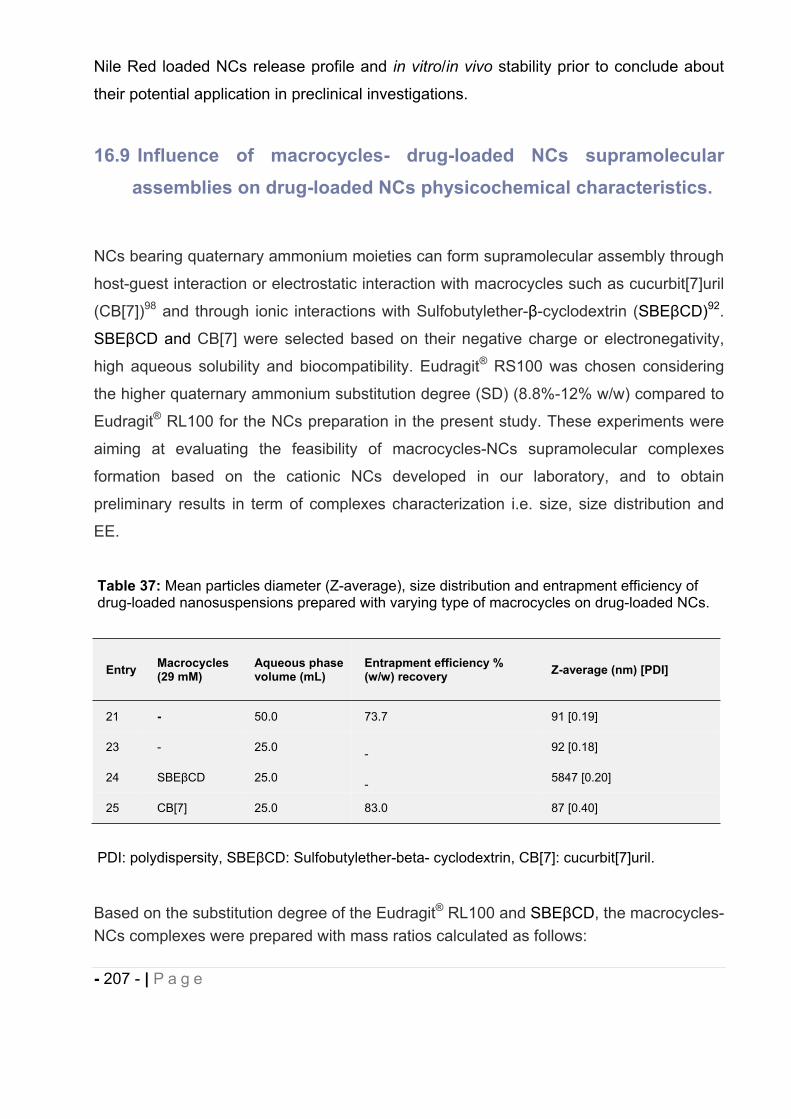
- 207 - | P a g e
Nile Red loaded NCs release profile and in vitro/in vivo stability prior to conclude about
their potential application in preclinical investigations.
16.9 Influence of macrocycles- drug-loaded NCs supramolecular assemblies on drug-loaded NCs physicochemical characteristics.
NCs bearing quaternary ammonium moieties can form supramolecular assembly through
host-guest interaction or electrostatic interaction with macrocycles such as cucurbit[7]uril
(CB[7])98 and through ionic interactions with Sulfobutylether- -cyclodextrin (SBE CD)92.
SBE CD and CB[7] were selected based on their negative charge or electronegativity,
high aqueous solubility and biocompatibility. Eudragit® RS100 was chosen considering
the higher quaternary ammonium substitution degree (SD) (8.8%-12% w/w) compared to
Eudragit® RL100 for the NCs preparation in the present study. These experiments were
aiming at evaluating the feasibility of macrocycles-NCs supramolecular complexes
formation based on the cationic NCs developed in our laboratory, and to obtain
preliminary results in term of complexes characterization i.e. size, size distribution and
EE.
Based on the substitution degree of the Eudragit® RL100 and SBE CD, the macrocycles-NCs complexes were prepared with mass ratios calculated as follows:
Table 37: Mean particles diameter (Z-average), size distribution and entrapment efficiency of drug-loaded nanosuspensions prepared with varying type of macrocycles on drug-loaded NCs.
Entry Macrocycles (29 mM)
Aqueous phase volume (mL)
Entrapment efficiency % (w/w) recovery Z-average (nm) [PDI]
21 - 50.0 73.7 91 [0.19]
23 - 25.0 - 92 [0.18]
24 SBE CD 25.0 - 5847 [0.20]
25 CB[7] 25.0 83.0 87 [0.40]
PDI: polydispersity, SBE CD: Sulfobutylether-beta- cyclodextrin, CB[7]: cucurbit[7]uril.
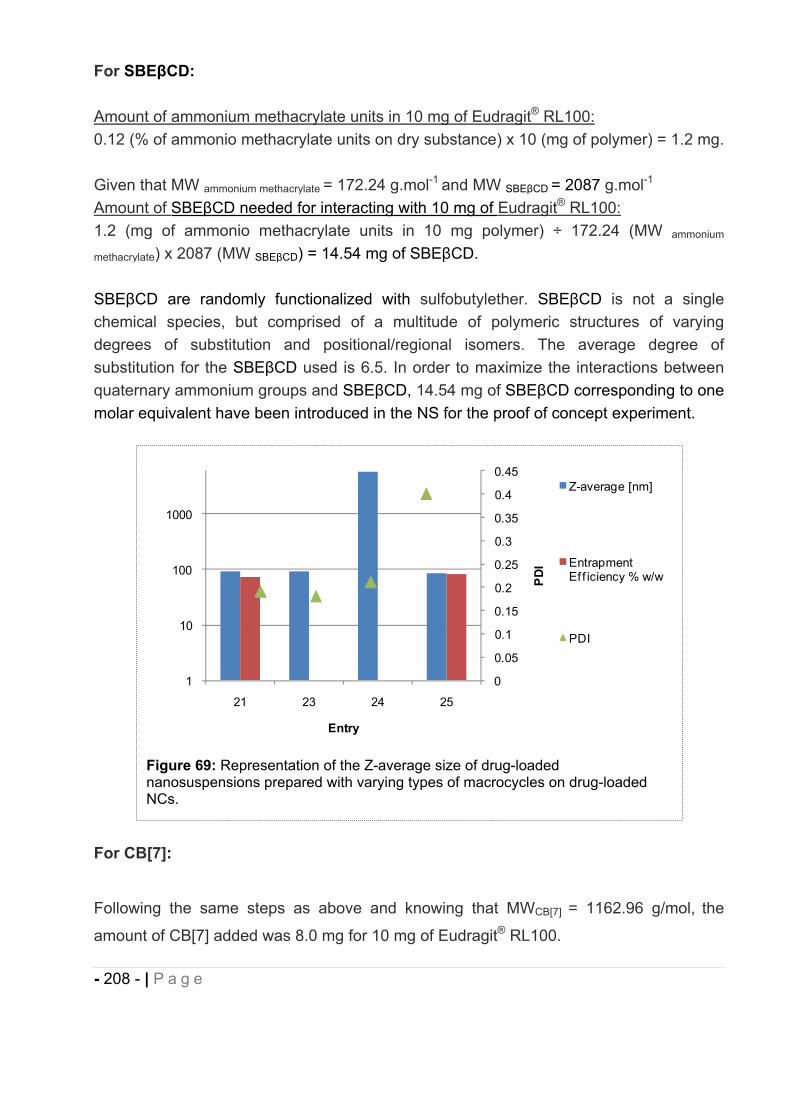
- 208 - | P a g e
For SBE CD:
Amount of ammonium methacrylate units in 10 mg of Eudragit® RL100:0.12 (% of ammonio methacrylate units on dry substance) x 10 (mg of polymer) = 1.2 mg.
Given that MW ammonium methacrylate = 172.24 g.mol-1 and MW SBE CD = 2087 g.mol-1
Amount of SBE CD needed for interacting with 10 mg of Eudragit® RL100:1.2 (mg of ammonio methacrylate units in 10 mg polymer) ÷ 172.24 (MW ammonium
methacrylate) x 2087 (MW SBE CD) = 14.54 mg of SBE CD.
SBE CD are randomly functionalized with sulfobutylether. SBE CD is not a single chemical species, but comprised of a multitude of polymeric structures of varying degrees of substitution and positional/regional isomers. The average degree of substitution for the SBE CD used is 6.5. In order to maximize the interactions between quaternary ammonium groups and SBE CD, 14.54 mg of SBE CD corresponding to one molar equivalent have been introduced in the NS for the proof of concept experiment.
For CB[7]:
Following the same steps as above and knowing that MWCB[7] = 1162.96 g/mol, the
amount of CB[7] added was 8.0 mg for 10 mg of Eudragit® RL100.
Figure 69: Representation of the Z-average size of drug-loaded nanosuspensions prepared with varying types of macrocycles on drug-loaded NCs.
0
0.05
0.1
0.15
0.2
0.25
0.3
0.35
0.4
0.45
1
10
100
1000
21 23 24 25
PDI
Entry
Z-average [nm]
Entrapment Ef f iciency % w/w
PDI
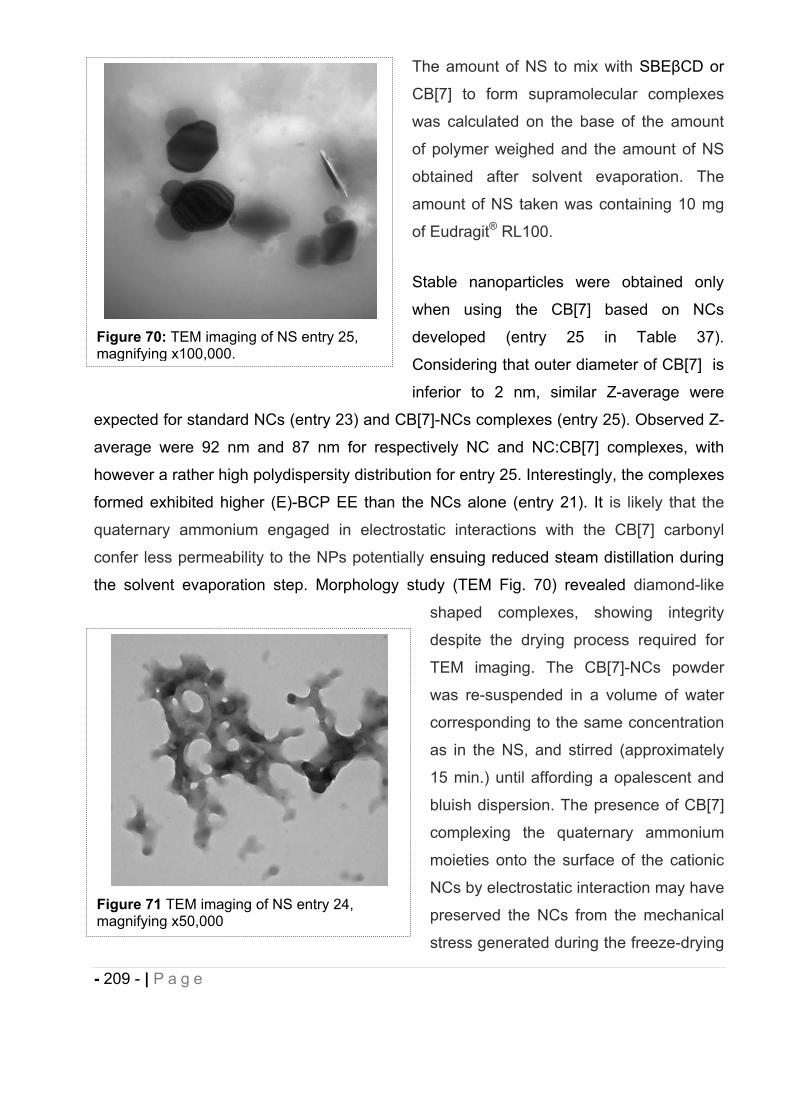
- 209 - | P a g e
The amount of NS to mix with SBE CD or
CB[7] to form supramolecular complexes
was calculated on the base of the amount
of polymer weighed and the amount of NS
obtained after solvent evaporation. The
amount of NS taken was containing 10 mg
of Eudragit® RL100.
Stable nanoparticles were obtained only
when using the CB[7] based on NCs
developed (entry 25 in Table 37).
Considering that outer diameter of CB[7] is
inferior to 2 nm, similar Z-average were
expected for standard NCs (entry 23) and CB[7]-NCs complexes (entry 25). Observed Z-
average were 92 nm and 87 nm for respectively NC and NC:CB[7] complexes, with
however a rather high polydispersity distribution for entry 25. Interestingly, the complexes
formed exhibited higher (E)-BCP EE than the NCs alone (entry 21). It is likely that the
quaternary ammonium engaged in electrostatic interactions with the CB[7] carbonyl
confer less permeability to the NPs potentially ensuing reduced steam distillation during
the solvent evaporation step. Morphology study (TEM Fig. 70) revealed diamond-like
shaped complexes, showing integrity
despite the drying process required for
TEM imaging. The CB[7]-NCs powder
was re-suspended in a volume of water
corresponding to the same concentration
as in the NS, and stirred (approximately
15 min.) until affording a opalescent and
bluish dispersion. The presence of CB[7]
complexing the quaternary ammonium
moieties onto the surface of the cationic
NCs by electrostatic interaction may have
preserved the NCs from the mechanical
stress generated during the freeze-drying
Figure 70: TEM imaging of NS entry 25, magnifying x100,000.
Figure 71 TEM imaging of NS entry 24, magnifying x50,000
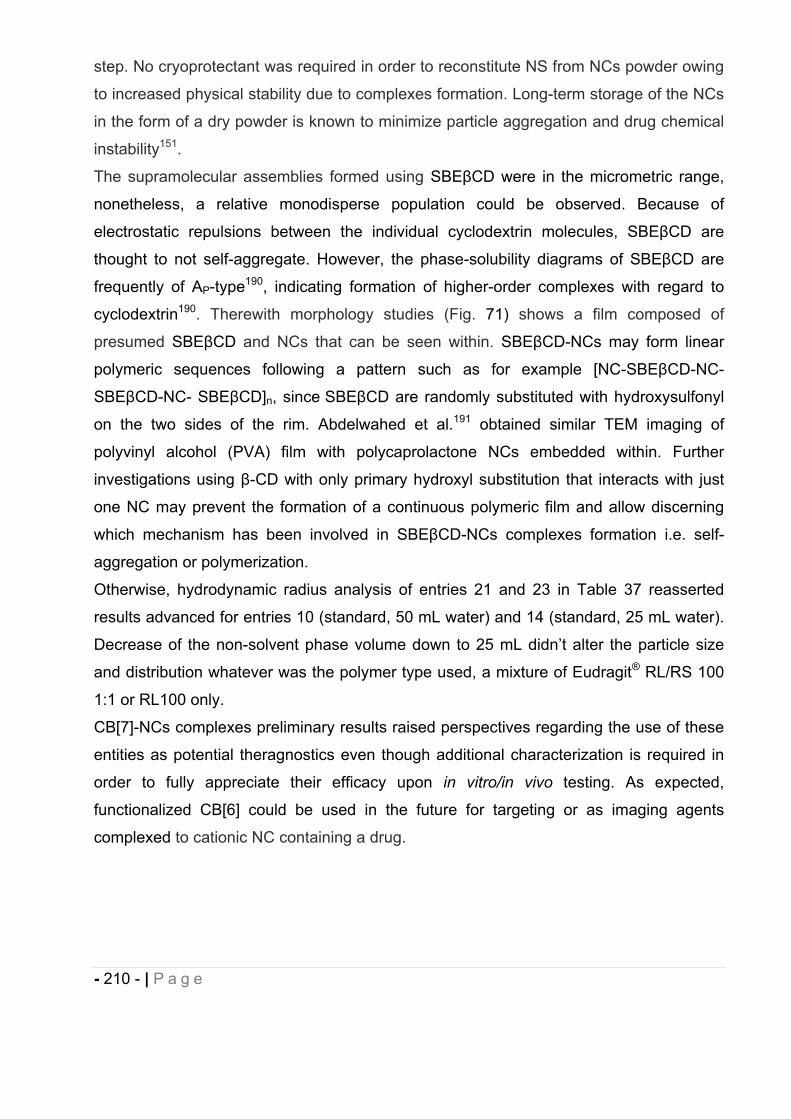
- 210 - | P a g e
step. No cryoprotectant was required in order to reconstitute NS from NCs powder owing
to increased physical stability due to complexes formation. Long-term storage of the NCs
in the form of a dry powder is known to minimize particle aggregation and drug chemical
instability151.
The supramolecular assemblies formed using SBE CD were in the micrometric range,
nonetheless, a relative monodisperse population could be observed. Because of
electrostatic repulsions between the individual cyclodextrin molecules, SBE CD are
thought to not self-aggregate. However, the phase-solubility diagrams of SBE CD are
frequently of AP-type190, indicating formation of higher-order complexes with regard to
cyclodextrin190. Therewith morphology studies (Fig. 71) shows a film composed of
presumed SBE CD and NCs that can be seen within. SBE CD-NCs may form linear
polymeric sequences following a pattern such as for example [NC-SBE CD-NC-
SBE CD-NC- SBE CD]n, since SBE CD are randomly substituted with hydroxysulfonyl
on the two sides of the rim. Abdelwahed et al.191 obtained similar TEM imaging of
polyvinyl alcohol (PVA) film with polycaprolactone NCs embedded within. Further
investigations using -CD with only primary hydroxyl substitution that interacts with just
one NC may prevent the formation of a continuous polymeric film and allow discerning
which mechanism has been involved in SBE CD-NCs complexes formation i.e. self-
aggregation or polymerization.
Otherwise, hydrodynamic radius analysis of entries 21 and 23 in Table 37 reasserted
results advanced for entries 10 (standard, 50 mL water) and 14 (standard, 25 mL water).
Decrease of the non-solvent phase volume down to 25 mL didn’t alter the particle size
and distribution whatever was the polymer type used, a mixture of Eudragit® RL/RS 100
1:1 or RL100 only.
CB[7]-NCs complexes preliminary results raised perspectives regarding the use of these
entities as potential theragnostics even though additional characterization is required in
order to fully appreciate their efficacy upon in vitro/in vivo testing. As expected,
functionalized CB[6] could be used in the future for targeting or as imaging agents
complexed to cationic NC containing a drug.
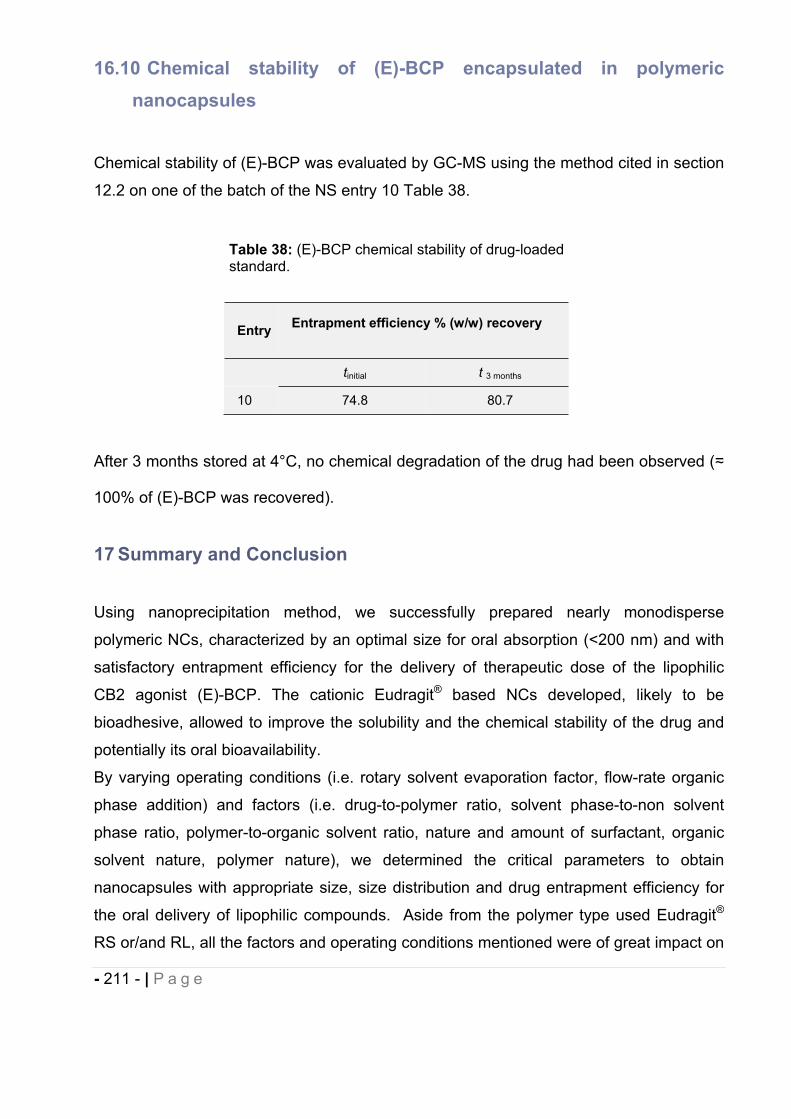
- 211 - | P a g e
16.10 Chemical stability of (E)-BCP encapsulated in polymeric nanocapsules
Chemical stability of (E)-BCP was evaluated by GC-MS using the method cited in section
12.2 on one of the batch of the NS entry 10 Table 38.
After 3 months stored at 4°C, no chemical degradation of the drug had been observed (
100% of (E)-BCP was recovered).
17 Summary and Conclusion
Using nanoprecipitation method, we successfully prepared nearly monodisperse
polymeric NCs, characterized by an optimal size for oral absorption (<200 nm) and with
satisfactory entrapment efficiency for the delivery of therapeutic dose of the lipophilic
CB2 agonist (E)-BCP. The cationic Eudragit® based NCs developed, likely to be
bioadhesive, allowed to improve the solubility and the chemical stability of the drug and
potentially its oral bioavailability.
By varying operating conditions (i.e. rotary solvent evaporation factor, flow-rate organic
phase addition) and factors (i.e. drug-to-polymer ratio, solvent phase-to-non solvent
phase ratio, polymer-to-organic solvent ratio, nature and amount of surfactant, organic
solvent nature, polymer nature), we determined the critical parameters to obtain
nanocapsules with appropriate size, size distribution and drug entrapment efficiency for
the oral delivery of lipophilic compounds. Aside from the polymer type used Eudragit®
RS or/and RL, all the factors and operating conditions mentioned were of great impact on
Table 38: (E)-BCP chemical stability of drug-loaded standard.
Entry Entrapment efficiency % (w/w) recovery
tinitial t 3 months
10 74.8 80.7
- 212 - | P a g e
the NCs size and drug loading. Incorporation of fluorescent dye in the core of the
nanocapsules was possible and may be used as imaging tool to investigate the
nanocapsules fate and drug delivery mechanisms in vivo.
Preliminary results on the feasibility and characterization of cucurbit[7]uril-nanocapsules
complexes based on host-guest/electrostatic interactions have been generated and
raised promising perspectives regarding the use of the developed NCS as theragnostic
agents. The putative complexes formed resulted in hydrodynamic diameter of 87 nm
(PDI 0.4) and (E)-BCP entrapment efficiency of 83.0%. Further investigations regarding
the drug release, physical stability measuring potential zeta potential change and in vivo
administration will be carried out in order to fully characterize these NCs. The cationic
nanocapsules can be used to deliver other lipophilic compounds, improving their
pharmaceutical properties and studying their biodistribution.
- 213 - | P a g e
18 REFERENCES.
1. Pichierri, F. Cucurbituril; Tohoku University: Sendai, Japan, 2006. 2. Kreuter, J., Nanoparticles as drug delivery systems American Scientific Publishers: Stevenson Ranch, U.S.A., 2004; Vol. 7, p 161–180 3. Orive, G.; Anitua, E.; Pedraz, J. L.; Emerich, D. F., Biomaterials for promoting
brain protection, repair and regeneration. Nat Rev Neurosci 2009, 10, (9), 682-692.
4. Mora-Huertas, C. E.; Fessi, H.; Elaissari, A., Polymer-based nanocapsules for drug delivery. International Journal of Pharmaceutics 2010, 385, (1-2), 113-142.
5. Fukuda, M.; Miller, D. A.; Peppas, N. A.; McGinity, J. W., Influence of sulfobutyl ether -cyclodextrin (Captisol®) on the dissolution properties of a poorly soluble drug from extrudates prepared by hot-melt extrusion. International Journal of Pharmaceutics 2008, 350, (1–2), 188-196.
6. Irache, J. M.; Esparza, I.; Gamazo, C.; Agueros, M.; Espuelas, S., Nanomedicine: novel approaches in human and veterinary therapeutics. Vet Parasitol 2011, 180, (1-2), 47-71.
7. Parveen, S.; Sahoo, S. K., Polymeric nanoparticles for cancer therapy. Journal of Drug Targeting 2008, 16, (2), 108-123.
8. Cheng, F. Y.; Su, C. H.; Wu, P. C.; Yeh, C. S., Multifunctional polymeric nanoparticles for combined chemotherapeutic and near-infrared photothermal cancer therapy in vitro and in vivo. Chem Commun 2010, 46, (18), 3167-3169.
9. Way, T. D.; Chang, C. J.; Lin, C. W., Bioconjugated Fluorescent Polymeric Nanoparticles for Imaging and Targeted Therapy of HER2-Overexpressing Cancer Cells. Journal of Fluorescence 2011, 21, (4), 1669-1676.
10. Singh, A.; Dinawaz, F.; Mewar, S.; Sharma, U.; Jagannathan, N. R.; Sahoo, S. K., Composite Polymeric Magnetic Nanoparticles for Co-Delivery of Hydrophobic and Hydrophilic Anticancer Drugs and MRI Imaging for Cancer Therapy. Acs Appl Mater Inter 2011, 3, (3), 842-856.
11. Scott, C. J.; Fay, F., Antibody targeting of polymeric nanoparticles for cancer therapy. Drug Discovery Today 2010, 15, (23-24), 1087-1087.
12. Hillaireau, H.; Le Doan, T.; Couvreur, P., Polymer-based nanoparticles for the delivery of nucleoside analogues. J Nanosci Nanotechno 2006, 6, (9-10), 2608-2617.
13. Chen, S.; Cheng, S. X.; Zhuo, R. X., Self-Assembly Strategy for the Preparation of Polymer-Based Nanoparticles for Drug and Gene Delivery. Macromolecular Bioscience 2011, 11, (5), 576-589.
14. Bhavsar, M. D.; Amiji, M. M., Polymeric nano- and microparticle technologies for oral gene delivery. Expert Opinion on Drug Delivery 2007, 4, (3), 197-213.
15. Vlieghe, P.; Khrestchatisky, M., Medicinal Chemistry Based Approaches and Nanotechnology-Based Systems to Improve CNS Drug Targeting and Delivery. Med Res Rev 2012.
16. Kreuter, J., Nanoparticles--a historical perspective. Int J Pharm 2007, 331, (1), 1-10.
17. Couvreur, R. G. P., Nanocapsules: Preparation, characterization and therapeutic applications. Nanoparticulates as Drug Carriers 2006, (276), 255.
- 214 - | P a g e
18. Legrand, P.; Barratt, G.; Mosqueira, V.; Fessi, H.; Devissaguet, J. P., Polymeric nanocapsules as drug delivery systems - A review. Stp Pharma Sci 1999, 9, (5), 411-418.
19. Barratt, G. M., Therapeutic applications of colloidal drug carriers. Pharm Sci Technolo Today 2000, 3, (5), 163-171.
20. Allémann, E.; Leroux, J.-C.; Gurny, R., Polymeric nano- and microparticles for the oral delivery of peptides and peptidomimetics. Advanced Drug Delivery Reviews 1998, 34, (2-3), 171-189.
21. Bhardwaj, V.; Hariharan, S.; Bala, I.; Lamprecht, A.; Kumar, N.; Panchagnula, R.; Ravi Kumar, M. N. V., Pharmaceutical Aspects of Polymeric Nanoparticles for Oral Drug Delivery. J Biomed Nanotechnol 2005, 1, (3), 235-258.
22. Davis, M. E.; Chen, Z.; Shin, D. M., Nanoparticle therapeutics: an emerging treatment modality for cancer. Nat Rev Drug Discov 2008, 7, (9), 771-782.
23. Jain, K. K., Nanoparticles as targeting ligands. Trends in Biotechnology 2006, 24, (4), 143-145.
24. Parveen, S.; Misra, R.; Sahoo, S. K., Nanoparticles: a boon to drug delivery, therapeutics, diagnostics and imaging. Nanomedicine: Nanotechnology, Biology and Medicine 2012, 8, (2), 147-166.
25. Ochekpe, N. A.; Olorunfemi, P. O.; Ngwuluka, N. C., Nanotechnology and Drug Delivery Part 1: Background and Applications. Tropical Journal of Pharmaceutical Research 2009, 8, (3), 265-274.
26. Steiniger, S. C.; Kreuter, J.; Khalansky, A. S.; Skidan, I. N.; Bobruskin, A. I.; Smirnova, Z. S.; Severin, S. E.; Uhl, R.; Kock, M.; Geiger, K. D.; Gelperina, S. E., Chemotherapy of glioblastoma in rats using doxorubicin-loaded nanoparticles. IntJ Cancer 2004, 109, (5), 759-67.
27. Barraud, L.; Merle, P.; Soma, E.; Lefrançois, L.; Guerret, S.; Chevallier, M.; Dubernet, C.; Couvreur, P.; Trépo, C.; Vitvitski, L., Increase of doxorubicin sensitivity by doxorubicin-loading into nanoparticles for hepatocellular carcinoma cells in vitro and in vivo. Journal of Hepatology 2005, 42, (5), 736-743.
28. Zhang, C.; Zhao, L.; Dong, Y.; Zhang, X.; Lin, J.; Chen, Z., Folate-mediated poly(3-hydroxybutyrate-co-3-hydroxyoctanoate) nanoparticles for targeting drug delivery. Eur J Pharm Biopharm 2010, 76, (1), 10-6.
29. Tang, J.; Xu, N.; Ji, H.; Liu, H.; Wang, Z.; Wu, L., Eudragit nanoparticles containing genistein: formulation, development, and bioavailability assessment. IntJ Nanomedicine 2011, 6, 2429-35.
30. Haas, S. E.; Bettoni, C. C.; de Oliveira, L. K.; Guterres, S. S.; Dalla Costa, T., Nanoencapsulation increases quinine antimalarial efficacy against Plasmodium berghei in vivo. Int J Antimicrob Agents 2009, 34, (2), 156-61.
31. Nayak, B.; Panda, A. K.; Ray, P.; Ray, A. R., Formulation, characterization and evaluation of rotavirus encapsulated PLA and PLGA particles for oral vaccination. J Microencapsul 2009, 26, (2), 154-65.
32. Agueros, M.; Zabaleta, V.; Espuelas, S.; Campanero, M. A.; Irache, J. M., Increased oral bioavailability of paclitaxel by its encapsulation through complex formation with cyclodextrins in poly(anhydride) nanoparticles. J Control Release 2010, 145, (1), 2-8.
33. Brambilla, D.; Nicolas, J.; Le Droumaguet, B.; Andrieux, K.; Marsaud, V.; Couraud, P. O.; Couvreur, P., Design of fluorescently tagged poly(alkyl cyanoacrylate) nanoparticles for human brain endothelial cell imaging. Chem Commun (Camb) 2010, 46, (15), 2602-4.
- 215 - | P a g e
34. Mailander, V.; Landfester, K., Interaction of Nanoparticles with Cells. Biomacromolecules 2009, 10, (9), 2379-2400.
35. Xia, T.; Kovochich, M.; Liong, M.; Meng, H.; Kabehie, S.; George, S.; Zink, J. I.; Nel, A. E., Polyethyleneimine Coating Enhances the Cellular Uptake of Mesoporous Silica Nanoparticles and Allows Safe Delivery of siRNA and DNA Constructs. ACS Nano 2009, 3, (10), 3273-3286.
36. des Rieux, A.; Fievez, V.; Garinot, M.; Schneider, Y.-J.; Préat, V., Nanoparticles as potential oral delivery systems of proteins and vaccines: A mechanistic approach. Journal of Controlled Release 2006, 116, (1), 1-27.
37. Zhang, X.; Sun, M.; Zheng, A.; Cao, D.; Bi, Y.; Sun, J., Preparation and characterization of insulin-loaded bioadhesive PLGA nanoparticles for oral administration. Eur J Pharm Sci 2012, 45, (5), 632-8.
38. Kumar, G.; Shafiq, N.; Malhotra, S., Drug-Loaded PLGA Nanoparticles for Oral Administration: Fundamental Issues and Challenges Ahead. Crit Rev Ther Drug Carrier Syst 2012, 29, (2), 149-82.
39. Doggui, S.; Sahni, J. K.; Arseneault, M.; Dao, L.; Ramassamy, C., Neuronal Uptake and Neuroprotective Effect of Curcumin-Loaded PLGA Nanoparticles on the Human SK-N-SH Cell Line. J Alzheimers Dis 2012.
40. Danhier, F.; Ansorena, E.; Silva, J. M.; Coco, R.; Le Breton, A.; Preat, V., PLGA-based nanoparticles: An overview of biomedical applications. J Control Release 2012.
41. Xiao, R. Z.; Zeng, Z. W.; Zhou, G. L.; Wang, J. J.; Li, F. Z.; Wang, A. M., Recent advances in PEG-PLA block copolymer nanoparticles. Int J Nanomedicine 2010,5, 1057-65.
42. Thomas, C.; Rawat, A.; Hope-Weeks, L.; Ahsan, F., Aerosolized PLA and PLGA nanoparticles enhance humoral, mucosal and cytokine responses to hepatitis B vaccine. Mol Pharm 2011, 8, (2), 405-15.
43. Zambaux, M. F.; Bonneaux, F.; Gref, R.; Dellacherie, E.; Vigneron, C., Preparation and characterization of protein C-loaded PLA nanoparticles. J Control Release 1999, 60, (2-3), 179-88.
44. Carvalho, F. C.; Bruschi, M. L.; Evangelista, R. C.; Gremiao, M. P. D., Mucoadhesive drug delivery systems. Braz J Pharm Sci 2010, 46, (1), 1-17.
45. Roy, S.; Pal, K.; Anis, A.; Pramanik, K.; Prabhakar, B., Polymer in Mucoadhesive Drug-Delivery Systems: A Brief Note. Des Monomers Polym 2009, 12, (6), 483-495.
46. Behrens, I.; Pena, A. I. V.; Alonso, M. J.; Kissel, T., Comparative Uptake Studies of Bioadhesive and Non-Bioadhesive Nanoparticles in Human Intestinal Cell Lines and Rats: The Effect of Mucus on Particle Adsorption and Transport. Pharmaceutical Research 2002, 19, (8), 1185-1193.
47. Das, S.; Suresh, P. K.; Desmukh, R., Design of Eudragit RL 100 nanoparticles by nanoprecipitation method for ocular drug delivery. Nanomedicine:Nanotechnology, Biology and Medicine 2010, In Press, Corrected Proof.
48. Gargouri M, S. A., Bouli S, Becuwe P, Merlin JL, Maincent P, Optimization of a new non-viral vector for transfection: Eudragit nanoparticles for the delivery of a DNA plasmid.
Technol Cancer Res 2009 8, (6),433-44.
- 216 - | P a g e
49. Pignatello, R.; Bucolo, C.; Puglisi, G., Ocular tolerability of Eudragit RS100® and RL100® nanosuspensions as carriers for ophthalmic controlled drug delivery. Journal of Pharmaceutical Sciences 2002, 91, (12), 2636-2641.
50. Barnabas, W.; Malay, K. S.; Kumaraswamy, S.; Kumar, K. P. S.; Muthu, R.; Bhojraj, S., Chitosan nanoparticles as a new delivery system for the anti-Alzheimer drug tacrine. Nanomedicine : the official journal of the American Academy of Nanomedicine 2010, 6, (1), 144-152.
51. Asane, G. S.; Nirmal, S. A.; Rasal, K. B.; Naik, A. A.; Mahadik, M. S.; Rao, Y. M., Polymer for mucoadhesive drug delivery system: a current status. Drug Dev Ind Pharm 2008, 34, (11), 1246-66.
52. Roger, E.; Lagarce, F.; Garcion, E.; Benoit, J. P., Biopharmaceutical parameters to consider in order to alter the fate of nanocarriers after oral delivery. Nanomedicine (Lond) 2010, 5, (2), 287-306.
53. Dodane, V.; Amin Khan, M.; Merwin, J. R., Effect of chitosan on epithelial permeability and structure. Int J Pharm 1999, 182, (1), 21-32.
54. Walsh, E. G.; Adamczyk, B. E.; Chalasani, K. B.; Maher, S.; O’Toole, E. B.; Fox, J. S.; Leonard, T. W.; Brayden, D. J., Oral delivery of macromolecules: rationale underpinning Gastrointestinal Permeation Enhancement Technology (GIPET®). Therapeutic Delivery 2011, 2, (12), 1595-1610.
55. Martien, R.; Loretz, B.; Schnürch, A. B., Oral gene delivery: Design of polymeric carrier systems shielding toward intestinal enzymatic attack. Biopolymer 2006, 83, (4), 327-336.
56. van der Lubben, I. M.; Verhoef, J. C.; Borchard, G.; Junginger, H. E., Chitosan and its derivatives in mucosal drug and vaccine delivery. European Journal of Pharmaceutical Sciences 2001, 14, (3), 201-207.
57. Badir Delf Loveymi, M. J., Parvin Zakeri-Milani, Hadi Valizadeh, Design of vancomycin RS-100 nanoparticles in order to increase the intestinal permeability. Advanced Pharmaceutical Bulletin 2012, 2, (1), 43-56.
58. Chen, V. M. a. Y., Nanoparticles – A Review. Tropical Journal of Pharmaceutical Research 2006, 5, (1), 561-573.
59. Garcia-Garcia, E.; Andrieux, K.; Gil, S.; Couvreur, P., Colloidal carriers and blood-brain barrier (BBB) translocation: A way to deliver drugs to the brain? InternationalJournal of Pharmaceutics 2005, 298, (2), 274-292.
60. H. Fessi, F. P., J.P. Devissaguet Procédé de préparation de systèmes colloidaux dispersibles d'une substance sous forme de nanocapsules. 1988.
61. Chorny, M.; Fishbein, I.; Danenberg, H. D.; Golomb, G., Lipophilic drug loaded nanospheres prepared by nanoprecipitation: effect of formulation variables on size, drug recovery and release kinetics. Journal of Controlled Release 2002, 83, (3), 389-400.
62. Lamprecht, A.; Ubrich, N.; Yamamoto, H.; Schafer, U.; Takeuchi, H.; Lehr, C. M.; Maincent, P.; Kawashima, Y., Design of rolipram-loaded nanoparticles: comparison of two preparation methods. Journal of Controlled Release 2001, 71, (3), 297-306.
63. Cauchetier, E.; Deniau, M.; Fessi, H.; Astier, A.; Paul, M., Atovaquone-loaded nanocapsules: influence of the nature of the polymer on their in vitro characteristics. Int J Pharm 2003, 250, (1), 273-81.
64. Lamprecht, A., Nanotherapeutics: Drug Delivery Concepts in Nanoscience. Pan Stanford publishing Pte. Ltd.: Singapore, 2009.
- 217 - | P a g e
65. Aubry, J.; Ganachaud, F.; Cohen Addad, J.-P.; Cabane, B., Nanoprecipitation of Polymethylmethacrylate by Solvent Shifting:1. Boundaries. Langmuir 2009, 25, (4), 1970-1979.
66. Beck-Broichsitter, M.; Rytting, E.; Lebhardt, T.; Wang, X.; Kissel, T., Preparation of nanoparticles by solvent displacement for drug delivery: A shift in the “ouzo region” upon drug loading. European Journal of Pharmaceutical Sciences 2010,41, (2), 244-253.
67. McManamey, W. J.; Davies, J. T.; Woollen, J. M.; Coe, J. R., The influence of molecular diffusion on mass transfer between turbulent liquids. Chem Eng Sci 1973, 28, (4), 1061-1069.
68. Quintanar-Guerrero, D.; Allémann, E.; Fessi, H.; Doelker, E., Preparation Techniques and Mechanisms of Formation of Biodegradable Nanoparticles from Preformed Polymer. Drug Development and Industrial Pharmacy 1998, 24, (12), 1113-1128.
69. Miller, C. A., Spontaneous Emulsification Produced by Diffusion - a Review. Colloid Surface 1988, 29, (1), 89-102.
70. Lopez-Montilla, J. C.; Herrera-Morales, P. E.; Pandey, S.; Shah, D. O., Spontaneous emulsification: Mechanisms, physicochemical aspects, modeling, and applications. Journal of Dispersion Science and Technology 2002, 23, (1-3), 219-268.
71. Ganachaud, F.; Katz, J. L., Nanoparticles and Nanocapsules Created Using the Ouzo Effect: Spontaneous Emulsification as an Alternative to Ultrasonic and High-Shear Devices. Chemphyschem 2005, 6, (2), 209-216.
72. Vitale, S. A.; Katz, J. L., Liquid droplet dispersions formed by homogeneous liquid-liquid nucleation: "The ouzo effect". Langmuir 2003, 19, (10), 4105-4110.
73. Lehr, C. M., Bioadhesion technologies for the delivery of peptide and protein drugs to the gastrointestinal tract. Crit Rev Ther Drug Carrier Syst 1994, 11, (2-3), 119-60.
74. Bowman, K.; Leong, K. W., Chitosan nanoparticles for oral drug and gene delivery. International journal of nanomedicine 2006, 1, (2), 117-28.
75. Kast, C. E.; Bernkop-Schnurch, A., Influence of the molecular mass on the permeation enhancing effect of different poly(acrylates). Stp Pharma Sci 2002, 12, (6), 351-356.
76. Martin, W.; Andreas, B.-S. r., Inhibition of Enzymes and Secretory Transport. In Enhancement in Drug Delivery, CRC Press: 2006.
77. Garrett, N. L.; Lalatsa, A.; Uchegbu, I.; Schätzlein, A.; Moger, J., Exploring uptake mechanisms of oral nanomedicines using multimodal nonlinear optical microscopy. Journal of Biophotonics 2012, n/a-n/a.
78. Szentkuti, L., Light microscopical observations on luminally administered dyes, dextrans, nanospheres and microspheres in the pre-epithelial mucus gel layer of the rat distal colon. Journal of Controlled Release 1997, 46, (3), 233-242.
79. Hussain, N.; Jaitley, V.; Florence, A. T., Recent advances in the understanding of uptake of microparticulates across the gastrointestinal lymphatics. Advanced Drug Delivery Reviews 2001, 50, (1–2), 107-142.
80. Aprahamian, M.; Michel, C.; Humbert, W.; Devissaguet, J. P.; Damge, C., Transmucosal passage of polyalkylcyanoacrylate nanocapsules as a new drug carrier in the small intestine. Biology of the Cell 1987, 61, (1-2), 69-76.
- 218 - | P a g e
81. Jani, P.; Halbert, G. W.; Langridge, J.; Florence, A. T., Nanoparticle Uptake by the Rat Gastrointestinal Mucosa: Quantitation and Particle Size Dependency. Journalof Pharmacy and Pharmacology 1990, 42, (12), 821-826.
82. Florence, A. T.; Hillery, A. M.; Hussain, N.; Jani, P. U., Factors Affecting the Oral Uptake and Translocation of Polystyrene Nanoparticles: Histological and Analytical Evidence. Journal of Drug Targeting 1995, 3, (1), 65-70.
83. Florence, A. T.; Hillery, A. M.; Hussain, N.; Jani, P. U., Nanoparticles as carriers for oral peptide absorption: Studies on particle uptake and fate. Journal of Controlled Release 1995, 36, (1–2), 39-46.
84. Desai, M. P.; Labhasetwar, V.; Amidon, G. L.; Levy, R. J., Gastrointestinal uptake of biodegradable microparticles: effect of particle size. Pharm Res 1996, 13, (12), 1838-45.
85. O'Hagan, D. T., The intestinal uptake of particles and the implications for drug and antigen delivery. J Anat 1996, 189 ( Pt 3), 477-82.
86. Florence, A. T., The oral absorption of micro- and nanoparticulates: Neither exceptional nor unusual. Pharmaceutical Research 1997, 14, (3), 259-266.
87. Hillyer, J. F.; Albrecht, R. M., Gastrointestinal persorption and tissue distribution of differently sized colloidal gold nanoparticles. Journal of Pharmaceutical Sciences 2001, 90, (12), 1927-1936.
88. Delie, F., Evaluation of nano- and microparticle uptake by the gastrointestinal tract. Advanced Drug Delivery Reviews 1998, 34, (2–3), 221-233.
89. Plapied, L.; Duhem, N.; des Rieux, A.; Préat, V., Fate of polymeric nanocarriers for oral drug delivery. Current Opinion in Colloid & Interface Science 2011,16, (3), 228-237.
90. Vollrath, A.; Schubert, S.; Windhab, N.; Biskup, C.; Schubert, U. S., Labeled Nanoparticles Based on Pharmaceutical EUDRAGIT® S 100 Polymer. MacromolRapid Comm 2010, 31, (23), 2053-2058.
91. Morgan, T. T.; Muddana, H. S.; Altinoglu, E. I.; Rouse, S. M.; Tabakovic, A.; Tabouillot, T.; Russin, T. J.; Shanmugavelandy, S. S.; Butler, P. J.; Eklund, P. C.; Yun, J. K.; Kester, M.; Adair, J. H., Encapsulation of Organic Molecules in Calcium Phosphate Nanocomposite Particles for Intracellular Imaging and Drug Delivery. Nano Letters 2008, 8, (12), 4108-4115.
92. Ardusso, M. S.; Manzo, R. H.; Jimenez-Kairuz, A. F., Comparative study of three structurally related acid polyelectrolytes as carriers of basic drugs: Carbomer, Eudragit L-100 and S-100. Supramol Chem 2010, 22, (5), 289-296.
93. Baena, Y.; Manzo, R. H.; D'Leon, L. F. P., Preparation and Physicochemical Characterization of Some Polyelectrolyte-Diclofenac Complexes. Vitae-Columbia 2011, 18, (3), 304-310.
94. Jimenez-Kairuz, A. F.; Allemandi, D. A.; Manzo, R. H., The improvement of aqueous chemical stability of a model basic drug by ion pairing with acid groups of polyelectrolytes. International Journal of Pharmaceutics 2004, 269, (1), 149-156.
95. Mischiati, C.; Sereni, A.; Finotti, A.; Breda, L.; Cortesi, R.; Nastruzzi, C.; Romanelli, A.; Saviano, M.; Bianchi, N.; Pedone, C.; Borgatti, M.; Gambari, R., Complexation to cationic microspheres of double-stranded peptide nucleic acid-DNA chimeras exhibiting decoy activity. J Biomed Sci 2004, 11, (5), 697-704.
96. Jimenez-Kairuz, A. F.; Allemandi, D. A.; Manzo, R. H., Equilibrium properties and mechanism of kinetic release of metoclopramide from carbomer hydrogels. Int J Pharm 2003, 250, (1), 129-36.
- 219 - | P a g e
97. Rigo, M. V.; Allemandi, D. A.; Manzo, R. H., Swellable drug-polyelectrolyte matrices (SDPM) of alginic acid characterization and delivery properties. Int J Pharm 2006, 322, (1-2), 36-43.
98. Isaacs, L., Cucurbit[n]urils: from mechanism to structure and function. Chem Commun 2009, (6), 619-629.
99. Lagona, J.; Mukhopadhyay, P.; Chakrabarti, S.; Isaacs, L., The Cucurbit[n]uril Family. Angewandte Chemie International Edition 2005, 44, (31), 4844-4870.
100. Liu, S.; Ruspic, C.; Mukhopadhyay, P.; Chakrabarti, S.; Zavalij, P. Y.; Isaacs, L., The Cucurbit[n]uril Family: Prime Components for Self-Sorting Systems. Journalof the American Chemical Society 2005, 127, (45), 15959-15967.
101. Jin Jeon, Y.; Kim, S.-Y.; Ho Ko, Y.; Sakamoto, S.; Yamaguchi, K.; Kim, K., Novel molecular drug carrier: encapsulation of oxaliplatin in cucurbit[7]uril and its effects on stability and reactivity of the drug. Organic & Biomolecular Chemistry 2005, 3, (11), 2122-2125.
102. Uzunova, V. D.; Cullinane, C.; Brix, K.; Nau, W. M.; Day, A. I., Toxicity of cucurbit[7]uril and cucurbit[8]uril: an exploratory in vitro and in vivo study. Organic & Biomolecular Chemistry 2010, 8, (9), 2037-2042.
103. Park, I.-K.; von Recum, H. A.; Jiang, S.; Pun, S. H., Supramolecular Assembly of Cyclodextrin-Based Nanoparticles on Solid Surfaces for Gene Delivery. Langmuir 2006, 22, (20), 8478-8484.
104. Xu, P.; Gullotti, E.; Tong, L.; Highley, C. B.; Errabelli, D. R.; Hasan, T.; Cheng, J.-X.; Kohane, D. S.; Yeo, Y., Intracellular Drug Delivery by Poly(lactic-co-glycolic acid) Nanoparticles, Revisited. Molecular Pharmaceutics 2008, 6, (1), 190-201.
105. Mukerjee, A.; Vishwanatha, J. K., Formulation, Characterization and Evaluation of Curcumin-loaded PLGA Nanospheres for Cancer Therapy. Anticancer Research 2009, 29, (10), 3867-3875.
106. White, N. S.; Errington, R. J., Fluorescence techniques for drug delivery research: theory and practice. Adv Drug Deliv Rev 2005, 57, (1), 17-42.
107. Yu, X.; Chen, L.; Deng, Y.; Li, K.; Wang, Q.; Li, Y.; Xiao, S.; Zhou, L.; Luo, X.; Liu, J.; Pang, D., Fluorescence analysis with quantum dot probes for hepatoma under one- and two-photon excitation. J Fluoresc 2007, 17, (2), 243-7.
108. Xue, F. L.; Chen, J. Y.; Guo, J.; Wang, C. C.; Yang, W. L.; Wang, P. N.; Lu, D. R., Enhancement of intracellular delivery of CdTe quantum dots (QDs) to living cells by Tat conjugation. J Fluoresc 2007, 17, (2), 149-54.
109. Tongiani, S.; Velde, D. V.; Ozeki, T.; Stella, V. J., Sulfoalkyl ether-alkyl ether cyclodextrin derivatives, their synthesis, NMR characterization, and binding of 6 alpha-methylprednisolone. Journal of Pharmaceutical Sciences 2005, 94, (11), 2380-2392.
110. Jon, S. Y.; Selvapalam, N.; Oh, D. H.; Kang, J. K.; Kim, S. Y.; Jeon, Y. J.; Lee, J. W.; Kim, K., Facile synthesis of cucurbit[n]uril derivatives via direct functionalization: Expanding utilization of cucurbit[n]uril. Journal of the American Chemical Society 2003, 125, (34), 10186-10187.
111. Vikrant K Nikam, K. B. K., Vinayak M Gaware, Ramdas T Dolas, Kiran B Dhamak, Sachin B Somwanshi, Atul N Khadse, Vivekanand A. Kashid, EUDRAGIT A VERSATILE POLYMER : A REVIEW. In Pharmacologyonline: 2011; Vol. 1, pp 152-164.
112. Dillen, K.; Vandervoort, J.; Van den Mooter, G.; Ludwig, A., Evaluation of ciprofloxacin-loaded Eudragit® RS100 or RL100/PLGA nanoparticles. International Journal of Pharmaceutics 2006, 314, (1), 72-82.
- 220 - | P a g e
113. Pignatello, R.; Ricupero, N.; Bucolo, C.; Maugeri, F.; Maltese, A.; Puglisi, G., Preparation and characterization of eudragit retard nanosuspensions for the ocular delivery of cloricromene. Aaps Pharmscitech 2006, 7, (1), E27.
114. Pignatello, R.; Bucolo, C.; Puglisi, G., Ocular tolerability of Eudragit RS100® and RL100® nanosuspensions as carriers for ophthalmic controlled drug delivery. Journal of Pharmaceutical Sciences 2002, 91, (12), 2636-2641.
115. Bodmeier, R.; Chen, H.; Tyle, P.; Jarosz, P., Spontaneous formation of drug-containing acrylic nanoparticles. J Microencapsul 1991, 8, (2), 161-70.
116. Ubrich, N.; Schmidt, C.; Bodmeier, R.; Hoffman, M.; Maincent, P., Oral evaluation in rabbits of cyclosporin-loaded Eudragit RS or RL nanoparticles. International Journal of Pharmaceutics 2005, 288, (1), 169-175.
117. Miller, D. A.; DiNunzio, J. C.; Williams, R. O., Advanced Formulation Design: Improving Drug Therapies for the Management of Severe and Chronic Pain. DrugDevelopment and Industrial Pharmacy 2008, 34, (2), 117-133.
118. FDA Inactive Ingredient Search for Approved Drug Products. http://www.accessdata.fda.gov/scripts/cder/iig/getiigWEB.cfm
119. Gertsch, J.; Leonti, M.; Raduner, S.; Racz, I.; Chen, J. Z.; Xie, X. Q.; Altmann, K. H.; Karsak, M.; Zimmer, A., Beta-caryophyllene is a dietary cannabinoid. P Natl Acad Sci USA 2008, 105, (26), 9099-9104.
120. Da Silva, S. L.; Figueiredo, P. M.; Yano, T., Chemotherapeutic potential of the volatile oils from Zanthoxylum rhoifolium Lam leaves. Eur J Pharmacol 2007, 576, (1-3), 180-8.
121. Darmanin, S.; Wismayer, P. S.; Podesta, M. T. C.; Micallef, M. J.; Buhagiar, J. A., An extract from Ricinus communis L. leaves possesses cytotoxic properties and induces apoptosis in SK-MEL-28 human melanoma cells. Natural Product Research 2009, 23, (6), 561-571.
122. Fernandes, E. S.; Passos, G. F.; Medeiros, R.; da Cunha, F. M.; Ferreira, J.; Campos, M. M.; Pianowski, L. F.; Calixto, J. B., Anti-inflammatory effects of compounds alpha-humulene and (-)-trans-caryophyllene isolated from the essential oil of Cordia verbenacea. European Journal of Pharmacology 2007, 569, (3), 228-236.
123. Jirovetz, L.; Buchbauer, G.; Stoilova, I.; Stoyanova, A.; Krastanov, A.; Schmidt, E., Chemical composition and antioxidant properties of clove leaf essential oil. J Agr Food Chem 2006, 54, (17), 6303-6307.
124. Russo, E. B., Taming THC: potential cannabis synergy and phytocannabinoid-terpenoid entourage effects. British Journal of Pharmacology 2011, 163, (7), 1344-1364.
125. Pichette, A.; Lavoie, S.; Legault, J. Sesquiterpene formulation, kits and methods of use thereof 2008.
126. Sköld, M.; Karlberg, A.-T.; Matura, M.; Börje, A., The fragrance chemical [beta]-caryophyllene--air oxidation and skin sensitization. Food and Chemical Toxicology 2006, 44, (4), 538-545.
127. Prashar, A.; Locke, I. C.; Evans, C. S., Cytotoxicity of clove (Syzygium aromaticum) oil and its major components to human skin cells. Cell Prolif 2006,39, (4), 241-8.
128. Naguib, M.; Diaz, P.; Xu, J. J.; Astruc-Diaz, F.; Craig, S.; Vivas-Mejia, P.; Brown, D. L., MDA7: a novel selective agonist for CB2 receptors that prevents allodynia in rat neuropathic pain models. Br J Pharmacol 2008, 155, (7), 1104-16.
- 221 - | P a g e
129. Rahn, E. J.; Zvonok, A. M.; Thakur, G. A.; Khanolkar, A. D.; Makriyannis, A.; Hohmann, A. G., Selective activation of cannabinoid CB2 receptors suppresses neuropathic nociception induced by treatment with the chemotherapeutic agent paclitaxel in rats. J Pharmacol Exp Ther 2008, 327, (2), 584-91.
130. Veiga, V. F.; Zunino, L.; Patitucci, M. L.; Pinto, A. C.; Calixto, J. B., The inhibition of paw oedema formation caused by the oil of Copaifera multijuga Hayne and its fractions. Journal of Pharmacy and Pharmacology 2006, 58, (10), 1405-1410.
131. Sylvestre, M.; Legault, J.; Dufour, D.; Pichette, A., Chemical composition and anticancer activity of leaf essential oil of Myrica gale L. Phytomedicine 2005, 12, (4), 299-304.
132. Reinsvold, R. E.; Jinkerson, R. E.; Radakovits, R.; Posewitz, M. C.; Basu, C., The production of the sesquiterpene beta-caryophyllene in a transgenic strain of the cyanobacterium Synechocystis. Journal of Plant Physiology 2011, 168, (8), 848-852.
133. Politeo, O.; Jukic, M.; Milos, M., Chemical composition and antioxidant activity of essential oils of twelve spice plants. Croat Chem Acta 2006, 79, (4), 545-552.
134. Pereira, F. J.; Martins, F. T.; Correa, R. S.; Moreira, M. E. C.; Costa, A. M. D. D.; Dos Santos, M. H.; Polo, M.; Barbosa, L. C. A., Isolation, chemical composition and anti-inflammatory activity of Copaifera langsdorffii desf. fruit peels essential oil according to successive hydrodistillations. Lat Am J Pharm 2008, 27, (3), 369-374.
135. Brown, A. E.; Riddick, E. W.; Aldrich, J. R.; Holmes, W. E., Identification of (-)-beta-caryophyllene as a gender-specific terpene produced by the multicolored Asian lady beetle. J Chem Ecol 2006, 32, (11), 2489-99.
136. Fessi, H.; Puisieux, F.; Devissaguet, J. P.; Ammoury, N.; Benita, S., Nanocapsule formation by interfacial polymer deposition following solvent displacement. International Journal of Pharmaceutics 1989, 55, (1), R1-R4.
137. Montasser, I.; Briançon, S.; Fessi, H., The effect of monomers on the formulation of polymeric nanocapsules based on polyureas and polyamides. InternationalJournal of Pharmaceutics 2007, 335, (1–2), 176-179.
138. Layre, A. M.; Couvreur, P.; Richard, J.; Requier, D.; Ghermani, N. E.; Gref, R., Freeze-drying of composite core-shell nanoparticles. Drug Development and Industrial Pharmacy 2006, 32, (7), 839-846.
139. Lamer, V. K.; Dinegar, R. H., Theory, Production and Mechanism of Formation of Monodispersed Hydrosols. Journal of the American Chemical Society 1950, 72, (11), 4847-4854.
140. Polymer, R. P., Preparatory and Associated Work. In 2012. 141. FDA, Guidance for Industry: Q3C — Tables and List. In 2003. 142. Wu, T.-H.; Yen, F.-L.; Lin, L.-T.; Tsai, T.-R.; Lin, C.-C.; Cham, T.-M., Preparation,
physicochemical characterization, and antioxidant effects of quercetin nanoparticles. International Journal of Pharmaceutics 2008, 346, (1–2), 160-168.
143. Bucolo, C.; Maltese, A.; Puglisi, G.; Pignatello, R., Enhanced ocular anti-inflammatory activity of ibuprofen carried by an Eudragit RS100 nanoparticle suspension. Ophthalmic Res 2002, 34, (5), 319-23.
144. Pignatello, R.; Bucolo, C.; Ferrara, P.; Maltese, A.; Puleo, A.; Puglisi, G., Eudragit RS100® nanosuspensions for the ophthalmic controlled delivery of ibuprofen. European Journal of Pharmaceutical Sciences 2002, 16, (1–2), 53-61.
145. Gargouri, M.; Sapin, A.; Bouali, S.; Becuwe, P.; Merlin, J. L.; Maincent, P., Optimization of a New Non-viral Vector for Transfection: Eudragit Nanoparticles for the Delivery of a DNA Plasmid. Technol Cancer Res T 2009, 8, (6), 433-443.
- 222 - | P a g e
146. Das, S.; Roy, P.; Auddy, R. G.; Mukherjee, A., Silymarin nanoparticle prevents paracetamol-induced hepatotoxicity. Int J Nanomedicine 2011, 6, 1291-301.
147. Romero-Pérez, A.; García-García, E.; Zavaleta-Mancera, A.; Ramírez-Bribiesca, J.; Revilla-Vázquez, A.; Hernández-Calva, L.; López-Arellano, R.; Cruz-Monterrosa, R., Designing and evaluation of sodium selenite nanoparticles <i>in vitro</i> to improve selenium absorption in ruminants. Veterinary Research Communications 2010, 34, (1), 71-79.
148. Eidi, H.; Joubert, O.; Attik, G.; Duval, R. E.; Bottin, M. C.; Hamouia, A.; Maincent, P.; Rihn, B. H., Cytotoxicity assessment of heparin nanoparticles in NR8383 macrophages. International Journal of Pharmaceutics 2010, 396, (1–2), 156-165.
149. Elshafeey, A. H.; Kamel, A. O.; Awad, G. A. S., Ammonium methacrylate units polymer content and their effect on acyclovir colloidal nanoparticles properties and bioavailability in human volunteers. Colloids and Surfaces B: Biointerfaces 2010,75, (2), 398-404.
150. Date, P. V.; Samad, A.; Devarajan, P. V., Freeze thaw: a simple approach for prediction of optimal cryoprotectant for freeze drying. Aaps Pharmscitech 2010,11, (1), 304-13.
151. Abdelwahed, W.; Degobert, G.; Stainmesse, S.; Fessi, H., Freeze-drying of nanoparticles: Formulation, process and storage considerations. Advanced Drug Delivery Reviews 2006, 58, (15), 1688-1713.
152. Sattler, K. D., Handbook of Nanophysics: Nanomedicine and Nanorobotics. In CRC Press: Boca Raton, FL, 2011.
153. Chattopadhyay, P.; Huff, R.; Shekunov, B. Y., Drug encapsulation using supercritical fluid extraction of emulsions. Journal of Pharmaceutical Sciences 2006, 95, (3), 667-679.
154. Zheng, G.-Q.; Kenney, P. M.; Lam, L. K. T., Sesquiterpenes from Clove (Eugenia caryophyllata) as Potential Anticarcinogenic Agents. Journal of Natural Products 2004, 55, (7), 999-1003.
155. Buchi Training papers: distillation and Environnement.; 1998. 156. Cauchetier, E.; Deniau, M.; Fessi, H.; Astier, A.; Paul, M., Atovaquone-loaded
nanocapsules: influence of the nature of the polymer on their in vitro characteristics. International Journal of Pharmaceutics 2003, 250, (1), 273-281.
157. Loxley, A.; Vincent, B., Preparation of Poly(methylmethacrylate) Microcapsules with Liquid Cores. J Colloid Interf Sci 1998, 208, (1), 49-62.
158. Romero-Cano, M. S.; Vincent, B., Controlled release of 4-nitroanisole from poly(lactic acid) nanoparticles. Journal of Controlled Release 2002, 82, (1), 127-135.
159. Poletto, F. S.; Jäger, E.; Cruz, L.; Pohlmann, A. R.; Guterres, S. S., The effect of polymeric wall on the permeability of drug-loaded nanocapsules. MaterialsScience and Engineering: C 2008, 28, (4), 472-478.
160. Jung, T.; Breitenbach, A.; Kissel, T., Sulfobutylated poly(vinyl alcohol)-graft-poly(lactide-co-glycolide)s facilitate the preparation of small negatively charged biodegradable nanospheres. Journal of Controlled Release 2000, 67, (2–3), 157-169.
161. Galindo-Rodriguez, S.; Allemann, E.; Fessi, H.; Doelker, E., Physicochemical parameters associated with nanoparticle formation in the salting-out, emulsification-diffusion, and nanoprecipitation methods. Pharmaceutical Research 2004, 21, (8), 1428-1439.
- 223 - | P a g e
162. Legrand, P.; Lesieur, S.; Bochot, A.; Gref, R.; Raatjes, W.; Barratt, G.; Vauthier, C., Influence of polymer behaviour in organic solution on the production of polylactide nanoparticles by nanoprecipitation. International Journal of Pharmaceutics 2007, 344, (1-2), 33-43.
163. Thioune, O.; Fessi, H.; Devissaguet, J. P.; Puisieux, F., Preparation of pseudolatex by nanoprecipitation: Influence of the solvent nature on intrinsic viscosity and interaction constant. International Journal of Pharmaceutics 1997,146, (2), 233-238.
164. Aubry, J.; Ganachaud, F.; Cohen Addad, J. P.; Cabane, B., Nanoprecipitation of polymethylmethacrylate by solvent shifting: 1. Boundaries. Langmuir 2009, 25, (4), 1970-9.
165. Stephanie Schubert , J. T. D., Jr and Ulrich S. Schubert Nanoprecipitation and nanoformulation of polymer: from history to powerful possibilities beyond poly(lactic acid) Soft Matter 2011, (5).
166. Dirksen, J. A.; Ring, T. A., Fundamentals of Crystallization - Kinetic Effects on Particle-Size Distributions and Morphology. Chem Eng Sci 1991, 46, (10), 2389-2427.
167. Skrdla, P. J., Roles of Nucleation, Denucleation, Coarsening, and Aggregation Kinetics in Nanoparticle Preparations and Neurological Disease. Langmuir 2012,28, (10), 4842-4857.
168. Teixeira, M.; Alonso, M. J.; Pinto, M. M.; Barbosa, C. M., Development and characterization of PLGA nanospheres and nanocapsules containing xanthone and 3-methoxyxanthone. Eur J Pharm Biopharm 2005, 59, (3), 491-500.
169. Khayata, N.; Abdelwahed, W.; Chehna, M. F.; Charcosset, C.; Fessi, H., Preparation of vitamin E loaded nanocapsules by the nanoprecipitation method: From laboratory scale to large scale using a membrane contactor. International Journal of Pharmaceutics 2012, 423, (2), 419-427.
170. Bilati, U.; Allemann, E.; Doelker, E., Development of a nanoprecipitation method intended for the entrapment of hydrophilic drugs into nanoparticles. Eur J Pharm Sci 2005, 24, (1), 67-75.
171. Stainmesse, S.; Orecchioni, A. M.; Nakache, E.; Puisieux, F.; Fessi, H., Formation and stabilization of a biodegradable polymeric colloidal suspension of nanoparticles. Colloid & Polymer Science 1995, 273, (5), 505-511.
172. Choi, S.-W.; Kwon, H.-Y.; Kim, W.-S.; Kim, J.-H., Thermodynamic parameters on poly(d,l-lactide-co-glycolide) particle size in emulsification–diffusion process. Colloids and Surfaces A: Physicochemical and Engineering Aspects 2002, 201, (1–3), 283-289.
173. Sitnikova, N. L.; Sprik, R.; Wegdam, G.; Eiser, E., Spontaneously Formed trans-Anethol/Water/Alcohol Emulsions: Mechanism of Formation and Stability. Langmuir 2005, 21, (16), 7083-7089.
174. Vitale, S. A.; Katz, J. L., Liquid Droplet Dispersions Formed by Homogeneous Liquid Liquid Nucleation: “The Ouzo Effect”. Langmuir 2003, 19, (10), 4105-4110.
175. Landfester, K., Miniemulsions for nanoparticle synthesis. Top Curr Chem 2003,227, 75-123.
176. Molpeceres, J.; Guzman, M.; Aberturas, M. R.; Chacon, M.; Berges, L., Application of central composite designs to the preparation of polycaprolactone nanoparticles by solvent displacement. J Pharm Sci 1996, 85, (2), 206-13.
- 224 - | P a g e
177. Fresta, M.; Puglisi, G.; Wehrli, E.; Giammona, G.; Di Marco, S., Freeze-fracture electron microscopy and light scattering studies on polyethylcyanoacrylate nanocapsule colloidal suspensions. Il Nuovo Cimento D 1994, 16, (8), 1271-1276.
178. El-Shabouri, M. H., Positively charged nanoparticles for improving the oral bioavailability of cyclosporin-A. International Journal of Pharmaceutics 2002, 249, (1-2), 101-108.
179. Batrakova, E. V.; Han, H. Y.; Alakhov, V.; Miller, D. W.; Kabanov, A. V., Effects of pluronic block copolymer on drug absorption in Caco-2 cell monolayers. Pharm Res 1998, 15, (6), 850-5.
180. Yadav, K. S.; Chuttani, K.; Mishra, A. K.; Sawant, K. K., Long Circulating Nanoparticles of Etoposide Using PLGA-MPEG and PLGA-Pluronic Block Copolymer: Characterization, Drug-Release, Blood-Clearance, and Biodistribution Studies. Drug Develop Res 2010, 71, (4), 228-239.
181. Devarajan, P. V.; Sonavane, G. S., Preparation and In Vitro/In Vivo Evaluation of Gliclazide Loaded Eudragit Nanoparticles as a Sustained Release Carriers. Drug Development and Industrial Pharmacy 2007, 33, (2), 101 - 111.
182. Rao, J. P.; Geckeler, K. E., Polymer nanoparticles: Preparation techniques and size-control parameters. Progress in Polymer Science 2011, 36, (7), 887-913.
183. Du, J.; O'Reilly, R. K., Advances and challenges in smart and functional polymer vesicles. Soft Matter 2009, 5, (19), 3544-3561.
184. Lin Mei, Y. Z., Yi Zheng, Ge Tian, Cunxian Song, Dongye Yang, Hongli Chen, Hongfan Sun, Yan Tian, Kexin Liu, Zhen Li, and Laiqiang Huang, A Novel Docetaxel-Loaded Poly ( -Caprolactone)/Pluronic F68 Nanoparticle Overcoming Multidrug Resistance for Breast Cancer Treatment. Nanoscale Res Lett 2009, 4, (12), 1530-1539.
185. Urata, T.; Arimori, K.; Nakano, M., Modification of release rates of cyclosporin A from polyl(L-lactic acid) microspheres by fatty acid esters and in-vivo evaluation of the microspheres. Journal of Controlled Release 1999, 58, (2), 133-141.
186. Aceves, J. M.; Cruz, R.; Hernandez, E., Preparation and characterization of Furosemide-Eudragit controlled release systems. Int J Pharm 2000, 195, (1-2), 45-53.
187. Shivakumar, H. N.; Desai, B. G.; Deshmukh, G., Design and optimization of diclofenac sodium controlled release solid dispersions by response surface methodology. Indian J Pharm Sci 2008, 70, (1), 22-30.
188. Haznedar, S.; Dortunç, B., Preparation and in vitro evaluation of Eudragit microspheres containing acetazolamide. International Journal of Pharmaceutics 2004, 269, (1), 131-140.
189. Horobin, R.; Rashid, F., Interactions of molecular probes with living cells and tissues. Part 1. Some general mechanistic proposals, making use of a simplistic Chinese box model. Histochemistry and Cell Biology 1990, 94, (2), 205-209.
190. Loftsson, T.; Masson, M.; Brewster, M. E., Self-association of cyclodextrins and cyclodextrin complexes. J Pharm Sci 2004, 93, (5), 1091-9.
191. Abdelwahed, W.; Degobert, G.; Fessi, H., A pilot study of freeze drying of poly(epsilon-caprolactone) nanocapsules stabilized by poly(vinyl alcohol): formulation and process optimization. Int J Pharm 2006, 309, (1-2), 178-88.
- 225 - | P a g e
CHAPTER IV EXPERIMENTAL 1 MDA7 purity determination.
1.1 LC-UV-MS
1.1.1 Sample Preparation
1.0-mg/ml solution of MDA7 was made by weighing out 2.246 mg of solid MDA7 (Lot #
PHD001.374F1), placing it in an amber vial, and then adding 2246 μl of methanol. This
solution was then diluted 100x to a concentration of 10 μg/ml using a 10% methanol (in
water) solution. Both a blank solution of 10% methanol and the 10 μg/ml solution of
MDA7 were then analyzed by LC-UV-MS.
1.1.2 LC-UV-MS Methodology
The instrumentation consisted of a Waters Acquity LC system, equipped with a Waters
Acquity photodiode array (PDA) detector, interfaced to a Waters TQD mass spectrometer
operated in ESI positive mode. The LC analysis was performed utilizing a reversed
phase gradient system with the aqueous phase A being 0.2% formic acid in water (pH
3.0) and the organic phase B being methanol. The mobile phase was delivered in a
gradient mode at 0.15 mL/min at 90 % A from 0 to 30 seconds, decreased from 90.0 %
to 5 % A from 30 secondes to 8 minutes, kept at 5% A from 8 to 10 minutes, returned
from 5% to 90 % A from 10 to 11 minutes, and equilibrated at 90 % from 11 to 14
minutes. The LC column used was a Waters Acquity BEH C18 1.7 μm, 1.0x100mm
column. The column was placed in a column heater that was maintained at 60°C. The
samples were placed in a refrigerated autosampler that was maintained at 8°C. The
sample (10 L) was injected for each analysis. The UV range for the PDA was 210-500
nm. Purity was assessed at 254 nm. The Waters LC system was also coupled with a
Waters TQD #1 mass spectrometer to identify MDA7. The mass spectrometer was
operated in an electrospray positive mode. Major parameters were set as follows:
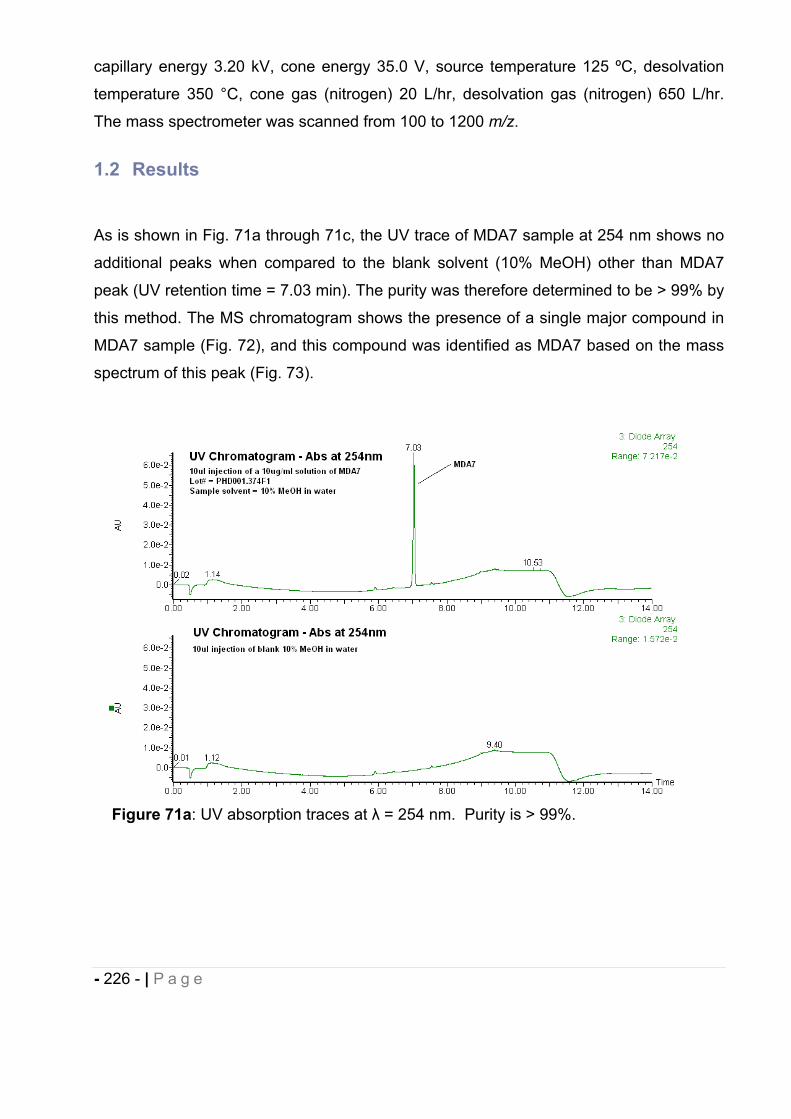
- 226 - | P a g e
capillary energy 3.20 kV, cone energy 35.0 V, source temperature 125 ºC, desolvation
temperature 350 °C, cone gas (nitrogen) 20 L/hr, desolvation gas (nitrogen) 650 L/hr.
The mass spectrometer was scanned from 100 to 1200 m/z.
1.2 Results
As is shown in Fig. 71a through 71c, the UV trace of MDA7 sample at 254 nm shows no
additional peaks when compared to the blank solvent (10% MeOH) other than MDA7
peak (UV retention time = 7.03 min). The purity was therefore determined to be > 99% by
this method. The MS chromatogram shows the presence of a single major compound in
MDA7 sample (Fig. 72), and this compound was identified as MDA7 based on the mass
spectrum of this peak (Fig. 73).
Figure 71a: UV absorption traces at = 254 nm. Purity is > 99%.
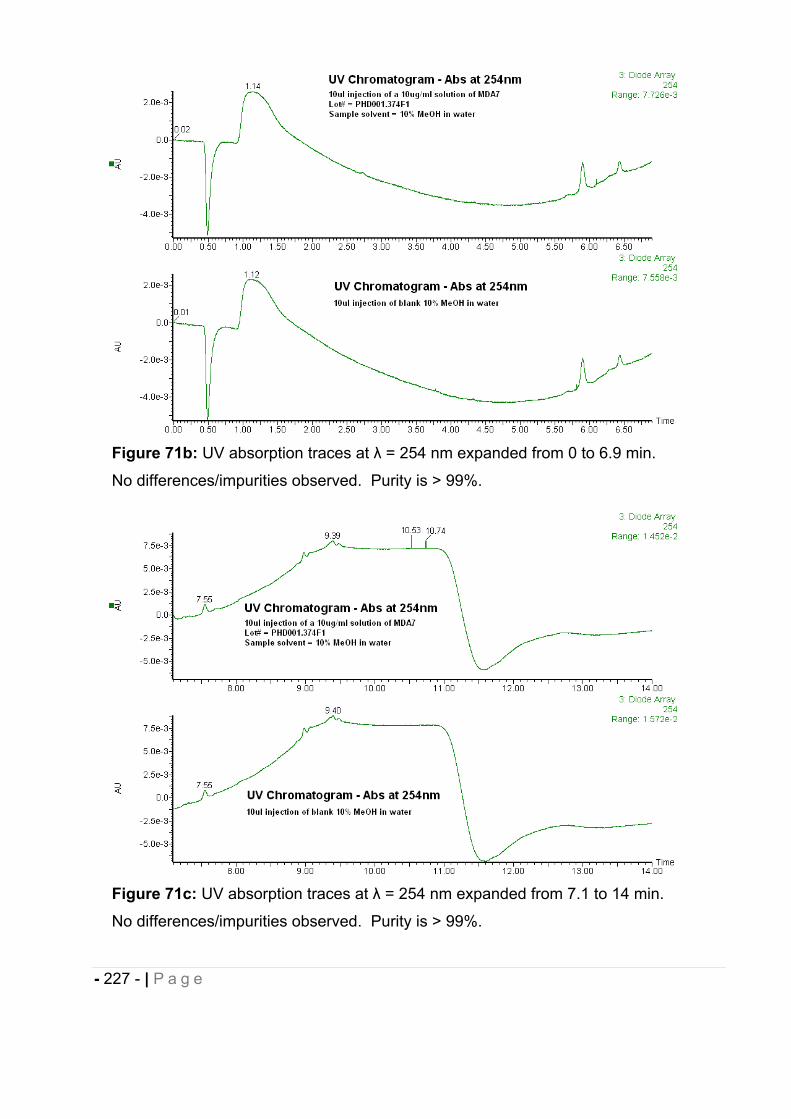
- 227 - | P a g e
Figure 71b: UV absorption traces at = 254 nm expanded from 0 to 6.9 min.
No differences/impurities observed. Purity is > 99%.
Figure 71c: UV absorption traces at = 254 nm expanded from 7.1 to 14 min.
No differences/impurities observed. Purity is > 99%.
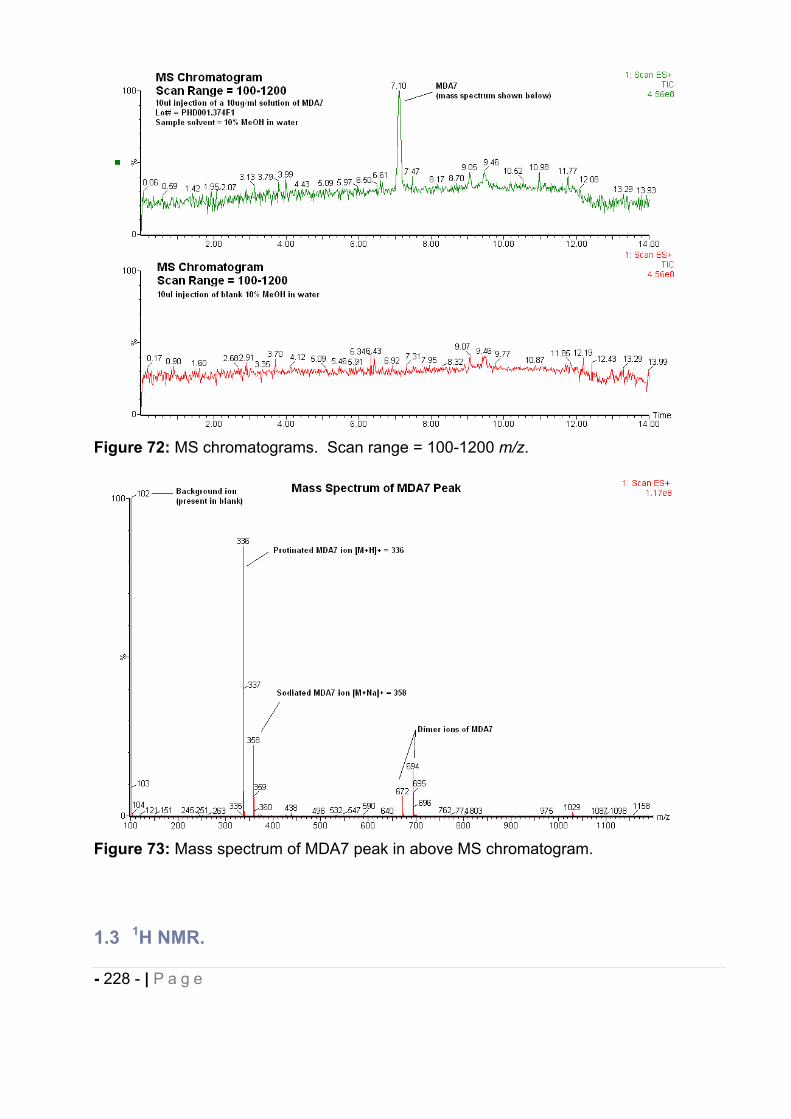
- 228 - | P a g e
Figure 72: MS chromatograms. Scan range = 100-1200 m/z.
Figure 73: Mass spectrum of MDA7 peak in above MS chromatogram.
1.3 1H NMR.
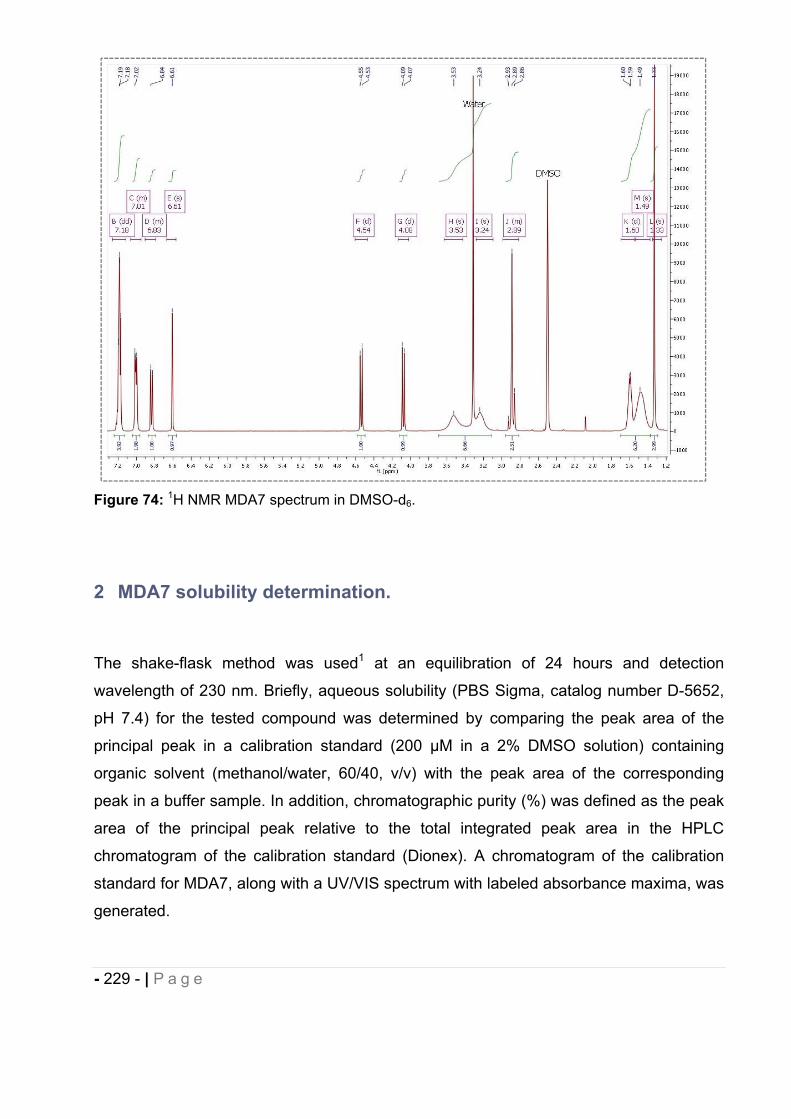
- 229 - | P a g e
Figure 74: 1H NMR MDA7 spectrum in DMSO-d6.
2 MDA7 solubility determination.
The shake-flask method was used1 at an equilibration of 24 hours and detection
wavelength of 230 nm. Briefly, aqueous solubility (PBS Sigma, catalog number D-5652,
pH 7.4) for the tested compound was determined by comparing the peak area of the
principal peak in a calibration standard (200 μM in a 2% DMSO solution) containing
organic solvent (methanol/water, 60/40, v/v) with the peak area of the corresponding
peak in a buffer sample. In addition, chromatographic purity (%) was defined as the peak
area of the principal peak relative to the total integrated peak area in the HPLC
chromatogram of the calibration standard (Dionex). A chromatogram of the calibration
standard for MDA7, along with a UV/VIS spectrum with labeled absorbance maxima, was
generated.
- 230 - | P a g e
3 In vitro MDA7 pharmacological characterization.
3.1 Materials.
MDA7 was obtained according to the methods previously described2. All chemicals used
for the synthesis of MDA7 were purchased from Sigma-Aldrich Inc. (St Louis, MO, USA).
AM251 and was SR141716A were purchased from Tocris Bioscience.
3.2 In vitro receptor radioligand binding studies.
3.2.1 Human CB1 and CB2 binding studies.
MDA7 was screened in a competitive binding experiment by using membranes of
Chinese hamster ovarian cells (CHO-K1 cells) expressing the human CB1 receptor at
different MDA7 concentrations in duplicate3. The competitive binding experiment was
performed in 96-well plates (Masterblock, catalogue number 786201, Greiner Bio-One,
San Diego, CA, USA) containing binding buffer (50 mM Tris, pH 7.4, 2.5 mM EDTA,
0.5% protease-free BSA, saponin 10 μg ml-1), recombinant membrane extracts (2 g
protein per well), and 1 nM [3H]SR141716A (5-(4-chloro-phenyl)-1-(2,4-dichloro-phenyl)-
4-methyl-1H-pyrazole-3-carboxylic acid piperidin-1-ylamide), a selective CB1 receptor
antagonist (GE Healthcare, TRK1028, 42 Ci mmol-1, diluted in binding buffer).
Nonspecific binding was determined in the presence of 10 M CP55,940 (5-(1,1-
dimethylheptyl)-2-[(1R,2R,5R)-5-hydroxy-2-(3-hydroxy-propyl)-cyclohexyl]-phenol)(Tocris
Bioscience, Ellisville, MO, USA). The sample was incubated in a final volume of 0.1 ml
for 60 min at 25°C and then filtered on a GF/C UniFilter microplate (Perkin Elmer,
Waltham, MA, USA; catalogue number 6005177) presoaked in 0.05% Brij for 2 h at room
temperature. Filters were washed six times with 4 ml of cold binding buffer, and bound
[3H]SR141716A was determined by liquid scintillation counting. The median inhibition
concentration (IC50) was determined by nonlinear regression using the one-site
competition equation. The inhibition constant (Ki) values were calculated by using the
- 231 - | P a g e
Cheng-Prusoff equation [Ki = IC50/(1 + (L/KD)], where L = concentration of radioligand in
the assay and KD = affinity of the radioligand for the receptor.
MDA7 was also screened in a competitive binding experiment by using membranes of
CHO-K1 cells selectively expressing the human CB2 receptor at different MDA7
concentrations in duplicate. The competitive binding experiment was performed in 96-
well plates (Masterblock) containing binding buffer (50 mM Tris, pH 7.4, 2.5 mM EDTA,
0.5% protease-free BSA), recombinant membrane extracts (0.25 μg protein per well) and
1 nM [3H]CP55,940 (Perkin Elmer, NEX-1051, 161 Ci mmol
-1, diluted in binding buffer).
Nonspecific binding was determined in the presence of 10 μM CP55,940 (Tocris
Bioscience). The sample was incubated in a final volume of 0.1 mL for 60min at 30 1C
and then filtered on a GF/B UniFilter microplate (Perkin Elmer, catalogue number
6005177) presoaked in 0.5% polyethyleneimine for 2 h at room temperature. Filters were
washed six times with 4 mL of cold binding buffer (50 mM Tris, pH 7.4, 2.5 mM EDTA,
0.5% protease-free BSA), and bound [3H]CP55,940 was determined by liquid scintillation
counting. The IC50 and Ki values were calculated as above.
3.2.2 Rat CB1 and CB2 receptor-binding studies.
MDA7 was screened in a competitive binding experiment using membranes of CHO-K1
cells selectively expressing the rat CB1 receptor at different MDA7 concentrations in
duplicate3. The competitive binding experiment was performed in 96-well plates
(Masterblock) containing binding buffer (50 mM Tris, pH 7.4, 1 mM EDTA, 0.5%
protease-free BSA, 3 mM MgCl2), recombinant membrane extracts (25 μg protein per
well) and 1.25 nM [3H]SR141716A (5-(4-chloro-phenyl)-1-(2,4-dichloro-phenyl)-4-methyl-
1H-pyrazole-3-carboxylic acid piperidin-1-ylamide), a selective CB1 receptor antagonist
(GE Healthcare diluted in binding buffer). Non-specific binding was determined in the
presence of 10 μM AM251 (N-(piperidin-1-yl)-5-(4-iodophenyl)-1-(2,4-dichloro-phenyl)-4-
methyl-1H-pyrazole-3-carboxamide) (Tocris Bioscience). The sample was incubated in a
final volume of 0.1 mL for 60 min at 25°C and then filtered on a GF/C UniFilter microplate
(Perkin Elmer, catalogue number 6005177) presoaked in 0.05% Brij for 2 h at room
temperature. Filters were washed six times with 4 mL of cold binding buffer, and bound
[3H]SR141716A was determined by liquid scintillation counting. The IC50 value was
- 232 - | P a g e
determined by nonlinear regression by using the one-site competition equation. The Ki
values were calculated using the Cheng–Prusoff equation.
MDA7 was also screened in a competitive binding experiment using membranes of CHO-
K1 cells selectively expressing the rat CB2 receptor at different MDA7 concentrations in
duplicate3. The competitive binding experiment was performed in 96-well plates
(Masterblock) containing binding buffer (50 mM Tris, pH 7.4, 2.5 mM EDTA, 0.5%
protease-free BSA), recombinant membrane extracts (0.25 μg protein per well) and 1 nM
[3H]CP55,940 (Perkin Elmer, NEX-1051, 161 Ci mmol-1, diluted in binding buffer).
Nonspecific binding was determined in the presence of 10 μM CP55,940 (Tocris
Bioscience). The sample was incubated in a final volume of 0.1 mL for 60 min at 30°C
and then filtered on a GF/B UniFilter microplate (Perkin Elmer, catalogue number
6005177) presoaked in 0.5% polyethyleneimine for 2 h at room temperature. Filters were
washed six times with 4 mL of cold binding buffer (50 mM Tris, pH 7.4, 2.5 mM EDTA,
0.5% protease-free BSA), and bound [3H]CP55,940 was determined by liquid scintillation
counting. IC50 and Ki values were calculated as described previously.
3.2.3 GTP [35
S] functional assays.
Functional activity was evaluated by using a GTP [35
S] assay in CHO-K1 cell membrane
extracts expressing recombinant human or rat CB1 or CB2 receptors. The assay relies
on the binding of GTP [35
S], a radiolabeled nonhydrolyzable GTP analogue, to the G-
protein upon binding of an agonist of the G-protein-coupled receptor. In this system,
agonists stimulate GTP [35
S] binding, whereas neutral antagonists have no effect and
inverse agonists decrease GTP [35
S] basal binding.
MDA7 was dissolved in 100% dimethylsulfoxide (DMSO) at a concentration of 10 mM
within 4 h of the first testing session (master solution). A pre-dilution for the dose–
response curve was performed in 100% DMSO, and this solution was diluted 100-fold in
assay buffer to a concentration 2-fold higher than the concentration to be tested. MDA7
was tested for agonist and antagonist activities at eight concentrations in duplicate: 10, 3,
1, 0.3, 0.1, 0.03, 0.01 and 0.001 μM. CP55,940 (Tocris Bioscience) was the reference
agonist. For GTP S, 5 μg of membranes were mixed with guanosine-5’-diphosphate
- 233 - | P a g e
diluted in assay buffer to give 30 μM solution (volume/volume), and incubated for at least
15 min on ice. In parallel, GTP [35S] (GE Healthcare, catalogue number SJ1308) was
mixed with scintillation beads (PVT-WGA, GE Healthcare, catalogue number RPNQ001),
diluted in assay buffer at 50 mg mL-1
(0.5 mg per 10 μL-1
) (volume/volume) just before the
reaction was started. The following reagents were successively added in the wells of an
OptiPlate (Perkin Elmer): 50 μL of ligand or the reference antagonist (AM251, a CB1
receptor-selective antagonist); 20 μL of the membrane/guanosine-5’-diphosphate mix; 10
μL of the reference agonist (CP55,940) at historical EC80 (30 nM); and 20 μL of the
GTP [35
S]:beads mix. The plates were covered with a topseal, shaken on an orbital
shaker for 2 min and then incubated for 1 h at room temperature. Then the plates were
centrifuged for 10 min at 800 g and counted for 1 min per well with a Perkin Elmer
TopCount scintillation counter. Assay reproducibility was monitored by the use of the
reference agonist, CP55,940. For replicate determinations, the maximum variability
tolerated in the test was ±20% of the average of the replicates. Efficacies (Emax) for CB1
or CB2 receptors were expressed as a percentage relative to the efficacy of CP55,940.
4 Enabling Drug Delivery System Design and Development.
4.1 Materials.
2-Hydroxypropyl- -cyclodextrin (HP CD) with an average degree of molar substitution of
4.4 was purchased from CTD Inc. Ethyl Alcohol, 190 Proof, 95%, ACS/USP was
purchased from PHARMCO AAPER. Dimyristoylphosphatidylcholine (DMPC) was
purchased from Avanti Polar Lipids. Dimethyl sulfoxide was purchased from SIGMA-
ALDRICH. PBS and maleic acid (>98%) were purchased from VWR. PBS with bovine
serum albumin 1 % dry powder in pouches to dilute in 1 Liter ultrapure water was
purchased from Fischer scientific. Acrodisc® Syringe Filters with Nylon Membrane were
purchased from PALL Corporation. Other reagents and chemicals were obtained as gift
samples, N-methyl-2-pyrrolidone (NMP or Pharmasolve™) from ISP, propylene glycol
USP and Cremophor™ ELP from BASF, Super refined™ Polysorbate 20 and Super
Refined™ PEG 400 from CRODA, PEG-8 capric/caprylic triglycerides (Labrasol®) and
Apricot Kernel oil PEG-6 esters (Labrafil® M 1944 CS) from Gattefosse, macrogol 15-
- 234 - | P a g e
hydroxystearate (Solutol® HS 15) from BASF . All chemicals were used as received. All
experiments were carried out using ultrapure water.
4.2 Preformulation studies.
4.2.1 Kinetic solubility procedure adapted from Li et al.4.
Approximately 5 mg of MDA7 was weighed into a vial. About 20 mg of cosolvent was
added. Then, the mixture was sonicated in water-bath at 25°C for 2 min. If particles were
not fully dissolved as determined by visual inspection, about 20 mg more cosolvent was
added, followed by sonication under the same conditions. The above cycle was
continued until all drug particles were fully dissolved. The kinetic solubility (S) was
calculated as followed: 5 mg / (n cycles* 20 mg) * 1000 = S (mg MDA7 / g solvent)
4.3 Micellar system.
4.3.1 Preparation.
At room temperature, the appropriate amount of MDA7 was weighed for a final
concentration in the micellar system ranging from 6 mg/mL to 30 mg/mL. Cosolvents
were added and the resulting solution was stirred with a magnetic bar (100 rpm) until a
clear solution was obtained.
Surfactant was melted at 40°C prior to the addition to the cosolvents mixture if necessary
(i.e. Solutol® HS15). The resulting solution was placed under the same stirring conditions
as previously described. The solution was diluted by drop wise addition of PBS using the
stirring conditions described above.
4.3.2 In vitro static serial dilution method5.
The testing procedure was conducted as follow:
-To 10 test tubes, 0.5 ml of phosphate buffered saline bovine serum albumin solution (a
facsimile of plasma) was added.
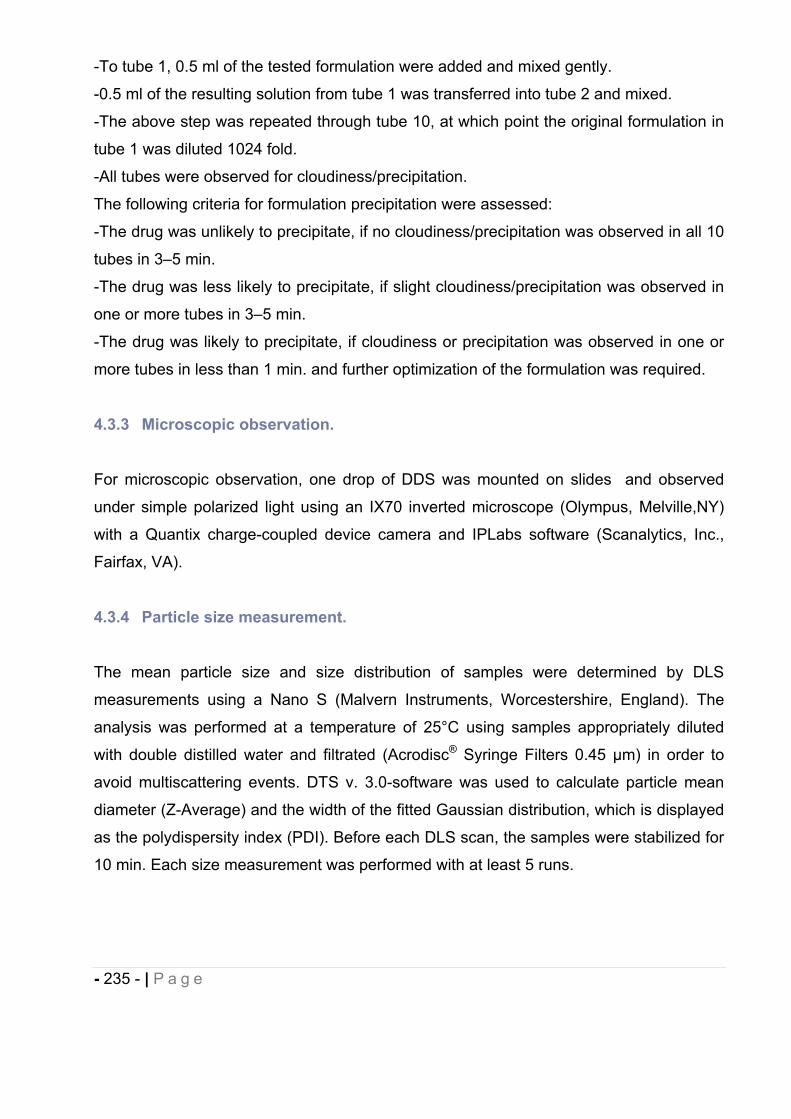
- 235 - | P a g e
-To tube 1, 0.5 ml of the tested formulation were added and mixed gently.
-0.5 ml of the resulting solution from tube 1 was transferred into tube 2 and mixed.
-The above step was repeated through tube 10, at which point the original formulation in
tube 1 was diluted 1024 fold.
-All tubes were observed for cloudiness/precipitation.
The following criteria for formulation precipitation were assessed:
-The drug was unlikely to precipitate, if no cloudiness/precipitation was observed in all 10
tubes in 3–5 min.
-The drug was less likely to precipitate, if slight cloudiness/precipitation was observed in
one or more tubes in 3–5 min.
-The drug was likely to precipitate, if cloudiness or precipitation was observed in one or
more tubes in less than 1 min. and further optimization of the formulation was required.
4.3.3 Microscopic observation.
For microscopic observation, one drop of DDS was mounted on slides and observed
under simple polarized light using an IX70 inverted microscope (Olympus, Melville,NY)
with a Quantix charge-coupled device camera and IPLabs software (Scanalytics, Inc.,
Fairfax, VA).
4.3.4 Particle size measurement.
The mean particle size and size distribution of samples were determined by DLS
measurements using a Nano S (Malvern Instruments, Worcestershire, England). The
analysis was performed at a temperature of 25°C using samples appropriately diluted
with double distilled water and filtrated (Acrodisc® Syringe Filters 0.45 μm) in order to
avoid multiscattering events. DTS v. 3.0-software was used to calculate particle mean
diameter (Z-Average) and the width of the fitted Gaussian distribution, which is displayed
as the polydispersity index (PDI). Before each DLS scan, the samples were stabilized for
10 min. Each size measurement was performed with at least 5 runs.
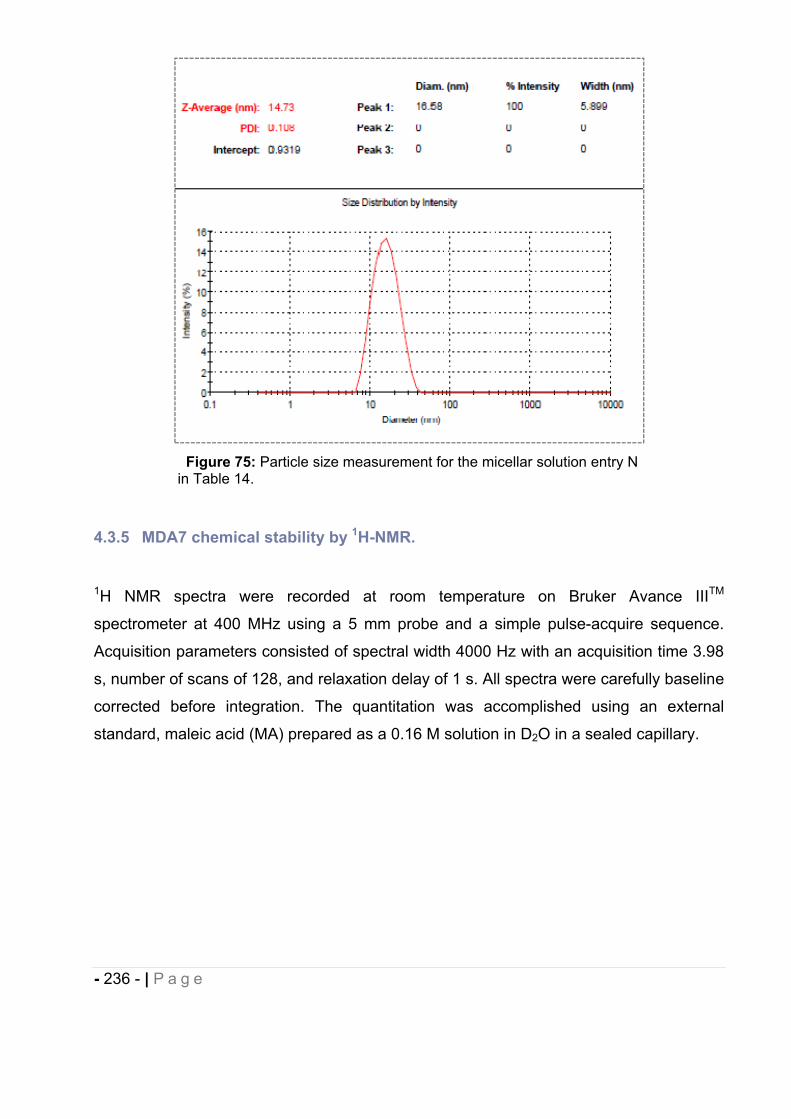
- 236 - | P a g e
Figure 75: Particle size measurement for the micellar solution entry N in Table 14.
4.3.5 MDA7 chemical stability by 1H-NMR.
1H NMR spectra were recorded at room temperature on Bruker Avance IIITM
spectrometer at 400 MHz using a 5 mm probe and a simple pulse-acquire sequence.
Acquisition parameters consisted of spectral width 4000 Hz with an acquisition time 3.98
s, number of scans of 128, and relaxation delay of 1 s. All spectra were carefully baseline
corrected before integration. The quantitation was accomplished using an external
standard, maleic acid (MA) prepared as a 0.16 M solution in D2O in a sealed capillary.
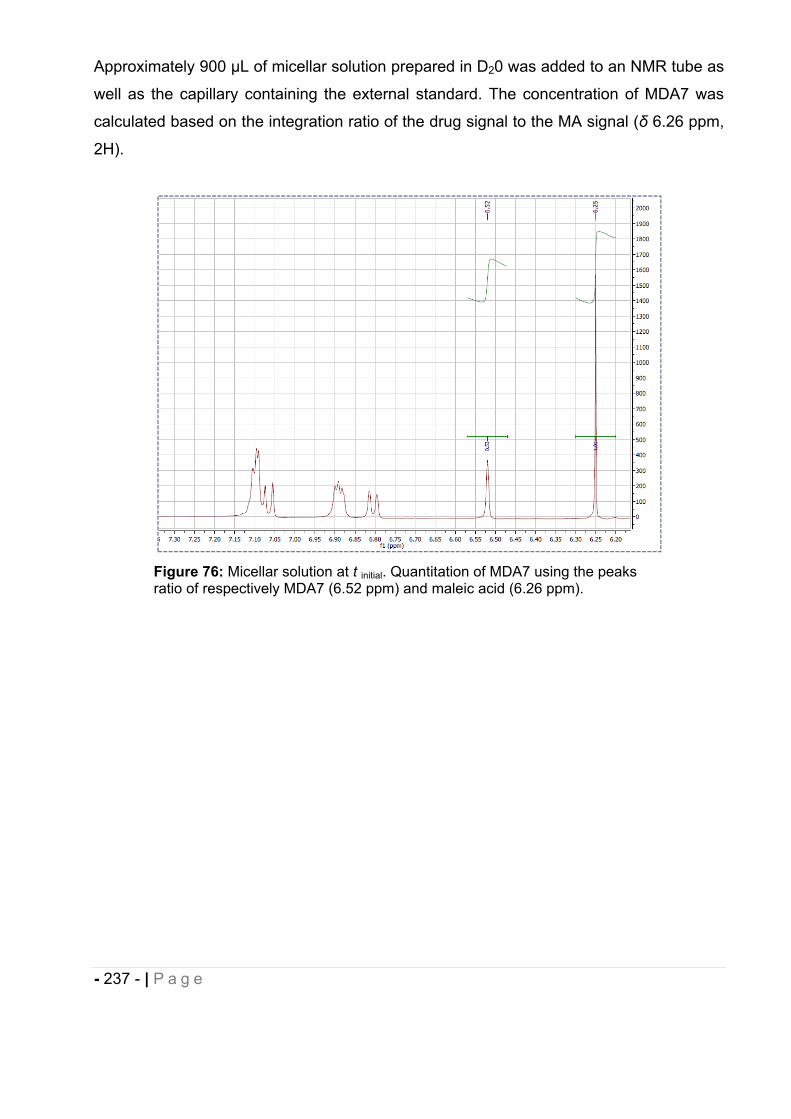
- 237 - | P a g e
Approximately 900 μL of micellar solution prepared in D20 was added to an NMR tube as
well as the capillary containing the external standard. The concentration of MDA7 was
calculated based on the integration ratio of the drug signal to the MA signal ( 6.26 ppm,
2H).
Figure 76: Micellar solution at t initial. Quantitation of MDA7 using the peaks ratio of respectively MDA7 (6.52 ppm) and maleic acid (6.26 ppm).
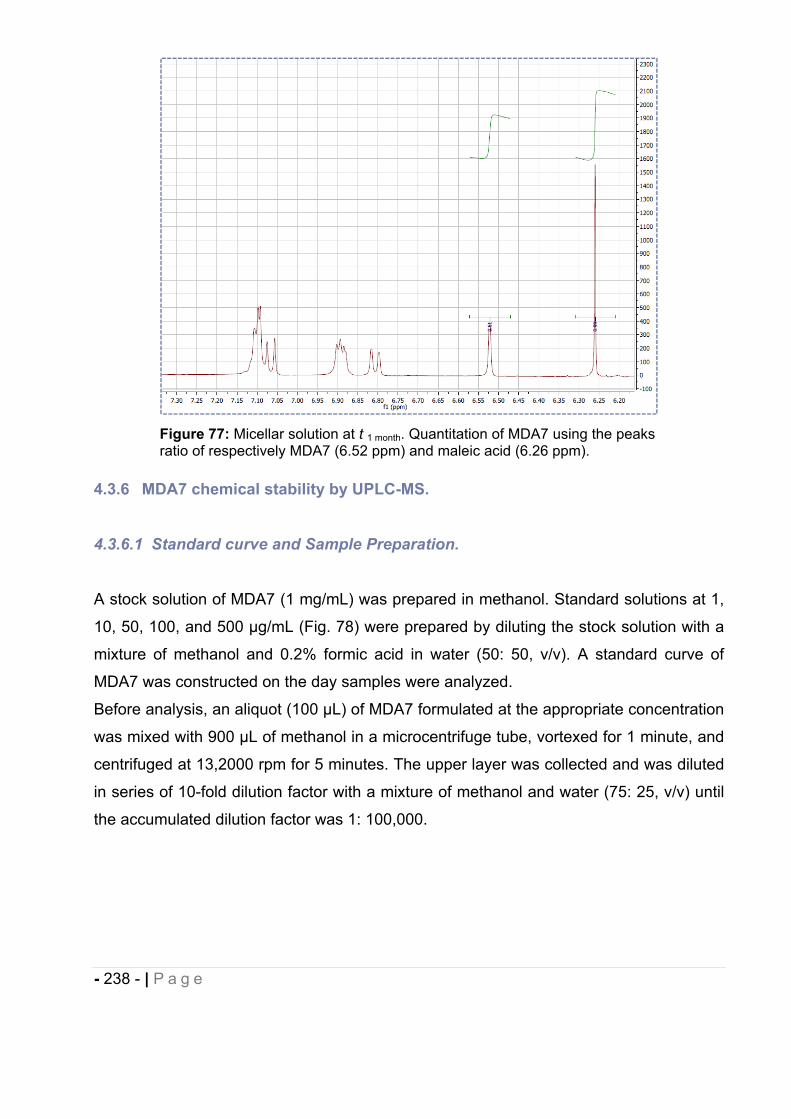
- 238 - | P a g e
Figure 77: Micellar solution at t 1 month. Quantitation of MDA7 using the peaks ratio of respectively MDA7 (6.52 ppm) and maleic acid (6.26 ppm).
4.3.6 MDA7 chemical stability by UPLC-MS.
4.3.6.1 Standard curve and Sample Preparation.
A stock solution of MDA7 (1 mg/mL) was prepared in methanol. Standard solutions at 1,
10, 50, 100, and 500 μg/mL (Fig. 78) were prepared by diluting the stock solution with a
mixture of methanol and 0.2% formic acid in water (50: 50, v/v). A standard curve of
MDA7 was constructed on the day samples were analyzed.
Before analysis, an aliquot (100 μL) of MDA7 formulated at the appropriate concentration
was mixed with 900 μL of methanol in a microcentrifuge tube, vortexed for 1 minute, and
centrifuged at 13,2000 rpm for 5 minutes. The upper layer was collected and was diluted
in series of 10-fold dilution factor with a mixture of methanol and water (75: 25, v/v) until
the accumulated dilution factor was 1: 100,000.
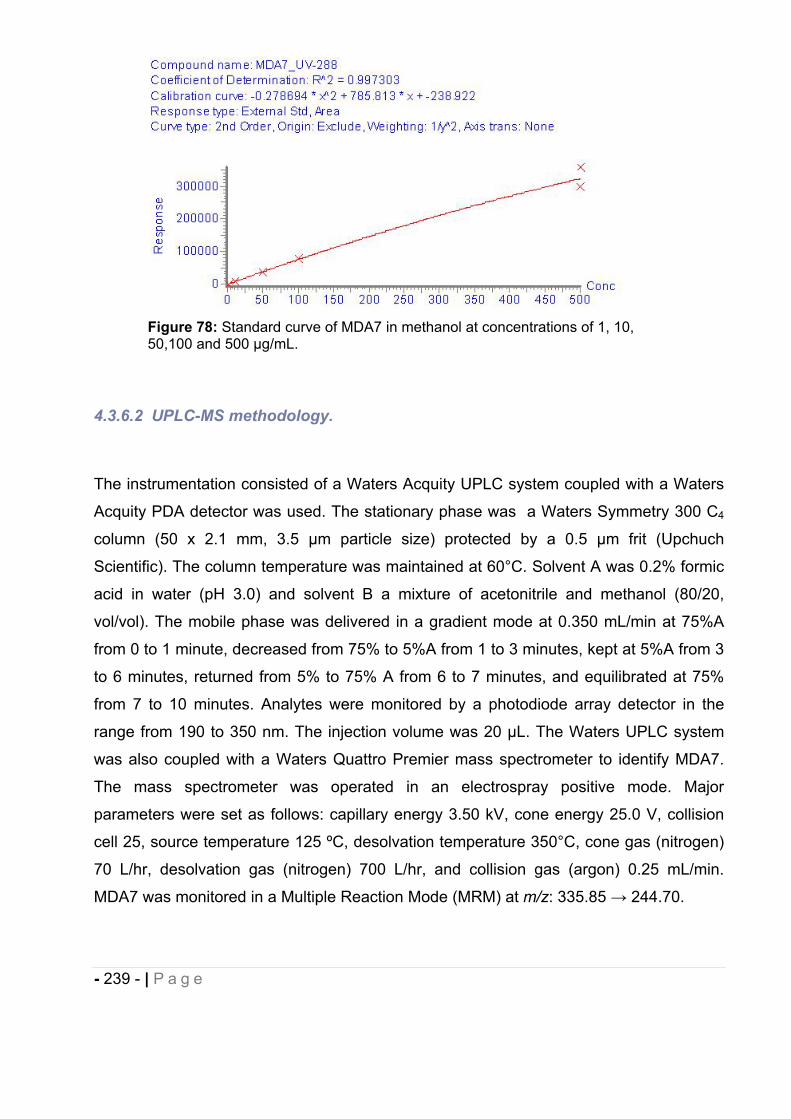
- 239 - | P a g e
Figure 78: Standard curve of MDA7 in methanol at concentrations of 1, 10, 50,100 and 500 μg/mL.
4.3.6.2 UPLC-MS methodology.
The instrumentation consisted of a Waters Acquity UPLC system coupled with a Waters
Acquity PDA detector was used. The stationary phase was a Waters Symmetry 300 C4
column (50 x 2.1 mm, 3.5 μm particle size) protected by a 0.5 μm frit (Upchuch
Scientific). The column temperature was maintained at 60°C. Solvent A was 0.2% formic
acid in water (pH 3.0) and solvent B a mixture of acetonitrile and methanol (80/20,
vol/vol). The mobile phase was delivered in a gradient mode at 0.350 mL/min at 75%A
from 0 to 1 minute, decreased from 75% to 5%A from 1 to 3 minutes, kept at 5%A from 3
to 6 minutes, returned from 5% to 75% A from 6 to 7 minutes, and equilibrated at 75%
from 7 to 10 minutes. Analytes were monitored by a photodiode array detector in the
range from 190 to 350 nm. The injection volume was 20 μL. The Waters UPLC system
was also coupled with a Waters Quattro Premier mass spectrometer to identify MDA7.
The mass spectrometer was operated in an electrospray positive mode. Major
parameters were set as follows: capillary energy 3.50 kV, cone energy 25.0 V, collision
cell 25, source temperature 125 ºC, desolvation temperature 350°C, cone gas (nitrogen)
70 L/hr, desolvation gas (nitrogen) 700 L/hr, and collision gas (argon) 0.25 mL/min.
MDA7 was monitored in a Multiple Reaction Mode (MRM) at m/z: 335.85 244.70.
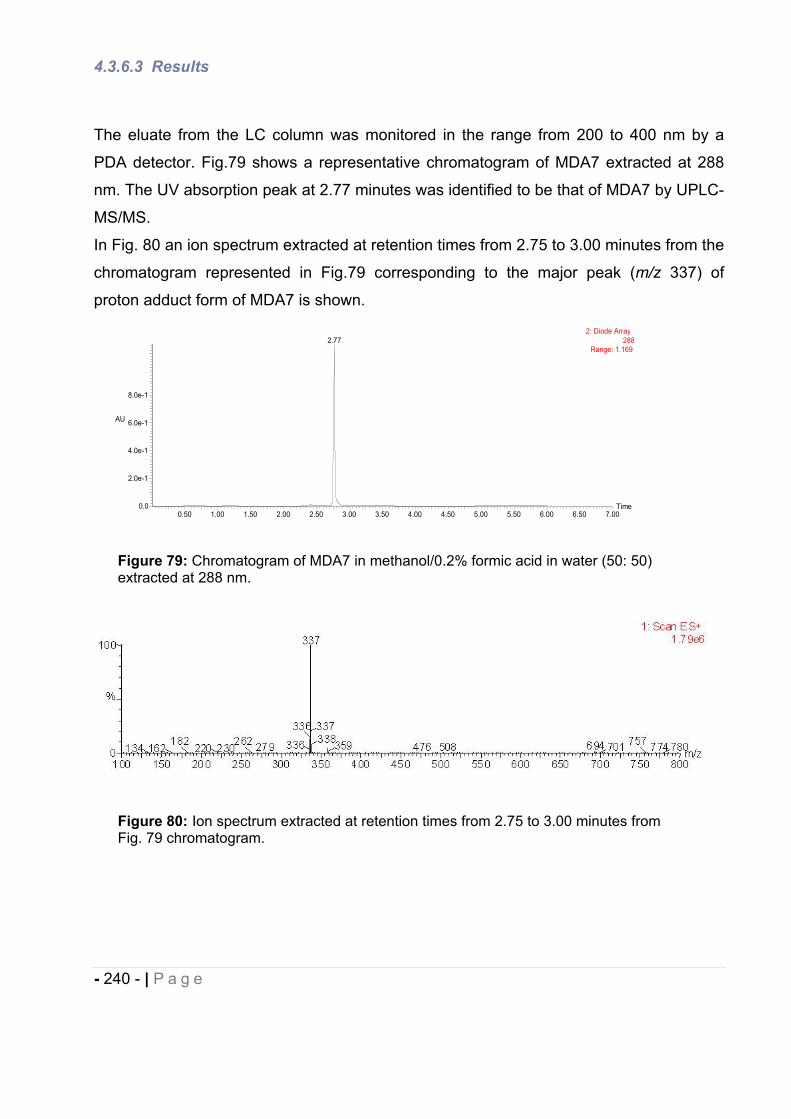
- 240 - | P a g e
4.3.6.3 Results
The eluate from the LC column was monitored in the range from 200 to 400 nm by a
PDA detector. Fig.79 shows a representative chromatogram of MDA7 extracted at 288
nm. The UV absorption peak at 2.77 minutes was identified to be that of MDA7 by UPLC-
MS/MS.
In Fig. 80 an ion spectrum extracted at retention times from 2.75 to 3.00 minutes from the
chromatogram represented in Fig.79 corresponding to the major peak (m/z 337) of
proton adduct form of MDA7 is shown.
Figure 79: Chromatogram of MDA7 in methanol/0.2% formic acid in water (50: 50) extracted at 288 nm.
Figure 80: Ion spectrum extracted at retention times from 2.75 to 3.00 minutes from Fig. 79 chromatogram.
Time0.50 1.00 1.50 2.00 2.50 3.00 3.50 4.00 4.50 5.00 5.50 6.00 6.50 7.00
AU
0.0
2.0e-1
4.0e-1
6.0e-1
8.0e-1
2: Diode Array288
Range: 1.1692.77
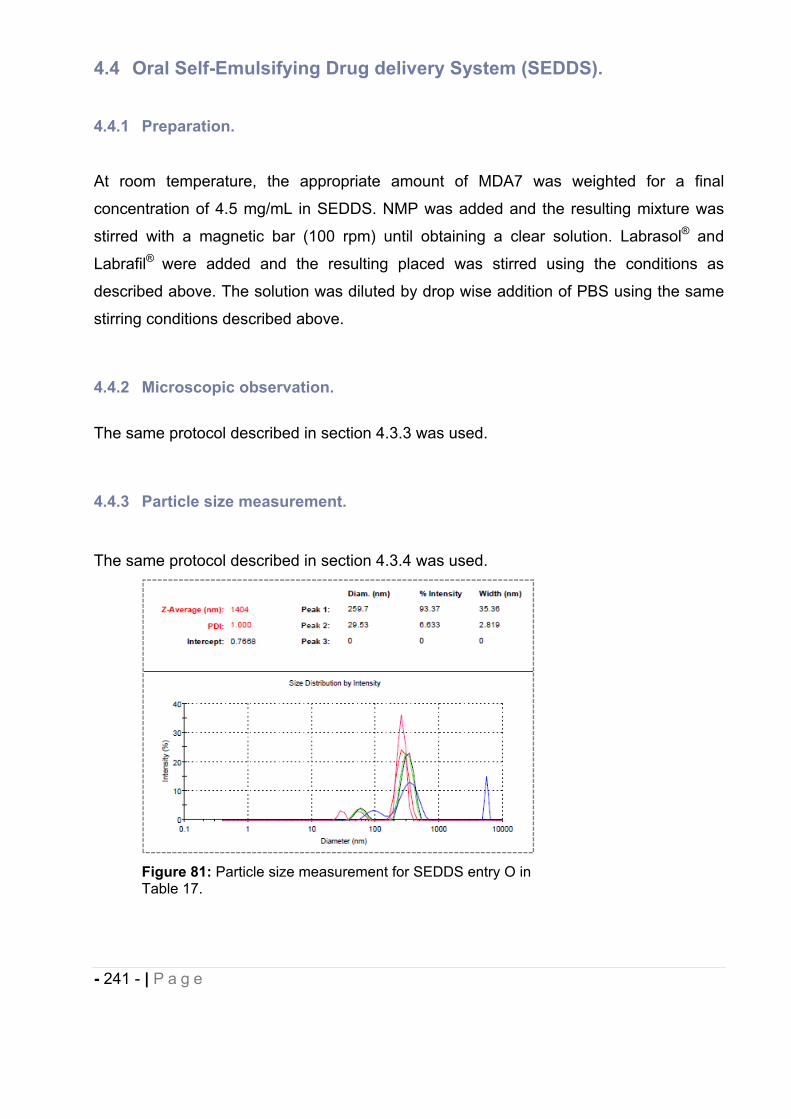
- 241 - | P a g e
4.4 Oral Self-Emulsifying Drug delivery System (SEDDS).
4.4.1 Preparation.
At room temperature, the appropriate amount of MDA7 was weighted for a final
concentration of 4.5 mg/mL in SEDDS. NMP was added and the resulting mixture was
stirred with a magnetic bar (100 rpm) until obtaining a clear solution. Labrasol® and
Labrafil® were added and the resulting placed was stirred using the conditions as
described above. The solution was diluted by drop wise addition of PBS using the same
stirring conditions described above.
4.4.2 Microscopic observation.
The same protocol described in section 4.3.3 was used.
4.4.3 Particle size measurement.
The same protocol described in section 4.3.4 was used.
Figure 81: Particle size measurement for SEDDS entry O in Table 17.
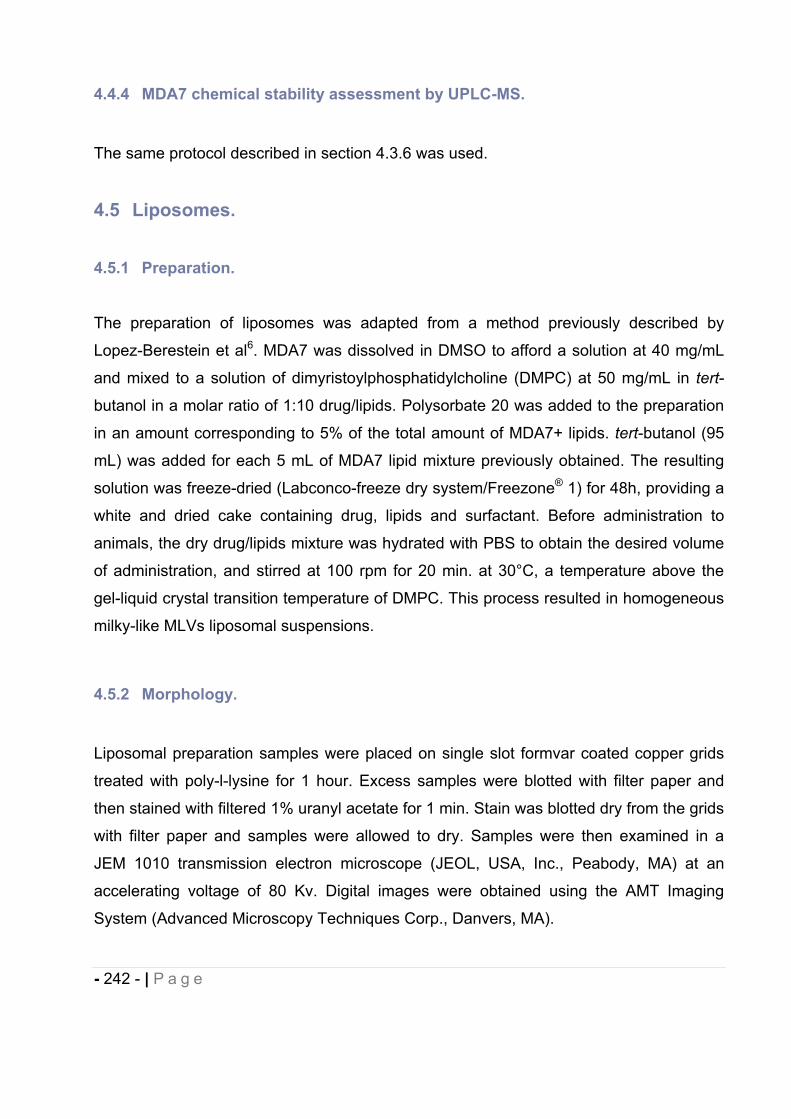
- 242 - | P a g e
4.4.4 MDA7 chemical stability assessment by UPLC-MS.
The same protocol described in section 4.3.6 was used.
4.5 Liposomes.
4.5.1 Preparation.
The preparation of liposomes was adapted from a method previously described by
Lopez-Berestein et al6. MDA7 was dissolved in DMSO to afford a solution at 40 mg/mL
and mixed to a solution of dimyristoylphosphatidylcholine (DMPC) at 50 mg/mL in tert-
butanol in a molar ratio of 1:10 drug/lipids. Polysorbate 20 was added to the preparation
in an amount corresponding to 5% of the total amount of MDA7+ lipids. tert-butanol (95
mL) was added for each 5 mL of MDA7 lipid mixture previously obtained. The resulting
solution was freeze-dried (Labconco-freeze dry system/Freezone® 1) for 48h, providing a
white and dried cake containing drug, lipids and surfactant. Before administration to
animals, the dry drug/lipids mixture was hydrated with PBS to obtain the desired volume
of administration, and stirred at 100 rpm for 20 min. at 30°C, a temperature above the
gel-liquid crystal transition temperature of DMPC. This process resulted in homogeneous
milky-like MLVs liposomal suspensions.
4.5.2 Morphology.
Liposomal preparation samples were placed on single slot formvar coated copper grids
treated with poly-l-lysine for 1 hour. Excess samples were blotted with filter paper and
then stained with filtered 1% uranyl acetate for 1 min. Stain was blotted dry from the grids
with filter paper and samples were allowed to dry. Samples were then examined in a
JEM 1010 transmission electron microscope (JEOL, USA, Inc., Peabody, MA) at an
accelerating voltage of 80 Kv. Digital images were obtained using the AMT Imaging
System (Advanced Microscopy Techniques Corp., Danvers, MA).
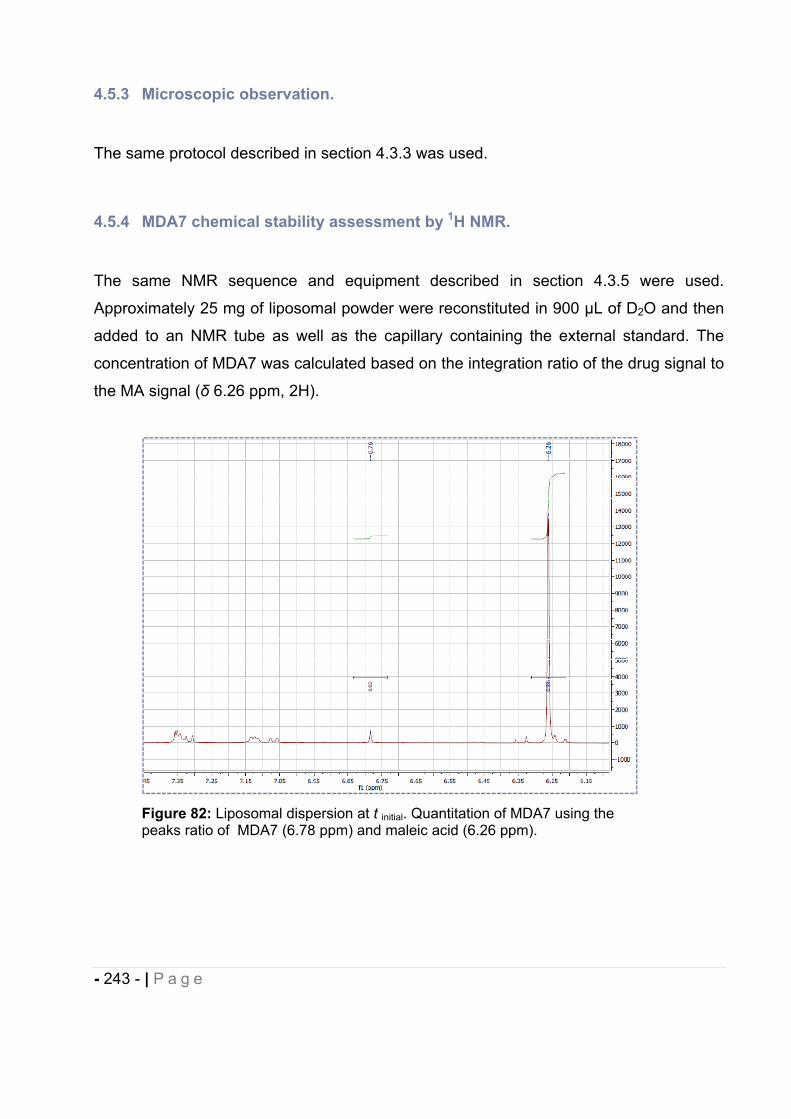
- 243 - | P a g e
4.5.3 Microscopic observation.
The same protocol described in section 4.3.3 was used.
4.5.4 MDA7 chemical stability assessment by 1H NMR.
The same NMR sequence and equipment described in section 4.3.5 were used.
Approximately 25 mg of liposomal powder were reconstituted in 900 μL of D2O and then
added to an NMR tube as well as the capillary containing the external standard. The
concentration of MDA7 was calculated based on the integration ratio of the drug signal to
the MA signal ( 6.26 ppm, 2H).
Figure 82: Liposomal dispersion at t initial. Quantitation of MDA7 using the peaks ratio of MDA7 (6.78 ppm) and maleic acid (6.26 ppm).
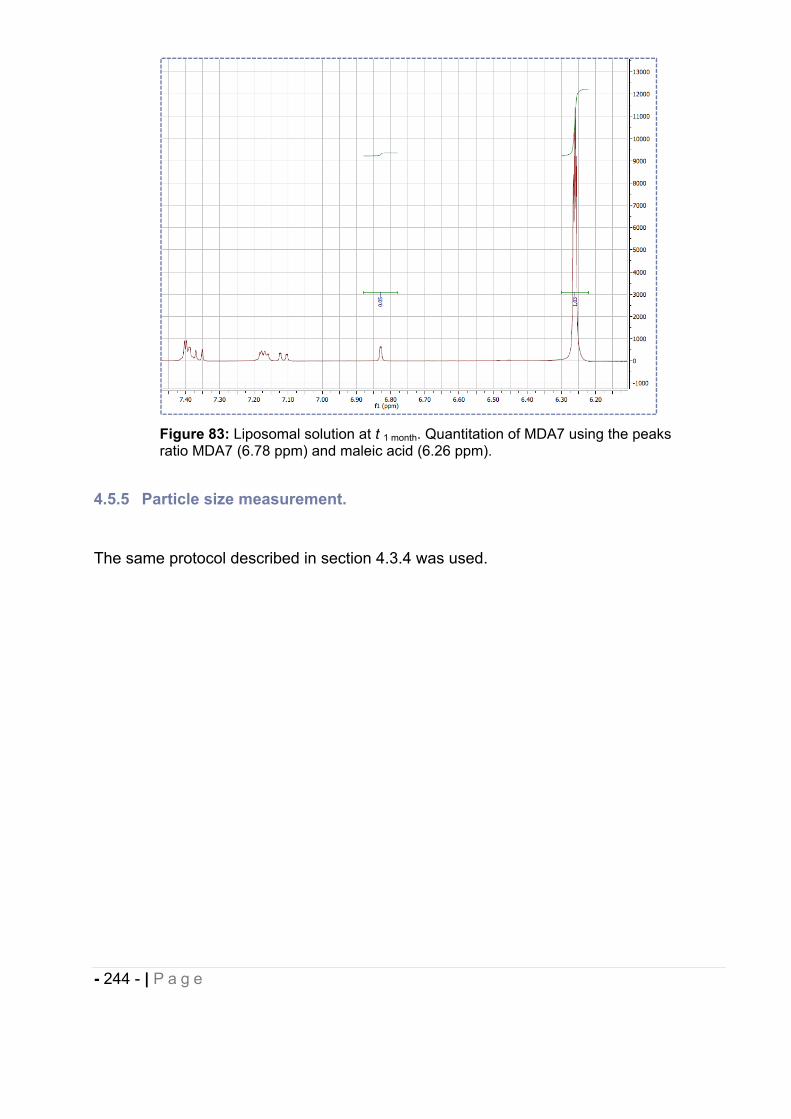
- 244 - | P a g e
Figure 83: Liposomal solution at t 1 month. Quantitation of MDA7 using the peaks ratio MDA7 (6.78 ppm) and maleic acid (6.26 ppm).
4.5.5 Particle size measurement.
The same protocol described in section 4.3.4 was used.
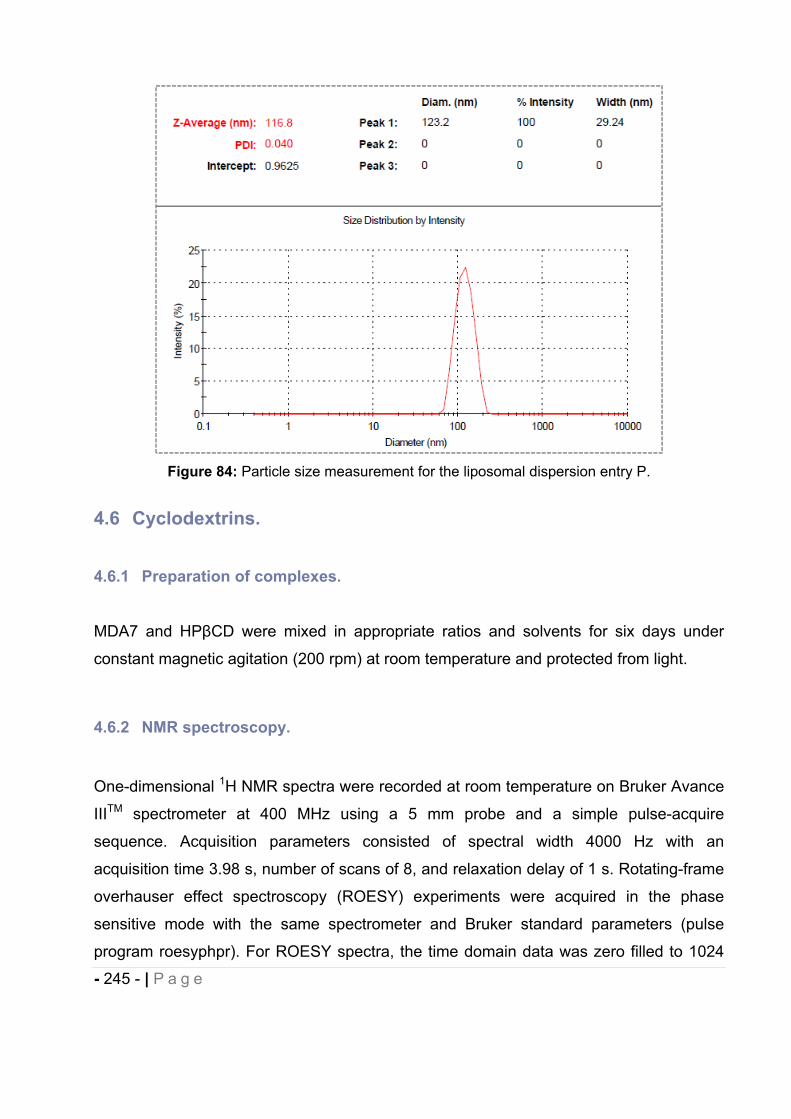
- 245 - | P a g e
Figure 84: Particle size measurement for the liposomal dispersion entry P.
4.6 Cyclodextrins.
4.6.1 Preparation of complexes.
MDA7 and HP CD were mixed in appropriate ratios and solvents for six days under
constant magnetic agitation (200 rpm) at room temperature and protected from light.
4.6.2 NMR spectroscopy.
One-dimensional 1H NMR spectra were recorded at room temperature on Bruker Avance
IIITM spectrometer at 400 MHz using a 5 mm probe and a simple pulse-acquire
sequence. Acquisition parameters consisted of spectral width 4000 Hz with an
acquisition time 3.98 s, number of scans of 8, and relaxation delay of 1 s. Rotating-frame
overhauser effect spectroscopy (ROESY) experiments were acquired in the phase
sensitive mode with the same spectrometer and Bruker standard parameters (pulse
program roesyphpr). For ROESY spectra, the time domain data was zero filled to 1024
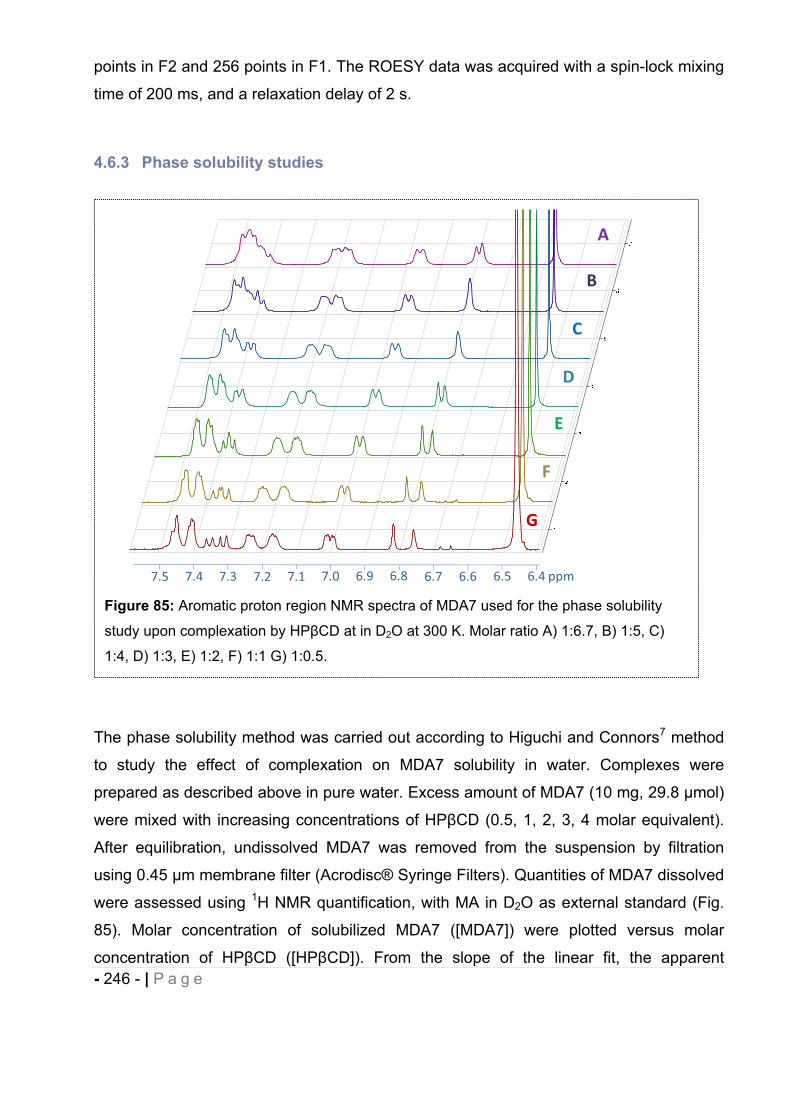
- 246 - | P a g e
points in F2 and 256 points in F1. The ROESY data was acquired with a spin-lock mixing
time of 200 ms, and a relaxation delay of 2 s.
4.6.3 Phase solubility studies
The phase solubility method was carried out according to Higuchi and Connors7 method
to study the effect of complexation on MDA7 solubility in water. Complexes were
prepared as described above in pure water. Excess amount of MDA7 (10 mg, 29.8 mol)
were mixed with increasing concentrations of HP CD (0.5, 1, 2, 3, 4 molar equivalent).
After equilibration, undissolved MDA7 was removed from the suspension by filtration
using 0.45 m membrane filter (Acrodisc® Syringe Filters). Quantities of MDA7 dissolved
were assessed using 1H NMR quantification, with MA in D2O as external standard (Fig.
85). Molar concentration of solubilized MDA7 ([MDA7]) were plotted versus molar
concentration of HP CD ([HP CD]). From the slope of the linear fit, the apparent
Figure 85: Aromatic proton region NMR spectra of MDA7 used for the phase solubility
study upon complexation by HP CD at in D2O at 300 K. Molar ratio A) 1:6.7, B) 1:5, C)
1:4, D) 1:3, E) 1:2, F) 1:1 G) 1:0.5.
A
B
C
D
E
F
G
7.5 7.4 7.3 7.2 7.1 7.0 6.9 6.8 6.7 6.6 6.5 6.4 ppm
- 247 - | P a g e
association constant was determined for MDA7 and HP CD at the linear increase of
MDA7 solubility according to equation 1. Complex stoichiometry is assumed to be 1:1 for
determining the apparent association constant K1:1.
The complexation efficiency (CE) was calculated as a product or the intrinsic solubility
(S0) and the association constant K1:1.
4.6.4 Differential scanning calorimetry (DSC).
Complexes were prepared by dissolving MDA7 (15 mg, 44.7 mol) and HP CD as
described above in 1.35 ml of pure water at 1:1, 1:4, 1:6.7 molar ratio. After equilibration
undissolved MDA7 was removed from the suspension with one molar equivalent of
HP CD by filtration using 0.45 m membrane filter (Acrodisc® Syringe Filter). MDA7 was
soluble at MDA7:HP CD molar ratio of 1:4 and 1:6.7. Solutions were freeze-dried
(Labconco-freeze dry system/Freezone® 1) for 24 hours under vacuum. The resulting
solid inclusion complexes were collected and analyzed. A physical mixture was prepared
by thoroughly mixing MDA7 and HP CD at 1:4 molar ratio. An excess of HP CD was
employed to reflect the molar ratio used for in vivo studies. The samples were placed in
hermetically sealed aluminium pans and the experiments run in a calorimeter (Mettler
Toledo DSC1 STARe system) at 10°C/min heating rate over 25-400°C. The instrument
was calibrated with indium. Thermograms for inclusion complexes were compared to
physical mixture.
4.6.5 ESI-MS analysis
Stoichiometry of the inclusion complex was confirmed by ESI-MS analysis using
acetonitrile/water as mobile phase. ESI-MS experiments were performed on a Waters
Micromass LCT PremierTM that utilizes a high-resolution time-of-flight (TOF) analyzer
K1:1 = Slope
[MDA7]0(1 Slope)
- 248 - | P a g e
equipped with a W-Optics and a regular and nanoelectrospray ionization sources. The
sample solutions were directly infused into the ESI source with a flow rate of 0.4 mL.min-
1. Capillary voltage 2900 V, Sample cone voltage 95 V, Desolvation temperature 150°C,
Source temperature 100°C in the negative ion mode.
4.6.6 Continuous variation method (Job’s plots)
Stoichiometry of the inclusion complex was determined using a continuous variation
method. The 1H NMR spectrum of MDA7 in D2O could not be determined due to its very
low aqueous solubility. Therefore, a plot was created from NMR chemical shift
measurements in D2O/methanol-d4 (1:1, v/v). The chemical shifts were referenced
relative to the residual peak of MeOH-d4 at 3.310 ppm (Fig 86). The total molar
concentration of MDA7 and HP CD were kept constant (6 mM) and their mole fraction
(R) varied from 0.1 to 0.9. In order to calculate the stoichiometry, the product of molar
ratio (R) by chemical shift variations ( ) of the H1, H5 and CH3 HP CD protons of HP CD
and Ha, Hb and Hc and CH3 protons of MDA7 were plotted versus R.
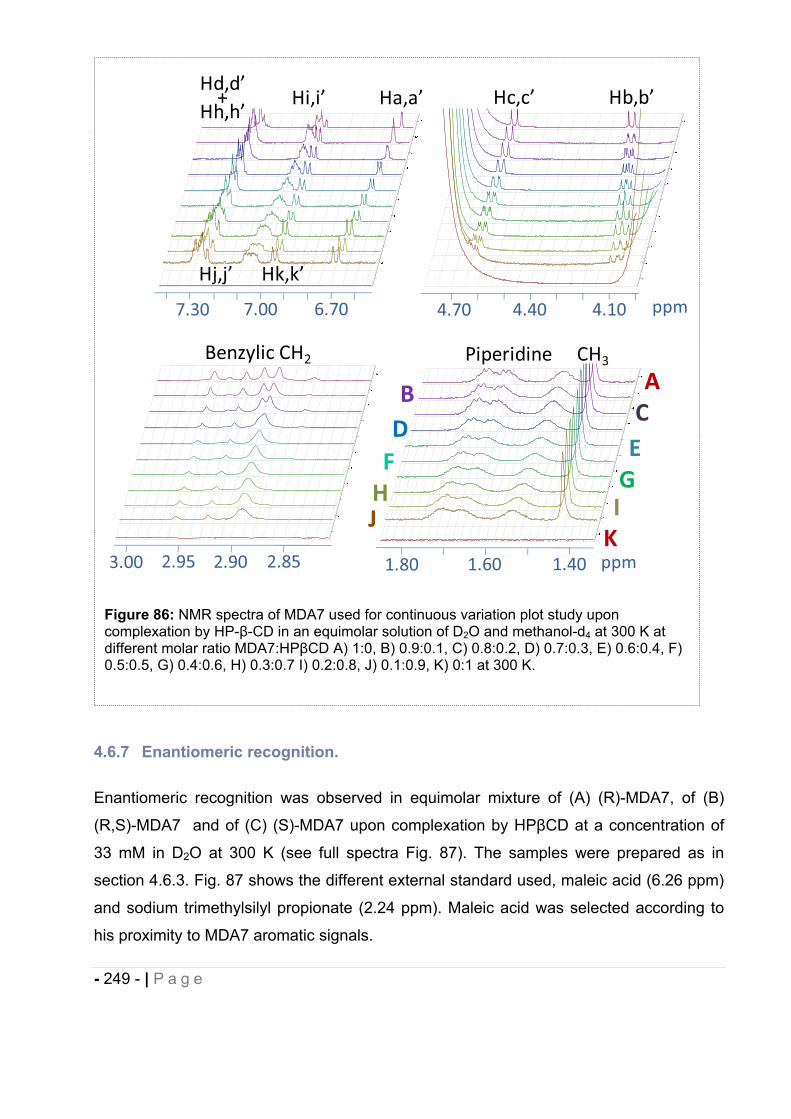
- 249 - | P a g e
4.6.7 Enantiomeric recognition.
Enantiomeric recognition was observed in equimolar mixture of (A) (R)-MDA7, of (B)
(R,S)-MDA7 and of (C) (S)-MDA7 upon complexation by HP CD at a concentration of
33 mM in D2O at 300 K (see full spectra Fig. 87). The samples were prepared as in
section 4.6.3. Fig. 87 shows the different external standard used, maleic acid (6.26 ppm)
and sodium trimethylsilyl propionate (2.24 ppm). Maleic acid was selected according to
his proximity to MDA7 aromatic signals.
Figure 86: NMR spectra of MDA7 used for continuous variation plot study upon complexation by HP- -CD in an equimolar solution of D2O and methanol-d4 at 300 K at different molar ratio MDA7:HP CD A) 1:0, B) 0.9:0.1, C) 0.8:0.2, D) 0.7:0.3, E) 0.6:0.4, F) 0.5:0.5, G) 0.4:0.6, H) 0.3:0.7 I) 0.2:0.8, J) 0.1:0.9, K) 0:1 at 300 K.
1.60 1.40 ppm
7.30 7.00 6.70 4.70 4.40 4.10
Hi,i’
Hj,j’
Ha,a’
Hk,k’
Hd,d’+
Hh,h’Hc,c’ Hb,b’
1.80
ppm
CH3PiperidineBenzylic CH2
2.903.00 2.852.95
BC
DEFG
J
A
H IK
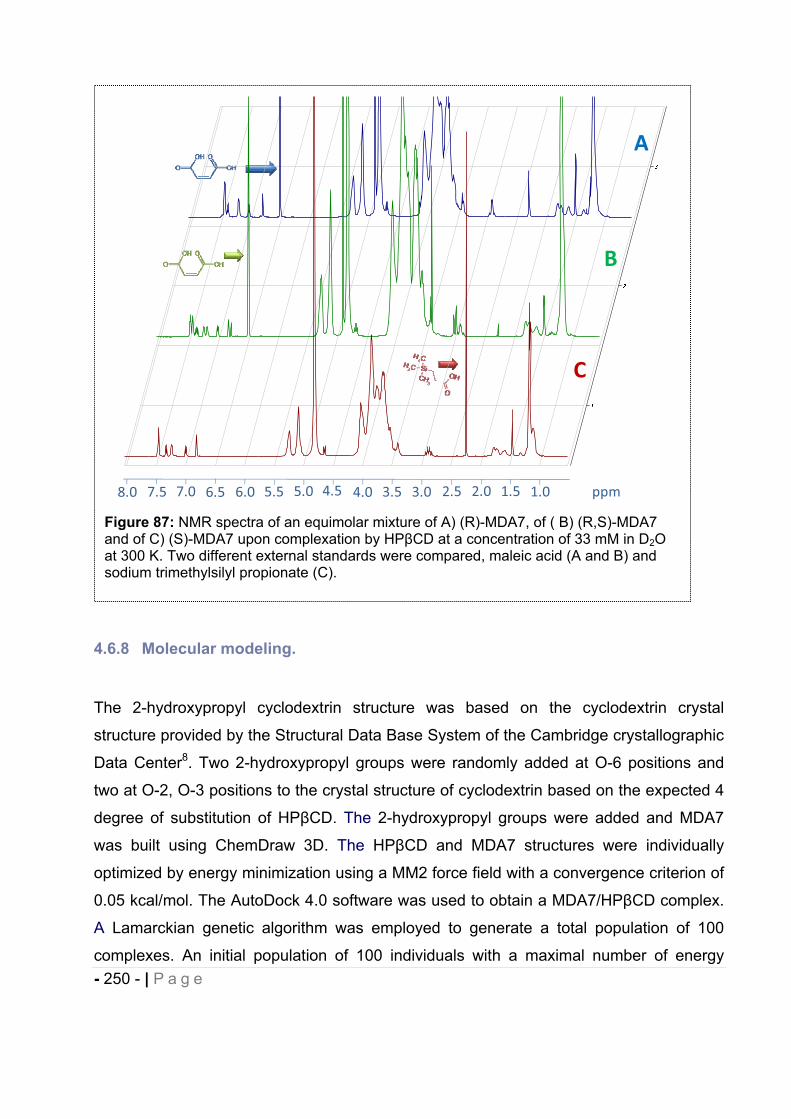
- 250 - | P a g e
4.6.8 Molecular modeling.
The 2-hydroxypropyl cyclodextrin structure was based on the cyclodextrin crystal
structure provided by the Structural Data Base System of the Cambridge crystallographic
Data Center8. Two 2-hydroxypropyl groups were randomly added at O-6 positions and
two at O-2, O-3 positions to the crystal structure of cyclodextrin based on the expected 4
degree of substitution of HP CD. The 2-hydroxypropyl groups were added and MDA7
was built using ChemDraw 3D. The HP CD and MDA7 structures were individually
optimized by energy minimization using a MM2 force field with a convergence criterion of
0.05 kcal/mol. The AutoDock 4.0 software was used to obtain a MDA7/HP CD complex.
A Lamarckian genetic algorithm was employed to generate a total population of 100
complexes. An initial population of 100 individuals with a maximal number of energy
Figure 87: NMR spectra of an equimolar mixture of A) (R)-MDA7, of ( B) (R,S)-MDA7 and of C) (S)-MDA7 upon complexation by HP CD at a concentration of 33 mM in D2Oat 300 K. Two different external standards were compared, maleic acid (A and B) and sodium trimethylsilyl propionate (C).
A
B
C
8.0 7.5 7.0 6.5 6.0 5.5 5.0 4.5 4.0 3.0 2.5 1.0 ppm3.5 2.0 1.5
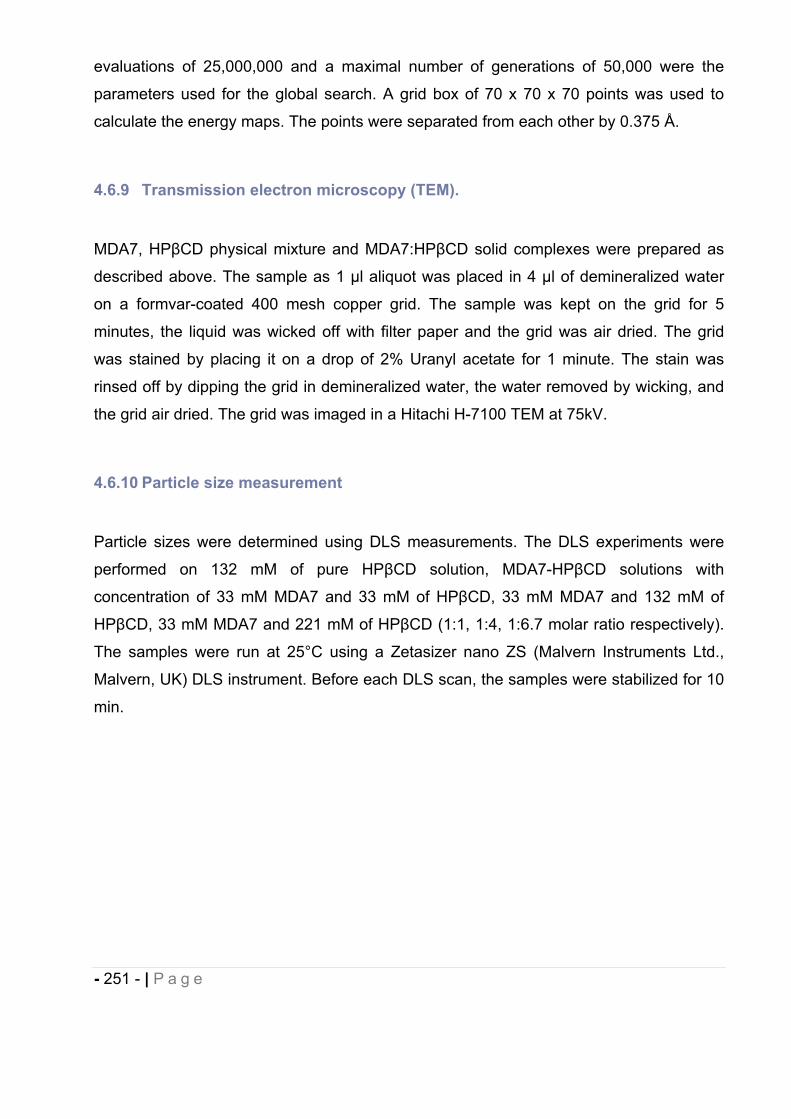
- 251 - | P a g e
evaluations of 25,000,000 and a maximal number of generations of 50,000 were the
parameters used for the global search. A grid box of 70 x 70 x 70 points was used to
calculate the energy maps. The points were separated from each other by 0.375 Å.
4.6.9 Transmission electron microscopy (TEM).
MDA7, HP CD physical mixture and MDA7:HP CD solid complexes were prepared as
described above. The sample as 1 l aliquot was placed in 4 l of demineralized water
on a formvar-coated 400 mesh copper grid. The sample was kept on the grid for 5
minutes, the liquid was wicked off with filter paper and the grid was air dried. The grid
was stained by placing it on a drop of 2% Uranyl acetate for 1 minute. The stain was
rinsed off by dipping the grid in demineralized water, the water removed by wicking, and
the grid air dried. The grid was imaged in a Hitachi H-7100 TEM at 75kV.
4.6.10 Particle size measurement
Particle sizes were determined using DLS measurements. The DLS experiments were
performed on 132 mM of pure HP CD solution, MDA7-HP CD solutions with
concentration of 33 mM MDA7 and 33 mM of HP CD, 33 mM MDA7 and 132 mM of
HP CD, 33 mM MDA7 and 221 mM of HP CD (1:1, 1:4, 1:6.7 molar ratio respectively).
The samples were run at 25°C using a Zetasizer nano ZS (Malvern Instruments Ltd.,
Malvern, UK) DLS instrument. Before each DLS scan, the samples were stabilized for 10
min.
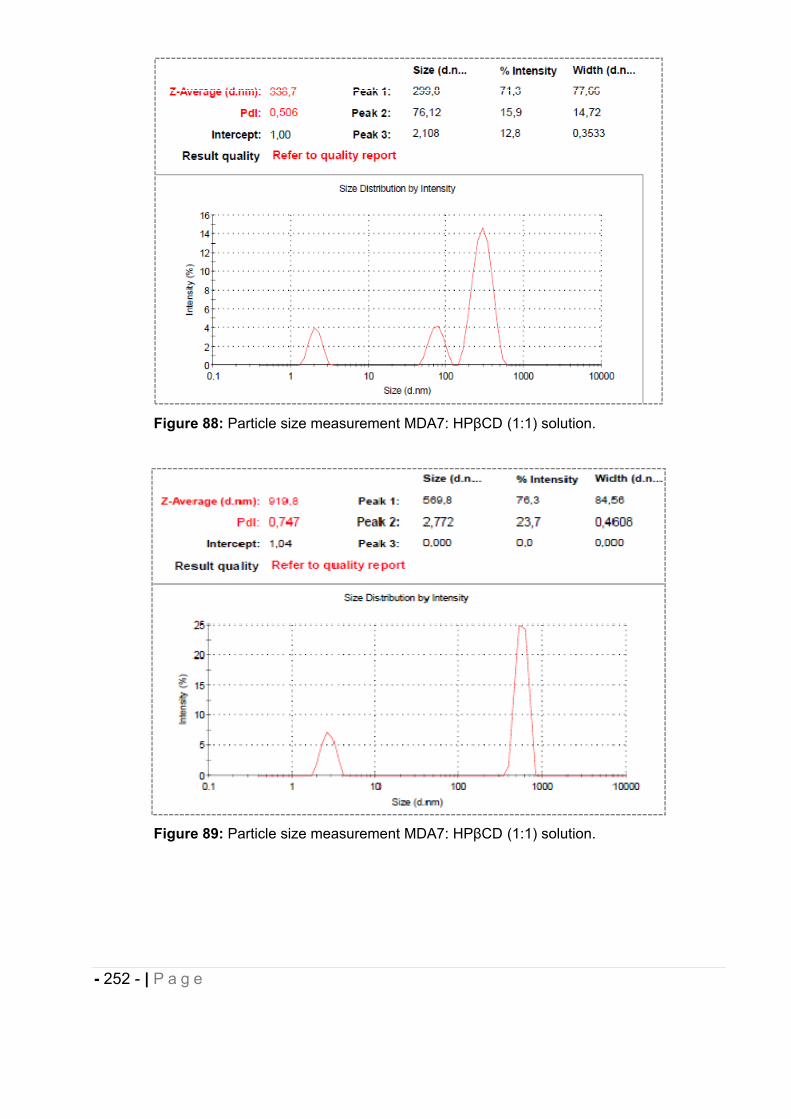
- 252 - | P a g e
Figure 88: Particle size measurement MDA7: HP CD (1:1) solution.
Figure 89: Particle size measurement MDA7: HP CD (1:1) solution.
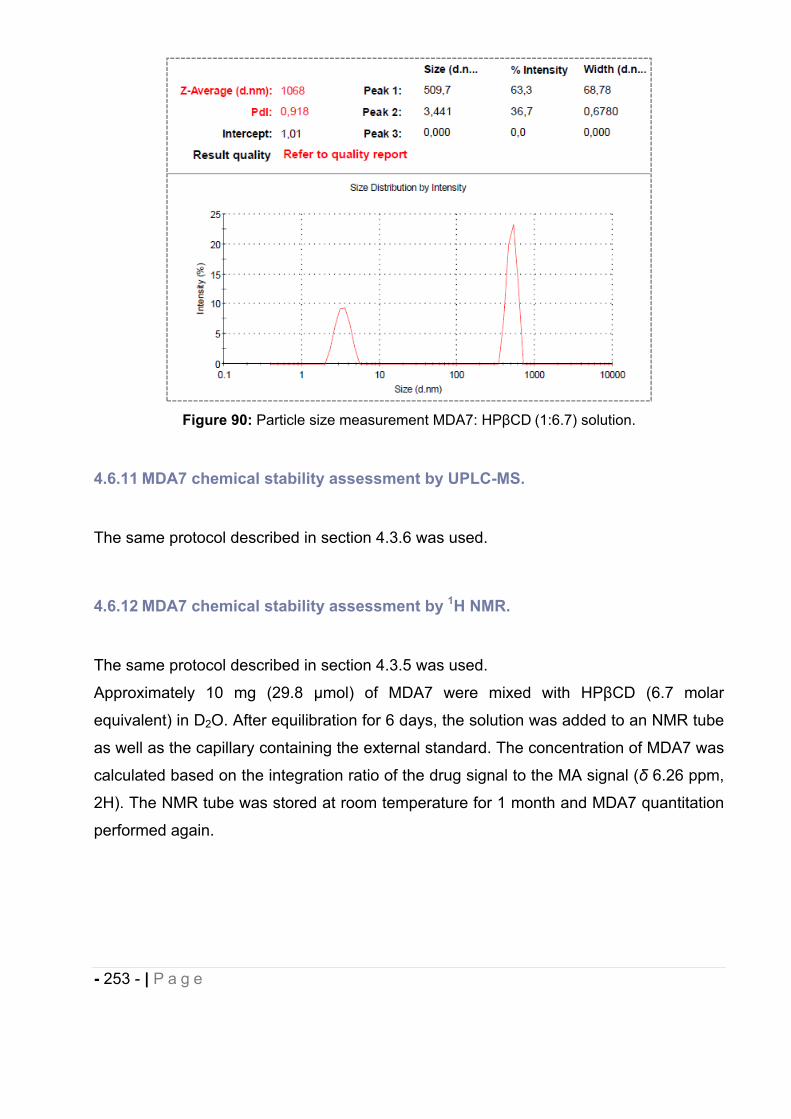
- 253 - | P a g e
Figure 90: Particle size measurement MDA7: HP CD (1:6.7) solution.
4.6.11 MDA7 chemical stability assessment by UPLC-MS.
The same protocol described in section 4.3.6 was used.
4.6.12 MDA7 chemical stability assessment by 1H NMR.
The same protocol described in section 4.3.5 was used.
Approximately 10 mg (29.8 mol) of MDA7 were mixed with HP CD (6.7 molar
equivalent) in D2O. After equilibration for 6 days, the solution was added to an NMR tube
as well as the capillary containing the external standard. The concentration of MDA7 was
calculated based on the integration ratio of the drug signal to the MA signal ( 6.26 ppm,
2H). The NMR tube was stored at room temperature for 1 month and MDA7 quantitation
performed again.
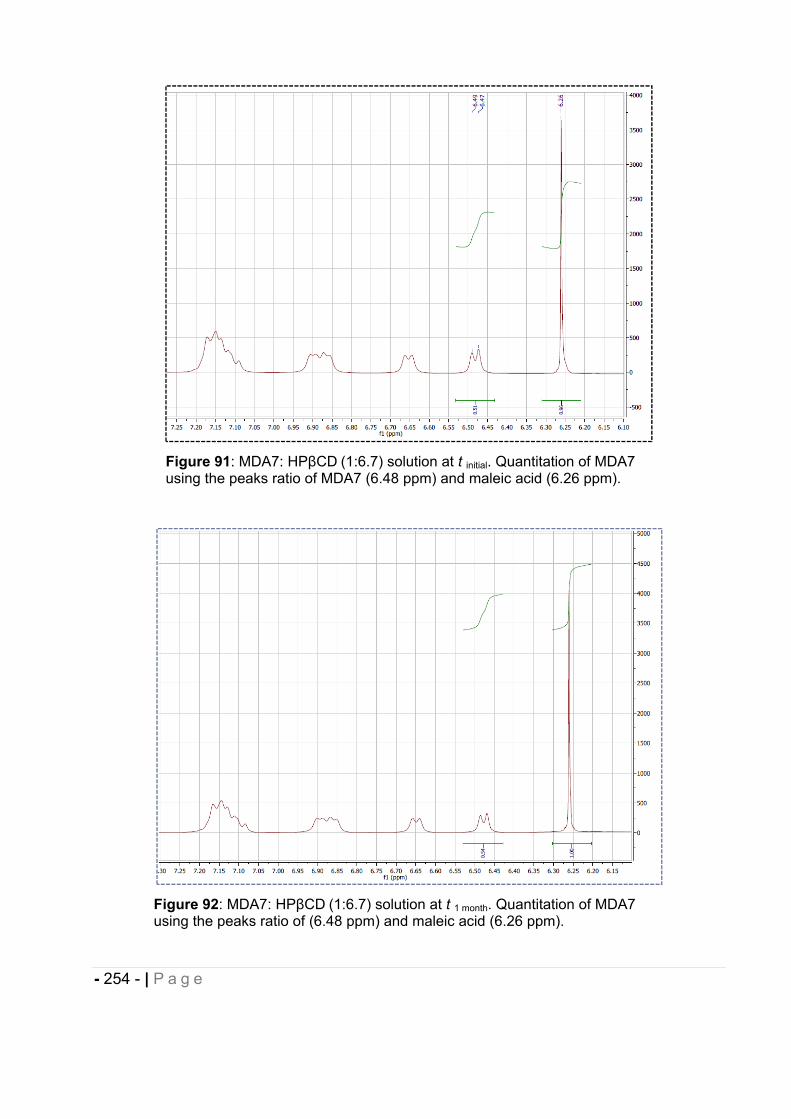
- 254 - | P a g e
Figure 91: MDA7: HP CD (1:6.7) solution at t initial. Quantitation of MDA7 using the peaks ratio of MDA7 (6.48 ppm) and maleic acid (6.26 ppm).
Figure 92: MDA7: HP CD (1:6.7) solution at t 1 month. Quantitation of MDA7 using the peaks ratio of (6.48 ppm) and maleic acid (6.26 ppm).
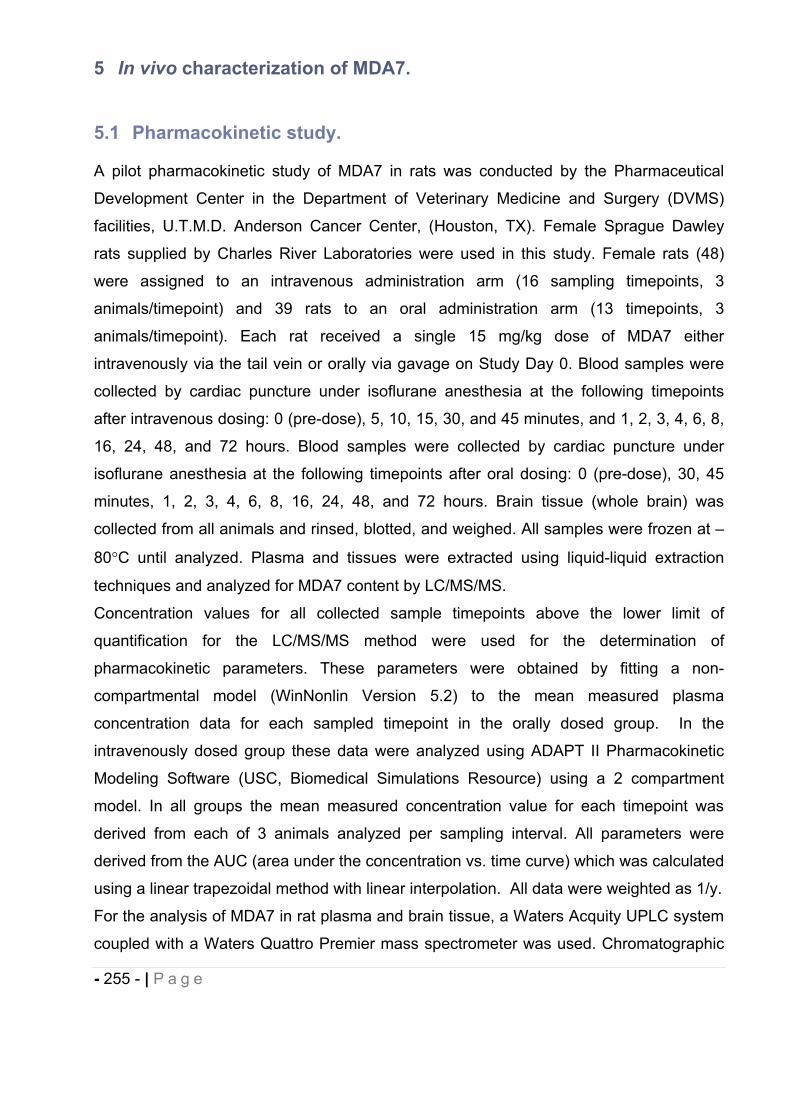
- 255 - | P a g e
5 In vivo characterization of MDA7.
5.1 Pharmacokinetic study.
A pilot pharmacokinetic study of MDA7 in rats was conducted by the Pharmaceutical
Development Center in the Department of Veterinary Medicine and Surgery (DVMS)
facilities, U.T.M.D. Anderson Cancer Center, (Houston, TX). Female Sprague Dawley
rats supplied by Charles River Laboratories were used in this study. Female rats (48)
were assigned to an intravenous administration arm (16 sampling timepoints, 3
animals/timepoint) and 39 rats to an oral administration arm (13 timepoints, 3
animals/timepoint). Each rat received a single 15 mg/kg dose of MDA7 either
intravenously via the tail vein or orally via gavage on Study Day 0. Blood samples were
collected by cardiac puncture under isoflurane anesthesia at the following timepoints
after intravenous dosing: 0 (pre-dose), 5, 10, 15, 30, and 45 minutes, and 1, 2, 3, 4, 6, 8,
16, 24, 48, and 72 hours. Blood samples were collected by cardiac puncture under
isoflurane anesthesia at the following timepoints after oral dosing: 0 (pre-dose), 30, 45
minutes, 1, 2, 3, 4, 6, 8, 16, 24, 48, and 72 hours. Brain tissue (whole brain) was
collected from all animals and rinsed, blotted, and weighed. All samples were frozen at –
80 C until analyzed. Plasma and tissues were extracted using liquid-liquid extraction
techniques and analyzed for MDA7 content by LC/MS/MS.
Concentration values for all collected sample timepoints above the lower limit of
quantification for the LC/MS/MS method were used for the determination of
pharmacokinetic parameters. These parameters were obtained by fitting a non-
compartmental model (WinNonlin Version 5.2) to the mean measured plasma
concentration data for each sampled timepoint in the orally dosed group. In the
intravenously dosed group these data were analyzed using ADAPT II Pharmacokinetic
Modeling Software (USC, Biomedical Simulations Resource) using a 2 compartment
model. In all groups the mean measured concentration value for each timepoint was
derived from each of 3 animals analyzed per sampling interval. All parameters were
derived from the AUC (area under the concentration vs. time curve) which was calculated
using a linear trapezoidal method with linear interpolation. All data were weighted as 1/y.
For the analysis of MDA7 in rat plasma and brain tissue, a Waters Acquity UPLC system
coupled with a Waters Quattro Premier mass spectrometer was used. Chromatographic
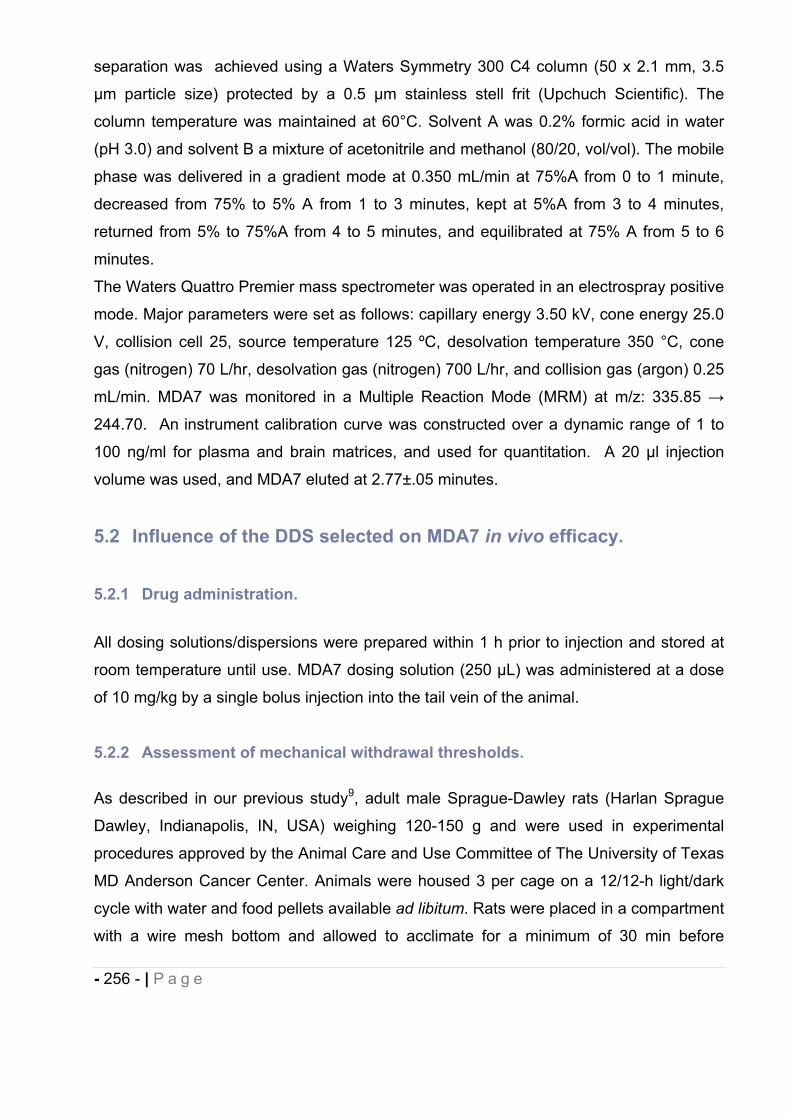
- 256 - | P a g e
separation was achieved using a Waters Symmetry 300 C4 column (50 x 2.1 mm, 3.5
μm particle size) protected by a 0.5 μm stainless stell frit (Upchuch Scientific). The
column temperature was maintained at 60°C. Solvent A was 0.2% formic acid in water
(pH 3.0) and solvent B a mixture of acetonitrile and methanol (80/20, vol/vol). The mobile
phase was delivered in a gradient mode at 0.350 mL/min at 75%A from 0 to 1 minute,
decreased from 75% to 5% A from 1 to 3 minutes, kept at 5%A from 3 to 4 minutes,
returned from 5% to 75%A from 4 to 5 minutes, and equilibrated at 75% A from 5 to 6
minutes.
The Waters Quattro Premier mass spectrometer was operated in an electrospray positive
mode. Major parameters were set as follows: capillary energy 3.50 kV, cone energy 25.0
V, collision cell 25, source temperature 125 ºC, desolvation temperature 350 °C, cone
gas (nitrogen) 70 L/hr, desolvation gas (nitrogen) 700 L/hr, and collision gas (argon) 0.25
mL/min. MDA7 was monitored in a Multiple Reaction Mode (MRM) at m/z: 335.85
244.70. An instrument calibration curve was constructed over a dynamic range of 1 to
100 ng/ml for plasma and brain matrices, and used for quantitation. A 20 μl injection
volume was used, and MDA7 eluted at 2.77±.05 minutes.
5.2 Influence of the DDS selected on MDA7 in vivo efficacy.
5.2.1 Drug administration.
All dosing solutions/dispersions were prepared within 1 h prior to injection and stored at
room temperature until use. MDA7 dosing solution (250 L) was administered at a dose
of 10 mg/kg by a single bolus injection into the tail vein of the animal.
5.2.2 Assessment of mechanical withdrawal thresholds.
As described in our previous study9, adult male Sprague-Dawley rats (Harlan Sprague
Dawley, Indianapolis, IN, USA) weighing 120-150 g and were used in experimental
procedures approved by the Animal Care and Use Committee of The University of Texas
MD Anderson Cancer Center. Animals were housed 3 per cage on a 12/12-h light/dark
cycle with water and food pellets available ad libitum. Rats were placed in a compartment
with a wire mesh bottom and allowed to acclimate for a minimum of 30 min before
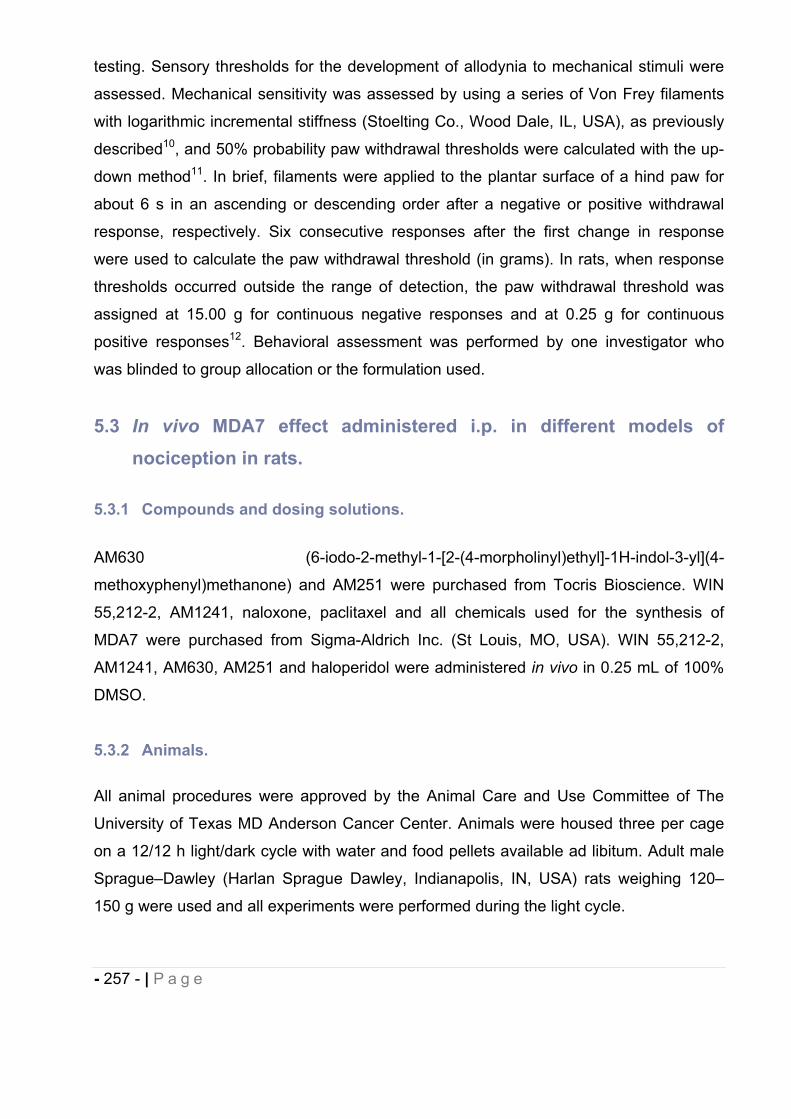
- 257 - | P a g e
testing. Sensory thresholds for the development of allodynia to mechanical stimuli were
assessed. Mechanical sensitivity was assessed by using a series of Von Frey filaments
with logarithmic incremental stiffness (Stoelting Co., Wood Dale, IL, USA), as previously
described10, and 50% probability paw withdrawal thresholds were calculated with the up-
down method11. In brief, filaments were applied to the plantar surface of a hind paw for
about 6 s in an ascending or descending order after a negative or positive withdrawal
response, respectively. Six consecutive responses after the first change in response
were used to calculate the paw withdrawal threshold (in grams). In rats, when response
thresholds occurred outside the range of detection, the paw withdrawal threshold was
assigned at 15.00 g for continuous negative responses and at 0.25 g for continuous
positive responses12. Behavioral assessment was performed by one investigator who
was blinded to group allocation or the formulation used.
5.3 In vivo MDA7 effect administered i.p. in different models of nociception in rats.
5.3.1 Compounds and dosing solutions.
AM630 (6-iodo-2-methyl-1-[2-(4-morpholinyl)ethyl]-1H-indol-3-yl](4-
methoxyphenyl)methanone) and AM251 were purchased from Tocris Bioscience. WIN
55,212-2, AM1241, naloxone, paclitaxel and all chemicals used for the synthesis of
MDA7 were purchased from Sigma-Aldrich Inc. (St Louis, MO, USA). WIN 55,212-2,
AM1241, AM630, AM251 and haloperidol were administered in vivo in 0.25 mL of 100%
DMSO.
5.3.2 Animals.
All animal procedures were approved by the Animal Care and Use Committee of The
University of Texas MD Anderson Cancer Center. Animals were housed three per cage
on a 12/12 h light/dark cycle with water and food pellets available ad libitum. Adult male
Sprague–Dawley (Harlan Sprague Dawley, Indianapolis, IN, USA) rats weighing 120–
150 g were used and all experiments were performed during the light cycle.
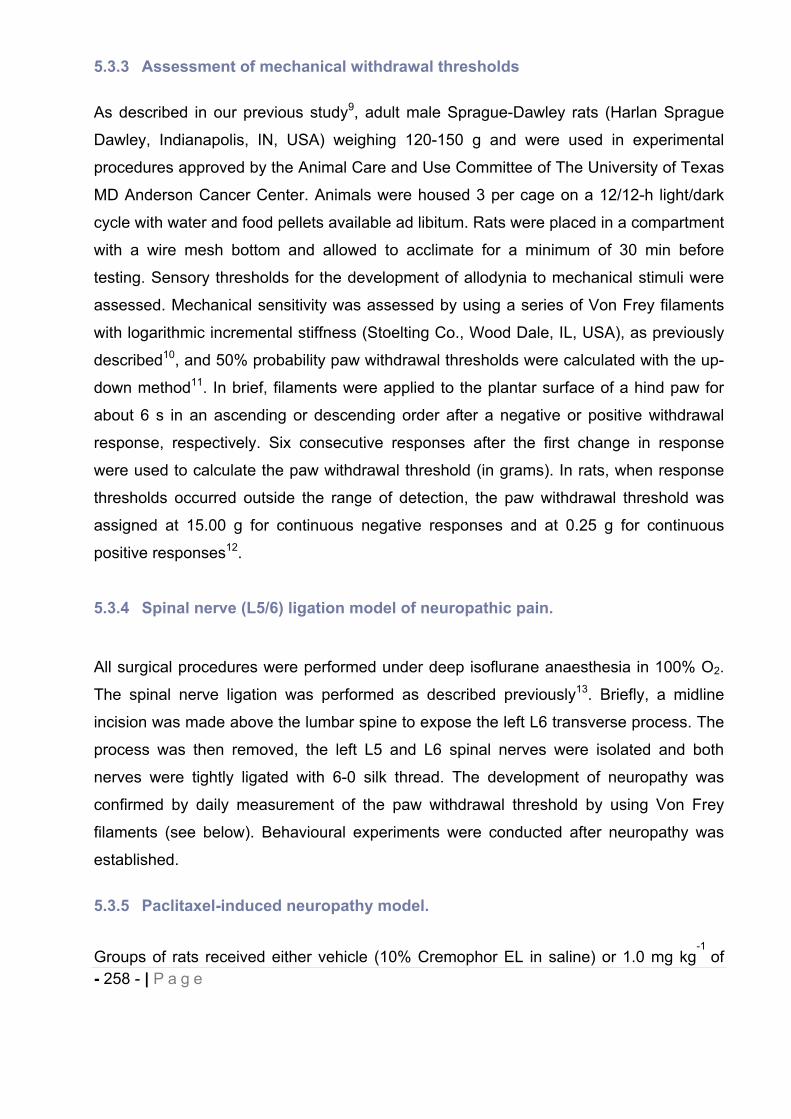
- 258 - | P a g e
5.3.3 Assessment of mechanical withdrawal thresholds
As described in our previous study9, adult male Sprague-Dawley rats (Harlan Sprague
Dawley, Indianapolis, IN, USA) weighing 120-150 g and were used in experimental
procedures approved by the Animal Care and Use Committee of The University of Texas
MD Anderson Cancer Center. Animals were housed 3 per cage on a 12/12-h light/dark
cycle with water and food pellets available ad libitum. Rats were placed in a compartment
with a wire mesh bottom and allowed to acclimate for a minimum of 30 min before
testing. Sensory thresholds for the development of allodynia to mechanical stimuli were
assessed. Mechanical sensitivity was assessed by using a series of Von Frey filaments
with logarithmic incremental stiffness (Stoelting Co., Wood Dale, IL, USA), as previously
described10, and 50% probability paw withdrawal thresholds were calculated with the up-
down method11. In brief, filaments were applied to the plantar surface of a hind paw for
about 6 s in an ascending or descending order after a negative or positive withdrawal
response, respectively. Six consecutive responses after the first change in response
were used to calculate the paw withdrawal threshold (in grams). In rats, when response
thresholds occurred outside the range of detection, the paw withdrawal threshold was
assigned at 15.00 g for continuous negative responses and at 0.25 g for continuous
positive responses12.
5.3.4 Spinal nerve (L5/6) ligation model of neuropathic pain.
All surgical procedures were performed under deep isoflurane anaesthesia in 100% O2.
The spinal nerve ligation was performed as described previously13. Briefly, a midline
incision was made above the lumbar spine to expose the left L6 transverse process. The
process was then removed, the left L5 and L6 spinal nerves were isolated and both
nerves were tightly ligated with 6-0 silk thread. The development of neuropathy was
confirmed by daily measurement of the paw withdrawal threshold by using Von Frey
filaments (see below). Behavioural experiments were conducted after neuropathy was
established.
5.3.5 Paclitaxel-induced neuropathy model.
Groups of rats received either vehicle (10% Cremophor EL in saline) or 1.0 mg kg-1
of
- 259 - | P a g e
paclitaxel daily i.p. for four consecutive days for a final cumulative dose of 4 mg kg-1 14;
the injection volume was 1 mL kg-1
. Baseline responses to mechanical stimulation of the
hind paw (see below) were established on day 0 and continued daily until the
development of neuropathy was confirmed.
5.3.6 Assessment of mechanical withdrawal thresholds.
Rats were placed in a compartment with a wire mesh bottom, and allowed to
acclimatize for a minimum of 30 min before testing. Mechanical sensitivity was
assessed by using a series of Von Frey filaments with logarithmic incremental stiffness
(0.41, 0.70, 1.20, 2.00, 3.63, 5.50, 8.50 and 15.1 g) (Stoelting Co., Wood Dale, IL,
USA), as previously described10 and 50% probability withdrawal thresholds were
calculated with the up–down method15. In brief, beginning with the 2.0-g probe,
filaments were applied to the plantar surface of a hind paw for 6–8 s, in an ascending or
descending order after a negative or positive withdrawal response, respectively. Six
consecutive responses after the first change in response were used to calculate the
withdrawal threshold (in grams). When response thresholds fell outside the range of
detection, the withdrawal threshold was assigned as 15 g for continuous negative
responses and 0.25 g for continuous positive responses. The percentage maximal
possible effect (%MPE) was calculated as ((postdrug threshold-baseline
threshold)/(cutoff threshold (15 g)-baseline threshold)) x 100. The baseline threshold
was determined once. Different groups were tested in the same hour on consecutive
days. The only exception is the ‘vehicle + vehicle’ group experiment, which was
performed on a different day, separate from other groups. The drug groups were not
randomized. Only one experimenter performed all behavioural tests and he, therefore,
was not unaware of the different treatment groups.
5.3.7 Assessment of paw withdrawal latencies in response to noxious heat.
To determine sensitivity to noxious heat, rats were placed in plexiglass enclosures on a
transparent glass surface maintained at 30 °C, and allowed to acclimatize for 30 min. A
thermal testing apparatus, consisting of a heat-emitting projector lamp and an electronic
timer, was used. The device was activated after the lamp was placed directly beneath the
plantar surface of the hind paw. The paw withdrawal latency in response to the radiant
- 260 - | P a g e
heat (50 W) was recorded using a digital timer. A cutoff of 30 s was used to prevent
tissue damage. After the baseline paw withdrawal response to noxious heat was
measured, three groups of naive rats (n=10 per group) received 1, 3 or 10 mg kg-1
of
MDA7 i.p. Response latencies were determined for each rat before i.p. drug injection and
at 5, 10, 15, 30, 45, 60, 90 and 120 min after i.p. drug injection. Each paw was only
stimulated once per time point.
5.3.8 Open-field chamber testing.
An automated open-field chamber (ENV-515 Test Environment, Med Associates, St
Albans, VT, USA), 43.2 x 43.2 x 30.5 cm (L x W x H), equipped with three pairs of 16
infrared arrays that continually monitored each animal’s movement, was used to
determine potential CNS effects of MDA7, WIN 55,212-2 ((R)-( þ )-[2,3-dihydro-5-methyl-
3-(4-morpholinylmethyl)pyrrolo[1,2,3-de)-1,4-benzoxazin-6-yl]-1-napthalenylmethanone),
and haloperidol in naive rats. Rats were individually tested 15 min after i.p. drug
administration. The infrared beams were set 2.5 cm apart horizontally and at a height of
3 cm above the floor, with the rearing array set at 12 cm from the floor. The area in the
box was divided into four equal quadrants (zones), with data collected within each
quadrant and across quadrants (zone entries). An ambulatory movement was defined as
a motion of at least 5 cm and was coded by quadrant. Vertical movements were counted
when the rat moves vertically at least 12 cm from the floor. Zone entries were defined as
an entry into a zone from another zone. Entry into a zone was counted when the rat was
far enough into the new zone to break two sets of new zone photoelectric beams during
an ambulatory movement.
5.3.9 Data analysis.
Statistical analyses were carried out by using BMDP 2007 (Statistical Solutions, Saugus,
MA, USA) and Graph Pad Prism (version 4.03; Graph Pad Software Inc., San Diego, CA,
USA). Data were analyzed by using one-way ANOVA. If findings on ANOVA were
significant, Tukey–Kramer post hoc analysis was used for multiple group comparison.
Area under the curve (AUC) was calculated using the trapezoidal rule. The results were
presented as mean±s.e.mean and were considered significant at P<0.05. Analyses of the
dose–response curves and statistics were obtained by using the pharmacological
- 261 - | P a g e
software programs of Tallarida and Murray (1987), and included calculation of the ED50
values and their 95% confidence intervals (CIs).
6 Nanocapsules
6.1 Materials
Beta-caryophyllene (#W225207) was purchased from Sigma-Aldrich. Sulfobutyl ether with
an average degree of molar substitution of 6.5 was purchased from CTD Inc.
Cucurbit[7]uril was purchased from Strem Chemicals Inc. Ethyl Alcohol, 190 Proof, 95%,
ACS/USP was purchased from PHARMCO AAPER. Alpha-pinene (98%) was purchased
from Fischer scientific. Trehalose, sucrose, glycerol, tetrahydrofuran (Omnisolv) and
acetone (ACS grade) were purchased from VWR. PBS was purchased from VWR.
Acrodisc® Syringe Filters with Nylon Membrane were purchased from PALL Corporation.
Other reagents and chemicals were obtained as gift samples, Eudragit® RS100 and
RL100 from Evonik, poloxamer 188 (Lutrol® F 68 ) from BASF. All chemicals were used
as received. All experiments were carried out using ultrapure water.
6.2 (E)-BCP Purification.
(E)-BCP was purified with a Biotage® Isolera one flash purification system using the
following parameters: collected fraction: 16mL/fraction; flow rate: 40mL/min; 3 Column
Volumes of equilibration; 1.8 g of (E)-BCP injected; cartridge: Biotage® SNAP KP-Sil
100g cartridge; medium slope; 500mAU; 7 Column Volumes (1-5-1).
TLC Rf value in heptane: 0.75
- 262 - | P a g e
6.3 (E)-BCP entrapment efficiency, drug loading and stability in nanoacapsules.
6.3.1 Equipment and instrumentation.
(E)-BCP nanocapsules analysis was performed using an Agilent 6890N Gas
Chromatograph with an Agilent 5973 Mass Spectrometer. An HP-5MS column ((5%-
Phenyl)-methylpolysiloxane) was used (0.25 mm ID x 30 m length x 0.25 m film
thickness). 2 L of sample was injected for each analysis into a Split/Splitless
FocusLinerTM for HP, single taper p/w quartz wool liner. Split injection was used with a
split ratio of 50:1. The inlet temperature and the auxiliary transfer line temperature were
set to respectively 250°C and 280°C. The temperature program started at 40°C for 1.5
minutes, ramped at 30°C/min to 190°C, 20°C/min to 210°C, and then 50°C/min to a final
temperature of 300°C, which was held for 1.5 minutes. The mass spectrometer was
operated with a solvent delay of 4 minutes and the mass range from 40-450 was
scanned.
6.3.2 Standards preparation.
A stock solution of (E)-BCP at a stock concentration of 10mg/mL was prepared in THF
and then diluted with THF to create calibration standards of the following range: 10, 25,
50 and 100 ppm.
A stock solution of -pinene at a stock concentration of 10mg/mL was prepared in THF
and added to standard solutions and unknown samples for comparative quantitation to
afford a final concentration of 100 ppm.
6.3.3 Samples preparation
(E)-BCP was extracted from nanocapsules using THF. 30 mg of freeze-dried
nanocapsule were placed in a vial and 1 mL of THF was added. This mixture was stirred
with a magnetic stirring bar at 300 rpm for one hour. Finally, 15 μL of this solution were
added to 100 L of -pinene and diluted with THF to obtain 1 mL of final solution which
was analyzed using GC-MS.
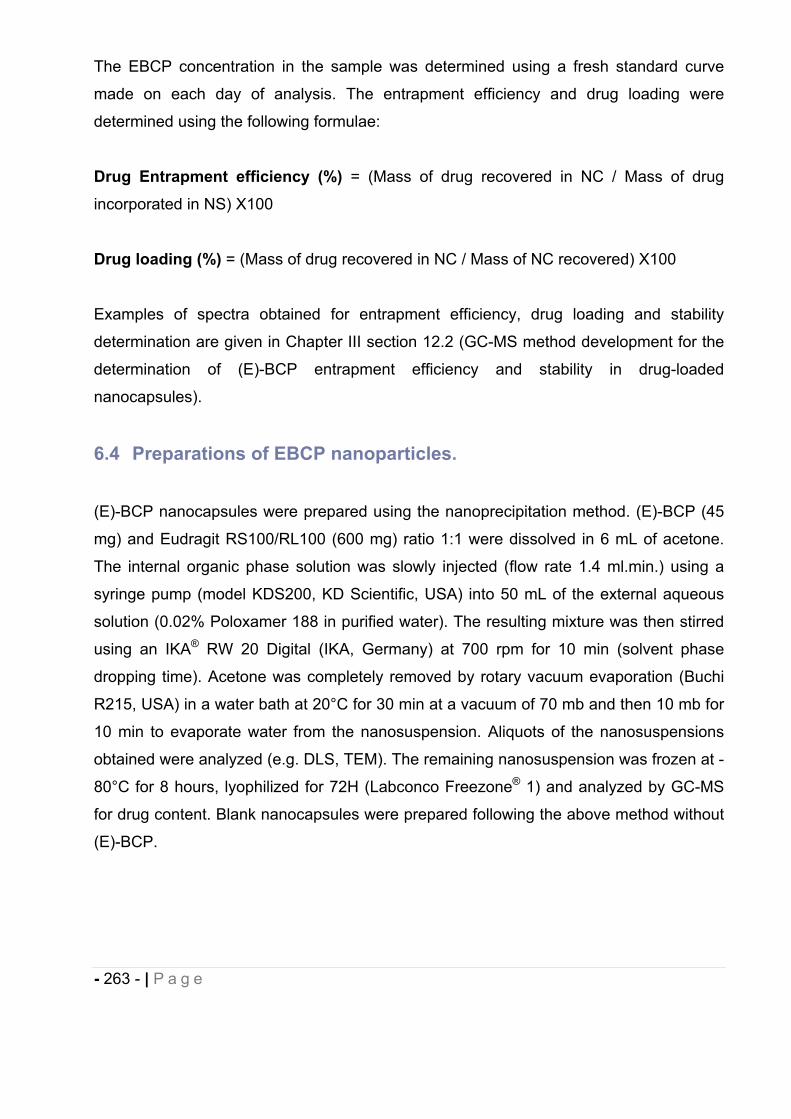
- 263 - | P a g e
The EBCP concentration in the sample was determined using a fresh standard curve
made on each day of analysis. The entrapment efficiency and drug loading were
determined using the following formulae:
Drug Entrapment efficiency (%) = (Mass of drug recovered in NC / Mass of drug
incorporated in NS) X100
Drug loading (%) = (Mass of drug recovered in NC / Mass of NC recovered) X100
Examples of spectra obtained for entrapment efficiency, drug loading and stability
determination are given in Chapter III section 12.2 (GC-MS method development for the
determination of (E)-BCP entrapment efficiency and stability in drug-loaded
nanocapsules).
6.4 Preparations of EBCP nanoparticles.
(E)-BCP nanocapsules were prepared using the nanoprecipitation method. (E)-BCP (45
mg) and Eudragit RS100/RL100 (600 mg) ratio 1:1 were dissolved in 6 mL of acetone.
The internal organic phase solution was slowly injected (flow rate 1.4 ml.min.) using a
syringe pump (model KDS200, KD Scientific, USA) into 50 mL of the external aqueous
solution (0.02% Poloxamer 188 in purified water). The resulting mixture was then stirred
using an IKA® RW 20 Digital (IKA, Germany) at 700 rpm for 10 min (solvent phase
dropping time). Acetone was completely removed by rotary vacuum evaporation (Buchi
R215, USA) in a water bath at 20°C for 30 min at a vacuum of 70 mb and then 10 mb for
10 min to evaporate water from the nanosuspension. Aliquots of the nanosuspensions
obtained were analyzed (e.g. DLS, TEM). The remaining nanosuspension was frozen at -
80°C for 8 hours, lyophilized for 72H (Labconco Freezone® 1) and analyzed by GC-MS
for drug content. Blank nanocapsules were prepared following the above method without
(E)-BCP.
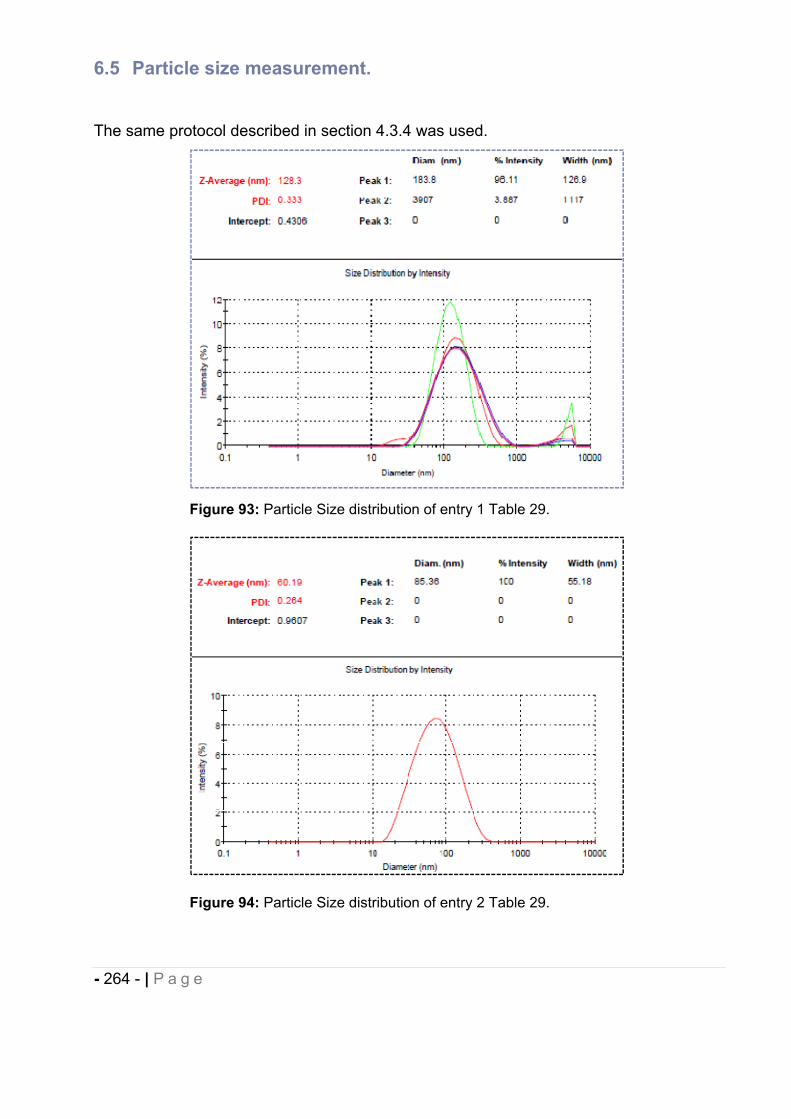
- 264 - | P a g e
6.5 Particle size measurement.
The same protocol described in section 4.3.4 was used.
Figure 93: Particle Size distribution of entry 1 Table 29.
Figure 94: Particle Size distribution of entry 2 Table 29.
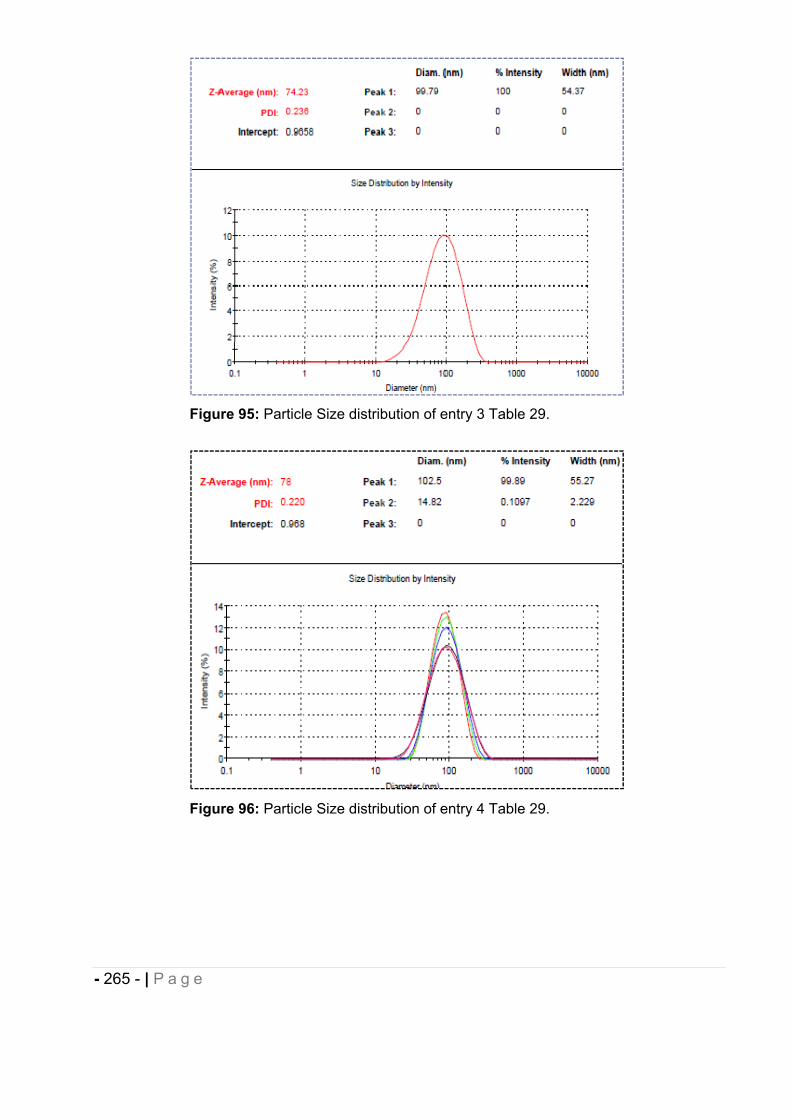
- 265 - | P a g e
Figure 95: Particle Size distribution of entry 3 Table 29.
Figure 96: Particle Size distribution of entry 4 Table 29.
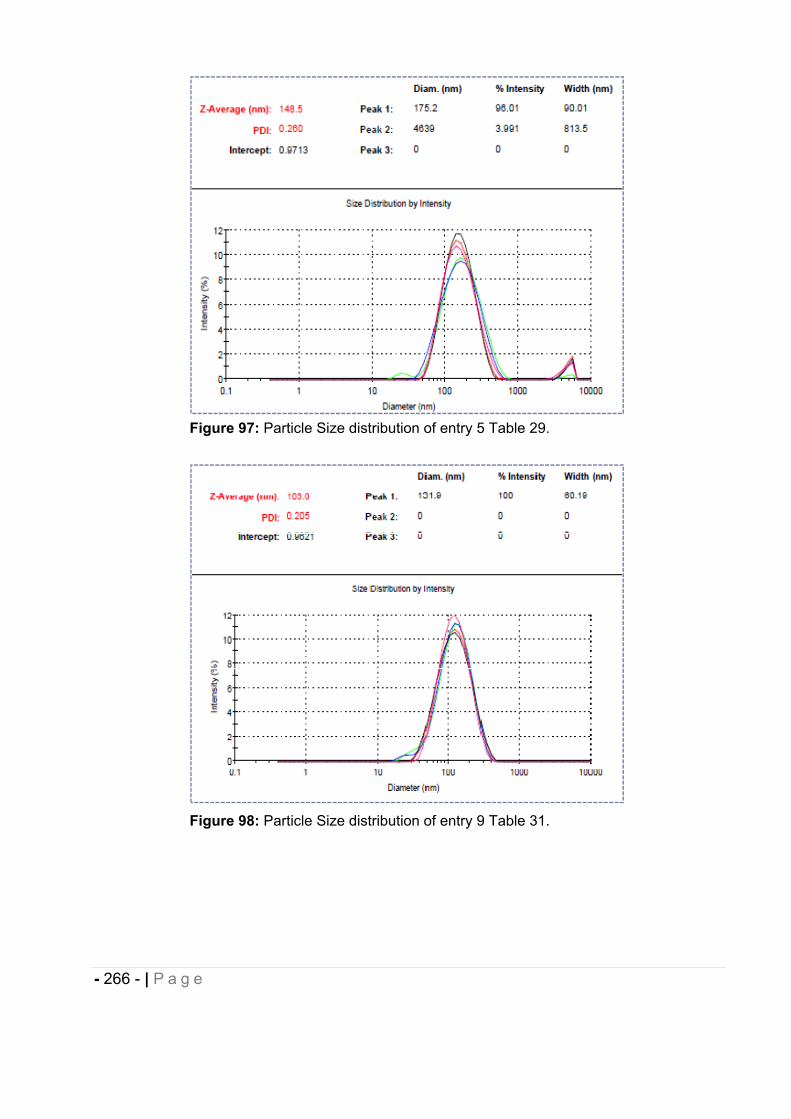
- 266 - | P a g e
Figure 97: Particle Size distribution of entry 5 Table 29.
Figure 98: Particle Size distribution of entry 9 Table 31.
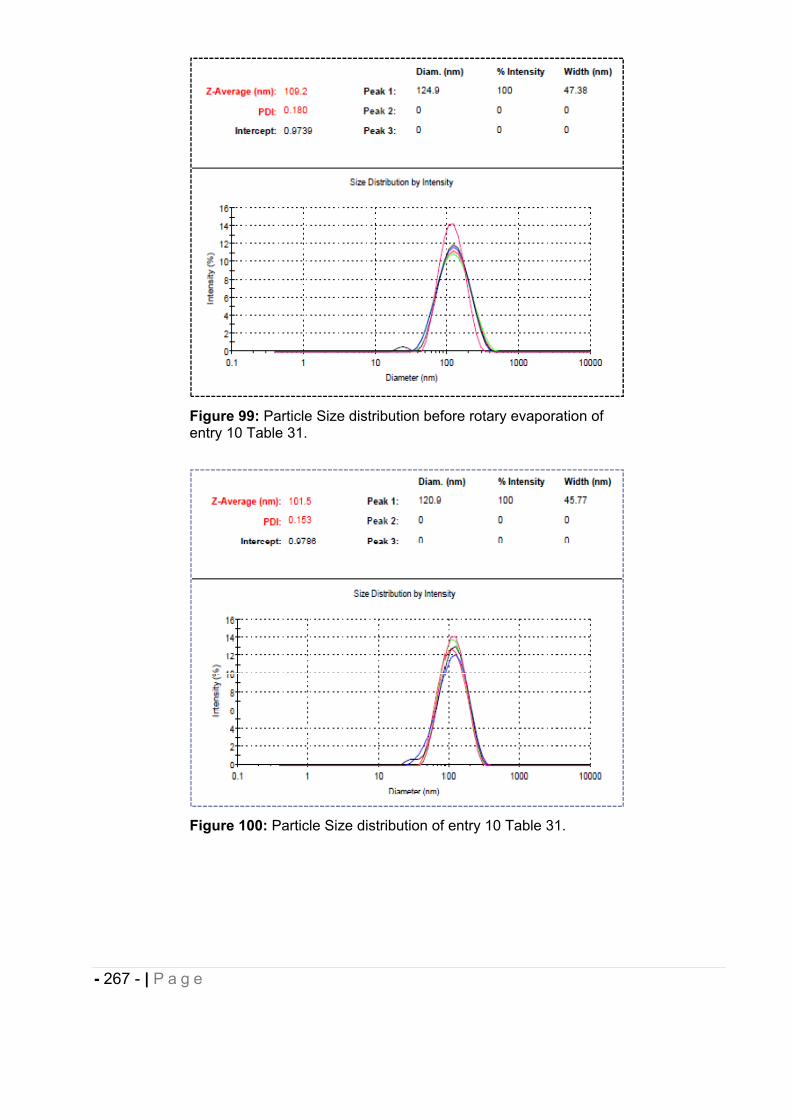
- 267 - | P a g e
Figure 99: Particle Size distribution before rotary evaporation of entry 10 Table 31.
Figure 100: Particle Size distribution of entry 10 Table 31.
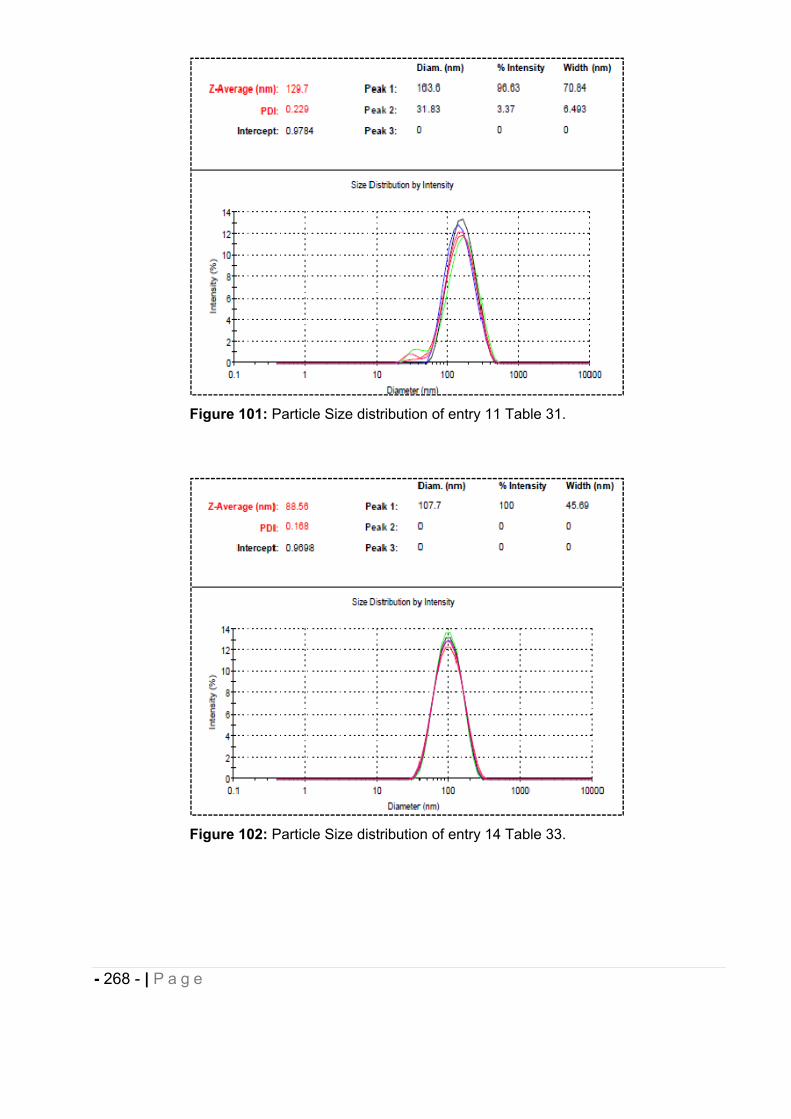
- 268 - | P a g e
Figure 101: Particle Size distribution of entry 11 Table 31.
Figure 102: Particle Size distribution of entry 14 Table 33.
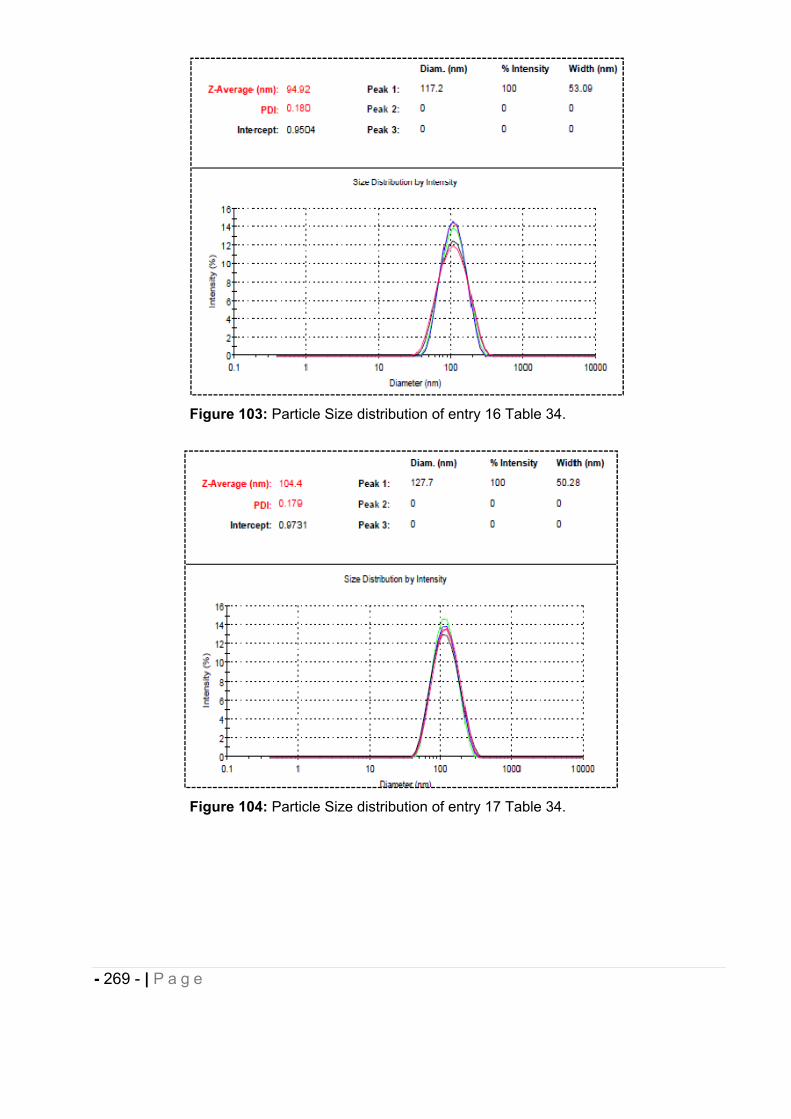
- 269 - | P a g e
Figure 103: Particle Size distribution of entry 16 Table 34.
Figure 104: Particle Size distribution of entry 17 Table 34.
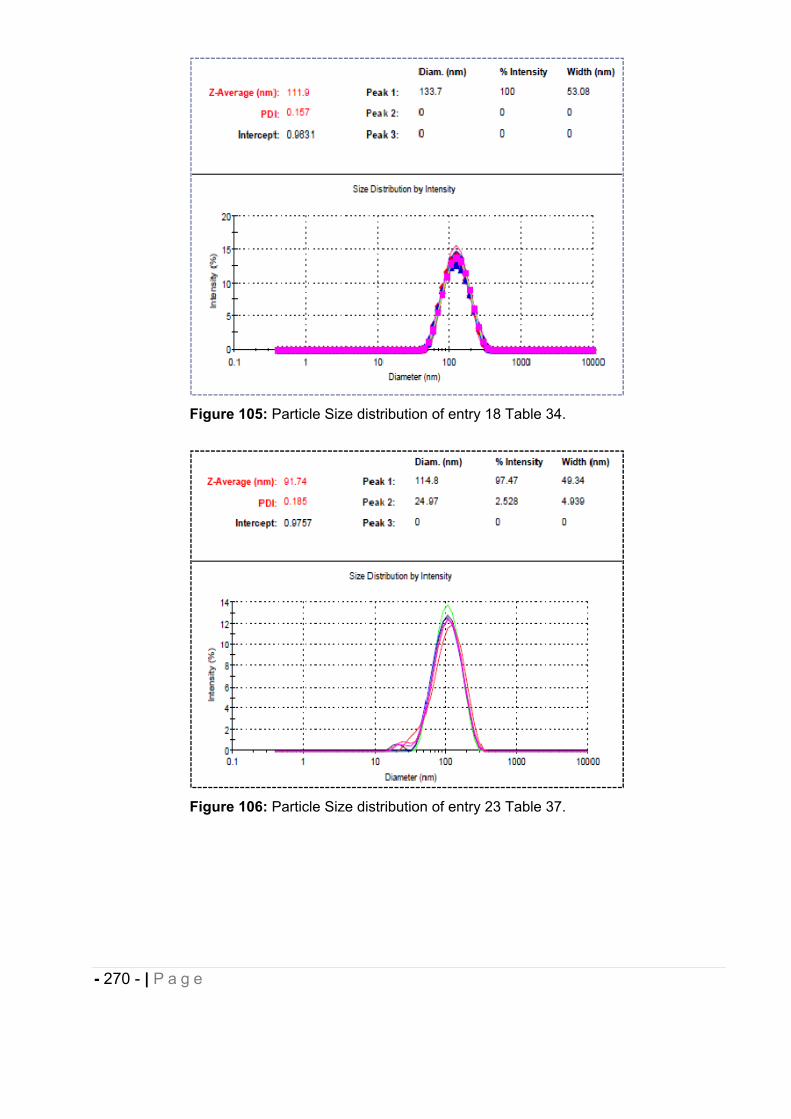
- 270 - | P a g e
Figure 105: Particle Size distribution of entry 18 Table 34.
Figure 106: Particle Size distribution of entry 23 Table 37.
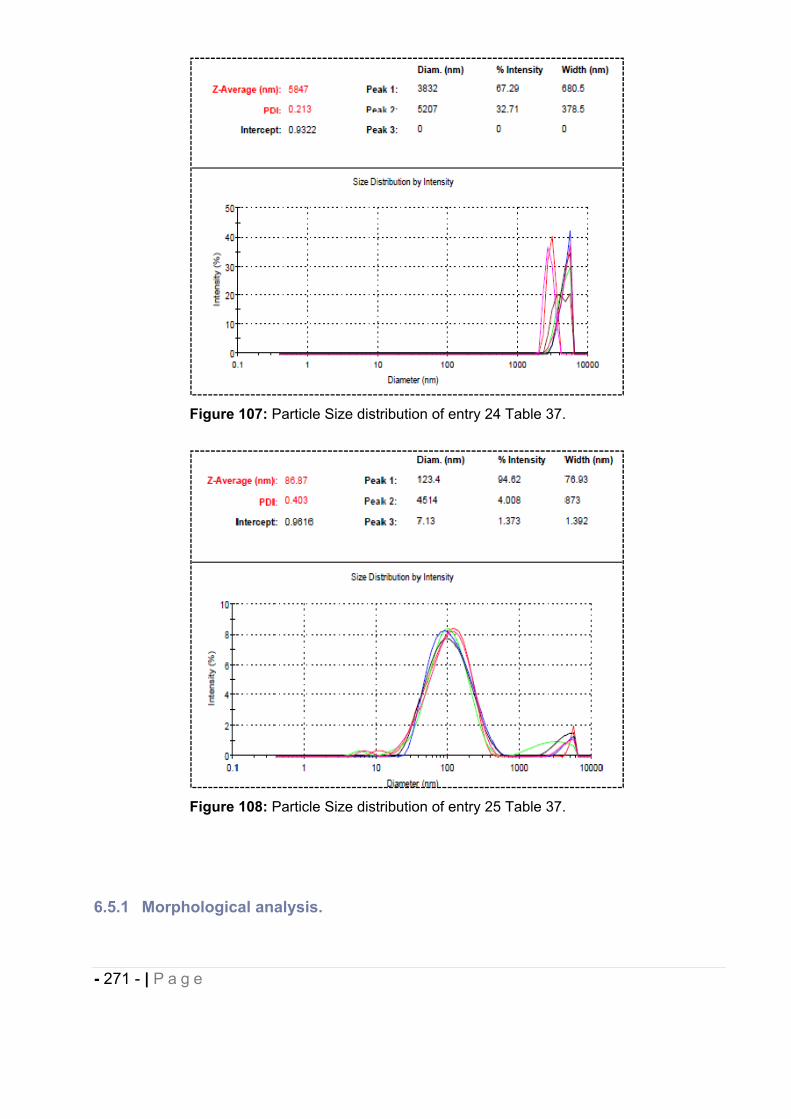
- 271 - | P a g e
Figure 107: Particle Size distribution of entry 24 Table 37.
Figure 108: Particle Size distribution of entry 25 Table 37.
6.5.1 Morphological analysis.
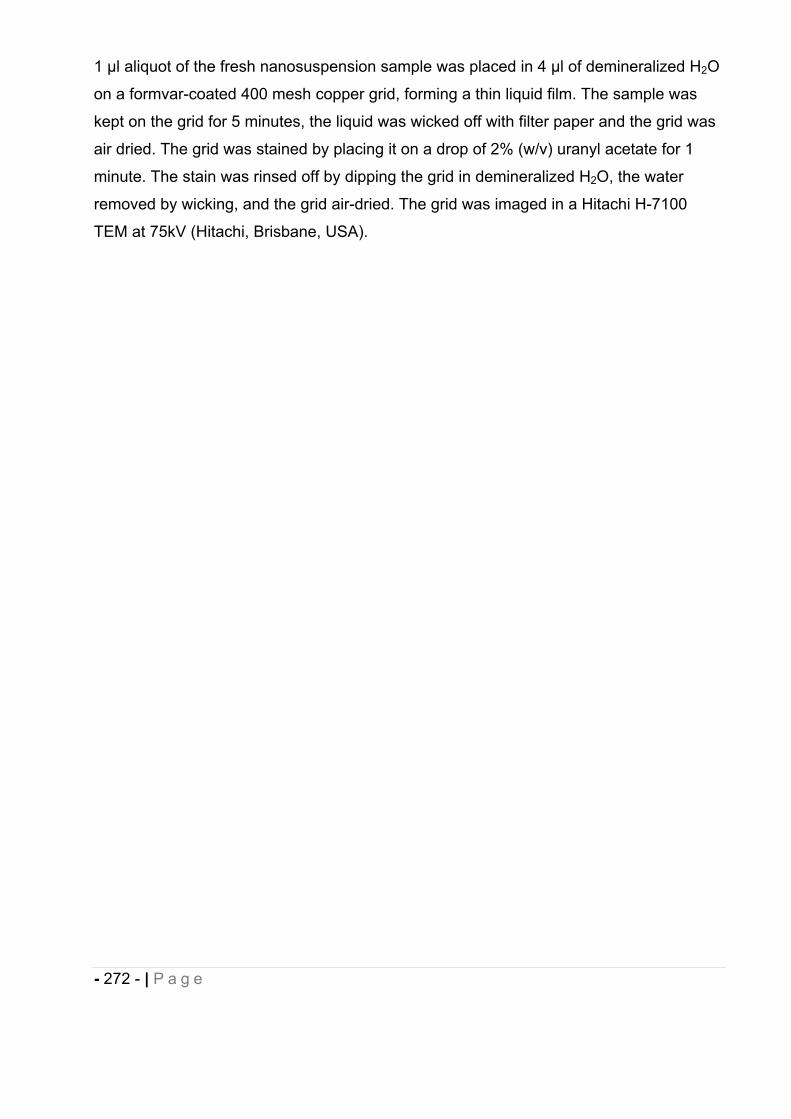
- 272 - | P a g e
1 l aliquot of the fresh nanosuspension sample was placed in 4 l of demineralized H2O
on a formvar-coated 400 mesh copper grid, forming a thin liquid film. The sample was
kept on the grid for 5 minutes, the liquid was wicked off with filter paper and the grid was
air dried. The grid was stained by placing it on a drop of 2% (w/v) uranyl acetate for 1
minute. The stain was rinsed off by dipping the grid in demineralized H2O, the water
removed by wicking, and the grid air-dried. The grid was imaged in a Hitachi H-7100
TEM at 75kV (Hitachi, Brisbane, USA).
- 273 - | P a g e
7 REFERENCES.
1. Lipinski, C. A.; Lombardo, F.; Dominy, B. W.; Feeney, P. J., Experimental and computational approaches to estimate solubility and permeability in drug discovery and development setting. Advanced Drug Delivery Reviews 2001, 46, 3-26.
2. Diaz, P.; Phatak, S. S.; Xu, J.; Fronczek, F. R.; Astruc-Diaz, F.; Thompson, C. M.; Cavasotto, C. N.; Naguib, M., 2,3-Dihydro-1-benzofuran derivatives as a series of potent selective cannabinoid receptor 2 agonists: design, synthesis, and binding mode prediction through ligand-steered modeling. ChemMedChem 2009, 4, (10), 1615-29.
3. Mukherjee, S.; Adams, M.; Whiteaker, K.; Daza, A.; Kage, K.; Cassar, S.; Meyer, M.; Yao, B. B., Species comparison and pharmacological characterization of rat and human CB2 cannabinoid receptors. European Journal of Pharmacology 2004, 505, (1–3), 1-9.
4. Li, P.; Zhao, L., Developing early formulations: Practice and perspective. International Journal of Pharmaceutics 2007, 341, (1–2), 1-19.
5. Li, P.; Vishnuvajjala, R.; Tabibi, S. E.; Yalkowsky, S. H., Evaluation of in vitro precipitation methods. Journal of Pharmaceutical Sciences 1998, 87, (2), 196-199.
6. Lopez-Berestein, G.; Tari, A. M.; Lim, S.-J. Method to incorporate N-(4-hydroxyphenyl) retinamide in liposomes. 2002.
7. Higuchi, T.; Connors, K. A., Advances in Analytical Chemistry and Instrumentation. Chapter 4. Phase Solubility Studies 1965, 117-212.
8. Aree, T.; Schulz, B.; Reck, G., Crystal Structures of -Cyclodextrin Complexes with Formic Acid and Acetic Acid Journal of Inclusion Phenomena and Macrocyclic Chemistry 2003, 47, (1-2), 39-45.
9. Naguib, M.; Diaz, P.; Xu, J. J.; Astruc-Diaz, F.; Craig, S.; Vivas-Mejia, P.; Brown, D. L., MDA7: a novel selective agonist for CB2 receptors that prevents allodynia in rat neuropathic pain models. Br J Pharmacol 2008, 155, (7), 1104-16.
10. Chaplan, S. R.; Bach, F. W.; Pogrel, J. W.; Chung, J. M.; Yaksh, T. L., Quantitative assessment of tactile allodynia in the rat paw. Journal of Neuroscience Methods 1994, 53, (1), 55-63.
11. Dixon, W., The up-and-down method for small samples. J Am Stat Assoc 1965,60, 967-978.
12. Brainin-Mattos, J.; Smith, N. D.; Malkmus, S.; Rew, Y.; Goodman, M.; Taulane, J.; Yaksh, T. L., Cancer-related bone pain is attenuated by a systemically available d-opioid receptor agonist. Pain 2006, 122, (1-2), 174-181.
13. Kim, S. H.; Chung, J. M., An experimental model for peripheral neuropathy produced by segmental spinal nerve ligation in the rat. Pain 1992, 50, (3), 355-63.
14. Polomano, R. C.; Mannes, A. J.; Clark, U. S.; Bennett, G. J., A painful peripheral neuropathy in the rat produced by the chemotherapeutic drug, paclitaxel. Pain 2001, 94, (3), 293-304.
15. Dixon, W. J., The up-and-down Method for Small Samples. J Am Stat Assoc 1965, 60, (312), 967-978.
- 274 - | P a g e
CONCLUSIONCannabinoid compounds are gaining interest as potential pharmacological agents to
treat neurodegenatrative and neuroinflammatory diseases such as neuropathic pain.
CB2 agonists are particularly interesting since no or few psychotropic effects have been
reported when tested in vivo on models of acute and chronic pain. Natural and synthetic
cannabinoids are generally highly lipophilic compounds, resulting in unsuitable
pharmacokinetic and efficacy profile in vivo. In the first part of this project, we designed
four DDS, namely micellar system, liposomes and inclusion complexes based on
HP CD for i.v. and i.p. injection and a SEDDS for oral administration, in order to improve
the physicochemical properties (i.e. solubility) of MDA7 required for PK and PD studies.
These DDS enabled sufficient and consistent systemic exposure of the novel CB2
agonists developed in our laboratory in different rat models of chronic pain. MDA7
complexed with HP CD proved to significantly alleviate tactile allodynia and exert
antinociceptive activity in a model of SNL. The HP CD based formulation was the most
efficient DDS compared to micellar and liposomal preparation administered parenterally.
The FDA approved HP CD appeared to be a well adapted enabling formulation
approach for delivery of lipophilic compounds such as cannabinoids at pre-clinical
stages of development and their use could be extended for the formulation of NCE
tested in high throughput pharmacological screening. These host molecules present
many advantages related to their safety, characterization, versatility forming easy-to-
obtain inclusion complexes with various drugs and their ability to improve delivery,
enhancing NCE solubility. Furthermore, the developed drug inclusion complexes can be
directly used in clinical trials. We also demonstrated HP CD could be successfully used
for the delivery of chiral drugs such as MDA7 since the same proportion of each
enantiomer was solubilized by the formation of a 1:1 complex and no enantiomeric
discrimination in term of solubility was observed. Should the enantiomeric excess be
required, determination by 1H-NMR is easy and affordable after complexation of a chiral
molecule such as MDA7 by HP CD. It should be noted that the use of a cosolvent such
as MeOH-d4 used in the Job’s plot analysis, can solve a potential problem of water
solubility of the small guest molecule. The specific nature of the lipophilic host/guest
interaction can be a weakness in that only molecule with the right size and geometry can
- 275 - | P a g e
be complexed by HP CD in DDS. One potential problem of drugs that show unusually
high affinity for HP CD might be that they can be retained in urine at early time after
injection since cyclodextrins undergo high renal clearance with small volume of
distribution and quite short half-lives. In regard with the development process, the
amount of cyclodextrins incorporated in the DDS has to be optimized by a phase
solubility study for each active substance to be tested. In this regard, a combination of
cosolvents or polymer with cyclodextrins can respectively increase the intrinsic solubility
or the constant affinity of the complex formed and thereby reducing the concentration in
cyclodextrins used in the design of DDS. We already started working on this approach
with some compounds from our library.
A powerful alternative for dissolving hydrophobic drugs is the use of cosolvents and
surfactants forming micelles and thus increasing their bioavailability. Micelles can have
prolonged blood residence time and can gradually accumulate in area with leaky
vasculature. Micellar preparations are applicable to a wide range of low crystalline and
lipophilic compounds. The micellar system developed has already enabled the in vivo
testing of various cannabinoids with different physicochemical properties. However,
micellar preparations often suffer from significant toxicity after parenteral administration
since high concentration of cosolvent and surfactant are usually necessary to solubilize
drugs, specifically when toxicological studies are carried out with increasing doses of
drug. In our study MDA7, encapsulated in liposomes yielded a limited antinociceptive
effect despite their propensity to distribute in tissues with discontinuous endothelium and
to target phagocytocic cells. Long-circulating liposomes coated with PEG might have
been more efficient as DDS while reducing mononuclear phagocyte system uptake and
subsequent high clearance. Overall, the early formulation strategy adopted with
liposomes, micellar system and inclusion complexes-based cyclodextrins allowed to
evaluate the in vivo activity of a selective but non specific CB2 agonist, MDA7, in models
of neuropathic pain without any vehicle effect. We currently design DDS for lipophilic
small molecules with a targeted polypharmacology for the treatment of complex
diseases such as neuropathic pain. The strategy developed in this work will be used
resulting in the rapid design of a suitable DDS for a rapid in vivo testing of our NCEs.
In the second part of this project, we designed polymeric nanocapsules for the delivery
of the highly lipophilic, naturally-occuring natural CB2 agonist, -caryophyllene. The NCs
prepared by nanoprecipitation resulted in enhanced solubility and chemical stability with
- 276 - | P a g e
high entrapment efficiency of (E)-BCP ( 80%). The cationic and round-shaped NCs
developed, are expected to be mucoadhesive. These NCs are nearly monodisperse and
exhibit the optimal size for oral absorption in the range of 100 nm. These properties
should confer consistent drug absorption through GI epithelium or increased lymphatic
transport and subsequent oral bioavailability of (E)-BCP. Whether cationic nanocarriers
such as our NCs when administered orally are absorbed transcellularly through the
membranous epithelial cells (M cells) of the Peyer’s patches in the GALT or through the
gut enterocytes, or paracellularly by persorption is not well known. NPs should reach the
bloodstream while keeping their native structure to target distant pharmacological
targets. To date no such NPs have been described since most of the previously
described cationic NPs are based on the metabolizable chitosan. Combining the use of
Nile Red, a fluorescent dye encapsulated in the core of our NCs and biocompatible but
non-biodegradable long-circulating polymeric NCs based on Eudragit® may provide
indispensable information in regards with the mechanism of nanocarriers and drug
absorption, their biodistribution and their fate in the body. Results from this study could
allow further toxicological investigations and perspective concerning the potential use of
these nanosystems combining delivery and imaging properties.
The cationic NCs developed are not limited to the model drug investigated and can
encapsulate other lipophilic compounds after solubilzing them in an appropriate oil and
raise for these substances the same opportunities as described above. In addition, we
demonstrated that the NCs prepared have the properties of forming supramolecular
complexes with anionic cyclodextrins or cucurbiturils macrocycles. Preliminary results
have been generated for the use of these intriguing macrocycles with our cationic
system which can be the base for the design of potential future theragnostic (drug
delivery and imaging) systems specially promising for the selective targeting of distant
pharmacological targets.
Further work might be undertaken to eventually adapt this concept using biodegradable
cationic polymer such as chitosan for chronic use or to avoid any potential toxicities
issues. Nevertheless the entrapment of imaging agent such as Nile Red will probably
improve the understanding of the in vivo behaviors of these non biodegradable
nanocapsules. A study to evaluate the in vivo antinociceptive efficacy of CB2 agonist
- 277 - | P a g e
after oral administration in the nanocapsules developed has been planned and will be
carried out in a near future.
Through this project, we set up an early formulation strategy and validated the
pharmacological activity of our CB2 agonists as well as developed a complex and
advanced DDS which may be used as a theragnostic tool in future drug discovery or
development process. The development of cannabinoids as therapeutics has been
limited for a long time because of their poor aqueous solubility, and attempts to
synthesize more water-soluble cannabinoids have been undertaken but these NCE may
suffer from non appropriate biodistribution in areas important for the treatment of pain
such as the CNS.
Mechanism of action for CB2 agonists is yet needed to be understood and selective
targeting of immune cells by the supramolecular complexes developed containing a CB2
agonist could elucidate their mode of action as well as validating the biological targets
involved in neuropathic pain and immune disorders. In addition, the early formulation
strategy developed may be extended to the CB1 ligands since they show significant
structural analogy with CB2 compounds to better understand their mechanism of action
on immune response. Otherwise cannabinoids have been described to have anticancer
properties and the use of PEGylated liposomes or functionalized nanocapsules could
allow increasing the knowledge regarding cannabinoids antitumoral activity by tumor-
specific targeting.
Overall, this work opens perspectives for further mechanistic investigations regarding the
activity of cannabinoids ligands, their pharmacological target(s) and their absorption
pathway with the possibility to develop a cannabinoid compound with an improved
biological profile for the clinical treatment of pain.