cancer incidence and mortality in delaware
TRANSCRIPT
Cancer Incidence and Mortality in Delaware
Prepared by Delaware’s Division of Public Health
June 2009
This report is made possible with funding from the Delaware Health Fund, with strategic leadership and guidance provided by the Delaware Cancer Consortium.
The Delaware Department of Health and Social Services, Division of Public Health acknowledges the analytic contributions of Macro InternationalSM to this report,
performed under contract to the Division.
MACRO INTERNATIONAL INC. 7315 WISCONSIN AVENUE • SUITE 400W • BETHESDA, MD 20814

Document Control Number 35-05-20/09/05/20

i
CONTENTS
1. INTRODUCTION..................................................................................................................... 1 1.1. Delaware Cancer Registry ............................................................................................. 1
1.1.1. Reporting Facilities ............................................................................................. 1 1.1.2. Data Confidentiality ............................................................................................ 1 1.1.3. Data Quality........................................................................................................ 1 1.1.4. NAACCR Certification and NPCR Standard Status ........................................... 2 1.1.5. Data Uses........................................................................................................... 2
1.2. Organization of This Report ........................................................................................... 2 2. GUIDELINES FOR THE INTERPRETATION OF INCIDENCE AND MORTALITY RATES ...2
2.1. Incidence and Mortality Rates ........................................................................................ 2 3. ALL CANCER SITES .............................................................................................................. 4
Data Highlights........................................................................................................................ 3 All-Cancer Incidence............................................................................................................... 4 All-Cancer Mortality................................................................................................................. 8
4. FEMALE BREAST CANCER ................................................................................................ 12 Risk Factors and Early Detection.......................................................................................... 13 Data Highlights...................................................................................................................... 14 Female Breast Cancer Incidence.......................................................................................... 16 Female Breast Cancer by Stage at Diagnosis ...................................................................... 19 Female Breast Cancer Mortality............................................................................................ 21
5. CERVICAL CANCER............................................................................................................ 22 Risk Factors and Early Detection.......................................................................................... 24 Data Highlights...................................................................................................................... 25 Cervical Cancer Incidence .................................................................................................... 27 Cervical Cancer by Stage at Diagnosis................................................................................. 30 Cervical Cancer Mortality ......................................................................................................31
6. COLORECTAL CANCER...................................................................................................... 32 Risk Factors and Early Detection.......................................................................................... 34 Data Highlights...................................................................................................................... 35 Colorectal Cancer Incidence................................................................................................. 37 Colorectal Cancer by Stage at Diagnosis ............................................................................. 40 Colorectal Cancer Mortality................................................................................................... 42
7. LUNG AND BROCHIAL CANCER........................................................................................ 44 Risk Factors and Early Detection.......................................................................................... 47 Data Highlights...................................................................................................................... 48 Lung and Bronchial Cancer Incidence .................................................................................. 50 Lung and Bronchial Cancer by Stage at Diagnosis............................................................... 53 Lung and Bronchial Cancer Mortality .................................................................................... 55
8. PROSTATE CANCER........................................................................................................... 56 Risk Factors and Early Detection.......................................................................................... 60 Data Highlights...................................................................................................................... 61 Prostate Cancer Incidence.................................................................................................... 63 Prostate Cancer by Stage at Diagnosis ................................................................................ 66 Prostate Cancer Mortality......................................................................................................68
ii
LIST OF TABLES
3. ALL CANCER SITES
Table 3.1. Number of All Cancer Cases in Delaware and Counties, by Race and Sex: 2001-05 ................................................................................................................. 4
Table 3.2. Five-Year Average Age-Adjusted All-Cancer Incidence Rates* in the U.S. , Delaware and Counties (2001-05), by Race and Sex........................................................................................................ 5
Table 3.3. Age-Specific All-Cancer Incidence Rates* in Delaware, by Race and Sex: 2001-05 ................................................................................................................. 7
Table 3.4. Number of All Cancer Deaths in Delaware and Counties, by Race and Sex: 2001-05 ................................................................................................................. 8
Table 3.5. Five-Year Average Age-Adjusted All-Cancer Mortality Rates* in the United States, Delaware and Counties (2001-05), by Race and Sex............................... 9
Table 3.6. Age-Specific All-Cancer Mortality Rates* in Delaware, by Race and Sex: 2001-05 ............................................................................................................... 11
4. FEMALE BREAST CANCER
Table 4.1. Number of Female Breast Cancer Cases in Delaware and Counties, by Race: 2001-05 ............................................................................................................... 16
Table 4.2. Five-Year Average Age-Adjusted Female Breast Cancer Incidence Rates* in the U.S. , Delaware and Counties (2001-05), by Race.............................................................................................. 16
Table 4.3. Age-Specific Female Breast Cancer Incidence Rates* in Delaware, by Race: 2001-05 ............................................................................................................... 18
Table 4.4. Number of Female Breast Cancer Cases in Delaware, by Stage at Diagnosis and Race: 2001-05.............................................................................................. 19
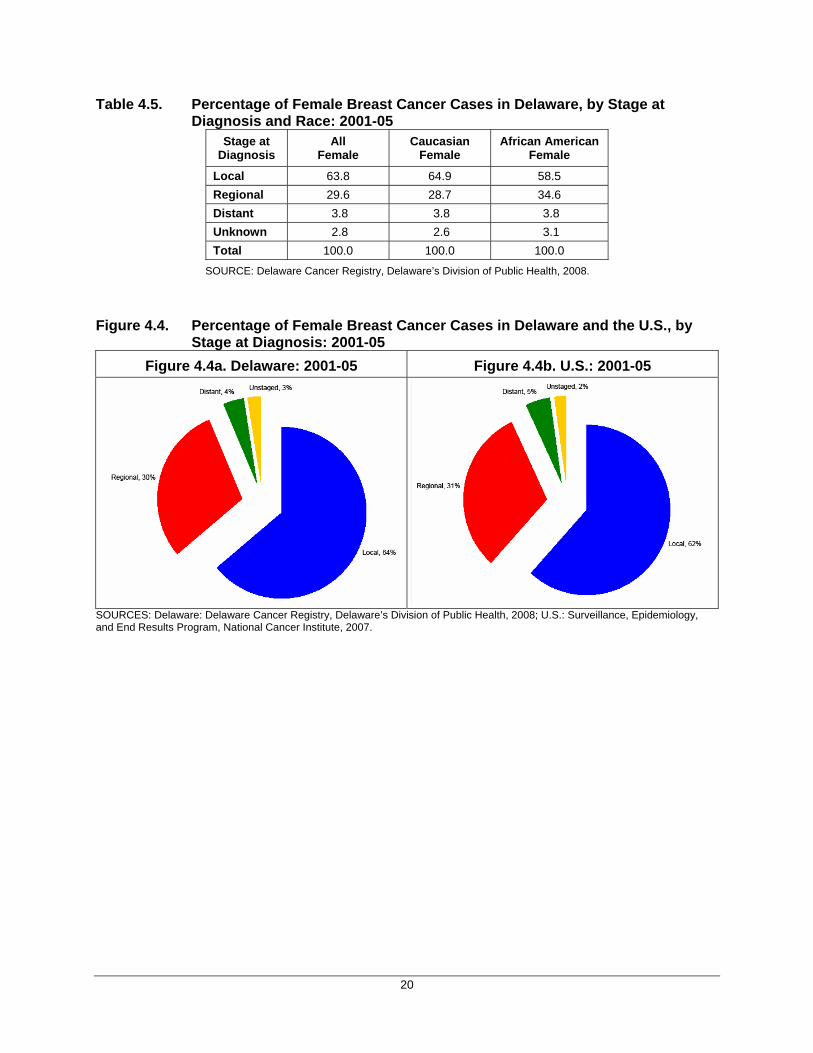
Table 4.5. Percentage of Female Breast Cancer Cases in Delaware, by Stage at Diagnosis and Race: 2001-05 ............................................................................. 20
Table 4.6. Number of Female Breast Cancer Deaths in Delaware and Counties, by Race: 2001-05 ............................................................................................................... 21
Table 4.7. Five-Year Average Age-Adjusted Female Breast Cancer Mortality Rates* in the U.S., Delaware and Counties (2001-05), by Race ........................................ 22
Table 4.8. Age-Specific Female Breast Cancer Mortality Rates* in Delaware, by Race: 2001-05 ............................................................................................................... 23
5. CERVICAL CANCER
Table 5.1. Number of Cervical Cancer Cases in Delaware and Counties, by Race: 2001-05 ............................................................................................................... 27
Table 5.2. Five-Year Average Age-Adjusted Cervical Cancer Incidence Rates* in the U.S. , Delaware and Counties (2001-05), by Race ............................................................................................................... 27
Table 5.3. Age-Specific Cervical Cancer Incidence Rates* in Delaware, by Race: 2001-05 ............................................................................................................... 29
Table 5.4. Number of Cervical Cancer Cases in Delaware, by Stage at Diagnosis and Race: 2001-05..................................................................................................... 30
Table 5.5. Percentage of Cervical Cancer Cases in Delaware, by Stage at Diagnosis and Race: 2001-05..................................................................................................... 30
iii
Table 5.6. Number of Cervical Cancer Deaths in Delaware and Counties, by Race: 2001-05 ............................................................................................................... 31
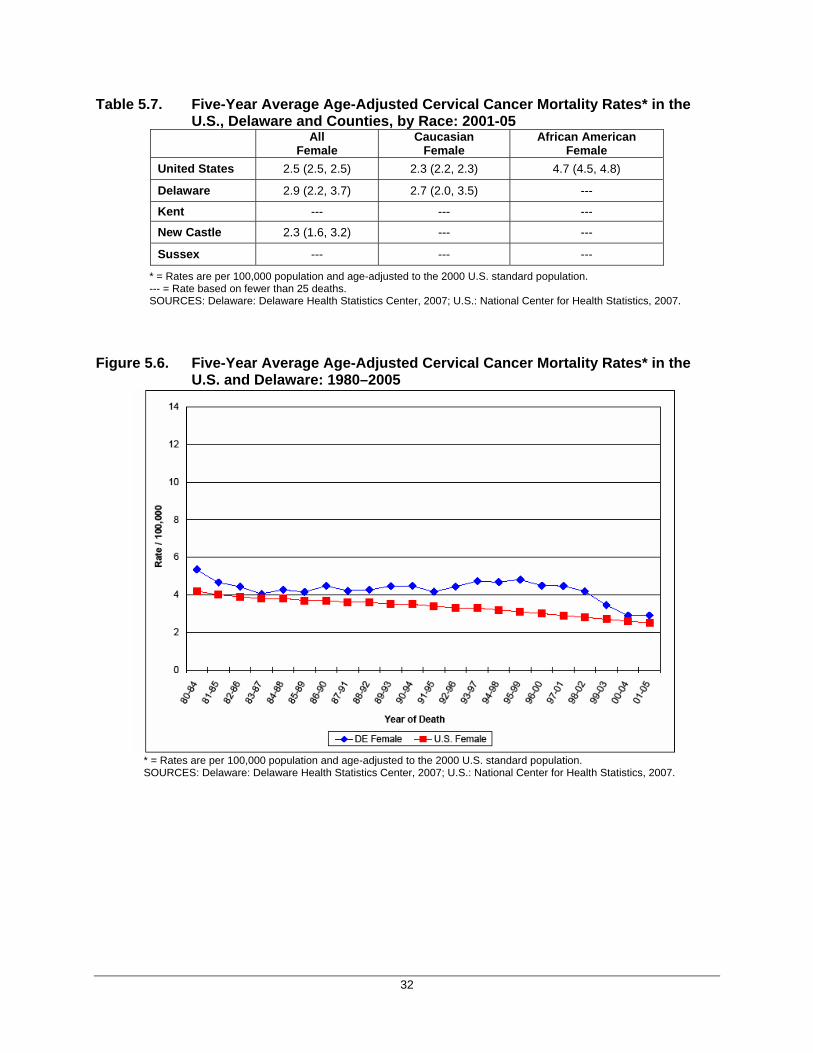
Table 5.7. Five-Year Average Age-Adjusted Cervical Cancer Mortality Rates* in the U.S., Delaware and Counties (2001-05), by Race .............................................. 32
Table 5.8. Age-Specific Cervical Cancer Mortality Rates* in Delaware, by Race: 2001-05 ............................................................................................................... 33
6. COLORECTAL CANCER
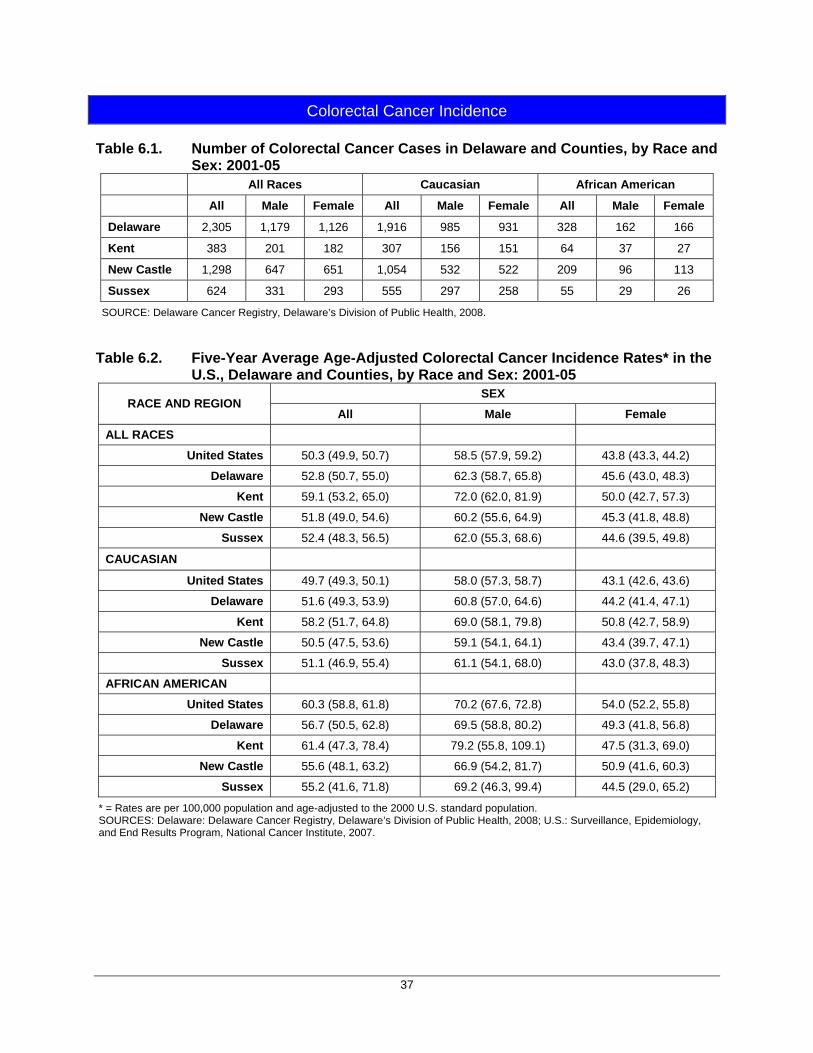
Table 6.1. Number of Colorectal Cancer Cases in Delaware and Counties, by Race and Sex: 2001-05 ....................................................................................................... 37
Table 6.2. Five-Year Average Age-Adjusted Colorectal Cancer Incidence Rates* in the U.S. , Delaware and Counties (2001-05), by Race and Sex ................................................................................................. 37
Table 6.3. Age-Specific Colorectal Cancer Incidence Rates* in Delaware, by Race and Sex: 2001-05 ....................................................................................................... 39
Table 6.4. Number of Colorectal Cancer Cases in Delaware, by Stage at Diagnosis, Race and Sex: 2001-05....................................................................................... 40
Table 6.5. Percentage of Colorectal Cancer Cases in Delaware, by Stage at Diagnosis, Race and Sex: 2001-05....................................................................................... 41
Table 6.6. Number of Colorectal Cancer Deaths in Delaware and Counties, by Race and Sex: 2001-05 ....................................................................................................... 42
Table 6.7. Five-Year Average Age-Adjusted Colorectal Cancer Mortality Rates* in the U.S., Delaware and Counties (2001-05), by Race and Sex ............................................................................................................... 43
Table 6.8. Age-Specific Colorectal Cancer Mortality Rates* in Delaware, by Race and Sex: 2001-05 ....................................................................................................... 45
7. LUNG AND BRONCHIAL CANCER
Table 7.1. Number of Lung and Bronchial Cancer Cases in Delaware and Counties, by Race and Sex: 2001-05....................................................................................... 50
Table 7.2. Five-Year Average Age-Adjusted Lung and Bronchial Cancer Incidence Rates* in the U.S. , Delaware and Counties (2001-05), by Race and Sex.......... 50
Table 7.3. Age-Specific Lung and Bronchial Cancer Incidence Rates* in Delaware, by Race and Sex: 2001-05....................................................................................... 52
Table 7.4. Number of Lung and Bronchial Cancer Cases in Delaware, by Stage at Diagnosis, Race and Sex: 2001-05..................................................................... 53
Table 7.5. Percentage of Lung and Bronchial Cancer Cases in Delaware, by Stage at Diagnosis, Race and Sex: 2001-05..................................................................... 54
Table 7.6. Number of Lung and Bronchial Cancer Deaths in Delaware and Counties, by Race and Sex: 2001-05....................................................................................... 55
Table 7.7. Five-Year Average Age-Adjusted Lung and Bronchial Cancer Mortality Rates* in the U.S., Delaware and Counties (2001-05), by Race and Sex...................................................................................................... 56
Table 7.8. Age-Specific Lung and Bronchial Cancer Mortality Rates* in Delaware, by Race and Sex: 2001-05....................................................................................... 58
8. PROSTATE CANCER
Table 8.1. Number of Prostate Cancer Cases in Delaware and Counties, by Race: 2001-05 ............................................................................................................... 63
iv
Table 8.2. Five-Year Average Age-Adjusted Prostate Cancer Incidence Rates* in the U.S. , Delaware and Counties (2001-05), by Race ............................................................................................................... 63
Table 8.3. Age-Specific Prostate Cancer Incidence Rates* in Delaware, by Race: 2001-05 ............................................................................................................... 65
Table 8.4. Number of Prostate Cancer Cases in Delaware, by Stage at Diagnosis and Race: 2001-05..................................................................................................... 66
Table 8.5. Percentage of Prostate Cancer Cases in Delaware, by Stage at Diagnosis and Race: 2001-05.............................................................................................. 67
Table 8.6. Number of Prostate Cancer Deaths in Delaware and Counties, by Race: 2001-05 ............................................................................................................... 68
Table 8.7. Five-Year Average Age-Adjusted Prostate Cancer Mortality Rates* in the U.S., Delaware and Counties (2001-05), by Race .............................................. 69
Table 8.8. Age-Specific Prostate Cancer Mortality Rates* in Delaware, by Race: 2001-05 ............................................................................................................... 70
v
LIST OF FIGURES
3. ALL CANCER SITES
Figure 3.1. Five-Year Average Age-Adjusted All-Cancer Incidence Rates* in the U.S. and Delaware, by Sex: 1980–2005 ..............................................................................6
Figure 3.2. Five-Year Average Age-Adjusted All-Cancer Incidence Rates* in Delaware, by Race and Sex: 1980–2005....................................................................................7
Figure 3.3. Age-Specific All-Cancer Incidence Rates in Delaware, by Race: 2001-05 ...........8 Figure 3.4. Five-Year Average Age-Adjusted All-Cancer Mortality Rates* in the United
States and Delaware, by Sex: 1980–2005 ..........................................................10 Figure 3.5. Five-Year Average Age-Adjusted All-Cancer Mortality Rates* in Delaware, by
Race and Sex: 1980–2005..................................................................................11 Figure 3.6. Age-Specific All-Cancer Mortality Rates in Delaware, by Race: 2001-05 ...........12
4. FEMALE BREAST CANCER
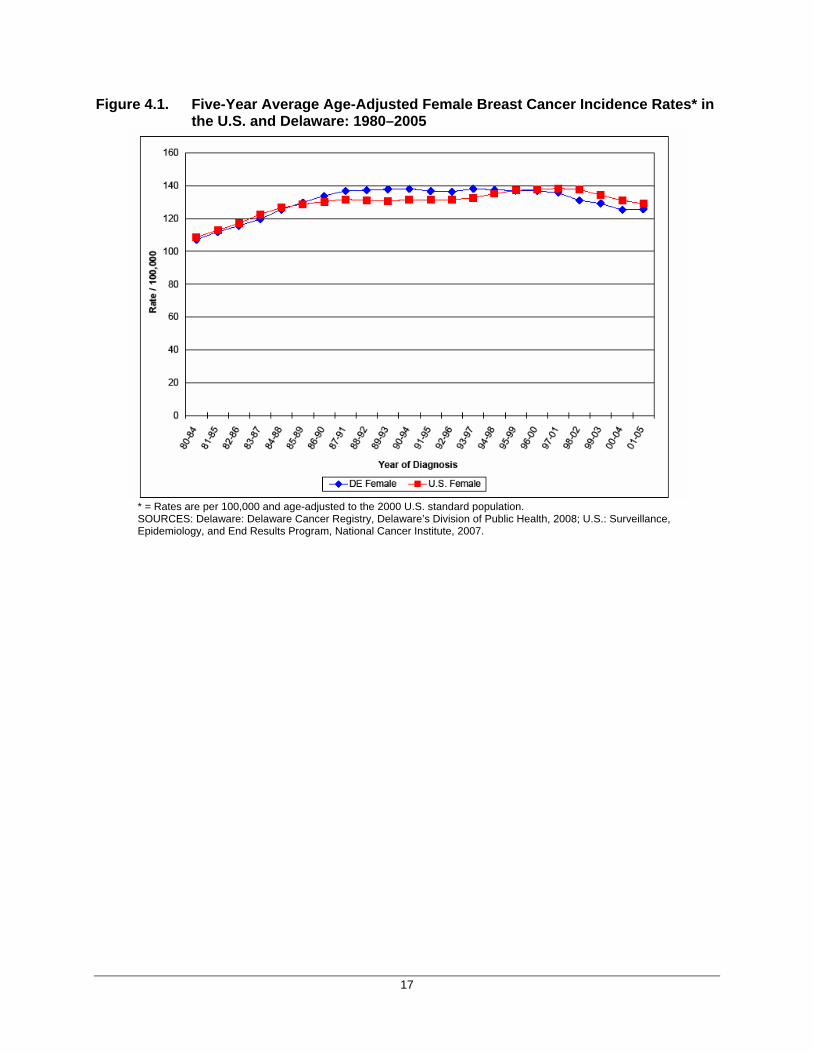
Figure 4.1. Five-Year Average Age-Adjusted Female Breast Cancer Incidence Rates* in the U.S. and Delaware: 1980–2005 ...................................................................17
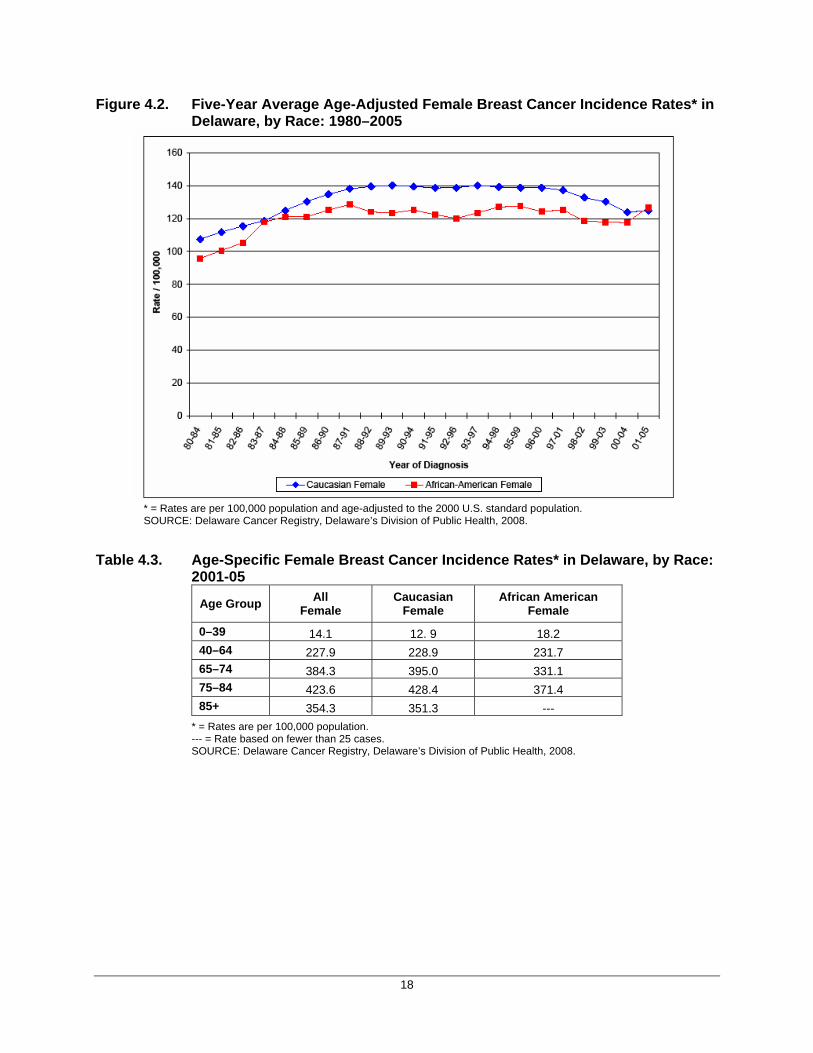
Figure 4.2. Five-Year Average Age-Adjusted Female Breast Cancer Incidence Rates* in Delaware, by Race: 1980–2005 ..........................................................................18
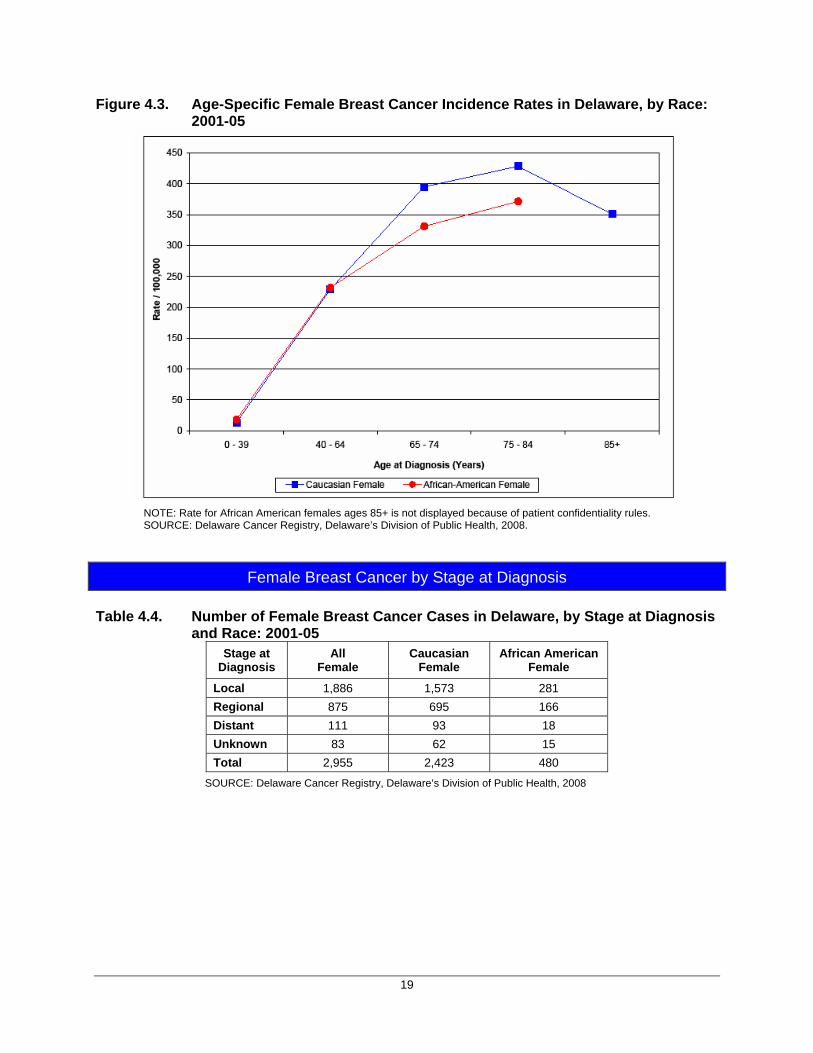
Figure 4.3. Age-Specific Female Breast Cancer Incidence Rates in Delaware, by Race: 2001-05 ...............................................................................................................19
Figure 4.4. Percentage of Female Breast Cancer Cases in Delaware and the U.S. : 2001-05, by Stage at Diagnosis ..........................................................20
Figure 4.5. Percentage of Female Breast Cancer Cases in Delaware, by Stage at Diagnosis: 1980–2005.........................................................................................21
Figure 4.6. Five-Year Average Age-Adjusted Female Breast Cancer Mortality Rates* in the U.S. and Delaware: 1980–2005 ....................................................................22
Figure 4.7. Five-Year Average Age-Adjusted Female Breast Cancer Mortality Rates* in Delaware, by Race: 1980–2005 ..........................................................................23
Figure 4.8. Age-Specific Female Breast Cancer Mortality Rates in Delaware, by Race: 2001-05 ...............................................................................................................23
5. CERVICAL CANCER
Figure 5.1. Five-Year Average Age-Adjusted Cervical Cancer Incidence Rates* in the U.S. and Delaware: 1980–2005 .........................................................................28
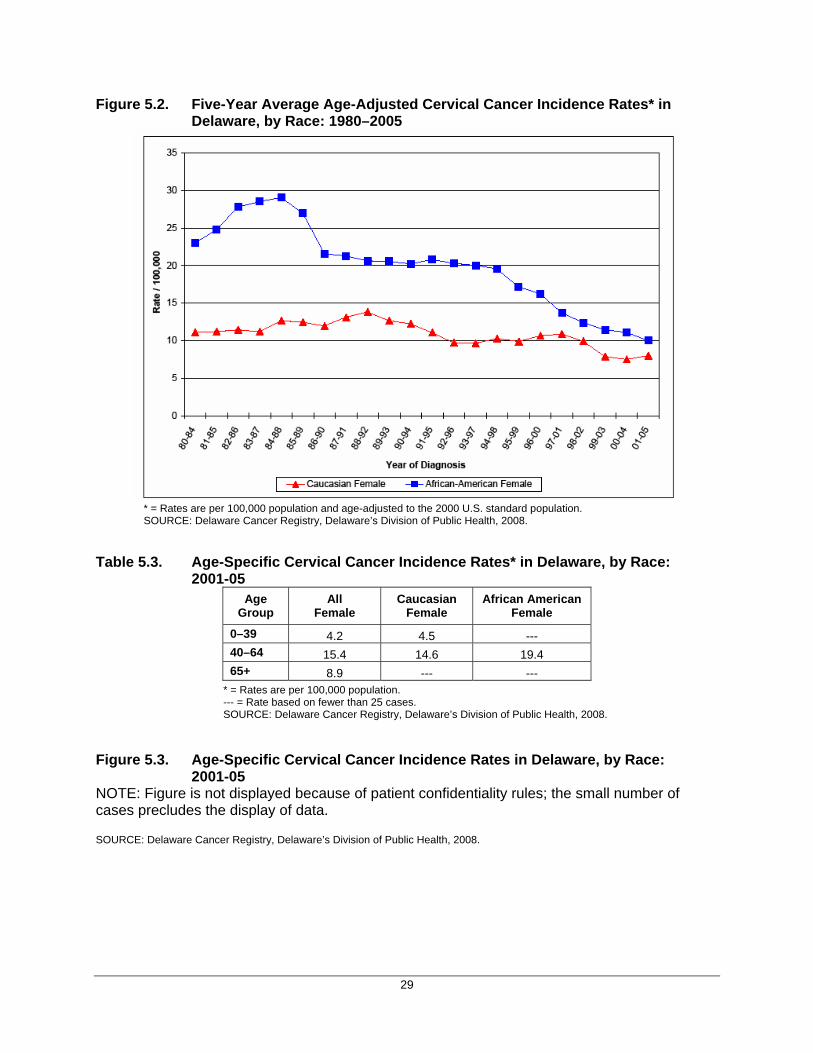
Figure 5.2. Five-Year Average Age-Adjusted Cervical Cancer Incidence Rates* in Delaware, by Race: 1980–2005 ..........................................................................29
Figure 5.3. Age-Specific Cervical Cancer Incidence Rates in Delaware, by Race: 2001-05 ...............................................................................................................29
Figure 5.4. Percentage of Cervical Cancer Cases in Delaware and the U.S. : 2001-05, by Stage at Diagnosis ................................................................30
Figure 5.5. Percentage of Cervical Cancer Cases in Delaware, by Stage at Diagnosis: 1980–2005 ..........................................................................................................31
Figure 5.6. Five-Year Average Age-Adjusted Cervical Cancer Mortality Rates* in the U.S. and Delaware: 1980–2005 ..........................................................................32
vi
Figure 5.7. Five-Year Average Age-Adjusted Cervical Cancer Mortality Rates* in Delaware, by Race: 1980–2005 ..........................................................................33
Figure 5.8. Age-Specific Cervical Cancer Mortality Rates in Delaware, by Race: 2001-05 ...............................................................................................................33
6. COLORECTAL CANCER
Figure 6.1. Five-Year Average Age-Adjusted Colorectal Cancer Incidence Rates* in the U.S. and Delaware, by Sex: 1980–2005 .....................................................................38
Figure 6.2. Five-Year Average Age-Adjusted Colorectal Cancer Incidence Rates* in Delaware, by Race and Sex: 1980–2005............................................................39
Figure 6.3. Age-Specific Colorectal Cancer Incidence Rates in Delaware, by Race: 2001-05 ...............................................................................................................40
Figure 6.4. Percentage of Colorectal Cancer Cases in Delaware and the U.S. : 2001-05), by Stage at Diagnosis ...............................................................41
Figure 6.5. Percentage of Colorectal Cancer Cases in Delaware, by Stage at Diagnosis: 1980–2005 ..........................................................................................................42
Figure 6.6. Five-Year Average Age-Adjusted Colorectal Cancer Mortality Rates* in the U.S. and Delaware, by Sex: 1980–2005 .....................................................................44
Figure 6.7. Five-Year Average Age-Adjusted Colorectal Cancer Mortality Rates* in Delaware, by Race and Sex: 1980–2005............................................................45
Figure 6.8. Age-Specific Colorectal Cancer Mortality Rates* in Delaware, by Race: 2001-05 ...............................................................................................................46
7. LUNG AND BRONCHIAL CANCER
Figure 7.1. Five-Year Average Age-Adjusted Lung and Bronchial Cancer Incidence Rates* in the U.S. and Delaware, by Sex: 1980–2005.......................................51
Figure 7.2. Five-Year Average Age-Adjusted Lung and Bronchial Cancer Incidence Rates* in Delaware, by Race and Sex: 1980–2005 ............................................52
Figure 7.3. Age-Specific Lung and Bronchial Cancer Incidence Rates in Delaware, by Race: 2001-05.....................................................................................................53
Figure 7.4. Percentage of Lung and Bronchial Cancer Cases in Delaware and the U.S. : 2001-05), by Stage at Diagnosis .........................................................................54
Figure 7.5. Percentage of Lung and Bronchial Cancer Cases in Delaware, by Stage at Diagnosis: 1980–2005.........................................................................................55
Figure 7.6. Five-Year Average Age-Adjusted Lung and Bronchial Cancer Mortality Rates* n the U.S. and Delaware, by Sex: 1980–2005 ....................................................57
Figure 7.7. Five-Year Average Age-Adjusted Lung and Bronchial Cancer Mortality Rates* in Delaware, by Race and Sex: 1980–2005 ........................................................58
Figure 7.8. Age-Specific Lung and Bronchial Cancer Mortality Rates in Delaware, by Race: 2001-05.....................................................................................................59
8. PROSTATE CANCER
Figure 8.1. Five-Year Average Age-Adjusted Prostate Cancer Incidence Rates* in the U.S. and Delaware: 1980–2005 .........................................................................64
Figure 8.2. Five-Year Average Age-Adjusted Prostate Cancer Incidence Rates* in Delaware, by Race: 1980–2005 ..........................................................................65
Figure 8.3. Age-Specific Prostate Cancer Incidence Rates in Delaware, by Race: 2001-05 ...............................................................................................................66
vii
Figure 8.4. Percentage of Prostate Cancer Cases in Delaware and the U.S. : 2001-05, by Stage at Diagnosis ................................................................67
Figure 8.5. Percentage of Prostate Cancer Cases in Delaware, by Stage at Diagnosis: 1980–2005 ..........................................................................................................68
Figure 8.6. Five-Year Average Age-Adjusted Prostate Cancer Mortality Rates* in the U.S. and Delaware: 1980–2005 ..........................................................................69
Figure 8.7. Five-Year Average Age-Adjusted Prostate Cancer Mortality Rates* in Delaware, by Race: 1980–2005 ..........................................................................70
Figure 8.8. Age-Specific Prostate Cancer Mortality Rates in Delaware, by Race: 2001-05 ...............................................................................................................71
1
1. INTRODUCTION 1.1. DELAWARE CANCER REGISTRY The Delaware Cancer Registry (DCR) serves as the state’s central cancer information center. The DCR is part of the Health Information & Science section of Delaware’s Division of Public Health. The DCR ensures accurate, timely and routine surveillance of cancer and certain benign tumors. The DCR was founded in 1972 and legally established in 1980 under the Delaware Cancer Control Act. The act stipulated that all hospitals, clinical laboratories and cancer treatment centers in the state report all new cancer cases to the DCR. In 1996, the Delaware Cancer Control Act was amended to require any health care practitioner who diagnoses or provides treatment to report cancer cases to the DCR. Further enhancements of the Delaware Cancer Control Act took effect in 2002 with the passage of Senate Bill 372. Senate Bill 372 required physicians to provide additional information to the DCR, including patients’ duration of residence in Delaware and their occupational history. Senate Bill 372 also extended the reporting deadline to 180 days from initial diagnosis or treatment. Today, Delaware is one of 45 states whose cancer registry is supported by the National Program of Cancer Registries (NPCR) of the Centers for Disease Control and Prevention. 1.1.1. Reporting Facilities A total of 33 facilities submit reports to the DCR; these facilities include all hospitals in Delaware, 10 diagnostic laboratories, 15 free-standing ambulatory surgery centers, and hundreds of physician offices. Additionally, the DCR has established reciprocal data exchange agreements with Alaska, Florida, Maryland, New Jersey, Pennsylvania, South Carolina, Texas, Washington, Wyoming and the District of Columbia. Interstate data exchange agreements assist in the identification of Delawareans whose cancers were diagnosed and/or treated in other states. 1.1.2. Data Confidentiality The DCR maintains patient confidentiality using a combination of techniques. Cancer data are submitted from reporting facilities using computerized data encryption techniques. Published reports and data requests are limited to the presentation of aggregate data. DCR datasets are released only after the removal of all personal identifiers. Researchers who use DCR data must comply with the regulations stated in the formal data-use agreement or obtain clearance from Delaware’s Human Subjects Review Board. 1.1.3. Data Quality Quality control procedures are implemented internally at the DCR to verify the consistency of coded demographic and medical information. Data consistency standards are set by the North American Association of Central Cancer Registries (NAACCR). The DCR performs visual reviews of coded data items; electronic text submissions are also checked for consistency. The DCR conducts record consolidation using a computerized matching program to identify multiple reports on the same individual. This scenario often arises when a patient is diagnosed and treated in separate hospitals, and each hospital submits a cancer case abstract to the DCR.

2
1.1.4. NAACCR Certification and NPCR Standard Status NAACCR certifies DCR data on an annual basis. Gold or silver certifications are awarded after an evaluation of data quality, completeness, and timeliness of reporting. DCR data met NAACCR standards for high quality for diagnosis years 1997, 1998, 1999, 2002, 2003 and 2004. Additionally, NPCR provides an annual Standard Status Report to state cancer registries supported by the CDC. Delaware’s data submission for diagnosis years 1997–2005 met the standard levels for quality, completeness and timeliness. 1.1.5. Data Uses The Delaware Division of Public Health uses DCR data to support various programs and initiatives including the Screening for Life Program and the Delaware Cancer Treatment Program. The Division of Public Health also uses DCR data to investigate citizen inquiries and provide up-to-date cancer statistics to federal agencies, research institutions, and academic institutions. The Delaware Cancer Consortium and other advisory committees rely heavily on DCR data to monitor cancer trends across the state. 1.2. ORGANIZATION OF THIS REPORT This report focuses on all site cancer, as well as, cervical, colorectal, lung, female breast and prostate cancers. Cancer incidence and mortality statistics for Delaware are broken down by sex, race and county. Race-specific data are limited to Caucasians and African Americans; cancer rates for other racial groups (e.g., Hispanic) are not presented due to small sample size issues and the need to protect patient confidentiality. Relevant behavioral risk factor data and stage at diagnosis are also presented throughout the report. Appendices A-D contain supplemental methodological information related to the report. Appendix E summarizes behavioral risk factor data specific to Delawareans.
2. GUIDELINES FOR THE INTERPRETATION OF INCIDENCE AND MORTALITY RATES
2.1. INCIDENCE AND MORTALITY RATES Rates are expressed per 100,000 individuals (i.e., cancer rates for Delaware are expressed per 100,000 Delawareans; cancer rates for the U.S. are expressed per 100,000 U.S. residents). Ninety-five-percent confidence intervals were computed for each cancer rate. Confidence intervals represent the range of values in which the cancer rate could reasonably fall. Confidence intervals were used to determine if the amount by which two cancer rates differ was statistically significant. If the confidence interval for one rate did not overlap with the confidence interval for another rate, the two rates were significantly different. When one rate is significantly different from another rate, the difference between the rates is larger than would be expected by chance alone. If the confidence interval for one rate overlapped with the confidence interval for another rate, the two rates were not significantly different. When rates are not significantly different from one another, it is commonly interpreted as “no meaningful difference” between rates.
3
3. All Cancer Sites (All Site)
Data Highlights New All Site Cancer Cases and Deaths (Tables 3.1 and 3.4)
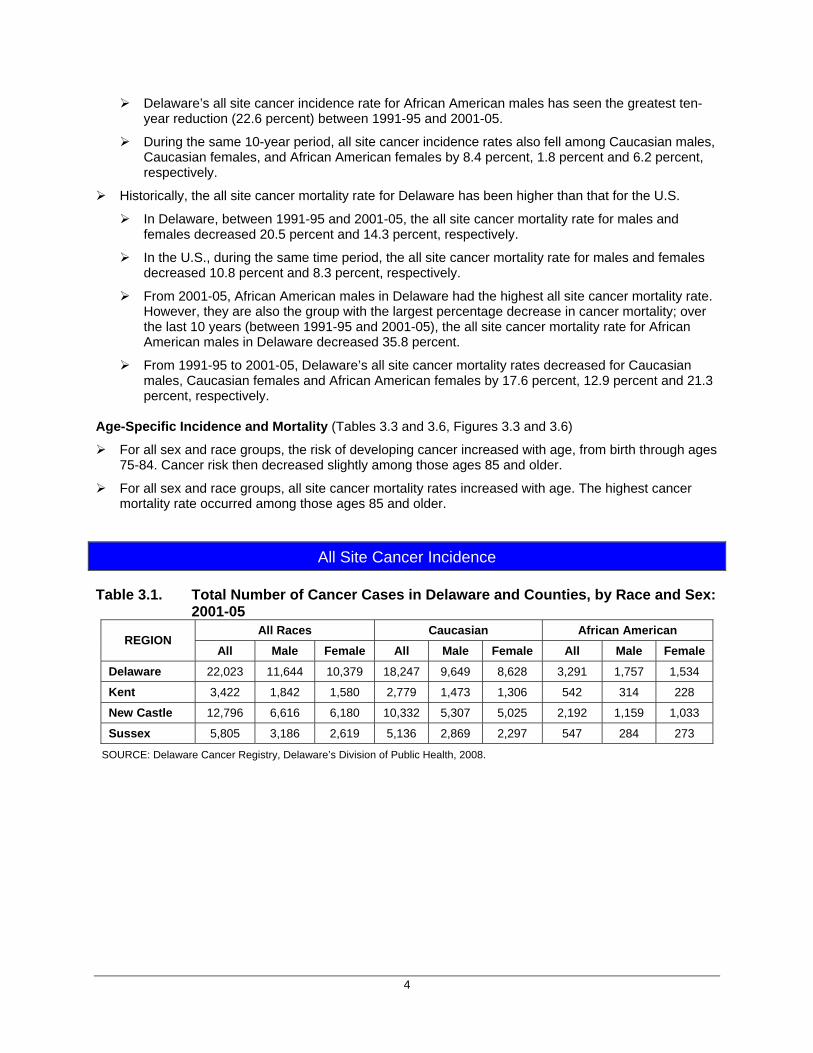
A total of 22,023 cases of cancer were diagnosed in Delaware between 2001 and 2005: 11,644 cases (52.9 percent) were diagnosed among males and 10,379 cases (47.1 percent) were diagnosed among females.
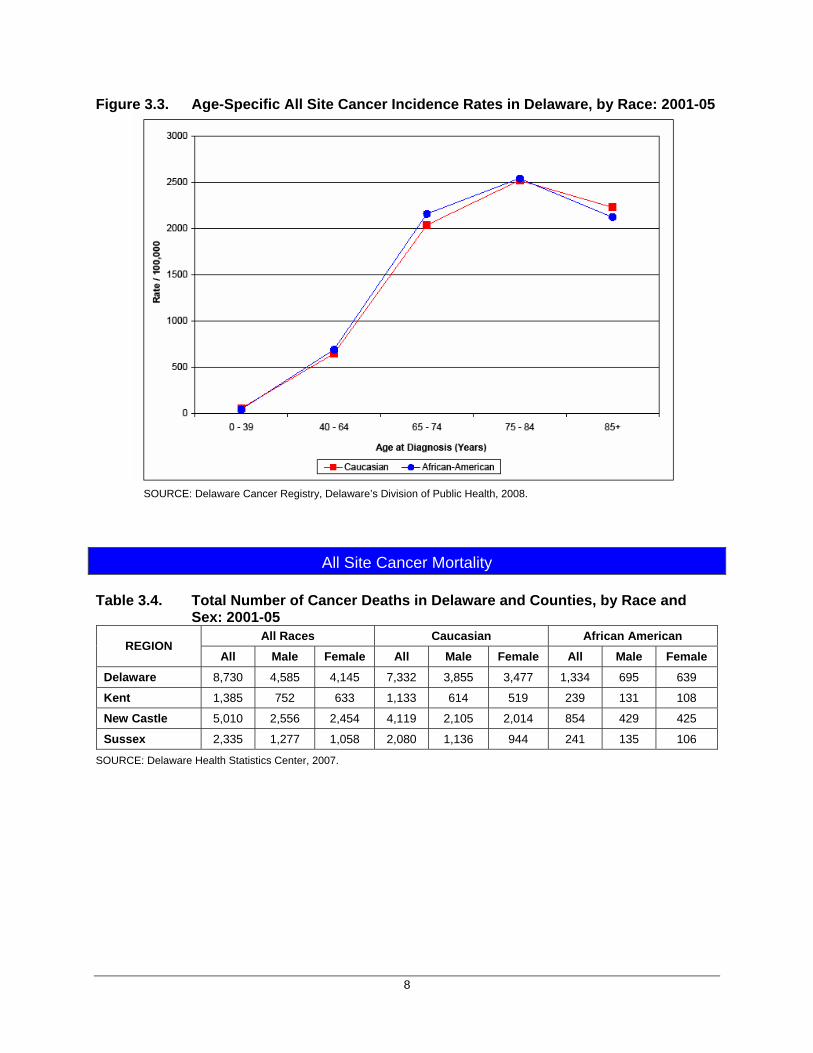
From 2001-05, 8,730 Delawareans died from cancer: 4,585 decedents (52.5 percent) were male and 4,145 decedents (47.5 percent) were female.
Incidence and Mortality Rates (Tables 3.2 and 3.5)
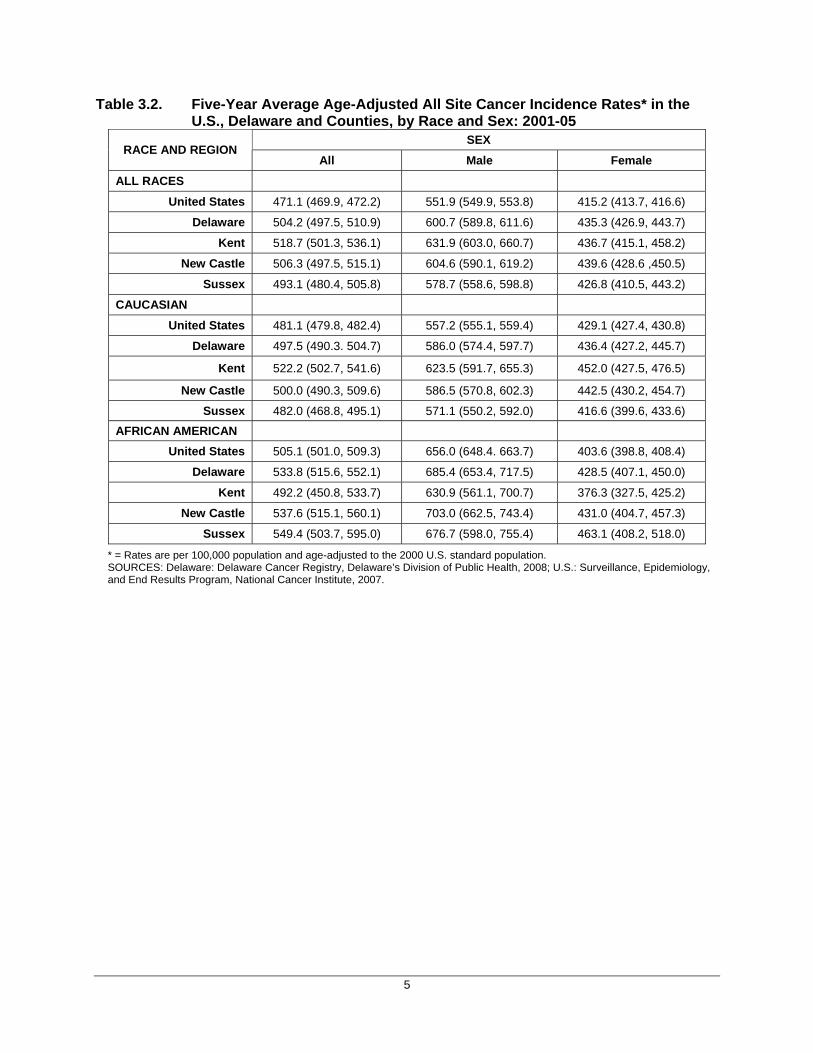
Delaware’s 2001-05 all site cancer incidence rate of 504.2 per 100,000 was significantly higher than the U.S. rate of 471.1 per 100,000.
The 2001-05 Delaware all site cancer incidence rate among males (600.7 per 100,000) was significantly higher than the rate among females (435.3 per 100,000); this difference persisted in all race and county groups.
Delaware’s 2001-05 all site incidence rate for African Americans (533.8 per 100,000) was significantly higher than the rate for Caucasians (497.5 per 100,000).
Incidence rates were significantly higher for African American males than for Caucasian males.
No significant differences were observed between the incidence rates for African American and Caucasian females.
Delaware’s 2001-05 overall cancer mortality rate of 200.6 per 100,000 was significantly higher than the U.S. rate of 189.8 per 100,000.
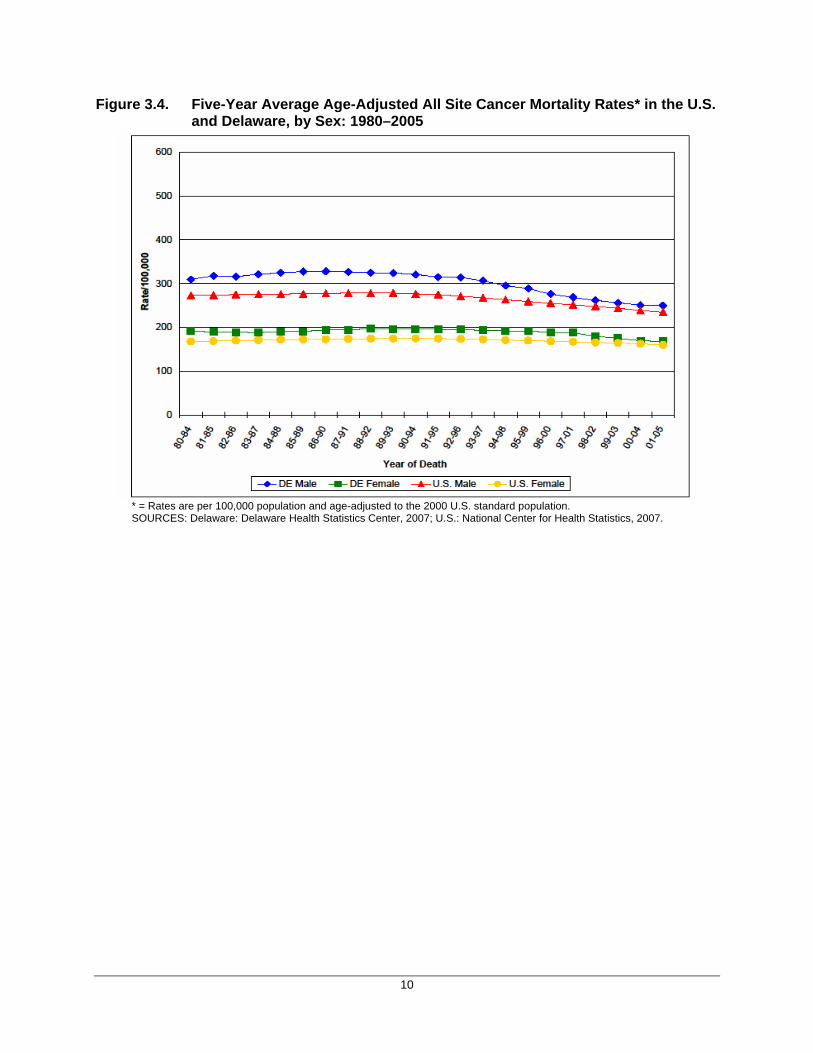
In Delaware, the 2001-05 all site cancer mortality rate for males (252.1 per 100,000) was significantly higher than that for females (170.7 per 100,000). This significant difference was observed among all race and county groups. At the national level, the all site cancer mortality rate for males was also significantly greater than that for females (234.4 per 100,000 vs. 159.9 per 100,000, respectively).
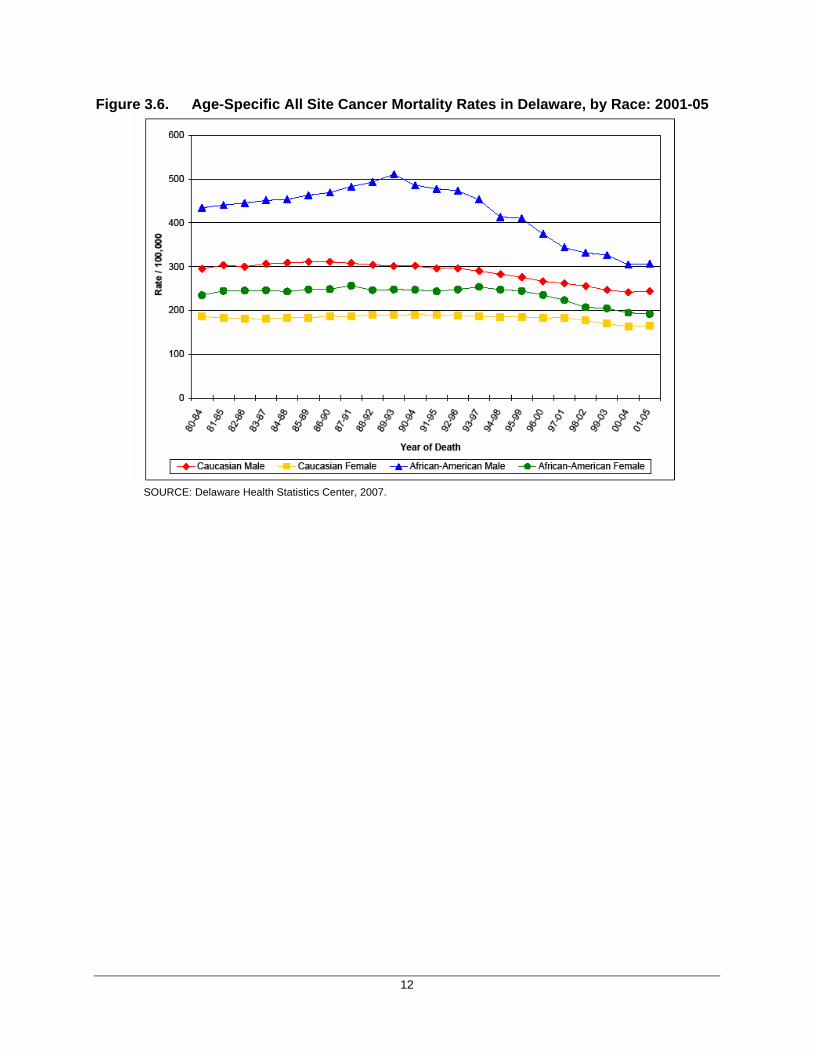
In the U.S., Delaware, and Sussex County, 2001-05 all site cancer mortality rates for African Americans of either sex were significantly higher than mortality rates for their Caucasian counterparts.
The Kent County mortality rates for African Americans of either sex were not significantly different from rates for their Caucasians counterparts.
The New Castle County mortality rate for African American males was significantly higher than the rate for Caucasian males; mortality rates for African American and Caucasian females in New Castle County were not significantly different.
Trends in Cancer Incidence and Mortality Rates (Figures 3.1–3.2 and 3.4–3.5)
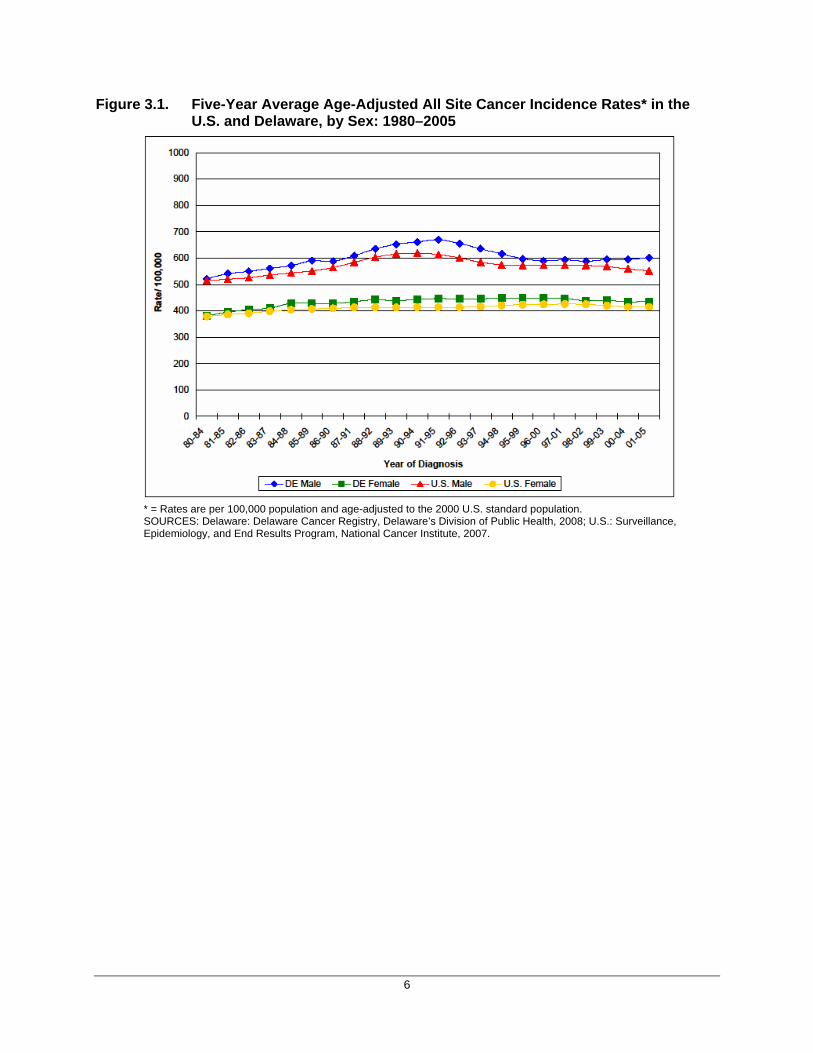
Delaware’s all site cancer incidence rate decreased 5.3 percent from 1991-95 to 2001-05. During the same time period, the U.S. all site cancer incidence rate decreased 4.4 percent.
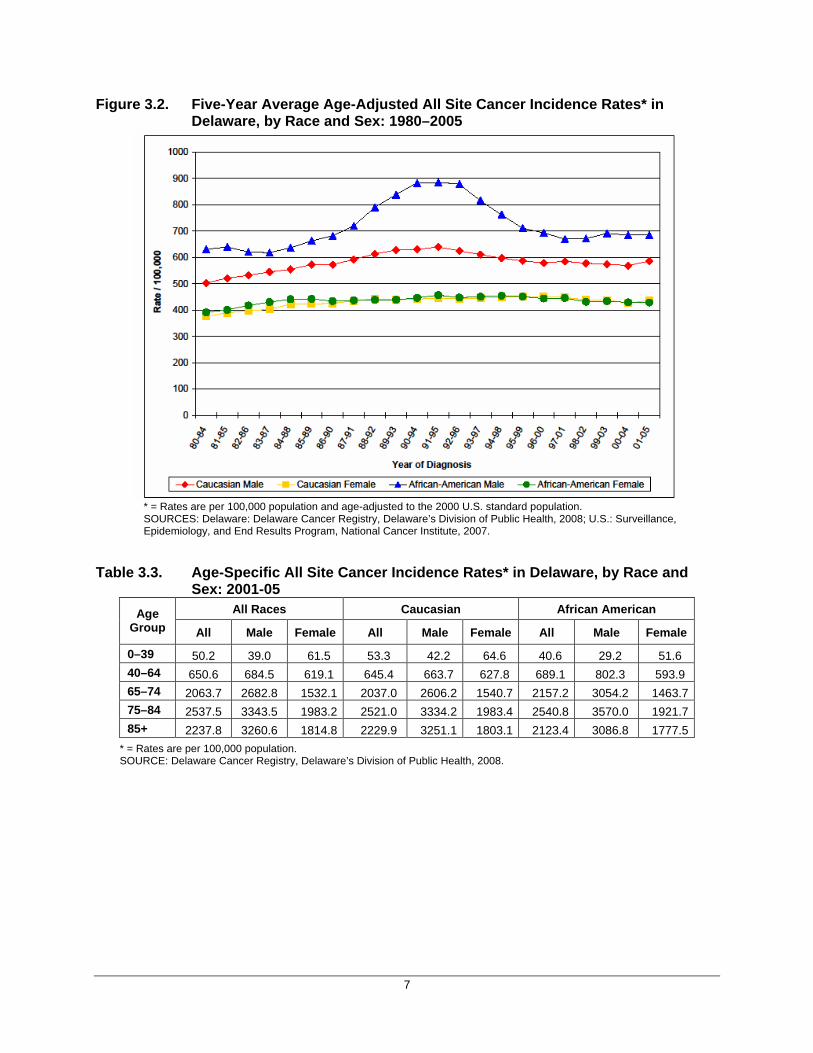
In Delaware, the percentage decrease in all site cancer incidence rates was larger for African Americans compared to Caucasians (13.8 percent vs. 4.1 percent, respectively) and for males compared to females (10.4 percent vs. 2.6 percent, respectively).
4
Delaware’s all site cancer incidence rate for African American males has seen the greatest ten-year reduction (22.6 percent) between 1991-95 and 2001-05.
During the same 10-year period, all site cancer incidence rates also fell among Caucasian males, Caucasian females, and African American females by 8.4 percent, 1.8 percent and 6.2 percent, respectively.
Historically, the all site cancer mortality rate for Delaware has been higher than that for the U.S.
In Delaware, between 1991-95 and 2001-05, the all site cancer mortality rate for males and females decreased 20.5 percent and 14.3 percent, respectively.
In the U.S., during the same time period, the all site cancer mortality rate for males and females decreased 10.8 percent and 8.3 percent, respectively.
From 2001-05, African American males in Delaware had the highest all site cancer mortality rate. However, they are also the group with the largest percentage decrease in cancer mortality; over the last 10 years (between 1991-95 and 2001-05), the all site cancer mortality rate for African American males in Delaware decreased 35.8 percent.
From 1991-95 to 2001-05, Delaware’s all site cancer mortality rates decreased for Caucasian males, Caucasian females and African American females by 17.6 percent, 12.9 percent and 21.3 percent, respectively.
Age-Specific Incidence and Mortality (Tables 3.3 and 3.6, Figures 3.3 and 3.6)
For all sex and race groups, the risk of developing cancer increased with age, from birth through ages 75-84. Cancer risk then decreased slightly among those ages 85 and older.
For all sex and race groups, all site cancer mortality rates increased with age. The highest cancer mortality rate occurred among those ages 85 and older.
All Site Cancer Incidence Table 3.1. Total Number of Cancer Cases in Delaware and Counties, by Race and Sex:
2001-05 All Races Caucasian African American
REGION All Male Female All Male Female All Male Female
Delaware 22,023 11,644 10,379 18,247 9,649 8,628 3,291 1,757 1,534
Kent 3,422 1,842 1,580 2,779 1,473 1,306 542 314 228
New Castle 12,796 6,616 6,180 10,332 5,307 5,025 2,192 1,159 1,033
Sussex 5,805 3,186 2,619 5,136 2,869 2,297 547 284 273
SOURCE: Delaware Cancer Registry, Delaware’s Division of Public Health, 2008.
5
Table 3.2. Five-Year Average Age-Adjusted All Site Cancer Incidence Rates* in the U.S., Delaware and Counties, by Race and Sex: 2001-05
SEX RACE AND REGION
All Male Female ALL RACES
United States 471.1 (469.9, 472.2) 551.9 (549.9, 553.8) 415.2 (413.7, 416.6)
Delaware 504.2 (497.5, 510.9) 600.7 (589.8, 611.6) 435.3 (426.9, 443.7)
Kent 518.7 (501.3, 536.1) 631.9 (603.0, 660.7) 436.7 (415.1, 458.2)
New Castle 506.3 (497.5, 515.1) 604.6 (590.1, 619.2) 439.6 (428.6 ,450.5)
Sussex 493.1 (480.4, 505.8) 578.7 (558.6, 598.8) 426.8 (410.5, 443.2)
CAUCASIAN
United States 481.1 (479.8, 482.4) 557.2 (555.1, 559.4) 429.1 (427.4, 430.8)
Delaware 497.5 (490.3. 504.7) 586.0 (574.4, 597.7) 436.4 (427.2, 445.7)
Kent 522.2 (502.7, 541.6) 623.5 (591.7, 655.3) 452.0 (427.5, 476.5)
New Castle 500.0 (490.3, 509.6) 586.5 (570.8, 602.3) 442.5 (430.2, 454.7)
Sussex 482.0 (468.8, 495.1) 571.1 (550.2, 592.0) 416.6 (399.6, 433.6)
AFRICAN AMERICAN
United States 505.1 (501.0, 509.3) 656.0 (648.4. 663.7) 403.6 (398.8, 408.4)
Delaware 533.8 (515.6, 552.1) 685.4 (653.4, 717.5) 428.5 (407.1, 450.0)
Kent 492.2 (450.8, 533.7) 630.9 (561.1, 700.7) 376.3 (327.5, 425.2)
New Castle 537.6 (515.1, 560.1) 703.0 (662.5, 743.4) 431.0 (404.7, 457.3)
Sussex 549.4 (503.7, 595.0) 676.7 (598.0, 755.4) 463.1 (408.2, 518.0)
* = Rates are per 100,000 population and age-adjusted to the 2000 U.S. standard population. SOURCES: Delaware: Delaware Cancer Registry, Delaware’s Division of Public Health, 2008; U.S.: Surveillance, Epidemiology, and End Results Program, National Cancer Institute, 2007.
6
Figure 3.1. Five-Year Average Age-Adjusted All Site Cancer Incidence Rates* in the U.S. and Delaware, by Sex: 1980–2005
* = Rates are per 100,000 population and age-adjusted to the 2000 U.S. standard population. SOURCES: Delaware: Delaware Cancer Registry, Delaware’s Division of Public Health, 2008; U.S.: Surveillance, Epidemiology, and End Results Program, National Cancer Institute, 2007.
7
Figure 3.2. Five-Year Average Age-Adjusted All Site Cancer Incidence Rates* in Delaware, by Race and Sex: 1980–2005
* = Rates are per 100,000 population and age-adjusted to the 2000 U.S. standard population. SOURCES: Delaware: Delaware Cancer Registry, Delaware’s Division of Public Health, 2008; U.S.: Surveillance, Epidemiology, and End Results Program, National Cancer Institute, 2007.
Table 3.3. Age-Specific All Site Cancer Incidence Rates* in Delaware, by Race and Sex: 2001-05
All Races Caucasian African American Age Group All Male Female All Male Female All Male Female
0–39 50.2 39.0 61.5 53.3 42.2 64.6 40.6 29.2 51.6 40–64 650.6 684.5 619.1 645.4 663.7 627.8 689.1 802.3 593.9 65–74 2063.7 2682.8 1532.1 2037.0 2606.2 1540.7 2157.2 3054.2 1463.775–84 2537.5 3343.5 1983.2 2521.0 3334.2 1983.4 2540.8 3570.0 1921.785+ 2237.8 3260.6 1814.8 2229.9 3251.1 1803.1 2123.4 3086.8 1777.5
* = Rates are per 100,000 population. SOURCE: Delaware Cancer Registry, Delaware’s Division of Public Health, 2008.
8
Figure 3.3. Age-Specific All Site Cancer Incidence Rates in Delaware, by Race: 2001-05
SOURCE: Delaware Cancer Registry, Delaware’s Division of Public Health, 2008.
All Site Cancer Mortality Table 3.4. Total Number of Cancer Deaths in Delaware and Counties, by Race and
Sex: 2001-05 All Races Caucasian African American
REGION All Male Female All Male Female All Male Female
Delaware 8,730 4,585 4,145 7,332 3,855 3,477 1,334 695 639
Kent 1,385 752 633 1,133 614 519 239 131 108
New Castle 5,010 2,556 2,454 4,119 2,105 2,014 854 429 425
Sussex 2,335 1,277 1,058 2,080 1,136 944 241 135 106
SOURCE: Delaware Health Statistics Center, 2007.

9
Table 3.5. Five-Year Average Age-Adjusted All Site Cancer Mortality Rates* in the U.S., Delaware and Counties, by Race and Sex: 2001-05
SEX RACE AND REGION
All Male Female ALL RACES
United States 189.8 (189.5, 190.0) 234.4 (234.0, 234.7) 159.9 (159.6, 160.2)
Delaware 200.6 (196.4, 204.9) 250.1 (242.8, 257.6) 167.6 (162.6, 172.9)
Kent 214.4 (203.2, 226.0) 276.8 (256.6, 298.0) 173.3 (160.1,187.4)
New Castle 201.0 (195.5, 206.7) 250.1 (240.3, 260.2) 170.1 (163.4, 177.0)
Sussex 193.7 (185.8, 201.9) 238.6 (225.3, 252.5) 160.1 (150.4, 170.4)
CAUCASIAN
United States 188.0 (187.7, 188.2) 230.7 (230.3, 231.1) 159.2 (158.9, 159.5)
Delaware 196.8 (192.3, 201.4) 244.0 (236.1, 251.9) 165.3 (169.8, 171.0)
Kent 213.9 (201.6, 226.8) 276.7 (254.5, 300.2) 174.4 (159.6, 190.1)
New Castle 197.1 (191.1, 203.2) 244.0 (233.5, 254.7) 167.1 (159.8, 174.6)
Sussex 189.7 (181.4, 198.2) 232.0 (218.2, 246.4) 158.2 (148.0, 169.0)
AFRICAN AMERICAN
United States 234.0 (233.2, 234.8) 313.0 (311.4, 314.6) 186.7 (185.7, 187.6)
Delaware 236.0 (223.1, 249.3) 306.6 (282.5, 332.0) 191.7 (176.9, 207.3)
Kent 235.5 (205.9, 267.9) 287.5 (238.0, 343.6) 194.2 (158.9, 234.6)
New Castle 231.9 (216.0, 248.6) 305.9 (274.4, 339.6) 192.1 (173.9, 211.6)
Sussex 245.4 (215.3, 278.4) 334.6 (279.6, 396.5) 183.3 (150.0, 221.6)
* = Rates are per 100,000 population and age-adjusted to the 2000 U.S. standard population. SOURCES: Delaware: Delaware Health Statistics Center, 2007; U.S.: National Center for Health Statistics, 2007.
10
Figure 3.4. Five-Year Average Age-Adjusted All Site Cancer Mortality Rates* in the U.S. and Delaware, by Sex: 1980–2005
* = Rates are per 100,000 population and age-adjusted to the 2000 U.S. standard population. SOURCES: Delaware: Delaware Health Statistics Center, 2007; U.S.: National Center for Health Statistics, 2007.

11
Figure 3.5. Five-Year Average Age-Adjusted All Site Cancer Mortality Rates* in
Delaware, by Race and Sex: 1980–2005
* = Rates are per 100,000 population and age-adjusted to the 2000 U.S. standard population. SOURCE: Delaware Health Statistics Center, 2007.
Table 3.6. Age-Specific All Site Cancer Mortality Rates* in Delaware, by Race and
Sex: 2001-05 All Races Caucasian African American Age
Group All Male Female All Male Female All Male Female
0–39 7.3 6.3 8.3 7.5 6.0 8.9 7.6 7.9 7.3 40–64 183.5 198.3 169.7 181.3 193.1 170.0 212.4 247.7 182.7 65–74 797.8 984.6 637.3 778.4 964.2 616.4 974.4 1,191.9 806.3 75–84 1,409.0 1,831.5 1,118.5 1,396.0 1,793.6 1,118.6 1,598.1 2,268.2 1,195.085+ 1,767.3 2,652.7 1,401.1 1,772.6 2,657.8 1,402.7 1,738.7 2,620.9 1,422.0
* = Rates are per 100,000 population. SOURCE: Delaware Health Statistics Center, 2007.
12
Figure 3.6. Age-Specific All Site Cancer Mortality Rates in Delaware, by Race: 2001-05
SOURCE: Delaware Health Statistics Center, 2007.
13
4. Female Breast Cancer
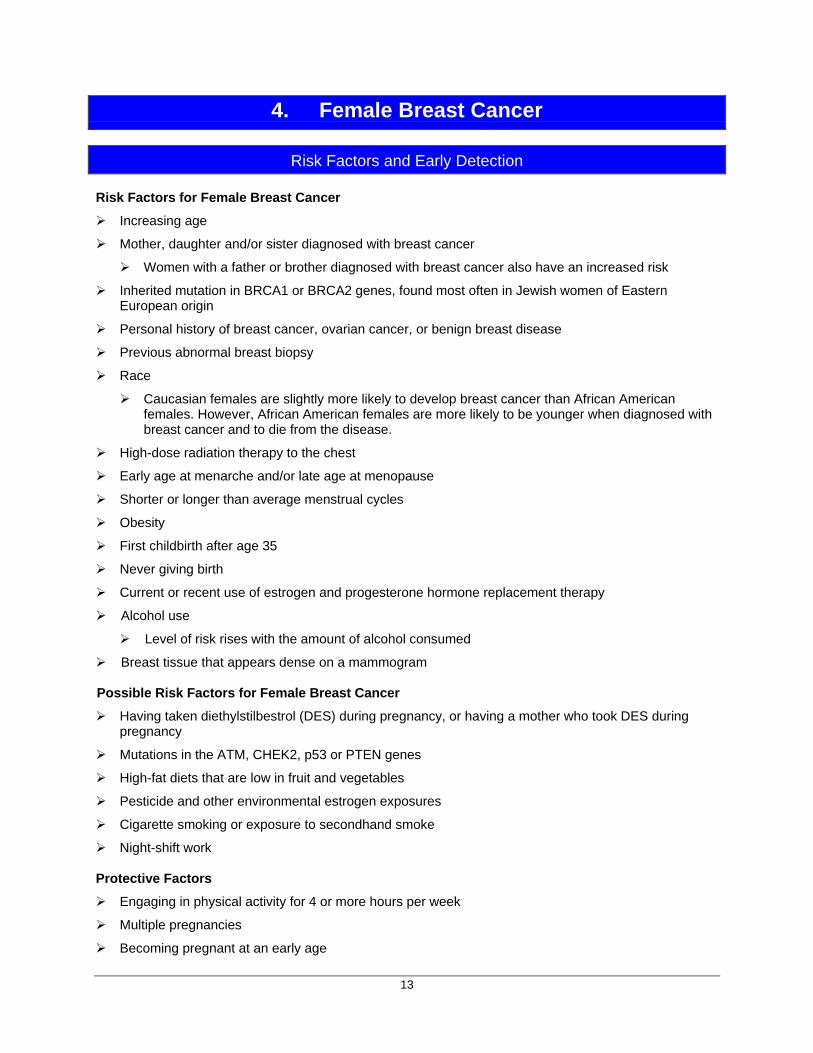
Risk Factors and Early Detection Risk Factors for Female Breast Cancer
Increasing age
Mother, daughter and/or sister diagnosed with breast cancer
Women with a father or brother diagnosed with breast cancer also have an increased risk
Inherited mutation in BRCA1 or BRCA2 genes, found most often in Jewish women of Eastern European origin
Personal history of breast cancer, ovarian cancer, or benign breast disease
Previous abnormal breast biopsy
Race
Caucasian females are slightly more likely to develop breast cancer than African American females. However, African American females are more likely to be younger when diagnosed with breast cancer and to die from the disease.
High-dose radiation therapy to the chest
Early age at menarche and/or late age at menopause
Shorter or longer than average menstrual cycles
Obesity
First childbirth after age 35
Never giving birth
Current or recent use of estrogen and progesterone hormone replacement therapy
Alcohol use
Level of risk rises with the amount of alcohol consumed
Breast tissue that appears dense on a mammogram Possible Risk Factors for Female Breast Cancer
Having taken diethylstilbestrol (DES) during pregnancy, or having a mother who took DES during pregnancy
Mutations in the ATM, CHEK2, p53 or PTEN genes
High-fat diets that are low in fruit and vegetables
Pesticide and other environmental estrogen exposures
Cigarette smoking or exposure to secondhand smoke
Night-shift work Protective Factors
Engaging in physical activity for 4 or more hours per week
Multiple pregnancies
Becoming pregnant at an early age
14
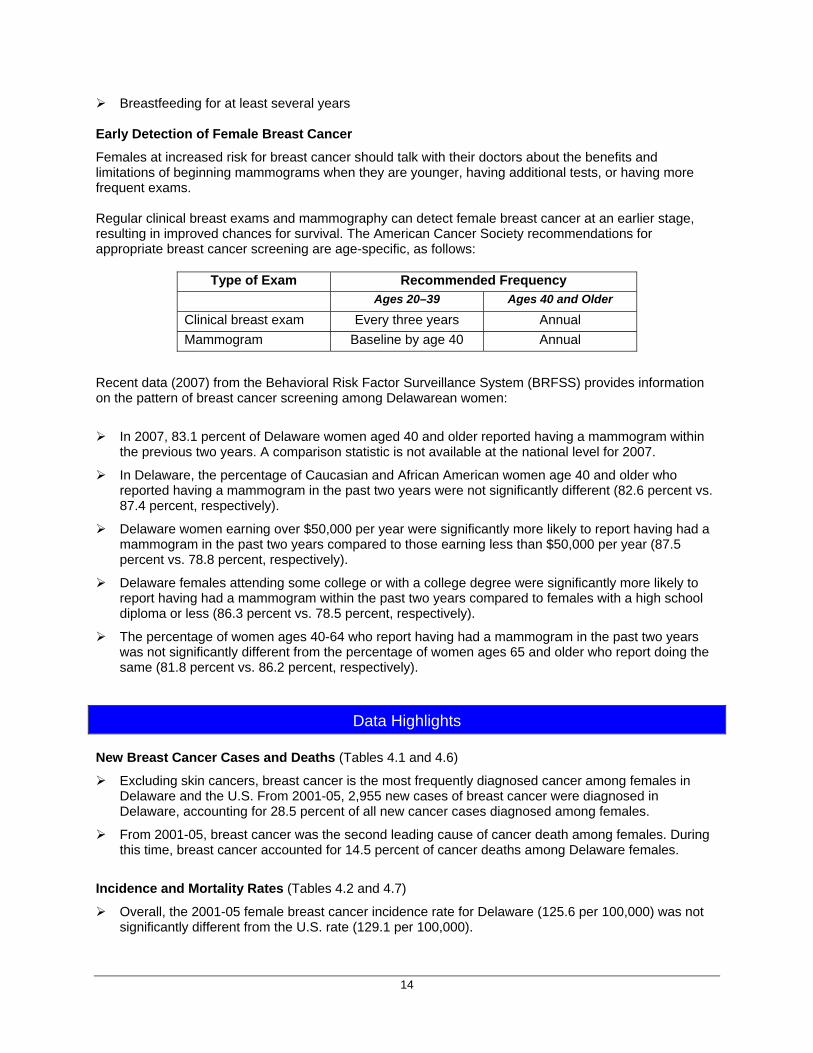
Breastfeeding for at least several years Early Detection of Female Breast Cancer
Females at increased risk for breast cancer should talk with their doctors about the benefits and limitations of beginning mammograms when they are younger, having additional tests, or having more frequent exams. Regular clinical breast exams and mammography can detect female breast cancer at an earlier stage, resulting in improved chances for survival. The American Cancer Society recommendations for appropriate breast cancer screening are age-specific, as follows:
Type of Exam Recommended Frequency Ages 20–39 Ages 40 and Older
Clinical breast exam Every three years Annual Mammogram Baseline by age 40 Annual
Recent data (2007) from the Behavioral Risk Factor Surveillance System (BRFSS) provides information on the pattern of breast cancer screening among Delawarean women:
In 2007, 83.1 percent of Delaware women aged 40 and older reported having a mammogram within the previous two years. A comparison statistic is not available at the national level for 2007.
In Delaware, the percentage of Caucasian and African American women age 40 and older who reported having a mammogram in the past two years were not significantly different (82.6 percent vs. 87.4 percent, respectively).
Delaware women earning over $50,000 per year were significantly more likely to report having had a mammogram in the past two years compared to those earning less than $50,000 per year (87.5 percent vs. 78.8 percent, respectively).
Delaware females attending some college or with a college degree were significantly more likely to report having had a mammogram within the past two years compared to females with a high school diploma or less (86.3 percent vs. 78.5 percent, respectively).
The percentage of women ages 40-64 who report having had a mammogram in the past two years was not significantly different from the percentage of women ages 65 and older who report doing the same (81.8 percent vs. 86.2 percent, respectively).
Data Highlights New Breast Cancer Cases and Deaths (Tables 4.1 and 4.6)
Excluding skin cancers, breast cancer is the most frequently diagnosed cancer among females in Delaware and the U.S. From 2001-05, 2,955 new cases of breast cancer were diagnosed in Delaware, accounting for 28.5 percent of all new cancer cases diagnosed among females.
From 2001-05, breast cancer was the second leading cause of cancer death among females. During this time, breast cancer accounted for 14.5 percent of cancer deaths among Delaware females.
Incidence and Mortality Rates (Tables 4.2 and 4.7)
Overall, the 2001-05 female breast cancer incidence rate for Delaware (125.6 per 100,000) was not significantly different from the U.S. rate (129.1 per 100,000).
15
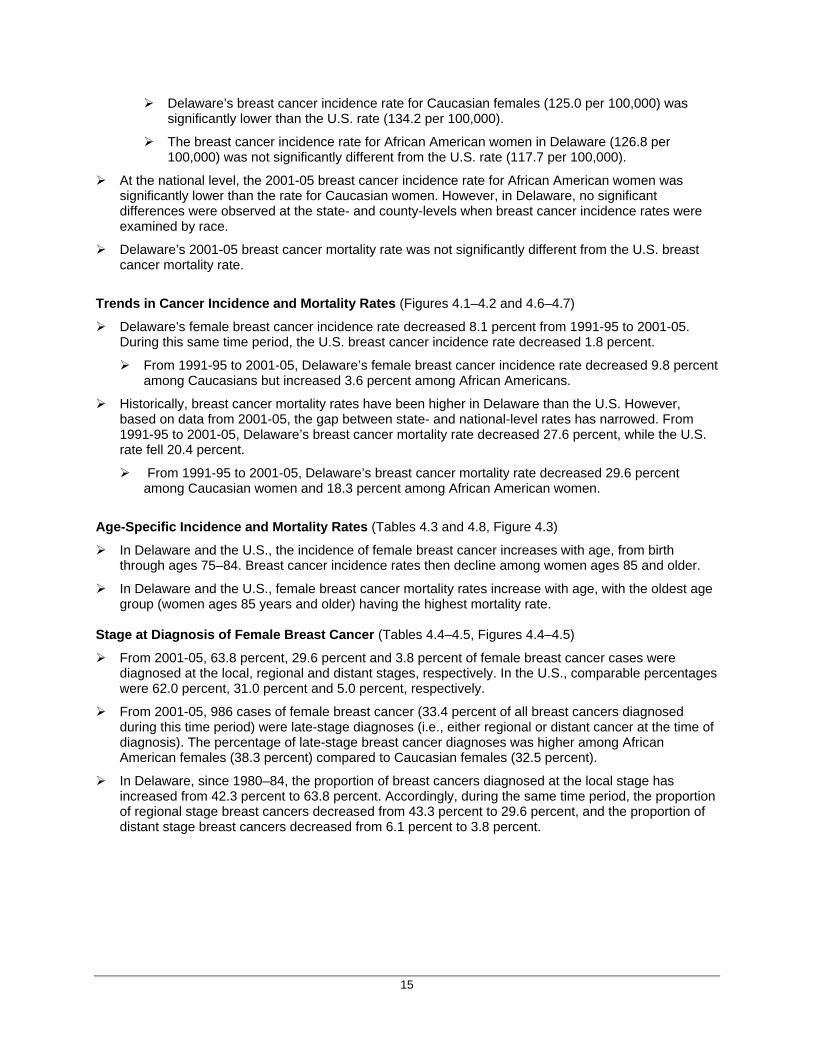
Delaware’s breast cancer incidence rate for Caucasian females (125.0 per 100,000) was significantly lower than the U.S. rate (134.2 per 100,000).
The breast cancer incidence rate for African American women in Delaware (126.8 per 100,000) was not significantly different from the U.S. rate (117.7 per 100,000).
At the national level, the 2001-05 breast cancer incidence rate for African American women was significantly lower than the rate for Caucasian women. However, in Delaware, no significant differences were observed at the state- and county-levels when breast cancer incidence rates were examined by race.
Delaware’s 2001-05 breast cancer mortality rate was not significantly different from the U.S. breast cancer mortality rate.
Trends in Cancer Incidence and Mortality Rates (Figures 4.1–4.2 and 4.6–4.7)
Delaware’s female breast cancer incidence rate decreased 8.1 percent from 1991-95 to 2001-05. During this same time period, the U.S. breast cancer incidence rate decreased 1.8 percent.
From 1991-95 to 2001-05, Delaware’s female breast cancer incidence rate decreased 9.8 percent among Caucasians but increased 3.6 percent among African Americans.
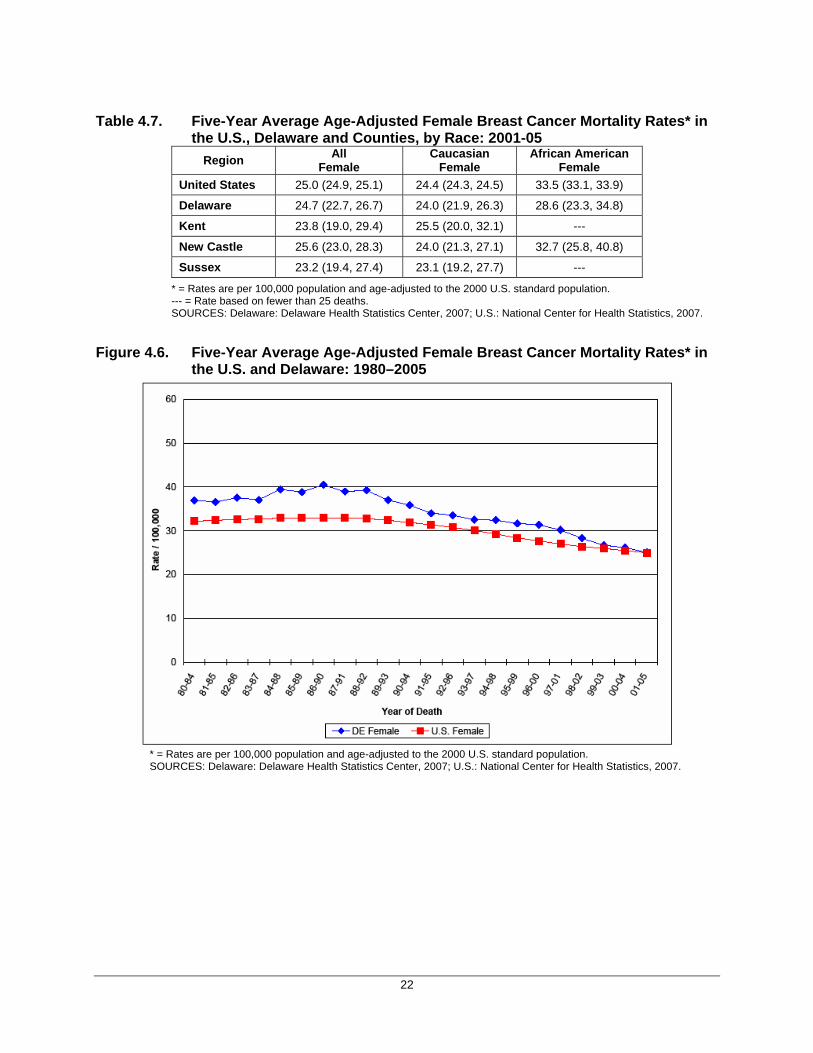
Historically, breast cancer mortality rates have been higher in Delaware than the U.S. However, based on data from 2001-05, the gap between state- and national-level rates has narrowed. From 1991-95 to 2001-05, Delaware’s breast cancer mortality rate decreased 27.6 percent, while the U.S. rate fell 20.4 percent.
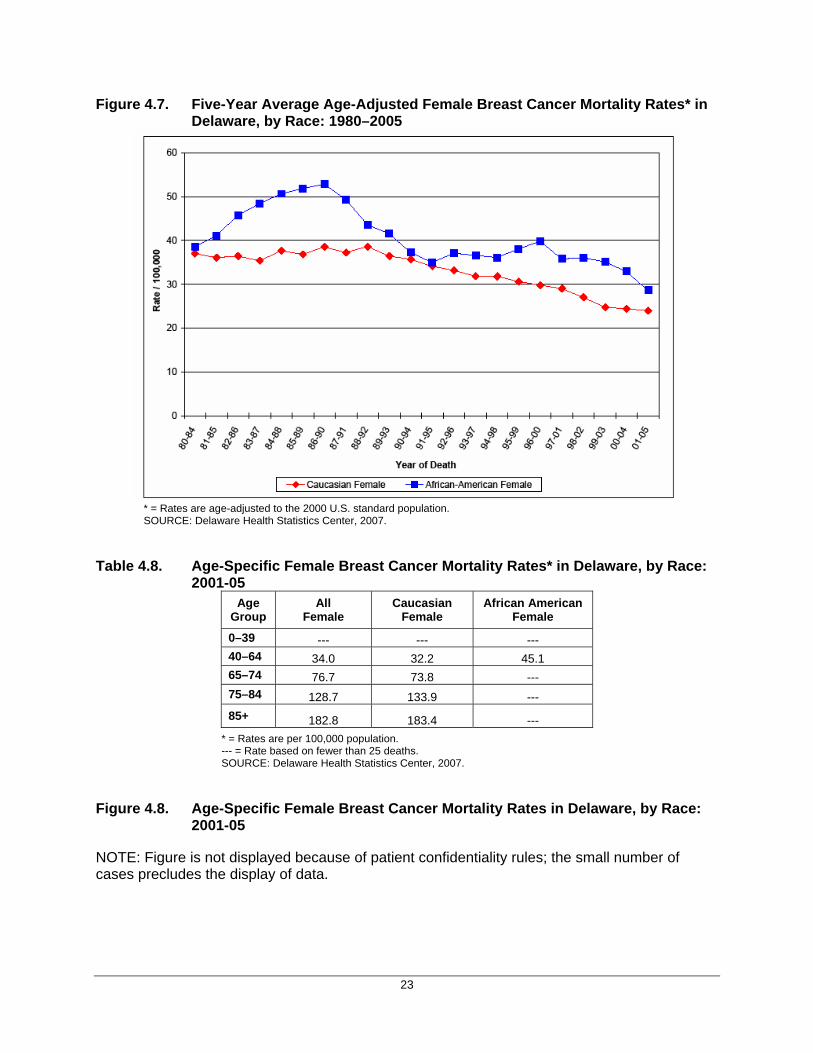
From 1991-95 to 2001-05, Delaware’s breast cancer mortality rate decreased 29.6 percent among Caucasian women and 18.3 percent among African American women.
Age-Specific Incidence and Mortality Rates (Tables 4.3 and 4.8, Figure 4.3)
In Delaware and the U.S., the incidence of female breast cancer increases with age, from birth through ages 75–84. Breast cancer incidence rates then decline among women ages 85 and older.
In Delaware and the U.S., female breast cancer mortality rates increase with age, with the oldest age group (women ages 85 years and older) having the highest mortality rate.
Stage at Diagnosis of Female Breast Cancer (Tables 4.4–4.5, Figures 4.4–4.5)
From 2001-05, 63.8 percent, 29.6 percent and 3.8 percent of female breast cancer cases were diagnosed at the local, regional and distant stages, respectively. In the U.S., comparable percentages were 62.0 percent, 31.0 percent and 5.0 percent, respectively.
From 2001-05, 986 cases of female breast cancer (33.4 percent of all breast cancers diagnosed during this time period) were late-stage diagnoses (i.e., either regional or distant cancer at the time of diagnosis). The percentage of late-stage breast cancer diagnoses was higher among African American females (38.3 percent) compared to Caucasian females (32.5 percent).
In Delaware, since 1980–84, the proportion of breast cancers diagnosed at the local stage has increased from 42.3 percent to 63.8 percent. Accordingly, during the same time period, the proportion of regional stage breast cancers decreased from 43.3 percent to 29.6 percent, and the proportion of distant stage breast cancers decreased from 6.1 percent to 3.8 percent.

16
Female Breast Cancer Incidence
Table 4.1. Number of Female Breast Cancer Cases in Delaware and Counties, by Race: 2001-05
All Female
Caucasian Female
African American Female
Delaware 2,955 2,423 480 Kent 436 360 67 New Castle 1,795 1,427 339 Sussex 724 636 74
SOURCE: Delaware: Delaware Cancer Registry, Delaware’s Division of Public Health, 2008.
Table 4.2. Five-Year Average Age-Adjusted Female Breast Cancer Incidence Rates* in
the U.S., Delaware and Counties, by Race: 2001-05 All
Female Caucasian
Female African American
Female United States 129.1 (128.3, 130.0) 134.2 (133.3, 135.2) 117.7 (115.1, 120.2)
Delaware 125.6 (121.1, 130.1) 125.0 (120.0, 130.0) 126.8 (115.5, 138.2)
Kent 121.0 (109.7, 132.4) 125.7 (112.7, 138.7) 107.2 (83.1, 136.1)
New Castle 128.1 (122.2, 134.1) 127.6 (120.9, 134.2) 132.9 (118.7, 147.0)
Sussex 121.1 (112.2, 129.9) 117.0 (107.9, 126.1) 122.8 (96.5, 154.2)
* = Rates are per 100,000 population and age-adjusted to the 2000 U.S. standard population. SOURCES: Delaware: Delaware Cancer Registry, Delaware’s Division of Public Health, 2008; U.S.: Surveillance, Epidemiology, and End Results Program, National Cancer Institute, 2007.
17
Figure 4.1. Five-Year Average Age-Adjusted Female Breast Cancer Incidence Rates* in the U.S. and Delaware: 1980–2005
* = Rates are per 100,000 and age-adjusted to the 2000 U.S. standard population. SOURCES: Delaware: Delaware Cancer Registry, Delaware’s Division of Public Health, 2008; U.S.: Surveillance, Epidemiology, and End Results Program, National Cancer Institute, 2007.
18
Figure 4.2. Five-Year Average Age-Adjusted Female Breast Cancer Incidence Rates* in Delaware, by Race: 1980–2005
* = Rates are per 100,000 population and age-adjusted to the 2000 U.S. standard population. SOURCE: Delaware Cancer Registry, Delaware’s Division of Public Health, 2008.
Table 4.3. Age-Specific Female Breast Cancer Incidence Rates* in Delaware, by Race: 2001-05
Age Group All Female
Caucasian Female
African American Female
0–39 14.1 12. 9 18.2 40–64 227.9 228.9 231.7 65–74 384.3 395.0 331.1 75–84 423.6 428.4 371.4 85+ 354.3 351.3 ---
* = Rates are per 100,000 population. --- = Rate based on fewer than 25 cases. SOURCE: Delaware Cancer Registry, Delaware’s Division of Public Health, 2008.
19
Figure 4.3. Age-Specific Female Breast Cancer Incidence Rates in Delaware, by Race: 2001-05
NOTE: Rate for African American females ages 85+ is not displayed because of patient confidentiality rules. SOURCE: Delaware Cancer Registry, Delaware’s Division of Public Health, 2008.
Female Breast Cancer by Stage at Diagnosis Table 4.4. Number of Female Breast Cancer Cases in Delaware, by Stage at Diagnosis
and Race: 2001-05 Stage at
Diagnosis All
Female Caucasian
Female African American
Female
Local 1,886 1,573 281 Regional 875 695 166 Distant 111 93 18 Unknown 83 62 15 Total 2,955 2,423 480
SOURCE: Delaware Cancer Registry, Delaware’s Division of Public Health, 2008
20
Table 4.5. Percentage of Female Breast Cancer Cases in Delaware, by Stage at Diagnosis and Race: 2001-05
Stage at Diagnosis
All Female
Caucasian Female
African American Female
Local 63.8 64.9 58.5 Regional 29.6 28.7 34.6 Distant 3.8 3.8 3.8 Unknown 2.8 2.6 3.1 Total 100.0 100.0 100.0
SOURCE: Delaware Cancer Registry, Delaware’s Division of Public Health, 2008.
Figure 4.4. Percentage of Female Breast Cancer Cases in Delaware and the U.S., by
Stage at Diagnosis: 2001-05
Figure 4.4a. Delaware: 2001-05
Figure 4.4b. U.S.: 2001-05
SOURCES: Delaware: Delaware Cancer Registry, Delaware’s Division of Public Health, 2008; U.S.: Surveillance, Epidemiology, and End Results Program, National Cancer Institute, 2007.

21
Figure 4.5. Percentage of Female Breast Cancer Cases in Delaware, by Stage at Diagnosis: 1980–2005
SOURCE: Delaware Cancer Registry, Delaware’s Division of Public Health, 2008.
Female Breast Cancer Mortality Table 4.6. Number of Female Breast Cancer Deaths in Delaware and Counties, by
Race: 2001-05
Region All Female
Caucasian Female
African American Female
Delaware 600 492 104
Kent 86 74 12
New Castle 368 286 80
Sussex 146 132 12
SOURCE: Delaware Health Statistics Center, 2007.
22
Table 4.7. Five-Year Average Age-Adjusted Female Breast Cancer Mortality Rates* in
the U.S., Delaware and Counties, by Race: 2001-05 Region All
Female Caucasian
Female African American
Female United States 25.0 (24.9, 25.1) 24.4 (24.3, 24.5) 33.5 (33.1, 33.9)
Delaware 24.7 (22.7, 26.7) 24.0 (21.9, 26.3) 28.6 (23.3, 34.8)
Kent 23.8 (19.0, 29.4) 25.5 (20.0, 32.1) ---
New Castle 25.6 (23.0, 28.3) 24.0 (21.3, 27.1) 32.7 (25.8, 40.8)
Sussex 23.2 (19.4, 27.4) 23.1 (19.2, 27.7) ---
* = Rates are per 100,000 population and age-adjusted to the 2000 U.S. standard population. --- = Rate based on fewer than 25 deaths. SOURCES: Delaware: Delaware Health Statistics Center, 2007; U.S.: National Center for Health Statistics, 2007.
Figure 4.6. Five-Year Average Age-Adjusted Female Breast Cancer Mortality Rates* in the U.S. and Delaware: 1980–2005
* = Rates are per 100,000 population and age-adjusted to the 2000 U.S. standard population. SOURCES: Delaware: Delaware Health Statistics Center, 2007; U.S.: National Center for Health Statistics, 2007.
23
Figure 4.7. Five-Year Average Age-Adjusted Female Breast Cancer Mortality Rates* in Delaware, by Race: 1980–2005
* = Rates are age-adjusted to the 2000 U.S. standard population. SOURCE: Delaware Health Statistics Center, 2007.
Table 4.8. Age-Specific Female Breast Cancer Mortality Rates* in Delaware, by Race:
2001-05 Age
Group All
Female Caucasian
Female African American
Female
0–39 --- --- --- 40–64 34.0 32.2 45.1 65–74 76.7 73.8 --- 75–84 128.7 133.9 --- 85+ 182.8 183.4 ---
* = Rates are per 100,000 population. --- = Rate based on fewer than 25 deaths. SOURCE: Delaware Health Statistics Center, 2007.
Figure 4.8. Age-Specific Female Breast Cancer Mortality Rates in Delaware, by Race:
2001-05 NOTE: Figure is not displayed because of patient confidentiality rules; the small number of cases precludes the display of data.
24
5. Cervical Cancer
Risk Factors and Early Detection Risk Factors for Cervical Cancer
Human papillomavirus (HPV) infection
Sexual intercourse at a young age
Multiple sexual partners
Having a partner who has had many sexual partners
Sexual intercourse with uncircumcised males
Long-term use of oral contraceptives
Mother who took diethylstilbestrol (DES) during pregnancy
Cigarette smoking
Low socioeconomic status
Many full-term pregnancies
Family history of cervical cancer
Being overweight
Not having regular Pap tests
Having a weakened immune system (e.g., through HIV, AIDS, or receiving drugs to suppress the immune system)
Possible Risk Factors for Cervical Cancer
History of sexually transmitted disease(s), such as Chlamydia
Diets low in fruits and vegetables
Exposure to secondhand smoke Protective Factors
Gardasil® vaccine to protect against HPV: The Federal Advisory Committee on Immunization Practices (ACIP) recommends that the vaccine be routinely given to females ages 11–12. Girls as young as nine may be vaccinated at the doctor’s discretion. ACIP also recommends that females ages 13–26 who have not been vaccinated receive catch-up vaccinations.
Condoms provide some protection against HPV infection, a known cervical cancer risk factor Early Detection of Cervical Cancer
Routine Pap tests can detect cervical cancer at an earlier stage, generally the in situ stage, resulting in greatly improved chances for survival Current recommendations for cervical cancer screening are as follows:
All females should begin having the Pap test about three years after they start having sex, but no later than age 21
25
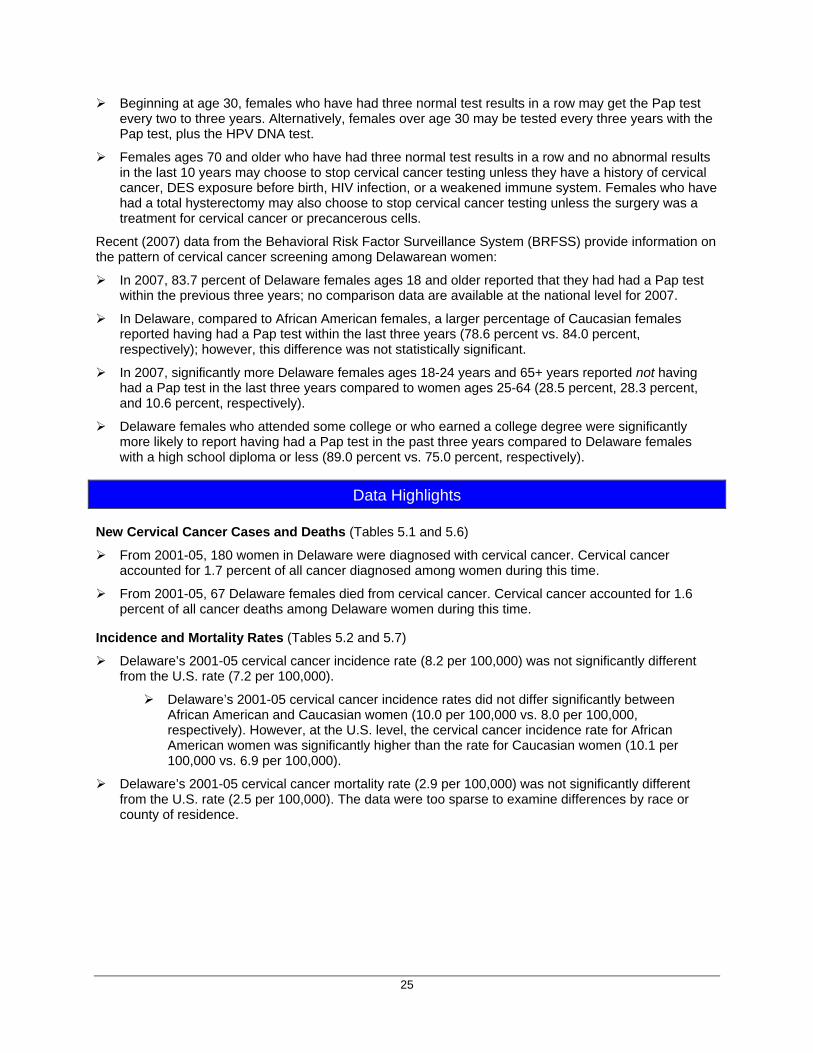
Beginning at age 30, females who have had three normal test results in a row may get the Pap test every two to three years. Alternatively, females over age 30 may be tested every three years with the Pap test, plus the HPV DNA test.
Females ages 70 and older who have had three normal test results in a row and no abnormal results in the last 10 years may choose to stop cervical cancer testing unless they have a history of cervical cancer, DES exposure before birth, HIV infection, or a weakened immune system. Females who have had a total hysterectomy may also choose to stop cervical cancer testing unless the surgery was a treatment for cervical cancer or precancerous cells.
Recent (2007) data from the Behavioral Risk Factor Surveillance System (BRFSS) provide information on the pattern of cervical cancer screening among Delawarean women:
In 2007, 83.7 percent of Delaware females ages 18 and older reported that they had had a Pap test within the previous three years; no comparison data are available at the national level for 2007.
In Delaware, compared to African American females, a larger percentage of Caucasian females reported having had a Pap test within the last three years (78.6 percent vs. 84.0 percent, respectively); however, this difference was not statistically significant.
In 2007, significantly more Delaware females ages 18-24 years and 65+ years reported not having had a Pap test in the last three years compared to women ages 25-64 (28.5 percent, 28.3 percent, and 10.6 percent, respectively).
Delaware females who attended some college or who earned a college degree were significantly more likely to report having had a Pap test in the past three years compared to Delaware females with a high school diploma or less (89.0 percent vs. 75.0 percent, respectively).
Data Highlights New Cervical Cancer Cases and Deaths (Tables 5.1 and 5.6)
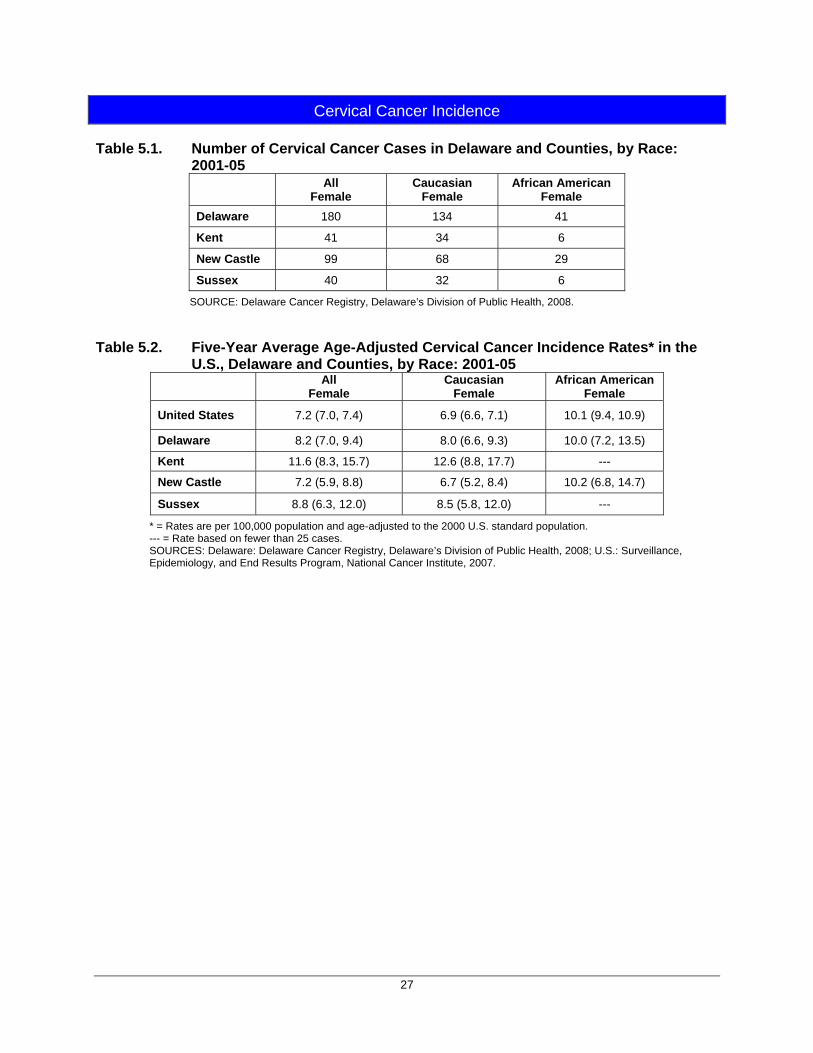
From 2001-05, 180 women in Delaware were diagnosed with cervical cancer. Cervical cancer accounted for 1.7 percent of all cancer diagnosed among women during this time.
From 2001-05, 67 Delaware females died from cervical cancer. Cervical cancer accounted for 1.6 percent of all cancer deaths among Delaware women during this time.
Incidence and Mortality Rates (Tables 5.2 and 5.7)
Delaware’s 2001-05 cervical cancer incidence rate (8.2 per 100,000) was not significantly different from the U.S. rate (7.2 per 100,000).
Delaware’s 2001-05 cervical cancer incidence rates did not differ significantly between African American and Caucasian women (10.0 per 100,000 vs. 8.0 per 100,000, respectively). However, at the U.S. level, the cervical cancer incidence rate for African American women was significantly higher than the rate for Caucasian women (10.1 per 100,000 vs. 6.9 per 100,000).
Delaware’s 2001-05 cervical cancer mortality rate (2.9 per 100,000) was not significantly different from the U.S. rate (2.5 per 100,000). The data were too sparse to examine differences by race or county of residence.
26
Trends in Cancer Incidence and Mortality (Figures 5.1–5.2 and 5.6–5.7)
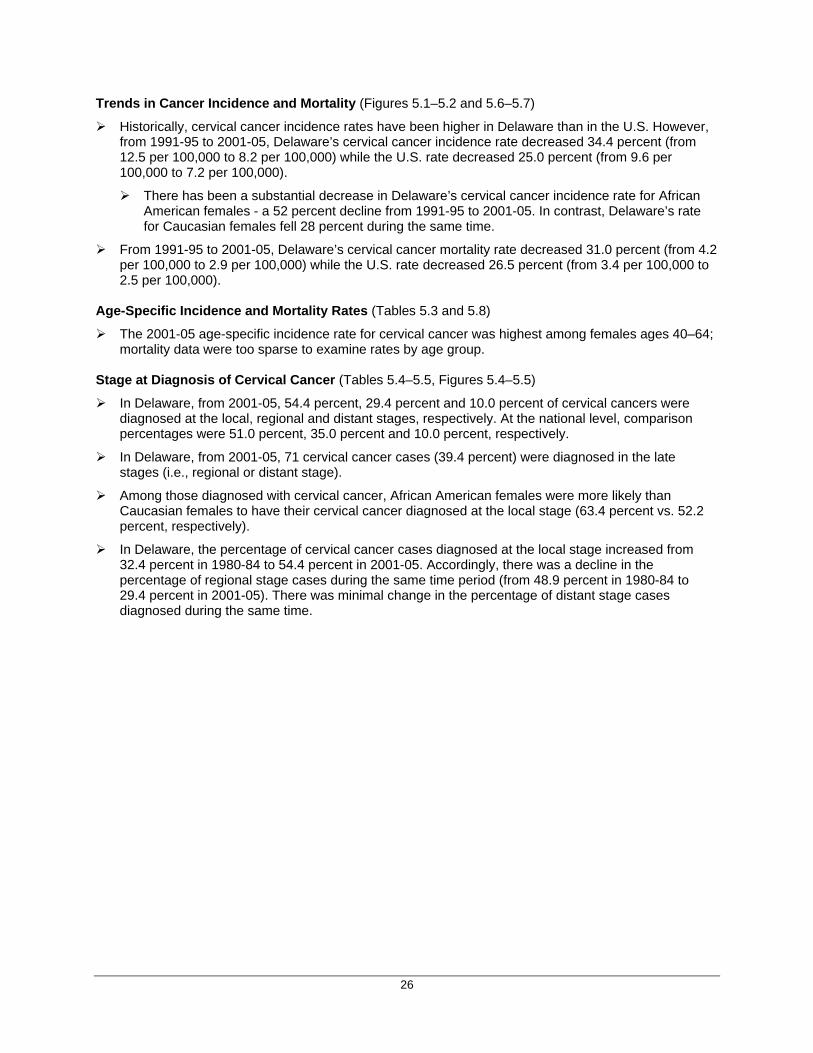
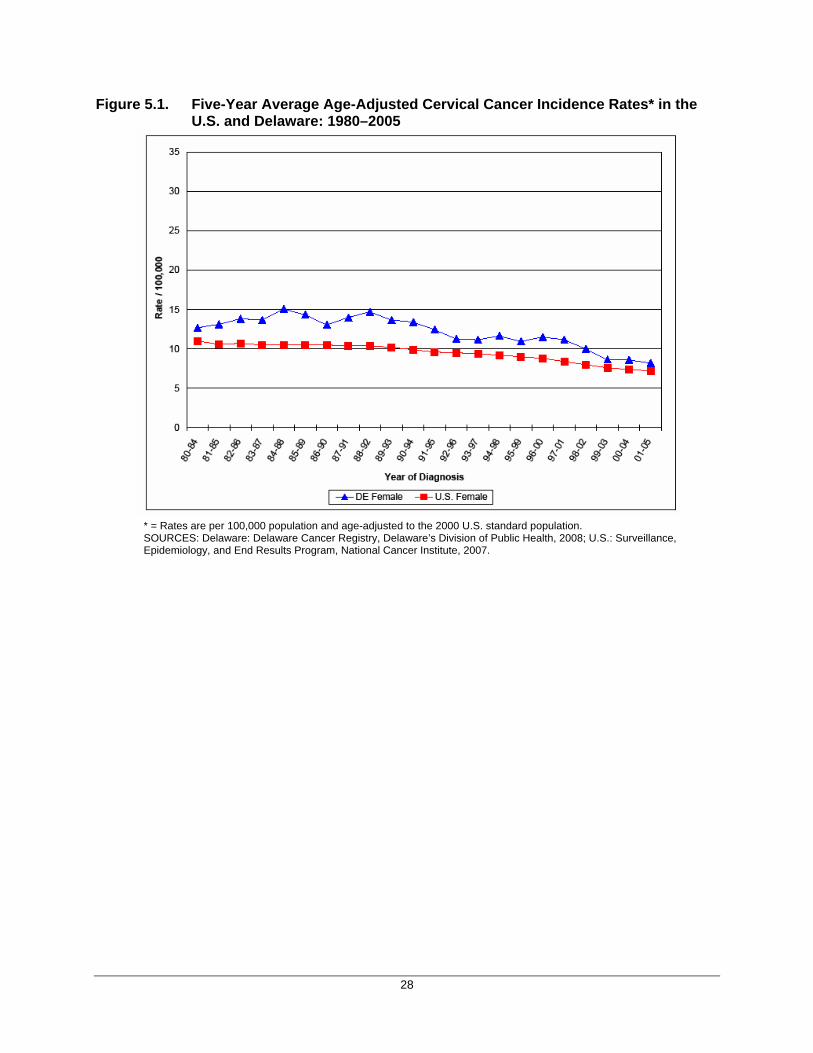
Historically, cervical cancer incidence rates have been higher in Delaware than in the U.S. However, from 1991-95 to 2001-05, Delaware’s cervical cancer incidence rate decreased 34.4 percent (from 12.5 per 100,000 to 8.2 per 100,000) while the U.S. rate decreased 25.0 percent (from 9.6 per 100,000 to 7.2 per 100,000).
There has been a substantial decrease in Delaware’s cervical cancer incidence rate for African American females - a 52 percent decline from 1991-95 to 2001-05. In contrast, Delaware’s rate for Caucasian females fell 28 percent during the same time.
From 1991-95 to 2001-05, Delaware’s cervical cancer mortality rate decreased 31.0 percent (from 4.2 per 100,000 to 2.9 per 100,000) while the U.S. rate decreased 26.5 percent (from 3.4 per 100,000 to 2.5 per 100,000).
Age-Specific Incidence and Mortality Rates (Tables 5.3 and 5.8)
The 2001-05 age-specific incidence rate for cervical cancer was highest among females ages 40–64; mortality data were too sparse to examine rates by age group.
Stage at Diagnosis of Cervical Cancer (Tables 5.4–5.5, Figures 5.4–5.5)
In Delaware, from 2001-05, 54.4 percent, 29.4 percent and 10.0 percent of cervical cancers were diagnosed at the local, regional and distant stages, respectively. At the national level, comparison percentages were 51.0 percent, 35.0 percent and 10.0 percent, respectively.
In Delaware, from 2001-05, 71 cervical cancer cases (39.4 percent) were diagnosed in the late stages (i.e., regional or distant stage).
Among those diagnosed with cervical cancer, African American females were more likely than Caucasian females to have their cervical cancer diagnosed at the local stage (63.4 percent vs. 52.2 percent, respectively).
In Delaware, the percentage of cervical cancer cases diagnosed at the local stage increased from 32.4 percent in 1980-84 to 54.4 percent in 2001-05. Accordingly, there was a decline in the percentage of regional stage cases during the same time period (from 48.9 percent in 1980-84 to 29.4 percent in 2001-05). There was minimal change in the percentage of distant stage cases diagnosed during the same time.
27
Cervical Cancer Incidence
Table 5.1. Number of Cervical Cancer Cases in Delaware and Counties, by Race: 2001-05
All Female
Caucasian Female
African American Female
Delaware 180 134 41
Kent 41 34 6
New Castle 99 68 29
Sussex 40 32 6
SOURCE: Delaware Cancer Registry, Delaware’s Division of Public Health, 2008. Table 5.2. Five-Year Average Age-Adjusted Cervical Cancer Incidence Rates* in the
U.S., Delaware and Counties, by Race: 2001-05 All
Female Caucasian
Female African American
Female
United States 7.2 (7.0, 7.4) 6.9 (6.6, 7.1) 10.1 (9.4, 10.9)
Delaware 8.2 (7.0, 9.4) 8.0 (6.6, 9.3) 10.0 (7.2, 13.5)
Kent 11.6 (8.3, 15.7) 12.6 (8.8, 17.7) ---
New Castle 7.2 (5.9, 8.8) 6.7 (5.2, 8.4) 10.2 (6.8, 14.7)
Sussex 8.8 (6.3, 12.0) 8.5 (5.8, 12.0) ---
* = Rates are per 100,000 population and age-adjusted to the 2000 U.S. standard population. --- = Rate based on fewer than 25 cases. SOURCES: Delaware: Delaware Cancer Registry, Delaware’s Division of Public Health, 2008; U.S.: Surveillance, Epidemiology, and End Results Program, National Cancer Institute, 2007.
28
Figure 5.1. Five-Year Average Age-Adjusted Cervical Cancer Incidence Rates* in the U.S. and Delaware: 1980–2005
* = Rates are per 100,000 population and age-adjusted to the 2000 U.S. standard population. SOURCES: Delaware: Delaware Cancer Registry, Delaware’s Division of Public Health, 2008; U.S.: Surveillance, Epidemiology, and End Results Program, National Cancer Institute, 2007.
29
Figure 5.2. Five-Year Average Age-Adjusted Cervical Cancer Incidence Rates* in Delaware, by Race: 1980–2005
* = Rates are per 100,000 population and age-adjusted to the 2000 U.S. standard population. SOURCE: Delaware Cancer Registry, Delaware’s Division of Public Health, 2008.
Table 5.3. Age-Specific Cervical Cancer Incidence Rates* in Delaware, by Race: 2001-05
Age Group
All Female
Caucasian Female
African American Female
0–39 4.2 4.5 --- 40–64 15.4 14.6 19.4 65+ 8.9 --- ---
* = Rates are per 100,000 population. --- = Rate based on fewer than 25 cases. SOURCE: Delaware Cancer Registry, Delaware’s Division of Public Health, 2008.
Figure 5.3. Age-Specific Cervical Cancer Incidence Rates in Delaware, by Race: 2001-05
NOTE: Figure is not displayed because of patient confidentiality rules; the small number of cases precludes the display of data. SOURCE: Delaware Cancer Registry, Delaware’s Division of Public Health, 2008.

30
Cervical Cancer by Stage at Diagnosis
Table 5.4. Number of Cervical Cancer Cases in Delaware, by Stage at Diagnosis and Race: 2001-05
Stage at Diagnosis
All Female
Caucasian Female
African American Female
Local 98 70 26 Regional 53 45 8 Distant 18 12 --- Unknown 11 7 --- Total 180 134 41
--- = Cell counts of less than six are suppressed for patient confidentiality. SOURCE: Delaware Cancer Registry, Delaware’s Division of Public Health, 2008.
Table 5.5. Percentage of Cervical Cancer Cases in Delaware, by Stage at Diagnosis and Race: 2001-05
Stage at Diagnosis
All Female
Caucasian Female
African American Female
Local 54.4 52.2 63.4
Regional 29.4 33.6 19.5
Distant 10.0 9.0 --- Unknown 6.1 5.2 --- Total 100.0 100.0 100.0
--- = Percentage based on fewer than six cases. SOURCE: Delaware Cancer Registry, Delaware’s Division of Public Health, 2008.
Figure 5.4. Percentage of Cervical Cancer Cases in Delaware and the U.S., by Stage at
Diagnosis: 2001-05
Figure 5.4a. Delaware: 2001-05
Figure 5.4b. U.S.: 2001-05
SOURCES: Delaware: Delaware Cancer Registry, Delaware’s Division of Public Health, 2008; U.S.: Surveillance, Epidemiology, and End Results Program, National Cancer Institute, 2007.

31
Figure 5.5. Percentage of Cervical Cancer Cases in Delaware, by Stage at Diagnosis: 1980–2005
SOURCE: Delaware Cancer Registry, Delaware’s Division of Public Health, 2008.
Cervical Cancer Mortality Table 5.6. Number of Cervical Cancer Deaths in Delaware and Counties, by Race:
2001-05 All
Female Caucasian
Female African American
Female Delaware 67 49 18
Kent 14 11 ---
New Castle 32 21 11
Sussex 21 17 ---
--- = Cell counts of less than six are suppressed for patient confidentiality. SOURCE: Delaware Health Statistics Center, 2007.
32
Table 5.7. Five-Year Average Age-Adjusted Cervical Cancer Mortality Rates* in the U.S., Delaware and Counties, by Race: 2001-05
All Female
Caucasian Female
African American Female
United States 2.5 (2.5, 2.5) 2.3 (2.2, 2.3) 4.7 (4.5, 4.8)
Delaware 2.9 (2.2, 3.7) 2.7 (2.0, 3.5) ---
Kent --- --- ---
New Castle 2.3 (1.6, 3.2) --- ---
Sussex --- --- ---
* = Rates are per 100,000 population and age-adjusted to the 2000 U.S. standard population. --- = Rate based on fewer than 25 deaths. SOURCES: Delaware: Delaware Health Statistics Center, 2007; U.S.: National Center for Health Statistics, 2007.
Figure 5.6. Five-Year Average Age-Adjusted Cervical Cancer Mortality Rates* in the
U.S. and Delaware: 1980–2005
* = Rates are per 100,000 population and age-adjusted to the 2000 U.S. standard population. SOURCES: Delaware: Delaware Health Statistics Center, 2007; U.S.: National Center for Health Statistics, 2007.

33
Figure 5.7. Five-Year Average Age-Adjusted Cervical Cancer Mortality Rates* in Delaware, by Race: 1980–2005
* = Rates are per 100,000 population and age-adjusted to the 2000 U.S. standard population. SOURCE: Delaware Health Statistics Center, 2007.
Table 5.8. Age-Specific Cervical Cancer Mortality Rates* in Delaware, by Race:
2001-05 Age
Group All
Female Caucasian
Female African American
Female
0–39 --- --- ---
40–64 5.4 4.7 ---
65–74 --- --- --- 75–84 --- --- --- 85+ --- --- ---
* = Rates are per 100,000 population. --- = Rate based on fewer than 25 deaths. SOURCE: Delaware Health Statistics Center, 2007.
Figure 5.8. Age-Specific Cervical Cancer Mortality Rates in Delaware, by Race:
2001-05 NOTE: Figure is not displayed because of patient confidentiality rules; the small number of cases precludes the display of data.
34
6. Colorectal Cancer
Risk Factors and Early Detection Risk Factors for Colorectal Cancer
Increasing age: the chance of developing colorectal cancer increases markedly after age 50
Personal history of colorectal adenomatous polyps or colorectal cancer
Family history of colorectal cancer or polyps, including hereditary nonpolyposis colorectal cancer and familial adenomatous polyposis
Personal history of inflammatory bowel disease, such as ulcerative colitis or Crohn’s disease
Personal history of ovarian, breast, or uterine cancer
Personal history of diabetes
Race: African Americans have the highest incidence and mortality rates of all racial groups in the U.S.
Ethnicity: Jews of Eastern European descent have the highest colorectal cancer risk of any ethnic group
Physical inactivity
Obesity
Heavy alcohol use
Cigarette smoking Possible Risk Factors for Colorectal Cancer
Diets high in red meat, processed meats and/or other high-fat foods
Diets low in fruits, vegetables, fiber and folic acid
Men who have had testicular cancer may be at greater risk for colorectal cancer
Men who have received radiation therapy for prostate cancer may be at greater risk for colorectal cancer
Night-shift work Protective Factors
Combined hormone replacement therapy, which includes both estrogen and progesterone
Removal of colorectal polyps Early Detection of Colorectal Cancer
The American Cancer Society colorectal cancer screening guidelines are as follows:
Beginning at age 50, both males and females should follow one of the five screening options below:
1. Yearly fecal occult blood test (FOBT) or immunochemical FOBT. The take-home multiple sample method should be used, and all positive tests should be followed up with colonoscopy;
2. Flexible sigmoidoscopy every five years;
3. Colonoscopy every 10 years;
4. Double contrast barium enema every five years; or
35
5. Yearly FOBT or immunochemical FOBT, plus flexible sigmoidoscopy every five years*.
Recent data from the Behavioral Risk Factor Surveillance System (BRFSS) provide information on the pattern of colorectal cancer screening among Delawareans:
In 2007, 42.1 percent of Delawareans ages 50 and older reported ever having used an at-home blood stool test. Significantly fewer African Americans than Caucasians reported ever having used an at-home blood stool test (31.9 percent vs. 44.2 percent, respectively).
Among Delawareans ages 50 and older, 75.1 percent reported that they had ever had a sigmoidoscopy or a colonoscopy.
The percentage of Delawareans who had had a colonoscopy or sigmoidoscopy increased with age. Significantly more Delawareans ages 65 and older reported ever having had a colonoscopy or sigmoidoscopy compared to those ages 50-64 (83.2 percent vs. 69.0 percent, respectively).
In 2007, African Americans ages 50 and older in Delaware were just as likely to have ever had a colonoscopy or sigmoidoscopy as Caucasians.
Education level and income category did not significantly affect the percentage of Delawareans ever having had a colonoscopy or sigmoidoscopy.
Data Highlights
New Colorectal Cancer Cases and Deaths (Tables 6.1 and 6.6)
Colorectal cancer was the third most frequently diagnosed cancer among males and females for 2001-05. A total of 2,300 cases of colorectal cancer were diagnosed in Delaware during this time.
Colorectal cancer accounted for 10.5 percent of all cancer cases diagnosed during 2001-05 in Delaware.
Newly diagnosed cases were fairly evenly split by sex: 1,176 cases (51.1 percent) were diagnosed among males and the remaining 1,124 cases (48.9 percent) were diagnosed among females.
Colorectal cancer was the third most common cause of cancer deaths among both males and females for 2001-05.
Deaths from colorectal cancer accounted for 9.7 percent of all cancer deaths in Delaware during 2001-05.
Of the 843 Delaware residents who died from colorectal cancer, 50.9 percent were male and 49.1 percent were female.
* “The ACS recommends more intensive surveillance for individuals at higher risk for colorectal cancer, including those with a history of adenomatous polyps; those with a personal history of curative-intent resection of colorectal cancer; those with a family history of either colorectal cancer or colorectal adenomas diagnosed in a first-degree relative before age 60; those with a history of inflammatory bowel disease of significant duration; or those with a family history or genetic testing indicating the presence of 1 of 2 hereditary syndromes, such as hereditary nonpolyposis colorectal cancer and familial adenomatous polyposis.”
36
Incidence and Mortality Rates (Tables 6.2 and 6.7)
Delaware’s 2001-05 colorectal cancer incidence rate was comparable to the U.S. rate.
For 2001-05, at all geographic levels and for all races combined, the colorectal cancer incidence rates for males were significantly higher than rates for females.
In the U.S., 2001-05 colorectal cancer incidence rates for African Americans were significantly higher than for Caucasians. However, for the same time period, incidence rates did not differ significantly between African Americans and Caucasians at the state and county levels.
Delaware’s 2001-05 colorectal cancer mortality rate was not significantly different from that of the U.S.
For 2001-05, at all geographic levels (with the exception of Kent County) and for all races combined, the colorectal cancer mortality rates were significantly higher for males than for females.
No differences in colorectal cancer mortality rates were observed by county of residence. Trends in Incidence and Mortality Rates (Figures 6.1–6.2 and 6.6–6.7)
From 1991-95 to 2001-05, Delaware’s colorectal cancer incidence rate decreased 17.7 percent (from 64.2 per 100,000 to 52.8 per 100,000) while the U.S. rate dropped 11.4 percent (from 56.8 per 100,000 to 50.3 per 100,000).
Delaware’s colorectal cancer incidence rates decreased 19.0 percent for Caucasians and 15.8 percent for African Americans between 1991-95 and 2001-05.
Delaware’s colorectal incidence rates decreased 21.4 percent for males and 15.1 percent for females between 1991-95 and 2001-05.
Historically, Delaware’s colorectal cancer mortality rate has been higher than the U.S. rate. However, Delaware’s 2001-05 colorectal cancer mortality rate was not significantly different from the U.S. rate.
Between 1991-95 and 2001-05, Delaware’s colorectal cancer mortality rate dropped 23.8 percent (from 25.6 per 100,000 to 19.5 per 100,000) while the U.S. rate dropped 19.3 percent (from 23.3 per 100,000 to 18.8 per 100,000).
Age-Specific Incidence and Mortality Rates (Tables 6.3 and 6.8, Figures 6.3 and 6.8)
The 2001-05 colorectal cancer incidence rate increased with age. Delawareans ages 85 and older had the highest age-specific incidence rate.
For all age groups, the colorectal cancer incidence rate was higher for males than for females. Stage at Diagnosis of Colorectal Cancer (Tables 6.4–6.5, Figures 6.4–6.5)
For 2001-05, 34.4 percent, 42.3 percent and 16.1 percent of colorectal cancers diagnosed in Delaware were detected at the local, regional and distant stages, respectively. Comparable percentages for the U.S. were 40.0 percent, 36.0 percent and 19.0 percent, respectively.
In Delaware, from 2001-05, 1,344 colorectal cancer cases (58.4 percent) were diagnosed in the late stages (i.e., regional or distant stage).
Among those diagnosed with colorectal cancer, African Americans were slightly more likely to have their cancer diagnosed in the local stage than were Caucasians (34.1 percent vs. 32.7 percent, respectively).
In Delaware, the percentage of colorectal cancer cases diagnosed in the local stage increased from 31.7 percent in 1980-84 to 34.3 percent in 2001-05. Accordingly, there was a decrease in cases diagnosed in the distant stage, from 20.0 percent in 1980-84 to 16.2 percent in 2001-05. There was minimal change in the percentage of regional stage cases diagnosed during the same time.
37
Colorectal Cancer Incidence
Table 6.1. Number of Colorectal Cancer Cases in Delaware and Counties, by Race and Sex: 2001-05
All Races Caucasian African American
All Male Female All Male Female All Male Female
Delaware 2,305 1,179 1,126 1,916 985 931 328 162 166
Kent 383 201 182 307 156 151 64 37 27
New Castle 1,298 647 651 1,054 532 522 209 96 113
Sussex 624 331 293 555 297 258 55 29 26
SOURCE: Delaware Cancer Registry, Delaware’s Division of Public Health, 2008. Table 6.2. Five-Year Average Age-Adjusted Colorectal Cancer Incidence Rates* in the
U.S., Delaware and Counties, by Race and Sex: 2001-05 SEX
RACE AND REGION All Male Female
ALL RACES
United States 50.3 (49.9, 50.7) 58.5 (57.9, 59.2) 43.8 (43.3, 44.2)
Delaware 52.8 (50.7, 55.0) 62.3 (58.7, 65.8) 45.6 (43.0, 48.3)
Kent 59.1 (53.2, 65.0) 72.0 (62.0, 81.9) 50.0 (42.7, 57.3)
New Castle 51.8 (49.0, 54.6) 60.2 (55.6, 64.9) 45.3 (41.8, 48.8)
Sussex 52.4 (48.3, 56.5) 62.0 (55.3, 68.6) 44.6 (39.5, 49.8)
CAUCASIAN
United States 49.7 (49.3, 50.1) 58.0 (57.3, 58.7) 43.1 (42.6, 43.6)
Delaware 51.6 (49.3, 53.9) 60.8 (57.0, 64.6) 44.2 (41.4, 47.1)
Kent 58.2 (51.7, 64.8) 69.0 (58.1, 79.8) 50.8 (42.7, 58.9)
New Castle 50.5 (47.5, 53.6) 59.1 (54.1, 64.1) 43.4 (39.7, 47.1)
Sussex 51.1 (46.9, 55.4) 61.1 (54.1, 68.0) 43.0 (37.8, 48.3)
AFRICAN AMERICAN
United States 60.3 (58.8, 61.8) 70.2 (67.6, 72.8) 54.0 (52.2, 55.8)
Delaware 56.7 (50.5, 62.8) 69.5 (58.8, 80.2) 49.3 (41.8, 56.8)
Kent 61.4 (47.3, 78.4) 79.2 (55.8, 109.1) 47.5 (31.3, 69.0)
New Castle 55.6 (48.1, 63.2) 66.9 (54.2, 81.7) 50.9 (41.6, 60.3)
Sussex 55.2 (41.6, 71.8) 69.2 (46.3, 99.4) 44.5 (29.0, 65.2)
* = Rates are per 100,000 population and age-adjusted to the 2000 U.S. standard population. SOURCES: Delaware: Delaware Cancer Registry, Delaware’s Division of Public Health, 2008; U.S.: Surveillance, Epidemiology, and End Results Program, National Cancer Institute, 2007.
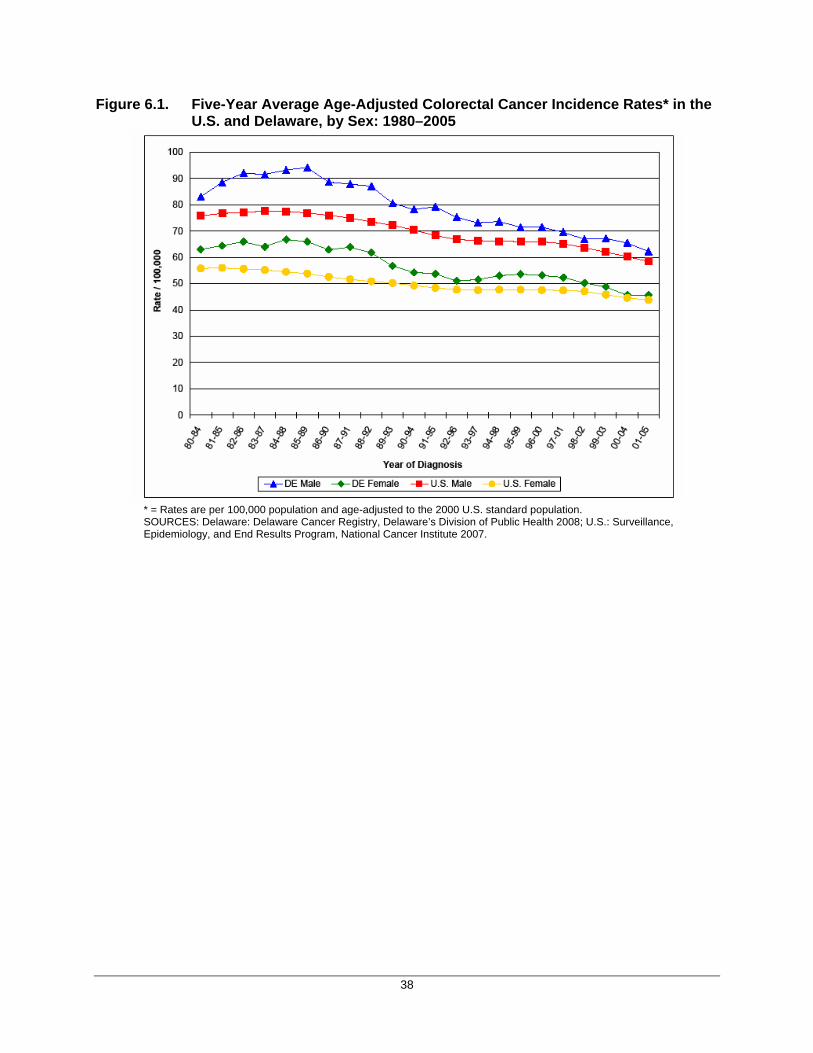
38
Figure 6.1. Five-Year Average Age-Adjusted Colorectal Cancer Incidence Rates* in the U.S. and Delaware, by Sex: 1980–2005
* = Rates are per 100,000 population and age-adjusted to the 2000 U.S. standard population. SOURCES: Delaware: Delaware Cancer Registry, Delaware’s Division of Public Health 2008; U.S.: Surveillance, Epidemiology, and End Results Program, National Cancer Institute 2007.
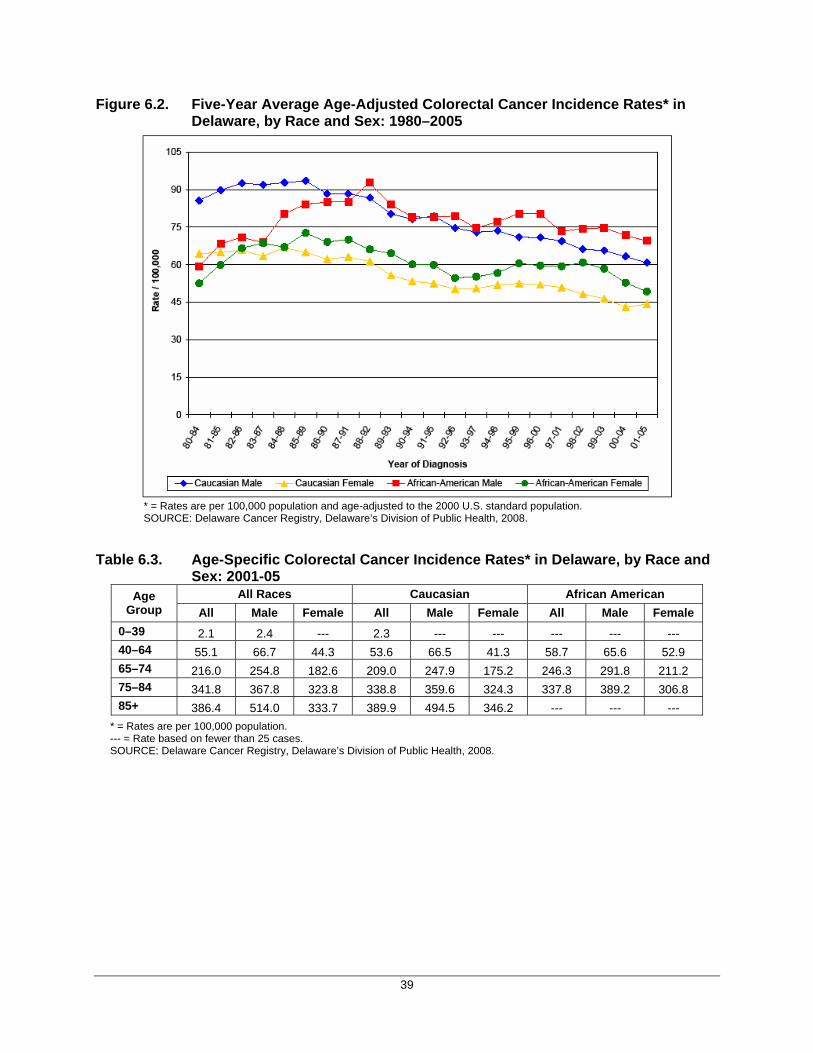
39
Figure 6.2. Five-Year Average Age-Adjusted Colorectal Cancer Incidence Rates* in Delaware, by Race and Sex: 1980–2005
* = Rates are per 100,000 population and age-adjusted to the 2000 U.S. standard population. SOURCE: Delaware Cancer Registry, Delaware’s Division of Public Health, 2008.
Table 6.3. Age-Specific Colorectal Cancer Incidence Rates* in Delaware, by Race and Sex: 2001-05
All Races Caucasian African American Age Group All Male Female All Male Female All Male Female
0–39 2.1 2.4 --- 2.3 --- --- --- --- --- 40–64 55.1 66.7 44.3 53.6 66.5 41.3 58.7 65.6 52.9 65–74 216.0 254.8 182.6 209.0 247.9 175.2 246.3 291.8 211.2 75–84 341.8 367.8 323.8 338.8 359.6 324.3 337.8 389.2 306.8 85+ 386.4 514.0 333.7 389.9 494.5 346.2 --- --- ---
* = Rates are per 100,000 population. --- = Rate based on fewer than 25 cases. SOURCE: Delaware Cancer Registry, Delaware’s Division of Public Health, 2008.
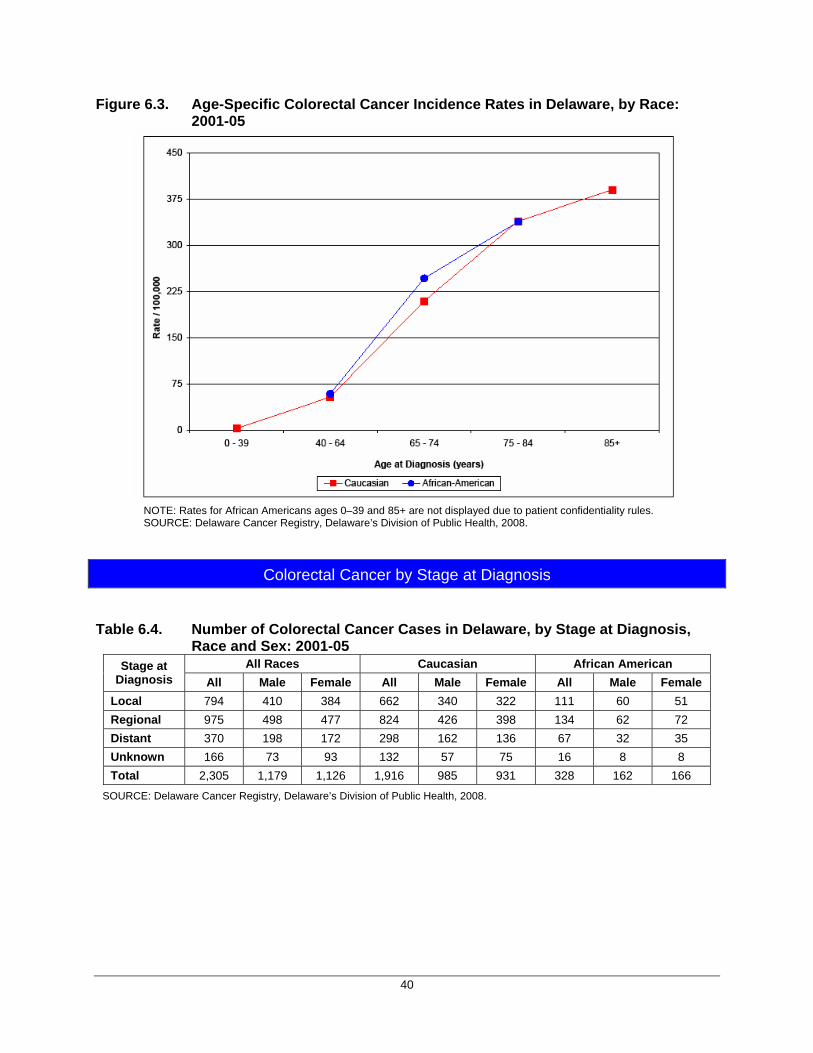
40
Figure 6.3. Age-Specific Colorectal Cancer Incidence Rates in Delaware, by Race: 2001-05
NOTE: Rates for African Americans ages 0–39 and 85+ are not displayed due to patient confidentiality rules. SOURCE: Delaware Cancer Registry, Delaware’s Division of Public Health, 2008.
Colorectal Cancer by Stage at Diagnosis
Table 6.4. Number of Colorectal Cancer Cases in Delaware, by Stage at Diagnosis,
Race and Sex: 2001-05 All Races Caucasian African American Stage at
Diagnosis All Male Female All Male Female All Male Female Local 794 410 384 662 340 322 111 60 51 Regional 975 498 477 824 426 398 134 62 72 Distant 370 198 172 298 162 136 67 32 35 Unknown 166 73 93 132 57 75 16 8 8 Total 2,305 1,179 1,126 1,916 985 931 328 162 166
SOURCE: Delaware Cancer Registry, Delaware’s Division of Public Health, 2008.
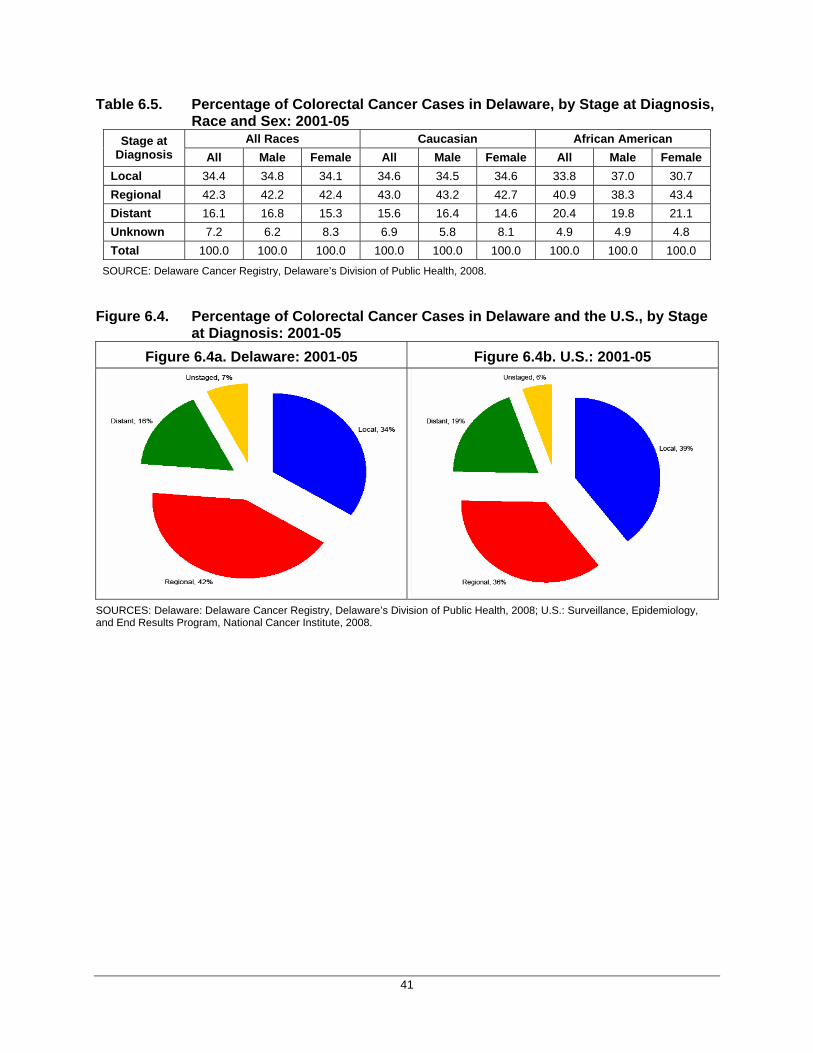
41
Table 6.5. Percentage of Colorectal Cancer Cases in Delaware, by Stage at Diagnosis, Race and Sex: 2001-05
All Races Caucasian African American Stage at Diagnosis All Male Female All Male Female All Male Female
Local 34.4 34.8 34.1 34.6 34.5 34.6 33.8 37.0 30.7 Regional 42.3 42.2 42.4 43.0 43.2 42.7 40.9 38.3 43.4 Distant 16.1 16.8 15.3 15.6 16.4 14.6 20.4 19.8 21.1 Unknown 7.2 6.2 8.3 6.9 5.8 8.1 4.9 4.9 4.8 Total 100.0 100.0 100.0 100.0 100.0 100.0 100.0 100.0 100.0
SOURCE: Delaware Cancer Registry, Delaware’s Division of Public Health, 2008. Figure 6.4. Percentage of Colorectal Cancer Cases in Delaware and the U.S., by Stage
at Diagnosis: 2001-05
Figure 6.4a. Delaware: 2001-05
Figure 6.4b. U.S.: 2001-05
SOURCES: Delaware: Delaware Cancer Registry, Delaware’s Division of Public Health, 2008; U.S.: Surveillance, Epidemiology, and End Results Program, National Cancer Institute, 2008.
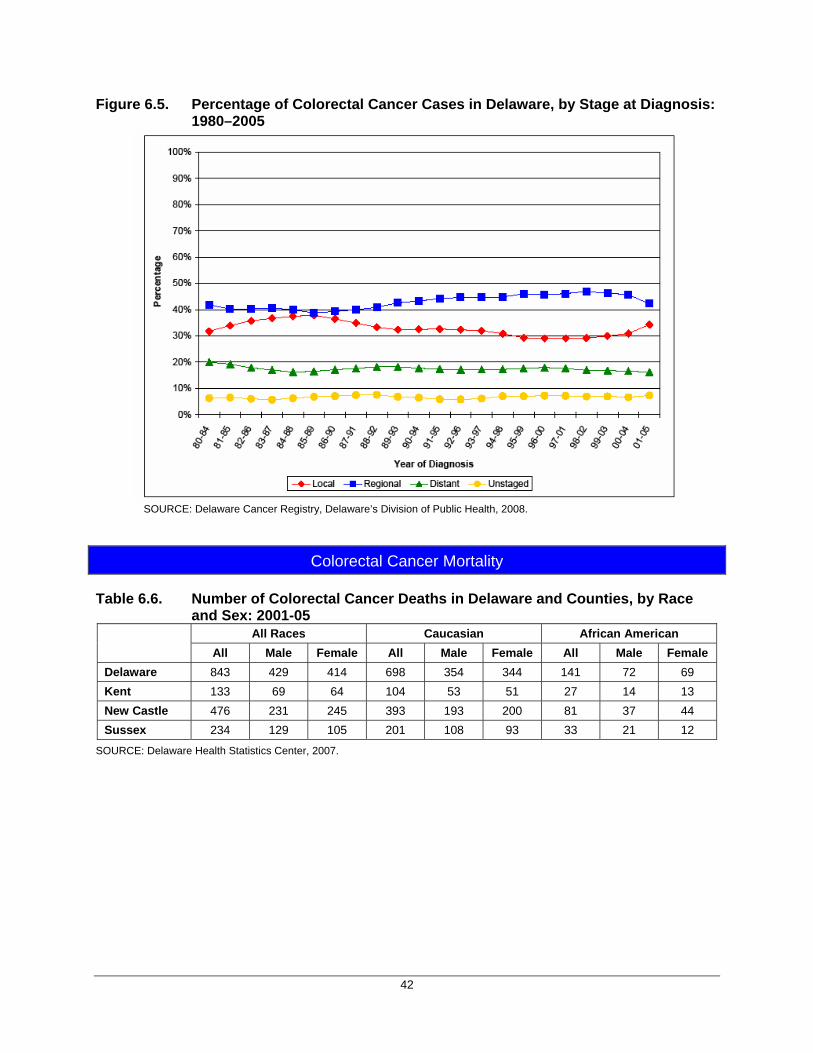
42
Figure 6.5. Percentage of Colorectal Cancer Cases in Delaware, by Stage at Diagnosis: 1980–2005
SOURCE: Delaware Cancer Registry, Delaware’s Division of Public Health, 2008.
Colorectal Cancer Mortality Table 6.6. Number of Colorectal Cancer Deaths in Delaware and Counties, by Race
and Sex: 2001-05 All Races Caucasian African American
All Male Female All Male Female All Male Female
Delaware 843 429 414 698 354 344 141 72 69 Kent 133 69 64 104 53 51 27 14 13 New Castle 476 231 245 393 193 200 81 37 44 Sussex 234 129 105 201 108 93 33 21 12
SOURCE: Delaware Health Statistics Center, 2007.
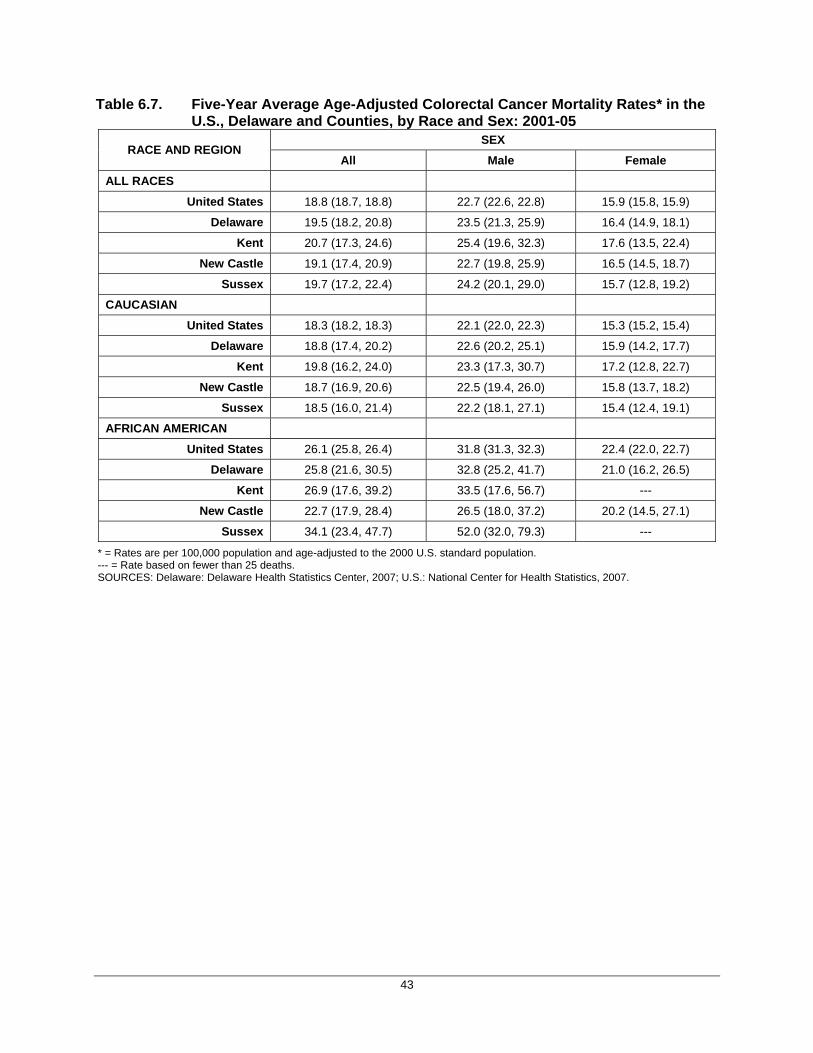
43
Table 6.7. Five-Year Average Age-Adjusted Colorectal Cancer Mortality Rates* in the U.S., Delaware and Counties, by Race and Sex: 2001-05
SEX RACE AND REGION
All Male Female ALL RACES
United States 18.8 (18.7, 18.8) 22.7 (22.6, 22.8) 15.9 (15.8, 15.9)
Delaware 19.5 (18.2, 20.8) 23.5 (21.3, 25.9) 16.4 (14.9, 18.1)
Kent 20.7 (17.3, 24.6) 25.4 (19.6, 32.3) 17.6 (13.5, 22.4)
New Castle 19.1 (17.4, 20.9) 22.7 (19.8, 25.9) 16.5 (14.5, 18.7)
Sussex 19.7 (17.2, 22.4) 24.2 (20.1, 29.0) 15.7 (12.8, 19.2)
CAUCASIAN
United States 18.3 (18.2, 18.3) 22.1 (22.0, 22.3) 15.3 (15.2, 15.4)
Delaware 18.8 (17.4, 20.2) 22.6 (20.2, 25.1) 15.9 (14.2, 17.7)
Kent 19.8 (16.2, 24.0) 23.3 (17.3, 30.7) 17.2 (12.8, 22.7)
New Castle 18.7 (16.9, 20.6) 22.5 (19.4, 26.0) 15.8 (13.7, 18.2)
Sussex 18.5 (16.0, 21.4) 22.2 (18.1, 27.1) 15.4 (12.4, 19.1)
AFRICAN AMERICAN
United States 26.1 (25.8, 26.4) 31.8 (31.3, 32.3) 22.4 (22.0, 22.7)
Delaware 25.8 (21.6, 30.5) 32.8 (25.2, 41.7) 21.0 (16.2, 26.5)
Kent 26.9 (17.6, 39.2) 33.5 (17.6, 56.7) ---
New Castle 22.7 (17.9, 28.4) 26.5 (18.0, 37.2) 20.2 (14.5, 27.1)
Sussex 34.1 (23.4, 47.7) 52.0 (32.0, 79.3) ---
* = Rates are per 100,000 population and age-adjusted to the 2000 U.S. standard population. --- = Rate based on fewer than 25 deaths. SOURCES: Delaware: Delaware Health Statistics Center, 2007; U.S.: National Center for Health Statistics, 2007.
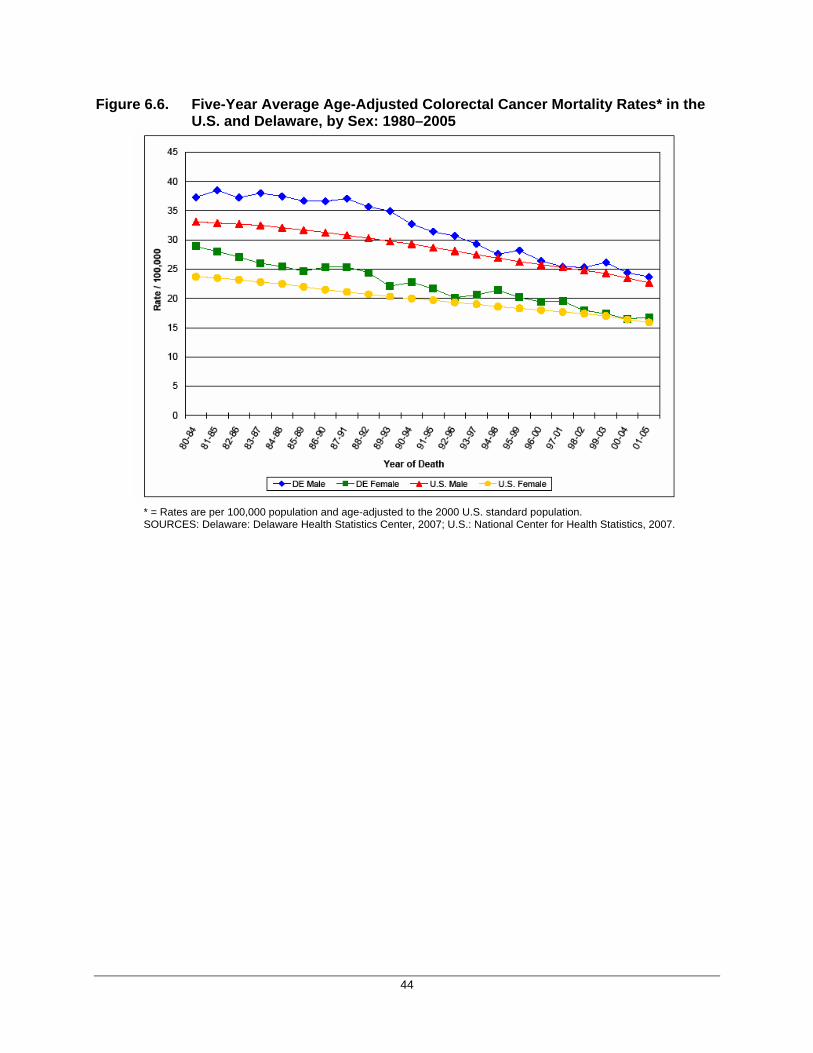
44
Figure 6.6. Five-Year Average Age-Adjusted Colorectal Cancer Mortality Rates* in the U.S. and Delaware, by Sex: 1980–2005
* = Rates are per 100,000 population and age-adjusted to the 2000 U.S. standard population. SOURCES: Delaware: Delaware Health Statistics Center, 2007; U.S.: National Center for Health Statistics, 2007.
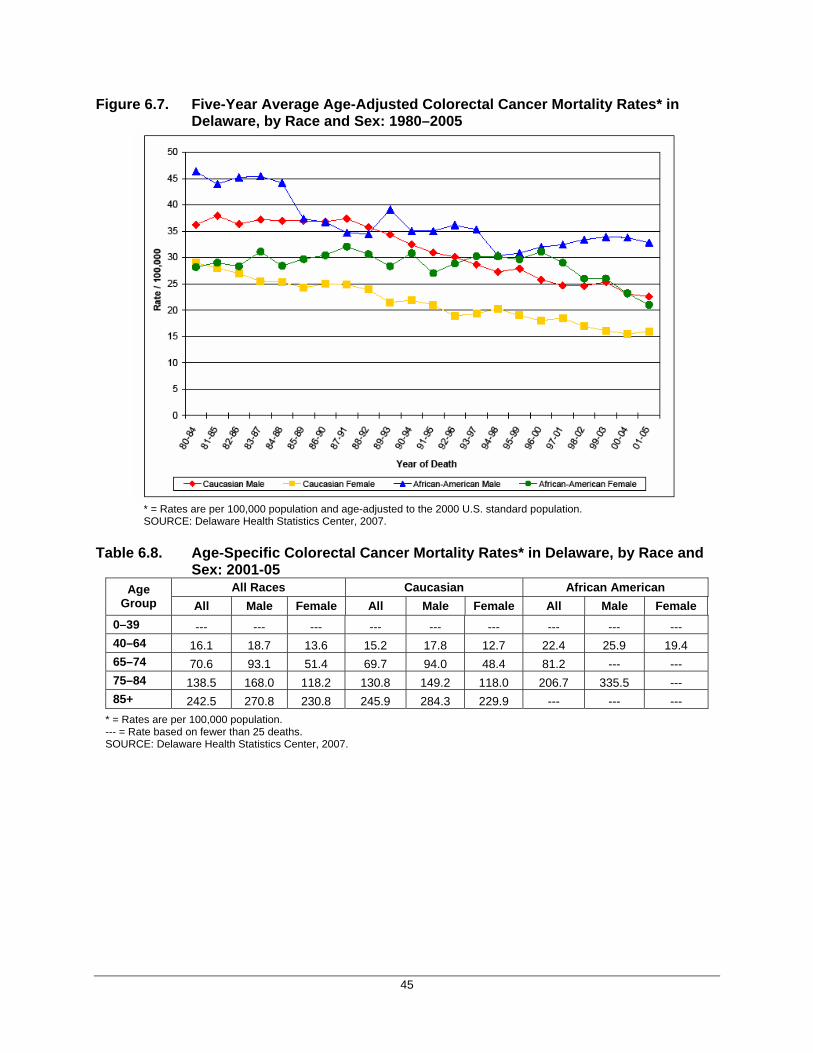
45
Figure 6.7. Five-Year Average Age-Adjusted Colorectal Cancer Mortality Rates* in Delaware, by Race and Sex: 1980–2005
* = Rates are per 100,000 population and age-adjusted to the 2000 U.S. standard population. SOURCE: Delaware Health Statistics Center, 2007.
Table 6.8. Age-Specific Colorectal Cancer Mortality Rates* in Delaware, by Race and
Sex: 2001-05 All Races Caucasian African American Age
Group All Male Female All Male Female All Male Female 0–39 --- --- --- --- --- --- --- --- --- 40–64 16.1 18.7 13.6 15.2 17.8 12.7 22.4 25.9 19.4 65–74 70.6 93.1 51.4 69.7 94.0 48.4 81.2 --- --- 75–84 138.5 168.0 118.2 130.8 149.2 118.0 206.7 335.5 --- 85+ 242.5 270.8 230.8 245.9 284.3 229.9 --- --- ---
* = Rates are per 100,000 population. --- = Rate based on fewer than 25 deaths. SOURCE: Delaware Health Statistics Center, 2007.
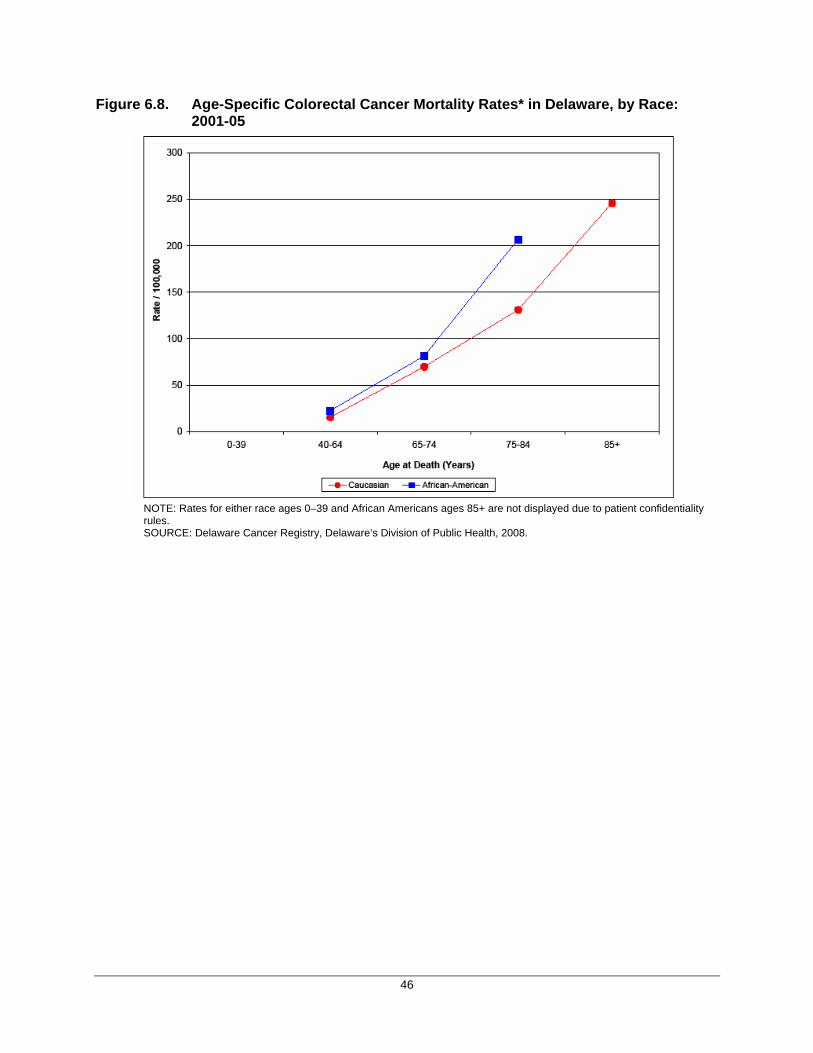
46
Figure 6.8. Age-Specific Colorectal Cancer Mortality Rates* in Delaware, by Race: 2001-05
NOTE: Rates for either race ages 0–39 and African Americans ages 85+ are not displayed due to patient confidentiality rules. SOURCE: Delaware Cancer Registry, Delaware’s Division of Public Health, 2008.
47
7. Lung and Bronchial Cancer
Risk Factors and Early Detection Risk Factors for Lung Cancer
Tobacco use: cigarette, cigar and pipe smoking
An estimated 87 percent of lung cancers are caused by smoking cigarettes, cigars or pipes
The longer a person has smoked and the more packs smoked per day, the greater the risk
Occupational exposures to known lung carcinogens, including asbestos, mustard gas, radioactive ores and heavy metals
Exposure to secondhand smoke
Exposure to radon gas
Radiation therapy to the chest, especially for people who smoke
Personal history of lung cancer
Family history of lung cancer
Diseases such as silicosis, berylliosis and chronic obstructive pulmonary disease Possible Risk Factors for Lung Cancer
Diets low in fruits and vegetables
High levels of arsenic in drinking water
Heavy alcohol use
Smoking marijuana
Exposure to air pollution Protective Factors
Never smoking
Stopping smoking at any age
Diets rich in fruits and possibly vegetables
Engaging in recommended levels of physical activity Early Detection of Lung Cancer
There is currently no effective screening test for lung cancer. The American Cancer Society recommends that people at higher risk for lung cancer be aware of their risk and discuss it with their doctor. In addition to lung cancer, cigarette smoking is recognized as a risk factor in the development of numerous other cancers, including cervical, esophageal, kidney, laryngeal, oral and pharyngeal, pancreatic and urinary bladder cancers. Current Trends in Smoking in Delaware and the U.S. Current smoking trends may be predictive of cancer rates in the 2030s. In the 1980s (i.e., the time period relevant to current lung and bronchial cancer rates), Delaware’s smoking prevalence rates were among
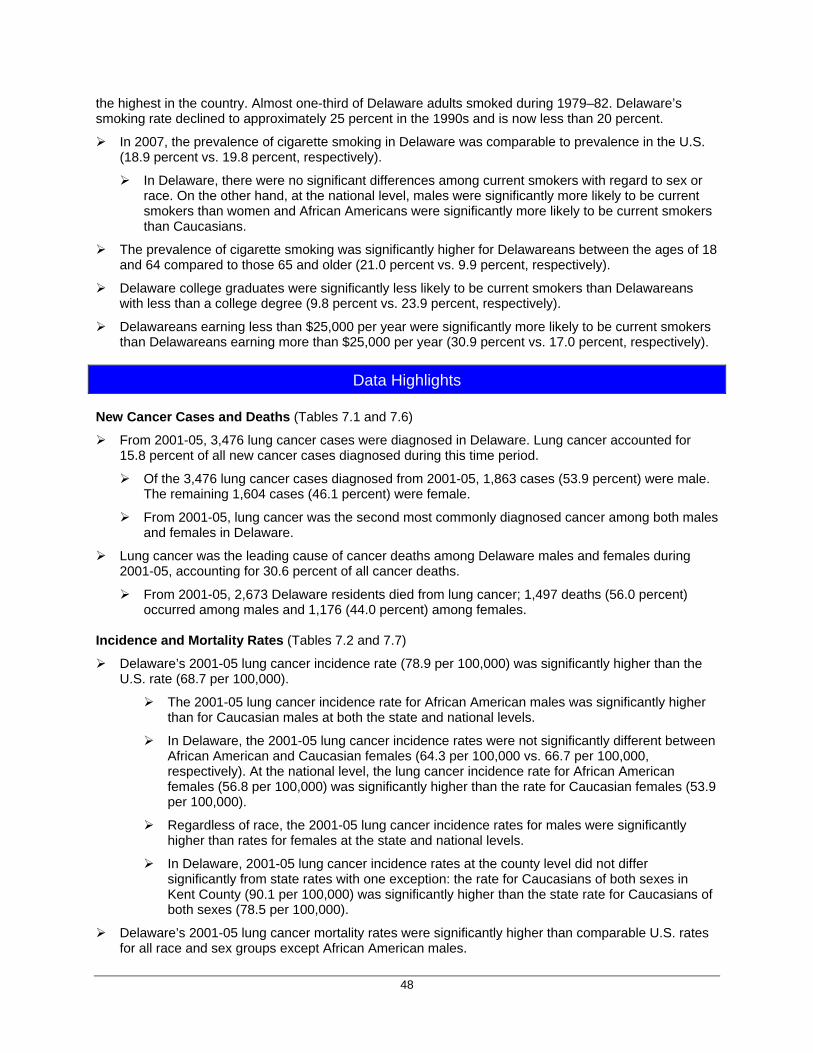
48
the highest in the country. Almost one-third of Delaware adults smoked during 1979–82. Delaware’s smoking rate declined to approximately 25 percent in the 1990s and is now less than 20 percent.
In 2007, the prevalence of cigarette smoking in Delaware was comparable to prevalence in the U.S. (18.9 percent vs. 19.8 percent, respectively).
In Delaware, there were no significant differences among current smokers with regard to sex or race. On the other hand, at the national level, males were significantly more likely to be current smokers than women and African Americans were significantly more likely to be current smokers than Caucasians.
The prevalence of cigarette smoking was significantly higher for Delawareans between the ages of 18 and 64 compared to those 65 and older (21.0 percent vs. 9.9 percent, respectively).
Delaware college graduates were significantly less likely to be current smokers than Delawareans with less than a college degree (9.8 percent vs. 23.9 percent, respectively).
Delawareans earning less than $25,000 per year were significantly more likely to be current smokers than Delawareans earning more than $25,000 per year (30.9 percent vs. 17.0 percent, respectively).
Data Highlights New Cancer Cases and Deaths (Tables 7.1 and 7.6)
From 2001-05, 3,476 lung cancer cases were diagnosed in Delaware. Lung cancer accounted for 15.8 percent of all new cancer cases diagnosed during this time period.
Of the 3,476 lung cancer cases diagnosed from 2001-05, 1,863 cases (53.9 percent) were male. The remaining 1,604 cases (46.1 percent) were female.
From 2001-05, lung cancer was the second most commonly diagnosed cancer among both males and females in Delaware.
Lung cancer was the leading cause of cancer deaths among Delaware males and females during 2001-05, accounting for 30.6 percent of all cancer deaths.
From 2001-05, 2,673 Delaware residents died from lung cancer; 1,497 deaths (56.0 percent) occurred among males and 1,176 (44.0 percent) among females.
Incidence and Mortality Rates (Tables 7.2 and 7.7)
Delaware’s 2001-05 lung cancer incidence rate (78.9 per 100,000) was significantly higher than the U.S. rate (68.7 per 100,000).
The 2001-05 lung cancer incidence rate for African American males was significantly higher than for Caucasian males at both the state and national levels.
In Delaware, the 2001-05 lung cancer incidence rates were not significantly different between African American and Caucasian females (64.3 per 100,000 vs. 66.7 per 100,000, respectively). At the national level, the lung cancer incidence rate for African American females (56.8 per 100,000) was significantly higher than the rate for Caucasian females (53.9 per 100,000).
Regardless of race, the 2001-05 lung cancer incidence rates for males were significantly higher than rates for females at the state and national levels.
In Delaware, 2001-05 lung cancer incidence rates at the county level did not differ significantly from state rates with one exception: the rate for Caucasians of both sexes in Kent County (90.1 per 100,000) was significantly higher than the state rate for Caucasians of both sexes (78.5 per 100,000).
Delaware’s 2001-05 lung cancer mortality rates were significantly higher than comparable U.S. rates for all race and sex groups except African American males.
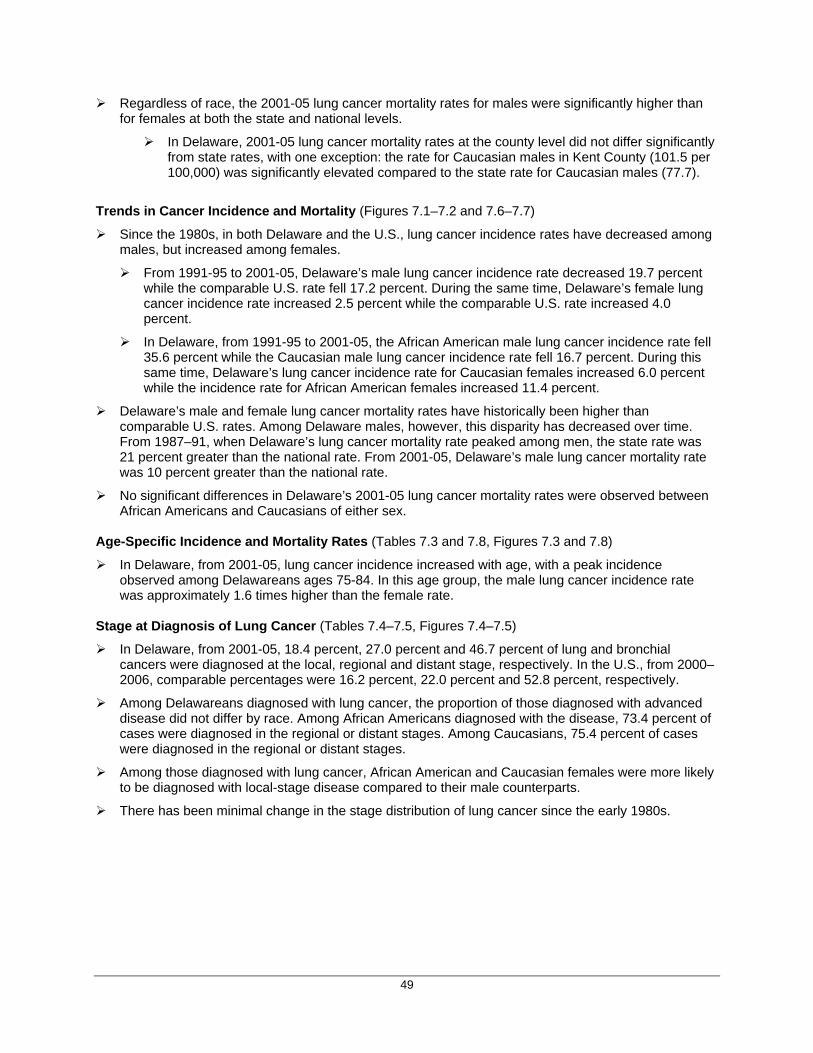
49
Regardless of race, the 2001-05 lung cancer mortality rates for males were significantly higher than for females at both the state and national levels.
In Delaware, 2001-05 lung cancer mortality rates at the county level did not differ significantly from state rates, with one exception: the rate for Caucasian males in Kent County (101.5 per 100,000) was significantly elevated compared to the state rate for Caucasian males (77.7).
Trends in Cancer Incidence and Mortality (Figures 7.1–7.2 and 7.6–7.7)
Since the 1980s, in both Delaware and the U.S., lung cancer incidence rates have decreased among males, but increased among females.
From 1991-95 to 2001-05, Delaware’s male lung cancer incidence rate decreased 19.7 percent while the comparable U.S. rate fell 17.2 percent. During the same time, Delaware’s female lung cancer incidence rate increased 2.5 percent while the comparable U.S. rate increased 4.0 percent.
In Delaware, from 1991-95 to 2001-05, the African American male lung cancer incidence rate fell 35.6 percent while the Caucasian male lung cancer incidence rate fell 16.7 percent. During this same time, Delaware’s lung cancer incidence rate for Caucasian females increased 6.0 percent while the incidence rate for African American females increased 11.4 percent.
Delaware’s male and female lung cancer mortality rates have historically been higher than comparable U.S. rates. Among Delaware males, however, this disparity has decreased over time. From 1987–91, when Delaware’s lung cancer mortality rate peaked among men, the state rate was 21 percent greater than the national rate. From 2001-05, Delaware’s male lung cancer mortality rate was 10 percent greater than the national rate.
No significant differences in Delaware’s 2001-05 lung cancer mortality rates were observed between African Americans and Caucasians of either sex.
Age-Specific Incidence and Mortality Rates (Tables 7.3 and 7.8, Figures 7.3 and 7.8)
In Delaware, from 2001-05, lung cancer incidence increased with age, with a peak incidence observed among Delawareans ages 75-84. In this age group, the male lung cancer incidence rate was approximately 1.6 times higher than the female rate.
Stage at Diagnosis of Lung Cancer (Tables 7.4–7.5, Figures 7.4–7.5)
In Delaware, from 2001-05, 18.4 percent, 27.0 percent and 46.7 percent of lung and bronchial cancers were diagnosed at the local, regional and distant stage, respectively. In the U.S., from 2000–2006, comparable percentages were 16.2 percent, 22.0 percent and 52.8 percent, respectively.
Among Delawareans diagnosed with lung cancer, the proportion of those diagnosed with advanced disease did not differ by race. Among African Americans diagnosed with the disease, 73.4 percent of cases were diagnosed in the regional or distant stages. Among Caucasians, 75.4 percent of cases were diagnosed in the regional or distant stages.
Among those diagnosed with lung cancer, African American and Caucasian females were more likely to be diagnosed with local-stage disease compared to their male counterparts.
There has been minimal change in the stage distribution of lung cancer since the early 1980s.
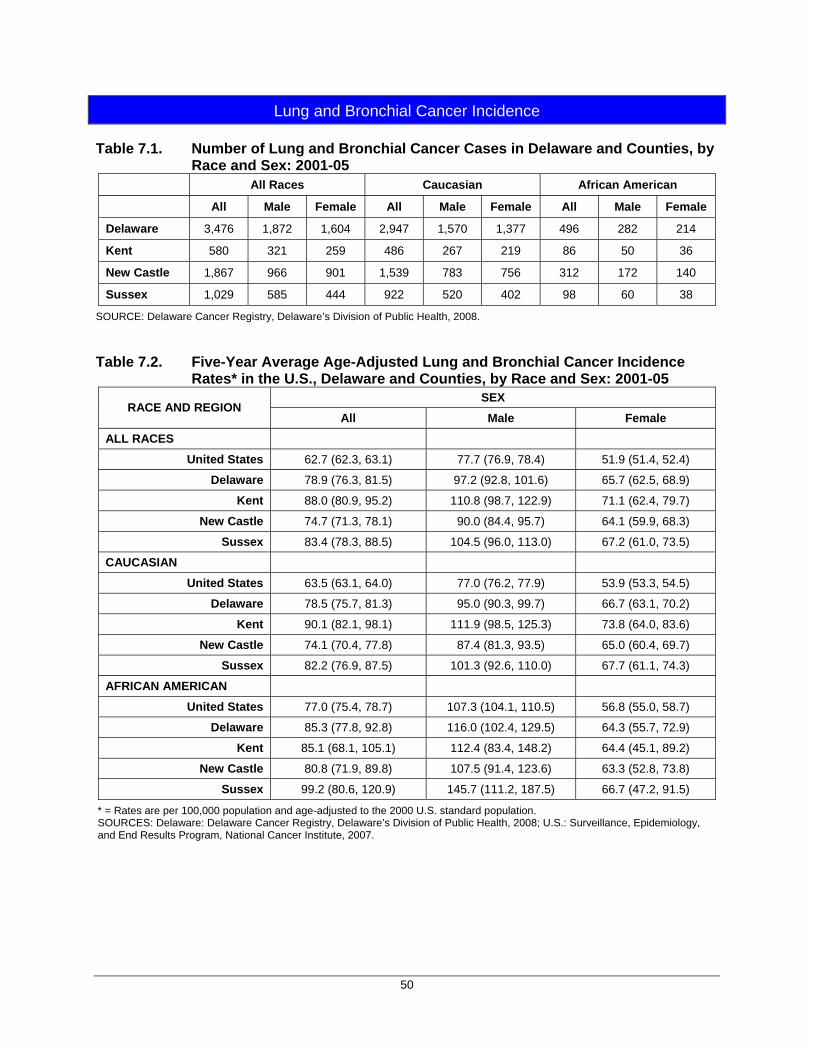
50
Lung and Bronchial Cancer Incidence Table 7.1. Number of Lung and Bronchial Cancer Cases in Delaware and Counties, by
Race and Sex: 2001-05 All Races Caucasian African American
All Male Female All Male Female All Male Female
Delaware 3,476 1,872 1,604 2,947 1,570 1,377 496 282 214
Kent 580 321 259 486 267 219 86 50 36
New Castle 1,867 966 901 1,539 783 756 312 172 140
Sussex 1,029 585 444 922 520 402 98 60 38
SOURCE: Delaware Cancer Registry, Delaware’s Division of Public Health, 2008. Table 7.2. Five-Year Average Age-Adjusted Lung and Bronchial Cancer Incidence
Rates* in the U.S., Delaware and Counties, by Race and Sex: 2001-05 SEX
RACE AND REGION All Male Female
ALL RACES
United States 62.7 (62.3, 63.1) 77.7 (76.9, 78.4) 51.9 (51.4, 52.4)
Delaware 78.9 (76.3, 81.5) 97.2 (92.8, 101.6) 65.7 (62.5, 68.9)
Kent 88.0 (80.9, 95.2) 110.8 (98.7, 122.9) 71.1 (62.4, 79.7)
New Castle 74.7 (71.3, 78.1) 90.0 (84.4, 95.7) 64.1 (59.9, 68.3)
Sussex 83.4 (78.3, 88.5) 104.5 (96.0, 113.0) 67.2 (61.0, 73.5)
CAUCASIAN
United States 63.5 (63.1, 64.0) 77.0 (76.2, 77.9) 53.9 (53.3, 54.5)
Delaware 78.5 (75.7, 81.3) 95.0 (90.3, 99.7) 66.7 (63.1, 70.2)
Kent 90.1 (82.1, 98.1) 111.9 (98.5, 125.3) 73.8 (64.0, 83.6)
New Castle 74.1 (70.4, 77.8) 87.4 (81.3, 93.5) 65.0 (60.4, 69.7)
Sussex 82.2 (76.9, 87.5) 101.3 (92.6, 110.0) 67.7 (61.1, 74.3)
AFRICAN AMERICAN
United States 77.0 (75.4, 78.7) 107.3 (104.1, 110.5) 56.8 (55.0, 58.7)
Delaware 85.3 (77.8, 92.8) 116.0 (102.4, 129.5) 64.3 (55.7, 72.9)
Kent 85.1 (68.1, 105.1) 112.4 (83.4, 148.2) 64.4 (45.1, 89.2)
New Castle 80.8 (71.9, 89.8) 107.5 (91.4, 123.6) 63.3 (52.8, 73.8)
Sussex 99.2 (80.6, 120.9) 145.7 (111.2, 187.5) 66.7 (47.2, 91.5)
* = Rates are per 100,000 population and age-adjusted to the 2000 U.S. standard population. SOURCES: Delaware: Delaware Cancer Registry, Delaware’s Division of Public Health, 2008; U.S.: Surveillance, Epidemiology, and End Results Program, National Cancer Institute, 2007.
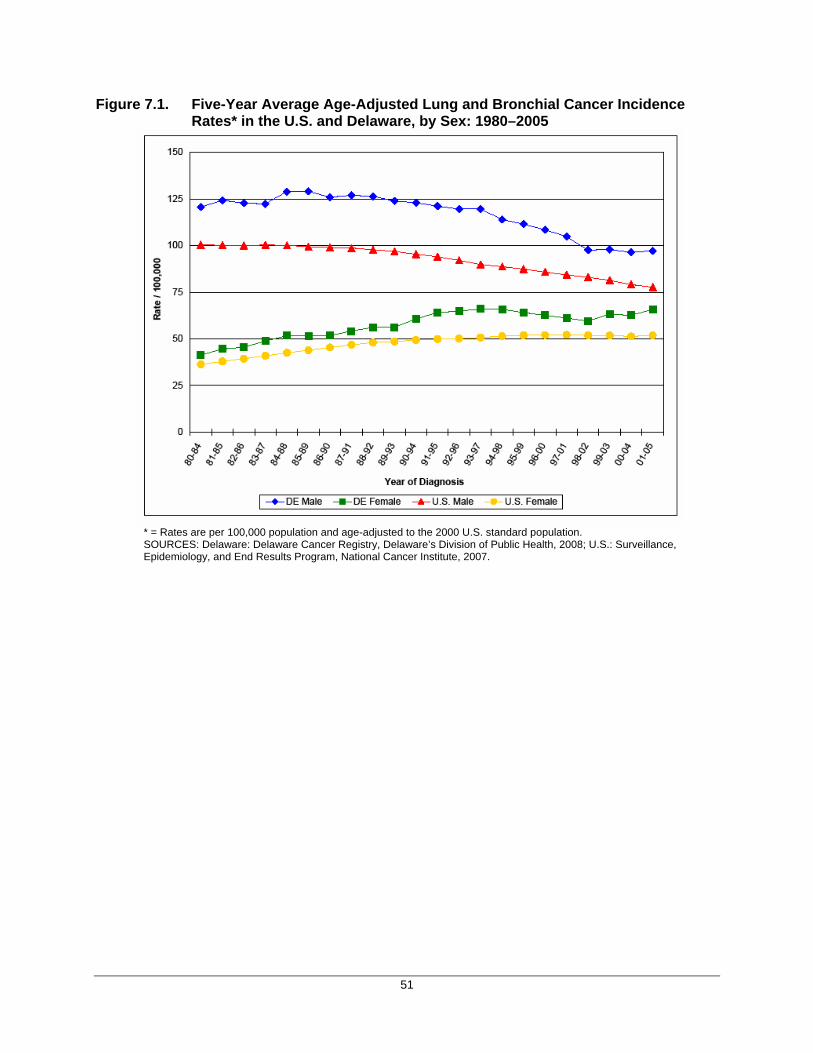
51
Figure 7.1. Five-Year Average Age-Adjusted Lung and Bronchial Cancer Incidence Rates* in the U.S. and Delaware, by Sex: 1980–2005
* = Rates are per 100,000 population and age-adjusted to the 2000 U.S. standard population. SOURCES: Delaware: Delaware Cancer Registry, Delaware’s Division of Public Health, 2008; U.S.: Surveillance, Epidemiology, and End Results Program, National Cancer Institute, 2007.
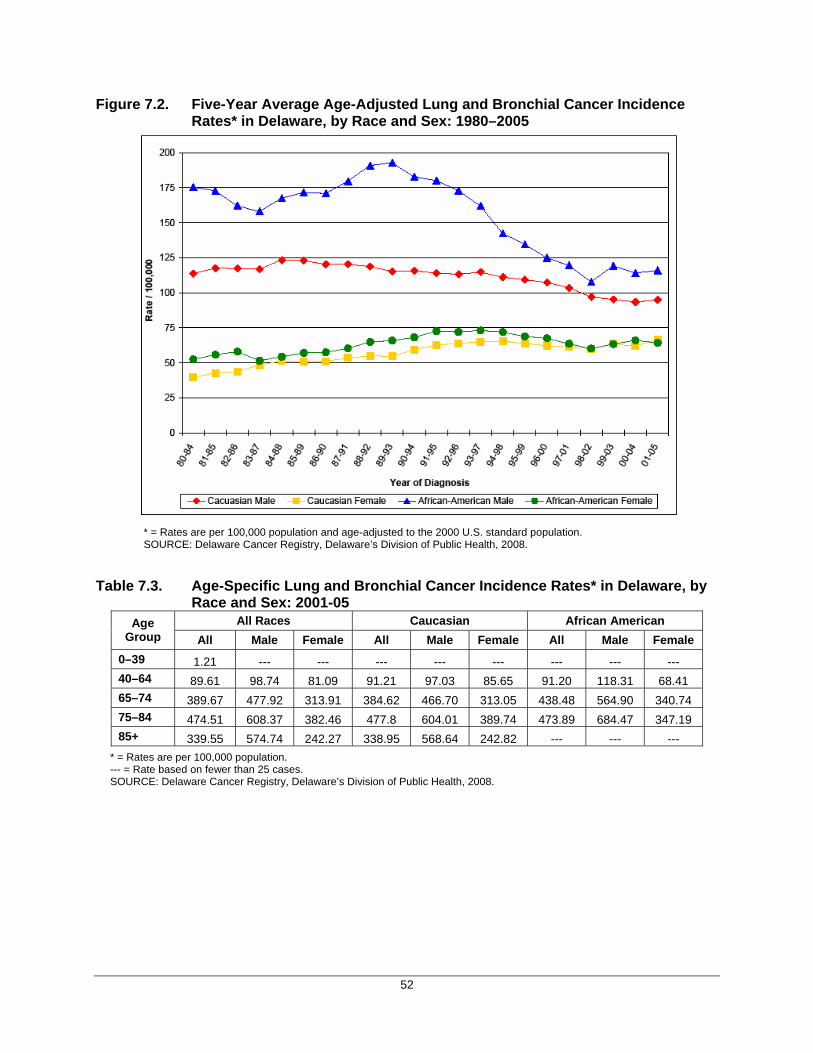
52
Figure 7.2. Five-Year Average Age-Adjusted Lung and Bronchial Cancer Incidence Rates* in Delaware, by Race and Sex: 1980–2005
* = Rates are per 100,000 population and age-adjusted to the 2000 U.S. standard population. SOURCE: Delaware Cancer Registry, Delaware’s Division of Public Health, 2008.
Table 7.3. Age-Specific Lung and Bronchial Cancer Incidence Rates* in Delaware, by Race and Sex: 2001-05
All Races Caucasian African American Age Group All Male Female All Male Female All Male Female
0–39 1.21 --- --- --- --- --- --- --- --- 40–64 89.61 98.74 81.09 91.21 97.03 85.65 91.20 118.31 68.41 65–74 389.67 477.92 313.91 384.62 466.70 313.05 438.48 564.90 340.74 75–84 474.51 608.37 382.46 477.8 604.01 389.74 473.89 684.47 347.19 85+ 339.55 574.74 242.27 338.95 568.64 242.82 --- --- ---
* = Rates are per 100,000 population. --- = Rate based on fewer than 25 cases. SOURCE: Delaware Cancer Registry, Delaware’s Division of Public Health, 2008.
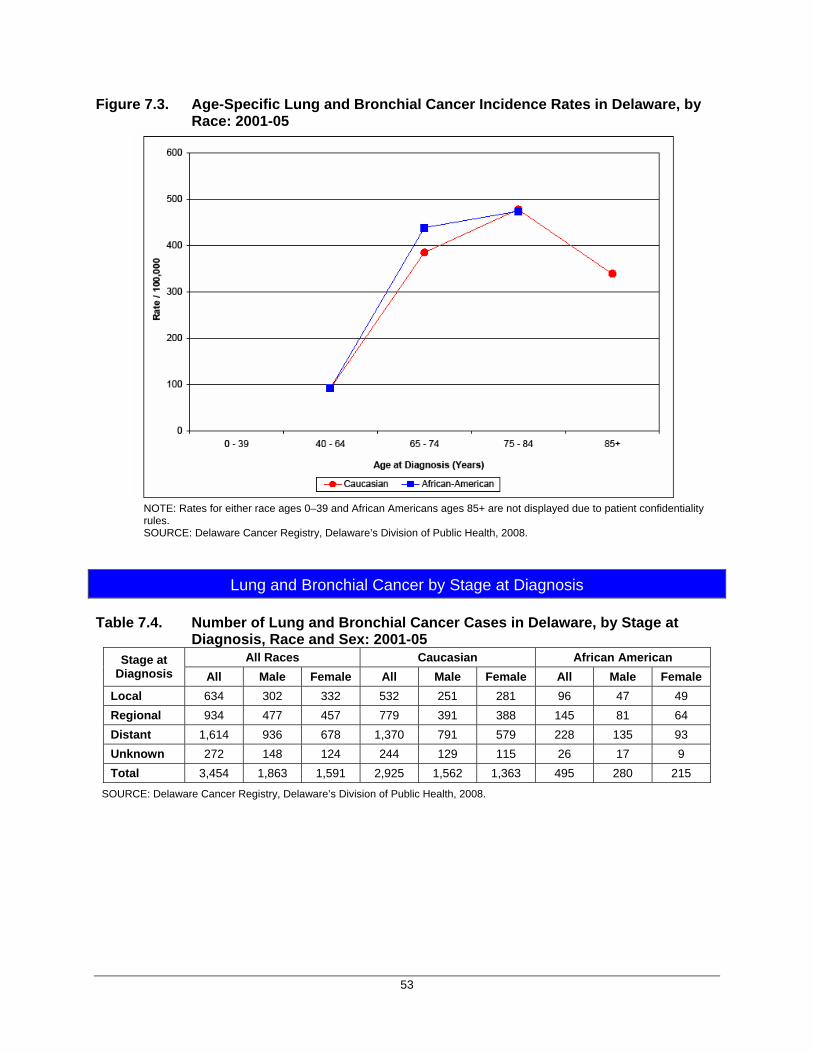
53
Figure 7.3. Age-Specific Lung and Bronchial Cancer Incidence Rates in Delaware, by Race: 2001-05
NOTE: Rates for either race ages 0–39 and African Americans ages 85+ are not displayed due to patient confidentiality rules. SOURCE: Delaware Cancer Registry, Delaware’s Division of Public Health, 2008.
Lung and Bronchial Cancer by Stage at Diagnosis
Table 7.4. Number of Lung and Bronchial Cancer Cases in Delaware, by Stage at Diagnosis, Race and Sex: 2001-05
All Races Caucasian African American Stage at Diagnosis All Male Female All Male Female All Male Female
Local 634 302 332 532 251 281 96 47 49 Regional 934 477 457 779 391 388 145 81 64 Distant 1,614 936 678 1,370 791 579 228 135 93 Unknown 272 148 124 244 129 115 26 17 9 Total 3,454 1,863 1,591 2,925 1,562 1,363 495 280 215
SOURCE: Delaware Cancer Registry, Delaware’s Division of Public Health, 2008.
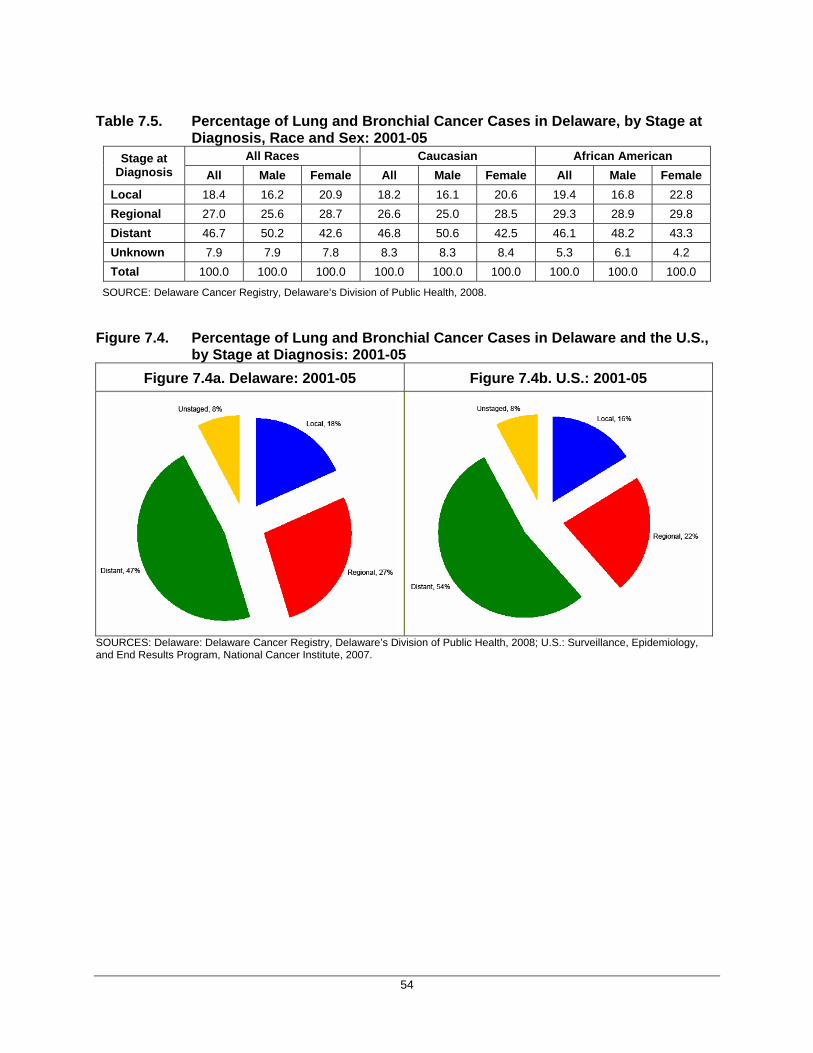
54
Table 7.5. Percentage of Lung and Bronchial Cancer Cases in Delaware, by Stage at
Diagnosis, Race and Sex: 2001-05 All Races Caucasian African American Stage at
Diagnosis All Male Female All Male Female All Male Female Local 18.4 16.2 20.9 18.2 16.1 20.6 19.4 16.8 22.8 Regional 27.0 25.6 28.7 26.6 25.0 28.5 29.3 28.9 29.8 Distant 46.7 50.2 42.6 46.8 50.6 42.5 46.1 48.2 43.3 Unknown 7.9 7.9 7.8 8.3 8.3 8.4 5.3 6.1 4.2 Total 100.0 100.0 100.0 100.0 100.0 100.0 100.0 100.0 100.0
SOURCE: Delaware Cancer Registry, Delaware’s Division of Public Health, 2008. Figure 7.4. Percentage of Lung and Bronchial Cancer Cases in Delaware and the U.S.,
by Stage at Diagnosis: 2001-05
Figure 7.4a. Delaware: 2001-05
Figure 7.4b. U.S.: 2001-05
SOURCES: Delaware: Delaware Cancer Registry, Delaware’s Division of Public Health, 2008; U.S.: Surveillance, Epidemiology, and End Results Program, National Cancer Institute, 2007.
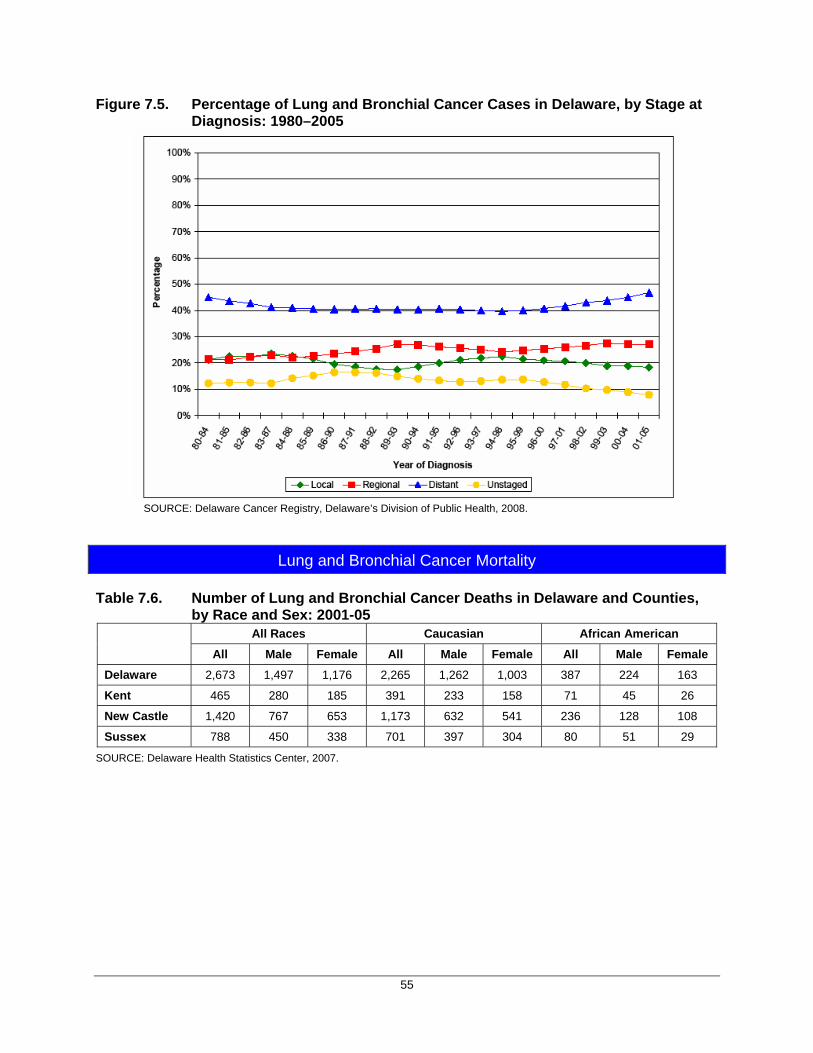
55
Figure 7.5. Percentage of Lung and Bronchial Cancer Cases in Delaware, by Stage at Diagnosis: 1980–2005
SOURCE: Delaware Cancer Registry, Delaware’s Division of Public Health, 2008.
Lung and Bronchial Cancer Mortality Table 7.6. Number of Lung and Bronchial Cancer Deaths in Delaware and Counties,
by Race and Sex: 2001-05 All Races Caucasian African American
All Male Female All Male Female All Male Female
Delaware 2,673 1,497 1,176 2,265 1,262 1,003 387 224 163
Kent 465 280 185 391 233 158 71 45 26
New Castle 1,420 767 653 1,173 632 541 236 128 108
Sussex 788 450 338 701 397 304 80 51 29
SOURCE: Delaware Health Statistics Center, 2007.
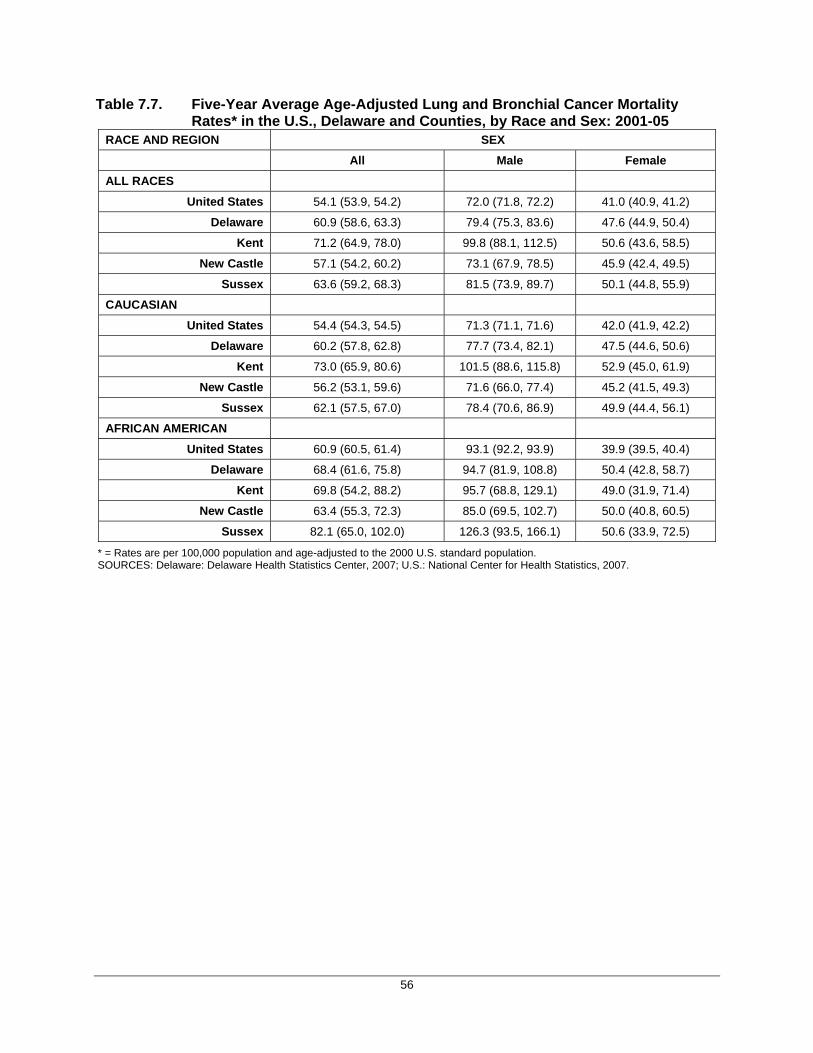
56
Table 7.7. Five-Year Average Age-Adjusted Lung and Bronchial Cancer Mortality Rates* in the U.S., Delaware and Counties, by Race and Sex: 2001-05
RACE AND REGION SEX All Male Female
ALL RACES
United States 54.1 (53.9, 54.2) 72.0 (71.8, 72.2) 41.0 (40.9, 41.2)
Delaware 60.9 (58.6, 63.3) 79.4 (75.3, 83.6) 47.6 (44.9, 50.4)
Kent 71.2 (64.9, 78.0) 99.8 (88.1, 112.5) 50.6 (43.6, 58.5)
New Castle 57.1 (54.2, 60.2) 73.1 (67.9, 78.5) 45.9 (42.4, 49.5)
Sussex 63.6 (59.2, 68.3) 81.5 (73.9, 89.7) 50.1 (44.8, 55.9)
CAUCASIAN
United States 54.4 (54.3, 54.5) 71.3 (71.1, 71.6) 42.0 (41.9, 42.2)
Delaware 60.2 (57.8, 62.8) 77.7 (73.4, 82.1) 47.5 (44.6, 50.6)
Kent 73.0 (65.9, 80.6) 101.5 (88.6, 115.8) 52.9 (45.0, 61.9)
New Castle 56.2 (53.1, 59.6) 71.6 (66.0, 77.4) 45.2 (41.5, 49.3)
Sussex 62.1 (57.5, 67.0) 78.4 (70.6, 86.9) 49.9 (44.4, 56.1)
AFRICAN AMERICAN
United States 60.9 (60.5, 61.4) 93.1 (92.2, 93.9) 39.9 (39.5, 40.4)
Delaware 68.4 (61.6, 75.8) 94.7 (81.9, 108.8) 50.4 (42.8, 58.7)
Kent 69.8 (54.2, 88.2) 95.7 (68.8, 129.1) 49.0 (31.9, 71.4)
New Castle 63.4 (55.3, 72.3) 85.0 (69.5, 102.7) 50.0 (40.8, 60.5)
Sussex 82.1 (65.0, 102.0) 126.3 (93.5, 166.1) 50.6 (33.9, 72.5)
* = Rates are per 100,000 population and age-adjusted to the 2000 U.S. standard population. SOURCES: Delaware: Delaware Health Statistics Center, 2007; U.S.: National Center for Health Statistics, 2007.
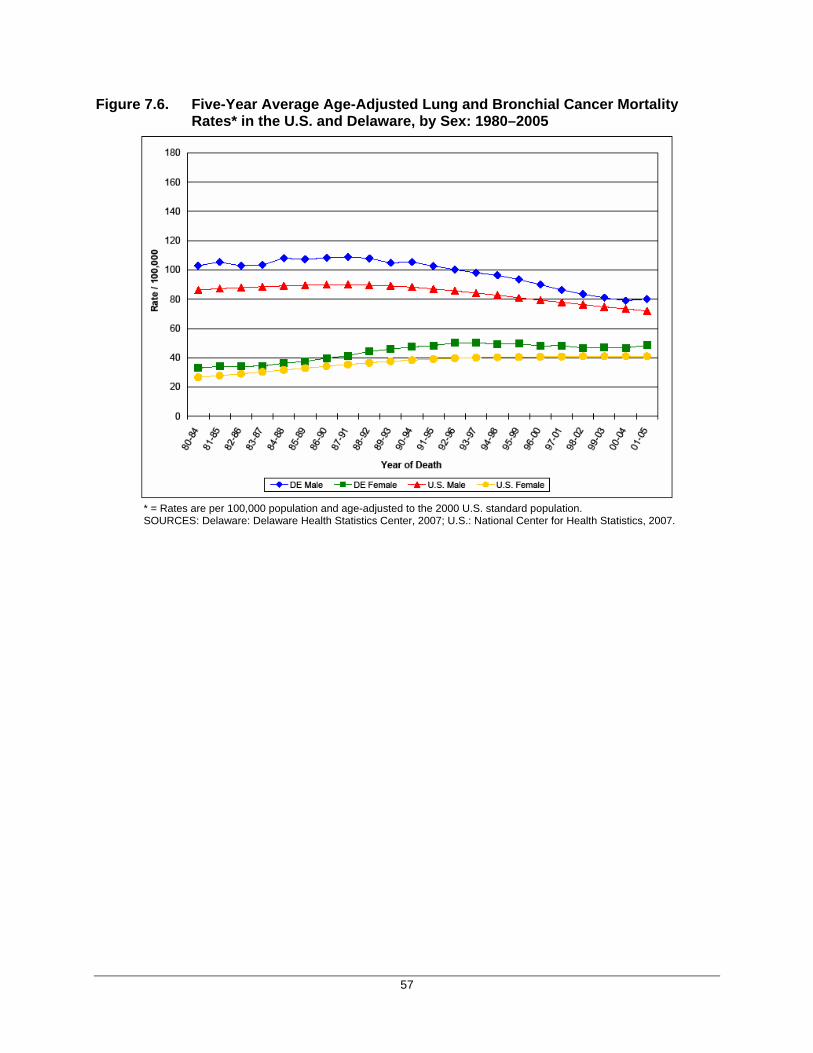
57
Figure 7.6. Five-Year Average Age-Adjusted Lung and Bronchial Cancer Mortality Rates* in the U.S. and Delaware, by Sex: 1980–2005
* = Rates are per 100,000 population and age-adjusted to the 2000 U.S. standard population. SOURCES: Delaware: Delaware Health Statistics Center, 2007; U.S.: National Center for Health Statistics, 2007.
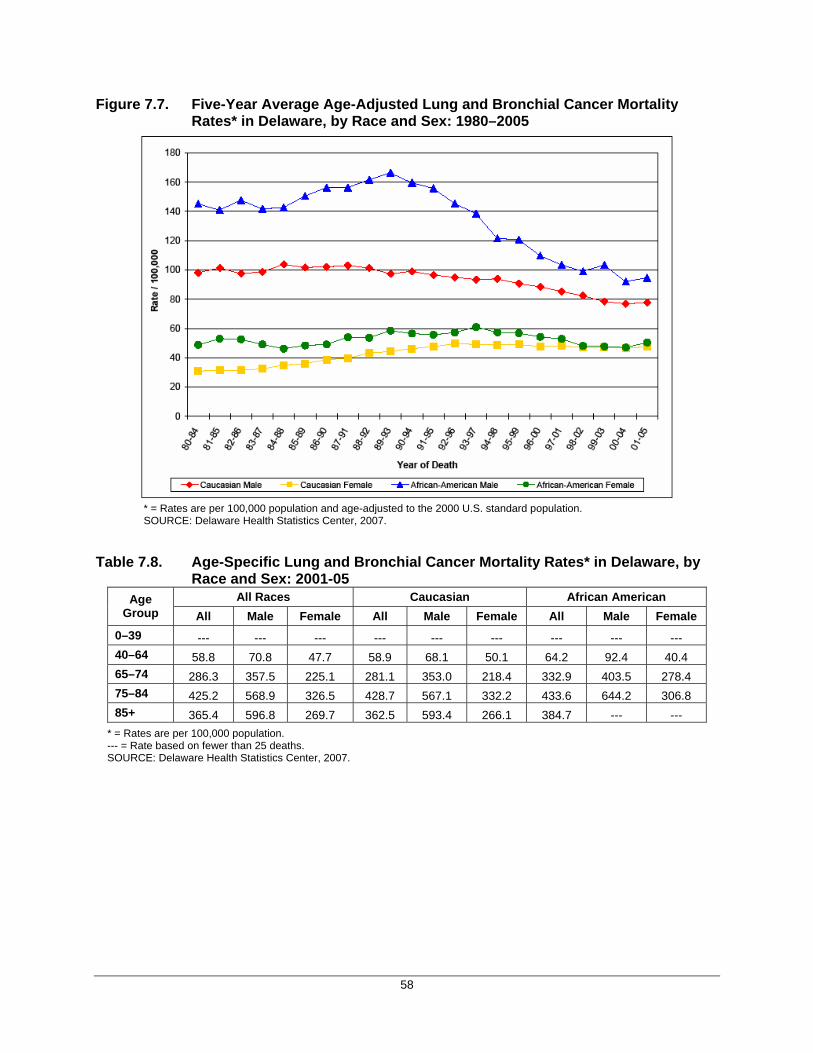
58
Figure 7.7. Five-Year Average Age-Adjusted Lung and Bronchial Cancer Mortality Rates* in Delaware, by Race and Sex: 1980–2005
* = Rates are per 100,000 population and age-adjusted to the 2000 U.S. standard population. SOURCE: Delaware Health Statistics Center, 2007.
Table 7.8. Age-Specific Lung and Bronchial Cancer Mortality Rates* in Delaware, by Race and Sex: 2001-05
All Races Caucasian African American Age Group All Male Female All Male Female All Male Female
0–39 --- --- --- --- --- --- --- --- --- 40–64 58.8 70.8 47.7 58.9 68.1 50.1 64.2 92.4 40.4 65–74 286.3 357.5 225.1 281.1 353.0 218.4 332.9 403.5 278.4 75–84 425.2 568.9 326.5 428.7 567.1 332.2 433.6 644.2 306.8 85+ 365.4 596.8 269.7 362.5 593.4 266.1 384.7 --- ---
* = Rates are per 100,000 population. --- = Rate based on fewer than 25 deaths. SOURCE: Delaware Health Statistics Center, 2007.
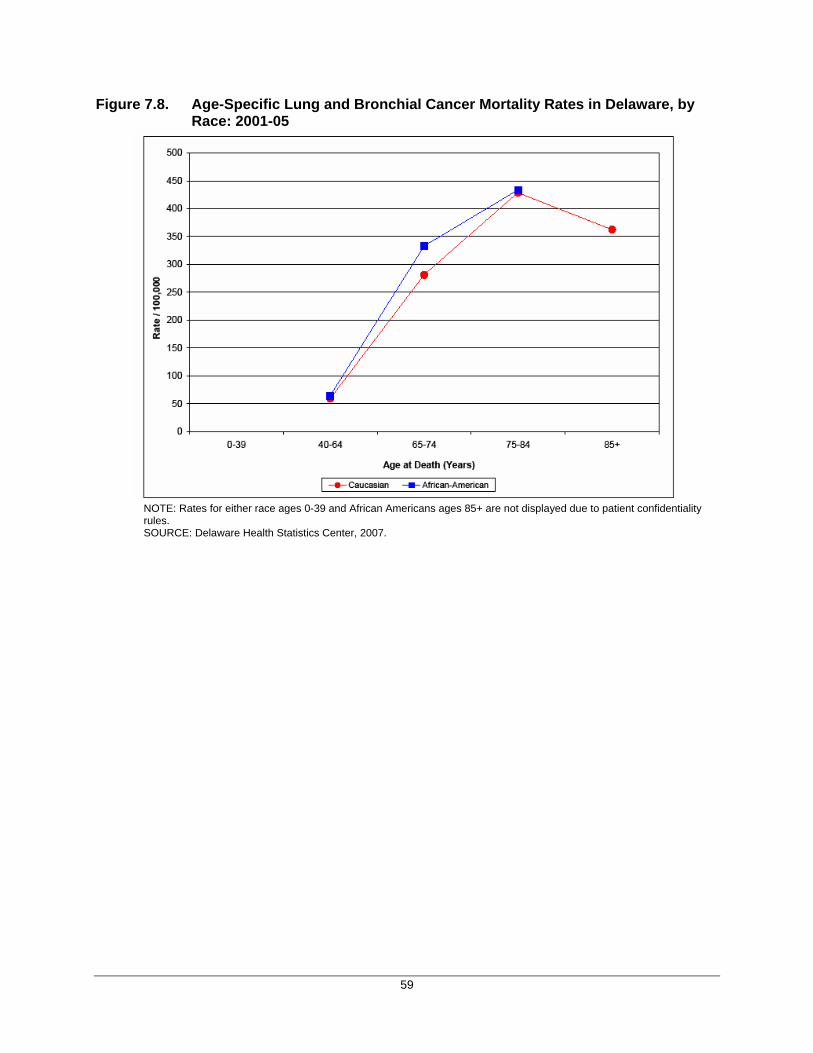
59
Figure 7.8. Age-Specific Lung and Bronchial Cancer Mortality Rates in Delaware, by Race: 2001-05
NOTE: Rates for either race ages 0-39 and African Americans ages 85+ are not displayed due to patient confidentiality rules. SOURCE: Delaware Health Statistics Center, 2007.
60
8. Prostate Cancer
Risk Factors and Early Detection Risk Factors for Prostate Cancer
Increasing age: the risk of prostate cancer rises rapidly after age 50
Family history of prostate cancer
African American race
Nationality: prostate cancer is most commonly diagnosed cancer among men in North America, northwestern Europe, Australia and the Caribbean
Possible Risk Factors for Prostate Cancer
Diets high in red meat and other high-fat foods (especially animal fats) and low in fruits and vegetables
Diets high in calcium
Heavy alcohol use
Inflammation of the prostate gland
Welders, battery manufacturers, rubber workers, and workers exposed to cadmium may be at greater risk
Protective Factors
High levels of physical activity, particularly in older men, may lower the risk of advanced prostate cancer
Early Detection of Prostate Cancer
Digital rectal exam
Prostate-specific antigen (PSA) blood test The American Cancer Society does not support routine testing for prostate cancer at this time. However, it recommends that the digital rectal exam and PSA blood test be offered yearly, beginning at age 50, and that men discuss their situation and risk with their doctor.
Recent data from the Behavioral Risk Factor Surveillance System (BRFSS) provide information on the pattern of prostate cancer screening among Delawarean men:
In 2007, 66.5 percent of Delaware males ages 40 and older reported ever having had a PSA blood test. No national data are available for comparison for 2007.
Out of those Delaware males who reported ever having had a PSA test, 89.6 percent were tested within the past two years.
No significant differences were found by race, age, education, or income levels.
61
Data Highlights New Cancer Cases and Deaths (Tables 8.1 and 8.6)
Prostate cancer was the most frequently diagnosed cancer among Delaware males. From 2001-05, it accounted for 3,430 (29.7 percent) of newly diagnosed cancer cases among males.
Prostate cancer was responsible for 10.4 percent of all cancer deaths among Delaware males from 2001-05.
Incidence and Mortality Rates (Tables 8.2 and 8.7)
Delaware’s 2001-05 overall prostate cancer rate (all races combined) was significantly higher than the national rate. However, when broken down by race, only Delaware’s African American prostate cancer rate was significantly higher than the comparable U.S. rate. Delaware’s Caucasian prostate cancer rate was not significantly different from the Caucasian prostate cancer rate at the U.S. level.
From 2001-05, Delaware’s African American prostate cancer rate was significantly higher than the state rate for Caucasians.
The prostate cancer rate for Sussex County males (135.8 per 100,000) was significantly lower than the rates for New Castle and Kent Counties (192.1 per 100,000 and 191.3 per 100,000, respectively).
Delaware’s 2001-05 overall prostate cancer mortality rates, as well as the African American and Caucasian rates, were not significantly different from comparable U.S. rates.
Within Delaware, the 2001-05 prostate cancer mortality rate for African Americans was significantly higher than the Caucasian rate (54.4 per 100,000 vs. 26.4 per 100,000, respectively).
No significant differences in prostate cancer mortality rates were observed by county of residence. Trends in Cancer Incidence and Mortality (Figures 8.1–8.2 and 8.6–8.7)
From 1991-95 to 2001-05, Delaware’s prostate cancer incidence rate fell 19.9 percent. During the same time period, the national prostate cancer incidence rate decreased 16.3 percent.
From 1991–95, when prostate cancer incidence rates peaked in Delaware, the rate for African American men was nearly 74.5 percent greater than the Caucasian rate. From 2001-05, the difference in prostate cancer rates between African American and Caucasian Delawareans had decreased slightly to 67.6 percent.
From 1991-95 to 2001-05, Delaware’s prostate cancer mortality rate fell 29.4 percent. During the same time period, the national prostate cancer mortality rate decreased 31.0 percent.
In Delaware, the difference in prostate cancer mortality rates between African Americans and Caucasians has decreased slightly over time. From 1991-95, the African American prostate cancer mortality rate was 2.64 times greater than the rate for Caucasians. From 2001-05, the African American prostate cancer mortality rate was 2.06 times greater than the rate for Caucasians.
Age-Specific Incidence and Mortality Rates (Tables 8.3 and 8.8, Figures 8.3 and 8.8)
From 2001-05, prostate cancer incidence rates in Delaware increased with age, peaking among males ages 65-74.
During the same time, prostate cancer mortality rates increased with age.
62
Stage at Diagnosis of Prostate Cancer (Tables 8.4–8.5, Figures 8.4–8.5)
In Delaware, from 2001-05, 86.7 percent, 6.8 percent and 2.9 percent of prostate cancers were diagnosed at the local, regional and distant stage respectively. At the national level, from 2001-2005, comparable percentages were 88.0 percent, 5.0 percent and 4.0 percent, respectively.
In Delaware, from 2001-05, 339 cases (9.8 percent of all prostate cancers) were diagnosed in the late (i.e., regional or distant) stages. The proportion of late stage diagnoses did not differ substantially by race.
The proportion of local stage prostate cancers increased from 1980-84 to 2001-05 (from 49.6 percent to 86.4 percent, respectively). During the same time, the proportion of distant stage prostate cancer diagnoses decreased from 27.3 percent to 2.9 percent.
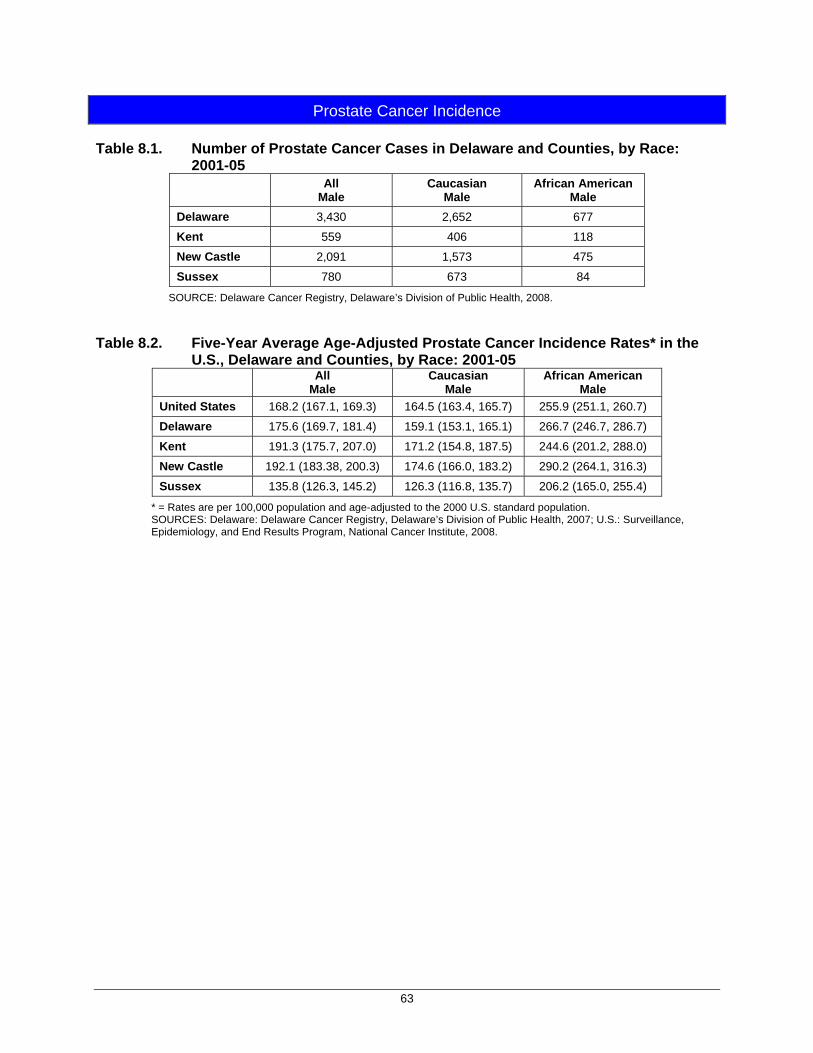
63
Prostate Cancer Incidence Table 8.1. Number of Prostate Cancer Cases in Delaware and Counties, by Race:
2001-05 All
Male Caucasian
Male African American
Male Delaware 3,430 2,652 677 Kent 559 406 118 New Castle 2,091 1,573 475 Sussex 780 673 84
SOURCE: Delaware Cancer Registry, Delaware’s Division of Public Health, 2008.
Table 8.2. Five-Year Average Age-Adjusted Prostate Cancer Incidence Rates* in the
U.S., Delaware and Counties, by Race: 2001-05 All
Male Caucasian
Male African American
Male United States 168.2 (167.1, 169.3) 164.5 (163.4, 165.7) 255.9 (251.1, 260.7) Delaware 175.6 (169.7, 181.4) 159.1 (153.1, 165.1) 266.7 (246.7, 286.7) Kent 191.3 (175.7, 207.0) 171.2 (154.8, 187.5) 244.6 (201.2, 288.0) New Castle 192.1 (183.38, 200.3) 174.6 (166.0, 183.2) 290.2 (264.1, 316.3) Sussex 135.8 (126.3, 145.2) 126.3 (116.8, 135.7) 206.2 (165.0, 255.4)
* = Rates are per 100,000 population and age-adjusted to the 2000 U.S. standard population. SOURCES: Delaware: Delaware Cancer Registry, Delaware’s Division of Public Health, 2007; U.S.: Surveillance, Epidemiology, and End Results Program, National Cancer Institute, 2008.
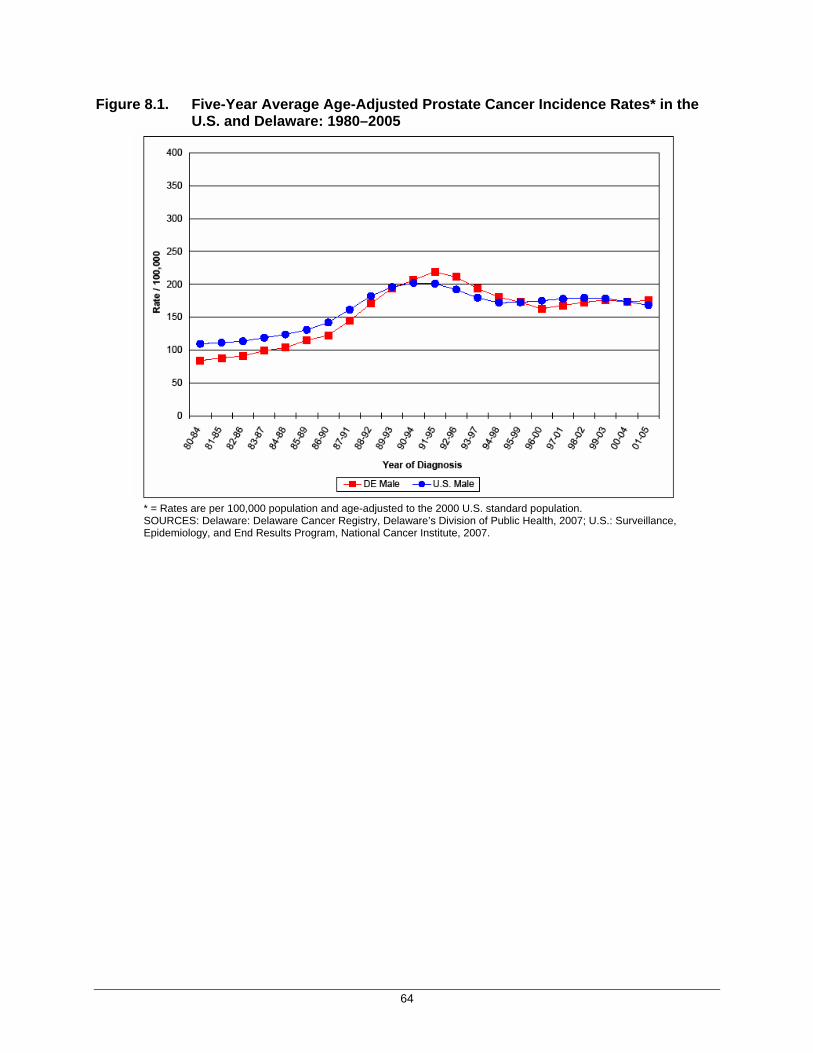
64
Figure 8.1. Five-Year Average Age-Adjusted Prostate Cancer Incidence Rates* in the U.S. and Delaware: 1980–2005
* = Rates are per 100,000 population and age-adjusted to the 2000 U.S. standard population. SOURCES: Delaware: Delaware Cancer Registry, Delaware’s Division of Public Health, 2007; U.S.: Surveillance, Epidemiology, and End Results Program, National Cancer Institute, 2007.

65
Figure 8.2. Five-Year Average Age-Adjusted Prostate Cancer Incidence Rates* in Delaware, by Race: 1980–2005
* = Rates are per 100,000 population and age-adjusted to the 2000 U.S. standard population. SOURCE: Delaware Cancer Registry, Delaware’s Division of Public Health, 2008.
Table 8.3. Age-Specific Prostate Cancer Incidence Rates* in Delaware, by Race: 2001-05
Age Group
All Male
Caucasian Male
African American Male
0–39 0.45 --- --- 40–64 206.1 181.2 326.3 65–74 958.1 894.1 1340.9 75–84 910.0 854.1 1275.0 85+ 757.1 710.8 ---
* = Rates are per 100,000 population. --- = Rate based on fewer than 25 cases. SOURCE: Delaware Cancer Registry, Delaware’s Division of Public Health, 2008.
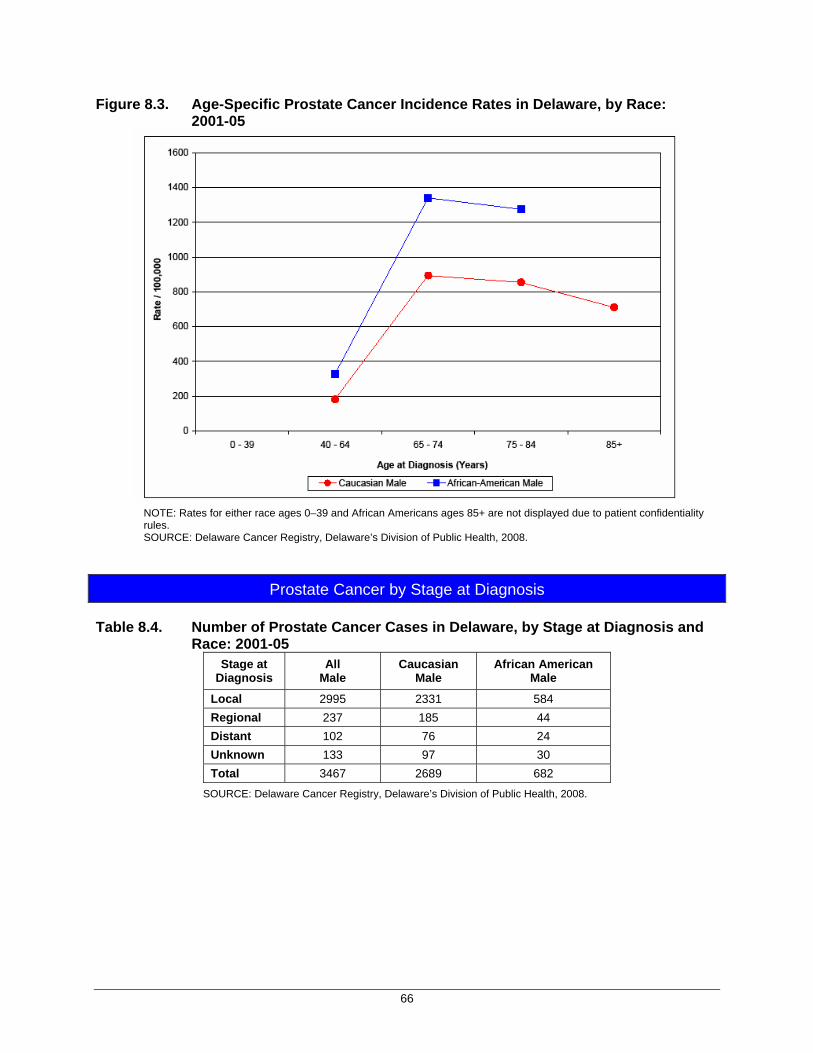
66
Figure 8.3. Age-Specific Prostate Cancer Incidence Rates in Delaware, by Race: 2001-05
NOTE: Rates for either race ages 0–39 and African Americans ages 85+ are not displayed due to patient confidentiality rules. SOURCE: Delaware Cancer Registry, Delaware’s Division of Public Health, 2008.
Prostate Cancer by Stage at Diagnosis
Table 8.4. Number of Prostate Cancer Cases in Delaware, by Stage at Diagnosis and Race: 2001-05
Stage at Diagnosis
All Male
Caucasian Male
African American Male
Local 2995 2331 584 Regional 237 185 44 Distant 102 76 24 Unknown 133 97 30 Total 3467 2689 682
SOURCE: Delaware Cancer Registry, Delaware’s Division of Public Health, 2008.
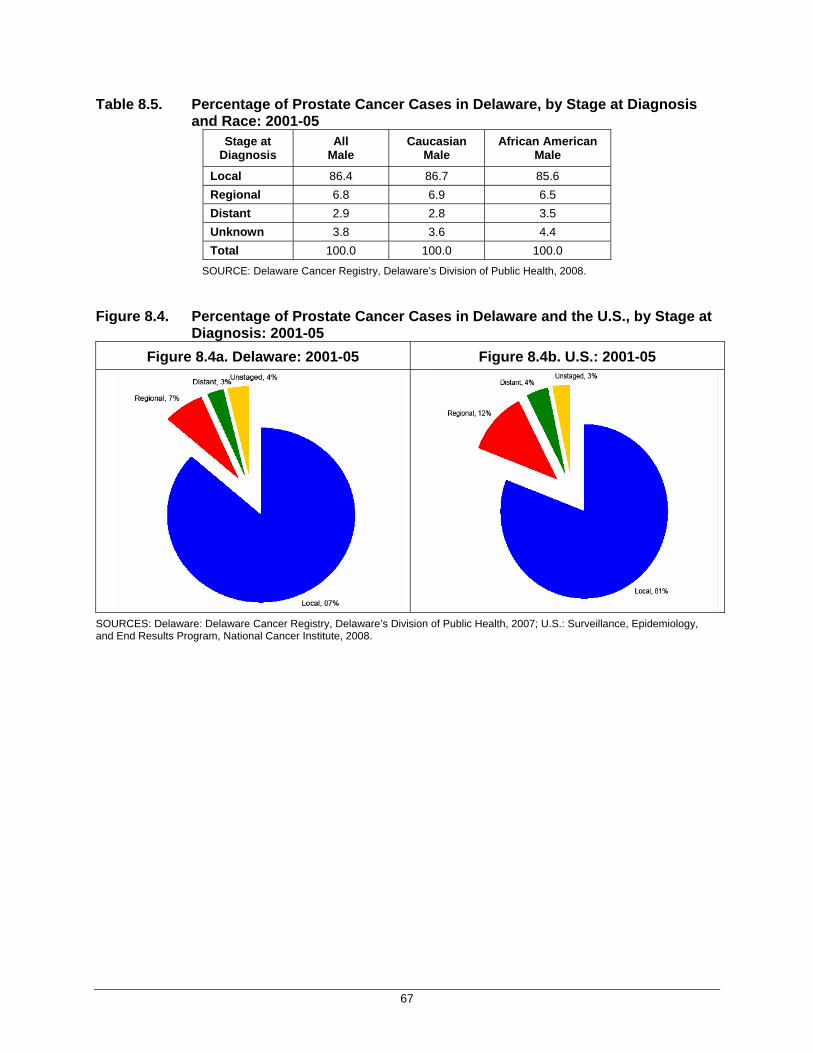
67
Table 8.5. Percentage of Prostate Cancer Cases in Delaware, by Stage at Diagnosis and Race: 2001-05
Stage at Diagnosis
All Male
Caucasian Male
African American Male
Local 86.4 86.7 85.6 Regional 6.8 6.9 6.5 Distant 2.9 2.8 3.5 Unknown 3.8 3.6 4.4 Total 100.0 100.0 100.0
SOURCE: Delaware Cancer Registry, Delaware’s Division of Public Health, 2008. Figure 8.4. Percentage of Prostate Cancer Cases in Delaware and the U.S., by Stage at
Diagnosis: 2001-05
Figure 8.4a. Delaware: 2001-05
Figure 8.4b. U.S.: 2001-05
SOURCES: Delaware: Delaware Cancer Registry, Delaware’s Division of Public Health, 2007; U.S.: Surveillance, Epidemiology, and End Results Program, National Cancer Institute, 2008.
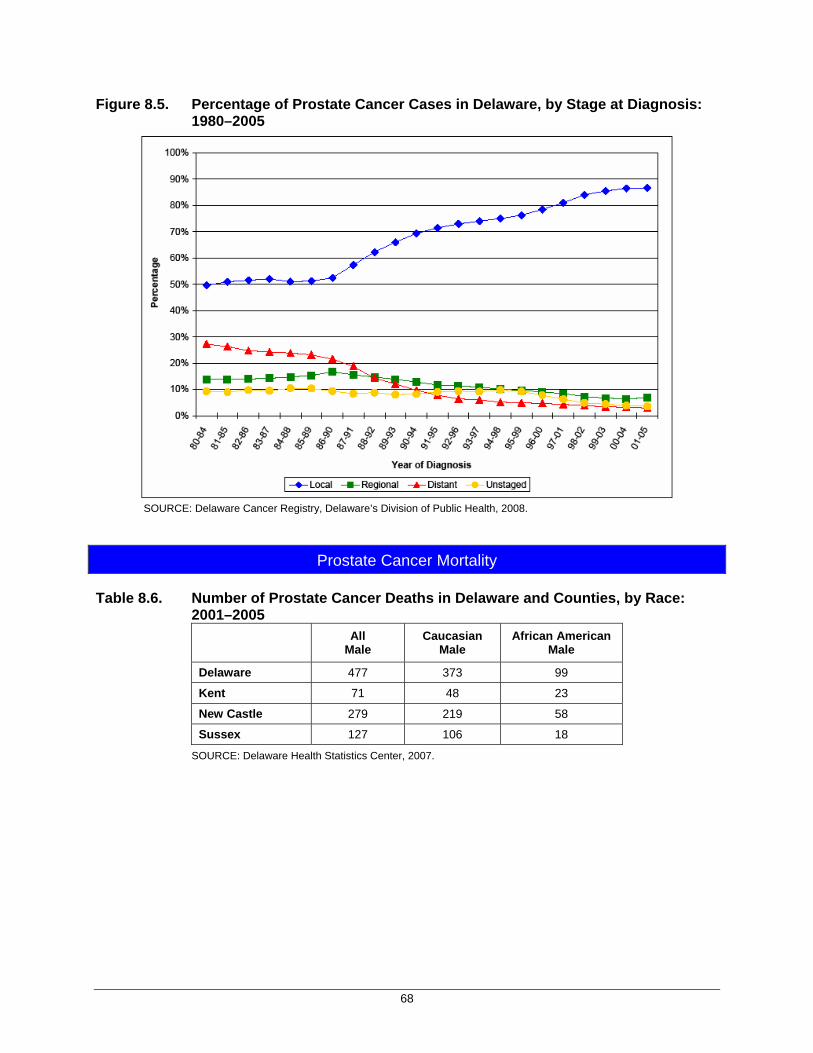
68
Figure 8.5. Percentage of Prostate Cancer Cases in Delaware, by Stage at Diagnosis: 1980–2005
SOURCE: Delaware Cancer Registry, Delaware’s Division of Public Health, 2008.
Prostate Cancer Mortality Table 8.6. Number of Prostate Cancer Deaths in Delaware and Counties, by Race:
2001–2005
All Male
Caucasian Male
African American Male
Delaware 477 373 99
Kent 71 48 23
New Castle 279 219 58
Sussex 127 106 18
SOURCE: Delaware Health Statistics Center, 2007.
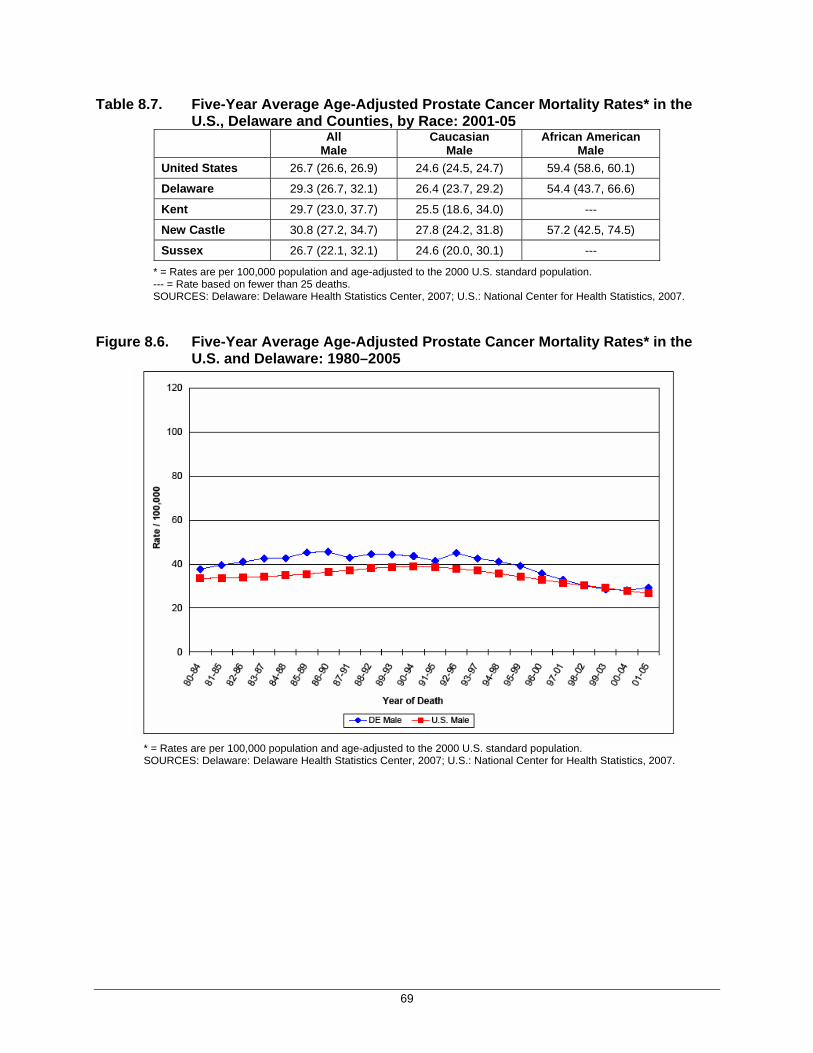
69
Table 8.7. Five-Year Average Age-Adjusted Prostate Cancer Mortality Rates* in the U.S., Delaware and Counties, by Race: 2001-05
All Male
Caucasian Male
African American Male
United States 26.7 (26.6, 26.9) 24.6 (24.5, 24.7) 59.4 (58.6, 60.1)
Delaware 29.3 (26.7, 32.1) 26.4 (23.7, 29.2) 54.4 (43.7, 66.6)
Kent 29.7 (23.0, 37.7) 25.5 (18.6, 34.0) ---
New Castle 30.8 (27.2, 34.7) 27.8 (24.2, 31.8) 57.2 (42.5, 74.5)
Sussex 26.7 (22.1, 32.1) 24.6 (20.0, 30.1) ---
* = Rates are per 100,000 population and age-adjusted to the 2000 U.S. standard population. --- = Rate based on fewer than 25 deaths. SOURCES: Delaware: Delaware Health Statistics Center, 2007; U.S.: National Center for Health Statistics, 2007.
Figure 8.6. Five-Year Average Age-Adjusted Prostate Cancer Mortality Rates* in the U.S. and Delaware: 1980–2005
* = Rates are per 100,000 population and age-adjusted to the 2000 U.S. standard population. SOURCES: Delaware: Delaware Health Statistics Center, 2007; U.S.: National Center for Health Statistics, 2007.
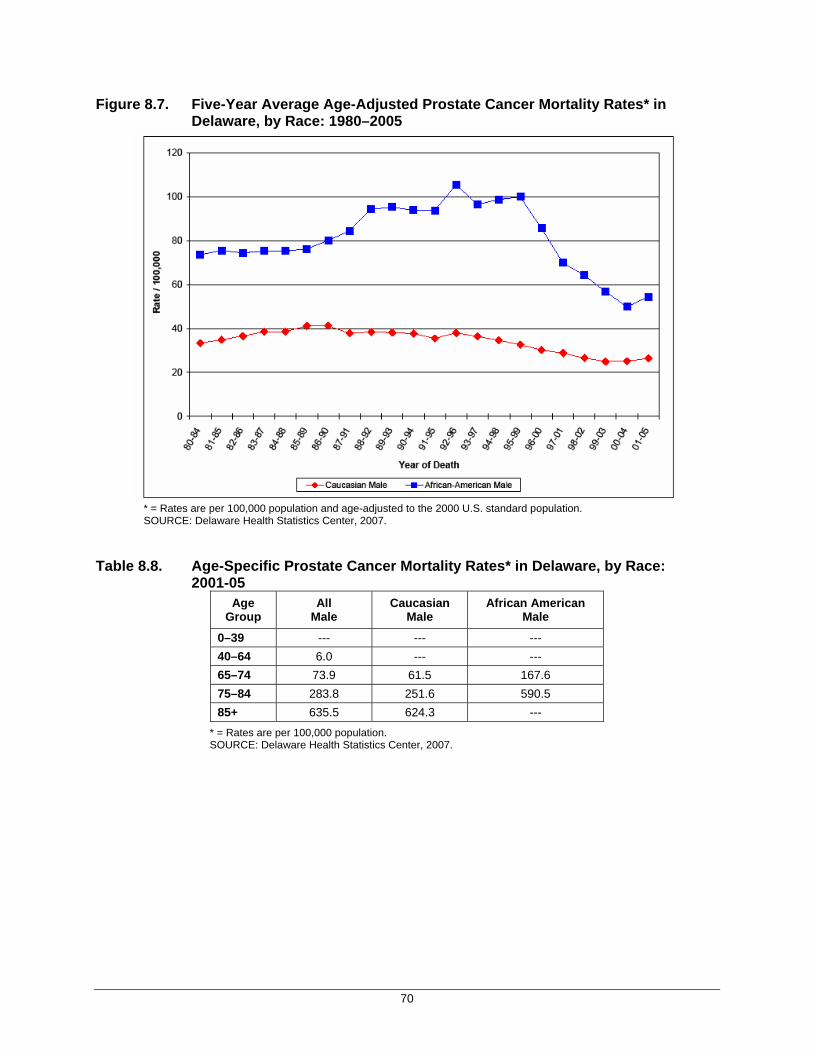
70
Figure 8.7. Five-Year Average Age-Adjusted Prostate Cancer Mortality Rates* in Delaware, by Race: 1980–2005
* = Rates are per 100,000 population and age-adjusted to the 2000 U.S. standard population. SOURCE: Delaware Health Statistics Center, 2007.
Table 8.8. Age-Specific Prostate Cancer Mortality Rates* in Delaware, by Race: 2001-05
Age Group
All Male
Caucasian Male
African American Male
0–39 --- --- --- 40–64 6.0 --- --- 65–74 73.9 61.5 167.6 75–84 283.8 251.6 590.5 85+ 635.5 624.3 ---
* = Rates are per 100,000 population. SOURCE: Delaware Health Statistics Center, 2007.
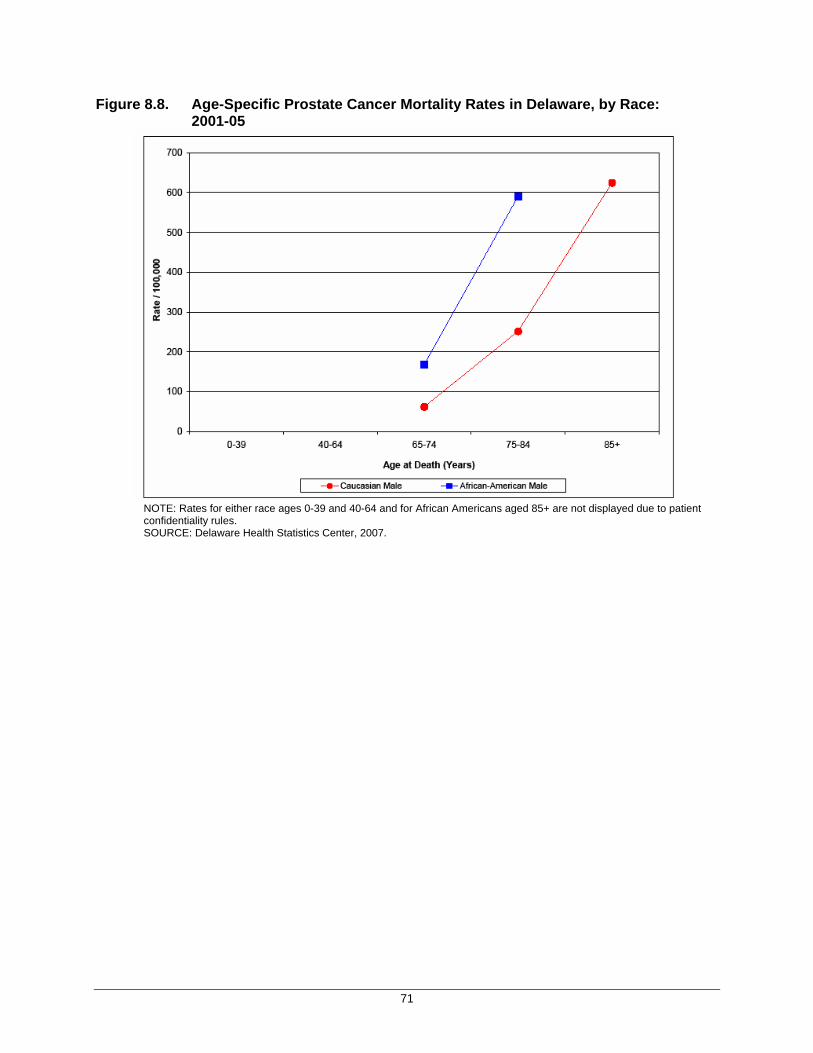
71
Figure 8.8. Age-Specific Prostate Cancer Mortality Rates in Delaware, by Race: 2001-05
NOTE: Rates for either race ages 0-39 and 40-64 and for African Americans aged 85+ are not displayed due to patient confidentiality rules. SOURCE: Delaware Health Statistics Center, 2007.

72
References
Anderson, R. N. & Rosenberg, H. M. (1998). Age Standardization of Death Rates: Implementation of the Year 2000 Standard. (Rep. No. 47(3)). Hyattsville, Maryland: National Center for Health Statistics.
Coughlin, S. S., Clutter, G. G., & Hutton, M. (1999). Ethics in Cancer Registries. Journal of Cancer Registry Management, 26, 5-10.
Goodman, M. T. & Wilkens, L. R. (1994). Calculation and assessment of incidence rates. In H.R. Menck & C. R. Smart (Eds.), Central Cancer Registries: Design, Management, and Use. (pp. 193-229). Langhorne, PA: Gordon and Breasch.
Klein, R. J. & Schoenborn, C. A. (2001). Age-adjustment using the 2000 projected U.S. population (Rep. No. 20). Hyattsville, Maryland: National Center for Health Statistics.
McLaughlin, C. C. (2002). Confidentiality protection in publicly released central registry data. Journal of Cancer Registry Management, 29, 84-88.

A-1
APPENDIX A HISPANIC CANCER RATES
Hispanic cancer rates were not calculated for this report because several methodological issues prevent Hispanic rates from being fairly compared with cancer rates for Caucasians and African Americans. Cancer rates are calculated by dividing the number of cancer cases (numerator) by a population (denominator); therefore, cancer rates are heavily influenced by changes or uncertainties in the number of cancer cases and the size of the population. Specific issues that suggest that Hispanic cancer rates would be subject to misinterpretation are presented below: • Uncertain estimate of Delaware’s Hispanic population—estimates of Delaware’s
population are derived from a census performed every 10 years by the U.S. Census Bureau. The Delaware Population Consortium (DPC) uses Census data to estimate the Delaware population between Census years. In 1997, the DPC began releasing studies on special topics of interest, including Hispanic population estimates. Because the estimates are calculated from mortality, fertility, labor force and migration statistics, and because these statistics are based on a small population of Hispanics, the DPC urged that the Hispanic population estimates presented in its studies be used with caution (Delaware Population Consortium. Delawareans of Hispanic Origin, 1991–1998. Population Study Series. PS-00-01, April 2000). For these reasons, the estimates are not included in the DPC’s annual Delaware population projection. In less-populated areas, such as small states, and especially in subsets of the population (for example, for one sex or one county), even a small inaccuracy can result in a substantial error in the cancer rate.
• Inaccurate recording of Hispanic ethnicity on death certificates—race and Hispanic
origin are treated as distinct concepts and reported separately on death certificates and to the Delaware Cancer Registry, in accordance with guidelines from the federal Office of Management and Budget. To assess the completeness of the reporting of Hispanic ethnicity, expected numbers of cancer cases and deaths in the Hispanic population were calculated and compared with the actual (observed) reports. Because the Hispanic population is younger than the overall Delaware population, and because cancer rates increase with age, the expected values were age-adjusted to ensure comparability. There were 89 deaths from cancer reported on death certificates between 2001 and 2005, but 153 deaths were expected. Similarly, 412 incident cancer cases were reported to the registry, but 476 cases were expected. Although this analysis is a cursory attempt to estimate the degree of underreporting of Hispanic ethnicity, it demonstrates the possibility of significantly inaccurate Hispanic cancer rates.1
• Small number of cases or deaths and small population sizes—an incidence or mortality
rate is an estimate, and the reliability of estimates can be measured by calculating a confidence interval. A narrow confidence interval suggests that the rate is a good estimate; a wide confidence interval suggests that the rate should be interpreted with caution. If the confidence intervals of two rates do not overlap, the rates are considered to be statistically
1 This analysis assumes that the risk of cancer in the Hispanic population, for any particular age, is the same as in the Delaware population as a whole. The indirect standardization of age adjustment was used to calculate the expected number of cases and deaths in the Hispanic population. The indirect method applies the age-specific rates of a standard population (Delaware’s 2000–04 rates) to the age distribution of the study (Hispanic) population to estimate the expected deaths or cases in the study population. Indirect adjustment is used when the number of deaths or cases in each age group in the study population is too small to calculate stable age-specific rates. The rest of this report uses the direct standardization of age adjustment, which is explained in appendix B.
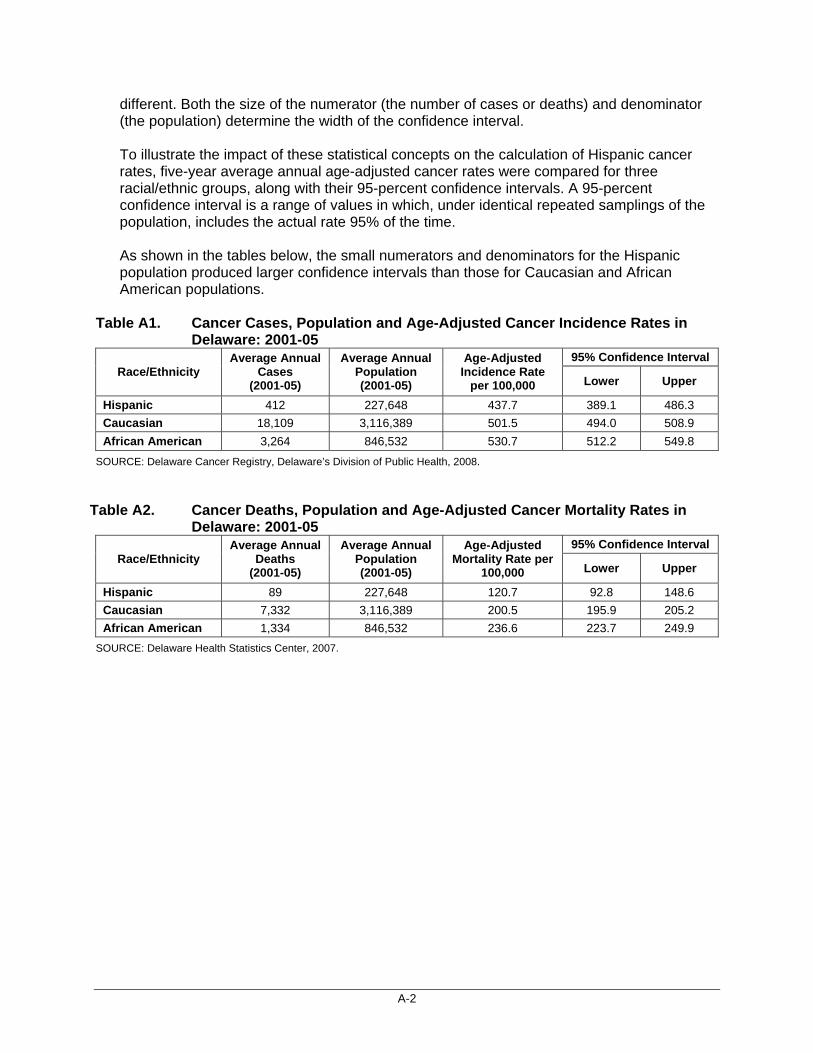
A-2
different. Both the size of the numerator (the number of cases or deaths) and denominator (the population) determine the width of the confidence interval.
To illustrate the impact of these statistical concepts on the calculation of Hispanic cancer rates, five-year average annual age-adjusted cancer rates were compared for three racial/ethnic groups, along with their 95-percent confidence intervals. A 95-percent confidence interval is a range of values in which, under identical repeated samplings of the population, includes the actual rate 95% of the time.
As shown in the tables below, the small numerators and denominators for the Hispanic population produced larger confidence intervals than those for Caucasian and African American populations.
Table A1. Cancer Cases, Population and Age-Adjusted Cancer Incidence Rates in
Delaware: 2001-05 95% Confidence Interval
Race/Ethnicity Average Annual
Cases (2001-05)
Average Annual Population (2001-05)
Age-Adjusted Incidence Rate
per 100,000 Lower Upper
Hispanic 412 227,648 437.7 389.1 486.3 Caucasian 18,109 3,116,389 501.5 494.0 508.9 African American 3,264 846,532 530.7 512.2 549.8
SOURCE: Delaware Cancer Registry, Delaware’s Division of Public Health, 2008.
Table A2. Cancer Deaths, Population and Age-Adjusted Cancer Mortality Rates in Delaware: 2001-05
95% Confidence Interval Race/Ethnicity
Average Annual Deaths
(2001-05)
Average Annual Population (2001-05)
Age-Adjusted Mortality Rate per
100,000 Lower Upper
Hispanic 89 227,648 120.7 92.8 148.6 Caucasian 7,332 3,116,389 200.5 195.9 205.2 African American 1,334 846,532 236.6 223.7 249.9
SOURCE: Delaware Health Statistics Center, 2007.
B-1
APPENDIX B METHODOLOGY
Appendix B documents the materials, data sources and statistical methods that were used to generate the counts and age-adjusted and age-specific incidence and mortality rates discussed in this report. Coding and classification schemes, as well as a description of technical terms, are provided below. SOURCES OF DATA Incidence Data: Delaware Cancer Registry This report includes incident cancer cases that were diagnosed between January 1, 2001, and December 31, 2005, and reported to the Delaware Cancer Registry (DCR) by November 2008. Incidence trends were based on cancer diagnoses from January 1, 1980, to December 31, 2005, reported to DCR by November 2008. In total, 22,023 cases of malignant cancer were diagnosed among Delawareans from 2001-05. This number includes individuals with cancers diagnosed at more than one site, also known as multiple primaries. The DCR adheres to reporting procedures consistent with those adopted by the American Cancer Society (ACS) and the National Cancer Institute’s (NCI) Surveillance, Epidemiology, and End Results (SEER) Program. Currently, reporting procedures exclude all cases of benign brain cancers and in situ cancer, except in situ bladder cancer. Invasive and in situ bladder cancer cases were included in the analyses because of the difficulty in distinguishing between the two cancer categories based on the language used by pathologists. The International Classification of Diseases for Oncology, Second Edition (ICD-O-2) was used to describe the topography (primary anatomic site) and morphology (histology) for cancers reported between 1988 and 2000. Cancers diagnosed between 2001 and 2005 were coded using the International Classification of Diseases for Oncology, Third Edition (ICD-O-3). The topography code defines both the site of the tumor and the cancer type. Five-digit morphology codes were used to describe tumor histology and behavior. The first four digits of the morphology codes define the histology of the cancer, and the fifth digit indicates whether the cancer was malignant, benign, in situ or uncertain. Consistent with the publication of the Centers for Disease Control and Prevention’s (CDC) U.S. Cancer Statistics, Kaposi’s sarcoma and mesothelioma were considered separate sites, based on histology codes. SEER Program SEER data were used to compare Delaware’s incidence and mortality rates with those for the U.S. Established in 1971 after legislation was passed by Congress, SEER collects, analyzes and disseminates data for cancer control, diagnosis and treatment. Several population-based registries that are representative of the different regions in the U.S. routinely collect data to allow SEER to produce cancer incidence and mortality statistics. Connecticut, Hawaii, Iowa, New Mexico, Utah and metropolitan areas of Detroit in Michigan and San Francisco and Oakland in California have provided data to SEER since January 1, 1973. Other states that participate include parts of Georgia and Washington, Kentucky, Louisiana, New Jersey and the remaining counties in California. Recently, SEER expanded data collection activities to 17

B-2
population-based registries. This report was based on the nine registries that have provided data to SEER since 1974–75. These registries include Atlanta, Connecticut, Detroit, Hawaii, Iowa, New Mexico, San Francisco-Oakland, Seattle-Puget Sound and Utah. Mortality Data:
Delaware Health Statistics Center
Cancer mortality data were provided by the Delaware Health Statistics Center. The data file was compiled from all death certificates filed in Delaware between 1980 and 2005. Five-year average age-adjusted mortality rates were based on deaths that occurred between 2001 and 2005. Trends in cancer mortality were presented for deaths that occurred between 1980 and 2005. Underlying cause-of-death codes were based on the International Classification of Diseases, Ninth Edition (ICD-9) for deaths that occurred between 1980 and 1998. The International Classification of Diseases, Tenth Edition (ICD-10) was used to code deaths that occurred between 2000 and 2005. To determine the underlying cause of death, the sequence of events leading to the individual’s death and recorded on the death certificate are run through the Automated Classification of Medical Entities (ACME) software used by the National Center for Health Statistics. This program uses a series of rules and hierarchies of events to select the most appropriate underlying cause of death. National Center for Health Statistics U.S. mortality data were obtained from the National Center for Health Statistics and used to make comparisons between cancer mortality rates at the sate and national levels. U.S. death data were compiled from all death certificates filed in the 50 states and the District of Columbia between 1980 and 2004. Cancer deaths were coded in accordance with World Health Organization regulations, which stipulate that cancer deaths be coded using the most current revision of the International Classification of Diseases. Accordingly, deaths that occurred prior to 1999 were coded using ICD-9. Beginning with 1999, deaths were coded using ICD-10. Population Data:
Standard Population The year 2000 standard U.S. population was used for age adjustment of incidence and mortality rates. The standard population was used for direct standardization of the incidence and mortality rates to enable comparisons among populations (i.e., U.S. vs. Delaware) that have different age structures.
Population Estimates, 2001-05 Cancer incidence and mortality rates for the U.S. are calculated using SEER population estimates and are based on the numbers estimated by the census. Delaware rates were based on population estimates provided by the Delaware Population Consortium. The population data for Delaware are presented in appendix D.
B-3
RISK FACTORS AND EARLY DETECTION Cancer risk factors and effective means of preventing cancer are described at the beginning of each chapter of this report. Three web sites were used as primary sources to update risk factors for cancer: (1) The American Cancer Society (www.cancer.org); (2) The National Cancer Institute (www.cancer.gov); and (3) WebMD (www.webmd.com). Behavioral Risk Factor Surveillance System (BRFSS) Behavioral Risk Factor Surveillance System data provided estimates of risk factor prevalence across Delaware and the U.S. Cancer risk factor data for Delaware and the U.S. were obtained from CDC’s interactive data system. The most recent updates included data from 2005 or 2006, depending on the risk factor. Risk factor data are included in appropriate chapters for site-specific cancers; supplemental data on obesity, physical inactivity and diet are presented in appendix E. STATISTICAL METHODOLOGY AND TECHNICAL TERMS
Age-adjusted and age-, race- and sex-specific incidence and mortality rates are presented in this report to describe the pattern of cancer incidence and mortality in Delaware. All rates and corresponding 95-percent confidence intervals were computed using SEER*Stat. All cancer rates are expressed as the five-year average per 100,000 population. Direct Standardization and Age-Adjusted Incidence and Mortality Rates The age distribution of a population is an important determinant of the burden of cancer. Because cancer incidence and mortality increase with age, crude rates cannot be used for comparisons of cancer statistics between sexes, racial or ethnic groups, or geographic entities across different time spans. To enable comparisons that were independent of the age distribution of the population of Delaware, age-adjusted rates were calculated (Anderson & Rosenberg, 1998; Klein & Schoenborn, 2001; Goodman & Wilkens, 1994). Age-adjusted incidence and mortality rates for Delaware were computed using an external reference population with a fixed standard age distribution. Age-adjusted rates represent the theoretical cancer rate in a population with an age distribution identical to the reference or standard population. Incidence and mortality rates were adjusted to the U.S. standard million population in 2000. This process involved calculating the age-specific incidence or mortality rates for the residents of Delaware and then applying or multiplying these rates to the proportion of individuals in the same age group in the reference population. The individual age-specific rates were then summed to obtain the overall age-adjusted rate. The formula for an age-adjusted rate can be presented as follows:
Age-Adjusted Rate = sum (wi x ((ci/ni) x 100,000))
Where ci is the number of new cases or deaths in the i age group, ni is the population estimate for the i age group and wi is the proportion of the standard population in the i age group. All rates were expressed per 100,000 of the population.
B-4
Age-Specific Incidence and Mortality Rates Age-related differences in the risk of cancer incidence and mortality were assessed using age-specific rates. Age-specific rates were calculated by dividing the number of cancer cases or deaths that occurred during a specific time period among five age groups (0–39, 40–64, 65–74, 75–84, and 85 and older). The total number of cases or deaths for each of the five age groups was then divided by the total population of the age group in Delaware during the same time period. Rates were expressed per 100,000 of the population. Race- and Sex-Specific Incidence and Mortality Rates Race- and sex-specific incidence and mortality rates were calculated to assess how cancer patterns differed across subgroups within the state. These rates were calculated by dividing the number of cases or deaths that occurred in each race and/or sex group by the total population in the corresponding race and/or sex group over the same time period. These rates were adjusted to the U.S. standard population and expressed per 100,000 of the population. Confidence Intervals Age-adjusted incidence and mortality rates are subject to chance variation, particularly when they are based on a small number of cancer cases or deaths occurring over a limited time period or in a limited geographic area. Aggregating several years of data provides more reliable estimates of incidence and mortality in these situations. The level of uncertainty associated with incidence and mortality statistics can be estimated by the standard error used to calculate the 95-percent confidence interval. Confidence intervals were calculated using SEER*Stat, using the method developed by Tiwari, et al. 2006. Stage at Diagnosis The stage of diagnosis describes the extent to which cancers had spread from the site of origin by the time of diagnosis. SEER summary staging was used to define the stage at diagnosis for all incident cancer cases. Cancer cases diagnosed between 1980 and 2000 were coded according to Summary Stage 1977; cases diagnosed between 2001 and 2003 were coded using the codes for Summary Stage 2000. Beginning in 2004, SEER Summary Stage 2000 was derived using the Collaborative Staging Algorithm. Three categories were used to code the stage for any particular cancer site: • Local: tumor is invasive but confined to the organ of origin. • Regional: tumor has extended beyond the limits of the organ of origin, but there is no
evidence of distant metastasis. • Distant: cancer cells have detached from the tumor at the primary site and begun
growing at a new site in the body. OTHER TECHNICAL INFORMATION Suppression of Data Data presentation was limited to those rates that were based on an adequate number of cancer cases or deaths. Rates that were based on a very small number of cases were unstable and could not be reliably interpreted.
B-5
Suppressing incidence and mortality statistics based on a small number of new cancer cases or deaths also helps protect patient privacy and confidentiality (Coughlin et al., 1999; McLaughlin, 2002). Cancer counts were suppressed using the recommendations of the National Center for Health Statistics. Incidence and mortality counts of fewer than six cases were suppressed. Age-adjusted incidence and mortality rates based on fewer than 25 cases or deaths were also suppressed. The same criteria were applied to age-, race- and sex-specific incidence and mortality rates. Definition of Race/Ethnicity Race groupings in this report included Caucasian, African American, and Other. Race groupings did not take into account residents’ ethnicity. For incidence and mortality rates, the total population included people of Hispanic ethnicity and those of unknown race. Hispanic ethnicity for incidence data was based on the North American Association of Central Cancer Registries Hispanic Identification Algorithm, and for mortality data on the ethnicity reported on the death certificate.
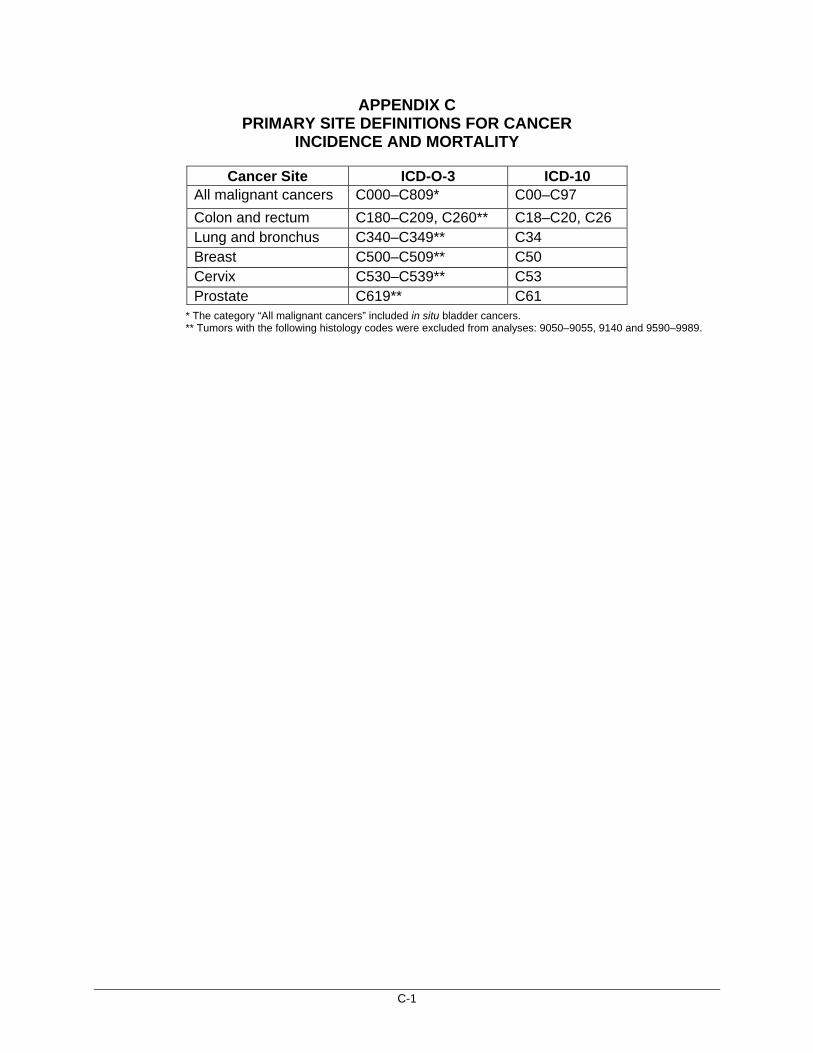
C-1
APPENDIX C PRIMARY SITE DEFINITIONS FOR CANCER
INCIDENCE AND MORTALITY
Cancer Site ICD-O-3 ICD-10 All malignant cancers C000–C809* C00–C97 Colon and rectum C180–C209, C260** C18–C20, C26 Lung and bronchus C340–C349** C34 Breast C500–C509** C50 Cervix C530–C539** C53 Prostate C619** C61
* The category “All malignant cancers” included in situ bladder cancers. ** Tumors with the following histology codes were excluded from analyses: 9050–9055, 9140 and 9590–9989.
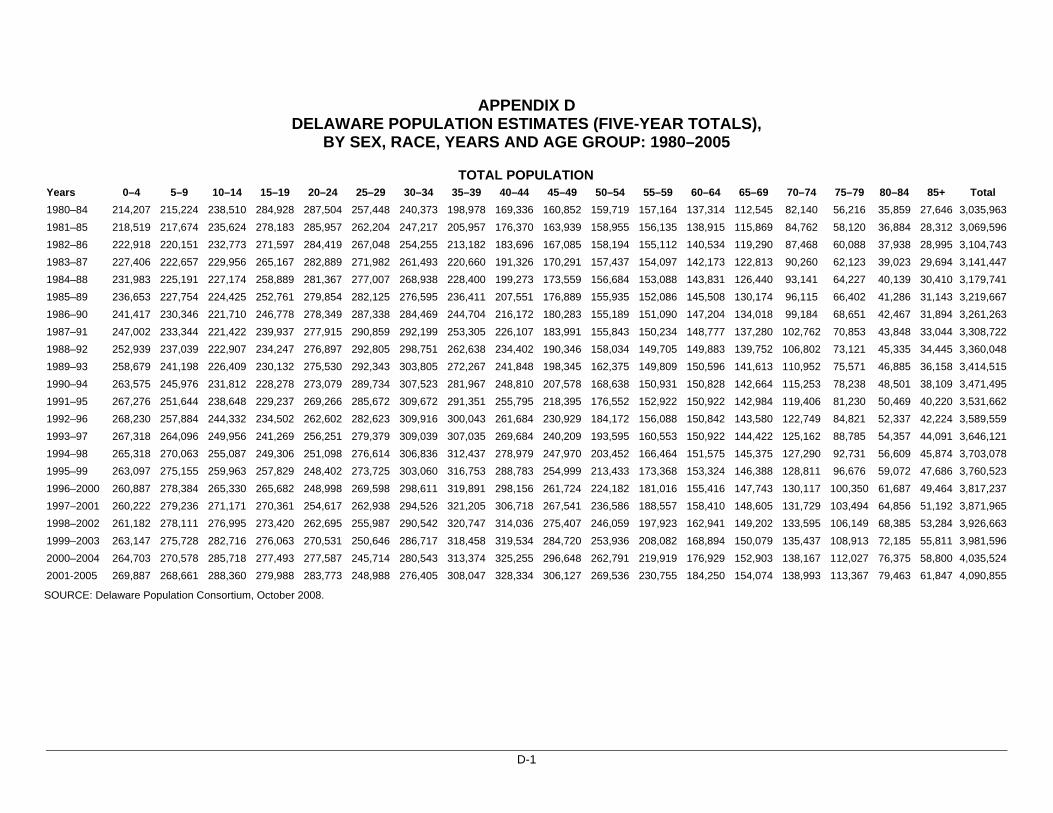
D-1
APPENDIX D DELAWARE POPULATION ESTIMATES (FIVE-YEAR TOTALS),
BY SEX, RACE, YEARS AND AGE GROUP: 1980–2005
TOTAL POPULATION Years 0–4 5–9 10–14 15–19 20–24 25–29 30–34 35–39 40–44 45–49 50–54 55–59 60–64 65–69 70–74 75–79 80–84 85+ Total 1980–84 214,207 215,224 238,510 284,928 287,504 257,448 240,373 198,978 169,336 160,852 159,719 157,164 137,314 112,545 82,140 56,216 35,859 27,646 3,035,963 1981–85 218,519 217,674 235,624 278,183 285,957 262,204 247,217 205,957 176,370 163,939 158,955 156,135 138,915 115,869 84,762 58,120 36,884 28,312 3,069,596 1982–86 222,918 220,151 232,773 271,597 284,419 267,048 254,255 213,182 183,696 167,085 158,194 155,112 140,534 119,290 87,468 60,088 37,938 28,995 3,104,743 1983–87 227,406 222,657 229,956 265,167 282,889 271,982 261,493 220,660 191,326 170,291 157,437 154,097 142,173 122,813 90,260 62,123 39,023 29,694 3,141,447 1984–88 231,983 225,191 227,174 258,889 281,367 277,007 268,938 228,400 199,273 173,559 156,684 153,088 143,831 126,440 93,141 64,227 40,139 30,410 3,179,741 1985–89 236,653 227,754 224,425 252,761 279,854 282,125 276,595 236,411 207,551 176,889 155,935 152,086 145,508 130,174 96,115 66,402 41,286 31,143 3,219,667 1986–90 241,417 230,346 221,710 246,778 278,349 287,338 284,469 244,704 216,172 180,283 155,189 151,090 147,204 134,018 99,184 68,651 42,467 31,894 3,261,263 1987–91 247,002 233,344 221,422 239,937 277,915 290,859 292,199 253,305 226,107 183,991 155,843 150,234 148,777 137,280 102,762 70,853 43,848 33,044 3,308,722 1988–92 252,939 237,039 222,907 234,247 276,897 292,805 298,751 262,638 234,402 190,346 158,034 149,705 149,883 139,752 106,802 73,121 45,335 34,445 3,360,048 1989–93 258,679 241,198 226,409 230,132 275,530 292,343 303,805 272,267 241,848 198,345 162,375 149,809 150,596 141,613 110,952 75,571 46,885 36,158 3,414,515 1990–94 263,575 245,976 231,812 228,278 273,079 289,734 307,523 281,967 248,810 207,578 168,638 150,931 150,828 142,664 115,253 78,238 48,501 38,109 3,471,495 1991–95 267,276 251,644 238,648 229,237 269,266 285,672 309,672 291,351 255,795 218,395 176,552 152,922 150,922 142,984 119,406 81,230 50,469 40,220 3,531,662 1992–96 268,230 257,884 244,332 234,502 262,602 282,623 309,916 300,043 261,684 230,929 184,172 156,088 150,842 143,580 122,749 84,821 52,337 42,224 3,589,559 1993–97 267,318 264,096 249,956 241,269 256,251 279,379 309,039 307,035 269,684 240,209 193,595 160,553 150,922 144,422 125,162 88,785 54,357 44,091 3,646,121 1994–98 265,318 270,063 255,087 249,306 251,098 276,614 306,836 312,437 278,979 247,970 203,452 166,464 151,575 145,375 127,290 92,731 56,609 45,874 3,703,078 1995–99 263,097 275,155 259,963 257,829 248,402 273,725 303,060 316,753 288,783 254,999 213,433 173,368 153,324 146,388 128,811 96,676 59,072 47,686 3,760,523 1996–2000 260,887 278,384 265,330 265,682 248,998 269,598 298,611 319,891 298,156 261,724 224,182 181,016 155,416 147,743 130,117 100,350 61,687 49,464 3,817,237 1997–2001 260,222 279,236 271,171 270,361 254,617 262,938 294,526 321,205 306,718 267,541 236,586 188,557 158,410 148,605 131,729 103,494 64,856 51,192 3,871,965 1998–2002 261,182 278,111 276,995 273,420 262,695 255,987 290,542 320,747 314,036 275,407 246,059 197,923 162,941 149,202 133,595 106,149 68,385 53,284 3,926,663 1999–2003 263,147 275,728 282,716 276,063 270,531 250,646 286,717 318,458 319,534 284,720 253,936 208,082 168,894 150,079 135,437 108,913 72,185 55,811 3,981,596 2000–2004 264,703 270,578 285,718 277,493 277,587 245,714 280,543 313,374 325,255 296,648 262,791 219,919 176,929 152,903 138,167 112,027 76,375 58,800 4,035,524 2001-2005 269,887 268,661 288,360 279,988 283,773 248,988 276,405 308,047 328,334 306,127 269,536 230,755 184,250 154,074 138,993 113,367 79,463 61,847 4,090,855
SOURCE: Delaware Population Consortium, October 2008.
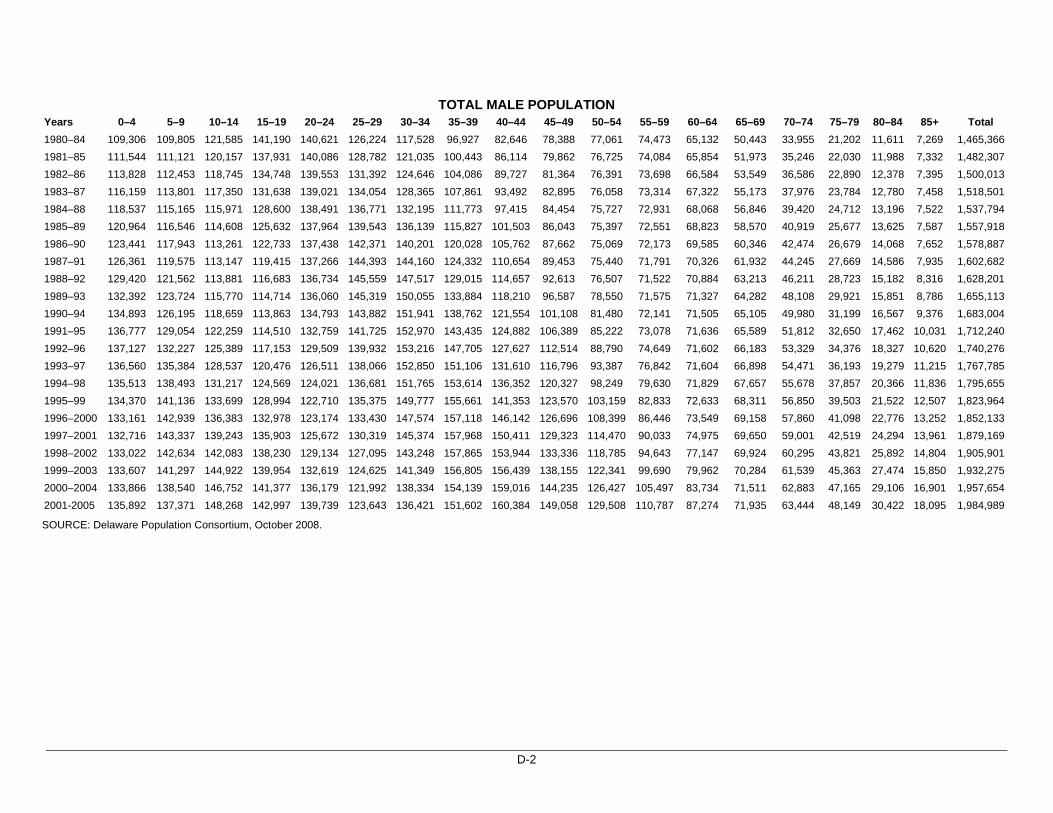
D-2
TOTAL MALE POPULATION Years 0–4 5–9 10–14 15–19 20–24 25–29 30–34 35–39 40–44 45–49 50–54 55–59 60–64 65–69 70–74 75–79 80–84 85+ Total 1980–84 109,306 109,805 121,585 141,190 140,621 126,224 117,528 96,927 82,646 78,388 77,061 74,473 65,132 50,443 33,955 21,202 11,611 7,269 1,465,366 1981–85 111,544 111,121 120,157 137,931 140,086 128,782 121,035 100,443 86,114 79,862 76,725 74,084 65,854 51,973 35,246 22,030 11,988 7,332 1,482,307 1982–86 113,828 112,453 118,745 134,748 139,553 131,392 124,646 104,086 89,727 81,364 76,391 73,698 66,584 53,549 36,586 22,890 12,378 7,395 1,500,013 1983–87 116,159 113,801 117,350 131,638 139,021 134,054 128,365 107,861 93,492 82,895 76,058 73,314 67,322 55,173 37,976 23,784 12,780 7,458 1,518,501 1984–88 118,537 115,165 115,971 128,600 138,491 136,771 132,195 111,773 97,415 84,454 75,727 72,931 68,068 56,846 39,420 24,712 13,196 7,522 1,537,794 1985–89 120,964 116,546 114,608 125,632 137,964 139,543 136,139 115,827 101,503 86,043 75,397 72,551 68,823 58,570 40,919 25,677 13,625 7,587 1,557,918 1986–90 123,441 117,943 113,261 122,733 137,438 142,371 140,201 120,028 105,762 87,662 75,069 72,173 69,585 60,346 42,474 26,679 14,068 7,652 1,578,887 1987–91 126,361 119,575 113,147 119,415 137,266 144,393 144,160 124,332 110,654 89,453 75,440 71,791 70,326 61,932 44,245 27,669 14,586 7,935 1,602,682 1988–92 129,420 121,562 113,881 116,683 136,734 145,559 147,517 129,015 114,657 92,613 76,507 71,522 70,884 63,213 46,211 28,723 15,182 8,316 1,628,201 1989–93 132,392 123,724 115,770 114,714 136,060 145,319 150,055 133,884 118,210 96,587 78,550 71,575 71,327 64,282 48,108 29,921 15,851 8,786 1,655,113 1990–94 134,893 126,195 118,659 113,863 134,793 143,882 151,941 138,762 121,554 101,108 81,480 72,141 71,505 65,105 49,980 31,199 16,567 9,376 1,683,004 1991–95 136,777 129,054 122,259 114,510 132,759 141,725 152,970 143,435 124,882 106,389 85,222 73,078 71,636 65,589 51,812 32,650 17,462 10,031 1,712,240 1992–96 137,127 132,227 125,389 117,153 129,509 139,932 153,216 147,705 127,627 112,514 88,790 74,649 71,602 66,183 53,329 34,376 18,327 10,620 1,740,276 1993–97 136,560 135,384 128,537 120,476 126,511 138,066 152,850 151,106 131,610 116,796 93,387 76,842 71,604 66,898 54,471 36,193 19,279 11,215 1,767,785 1994–98 135,513 138,493 131,217 124,569 124,021 136,681 151,765 153,614 136,352 120,327 98,249 79,630 71,829 67,657 55,678 37,857 20,366 11,836 1,795,655 1995–99 134,370 141,136 133,699 128,994 122,710 135,375 149,777 155,661 141,353 123,570 103,159 82,833 72,633 68,311 56,850 39,503 21,522 12,507 1,823,964 1996–2000 133,161 142,939 136,383 132,978 123,174 133,430 147,574 157,118 146,142 126,696 108,399 86,446 73,549 69,158 57,860 41,098 22,776 13,252 1,852,133 1997–2001 132,716 143,337 139,243 135,903 125,672 130,319 145,374 157,968 150,411 129,323 114,470 90,033 74,975 69,650 59,001 42,519 24,294 13,961 1,879,169 1998–2002 133,022 142,634 142,083 138,230 129,134 127,095 143,248 157,865 153,944 133,336 118,785 94,643 77,147 69,924 60,295 43,821 25,892 14,804 1,905,901 1999–2003 133,607 141,297 144,922 139,954 132,619 124,625 141,349 156,805 156,439 138,155 122,341 99,690 79,962 70,284 61,539 45,363 27,474 15,850 1,932,275 2000–2004 133,866 138,540 146,752 141,377 136,179 121,992 138,334 154,139 159,016 144,235 126,427 105,497 83,734 71,511 62,883 47,165 29,106 16,901 1,957,654 2001-2005 135,892 137,371 148,268 142,997 139,739 123,643 136,421 151,602 160,384 149,058 129,508 110,787 87,274 71,935 63,444 48,149 30,422 18,095 1,984,989
SOURCE: Delaware Population Consortium, October 2008.
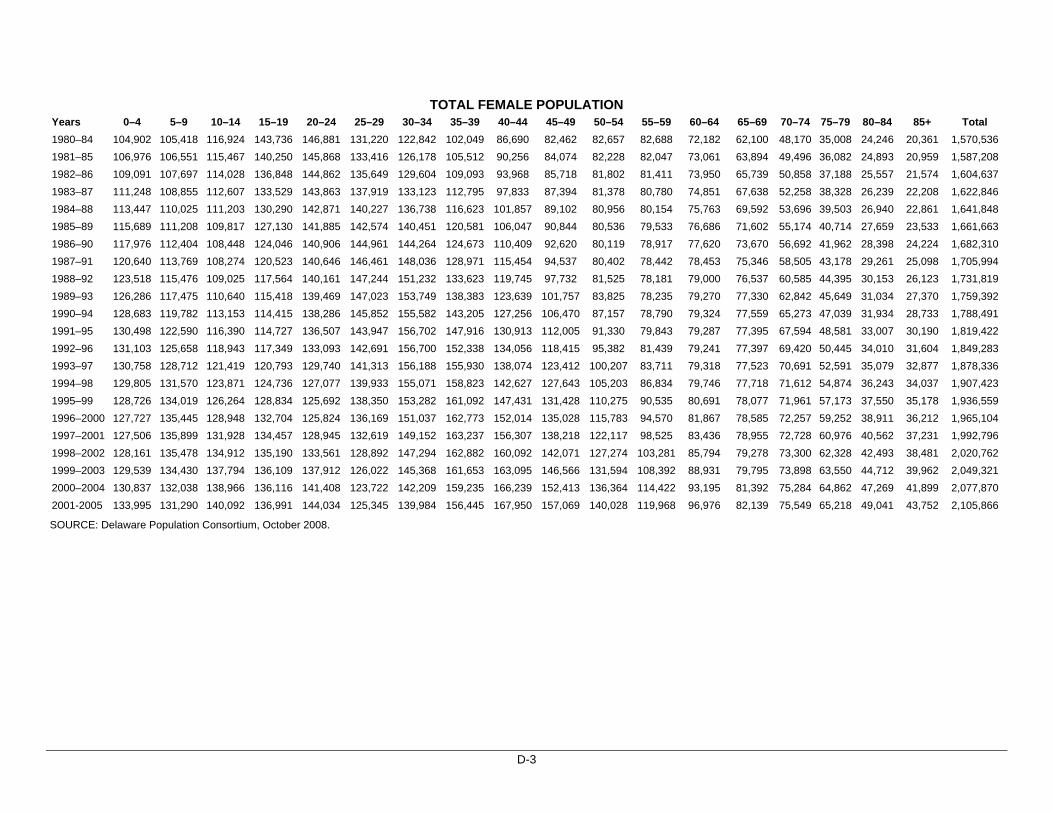
D-3
TOTAL FEMALE POPULATION Years 0–4 5–9 10–14 15–19 20–24 25–29 30–34 35–39 40–44 45–49 50–54 55–59 60–64 65–69 70–74 75–79 80–84 85+ Total 1980–84 104,902 105,418 116,924 143,736 146,881 131,220 122,842 102,049 86,690 82,462 82,657 82,688 72,182 62,100 48,170 35,008 24,246 20,361 1,570,536 1981–85 106,976 106,551 115,467 140,250 145,868 133,416 126,178 105,512 90,256 84,074 82,228 82,047 73,061 63,894 49,496 36,082 24,893 20,959 1,587,208 1982–86 109,091 107,697 114,028 136,848 144,862 135,649 129,604 109,093 93,968 85,718 81,802 81,411 73,950 65,739 50,858 37,188 25,557 21,574 1,604,637 1983–87 111,248 108,855 112,607 133,529 143,863 137,919 133,123 112,795 97,833 87,394 81,378 80,780 74,851 67,638 52,258 38,328 26,239 22,208 1,622,846 1984–88 113,447 110,025 111,203 130,290 142,871 140,227 136,738 116,623 101,857 89,102 80,956 80,154 75,763 69,592 53,696 39,503 26,940 22,861 1,641,848 1985–89 115,689 111,208 109,817 127,130 141,885 142,574 140,451 120,581 106,047 90,844 80,536 79,533 76,686 71,602 55,174 40,714 27,659 23,533 1,661,663 1986–90 117,976 112,404 108,448 124,046 140,906 144,961 144,264 124,673 110,409 92,620 80,119 78,917 77,620 73,670 56,692 41,962 28,398 24,224 1,682,310 1987–91 120,640 113,769 108,274 120,523 140,646 146,461 148,036 128,971 115,454 94,537 80,402 78,442 78,453 75,346 58,505 43,178 29,261 25,098 1,705,994 1988–92 123,518 115,476 109,025 117,564 140,161 147,244 151,232 133,623 119,745 97,732 81,525 78,181 79,000 76,537 60,585 44,395 30,153 26,123 1,731,819 1989–93 126,286 117,475 110,640 115,418 139,469 147,023 153,749 138,383 123,639 101,757 83,825 78,235 79,270 77,330 62,842 45,649 31,034 27,370 1,759,392 1990–94 128,683 119,782 113,153 114,415 138,286 145,852 155,582 143,205 127,256 106,470 87,157 78,790 79,324 77,559 65,273 47,039 31,934 28,733 1,788,491 1991–95 130,498 122,590 116,390 114,727 136,507 143,947 156,702 147,916 130,913 112,005 91,330 79,843 79,287 77,395 67,594 48,581 33,007 30,190 1,819,422 1992–96 131,103 125,658 118,943 117,349 133,093 142,691 156,700 152,338 134,056 118,415 95,382 81,439 79,241 77,397 69,420 50,445 34,010 31,604 1,849,283 1993–97 130,758 128,712 121,419 120,793 129,740 141,313 156,188 155,930 138,074 123,412 100,207 83,711 79,318 77,523 70,691 52,591 35,079 32,877 1,878,336 1994–98 129,805 131,570 123,871 124,736 127,077 139,933 155,071 158,823 142,627 127,643 105,203 86,834 79,746 77,718 71,612 54,874 36,243 34,037 1,907,423 1995–99 128,726 134,019 126,264 128,834 125,692 138,350 153,282 161,092 147,431 131,428 110,275 90,535 80,691 78,077 71,961 57,173 37,550 35,178 1,936,559 1996–2000 127,727 135,445 128,948 132,704 125,824 136,169 151,037 162,773 152,014 135,028 115,783 94,570 81,867 78,585 72,257 59,252 38,911 36,212 1,965,104 1997–2001 127,506 135,899 131,928 134,457 128,945 132,619 149,152 163,237 156,307 138,218 122,117 98,525 83,436 78,955 72,728 60,976 40,562 37,231 1,992,796 1998–2002 128,161 135,478 134,912 135,190 133,561 128,892 147,294 162,882 160,092 142,071 127,274 103,281 85,794 79,278 73,300 62,328 42,493 38,481 2,020,762 1999–2003 129,539 134,430 137,794 136,109 137,912 126,022 145,368 161,653 163,095 146,566 131,594 108,392 88,931 79,795 73,898 63,550 44,712 39,962 2,049,321 2000–2004 130,837 132,038 138,966 136,116 141,408 123,722 142,209 159,235 166,239 152,413 136,364 114,422 93,195 81,392 75,284 64,862 47,269 41,899 2,077,870 2001-2005 133,995 131,290 140,092 136,991 144,034 125,345 139,984 156,445 167,950 157,069 140,028 119,968 96,976 82,139 75,549 65,218 49,041 43,752 2,105,866
SOURCE: Delaware Population Consortium, October 2008.
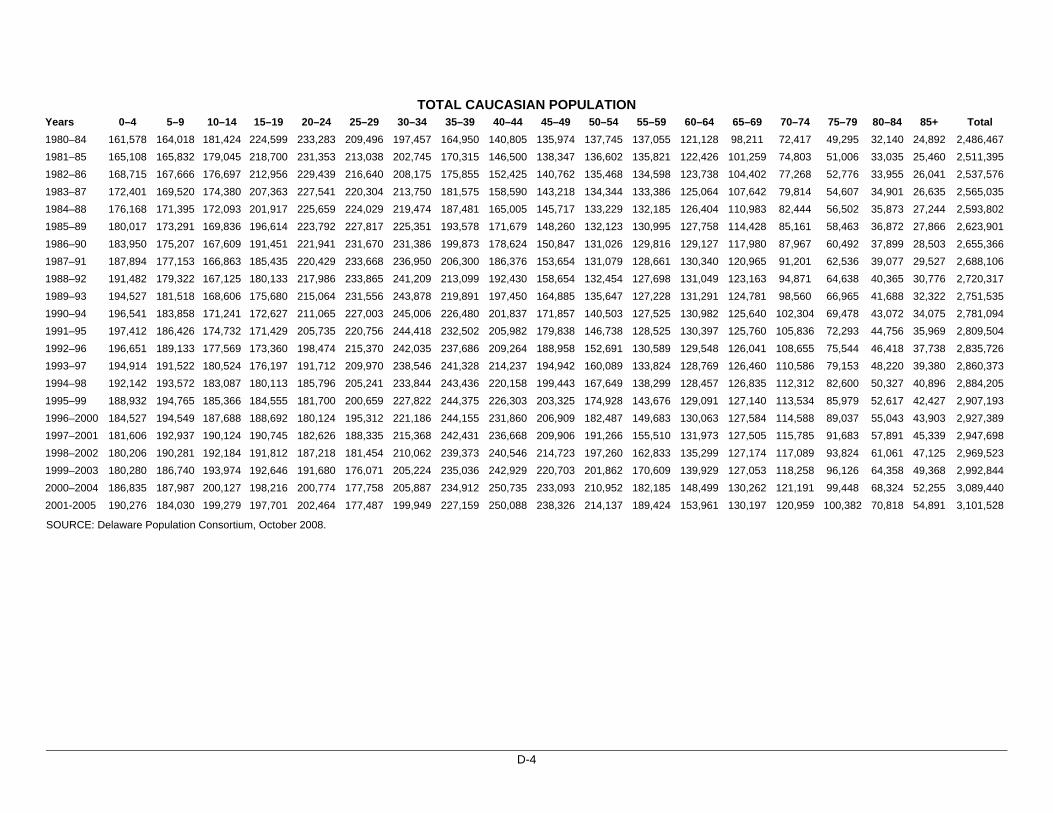
D-4
TOTAL CAUCASIAN POPULATION Years 0–4 5–9 10–14 15–19 20–24 25–29 30–34 35–39 40–44 45–49 50–54 55–59 60–64 65–69 70–74 75–79 80–84 85+ Total 1980–84 161,578 164,018 181,424 224,599 233,283 209,496 197,457 164,950 140,805 135,974 137,745 137,055 121,128 98,211 72,417 49,295 32,140 24,892 2,486,467 1981–85 165,108 165,832 179,045 218,700 231,353 213,038 202,745 170,315 146,500 138,347 136,602 135,821 122,426 101,259 74,803 51,006 33,035 25,460 2,511,395 1982–86 168,715 167,666 176,697 212,956 229,439 216,640 208,175 175,855 152,425 140,762 135,468 134,598 123,738 104,402 77,268 52,776 33,955 26,041 2,537,576 1983–87 172,401 169,520 174,380 207,363 227,541 220,304 213,750 181,575 158,590 143,218 134,344 133,386 125,064 107,642 79,814 54,607 34,901 26,635 2,565,035 1984–88 176,168 171,395 172,093 201,917 225,659 224,029 219,474 187,481 165,005 145,717 133,229 132,185 126,404 110,983 82,444 56,502 35,873 27,244 2,593,802 1985–89 180,017 173,291 169,836 196,614 223,792 227,817 225,351 193,578 171,679 148,260 132,123 130,995 127,758 114,428 85,161 58,463 36,872 27,866 2,623,901 1986–90 183,950 175,207 167,609 191,451 221,941 231,670 231,386 199,873 178,624 150,847 131,026 129,816 129,127 117,980 87,967 60,492 37,899 28,503 2,655,366 1987–91 187,894 177,153 166,863 185,435 220,429 233,668 236,950 206,300 186,376 153,654 131,079 128,661 130,340 120,965 91,201 62,536 39,077 29,527 2,688,106 1988–92 191,482 179,322 167,125 180,133 217,986 233,865 241,209 213,099 192,430 158,654 132,454 127,698 131,049 123,163 94,871 64,638 40,365 30,776 2,720,317 1989–93 194,527 181,518 168,606 175,680 215,064 231,556 243,878 219,891 197,450 164,885 135,647 127,228 131,291 124,781 98,560 66,965 41,688 32,322 2,751,535 1990–94 196,541 183,858 171,241 172,627 211,065 227,003 245,006 226,480 201,837 171,857 140,503 127,525 130,982 125,640 102,304 69,478 43,072 34,075 2,781,094 1991–95 197,412 186,426 174,732 171,429 205,735 220,756 244,418 232,502 205,982 179,838 146,738 128,525 130,397 125,760 105,836 72,293 44,756 35,969 2,809,504 1992–96 196,651 189,133 177,569 173,360 198,474 215,370 242,035 237,686 209,264 188,958 152,691 130,589 129,548 126,041 108,655 75,544 46,418 37,738 2,835,726 1993–97 194,914 191,522 180,524 176,197 191,712 209,970 238,546 241,328 214,237 194,942 160,089 133,824 128,769 126,460 110,586 79,153 48,220 39,380 2,860,373 1994–98 192,142 193,572 183,087 180,113 185,796 205,241 233,844 243,436 220,158 199,443 167,649 138,299 128,457 126,835 112,312 82,600 50,327 40,896 2,884,205 1995–99 188,932 194,765 185,366 184,555 181,700 200,659 227,822 244,375 226,303 203,325 174,928 143,676 129,091 127,140 113,534 85,979 52,617 42,427 2,907,193 1996–2000 184,527 194,549 187,688 188,692 180,124 195,312 221,186 244,155 231,860 206,909 182,487 149,683 130,063 127,584 114,588 89,037 55,043 43,903 2,927,389 1997–2001 181,606 192,937 190,124 190,745 182,626 188,335 215,368 242,431 236,668 209,906 191,266 155,510 131,973 127,505 115,785 91,683 57,891 45,339 2,947,698 1998–2002 180,206 190,281 192,184 191,812 187,218 181,454 210,062 239,373 240,546 214,723 197,260 162,833 135,299 127,174 117,089 93,824 61,061 47,125 2,969,523 1999–2003 180,280 186,740 193,974 192,646 191,680 176,071 205,224 235,036 242,929 220,703 201,862 170,609 139,929 127,053 118,258 96,126 64,358 49,368 2,992,844 2000–2004 186,835 187,987 200,127 198,216 200,774 177,758 205,887 234,912 250,735 233,093 210,952 182,185 148,499 130,262 121,191 99,448 68,324 52,255 3,089,440 2001-2005 190,276 184,030 199,279 197,701 202,464 177,487 199,949 227,159 250,088 238,326 214,137 189,424 153,961 130,197 120,959 100,382 70,818 54,891 3,101,528
SOURCE: Delaware Population Consortium, October 2008.
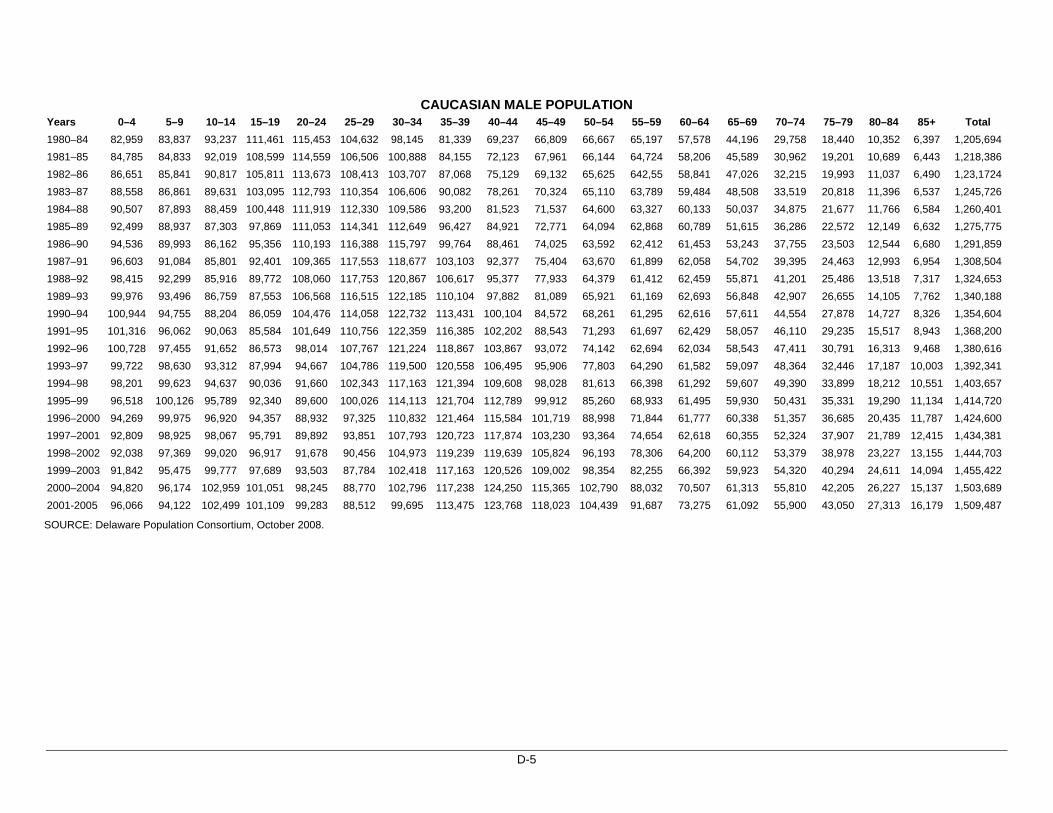
D-5
CAUCASIAN MALE POPULATION Years 0–4 5–9 10–14 15–19 20–24 25–29 30–34 35–39 40–44 45–49 50–54 55–59 60–64 65–69 70–74 75–79 80–84 85+ Total 1980–84 82,959 83,837 93,237 111,461 115,453 104,632 98,145 81,339 69,237 66,809 66,667 65,197 57,578 44,196 29,758 18,440 10,352 6,397 1,205,694 1981–85 84,785 84,833 92,019 108,599 114,559 106,506 100,888 84,155 72,123 67,961 66,144 64,724 58,206 45,589 30,962 19,201 10,689 6,443 1,218,386 1982–86 86,651 85,841 90,817 105,811 113,673 108,413 103,707 87,068 75,129 69,132 65,625 642,55 58,841 47,026 32,215 19,993 11,037 6,490 1,23,1724 1983–87 88,558 86,861 89,631 103,095 112,793 110,354 106,606 90,082 78,261 70,324 65,110 63,789 59,484 48,508 33,519 20,818 11,396 6,537 1,245,726 1984–88 90,507 87,893 88,459 100,448 111,919 112,330 109,586 93,200 81,523 71,537 64,600 63,327 60,133 50,037 34,875 21,677 11,766 6,584 1,260,401 1985–89 92,499 88,937 87,303 97,869 111,053 114,341 112,649 96,427 84,921 72,771 64,094 62,868 60,789 51,615 36,286 22,572 12,149 6,632 1,275,775 1986–90 94,536 89,993 86,162 95,356 110,193 116,388 115,797 99,764 88,461 74,025 63,592 62,412 61,453 53,243 37,755 23,503 12,544 6,680 1,291,859 1987–91 96,603 91,084 85,801 92,401 109,365 117,553 118,677 103,103 92,377 75,404 63,670 61,899 62,058 54,702 39,395 24,463 12,993 6,954 1,308,504 1988–92 98,415 92,299 85,916 89,772 108,060 117,753 120,867 106,617 95,377 77,933 64,379 61,412 62,459 55,871 41,201 25,486 13,518 7,317 1,324,653 1989–93 99,976 93,496 86,759 87,553 106,568 116,515 122,185 110,104 97,882 81,089 65,921 61,169 62,693 56,848 42,907 26,655 14,105 7,762 1,340,188 1990–94 100,944 94,755 88,204 86,059 104,476 114,058 122,732 113,431 100,104 84,572 68,261 61,295 62,616 57,611 44,554 27,878 14,727 8,326 1,354,604 1991–95 101,316 96,062 90,063 85,584 101,649 110,756 122,359 116,385 102,202 88,543 71,293 61,697 62,429 58,057 46,110 29,235 15,517 8,943 1,368,200 1992–96 100,728 97,455 91,652 86,573 98,014 107,767 121,224 118,867 103,867 93,072 74,142 62,694 62,034 58,543 47,411 30,791 16,313 9,468 1,380,616 1993–97 99,722 98,630 93,312 87,994 94,667 104,786 119,500 120,558 106,495 95,906 77,803 64,290 61,582 59,097 48,364 32,446 17,187 10,003 1,392,341 1994–98 98,201 99,623 94,637 90,036 91,660 102,343 117,163 121,394 109,608 98,028 81,613 66,398 61,292 59,607 49,390 33,899 18,212 10,551 1,403,657 1995–99 96,518 100,126 95,789 92,340 89,600 100,026 114,113 121,704 112,789 99,912 85,260 68,933 61,495 59,930 50,431 35,331 19,290 11,134 1,414,720 1996–2000 94,269 99,975 96,920 94,357 88,932 97,325 110,832 121,464 115,584 101,719 88,998 71,844 61,777 60,338 51,357 36,685 20,435 11,787 1,424,600 1997–2001 92,809 98,925 98,067 95,791 89,892 93,851 107,793 120,723 117,874 103,230 93,364 74,654 62,618 60,355 52,324 37,907 21,789 12,415 1,434,381 1998–2002 92,038 97,369 99,020 96,917 91,678 90,456 104,973 119,239 119,639 105,824 96,193 78,306 64,200 60,112 53,379 38,978 23,227 13,155 1,444,703 1999–2003 91,842 95,475 99,777 97,689 93,503 87,784 102,418 117,163 120,526 109,002 98,354 82,255 66,392 59,923 54,320 40,294 24,611 14,094 1,455,422 2000–2004 94,820 96,174 102,959 101,051 98,245 88,770 102,796 117,238 124,250 115,365 102,790 88,032 70,507 61,313 55,810 42,205 26,227 15,137 1,503,689 2001-2005 96,066 94,122 102,499 101,109 99,283 88,512 99,695 113,475 123,768 118,023 104,439 91,687 73,275 61,092 55,900 43,050 27,313 16,179 1,509,487
SOURCE: Delaware Population Consortium, October 2008.
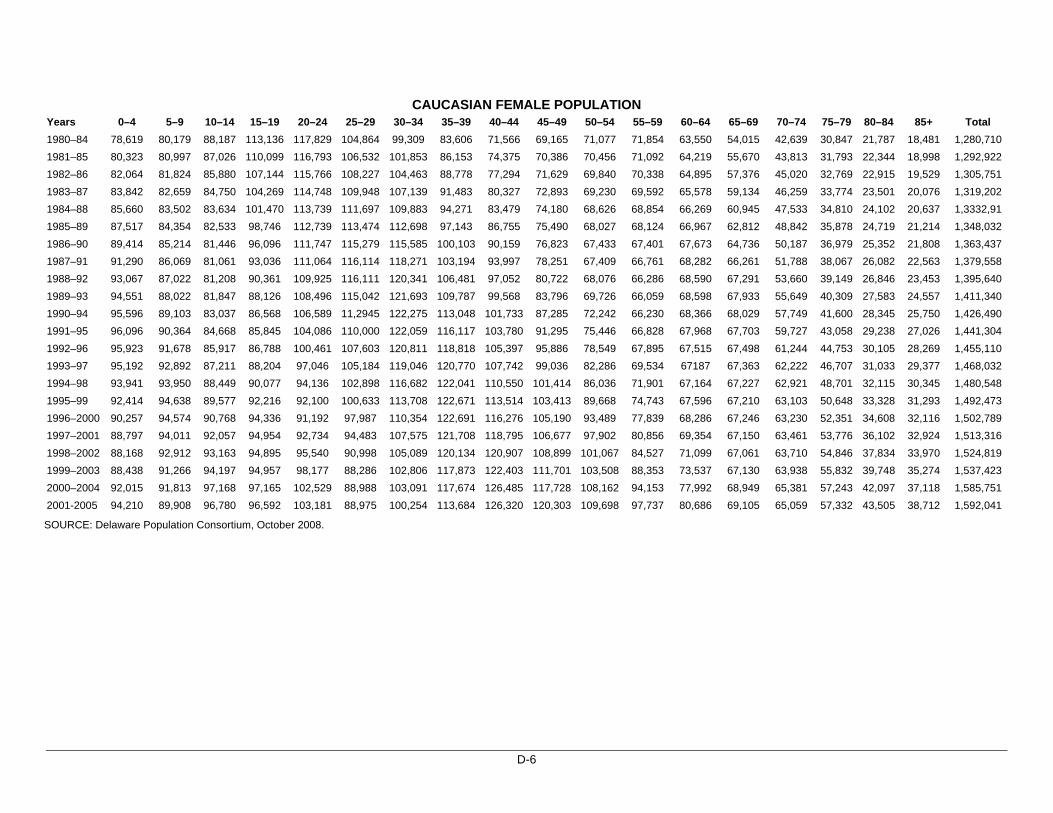
D-6
CAUCASIAN FEMALE POPULATION Years 0–4 5–9 10–14 15–19 20–24 25–29 30–34 35–39 40–44 45–49 50–54 55–59 60–64 65–69 70–74 75–79 80–84 85+ Total 1980–84 78,619 80,179 88,187 113,136 117,829 104,864 99,309 83,606 71,566 69,165 71,077 71,854 63,550 54,015 42,639 30,847 21,787 18,481 1,280,710 1981–85 80,323 80,997 87,026 110,099 116,793 106,532 101,853 86,153 74,375 70,386 70,456 71,092 64,219 55,670 43,813 31,793 22,344 18,998 1,292,922 1982–86 82,064 81,824 85,880 107,144 115,766 108,227 104,463 88,778 77,294 71,629 69,840 70,338 64,895 57,376 45,020 32,769 22,915 19,529 1,305,751 1983–87 83,842 82,659 84,750 104,269 114,748 109,948 107,139 91,483 80,327 72,893 69,230 69,592 65,578 59,134 46,259 33,774 23,501 20,076 1,319,202 1984–88 85,660 83,502 83,634 101,470 113,739 111,697 109,883 94,271 83,479 74,180 68,626 68,854 66,269 60,945 47,533 34,810 24,102 20,637 1,3332,91 1985–89 87,517 84,354 82,533 98,746 112,739 113,474 112,698 97,143 86,755 75,490 68,027 68,124 66,967 62,812 48,842 35,878 24,719 21,214 1,348,032 1986–90 89,414 85,214 81,446 96,096 111,747 115,279 115,585 100,103 90,159 76,823 67,433 67,401 67,673 64,736 50,187 36,979 25,352 21,808 1,363,437 1987–91 91,290 86,069 81,061 93,036 111,064 116,114 118,271 103,194 93,997 78,251 67,409 66,761 68,282 66,261 51,788 38,067 26,082 22,563 1,379,558 1988–92 93,067 87,022 81,208 90,361 109,925 116,111 120,341 106,481 97,052 80,722 68,076 66,286 68,590 67,291 53,660 39,149 26,846 23,453 1,395,640 1989–93 94,551 88,022 81,847 88,126 108,496 115,042 121,693 109,787 99,568 83,796 69,726 66,059 68,598 67,933 55,649 40,309 27,583 24,557 1,411,340 1990–94 95,596 89,103 83,037 86,568 106,589 11,2945 122,275 113,048 101,733 87,285 72,242 66,230 68,366 68,029 57,749 41,600 28,345 25,750 1,426,490 1991–95 96,096 90,364 84,668 85,845 104,086 110,000 122,059 116,117 103,780 91,295 75,446 66,828 67,968 67,703 59,727 43,058 29,238 27,026 1,441,304 1992–96 95,923 91,678 85,917 86,788 100,461 107,603 120,811 118,818 105,397 95,886 78,549 67,895 67,515 67,498 61,244 44,753 30,105 28,269 1,455,110 1993–97 95,192 92,892 87,211 88,204 97,046 105,184 119,046 120,770 107,742 99,036 82,286 69,534 67187 67,363 62,222 46,707 31,033 29,377 1,468,032 1994–98 93,941 93,950 88,449 90,077 94,136 102,898 116,682 122,041 110,550 101,414 86,036 71,901 67,164 67,227 62,921 48,701 32,115 30,345 1,480,548 1995–99 92,414 94,638 89,577 92,216 92,100 100,633 113,708 122,671 113,514 103,413 89,668 74,743 67,596 67,210 63,103 50,648 33,328 31,293 1,492,473 1996–2000 90,257 94,574 90,768 94,336 91,192 97,987 110,354 122,691 116,276 105,190 93,489 77,839 68,286 67,246 63,230 52,351 34,608 32,116 1,502,789 1997–2001 88,797 94,011 92,057 94,954 92,734 94,483 107,575 121,708 118,795 106,677 97,902 80,856 69,354 67,150 63,461 53,776 36,102 32,924 1,513,316 1998–2002 88,168 92,912 93,163 94,895 95,540 90,998 105,089 120,134 120,907 108,899 101,067 84,527 71,099 67,061 63,710 54,846 37,834 33,970 1,524,819 1999–2003 88,438 91,266 94,197 94,957 98,177 88,286 102,806 117,873 122,403 111,701 103,508 88,353 73,537 67,130 63,938 55,832 39,748 35,274 1,537,423 2000–2004 92,015 91,813 97,168 97,165 102,529 88,988 103,091 117,674 126,485 117,728 108,162 94,153 77,992 68,949 65,381 57,243 42,097 37,118 1,585,751 2001-2005 94,210 89,908 96,780 96,592 103,181 88,975 100,254 113,684 126,320 120,303 109,698 97,737 80,686 69,105 65,059 57,332 43,505 38,712 1,592,041
SOURCE: Delaware Population Consortium, October 2008.
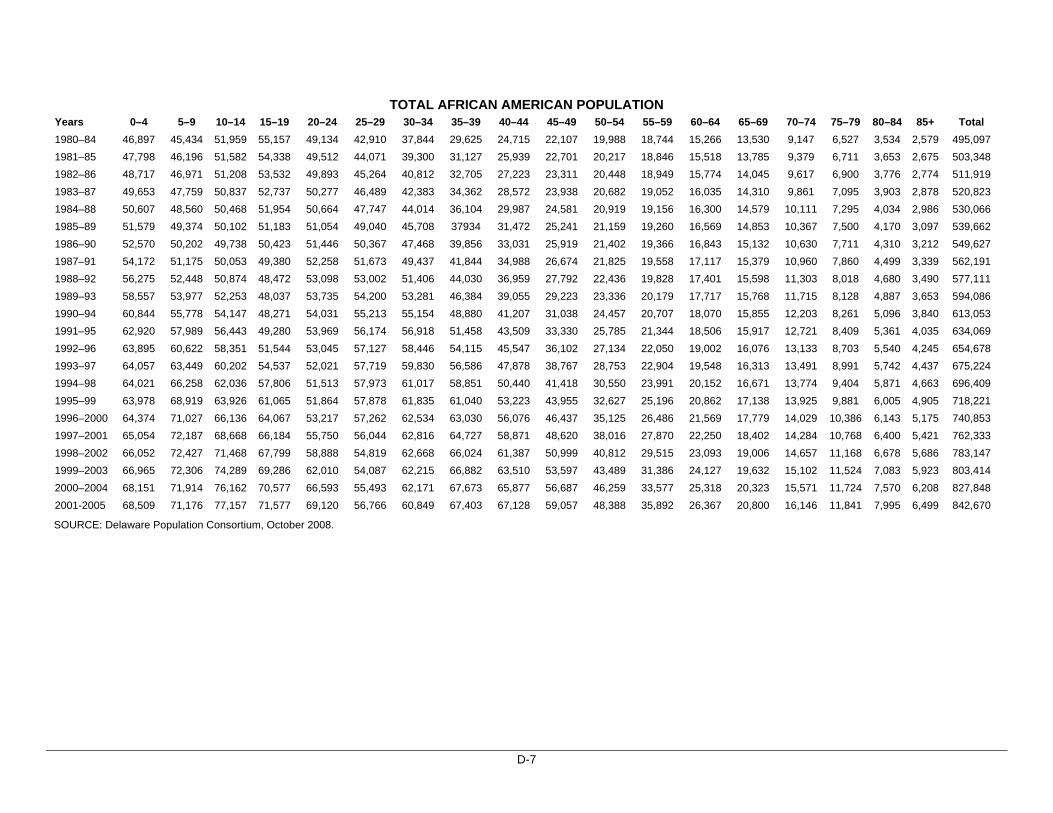
D-7
TOTAL AFRICAN AMERICAN POPULATION Years 0–4 5–9 10–14 15–19 20–24 25–29 30–34 35–39 40–44 45–49 50–54 55–59 60–64 65–69 70–74 75–79 80–84 85+ Total 1980–84 46,897 45,434 51,959 55,157 49,134 42,910 37,844 29,625 24,715 22,107 19,988 18,744 15,266 13,530 9,147 6,527 3,534 2,579 495,097 1981–85 47,798 46,196 51,582 54,338 49,512 44,071 39,300 31,127 25,939 22,701 20,217 18,846 15,518 13,785 9,379 6,711 3,653 2,675 503,348 1982–86 48,717 46,971 51,208 53,532 49,893 45,264 40,812 32,705 27,223 23,311 20,448 18,949 15,774 14,045 9,617 6,900 3,776 2,774 511,919 1983–87 49,653 47,759 50,837 52,737 50,277 46,489 42,383 34,362 28,572 23,938 20,682 19,052 16,035 14,310 9,861 7,095 3,903 2,878 520,823 1984–88 50,607 48,560 50,468 51,954 50,664 47,747 44,014 36,104 29,987 24,581 20,919 19,156 16,300 14,579 10,111 7,295 4,034 2,986 530,066 1985–89 51,579 49,374 50,102 51,183 51,054 49,040 45,708 37934 31,472 25,241 21,159 19,260 16,569 14,853 10,367 7,500 4,170 3,097 539,662 1986–90 52,570 50,202 49,738 50,423 51,446 50,367 47,468 39,856 33,031 25,919 21,402 19,366 16,843 15,132 10,630 7,711 4,310 3,212 549,627 1987–91 54,172 51,175 50,053 49,380 52,258 51,673 49,437 41,844 34,988 26,674 21,825 19,558 17,117 15,379 10,960 7,860 4,499 3,339 562,191 1988–92 56,275 52,448 50,874 48,472 53,098 53,002 51,406 44,030 36,959 27,792 22,436 19,828 17,401 15,598 11,303 8,018 4,680 3,490 577,111 1989–93 58,557 53,977 52,253 48,037 53,735 54,200 53,281 46,384 39,055 29,223 23,336 20,179 17,717 15,768 11,715 8,128 4,887 3,653 594,086 1990–94 60,844 55,778 54,147 48,271 54,031 55,213 55,154 48,880 41,207 31,038 24,457 20,707 18,070 15,855 12,203 8,261 5,096 3,840 613,053 1991–95 62,920 57,989 56,443 49,280 53,969 56,174 56,918 51,458 43,509 33,330 25,785 21,344 18,506 15,917 12,721 8,409 5,361 4,035 634,069 1992–96 63,895 60,622 58,351 51,544 53,045 57,127 58,446 54,115 45,547 36,102 27,134 22,050 19,002 16,076 13,133 8,703 5,540 4,245 654,678 1993–97 64,057 63,449 60,202 54,537 52,021 57,719 59,830 56,586 47,878 38,767 28,753 22,904 19,548 16,313 13,491 8,991 5,742 4,437 675,224 1994–98 64,021 66,258 62,036 57,806 51,513 57,973 61,017 58,851 50,440 41,418 30,550 23,991 20,152 16,671 13,774 9,404 5,871 4,663 696,409 1995–99 63,978 68,919 63,926 61,065 51,864 57,878 61,835 61,040 53,223 43,955 32,627 25,196 20,862 17,138 13,925 9,881 6,005 4,905 718,221 1996–2000 64,374 71,027 66,136 64,067 53,217 57,262 62,534 63,030 56,076 46,437 35,125 26,486 21,569 17,779 14,029 10,386 6,143 5,175 740,853 1997–2001 65,054 72,187 68,668 66,184 55,750 56,044 62,816 64,727 58,871 48,620 38,016 27,870 22,250 18,402 14,284 10,768 6,400 5,421 762,333 1998–2002 66,052 72,427 71,468 67,799 58,888 54,819 62,668 66,024 61,387 50,999 40,812 29,515 23,093 19,006 14,657 11,168 6,678 5,686 783,147 1999–2003 66,965 72,306 74,289 69,286 62,010 54,087 62,215 66,882 63,510 53,597 43,489 31,386 24,127 19,632 15,102 11,524 7,083 5,923 803,414 2000–2004 68,151 71,914 76,162 70,577 66,593 55,493 62,171 67,673 65,877 56,687 46,259 33,577 25,318 20,323 15,571 11,724 7,570 6,208 827,848 2001-2005 68,509 71,176 77,157 71,577 69,120 56,766 60,849 67,403 67,128 59,057 48,388 35,892 26,367 20,800 16,146 11,841 7,995 6,499 842,670
SOURCE: Delaware Population Consortium, October 2008.
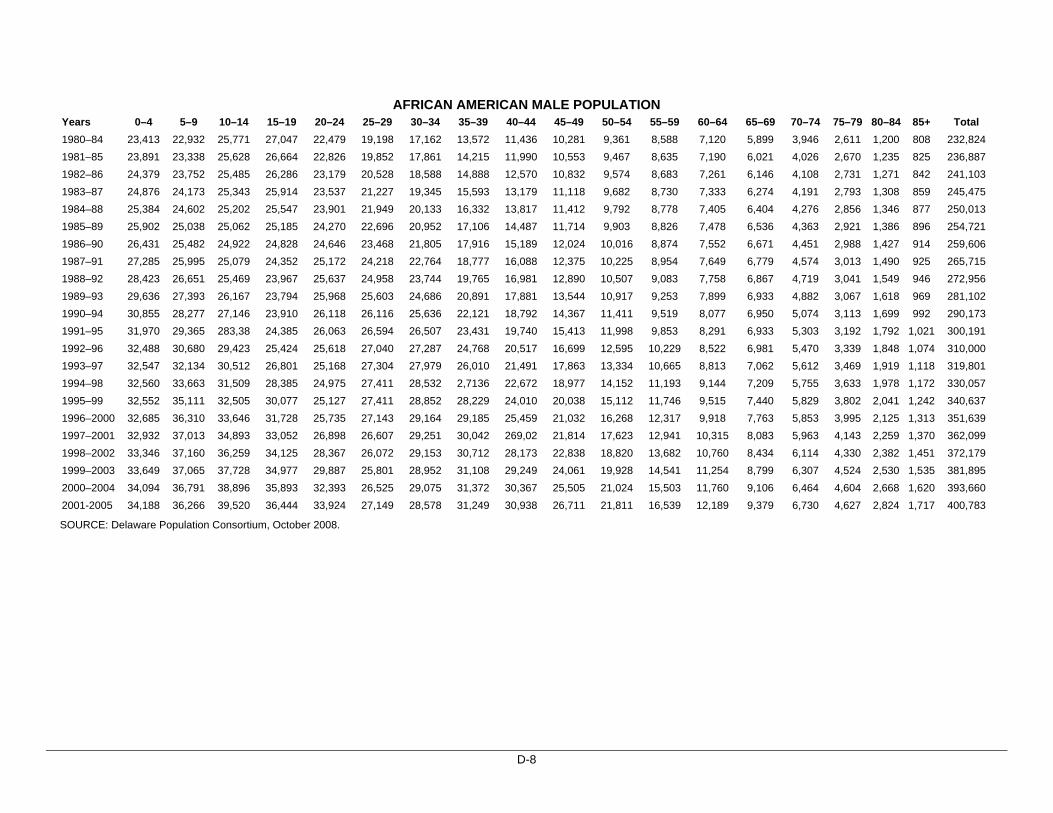
D-8
AFRICAN AMERICAN MALE POPULATION Years 0–4 5–9 10–14 15–19 20–24 25–29 30–34 35–39 40–44 45–49 50–54 55–59 60–64 65–69 70–74 75–79 80–84 85+ Total 1980–84 23,413 22,932 25,771 27,047 22,479 19,198 17,162 13,572 11,436 10,281 9,361 8,588 7,120 5,899 3,946 2,611 1,200 808 232,824 1981–85 23,891 23,338 25,628 26,664 22,826 19,852 17,861 14,215 11,990 10,553 9,467 8,635 7,190 6,021 4,026 2,670 1,235 825 236,887 1982–86 24,379 23,752 25,485 26,286 23,179 20,528 18,588 14,888 12,570 10,832 9,574 8,683 7,261 6,146 4,108 2,731 1,271 842 241,103 1983–87 24,876 24,173 25,343 25,914 23,537 21,227 19,345 15,593 13,179 11,118 9,682 8,730 7,333 6,274 4,191 2,793 1,308 859 245,475 1984–88 25,384 24,602 25,202 25,547 23,901 21,949 20,133 16,332 13,817 11,412 9,792 8,778 7,405 6,404 4,276 2,856 1,346 877 250,013 1985–89 25,902 25,038 25,062 25,185 24,270 22,696 20,952 17,106 14,487 11,714 9,903 8,826 7,478 6,536 4,363 2,921 1,386 896 254,721 1986–90 26,431 25,482 24,922 24,828 24,646 23,468 21,805 17,916 15,189 12,024 10,016 8,874 7,552 6,671 4,451 2,988 1,427 914 259,606 1987–91 27,285 25,995 25,079 24,352 25,172 24,218 22,764 18,777 16,088 12,375 10,225 8,954 7,649 6,779 4,574 3,013 1,490 925 265,715 1988–92 28,423 26,651 25,469 23,967 25,637 24,958 23,744 19,765 16,981 12,890 10,507 9,083 7,758 6,867 4,719 3,041 1,549 946 272,956 1989–93 29,636 27,393 26,167 23,794 25,968 25,603 24,686 20,891 17,881 13,544 10,917 9,253 7,899 6,933 4,882 3,067 1,618 969 281,102 1990–94 30,855 28,277 27,146 23,910 26,118 26,116 25,636 22,121 18,792 14,367 11,411 9,519 8,077 6,950 5,074 3,113 1,699 992 290,173 1991–95 31,970 29,365 283,38 24,385 26,063 26,594 26,507 23,431 19,740 15,413 11,998 9,853 8,291 6,933 5,303 3,192 1,792 1,021 300,191 1992–96 32,488 30,680 29,423 25,424 25,618 27,040 27,287 24,768 20,517 16,699 12,595 10,229 8,522 6,981 5,470 3,339 1,848 1,074 310,000 1993–97 32,547 32,134 30,512 26,801 25,168 27,304 27,979 26,010 21,491 17,863 13,334 10,665 8,813 7,062 5,612 3,469 1,919 1,118 319,801 1994–98 32,560 33,663 31,509 28,385 24,975 27,411 28,532 2,7136 22,672 18,977 14,152 11,193 9,144 7,209 5,755 3,633 1,978 1,172 330,057 1995–99 32,552 35,111 32,505 30,077 25,127 27,411 28,852 28,229 24,010 20,038 15,112 11,746 9,515 7,440 5,829 3,802 2,041 1,242 340,637 1996–2000 32,685 36,310 33,646 31,728 25,735 27,143 29,164 29,185 25,459 21,032 16,268 12,317 9,918 7,763 5,853 3,995 2,125 1,313 351,639 1997–2001 32,932 37,013 34,893 33,052 26,898 26,607 29,251 30,042 269,02 21,814 17,623 12,941 10,315 8,083 5,963 4,143 2,259 1,370 362,099 1998–2002 33,346 37,160 36,259 34,125 28,367 26,072 29,153 30,712 28,173 22,838 18,820 13,682 10,760 8,434 6,114 4,330 2,382 1,451 372,179 1999–2003 33,649 37,065 37,728 34,977 29,887 25,801 28,952 31,108 29,249 24,061 19,928 14,541 11,254 8,799 6,307 4,524 2,530 1,535 381,895 2000–2004 34,094 36,791 38,896 35,893 32,393 26,525 29,075 31,372 30,367 25,505 21,024 15,503 11,760 9,106 6,464 4,604 2,668 1,620 393,660 2001-2005 34,188 36,266 39,520 36,444 33,924 27,149 28,578 31,249 30,938 26,711 21,811 16,539 12,189 9,379 6,730 4,627 2,824 1,717 400,783
SOURCE: Delaware Population Consortium, October 2008.
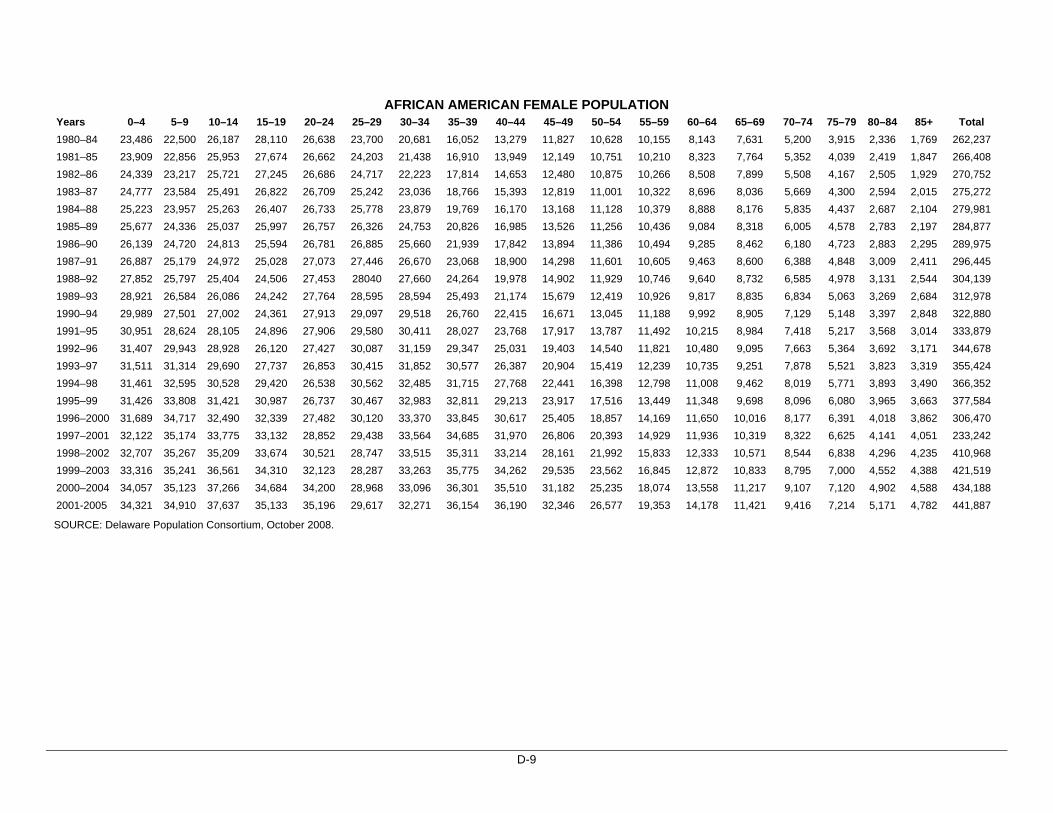
D-9
AFRICAN AMERICAN FEMALE POPULATION Years 0–4 5–9 10–14 15–19 20–24 25–29 30–34 35–39 40–44 45–49 50–54 55–59 60–64 65–69 70–74 75–79 80–84 85+ Total 1980–84 23,486 22,500 26,187 28,110 26,638 23,700 20,681 16,052 13,279 11,827 10,628 10,155 8,143 7,631 5,200 3,915 2,336 1,769 262,237 1981–85 23,909 22,856 25,953 27,674 26,662 24,203 21,438 16,910 13,949 12,149 10,751 10,210 8,323 7,764 5,352 4,039 2,419 1,847 266,408 1982–86 24,339 23,217 25,721 27,245 26,686 24,717 22,223 17,814 14,653 12,480 10,875 10,266 8,508 7,899 5,508 4,167 2,505 1,929 270,752 1983–87 24,777 23,584 25,491 26,822 26,709 25,242 23,036 18,766 15,393 12,819 11,001 10,322 8,696 8,036 5,669 4,300 2,594 2,015 275,272 1984–88 25,223 23,957 25,263 26,407 26,733 25,778 23,879 19,769 16,170 13,168 11,128 10,379 8,888 8,176 5,835 4,437 2,687 2,104 279,981 1985–89 25,677 24,336 25,037 25,997 26,757 26,326 24,753 20,826 16,985 13,526 11,256 10,436 9,084 8,318 6,005 4,578 2,783 2,197 284,877 1986–90 26,139 24,720 24,813 25,594 26,781 26,885 25,660 21,939 17,842 13,894 11,386 10,494 9,285 8,462 6,180 4,723 2,883 2,295 289,975 1987–91 26,887 25,179 24,972 25,028 27,073 27,446 26,670 23,068 18,900 14,298 11,601 10,605 9,463 8,600 6,388 4,848 3,009 2,411 296,445 1988–92 27,852 25,797 25,404 24,506 27,453 28040 27,660 24,264 19,978 14,902 11,929 10,746 9,640 8,732 6,585 4,978 3,131 2,544 304,139 1989–93 28,921 26,584 26,086 24,242 27,764 28,595 28,594 25,493 21,174 15,679 12,419 10,926 9,817 8,835 6,834 5,063 3,269 2,684 312,978 1990–94 29,989 27,501 27,002 24,361 27,913 29,097 29,518 26,760 22,415 16,671 13,045 11,188 9,992 8,905 7,129 5,148 3,397 2,848 322,880 1991–95 30,951 28,624 28,105 24,896 27,906 29,580 30,411 28,027 23,768 17,917 13,787 11,492 10,215 8,984 7,418 5,217 3,568 3,014 333,879 1992–96 31,407 29,943 28,928 26,120 27,427 30,087 31,159 29,347 25,031 19,403 14,540 11,821 10,480 9,095 7,663 5,364 3,692 3,171 344,678 1993–97 31,511 31,314 29,690 27,737 26,853 30,415 31,852 30,577 26,387 20,904 15,419 12,239 10,735 9,251 7,878 5,521 3,823 3,319 355,424 1994–98 31,461 32,595 30,528 29,420 26,538 30,562 32,485 31,715 27,768 22,441 16,398 12,798 11,008 9,462 8,019 5,771 3,893 3,490 366,352 1995–99 31,426 33,808 31,421 30,987 26,737 30,467 32,983 32,811 29,213 23,917 17,516 13,449 11,348 9,698 8,096 6,080 3,965 3,663 377,584 1996–2000 31,689 34,717 32,490 32,339 27,482 30,120 33,370 33,845 30,617 25,405 18,857 14,169 11,650 10,016 8,177 6,391 4,018 3,862 306,470 1997–2001 32,122 35,174 33,775 33,132 28,852 29,438 33,564 34,685 31,970 26,806 20,393 14,929 11,936 10,319 8,322 6,625 4,141 4,051 233,242 1998–2002 32,707 35,267 35,209 33,674 30,521 28,747 33,515 35,311 33,214 28,161 21,992 15,833 12,333 10,571 8,544 6,838 4,296 4,235 410,968 1999–2003 33,316 35,241 36,561 34,310 32,123 28,287 33,263 35,775 34,262 29,535 23,562 16,845 12,872 10,833 8,795 7,000 4,552 4,388 421,519 2000–2004 34,057 35,123 37,266 34,684 34,200 28,968 33,096 36,301 35,510 31,182 25,235 18,074 13,558 11,217 9,107 7,120 4,902 4,588 434,188 2001-2005 34,321 34,910 37,637 35,133 35,196 29,617 32,271 36,154 36,190 32,346 26,577 19,353 14,178 11,421 9,416 7,214 5,171 4,782 441,887
SOURCE: Delaware Population Consortium, October 2008.
E-1
APPENDIX E BEHAVIORAL RISK FACTORS
Delaware’s Behavioral Risk Factor Surveillance System (BRFSS), an annual survey of adults ages 18 and older, is a collaborative effort between Delaware’s Division of Public Health and the Centers for Disease Control and Prevention (CDC). The BRFSS survey includes a core set of questions developed by CDC and is administered annually as a random-digit-dial telephone survey in all 50 states. The BRFSS survey was developed to monitor the statewide prevalence of behavioral risk factors among adults that relate to premature morbidity and mortality. Questions in the survey include lifestyle behaviors (including tobacco use, fruit and vegetable consumption, exercise and weight control), cancer screening practices, health status and health care access and use. The data provided below relate specifically to risk factor prevalence and cancer screening practices among Delawareans. More information about Delaware’s BRFSS is available at http://www.state.de.us/dhss/dph/dpc/ brfsurveys.html. General information on the BRFSS is available at http://www.cdc.gov/brfss/.
Overweight/Obesity Being overweight or obese is a risk factor for several cancers, including female breast (in postmenopausal females), colorectal, kidney and uterine cancers. In addition, being overweight or obese is a major risk factor for other chronic diseases, including coronary heart disease, type 2 diabetes and stroke. The CDC defines “overweight” as a body mass index (BMI) greater than or equal to 25 and less than 30; “obese” is defined as a BMI greater than or equal to 30. BMI is calculated using an individual’s height and weight. The following data are specific to the 2007 BRFSS:
In Delaware, 65.1 percent of adults ages 18 and over were overweight or obese. At the national level, 62.9 percent of adults were overweight or obese. This difference was not statistically significant.
The prevalence of overweight/obese people in Delaware differed significantly by sex: 73.4 percent of males and 57.0 percent of females were overweight or obese.
While more African Americans were overweight/obese than Caucasians in Delaware (73.2 percent vs. 64.2 percent, respectively), the difference was not statistically significant.
In Delaware, the prevalence of overweight/obese was highest among adults aged 50 to 64 years (71.4 percent). This number was significantly higher than the percent of overweight/obese adults aged 18-49 (62.2 percent) but not significantly higher than adults aged 65 and older (65.8 percent).
In Kent, New Castle and Sussex counties, 68.1 percent, 62.8 percent and 68.8 percent of adults, respectively, were overweight/obese. These numbers were not significantly different.
No significant differences were observed by education level or income level.
Physical Activity Lack of physical activity is a substantiated risk factor for colorectal cancer and a suspected risk factor for other cancers (e.g., prostate cancer). The benefits of regular sustained physical activity also include reduction in risk for other chronic diseases including coronary heart disease, type 2 diabetes, and stroke, as well as improved overall well-being. BRFSS questions examine the intensity, duration and frequency of activity reported by respondents. Respondents are considered “physically active” if they engage in 30 or more minutes of moderate activity at least five days per week or 20 or more minutes of vigorous activity at least three days per week. The following data are specific to the 2007 BRFSS:
E-2
In Delaware, 47.9 percent of adults ages 18 and older were considered physically active. At the
national level, 49.5 percent of adults were physically active. The state and national percentages were not statistically significantly different.
Physical activity differed significantly by sex. Only 44.1 percent of Delaware females met the recommended levels of physical activity, compared to 52.2 percent of Delaware males.
Significantly more Caucasians (49.9 percent) met the recommended level of physical activity that did African Americans (38.2 percent) in Delaware.
The prevalence of physical activity in Delaware was significantly greater for adults aged 18-49 (52.7 percent) compared to adults aged 50-64 (44.3 percent) and adults aged 65 and older (37.5 percent).
The prevalence of physical activity was positively correlated with annual income; Delawareans earning more than $50,000 annually were significantly more likely to meet physical activity recommendations (51.8 percent) compared to Delawareans earning less than $25,000 per year (39.9 percent) and Delawareans earning between $25-50,000 per year (42.2 percent).
No significant differences were observed by county of residence or by education level.
Dietary Fruits and Vegetables
A diet high in fruits and vegetables is a protective factor against numerous cancers, including breast, cervical, colorectal, uterine, esophageal, oral cavity, ovarian, pancreatic, prostate, and stomach cancers. The following data are specific to the 2007 BRFSS:
Significantly fewer adults aged 18 and older in Delaware (21.4 percent) consumed five or more
servings of fruits and vegetables a day compared to adults at the national level (24.4 percent).
While fewer Delaware males than females consumed five or more servings of fruits and vegetables daily (19.4 percent and 23.2 percent, respectively), the difference was not statistically significant.
In Delaware, a larger percentage of African Americans (22.9 percent) than Caucasians (20.7 percent) consumed five or more servings of fruits and vegetables daily but the difference was not statistically significant.
No significant differences were observed by county of residence, age group or income level.
For questions or comments related to this report, please contact the Division of Public Health at the following address:
Delaware Health and Social Services Division of Public Health 540 S. DuPont Highway Dover, DE 19901 Phone: 302-744-1040 Fax: 302-739-2545 http://www.dhss.delaware.gov/dhss/dph/index.html