campbell soup company - lark research
TRANSCRIPT
Lark Research Stephen P. Percoco P.O. Box 768, Norwood, MA 02062 (781) 762-1476 www.larkresearch.com [email protected]
Campbell Soup Company
Executive Summary August 6, 2014 In response to stagnating sales and profits, Campbell Soup Company adopted a dual mandate in Febru-ary 2013 under which it would seek to (1) stabilize and strengthen its core businesses and (2) build new avenues for growth in products, consumer niches or geographies. Although the company reported good progress on this mandate in fiscal 2013, it has not achieved a successful follow-through in fiscal 2014. Management attributes disappointing performance to sluggish consumer spending associated with slow income growth and uncertainty about the future.
Management says that this disappointing financial performance will continue in fiscal 2015. Its prelimi-nary guidance for fiscal 2015 is below long-term targets. Although it plans to launch another 200 prod-ucts in the coming year, it says that more significant changes to the company’s product portfolio may be necessary to get back on track. Given this sentiment, its guidance for the fiscal 2014 fourth quarter looks aggressive, but management has also set a low bar for fiscal 2015.
Although the recent acquisitions of Bolthouse Farms, Plum Organics and Kelsen appear to be good growth platforms, many aspects of Campbell’s growth initiatives seem out of step with the “new normal” in consumer spending. In this environment, it would be more appropriate for the company to reduce cost and operational complexity by trimming many product line extensions and shifting the weighting of its product portfolio more in favor of products that deliver better value to the consumer, through a com-bination of lower prices and higher product quality (e.g. more nutritious products). The company should also improve its disclosures in several ways, for example, by providing a review of its product innovation efforts in the MD&A section of its financial statements that includes summary performance figures.
In this tougher consumer environment, Campbell should focus on improving its financial flexibility by par-ing fixed costs, rather than adopting a 5-year sales target of $10 billion. It should reduce its current heavy reliance on short-term financing. Instead of stock buybacks, the company should concentrate on raising its dividend and using excess free cash flow to reduce debt. All of this would enhance its ability to respond both to future challenges and opportunities, if conditions in its core business deteriorate further.
Common Stock Performance Rating: 3; Safety Rating: C- S&P 500: 1920.21
Amt Outst ($m) CUSIP Type Recent
Price Coupon Maturity Yield Spread Call Date
Call Price
Credit Ratings
400.0 134429AV1 Senior Notes 104.94 3.050% 7/15/17 1.33% 43 bp Now MW A2/BBB+ 300.0 134429AT6 Senior Notes 110.18 4.500% 2/15/19 2.13% 58 bp Now MW A2/BBB+ 500.0 134429AW9 Senior Notes 107.90 4.250% 4/15/21 2.94% 74 bp Now MW A2/BBB+ 200.0 134429AG4 Senior Notes a 131.98 8.875% 5/01/21 3.50% 140 bp None N/C A2/BBB+ 450.0 134429AY5 Senior Notes 95.56 2.500% 8/02/22 3.13% 84 bp Now MW A2/BBB+ 400.0 134429AZ2 Senior Notes 88.07 3.800% 8/02/42 4.56% 129 bp Now MW A2/BBB+
(a) The 8 7/8% Senior Notes trade less frequently than other Campbell debt issues. N/C = non-call; MW = make whole
Shares Outst. (mil.) Common Stock
8/5/14Price
Div. perShare
Div. Yield
Tangible Book Val.
Proj ’14 EPS
2014 P/E
Proj. ’15 EPS
2015 P/E
313.9 Campbell Soup Co. (N:CPB) $41.81 $1.25 3.0% ($6.72) $2.53 16.5 $2.61 16.0
Lark Research Campbell Soup Company Report
Page 2 August 6, 2014
Positive Investment Considerations
U.S. market leader in soups with an estimated 60% market share. Campbell has a formidable position in soups with leading positions in condensed (eating and cooking), ready-to-serve (Campbell’s HomeStyle and Chunky), premium (Habitant and Wolfgang Puck) and broths (Swanson). Its long-standing market leadership gives it key advantages, such as high profit margins and strong, relatively stable cash flows. Its recent product innovations have reinforced its market leadership and put competitors on the defen-sive; but its ability to grow the category and raise market share beyond 60% appear to be limited. With tough competition from Progresso in ready-to-serve and the receptivity of budget-minded consumers to store brands, growing sales and profits in soups is a challenge for Campbell.
Well-recognized brands in a range of product categories. Besides soups, Campbell’s is among the market leaders in shelf stable beverages (V8, Campbell’s Tomato Juice), pasta sauces (Prego), Mexican sauces (Pace) and premium bakery products, including breads, cookies and Goldfish crackers (Pepperidge Farm). In Australia, Arnott’s is a recognized leader in biscuits and snacks. Several of these brands, including Campbell’s, Prego and Pace, fall into a key product category called Simple Meals, a strategic priority for the company, with greater potential for synergistic growth. Besides their inherent value, Campbell’s strong brands can also facilitate the success of new products in related categories and product line exten-sions.
New growth platforms. Over the past couple of years, Campbell has made three acquisitions to expand its growth opportunities: Bolthouse Farms, a producer of carrots (and related products) and premium fresh beverages and salad dressings; Plum Organics, a producer of organic food for babies, toddlers and small children; and Kelsen Group, a maker of premium butter cookies with well-established positions in Asian growth markets, especially China. The company intends to grow each of these businesses by in-creasing distribution and ramping up product development.
Sophisticated and knowledgeable consumer marketer. Campbell’s understands consumers and has strong relationships in all distribution channels. It regularly tracks who is using its products, how they are using them and what motivates purchase decisions. Thus, it is adept at devising advertising and marketing campaigns to reach consumers to exploit sales opportunities. This also gives it the ability to spot new trends and adjust its advertising, promotion and distribution strategies as required.
Strong balance sheet. Campbell’s ratio of debt-to-total market capitalization is only 23%. Its publicly-traded debt is solidly investment grade, with ratings of A2 by Moody’s and BBB+ by Standard & Poor’s. At April 27, 2014, it had $222 million of cash on the balance sheet and more than $500 million in excess availability (over and above the outstanding amount of commercial paper) under a $2.2 billion bank re-volving credit facility.
Consistent generator of free cash flow. Campbell’s cash flow from operating activities has averaged more than $1.0 billion annually for the past six fiscal years. During this period, annual capital expenditures have averaged $315 million and dividends $360 million. Except for recent acquisitions, the company has used its free cash flow mostly to buy back debt.
Growth Opportunities in Asia and Latin America. Although it has had mixed success in its international expansion efforts, Campbell still sees opportunities to grow, particularly in Asia and Latin America. In Asia, the company is growing by expanding its Arnott’s biscuits and snacks businesses and Kimball sauce brand to boost sales in Indonesia, Malaysia and other parts of Southeast Asia. It is leveraging its recent acquisition of Kelsen to pursue growth in China. In Mexico, Campbell has transferred its existing opera-tions to joint ventures with Jumex and La Costena, which it believes will facilitate greater penetration of local and regional markets. It is also looking to enter into similar arrangements in other Latin American and Asian markets.
Campbell Soup Company Report Lark Research
August 6, 2014 Page 3
Key Concerns
Difficult market environment for branded food companies. After an encouraging rebound in fiscal 2013, led by 9% growth in ready-to-serve soup, Campbell has experienced disappointing sales growth in fiscal 2014. Much of the softness in sales is due to weak consumer spending. Slow income growth and contin-uing economic uncertainty probably represent a “new normal” for consumers. If so, branded food com-panies will have to adjust their product strategies to emphasize price and value in order to sustain sales.
Many of its new product launches seem inconsistent with current market conditions and challenges facing consumers. If a new normal for the consumer is at hand, the company’s continuing emphasis on new product introductions seems misplaced, especially for those products that are premium-priced, discretion-ary purchases. In this environment, the company should place greater emphasis on products that offer greater value, including those that meet its sustainability goals for health and nutrition.
The company has had only limited success with new product launches in recent years. Many of Camp-bell’s new products have not found permanent space on grocers’ shelves. In most cases, I believe that the quality of Campbell’s new products has been excellent; but it is difficult to get customers to incorpo-rate new products into their eating routines within the timeframes normally allotted by grocers and other retailers to demonstrate adequate sales levels.
Campbell’s innovation effort is too broad. Given the challenges facing consumers and the difficulty of creating successful new products, Campbell’s decisions to (1) establish three new growth platforms through acquisitions (with possibly more to come) and (2) introduce 200 new products each year (in the current and upcoming fiscal years) seems like an overreach. It is hard to imagine that the company will be able to devote the necessary resources in both manpower and especially investment to ensure the success of this far-reaching and ambitious innovation effort.
Inadequate financial reporting on new product initiatives. Given the growing importance of product inno-vation in recent years, Campbell should incorporate a discussion of and summary performance figures for its new product development efforts into its public financial reporting framework. Although distinguishing between costs in the core business and new product initiatives may be subjective, management should be able to adapt reports that are used internally for this purpose at little or no additional cost.
Although management says that fiscal 2014 profits will be at the low end of its guidance range, the im-plied guidance for the fourth quarter looks aggressive. At its recent analyst meeting, management said that it expects that EPS for fiscal 2014 (which ended on August 2, will likely be at the low end of its previ-ous guidance ranges of 2%-4% growth ($2.53-$2.58). However, the implied guidance for the fourth quarter looks aggressive, with revenue growth of more than 8% and adjusted EPS growth of nearly 14%.
Management’s preliminary guidance for fiscal 2015 indicates that the company’s performance will fall short of long-term targets. It said that it is taking longer than anticipated to meet the goals of the dual mandate. A further reconfiguration of the product portfolio may be required to get Campbell’s financial performance back on track. Management will offer detailed guidance on Monday, September 8, when it reports fiscal 2014 fourth quarter results.
Campbell currently has too much short-term debt. At April 27, 2014, total debt was $3.91 billion, includ-ing $1.66 billion of short-term debt. Short-term debt consisted of $915 million of commercial paper and $700 million of publicly-traded debt maturing in August. The company will apparently fund this maturing debt by issuing more commercial paper. It is overdue for another public debt offering which would re-duce short-term and lengthen maturities at fixed interest rates. (Its last debt issuance was in July 2012.) Although Campbell has hedged some of its interest rate exposure in the past, it would be better served, given the risk of rising interest rates and its aggressive growth agenda, by issuing more fixed-rate debt, refraining from ramping up share buybacks or both.
Lark Research Campbell Soup Company Report
Page 4 August 6, 2014
Business
Campbell Soup Company is one of the world’s leading consumer branded foods companies. Although it manages its operations through 10 operating segments (based upon product type and geographic loca-tion), it reports its performance in five segments:1
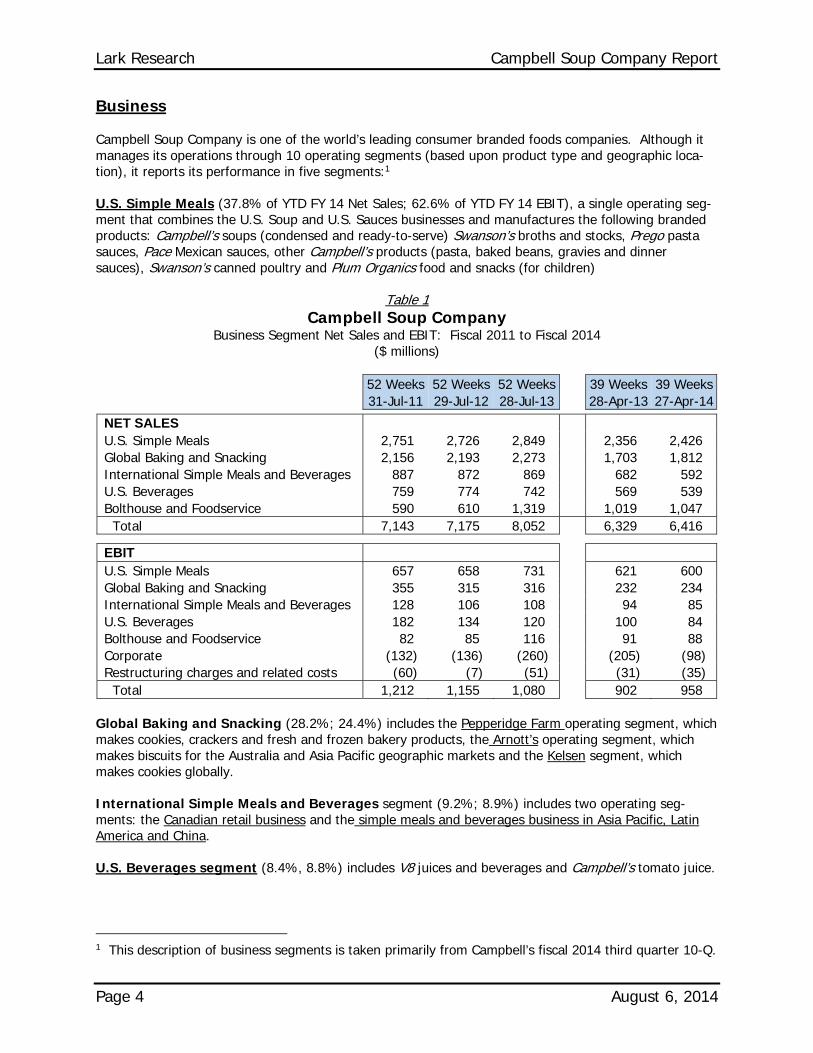
U.S. Simple Meals (37.8% of YTD FY 14 Net Sales; 62.6% of YTD FY 14 EBIT), a single operating seg-ment that combines the U.S. Soup and U.S. Sauces businesses and manufactures the following branded products: Campbell’s soups (condensed and ready-to-serve) Swanson’s broths and stocks, Prego pasta sauces, Pace Mexican sauces, other Campbell’s products (pasta, baked beans, gravies and dinner sauces), Swanson’s canned poultry and Plum Organics food and snacks (for children)
Table 1 Campbell Soup Company
Business Segment Net Sales and EBIT: Fiscal 2011 to Fiscal 2014 ($ millions)
52 Weeks 52 Weeks 52 Weeks 39 Weeks 39 Weeks 31-Jul-11 29-Jul-12 28-Jul-13 28-Apr-13 27-Apr-14
NET SALES U.S. Simple Meals 2,751 2,726 2,849 2,356 2,426 Global Baking and Snacking 2,156 2,193 2,273 1,703 1,812 International Simple Meals and Beverages 887 872 869 682 592 U.S. Beverages 759 774 742 569 539 Bolthouse and Foodservice 590 610 1,319 1,019 1,047 Total 7,143 7,175 8,052 6,329 6,416
EBIT U.S. Simple Meals 657 658 731 621 600 Global Baking and Snacking 355 315 316 232 234 International Simple Meals and Beverages 128 106 108 94 85 U.S. Beverages 182 134 120 100 84 Bolthouse and Foodservice 82 85 116 91 88 Corporate (132) (136) (260) (205) (98) Restructuring charges and related costs (60) (7) (51) (31) (35) Total 1,212 1,155 1,080 902 958
Global Baking and Snacking (28.2%; 24.4%) includes the Pepperidge Farm operating segment, which makes cookies, crackers and fresh and frozen bakery products, the Arnott’s operating segment, which makes biscuits for the Australia and Asia Pacific geographic markets and the Kelsen segment, which makes cookies globally.
International Simple Meals and Beverages segment (9.2%; 8.9%) includes two operating seg-ments: the Canadian retail business and the simple meals and beverages business in Asia Pacific, Latin America and China.
U.S. Beverages segment (8.4%, 8.8%) includes V8 juices and beverages and Campbell’s tomato juice.
1 This description of business segments is taken primarily from Campbell’s fiscal 2014 third quarter 10-Q.
Campbell Soup Company Report Lark Research
August 6, 2014 Page 5
Bolthouse and Foodservice segment (16.3%, 9.2%) comprises the Bolthouse Farms carrot products operating segment, the Bolthouse Farms super-premium refrigerated beverages and refrigerated salad dressings operating segment and the North America Foodservice operating segment.
Besides segment earnings, consolidated EBIT includes corporate expenses and restructuring charges (and related costs), which are not allocated to the individual reporting segments. Collectively, these amounted to -13.9% of consolidated EBIT in the fiscal 2014 year-to-date period.
Strategy
Under President and CEO Denise Morrison, who is beginning her fourth year at the helm, Campbell’s has adopted a “dual mandate”: It is seeking both to strengthen its core business and expand into higher growth spaces.
Strengthening the Core. Campbell’s aims to strengthen its core businesses by focusing on three key tactics:
1) Growing its brands 2) Reinforcing its relationships with consumers; and 3) Enhancing the appeal of its products.
A key guideline for its efforts to strengthen the core is to approach consumers as they are living now (and presumably not to try to change the way that they live or predict how they might live in the future).
A large part of “Strengthening the Core” might simply be described as attending to the day-to-day “block-ing and tackling” that is necessary to preserve and enhance the core franchises. The three tactics are mutually reinforcing. Brands can be strengthened through improved advertising and promotion, but also by reinforcing consumer relationships and enhancing product appeal. Product line extensions and new varieties can play a key role in strengthening and growing brands. Ms. Morrison and her management team have undertaken a number of initiatives to this end:
In U.S. Soup, Campbell’s has refreshed its product line to offer more varieties that appeal to key cus-tomer segments, such as millenials and Hispanics. It has converted its “Select” ready-to-serve soups to “Homestyle,” using wholesome ingredients and no added preservatives. It has added new varieties to its condensed soup line, including more flavors for children. It has expanded its “Healthy Request” line, which is certified by the American Heart Association as being low in saturated fat and cholesterol. It has focused its Chunky advertising on its core customer: soup-loving, (male) football fans. It has also up-dated its advertising, reduced its emphasis on promotions and discounting and consolidated manufactur-ing operations to improve efficiency.
Although Campbell’s led “the veggie craze” in beverages, its U.S. Beverages business suffered a 34% de-cline in profits from fiscal 2011 to fiscal 2013 and another 16% decline so far in fiscal 2014. This has oc-curred even though more people are juicing vegetables these days. Both V8 and Campbell’s Tomato Juice have been among the leaders in the shelf-stable 100% vegetable juice for decades. Campbell’s scored big wins with V8 Splash (a fruit and vegetable juice drink) and V8-Fusion (made 100% with juice), especially among children and young adults; but consumer enthusiasm seems to have waned and compe-tition has stiffened. Its efforts have been designed to make vegetable and fruit juice combinations more appealing to consumers, especially children. This may be an attractive proposition to parents who would prefer to see their children drink juice rather than sugar-sweetened soda, but it carries less weight with truly health conscious consumers. Campbell’s hopes to reinvigorate the business by 1) making V8 the “go-to” beverage for health focused adults, 2) building V8 Splash into a powerhouse brand for kids and 3) broadening the distribution of its beverages (in suitable sizes) to discount stores, wholesale clubs, drug stores and convenience stores.
Lark Research Campbell Soup Company Report
Page 6 August 6, 2014
With three new distinctive tomato varieties, its first line of white pasta sauces and a new advertising cam-paign, Campbell’s Prego pasta sauce (#2 in the U.S. market behind Unilever’s Ragu) increased sales by 8.7% to $427 million in North America in the 52-weeks through June 2014, despite a modest decline in global sales for the category.
Campbell’s Pace Mexican sauces have also gotten a sales boost from new products including super hot salsas and new dip varieties.
In Australia, where Arnott’s and its other product offerings have suffered declines in market share and profits, management is seeking to step up its marketing efforts and boosting advertising spending to re-invigorate many of its iconic brands. In the past year, it has streamlined and strengthened its organiza-tional structure and leadership. It has also upgraded its manufacturing capabilities to promote greater efficiency, including the installation of automated packaging equipment, which will allow it to produce a range of package sizes efficiently and thereby appeal to the desires of more consumers.
Expanding Into Higher Growth Spaces. The second part of Campbell’s dual mandate involves re-shaping its product portfolio by adding new product and business lines that it believes have greater growth potential. Under Ms. Morrison, the company has effectively launched three new product plat-forms through acquisitions.
In August 2012, the company acquired Bolthouse Farms, a California-based vertically-integrated producer of carrot products (carrots, juice concentrate and fiber) and super premium refrigerated juices, drinks and salad dressings, for $1.55 billion. Besides expanding Bolthouse’s product line, package sizes and product distribution, Campbell’s is also seeking to use the Bolthouse platform to launch a new line of V8 super-premium refrigerated beverages. The V8 brand may be better suited for distribution in venues where the Bolthouse brand is less well known, such as convenience stores, smaller supermarkets or per-haps less affluent markets. Since management has said nothing to the contrary, it does appear that it intends to keep and build both brands, at least for the time being.
In June 2013, Campbell’s acquired Plum Organics, a maker of premium-priced organic food and snacks for babies, toddlers and children, for $249 million. Plum Organics is the second largest producer in this segment. (I believe that Earth’s Best is number one.) As with Bolthouse, Campbell’s intends to scale the business by broadening its product line and increasing its distribution.
In August 2013, Campbell’s acquired Kelsen AG, a Danish producer of premium-priced cookies and snacks under the brand names of Royal Dansk and Kjeldsen’s, for $325 million. Kelsen sells its products in 85 countries, but Campbell was interested in Kelsen was primarily because of its market position in China, which it intends to expand over time. Kelsen should also help Campbell’s to achieve greater distri-bution of Arnott’s product line in China.
The acquisitions of Bolthouse and Plum Organics provide new platforms upon which Campbell can grow its product offerings primarily to higher income consumers. Although consumers of all income classes can afford to make individual purchases of these products, the heaviest and most frequent users will probably be consumers with higher levels of discretionary income. This could address one of the chal-lenges currently facing the company: Its traditional product lines serve mostly low- and middle-income consumers whose budgets remain tight, even after six years of economic recovery. As noted, Campbell’s believes that this represents a “new normal” for its core customers. So new product platforms that target higher income consumers should allow it to continue utilizing its brand management skills and assets.
Besides these acquisitions, Campbell’s can also create new growth platforms internally, through exten-sions of existing brands or product lines or launching new brands or product lines. This is most readily evident from the development and growth of its Simple Meals platform.
Campbell Soup Company Report Lark Research
August 6, 2014 Page 7
Simple Meals. Campbell was among the first to recognize and respond to rising consumer demand for “simple meals.” While many of its products, such as Prego pasta sauces, Pace Mexican sauces, Swan-son’s broths and Campbell’s condensed cooking soups, were designed for convenience, the growth of simple meals – which use convenience foods in combination with traditionally-prepared ingredients or side dishes to create “home cooked” meals cheaply and in 30 minutes or less – really took off with the growth in two wage earner households and tight family budgets. This trend helped launch the career of television personality Rachael Ray, whose “30-Minute Meals” on the Food Network became a big hit.
Campbell noticed early on that consumers were creating meals by augmenting its products. For example, some consumers were adding rice and steamed vegetables to its ready-to-serve soups. The company helped to promote the trend by posting recipes on product labels and on its various product websites.
Meeting the demand for simple meals tackles both sides of the dual mandate. It strengthens the core, raising consumer demand by promoting new uses for its products. In this way, it builds brand value and reinforces the company’s relationships with consumers.
The concept of simple meals also addresses the second part of the dual mandate: finding and developing new, higher growth spaces. Those spaces can be found within existing product lines, such as soups, broths and stocks, or entirely new product lines. The company now offers Campbell’s Skillet Sauces, which are used in combination with browned meat and rice to make meals in just fifteen minutes. It also offers Slow-Cooker Sauces, which facilitate and enhance the preparation of meat dishes, such as Sweet Korean Barbeque and Tavern-Style Pot Roast, in slow cookers, such as crock pots. Both Skillet Sauces and Slow-Cooker Sauces are typically located in a separate section of the grocery store center aisle, with other simple meal components, like chili, baked beans and dinner sauces, often near the soup section. Both are logical additions to Campbell’s “simple meal” product line, but require new advertising and pro-motion campaigns in order to build customer awareness. It is still not clear whether Campbell will be able to make this a permanent addition to its product line-up at an acceptable return on investment.
Innovation Return on Investment. Campbell’s has pursued innovation through much of its recent history, but it is difficult to gauge its overall success. The company has not published return on invest-ment figures for its innovation efforts.
Nevertheless, I believe that the company’s track record on new product innovation is mixed. I have reached that conclusion by watching grocery store shelves over the years and seeing whether new prod-ucts earn a permanent place on them or how long they last. New Campbell products routinely come and go. Many have not stayed for long.
Campbell’s lack of consistent success is not, in my opinion, because of poor product quality. Indeed, I think that the quality of most of its new products has been quite good; but product quality alone is ap-parently not enough to ensure success.
So why do most new products fail? Each product has its own story; but the simple answer is that it is often tough to get consumers to change habits (i.e. to incorporate new products into their daily routines). By virtue of its strong relationships with retail store chains, Campbell’s can muscle most new products on to store shelves, but unless those products are able to demonstrate a minimum level of sales and profita-bility, retailers will eventually discontinue them. Keeping slow-selling products on the shelves (in order to give them more time to succeed) probably requires a level of investment – in advertising, promotion and distribution – that Campbell has so far been unwilling to make, in most instances.
Examples of discontinued products include Campbell’s Chunky Chili (which apparently is still around, but not in any of my local stores), Campbell’s Supper Bakes and Campbell’s Gourmet Bisques (in aseptic packages). Innovation also extends to product packaging and distribution, including gravity-feed shelv-ing, which has been scaled back (or even discontinued) by most grocers, and microwaveable bowls,
Lark Research Campbell Soup Company Report
Page 8 August 6, 2014
whose popularity has probably been waning (as evidenced by Campbell’s decision to consolidate produc-tion for this type of packaging in fewer thermal plants).
To its credit, Campbell has not given up on some of its innovations. For example, it has relaunched the Gourmet Bisques line over the past couple of years, with new package designs and some flavor reformu-lations. I thought the product was great the first time around (five years or so ago); but it was obvious that it did not sell well. This time around, the company appears to have achieved broader distribution; but already I see that it has been discontinued by one of the major local chains.
A similar experience may await Campbell’s GO soups, a new line of exotically-flavored soups in innova-tive, stand-up, microwaveable, heavy plastic containers. With flavors like Creamy Red Pepper with Smoked Gouda, Moroccan Style Chicken with Chick Peas and Golden Lentil with Madras Curry, and pic-tures of happy and surprised twenty-somethings on the packages, GO soups are clearly targeted to mille-nials who crave exotic and bold flavors. I think that the product is great; but I first tried it a little over a year ago after purchasing it from the bargain bin (for $1) at a local supermarket, after it had already been discontinued. Campbell’s has obviously remain committed to the success of its GO soups. In fact, I recently saw that the product was back on the shelves at that same local supermarket. It is also carried now by all of the major supermarket chains in my area; but it is still too early to call it a success.
The cost of innovation can vary widely among products. Product line extensions are typically less costly and can be pursued more aggressively because the consequence of failure is low. On the other hand, expansion into adjacent product lines or especially into altogether new product categories is more costly and therefore much more risky.
Adding another flavor of Chunky ready-to-serve soup may require some market research, a new recipe and a new label design. Existing equipment and administrative infrastructure can be used to roll out the new flavor. This type of innovation is relatively cheap and can serve to keep the product line fresh and relevant in the minds of consumers.
Innovations such as Campbell’s Skillet Sauces and Slow-Cooker Sauces, on the other hand, are more costly, because they require new recipes, new forms of packaging, securing new space on retail shelves and the creation of new marketing campaigns. It may still make sense for Campbell to pursue this more costly form of product innovation, but it must also be able to gauge the effort required to ensure success and an acceptable return on investment.
Innovation into new product categories represents an even higher hurdle. The cost of this type of inno-vation is usually quite high and the chances of success are often quite low. Pursuit of this type of innova-tion must, as a consequence, be more selective and as a rule, undertaken only for products that have strategic significance, especially in the current operating environment.
Campbell Soup Company Report Lark Research
August 6, 2014 Page 9
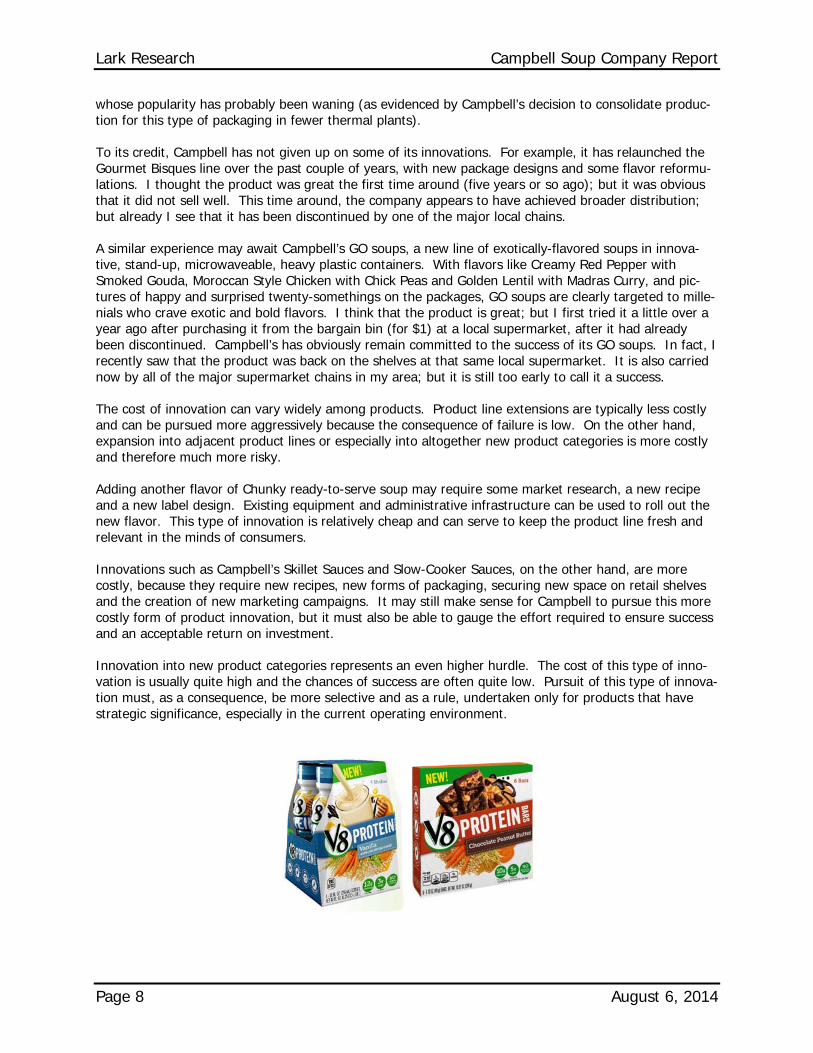
Campbell’s new products for fiscal 2015 include V8 Protein Shakes and Protein Bars. Both are new en-tries into product categories in which the company does not currently compete. Both are an attempt to extend the V8 brand to a new product category. In my view, this type of innovation is costly and has a very low probability of success. If, in fact, the V8 brand is strong enough to elicit sufficiently high con-sumer trials, the concept of the product appears to be weak.
In my opinion, these shakes and protein bar products convey dubious health benefits. Campbell is seek-ing to moving into an already crowded field, straddling the space between breakfast cereal bars and nat-ural food (or organic) bars. Unless this product has strategic significance – either the company has de-termined that there is significant growth potential or it plans to acquire a firm already in the space, this product seems to make little sense and would probably be a drag, even if a small one, on its profitability.
The cost of product innovation may not be a problem, if the entire innovation effort is more keenly fo-cused. However, Campbell launched 200 new products in fiscal 2014 and is gearing up to launch another 200 products in fiscal 2015. Even though many of these are product line extensions, it is not clear how much the overall effort is costing the company, including both the costs of continuing to supporting the 2014 product launches or to initiate and support the 2015 new ones. Given the company’s mixed track record (and the still uncertain economic environment), there is a significant risk that the majority of these new product launches may prove to be losers.
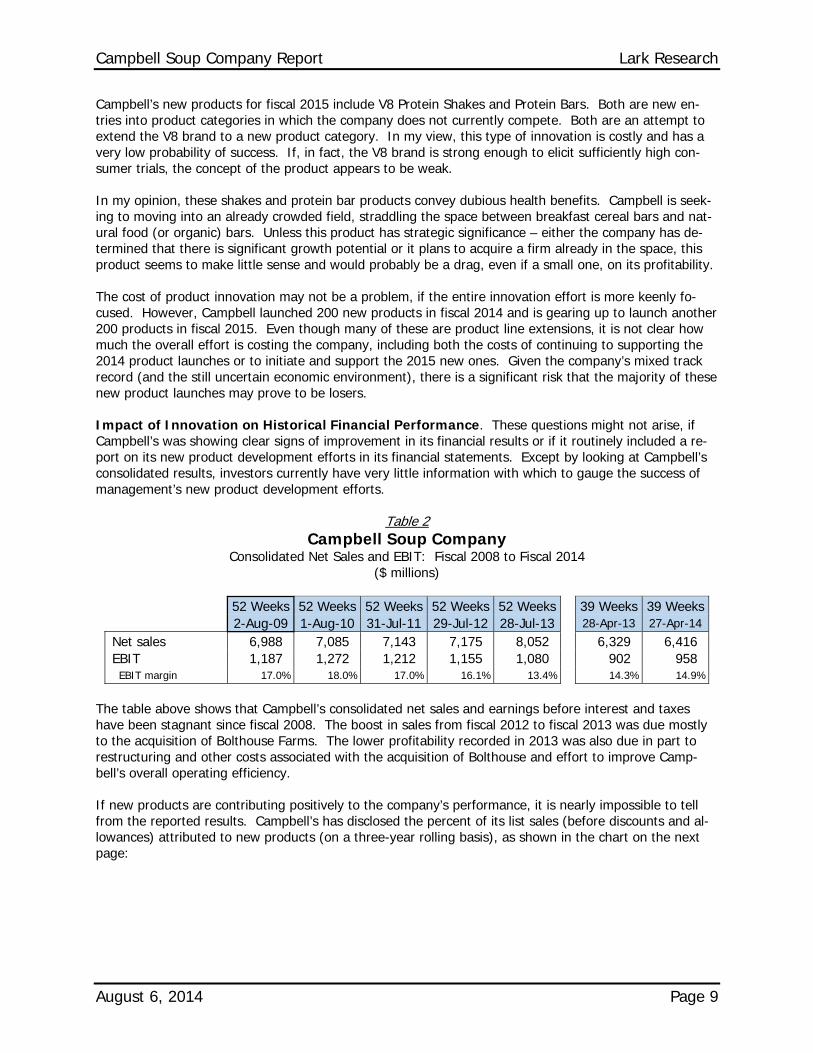
Impact of Innovation on Historical Financial Performance. These questions might not arise, if Campbell’s was showing clear signs of improvement in its financial results or if it routinely included a re-port on its new product development efforts in its financial statements. Except by looking at Campbell’s consolidated results, investors currently have very little information with which to gauge the success of management’s new product development efforts.
Table 2 Campbell Soup Company
Consolidated Net Sales and EBIT: Fiscal 2008 to Fiscal 2014 ($ millions)
52 Weeks 52 Weeks 52 Weeks 52 Weeks 52 Weeks 39 Weeks 39 Weeks 2-Aug-09 1-Aug-10 31-Jul-11 29-Jul-12 28-Jul-13 28-Apr-13 27-Apr-14
Net sales 6,988 7,085 7,143 7,175 8,052 6,329 6,416 EBIT 1,187 1,272 1,212 1,155 1,080 902 958 EBIT margin 17.0% 18.0% 17.0% 16.1% 13.4% 14.3% 14.9%
The table above shows that Campbell’s consolidated net sales and earnings before interest and taxes have been stagnant since fiscal 2008. The boost in sales from fiscal 2012 to fiscal 2013 was due mostly to the acquisition of Bolthouse Farms. The lower profitability recorded in 2013 was also due in part to restructuring and other costs associated with the acquisition of Bolthouse and effort to improve Camp-bell’s overall operating efficiency.
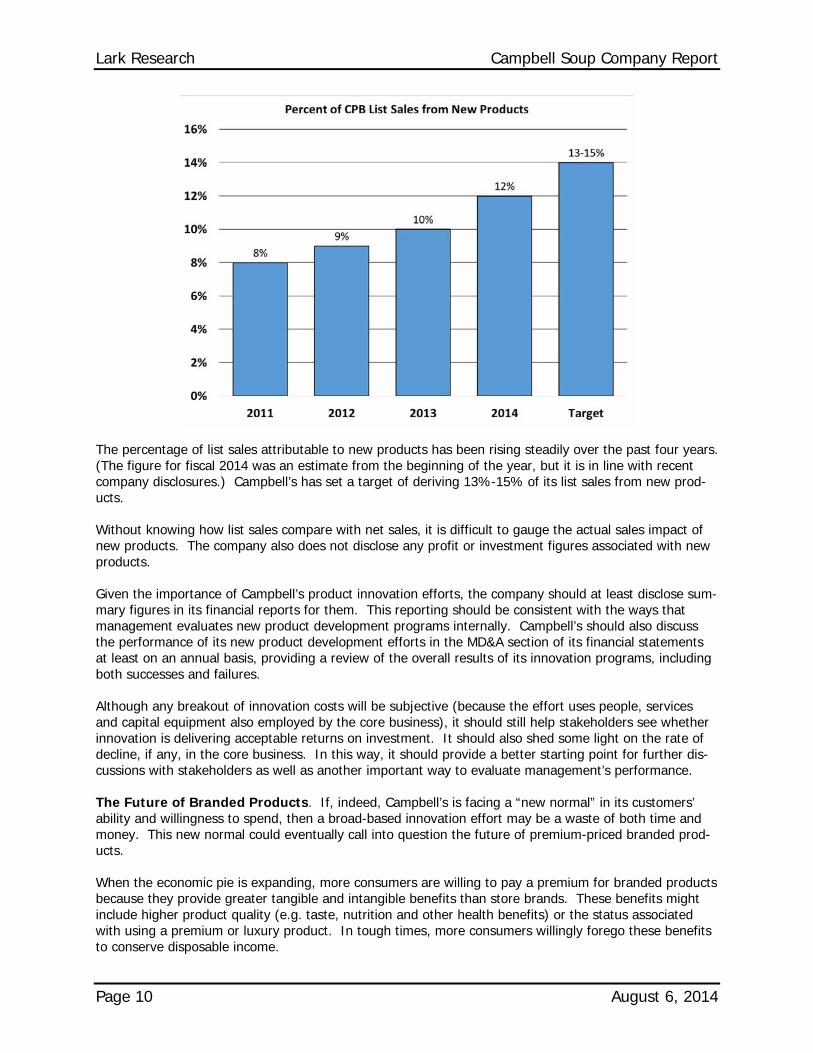
If new products are contributing positively to the company’s performance, it is nearly impossible to tell from the reported results. Campbell’s has disclosed the percent of its list sales (before discounts and al-lowances) attributed to new products (on a three-year rolling basis), as shown in the chart on the next page:
Lark Research Campbell Soup Company Report
Page 10 August 6, 2014
The percentage of list sales attributable to new products has been rising steadily over the past four years. (The figure for fiscal 2014 was an estimate from the beginning of the year, but it is in line with recent company disclosures.) Campbell’s has set a target of deriving 13%-15% of its list sales from new prod-ucts.
Without knowing how list sales compare with net sales, it is difficult to gauge the actual sales impact of new products. The company also does not disclose any profit or investment figures associated with new products.
Given the importance of Campbell’s product innovation efforts, the company should at least disclose sum-mary figures in its financial reports for them. This reporting should be consistent with the ways that management evaluates new product development programs internally. Campbell’s should also discuss the performance of its new product development efforts in the MD&A section of its financial statements at least on an annual basis, providing a review of the overall results of its innovation programs, including both successes and failures.
Although any breakout of innovation costs will be subjective (because the effort uses people, services and capital equipment also employed by the core business), it should still help stakeholders see whether innovation is delivering acceptable returns on investment. It should also shed some light on the rate of decline, if any, in the core business. In this way, it should provide a better starting point for further dis-cussions with stakeholders as well as another important way to evaluate management’s performance.
The Future of Branded Products. If, indeed, Campbell’s is facing a “new normal” in its customers’ ability and willingness to spend, then a broad-based innovation effort may be a waste of both time and money. This new normal could eventually call into question the future of premium-priced branded prod-ucts.
When the economic pie is expanding, more consumers are willing to pay a premium for branded products because they provide greater tangible and intangible benefits than store brands. These benefits might include higher product quality (e.g. taste, nutrition and other health benefits) or the status associated with using a premium or luxury product. In tough times, more consumers willingly forego these benefits to conserve disposable income.
Campbell Soup Company Report Lark Research
August 6, 2014 Page 11
Under this new normal, however, the financial status and behavior of consumers is not easily catego-rized; first, because there is great diversity among consumers with respect to nationality, race, age and family status and second, because even low income consumers are able to afford (albeit with the aid of some forms of assistance, such as food stamps and disability payments) many goods and services (like cell phones, internet access and cable television) that should be considered luxuries.
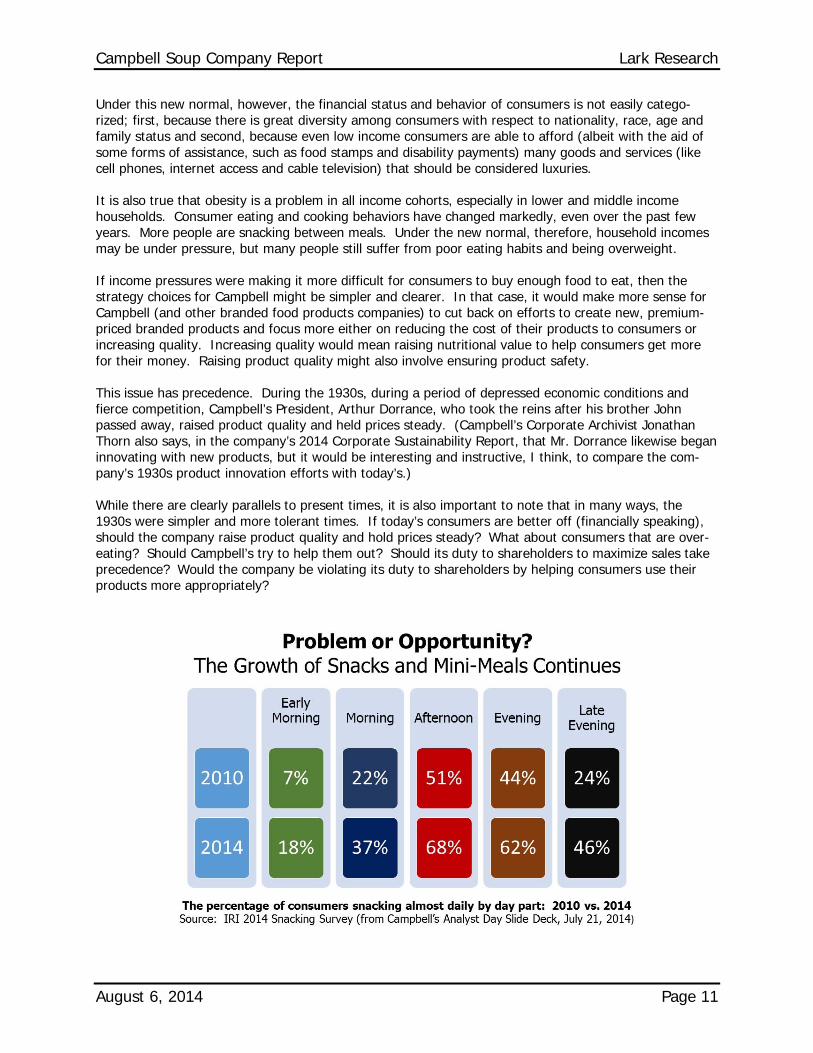
It is also true that obesity is a problem in all income cohorts, especially in lower and middle income households. Consumer eating and cooking behaviors have changed markedly, even over the past few years. More people are snacking between meals. Under the new normal, therefore, household incomes may be under pressure, but many people still suffer from poor eating habits and being overweight.
If income pressures were making it more difficult for consumers to buy enough food to eat, then the strategy choices for Campbell might be simpler and clearer. In that case, it would make more sense for Campbell (and other branded food products companies) to cut back on efforts to create new, premium-priced branded products and focus more either on reducing the cost of their products to consumers or increasing quality. Increasing quality would mean raising nutritional value to help consumers get more for their money. Raising product quality might also involve ensuring product safety.
This issue has precedence. During the 1930s, during a period of depressed economic conditions and fierce competition, Campbell’s President, Arthur Dorrance, who took the reins after his brother John passed away, raised product quality and held prices steady. (Campbell’s Corporate Archivist Jonathan Thorn also says, in the company’s 2014 Corporate Sustainability Report, that Mr. Dorrance likewise began innovating with new products, but it would be interesting and instructive, I think, to compare the com-pany’s 1930s product innovation efforts with today’s.)
While there are clearly parallels to present times, it is also important to note that in many ways, the 1930s were simpler and more tolerant times. If today’s consumers are better off (financially speaking), should the company raise product quality and hold prices steady? What about consumers that are over-eating? Should Campbell’s try to help them out? Should its duty to shareholders to maximize sales take precedence? Would the company be violating its duty to shareholders by helping consumers use their products more appropriately?
Lark Research Campbell Soup Company Report
Page 12 August 6, 2014
Consider, for a moment, the Pepperidge Farm Goldfish franchise. Launched in 1961, Goldfish is among the most lucrative of Campbell’s franchises. Today, Goldfish is in the cupboards of more than one-half of all U.S. households with children. Pepperidge Farm says that Goldfish is popular with “kids-of-all-ages.” It still working hard to continue expanding that franchise by deepening its connection with parents, many of whom have a strong emotional connection to the product, enhancing brand love with children and driving incremental growth through product innovation.
A Pepperidge Farm Goldfish is essentially a Cheez-It cracker shaped into a fish. The product has greater nutritional value than Cheez-Its, because it is made with vitamin-enriched flour; but most nutritionists would probably say that the caloric content is what’s most important. Like any snack, Goldfish are fine if eaten in moderation. Kids can and regularly do eat things that are a lot worse for them than Goldfish.
In recent years, however, product innovation has resulted in an expansion of Goldfish varieties. Today, Goldfish come in many flavors: like Xtra Cheddar, Xplosive Pizza, Slammin’ Sour Cream & Onion and Fla-vor-Blasted White Cheddar. The Goldfish Grahams line includes French Toast, Strawberry, Honey Bun Vanilla Cupcake, Fudge Brownie, Cookies & Cream, S’mores and Cocoa Adventures. You can also buy Goldfish in bags, boxes, cartons, multipacks, 100 calorie pouches and Grab & Go containers. A new product, Goldfish Puffs, is designed to appeal to teenagers.
Clearly, with such variety, Goldfish are not being marketed solely to children. But where is the line drawn? What might have been recognized years ago as a cute snack for children is now much more today. Goldfish’s product innovation encourages overconsumption and unhealthy eating.
The profusion in product SKUs and efforts to promote greater consumption through advertising raise a number of questions. Among them: Is Campbell’s serving its customers best in the long-run with this approach? Isn’t the company contributing to the problems of both childhood and adult obesity by pursu-ing its current Goldfish marketing strategy? Is the drive to “enhance brand love” among children (primar-ily through advertising) appropriate? Does this effort meet standards of corporate social responsibility and sustainability? (Campbell’s has won numerous awards for CSR and is included in several CSR indi-ces.) Is CSR mainly about reduction of greenhouse gas emissions? Is this profusion of flavors and pack-aging profitable and is it likely to generate an acceptable return on investment in the long-run? Would Campbell’s serve both its customers and its shareholders better by harvesting the Goldfish brand? (i.e. scaling back advertising, marketing and product innovation, cutting back operating expenses as much as possible and letting the brand carry itself without any further marketing efforts)?)
In the short-term, this is primarily a question of where Campbell’s should draw the line in its marketing efforts. Importantly, the company has already determined where it aims to draw the line. This is given, as discussed above, as one of its guidelines under the dual mandate for strengthening the core: to ap-proach consumers as they are living now.
I believe that there is much wisdom in this approach. It is risky to change business practices today in anticipation of what Campbell might think consumer wants and needs might be in the future or what Campbell might determine that their wants and needs should be. Consumers may not respond to Camp-bell’s predictions about their future wants and needs. Many, for example, are likely to maintain their bad habits no matter what products are available or marketing messages they see. In that case, foregoing profit opportunities now would be a disservice to shareholders. The future may turn out different from what any of us might imagine.
On the other hand, there is also a risk to approaching consumers only as they are living now. Meeting current consumer needs may put the company at a disadvantage, if and when those needs change, espe-cially if the change is sudden. Just as the best chess players anticipate their opponents’ moves, it would be best for Campbell to anticipate consumer moves and make changes at the appropriate times to ensure
Campbell Soup Company Report Lark Research
August 6, 2014 Page 13
that it can continue to serve them effectively. But, of course, this requires anticipating changes in con-sumer behavior correctly. Without a clear and well-functioning crystal ball, Campbell’s may be best served by focusing on the here and now.
Under these circumstances, it may be appropriate for the company to adjust certain of its policies. With Goldfish, for example, a case can be made that most of the marketing is targeted to adults, who rightfully should bear responsibility for their actions, including the actions that they take with respect to their chil-dren. Personally, however, I think that the company should stop advertising Goldfish directly to children on television (and probably elsewhere). Some might disagree and say that parents are responsible for what their children watch; but as a parent, I know that it is impossible to control everything that a child experiences. In my opinion, children already face significant challenges in this environment. Campbell can and should take steps to avoid making it more challenging for them.
The company faces a similar issue with its V8 Splash product line. That product offers a splash of juice, 5%-10% of total content, and is sweetened with high fructose corn syrup. Yet, it is also vitamin C-forti-fied and provides refreshment at only 80 calories per eight ounce serving. Some parents may see this as a better alternative than soda or even fruit juices with a higher caloric content. Nevertheless, Campbell has set its sights on turning V8 Splash into a powerful brand for kids. Even so, it is unclear (in my mind, at least) whether the company can at the same time, extend the V8 brand into the premium, fresh pack-aged category. (What, then, does the V8 brand really represent to the consumer?) I think that the com-pany would be better served under the circumstances to forego its brand building initiatives for V8 Splash with children.
In summary, based upon my analysis, there is a strong likelihood that a meaningful portion of Campbell’s current product innovation expenditures is wasteful and so should be adjusted and probably scaled back. The company should improve its financial reporting practices by providing a review and assessment of its product innovation efforts at the very least on an annual basis. It should take steps to ensure that its marketing and product development efforts generate a satisfactory return on investment and discontinue programs that are either too risky (because they are both costly and outside of its current asset base and expertise) or have little chance of success. It should take steps to ensure that it is serving its consumers effectively now, while retaining both the operating and financial flexibility to serve them well in the fu-ture. It should include a specific discussion of its product marketing and innovation efforts in its corpo-rate social responsibility and sustainability reporting. Finally, Campbell’s should take steps now to elimi-nate direct advertising to children and scale back other marketing efforts to adult consumers of products that have few or no nutritional benefits, as warranted by business and economic conditions.
Historical Consolidated and Segment Financial Performance
Net Sales. Consolidated net sales increased 12.2% in fiscal 2013 to $8.05 billion, due mostly to the ac-quisition of Bolthouse Farms. A gain of 5% in U.S. Simple Meals was driven primarily by increased soup sales and primarily a 9% surge in Campbell’s Chunky canned soups. Global Baking and Snack-ing sales increased 4% due to gains at both Pepperidge Farms and Arnott’s. Pepperidge Farms sales in-creased across all product lines, but were also helped by the bankruptcy of Hostess Brands. Arnott’s sales benefited from gains in Indonesia. Sales of International Simple Meals and Beverages were flat. U.S. Beverages reported a 4% decline in sales as a result of lower sales of V8 vegetable juice and V8 V-Fusion beverages. Excluding the acquisition of Bolthouse, net sales in the Bolthouse and Foodser-vice segment declined 8%, due to the loss of a major customer and higher levels of trade spending.
Across all business segments, volume and mix increased net sales by 1%. Higher prices and lower sales allowances raised net sales by 2%. Increased promotional spending reduced sales by 1%. The acquisi-tions of Bolthouse and Plum Organics increased sales by 11%.
Lark Research Campbell Soup Company Report
Page 14 August 6, 2014
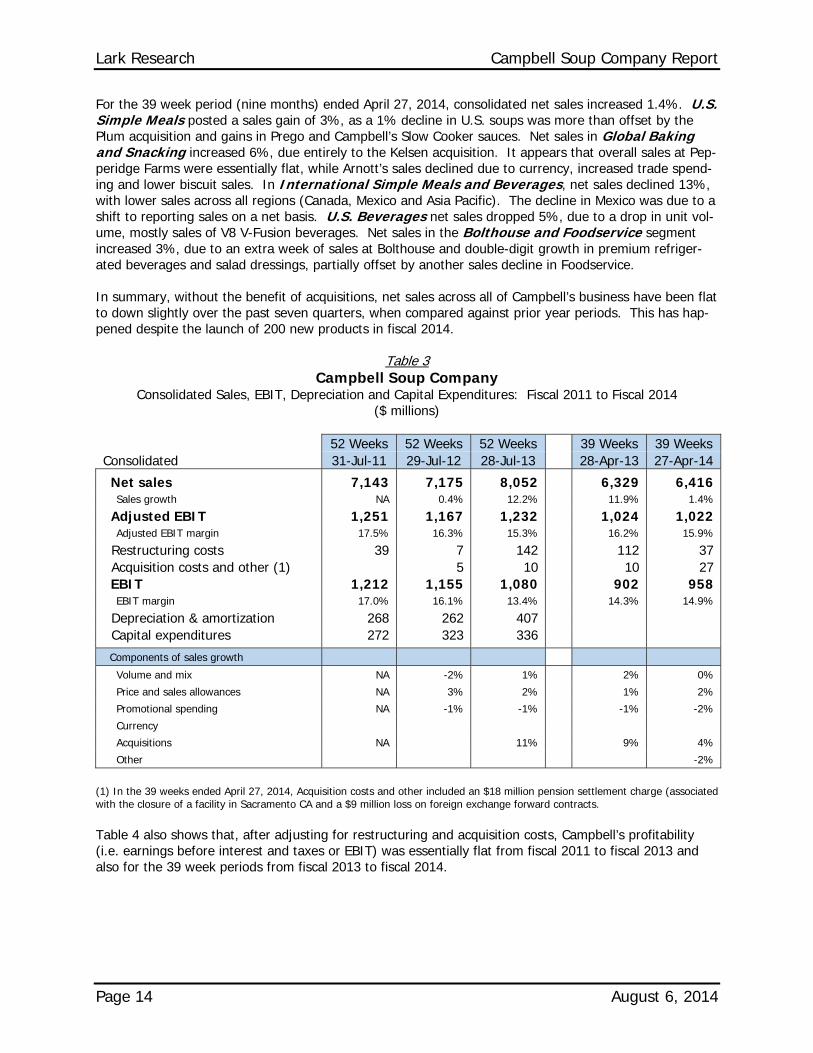
For the 39 week period (nine months) ended April 27, 2014, consolidated net sales increased 1.4%. U.S. Simple Meals posted a sales gain of 3%, as a 1% decline in U.S. soups was more than offset by the Plum acquisition and gains in Prego and Campbell’s Slow Cooker sauces. Net sales in Global Baking and Snacking increased 6%, due entirely to the Kelsen acquisition. It appears that overall sales at Pep-peridge Farms were essentially flat, while Arnott’s sales declined due to currency, increased trade spend-ing and lower biscuit sales. In International Simple Meals and Beverages, net sales declined 13%, with lower sales across all regions (Canada, Mexico and Asia Pacific). The decline in Mexico was due to a shift to reporting sales on a net basis. U.S. Beverages net sales dropped 5%, due to a drop in unit vol-ume, mostly sales of V8 V-Fusion beverages. Net sales in the Bolthouse and Foodservice segment increased 3%, due to an extra week of sales at Bolthouse and double-digit growth in premium refriger-ated beverages and salad dressings, partially offset by another sales decline in Foodservice.
In summary, without the benefit of acquisitions, net sales across all of Campbell’s business have been flat to down slightly over the past seven quarters, when compared against prior year periods. This has hap-pened despite the launch of 200 new products in fiscal 2014.
Table 3 Campbell Soup Company
Consolidated Sales, EBIT, Depreciation and Capital Expenditures: Fiscal 2011 to Fiscal 2014 ($ millions)
52 Weeks 52 Weeks 52 Weeks 39 Weeks 39 Weeks Consolidated 31-Jul-11 29-Jul-12 28-Jul-13 28-Apr-13 27-Apr-14
Net sales 7,143 7,175 8,052 6,329 6,416 Sales growth NA 0.4% 12.2% 11.9% 1.4%
Adjusted EBIT 1,251 1,167 1,232 1,024 1,022 Adjusted EBIT margin 17.5% 16.3% 15.3% 16.2% 15.9%
Restructuring costs 39 7 142 112 37 Acquisition costs and other (1) 5 10 10 27 EBIT 1,212 1,155 1,080 902 958 EBIT margin 17.0% 16.1% 13.4% 14.3% 14.9%
Depreciation & amortization 268 262 407 Capital expenditures 272 323 336
Components of sales growth
Volume and mix NA -2% 1% 2% 0%
Price and sales allowances NA 3% 2% 1% 2%
Promotional spending NA -1% -1% -1% -2%
Currency
Acquisitions NA 11% 9% 4%
Other -2%
(1) In the 39 weeks ended April 27, 2014, Acquisition costs and other included an $18 million pension settlement charge (associated with the closure of a facility in Sacramento CA and a $9 million loss on foreign exchange forward contracts.
Table 4 also shows that, after adjusting for restructuring and acquisition costs, Campbell’s profitability (i.e. earnings before interest and taxes or EBIT) was essentially flat from fiscal 2011 to fiscal 2013 and also for the 39 week periods from fiscal 2013 to fiscal 2014.
Campbell Soup Company Report Lark Research
August 6, 2014 Page 15
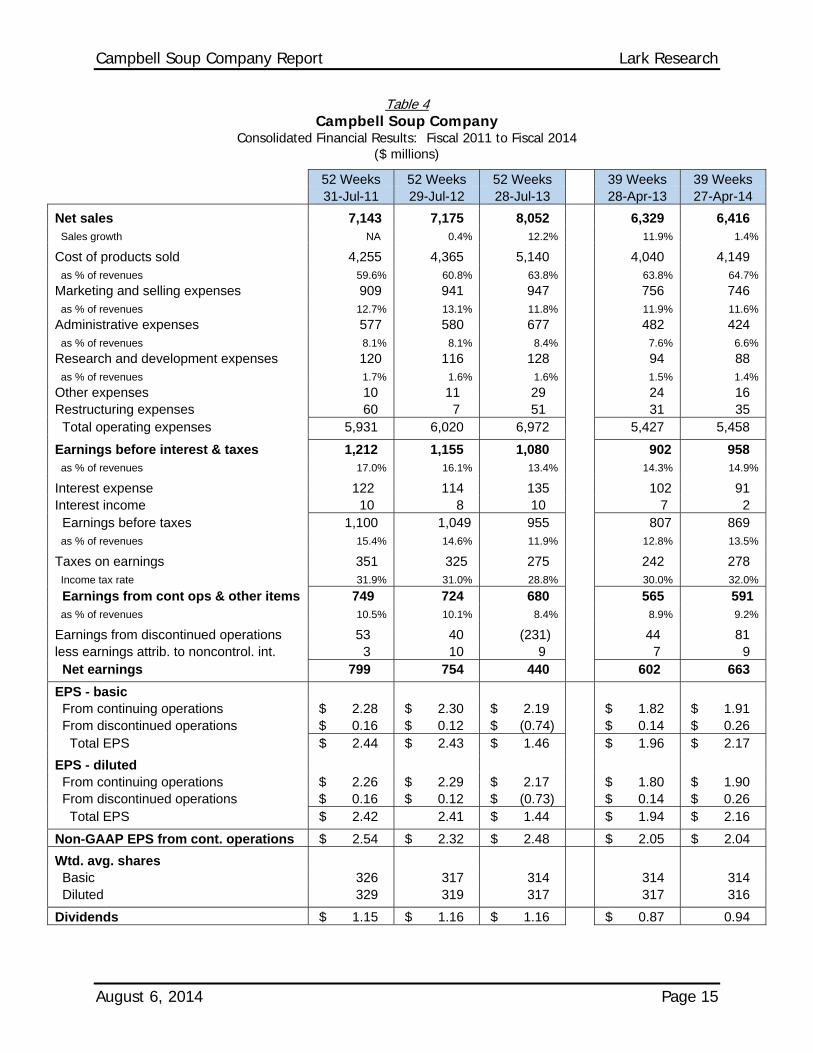
Table 4 Campbell Soup Company
Consolidated Financial Results: Fiscal 2011 to Fiscal 2014 ($ millions)
52 Weeks 52 Weeks 52 Weeks 39 Weeks 39 Weeks 31-Jul-11 29-Jul-12 28-Jul-13 28-Apr-13 27-Apr-14
Net sales 7,143 7,175 8,052 6,329 6,416 Sales growth NA 0.4% 12.2% 11.9% 1.4%
Cost of products sold 4,255 4,365 5,140 4,040 4,149 as % of revenues 59.6% 60.8% 63.8% 63.8% 64.7%
Marketing and selling expenses 909 941 947 756 746 as % of revenues 12.7% 13.1% 11.8% 11.9% 11.6%
Administrative expenses 577 580 677 482 424 as % of revenues 8.1% 8.1% 8.4% 7.6% 6.6%
Research and development expenses 120 116 128 94 88 as % of revenues 1.7% 1.6% 1.6% 1.5% 1.4%
Other expenses 10 11 29 24 16 Restructuring expenses 60 7 51 31 35 Total operating expenses 5,931 6,020 6,972 5,427 5,458
Earnings before interest & taxes 1,212 1,155 1,080 902 958 as % of revenues 17.0% 16.1% 13.4% 14.3% 14.9%
Interest expense 122 114 135 102 91 Interest income 10 8 10 7 2 Earnings before taxes 1,100 1,049 955 807 869 as % of revenues 15.4% 14.6% 11.9% 12.8% 13.5%
Taxes on earnings 351 325 275 242 278 Income tax rate 31.9% 31.0% 28.8% 30.0% 32.0%
Earnings from cont ops & other items 749 724 680 565 591 as % of revenues 10.5% 10.1% 8.4% 8.9% 9.2%
Earnings from discontinued operations 53 40 (231) 44 81 less earnings attrib. to noncontrol. int. 3 10 9 7 9 Net earnings 799 754 440 602 663
EPS - basic From continuing operations $ 2.28 $ 2.30 $ 2.19 $ 1.82 $ 1.91 From discontinued operations $ 0.16 $ 0.12 $ (0.74) $ 0.14 $ 0.26 Total EPS $ 2.44 $ 2.43 $ 1.46 $ 1.96 $ 2.17
EPS - diluted From continuing operations $ 2.26 $ 2.29 $ 2.17 $ 1.80 $ 1.90 From discontinued operations $ 0.16 $ 0.12 $ (0.73) $ 0.14 $ 0.26 Total EPS $ 2.42 2.41 $ 1.44 $ 1.94 $ 2.16
Non-GAAP EPS from cont. operations $ 2.54 $ 2.32 $ 2.48 $ 2.05 $ 2.04
Wtd. avg. shares Basic 326 317 314 314 314 Diluted 329 319 317 317 316
Dividends $ 1.15 $ 1.16 $ 1.16 $ 0.87 0.94
Lark Research Campbell Soup Company Report
Page 16 August 6, 2014
Campbell’s gross margin declined by 120 basis points from 40.4% in fiscal 2011 to 39.2% in fiscal 2011 and then by 300 basis points to 36.2% in fiscal 2011. Cost inflation and other (related) factors have been a primary driver. This has been mostly offset by higher selling prices and productivity improve-ments. In fiscal 2013, 270 basis points of the decline was due to the impact of acquisitions and restruc-turing costs. (Unfortunately, the company does not describe exactly what the impact of acquisitions or whether this negative impact is expected to continue. Some of the decline may be due to one-time, pur-chase accounting adjustments, but Bolthouse’s gross margin are also lower than the company average.)
Year-to-date in fiscal 2014, Campbell’s gross margin has slipped another 90 basis points to 35.3%. Here again, cost inflation was mostly offset by higher selling prices and productivity improvements. This year, the company has incurred a higher level (110 bp) of promotional spending. The continuing negative im-pact on gross margins from acquisitions (including a product recall by Plum Organics) and the pension settlement charge, was essentially offset by lower restructuring related costs.
Marketing and selling expenses as a percent of net sales have declined steadily in recent years – by 130 bp in fiscal 2013 to 11.8% - and by another 30 bp vs. the prior year to 11.6% year-to-date in fiscal 2014. In general, higher administrative expenses associated with recent acquisitions and higher selling and marketing expenses associated with new product rollouts have been offset by lower advertising and con-sumer promotion expenses. Marketing and selling spending has still increased, but at a slower pace than net sales.
Administrative expense as a percent of sales increased by 30 bp to 8.4% in fiscal 2013, but decreased by 100 bp to 6.6% year-to-date fiscal 2014. The 2013 increase was due to acquisition costs, higher com-pensation and benefit costs, and higher administrative costs and inflation, offset partially by restructuring initiatives. This year’s decline was driven mostly by a big drop in incentive compensation (i.e. stock-based compensation). Management has indicated that stock-based compensation will be higher next year, providing a modest headwind for the company’s administrative expense ratio.
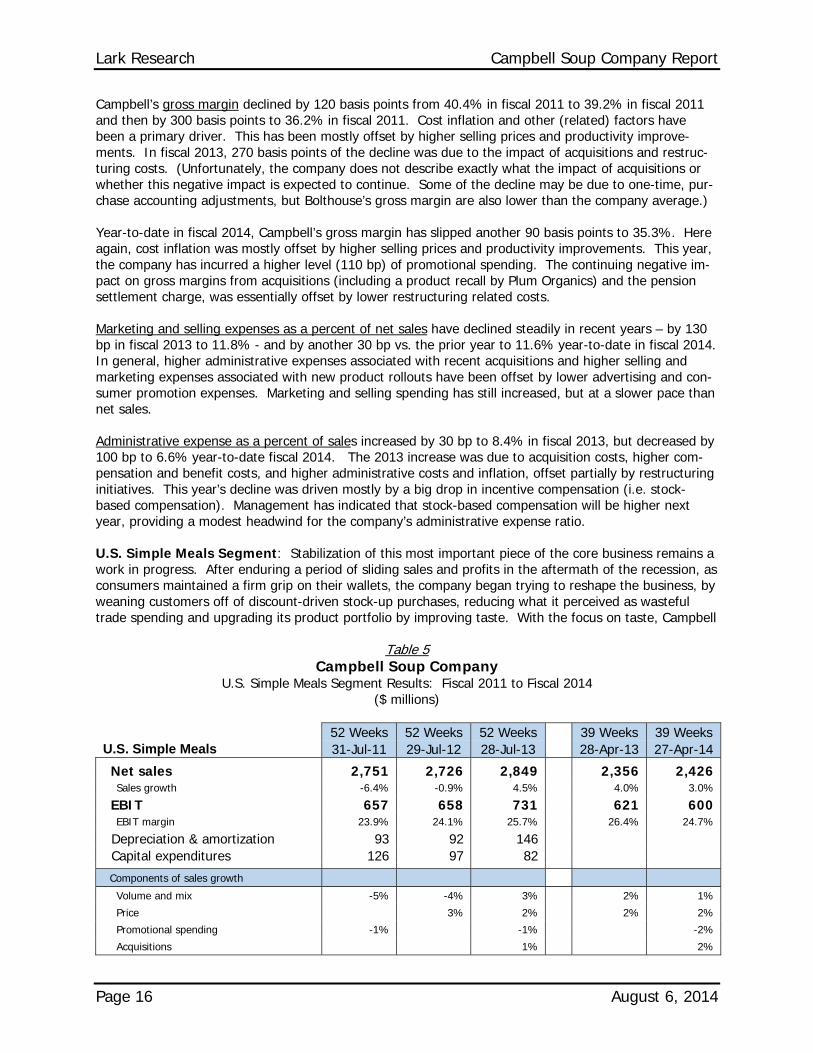
U.S. Simple Meals Segment: Stabilization of this most important piece of the core business remains a work in progress. After enduring a period of sliding sales and profits in the aftermath of the recession, as consumers maintained a firm grip on their wallets, the company began trying to reshape the business, by weaning customers off of discount-driven stock-up purchases, reducing what it perceived as wasteful trade spending and upgrading its product portfolio by improving taste. With the focus on taste, Campbell
Table 5 Campbell Soup Company
U.S. Simple Meals Segment Results: Fiscal 2011 to Fiscal 2014 ($ millions)
52 Weeks 52 Weeks 52 Weeks 39 Weeks 39 Weeks U.S. Simple Meals 31-Jul-11 29-Jul-12 28-Jul-13 28-Apr-13 27-Apr-14
Net sales 2,751 2,726 2,849 2,356 2,426 Sales growth -6.4% -0.9% 4.5% 4.0% 3.0%
EBIT 657 658 731 621 600 EBIT margin 23.9% 24.1% 25.7% 26.4% 24.7%
Depreciation & amortization 93 92 146 Capital expenditures 126 97 82
Components of sales growth
Volume and mix -5% -4% 3% 2% 1%
Price 3% 2% 2% 2%
Promotional spending -1% -1% -2%
Acquisitions 1% 2%
Campbell Soup Company Report Lark Research
August 6, 2014 Page 17
began to address the perception among many consumers that Progresso soups have better taste, which was undoubtedly a major source of irritation to Campbell’s management. The strategy was also designed to appeal to important emerging consumer segments, like millenials and Hispanics. In U.S. Sauces, the goal was to introduce new cooking sauces, such as Campbell’s Skillet Sauces and Slow-Cooker Sauces, to meet the growing demand for quick, home-cooked meals.
The segment showed good progress in fiscal 2013, with a 4.5% increase in sales and an 11.1% increase in profits. Higher sales volume and prices more than offset the pick-up in promotional spending that sup-ported the company’s marketing efforts. One key driver of performance was the 9% jump in Campbell’s Chunky soup sales, which resulted from the introduction of new varieties, higher promotional spending and a return to the NFL mama’s boy-themed advertising. Sales of both condensed soups and broths were also up, by 2% and 4%, respectively. Campbell introduced 38 new soups in fiscal 2013. U.S. Sauces sales increased 5%, due to the acquisition of Plum Organics, growth in Prego pasta sauces and Pace Mexican sauces and the launch of Skillet Sauces.
Unfortunately, the improvement in performance at U.S. Simple Meals has not continued in fiscal 2014. Year-to-date, sales were up 3%, due mostly to the acquisition of Plum. Small gains in sales volume and price were mostly offset by promotional spending. U.S. Soup sales decreased 1%, with modest declines in condensed and ready-to-serve only partially offset by an 11% jump in broth sales. Admittedly, the company faced tough comparisons against last year’s very strong results, but it had expected to do bet-ter. Excluding the Plum acquisition, U.S. Sauces sales increased 4% with the aid of further gains in Prego sales and the introduction of Campbell’s Slow Cooker sauces.
Despite ongoing innovation, the company has been unable to drive category growth in fiscal 2014. Man-agement points to the challenges still facing consumers as the primary cause of this disappointment. Yet, it will continue rolling out new products in fiscal 2015, including a line of organic soups in aseptic packaging and a line of Campbell’s Oven Sauces (for oven-cooked meat dishes). A key test will be whether it is able to keep shelf space for products introduced over the past two years, including GO soups, Gourmet Bisques and Slow Kettle-Style soups in the soup section and Campbell’s Skillet Sauces and Campbell’s Slow Cooker Sauces in the simple meals section.
The company remains optimistic. In sauces, for example, stores representing 60% of all-commodity vol-ume now have dedicated dinner sauce sections. Management says that its new products are winning trial and repeat purchase rates above its competitive benchmark; but it remains to be seen whether these purchase rates are enough to keep retailers (and ultimately Campbell) happy.
To its credit, Campbell has positively changed its profile in the soup and dinner sauce aisles. It has clearly been the leader in innovation in recent years and based upon my personal experience, the quality of its products is good. Progresso has been a quick imitator, following Campbell in most new niches with copycat products; but it seems to have lost mind share (if not market share) and remains somewhat committed to its long standing practice of driving sales of ready-to-serve soups through discounting. I have been surprised on some busy supermarket days to see the shelves that hold Campbell’s new soup and sauce offerings roughed-up with empty spaces, a sure sign of good sales; but it does seem (from my admittedly limited observations) that both trial and repeat purchases are on the whole not as strong as they need to be with many of these new products. Hopefully, if the economy holds up and job growth remains robust, consumers will become a little less cautious and fall in love with soup and sauces again.
Global Baking and Snacking. Although this segment now includes three very different businesses – Pepperidge Farm, Arnott’s and Kelsen – with virtually no overlap or synergies, recent results have unfor-tunately been similar (except for the recently-acquired Kelsen, which has not been in the fold long enough to exhibit a trend)
Lark Research Campbell Soup Company Report
Page 18 August 6, 2014
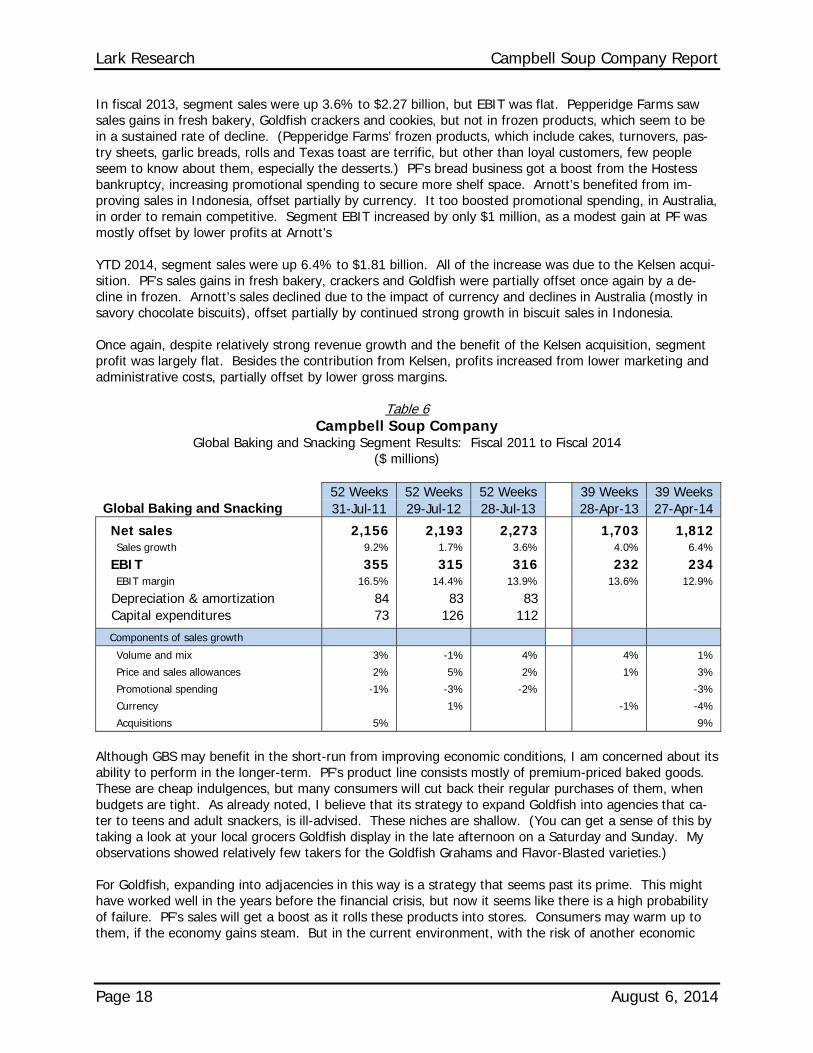
In fiscal 2013, segment sales were up 3.6% to $2.27 billion, but EBIT was flat. Pepperidge Farms saw sales gains in fresh bakery, Goldfish crackers and cookies, but not in frozen products, which seem to be in a sustained rate of decline. (Pepperidge Farms’ frozen products, which include cakes, turnovers, pas-try sheets, garlic breads, rolls and Texas toast are terrific, but other than loyal customers, few people seem to know about them, especially the desserts.) PF’s bread business got a boost from the Hostess bankruptcy, increasing promotional spending to secure more shelf space. Arnott’s benefited from im-proving sales in Indonesia, offset partially by currency. It too boosted promotional spending, in Australia, in order to remain competitive. Segment EBIT increased by only $1 million, as a modest gain at PF was mostly offset by lower profits at Arnott’s
YTD 2014, segment sales were up 6.4% to $1.81 billion. All of the increase was due to the Kelsen acqui-sition. PF’s sales gains in fresh bakery, crackers and Goldfish were partially offset once again by a de-cline in frozen. Arnott’s sales declined due to the impact of currency and declines in Australia (mostly in savory chocolate biscuits), offset partially by continued strong growth in biscuit sales in Indonesia.
Once again, despite relatively strong revenue growth and the benefit of the Kelsen acquisition, segment profit was largely flat. Besides the contribution from Kelsen, profits increased from lower marketing and administrative costs, partially offset by lower gross margins.
Table 6 Campbell Soup Company
Global Baking and Snacking Segment Results: Fiscal 2011 to Fiscal 2014 ($ millions)
52 Weeks 52 Weeks 52 Weeks 39 Weeks 39 Weeks Global Baking and Snacking 31-Jul-11 29-Jul-12 28-Jul-13 28-Apr-13 27-Apr-14
Net sales 2,156 2,193 2,273 1,703 1,812 Sales growth 9.2% 1.7% 3.6% 4.0% 6.4%
EBIT 355 315 316 232 234 EBIT margin 16.5% 14.4% 13.9% 13.6% 12.9%
Depreciation & amortization 84 83 83 Capital expenditures 73 126 112
Components of sales growth
Volume and mix 3% -1% 4% 4% 1%
Price and sales allowances 2% 5% 2% 1% 3%
Promotional spending -1% -3% -2% -3%
Currency 1% -1% -4%
Acquisitions 5% 9%
Although GBS may benefit in the short-run from improving economic conditions, I am concerned about its ability to perform in the longer-term. PF’s product line consists mostly of premium-priced baked goods. These are cheap indulgences, but many consumers will cut back their regular purchases of them, when budgets are tight. As already noted, I believe that its strategy to expand Goldfish into agencies that ca-ter to teens and adult snackers, is ill-advised. These niches are shallow. (You can get a sense of this by taking a look at your local grocers Goldfish display in the late afternoon on a Saturday and Sunday. My observations showed relatively few takers for the Goldfish Grahams and Flavor-Blasted varieties.)
For Goldfish, expanding into adjacencies in this way is a strategy that seems past its prime. This might have worked well in the years before the financial crisis, but now it seems like there is a high probability of failure. PF’s sales will get a boost as it rolls these products into stores. Consumers may warm up to them, if the economy gains steam. But in the current environment, with the risk of another economic
Campbell Soup Company Report Lark Research
August 6, 2014 Page 19
setback within the next few years looming large, I think that PF would better serve Campbell’s sharehold-ers by milking the Goldfish business for profits and keeping its fixed costs as low and its financial flexibil-ity as high as possible. To compete more effectively over the long haul, PF might even consider acquisi-tions in fresh bakery or cookies that would raise its market share across the country and help lower its per unit marketing costs.
Arnott’s, the Australian biscuit and snack maker, appears to face similar challenges in its home market. After several years of expanding its product line before the financial crisis and a recent manufacturing ca-pacity expansion, the business has hit a rough patch due to weakness in the local economy, tightness in consumer spending and heightened competition. However, growth in Indonesia, in part due to increased penetration of the retail trade, has been a bright spot. The company has met its domestic challenges by raising promotional spending. It has also further upgraded its manufacturing (and also its marketing) ca-pabilities by adding automated flexible packaging to its Virginia, Australia plant.
With its $325 million purchase of Kelsen Group in August 2013, Campbell’s acquired a leading producer of premium butter cookies, marketed under the Kjeldsen’s and Royal Dansk brand names. The business has a strong position in China, where its cookie tins are regularly given as gifts. Kelsen’s brands enjoy strong consumer awareness – in excess of 90% - in Hong Kong and Shanghai. Campbell International will seek to expand its distribution into adjacent geographic markets within China and hopes to use this ultimately as a platform to introduce other products into the Chinese market.
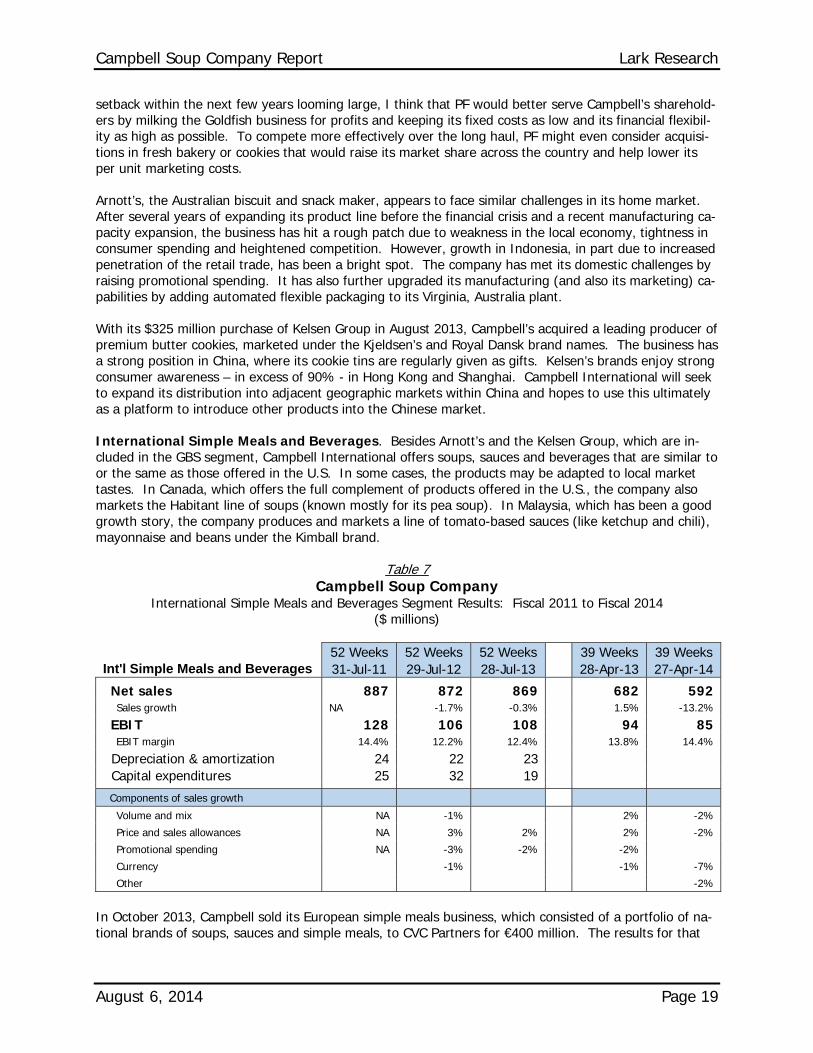
International Simple Meals and Beverages. Besides Arnott’s and the Kelsen Group, which are in-cluded in the GBS segment, Campbell International offers soups, sauces and beverages that are similar to or the same as those offered in the U.S. In some cases, the products may be adapted to local market tastes. In Canada, which offers the full complement of products offered in the U.S., the company also markets the Habitant line of soups (known mostly for its pea soup). In Malaysia, which has been a good growth story, the company produces and markets a line of tomato-based sauces (like ketchup and chili), mayonnaise and beans under the Kimball brand.
Table 7 Campbell Soup Company
International Simple Meals and Beverages Segment Results: Fiscal 2011 to Fiscal 2014 ($ millions)
52 Weeks 52 Weeks 52 Weeks 39 Weeks 39 Weeks Int'l Simple Meals and Beverages 31-Jul-11 29-Jul-12 28-Jul-13 28-Apr-13 27-Apr-14
Net sales 887 872 869 682 592 Sales growth NA -1.7% -0.3% 1.5% -13.2%
EBIT 128 106 108 94 85 EBIT margin 14.4% 12.2% 12.4% 13.8% 14.4%
Depreciation & amortization 24 22 23 Capital expenditures 25 32 19
Components of sales growth
Volume and mix NA -1% 2% -2%
Price and sales allowances NA 3% 2% 2% -2%
Promotional spending NA -3% -2% -2%
Currency -1% -1% -7%
Other -2%
In October 2013, Campbell sold its European simple meals business, which consisted of a portfolio of na-tional brands of soups, sauces and simple meals, to CVC Partners for €400 million. The results for that
Lark Research Campbell Soup Company Report
Page 20 August 6, 2014
business have been excluded from continuing operations for both the ISMB segment and on a consoli-dated basis and now appear in discontinued operations. In conjunction with the sale, Campbell wrote down the carrying value of its goodwill by $396 million ($263 million after-tax or $0.83 per share). It also recorded tax expense of $0.06 per share, reflecting the difference between the carrying value and taxable basis of its assets.
In Mexico, Campbell forged new partnerships in early 2013 with local food producers, Grupo Jumex and Conservas la Costena, to manufacture and distribute its entire Mexican product line. The agreements ex-panded Campbell’s manufacturing and its distribution capabilities. Grupo Jumex will produce V8. La Costena will be responsible for soups, broths and Italian sauces. Both partners will also be responsible for consumer marketing and R&D. In conjunction with the move, Campbell closed its Villagran manufac-turing plant and laid off its 260 workers. The remaining 70 employees, who work in general manage-ment, sales, marketing, R&D and supply chain management, were retained. Two percentage points of the year-to-date decline in fiscal 2014 sales in the ISMB segment came as a result of a switch in reporting from gross to net sales in Mexico.
In fiscal 2013, ISMB sales of $869 million were down slightly, as declines in Asia Pacific were mostly off-set by increases in China, Latin America and Canada. Segment profits rose 2%, mostly as a result of re-duced losses in China.
So far in fiscal 2014, ISMB sales have fallen 13.2% to $592 million. Sales fell in all three regions: in Can-ada, due to the negative impact of currency and lower soup and beverage sales; in Asia Pacific, also due to currency and lower soup sales in Australia; and in Mexico, due to the aforementioned transition to net sales and lower product prices. Segment EBIT fell 9.6% to $85 million, due to the drop in sales volume and prices and also to the unfavorable impact of currency.
Despite the weak year-to-date results, Campbell International is upbeat about its future prospects. It has recently streamlined and strengthened its management team. It expects to stabilize performance in Aus-tralia and eventually restore growth. It sees good prospects continuing in Malaysia, with Kimball as its anchor, and also in Indonesia, where it expects to achieve double-digit growth in biscuits. It anticipates good growth in China from Kelsen and eventually from introducing some of Arnott’s biscuits into select markets. It expects improved performance in Mexico, especially near-term in beverages. It also intends to pursue more development deals (i.e. joint venture arrangements) in other regions, especially Asia Pa-cific. An eventual moderation in dollar strength should turn a significant headwind into a tailwind.
U.S. Beverages. The U.S. Beverage segment has suffered an extended decline in its operating and fi-nancial performance. Although revenues have hovered around the $750 million level for the past five fis-cal years, segment profit peaked at $206 million in fiscal 2010 and have fallen by 16% per year on aver-age since then. In fiscal 2013, profits declined 10.5% to $120 million. So far in fiscal 2014, EBIT is down another 16% to $84 million.
The U.S. Beverage business originally consisted of V8 vegetable juice, purchased by Campbell in 1948, and Campbell’s tomato juice. In the late 1990s, the company created the V8 Splash line, which has only a “splash” of juice, 5%-10%, and is sweetened with high fructose corn syrup and sucralose. V8 Splash became a big hit, fueling the segment’s growth in sales and profitability. Eventually, Campbell added V-8 V-Fusion, a 100% fruit-vegetable juice blend. It broadened the product line with versions that included tea and energy drinks. In 2013, the company added V8 Refreshers, which contain 20%-25% juice.
The weakness in U.S. Beverage’s performance is due to several factors: First, sales of V8 have mostly declined steadily for several years. The popularity of vegetable-juice combination drinks appears to have peaked several years ago. Greater attention to ingredients, especially in sweetened drinks, may also have prompted consumers (and especially parents) to seek alternatives. Competition has also been on the rise. Campbell has had to offer increasing sales discounts and promotions in order to keep sales flat.
Campbell Soup Company Report Lark Research
August 6, 2014 Page 21
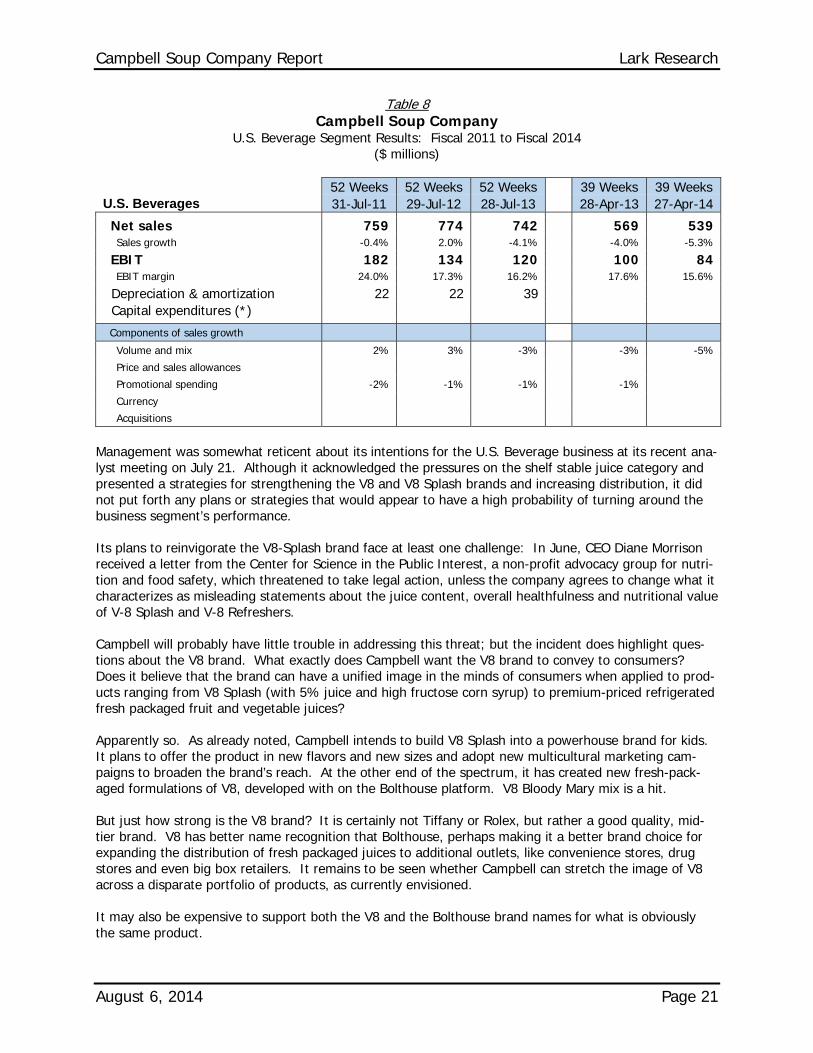
Table 8 Campbell Soup Company
U.S. Beverage Segment Results: Fiscal 2011 to Fiscal 2014 ($ millions)
52 Weeks 52 Weeks 52 Weeks 39 Weeks 39 Weeks U.S. Beverages 31-Jul-11 29-Jul-12 28-Jul-13 28-Apr-13 27-Apr-14
Net sales 759 774 742 569 539 Sales growth -0.4% 2.0% -4.1% -4.0% -5.3%
EBIT 182 134 120 100 84 EBIT margin 24.0% 17.3% 16.2% 17.6% 15.6%
Depreciation & amortization 22 22 39 Capital expenditures (*)
Components of sales growth
Volume and mix 2% 3% -3% -3% -5%
Price and sales allowances
Promotional spending -2% -1% -1% -1%
Currency
Acquisitions
Management was somewhat reticent about its intentions for the U.S. Beverage business at its recent ana-lyst meeting on July 21. Although it acknowledged the pressures on the shelf stable juice category and presented a strategies for strengthening the V8 and V8 Splash brands and increasing distribution, it did not put forth any plans or strategies that would appear to have a high probability of turning around the business segment’s performance.
Its plans to reinvigorate the V8-Splash brand face at least one challenge: In June, CEO Diane Morrison received a letter from the Center for Science in the Public Interest, a non-profit advocacy group for nutri-tion and food safety, which threatened to take legal action, unless the company agrees to change what it characterizes as misleading statements about the juice content, overall healthfulness and nutritional value of V-8 Splash and V-8 Refreshers.
Campbell will probably have little trouble in addressing this threat; but the incident does highlight ques-tions about the V8 brand. What exactly does Campbell want the V8 brand to convey to consumers? Does it believe that the brand can have a unified image in the minds of consumers when applied to prod-ucts ranging from V8 Splash (with 5% juice and high fructose corn syrup) to premium-priced refrigerated fresh packaged fruit and vegetable juices?
Apparently so. As already noted, Campbell intends to build V8 Splash into a powerhouse brand for kids. It plans to offer the product in new flavors and new sizes and adopt new multicultural marketing cam-paigns to broaden the brand’s reach. At the other end of the spectrum, it has created new fresh-pack-aged formulations of V8, developed with on the Bolthouse platform. V8 Bloody Mary mix is a hit.
But just how strong is the V8 brand? It is certainly not Tiffany or Rolex, but rather a good quality, mid-tier brand. V8 has better name recognition that Bolthouse, perhaps making it a better brand choice for expanding the distribution of fresh packaged juices to additional outlets, like convenience stores, drug stores and even big box retailers. It remains to be seen whether Campbell can stretch the image of V8 across a disparate portfolio of products, as currently envisioned.
It may also be expensive to support both the V8 and the Bolthouse brand names for what is obviously the same product.
Lark Research Campbell Soup Company Report
Page 22 August 6, 2014
As noted above, if Campbell’s follows through on its plan to extend the V8 brand to protein bars and shakes, it will, I believe, eventually run up against the V8 brand’s limits. Stretching the V8 brand further in this way will likely require a significant investment in order to carve out a meaningful stake in this com-petitive product niche.
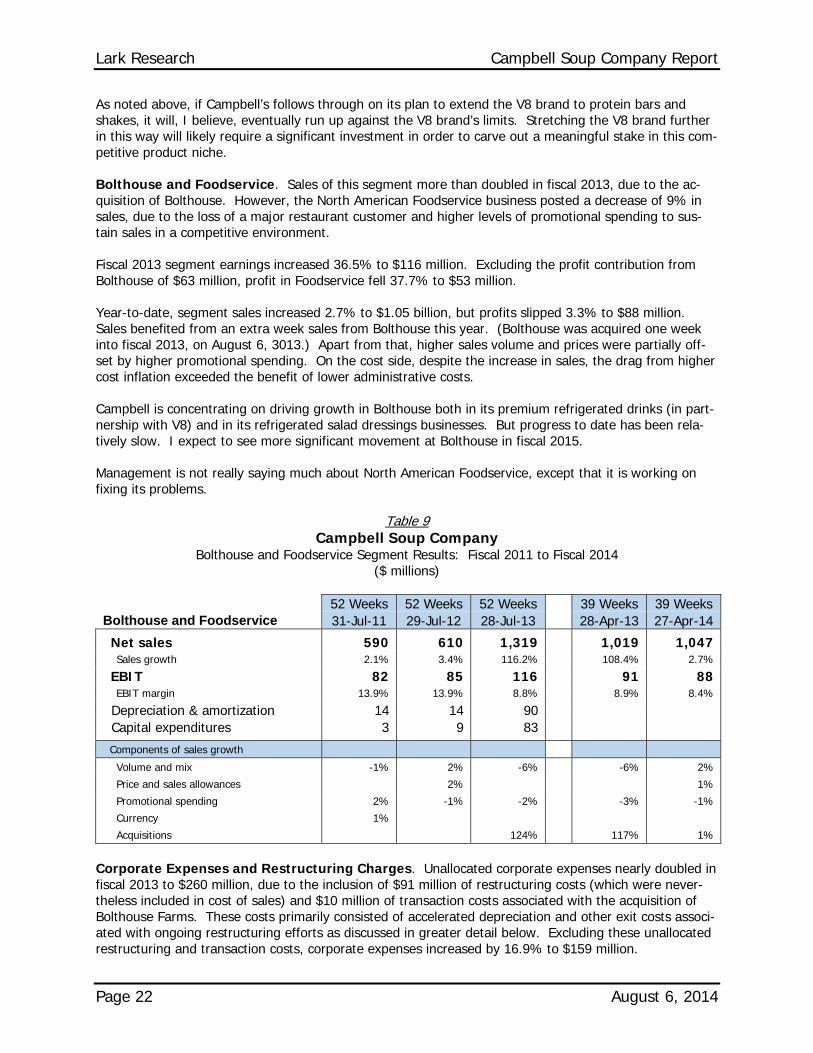
Bolthouse and Foodservice. Sales of this segment more than doubled in fiscal 2013, due to the ac-quisition of Bolthouse. However, the North American Foodservice business posted a decrease of 9% in sales, due to the loss of a major restaurant customer and higher levels of promotional spending to sus-tain sales in a competitive environment.
Fiscal 2013 segment earnings increased 36.5% to $116 million. Excluding the profit contribution from Bolthouse of $63 million, profit in Foodservice fell 37.7% to $53 million.
Year-to-date, segment sales increased 2.7% to $1.05 billion, but profits slipped 3.3% to $88 million. Sales benefited from an extra week sales from Bolthouse this year. (Bolthouse was acquired one week into fiscal 2013, on August 6, 3013.) Apart from that, higher sales volume and prices were partially off-set by higher promotional spending. On the cost side, despite the increase in sales, the drag from higher cost inflation exceeded the benefit of lower administrative costs.
Campbell is concentrating on driving growth in Bolthouse both in its premium refrigerated drinks (in part-nership with V8) and in its refrigerated salad dressings businesses. But progress to date has been rela-tively slow. I expect to see more significant movement at Bolthouse in fiscal 2015.
Management is not really saying much about North American Foodservice, except that it is working on fixing its problems.
Table 9 Campbell Soup Company
Bolthouse and Foodservice Segment Results: Fiscal 2011 to Fiscal 2014 ($ millions)
52 Weeks 52 Weeks 52 Weeks 39 Weeks 39 Weeks Bolthouse and Foodservice 31-Jul-11 29-Jul-12 28-Jul-13 28-Apr-13 27-Apr-14
Net sales 590 610 1,319 1,019 1,047 Sales growth 2.1% 3.4% 116.2% 108.4% 2.7%
EBIT 82 85 116 91 88 EBIT margin 13.9% 13.9% 8.8% 8.9% 8.4%
Depreciation & amortization 14 14 90 Capital expenditures 3 9 83
Components of sales growth
Volume and mix -1% 2% -6% -6% 2%
Price and sales allowances 2% 1%
Promotional spending 2% -1% -2% -3% -1%
Currency 1%
Acquisitions 124% 117% 1%
Corporate Expenses and Restructuring Charges. Unallocated corporate expenses nearly doubled in fiscal 2013 to $260 million, due to the inclusion of $91 million of restructuring costs (which were never-theless included in cost of sales) and $10 million of transaction costs associated with the acquisition of Bolthouse Farms. These costs primarily consisted of accelerated depreciation and other exit costs associ-ated with ongoing restructuring efforts as discussed in greater detail below. Excluding these unallocated restructuring and transaction costs, corporate expenses increased by 16.9% to $159 million.
Campbell Soup Company Report Lark Research
August 6, 2014 Page 23
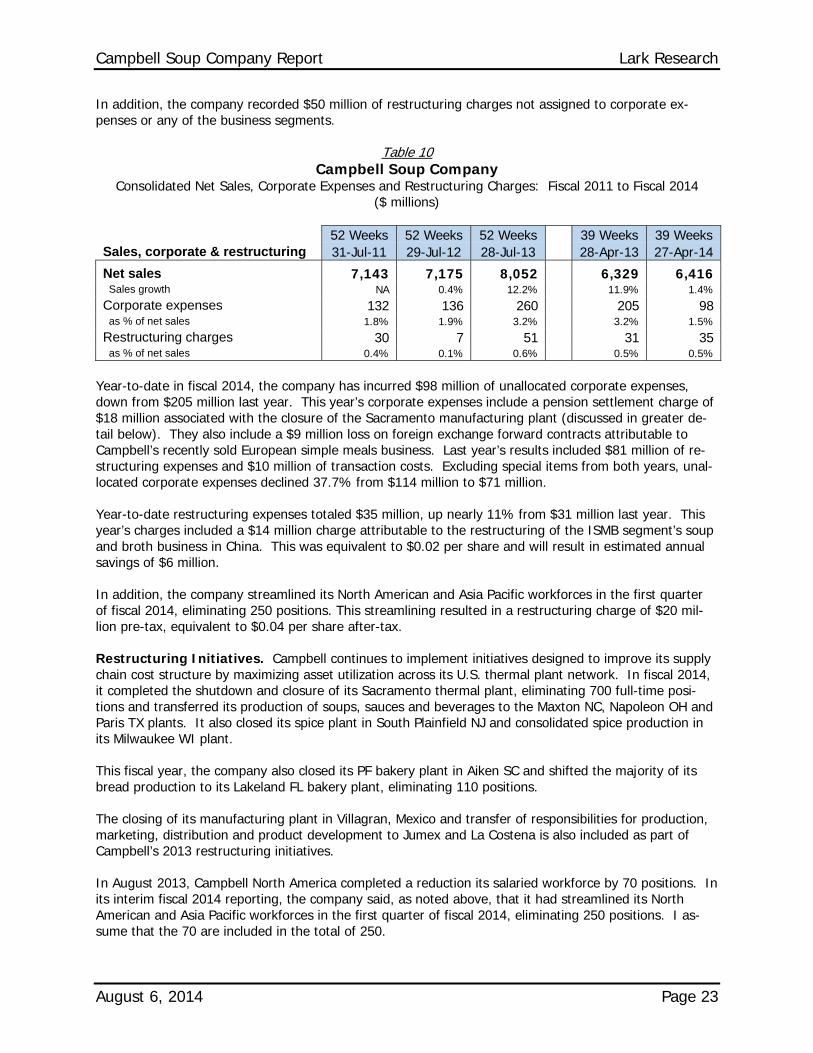
In addition, the company recorded $50 million of restructuring charges not assigned to corporate ex-penses or any of the business segments.
Table 10 Campbell Soup Company
Consolidated Net Sales, Corporate Expenses and Restructuring Charges: Fiscal 2011 to Fiscal 2014 ($ millions)
52 Weeks 52 Weeks 52 Weeks 39 Weeks 39 Weeks Sales, corporate & restructuring 31-Jul-11 29-Jul-12 28-Jul-13 28-Apr-13 27-Apr-14
Net sales 7,143 7,175 8,052 6,329 6,416 Sales growth NA 0.4% 12.2% 11.9% 1.4% Corporate expenses 132 136 260 205 98 as % of net sales 1.8% 1.9% 3.2% 3.2% 1.5% Restructuring charges 30 7 51 31 35 as % of net sales 0.4% 0.1% 0.6% 0.5% 0.5%
Year-to-date in fiscal 2014, the company has incurred $98 million of unallocated corporate expenses, down from $205 million last year. This year’s corporate expenses include a pension settlement charge of $18 million associated with the closure of the Sacramento manufacturing plant (discussed in greater de-tail below). They also include a $9 million loss on foreign exchange forward contracts attributable to Campbell’s recently sold European simple meals business. Last year’s results included $81 million of re-structuring expenses and $10 million of transaction costs. Excluding special items from both years, unal-located corporate expenses declined 37.7% from $114 million to $71 million.
Year-to-date restructuring expenses totaled $35 million, up nearly 11% from $31 million last year. This year’s charges included a $14 million charge attributable to the restructuring of the ISMB segment’s soup and broth business in China. This was equivalent to $0.02 per share and will result in estimated annual savings of $6 million.
In addition, the company streamlined its North American and Asia Pacific workforces in the first quarter of fiscal 2014, eliminating 250 positions. This streamlining resulted in a restructuring charge of $20 mil-lion pre-tax, equivalent to $0.04 per share after-tax.
Restructuring Initiatives. Campbell continues to implement initiatives designed to improve its supply chain cost structure by maximizing asset utilization across its U.S. thermal plant network. In fiscal 2014, it completed the shutdown and closure of its Sacramento thermal plant, eliminating 700 full-time posi-tions and transferred its production of soups, sauces and beverages to the Maxton NC, Napoleon OH and Paris TX plants. It also closed its spice plant in South Plainfield NJ and consolidated spice production in its Milwaukee WI plant.
This fiscal year, the company also closed its PF bakery plant in Aiken SC and shifted the majority of its bread production to its Lakeland FL bakery plant, eliminating 110 positions.
The closing of its manufacturing plant in Villagran, Mexico and transfer of responsibilities for production, marketing, distribution and product development to Jumex and La Costena is also included as part of Campbell’s 2013 restructuring initiatives.
In August 2013, Campbell North America completed a reduction its salaried workforce by 70 positions. In its interim fiscal 2014 reporting, the company said, as noted above, that it had streamlined its North American and Asia Pacific workforces in the first quarter of fiscal 2014, eliminating 250 positions. I as-sume that the 70 are included in the total of 250.
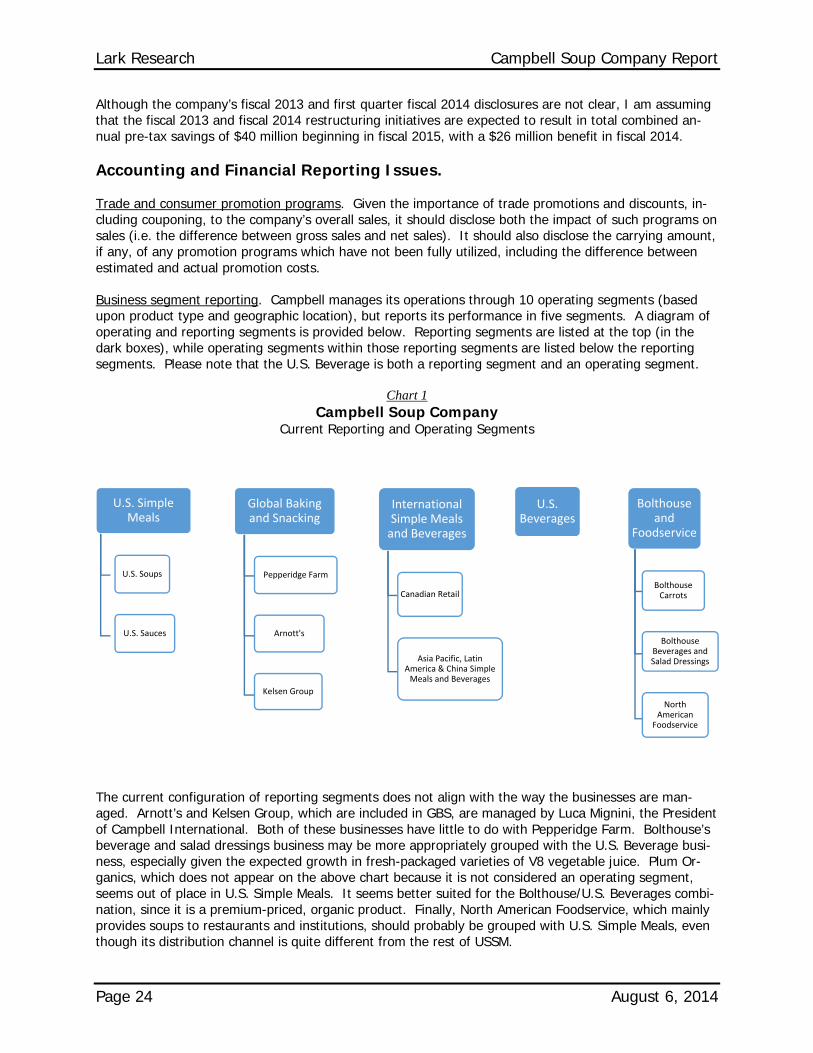
Lark Research Campbell Soup Company Report
Page 24 August 6, 2014
Although the company’s fiscal 2013 and first quarter fiscal 2014 disclosures are not clear, I am assuming that the fiscal 2013 and fiscal 2014 restructuring initiatives are expected to result in total combined an-nual pre-tax savings of $40 million beginning in fiscal 2015, with a $26 million benefit in fiscal 2014.
Accounting and Financial Reporting Issues.
Trade and consumer promotion programs. Given the importance of trade promotions and discounts, in-cluding couponing, to the company’s overall sales, it should disclose both the impact of such programs on sales (i.e. the difference between gross sales and net sales). It should also disclose the carrying amount, if any, of any promotion programs which have not been fully utilized, including the difference between estimated and actual promotion costs.
Business segment reporting. Campbell manages its operations through 10 operating segments (based upon product type and geographic location), but reports its performance in five segments. A diagram of operating and reporting segments is provided below. Reporting segments are listed at the top (in the dark boxes), while operating segments within those reporting segments are listed below the reporting segments. Please note that the U.S. Beverage is both a reporting segment and an operating segment.
Chart 1 Campbell Soup Company
Current Reporting and Operating Segments
The current configuration of reporting segments does not align with the way the businesses are man-aged. Arnott’s and Kelsen Group, which are included in GBS, are managed by Luca Mignini, the President of Campbell International. Both of these businesses have little to do with Pepperidge Farm. Bolthouse’s beverage and salad dressings business may be more appropriately grouped with the U.S. Beverage busi-ness, especially given the expected growth in fresh-packaged varieties of V8 vegetable juice. Plum Or-ganics, which does not appear on the above chart because it is not considered an operating segment, seems out of place in U.S. Simple Meals. It seems better suited for the Bolthouse/U.S. Beverages combi-nation, since it is a premium-priced, organic product. Finally, North American Foodservice, which mainly provides soups to restaurants and institutions, should probably be grouped with U.S. Simple Meals, even though its distribution channel is quite different from the rest of USSM.
U.S. Simple Meals
U.S. Soups
U.S. Sauces
Global Baking and Snacking
Pepperidge Farm
Arnott's
Kelsen Group
International Simple Meals and Beverages
Canadian Retail
Asia Pacific, Latin America & China Simple Meals and Beverages
U.S. Beverages
Bolthouse and
Foodservice
Bolthouse Carrots
Bolthouse Beverages and Salad Dressings
North American Foodservice
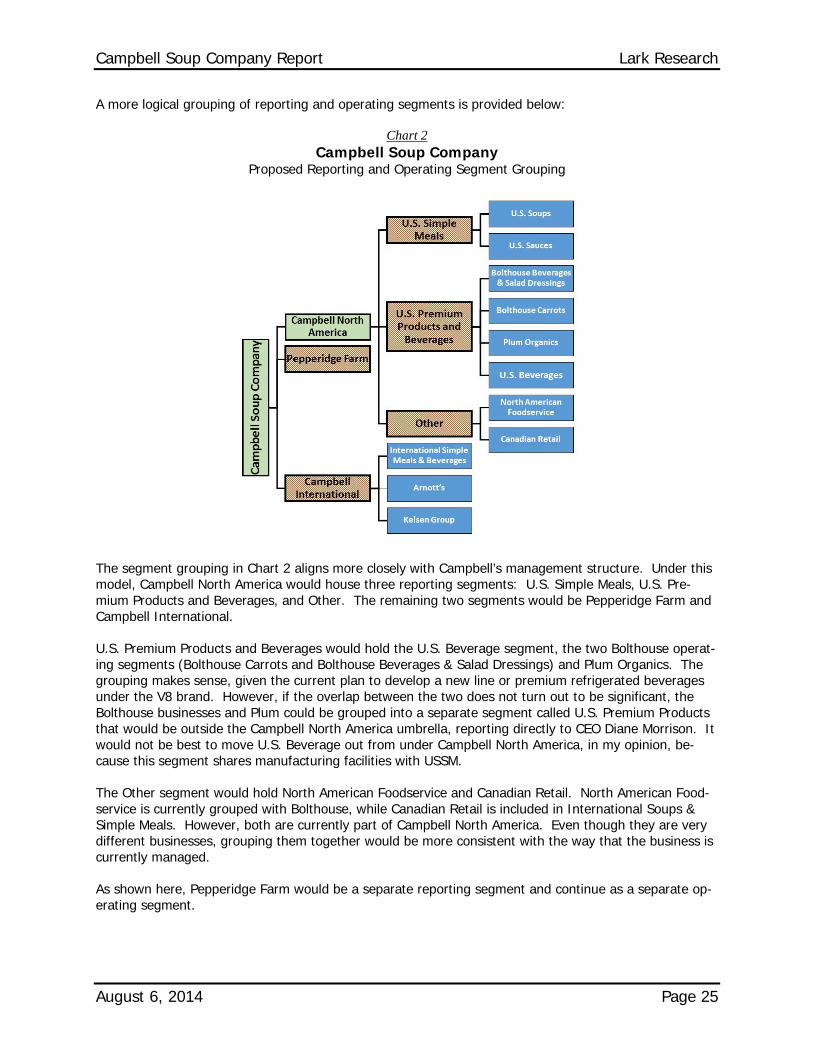
Campbell Soup Company Report Lark Research
August 6, 2014 Page 25
A more logical grouping of reporting and operating segments is provided below:
Chart 2 Campbell Soup Company
Proposed Reporting and Operating Segment Grouping
The segment grouping in Chart 2 aligns more closely with Campbell’s management structure. Under this model, Campbell North America would house three reporting segments: U.S. Simple Meals, U.S. Pre-mium Products and Beverages, and Other. The remaining two segments would be Pepperidge Farm and Campbell International.
U.S. Premium Products and Beverages would hold the U.S. Beverage segment, the two Bolthouse operat-ing segments (Bolthouse Carrots and Bolthouse Beverages & Salad Dressings) and Plum Organics. The grouping makes sense, given the current plan to develop a new line or premium refrigerated beverages under the V8 brand. However, if the overlap between the two does not turn out to be significant, the Bolthouse businesses and Plum could be grouped into a separate segment called U.S. Premium Products that would be outside the Campbell North America umbrella, reporting directly to CEO Diane Morrison. It would not be best to move U.S. Beverage out from under Campbell North America, in my opinion, be-cause this segment shares manufacturing facilities with USSM.
The Other segment would hold North American Foodservice and Canadian Retail. North American Food-service is currently grouped with Bolthouse, while Canadian Retail is included in International Soups & Simple Meals. However, both are currently part of Campbell North America. Even though they are very different businesses, grouping them together would be more consistent with the way that the business is currently managed.
As shown here, Pepperidge Farm would be a separate reporting segment and continue as a separate op-erating segment.
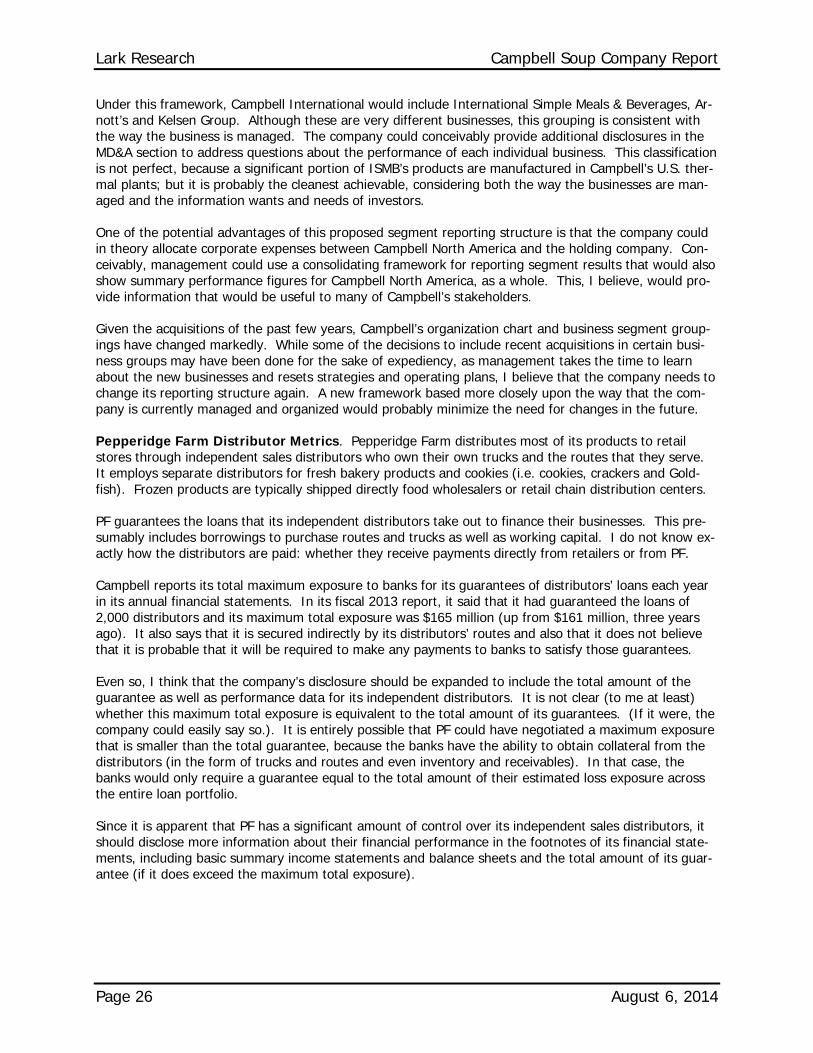
Lark Research Campbell Soup Company Report
Page 26 August 6, 2014
Under this framework, Campbell International would include International Simple Meals & Beverages, Ar-nott’s and Kelsen Group. Although these are very different businesses, this grouping is consistent with the way the business is managed. The company could conceivably provide additional disclosures in the MD&A section to address questions about the performance of each individual business. This classification is not perfect, because a significant portion of ISMB’s products are manufactured in Campbell’s U.S. ther-mal plants; but it is probably the cleanest achievable, considering both the way the businesses are man-aged and the information wants and needs of investors.
One of the potential advantages of this proposed segment reporting structure is that the company could in theory allocate corporate expenses between Campbell North America and the holding company. Con-ceivably, management could use a consolidating framework for reporting segment results that would also show summary performance figures for Campbell North America, as a whole. This, I believe, would pro-vide information that would be useful to many of Campbell’s stakeholders.
Given the acquisitions of the past few years, Campbell’s organization chart and business segment group-ings have changed markedly. While some of the decisions to include recent acquisitions in certain busi-ness groups may have been done for the sake of expediency, as management takes the time to learn about the new businesses and resets strategies and operating plans, I believe that the company needs to change its reporting structure again. A new framework based more closely upon the way that the com-pany is currently managed and organized would probably minimize the need for changes in the future.
Pepperidge Farm Distributor Metrics. Pepperidge Farm distributes most of its products to retail stores through independent sales distributors who own their own trucks and the routes that they serve. It employs separate distributors for fresh bakery products and cookies (i.e. cookies, crackers and Gold-fish). Frozen products are typically shipped directly food wholesalers or retail chain distribution centers.
PF guarantees the loans that its independent distributors take out to finance their businesses. This pre-sumably includes borrowings to purchase routes and trucks as well as working capital. I do not know ex-actly how the distributors are paid: whether they receive payments directly from retailers or from PF.
Campbell reports its total maximum exposure to banks for its guarantees of distributors’ loans each year in its annual financial statements. In its fiscal 2013 report, it said that it had guaranteed the loans of 2,000 distributors and its maximum total exposure was $165 million (up from $161 million, three years ago). It also says that it is secured indirectly by its distributors’ routes and also that it does not believe that it is probable that it will be required to make any payments to banks to satisfy those guarantees.
Even so, I think that the company’s disclosure should be expanded to include the total amount of the guarantee as well as performance data for its independent distributors. It is not clear (to me at least) whether this maximum total exposure is equivalent to the total amount of its guarantees. (If it were, the company could easily say so.). It is entirely possible that PF could have negotiated a maximum exposure that is smaller than the total guarantee, because the banks have the ability to obtain collateral from the distributors (in the form of trucks and routes and even inventory and receivables). In that case, the banks would only require a guarantee equal to the total amount of their estimated loss exposure across the entire loan portfolio.
Since it is apparent that PF has a significant amount of control over its independent sales distributors, it should disclose more information about their financial performance in the footnotes of its financial state-ments, including basic summary income statements and balance sheets and the total amount of its guar-antee (if it does exceed the maximum total exposure).
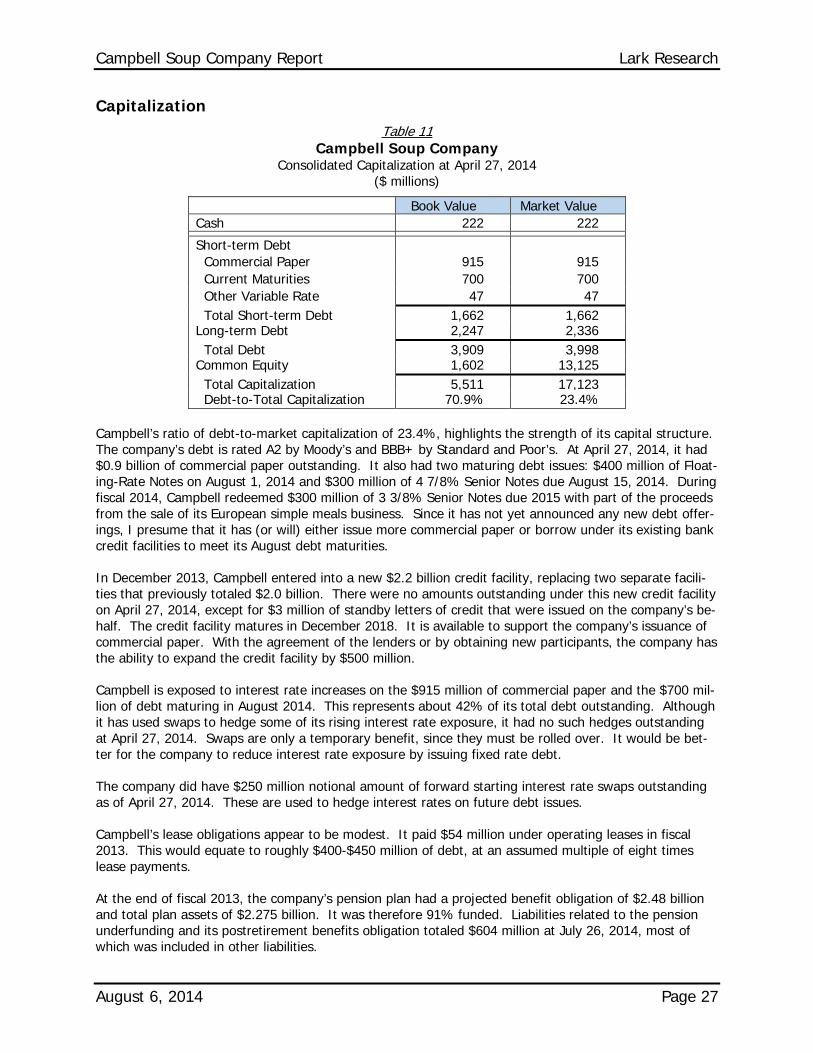
Campbell Soup Company Report Lark Research
August 6, 2014 Page 27
Capitalization Table 11
Campbell Soup Company Consolidated Capitalization at April 27, 2014
($ millions)
Book Value Market Value Cash 222 222
Short-term Debt Commercial Paper 915 915 Current Maturities 700 700 Other Variable Rate 47 47 Total Short-term Debt 1,662 1,662 Long-term Debt 2,247 2,336 Total Debt 3,909 3,998 Common Equity 1,602 13,125 Total Capitalization 5,511 17,123 Debt-to-Total Capitalization 70.9% 23.4%
Campbell’s ratio of debt-to-market capitalization of 23.4%, highlights the strength of its capital structure. The company’s debt is rated A2 by Moody’s and BBB+ by Standard and Poor’s. At April 27, 2014, it had $0.9 billion of commercial paper outstanding. It also had two maturing debt issues: $400 million of Float-ing-Rate Notes on August 1, 2014 and $300 million of 4 7/8% Senior Notes due August 15, 2014. During fiscal 2014, Campbell redeemed $300 million of 3 3/8% Senior Notes due 2015 with part of the proceeds from the sale of its European simple meals business. Since it has not yet announced any new debt offer-ings, I presume that it has (or will) either issue more commercial paper or borrow under its existing bank credit facilities to meet its August debt maturities.
In December 2013, Campbell entered into a new $2.2 billion credit facility, replacing two separate facili-ties that previously totaled $2.0 billion. There were no amounts outstanding under this new credit facility on April 27, 2014, except for $3 million of standby letters of credit that were issued on the company’s be-half. The credit facility matures in December 2018. It is available to support the company’s issuance of commercial paper. With the agreement of the lenders or by obtaining new participants, the company has the ability to expand the credit facility by $500 million.
Campbell is exposed to interest rate increases on the $915 million of commercial paper and the $700 mil-lion of debt maturing in August 2014. This represents about 42% of its total debt outstanding. Although it has used swaps to hedge some of its rising interest rate exposure, it had no such hedges outstanding at April 27, 2014. Swaps are only a temporary benefit, since they must be rolled over. It would be bet-ter for the company to reduce interest rate exposure by issuing fixed rate debt.
The company did have $250 million notional amount of forward starting interest rate swaps outstanding as of April 27, 2014. These are used to hedge interest rates on future debt issues.
Campbell’s lease obligations appear to be modest. It paid $54 million under operating leases in fiscal 2013. This would equate to roughly $400-$450 million of debt, at an assumed multiple of eight times lease payments.
At the end of fiscal 2013, the company’s pension plan had a projected benefit obligation of $2.48 billion and total plan assets of $2.275 billion. It was therefore 91% funded. Liabilities related to the pension underfunding and its postretirement benefits obligation totaled $604 million at July 26, 2014, most of which was included in other liabilities.
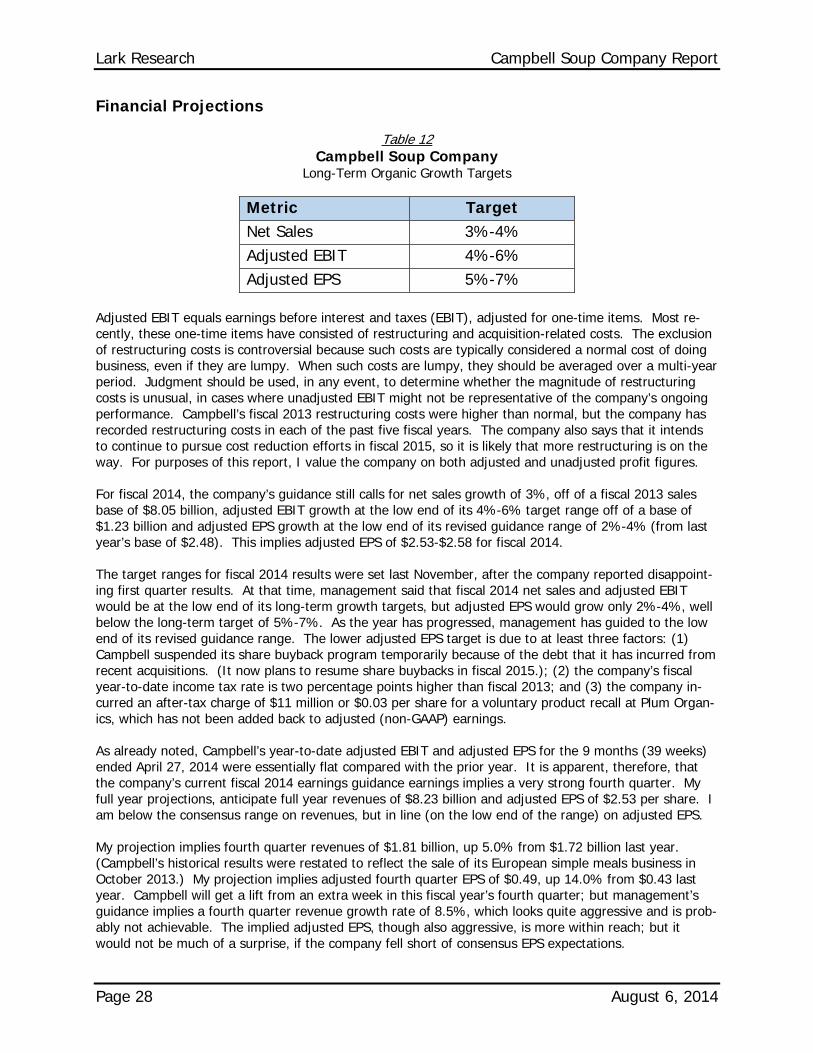
Lark Research Campbell Soup Company Report
Page 28 August 6, 2014
Financial Projections
Table 12 Campbell Soup Company
Long-Term Organic Growth Targets
Metric Target Net Sales 3%-4% Adjusted EBIT 4%-6% Adjusted EPS 5%-7%
Adjusted EBIT equals earnings before interest and taxes (EBIT), adjusted for one-time items. Most re-cently, these one-time items have consisted of restructuring and acquisition-related costs. The exclusion of restructuring costs is controversial because such costs are typically considered a normal cost of doing business, even if they are lumpy. When such costs are lumpy, they should be averaged over a multi-year period. Judgment should be used, in any event, to determine whether the magnitude of restructuring costs is unusual, in cases where unadjusted EBIT might not be representative of the company’s ongoing performance. Campbell’s fiscal 2013 restructuring costs were higher than normal, but the company has recorded restructuring costs in each of the past five fiscal years. The company also says that it intends to continue to pursue cost reduction efforts in fiscal 2015, so it is likely that more restructuring is on the way. For purposes of this report, I value the company on both adjusted and unadjusted profit figures.
For fiscal 2014, the company’s guidance still calls for net sales growth of 3%, off of a fiscal 2013 sales base of $8.05 billion, adjusted EBIT growth at the low end of its 4%-6% target range off of a base of $1.23 billion and adjusted EPS growth at the low end of its revised guidance range of 2%-4% (from last year’s base of $2.48). This implies adjusted EPS of $2.53-$2.58 for fiscal 2014.
The target ranges for fiscal 2014 results were set last November, after the company reported disappoint-ing first quarter results. At that time, management said that fiscal 2014 net sales and adjusted EBIT would be at the low end of its long-term growth targets, but adjusted EPS would grow only 2%-4%, well below the long-term target of 5%-7%. As the year has progressed, management has guided to the low end of its revised guidance range. The lower adjusted EPS target is due to at least three factors: (1) Campbell suspended its share buyback program temporarily because of the debt that it has incurred from recent acquisitions. (It now plans to resume share buybacks in fiscal 2015.); (2) the company’s fiscal year-to-date income tax rate is two percentage points higher than fiscal 2013; and (3) the company in-curred an after-tax charge of $11 million or $0.03 per share for a voluntary product recall at Plum Organ-ics, which has not been added back to adjusted (non-GAAP) earnings.
As already noted, Campbell’s year-to-date adjusted EBIT and adjusted EPS for the 9 months (39 weeks) ended April 27, 2014 were essentially flat compared with the prior year. It is apparent, therefore, that the company’s current fiscal 2014 earnings guidance earnings implies a very strong fourth quarter. My full year projections, anticipate full year revenues of $8.23 billion and adjusted EPS of $2.53 per share. I am below the consensus range on revenues, but in line (on the low end of the range) on adjusted EPS.
My projection implies fourth quarter revenues of $1.81 billion, up 5.0% from $1.72 billion last year. (Campbell’s historical results were restated to reflect the sale of its European simple meals business in October 2013.) My projection implies adjusted fourth quarter EPS of $0.49, up 14.0% from $0.43 last year. Campbell will get a lift from an extra week in this fiscal year’s fourth quarter; but management’s guidance implies a fourth quarter revenue growth rate of 8.5%, which looks quite aggressive and is prob-ably not achievable. The implied adjusted EPS, though also aggressive, is more within reach; but it would not be much of a surprise, if the company fell short of consensus EPS expectations.
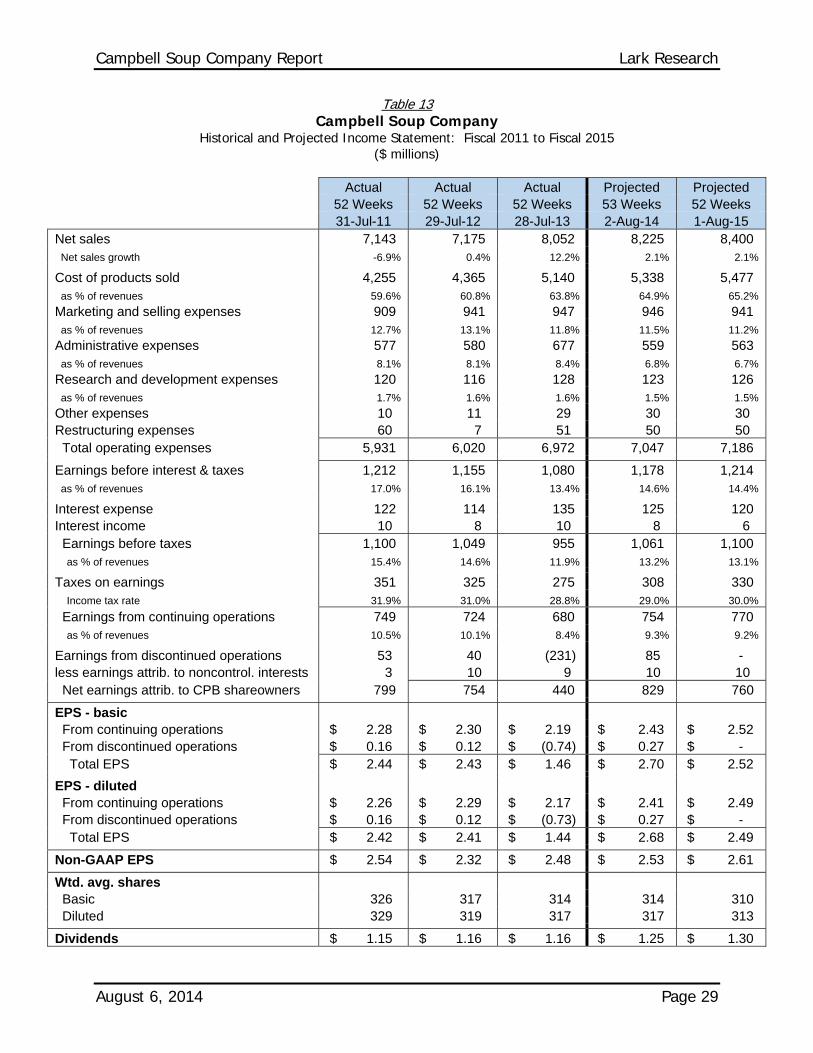
Campbell Soup Company Report Lark Research
August 6, 2014 Page 29
Table 13 Campbell Soup Company
Historical and Projected Income Statement: Fiscal 2011 to Fiscal 2015 ($ millions)
Actual Actual Actual Projected Projected 52 Weeks 52 Weeks 52 Weeks 53 Weeks 52 Weeks
31-Jul-11 29-Jul-12 28-Jul-13 2-Aug-14 1-Aug-15 Net sales 7,143 7,175 8,052 8,225 8,400 Net sales growth -6.9% 0.4% 12.2% 2.1% 2.1%
Cost of products sold 4,255 4,365 5,140 5,338 5,477 as % of revenues 59.6% 60.8% 63.8% 64.9% 65.2%
Marketing and selling expenses 909 941 947 946 941 as % of revenues 12.7% 13.1% 11.8% 11.5% 11.2%
Administrative expenses 577 580 677 559 563 as % of revenues 8.1% 8.1% 8.4% 6.8% 6.7%
Research and development expenses 120 116 128 123 126 as % of revenues 1.7% 1.6% 1.6% 1.5% 1.5%
Other expenses 10 11 29 30 30 Restructuring expenses 60 7 51 50 50 Total operating expenses 5,931 6,020 6,972 7,047 7,186
Earnings before interest & taxes 1,212 1,155 1,080 1,178 1,214 as % of revenues 17.0% 16.1% 13.4% 14.6% 14.4%
Interest expense 122 114 135 125 120 Interest income 10 8 10 8 6 Earnings before taxes 1,100 1,049 955 1,061 1,100 as % of revenues 15.4% 14.6% 11.9% 13.2% 13.1%
Taxes on earnings 351 325 275 308 330 Income tax rate 31.9% 31.0% 28.8% 29.0% 30.0%
Earnings from continuing operations 749 724 680 754 770 as % of revenues 10.5% 10.1% 8.4% 9.3% 9.2%
Earnings from discontinued operations 53 40 (231) 85 - less earnings attrib. to noncontrol. interests 3 10 9 10 10 Net earnings attrib. to CPB shareowners 799 754 440 829 760
EPS - basic From continuing operations $ 2.28 $ 2.30 $ 2.19 $ 2.43 $ 2.52 From discontinued operations $ 0.16 $ 0.12 $ (0.74) $ 0.27 $ - Total EPS $ 2.44 $ 2.43 $ 1.46 $ 2.70 $ 2.52
EPS - diluted From continuing operations $ 2.26 $ 2.29 $ 2.17 $ 2.41 $ 2.49 From discontinued operations $ 0.16 $ 0.12 $ (0.73) $ 0.27 $ - Total EPS $ 2.42 $ 2.41 $ 1.44 $ 2.68 $ 2.49
Non-GAAP EPS $ 2.54 $ 2.32 $ 2.48 $ 2.53 $ 2.61
Wtd. avg. shares Basic 326 317 314 314 310 Diluted 329 319 317 317 313
Dividends $ 1.15 $ 1.16 $ 1.16 $ 1.25 $ 1.30
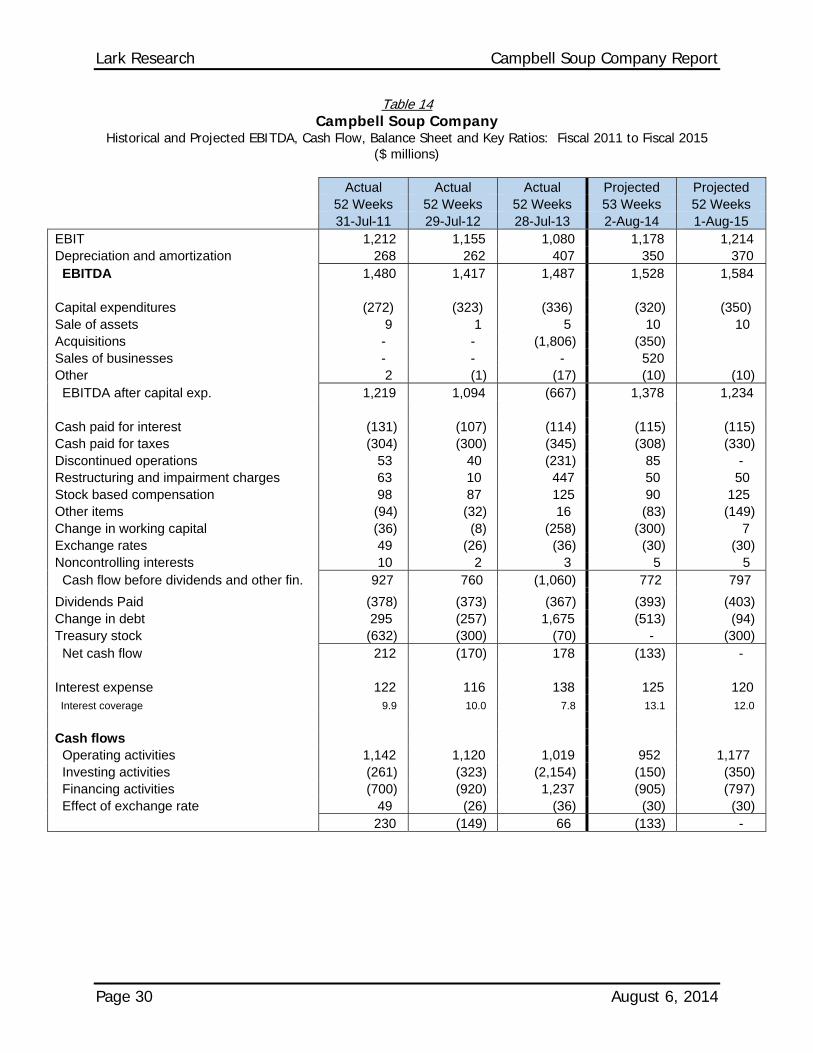
Lark Research Campbell Soup Company Report
Page 30 August 6, 2014
Table 14 Campbell Soup Company
Historical and Projected EBITDA, Cash Flow, Balance Sheet and Key Ratios: Fiscal 2011 to Fiscal 2015 ($ millions)
Actual Actual Actual Projected Projected 52 Weeks 52 Weeks 52 Weeks 53 Weeks 52 Weeks
31-Jul-11 29-Jul-12 28-Jul-13 2-Aug-14 1-Aug-15 EBIT 1,212 1,155 1,080 1,178 1,214 Depreciation and amortization 268 262 407 350 370 EBITDA 1,480 1,417 1,487 1,528 1,584 Capital expenditures (272) (323) (336) (320) (350) Sale of assets 9 1 5 10 10 Acquisitions - - (1,806) (350) Sales of businesses - - - 520 Other 2 (1) (17) (10) (10) EBITDA after capital exp. 1,219 1,094 (667) 1,378 1,234 Cash paid for interest (131) (107) (114) (115) (115) Cash paid for taxes (304) (300) (345) (308) (330) Discontinued operations 53 40 (231) 85 - Restructuring and impairment charges 63 10 447 50 50 Stock based compensation 98 87 125 90 125 Other items (94) (32) 16 (83) (149) Change in working capital (36) (8) (258) (300) 7 Exchange rates 49 (26) (36) (30) (30) Noncontrolling interests 10 2 3 5 5 Cash flow before dividends and other fin. 927 760 (1,060) 772 797
Dividends Paid (378) (373) (367) (393) (403) Change in debt 295 (257) 1,675 (513) (94) Treasury stock (632) (300) (70) - (300) Net cash flow 212 (170) 178 (133) - Interest expense 122 116 138 125 120 Interest coverage 9.9 10.0 7.8 13.1 12.0
Cash flows Operating activities 1,142 1,120 1,019 952 1,177 Investing activities (261) (323) (2,154) (150) (350) Financing activities (700) (920) 1,237 (905) (797) Effect of exchange rate 49 (26) (36) (30) (30) 230 (149) 66 (133) -
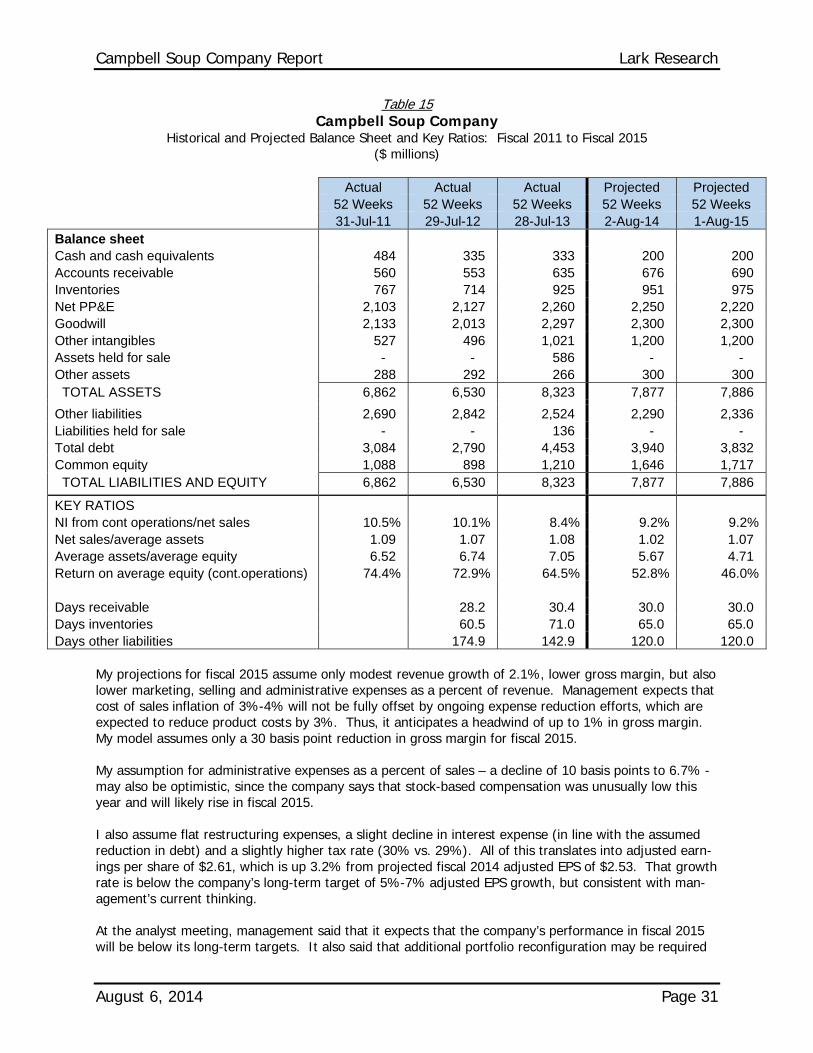
Campbell Soup Company Report Lark Research
August 6, 2014 Page 31
Table 15 Campbell Soup Company
Historical and Projected Balance Sheet and Key Ratios: Fiscal 2011 to Fiscal 2015 ($ millions)
Actual Actual Actual Projected Projected 52 Weeks 52 Weeks 52 Weeks 52 Weeks 52 Weeks
31-Jul-11 29-Jul-12 28-Jul-13 2-Aug-14 1-Aug-15 Balance sheet Cash and cash equivalents 484 335 333 200 200 Accounts receivable 560 553 635 676 690 Inventories 767 714 925 951 975 Net PP&E 2,103 2,127 2,260 2,250 2,220 Goodwill 2,133 2,013 2,297 2,300 2,300 Other intangibles 527 496 1,021 1,200 1,200 Assets held for sale - - 586 - - Other assets 288 292 266 300 300 TOTAL ASSETS 6,862 6,530 8,323 7,877 7,886
Other liabilities 2,690 2,842 2,524 2,290 2,336 Liabilities held for sale - - 136 - - Total debt 3,084 2,790 4,453 3,940 3,832 Common equity 1,088 898 1,210 1,646 1,717 TOTAL LIABILITIES AND EQUITY 6,862 6,530 8,323 7,877 7,886
KEY RATIOS NI from cont operations/net sales 10.5% 10.1% 8.4% 9.2% 9.2%Net sales/average assets 1.09 1.07 1.08 1.02 1.07 Average assets/average equity 6.52 6.74 7.05 5.67 4.71 Return on average equity (cont.operations) 74.4% 72.9% 64.5% 52.8% 46.0% Days receivable 28.2 30.4 30.0 30.0 Days inventories 60.5 71.0 65.0 65.0 Days other liabilities 174.9 142.9 120.0 120.0
My projections for fiscal 2015 assume only modest revenue growth of 2.1%, lower gross margin, but also lower marketing, selling and administrative expenses as a percent of revenue. Management expects that cost of sales inflation of 3%-4% will not be fully offset by ongoing expense reduction efforts, which are expected to reduce product costs by 3%. Thus, it anticipates a headwind of up to 1% in gross margin. My model assumes only a 30 basis point reduction in gross margin for fiscal 2015.
My assumption for administrative expenses as a percent of sales – a decline of 10 basis points to 6.7% - may also be optimistic, since the company says that stock-based compensation was unusually low this year and will likely rise in fiscal 2015.
I also assume flat restructuring expenses, a slight decline in interest expense (in line with the assumed reduction in debt) and a slightly higher tax rate (30% vs. 29%). All of this translates into adjusted earn-ings per share of $2.61, which is up 3.2% from projected fiscal 2014 adjusted EPS of $2.53. That growth rate is below the company’s long-term target of 5%-7% adjusted EPS growth, but consistent with man-agement’s current thinking.
At the analyst meeting, management said that it expects that the company’s performance in fiscal 2015 will be below its long-term targets. It also said that additional portfolio reconfiguration may be required
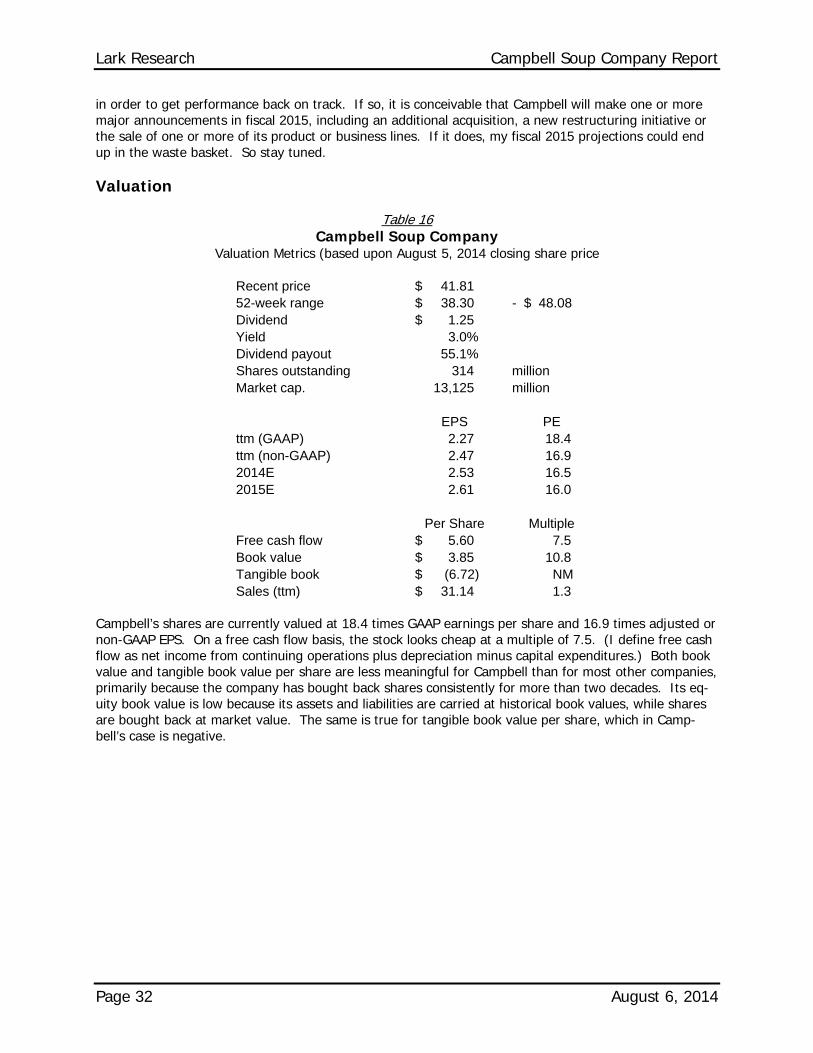
Lark Research Campbell Soup Company Report
Page 32 August 6, 2014
in order to get performance back on track. If so, it is conceivable that Campbell will make one or more major announcements in fiscal 2015, including an additional acquisition, a new restructuring initiative or the sale of one or more of its product or business lines. If it does, my fiscal 2015 projections could end up in the waste basket. So stay tuned.
Valuation
Table 16 Campbell Soup Company
Valuation Metrics (based upon August 5, 2014 closing share price
Recent price $ 41.81 52-week range $ 38.30 - $ 48.08 Dividend $ 1.25 Yield 3.0% Dividend payout 55.1% Shares outstanding 314 million Market cap. 13,125 million
EPS PE
ttm (GAAP) 2.27 18.4 ttm (non-GAAP) 2.47 16.9 2014E 2.53 16.5 2015E 2.61 16.0
Per Share Multiple
Free cash flow $ 5.60 7.5 Book value $ 3.85 10.8 Tangible book $ (6.72) NM Sales (ttm) $ 31.14 1.3
Campbell’s shares are currently valued at 18.4 times GAAP earnings per share and 16.9 times adjusted or non-GAAP EPS. On a free cash flow basis, the stock looks cheap at a multiple of 7.5. (I define free cash flow as net income from continuing operations plus depreciation minus capital expenditures.) Both book value and tangible book value per share are less meaningful for Campbell than for most other companies, primarily because the company has bought back shares consistently for more than two decades. Its eq-uity book value is low because its assets and liabilities are carried at historical book values, while shares are bought back at market value. The same is true for tangible book value per share, which in Camp-bell’s case is negative.
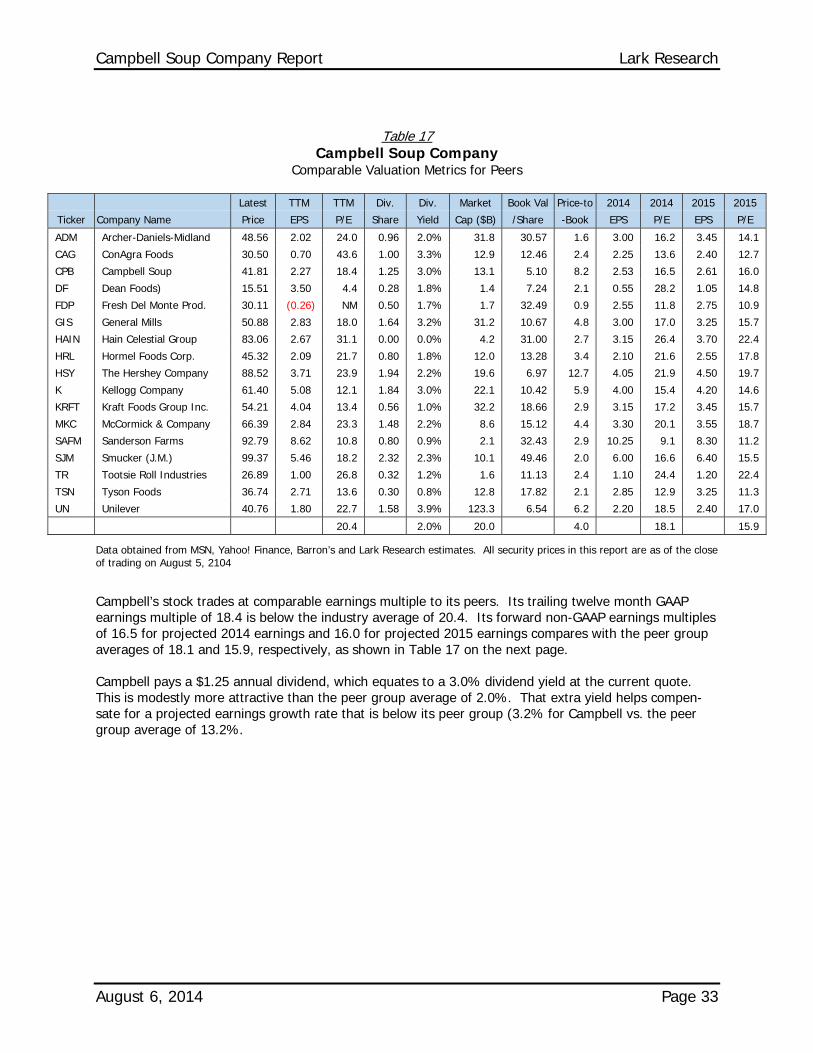
Campbell Soup Company Report Lark Research
August 6, 2014 Page 33
Table 17 Campbell Soup Company
Comparable Valuation Metrics for Peers
Latest TTM TTM Div. Div. Market Book Val Price-to 2014 2014 2015 2015
Ticker Company Name Price EPS P/E Share Yield Cap ($B) /Share -Book EPS P/E EPS P/E
ADM Archer-Daniels-Midland 48.56 2.02 24.0 0.96 2.0% 31.8 30.57 1.6 3.00 16.2 3.45 14.1
CAG ConAgra Foods 30.50 0.70 43.6 1.00 3.3% 12.9 12.46 2.4 2.25 13.6 2.40 12.7
CPB Campbell Soup 41.81 2.27 18.4 1.25 3.0% 13.1 5.10 8.2 2.53 16.5 2.61 16.0
DF Dean Foods) 15.51 3.50 4.4 0.28 1.8% 1.4 7.24 2.1 0.55 28.2 1.05 14.8
FDP Fresh Del Monte Prod. 30.11 (0.26) NM 0.50 1.7% 1.7 32.49 0.9 2.55 11.8 2.75 10.9
GIS General Mills 50.88 2.83 18.0 1.64 3.2% 31.2 10.67 4.8 3.00 17.0 3.25 15.7
HAIN Hain Celestial Group 83.06 2.67 31.1 0.00 0.0% 4.2 31.00 2.7 3.15 26.4 3.70 22.4
HRL Hormel Foods Corp. 45.32 2.09 21.7 0.80 1.8% 12.0 13.28 3.4 2.10 21.6 2.55 17.8
HSY The Hershey Company 88.52 3.71 23.9 1.94 2.2% 19.6 6.97 12.7 4.05 21.9 4.50 19.7
K Kellogg Company 61.40 5.08 12.1 1.84 3.0% 22.1 10.42 5.9 4.00 15.4 4.20 14.6
KRFT Kraft Foods Group Inc. 54.21 4.04 13.4 0.56 1.0% 32.2 18.66 2.9 3.15 17.2 3.45 15.7
MKC McCormick & Company 66.39 2.84 23.3 1.48 2.2% 8.6 15.12 4.4 3.30 20.1 3.55 18.7
SAFM Sanderson Farms 92.79 8.62 10.8 0.80 0.9% 2.1 32.43 2.9 10.25 9.1 8.30 11.2
SJM Smucker (J.M.) 99.37 5.46 18.2 2.32 2.3% 10.1 49.46 2.0 6.00 16.6 6.40 15.5
TR Tootsie Roll Industries 26.89 1.00 26.8 0.32 1.2% 1.6 11.13 2.4 1.10 24.4 1.20 22.4
TSN Tyson Foods 36.74 2.71 13.6 0.30 0.8% 12.8 17.82 2.1 2.85 12.9 3.25 11.3
UN Unilever 40.76 1.80 22.7 1.58 3.9% 123.3 6.54 6.2 2.20 18.5 2.40 17.0
20.4 2.0% 20.0 4.0 18.1 15.9
Data obtained from MSN, Yahoo! Finance, Barron’s and Lark Research estimates. All security prices in this report are as of the close of trading on August 5, 2104
Campbell’s stock trades at comparable earnings multiple to its peers. Its trailing twelve month GAAP earnings multiple of 18.4 is below the industry average of 20.4. Its forward non-GAAP earnings multiples of 16.5 for projected 2014 earnings and 16.0 for projected 2015 earnings compares with the peer group averages of 18.1 and 15.9, respectively, as shown in Table 17 on the next page.
Campbell pays a $1.25 annual dividend, which equates to a 3.0% dividend yield at the current quote. This is modestly more attractive than the peer group average of 2.0%. That extra yield helps compen-sate for a projected earnings growth rate that is below its peer group (3.2% for Campbell vs. the peer group average of 13.2%.
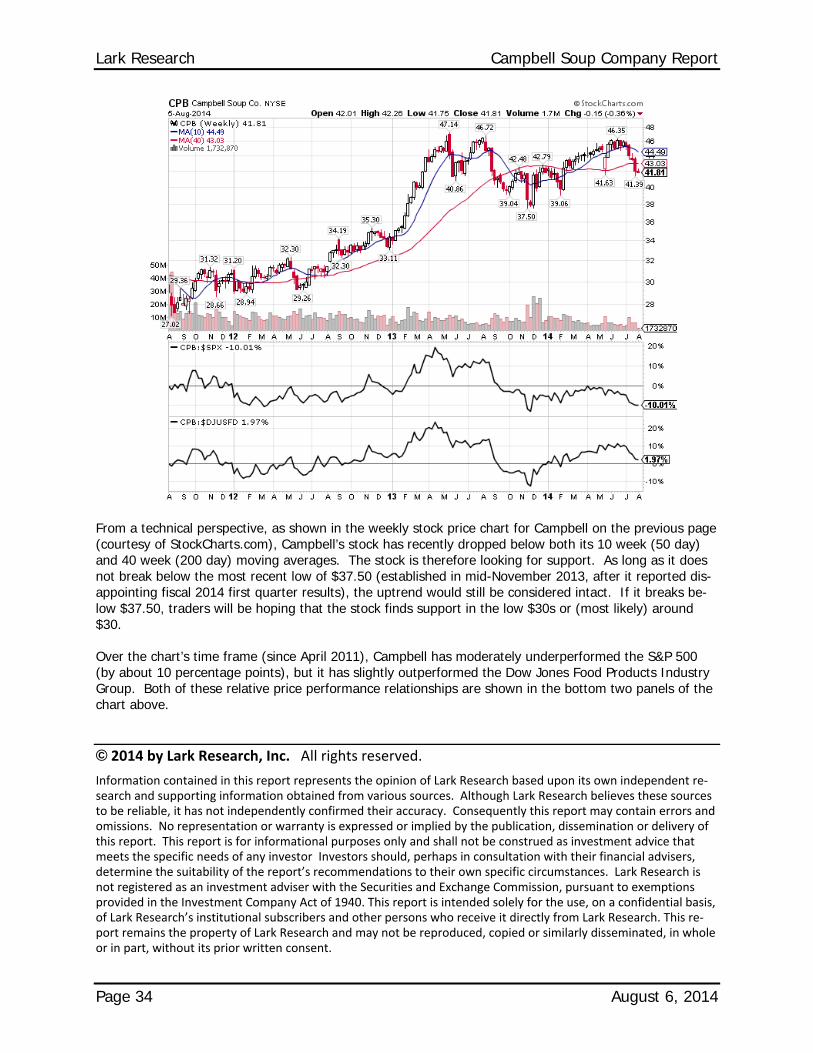
Lark Research Campbell Soup Company Report
Page 34 August 6, 2014
From a technical perspective, as shown in the weekly stock price chart for Campbell on the previous page (courtesy of StockCharts.com), Campbell’s stock has recently dropped below both its 10 week (50 day) and 40 week (200 day) moving averages. The stock is therefore looking for support. As long as it does not break below the most recent low of $37.50 (established in mid-November 2013, after it reported dis-appointing fiscal 2014 first quarter results), the uptrend would still be considered intact. If it breaks be-low $37.50, traders will be hoping that the stock finds support in the low $30s or (most likely) around $30.
Over the chart’s time frame (since April 2011), Campbell has moderately underperformed the S&P 500 (by about 10 percentage points), but it has slightly outperformed the Dow Jones Food Products Industry Group. Both of these relative price performance relationships are shown in the bottom two panels of the chart above.
© 2014 by Lark Research, Inc. All rights reserved.
Information contained in this report represents the opinion of Lark Research based upon its own independent re‐search and supporting information obtained from various sources. Although Lark Research believes these sources to be reliable, it has not independently confirmed their accuracy. Consequently this report may contain errors and omissions. No representation or warranty is expressed or implied by the publication, dissemination or delivery of this report. This report is for informational purposes only and shall not be construed as investment advice that meets the specific needs of any investor Investors should, perhaps in consultation with their financial advisers, determine the suitability of the report’s recommendations to their own specific circumstances. Lark Research is not registered as an investment adviser with the Securities and Exchange Commission, pursuant to exemptions provided in the Investment Company Act of 1940. This report is intended solely for the use, on a confidential basis, of Lark Research’s institutional subscribers and other persons who receive it directly from Lark Research. This re‐port remains the property of Lark Research and may not be reproduced, copied or similarly disseminated, in whole or in part, without its prior written consent.