calculation and measurements of self-ignition nuclei in diesel combustion
TRANSCRIPT
811r 2010 American Chemical Society pubs.acs.org/EF
Energy Fuels 2010, 24, 811–820 : DOI:10.1021/ef900695wPublished on Web 01/07/2010
Calculation and Measurements of Self-Ignition Nuclei in Diesel Combustion
Milan Mar�ci�c,*,† Jurij Avsec,† Michael Wensing,‡ Marcus Schmid,‡ Alfred Leipertz,‡ and Christian Fettes§
†University of Maribor, Smetanova 17, 2000 Maribor, Slovenia, ‡Erlangen Graduate School in Advanced Optical Technologies(SAOT) and Lehrstuhl f€ur Technische Thermodynamik (LTT ), Friedrich-Alexander-Universit€at Erlangen-N€urnberg,Am Weichselgarten 8, D-91 058 Erlangen, Germany, and §Meta Motorentechnik GmbH, Herzogenrath, Germany
Received July 7, 2009. Revised Manuscript Received December 1, 2009
This paper describes a computer simulation of diesel spray formation and the locations of self-ignitionnuclei. The spray is divided into small elementary volumes, in which the amounts of fuel, fuel vapors, andair and mean, maximum, and minimum fuel droplet diameters are calculated, as well as their number.The total air/fuel and air/fuel-vapor ratios are calculated for each elementary volume. The paperintroduces a new criterion for determining self-ignition nuclei based on assumptions that the strongestself-ignition probability lies in those elementary volumes containing the stoichiometric air ratio, wherethe fuel is evaporated or the fuel droplet diameter is equal to or lower than 0.0065mm. Themost efficientcombustionwith regard to consumption and emissionwill be in those elementary volumes containing thestoichiometric air ratio and fuel droplets with the lowest mean diameters.Measurements of injection andcombustionwere carried out in a transparent research engine. This engine is a single-cylinder transparentengine based on the Audi V6 engine, equipped with a Bosch common rail injection system. The opticalpart of the experimental setup contains two different lasers, while the camera system allows forsimultaneously detecting four signals: the Mie scattering of the injected fuel, the laser-inducedfluorescence (LIF) of fuel and vapor, light emissions from the flame indicating the premixed combustionmode, and flame emissions indicating the diffusion mode. A comparison of the computed points to thehighest self-ignition probability and the measured points where self-ignition occurred showed goodmatching.
Introduction
Combustion is still the most important contemporarysource of energy. The most important process influencingconsumption and emissions of diesel engines is combustionitself. In contrast to Otto engines, where the ignition of thepetrol-vapor/air mixture is effected by a spark, the mixture isself-ignited in diesel engines. For efficient combustion, being aprecondition for low consumption and reduced pollution ofthe environment, it is very important to understand the nucleiwhere self-ignition of the mixture occurs. Diesel engine loadsvary during operation, and consequently, those locationsin the combustion chamber where nuclei for mixture self-ignition are formed also vary.
One of the key elements affecting the combustion process isthe fuel injection system, where the injection nozzle plays adecisive role in dispersing the fuel in the droplet-vapor/airmixture throughout the combustion chamber. Therefore, wehave developed two computer programs: first, a simulation ofthe common rail accumulator fuel-injection system, whichitself is not presented in this paper but which provides thestarting condition for diesel spray simulation, as presented inthis paper. A combination of the two computer programsenables computation of the injection1,2 and combustion pro-cesses, starting from the electric current at the triggering
element (solenoid valve) and ending with the self-ignitionnuclei in the combustion chamber. Both programs are mu-tually connected. This paper describes a new self-ignitionnuclei identification criterion for computing the probabilitythat, at a particular point in the combustion chamber of adiesel engine, self-ignition of the mixture occurs between theliquid fuel in droplets and the fuel vapor/air. Computation ofthe mixture self-ignition probability is based on the followingassumptions: (1)Thehighest efficiencyof combustion in termsof fuel consumption and environmental pollution is found atthe stoichiometric fuel/air ratio. (2) Combustion efficiencyandmixture self-ignition are influenced by the diameter of thefuel droplets in the diesel spray. Fuel droplets with diametersof less than 0.0065 mm burn practically as fuel vapors, whichmeans that combustion will be most complete if the fuel isentirely evaporated or if droplets have a diameter3 smallerthan 0.0065 mm.
The mathematical model of diesel spray is obtained fromthe continuity and momentum equation. The spray is dividedinto small elementary volumes, in which the amounts of fuel,fuel vapors, and air and mean, maximum, and minimum fueldroplet diameters are calculated, as well as their number. Thetotal air/fuel ratio and air/fuel-vapor ratio are calculated ineach elementary volume. These data are used to compute theself-ignition probability in any elementary volume. Identicalself-ignition probabilities are then joined into curves to obtainareas with equal self-ignition probabilities regarding the fuel-vapor/air mixture.
*Towhom correspondence should be addressed. Telephone:þ386-2-220-77-50. Fax: þ386-2-220-79-90. E-mail: [email protected].(1) Marcic, M.; Kovacic, Z. Computer simulation of the diesel fuel
injection system. SAE Tech. Pap. 851583, 1985.(2) Marcic, M. Calculation of the diesel fuel injection parameters.
SAE Tech. Pap. 952071, 1995.(3) Chigier, N. A. Energy and Combustion Science; Pergamon Press:
Oxford, U.K., 1979.
812
Energy Fuels 2010, 24, 811–820 : DOI:10.1021/ef900695w Mar�ci�c et al.
Mathematical Model of Diesel Spray
The mathematical model of the diesel spray is based oncontinuity and momentum equations in Eulerian-Lagrangianformulation.4-6 In the paper presented, the spray model enablescalculations of all spray parameters that can be measured by thedetailed laser diagnostic technique. In this way, we can comparemeasured spray parameters to calculated ones. The proposedtwo-dimensional (radial and axial) spray model is simple and canbe solved very quickly using a PC.A three-dimensional computa-tional fluid dynamics (CFD) method requires expensive CFDprograms and a much faster computer, which is much moreexpensive than the proposed spray computer program. The spraycalculation covers the interval from the fuel outlet of the nozzle tothe mixture formation, ideal for self-ignition in the combustionchamber of a diesel engine. The fuel leaves the nozzle sac volumeat a high velocity because of the pressure difference between thesac volume and cylinder pressures.
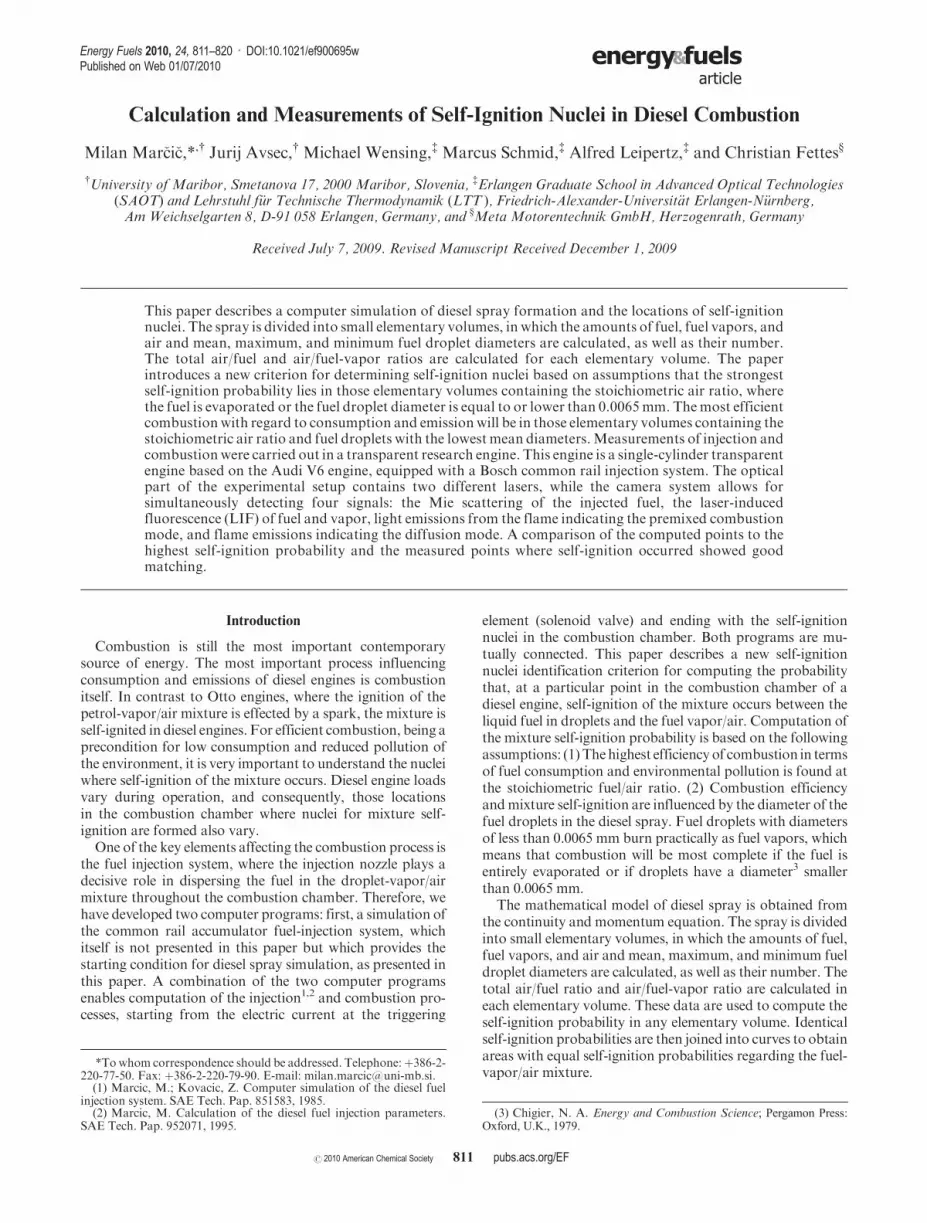
The exit velocity of the fuel u(t) is calculated on the basis ofinjection characteristics Q(t), which can be measured or calcu-lated by computer simulation of the fuel injection system1,2
(Figures 1 and 2). The injection characteristics Q(t) is input datafor spray simulation. The equation for exit velocity is
uðtÞ ¼ QðtÞ=A ð1Þ
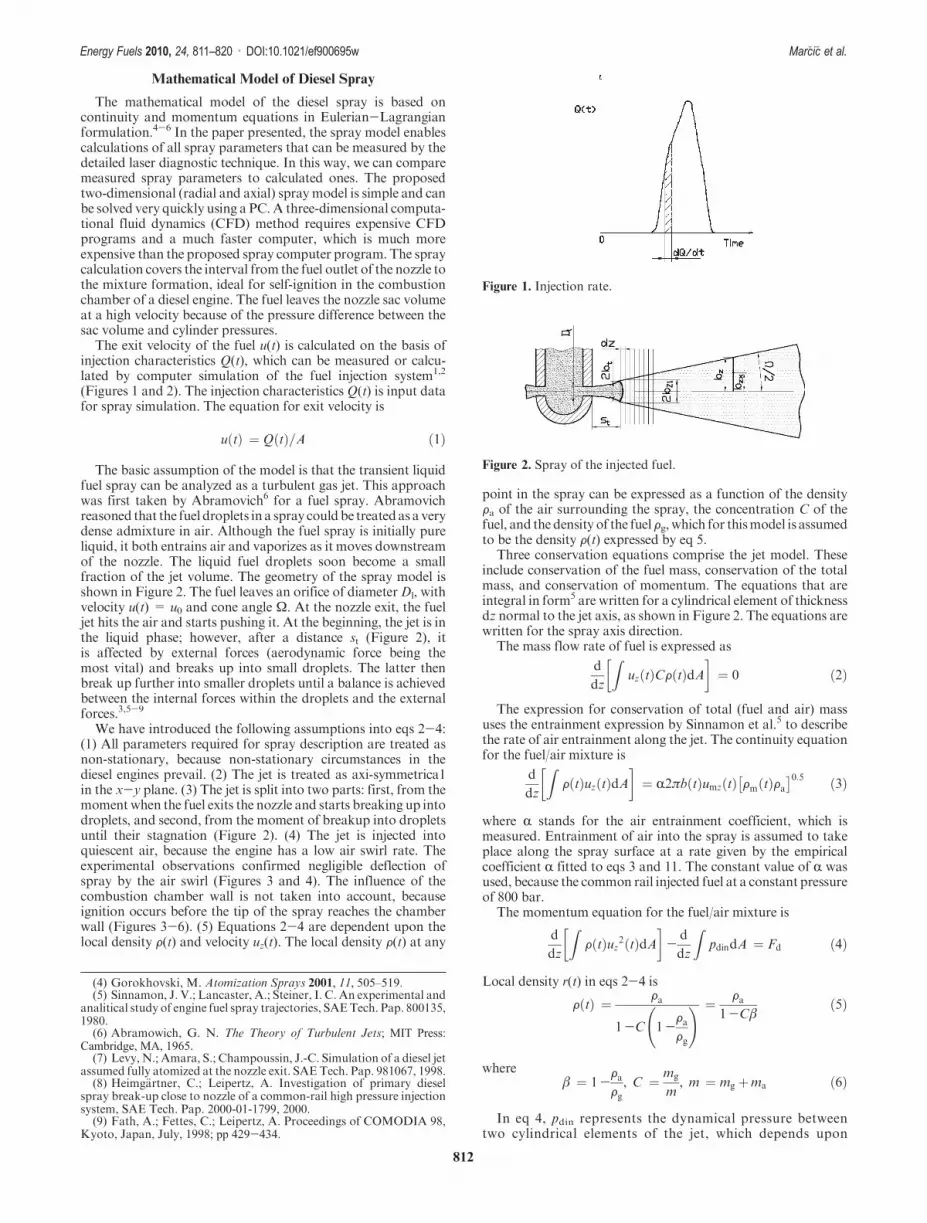
The basic assumption of the model is that the transient liquidfuel spray can be analyzed as a turbulent gas jet. This approachwas first taken by Abramovich6 for a fuel spray. Abramovichreasoned that the fuel droplets in a spray could be treatedas a verydense admixture in air. Although the fuel spray is initially pureliquid, it both entrains air and vaporizes as it moves downstreamof the nozzle. The liquid fuel droplets soon become a smallfraction of the jet volume. The geometry of the spray model isshown in Figure 2. The fuel leaves an orifice of diameterDl, withvelocity u(t) = u0 and cone angle Ω. At the nozzle exit, the fueljet hits the air and starts pushing it. At the beginning, the jet is inthe liquid phase; however, after a distance st (Figure 2), itis affected by external forces (aerodynamic force being themost vital) and breaks up into small droplets. The latter thenbreak up further into smaller droplets until a balance is achievedbetween the internal forces within the droplets and the externalforces.3,5-9
We have introduced the following assumptions into eqs 2-4:(1) All parameters required for spray description are treated asnon-stationary, because non-stationary circumstances in thediesel engines prevail. (2) The jet is treated as axi-symmetrica1in the x-y plane. (3) The jet is split into two parts: first, from themoment when the fuel exits the nozzle and starts breaking up intodroplets, and second, from the moment of breakup into dropletsuntil their stagnation (Figure 2). (4) The jet is injected intoquiescent air, because the engine has a low air swirl rate. Theexperimental observations confirmed negligible deflection ofspray by the air swirl (Figures 3 and 4). The influence of thecombustion chamber wall is not taken into account, becauseignition occurs before the tip of the spray reaches the chamberwall (Figures 3-6). (5) Equations 2-4 are dependent upon thelocal density F(t) and velocity uz(t). The local density F(t) at any
point in the spray can be expressed as a function of the densityFa of the air surrounding the spray, the concentration C of thefuel, and the density of the fuel Fg,which for thismodel is assumedto be the density F(t) expressed by eq 5.
Three conservation equations comprise the jet model. Theseinclude conservation of the fuel mass, conservation of the totalmass, and conservation of momentum. The equations that areintegral in form5 are written for a cylindrical element of thicknessdz normal to the jet axis, as shown in Figure 2. The equations arewritten for the spray axis direction.
The mass flow rate of fuel is expressed as
d
dz
ZuzðtÞCFðtÞdA
� �¼ 0 ð2Þ
The expression for conservation of total (fuel and air) massuses the entrainment expression by Sinnamon et al.5 to describethe rate of air entrainment along the jet. The continuity equationfor the fuel/air mixture is
d
dz
ZFðtÞuzðtÞdA
� �¼ R2πbðtÞumzðtÞ FmðtÞFa
� �0:5 ð3Þ
where R stands for the air entrainment coefficient, which ismeasured. Entrainment of air into the spray is assumed to takeplace along the spray surface at a rate given by the empiricalcoefficient R fitted to eqs 3 and 11. The constant value of R wasused, because the common rail injected fuel at a constant pressureof 800 bar.
The momentum equation for the fuel/air mixture is
d
dz
ZFðtÞuz2ðtÞdA
� �-d
dz
ZpdindA ¼ Fd ð4Þ
Local density r(t) in eqs 2-4 is
FðtÞ ¼ Fa
1-C 1-FaFg
! ¼ Fa1-Cβ
ð5Þ
whereβ ¼ 1-
FaFg, C ¼ mg
m, m ¼ mg þma ð6Þ
In eq 4, pdin represents the dynamical pressure betweentwo cylindrical elements of the jet, which depends upon
Figure 1. Injection rate.
Figure 2. Spray of the injected fuel.
(4) Gorokhovski, M. Atomization Sprays 2001, 11, 505–519.(5) Sinnamon, J. V.; Lancaster, A.; Steiner, I. C. An experimental and
analitical study of engine fuel spray trajectories, SAETech. Pap. 800135,1980.(6) Abramowich, G. N. The Theory of Turbulent Jets; MIT Press:
Cambridge, MA, 1965.(7) Levy,N.; Amara, S.; Champoussin, J.-C. Simulation of a diesel jet
assumed fully atomized at the nozzle exit. SAE Tech. Pap. 981067, 1998.(8) Heimg€artner, C.; Leipertz, A. Investigation of primary diesel
spray break-up close to nozzle of a common-rail high pressure injectionsystem, SAE Tech. Pap. 2000-01-1799, 2000.(9) Fath, A.; Fettes, C.; Leipertz, A. Proceedings of COMODIA 98,
Kyoto, Japan, July, 1998; pp 429-434.
813
Energy Fuels 2010, 24, 811–820 : DOI:10.1021/ef900695w Mar�ci�c et al.
the relative velocity between them. The same velocity isassumed within each of the cylindrical elements, whereasthe velocity of a single element differs from one element toanother. The cylindrical elements are further divided insmaller elementary volumes, what is explained later. Thedynamical pressure between two cylindrical elements of
the jet is
pdin ¼ FðtÞΔuzðtÞ2
2ð7Þ
where Δuz stands for the velocity difference between twocylindrical elements. In some cases, we omit this term.
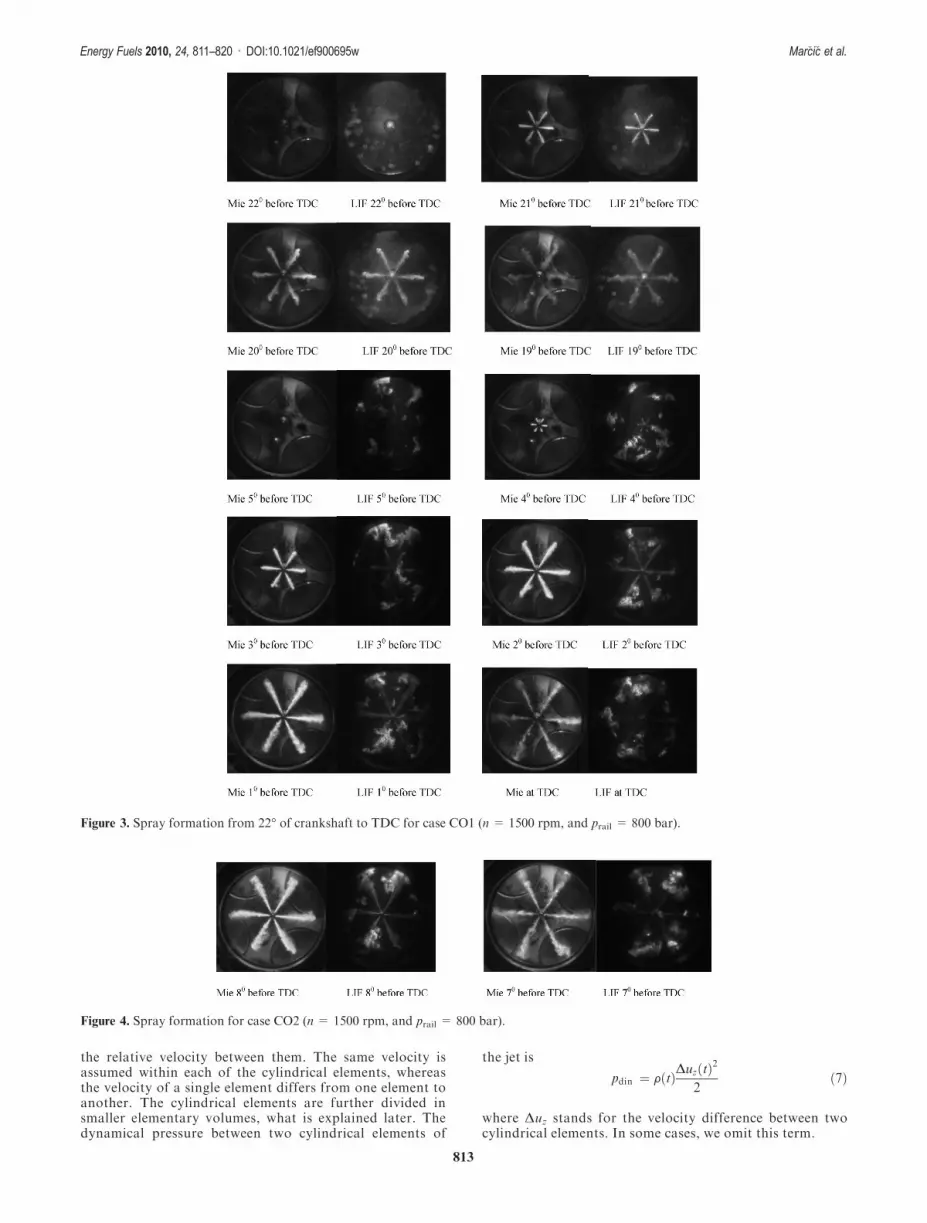
Figure 3. Spray formation from 22� of crankshaft to TDC for case CO1 (n = 1500 rpm, and prail = 800 bar).
Figure 4. Spray formation for case CO2 (n = 1500 rpm, and prail = 800 bar).
814
Energy Fuels 2010, 24, 811–820 : DOI:10.1021/ef900695w Mar�ci�c et al.
We also introduced factor ε as a dimensionless radial distancefrom the spray axis, which demonstrates that at a certain distancez from the injection nozzle a (bzx/bz) (Figure 2) relationship exists,where bz is the spray radius and bzx is the spray local pointdistance.
ε ¼ bzx
bzð8Þ
The distribution function f(ε) is also introducedwithin this factor,which allows for the calculations of the density, the concentration,
and the speedprofilewithin the spray. The distribution function is
f ðεÞ ¼ 1-ε1:5 ð9Þand has been empirically determined by measurements. Theradial profiles of density, concentration, and speed are describedby the following equations:
C ¼ Cm f ðεÞ and u ¼ um f ðεÞ2 ð10Þ
where subscript m stands for the middle of the spray.If we insert eqs 7-9 into eqs 2-4, we obtain(1) continuity equation for fuel
d
dz
Z 1
0
umzðtÞCmðtÞ Fa f ð1-ε1:5Þ31-CmðtÞf ð1-ε1:5Þβ2πbz
2εdε
" #¼ 0 ð11Þ
(2) continuity equation for the fuel/air mixture
d
dz
Z 1
0
umzðtÞ Fa f ð1-ε1:5Þ21-Cm f ð1-ε1:5Þβ2πbz
2εdε
" #
¼ R2πbzðtÞumzðtÞ½FmðtÞFa�0:5 ð12Þ(3) momentum equation for the fuel/air mixture
d
dz
Z 1
0
Faum2 ð1-ε1:5Þ41-βCmð1-ε1:5Þ2πbz
2εdε
!
-d
dz
Z 1
0
FaΔum2
2
ð1-ε1:5Þ41-βCmð1-ε1:5Þ2πbz
2εdε
!¼ πb2CdFa
um2
2
ð13Þ
A detailed derivation of eqs 11-13 are in the Appendix.These equations apply to the secondpart of the spray, i.e., from
the moment of breakup into fine droplets until their stagnation(Figure 2). With eqs 11-13, we can compute the velocity anddiameter of the spray and the fuel concentration within the spray.These equations are numerically solved by applying the Run-ge-Kutta method. The values vary constantly because of thevelocity of the fuel exiting from the nozzle, which changes overtime.
From the continuity and momentum equations, we can calcu-late diameter 2bt of the liquid jet and the point st (Figure 2) thatdepend upon the exit velocity u(t). At a higher exit velocity u(t),the distance st is shorter. The exit velocity is calculated on thebasis of injection characteristics Q(t) (eq 1).
The continuity equation for the fuel at the nozzle outlet holeand point st is
2πbt2Fau0
Z 1
0
ð1-ε1:5Þ31-βcmð1-ε1:5Þεdε ¼ Fg
πDl2
4u0 ð14Þ
and the momentum equation for the fuel is
2πbt2Fau0
2
Z 1
0
ð1-ε1:5Þ41-βcmð1-ε1:5Þεdε ¼ Fg
πDl2
4u0
2 ð15Þ
In eqs 14 and 15, u(t) = u0. Computation is carried out bydividing injection characteristics into individual cylindrical ele-ments (Figure 1). The exit velocity u0 is computed for each of suchcylindrical elements. The cylindrical elements are then furtherdivided into smaller fuel elementary volumes dV = dzdxdy(Figure 2). The elementary volume dimensions generally dependupon the injection pressure (lower pressuremeans greater dropletdiameter) and computer capacity. The same velocity is assumedwithin each of these volumes, whereas the velocity of a singlevolume differs from one volume to another. Each elementaryvolume consists of a large number of droplets. When known
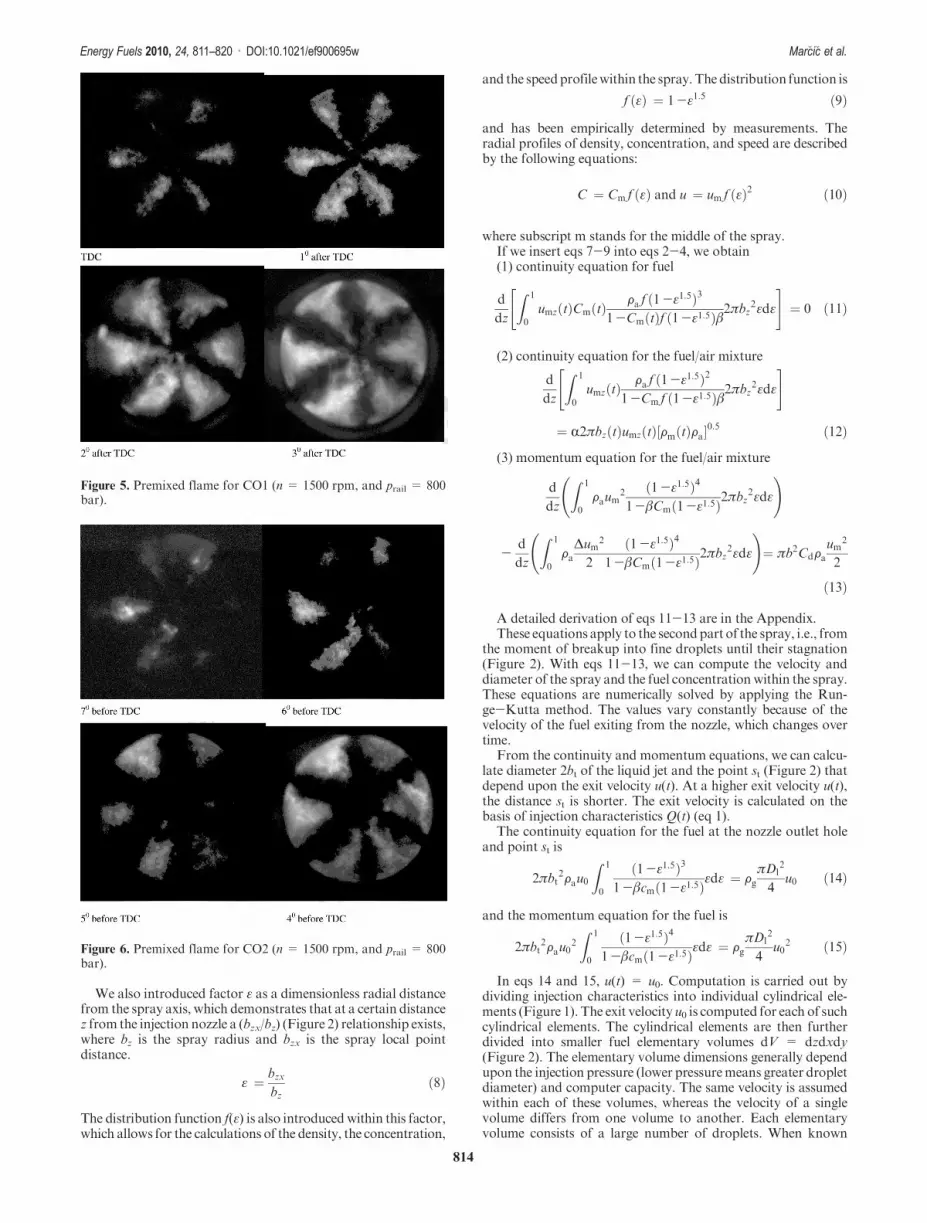
Figure 5. Premixed flame for CO1 (n = 1500 rpm, and prail = 800bar).
Figure 6. Premixed flame for CO2 (n = 1500 rpm, and prail = 800bar).

815
Energy Fuels 2010, 24, 811–820 : DOI:10.1021/ef900695w Mar�ci�c et al.
equations are applied, their mean dmz, maximum dmaxz, andminimum dminz diameters can be computed.10-14
dmz ¼ 1:1 25þ 50ðDl -0:2Þþ 30 1-pIV -pc
300
� �150
pIV-pc
� �lb
Dl
� �1=8" #
ð16Þ
dminz ¼ 0:25
Dl þ 0:25
pIV -pc
300
� �1=4lb
Dl
� �1=8
dm ð17Þ
dmaxz ¼ 2dmz -dminz ð18Þwhere the nozzle hole diameter Dl is in millimeters and sacpressure pIV is in bar. The sac pressure is actually the injectionpressure. Measurements of the sac pressure are very demanding;therefore, we calculate it for various nozzles by computer simula-tion.1,2 The cylinder pressure pc expresses the influence of thecompressed air on the droplet diameter.At themoment of dropletformation (distance st; Figure 2), their temperature is similar tothe liquid fuel temperature at the nozzle hole exit; therefore, wesupposed that injected fuel and droplets at point st have the sametemperature. From the point of their formation to their total orpartial evaporation, they are heated as a result of their movementthrough the hot compressed air. The influence of the compressedair temperature and the density on the diameter of the droplets isexpressed by the law of droplet evaporation3 (eq 20). Theseequations are applied for droplet diameters at the spray center.Both theory14 and practice show that bigger droplets are found inthemiddle of the spray and smaller ones are found at the edges ofthe spray. Therefore, the diameters of those elementary volumedroplets found at the edges of the spray are computed using theequation
dmzx ¼ dmz f ðεÞdminzx ¼ dminz f ðεÞdmaxzx ¼ dmaxz f ðεÞ
ð19Þ
If the concentration and mean diameter dm of the liquid dropletsat the moment of forming the spray at point st are known, theirnumbers can be computed in elementary volumes. When the lawof droplet evaporation is applied,3 the vapor quantity in anelementary volume can also be computed. The law of dropletevaporation is
-dðdm2Þdt
¼ λ ð20Þ
where λ = λ0(1 þ 0.27Re1/2Sc1/3), Re = (udm)/ν, Sc = ν/D =η/(FD), λ0 = ((8kp)/(Fgcpa))ln(1 þ B), and B = (1/Lu)cpa(Ta -Tg).
The mass of fuel mg and air ma in the elementary volume ischaracterized by the equations
me ¼ mg þma
mg ¼ Cmeð21Þ
In the elementary volume, the fuel is in a liquid and vapor form.Fuel mass mg is
mg ¼ mgl þmgv ð22ÞThe number of droplets N in the elementary volume at thedistance st is
N ¼ 6mg
πdm2Fg
ð23Þ
The mass of vapor fuel mgv in elementary volume after the timeinterval dt is
mgv ¼ π
6Fg dm
3 - dm -dðdm2Þdt
!324
35N ð24Þ
where the termd(dm2)/dt represents the droplet diameter reducing
after the time period dt according to the law of droplet evapora-tion. A term dm - (d(dm
2)/dt) represents the actual dropletdiameter after the time interval dt.
The mass of liquid fuelmgl in elementary volume after the timeinterval dt is
mgl ¼π dm -
dðdm2Þdt
!3
6FgN ð25Þ
To determine the points or elementary volumes where self-ignition occurs first, we have introduced the term “ignitionprobabilityΨ” referring to the local air ratio and fuel dispersionquality within the spray. The ignition probabilityΨ is
Ψ ¼ ΨcΨde1 ð26ÞThe termΨc takes into account the local air ratio in the spray andhas the highest value for the stoichiometric air ratio.
Ψc ¼ exp -
�����ln jr
js
�����24
35 ð27Þ
where jr = (mg/ma) and js = (mg/ma) = 0.071.We decided to implement the local fuel/air ratio as one of the
criteria for self-ignition. The choice wasmade on the basis of longyear practical and theoretical experiences. The highest efficiencyof combustion in terms of fuel consumption and environmentalpollution is at the stoichiometric fuel/air ratio.Nowadays, all carsare equipped with one sensor that assures stoichiometric ignitionand combustion. Therefore, we decided to implement the localfuel/air ratio as one of the criteria for self-ignition instead ofactivation energy.
Equation 20 describes droplet evaporation. That equationshows that the amount of evaporated fuel strongly depend uponthe temperature. Equation 20 also considers another influence ondroplet evaporation, such as velocity, density, and others. In thatway,we consider temperature an influence on self-ignition.Whenin one point the stoichiometric fuel/air ratio is reached, then thatis mean an optimal ignition condition.
Futhermore, the term Ψd takes into account the fuel spraydispersion quality and has its maximum value at the dropletdiameter dopt = 0.0065 mm or less. Droplets with a diameter of0.0065 mm may already be treated as those burning as gas.3
Ψd ¼ 1
3σ0ð2πÞ1=2exp -
1
2
dm -dopt
3σ0
� �2" #
ð28Þ
where σ0 = |dm - dmin|.The pointswhereΨhas an equal value are joined into curves to
visualize the areas where the self-ignition probability is higher(Figures 8 and 10).
(10) Hiroyasu, H.; Nishida, F. Simplified three-dimensional modell-ing of mixture formation and combustion in a DI diesel engine. SAETech. Pap. 890269, 1989.(11) Varde, K. S.; Papa, D. M. Spray angle and atomization in diesel
sprays. SAE Tech. Pap. 841055, 1984.(12) Kamimoto, T.; Ahn, S. K.; Chan, M. Measurement of droplet
diameter and fuel concentration in a non-evaporating diesel spray bymeans of an image analysis of shadow photographs. SAE Tech. Pap.840274, 1984.(13) Arai, M.; Tabata, M.; Hiroyasu, H.; Shimizu, M. Disintegrating
process and spray characterization of fuel jet injected by a diesel nozzle.SAE Tech. Pap. 840275, 1984.(14) Takeuchi, T.; Hiroyasu, H.; Senda, J.; Yamada, K. Droplet size
distribution in diesel fuel spray. Japan Society Mechanical Engineering(JSME), May, 1983; Vol. 26 (215).

816
Energy Fuels 2010, 24, 811–820 : DOI:10.1021/ef900695w Mar�ci�c et al.
Computer Simulation
All data concerning nozzles, obtained partly from technicaldocumentation and partly by measurement, are stored in thedatabase to ensure an easily accessible source of availableinformation at any time. Simulations of common rail anddiesel spray can be put together by combining differentprograms for the simulation of fuel injection systems. Wehave developed computer simulations of various classical andcommon rail injection systems.1,2
Themathematicalmodel of the nozzle is solved numericallyaccording to the Runge-Kutta method of the fourth order,by means of a changeable integration step. The integra-tion step changes during the operation depending upon theinitial integration step, as well as permissible and factualintegration errors. As soon as the factual error exceeds thepermissible error, the step is halved. The program allows10-fold halving of the integration step. In cases processedduring our investigation, no error exceeded a pressure of 0.1bar when the timing prescribed for the initial step of integra-tion ranged between 10 and 20 μs (0.06-0.12 of crank angledegree at 1500 rpm).
The programs run on PCs or ALPHA DS 20 computers.Wehave developed several computer programs for classical
and common rail fuel injection systems; therefore, variouscombinations of programs modeling injection system spraycan be used. Combining programs depends upon the engineequipment.
Measurement Technique
Similar experimental data to those presented below wereprovided earlier by the same group as published in ref 15 andare now used to compare to the computations. A detailedexplanation of themeasurement techniques used canbe foundin ref 16. Because this reference is written in German, a briefdescription of the most import features of the measurementtechniques will be given. The experimental setup is outlined inFigure 11. The engine and optical timing is graphically shownin Figure 12.
The combination of two different lasers and two camerasystems (with camera system 1 containing more than onecamera) allows us to simultaneously detect the Mie scatter-ing of the injected fuel, the laser-induced fluorescence offuel and vapor, the premixed combustion mode, and thediffusion mode. It is possible to detect these four signalson three cameras if one camera is operated in double-shuttermode.
Figure 7. Air/fuel ratio λ vapor and λ total in pre-spray and mainspray for CO1 (n = 1500 rpm, and prail = 800 bar).
Figure 8.Probability of self-ignition in pre-spray andmain spray forCO1 (n = 1500 rpm, and prail = 800 bar).
Figure 9. Air/fuel ratio λ vapor and λ total in pre-spray and mainspray for CO2 (n = 1500 rpm, and prail = 800 bar).
Figure 10. Probability of self-ignition in pre-spray and main sprayfor CO2.
(15) Schmid, M.; Leipertz, A.; Fettes, C. Influence of nozzle holegeometry, rail pressure and pre-injection on injection, vaporisation andcombustion in a single-cylinder transparent passenger car common railengine. SAE Tech. Pap. 2002-01-2665, 2002; Vol. 111, Section 4: Journalof Fuels and Lubricants, pp 1051-1058.
(16) Fettes, C. Untersuchungen zur common-rail-einspritzung f€urPKW-dieselmotoren mittels kombinativer applikation optischer mess-methoden. Dissertation, Friedrich-Alexander-Universit€at Erlangen-N€urnberg, Berichte zur Energie- und Verfahrenstechnik (BEV), Heft2.2, ESYTEC, Erlangen, Germany, 2002.

817
Energy Fuels 2010, 24, 811–820 : DOI:10.1021/ef900695w Mar�ci�c et al.
For the detection of the diffusion flame, which deliverssignificant emission intensities in the visible range of light, anintensified CCD camera was used. It is placed in a housingthat can contain up to four cameras that are individuallytriggered (system 1). The exposure time of the first camera is1 μs.
The detection of the premixed flame, which delivers sig-nificant emission intensities in the UV range, is made by theapplication of a separate intensified UV camera (system 2),placed perpendicular to the first camera. Because of thetransmission character of the filters used and the beamsplitter, only wavelengths in the range of 300-380 nm aredetected by this camera. Its exposure time is also 1 μs. Becausethe fluorescence signal is in the same wavelength range, it canbe acquired in a second exposure of the same camera. There-fore, the UV camera (system 2) is equipped with a double-shutter function. Because the exposure time for the LIF signalacquisition is only 140 ns, no influences of the premixed flamecan be seen. An excimer laser (wavelength, 248 nm; pulse
duration, 20 ns) is used to excite fuel and vapor to fluore-scence, providing relatively strong intensities in theUV range.
ANd:YAG laser is used for the excitation ofMie scatteringat a wavelength of 532 nm (pulse duration, 10 ns) to detect theinjection with a second intensified camera, placed in thehousing of the intensified CCD camera (system 1). A filter isapplied to suppress influences of the combustion signal. Theexposure time is 200 ns.
The detection mirror was placed at the constant axialposition in themiddle of the elongated piston duringmeasure-ments. All of the images presented in the paper are averagedover a hundred cycles.
Comparison of Measured and Calculated Values
This section contains the results of spray and ignitionsimulation, measurements taken in an optically accessibleengine, and a comparison between the computed and mea-sured parameters. All measurements were carried out in asingle-cylinder transparent engine based on the Audi V6engine, equipped with a Bosch common rail injection system.We used a Bosch DLLA 160 PV3 188 667, six-hole mini-sac-hole nozzle with a flow value of μ= 0.77, which is measuredand mainly depends upon the hole shape. The nozzle holeshape can be conical or cylindrical. In our case, the hole shapewas cylindrical. The nozzle flow rate is measured at a pressuredifference of 800 bar on the test stand at steady state for thetime period of 10 s. From eq 29, we calculate flow value μ.
Q ¼ μXi
Ai
ffiffiffiffiffiffiffiffiffi2Δp
Fg
st ð29Þ
The diameter of the flat-bottom piston bowl was 48 mm.The compression ratio of 15.5 was kept constant. Shell dieselfuel was used for engine testing.
A combination of two different lasers and camera systemsallows for15-19 simultaneously detectingMie scattering of the
Figure 11. Optical setup.
Figure 12. Engine and optical timing.
(15) Schmid, M.; Leipertz, A.; Fettes, C. Influence of nozzle holegeometry, rail pressure and pre-injection on injection, vaporisation andcombustion in a single-cylinder transparent passenger car common railengine. SAE Tech. Pap. 2002-01-2665, 2002; Vol. 111, Section 4: Journalof Fuels and Lubricants, pp 1051-1058.
(16) Fettes, C. Untersuchungen zur common-rail-einspritzung f€urPKW-dieselmotoren mittels kombinativer applikation optischer mess-methoden. Dissertation, Friedrich-Alexander-Universit€at Erlangen-N€urnberg, Berichte zur Energie- und Verfahrenstechnik (BEV), Heft2.2, ESYTEC, Erlangen, Germany, 2002.
(17) Fettes, C.; Schraml, S.; Heimg€artner, C.; Leipertz, A. Analysis ofthe combustion process in a transparent passenger car DI-diesel engineby means of multi-dimensional optical measurements techniques. SAETech. Pap. 2000-01-2860, 2000.

818
Energy Fuels 2010, 24, 811–820 : DOI:10.1021/ef900695w Mar�ci�c et al.
injected fuel, the laser-induced fluorescence (LIF) of fuel andvapor, the premixed combustion mode, and the diffusionmode.
The injection process, spray and ignition at 1500 rpm of theengine, and prail = 800 bar are simulated. The key input datafor spray simulation are the injection rate calculated by thefuel injection process program, cylinder pressure, and thepressure in the nozzle sac volume, which is decisive for sprayformation.
This paper presents two cases of two-stage spray simula-tions and measurements. In both cases of operation (CO),the pre-injected fuel amount was 0.65 mg= 0.779 mm3, witha main injected fuel amount of 10 mg = 11.97 mm3. Theinjected fuel is inmillimeters cubed insteadofmilligrams in thepaper, because millimeters cubed is a value more familiaramong diesel engineers. In the first case (CO1), the pre-injection process started at 21� (Figure 3) of the crank shaftbefore top dead center (TDC) and the main injection processstarted at 4� before TDC (Figure 3), whereas, in the secondcase (CO2), the pre-injection process started at 28� and themain injection process started at 11� before TDC (Figure 4).The cylinder pressure pc was 37 and 29 bar in the first andsecond case at the moment of pre-injection, respectively. Themain injection started at a cylinder pressure of 55 and 50 barfor the first (CO1) and second (CO2) cases, respectively.
Congruity was good between the calculated and measuredspray cone angles. The measured spray cone angle for caseCO1 was 7.6� (Figure 3; 1� before TDC) and 10.6� (Figure 4;8� before TDC) for CO2. The calculated spray cone angle was7.76� (Figure 7; main injection) for CO1 and 9.31� (Figure 9;main injection) for CO2. The spray cone for case CO2 isgreater than that forCO1.At themoment of fuel injection, thecylinder pressure is higher for CO1 than for CO2, whichcauses a higher density and temperature of the compressedair; therefore, aerodynamic forces on the spray are greater forCO1 than for CO2, which causes a smaller spray cone.
Themeasured length of fully developed spray at pre-injectionwas 10mm (Figure 3; 20� before TDC) forCO1. The calculatedspray length was 7.9 mm (Figure 7; 20� before TDC). Themeasured length of the fully developed spray length was thesame for CO1 (Figure 3; at TDC) and CO2 (Figure 4; 7� beforeTDC). The calculated spray length was 25 mm for CO1(Figure 7; at TDC) and 24.2 mm for CO2 (Figure 9; 7� beforeTDC).
The spray formation lasts for approximately 3� of the crankshaft (Figure 3; Mie and LIF from 22� to 19�) for CO1 andCO2 at pre-injection. The vaporization of the spray is nearlyfinished at 19� before TDC for CO1 and 26� for CO2. Snap-shots from 19� to 5� before TDC (Figure 3) for CO1 are notshown, because there was no fuel injection. There was noignition (Figure 3) at pre-injection, which is confirmed by theprobability of the self-ignition calculation (Figures 8 and 10).The probability of self-ignition never reached a greater valuethan 0.88 that spreads out over a very small area at the edge ofthe spray.Most of the spray area is covered by a probability ofself-ignition smaller than 0.2.
Figures 7 and 9 show a total air ratio λtot (λ total) in thespray and air ratio λv (λ vapor), where only fuel vapor is takeninto account. More importantly, the air ratio is calculated forthe mixture self-ignition probability, with only the fuel vaporbeing taken into account. The areas λtot = 1 and λv = 1 forpre-injected spray are very small for CO1 (Figure 7), whereasthere are no such areas for CO2 (Figure 9). It is the mainreason prohibiting ignition.
The area λv=1, being decisive for self-ignition, is greater inthe main spray for CO1 (Figure 7; main injection) than forCO2 (Figure 9; main injection), whereas the area λtot = 1 isslightly greater for CO2. The areaswhere λtot= λv=1 do notfully overlap. At CO1, the fuel is injected under a highercylinder pressure and temperature of compressed air, causingmore intensive evaporation of the injected fuel.
Figure 7 showsvariations of λv at z∼ 5mmfor pre-injectionand at z∼ 13 mm for main injection. Smaller variations of λvat z ∼ 11 and 20 mm are also shown in Figure 9 for maininjection. λv variations are caused by strong turbulence in thespray.
The zones with high values of λv and λtot are at the sprayedge (Figures 7 and 9), because of more intensive mixing offuel droplets and vapor with the hot air at the spray edge thanin the spray core. The zones with high λtot values are slightlygreater for CO2 (Figure 9) than for CO1 (Figure 9), whereasthe zones with high λv are slightly greater for CO1 (Figure 7)than for CO2 (Figure 9).
Figures 8 and 10 show the probability of self-ignition forCO1 and CO2. The highest values (from 0.98 to 1) for theprobability of self-ignition areas for CO1 (Figure 8; mainspray) are greater than those for CO2 (Figure 10;main spray).ForCO1, the areawith the highest probability (from0.98 to 1)of self-ignition spreads from the middle of the spray axis andthen runs between the edge and axis of the spray to its end.Small areas with the highest probability of ignition are at theedge and close to the tip of the nozzle. The areas with thehighest probability of ignition lie in the same sector of sprayfor CO2 (Figure 10; main injection) as for CO1 (Figure 8;main injection), but they are smaller. This is the consequenceof smaller λv = 1 area.
Figures 5 and 6 show self-ignition for CO1 and CO2,respectively. The first self-ignition nuclei are observed atTDC for CO1 (Figure 5). The self-ignition nuclei appear atthe last part of 5-6 sprays, where there is the highestcalculated probability of self-ignition (Figure 8). After igni-tion, the flame burns from the outer to the inner regions of thecombustion chamber in the direction of the nozzle. Soon, thewhole combustion chamber is filled by flames.
The first evidence of self-ignition is visible at 7� before TDCfor CO2 (Figure 6). Two of the six sprays ignite in the secondhalf of the spray. In one spray, self-ignition occurs in thesmaller areas of the highest calculated probability (Figure 10;main injection) in the vicinity of the nozzle tip. Only thepremixed combustion was observed in both cases.
The main injection starts at 4� (Figure 3; Mie 4� beforeTDC) for CO1 and 11� of crank shaft rotation for CO2. Thefuel injection process lasts 4� of crank shaft rotation in bothcases. The time lag from the start of the main injection to thefirst evidence of self-ignition is 4� of crank shaft rotation inboth cases. Computer simulations of self-ignition probabilityfor CO1 (Figure 8; main injection at TDC) and CO2(Figure 10; main injection 7� before TDC) confirm theexperimental results. The flame spreads more equally andintensely through the combustion chamber forCO1 (Figure 5)
(18) Fettes, C.; Leipertz, A. Potentials of a piezo-driven passenger carcommon rail system tomeet future emission legislations;Anevaluationbymeans of in-cylinder analysis of injection and combustion. SAETech.Pap. 2001-01-3499, 2001.(19) Fettes, C. Untersuchungen zur common-rail-einspritzung f€ur
PKW-dieselmotoren mittels kombinativer applikation optischer mess-methoden. Dissertation, Technischen Fakult€at, Universit€at Erlangen-N€urberg, Erlangen, Germany, 2002.

819
Energy Fuels 2010, 24, 811–820 : DOI:10.1021/ef900695w Mar�ci�c et al.
than for CO2 (Figure 6) because of the greater area of self-ignition probability for CO1 (Figure 8) than for CO2(Figure 10).
The agreement between the calculated areas of self-ignitionand the measured ones is good for both cases.
Summary
This paper describes computer simulation of diesel sprayand self-ignition nuclei. Diesel spray simulation is based onthe continuity and momentum equation. The entire spray isdivided into small volumes, inwhich theminimum,mean, andmaximum droplet diameters are calculated, as well as thequantities of air and liquid and the evaporated fuel.Moreover,the number of droplets, the total air/fuel ratio, and the air/fuel-vapor ratio are calculated for each volume. The paperdefines a new criterion for the calculation of mixture self-ignition. This criterion is based on the assumption that, as faras consumption and pollution are concerned, combustion ismost efficient in elementary volumes with a stoichiometric airratio. The second assumption refers to fuel dispersion quality;namely, that droplets with diameters of less than 0.0065 mmburn practically as fuel vapors. These two assumptions areused to compute the highest probability for mixture self-ignition. Elementary volumes with the same self-ignitionprobabilities are then joined by a curve to obtain those areasof identical mixture self-ignition probabilities.
Experiments were carried out in a single-cylinder transpa-rent engine based on the Audi V6 TDI engine. The engine isequipped with a BOSCH common rail injection system and asix-hole mini-sac-hole nozzle. The optical part of the experi-mental setup contains a combination of two different lasersand camera systems, which allows for simultaneously detect-ing the Mie scattering of the injected fuel, the laser-inducedfluorescence of fuel and vapor, the premixed combustionmode, and the diffusion mode.
Agreement between the calculated and measured spraycones was excellent. The measured spray cone was 7.6� forCO1 and 10.6� for CO2. The calculated spray cone was 7.76�for CO1 and 9.31� for CO2.
Self-ignition of the combustiblemixture occurred at the endand close to the edge of the spray. Self-ignition also occurredin the vicinity of the nozzle tip. Agreement between measuredand calculated points of self-ignition was relatively good, thusconfirming our criteria of self-ignition.
Some recent analysis has shown20 that the fuel concentrationin the spray varies considerably from one injection to another,with an enormous impact on the self-ignition locationwithin thespray. Therefore, self-ignition locations vary from one injectionto another.One possible solution to overcome this problem is topredict the self-ignition location by its probability.
Equations Formulation. (1) Continuity eq 11 for fuel iscarried out if we insert eqs 5 and 8-10 into eq 2
d
dz
ZuzðtÞCFðtÞdA
� �
¼ d
dz
ZumzðtÞf ðεÞ2CmðtÞf ðεÞ Fa
1-CmðtÞf ðεÞβdA� �
¼ 0
ðA1Þ
If we insert the following relations:
dA ¼ 2πbzxdbzx, ε ¼ bzx
bz, bzx ¼ bzε, dbzx
¼ bzdε, and f ðεÞ ¼ 1-ε1:5 ðA2Þin eq A1, we obtain
d
dz
Z 1
0
umzðtÞCmðtÞ Fa f ðεÞ31-CmðtÞf ðεÞβ2πbz
2εdε
" #
¼ d
dz
Z 1
0
umzðtÞCmðtÞ Fa f ð1-ε1:5Þ31-CmðtÞf ð1-ε1:5Þβ2πbz
2εdε
" #¼ 0
which is eq 11.
(2) Continuity eq 12 for the fuel/airmixture is carried out ifwe insert eqs 5, 8-10, and A2 into eq 3
d
dz
ZFðtÞuzðtÞdA
� �¼ R2πbzðtÞuzðtÞ FmðtÞFa
� �0:5
¼ d
dz
ZumzðtÞf ðεÞ2 Fa
1-CmðtÞf ðεÞβdA� �
d
dz
Z 1
0
umzðtÞ Fa f ð1-ε1:5Þ21-Cm f ð1-ε1:5Þβ2πbz
2εdε
" #
¼ R2πbzðtÞumzðtÞ½FmðtÞFa�0:5 ðA3Þwhich is eq 12.
(3) Momentum eq 13 for the fuel/air mixture is carried outif we insert eqs 5, 7-10, and A2 into eq 4
d
dz
ZFðtÞuz2ðtÞdA
� �-
d
dz
ZpdindA ¼ Fd
d
dz
Z 1
0
Faum2 ð1-ε1:5Þ41-βCmð1-ε1:5Þ2πbz
2εdε
!
-d
dz
Z 1
0
FaΔum2
2
ð1-ε1:5Þ41-βCmð1-ε1:5Þ2πbz
2εdε
!
¼ πb2CdFaum
2
2ðA4Þ
which is eq 13.
Nomenclature
A and Ai = nozzle hole area with diameter Dl
dA= differential of the spray cross-sectionbz = spray radius at distance z from the nozzlebzx = spray local point distancebt = jet radius at the transition pointcpa = specific heat of the surrounding airC = local fuel mass fraction or concentrationCd = air resistance coefficientCm = fuel mass fraction on the spray centerlineD = diffusivityDl = nozzle hole diameterdmz, dmaxz, dminz, and dopt = droplet diameterdV= dzdxdy= elementary volumeFd = aerodynamic drag forcei = number of the nozzle hole
(20) Bruneaux, G. Liquid and spray structure in high-pressurecommon rail diesel injection. Atomization Sprays 2001, 11, 533–556.

820
Energy Fuels 2010, 24, 811–820 : DOI:10.1021/ef900695w Mar�ci�c et al.
kp = thermal conductivitylb = length of the nozzle holeLu = latent heat of vaporizationma = air massme = mass of fuel and air in the elementary volumemg = fuel massmgv = mass of vapor fuel in the elementary volumemgl = mass of liquid fuel in the elementary volumeN= number of droplets in the elementary volumepIV = pressure in the nozzle sac volumeΔp= test pressurePc = cylinder pressureQ(t) = injection characteristicsRe= Reynolds numberst = transition pointSc= Schmidt numbert= timeTa = temperature of the surrounding airTg = temperature at the surface of the dropletu(t) = exit velocity of the fuel at the nozzle holeuz(t) = velocity in the sprayum = velocity in the spray centerline
umz = velocity in the spray centerline at distance zu0 = exit velocity in the nozzle holeΔuz=velocity difference between two cylindrical elementsz = axial distance from the nozzleR = air entrainment coefficientβ = 1 - (Fa/Fg)e = distance from the jet axis/jet radiusjs = stoichiometric fuel/air ratiojr = relative fuel/air ratioη = dynamic viscosityμ = nozzle flow valueν= kinematic viscosityλ= evaporation constant for forced convectionF(t) = local densityFa = air density surrounding the sprayFg = fuel densityΨ = ignition probabilityΨc = ignition probability taking into account the local air
ratioΨd = ignition probability taking into account the fuel
spray dispersion qualityQ = nozzle flow rate