calcium and phosphorus dynamics in commercial laying hens housed in conventional or enriched cage...
TRANSCRIPT
INTRODUCTION Although laying hens have been kept in wire cag-
es since the 1920s (Rahn, 2001), the pressure to shift laying hens from these conventional cages (CC) to al-ternative housing systems necessitates the gathering of sound performance, health, and welfare data that are based on North American conditions (Holt et al., 2011). Enriched cage (EC) systems provide environ-mental enrichment to hens (Hester, 2005; Tactacan et al., 2009); however, environmental changes may lead to alterations in the efficiency with which hens use dietary nutrients (Lay et al., 2011).
For hens, calcium (Ca) and phosphorus (P) are key minerals, and their availability is most crucial during the laying period (De Vries et al., 2010). Calcium con-stitutes approximately 1.5% of hen BW and 40% of eggshell weight (Bolukbasi et al., 2005). It is mainly stored in the form of calcium phosphate in the skeleton (Whitehead and Fleming, 2000) and in the form of cal-cium carbonate in an eggshell (Bolukbasi et al., 2005; Bar, 2009). On the other hand, P, when in excess, is detrimental to eggshell quality (Chandramoni et al., 1998) because it forms insoluble calcium phosphate in the intestine, which renders Ca unusable (De Vries et al., 2010). Phosphorus is required in small amounts for eggshell formation (Taylor, 1965); it influences the egg-forming process (Ahmad and Balander, 2004) because the metabolisms of Ca and P are interrelated (Kebreab et al., 2009). During eggshell formation, P is also used in decreasing blood acidosis by flushing out excess hy-drogen ions through excretion and hence, contributing
Calcium and phosphorus dynamics in commercial laying hens housed in conventional or enriched cage systems
M. Neijat,* J. D. House,*†1 W. Guenter,* and E. Kebreab‡
*Department of Animal Science, and †Human Nutritional Sciences, University of Manitoba, Winnipeg, Canada R3T 2N2; and ‡Department of Animal Science, University of California, Davis 95616
ABSTRACT Calcium (Ca) and phosphorus (P) dynam-ics in Shaver White hens (19–63 wk of age) were com-pared between enriched (EC) and conventional cage (CC) systems. Calcium and P intake and their levels in egg components and excreta were considered. Us-ing commercial levels of production (4,836 hens), 10 test cages/system (24 hens/test cage) were used as rep-licate units. Enriched cages provided a nesting area, scratch pad, perches, and more floor space (643 cm2/hen ) than CC (468 cm2/hen). All birds were offered similar phase-fed diets based on wheat-soybean formu-lation and housed under semicontrolled environmental conditions for 11 periods (28 d each). Egg weight, pro-duction, and shell quality indices (egg specific gravity, shell weight, thickness, and percentage shell) were also measured. Data were analyzed as a repeated measures design using the MIXED procedure of SAS. Egg pro-duction, weight, and shell quality measurements were not significantly different between the 2 systems. On a DM basis, EC hens exhibited lower feed disappearance
than CC hens (92.5 vs. 95.0 ± 0.61 g/hen per day, re-spectively; P < 0.01), and lower Ca and P excretions in manure compared with CC hens (Ca: 2.11 vs. 2.29 ± 0.04 g/hen per day, respectively; P: 0.619 vs. 0.643 ± 0.005 g/hen per day, respectively; P < 0.01). Even though eggs from EC compared with CC had lower Ca deposition (2.07 vs. 2.13 ± 0.01 g/hen per day, respec-tively; P < 0.0001) and output (38.3 vs. 38.8 ± 0.15 mg/g of egg, respectively; P < 0.05), both EC and CC systems exhibited similar Ca outputs in eggs when ex-pressed as a proportion of Ca intake (56.5 vs. 56.6 ± 0.51% Ca intake, respectively). The overall mean P re-tention between EC and CC hens was not significantly different (−7.22 vs. −7.45 ± 0.71% P intake, respec-tively), but Ca retention was higher in EC than CC hens (−1.37 vs. −4.76 ± 0.89% Ca intake, respectively; P < 0.05). In addition to providing environmental en-richment, EC systems may help to reduce Ca and P excretions when compared with CC systems, thereby improving the utilization of these nutrients.
Key words: cage system , calcium , phosphorus , hen
2011 Poultry Science 90 :2383–2396doi: 10.3382/ps.2011-01401
PRODUCTION, MODELING, AND EDUCATION
2383
Received January 27, 2011. Accepted July 3, 2011. 1 Corresponding author: [email protected]
© 2011 Poultry Science Association Inc.
to the maintenance of bicarbonate levels (Pelicia et al., 2009). However, in addition to intake levels, the latter function of P coupled with its subsequent (unintended) release (Whitehead and Fleming, 2000) during the mo-bilization of Ca from medullary bone tissue (Etches, 1987) in the calcification process (Bar, 2009) can influ-ence the amount of P excreted in manure in a given laying period (De Vries et al., 2010).
Although adequate nutrient intake can help in pre-venting birds from draining their skeletal Ca reserves needed for shell formation, structural bone loss (osteo-porosis) is primarily accelerated by a lack of exercise, which leads to the loss of bone volume (Whitehead and Fleming, 2000). The ability of hens to use and deposit Ca and P can differ due to several factors, including nu-trition (Hurwitz and Bar, 1967; Guinotte et al., 1991), physiological status (Gilbert, 1983; Scott and Balnave, 1991), genetics or breed type (Pandey et al., 1986), and management or housing type (Mench et al., 1986; Nor-gaard-Nielsen, 1990; Appleby et al., 2002). Although alternative housing systems have been evaluated for productivity and welfare in birds (Abrahamsson and Tauson, 1995; Vits et al., 2005; Jendral et al., 2008), comparative studies on nutrient dynamics in laying hens housed in different systems are lacking. Therefore, the aim of the present study was to compare Ca and P dynamics in laying hens housed in EC and CC systems in a large-scale production unit. The comparison was based on the assessment of Ca and P flow from feed to egg components and their excretion in manure.
MATERIALS AND METHODS
The experiment was conducted at the University of Manitoba (Winnipeg, Canada) poultry farm in ac-cordance with the recommended code of practice for the care and handling of pullets, layers, and spent fowl (Canadian Agri-Food Research Council, 2003), and fol-lowed the ethical principles within the Guide to the Care and Use of Experimental Animals (Canadian Council on Animal Care, 1993). All experimental procedures were reviewed and approved by the University of Manitoba
Animal Care Protocol Management and Review Com-mittee.
Details on the experimental design for this study have been previously reported (Neijat et al., 2011). In brief, Shaver White pullets, obtained from Manitoba Perfect Pullets Ltd. (Rosenort, MB, Canada), were stocked at a commercial level (4,836 hens) from the age of 19 wk in cages under semicontrolled environmental conditions and were provided with 15 h of light/day. Of these, 10 test cages/system were randomly selected. In this study, an EC unit contained 24 hens (643 cm2/hen of floor space). Each CC unit was divided into 4 parts that contained 6 hens each (468 cm2/hen of floor space). In addition, EC provided a nesting area, roost area with perches, and scratch pads. A full description of the cages has been reported previously (Tactacan et al., 2009). Bird losses from test cages were replaced with spare birds of similar weight from nontest cages to maintain 24 birds per test cage unit.
Diet and Sample CollectionAll hens were offered similar phase-fed diets based on
a wheat-soybean meal mix for 11 periods (28 d each), as recommended for the strain (ISA, 2009). The recom-mended Ca levels were 4.2, 4.3, and 4.4%, and available P levels were 0.45, 0.43, and 0.41% for phase 1 (19–42 wk; periods 1–6), phase 2 (43–54 wk; periods 7–9), and phase 3 (55–63 wk; periods 10 and 11), respectively. Table 1 shows the nutrient composition of the diets provided. Granular limestone (38% Ca) was used as the main source of Ca. All the hens were fed ad libitum in accordance with the Canadian Agri-Food Research Council (2003) and water was provided ad libitum us-ing nipple drinkers. Measurements and sampling were taken in the middle of the 28-d period for 5 consecutive days for each of the 11 periods. Sampling for hen daily egg production, egg weight, and feed disappearance was conducted according to Neijat et al. (2011). Feed disap-pearance included a component of feed wastage, and disappearance was calculated in the middle of each pe-riod as the difference between feed offered and the final weigh back over a 5-d span.
Table 1. Composition of phase-fed diets on DM basis1
Diet composition2
Phase
1 (Period 1–6; 19–42 wk)
2 (Period 7–9; 43–54 wk)
3 (Period 10–11; 55–63 wk)
DM (%) 91.2 ± 0.26 90.1 ± 0.30 89.9 ± 0.41Nitrogen (%) 3.49 ± 0.10 2.93 ± 0.10 2.86 ± 0.10Calcium (%) 4.36 ± 0.42 4.03 ± 0.72 4.67 ± 1.27Phosphorus (Total, %) 0.72 ± 0.03 0.71 ± 0.08 0.68 ± 0.05Phosphorus (Available, %) 0.39 ± 0.002 0.38 ± 0.006 0.35 ± 0.003NDF (%) 12.4 ± 1.04 9.91 ± 0.66 11.7 ± 0.60ADF (%) 4.28 ± 0.31 3.92 ± 0.16 3.39 ± 0.10Crude fat (%) 6.17 ± 0.15 3.28 ± 0.23 2.81 ± 0.26Energy (GE, MJ/kg) 20.5 ± 0.25 17.1 ± 0.37 16.7 ± 0.70
1Data represent means for each phase ± SD.2NDF = neutral detergent fiber; ADF = acid detergent fiber; GE = gross energy.
2384 NEIJAT ET AL.
For the analysis of macrominerals (Ca and P) in feed, manure, and egg components, respective representative subsamples were obtained. In every period, subsamples of 150 to 200 g of feed were obtained from 2 to 3 batch-es of feed supplied to the unit. These were ground to pass through a 1-mm sieve screen before analysis. Ma-nure was collected from each test cage unit using plas-tic trays placed on the conveyor belts underneath each test cage unit during the 5-d collection period. Manure subsamples of 1.5 to 2 kg were obtained and frozen at −20°C before being freeze-dried and finally ground to pass through a 1-mm sieve screen and stored for subse-quent analysis. Consistent with commercial production practices, the collected manure included excreta, spilled water and feed, feathers, and broken eggs. To obtain a representative sample of the manure, total manure output per cage unit was homogenized by use of a mix-ing implement attached to an electric hand drill. In addition, feed spillage was reduced by use of wire mesh (2.5 × 3.8 cm) to cover the feed in the troughs, and the feed was rationed into 2 lots (d 1 and 4). The number of broken eggs was minimized because the cage design in both systems provided a gentle slope, allowing the eggs to roll onto an egg-saver wire, thus minimizing egg breakage before the eggs moved onto the collection belt.
Four eggs from each cage unit were sampled daily during the 5-d collection period and immediately stored in an egg cooler (10–12°C). On d 6, the eggs were re-moved from the cooler and weighed to determine the average egg weight. In total, 20 eggs per cage unit were sampled. Of these, 10 eggs were broken and the yolks were carefully separated from the whites (albumen) us-ing an egg separator. The yolk, white, and shell samples were pooled and homogenized to yield 2 replicates of 5 eggs (1 from each day) for every cage unit, placed in la-beled plastic bags, and weighed. The samples were fro-zen at −20°C, and later freeze-dried and weighed. Cor-responding final freeze-dried weights were taken for the different component samples to determine the DM of the samples. Egg yolk and white samples were crushed using a mortar and pestle, and a coffee grinder was used to grind the eggshells before analysis. For each measurement in the statistical analysis, the averages of 2 replicates per cage unit were used. The remaining 10 eggs per cage unit were reserved for eggshell quality assessment; that is, egg specific gravity, shell weight, thickness, and percentage shell, as described in the fol-lowing section. The influence of the length of storage on eggshell quality parameters (Butcher and Miles, 2004; Jones and Musgrove, 2005) represents a potential source of variability; however, the comparisons between the 2 housing systems were considered under similar barn and storage conditions.
Eggshell Quality AssessmentThe eggs were broken and the shells were carefully
washed with shell membranes intact. They were left to
dry for 2 d at room temperature. Shell weight (weight per egg) was determined on dried shells using a digital scale. Shell thickness was measured with membranes intact using a thickness gauge micrometer (B. C. Ames Co., Waltham, MA), in which the eggshell thickness of a chip was taken from the equator region of the egg. Ten measurements from 10 eggs/cage unit were tak-en, and these observations were averaged to determine the eggshell thickness for each cage unit. The obtained thickness values (in thousandths of an inch) were con-verted into microns by multiplying by 25.4. Egg specific gravity was determined on d 6 for all eggs collected, including those slated for egg component assessments that were stored in an egg cooler (10–12°C) during the sampling period. The Holder and Bradford (1979) method, using sodium chloride solutions ranging in spe-cific gravity from 1.070 to 1.085 in increments of 0.005 units, was used for egg specific gravity determination. The eggs were immersed in solutions with increasing concentrations of salt. The determined specific grav-ity was similar to the density of the solution in which the egg floated and broke the surface. For statistical analysis, eggs that remained submerged in the specific gravity solution of 1.085 were considered to have a spe-cific gravity of 1.090. Percentage shell (with membrane intact) was calculated from the dry shell weight and the egg weight.
Calcium and Total Phosphorus AnalysisSamples of feed (1 to 2 g), manure and egg yolk (0.5
to 1 g), egg white (0.5 to 0.6 g), and eggshell (0.1 to 0.2 g) were put in a furnace at 600°C to ash overnight, according to procedures described by method 942.05 of AOAC (1990). Considering the frothy nature of egg white samples, the furnace temperature was gradually increased from 150°C (for 1 h) to 260°C (for 1 h), then to 427°C (for 1 h) before finally setting it to 600°C over-night. Following method 985.01 of AOAC (2005), the samples were then digested using 10 mL of 1% HNO3 and 5 N HCl for 1 h in a sonication water bath at 60°C. The digests were then mixed by vortex and 10 mL (for feed, and manure and yolk samples), 5 mL (for eggshell samples), and all the digest (for egg white samples) were used for dilution with deionized water in a 100-mL volumetric conical flask. At least 20 mL was filtered through P5 filter paper into scintillation vials. The Ca and P contents were then measured by an inductively coupled plasma mass spectrometer (Varian Inc., Palo Alto, CA).
Nutrient BalanceCalcium and P balances (retention) were calculated
using the amount of each nutrient consumed and sub-tracting the amount of each nutrient that was deposit-ed in the egg and excreted in the manure. Additionally, the percentages of nutrients retained relative to intake were calculated for both Ca and P.
2385CALCIUM AND PHOSPHORUS FLOW OF HENS
Statistical AnalysisA group of 24 hens was randomly assigned to each
of 10 cage units per treatment (cage type of either EC or CC) giving a completely randomized design for cage units. A total of 480 hens were used in the study for both systems. Production performance and other vari-ables were observed in the middle of every period (28 d each) as 5-d averages for all 11 periods. The experiment had a repeated measures design with the cage system as the treatment applied to the main plot (the cage units) and 11 measurements (periods) were taken per cage. Statistical analyses of all dependent variables for the effects of cage system type and time period during the production cycle were carried out using the MIXED procedure of SAS (SAS Inst. Inc., Cary, NC). The sta-tistical model used in the analysis was as follows:
Yijk = µ + ti + cij + pk + tpik + eijk,
where Yijk is the observation on a variable, µ is the model constant, ti is the effect of the cage system (treat-ment i = 1, 2), cij is the effect of the different cage units within a cage system (j = 1 to 10), pk is the effect of the experimental period (k = 1 to 11), tpik is the inter-action between the cage system and the experimental period (treatment × period), and eijk is random error variation. In the repeated measure (split plot design), cij is the error term for the factor applied to the main plots (type of cage system, ti). Experimental period and treatment by period interactions were considered fixed effects applied to the subplot and were tested us-ing the residual error (eijk). Least squares means were estimated for all variables. Means were compared us-ing Tukey’s test. Comparisons giving P-values < 0.05 were considered significant. Studentized residuals were evaluated for each variable and observations where stu-dentized residuals exceeded ± 3 were excluded from the analysis. For most of the variables tested, 0 to 6 obser-vations per variable were dropped as outliers, but when missing observations were noted, as for Ca intakes for period 7 to 11, the new sample size (n) values were in-dicated. In all analyses, the Shapiro-Wilk test was used to evaluate normality of the residuals.
RESULTS
Feed Disappearance, Egg Production, and Weight
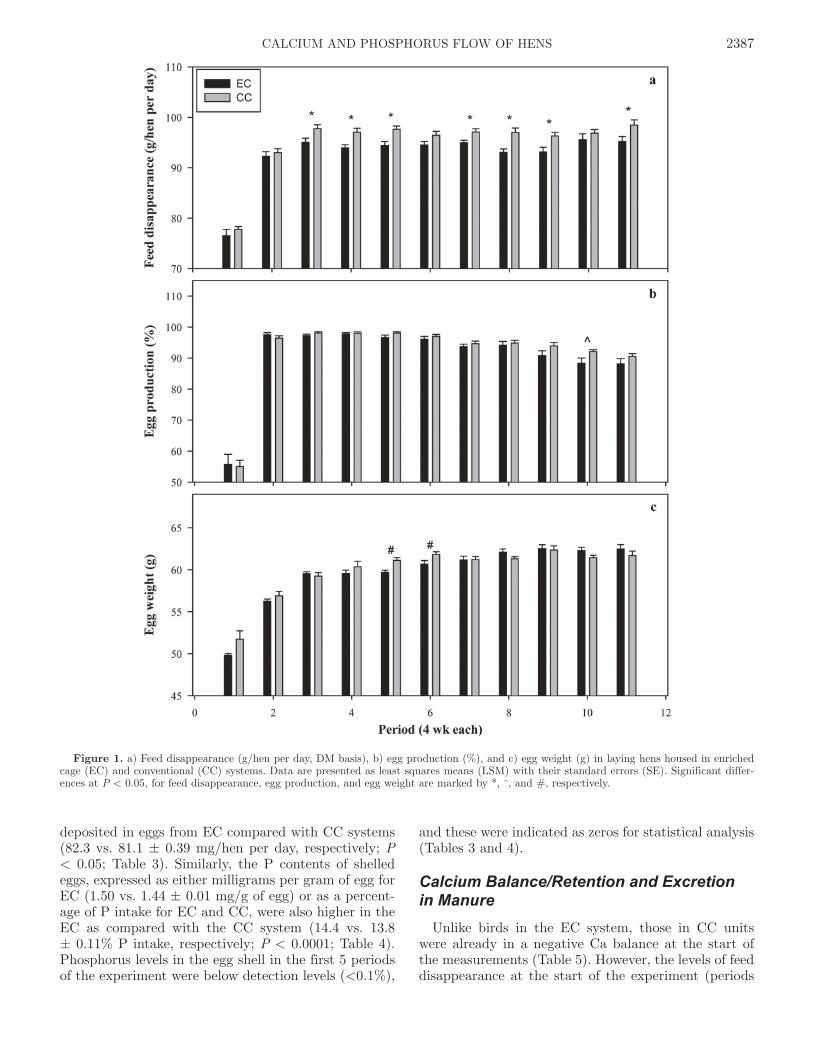
Feed disappearance was higher (P < 0.01) for hens in CC than those in EC (on DM basis, 95.0 and 92.5 ± 0.61 g/hen per day, respectively; Figure 1a). The overall egg production (%/hen per day) and egg weight values were not statistically different between the 2 sys-tems. On average for EC and CC systems, the rate of lay was 90.6 vs. 91.7 ± 0.43% (Figure 1b) and egg weight was 59.7 vs. 59.8 ± 0.24 g (Figure 1c), respec-
tively. Heavier eggs were produced in periods 5 and 6 in the CC system compared with the EC system, showing significant cage by period effects for egg weights (P < 0.001). This may have resulted from the consecutive increases in feed disappearance from periods 3 to 5 for the CC compared with the EC system. During the en-tire production period, irrespective of housing system, all variables tested were influenced by period (age of hen; P < 0.0001).
Calcium and Phosphorus IntakeDuring the course of the study, the values for Ca
intake in periods 7 to 11 were disregarded due to high variation (18 to 27%) in the Ca contents of the compos-ited sample (Table 2). The granular limestone used as the main source of Ca was segregated in the feed during those periods. The lower feed disappearance (P < 0.01) by hens in EC compared with those in CC resulted in lower average daily intakes of Ca (3.97 vs. 4.06 ± 0.03 g/hen, respectively; P < 0.05; Table 2) and P (0.66 vs. 0.68 ± 0.004 g/hen, respectively, P < 0.01; Table 3) for EC hens.
Egg Calcium and Phosphorus ContentsThere were significantly lower Ca contents in egg-
shells from the EC system versus those from the CC system (2.03 vs. 2.10 ± 0.01 g/hen per day, respectively; P < 0.0001; Table 2), equivalent to 37.4 vs. 38.2 ± 0.15 mg/g of egg, respectively (P < 0.01; Table 4). However, Ca output in eggshells, expressed as a percentage of Ca intake, was not significantly different between the EC and CC systems (55.5 vs. 55.3 ± 0.39% Ca intake, respectively; Table 4). Although there was no difference in the overall yolk Ca deposition due to the main effect of housing in the EC and CC systems (34.3 vs. 33.5 ± 0.34 mg/hen per day, respectively; Table 2), higher amounts of Ca were deposited in egg whites obtained from hens housed in the EC compared with the CC system (4.14 vs. 3.83 ± 0.04 mg/hen per day, respec-tively; P < 0.0001; Table 2). Overall, this resulted in EC-housed hens depositing less Ca in a shelled egg (P < 0.0001) compared with their counterparts in the CC system (2.07 vs. 2.13 ± 0.01 g/hen per day, respec-tively), which was equivalent to Ca deposits of 38.3 vs. 38.8 ± 0.15 mg/g of egg, respectively (P < 0.05; Table 4). However, there was no difference between the EC and CC systems in the content of egg Ca intake (56.5 vs. 56.6 ± 0.51% Ca intake, respectively).
Phosphorus deposition or output in individual egg components was not statistically different owing to the main effect of caging in the EC and CC systems, except for in the cage by period interactions (eggshell: 2.57 vs. 2.71 ± 0.18 mg/hen per day; egg white: 3.72 vs. 3.81 ± 0.04 mg/hen per day; egg yolk: 76.0 vs. 74.8 ± 0.46 mg/hen per day, respectively; P < 0.0001 Table 3). However, overall, there were higher levels of P being
2386 NEIJAT ET AL.
deposited in eggs from EC compared with CC systems (82.3 vs. 81.1 ± 0.39 mg/hen per day, respectively; P < 0.05; Table 3). Similarly, the P contents of shelled eggs, expressed as either milligrams per gram of egg for EC (1.50 vs. 1.44 ± 0.01 mg/g of egg) or as a percent-age of P intake for EC and CC, were also higher in the EC as compared with the CC system (14.4 vs. 13.8 ± 0.11% P intake, respectively; P < 0.0001; Table 4). Phosphorus levels in the egg shell in the first 5 periods of the experiment were below detection levels (<0.1%),
and these were indicated as zeros for statistical analysis (Tables 3 and 4).
Calcium Balance/Retention and Excretion in Manure
Unlike birds in the EC system, those in CC units were already in a negative Ca balance at the start of the measurements (Table 5). However, the levels of feed disappearance at the start of the experiment (periods
Figure 1. a) Feed disappearance (g/hen per day, DM basis), b) egg production (%), and c) egg weight (g) in laying hens housed in enriched cage (EC) and conventional (CC) systems. Data are presented as least squares means (LSM) with their standard errors (SE). Significant differ-ences at P < 0.05, for feed disappearance, egg production, and egg weight are marked by *, ^, and #, respectively.
2387CALCIUM AND PHOSPHORUS FLOW OF HENS
1 and 2; Figure 1a) were not different in both systems. Egg production peaked in period 4 when Ca balance for hens in the EC system became positive after being in negative balance in periods 2 and 3. Similarly, Ca balance for hens in the CC system started improving by period 4, although it was still negative. This can be explained by the reduced Ca excretion in manure (Table 2) during periods of higher egg laying (periods 2 to 5; Figure 2a), resulting in a high and positive Ca balance in period 5 for both cage systems (Table 5). Both groups of hens experienced another phase of nega-tive balance after period 5 (as indicated in period 6). Although negative, overall Ca balance was higher (P < 0.05) in EC than CC hens (−1.37 vs. −4.76 ± 0.89% Ca intake, respectively; Table 2). In addition, overall mean manure Ca excretion was found to be significant-ly lower in the EC than CC birds (2.11 vs. 2.29 ± 0.04 g/hen per day, respectively; P < 0.01). This was based on analyzed manure output for EC and CC hens (34.1 vs. 31.0 ± 0.32% DM output, respectively; P < 0.0001; Neijat et al., 2011).
Phosphorus Balance/Retention and Excretion in Manure
Apart from a positive balance in period 1 for both systems, P balance in periods 2 to 6 (in the first half
of the production cycle) were similar to the patterns of Ca balance, with a higher balance in period 5 (Table 5). However, the trend for P balance in the second half of the cycle fluctuated through the remaining periods. The highly positive P balance in period 9 for both groups was likely from high P intake levels in the same period. The explanation for this is not clear because there was no difference in the amount of feed disappearance in both systems. Feed disappearance for period 9 was the same as for period 8 in the EC birds (Figure 1a) and was slightly less than for period 8 for the CC birds, which was reflected in higher retention in both systems for period 9. Moreover, birds in both systems did not have an increase in manure P excretion in period 9 compared with other periods of lesser P intake levels (Figure 2b). Although there was no significant differ-ence in the overall mean P balance between EC and CC systems (−7.22 vs. −7.45 ± 0.71% P intake, respec-tively), manure P excretion was significantly lower in EC than CC hens (619 vs. 643 ± 5.23 mg/hen per day, respectively; P < 0.01; Table 3).
Eggshell Quality and Egg Component Weights
Shell quality measurements are summarized in Table 6. There was no significant difference in the shell qual-
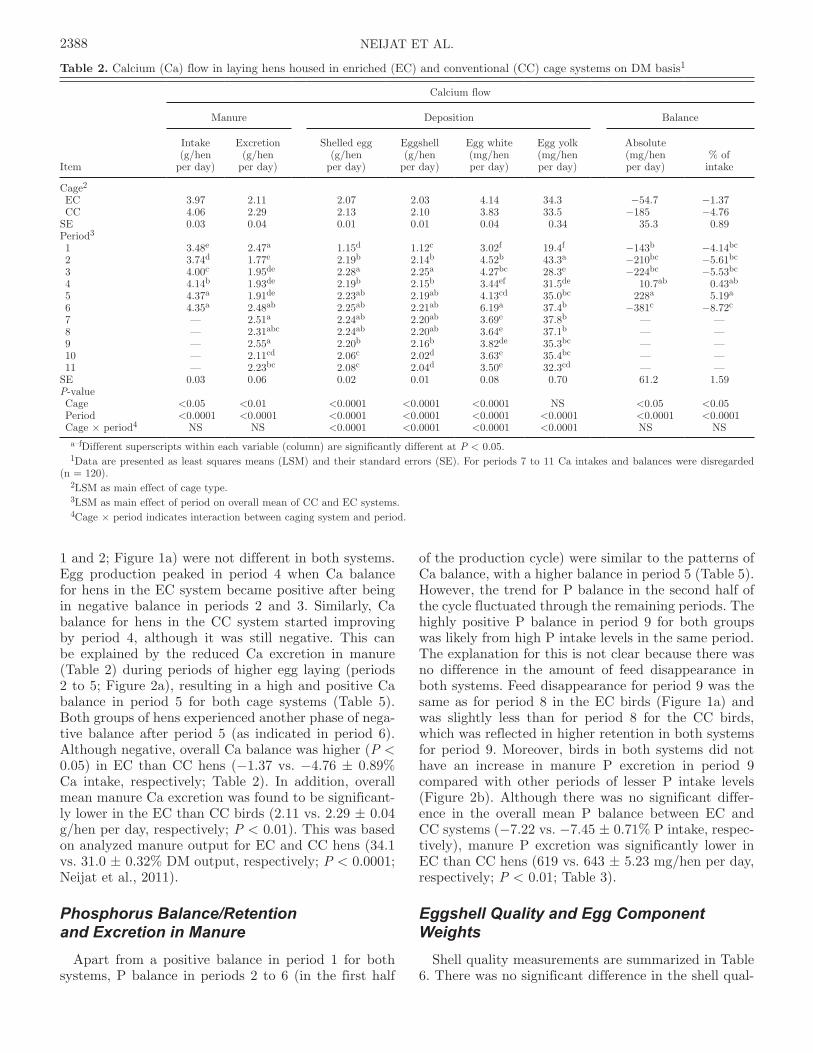
Table 2. Calcium (Ca) flow in laying hens housed in enriched (EC) and conventional (CC) cage systems on DM basis1
Item
Calcium flow
Manure Deposition Balance
Intake (g/hen
per day)
Excretion (g/hen
per day)
Shelled egg (g/hen
per day)
Eggshell (g/hen
per day)
Egg white (mg/hen per day)
Egg yolk (mg/hen per day)
Absolute (mg/hen per day)
% of intake
Cage2
EC 3.97 2.11 2.07 2.03 4.14 34.3 −54.7 −1.37 CC 4.06 2.29 2.13 2.10 3.83 33.5 −185 −4.76SE 0.03 0.04 0.01 0.01 0.04 0.34 35.3 0.89Period3
1 3.48e 2.47a 1.15d 1.12c 3.02f 19.4f −143b −4.14bc
2 3.74d 1.77e 2.19b 2.14b 4.52b 43.3a −210bc −5.61bc
3 4.00c 1.95de 2.28a 2.25a 4.27bc 28.3e −224bc −5.53bc
4 4.14b 1.93de 2.19b 2.15b 3.44ef 31.5de 10.7ab 0.43ab
5 4.37a 1.91de 2.23ab 2.19ab 4.13cd 35.0bc 228a 5.19a
6 4.35a 2.48ab 2.25ab 2.21ab 6.19a 37.4b −381c −8.72c
7 — 2.51a 2.24ab 2.20ab 3.69e 37.8b — — 8 — 2.31abc 2.24ab 2.20ab 3.64e 37.1b — — 9 — 2.55a 2.20b 2.16b 3.82de 35.3bc — — 10 — 2.11cd 2.06c 2.02d 3.63e 35.4bc — — 11 — 2.23bc 2.08c 2.04d 3.50e 32.3cd — —SE 0.03 0.06 0.02 0.01 0.08 0.70 61.2 1.59P-value Cage <0.05 <0.01 <0.0001 <0.0001 <0.0001 NS <0.05 <0.05 Period <0.0001 <0.0001 <0.0001 <0.0001 <0.0001 <0.0001 <0.0001 <0.0001 Cage × period4 NS NS <0.0001 <0.0001 <0.0001 <0.0001 NS NS
a–fDifferent superscripts within each variable (column) are significantly different at P < 0.05.1Data are presented as least squares means (LSM) and their standard errors (SE). For periods 7 to 11 Ca intakes and balances were disregarded
(n = 120).2LSM as main effect of cage type.3LSM as main effect of period on overall mean of CC and EC systems.4Cage × period indicates interaction between caging system and period.
2388 NEIJAT ET AL.
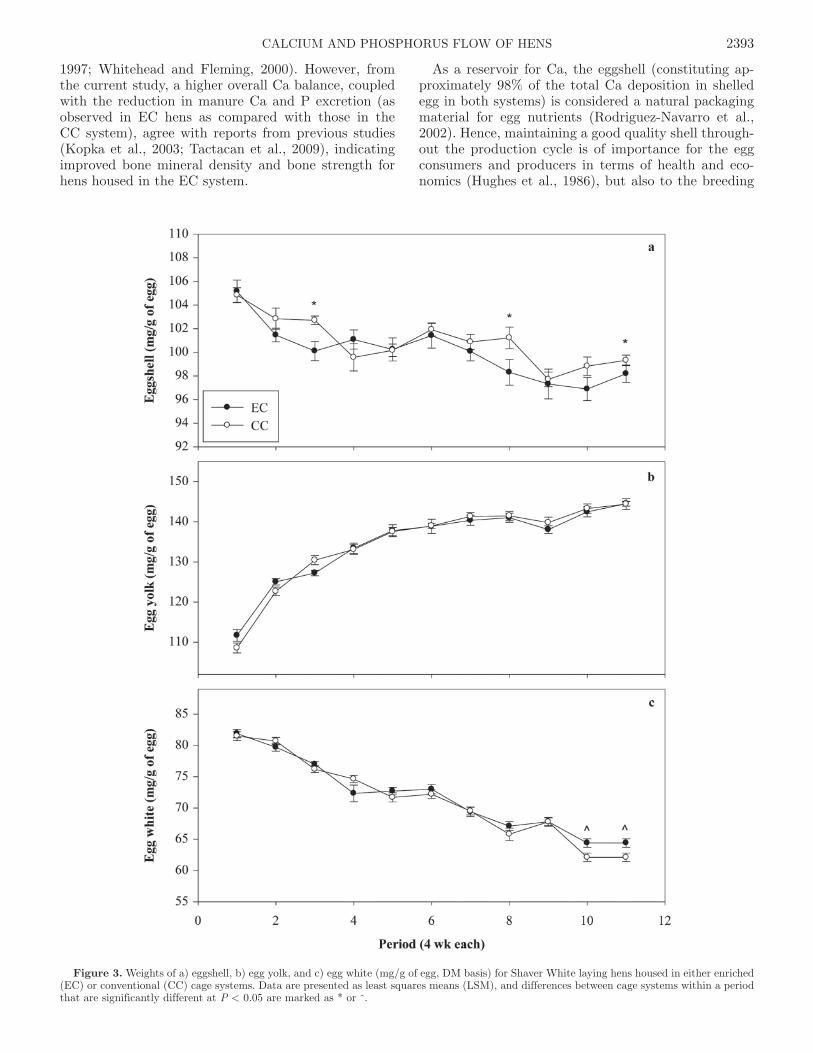
ity assessments for laying hens between the 2 systems of housing. These measures for EC and CC systems included air-dried shell weight (5.79 vs. 5.78 ± 0.03 g/egg), shell thickness (385 vs. 385 ± 1.35 μm), egg spe-cific gravity (1.087 vs. 1.087 ± 0.0001) and percentage of shell (9.72 vs. 9.68 ± 0.04%), respectively. However, there was a cage by period interaction for air-dried egg-shell weight. Air-dried eggshell weight was significantly higher in the EC than the CC system in periods 10 and 11 (6.06 vs. 5.84 g/egg and 5.90 vs. 5.71 ± 0.06 g/egg, respectively; P < 0.05). Similarly, a separate assess-ment of the weights of the different egg components, expressed as mg/g of egg (DM basis), is presented in Figure 3. There was no difference between the EC and CC systems in the overall mean eggshell weight (100.0 vs. 100.9 ± 0.35 mg/g of egg). However, there was a cage by period effect in periods 3, 8, and 11 (P < 0.05; Figure 3a) showing higher values for CC than EC pro-duced eggs. Differences in the 2 measures of eggshell weights could be attributable to the effect of extended cold storage of eggs, which is found to decrease egg weight due to moisture loss (Butcher and Miles, 2004; Jones and Musgrove, 2005). This might have accounted for the observed lower overall eggshell weight in our study compared with a previous study by Valkonen et al. (2010). Consequently, this may influence egg specific gravity (Butcher and Miles, 2004); however, the influ-
ence is equal for both cage systems. Although all 3 egg components changed with age (P < 0.0001; Figure 3), there was no difference in the weights of the other 2 egg components between the 2 systems. On a DM basis for EC and CC hens, egg yolk obtained from both systems weighed 135 ± 0.59 mg/g of egg (P = 0.956; Figure 3b) and egg white weighed 71.8 vs. 71.3 ± 0.31 mg/g of egg, respectively (P = 0.242; Figure 3c).
DISCUSSION
Overall, hens in the EC and CC systems were pro-vided with the recommended intake levels of Ca (3.97 vs. 4.06 ± 0.03 g/hen per day, respectively; Tables 2) in accordance with Roland (1986), NRC (1994), and Chandramoni et al. (1998), and P (657 vs. 675 ± 4.35 mg/hen per day, respectively; Table 3) in accordance with Miles et al. (1983), Chandramoni et al. (1998), and ISA (2009). Although there was no significant dif-ference in egg production and egg weight between the 2 systems, lower Ca and P excretion coupled with higher Ca balance was observed in EC-housed hens. Similarly, there was a lack of significant difference between the 2 systems in the eggshell quality assessments.
The recommended specifications for Ca in a phase-feeding program should be 4.2, 4.3, and 4.4% for 19 to
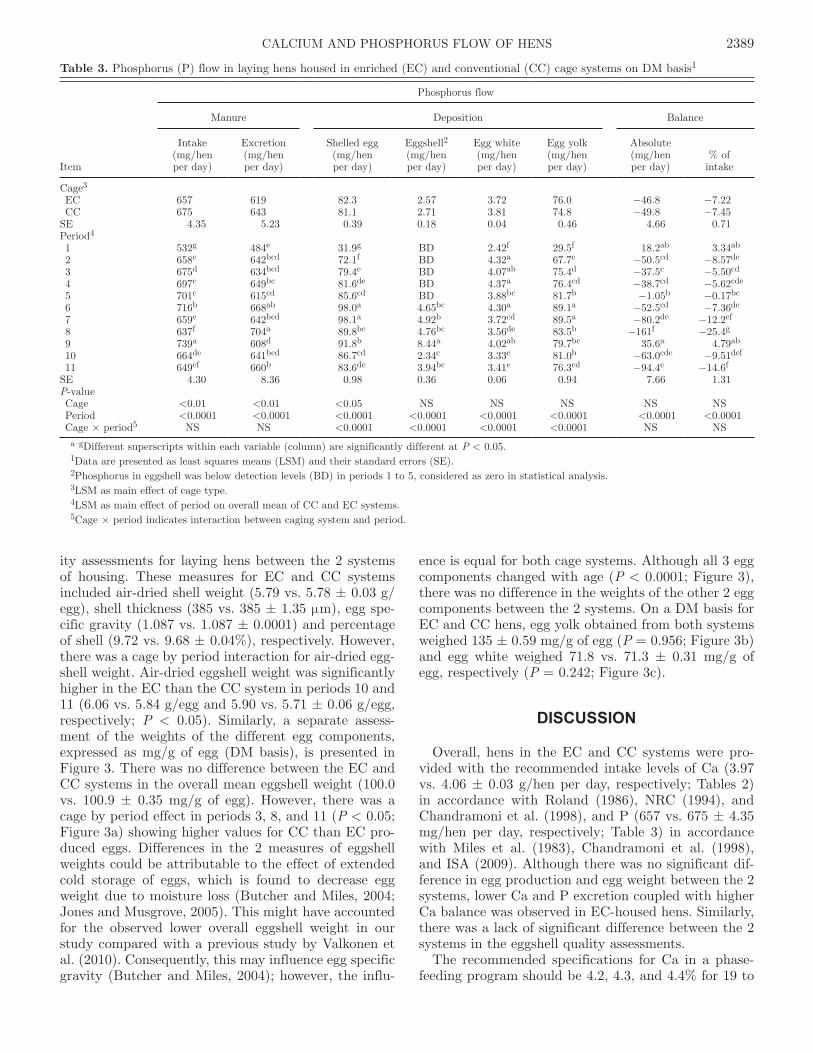
Table 3. Phosphorus (P) flow in laying hens housed in enriched (EC) and conventional (CC) cage systems on DM basis1
Item
Phosphorus flow
Manure Deposition Balance
Intake (mg/hen per day)
Excretion (mg/hen per day)
Shelled egg (mg/hen per day)
Eggshell2 (mg/hen per day)
Egg white (mg/hen per day)
Egg yolk (mg/hen per day)
Absolute (mg/hen per day)
% of intake
Cage3
EC 657 619 82.3 2.57 3.72 76.0 −46.8 −7.22 CC 675 643 81.1 2.71 3.81 74.8 −49.8 −7.45SE 4.35 5.23 0.39 0.18 0.04 0.46 4.66 0.71Period4 1 532g 484e 31.9g BD 2.42f 29.5f 18.2ab 3.34ab
2 658e 642bcd 72.1f BD 4.32a 67.7e −50.5cd −8.57de
3 675d 634bcd 79.4e BD 4.07ab 75.4d −37.5c −5.50cd
4 697c 649bc 81.6de BD 4.37a 76.4cd −38.7cd −5.62cde
5 701c 615cd 85.6cd BD 3.88bc 81.7b −1.05b −0.17bc
6 716b 668ab 98.0a 4.65bc 4.30a 89.1a −52.5cd −7.36de
7 659e 642bcd 98.1a 4.92b 3.72cd 89.5a −80.2de −12.2ef
8 637f 704a 89.8bc 4.76bc 3.56de 83.5b −161f −25.4g
9 739a 608d 91.8b 8.44a 4.02ab 79.7bc 35.6a 4.79ab
10 664de 641bcd 86.7cd 2.34c 3.33e 81.0b −63.0cde −9.51def
11 649ef 660b 83.6de 3.94bc 3.41e 76.3cd −94.4e −14.6f
SE 4.30 8.36 0.98 0.36 0.06 0.94 7.66 1.31P-value Cage <0.01 <0.01 <0.05 NS NS NS NS NS Period <0.0001 <0.0001 <0.0001 <0.0001 <0.0001 <0.0001 <0.0001 <0.0001 Cage × period5 NS NS <0.0001 <0.0001 <0.0001 <0.0001 NS NS
a–gDifferent superscripts within each variable (column) are significantly different at P < 0.05.1Data are presented as least squares means (LSM) and their standard errors (SE).2Phosphorus in eggshell was below detection levels (BD) in periods 1 to 5, considered as zero in statistical analysis.3LSM as main effect of cage type.4LSM as main effect of period on overall mean of CC and EC systems.5Cage × period indicates interaction between caging system and period.
2389CALCIUM AND PHOSPHORUS FLOW OF HENS
42, 43 to 54, and 55 to 63 wk of age; that is, periods 1 to 6, 7 to 9, and 10 and 11, respectively (ISA, 2009). Calcium levels were obtained during periods 1 to 6. However, representative feed samples for periods 7 to 11 were not obtained due to challenges with diet segre-gation, which resulted from the nature of the particu-late limestone used. Therefore, data from these periods were not included in the analysis. Feed disappearance, egg production, and eggshell quality measures were not negatively affected during periods 7 to 11, which im-plied that the challenges experienced in this study re-lated to obtaining representative feed samples were not owing to inaccuracies in feed formulation or delivery of sufficient Ca (or other nutrients) to the hens. Corre-sponding P intakes for periods 7 to 11 were considered because total and available P contents in the feed were within the recommended limits for laying hens (Miles et al., 1983; Chandramoni et al., 1998; ISA, 2009). However, fluctuations in the trend of P balance in both groups of hens in the second half of the laying cycle was likely from levels of dietary Ca, which influence P retention in laying hens (Scheideler and Sell, 1986).
Although feed disappearance in periods 1 and 2 was not significantly different between the 2 systems, hens in the CC system were already in negative Ca balance at the start of the study (Table 5). In sourcing Ca, lay-ing hens obtain the majority from their diet (60–75%),
whereas the remaining 25 to 40% is taken from skel-etal stores (Mueller et al., 1964). Hence, during egg formation, hens must maintain adequate Ca reserves (Roland and Harms, 1973) via actions that affect the extracellular Ca pool of the small intestine (De Vries et al., 2010), principally the anterior portion, which is the major site of Ca absorption (Hurwitz and Bar, 1967). However, it is also important to note that the intestinal capacity to absorb Ca does not reach its maximum at the onset of production, but gradually increases dur-ing the early laying periods (Scott and Balnave, 1991). Therefore, these results imply that, at the beginning of the production cycle, the birds were possibly mobiliz-ing more Ca from bone reserves. This is also supported by the observation of a high positive P balance at the beginning of the production cycle (period 1), with the move to negative P balances in the later periods, sig-nifying that excess P was released as Ca was removed from the bone for shell formation (Boorman and Gu-naratne, 2001; Ahmad and Balander, 2004). This is re-flected in the higher negative Ca balance during the early production periods (P < 0.05). This was exac-erbated by higher Ca deposition in the CC compared with the EC eggs during the early production periods compared with other periods, observed from the trend of Ca outputs in shelled egg or eggshell (Table 4). In addition, regardless of the amount of intake, birds reach
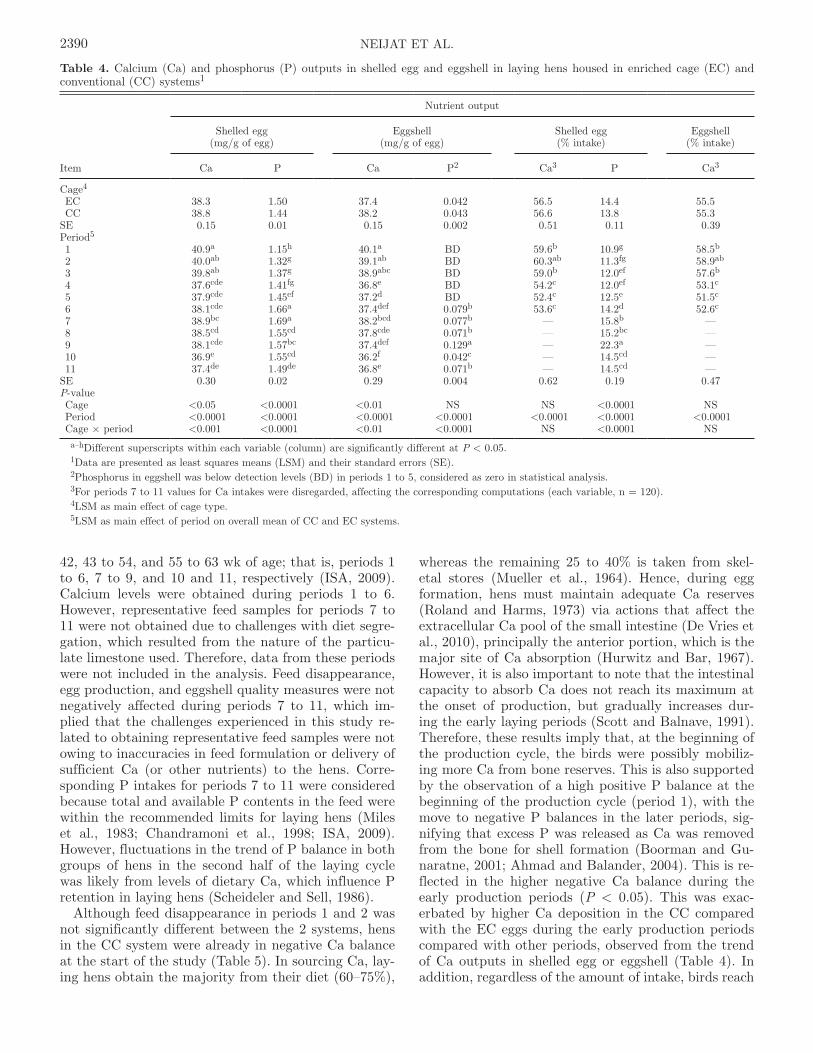
Table 4. Calcium (Ca) and phosphorus (P) outputs in shelled egg and eggshell in laying hens housed in enriched cage (EC) and conventional (CC) systems1
Item
Nutrient output
Shelled egg (mg/g of egg)
Eggshell (mg/g of egg)
Shelled egg (% intake)
Eggshell (% intake)
Ca P Ca P2 Ca3 P Ca3
Cage4
EC 38.3 1.50 37.4 0.042 56.5 14.4 55.5 CC 38.8 1.44 38.2 0.043 56.6 13.8 55.3SE 0.15 0.01 0.15 0.002 0.51 0.11 0.39Period5 1 40.9a 1.15h 40.1a BD 59.6b 10.9g 58.5b
2 40.0ab 1.32g 39.1ab BD 60.3ab 11.3fg 58.9ab
3 39.8ab 1.37g 38.9abc BD 59.0b 12.0ef 57.6b
4 37.6cde 1.41fg 36.8e BD 54.2c 12.0ef 53.1c
5 37.9cde 1.45ef 37.2d BD 52.4c 12.5e 51.5c
6 38.1cde 1.66a 37.4def 0.079b 53.6c 14.2d 52.6c
7 38.9bc 1.69a 38.2bcd 0.077b — 15.8b — 8 38.5cd 1.55cd 37.8cde 0.071b — 15.2bc — 9 38.1cde 1.57bc 37.4def 0.129a — 22.3a — 10 36.9e 1.55cd 36.2f 0.042c — 14.5cd — 11 37.4de 1.49de 36.8e 0.071b — 14.5cd —SE 0.30 0.02 0.29 0.004 0.62 0.19 0.47P-value Cage <0.05 <0.0001 <0.01 NS NS <0.0001 NS Period <0.0001 <0.0001 <0.0001 <0.0001 <0.0001 <0.0001 <0.0001 Cage × period <0.001 <0.0001 <0.01 <0.0001 NS <0.0001 NS
a–hDifferent superscripts within each variable (column) are significantly different at P < 0.05.1Data are presented as least squares means (LSM) and their standard errors (SE).2Phosphorus in eggshell was below detection levels (BD) in periods 1 to 5, considered as zero in statistical analysis.3For periods 7 to 11 values for Ca intakes were disregarded, affecting the corresponding computations (each variable, n = 120).4LSM as main effect of cage type.5LSM as main effect of period on overall mean of CC and EC systems.
2390 NEIJAT ET AL.
a plateau in absorption of around 1 to 1.5 g of Ca/d, yet each eggshell needs a deposit of about 2 g of Ca/d (Simkiss, 1961; Summers et al., 1976). Therefore, Ca supply from intestinal absorption alone is inadequate (Hurwitz and Bar, 1967). It is also possible that by period 5 (36–39 wk of age), when positive Ca balance was achieved, hens in both housing systems could have attained peak Ca retention or their maximum ability to absorb Ca from the intestine. Parkinson and Cransberg (1999) observed peak Ca reserves to occur at 30 wk of age, in a previous study.
The higher overall Ca balance (P < 0.05) and lower manure Ca excretion rate (P < 0.01) observed in EC compared with CC hens are in line with earlier studies by Guru et al. (1974), who noted the influence of the degree of confinement of laying hens (based on floor space and the duration of caging) on the percentage retention of Ca and P, suggesting that the birds kept in severe confinement (smaller cage space) for a pro-longed period tend to excrete larger amounts of Ca with a subsequent decrease in P retention. However, in the current study, although manure P excretion was significantly lower in the EC compared with the CC hens (P < 0.01), no difference was noted in the overall mean P balance between the 2 systems. Although the actual loss of a nutrient in the manure of a given ani-mal may vary with management, diet, and age of the
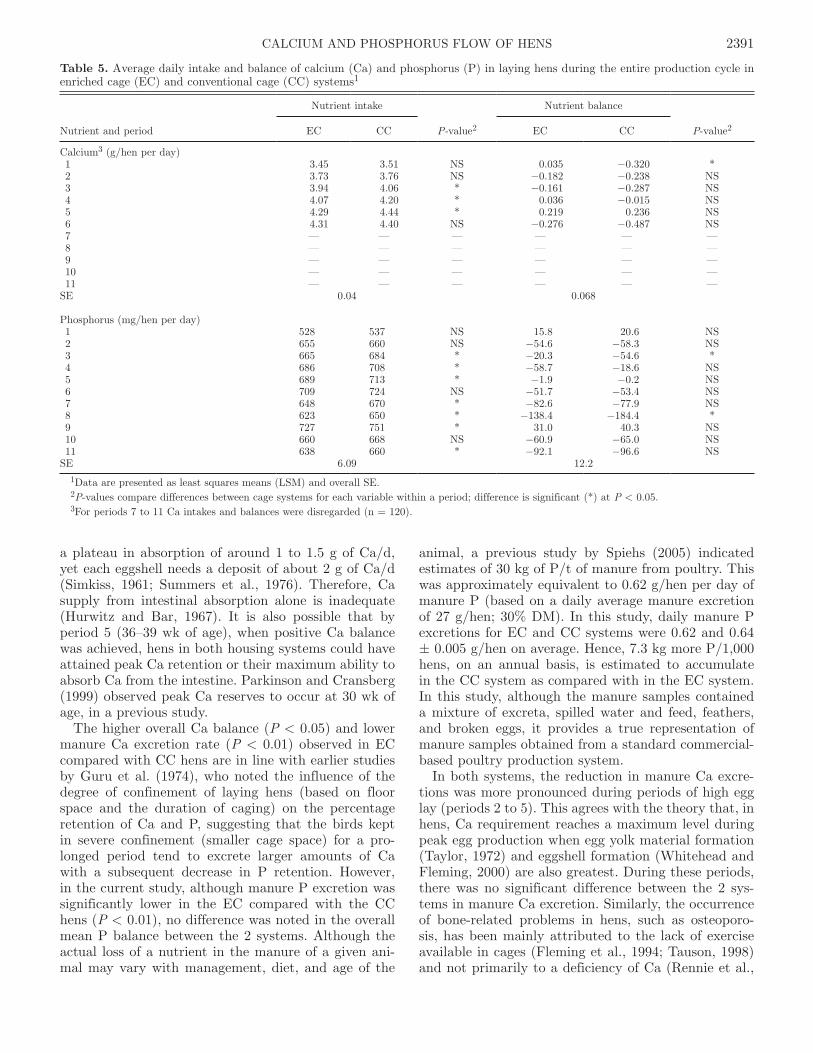
animal, a previous study by Spiehs (2005) indicated estimates of 30 kg of P/t of manure from poultry. This was approximately equivalent to 0.62 g/hen per day of manure P (based on a daily average manure excretion of 27 g/hen; 30% DM). In this study, daily manure P excretions for EC and CC systems were 0.62 and 0.64 ± 0.005 g/hen on average. Hence, 7.3 kg more P/1,000 hens, on an annual basis, is estimated to accumulate in the CC system as compared with in the EC system. In this study, although the manure samples contained a mixture of excreta, spilled water and feed, feathers, and broken eggs, it provides a true representation of manure samples obtained from a standard commercial-based poultry production system.
In both systems, the reduction in manure Ca excre-tions was more pronounced during periods of high egg lay (periods 2 to 5). This agrees with the theory that, in hens, Ca requirement reaches a maximum level during peak egg production when egg yolk material formation (Taylor, 1972) and eggshell formation (Whitehead and Fleming, 2000) are also greatest. During these periods, there was no significant difference between the 2 sys-tems in manure Ca excretion. Similarly, the occurrence of bone-related problems in hens, such as osteoporo-sis, has been mainly attributed to the lack of exercise available in cages (Fleming et al., 1994; Tauson, 1998) and not primarily to a deficiency of Ca (Rennie et al.,
Table 5. Average daily intake and balance of calcium (Ca) and phosphorus (P) in laying hens during the entire production cycle in enriched cage (EC) and conventional cage (CC) systems1
Nutrient and period
Nutrient intake
P-value2
Nutrient balance
P-value2EC CC EC CC
Calcium3 (g/hen per day) 1 3.45 3.51 NS 0.035 −0.320 * 2 3.73 3.76 NS −0.182 −0.238 NS 3 3.94 4.06 * −0.161 −0.287 NS 4 4.07 4.20 * 0.036 −0.015 NS 5 4.29 4.44 * 0.219 0.236 NS 6 4.31 4.40 NS −0.276 −0.487 NS 7 — — — — — — 8 — — — — — — 9 — — — — — — 10 — — — — — — 11 — — — — — —SE 0.04 0.068
Phosphorus (mg/hen per day) 1 528 537 NS 15.8 20.6 NS 2 655 660 NS −54.6 −58.3 NS 3 665 684 * −20.3 −54.6 * 4 686 708 * −58.7 −18.6 NS 5 689 713 * −1.9 −0.2 NS 6 709 724 NS −51.7 −53.4 NS 7 648 670 * −82.6 −77.9 NS 8 623 650 * −138.4 −184.4 * 9 727 751 * 31.0 40.3 NS 10 660 668 NS −60.9 −65.0 NS 11 638 660 * −92.1 −96.6 NSSE 6.09 12.2
1Data are presented as least squares means (LSM) and overall SE.2P-values compare differences between cage systems for each variable within a period; difference is significant (*) at P < 0.05.3For periods 7 to 11 Ca intakes and balances were disregarded (n = 120).
2391CALCIUM AND PHOSPHORUS FLOW OF HENS
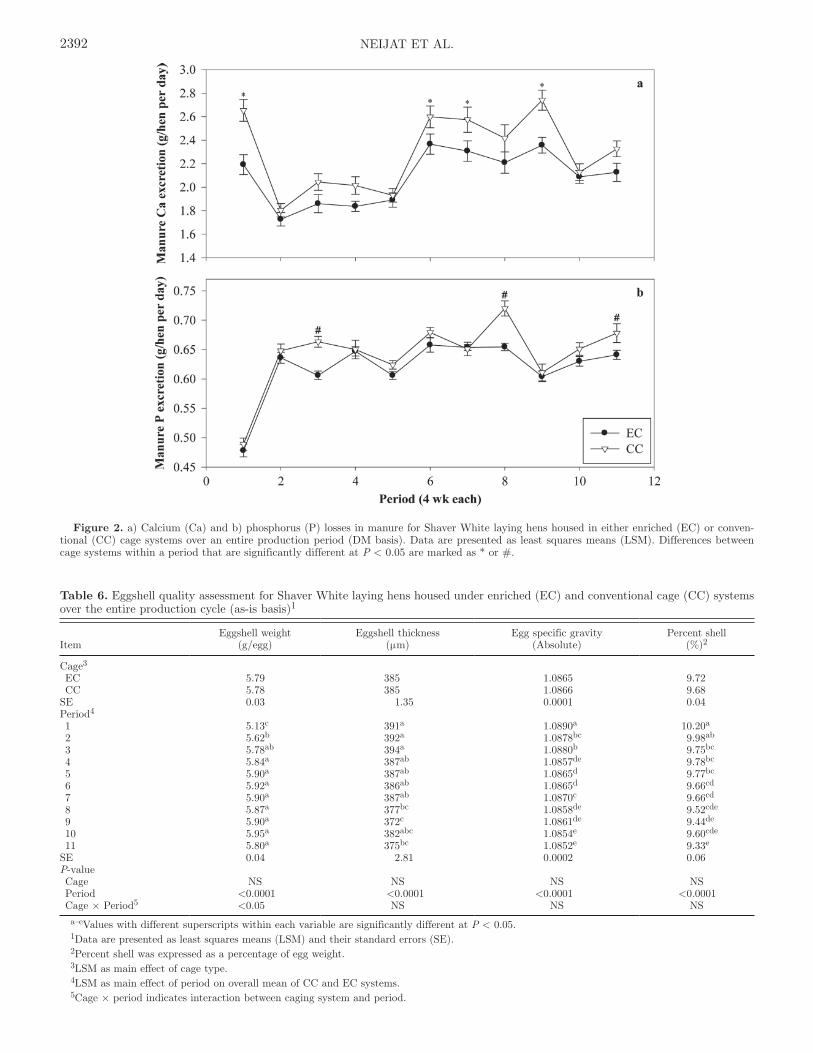
Figure 2. a) Calcium (Ca) and b) phosphorus (P) losses in manure for Shaver White laying hens housed in either enriched (EC) or conven-tional (CC) cage systems over an entire production period (DM basis). Data are presented as least squares means (LSM). Differences between cage systems within a period that are significantly different at P < 0.05 are marked as * or #.
Table 6. Eggshell quality assessment for Shaver White laying hens housed under enriched (EC) and conventional cage (CC) systems over the entire production cycle (as-is basis)1
ItemEggshell weight
(g/egg)Eggshell thickness
(μm)Egg specific gravity
(Absolute)Percent shell
(%)2
Cage3 EC 5.79 385 1.0865 9.72 CC 5.78 385 1.0866 9.68SE 0.03 1.35 0.0001 0.04Period4 1 5.13c 391a 1.0890a 10.20a
2 5.62b 392a 1.0878bc 9.98ab
3 5.78ab 394a 1.0880b 9.75bc
4 5.84a 387ab 1.0857de 9.78bc
5 5.90a 387ab 1.0865d 9.77bc
6 5.92a 386ab 1.0865d 9.66cd
7 5.90a 387ab 1.0870c 9.66cd
8 5.87a 377bc 1.0858de 9.52cde
9 5.90a 372c 1.0861de 9.44de
10 5.95a 382abc 1.0854e 9.60cde
11 5.80a 375bc 1.0852e 9.33e
SE 0.04 2.81 0.0002 0.06P-value Cage NS NS NS NS Period <0.0001 <0.0001 <0.0001 <0.0001 Cage × Period5 <0.05 NS NS NS
a–eValues with different superscripts within each variable are significantly different at P < 0.05.1Data are presented as least squares means (LSM) and their standard errors (SE).2Percent shell was expressed as a percentage of egg weight.3LSM as main effect of cage type. 4LSM as main effect of period on overall mean of CC and EC systems.5Cage × period indicates interaction between caging system and period.
2392 NEIJAT ET AL.
1997; Whitehead and Fleming, 2000). However, from the current study, a higher overall Ca balance, coupled with the reduction in manure Ca and P excretion (as observed in EC hens as compared with those in the CC system), agree with reports from previous studies (Kopka et al., 2003; Tactacan et al., 2009), indicating improved bone mineral density and bone strength for hens housed in the EC system.
As a reservoir for Ca, the eggshell (constituting ap-proximately 98% of the total Ca deposition in shelled egg in both systems) is considered a natural packaging material for egg nutrients (Rodriguez-Navarro et al., 2002). Hence, maintaining a good quality shell through-out the production cycle is of importance for the egg consumers and producers in terms of health and eco-nomics (Hughes et al., 1986), but also to the breeding
Figure 3. Weights of a) eggshell, b) egg yolk, and c) egg white (mg/g of egg, DM basis) for Shaver White laying hens housed in either enriched (EC) or conventional (CC) cage systems. Data are presented as least squares means (LSM), and differences between cage systems within a period that are significantly different at P < 0.05 are marked as * or ^.
2393CALCIUM AND PHOSPHORUS FLOW OF HENS
industry where eggshell porosity is of concern during embryonic development (Reynard and Savory, 1999). The most commonly used indicators of Ca metabolism in layers are shell quality assessment parameters (Gor-don and Roland, 1998). In our study, we considered both the chemical (Ca and P levels) and physical (egg-shell weight, thickness, specific gravity of egg, and per-centage shell) qualities.
With respect to chemical analysis, although there was a lower Ca content in eggshells derived from the EC as compared with the CC system, EC hens were found to be more efficient in depositing Ca into their eggshells. Calcium output in eggshell, expressed as a percentage of Ca intake, was not significantly differ-ent between the 2 systems. This indicates that a lower daily intake of Ca by hens housed in the EC system led to the production of eggs of similar eggshell quality to those obtained from the CC system. The influence of housing environment on egg Ca levels were also noted by Mench et al. (1986), who reported higher Ca levels in eggs from caged hens compared with those in floor pen management systems. On the other hand, although the amount of P deposited in eggshells showed no sig-nificant difference owing to the main effect of housing, the interaction of cage by period effect was highly sig-nificant. This was probably because of the nonunifor-mity of distribution in the amounts of P in the eggshells (Hossain and Bertechini, 1998).
Previous reports regarding eggshell quality from caged hens in EC and CC systems have been contra-dictory. Although Vits et al. (2005) reported stronger eggshells from birds in furnished cages compared with CC, Wall et al. (2002) observed a lower percentage of broken eggs collected from hens in CC compared with furnished cages. Difference in genetic background could also have a direct influence on the parameters of egg quality (Pandey et al., 1986). In the current study, the overall higher Ca content in eggshells in the CC com-pared with the EC system agrees with previous studies that reported a lower percentage of broken eggs in the CC system. However, Guesdon et al. (2006) explained that differences in egg breakage may be because of the influence of cage design elements, including the pres-ence of perches (Duncan et al., 1992; Abrahamsson and Tauson, 1998), rather than specific cage effects. This could also be supported by the current results for physical eggshell quality measurements where no significant differences between the 2 systems were ob-served. Hence, the current data support the findings of Guesdon et al. (2006) in relating an increase in the incidence of egg breakage observed in EC systems to cage design, rather than differences in eggshell quality. Eggshell quality parameters deteriorate with increas-ing age (Riczu et al., 2004), with the exception of egg-shell weight, which increases with age, but at a slower rate compared with the weight of egg yolk (Johnston and Gous, 2007). The latter observations agree with the current results for both systems used in this study
(Table 6). Finally, there were no significant differenc-es between the 2 housing systems in the overall mean weights of the individual egg components (Figure 3). The influence of storage period on egg weight (Jones and Musgrove, 2005) may also explain our observed variations in eggshell weight (Figure 3a) in contrast to close values for egg yolk and egg white weight (Figure 3b and 3c, respectively).
In conclusion, the study showed an overall higher Ca balance and reduced manure Ca and P excretion in hens housed in EC compared with CC systems. Al-though research to explain the biological mechanism by which environmental enrichment may affect nutrient balance in hens is limited, the current results indicate that EC systems may provide better means of utilizing Ca and P. The current data, therefore, provide evidence that nutrient utilization should continue to be a param-eter monitored in studies comparing housing systems for laying hens.
ACKNOWLEDGMENTS
The authors acknowledge financial support from Manitoba Rural Adaptation Council and Manitoba Egg Farmers. Statistical assistance from G. H. Crow and L. Onischuk, and support from technical staff members at the Department of Animal Science, University of Manitoba (Winnipeg, Canada) are highly appreciated. The work is also, in part, supported by the Canada Research Chairs Program and Sesnon Endowed Chair (UC Davis, CA).
REFERENCES
Abrahamsson, P., and R. Tauson. 1995. Aviary systems and conven-tional cages for laying hens. Effects on production, egg quality, health, and bird location in three hybrids. Acta Agric. Scand. A Anim. Sci. 45:191–203.
Abrahamsson, P., and R. Tauson. 1998. Performance and egg qual-ity of laying hens in an aviary system. J. Appl. Poult. Res. 7:225–232.
Ahmad, H. A., and R. J. Balander. 2004. Physiological response of layers to alternative feeding regimen of calcium source and phos-phorus level. Int. J. Poult. Sci. 3:100–111.
Appleby, M. C., A. W. Walker, C. J. Nicol, A. C. Lindberg, R. Freire, B. O. Hughes, and H. A. Elson. 2002. Development of furnished cages for laying hens. Br. Poult. Sci. 43:489–500.
AOAC. 1990. Official Methods of Analysis. 15th ed. AOAC, Wash-ington, DC.
AOAC. 2005. Official Methods of Analysis of AOAC International. 18th ed. AOAC, Washington, DC.
Bar, A. 2009. Calcium transport in strongly calcifying laying birds: Mechanisms and regulation. Comp. Biochem. Physiol. Part A 152:447–469.
Bolukbasi, S. C., S. Çelebi, and N. Utlu. 2005. The effects of calcium and vitamin D in diet on plasma calcium and phosphorus, egg-shell calcium, and phosphorus levels of laying hens in late laying production period. Int. J. Poult. Sci. 4:600–603.
Boorman, K. N., and S. P. Gunaratne. 2001. Dietary phosphorus supply, egg-shell deposition, and plasma inorganic phosphorus in laying hens. Br. Poult. Sci. 42:81–91.
Butcher, G. D., and R. D. Miles. 2004. Egg specific gravity — De-signing a monitoring program. University of Florida. IFAS Ex-
2394 NEIJAT ET AL.
tension. Accessed Mar. 2011. http://edis.ifas.ufl.edu/pdffiles/VM/VM04400.pdf.
Canadian Agri-Food Research Council. 2003. Recommended code of practice for the care and handling of pullets, layers, and spent fowl. CARC, Ottawa, Ontario, Canada.
Canadian Council on Animal Care. 1993. Guide to the Care and Use of Experimental Animals. 2nd ed. E. D. Olfert, B. M. Cross, A. A. McWilliam, ed. CCAC, Ottawa, Ontario, Canada.
Chandramoni, B., Jadhao, and R. P. Sinha. 1998. Effect of dietary calcium and phosphorus concentrations on retention of these nu-trients by caged layers. Br. Poult. Sci. 39:544–548.
De Vries, S., R. P. Kwakkel, and J. Dijkstra. 2010. Dynamics of calcium and phosphorus metabolism in laying hens. Pages 133–150 in Phosphorus and Calcium Utilization and Requirements in Farm Animals. D. M. S. S. Vitti and E. Kebreab, ed. CAB International, Wallingford, UK.
Duncan, E. T., M. C. Appleby, and B. O. Hughes. 1992. Effect of perches in laying cages on welfare and production of hens. Br. Poult. Sci. 33:25–35.
Etches, R. J. 1987. Calcium logistics in the laying hen. J. Nutr. 117:619–628.
Fleming, R. H., C. C. Whitehead, D. Alvey, N. G. Gregory, and L. J. Wilkins. 1994. Bone structure and breaking strength in lay-ing hens housed in different husbandry systems. Br. Poult. Sci. 35:651–662.
Gilbert, A. B. 1983. Calcium and reproductive function in the hen. Proc. Nutr. Soc. 42:195–212.
Gordon, R. W., and D. A. Roland Sr.. 1998. Influence of supplemen-tal phytase on calcium and phosphorus utilization in laying hens. Poult. Sci. 77:290–294.
Guesdon, V., A. M. H. Ahmed, S. Mallet, J. M. Faure, and Y. Nys. 2006. Effects of beak trimming and cage design on laying hen performance and egg quality. Br. Poult. Sci. 47:1–12.
Guinotte, F., Y. Nys, and F. De Monredon. 1991. The effects of particle size and origin of calcium carbonate on performance and ossification characteristics in broiler chicks. Poult. Sci. 70:1908–1920.
Guru, V. K., S. K. Saxena, and S. P. Netke. 1974. Some effects of confinement on laying pullets. Br. Poult. Sci. 15:333–337.
Hester, P. Y. 2005. Impact of science and management on the wel-fare of egg laying strains of hens. Poult. Sci. 84:687–696.
Holder, D. P., and M. V. Bradford. 1979. Relationship of specific gravity of chicken eggs to number of cracked eggs observed and percent shell. Poult. Sci. 58:250–251.
Holt, P. S., R. H. Davies, J. Dewulf, R. K. Gast, J. K. Huwe, D. R. Jones, D. Waltman, and K. R. Willian. 2011. The impact of different housing systems on egg safety and quality. Poult. Sci. 90:251–262.
Hossain, S. M., and A. G. Bertechini. 1998. Effect of varying man-ganese and available phosphorus levels in the diet on egg produc-tion and eggshell quality of layers. Anim. Feed Sci. Technol. 71:303–308.
Hughes, B. O., A. B. Gilbert, and M. F. Brown. 1986. Categorisation and causes of abnormal eggshells: Relationship with stress. Br. Poult. Sci. 27:325–337.
Hurwitz, S., and A. Bar. 1967. Calcium metabolism of hens secreting heavy or light eggshells. Poult. Sci. 46:1522–1527.
ISA. 2009. Shaver. Nutrition management guide commercials, 2009–10. Accessed Oct. 2010. http://www.isapoultry.com/down-loads/1/nutrition_management_guide_commercials_isa_white.pdf.
Jendral, M. J., D. R. Korver, J. S. Church, and J. J. R. Feddes. 2008. Bone mineral density and breaking strength of White Leghorns housed in conventional, modified, and commercially available colony battery cages. Poult. Sci. 87:828–837.
Johnston, S. A., and R. M. Gous. 2007. Modelling the changes in the proportions of the egg components during a laying cycle. Br. Poult. Sci. 48:347–353.
Jones, D. R., and M. T. Musgrove. 2005. Effects of extended storage on egg quality factors. Poult. Sci. 84:1774–1777.
Kebreab, E., J. France, R. P. Kwakkel, S. Leeson, H. D. Kuhi, and J. Dijkstra. 2009. Development and evaluation of a dynamic model of calcium and phosphorus flows in layers. Poult. Sci. 88:680–689.
Kopka, M. N., H. W. Cheng, and P. Y. Hester. 2003. Bone mineral density of laying hens housed in enriched versus conventional cages. Poult. Sci. 82(Suppl. 1):29. (Abstr.)
Lay, D. C. Jr., R. M. Fulton, P. Y. Hester, D. M. Karcher, J. B. Kjaer, J. A. Mench, B. A. Mullens, R. C. Newberry, C. J. Nicol, N. P. O’Sullivan, and R. E. Porter. 2011. Hen welfare in different housing systems. Poult. Sci. 90:278–294.
Mench, J. A., A. V. Tienhoven, J. A. Marsh, C. C. McCormic, D. L. Cunningham, and R. C. Baker. 1986. Effects of cage and floor pen management on behavior, production, and physiological stress responses of laying hens. Poult. Sci. 65:1058–1069.
Miles, R. D., A. P. T. Costa, and R. H. Harms. 1983. The influence of dietary phosphorus levels on laying hen performance, eggshell quality, and various blood parameters. Poult. Sci. 62:1033–1037.
Mueller, W. J., R. Schraer, and H. Schraer. 1964. Calcium metabo-lism and skeletal dynamics of laying pullets. J. Nutr. 84:20–26.
NRC. 1994. Nutrient Requirements of Poultry. 9th ed. National Academy of Sciences, Washington, DC.
Neijat, M., J. D. House, W. Guenter, and E. Kebreab. 2011. Pro-duction performance and nitrogen flow of Shaver White layers housed in enriched or conventional caged systems. Poult. Sci. 90:543–554.
Nørgaard-Nielsen, G. 1990. Bone strength of laying hens kept in an alternative system, compared with hens in cages and on deep-litter. Br. Poult. Sci. 31:81–89.
Pandey, N. K., C. M. Mahapatra, S. S. Verma, and D. C. Johari. 1986. Effect of strain on physical egg quality characteristics in White Leghorn chickens. Int. J. Poult. Sci. 21:304–307.
Parkinson, G., and P. Cransberg. 1999. Early egg production: The relationship between calcium nutrition, appetite, growth, pro-duction, and skeletal development. Pages 1–24. A report for the Rural Industries Research and Development Corporation. June 1999. RIRDC Project No: DAV-143A. RIRDC, Attwood, Victo-ria, Australia.
Pelicia, K., E. A. Garcia, A. B. G. Faitarone, A. P. Silva, D. A. Berto, A. B. Molino, and F. Vercese. 2009. Calcium and avail-able phosphorus levels for laying hens in second production cycle. Braz. J. Poult. Sci. 11:39–49.
Rahn, A. P. 2001. Caged laying hen well-being: An economic per-spective. Pages 19–32 in Proc. 52nd North Central Avian Dis-ease Conf. and Symp. The Science Behind Poultry Husbandry, Grand Rapids, MI. Animal Health Diagnostic Laboratory and College of Veterinary Medicine, Michigan State University, Grand Rapids.
Rennie, J. S., R. H. Fleming, H. A. McCormack, C. C. McCorquo-dale, and C. C. Whitehead. 1997. Studies on effects of nutritional factors on bone structure and osteoporosis in laying hens. Br. Poult. Sci. 38:417–424.
Reynard, M., and C. J. Savory. 1999. Stress-induced oviposition de-lays in laying hens: Duration and consequences for eggshell qual-ity. Br. Poult. Sci. 40:585–591.
Riczu, C. M., J. L. Saunders-Blades, A. K. Yngvesson, F. E. Robin-son, and D. R. Korver. 2004. End-of-cycle bone quality in white- and brown-egg laying hens. Poult. Sci. 83:375–383.
Rodriguez-Navarro, A., O. Kalim, Y. Nys, and J. M. Garcia-Ruiz. 2002. Influence of the microstructure on the shell strength of eggs laid by hens of different ages. Br. Poult. Sci. 43:395–403.
Roland, D. A., Sr. 1986. Eggshell quality III: Calcium and phospho-rus requirements of commercial Leghorns. World’s Poult. Sci. J. 42:154–163.
Roland, D. A., Sr., and R. H. Harms. 1973. Calcium metabolism in the laying hen. 5. Effect of various sources and size of calcium carbonate on shell quality. Poult. Sci. 55:369–372.
Scheideler, S. E., and J. L. Sell. 1986. Effects of calcium and phase-feeding phosphorus on production traits and phosphorus reten-tion in two strains of laying hens. Poult. Sci. 65:2110–2119.
Scott, T. A., and D. Balnave. 1991. Influence of temperature, dietary energy, nutrient concentration, and self-selection feeding on the retention of dietary energy, protein, and calcium by sexually-maturing egg-laying pullets. Br. Poult. Sci. 32:1005–1016.
Simkiss, K. 1961. Calcium metabolism and avian reproduction. Biol. Rev. Camb. Philos. Soc. 36:321–367.
Spiehs, M. J. 2005. Nutritional and feeding strategies to minimize nutrient losses in livestock manure (M1188). Accessed Nov. 2010.
2395CALCIUM AND PHOSPHORUS FLOW OF HENS
http://www.extension.umn.edu/distribution/livestocksystems/M1188.html.
Summers, J. D., R. Grandhi, and S. Leeson. 1976. Calcium and phos-phorus requirements of the laying hen. Poult. Sci. 55:402–413.
Tactacan, G. B., W. Guenter, N. J. Lewis, J. C. Rodriguez-Lecompte, and J. D. House. 2009. Performance and welfare of laying hens in conventional and enriched cages. Poult. Sci. 88:698–707.
Tauson, R. 1998. Health and production in improved cage designs. Poult. Sci. 77:1820–1827.
Taylor, T. G. 1965. Dietary phosphorus and eggshell thickness in domestic fowl. Br. Poult. Sci. 6:79–87.
Taylor, T. G. 1972. The role of calcium in egg production. Pages 107–111 in Egg Formation and Production. Symp. 8. Eds. B. M. Freeman, and P. E. Lake. Br. Poult. Sci. Ltd., Edinburgh, Scotland.
Valkonen, E., E. Venalainen, L. Rossow, and J. Valaja. 2010. Effects of calcium diet supplements on egg strength in conventional and furnished cages, and effects of 2 different nest floor materials. Poult. Sci. 89:2307–2316.
Vits, A., D. Weitzenburger, H. Hamann, and O. Distl. 2005. Produc-tion, egg quality, bone strength, claw length, and keel bone de-formities of laying hens housed in furnished cages with different group sizes. Poult. Sci. 84:1511–1519.
Wall, H., R. Tauson, and K. Elwinger. 2002. Effect of design, pas-sages, and hybrid on use of nest and production of layers in furnished cages. Poult. Sci. 81:333–339.
Whitehead, C. C., and R. H. Fleming. 2000. Osteoporosis in cage layers. Poult. Sci. 79:1033–1041.
2396 NEIJAT ET AL.