c-fos expression in preoptic nuclei as a marker of sleep rebound in the rat
TRANSCRIPT
BEHAVIORAL NEUROSCIENCE
c-Fos expression in preoptic nuclei as a marker of sleeprebound in the rat
Daniela Dentico,1 Roberto Amici,1 Francesca Baracchi,1,2 Matteo Cerri,1 Elide Del Sindaco,1 Marco Luppi,1
Davide Martelli,1 Emanuele Perez1 and Giovanni Zamboni11Department of Human and General Physiology, Alma Mater Studiorum-University of Bologna, Piazza P.ta S. Donato, 2, I-40126Bologna, Italy2Research Division, Department of Anesthesiology, University of Michigan, Ann Arbor, MI, USA
Keywords: c-Fos, cold exposure, median preoptic nucleus, P-CREB, ventrolateral preoptic nucleus
Abstract
Thermoregulation is known to interfere with sleep, possibly due to a functional interaction at the level of the preoptic area (POA).Exposure to low ambient temperature (Ta) induces sleep deprivation, which is followed by sleep rebound after a return to laboratoryTa. As two POA subregions, the ventrolateral preoptic nucleus (VLPO) and the median preoptic nucleus (MnPO), have beenproposed to have a role in sleep-related processes, the expression of c-Fos and the phosphorylated form of the cAMP ⁄ Ca2+-responsive element-binding protein (P-CREB) was investigated in these nuclei during prolonged exposure to a Ta of )10 �C and inthe early phase of the recovery period. Moreover, the dynamics of the sleep rebound during recovery were studied in a separategroup of animals. The results show that c-Fos expression increased in both the VLPO and the MnPO during cold exposure, but not ina specific subregion within the VLPO cluster counting grid (VLPO T-cluster). During the recovery, concomitantly with a large rapid eyemovement sleep (REMS) rebound and an increase in delta power during non-rapid eye movement sleep (NREMS), c-Fos expressionwas high in both the VLPO and the MnPO and, specifically, in the VLPO T-cluster. In both nuclei, P-CREB expression showedspontaneous variations in basal conditions. During cold exposure, an increase in expression was observed in the MnPO, but not inthe VLPO, and a decrease was observed in both nuclei during recovery. Dissociation in the changes observed between c-Fosexpression and P-CREB levels, which were apparently subject to state-related non-regulatory modulation, suggests that the sleep-related changes observed in c-Fos expression do not depend on a P-CREB-mediated pathway.
Introduction
The preoptic area (POA) is known to be a key structure in theregulation of body temperature (Romanovsky, 2007), and has beenclearly recognized as a sleep-promoting site (Szymusiak et al., 2007),probably representing the diencephalic substrate of the integrationbetween thermoregulation and sleep-related processes (Parmeggiani,2003). A relevant feature of the POA is that almost 25% of neuronstherein increase their activity at sleep onset and ⁄ or during sleepoccurrence (Szymusiak et al., 2007). It has been proposed that twoPOA subregions, the ventrolateral preoptic nucleus (VLPO) and themedian preoptic nucleus (MnPO), may have a key role in sleep-relatedprocesses on the basis of the results of unit recording (Szymusiaket al., 1998; Suntsova et al., 2002, 2007), anatomical tracer (Sherinet al., 1996, 1998; Steininger et al., 2001; Uschakov et al., 2007) andimmunohistochemical studies (analysis of c-Fos expression) (Morgan& Curran, 1991; Sherin et al., 1996; Gong et al., 2000, 2004). Sleepdeprivation studies have suggested that, in both nuclei, c-Fosactivation is related to sleep occurrence and ⁄ or to an increase insleep pressure (Gong et al., 2004; Gvilia et al., 2006a,b).
Exposure to low ambient temperature (Ta) represents a useful toolfor inducing physiological sleep deprivation, which is followed by asleep rebound after a return to normal laboratory conditions(Parmeggiani, 2003). The thermoregulatory impairment that charac-terizes rapid eye movement sleep (REMS) makes cold exposureparticularly challenging for REMS (Parmeggiani, 2003; Heller, 2005).In particular, during prolonged exposure to very low Tas, REMSpressure was shown to increase dramatically, leading to an intenseREMS rebound during the following recovery (Amici et al., 1994,1998, 2008; Cerri et al., 2005). Extreme cold is apparently lesschallenging for non-rapid eye movement sleep (NREMS), as, under a24-h exposure to a Ta of )10 �C protocol, the changes in both NREMSamount and the power density in the delta band of the electroenceph-alogram were smaller than those observed in REMS amount, duringboth the exposure and the following recovery (Cerri et al., 2005).In the present study, in order to better assess the role of the VLPO
and MnPO in sleep-related processes under a long-term physiologicalsleep deprivation protocol, c-Fos expression was studied duringprolonged exposure to a Ta of )10 �C and the subsequent earlyrecovery at laboratory Ta. In addition, as prolonged exposure to a Ta of)10 �C was shown to dampen the maximum accumulation capacity ofthe second messenger cAMP at the POA level (Zamboni et al., 1996,1999, 2004), the expression of the phosphorylated form of the
Correspondence: Dr Giovanni Zamboni, as above.E-mail: [email protected]
Received 4 December 2008, revised 11 June 2009, accepted 16 June 2009
European Journal of Neuroscience, Vol. 30, pp. 651–661, 2009 doi:10.1111/j.1460-9568.2009.06848.x
ª The Authors (2009). Journal Compilation ª Federation of European Neuroscience Societies and Blackwell Publishing Ltd
European Journal of Neuroscience
constitutive transcription factor cAMP ⁄ Ca2+-responsive element-binding protein (P-CREB), a key activator of c-fos transcription(Herdegen & Leah, 1998), was studied in parallel. Furthermore, sleepparameters were studied in a separate group of animals during earlyrecovery following a 48-h exposure to a Ta of )10 �C, as data on thesize of the NREMS rebound under these conditions were missing.Preliminary results have already been presented in abstract form (DelSindaco et al., 2006; Dentico et al., 2008a,b).
Materials and methods
Animals and experimental approaches
Male Sprague–Dawley rats (Charles River; 250–300 g at the begin-ning of experimental sessions) were used. The animals wereacclimated to a normal laboratory Ta and to a 12-h ⁄ 12-h light ⁄ darkcycle (light: 09:00–21:00 h; 100–150 lux at cage level); food andwater were available ad libitum. The experiments were approved bythe Ethical Committee of the University of Bologna under thesupervision of the National Health Authority (Ministero della Sanita)in accordance with European Union Directive 86 ⁄ 609 ⁄ EEC. Animalcare was under the direct control of the University Veterinary Service.The experiment was carried out on two separate groups of animals bymeans of two experimental approaches: one behavioral, studying thechanges in the wake–sleep cycle; and the other immunohistochemical,studying cFos and P-CREB expression at the VLPO and MnPO levels.
Wake–sleep study
Experimental plan
Ten animals, previously adapted to normal laboratory conditions(Ta, 25.0 ± 1.0 �C), were placed under general anesthesia [diazepam(Valium;Roche, Basel, Switzerland), 5 mg ⁄ kg, intramuscular, followedby ketamine-HCl (Ketalar; Parke-Davis, Milan, Italy), 100 mg ⁄ kg,intraperitoneal] and were implanted epidurally with two stainless steelelectrodes for electroencephalographic (EEG) recording. Also, athermistor (B10KA303N; Thermometrics, Northridge, CA, USA)mounted inside the tip of a stainless steel needle was implanted tomeasure hypothalamic temperature (Thy). The plugs connecting elec-troencephalography electrodes and the thermistor to the recordingapparatus were embedded in acrylic dental resin anchored to the skull bysmall stainless steel screws. The animals were allowed to recover fromsurgery and to adapt to the recording apparatus for at least 1 week. Therats were individually kept in Plexiglas cages, placed in a thermoreg-ulated and sound-attenuated box, which, in turn, was placed in a sound-attenuated room. The EEG activity, Thy and motor activity (MA) of eachanimal were continuously recorded during each experimental session,except between 09:00 h and 09:15 h, when cage bedding, water andfood were changed.The experimental protocol for EEG recordings consisted of
consecutive 24-h recording sessions. Following 2 days of recordingfor the baseline condition, the animals were exposed for 48 h (n = 10)to low Ta ()10.0 ± 1.0 �C). The exposure started at the onset (09:00 h)of the light period of the light ⁄ dark cycle. Following cold exposure,the animals were allowed to recover at a Ta of 25 �C.
Analysis of sleep–wake state data
User software was developed (QuickBASIC) to handle the data. Ineach experiment, the EEG signal was amplified and filtered (high-passfilter, )40 dB at 0.35 Hz; low-pass filter, )6 dB at 60 Hz; digitalnotch filter, )40 dB at 50 Hz), and after AD conversion (sampling
rate: electroencephalography, 128 Hz) stored on a PC (486 ⁄ 100DX-4). The EEG signal was subjected to on-line fast Fouriertransform, and EEG power values were obtained for 4-s epochs inthe delta (0.75–4.0 Hz), theta (5.5–9.0 Hz) and sigma (11.0–16.0 Hz)bands. The Thy signal was amplified (1 �C ⁄ 1 V) before AD conversion(sampling rate, 8 Hz). MA was monitored by means of a passiveinfrared detector (PID10; Siemens, Munich, Germany) placed at thetop of each cage. The signal was amplified and integrated before ADconversion (sampling rate, 8 Hz), to make the output proportional tothe amplitude and duration of movement.EEG signals, Thy and MA were visually scored to determine the
beginning and end of each REMS episode. The main criteria used forthis assessment were based on the analysis of EEG signals, MA, andThy (Cerri et al., 2005). Particular consideration was given to thechanges in Thy. For example, a REMS episode was considered to havebegun only if the EEG changes associated with this sleep stage (i.e.high theta power, low delta power, and low sigma power) wereconcomitant with an increase in Thy. Moreover, a REMS episode wasconsidered to be over only if the EEG and postural changes wereassociated with a decrease in Thy. On the basis of these criteria, thetransition periods from either NREMS to REMS or REMS towakefulness were not scored as REMS. The time for the minimalduration of a REMS episode was fixed at 8 s. Following the removalof REMS epochs and that of the 4-s epochs that showed EEG artifacts,an automatic procedure allowed us to separate being wakefulness fromNREMS, according to a procedure that has been extensively discussedpreviously (Cerri et al., 2005).Data relative to the first 5 h of the light period (09:00 h to 14:00 h)
of the baseline (BL) and of a 5-h period at a Ta of 25 �C following 48 hat a Ta of )10 �C (RE48) for the following sleep parameters are shown inthe present article: (i) hourly amount of REMS; (ii) hourly amount ofNREMS; and (iii) relative power density in the delta band of theelectroencephalogram in NREMS. In order to allow a comparison ofthe intensity of the sleep rebound following either a 24-h or a 48-hexposure to a Ta of )10 �C, data relative to the 5-h period of recovery ata Ta of 25 �C following a 24-h exposure to a Ta of )10 �C (RE24) (n = 6)are also shown in the present article. This analysis represents a newelaboration of data from a previous experiment (Cerri et al., 2005).
Statistical analysis
Statistical analysis was performed by means of repeated measuresanova (spss 9.0; SPSS, Chicago, IL, USA) for both the time spent inNREMS and REMS and power density in the delta EEG band inNREMS. Significance levels were pre-set at P < 0.05. A number ofpre-selected post hoc comparisons, allowing the data relative to each5-h period of recovery (RE24; RE48) to be compared with the respectiveaverage BL values, were made by means of the modified t-statistics(t*) and Bonferroni’s correction of the significance level (Wallensteinet al., 1980). Total degrees of freedom [nk)1; n = number of subjects(six for RE24; 10 for RE48); k = number of treatments (10)] werepartitioned as follows: between subjects (n)1); within subjects[n (k)1)], subdivided in between treatments (k)1), and residual[(n)1) (k)1)]. Thus, the degrees of freedom for the residual were 45for RE24 and 81 for RE48.
Immunohistochemical approach
Experimental plan
Twenty-four animals, previously adapted to the normal laboratoryconditions (Ta, 23.0 ± 1.0 �C), were used. Animals were individuallyhoused 24 h before the start of the experimental session. They were
652 D. Dentico et al.
ª The Authors (2009). Journal Compilation ª Federation of European Neuroscience Societies and Blackwell Publishing LtdEuropean Journal of Neuroscience, 30, 651–661
then randomly assigned to one of the following seven experimentalconditions, starting at lights-on (Fig. 1): (i) two control conditions, inwhich animals were kept for either 5 h (C5, n = 3) or 24 h (C24,n = 3) at normal laboratory Ta, in order to match the time schedule oftreatments; (ii) three cold exposure conditions, in which animals werekept for either 5 h (E5, n = 4), 24 h (E24, n = 3) or 48 h (E48, n = 3)at low Ta ()10.0 ± 1.0 �C). The 5-h exposure condition wasintroduced to test the acute response to cold exposure (Cano et al.,2003); and (iii) two recovery conditions, in which animals wereallowed to spend 5 h at normal laboratory Ta after either a 24-h (R5-E24, n = 4) or a 48-h (R5-E48, n = 4) exposure to a Ta of )10 �C.
During cold exposure, in order to maintain water availability, bottleswere renewed twice a day. At the end of each experimental condition,rats were killed under ether anesthesia by intra-aortic perfusion with300 mL of a cold fixative solution of 4% paraformaldehyde, precededby a wash with 100 mL of cold 0.01 m phosphate-buffered saline. Theinduction time of the ether anesthesia ranged from 1 min 40 s to 2 min50 s, a time largely insufficient to produce ether-induced P-CREBexpression (Kovacs & Sawchenko, 1996). Brains were post-fixed in4% paraformaldehyde (Sigma-Aldrich, St Louis, MO, USA) at 4 �Cfor 4–6 h.
Immunohistochemistry
Following 60–72 h of immersion in a 20% sucrose solution, brainswere frozen by dipping them for 10 min in 2-methylbutane (Merck,Darmstadt, Germany) cooled with dry ice, and were then stored at)80 �C. The immunohistochemical procedures were carried outconcurrently on subgroups of three brains. Consecutive coronalsections were cut at 40 lm on a freezing microtome (Frigocut;Reichert-Jung, Leica Microsystems Nussloch GmbH, Wetzlar, Ger-many). Sections were processed as following: one out of every fivewas stained with cresyl violet [Paxinos & Watson (1998), modifiedaccording to Geisler et al. (2002)], in order to reveal the anatomicalstructures; the other four out of the five were alternately processed forc-Fos and P-CREB immunohistochemistry, so that two sections out offive were stained for c-Fos antigen and two for P-CREB antigen.
For immunohistochemical staining, free-floating sections wereincubated with rabbit anti-c-Fos primary antiserum (cat. no. PC38,Ab-5, 1 : 20 000; Calbiochem, La Jolla, CA, USA) or rabbit anti-
P-CREB immunopurified IgG (cat. no. 06-519, 1 : 1000; Upstate,Lake Placid, NY, USA) on a shaking table for 72 h or 48 h,respectively, at 4 �C. For technical reasons, two different lots of theanti-P-CREB primary antibody were used for two different groups of12 animals. The differences between the two lots were tested in thestatistical analysis of the results, where a factor ‘antibody lot’ wasintroduced (see below). Sections were then incubated with abiotinylated goat anti-rabbit IgG (cat. no. BA-1000, 1 : 200; VectorLaboratories, Burlingame, CA, USA) for 2 h at room temperature, andsubsequently reacted with biotinylated horseradish peroxidase pre-incubated with avidin (AB complex, cat. no. PK-4000, 1 : 100; VectorVectastain ABC kit standard; Vector Laboratories) and developed with3,3¢-diaminobenzidine tetrahydrochloride (Sigma-Aldrich; 0.05 mgper 100 mL) to produce a brown reaction product in cell nuclei.In order to test the specificity of antibodies, the primary antibody
was routinely omitted and replaced with normal rabbit serum for c-Fos(cat. no. S-5000, 1 : 20 000; Vector Laboratories) and with normalrabbit IgG for P-CREB (cat. no. I-1000, 1 : 1000; Vector Laborato-ries) at the proper dilutions. The specificity of antibodies was alsotested after the pre-adsorption of the primary antibody with a highconcentration of the specific immunizing peptide [cFos peptide-2, cat.no. PP10, 10 lg per 100 lL antiserum (Calbiochem); P-CREBimmunizing peptide, cat. no. 12-378, 10 lm (Upstate)]. In both tests,nuclear staining was absent. After staining, the sections were mountedon gelatinized slides, dehydrated through graded alcohol, andcoverslipped with DPX mountant for histology.
Analysis of immunohistochemical data
Images were acquired by means of a color digital video camera(CoolSnap, Pro Color; Media Cybernetics, Silver Spring, MD,USA) adapted to a Leitz Diaplan microscope (Leica MicrosystemsGmbH, Wetzlar, Germany) equipped with a motorized xyz stage(Media Cybernetics), under a 10· objective (with 0.30 numericalaperture) and standardized lighting conditions. The images wereanalysed blindly by using Image Pro Plus 4.5 (Media Cybernet-ics), without applying any adjustment for brightness or contrast.Digital images were segmented in order to separate the stained areafrom the background. The positive threshold value, identified in apilot study to match visual counting, was normalized for eachspecimen on the basis of the background intensity value. For c-Fos-stained sections, each object counted by the image analysis programwas visually checked under the microscope in order to separateindividual cell nuclei if they were clustered as a single object,carefully focusing up and down in order not to miss cell nucleipiled on top of one another; only objects exceeding 10 lm2 wereconsidered to be positive nuclei. This standardized method of cellcounting was validated against two independent observers. For P-CREB-stained sections, owing to the very large number of stainednuclei, the quantification was not made in terms of number ofpositive nuclei but in terms of the stained area. This method waspreviously validated by comparing the number of positive nucleiand the stained areas for c-Fos-stained sections.All quantifications were calculated for standardized rectangular
grids placed over the selected areas of interest (see Fig. 2 for depictionof the grids). The VLPO counting grids (Lu et al., 2002) were placedon all the immunohistochemically stained sections between )0.05 mmand )0.55 mm from bregma (Paxinos & Watson, 2005): (i) the VLPOcluster grid was 300 lm wide by 300 lm high, placed along the baseof the brain, with its far border 400 lm lateral to the lateral edge of theoptic chiasm, just medial to the diagonal band of Broca; (ii) the medialextended VLPO grid was medial to the VLPO cluster grid, 400 lm
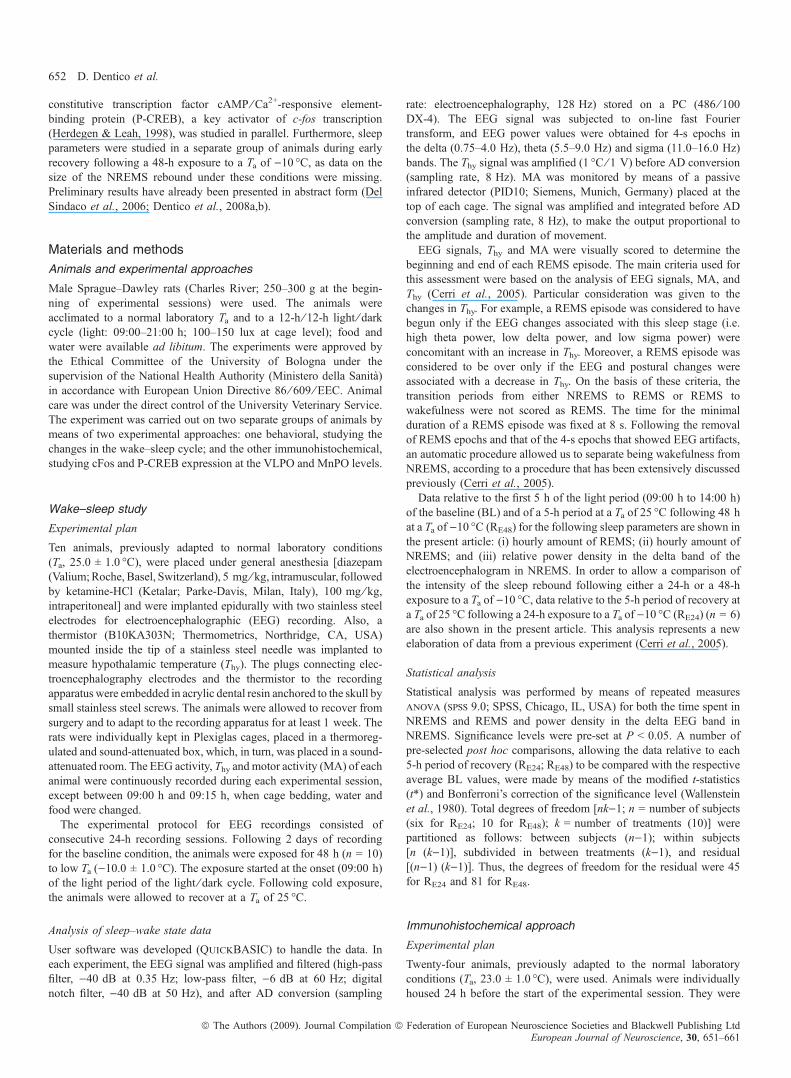
Fig. 1. Schematic representation of the experimental protocol. Each boxrepresents either a 12-h (long) or a 5-h (short) period. The last 24 h of theacclimation period are also represented. Light gray, normal laboratory ambienttemperature (Ta 23.0 ± 1.0 �C); dark gray, low Ta ()10.0 ± 1.0 �C). L, light; D,dark; C5, 5 h at a Ta of 23 �C; C24, 24 h at a Ta of 23 �C; E5, 5 h at a Ta of)10 �C; E24, 24 h at a Ta of )10 �C; E48, 48 h at a Ta of )10 �C; R5-E24, 5 h ata Ta of 23 �C following 24 h at a Ta of )10 �C; R5-E48, 5 h at a Ta of 23 �Cfollowing 48 h at a Ta of )10 �C.
Sleep-related activation of VLPO and MnPO 653
ª The Authors (2009). Journal Compilation ª Federation of European Neuroscience Societies and Blackwell Publishing LtdEuropean Journal of Neuroscience, 30, 651–661
wide by 300 lm high; and (iii) the dorsal extended VLPO grid was200 lm wide by 300 lm high, positioned above the VLPO cluster andmedial extended VLPO grids and centered over their border. TheMnPO was examined at both the rostral and the caudal level:(i) the rostral MnPO grid was placed immediately over the vascularorgan of the lamina terminalis, which surrounds the third ventricle(+0.40 mm to +0.12 mm from bregma) (Paxinos & Watson, 2005),and was composed of three 300 · 300 lm squares arranged in theshape of a horseshoe [with the two lateral frames shifted 150 lmdown in relation to the central frame; modified from Peterfi et al.(2004)]; (ii) the caudal ventral MnPO grid was placed immediatelydorsal to the third ventricle, centered on the midline (+0.12 mm to)0.28 mm from bregma) (Paxinos & Watson, 2005), extending150 lm from the midline bilaterally, and from 100 lm to 800 lm,with 100-lm steps, dorsally, according to the rostrocaudal changes innucleus shape [modified from Gong et al. (2000)]; and (iii) the caudaldorsal MnPO grid was placed immediately dorsal to the anteriorcommissure level centered on the midline (+0.04 mm to )0.28 mmfrom bregma) (Paxinos & Watson, 2005), extending 150 lm from themidline bilaterally, and 100 lm or 200 lm dorsally according to therostrocaudal changes in nucleus shape [modified from Gong et al.(2000)].For each VLPO division, cell counts were made bilaterally in five
sections for each antigen, and averaged to yield a single value for each ratand antigen. For the rostral, caudal ventral and caudal dorsalMnPO, cellcounts were made in three, five and four sections, respectively, for eachantigen and referred to the following dimensions of the counting grids:900 · 300 lm for the rostral MnPO, 300 · 600 lm for the caudalventral MnPO, and 300 · 200 lm for the caudal dorsal MnPO. Theywere then averaged to yield a single value for each rat and antigen. Thesizes of both c-Fos-labeled and P-CREB-labeled nuclei were determinedfor each experimental condition and for each nucleus from an overallsample of 840 cell nuclei. As the diameters (mean ± SEM) of c-Fos-labeled (12.32 ± 0.15 lm) and P-CREB-labeled (10.97 ± 0.10 lm)nuclei were homogeneous among the seven experimental groups, andour experimental plan was only aimed at comparing experimentalconditions, we did not use a correction factor for cell size to compare thedifferent groups (Guillery & Herrup, 1997).
Statistical analysis
Statistical analysis was performed with spss 9.0 (SPSS). As thestandard deviation and the mean of the samples varied in directproportion, logarithmic (ln) transformation of the data was performed(Snedecor & Cochran, 1991). For each nucleus, antigens wereanalysed separately, and the experiment was organized according toa factorial (a · b) design. Factor a, the nuclear division factor, hadthree levels for VLPO (VLPO cluster, medial extended VLPO, anddorsal extended VLPO) and three levels for MnPO (rostral MnPO,caudal ventral MnPO, and caudal dorsal MnPO). Factor b, theexperimental condition factor, had seven levels (C24, E24, E48, C5,E5, R5-E24, and R5-E48) for both nuclei. Only for P-CREB antigenwas the experimental plan modified to a three-level factorial(a · b · c) design, in which factor c had two levels (antibody lot 1and antibody lot 2), in order to test a possible influence of the differentlots on the results.Results were evaluated by using univariate analysis of variance
(anova). Significance levels were pre-set at P < 0.05. Pre-plannedcontrasts (between mean values of grouped data) were carried outaccording to the following: (i) (C24 ⁄ E24 ⁄ E48) vs. (C5 ⁄ E5 ⁄R5-E24 ⁄ R5-E48); (ii) (E24 ⁄ E48) vs. C24; (iii) E48 vs. E24; (iv)(C5 ⁄ R5-E24 ⁄ R5-E48) vs. E5; (v) (R5-E24 ⁄ R5-E48) vs. C5; and (vi)R5-E48 vs. R5-E24. Pre-selected post hoc comparisons were also set:C5 vs. C24; E5 vs. C5; E24 vs. C24; E48 vs. C24; R5-E24 vs. C5;R5-E48 vs. C5; R5-E24 vs. E24; R5-E48 vs. E48; and (R5-E24 ⁄ R5-E48)vs. (E24 ⁄ E48). Significance levels were determined by means of theFisher F-test for pre-planned contrasts and by means of t* andsequential Bonferroni correction of the significance level (Holm, 1979;Wallenstein et al., 1980) for post hoc comparisons. Total degrees offreedom [nk)1; n = number of subjects (24); k = number of indepen-dent measures in different nuclear divisions (3)] were partitioned asfollows:
1. c-Fos: between groups, ab)1 [a, levels of factor a (3); b, levels offactor b (7)]; within groups (residual), (nk)1))(ab)1) = 71)20 =51. However, for c-Fos (VLPO), owing to the presence ofa significant two-way interaction, three independent one-wayanovas were performed for each nuclear division, with degrees
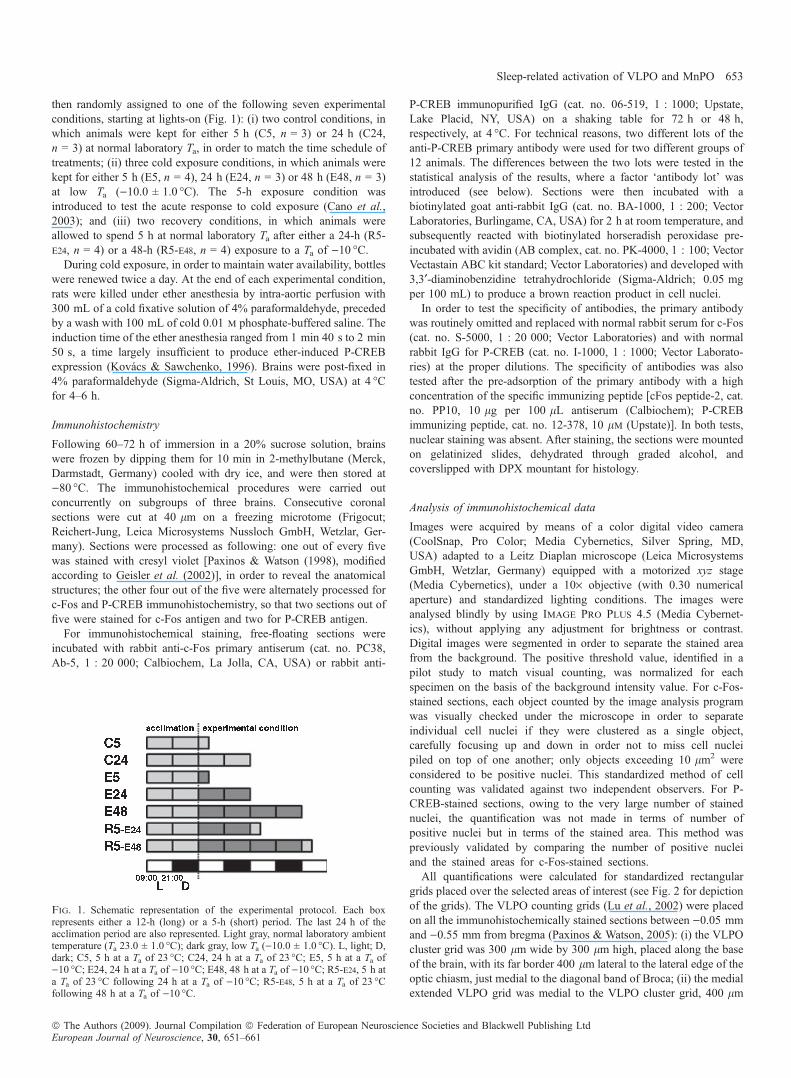
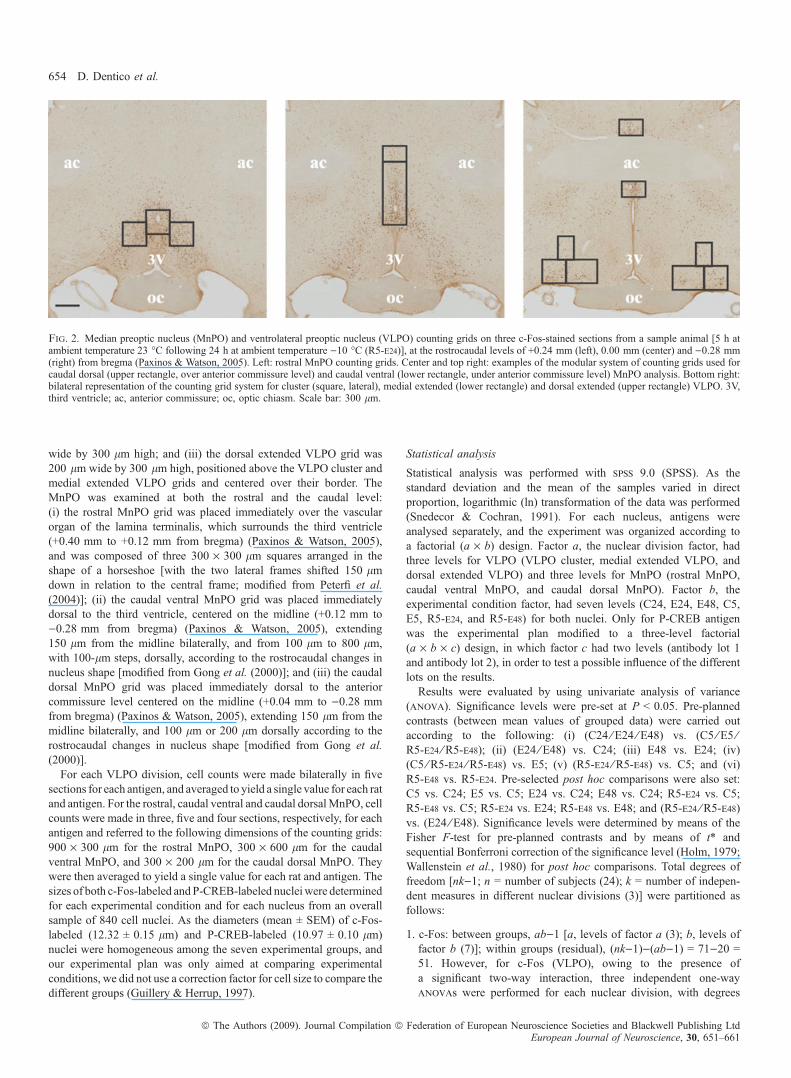
Fig. 2. Median preoptic nucleus (MnPO) and ventrolateral preoptic nucleus (VLPO) counting grids on three c-Fos-stained sections from a sample animal [5 h atambient temperature 23 �C following 24 h at ambient temperature )10 �C (R5-E24)], at the rostrocaudal levels of +0.24 mm (left), 0.00 mm (center) and )0.28 mm(right) from bregma (Paxinos & Watson, 2005). Left: rostral MnPO counting grids. Center and top right: examples of the modular system of counting grids used forcaudal dorsal (upper rectangle, over anterior commissure level) and caudal ventral (lower rectangle, under anterior commissure level) MnPO analysis. Bottom right:bilateral representation of the counting grid system for cluster (square, lateral), medial extended (lower rectangle) and dorsal extended (upper rectangle) VLPO. 3V,third ventricle; ac, anterior commissure; oc, optic chiasm. Scale bar: 300 lm.
654 D. Dentico et al.
ª The Authors (2009). Journal Compilation ª Federation of European Neuroscience Societies and Blackwell Publishing LtdEuropean Journal of Neuroscience, 30, 651–661
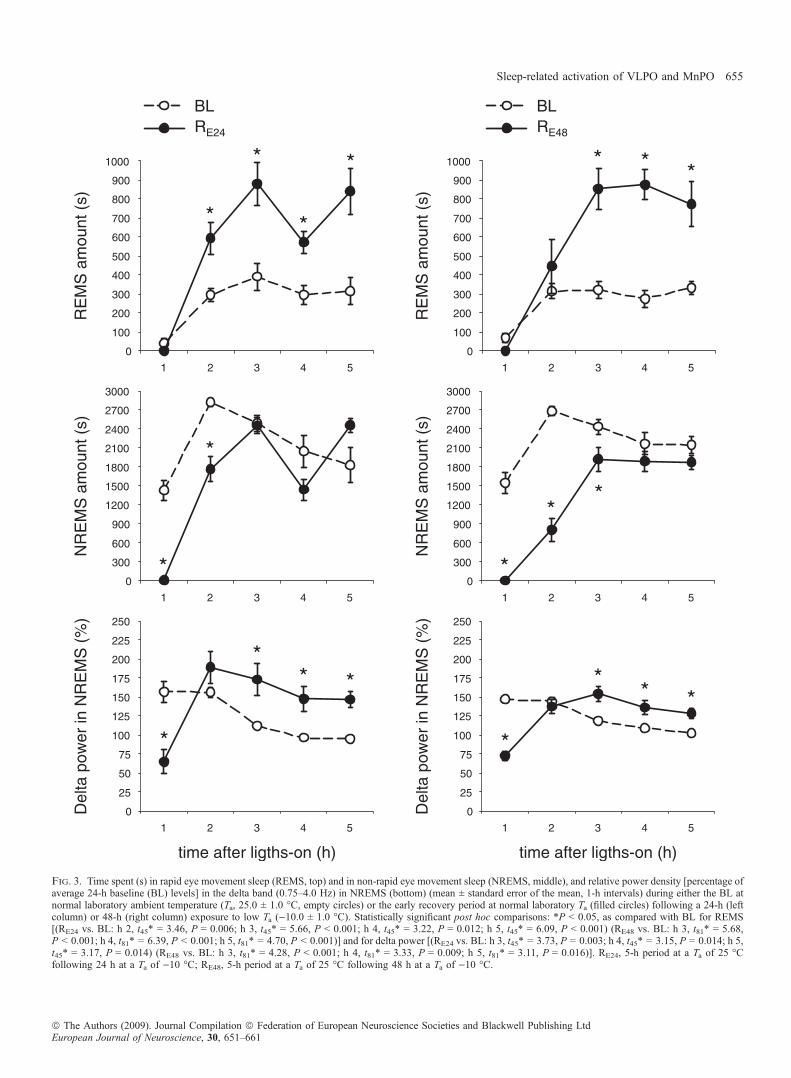
Fig. 3. Time spent (s) in rapid eye movement sleep (REMS, top) and in non-rapid eye movement sleep (NREMS, middle), and relative power density [percentage ofaverage 24-h baseline (BL) levels] in the delta band (0.75–4.0 Hz) in NREMS (bottom) (mean ± standard error of the mean, 1-h intervals) during either the BL atnormal laboratory ambient temperature (Ta, 25.0 ± 1.0 �C, empty circles) or the early recovery period at normal laboratory Ta (filled circles) following a 24-h (leftcolumn) or 48-h (right column) exposure to low Ta ()10.0 ± 1.0 �C). Statistically significant post hoc comparisons: *P < 0.05, as compared with BL for REMS[(RE24 vs. BL: h 2, t45* = 3.46, P = 0.006; h 3, t45* = 5.66, P < 0.001; h 4, t45* = 3.22, P = 0.012; h 5, t45* = 6.09, P < 0.001) (RE48 vs. BL: h 3, t81* = 5.68,P < 0.001; h 4, t81* = 6.39, P < 0.001; h 5, t81* = 4.70, P < 0.001)] and for delta power [(RE24 vs. BL: h 3, t45* = 3.73, P = 0.003; h 4, t45* = 3.15, P = 0.014; h 5,t45* = 3.17, P = 0.014) (RE48 vs. BL: h 3, t81* = 4.28, P < 0.001; h 4, t81* = 3.33, P = 0.009; h 5, t81* = 3.11, P = 0.016)]. RE24, 5-h period at a Ta of 25 �Cfollowing 24 h at a Ta of )10 �C; RE48, 5-h period at a Ta of 25 �C following 48 h at a Ta of )10 �C.
Sleep-related activation of VLPO and MnPO 655
ª The Authors (2009). Journal Compilation ª Federation of European Neuroscience Societies and Blackwell Publishing LtdEuropean Journal of Neuroscience, 30, 651–661
of freedom of the residual: (n)1))(b)1) = 17. For c-Fos (MnPO),owing to the absence of a statistically significant interaction,degrees of freedom of the interaction [(a)1) (b)1)] were kept in theresidual: 51 + 12 = 63.
2. P-CREB: between groups, abc)1 [a, levels of factor a (3); b, levelsof factor b (7); c, levels of factor c (2)]; within groups (residual),(nk)1))(abc)1) = 71)41 = 30. However, in both the VLPO andMnPO, owing to the absence of statistically significant interactions,degrees of freedom of interactions [(a)1) (b)1) (c)1); (a)1) (b)1);(a)1) (c)1); (b)1) (c)1)] were kept in the residual: 30 + (12 + 12+ 2 + 6) = 62.
Results
Sleep–wake states
As shown in Fig. 3, a clear sleep rebound was observed following boththe 24-h and the 48-h exposures to a Ta of)10 �C. In both RE24 andRE48,the REMS rebound was stronger than that of NREMS. Although theREMS rebound was apparently postponed by about 1 h in RE48, nomajor differences were observed between the two conditions from thethird to the fifth hour of the recovery period, and, in particular, 166% and133% increases in time spent in REMS as compared with BL levels wasobserved at the fifth hour in RE24 and RE48, respectively. In contrast, nosignificant rebound was observed in the time spent in NREMS. In bothconditions, delta power was significantly increased in relation to the BLlevels, starting from the third hour of the recovery, but only 55% and25% increases were observed at the fifth hour in RE24 and RE48,respectively. Statistically significant comparisons for either REMSamount or delta power are shown in the legend to Fig. 3.
Immunohistochemistry
c-Fos expression
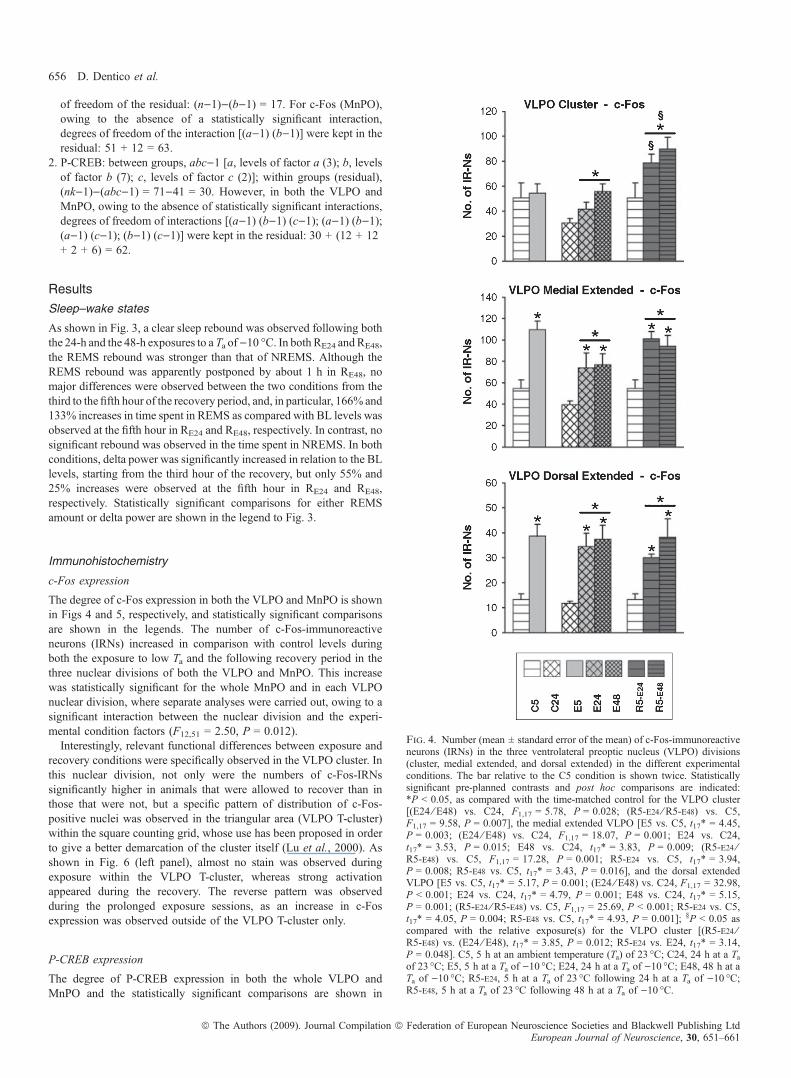
The degree of c-Fos expression in both the VLPO and MnPO is shownin Figs 4 and 5, respectively, and statistically significant comparisonsare shown in the legends. The number of c-Fos-immunoreactiveneurons (IRNs) increased in comparison with control levels duringboth the exposure to low Ta and the following recovery period in thethree nuclear divisions of both the VLPO and MnPO. This increasewas statistically significant for the whole MnPO and in each VLPOnuclear division, where separate analyses were carried out, owing to asignificant interaction between the nuclear division and the experi-mental condition factors (F12,51 = 2.50, P = 0.012).Interestingly, relevant functional differences between exposure and
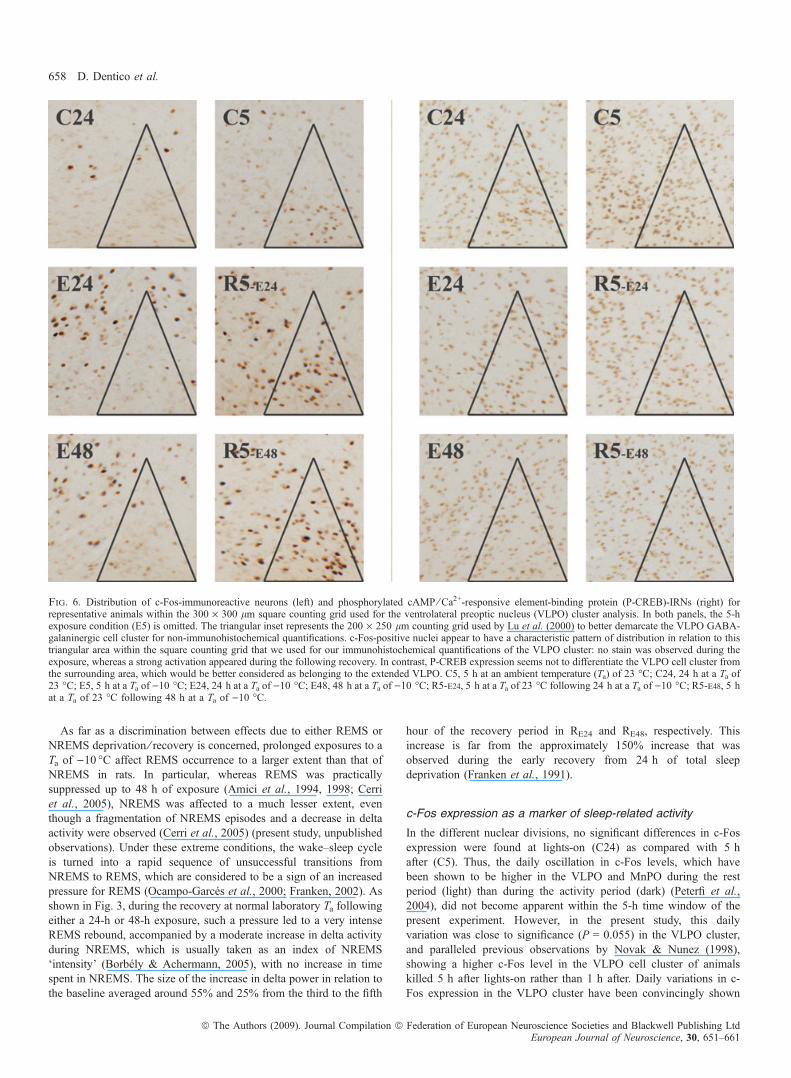
recovery conditions were specifically observed in the VLPO cluster. Inthis nuclear division, not only were the numbers of c-Fos-IRNssignificantly higher in animals that were allowed to recover than inthose that were not, but a specific pattern of distribution of c-Fos-positive nuclei was observed in the triangular area (VLPO T-cluster)within the square counting grid, whose use has been proposed in orderto give a better demarcation of the cluster itself (Lu et al., 2000). Asshown in Fig. 6 (left panel), almost no stain was observed duringexposure within the VLPO T-cluster, whereas strong activationappeared during the recovery. The reverse pattern was observedduring the prolonged exposure sessions, as an increase in c-Fosexpression was observed outside of the VLPO T-cluster only.
P-CREB expression
The degree of P-CREB expression in both the whole VLPO andMnPO and the statistically significant comparisons are shown in
Fig. 4. Number (mean ± standard error of the mean) of c-Fos-immunoreactiveneurons (IRNs) in the three ventrolateral preoptic nucleus (VLPO) divisions(cluster, medial extended, and dorsal extended) in the different experimentalconditions. The bar relative to the C5 condition is shown twice. Statisticallysignificant pre-planned contrasts and post hoc comparisons are indicated:*P < 0.05, as compared with the time-matched control for the VLPO cluster[(E24 ⁄ E48) vs. C24, F1,17 = 5.78, P = 0.028; (R5-E24 ⁄ R5-E48) vs. C5,F1,17 = 9.58, P = 0.007], the medial extended VLPO [E5 vs. C5, t17* = 4.45,P = 0.003; (E24 ⁄ E48) vs. C24, F1,17 = 18.07, P = 0.001; E24 vs. C24,t17* = 3.53, P = 0.015; E48 vs. C24, t17* = 3.83, P = 0.009; (R5-E24 ⁄R5-E48) vs. C5, F1,17 = 17.28, P = 0.001; R5-E24 vs. C5, t17* = 3.94,P = 0.008; R5-E48 vs. C5, t17* = 3.43, P = 0.016], and the dorsal extendedVLPO [E5 vs. C5, t17* = 5.17, P = 0.001; (E24 ⁄ E48) vs. C24, F1,17 = 32.98,P < 0.001; E24 vs. C24, t17* = 4.79, P = 0.001; E48 vs. C24, t17* = 5.15,P = 0.001; (R5-E24 ⁄ R5-E48) vs. C5, F1,17 = 25.69, P < 0.001; R5-E24 vs. C5,t17* = 4.05, P = 0.004; R5-E48 vs. C5, t17* = 4.93, P = 0.001]; §P < 0.05 ascompared with the relative exposure(s) for the VLPO cluster [(R5-E24 ⁄R5-E48) vs. (E24 ⁄ E48), t17* = 3.85, P = 0.012; R5-E24 vs. E24, t17* = 3.14,P = 0.048]. C5, 5 h at an ambient temperature (Ta) of 23 �C; C24, 24 h at a Taof 23 �C; E5, 5 h at a Ta of )10 �C; E24, 24 h at a Ta of )10 �C; E48, 48 h at aTa of )10 �C; R5-E24, 5 h at a Ta of 23 �C following 24 h at a Ta of )10 �C;R5-E48, 5 h at a Ta of 23 �C following 48 h at a Ta of )10 �C.
656 D. Dentico et al.
ª The Authors (2009). Journal Compilation ª Federation of European Neuroscience Societies and Blackwell Publishing LtdEuropean Journal of Neuroscience, 30, 651–661
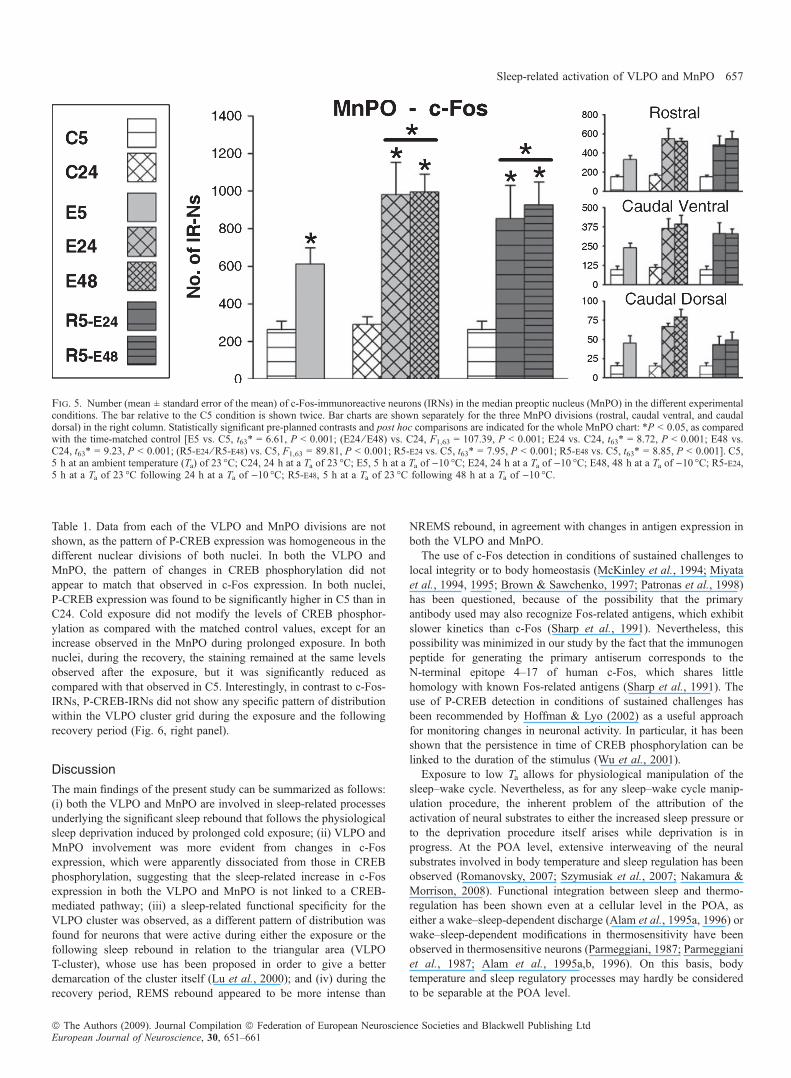
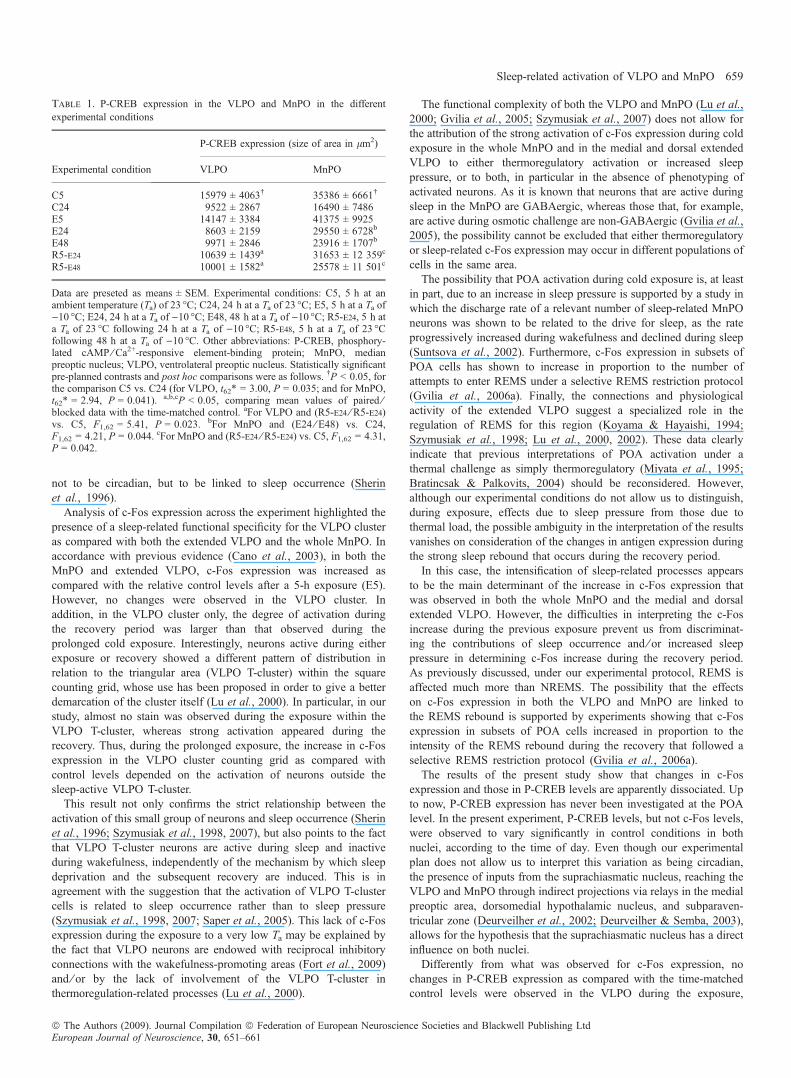
Table 1. Data from each of the VLPO and MnPO divisions are notshown, as the pattern of P-CREB expression was homogeneous in thedifferent nuclear divisions of both nuclei. In both the VLPO andMnPO, the pattern of changes in CREB phosphorylation did notappear to match that observed in c-Fos expression. In both nuclei,P-CREB expression was found to be significantly higher in C5 than inC24. Cold exposure did not modify the levels of CREB phosphor-ylation as compared with the matched control values, except for anincrease observed in the MnPO during prolonged exposure. In bothnuclei, during the recovery, the staining remained at the same levelsobserved after the exposure, but it was significantly reduced ascompared with that observed in C5. Interestingly, in contrast to c-Fos-IRNs, P-CREB-IRNs did not show any specific pattern of distributionwithin the VLPO cluster grid during the exposure and the followingrecovery period (Fig. 6, right panel).
Discussion
The main findings of the present study can be summarized as follows:(i) both the VLPO and MnPO are involved in sleep-related processesunderlying the significant sleep rebound that follows the physiologicalsleep deprivation induced by prolonged cold exposure; (ii) VLPO andMnPO involvement was more evident from changes in c-Fosexpression, which were apparently dissociated from those in CREBphosphorylation, suggesting that the sleep-related increase in c-Fosexpression in both the VLPO and MnPO is not linked to a CREB-mediated pathway; (iii) a sleep-related functional specificity for theVLPO cluster was observed, as a different pattern of distribution wasfound for neurons that were active during either the exposure or thefollowing sleep rebound in relation to the triangular area (VLPOT-cluster), whose use has been proposed in order to give a betterdemarcation of the cluster itself (Lu et al., 2000); and (iv) during therecovery period, REMS rebound appeared to be more intense than
NREMS rebound, in agreement with changes in antigen expression inboth the VLPO and MnPO.The use of c-Fos detection in conditions of sustained challenges to
local integrity or to body homeostasis (McKinley et al., 1994; Miyataet al., 1994, 1995; Brown & Sawchenko, 1997; Patronas et al., 1998)has been questioned, because of the possibility that the primaryantibody used may also recognize Fos-related antigens, which exhibitslower kinetics than c-Fos (Sharp et al., 1991). Nevertheless, thispossibility was minimized in our study by the fact that the immunogenpeptide for generating the primary antiserum corresponds to theN-terminal epitope 4–17 of human c-Fos, which shares littlehomology with known Fos-related antigens (Sharp et al., 1991). Theuse of P-CREB detection in conditions of sustained challenges hasbeen recommended by Hoffman & Lyo (2002) as a useful approachfor monitoring changes in neuronal activity. In particular, it has beenshown that the persistence in time of CREB phosphorylation can belinked to the duration of the stimulus (Wu et al., 2001).Exposure to low Ta allows for physiological manipulation of the
sleep–wake cycle. Nevertheless, as for any sleep–wake cycle manip-ulation procedure, the inherent problem of the attribution of theactivation of neural substrates to either the increased sleep pressure orto the deprivation procedure itself arises while deprivation is inprogress. At the POA level, extensive interweaving of the neuralsubstrates involved in body temperature and sleep regulation has beenobserved (Romanovsky, 2007; Szymusiak et al., 2007; Nakamura &Morrison, 2008). Functional integration between sleep and thermo-regulation has been shown even at a cellular level in the POA, aseither a wake–sleep-dependent discharge (Alam et al., 1995a, 1996) orwake–sleep-dependent modifications in thermosensitivity have beenobserved in thermosensitive neurons (Parmeggiani, 1987; Parmeggianiet al., 1987; Alam et al., 1995a,b, 1996). On this basis, bodytemperature and sleep regulatory processes may hardly be consideredto be separable at the POA level.
Fig. 5. Number (mean ± standard error of the mean) of c-Fos-immunoreactive neurons (IRNs) in the median preoptic nucleus (MnPO) in the different experimentalconditions. The bar relative to the C5 condition is shown twice. Bar charts are shown separately for the three MnPO divisions (rostral, caudal ventral, and caudaldorsal) in the right column. Statistically significant pre-planned contrasts and post hoc comparisons are indicated for the whole MnPO chart: *P < 0.05, as comparedwith the time-matched control [E5 vs. C5, t63* = 6.61, P < 0.001; (E24 ⁄ E48) vs. C24, F1,63 = 107.39, P < 0.001; E24 vs. C24, t63* = 8.72, P < 0.001; E48 vs.C24, t63* = 9.23, P < 0.001; (R5-E24 ⁄ R5-E48) vs. C5, F1,63 = 89.81, P < 0.001; R5-E24 vs. C5, t63* = 7.95, P < 0.001; R5-E48 vs. C5, t63* = 8.85, P < 0.001]. C5,5 h at an ambient temperature (Ta) of 23 �C; C24, 24 h at a Ta of 23 �C; E5, 5 h at a Ta of )10 �C; E24, 24 h at a Ta of )10 �C; E48, 48 h at a Ta of )10 �C; R5-E24,5 h at a Ta of 23 �C following 24 h at a Ta of )10 �C; R5-E48, 5 h at a Ta of 23 �C following 48 h at a Ta of )10 �C.
Sleep-related activation of VLPO and MnPO 657
ª The Authors (2009). Journal Compilation ª Federation of European Neuroscience Societies and Blackwell Publishing LtdEuropean Journal of Neuroscience, 30, 651–661
As far as a discrimination between effects due to either REMS orNREMS deprivation ⁄ recovery is concerned, prolonged exposures to aTa of )10 �C affect REMS occurrence to a larger extent than that ofNREMS in rats. In particular, whereas REMS was practicallysuppressed up to 48 h of exposure (Amici et al., 1994, 1998; Cerriet al., 2005), NREMS was affected to a much lesser extent, eventhough a fragmentation of NREMS episodes and a decrease in deltaactivity were observed (Cerri et al., 2005) (present study, unpublishedobservations). Under these extreme conditions, the wake–sleep cycleis turned into a rapid sequence of unsuccessful transitions fromNREMS to REMS, which are considered to be a sign of an increasedpressure for REMS (Ocampo-Garces et al., 2000; Franken, 2002). Asshown in Fig. 3, during the recovery at normal laboratory Ta followingeither a 24-h or 48-h exposure, such a pressure led to a very intenseREMS rebound, accompanied by a moderate increase in delta activityduring NREMS, which is usually taken as an index of NREMS‘intensity’ (Borbely & Achermann, 2005), with no increase in timespent in NREMS. The size of the increase in delta power in relation tothe baseline averaged around 55% and 25% from the third to the fifth
hour of the recovery period in RE24 and RE48, respectively. Thisincrease is far from the approximately 150% increase that wasobserved during the early recovery from 24 h of total sleepdeprivation (Franken et al., 1991).
c-Fos expression as a marker of sleep-related activity
In the different nuclear divisions, no significant differences in c-Fosexpression were found at lights-on (C24) as compared with 5 hafter (C5). Thus, the daily oscillation in c-Fos levels, which havebeen shown to be higher in the VLPO and MnPO during the restperiod (light) than during the activity period (dark) (Peterfi et al.,2004), did not become apparent within the 5-h time window of thepresent experiment. However, in the present study, this dailyvariation was close to significance (P = 0.055) in the VLPO cluster,and paralleled previous observations by Novak & Nunez (1998),showing a higher c-Fos level in the VLPO cell cluster of animalskilled 5 h after lights-on rather than 1 h after. Daily variations in c-Fos expression in the VLPO cluster have been convincingly shown
Fig. 6. Distribution of c-Fos-immunoreactive neurons (left) and phosphorylated cAMP ⁄ Ca2+-responsive element-binding protein (P-CREB)-IRNs (right) forrepresentative animals within the 300 · 300 lm square counting grid used for the ventrolateral preoptic nucleus (VLPO) cluster analysis. In both panels, the 5-hexposure condition (E5) is omitted. The triangular inset represents the 200 · 250 lm counting grid used by Lu et al. (2000) to better demarcate the VLPO GABA-galaninergic cell cluster for non-immunohistochemical quantifications. c-Fos-positive nuclei appear to have a characteristic pattern of distribution in relation to thistriangular area within the square counting grid that we used for our immunohistochemical quantifications of the VLPO cluster: no stain was observed during theexposure, whereas a strong activation appeared during the following recovery. In contrast, P-CREB expression seems not to differentiate the VLPO cell cluster fromthe surrounding area, which would be better considered as belonging to the extended VLPO. C5, 5 h at an ambient temperature (Ta) of 23 �C; C24, 24 h at a Ta of23 �C; E5, 5 h at a Ta of )10 �C; E24, 24 h at a Ta of )10 �C; E48, 48 h at a Ta of )10 �C; R5-E24, 5 h at a Ta of 23 �C following 24 h at a Ta of )10 �C; R5-E48, 5 hat a Ta of 23 �C following 48 h at a Ta of )10 �C.
658 D. Dentico et al.
ª The Authors (2009). Journal Compilation ª Federation of European Neuroscience Societies and Blackwell Publishing LtdEuropean Journal of Neuroscience, 30, 651–661
not to be circadian, but to be linked to sleep occurrence (Sherinet al., 1996).
Analysis of c-Fos expression across the experiment highlighted thepresence of a sleep-related functional specificity for the VLPO clusteras compared with both the extended VLPO and the whole MnPO. Inaccordance with previous evidence (Cano et al., 2003), in both theMnPO and extended VLPO, c-Fos expression was increased ascompared with the relative control levels after a 5-h exposure (E5).However, no changes were observed in the VLPO cluster. Inaddition, in the VLPO cluster only, the degree of activation duringthe recovery period was larger than that observed during theprolonged cold exposure. Interestingly, neurons active during eitherexposure or recovery showed a different pattern of distribution inrelation to the triangular area (VLPO T-cluster) within the squarecounting grid, whose use has been proposed in order to give a betterdemarcation of the cluster itself (Lu et al., 2000). In particular, in ourstudy, almost no stain was observed during the exposure within theVLPO T-cluster, whereas strong activation appeared during therecovery. Thus, during the prolonged exposure, the increase in c-Fosexpression in the VLPO cluster counting grid as compared withcontrol levels depended on the activation of neurons outside thesleep-active VLPO T-cluster.
This result not only confirms the strict relationship between theactivation of this small group of neurons and sleep occurrence (Sherinet al., 1996; Szymusiak et al., 1998, 2007), but also points to the factthat VLPO T-cluster neurons are active during sleep and inactiveduring wakefulness, independently of the mechanism by which sleepdeprivation and the subsequent recovery are induced. This is inagreement with the suggestion that the activation of VLPO T-clustercells is related to sleep occurrence rather than to sleep pressure(Szymusiak et al., 1998, 2007; Saper et al., 2005). This lack of c-Fosexpression during the exposure to a very low Ta may be explained bythe fact that VLPO neurons are endowed with reciprocal inhibitoryconnections with the wakefulness-promoting areas (Fort et al., 2009)and ⁄ or by the lack of involvement of the VLPO T-cluster inthermoregulation-related processes (Lu et al., 2000).
The functional complexity of both the VLPO and MnPO (Lu et al.,2000; Gvilia et al., 2005; Szymusiak et al., 2007) does not allow forthe attribution of the strong activation of c-Fos expression during coldexposure in the whole MnPO and in the medial and dorsal extendedVLPO to either thermoregulatory activation or increased sleeppressure, or to both, in particular in the absence of phenotyping ofactivated neurons. As it is known that neurons that are active duringsleep in the MnPO are GABAergic, whereas those that, for example,are active during osmotic challenge are non-GABAergic (Gvilia et al.,2005), the possibility cannot be excluded that either thermoregulatoryor sleep-related c-Fos expression may occur in different populations ofcells in the same area.The possibility that POA activation during cold exposure is, at least
in part, due to an increase in sleep pressure is supported by a study inwhich the discharge rate of a relevant number of sleep-related MnPOneurons was shown to be related to the drive for sleep, as the rateprogressively increased during wakefulness and declined during sleep(Suntsova et al., 2002). Furthermore, c-Fos expression in subsets ofPOA cells has shown to increase in proportion to the number ofattempts to enter REMS under a selective REMS restriction protocol(Gvilia et al., 2006a). Finally, the connections and physiologicalactivity of the extended VLPO suggest a specialized role in theregulation of REMS for this region (Koyama & Hayaishi, 1994;Szymusiak et al., 1998; Lu et al., 2000, 2002). These data clearlyindicate that previous interpretations of POA activation under athermal challenge as simply thermoregulatory (Miyata et al., 1995;Bratincsak & Palkovits, 2004) should be reconsidered. However,although our experimental conditions do not allow us to distinguish,during exposure, effects due to sleep pressure from those due tothermal load, the possible ambiguity in the interpretation of the resultsvanishes on consideration of the changes in antigen expression duringthe strong sleep rebound that occurs during the recovery period.In this case, the intensification of sleep-related processes appears
to be the main determinant of the increase in c-Fos expression thatwas observed in both the whole MnPO and the medial and dorsalextended VLPO. However, the difficulties in interpreting the c-Fosincrease during the previous exposure prevent us from discriminat-ing the contributions of sleep occurrence and ⁄ or increased sleeppressure in determining c-Fos increase during the recovery period.As previously discussed, under our experimental protocol, REMS isaffected much more than NREMS. The possibility that the effectson c-Fos expression in both the VLPO and MnPO are linked tothe REMS rebound is supported by experiments showing that c-Fosexpression in subsets of POA cells increased in proportion to theintensity of the REMS rebound during the recovery that followed aselective REMS restriction protocol (Gvilia et al., 2006a).The results of the present study show that changes in c-Fos
expression and those in P-CREB levels are apparently dissociated. Upto now, P-CREB expression has never been investigated at the POAlevel. In the present experiment, P-CREB levels, but not c-Fos levels,were observed to vary significantly in control conditions in bothnuclei, according to the time of day. Even though our experimentalplan does not allow us to interpret this variation as being circadian,the presence of inputs from the suprachiasmatic nucleus, reaching theVLPO and MnPO through indirect projections via relays in the medialpreoptic area, dorsomedial hypothalamic nucleus, and subparaven-tricular zone (Deurveilher et al., 2002; Deurveilher & Semba, 2003),allows for the hypothesis that the suprachiasmatic nucleus has a directinfluence on both nuclei.Differently from what was observed for c-Fos expression, no
changes in P-CREB expression as compared with the time-matchedcontrol levels were observed in the VLPO during the exposure,
Table 1. P-CREB expression in the VLPO and MnPO in the differentexperimental conditions
Experimental condition
P-CREB expression (size of area in lm2)
VLPO MnPO
C5 15979 ± 4063� 35386 ± 6661�
C24 9522 ± 2867 16490 ± 7486E5 14147 ± 3384 41375 ± 9925E24 8603 ± 2159 29550 ± 6728b
E48 9971 ± 2846 23916 ± 1707b
R5-E24 10639 ± 1439a 31653 ± 12 359c
R5-E48 10001 ± 1582a 25578 ± 11 501c
Data are preseted as means ± SEM. Experimental conditions: C5, 5 h at anambient temperature (Ta) of 23 �C; C24, 24 h at a Ta of 23 �C; E5, 5 h at a Ta of)10 �C; E24, 24 h at a Ta of )10 �C; E48, 48 h at a Ta of )10 �C; R5-E24, 5 h ata Ta of 23 �C following 24 h at a Ta of )10 �C; R5-E48, 5 h at a Ta of 23 �Cfollowing 48 h at a Ta of )10 �C. Other abbreviations: P-CREB, phosphory-lated cAMP ⁄ Ca2+-responsive element-binding protein; MnPO, medianpreoptic nucleus; VLPO, ventrolateral preoptic nucleus. Statistically significantpre-planned contrasts and post hoc comparisons were as follows. �P < 0.05, forthe comparison C5 vs. C24 (for VLPO, t62* = 3.00, P = 0.035; and for MnPO,t62* = 2.94, P = 0.041). a,b,cP < 0.05, comparing mean values of paired ⁄blocked data with the time-matched control. aFor VLPO and (R5-E24 ⁄ R5-E24)vs. C5, F1,62 = 5.41, P = 0.023. bFor MnPO and (E24 ⁄ E48) vs. C24,F1,62 = 4.21, P = 0.044. cFor MnPO and (R5-E24 ⁄ R5-E24) vs. C5, F1,62 = 4.31,P = 0.042.
Sleep-related activation of VLPO and MnPO 659
ª The Authors (2009). Journal Compilation ª Federation of European Neuroscience Societies and Blackwell Publishing LtdEuropean Journal of Neuroscience, 30, 651–661
whereas an increase in P-CREB expression was observed in the MnPOonly after prolonged exposure. Such a difference between the twonuclei may depend on different levels of involvement of the VLPOand MnPO in facing the ambient challenge on a long-term basis.A clear dissociation between the changes in CREB phosphorylation
and those in c-Fos expression was observed in both the VLPO andMnPO during the recovery period, as a decrease in P-CREB expressionas compared with time-matched control levels was observed in bothnuclei. Although P-CREB is a key activator of c-fos transcription, theinduction of c-Fos expression can also be mediated by other pathwaysvia different DNA-binding sites (Herdegen & Leah, 1998). Thus, wecan reasonably suppose that the sleep-related increase in c-Fosexpression during the recovery period is not linked to a CREB-mediated pathway. More interestingly, in contrast to what was observedfor c-Fos expression, P-CREB expression did not appear to allow forthe functional differentiation of the sleep-related activity of the VLPOT-cluster from that of the extended VLPO and the whole MnPO.Consequently, any sleep-related change in CREB phosphorylation inthese nuclei does not seem to be related to sleep regulatory processes,but rather to a state-dependent modulation of P-CREB expression.
Conclusions
In conclusion, the pattern of changes in c-Fos expression that has beenobserved in the present study clearly indicates the involvement ofboth the VLPO and MnPO in the sleep regulatory processes thatcharacterize the recovery period following a long-term physiologicalsleep deprivation protocol. In particular, the specificity of changesobserved in the VLPO T-cluster support previous data indicating a rolefor this area in processes related to sleep occurrence. The dissociationbetween the changes in c-Fos expression and those in P-CREB levels,which are subject to state-related non-regulatory modulation, suggeststhat these changes in c-Fos expression do not depend on a P-CREB-mediated pathway.
Acknowledgements
This article is dedicated to Christine Ann Jones, who made an importantcontribution to the experimental work but who sadly passed away before wesubmitted the manuscript. This work was supported by grants from both theMinistero dell’Universita e della Ricerca Scientifica, Italy and the University ofBologna. The authors would like to thank R. Bartesaghi for permitting the useof image acquisition instrumentation and software for image analysis (Image
Pro Plus 4.5; Media Cybernetics). The authors would also like to thank G.Mancinelli and L. Sabattini for the electronic and mechanical work needed.
Abbreviations
BL, baseline; C24, 24 h at an ambient temperature of 23 �C; C5, 5 h at anambient temperature of 23 �C; CREB, Ca2+ ⁄ cAMP-responsive element-binding protein; E24, 24 h at an ambient temperature of )10 �C; E48, 48 hat an ambient temperature of )10 �C; E5, 5 h at an ambient temperature of)10 �C; EEG, electroencephalographic; IRN, immunoreactive neuron; MA,motor activity; MnPO, median preoptic nucleus; NREMS, non-rapid eyemovement sleep; P-CREB, phosphorylated form of the cAMP ⁄ Ca2+-responsive element-binding protein; POA, preoptic area; R5-E24, 5 h at anambient temperature of 23 �C following 24 h at an ambient temperature of)10 �C; R5-E48, 5 h at an ambient temperature of 23 �C following 48 h atan ambient temperature of )10 �C; RE24, 5-h period at an ambienttemperature of 25 �C following 24 h at an ambient temperature of )10 �C;RE48, 5-h period at an ambient temperature of 25 �C following 48 h at anambient temperature of )10 �C; REMS, rapid eye movement sleep; t*,modified t-statistic; Ta, ambient temperature; Thy, hypothalamic temperature;VLPO, ventrolateral preoptic nucleus.
References
Alam, M.N., McGinty, D. & Szymusiak, R. (1995a) Neuronal discharge ofpreoptic ⁄ anterior hypothalamic thermosensitive neurons: relation to NREMsleep. Am. J. Physiol., 269, R1240–R1249.
Alam, M.N., McGinty, D. & Szymusiak, R. (1995b) Preoptic ⁄ anteriorhypothalamic neurons: thermosensitivity in rapid eye movement sleep. Am.J. Physiol., 269, R1250–R1257.
Alam, M.N., McGinty, D. & Szymusiak, R. (1996) Preoptic ⁄ anteriorhypothalamic neurons: thermosensitivity in wakefulness and non rapid eyemovement sleep. Brain Res., 718, 76–82.
Amici, R., Zamboni, G., Perez, E., Jones, C.A., Toni, I.I., Culin, F. &Parmeggiani, P.L. (1994) Pattern of desynchronized sleep during deprivationand recovery induced in the rat by changes in ambient temperature. J. SleepRes., 3, 250–256.
Amici, R., Zamboni, G., Perez, E., Jones, C.A. & Parmeggiani, P.L. (1998) Theinfluence of a heavy thermal load on REM sleep in the rat. Brain Res., 781,252–258.
Amici, R., Cerri, M., Ocampo-Garces, A., Baracchi, F., Dentico, D., Jones,C.A., Luppi, M., Perez, E., Parmeggiani, P.L. & Zamboni, G. (2008) Coldexposure and sleep in the rat: REM sleep homeostasis and body size. Sleep,31, 708–715.
Borbely, A. & Achermann, P. (2005) Sleep homeostasis and models of sleepregulation. In Kryger, M., Roth, T. & Dement, W.C. (ed.), Principles andPractice of Sleep Medicine. Elsevier Saunders, Philadelphia, pp. 405–417.
Bratincsak, A. & Palkovits, M. (2004) Activation of brain areas in rat followingwarm and cold ambient exposure. Neuroscience, 127, 385–397.
Brown, E.R. & Sawchenko, P.E. (1997) Hypophysiotropic CRF neuronsdisplay a sustained immediate-early gene response to chronic stress but notto adrenalectomy. J. Neuroendocrinol., 9, 307–316.
Cano, G., Passerin, A.M., Schiltz, J.C., Card, J.P., Morrison, S.F. & Sved, A.F.(2003) Anatomical substrates for the central control of sympathetic outflowto interscapular adipose tissue during cold exposure. J. Comp. Neurol., 460,303–326.
Cerri, M., Ocampo-Garces, A., Amici, R., Baracchi, F., Capitani, P., Jones,C.A., Luppi, M., Perez, E., Parmeggiani, P.L. & Zamboni, G. (2005) Coldexposure and sleep in the rat: effects on sleep architecture and theelectroencephalogram. Sleep, 28, 694–705.
Del Sindaco, E., Baracchi, F., Cerri, M., Dentico, D., Luppi, M., Martelli, D.,Perez, E. & Amici, R. (2006) Long-term aspects of REM sleep regulation inthe rat. J. Sleep Res., 15, 99–100.
Dentico, D., Jones, C.A., Del Sindaco, E., Laudadio, S., Luppi, M., Martelli,D., Perez, E. & Zamboni, G. (2008a) An integrative role of the medianpreoptic nucleus in sleep deprivation and recovery induced by low ambienttemperature. J. Sleep Res., 17, P401.
Dentico, D., Jones, C.A., Amici, R., Baracchi, F., Cerri, M., Perez, E., Tupone,D. & Zamboni, G. (2008b) Sleep related activation of the ventrolateralpreoptic nucleus following the exposure to low ambient temperature. J. SleepRes., 17, P467.
Deurveilher, S. & Semba, K. (2003) Indirect projections from the suprachias-matic nucleus to the median preoptic nucleus in rat. Brain Res., 987, 100–106.
Deurveilher, S., Burns, J. & Semba, K. (2002) Indirect projections from thesuprachiasmatic nucleus to the ventrolateral preoptic nucleus: a dual tract-tracing study in rat. Eur. J. Neurosci., 16, 1195–1213.
Fort, P., Bassetti, C.L. & Luppi, P.H. (2009) Alternating vigilance states: newinsights regarding neuronal networks and mechanisms. Eur. J. Neurosci., 29,1741–1753.
Franken, P. (2002) Long-term vs. short-term processes regulating REM sleep.J. Sleep Res., 11, 17–28.
Franken, P., Dijk, D.J., Tobler, I. & Borbely, A.A. (1991) Sleep deprivation inrats: effects on EEG power spectra, vigilance states, and cortical temperature.Am. J. Physiol., 261, R198–R208.
Geisler, S., Heilmann, H. & Veh, R.W. (2002) An optimized method forsimultaneous demonstration of neurons and myelinated fiber tracts fordelineation of individual trunco- and palliothalamic nuclei in the mammalianbrain. Histochem. Cell Biol., 117, 69–79.
Gong, H., Szymusiak, R., King, J., Steininger, T. & McGinty, D. (2000) Sleep-related c-Fos protein expression in the preoptic hypothalamus: effects ofambient warming. Am. J. Physiol. Regul. Integr. Comp. Physiol., 279,R2079–R2088.
Gong, H., McGinty, D., Guzman-Marin, R., Chew, K.T., Stewart, D. &Szymusiak, R. (2004) Activation of c-fos in GABAergic neurones in thepreoptic area during sleep and in response to sleep deprivation. J. Physiol.,556, 935–946.
660 D. Dentico et al.
ª The Authors (2009). Journal Compilation ª Federation of European Neuroscience Societies and Blackwell Publishing LtdEuropean Journal of Neuroscience, 30, 651–661
Guillery, R.W. & Herrup, K. (1997) Quantification without pontification:choosing a method for counting objects in sectioned tissues. J. Comp.Neurol., 386, 2–7.
Gvilia, I., Angara, C., McGinty, D. & Szymusiak, R. (2005) Different neuronalpopulations of the rat median preoptic nucleus express c-fos during sleep andin response to hypertonic saline or angiotensin-II. J. Physiol., 569, 587–599.
Gvilia, I., Turner, A., McGinty, D. & Szymusiak, R. (2006a) Preoptic areaneurons and the homeostatic regulation of rapid eye movement sleep.J. Neurosci., 26, 3037–3044.
Gvilia, I., Xu, F., McGinty, D. & Szymusiak, R. (2006b) Homeostaticregulation of sleep: a role for preoptic area neurons. J. Neurosci., 26, 9426–9433.
Heller, H. (2005) Temperature, thermoregulation, and sleep. In Kryger, M.,Roth, T. & Dement, W.C. (ed.), Principles and Practice of Sleep Medicine.Elsevier Saunders, Philadelphia, pp. 292–304.
Herdegen, T. & Leah, J.D. (1998) Inducible and constitutive transcriptionfactors in the mammalian nervous system: control of gene expression by Jun,Fos and Krox, and CREB ⁄ ATF proteins. Brain Res. Brain Res. Rev., 28,370–490.
Hoffman,G.E.&Lyo,D. (2002)Anatomicalmarkersofactivity inneuroendocrinesystems: are we all ‘fos-ed out’? J. Neuroendocrinol., 14, 259–268.
Holm, S. (1979) A simple sequentially rejective multiple test procedure. Scand.J. Stat., 6, 65–70.
Kovacs, K.J. & Sawchenko, P.E. (1996) Sequence of stress-induced alterationsin indices of synaptic and transcriptional activation in parvocellularneurosecretory neurons. J. Neurosci., 16, 262–273.
Koyama, Y. & Hayaishi, O. (1994) Firing of neurons in the preoptic ⁄ anteriorhypothalamic areas in rat: its possible involvement in slow wave sleep andparadoxical sleep. Neurosci. Res., 19, 31–38.
Lu, J., Greco, M.A., Shiromani, P. & Saper, C.B. (2000) Effect of lesions of theventrolateral preoptic nucleus on NREM and REM sleep. J. Neurosci., 20,3830–3842.
Lu, J., Bjorkum, A.A., Xu, M., Gaus, S.E., Shiromani, P.J. & Saper, C.B.(2002) Selective activation of the extended ventrolateral preoptic nucleusduring rapid eye movement sleep. J. Neurosci., 22, 4568–4576.
McKinley, M.J., Hards, D.K. & Oldfield, B.J. (1994) Identification of neuralpathways activated in dehydrated rats by means of Fos-immunohistochem-istry and neural tracing. Brain Res., 653, 305–314.
Miyata, S., Nakashima, T. & Kiyohara, T. (1994) Expression of c-fosimmunoreactivity in the hypothalamic magnocellular neurons during chronicosmotic stimulations. Neurosci. Lett., 175, 63–66.
Miyata, S., Ishiyama, M., Shido, O., Nakashima, T., Shibata, M. & Kiyohara, T.(1995) Central mechanism of neural activation with cold acclimation of ratsusing Fos immunohistochemistry. Neurosci. Res., 22, 209–218.
Morgan, J.I. & Curran, T. (1991) Stimulus–transcription coupling in thenervous system: involvement of the inducible proto-oncogenes fos and jun.Annu. Rev. Neurosci., 14, 421–451.
Nakamura, K. & Morrison, S.F. (2008) Preoptic mechanism for cold-defensiveresponses to skin cooling. J. Physiol., 586, 2611–2620.
Novak, C.M. & Nunez, A.A. (1998) Daily rhythms in Fos activity in the ratventrolateral preoptic area and midline thalamic nuclei. Am. J. Physiol., 275,R1620–R1626.
Ocampo-Garces, A., Molina, E., Rodriguez, A. & Vivaldi, E.A. (2000)Homeostasis of REM sleep after total and selective sleep deprivation in therat. J. Neurophysiol., 84, 2699–2702.
Parmeggiani, P.L. (1987) Interaction between sleep and thermoregulation: anaspect of the control of behavioral states. Sleep, 10, 426–435.
Parmeggiani, P.L. (2003) Thermoregulation and sleep. Front. Biosci., 8, s557–s567.
Parmeggiani, P.L., Cevolani, D., Azzaroni, A. & Ferrari, G. (1987) Thermo-sensitivity of anterior hypothalamic-preoptic neurons during the waking–sleeping cycle: a study in brain functional states. Brain Res., 415, 79–89.
Patronas, P., Horowitz, M., Simon, E. & Gerstberger, R. (1998) Differentialstimulation of c-fos expression in hypothalamic nuclei of the rat brainduring short-term heat acclimation and mild dehydration. Brain Res., 798,127–139.
Paxinos, G. & Watson, C. (1998) The Rat Brain in Stereotaxic Coordinates.Academic Press, Sydney.
Paxinos, G. & Watson, C. (2005) The Rat Brain in Stereotaxic Coordinates.Academic Press, Sydney.
Peterfi, Z., Churchill, L., Hajdu, I., Obal, F. Jr, Krueger, J.M. & Parducz, A.(2004) Fos-immunoreactivity in the hypothalamus: dependency on thediurnal rhythm, sleep, gender, and estrogen. Neuroscience, 124, 695–707.
Romanovsky, A.A. (2007) Thermoregulation: some concepts have changed.Functional architecture of the thermoregulatory system. Am. J. Physiol.Regul. Integr. Comp. Physiol., 292, R37–R46.
Saper, C.B., Scammell, T.E. & Lu, J. (2005) Hypothalamic regulation of sleepand circadian rhythms. Nature, 437, 1257–1263.
Sharp, F.R., Sagar, S.M., Hicks, K., Lowenstein, D. & Hisanaga, K. (1991)c-fos mRNA, Fos, and Fos-related antigen induction by hypertonic salineand stress. J. Neurosci., 11, 2321–2331.
Sherin, J.E., Shiromani, P.J., McCarley, R.W. & Saper, C.B. (1996) Activationof ventrolateral preoptic neurons during sleep. Science, 271, 216–219.
Sherin, J.E., Elmquist, J.K., Torrealba, F. & Saper, C.B. (1998) Innervation ofhistaminergic tuberomammillary neurons by GABAergic and galaninergicneurons in the ventrolateral preoptic nucleus of the rat. J. Neurosci., 18,4705–4721.
Snedecor, G. & Cochran, W.G. (1991) Statistical Methods. Iowa StateUniversity Press, Ames.
Steininger, T.L., Gong, H., McGinty, D. & Szymusiak, R. (2001) Subregionalorganization of preoptic area ⁄ anterior hypothalamic projections to arousal-related monoaminergic cell groups. J. Comp. Neurol., 429, 638–653.
Suntsova, N., Szymusiak, R., Alam, M.N., Guzman-Marin, R. & McGinty, D.(2002) Sleep–waking discharge patterns of median preoptic nucleus neuronsin rats. J. Physiol., 543, 665–677.
Suntsova, N., Guzman-Marin, R., Kumar, S., Alam, M.N., Szymusiak, R. &McGinty, D. (2007) The median preoptic nucleus reciprocally modulatesactivity of arousal-related and sleep-related neurons in the perifornical lateralhypothalamus. J. Neurosci., 27, 1616–1630.
Szymusiak, R., Alam, N., Steininger, T.L. & McGinty, D. (1998) Sleep–wakingdischarge patterns of ventrolateral preoptic ⁄ anterior hypothalamic neurons inrats. Brain Res., 803, 178–188.
Szymusiak, R., Gvilia, I. & McGinty, D. (2007) Hypothalamic control of sleep.Sleep Med., 8, 291–301.
Uschakov, A., Gong, H., McGinty, D. & Szymusiak, R. (2007) Efferentprojections from the median preoptic nucleus to sleep- and arousal-regulatory nuclei in the rat brain. Neuroscience, 150, 104–120.
Wallenstein, S., Zucker, C.L. & Fleiss, J.L. (1980) Some statistical methoduseful in circulation research. Circ. Res., 47, 1–9.
Wu, G.Y., Deisseroth, K. & Tsien, R.W. (2001) Activity-dependent CREBphosphorylation: convergence of a fast, sensitive calmodulin kinase pathwayand a slow, less sensitive mitogen-activated protein kinase pathway. Proc.Natl Acad. Sci. USA, 98, 2808–2813.
Zamboni, G., Jones, C.A., Amici, R., Perez, E. & Parmeggiani, P.L. (1996) Thecapacity to accumulate cyclic AMP in the preoptic-anterior hypothalamicarea of the rat is affected by the exposition to low ambient temperature andthe subsequent recovery. Exp. Brain Res., 109, 164–168.
Zamboni, G., Perez, E., Amici, R., Jones, C.A. & Parmeggiani, P.L. (1999)Control of REM sleep: an aspect of the regulation of physiologicalhomeostasis. Arch. Ital. Biol., 137, 249–262.
Zamboni, G., Jones, C.A., Domeniconi, R., Amici, R., Perez, E., Luppi, M.,Cerri, M. & Parmeggiani, P.L. (2004) Specific changes in cerebral secondmessenger accumulation underline REM sleep inhibition induced by theexposure to low ambient temperature. Brain Res., 1022, 62–70.
Sleep-related activation of VLPO and MnPO 661
ª The Authors (2009). Journal Compilation ª Federation of European Neuroscience Societies and Blackwell Publishing LtdEuropean Journal of Neuroscience, 30, 651–661