c-error simulator for development for sensor and location aware sensing applications
TRANSCRIPT
3rd International Conference on Sensing Technology, Nov. 30 - Dec. 3, 2008, Tainan, Taiwan
C-ERROR Simulator for Development for Sensorand Location Aware Sensing Applications
Vasanth Iyer, G. Rama Murthy and M.B. SrinivasInternational Institute of Information Technology
Hyderabad, [email protected] [email protected] [email protected]
Bertrand HocheteMbedded Information Systems Institute (MIS) Digital Communications Group
University of Applied Science, Western [email protected]
Abstract-Distributed Wireless Sensor Applications are usefulfor visualizing spatially and geographically related data such aslocation, neighborhood, weather, and measuring specific changesin the environment. Desires to augment these interfaces with additional specifications needed for distributed applications such asPower-Aware, Fault-tolerance and Processor agnostic deploymentrequirements have led to create a custom distributed NetworkEmbedded Test-Bed that locally aggregate the measured signalfrom individual sensors and send it to a central coordinatorfor combined processing. We envision publishing and queryingreal-time (e.g. from sensors) over such distributed sensor farmapplications which are deployed wirelessly and form a largesensor network. Existing solutions, although useful for writingthe simple applications mentioned above, have several drawbacksin achieving this vision. First, publishing even a single stream ofdata as a useful service is a non-trivial task. Much useful datais not being stored yet because the need for managing a sensorfarm has lots of complexities which make them unreliable interms of polling time and communications costs. Second, existingapplications are mutually incompatible and are processor centricand needs many ports which may introduce un-reliability. Thirdcommunication costs are not scalable to handle a sensor farmapplication and it does not provide an easy way to extend such aNetwork Embedded Test-Bed. The Network Embedded Test-Bedproject aims to address these challenges, we like to model existingapplications needs into a cross layer sensor network simulatorcalled C-ERROR(Cross Layer Reusable Resource OptimizedRouting) which allows different clustering algorithms to beintegrated and measure its performance at each layer of the stack.To have a platform independent sensor OS and a scheduler whichallows creating sensing tasks that have real-time constraints
Index Terms-Power-aware Routing, Sensor Network LifeTime, MAC layer, Distributed algorithms, Real-time sensing.
I. INTRODUCTION
The design of interoperable sensors for the new wirelessstandards is a task for VLSI hardware and software (firmware)domains. Resource constrained prototypes are hard to deployand debug so we use a cross-layer simulator due to itsunique deployment needs. Such as unreliable wireless channels, remote sensing and non-replenishable energy resourceand wastage of energy due to idle and collisions in theunderlying protocol. As the sensor application goals is to usea large amount of sensors and use collaborative processing for
local tasks. This type of distributed processing not only savesprecious sensor's energy but makes is more reliable than usinga few nodes and also creates a secure network. Simulator givesa controlled environment to deploy large amounts of nodesand measure faults due to resource bottlenecks at each crossfunctional layer of the application. Simulation is performed ateach abstraction layer such as energy management, networkdiscovery or point to point communication. The same conceptscan be extended to an emulator with common programmingmethods which once tested can be deployed into hardwarerunning co-resident real-time as with real drivers and la'sconnected. Common goal is to find an micro-OS whichinterfaces with RS-232, Bluetooth, USB, GPRS or SDIO. Thisallows transparency to communicate with the external worldand allows an easy testing platform with networked PC's. Thecommunication to the PC or a laptop is through a centralcoordinator node which typically has enough resources andhelps manage the sensor network and works as a gateway nodebetween sensing and IP based networks. The coordinator storesall the global parameters which it needs to maintain the network and at the same time manages a data stream with a givencommunication rate. In contrast to other simulators whichgive a lot of standard statistics this method allows debuggingthe resource constraints for custom sensing applications andeasily ports into real mote hardware and test their reliability inone common framework. The architecture combines the uppernetwork layers which solely deal with distributed optimizationwith the frequent connectivity needs required by the lowerlayers to achieve balanced performance in terms of energysavings for sensing and routing activity. Since the hardwarelayers are non-programmable, it is best to use the specificationfor low cost, low memory and low data rate requirements. TheNetworkEmbedded Test-Bed infrastructure for managementand operation of the Test-Bed gives information of the overallrunning tasks and also supplies management data of thestate of the sensors such as expected events, drifting of theclocks, and low resource state indicators. The research presentsimplementation of different power-aware algorithms and theireffects on routing and complexity of implementation. It uses a
978-1-4244-2177-0/08/$25.00 © 2008 IEEE 192
3rd International Conference on Sensing Technology, Nov. 30 - Dec. 3, 2008, Tainan, Taiwan
Large Sensor Network Life-TimeReliability of > 100 nodes
DistributedAlgorithms(CO~Xity)
,,!.J
SENSINGOPERATING
SYSTEM(~)
\.~)
MAC. (Local w.w-Time)
C!!!)
/~--Energy----
I, Management
(i -Zo~aOS' '\)/---~' -" tinY /
/ MicroFrame~---Work )
.NET/~TACK /
,/ Shared -'---,--'(\ STACK /1
SENSORCross Layer
OptimizerPlatform
C-ERROR Simulator
LEACH-S Life-Time
Network Layer-I LEACH-E Routing
CRF
RF-FULL ROM
RF-MULTIHOP SizeFrameWork Layer-II
RF-KERNEL
802.11 Duty Cycle
CSMA Selective Sleep ScheduleMAC Layer-III
B-MAC
Fig. 1. (a) WSN simulator
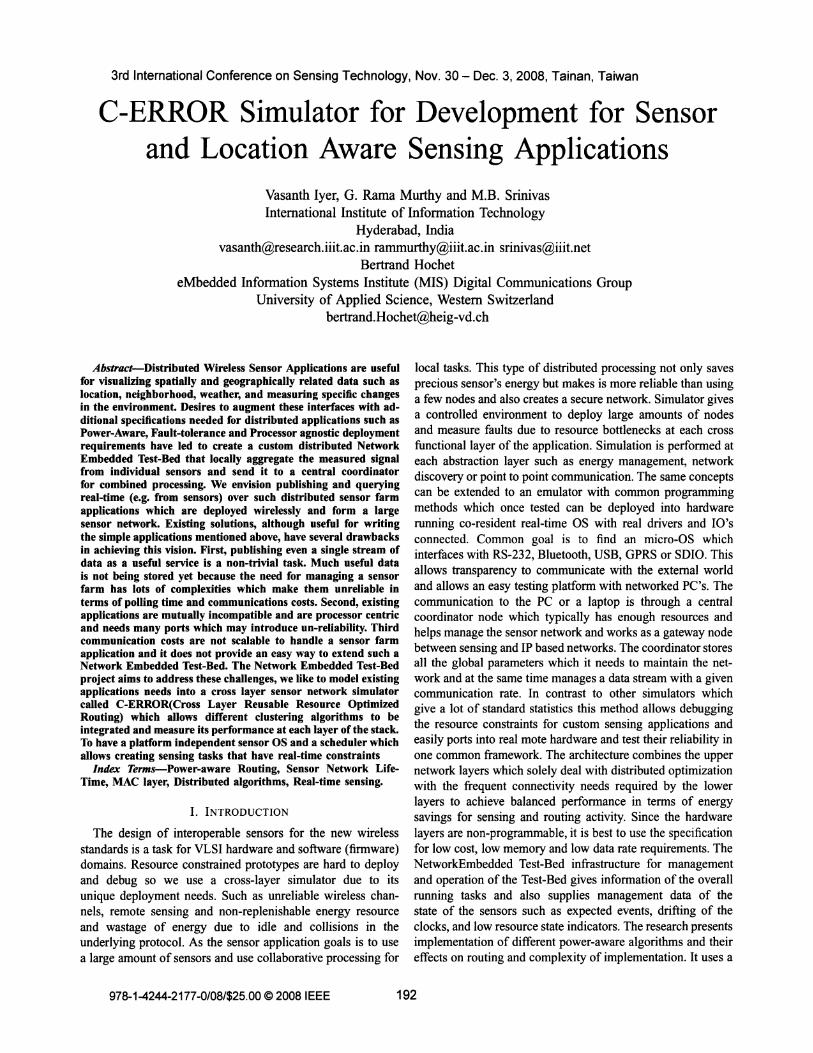
Texas Instrument MCV development platform to validate thememory requirements and target needs used during abstractedsimulation. The flexibility in setup allows the target platformto choose according to the needs such as network management, routing or real-time sensing functionality of the OS.This research summary discusses work in progress regardingopportunities and challenges related to cross-level simulationand optimization based on realistic scalable reliability. Thecross level approach is shown in figure 1 where the baselinearchitecture is shown in (a) and the respective timing, resource,computation complexity and energy model is shown in (b).
What are the reliabilities which are built-in to the systemfor such a test-bed. A real-time system responds in a (timely)predictable way to all individual unpredictable external stimuliarrivals. It is important to note that the average performanceis not the issue.
A. Real-time System Components
To build a predictable system, ALL of its wireless sensornetwork components, hardware and software, plus a gooddesign are contributing to this long term predictability. Havingboth good sensor hardware and a good networkable RTOSis a minimal but not a sufficient requirement for building acorrect reactive sensor system. A wrongly designed test-bedsystem with excellent hardware and software building blocksmay still lead to disaster. This paper deals with sensor test-bedmicro-framework. In general a good micro-framework can bedefined as one that has a bounded (predictable) behavior underall system load scenarios [1]. The current architecture uses amore flexible design with two microcontrollers one dedicatedto transmission and other to do data sensing. As scheduleris more dependent to sensing a real-time framework is usedto create specific sensing tasks which allow to isolate errorduring sensing and transmission.
B. Complexity
Wireless sensor systems are dedicated and unattended forall most their lifetime, the complexity of the design needsto address the time (scheduling, polling, synchronization)local, global and communication overhead to generate the datastream (real-time sensor data). We use specific MAC levelprotocols such Berkeley MAC(B-MAC)[4] used by TOSSIM,
(b) Cross Layer resource allocation and optimizer
Carrier Sense Multiple Access(CSMA) and the general 802.11wireless predecessor without RTS/CTS. These are implemented using GlomoSIM routing layer.
C. Event Driven System
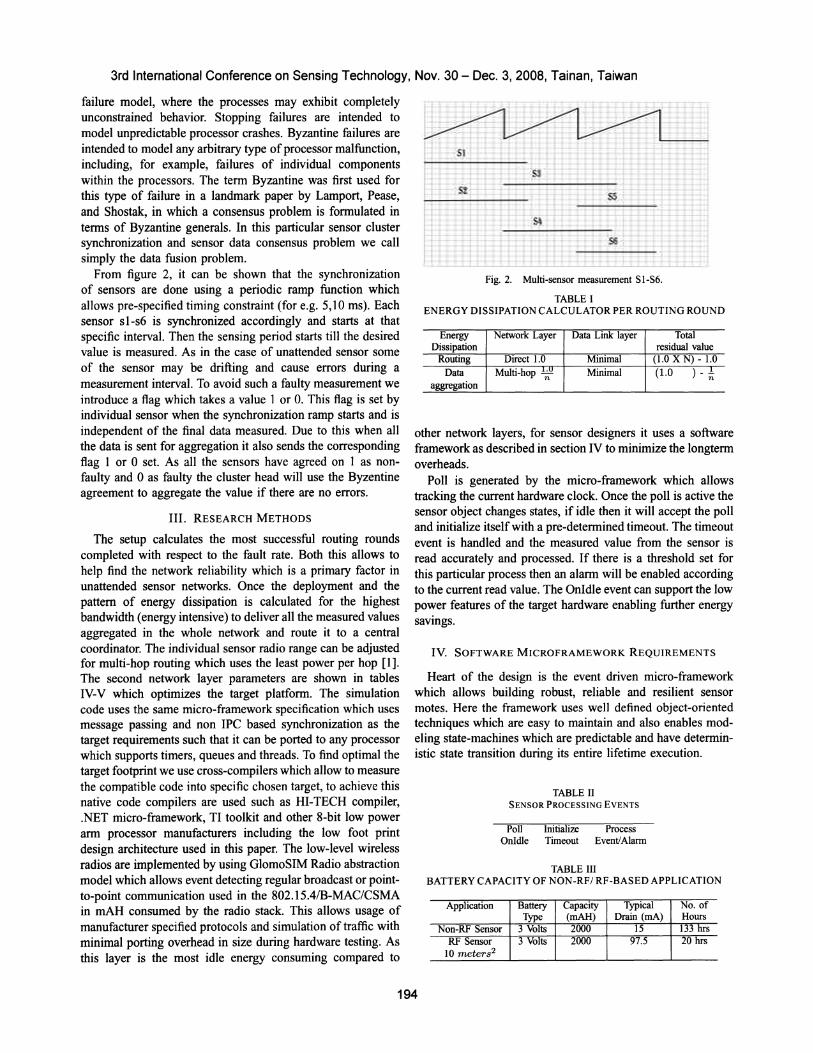
Wireless sensor systems are dedicated and event driven weuse an common platform which allows modules to be programmed with events. A simple sensor cluster is implementedin figure 3 which has five states for performing a useful task.
II. CRoss-LEVEL SIMULATION
Simulation should be based on some abstraction level. Inthis case it is a distributed network simulator with resourcemonitoring such as energy usage, successful packet transmission and tunable MAC parameters for WSN applications.Traditional simulators provide a network model but do notscale to a large network(server farms) with 100's of sensingnodes. Results presented according to the cross-layer simulation methods used, to cover all optimization aspects ituses different simulation environments at each design level.Initial design of distributed algorithms uses the WINSIMsimulator as shown in figure 1(a) for determining the residualenergy efficiency compared to the fault rate, where m isthe measured value and c is the correction [2] needed. Thetarget footprint for the software framework which allowsready programming of event driven state machines uses anobject oriented framework which can be ported into anyhardware platform which are manufacturer processor specific,the tools used by manufacturer are used to bench mark theneeded available memory which is specific to sensor nodefunctionalities as some them need multi-hop routing as wellas sensing capabilities and some can run as base motes withonly sensing. The communication overheads which are uniqueto the MAC layer which supports unique radio model withbattery consumption of each packed received, transmitted andidle power consumed. This Radio and a battery model of thephysical layer is implemented in GlomoSIM ver 2.0 which hasthe ability to configure radio with specific range and frequencyrequirements. The cross-layer energy consumption calculationis based on simulation time which can be varied to differentduty-cycle requirements for best battery efficiency measuredin mAH. We investigate the two failure models, the stopping
193
3rd International Conference on Sensing Technology, Nov. 30 - Dec. 3, 2008, Tainan, Taiwan
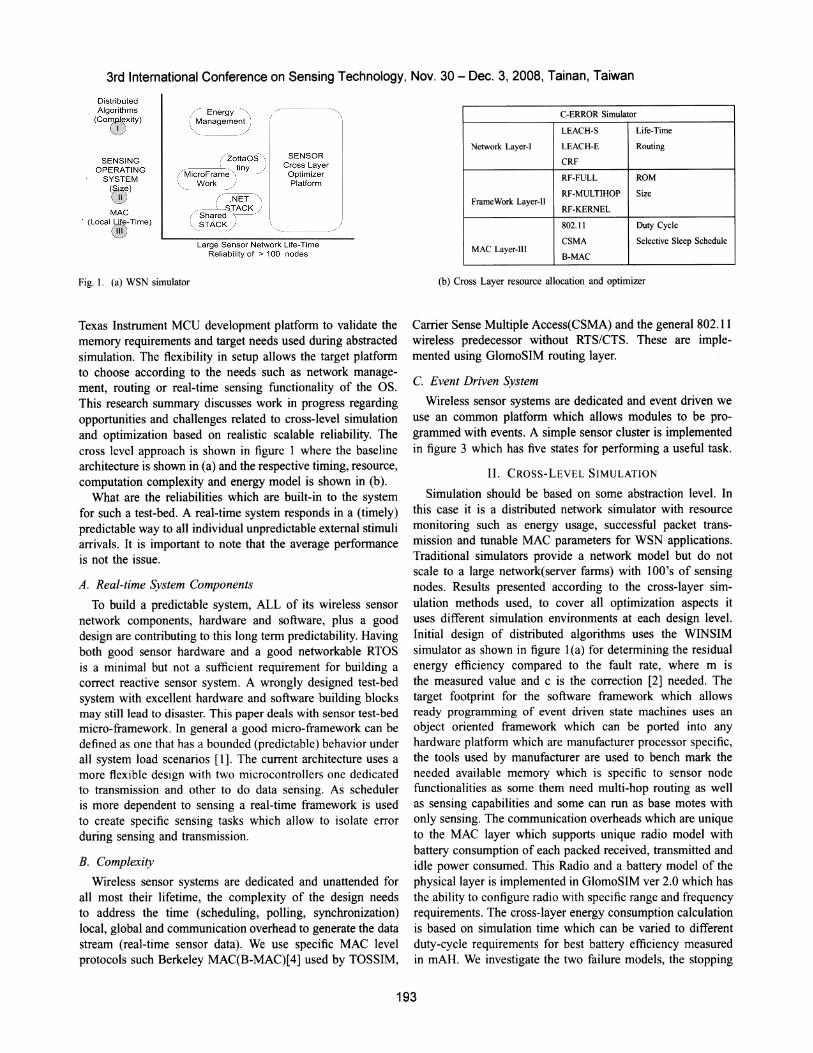
failure model, where the processes may exhibit completelyunconstrained behavior. Stopping failures are intended tomodel unpredictable processor crashes. Byzantine failures areintended to model any arbitrary type ofprocessor malfunction,including, for example, failures of individual componentswithin the processors. The term Byzantine was first used forthis type of failure in a landmark paper by Lamport, Pease,and Shostak, in which a consensus problem is formulated interms of Byzantine generals. In this particular sensor clustersynchronization and sensor data consensus problem we callsimply the data fusion problem.
From figure 2, it can be shown that the synchronizationof sensors are done using a periodic ramp function whichallows pre-specified timing constraint (for e.g. 5,10 ms). Eachsensor sI-s6 is synchronized accordingly and starts at thatspecific interval. Then the sensing period starts till the desiredvalue is measured. As in the case of unattended sensor someof the sensor may be drifting and cause errors during ameasurement interval. To avoid such a faulty measurement weintroduce a flag which takes a value 1 or O. This flag is set byindividual sensor when the synchronization ramp starts and isindependent of the final data measured. Due to this when allthe data is sent for aggregation it also sends the correspondingflag I or 0 set. As all the sensors have agreed on I as nonfaulty and 0 as faulty the cluster head will use the Byzentineagreement to aggregate the value if there are no errors.
III. RESEARCH METHODS
The setup calculates the most successful routing roundscompleted with respect to the fault rate. Both this allows tohelp find the network reliability which is a primary factor inunattended sensor networks. Once the deployment and thepattern of energy dissipation is calculated for the highestbandwidth (energy intensive) to deliver all the measured valuesaggregated in the whole network and route it to a centralcoordinator. The individual sensor radio range can be adjustedfor multi-hop routing which uses the least power per hop [1].The second network layer parameters are shown in tablesIV-V which optimizes the target platform. The simulationcode uses the same micro-framework specification which usesmessage passing and non IPC based synchronization as thetarget requirements such that it can be ported to any processorwhich supports timers, queues and threads. To find optimal thetarget footprint we use cross-compilers which allow to measurethe compatible code into specific chosen target, to achieve thisnative code compilers are used such as HI-TECH compiler,.NET micro-framework, TI toolkit and other 8-bit low powerarm processor manufacturers including the low foot printdesign architecture used in this paper. The low-level wirelessradios are implemented by using GlomoSIM Radio abstractionmodel which allows event detecting regular broadcast or pointto-point communication used in the 802.15.4/B-MAC/CSMAin mAH consumed by the radio stack. This allows usage ofmanufacturer specified protocols and simulation of traffic withminimal porting overhead in size during hardware testing. Asthis layer is the most idle energy consuming compared to
Fig. 2. Multi-sensor measurement SI-S6.
TABLE IENERGY DISSIPATION CALCULATOR PER ROUTING ROUND
Energy Network Layer Data Link layer TotalDissipation residual value
Routing Direct 1.0 Minimal (1.0 X N) - 1.0Data Multi-hop l~U Minimal (1.0 ) - ~
aggregation
other network layers, for sensor designers it uses a softwareframework as described in section IV to minimize the longtermoverheads.
Poll is generated by the micro-framework which allowstracking the current hardware clock. Once the poll is active thesensor object changes states, if idle then it will accept the polland initialize itself with a pre-determined timeout. The timeoutevent is handled and the measured value from the sensor isread accurately and processed. If there is a threshold set forthis particular process then an alarm will be enabled accordingto the current read value. The OnIdle event can support the lowpower features of the target hardware enabling further energysavings.
IV. SOFTWARE MICROFRAMEWORK REQUIREMENTS
Heart of the design is the event driven micro-frameworkwhich allows building robust, reliable and resilient sensormotes. Here the framework uses we]] defined object-orientedtechniques which are easy to maintain and also enables modeling state-machines which are predictable and have deterministic state transition during its entire lifetime execution.
TABLE IISENSOR PROCESSING EVENTS
Poll Initialize ProcessOnldle Timeout Event!Alarm
TABLE IIIBATTERY CAPACITY OF NON-RF/ RF-BASED APPLICATION
Application Battery Capacity Typical No. ofType (mAH) Drain (rnA) Hours
Non-RF Sensor 3 Volts 2000 15 133 hrsRF Sensor 3 Volts 2000 97.5 20 hrs
10 meters2
194
3rd International Conference on Sensing Technology, Nov. 30 - Dec. 3,2008, Tainan, Taiwan
CHE• ...-bla-h••....d..-q.......joI....._e
CH .dd.. it to it,.--ov-"..,ooct-
-.lL::.-:eOP I
-.J1..TI-HOPCHN
-_._--!i fJ..ill
~-ENDI.IF£TIME - - - - --
~
COORDINATOR;~
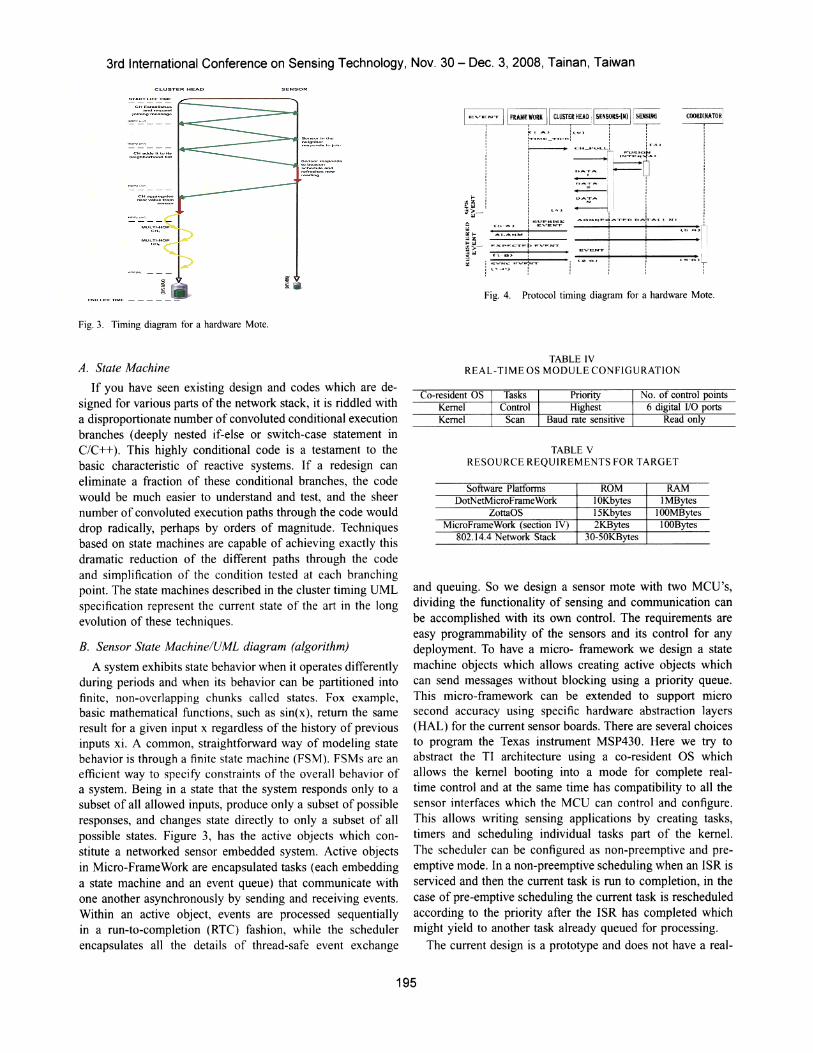
Fig. 4. Protocol timing diagram for a hardware Mote.
Fig. 3. Timing diagram for a hardware Mote.
TABLE IVREAL-TIME OS MODULE CONFIGURATION
TABLE VRESOURCE REQUIREMENTS FOR TARGET
Software Platfonns ROM RAMDotNetMicroFrameWork 10Kbytes IMBytes
ZottaOS 15Kbytes l00MBytesMicroFrameWork (section IV) 2KBytes l00Bytes
802.14.4 Network Stack 30-50KBytes
Read only6 digital I/O ports
No. of control pointsPriorityHighest
Baud rate sensitiveKernelKernel
Co-resident OS
and queuing. So we design a sensor mote with two MCV's,dividing the functionality of sensing and communication canbe accomplished with its own control. The requirements areeasy programmability of the sensors and its control for anydeployment. To have a micro- framework we design a statemachine objects which allows creating active objects whichcan send messages without blocking using a priority queue.This micro-framework can be extended to support microsecond accuracy using specific hardware abstraction layers(HAL) for the current sensor boards. There are several choicesto program the Texas instrument MSP430. Here we try toabstract the TI architecture using a co-resident OS whichallows the kernel booting into a mode for complete realtime control and at the same time has compatibility to all thesensor interfaces which the MeV can control and configure.This allows writing sensing applications by creating tasks,timers and scheduling individual tasks part of the kernel.The scheduler can be configured as non-preemptive and preemptive mode. In a non-preemptive scheduling when an ISR isserviced and then the current task is run to completion, in thecase of pre-emptive scheduling the current task is rescheduledaccording to the priority after the ISR has completed whichmight yield to another task already queued for processing.
The current design is a prototype and does not have a real-
A. State Machine
If you have seen existing design and codes which are designed for various parts of the network stack, it is riddled witha disproportionate number of convoluted conditional executionbranches (deeply nested if-else or switch-case statement inC/C++). This highly conditional code is a testament to thebasic characteristic of reactive systems. If a redesign caneliminate a fraction of these conditional branches, the codewould be much easier to understand and test, and the sheernumber of convoluted execution paths through the code woulddrop radically, perhaps by orders of magnitude. Techniquesbased on state machines are capable of achieving exactly thisdramatic reduction of the different paths through the codeand simplification of the condition tested at each branchingpoint. The state machines described in the cluster timing VMLspecification represent the current state of the art in the longevolution of these techniques.
B. Sensor State Machine/UML diagram (algorithm)
A system exhibits state behavior when it operates differentlyduring periods and when its behavior can be partitioned intofinite, non-overlapping chunks called states. Fox example,basic mathematical functions, such as sin(x), return the sameresult for a given input x regardless of the history of previousinputs xi. A common, straightforward way of modeling statebehavior is through a finite state machine (FSM). FSMs are anefficient way to specify constraints of the overall behavior ofa system. Being in a state that the system responds only to asubset of all allowed inputs, produce only a subset of possibleresponses, and changes state directly to only a subset of allpossible states. Figure 3, has the active objects which constitute a networked sensor embedded system. Active objectsin Micro-FrameWork are encapsulated tasks (each embeddinga state machine and an event queue) that communicate withone another asynchronously by sending and receiving events.Within an active object, events are processed sequentiallyin a run-to-completion (RTC) fashion, while the schedulerencapsulates all the details of thread-safe event exchange
195

3rd International Conference on Sensing Technology, Nov. 30 - Dec. 3, 2008, Tainan, Taiwan
time kernel at the deployment level so it only supports softreal-time capabilities. The primary goal is to make this microframework scalable to any MCU kit using the same base objectoriented class abstraction.
V. NETWORK STACK API'S
The maintenance ofthe 802.14.4 sensor network is the backbone of the easily programmable model of the network stackdesign. As by design they are self-organizing they are easy tomaintain and uses a hierarchical addressing. To use the selforganizing capability we divide the functional specificationsof the stack into three types. The first being a fully functionalstack, the second being a muli-hop routing stack and the thirdbeing a multi-tasking stack with co-resident sensing OS. Thefirst type of mote is the central coordinator which typically isaddressed as node-O and acts as a communication gateway andcontrol node. There is typically only one such node in a givencluster based topology and can address up to a large number ofnodes and these have sufficient resources in terms of memoryand data handling capability. Node-O when configured doesthe topology discovery and initial assignment of addressesand identifies specific nodes such as routers or sensing nodesto initialize the sensor network. The second types of nodesare routers whose primary capability is to forward multi-hopcommunication from the data nodes to the central coordinatorgateway. These nodes need to have a routing stack so that itcan effectively participate in routing of the measured data fromits next hop neighbors. The third type of nodes is the mostadaptive as these are long term remotely placed and needsto accurately measure environmental values and only transmitwhen quarried or an event has triggered idling most of its lifetime. The 802.15.4 stack code is designed as a state machinewhich allows a re-entrant API library for sending non-blockingmessages. The programming API's cover each network layerindividually such that it is documented as a library function,which are compiled into native target processors with hardwarespecific optimizations.
A. Application Layer
Application is customized based on some sensing specificparameter which are measured [5] in a distributed networkand aggregated. As this measurement needs deterministic localmeasurements it uses a preemptive kernel. The priorities ofcritical tasks which can be configured at boot time are asshown below.
r1 == Scheduler frequency
r2 == Deadline of task
r3 = Reports when deadlines has passed
The default behavior is based on multi-tasking which yieldswhenever the task in suspended for the remaining non-criticaltasks to run. This is explained in the OS section in moredetails.
B. Network Layer
The upper layer is the energy-aware layer which allowsdistributed algorithms to load balance critical sensor resourceswhich are non-replenishable. These distributed routing algorithms keep track of the residual energy which is the sum ofall the sensor's energy put together and is available for dataforwarding which is a global threshold.
Gl b l == Total collaborative resource neededo a Resource available in individual sensor
This factor is calculated on routing or completing a sensornetwork task without having a single failure, keeping layer Ito a minimum.
C. Data-link Layer
The low-level layers allow the network to be connectedall the time with a near neighborhood path algorithm. Thenetwork reliability index which is different from the typicalsignal link quality can be determined as
C 8 hTotal number of sensor deployed
onnect trengt == ------------Current number of sensor connected
This index varies as the lifetime time of the sensors is extendedusing the distributed resource threshold and network maintenance requirements. The algorithm used in the simulation usesa controlled flooding factor which is based on the densityof the network (highly optimized in large network). If thewireless topology graph is represented as
G == (8, T)
Where G represents the connected weighted graph for adeployment where S is the sensors and T represents theminimum power used to flood its neighbor. Then
T S Max. edge of the connected G
The energy consumed in this layer is plotted using GlomoSIMradio model.
D. Physical Layer
As the state of the radio can be emulated Tx, Rx tasks inthe cross layer simulator using the built in GlomoSIM radiomodel and a battery consumption based on a given MAC.
VI. SIMULATION BASED OPTIMIZATION FOR LIFETIME OF
SENSOR NETWORKS
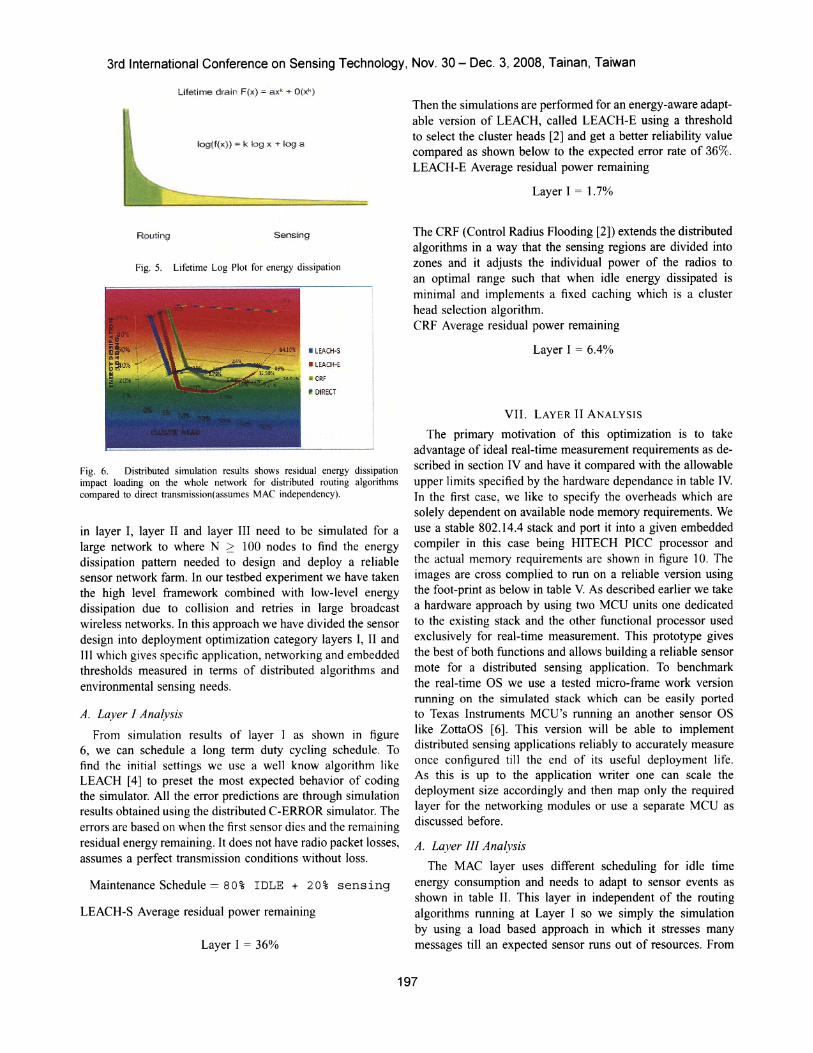
If the lifetime of the sensor network is defined as in figure5, then the dissipation of energy can be plotted as a loggraph. The expected depletion over the entire lifetime canbe divided into majority routing and minor sensing in termsof mAH consumed per routing round. This expected energyconsumption is compared with the actual measured valuesusing specific MAC layers to calculate the optimal parametersfor each sensor requirements.
The cross-level sensor network simulator for large deployment as described in figure I(b) determines the frameworkto design a reliable sensor mote. These parameters described
196
3rd International Conference on Sensing Technology, Nov. 30 - Dec. 3,2008, Tainan, Taiwan
Ufetlme dra~r" F(x) = ax" + O(~)
k>g(f(x)) = k log )( ... log a
Routing Sensing
Fig. 5. Lifetime Log Plot for energy dissipation
IlEACH-S
IlEACH-E
Fig. 6. Distributed simulation results shows residual energy dissipationimpact loading on the whole network for distributed routing algorithmscompared to direct transmission(assumes MAC independency).
in layer I, layer II and layer III need to be simulated for alarge network to where N 2: 100 nodes to find the energydissipation pattern needed to design and deploy a reliablesensor network farm. In our testbed experiment we have takenthe high level framework combined with low-level energydissipation due to collision and retries in large broadcastwireless networks. In this approach we have divided the sensordesign into deployment optimization category layers I, II andIII which gives specific application, networking and embeddedthresholds measured in terms of distributed algorithms andenvironmental sensing needs.
A. Layer I Ana(vsis
From simulation results of layer I as shown in figure6, we can schedule a long term duty cycling schedule. Tofind the initial settings we use a well know algorithm likeLEACH [4] to preset the most expected behavior of codingthe simulator. All the error predictions are through simulationresults obtained using the distributed C-ERROR simulator. Theerrors are based on when the first sensor dies and the remainingresidual energy remaining. It does not have radio packet losses,assumes a perfect transmission conditions without loss.
Maintenance Schedule == 80% IDLE + 20% sensing
LEACH-S Average residual power remaining
Layer I = 36%
Then the simulations are performed for an energy-aware adaptable version of LEACH, called LEACH-E using a thresholdto select the cluster heads [2] and get a better reliability valuecompared as shown below to the expected error rate of 36%.LEACH-E Average residual power remaining
Layer I = 1.7%
The CRF (Control Radius Flooding [2]) extends the distributedalgorithms in a way that the sensing regions are divided intozones and it adjusts the individual power of the radios toan optimal range such that when idle energy dissipated isminimal and implements a fixed caching which is a clusterhead selection algorithm.CRF Average residual power remaining
Layer I = 6.4%
VII. LAYER II ANALYSIS
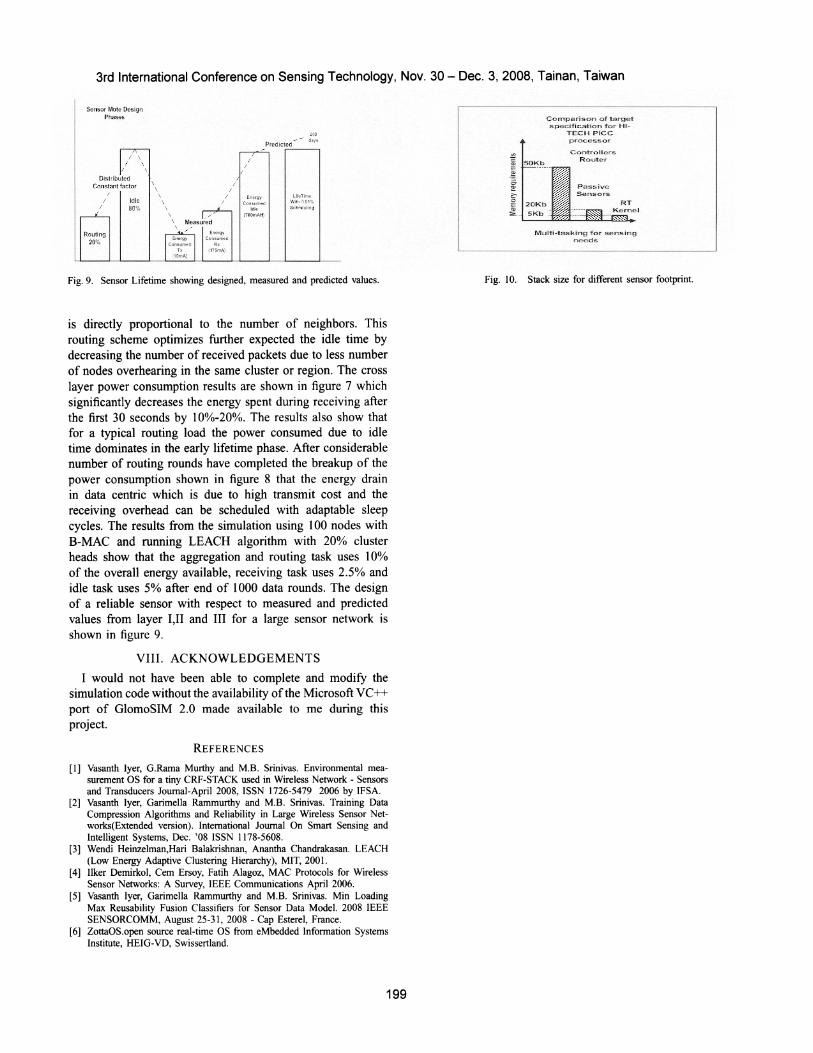
The primary motivation of this optimization is to takeadvantage of ideal real-time measurement requirements as described in section IV and have it compared with the allowableupper limits specified by the hardware dependance in table IV.In the first case, we like to specify the overheads which aresolely dependent on available node memory requirements. Weuse a stable 802.14.4 stack and port it into a given embeddedcompiler in this case being HITECH PICC processor andthe actual memory requirements are shown in figure 10. Theimages are cross complied to run on a reliable version usingthe foot-print as below in table V. As described earlier we takea hardware approach by using two MCV units one dedicatedto the existing stack and the other functional processor usedexclusively for real-time measurement. This prototype givesthe best of both functions and allows building a reliable sensormote for a distributed sensing application. To benchmarkthe real-time OS we use a tested micro-frame work versionrunning on the simulated stack which can be easily portedto Texas Instruments MCV's running an another sensor OSlike ZottaOS [6]. This version will be able to implementdistributed sensing applications reliably to accurately measureonce configured till the end of its useful deployment life.As this is up to the application writer one can scale thedeployment size accordingly and then map only the requiredlayer for the networking modules or use a separate MCV asdiscussed before.
A. Layer III Ana(vsis
The MAC layer uses different scheduling for idle timeenergy consumption and needs to adapt to sensor events asshown in table II. This layer in independent of the routingalgorithms running at Layer I so we simply the simulationby using a load based approach in which it stresses manymessages till an expected sensor runs out of resources. From
197

3rd International Conference on Sensing Technology, Nov. 30 - Dec. 3, 2008, Tainan, Taiwan
Cross layer EnefIY Consumption for Short UfeTnne (fewdata round)
I I I I I I I I I III1 2 J .5 , 7 • 9 10 11 U U 14 15 16 11 11 19 20 11 22 23 24 2S 2'6 27 21 19 !IO 31 :n )3 ).ISS 36 37 31 J9 ~ 41 .2 U
Fig. 7. Sensor Initial Lifetime measured using simulation model until the first 60 seconds showing Idle, Receive and Transmit energy consumption in total rnA.
TABLE VILOAD SIMULATION FOR LIFETIME ROUTING WHEN N=1 00
AND F= 1 (NANO SEC)
TABLE VIIENERGY CONSUMPTION IN DUTY CYCLE WHEN N=100 AND
F=1
Routing AlgorithmLEACH
Rx1755686616
Routing AlgorithmLEACH
Rx175.35 mAH
Lifetime == 269 days(predicted for a AA battery)
Cross Layer Enersv ConsuRlption 'forrnA Lonser U'feTiRle (1000 data rounds)
Fig. 8. Sensor Total Lifetime measured using simulation model upto 20,000seconds and the total rnA consumed for transmit, received and idle.
RoutingRounds
- Rx -"h Sleep
30 45 50 55 68 78 98 400 1000
. d d' . . ( ) 10.0+ 744.3 + 175.35AmortIze lsslpatlon mAH == 3
Amortized dissipation == 309.66 mAH
Substituting this amortized dissipation value for a standardbattery of 2000 mAH into the lifetime equation with 0.01 %duty cycle a 100 milli second preamble MAC.
.. 2000 mAHL'lfet'lme == 309.66 mAH x 0.01%
the battery calculation in table III for RF applications we assign a 3000J of reserve power. Using the GlomoSIM simulatorwith 100 nodes placed 140 x 140 meters with RF range of50 meters. From the lifetime energy depletion log plot weknow that the energy consumed for routing is constant whatever the distributed scheme for load balancing it so we needto find the time spent on routing and its difference whichis idle and receiving time per algorithm. The results of theGlomoSIM simulation are shown for each routing algorithmfor 100 node (N) topology until the sensor fails (F), running BMAC, CSMA and 802.11 in tables VI and VII. The results for100 node topology is as shown in figure 7 and 8 in which MAClayer radio for a constant routing load which is set as 2 packetsper seconds running for short period compared to running until20,000 simulation seconds. From the results in figure 7 and 8the initial load is dominated by idle power consumption andin long period of operation the transmit power consumptiondominates over idle and receive consumptions combined. Thelifetime spent in idling 63 seconds, receives for 1.7 secondsand transmits for 0.14 sec during the sensor network MACload testing. This is as predicted in the life-time calculationfrom figure 5 where 80% idling and 20% routing was expectedfor a large sensor network. The corresponding energy costare shown in table VII which does not factor in how thepower saving is calculated in the current simulator code. Tounderstand this the layer III MAC duty cycle can be definesas
L'f' Cbatt X V x 60 x 60'l et'lme == x dutycycle
EnergYTx+ Rx+I dle+ Lis
A . d d' . t' EnergYTx+Rx+ldlemortlze lsslpa Ion == 3
B. Cross Layer Energy Analysis with Sleep Scheduling
To compliment the duty cycle power savings we use a sleepschedule such as S-MAC[4], Z-MAC [4] for most recentlyused cluster heads or traffic overhead for listening which
198
3rd International Conference on Sensing Technology, Nov. 30 - Dec. 3,2008, Tainan, Taiwan
Mutti-tasking for sens.ingneeds
Comparison of targetspecification for HI
TECH PICCp4"ocessor
ControllersRouter
I!
\\
\Idle80%
/ \I \
I \
DistributedConstant factor
Sensor Mote DesignPhases
Fig. 9. Sensor Lifetime showing designed, measured and predicted values. Fig. 10. Stack size for different sensor footprint.
is directly proportional to the number of neighbors. Thisrouting scheme optimizes further expected the idle time bydecreasing the number of received packets due to less numberof nodes overhearing in the same cluster or region. The crosslayer power consumption results are shown in figure 7 whichsignificantly decreases the energy spent during receiving afterthe first 30 seconds by 10%-20%. The results also show thatfor a typical routing load the power consumed due to idletime dominates in the early lifetime phase. After considerablenumber of routing rounds have completed the breakup of thepower consumption shown in figure 8 that the energy drainin data centric which is due to high transmit cost and thereceiving overhead can be scheduled with adaptable sleepcycles. The results from the simulation using 100 nodes withB-MAC and running LEACH algorithm with 20% clusterheads show that the aggregation and routing task uses 10%of the overall energy available, receiving task uses 2.50/0 andidle task uses 5% after end of 1000 data rounds. The designof a reliable sensor with respect to measured and predictedvalues from layer I,ll and III for a large sensor network isshown in figure 9.
VIII. ACKNOWLEDGEMENTS
I would not have been able to complete and modify thesimulation code without the availability of the Microsoft VC++port of GlomoSIM 2.0 made available to me during thisproject.
REFERENCES
[1] Vasanth Iyer, G.Rama Murthy and M.B. Srinivas. Environmental measurement OS for a tiny CRF-STACK used in Wireless Network - Sensorsand Transducers Journal-April 2008, ISSN 1726-5479 2006 by IFSA.
[2] Vasanth Iyer, Garimella Rammurthy and M.B. Srinivas. Training DataCompression Algorithms and Reliability in Large Wireless Sensor Networks(Extended version). International Journal On Smart Sensing andIntelligent Systems, Dec. '08 ISSN 1178-5608.
[3] Wendi Heinzelman,Hari Balakrishnan, Anantha Chandrakasan. LEACH(Low Energy Adaptive Clustering Hierarchy), MIT, 2001.
[4] Ilker Demirkol, Cern Ersoy, Fatih Alagoz, MAC Protocols for WirelessSensor Networks: A Survey, IEEE Communications April 2006.
[5] Vasanth Iyer, Garimella Rammurthy and M.B. Srinivas. Min LoadingMax Reusability Fusion Classifiers for Sensor Data Model. 2008 IEEESENSORCOMM, August 25-31, 2008 - Cap Esterel, France.
[6] ZottaOS.open source real-time OS from eMbedded Information SystemsInstitute, HEIG-VD, Swissertland.
199