burrowing behaviour and movements of the signal crayfish
TRANSCRIPT
Burrowing Behaviour and Movements of the Signal Crayfish Pacifastacus
leniusculus (Dana)
A thesis submitted for the degree of Doctor of Philosophy
By
Jeama Amanda StantonDepartment of Biology University of Leicester
2004
UMI Number: U179387
All rights reserved
INFORMATION TO ALL USERS The quality of this reproduction is dependent upon the quality of the copy submitted.
In the unlikely event that the author did not send a complete manuscript and there are missing pages, these will be noted. Also, if material had to be removed,
a note will indicate the deletion.
Dissertation Publishing
UMI U179387Published by ProQuest LLC 2013. Copyright in the Dissertation held by the Author.
Microform Edition © ProQuest LLC.All rights reserved. This work is protected against
unauthorized copying under Title 17, United States Code.
ProQuest LLC 789 East Eisenhower Parkway
P.O. Box 1346 Ann Arbor, Ml 48106-1346
Abstract
Abstract
Burrowing Behaviour and Movements of the Signal Crayfish Pacifastacus leniusculus (Dana)
Jeama Amanda Stanton.
The major burrowing characteristics leading to, during and after burrow construction are described. Burrow initiation was significantly correlated to crayfish size; smaller individuals beginning construction more quickly. Field burrow morphologies, examined using an optic cable video camera, showed 92% to be simple with only a single opening (Length range 3.5 - 79.0 cm).
Significant associations were found between the clay/sand content of stream bank sediments and crayfish burrow densities. Substrate selection experiments indicated a significant preference for artificial shelter over burrowing in clay for adult crayfish, and a significant preference for clay and artificial shelter over mud or gravel in juveniles.
The rate o f range extension of P. leniusculus along the Gaddesby Brook shows polynomial expansion i.e. the speed of new habitat colonisation is increasing each year. Juveniles, on the basis of burrow sizes and movements made by adult crayfish, are mainly responsible for this colonisation.
Measurements of burrow water O2 , CO2 , ammonia and pH were made and showed slightly hypoxic conditions and elevated levels of ammonia in occupied burrows. Burrow irrigation rates were examined with average turnover rates being 14.8 1 h '1 for adults (mass range = 31.7“ 117 g)-
Crayfish movements were monitored by means of radio tracking. Results indicated that activity was greatest during and immediately following dusk and that crayfish activity was significantly less in winter than summer. Most individuals were position-fixed at the same burrow/shelter for the duration of radio tracking, a few made occasional large movements between stationary phases of between 2-8 days. The maximum distance recorded by any individual in one night was 89.6 m. During two flood events, all tagged animals maintained their pre-flood positions. Abdominal tags used to measure longer-term movements (over 2 years) gave an overall recapture rate of 19.0% (51 from 268) and generally showed that adult P. leniusculus remained in the same vicinity for in excess of 2 years.
Hopefully this study will help in the control and management of P. leniusculus. For example, forecasts on preferred sites for population expansion and identification of sites vulnerable to bank damage can be deduced from substrate preferences. Furthermore, information on burrow construction, behaviour and irrigation rates may be relevant in biocide application and assessing the effects on bank stability. A knowledge of crayfish movement and activity is important for predicting time scale of spread and colonisation of new habitats.
I

AcknowledgementsThank you to Dr. Bob Harris for his vast experience, advice and unerring support on fieldwork, laboratory work and the writing of this thesis. My grateful thanks must also go to all those in the Biology Department of the University of Leicester who have helped with this work, especially Maurice Andrews.
Thanks also to NERC for their support over the years and to Peter Sibley of the Environment Agency for his help, support and the provision of a radio receiver and transmitters for animal tracking.
To Mr. and Mrs. Smith and Professor and Mrs. Lamming, thank you, for granting access to your land in order to carry out fieldwork (even at the most unsocial hours!)
Final thanks must go to my family and friends for their understanding, forbearance and unstinting support, without which this thesis could not have been realised.
II

Contents
Page
Chapter 1 Introduction 11.1 General Introduction 21.2 Habitat selection and the use of refugia and 4
burrows1.3 Movements and Activity Patterns 81.4 Population densities and spread 111.5 Social interactions 121.6 Predation and feeding behaviour 141.7 Management and exploitation 151.8 Study aims and objectives 16
Chapter 2 Materials and Methods 182.1 Field Studies 20
2.1.1 Burrow densities in relation to substrate 21 type
2.1.2 Internal burrow features 232.1.3 The internal burrow water chemistry 252.1.4 Population densities, range extension and 27
burrow erosion damage2.1.5 Short term movements and activities in the 31
field2.1.6 Long term movements and tagging 352.1.7 Comparisons with the River Greet 36
2 2 Observations of burrowing and associated 37behaviour in the laboratory2.2.1 Crayfish behaviour before, during and after 38
burrowing2.2.2 Substrate Choice Experiments 392.2.3 Rates of burrow irrigation by crayfish and 42
passive irrigationChapter 3 Results 46
3.1 Field Studies 473.1.1 Burrow densities in relation to substrate 47
type3.1.2 Internal burrow features 523.1.3 The internal burrow chemistry 563.1.4 Population densities, range extension and 60
burrow erosion damage3.1.5 Short term movements and activities in the 68
field3.1.6 Long term movements and tagging 773.1.7 Comparisons with the River Greet 79
III
3.2 Observations of burrowing and associated 82behaviour in the laboratory3.2.1 Crayfish behaviour, during and after 82
burrowing3.2.2 Substrate Choice Experiments 913.2.3 Rates of burrow irrigation by crayfish and 95
passive irrigationChapter 4 Discussion 100
4.1 Field Studies 1014.1.1 Burrow densities in relation to substrate 101
type4.1.2 Internal burrow features 1024.1.3 The internal burrow water chemistry 1054.1.4 Population densities, range extension and 107
burrow erosion damage4.1.5 Short term movements and activities in the 109
field4.1.6 Long term movements and tagging 1124.1.7 Comparisons with the River Greet 114
4.2 Observations of burrowing and associated 115behaviour in the laboratory4.2.1 Crayfish behaviour before, during and after 115
burrowing4.2.2 Substrate Choice Experiments 1174.2.3 Rates of burrow irrigation by crayfish and 120
passive irrigation4.2.4 Management prospects for the future 122
Appendices 125
References 148
Addenda consisting of one CD-ROM
IV

Chapter 1
Introduction
1
Introduction
Chapter 1: Introduction
1.1 General Introduction
Crayfish are arthropod crustaceans of the class Malacostraca and Order Decapoda. They
inhabit mostly freshwater habitats, for example, rivers, lakes and ponds. Higher salinity is
tolerated by some species, but a real marine environment is never inhabited (Scholtz, 1999).
There are more than 540 recognised crayfish species (Holdich, 2002b), divided into two
superfamilies:
1. Astacoidea, which occur in the Northern Hemisphere and consist of two families, the
Astacidae and Cambaridae.
2. Parastacoidea, which occur in the Southern Hemisphere and consist of one family, the
Parastacidae.
Crayfish are naturally absent from the Antarctic and African continents (except Madagascar),
the Indian sub-continent and the northern parts of central Asia (Holdich, 2002b). In these
regions, the predominant freshwater decapod crustaceans are brachyuran crabs. Crayfish have
been frequently transported by man, a common practice from as early as the Middle Ages
(Laurent, 1988), and it was found that certain crayfish species when moved outside their
home range, quickly established themselves in new areas (Holdich and Gherardi, 1999).
The only species native to the British Isles is the white-clawed crayfish, Austropotamobius
pallipes (Holdich et al., 1990), which is widespread in England and parts of lowland Wales. It
prefers either running or standing clean water and is absent in areas with naturally acidic
water or weather-resistant rocks, for example, Cornwall and the Lake District (Laurent, 1988).
In the 1970’s, Pacifastacus leniusculus, the signal crayfish, was introduced into Britain for
culinary and aquacultural purposes (Lowery and Holdich, 1988; Richards, 1983).This species
originated from north-western North America between the Pacific Ocean and the Rocky
Mountains (Hobbs, 1988; Lowery and Holdich, 1988). Unlike A. pallipes, P. leniusculus was
found to be more suitable for commercial farming, as it grew rapidly, reached a larger fully-
grown size and could sometimes reach a marketable size in two years (Alderman and
Wickins, 1996).
2
Introduction
There were other advantages for farming P. leniusculus. It was highly adaptable. It could
occupy both clean and brackish water, survive high salinity as much as 20 ppt (Rundquist and
Goldman, 1978) and acclimatise itself to a wide range of temperatures up to 33°C (Becker et
a l , 1975).
By 1983, there were over two hundred and fifty commercial crayfish farms of varying sizes
throughout the country. The industry proved profitable; there was a virtually guaranteed
market, with the additional advantages that the breeding stock could be kept out-of-doors with
minimum outlay and low maintenance costs (Marren, 1986).
By the mid 1980’s, however, the crayfish market collapsed in Britain and ponds and lakes
containing signal crayfish stocks were left neglected. Many of them relied on a water source
from small streams or springs (Harris, 1999). Not surprisingly, these very mobile animals,
which are capable of climbing obstacles and walking large distances out of water, were able
to escape into nearby waters. Once in the rivers, it was found that they altered aquatic
ecosystems by destroying plant life, invertebrate communities and fish populations and by
burrowing and weakening riverbanks (Alderman and Wickins, 1996).
After P. leniusculus was introduced into Britain it was also discovered that it was the vector
for crayfish plague (Alderman, 1993). This is caused by the fungus Aphanomyces astaci,
which signal crayfish carry naturally in their tissues, but are immune to its effects unless
under extreme stress (Smith and Soderhall, 1986). Britain’s native crayfish A. pallipes is,
however, susceptible to the fungus.
The fungal hyphae grow through the shell to invade the animal’s muscles, causing a
melanisation of the exoskeleton. Infected crayfish show abnormal behaviour. For example,
although normally nocturnal, they wander about the stream in broad daylight and appear
disorientated. Later, dying animals are found lying on their backs with brown patches on their
carapace, indicative of the presence of the plague (Marren, 1986).
The fungal spores were found to be transmittable through water (Cerenius et al., 1988). The
first confirmed outbreak of the plague in Britain was in 1981, but it was not until 1983, that
the then Ministry of Agriculture, Fisheries and Food (MAFF, now DEFRA), identified the
fungus, which has since devastated populations of native crayfish, A. pallipes, particularly in
southern England (Marren, 1986).
3
Introduction
In the 1980’s, three Acts of Parliament were passed, which were intended to prevent or
contain the spread of crayfish plague in Britain. These were, The Import o f Live Fish Act
1980; The Animal Health Act 1981 and The Diseases o f Fish Act 1983. At the time, there was
a reluctance to enforce these laws, and, by 1984, it was considered that any restrictions
imposed to prohibit imports of live crayfish or to control their movements would be too
disruptive to trade (Marren, 1986).
Since then, efforts have been made to try and prevent the further spread of signal crayfish in
an attempt to protect A. pallipes. In 1985, for example, an order was made that required
crayfish farmers to register with the fishery boards, giving details of location, stocks and
facilities. Farmers were also required to keep records, which were open to inspection, of all
movements of live crayfish to and from their farms. In March 1992, legislation was
introduced listing P. leniusculus, Astacus astacus and Astacus leptodactylus under the Part 1
of Schedule 9 of the Wildlife and Countryside Act (1981) (Guan, 1995). These species became
subject to controls under Schedule 14 (1) where it is an offence (except under licence) to
release into the wild ‘any animal of a species not ordinarily in resident in, or not a regular
visitor to, Great Britain in the wild state’ (Holdich and Rogers, 1992). This was then followed
by The Prohibition o f Keeping Live Fish (Crayfish) Order 1996, making unlicensed keeping
of non-native crayfish an offence with the exception of the species P. leniusculus kept within
certain postcode areas of England and Wales.
1.2 Habitat selection and the use of refuges and burrows
Crayfish can live in lentic and lotic waters, in environments that are subterranean and semi-
terrestrial, as well as brackish waters. Both physiologically and behaviourally, they are very
adaptable (Holdich, 2002b).
All freshwater crayfish show burrowing behaviour to some extent, given the need to do so,
that is, when there are no natural refuges present (Berrill and Chenoweth, 1982; Horwitz et
al., 1985a). Crayfish do, however, require a suitable substrate in which to find refuge or to
burrow. Some species, such as, P. leniusculus and A. pallipes tend to favour slower-flowing
waters coupled with adequate conditions for shelter, like tree roots, stones or sediment banks
in which to burrow (Nystrom, 2002; Peay and Rogers, 1999). Other species, such as,
Cambarus diogenes diogenes and Engaeus leptorhyncus, live in burrows which are not
directly connected to any surface water body. Instead the burrows extend to below the water
table (Grow and Merchant, 1979; Horwitz et al., 1985b).
4
Introduction
The most vulnerable periods for the crayfish, regarding predation, are, the juvenile stage,
particularly between hatching and finding a suitable ‘safe’ refuge (Blake and Hart, 1993) and
the immediate post-moult period, particularly when food is scarce, which can affect the
frequency of cannibalism (Dong and Polis, 1992).
In the study by Alberstadt et al. (1995), on cover-seeking behaviour of the juvenile and adult
crayfish, Orconectes rusticus, thigmotactic cues (tactile stimulation) and the effect of
darkness were found to be of prime importance. This was supported by Antonelli et al.,
(1999), who observed that for both juvenile and adult Procambarus clarkii, darkness appeared
to be the controlling factor in their cover seeking-behaviour.
Crayfish distribution can also be related to temperature (Claussen, 1980; Crawshaw, 1974;
Kivivuori, 1977). Orconectes causeyi, for example, was found to actively seek shelter, but
only within optimum thermal areas. This species was sensitive to a range of temperatures,
establishing a thermal selection index (14 - 29°C) (Loring and Hill, 1976).
Thus, there is evidence that, in some instances, choice of habitat does occur (Partridge, 1978),
but because some species are extremely invasive and competitive (Holdich and Gherardi,
1999) some individuals, due to either interspecific or intraspecific agonistic encounters and/or
the effects of predation, are excluded from preferred habitats and thus forced to live in less
suitable areas (Gherardi, 2002).
To fully understand the patterns of distribution and spread of the species P. leniusculus, it is
important to have an understanding of their substrate preferences. Although, work has been
carried out to determine substrate choices in crayfish (Klosterman and Goldman, 1983;
Vorburger and Ribi, 1998), research has been limited, and has not examined how preferences
of habitat may be affected when animals are in competition with one another.
Many species of crayfish have been observed to burrow, particularly in the family
Cambaridae (Abbott, 1884; Berrill and Chenoweth, 1982; Bouchard and Etnier, 1979;
Capelli, 1980; Creaser, 1931; Girard, 1852; Grow, 1982; Hasiotis, 1993a, 1993b; Huner,
2002; McManus, 1960; Payne and Price, 1981; Rogers and Huner, 1985; Tarr, 1884;
Williams et al., 1974). In addition, the families Astacidae, (Guan, 1994; Holdich, 2002a;
Stanton and Harris, 2003) and Parastacidae (Horwitz and Richardson, 1986; Horwitz et al.,
5
Introduction
1985a; Horwitz et al., 1985b; Richardson, 1983; Richardson and Swain, 1980) have been
reported to show burrowing behaviour.
Although there is a positive correlation found between the abundance of non-burrowing
crayfish and the abundance of refuges (Lodge and Hill, 1994), it is interesting to note that
non-burrowing species will occasionally construct burrows when necessary. For example,
Berrill and Chenoweth (1982), observed that burrowing occurred when river or lake waters
disappeared and Guan (1994) found that in the British Isles, when appropriate substrate was
available, the species P. leniusculus, a non-burrowing species in its native habitat, burrowed
extensively.
For most burrowing animals the primary role of a burrow is for protection, be it from
predators, competitive rivals or severe weather conditions. However, some burrows can serve
more than one purpose. For example, Kamofsky and Price (1989), observed that burrows of
Homarus americanus, the common lobster, not only offered protection, but were also used for
food storage and to aid food harvesting. Horwitz et al., (1985a), found that Engaeus
leptorhyncus, constructed burrows with large chambers and that the juvenile crayfish grew
within the parental burrow. Unlike other crayfish the juveniles were unable to move at an
early age to a new burrow, as they could not make their way easily into a nearby water body.
North American burrowing species of crayfish have been classified into three categories (Hobbs, 1981):
1. Primary burrowers - for example, Procambarus hagenianus. Crayfish that spend
almost their entire life in complex burrow systems, below the surface of the ground,
rarely linked with open water.
2. Secondary burrowers - for example, Procambarus clarkii. Crayfish that excavate
simple burrows, which they remain in for most of their life. However, they frequently
move to open water when the water table rises, usually in the rainy season.
3. Tertiary burrowers - for example, Orconectes causeyi. Crayfish that only burrow in
winter, during drought conditions and in some cases during the breeding season. The
burrows are usually simple tubes extending 1-2 m into the substrate with one opening.
The burrows of Australian crayfish have also been divided into three types (Horwitz and
Richardson, 1986). Type 1 burrows are found in, or directly connected to, open water; Type 2
6
Introduction
burrows are connected to the water table and Type 3 burrows are independent of the water
table.
Burrow morphology is usually determined using a variety of casting methods, including foam,
plaster and concrete, and can be excavated by either digging or by the use of high pressured
water (Guan, 1995; Lawrence et al., 2002). The burrows of some crayfish species, particularly
those present in stream banks such as P. leniusculus and Orconectes immunis, can cause
serious erosion. Burrows, in the first instance, weaken the bank and if this is followed by a
small amount of water table fluctuation, whole stream or river banks can be undermined
(Hasiotis, 1993a).
Holdich and Rogers, (1992), found that in a river in Buckinghamshire, banks had collapsed
under the weight of grazing cattle, which may have been the direct result of the burrows of P.
leniusculus. The extent of the damage caused by burrowing has not as yet been quantified.
The gathering of these data is important for, as the species P. leniusculus spreads, it may
eventually reach areas at risk of flooding and its burrowing could not only escalate erosion,
but also detrimentally affect any defence systems in place.
Irrigation is also an important feature of burrow dwelling crustaceans. This is the process of
creating water circulation between burrow water and external water, with the purpose of
exchanging potentially toxic water (e.g. hypoxic or high in ammonia) with more favourable
water. A common and well-studied initial reaction to compensate for hypoxic conditions in
the environment, is to increase ventilation rate (McMahon, 2001; Taylor and Wheatly, 1980).
This behaviour in crustaceans creates a water current in burrowing species which helps to
exchange burrow water with external water. Normal ventilation achieves the same results but
to a lesser extent.
Another method is passive irrigation. This can either be due to induced water flow over
burrows with two openings at different levels, as employed by a thalassinidean shrimp, Jaxea
nocturna (Pervesler and Dworschak, 1985), or by water exchange as a result of externally
flowing water. A less investigated process of irrigation is that created by the beating of
abdominal pleopods or swimmerets. The current produced allows water with higher oxygen
levels, to reach the ventilating animal (Gerhardt and Baden, 1998).
7
Introduction
It is not known whether the species P. leniusculus irrigates its burrows, but if it does, it would
be interesting to understand when and how burrow irrigation takes place. The process of
irrigation may well influence its behaviour due to possible energy cost implications.
13 Movements and Activity Patterns
Crayfish movements and activity patterns are crucial in the understanding of habitat
requirements, colonisation of new areas and use of essential resources, such as, food, shelter
and accessible mates.
Crayfish are capable of making substantial active movements. They can live on land for
several days and have the ability to walk forwards, backwards and sideways both on land and
in water (Pond, 1975). Their powerful tails also help to propel them backwards in water.
These ‘tail flips’ (repeated abdominal contractions), are used predominantly as an escape
mechanism (McMahon, 2002).
Crayfish movements and activity can be affected by temperature, light, food and the presence
of predators. Gherardi et al. (2002a), found that a decrease in air temperature, water level and
day length, increased burrow occupancy, thus reducing locomotory speed of Procambaras
clarkii.
Both the signal and noble crayfish were more active during the night (Abrahamsson, 1983).
Merkle (1969), found that Orconectes juvenalis seemed to be more active on dark nights,
cloudy days or in muddy water. In some species, movement was related to seasonal events.
For example, P. leniusculus was observed to reside in shallow water in Lake Tahoe during
summer and autumn, while in late autumn moved to deeper waters, possibly to avoid winter
storms (Flint, 1977). Abrahamsson (1983), found that dense populations of crayfish were
more active and foraged during the day.
Overcrowding, limited shelters, poor environmental conditions, predation and interspecific
and intraspecific agonistic encounters can cause crayfish to colonise new areas (Westman,
1973). These have been noted for O. rusticus where predation affected its distribution (Hill
and Lodge, 1994), A. astacus where distribution was limited by acidification, predation and
climate in lakes and streams in Sweden (Furst and Eriksson, 1973), and O. virilis where
8
Introduction
distribution was affected by agonistic behaviour of conspecifics (Levenbach and Hazlett,
1996). Peay and Rogers (1999), reported that the expansion of P. leniusculus was intermittent
rather than a uniform spread. The reason for this was a reluctance to move into and beyond
unfavourable habitats, thus delaying spread until full population capacity was reached. At this
point, some individuals were forced to seek new more favourable sites.
Home range is an area in which an individual normally travels for food, shelter and mates.
Some crayfish species such as O. juvenalis, have been observed to have a home range
(Merkle, 1969). However, many crayfish species such as P. leniusculus (Bubb et a l , 2002a),
A. pallipes (Gherardi et al., 1998; Robinson et al., 2000), and P. clarkii (Ilheu et al., 2003),
have been observed to have an ephemeral home range, that is, they live in one place for only a
short time and make occasional movements to new locations.
Homing behaviour is when an animal, if displaced, can return to its original place of origin.
There is little research in this area and most studies carried out suggested that crayfish species
displayed no homing behaviour. For example, P. clarkii was shown to have no homing
behaviour in either a stream south of the Iberian Peninsula (Ilheu et al., 2003), or in a stream
in southern Portugal (Gherardi et al., 2002b). Similarly, A, pallipes displayed no homing
behaviour in Dalton Beck, North Yorkshire (Robinson et al., 2000).
Various methods of tagging have been tried to investigate movement, territoriality and
homing o f crayfish, some external and some internal in nature.
Examples of external tags, include, metal labels, glued on discs (Penn, 1943) and streamer
tags (attached through the animal). The use of paint and dye applied to the carapace,
mutilating the surface of the animal by clipping or punching holes in the telson or uropods
(Abrahamsson, 1965; George, 1957, 1958) or branding with a soldering iron (Pratten, 1980),
have also been used.
There are a number of limitations to external tagging. The projections were found to restrict
shelter-seeking behaviour (Bubb et al., 2002b), there was evidence to suggest that the crayfish
were more prone to predators (Weingartner, 1982), and the tags proved only to be semi
permanent as they became indistinct or were lost over time due to moulting (Bubb et al.,
2002b). A study by Guan (1997), also suggested that mutilating the surface of the crayfish
restricted growth and affected behaviour.
9
Introduction
However, there are a number of advantages of external tagging. They are, for example,
usually quick and easy to attach and relatively cheap, enabling large numbers of animals to be
tagged. Nevertheless, retrieval of tagged individuals is reliant on recapture by hand and traps.
Internal tags are usually inserted into crayfish tissues or body cavities by means of
hypodermic needles. The advantages of this technique are, that the tags do not protrude and
they are more permanent because they are not affected by moulting. Examples of internal tags
include, binary coded tags (Isely and Eversole, 1998), visual implant elastomer (VLE) and
visual alphanumeric (Vialpha) tags (Jerry et al., 2001), radio-active tags (Merkle, 1969),
colour coded flexible nylon rods (Weingartner, 1982), and PIT tags (passive integrated
transponders) (Bubb et al., 2002b).
More recently, there has been an increased use of external radiotelemetry tags. Crayfish can
be fitted with individual radio-transmitters, which transmit signals at a unique frequency. This
means that individual animals can be differentiated.
The United Kingdom originally had a protected frequency allocation for radio tracking at 102
MHz, but this was later shifted to 104.6-105.0 MHz. Another band was available at 173.20-
173.35 MHz. Unfortunately for many biologists, the lower band is being lost to radio
broadcasting. In compensation, a further band has been allocated at 173.70-174.00 (Kenward,
1987).
For use on crayfish, these transmitters are waterproof, light in weight and can be attached to
either the cephalthorax or chelae with epoxy resin. The animal on release is then able to move
freely, dig shelters and hide inside natural refuges (Gherardi et al., 2000).
Not only can crayfish movements be assessed using this method, but also activity levels can
be monitored, as alignment of the receiving antenna with the whip antenna of the tag
transmitter, results in changes of signal amplitude (Nams, 1989). However, one major
disadvantage is the cost involved, usually resulting in a reduced sample number. This is
outweighed, however, by the fact that individual crayfish can be observed continuously
without being disturbed (Bohl, 1999; Gherardi et al., 2000).
10
Introduction
This method is ideal for monitoring short-term movements of crayfish and is capable of
providing valuable information of microhabitat preferences, activity levels and travelling
distances of P. leniusculus.
1.4 Population densities and species invasions
It is difficult to ascertain crayfish population density because unless the whole population can
be captured, the researcher has to rely on sampling. Sampling is when crayfish are caught,
marked and recaptured. The frequency of recapture is then analysed in order to estimate
population density of any given area. Any sampling must be representative of all stages of the
life cycle (Brown and Brewis, 1978).
In order to make valid estimates of population density using the mark-recapture method,
certain assumptions have to be upheld. One basic assumption, albeit difficult to test under
natural conditions, is, that all members of the population are equally likely to be captured
(Southwood, 1978).
There are a number of methods of taking samples from crayfish populations, but the most
common is the use of baited traps. Unlike the other methods, which include, the use of drop
nets, hand collection with or without scuba, electro-fishing and dip netting, baited traps do not
rely on the nature and conditions of the water body (Brown and Brewis, 1978).
The use of baited traps, however, can produce unreliable results (Brown and Brewis, 1978).
Research suggests that unequal catchability may be the result of innate or learned behavioural
responses to traps (Cormack, 1969), and trapping may select the hungrier or more active
segments o f the population. It has also been suggested that adult male crayfish may be ‘trap
happy’ and females ‘trap shy’, resulting in an under-estimation of population density and sex
ratio (Brown and Brewis, 1978). However, for comparative purposes, trapping is still a useful
technique to use.
Exotic species of crayfish introduced into freshwater communities have proved a major threat
to native species, in fact, several species have been driven to local extinction through
interactions with exotic crayfishes and/or their diseases. Examples of these include, the
replacement of A. astacus, a European native crayfish by the introduced species P. leniusculus
11
Introduction
in a small enclosed Finnish lake (Westman et al., 2002) and a Swedish lake (Soderback,
1995), the replacement of O. virilis (the native) and O. propinqus (a previous invader) by
Orconectes rusticus in northern Wisconsin Lakes (Hill and Lodge, 1994), and the replacement
of A. papilles in British streams by P. leniusculus. The mechanisms of these invasions
include, crayfish plague, which can wipe out populations of native crayfish, and predation
which can also play an important role in species replacement (Butler and Stein, 1985). Higher
growth rates, early sexual maturity and a higher capita egg production have also been thought
to aid the predominance of a species (Soderback, 1995).
Garvey and Stein (1993), found that chela size was also an important factor in the
replacement of species. Chela size was advantageous in aggressive encounters and for
successful mating (Garvey and Stein, 1993). Agonistic interspecific encounters occur between
species. It was observed, for example, that P. leniusculus had fewer chela injuries than A.
astacus (Westman et al., 2002), as the former was much more competitive. This resulted in A.
astacus being displaced from preferred food sources and safer shelters, leaving them more at
risk of predation (Garvey and Stein, 1993). However, another crucial factor in the decline of
A. astacus was the cessation of successful reproduction due to reproductive interference
(Soderback, 1995; Westman et al., 2002).
1.5 Social interactions
Territory can be defined as a 'fixed portion of an individual's or group's range in which it has
priority of access to one or more critical resources over others’, and territoriality can be
defined as a form of social dominance (Kaufmann, 1983).
Dominance/subordinance is a relationship where one individual defers to the other. Reasons
for this may vary, for example, size or age. However, compromises are made in each
relationship and are dependent on the circumstances, each animal weighing up the costs and
benefits of either deferring to the other animal of not (Kaufmann, 1983). Dominance can be
absolute or relative depending on the species and the situation. However, high population
density and a decrease in available resources can shift relative dominance towards absolute
dominance (Kaufmann, 1983).
12
Introduction
Important characteristics such as rate of growth, maturation and reproduction are important
for the fitness and survival of any crayfish species (Guan and Wiles, 1999). It has been
suggested that deteriorating living conditions due to increased crayfish population density
may be one of the main factors affecting poor growth and decreased fertility (Guan and Wiles,
1999).
Reasons for agonistic behaviour vary. Competition for suitable refuges, reduced availability
of food (Stein and Magnuson, 1976) and inappropriate mate selection (Butler and Stein, 1985)
have all been suggested.
Agonistic behaviour in crayfish can be either interspecific, that is when they defend against
individuals of other species for example Cambarus bartonii and C. robustus (Guiasu and
Dunham, 1999) or intraspecific where they defend against members of their own species,
such as C. robustus (Guiasu and Dunham, 1998). Juvenile species were found to be less
aggressive than adult ones, especially those in a larger body size groups (Soderback, 1990).
However, in accordance with theoretical models of animal conflicts it was found that
interactions between equally sized contestants were more severe than between crayfish of
different size (Vorburger and Ribi, 1999).
Kamofsky et al. (1989), observed that in Homarus americanus, high-level aggression was
displayed by mature males which were establishing a mating shelter area and that low-level
aggression was generally related to premoult increase in activity.
Research has been carried out to examine the sensory cues involved in crayfish agonistic
behaviour. It was found that during combative encounters crayfish used both vision and
taction (Bruski and Dunham, 1987). Bruski and Dunham (1987), also investigated the
importance of vision in Orconectes rusticas and found that the efficiency of communication
diminished as it became darker and that combative behaviour changed from visual cues like,
‘Lunge and Follow’ to more tactile encounters like ‘Antenna Tap’, ‘Chelae Strike’ and
‘Push’.
Some species demonstrate maternal aggression such as P. clarkii (Figler et al., 1997). This is
when a female carrying eggs or offspring may well have a dominant advantage in an agonistic
encounter against conspecific males or non-matemal females.
13
Introduction
1.6 Predation and feeding behaviour
Crayfish are abundant omnivores (Capelli and Hamilton, 1984; Chambers et al., 1990;
Chambers et al., 1991; Guan and Wiles, 1998; Nystrom et al., 1996), and are opportunistic in
nature (Gherardi, 2002). Cannibalism is common, but they also feed on aquatic invertebrates
such as stoneflies and mayflies (Keller and Ruman, 1998), as well as grazing on macrophytes
(Nystrom and Strand, 1996), vegetable detritus and moss, important sources for protein and
energy.
As crayfish graze and scavenge, they keep waters free of carrion and quantities of algae and
vegetation (Richards and Fluke, 1977). The five main diet items consumed by P. leniusculus
in the River Great Ouse were vascular plant detritus, filamentous green algae Cladophora,
crayfish fragments (cannibalism), Chironomidae, and Ephemeroptera. This was apparently
similar for all ages, seasons and gender (Guan and Wiles, 1998).
Research suggests that high population density and poor availability of food affect the
frequency of cannibalism in crayfish (Dong and Polis, 1992). Crayfish were found to prey on
their own species as well as on other crayfish species and there is evidence to support the
notion that aggressive species may be partly responsible for the demise or decline of less
aggressive species (Holdich and Domaniewski, 1995).
Several studies have shown that crayfish can have a negative impact on macrophyte biomass
(Flint and Goldman, 1975) and invertebrates (Chambers et al., 1991; Keller and Ruman,
1998), thus disturbing the aquatic ecosystem. Crayfish can reduce or eliminate aquatic
vegetation from many lakes and rivers and have the ability to modify macro invertebrates and
ultimately affect the fish community (Chambers et al., 1991; Nystrom and Strand, 1996).
Plant species, crayfish sex and activity and the amount of alternative food sources affect
macrophyte growth (Chambers et al., 1991). It was also noted that the impact of crayfish
grazing on aquatic macrophytes was dependent on the stage of development of the
macrophyte when grazed. For example, younger plants and seedlings were more affected than
older more established plants (Chambers et al., 1990; Lorman and Magnuson, 1978).
14
Introduction
Crayfish have a number of predators, including fish, aquatic invertebrates, reptiles, birds,
amphibians and mammals (Marren, 1986; Nystrom, 2002). Freshwater crayfish are more at
risk from predatory fish, for example, perch and bass. Larger crayfish have more chance of
survival (Elvira et al., 1996; Stein and Magnuson, 1976), in fact, it was found that bass had no
affect on the survival rate of adult crayfish (Stein and Magnuson, 1976). Juveniles were
however, more at risk, because of their size and their less rigid exoskeleton (Stein, 1977).
It was also observed that newly independent juvenile P. leniusculus on average comprised
22% of the prey items in the diets of the perch in which they were found. Yearling juveniles
on average constituted 48% of the total number of prey items per stomach in which they were
found, but in terms of volume they constituted the majority of the diet (Blake and Hart, 1993).
Appelberg and Odelstrfim (1988), observed that the presence of perch strongly reduced the
activity and growth of P. leniusculus young of the year.
Predators impact on crayfish behaviour. It was observed that crayfish growth rate was slower
when the abundance of predators was high (Appelberg and Odelstrom, 1988), and that
crayfish nocturnal activity patterns were possibly an adaptation from visual predators
(Hamrin, 1987; Stein, 1977).
1.7 Management and exploitation
For those who harvest, farm or sell crayfish, the introduction of alien species has been
relatively successful (Holdich et al., 1999), a view not shared by conservationists who have
serious concerns about the adverse affects of alien crayfish species on native species and on
freshwater environments. It is believed that introduced crayfish alter ecological balance
(Holdich et al., 1999), for example, by causing shifts in species diversity (Hobbs et al., 1989).
Legislation aimed at controlling the spread of alien crayfish and conserving the native species
is in place in many countries in Europe, for example, Britain (as described at the beginning of
the chapter), Austria (Pockl, 1999), Germany (Lukowicz, 1999) and Sweden (Holdich et al.,
1999), to name but a few. These laws, however, are proving to have only a limited impact due
to lowered trade barriers between countries and a reluctance by authorities to prosecute
(Holdich et al., 1999).
15
Introduction
It has been suggested that a unified approach within Europe is needed in order to preserve and
conserve native crayfish like A. papilles, A. astacas and A.torrentium and to manage the
spread of alien crayfish populations. A way forward is perhaps to set up a European database,
like the one in Britain, which holds information on species details and distribution and which
is regularly updated (Holdich et a l , 1999). Also, maybe there is a need to develop crayfish
management plans as described by (Skurdal et al., 1999). These would culminate in co
ordinated action plans, bearing in mind the need to protect, restore and enhance native
populations, protect the freshwater environment as well as sustain the exploitation of the
crayfish populations for aquaculture and culinary purposes.
1.8 Study aims and objectives
Thus it is clear from the literature that there are areas of the biology, behaviour and ecology of
P. leniusculus, which require further research. The intention of this study, therefore, will be to
look into aspects of substrate selection, burrowing behaviour and movements by P.
leniusculus as these areas are useful in terms of predicting population spread, ascertaining
colonisation and the impact it has on stream environments. The gathering of the above data
will aid future recommendations to manage and control the spread of the species and provide
a basis for decisions to this end.
Investigation of substrate preference of P. leniusculus for either natural refuges or burrow
construction will be useful in managing population spread by identifying those stretches of
river that are most likely to be at risk of bank erosion in the future and perhaps introduce the
possibility of channel modification which would discourage extensive burrowing. Further
information on burrow morphology, construction and environment will provide an indication
of the level of burrow damage and help to predict the likelihood of bank collapse. A
knowledge of burrow water chemistry could be useful in identifying reliable indicators of
burrow occupancy and may provide data on burrow irrigation levels and water turnover.
The possibility of water exchange between burrow and stream will be of significance in
providing vital information for those researching into the use of biocides to eradicate crayfish.
If no or very slow water exchange is taking place then these methods would be relatively
ineffective.
16

Introduction
Finally, the investigation of short and long-term movements of adult crayfish will be helpful
in establishing distances travelled, providing information about any home range and
identifying those life stages responsible for range extension. It should then be possible to
predict future spread of this alien invader.
17
Chapter 2
Materials and Methods
18
Materials and Methods
Chapter 2: Materials and Methods
Collection and maintenance of animals
A licence authorising the keeping of Pacifastacus leniusculus (Dana) was obtained from the
Ministry of Agriculture, Fisheries and Food (now DEFRA) (Appendix I). Before the
commencement of any practical or fieldwork, a risk assessment for laboratory and solo
fieldwork procedures was completed (Appendix II). This incorporated a buddy system, a log
detailing locations and times of visits, a mobile phone and a buoyancy aid, all of which
adhered to Health and Safety requirements set by the University.
Crayfish used in the following experiments were collected from the Gaddesby/Twyford
Brook using Swedish ‘Trappys’ baited with ‘Safeway Savers’ cat food. The cans of cat food
were cut in half and each half was placed in a trap and replaced daily. Traps were set in the
afternoon and lifted the following day. Any captured animals were placed in lidded buckets
with a little water and a few handfuls of damp grass to transport them back to the laboratory
by car. Whilst conducting fieldwork, a letter outlining the project (from the Environment
Agency) was carried, which was shown to landowners, when seeking permission for access to
their land (Appendix III).
All traps and equipment were thoroughly washed and scrubbed to remove mud and silt before
use at different locations in the stream. They were then soaked in 11% industrial sodium
hypochlorite (Chloros) to destroy any biofilm present. The equipment was left to air dry
before rinsing in tap water to remove any residual disinfectant (Harris and Lawrence, 1999).
Captured crayfish were kept in opaque-lidded polythene tanks in copper-free re-circulated
filtered water (System “Tropical Marine System 2500/5000 Freshwater Filtration Unit”) at a
temperature of 15 ± 1°C. Short lengths of plastic pipe of sizes ranging from 4-7 cm diameter
and 10-20 cm in length, were provided for use as artificial refuges. A maximum of 6 adult
animals were held in each 0.6 x 0.4 x 0.5 m tank, with a combination of single and mixed
sexed tanks. The lighting regime was set on a 12 h light and dark cycle. Crayfish were fed
weekly with ‘HiLife Complete Moist Menus’ dog pellets. Any ovigerous females were placed
in individual tanks until their young were hatched. After hatching they were removed and
19
Materials and Methods
placed in shared holding tanks. The newly hatched crayfish were left until they grew to a size
where it was judged that they required more space per individual. They were then re-allocated
to other tanks. Animal size was determined as Carapace Length (CL; mm to the nearest
0.1 mm); measured from the rostral apex to the posterior median edge of the cephalothorax by
means of Vernier callipers.
2.1 Field Studies
The main field research site was the Gaddesby Brook in Leicestershire (SK 792 082 to SK
627 133). However, a small comparison study was conducted on the River Greet in
Nottinghamshire (SK 667 574 to SK 743 515) to establish whether a different population of
P. leniusculus would behave similarly. These sites were chosen because of known
introductions of signal crayfish.
The Gaddesby Brook runs through mainly rural areas and farmland in a northwesterly
direction. It is approximately 15 km long and joins with the Queniborough Brook shortly
before running into the River Wreake at East Goscote (Figure 2.1.1). The bank substrate
varies from clay to sand-based sediments and the stream bed ranges from fine silt to boulders.
The depth of the Brook can be from as little as a few centimetres to as much as several
metres; the width also varies considerably along its course. Water velocities are also very
variable and change rapidly in response to rainfall with the result that large changes in depth
can occur.
The River Greet also runs through mainly rural landscape and is approximately 10 km in
length. It flows in a southeasterly direction and enters the River Trent at Fiskerton, south of
Nottingham (Figure 2.1.1). Its bank and bed substrate shows a variability similar to that of the
Gaddesby Brook.
During the majority of field based research, and whilst making general observations of
crayfish behaviour in their natural environment, it was necessary to enter the stream water
equipped with a dry suit, mask and snorkel. This was because, at times, animals or burrows
were inaccessible from the stream bank. It was particularly important in winter since the
stream water temperature would otherwise have prevented long term exposure.
20
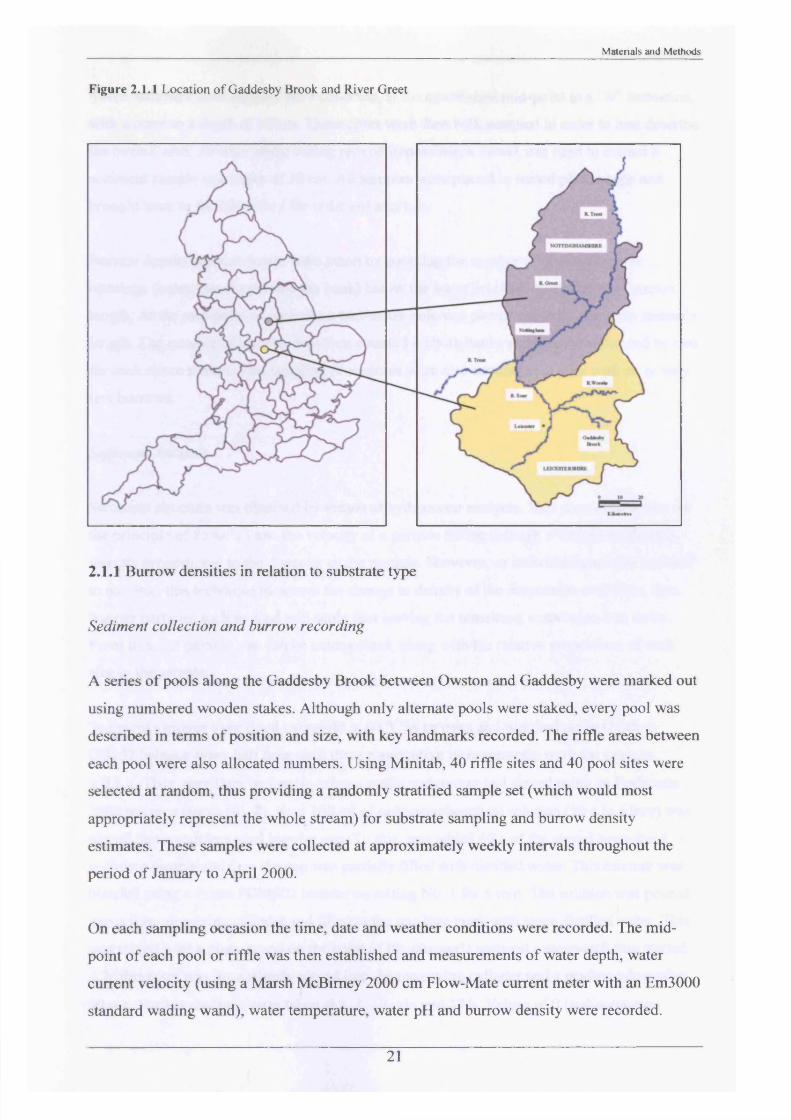
Figure 2.1.1 Location o f Gaddesby Brook and River Greet
Materials and Methods
2.1.1 Burrow densities in relation to substrate type
Sediment collection and burrow recording
A series of pools along the Gaddesby Brook between Owston and Gaddesby were marked out
using numbered wooden stakes. Although only alternate pools were staked, every pool was
described in terms of position and size, with key landmarks recorded. The riffle areas between
each pool were also allocated numbers. Using Minitab, 40 riffle sites and 40 pool sites were
selected at random, thus providing a randomly stratified sample set (which would most
appropriately represent the whole stream) for substrate sampling and burrow density
estimates. These samples were collected at approximately weekly intervals throughout the
period of January to April 2000.
On each sampling occasion the time, date and weather conditions were recorded. The mid
point of each pool or riffle was then established and measurements of water depth, water
current velocity (using a Marsh McBimey 2000 cm Flow-Mate current meter with an Em3000
standard wading wand), water temperature, water pH and burrow density were recorded.
21
Materials and Methods
Seven sediment core samples were collected, at the established mid-point in a ‘W’ formation,
with a corer to a depth of 10 cm. These cores were then bulk sampled in order to best describe
the overall area. At sites where coring proved impossible, a trowel was used to extract a
sediment sample to a depth of 10 cm. All samples were placed in sealed plastic bags and
brought back to the laboratory for sediment analysis.
Burrow density measurements were taken by counting the number of obvious burrow
openings (holes that extend into the bank) below the water level per linear metre of stream
length. At the mid-point of each site a two-metre pole was placed centrally along the stream’s
length. The number of burrows was then counted on both banks and this value divided by two
for each metre stretch. The sampling procedures were also conducted at sites with no or very
few burrows.
Sediment Analysis
Sediment structure was obtained by means of hydrometer analysis. This procedure works on
the principle of Stoke’s Law: the velocity of a particle falling through a viscous medium is
directly proportional to the diameter of the particle. However, as individual particles are hard
to monitor, this technique measures the change in density of the suspension over time, thus
heavier particles such as sand will settle first leaving the remaining suspension less dense.
From this, the particle size can be extrapolated, along with the relative proportions of each
size in the sample.
Sediment samples were dried overnight at 60 °C in an oven and weighed on an Oertling
OBI 52 balance every half hour until three consecutive measurements were the same to
± 0.1 g. They were then broken up using a pestle and mortar and sieved using an Endecotts
2000 microns (mesh No. 8). Next 100 ml of polymetaphosphate solution (50 g in a litre) was
placed into a stainless steel blender cup. To this, was added 40 g of the sieved oven-dried
sediment sample and then the cup was partially filled with distilled water. This mixture was
blended using a Prima PDM002 blender on setting No. 1 for 5 min. The solution was poured
into a litre-measuring cylinder and filled to the one litre mark with more distilled water. This
was mixed with a plunger and on the point of the plunger’s removal a stopwatch was started.
A hydrometer was immediately placed into the measuring cylinder and a reading taken after
30 sec. Further readings were taken at 1, 3,10 min and 17 h. Values of 0 (sedimentation
22
Materials m d Methods
parameter) for each hydrometer reading were obtained from Day (1956) and particle size was
then calculated using the following equation:
Particle size (p) = 0
V t (mins)
The % of sediment was plotted against calculated particle size on 90 Divisions (2 millimetres)
5th, 10th Accent by 2 Cycle Semi-Log graph paper. At particle sizes of <2 p, 2 p<20 p,
20 p<63 p and >63 p, the percentages of clay, fine silt, coarse silt and sand respectively were
extrapolated. This established the composition of each sediment type (British Standard 1377:
1975).
2.1.2 Internal burrow features
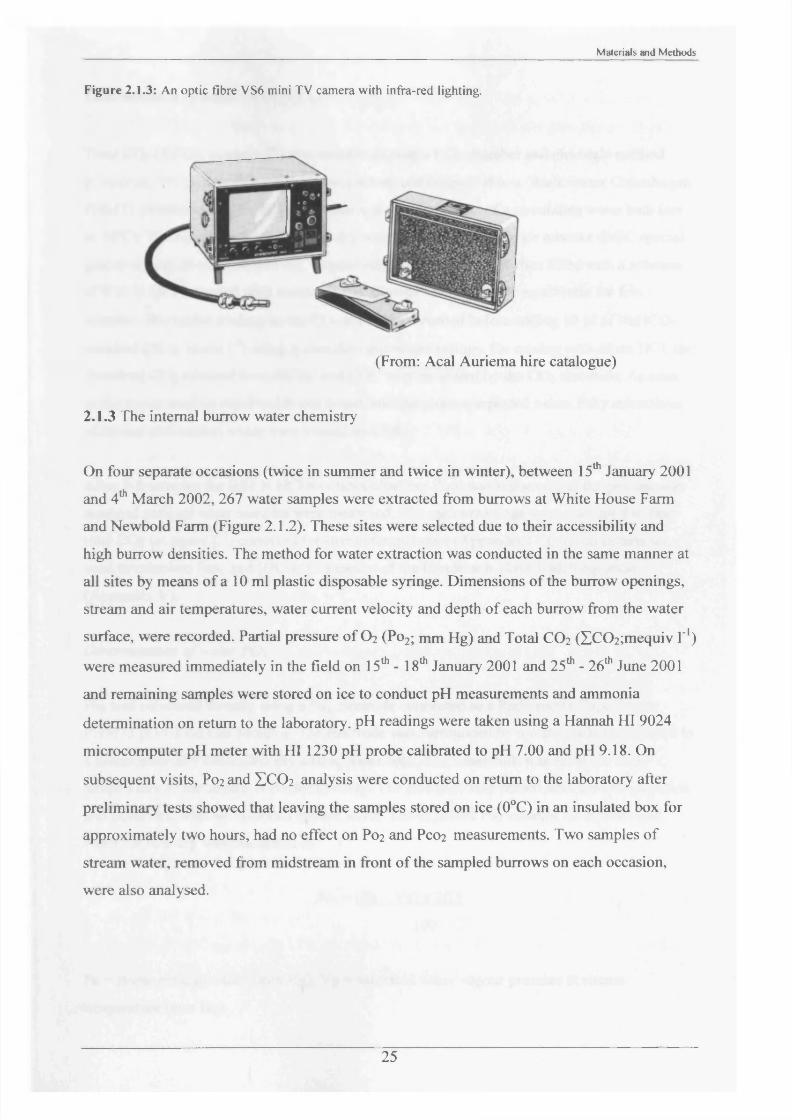
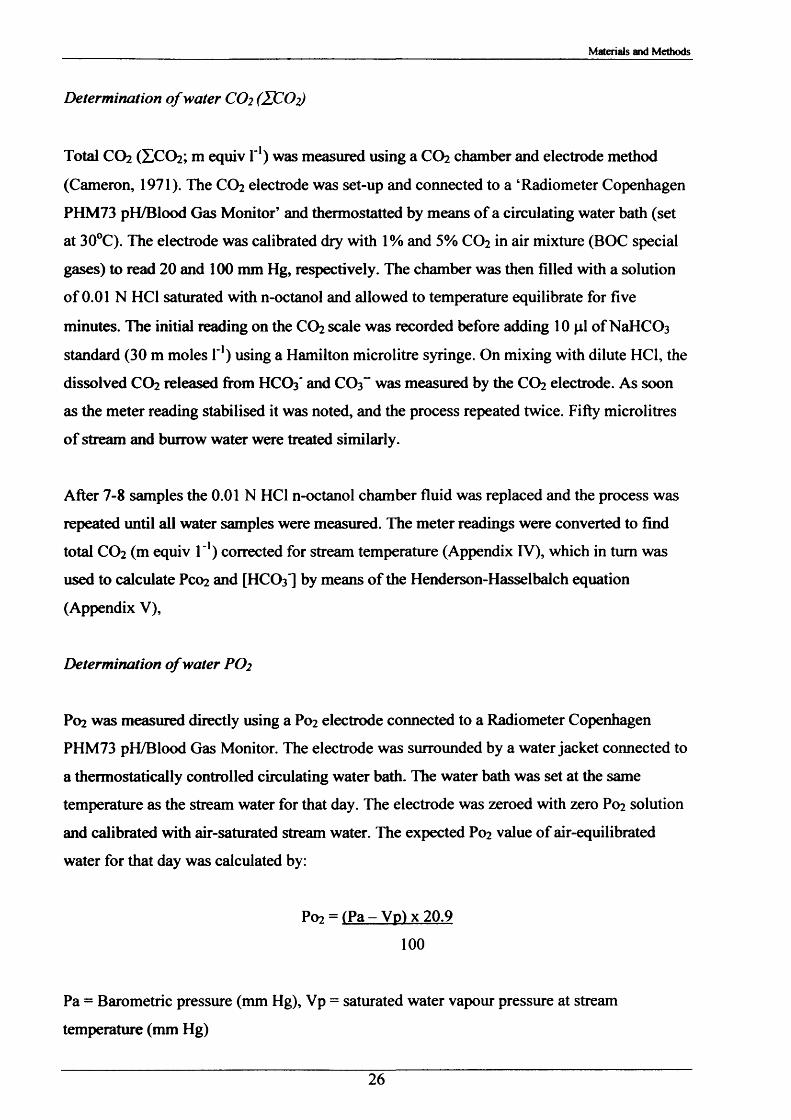
In the period 21st - 26th June 2001, one hundred burrows were examined at two sites, Newbold
Farm (SK 766 091) and White House Farm (SK 753 089) (Figure 2.1.2), using an optic fibre
VS6 mini TV camera with infrared lighting hired from Acal Auriema Ltd. This camera was
12.5 mm in diameter and was normally used for the internal examination of small pipes of
diameters in the range of 15-100 mm (Figure 2.1.3). The optic cable with camera head was
inserted slowly into the burrows and images were observed on the stream bank on a portable
monitor and recorded onto videotape. The length of cable inserted once the camera was
touching the back wall of the burrow determined burrow length. Information was also
recorded on:
1. Number of entrances in each burrow.
2. Number of tunnels in each burrow.
3. Angle at which the burrow entered the stream bank.
4. Approximate shape of the burrow and whether it was tapered.
5. Presence of plant matter.
6. Percentage occupancy of burrows examined.
23
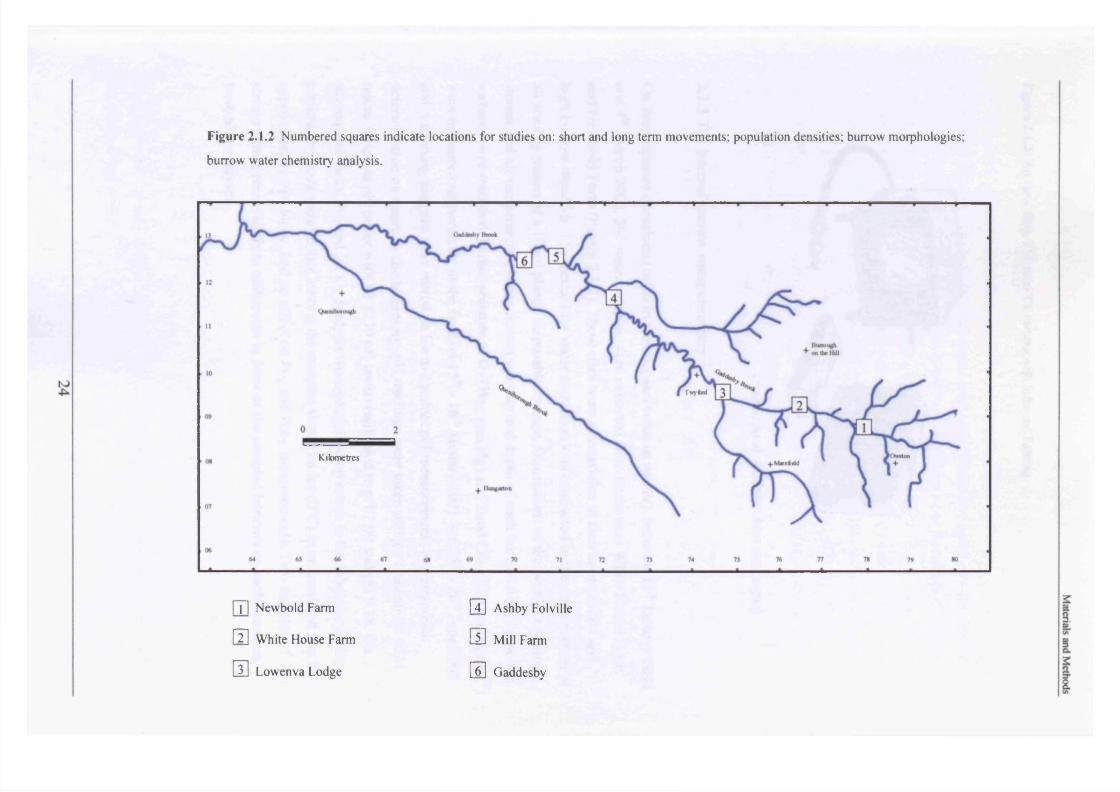
Figure 2.1.2 Numbered squares indicate locations for studies on: short and long term movements; population densities; burrow morphologies;
burrow water chemistry analysis.
Kilometres
[T1 Newbold Farm [4] Ashby Folville
[2] White House Farm I j] Mill Farm
Q ] Lowenva Lodge [6] Gaddesby
Materials and Methods
Figure 2.1.3: An optic fibre VS6 mini TV camera with infra-red lighting.
(From: Acal Auriema hire catalogue)
2.1.3 The internal burrow water chemistry
On four separate occasions (twice in summer and twice in winter), between 15th January 2001
and 4th March 2002, 267 water samples were extracted from burrows at White House Farm
and Newbold Farm (Figure 2.1.2). These sites were selected due to their accessibility and
high burrow densities. The method for water extraction was conducted in the same manner at
all sites by means of a 10 ml plastic disposable syringe. Dimensions of the burrow openings,
stream and air temperatures, water current velocity and depth of each burrow from the water
surface, were recorded. Partial pressure of O2 (Po2; mm Hg) and Total CO2 (ZC 02;mequiv I'1)
were measured immediately in the field on 15th - 18th January 2001 and 25th - 26th June 2001
and remaining samples were stored on ice to conduct pH measurements and ammonia
determination on return to the laboratory. pH readings were taken using a Hannah HI 9024
microcomputer pH meter with HI 1230 pH probe calibrated to pH 7.00 and pH 9.18. On
subsequent visits, P0 2 and Z C 02 analysis were conducted on return to the laboratory after
preliminary tests showed that leaving the samples stored on ice (0°C) in an insulated box for
approximately two hours, had no effect on P0 2 and Pco2 measurements. Two samples of
stream water, removed from midstream in front of the sampled burrows on each occasion,
were also analysed.
25
Materials and Methods
Determination o f water CO2 (ZCO2)
Total CO2 (ZCO2 ; m equiv I"1) was measured using a CO2 chamber and electrode method
(Cameron, 1971). The CO2 electrode was set-up and connected to a ‘Radiometer Copenhagen
PHM73 pH/Blood Gas Monitor’ and thermostatted by means of a circulating water bath (set
at 30°C). The electrode was calibrated dry with 1 % and 5% CO2 in air mixture (BOC special
gases) to read 20 and 100 mm Hg, respectively. The chamber was then filled with a solution
of 0.01 N HC1 saturated with n-octanol and allowed to temperature equilibrate for five
minutes. The initial reading on the CO2 scale was recorded before adding 10 pi of NaHCC>3
standard (30 m moles f 1) using a Hamilton microlitre syringe. On mixing with dilute HC1, the
dissolved CO2 released from HCO3 ' and C0 3 ~ was measured by the CO2 electrode. As soon
as the meter reading stabilised it was noted, and the process repeated twice. Fifty microlitres
of stream and burrow water were treated similarly.
After 7-8 samples the 0.01 N HC1 n-octanol chamber fluid was replaced and the process was
repeated until all water samples were measured. The meter readings were converted to find
total CO2 (m equiv I"1) corrected for stream temperature (Appendix IV), which in turn was
used to calculate PC0 2 and [HCC^-] by means of the Henderson-Hasselbalch equation
(Appendix V),
Determination o f water PO2
P0 2 was measured directly using a P0 2 electrode connected to a Radiometer Copenhagen
PHM73 pH/Blood Gas Monitor. The electrode was surrounded by a water jacket connected to
a thermostatically controlled circulating water bath. The water bath was set at the same
temperature as the stream water for that day. The electrode was zeroed with zero P0 2 solution
and calibrated with air-saturated stream water. The expected P0 2 value of air-equilibrated
water for that day was calculated by:
Po? = (Pa - Yd) x 20.9
100
Pa = Barometric pressure (mm Hg), Vp = saturated water vapour pressure at stream
temperature (mm Hg)
26
Materials and Methods
The sample chamber was emptied by suction and then injected with a 200 pi volume of the
sample water directly from the syringe. After a couple of minutes, a further 100 pi volume of
sample was injected and a reading was noted after 30 seconds. In between samples, the
chamber was flushed with distilled water and emptied by suction.
The unit mm Hg was used for comparative purposes, 1 mm Hg (also called Torr) equates to
0.133 kPa (kilopascals) the SI unit of partial pressure.
Ammonia Determination
A 1 M ammonia stock solution was prepared with NH4NO3 (Analar) in deionised water. The
stock was subsequently diluted to give standards in the range of 10-100 pmoles I'1. 1 ml of
water samples and standards were then added to 1 ml each of salicylate and cyanurate reagent,
shaken and allowed to develop (blue colour) for 30 minutes. The standards were then read in
a 1 ml cuvette at 655 nm by a Pye Unicam SP6-400 UV spectrophotometer. A calibration
curve was then plotted and fitted with a linear regression line. The equation of the line was
then re-arranged to find unknown ammonia concentrations from the absorbance values of
water samples prepared in the same way (Harris and Andrews, 1985). The lowest limit of
detection for this method was 1 pmoles l*1.
2.1.4 Population densities, range extension and burrow erosion damage
Population density
In August 2000,2001 and 2002, population density measurements were carried out in the
Gaddesby Brook. Five sites were selected for their accessibility and positioning along the
length of the stream (Figure 2.1.2):
1) SK 774 085 (Newbold Farm)
2) SK 753 093 (White House Farm)
3) SK 737 094 (Lowenva Lodge)
4) SK 710 118 (Ashby Folville, at start of public footpath)
5) SK 693 127 (Gaddesby, Under Ashby Road bridge)
27
Materials and Methods
Five Swedish ‘Trappys’ with cable ties attached at the funnel entrances to reduce escapees
were deployed 3 m apart at each site and baited (See page 18). Captured animals were
weighed, measured, sexed and numbered with quick drying red nail varnish before being re-
released; a laboratory trial showed this to have no behavioural effect and the marks lasted for
weeks after application. Trapping continued for 3 consecutive nights and all newly captured
animals were marked, whilst a record was made of any recaptures.
It was assumed, as with all capture-mark-release (CMR) experiments, that tagging and repeat
capture did not affect the ‘catchability’ of individuals and that the population was sampled at
random (Southwood, 1978).
Population sizes at each site in all three years were calculated using two methods:
Bailey’s Triple catch method, with a correction for small numbers of recaptures (Southwood,
1978):
N2 = a2(n2+l)r3, / (r21+l)(r32+l)
N2 = estimate o f the number of individuals in the population sampled.
a2 = number of newly marked individuals released on day 2.
n2 = total number of animals captured on day 2.
r = recaptures, with 1st subscript representing day of capture and 2nd subscript the day of
marking.
A standard Peterson (Lincoln) method with Bailey’s correction for small samples
(Southwood, 1978):
N = a(n+l) / r+1
a = total number of marked animals
n = total number of individuals in second sample
r = total number of recaptures.
28
Materials and Methods
Range Extension
Previous studies of the Gaddesby Brook, the most recent conducted in 2000 and reported by
Sibley (2001), showed how far up and down the stream the crayfish had reached since their
introduction in 1985. In order to ascertain the present situation, traps were placed upstream
and downstream of the last known place of occurrence (Figure 2.1.4). These traps were
baited, left for a week and checked daily. If trapping failed to locate crayfish, the Brook was
searched by hand at these sites, turning boulders and netting to see if animals could be
located. Presence or absence could then be plotted onto maps and any range extension
determined by comparison with previous records.
The sizes of burrow openings were measured at progressive sites from the area of P.
leniusculus introduction to the lower most site where burrows had been observed. This was to
ascertain which size range of individuals were occupying the newest areas of stream habitat,
thereby indicating how range extension was occurring. Six sites were selected (Figure 2.1.4).
These were:
1. Newbold Farm (SK 766 091)
2. Newbold Grange Farm (SK 759 092)
3. White House Farm (SK 753 089)
4. Twyford Lodge (SK 725 105)
5. Ashby Folville (SK 703 124)
6. Gaddesby (SK 686 127)
At each site a minimum of 35 burrow entrances were measured (equating to the maximum
number present at Gaddesby), height (mm) and width (mm). These were then converted to
areas assuming the burrow entrance was elliptical, using the formula: (0.5 x height) x (0.5 x
width) x n.
29
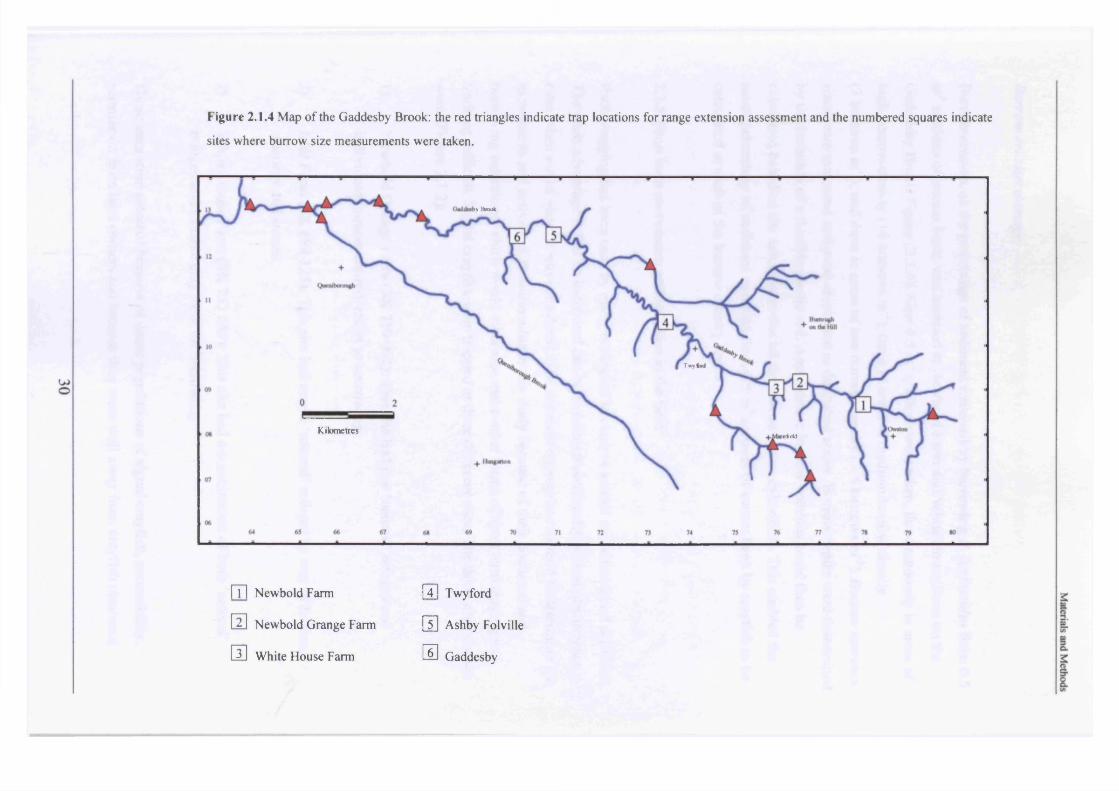
Figure 2.1.4 Map of the Gaddesby Brook: the red triangles indicate trap locations for range extension assessment and the numbered squares indicate
sites where burrow size measurements were taken.
>y Brook
Twyfoni
Kilometres :idd
IT] Newbold Farm [4] Twyford
S Newbold Grange Farm [ 5] Ashby Folville
a White House Farm E Gaddesby
Materials and Methods
Burrow erosion damage
Burrow erosion, as the percentage of sediment removed by burrowing P. leniusculus from 0.5
m3 sections of stream bank, was assessed at Newbold Farm and White House Farm on the
Gaddesby Brook Figure (2.1.4). Nine 0.5 m2 quadrats were taken, three randomly in areas of
high burrow density (14 burrows m*1), three in areas of medium burrow density
(7 burrows m '1), and three in areas of low burrow density (3-4 burrows m'1). Burrow entrance
sizes were measured and areas calculated as described above. Burrow depths were determined
by the insertion of a flexible plastic rod. Approximate burrow volumes could then be
calculated based on the assumption that all the burrows were cylindrical. This enabled the
mean percentage of sediment removed from 0.5 m3 sections of stream bank by crayfish to be
calculated at each of the burrow density levels.
2.1.5 Short term movements and activities in the field
Radio-tagging has been used by many ecologists to observe animal movements and activities.
The main advantage is that an individual can be monitored continually without disturbance,
even when out of view. It was considered to be the most appropriate method to determine the
movements and activity of P. leniusculus in this study because of their nocturnal and
burrowing behaviour, which would otherwise make other forms o f short term tagging and
tracking difficult. Signal crayfish were trapped at three different sites. The three sites chosen
were (Figure 2.1.2):
1) Newbold Grange Farm (SK 759 092): This site had few ‘natural’ refuges and
individuals almost entirely resort to burrowing.
2) Mill Farm (SK 698 125): This site had ample ‘natural’ refuges by way of broken
masonry and stones.
3) White House Farm (SK 753 089): This site had a combination of both ‘natural’
refuges and suitable clay bank for burrowing.
These sites were selected because of dense populations of signal crayfish, accessibility,
permission from land owners and because they were well away from crayfish clearance
31
Materials and Methods
projects being conducted during this period by the Environment Agency.
A total of 44 Crayfish were radio tagged between May 2000 and August 2002, 18 at Mill
Farm, 20 at Newbold Grange Farm and 6 relocated animals at White House Farm.
Animals selected for tagging met the following criteria:
1) Large enough to be fitted with transmitter (ratio o f mass of transmitter to mass of
animal generally not exceeding 1:10)(mass range 15.5 to 97.4 g).
2) Healthy, i.e. no signs o f moulting or loss of limbs;
3) A balance of sexes to allow 1:1 ratio of radio-tagged males and females at each site.
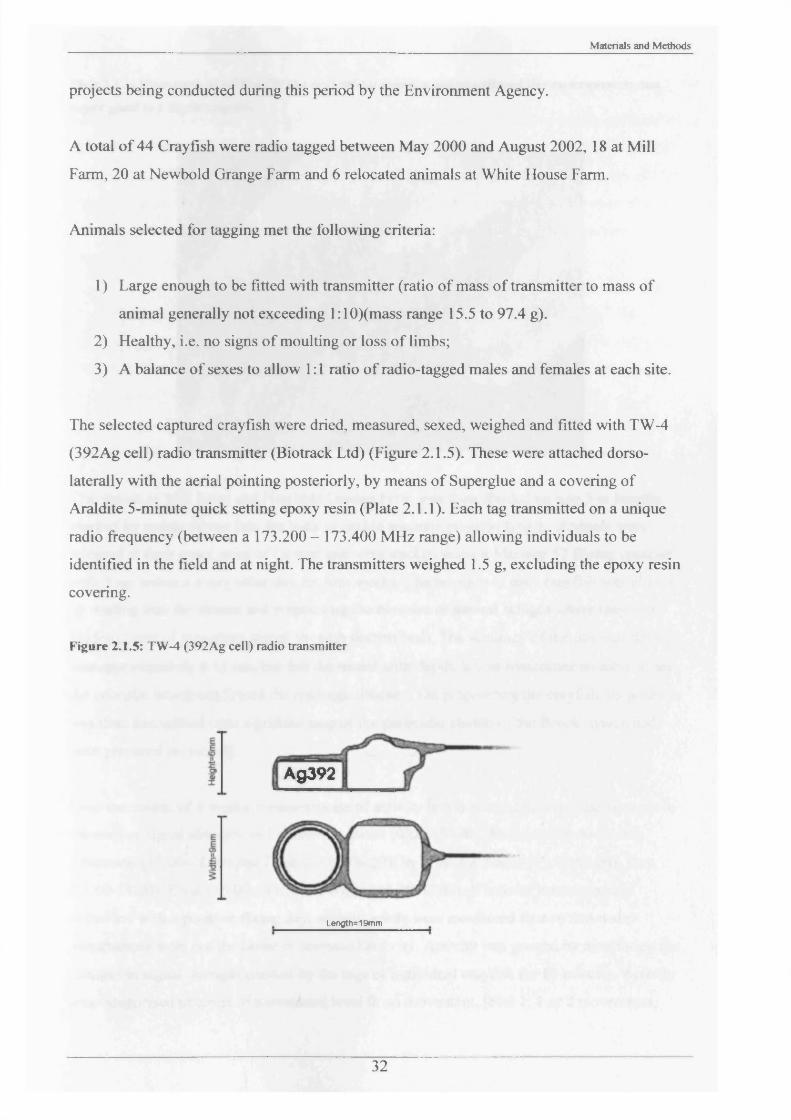
The selected captured crayfish were dried, measured, sexed, weighed and fitted with TW-4
(392Ag cell) radio transmitter (Biotrack Ltd) (Figure 2.1.5). These were attached dorso-
laterally with the aerial pointing posteriorly, by means of Superglue and a covering of
Araldite 5-minute quick setting epoxy resin (Plate 2.1.1). Each tag transmitted on a unique
radio frequency (between a 173.200 - 173.400 MHz range) allowing individuals to be
identified in the field and at night. The transmitters weighed 1.5 g, excluding the epoxy resin
covering.
Figure 2.1.5: TW-4 (392Ag cell) radio transmitter
Ag392
Length=19mm
32
________________________________________________________________________________________________________ Materials aid Methods
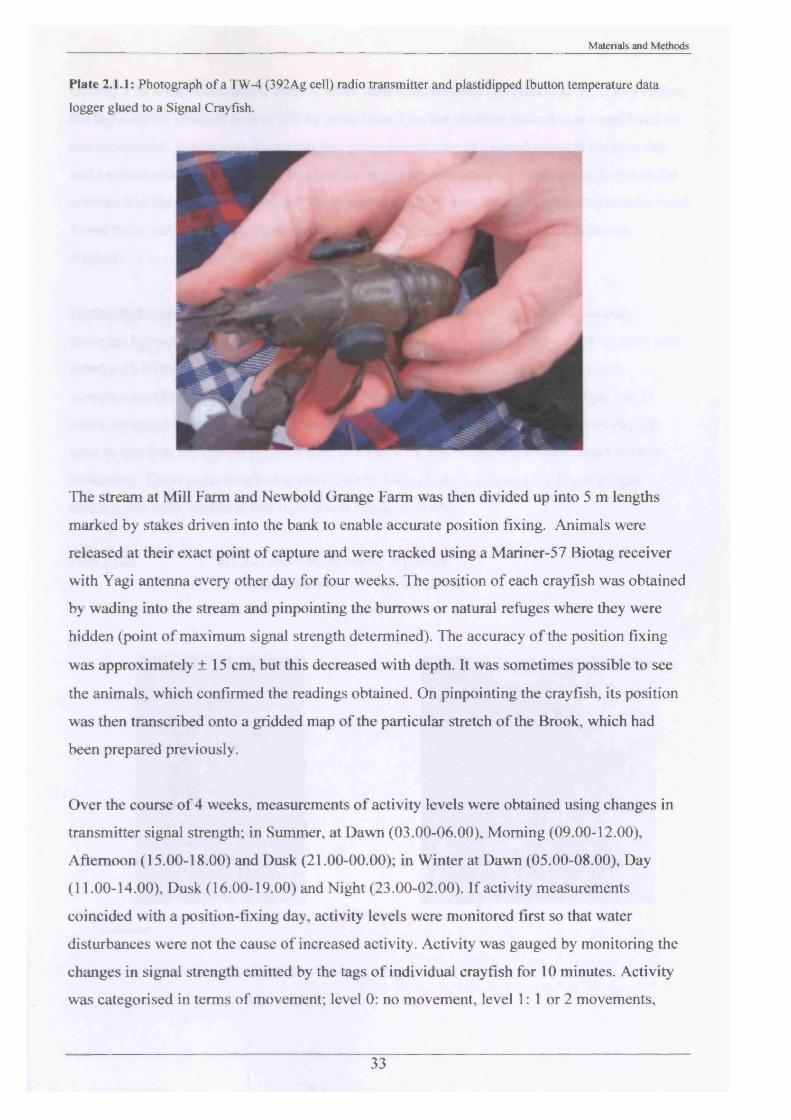
Plate 2.1.1: Photograph o f a TW-4 (392Ag cell) radio transmitter and plastidipped Ibutton temperature data
logger glued to a Signal Crayfish.
The stream at Mill Farm and Newbold Grange Farm was then divided up into 5 m lengths
marked by stakes driven into the bank to enable accurate position fixing. Animals were
released at their exact point of capture and were tracked using a Mariner-57 Biotag receiver
with Yagi antenna every other day for four weeks. The position of each crayfish was obtained
by wading into the stream and pinpointing the burrows or natural refuges where they were
hidden (point of maximum signal strength determined). The accuracy o f the position fixing
was approximately ± 15 cm, but this decreased with depth. It was sometimes possible to see
the animals, which confirmed the readings obtained. On pinpointing the crayfish, its position
was then transcribed onto a gridded map of the particular stretch of the Brook, which had
been prepared previously.
Over the course of 4 weeks, measurements of activity levels were obtained using changes in
transmitter signal strength; in Summer, at Dawn (03.00-06.00), Morning (09.00-12.00),
Afternoon (15.00-18.00) and Dusk (21.00-00.00); in Winter at Dawn (05.00-08.00), Day
(11.00-14.00), Dusk (16.00-19.00) and Night (23.00-02.00). If activity measurements
coincided with a position-fixing day, activity levels were monitored first so that water
disturbances were not the cause of increased activity. Activity was gauged by monitoring the
changes in signal strength emitted by the tags o f individual crayfish for 10 minutes. Activity
was categorised in terms of movement; level 0: no movement, level 1: 1 or 2 movements,
33
Materials and Methods
level 2: 3 or 4 movements and level 3: more than 4 movements (Robinson et al., 2000). When
the tag’s signal strength rose or fell by more than 2 on the receiver scale it was considered as
one movement. It was very important that when monitoring the signal strength the receiver
and antenna remained stationary and that there was no movement or obstruction between the
antenna and the crayfish transmitter. In laboratory preliminary tests, crayfish movements were
found to be correlated with directionality of antennas (strongest signal when antennae
aligned).
During radio-tracking, stream and burrow/refuge water temperatures were continually
recorded by means of TinyTalk or Ibutton temperature data loggers. Three crayfish were also
fitted with Ibutton temperature data loggers coated with Plastidip to make them less
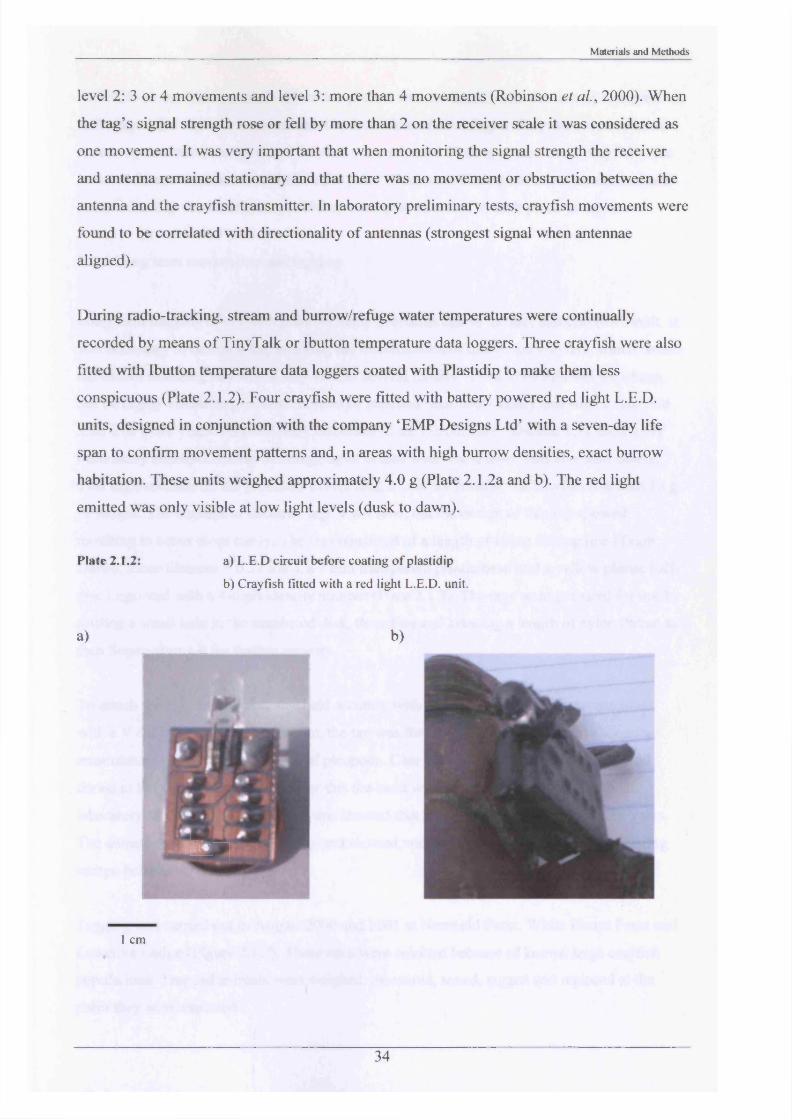
conspicuous (Plate 2.1.2). Four crayfish were fitted with battery powered red light L.E.D.
units, designed in conjunction with the company ‘EMP Designs Ltd’ with a seven-day life
span to confirm movement patterns and, in areas with high burrow densities, exact burrow
habitation. These units weighed approximately 4.0 g (Plate 2.1.2a and b). The red light
emitted was only visible at low light levels (dusk to dawn).
Plate 2.1.2: a) L.E.D circuit before coating o f plastidip
b) Crayfish fitted with a red light L.E.D. unit.
a) b)
, Tp w
1 cm
34
Materials and Methods
At White House Farm, a small relocation project was conducted with the last six retrieved
radio-tags. Six animals were collected by hand from their refuges. They were treated in the
same way as above, except that 3 crayfish were released 50 m upstream and 3 crayfish were
released 50 m downstream of their initial point of capture. Their positions were determined
every other day for 4 weeks to see if they attempted to return to their place of capture.
2.1.6 Long term movements and tagging
Long term tracking of crayfish presents many problems due to the fact that crayfish moult. It
was necessary to design a tag, enabling the identification of individual crayfish, which would
not hinder moulting and would stay in after several moults. It had to be lightweight, cheap,
not be highly visible to predators, able to be attached reasonably easily and still be readable
after 2 or more years. As previously discussed in the Introduction (Section 1.3), there have
been many attempts at long-term tagging of crustaceans, some more effective than others.
This tag overcame all the problems except one; it was not suitable for crayfish less than 15 g
in weight. The concept of streamer tags is not new, but the design of this tag allowed
moulting to occur more easily. The tags consisted of a length of nylon fishing line (Team
Daiwa, monofilament = 0.32 mm), a 7 mm transparent plastic bead and a yellow plastic half
disc imprinted with a 4-digit identity number (Plate 2.1.3). The tags were prepared for use by
drilling a small hole in the numbered disk, threading and knotting a length of nylon thread and
then Super-gluing it for further security.
To attach the tag, the crayfish was held securely with elastic bands to a polystyrene block
with a V cut in it. Using a fine needle, the tag was threaded through the ventral abdominal
musculature in front of the first set of pleopods. Care was taken to ensure the line passed
dorsal to the ventral nerve cord. After this the bead was knotted on and glued. A small
laboratory study was conducted and this showed that the tag could be retained for 2+ years.
The animals tested moulted normally and showed normal behaviour, including tail-flipping
escape behaviour.
Tagging was carried out in August 2000 and 2001 at Newbold Farm, White House Farm and
Lowenva Lodge (Figure 2.1.2). These sites were selected because of known large crayfish
populations. Trapped animals were weighed, measured, sexed, tagged and replaced at the
point they were captured.
35
Materials and Methods
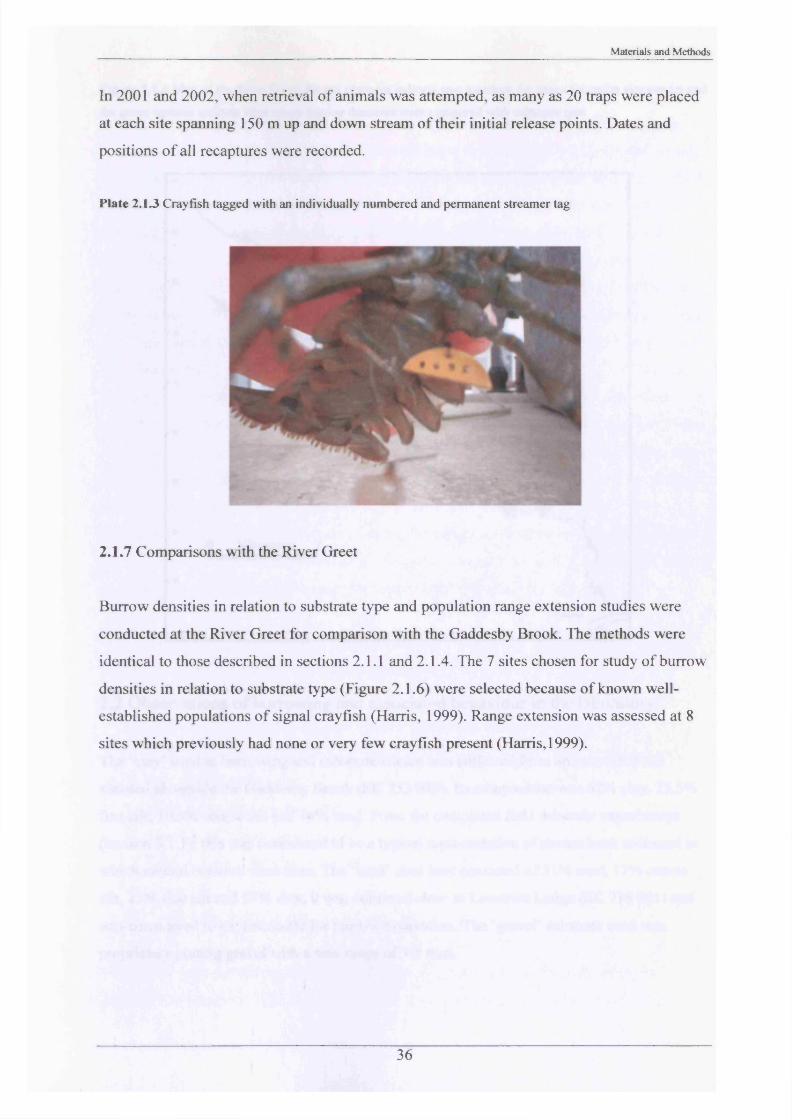
In 2001 and 2002, when retrieval of animals was attempted, as many as 20 traps were placed
at each site spanning 150 m up and down stream of their initial release points. Dates and
positions of all recaptures were recorded.
Plate 2 .1 3 Crayfish tagged with an individually numbered and permanent streamer tag
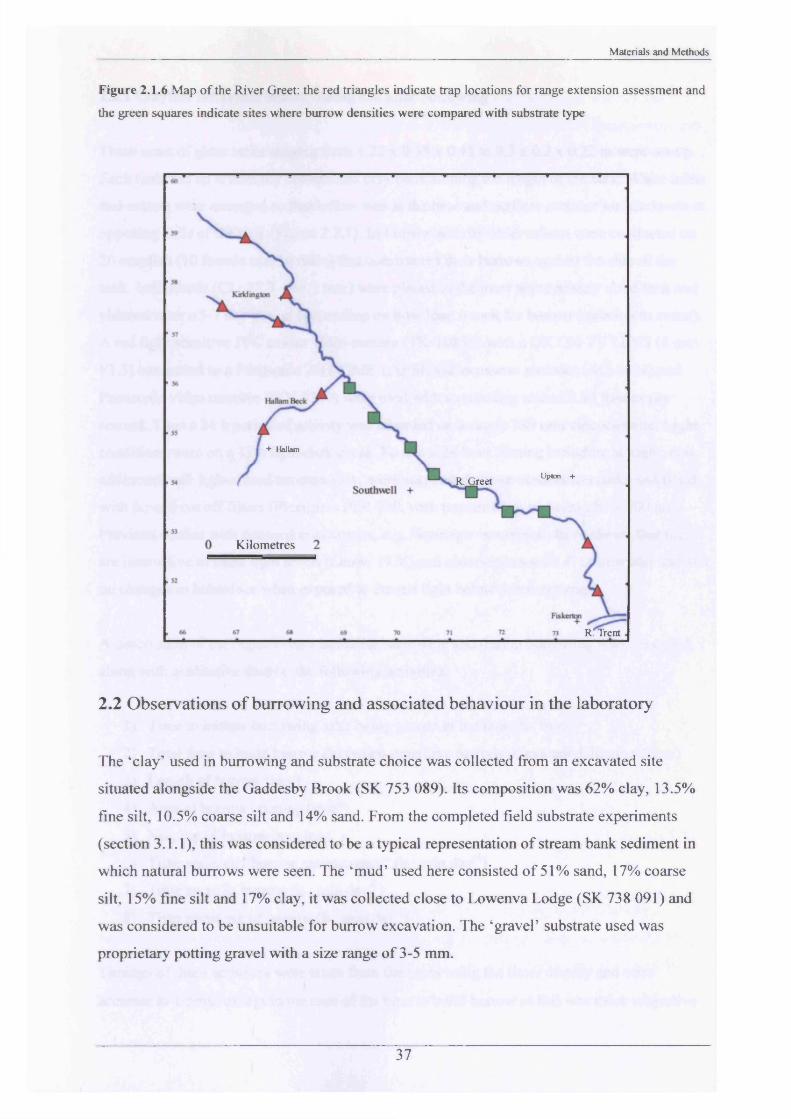
2.1.7 Comparisons with the River Greet
Burrow densities in relation to substrate type and population range extension studies were
conducted at the River Greet for comparison with the Gaddesby Brook. The methods were
identical to those described in sections 2.1.1 and 2.1.4. The 7 sites chosen for study of burrow
densities in relation to substrate type (Figure 2.1.6) were selected because of known well-
established populations of signal crayfish (Harris, 1999). Range extension was assessed at 8
sites which previously had none or very few crayfish present (Harris, 1999).
36
Materials and Methods
Figure 2.1.6 Map o f the River Greet: the red triangles indicate trap locations for range extension assessment and
the green squares indicate sites where burrow densities were compared with substrate type
+ Hal lam
Upton +R. Greet
Kilometres
R. Trent
2.2 Observations o f burrowing and associated behaviour in the laboratory
The ‘clay’ used in burrowing and substrate choice was collected from an excavated site
situated alongside the Gaddesby Brook (SK 753 089). Its composition was 62% clay, 13.5%
fine silt, 10.5% coarse silt and 14% sand. From the completed field substrate experiments
(section 3.1.1), this was considered to be a typical representation of stream bank sediment in
which natural burrows were seen. The ‘mud’ used here consisted of 51% sand, 17% coarse
silt, 15% fine silt and 17% clay, it was collected close to Lowenva Lodge (SK 738 091) and
was considered to be unsuitable for burrow excavation. The ‘gravel’ substrate used was
proprietary potting gravel with a size range of 3-5 mm.
37
Materials and Methods
2.2.1 Crayfish behaviour before, during and after burrowing
Three sizes of glass tanks ranging from 1.22 x 0.38 x 0.45 to 0.3 x 0.2 x 0.22 m were set-up.
Each tank had an artificially constructed clay bank sloping the length of the tank. Water inlets
and outlets were arranged so that inflow was at the base and outflow at water surface levels at
opposing ends of the tank (Figure 2.2.1). In-burrow activity observations were conducted on
20 crayfish (10 female and 10 male) that constructed their burrows against the side of the
tank. Individuals (CL; 22.3 - 66.2 mm) were placed in the most appropriately sized tank and
videoed over a 5-7 day period (depending on how long it took for burrow initiation to occur).
A red light sensitive JVC colour video camera (TK-1085E) with a DICON TV LENS (8 mm
FI .3) connected to a Panasonic 24H TIME LAPSE videocassette recorder (AG-6024) and
Panasonic video monitor (WV-5340) were used with a recording rate of 8.33 frames per
second. Thus a 24 h period of activity was recorded on a single 180 mm videocassette. Light
conditions were on a 12 h light-dark cycle. To allow 24 hour filming including at night, two
additional safe lights, used continuously, were suspended above observation tanks and fitted
with far-red cut off filters (Plexiglass PFR 700, with transmission wavelengths > 700 nm).
Previous studies with decapod crustaceans, e.g. Nephrops norvegicus have shown that they
are insensitive to these light levels (Leow, 1976) and observations with P. leniusculus showed
no changes in behaviour when exposed to far-red light below this wavelength.
A description of the major events initiating burrowing and during burrowing were recorded,
along with qualitative data on the following activities:
1) Time to initiate burrowing after being placed in the tank (h : min)
2) Total time to build burrow (h) (when repetitive periods of extended digging cease)
3) Length of burrow (mm)
4) Area of burrow opening (mm2)
5) Number of burrow openings
6) Time spent on “burrow maintenance” (h : min day’1)
7) Time spent in burrow (h : min day'1)
8) Time spent out of burrow (h : min day'1)
Timings of these activities were taken from the tapes using the timer display and were
accurate to ± 5min except in the case of the time to build burrow as this was more subjective
38
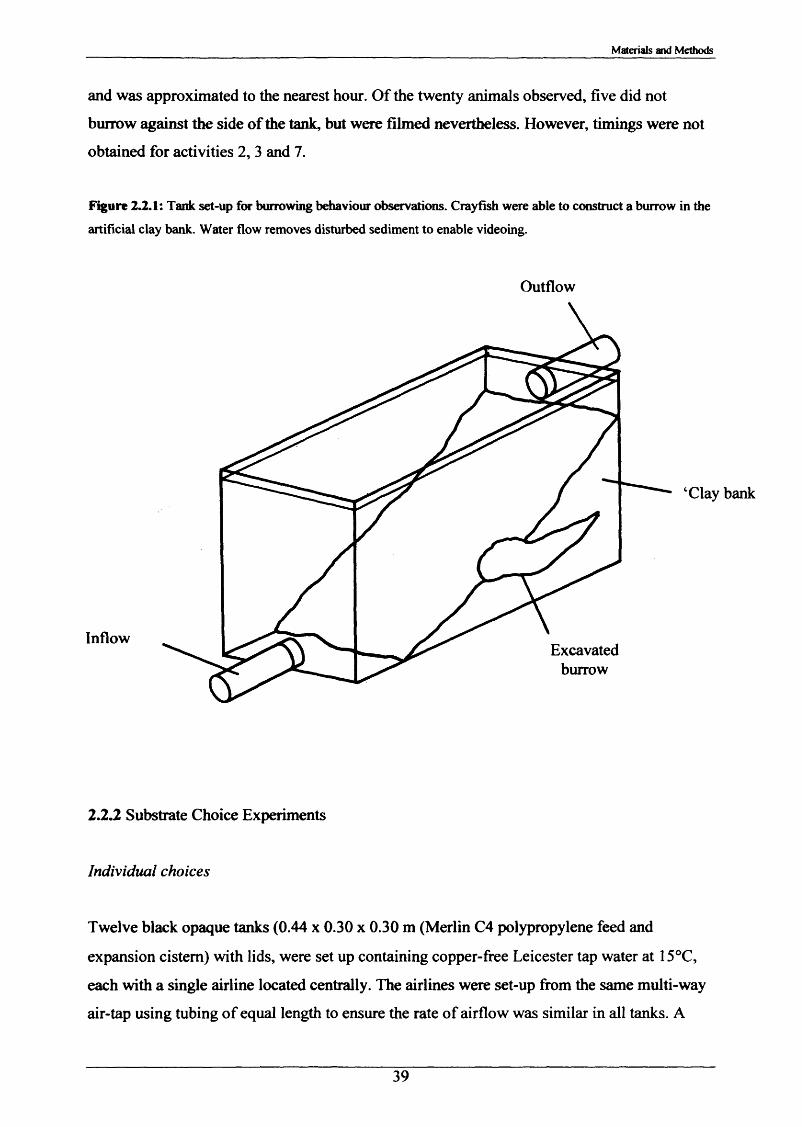
Materials and Methods
and was approximated to the nearest hour. Of the twenty animals observed, five did not
burrow against the side of the tank, but were filmed nevertheless. However, timings were not
obtained for activities 2, 3 and 7.
Figure 2.2.1: Tank set-up for burrowing behaviour observations. Crayfish were able to construct a burrow in the
artificial clay bank. Water flow removes disturbed sediment to enable videoing.
Outflow
InflowExcavated
burrow
‘Clay bank
2.2.2 Substrate Choice Experiments
Individual choices
Twelve black opaque tanks (0.44 x 0.30 x 0.30 m (Merlin C4 polypropylene feed and
expansion cistern) with lids, were set up containing copper-free Leicester tap water at 15°C,
each with a single airline located centrally. The airlines were set-up from the same multi-way
air-tap using tubing of equal length to ensure the rate of airflow was similar in all tanks. A
39
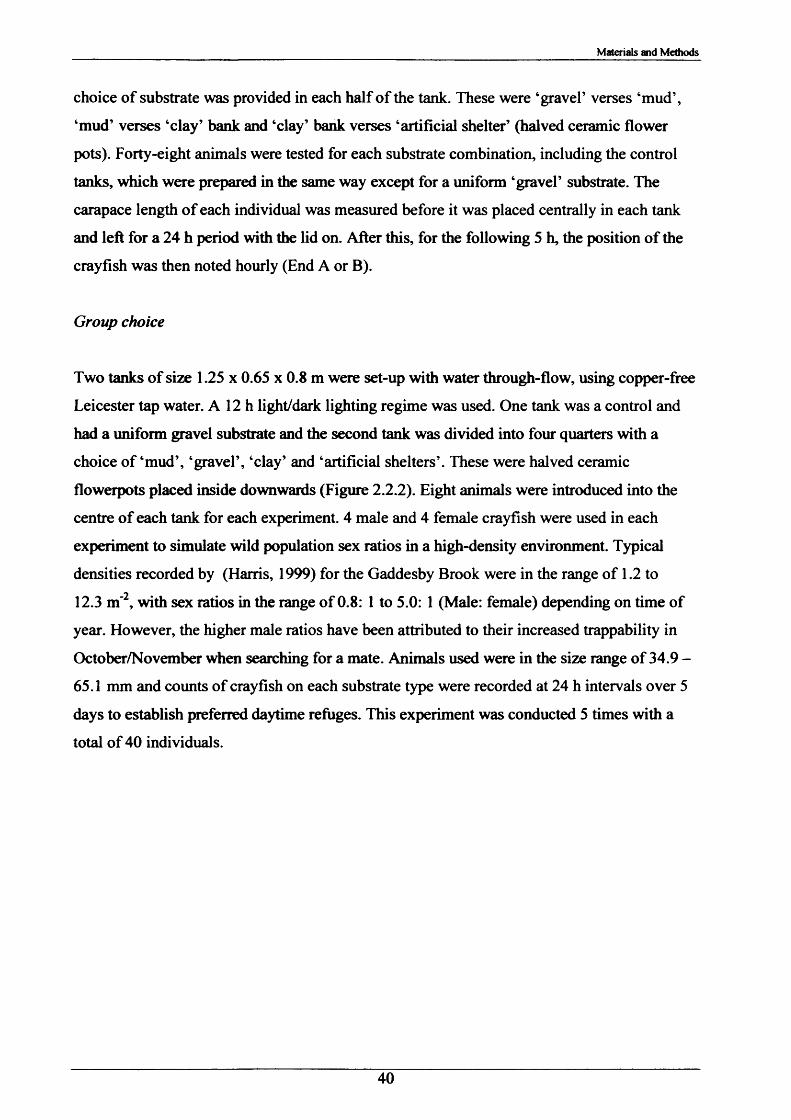
Materials and Methods
choice of substrate was provided in each half of the tank. These were ‘gravel’ verses ‘mud’,
‘mud’ verses ‘clay’ bank and ‘clay’ bank verses ‘artificial shelter’ (halved ceramic flower
pots). Forty-eight animals were tested for each substrate combination, including the control
tanks, which were prepared in the same way except for a uniform ‘gravel’ substrate. The
carapace length of each individual was measured before it was placed centrally in each tank
and left for a 24 h period with the lid on. After this, for the following 5 h, the position of the
crayfish was then noted hourly (End A or B).
Group choice
Two tanks of size 1.25 x 0.65 x 0.8 m were set-up with water through-flow, using copper-free
Leicester tap water. A 12 h light/dark lighting regime was used. One tank was a control and
had a uniform gravel substrate and the second tank was divided into four quarters with a
choice o f ‘mud’, ‘gravel’, ‘clay’ and ‘artificial shelters’. These were halved ceramic
flowerpots placed inside downwards (Figure 2.2.2). Eight animals were introduced into the
centre of each tank for each experiment. 4 male and 4 female crayfish were used in each
experiment to simulate wild population sex ratios in a high-density environment. Typical
densities recorded by (Harris, 1999) for the Gaddesby Brook were in the range of 1.2 to
12.3 m ', with sex ratios in the range of 0.8: 1 to 5.0: 1 (Male: female) depending on time of
year. However, the higher male ratios have been attributed to their increased trappability in
October/November when searching for a mate. Animals used were in the size range of 34.9 -
65.1 mm and counts of crayfish on each substrate type were recorded at 24 h intervals over 5
days to establish preferred daytime refuges. This experiment was conducted 5 times with a
total of 40 individuals.
40
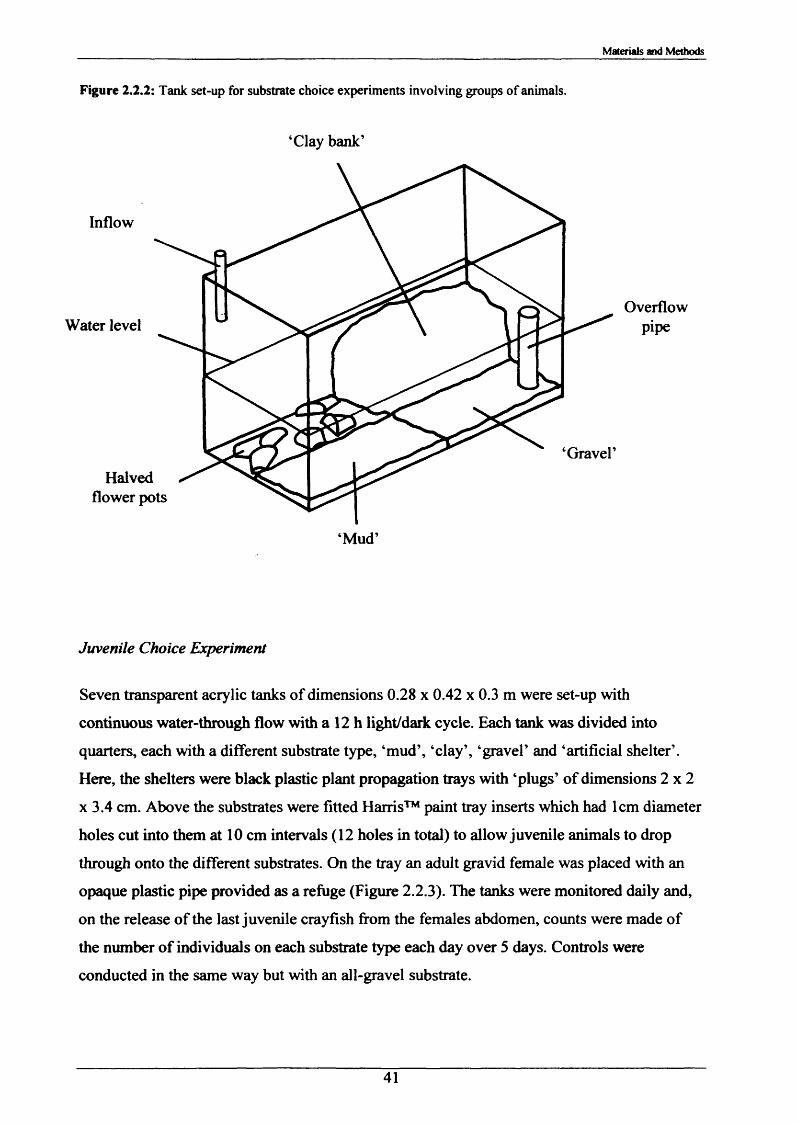
Materials and Methods
Figure 2.2.2: Tank set-up for substrate choice experiments involving groups o f animals.
‘Clay bank’
Inflow
Water level
‘Gravel’Halved
flower pots
‘Mud’
Overflowpipe
Juvenile Choice Experiment
Seven transparent acrylic tanks of dimensions 0.28 x 0.42 x 0.3 m were set-up with
continuous water-through flow with a 12 h light/dark cycle. Each tank was divided into
quarters, each with a different substrate type, ‘mud’, ‘clay’, ‘gravel’ and ‘artificial shelter’.
Here, the shelters were black plastic plant propagation trays with ‘plugs’ of dimensions 2 x 2
x 3.4 cm. Above the substrates were fitted Harris™ paint tray inserts which had 1cm diameter
holes cut into them at 10 cm intervals (12 holes in total) to allow juvenile animals to drop
through onto the different substrates. On the tray an adult gravid female was placed with an
opaque plastic pipe provided as a refuge (Figure 2.2.3). The tanks were monitored daily and,
on the release of the last juvenile crayfish from the females abdomen, counts were made of
the number of individuals on each substrate type each day over 5 days. Controls were
conducted in the same way but with an all-gravel substrate.
41
Materials and Methods
Figure 2 .2 3 : Tank set-up for juvenile crayfish substrate choice experiments.
Water level Outflow
Inflow Refuge tube for gravid female
OQOO
O
O
‘Artificialshelter’ ‘Gravel’
Paint tray insert
‘Mud’
2.23 Rates of burrow irrigation by crayfish and passive irrigation
Rates o f burrow irrigation by crayfish
This experiment was designed to establish if P. leniusculus irrigate their burrows and if so by
what means and how rapidly. A transparent Perspex pipe (diameter 7.5 cm and length of 45
cm) was sealed at one end with a piece of acrylic sheet. A hole was drilled into it on the
upper-most surface, 1 cm from the sealed end into which the Luer fitting of a plastic
disposable 1 ml syringe fitted tightly. In a lidded tank, N2 was pumped through copper-free
Leicester tap water to make it hypoxic down to a P0 2 in the range o f40-70 mm Hg. This
water was then poured into the transparent pipe and covered with a square of acrylic. The pipe
was then submerged in a filled static glass tank of dimensions 1.22 x 3.8 x 4.5 m and the
42
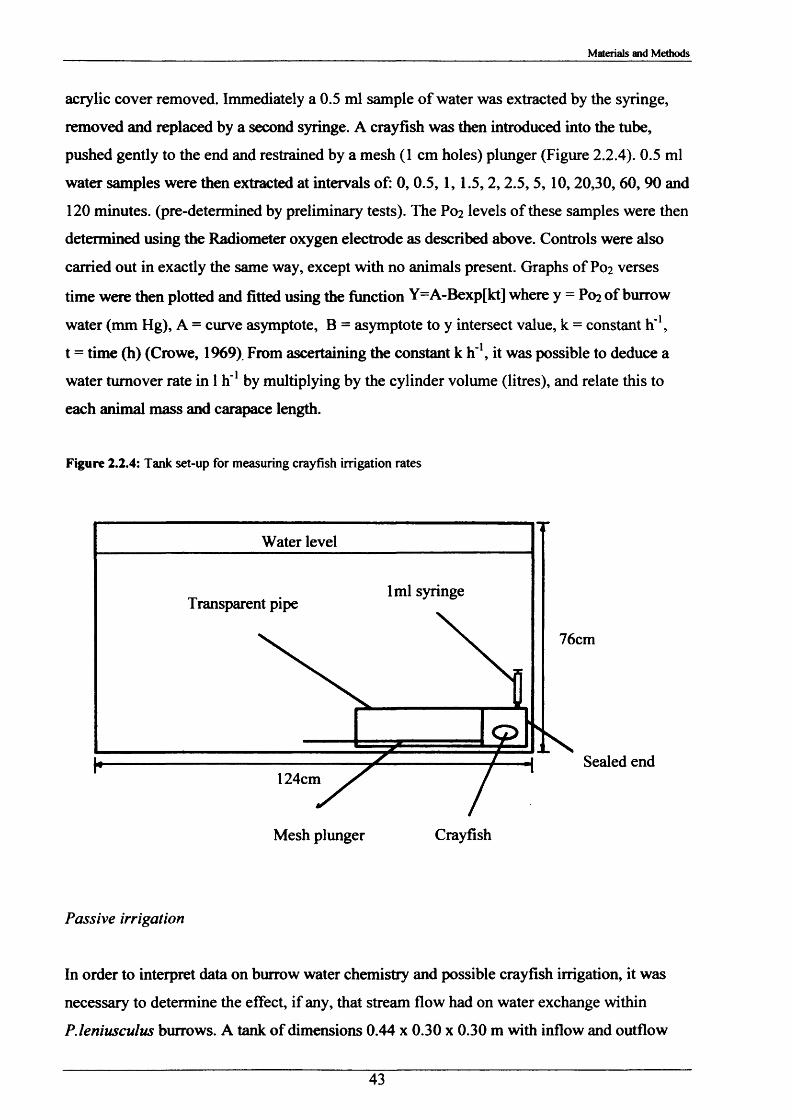
Materials and Methods
acrylic cover removed. Immediately a 0.5 ml sample of water was extracted by the syringe,
removed and replaced by a second syringe. A crayfish was then introduced into the tube,
pushed gently to the end and restrained by a mesh (1 cm holes) plunger (Figure 2.2.4). 0.5 ml
water samples were then extracted at intervals of: 0, 0.5, 1, 1.5,2,2.5, 5, 10, 20,30, 60, 90 and
120 minutes, (pre-determined by preliminary tests). The P0 2 levels of these samples were then
determined using the Radiometer oxygen electrode as described above. Controls were also
carried out in exactly the same way, except with no animals present. Graphs of P0 2 verses
time were then plotted and fitted using the function Y=A-Bexp[kt] where y = P0 2 of burrow
water (mm Hg), A = curve asymptote, B = asymptote to y intersect value, k = constant h '1,
t = time (h) (Crowe, 1969). From ascertaining the constant k h '1, it was possible to deduce a
water turnover rate in 1 h '1 by multiplying by the cylinder volume (litres), and relate this to
each animal mass and carapace length.
Figure 2.2.4: Tank set-up for measuring crayfish irrigation rates
Water level
lml syringe
76cm
Sealed end124cm
CrayfishMesh plunger
Passive irrigation
In order to interpret data on burrow water chemistry and possible crayfish irrigation, it was
necessary to determine the effect, if any, that stream flow had on water exchange within
P. leniusculus burrows. A tank of dimensions 0.44 x 0.30 x 0.30 m with inflow and outflow
43
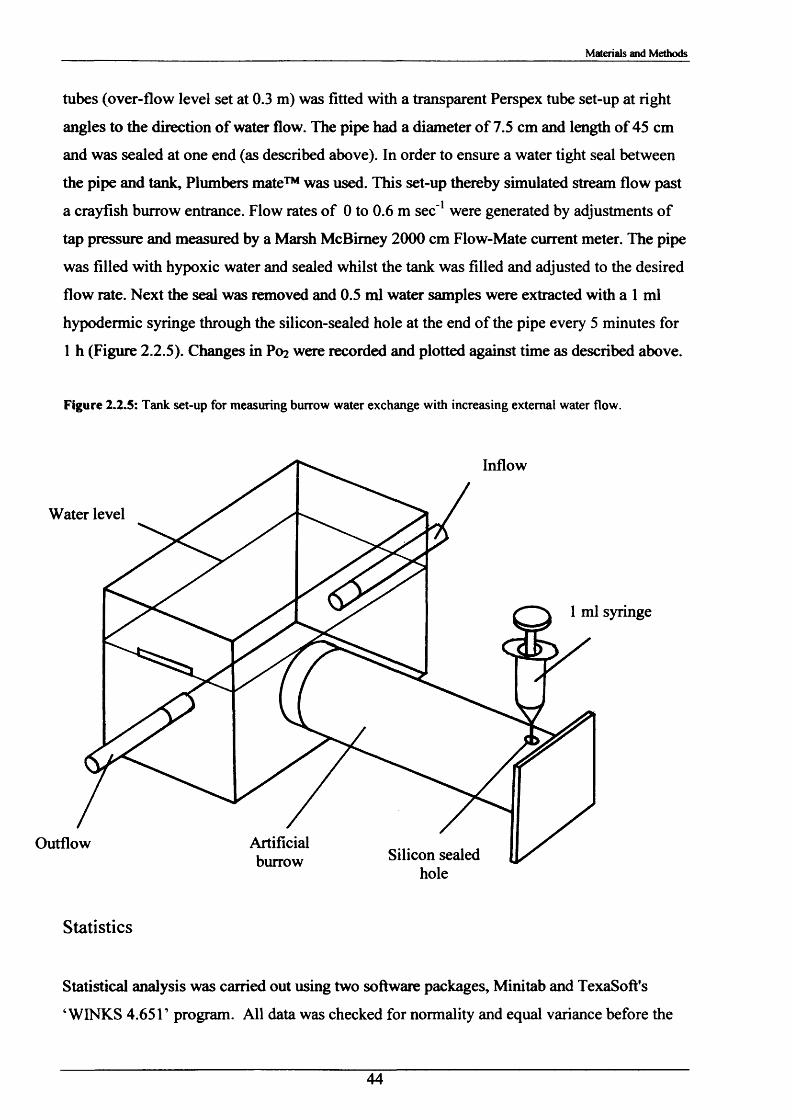
Materials and Methods
tubes (over-flow level set at 0.3 m) was fitted with a transparent Perspex tube set-up at right
angles to the direction of water flow. The pipe had a diameter of 7.5 cm and length of 45 cm
and was sealed at one end (as described above). In order to ensure a water tight seal between
the pipe and tank, Plumbers mate™ was used. This set-up thereby simulated stream flow past
a crayfish burrow entrance. Flow rates of 0 to 0.6 m sec'1 were generated by adjustments of
tap pressure and measured by a Marsh McBimey 2000 cm Flow-Mate current meter. The pipe
was filled with hypoxic water and sealed whilst the tank was filled and adjusted to the desired
flow rate. Next the seal was removed and 0.5 ml water samples were extracted with a 1 ml
hypodermic syringe through the silicon-sealed hole at the end of the pipe every 5 minutes for
1 h (Figure 2.2.5). Changes in P0 2 were recorded and plotted against time as described above.
Figure 2.2.5: Tank set-up for measuring burrow water exchange with increasing external water flow.
Inflow
Water level
1 ml syringe
Artificialburrow
OutflowSilicon sealed
hole
Statistics
Statistical analysis was carried out using two software packages, Minitab and TexaSoft's
‘WINKS 4.651’ program. All data was checked for normality and equal variance before the
44

_______________________________ Materials and Methods
application of appropriate parametric or non-parametric tests. The TexaSoft's ‘WINKS 4.651 ‘
program was used because it could perform ranked Tukey multiple comparisons on a non-
parametric Kruskal-Wallis analysis.
45

Chapter 3
Results
/
46
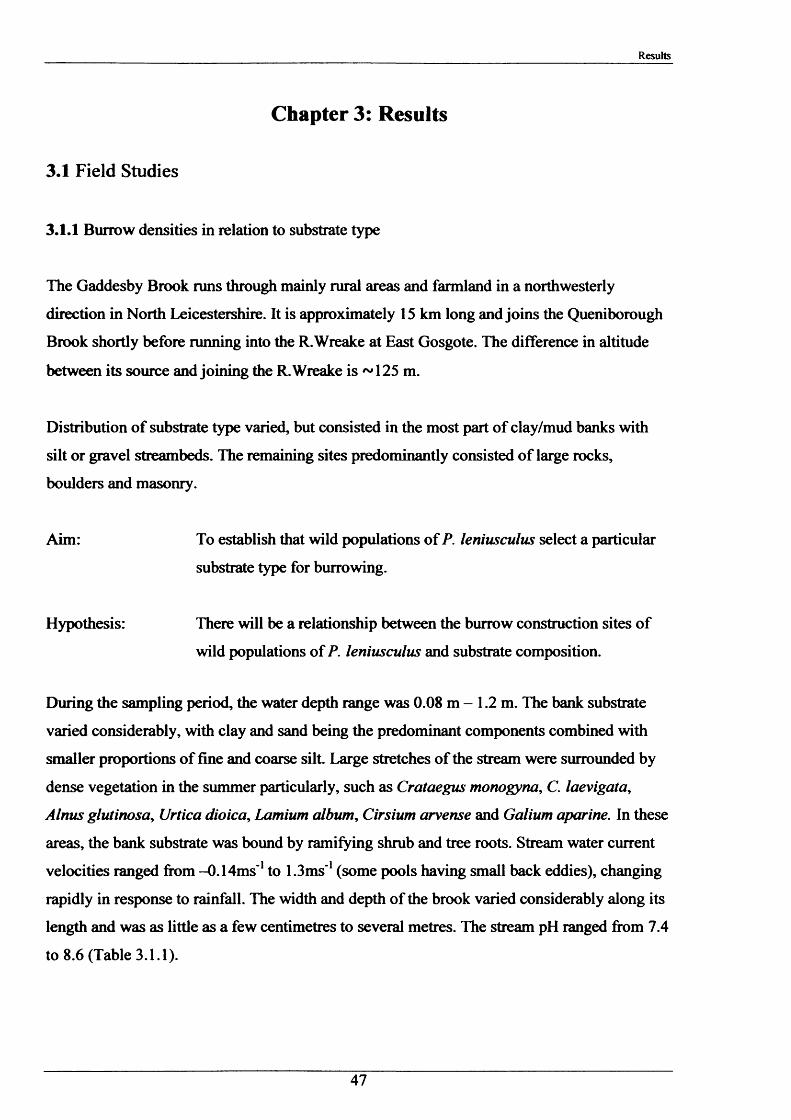
Results
Chapter 3: Results
3.1 Field Studies
3.1.1 Burrow densities in relation to substrate type
The Gaddesby Brook runs through mainly rural areas and farmland in a northwesterly
direction in North Leicestershire. It is approximately 15 km long and joins the Queniborough
Brook shortly before running into the R.Wreake at East Gosgote. The difference in altitude
between its source and joining the R.Wreake is ~ 125 m.
Distribution of substrate type varied, but consisted in the most part of clay/mud banks with
silt or gravel streambeds. The remaining sites predominantly consisted of large rocks,
boulders and masonry.
Aim: To establish that wild populations of P. leniusculus select a particular
substrate type for burrowing.
Hypothesis: There will be a relationship between the burrow construction sites of
wild populations of P. leniusculus and substrate composition.
During the sampling period, the water depth range was 0.08 m - 1.2 m. The bank substrate
varied considerably, with clay and sand being the predominant components combined with
smaller proportions of fine and coarse silt. Large stretches of the stream were surrounded by
dense vegetation in the summer particularly, such as Crataegus monogyna, C. laevigata,
Alnus glut inos a, Urtica dioica, Lamium album, Cirsium arvense and Galium aparine. In these
areas, the bank substrate was bound by ramifying shrub and tree roots. Stream water current
velocities ranged from -0.14ms'1 to 1.3ms'1 (some pools having small back eddies), changing
rapidly in response to rainfall. The width and depth of the brook varied considerably along its
length and was as little as a few centimetres to several metres. The stream pH ranged from 7.4
to 8.6 (Table 3.1.1).
47
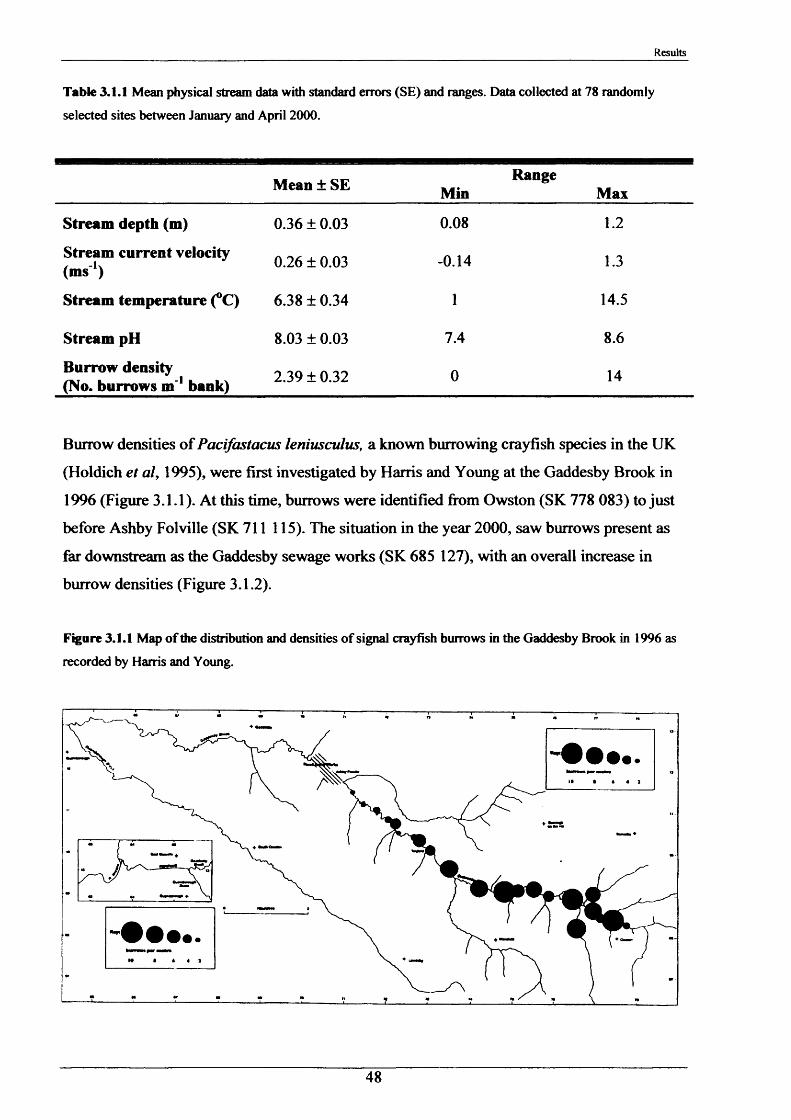
Results
Table 3.1.1 Mean physical stream data with standard errors (SE) and ranges. Data collected at 78 randomly
selected sites between January and April 2000.
Mean ± SE MinRange
Max
Stream depth (m) 0.36 ± 0.03 0.08 1.2
Stream current velocity (m s1) 0.26 ± 0.03 -0.14 1.3
Stream temperature (°C) 6.38 ± 0.34 1 14.5
Stream pH 8.03 ± 0.03 7.4 8.6
Burrow density (No. burrows m'1 bank) 2.39 ± 0.32 0 14
Burrow densities of Pacifastacus leniusculus, a known burrowing crayfish species in the UK
(Holdich et al, 1995), were first investigated by Harris and Young at the Gaddesby Brook in
1996 (Figure 3.1.1). At this time, burrows were identified from Owston (SK 778 083) to just
before Ashby Folville (SK 711 115). The situation in the year 2000, saw burrows present as
far downstream as the Gaddesby sewage works (SK 685 127), with an overall increase in
burrow densities (Figure 3.1.2).
Figure 3.1.1 Map o f the distribution and densities o f signal crayfish burrows in the Gaddesby Brook in 1996 as
recorded by Harris and Young.
48
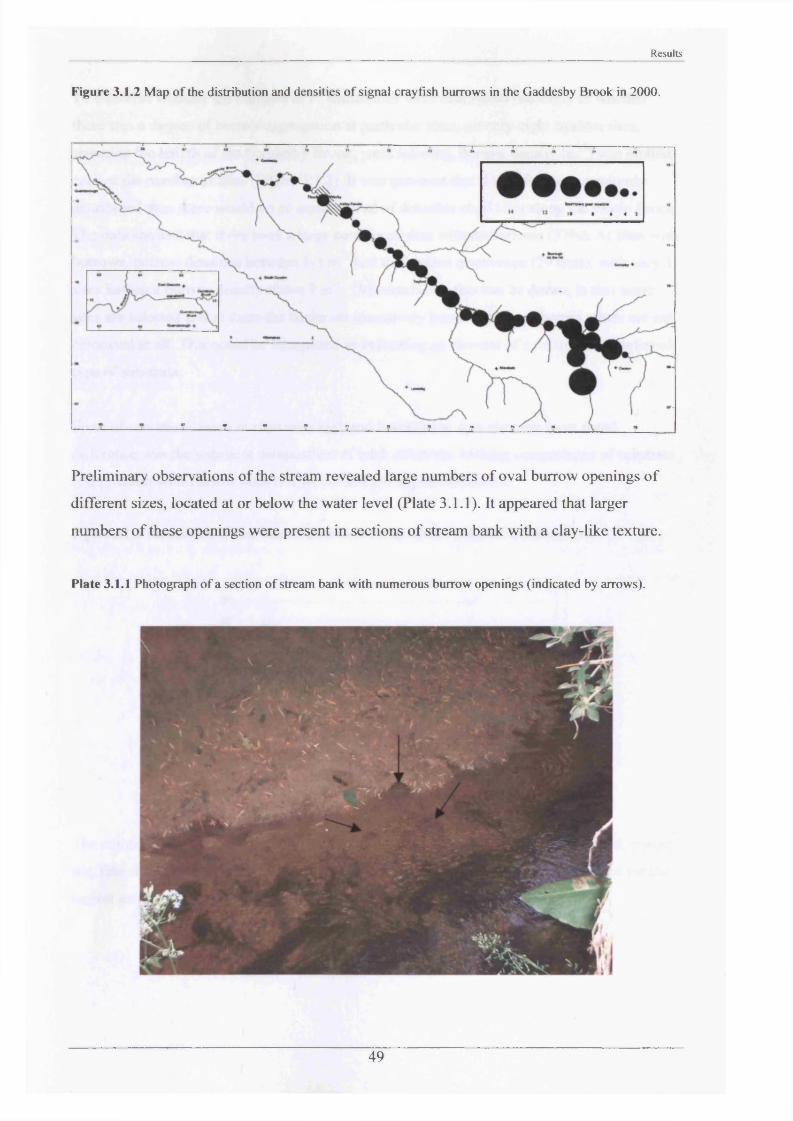
Results
Figure 3.1.2 Map o f the distribution and densities o f signal crayfish burrows in the Gaddesby Brook in 2000.
Preliminary observations of the stream revealed large numbers of oval burrow openings of
different sizes, located at or below the water level (Plate 3.1.1). It appeared that larger
numbers of these openings were present in sections of stream bank with a clay-like texture.
Plate 3.1.1 Photograph o f a section o f stream bank with numerous burrow openings (indicated by arrows).
49
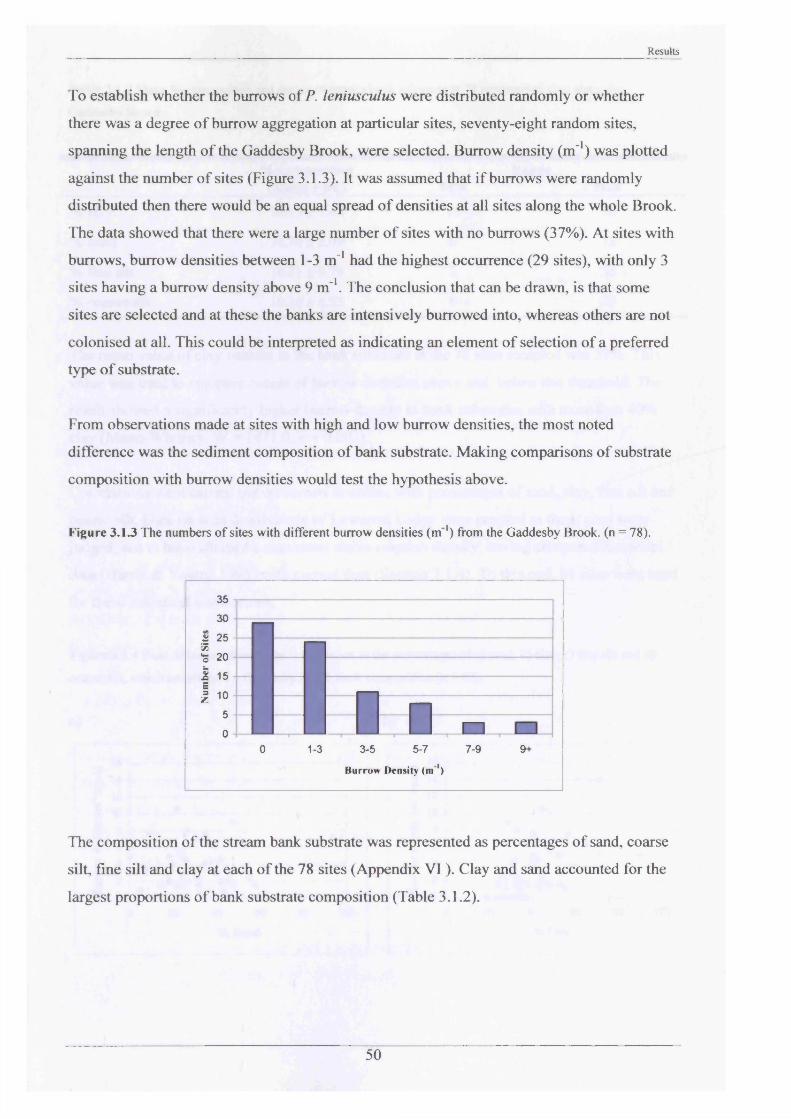
Results
To establish whether the burrows of P. leniusculus were distributed randomly or whether
there was a degree of burrow aggregation at particular sites, seventy-eight random sites,
spanning the length of the Gaddesby Brook, were selected. Burrow density (m*1) was plotted
against the number of sites (Figure 3.1.3). It was assumed that if burrows were randomly
distributed then there would be an equal spread of densities at all sites along the whole Brook.
The data showed that there were a large number of sites with no burrows (37%). At sites with
burrows, burrow densities between 1-3 m '1 had the highest occurrence (29 sites), with only 3
sites having a burrow density above 9 m '1. The conclusion that can be drawn, is that some
sites are selected and at these the banks are intensively burrowed into, whereas others are not
colonised at all. This could be interpreted as indicating an element of selection of a preferred
type of substrate.
From observations made at sites with high and low burrow densities, the most noted
difference was the sediment composition of bank substrate. Making comparisons of substrate
composition with burrow densities would test the hypothesis above.
Figure 3.1.3 The numbers o f sites with different burrow densities ( m 1) from the Gaddesby Brook, (n = 78).
35
30
I 2533 *5 20I 15 EI 1°
5
0
The composition of the stream bank substrate was represented as percentages of sand, coarse
silt, fine silt and clay at each of the 78 sites (Appendix VI ). Clay and sand accounted for the
largest proportions of bank substrate composition (Table 3.1.2).
I I , . .
0 1-3 3-5 5-7 7-9 9+
Burrow Density (m ')
50
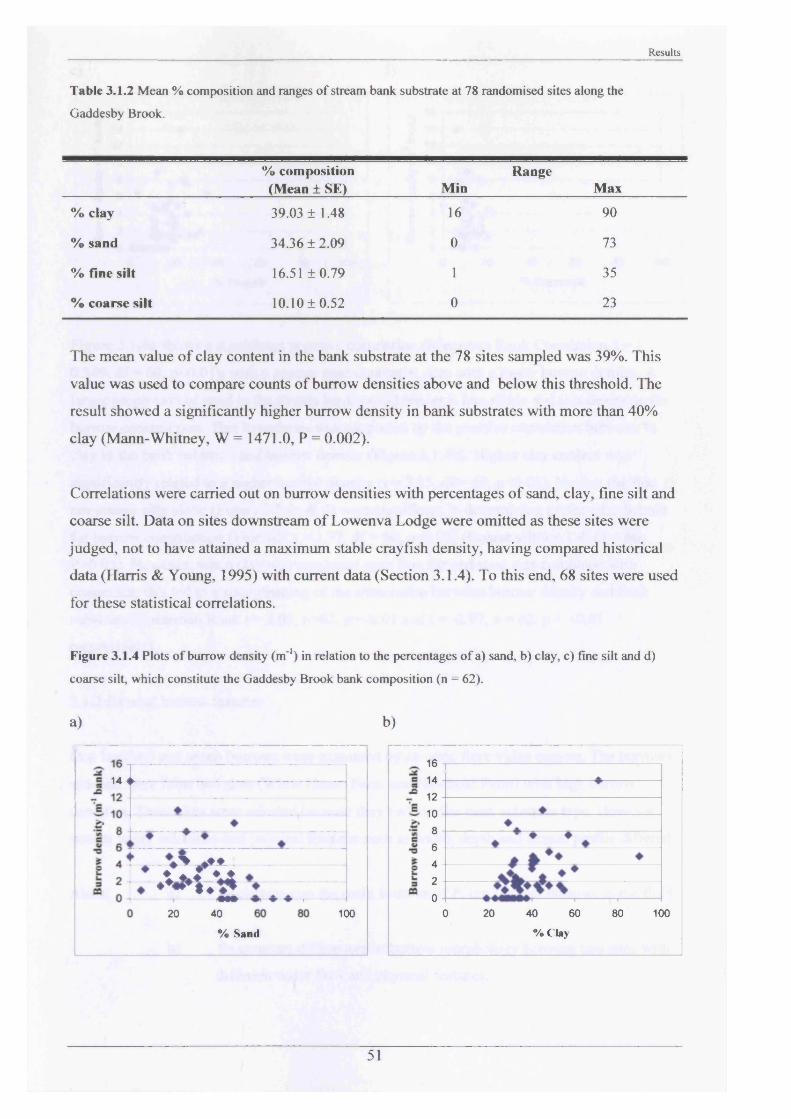
Results
Table 3.1.2 Mean % composition and ranges o f stream bank substrate at 78 randomised sites along the
Gaddesby Brook.
% composition (Mean ± SE) Min
RangeMax
% clay 39.03 ± 1.48 16 90
% sand 34.36 ± 2.09 0 73
% fine silt 16.51 ±0.79 1 35
% coarse silt 10.10 ±0.52 0 23
The mean value of clay content in the bank substrate at the 78 sites sampled was 39%. This
value was used to compare counts of burrow densities above and below this threshold. The
result showed a significantly higher burrow density in bank substrates with more than 40%
clay (Mann-Whitney, W = 1471.0, P = 0.002).
Correlations were carried out on burrow densities with percentages of sand, clay, fine silt and
coarse silt. Data on sites downstream of Lowenva Lodge were omitted as these sites were
judged, not to have attained a maximum stable crayfish density, having compared historical
data (Harris & Young, 1995) with current data (Section 3.1.4). To this end, 68 sites were used
for these statistical correlations.
Figure 3.1.4 Plots o f burrow density ( m 1) in relation to the percentages o f a) sand, b) clay, c) fine silt and d)
coarse silt, which constitute the Gaddesby Brook bank composition (n = 62).
a) b)
14 ♦
♦> / ♦ An.*
20 40 100
% Sand
1614121086420
0 20 40 60 80 100
% Clay
51
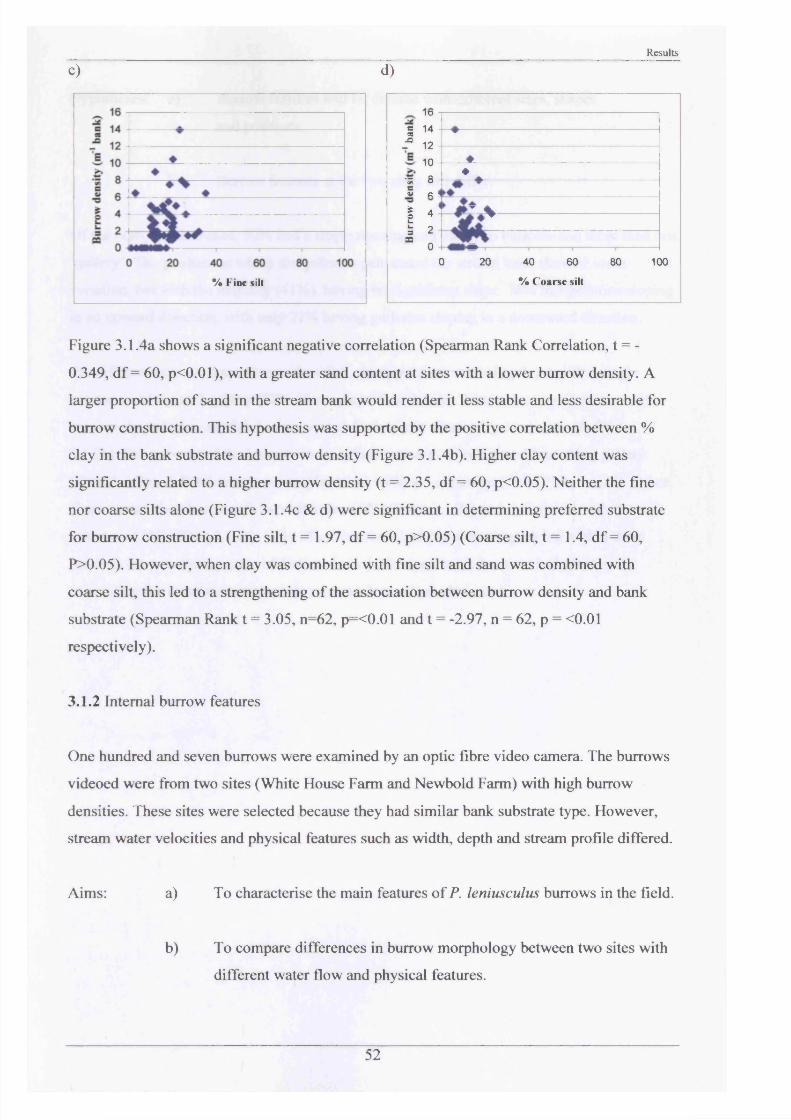
Results
c)
% F i n e sil t
d)
_ ID
= 14 ▲£ 1 4
■° 12w
*4 I C.
10 ♦' l U
- - Q ♦Ato o
5 ft ^
* 4 < M * \I 2
“ 0u() 20 40 60 80 100
% Coarse silt
Figure 3.1,4a shows a significant negative correlation (Spearman Rank Correlation, t = -
0.349, df = 60, p<0.01), with a greater sand content at sites with a lower burrow density. A
larger proportion of sand in the stream bank would render it less stable and less desirable for
burrow construction. This hypothesis was supported by the positive correlation between %
clay in the bank substrate and burrow density (Figure 3.1.4b). Higher clay content was
significantly related to a higher burrow density (t = 2.35, df = 60, p<0.05). Neither the fine
nor coarse silts alone (Figure 3.1.4c & d) were significant in determining preferred substrate
for burrow construction (Fine silt, t = 1.97, d f = 60, p>0.05) (Coarse silt, t = 1.4, df = 60,
P>0.05). However, when clay was combined with fine silt and sand was combined with
coarse silt, this led to a strengthening of the association between burrow density and bank
substrate (Spearman Rank t = 3.05, n=62, p=<0.01 and t = -2.97, n = 62, p = <0.01
respectively).
3.1.2 Internal burrow features
One hundred and seven burrows were examined by an optic fibre video camera. The burrows
videoed were from two sites (White House Farm and Newbold Farm) with high burrow
densities. These sites were selected because they had similar bank substrate type. However,
stream water velocities and physical features such as width, depth and stream profile differed.
Aims: a) To characterise the main features of P. leniusculus burrows in the field.
b) To compare differences in burrow morphology between two sites with
different water flow and physical features.
52
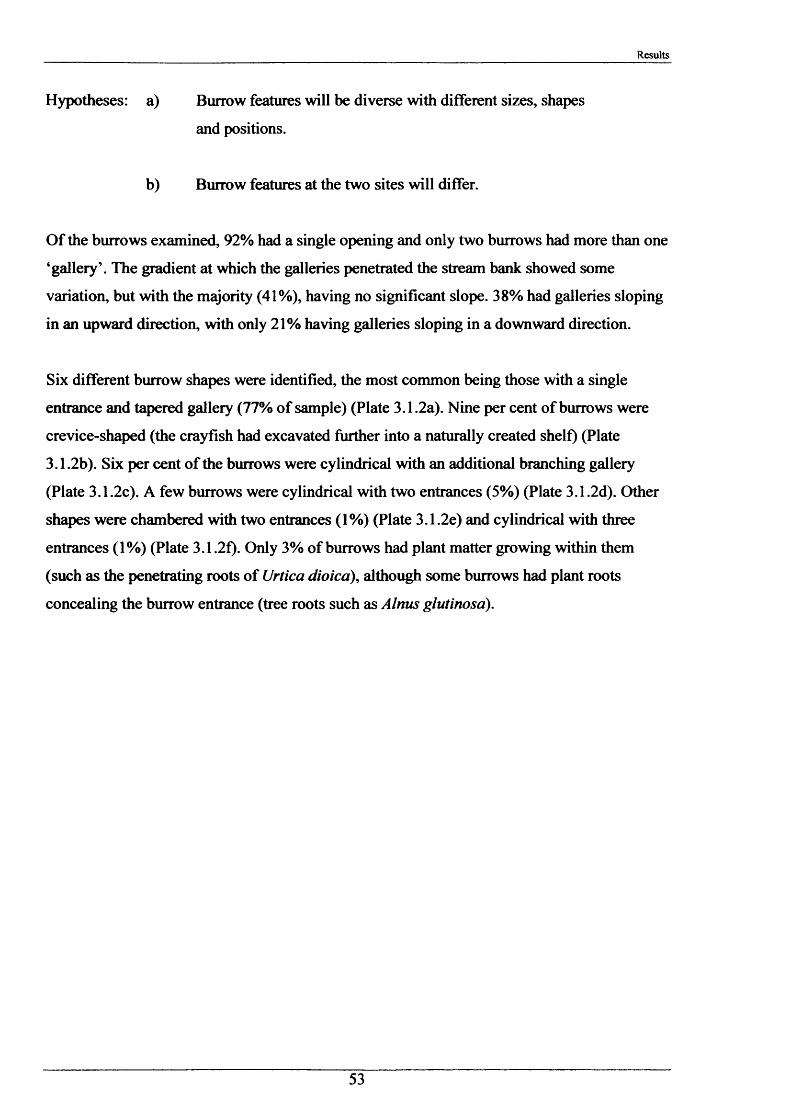
Results
Hypotheses: a) Burrow features will be diverse with different sizes, shapes
and positions.
b) Burrow features at the two sites will differ.
Of the burrows examined, 92% had a single opening and only two burrows had more than one
‘gallery’. The gradient at which the galleries penetrated the stream bank showed some
variation, but with the majority (41%), having no significant slope. 38% had galleries sloping
in an upward direction, with only 2 1 % having galleries sloping in a downward direction.
Six different burrow shapes were identified, the most common being those with a single
entrance and tapered gallery (77% of sample) (Plate 3.1.2a). Nine per cent of burrows were
crevice-shaped (the crayfish had excavated further into a naturally created shelf) (Plate
3.1.2b). Six per cent of the burrows were cylindrical with an additional branching gallery
(Plate 3.1.2c). A few burrows were cylindrical with two entrances (5%) (Plate 3.1.2d). Other
shapes were chambered with two entrances (1%) (Plate 3.1.2e) and cylindrical with three
entrances (1%) (Plate 3.1.2f). Only 3% of burrows had plant matter growing within them
(such as the penetrating roots of Urtica dioica), although some burrows had plant roots
concealing the burrow entrance (tree roots such as A Inus glutinosa).
53
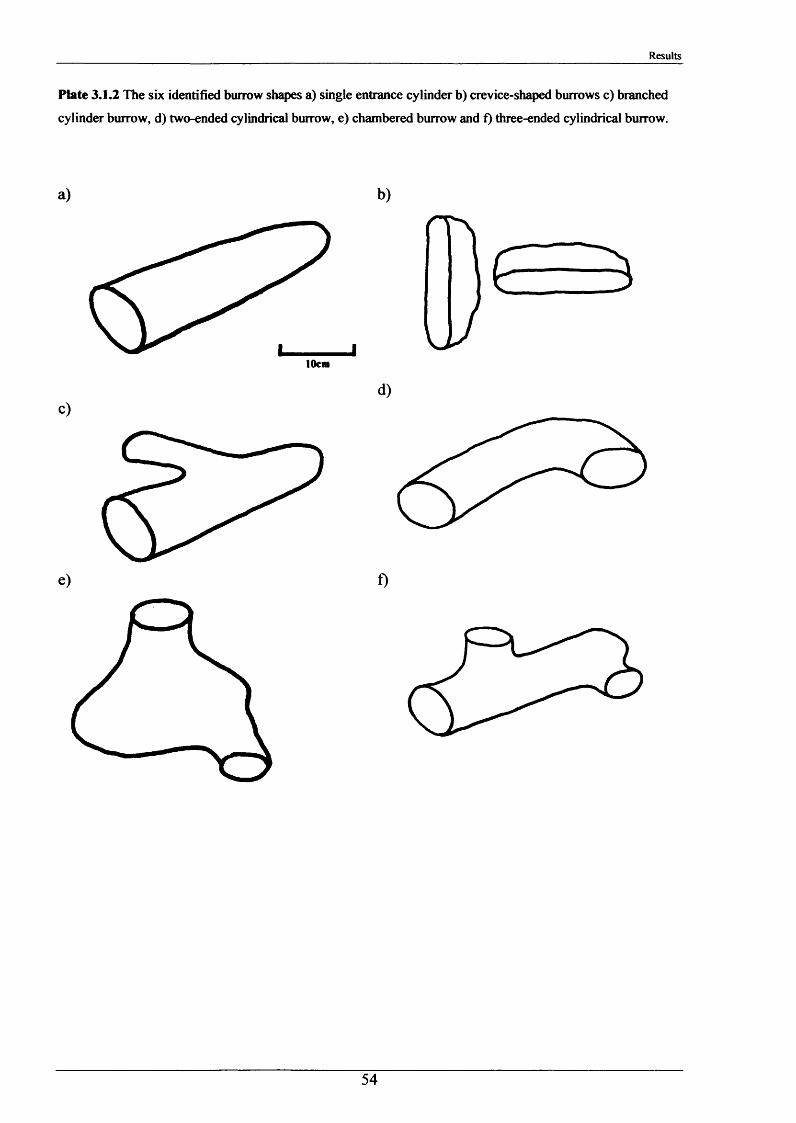
Results
Plate 3.1.2 The six identified burrow shapes a) single entrance cylinder b) crevice-shaped burrows c) branched
cylinder burrow, d) two-ended cylindrical burrow, e) chambered burrow and f) three-ended cylindrical burrow.
a) b)
10cm
c)
e)
d)
f)
54
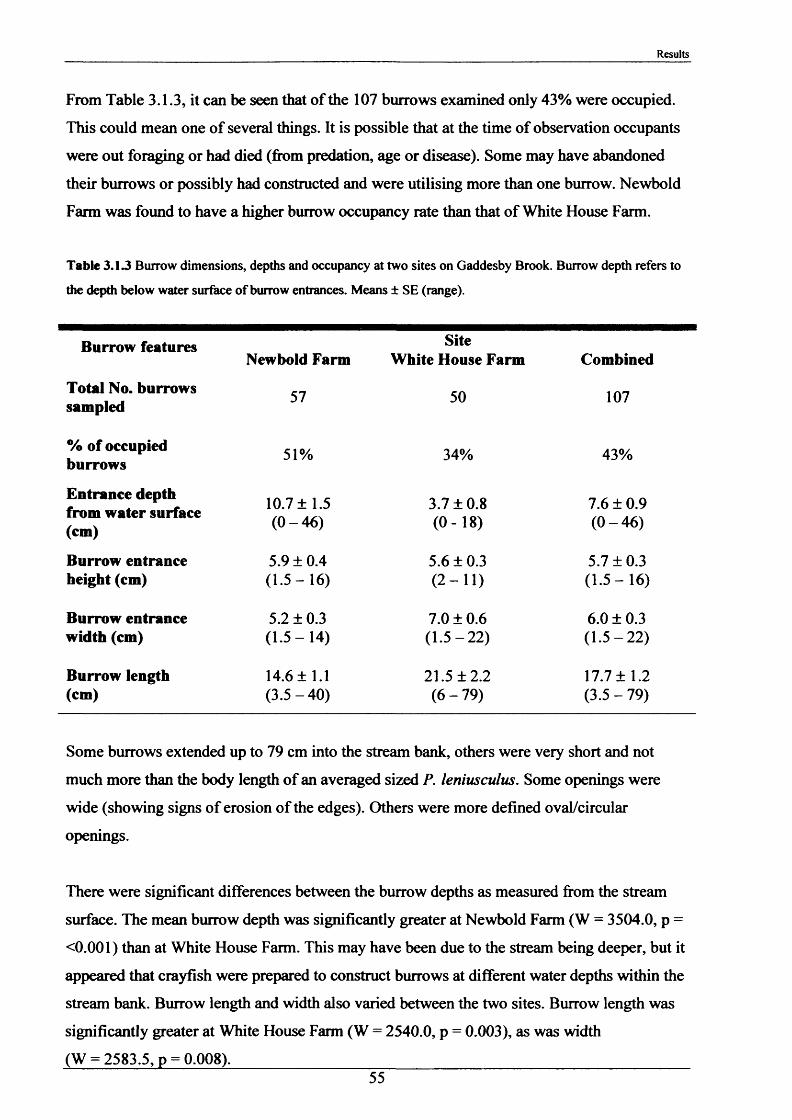
Results
From Table 3.1.3, it can be seen that of the 107 burrows examined only 43% were occupied.
This could mean one of several things. It is possible that at the time of observation occupants
were out foraging or had died (from predation, age or disease). Some may have abandoned
their burrows or possibly had constructed and were utilising more than one burrow. Newbold
Farm was found to have a higher burrow occupancy rate than that of White House Farm.
Table 3 .1 3 Burrow dimensions, depths and occupancy at two sites on Gaddesby Brook. Burrow depth refers to
the depth below water surface o f burrow entrances. Means ± SE (range).
Burrow featuresNewbold Farm
SiteWhite House Farm Combined
Total No. burrows 57 50 107sampled
% of occupied burrows 51% 34% 43%
Entrance depth from water surface (cm)
10.7 ±1.5 (0 -4 6 )
3.7 ±0.8 (0 -18)
7.6 ± 0.9 (0 -4 6 )
Burrow entrance 5.9 ± 0.4 5.6 ±0.3 5.7 ± 0.3height (cm) (1 .5-16) (2 - 1 1 ) (1 .5 -16)
Burrow entrance 5.2 ± 0.3 7.0 ± 0.6 6.0 ± 0.3width (cm) (1 .5 -14) (1 .5 -22) (1 .5 -22)
Burrow length 14.6 ± 1.1 21.5 ±2.2 17.7 ± 1.2(cm) (3 .5 -40) ( 6 - 79) (3 .5 -79)
Some burrows extended up to 79 cm into the stream bank, others were very short and not
much more than the body length of an averaged sized P. leniusculus. Some openings were
wide (showing signs of erosion of the edges). Others were more defined oval/circular
openings.
There were significant differences between the burrow depths as measured from the stream
surface. The mean burrow depth was significantly greater at Newbold Farm (W = 3504.0, p =
<0.001) than at White House Farm. This may have been due to the stream being deeper, but it
appeared that crayfish were prepared to construct burrows at different water depths within the
stream bank. Burrow length and width also varied between the two sites. Burrow length was
significantly greater at White House Farm (W = 2540.0, p = 0.003), as was width
(W = 2583.5, p = 0.008)._________________________________________________________55
Results
3.13 The internal burrow water chemistry
Water samples were extracted by large hypodermic syringe from 267 burrows and analysed
for selected water chemistry components. This data was compared with that of the external
flowing stream water also collected on each sampling occasion (Table 3.1.4).
Aim: To establish what affect the presence of P. leniusculus has on internal
burrow water chemistry.
Hypothesis: The internal burrow water chemistry of occupied burrows will differ
significantly from unoccupied burrows and external stream water.
From Table 3.1.4, it can be seen that the total ammonia (Tamm) levels within burrows were
higher than the external stream water at both sites during summer and winter. However, the
differences were significantly greater in summer compared to that of winter (Mann-Whitney,
W = 15568.0, P = 0.008). This may be linked to increased activity levels shown by P.
leniusculus during this season. The Pa> levels within the burrows during winter at both sites
were quite similar to that of the stream level. During summer, however, they were
significantly higher (Mann-Whitney, W = 13441.5, P = 0.036), demonstrating slight hypoxic
conditions. In general, levels of ZCO2 were higher within the burrows showing slight
hypercapnic conditions, however, there were no significant differences between summer and
winter levels (Mann-Whitney, W = 15687.0, P = 0.123). The pH levels remained fairly
consistent, with no substantial differences between sites or within burrows.
56
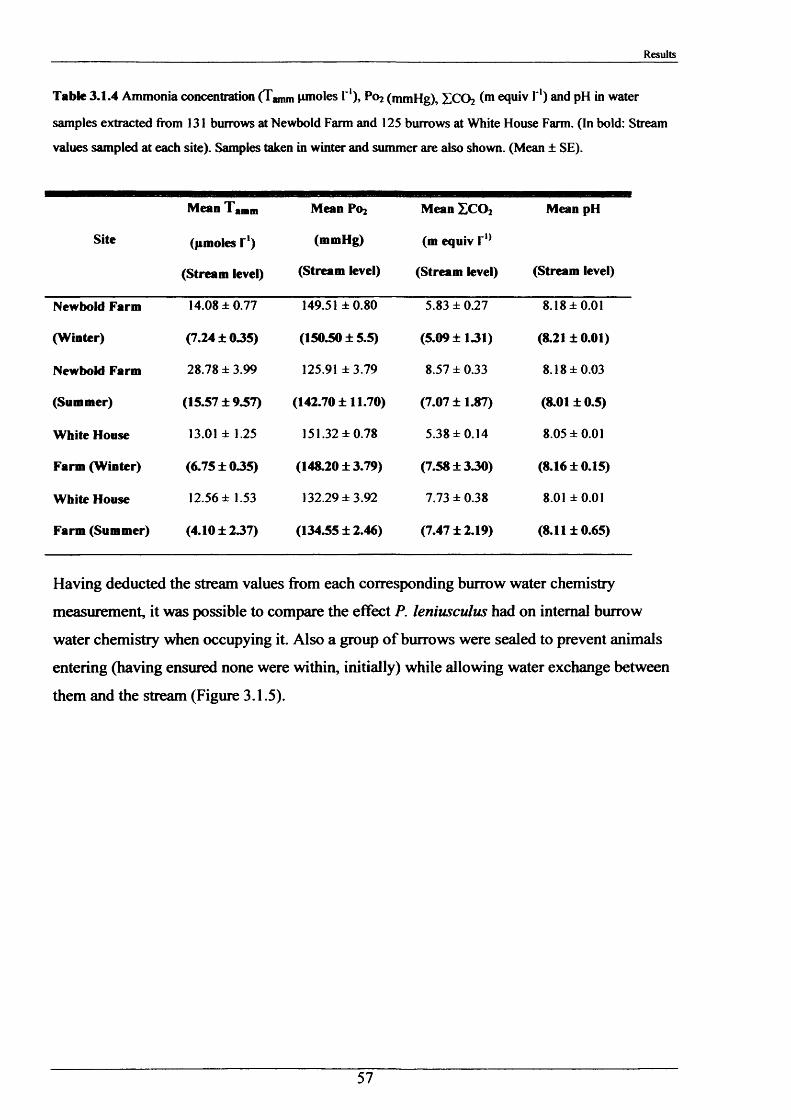
Results
Table 3.1.4 Ammonia concentration (Tamm nmoles I'1), P0 2 (mmHg), ZCO2 (m equiv I*1) and pH in water
samples extracted from 131 burrows at Newbold Farm and 125 burrows at White House Farm. (In bold: Stream
values sampled at each site). Samples taken in winter and summer are also shown. (Mean ± SE).
Site
Mean Tanm
(pmoles T1)
(Stream level)
Mean P0 2
(mmHg)
(Stream level)
Mean I C 0 2
(m equiv r!)
(Stream level)
Mean pH
(Stream level)
Newbold Farm 14.08 ±0.77 149.51 ±0.80 5.83 ± 0.27 8.18 ± 0.01
(Winter) (7.24 ± 035) (15030 ± 5.5) (5.09 ± 131) (8.21 ± 0.01)
Newbold Farm 28.78 ±3.99 125.91 ±3.79 8.57 ± 0.33 8.18 ±0.03
(Summer) (15.57 ± 937) (142.70 ±11.70) (7.07 ± 1.87) (8.01 ± 0.5)
White House 13.01 ± 1.25 151.32 ±0.78 5.38 ±0.14 8.05 ±0.01
Farm (Winter) (6.75 ± 035 ) (148.20 ±3.79) (7.58 ± 330 ) (8.16 ± 0.15)
White House 12.56 ± 1.53 132.29 ±3.92 7.73 ± 0.38 8.01 ± 0.01
Farm (Summer) (4.10 ± 237) (134.55 ± 2.46) (7.47 ± 2.19) (8.11 ±0.65)
Having deducted the stream values from each corresponding burrow water chemistry
measurement, it was possible to compare the effect P. leniusculus had on internal burrow
water chemistry when occupying it. Also a group of burrows were sealed to prevent animals
entering (having ensured none were within, initially) while allowing water exchange between
them and the stream (Figure 3.1.5).
57
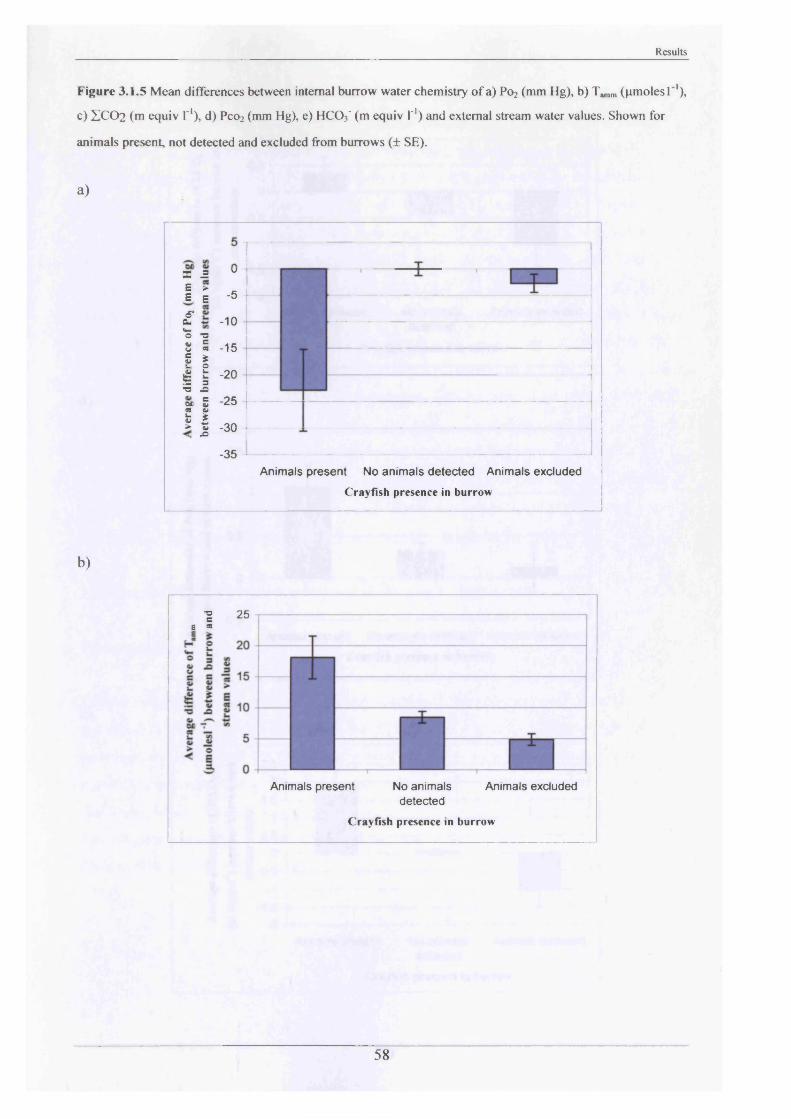
Results
Figure 3.1.5 Mean differences between internal burrow water chemistry o f a) P0 2 (mm Hg), b) Tmm (nmoles I 1),
c) ZCO2 (m equiv I'1), d) PCO2 (mm Hg), e) HC03‘ (m equiv I"1) and external stream water values. Shown for
animals present, not detected and excluded from burrows (± SE).
a)
X 3 u E >E E ‘5
£ ~ -10© -OS 5 -15£ |- O£ t -20s: 3 ■o .©ot g -25OS Sfc *> 2 - 3 0
-35Animals present No animals detected Animals excluded
Crayfish presence in burrow
b)
■g 25E «
Animals present No animals Animals excluded detected
Crayfish presence in burrow
58
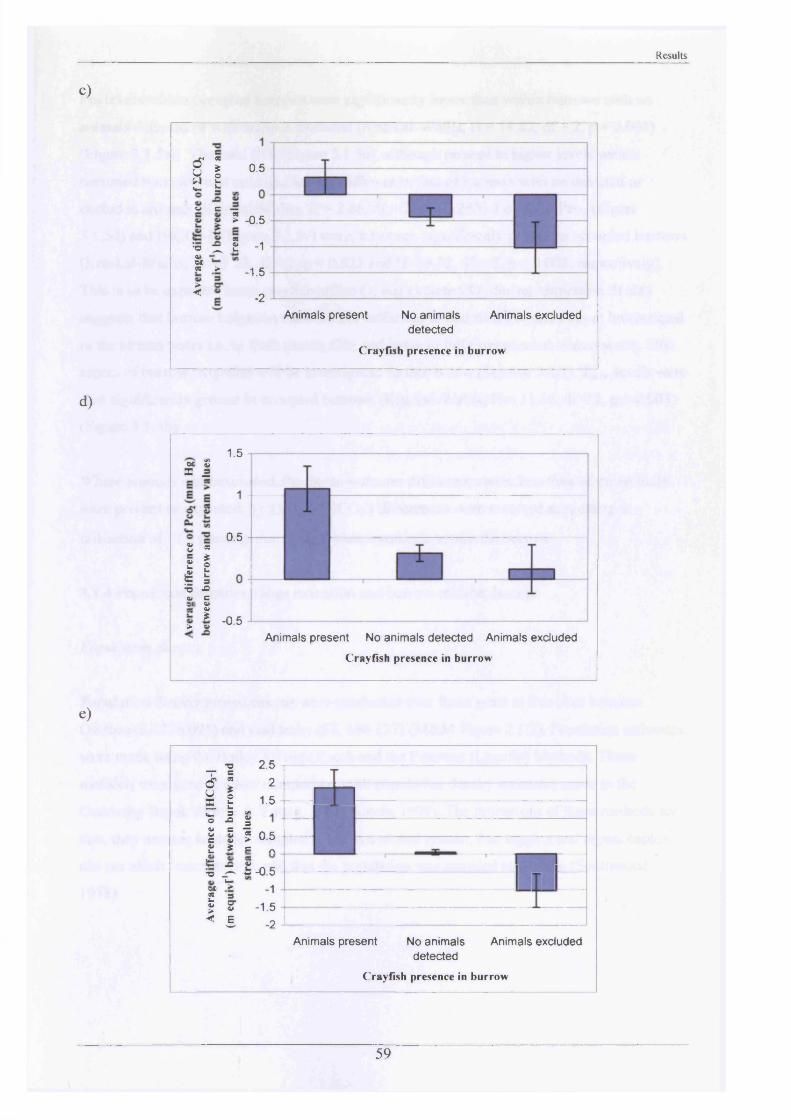
Results
c)
<5 "5 Ia 1
0.5
o c —« _ _ > -0.5
■° ^ <-S*« >
8 -1
>«<-1.5
-2Animals present No animals
detectedAnimals excluded
Crayfish presence in burrow
d)
at £S —
s «s I
1 1 ■o -e o ezi aI
I> <w
1.5
0.5
-0.5Animals present No animals detected Animals excluded
Crayfish presence in burrow
e)
renc
e of
|HC
O,-j
:wee
n bu
rrow
an
d m
valu
eso
r* N
) Ol
Ol
fO
Ol
y
r h
fc -O 4, ^■O £ - - -0 5at > -1 2 3£ ? -1 .5 ^ £ -2
I T IrAnimals present No animals Animals excluded
detected
Crayfish presence in burrow
59
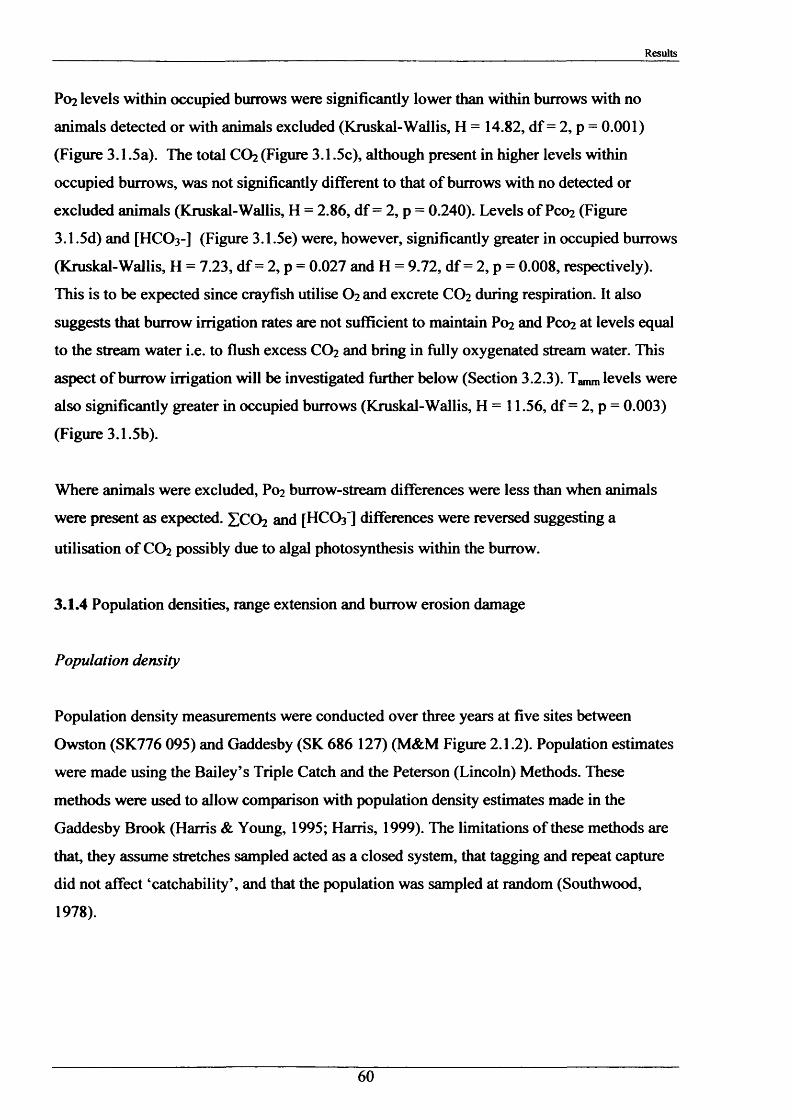
Results
P0 2 levels within occupied burrows were significantly lower than within burrows with no
animals detected or with animals excluded (Kruskal-Wallis, H = 14.82, df = 2, p = 0.001)
(Figure 3.1.5a). The total CO2 (Figure 3.1.5c), although present in higher levels within
occupied burrows, was not significantly different to that of burrows with no detected or
excluded animals (Kruskal-Wallis, H = 2.86, df = 2, p = 0.240). Levels of PCO2 (Figure
3.1.5d) and [HCO3-] (Figure 3.1.5e) were, however, significantly greater in occupied burrows
(Kruskal-Wallis, H = 7.23, df = 2, p = 0.027 and H = 9.72, df = 2, p = 0.008, respectively).
This is to be expected since crayfish utilise O2 and excrete CO2 during respiration. It also
suggests that burrow irrigation rates are not sufficient to maintain P0 2 and PCO2 at levels equal
to the stream water i.e. to flush excess CO2 and bring in fully oxygenated stream water. This
aspect of burrow irrigation will be investigated further below (Section 3.2.3). Tamm levels were
also significantly greater in occupied burrows (Kruskal-Wallis, H = 11.56, df = 2, p = 0.003)
(Figure 3.1.5b).
Where animals were excluded, P0 2 burrow-stream differences were less than when animals
were present as expected. XCO2 and [HCO3 ] differences were reversed suggesting a
utilisation of CO2 possibly due to algal photosynthesis within the burrow.
3.1.4 Population densities, range extension and burrow erosion damage
Population density
Population density measurements were conducted over three years at five sites between
Owston (SK776 095) and Gaddesby (SK 6 8 6 127) (M&M Figure 2.1.2). Population estimates
were made using the Bailey’s Triple Catch and the Peterson (Lincoln) Methods. These
methods were used to allow comparison with population density estimates made in the
Gaddesby Brook (Harris & Young, 1995; Harris, 1999). The limitations of these methods are
that, they assume stretches sampled acted as a closed system, that tagging and repeat capture
did not affect ‘catchability’, and that the population was sampled at random (Southwood,
1978).
60
Results
Aim: To monitor the change in population densities at five sites along the
Gaddesby Brook over a three-year period.
Hypothesis: Crayfish population density at any one site will increase until all
available substrate and resources have been used.
Table 3.1.5 provides data on changes in population density at the five consecutive sites over
three years. Newbold Farm was the site nearest to the point of the first introduction of P.
leniusculus in the Gaddesby Brook. Gaddesby (village) was the site furthest away. The site
with the highest overall population density (m‘ ) was White House Farm. Although this site
had a low catch per unit effort (CPUE), when corrections for length of bank and area of'y
streambed were made (m' ) it proved to have the greatest population density. The site at
Gaddesby had the lowest population densities and with such low CPUE’s it was not possible
to calculate the densities using the Bailey’s Triple Catch method. The population densities at
all sites showed fluctuation from year to year but, in general, at the first three sites, densities
remained relatively constant throughout. The final two sites, however, showed in some cases,
more than a two-fold increase in population densities over the three years.
61
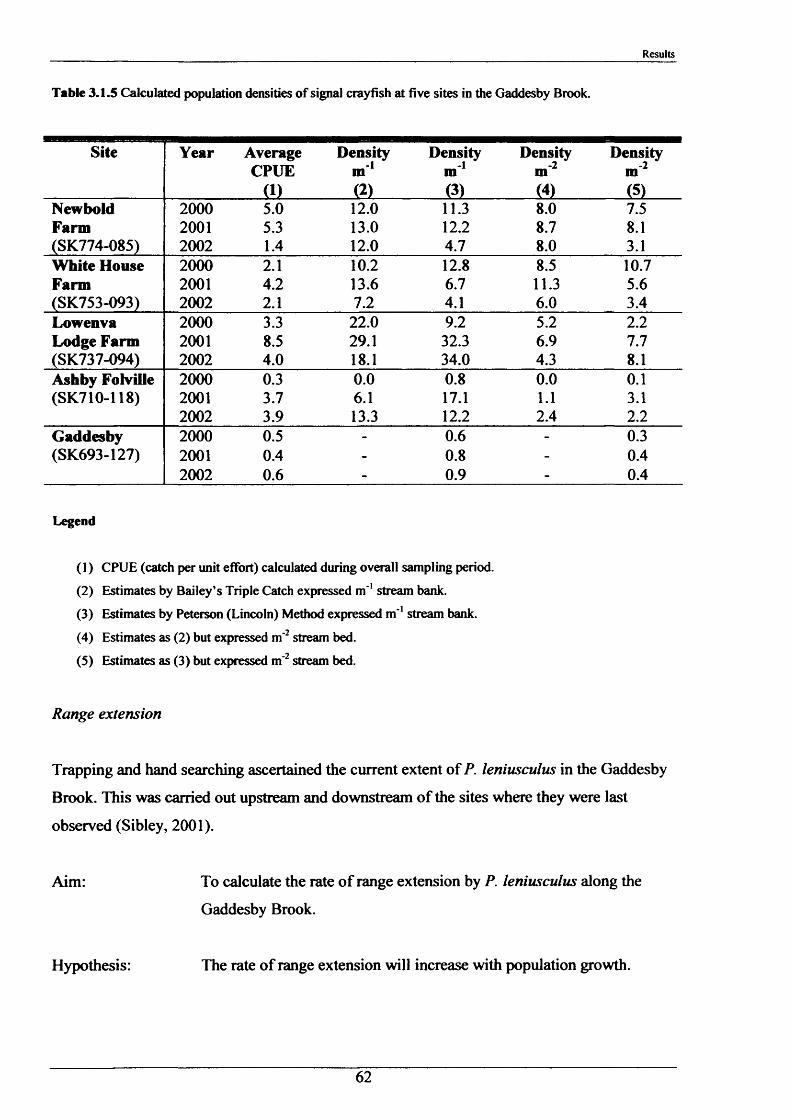
Results
Table 3.1.5 Calculated population densities of signal crayfish at five sites in the Gaddesby Brook.
Site Year AverageCPUE
(1)
Densitym'(2)
Densitym 1(3)
Densitym 2(4)
Density m 2 (5)
Newbold 2 0 0 0 5.0 1 2 . 0 11.3 8 . 0 7.5Farm 2 0 0 1 5.3 13.0 1 2 . 2 8.7 8 .1
(SK774-085) 2 0 0 2 1.4 1 2 . 0 4.7 8 . 0 3.1White House 2 0 0 0 2 .1 1 0 . 2 1 2 . 8 8.5 10.7Farm 2 0 0 1 4.2 13.6 6.7 11.3 5.6(SK753-093) 2 0 0 2 2 .1 7.2 4.1 6 . 0 3.4Lowenva 2 0 0 0 3.3 2 2 . 0 9.2 5.2 2 . 2
Lodge Farm 2 0 0 1 8.5 29.1 32.3 6.9 7.7(SK737-094) 2 0 0 2 4.0 18.1 34.0 4.3 8 .1
Ashby Folville 2 0 0 0 0.3 0 . 0 0 . 8 0 . 0 0 .1
(SK710-118) 2 0 0 1 3.7 6 .1 17.1 1 .1 3.12 0 0 2 3.9 13.3 1 2 . 2 2.4 2 . 2
Gaddesby 2 0 0 0 0.5 - 0 . 6 - 0.3(SK693-127) 2 0 0 1 0.4 - 0 . 8 - 0.4
2 0 0 2 0 . 6 - 0.9 - 0.4
Legend
(1) CPUE (catch per unit effort) calculated during overall sampling period.(2) Estimates by Bailey’s Triple Catch expressed m'1 stream bank.(3) Estimates by Peterson (Lincoln) Method expressed m'1 stream bank.(4) Estimates as (2) but expressed m'2 stream bed.(5) Estimates as (3) but expressed rrf2 stream bed.
Range extension
Trapping and hand searching ascertained the current extent of P. leniusculus in the Gaddesby
Brook. This was carried out upstream and downstream of the sites where they were last
observed (Sibley, 2001).
Aim: To calculate the rate of range extension by P. leniusculus along the
Gaddesby Brook.
Hypothesis: The rate of range extension will increase with population growth.
62
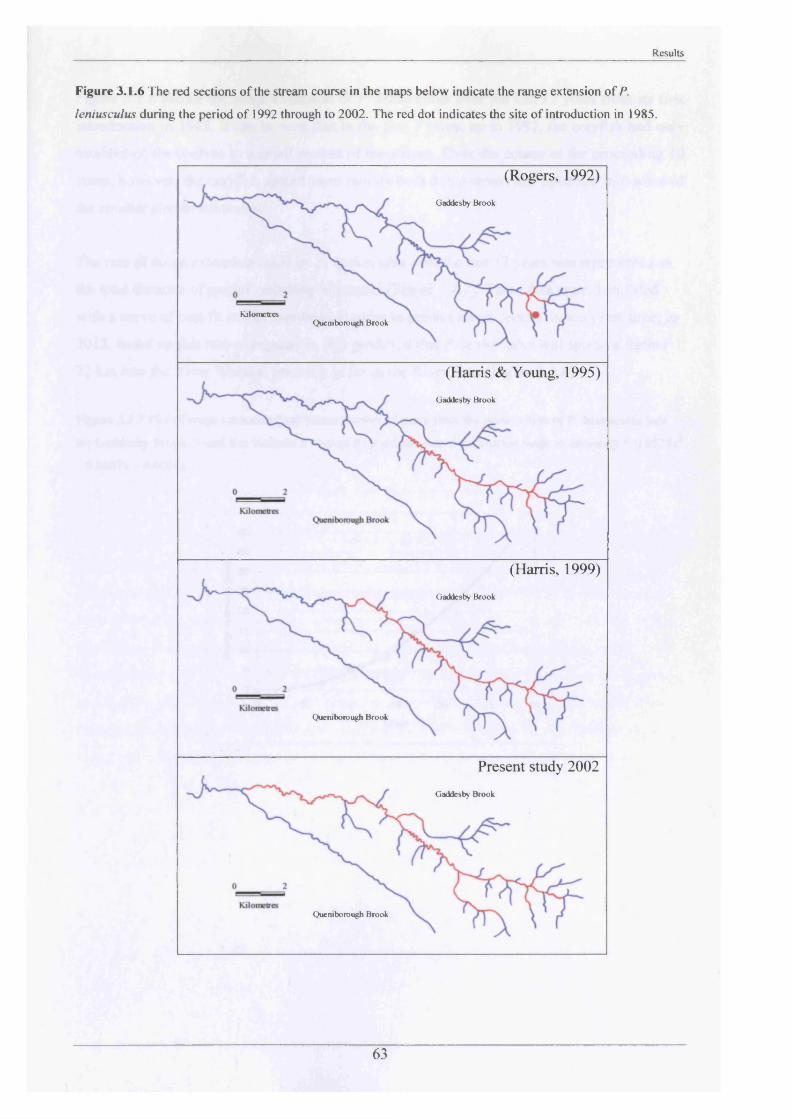
Results
Figure 3.1.6 The red sections of the stream course in the maps below indicate the range extension o f P.
leniusculus during the period of 1992 through to 2002. The red dot indicates the site o f introduction in 1985.
(Rogers, 1992)Gaddesby Brook
KilometresQueniborough Brook
(Harris & Young, 1995)
Gaddesby Brook
(Harris, 1999)
Gaddesby Brook
Quern borough Brook
Present study 2002
Gaddesby Brook
Queniborough Brook
63
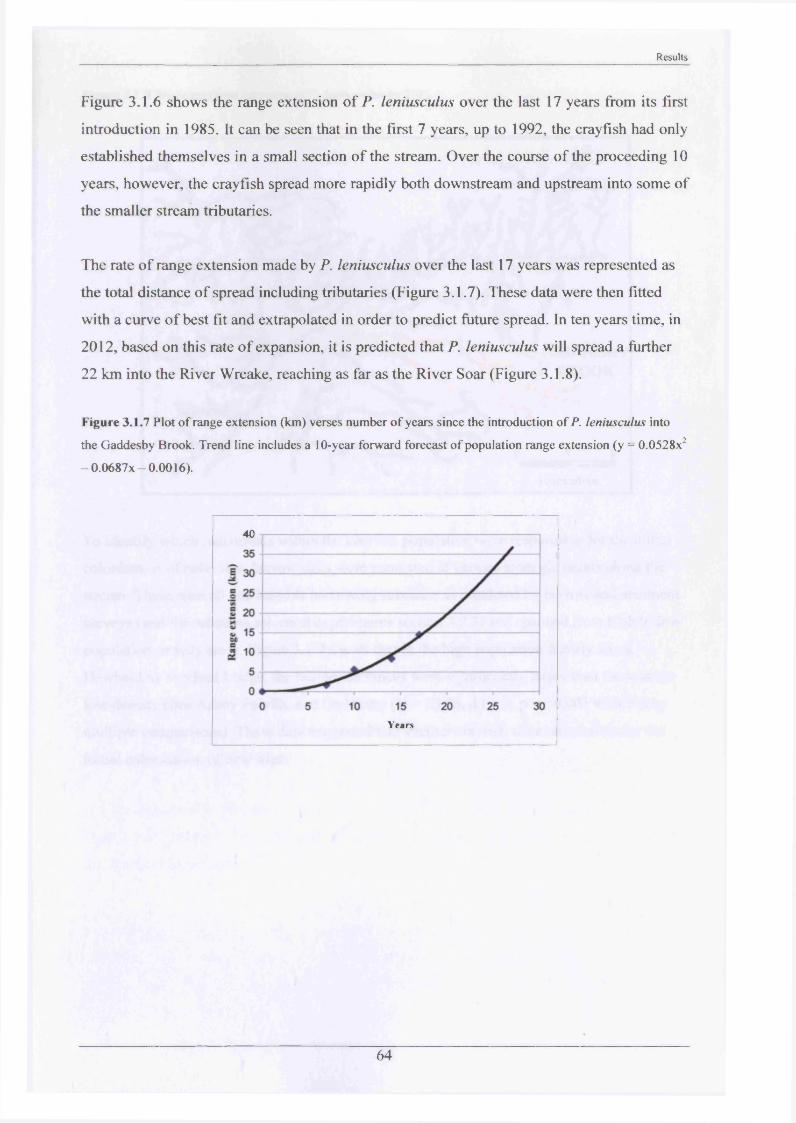
Results
Figure 3.1.6 shows the range extension of P. leniusculus over the last 17 years from its first
introduction in 1985. It can be seen that in the first 7 years, up to 1992, the crayfish had only
established themselves in a small section of the stream. Over the course of the proceeding 10
years, however, the crayfish spread more rapidly both downstream and upstream into some of
the smaller stream tributaries.
The rate of range extension made by P. leniusculus over the last 17 years was represented as
the total distance of spread including tributaries (Figure 3.1.7). These data were then fitted
with a curve of best fit and extrapolated in order to predict future spread. In ten years time, in
2012, based on this rate of expansion, it is predicted that P. leniusculus will spread a further
22 km into the River Wreake, reaching as far as the River Soar (Figure 3.1.8).
Figure 3.1.7 Plot o f range extension (km) verses number o f years since the introduction o f P. leniusculus into
the Gaddesby Brook. Trend line includes a 10-year forward forecast o f population range extension (y = 0.0528x2
- 0 .0 6 8 7 x - 0.0016).
40
Years
64
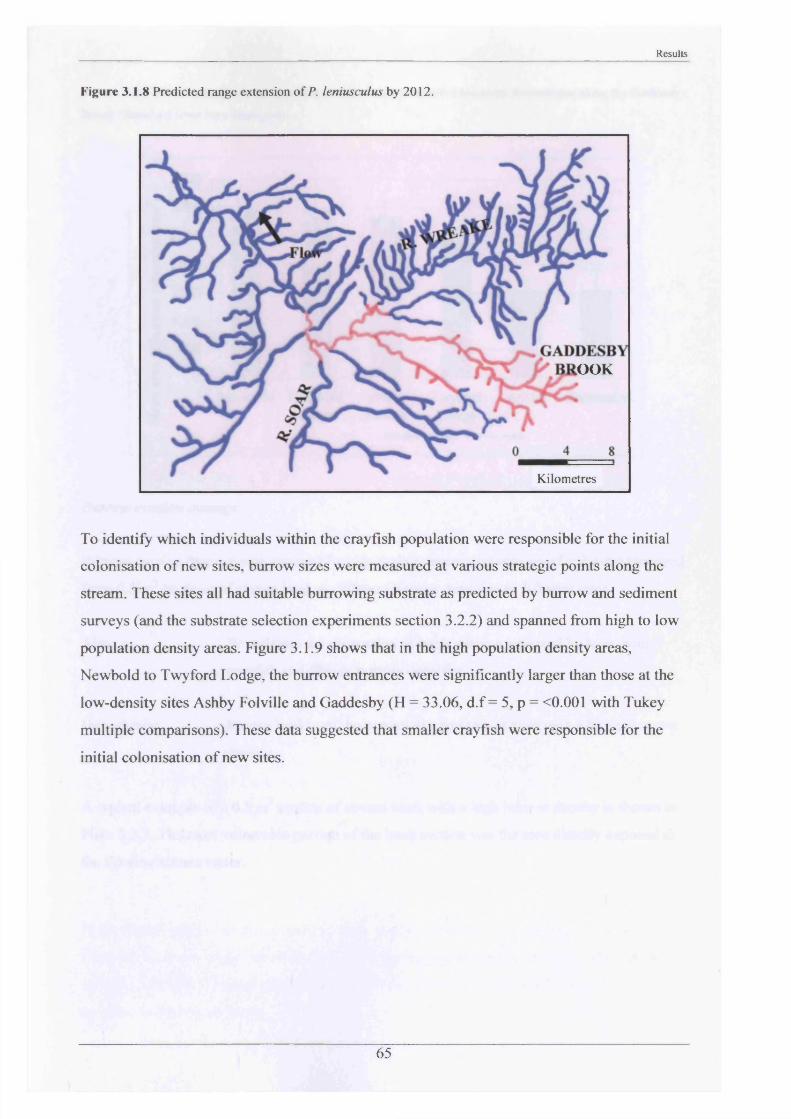
Figure 3.1.8 Predicted range extension o f P. leniusculus by 2012.
Results
:OOK
Kilometres
To identify which individuals within the crayfish population were responsible for the initial
colonisation of new sites, burrow sizes were measured at various strategic points along the
stream. These sites all had suitable burrowing substrate as predicted by burrow and sediment
surveys (and the substrate selection experiments section 3.2.2) and spanned from high to low
population density areas. Figure 3.1.9 shows that in the high population density areas,
Newbold to Twyford Lodge, the burrow entrances were significantly larger than those at the
low-density sites Ashby Folville and Gaddesby (H = 33.06, d.f = 5, p = <0.001 with Tukey
multiple comparisons). These data suggested that smaller crayfish were responsible for the
initial colonisation of new sites.
65
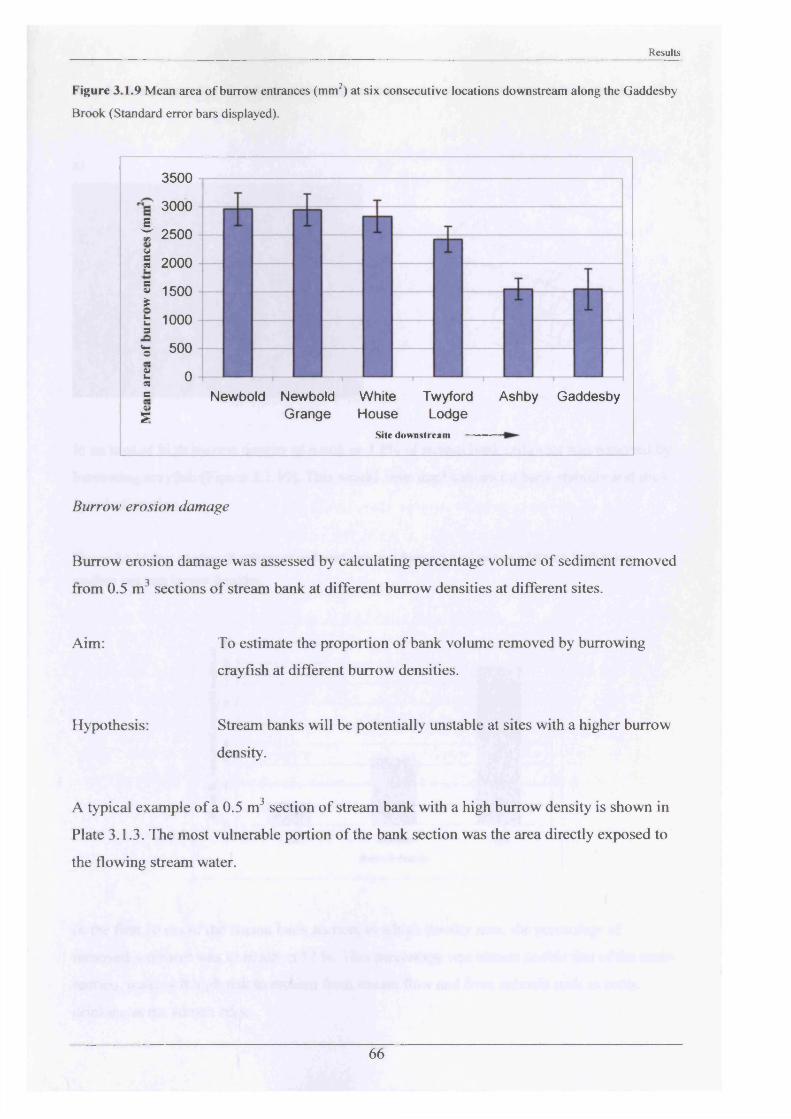
Results
Figure 3.1.9 Mean area o f burrow entrances (mm2) at six consecutive locations downstream along the Gaddesby
Brook (Standard error bars displayed).
3500
3000Er 2500
I 2000
s 1500 £t 10003
% 500
I 0= Newbold Newbold White Twyford Ashby GaddesbyJjr Grange House Lodge
Site downstream ----------
Burrow erosion damage
Burrow erosion damage was assessed by calculating percentage volume of sediment removed
from 0.5 m3 sections of stream bank at different burrow densities at different sites.
Aim: To estimate the proportion of bank volume removed by burrowing
crayfish at different burrow densities.
Hypothesis: Stream banks will be potentially unstable at sites with a higher burrow
density.
A typical example of a 0.5 m3 section of stream bank with a high burrow density is shown in
Plate 3.1.3. The most vulnerable portion of the bank section was the area directly exposed to
the flowing stream water.
66
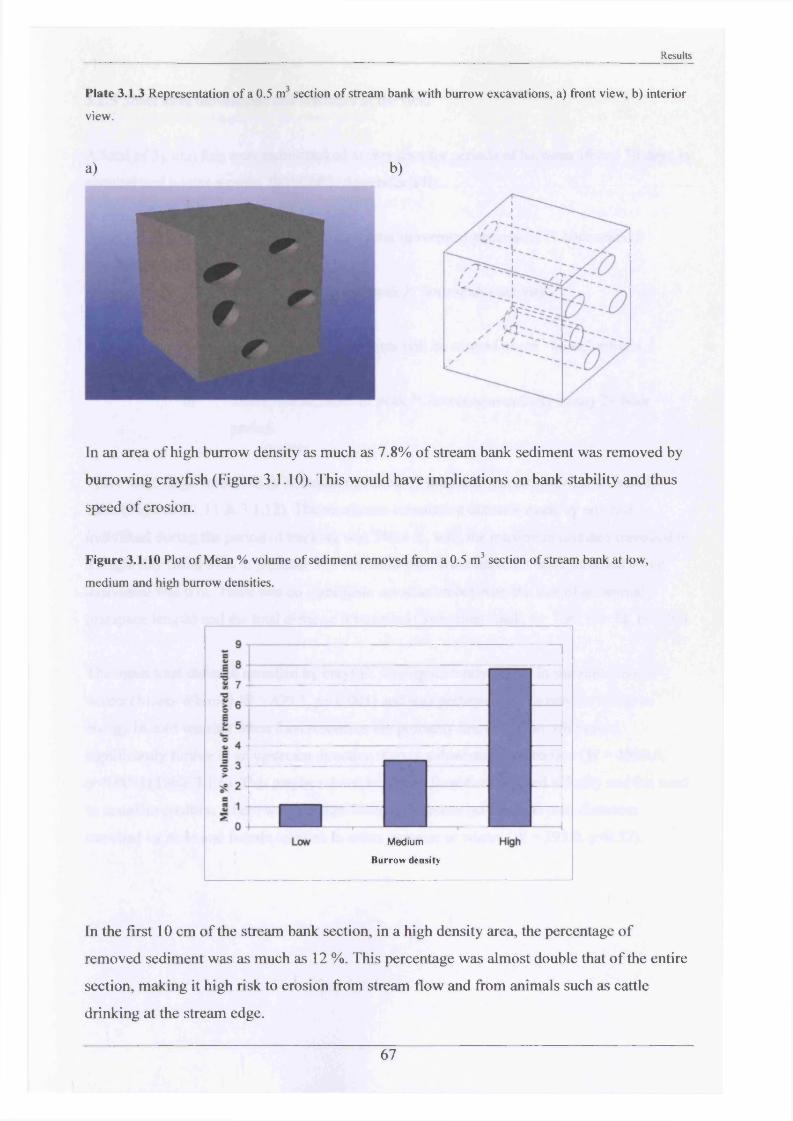
Results
Plate 3.1.3 Representation o f a 0.5 m section o f stream bank with burrow excavations, a) front view, b) interior
view.
a) b)
In an area of high burrow density as much as 7.8% of stream bank sediment was removed by
burrowing crayfish (Figure 3.1.10). This would have implications on bank stability and thus
speed of erosion.
Figure 3.1.10 Plot o f Mean % volume o f sediment removed from a 0.5 m3 section o f stream bank at low,
medium and high burrow densities.
Medium Burrow density
In the first 10 cm of the stream bank section, in a high density area, the percentage of
removed sediment was as much as 12 %. This percentage was almost double that of the entire
section, making it high risk to erosion from stream flow and from animals such as cattle
drinking at the stream edge.
67
Results
3.1.5 Short term movements and activities in the field
A total of 38 crayfish were radio-tracked at two sites for periods of between 16 and 30 days in
summer and winter months 2001/2002 (Appendix VII).
Aims: a) To monitor the short term movement patterns of P. leniusculus.
b) To ascertain times of peak P. leniusculus activity.
Hypotheses: a) P. leniusculus movements will be centred about ‘home’ refugia.
b) There will be times of peak P. leniusculus activity in any 24 hour
period.
There were large variations in distances travelled by the radio-tracked crayfish on a daily
basis (Figures 3.1.11 & 3.1.12). The maximum cumulative distance made by any one
individual during the period of tracking was 340.4 m, with the maximum distance travelled in
a single day being 89.6 m (Animal 38). The minimum cumulative distance travelled by an
individual was 0 m. There was no significant association between the size of an animal
(carapace length) and the total distance it travelled (Spearman Rank, t = 1.90, n = 38, p<0.05).
The mean total distance travelled by crayfish was significantly higher in summer than in
winter (Mann-Whitney W = 499.5, p< 0.001) and was perhaps due to a need to conserve
energy in cold weather when food resources are probably limiting. Crayfish moved
significantly further in an upstream direction than in a downstream direction (W = 1929.0,
p<0.001) (Table 3.1.6). This maybe related to stream flow direction and velocity and the need
to maintain position. There were no significant differences between the total distances
travelled by male and female crayfish in either summer or winter (W = 393.0, p=0.52).
68
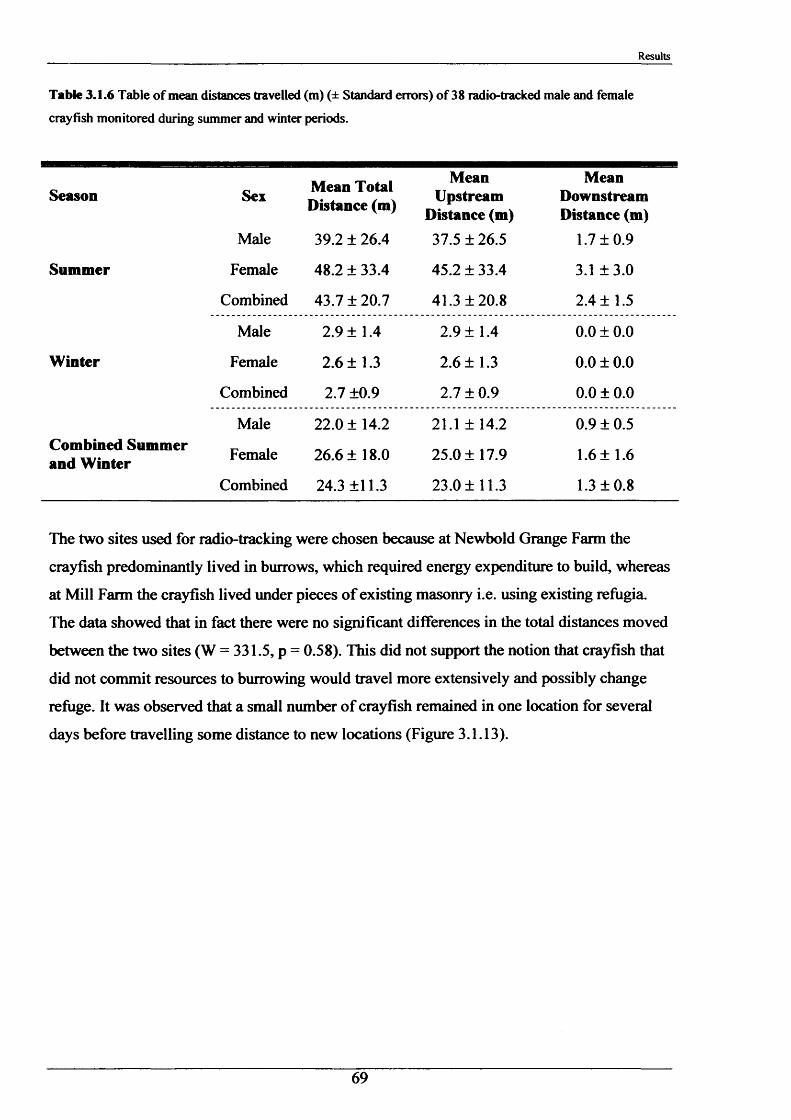
Results
Table 3.1.6 Table o f mean distances travelled (m) (± Standard errors) o f 38 radio-tracked male and female
crayfish monitored during summer and winter periods.
Season
Summer
Winter
Combined Summer and Winter
Sex
Male
Female
Combined
Male
Female
Combined
Male
Female
Combined
Mean Total Distance (m)
39.2 ± 26.4
48.2 ± 33.4
43.7 ± 20.7
2.9 ± 1.4
2.6 ± 1.3
2.7 ±0.9
22.0 ± 14.2
26.6 ± 18.0
24.3 ±11.3
Mean Upstream
Distance (m)37.5 ± 26.5
45.2 ± 33.4
41.3 ±20.8
2.9 ± 1.4
2.6 ±1.3
2.7 ± 0.9
21.1 ± 14.2
25.0 ±17.9
23.0 ± 11.3
Mean Downstream Distance (m)
1.7 ±0.9
3.1 ±3.0
2.4 ± 1.5
0.0 ± 0.0
0.0 ± 0.0
0.0 ± 0.0
0.9 ± 0.5
1.6 ± 1.6
1.3 ±0.8
The two sites used for radio-tracking were chosen because at Newbold Grange Farm the
crayfish predominantly lived in burrows, which required energy expenditure to build, whereas
at Mill Farm the crayfish lived under pieces of existing masonry i.e. using existing refugia.
The data showed that in fact there were no significant differences in the total distances moved
between the two sites (W = 331.5, p = 0.58). This did not support the notion that crayfish that
did not commit resources to burrowing would travel more extensively and possibly change
refuge. It was observed that a small number of crayfish remained in one location for several
days before travelling some distance to new locations (Figure 3.1.13).
69
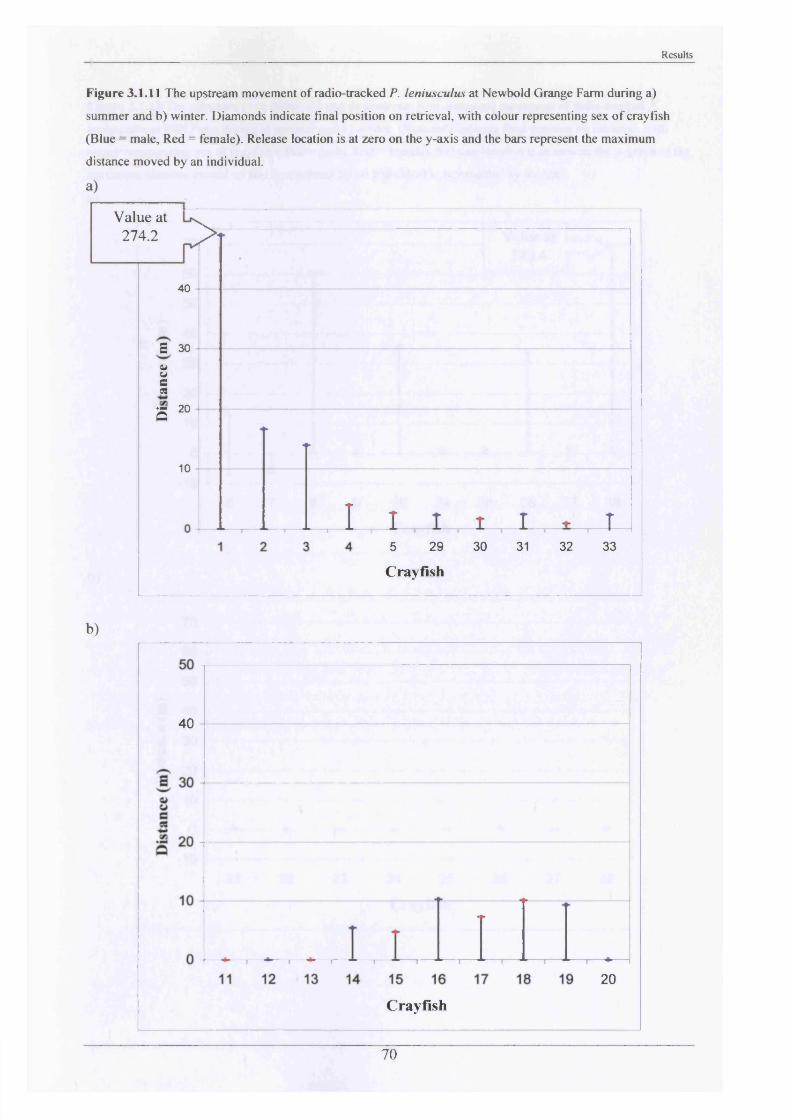
Results
Figure 3.1.11 The upstream movement of radio-tracked P. leniusculus at Newbold Grange Farm during a)
summer and b) winter. Diamonds indicate final position on retrieval, with colour representing sex o f crayfish
(Blue = male, Red = female). Release location is at zero on the y-axis and the bars represent the maximum
distance moved by an individual.
a)
Value at274.2 r>:
40
£ 304*Qs9
5 20
10
L l i i5 2 9
Crayfish30 31 32 33
b)
40
20
Crayfish
70
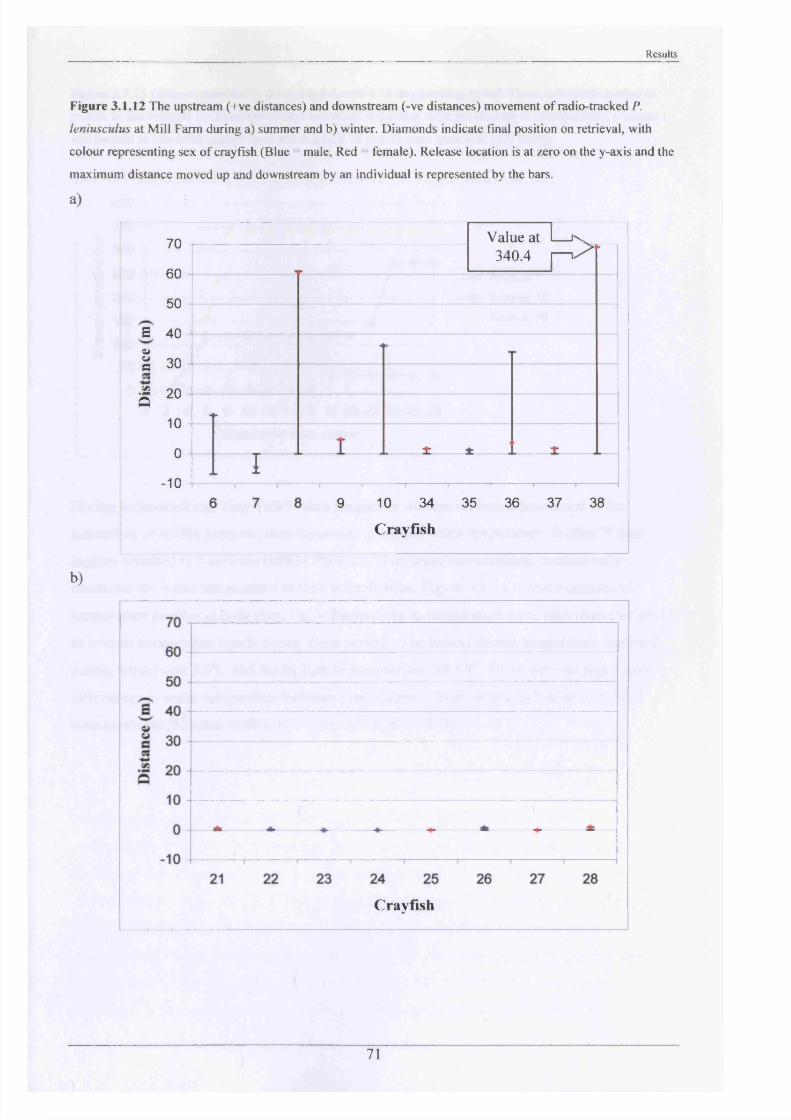
Results
Figure 3.1.12 The upstream (+ve distances) and downstream (-ve distances) movement o f radio-tracked P.
leniusculus at Mill Farm during a) summer and b) winter. Diamonds indicate Final position on retrieval, with
colour representing sex o f crayfish (Blue = male, Red = female). Release location is at zero on the y-axis and the
maximum distance moved up and downstream by an individual is represented by the bars.
a)
b)
70
60
50
£ 40o>ue 30n5*55 20
10
0
-10
Value340
I
eat I— is..4 I— i / '
* 1 ±_
------T--------- 1--------- 1--------- 1---------1--------- 1-------9 10 34 35 36 37 38
Crayfish
Crayfish
71
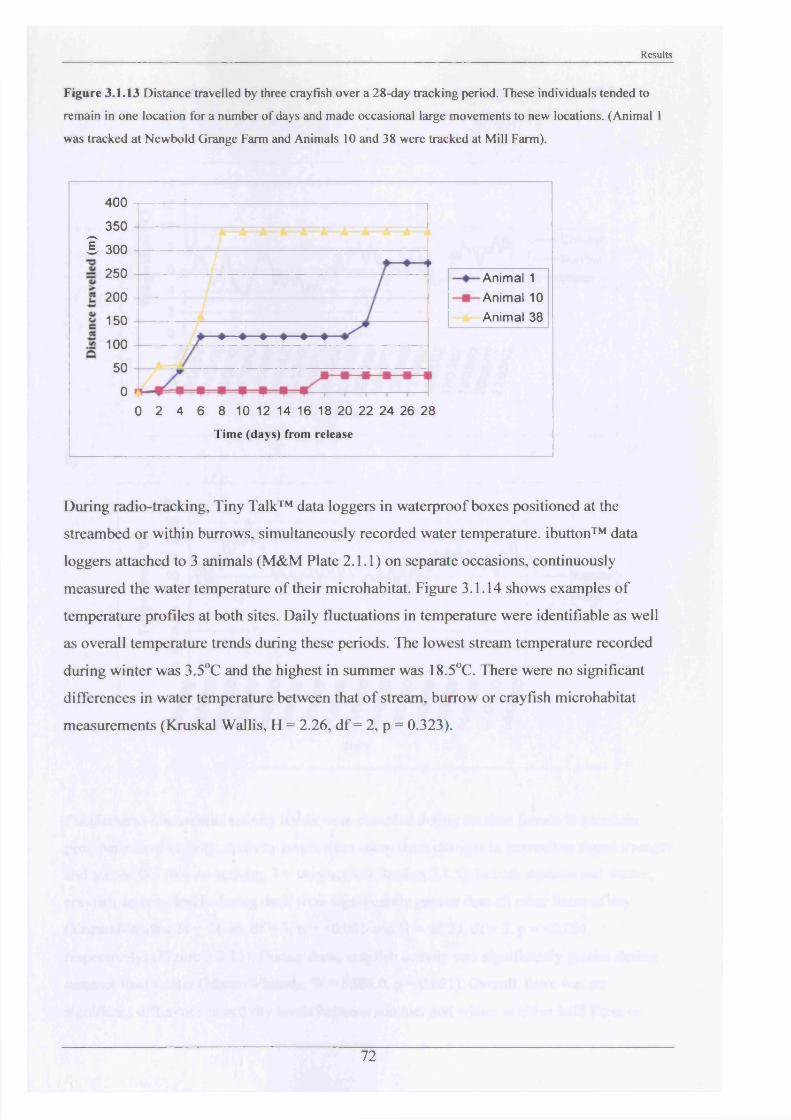
Results
Figure 3.1.13 Distance travelled by three crayfish over a 28-day tracking period. These individuals tended to
remain in one location for a number o f days and made occasional large movements to new locations. (Animal 1
was tracked at Newbold Grange Farm and Animals 10 and 38 were tracked at Mill Farm).
400
350
1 300
250
200
150
1 0 0
50
0
0 2 4 6 8 10 12 14 16 18 20 22 24 26 28
Animal 1 Animal 10 Animal 38
Time (days) from release
During radio-tracking, Tiny Talk™ data loggers in waterproof boxes positioned at the
streambed or within burrows, simultaneously recorded water temperature, ibutton™ data
loggers attached to 3 animals (M&M Plate 2.1.1) on separate occasions, continuously
measured the water temperature of their microhabitat. Figure 3.1.14 shows examples of
temperature profiles at both sites. Daily fluctuations in temperature were identifiable as well
as overall temperature trends during these periods. The lowest stream temperature recorded
during winter was 3.5°C and the highest in summer was 18.5°C. There were no significant
differences in water temperature between that of stream, burrow or crayfish microhabitat
measurements (Kruskal Wallis, H = 2.26, df = 2, p = 0.323).
72
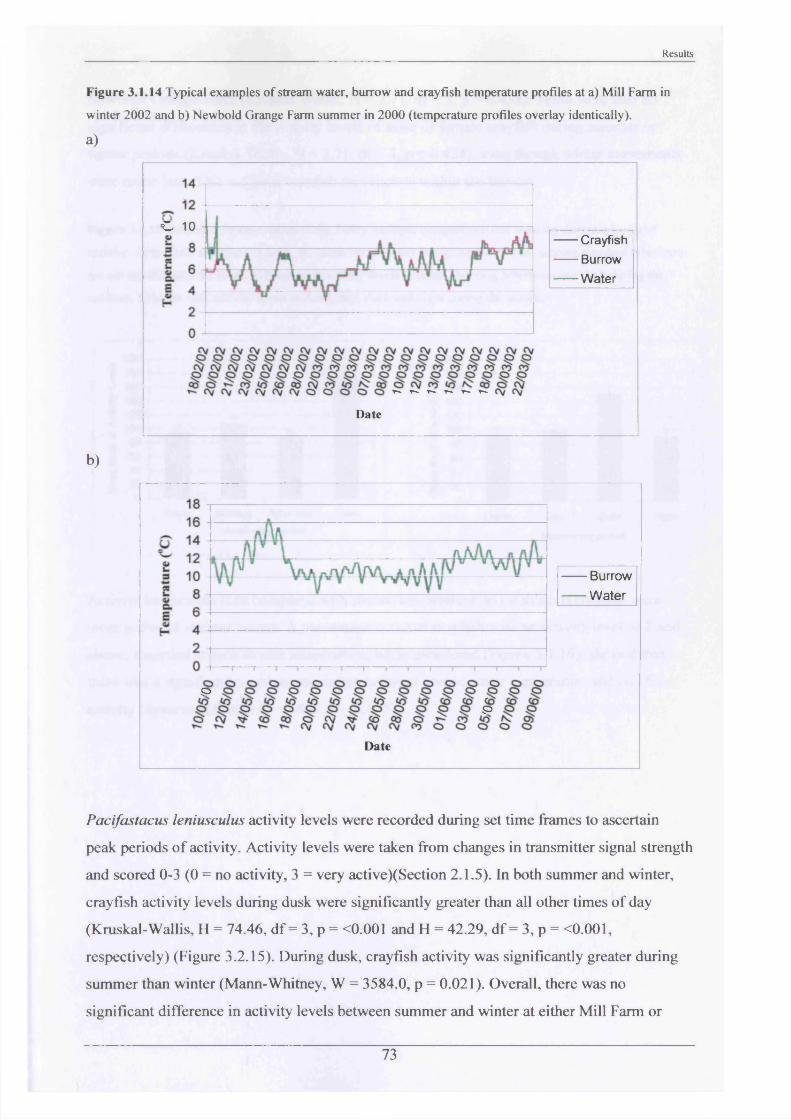
Results
Figure 3.1.14 Typical examples o f stream water, burrow and crayfish temperature profiles at a) Mill Farm in
winter 2002 and b) Newbold Grange Farm summer in 2000 (temperature profiles overlay identically).
a)
C 10 Crayfish Burrow Water
Date
b)
Burrow■ Water
PP
Date
Pacifastacus leniusculus activity levels were recorded during set time frames to ascertain
peak periods of activity. Activity levels were taken from changes in transmitter signal strength
and scored 0-3 (0 = no activity, 3 = very active)(Section 2.1.5). In both summer and winter,
crayfish activity levels during dusk were significantly greater than all other times of day
(Kruskal-Wallis, H = 74.46, d f= 3, p = <0.001 and H = 42.29, df = 3, p = <0.001,
respectively) (Figure 3.2.15). During dusk, crayfish activity was significantly greater during
summer than winter (Mann-Whitney, W = 3584.0, p = 0.021). Overall, there was no
significant difference in activity levels between summer and winter at either Mill Farm or
73
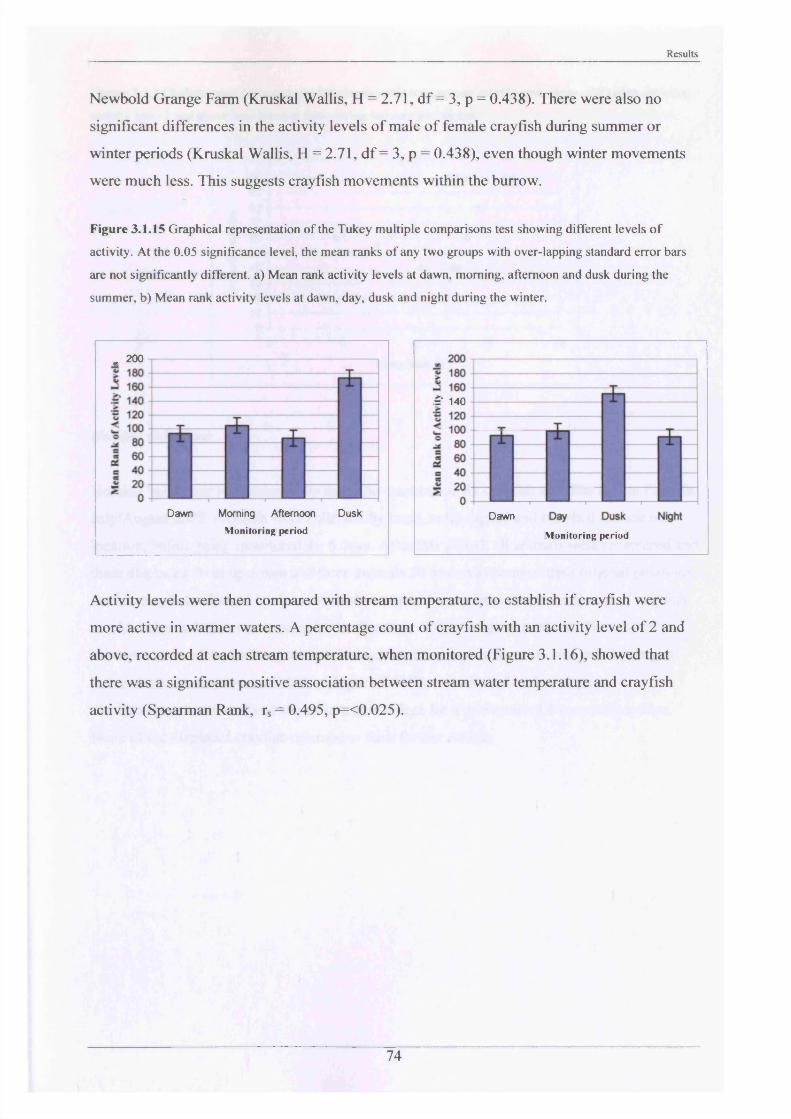
Results
Newbold Grange Farm (Kruskal Wallis, H = 2.71, d f = 3, p = 0.438). There were also no
significant differences in the activity levels of male of female crayfish during summer or
winter periods (Kruskal Wallis, H = 2.71, df = 3, p = 0.438), even though winter movements
were much less. This suggests crayfish movements within the burrow.
Figure 3.1.15 Graphical representation o f the Tukey multiple comparisons test showing different levels o f
activity. At the 0.05 significance level, the mean ranks o f any two groups with over-lapping standard error bars
are not significantly different, a) Mean rank activity levels at dawn, morning, afternoon and dusk during the
summer, b) Mean rank activity levels at dawn, day, dusk and night during the winter.
. 200
Dawn Morning Afternoon Dusk Monitoring period
£ 140
Dawn
Monitoring period
Activity levels were then compared with stream temperature, to establish if crayfish were
more active in warmer waters. A percentage count of crayfish with an activity level of 2 and
above, recorded at each stream temperature, when monitored (Figure 3.1.16), showed that
there was a significant positive association between stream water temperature and crayfish
activity (Spearman Rank, rs = 0.495, p=<0.025).
74
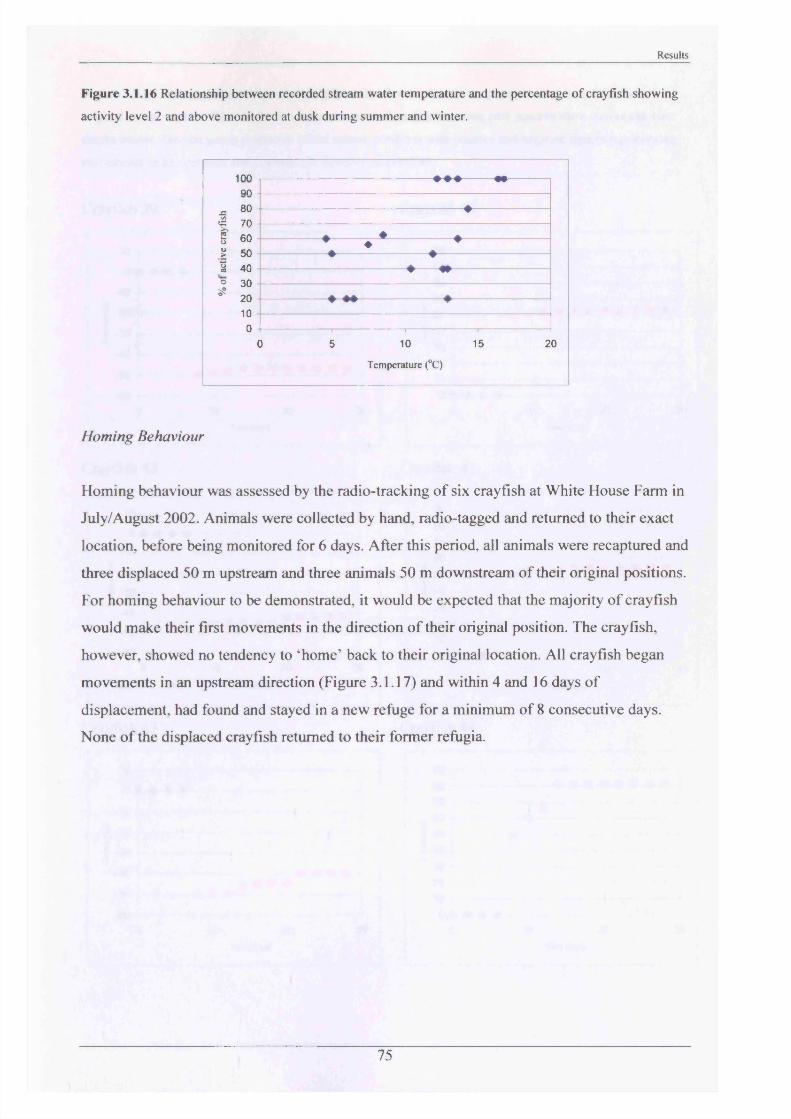
Results
Figure 3.1.16 Relationship between recorded stream water temperature and the percentage o f crayfish showing
activity level 2 and above monitored at dusk during summer and winter.
i n n ^ ^ ^
QO
▼ ▼ ▼ W
0
AO A .£ 80«2 70
▼
¥2 a h * ♦ *S o u
Si <vO♦ ♦ ♦
▲ A.> J v
5 AD
▼ w
co 4 U
o A n
----------------------------v ----------w
^ 3 0 ^ 20 A 4 A AA \J
m▼ ▼ ▼ “
IUnu
c
r _l 1 i i
) 5 10 15 2
Temperature (°C)
Homing Behaviour
Homing behaviour was assessed by the radio-tracking of six crayfish at White House Farm in
July/August 2002. Animals were collected by hand, radio-tagged and returned to their exact
location, before being monitored for 6 days. After this period, all animals were recaptured and
three displaced 50 m upstream and three animals 50 m downstream of their original positions.
For homing behaviour to be demonstrated, it would be expected that the majority of crayfish
would make their first movements in the direction of their original position. The crayfish,
however, showed no tendency to ‘home’ back to their original location. All crayfish began
movements in an upstream direction (Figure 3.1.17) and within 4 and 16 days of
displacement, had found and stayed in a new refuge for a minimum of 8 consecutive days.
None of the displaced crayfish returned to their former refugia.
75
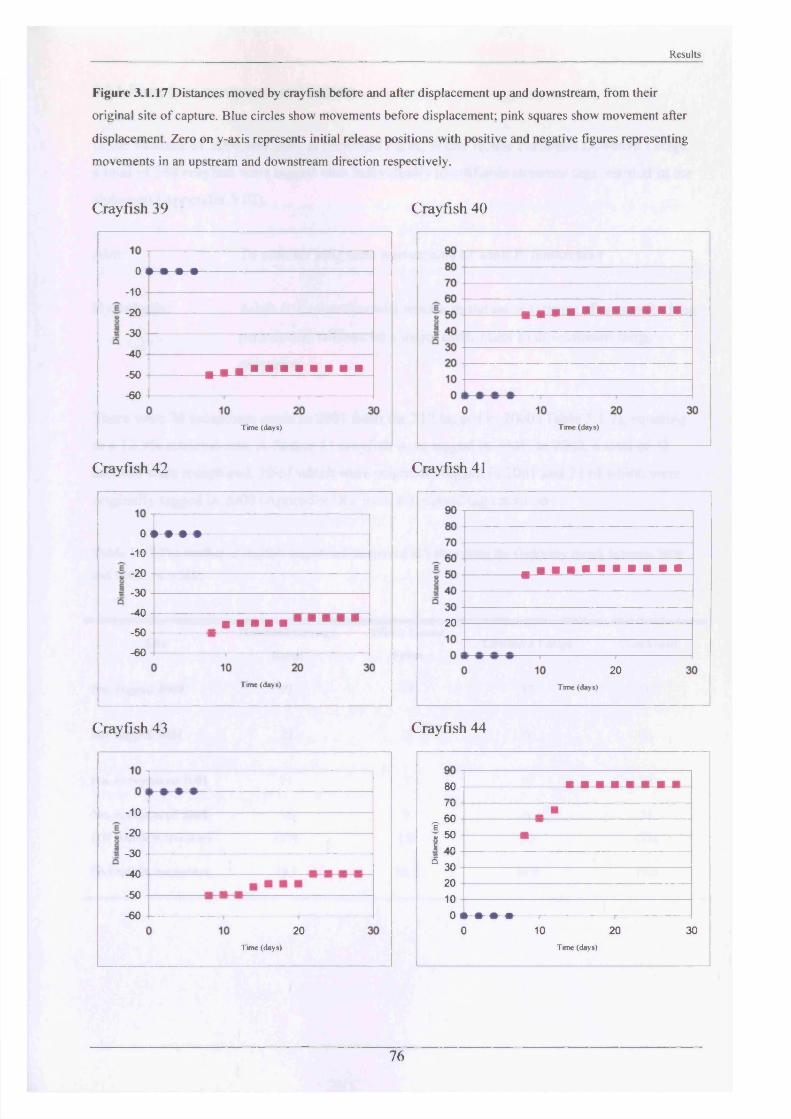
Results
Figure 3.1.17 Distances moved by crayfish before and after displacement up and downstream, from their
original site o f capture. Blue circles show movements before displacement; pink squares show movement after
displacement. Zero on y-axis represents initial release positions with positive and negative figures representing
movements in an upstream and downstream direction respectively.
Crayfish 39 Crayfish 40
o • • • •-10
-20
-30
-40
-50
-60
Time (days)
Crayfish 42
o • « • •-10
-20
-30
-40
-50
-60
Time (days)
Crayfish 43
-10
-20
-30
-40
-50
-6020
Tone (days)
Time (days)
Crayfish 41
20
20Time (days)
Crayfish 44
o n
0
oU
(VI
cn ■^ OU1 50u OU
§ a h
■ - ~
a 30OU
o nC.VI
i nIU
n 4t a a aU ■
Cw w W W
) 10 20 3Time (days)
76
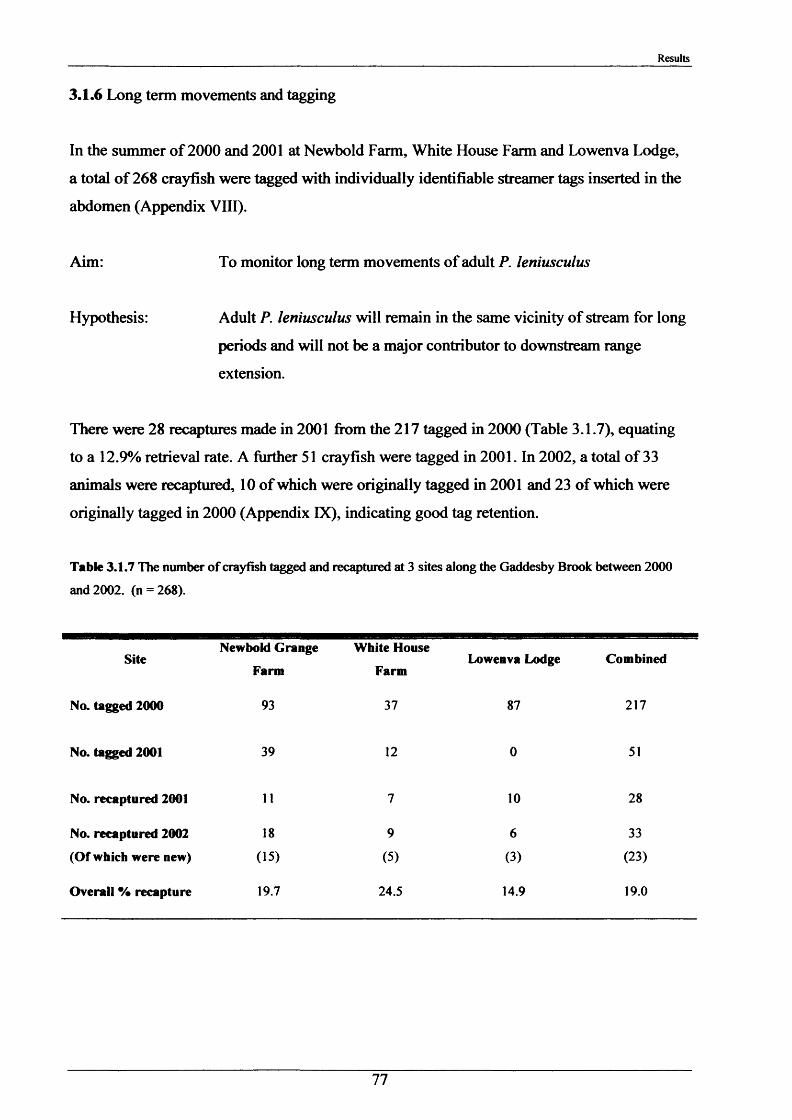
Results
3.1.6 Long term movements and tagging
In the summer of 2000 and 2001 at Newbold Farm, White House Farm and Lowenva Lodge,
a total of 268 crayfish were tagged with individually identifiable streamer tags inserted in the
abdomen (Appendix VIII).
Aim: To monitor long term movements of adult P. leniusculus
Hypothesis: Adult P. leniusculus will remain in the same vicinity of stream for long
periods and will not be a major contributor to downstream range
extension.
There were 28 recaptures made in 2001 from the 217 tagged in 2000 (Table 3.1.7), equating
to a 12.9% retrieval rate. A further 51 crayfish were tagged in 2001. In 2002, a total of 33
animals were recaptured, 10 of which were originally tagged in 2001 and 23 of which were
originally tagged in 2000 (Appendix EX), indicating good tag retention.
Table 3.1.7 The number of crayfish tagged and recaptured at 3 sites along the Gaddesby Brook between 2000 and 2002. (n = 268).
Newbold Grange White House Site Lowenva Lodge Combined
Farm Farm
No. tagged 2000 93 37 87 217
No. tagged 2001 39 12 0 51
No. recaptured 2001 11 7 10 28
No. recaptured 2002 18 9 6 33(Of which were new) (15) (5) (3) (23)
Overall % recapture 19.7 24.5 14.9 19.0
77
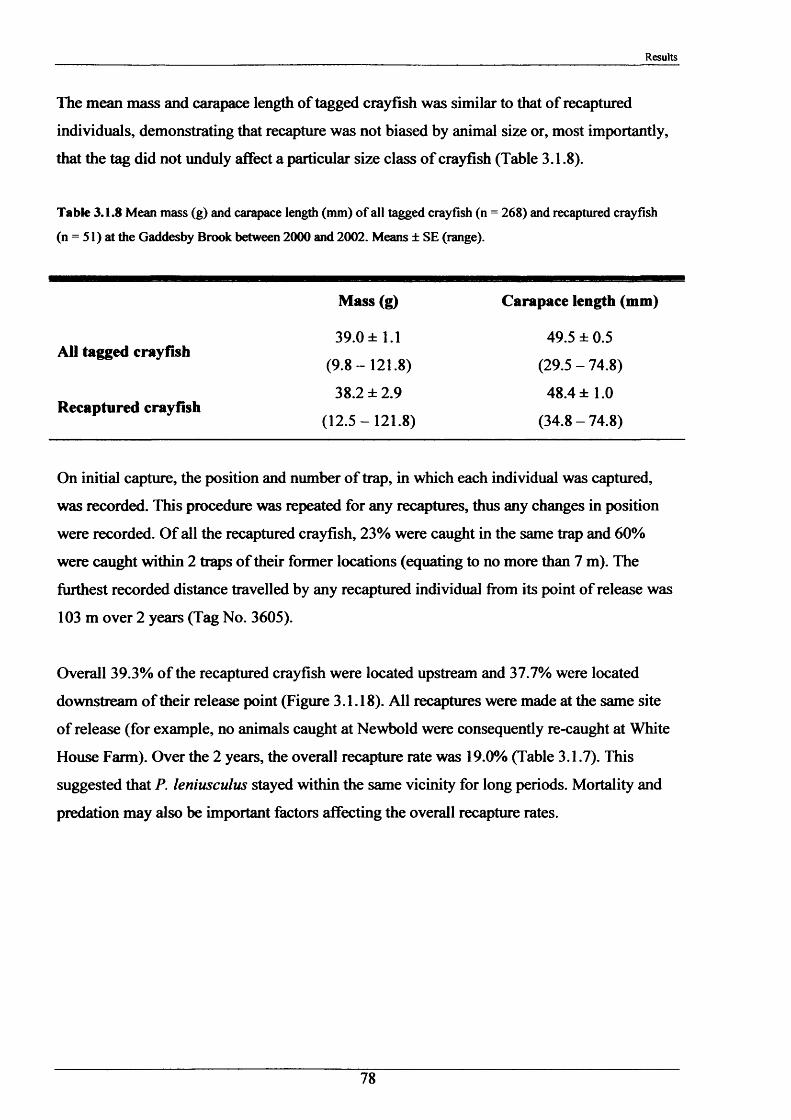
Results
The mean mass and carapace length of tagged crayfish was similar to that of recaptured
individuals, demonstrating that recapture was not biased by animal size or, most importantly,
that the tag did not unduly affect a particular size class of crayfish (Table 3.1.8 ).
Table 3.1.8 Mean mass (g) and carapace length (mm) o f all tagged crayfish (n = 268) and recaptured crayfish
(n = 51) at the Gaddesby Brook between 2000 and 2002. Means ± SE (range).
Mass (g) Carapace length (mm)
39.0 ± 1.1 49.5 ± 0.5All tagged crayfish
(9.8-121.8) (29.5 - 74.8)
38.2 ± 2.9 48.4 ± 1.0Recaptured crayfish
(12.5-121.8) (34.8 - 74.8)
On initial capture, the position and number of trap, in which each individual was captured,
was recorded. This procedure was repeated for any recaptures, thus any changes in position
were recorded. Of all the recaptured crayfish, 23% were caught in the same trap and 60%
were caught within 2 traps of their former locations (equating to no more than 7 m). The
furthest recorded distance travelled by any recaptured individual from its point of release was
103 m over 2 years (Tag No. 3605).
Overall 39.3% of the recaptured crayfish were located upstream and 37.7% were located
downstream of their release point (Figure 3.1.18). All recaptures were made at the same site
of release (for example, no animals caught at Newbold were consequently re-caught at White
House Farm). Over the 2 years, the overall recapture rate was 19.0% (Table 3.1.7). This
suggested that P. leniusculus stayed within the same vicinity for long periods. Mortality and
predation may also be important factors affecting the overall recapture rates.
78
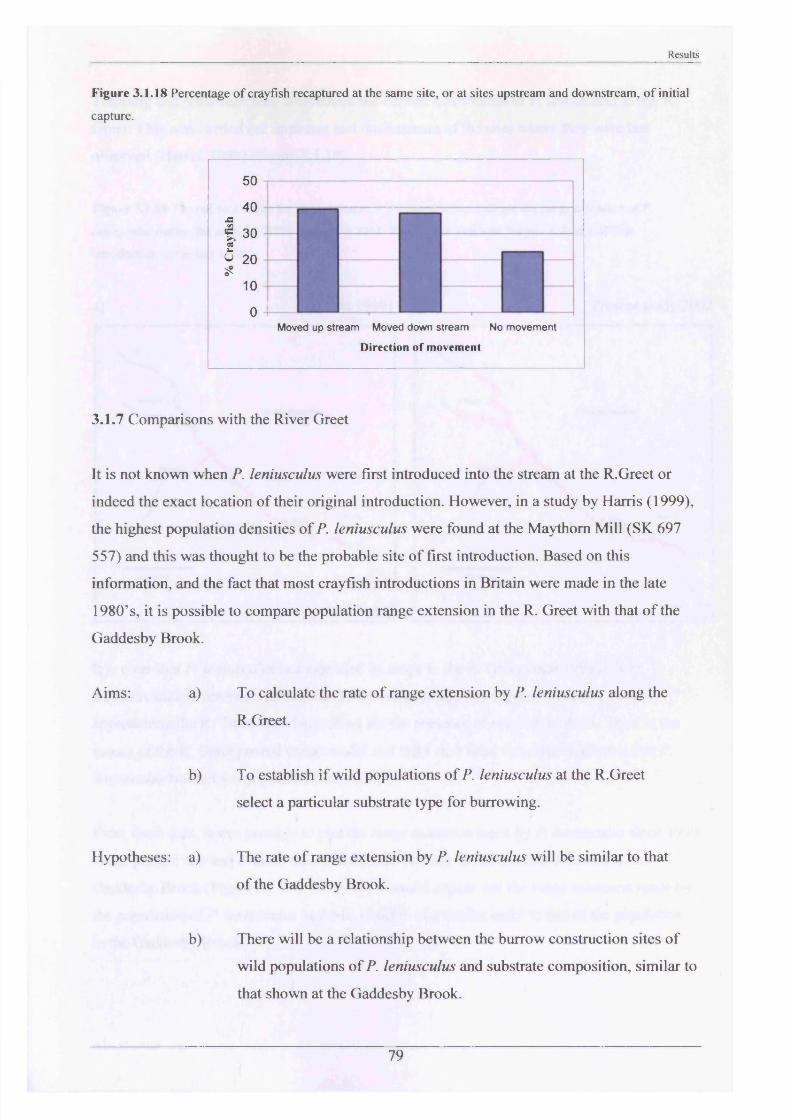
Results
Figure 3.1.18 Percentage o f crayfish recaptured at the same site, or at sites upstream and downstream, o f initial
capture.
50
40
I 30OS
£ 20£
10
o -IMoved up stream Moved down stream No movement
Direction o f movement
3.1.7 Comparisons with the River Greet
It is not known when P. leniusculus were first introduced into the stream at the R.Greet or
indeed the exact location of their original introduction. However, in a study by Harris (1999),
the highest population densities of P. leniusculus were found at the Maythom Mill (SK 697
557) and this was thought to be the probable site of first introduction. Based on this
information, and the fact that most crayfish introductions in Britain were made in the late
1980’s, it is possible to compare population range extension in the R. Greet with that of the
Gaddesby Brook.
Aims: a)
b)
Hypotheses: a)
b)
79
To calculate the rate of range extension by P. leniusculus along the
R.Greet.
To establish if wild populations of P. leniusculus at the R.Greet
select a particular substrate type for burrowing.
The rate of range extension by P. leniusculus will be similar to that
of the Gaddesby Brook.
There will be a relationship between the burrow construction sites of
wild populations of P. leniusculus and substrate composition, similar to
that shown at the Gaddesby Brook.
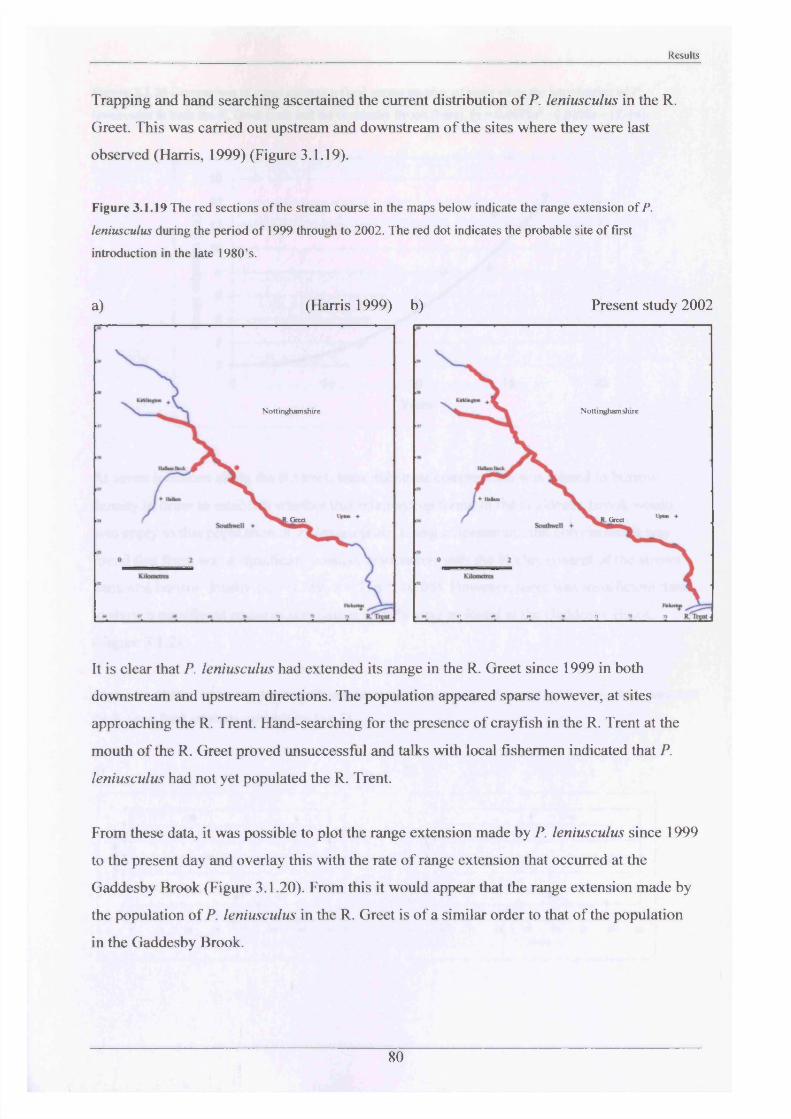
Results
Trapping and hand searching ascertained the current distribution of P. leniusculus in the R.
Greet. This was carried out upstream and downstream of the sites where they were last
observed (Harris, 1999) (Figure 3.1.19).
Figure 3.1.19 The red sections o f the stream course in the maps below indicate the range extension o f P.
leniusculus during the period o f 1999 through to 2002. The red dot indicates the probable site o f first
introduction in the late 1980’s.
a) (Harris 1999) b) Present study 2002
Nottingham shire
Greet
Nottinghamshire
Greet
It is clear that P. leniusculus had extended its range in the R. Greet since 1999 in both
downstream and upstream directions. The population appeared sparse however, at sites
approaching the R. Trent. Hand-searching for the presence of crayfish in the R. Trent at the
mouth of the R. Greet proved unsuccessful and talks with local fishermen indicated that P.
leniusculus had not yet populated the R. Trent.
From these data, it was possible to plot the range extension made by P. leniusculus since 1999
to the present day and overlay this with the rate of range extension that occurred at the
Gaddesby Brook (Figure 3.1.20). From this it would appear that the range extension made by
the population of P. leniusculus in the R. Greet is of a similar order to that of the population
in the Gaddesby Brook.
80
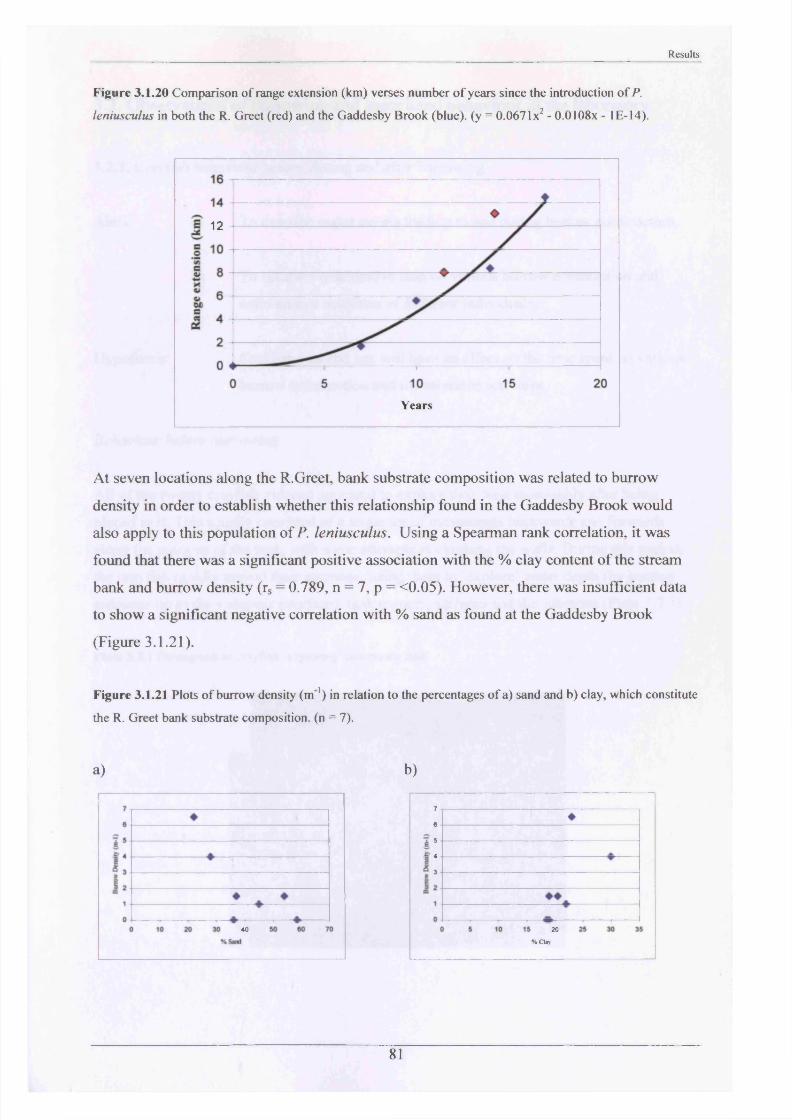
Results
Figure 3.1.20 Comparison o f range extension (km) verses number o f years since the introduction o f P.
leniusculus in both the R. Greet (red) and the Gaddesby Brook (blue), (y = 0.067lx 2 - 0.0108x - IE-14).
12
Years
At seven locations along the R.Greet, bank substrate composition was related to burrow
density in order to establish whether this relationship found in the Gaddesby Brook would
also apply to this population of P. leniusculus. Using a Spearman rank correlation, it was
found that there was a significant positive association with the % clay content of the stream
bank and burrow density (rs = 0.789, n = 7, p = <0.05). However, there was insufficient data
to show a significant negative correlation with % sand as found at the Gaddesby Brook
(Figure 3.1.21).
Figure 3.1.21 Plots o f burrow density ( m 1) in relation to the percentages o f a) sand and b) clay, which constitute
the R. Greet bank substrate composition, (n = 7).
a) b)
20SClay
40
81
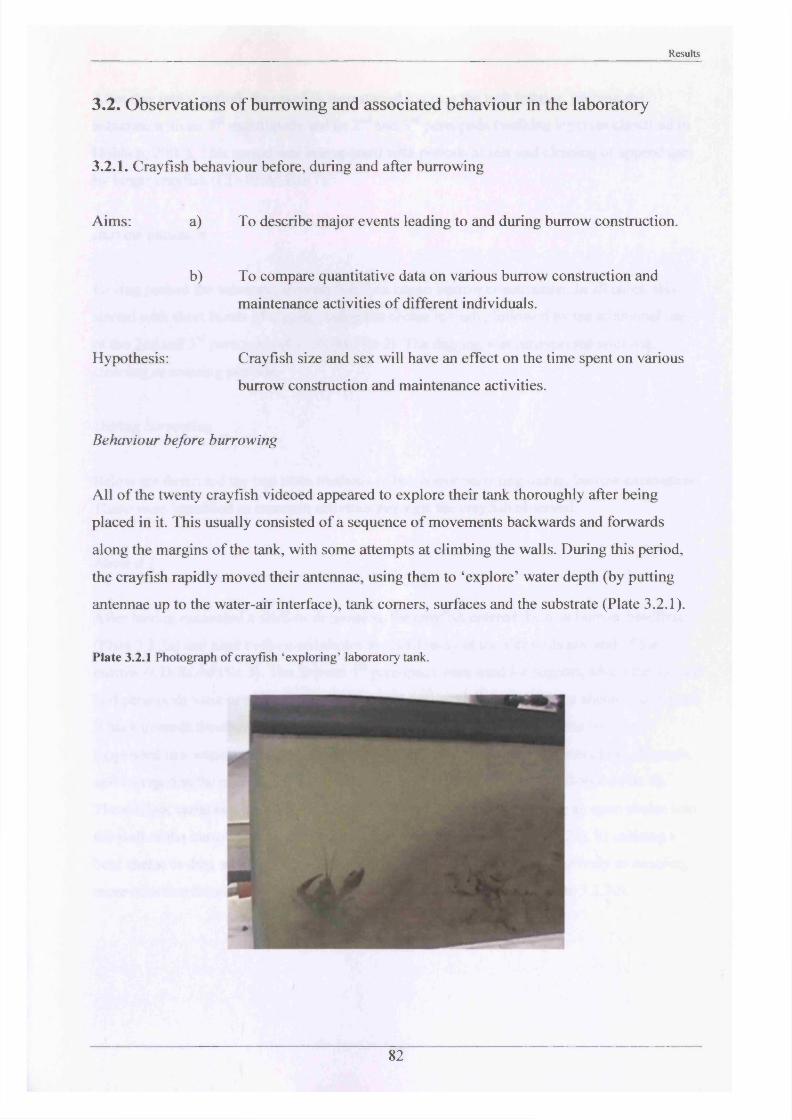
Results
3.2. Observations of burrowing and associated behaviour in the laboratory
3.2.1. Crayfish behaviour before, during and after burrowing
Aims: a) To describe major events leading to and during burrow construction.
b) To compare quantitative data on various burrow construction and
maintenance activities of different individuals.
Hypothesis: Crayfish size and sex will have an effect on the time spent on various
burrow construction and maintenance activities.
Behaviour before burrowing
All of the twenty crayfish videoed appeared to explore their tank thoroughly after being
placed in it. This usually consisted of a sequence of movements backwards and forwards
along the margins of the tank, with some attempts at climbing the walls. During this period,
the crayfish rapidly moved their antennae, using them to ‘explore’ water depth (by putting
antennae up to the water-air interface), tank comers, surfaces and the substrate (Plate 3.2.1).
Plate 3.2.1 Photograph o f crayfish ‘exploring’ laboratory tank.
82
Results
After this initial period, the crayfish then started to cross the tank interior, probing the
substrate with its 3rd maxillipeds and its 2nd and 3rd pereopods (walking legs) (as classified in
Holdich, 2002). This period was interspersed with periods of rest and cleaning of appendages
by larger crayfish (CD-ROM File 1).
Burrow initiation
Having probed the substrate, the crayfish then began burrow construction. In all cases, this
started with short bursts of digging, using the chelae initially, followed by the additional use
of the 2nd and 3rd pereopods (CD-ROM File 2). The digging was interspersed with rest,
cleaning or roaming periods.
During burrowing
Below are described the two main methods of behaviour occurring during burrow excavation.
These were identified as common activities amongst the crayfish observed.
Method 1
After having excavated a shallow depression, the crayfish entered the new burrow headfirst
(Plate 3.2.2a) and used both closed chelae to chisel away at the sidewalls and end of the
burrow (CD-ROM File 3). The 3rd and 4th pereopods were used for support, whilst the 1st and
2 nd pereopods were used to snip at the loosened sediment dislodged by the chelae and to push
it back towards the abdomen. This fine sediment was then expelled from the burrow,
suspended in a water current created by the synchronous beating movements of the pleopods,
and emerged at the opening from beneath the raised tail (Plate 3.2.2b) (CD-ROM File 4).
Three slight variations to this main method of excavation were: a) forcing an open chelae into
the wall of the burrow and then closing it to dislodge sediment (Plate 3.2.2d). b) utilising a
bent chelae to drag sediment under the body (Plate 3.2.2c). c) inverting the body so enabling
more effective excavation at the bottom, leading edge of the burrow. (Plate 3.2.2d).
83
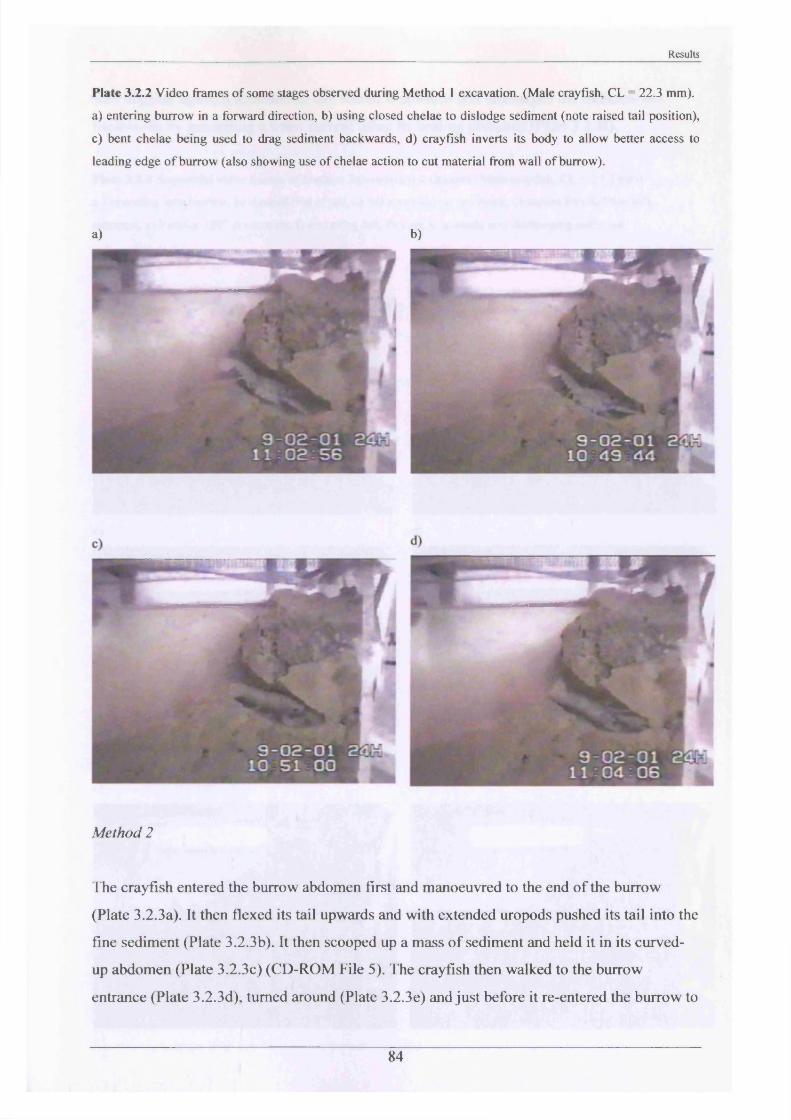
Results
Plate 3.2.2 Video frames o f some stages observed during Method 1 excavation. (Male crayfish, CL = 22.3 mm),
a) entering burrow in a forward direction, b) using closed chelae to dislodge sediment (note raised tail position),
c) bent chelae being used to drag sediment backwards, d) crayfish inverts its body to allow better access to
leading edge o f burrow (also showing use o f chelae action to cut material from wall o f burrow).
a) b)
M ethod 2
The crayfish entered the burrow abdomen first and manoeuvred to the end of the burrow
(Plate 3.2.3a). It then flexed its tail upwards and with extended uropods pushed its tail into the
fine sediment (Plate 3.2.3b). It then scooped up a mass of sediment and held it in its curved-
up abdomen (Plate 3.2.3c) (CD-ROM File 5). The crayfish then walked to the burrow
entrance (Plate 3.2.3d), turned around (Plate 3.2.3e) and just before it re-entered the burrow to
84
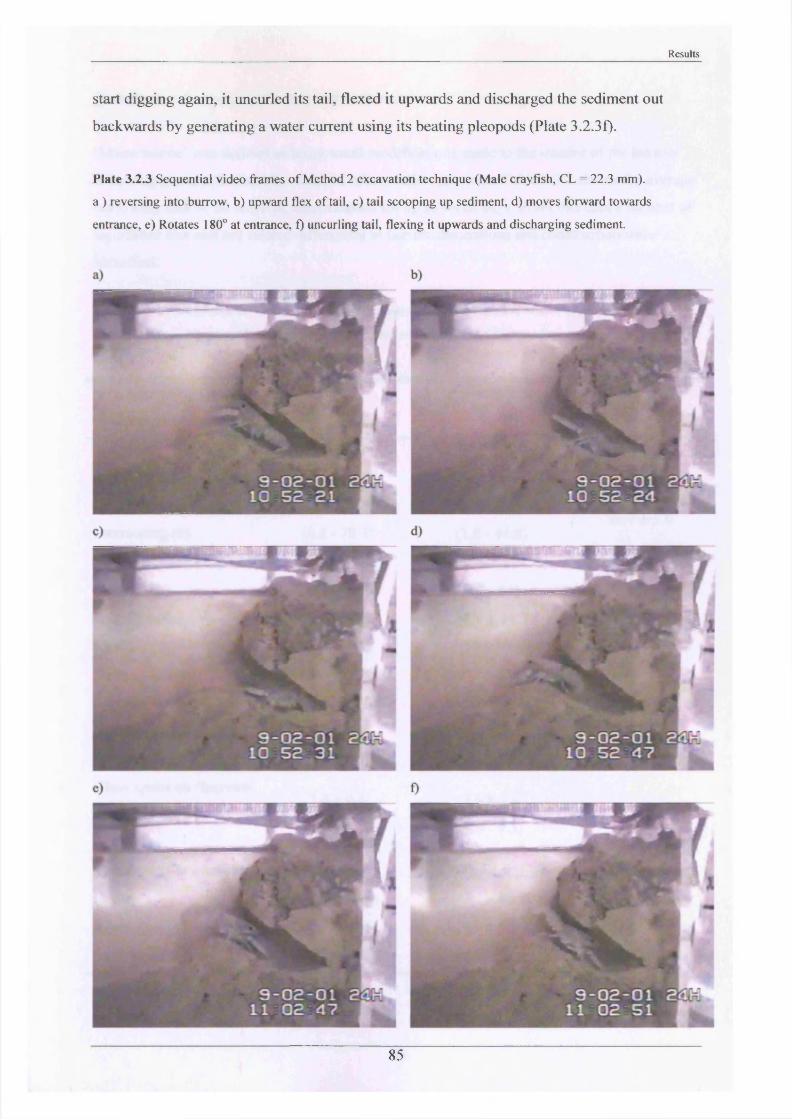
Results
start digging again, it uncurled its tail, flexed it upwards and discharged the sediment out
backwards by generating a water current using its beating pleopods (Plate 3.2.3f).
Plate 3 .2 3 Sequential video frames o f Method 2 excavation technique (Male crayfish, CL = 22.3 mm),
a ) reversing into burrow, b) upward flex o f tail, c) tail scooping up sediment, d) moves forward towards
entrance, e) Rotates 180° at entrance, f) uncurling tail, flexing it upwards and discharging sediment.
85
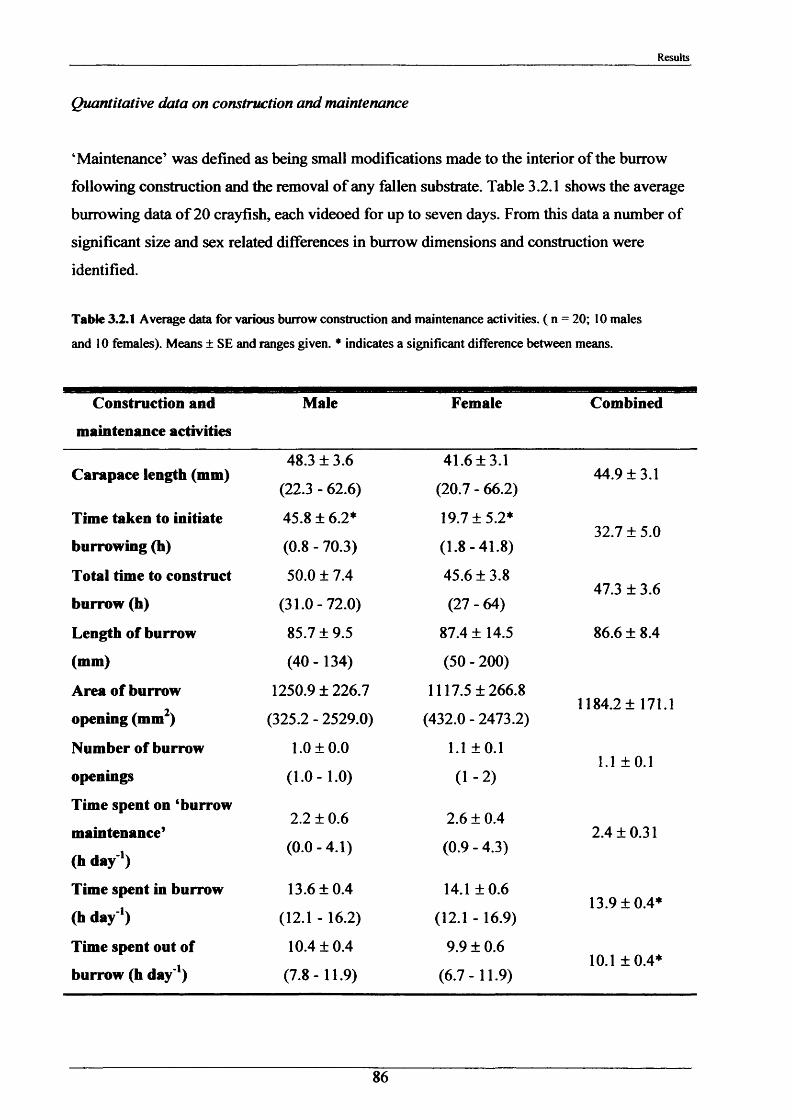
Results
Quantitative data on construction and maintenance
‘Maintenance’ was defined as being small modifications made to the interior of the burrow
following construction and the removal of any fallen substrate. Table 3.2.1 shows the average
burrowing data of 20 crayfish, each videoed for up to seven days. From this data a number of
significant size and sex related differences in burrow dimensions and construction were
identified.
Table 3.2.1 Average data for various burrow construction and maintenance activities. ( n = 20; 10 males
and 10 females). Means ± SE and ranges given. * indicates a significant difference between means.
Construction and
maintenance activities
Male Female Combined
Carapace length (mm)
Time taken to initiate
48.3 ± 3.6
(22.3 - 62.6)
45.8 ± 6.2*
41.6 ± 3.1
(20.7 - 66.2)
19.7 ±5.2*
44.9 ±3.1
burrowing (h) (0.8 - 70.3) (1.8-41.8)32.7 ±5.0
Total time to construct 50.0 ± 7.4 45.6 ±3.8
burrow (h) (31.0-72.0) (27 - 64)47.3 ± 3.6
Length of burrow 85.7 ± 9.5 87.4 ± 14.5 8 6 . 6 ± 8.4
(mm) (40 - 134) (50 - 200)
Area of burrow 1250.9 ±226.7 1117.5 ±266.8
opening (mm2) (325.2 - 2529.0) (432.0 - 2473.2)1184.2 ± 171.1
Number of burrow 1 .0 ± 0 . 0 1 .1 ± 0 .1
openings ( 1 .0 - 1 .0 ) ( 1 - 2 )1 .1 ± 0 .1
Time spent on ‘burrow
maintenance’
(h day')
Time spent in burrow
2 . 2 ± 0 . 6
(0.0-4.1)
13.6 ±0.4
2.6 ± 0.4
(0.9 - 4.3)
14.1 ±0.6
2.4 ±0.31
(h day'1) ( 1 2 .1 -16.2) (12.1 - 16.9)13.9 ±0.4*
Time spent out of 10.4 ±0.4 9.9 ± 0.6
burrow (h day'1) (7.8-11.9) (6.7-11.9)10.1 ±0.4*
86
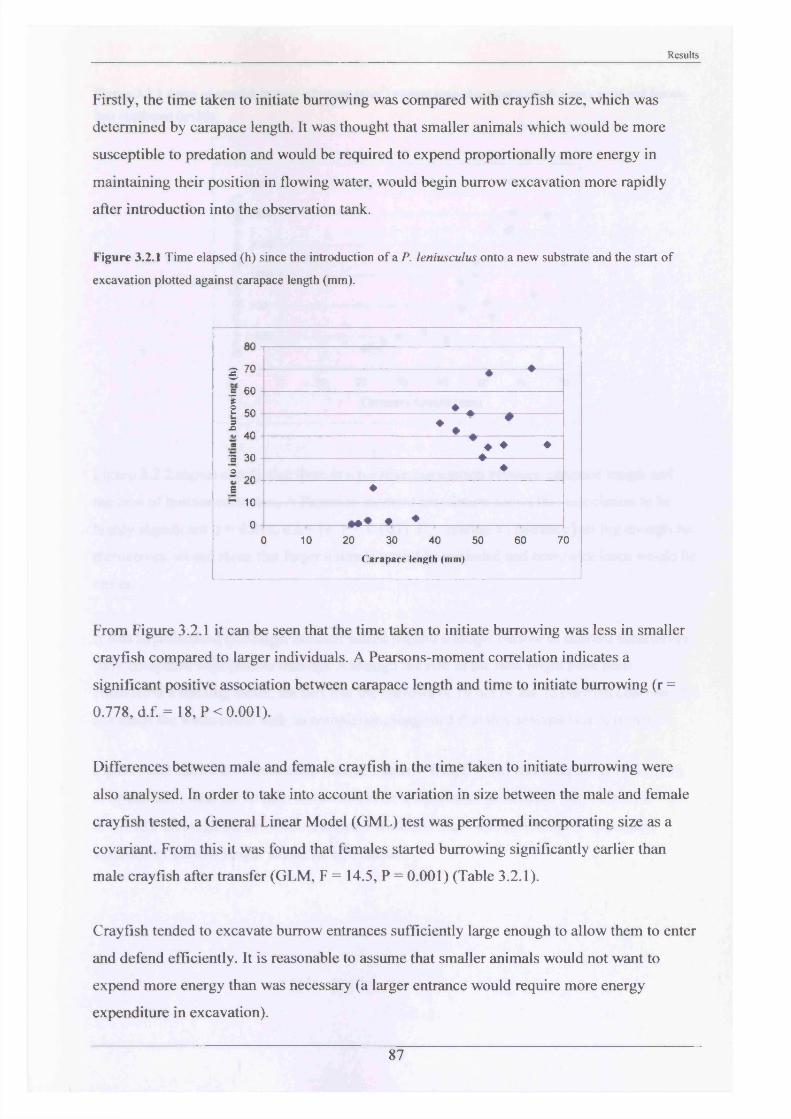
Results
Firstly, the time taken to initiate burrowing was compared with crayfish size, which was
determined by carapace length. It was thought that smaller animals which would be more
susceptible to predation and would be required to expend proportionally more energy in
maintaining their position in flowing water, would begin burrow excavation more rapidly
after introduction into the observation tank.
Figure 3.2.1 Time elapsed (h) since the introduction o f a P. leniusculus onto a new substrate and the start o f
excavation plotted against carapace length (mm).
fiA
^ 70 ▲
0
ee? 60
♦ *c DU
1 £ 60 ♦ * Aa.oaj AH * ♦ , #**— on
w♦ ♦ ♦▲c ou
o~ 90
▼♦
£H 10
♦^ IU
n ♦ ♦ ♦ ♦ *u() 10 20 30 40 50 60 7
Carapace length (mm)
From Figure 3.2.1 it can be seen that the time taken to initiate burrowing was less in smaller
crayfish compared to larger individuals. A Pearsons-moment correlation indicates a
significant positive association between carapace length and time to initiate burrowing (r =
0.778, d.f. = 18, P < 0.001).
Differences between male and female crayfish in the time taken to initiate burrowing were
also analysed. In order to take into account the variation in size between the male and female
crayfish tested, a General Linear Model (GML) test was performed incorporating size as a
covariant. From this it was found that females started burrowing significantly earlier than
male crayfish after transfer (GLM, F = 14.5, P = 0.001) (Table 3.2.1).
Crayfish tended to excavate burrow entrances sufficiently large enough to allow them to enter
and defend efficiently. It is reasonable to assume that smaller animals would not want to
expend more energy than was necessary (a larger entrance would require more energy
expenditure in excavation).
87
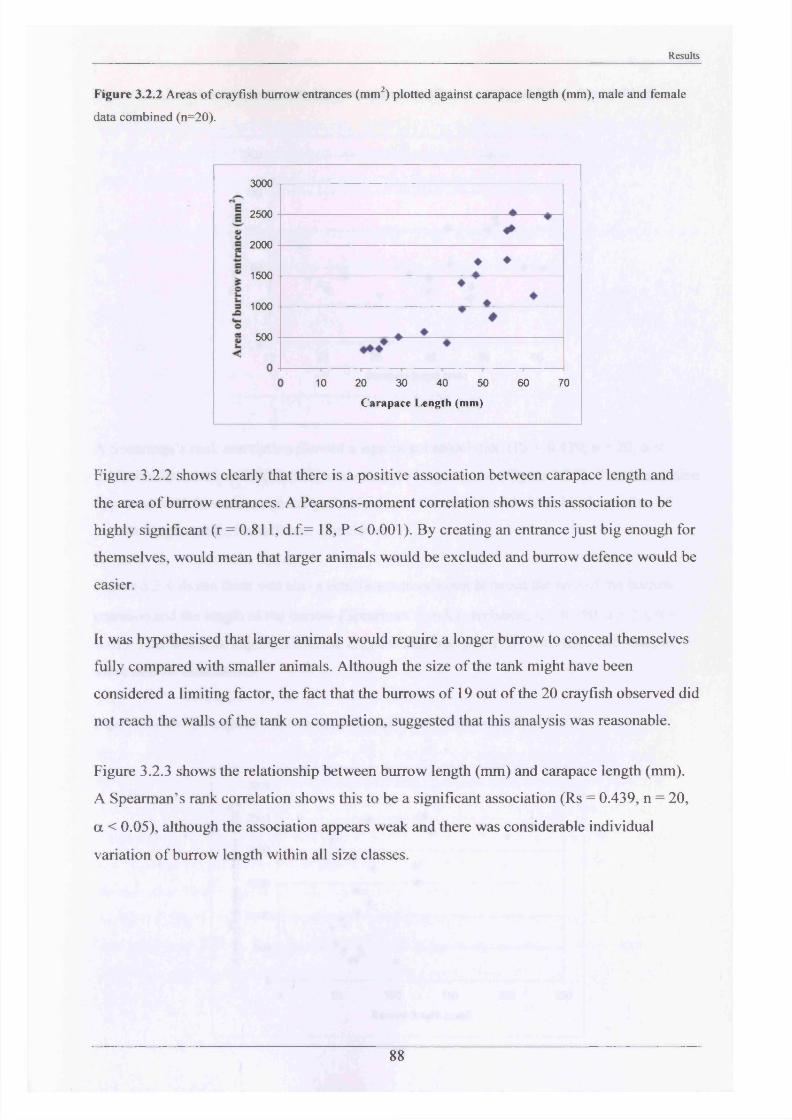
Results
Figure 3.2.2 Areas o f crayfish burrow entrances (mm2) plotted against carapace length (mm), male and female
data combined (n=20).
3000
2500
2000
1500
1000
500
10 20 30 40 50 60
Carapace Length (mm)
70
Figure 3.2.2 shows clearly that there is a positive association between carapace length and
the area of burrow entrances. A Pearsons-moment correlation shows this association to be
highly significant (r = 0.811, d.f.= 18, P < 0.001). By creating an entrance just big enough for
themselves, would mean that larger animals would be excluded and burrow defence would be
easier.
It was hypothesised that larger animals would require a longer burrow to conceal themselves
fully compared with smaller animals. Although the size of the tank might have been
considered a limiting factor, the fact that the burrows of 19 out of the 20 crayfish observed did
not reach the walls of the tank on completion, suggested that this analysis was reasonable.
Figure 3.2.3 shows the relationship between burrow length (mm) and carapace length (mm).
A Spearman’s rank correlation shows this to be a significant association (Rs = 0.439, n = 20,
a < 0.05), although the association appears weak and there was considerable individual
variation of burrow length within all size classes.
88
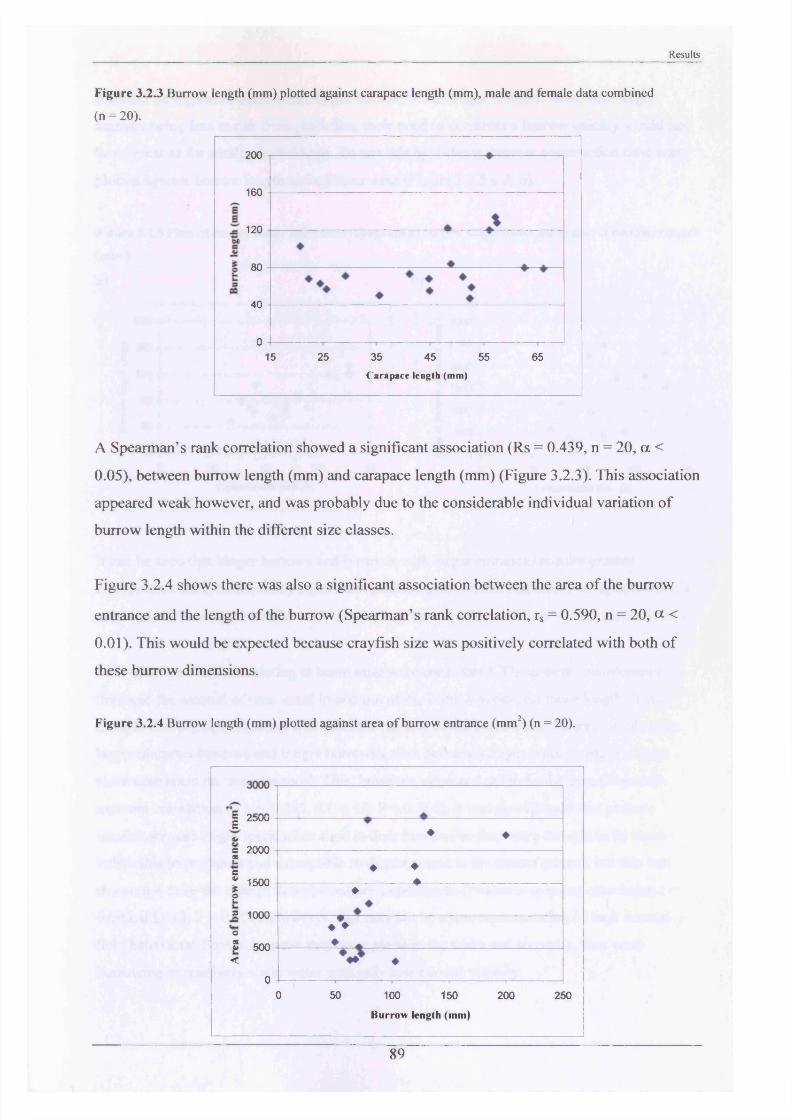
Results
Figure 3 .2 3 Burrow length (mm) plotted against carapace length (mm), male and female data combined
(n = 20).
200
160
120
80
40
015 25 35 45 55 65
Carapace length (mm)
A Spearman’s rank correlation showed a significant association (Rs = 0.439, n = 20, a <
0.05), between burrow length (mm) and carapace length (mm) (Figure 3.2.3). This association
appeared weak however, and was probably due to the considerable individual variation of
burrow length within the different size classes.
Figure 3.2.4 shows there was also a significant association between the area of the burrow
entrance and the length of the burrow (Spearman’s rank correlation, rs = 0.590, n = 20, a <
0.01). This would be expected because crayfish size was positively correlated with both of
these burrow dimensions.
Figure 3.2.4 Burrow length (mm) plotted against area o f burrow entrance (mm2) (n = 20).
E 9
>0
g zjUU
4>e 9 0 0 0
♦ ♦E zUUUmEc* i^nn
♦ ♦ A^ 1 J U v
2s 1 nnn
♦
I w U
o2 500
<
0(
♦ * .♦ ** 3 ♦
> i i i
D 50 100 150 200 2‘
Burrow length (mm)
89
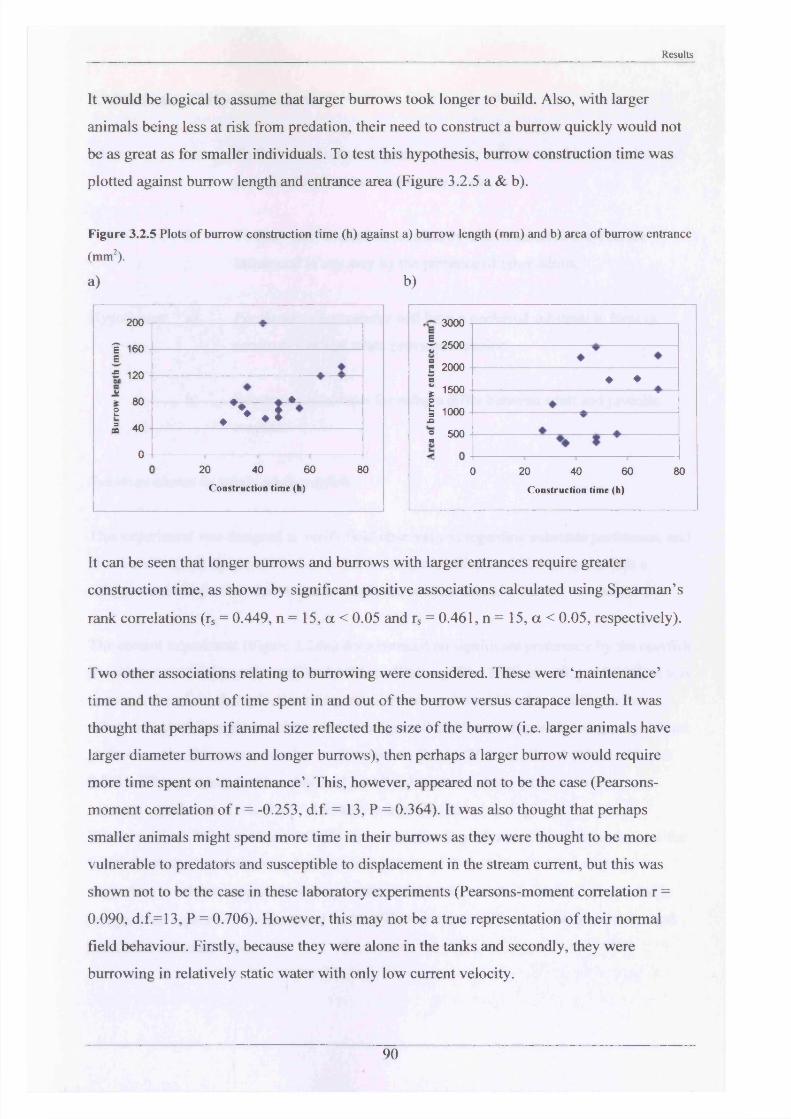
Results
It would be logical to assume that larger burrows took longer to build. Also, with larger
animals being less at risk from predation, their need to construct a burrow quickly would not
be as great as for smaller individuals. To test this hypothesis, burrow construction time was
plotted against burrow length and entrance area (Figure 3.2.5 a & b).
Figure 3.2.5 Plots o f burrow construction time (h) against a) burrow length (mm) and b) area o f burrow entrance
(mm2).
a) b)
200
? 160_E£ 120V
80E=ce 40
0
/ ' ♦ S '
20 40 60 80Construction time (h)
3000
f 2500
| 2000
I 1500 ££ 1000 £® 500M
0 20 40 60 80Construction time (h)
♦ ♦
It can be seen that longer burrows and burrows with larger entrances require greater
construction time, as shown by significant positive associations calculated using Spearman’s
rank correlations (rs = 0.449, n = 15, a < 0.05 and rs = 0.461, n = 15, a < 0.05, respectively).
Two other associations relating to burrowing were considered. These were ‘maintenance’
time and the amount of time spent in and out of the burrow versus carapace length. It was
thought that perhaps if animal size reflected the size of the burrow (i.e. larger animals have
larger diameter burrows and longer burrows), then perhaps a larger burrow would require
more time spent on ‘maintenance’. This, however, appeared not to be the case (Pearsons-
moment correlation of r = -0.253, d.f. = 13, P = 0.364). It was also thought that perhaps
smaller animals might spend more time in their burrows as they were thought to be more
vulnerable to predators and susceptible to displacement in the stream current, but this was
shown not to be the case in these laboratory experiments (Pearsons-moment correlation r =
0.090, d.f.=13, P = 0.706). However, this may not be a true representation of their normal
field behaviour. Firstly, because they were alone in the tanks and secondly, they were
burrowing in relatively static water with only low current velocity.
90
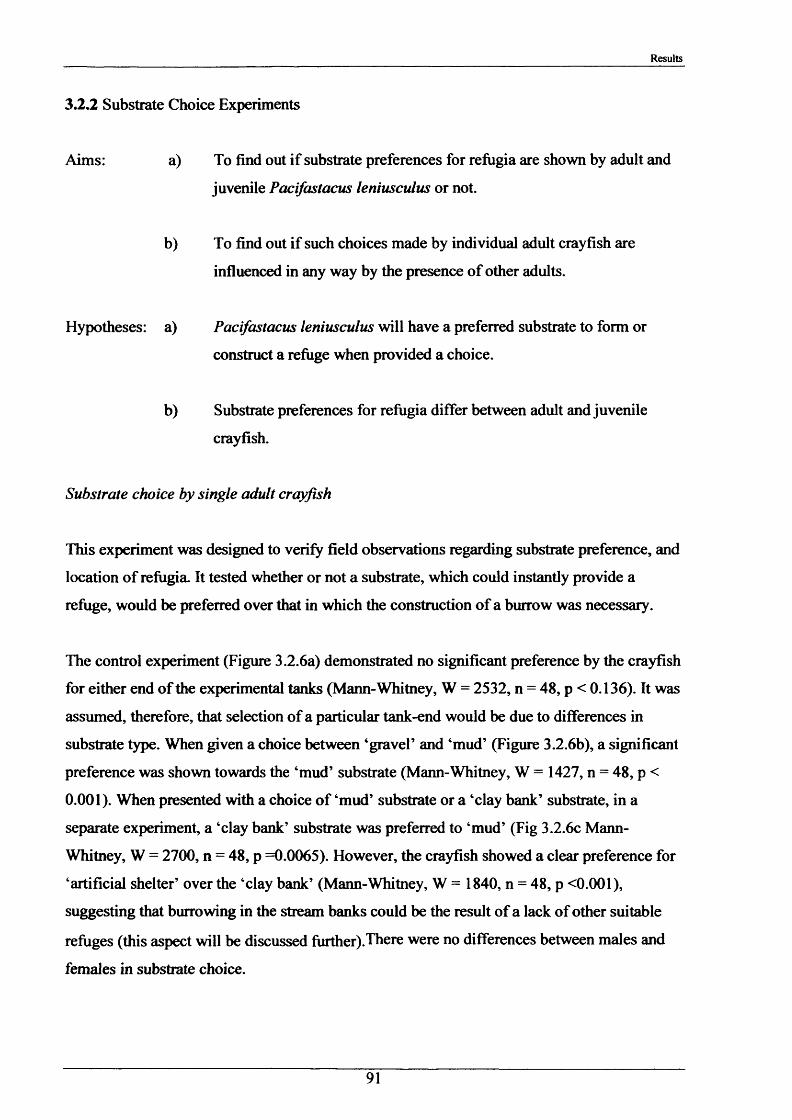
Results
3.2.2 Substrate Choice Experiments
Aims: a) To find out if substrate preferences for refugia are shown by adult and
juvenile Pacifastacus leniusculus or not.
b) To find out if such choices made by individual adult crayfish are
influenced in any way by the presence of other adults.
Hypotheses: a) Pacifastacus leniusculus will have a preferred substrate to form or
construct a refuge when provided a choice.
b) Substrate preferences for refugia differ between adult and juvenile
crayfish.
Substrate choice by single adult crayfish
This experiment was designed to verify field observations regarding substrate preference, and
location of refugia. It tested whether or not a substrate, which could instantly provide a
refuge, would be preferred over that in which the construction of a burrow was necessary.
The control experiment (Figure 3.2.6a) demonstrated no significant preference by the crayfish
for either end of the experimental tanks (Mann-Whitney, W = 2532, n = 48, p < 0.136). It was
assumed, therefore, that selection of a particular tank-end would be due to differences in
substrate type. When given a choice between ‘gravel’ and ‘mud’ (Figure 3.2.6b), a significant
preference was shown towards the ‘mud’ substrate (Mann-Whitney, W = 1427, n = 48, p <
0.001). When presented with a choice of ‘mud’ substrate or a ‘clay bank’ substrate, in a
separate experiment, a ‘clay bank’ substrate was preferred to ‘mud’ (Fig 3.2.6c Mann-
Whitney, W = 2700, n = 48, p =0.0065). However, the crayfish showed a clear preference for
‘artificial shelter’ over the ‘clay bank’ (Mann-Whitney, W = 1840, n = 48, p <0.001),
suggesting that burrowing in the stream banks could be the result of a lack of other suitable
refuges (this aspect will be discussed further).There were no differences between males and
females in substrate choice.
91
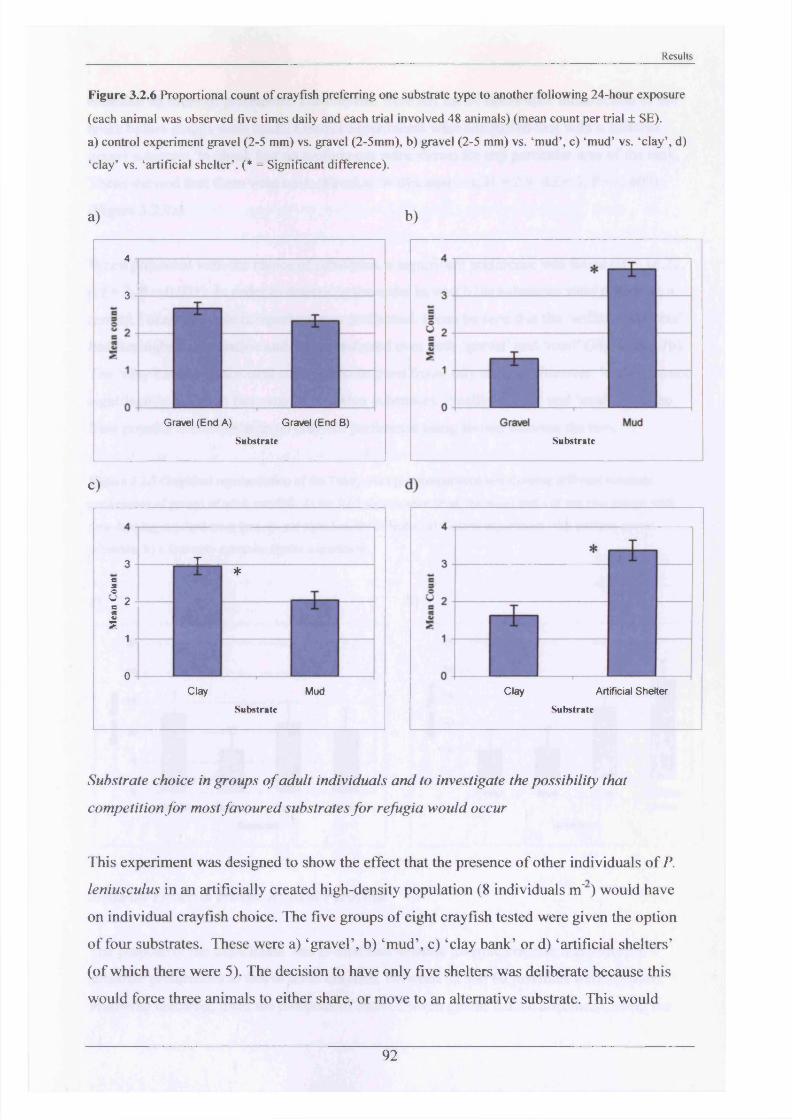
Results
Figure 3.2.6 Proportional count o f crayfish preferring one substrate type to another following 24-hour exposure
(each animal was observed five times daily and each trial involved 48 animals) (mean count per trial ± SE).
a) control experiment gravel (2-5 mm) vs. gravel (2-5mm), b) gravel (2-5 mm) vs. ‘mud’, c) ‘mud’ vs. ‘clay’, d)
‘clay’ vs. ‘artificial shelter’. (* = Significant difference).
a) b)
4
3 |
Gravel (End A) Gravel (End B)Substrate
c)
J— __ .___X___ ____________________ _s3s
w O
*
a * t 1 2
1 I
n .UClay
SubstrateMud
Substrate
Clay Artificial ShelterSubstrate
Substrate choice in groups of adult individuals and to investigate the possibility that
competition for most favoured substrates for refugia would occur
This experiment was designed to show the effect that the presence of other individuals of P.
leniusculus in an artificially created high-density population (8 individuals m‘ ) would have
on individual crayfish choice. The five groups of eight crayfish tested were given the option
of four substrates. These were a) ‘gravel’, b) ‘mud’, c) ‘clay bank’ or d) ‘artificial shelters’
(of which there were 5). The decision to have only five shelters was deliberate because this
would force three animals to either share, or move to an alternative substrate. This would
92
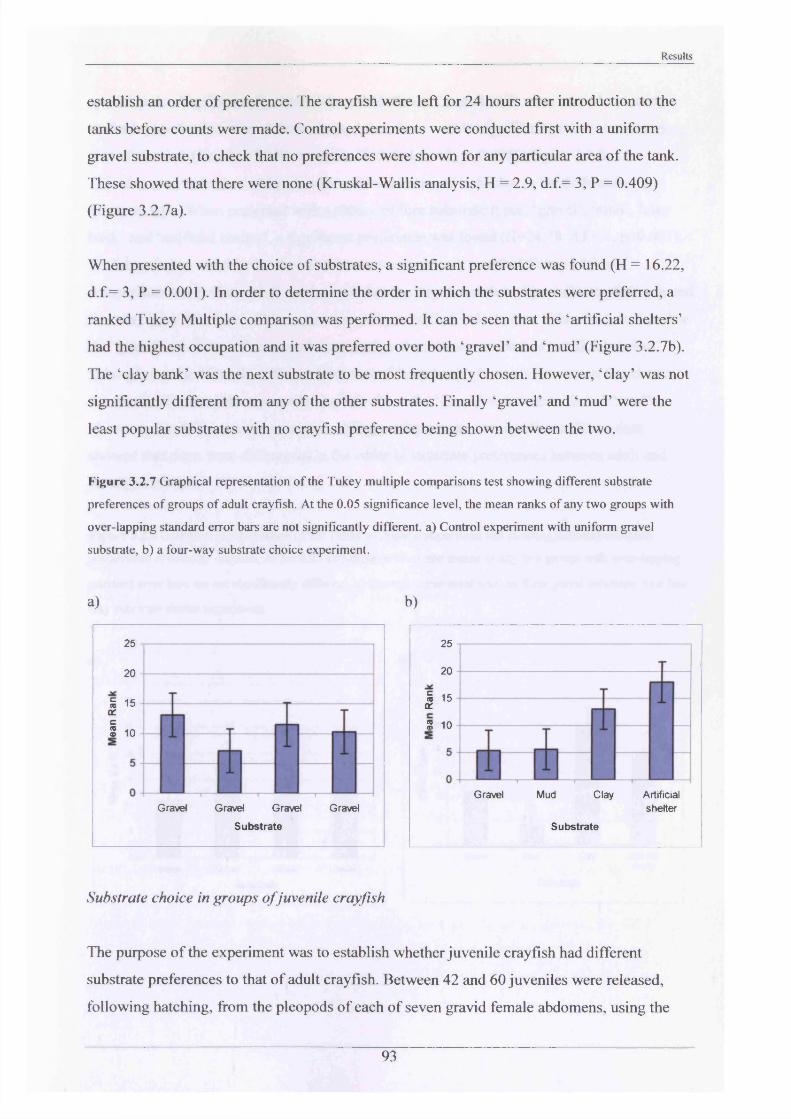
Results
establish an order of preference. The crayfish were left for 24 hours after introduction to the
tanks before counts were made. Control experiments were conducted first with a uniform
gravel substrate, to check that no preferences were shown for any particular area of the tank.
These showed that there were none (Kruskal-Wallis analysis, H = 2.9, d.f.= 3, P = 0.409)
(Figure 3.2.7a).
When presented with the choice of substrates, a significant preference was found (H = 16.22,
d.f.= 3, P = 0.001). In order to determine the order in which the substrates were preferred, a
ranked Tukey Multiple comparison was performed. It can be seen that the ‘artificial shelters’
had the highest occupation and it was preferred over both ‘gravel’ and ‘mud’ (Figure 3.2.7b).
The ‘clay bank’ was the next substrate to be most frequently chosen. However, ‘clay’ was not
significantly different from any of the other substrates. Finally ‘gravel’ and ‘mud’ were the
least popular substrates with no crayfish preference being shown between the two.
Figure 3.2.7 Graphical representation o f the Tukey multiple comparisons test showing different substrate
preferences o f groups o f adult crayfish. At the 0.05 significance level, the mean ranks o f any two groups with
over-lapping standard error bars are not significantly different, a) Control experiment with uniform gravel
substrate, b) a four-way substrate choice experiment.
a) b)
25
20
| 15
i 10
Gravel Gravel Gravel Gravel Substrate
25
20
| 15
S 10
Gravel Mud Clay Artificialshelter
Substrate
Substrate choice in groups o f juvenile crayfish
The purpose of the experiment was to establish whether juvenile crayfish had different
substrate preferences to that of adult crayfish. Between 42 and 60 juveniles were released,
following hatching, from the pleopods of each of seven gravid female abdomens, using the
93
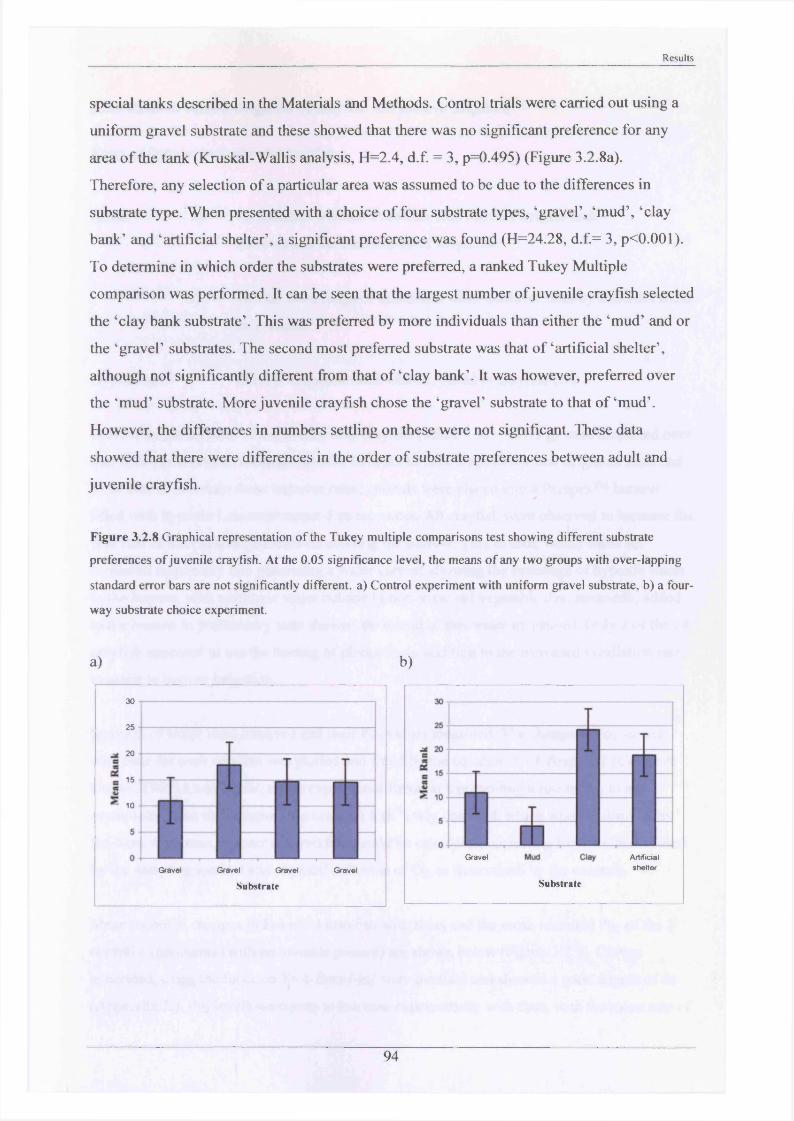
Results
special tanks described in the Materials and Methods. Control trials were carried out using a
uniform gravel substrate and these showed that there was no significant preference for any
area of the tank (Kruskal-Wallis analysis, H=2.4, d.f. = 3, p=0.495) (Figure 3.2.8a).
Therefore, any selection of a particular area was assumed to be due to the differences in
substrate type. When presented with a choice of four substrate types, ‘gravel’, ‘mud’, ‘clay
bank’ and ‘artificial shelter’, a significant preference was found (H=24.28, d.f.= 3, p<0.001).
To determine in which order the substrates were preferred, a ranked Tukey Multiple
comparison was performed. It can be seen that the largest number of juvenile crayfish selected
the ‘clay bank substrate’. This was preferred by more individuals than either the ‘mud’ and or
the ‘gravel’ substrates. The second most preferred substrate was that of ‘artificial shelter’,
although not significantly different from that o f ‘clay bank’. It was however, preferred over
the ‘mud’ substrate. More juvenile crayfish chose the ‘gravel’ substrate to that o f ‘mud’.
However, the differences in numbers settling on these were not significant. These data
showed that there were differences in the order of substrate preferences between adult and
juvenile crayfish.
Figure 3.2.8 Graphical representation o f the Tukey multiple comparisons test showing different substrate
preferences o f juvenile crayfish. At the 0.05 significance level, the means o f any two groups with over-lapping
standard error bars are not significantly different, a) Control experiment with uniform gravel substrate, b) a four
way substrate choice experiment.
a) b)
30
25
20
15
10
Gravel Gravel Gravel Gravel
Substrate
Gravel Artificialshelter
Substrate
94
Results
3.23 Rates of burrow irrigation by crayfish and passive irrigation
Rates o f burrow irrigation by crayfish
Aims: a) To establish whether P. leniusculus actively irrigate their
burrows and the mechanism of irrigation.
b) To find out a range of maximum water turnover rates by different sized
individuals.
Hypothesis: Burrow irrigation rates will be related to crayfish size.
Burrow irrigation rates of the twenty-four crayfish (Mass = 30 - 101.3 g) were measured over
half hour periods in an artificial burrow. In order to encourage maximum irrigation rates and
to be able to ascertain these turnover rates, animals were placed into a Perspex™ burrow
filled with hypoxic Leicester copper-free tap water. All crayfish were observed to increase the
beat rate of their scaphognathites on entering the burrow. This in turn, would cause an
increased respiratory rate generating a water current allowing the exchange of hypoxic water
in the burrow, with normoxic water outside (a non-toxic red vegetable dye, amaranth, added
to the burrow in preliminary tests showed the extent of this water irrigation). Only 2 of the 24
crayfish appeared to use the beating of pleopods, in addition to the increased ventilation rate,
to assist in burrow irrigation.
Samples of water were removed and their P0 2 values measured. The change in P0 2 values
with time for each crayfish was plotted and fitted by the equation Y=A-Bexp[-kt] (Crowe &
Crowe, 1969) a non-linear, single exponential function representing a rise in P0 2 to an
asymptote. From the equation, the constant k (h'1) was obtained, which when multiplied by
the burrow volume, a water turnover rate could be calculated, correcting for the effect caused
by the sampling method and physical diffusion of O2 , as determined by the controls.
Mean recorded changes in P0 2 of 24 crayfish with time, and the mean recorded P0 2 of the 3
control experiments (with no animals present) are shown below (Figure 3.2.9). Curves
generated, using the function Y=A-Bexp[-kt] were overlaid and showed a good degree of fit
(Appendix X). P0 2 levels were seen to increase exponentially with time, with the mean rate of
95
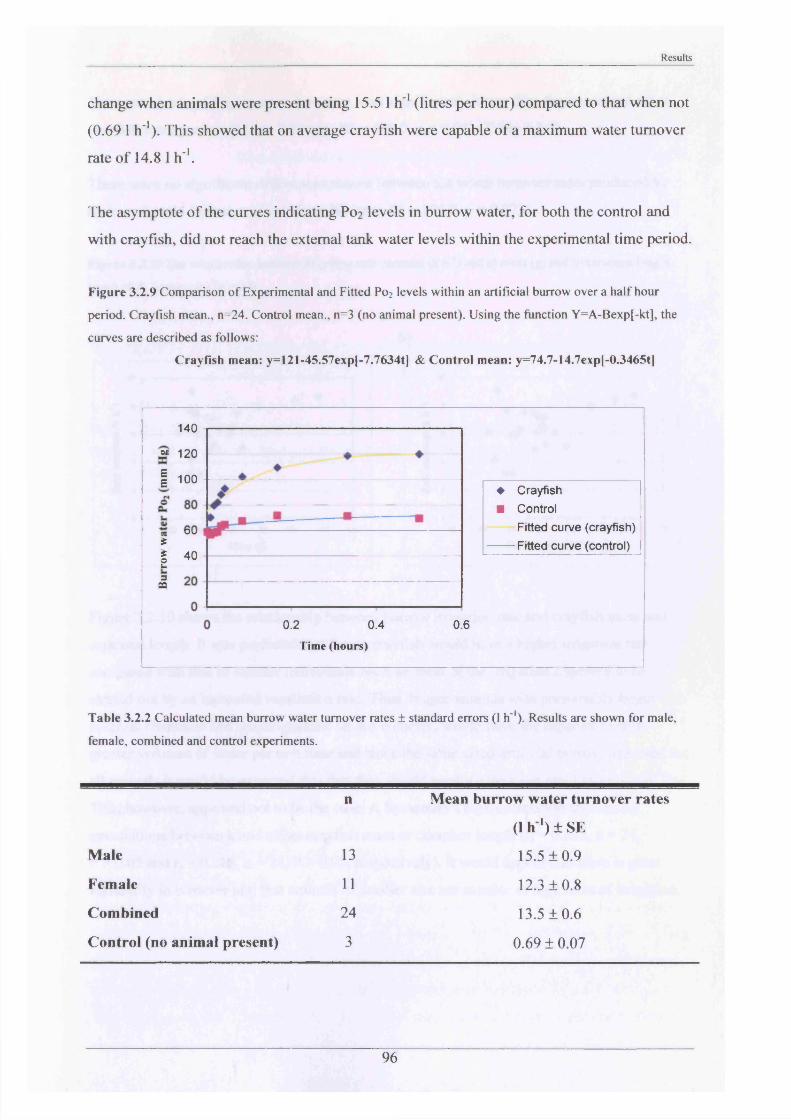
Results
change when animals were present being 15.5 1 h '1 (litres per hour) compared to that when not
(0.69 1 h '1). This showed that on average crayfish were capable of a maximum water turnover
rate of 14.8 1 h '1.
The asymptote of the curves indicating P0 2 levels in burrow water, for both the control and
with crayfish, did not reach the external tank water levels within the experimental time period.
Figure 3.2.9 Comparison o f Experimental and Fitted Po2 levels within an artificial burrow over a half hour
period. Crayfish mean., n=24. Control mean., n=3 (no animal present). Using the function Y=A-Bexp[-kt], the
curves are described as follows:
Crayfish mean: y=121-45.57exp[-7.7634t) & Control mean: y=74.7-14.7exp|-0.3465t)
140
m 120
i 100
SB O U £| 40sso
0.2 0.4
Time (hours)
0.6
♦ Crayfish ■ Control
Fitted curve (crayfish) Fitted curve (control)
Table 3.2.2 Calculated mean burrow water turnover rates ± standard errors (1 h'1). Results are shown for male,
female, combined and control experiments.
n Mean burrow water turnover rates
(1 h ') ± SE
Male 13 15.5±0.9
Female 11 12.310.8
Combined 24 13.510.6
Control (no animal present) 3 0.691 0.07
96
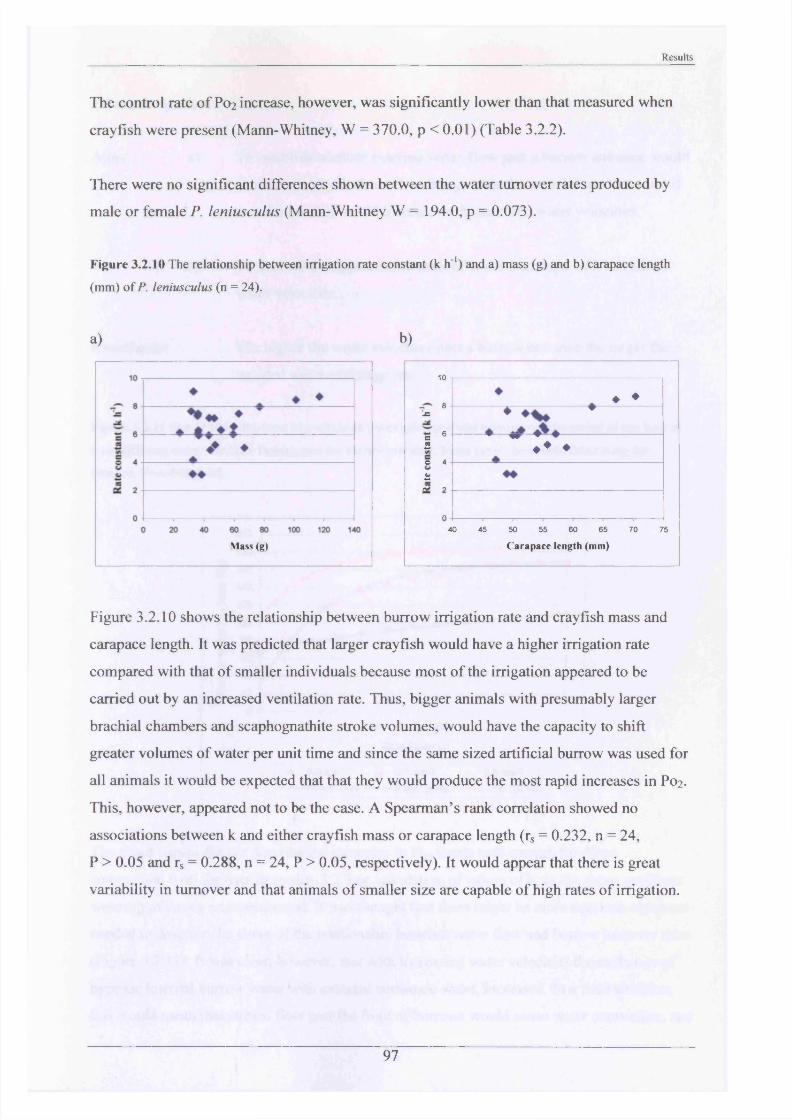
Results
The control rate of P0 2 increase, however, was significantly lower than that measured when
crayfish were present (Mann-Whitney, W = 370.0, p < 0.01) (Table 3.2.2).
There were no significant differences shown between the water turnover rates produced by
male or female P. leniusculus (Mann-Whitney W = 194.0, p = 0.073).
Figure 3.2.10 The relationship between irrigation rate constant (k h'1) and a) mass (g) and b) carapace length
(mm) o f P. leniusculus (n = 24).
a) b)
Mass (g)
10
0 . ♦ ♦— 0Us
a 62■O 4
♦v W v W
♦ ♦ ♦w
am 9
n40 45 50 55 60 65 70 75
Carapace length (mm)
Figure 3.2.10 shows the relationship between burrow irrigation rate and crayfish mass and
carapace length. It was predicted that larger crayfish would have a higher irrigation rate
compared with that of smaller individuals because most of the irrigation appeared to be
carried out by an increased ventilation rate. Thus, bigger animals with presumably larger
brachial chambers and scaphognathite stroke volumes, would have the capacity to shift
greater volumes of water per unit time and since the same sized artificial burrow was used for
all animals it would be expected that that they would produce the most rapid increases in P0 2 .
This, however, appeared not to be the case. A Spearman’s rank correlation showed no
associations between k and either crayfish mass or carapace length (rs = 0.232, n = 24,
P > 0.05 and rs = 0.288, n = 24, P > 0.05, respectively). It would appear that there is great
variability in turnover and that animals of smaller size are capable of high rates of irrigation.
97
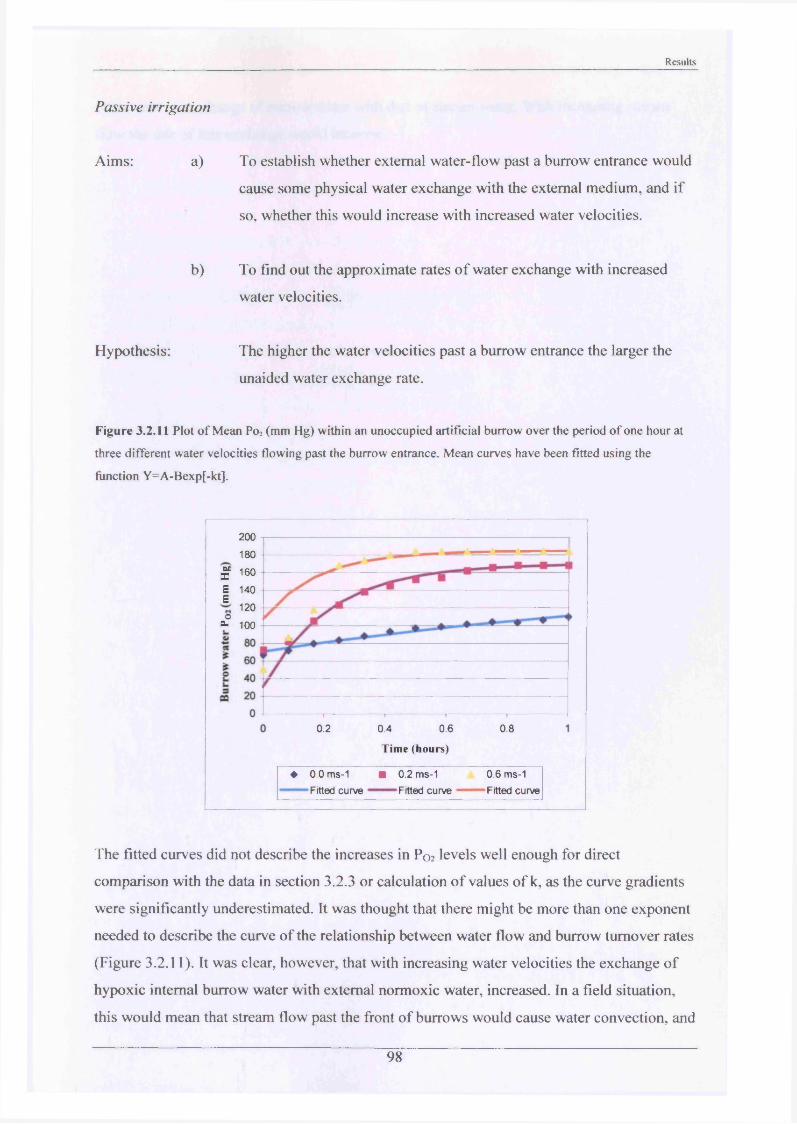
Results
Passive irrigation
Aims: a) To establish whether external water-flow past a burrow entrance would
cause some physical water exchange with the external medium, and if
so, whether this would increase with increased water velocities.
b) To find out the approximate rates of water exchange with increased
water velocities.
Hypothesis: The higher the water velocities past a burrow entrance the larger the
unaided water exchange rate.
Figure 3.2.11 Plot o f Mean P02 (mm Hg) within an unoccupied artificial burrow over the period o f one hour at
three different water velocities flowing past the burrow entrance. Mean curves have been fitted using the
function Y=A-Bexp[-kt].
200180
S 160E 140* 120 o=- 100
0.6
Time (hours)
0.2 0.4 0.8
♦ 0.0 ms-1Fitted curve Fitted curve - ■ Fitted curve
■ 0.2 ms-1 0.6 ms-1
The fitted curves did not describe the increases in P0 2 levels well enough for direct
comparison with the data in section 3.2.3 or calculation of values of k, as the curve gradients
were significantly underestimated. It was thought that there might be more than one exponent
needed to describe the curve of the relationship between water flow and burrow turnover rates
(Figure 3.2.11). It was clear, however, that with increasing water velocities the exchange of
hypoxic internal burrow water with external normoxic water, increased. In a field situation,
this would mean that stream flow past the front of burrows would cause water convection, and
98

______________________________________________________________________________ Results
thus cause an exchange of burrow water with that of stream water. With increasing stream
flow the rate of this exchange would increase.
99

Chapter 4
Discussion
1 0 0
Discussion
Chapter 4: Discussion
4.1 Field Studies
4.1.1 Burrow densities in relation to substrate type
Information on population expansion and preference of substrate for burrowing is helpful in
the control and management of P. leniusculus. Research carried out in this study shows that
there has been an increase in burrow densities along the Gaddesby Brook, particularly in areas
downstream of Lowenva Lodge (SK 737 094). Burrows are now present a further 3 km
downstream, since the data collected by Harris and Young (1996).
Burrow density data collected for P. leniusculus in the Gaddesby Brook, ranged between 0 -
14 m"1 and were comparable to estimates made by Guan (1995), for P. leniusculus in the
River Great Ouse (0 to 25.7 m '1), and also, similar to that obtained by Correia and Ferreira
(1995), for Procambarus clarkii (0.013 to 6.28 m"2), in rice fields, marshes and reservoirs in
Portugal.
Adult and juvenile P. leniusculus showed definite preferences for particular stream bank
substrates when excavating burrows. This was demonstrated by the different burrow densities
which occurred along the Gaddesby Brook and which indicated burrow aggregation at
particular sites. It was also shown by the significantly higher burrow densities present in areas
with a stream bank clay content greater than 39%, and the significant negative correlation
between burrow density and sand content. One explanation is that banks with high clay
content are more stable and less likely to collapse during and after burrow excavation. This is
not necessarily the case for all crayfish species, since Lawrence et al. (2002), found that there
was no relationship between burrow occurrence and sediment type for Cherax albidus.
However, many crayfish species do show preference for burrowing in predominantly clay
substrate. For example, Grow (1982), claimed that Cambarus diogenes diogenes (Girard)
preferred to excavate burrows in fine-grained clays to that of coarse-grained sands and Guan
(1995), found that the burrows of P. leniusculus had a clumped distribution in clay banks and
were absent in predominantly sand and gravel banks. Similarly, Correia and Ferreira (1995),
1 0 1
Discussion
found burrowing activity of Procambarus clarkii occurred only when the ratio of fine
particles over coarse particles was higher than 0.1 - 0.2 and Rogers and Huner (1985),
observed that the burrows of Cambarus diogenes were constructed in soils classified as silty
clay loams and silty clays.
There were a large number of sites, spanning the Gaddesby Brook, where no burrows were
present, accounting for 37% of sites sampled. There are a number of possible reasons why
burrow construction did not occur at these sites. 55% were in areas where a stable population
density had not been attained, suggesting that perhaps the available habitat suitable for
occupying natural shelters, or for burrowing, had not as yet been utilised. 27% were at sites
where substrate type was unsuitable for burrowing or where substrate type was not ideal,
combined with the fact that there were plenty of unoccupied ‘natural refuges’ such as stones,
bricks and tree roots, to be used. The final 18% were at sites where there was suitable
available bank substrate. The reasons why burrows were not present at these sites could be
because, again, there were plenty of ‘natural refuges’ (therefore no need), or because they
were at sites that were shallow, making burrow construction difficult below the waterline, or
because some sites had high water velocity (some riffle sites), which may have prevented
burrow initiation.
There was sufficient data to suggest that the physical property of the bank substrate appeared
to be a major factor in determining burrow density in the Gaddesby Brook. Furthermore, P.
leniusculus did select a preferred substrate type for burrowing. This finding was concurred by
Lodge and Hill (1994), who suggested that substrate type was the most important factor
determining habitat choice of freshwater crayfish.
4.1.2 Internal burrow features
Internal burrow features were inspected by use of an infrared optic fibre video camera. This
technique was new to crayfish burrow examination and was used because landowners had
expressed their concern at bank damage caused by casting. The main advantages of this
method were; it was quicker to examine burrows than conventional methods; it did not
damage the stream bank; there was minimal disturbance of the crayfish, and finally; it was
possible to observe crayfish behaviour in the burrow. However, had the burrows inspected
been more complex, with several branched ‘galleries’, this method would have been less
102
Discussion
effective as control of the camera head was limited and videoing could only be conducted in
clear waters. Another constraint was that the equipment was expensive to rent.
Although there was a diverse range of burrow features of P. leniusculus observed, the most
common, accounting for 77% of those examined, was a single entranced burrow with a
tapered ‘gallery’. This was similar at both White House Farm and Newbold Farm. These
burrows were quasi-horizontal to the stream surface and penetrated into the stream bank to a
maximum-recorded distance of 79 cm. This burrow type has also been described for several
other crayfish species, such as, Cherax albidus clark, with a maximum recorded burrow
length of 65 cm (Lawrence et al., 2002) and Procambarus clarkii, where burrow morphology
was generally simple, with a few observed complex burrows and where mean tunnel depths
ranged from 0.28 - 0.58 m (Correia and Ferreira, 1995).
This type of simple burrow morphology, lends itself to certain adaptive advantages. Its
simplicity means that construction is both quicker and easier, requiring less energy to build
and a single entrance probably makes it more easily defendable from conspecifics. The
tapered ‘gallery’ could also have a purpose in defence, because if a larger invader cannot be
fended off at the entrance, retreating into a narrower part of the ‘gallery’ would make it more
difficult for an attacker to pursue.
This type of crayfish burrow cannot be classified properly using the North American
classification of burrowing crayfish described by (Hobbs, 1981), but is better described using
the ecological classification of Australian crayfish burrows (Horwitz and Richardson, 1986).
From this P. leniusculus can be described as a ‘Type la ’ burrowing crayfish, which “lives in
permanent bodies of surface water, under rocks, ledges, in rock crevices, in or under logs and
in short, unbranched burrows in the substratum”.
A number of burrow entrances were observed above the water level in the Gaddesby Brook,
all of which, when examined were empty. It was thought that these were a result of changes in
water level, and had been constructed when water levels were higher and would have
immersed them (in winter). This theory concurred with that of Guan (1995), for P. leniusculus
in the River Great Ouse.
103
Discussion
Burrow lengths were significantly longer at White House Farm to that of Newbold Farm. This
may have been due to the higher stream water velocity and the significantly wider burrow
entrances present at White House Farm. A higher stream water velocity, combined with a
larger entrance width (increased surface area of the stream and burrow water interface), would
allow greater water exchange between the stream and burrow waters (see section 4.2.3), so the
burrows could be longer and still have sufficient water turnover to maintain favourable
internal burrow environments.
There were a surprisingly large number of unoccupied burrows at both White House Farm
(6 6 %) and Newbold Farm (49%). This was similar to observations made by Ilheu et al.
(2003), for Procambarus clarkii in a temporary stream of the south of the Iberian Peninsula,
in which burrows were mostly found either empty or occupied by a single individual. It was
suggested in this case, that the crayfish did not hide exclusively inside excavated burrows, but
regularly used natural refuges. However, as later radio tracking data suggests (see section
4.1.5) P. leniusculus mainly remained loyal to a particular shelter, thus, some vacant burrows
must have been due to other factors, such as, death from predation, age or disease.
The internal burrow surface of most examined burrows of P. leniusculus had both scrape
marks and ‘lumpy’ surfaces. These findings were similar at both White House and Newbold
Farm. Blank and Figler (1996), suggested that there were three reasons why a rough internal
texture for a shelter may have been preferred over a smooth surface. Firstly, it more closely
resembled the inside of a burrow or the type of shelter a crayfish would naturally excavate.
Secondly, it was easier to defend against an intruder (i.e. provided better leverage during
agonistic encounters), and/or, thirdly, it provided an additional food source (i.e., rough
shelters appeared to attract algae more rapidly than smooth shelters, perhaps because of the
increased surface area).
Through observations of the insides of the burrows of P. leniusculus, it seemed that the scrape
marks could have been created by the chiselling action of the chelae during excavation and
the ‘lumpy’ surfaces caused by the snipping action of the pereopods both during excavation
and whilst making burrow modifications after burrow construction. This was concurred by
Hasiotis (1993b), who found scrape marks and knobbly features in internal burrows, in both
Triassic and Holocene North American crayfish burrows.
104
Discussion
Interestingly, Hasiotis (1993b), also suggested that depths of burrowing, burrow architecture,
population densities and distribution of types of crayfish burrowers were highly influenced by
environmental factors and that both ancient and modem crayfish were similarly affected
despite a difference o f 2 2 0 million years.
4.13 The internal burrow water chemistry
Data on the water chemistry within burrows of aquatic decapod crustaceans is limited and
most focus primarily on oxygen levels (Atkinson and Taylor, 1988; Burggren and McMahon,
1983; Forgue et al., 2001; Gerhardt and Baden, 1998; Taylor and Wheatly, 1980). Knowledge
of the levels of O2 , CO2 and ammonia within occupied and non-occupied burrows could be
useful indicators of animal presence and possible irrigation behaviours.
Ammonia exists in two forms in the natural environment, NH3 (unionised) and NH4+
(ionised), their relative proportions being dependent primarily on pH, but to a lesser extent on
temperature and ionic strength (Lourey and Mitchell, 1995). NH3 is considered more toxic to
aquatic organisms because it is a dissolved gas in water, which can pass unimpeded through
gill membranes and, as such, it has been used in a number of acute toxicity experiments (Liu
et al., 1995; Lourey and Mitchell, 1995; Rouse and Kastner, 1995). For the purpose of
determining internal burrow ammonia concentrations, total ammonia, (Tamm), which included
both forms, was calculated.
The mean Tamm concentrations within the burrows were higher than the external stream water
at both Newbold and White House Farm during summer and winter. Crayfish presence was
determined to be the main cause of this increased ammonia level, as measurements made in
burrows with crayfish excluded, showed significantly lower concentrations. Ammonia is a
waste product excreted by all crayfish, including P. leniusculus (Harris et al., 2001). The
higher ammonia levels recorded in the burrows in summer probably reflect the increased
activity levels shown by P. leniusculus during this season. This could be due to water
temperature, feeding and mating, which would increase metabolic rate. On this basis, the
number of burrows, which were indicated to be inhabited by their elevated ammonia
concentration, was 33% at White House Farm and 57% at Newbold Farm. This compared
with the independent estimates made at each site, determined using an optic camera,
105
Discussion
(see section 3.1.2); White House Farm = 34%, Newbold = 51%) which showed that ammonia
was a good means of determining burrow occupancy.
The highest mean Tamm concentration reached in burrows was at Newbold Farm in summer
(28.78 ± 3.99 pmoles I'1), almost 2-fold that of stream levels. It was found that the acute lethal
concentration (LC50) for P. leniusculus, established by Harris et a l (2001), was substantially
higher (24 h LC50 = 15.0 ± 2.6 mmol-1 and 48 h LC50 = 4.9 ±1.1 m m o l^ ^ C , pH = 8.2)).
Thus, P. leniusculus could tolerate much higher ammonia concentrations than that found at
Newbold Farm.
As the ammonia levels in burrows at Newbold Farm did not rise to an acute concentration, it
could be possible that a process of ammonia removal was occurring. A likely explanation was
that some form of burrow irrigation was occurring (discussed further in section 4.2.3). A
reason for burrow irrigation could be that, although P. leniusculus can survive in high
ammonia levels, these conditions are not necessarily favourable. Lourey and Mitchell (1995)
found that the growth rate and/or reproduction for Cherax albidus were reduced at unionised
ammonia levels above 0.096mg f 1.
The PO2 levels within the burrows during winter at both sites were quite similar to that of the
stream level. This may be because P. leniusculus were less active during the winter due to
reduced water temperature (Bubb et a l, 2002a), as such, respiration and metabolic rates
would be lower resulting in less oxygen consumption. During summer, the PO2 levels were
significantly lower than that of stream water, demonstrating moderately hypoxic conditions
within the burrows. During this season, higher water temperatures meant that P. leniusculus
were more active within burrows, resulting in an increased metabolic rate, thereby depleting
burrow water oxygen levels because of an increase in respiration rate. Grow and Merchant
(1979), found that the burrow water of the crayfish Cambarus diogenes diogenes showed
nearly aneorobic conditions (9.1% of air saturation), and even when in direct contact with
highly oxygenated water, resulting from the flooding Potomac River, oxygenation levels
remained low.
In general, the levels of ZCO2 were higher within the burrows at both sites compared to that
of stream water, showing slight hypercapnic conditions. Levels of PCO2 and [HC03 ] were
significantly greater in occupied burrows than that of burrows with animals not detected or
106
Discussion
excluded, this showed that P. leniusculus were responsible for the excretion of CO2 during
respiration.
In burrows where animals were excluded, levels of ECO2 and [HC03'] were reversed,
showing lower concentrations than in stream water. This could possibly indicate the process
of algal photosynthesis occurring in the burrow, as such, CO2 would be converted to O2.
4.1.4 Population densities, range extension and burrow erosion damage
Population densities of P. leniusculus at Newbold Farm, White House Farm and Lowenva
Lodge remained relatively constant between 2000 and 2002. It is possible that this may have
been because the utilisation of all available suitable substrate type had occurred (Mason,
1978; Peay and Rogers, 1999). At Ashby Folville and Gaddesby, however, population
densities and CPUE’s steadily increased over the two years of this study, indicating that a
maximum sustainable density had not yet been reached.
When the data of this study, was compared with that collected by Harris and Young (1996)
and Harris (1999), it was found that population density estimates for the sites at Newbold
Farm, White House Farm and Lowenva Lodge had increased from 1995 to 1998 and from
1998 to 2000, suggesting perhaps that during these periods, occupancy of all available shelter
had not been fully utilised.
Estimates of population densities at sites at Ashby Folville and Gaddesby were not calculated
in 1995 or 1998 by Harris and Young and Harris respectively, because there were insufficient
numbers of crayfish. However, by 2000, numbers of signal crayfish had increased sufficiently
to calculate population density estimates. It was also found at these sites, crayfish density rose
between 2000 and 2002. These data, therefore, demonstrate that between 1995 and 2002 there
has been a downstream spread of P. leniusculus.
To determine the rate of population spread, the current distribution of P. leniusculus in the
Gaddesby Brook, was ascertained by trapping and hand searches. This information was then
compared to data gathered in 1992,1995 and 1999 by (Harris, 1999; Harris and Young, 1996;
Rogers, 1993) respectively. From this it was found that the rate of range extension of P.
107
Discussion
leniusculus showed polynomial expansion i.e. the speed of new habitat colonisation was
increasing each year.
Other research on range extension of crayfish species only tended to quote rate of range
extension in terms of average rate in km per year (Guan and Wiles, 1997b; Harris, 1999; Peay
and Rogers, 1999; Sibley, 2001), most being ~ 1 km year1. However, the implications of this
polynomial rate of expansion, clearly demonstrates that well-established colonies of P.
leniusculus, already present in U.K. rivers, will become increasingly more problematic in the
future. It is likely that colonisation of this species will be even more rapid than was previously
thought.
As burrow entrance size is correlated to crayfish size (Guan, 1995 and see section 3.2.1), the
significantly smaller burrows found at the low population density sites of Ashby Folville and
Gaddesby compared with those at the high density sites of Newbold Farm and Twyford
Lodge. This could suggest that initial colonisation of new sites may be driven by smaller
crayfish, as these individuals are less able to defend themselves in a high density population
and would therefore need to venture further a field to settle. This view, was supported in part
by Reyjol and Roqueplo (2002), for A. pallipes, who found that the reduction or
disappearance of one habitat, which is particularly favourable to the young of the year, might
be compensated by a more active colonisation of some habitats which normally shelter only a
few crayfish.
In the knowledge that P. leniusculus will continue to colonise new sites, it becomes
increasingly important to understand the impact the species will have on stream
environments. Much research has been conducted on the impact of invasive crayfish species
in relation to the reduction in stream vegetation, impact on benthic fishes and direct and
indirect impacts on invertebrate communities (Guan and Wiles, 1997a; Holdich, 1999;
Soderback, 1995; Usio, 2002). However, in the U.K., another important factor to be
considered are the burrows constructed by P. leniusculus and their impact on the structural
stability of stream banks.
It was found that in areas of high burrow density as much as 7.8% of stream bank sediment
was removed. This had the largest impact at the leading bank edge, which was not only
directly exposed to stream water flow, but would be the point at which most weight would be
108
Discussion
placed by drinking animals, such as cattle. Several areas were observed to have had recent
bank subsidence, where high densities of burrows had been excavated. Guan (1995), also
noted, bank collapse from P. leniusculus burrows in the River Great Ouse, and, in laboratory
experiments by Hasiotis (1993a), it was shown that stream bank collapse did take place
because of crayfish burrows as they weakened the banks. It was also suggested that water
table fluctuations would accent voids created by the burrows and that these voids would allow
the clay in the soil to expand and virtually undermine the whole stream or river bank or that
the weight of the bank itself would cause its collapse under the force of gravity (Hasiotis,
1993a).
4.1.5 Short term movements and activities in the field
Radio tracking is a costly method for determining animal movements in their natural
environment and as such has meant that only small samples have been observed at any one
time. However, the advantage of this method of tracking is that individuals can be
continuously monitored without disturbance or having to rely on the tag recapture procedures
(Bohl, 1999; Bubb et a l , 2002a; Gherardi et a l , 2002; Gherardi et a l , 2000; Robinson et a l,
2000; Schutze et a l, 1999). The other major limitation of radio telemetry suggested by Nams
(1989), was the inability to determine the behaviour of radio-tagged animals when out of sight
(e.g. crayfish in a burrow /refuge or at night).
The use of red L.E.D units solved the problem in darkness and this enabled crayfish
movements to be observed directly and be related to radio telemetry data. This technique also
enabled the identification of individual burrow use, in areas where burrows/refuges were too
closely packed to be differentiated by the radio tracking. The L.E.D. unit enabled verification
that individuals were returning to the same burrow on consecutive nights for up to 7 nights,
unlike the beta lights used by Robinson (1997) which only lasted for 8 hours.
Initial movements made by P. leniusculus after release, did not indicate a ‘fright response’ as
found for A. pallipes by Robinson et al (2000). This was in agreement with findings by Bubb
et a l (2002a), who also observed no ‘fright response’ for P. leniusculus.
Of the 38 radio tracked crayfish, 28 were pinpointed in the same burrow or refuge for the
duration of the tracking period. These animals exhibited the behaviour of staying in a ‘home’
109
Discussion
refuge, with movements centred about it. Robinson et al. (2000), also observed high levels of
local activity around refuges of A. pallipes and suggested it was due to the use of home areas.
Seven crayfish (Animal Nos 1,2,3,6,10,18 and 19), however, made occasional large
movements (up to 89.6 m in one day), followed by stationary phases of between 2-8 days.
This pattern of behaviour was also observed in Pacifastacus leniusculus (Bubb et al., 2002a),
Orconectes rusticus (Byron and Wilson, 2001), A. pallipes (Gherardi et al., 1998; Robinson et
al., 2000), and in a freshwater crab Potamonfluviatile (Gherardi, 1988). In all these cases,
however, the majority of basic movements by individuals consisted of short distances
travelled around a shelter. Although it is not known why certain individuals make sudden
large-scale movements, it could be attributed to population density pressures (an individual
loses its refuge to another crayfish), insufficient food supply, loss of shelter through collapse,
or displacement by water flow. Byron and Wilson (2001), have suggested that these large
distances could also have important implications in crayfish invasion rates.
In this study, all the long distance movements made by P. leniusculus were in an upstream
direction. This finding conflicted with those of Bubb et al. (2002) who reported movements
by P. leniusculus being in both directions and Robinson et al. (2000) who also found
movements were both up and downstream for A. pallipes. This suggests that different crayfish
populations of the same species exhibit differences in movement traits, which may be
dependent on location and habitat environment. In the present study, on no occasion did an
individual, after a large-scale movement, return to a previously occupied shelter. This was
also reported in P. leniusculus (Bubb et al, 2002), Procambarus clarkii (Gherardi et al.,
2002) and A. pallipes (Robinson et a l, 2000).
There were no significant differences in the distances travelled by male and female P.
leniusculus, again, this was likely due to having a fixed refuge. The same findings were also
true for A. pallipes (Robinson et al., 2000), Orconectes rusticus (Byron and Wilson, 2001),
Procambarus clarkii (Gherardi et al., 2002) and P. leniusculus (Bubb et al., 2002b).
As most of the radio-tagged crayfish movements centred about a fixed refuge, it was not
surprising that animal size (carapace length), did not affect the overall distances travelled by
individuals. This agreed with the findings of Bubb et al. (2002a), for P. leniusculus and of
Byron and Wilson (2001), for Orconetes rusticus. However, Robinson et al (2000), found
110
Discussion
that there was a positive correlation between distance moved per day and size, for
downstream movements made by both male and female crayfish, but not for upstream
movements in the species A. pallipes. These differences may be related to shelter fidelity, for,
if no commitment towards a specific shelter was shown by A. pallipes, there would possibly
be a greater tendency to roam, with larger animals perhaps covering a greater distance.
No P. leniusculus were lost or displaced during the two flood events, which occurred at the
Gaddesby Brook during radio tracking. This was similarly the case for P. leniusculus in the
River Wharfe (Bubb et al., 2002b) and Orconectes Juvenalis (Merkle, 1969), which contrary
to being dislodged, had actually moved upstream. However, Robinson et al. (2000), felt that
flood events could be catastrophic for A. pallipes, because two out of five tracked crayfish
were found dead after a high stream-discharge event.
Stream, burrow and crayfish microhabitat temperature data was recorded using Tiny Talk and
ibutton data loggers during the radio tracking study. The ibutton data loggers were found to be
more reliable because they were not dependent on a rubber sealed casing, which was prone to
flooding. However, they were slightly less accurate, recording temperature to only the nearest
0.5°C, rather than that recorded by the Tiny Talks of 0.1 °C. Nevertheless, the data obtained
showed that there was no significant variation between stream, burrow and crayfish
microhabitat temperature. A similar finding was also made by Gherardi and Barbaresi (2000)
for P. clarkii, in rice fields, where, during the day, both water and crayfish microhabitat
temperatures were 22°C and at night there was only a slight difference of 2°C (microhabitat
being lower).
Pacifastacus leniusculus was shown to be most active at dusk. This concurred with the
findings of Kozak et al (2002), who observed that adult signal crayfish in laboratory
experiments showed only one activity peak (at dusk), while there was low activity at dawn.
He also noted, that slight activity reduction over the night (at around 2200) was probably
caused by the animals processing food already taken into their shelters. Robinson (1997)
found that A. pallipes were also more active at dusk and that during dawn, morning and
afternoon the crayfish remained in their refuges, which would account for their limited
activity. This nocturnal behaviour could be considered to be an adaptive advantage as it could
reduce the risk of predation from daytime predators, or it could be a synchronising behaviour
with prey species (Hamrin, 1987; Stein, 1977).
I l l
Discussion
Distances travelled by P. leniusculus were greater in summer than winter. This may be linked
to food availability, temperature of the water and energy requirements. In winter, there was
less food available generally, the stream water was colder, for example, at times as low as ~
2°C to as high as ~ 10°C, so there is likely to be more need for P. leniusculus to conserve
energy.
When water temperature was compared with the activity of P. leniusculus in the field, it was
found that they were significantly more active in warmer stream temperatures. Temperature is
probably a major factor influencing crayfish activity and is substantiated by Flint (1977), who
also found peak activity in the warmer summer season and very little activity in winter, and
Bubb et al. (2002a), who correlated temperature differences in winter with activity for P.
leniusculus. However, temperature may not be the only factor influencing activity. Day
length, food availability, moulting, shelter, predation, stream flow and reproduction are all
factors with possible associations to activity levels in crayfish (Bubb et al., 2002a; Byron and
Wilson, 2001; Capelli, 1980; Capelli and Hamilton, 1984; Capelli and Munjal, 1982; Cobb,
1971; Collins et al., 1983; Crawshaw, 1974; Doroshenko, 1988; Flint, 1977; Garvey et al.,
1994; Gherardi and Barbaresi, 2000; Gherardi et a l, 1988; Hazlett et al., 1979; Kamofsky et
a l, 1989; Kozak et al., 2002; Maude and Williams, 1983; Moller and Naylor, 1980; Williams
et al., 2001).
Pacifastacus leniusculus demonstrated no homing behaviour when displaced 50 m up or
downstream in the Gaddesby Brook. This was similar to findings for adult A. pallipes
(Robinson et al., 2000) and Procambarus clarkii (Ilheu et a l, 2003). However, (Gherardi et
a l, 1998), in a Tuscan stream, found A. pallipes to have a weak tendency to return to the
‘home’ pool when released at a distance of 50 m. This perhaps suggests that they either have
poor orientation abilities, or that it is more energy efficient to seek shelter in the new area,
especially if shelters are in abundance.
4.1.6 Long term movements and tagging
As discussed earlier, animal movements play a key role in the understanding of habitat
requirements, resource utilization and potential colonisation of new areas. Animal tagging and
re-capture techniques provide a useful means in which to assess these movements.
1 1 2
Discussion
The new design of streamer tag used for this study, was successfully retained during moult
cycles. This was attributed to the fine monofilament used, which on moulting, effortlessly tore
through the softened cuticle, which was being shed. The numbered half disc used to identify
individuals became coated with algae after 2 years, however, this was easily scraped away,
making all recaptured tags identifiable. The tag was biologically compatible, permanent,
easily constructed, cheap and was relatively easy to attach. The only disadvantage was that it
was unsuitable for small individuals.
Over the 2 years, recapture of P. leniusculus in the Gaddesby Brook, using this tagging
method and baited traps for retrieval, was 19.0%. This was higher than other studies such as,
Rhodes and Avault (1986), in which only 3.5% of 1602 fluorescent dye marked P. clarkii
were retrieved (crayfish migration accounting for the low recapture). Robinson (1997),
tagged 888 A. pallipes and had a 9.3 % retrieval rate over a period of 83 days (this species
was suggested to have an ‘ephemeral home range’ maintained in a restricted area on a daily to
weekly time table) and Guan (1995), retrieved only 13.2 % of 8000 marked P. leniusculus,
the majority of which were recaptured within 100 m of release, 2 months to a year later
indicating a possible home range.
The mean mass and carapace length of tagged crayfish were similar to that of re-captured
individuals. This demonstrated that the tag did not unduly affect a particular size class of
crayfish. There was also no evidence of tag loss, as all re-captured animals, whether they were
tagged or not, were checked for potential damage that would have resulted from tag loss.
23% of recaptured animals were re-caught in the same trap, i.e. the exact place of initial
capture. 60% of recaptured animals were caught within ~7 m of the initial trap, while 17% of
animals were caught up to ~ 103 m from their original point of release. Overall, these
movements equated to 39% of recaptured animals moving in an upstream direction and 37.7%
in a downstream direction. However, it must be noted that these distances were small. This
agrees with Bubb et al. (2002a), who found that there was no significant difference in the
movement of P. leniusculus in the R. Wharfe, in either an upstream or downstream direction.
Considering that a stream is an open system and that P leniusculus are very agile (Harris,
1999), with the ability to make large scale movements, such high recapture rates within the
vicinity of release (60% re-caught within 7 m of release) suggests that adult P. leniusculus
113
Discussion
have a home range and stay within the same vicinity for long periods. It also suggests that
adults may only play a small role in the colonisation of new down and upstream sites. This is
supported by the data collected on burrow sizes, where significantly larger burrows were
found in well-established sites (point of P. leniusculus introduction), compared to those,
which were being newly colonised.
4.1.7 Comparisons with the River Greet
This small comparison study between the River Greet and the Gaddesby Brook was
conducted to ascertain whether a different population of P. leniusculus in a different
catchment area, would demonstrate similar preferences of substrate for burrow construction
and similar rates of range extension.
In 1999, it was observed by Harris, that population densities of P. leniusculus in the River
Greet, were between 0.1-12.7 m ', with the highest densities being, ‘particularly m the middle
stretches’. From this it was suggested, that the site of first introduction of P. leniusculus in
this river was at Maythome Mill. At this time, crayfish distribution had been identified to
span from Kirklington Mill (the upper most site) to Upton (see Figure 3.1.19a), and burrows
had been identified in densities of up to 12.5 m 1 comparable to that of the Gaddesby Brook.
Thus the River Greet was similar to that of the Gaddesby Brook in that there was a range of
substrates types, predominately consisting of clay/mud banks, with silt and gravel stream
beds. Also, a few areas had high numbers of natural refuges, in the form of rubble and
masonry. Vegetation on the riverbanks was similar in both water bodies, although access to
some of the sites were more difficult on the River Greet.
This study shows that there is a significant positive association between the percentage of clay
content of the stream bank and burrow density at the River Greet, similar to that shown at the
Gaddesby Brook. This indicates that two separate populations of P. leniusculus are selecting
the same substrate type in which to burrow.
It was also found that P. leniusculus had spread in both an upstream and downstream
direction since recorded by Harris in 1999. This was somewhat different than the situation in
the Gaddesby Brook, where range extension is predominantly in a downstream direction.
114
Discussion
When the range extension data was overlaid with data of the Gaddesby Brook, it could be
seen that the rate of range extension appeared to be fairly similar. If this does prove to be the
case, that is, when more data is collected over the next few years, it could be that this
population of P. leniusculus will soon be prevalent in the R. Trent.
4.2. Observations of burrowing and associated behaviour in the laboratory
4.2.1 Crayfish behaviour before, during and after burrowing
Male and female P. leniusculus of varying sizes (CL = 20.7 - 66.2 mm) were videoed
constructing burrows. The methods used in burrow construction were similar for all sizes and
both sexes. This was also reported by Rogers and Huner (1985), for both Fallicambarus
hedgpethi and Procambarus planirostris.
On initial introduction to experimental tanks, all crayfish took time to ‘explore’ before burrow
construction or ‘resting*. During this period, there was rapid antennae movement and probing
of the substrate by 3rd maxillipeds and 2nd and 3rd pereopods. It could be suggested that this
behaviour was to establish whether substrate was suitable for burrowing. Similar tank
exploration was noted for adult P. planirostris, P. clarkii, and P. a. acutus (Rogers and Huner,
1985).
A correlation was found between crayfish size and the amount of time taken to begin burrow
construction after introduction to the tank. The quickest initiation time recorded was 30
minutes for a small crayfish, with larger crayfish sometimes taking over two days. It could be
postulated that this behaviour reflects the need of small individuals to obtain shelter quickly
because of a higher risk of predation. Rogers and Huner (1985), investigated the initiation
times for burrowing of P. planirostris, P. clarkii, P. a. acutus. Procambarus planirostris was
found to initiate burrowing after only 6 minutes; P clarkii took from between 10 minutes and
several hours, whilst all of P.a.acutus took several hours. All three species were reported to
have completed burrow construction overnight. This was different to that of P. leniusculus, as
in some instances, it took up to 3 days to complete burrow construction. This supported
findings by Guan (1994) who found that adult P. leniusculus required periods from several
hours to days to complete burrow excavations.
115
Discussion
There were two main methods of burrow excavation. These were: Method 1: entering the
burrow headfirst and using the chelae to chisel away at the burrow walls. Method 2: entering
the burrow abdomen first, and utilising the tail and abdomen to scoop up sediment, before
returning to the burrow entrance, turning and releasing the sediment. Both excavation
methods, in order to remove fine sediments, generated a current of water by the synchronous
beating of the pleopods. This was done, whilst excavating in the burrow for Method 1, and at
the burrow entrance, whilst releasing the sediment collected in the abdomen, for Method 2.
Observations on the burrow excavation of P. leniusculus were noted by Guan (1994), who
described the method of digging using the chelae and walking legs, but made no mention of
reversed entrance or extraction of sediment utilising pleopods. However, reversed entrance
and use of the abdomen for sediment removal has been observed in the Norwegian lobster
Nephrops norvegicus (Rice and Chapman, 1971) and extraction of fine sediments utilising
vigorous fanning of the pleopods has be observed in the lobster Homarus americanus (Cobb,
1971).
From these observations, it was seen that chelae played an important role in burrow
construction. However, as demonstrated by Trepanier and Dunham (1999), for some juvenile
Fallicambarus fodiens, burrow construction still occurred when both major chelipeds were
missing. This suggests that chelipeds are not essential for at least some individuals, and that
pereopod use is an important part of burrow construction.
Differences between male and female crayfish, in the time taken to initiate burrowing, showed
that females started burrowing significantly earlier than male crayfish. This could be due,
either to the fact that female crayfish are generally smaller and therefore more vulnerable to
predation, or, because burrowing is of greater priority to female crayfish. For example, once a
burrow was constructed, less energy would be utilised on defence and position maintenance,
so more could be diverted towards reproduction.
A significant association was also found between crayfish size and burrow entrance area. Two
possible reasons for this were; constructing a burrow bigger than necessary would require an
unnecessary increase in energy expenditure and by having a ‘burrow to fit’, smaller
individuals would be better protected. Burrow defence would be easier because of exclusion
from larger conspecifics.
116
Discussion
There were significant associations found between burrow length and carapace length,
showing that larger individuals constructed longer burrows. There was also a significant
association between construction time with that of burrow length and burrow entrance size i.e.
larger burrows took longer to build.
4.2.2 Substrate Choice Experiments
Establishing preferred substrate types selected by P. leniusculus is important in the
understanding of their patterns of distribution and their colonisation of new areas.
A number of laboratory substrate choice experiments have been conducted, but the majority
focussed on the most suitable substrate for commercial farming. The purpose of these
experiments was to promote good growth and reduced mortality (Klosterman and Goldman,
1983; Kozak et al., 2002; Mason, 1978; Savolainen et al., 2003). As such, limited substrate
types were tested and few reflected substrate types that might have been preferred by animals
in the natural environment.
Adult P. leniusculus were shown to have distinct substrate preferences when provided with a
choice. A significant preference for ‘mud’ was shown over that of ‘gravel’. This was also
shown by Vorburger and Ribi (1998), where they concluded that mud was preferred over
pebbles (8 -1 6 mm). This may have been because neither gravel nor pebble substrates
offered structural shelter. The mud did allow the crayfish to part conceal their bodies, an
advantage in the natural environment, as it would offer camouflage from potential predators.
Although this behaviour was not observed in the Gaddesby Brook, it was noted by Guan
(1994), for P. leniusculus in the River Great Ouse ‘crayfish simply buried themselves in the
surface mud of the river bottom’.
When P. leniusculus was provided with a choice between ‘mud’ and ‘clay bank’, a significant
preference was shown for ‘clay bank’. All crayfish that selected this substrate either
constructed a burrow or created a small depression in which to sit, normally against a tank
wall. This was supported by Correia and Ferreira (1995), who found that burrowing activity
only occurred when the ratio of fine particles over coarser particles was higher than 0.1 - 0.2.
Construction of a burrow in the natural environment could possibly offer greater protection
from predators than concealment in mud. However, it could also be argued that making a
117
Discussion
depression in the clay bank was less effective as a camouflage than concealment in mud. This
poses the question of why did P. leniusculus select clay? The answer could be because the
risk of predation was offset by the disadvantages of loose mud particles, having the potential
to reduce gill function due to clogging as found with the lobster Homarus americanus
(Wilkins, 1972), or perhaps because a depression in clay offers better protection from
variations in stream flow.
The most favoured substrate type was that of an ‘artificial shelter’ which could instantly
provide refuge without the need to construct a burrow. This agreed with Shimizu and
Goldman (1983), who found that in a river in Sacramento, P. leniusculus preferred areas in
which there was a rocky substrate, although indications of other substrates available were not
mentioned. Klosterman and Goldman (1983), also found that P. leniusculus preferred larger
mixed rocks, where shelter could be provided, to that of small gravel. Burrowing is
considered to be energy expensive (Atkinson and Taylor, 1988), so it is not surprising that if a
similarly protective environment is available which negates the need to expend energy in
burrow construction, then it would be first choice. However, this is not the case for all
crayfish species, for example, adult Orconectes species were found to prefer to construct
burrows under rocks, cobbles and between stones, rather than to inhabit cracks and crevices
between them (Hasiotis, 1993a).
Another important factor governing substrate choice was found to be competition from
conspecifics. Although the preferred substrate was ‘artificial shelter’, when a group of adults
was placed in a high-density situation where ‘artificial shelters’ were limited, it was observed
that some individuals were excluded and forced to occupy a less favoured substrate. Thus
conspecific competition maybe an important mechanism in habitat colonisation (Levenbach
and Hazlett, 1996).
On no occasion was an ‘artificial shelter’ found to be occupied by more than one individual
and on most occasions the shelters were occupied by the largest crayfish. This further
supports observations by Ranta and Lindstrom (1993), where it was found that the larger the
weight ratio between two opponents competing for shelter, the greater the likelihood of the
larger individual ‘winning’. However Peeke et al. (1995), observed that prior residence could
affect shelter possession. In same-sex P. leniusculus encounters, 76% of female residents
retained shelter possession, as did approximately 70% of male residents. In mixed-sex
118
Discussion
encounters of P. leniusculus, female residents retained shelter possession against male
intruders in 80% of cases, whilst male residents only retained 33% of encounters. This would
indicate that size is not solely responsible for crayfish displacements.
From this and individual choice experiments, it was found that the order of preference starting
with most preferred first, was ‘artificial shelter’, ‘clay bank’, ‘mud’ and ‘gravel’. The
relevance of this in the field means that areas with natural refuges would be occupied first,
before burrow construction
Juvenile substrate choice experiments were also conducted and showed that juvenile
P. leniusculus had different substrate preferences to that of adult individuals. There was no
significant preference shown between ‘clay bank’ and ‘artificial shelter’, and both of these
were preferred over ‘mud’. ‘Clay’ was also preferred over gravel. Juveniles that selected
‘clay’ either, positioned themselves on the clay next to the tank wall, or, hid their bodies in
the sediment or burrowed (demonstrating the ability of newly independent P. leniusculus to
burrowing). Due to there being no significant preference between burrowing or provided
shelter, this could imply that in the field, juveniles showed no preference between natural
refuges and burrowing unless influenced by other factors, such as, stream velocity, food
availability, predation and interspecific encounters (Flinders and Magoulick, 2003; Gherardi
et a l , 2002b). Blake and Hart (1993), suggested that gravid females may exert a strong
influence on the initial distribution of the juvenile P. leniusculus.
Another reason why juveniles may choose to burrow or take refuge in ‘artifical shelter’ may
be attributed to the need for darkness. Darkness appears to be a controlling factor in cover
seeking behaviour by Orconectes rusticus and Procambarus clarkii (Alberstadt et al., 1995;
Antonelli et al., 1999).
In an experiment by Mason (1978), three substrate conditions were compared, bare floor,
pebbles and burrows (artificial). The findings demonstrated that survival of juvenile P.
leniusculus was highest in burrows, and that an increased usage of burrows was directly
dependent on an increase in population density. As the most vulnerable period for the
crayfish, regarding predation, is, the juvenile stage, particularly between hatching and finding
a suitable ‘safe’ refuge (Blake and Hart, 1993), the ability to be able to construct a burrow
immediately on independence would certainly be an advantage.
119
Discussion
4.23 Rates o f burrow irrigation by crayfish and passive irrigation
Although a burrow-dwelling lifestyle offers many advantages, one disadvantage is that
occupants are faced with the problems of reduced oxygen tension (hypoxia) and elevated
levels of carbon dioxide and ammonia (Astall et al., 1997; see section 4.1.3). Several
burrowing decapods, such as, Nephrops norvegicus, Upogebia stellata and Callianassa
subterranea overcome this problem by irrigating their burrows. This was done either by
means of an increased ventilation current, pleopod beating, or both (Astall et al., 1997;
Gerhardt and Baden, 1998; Stamhuis and Videler, 1998a, 1998b, 1998c).
Studies of burrow irrigation by decapods are limited (Astall et al., 1997; Dworschak, 1981;
Gerhardt and Baden, 1998), with only a small number quantifying rates of irrigation, such as,
Dworschak (1981), who found the pumping rate of Upogebia pusilla to be in the range of 5 to
900 ml/h using over flow apparatus. To date, burrow irrigation by P.leniusculus has not been
documented, probably because they were only first discovered to be burrowers in Britain in
1995 (Guan, 1995).
The laboratory experiment in this study was deliberately set up to expose each crayfish to
artificially created hypoxic burrow waters, in order to produce a rapid irrigation response and
a means of calculating a mean maximum irrigation rate (see section 3.2.3). It also insured the
use of their main irrigation technique, which was primarily an increased ventilation rate, with
only two animals also utilising their pleopods. This was different to the situation found for N.
norvegicus in which all individuals utilised pleopod activity when placed in a hypoxic water-
filled burrow (Gerhardt and Baden, 1998). In initial trials, a few crayfish also had the
tendency to move to and from the burrow entrance (until restricted) and this also proved to be
an effective means of exchanging internal burrow water with normoxic external water and is
probably another adaptive mode of irrigation.
The artificial situation created in the laboratory placed P. leniusculus under extreme
conditions, which are unlikely to be replicated in the field. Burrow irrigation is energetically
expensive (Atkinson and Taylor, 1988), and it is unlikely that signal crayfish will irrigate to
the extent described above unless necessary for survival. However, the evidence did suggest
that some form of water exchange was taking place because toxic levels of Pco2 , P0 2 and Tamm
were not reached in occupied burrows in the field (see section 4.2.3).
1 2 0
Discussion
There are several possibilities for this water exchange. It could be through normal ventilation
by the animal, water exchange due to stream flow (passive irrigation) or by active irrigation
by the crayfish.
This study investigated the possibility of passive irrigation and found that it did occur. Results
showed that with increased water velocity there was an increase in burrow water exchange.
Since the levels of ammonia, PCO2 and P0 2 were not the same as external stream water and
because irrigation is costly in terms of energy expenditure, the most likely explanation is that
the majority of water exchange occurs from normal ventilation or passively as a result of
stream flow. When necessary, active irrigation could occur if unfavourable levels of
ammonia, PC0 2 and P0 2 were reached.
According to Astall et al. (1997), the complexity of the burrow architecture affected the
spatial distribution of oxygen through the burrow. Thus, the simple burrow with a single
entrance constructed by P. leniuscuius, may be of significance. This shape may make burrow
water exchange more effective, reducing the need to actively irrigate.
The mean calculated irrigation rate resulting from an increased ventilation rate was 14.8 1 h '1.
As this was obtained from changes in P0 2 levels, the picture is slightly more complex as the
process of irrigation is in itself oxygen consuming. Thus, the figure of 14.8 h_1 maybe a slight
over-estimation of actual irrigation rate. Over the duration of the experiment, the internal
burrow water P0 2 did not reach that of the external water. This was most likely the result of an
equilibrium having been reached between the rate of O2 consumption and the rate of
irrigation.
Burrow irrigation rates did not correlate with animal size, which meant that smaller
individuals were managing to create a greater flow of water over their gills. There were also
no significant differences in irrigation rates between male or female crayfish. This may be due
to smaller crayfish having a faster scaphognthite pumping rate, or as described by Burggren
and McMahon (1983), for O. virilis, stroke volume was adjustable. This was achieved either
by changes in the position or flexibility of the scaphognthites, thereby increasing performance
due to increased pressure and sealing, or, by changing the geometry of the scaphognthite
channel by raising or depressing the epipodites of the first maxillipeds.
1 2 1
Discussion
4.2.4 Management prospects for the future
According to Holdich et al. (1999), it seems inevitable that alien crayfish species like P.
leniusculus will remain in our waterways until suitable methods for eradication are found that
are specific and environmentally sound. Failing the discovery of such methods the only way
forward is damage limitation. This is already occurring in many areas where intense trapping
and removals from waterways are being carried out to control alien species like P.
leniusculus. With a view to preserving native species from the impact of alien crayfish, ‘at
risk’ populations of A. pallipes are being transplanted into isolated ponds and lakes in the
hope of preserving the genetic variation of the species.
Over the last few years a database has been set up in the U.K., detailing distribution of both
native and alien species of crayfish, both regionally and nationally. As this needs to be
regularly updated, studies focussing in part on population densities and population spread are
important. Hopefully, the relevant information gathered in this thesis will be entered onto the
database and the findings will also help with the control and management of P. leniusculus.
Data in this study suggest that it may be the juveniles that are mainly responsible for
downstream range extension. Evidence to support this theory is threefold.
Firstly, through radio tracking and long-term streamer tagging it was found that most adult P.
leniusculus remained in the same vicinity for up to two years. Their movements were centred
around their refuge/burrow and neither flooding nor increased water velocity dislodged them.
And yet, during that time, population expansion occurred and the species continued to extend
its range downstream.
Secondly, the burrow opening dimensions measured in the field were found to be significantly
smaller towards the leading edge of range extension, suggesting that smaller more vulnerable
animals, which include juveniles, dug these burrows.
Thirdly, although not observed in this research, Peay and Rogers (1999), reported that the
expansion of P. leniusculus was intermittent rather than a uniform spread. It was suggested
that the reason for this was a reluctance to move into and beyond unfavourable habitats, thus
delaying spread until full population capacity was reached. It could be surmised that smaller
1 2 2
Discussion
crayfish, including juveniles, may drive the initial colonisation of new sites, as these animals
are less able to defend themselves in high-density populations.
Forecasts on preferred sites for population expansion can be deduced by understanding the
substrate preferences of P. leniusculus. It was found in this study that adult P. leniusculus
preferred artificial shelters. It may therefore be possible to either slow downstream range
extension of the adult species by substrate manipulation. For example, by the introduction of
more artificial shelters, which would reduce the need for animals to seek new habitats and
contain them within areas where they can be more easily trapped.
Juvenile P. leniusculus, however, showed different substrate choices to that of adults, with an
equal preference for either clay or artificial shelters. If juveniles are more likely to be
responsible for the majority of downstream range extension, as the results suggest, this
difference in substrate preference may well be an adaptive advantage, as it enables the
juveniles to occupy a greater variety of downstream sites. However, it makes substrate
manipulation as an effective strategy to slow downstream range more challenging.
Knowledge of substrate preference enables the identification of sites vulnerable to bank
damage. It was found that adults only constructed burrows where there were no available
existing shelters and where there were stream banks with sufficient clay content. By either
manipulating substrates so that P. leniusculus are encouraged to bypass high-risk areas, for
example, where bank erosion will cause severe flooding, or by introducing alternative
artificial shelters so that burrowing does not occur, some control, although limited, of bank
erosion may be possible. This would not be a solution to curtail the activities of the juveniles,
but as they are much smaller their burrowing activities have less of an impact on bank erosion
and as they grow into adulthood their preference to occupy existing refuges before burrowing
will develop.
The above strategies are only short-term solutions. Both would however, either provide a
degree of control with regards to downstream range expansion or at the very least delay it,
providing some much needed time before more radical or efficient methods of eradication are
developed, like suitable biocides or biological control.
123
Discussion
Knowledge of water chemistry within the burrow is important because it is possible to predict
animal presence, either from the high levels of ammonia or by lower oxygen concentrations.
These results mean that it is possible to identify burrows that are inhabited without causing
further bank damage. It was also found that P. leniusculus burrows were irrigated both
passively and actively. With this data, the possible use of biocides or other controls could be
successfully used to eradicate P. leniusculus if a species specific type could be developed. It
should also help in calculations of in-burrow biocide concentrations and persistence.
Furthermore, information on the time span of burrowing, the type of burrows and the
mechanics of burrowing may be useful to support predictions on bank erosion. This data
would also help decisions regarding the use of biocides.
Finally, the work comparing the range extension of P. leniusculus in the River Greet with that
of the Gaddesby Brook has proved to be of some importance. It shows that a second separate
population of P. leniusculus displays a similar pattern of range extension. This suggests that
this model could be applied to other populations in the UK in order to predict spread. Also the
polynomial expansion recorded shows the importance of dealing with outbreaks sooner rather
than later, at the time when the population is still trying to establish itself i.e. less man hours
would be needed in terms of clearance work to limit spread.
124

Appendices
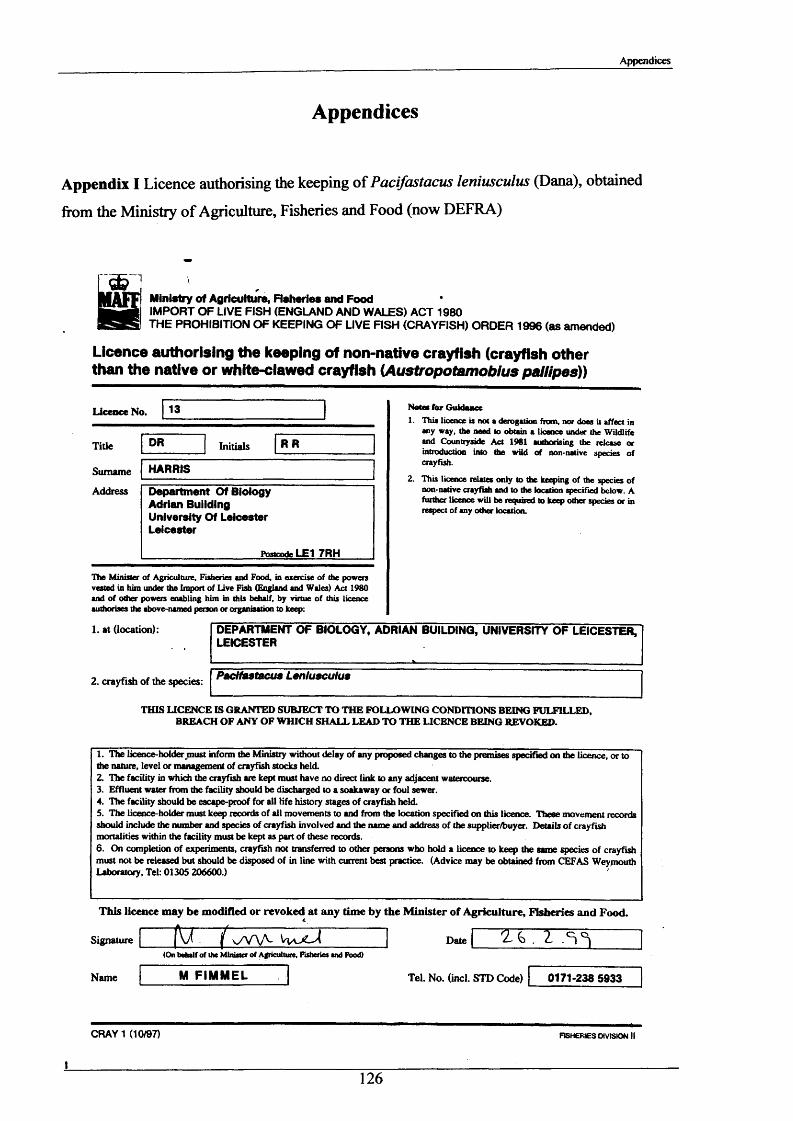
Appendices
Appendices
Appendix I Licence authorising the keeping of Pacifastacus leniusculus (Dana), obtained
from the Ministry of Agriculture, Fisheries and Food (now DEFRA)
WMinistry of Agriculture, Fisheries and FoodIMPORT OF LIVE FISH (ENGLAND AND WALES) ACT 1980THE PROHIBITION OF KEEPING OF LIVE FISH (CRAYFISH) ORDER 1996 (as amended)
Licence authorising the keeping of non-native crayfish (crayfish other than the native or white-clawed crayfish lAustropotamobius pal/ipes))
Licence No. 13
Tide
Surname
Address
DR Initials RR
HARRIS
Department Of Biology Adrian Building University Of Leicester Leicester
Postcode LE1 7RH
The Minister of Agriculture, Fisheries and Food, in exercise of the powers vested in him under the Import of Live Fish (England and Wales) Act 1980 and of other powers enabling him in this behalf, by virtue of this licence authorises the above-named person or organisation to keep:
Notes for Guidance1. This licence is not a derogation from, nor does it affect in
any way, the need to obtain a licence under the Wildlife and Countryside Act 1981 authorising the release or introduction into the wild of non-native species of crayfish.
2. This licence relates only to the keeping of the species of non-native crayfish and to the location specified below. A further licence will be required to keep other species or in respect of any other location.
1. at (location):
2. crayfish of the species: Pacifastacus Leniusculus
DEPARTMENT OF BIOLOGY, ADRIAN BUILDING, UNIVERSITY OF LEICESTER, LEICESTER
THIS LICENCE IS GRANTED SUBJECT TO THE FOLLOWING CONDITIONS BEING FULFILLED, BREACH OF ANY OF WHICH SHALL LEAD TO THE LICENCE BEING REVOKED.
1. The licence-holdermust inform the Ministry without delay of any proposed changes to the premises specified on the licence, or to the nature, level or management of crayfish stocks held.2. The facility in which the crayfish are kept must have no direct link to any adjacent watercourse.3. Effluent water from the facility should be discharged to a soakaway or foul sewer.4. The facility should be escape-proof for all life history stages of crayfish held5. The licence-holder must keep records of all movements to and from the location specified on this licence. These movement records should include the number and species of crayfish involved and the name and address of the supplier/buyer. Details of crayfish mortalities within the facility must be kept as part of these records.6. On completion of experiments, crayfish not transferred to other persons who hold a licence to keep the same species of crayfish must not be released but should be disposed of in line with current best practice. (Advice may be obtained from CEFAS Weymouth Laboratory, Tel: 01305 206600.)
This licence may be modified or revoked at any time by the Minister of Agriculture, Fisheries and Food.
\ J . { v/vyvSignature
Name
Date(On behalf of the M iniiter of Agriculture, Fisheries and Food)
ZS>. 1
M FIMMEL Tel. No. (incl. STD Code) 0171-238 5933
CRAY 1 (10/97) FISHERIES DIVISION II
126
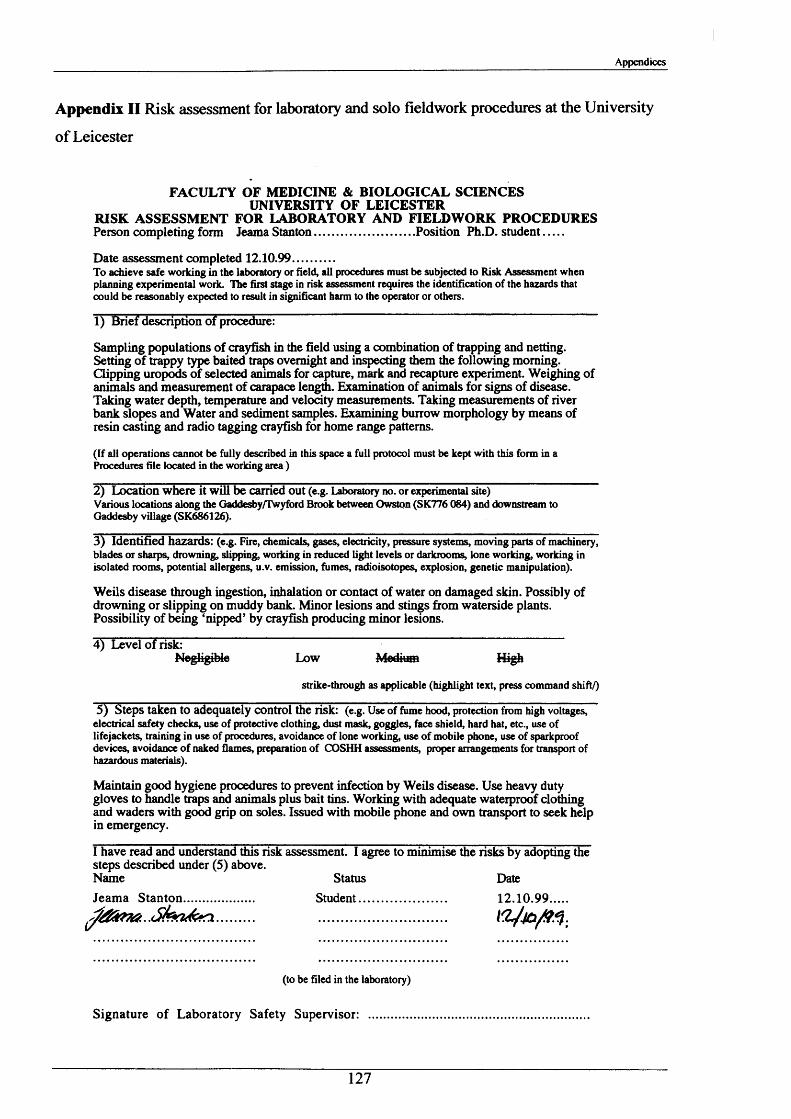
Appendices
Appendix II Risk assessment for laboratory and solo fieldwork procedures at the University
of Leicester
FACULTY OF MEDICINE & BIOLOGICAL SCIENCES UNIVERSITY OF LEICESTER
RISK ASSESSMENT FOR LABORATORY AND FIELDWORK PROCEDURESPerson completing form Jeama Stanton........................... Position Ph.D. student.....
Date assessment completed 12.10.99...........To achieve safe working in the laboratory or field, all procedures must be subjected to Risk Assessment when planning experimental work. The first stage in risk assessment requires the identification of the hazards that could be reasonably expected to result in significant harm to the operator or others.
1) Brief description of procedure:
Sampling populations of crayfish in the field using a combination of trapping and netting. Setting of trappy type baited traps overnight and inspecting them the following morning, dipping uropods of selected animals for capture, mark and recapture experiment. Weighing of animals and measurement of carapace length. Examination of animals for signs of disease. Taking water depth, temperature and velocity measurements. Taking measurements of river bank slopes and Water and sediment samples. Examining burrow morphology by means of resin casting and radio tagging crayfish for home range patterns.
(If all operations cannot be fully described in this space a full protocol must be kept with this form in a Procedures file located in the working area )
2) Location where it will be carried out (e.g. Laboratory no. or experimental site)Various locations along the Gaddesby/Twyford Brook between Owston (SK776 084) and downstream to Gaddesby village (SK686126).
3) Identified hazards: (e.g. Fire, chemicals, gases, electricity, pressure systems, moving parts of machinery, blades or sharps, drowning, slipping, working in reduced light levels or darkrooms, lone working, working in isolated rooms, potential allergens, u.v. emission, fumes, radioisotopes, explosion, genetic manipulation).
Weils disease through ingestion, inhalation or contact of water on damaged skin. Possibly of drowning or slipping on muddy bank. Minor lesions and stings from waterside plants. Possibility of being ‘nipped’ by crayfish producing minor lesions.
4) Level of risk:Negligible Low Medium High
strike-through as applicable (highlight text, press command shift/)
5) Steps taken to adequately control the risk: (e.g. Use of fume hood, protection from high voltages, electrical safety checks, use of protective clothing, dust mask, goggles, face shield, hard hat, etc., use of lifejackets, training in use of procedures, avoidance of lone working, use of mobile phone, use of sparkproof devices, avoidance of naked flames, preparation of COSHH assessments, proper arrangements for transport of hazardous materials).
Maintain good hygiene procedures to prevent infection by Weils disease. Use heavy duty gloves to handle traps and animals plus bait tins. Working with adequate waterproof clothing and waders with good grip on soles. Issued with mobile phone and own transport to seek help in emergency.
I have read and understand this risk assessment. I agree to minimise the risks by adopting the steps described under (5) above.Name Status DateJeama Stanton................... Student........................ 12.10.99....
Sfesa&a ............................. KL/j&ftq.
(to be filed in the laboratory)
Signature of Laboratory Safety Supervisor: ...........
127

Appendices
Appendix III Letter outlining the project (from the Environment Agency), which was shown
to landowners, when seeking permission for access to their land
To whom it may concern
ENVIRONMENT AGENCY: CRAYFISH SURVEY, GADDESBY BK & R.GREET
Previous work has identified the presence of the non-native crayfish, Pacifastacus leniusculus, in large numbers within the above watercourses. These populations represent a significant threat to local fauna and flora, including the native crayfish Austropotamobius pallipes, which is becoming increasingly threatened across many parts of England and Wales.
The Environment Agency, in partnership with Leicester University, is undertaking to investigate the behaviour and distribution of non-native crayfish in Midlands Region, and reduce established populations where possible.
The person in possession of this letter is working with die Environment Agency to undertake survey work in this area. Your co-operation in allowing them access to parts of the brook or tributaries on your land would be very much appreciated.
Should you require further information regarding this work please contact the Fisheries, Ecology and Recreation section based at our Nottingham office, op 0115 846 3625 and ask for Peter Sibley (biologist).
Yours faithfully
PETER SIBLEY Biologist
EavtroMMBt AfeacyTrentside Offices, Scarrington Road, West Bridgfbrd, Nottingham, NG2 SFA Tel: 0115 945 5722 Fax 0115 981 7743
Our ref: PJS/letautK99Your ref:
En v ir o n m e n tAg e n c y
Date: 17 December 1999
h:\ay dcriw »nU\crayfiA\t»ddwby-frecrpp. lctMdh99.doc
128
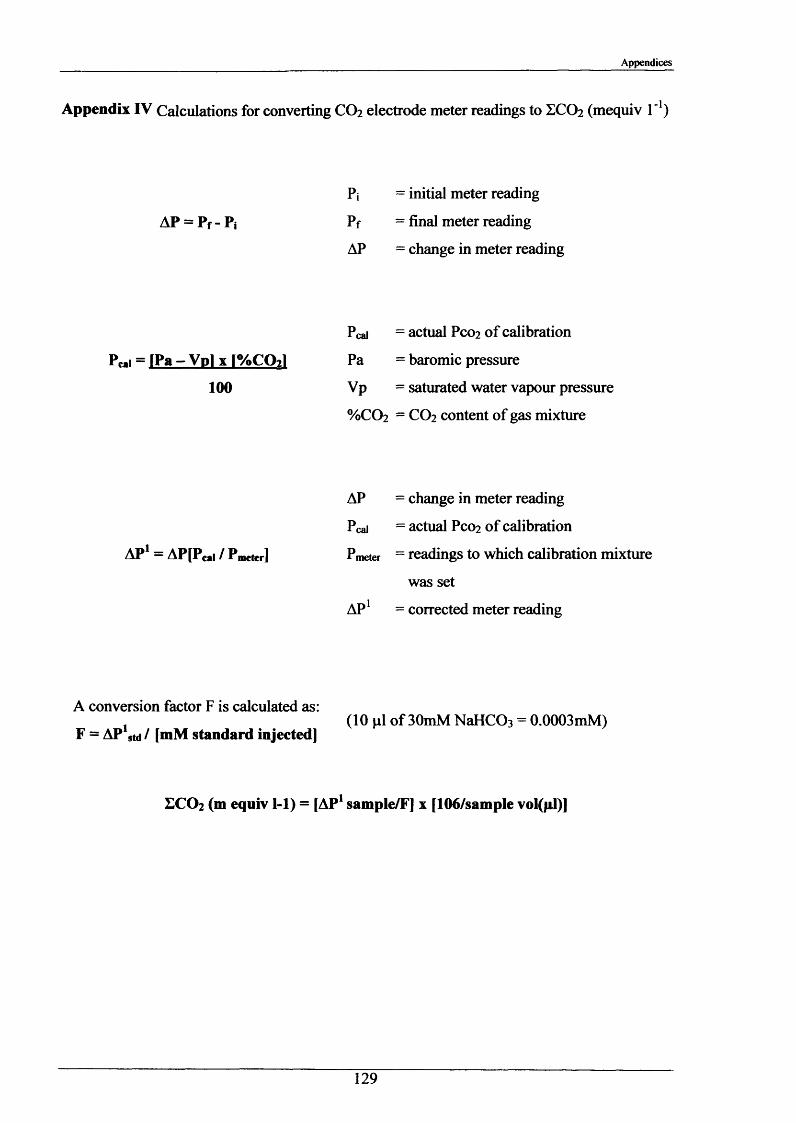
Appendices
Appendix IV Calculations for converting CO2 electrode meter readings to ZCO2 (mequiv I '1)
Pi = initial meter reading
A P = P f - Pj P f = final meter reading
A P = change in meter reading
Pcai = actual PC0 2 of calibration
Pca. = l P a - V p l x r % C 0 21 Pa = baromic pressure
100 Vp = saturated water vapour pressure
%C02 = CO2 content of gas mixture
A P = change in meter reading
Pcai = actual PC0 2 of calibration
A P 1 = A P [P cai / Praetor] Pmeter = readings to which calibration mixture
was set>1
A P = corrected meter reading
A conversion factor F is calculated as:, (10 pi of 30mM NaHC03 = 0.0003mM)
F = AP std / [mM standard injected]
ICO 2 (m equiv 1-1) = [AP1 sample/F] x [106/sample vol(pl)]
129
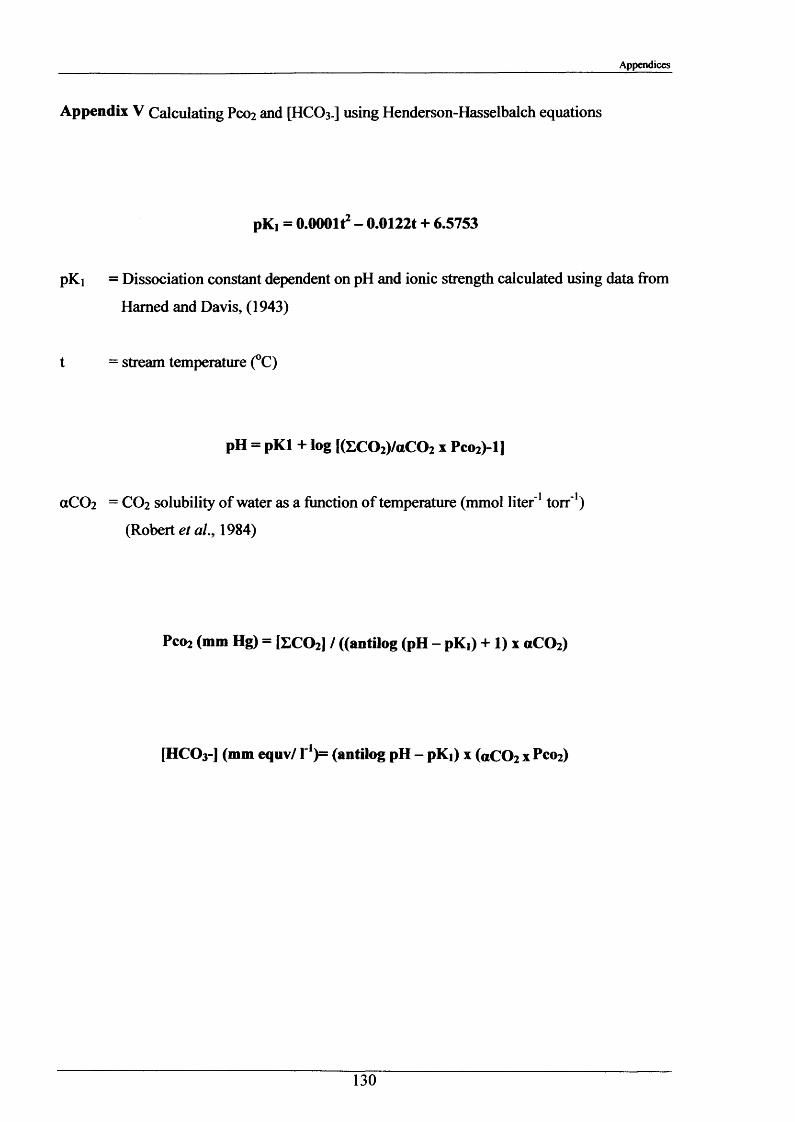
Appendices
Appendix V Calculating Pco2 and [HCO3-] using Henderson-Hasselbalch equations
pK, = O.OOOlt2 - 0.0122t + 6.5753
pKj = Dissociation constant dependent on pH and ionic strength calculated using data from
Hamed and Davis, (1943)
t = stream temperature (°C)
pH = pKl + log [(£C02)/aC02 x Pco2)-l]
aC 0 2 = C 02 solubility of water as a function of temperature (mmol liter' 1 torr*1)
(Robert et a l 1984)
Pco2 (mm Hg) = [£C0 2] / ((antilog (pH - pK,) + 1) x «C 02)
[HCO3-] (mm equv/1'1 (antilog pH - pKi) x («C02 x Pco2)
130
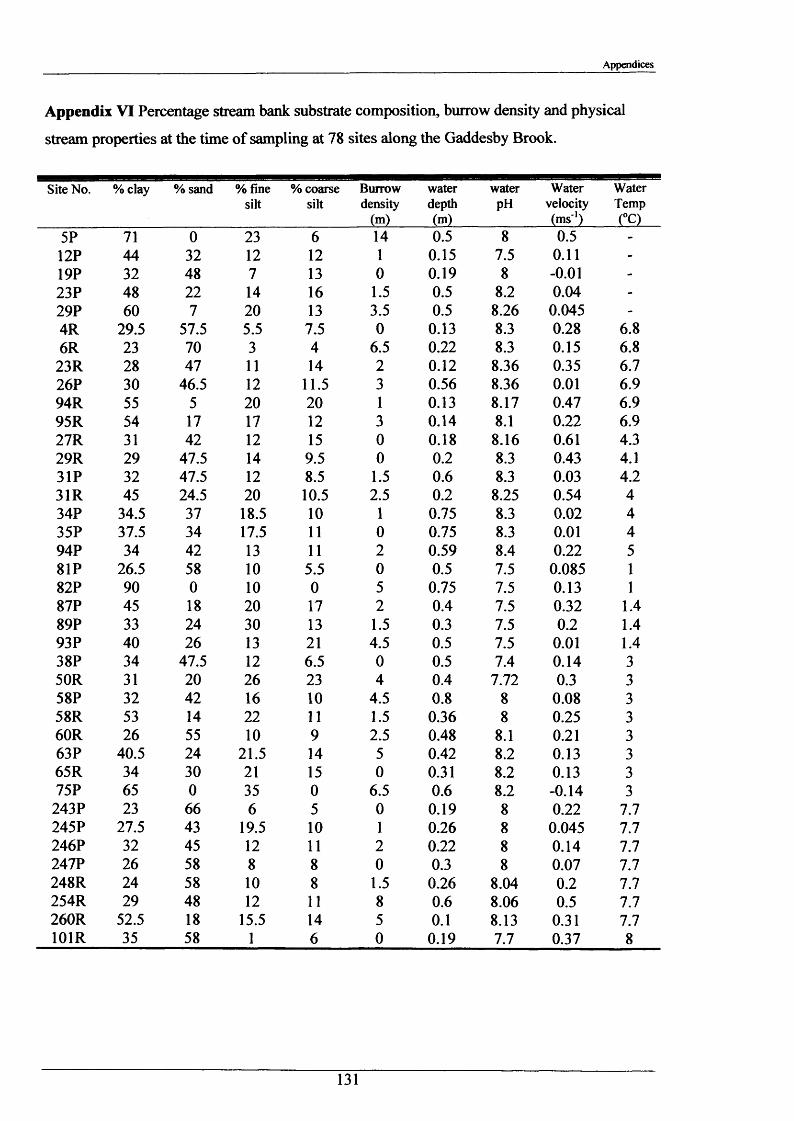
Appendices
Appendix VI Percentage stream bank substrate composition, burrow density and physical
stream properties at the time of sampling at 78 sites along the Gaddesby Brook.
Site No. % clay % sand % fine silt
% coarse silt
Burrowdensity
(m)
waterdepth(m)
waterpH
Watervelocity(m s1)
WaterTemp(°C)
5P 71 0 23 6 14 0.5 8 0.5 -
12P 44 32 1 2 1 2 1 0.15 7.5 0 .1 1 -
19P 32 48 7 13 0 0.19 8 -0 .0 1 -
23P 48 2 2 14 16 1.5 0.5 8 . 2 0.04 -
29P 60 7 2 0 13 3.5 0.5 8.26 0.045 -
4R 29.5 57.5 5.5 7.5 0 0.13 8.3 0.28 6 . 8
6 R 23 70 3 4 6.5 0 . 2 2 8.3 0.15 6 . 8
23R 28 47 11 14 2 0 . 1 2 8.36 0.35 6.726P 30 46.5 1 2 11.5 3 0.56 8.36 0 .0 1 6.994R 55 5 2 0 2 0 1 0.13 8.17 0.47 6.995R 54 17 17 1 2 3 0.14 8 .1 0 . 2 2 6.927R 31 42 1 2 15 0 0.18 8.16 0.61 4.329R 29 47.5 14 9.5 0 0 . 2 8.3 0.43 4.131P 32 47.5 1 2 8.5 1.5 0 . 6 8.3 0.03 4.231R 45 24.5 2 0 10.5 2.5 0 . 2 8.25 0.54 434P 34.5 37 18.5 1 0 1 0.75 8.3 0 . 0 2 435P 37.5 34 17.5 11 0 0.75 8.3 0 . 0 1 494P 34 42 13 11 2 0.59 8.4 0 . 2 2 581P 26.5 58 1 0 5.5 0 0.5 7.5 0.085 1
82P 90 0 1 0 0 5 0.75 7.5 0.13 1
87P 45 18 2 0 17 2 0.4 7.5 0.32 1.489P 33 24 30 13 1.5 0.3 7.5 0 . 2 1.493P 40 26 13 2 1 4.5 0.5 7.5 0 .0 1 1.438P 34 47.5 1 2 6.5 0 0.5 7.4 0.14 350R 31 2 0 26 23 4 0.4 7.72 0.3 358P 32 42 16 1 0 4.5 0 . 8 8 0.08 358R 53 14 2 2 11 1.5 0.36 8 0.25 360R 26 55 1 0 9 2.5 0.48 8 .1 0 .2 1 363P 40.5 24 21.5 14 5 0.42 8 . 2 0.13 365R 34 30 2 1 15 0 0.31 8 . 2 0.13 375P 65 0 35 0 6.5 0 . 6 8 . 2 -0.14 3243P 23 6 6 6 5 0 0.19 8 0 . 2 2 7.7245P 27.5 43 19.5 1 0 1 0.26 8 0.045 7.7246P 32 45 1 2 11 2 0 . 2 2 8 0.14 7.7247P 26 58 8 8 0 0.3 8 0.07 7.7248R 24 58 1 0 8 1.5 0.26 8.04 0 . 2 7.7254R 29 48 1 2 11 8 0 . 6 8.06 0.5 7.7260R 52.5 18 15.5 14 5 0 .1 8.13 0.31 7.7101R 35 58 1 6 0 0.19 7.7 0.37 8
131
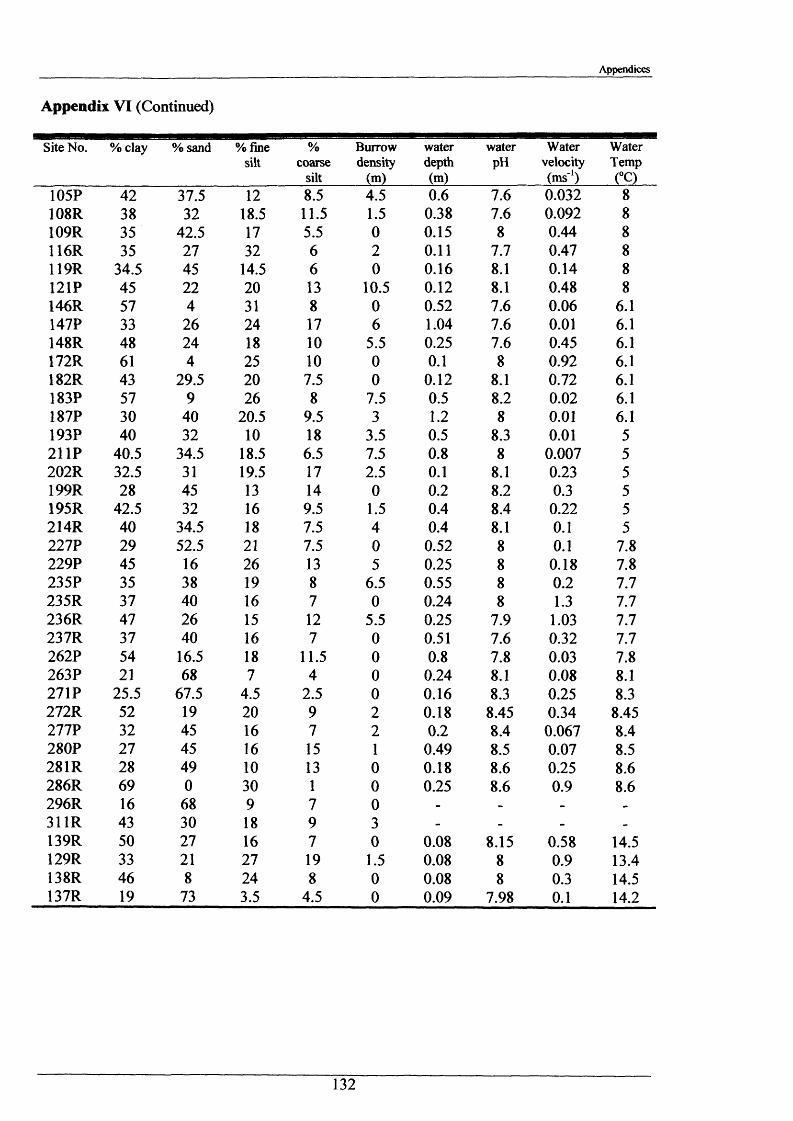
Appendices
Appendix VI (Continued)
Site No. % clay % sand %finesilt
%coarse
silt
Burrowdensity
(m)
waterdepth(m)
waterpH
Watervelocity(m s1)
WaterTemp(°C)
105P 42 37.5 12 8.5 4.5 0.6 7.6 0.032 8108R 38 32 18.5 11.5 1.5 0.38 7.6 0.092 8109R 35 42.5 17 5.5 0 0.15 8 0.44 8116R 35 27 32 6 2 0.11 7.7 0.47 8119R 34.5 45 14.5 6 0 0.16 8.1 0.14 8121P 45 22 20 13 10.5 0.12 8.1 0.48 8146R 57 4 31 8 0 0.52 7.6 0.06 6.1147P 33 26 24 17 6 1.04 7.6 0.01 6.1148R 48 24 18 10 5.5 0.25 7.6 0.45 6.1172R 61 4 25 10 0 0.1 8 0.92 6.1182R 43 29.5 20 7.5 0 0.12 8.1 0.72 6.1183P 57 9 26 8 7.5 0.5 8.2 0.02 6.1187P 30 40 20.5 9.5 3 1.2 8 0.01 6.1193P 40 32 10 18 3.5 0.5 8.3 0.01 5211P 40.5 34.5 18.5 6.5 7.5 0.8 8 0.007 5202R 32.5 31 19.5 17 2.5 0.1 8.1 0.23 5199R 28 45 13 14 0 0.2 8.2 0.3 5195R 42.5 32 16 9.5 1.5 0.4 8.4 0.22 5214R 40 34.5 18 7.5 4 0.4 8.1 0.1 5227P 29 52.5 21 7.5 0 0.52 8 0.1 7.8229P 45 16 26 13 5 0.25 8 0.18 7.8235P 35 38 19 8 6.5 0.55 8 0.2 7.7235R 37 40 16 7 0 0.24 8 1.3 7.7236R 47 26 15 12 5.5 0.25 7.9 1.03 7.7237R 37 40 16 7 0 0.51 7.6 0.32 7.7262P 54 16.5 18 11.5 0 0.8 7.8 0.03 7.8263P 21 68 7 4 0 0.24 8.1 0.08 8.1271P 25.5 67.5 4.5 2.5 0 0.16 8.3 0.25 8.3272R 52 19 20 9 2 0.18 8.45 0.34 8.45211V 32 45 16 7 2 0.2 8.4 0.067 8.4280P 27 45 16 15 1 0.49 8.5 0.07 8.5281R 28 49 10 13 0 0.18 8.6 0.25 8.6286R 69 0 30 1 0 0.25 8.6 0.9 8.6296R 16 68 9 7 0 - - - -
311R 43 30 18 9 3 - - - -
139R 50 27 16 7 0 0.08 8.15 0.58 14.5129R 33 21 27 19 1.5 0.08 8 0.9 13.4138R 46 8 24 8 0 0.08 8 0.3 14.5137R 19 73 3.5 4.5 0 0.09 7.98 0.1 14.2
132
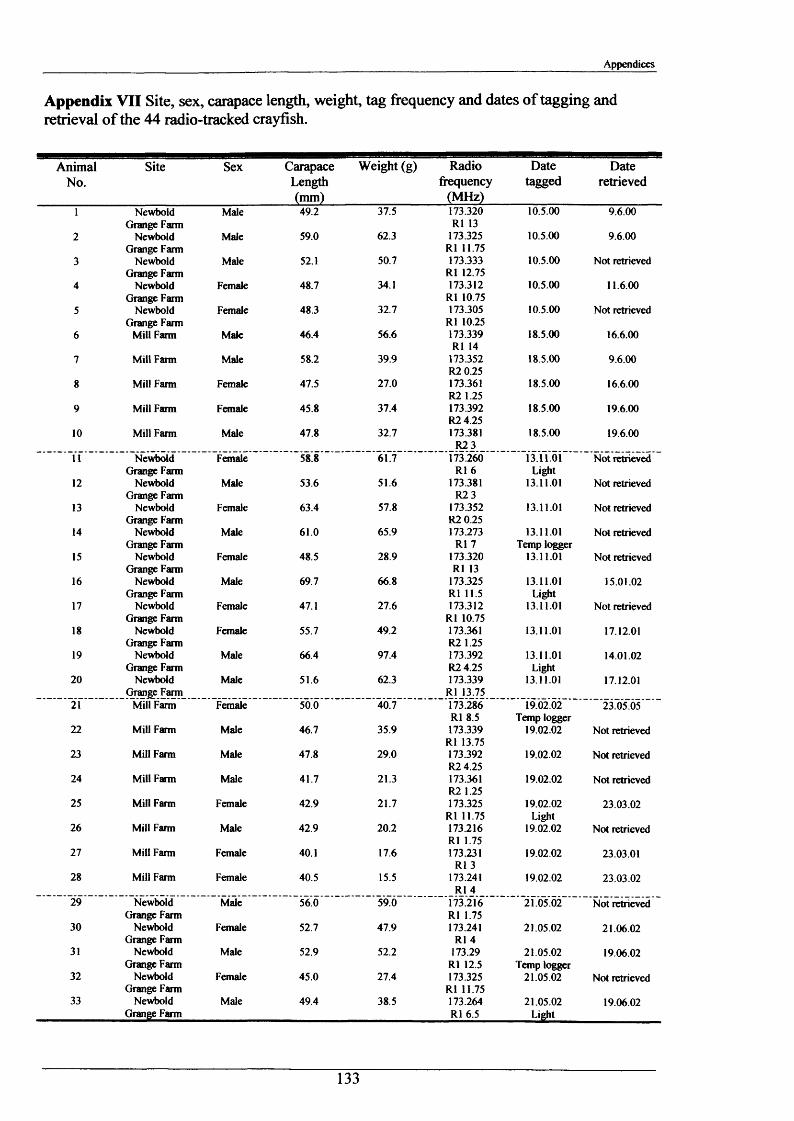
Appendices
Appendix VII Site, sex, carapace length, weight, tag frequency and dates of tagging and retrieval of the 44 radio-tracked crayfish.
AnimalNo.
Site Sex CarapaceLength(mm)
Weight (g) Radiofrequency
(MHz)
Datetagged
Dateretrieved
l Newbold Grange Farm
Male 49.2 37.5 173.320 R1 13
10.5.00 9.6.00
2 Newbold Grange Farm
Male 59.0 62.3 173.325 R1 11.75
10.5.00 9.6.00
3 Newbold Grange Farm
Male 52.1 50.7 173.333 R1 12.75
10.5.00 Not retrieved
4 Newbold Grange Farm
Female 48.7 34.1 173.312 R1 10.75
10.5.00 11.6.00
5 Newbold Grange Farm
Female 48.3 32.7 173.305 R1 10.25
10.5.00 Not retrieved
6 Mill Farm Male 46.4 56.6 173.339 R1 14
18.5.00 16.6.00
7 Mill Farm Male 58.2 39.9 173.352 R2 0.25
18.5.00 9.6.00
8 Mill Farm Female 47.5 27.0 173.361 R2 1.25
18.5.00 16.6.00
9 Mill Farm Female 45.8 37.4 173.392 R2 4.25
18.5.00 19.6.00
10 Mill Farm Male 47.8 32.7 173.381R23
18.5.00 19.6.00
11 Newbold Grange Farm
Female 58.8 61.7 173.260 R1 6
13.11.01Light
Not retrieved
12 Newbold Grange Farm
Male 53.6 51.6 173.381R23
13.11.01 Not retrieved
13 Newbold Grange Farm
Female 63.4 57.8 173.352 R2 0.25
13.11.01 Not retrieved
14 Newbold Grange Farm
Male 61.0 65.9 173.273 R1 7
13.11.01 Temp logger
Not retrieved
15 Newbold Grange Farm
Female 48.5 28.9 173.320 R1 13
13.11.01 Not retrieved
16 Newbold Grange Farm
Male 69.7 66.8 173.325 R1 11.5
13.11.01Light
15.01.02
17 Newbold Grange Farm
Female 47.1 27.6 173.312 R1 10.75
13.11.01 Not retrieved
18 Newbold Grange Farm
Female 55.7 49.2 173.361 R2 1.25
13.11.01 17.12.01
19 Newbold Grange Farm
Male 66.4 97.4 173.392 R2 4.25
13.11.01Light
14.01.02
20 Newbold Grange Farm
Male 51.6 62.3 173.339 R1 13.75
13.11.01 17.12.01
21 Mill Farm Female 50.0 40.7 173.286 R1 8.5
19.02.02 Temp logger
23.05.05
22 Mill Farm Male 46.7 35.9 173.339 R1 13.75
19.02.02 Not retrieved
23 Mill Farm Male 47.8 29.0 173.392 R2 4.25
19.02.02 Not retrieved
24 Mill Farm Male 41.7 21.3 173.361 R2 1.25
19.02.02 Not retrieved
25 Mill Farm Female 42.9 21.7 173.325 R1 11.75
19.02.02Light
23.03.02
26 Mill Farm Male 42.9 20.2 173.216 R1 1.75
19.02.02 Not retrieved
27 Mill Farm Female 40.1 17.6 173.231 R1 3
19.02.02 23.03.01
28 Mill Farm Female 40.5 15.5 173.241 R1 4
19.02.02 23.03.02
29 Newbold Grange Farm
Male 56.0 59.0 173.216 R1 1.75
21.05.02 Not retrieved
30 Newbold Grange Farm
Female 52.7 47.9 173.241 R1 4
21.05.02 21.06.02
31 Newbold Grange Farm
Male 52.9 52.2 173.29 R1 12.5
21.05.02 Temp logger
19.06.02
32 Newbold Grange Farm
Female 45.0 27.4 173.325 R1 11.75
21.05.02 Not retrieved
33 Newbold Grange Farm
Male 49.4 38.5 173.264 R1 6.5
21.05.02Light
19.06.02
133
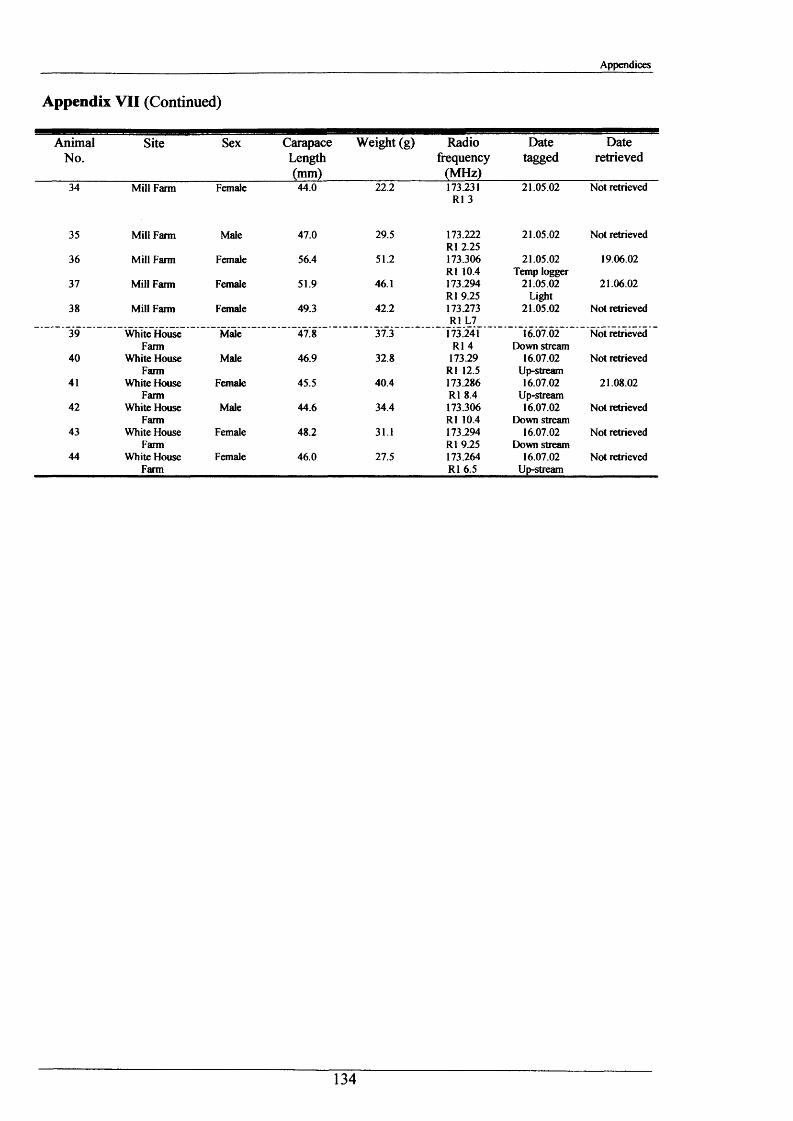
Appendices
Appendix VII (Continued)
AnimalNo.
Site Sex CarapaceLength(mm)
Weight (g) Radiofrequency
(MHz)
Datetagged
Dateretrieved
34 Mill Farm Female 44.0 22.2 173.231R13
21.05.02 Not retrieved
35 Mill Farm Male 47.0 29.5 173.222 R1 2.25
21.05.02 Not retrieved
36 Mill Farm Female 56.4 51.2 173.306 R1 10.4
21.05.02 Temp logger
19.06.02
37 Mill Farm Female 51.9 46.1 173.294 R1 9.25
21.05.02Light
21.06.02
38 Mill Farm Female 49.3 42.2 173.273 R1 L7
21.05.02 Not retrieved
39 White House Farm
Male 47.8 37.3 173.241 R1 4
16.07.02 Down stream
Not retrieved
40 White House Farm
Male 46.9 32.8 173.29 R1 12.5
16.07.02Up-stream
Not retrieved
41 White House Farm
Female 45.5 40.4 173.286 R1 8.4
16.07.02Up-stream
21.08.02
42 White House Farm
Male 44.6 34.4 173.306 R1 10.4
16.07.02 Down stream
Not retrieved
43 White House Farm
Female 48.2 31.1 173.294 R1 9.25
16.07.02 Down stream
Not retrieved
44 White House Farm
Female 46.0 27.5 173.264 R1 6.5
16.07.02Up-stream
Not retrieved
134
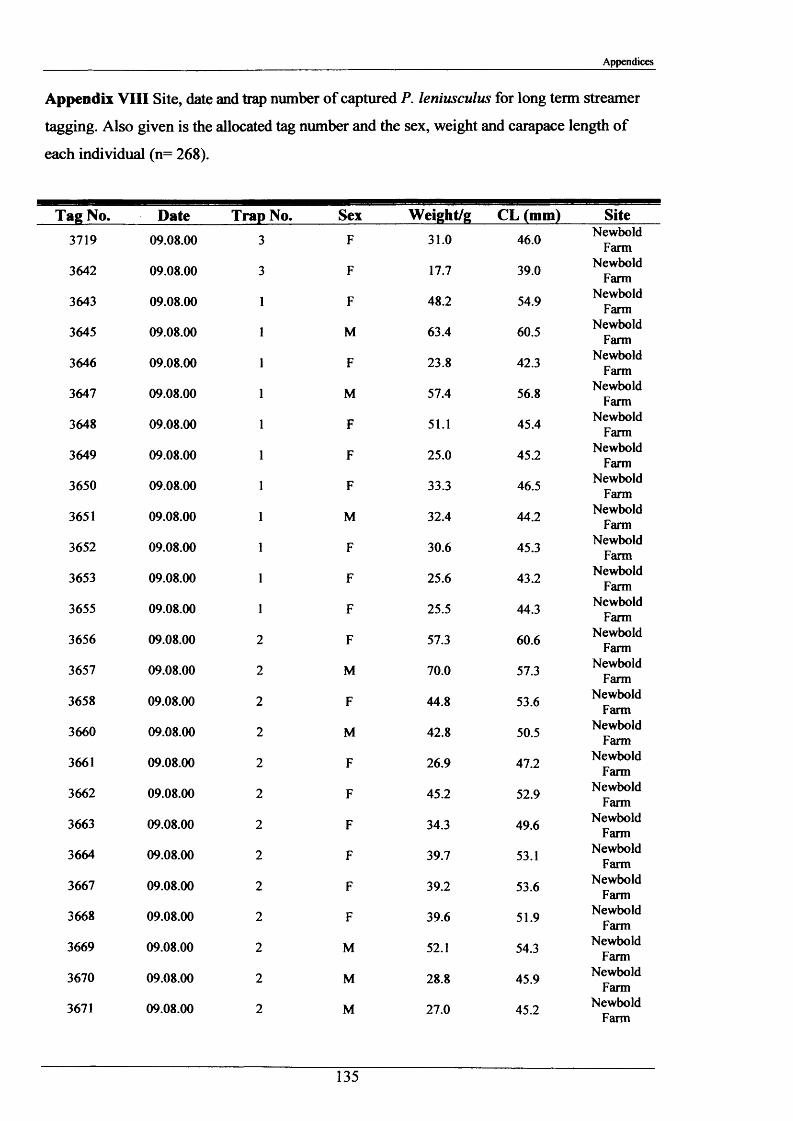
Appendices
Appendix VIII Site, date and trap number of captured P. leniusculus for long term streamer
tagging. Also given is the allocated tag number and the sex, weight and carapace length of
each individual (n= 268).
Tag No. Date Trap No. Sex Weight/g CL (m3719 09.08.00 3 F 31.0 46.0
3642 09.08.00 3 F 17.7 39.0
3643 09.08.00 1 F 48.2 54.9
3645 09.08.00 1 M 63.4 60.5
3646 09.08.00 1 F 23.8 42.3
3647 09.08.00 1 M 57.4 56.8
3648 09.08.00 1 F 51.1 45.4
3649 09.08.00 1 F 25.0 45.2
3650 09.08.00 1 F 33.3 46.5
3651 09.08.00 1 M 32.4 44.2
3652 09.08.00 1 F 30.6 45.3
3653 09.08.00 1 F 25.6 43.2
3655 09.08.00 1 F 25.5 44.3
3656 09.08.00 2 F 57.3 60.6
3657 09.08.00 2 M 70.0 57.3
3658 09.08.00 2 F 44.8 53.6
3660 09.08.00 2 M 42.8 50.5
3661 09.08.00 2 F 26.9 47.2
3662 09.08.00 2 F 45.2 52.9
3663 09.08.00 2 F 34.3 49.6
3664 09.08.00 2 F 39.7 53.1
3667 09.08.00 2 F 39.2 53.6
3668 09.08.00 2 F 39.6 51.9
3669 09.08.00 2 M 52.1 54.3
3670 09.08.00 2 M 28.8 45.9
3671 09.08.00 2 M 27.0 45.2
SiteNewbold
FarmNewbold
FarmNewbold
FarmNewbold
FarmNewbold
FarmNewbold
FarmNewbold
FarmNewbold
FarmNewbold
FarmNewbold
FarmNewbold
FarmNewbold
FarmNewbold
FarmNewbold
FarmNewbold
FarmNewbold
FarmNewbold
FarmNewbold
FarmNewbold
FarmNewbold
FarmNewbold
FarmNewbold
FarmNewbold
FarmNewbold
FarmNewbold
FarmNewbold
Farm
135
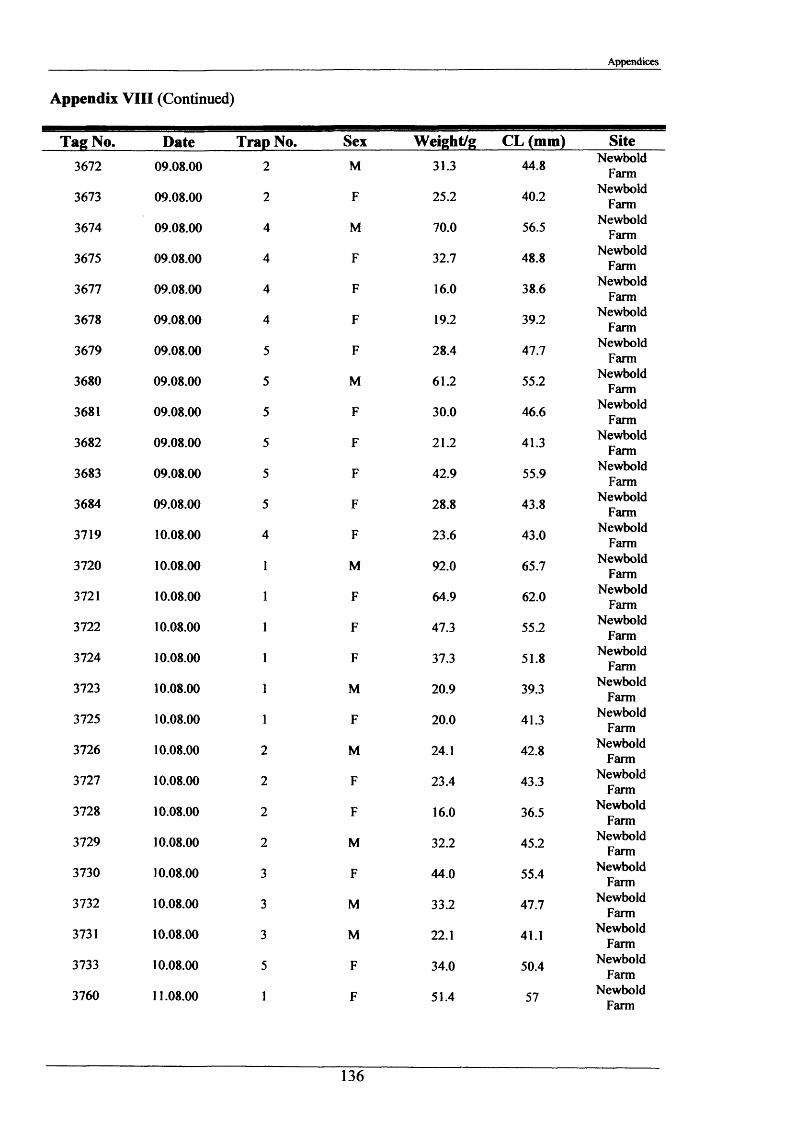
Appendices
Appendix VIII (Continued)
Tag No. Date Trap No. Sex Weight/g CL (mm) Site3672 09.08.00 2 M 31.3 44.8 Newbold
Farm
3673 09.08.00 2 F 25.2 40.2 NewboldFarm
3674 09.08.00 4 M 70.0 56.5 NewboldFarm
3675 09.08.00 4 F 32.7 48.8 NewboldFarm
3677 09.08.00 4 F 16.0 38.6 NewboldFarm
3678 09.08.00 4 F 19.2 39.2 NewboldFarm
3679 09.08.00 5 F 28.4 47.7 NewboldFarm
3680 09.08.00 5 M 61.2 55.2 NewboldFarm
3681 09.08.00 5 F 30.0 46.6 NewboldFarm
3682 09.08.00 5 F 21.2 41.3Newbold
Farm
3683 09.08.00 5 F 42.9 55.9 NewboldFarm
3684 09.08.00 5 F 28.8 43.8 NewboldFarm
3719 10.08.00 4 F 23.6 43.0 NewboldFarm
3720 10.08.00 1 M 92.0 65.7 NewboldFarm
3721 10.08.00 1 F 64.9 62.0 NewboldFarm
3722 10.08.00 1 F 47.3 55.2 NewboldFarm
3724 10.08.00 1 F 37.3 51.8 NewboldFarm
3723 10.08.00 1 M 20.9 39.3 NewboldFarm
3725 10.08.00 1 F 20.0 41.3 NewboldFarm
3726 10.08.00 2 M 24.1 42.8 NewboldFarm
3727 10.08.00 2 F 23.4 43.3 NewboldFarm
3728 10.08.00 2 F 16.0 36.5 NewboldFarm
3729 10.08.00 2 M 32.2 45.2 NewboldFarm
3730 10.08.00 3 F 44.0 55.4 NewboldFarm
3732 10.08.00 3 M 33.2 47.7 NewboldFarm
3731 10.08.00 3 M 22.1 41.1 NewboldFarm
3733 10.08.00 5 F 34.0 50.4 NewboldFarm
3760 11.08.00 1 F 51.4 57 NewboldFarm
136
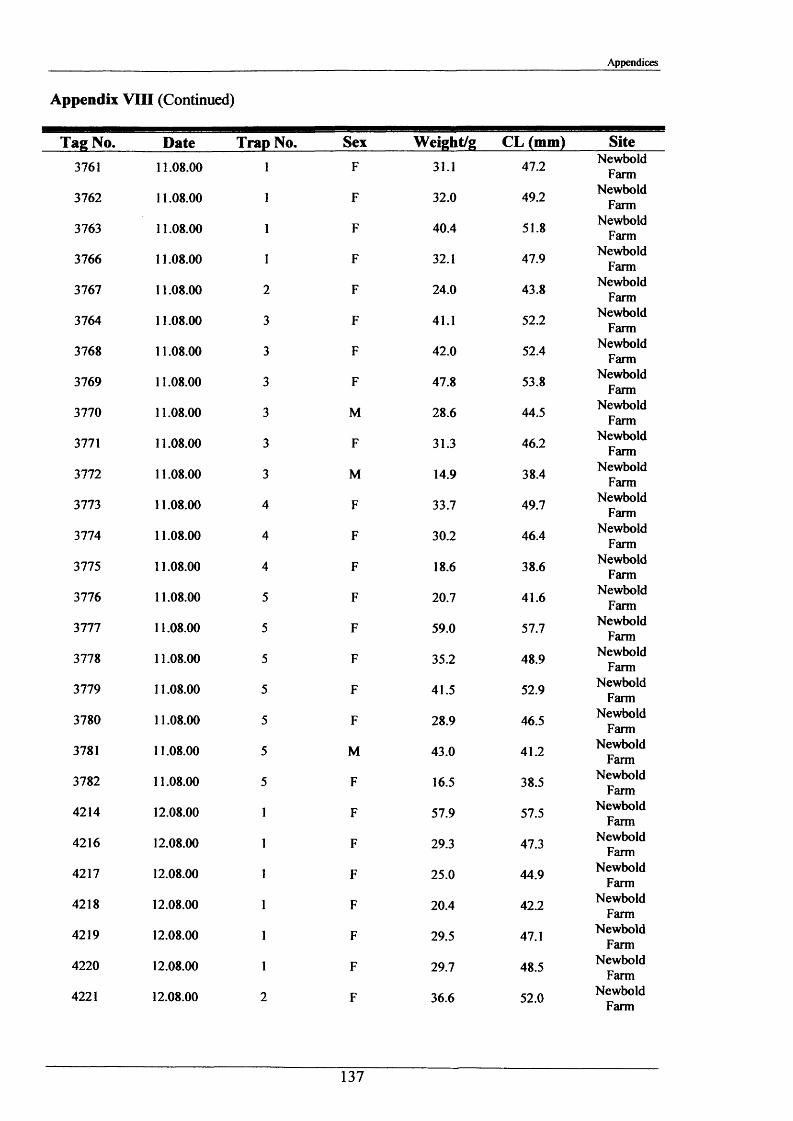
Appendices
Appendix VIII (Continued)
Tag No. Date Trap No. Sex Weight/g CL (mm) Site3761 11.08.00 l F 31.1 47.2 Newbold
Farm
3762 11.08.00 l F 32.0 49.2 NewboldFarm
3763 11.08.00 1 F 40.4 51.8 NewboldFarm
3766 11.08.00 1 F 32.1 47.9 NewboldFarm
3767 11.08.00 2 F 24.0 43.8 NewboldFarm
3764 11.08.00 3 F 41.1 52.2 NewboldFarm
3768 11.08.00 3 F 42.0 52.4 NewboldFarm
3769 11.08.00 3 F 47.8 53.8 NewboldFarm
3770 11.08.00 3 M 28.6 44.5 NewboldFarm
3771 11.08.00 3 F 31.3 46.2 NewboldFarm
3772 11.08.00 3 M 14.9 38.4 NewboldFarm
3773 11.08.00 4 F 33.7 49.7 NewboldFarm
3774 11.08.00 4 F 30.2 46.4 NewboldFarm
3775 11.08.00 4 F 18.6 38.6 NewboldFarm
3776 11.08.00 5 F 20.7 41.6 NewboldFarm
3777 11.08.00 5 F 59.0 57.7 NewboldFarm
3778 11.08.00 5 F 35.2 48.9 NewboldFarm
3779 11.08.00 5 F 41.5 52.9 NewboldFarm
3780 11.08.00 5 F 28.9 46.5 NewboldFarm
3781 11.08.00 5 M 43.0 41.2 NewboldFarm
3782 11.08.00 5 F 16.5 38.5 NewboldFarm
4214 12.08.00 1 F 57.9 57.5 NewboldFarm
4216 12.08.00 1 F 29.3 47.3 NewboldFarm
4217 12.08.00 1 F 25.0 44.9 NewboldFarm
4218 12.08.00 1 F 20.4 42.2 NewboldFarm
4219 12.08.00 1 F 29.5 47.1 NewboldFarm
4220 12.08.00 1 F 29.7 48.5 NewboldFarm
4221 12.08.00 2 F 36.6 52.0 NewboldFarm
137
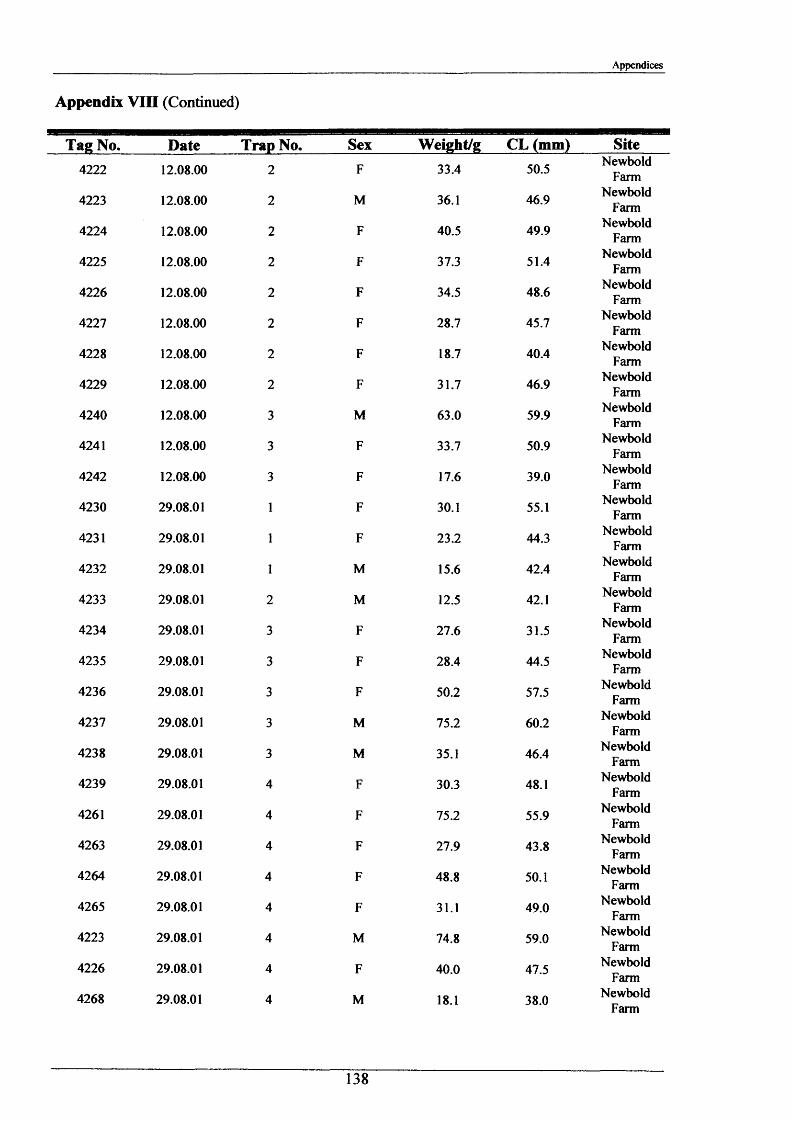
Appendices
Appendix VIII (Continued)
Tag No. Date Trap No. Sex Weight/g CL (mm) Site4222 12.08.00 2 F 33.4 50.5 Newbold
Farm
4223 12.08.00 2 M 36.1 46.9 NewboldFarm
4224 12.08.00 2 F 40.5 49.9 NewboldFarm
4225 12.08.00 2 F 37.3 51.4 NewboldFarm
4226 12.08.00 2 F 34.5 48.6 NewboldFarm
4227 12.08.00 2 F 28.7 45.7 NewboldFarm
4228 12.08.00 2 F 18.7 40.4 NewboldFarm
4229 12.08.00 2 F 31.7 46.9 NewboldFarm
4240 12.08.00 3 M 63.0 59.9 NewboldFarm
4241 12.08.00 3 F 33.7 50.9 NewboldFarm
4242 12.08.00 3 F 17.6 39.0 NewboldFarm
4230 29.08.01 1 F 30.1 55.1 NewboldFarm
4231 29.08.01 1 F 23.2 44.3 NewboldFarm
4232 29.08.01 1 M 15.6 42.4 NewboldFarm
4233 29.08.01 2 M 12.5 42.1 NewboldFarm
4234 29.08.01 3 F 27.6 31.5 NewboldFarm
4235 29.08.01 3 F 28.4 44.5 NewboldFarm
4236 29.08.01 3 F 50.2 57.5 NewboldFarm
4237 29.08.01 3 M 75.2 60.2 NewboldFarm
4238 29.08.01 3 M 35.1 46.4 NewboldFarm
4239 29.08.01 4 F 30.3 48.1 NewboldFarm
4261 29.08.01 4 F 75.2 55.9 NewboldFarm
4263 29.08.01 4 F 27.9 43.8 NewboldFarm
4264 29.08.01 4 F 48.8 50.1 NewboldFarm
4265 29.08.01 4 F 31.1 49.0 NewboldFarm
4223 29.08.01 4 M 74.8 59.0 NewboldFarm
4226 29.08.01 4 F 40.0 47.5 NewboldFarm
4268 29.08.01 4 M 18.1 38.0 NewboldFarm
138
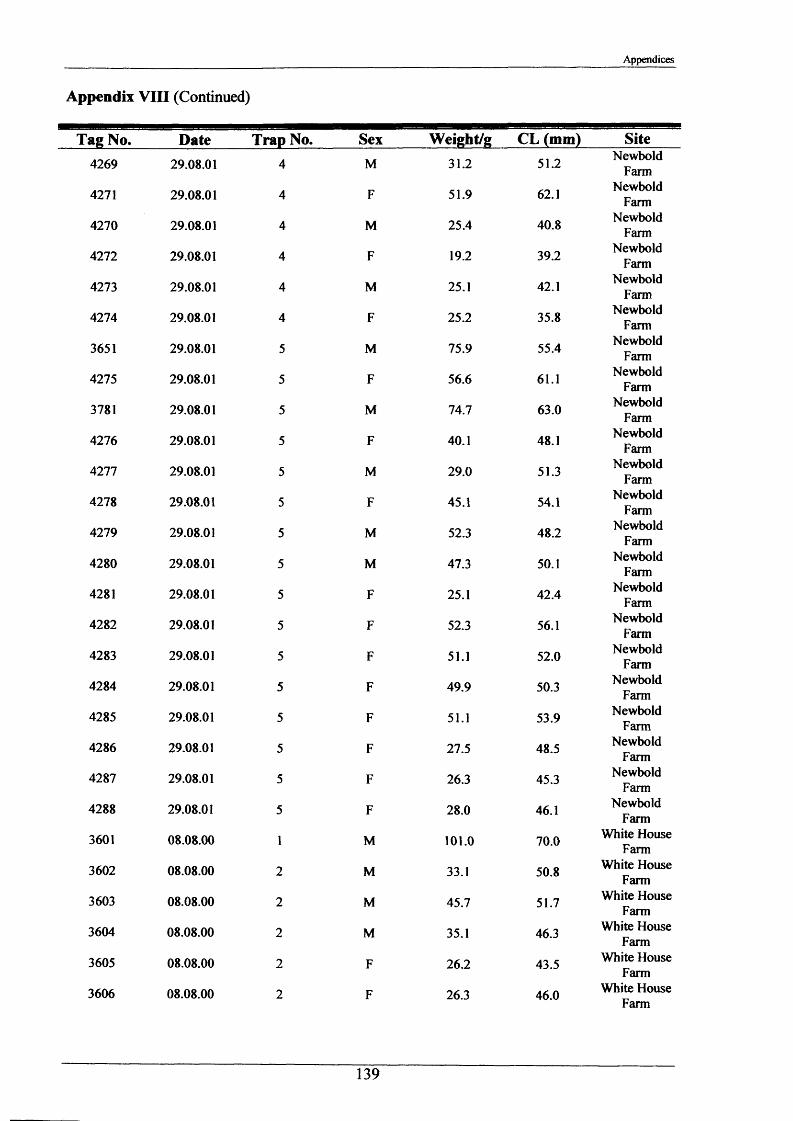
Appendices
Appendix VIII (Continued)
Tag No. Date Trap No. Sex Weight/g CL (mm) Site4269 29.08.01 4 M 31.2 51.2 Newbold
Farm
4271 29.08.01 4 F 51.9 62.1 NewboldFarm
4270 29.08.01 4 M 25.4 40.8 NewboldFarm
4272 29.08.01 4 F 19.2 39.2 NewboldFarm
4273 29.08.01 4 M 25.1 42.1 NewboldFarm
4274 29.08.01 4 F 25.2 35.8 NewboldFarm
3651 29.08.01 5 M 75.9 55.4 NewboldFarm
4275 29.08.01 5 F 56.6 61.1 NewboldFarm
3781 29.08.01 5 M 74.7 63.0 NewboldFarm
4276 29.08.01 5 F 40.1 48.1 NewboldFarm
4277 29.08.01 5 M 29.0 51.3 NewboldFarm
4278 29.08.01 5 F 45.1 54.1 NewboldFarm
4279 29.08.01 5 M 52.3 48.2 NewboldFarm
4280 29.08.01 5 M 47.3 50.1 NewboldFarm
4281 29.08.01 5 F 25.1 42.4 NewboldFarm
4282 29.08.01 5 F 52.3 56.1 NewboldFarm
4283 29.08.01 5 F 51.1 52.0 NewboldFarm
4284 29.08.01 5 F 49.9 50.3 NewboldFarm
4285 29.08.01 5 F 51.1 53.9 NewboldFarm
4286 29.08.01 5 F 27.5 48.5 NewboldFarm
4287 29.08.01 5 F 26.3 45.3 NewboldFarm
4288 29.08.01 5 F 28.0 46.1 NewboldFarm
3601 08.08.00 1 M 101.0 70.0 White House Farm
3602 08.08.00 2 M 33.1 50.8 White House Farm
3603 08.08.00 2 M 45.7 51.7 White House Farm
3604 08.08.00 2 M 35.1 46.3 White House Farm
3605 08.08.00 2 F 26.2 43.5 White House Farm
3606 08.08.00 2 F 26.3 46.0 White House Farm
139
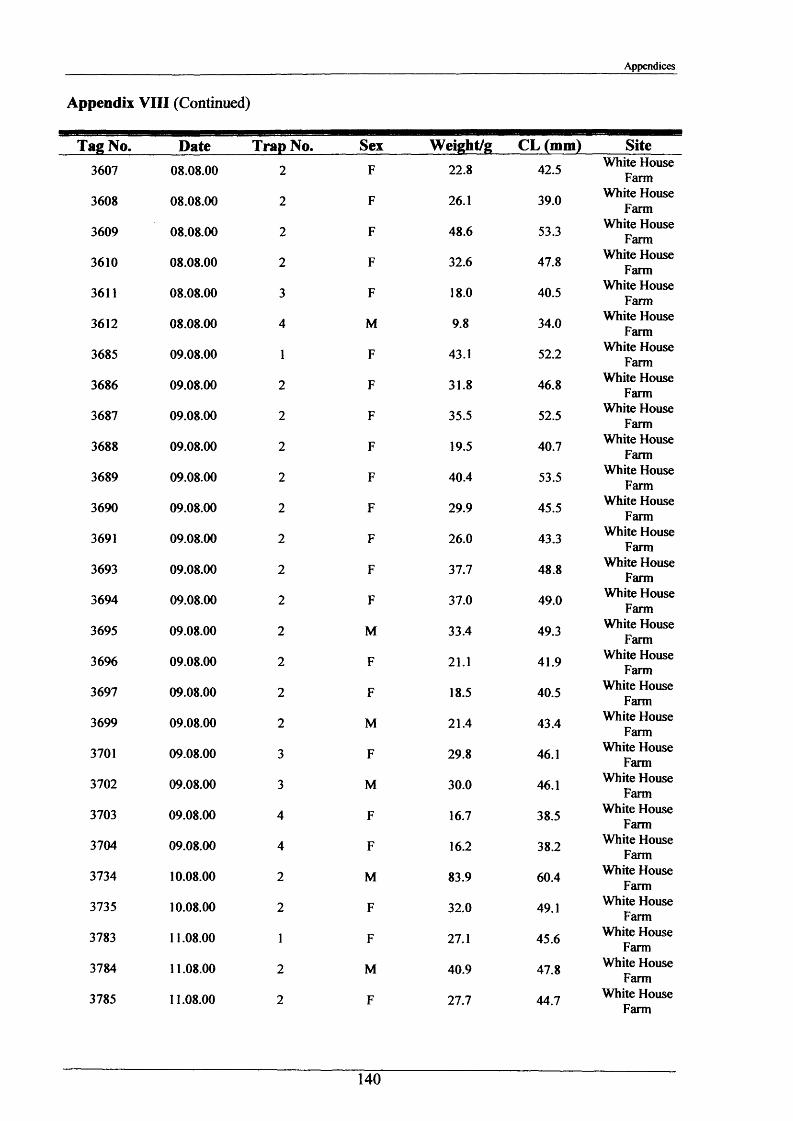
Appendices
Appendix VIII (Continued)
Tag No. Date Trap No. Sex Weight/g CL (mm) Site3607 08.08.00 2 F 22.8 42.5 White House
Farm
3608 08.08.00 2 F 26.1 39.0 White House Farm
3609 08.08.00 2 F 48.6 53.3 White House Farm
3610 08.08.00 2 F 32.6 47.8 White House Farm
3611 08.08.00 3 F 18.0 40.5 White House Farm
3612 08.08.00 4 M 9.8 34.0 White House Farm
3685 09.08.00 1 F 43.1 52.2 White House Farm
3686 09.08.00 2 F 31.8 46.8 White House Farm
3687 09.08.00 2 F 35.5 52.5 White House Farm
3688 09.08.00 2 F 19.5 40.7 White House Farm
3689 09.08.00 2 F 40.4 53.5 White House Farm
3690 09.08.00 2 F 29.9 45.5 White House Farm
3691 09.08.00 2 F 26.0 43.3 White House Farm
3693 09.08.00 2 F 37.7 48.8 White House Farm
3694 09.08.00 2 F 37.0 49.0 White House Farm
3695 09.08.00 2 M 33.4 49.3 White House Farm
3696 09.08.00 2 F 21.1 41.9 White House Farm
3697 09.08.00 2 F 18.5 40.5 White House Farm
3699 09.08.00 2 M 21.4 43.4 White House Farm
3701 09.08.00 3 F 29.8 46.1 White House Farm
3702 09.08.00 3 M 30.0 46.1 White House Farm
3703 09.08.00 4 F 16.7 38.5 White House Farm
3704 09.08.00 4 F 16.2 38.2 White House Farm
3734 10.08.00 2 M 83.9 60.4 White House Farm
3735 10.08.00 2 F 32.0 49.1 White House Farm
3783 11.08.00 1 F 27.1 45.6 White House Farm
3784 11.08.00 2 M 40.9 47.8 White House Farm
3785 11.08.00 2 F 27.7 44.7 White House Farm
140
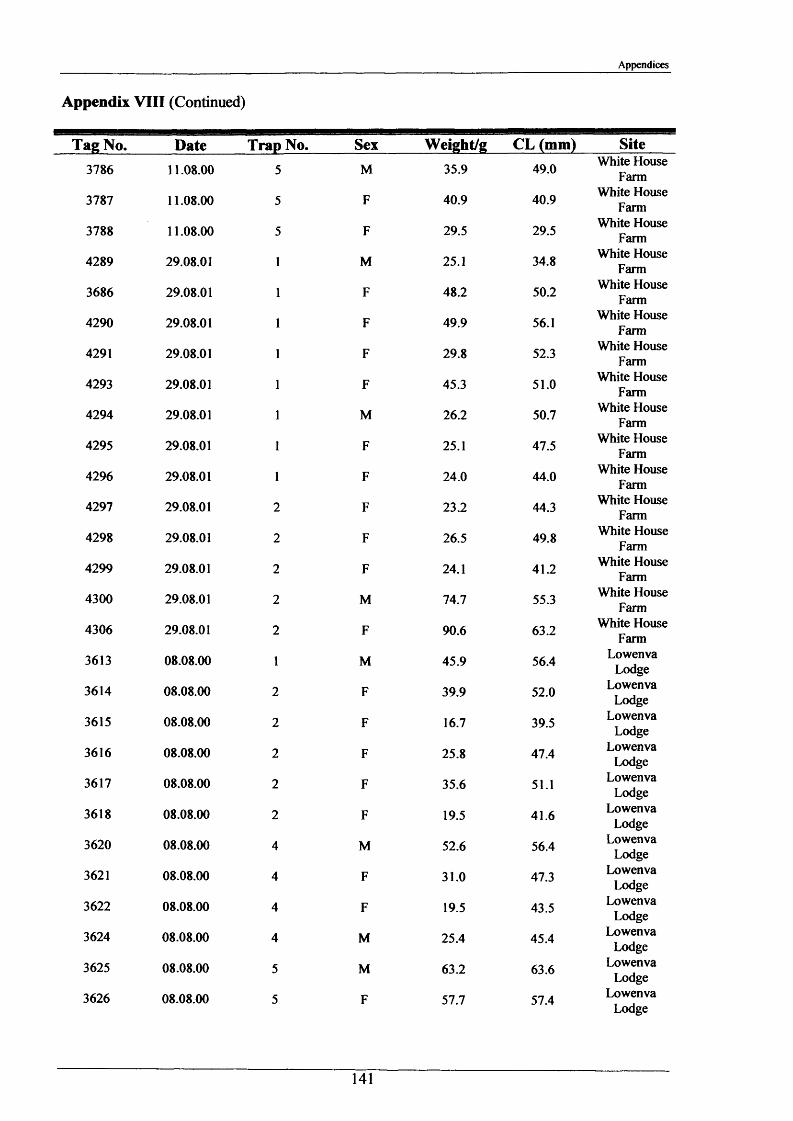
Appendices
Appendix VIII (Continued)
Tag No. Date Trap No. Sex Weight/g CL (mm) Site3786 11.08.00 5 M 35.9 49.0 White House
Farm
3787 11.08.00 5 F 40.9 40.9 White House Farm
3788 11.08.00 5 F 29.5 29.5 White House Farm
4289 29.08.01 1 M 25.1 34.8White House
Farm
3686 29.08.01 1 F 48.2 50.2 White House Farm
4290 29.08.01 1 F 49.9 56.1 White House Farm
4291 29.08.01 1 F 29.8 52.3White House
Farm
4293 29.08.01 1 F 45.3 51.0White House
Farm
4294 29.08.01 1 M 26.2 50.7 White House Farm
4295 29.08.01 1 F 25.1 47.5 White House Farm
4296 29.08.01 1 F 24.0 44.0 White House Farm
4297 29.08.01 2 F 23.2 44.3 White House Farm
4298 29.08.01 2 F 26.5 49.8 White House Farm
4299 29.08.01 2 F 24.1 41.2 White House Farm
4300 29.08.01 2 M 74.7 55.3White House
Farm
4306 29.08.01 2 F 90.6 63.2 White House Farm
3613 08.08.00 1 M 45.9 56.4 LowenvaLodge
LowenvaLodge
LowenvaLodge
LowenvaLodge
LowenvaLodge
LowenvaLodge
LowenvaLodge
LowenvaLodge
3614 08.08.00 2 F 39.9 52.0
3615 08.08.00 2 F 16.7 39.5
3616 08.08.00 2 F 25.8 47.4
3617 08.08.00 2 F 35.6 51.1
3618 08.08.00 2 F 19.5 41.6
3620 08.08.00 4 M 52.6 56.4
3621 08.08.00 4 F 31.0 47.3
3622 08.08.00 4 F 19.5 43.5 LowenvaLodge
3624 08.08.00 4 M 25.4 45.4 LowenvaLodge
3625 08.08.00 5 M 63.2 63.6 LowenvaLodge
3626 08.08.00 5 F 57.7 57.4 LowenvaLodge
141
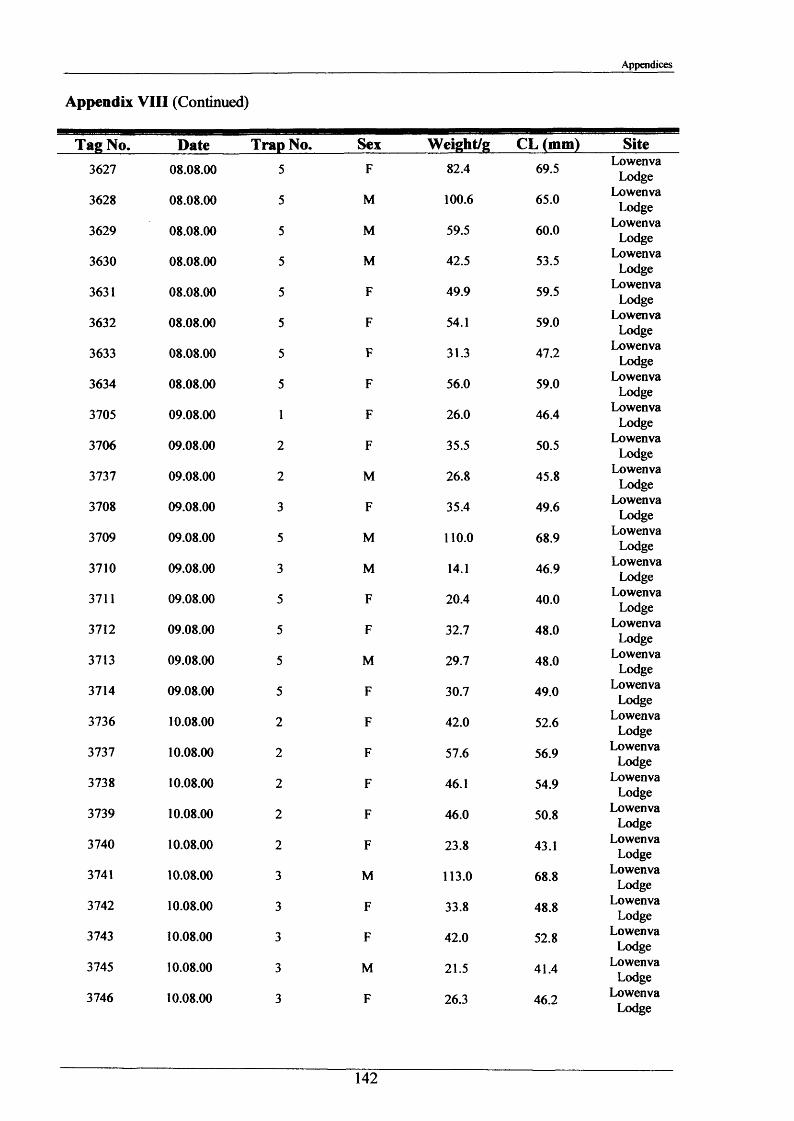
Appendices
Appendix VIII (Continued)
Tag No. Date Trap No. Sex Weight/g CL (mm) Site3627 08.08.00 5 F 82.4 69.5 Lowenva
Lodge
3628 08.08.00 5 M 100.6 65.0 LowenvaLodge
LowenvaLodge
LowenvaLodge
LowenvaLodge
LowenvaLodge
LowenvaLodge
LowenvaLodge
LowenvaLodge
LowenvaLodge
LowenvaLodge
LowenvaLodge
LowenvaLodge
LowenvaLodge
LowenvaLodge
LowenvaLodge
LowenvaLodge
LowenvaLodge
LowenvaLodge
LowenvaLodge
Lowenva
3629 08.08.00 5 M 59.5 60.0
3630 08.08.00 5 M 42.5 53.5
3631 08.08.00 5 F 49.9 59.5
3632 08.08.00 5 F 54.1 59.0
3633 08.08.00 5 F 31.3 47.2
3634 08.08.00 5 F 56.0 59.0
3705 09.08.00 1 F 26.0 46.4
3706 09.08.00 2 F 35.5 50.5
3737 09.08.00 2 M 26.8 45.8
3708 09.08.00 3 F 35.4 49.6
3709 09.08.00 5 M 110.0 68.9
3710 09.08.00 3 M 14.1 46.9
3711 09.08.00 5 F 20.4 40.0
3712 09.08.00 5 F 32.7 48.0
3713 09.08.00 5 M 29.7 48.0
3714 09.08.00 5 F 30.7 49.0
3736 10.08.00 2 F 42.0 52.6
3737 10.08.00 2 F 57.6 56.9
3738 10.08.00 2 F 46.1 54.9
3739 10.08.00 2 F 46.0 50.8
LodgeLowenva
3740 10.08.00 2 F 23.8 43.1
LodgeLowenva
3741 10.08.00 3 M 113.0 68.8Lodge
Lowenva
3742 10.08.00 3 F 33.8 48.8
LodgeLowenva
3743 10.08.00 3 F 42.0 52.8
LodgeLowenva
3745 10.08.00 3 M 21.5 41.4
LodgeLowenva
3746 10.08.00 3 F 26.3 46.2
LodgeLowenva
Lodge
142
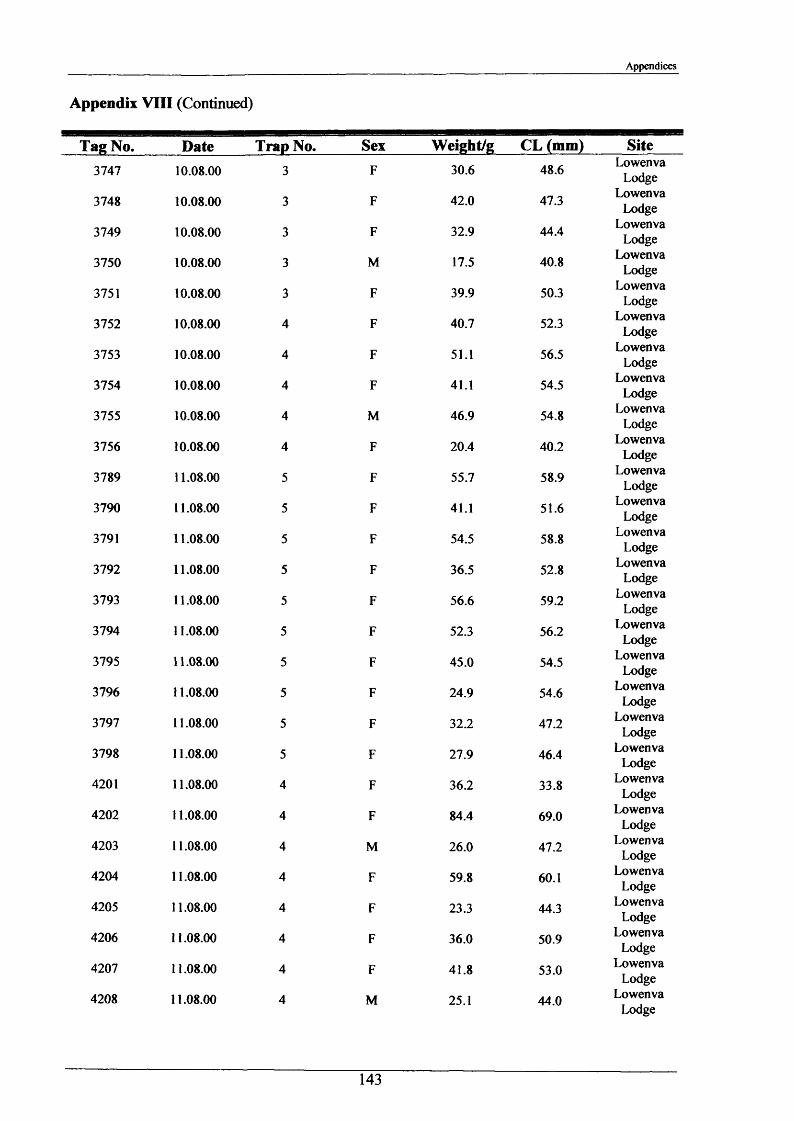
Appendices
Appendix VIII (Continued)
Tag No. Date Trap No. Sex Weight/g CL (mm) Site3747 10.08.00 3 F 30.6 48.6 Lowenva
Lodge
3748 10.08.00 3 F 42.0 47.3 LowenvaLodge
3749 10.08.00 3 F 32.9 44.4 LowenvaLodge
3750 10.08.00 3 M 17.5 40.8Lowenva
LodgeLowenva
LodgeLowenva
LodgeLowenva
LodgeLowenva
LodgeLowenva
LodgeLowenva
LodgeLowenva
LodgeLowenva
LodgeLowenva
LodgeLowenva
LodgeLowenva
LodgeLowenva
LodgeLowenva
LodgeLowenva
LodgeLowenva
LodgeLowenva
LodgeLowenva
LodgeLowenva
LodgeLowenva
3751 10.08.00 3 F 39.9 50.3
3752 10.08.00 4 F 40.7 52.3
3753 10.08.00 4 F 51.1 56.5
3754 10.08.00 4 F 41.1 54.5
3755 10.08.00 4 M 46.9 54.8
3756 10.08.00 4 F 20.4 40.2
3789 11.08.00 5 F 55.7 58.9
3790 11.08.00 5 F 41.1 51.6
3791 11.08.00 5 F 54.5 58.8
3792 11.08.00 5 F 36.5 52.8
3793 11.08.00 5 F 56.6 59.2
3794 11.08.00 5 F 52.3 56.2
3795 11.08.00 5 F 45.0 54.5
3796 11.08.00 5 F 24.9 54.6
3797 11.08.00 5 F 32.2 47.2
3798 11.08.00 5 F 27.9 46.4
4201 11.08.00 4 F 36.2 33.8
4202 11.08.00 4 F 84.4 69.0
4203 11.08.00 4 M 26.0 47.2
4204 11.08.00 4 F 59.8 60.1
LodgeLowenva
4205 11.08.00 4 F 23.3 44.3
LodgeLowenva
4206 11.08.00 4 F 36.0 50.9
LodgeLowenva
4207 11.08.00 4 F 41.8 53.0
LodgeLowenva
4208 11.08.00 4 M 25.1 44.0
LodgeLowenva
Lodge
143
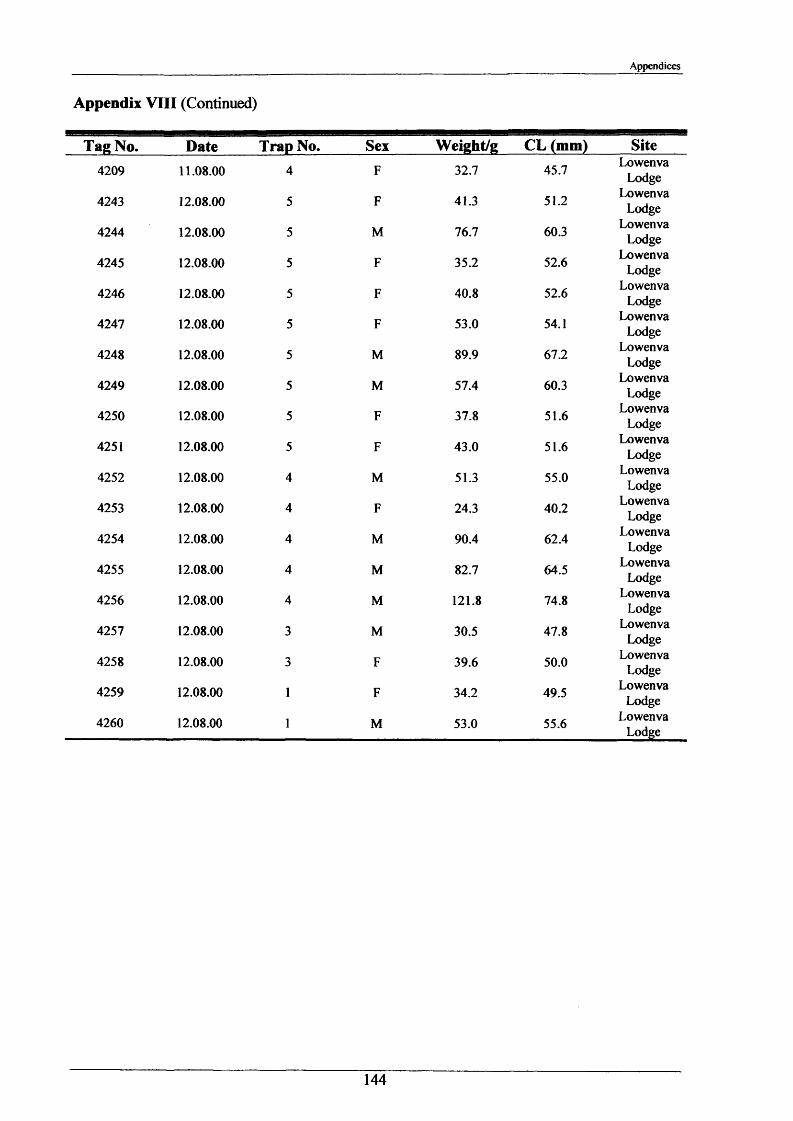
Appendices
Appendix VIII (Continued)
Tag No. Pate Trap No. Sex Weight/g CL (mm) Site4209 11.08.00 4 F 32.7 45.7
4243 12.08.00 5 F 41.3 51.2
4244 12.08.00 5 M 76.7 60.3
4245 12.08.00 5 F 35.2 52.6
4246 12.08.00 5 F 40.8 52.6
4247 12.08.00 5 F 53.0 54.1
4248 12.08.00 5 M 89.9 67.2
4249 12.08.00 5 M 57.4 60.3
4250 12.08.00 5 F 37.8 51.6
4251 12.08.00 5 F 43.0 51.6
4252 12.08.00 4 M 51.3 55.0
4253 12.08.00 4 F 24.3 40.2
4254 12.08.00 4 M 90.4 62.4
4255 12.08.00 4 M 82.7 64.5
4256 12.08.00 4 M 121.8 74.8
4257 12.08.00 3 M 30.5 47.8
4258 12.08.00 3 F 39.6 50.0
4259 12.08.00 1 F 34.2 49.5
4260 12.08.00 1 M 53.0 55.6
LowenvaLodge
LowenvaLodge
LowenvaLodge
LowenvaLodge
LowenvaLodge
LowenvaLodge
LowenvaLodge
LowenvaLodge
LowenvaLodge
LowenvaLodge
LowenvaLodge
LowenvaLodge
LowenvaLodge
LowenvaLodge
LowenvaLodge
LowenvaLodge
LowenvaLodge
LowenvaLodge
LowenvaLodge
144
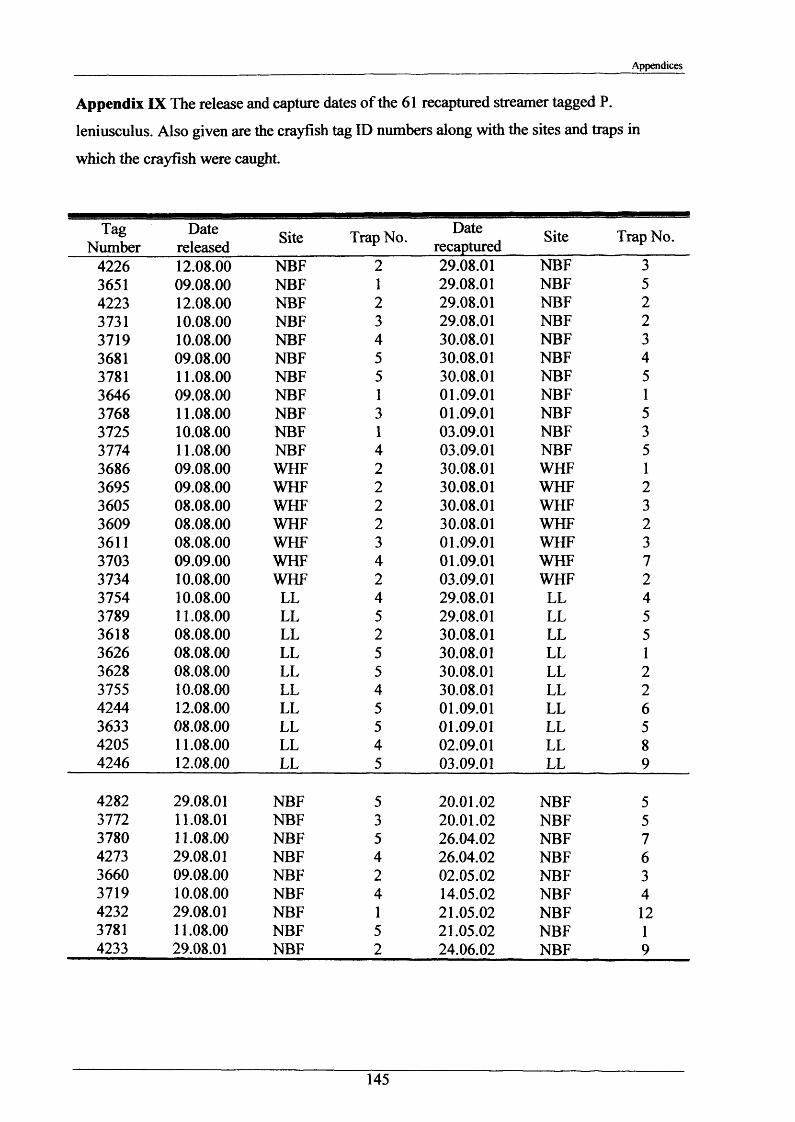
Appendices
Appendix IX The release and capture dates of the 61 recaptured streamer tagged P.
leniusculus. Also given are the crayfish tag ID numbers along with the sites and traps in
which the crayfish were caught.
TagNumber
Datereleased Site Trap No. Date
recaptured Site Trap No.
4226 12.08.00 NBF 2 29.08.01 NBF 33651 09.08.00 NBF 1 29.08.01 NBF 54223 12.08.00 NBF 2 29.08.01 NBF 23731 10.08.00 NBF 3 29.08.01 NBF 23719 10.08.00 NBF 4 30.08.01 NBF 33681 09.08.00 NBF 5 30.08.01 NBF 43781 11.08.00 NBF 5 30.08.01 NBF 53646 09.08.00 NBF 1 01.09.01 NBF 13768 11.08.00 NBF 3 01.09.01 NBF 53725 10.08.00 NBF 1 03.09.01 NBF 33774 11.08.00 NBF 4 03.09.01 NBF 53686 09.08.00 WHF 2 30.08.01 WHF 13695 09.08.00 WHF 2 30.08.01 WHF 23605 08.08.00 WHF 2 30.08.01 WHF 33609 08.08.00 WHF 2 30.08.01 WHF 23611 08.08.00 WHF 3 01.09.01 WHF 33703 09.09.00 WHF 4 01.09.01 WHF 73734 10.08.00 WHF 2 03.09.01 WHF 23754 10.08.00 LL 4 29.08.01 LL 43789 11.08.00 LL 5 29.08.01 LL 53618 08.08.00 LL 2 30.08.01 LL 53626 08.08.00 LL 5 30.08.01 LL 13628 08.08.00 LL 5 30.08.01 LL 23755 10.08.00 LL 4 30.08.01 LL 24244 12.08.00 LL 5 01.09.01 LL 63633 08.08.00 LL 5 01.09.01 LL 54205 11.08.00 LL 4 02.09.01 LL 84246 12.08.00 LL 5 03.09.01 LL 9
4282 29.08.01 NBF 5 20.01.02 NBF 53772 11.08.01 NBF 3 20.01.02 NBF 53780 11.08.00 NBF 5 26.04.02 NBF 74273 29.08.01 NBF 4 26.04.02 NBF 63660 09.08.00 NBF 2 02.05.02 NBF 33719 10.08.00 NBF 4 14.05.02 NBF 44232 29.08.01 NBF 1 21.05.02 NBF 123781 11.08.00 NBF 5 21.05.02 NBF 14233 29.08.01 NBF 2 24.06.02 NBF 9
145
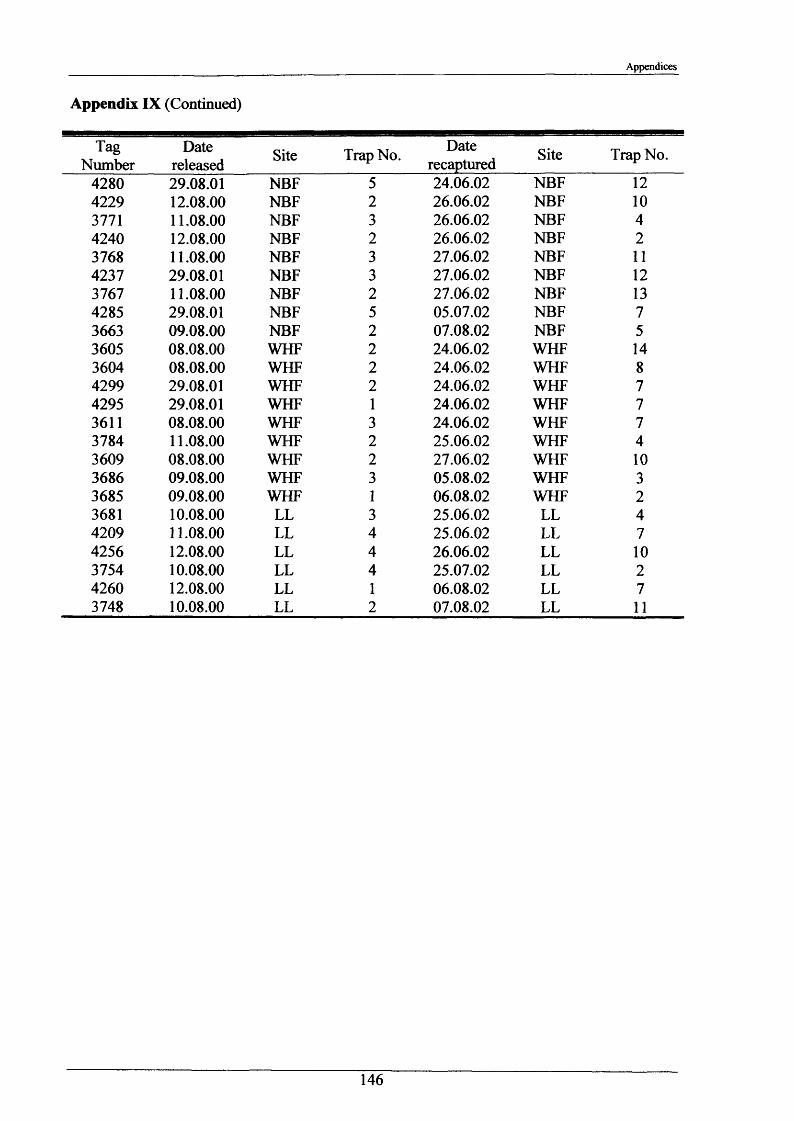
Appendices
Appendix IX (Continued)
TagNumber
Datereleased Site Trap No. Date
recaptured Site Trap No.
4280 29.08.01 NBF 5 24.06.02 NBF 124229 12.08.00 NBF 2 26.06.02 NBF 103771 11.08.00 NBF 3 26.06.02 NBF 44240 12.08.00 NBF 2 26.06.02 NBF 23768 11.08.00 NBF 3 27.06.02 NBF 114237 29.08.01 NBF 3 27.06.02 NBF 123767 11.08.00 NBF 2 27.06.02 NBF 134285 29.08.01 NBF 5 05.07.02 NBF 73663 09.08.00 NBF 2 07.08.02 NBF 53605 08.08.00 WHF 2 24.06.02 WHF 143604 08.08.00 WHF 2 24.06.02 WHF 84299 29.08.01 WHF 2 24.06.02 WHF 74295 29.08.01 WHF 1 24.06.02 WHF 73611 08.08.00 WHF 3 24.06.02 WHF 73784 11.08.00 WHF 2 25.06.02 WHF 43609 08.08.00 WHF 2 27.06.02 WHF 103686 09.08.00 WHF 3 05.08.02 WHF 33685 09.08.00 WHF 1 06.08.02 WHF 23681 10.08.00 LL 3 25.06.02 LL 44209 11.08.00 LL 4 25.06.02 LL 74256 12.08.00 LL 4 26.06.02 LL 103754 10.08.00 LL 4 25.07.02 LL 24260 12.08.00 LL 1 06.08.02 LL 73748 10.08.00 LL 2 07.08.02 LL 11
146
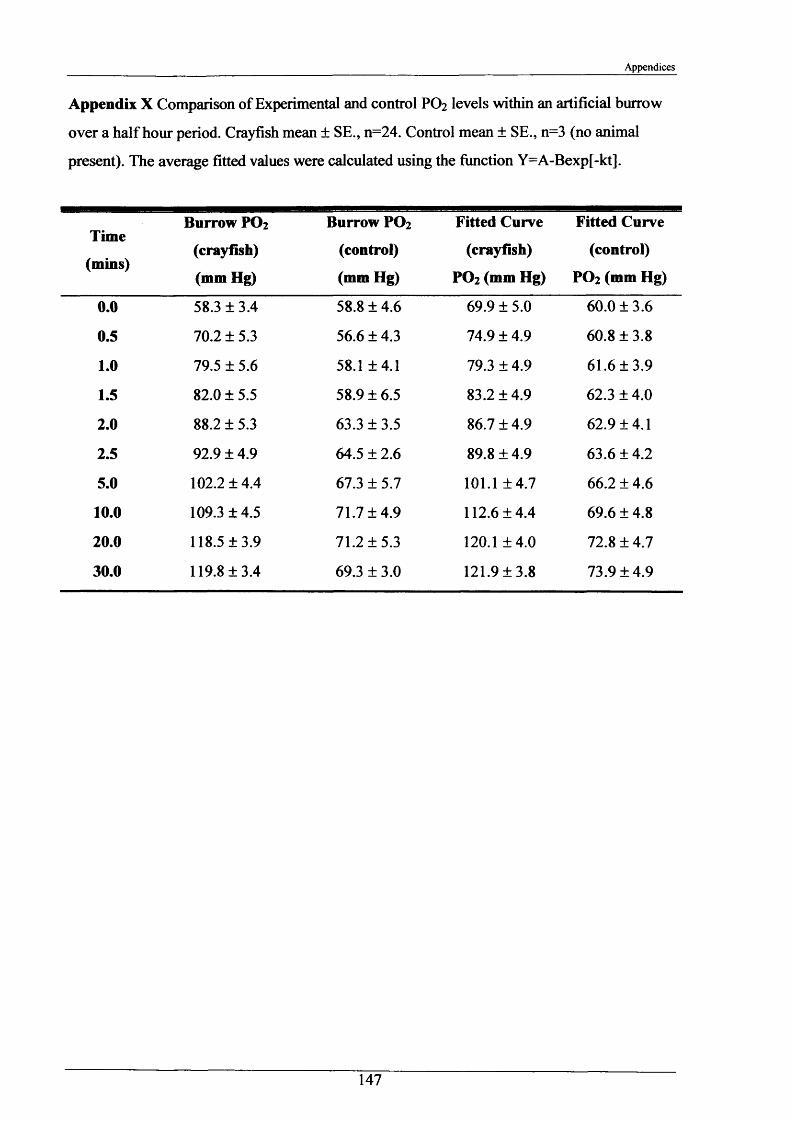
Appendices
Appendix X Comparison of Experimental and control PO2 levels within an artificial burrow
over a half hour period. Crayfish mean ± SE., n=24. Control mean ± SE., n=3 (no animal
present). The average fitted values were calculated using the function Y=A-Bexp[-kt].
Time
(mins)
Burrow PO2
(crayfish)
(mm Hg)
Burrow PO2
(control)
(mm Hg)
Fitted Curve
(crayfish)
PO2 (mm Hg)
Fitted Curve
(control)
PO2 (mm Hg)
0.0 58.3 ± 3.4 58.8 ± 4.6 69.9 ± 5.0 60.0 ±3.6
0.5 70.2 ± 5.3 56.6 ± 4.3 74.9 ± 4.9 60.8 ± 3.8
1.0 79.5 ± 5.6 58.1 ±4.1 79.3 ± 4.9 61.6 ±3.9
1.5 82.0 ±5.5 58.9 ± 6.5 83.2 ±4.9 62.3 ± 4.0
2.0 88.2 ± 5.3 63.3 ± 3.5 86.7 ±4.9 62.9 ±4.1
2.5 92.9 ±4.9 64.5 ± 2.6 89.8 ±4.9 63.6 ±4.2
5.0 102.2 ±4.4 67.3 ± 5.7 101.1 ±4.7 66.2 ± 4.6
10.0 109.3 ±4.5 71.7 ±4.9 112.6 ±4.4 69.6 ± 4.8
20.0 118.5 ±3.9 71.2 ±5.3 120.1 ±4.0 72.8 ± 4.7
30.0 119.8 ±3.4 69.3 ± 3.0 121.9 ±3.8 73.9 ±4.9
147
References
148
References
References
Abbott, C. C. (1884) Are the 'Chimneys' of burrowing crayfish designed? American Naturalist
18:1157- 1158.
Abrahamsson, S. (1965) A method of marking crayfish Astacus astacus Linne in population
studies. Oikos 16:228-231.
Abrahamsson, S. (1983) Trappability, locomotion and the diel pattern of activity of the
crayfish Astacus astacus L. and Pacifastacus leniusculus Dana. Freshwater Crayfish
5:239-253.
Alberstadt, P. J., C. W. Steele, and C. Skinner. (1995) Cover-seeking behaviour in juvenile
and adult crayfish, Orconectes rusticus - effects of darkness and thigmotactic cues.
Journal of Crustacean Biology 15:537-541.
Alderman, D. J. (1993) Crayfish plague in Britain, the first twelve years. Freshwater Crayfish
9:266 - 272.
Alderman, D. J., and J. F. Wickins. (1996) Laboratory leaflet number 76, Crayfish culture,
Pages 1-21. Lowestoft, Ministry of Agriculture, Fisheries and Food.
Antonelli, J., C. Steele, and C. Skinner. (1999) Cover-seeking behavior and shelter use by
juvenile and adult crayfish, Procambarus clarkii: Potential importance in species
invasion. Journal of Crustacean Biology 19:293-300.
Appelberg, M., and T. Odelstrom. (1988) Interaction between European perch (.Perea
fluviatilis) and juvenile Pacifastacus leniusculus (Dana) in a pond experiment.
Freshwater Crayfish 7:37-45.
Astall, C. M., A. C. Taylor, and R. J. A. Atkinson. (1997) Behavioural and physiological
implications of a burrow-dwelling lifestyle for two species of upogebiid mud-shrimp
(Crustacea: Thalassinidea). Estuarine, Coastal and Shelf Science 44:155 - 168.
149
References
Atkinson, R. J. A., and A. C. Taylor. (1988) Physiological ecology of burrowing decopods.
Symposium of the Zoological Society of London 59:201 - 226.
Becker, C. D., R. G. Genoway, and J. A. Merril. (1975) Resistance of the north-western
crayfish Pacifasticus leniusculus (Dana) to elevated temperatures. Transactions of the
American Fisheries Society 2:374 - 387.
Berrill, M., and B. Chenoweth. (1982) The burrowing ability of non-burrowing crayfish.
American Midland Naturalist 108:199-201.
Blake, M. A., and P. J. B. Hart. (1993) Habitat preferences and survival of juvenile signal
crayfish, Pacifastacus leniusculus - the influence of water depth, substratum,
predatory fish and gravid female crayfish. Freshwater Crayfish 9:318-332.
Blank, G. S., and M. H. Figler. (1996) Interspecific shelter competition between the sympatric
crayfish species Procambarus clarkii (Girard) and Procambarus zonangulus (Hobbs
and Hobbs). Journal of Crustacean Biology 16:300-309.
Bohl, E. (1999) Motion of individual noble crayfish Astacus astacus in different biological
situations: in-situ studies using radio telemetry. Freshwater Crayfish 12:677 - 687.
Bouchard, R. W., and D. A. Etnier. (1979) A new species of primary burrowing crayfish of
the Genus Cambarus from the Ridge and Valley Province in Tennessee. Proceedings
of the Biological Society of Washington 92:589 - 600.
Brown, D. J., and J. M. Brewis. (1978) A critical look at trapping as a method of sampling a
population of Austropotamobiuspallipes (Lereboullet) in a mark and recapture study.
Freshwater Crayfish 4:159-164.
Bruski, C. A., and D. W. Dunham. (1987) The importance of vision in agonistic
communication of the crayfish Orconectes rusticus . 1. An analysis of bout dynamics.
Behaviour 103:83-107.
150
References
Bubb, D. H., M. C. Lucas, and T. J. Thom. (2002a) Winter movements and activity of signal
crayfish Pacifastacus leniusculus in an upland river, determined by radio telemetry.
Hydrobiologia 483:111-119.
Bubb, D. H., M. C. Lucas, T. J. Thom, and P. Rycroft. (2002b) The potential use of PIT
telemetry for identifying and tracking crayfish in their natural environment.
Hydrobiologia 483:225-230.
Burggren, W. W., and B. R. McMahon. (1983) An analysis of scaphognathite pumping
performance in the crayfish Orenectes virilis: Compensatory changes to acute and
chronic hypoxic exposure. Physiological Zoology 56:309 - 318.
Butler, M. J., and R. A. Stein. (1985) An analysis of the mechanism governing species
replacements in crayfish. Oecologia 66:168 - 177.
Byron, C. J., and K. A. Wilson. (2001) Rusty crayfish (Orconectes rusticus) movement within
and between habitats in Trout Lake, Vilas County Wisconsin. Journal of the North
American Benthological Society 20:606-614.
Cameron, J. N. (1971) Rapid method for determination of total carbon dioxide in small blood
samples. Journal of Applied Physiology 31:632-634.
Capelli, G. M. (1980) Seasonal variation in the found habits of the crayfish Orconectes
propinquus (girard) in a trout lake, Vilas county, Wisconsin, U.S.A. (Decapoda,
Astacidea, Cambaridae). Crustaceana 38:82-86.
Capelli, G. M., and P. A. Hamilton. (1984) Effects of food and shelter on aggressive activity
in the crayfish Orconectes rusticus (Girard). Journal of Crustacean Biology 4:252-260.
Capelli, G. M., and B. L. Munjal. (1982) Aggressive interactions and resource competition in
relation to species displacement among crayfish of the genus Orconectes. Journal of
Crustacean Biology 2:486-492.
151
References
Cerenius, L., K. Soderhall, M. Persson, and R. Ajaxon. (1988) The crayfish plague fungus
Aphanomyces astaci - diagnosis, isolation and pathobiology. Freshwater Crayfish
7:131-144.
Chambers, P. A., J. M. Hanson, J. M. Burke, and E. E. Prepas. (1990) The impact of the
crayfish Orconectes virilis on aquatic macrophytes. Freshwater Biology 24:81-91.
Chambers, P. A., J. M. Hanson, and E. E. Prepas. (1991) The effect of aquatic plant chemistry
and morphology on feeding selectivity by the crayfish, Orconectes virilis. Freshwater
Biology 25:339-348.
Claussen, D. L. (1980) Thermal acclimation in the crayfish Orconectes rusticus and O. virilis.
Comparative Biochemistry and Physiology A 66:377 - 384.
Cobb, J. S. (1971) The shelter-related behavior of the lobster, Homarus americanus. Ecology
52:108-115.
Collins, N. C., H. H. Harvey, A. J. Tiemey, and D. W. Dunham. (1983) Influence of
predatory fish density on trapability of crayfish in Ontario lakes. Canadian Journal of
Fisheries and Aquatic Sciences 40:1820-1828.
Cormack, R. M. (1969) The statistics of capture-recapture methods. Oceanography and
Marine Biology Review 6:455 - 506.
Correia, A. M., and O. Ferreira. (1995) Burrowing behavior of the introduced red swamp
crayfish Procambarus clarkii (Decapoda, Cambaridae) in Portugal. Journal of
Crustacean Biology 15:248-257.
Crawshaw, L. I. (1974) Temperature selection and activity in the crayfish, Orconectes
immunis. Journal of Comparative Physiology 95A:315-322.
Creaser, E. P. (1931) Some cohabitants of burrowing crayfish. Ecology 12:243 - 244.
152
References
Crowe, A., and A. Crowe. (1969) Mathematics for biologists, Academic Press London . New
York.
Dong, Q., and G. A. Polis. (1992) The dynamics of cannibalistic populations: a foraging
perspective, Pages 13-37 in M. A. Elgar, and B. J. Crespi, eds., Cannibalism Ecology
and Evolution among Diverse Taxa, Oxford University Press, Oxford.
Doroshenko, J. (1988) Socioethological aspects of sexual behaviour of the signal crayfish
Pacifastacus leniusculus Dana introduced in the Lithuanian SSR. Freshwater Crayfish
7:351-356.
Dworschak, P. C. (1981) The pumping rate of the burrowing shrimp Upogebia pusilla
(Petanga) (Decapoda:Thalassinidea). Journal of Marine Biology and Ecology 52:25 -
35.
Elvira, B., G. G. Nicola, and A. Almodovar. (1996) Pike and red swamp crayfish: a new case
on predator-prey relationship between aliens in central Spain. Journal of Fish Biology
48:437 - 446.
Figler, M. H., G. S. Blank, and H. V. S. Peeke. (1997) Maternal aggression and post-hatch
care in red swamp crayfish, Procambarus clarkii (Girard): The influences of presence
of off spring, fostering, and maternal molting. Marine and Freshwater Behaviour and
Physiology 30:173 - 194.
Flinders, C. A., and D. D. Magoulick. (2003) Effects of stream permanence on crayfish
community structure. American Midland Naturalist 149:134-147.
Flint, R. W. (1977) Seasonal activity, migration, and distribution of the crayfish, Pacifastacus
leniusculus, in Lake Tahoe. American Midland Naturalist 97:280-292.
153
References
Flint, R. W., and C. R. Goldman. (1975) The effects of benthic grazers on the primary
productivity of the littoral zone of lake Tahoe. Limnology and Oceanography
20:935-944.
Forgue, J., A. Legeay, and J. C. Massabuau. (2001) Is the resting rate of oxygen consumption
of locomotor muscles in crustaceans limited by the low blood oxygenation strategy?
Journal of Experimental Biology 204:933-940.
Furst, M., and B. Eriksson. (1973) Climate and stream as limiting factors in the distribution of
Astacas astacus L. Freshwater Crayfish 1:268 - 279.
Garvey, J. E., and R. A. Stein. (1993) Evaluating how chela size influences the invasion
potential of an introduced crayfish (Orconectes rusticus). American Midland
Naturalist 129:172-181.
Garvey, J. E., R. A. Stein, and H. M. Thomas. (1994) Assessing how fish predation and
interspecific prey competition influence a crayfish assemblage. Ecology 75:532-547.
George, R. (1957) Continuous crayfish tests: Pelsant group, Hourthman, Abrolhos, Western
Australia. Australian Journal of Marine and Freshwater Research 8:476 - 490.
George, R. (1958) The status of the 'white' crayfish in Western Australia. Australian Journal
of Marine and Freshwater Research 9:537 - 545.
Gerhardt, L., and S. P. Baden. (1998) Gender- and oxygen-related irrigation behaviour of the
decapod Nephrops norvegicus. Marine Biology 131:553-558.
Gherardi, F. (2002) Behaviour, Pages 258 -290 in D. M. Holdich, ed., Biology of Freshwater
Crayfish, Blackwell Science Ltd.
154
References
Gherardi, F., P. Acquistapace, E. Tricarico, and S. Barbaresi. (2002a) Ranging and burrowing
behaviour of the red swamp crayfish in an invaded habitat: the onset of hibernation.
Freshwater Crayfish 13:330 - 337.
Gherardi, F., and S. Barbaresi. (2000) Invasive crayfish: activity patterns of Procambarus
clarkii in the rice fields of the lower Guadalquivir (Spain). Archiv Fur Hydrobiologie
150:153- 168.
Gherardi, F., S. Barbaresi, and G. Salvi. (2000) Spatial and temporal patterns in the
movement of Procambarus clarkii, an invasive crayfish. Aquatic Sciences 62:179-
193.
Gherardi, F., S. Barbaresi, and F. Villanelli. (1998) Movement patterns of the white-clawed
crayfish, Austropotamobius pallipes, in a tuscan stream. Journal of Freshwater
Ecology 13:413-424.
Gherardi, F., G. Messana, A. Ugolini, and M. Vannini. (1988) Studies on the locomotor-
activity of the freshwater crab, Potamon fluviatile. Hydrobiologia 169:241-250.
Gherardi, F., E. Tricarico, and M. Ilheu. (2002b) Movement patterns of an invasive crayfish,
Procambarus clarkii, in a temporary stream of southern Portugal. Ethology Ecology &
Evolution 14:183 -197.
Girard, C. (1852) A revision of the North American Astaci, with observations on their habits
and geographical distribution. Proceedings of the Academy of Natural Sciences of
Philadelphia 6:87-104.
Grow, L. (1982) Burrowing soil-texture relationships in the crayfish, Cambarus diogenes
diogenes Girard (Decapoda, Astacidea). Crustaceana 42:150-157.
Grow, L., and H. Merchant. (1979) The burrow habits of the crayfish, Cambarus diogenes
(Girard). American Midland Naturalist 103:231-237.
155
References
Guan, R. Z. (1994) Burrowing behaviour of the Signal Crayfish, Pacifastacus leniusculus
(Dana), in the River Great Ouse, England. Freshwater Forum 4:155-168.
Guan, R. Z. (1995) Ecological studies on the crayfish Pacifastacus leniusculus (Dana). PhD
thesis, The University of Buckingham.
Guan, R. Z. (1997) An improved method for marking crayfish. Crustaceana 70:641-652.
Guan, R. Z., and P. R. Wiles. (1997a) Ecological impact of introduced crayfish on benthic
fishes in a British lowland river. Conservation Biology 11:641-647.
Guan, R. Z., and P. R. Wiles. (1997b) The home range of signal crayfish in a British lowland
river. Freshwater Forum 8:45-54.
Guan, R. Z., and P. R. Wiles. (1998) Feeding ecology of the signal crayfish Pacifastacus
leniusculus in a British lowland river. Aquaculture 169:177-193.
Guan, R. Z., and P. R. Wiles. (1999) Growth and reproduction of the introduced crayfish
Pacifastacus leniusculus in a British lowland river. Fisheries Research 42:245-259.
Guiasu, R. C., and D. W. Dunham. (1998) Inter-form agonistic contests in male crayfishes,
Cambarus robustus (Decapoda, Cambaridae). Invertebrate Biology 117:144-154.
Guiasu, R. C., and D. W. Dunham. (1999) Aggressive interactions between the crayfishes
Cambarus bartonii bartonii and C. robustus (Decapoda, Cambaridae): Interspecific
and intraspecific contests. Journal of Crustacean Biology 19:131-146.
Hamrin, S. (1987) Seasonal crayfish activity as influenced by fluctuating water levels and
presence of a fish predator. Holarctic Ecology 10:45-51.
156
References
Hams, R. R. (1999) An assessment of signal crayfish, Pacifastacus leniusculus (Dana), in the
Gaddesby/Twyford Brook, Leicestershire and the River Greet, Nottinghamshire,
Pages 1-19. Trent Region, Environment Agency.
Harris, R. R., and M. B. Andrews. (1985) Total NPS pool and ammonia net efflux rate
changes in Carcinus maenas during acclimation to low environmental salinity.
Comparative Biochemistry and Physiology 82A:301-308.
Harris, R. R., S. Coley, S. Collins, and R. McCabe. (2001) Ammonia uptake and its effects on
ionoregulation in the freshwater crayfish Pacifastacus leniusculus (Dana). Journal of
Comparative Physiology B-Biochemical Systemic and Environmental Physiology
171:681-693.
Harris, R. R., and J. Young. (1996) Distribution, densities and population characteristics of
the signal crayfish Pacifastacus leniusculus (Dana) in the Gaddesby Brook,
Leicestershire., Pages 2 -28, National Rivers Authority. Severn Trent Region.
Hasiotis, S., T. (1993a) Evaluation of the burrowing behaviour of stream and pond dwelling
species of Orconectes in the Front Range of Boulder, Colorado, USA: their
ethological and geological implications. Freshwater Crayfish 9:399-406.
Hasiotis, S., T. (1993b) Ichnology of Triassic and Holocene cambarid crayfish of North
America: an overview of burrowing behaviour and morphology as reflected by their
burrow morphologies in the geological record. Freshwater Crayfish 9:407 - 418.
Hazlett, B., D. Rittschof, and C. Ameyaw-Akumfi. (1979) Factors affecting the daily
movements of the crayfish Orconectes virilis (Hagen, 1870)) (Decapoda, Cambaridae).
Crustaceana Suppl. 5:121-130.
Hill, A. M., and D. M. Lodge. (1994) Diel changes in resource demand - Competition and
predation in species replacement among crayfishes. Ecology 75:2118-2126.
157
References
Hobbs, H. H., J. P. Jass, and J. Huner, V. (1989) A review of global crayfish introductions
with particular emphasis on two North American species (Decapoda, Cambaridae).
Crustaceana 56:300 - 316.
Hobbs, H. H., Jr. (1981) The crayfishes of Georgia. Smithsonian Contributions to Zoology
318:1-549.
Hobbs, H. H. J. (1988) Crayfish distribution, adaptive radiation and evolution in D. M.
Holdich, and R. S. Lowery, eds., Freshwater Crayfish Biology, Management and
Exploitation, The University Press, Cambridge.
Holdich, D. (1999) The negative effects of established crayfish introductions in F. Gherardi,
and D. Holdich, eds., Crayfish in Europe as alien species: How to make the best of a
bad situation, A. A. Balkema, Rotterdam, Brookfield.
Holdich, D. (2002a) Crayfish Burrows. Crayfish News 24:4-5.
Holdich, D. M. (2002b) Background and functional morphology, Pages 3 -2 9 in D. M.
Holdich, ed., Biology of Freshwater Crayfish, Blackwell Science Ltd.
Holdich, D. M., H. E. G. Ackefors, F. Gherardi, D. Rogers, and J. Skurdal. (1999) Native and
alien crayfish in Europe: Some conclusions, Pages 281 - 292 in F. Gherardi, and D. M.
Holdich, eds., Crayfish in Europe as alien species. How to make the best of a bad
situation, A. A. Balkema, Rotterdam, Brookfield.
Holdich, D. M., and J. C. J. Domaniewski. (1995) Studies on a mixed population of the
crayfish Austropotamobiuspallipes and Pacifastacus leniusculus in England.
Freshwater Crayfish 10:37 - 45.
Holdich, D. M., and F. Gherardi. (1999) Native and alien crayfish in Europe : An
introduction, Pages 3 -9 in F. Gherardi, and D. M. Holdich, eds., Crayfish in Europe
158
References
as alien species. How to make the best of a bad situation?, A. A. Balkema, Rotterdam,
Brookfield.
Holdich, D. M., I. D. Reeve, and W. D. Rogers. (1990) Introduction and spread of alien
crayfish in British waters - Implications for native crayfish populations. Freshwater
Crayfish 8:99 -112
Holdich, D. M., and W. D. Rogers. (1992) Crayfish populations in the British Isles: Farming,
legislation, conservation and management. Finnish Fisheries Research 14:23 - 32.
Horwitz, P. H. J., and A. M. M. Richardson. (1986) An ecological classification of the
burrows of Australian freshwater crayfish. Australian Journal of Marine and
Freshwater Research 37:237 - 242.
Horwitz, P. H. J., A. M. M. Richardson, and A. Boulton. (1985a) The burrow habitat of two
sympatric species of land crayfish, Engaeus urostrictus and E. tuberculatus
(Decapoda: Parastacidae). Victorian Natuaralist 102:188-197.
Horwitz, P. H. J., A. M. M. Richardson, and P. M. Cramp. (1985b) Aspects of the life history
of the burrowing freshwater crayfish Engaeus Leptorhyncus, The Tasmanian
Naturalist.
Huner, J., V. (2002) A brief description of the burrows of the commercial procambarid
crayfishes in Louisiana research and demonstration ponds. Freshwater Crayfish
13:247-252.
Ilheu, M., P. Acquistapace, C. Benvenuto, and F. Gherardi. (2003) Shelter use of the Red-
Swamp Crayfish (Procambarus clarkii) in dry-season stream pools. Archiv Fur
Hydrobiologie 157:535-546.
159
References
Isely, J. J., and A. G. Eversole. (1998) Tag retention, growth, and survival of red swamp
crayfish Procambarus clarkii marked with coded wire tags. Transactions of the
American Fisheries Society 127:658-660.
Jerry, D. R., T. Stewart, I. W. Purvis, and L. R. Piper. (2001) Evaluation of visual implant
elastomer and alphanumeric internal tags as a method to identify juveniles of the
freshwater crayfish, Cher ax destructor. Aquaculture 193:149-154.
Kamofsky, E. B., J. Atema, and R. H. Elgin. (1989) Field observations of social-behavior,
shelter use, and foraging in the lobster, Homarus americanus. Biological Bulletin
176:239-246.
Kamofsky, E. B., and H. J. Price. (1989) Dominance, territoriality and mating in the lobster,
Homarus americanus - a mesocosm Study. Marine Behaviour and Physiology 15:101-
121.
Kaufmann, J. H. (1983) On the definitions and functions of dominance and territoriality.
Biological Reviews of the Cambridge Philosophical Society 58:1-20.
Keller, T. A., and L. C. Ruman. (1998) Short-term crayfish effects on stream algae and
invertebrates. Journal of Freshwater Ecology 13:97-104.
Kivivuori, L. (1977) Temperature acclimation of the motor activity in the crayfish Astacus
astacus L. Freshwater Crayfish 3:263 - 274.
Klosterman, B. J., and C. Goldman. (1983) Substrate selection behaviour of the crayfish
Pacifastacus leniusculus. Freshwater Crayfish 5:254-267.
Kozak, P., J. Kajtman, J. Kouril, and T. Policar. (2002) The effect of crayfish density and
shelter number on the daily activity of signal crayfish. Freshwater Crayfish 13:457 -
462.
160
References
Laurent, P. J. (1988) Austropotamobius pallipes and A. torrentium, with observations on their
interactions with other species in Europe., Pages 341 - 364 in D. M. Holdich, and R. S.
Lowery, eds., Freshwater Crayfish Biology, Management and exploitation., The
University Press, Cambridge.
Lawrence, C. S., J. I. Brown, and J. E. Bellanger. (2002) Morphology and occurrence of
yabby (Cherax albidus Clark) burrows in Western Australian farm dams. Freshwater
Crayfish 13:253 - 264.
Levenbach, S., and B. A. Hazlett. (1996) Habitat displacement and the mechanical and
display functions of chelae in crayfish. Journal of Freshwater Ecology 11:485-492.
Liu, H., J. W. Avault Jr, and P. Medley. (1995) Toxicity of ammonia and nitrite to juvenile
redclaw crayfish, Cherax quadricarinatus (von Martens). Freshwater Crayfish 10:249
-255.
Lodge, D. M., and A. M. Hill. (1994a) Factors governing species composition, population
size, and productivity of cool water crayfishes. Nordic Journal of Freshwater Research
69:111-136.
Lodge, D. M., and A. M. Hill. (1994b) Factors governing species composition, population
size, and productivity of cool-water crayfishes. Nordic Journal of Freshwater Research
69:111 - 136.
Loew, E. R. (1980) Visual pigment regeneration rate and suseptibility to photic damage.
Pages 298 - 308 in T. P. Williams, and N. B. Baker, eds., Effects of constant light on
visual processes, New York: Plenham Press.
Loring, M. W., and L. G. Hill. (1976) Temperature selection and shelter utilization of the
crayfish, Orconectes causeyi. The Southwestern Naturalist 21:219-226.
161
References
Lorman, J. G., and J. J. Magnuson. (1978) The role of crayfishes in aquatic ecosystems.
Fisheries 3:8-10.
Lourey, M., and B. D. Mitchell. (1995) The sublethal effects of unionised ammonia on growth
of the yabby, Cherax albidus Clark. Freshwater Crayfish 10:256 - 266.
Lowery, R. S., and D. M. Holdich. (1988) Pacifastacus leniusculus in North America and
Europe, with details of the distributions of introduced and native crayfish speicies in
Europe., Pages 283 - 308 in D. M. Holdich, and R. S. Lowery, eds., Freshwater
Crayfish Biology, Management and Exploitation, The University Press, Cambridge.
Lukowicz, M. (1999) Freshwater crayfish in the fishery legislation of the federal states
(Bundeslander) of Germany. Freshwater Crayfish 12:891 - 898.
Marren, P. (1986) The lethal harvest of crayfish plague. New Scientist 109:46-50.
Mason, J. (1978) Effects of temperature, photoperiod, substrate and shelter on survival,
growth and biomass accumulation of juvenile Pacifastacus leniusculus in culture.
Freshwater Crayfish 4:73-82.
Maude, S. H., and D. D. Williams. (1983) Behavior of crayfish in water currents -
hydrodynamics of 8 species with reference to their distribution patterns in Southern
Ontario. Canadian Journal of Fisheries and Aquatic Sciences 40:68-77.
McMahon, B. R. (2001) Respiratory and circulatory compensation to hypoxia in crustaceans.
Respiration Physiology 128:349-364.
McMahon, B. R. (2002) Physiological adaptation to environment, Pages 327 - 376 in D. M.
Holdich, ed., Biology of Freshwater Crayfish, Blackwell Science Ltd.
McManus, L. R. (1960) An occurrence of'Chimney' construction by the crayfish, Cambarus
bartoni. Ecology 41:383 - 384.
162
References
Merkle, E. E. (1969) Home Range of crayfish Orconectes juvenalis. American Midland
Naturalist 81:228-235.
Moller, T. H., and E. Naylor. (1980) Environmental influence on locomotor activity in
Nephrops norvegicus (Crustacea: Decopoda). Journal of the Marine Biological
Association U.K 60:103-113.
Nams, V. O. (1989) A technique to determine the behavior of a radio-tagged animal.
Canadian Journal of Zoology 67:254-258.
Nystrom, P. (2002) Ecology, Pages 192 - 235 in D. M. Holdich, ed., Biology of Freshwater
Crayfish, Blackwell Science Ltd.
Nystrom, P., C. Bronmark, and W. Graneli. (1996) Patterns in benthic food webs: A role for
omnivorous crayfish? Freshwater Biology 36:631-646.
Nystrom, P., and J. A. Strand. (1996) Grazing by a native and an exotic crayfish on aquatic
macrophytes. Freshwater Biology 36:673-682.
Partridge, L. (1978) Habitat selection, Pages 351 - 376 in J. R. Krebs, and N. B. Davies, eds.,
Behavioural Ecology: An Evolutionary Approach, Blackwell Scientific Publications,
Oxford.
Payne, J. F., and J. O. Price. (1981) Studies of the life history and ecology of Oronectes
palmeri palmeri (Faxon). Freshwater Crayfish 5:183-191.
Peay, S., and D. Rogers. (1999) The peristaltic spread of Signal Crayfish (Pacifastacus
leniusculus) in the River Wharfe, Yorkshire, England). Freshwater Crayfish 12:665 -
676.
163
References
Peeke, H. V. S., J. Sippel, and M. H. Figler. (1995) Prior residence effects in shelter defense
in adult signal crayfish {Pacifastacus-leniusculus (Dana)) - Results in same- sex and
mixed-sex dyads. Crustaceana 68:873-881.
Penn, G. H. (1943) A study of the life history of the Louisiana red-crawfish, Cambarus clarkii
Girard. Ecology 24:1 -18.
Pervesler, P., and P. C. Dworschak. (1985) Burrows of Jaxea nocturna NARDO in the Gulf
of Trieste. Senckenbergiana Maritima 17:33-53.
Pockl, M. (1999) Freshwater crayfish in the legislation of Austria: Federal, national and
international laws, Pages 899 - 914 in M. Keller, M. M. Keller, R. Hoffmann, B.
Oidtmann, and G. Vogt, eds., Freshwater Crayfish, Weltbild Verlag.
Pond, C. M. (1975) The role of the "walking legs" in aquatic and terrestrial locomotion of the
crayfish Austropotamobius pallipes (Lereboullet). Journal of Experimental Biology
62:447-454.
Pratten, D. J. (1980) Growth in the crayfish Austropotamobius pallipes (Crustacea:
Astacidae). Freshwater Biology 10:401-412.
Ranta, E., and K. Lindstrom. (1993) Body-size and shelter possession in mature signal
crayfish, Pacifastacus leniusculus. Annales Zoologici Fennici 30:125-132.
Reyjol, Y., and C. Roqueplo. (2002) Preferential habitat analysis of white-clawed crayfish,
notably juveniles, in three brooks of Correze - France. Bulletin Francais De La Peche
Et De La Pisciculture:741-759.
Rhodes, R. J., and J. W. Avault Jr. (1986) Mark and recapture of the red swamp crayfish
Procambarus clarkii. Freshwater Crayfish 6:243-246.
164
References
Rice, A. L., and C. J. Chapman. (1971) Observations on the burrows and the burrowing
behaviour of two mud-dwelling decapod crustaceans, Nephrops norvegicus and
Goneplax rhomboides. Marine Biology (Berlin) 10:330-342
Richards, K. (1983) The introduction of the signal crayfish into the United Kingdom and its
development as a farm crop. Freshwater Crayfish 5:557-563.
Richards, K. J., and P. Fluke. (1977) Freshwater crayfish - the first centre in Britain. Fish
Farming International 4:12-15.
Richardson, A. M. M. (1983) The Effect of the burrows of a crayfish on the respiration of the
surrounding soil. Soil Biology & Biochemistry 15:239-242.
Richardson, A. M. M., and R. Swain. (1980) Habitat requirements and distribution of
Engaeus cisternarius and three subspecies of Parastacoides tasmanicus (Decapoda :
Parastacidae), burrowing crayfish from an area of south-western Tasmania. Australian
Journal of Marine and Freshwater Research 31:475-484.
Robinson, C. A. (1997) Ranging behaviour of a large freshwater invertebrate, the white-
clawed crayfish Austropotamobius pallipes. MSc thesis, University of Durham,
Durham.
Robinson, C. A., T. J. Thom, and M. C. Lucas. (2000) Ranging behaviour of a large
freshwater invertebrate, the white-clawed crayfish Austropotamobius pallipes.
Freshwater Biology 44:509-521.
Rogers, R., and J. V. Huner. (1985) Comparison of burrows and burrowing behaviour of five
species of cambarid crawfish (Crustacea, Decapoda) from the Southern University
Campus, Baton Rouge, Lousiana. Proceedings of the Lousiana Academy of Science
48:23-29.
165
References
Rogers, W. D. (1993) Report on signal crayfish in Owston Brook, Report for the National
Rivers Authority.
Rouse, D. B., and R. J. Kastner. (1995) Toxicity of ammonia and nitrite to hatchling redclaw
crayfish, Cherax quadricarinatus. Freshwater Crayfish 10:298 - 303.
Rundquist, J. C., and C. R. Goldman. (1978) Growth and food conversion efficiency of
juvenile P. leniusculus along a salinity gradient. Freshwater Crayfish 4:105 - 114.
Savolainen, R., K. Ruohonen, and J. Tulonen. (2003) Effects of bottom substrate and presence
of shelter in experimental tanks on growth and survival of signal crayfish,
Pacifastacus leniusculus (Dana) juveniles. Aquaculture Research 34:289-297.
Scholtz, G. (1999) Freshwater crayfish evolution. Freshwater Crayfish 12:37 - 48.
Schutze, S., H. Stein, and O. Bom. (1999) Radio telemetry observations on migration and
activity patterns of restocked noble crayfish Astacus astacus (L.) in the small river
Sempt, North-East of Munich, Germany. Freshwater Crayfish 12:688 - 695.
Shimizu, S. J., and C. Goldman. (1983) Pacifastacus leniusculus (Dana) production in the
Sacramento River. Freshwater Crayfish 5:210-228.
Sibley, P. J. (2001) Signal Crayfish, Pacifastacus leniusculus (Dana), in the Gaddesby Brook,
Leicestershire. Population assessment and management options. 'Unpublished IFM
Diploma project report'.
Skurdal, J., T. Taugbol, A. Burba, and J. Tussti. (1999) Crayfish management plans -
Experiences from Norway and Lithuania. Pages 878 - 889 in M. Keller, M. M. Keller,
R. Hoffinann, B. Oidtmann, and G. Vogt, eds., Freshwater Crayfish, Weltbild Verlag.
Smith, V. J., and K. Soderhall. (1986) Crayfish pathology: an overview. Freshwater Crayfish
6:119-211.
166
References
Soderback, B. (1990) Interspecific dominance relationship and aggressive interactions in the
freshwater crayfishes Astacus astacus (L.) and Pacifastacus leniusculus (Dana).
Canadian Journal of Zoology 69:1321 - 1325.
Soderback, B. (1995) Replacement of the native crayfish Astacus astacus by the introduced
species Pacifastacus leniusculus in a Swedish Lake - Possible causes and mechanisms.
Freshwater Biology 33:291-304.
Southwood, T. R. E. (1978) Ecological methods, Chapman & Hall, London and New York.
Stamhuis, E. J., and J. Videler. (1998a) Burrow ventilation in the tube-dwelling shrimp
Callianassa sibterranea (Decapoda: Thalassinidea). Journal of Experimental Biology
201:2151 -2158.
Stamhuis, E. J., and J. Videler. (1998b) Burrow ventilation in the tube-dwelling shrimp
Callianassa sibterranea (Decapoda: Thalassinidea). Journal of Experimental Biology
201:2159-2170.
Stamhuis, E. J., and J. Videler. (1998c) Burrow ventilation in the tube-dwelling shrimp
Callianassa sibterranea (Decapoda: Thalassinidea). Journal of Experimental Biology
201:2171-2181.
Stanton, J. A., and R. R. Harris. (2003) Burrowing behaviour and movements of the signal
crayfish Pacifastacus leniusculus (Dana) in the U.K. Midlands. D. M. Holdich, and P.
J. Sibley, eds. Management & Conservation of Crayfish. Proceedings of a conference
held on 7th November 2002.
Stein, R. A. (1977) Selective predation, optimal foraging, and the predator-prey interaction
between fish and crayfish. Ecology 58:1237-1253.
Stein, R. A., and J. J. Magnuson. (1976) Behavioral response of crayfish to a fish predator.
Ecology 57:751-761.
167
References
Tarr, R. S. (1884) Habits of burrowing crayfishes in the United States. Nature (London)
30:127-128.
Taylor, E. W., and M. G. Wheatly. (1980) Ventilation, heart rate and respiratory gas exchange
in the crayfish Austropotamobius pallipes (Lereboullet) submerged in normoxic water
and after 3 h exposure in air at 15 °C. Journal of Comparative Physiology 138: 256-
271.
Trepanier, T. L., and D. W. Dunham. (1999) Burrowing and chimney building by juvenile
burrowing crayfish Fallicambarus fodiens (Cottle, 1863) (Decapoda, Cambaridae).
Crustaceana 72:435-442.
Usio, N. (2002) Do crayfish effect invertebrate distribution in a headwater stream? Freshwater
Crayfish 13:396-402.
Vorburger, C., and G. Ribi. (1998) Pacifastacus leniusculus and Austropotamobius
torrentium prefer different substrates. Freshwater Crayfish 12:696 - 704.
Vorburger, C., and G. Ribi. (1999) Aggression and competition for shelter between a native
and an introduced crayfish in Europe. Freshwater Biology 42:111-119.
Weingartner, D. L. (1982) A field-tested internal tag for crayfish (Decapoda, Astacidea).
Crustaceana 43:181 -188.
Westman, K. (1973) Cultivation of the American crayfish Pacifastacus leniusculus.
Freshwater Crayfish 1:211 -220.
Westman, K., R. Savolainen, and M. Julkunen. (2002) Replacement of the native crayfish
Astacus astacus by the introduced species Pacifastacus leniusculus in a small,
enclosed Finnish lake: a 30-year study. Ecography 25:53 - 73.
168

References
Williams, D. D., N. E. Williams, and H. B. N. Myers. (1974) Observations of the life history
and burrow construction of the crayfish Cambarus fodiens (Cottle) in a tempory
stream in Southern Ontario. Canadian Journal of Zoology 52:365-370.
Williams, J. B., S. Ostrowski, E. Bedin, and K. Ismail. (2001) Seasonal variation in energy
expenditure, water flux and food consumption of Arabian oryx Oryx leucoryx. Journal
of Experimental Biology 204:2301-2311.
169