building a beta portfolio in an environment that looks
TRANSCRIPT
Building a Beta Portfolio in an Environment That Looks Difficult for AssetsAssets are facing significant headwinds from inflation and Fed tightening, but not holding assets is not an option. This raises the question—how should investors think about holding beta in the current environment?
MAY 31, 2022
DAVID GORDONRUTENDO CHIGORAANDREI CRETU
© 2022 Bridgewater Associates, LP
1© 2022 Bridgewater Associates, LP
In chart above, “Typical Portfolio” refers to the US Traditional Portfolio. For more on US Traditional Portfolio or the All Weather Asset Mix, please see the end of this document.
Investors now face drastically different circumstances compared to the last decade’s favorable environment for beta in general and equities in particular. From an alpha perspective, our outlook for assets is dim. We
worry about the impact of the ongoing withdrawal of liquidity on assets (more so than on the economy itself ), believe that markets are underpricing the amount of tightening that will be required to tame inflation, and see developed world policy makers as highly constrained.
At the same time, for most investors, not holding assets is not an option. Holding cash isn’t viable for most in a world in which it is destroying wealth at rate of 5% per year. Alpha can be extremely valuable, but it is difficult to generate and difficult to find at scale, as it requires unique insight not already priced into markets. That explains why roughly 90% of the risk in a typical institutional portfolio comes from the strategic asset allocation. Additionally, alpha views will often be wrong. Even the highest-conviction alpha views are at best 60/40 propositions. And those views can change quickly as market conditions unfold. So, we would hesitate to make big portfolio shifts on the basis of a handful of alpha views, including our own. Our approach to building a total portfolio has always been to build the best beta you can, independent of any active views, and then carefully layer in a diversified set of alphas to the degree that you have them or can find them in manager alpha.
That is to say, alpha is not to be ignored—just the opposite—but the most important question for most investors right now is: What is the best way to build a robust beta portfolio in an environment that seems likely to be difficult for assets for some time?
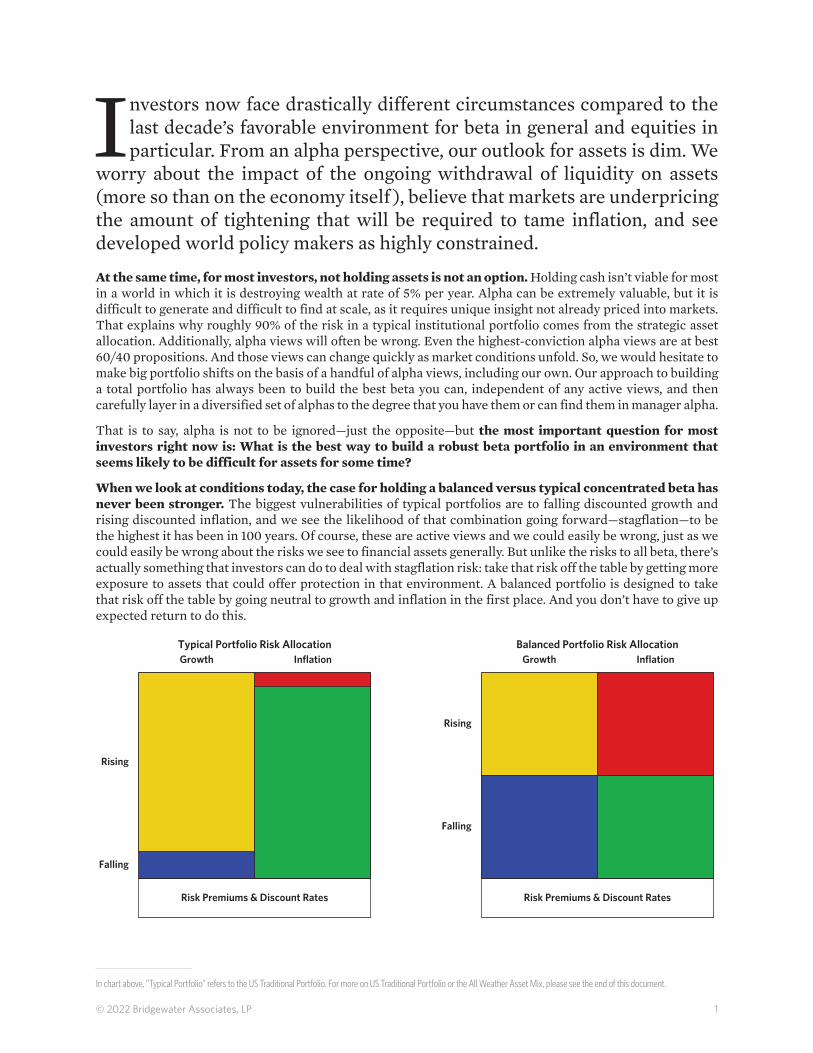
When we look at conditions today, the case for holding a balanced versus typical concentrated beta has never been stronger. The biggest vulnerabilities of typical portfolios are to falling discounted growth and rising discounted inflation, and we see the likelihood of that combination going forward—stagflation—to be the highest it has been in 100 years. Of course, these are active views and we could easily be wrong, just as we could easily be wrong about the risks we see to financial assets generally. But unlike the risks to all beta, there’s actually something that investors can do to deal with stagflation risk: take that risk off the table by getting more exposure to assets that could offer protection in that environment. A balanced portfolio is designed to take that risk off the table by going neutral to growth and inflation in the first place. And you don’t have to give up expected return to do this.
Rising
Falling
Growth
Risk Premiums & Discount Rates
Inflation
Rising
Falling
Growth
Risk Premiums & Discount Rates
InflationTypical Portfolio Risk Allocation Balanced Portfolio Risk Allocation
2© 2022 Bridgewater Associates, LP
Data as of May 23.
In the remainder of this report we expand on these thoughts. We review the recent performance of balanced beta in the context of the macro backdrop, discuss the prospects for beta going forward, and end with some thoughts on the challenges of investing in this environment.
Rising Risk Premiums and Discount Rates Have Hurt All Assets; the Big Shifts in Discounted Growth and Inflation That Are Particularly Bad for Equities and Typical Portfolios Have Not Yet Occurred When we look at what has happened in economies and markets so far this year, the outright and relative performance of typical beta portfolios and balanced beta makes sense. In brief: risk premiums and discount rates rose, hurting all assets. This is the risk inherent to beta, and there is no way of diversifying it away. At the same time, we have not yet seen the big shifts in discounted growth and inflation that are particularly bad for typical portfolios. As a result, all of the beta portfolios that we see are down by roughly similar amounts.
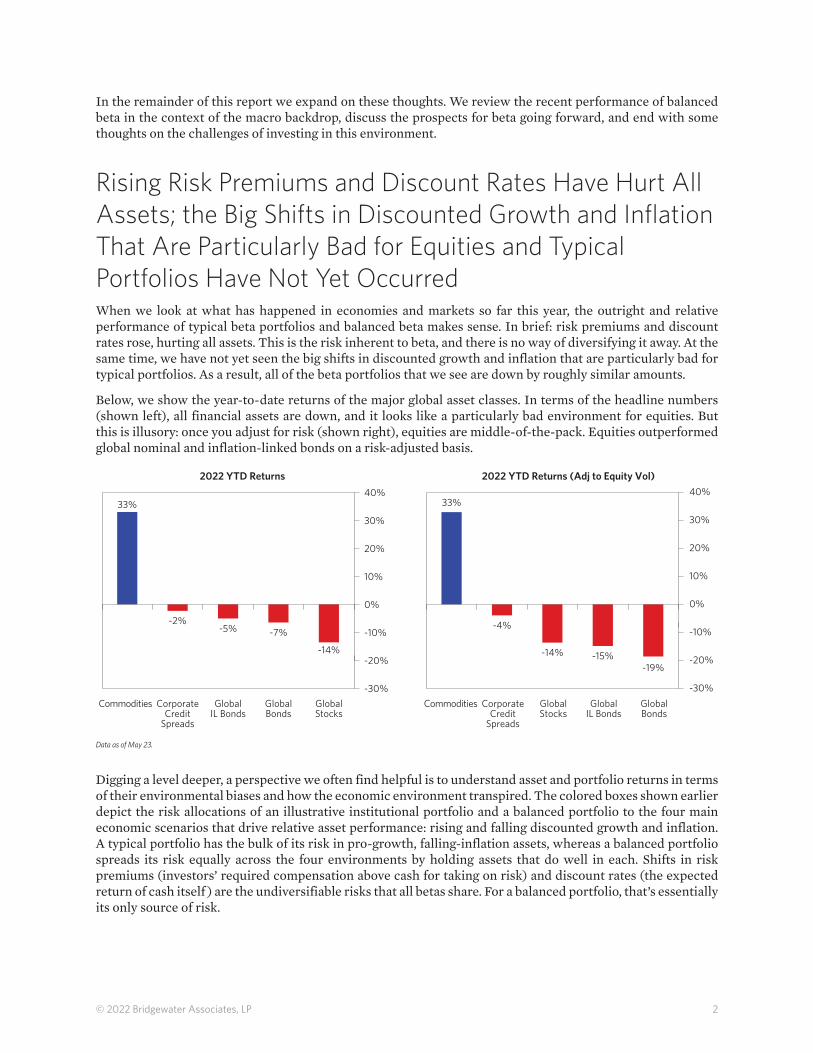
Below, we show the year-to-date returns of the major global asset classes. In terms of the headline numbers (shown left), all financial assets are down, and it looks like a particularly bad environment for equities. But this is illusory: once you adjust for risk (shown right), equities are middle-of-the-pack. Equities outperformed global nominal and inflation-linked bonds on a risk-adjusted basis.
-30%
20%
0%
30%
10%
-20%
-10%
Commodities CorporateCredit
Spreads
GlobalIL Bonds
GlobalStocks
GlobalBonds
Commodities CorporateCredit
Spreads
GlobalStocks
GlobalBonds
GlobalIL Bonds
20%
10%
-30%
-10%
0%
-20%
2022 YTD Returns 2022 YTD Returns (Adj to Equity Vol)
30%
40% 40%33%
-2%-5% -7%
-14%
33%
-4%
-14% -15%-19%
Digging a level deeper, a perspective we often find helpful is to understand asset and portfolio returns in terms of their environmental biases and how the economic environment transpired. The colored boxes shown earlier depict the risk allocations of an illustrative institutional portfolio and a balanced portfolio to the four main economic scenarios that drive relative asset performance: rising and falling discounted growth and inflation. A typical portfolio has the bulk of its risk in pro-growth, falling-inflation assets, whereas a balanced portfolio spreads its risk equally across the four environments by holding assets that do well in each. Shifts in risk premiums (investors’ required compensation above cash for taking on risk) and discount rates (the expected return of cash itself ) are the undiversifiable risks that all betas share. For a balanced portfolio, that’s essentially its only source of risk.
3© 2022 Bridgewater Associates, LP
The analysis in the cumulative return charts above is based on the All Weather Lens, which is an analytical approach to assess the behavior of the major drivers of asset performance and their impact on markets during any given period based on Bridgewater’s understanding of global financial markets. Information shown is the result of analyses of actual and simulated market data.
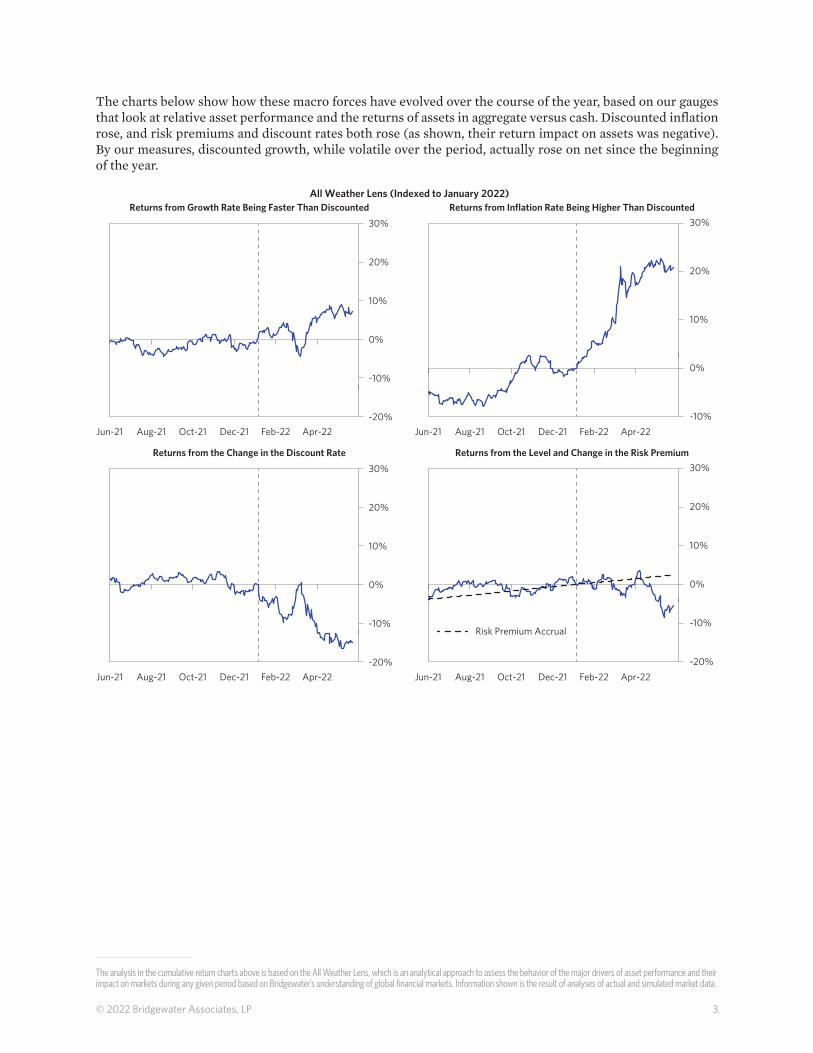
The charts below show how these macro forces have evolved over the course of the year, based on our gauges that look at relative asset performance and the returns of assets in aggregate versus cash. Discounted inflation rose, and risk premiums and discount rates both rose (as shown, their return impact on assets was negative). By our measures, discounted growth, while volatile over the period, actually rose on net since the beginning of the year.
-10%
10%
20%
0%
Jun-21 Aug-21 Oct-21 Dec-21 Feb-22 Apr-22
10%
20%
0%
30%
-20%
-10%
Returns from Growth Rate Being Faster Than DiscountedAll Weather Lens (Indexed to January 2022)
Returns from Inflation Rate Being Higher Than Discounted30%
Risk Premium Accrual
Jun-21 Aug-21 Oct-21 Dec-21 Feb-22 Apr-22
-20%
-10%
10%
20%
0%
Jun-21 Aug-21 Oct-21 Dec-21 Feb-22 Apr-22
10%
20%
0%
30%
-20%
-10%
Returns from the Change in the Discount Rate Returns from the Level and Change in the Risk Premium30%
Jun-21 Aug-21 Oct-21 Dec-21 Feb-22 Apr-22
4© 2022 Bridgewater Associates, LP
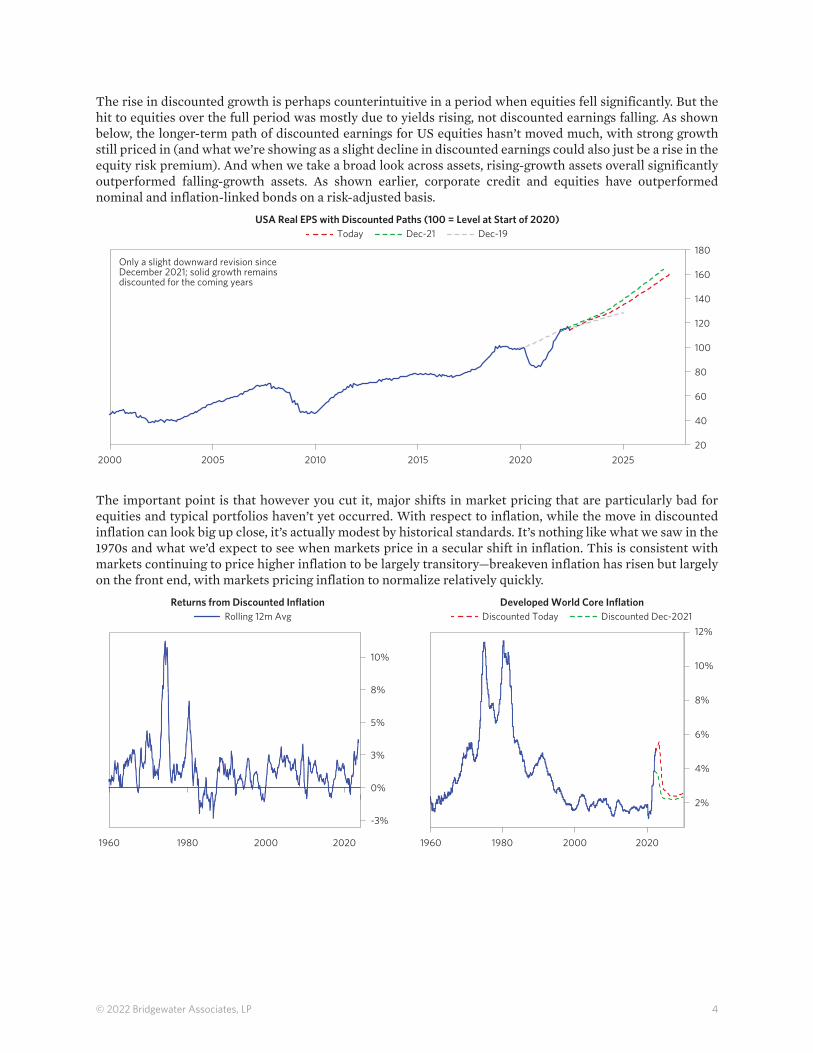
The rise in discounted growth is perhaps counterintuitive in a period when equities fell significantly. But the hit to equities over the full period was mostly due to yields rising, not discounted earnings falling. As shown below, the longer-term path of discounted earnings for US equities hasn’t moved much, with strong growth still priced in (and what we’re showing as a slight decline in discounted earnings could also just be a rise in the equity risk premium). And when we take a broad look across assets, rising-growth assets overall significantly outperformed falling-growth assets. As shown earlier, corporate credit and equities have outperformed nominal and inflation-linked bonds on a risk-adjusted basis.
20102000 20202005 2025201520
40
80
140
60
120
100
160
USA Real EPS with Discounted Paths (100 = Level at Start of 2020)
180Only a slight downward revision sinceDecember 2021; solid growth remainsdiscounted for the coming years
Today Dec-21 Dec-19
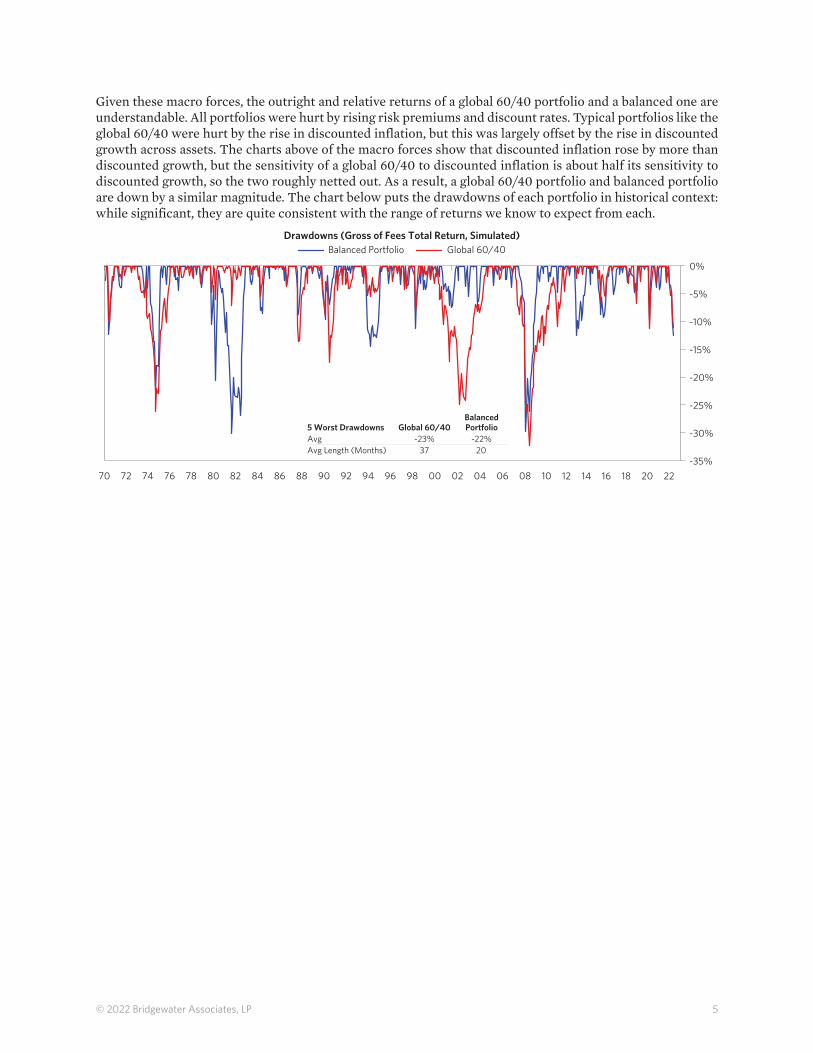
The important point is that however you cut it, major shifts in market pricing that are particularly bad for equities and typical portfolios haven’t yet occurred. With respect to inflation, while the move in discounted inflation can look big up close, it’s actually modest by historical standards. It’s nothing like what we saw in the 1970s and what we’d expect to see when markets price in a secular shift in inflation. This is consistent with markets continuing to price higher inflation to be largely transitory—breakeven inflation has risen but largely on the front end, with markets pricing inflation to normalize relatively quickly.
Returns from Discounted Inflation
8%
4%
10%
6%
2%
1960 20201980 2000 1960 20201980 2000
5%
8%
3%
-3%
0%
Developed World Core InflationDiscounted Today Discounted Dec-2021Rolling 12m Avg
10%
12%
5© 2022 Bridgewater Associates, LP
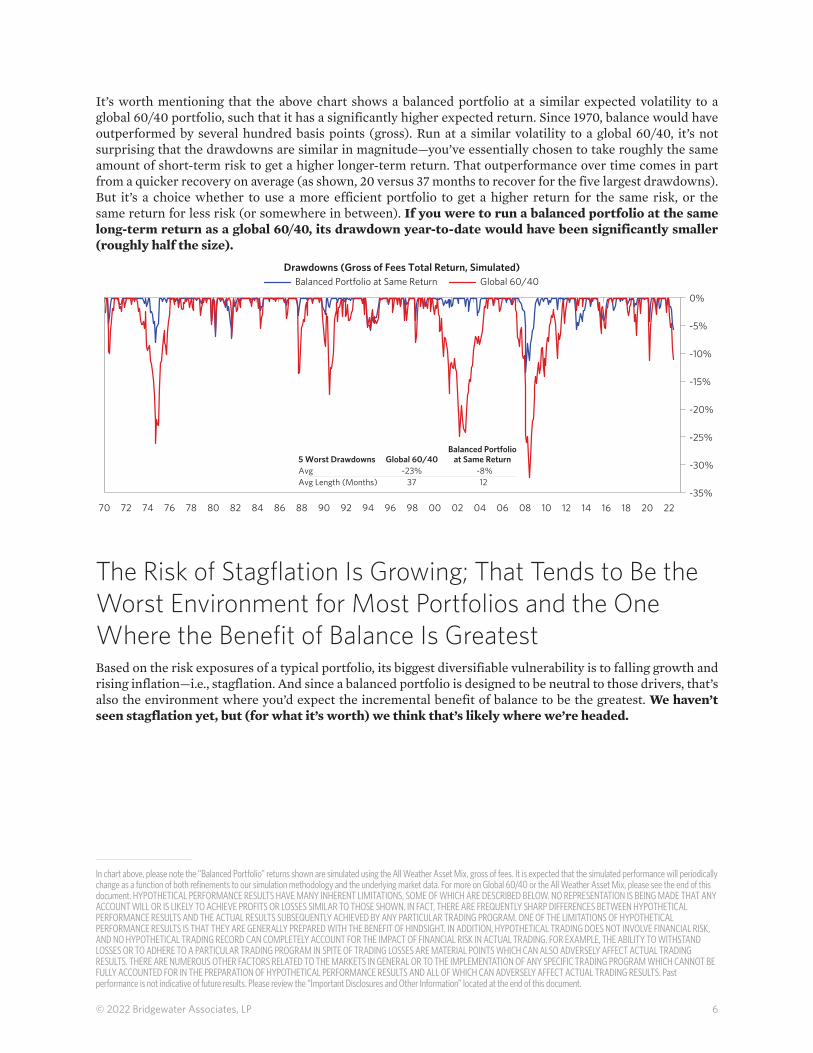
Given these macro forces, the outright and relative returns of a global 60/40 portfolio and a balanced one are understandable. All portfolios were hurt by rising risk premiums and discount rates. Typical portfolios like the global 60/40 were hurt by the rise in discounted inflation, but this was largely offset by the rise in discounted growth across assets. The charts above of the macro forces show that discounted inflation rose by more than discounted growth, but the sensitivity of a global 60/40 to discounted inflation is about half its sensitivity to discounted growth, so the two roughly netted out. As a result, a global 60/40 portfolio and balanced portfolio are down by a similar magnitude. The chart below puts the drawdowns of each portfolio in historical context: while significant, they are quite consistent with the range of returns we know to expect from each.
9470 1086 18 2202-35%
-25%
-10%
-30%
-15%
-20%
-5%
2092 0884 160090 0680 1498787672 82 88 0474 1296
Drawdowns (Gross of Fees Total Return, Simulated)
0%
Balanced Portfolio Global 60/40
5 Worst DrawdownsAvgAvg Length (Months)
Global 60/40-23%
37
BalancedPortfolio
-22%20
6© 2022 Bridgewater Associates, LP
In chart above, please note the “Balanced Portfolio” returns shown are simulated using the All Weather Asset Mix, gross of fees. It is expected that the simulated performance will periodically change as a function of both refinements to our simulation methodology and the underlying market data. For more on Global 60/40 or the All Weather Asset Mix, please see the end of this document. HYPOTHETICAL PERFORMANCE RESULTS HAVE MANY INHERENT LIMITATIONS, SOME OF WHICH ARE DESCRIBED BELOW. NO REPRESENTATION IS BEING MADE THAT ANY ACCOUNT WILL OR IS LIKELY TO ACHIEVE PROFITS OR LOSSES SIMILAR TO THOSE SHOWN. IN FACT, THERE ARE FREQUENTLY SHARP DIFFERENCES BETWEEN HYPOTHETICAL PERFORMANCE RESULTS AND THE ACTUAL RESULTS SUBSEQUENTLY ACHIEVED BY ANY PARTICULAR TRADING PROGRAM. ONE OF THE LIMITATIONS OF HYPOTHETICAL PERFORMANCE RESULTS IS THAT THEY ARE GENERALLY PREPARED WITH THE BENEFIT OF HINDSIGHT. IN ADDITION, HYPOTHETICAL TRADING DOES NOT INVOLVE FINANCIAL RISK, AND NO HYPOTHETICAL TRADING RECORD CAN COMPLETELY ACCOUNT FOR THE IMPACT OF FINANCIAL RISK IN ACTUAL TRADING. FOR EXAMPLE, THE ABILITY TO WITHSTAND LOSSES OR TO ADHERE TO A PARTICULAR TRADING PROGRAM IN SPITE OF TRADING LOSSES ARE MATERIAL POINTS WHICH CAN ALSO ADVERSELY AFFECT ACTUAL TRADING RESULTS. THERE ARE NUMEROUS OTHER FACTORS RELATED TO THE MARKETS IN GENERAL OR TO THE IMPLEMENTATION OF ANY SPECIFIC TRADING PROGRAM WHICH CANNOT BE FULLY ACCOUNTED FOR IN THE PREPARATION OF HYPOTHETICAL PERFORMANCE RESULTS AND ALL OF WHICH CAN ADVERSELY AFFECT ACTUAL TRADING RESULTS. Past performance is not indicative of future results. Please review the “Important Disclosures and Other Information” located at the end of this document.
It’s worth mentioning that the above chart shows a balanced portfolio at a similar expected volatility to a global 60/40 portfolio, such that it has a significantly higher expected return. Since 1970, balance would have outperformed by several hundred basis points (gross). Run at a similar volatility to a global 60/40, it’s not surprising that the drawdowns are similar in magnitude—you’ve essentially chosen to take roughly the same amount of short-term risk to get a higher longer-term return. That outperformance over time comes in part from a quicker recovery on average (as shown, 20 versus 37 months to recover for the five largest drawdowns). But it’s a choice whether to use a more efficient portfolio to get a higher return for the same risk, or the same return for less risk (or somewhere in between). If you were to run a balanced portfolio at the same long-term return as a global 60/40, its drawdown year-to-date would have been significantly smaller (roughly half the size).
9470 1086 18 2202-35%
-25%
-10%
-30%
-15%
-20%
-5%
2092 0884 160090 0680 1498787672 82 88 0474 1296
Drawdowns (Gross of Fees Total Return, Simulated)
0%
Balanced Portfolio at Same Return Global 60/40
5 Worst DrawdownsAvgAvg Length (Months)
Global 60/40-23%
37
Balanced Portfolioat Same Return
-8%12
The Risk of Stagflation Is Growing; That Tends to Be the Worst Environment for Most Portfolios and the One Where the Benefit of Balance Is Greatest Based on the risk exposures of a typical portfolio, its biggest diversifiable vulnerability is to falling growth and rising inflation—i.e., stagflation. And since a balanced portfolio is designed to be neutral to those drivers, that’s also the environment where you’d expect the incremental benefit of balance to be the greatest. We haven’t seen stagflation yet, but (for what it’s worth) we think that’s likely where we’re headed.
7© 2022 Bridgewater Associates, LP
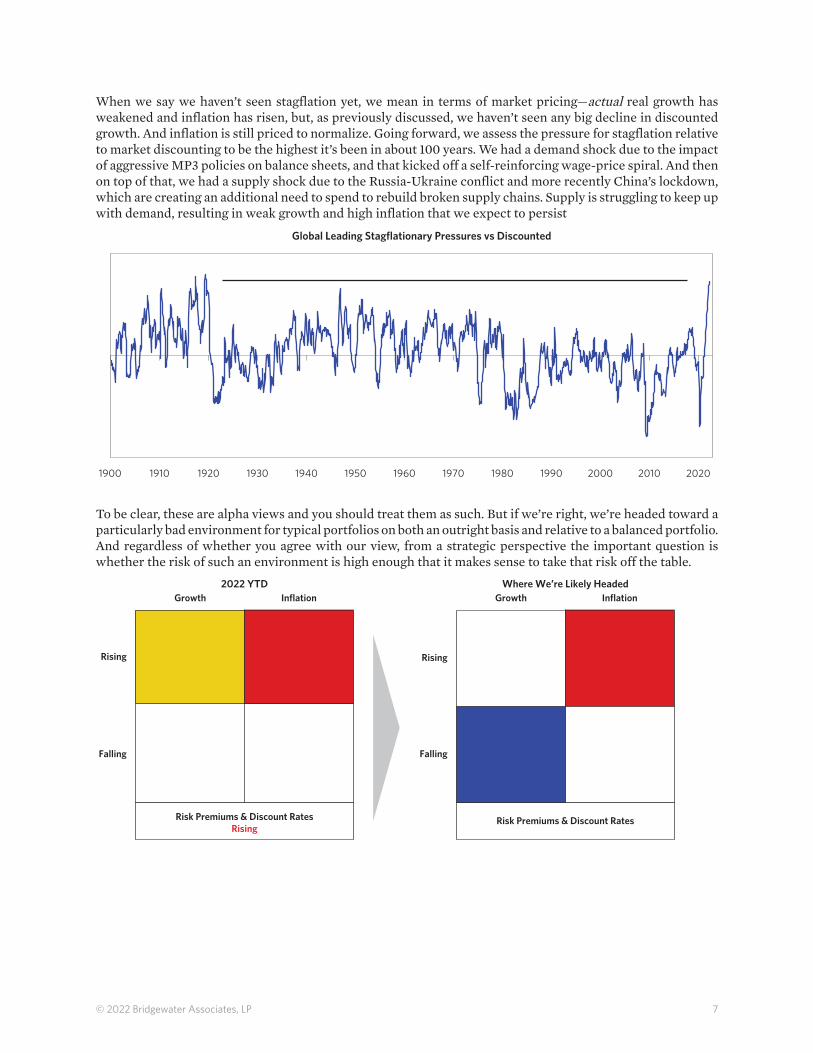
When we say we haven’t seen stagflation yet, we mean in terms of market pricing—actual real growth has weakened and inflation has risen, but, as previously discussed, we haven’t seen any big decline in discounted growth. And inflation is still priced to normalize. Going forward, we assess the pressure for stagflation relative to market discounting to be the highest it’s been in about 100 years. We had a demand shock due to the impact of aggressive MP3 policies on balance sheets, and that kicked off a self-reinforcing wage-price spiral. And then on top of that, we had a supply shock due to the Russia-Ukraine conflict and more recently China’s lockdown, which are creating an additional need to spend to rebuild broken supply chains. Supply is struggling to keep up with demand, resulting in weak growth and high inflation that we expect to persist
19401900 19801920 1960 19901910 1950 20001930 20201970 2010
Global Leading Stagflationary Pressures vs Discounted
To be clear, these are alpha views and you should treat them as such. But if we’re right, we’re headed toward a particularly bad environment for typical portfolios on both an outright basis and relative to a balanced portfolio. And regardless of whether you agree with our view, from a strategic perspective the important question is whether the risk of such an environment is high enough that it makes sense to take that risk off the table.
Rising
Falling
Growth
Risk Premiums & Discount RatesRising
Inflation
Rising
Falling
Growth
Risk Premiums & Discount Rates
Inflation2022 YTD Where We’re Likely Headed
8© 2022 Bridgewater Associates, LP
In table above, returns for cases less than a year are not annualized. Please note the “Balanced Portfolio” returns shown are simulated using the All Weather Asset Mix, gross of fees. The global 60/40 is comprised of 60% hedged global equities and 40% hedged global nominal government bonds. It is expected that the simulated performance will periodically change as a function of both refinements to our simulation methodology and the underlying market data. For more on the All Weather Asset Mix and the global 60/40, please see the end of this document. HYPOTHETICAL PERFORMANCE RESULTS HAVE MANY INHERENT LIMITATIONS, SOME OF WHICH ARE DESCRIBED BELOW. NO REPRESENTATION IS BEING MADE THAT ANY ACCOUNT WILL OR IS LIKELY TO ACHIEVE PROFITS OR LOSSES SIMILAR TO THOSE SHOWN. IN FACT, THERE ARE FREQUENTLY SHARP DIFFERENCES BETWEEN HYPOTHETICAL PERFORMANCE RESULTS AND THE ACTUAL RESULTS SUBSEQUENTLY ACHIEVED BY ANY PARTICULAR TRADING PROGRAM. ONE OF THE LIMITATIONS OF HYPOTHETICAL PERFORMANCE RESULTS IS THAT THEY ARE GENERALLY PREPARED WITH THE BENEFIT OF HINDSIGHT. IN ADDITION, HYPOTHETICAL TRADING DOES NOT INVOLVE FINANCIAL RISK, AND NO HYPOTHETICAL TRADING RECORD CAN COMPLETELY ACCOUNT FOR THE IMPACT OF FINANCIAL RISK IN ACTUAL TRADING. FOR EXAMPLE, THE ABILITY TO WITHSTAND LOSSES OR TO ADHERE TO A PARTICULAR TRADING PROGRAM IN SPITE OF TRADING LOSSES ARE MATERIAL POINTS WHICH CAN ALSO ADVERSELY AFFECT ACTUAL TRADING RESULTS. THERE ARE NUMEROUS OTHER FACTORS RELATED TO THE MARKETS IN GENERAL OR TO THE IMPLEMENTATION OF ANY SPECIFIC TRADING PROGRAM WHICH CANNOT BE FULLY ACCOUNTED FOR IN THE PREPARATION OF HYPOTHETICAL PERFORMANCE RESULTS AND ALL OF WHICH CAN ADVERSELY AFFECT ACTUAL TRADING RESULTS. Past performance is not indicative of future results. Please review the “Important Disclosures and Other Information” located at the end of this document.
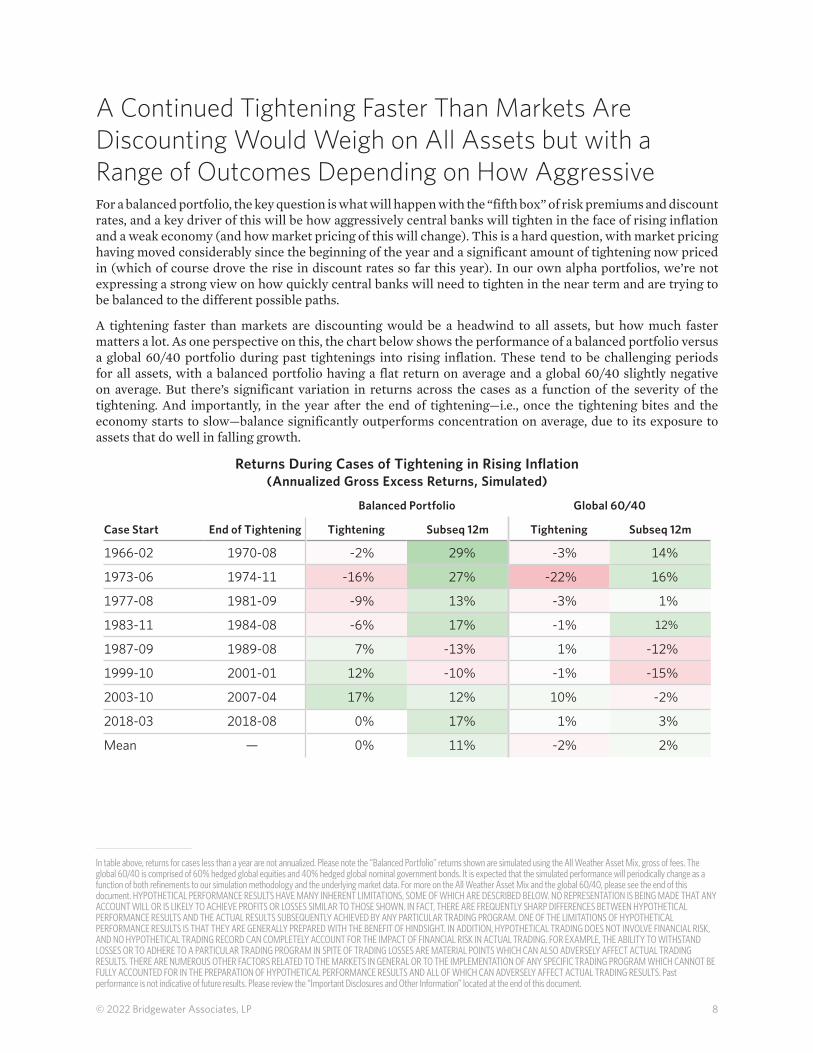
A Continued Tightening Faster Than Markets Are Discounting Would Weigh on All Assets but with a Range of Outcomes Depending on How Aggressive For a balanced portfolio, the key question is what will happen with the “fifth box” of risk premiums and discount rates, and a key driver of this will be how aggressively central banks will tighten in the face of rising inflation and a weak economy (and how market pricing of this will change). This is a hard question, with market pricing having moved considerably since the beginning of the year and a significant amount of tightening now priced in (which of course drove the rise in discount rates so far this year). In our own alpha portfolios, we’re not expressing a strong view on how quickly central banks will need to tighten in the near term and are trying to be balanced to the different possible paths.
A tightening faster than markets are discounting would be a headwind to all assets, but how much faster matters a lot. As one perspective on this, the chart below shows the performance of a balanced portfolio versus a global 60/40 portfolio during past tightenings into rising inflation. These tend to be challenging periods for all assets, with a balanced portfolio having a flat return on average and a global 60/40 slightly negative on average. But there’s significant variation in returns across the cases as a function of the severity of the tightening. And importantly, in the year after the end of tightening—i.e., once the tightening bites and the economy starts to slow—balance significantly outperforms concentration on average, due to its exposure to assets that do well in falling growth.
Balanced Portfolio Global 60/40
Case Start End of Tightening Tightening Subseq 12m Tightening Subseq 12m
—
9© 2022 Bridgewater Associates, LP
Please note the “Balanced Portfolio” returns shown are simulated using the All Weather Asset Mix, gross of fees. It is expected that the simulated performance will periodically change as a function of both refinements to our simulation methodology and the underlying market data. For more on Global 60/40 or the All Weather Asset Mix, please see the end of this document. HYPOTHETICAL PERFORMANCE RESULTS HAVE MANY INHERENT LIMITATIONS, SOME OF WHICH ARE DESCRIBED BELOW. NO REPRESENTATION IS BEING MADE THAT ANY ACCOUNT WILL OR IS LIKELY TO ACHIEVE PROFITS OR LOSSES SIMILAR TO THOSE SHOWN. IN FACT, THERE ARE FREQUENTLY SHARP DIFFERENCES BETWEEN HYPOTHETICAL PERFORMANCE RESULTS AND THE ACTUAL RESULTS SUBSEQUENTLY ACHIEVED BY ANY PARTICULAR TRADING PROGRAM. ONE OF THE LIMITATIONS OF HYPOTHETICAL PERFORMANCE RESULTS IS THAT THEY ARE GENERALLY PREPARED WITH THE BENEFIT OF HINDSIGHT. IN ADDITION, HYPOTHETICAL TRADING DOES NOT INVOLVE FINANCIAL RISK, AND NO HYPOTHETICAL TRADING RECORD CAN COMPLETELY ACCOUNT FOR THE IMPACT OF FINANCIAL RISK IN ACTUAL TRADING. FOR EXAMPLE, THE ABILITY TO WITHSTAND LOSSES OR TO ADHERE TO A PARTICULAR TRADING PROGRAM IN SPITE OF TRADING LOSSES ARE MATERIAL POINTS WHICH CAN ALSO ADVERSELY AFFECT ACTUAL TRADING RESULTS. THERE ARE NUMEROUS OTHER FACTORS RELATED TO THE MARKETS IN GENERAL OR TO THE IMPLEMENTATION OF ANY SPECIFIC TRADING PROGRAM WHICH CANNOT BE FULLY ACCOUNTED FOR IN THE PREPARATION OF HYPOTHETICAL PERFORMANCE RESULTS AND ALL OF WHICH CAN ADVERSELY AFFECT ACTUAL TRADING RESULTS. Past performance is not indicative of future results. Please review the “Important Disclosures and Other Information” located at the end of this document.
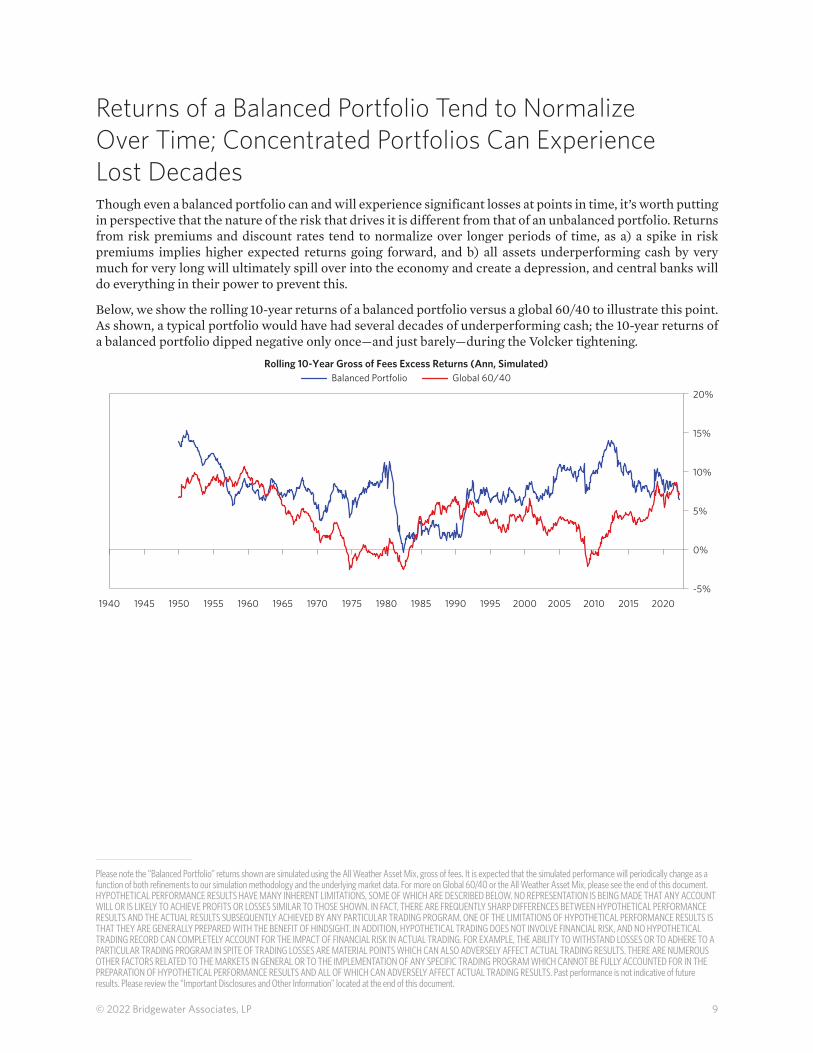
Returns of a Balanced Portfolio Tend to Normalize Over Time; Concentrated Portfolios Can Experience Lost DecadesThough even a balanced portfolio can and will experience significant losses at points in time, it’s worth putting in perspective that the nature of the risk that drives it is different from that of an unbalanced portfolio. Returns from risk premiums and discount rates tend to normalize over longer periods of time, as a) a spike in risk premiums implies higher expected returns going forward, and b) all assets underperforming cash by very much for very long will ultimately spill over into the economy and create a depression, and central banks will do everything in their power to prevent this.
Below, we show the rolling 10-year returns of a balanced portfolio versus a global 60/40 to illustrate this point. As shown, a typical portfolio would have had several decades of underperforming cash; the 10-year returns of a balanced portfolio dipped negative only once—and just barely—during the Volcker tightening.
20001940 1980 2020-5%
10%
5%
0%
15%
19951975 201519901965 2010196019551945 1970 19851950 2005
Rolling 10-Year Gross of Fees Excess Returns (Ann, Simulated)
20%
Balanced Portfolio Global 60/40
10© 2022 Bridgewater Associates, LP
In charts above, please note the “Balanced Portfolio” returns shown are simulated using the All Weather Asset Mix, gross of fees. Global 60/40 (USD Base) simulated based on the Global 60/40 (USD Base) regionalized to US assets. It is expected that the simulated performance will periodically change as a function of both refinements to our simulation methodology and the underlying market data. For more on the All Weather Asset Mix and the portfolios selected above, please see the end of this document. Information shown is the result of analyses of actual and simulated market data. It is expected that the simulated performance will periodically change as a function of both refinements to our simulation methodology and the underlying market data. HYPOTHETICAL PERFORMANCE RESULTS HAVE MANY INHERENT LIMITATIONS, SOME OF WHICH ARE DESCRIBED BELOW. NO REPRESENTATION IS BEING MADE THAT ANY ACCOUNT WILL OR IS LIKELY TO ACHIEVE PROFITS OR LOSSES SIMILAR TO THOSE SHOWN. IN FACT, THERE ARE FREQUENTLY SHARP DIFFERENCES BETWEEN HYPOTHETICAL PERFORMANCE RESULTS AND THE ACTUAL RESULTS SUBSEQUENTLY ACHIEVED BY ANY PARTICULAR TRADING PROGRAM. ONE OF THE LIMITATIONS OF HYPOTHETICAL PERFORMANCE RESULTS IS THAT THEY ARE GENERALLY PREPARED WITH THE BENEFIT OF HINDSIGHT. IN ADDITION, HYPOTHETICAL TRADING DOES NOT INVOLVE FINANCIAL RISK, AND NO HYPOTHETICAL TRADING RECORD CAN COMPLETELY ACCOUNT FOR THE IMPACT OF FINANCIAL RISK IN ACTUAL TRADING. FOR EXAMPLE, THE ABILITY TO WITHSTAND LOSSES OR TO ADHERE TO A PARTICULAR TRADING PROGRAM IN SPITE OF TRADING LOSSES ARE MATERIAL POINTS WHICH CAN ALSO ADVERSELY AFFECT ACTUAL TRADING RESULTS. THERE ARE NUMEROUS OTHER FACTORS RELATED TO THE MARKETS IN GENERAL OR TO THE IMPLEMENTATION OF ANY SPECIFIC TRADING PROGRAM WHICH CANNOT BE FULLY ACCOUNTED FOR IN THE PREPARATION OF HYPOTHETICAL PERFORMANCE RESULTS AND ALL OF WHICH CAN ADVERSELY AFFECT ACTUAL TRADING RESULTS. Past performance is not indicative of future results. Please review the “Important Disclosures and Other Information” located at the end of this document.
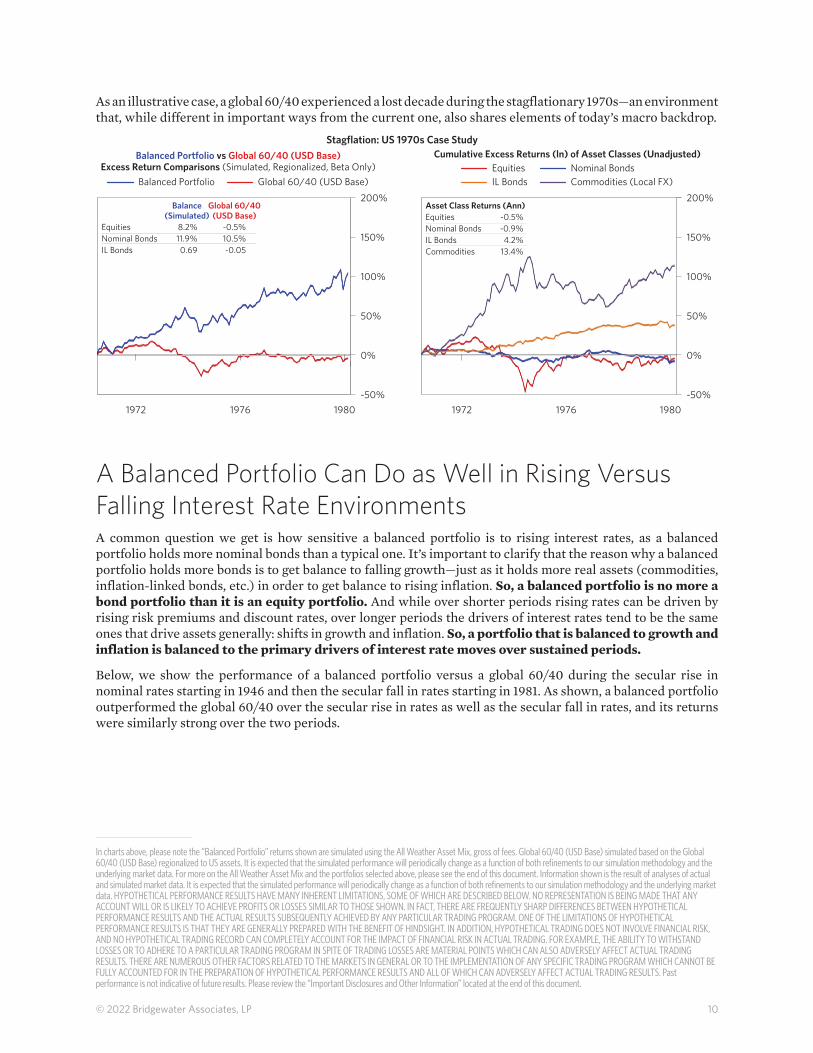
As an illustrative case, a global 60/40 experienced a lost decade during the stagflationary 1970s—an environment that, while different in important ways from the current one, also shares elements of today’s macro backdrop.
Balanced Portfolio vs Global 60/40 (USD Base)Excess Return Comparisons (Simulated, Regionalized, Beta Only)
Stagflation: US 1970s Case Study
19801972 1976
100%
150%
50%
-50%
0%
Cumulative Excess Returns (ln) of Asset Classes (Unadjusted)Equities Nominal BondsIL Bonds Commodities (Local FX)Balanced Portfolio Global 60/40 (USD Base)
200%
100%
150%
50%
-50%
0%
19801972 1976
EquitiesNominal BondsIL Bonds
Asset Class Returns (Ann)-0.5%-0.9%4.2%
Commodities 13.4%
200%
EquitiesNominal BondsIL Bonds
Balance(Simulated)
8.2%11.9%0.69
Global 60/40(USD Base)
-0.5%10.5%-0.05
A Balanced Portfolio Can Do as Well in Rising Versus Falling Interest Rate EnvironmentsA common question we get is how sensitive a balanced portfolio is to rising interest rates, as a balanced portfolio holds more nominal bonds than a typical one. It’s important to clarify that the reason why a balanced portfolio holds more bonds is to get balance to falling growth—just as it holds more real assets (commodities, inflation-linked bonds, etc.) in order to get balance to rising inflation. So, a balanced portfolio is no more a bond portfolio than it is an equity portfolio. And while over shorter periods rising rates can be driven by rising risk premiums and discount rates, over longer periods the drivers of interest rates tend to be the same ones that drive assets generally: shifts in growth and inflation. So, a portfolio that is balanced to growth and inflation is balanced to the primary drivers of interest rate moves over sustained periods.
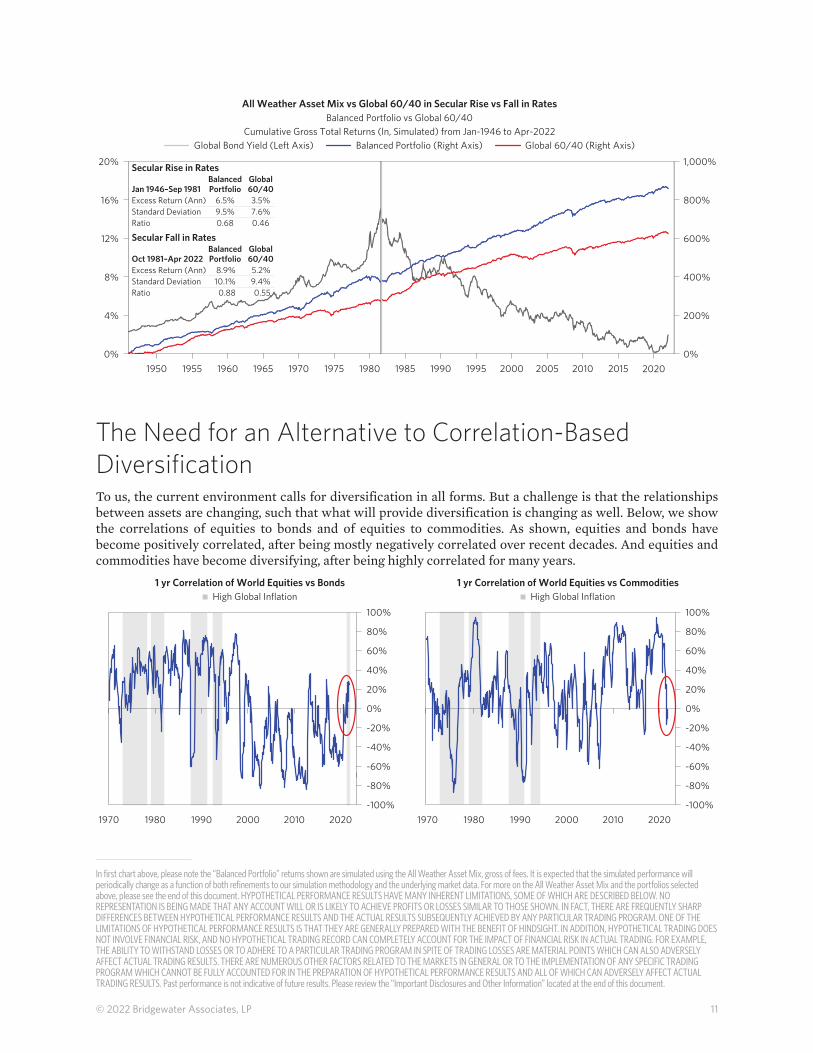
Below, we show the performance of a balanced portfolio versus a global 60/40 during the secular rise in nominal rates starting in 1946 and then the secular fall in rates starting in 1981. As shown, a balanced portfolio outperformed the global 60/40 over the secular rise in rates as well as the secular fall in rates, and its returns were similarly strong over the two periods.
11© 2022 Bridgewater Associates, LP
In first chart above, please note the “Balanced Portfolio” returns shown are simulated using the All Weather Asset Mix, gross of fees. It is expected that the simulated performance will periodically change as a function of both refinements to our simulation methodology and the underlying market data. For more on the All Weather Asset Mix and the portfolios selected above, please see the end of this document. HYPOTHETICAL PERFORMANCE RESULTS HAVE MANY INHERENT LIMITATIONS, SOME OF WHICH ARE DESCRIBED BELOW. NO REPRESENTATION IS BEING MADE THAT ANY ACCOUNT WILL OR IS LIKELY TO ACHIEVE PROFITS OR LOSSES SIMILAR TO THOSE SHOWN. IN FACT, THERE ARE FREQUENTLY SHARP DIFFERENCES BETWEEN HYPOTHETICAL PERFORMANCE RESULTS AND THE ACTUAL RESULTS SUBSEQUENTLY ACHIEVED BY ANY PARTICULAR TRADING PROGRAM. ONE OF THE LIMITATIONS OF HYPOTHETICAL PERFORMANCE RESULTS IS THAT THEY ARE GENERALLY PREPARED WITH THE BENEFIT OF HINDSIGHT. IN ADDITION, HYPOTHETICAL TRADING DOES NOT INVOLVE FINANCIAL RISK, AND NO HYPOTHETICAL TRADING RECORD CAN COMPLETELY ACCOUNT FOR THE IMPACT OF FINANCIAL RISK IN ACTUAL TRADING. FOR EXAMPLE, THE ABILITY TO WITHSTAND LOSSES OR TO ADHERE TO A PARTICULAR TRADING PROGRAM IN SPITE OF TRADING LOSSES ARE MATERIAL POINTS WHICH CAN ALSO ADVERSELY AFFECT ACTUAL TRADING RESULTS. THERE ARE NUMEROUS OTHER FACTORS RELATED TO THE MARKETS IN GENERAL OR TO THE IMPLEMENTATION OF ANY SPECIFIC TRADING PROGRAM WHICH CANNOT BE FULLY ACCOUNTED FOR IN THE PREPARATION OF HYPOTHETICAL PERFORMANCE RESULTS AND ALL OF WHICH CAN ADVERSELY AFFECT ACTUAL TRADING RESULTS. Past performance is not indicative of future results. Please review the “Important Disclosures and Other Information” located at the end of this document.
20001980 20200%
600%
400%
200%
800%
19951975 201519901965 201019601955 1970 19851950 2005
Cumulative Gross Total Returns (ln, Simulated) from Jan-1946 to Apr-2022Balanced Portfolio vs Global 60/40
All Weather Asset Mix vs Global 60/40 in Secular Rise vs Fall in Rates
1,000%
0%
12%
8%
4%
16%
20%
Global Bond Yield (Left Axis) Balanced Portfolio (Right Axis) Global 60/40 (Right Axis)
Excess Return (Ann)Jan 1946–Sep 1981
Secular Rise in Rates
Standard DeviationRatio
BalancedPortfolio
6.5%9.5%
Global60/403.5%7.6%
0.68 0.46
Excess Return (Ann)Oct 1981–Apr 2022
Secular Fall in Rates
Standard DeviationRatio
BalancedPortfolio
8.9%10.1%
Global60/405.2%9.4%
0.88 0.55
The Need for an Alternative to Correlation-Based DiversificationTo us, the current environment calls for diversification in all forms. But a challenge is that the relationships between assets are changing, such that what will provide diversification is changing as well. Below, we show the correlations of equities to bonds and of equities to commodities. As shown, equities and bonds have become positively correlated, after being mostly negatively correlated over recent decades. And equities and commodities have become diversifying, after being highly correlated for many years.
1 yr Correlation of World Equities vs Bonds
1970 20201990 20101980 2000
40%
60%
-20%
0%
-80%
-100%
-60%
20%
-40%
1 yr Correlation of World Equities vs Commodities
80%
40%
60%
-20%
0%
-80%
-100%
-60%
20%
-40%
80%
100% 100%High Global Inflation High Global Inflation
1970 20201990 20101980 2000
12© 2022 Bridgewater Associates, LP
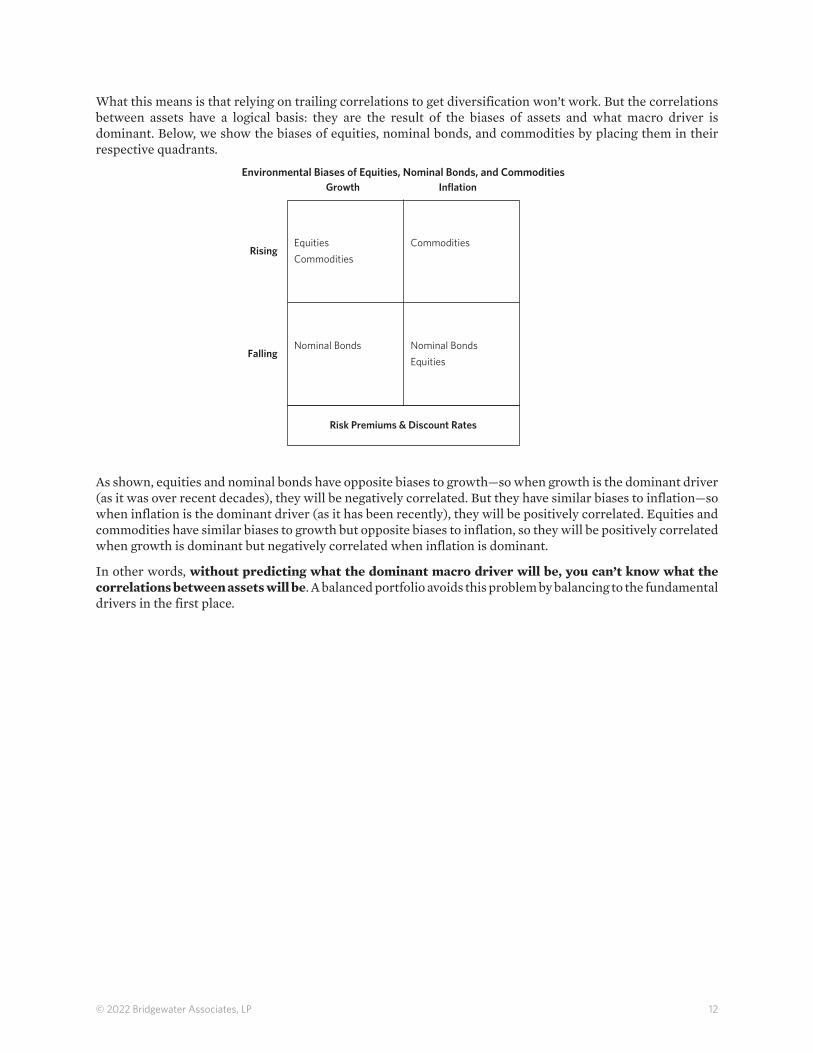
What this means is that relying on trailing correlations to get diversification won’t work. But the correlations between assets have a logical basis: they are the result of the biases of assets and what macro driver is dominant. Below, we show the biases of equities, nominal bonds, and commodities by placing them in their respective quadrants.
Rising
Falling
GrowthEnvironmental Biases of Equities, Nominal Bonds, and Commodities
EquitiesCommodities
Commodities
Nominal Bonds Nominal BondsEquities
Risk Premiums & Discount Rates
Inflation
As shown, equities and nominal bonds have opposite biases to growth—so when growth is the dominant driver (as it was over recent decades), they will be negatively correlated. But they have similar biases to inflation—so when inflation is the dominant driver (as it has been recently), they will be positively correlated. Equities and commodities have similar biases to growth but opposite biases to inflation, so they will be positively correlated when growth is dominant but negatively correlated when inflation is dominant.
In other words, without predicting what the dominant macro driver will be, you can’t know what the correlations between assets will be. A balanced portfolio avoids this problem by balancing to the fundamental drivers in the first place.
13© 2022 Bridgewater Associates, LP
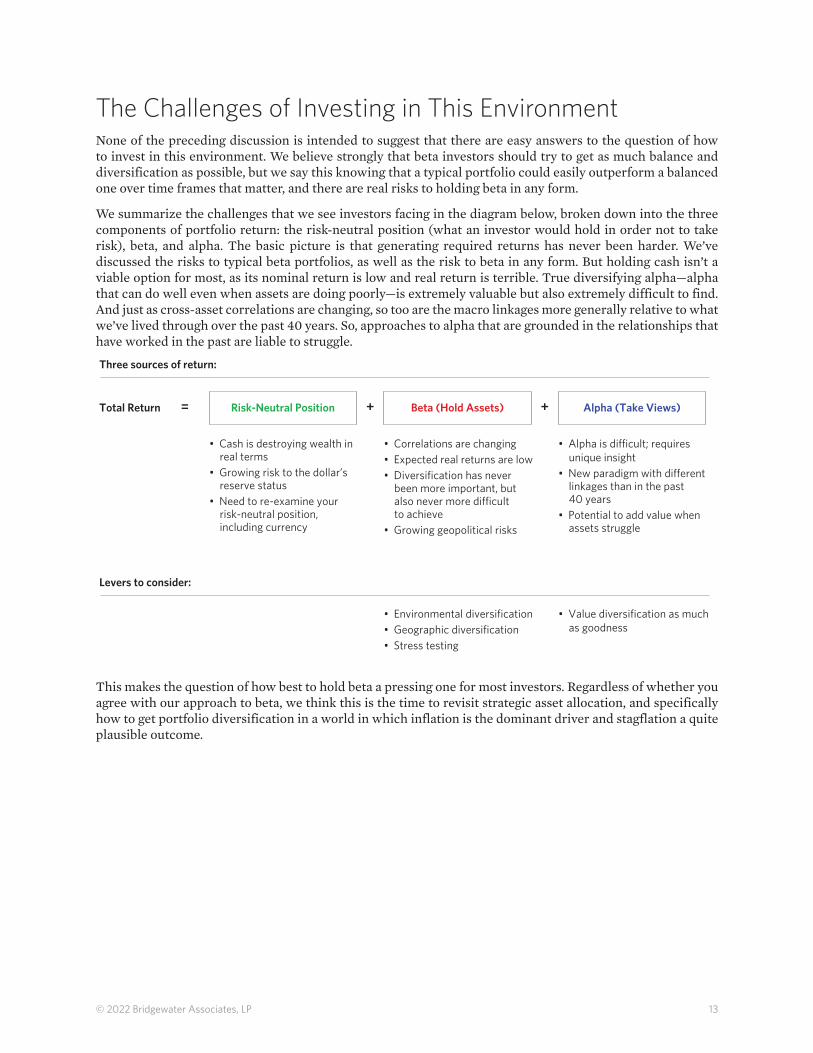
The Challenges of Investing in This EnvironmentNone of the preceding discussion is intended to suggest that there are easy answers to the question of how to invest in this environment. We believe strongly that beta investors should try to get as much balance and diversification as possible, but we say this knowing that a typical portfolio could easily outperform a balanced one over time frames that matter, and there are real risks to holding beta in any form.
We summarize the challenges that we see investors facing in the diagram below, broken down into the three components of portfolio return: the risk-neutral position (what an investor would hold in order not to take risk), beta, and alpha. The basic picture is that generating required returns has never been harder. We’ve discussed the risks to typical beta portfolios, as well as the risk to beta in any form. But holding cash isn’t a viable option for most, as its nominal return is low and real return is terrible. True diversifying alpha—alpha that can do well even when assets are doing poorly—is extremely valuable but also extremely difficult to find. And just as cross-asset correlations are changing, so too are the macro linkages more generally relative to what we’ve lived through over the past 40 years. So, approaches to alpha that are grounded in the relationships that have worked in the past are liable to struggle.
Three sources of return:
Total Return = + +Risk-Neutral Position
• Cash is destroying wealth in real terms• Growing risk to the dollar’s reserve status• Need to re-examine your risk-neutral position, including currency
• Correlations are changing• Expected real returns are low• Diversification has never been more important, but also never more di�cult to achieve• Growing geopolitical risks
• Alpha is di�cult; requires unique insight• New paradigm with di erent linkages than in the past 40 years• Potential to add value when assets struggle
• Environmental diversification• Geographic diversification• Stress testing
• Value diversification as much as goodness
Beta (Hold Assets) Alpha (Take Views)
Levers to consider:
This makes the question of how best to hold beta a pressing one for most investors. Regardless of whether you agree with our approach to beta, we think this is the time to revisit strategic asset allocation, and specifically how to get portfolio diversification in a world in which inflation is the dominant driver and stagflation a quite plausible outcome.
14© 2022 Bridgewater Associates, LP
Important Disclosures and Other InformationThis research paper is prepared by and is the property of Bridgewater Associates, LP and is circulated for informational and educational purposes only. There is no consideration given to the specific investment needs, objectives or tolerances of any of the recipients. Additionally, Bridgewater’s actual investment positions may, and often will, vary from its conclusions discussed herein based on any number of factors, such as client investment restrictions, portfolio rebalancing and transactions costs, among others. Recipients should consult their own advisors, including tax advisors, before making any investment decision. This material is for informational and educational purposes only and is not an offer to sell or the solicitation of an offer to buy the securities or other instruments mentioned. Any such offering will be made pursuant to a definitive offering memorandum. This material does not constitute a personal recommendation or take into account the particular investment objectives, financial situations, or needs of individual investors which are necessary considerations before making any investment decision. Investors should consider whether any advice or recommendation in this research is suitable for their particular circumstances and, where appropriate, seek professional advice, including legal, tax, accounting, investment or other advice.
The information provided herein is not intended to provide a sufficient basis on which to make an investment decision and investment decisions should not be based on simulated, hypothetical or illustrative information that have inherent limitations. Unlike an actual performance record simulated or hypothetical results do not represent actual trading or the actual costs of management and may have under or over compensated for the impact of certain market risk factors. Bridgewater makes no representation that any account will or is likely to achieve returns similar to those shown. The price and value of the investments referred to in this research and the income therefrom may fluctuate. Every investment involves risk and in volatile or uncertain market conditions, significant variations in the value or return on that investment may occur. Investments in hedge funds are complex, speculative and carry a high degree of risk, including the risk of a complete loss of an investor’s entire investment. Past performance is not a guide to future performance, future returns are not guaranteed, and a complete loss of original capital may occur. Certain transactions, including those involving leverage, futures, options, and other derivatives, give rise to substantial risk and are not suitable for all investors. Fluctuations in exchange rates could have material adverse effects on the value or price of, or income derived from, certain investments.
The All Weather asset mix performance is simulated by applying All Weather asset mix weights, which are determined by Bridgewater’s proprietary process for building an environmentally balanced portfolio, to historical market returns. We use actual market returns when available and otherwise use Bridgewater Associates’ proprietary estimates, based on other available data and our fundamental understanding of asset classes. In certain cases, market data for an exposure which otherwise would exist in the simulation may be omitted if the relevant data is unavailable, deemed unreliable, immaterial or accounted for using proxies. Simulated asset returns are subject to considerable uncertainty and potential error, as there is a great deal that cannot be known about how assets would have performed in the absence of actual market returns. It is expected that the simulated performance will periodically change as a function of both refinements to our simulation methodology (including the addition/removal of asset classes) and the underlying market data. There is no guarantee that previous results would not be materially different.
The Traditional Portfolio includes interest in a variety of assets (which include, equities, nominal bonds, corporate bonds, MBS, inflation linked bonds, high yield bonds, real estate, commodities, and hedge fund interests). Allocation weights are estimates based either upon Bridgewater Associates’ understanding of standard asset allocation (which may change without notice) or publicly available information. Asset class returns are actual market returns where available and otherwise a proxy constructed based on Bridgewater Associates understanding of global financial markets. Information regarding specific indices and simulation methods used for proxies is available upon request (except where the proprietary nature of information precludes its dissemination). Results are hypothetical or simulated and gross of fees unless otherwise indicated.
Where shown, the All Weather Lens is an analytical approach to assess the behavior of the major drivers of asset performance and their impact on markets during any given period, based on Bridgewater’s understanding of global financial markets. Information shown is the result of analyses of actual and simulated market data.
Bridgewater research utilizes data and information from public, private and internal sources, including data from actual Bridgewater trades. Sources include, Arabesque ESG Book, Bloomberg Finance L.P., Bond Radar, Candeal, Capital Economics, CBRE, Inc., CEIC Data Company Ltd., Clarus Financial Technology, Conference Board of Canada, Consensus Economics Inc., Corelogic, Inc., Cornerstone Macro, Dealogic, DTCC Data Repository, Ecoanalitica, Empirical Research Partners, Entis (Axioma Qontigo), EPFR Global, Eurasia Group, Evercore ISI, Factset Research Systems, The Financial Times Limited, FINRA, GaveKal Research Ltd., Global Financial Data, Inc., Harvard Business Review, Haver Analytics, Inc., Institutional Shareholder Services (ISS), The Investment Funds Institute of Canada, ICE Data, ICE Derived Data (UK), Investment Company Institute, International Institute of Finance, JP Morgan , MarketAxess, Medley Global Advisors, Metals Focus Ltd, Moody’s ESG Solutions, MSCI, Inc., National Bureau of Economic Research, OAG Aviation, Organisation for Economic Cooperation and Development, Pensions & Investments Research Center, Refinitiv , Rhodium Group, RP Data, Rystad Energy, S&P Global Market Intelligence, Sentix Gmbh, Shanghai Wind Information, Sustainalytics, Swaps Monitor, Totem Macro, Tradeweb, , United Nations, US Department of Commerce, Verisk Maplecroft, Visible Alpha, Wells Bay, Wind Financial Information LLC, Wood Mackenzie Limited, World Bureau of Metal Statistics, World Economic Forum, YieldBook. While we consider information from external sources to be reliable, we do not assume responsibility for its accuracy.
This information is not directed at or intended for distribution to or use by any person or entity located in any jurisdiction where such distribution, publication, availability or use would be contrary to applicable law or regulation or which would subject Bridgewater to any registration or licensing requirements within such jurisdiction. No part of this material may be (i) copied, photocopied or duplicated in any form by any means or (ii) redistributed without the prior written consent of Bridgewater ® Associates, LP.
The views expressed herein are solely those of Bridgewater as of the date of this report and are subject to change without notice. Bridgewater may have a significant financial interest in one or more of the positions and/or securities or derivatives discussed. Those responsible for preparing this report receive compensation based upon various factors, including, among other things, the quality of their work and firm revenues.
15© 2022 Bridgewater Associates, LP
16© 2022 Bridgewater Associates, LP