brief communication
TRANSCRIPT
The Cryosphere, 5, 651–657, 2011www.the-cryosphere.net/5/651/2011/doi:10.5194/tc-5-651-2011© Author(s) 2011. CC Attribution 3.0 License.
The Cryosphere
Brief Communication:“An inventory of permafrost evidence for the European Alps”
E. Cremonese1, S. Gruber2, M. Phillips3, P. Pogliotti1, L. Boeckli2, J. Noetzli2, C. Suter3, X. Bodin4, A. Crepaz5,A. Kellerer-Pirklbauer 6,7, K. Lang8, S. Letey1, V. Mair 8, U. Morra di Cella 1, L. Ravanel4, C. Scapozza9, R. Seppi10,and A. Zischg11
1Environmental Protection Agency of Aosta Valley, ARPA Valle d’Aosta, Saint Christophe, Italy2Glaciology, Geomorphodynamics and Geochronology, Department of Geography, University of Zurich, Zurich, Switzerland3WSL Institute for Snow and Avalanche Research SLF, Davos, Switzerland4Laboratoire EDYTEM, CNRS, Universite de Savoie, Le Bourget du Lac, France5Arabba Avalanche Center, Environmental Protection Agency of Veneto, ARPAV, Arabba di Livinallongo, Italy6Department of Geography and Regional Science, University of Graz, Graz, Austria7Institute of Remote Sensing and Photogrammetry, Graz University of Technology, Graz, Austria8Autonomous Province of Bolzano, Geological Service, Bolzano, Italy9Institute of Geography, University of Lausanne, Lausanne, Switzerland10Earth Science Department, University of Pavia, Pavia, Italy11Abenis Alpinexpert Srl, Bozen/Bolzano, Italy
Received: 28 March 2011 – Published in The Cryosphere Discuss.: 18 April 2011Revised: 3 August 2011 – Accepted: 4 August 2011 – Published: 22 August 2011
Abstract. The investigation and modelling of permafrostdistribution, particularly in areas of discontinuous per-mafrost, is challenging due to spatial heterogeneity, remote-ness of measurement sites and data scarcity. We have de-signed a strategy for standardizing different local data setscontaining evidence of the presence or absence of permafrostinto an inventory for the entire European Alps. With thisbrief communication, we present the structure and contentsof this inventory. This collection of permafrost evidence notonly highlights existing data and allows new analyses basedon larger data sets, but also provides complementary infor-mation for an improved interpretation of monitoring results.
1 Introduction
In mountain areas, permafrost distribution is spatially het-erogeneous and there is a scarcity of direct permafrost mea-surements and observations. In the European Alps, numer-ous local permafrost distribution models have been devel-
Correspondence to:E. Cremonese([email protected])
oped (e.g.Keller, 1992; Hoelzle, 1996; Imhof, 1996; Gru-ber and Hoelzle, 2001; Lambiel and Reynard, 2001), butare usually based on a small number of data points (oftenproxies) from rather restricted regions. Similarly, statisticalanalyses of permafrost distribution patterns taking into ac-count topography, mean annual air temperature (MAAT) orprecipitation face the challenge of assembling heterogeneousdata. In order to make the most of the potential of existingdata, an Alpine-wide standardized collection of permafrostevidence has been carried out and is described here. We de-fine a permafrost evidence to be a point or an area wherepermafrost is known to be present during a certain time orwhere the absence of permafrost can be ascertained. Thewide variety of relevant field measurements and observations(e.g. temperature in boreholes or near the ground surface,rock glacier mapping, geophysics), and their different spa-tial scale of reference, make the process of data standardiza-tion challenging. Permafrost experts from several EuropeanAlpine countries have contributed to the inventory presentedhere (AppendixB). It was compiled within the frameworkof the project PermaNET and combines results obtained bymany researchers and data assembled by national or regionalmonitoring programmes such as PERMOS (Noetzli and Von-der Muehll, 2010), PermaFRANCE (Schoeneich et al., 2010)
Published by Copernicus Publications on behalf of the European Geosciences Union.
652 E. Cremonese et al.: An inventory of permafrost evidence for the European Alps
or PROALP (Mair et al., 2008). With this brief communica-tion we aim to present the first version of the concept, struc-ture and data of the inventory. In addition, we hope this briefcommunication will also contribute to the further improve-ment of the inventory through peer-review, to widen its usageand to improve its integration in the context of national andinternational monitoring and measurement programs.
2 Structure and organization of the inventory
The design and implementation of the inventory is based onthe following principles: the inventory has to be simple instructure and technical implementation and the number of pa-rameters must be kept small. This allows researchers to reg-ister their existing data within the newly standardized schemein a user-friendly manner. For important variables, at least aqualitative uncertainty is assigned. After insertion, data areverified in order to remove obvious errors. Basic informa-tion on the origin of each evidence point is required, such as apublished reference or the measurement method applied. Theinventory contains the following types of evidence: bore-hole temperature (BH), ground surface temperature (GST),rock fall scar (SC), trench or construction site (TR), surfacemovement (SM), geophysical prospecting (GP), other indi-rect evidence (OIE) and rock glaciers (RG). SC and TR areconsidered to be evidence of permafrost only if ice has beenseen (e.g. on photographs or in-situ) and can be excludedto be seasonal. The criterion to exclude seasonal ice is adepth exceeding five meters from the surface. SM is usuallybased on field observations, terrestrial surveys, photogram-metric analyses or DInSAR data. GP include primarily geo-electrics, seismics, ground penetrating radar and electromag-netic prospecting. OIE provides room for further types ofevidence such as thermokarst depressions.
For all types of evidence, general information concerningfor example location and the person responsible are required.Additionally, contributors can use the optional fields avail-able for comments and further specification of criteria. BH,GST and SM have additional specific data fields. The com-plete list and description of information contained in the in-ventory are presented in AppendixA.
The rock glacier inventory (RG) is managed separatelyfrom the point types of evidence. Individual RG invento-ries are supplied as a collection of polygons and/or centroids(shapefiles) in local coordinate systems and then transformedto the common coordinate system WGS84. The contributionof an inventory requires the addition of common data fieldsinto the GIS attribute table and supplying separate meta-information about the inventory. The estimation of RG activ-ity is based on field observation or image interpretation (e.g.aerial photography, satellite imagery) of typical morpholog-ical characteristics (e.g. steepness of the front, absence ofvegetation) and then classified as being “intact” (i.e. activeor inactive landform with permafrost) or “relict” (i.e. without
permafrost) and minimal information explaining the groundsfor this assessment is included (AppendixA).
3 Data collection, verification and homogenization
The inventory was completed using four “calls for evidence”accompanied by a spreadsheet and detailed instructions.Thirty-five individuals or institutions provided data. Con-tributors provided information from their own research ar-eas, consisting of existing data and knowledge adapted to thecommon data format used in this inventory. This was com-plemented by specific investigations in collaboration withregional/local geological services, ski resort operators, en-gineering companies or alpine guide societies. The designand administration of the inventory was carried out jointlyby ARPA Valle d’Aosta (Italy), the WSL Institute for Snowand Avalanche Research SLF and the Department of Geog-raphy of the University of Zurich (Switzerland).
To avoid errors in spatial positioning introduced duringdata entry or coordinate transformation, the assembled in-ventory was sent as a KML file to all contributors for visualverification of the provided information using Google Earth.An updated version of the inventory was released using thefeedback from the contributors after verification.
As the dataset is characterized by a high degree of hetero-geneity, the issue of data homogenization is very importantand still under development. A first step towards homog-enization has been made for GST data measured on steeprock walls: as their inter-annual variation is similar to that ofMAAT, a normalization procedure (Allen et al., 2009) to es-timate mean annual ground surface temperature (MAGST)for the period 1961–1990 has been applied to make mea-surements from differing years comparable. Based on theresulting temperatures and considering possible mechanismsof thermal offset, GST points were classified into the cate-gories “presence” or “absence” of permafrost with differingdegrees of certainty (permafrost presence: MAGST<−2◦Cmedium certainty;−2 ◦C < MAGST <0 ◦C low certainty;permafrost absence: 0◦C < MAGST <2 ◦C low certainty;MAGST >2◦C medium certainty).
4 Content of the inventory
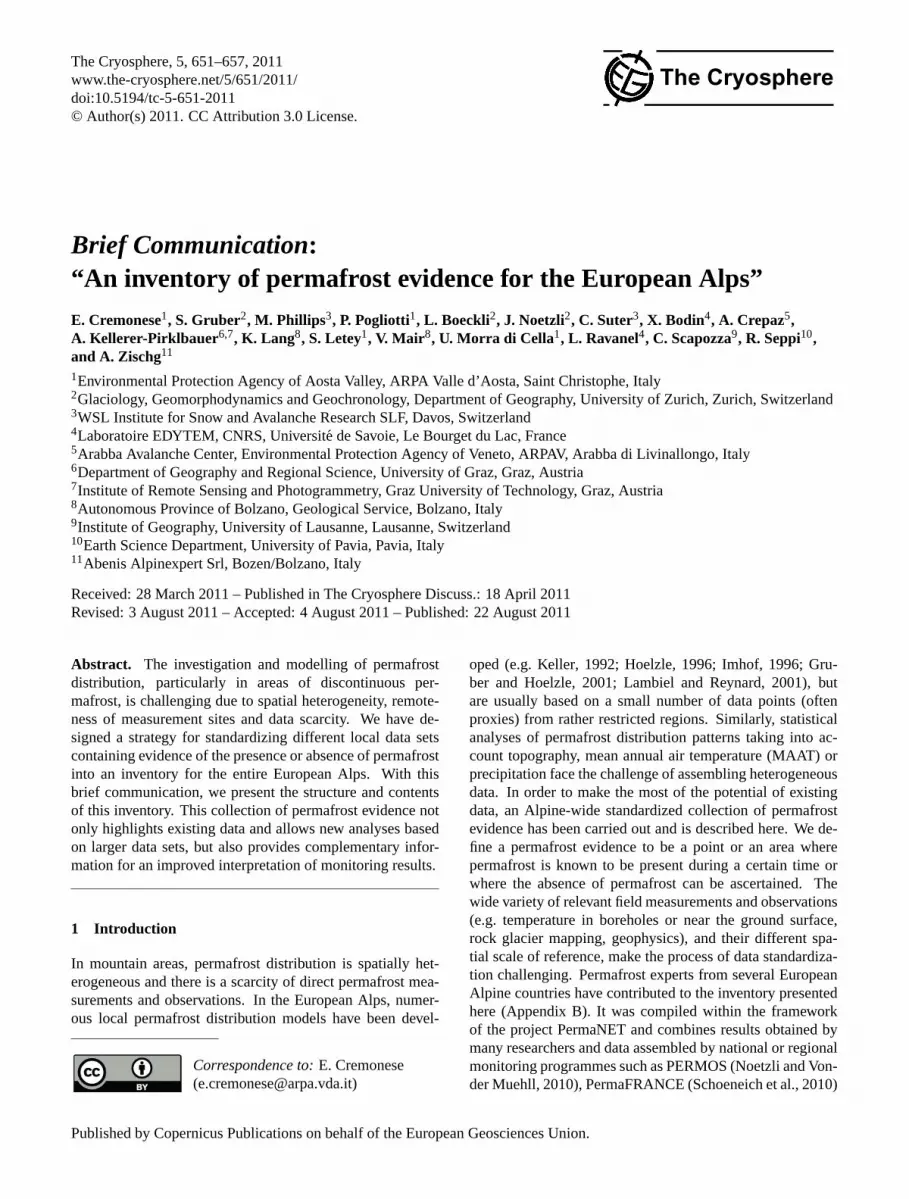
The total number of point type permafrost evidence is408 (October 2010), extending from 44.29 to 47.47◦ Nand from 5.91 to 14.88◦ E and covering all Alpine coun-tries except Monaco, Liechtenstein and Slovenia. The rockglacier dataset includes seven inventories from Italy, Austria,Switzerland and France with a total of 4795 rock glaciers(Fig. 1). The seven inventories are regional (Valle d’Aosta,Piemonte, Veneto, Trentino Alto Adige in Italy, Massif duCombeynot in France, Ticino in Switzerland and central andeastern Austria) and thus do not cover the entire EuropeanAlps.
The Cryosphere, 5, 651–657, 2011 www.the-cryosphere.net/5/651/2011/
E. Cremonese et al.: An inventory of permafrost evidence for the European Alps 653
Fig. 1. Map of the permafrost evidence acquired in the Alps. The dots represent point permafrost evidence. The colors of dots represent theclasses of last observation dates confirming permafrost state (before 1990, between 1900 and 2000, after 2000). The size of the dots indicates3 classes (<3 yr, 3–8 yr,>8 yr) representing the length of observations/measured data associated with each evidence. Orange polygonsrepresent rock glacier inventories.
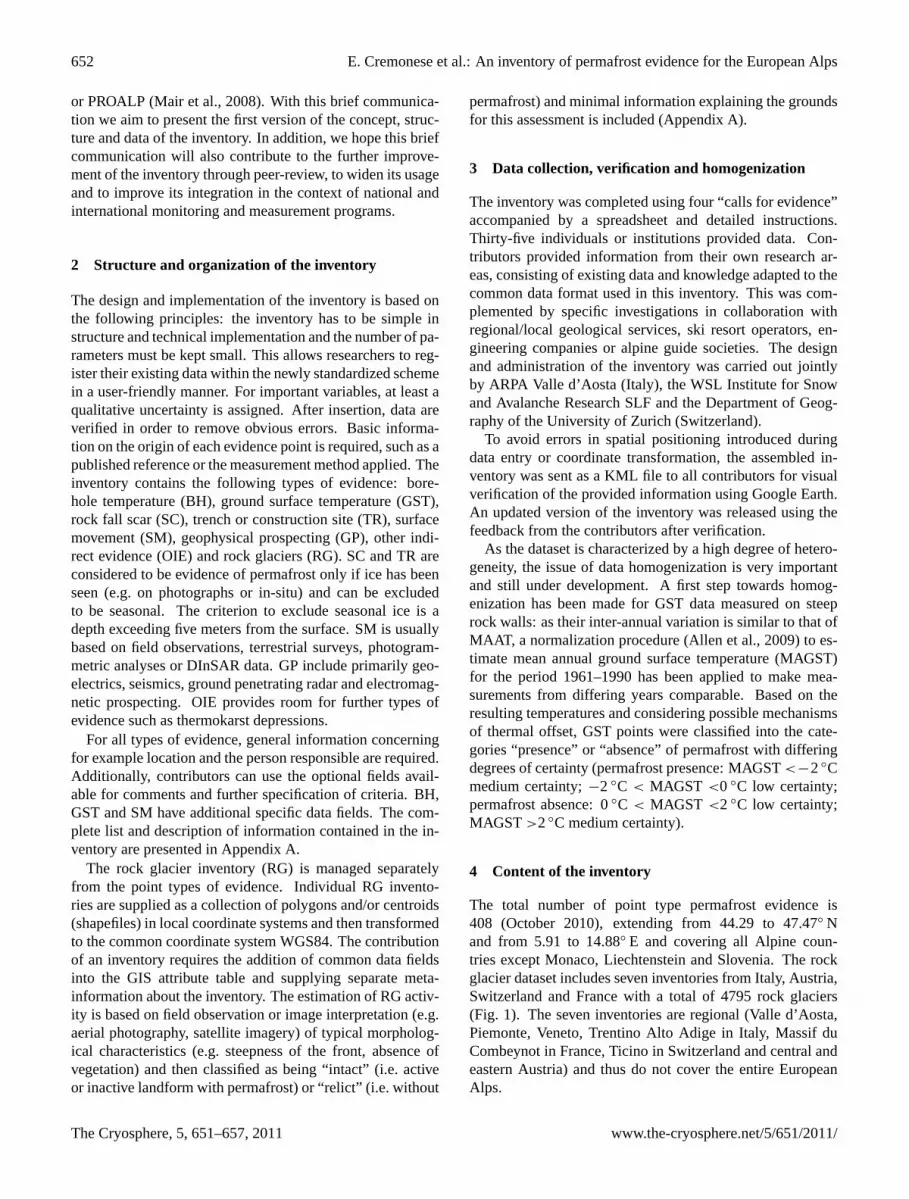
Fig. 2. (a) Relative amounts of point evidence types (borehole (BH), geophysical prospecting (GP), ground surface temperature (GST),other indirect evidence (OIE), rock fall scar (SC), surface movement (SM), trench or construction site (TR)) in the entire inventory and(b) by country. Bar width represents the relative abundance of evidence in each country: A–24 %, CH–29 %, D–0.5 %, F–28 %, I–17 %; forgraphical reasons, Germany bar width has been increased (tripled).
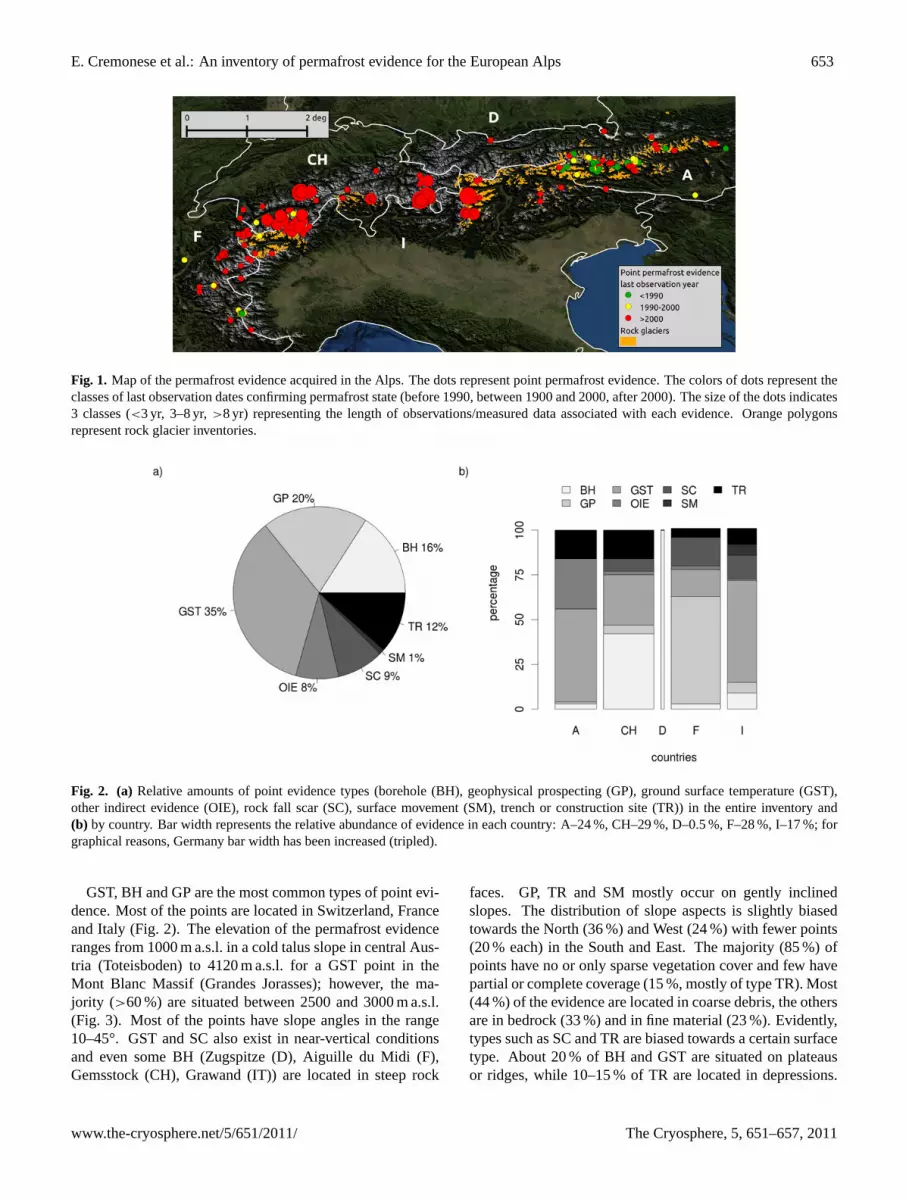
GST, BH and GP are the most common types of point evi-dence. Most of the points are located in Switzerland, Franceand Italy (Fig. 2). The elevation of the permafrost evidenceranges from 1000 m a.s.l. in a cold talus slope in central Aus-tria (Toteisboden) to 4120 m a.s.l. for a GST point in theMont Blanc Massif (Grandes Jorasses); however, the ma-jority (>60 %) are situated between 2500 and 3000 m a.s.l.(Fig. 3). Most of the points have slope angles in the range10–45°. GST and SC also exist in near-vertical conditionsand even some BH (Zugspitze (D), Aiguille du Midi (F),Gemsstock (CH), Grawand (IT)) are located in steep rock
faces. GP, TR and SM mostly occur on gently inclinedslopes. The distribution of slope aspects is slightly biasedtowards the North (36 %) and West (24 %) with fewer points(20 % each) in the South and East. The majority (85 %) ofpoints have no or only sparse vegetation cover and few havepartial or complete coverage (15 %, mostly of type TR). Most(44 %) of the evidence are located in coarse debris, the othersare in bedrock (33 %) and in fine material (23 %). Evidently,types such as SC and TR are biased towards a certain surfacetype. About 20 % of BH and GST are situated on plateausor ridges, while 10–15 % of TR are located in depressions.
www.the-cryosphere.net/5/651/2011/ The Cryosphere, 5, 651–657, 2011
654 E. Cremonese et al.: An inventory of permafrost evidence for the European Alps
Fig. 3. Elevation range of each type of evidence (except rockglaciers). The plot shown is a combination of a box plot (the whitedot is the median, the black boxes range from the lower to upperquartile, and the thin black lines represent the whiskers) and a kerneldensity plot super-imposed in a mirror image fashion (grey shadedareas).
The depth of BH ranges from 5 to 133 m with a mean of33 m. Most boreholes are equipped with temperature sen-sor chains and data loggers but some require manual mea-surements. For each BH, active layer depth as well as meanannual ground temperature (MAGT) of the coldest sensor isreported as the mean of all available measurement years. AsBH have variable depths, the MAGST of the coldest sensoris used as an indication for permafrost conditions. GST ismostly measured at a depth of around 10 cm (55 %), withsome measurements being shallower (25 % at 0–2 cm) andothers deeper (20 % at 15–55 cm). GST is reported as themean of all full measurement years with durations rangingfrom 3 to 5 yr.
Evidence of the absence of permafrost is also relevant:whilst 75 % of the rock glaciers presented in the inventoryare relict forms, only 23 % of the point types of evidenceindicate the absence of permafrost. 61 % of point evidencewhere permafrost absence has been ascertained are groundsurface temperature, 17 % are boreholes and 22 % are rep-resented by geophysical investigations and trenches. Pointsof permafrost absence have a mean elevation of 2600 m a.s.l.but can reach also elevations higher than 3500 m a.s.l. in par-ticularly unfavourable conditions (e.g. south exposed rockwalls).
5 Data access
The October 2010 version of the inventory is available digi-tally at www.geo.uzh.ch/microsite/cryodata/. A compressedversion of the inventory can be downloaded containing pointtypes of evidence in ASCII format. Since the rationale be-hind the inventory is data sharing, point evidence publicationpolicy are classified in two categories: “Usage without re-striction” and “Inform before publication”. Data belongingto the first category can be downloaded without any feed-back to the owner while in the latter case, an automatic emailreporting the contact person and the intended use of the data,will be sent to the owner when a download occurs.
6 Conclusions
We have established an inventory of permafrost evidence forthe Alps and made its contents freely available to other sci-entists and practitioners. This inventory complements mon-itoring programmes in which changes in permafrost terrainare measured at individual locations with great precisionand over long time spans (e.g. PERMOS, PermaFRANCEor NorPerm,Juliussen et al., 2010) by providing a solid ba-sis to advance the understanding of the spatial distribution ofpermafrost and its evolution in heterogeneous mountain envi-ronments. While the homogenized contents and public avail-ability of the inventory increase the value of the data con-tained, the synopsis of data over a larger region additionallyenables analyses that were previously not possible, as largerenvironmental gradients are covered and more data pointsavailable. Future experience with data homogenization, sci-entific analyses, gathering of evidence, re-interpretation ofexisting data for inclusion in the inventory and with merg-ing differing inventories and monitoring systems into higher-level products will likely require or inspire changes to thestructure and strategy outlined here. In addition, the provi-sion of proper user interfaces for the input, validity check-ing and output of data as well as strategies to ensure correctscientific governance and data stewardship are important tomaximize the acceptance and utility of inventories such asthe one presented here.
Appendix A
Inventory structure
1. General Information (required for all types of evidence)
– Evidence Type: Borehole (BH), Geophysics (GP),Rock fall scar (SC), Ground surface temperature(GST), Surface movement (SM), Trench or con-struction site (TR), Other indirect evidence (OIE);
– Country ID: Austria (A), Germany (D), France(F), Italy (I), Switzerland (CH), Liechtenstein (FL),Slovenia (SLO);
The Cryosphere, 5, 651–657, 2011 www.the-cryosphere.net/5/651/2011/
E. Cremonese et al.: An inventory of permafrost evidence for the European Alps 655
– Evidence ID: progressive code to identify the singleevidence;
– Site name: established name for site;
– Responsible name: first and last name of responsi-ble person/data owner. This person is to be con-tacted for any questions and also for impendingpublications;
– Responsible email: e-mail address of responsibleperson/data owner;
– Longitude: coordinates of the evidences (WGS84,decimal degrees);
– Latitude: coordinates of the evidences (WGS84,decimal degrees);
– Coordinate accuracy: approximate accuracy of co-ordinates (m);
– Position method: method used for locating site(e.g. GPS, MAP, Google Earth, others);
– Orientation method: method used for determiningslope and aspect (e.g. field, GIS, other);
– Elevation: elevation of the evidence point (m);
– Slope: slope, expressed in degrees, of the evidencepoint (°);
– Aspect: aspect, expressed in degrees, of the evi-dence point (90° for East, 180° for South, 270° forWest, 360° for North);
– Vegetation: degree of vegetation cover: none,sparse, partly covered, complete coverage;
– Surface type: coarse debris (no fines at surface),fine grained debris (fines at surface) or bedrock;
– Permafrost YES/NO: permafrost presence or ab-sence (Yes/No);
– Permafrost certainty: degree of certainty relatedto permafrost presence or absence: high certainty(i.e.definite proof), medium certainty,low certainty;
– Justification: explanation and justification of thepermafrost degree of certainty given;
– Ice: indication of the presence of ice belowactive layer depth or visible in rock fall scar(Yes/No/Unknown);
– Ice depth: depth of visible ice (m);
– Date last: last observation confirming permafroststate;
– Permafrost comments: any additional comments onpermafrost;
– Terrain characteristics: indication of the type of ter-rain: slope, ridge, peak, plateau, depression, slopebase;
– Source type: source of the information related tothe evidence: literature, field observation, personalcommunication;
– Source comment: any additional comment on thesource type;
– Publication policy: Usage without restriction, In-form before publication.
2. Additional information (not obligatory)
– Additional data: indication of any additional mea-surement existing at this site (e.g. snow depth, airtemperature, ...);
– Comments general: any other information about thesite that may be important;
– Publications: indication of publications where thesite and its permafrost condition are discussed(specifically).
3. Boreholes (specific information required for boreholes)
– Borehole name: established local borehole name;
– Borehole depth: maximum depth of the borehole(m);
– Borehole ALT: mean of maximum annual activelayer thickness (m);
– Borehole ALT years: years used for the calculationof average active layer depth;
– Borehole MAGT min: minimum mean annual tem-perature in the borehole (i.e. the mean annual tem-perature of the coldest sensor) (°C);
– Borehole MAGT min depth: depth of the sensorused for the minimum mean annual temperature(m);
– Borehole MAGT period: years used for the calcu-lation of the minimum mean annual temperature;
– Borehole MAGT accuracy: accuracy of the temper-ature sensors installed in the borehole;
– Borehole GST: mean annual ground surface tem-perature; indicates if a measurement is availablenear the borehole not in the same thermistor chain(°C);
– Borehole comments: any additional information:e.g. borehole with/without tubing, depth of Zero-annual amplitude (ZAA), angle of drilling (relativeto ground surface) if borehole is not vertical.
4. Ground Surface Temperatures (specific information re-quired for GST)
– GST mean: mean ground surface temperature (°C);
– GST period: years used for the calculation of themean ground surface temperature;
www.the-cryosphere.net/5/651/2011/ The Cryosphere, 5, 651–657, 2011
656 E. Cremonese et al.: An inventory of permafrost evidence for the European Alps
– GST measurement depth: maximum depth of mea-surement from surface (cm);
– GST accuracy: accuracy of the temperaturesensors;
5. Surface Displacement (specific information requiredfor SD)
– Displacement method: indication of the methodused to measure displacement: field observation,air photo observation, photogrammetric analysis,terrestrial survey, InSAR, ...;
– Movement rate: cm day−1, cm month−1
or cm yr−1;
– Movement date: date of measurement.
6. Rock glacier inventory (required for each rock glacierinventory)
– RGI ID: number of the rock glacier inventory;
– RGI name: name of the inventory;
– RGI file name: filename of the correspondingshapefile;
– RGI coordinate system: coordinate system of theinventory;
– RGI delineation base: specification of the delin-eation method used (e.g. air photo, map, field ob-servation etc.);
– RGI mapping strategy: specification of the map-ping strategy used to compile the inventory(e.g. random sample of rock glaciers/all rockglaciers/only large rock glaciers etc.);
– RGI year: date of the rock glacier inventory;
– RGI responsible name: first and last name of re-sponsible person/data owner;
– RGI responsible email: e-mail address of responsi-ble person/data owner;
– RGI publication: indication of publications wherethe rock glacier inventory is discussed(specifically).
7. Rock glacier (required for each rock glacier)
– Degree of activity: definition of the degree of ac-tivity using two classes: Intact (Active/inactive) orRelict;
– RG field evidence: presence of field evidence forthe rock glacier (e.g. Measurements)? Yes/No;
– RG activity data: presence of InSAR (A), geode-tic (B), photogrammetric (C), GPS (D) or other (E)data for the rock glacier: no data, activity,no activity;
– RG vegetation front: presence of vegetation on thefront of the rock glacier: Yes, No, Unknown;
– RG glacier above: presence of a glacier or peren-nial snow field in the root zone of the rock glacier:Glacier, Perennial snow field, No.
Appendix B
List of contributing institutions
– Austria
1. ZentralAnstalt fur Meteorologie und Geodynamik– ZAMG
2. Universitat Graz
– France
1. Conservatoire National des Arts et Metiers– CNAM
2. Universite Joseph Fourier
3. Universite de Savoie
4. Centre national de la recherche scientifique– CNRS
– Germany
1. Bayerisches Landesamt fur Umwelt – LfU
– Italy
1. Agenzia Regionale per la Protezione dell’Ambientedel Piemonte – ARPA Piemonte
2. Agenzia Regionale per la Protezione dell’Ambientedella Valle d’Aosta – ARPA VdA
3. Fondazione Montagna Sicura
4. Provincia Autonoma di Bolzano
5. Provincia Autonoma di Trento
6. Regione Veneto
– Switzerland
1. Bundesamt fur Umwelt – BAFU
2. Universite de Lausanne – UNIL
3. Universitat Freiburg
4. WSL Institute for Snow and Avalanche Research– SLF
5. Universitat Zurich – UZH
The Cryosphere, 5, 651–657, 2011 www.the-cryosphere.net/5/651/2011/
E. Cremonese et al.: An inventory of permafrost evidence for the European Alps 657
Acknowledgements.The project PermaNET is part of the EuropeanTerritorial Cooperation and is co-funded by the European RegionalDevelopment Fund (ERDF) in the scope of the Alpine SpaceProgramme (http://www.alpine-space.eu). We are grateful to alldata contributors: Broccard A., Crittin C., Curtaz M., Delaloye R.,Fabre D., Garcia S., Holzle M., Keusen H. R., Kroisleitner C.,Krysiecki J. M., Lambiel C., Lieb G., Mari S., Monnier S., Paro L.,Riedl C., Rovera G., Schoeneich P., Springman S., Walcher J.,Zampedri G., as well as the Swiss Permafrost Monitoring Network(PERMOS). Alexander Brenning has contributed to designing theinitial structure of the inventory.
Edited by: R. Rigon
References
Allen, S., Gruber, S., and Owens, I.: Exploring steep bedrockpermafrost and its relationship with recent slope failures in theSouthern Alps of New Zealand, Permafrost Periglac., 20, 345–356, 2009.
Gruber, S. and Hoelzle, M.: Statistical modelling of mountain per-mafrost distribution: local calibration and incorporation of re-motely sensed data, Permafrost Periglac., 12, 69–77, 2001.
Hoelzle, M.: Mapping and modelling of mountain permafrost dis-tribution in the Alps, Norsk Geogr. Tidsskr., 50, 11–15, 1996.
Imhof, M.: Modelling and verification of the permafrost distributionin the Bernese Alps (Western Switzerland), Permafrost Periglac.,7, 267–280, 1996.
Juliussen, H., Christiansen, H. H., Strand, G. S., Iversen, S.,Midttømme, K., and Rnning, J. S.: NORPERM, the NorwegianPermafrost Database – a TSP NORWAY IPY legacy, Earth Syst.Sci. Data, 2, 235–246,doi:10.5194/essd-2-235-2010, 2010.
Keller, F.: Automated mapping of mountain permafrost using theprogram PERMAKART within the geographical informationsystem ARC/INFO, Permafrost Periglac., 3, 133–138, 1992.
Lambiel, C. and Reynard, E.: Regional modelling of present,past and future potential distribution of discontinuous permafrostbased on a rock glacier inventory in the Bagnes-Heremence area(Western Swiss Alps), Norsk. Geogr. Tidsskr., 55, 219–223,2001.
Mair, V., Zischg, A., Krainer, K., Stotter, J., Zilger, J., Belitz, K.,Schenk, A., Damm, B., Kleindienst, H., Bucher, K., Lang, K.,Tagnin, S., and Munari, M.: PROALP Rilevamento e monitor-aggio dei fenomeni permafrost. Esperienze della Provincia diBolzano, Neve e Valanghe, 64, 50–59, 2008.
Noetzli, J. and Vonder Muehll, D. (Eds.): PERMOS 2010. Per-mafrost in Switzerland 2006/2007 and 2007/2008, Glaciologi-cal Report Permafrost No. 8/9, Cryospheric Commission of theSwiss Academy of Sciences, 2010.
Schoeneich, P., Bodin, X., Krysiecki, J., Deline, P., and Ravanel, L.:Permafrost in France. Report No. 1, Institute of Alpine Geogra-phy, University of Grenoble, 2010.
www.the-cryosphere.net/5/651/2011/ The Cryosphere, 5, 651–657, 2011