brand equity, efficiency and valuation of professional sports franchises: the case of major league...
TRANSCRIPT
http://www.thejournalofbusiness.org/index.php/site 63
Brand Equity, Efficiency and Valuation of Professional Sports Franchises: The Case of Major League Baseball
Srinivas K. Reddy1, Antonie Stam2, Per J. Agrell3
ABSTRACT
Values of professional sports franchises have outpaced even investment returns in recent bull markets. Financial World found the value of professional teams like the Dallas Cowboys, Miami Dolphins and the NY Yankees to exceed $200 million each. In 1996, the average estimated value of Major League Baseball (MLB) teams was $134 million, and most showed double-digit growth in value, although 13 of the 26 teams were in the red. Our research proposes a model to determine the value of a professional sports franchise, by treating the franchise as a brand whose value is enhanced by its key attributes. This approach is appropriate because each franchise represents a single brand firm. Our model takes into account equity enhancing factors like the franchise longevity, historical performance, the number of marquee/award-winning roster players, and market factors such as market size, competition and franchise efficiency. We determine the extent to which a franchise is managed efficiently with respect to inputs like investments in players (player costs) and outputs such as franchise revenue and team performance (win-loss ratio). Using data from 1990-1995 to illustrate our model, we are able to determine (1) the brand equity of MLB franchises, (2) how efficiently each team is managed, and (3) the contribution of marketing factors like brand equity, market size, competition, as well as efficiency, to franchise value. While this paper focuses on MBL, the methodology can easily be extended to other professional sports.
Keywords: Brand equity, data envelopment analysis, efficiency analysis, sports franchises. JEL Codes: C61, L83, M21, M3. Available Online: 25th January, 2015. MIR Centre for Socio-Economic Research, USA.
1.0 INTRODUCTION Over the past 25 years, the value of professional baseball franchises has soared, outpacing even the growth seen in the stock market during the same period. Although half of the Major League Baseball (MLB) teams or more have been in the red over this period, most experienced double-digit growth in value. A valuation in 1996 of sports franchises by (Atre et al., 1996) has put the average value of a professional baseball team at $134 million, with NY Yankees valued in excess of $240 million. Rupert
1 Professor of Marketing, Singapore Management University, E-mail: [email protected]. 2 Leggett & Platt Distinguished Professor of Information Systems, University of Missouri-Columbia E-mail: [email protected]. 3 Associate Professor, CORE, Louvain-la-Neuve, Belgium. E-mail: [email protected].
International Journal of Business and Social Research Volume 05, Issue 01, 2015

Reddy, Stam and Agrell, IJBSR (2015), 05(01): 63-89
http://www.thejournalofbusiness.org/index.php/site 64
Murdoch and the News Corp. have bought Los Angeles Dodgers for over $350 million (Zimbalist, 2006). Today, these values have increased by an order of magnitude. Brand equity “describes the value of having a well-known brand name, based on the idea that the owner of a well-known brand name can generate more money from products with that brand name than from products with a less well known name, as consumers believe that a product with a well-known name is better than products with less well-known names” (Wikipedia 2015, Aaker 1991, Ailawadi 2003, Keller 2003, Leuthesser 1995). The task of brand valuation and determining brand equity has always been challenging and particularly complex as very few publicly traded companies are single brand firms, so that the market value of the vast majority of companies cannot be apportioned accurately to any specific brand. However, sports franchises like the NY Yankees and the Los Angeles Dodgers are single brand franchises, thus facilitating the linking of specific management, team, market and other factors to their value. Hence, the study of professional sports franchises provides a unique opportunity to study how brands may be valued. We seek to analyze which characteristics determine the value of a franchise, by treating it as a brand whose value is enhanced by its key attributes. Although our methodology can easily be extended to other professional sports, in this study we focus on MLB. In the first part of our analysis, we develop and empirically estimate a model that takes into account a team’s equity measures such as winning percentage and the number of marquee players on the roster, and Market factors such as location characteristics and competition, as well as managerial efficiency. The managerial efficiency of a MLB franchise is determined by the degree to which the controllable resources (inputs, such as various types of cost) are used in an “optimal” manner in order to achieve either a desired performance or outcome (revenues generated, win/loss ratio) with the lowest possible level of resources, or the highest possible performance for a given level of resources. In our research, the efficiency information is derived using data envelopment analysis (DEA). The analysis establishes that the degree of efficiency of its management is indeed a significant determinant of MLB franchise value. We use this model to address several interesting questions, such as how much a given professional MLB sports franchise may be worth, and whether those teams with the highest success on the field are also the most efficiently managed ones viewed from a financial perspective, whether the teams that are the most successful on the field are also the highest valued ones, what the equity of each sports franchise is and how their location and competition may impact value. In addition to providing clarity about the origins of valuation of baseball franchises, we present valuable managerial insight as to how value can be created and discuss the implications for professional sports in general. In the second part of our study, we focus in more detail on efficiency related issues. For instance, we use the analysis to identify reasons for the inefficiencies of certain teams, and to compare the relative efficiency of each franchise directly, providing us with valuable insights into how the various MLB franchises were managed in the early to mid nineties. These insights, in turn, may be of interest to managers of professional sports franchises The outline of the paper is as follows. In the next section, we develop a conceptual framework that outlines the key factors affecting sports teams’ value, along with a brief description of the DEA efficiency analysis. A detailed review of the DEA methodology as it applies to our study is presented in Appendix A. The data used to test the efficiency and valuation models are presented next, followed by a comprehensive discussion of the results of our franchise valuation and brand equity models. As the efficiency figures yield has clear managerial implications, we examine and discuss the results from the DEA analysis in detail. The final section presents the conclusions and future research directions.
2.0 CONCEPTUAL FRAMEWORK
(Scully, 1992a) argues that a poor athletic performance is evidence of either low quality players or poor management. He concludes that in baseball and basketball, franchise owners appear to use the team’s

Brand equity, efficiency and valuation ...
http://www.thejournalofbusiness.org/index.php/ 65
standing as information indicative of managerial quality, e.g., when deciding on whether or not to make changes in the coaching staff and the front office. Scully also finds that, on average, the chance of being fired as a MLB manager is about 7 percent for each unit drop in club standing, and detects evidence of improvement in a team’s standing after the termination of a manager.
In dealing with management at more of a micro level, (McCormick and Clement, 1992) find that NBA coaches do not always manage their strategic options, such as deciding on how many two-point shots to take relative to the more difficult but higher valued three-point shots, well during a game or season, but appear to get better with these decisions with experience. These authors conclude that those coaches who manage to nearly equate the expected rates of return on the two- and three-point shot options tend to win the most games. Besides, in investigating coaching quality and longevity in three professional team sports, (Scully, 1992a) notes that the managerial longevity is determined both by managerial efficiency and improvement in managerial efficiency over time. Although managers and coaches who survive the longest tend to have better win-loss records, the coaches with the best records do not always endure. Based on his analysis, (Scully, 1992b) concludes that over the period of 1876 to 1989 the most efficient MLB managers of all time were Frank Selle, Al Lopez, Billy Martin, Earl Weaver, Walt Alston and Sparky Anderson.
Several studies have addressed the financial and economic dimension of MLB. For instance, (Dortch, 1996) discusses the impact of the free agency system on the economics and performance of metropolitan and non-metropolitan franchises, a finding noted earlier by Thomas and Jolson (1979). However, whereas some researchers (Thomas and Jolson 1979; Dortch 1994, 1996) stress that professional baseball is also an economic enterprise of significant importance, with a more diversified product mix than the game itself, the relationship of economic factors to value has not been pursued. These studies suggest a link between managerial quality and team performance, but do not address the question whether this translates into efficiency and enhances the franchise’s value.
We propose the conceptual model described in Figure 1, which identifies key factors that the literature has identified as potentially contributing to a professional sports team’s value. Our model poses that value is determined to a significant extent by equity enhancing factors, by certain exogenous market factors and by the extent to which a team’s resources are used efficiently. We next present how we operationalize the three major components of the model, equity, market factors and efficiency.
Figure 1: The conceptual model for sports team value
2.01 EQUITY FACTORS The relatively long tenure of most sports franchises provides an opportunity for building relationships

Reddy, Stam and Agrell, IJBSR (2015), 05(01): 63-89
http://www.thejournalofbusiness.org/index.php/site 66
with the local community. The fierce fan loyalty is evidence of sport franchise’s equity. The local community typically reacts with disenchantment when a sports franchise decides to leave the area for financial reasons. Recent examples of moves by NFL franchises from Cleveland to Baltimore and from Houston to Nashville have caused a tremendous amount of bad sentiment in the local communities that were abandoned. Often, communities desperately try to keep the local sports franchises by promises of new stadium facilities and tax breaks. Sometimes, team loyalty may persist for many years after it has left town. For example, people still talk dearly about Brooklyn Dodgers, decades after they relocated to Los Angeles. Generally, teams with a long history in a given market have the potential to build substantial equity. However, as we will show in our analysis, a long stay alone is no guarantee that equity will be enhanced, and a team’s value must be supported by its performance both on and off the field. Superior athletes on a team could contribute to a winning performance, although the extent of the impact may depend on the sport. In a game like baseball, which depends on a superior performance by the entire team to win, the presence of one or two marquee players may not have a significant influence. However, in basketball it is more likely that one or two outstanding players turn a team’s performance around. Nevertheless, whatever the influence of star players on the outcome of a game, they provide a major incentive for fans to attend the games. Moreover, individual athletic performance is often recognized by the professional leagues, initially through annual awards such as the Cy Young for pitchers, the Golden Glove for fielders, and finally through the induction into the Hall of Fame of players with an outstanding life-time career. As our analysis will show, the presence of outstanding athletes is indeed equity enhancing and has a positive effect on a team’s value. A team that consistently has winning seasons and frequently wins divisionally, league and national championships (World Series, Super Bowl, etc.) will be more endearing to its fans (Whitney, 1988). Due to their consistently winning ways, baseball teams like the NY Yankees and the Atlanta Braves, basketball teams such as the Chicago Bulls and football teams like the Dallas Cowboys and the San Francisco 49ers have become icons that other sports franchises seek to emulate. Consistently superior performance promotes increased attendance for home games, creates a wider audience for its televised games and improves its merchandising prospects. In addition, an outstanding performance on the field may not only enhance the local following, but also draw audiences from all around the country. The Dallas Cowboys are often called the “true” American Team. Therefore, consistent athletic performance enhances the equity of a sports franchise, improves its “marketability,” and thus increases its value.
2.02 MARKET FACTORS Exogenous market factors that may influence sports franchise value include the demographic make-up of the market in which the team operates, such as the market size (population), and the extent of athletic competition from other sports franchises. As professional sports teams in larger markets have a competitive advantage due to higher revenue potential, such teams are able to afford highly priced players who contribute to their winning percentage. Most of the early research has linked market size with performance, with somewhat ambivalent results. (Quirk and El Hadiri, 1974) find that big-city teams tend to win more games than small-city teams. However, (Scully, 1989) and (Balfour and Porter, 1991) observe no such relationship in baseball. Similarly, (Porter, 1992) does not find market size to be a significant determinant of team performance, but does show that the value of a sports team is strongly influenced by market size. In certain markets, the competition for consumers’ entertainment dollars is intense, not only from other professional sports franchises but also from alternative outlets for entertainment such as the performing arts.4 Whereas the effect of non-sporting entertainment events on the competitive
4 We do not explore the impact of non-sporting entertainment on demand for sporting events and hence on the valuation of

Brand equity, efficiency and valuation ...
http://www.thejournalofbusiness.org/index.php/ 67
position of a sports franchise is unclear, it is reasonable to assume that the presence of other sports alternatives during the same season does have some impact on attendance and thus on revenues.
2.03 EFFICIENCY IN SPORTS Studies employing non-parametric efficiency analysis approaches, in particular DEA (Charnes et al. 1978), have increased dramatically in frequency since the early 1980s. (Seiford, 1996) lists numerous applications in various fields. Among marketing applications we note (Parsons, 1991) and (Horsky and Nelson, 1996), who evaluate sales force performance using DEA models at the enterprise, franchise and individual level, as well as (Doyle and Green, 1991), which use DEA to screen prospective products. (Banker, 1993) has shown that the DEA approach allows for the assessment of a range of relevant information about the system that is being studied, such as returns to scale, input substitution, model specification and efficiency variations. Much of the information provided by a DEA analysis is typically not revealed by a traditional statistical analysis. DEA provides valuable insights to the manager, particularly through an assessment of the relative performance of each entity, identifies those best-practice entities that perform at efficient levels, and offers concrete improvement targets and individual best practice role models for all entities. Currently, DEA is used operationally to manage performance in many profit and not-for-profit organizations, and has gained popularity among regulatory agencies for utilities. Several commercial software products implementing DEA are now available. The concept of efficiency is illustrated by the following example from the health industry. When analyzing the relative efficiency of hospitals, staff hours and assets may be considered the system’s inputs and the number of various undertaken treatments as its outputs. If, compared with the other hospitals under consideration, a particular hospital has the lowest input mix given a specific number of treatments (input orientation), or equivalently if it has the highest number of treatments at a given input level (output orientation), then this hospital is efficient. If exact valuations of inputs and outputs are known, the calculation of relative efficiency is straightforward as the ratio of costs to revenues. However, in many situations monetary valuations may not be available (such as for the treatments in the hospital example), prompting the use of a multi-dimensional efficiency model. A professional sports franchises resources consist of its players, home venue, and reputation, coaching staff and management and the media. A team’s winning ways, i.e., the number of games won, should be a very important determinant in the appreciation of its value. In fact, the majority of studies undertaken assume implicitly that the primary objective of the organization is to maximize either the number of wins or the win-loss ratio, (e.g., Athey, 1982), (Zech, 1981), (Porter and Scully, 1982), (Kahn, 1993), (Scully, 1994), (Bukiet et al., 1997). Thus, team costs and revenues are indicative of how well a professional sports franchise manages its resources, and an efficient franchise would expend an appropriate amount of resources towards the athletic goals, i.e., winning the game, and achieving business-related goals, i.e., generating revenues (Bruggink, 1993). In turn, the efficient management of these resources could translate into higher value. Applications of efficiency analysis in the area of sports include studies by (Zech, 1981), (Porter and Scully, 1982), (Clement and McCormick, 1989), (Howard and Miller, 1993), (Zappe, Webster and Horwitz, 1993) and (Anderson and Sharp, 1997). (Zech, 1981), (Porter and Scully, 1982) and (Clement and McCormick, 1989) estimate that parametric production functions to estimate the impact of management, pricing and technology. (Howard and Miller, 1993) use a non-parametric non-stochastic frontier approach to assessing individual player efficiency in MLB. Using an activity model with twenty-nine inputs and one single output (salary), these authors investigate player strengths, classify players into categories with respect to their expected salary level, identify referents for under- and over-paid players and suggest alternative incentive structures. (Anderson and Sharp, 1997) use a univariate
sports teams in this study, but it would be an interesting avenue for future research.

Reddy, Stam and Agrell, IJBSR (2015), 05(01): 63-89
http://www.thejournalofbusiness.org/index.php/site 68
approach to evaluating the efficiency of MLB hitters. Other researchers have looked at issues related to professional sports and Baseball (Butler 1995; Estenson 1994; Gramlich 1994; Jessel and Mcavoy 1997; Holbrook 1996; Kochman and Badarinath 1995; Lord and Hohenfield 1979), but none of these studies address the issue of managerial efficiency in the context of professional sports, and the idea to analyze the valuation of a franchise from an efficiency viewpoint is novel. In our research, the inputs into the efficiency model consist of player costs and other costs incurred in a given year. The outputs used are the revenues generated by the franchise and the team’s win-loss ratio. The DEA activity model for MLB is depicted in Figure 2.
Figure 2: The baseball team activity model
3.0 DATA In order to test our efficiency and valuation models, we compiled data on 26 MLB teams over the period of 1990-1995.5 We did not include the expansion teams, the Florida Marlins and the Colorado Rockies, which joined MLB in 1994. In our analysis, we use the estimated values of all MLB franchises based on recent revenue streams and team assets provided by Financial World. Financial World does not reveal the exact method it used to calculate valuations, but it is based on a method developed by (Murphy, 1992) for brand valuation. Murphy uses the brand’s historical revenues, adjusted by a multiplication factor that takes the strengths of the brand into account. Similarly, Financial World calculates baseball franchise values by applying a multiplication factor to the team’s average revenues for the past three seasons. This multiplication factor reflects special considerations such as a team’s favorable demographics, and its move to a modern facility. From the same source, we were also able to gather the annual player costs, other costs (e.g., travel) and revenues (including gate receipts, media revenue and stadium revenue) for each team. These data were supplemented with information on population (source: US Bureau of Census 1996) and the extent of competition (the number of other professional sports franchises) in the metropolitan area in which the MLB franchise is located. From (Thorn and Palmer’s, 1997) Total Baseball and The Baseball Encyclopedia we obtained data on each team’s history (age), performance (win/loss ratio, historical performance) and the number of players who have won major league awards (such Cy Young, Golden Glove, etc.). Table 1 summarizes the descriptive statistics of the key variables used in our study. Table 1: Descriptive statistics of variables
Variable Mean Std. Dev. Min Max Value (Mill $) 113.45 34.06 62.00 225.00 Efficiency
VRS-OUT kOUT 86.55 9.65 62.20 100.00
VRS-IN kIN 78.85 13.61 54.90 100.00
Revenues (Mill $) Gate Receipts 20.82 8.12 8.00 48.90 Media Revenue 24.86 10.11 9.60 69.40 Stadium Revenue 8.88 5.05 0.00 23.00 Total Revenue 57.49 17.30 24.90 107.60 Costs (Mill $) Player Costs 30.74 11.50 8.10 59.30
5 The period of study was determined to a large extent due to the availability of data on valuations, costs and revenues from Financial World. Financial World ceased to publication of these annual data from 1990-1996.
BASEBALL FRANCHISE
PLAYER COST
OTHER COST
WIN RATIO
REVENUE

Brand equity, efficiency and valuation ...
http://www.thejournalofbusiness.org/index.php/ 69
Other Costs 23.23 7.09 8.50 52.90 Total Costs 53.98 14.19 22.20 89.40 Market Factors Population (000s) 6193.00 4889.00 1601.00 18,183.00 Competition (# of 3.19 1.42 1 6 sports franchises in market) Equity Enhancing Factors Franchise Age 56.15 38.29 13 125 Player Awards 7.08 4.42 0 23 Historical Performance Mean 0.50 0.03 0.427 0.613 Coeff. of Var. 0.12 0.04 0.040 0.260
4.0 RESULTS AND DISCUSSION In this section we present the results of our analysis. First, we use market and equity enhancing factors, as well as the efficiency scores, to develop a better understanding of the determinants of the value of a professional MLB sports franchise. To this purpose, we formulate and analyze several regression models. Among others, our analysis confirms that the effect of efficiency on franchise value is statistically significant. The residuals will be analyzed to draw conclusions about the equity of each team. Next, we analyze the relative efficiency of all MLB teams. Through the various efficiency scores, this analysis provides interesting and valuable insights into which franchises were run efficiently and which ones made poor managerial decisions.
4.01 STATISTICAL ANALYSIS OF FRANCHISE VALUE We use a statistical model based on the conceptual model presented in Figure 1 to investigate the impact of efficiency, market factors and equity enhancing factors on the value. As discussed earlier, several variables, such as population of the metropolitan area where the team is located, the competition from other professional sports teams in the market area, the number of award winning marquee players on the roster, the age and historical performance of the franchise all have a potential effect on the value of a team.6 In addition, we add dummy variables to identify whether the team belongs to National League or American League and whether the team is located in the US or Canada. The impact of all these factors, along with technical efficiency (output-oriented model), is estimated using the model in (1).
VALUEk = 0 + 1 EFFICIENCYk + 2 POPk + 3 BASECOMPk + 4 OTCOMPk + 5 AGEk + 6 AWARDk +7
MPERFk + 8 CPERFk + 9 CHAMPk,t + 10 CHAMPk, t-1 + 11 CHAMPk, t-2 + 12 NLk + 13 USk + k , (1) where: VALUEk = the value of team k,
EFFICIENCYk (k,k) = the efficiency score of team k, POPk = the population size of the metropolitan area where team k is located, BASECOMPk = the number of other professional baseball franchises located in the metropolitan area of team k, OTCOMPk = the number of other professional sports franchises located in the metropolitan area of team k, AGEk = the number of years team k has been in the metropolitan area, AWARDk = the number of awards received by players on the roster of team k, MPERFk = the mean winning percentage over the last five seasons of team k,
6 To check if the changes in team’s value may be related to the general economic conditions and positive stock market we have included several economic indicators such as T-bill rate, S&P Index value, Dow Jones Industrials Index value. None of them were significantly related to value.

Reddy, Stam and Agrell, IJBSR (2015), 05(01): 63-89
http://www.thejournalofbusiness.org/index.php/site 70
CPERFk = the coefficient of variation (/) of winning percentage of team k over last five seasons, CHAMPk,j= the championship record team k in time period j (teams that made it to the Divisional Championship receive a score of 3; the team that won the Divisional Championship but lost the World Series receives a score of 5, and the team that won the World Series receives a score of 10),7 NLk = MLB identification of team k, coded 1 if the team is in the National League, 0 otherwise, USk = location of team k, coded 1 if located in the US, 0 otherwise. Table 2: Regression results
VALUE VALUE
Efficiency
VRS-OUT(kOUT) 0.680*** -----
VRS-IN (kIN) ------ 0.427***
Market Factors
Population (POP) 0.006*** 0.006***
Competition
BASECOMP -21.924*** -22.750***
OTCOMP -2.579ns -2.804ns
National League Team (NL) -11.417*** -10.969***
US Team (US) 6.683 ns 8.516 ns
Equity Enhancing Factors
Franchise Age (AGE) 0.098* 0.096*
Player Awards (AWARD) 0.963** 1.025**
Historical Performance
Mean (MPERF) 200.532*** 230.928***
Coeff. Var. (CPERF) -107.464** -108.369*
CHAMPt 0.875 ns 1.208 ns
CHAMPt-1 -0.115 ns 0.031 ns CHAMPt-2 1.971** 1.801*
Constant -58.142 -44.983
R2
0.587 0.581
Adj. R2 0.549 0.543
* Significant at p < 0.10 level. ** Significant at p < 0.05 level. *** Significant at p < 0.01 level. ns Not significant.
The results of estimating the model in (1) are presented in Table 2. The model explains about 55% of the variation in the team’s value (adj. R2 = 0.549). A similar model estimated with input-based efficiency scores (rather than output-based scores) yields similar results (with adj. R2 = 0.543).8 A model with just efficiency as the explanatory variable is significant at the p=.01 level, and explains about 10 percent of the variance in sports team value, suggesting that efficiency has a significant positive effect on MLB
7 Although this scoring scheme involves some arbitrariness, we implement it in order to assign a greater relative weight to winning the Divisional Championship and the World Series. Alternative simpler schemes, such as coding the winner of Divisional Championship and World Series as separate dummy variables, yield similar results in terms of significance. We report the results for the single dummy with weighted values for reasons of parsimony, as the alternative was to include two dummy variables for each time period. 8 The model was estimated using OLS. Due to the pooling of cross-sectional and time-series data, the potential of heteroscedastic errors exists. Although still unbiased, the OLS estimates would not have minimum variance in the case of heteroscedasticity. Weighted Least Squares (WLS) or Generalized Least Squares (GLS) estimates will produce minimum variance estimates. We also estimated the model using Weighted Least Squares, yielding an adjusted R2 of 0.520. AGE, which was significant in the OLS model, was not significant in the WLS model. Except for this, no significant differences were observed, either in direction or significance of the results.

Brand equity, efficiency and valuation ...
http://www.thejournalofbusiness.org/index.php/ 71
team value. As efficiency may be correlated with output measures, for instance through a team’s historical performance, we ran the model both with and without efficiency as one of the explanatory variables, and also verified that the correlation of efficiency with each of the other explanatory variables in (1) is low. Several of the market variables appear to affect the value. Population (a proxy for market size) has a significant positive relationship with value. As the New York and Los Angeles markets have a substantially larger population than any other market areas, we check whether the results would be sensitive to omitting these markets from the analysis. Estimating the model without the four teams located in these markets improves its explanatory power somewhat (adj. R2 = 0.578), without producing much difference in the model estimates. Initially, we used the total number of competing professional sports franchises in the metropolitan area of the MLB franchise in the model. This variable had a negative effect on the value of a team. On average there are three other sports franchises in a typical market area. In some highly competitive markets, however, there are two baseballs, two basketball and two football franchisees. Thus, it appears of interest to determine whether or not the presence of direct competition, in the form of a competing professional baseball franchise in the same market, has an influence on the value.9 To investigate this, competition was operated as two separate variables, one being the number of competing professional baseball franchises in the same market (BASECOMP) and the other the number of other professional sports franchises in the same market (OTCOMP). Interestingly, the results (see Table 3) show that, while the presence of another professional baseball team has a significant negative impact on value, the presence of other professional teams in the market was not significant, perhaps because the overlap of the sport seasons is limited. While one may argue that some amount of competition may be beneficial, the results of our analysis suggest that direct competition may in fact depress franchise value. We also tested a model to estimate the curvilinear effect of competition, but found this model to be invalid, as the quadratic term was insignificant. Although the location in or outside the US has no significant effect, we find that a team in the National League is valued approximately $10 million less than an American League team. While some subtle differences between the two leagues exist, e.g., National League teams on average are older (64 years) than the American League (50 years), we have found no compelling cause for this difference in average value between leagues. Interestingly, while the range of on-the-field performance over the last five years of National League teams is larger and less consistent than the American League, there is no significant difference in efficiencies between the two leagues. Efficiency is included in the regression model as a separate entity, because it provides a relative measure of managerial judgment and strategy that affects value in a way that is different from the individual variables that serve as inputs and outputs to the efficiency analysis. In other words, we pose that, while the levels of the input and output variables to efficiency alone do explain value to a substantial extent, managerial efficiency as measured in our research provides additional insights and offers additional explanatory power not provided by the other model variables. Our conjecture that efficiency contributes to value in its own unique way is confirmed by the fact that it is a statistically significant component to the regression model, explains an additional 10% of the model variability, and is not strongly correlated to any of the independent variables in the regression model. Hence, managerial efficiency proves to be a legitimate and valuable factor in explaining franchise value.
4.02 EQUITY ENHANCEMENT Next we use the results in Table 2 to explore how the equity is enhancing factors influence value. The
9 Four markets have two professional baseball franchises each: New York (Mets and Yankees), Los Angeles (Dodgers and Angels), Chicago (Cubs and White Sox), and San Francisco Bay area (Giants and A’s).
Reddy, Stam and Agrell, IJBSR (2015), 05(01): 63-89
http://www.thejournalofbusiness.org/index.php/site 72
number of years that sports franchise has been in the same market (AGE) has a significant positive impact on the value. Despite the emergence of expansion teams and team relocations, the average tenure of a major league team is over 50 years. The positive relationship between AGE and value indicates that fan loyalty grows more intense as the franchise remains in the same market. Note that the expansion teams Colorado Rockies and Florida Marlins have not been included in the analysis. A log transformation and the addition of a quadratic term to examine any non-linear effects did not yield any significant results. The number of awards received by the players on the team roster (AWARD) captures the extent to which key players are capable of attracting fans. It is not surprising that AWARD, like AGE, has a significant positive impact on the value. In this context, it is interesting (calculation not shown) that AWARD is positively correlated with player costs (r = 0.34), so that increased player costs may translate into higher revenues. Thus, our analysis implies that having a number of award winning players on the roster will (generally) have a significant positive influence on the value of a team. Historical performance is captured by several measures. The mean performance over the previous five seasons (MPERF) has a significant positive effect on the value. The consistency of historical performance (CPERF) is measured by the coefficient of variation of the winning percentage over the past five seasons, so that smaller values indicate more consistency. Hence, the significant negative coefficient is to be expected and indicates that higher levels of consistency have a positive effect on the value. We also investigate a shorter (3 season) and a longer (7 and 10 season) horizon for assessing historical performance, but found that the five-season horizon provides the best results, in terms of both model fit and magnitude of the effect.
The effects of winning Divisional and League championships and the World Series in the current (CHAMPk,t) and previous (CHAMPk,t-1) year are not significant, whereas the two-year lagged variable (CHAMPk,t-2) does have a significant positive effect on value. This suggests that it takes at least two years for these important athletic achievements to impact franchise value, which is not be too surprising, considering that the improvements in attendance and revenue may not be fully realized immediately, but would take a few years to take hold.
Following Simon and Sullivan (1993), who computed brand equity value in a similar manner, we derive the equity of each baseball team using the regression coefficients associated with the equity enhancing factors:
EQUITYk = 0.098*AGEk + 0.963*AWARDk + 200.532*MPERFk 107.464*CPERFk + 0.875*CHAMPk,t 0.115*CHAMPk,t-1 + 1.971*CHAMPk,t-2
Those baseball teams with the highest and lowest equity estimates for a given year during 1990-1995 are presented in Table 3. It is interesting that the Atlanta Braves appear in both columns. The 1995 Braves, with their consistent on-the-field performance has emerged as one of the teams with the highest equity. This is a dramatic change from being at the low end of the equity in 1990 and 1991.
Table 3: Estimates of equity of baseball teams Teams with Highest Equity
Equity Estimate Teams with Lowest Equity Equity Estimate
1991 Oakland A’s 103.15 1990 Atlanta Braves 41.46 1995 Atlanta Braves 102.30 1991 Atlanta Braves 46.09 1990 Cincinnati Reds 90.70 1990 Baltimore Orioles 47.33 1994 Toronto Blue Jays 90.70 1991 Baltimore Orioles 49.23 1990 Los Angeles Dodgers
89.51 1994 New York Mets 50.18
We estimated several models with blocks of variables, in order to determine the incremental contribution of these sets of variables on franchise value. As reported earlier, the efficiency of a franchise explains about 10 percent of its value. Table 4 shows that adding the block of market

Brand equity, efficiency and valuation ...
http://www.thejournalofbusiness.org/index.php/ 73
variables improves the explanatory power of the model to 44 percent. The addition of equity variables further improves the explanatory power to about 55 percent. Table 4: Contribution of blocks of variables
Model R2 adj. R2 Only Efficiency 0.097 0.091 Only Market Factors 0.425 0.407 Only Equity Enhancing Factors 0.132 0.091 Efficiency + Market 0.462 0.440 Efficiency + Equity 0.230 0.189 Market + Equity 0.557 0.520 All Factors 0.587 0.549
Although the prediction is not the main purpose of our study, we note that the predictive ability of the model was good. For 66 percent of the teams, the model is able to predict within $20 million of the Financial World valuation, and for over 38 percent of the teams our model even predicts within $10 million; 29 percent of the predicted team values are within 5 percent of the Financial World valuation and about 81 percent of the values are within 20 percent. The main purpose of testing the model in (1) is to determine its explanatory power. We can also use the model for prediction, in order to assess the under- and overvaluation of teams. However, the model accuracy is limited, so that one needs to exercise caution in interpreting the prediction results. With this limitation in mind, the discussion that follows would indicate that interesting insights into the relative under- and overvaluation of baseball teams are still possible. Based on the model predictions, we assess the “true” value of a franchise, based on how efficiently it is managed, which exogenous circumstances it faces and which equity is enhancing factors it possesses. If the predicted value of a particular franchise yielded by our model exceeds its valuation by Financial World (FW), we consider this franchise to be undervalued. On the other hand, if the predicted value of a franchise from our model is less than the FW value, we consider it overvalued. Table 5 summarizes which franchises are the most seriously under- and overvalued teams during the 1990-1995 periods.10 Table 5: List of the most undervalued and overvalued baseball teams Ten Most Undervalued Teams Ten Most Overvalued Teams
FW-Value Pred-Value Under Value
FW-Value Pred -Value Over Value
Year Team Mill. $ Mill. $ Mill. $ Year Team Mill. $ Mill. $ Mill. $ 1995 California
Angels 90.00 162.11 -72.11 1990 Baltimore
Orioles 200.00 112.04 87.96
1991 California Angels
103.00 153.60 -50.60 1995 Toronto Blue Jays
152.00 128.54 23.46
1990 California Angels
102.00 149.21 -47.21 1994 Toronto Blue Jays
146.00 109.73 36.27
1993 California Angels
93.00 140.00 -47.00 1995 Baltimore Orioles
168.00 122.38 45.62
1994 California Angels
88.00 133.45 -45.45 1990 NY Yankees
225.00 181.77 43.23
1992 California Angels
105.00 142.48 -37.48 1990 Los Angeles Dodgers
200.00 160.45 39.55
1993 Minnesota Twins
83.00 116.63 -33.63 1995 San Francisco Giants
122.00 86.51 35.49
1991 Minnesota 83.00 116.61 -33.61 1991 Baltimore 140.00 106.28 33.72
10 This concept is not dissimilar to what one would consider as “market inefficiency”. A baseball team is considered “inefficient” (compared to other baseball teams) if the team possesses similar characteristics but is valued higher (Lancaster 1971). In our case, these are the teams that we consider to be overvalued. Another interesting interpretation provided by Holbrook (1992) treats this overvaluation as equity that the baseball team has earned. So baseball teams that we consider overvalued are teams that possess high equity in the market place and teams that we consider undervalued are those which have to low equity.

Reddy, Stam and Agrell, IJBSR (2015), 05(01): 63-89
http://www.thejournalofbusiness.org/index.php/site 74
Twins Orioles 1994 Pittsburgh
Pirates 70.00 101.83 -31.83 1991 Los Angeles
Dodgers 180.00 147.14 32.86
1995 Minnesota Twins
74.00 105.79 -31.79 1994 Baltimore Orioles
164.00 131.20 32.80
In particular, Table 5 suggests that the California (now Anaheim) Angels franchise has consistently been undervalued (by between about $37 to $72 million), especially during 1995, when the Angels had a winning record for the first time in five years and were fully efficient (see Table 2). As it is located in one of the most populated and lucrative markets, the Angels possibly should be valued much higher. According to our model, during several seasons the Minnesota Twins (1991, 1993, 1995) and Pittsburgh Pirates (1994) were also undervalued by around $30 million. The market has apparently not realized the full potential of these underachieving teams. On the other side, the 1990 Baltimore Orioles appears to be one of the most overvalued team. Financial World valued this franchise higher as well in 1991, 1994 and 1995. Other teams that the model identified as overvalued are the 1990 NY Yankees, 1990 and 1991 Los Angeles Dodgers, the 1995 San Francisco Giants and 1994 and 1995 Toronto Blue Jays. The common characteristic of all these teams is that they are in major metropolitan areas. These are also the teams with the largest media markets and substantially higher media revenues than the average MLB team. It is possible that Financial World valuation may be weighting these large media market teams more heavily. It appears that in years that our model identified these teams as overvalued by Financial World, we find that the Financial World valuations do not adjust quickly to changes in performance of these teams. For example, although the 1995 Toronto Blue Jays whose performance has dropped dramatically during that year (total revenue dropped from $88.4 million in 1993 to $62.5 million in 1995 and their winning percentage dropped from 0.586 to 0.389 during the same time period) Financial World valuations did not accommodate these changes quickly. In fact, the FW valuation of the Toronto Blue Jays was $150 million in 1993 and $152 million in 1995.
The NY Yankees are consistently the highest valued team in MLB, with model valuations ranging from $177-190 million. Although these are generally reasonably in line with the FW valuations, the model would suggest that the Yankees are on average about $10 million overvalued for 1990-1995. Interestingly, the Yankees were consistently efficient during this period; although their spending was consistently high and they did not win any divisional championships (See Figure 3). Contrast this with the other New York team, the NY Mets. The valuation of the Mets has ranged between $140-185 million, with a 1995 value of around $140 million. Unlike the Yankees, the efficiency of the Mets, their on-the-field record and player costs have vacillated much during this period. The model suggests that the Mets were a substantially overvalued team until 1993, but slightly undervalued in 1995 (by $9 million), perhaps due in part to drastic cost-cutting measures imposed in 1993-1995.
Figure 3: Valuation and performance of some ML Baseball Teams – NY Yankees and Mets

Brand equity, efficiency and valuation ...
http://www.thejournalofbusiness.org/index.php/ 75
Figure 4: Valuation and performance of some ml baseball teams
Examples of a few other teams (the Atlanta Braves, Montreal Expos and Cleveland Indians) are provided in Figure 4. The graph for the Expos shows that this franchise is systematically undervalued, especially during 1993-1995. It appears that in its valuation, FW weights revenues more heavily than player costs. As both are low during these years for the Expos, FW values the Expos low. In contrast, our model considers revenues as well as costs and efficiency, and places a much higher value on the Expos. Figure 4 illustrates clearly that the Braves and Indians are examples of “up and coming” franchises, with a rising trend in win/loss ratio, efficiency, revenues as well as valuation during 1990-1995. It appears that both the Braves and Indians laid a solid foundation in the early nineties for their surge to excellence in the late nineties.
4.03 EFFICIENCY OF MLB TEAMS The summary statistics of the efficiency analysis, aggregated across all teams, are presented in Tables 1 and 2. A detailed introduction of the DEA terminology and concepts is presented in Appendix A. Table 1 provides the mean, standard deviation, minimum and maximum values of the technical efficiency for the input- and output-oriented analysis, as well as the input and output slacks for the input-oriented model. The mean efficiency score for the input-oriented model of 78.85 indicates that the average potential for input reductions equals 100-78.85= 21.15 percent, implying that there is substantial room for team management to cut costs (inputs) without negatively affecting the win-loss ratio or revenues (outputs). Of course this result is an average across all teams, and some teams are more efficient than others. A detailed team-by-team analysis follows later in the paper. Table 6: Descriptive statistics of the efficiency scores
Mean Std. Dev Min Max
Technical Efficiency
VRS-IN kIN % 78.85 13.61 54.86 100.00
VRS-OUT kOUT % 86.55 9.65 62.21 100.00
Scale Efficiency

Reddy, Stam and Agrell, IJBSR (2015), 05(01): 63-89
http://www.thejournalofbusiness.org/index.php/site 76
SE-IN kIN % 95.48 5.40 74.60 100.00
SE-OUT kOUT % 86.51 8.25 68.50 100.00
Slacks (VRS-IN)* Player Costs M$ 8.30 4.49 0.28 18.57 Other Costs M$ 6.00 3.07 0.48 16.98 Revenues M$ -0.25 1.16 -7.65 0.00 Win/Loss Ratio 1000 -18.73 33.07 -169.47 0.00 * Excluding technically input-efficient teams, n=20.
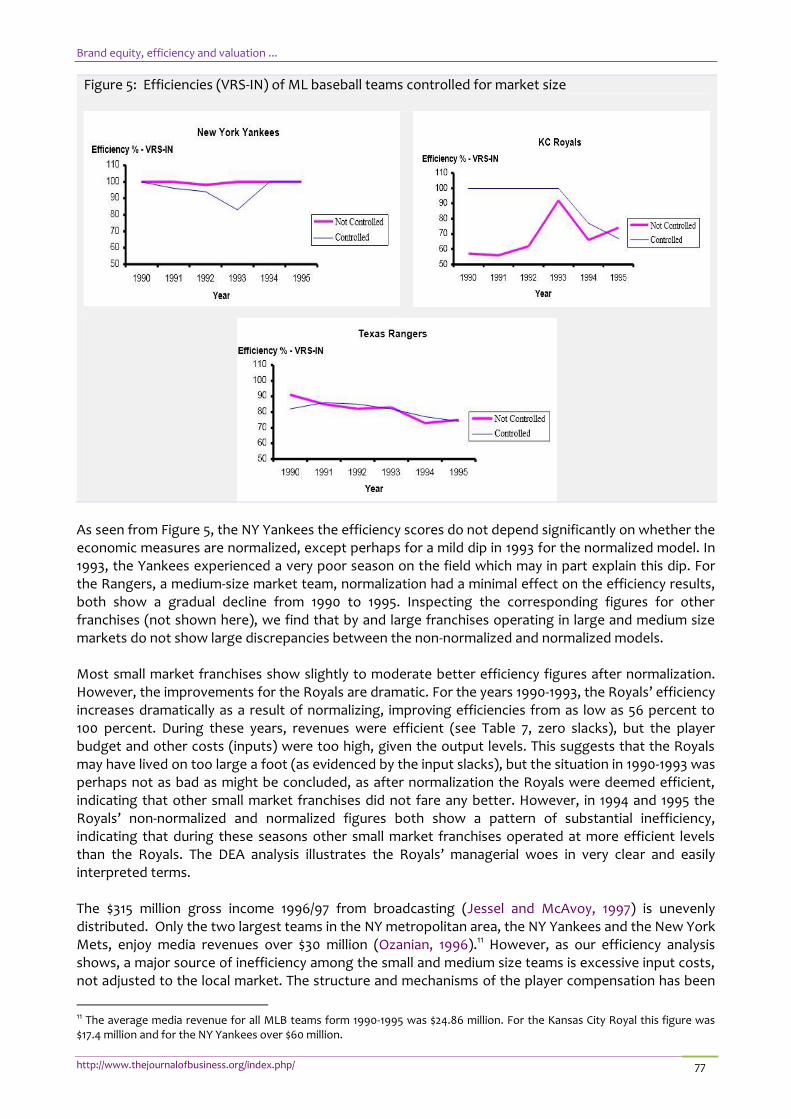
The slacks in Table 6 reveal that, given their output levels, inefficient franchises spend on average $8.30 million too much in player costs and $6.00 million in other expenditures. Interestingly, on an average basis the teams managed their revenues much better than their costs during 1990-1995, with an average revenue slack of only –$250,000. However, managing performance on the field appears to be much more difficult, judging by the fact that the average slack is 1.873 percentage points, which is substantial since many of the teams are bunched around .500. One of the teams even was under-performed by almost 17 points. Note that the negative sign of the revenue and win/loss ratio slacks are due to the fact that -- in contrast to the model inputs -- in the case of these outputs “more is better.” Efficiency analysis contributes to a deeper understanding of managerial performance not only by evaluating the state of the system as a whole, but also by assessing the performance of an individual franchise relative to the other franchises. Table A1 in the appendix facilitates a comparison of individual franchises by reporting the detailed technical efficiency results for each team and each year, including slacks for all inputs and outputs.
We use the Toronto Blue Jays to illustrate the interpretation of Table A1. While the Blue Jays operated at almost full efficiency in 1990-1991, as indicated by the technical efficiency measures (98.43% and 100% for 1990 and 1991, respectively) and close to zero slacks, in 1992-1995 the cost slacks soared, indicating a severely inefficient management situation. For instance, in 1992 the Blue Jays experienced $13.92 million in excess player costs and an overrun of $6.97 million in other costs. In 1992, the Blue Jays’ win/loss ratio was .593 and franchise revenues were $87.70 million. The expected player expenditures of the Blue Jays for this level of performance would be $59.30-$13.92=$45.38 million, instead of the actual amount spent. In other words, in 1992 the Blue Jays overspent on its players. This interpretation is supported by the fact that in spite of a dramatic increase in the player costs from $29.70 million (1991) to $59.30 million (1992), the Blue Jays’ franchise revenue actually decreased from $88.70 million to $87.70 million. As a result, a substantial profit of $26.30 million in 1991 changed to a $1.30 million loss in 1992. Interestingly, in 1990-1993 the Blue Jays did perform well in terms of revenues and on-the-field performance (zero slacks), so the managerial inefficiencies that started on the input side may have been obscured by the efficient outputs. However, the following years show a much bleaker picture. Whereas the Blue Jays’ cost structure did not recover much in 1993-1995, the team’s on-the-field performance deteriorated in 1994-1995 (non-zero slacks), adding to the inefficiency. For instance, the win/loss slack in 1994 of -48.34 in 1994 means that teams with lower budgets achieved 5 percentage points more wins. The example shows how tightly interconnected the slacks are to the operations of the franchise and how easily the slacks can be interpreted.
One issue of interest is whether or not a franchise’s efficiency depends on the size of its market. This issue may be relevant, as small markets may experience decreasing marginal revenues at lower levels than franchises located in larger markets. In order to analyze this, we select three franchises: one large market franchise, the NY Yankees, one medium market franchise, the Texas Rangers, and one small market franchise, the Kansas City Royals. We compare their technical efficiency scores (VRS-IN model) without controlling for market size (this is the model we use elsewhere in our study) with a model in which the economic measures, costs and revenues, are calculated on a per capita basis.
Brand equity, efficiency and valuation ...
http://www.thejournalofbusiness.org/index.php/ 77
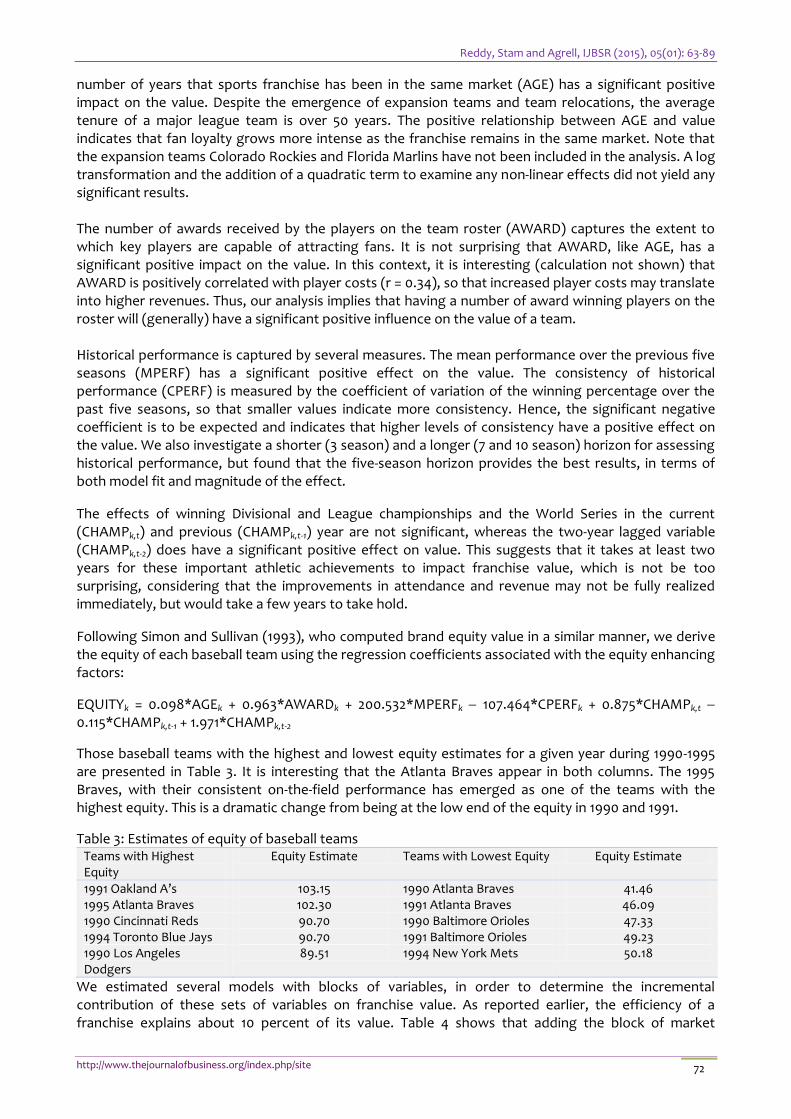
Figure 5: Efficiencies (VRS-IN) of ML baseball teams controlled for market size
As seen from Figure 5, the NY Yankees the efficiency scores do not depend significantly on whether the economic measures are normalized, except perhaps for a mild dip in 1993 for the normalized model. In 1993, the Yankees experienced a very poor season on the field which may in part explain this dip. For the Rangers, a medium-size market team, normalization had a minimal effect on the efficiency results, both show a gradual decline from 1990 to 1995. Inspecting the corresponding figures for other franchises (not shown here), we find that by and large franchises operating in large and medium size markets do not show large discrepancies between the non-normalized and normalized models. Most small market franchises show slightly to moderate better efficiency figures after normalization. However, the improvements for the Royals are dramatic. For the years 1990-1993, the Royals’ efficiency increases dramatically as a result of normalizing, improving efficiencies from as low as 56 percent to 100 percent. During these years, revenues were efficient (see Table 7, zero slacks), but the player budget and other costs (inputs) were too high, given the output levels. This suggests that the Royals may have lived on too large a foot (as evidenced by the input slacks), but the situation in 1990-1993 was perhaps not as bad as might be concluded, as after normalization the Royals were deemed efficient, indicating that other small market franchises did not fare any better. However, in 1994 and 1995 the Royals’ non-normalized and normalized figures both show a pattern of substantial inefficiency, indicating that during these seasons other small market franchises operated at more efficient levels than the Royals. The DEA analysis illustrates the Royals’ managerial woes in very clear and easily interpreted terms. The $315 million gross income 1996/97 from broadcasting (Jessel and McAvoy, 1997) is unevenly distributed. Only the two largest teams in the NY metropolitan area, the NY Yankees and the New York Mets, enjoy media revenues over $30 million (Ozanian, 1996).11 However, as our efficiency analysis shows, a major source of inefficiency among the small and medium size teams is excessive input costs, not adjusted to the local market. The structure and mechanisms of the player compensation has been
11 The average media revenue for all MLB teams form 1990-1995 was $24.86 million. For the Kansas City Royal this figure was $17.4 million and for the NY Yankees over $60 million.

Reddy, Stam and Agrell, IJBSR (2015), 05(01): 63-89
http://www.thejournalofbusiness.org/index.php/site 78
thoroughly discussed, see e.g. (Silverman, 1981), (Sommers and Quinton, 1982), (Scully, 1989), (MacDonald and Reynolds, 1994), (Oorlog, 1995), (Telser, 1995) and (Vrooman, 1996, 1997). The common denominator is that the Free Agency system, allowing players to move freely between teams after the first six years of contract, has created a market for “monopsonistic exploitation and monopolistic inefficiency” (Vrooman, 1996). The contractual agreements have raised the average share of player compensation from 20% to 58% in the last 20 years (Vrooman, 1997) or in our data, from 35% to 66% in just six years. The trend is statistically significant at the 1% level. We also checked whether or not certain “common wisdoms” are confirmed by our analysis. Several of these wisdoms appear not to hold under close inspection. For instance, we have found no convincing evidence that money can buy a baseball franchise everything, or at least not in a cost-efficient manner. Some franchises spend much money on players and other activities, without a commensurate win/loss ratio or revenues. Our efficiency analysis clearly reveals the extent to which this situation exists (see, e.g., Table 7). For example, after a successful year on-the-field in 1990, with full efficiency, New York Mets’ management made the decision to bolster its line-up with established players. The result was that the player payroll increased from $22.2 million in 1990 to $50.8 million in 1993 (compared to a league average of $31.4 million over 1990-1995), but this did not translate into improved performance on the field.12 Rather, the opposite was the case, as the Mets seriously underachieved in 1992-1994, with win/loss ratios between .364 and .444. The efficiency analysis reveals that in 1992-1993 the Mets’ win-loss ratio was more than 100 points below what could be expected. The shift in managerial strategy to subsequently cut player costs in 1994-1995 resulted in persistent below-average win/loss ratios (.438 and .479), but the this was to be expected given the lower player costs, and the Mets were virtually efficient in 1994 and 1995. Interestingly, throughout 1990-1995 the annual revenues generated by the Mets were at an efficient level, which is likely due to the size of the market and fan loyalty. The Chicago Cubs are another example of a large market franchise that tends to perform inefficiently, including a poor performance on the field, except in terms of revenues. Conversely, our analysis shows that it is possible for small market teams to operate efficiently, without spending the big bucks. The Montreal Expos are a point in case. The Expos, who operate in a relatively small market, were generally close to efficient in 1990-1995. This franchise was in fact fully efficient (efficient with respect to all inputs and outputs) in 1990 and 1993-1995, which was mostly due to the conservative managerial strategy to replace high-cost players by promising prospects. Over the period of 1990-1995, the Expos had an average player cost of about $17.8 million and an average win/loss ratio of .531. Of course, at any time a prudent managerial strategy is crucial. Particularly when a team has a few winning seasons the temptation is to keep the best players by offering inflated player contracts, which may lead to severe inefficiencies down the road. Similarly, teams that experience several losing seasons may depend on the free agent market to improve their performance on the field, thereby unduly increasing the pressure on the player payroll. Summarizing, each MLB franchise has its own story to tell. Table 7 does a great job of exposing teams of which management made (retrospectively) poor and good business decisions.
5.0 CONCLUSIONS AND POLICY IMPLICATIONS In this study, we analyze characteristics that determine the value of a professional sports franchise, by treating the franchise as a brand whose value is enhanced by its key attributes. Using data for 26 MLB franchises from 1990-1995, we explore the hypothesis that a sports franchise’s value is determined in part by how efficiently the team is managed. The contribution of this research is two-fold. First, we use DEA to determine which teams operate in an efficient manner with respect to several relative measures of financial and athletic performance, and show that the relative efficiency is indeed a significant predictor of franchise value. We also show how the DEA results for individual franchises provide valuable information about their management that cannot be captured in traditional types of
12 In this paper, we do not provide the raw data. These data are available from the authors upon request.

Brand equity, efficiency and valuation ...
http://www.thejournalofbusiness.org/index.php/ 79
analysis. Second, we develop and empirically estimate a model that, in addition to a franchise’s efficiency, uses its equity enhancing factors and market factors to determine its “true” value. We use our model to identify which teams appear to be over- or undervalued. One of the limitations of the current is research is the reliance on Financial World for the valuation of sports teams. One can argue that a market based valuation may be a more accurate reflection of the “true” value of a sports team. The phenomenon of sports teams being publicly traded is a more recent phenomenon and none of the baseball teams during the period of study were publicly traded. Even if one questions the accuracy of Financial World’s valuations, if their method of valuing is consistent across all the teams, it may be sufficient for the purposes of our analysis. This study provides a basis for some interesting issues that may investigate in the future. While this paper focuses on MLB, the methodology used can easily be extended to other professional sports. Questions that arise include whether the impact of efficiency on valuation be similar in basketball, football, hockey or soccer. If not, would the differences be attributable to the fundamental nature of these sports? For example, unlike baseball, in basketball a single player can make a significant difference in terms of team performance, as evidenced by Michael Jordan of Chicago Bulls and Shaquille O'Neal of Los Angeles Lakers. Therefore, there may be greater justification for paying the huge contracts (seven year $120 million contract) for some individual basketball players like O’Neal. However, could huge contracts, such as the ten-year, $252 million contract extending through the 2010 season that free agent shortstop Alex Rodriguez recently signed with the Texas Rangers, be justified in baseball? One of the important findings of this study is the tendency of many baseball teams to overspend on their player roster, ostensibly to improve their win/loss ratio and in turn to increase the attendance. (Knowles et al., 1992, 1995) show that attendance, a major source of income for most baseball franchises, is actually not maximized when the win/loss ratio is maximized.13 Other issues are to study whether the results obtained in our research for the period of 1990-1995 would be applicable in the current environment, where the valuations of sports teams have skyrocketed. The increase in valuation appears to be a result of a substantial increase in revenue from newly built stadiums and renegotiated television media revenue. We feel that our results should remain just as relevant, as long as the valuations reflect the usual underlying assumptions of cash flow and revenue stream. In fact, in the current circumstances where we observe not only increased revenues but also a substantial escalation in the costs of managing and operating sports teams, the efficiency analysis may even be more helpful than before. Moreover, in the recent past equity factors may have become more relevant and important in preserving the value of sports teams.
APPENDIX A. EFFICIENCY ANALYSIS A.1. DEA FOR EVALUATING MAJOR LEAGUE BASEBALL FRANCHISE MANAGEMENT We use DEA to evaluate the overall managerial performance of each MLB franchise, considering both the resources expended (inputs) and a set of desirable final outcomes (outputs). In DEA, a decision
making unit (DMU) k, DMUk, represents one observation in a set of P observations DMU1, ..., DMUP. DMUk is fully characterized by its inputs xk
i, i = 1, ..., m, and outputs ykj, j = 1, ..., n. Denote the vector of
inputs and outputs by (xk, yk), where xk=(xk1, ..., xk
m) and yk=(yk1, ..., yk
n). The objective in efficiency analysis is to find a measure of efficiency of a DMU that reflects a distance or ratio to some relevant
subset of DMUs, the reference set . In our application, each DMU represents an MLB franchise in a particular year, and we denote DMUk by
MLBk. The observations on all franchises for all years combined form , and all franchises in a specific
13 These authors show a saturation effect around a win/loss ratio of 0.60, above which the attendance actually declines.

Reddy, Stam and Agrell, IJBSR (2015), 05(01): 63-89
http://www.thejournalofbusiness.org/index.php/site 80
year t form a subset t. MLBk and MLBl may represent the performance of the same franchise for two different time periods. In our case, the inputs (resources) of MLBk are the franchise’s cost figures, divided into player costs and other costs (xk
1, xk2), whereas the team’s win-loss ratio and franchise
revenue serve as the output (performance) measures (yk1, y
k2).
Since the formulation of DEA in its present form (Charnes et al., 1978), a number of model variations and properties have been proposed and investigated. For instance, efficiency models may differ in terms of orientation, type of measurement and assumptions regarding economies of scale, disposability and diversification; the efficiency measure may be radial or non-radial. See (Ali et al., 1995) for an in-depth treatment of the interrelations between various types of DEA models. Throughout our analysis, we assume that the production set is convex. A potential drawback of using the non-parametric DEA model is that, by virtue of the construction of the convex envelope, the proportion of franchises that are efficient will be larger as the number of observations is smaller and the number of inputs and outputs is larger. In other words, the more inputs and outputs the model has, the more likely it is that any given franchise will be efficient with respect to at least one input or output. Our application has 156 franchises in a four-dimensional space (two inputs, two outputs), which is more than sufficient for a DEA analysis to make sense and be reasonable. In the next subsections we explain the major assumptions made in our DEA model. A.2. INPUT VERSUS OUTPUT ORIENTATION The DEA model can be input or output-oriented. Denote the radial efficiency measure of MLBk in an
input-oriented model by k and that in an output-oriented model by k. The purpose of an input-oriented analysis is to identify the extent to which a franchise should be able to reduce its inputs, while keeping its output levels fixed, taking the performance of the other franchises during that same year into account. Similarly, an output-oriented model seeks to determine how much a franchise should be able to improve its outputs if its inputs are kept at the current level. Any franchise that ought to be able to achieve the same output with fewer inputs or a better output with the same input is said to be inefficient. The appropriate choice of model orientation depends on the purpose of the analysis and the nature of the problem at hand. In applications with resources that are exogenously fixed or difficult to adjust, and where it is possible to attain a range of different performance levels, the output-orientation is appropriate. In cases where outputs are essentially given, an input-oriented model is more relevant. In our case both the input- and output-orientation provide useful information. From the perspective of an individual team, management is frequently faced with issues related to resource allocation and the inputs (player other costs) can be controlled. Thus, at the franchise level the input orientation is more informative. However, in an aggregate analysis the output orientation provides information on how well the resources (players, stadium) are utilized in terms of generating revenue and athletic achievement. A.3. RADIAL AND NON-RADIAL EFFICIENCY Figure A1 depicts the case of an efficiency analysis involving two inputs, x=(x1, x2) and a single output y0. The input set L(y0) consists of all possible franchises that produce an output of y0 during a given year t
(so, the reference set is t). Radial efficiency refers to the direction. The piece-wise linear frontier in Figure A1 connects all radially efficient franchises in L(y0). Any franchise in the interior of L(y0), i.e., above the piece-wise linear frontier, is radially inefficient, as these franchises expend more input resources to achieve the output y0. For instance, suppose that franchises MLBq and MLBr both achieve the output y0, with input vectors xq and xr, respectively. MLBq is radially efficient but MLBr is not. Obviously, no franchise with output y0 can be located on the frontier (otherwise the line would have passed though this franchise). The extent of the inefficiency of franchises in the interior of L(y0),

Brand equity, efficiency and valuation ...
http://www.thejournalofbusiness.org/index.php/ 81
represented by their distance from the piece-wise linear frontier, is determined by connecting the franchise’s input coordinates and measuring the length of the part of the line within the interior of L(y0). For MLBr, this amounts to the length of the line connecting the coordinates of MLBr (i.e., xr) and point B. This is the non-radial efficiency measure.
Figure A1: Radial Efficiency for Output Level y0
X1
X2MLBr
MLBpMLBq
L(y0)
B
A
The following illustration accentuates that both radial and non-radial efficiency measures are useful. Both MLBp and MLBq have an output of y0 and an identical radial efficiency, as each is located on the piece-wise linear frontier. However, as MLBq uses A units less of resource x1 than MLBp, while expending the same amount of x2, MLBp has a positive slack of magnitude with respect to input x1. Any franchise with positive slack is inefficient, so that MLBq is efficient but MLBp is not, although both have an identical radial efficiency. The slack values are sensitive to the units of measurement of the inputs. For efficient franchises this does not represent a potential ambiguity, as these have zero slacks. However, the interpretation of the non-zero slacks for inefficient franchises can be problematic. As radial efficiency measures are insensitive to the units of measurement, it is important to consider these as well. The scale dependency problem of the slacks can also be addressed in part by calculating the input and output slacks as a
weighted sum of all dimensions of slack (see Charnes et al., 1985, for the case of additive models), but the implicit determination of these weights is subjective and we do not explore this further. All efficiency figures reported in this paper refer to the case in which the inputs and outputs are not weighted. Non-weighted efficiency is also known as technical efficiency. The example above shows that the consideration of both radial and non-radial efficiency measures allows us to view the problem from different angles, resulting in valuable additional information about franchise performance that might otherwise go undetected. Hence, in order to facilitate as complete an interpretation as possible, we report both radial efficiency measures and non-radial efficiency slack information. A.4. CONSTANT VERSUS VARIABLE RETURNS TO SCALE Prior to the efficiency analysis, we need to make an assumption regarding the economies of scale (returns to scale) that apply to the problem (Banker et al., 1984; Maindiratta, 1990). An assumption of constant returns to scale (CRS) will hold in a long-run equilibrium with free market entry and zero profit, and implies that any change in the input (output) levels will result in a proportional change in the
output (input) levels (Charnes et al., 1978, 1979; Seiford, 1996). However, in practice short-run situations may be characterized by initially increasing returns for firms operating below the optimal scale size, and decreasing returns for firms operating at optimal scale. As the latter appears to more

Reddy, Stam and Agrell, IJBSR (2015), 05(01): 63-89
http://www.thejournalofbusiness.org/index.php/site 82
closely apply to our application, we use this variable returns to scale (VRS) assumption.
Figure A2. Efficient Frontier and Slacks
w
y V R S
y
y C R S
xx C R S x V R S
y r
V R S
(x r, y r) = M L B r
v
x r
C R S
The concepts of CRS and VRS are illustrated in Figure A2. As it is impossible to meaningfully present our application with two inputs and two outputs in a two-dimensional picture, in Figure A2 we show the case of a single input x on the horizontal axis and a single output y on the vertical axis. Whereas CRS is characterized by a straight line from the origin (after all, input and output can be increased proportionally regardless of the magnitude of input and output), VRS is characterized by the piece-wise linear line, the efficient frontier, which is the convex envelopment formed by linear combinations of the franchises. Those franchises on the efficient frontier are efficient. Each corner point of the efficient frontier corresponds to the input-output combination of an efficient franchise. Any franchise located on the efficient frontier is inefficient, since the same output can be achieved with less input, or a better output can be achieved with the same input. For instance, in Figure A2 franchise MLBr, with input xr and output yr, is clearly inefficient, as it is located strictly below the efficient frontier. Assuming VRS, an input-oriented analysis concludes that this franchise should be able
to achieve its current output of yr with an input level of xVRS, an improvement of w=xrxVRS. An output
oriented analysis would imply that, given an input level of xr, an output of yVRS should be possible, an
improvement of v=yVRSyr. Thus, MLBr has an input slack of size w and an output slack of size v.
Assuming CRS, the corresponding slacks would even be larger, xrxCRS and yCRSyr, respectively.
A.5. INPUT ORIENTED MODEL, VARIABLE RETURNS TO SCALE (VRS-IN) As we will assume VRS models throughout, we denote the efficiency for MLBr for an input-oriented
model by r, rather than by rVRS. In the Banker et al. (1984) formulation, each MLBr (whether efficient
or not) is compared with a “best practice” franchise MLB*r located on the efficient frontier. MLB*
r is
created as a linear combination of the franchises in the reference set t, with inputs i() and outputs
j(), where = {1, ..., P} is a set of nonnegative weights such that
i() = k=1P xi
kk, i=1, ..., m, (A1)
j() = k=1Pyj
kk, j=1, ..., n, (A2)
k=1Pk=1, (A3)
k0, k=1, …, P. (A4) Following Banker et al. (1984), we formulate the input-oriented VRS model in (A5)-(A9) for each

Brand equity, efficiency and valuation ...
http://www.thejournalofbusiness.org/index.php/ 83
franchise MLBr, rt. This model determines the radial efficiency r for franchise MLBr, by comparing it with MLB*
r:
Min k,r r (A5) Subject to:
k=1P xi
kk rxi
r, i=1, ..., m, (A6)
k=1Pyj
kk yjr, j=1, ..., m, (A7)
k=1P k= 1, (A8)
k 0, k=1, ..., P. (A9) Constraint (A6) stipulates that the resource consumption of MLB*
r is at most equal to that of MLBr. Constraint (A7) assures that MLB*
r meets the output of MLBr. Equations (A8) and (A9) ensure that the
multipliers of the franchises in t are nonnegative and sum to unity. By substituting the optimal
solution to (A5)-(A9), (r*, *), we can write (A6)(A7) as (A10)(A11):
r* = maxi [i(
*)/xir] (A10)
j(*) yj
r, j=1, ..., n, (A11) The expressions in (A11)-(A12) facilitate a useful interpretation of the efficiency scores. From (A10) it
follows that i(*)r
*xir, so that the input level of MLB*
r is at most that of MLBr (efficient or not). It can be shown that in the optimal solution the constraint set in (A11) will be binding for at least one output j, so that at least one of the output levels of MLB*
r will equal that of MLBr. Thus, for MLBr the maximum
attainable savings in input i are given by wir = xi
ri(
*) xir(1r
*). The factor (1r*) represents the
proportional input savings for MLBr. If r*=1 and wi
r=0 for all i, then MLBr is input-efficient, otherwise it is input-inefficient. A.6. OUTPUT ORIENTED MODEL, VARIABLE RETURNS TO SCALE (VRS-OUT)
In an output-oriented model, we solve the problem in (A12)(A16) for each MLBr:
Max k,r r (A12) Subject to:
k=1Pxi
kk xi
r, i=1, ..., m, (A13)
k=1Pyj
kk ryjr, j=1, ..., m, (A14)
k=1Pk = 1, (A15)
k 0, k=1, ..., P. (A16)
The managerial interpretation of the optimal solution r* for an arbitrary MLBr follows directly from
(A14). For example, r* = 1.12 would imply that MLBr should be able to raise its outputs by 12 percent,
given its current input level. Analogous to the input-oriented model, (A14) implies that the maximum
improvement for MLBr in output j equals vjr = j(
*)yjr yj
r(r*1). The factor (r
*1) represents the
proportional output savings factor for MLBr. If r* = 1 and vj
r =0 for all j, then MLBr is efficient, otherwise it is inefficient. We have now introduced the DEA model used in our research and its assumptions. Summarizing, we employ a VRS model based on the formulation proposed by Banker et al. (1984); we analyze our models
using (1) the technical (radial) efficiency measure, using both an input (r* ) and output (r
*) orientation; and (2) the (non-radial) slack values for the inputs (wi
r) and outputs (vjr).
Appendix Table: Table A1: Efficiency results for professional baseball teams 1990-1995, including slack measures
Technical Efficiency (in
%) Slacks (VRS-IN)
Team Year VRS-IN VRS-OUT Player costs Other costs
Revenue Win ratio

Reddy, Stam and Agrell, IJBSR (2015), 05(01): 63-89
http://www.thejournalofbusiness.org/index.php/site 84
Atlanta Braves 1990 90.66 87.13 1.33 1.25 0 -65.95 Atlanta Braves 1991 82.74 90.45 3.52 3.52 -5.16 0 Atlanta Braves 1992 82.44 91.02 6.99 3.5 0 0 Atlanta Braves 1993 89.95 97.53 9.89 2.69 0 0 Atlanta Braves 1994 72.15 92.35 13.76 9.16 0 0 Atlanta Braves 1995 95.88 98.43 3.88 0.79 0 0 Baltimore Orioles 1990 100 100 0 0 0 0 Baltimore Orioles 1991 82.72 85.07 2.73 4.09 0 0 Baltimore Orioles 1992 100 100 0 0 0 0 Baltimore Orioles 1993 100 100 0 0 0 0 Baltimore Orioles 1994 88.78 94.89 4.87 2.47 0 0 Baltimore Orioles 1995 69.65 82.37 13.11 7.86 0 -27.27 Boston Red Sox 1990 83.4 93.11 3.77 5.56 0 0 Boston Red Sox 1991 70.84 89.02 10.32 10.32 0 0 Boston Red Sox 1992 78.51 89.48 10.59 6.36 0 -111.81 Boston Red Sox 1993 71.9 83.81 12.7 7 0 -23.11 Boston Red Sox 1994 67.38 78.43 13.27 8.45 0 -45.49 Boston Red Sox 1995 97.56 98.72 0.78 0.5 0 0 California Angels 1990 80.13 86.02 4.35 3.58 0 0 California Angels 1991 56.35 76.85 14.97 11.96 0 0 California Angels 1992 63.41 73.05 11.42 9.11 0 -57.91 California Angels 1993 67.26 73.16 9.23 7.53 0 -61.07 California Angels 1994 59.24 64.93 11.21 9.78 0 -90.59 California Angels 1995 100 100 0 0 0 0 Chicago Cubs 1990 85.76 89.43 1.96 3.89 0 0 Chicago Cubs 1991 67.63 81.32 9.39 9.39 0 -6.49 Chicago Cubs 1992 71.47 80.4 10.67 6.39 0 -23.52 Chicago Cubs 1993 68.22 85.32 14.53 9.44 0 -18.67 Chicago Cubs 1994 68.13 81.53 11.57 9.88 0 -93.51 Chicago Cubs 1995 70.03 82.06 10.43 6.98 0 0 Chicago White Sox 1990 100 100 0 0 0 0 Chicago White Sox 1991 100 100 0 0 0 0 Chicago White Sox 1992 77.13 90.26 8 5.99 0 -5.2 Chicago White Sox 1993 79.53 92.47 8.45 5.49 0 0 Chicago White Sox 1994 78.47 90.9 9.69 5.36 0 0 Chicago White Sox 1995 58.54 73.03 16.09 10.32 0 -21.18
Team Year VRS-IN VRS-OUT Player costs Other costs
Revenue Win ratio
Cincinnati Reds 1990 94.56 96.78 0.86 1.19 0 0 Cincinnati Reds 1991 65.93 74.32 9.23 7.39 0 -33.48 Cincinnati Reds 1992 70.86 83.69 11.92 5.97 0 0 Cincinnati Reds 1993 100 100 0 0 0 0 Cincinnati Reds 1994 74.66 88.81 11.76 4.69 0 0 Cincinnati Reds 1995 100 100 0 0 0 0 Cleveland Indians 1990 65.64 77.87 5.29 9 -5.76 0 Cleveland Indians 1991 58.84 62.21 8.03 11.24 0 -121.59 Cleveland Indians 1992 100 100 0 0 0 0 Cleveland Indians 1993 89.26 89.44 1.99 1.83 0 -20.25 Cleveland Indians 1994 75.67 90.24 8.64 6.3 0 0 Cleveland Indians 1995 100 100 0 0 0 0 Detroit Tigers 1990 82.83 88.16 3.07 2.58 0 0 Detroit Tigers 1991 65.02 79.68 10.88 8.15 0 0 Detroit Tigers 1992 64.16 74.27 11.65 7.6 0 -22.59 Detroit Tigers 1993 78.47 87.25 9.39 3.75 0 0 Detroit Tigers 1994 60.89 72.94 18.03 7.82 0 0 Detroit Tigers 1995 75.88 77.98 7.5 3.21 0 0 Houston Astros 1990 63.56 75.63 6.63 8.67 0 -8.13 Houston Astros 1991 94.82 95.61 0.63 1 0 -2.36 Houston Astros 1992 93.91 95.74 1.05 0.89 0 0
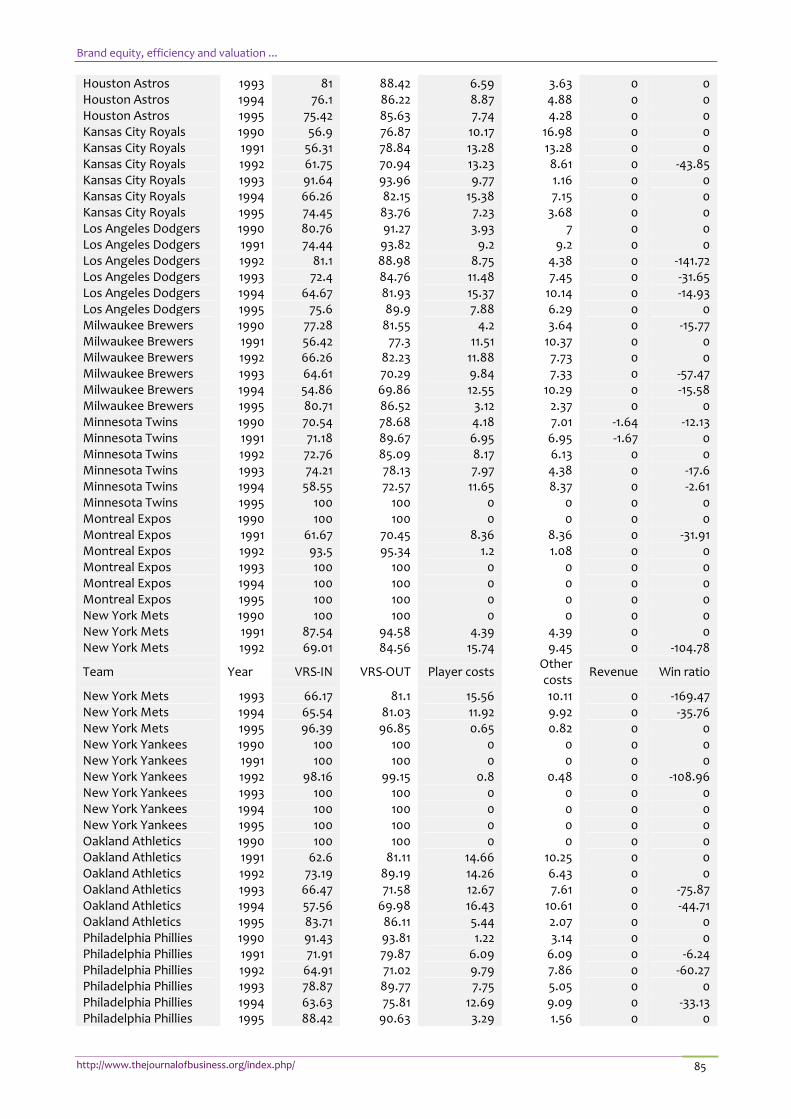
Brand equity, efficiency and valuation ...
http://www.thejournalofbusiness.org/index.php/ 85
Houston Astros 1993 81 88.42 6.59 3.63 0 0 Houston Astros 1994 76.1 86.22 8.87 4.88 0 0 Houston Astros 1995 75.42 85.63 7.74 4.28 0 0 Kansas City Royals 1990 56.9 76.87 10.17 16.98 0 0 Kansas City Royals 1991 56.31 78.84 13.28 13.28 0 0 Kansas City Royals 1992 61.75 70.94 13.23 8.61 0 -43.85 Kansas City Royals 1993 91.64 93.96 9.77 1.16 0 0 Kansas City Royals 1994 66.26 82.15 15.38 7.15 0 0 Kansas City Royals 1995 74.45 83.76 7.23 3.68 0 0 Los Angeles Dodgers 1990 80.76 91.27 3.93 7 0 0 Los Angeles Dodgers 1991 74.44 93.82 9.2 9.2 0 0 Los Angeles Dodgers 1992 81.1 88.98 8.75 4.38 0 -141.72 Los Angeles Dodgers 1993 72.4 84.76 11.48 7.45 0 -31.65 Los Angeles Dodgers 1994 64.67 81.93 15.37 10.14 0 -14.93 Los Angeles Dodgers 1995 75.6 89.9 7.88 6.29 0 0 Milwaukee Brewers 1990 77.28 81.55 4.2 3.64 0 -15.77 Milwaukee Brewers 1991 56.42 77.3 11.51 10.37 0 0 Milwaukee Brewers 1992 66.26 82.23 11.88 7.73 0 0 Milwaukee Brewers 1993 64.61 70.29 9.84 7.33 0 -57.47 Milwaukee Brewers 1994 54.86 69.86 12.55 10.29 0 -15.58 Milwaukee Brewers 1995 80.71 86.52 3.12 2.37 0 0 Minnesota Twins 1990 70.54 78.68 4.18 7.01 -1.64 -12.13 Minnesota Twins 1991 71.18 89.67 6.95 6.95 -1.67 0 Minnesota Twins 1992 72.76 85.09 8.17 6.13 0 0 Minnesota Twins 1993 74.21 78.13 7.97 4.38 0 -17.6 Minnesota Twins 1994 58.55 72.57 11.65 8.37 0 -2.61 Minnesota Twins 1995 100 100 0 0 0 0 Montreal Expos 1990 100 100 0 0 0 0 Montreal Expos 1991 61.67 70.45 8.36 8.36 0 -31.91 Montreal Expos 1992 93.5 95.34 1.2 1.08 0 0 Montreal Expos 1993 100 100 0 0 0 0 Montreal Expos 1994 100 100 0 0 0 0 Montreal Expos 1995 100 100 0 0 0 0 New York Mets 1990 100 100 0 0 0 0 New York Mets 1991 87.54 94.58 4.39 4.39 0 0 New York Mets 1992 69.01 84.56 15.74 9.45 0 -104.78
Team Year VRS-IN VRS-OUT Player costs Other costs
Revenue Win ratio
New York Mets 1993 66.17 81.1 15.56 10.11 0 -169.47 New York Mets 1994 65.54 81.03 11.92 9.92 0 -35.76 New York Mets 1995 96.39 96.85 0.65 0.82 0 0 New York Yankees 1990 100 100 0 0 0 0 New York Yankees 1991 100 100 0 0 0 0 New York Yankees 1992 98.16 99.15 0.8 0.48 0 -108.96 New York Yankees 1993 100 100 0 0 0 0 New York Yankees 1994 100 100 0 0 0 0 New York Yankees 1995 100 100 0 0 0 0 Oakland Athletics 1990 100 100 0 0 0 0 Oakland Athletics 1991 62.6 81.11 14.66 10.25 0 0 Oakland Athletics 1992 73.19 89.19 14.26 6.43 0 0 Oakland Athletics 1993 66.47 71.58 12.67 7.61 0 -75.87 Oakland Athletics 1994 57.56 69.98 16.43 10.61 0 -44.71 Oakland Athletics 1995 83.71 86.11 5.44 2.07 0 0 Philadelphia Phillies 1990 91.43 93.81 1.22 3.14 0 0 Philadelphia Phillies 1991 71.91 79.87 6.09 6.09 0 -6.24 Philadelphia Phillies 1992 64.91 71.02 9.79 7.86 0 -60.27 Philadelphia Phillies 1993 78.87 89.77 7.75 5.05 0 0 Philadelphia Phillies 1994 63.63 75.81 12.69 9.09 0 -33.13 Philadelphia Phillies 1995 88.42 90.63 3.29 1.56 0 0

Reddy, Stam and Agrell, IJBSR (2015), 05(01): 63-89
http://www.thejournalofbusiness.org/index.php/site 86
Pittsburgh Pirates 1990 88.8 94.88 1.85 2.83 -5.9 0 Pittsburgh Pirates 1991 73.6 92.17 6.57 6.57 0 0 Pittsburgh Pirates 1992 73.63 85.45 9.89 5.93 0 0 Pittsburgh Pirates 1993 79.45 84.76 4.87 3.12 0 -2.09 Pittsburgh Pirates 1994 64.36 75.6 8.59 6.56 0 -6.59 Pittsburgh Pirates 1995 93.88 84.89 1.02 0.61 -4.85 -20.23 SanDiego Padres 1990 77.92 84.01 3.69 4.86 0 -19.42 San Diego Padres 1991 66.57 81.08 8.16 8.16 0 0 San Diego Padres 1992 68.62 80.35 10.26 6.65 0 0 San Diego Padres 1993 100 100 0 0 0 0 San Diego Padres 1994 74.08 74.83 3.99 5 0 -66.06 San Diego Padres 1995 100 100 0 0 0 0 San Francisco Giants 1990 83.36 89.23 3.74 3.08 0 0 San Francisco Giants 1991 64.82 74.95 11.71 7.04 0 -6.62 San Francisco Giants 1992 59.51 69.88 15.19 8.34 0 -7.29 San Francisco Giants 1993 79.76 94.56 8.56 5.57 0 0 San Francisco Giants 1994 60.74 75.71 18.57 9.74 0 0 San Francisco Giants 1995 77.79 83 7.33 3.4 0 0 Seattle Mariners 1990 77.98 83.37 2.77 5.39 -7.65 0 Seattle Mariners 1991 73.61 84.39 4.59 6.44 0 0 Seattle Mariners 1992 66.91 68.58 9.6 6.22 0 -77.63 Seattle Mariners 1993 70 81.02 10.59 5.82 0 0 Seattle Mariners 1994 59.77 69.1 12.83 8.77 0 -43.02 Seattle Mariners 1995 95.14 97.07 2.16 0.57 0 0 St. Louis Cardinals 1990 77.98 81.13 4.32 5.66 0 0 St. Louis Cardinals 1991 79.93 87.5 4.66 4.66 0 0 St. Louis Cardinals 1992 76 85.09 6.94 4.49 0 0 St. Louis Cardinals 1993 91.47 94.35 2.12 1.71 0 0 St. Louis Cardinals 1994 64.5 75.76 11.79 8.84 0 -39.18 St. Louis Cardinals 1995 69.83 74.41 8.69 5.76 0 -49.49 Texas Rangers 1990 90.76 93.41 1.17 2.63 0 0 Texas Rangers 1991 84.78 90.96 3.15 4.09 0 0 Texas Rangers 1992 81.54 83.78 5.58 3.91 0 -38.86 Texas Rangers 1993 83.23 89.89 6.97 2.95 0 0 Texas Rangers 1994 73.32 79.29 9.68 6.46 0 -61.58 Texas Rangers 1995 75.46 84.74 8.07 5.25 0 0
Team Year VRS-IN VRS-OUT Player costs Other costs
Revenue Win ratio
Toronto Blue Jays 1990 98.43 99.18 0.28 3.71 0 0 Toronto Blue Jays 1991 100 100 0 0 0 0 Toronto Blue Jays 1992 76.53 93.08 13.92 6.97 0 0 Toronto Blue Jays 1993 75.53 92.31 13.75 7.56 0 0 Toronto Blue Jays 1994 70.11 82.76 14.14 8.01 0 -48.34 Toronto Blue Jays 1995 72.96 70.37 12.01 5.33 0 -83.08
REFERENCES Aaker, David A. (1991), Managing Brand Equity, New York: The Free Press. Ailawadi, K. L., Lehmann, D. R., & Neslin, S. A. (2003). Revenue premium as an outcome measure of
brand equity. Journal of Marketing, 67(4), 1-17. Ali, A. I., Lerme, C. S., & Seiford, L. M. (1995). Components of efficiency evaluation in data envelopment
analysis. European Journal of Operational Research, 80(3), 462-473. Anderson, T. R., & Sharp, G. P. (1997). A new measure of baseball batters using DEA. Annals of
Operations Research, 73, 141-155. Athey, T. H. (1982). Systems Approach to winning Baseball. Journal of Systems Management, 33 (4), 9-13. Atre, T., Auns, K., Badenhausen, K., McAuliffe, K., Niklov, C., & Ozanian, M. K. (1996, May). Sports the
Brand equity, efficiency and valuation ...
http://www.thejournalofbusiness.org/index.php/ 87
high stake game of team ownership. Financial World, 55. Banker, R. D. (1993). Maximum Likelihood, Consistency and Data Envelopment Analysis: A Statistical
Foundation. Management Science, 39(10), 1265-73. Banker, R. D., Charnes, A., & Cooper, W. W. (1984). Some models for estimating technical and scale
inefficiencies in data envelopment analysis. Management science, 30(9), 1078-1092. Balfour, A., & Porter, P. K. (1991). THE RESERVE CLAUSE IN PROFESSIONAL SPORTS-LEGALITY AND
EFFECT ON COMPETITIVE BALANCE. Labor Law Journal, 42(1), 8-18. Bruggink, T. H. (1993). National pastime to dismal science: using baseball to illustrate economic
principles. Eastern Economic Journal, 275-294. Bukiet, B., Harold, E. R., & Palacios, J. L. (1997). A Markov chain approach to baseball. Operations
Research, 45(1), 14-23. Butler, M. R. (1995). Competitive Balance in Major League Baseball. American Economist, 39 (2), 46-52. Charnes, A., Cooper, W. W., & Rhodes, E. (1978). Measuring the efficiency of decision making
units. European journal of operational research, 2(6), 429-444. Charnes, A., Cooper, W. W., & Rhodes, E. (1979). Measuring the efficiency of decision-making
units. European Journal of Operational Research, 3(4), 339. Charnes, A., Cooper, W. W., Golany, B., Seiford, L., & Stutz, J. (1985). Foundations of data envelopment
analysis for Pareto-Koopmans efficient empirical production functions. Journal of econometrics, 30(1), 91-107.
Clement, R. C., & McCormick, R. E. (1989). Coaching team production. Economic Inquiry, 27(2), 287-304. Dortch, S. (1994). Do Big Bucks build better Baseball? American Demographics, 16(10), 9-11. Dortch, S. (1996). The Future of Baseball. American Demographics, 18(4), 22-8. Doyle, J. R. and R. H. Green (1991). Comparing Products using Data Envelopment Analysis. Omega,
19(6), 631-38. Estenson, P. S. (1994). Salary Determination in Major League Baseball: A Classroom Exercise.
Managerial and Decision Economics. 15(5), 537-541. Färe, R., Grosskopf, S., & Lovell, C. K. (1985). The measurement of efficiency of production (Vol. 6).
Springer. Financial World (1991). Annual Sports Valuations. June issues of 1991, 1992, 1993, 1994, 1995 and 1996. Gramlich, E. M. (1994). A natural experiment in styles of capitalism: Professional sports. The Quarterly
Review of Economics and Finance, 34(2), 121-130. Holbrook, M. B. (1992). Product quality, attributes, and brand name as determinants of price: The case
of consumer electronics. Marketing Letters, 3(1), 71-83. Holbrook, M. B. (1996). Market success as a criterion for assessing player contributions in sports
businesses via a regression-based approach using adjusted performance measures and quasi-dummy variables. Marketing Letters, 7(4), 341-353.
Horsky, D., & Nelson, P. (1996). Evaluation of sales force size and productivity through efficient frontier benchmarking. Marketing science, 15(4), 301-320.
Howard, L. W., & Miller, J. L. (1993). Fair pay for fair play: Estimating pay equity in professional baseball with data envelopment analysis. Academy of Management Journal, 36(4), 882-894.
Jessell, H. A. and K. MCavoy (1997). Baseball Scores: $315 million from Rights. Broadcasting and Cable, 127(7), 24-5.
Kahn, L. M. (1993). Managerial Quality, Team Success, and Individual Player Performance in Major League Baseball. Industrial and Labor Relations Review, 46(3), 531-47.
Keller, Kevin Lane (2003). Brand Synthesis: The Multidimensionality of Brand Knowledge. Journal of Consumer Research, 29 (4), 595-600. Knowles, G., K. Sherony and M. Haupert (1992). The Demand for Major League Baseball: A Test of
Uncertainty of Outcome Hypothesis. American Economist, 36(2), 72-80. Knowles, G., K. Sherony and M. Haupert (1995). Baseball Attendance and Outcome Uncertainty: Reply.
American Economist, 39(2), 88-9. Kochman, L. and R. Badarinathi (1995). Baseball Attendance and Outcome Uncertainty: A Note.
American Economist, 39(2), 87. Leuthesser, L., C.S. Kohli and K.R. Harich (1995). Brand Equity: The Halo Effect Measure. European

Reddy, Stam and Agrell, IJBSR (2015), 05(01): 63-89
http://www.thejournalofbusiness.org/index.php/site 88
Journal of Marketing, 29 (4), 57-66. Lord, R. G. and J. A. Hohenfield (1979). Longitudinal Field Assessment of Equity Effects on the
Performance of Major League Baseball Players. Journal of Applied Psychology, 64(1), 19-26. MacDonald, D. N. and M. O. Reynolds (1994). Are Baseball Players paid their marginal Products?
Managerial and Decision Economics, 15(5), 443-57. Maindiratta, A. (1990). Largest Size-Efficient Scale and Size Efficiencies of decision-making Units in Data
Envelopment Analysis. Journal of Econometrics, 46(1/2), 57-72. McCormick, Robert E., and Robert C. Clement (1992). Intrafirm Profit Opportunities and Managerial
Slack: Evidence from professional Basketball, in G. W. Scully (Ed.). Advances in the Economics of Sport, Jain Press, Greenwich, CT, 1, 3-35.
Murphy, John (1992). Assessing the Value of Brands, in J. Murphy (Ed.), Branding: A Key Marketing Tool, McMillan, London, 184-98. Oorlog, D. R. (1995). Marginal Revenue and Labor Strife in Major League Baseball. Journal of Labor
Research, 16(1), 25-42. Ozanian, M. K. (1996). Valuation Scoreboard. Financial World, 165(8), 54-5. Parsons, L. J. (1991). Assessing Sales force Performance with Data Envelopment Analysis. TIMS
Marketing Science Conference, University of Illinois. Porter, P. K. (1992). Market Advantage as Rent: Do professional Teams in larger Markets have a
competitive Advantage, in G. W. Scully (Ed.). Advances in the Economics of Sport, Jain Press, Greenwich, CT, 1, 237-48.
Porter, P. K. and G. W. Scully (1982). Measuring managerial Efficiency: The Case of Baseball. Southern Economic Journal, 48(3), 642-50.
Quirk, J., and M. El-Hodiri (1974). The economic Theory of professional Sports Leagues, Chapter 2 in R. G. Noll (Ed.). Government and the Sports Business, Brooking Institute, Washington, DC.
Sandomir, R (1997). Murdoch Bids for Dodgers simply to bolster a Lineup. New York Times, May 16, 1997.
Scully, G. W. (1989). The Business of Major League Baseball. University of Chicago Press, Chicago, IL. Scully, G. W. (1992a). Coaching Quality, Turnover, Longevity in professional Team Sports, in G. W. Scully
(Ed.). Advances in the Economics of Sport, Jain Press, Greenwich, CT, 1, 53-65. Scully, G. W. (1992b). Is managerial Termination rational? Evidence from professional Team Sports, in G.
W. Scully (Ed.). Advances in the Economics of Sport, Jain Press, Greenwich, CT, 1, 67-87. Scully, G. W. (1994). Managerial Efficiency and Survivability in professional Team Sports. Managerial and
Decision Economics, 15(5), 403-411. Seiford, L. M. (1996). Data Envelopment Analysis: The Evolution of the State of the Art (1978-1995).
Journal of Productivity Analysis, 7, 99-137. Silverman, B. R. S. (1981). Systems Approach to Baseball Player's Compensation. Journal of Systems
Management, 32 (9), 6-13. Sommers, P. M. and N. Quinton (1982). Pay and Performance in Major League Baseball: The Case of the
first Family of free Agents. Journal of Human Resources, 17(3), 426-35. Telser, L. G. (1995). The Ultimatum Game and the Law of Demand. Economic Journal: The Journal of the
Royal Economic Society, 105, 1519-23. Thomas, S. M. and M. A. Jolson (1979). Components of Demand for Major League Baseball. Michigan
Business Review, 31(3), 1-6. Thorn, J. and P. Palmer (1997). Total Baseball: The Ultimate Encyclopedia of Baseball. 5th Edition, Harper
Perennial, New York, NY. US Bureau of the Census (1996). Census of Population and Housing, US Government Printing Office,
Washington D.C. Vrooman, J. (1995). A general Theory of professional Sports Leagues. Southern Economic Journal, 61(4),
971-90. Vrooman, J. (1996). The Baseball Players' Labor Market reconsidered. Southern Economic Journal, 63(2),
339-60. Vrooman, J. (1997). A unified Theory of Capital and Labor Markets in Major League Baseball. Southern
Economic Journal, 63(3), 594-619.

Brand equity, efficiency and valuation ...
http://www.thejournalofbusiness.org/index.php/ 89
Whitney, J. D. (1988). Winning Games versus winning Championships: The Economics of Fan Interest and Team Performance. Economic Inquiry, 26(4), 703-24.
Wikipedia (2015). http://en.wikipedia.org/wiki/Brand_equity Zappe, C., W. Webster and I. Horowitz (1993). Using Linear Programming to determine Post-Facto
Consistency in Performance Evaluations of Major League Baseball Players. Interfaces, 23(6), 197-213.
Zech, C. E. (1981). An empirical Estimation of a Production Function: The Case of Major League Baseball. American Economist, 25(2), 19-23.
Zimbalist, A. (2006). 9. Economic Perspectives on Market Power in the Telecasting of US Team Sports1. The Economics of Sport and the Media, 160-178.