bovine tb infection status in cattle in great britain in 2012
TRANSCRIPT
600 | Veterinary Record | June 14, 2014
SurveillanceSurveillance SurveillanceSurveillance
SurveillanceBoVine TB
Bovine TB infection status in cattle in Great Britain in 2012This report, provided by the AHVLA, summarises the infection status of bovine tuberculosis (TB) in cattle in Great Britain from January 1 to December 31, 2012 and describes some of the temporal trends observed over a longer period. The AHVLA intends to produce similar reports for future years to provide a concise summary of how the situation is developing.
AnnuAl surveillance reports describing bovine TB infection status of cattle in Great Britain were first produced in 1998 for the then Ministry of Agriculture, Fisheries and Food (MAFF) providing important information for internal briefing and policymaking. The first report to be published on Defra’s website was the mid-year report for July 2009 to June 2010. From 2010, a separate report was completed for Wales and, since 2012, an additional report for England has been published (Defra 2012a, b, Welsh Government 2012).
The aim of publishing this summary of the GB surveillance reports is to provide a more concise description of the epidemiology of TB in cattle in GB on an annual basis and to put the surveillance data into context.
The frequency and geographic distribution of bovine TB has continued to increase in England and Wales since the mid-1980s (Fig 1 in Defra 2011). Control measures in cattle include routine testing and surveillance, premovement testing, movement restriction of infected herds and rapid slaughter of infected animals. Promoting good biosecurity is also important to address transmission between cattle and between badgers and cattle. Controlling the disease in wildlife is a key factor towards eradication in GB; reducing transmission in endemic areas through control of infection in badgers includes vaccination in Wales and England, along with licensed badger
culling pilots in two high-incidence areas of England. The incidence of bovine TB is measured through surveillance data collected by the AHVlA through an IT system known as SAM (formerly Vetnet).
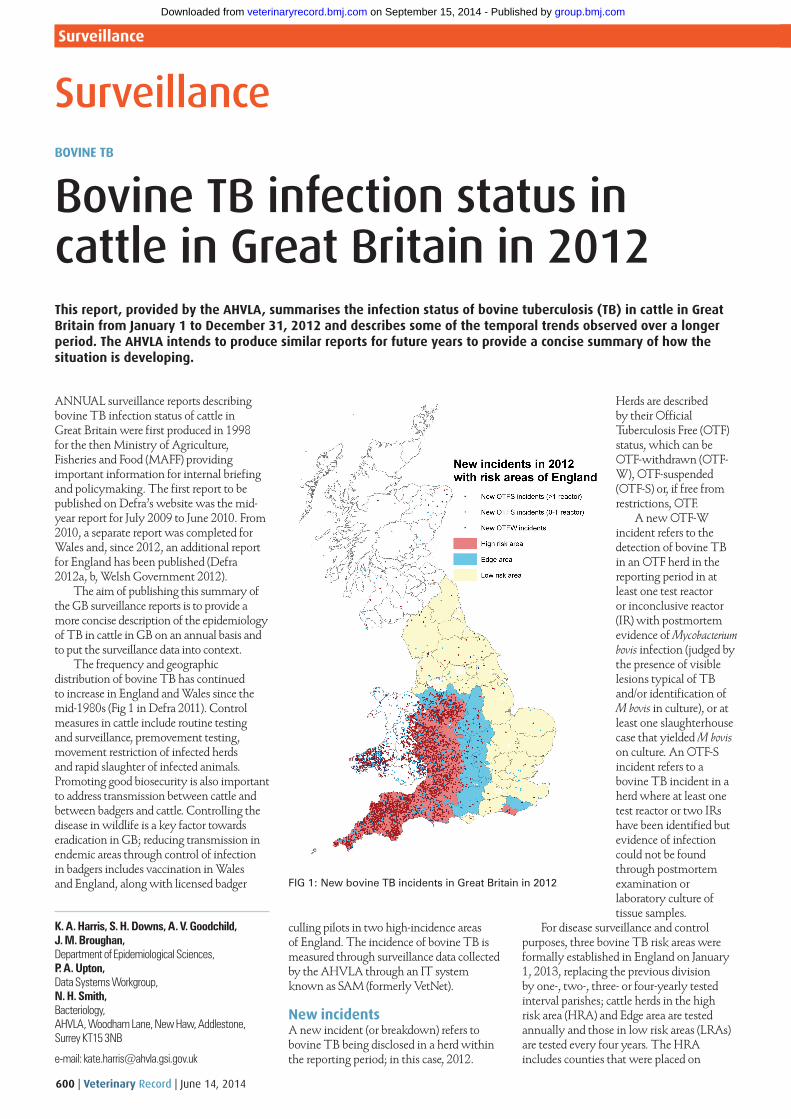
new incidentsA new incident (or breakdown) refers to bovine TB being disclosed in a herd within the reporting period; in this case, 2012.
Herds are described by their Official Tuberculosis Free (OTF) status, which can be OTF-withdrawn (OTF-W), OTF-suspended (OTF-S) or, if free from restrictions, OTF.
A new OTF-W incident refers to the detection of bovine TB in an OTF herd in the reporting period in at least one test reactor or inconclusive reactor (IR) with postmortem evidence of Mycobacterium bovis infection (judged by the presence of visible lesions typical of TB and/or identification of M bovis in culture), or at least one slaughterhouse case that yielded M bovis on culture. An OTF-S incident refers to a bovine TB incident in a herd where at least one test reactor or two IRs have been identified but evidence of infection could not be found through postmortem examination or laboratory culture of tissue samples.
For disease surveillance and control purposes, three bovine TB risk areas were formally established in England on January 1, 2013, replacing the previous division by one-, two-, three- or four-yearly tested interval parishes; cattle herds in the high risk area (HRA) and Edge area are tested annually and those in low risk areas (lRAs) are tested every four years. The HRA includes counties that were placed on
Fig 1: New bovine TB incidents in great Britain in 2012
K. A. Harris, S. H. Downs, A. V. Goodchild, J. M. Broughan,Department of Epidemiological Sciences,P. A. Upton,Data Systems Workgroup,N. H. Smith,Bacteriology,AHVLA, Woodham Lane, New Haw, Addlestone, Surrey KT15 3NB
e-mail: [email protected]
group.bmj.com on September 15, 2014 - Published by veterinaryrecord.bmj.comDownloaded from
June 14, 2014 | Veterinary Record | 601
SurveillanceSurveillance SurveillanceSurveillance
a substantial number of areas where the density was greater than 1 per km2.
The median number of reactors detected in each OTF-W incident that ended in 2012 was three in GB, England and Wales and slightly higher at four-and-a-half for Scotland, although this is based on just six OTF-W incidents compared to 482 in Wales and 2568 in England. More than a third of OTF-W incidents ending in 2012 had between two and five reactors; however, around 20 per cent in England, Wales and GB overall had 11 or more.
Herd incidence and prevalenceThe incidence of bovine TB in cattle herds is expressed here as the rate of newly detected incidents per 100 herd-years at risk. Herd-years at risk is the total time (days, months or years) that herds in the population are OTF and at risk of suffering a new bovine TB incident. For each herd, the time at risk begins with a negative herd test and ends with the next herd test or incident occurring during the reporting period of interest (in this case, 2012). It is an estimate since the time at which a herd becomes infected is unknown and knowledge of infection status is dependent on bovine TB testing frequency. The time at which a herd is cleared of infection after a breakdown, however, is fairly well known.
Other denominators used to estimate incidence include ‘100 unrestricted herds tested’ and ‘100 live herds’, but these do not explicitly take testing frequency into account (Table 3.1 in Defra 2012a, b, ). Gathering information on how incidence varies across risk area (Wales, Scotland and English HRA, Edge and lRA) and the effect of herd size and herd type assists in the development of targeted surveillance strategies.
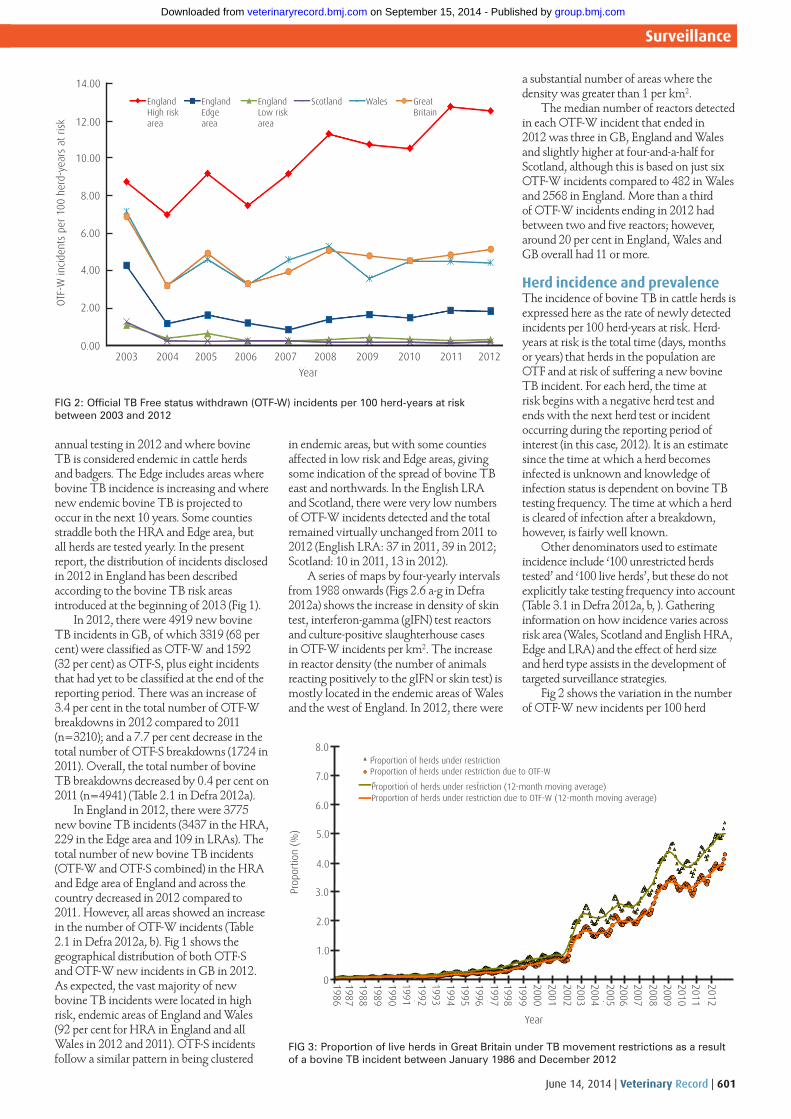
Fig 2 shows the variation in the number of OTF-W new incidents per 100 herd
annual testing in 2012 and where bovine TB is considered endemic in cattle herds and badgers. The Edge includes areas where bovine TB incidence is increasing and where new endemic bovine TB is projected to occur in the next 10 years. Some counties straddle both the HRA and Edge area, but all herds are tested yearly. In the present report, the distribution of incidents disclosed in 2012 in England has been described according to the bovine TB risk areas introduced at the beginning of 2013 (Fig 1).
In 2012, there were 4919 new bovine TB incidents in GB, of which 3319 (68 per cent) were classified as OTF-W and 1592 (32 per cent) as OTF-S, plus eight incidents that had yet to be classified at the end of the reporting period. There was an increase of 3.4 per cent in the total number of OTF-W breakdowns in 2012 compared to 2011 (n=3210); and a 7.7 per cent decrease in the total number of OTF-S breakdowns (1724 in 2011). Overall, the total number of bovine TB breakdowns decreased by 0.4 per cent on 2011 (n=4941) (Table 2.1 in Defra 2012a).
In England in 2012, there were 3775 new bovine TB incidents (3437 in the HRA, 229 in the Edge area and 109 in lRAs). The total number of new bovine TB incidents (OTF-W and OTF-S combined) in the HRA and Edge area of England and across the country decreased in 2012 compared to 2011. However, all areas showed an increase in the number of OTF-W incidents (Table 2.1 in Defra 2012a, b). Fig 1 shows the geographical distribution of both OTF-S and OTF-W new incidents in GB in 2012. As expected, the vast majority of new bovine TB incidents were located in high risk, endemic areas of England and Wales (92 per cent for HRA in England and all Wales in 2012 and 2011). OTF-S incidents follow a similar pattern in being clustered
in endemic areas, but with some counties affected in low risk and Edge areas, giving some indication of the spread of bovine TB east and northwards. In the English lRA and Scotland, there were very low numbers of OTF-W incidents detected and the total remained virtually unchanged from 2011 to 2012 (English lRA: 37 in 2011, 39 in 2012; Scotland: 10 in 2011, 13 in 2012).
A series of maps by four-yearly intervals from 1988 onwards (Figs 2.6 a-g in Defra 2012a) shows the increase in density of skin test, interferon-gamma (gIFn) test reactors and culture-positive slaughterhouse cases in OTF-W incidents per km2. The increase in reactor density (the number of animals reacting positively to the gIFn or skin test) is mostly located in the endemic areas of Wales and the west of England. In 2012, there were
Fig 2: Official TB Free status withdrawn (OTF-W) incidents per 100 herd-years at risk between 2003 and 2012
Fig 3: Proportion of live herds in great Britain under TB movement restrictions as a result of a bovine TB incident between January 1986 and December 2012
July 7, 2012 | Veterinary Record | 11
Year
OTF
-W in
cide
nts
per
100
herd
-yea
rs a
t ris
k
14.00
EnglandHigh risk area
EnglandEdge area
EnglandLow risk area
Scotland Wales Great Britain
12.00
10.00
8.00
6.00
4.00
2.00
0.002003 2004 2005 2006 2007 2008 2009 2010 2011 2012
July 7, 2012 | Veterinary Record | 11
Prop
ortio
n (%
)
Proportion of herds under restrictionProportion of herds under restriction due to OTF-W
Proportion of herds under restriction (12-month moving average)Proportion of herds under restriction due to OTF-W (12-month moving average)
2012
2011201020092008
200720062005
200420032002
20012000199919981997
19961995199419931992
199119901989198819871986
0
1.0
2.0
3.0
4.0
5.0
6.0
7.0
8.0
Year
group.bmj.com on September 15, 2014 - Published by veterinaryrecord.bmj.comDownloaded from
602 | Veterinary Record | June 14, 2014
SurveillanceSurveillance
The proportion of persistent OTF-S herd breakdowns was around 1 per cent in 2012 for England (HRA and total England, 0.7 per cent; and Edge area, 1.0 per cent) and for GB as a whole (1.1 per cent in 2011). The
proportion of persistent OTF-S herd breakdowns in Wales was greater, at 1.9 per cent. no OTF-S incident persisted beyond 18 months in Scotland or England lRAs in 2012. Overall, the proportion of persistent bovine TB herds (OTF-S and OTF-W) was 7.8 per cent in England, 6.7 per cent in Wales and 7.5 per cent in GB (8.3 per cent in 2011). Again, there was considerable variation between England risk areas (HRA, 8.2 per cent; Edge, 3.1 per cent; and lRA, 2.2 per cent).
Routine slaughterhouse surveillanceRoutine postmortem meat inspection of non-reactor cattle carcases for tuberculous lesions complements the skin testing programme of cattle on farms. Bovine TB is not confirmed in slaughterhouse cases unless M bovis is identified by laboratory culture or histology. On suspicion of bovine TB in the slaughterhouse, the OTF status of the herd of origin is suspended (OTF-S) and samples are taken for culture. A new OTF-S incident is not triggered unless reactors are found at the follow-up herd skin test. If M bovis can be isolated, the OTF status of the herd is withdrawn (OTF-W).
Just under a third of lesions (28.9 per cent) that are suggestive of bovine TB in abattoirs in non-reactor cattle are in fact due to other organisms. The number of tissue samples from which M bovis was isolated was 10 per cent lower in 2012
years at risk, for England risk areas, Wales, Scotland and GB overall. The bovine TB incidence rate has consistently been highest in the English HRA and fairly similar between Wales and across GB overall. The incidence rate in English lRAs and Scotland has been less than 1 since 2004.
Herd prevalence is described as the proportion of live herds under restriction as a result of a bovine TB incident, both total incidents and OTF-W incidents, at the middle of each month. Fig 3 shows the prevalence of bovine TB in GB overall, from 1986 to 2012, with the smooth lines representing a 12-month moving average. Following a dip in 2010, the prevalence of bovine TB has continued to increase through 2011 and 2012.
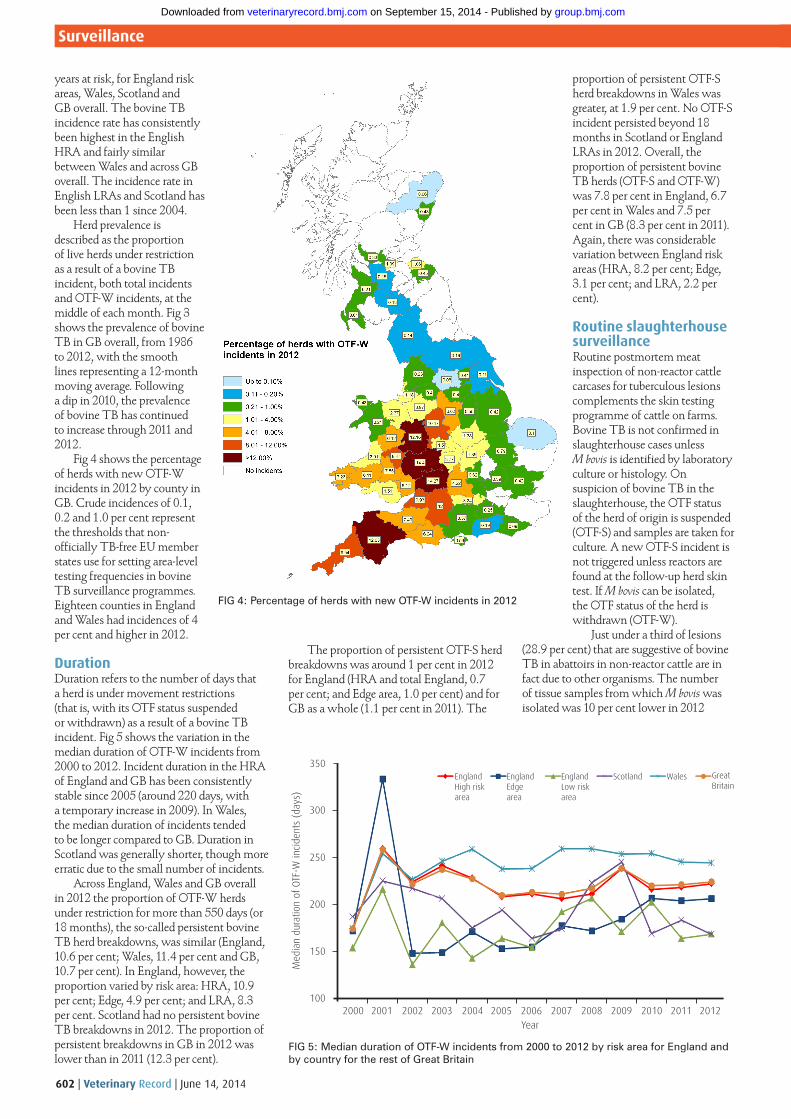
Fig 4 shows the percentage of herds with new OTF-W incidents in 2012 by county in GB. Crude incidences of 0.1, 0.2 and 1.0 per cent represent the thresholds that non-officially TB-free Eu member states use for setting area-level testing frequencies in bovine TB surveillance programmes. Eighteen counties in England and Wales had incidences of 4 per cent and higher in 2012.
DurationDuration refers to the number of days that a herd is under movement restrictions (that is, with its OTF status suspended or withdrawn) as a result of a bovine TB incident. Fig 5 shows the variation in the median duration of OTF-W incidents from 2000 to 2012. Incident duration in the HRA of England and GB has been consistently stable since 2005 (around 220 days, with a temporary increase in 2009). In Wales, the median duration of incidents tended to be longer compared to GB. Duration in Scotland was generally shorter, though more erratic due to the small number of incidents.
Across England, Wales and GB overall in 2012 the proportion of OTF-W herds under restriction for more than 550 days (or 18 months), the so-called persistent bovine TB herd breakdowns, was similar (England, 10.6 per cent; Wales, 11.4 per cent and GB, 10.7 per cent). In England, however, the proportion varied by risk area: HRA, 10.9 per cent; Edge, 4.9 per cent; and lRA, 8.3 per cent. Scotland had no persistent bovine TB breakdowns in 2012. The proportion of persistent breakdowns in GB in 2012 was lower than in 2011 (12.3 per cent).
Fig 5: Median duration of OTF-W incidents from 2000 to 2012 by risk area for England and by country for the rest of great Britain
Fig 4: Percentage of herds with new OTF-W incidents in 2012
July 7, 2012 | Veterinary Record | 11
Year
Med
ian
dura
tion
of O
TF-W
inci
dent
s (d
ays)
EnglandHigh risk area
EnglandEdge area
EnglandLow risk area
Scotland Wales Great Britain
100
150
200
250
300
350
2003200220012000 2004 2005 2006 2007 2008 2009 2010 2011 2012
group.bmj.com on September 15, 2014 - Published by veterinaryrecord.bmj.comDownloaded from
June 14, 2014 | Veterinary Record | 603
SurveillanceSurveillance
(n=1203) compared to 2011 (n=1340). The number of negative culture results increased by 28 per cent in 2012 (n=425) compared to 2011 (n=333).
There has been an increasing trend in the proportion of OTF-W new incidents initiated by slaughterhouse cases in England and GB. The proportions in Wales and particularly in Scotland have been more variable as would be expected given the low number of incidents. The proportion of OTF-W incidents that were first detected in the slaughterhouse was similar for England (22.7 per cent) and across GB (21.2 per cent). However, there was substantial variation in the risk areas in England; from 22 per cent in the HRA, 35 per cent in Edge area and 55 per cent in lRA in 2012. In Wales, the proportion was much lower (13 per cent) and in Scotland nearly half (46.2 per cent) of all incidents were detected through slaughterhouse surveillance, although based on a much lower denominator (n=6/13) (Fig 5.2 in Defra 2012a and Fig 5.1 in Defra 2012b).
Postmortem and microbiological examinationAnimals slaughtered for bovine TB control reasons include reactors to the tuberculin skin test (standard or severe interpretation), reactors to the supplementary gIFn blood test, IRs to the skin test (which may be voluntarily slaughtered before their retest 60 days later) and direct contacts (non-reactor animals in OTF-W incidents which are perceived to have been at risk of infection with M bovis). Following slaughter, the vast majority of such animals are examined for visible lesions at postmortem examination. Where more than one reactor is detected in a herd, a representative number of those animals undergo tissue sampling for microbiological culture and (if M bovis is isolated) molecular typing in one of the
AHVlA national bovine TB reference laboratories .
The proportion of visibly lesioned samples with M bovis-positive culture results has consistently been over 90 per cent since 2004 (around 95 to 97 per cent); however, the proportion declined through 2012. This could be due to more rigorous inspections resulting in more false positives being detected; increased testing frequency – so infected animals are detected earlier but these animals have not yet developed pathology; or increased testing of animals from an area with a lower background incidence of bovine TB, so the positive predictive value of the tuberculin test is lower.
The proportion of non-visibly lesioned samples from which M bovis was cultured also decreased to around 4 per cent by the end of 2012, returning to levels observed between 2003 and 2009 before an increase to around 7 per cent between 2009 and 2010 (Fig 6.2 in Defra 2012a, ). The proportion of culled cattle with evidence of bovine TB, either with visible lesions or culture positive, was around 30 to 40 per cent between 2003 and 2008. However, proportions vary depending on the reason for slaughter (ie, IR, standard, severe or gIFn reactor) (Fig 6.3 and Table 6.4 in Defra 2012a). In 2009, there was a rise, bringing the proportion up to 50 per cent, close to historical levels seen between 1990 and 2000. Possible reasons for this include the additional training of Food Standards Agency meat inspectors when they took over reactor sampling, as well as an increase in the specificity of the skin and gIFn tests, or a possible effect from the change in tuberculin manufacturing source from Weybridge to lelystad in the netherlands (Downs and others 2013).
RecurrenceA recurrent bovine TB herd is defined as a herd that had a bovine TB incident in a reporting year (eg, 2012) that had also been under movement restrictions for a different incident in the previous 36 months. Recurrence can result from a general increase in incidence (a herd would have a greater probability of a past incident if the previous incidence was high), or may be due to a change in risk factors for bovine TB, culminating in the herds being more likely to have repeated incidents. Further details on the definition of recurrence used in the surveillance reports can be found in section 7 of the GB and England reports (Defra 2012a, b) and Section 6 in the Welsh report (Welsh Government 2012). The cause of recurrence is difficult to ascertain with surveillance data, since one cannot distinguish between residual undisclosed cattle infection resulting from a previous TB incident and a new introduced infection.
Recurrent OTF-W incidents tend to be concentrated in high risk areas of GB.
The majority of herds with recurrent OTF-W incidents had one or two incidents in the previous 36 months, with a small number of herds sustaining three or four previous incidents, mostly in endemic areas of south-west England and Wales. The annual proportion of incidents in herds with a history of a bovine TB incident in the previous 36 months since 2006 can be found in Figs 7.2 a-d in the GB report (Defra 2012a).
In GB, 45 per cent of herds that sustained an OTF-W incident, and 40 per cent of herds that sustained an OTF-S incident, had a history of at least one previous bovine TB incident from 2006 until 2009, when the proportion increased to around 55 per cent in OTF-W and 45 per cent in OTF-S incidents. The proportion of OTF herds that had a similar history of a bovine TB incident rose from around 7 per cent between 2006 and 2009 to just over 10 per cent.
Bovine TB genotyping databaseGenotyping is a molecular typing technique used to differentiate the strains of M bovis responsible for bovine TB incidents in cattle and other species. DnA is taken from a sample of bacteria and genetic sequences unique to a particular strain are identified using two PCR-based techniques known as spoligotyping and variable number tandem repeat (VnTR) typing, which target different regions or markers in the M bovis genome. This approach works well on bacteria grown in the laboratory, but is insensitive when using pathological samples taken directly from infected animals at postmortem examination. Therefore, M bovis bacteria from field samples need to be cultured in the laboratory before molecular typing of the isolates can take place, a process that can take up to six weeks and occasionally longer.
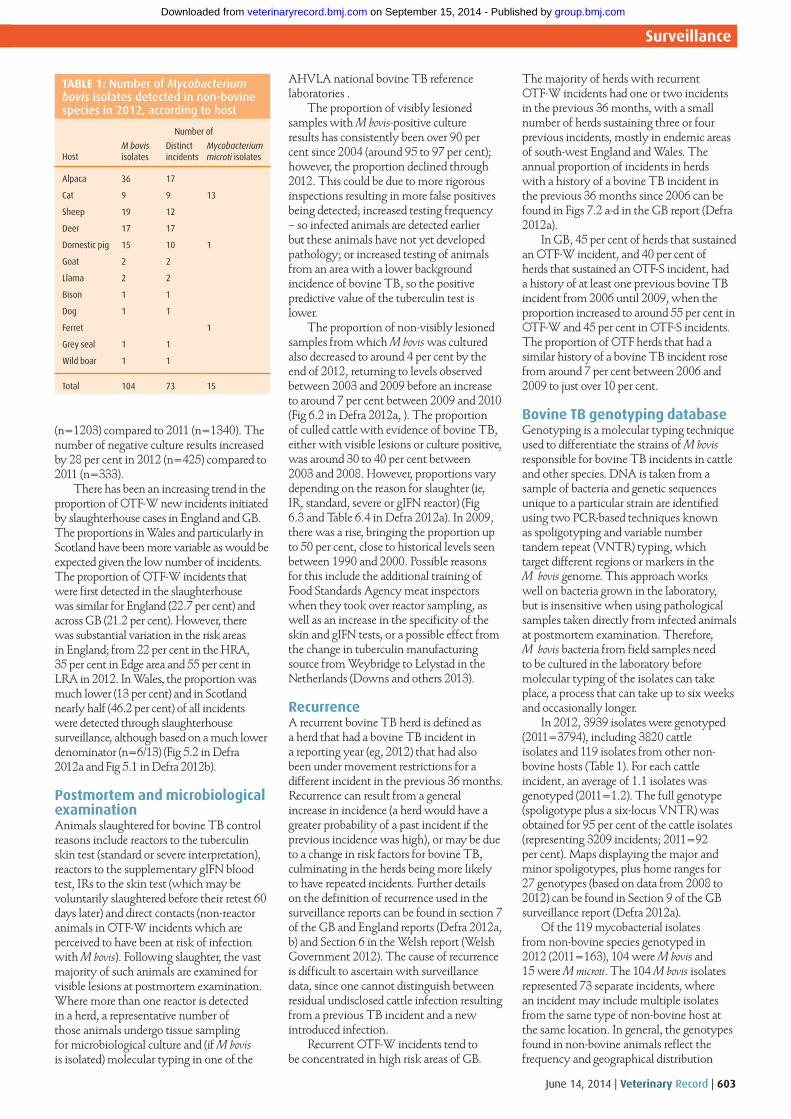
In 2012, 3939 isolates were genotyped (2011=3794), including 3820 cattle isolates and 119 isolates from other non-bovine hosts (Table 1). For each cattle incident, an average of 1.1 isolates was genotyped (2011=1.2). The full genotype (spoligotype plus a six-locus VnTR) was obtained for 95 per cent of the cattle isolates (representing 3209 incidents; 2011=92 per cent). Maps displaying the major and minor spoligotypes, plus home ranges for 27 genotypes (based on data from 2008 to 2012) can be found in Section 9 of the GB surveillance report (Defra 2012a).
Of the 119 mycobacterial isolates from non-bovine species genotyped in 2012 (2011=163), 104 were M bovis and 15 were M microti. The 104 M bovis isolates represented 73 separate incidents, where an incident may include multiple isolates from the same type of non-bovine host at the same location. In general, the genotypes found in non-bovine animals reflect the frequency and geographical distribution
TABLe 1: Number of Mycobacterium bovis isolates detected in non-bovine species in 2012, according to host
Number of
HostM bovis isolates
Distinct incidents
Mycobacterium microti isolates
Alpaca 36 17
Cat 9 9 13
Sheep 19 12
Deer 17 17
Domestic pig 15 10 1
Goat 2 2
Llama 2 2
Bison 1 1
Dog 1 1
Ferret 1
Grey seal 1 1
Wild boar 1 1
Total 104 73 15
group.bmj.com on September 15, 2014 - Published by veterinaryrecord.bmj.comDownloaded from
604 | Veterinary Record | June 14, 2014
SurveillanceSurveillance
of those found in cattle and were typical M bovis genotypes. The exception was feline samples, in which, as seen in previous years, M microti isolates were common outside the endemic bovine TB areas. For the first time since 2009, the number of M microti isolates from cats exceeded the frequency of M bovis isolates. Over 82 per cent of the non-bovine incidents were located in the relevant cattle home range for the genotype. Incidents among sheep and swine decreased in 2012, having peaked in 2010/11.
ConclusionThe situation at the end of 2012 indicated that there was no sign of abatement of the bovine TB epidemic in cattle as yet. Despite an overall decrease in the total number of new bovine TB incidents (–0.4 per cent) and OTF-S incidents (–7 per cent) in 2012, there was an increase in the total number of OTF-W incidents in GB during 2012 (+3.4 per cent).
The bovine TB epidemic in GB is difficult to evaluate, due in part to frequent changes in surveillance and control policy; for example, regarding testing frequency and local policies such as the Intensive Action Area in Wales and the Edge area in England.
To be sure that there is a reduction in the frequency of bovine TB in England and Wales, there would need to be a marked and sustained downward trend in the incidence and prevalence of infected herds for more than five consecutive years (to avoid historical cyclical trends associated with testing frequency), as well as a reduction in the geographical range of new incidents in cattle and non-bovine animals. We intend to publish summaries of the AHVlA surveillance reports on the trends of bovine TB infection status in cattle in GB annually.
AcknowledgementsThe authors would like to thank Adam Brouwer and James Tiller, who assisted with the compilation of the annual surveillance reports, and also their policy customers and their veterinary advisers, Ricardo de la Rua Domenech, Malla Hovi, Simon Rolfe and Martyn Blissitt, for their advice and guidance in the production of the surveillance reports and for reviewing this summary. The compilation of the annual bovine TB surveillance reports is funded by Defra and the Scottish and Welsh Governments (project SB4500).
They would also like to thank James
Dale, Monika Klita and Karen Gover for their excellent technical assistance in genotyping the strains. Bovine TB genotyping was funded by Defra project SB4020.
ReferencesDEFRA (2011) Bovine TB Eradication Programme for
England July 2011. www.gov.uk/government/uploads/system/uploads/attachment_data/file/69443/pb13601-bovinetb-eradication-programme-110719.pdf. Accessed May 30, 2014
DEFRA (2012a) Bovine tuberculosis: Infection status in cattle in GB. Annual surveillance report for the period January to December 2012. www.defra.gov.uk/ahvla-en/files/pub-survreport-tb12.pdf. Accessed May 30, 2014
DEFRA (2012b) Bovine tuberculosis: Infection status in cattle in England. Annual surveillance report for the period January to December 2012. www.defra.gov.uk/ahvla-en/files/pub-survreport-tb12e.pdf. Accessed May 30, 2014
DOWnS, S. H., ClIFTOn-HADlEy, R. S., uPTOn, P. u., MIlnE, I., Ely, E., GOPAl, R., GOODCHIlD, A. V. & SAyERS, A. R. (2013) Tuberculin manufacturing source and breakdown incidence rate of bovine tuberculosis in British cattle, 2005-2009. Veterinary Record doi: 10.1136/vr.100679
WElSH GOVERnMEnT (2012) Epidemiology of bovine tuberculosis in Wales. Annual surveillance report for the period January to December 2012. http://wales.gov.uk/docs/drah/publications/130719annualsurveillancereport2012.pdf. Accessed May 30, 2014
doi: 10.1136/vr.g3644
group.bmj.com on September 15, 2014 - Published by veterinaryrecord.bmj.comDownloaded from
doi: 10.1136/vr.g3644 2014 174: 600-604Veterinary Record
K. A. Harris, S. H. Downs, A. V. Goodchild, et al. Britain in 2012Bovine TB infection status in cattle in Great
http://veterinaryrecord.bmj.com/content/174/24/600.full.htmlUpdated information and services can be found at:
These include:
serviceEmail alerting
the box at the top right corner of the online article.Receive free email alerts when new articles cite this article. Sign up in
Notes
http://group.bmj.com/group/rights-licensing/permissionsTo request permissions go to:
http://journals.bmj.com/cgi/reprintformTo order reprints go to:
http://group.bmj.com/subscribe/To subscribe to BMJ go to:
group.bmj.com on September 15, 2014 - Published by veterinaryrecord.bmj.comDownloaded from