bottlenecks in bernoulli serial lines with rework
TRANSCRIPT
208 IEEE TRANSACTIONS ON AUTOMATION SCIENCE AND ENGINEERING, VOL. 7, NO. 2, APRIL 2010
Bottlenecks in Bernoulli Serial Lines With ReworkStephan Biller, Member, IEEE, Jingshan Li, Senior Member, IEEE, Samuel P. Marin,
Semyon M. Meerkov, Fellow, IEEE, and Liang Zhang, Member, IEEE
Abstract—The bottleneck (BN) of a production system is amachine with the strongest effect on the system’s throughput.In this paper, a method for BN identification in serial lines withrework and Bernoulli machines is developed. The method can beapplied using either calculated or measured data on blockagesand starvations of the machines. For the case of calculated data, atechnique for evaluating performance measures of Bernoulli lineswith rework is developed. Along with these quantitative contribu-tions, the paper provides three qualitative results. First, it showsthat Bernoulli lines with rework do not observe the property ofreversibility. Second, it demonstrates that downstream machinesmay have a larger effect on the throughput than upstream ones.Third, it demonstrates that BNs may be shifting not only becauseof changes in machine and buffer parameters but also due tochanges in quality of parts produced.
Note to Practitioners—This paper shows how one can identifythe bottleneck of a serial line with rework using data on block-ages and starvations of the machines. Also, it demonstrates thatthe BN shifts when the quality buy rate is fluctuating. Finally, itshows that downstream machines in production lines with reworkhave a larger effect on the throughput than those upstream (whichis unlike the serial lines with no rework where the effect of a ma-chine is independent of its position in the system).
Index Terms—Bernoulli machines, bottleneck identification, se-rial line with rework.
I. INTRODUCTION
S ERIAL production lines with rework are used in largevolume manufacturing, for instance, in the automotive
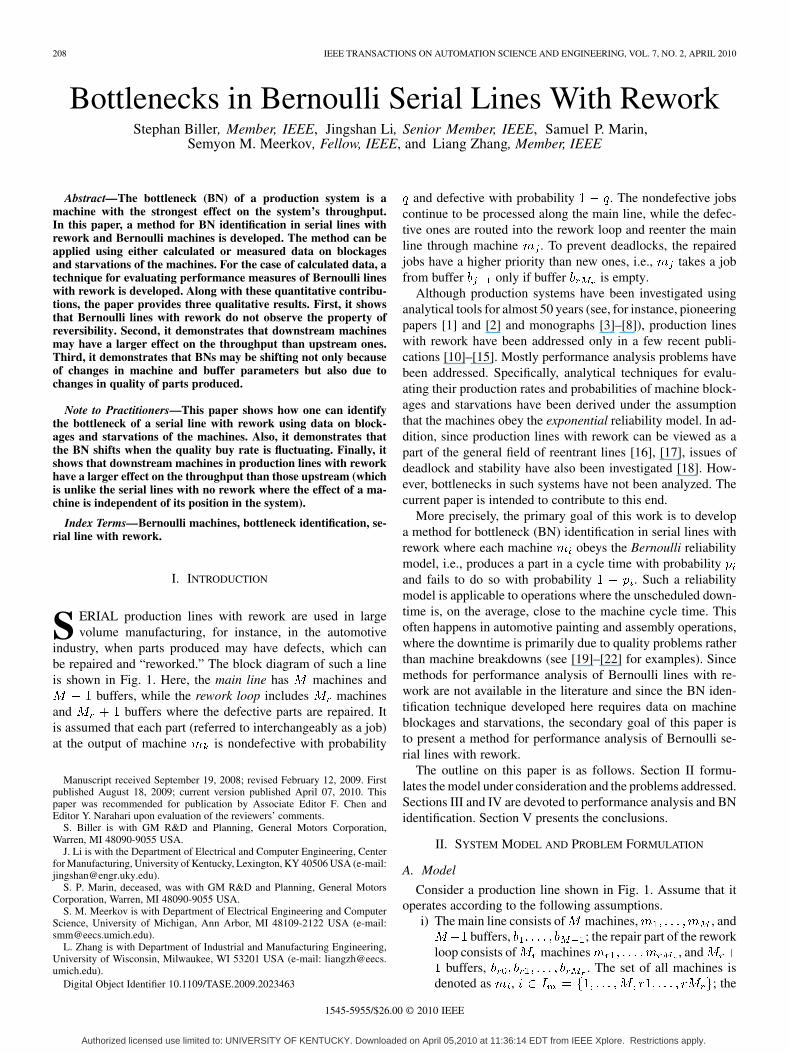
industry, when parts produced may have defects, which canbe repaired and “reworked.” The block diagram of such a lineis shown in Fig. 1. Here, the main line has machines and
buffers, while the rework loop includes machinesand buffers where the defective parts are repaired. Itis assumed that each part (referred to interchangeably as a job)at the output of machine is nondefective with probability
Manuscript received September 19, 2008; revised February 12, 2009. Firstpublished August 18, 2009; current version published April 07, 2010. Thispaper was recommended for publication by Associate Editor F. Chen andEditor Y. Narahari upon evaluation of the reviewers’ comments.
S. Biller is with GM R&D and Planning, General Motors Corporation,Warren, MI 48090-9055 USA.
J. Li is with the Department of Electrical and Computer Engineering, Centerfor Manufacturing, University of Kentucky, Lexington, KY 40506 USA (e-mail:[email protected]).
S. P. Marin, deceased, was with GM R&D and Planning, General MotorsCorporation, Warren, MI 48090-9055 USA.
S. M. Meerkov is with Department of Electrical Engineering and ComputerScience, University of Michigan, Ann Arbor, MI 48109-2122 USA (e-mail:[email protected]).
L. Zhang is with Department of Industrial and Manufacturing Engineering,University of Wisconsin, Milwaukee, WI 53201 USA (e-mail: [email protected]).
Digital Object Identifier 10.1109/TASE.2009.2023463
and defective with probability . The nondefective jobscontinue to be processed along the main line, while the defec-tive ones are routed into the rework loop and reenter the mainline through machine . To prevent deadlocks, the repairedjobs have a higher priority than new ones, i.e., takes a jobfrom buffer only if buffer is empty.
Although production systems have been investigated usinganalytical tools for almost 50 years (see, for instance, pioneeringpapers [1] and [2] and monographs [3]–[8]), production lineswith rework have been addressed only in a few recent publi-cations [10]–[15]. Mostly performance analysis problems havebeen addressed. Specifically, analytical techniques for evalu-ating their production rates and probabilities of machine block-ages and starvations have been derived under the assumptionthat the machines obey the exponential reliability model. In ad-dition, since production lines with rework can be viewed as apart of the general field of reentrant lines [16], [17], issues ofdeadlock and stability have also been investigated [18]. How-ever, bottlenecks in such systems have not been analyzed. Thecurrent paper is intended to contribute to this end.
More precisely, the primary goal of this work is to developa method for bottleneck (BN) identification in serial lines withrework where each machine obeys the Bernoulli reliabilitymodel, i.e., produces a part in a cycle time with probabilityand fails to do so with probability . Such a reliabilitymodel is applicable to operations where the unscheduled down-time is, on the average, close to the machine cycle time. Thisoften happens in automotive painting and assembly operations,where the downtime is primarily due to quality problems ratherthan machine breakdowns (see [19]–[22] for examples). Sincemethods for performance analysis of Bernoulli lines with re-work are not available in the literature and since the BN iden-tification technique developed here requires data on machineblockages and starvations, the secondary goal of this paper isto present a method for performance analysis of Bernoulli se-rial lines with rework.
The outline on this paper is as follows. Section II formu-lates the model under consideration and the problems addressed.Sections III and IV are devoted to performance analysis and BNidentification. Section V presents the conclusions.
II. SYSTEM MODEL AND PROBLEM FORMULATION
A. Model
Consider a production line shown in Fig. 1. Assume that itoperates according to the following assumptions.
i) The main line consists of machines, , andbuffers, ; the repair part of the rework
loop consists of machines , andbuffers, . The set of all machines is
denoted as , ; the
1545-5955/$26.00 © 2010 IEEE
Authorized licensed use limited to: UNIVERSITY OF KENTUCKY. Downloaded on April 05,2010 at 11:36:14 EDT from IEEE Xplore. Restrictions apply.
BILLER et al.: BOTTLENECKS IN BERNOULLI SERIAL LINES WITH REWORK 209
Fig. 1. Bernoulli serial production line with rework.
set of all buffers is denoted as ,. Machines and are referred to as
the merge and split machines, respectively.ii) The machines have identical cycle time . The time axis is
slotted with the slot duration . The status of the machines(up or down) is determined at the beginning of each timeslot.
iii) The machines obey the Bernoulli reliability model, i.e.,, , being neither blocked nor starved, produces
a part during a time slot with probability and fails to doso with probability . Parameter is referred to asthe efficiency of .
iv) Each buffer , , is characterized by its capacity,, where . The state of the buffer (i.e., the
number of parts in it) is determined at the end of each timeslot.
v) Machine , , is starved during a time slot if bufferis empty at the beginning of the time slot. Machine
is starved if both and are empty. Machineis never starved.
vi) Machine , , is blocked during a time slot if bufferhas parts at the beginning of the time slot and ma-
chine fails to take a part during this time slot. Ma-chine is blocked by the main line if is full anddoes not take a part during this time slot; it is blocked bythe rework loop if is full and does not take a partduring this time slot. Machine is never blocked.
vii) Parts at the output of are nondefective and defectivewith probability and , respectively. Parameteris referred to as the quality buy rate. Defective and non-defective parts form a sequence of independent randomvariables. Nondefective and defective parts are routed tobuffers and , respectively.
viii) The repaired parts from the rework loop have a higherpriority than those from the main line. In other words,does not take a part from unless is empty.
Note that assumptions vi) and vii) imply, respectively, thatthe blocked before service convention [23] is used and that thesplit machine contains a quality control operation. Note alsothat the defective parts may be produced by all machines priorto , but they are identified as such only at .
B. Problems Addressed
In the framework of the above model, this paper addresses thefollowing problems.
1) Performance Analysis Problem: Given the machine andbuffer parameters and the quality buy rate, evaluate the produc-tion rate of the line with rework and the probabilities ofblockages and starvations of each machine in
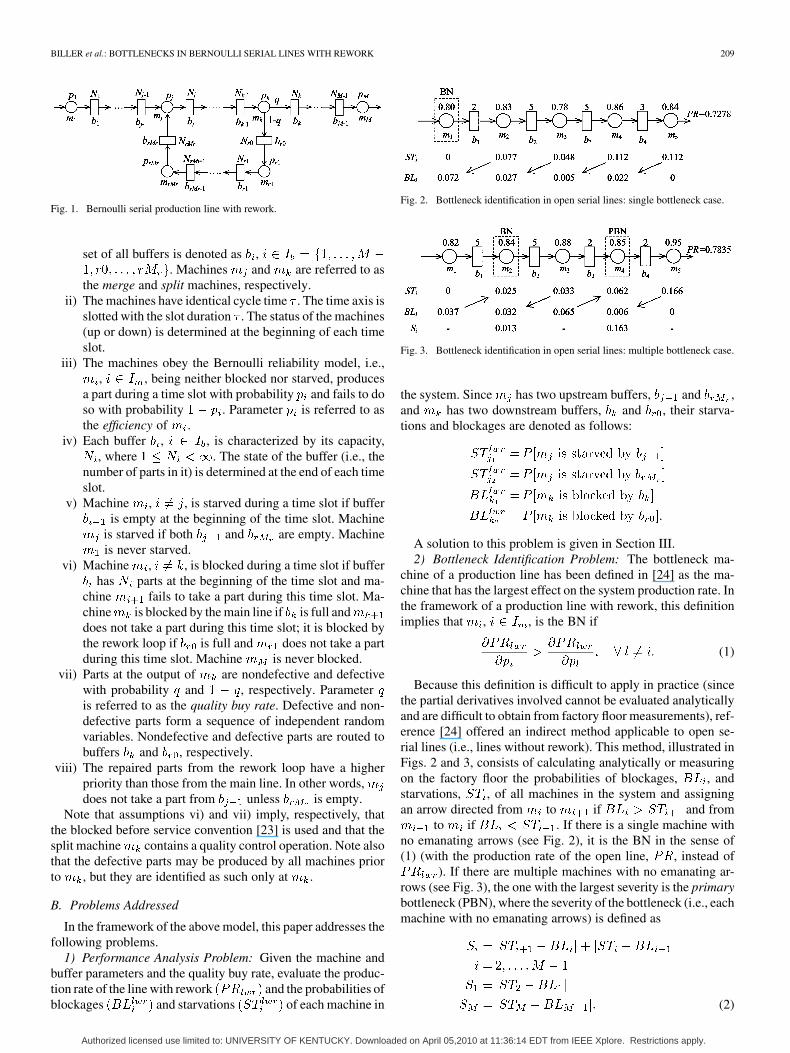
Fig. 2. Bottleneck identification in open serial lines: single bottleneck case.
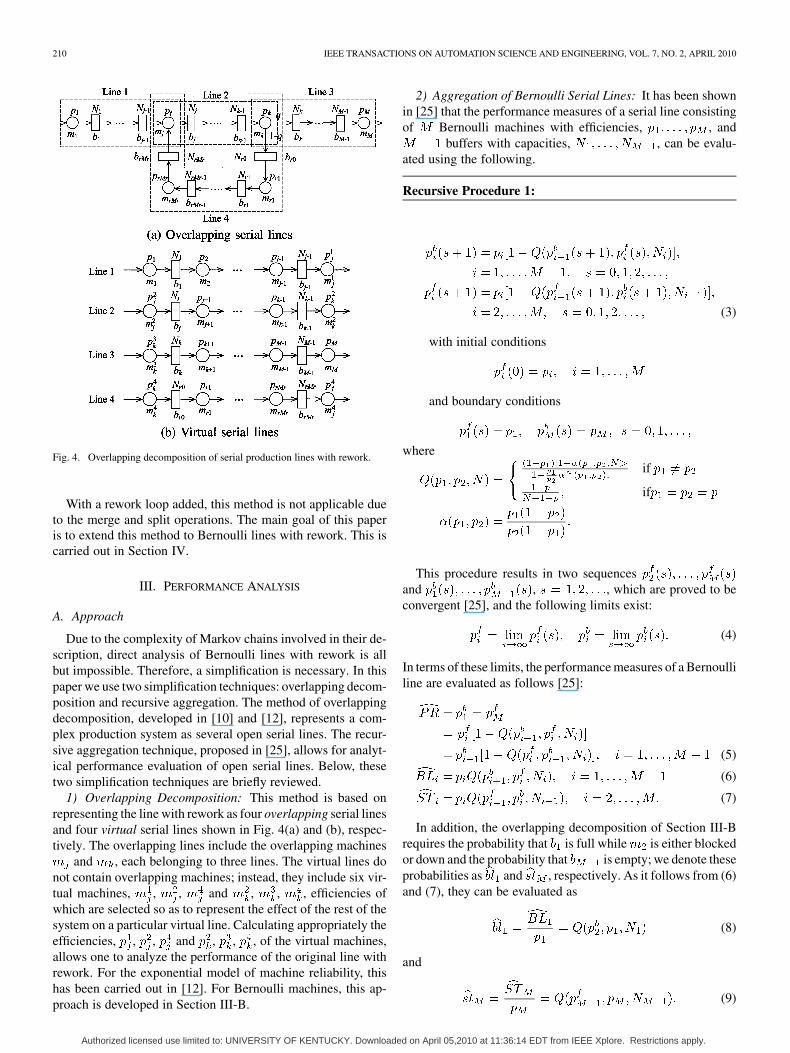
Fig. 3. Bottleneck identification in open serial lines: multiple bottleneck case.
the system. Since has two upstream buffers, and ,and has two downstream buffers, and , their starva-tions and blockages are denoted as follows:
A solution to this problem is given in Section III.2) Bottleneck Identification Problem: The bottleneck ma-
chine of a production line has been defined in [24] as the ma-chine that has the largest effect on the system production rate. Inthe framework of a production line with rework, this definitionimplies that , , is the BN if
(1)
Because this definition is difficult to apply in practice (sincethe partial derivatives involved cannot be evaluated analyticallyand are difficult to obtain from factory floor measurements), ref-erence [24] offered an indirect method applicable to open se-rial lines (i.e., lines without rework). This method, illustrated inFigs. 2 and 3, consists of calculating analytically or measuringon the factory floor the probabilities of blockages, , andstarvations, , of all machines in the system and assigningan arrow directed from to if and from
to if . If there is a single machine withno emanating arrows (see Fig. 2), it is the BN in the sense of(1) (with the production rate of the open line, , instead of
). If there are multiple machines with no emanating ar-rows (see Fig. 3), the one with the largest severity is the primarybottleneck (PBN), where the severity of the bottleneck (i.e., eachmachine with no emanating arrows) is defined as
(2)
Authorized licensed use limited to: UNIVERSITY OF KENTUCKY. Downloaded on April 05,2010 at 11:36:14 EDT from IEEE Xplore. Restrictions apply.
210 IEEE TRANSACTIONS ON AUTOMATION SCIENCE AND ENGINEERING, VOL. 7, NO. 2, APRIL 2010
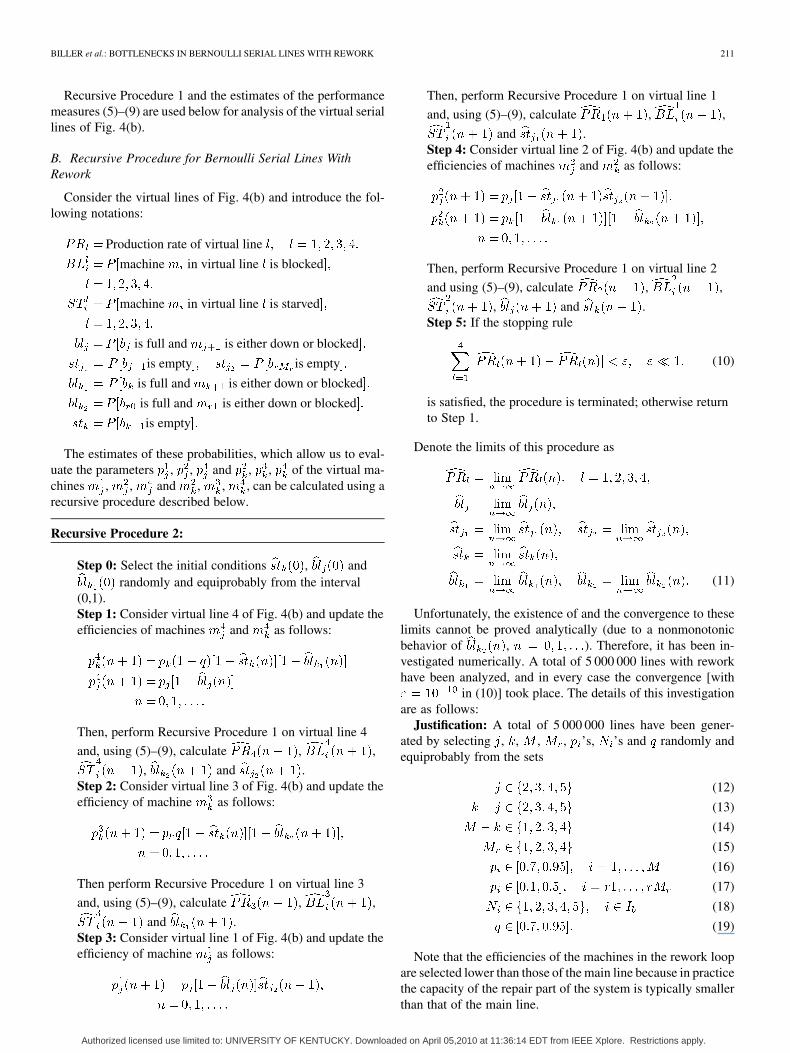
Fig. 4. Overlapping decomposition of serial production lines with rework.
With a rework loop added, this method is not applicable dueto the merge and split operations. The main goal of this paperis to extend this method to Bernoulli lines with rework. This iscarried out in Section IV.
III. PERFORMANCE ANALYSIS
A. Approach
Due to the complexity of Markov chains involved in their de-scription, direct analysis of Bernoulli lines with rework is allbut impossible. Therefore, a simplification is necessary. In thispaper we use two simplification techniques: overlapping decom-position and recursive aggregation. The method of overlappingdecomposition, developed in [10] and [12], represents a com-plex production system as several open serial lines. The recur-sive aggregation technique, proposed in [25], allows for analyt-ical performance evaluation of open serial lines. Below, thesetwo simplification techniques are briefly reviewed.
1) Overlapping Decomposition: This method is based onrepresenting the line with rework as four overlapping serial linesand four virtual serial lines shown in Fig. 4(a) and (b), respec-tively. The overlapping lines include the overlapping machines
and , each belonging to three lines. The virtual lines donot contain overlapping machines; instead, they include six vir-tual machines, , , and , , , efficiencies ofwhich are selected so as to represent the effect of the rest of thesystem on a particular virtual line. Calculating appropriately theefficiencies, , , and , , , of the virtual machines,allows one to analyze the performance of the original line withrework. For the exponential model of machine reliability, thishas been carried out in [12]. For Bernoulli machines, this ap-proach is developed in Section III-B.
2) Aggregation of Bernoulli Serial Lines: It has been shownin [25] that the performance measures of a serial line consistingof Bernoulli machines with efficiencies, , and
buffers with capacities, , can be evalu-ated using the following.
Recursive Procedure 1:
(3)
with initial conditions
and boundary conditions
whereif
if
This procedure results in two sequencesand , , which are proved to beconvergent [25], and the following limits exist:
(4)
In terms of these limits, the performance measures of a Bernoulliline are evaluated as follows [25]:
(5)
(6)
(7)
In addition, the overlapping decomposition of Section III-Brequires the probability that is full while is either blockedor down and the probability that is empty; we denote theseprobabilities as and , respectively. As it follows from (6)and (7), they can be evaluated as
(8)
and
(9)
Authorized licensed use limited to: UNIVERSITY OF KENTUCKY. Downloaded on April 05,2010 at 11:36:14 EDT from IEEE Xplore. Restrictions apply.
BILLER et al.: BOTTLENECKS IN BERNOULLI SERIAL LINES WITH REWORK 211
Recursive Procedure 1 and the estimates of the performancemeasures (5)–(9) are used below for analysis of the virtual seriallines of Fig. 4(b).
B. Recursive Procedure for Bernoulli Serial Lines WithRework
Consider the virtual lines of Fig. 4(b) and introduce the fol-lowing notations:
Production rate of virtual line
machine in virtual line is blocked
machine in virtual line is starved
is full and is either down or blocked
is empty is empty
is full and is either down or blocked
is full and is either down or blocked
is empty
The estimates of these probabilities, which allow us to eval-uate the parameters , , and , , of the virtual ma-chines , , and , , , can be calculated using arecursive procedure described below.
Recursive Procedure 2:
Step 0: Select the initial conditions , andrandomly and equiprobably from the interval
(0,1).Step 1: Consider virtual line 4 of Fig. 4(b) and update theefficiencies of machines and as follows:
Then, perform Recursive Procedure 1 on virtual line 4
and, using (5)–(9), calculate , ,
, and .Step 2: Consider virtual line 3 of Fig. 4(b) and update theefficiency of machine as follows:
Then perform Recursive Procedure 1 on virtual line 3
and, using (5)–(9), calculate , ,
and .Step 3: Consider virtual line 1 of Fig. 4(b) and update theefficiency of machine as follows:
Then, perform Recursive Procedure 1 on virtual line 1
and, using (5)–(9), calculate , ,
and .Step 4: Consider virtual line 2 of Fig. 4(b) and update theefficiencies of machines and as follows:
Then, perform Recursive Procedure 1 on virtual line 2
and using (5)–(9), calculate , ,
, and .Step 5: If the stopping rule
(10)
is satisfied, the procedure is terminated; otherwise returnto Step 1.
Denote the limits of this procedure as
(11)
Unfortunately, the existence of and the convergence to theselimits cannot be proved analytically (due to a nonmonotonicbehavior of , ). Therefore, it has been in-vestigated numerically. A total of 5 000 000 lines with reworkhave been analyzed, and in every case the convergence [with
in (10)] took place. The details of this investigationare as follows:
Justification: A total of 5 000 000 lines have been gener-ated by selecting , , , , ’s, ’s and randomly andequiprobably from the sets
(12)
(13)
(14)
(15)
(16)
(17)
(18)
(19)
Note that the efficiencies of the machines in the rework loopare selected lower than those of the main line because in practicethe capacity of the repair part of the system is typically smallerthan that of the main line.
Authorized licensed use limited to: UNIVERSITY OF KENTUCKY. Downloaded on April 05,2010 at 11:36:14 EDT from IEEE Xplore. Restrictions apply.
212 IEEE TRANSACTIONS ON AUTOMATION SCIENCE AND ENGINEERING, VOL. 7, NO. 2, APRIL 2010
For each of the lines, we ran Recursive Procedure 2 and ob-served the convergence in all cases studied, with the conver-gence taking place within a second using a standard laptop witha Pentium M 1.60 GHz processor and 1.23 GB RAM. Thus, weconclude that this procedure can be used for analysis of produc-tion lines with rework defined by assumptions i)–viii).
Concluding this subsection, we point out the following rela-tionships among the production rates of the virtual lines 1–4.
Theorem 1: The production rates of the virtual lines are re-lated as follows:
Proof: The production rates of Lines 2, 3, and 4 can beexpressed as
This leads to
On the other hand,
Therefore,
and
C. Performance Measure Estimates and Their Accuracy
In Section II, the production rate of the line with rework wasdenoted as and the probabilities of blockages and star-vations as and . Based on the limits (11) of Re-cursive Procedure 2, their estimates are introduced as follows:
(20)
(21)
(22)
(23)
The accuracy of these estimates has been investigated by sim-ulations. Since an analogous approach is used elsewhere in thispaper, we describe it below as a standard procedure.
Numerical Simulation Procedure 1:
• A C++ code to simulate the production system defined byassumptions i)–viii) is constructed.
• The initial status of each machine is selected up withprobability
• and down with probability , .• For each line with rework under consideration, 20 runs of
the simulation code are carried out.• In each run, the first 20 000 time slots are used as a
warm-up period and the subsequent 200 000 time slots areused to statistically evaluate the performance measuresof interest.
• This results in the estimate of with 95% confidenceintervals 0.001 and estimates of and with95% confidence interval 0.002.
For the system parameters , , and, we constructed 100 000 lines with ’s, ’s and ’s selected
randomly and equiprobably from sets (16)–(19). The followingmetrics were used to evaluate the accuracy of the estimates:
(24)
(25)
(26)
where , and are obtained by NumericalSimulation Procedure 1 and , and , are defined inSection II-B.
Among the 100 000 lines studied, the average of was3.97%, with very few extreme cases resulting in up to20.4%. This accuracy is comparable with that obtained in [10]for the case of exponential machines with similar parameters.The average of and were both less than 0.01. There-fore, we conclude that Recursive Procedure 2 provides an effec-tive tool for performance evaluation of serial lines with reworkdefined by assumptions i)-viii).
D. System Properties of Lines With Rework
Using Recursive Procedure 2, we establish two system-theo-retic properties described next.
As it is well known, serial production lines observe the prop-erty of reversibility [26]–[29]: the production rates of a serialline and its reverse (i.e., when the parts flow from the last ma-chine to the first) are the same. This property certainly holds foropen and closed Bernoulli lines. However, as we show below,reversibility does not hold for Bernoulli lines with rework.
Indeed, consider a serial line and its reverse shown inFig. 5(a) and (b), respectively. Using Recursive Procedure
Authorized licensed use limited to: UNIVERSITY OF KENTUCKY. Downloaded on April 05,2010 at 11:36:14 EDT from IEEE Xplore. Restrictions apply.
BILLER et al.: BOTTLENECKS IN BERNOULLI SERIAL LINES WITH REWORK 213
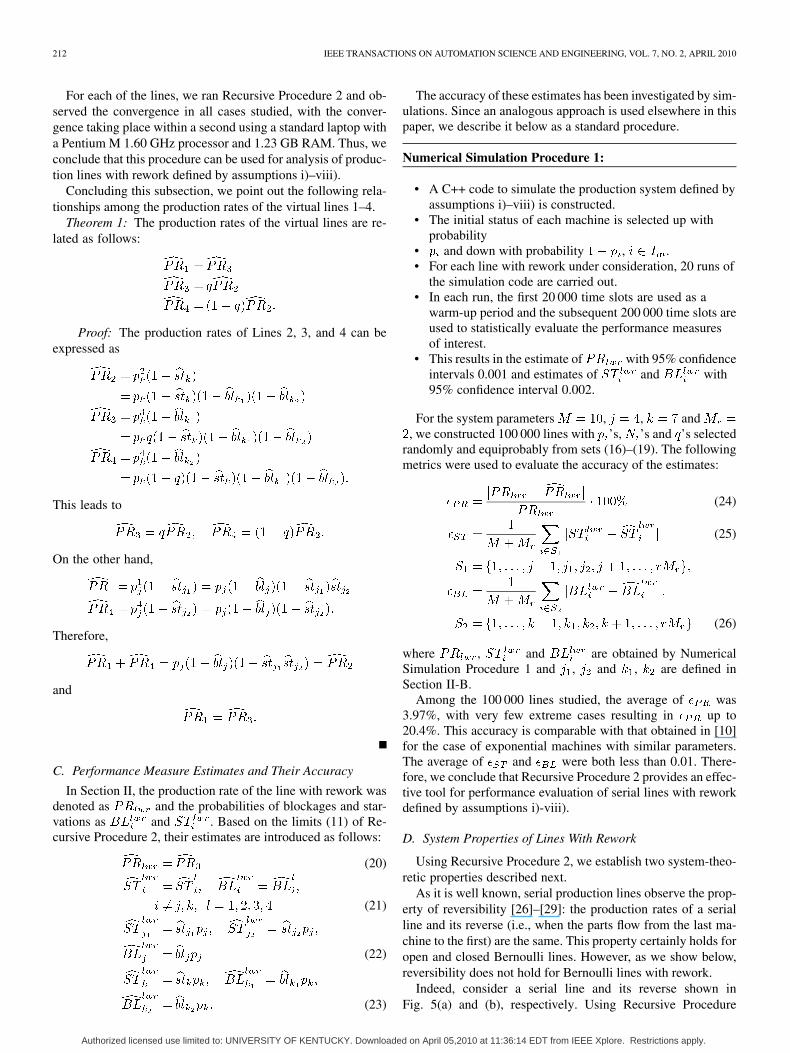
Fig. 5. Production system with rework and its reverse.
2, we determine that the production rate of the reverse lineis not the same as that of the original one; this conclusion isalso supported by simulations (see the data of Fig. 5). Thus,reversibility is violated. The lack of reversibility constitutes afundamental difference between the usual (i.e., open) Bernoullilines and those with rework.
In addition, comparing the data of Fig. 5, we observe thatplacing more efficient machines towards the end of the line re-sults in higher production rate than placing them upstream. Thisis also qualitatively different from serial lines with no reworkwhere the position of a machine does not indicate its importancefor performance of the system.
The reasons for the loss of reversibility in Bernoulli lines withrework can be explained by the asymmetric routing of jobs atthe merge and the split machines. Indeed, at the input of themerge machine, the repaired jobs have higher priority than thenew ones. Also, after the split machine, the routing of the jobsis based on the quality buy rate. Finally, the merge machine isstarved when both and are empty, while, due to theblocked before service convention, the split machine does notproduce a part when it is blocked either by or by . Asa result, the flow of jobs in Bernoulli lines with rework is nolonger reversible, and the downstream machines, which processreworked parts, have a larger effect on the production rate thanthe upstream ones.
IV. BOTTLENECK IDENTIFICATION
A. Approach
The method of Section III reduces a line with rework to fourusual serial lines, i.e., the virtual lines of Fig. 4(b). Their BNscan be identified using and , ,2,3,4, evaluated ac-cording to Recursive Procedure 2. This, however, would identifynot the BN of the line with rework but the BNs of the serial lines,where the rest of the system is represented by virtual machines
, , and , , . In other words, each of theseBNs would be a machine with the strongest effect on the overallproduction rate from the point of view of an individual virtualline. Although these bottlenecks may be of interest in some ap-plications, the goal of this paper is to identify the true BN of theline with rework in the sense of (1).
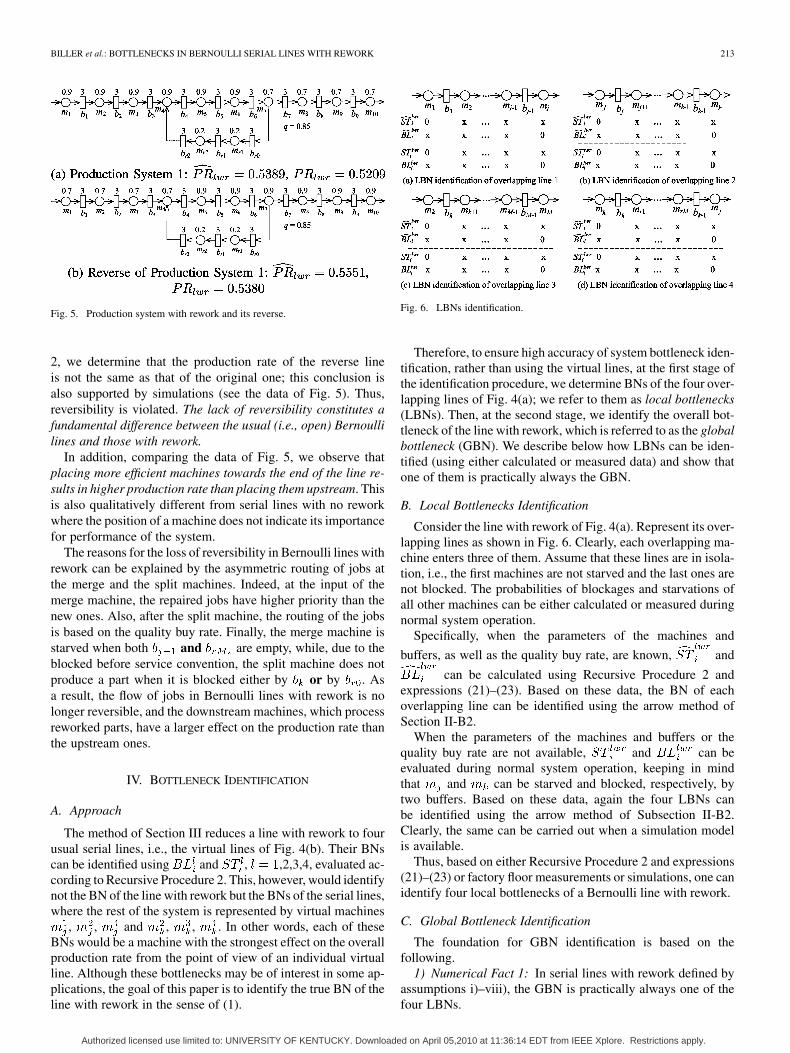
Fig. 6. LBNs identification.
Therefore, to ensure high accuracy of system bottleneck iden-tification, rather than using the virtual lines, at the first stage ofthe identification procedure, we determine BNs of the four over-lapping lines of Fig. 4(a); we refer to them as local bottlenecks(LBNs). Then, at the second stage, we identify the overall bot-tleneck of the line with rework, which is referred to as the globalbottleneck (GBN). We describe below how LBNs can be iden-tified (using either calculated or measured data) and show thatone of them is practically always the GBN.
B. Local Bottlenecks Identification
Consider the line with rework of Fig. 4(a). Represent its over-lapping lines as shown in Fig. 6. Clearly, each overlapping ma-chine enters three of them. Assume that these lines are in isola-tion, i.e., the first machines are not starved and the last ones arenot blocked. The probabilities of blockages and starvations ofall other machines can be either calculated or measured duringnormal system operation.
Specifically, when the parameters of the machines and
buffers, as well as the quality buy rate, are known, and
can be calculated using Recursive Procedure 2 andexpressions (21)–(23). Based on these data, the BN of eachoverlapping line can be identified using the arrow method ofSection II-B2.
When the parameters of the machines and buffers or thequality buy rate are not available, and can beevaluated during normal system operation, keeping in mindthat and can be starved and blocked, respectively, bytwo buffers. Based on these data, again the four LBNs canbe identified using the arrow method of Subsection II-B2.Clearly, the same can be carried out when a simulation modelis available.
Thus, based on either Recursive Procedure 2 and expressions(21)–(23) or factory floor measurements or simulations, one canidentify four local bottlenecks of a Bernoulli line with rework.
C. Global Bottleneck Identification
The foundation for GBN identification is based on thefollowing.
1) Numerical Fact 1: In serial lines with rework defined byassumptions i)–viii), the GBN is practically always one of thefour LBNs.
Authorized licensed use limited to: UNIVERSITY OF KENTUCKY. Downloaded on April 05,2010 at 11:36:14 EDT from IEEE Xplore. Restrictions apply.
214 IEEE TRANSACTIONS ON AUTOMATION SCIENCE AND ENGINEERING, VOL. 7, NO. 2, APRIL 2010
Although a justification of this fact (including the quantifica-tion of the term “practically always”) is given later on (alongwith other numerical facts formulated below), its application isclear: To identify the GBN, one must test the effect of each LBNon the production rate of the system; the LBN with the largest ef-fect is the GBN. While this process is somewhat involved—dueto four, rather than one, BNs to be investigated—it can be facil-itated by the following.
2) Numerical Fact 2: For serial lines with rework defined byassumptions i)–viii)
(a) if an overlapping machine is the LBN in three of the over-lapping lines, then it is practically always the GBN;
(b) if an overlapping machine is the LBN in only one of theoverlapping lines, then it is practically never the GBN.
3) Numerical Fact 3: In a serial line with rework defined byassumptions i)-viii) and with the quality buy rate ,
if its GBN is a nonoverlapping machine of line 1, thenthis machine is practically always the GBN for all ;
if its GBN is a nonoverlapping machine of line 3, thenthis machine is practically always the GBN for all ;
if its GBN is a nonoverlapping machine of line 4, thenthis machine is practically always the GBN for all ;
if its GBN is a nonoverlapping machine of line 2 or line4, then the GBN is practically always in ether line 2 or line 4 forall .
Justification: The justification of Numerical Facts 1–3 hasbeen carried out as follows: A total of 100 000 lines have beengenerated with , , , and and param-eters of machines and buffers selected randomly and equiprob-ably from sets (16)–(19). For the calculation-based approach,each of these lines has been analyzed using the Recursive Proce-dure 2 and the LBNs have been identified by calculating block-ages and starvations using (21)–(23). Then, the partial deriva-tives have been estimated using
with . For the measurement-based approach, eachof these lines has been analyzed using Numerical SimulationProcedure 1 and the partial derivatives have been estimated viasimulation using
with .Based on this procedure, the following results, quantifying
the term “practically always” have been obtained:• Numerical Fact 1 holds in 97.7% of cases using calcula-
tions and 93.3% of cases using measurements.• Numerical Fact 2:
— Claim (a) holds in 88.1% of cases using calculations and86.9% of cases using measurements.
— Claim (b) holds in 95.3% of cases using calculations and94.9% of cases using measurements.
• Numerical Fact 3:— Claim holds in 91.3% of cases using calculations
and 92.2% of cases using measurements.— Claim holds in 94.6% of cases using calculations
and 94.0% of cases using measurements.
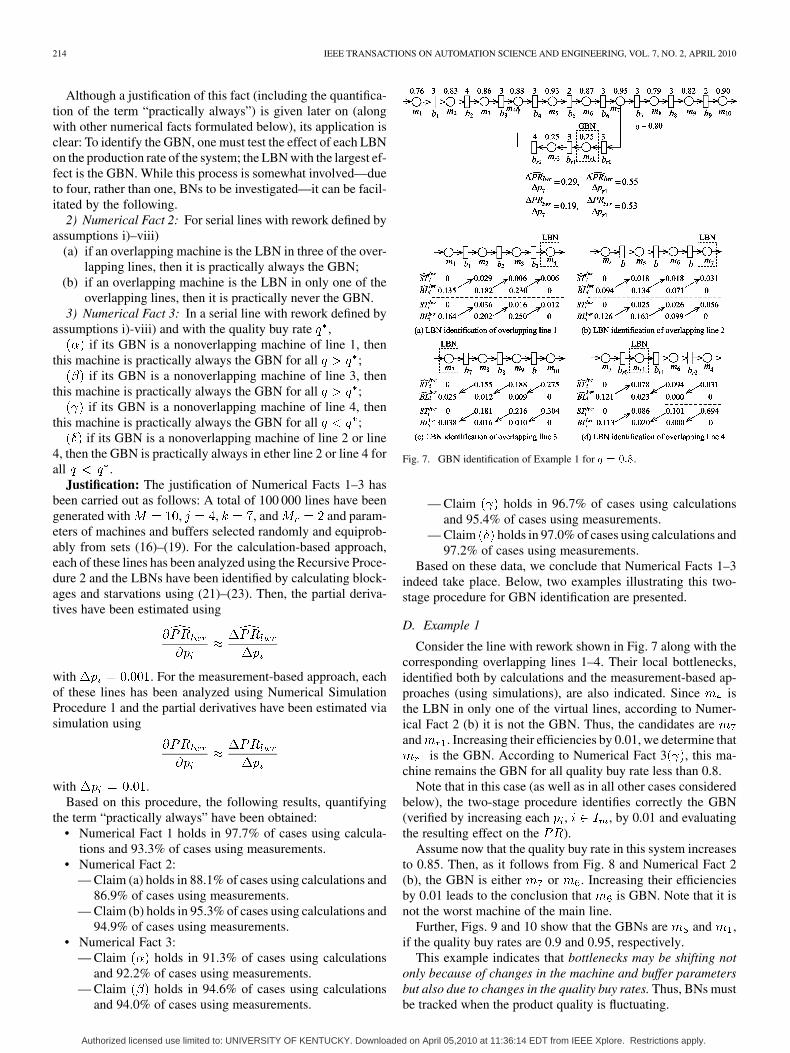
Fig. 7. GBN identification of Example 1 for � � ���.
— Claim holds in 96.7% of cases using calculationsand 95.4% of cases using measurements.
— Claim holds in 97.0% of cases using calculations and97.2% of cases using measurements.
Based on these data, we conclude that Numerical Facts 1–3indeed take place. Below, two examples illustrating this two-stage procedure for GBN identification are presented.
D. Example 1
Consider the line with rework shown in Fig. 7 along with thecorresponding overlapping lines 1–4. Their local bottlenecks,identified both by calculations and the measurement-based ap-proaches (using simulations), are also indicated. Since isthe LBN in only one of the virtual lines, according to Numer-ical Fact 2 (b) it is not the GBN. Thus, the candidates areand . Increasing their efficiencies by 0.01, we determine that
is the GBN. According to Numerical Fact 3 , this ma-chine remains the GBN for all quality buy rate less than 0.8.
Note that in this case (as well as in all other cases consideredbelow), the two-stage procedure identifies correctly the GBN(verified by increasing each , , by 0.01 and evaluatingthe resulting effect on the ).
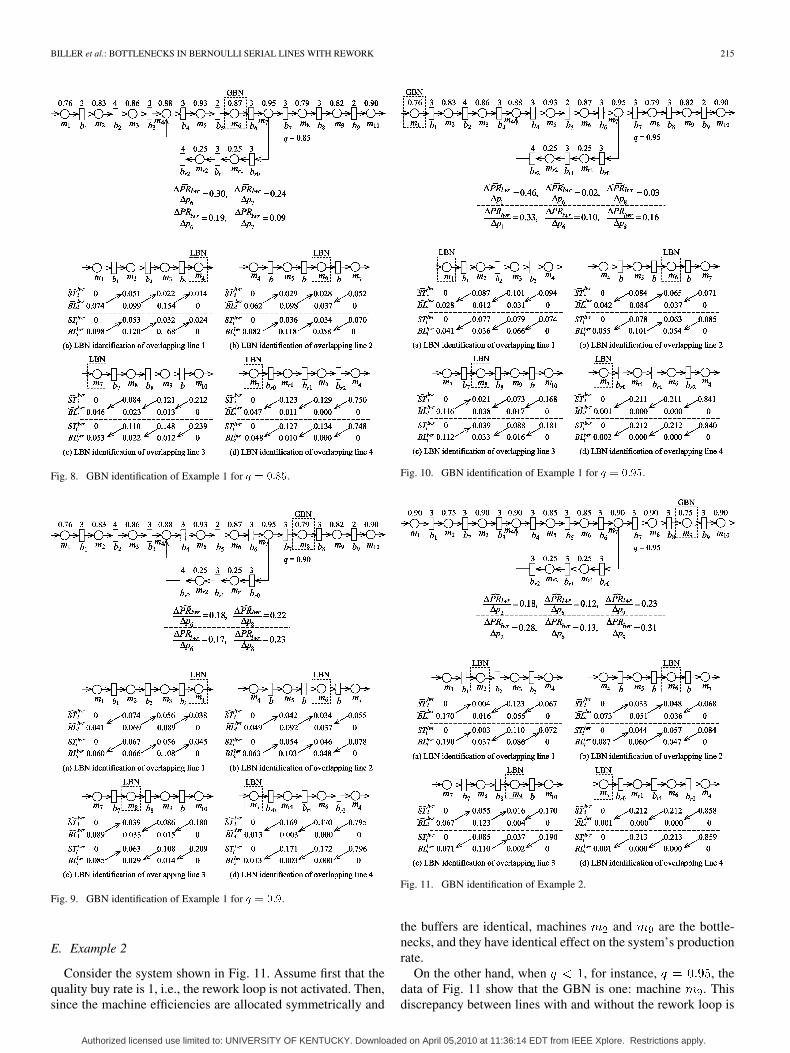
Assume now that the quality buy rate in this system increasesto 0.85. Then, as it follows from Fig. 8 and Numerical Fact 2(b), the GBN is either or . Increasing their efficienciesby 0.01 leads to the conclusion that is GBN. Note that it isnot the worst machine of the main line.
Further, Figs. 9 and 10 show that the GBNs are and ,if the quality buy rates are 0.9 and 0.95, respectively.
This example indicates that bottlenecks may be shifting notonly because of changes in the machine and buffer parametersbut also due to changes in the quality buy rates. Thus, BNs mustbe tracked when the product quality is fluctuating.
Authorized licensed use limited to: UNIVERSITY OF KENTUCKY. Downloaded on April 05,2010 at 11:36:14 EDT from IEEE Xplore. Restrictions apply.
BILLER et al.: BOTTLENECKS IN BERNOULLI SERIAL LINES WITH REWORK 215
Fig. 8. GBN identification of Example 1 for � � ����.
Fig. 9. GBN identification of Example 1 for � � ���.
E. Example 2
Consider the system shown in Fig. 11. Assume first that thequality buy rate is 1, i.e., the rework loop is not activated. Then,since the machine efficiencies are allocated symmetrically and
Fig. 10. GBN identification of Example 1 for � � ����.
Fig. 11. GBN identification of Example 2.
the buffers are identical, machines and are the bottle-necks, and they have identical effect on the system’s productionrate.
On the other hand, when , for instance, , thedata of Fig. 11 show that the GBN is one: machine . Thisdiscrepancy between lines with and without the rework loop is
Authorized licensed use limited to: UNIVERSITY OF KENTUCKY. Downloaded on April 05,2010 at 11:36:14 EDT from IEEE Xplore. Restrictions apply.
216 IEEE TRANSACTIONS ON AUTOMATION SCIENCE AND ENGINEERING, VOL. 7, NO. 2, APRIL 2010
due to the lack of reversibility in the former ones and the fact thatdownstream machines have a larger effect on the production ratethan those upstream.
V. CONCLUSION
This paper provided tools for analysis and improvement ofserial lines with Bernoulli machines and with rework. As far asthe analysis is concerned, the method of overlapping decom-position has been extended to Bernoulli machines; the averageaccuracy of the resulting production rate estimate is within 4%.As far as the improvement is concerned, it has been shown howfour local bottlenecks of the overlapping lines can be identified,one of which is practically always the global bottleneck of theoverall system; the accuracy of the global bottleneck identifica-tion is above 90%. In addition, it has been shown that the prop-erty of reversibility—one of the fundamental properties of openand closed serial lines—does not hold in serial lines with re-work. Based on this, it has been demonstrated that the machinesdownstream have a stronger effect on the production rate thanthose upstream.
As topics for future work on production systems with rework,the following can be mentioned.
• Extensions of the bottleneck identification technique toother than Bernoulli reliability models (e.g., exponential,Weibull, and, perhaps, general).
• Extensions to assembly systems with rework.• Extensions to systems with machines having different cy-
cles times (i.e., the asynchronous case).• Extensions to systems where the quality buy rate is a func-
tion of machine parameters.• Analysis of transients in serial lines and assembly systems
with rework.
REFERENCES
[1] B. A. Sevast’yanov, “Influence of storage bin capacity on the averagestandstill time of a production line,” Theory Prob. Appl., vol. 7, no. 4,pp. 429–438, 1962.
[2] J. A. Buzacott, “Automatic transfer lines with buffer stocks,” Int. J.Prod. Res., vol. 5, no. 3, pp. 183–200, 1967.
[3] N. Viswanadham and Y. Narahari, Performance Modeling of Auto-mated Manufacturing System. Englewood Cliffs, NJ: Prentice-Hall,1992.
[4] R. Askin and C. R. Standridge, Modeling and Analysis of Manufac-turing Systems. New York: Wiley, 1993.
[5] J. A. Buzacott and J. G. Shantikumar, Stochastic Models of Manufac-turing Systems. Englewood Cliffs, NJ: Prentice-Hall, 1993.
[6] H. T. Papadopoulos, C. Heavey, and J. Browne, Queueing Theoryin Manufacturing Systems Analysis and Design. London, U.K.:Chapman & Hall, 1993.
[7] S. B. Gershwin, Manufacturing Systems Engineering. EnglewoodCliffs, NJ: Prentice-Hall, 1994.
[8] H. G. Perros, Queueing Networks with Blocking. Oxford, U.K.: Ox-ford Univ. Press, 1994.
[9] T. Altiok, Performance Analysis of Manufacturing Systems. NewYork: Springer, 1997.
[10] J. Li, “Performance analysis of production systems with rework loops,”IIE Trans., vol. 36, no. 8, pp. 755–765, 2004.
[11] J. Li, “Throughput analysis in automotive paint shops: A case study,”IEEE Trans. Autom. Sci. Eng., vol. 1, no. 1, pp. 90–98, 2004.
[12] J. Li, “Overlapping decomposition: A system-theoretic method formodeling and analysis of complex manufacturing systems,” IEEETrans. Autom. Sci. Eng., vol. 2, no. 1, pp. 40–53, 2005.
[13] J. Li, D. E. Blumenfeld, and S. P. Marin, “Manufacturing system de-sign to improve quality buy rate: An automotive paint shop applicationstudy,” IEEE Trans. Autom. Sci. Eng., vol. 4, no. 1, pp. 75–79, 2007.
[14] A. Korugan and O. F. Hancer, “On the quality information feedbackand the rework loop,” in Proc. 6th Int. Conf. Anal. Manuf. Syst., 2007,pp. 7–14.
[15] D. Borgh, M. Colledani, F. Simone, and T. Tolio, “Integrated analysisof production logistics and quality performance in transfer lines withrework,” in Proc. 6th Int. Conf. Anal. Manuf. Syst., 2007, pp. 15–20.
[16] P. R. Kumar, “Re-entrant lines,” Queueing Syst. Theory Appl., vol. 13,no. 1–3, pp. 87–110, 1993.
[17] J. R. Morrison and P. R. Kumar, “On the guaranteed throughput andefficiency of closed re-entrant lines,” Queueing Syst. Theory Appl., vol.28, no. 1, 1998.
[18] S. Kumar and P. R. Kumar, “Fluctuation smoothing policies are stablefor stochastic re-entrant lines,” Discrete Event Dyn. Syst., Theory Ap-plicat., vol. 6, no. 4, pp. 361–370, 1996.
[19] J.-T. Lim, S. M. Meerkov, and F. Top, “Homogeneous, asymptoticallyreliable serial production lines: Theory and a case study,” IEEE Trans.Automat. Contr., vol. 35, pp. 524–534, 1990.
[20] J.-T. Lim and S. M. Meerkov, “On asymptotically reliable closed serialproduction lines,” Contr. Eng. Pract., vol. 1, no. 1, pp. 147–152, 1993.
[21] S.-Y. Chiang, C.-T. Kuo, J.-T. Lim, and S. M. Meerkov, “Improvabilityof assembly systems II: Improvability indicators and case study,” Math.Prob. Eng., vol. 6, pp. 359–393, 2000.
[22] J. Li and S. M. Meerkov, “Customer demand satisfaction in productionsystems: A due-time performance approach,” IEEE Trans. Robot. Au-tomat., vol. 17, no. 4, pp. 474–482, 2001.
[23] Y. Dallery and S. B. Gershwin, “Manufacturing flow line systems: Areview of models and analytical results,” Queueing Syst. Theory Appl.,vol. 12, no. 1–2, pp. 3–94, 1992.
[24] C.-T. Kuo, J.-T. Lim, and S. M. Meerkov, “Bottlenecks in serial pro-duction lines: A system-theoretic approach,” Math. Prob. Eng., vol. 2,no. 3, pp. 233–276, 1996.
[25] D. Jacobs and S. M. Meerkov, “A system-theoretic property of serialproduction lines—Improvability,” Int. J. Syst. Sci., vol. 26, no. 5, pp.755–785, 1995.
[26] G. Yamazaki and H. Sakasegawa, “Property of duality in tandemqueueing systems,” Ann. Inst. Statist. Math., vol. 27, pp. 201–212,1975.
[27] G. Yamazaki and H. Sakasegawa, “Property of duality in tandemqueueing systems,” Manage. Sci., vol. 31, no. 1, pp. 78–83, 1985.
[28] X.-G. Liu and J. A. Buzacott, “The reversibility of cyclic queues,”Oper. Res. Lett., vol. 11, no. 4, pp. 233–242, 1992.
[29] D. W. Cheng, “Line reversibility of tandem queues with generalblocking,” Manage. Sci., vol. 41, no. 5, pp. 864–873, 1995.
Stephan Biller (M’07) received the Dipl.-Ing.degree in electrical engineering from the RWTHAachen, Germany, the Ph.D. degree in industrialengineering and management science from North-western University, Chicago, IL, and the M.B.A.degree from the University of Michigan, Ann Arbor.
He is currently a Group Manager with GM R&Dand Planning, General Motors Corporation, Warren,MI, where he has responsibility for innovations inplant floor systems and controls. He is currently fo-cusing on the digital factory, the real-time informa-
tion enterprise, and the interoperability of the two.
Jingshan Li (S’97–M’00–SM’06) received the B.S.degree in automation from Tsinghua University,Beijing, China, the M.S. degree in automation fromthe Chinese Academy of Sciences, Beijing, and thePh.D. degree in electrical engineering systems fromthe University of Michigan, Ann Arbor, in 1989,1992, and 2000, respectively.
From 2000 to 2006, he worked in the Manu-facturing Systems Research Lab, General MotorsResearch & Development Center, Warren, MI. Hejoined the University of Kentucky in 2006 as a joint
faculty member in electrical engineering and the Center for Manufacturing. Hisresearch area is in system and control with applications to manufacturing andservice systems modeling, analysis, control, lean system design, and supplychain management. He is a coauthor (with S. M. Meerkov) of the textbookProduction Systems Engineering (New York: Springer 2009), and he has about70 referred journal and conference publications.
Authorized licensed use limited to: UNIVERSITY OF KENTUCKY. Downloaded on April 05,2010 at 11:36:14 EDT from IEEE Xplore. Restrictions apply.
BILLER et al.: BOTTLENECKS IN BERNOULLI SERIAL LINES WITH REWORK 217
Dr. Li is a senior member of the IIE. He received the 2005 IEEE Transac-tions on Automation Science and Engineering Best Paper Award, the 2006 IEEEEarly Industry/Government Career Award in Robotics and Automation, and the2009 IIE Transactions Best Application Paper Award. He was also a finalist forthe Best Automation Paper Award in the 2005 IEEE International Conferenceon Robotics and Automation. He is currently an Associate Editor of the IEEETRANSACTIONS ON AUTOMATION SCIENCE AND ENGINEERING, and has servedas Associate Editor for Mathematical Problems in Engineering, the IEEE Inter-national Conference on Robotics and Automation, and the IEEE InternationalConference on Automation Science and Engineering.
Samuel P. Marin received the Ph.D. degree inmathematics from Carnegie Mellon University,Pittsburgh, PA, in 1978.
He was with the General Motors Research andDevelopment Center since 1978. He was a ResearchFellow and Laboratory Group Manager in theManufacturing Systems Research Laboratory, andconducted and managed research programs to de-velop new mathematical modeling and analysis toolsfor application to GM’s engineering, manufacturing,and design operations.
Dr. Marin was a member of the Board of Governors of the Institute for Math-ematics and Its Applications at the University of Minnesota, and also served asCo-Director of the General Motors/University of Michigan Collaborative Re-search Laboratory in Advanced Vehicle Manufacturing. He was a member ofSIAM and Sigma Xi. He passed away in May 2008.
Semyon M. Meerkov (M’78–SM’83–F’90) re-ceived the M.S.E.E. degree from the Polytechnicof Kharkov, Kharkov, Ukraine, in 1962 and thePh.D. degree in systems science from the Institute ofControl Sciences, Moscow, Russia, in 1966.
He was with the Institute of Control Sciences until1977. From 1979 to 1984, he was with the Depart-ment of Electrical and Computer Engineering, Illi-nois Institute of Technology, Chicago. Since 1984,he has been a Professor at the Department of Elec-trical Engineering and Computer Science, University
of Michigan, Ann Arbor. He has held visiting positions at the University of Cal-ifornia, Los Angeles (1978–1979), Stanford University (1991), Technion, Israel(1997–1998, 2008), and Tsinghua, China (2008). He is a coauthor (with J. Li)of the recent textbook Production Systems Engineering (New York: Springer,2009). His research interests are in systems and control with applications toproduction systems and communication networks.
Liang Zhang (S’04–M’09) received the B.E.and M.E. degrees from the Center for IntelligentNetworks and Systems (CFINS), Department ofAutomation, Tsinghua University, Beijing, China, in2002 and 2004, respectively, and the Ph.D. degree inelectrical engineering systems from the Universityof Michigan, Ann Arbor, in 2009.
He is currently an Assistant Professor with theDepartment of Industrial and Manufacturing Engi-neering, University of Wisconsin, Milwaukee. Hisresearch interests include modeling, analysis, and
continuous improvement and design of manufacturing and service systems.
Authorized licensed use limited to: UNIVERSITY OF KENTUCKY. Downloaded on April 05,2010 at 11:36:14 EDT from IEEE Xplore. Restrictions apply.