structural bottlenecks - world bank documents & reports
TRANSCRIPT
Policy Research Working Paper 7107
The Post-Crisis Growth Slowdown in Emerging Economies and the Role
of Structural ReformsZia Qureshi
Jose L. Diaz-SanchezAristomene Varoudakis
Development Economics Vice PresidencyOperations and Strategy UnitNovember 2014
WPS7107P
ublic
Dis
clos
ure
Aut
horiz
edP
ublic
Dis
clos
ure
Aut
horiz
edP
ublic
Dis
clos
ure
Aut
horiz
edP
ublic
Dis
clos
ure
Aut
horiz
edP
ublic
Dis
clos
ure
Aut
horiz
edP
ublic
Dis
clos
ure
Aut
horiz
edP
ublic
Dis
clos
ure
Aut
horiz
edP
ublic
Dis
clos
ure
Aut
horiz
ed
Produced by the Research Support Team
Abstract
The Policy Research Working Paper Series disseminates the findings of work in progress to encourage the exchange of ideas about development issues. An objective of the series is to get the findings out quickly, even if the presentations are less than fully polished. The papers carry the names of the authors and should be cited accordingly. The findings, interpretations, and conclusions expressed in this paper are entirely those of the authors. They do not necessarily represent the views of the International Bank for Reconstruction and Development/World Bank and its affiliated organizations, or those of the Executive Directors of the World Bank or the governments they represent.
Policy Research Working Paper 7107
This paper is a product of the Operations and Strategy Unit, Development Economics Vice Presidency. It is part of a larger effort by the World Bank to provide open access to its research and make a contribution to development policy discussions around the world. Policy Research Working Papers are also posted on the Web at http://econ.worldbank.org. The authors may be contacted at [email protected], [email protected], or [email protected].
This paper constructs indicators of structural bottlenecks arising from barriers to open markets, obstacles to business operations, and constraints to access to finance. Empirical evidence from a sample of 30 emerging economies indi-cates that barriers to open markets and access to finance are significantly associated with differences in total factor pro-ductivity growth in the post-global financial crisis period compared with the pre-crisis period—with countries with fewer barriers showing stronger recovery and resilience.
Barriers to access to finance are also associated with differ-ences in the performance of private investment. Reforms to improve the policy framework in these areas, up to the level of the best-ranking countries, could offset the recently observed growth slowdown in emerging economies. These reforms would revitalize potential growth and mitigate the risks from external shocks associated with the global envi-ronment in the transition from the global financial crisis.
The Post-Crisis Growth Slowdown in Emerging Economies
and the Role of Structural Reforms
Zia Qureshi, Jose L. Diaz-Sanchez, and Aristomene Varoudakis
The World Bank
Development Economics
Keywords: Emerging economies, Investment climate, Structural reform indicators, TFP growth
JEL Classification: C81, D24, O47
______________________________________
ACKNOWLEDGEMENTS
The authors are thankful to the participants in a seminar at the University of Clermont-Ferrand (CERDI), France, for
comments and suggestions. Views expressed in the paper must not be attributed to the World Bank or its Executive
Directors.
2
I. Introduction
The period preceding the 2008-09 global financial crisis saw remarkable growth and poverty
reduction in developing countries. In the boom years, from 2003 to 2007, developing country per
capita GDP grew by 5.9 percent per year, compared to 2.3 percent in high-income countries.
Higher growth spread across most developing countries, including in some of the poorest. The
so-called “decoupling” of developing country growth prior to the crisis was in sharp contrast to
earlier trends: Over the 1990s, developing countries grew at par with advanced economies, while
in the 1980s, hit by the debt crisis, developing countries lagged behind advanced economies.
Strong growth and improved macroeconomic policy frameworks made developing countries
relatively resilient to the global financial crisis compared to previous crises. Some countries even
found policy room for counter-cyclical response. Thus, during 2008-09, per capita GDP in
developing countries grew at a slower pace of 3 percent, while it contracted by 2.2 percent in
advanced economies. Developing countries staged an impressive recovery in 2010, with growth
rebounding to 6.8 percent. However, growth has been slowing steadily since then. Per capita
GDP grew by 4.6 percent per year over 2010-2013, faster than in advanced economies but about
2 percentage points slower than in the pre-crisis period. A number of large emerging economies,
including China, India, and Brazil, are growing at a slower pace than before the crisis.
One concern is whether part of this slowdown may reflect structural bottlenecks that impede
growth over the medium term. Rapidly growing emerging economies are exposed to the so-
called “middle-income traps”, a phenomenon that entails stagnation at middle-income levels and
a failure to “graduate” into the advanced economy group (Eichengreen, Park, and Shin, 2013; Im
and Rosenblatt, 2013). As countries reach middle-income status, “easy” productivity gains, by
reallocating production from agriculture to manufacturing and exploiting low-hanging
productivity gains and technology catch-up, become increasingly exhausted. Potential growth
thenceforward needs to rely more on within-sector productivity improvements and
transformation into activities that demand better skills and the production of more innovative
goods and services. Population ageing that reduces savings may add to the difficulties to sustain
high growth. Structural reforms and pro-active public investments could facilitate the
transformations needed to sustain strong growth and avoid middle-income traps (Kharas and
Kohli, 2011).
About two-thirds of the slowdown in emerging economies is estimated to reflect a decline in the
cyclical component of growth, linked to a large extent to the sluggish recovery in advanced
economies. About one-third is estimated to be structural, due to a decline in potential growth
resulting from slowing productivity growth (World Bank, 2014a). There is concern that the post-
crisis sluggish growth in advanced economies may continue, due to the fragilities in banking
systems, the high levels of debt, and high structural unemployment. In Europe, in particular,
growth is likely to remain substantially below the pre-crisis peak. Overall, in the coming years,
the external environment for developing countries is likely to be less supportive to growth than
3
during the pre-crisis period. This would compound the risks of a structural growth slowdown as
many countries that relied on fast growing export markets and favorable terms of trade will not
be able to count on the same degree of external demand stimulus.
Moreover, the internal stimulus injected during the crisis has largely run its course. Reforms and
structural transformations that boost productivity could help developing countries mitigate the
risks associated with the post-crisis transition. Both theory and evidence highlight the role of
total factor productivity (TFP) in driving long-run growth. Although reform priorities vary across
countries, policies to improve the investment climate, spur competition, and facilitate resource
allocation toward more productive and higher value-added sectors are essential for higher
productivity and structural transformation in middle-income countries (Dabla-Norris, 2013).
Middle-income countries, on average, have been improving their business environments, as
indicated, for example, by the World Bank’s Cost of Doing Business indicators and Enterprise
Surveys. However, they are still far from the frontier and there is substantial room for further
reform—a challenge even in many advanced economies.
In this paper, we address this policy agenda by assessing the extent to which structural
bottlenecks to growth are linked to the economic performance of emerging economies in the
post-crisis period. Several studies have addressed the question of business regulations and how
they affect economic performance. A survey of cross-country evidence is provided by Scantarelli
(2010). Early studies included advanced economies, based on OECD indicators of product
market regulation (Nicoletti and Scarpetta, 2003). Studies were extended to developing countries
with the availability of enterprise survey data and the DB indicators (Dethier, Hirn, and Straub,
2010; Djankov, McLiesh, and Ramalho, 2006; Hanusch, 2012). Results vary across studies, but a
common finding is that more heavily regulated economies tend to grow slower and often also
experience higher volatility (Loayza, Oviedo, and Serven, 2010).
We attempt a more granular investigation of structural bottlenecks compared to previous studies,
by using indicators that measure barriers to open markets (reflected in barriers to trade, foreign
direct investment, and competition); obstacles to business operations; and ease of access to
finance. Bottlenecks in these areas could impede resource reallocation towards higher-
productivity sectors, thus hindering long-run growth in middle-income economies. We construct
indexes of structural bottlenecks in these areas for a sample of 30 upper middle-income emerging
economies. These indexes are based on the World Bank’s Cost of Doing Business database and
selected indicators from the World Economic Forum’s Global Competiveness Report. Indicators
from these two sources are available on a yearly basis starting from 2005, thus covering the pre-
and post-crisis periods.
We focus on two variables of interest for long-run economic performance: the growth of total
factor productivity (TFP) and private investment in proportion to GDP. We compare post-crisis
trends in these two variables, over the period 2010-12, to the pre-crisis period 2003-07. TFP
growth and private investment declined in most emerging economies when the 2008-09 crisis hit
4
and recovered at varying speed. We assess whether the post-crisis recovery of TFP growth and
private investment in emerging economies is related to the structural bottlenecks in the business
environment as captured by the relevant indicators. We find that the ease of access to finance and
the barriers to open markets are robust in accounting for country differences in TFP growth in
the period following the crisis while the ease of access to finance partly accounts for private
investment recovery.
The next section presents the main characteristics of the country sample, the construction of the
aggregate indexes of structural bottlenecks, and the associated country rankings. The third
section examines the empirical association of these aggregate indexes with TFP growth and
private investment post-crisis compared to the pre-crisis period. We also construct an aggregate
index of structural bottlenecks to growth based on the individual indicators that seem more
robust in explaining differences in country performance. The last section concludes.
II. Indexes of structural bottlenecks to growth
The country sample covers 30 upper middle-income emerging economies, including all emerging
economy members of the G20.i European Union emerging economies have not been considered
because of the particular severity of the financial crisis in the Eurozone that evolved into a
sovereign debt crisis and led to a double-dip recession in 2012 with significant repercussions also
for EU emerging economies.
We consider three key areas of the enabling environment for private entrepreneurship that may
affect resource reallocation toward higher productivity activities and the capacity to innovate and
generate higher growth. These include:
i) access to finance;
ii) barriers to open markets (including barriers to trade, FDI, and competition);
iii) barriers to business operations.
Access to finance: Obtaining finance is essential for successful entrepreneurs to expand business
and realize economies of scale, initiate endeavors in new market segments, and adopt new
technologies required for productivity gains. The financial crisis has tested the capacity of
banking systems and capital markets to provide credit and capital at affordable terms, especially
to small and medium enterprises that form the backbone of emerging economies. Our working
hypothesis is that countries where companies face fewer obstacles in getting credit and capital,
and where there are better mechanisms for resolving financial distress (company insolvency), are
better placed to improve productivity and maintain sustained levels of private investment.ii
Barriers to open markets: Open markets prevail when domestic competition is unhindered and
when barriers to international trade and FDI are low—as both trade and FDI promote
5
competitive forces in the economy. The ability of countries to reallocate resources to more
productive uses and the efficiency of their investments may depend on the regulatory and
institutional framework governing competition and market entry. Dynamism in firm entry when
markets are open usually contributes to innovation, increases productivity, and crowds out
inefficient firms. Countries that open their borders to trade and lower their trade costs usually see
bigger increases in national income than those that restrict trade. Growth benefits from a
reduction of trade barriers not only because of the enlarged opportunities for exchange of goods
and services but also because of the higher productivity and innovation in the economy brought
by more intense competition. Similarly, countries that place fewer restrictions on FDI can expect
to benefit from know-how that usually comes with foreign investment and from a better
positioning into global value chains. This in turn may boost productivity and help further
improve trade performance, with a multiplier effect on productivity and growth. Our working
hypothesis is that countries with open markets—i.e., with fewer structural bottlenecks to
international trade, FDI, and competition—were in a better position to recover from the global
financial crisis and regain pre-crisis levels of productivity growth and investment.iii
Barriers to business operations: Businesses may encounter barriers to their operations for many
reasons: for example, because of cumbersome procedures for obtaining licenses or construction
permits; or lengthy, costly, and unreliable procedures involved in enforcing contracts or
resolving commercial disputes. These can be seen as “generic” barriers to business operations, in
addition to those mentioned above related to accessing credit, trading across borders, or entering
a new market. Barriers to business operations usually result in a less friendly environment, which
may even encourage firms to move part of business operations to the informal economy. These
barriers can inhibit access to credit, innovation, and productivity growth. It can thus be
hypothesized that high barriers to business operations hamper productivity growth and
discourage private investment.
Definition of indexes of structural bottlenecks
Indexes of structural bottlenecks in these three areas of the business environment have been
constructed based on selected indicators from the World Bank’s Doing Business (DB) database
and the World Economic Forum’s Global Competitiveness Report (GCR).iv
For the construction
of these indexes, annual data were used over 2005-12, covering the pre- and post-crisis periods.
The indicators for each year represent surveys conducted in the previous year—e.g., the
indicators for 2012 show the results from surveys conducted in 2011. The three indexes are
composed of 31 individual indicators, of which 24 are extracted from DB and 7 from GCR. The
composition of the three indexes is shown below.
Access to Finance: Includes 9 indicators from DB:
Getting credit 1-Strength of legal rights index;
Getting credit 2-Depth of credit information index;
6
Getting credit 3-Private bureau coverage (% of adults);
Protecting investors 1-Extent of disclosure index;
Protecting investors 2- Extent of director liability index;
Protecting investors 3-Ease of shareholder suits index;
Resolving insolvency 1-Time (years);
Resolving insolvency 2-Cost (% of estate);
Resolving insolvency 3-Recovery rate (cents on the dollar).
The index is meant to assess some key systems and institutions that underpin the ease of access
to finance. Strong legal rights can facilitate the use of collateral to obtain credit and, at the same
time, improve the ability of lenders to collect claims in the event of default. This can encourage
lenders to extend credit, especially to SMEs. Strong credit registries and bureaus improve the
information on the quality of borrowers and help to ease access to credit. These requirements are
captured by the first three indicators on getting credit. Lenders or shareholders may also be
reluctant to provide finance if corporate insiders can manipulate information or appropriate funds
with little possibility for being sued by shareholders. The three indicators on protecting investors
are meant to assess this prerequisite for a well-functioning financial system. The last three
indicators measure the ease of resolving insolvency. Weak insolvency frameworks do not allow
timely corporate debt resolution so that companies facing difficulties remain insolvent while
their assets remain unavailable to their creditors. Efficient insolvency regimes can facilitate debt
recovery and company restructuring, thus encouraging lending and helping viable companies to
survive. A higher score of the index indicates better conditions for access to finance.v
Barriers to Open Markets: Includes 7 indicators from GCR and 3 indicators from DB:
-GCR indicators:
Prevalence of trade barriers;
Trade tariffs (trade-weighted average tariff rate);
Business impact of rules on FDI;
Burden of customs procedures;
Intensity of local competition;
Extent of market dominance;
Effectiveness of anti-monopoly policy.
-DB indicators:
Trading across borders 1-Documents to export (number);
Trading across borders 2-Time to export (days);
Trading across borders 3-Cost to export (US$ per container).
The index on barriers to open markets combines GCR and DB indicators on the prevalence of
trade barriers, the level of trade tariffs, the extent of regulation of FDI, and the extent of red tape
and the cost to ship goods overseas with indicators that capture the extent of competition and the
7
effectiveness of competition policy (the last three GCR indicators). The individual indicators are
measured in such a way that a lower score of the index signals lower barriers to open markets.vi
Barriers to Business Operations: Includes 10 indicators from DB:
Number of procedures to start a business;
Number of days to start a business;
Registering property 1-Procedures (number);
Registering property 2-Time (days);
Registering property 3-Cost (% of property value);
Construction permits 1- Procedures (number);
Construction permits 2-Time (days);
Construction permits 3-Cost (% of income per capita);
Enforcing contracts 1-Time (days);
Enforcing contracts 2-Cost (% of claim).
The index of barriers to business operations captures dimensions of the regulatory and policy
environment that may hamper the ability of businesses to adapt to changing conditions, or may
generate red tape and rent seeking that reduce business returns. The first two indicators measure
the administrative ease of starting a business. The next three indicators measure the ease and cost
of registering property. Bottlenecks in registering property may impede business operation,
especially in the more productive, formal sector. Unregistered property cannot be used as
collateral to obtain credit, thus limiting opportunities for new businesses to be created or existing
ones to expand. Obtaining construction permits is a common hurdle. The ease of obtaining
construction permits is measured by the 6th
, 7th
and 8th
indicators. They identify the extent to
which cumbersome procedures or licensing from several different agencies expose businesses to
opportunities for rent seeking. The last two indicators measure the time and cost involved in
resolving, through the local courts, a standard commercial dispute between domestic businesses.
In view of the definition of the individual indicators, a lower score of the composite index
signals lower barriers to business operations.
Methodology for the construction of the indexes
The three composite indexes of structural bottlenecks to growth have been constructed by first
normalizing the individual indicators listed above. For each individual indicator the mean and the
standard deviation have been computed for the entire sample of countries. The individual
indicators are then normalized by subtracting from each value the mean and dividing by the
computed standard deviation:
�̂�𝑛,𝑡𝑖 =
(𝑋𝑛,𝑡𝑖 − 𝑚𝑖)
𝜎𝑖
8
Where 𝑋𝑖 represents the i individual indicator from GCR and DB; n and t denote the country and
the year, respectively; and mi denotes the mean and 𝜎𝑖 the standard deviation of indicator 𝑋𝑖.
The aim of this normalization is to prevent one individual indicator with a high variance from
dominating the variation in the composite index. Each of the three composite indexes is
constructed using these transformed individual indicators. The composite indexes for each
country in each year are, first, computed as the average of the scores of the (normalized)
individual indicators. The three composite indexes are then normalized using a similar
transformation, by subtracting from each value the mean of the index and dividing by the
standard deviation of the composite index:vii
𝐼𝑛,𝑡𝑗
= (𝐼𝑛,𝑡
𝑗− 𝑚𝑗)
𝜎𝑗
Where 𝐼𝑗 represents the composite index j of structural bottlenecks to growth, n and t denote the
country and the year, respectively; and 𝑚𝑗accounts for the mean and 𝜎𝑗for the standard
deviation of index 𝑗. The values of the indexes indicate divergence from the mean in terms of
number of standard deviations (computed for the whole country sample).
We list below the ranking of the countries included in the sample on each of the three composite
indexes according to the average country scores on each index over the period 2005-2012
(Figures 1-3). Countries with better conditions for access to finance score higher on the relevant
composite index (“access to finance”). Countries with lower barriers to open markets and
barriers to business operations score lower on the respective composite indexes that measure
these barriers.viii

9
As shown in Figures 1-3, overall, the ten G20 emerging economies do not rank particularly well
on the three composite indexes compared to the other emerging economies included in the
sample. They are relatively better positioned on the index of barriers to open markets, where
their average rank is 14.9 among the 30 countries. However, room still exists for reform action
among the G20 members to unlock further growth gains from trade and cross-border investment.
Emerging G20 economies rank below average on the two other indicators, with an average rank
of 16.2 and 17.6 on the indexes of ease of access to finance and barriers to business operations,
respectively.
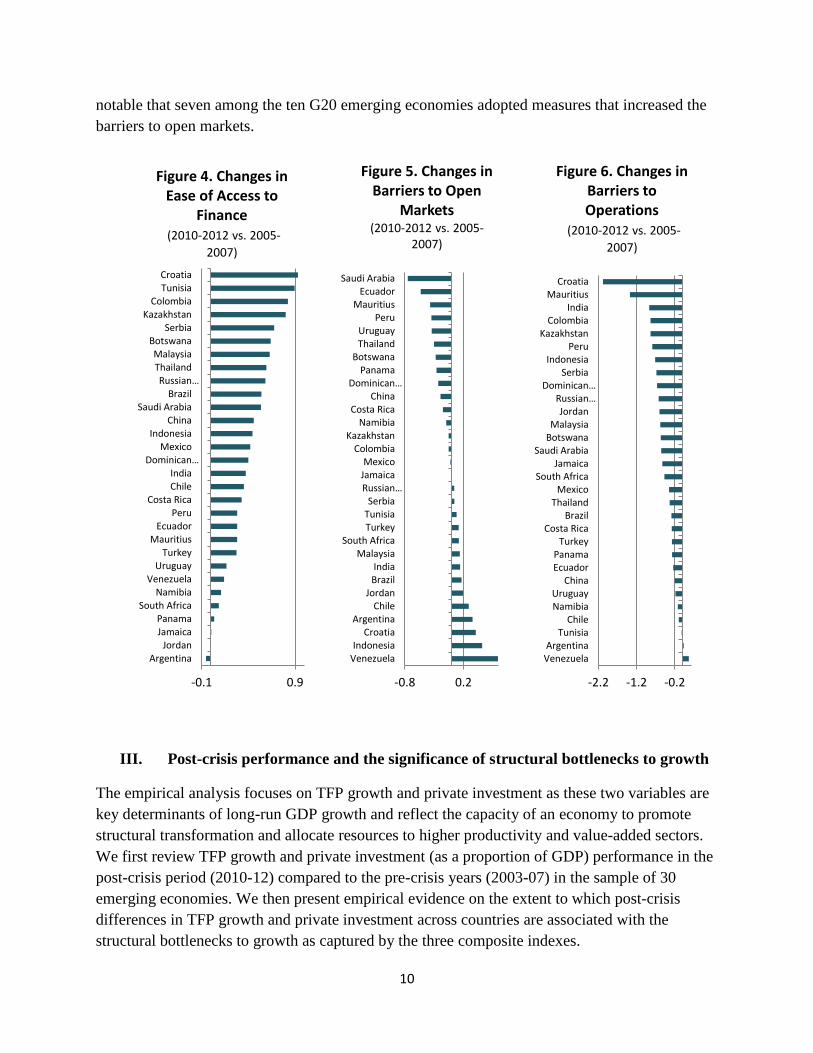
After the crisis, the emerging economies included in the sample have taken measures to address
the structural bottlenecks to growth as measured by the three composite indexes. This is shown
by the improved country scores in the post-crisis period (2010-12) compared to the scores in the
pre-crisis period (2005-07). All but two of the 30 countries saw an improvement in the indexes
measuring the access to finance and barriers to operations (Figure 4 and 6). By contrast, progress
in lowering barriers to open markets was uneven, with about half of the countries in the sample
reducing these barriers post-crisis but with the rest increasing these barriers (Figure 5). It is
-3 -1 1
VenezuelaJordan
Dominican RepEcuador
IndonesiaCosta Rica
BrazilChina
CroatiaTurkeyRussia
Saudi ArabiaKazakhstan
PanamaChile
ThailandIndia
TunisiaSerbia
JamaicaNamibia
ArgentinaMauritiusBotswana
PeruUruguay
MexicoColombia
South AfricaMalaysia
Figure 1. Ease of Access to Finance
-2 0 2 4
Venezuela
Kazakhstan
Russian…
Ecuador
Argentina
Serbia
Croatia
Colombia
Namibia
Botswana
Dominican…
Brazil
Mexico
Jamaica
Uruguay
India
Thailand
China
Peru
South Africa
Costa Rica
Turkey
Jordan
Indonesia
Tunisia
Mauritius
Panama
Saudi Arabia
Malaysia
Chile
Figure 2. Barriers to Open Markets
-2 0 2 4
India
Brazil
Indonesia
Venezuela
Argentina
Uruguay
Croatia
Russian…
Namibia
Colombia
Costa Rica
Serbia
Botswana
China
Ecuador
Jordan
Mauritius
Dominican…
Jamaica
Malaysia
Panama
South Africa
Mexico
Peru
Tunisia
Kazakhstan
Turkey
Chile
Saudi Arabia
Thailand
Figure 3. Barriers to Operations
10
notable that seven among the ten G20 emerging economies adopted measures that increased the
barriers to open markets.
III. Post-crisis performance and the significance of structural bottlenecks to growth
The empirical analysis focuses on TFP growth and private investment as these two variables are
key determinants of long-run GDP growth and reflect the capacity of an economy to promote
structural transformation and allocate resources to higher productivity and value-added sectors.
We first review TFP growth and private investment (as a proportion of GDP) performance in the
post-crisis period (2010-12) compared to the pre-crisis years (2003-07) in the sample of 30
emerging economies. We then present empirical evidence on the extent to which post-crisis
differences in TFP growth and private investment across countries are associated with the
structural bottlenecks to growth as captured by the three composite indexes.
-0.1 0.9
ArgentinaJordan
JamaicaPanama
South AfricaNamibia
VenezuelaUruguay
TurkeyMauritius
EcuadorPeru
Costa RicaChileIndia
Dominican…Mexico
IndonesiaChina
Saudi ArabiaBrazil
Russian…ThailandMalaysia
BotswanaSerbia
KazakhstanColombia
TunisiaCroatia
Figure 4. Changes in Ease of Access to
Finance (2010-2012 vs. 2005-
2007)
-0.8 0.2
VenezuelaIndonesia
CroatiaArgentina
ChileJordan
BrazilIndia
MalaysiaSouth Africa
TurkeyTunisiaSerbia
Russian…JamaicaMexico
ColombiaKazakhstan
NamibiaCosta Rica
ChinaDominican…
PanamaBotswana
ThailandUruguay
PeruMauritius
EcuadorSaudi Arabia
Figure 5. Changes in Barriers to Open
Markets (2010-2012 vs. 2005-
2007)
-2.2 -1.2 -0.2
VenezuelaArgentina
TunisiaChile
NamibiaUruguay
ChinaEcuadorPanama
TurkeyCosta Rica
BrazilThailand
MexicoSouth Africa
JamaicaSaudi Arabia
BotswanaMalaysia
JordanRussian…
Dominican…Serbia
IndonesiaPeru
KazakhstanColombia
IndiaMauritius
Croatia
Figure 6. Changes in Barriers to Operations
(2010-2012 vs. 2005-
2007)
11
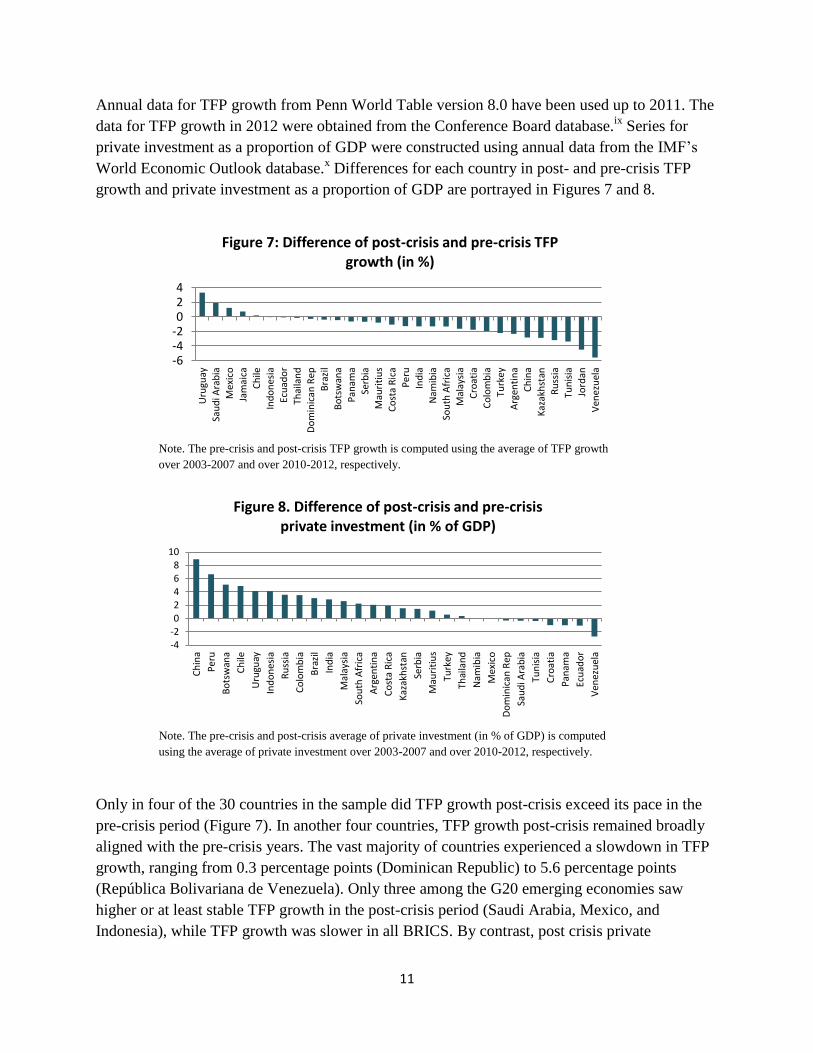
Annual data for TFP growth from Penn World Table version 8.0 have been used up to 2011. The
data for TFP growth in 2012 were obtained from the Conference Board database.ix
Series for
private investment as a proportion of GDP were constructed using annual data from the IMF’s
World Economic Outlook database.x Differences for each country in post- and pre-crisis TFP
growth and private investment as a proportion of GDP are portrayed in Figures 7 and 8.
Note. The pre-crisis and post-crisis TFP growth is computed using the average of TFP growth
over 2003-2007 and over 2010-2012, respectively.
Note. The pre-crisis and post-crisis average of private investment (in % of GDP) is computed
using the average of private investment over 2003-2007 and over 2010-2012, respectively.
Only in four of the 30 countries in the sample did TFP growth post-crisis exceed its pace in the
pre-crisis period (Figure 7). In another four countries, TFP growth post-crisis remained broadly
aligned with the pre-crisis years. The vast majority of countries experienced a slowdown in TFP
growth, ranging from 0.3 percentage points (Dominican Republic) to 5.6 percentage points
(República Bolivariana de Venezuela). Only three among the G20 emerging economies saw
higher or at least stable TFP growth in the post-crisis period (Saudi Arabia, Mexico, and
Indonesia), while TFP growth was slower in all BRICS. By contrast, post crisis private
-6-4-2024
Uru
guay
Sau
di A
rab
ia
Mex
ico
Jam
aica
Ch
ile
Ind
on
esia
Ecu
ado
r
Thai
lan
d
Do
min
ican
Rep
Bra
zil
Bo
tsw
ana
Pan
ama
Serb
ia
Mau
riti
us
Co
sta
Ric
a
Pe
ru
Ind
ia
Nam
ibia
Sou
th A
fric
a
Mal
aysi
a
Cro
atia
Co
lom
bia
Turk
ey
Arg
enti
na
Ch
ina
Kaz
akh
stan
Ru
ssia
Tun
isia
Jord
an
Ven
ezu
ela
Figure 7: Difference of post-crisis and pre-crisis TFP growth (in %)
-4-202468
10
Ch
ina
Pe
ru
Bo
tsw
ana
Ch
ile
Uru
guay
Ind
on
esia
Ru
ssia
Co
lom
bia
Bra
zil
Ind
ia
Mal
aysi
a
Sou
th A
fric
a
Arg
enti
na
Co
sta
Ric
a
Kaz
akh
stan
Serb
ia
Mau
riti
us
Turk
ey
Thai
lan
d
Nam
ibia
Mex
ico
Do
min
ican
Rep
Sau
di A
rab
ia
Tun
isia
Cro
atia
Pan
ama
Ecu
ado
r
Ven
ezu
ela
Figure 8. Difference of post-crisis and pre-crisis private investment (in % of GDP)
12
investment in proportion to GDP has been significantly more resilient than TFP growth. It
exceeded its pre-crisis level in 18 countries of the sample while it declined in only 4 (Figure 8).
Private investment was higher post-crisis in eight of the G20 emerging economies.
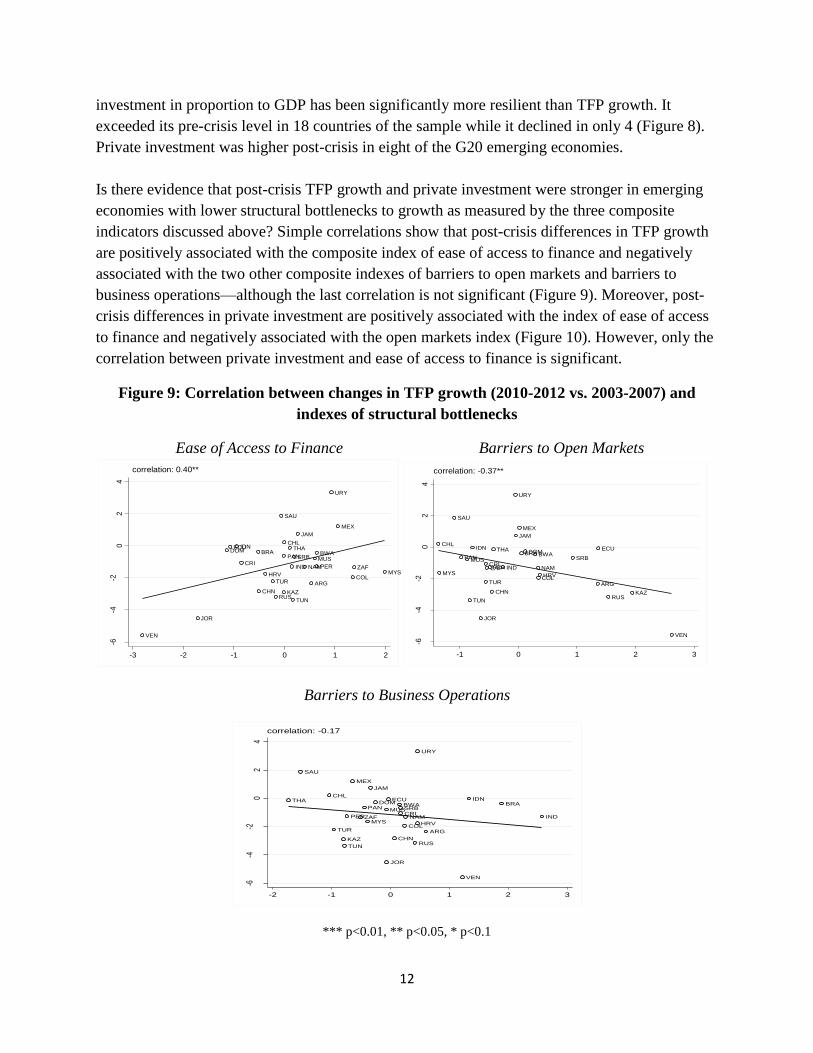
Is there evidence that post-crisis TFP growth and private investment were stronger in emerging
economies with lower structural bottlenecks to growth as measured by the three composite
indicators discussed above? Simple correlations show that post-crisis differences in TFP growth
are positively associated with the composite index of ease of access to finance and negatively
associated with the two other composite indexes of barriers to open markets and barriers to
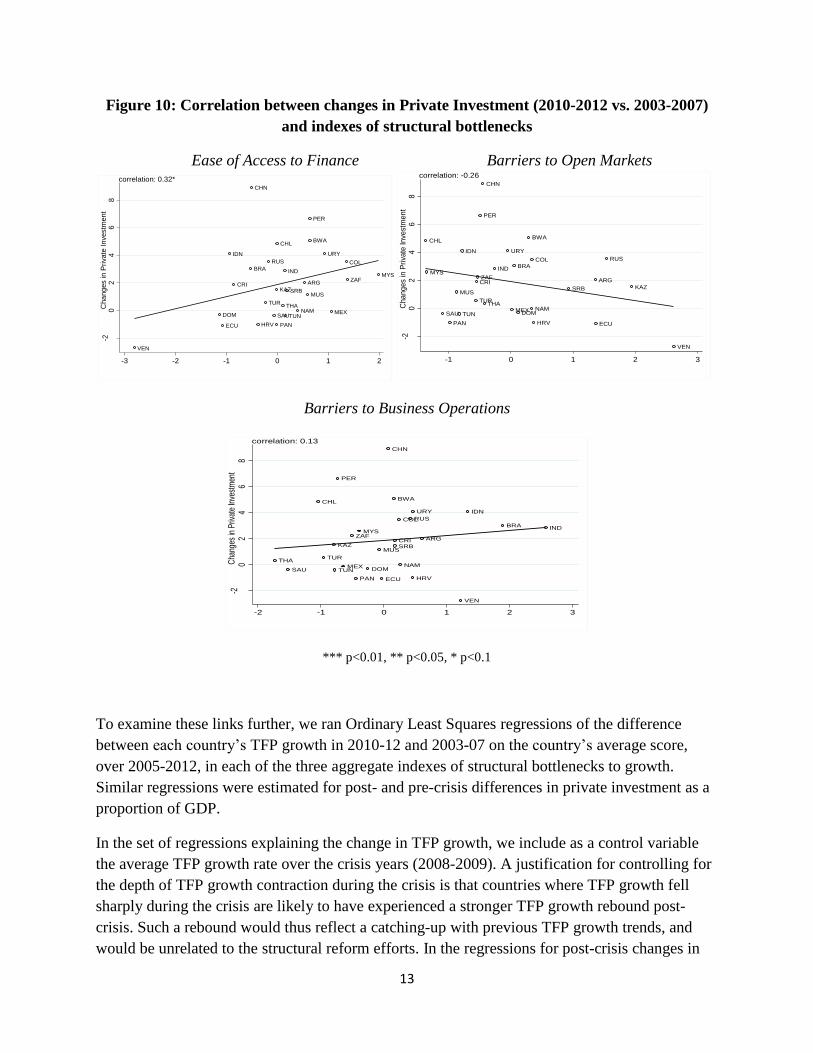
business operations—although the last correlation is not significant (Figure 9). Moreover, post-
crisis differences in private investment are positively associated with the index of ease of access
to finance and negatively associated with the open markets index (Figure 10). However, only the
correlation between private investment and ease of access to finance is significant.
Figure 9: Correlation between changes in TFP growth (2010-2012 vs. 2003-2007) and
indexes of structural bottlenecks
Ease of Access to Finance Barriers to Open Markets
Barriers to Business Operations
*** p<0.01, ** p<0.05, * p<0.1
ARG
BRA BWA
CHL
CHN
COL
CRI
DOMECU
HRV
IDN
IND
JAM
JOR
KAZ
MEX
MUS
MYSNAM
PAN
PER
RUS
SAU
SRB
THA
TUN
TUR
URY
VEN
ZAF
-6-4
-20
24
Cha
ng
es in
TF
P g
row
th
-3 -2 -1 0 1 2
correlation: 0.40**
ARG
BRA BWA
CHL
CHN
COL
CRI
DOMECU
HRV
IDN
IND
JAM
JOR
KAZ
MEX
MUS
MYSNAM
PAN
PER
RUS
SAU
SRB
THA
TUN
TUR
URY
VEN
ZAF
-6-4
-20
24
Cha
ng
es
in T
FP
gro
wth
-1 0 1 2 3
correlation: -0.37**
ARG
BRABWA
CHL
CHN
COL
CRI
DOMECU
HRV
IDN
IND
JAM
JOR
KAZ
MEX
MUS
MYSNAM
PAN
PER
RUS
SAU
SRB
THA
TUN
TUR
URY
VEN
ZAF
-6-4
-20
24
Cha
nges
in T
FP g
row
th
-2 -1 0 1 2 3
correlation: -0.17
13
Figure 10: Correlation between changes in Private Investment (2010-2012 vs. 2003-2007)
and indexes of structural bottlenecks
Ease of Access to Finance Barriers to Open Markets
Barriers to Business Operations
*** p<0.01, ** p<0.05, * p<0.1
To examine these links further, we ran Ordinary Least Squares regressions of the difference
between each country’s TFP growth in 2010-12 and 2003-07 on the country’s average score,
over 2005-2012, in each of the three aggregate indexes of structural bottlenecks to growth.
Similar regressions were estimated for post- and pre-crisis differences in private investment as a
proportion of GDP.
In the set of regressions explaining the change in TFP growth, we include as a control variable
the average TFP growth rate over the crisis years (2008-2009). A justification for controlling for
the depth of TFP growth contraction during the crisis is that countries where TFP growth fell
sharply during the crisis are likely to have experienced a stronger TFP growth rebound post-
crisis. Such a rebound would thus reflect a catching-up with previous TFP growth trends, and
would be unrelated to the structural reform efforts. In the regressions for post-crisis changes in
ARG
BRA
BWACHL
CHN
COL
CRI
DOM
ECU HRV
IDN
IND
KAZ
MEX
MUS
MYS
NAM
PAN
PER
RUS
SAU
SRB
THA
TUN
TUR
URY
VEN
ZAF
-20
24
68
-3 -2 -1 0 1 2
correlation: 0.32*
Cha
ng
es in
Pri
vate
In
vestm
en
t
ARG
BRA
BWACHL
CHN
COL
CRI
DOM
ECUHRV
IDN
IND
KAZ
MEX
MUS
MYS
NAM
PAN
PER
RUS
SAU
SRB
THA
TUN
TUR
URY
VEN
ZAF
-20
24
68
-1 0 1 2 3
correlation: -0.26
Cha
ng
es
in P
riva
te In
vest
men
t
ARG
BRA
BWACHL
CHN
COL
CRI
DOM
ECU HRV
IDN
IND
KAZ
MEX
MUS
MYS
NAM
PAN
PER
RUS
SAU
SRB
THA
TUN
TUR
URY
VEN
ZAF
Cha
nges
in P
rivat
e In
vest
men
t-2
02
46
8
-2 -1 0 1 2 3
correlation: 0.13
14
the private investment ratio, we include as a control variable the average GDP growth rate over
the crisis (2008-2009). The intuition here is that relatively higher economic growth during the
crisis may have boosted confidence, helping businesses to maintain and possibly increase
investment in the aftermath of the crisis.
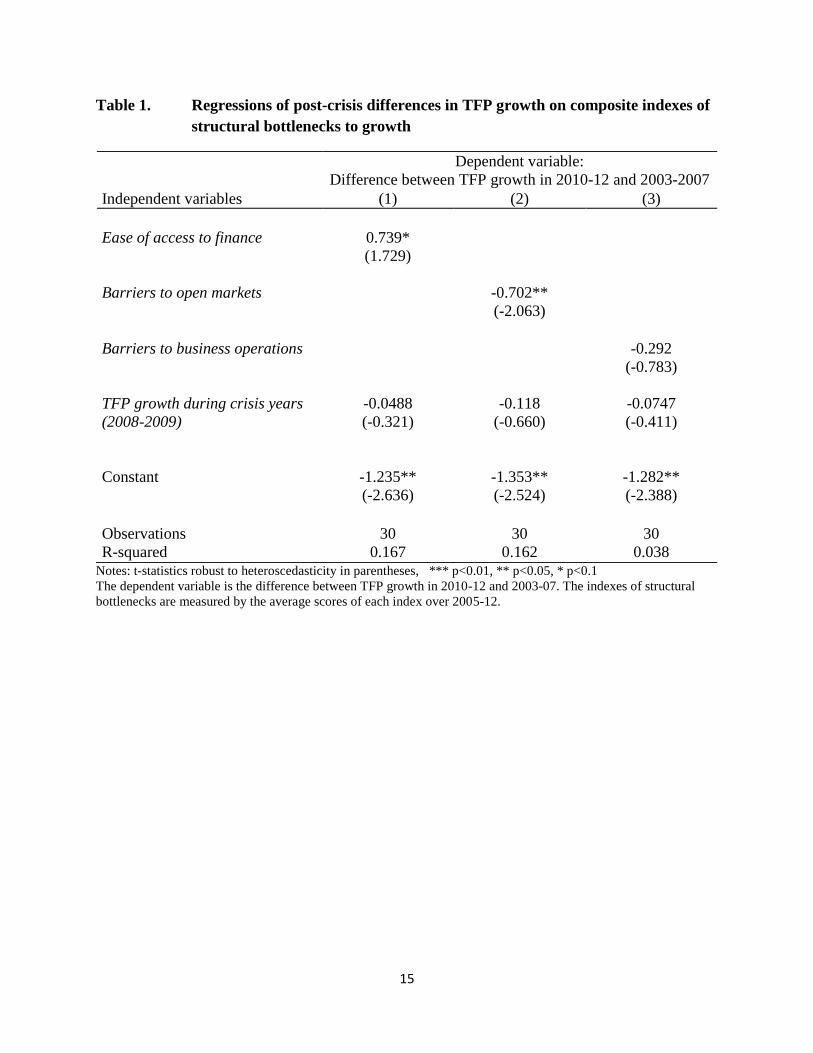
Table 1 shows results for post-crisis TFP growth. The coefficients of the three indexes have the
expected sign: easier access to finance (column 1), lower barriers to open markets (column 2),
and lower barriers to business operations (column 3) are all associated with higher TFP growth
post-crisis compared to pre-crisis levels. Only the coefficient associated with barriers to
operations is not significant.
Table 2 shows the results for changes in private investment post-crisis compared to pre-crisis
levels. Easier access to finance (column 1) has a significant positive effect on private investment
changes. Lower barriers to open markets are associated with higher private investment post-crisis
but the effect is not significant (column 2). Lower barriers to business operations carry the
“wrong sign” and are not statistically significant.
The robust results on the impact of barriers to open markets on TFP growth post-crisis are worth
emphasizing. As the reduction of these barriers has been slow post-crisis, and they have even
increased in several emerging economies, including G20 members (Figure 5), a more ambitious
reform agenda in this area can contribute to faster potential growth by boosting TFP growth.
15
Table 1. Regressions of post-crisis differences in TFP growth on composite indexes of
structural bottlenecks to growth
Dependent variable:
Difference between TFP growth in 2010-12 and 2003-2007
Independent variables (1) (2) (3)
Ease of access to finance 0.739*
(1.729)
Barriers to open markets -0.702**
(-2.063)
Barriers to business operations -0.292
(-0.783)
TFP growth during crisis years
(2008-2009)
Constant
-0.0488
(-0.321)
-1.235**
(-2.636)
-0.118
(-0.660)
-1.353**
(-2.524)
-0.0747
(-0.411)
-1.282**
(-2.388)
Observations 30 30 30
R-squared 0.167 0.162 0.038 Notes: t-statistics robust to heteroscedasticity in parentheses, *** p<0.01, ** p<0.05, * p<0.1
The dependent variable is the difference between TFP growth in 2010-12 and 2003-07. The indexes of structural
bottlenecks are measured by the average scores of each index over 2005-12.
16
Table 2. Regressions of post-crisis differences in private investment (in % of GDP) on
composite indexes of structural bottlenecks to growth
Dependent variable:
Difference between private investment in 2010-12 and
2003-2007
Independent variables (1) (2) (3)
Ease of access to finance 0.961***
(2.859)
Barriers to open markets -0.501
(-1.071)
Barriers to business operations 0.234
(0.515)
GDP growth during crisis years
(2008-2009)
0.285
(1.295)
0.214
(0.974)
0.247
(1.072)
Constant 1.191**
(2.202)
1.422**
(2.517)
1.330**
(2.195)
Observations 28 28 28
R-squared 0.210 0.125 0.098 Notes: t-statistics robust to heteroscedasticity in parentheses, *** p<0.01, ** p<0.05, * p<0.1
The dependent variable is the difference between private investment (in % of GDP) in 2010-12 and 2003-07.
The independent variables are measured by the average scores of each index over 2005-12.
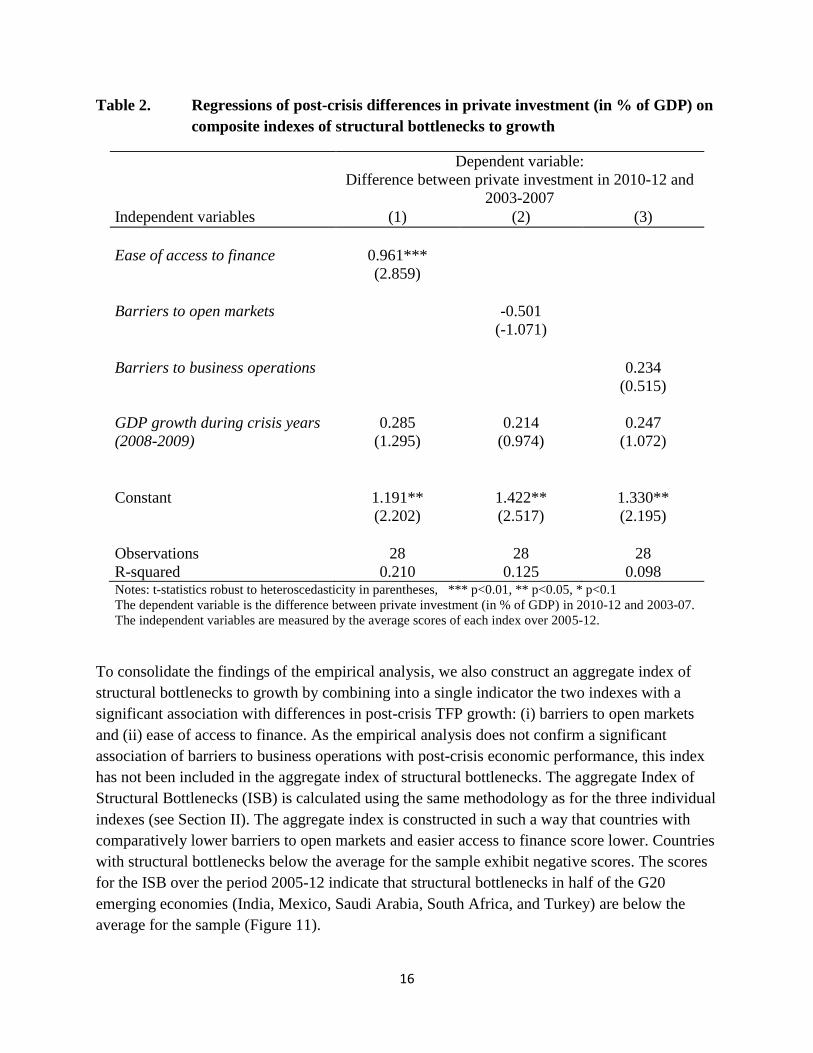
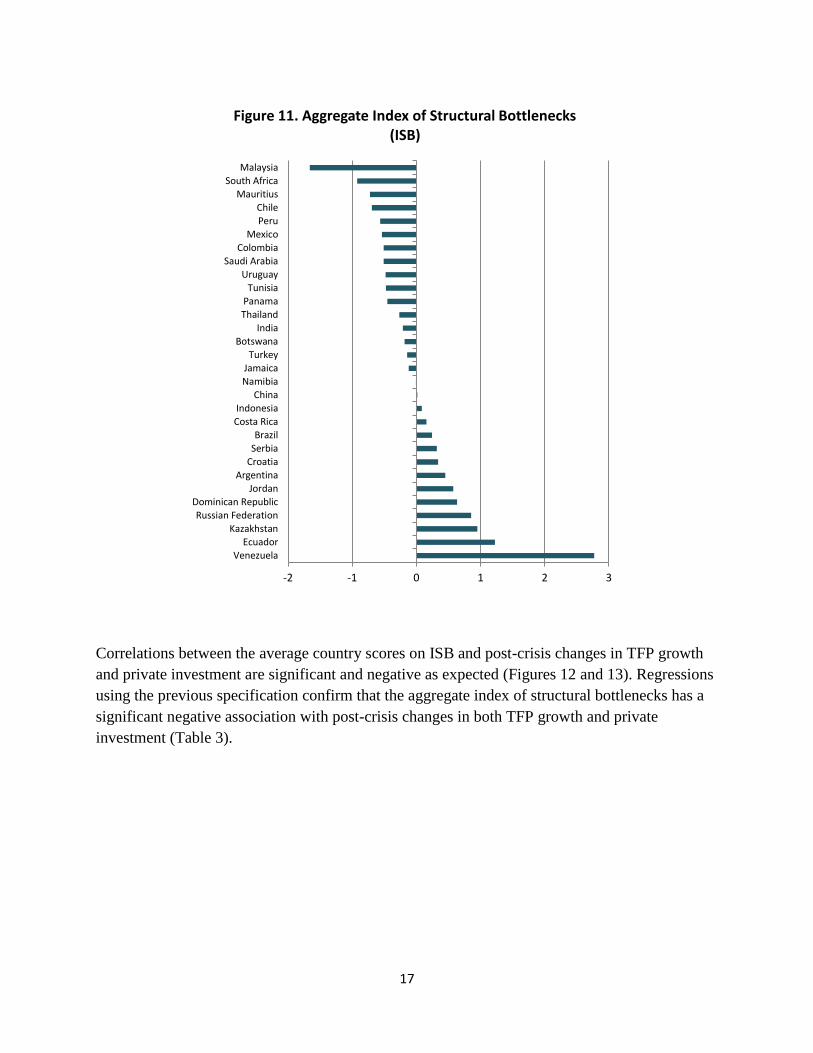
To consolidate the findings of the empirical analysis, we also construct an aggregate index of
structural bottlenecks to growth by combining into a single indicator the two indexes with a
significant association with differences in post-crisis TFP growth: (i) barriers to open markets
and (ii) ease of access to finance. As the empirical analysis does not confirm a significant
association of barriers to business operations with post-crisis economic performance, this index
has not been included in the aggregate index of structural bottlenecks. The aggregate Index of
Structural Bottlenecks (ISB) is calculated using the same methodology as for the three individual
indexes (see Section II). The aggregate index is constructed in such a way that countries with
comparatively lower barriers to open markets and easier access to finance score lower. Countries
with structural bottlenecks below the average for the sample exhibit negative scores. The scores
for the ISB over the period 2005-12 indicate that structural bottlenecks in half of the G20
emerging economies (India, Mexico, Saudi Arabia, South Africa, and Turkey) are below the
average for the sample (Figure 11).
17
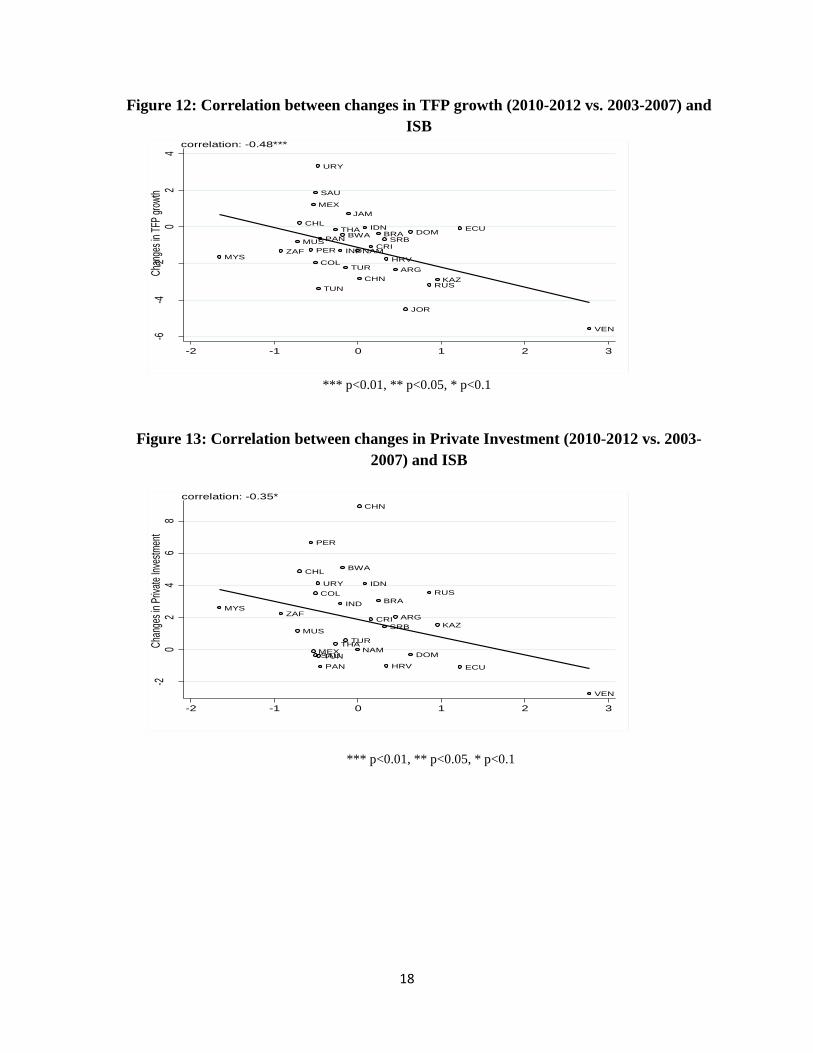
Correlations between the average country scores on ISB and post-crisis changes in TFP growth
and private investment are significant and negative as expected (Figures 12 and 13). Regressions
using the previous specification confirm that the aggregate index of structural bottlenecks has a
significant negative association with post-crisis changes in both TFP growth and private
investment (Table 3).
-2 -1 0 1 2 3
VenezuelaEcuador
Kazakhstan
Russian Federation
Dominican Republic
Jordan
Argentina
Croatia
Serbia
BrazilCosta Rica
Indonesia
ChinaNamibia
Jamaica
TurkeyBotswana
India
ThailandPanama
Tunisia
UruguaySaudi Arabia
Colombia
MexicoPeru
Chile
MauritiusSouth Africa
Malaysia
Figure 11. Aggregate Index of Structural Bottlenecks (ISB)
18
Figure 12: Correlation between changes in TFP growth (2010-2012 vs. 2003-2007) and
ISB
*** p<0.01, ** p<0.05, * p<0.1
Figure 13: Correlation between changes in Private Investment (2010-2012 vs. 2003-
2007) and ISB
*** p<0.01, ** p<0.05, * p<0.1
ARG
BRABWA
CHL
CHN
COL
CRI
DOMECU
HRV
IDN
IND
JAM
JOR
KAZ
MEX
MUS
MYSNAM
PAN
PER
RUS
SAU
SRB
THA
TUN
TUR
URY
VEN
ZAF
-6-4
-20
24
-2 -1 0 1 2 3
correlation: -0.48***
Cha
nges
in T
FP g
row
th
ARG
BRA
BWACHL
CHN
COL
CRI
DOM
ECUHRV
IDN
IND
KAZ
MEX
MUS
MYS
NAM
PAN
PER
RUS
SAU
SRB
THA
TUN
TUR
URY
VEN
ZAF
-20
24
68
-2 -1 0 1 2 3
correlation: -0.35*
Cha
nges
in P
rivat
e In
vest
men
t
19
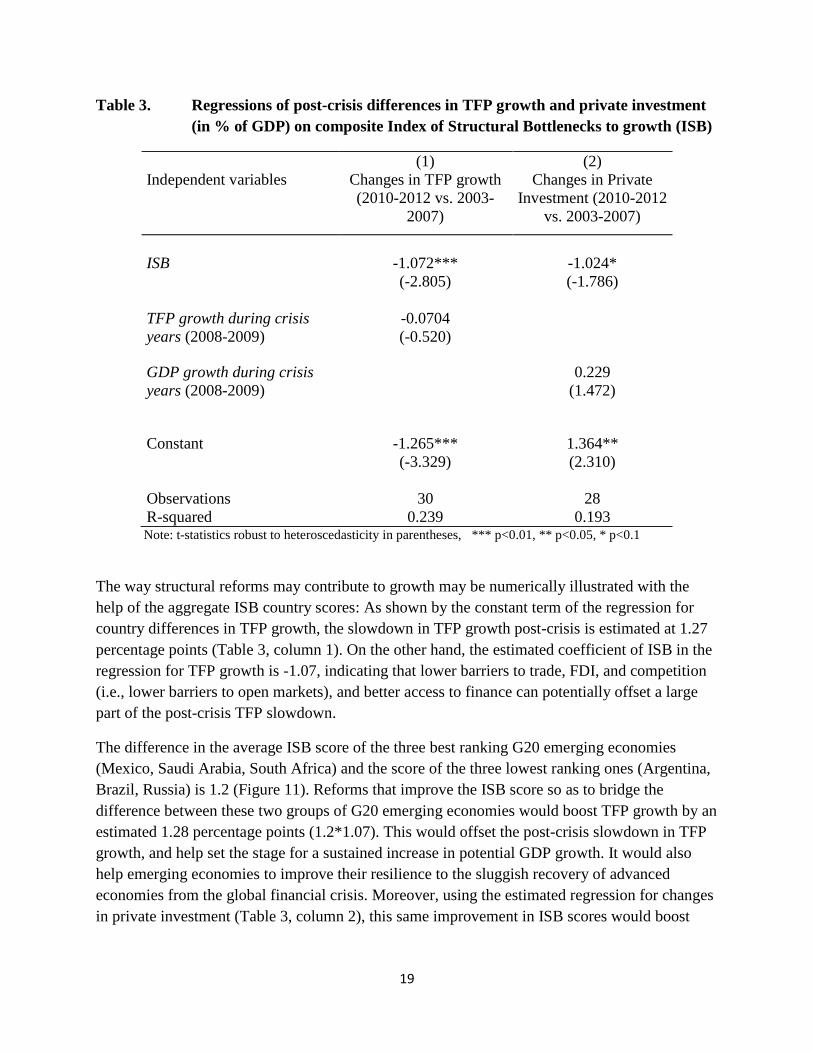
Table 3. Regressions of post-crisis differences in TFP growth and private investment
(in % of GDP) on composite Index of Structural Bottlenecks to growth (ISB)
(1) (2)
Independent variables Changes in TFP growth
(2010-2012 vs. 2003-
2007)
Changes in Private
Investment (2010-2012
vs. 2003-2007)
ISB -1.072***
(-2.805)
-1.024*
(-1.786)
TFP growth during crisis
years (2008-2009)
-0.0704
(-0.520)
GDP growth during crisis
years (2008-2009)
0.229
(1.472)
Constant -1.265***
(-3.329)
1.364**
(2.310)
Observations 30 28
R-squared 0.239 0.193 Note: t-statistics robust to heteroscedasticity in parentheses, *** p<0.01, ** p<0.05, * p<0.1
The way structural reforms may contribute to growth may be numerically illustrated with the
help of the aggregate ISB country scores: As shown by the constant term of the regression for
country differences in TFP growth, the slowdown in TFP growth post-crisis is estimated at 1.27
percentage points (Table 3, column 1). On the other hand, the estimated coefficient of ISB in the
regression for TFP growth is -1.07, indicating that lower barriers to trade, FDI, and competition
(i.e., lower barriers to open markets), and better access to finance can potentially offset a large
part of the post-crisis TFP slowdown.
The difference in the average ISB score of the three best ranking G20 emerging economies
(Mexico, Saudi Arabia, South Africa) and the score of the three lowest ranking ones (Argentina,
Brazil, Russia) is 1.2 (Figure 11). Reforms that improve the ISB score so as to bridge the
difference between these two groups of G20 emerging economies would boost TFP growth by an
estimated 1.28 percentage points (1.2*1.07). This would offset the post-crisis slowdown in TFP
growth, and help set the stage for a sustained increase in potential GDP growth. It would also
help emerging economies to improve their resilience to the sluggish recovery of advanced
economies from the global financial crisis. Moreover, using the estimated regression for changes
in private investment (Table 3, column 2), this same improvement in ISB scores would boost
20
private investment by an estimated 1.22 (1.2*1.02) percentage points of GDP, further stimulating
GDP growth and spurring job creation in emerging economies.
IV. Conclusion
Growth has slowed in emerging economies in the years following the global financial crisis,
partly because of cyclical reasons, owing to the sluggish recovery of advanced economies, and
partly because of structural reasons, reflecting a homegrown slowdown in potential growth.
Emerging economies are also exposed to the risk of the so-called “middle-income traps” as they
exhaust the potential for low-hanging productivity gains from factor reallocation out of
agriculture and technological catch-up. The risks associated with the “new normal” of the post-
crisis global environment and possible “middle-income traps” could be mitigated by a renewed
focus on reforms to spur structural transformation. Such reforms would need to facilitate
resource allocation toward more productive and higher value-added activities and the production
of more innovative goods and services.
Our results suggest that removing bottlenecks to such structural transformation may help sustain
high growth in emerging economies in the future. We focused on structural bottlenecks arising
from barriers to open markets—including obstacles to trade, FDI, market entry, and
competition—barriers to business operation, and barriers to access to finance. Empirical
evidence from a sample of upper middle-income emerging economies indicates that barriers to
open markets and the ease of access to finance are significantly associated with changes in post-
crisis TFP growth and private investment compared to the pre-crisis period.
The findings suggest that improving the policy framework in these two areas, by bringing it up to
the level of the best-ranking emerging economies, could offset the growth slowdown in the post-
crisis period. Reforms to reduce barriers to open markets would merit particular attention as in
this area progress has been limited and uneven. Practically all G20 members have resorted to
trade distorting measures since the onset of the crisis, some more than others. In the post-crisis
period, several G20 emerging economies have raised barriers to trade and FDI (WTO, 2014). To
date, the G20 has reached multilateral commitment only to refraining from imposing new
protectionist measures but has shown low ambition on multilateral cooperation for trade reform
to reduce trade barriers and increase transparency in trade. Not only is there a need to adhere
firmly to the G20 commitment to refrain from new protectionist measures, but there is also a
need to unwind the protectionist measures that have been put in place so far and to implement
fresh reforms to reduce trade barriers (including in services) and improve investment disciplines.
These actions need to be complemented by domestic regulatory and institutional reforms to
enhance competition in product and factor markets.
21
References
Ang, J.B. (2008), “A Survey of Recent Developments in the Literature on Finance and Growth”,
Journal of Economic Surveys, 22(3), 536-576.
Chowdhury, A. and G. Mavrotas (2006), “FDI and Growth: What Causes What?”, The World
Economy, 29(1), 9-19.
Dabla-Norris, Era, et al. (2013), “Anchoring Growth: The Importance of Productivity-
Enhancing Reforms in Emerging Market and Developing Economies,” IMF Staff Discussion
Note SDN/13/08.
Dethier, J-J., M. Hirn and S. Straub (2010), “Explaining Enterprise Performance in Developing
Countries with Business Climate Survey Data”, The World Bank Research Observer, 26(2), 258-
309.
Djankov, S., C. McLiesh, R.M. Ramalho (2006), “Regulation and Growth”, Economic Letters,
(92), 395-401.
Eichengreen, Barry, Donghyung Park and Kwanho Shin (2013), “Growth Slowdowns Redux:
New Evidence on the Middle-Income Trap”, NBER Working Paper, 18673, January.
Hanusch, M. (2012), “The Doing Business Indicators, economic growth and Regulatory
Reform”, The World Bank, Policy Research Working Paper No. 6176, August.
Im, F. and D. Rosenblatt (2013), “Middle-income Traps: A Conceptual and Empirical Survey”,
World Bank Policy Research Working paper No. 6594, September.
Kharas, H. and H. Kohli (2011), “What is the Middle Income Trap, Why do Countries Fall into
it, and How Can it be avoided?”, Global Journal of Emerging Market Economies, 3(3) 281-289
Loayza, N., A.M. Oviedo and L. Serven (2010), “Regulation and macroeconomic Performance”,
in N.V. Loayza and L. Serven, “Business Regulation and Economic Performance”, The World
Bank, Washington DC, 65-117.
Nicoletti, G. and S. Scarpetta (2003), “Regulation, Productivity, and Growth: OECD Evidence”,
Economic Policy, 18(36), 11-72.
Schiantarelli, F. (2010), “Product market Regulation and Macroeconomic Performance: A
Review of Cross-Country Evidence’, in N.V. Loayza and L. Serven, “Business Regulation and
Economic Performance”, The World Bank, Washington DC, 23-63.
Singh, T. (2010), “Does International Trade Cause Economic Growth? A Survey” The World
Economy, 33(11), 1517-1564.
22
World Bank (2014a), “Growth in the Post-Crisis Global Economy: Policy Challenges For
Developing Countries”, Development Committee of the Board of Governors of the World Bank
and the IMF, March.
World Bank (2014b), “Doing Business 2014: Understanding Regulations for Small and Medium-
Size Enterprises”, Washington DC.
World Economic Forum (2013), “The Global Competitiveness report 2013-14”, Geneva.
World Trade Organization (2014). Report to the TPRB from the Director-General on Trade-
related Developments. WT/TPR/ov/w/8. World Trade Organization.
23
Endnotes
i Country sample: Argentina, Botswana, Brazil, Chile, China, Colombia, Costa Rica, Croatia, Dominican Republic,
Ecuador, India, Indonesia, Jamaica, Jordan, Kazakhstan, Malaysia, Mauritius, Mexico, Namibia, Panama, Peru,
Russian Federation, Saudi Arabia, Serbia, South Africa, Thailand, Tunisia, Turkey, Uruguay, and Venezuela (G20
members in bold).
ii There is an extensive empirical literature on finance and growth. A recent survey is provided by J.B. Ang (2008).
iii As for the linkages between finance and growth, the empirical literature on trade, FDI, and growth is extensive.
Surveys are provided by T. Singh (2010) and A. Chowdhury and G. Mavrotas (2006). iv For detailed descriptions of the indicators used, see World Bank (2014b) and World Economic Forum (2013).
v In order to ensure consistency in the definition of the composite index, the indicators of time and cost to resolve
insolvency are multiplied by -1. vi In view of their definition in GCR, the indicators on prevalence of trade barriers, business impact of rules on FDI,
and burden of customs procedures are multiplied by -1. vii
Instead of using the average of the individual normalized indicators to construct the composite indicators, we also experimented with a different aggregation procedure using principal components analysis. The results are broadly similar to those shown below and are available on request. viii
Countries with a positive score on the access to finance index are characterized by better conditions for access to finance compared to the average for the sample. Concerning the indexes of barriers to open markets and barriers to business operations, countries with a negative score are characterized by lower barriers than the average for the sample as measured by the respective composite indexes. ix Data sources are respectively: http://www.rug.nl/research/ggdc/data/penn-world-table and
https://www.conference-board.org/data/economydatabase/. The TFP growth data for 2012 from the Conference Board are available for 25 countries of the sample. For the remaining 5 countries, the post-crisis data cover only the shorter 2010-11 period. x Private investment as proportion of GDP is computed by dividing the real private investment (current private
investment deflated by the investment deflator) by the real GDP. No data are available to allow the computation of the private investment variable for Jamaica and Jordan.