bollywood-hollywood initiative - infojustice.org
TRANSCRIPT


1
PIRACY ESTIMATION STUDY
!@#
Table of Contents 1. Business Ecosystem: Key Drivers of Piracy ............................................................... 7
2. Business Ecosystem: Key drivers of Piracy in Relation to Each Industry Segment 10
2.1. Film Industry............................................................................................ 10 2.2. Music Industry.......................................................................................... 12 2.3. Television Industry:.................................................................................. 14 2.4. Gaming Industry....................................................................................... 16
3. Financial Estimates and Methodology………………………………………………. 18
3.1. Summary of Revenue Streams Impacted by Piracy:................................... 18 3.2. Summary of Methodologies Adopted for Piracy Estimation: ..................... 19 3.3. Optical Disc Piracy:................................................................................. 20 3.4. Cassette Piracy: ....................................................................................... 23 3.5. Internet Piracy: ........................................................................................ 23 3.6. Cable Piracy: ........................................................................................... 24 3.7. Loss Due to Under Declaration:............................................................... 29
4. Employment Loss Estimates .............................................................................. 31 5. The Way Forward..................................................................................................... 36
6. Annexure: List of Company and Association meetings ........................................... 38
© 2008 US India Business Council Note: Information in this publication is intended to provide an overview of the estimated loss due to piracy in chosen segments of the Media & Entertainment industry. It should neither be regarded as comprehensive nor sufficient for making decisions, nor should it be used in place of professional advice. Ernst & Young Pvt. Ltd. accepts no responsibility for any loss arising from any action taken or not taken by anyone using this material.
2 !@#
FOREWORD
The US-India Business Council (USIBC), together with the U.S. Chamber’s Global Intellectual Property Center, is pleased to present this report on “The Effects of Counterfeiting and Piracy on India’s Entertainment Industry.” This report is a part of the “Bollywood-Hollywood Anti-Piracy Initiative” – a multifaceted initiative aimed at the scourge of piracy and counterfeiting that plagues both the US and Indian media and entertainment industries. This report estimates that the Indian media and entertainment industry loses some 820,000 jobs and revenue equivalent to $4 billion each year to piracy and counterfeiting. Bollywood makes more feature films than any film industry on earth and yet has only about 2% of the revenues of Hollywood. Hollywood is the largest film industry by revenue in the world and yet India with a sixth of the world’s population and fourth largest economy is only a marginal market for Hollywood. The story is much the same for music, television, electronic games and across the media and entertainment sectors. Counterfeiting and piracy are chief causes of this situation. For this reason, USIBC in cooperation with the Federation of Indian Chambers of Commerce and Industry (FICCI) launched the “Bollywood-Hollywood Anti-Piracy Initiative.” This report is only a part of this initiative. USIBC commissioned Ernst & Young Pvt. Ltd. to carry out the study for this report. The USIBC is delighted that we will be working with FICCI and the World Intellectual Property Organization (WIPO) to spread the word that piracy hurts everyone in the long run. We are pushing for optical disc legislation to help regulate piracy-facilitating technology and to use technology to frustrate pirates and counterfeiters. We are working with governments internationally to stop piracy. The optical disc legislation prepared by the FICCI committee and presented to the Ministry of Information and Broadcasting should be adopted quickly, as it provides an important opportunity to safeguard investments in intellectual property and will empower law enforcement officials to strike at the heart of counterfeiting and piracy. It would also cement India’s status as an early adopter of international best practices, joining at least 16 other nations that have already adopted this critical legislation such as Hong Kong, China, Taiwan, Malaysia, Indonesia, and Thailand. Four other nations are currently reviewing drafts of such legislation. In joining this group of early adopters, India will be able to credibly argue for similar protections in other key markets, which will aid India’s firms looking to expand globally.
The USIBC looks forward to continuing to work with our Indian colleagues to stop piracy and build jobs and prosperity through the growth of the Indian and US media and entertainment industries.
Ronald S. Somers President US-India Business Council The US-India Business Council is the premier business advocacy organization representing America’s top companies investing in India, joined by global Indian companies, promoting economic reforms with an aim to deepen trade and strengthen commercial ties.

3
PIRACY ESTIMATION STUDY
!@#
Executive Summary
The Media and Entertainment (M&E) business in India is one of the fastest growing segments of the economy. It is a US$ 11 bn industry growing at a CAGR of 18%. The segment-wise revenue share of the M&E industry in India is depicted below.
Segment wise revenue share of the M&E Industry
2%1% 3% 1%
42%
0%
30%
21%
Television Print Media Filmed EntertainmentMusic Gaming OOH advertisingRadio Internet advertising
However the M&E industry in India has been plagued by widespread piracy. Piracy clearly has struck deep roots in India and elsewhere. It is difficult to contain piracy until there are comprehensive measures adopted by all stakeholders in step with the government and the law enforcement agencies. The efforts have so far been a mix of some creative initiatives and old conventional methods. However, these have been limited in their impact due to the fragmented nature of the effort undertaken by various industry bodies and individual players. The underground nature of piracy itself and the fact that it lurks in almost every sector of the M&E industry makes it imperative to quantify and assess where the key revenue leakages are and where the loss really lies. It is only then that there can be cogent policy initiatives with global cooperation to assist the industry in tackling this menace. This study endeavors to address this issue and attempts to estimate the loss due to piracy with special focus on films, television, music and gaming segments.
Corporate India has always acted against piracy in support of the M&E industry. This study hopes to bring together all strands of the M&E business and assess & quantify the direct loss due to the piracy rampant across the M&E industry.
Revenue Loss Due To Piracy:
The current losses to the industry due to piracy are estimated to be US$ 4 billion per year. The segment-wise losses are depicted below.
Loss due to piracy for the M&E industry in India: Industry S ize of the Industry Value Loss due to Piracy Estimated Piracy
US$ mn US$ mn % of Total Market1
Film2 2,095 959 31%Music 183 325 64%Gaming 24 40 63%Television 4,263 2,682 39%
6,565 4,005 38%
Note1: The total market includes the legitimate and the pirated business
Source: SSKI Media Research, June 2007

4 !@#
Comparative estimates of sector-wise revenue losses
0
1,000
2,000
3,000
4,000
5,000
Television FilmedEntertainment
M usic Gaming
US
$ m
n
Legitimate M arket Pirated M arket
The revenue losses have been estimated based on extensive primary research (industry players, visits to the grey market and meetings with entities engaged in piracy), anecdotal evidence gathered through industry interviews, and trusted secondary sources.
As the first stage, the market size and value chain have been estimated for each of the four business segments (films, television, music and gaming segments).
As the next stage, the key factors resulting in loss of revenues through piracy have been determined and the revenue loss has been estimated for the same across the value chain. This has been done through interviews with key companies representing each businesses segment, individuals engaged in piracy, legal experts and independent industry experts.
The industry loss estimates have been validated and revised using surrogates, assessment of market consumption capacities and by reconciling the loss estimates with inputs from a different set of experts and media companies in each of the business segments.
Employment Loss Due To Piracy:
Piracy also has a direct impact on employment. The employment loss due to piracy comprises of direct loss due to decrease in volumes of sales and loss of employment due to impact on production itself i.e. fewer records, movies, games etc. being produced.
The total estimated loss of employment to the M&E industry is estimated to be 819,712.
Employment loss due to piracy for the M&E industry in India:
Market
Total S ize of the Market (US$ mn)
Total people employed (Nos)
Revenue Per Employee(US$ mn)
Total Loss to the market (US$ mn) Factor of Loss
Loss of Employment % Loss
Gaming 24 3,500 0.0068 40 50% 2,927 84%Television 4,263 506,290 0.0084 2,683 35% 111,530 22%Films 2,095 5,000,000 0.0004 959 25% 571,896 11%Music Industry 183 150,000 0.0012 325 50% 133,434 89%
5,659,790 819,786 14%
The loss of employment has been estimated by assuming labour to be a semi variable expense and then by extrapolating possible loss of jobs based on current levels of employment in the assessed media segments.

5
PIRACY ESTIMATION STUDY
!@#
The methodology employed by the Ernst & Young team has used the current employment to revenue levels as the basis for loss estimation. As employment has been assumed to be a semi variable component, the losses have been discounted by a factor before applying the derived revenue to employment ratio for estimating the total loss of employment. This factor has been calculated based on the Ernst & Young team analysis while evaluating key employment drivers such as current capacity utilization, part of the value chain that have been impacted and technologies deployed amongst other factors.
Piracy Ecosystem:
The principal factors impacting piracy are:
I. Market Need:
o Accessibility
o Product Pricing
II. Business Environment:
o Profitability
o Technology
o Ease of Content Acquisition
o Industry Support
III. Political & Regulatory
o Legal Framework
o Law Enforcement
IV. Lack of Consumer Awareness
Impact of Technology:
The Indian M&E industry has been going through a significant transition over the past decade with the advent of new technologies and changing entertainment consumption patterns.
However, it is only now that the industry is witnessing significant investments in infrastructure across all segments throughout the value chain. These investments have happened predominantly in the distribution and delivery segments for setting up multiplexes, digital film distribution, DTH, digitization of cable, and the roll-out of IP TV among other infrastructure needs.
Introduction and comprehensive application of these technologies will hopefully help to mitigate piracy, in tandem with efforts by the government and the judiciary. These investments will enable the industry to plug the losses incurred due to piracy by making content more accessible to wider audiences and creating differential pricing across platforms. This would cater to the needs of different target segments and also allow closer monitoring. What is therefore required is that the industry is able to innovatively utilize and exploit new technology platforms to continue to earn more and more revenues while making the product more accessible to the consumer. This would effectively take the advantage away from the piracy business and take over the market that it tries to create and cater to.
Consumer
Need
Business Environment
Business Environment
Political & Regulatory Environment
Consumer Awareness
Consumer Awareness
PIRACY ECOSYSTEM
6 !@#
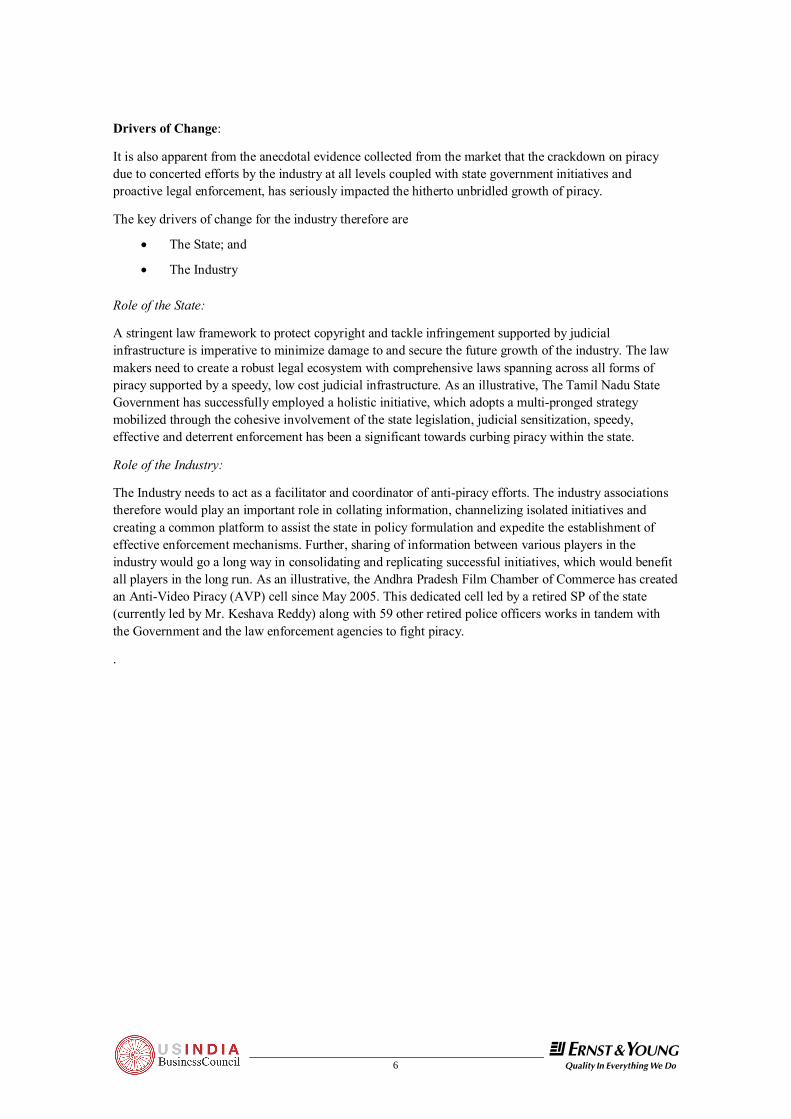
Drivers of Change:
It is also apparent from the anecdotal evidence collected from the market that the crackdown on piracy due to concerted efforts by the industry at all levels coupled with state government initiatives and proactive legal enforcement, has seriously impacted the hitherto unbridled growth of piracy.
The key drivers of change for the industry therefore are
• The State; and
• The Industry Role of the State:
A stringent law framework to protect copyright and tackle infringement supported by judicial infrastructure is imperative to minimize damage to and secure the future growth of the industry. The law makers need to create a robust legal ecosystem with comprehensive laws spanning across all forms of piracy supported by a speedy, low cost judicial infrastructure. As an illustrative, The Tamil Nadu State Government has successfully employed a holistic initiative, which adopts a multi-pronged strategy mobilized through the cohesive involvement of the state legislation, judicial sensitization, speedy, effective and deterrent enforcement has been a significant towards curbing piracy within the state.
Role of the Industry:
The Industry needs to act as a facilitator and coordinator of anti-piracy efforts. The industry associations therefore would play an important role in collating information, channelizing isolated initiatives and creating a common platform to assist the state in policy formulation and expedite the establishment of effective enforcement mechanisms. Further, sharing of information between various players in the industry would go a long way in consolidating and replicating successful initiatives, which would benefit all players in the long run. As an illustrative, the Andhra Pradesh Film Chamber of Commerce has created an Anti-Video Piracy (AVP) cell since May 2005. This dedicated cell led by a retired SP of the state (currently led by Mr. Keshava Reddy) along with 59 other retired police officers works in tandem with the Government and the law enforcement agencies to fight piracy.
.
7
PIRACY ESTIMATION STUDY
!@#
1. Business Ecosystem: Key Drivers of Piracy
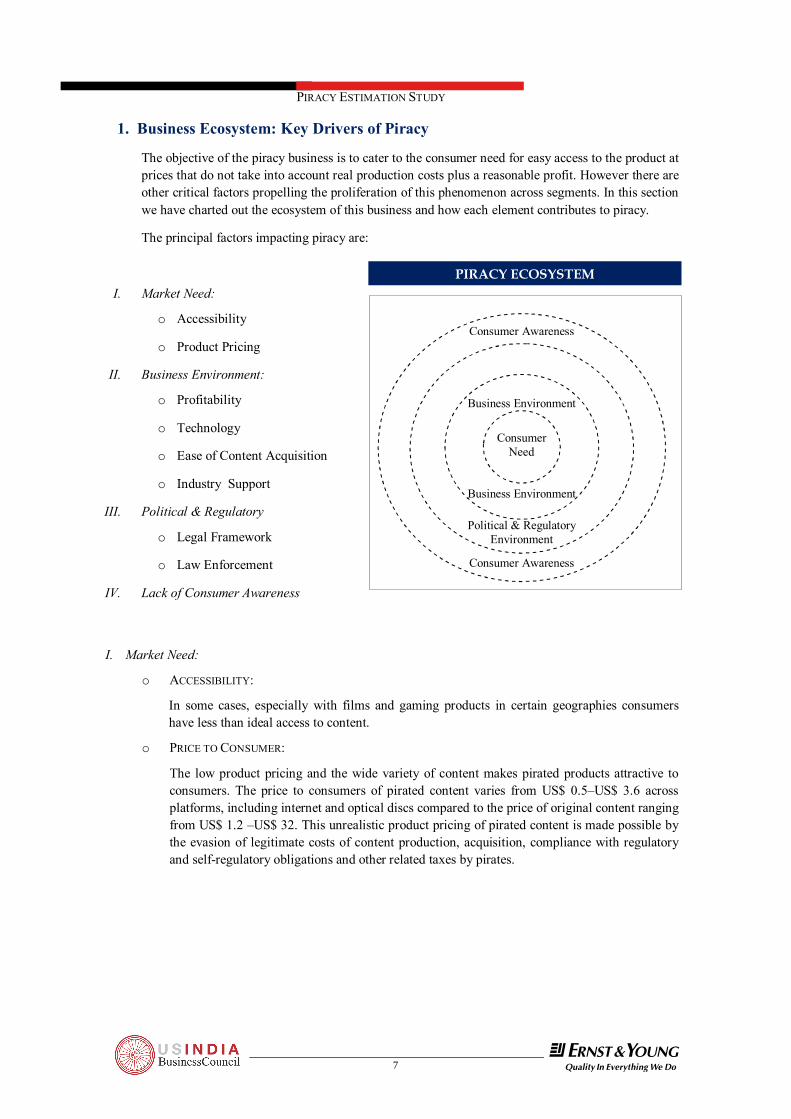
The objective of the piracy business is to cater to the consumer need for easy access to the product at prices that do not take into account real production costs plus a reasonable profit. However there are other critical factors propelling the proliferation of this phenomenon across segments. In this section we have charted out the ecosystem of this business and how each element contributes to piracy.
The principal factors impacting piracy are:
I. Market Need:
o Accessibility
o Product Pricing
II. Business Environment:
o Profitability
o Technology
o Ease of Content Acquisition
o Industry Support
III. Political & Regulatory
o Legal Framework
o Law Enforcement
IV. Lack of Consumer Awareness
I. Market Need:
o ACCESSIBILITY:
In some cases, especially with films and gaming products in certain geographies consumers have less than ideal access to content.
o PRICE TO CONSUMER:
The low product pricing and the wide variety of content makes pirated products attractive to consumers. The price to consumers of pirated content varies from US$ 0.5–US$ 3.6 across platforms, including internet and optical discs compared to the price of original content ranging from US$ 1.2 –US$ 32. This unrealistic product pricing of pirated content is made possible by the evasion of legitimate costs of content production, acquisition, compliance with regulatory and self-regulatory obligations and other related taxes by pirates.
Consumer
Need
Business Environment
Business Environment
Political & Regulatory Environment
Consumer Awareness
Consumer Awareness
PIRACY ECOSYSTEM
8 !@#
II. Business Environment:
o PROFITABILITY:
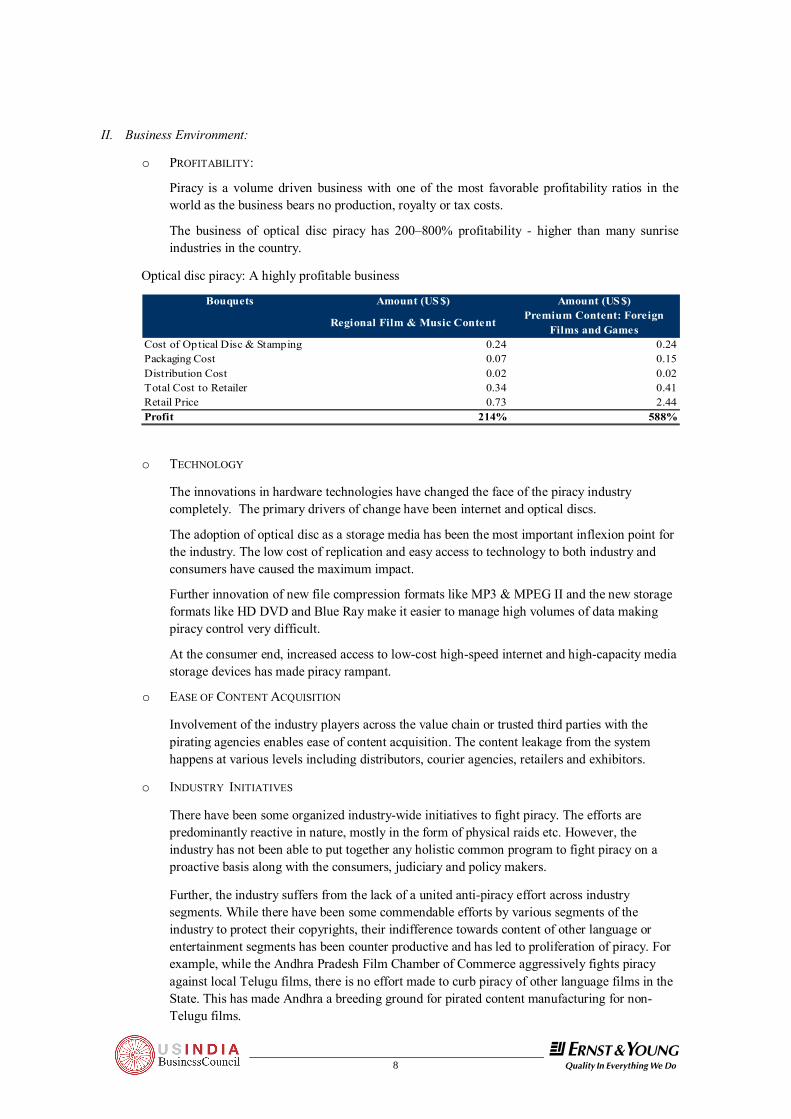
Piracy is a volume driven business with one of the most favorable profitability ratios in the world as the business bears no production, royalty or tax costs.
The business of optical disc piracy has 200–800% profitability - higher than many sunrise industries in the country.
Optical disc piracy: A highly profitable business
Bouquets Amount (US $) Amount (US $)
Regional Film & Music ContentPremium Content: Foreign
Films and GamesCost of Optical Disc & Stamping 0.24 0.24Packaging Cost 0.07 0.15Distribution Cost 0.02 0.02Total Cost to Retailer 0.34 0.41Retail Price 0.73 2.44Profit 214% 588%
o TECHNOLOGY
The innovations in hardware technologies have changed the face of the piracy industry completely. The primary drivers of change have been internet and optical discs.
The adoption of optical disc as a storage media has been the most important inflexion point for the industry. The low cost of replication and easy access to technology to both industry and consumers have caused the maximum impact.
Further innovation of new file compression formats like MP3 & MPEG II and the new storage formats like HD DVD and Blue Ray make it easier to manage high volumes of data making piracy control very difficult.
At the consumer end, increased access to low-cost high-speed internet and high-capacity media storage devices has made piracy rampant.
o EASE OF CONTENT ACQUISITION
Involvement of the industry players across the value chain or trusted third parties with the pirating agencies enables ease of content acquisition. The content leakage from the system happens at various levels including distributors, courier agencies, retailers and exhibitors.
o INDUSTRY INITIATIVES
There have been some organized industry-wide initiatives to fight piracy. The efforts are predominantly reactive in nature, mostly in the form of physical raids etc. However, the industry has not been able to put together any holistic common program to fight piracy on a proactive basis along with the consumers, judiciary and policy makers.
Further, the industry suffers from the lack of a united anti-piracy effort across industry segments. While there have been some commendable efforts by various segments of the industry to protect their copyrights, their indifference towards content of other language or entertainment segments has been counter productive and has led to proliferation of piracy. For example, while the Andhra Pradesh Film Chamber of Commerce aggressively fights piracy against local Telugu films, there is no effort made to curb piracy of other language films in the State. This has made Andhra a breeding ground for pirated content manufacturing for non-Telugu films.
9
PIRACY ESTIMATION STUDY
!@#
III. Political & Regulatory
o LEGAL FRAMEWORK
Little work has been done to create robust legal frameworks to fight piracy across media such as TV broadcast, optical discs, and internet. While some significant initiatives have been taken at the State Government levels, these laws are limited in application by either an industry segment or by language. For instance, the State of Tamil Nadu has successfully put into place the Goondas Act for fighting piracy; however the Act is limited to film video piracy of Tamil language only. This leaves all films of all other languages and other entertainment segments like music and gaming totally vulnerable to piracy.
o LAW ENFORCEMENT
A cumbersome and time consuming judicial process coupled with limited support from the enforcement agencies acts as a huge impediment in the fight against piracy. The key issues relating to law enforcement are: - Lack of sensitization of the judiciary.
- Time consuming and expensive legal process.
- Problems with enforcement agencies including the customs and police.
- A strong organized crime nexus backing the piracy industry.
IV. Consumer Awareness
Technology innovations in the past few years have placed the consumer in the driver’s seat. The lack of consumer awareness about implications of copyright infringement is crippling the industry.
The consumers are not only consumers of pirated products but have in fact become pirates of products themselves. The tech savvy consumers have often been found to be the key segments indulging in optical disc and internet piracy.
Piracy by the consumer is prevalent through various forms including replicating optical discs (commonly known as ripping), uploading content on the internet, file sharing sites, and P2P networks amongst others.
10 !@#
2. Business Ecosystem: Key Drivers of Piracy in Relation to Each Industry Segment
In this section we have highlighted each industry segment and how some of the key drivers of piracy (discussed above) impact them more specifically.
2.1. Film Industry
I. Market Need:
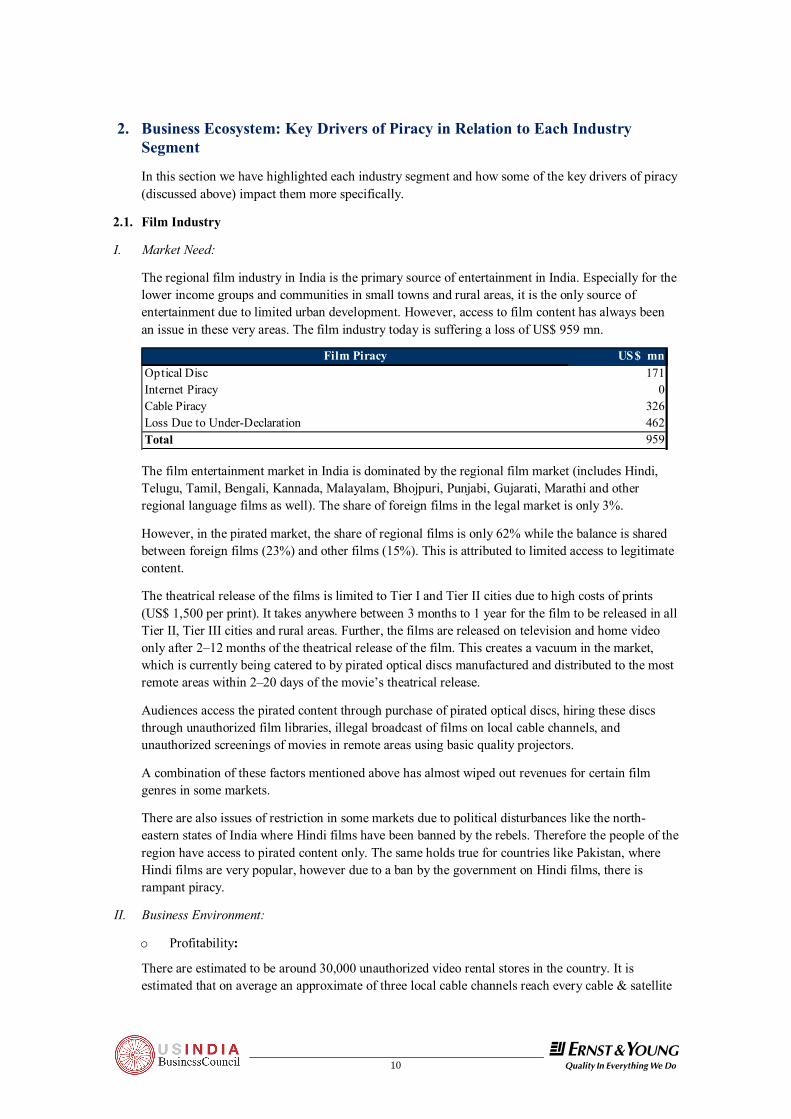
The regional film industry in India is the primary source of entertainment in India. Especially for the lower income groups and communities in small towns and rural areas, it is the only source of entertainment due to limited urban development. However, access to film content has always been an issue in these very areas. The film industry today is suffering a loss of US$ 959 mn.
Film Piracy US$ mnOptical Disc 171Internet Piracy 0Cable Piracy 326Loss Due to Under-Declaration 462Total 959
The film entertainment market in India is dominated by the regional film market (includes Hindi, Telugu, Tamil, Bengali, Kannada, Malayalam, Bhojpuri, Punjabi, Gujarati, Marathi and other regional language films as well). The share of foreign films in the legal market is only 3%.
However, in the pirated market, the share of regional films is only 62% while the balance is shared between foreign films (23%) and other films (15%). This is attributed to limited access to legitimate content.
The theatrical release of the films is limited to Tier I and Tier II cities due to high costs of prints (US$ 1,500 per print). It takes anywhere between 3 months to 1 year for the film to be released in all Tier II, Tier III cities and rural areas. Further, the films are released on television and home video only after 2–12 months of the theatrical release of the film. This creates a vacuum in the market, which is currently being catered to by pirated optical discs manufactured and distributed to the most remote areas within 2–20 days of the movie’s theatrical release.
Audiences access the pirated content through purchase of pirated optical discs, hiring these discs through unauthorized film libraries, illegal broadcast of films on local cable channels, and unauthorized screenings of movies in remote areas using basic quality projectors.
A combination of these factors mentioned above has almost wiped out revenues for certain film genres in some markets.
There are also issues of restriction in some markets due to political disturbances like the north-eastern states of India where Hindi films have been banned by the rebels. Therefore the people of the region have access to pirated content only. The same holds true for countries like Pakistan, where Hindi films are very popular, however due to a ban by the government on Hindi films, there is rampant piracy.
II. Business Environment:
o Profitability:
There are estimated to be around 30,000 unauthorized video rental stores in the country. It is estimated that on average an approximate of three local cable channels reach every cable & satellite
11
PIRACY ESTIMATION STUDY
!@#
home. These channels air about 60% pirated content reaching 65 million C&S homes in the country. Over 80% of the pirated content is regional films, film music videos or clips of the same.
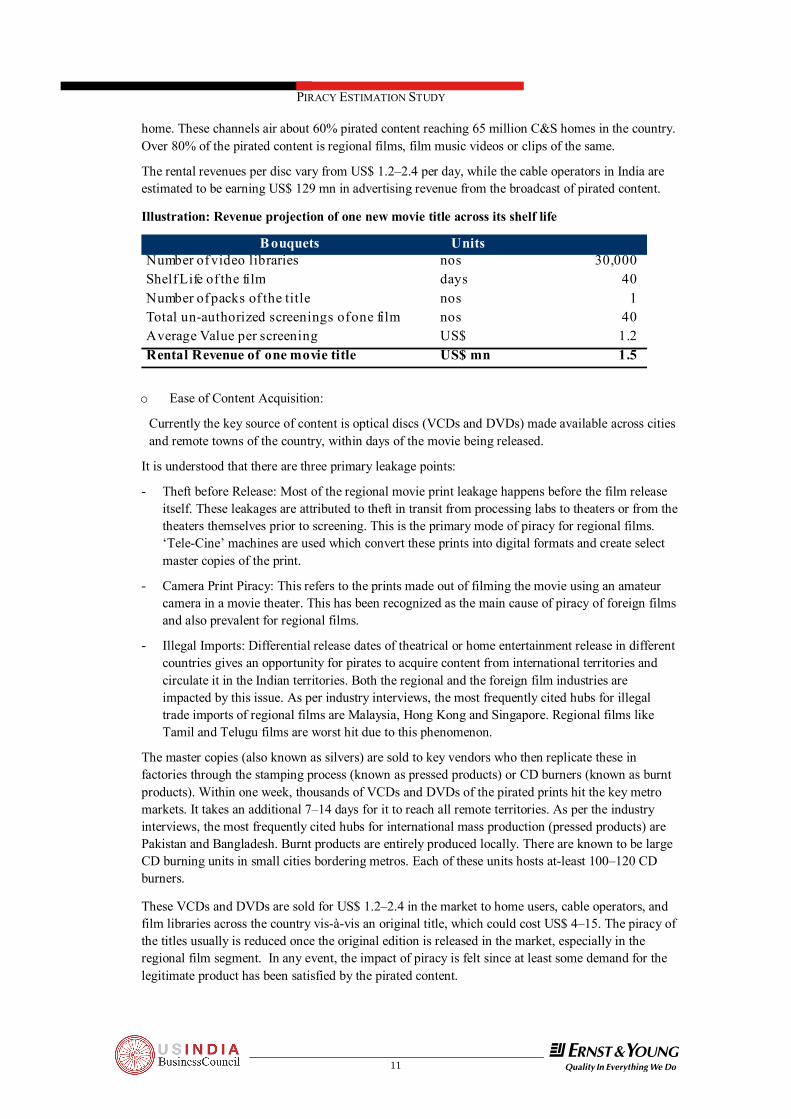
The rental revenues per disc vary from US$ 1.2–2.4 per day, while the cable operators in India are estimated to be earning US$ 129 mn in advertising revenue from the broadcast of pirated content.
Illustration: Revenue projection of one new movie title across its shelf life
B ouquets UnitsNumber of video libraries nos 30,000 Shelf Life of the film days 40 Number of packs of the title nos 1 Total un-authorized screenings of one film nos 40 Average Value per screening US$ 1.2 Rental Revenue of one movie title US$ mn 1.5
o Ease of Content Acquisition:
Currently the key source of content is optical discs (VCDs and DVDs) made available across cities and remote towns of the country, within days of the movie being released.
It is understood that there are three primary leakage points:
- Theft before Release: Most of the regional movie print leakage happens before the film release itself. These leakages are attributed to theft in transit from processing labs to theaters or from the theaters themselves prior to screening. This is the primary mode of piracy for regional films. ‘Tele-Cine’ machines are used which convert these prints into digital formats and create select master copies of the print.
- Camera Print Piracy: This refers to the prints made out of filming the movie using an amateur camera in a movie theater. This has been recognized as the main cause of piracy of foreign films and also prevalent for regional films.
- Illegal Imports: Differential release dates of theatrical or home entertainment release in different countries gives an opportunity for pirates to acquire content from international territories and circulate it in the Indian territories. Both the regional and the foreign film industries are impacted by this issue. As per industry interviews, the most frequently cited hubs for illegal trade imports of regional films are Malaysia, Hong Kong and Singapore. Regional films like Tamil and Telugu films are worst hit due to this phenomenon.
The master copies (also known as silvers) are sold to key vendors who then replicate these in factories through the stamping process (known as pressed products) or CD burners (known as burnt products). Within one week, thousands of VCDs and DVDs of the pirated prints hit the key metro markets. It takes an additional 7–14 days for it to reach all remote territories. As per the industry interviews, the most frequently cited hubs for international mass production (pressed products) are Pakistan and Bangladesh. Burnt products are entirely produced locally. There are known to be large CD burning units in small cities bordering metros. Each of these units hosts at-least 100–120 CD burners.
These VCDs and DVDs are sold for US$ 1.2–2.4 in the market to home users, cable operators, and film libraries across the country vis-à-vis an original title, which could cost US$ 4–15. The piracy of the titles usually is reduced once the original edition is released in the market, especially in the regional film segment. In any event, the impact of piracy is felt since at least some demand for the legitimate product has been satisfied by the pirated content.
12 !@#
Once the DVDs have hit the market, the problem is further aggravated by the phenomenon of consumers copying the discs (commonly known as ripping) and either uploading the content on the internet or making unauthorised copies of the same and selling them or sharing them amongst friends and family.
o Industry Initiatives
The Indian film industry has made multiple efforts to fight piracy at different levels. While the industry has been able to conduct some successful film specific operations, it has met with limited success in curbing the piracy business at large.
The main causes for this are:
- Lack of a common organized front to fight piracy (industry initiatives are strong only at regional level i.e. with language focus);
- Lack of sustained activity to fight piracy.
- Insufficient allocation of funds from the industry for fighting piracy.
The primary issue according to regional stakeholders is the apathy of the industry to other language industries. The example cited was of the Andhra Pradesh Film Chamber of Commerce. Though the Chamber’s efforts for the local Telugu language film market have been commendable in the region, the Chamber services only the local film producer community. This is reflected in the declining revenues of other language films from the market; for instance, the Hindi language market. In Tier III cities, the revenues of Telugu films in Andhra Pradesh have grown three times while the revenue of Hindi films from the same territories has declined.
2.2. Music Industry
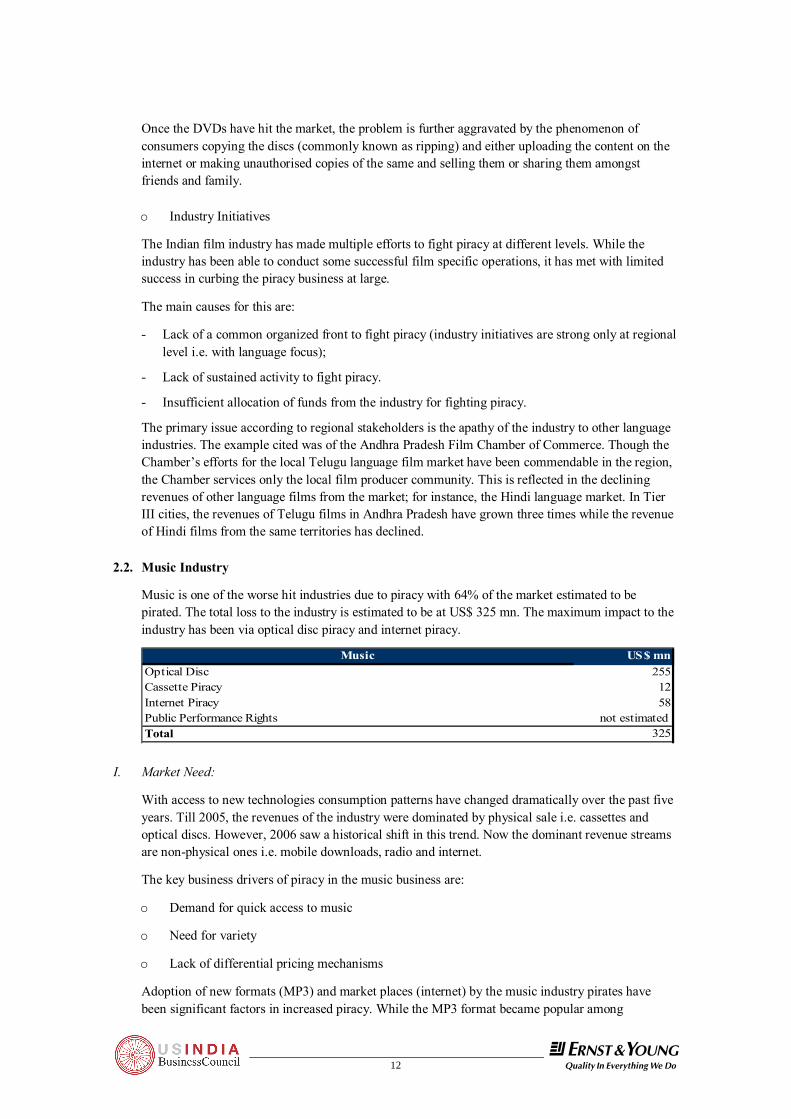
Music is one of the worse hit industries due to piracy with 64% of the market estimated to be pirated. The total loss to the industry is estimated to be at US$ 325 mn. The maximum impact to the industry has been via optical disc piracy and internet piracy.
Music US$ mnOptical Disc 255Cassette Piracy 12Internet Piracy 58Public Performance Rights not estimated Total 325
I. Market Need:
With access to new technologies consumption patterns have changed dramatically over the past five years. Till 2005, the revenues of the industry were dominated by physical sale i.e. cassettes and optical discs. However, 2006 saw a historical shift in this trend. Now the dominant revenue streams are non-physical ones i.e. mobile downloads, radio and internet.
The key business drivers of piracy in the music business are:
o Demand for quick access to music
o Need for variety
o Lack of differential pricing mechanisms
Adoption of new formats (MP3) and market places (internet) by the music industry pirates have been significant factors in increased piracy. While the MP3 format became popular among
13
PIRACY ESTIMATION STUDY
!@#
consumers in 1995 and MP3 format supporting players have been available since 1998, the Indian music companies have only now started adopting MP3 as an alternate standard format for their music.
The consumers today want to pay only for the music they like. The inputs from the consumers indicate that they would welcome differential price points and availability of variety of music on one platform, irrespective of the labels and copyrights.
o Public Performance Rights (PPR): The loss on account of PPR in India stems essentially from lack of awareness rather than consumer intent. This has been further fuelled by the dominance of unorganized retail players across the country. Over 80% of Indian retail is still dominated by unorganized players. This loss has not been estimated due to the following reasons:
- Lack of data available on the number and nature of outlets across the country.
- Lack of any pricing mechanism defined by the industry for the same. II. Business Environment:
o Profitability:
- The music piracy business is driven by consumers and the piracy industry.
- Internet Piracy: There are innumerable peer to peer networks and websites which allow illegal download of music. These services are either free or earn revenues from advertising and/or subscription fees for its premium services.
- Optical Disc Piracy: The optical disc business thrives on volumes. It is a low margin business. The music piracy business is driven by new regional film music piracy; this is further dominated by Hindi films which have a share of 60% of the total music piracy business.
The pirated music discs are available at US$ 0.75 to US$ 2.4 with an average of 100–150 songs each. The cost of manufacturing of these discs ranges from US$ 0.36 to US$ 0.50.
- Audio Cassette Piracy: Audio cassette piracy is limited to remote towns of the country where optical disc players have not yet become popular. Further there is the high cost of manufacturing, fast adoption of optical disc and limited variety offered through this media.
o Technology
Hardware technology has been a main factor in increased music industry piracy. Consumers have played a key role in this trend. The primary access points of music for consumers are: - Free music available on the internet through peer to peer (P2P) networks and illegal music
download sites.
- MP3 format optical discs
A key issue with the industry is lack of mechanical copy protection. The music CDs released in the market by the record companies are not protected mechanically and thus can be easily copied and replicated. Further there are various free softwares available for converting WAV and AAC files to MP3 formats making it easy to convert and store data.
14 !@#
o Ease of Content Acquisition
- Internet piracy:
The consumers today have access to music across borders with the help of sophisticated P2P systems and illegal file sharing sites. Most of this content is uploaded by consumers themselves. Two of the most popular P2P networks are “Lime-Wire” and “Bit-Torrent.” Also, there are websites providing pirated music content; however increasingly users have been relying on P2P servers over individual websites.
- Optical disc piracy:
Most of the optical discs are burnt products with approximately 100–150 MP3 songs burnt onto one disc. These discs are distributed using the same distribution networks as the legitimate content discs.
Further, the research has also revealed that due to the depleting volumes of legitimate products, the music industry has seen a shift of the distributors to the video business.
While the music CDs (AAC format and MP3 formats) of each film ranges from US$ 2.5 to US$ 7.5, the pirated discs with MP3 formats that provide music of over 10 films in one disc are made available by the same distributors for US$ 0.75 to US$ 2.5.
o Industry Initiatives
The music industry is represented by two prominent entities namely the Indian Music Industry Association (IMI) and the South Indian Music Company’s Association (SIMCA).
The industry associations have played an important role in initiating anti-piracy operations through raids. However, structuring and executing a large scale proactive action plan to fight causes of piracy and helping member companies maximize revenues from new emerging revenue streams would also be helpful in curbing piracy.
Further, there are allegations of some companies mixing legitimate production with pirated copies and distributing both through official channels.
2.3. Television Industry:
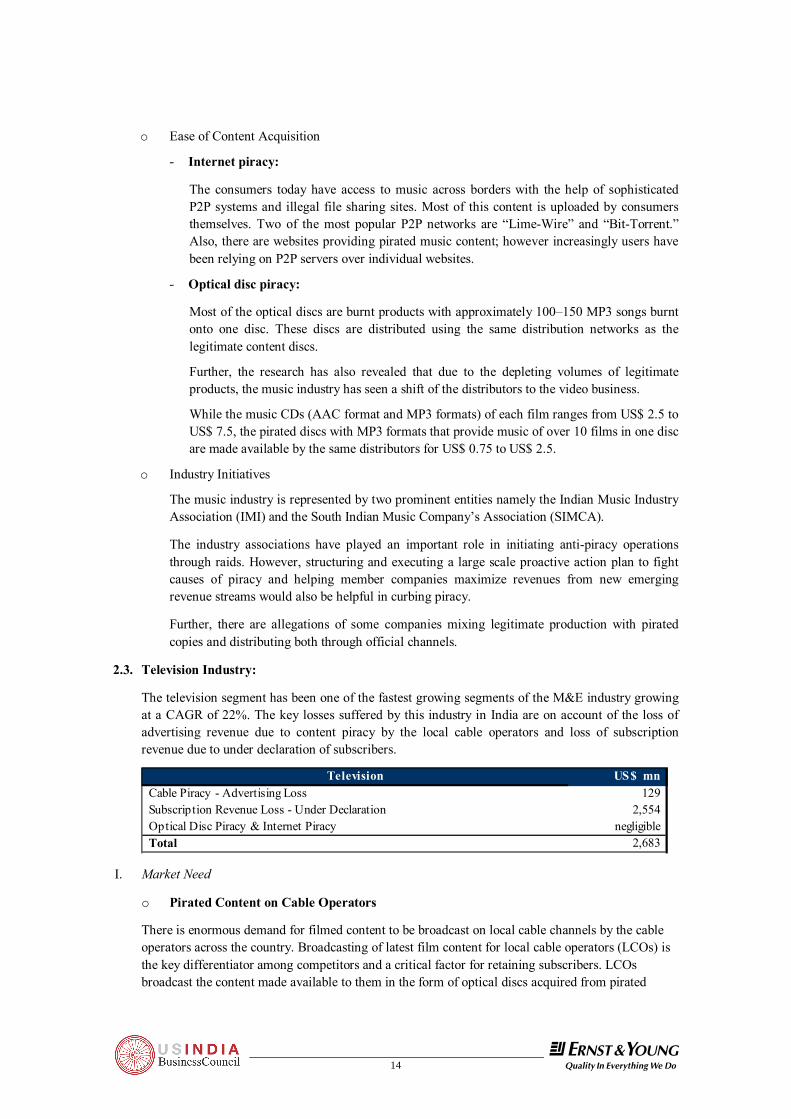
The television segment has been one of the fastest growing segments of the M&E industry growing at a CAGR of 22%. The key losses suffered by this industry in India are on account of the loss of advertising revenue due to content piracy by the local cable operators and loss of subscription revenue due to under declaration of subscribers.
Television US$ mnCable Piracy - Advertising Loss 129 Subscription Revenue Loss - Under Declaration 2,554 Optical Disc Piracy & Internet Piracy negligibleTotal 2,683
I. Market Need
o Pirated Content on Cable Operators
There is enormous demand for filmed content to be broadcast on local cable channels by the cable operators across the country. Broadcasting of latest film content for local cable operators (LCOs) is the key differentiator among competitors and a critical factor for retaining subscribers. LCOs broadcast the content made available to them in the form of optical discs acquired from pirated
15
PIRACY ESTIMATION STUDY
!@#
sources. Due to lack of enforcement of anti-piracy laws against LCOs and lack of monitoring coupled with high consumer demand, LCOs have got used to broadcasting pirated content regularly.
o Loss Due to Under Declaration:
There is significant loss due to under declaration in the Indian cable and satellite market. The cable distribution is entirely analogue except for the metros where the Conditional Access System (CAS) has been made mandatory. The analogue system does not provide the consumer with the option of choosing channels. Thus, all subscribers receive all channels. The effective Average Revenue Per User (ARPU) has been restricted to an average of INR 180 per month (US$ 4.4 in the lower income areas going up to US$ 7.3 in the areas with high per capita incomes). This is further validated by the ARPU of DTH players like DISH TV, where the projected ARPU for 2007–08 is US$ 4.6 per month.
II. Business Environment:
o Profitability:
- Pirated Content Broadcast:
Pirated content on cable not only helps gain and retain a large subscriber base but also provides the industry with huge advertising revenues due to the high viewership of cable channels. The local channels which are programmed & relayed by local cable operators in their territories, in most Indian states collectively enjoy No. 2 or No. 3 position in channel viewership share. This makes them one of the most sought after groups for advertisers. The advertiser profile of the cable operators includes local as well as national brands.
- Loss Due to Under Declaration:
The total cost of the content distributed via cable & satellite today has doubled based on rack rates defined by the broadcasters.
o Ease of Content Availability:
The most sought after content that attracts viewership for the cable operators is filmed entertainment. This content is easily available across the country.
Due to the cable systems being analogue, the LCOs can easily add local channels at the local cable head-end level (a local head-end is a facility at the LCO level for receiving television signals for processing and distribution to its subscribers) and push it along with the satellite channel bouquet. There are no content monitoring mechanisms in place for these local channels.
The content is dominated by regional filmed content. The share of foreign films is very low. This is due to successful efforts of MPAA in the country and a favorable court judgment allowing MPAA to hold the MSOs (the controlling cable operators who franchise the LCOs) responsible for piracy at the LCO level and taking legal action against them. As the LCOs cannot differentiate between MPAA and Non-MPAA content, regional films have benefited from their effort.
o Industry Initiative:
The Indian film and television industry is still struggling to effectively deal with cable piracy. While MPAA has successfully brought down piracy of its content, the regional film producers have not been able to make an impact. The two major reasons for this are:
- The local cable operators are powerful business persons locally – sometimes with strong unlawful protection.
16 !@#
- Lack of organized industry-wide initiative by the film industry to undertake anti-piracy operations and influence policy makers and law enforcement personnel.
Currently, the ability of a producer or studio to fight piracy is largely dependent on their financial strength and the individual initiatives they can take to protect their films. This makes revenues of the industry very vulnerable.
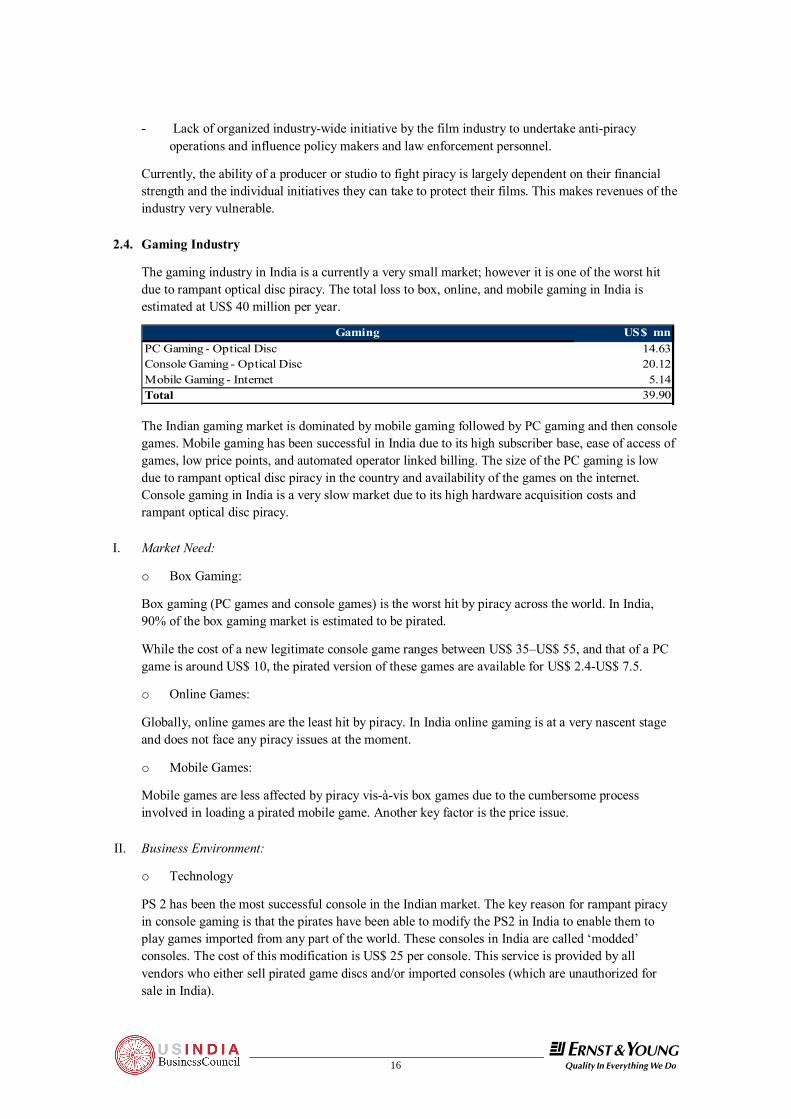
2.4. Gaming Industry
The gaming industry in India is a currently a very small market; however it is one of the worst hit due to rampant optical disc piracy. The total loss to box, online, and mobile gaming in India is estimated at US$ 40 million per year.
Gaming US$ mnPC Gaming - Optical Disc 14.63Console Gaming - Optical Disc 20.12Mobile Gaming - Internet 5.14Total 39.90
The Indian gaming market is dominated by mobile gaming followed by PC gaming and then console games. Mobile gaming has been successful in India due to its high subscriber base, ease of access of games, low price points, and automated operator linked billing. The size of the PC gaming is low due to rampant optical disc piracy in the country and availability of the games on the internet. Console gaming in India is a very slow market due to its high hardware acquisition costs and rampant optical disc piracy.
I. Market Need:
o Box Gaming:
Box gaming (PC games and console games) is the worst hit by piracy across the world. In India, 90% of the box gaming market is estimated to be pirated.
While the cost of a new legitimate console game ranges between US$ 35–US$ 55, and that of a PC game is around US$ 10, the pirated version of these games are available for US$ 2.4-US$ 7.5.
o Online Games:
Globally, online games are the least hit by piracy. In India online gaming is at a very nascent stage and does not face any piracy issues at the moment.
o Mobile Games:
Mobile games are less affected by piracy vis-à-vis box games due to the cumbersome process involved in loading a pirated mobile game. Another key factor is the price issue.
II. Business Environment:
o Technology
PS 2 has been the most successful console in the Indian market. The key reason for rampant piracy in console gaming is that the pirates have been able to modify the PS2 in India to enable them to play games imported from any part of the world. These consoles in India are called ‘modded’ consoles. The cost of this modification is US$ 25 per console. This service is provided by all vendors who either sell pirated game discs and/or imported consoles (which are unauthorized for sale in India).

17
PIRACY ESTIMATION STUDY
!@#
o Ease of Acquiring Content:
The primary form of piracy in the box gaming segment is through optical discs. Due to high volume of data, downloading the games is less probable in the case of box games; however for mobile games illegal internet downloads is the primary issue. Illegal Russian sites have been often cited by the industry as sources for uploading pirated mobile games.
The games are imported from trading hubs like Malaysia, Singapore and Hong Kong & are then replicated in India. These discs are then distributed using legal distribution channels to all vendors.
o Industry Initiatives:
The gaming industry though at a nascent stage in India is taking proactive measures to resolve the issue of piracy by adapting their business models to the market.
- Anti-Piracy Programs: The key players like Microsoft, Electronic Arts and Sony have hired different agencies already involved in Anti-Piracy operations to provide these companies support.
- Pricing: The players have been actively revising their prices to suit the Indian market
- Adoption of new business models: Having understood the optical disc piracy situation, most new players are entering the gaming market in the online gaming space in India. New online gaming models are coming up for casual games, dedicated PC games and Massive Multiplayer Online Games (MMOGs).
III. Political and Regulatory
o Legal Framework
The main issue facing the industry is the high incidence of indirect tax. While the rest of the entertainment industry enjoys a 4% Value Added Tax (VAT) on sales of a product, gaming products in many states face upto 12% VAT. The industry is therefore currently struggling with the pricing of its products. While the industry has now taken initiatives to reduce its margins and revise pricing for the consumers, it is looking for more support from the government.

18 !@#
3. Financial Estimates and Methodology
3.1. Summary of Revenue Streams Impacted by Piracy:
Industry Segments Revenue Streams Key forms of Piracy Quantified
VAS
Film Piracy Theatrical Revenue Optical Disc Piracy
Home Entertainment Cable Piracy
Broadcast Rights Loss Due to Under Declaration
Music Rights Internet Piracy (negligible-not estimated)
Television Piracy Advertising Revenue Cable Piracy
Subscription Revenue Loss Due to Under Declaration
Music Piracy Physical Sales (CDs & Cassettes) CD Piracy
Mobile Rights Cassettes Piracy
Radio Rights
Public Performance Rights (PPR)
Public Performance Loss (not estimated due to lack of data availability)
Internet Illegal Internet Downloads
Synchronization Rights
Grand Rights
Game Piracy
PC Games Game CD Sales Optical Disc Piracy
Console Games Game CD Sales Optical Disc Piracy
Mobile Games Game Sale via Mobile Downloads Internet Piracy
Online Games Subscription
Legend: Revenue streams impacted by piracy

19
PIRACY ESTIMATION STUDY
!@#
3.2. Summary of Methodologies Adopted for Piracy Estimation:
Key forms of Piracy Quantified
Methodologies Estimated/Cannot be Estimated
Optical Disc Piracy Volume estimation based on production capacity
Estimated
Box Game Piracy Volume break-up based on install base and estimated tie ratio (machine to games)
Estimated
Film Piracy Used MPAA's estimates as a base and estimated the losses for other film industries based on their share of the total pie determined through primary research
Estimated
Music Piracy Average realization per unit— derived from market trends
Estimated
Television Content Piracy Very marginal numbers. There is not much market in India for the same as the TV broadcasters do not see much market in the same
Marginal, not estimated
Cassette Piracy No data available for validation methodology. Industry estimates are available
Estimated but not validated. The production capacity has not been established to enable validation of industry estimates
Cable Piracy
Cable Piracy—Films Estimated based on number of potential paid screenings lost due to cable film piracy
Estimated
Cable Piracy—Music Revenue share estimation based on the viewership of local cable channels (operated by the local operators) and the revenue share proportions of cable & satellite general entertainment channels in India.
Estimated
Internet Piracy
Music Estimates derived using install base and mobile downloads as a surrogate
Estimated
Films Marginal. Estimates can be derived by using the home user broadband connections and using surrogates to estimate their propensity to download filmed content.
Marginal, not estimated.
Mobile Games No data available for validation methodology. Industry estimates are available.
Estimated, but no mechanism for download has been established
20 !@#
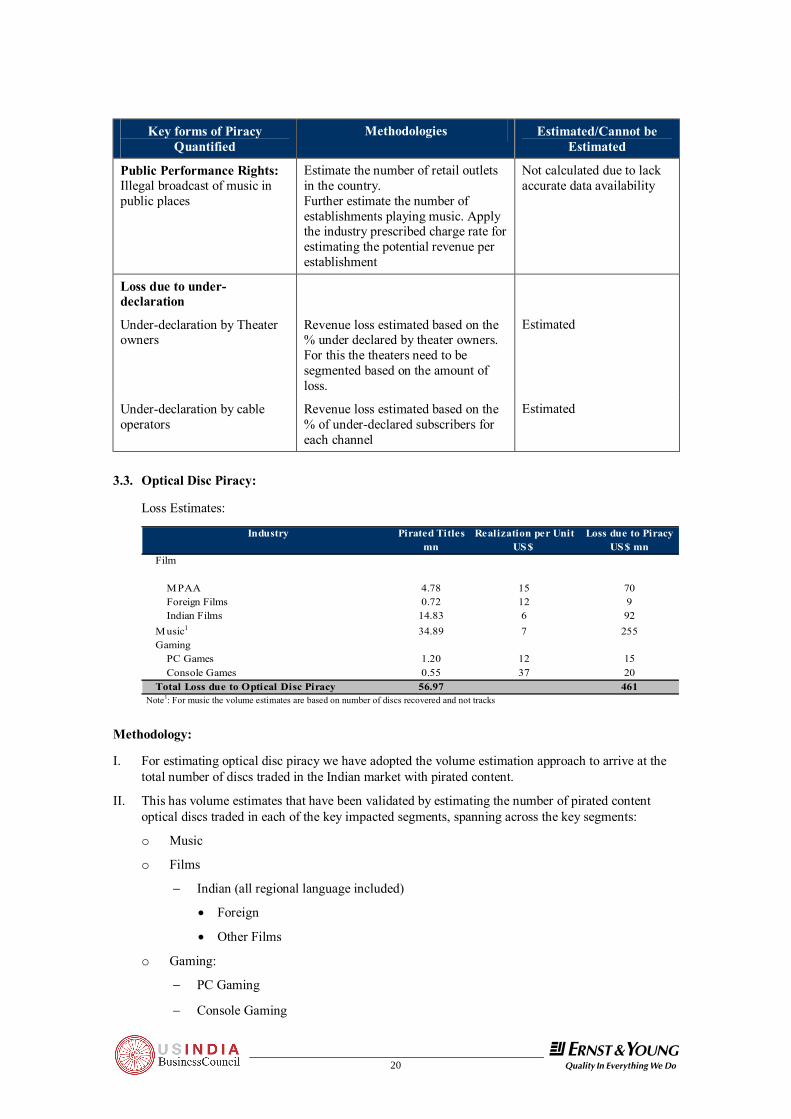
Key forms of Piracy Quantified
Methodologies Estimated/Cannot be Estimated
Public Performance Rights: Illegal broadcast of music in public places
Estimate the number of retail outlets in the country. Further estimate the number of establishments playing music. Apply the industry prescribed charge rate for estimating the potential revenue per establishment
Not calculated due to lack accurate data availability
Loss due to under-declaration
Under-declaration by Theater owners
Revenue loss estimated based on the % under declared by theater owners. For this the theaters need to be segmented based on the amount of loss.
Estimated
Under-declaration by cable operators
Revenue loss estimated based on the % of under-declared subscribers for each channel
Estimated
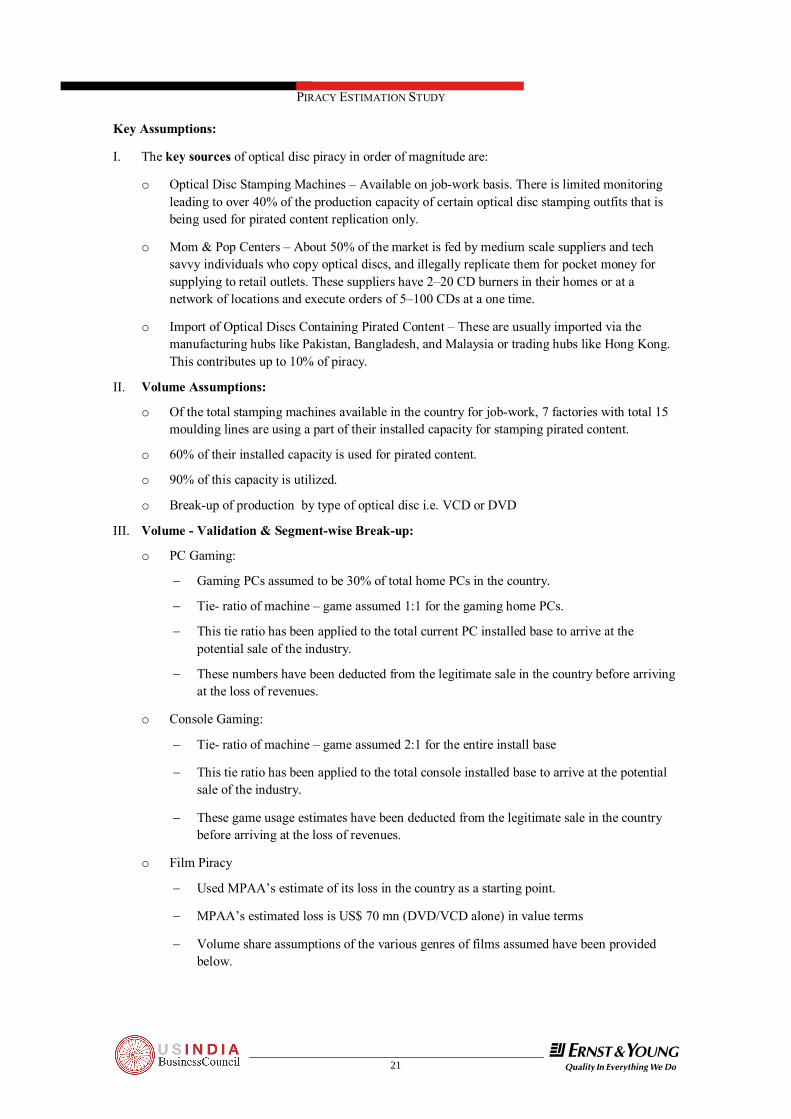
3.3. Optical Disc Piracy:
Loss Estimates:
Industry Pirated Titles Realization per Unit Loss due to Piracymn US$ US$ mn
Film
M PAA 4.78 15 70Foreign Films 0.72 12 9Indian Films 14.83 6 92
M usic1 34.89 7 255Gaming
PC Games 1.20 12 15Console Games 0.55 37 20
Total Loss due to Optical Disc Piracy 56.97 461 Note1: For music the volume estimates are based on number of discs recovered and not tracks
Methodology:
I. For estimating optical disc piracy we have adopted the volume estimation approach to arrive at the total number of discs traded in the Indian market with pirated content.
II. This has volume estimates that have been validated by estimating the number of pirated content optical discs traded in each of the key impacted segments, spanning across the key segments:
o Music
o Films
− Indian (all regional language included)
• Foreign
• Other Films
o Gaming:
− PC Gaming
− Console Gaming
21
PIRACY ESTIMATION STUDY
!@#
Key Assumptions:
I. The key sources of optical disc piracy in order of magnitude are:
o Optical Disc Stamping Machines – Available on job-work basis. There is limited monitoring leading to over 40% of the production capacity of certain optical disc stamping outfits that is being used for pirated content replication only.
o Mom & Pop Centers – About 50% of the market is fed by medium scale suppliers and tech savvy individuals who copy optical discs, and illegally replicate them for pocket money for supplying to retail outlets. These suppliers have 2–20 CD burners in their homes or at a network of locations and execute orders of 5–100 CDs at a one time.
o Import of Optical Discs Containing Pirated Content – These are usually imported via the manufacturing hubs like Pakistan, Bangladesh, and Malaysia or trading hubs like Hong Kong. This contributes up to 10% of piracy.
II. Volume Assumptions:
o Of the total stamping machines available in the country for job-work, 7 factories with total 15 moulding lines are using a part of their installed capacity for stamping pirated content.
o 60% of their installed capacity is used for pirated content.
o 90% of this capacity is utilized.
o Break-up of production by type of optical disc i.e. VCD or DVD
III. Volume - Validation & Segment-wise Break-up:
o PC Gaming:
− Gaming PCs assumed to be 30% of total home PCs in the country.
− Tie- ratio of machine – game assumed 1:1 for the gaming home PCs.
− This tie ratio has been applied to the total current PC installed base to arrive at the potential sale of the industry.
− These numbers have been deducted from the legitimate sale in the country before arriving at the loss of revenues.
o Console Gaming:
− Tie- ratio of machine – game assumed 2:1 for the entire install base
− This tie ratio has been applied to the total console installed base to arrive at the potential sale of the industry.
− These game usage estimates have been deducted from the legitimate sale in the country before arriving at the loss of revenues.
o Film Piracy
− Used MPAA’s estimate of its loss in the country as a starting point.
− MPAA’s estimated loss is US$ 70 mn (DVD/VCD alone) in value terms
− Volume share assumptions of the various genres of films assumed have been provided below.
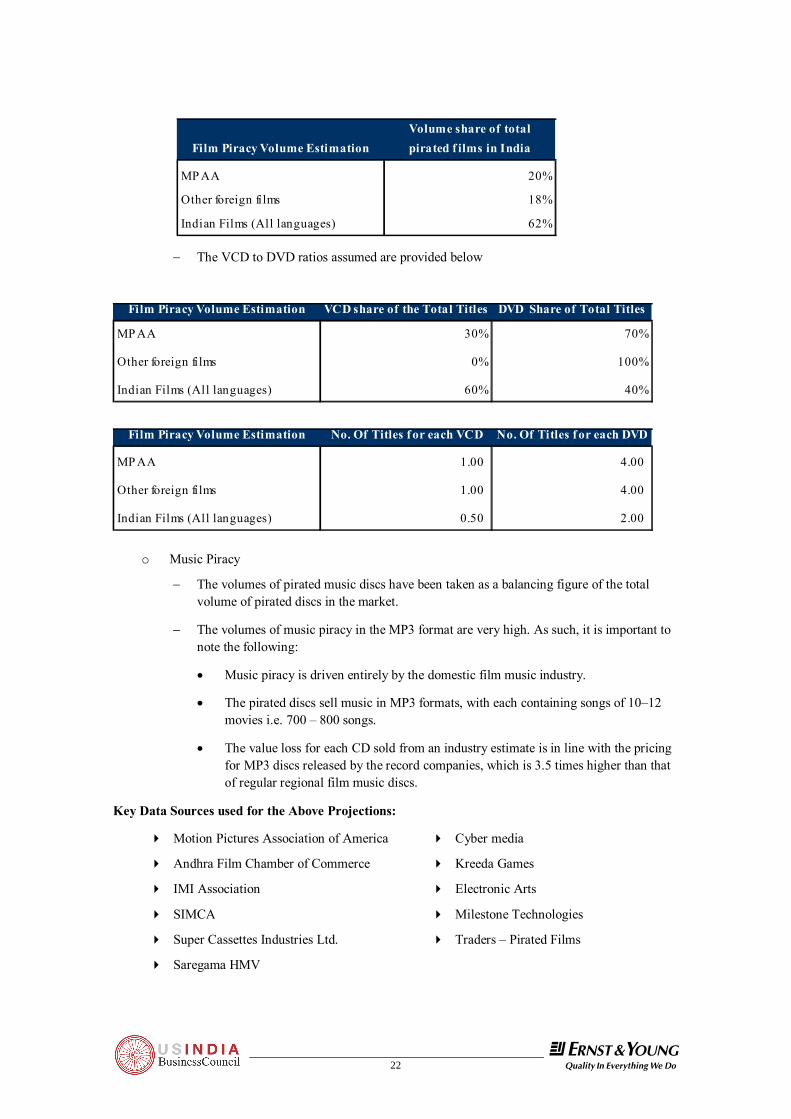
22 !@#
Film Piracy Volume EstimationVolume share of total pirated f ilms in India
MP AA 20%
Other foreign films 18%
Indian Films (All languages) 62%
− The VCD to DVD ratios assumed are provided below
Film Piracy Volume Estimation VCD share of the Total Titles DVD Share of Total Titles
MP AA 30% 70%
Other foreign films 0% 100%
Indian Films (All languages) 60% 40%
Film Piracy Volume Estimation No. Of Titles f or each VCD No. Of Titles f or each DVD
MP AA 1.00 4.00
Other foreign films 1.00 4.00
Indian Films (All languages) 0.50 2.00
o Music Piracy
− The volumes of pirated music discs have been taken as a balancing figure of the total volume of pirated discs in the market.
− The volumes of music piracy in the MP3 format are very high. As such, it is important to note the following:
• Music piracy is driven entirely by the domestic film music industry.
• The pirated discs sell music in MP3 formats, with each containing songs of 10–12 movies i.e. 700 – 800 songs.
• The value loss for each CD sold from an industry estimate is in line with the pricing for MP3 discs released by the record companies, which is 3.5 times higher than that of regular regional film music discs.
Key Data Sources used for the Above Projections:
4 Motion Pictures Association of America
4 Andhra Film Chamber of Commerce
4 IMI Association
4 SIMCA
4 Super Cassettes Industries Ltd.
4 Saregama HMV
4 Cyber media
4 Kreeda Games
4 Electronic Arts
4 Milestone Technologies
4 Traders – Pirated Films
23
PIRACY ESTIMATION STUDY
!@#
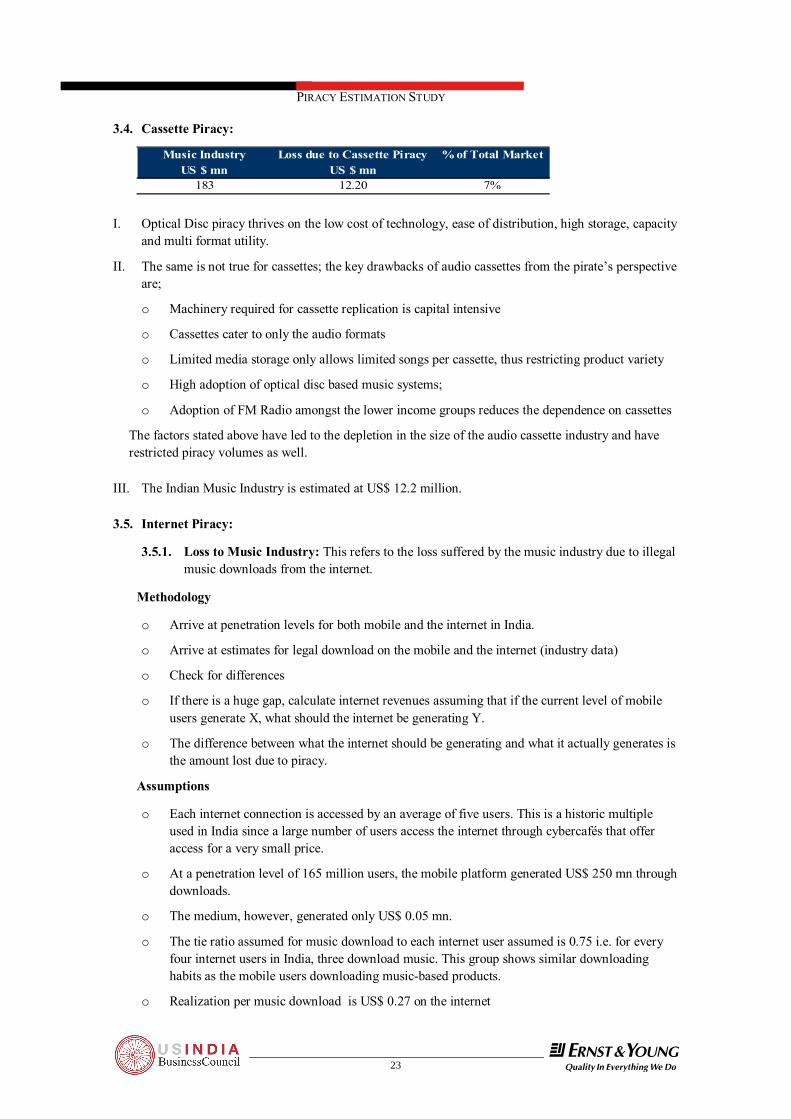
3.4. Cassette Piracy:
Music Industry Loss due to Cassette Piracy % of Total MarketUS $ mn US $ mn
183 12.20 7% I. Optical Disc piracy thrives on the low cost of technology, ease of distribution, high storage, capacity
and multi format utility.
II. The same is not true for cassettes; the key drawbacks of audio cassettes from the pirate’s perspective are;
o Machinery required for cassette replication is capital intensive
o Cassettes cater to only the audio formats
o Limited media storage only allows limited songs per cassette, thus restricting product variety
o High adoption of optical disc based music systems;
o Adoption of FM Radio amongst the lower income groups reduces the dependence on cassettes
The factors stated above have led to the depletion in the size of the audio cassette industry and have restricted piracy volumes as well.
III. The Indian Music Industry is estimated at US$ 12.2 million. 3.5. Internet Piracy:
3.5.1. Loss to Music Industry: This refers to the loss suffered by the music industry due to illegal music downloads from the internet.
Methodology
o Arrive at penetration levels for both mobile and the internet in India.
o Arrive at estimates for legal download on the mobile and the internet (industry data)
o Check for differences
o If there is a huge gap, calculate internet revenues assuming that if the current level of mobile users generate X, what should the internet be generating Y.
o The difference between what the internet should be generating and what it actually generates is the amount lost due to piracy.
Assumptions
o Each internet connection is accessed by an average of five users. This is a historic multiple used in India since a large number of users access the internet through cybercafés that offer access for a very small price.
o At a penetration level of 165 million users, the mobile platform generated US$ 250 mn through downloads.
o The medium, however, generated only US$ 0.05 mn.
o The tie ratio assumed for music download to each internet user assumed is 0.75 i.e. for every four internet users in India, three download music. This group shows similar downloading habits as the mobile users downloading music-based products.
o Realization per music download is US$ 0.27 on the internet

24 !@#
Key Data Sources used for the Above Projections:
4 Revenues for mobile and internet music Soundbuzz India Pvt. Ltd.
4 PWC, IFPI and Indian Music Industry Association’s numbers.
4 TRAI
3.5.2. Loss to Mobile Gaming industry: This refers to the loss incurred due to illegal downloads
of mobile games.
US$ mn % of Total MarketMobile Gaming Industry 12.00 70%Pirated Market 5.14 30%
o Estimated by the industry to be at approximately 30% of the total Industry.
o There are no surrogates or market studies available to independently estimate this loss. 3.6. Cable Piracy:
3.6.1. Advertising Revenue Loss: This refers to the loss of revenue and viewership to television broadcasters due to pirated content being aired on local cable channels.
Television Industry Advertising Revenue S ize
Loss of Advertising Revenue to Cable Piracy % of Total Market
US$ mn US$ mn1989 129 7%
Methodology: o Calculate the share of cable channels in total TV viewership in India through TAM data o Arrive at estimates on the proportion of pirated content shown on cable through industry
experts/cable operators o Calculate the share of GEC, film and music channels in total TV viewership o Calculate the share of GEC, movies and music channels in total advertising revenues. o Calculate proportionate share of revenues for cable channels. These show GEC, film and music
content. So if GEC, film and music channels get 68.5% revenues for a 71.8% share of TV viewing, what could be the share of cable channels.
o Calculate the proportion of ad revenues that cable channels make from pirated content on the basis of the proportion of pirated content shown.
Assumptions o TV advertising revenues for financial year 2007 are projected at US$ 1989 mn based on a 22%
estimated growth over 2006, as per PWC projections. The basic data comes from TAM Adex data
o The viewership shares for all the clusters are an average across the first six months of 2007. They are assumed to remain at the same average throughout 2007.
o About 60% of the content on cable channels is pirated and it attracts a bulk of the advertising. o A bulk or more than 95% of the content shown on cable channels is GEC, movies and music
content. o 80% of advertising revenue for the local cable channels (operated by the local cable operators)
is earned from pirated content.
25
PIRACY ESTIMATION STUDY
!@#
Key Data Sources used for the Above Projections:
4 TAM Peoplemeter, AdexData,
4 MPAA
4 Dish TV
4 Sahara One
4 UTV software ltd.
3.6.2. Filmed Entertainment Revenue Loss: This refers to the loss of home entertainment
revenues and theatrical revenues due to the broadcast of pirated content being aired on local cable channels. The estimated loss to the film industry due to cable piracy is US$ 326 million.
Methodology:
o Estimate the number of paid film screenings lost due to broadcast of pirated content.
o Estimate the ratio of loss of these screenings to home entertainment and theatrical segment.
o Estimate the value loss based on the average realization per screening derived of home entertainment and theatrical screenings.
Key assumptions:
o Cable Reach:
- Cable households in India — 65 mn
- Average number of local channels (programmed & relayed by cable operators for their distribution territories) reaching each household — 3
- No. of pirated movies reaching each household each day — 8
- No. of pirated screenings (per person) viewed per household per day — 1
- The number of movies viewed per household if they were to pay for the content — 1 per month
o Home Entertainment Market:
- Total legitimate size of the home entertainment market is US$ 147 mn based on SSKI media research report.
- The total legitimate titles sold are 23.6 mn
- The ratio of titles sold for hire versus personal consumption is 35%:65%
- The total illegitimate titles sold are 20.3 mn
- The ratio of titles sold for hire versus personal consumption is 60% : 40%
- The average screenings per title sold for home use is 1
- The average screenings per title sold for hiring is 40
26 !@#
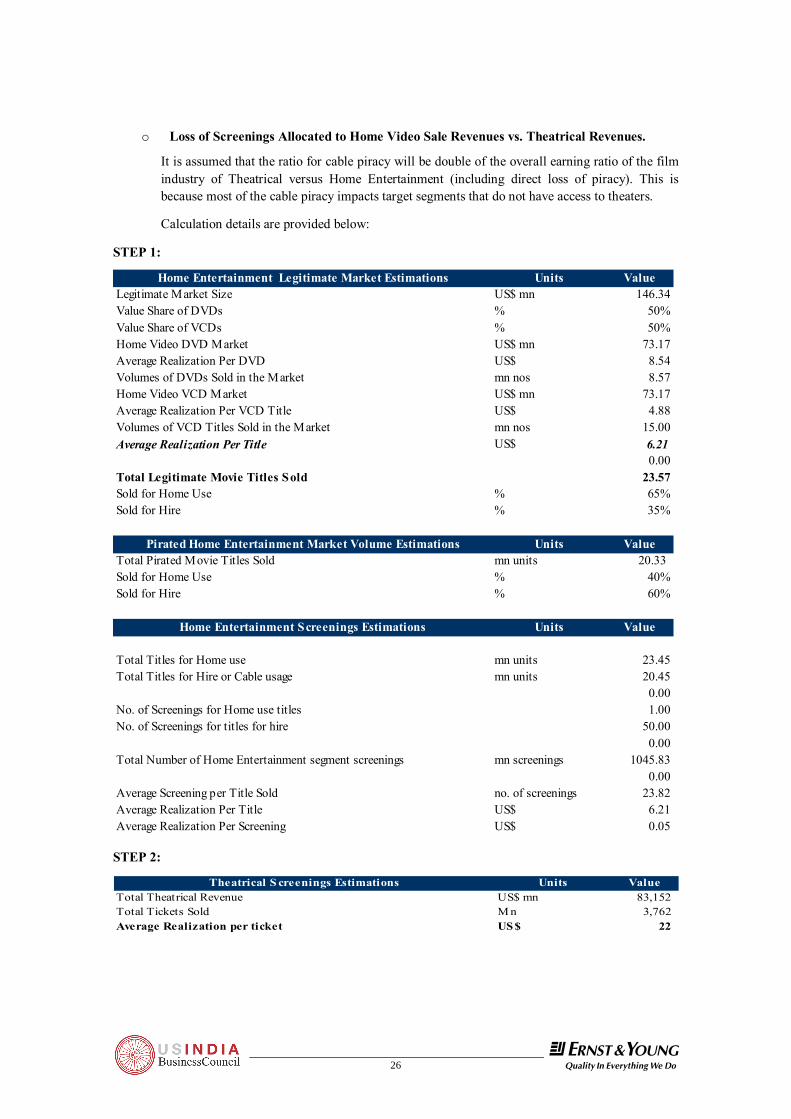
o Loss of Screenings Allocated to Home Video Sale Revenues vs. Theatrical Revenues.
It is assumed that the ratio for cable piracy will be double of the overall earning ratio of the film industry of Theatrical versus Home Entertainment (including direct loss of piracy). This is because most of the cable piracy impacts target segments that do not have access to theaters.
Calculation details are provided below:
STEP 1:
Home Entertainment Legitimate Market Estimations Units ValueLegitimate Market Size US$ mn 146.34Value Share of DVDs % 50%Value Share of VCDs % 50%Home Video DVD Market US$ mn 73.17Average Realization Per DVD US$ 8.54Volumes of DVDs Sold in the Market mn nos 8.57Home Video VCD Market US$ mn 73.17Average Realization Per VCD Title US$ 4.88Volumes of VCD Titles Sold in the Market mn nos 15.00Average Realization Per Title US$ 6.21
0.00Total Legitimate Movie Titles Sold 23.57Sold for Home Use % 65%Sold for Hire % 35%
Pirated Home Entertainment Market Volume Estimations Units ValueTotal Pirated Movie Titles Sold mn units 20.33 Sold for Home Use % 40%Sold for Hire % 60%
Home Entertainment Screenings Estimations Units Value
Total Titles for Home use mn units 23.45Total Titles for Hire or Cable usage mn units 20.45
0.00No. of Screenings for Home use titles 1.00No. of Screenings for titles for hire 50.00
0.00Total Number of Home Entertainment segment screenings mn screenings 1045.83
0.00Average Screening per Title Sold no. of screenings 23.82Average Realization Per Title US$ 6.21Average Realization Per Screening US$ 0.05
STEP 2:
Theatrical S creenings Estimations Units ValueTotal Theatrical Revenue US$ mn 83,152 Total Tickets Sold M n 3,762 Average Realization per ticket US$ 22
27
PIRACY ESTIMATION STUDY
!@#
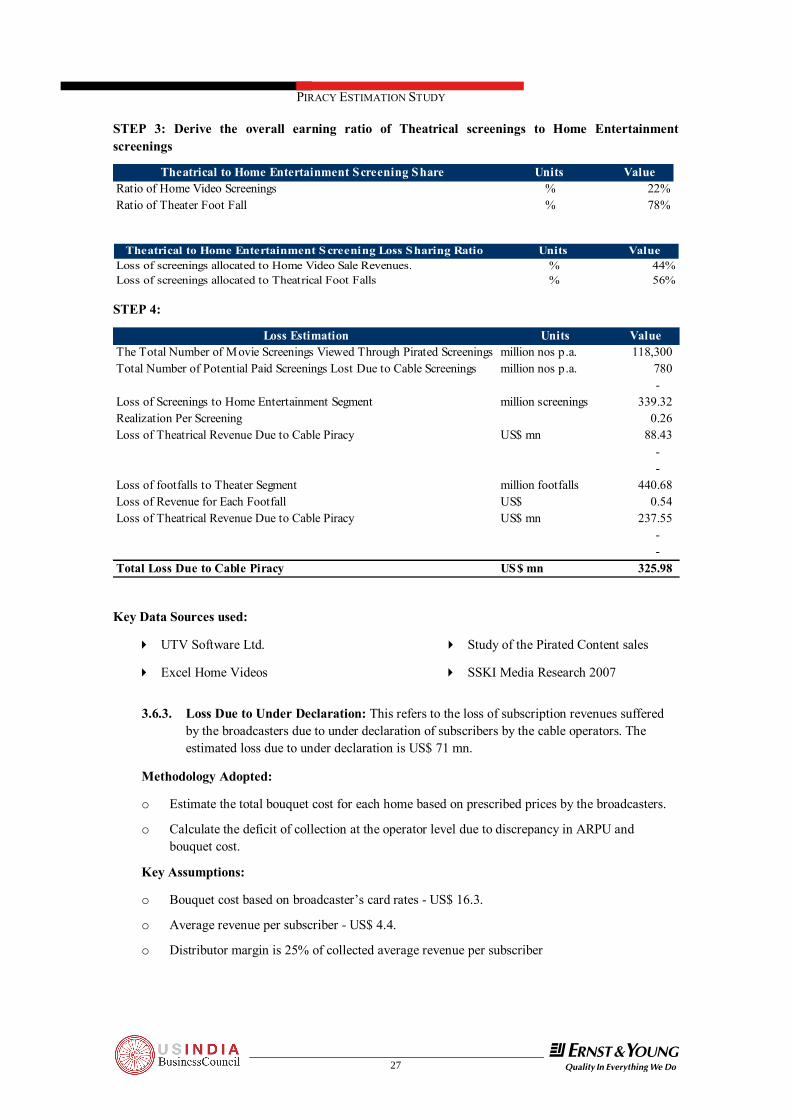
STEP 3: Derive the overall earning ratio of Theatrical screenings to Home Entertainment screenings
Theatrical to Home Entertainment Screening Share Units ValueRatio of Home Video Screenings % 22%Ratio of Theater Foot Fall % 78%
Theatrical to Home Entertainment Screening Loss Sharing Ratio Units ValueLoss of screenings allocated to Home Video Sale Revenues. % 44%Loss of screenings allocated to Theatrical Foot Falls % 56%
STEP 4:
Loss Estimation Units ValueThe Total Number of Movie Screenings Viewed Through Pirated Screenings million nos p.a. 118,300 Total Number of Potential Paid Screenings Lost Due to Cable Screenings million nos p.a. 780
- Loss of Screenings to Home Entertainment Segment million screenings 339.32 Realization Per Screening 0.26 Loss of Theatrical Revenue Due to Cable Piracy US$ mn 88.43
- -
Loss of footfalls to Theater Segment million footfalls 440.68 Loss of Revenue for Each Footfall US$ 0.54 Loss of Theatrical Revenue Due to Cable Piracy US$ mn 237.55
- -
Total Loss Due to Cable Piracy US$ mn 325.98
Key Data Sources used:
4 UTV Software Ltd.
4 Excel Home Videos
4 Study of the Pirated Content sales
4 SSKI Media Research 2007
3.6.3. Loss Due to Under Declaration: This refers to the loss of subscription revenues suffered
by the broadcasters due to under declaration of subscribers by the cable operators. The estimated loss due to under declaration is US$ 71 mn.
Methodology Adopted:
o Estimate the total bouquet cost for each home based on prescribed prices by the broadcasters.
o Calculate the deficit of collection at the operator level due to discrepancy in ARPU and bouquet cost.
Key Assumptions:
o Bouquet cost based on broadcaster’s card rates - US$ 16.3.
o Average revenue per subscriber - US$ 4.4.
o Distributor margin is 25% of collected average revenue per subscriber

28 !@#
Calculation Details:
STEP 1:
Bouquets Cost based on Broadcaster Card Rates
Monthly Subscription
Charges (US$)
Star India 1.46Set Discovery 1.29Zee Turner bouquet 2.41Sahara India 0.61
ESPN Star Sports 0.78
Other channels 2.20Total charges 8.76
STEP 2:
Projected Subscription Revenue Based on Broadcaster Card
Rates Unit Value
Monthly APRU as per the Broadcaster Rate Card US$ mn 9 Reach mn homes 65 Estimated ARPU US$ mn 569 Distributor Margin % 25%Annual Revenue accruing to Broad Caster & MSO US$ mn 5,122
STEP 3:
Loss on Account of Low ARPU Unit Amount
Actual Average Monthly APRU US$ mn 4.39 Reach mn homes 65.00 Estimated ARPU US$ mn 285.37 Distributor Margin % 25%
Annual Revenue accruing to Broadcaster & MSO US$ mn 2,568.29 No of Subscribers Paid for Based on Prescribed Card Rates mn homes 32.59 Under Declaration of Subscribers % 50%Revenue Loss Due to Under-Declaration US$ mn 2,554.02
Key Data Sources used for the Above Projections:
4 UTV software ltd. 4 Sahara One
4 MAA TV 4 Dish TV
4 Hathway Cable
29
PIRACY ESTIMATION STUDY
!@#
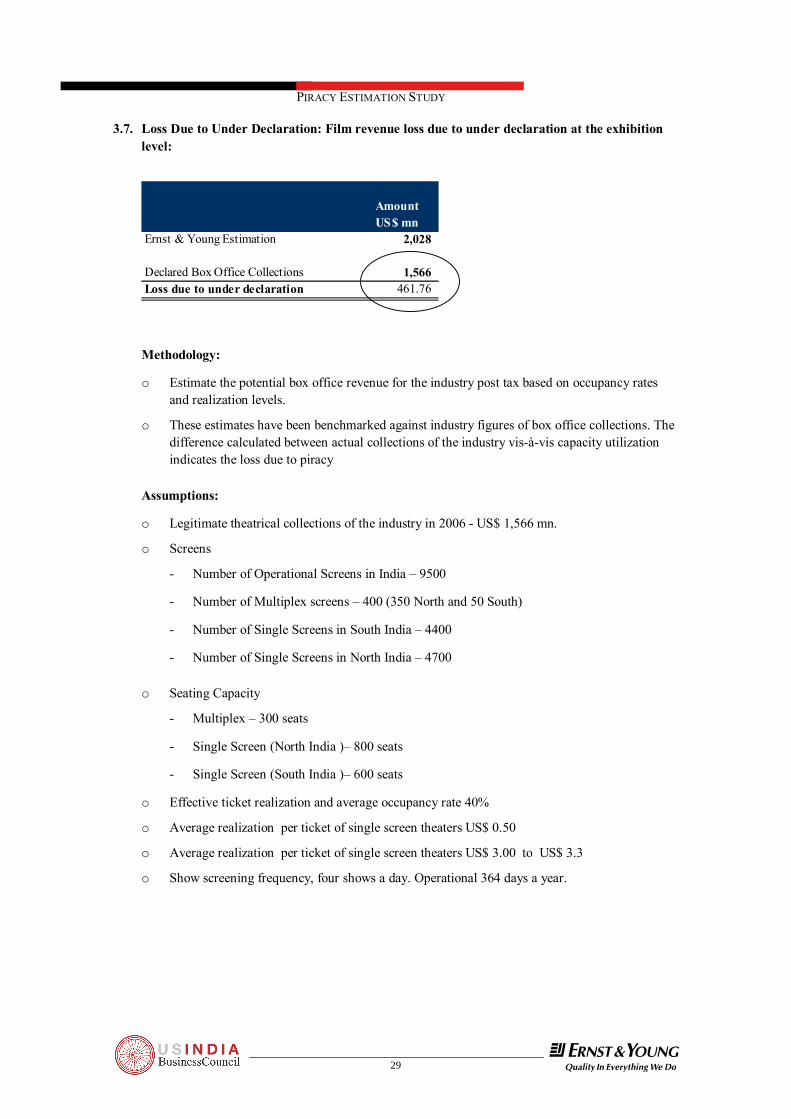
3.7. Loss Due to Under Declaration: Film revenue loss due to under declaration at the exhibition level:
Amount US$ mn
Ernst & Young Estimation 2,028
Declared Box Office Collections 1,566 Loss due to under declaration 461.76
Methodology:
o Estimate the potential box office revenue for the industry post tax based on occupancy rates and realization levels.
o These estimates have been benchmarked against industry figures of box office collections. The difference calculated between actual collections of the industry vis-à-vis capacity utilization indicates the loss due to piracy
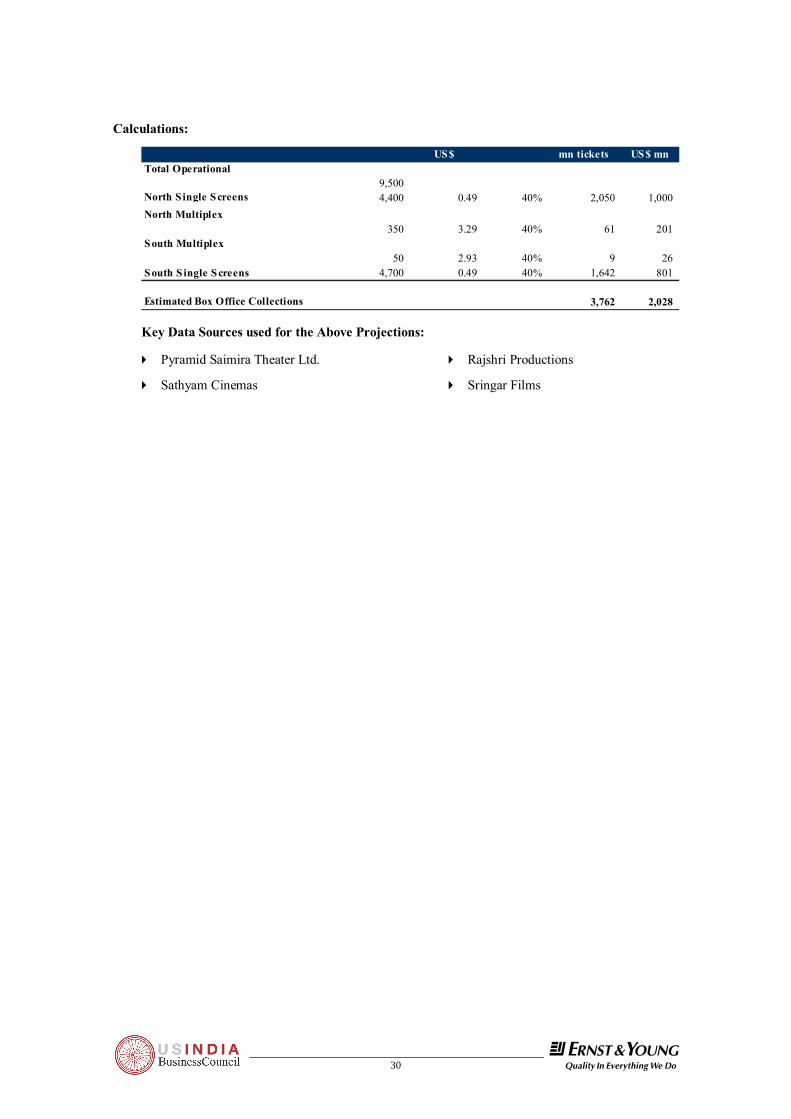
Assumptions:
o Legitimate theatrical collections of the industry in 2006 - US$ 1,566 mn.
o Screens
- Number of Operational Screens in India – 9500
- Number of Multiplex screens – 400 (350 North and 50 South)
- Number of Single Screens in South India – 4400
- Number of Single Screens in North India – 4700
o Seating Capacity
- Multiplex – 300 seats
- Single Screen (North India )– 800 seats
- Single Screen (South India )– 600 seats
o Effective ticket realization and average occupancy rate 40%
o Average realization per ticket of single screen theaters US$ 0.50
o Average realization per ticket of single screen theaters US$ 3.00 to US$ 3.3
o Show screening frequency, four shows a day. Operational 364 days a year.
30 !@#
Calculations:
US$ mn tickets US$ mnTotal Operational
9,500 North S ingle Screens 4,400 0.49 40% 2,050 1,000 North Multiplex
350 3.29 40% 61 201 South Multiplex
50 2.93 40% 9 26 South S ingle Screens 4,700 0.49 40% 1,642 801
Estimated Box Office Collections 3,762 2,028
Key Data Sources used for the Above Projections:
4 Pyramid Saimira Theater Ltd.
4 Sathyam Cinemas
4 Rajshri Productions
4 Sringar Films
31
PIRACY ESTIMATION STUDY
!@#
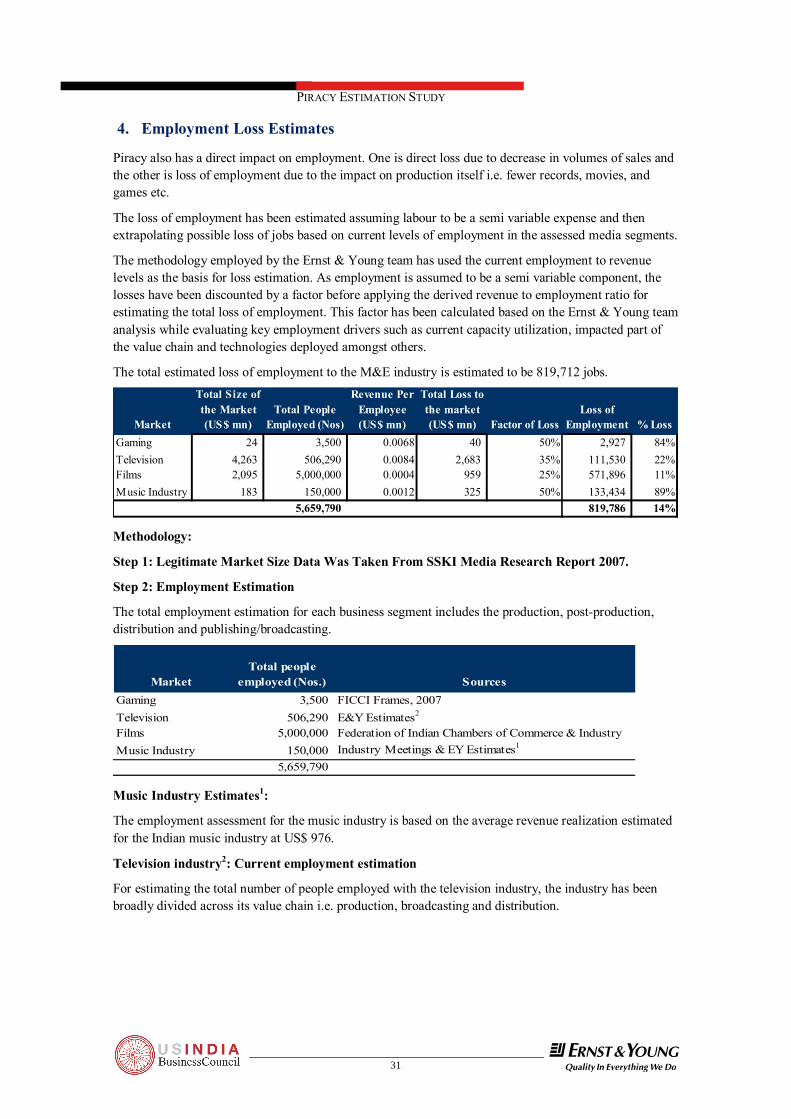
4. Employment Loss Estimates
Piracy also has a direct impact on employment. One is direct loss due to decrease in volumes of sales and the other is loss of employment due to the impact on production itself i.e. fewer records, movies, and games etc.
The loss of employment has been estimated assuming labour to be a semi variable expense and then extrapolating possible loss of jobs based on current levels of employment in the assessed media segments.
The methodology employed by the Ernst & Young team has used the current employment to revenue levels as the basis for loss estimation. As employment is assumed to be a semi variable component, the losses have been discounted by a factor before applying the derived revenue to employment ratio for estimating the total loss of employment. This factor has been calculated based on the Ernst & Young team analysis while evaluating key employment drivers such as current capacity utilization, impacted part of the value chain and technologies deployed amongst others.
The total estimated loss of employment to the M&E industry is estimated to be 819,712 jobs.
Market
Total Size of the Market (US$ mn)
Total People Employed (Nos)
Revenue Per Employee(US$ mn)
Total Loss to the market (US$ mn) Factor of Loss
Loss of Employment % Loss
Gaming 24 3,500 0.0068 40 50% 2,927 84%Television 4,263 506,290 0.0084 2,683 35% 111,530 22%Films 2,095 5,000,000 0.0004 959 25% 571,896 11%Music Industry 183 150,000 0.0012 325 50% 133,434 89%
5,659,790 819,786 14%
Methodology:
Step 1: Legitimate Market Size Data Was Taken From SSKI Media Research Report 2007.
Step 2: Employment Estimation
The total employment estimation for each business segment includes the production, post-production, distribution and publishing/broadcasting.
MarketTotal people
employed (Nos.) SourcesGaming 3,500 FICCI Frames, 2007Television 506,290 E&Y Estimates2
Films 5,000,000 Federation of Indian Chambers of Commerce & IndustryMusic Industry 150,000 Industry Meetings & EY Estimates1
5,659,790
Music Industry Estimates1:
The employment assessment for the music industry is based on the average revenue realization estimated for the Indian music industry at US$ 976.
Television industry2: Current employment estimation
For estimating the total number of people employed with the television industry, the industry has been broadly divided across its value chain i.e. production, broadcasting and distribution.
32 !@#
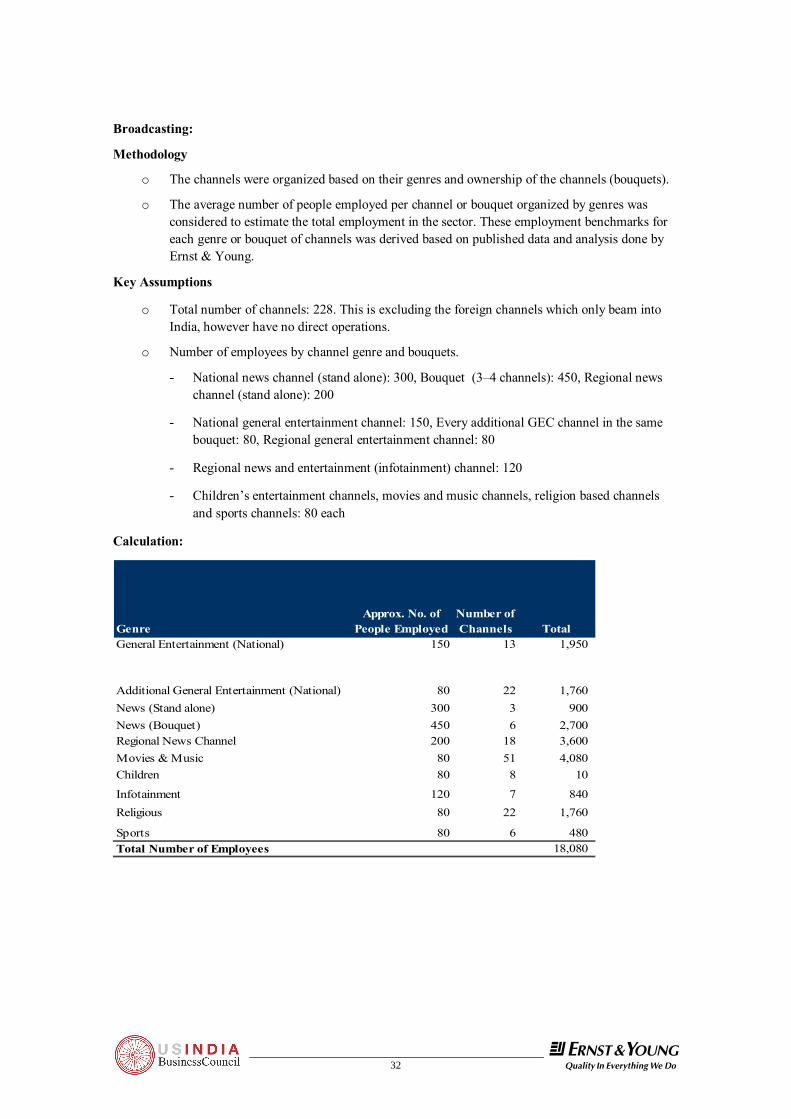
Broadcasting:
Methodology
o The channels were organized based on their genres and ownership of the channels (bouquets).
o The average number of people employed per channel or bouquet organized by genres was considered to estimate the total employment in the sector. These employment benchmarks for each genre or bouquet of channels was derived based on published data and analysis done by Ernst & Young.
Key Assumptions
o Total number of channels: 228. This is excluding the foreign channels which only beam into India, however have no direct operations.
o Number of employees by channel genre and bouquets.
- National news channel (stand alone): 300, Bouquet (3–4 channels): 450, Regional news channel (stand alone): 200
- National general entertainment channel: 150, Every additional GEC channel in the same bouquet: 80, Regional general entertainment channel: 80
- Regional news and entertainment (infotainment) channel: 120
- Children’s entertainment channels, movies and music channels, religion based channels and sports channels: 80 each
Calculation:
GenreApprox. No. of
People EmployedNumber of Channels Total
General Entertainment (National) 150 13 1,950
Additional General Entertainment (National) 80 22 1,760 News (Stand alone) 300 3 900 News (Bouquet) 450 6 2,700 Regional News Channel 200 18 3,600 Movies & Music 80 51 4,080 Children 80 8 10
Infotainment 120 7 840 Religious 80 22 1,760
Sports 80 6 480 Total Number of Employees 18,080

33
PIRACY ESTIMATION STUDY
!@#
Production:
Methodology:
o Estimate the number of unique programs across channels and average annual employment per unique program.
o Calculate the loss of annual employment based on the average annual employment estimated earlier.
Key Assumptions:
o Total number of channels programming in India: 240
o Average number of programs per hour: 2
o Average annual employment by program genre
- Drama/soap for national general entertainment channels: 80
- Drama/soap for regional general entertainment channels and infotainment: 60
- Drama/soap for children and movies and music: 40
- News programming, sport and religion based channels– 10
o Daily Fresh Programming
- GEC: 4 hours, leading to 12 unique entertainment programs produced per annum. This does not include special content of films and shows.
- News Channels: 1 hour of outsourced programming, 4 unique programs per annum
- Infotainment Channels (all regional): 5 hours (3 GEC + 2 News), 20 unique entertainment programs per annum. This does not include special content of films, and shows.
Calculation:
GenreNumber of Channels
Average Fresh Programming
Per day/ Channel
Hours
No. of Programs Per Hour
1No. of Unique
programs per Channel
No. of Programs New Programs Across Genres of Channels
No. of Additional People Employed
Per ProgramGeneral Entertainment 122 3 2 12 1,464 80
News2 53 1 2 4 212 10Religious/ Spiritual 23 1 2 4 92 10Children 10 4 2 16 160 60Infotainment 23 5 2 20 460 40Sports 9 1 2 4 36 10Total 2,424 61
Note1: The programming for the channels is distinctly divided by parts of week (weekend and weekdays) thus doubling the number of unique programs by a factor of 2.
Note2: For News programming only outsourced production hours have been considered for production employment estimation.
34 !@#
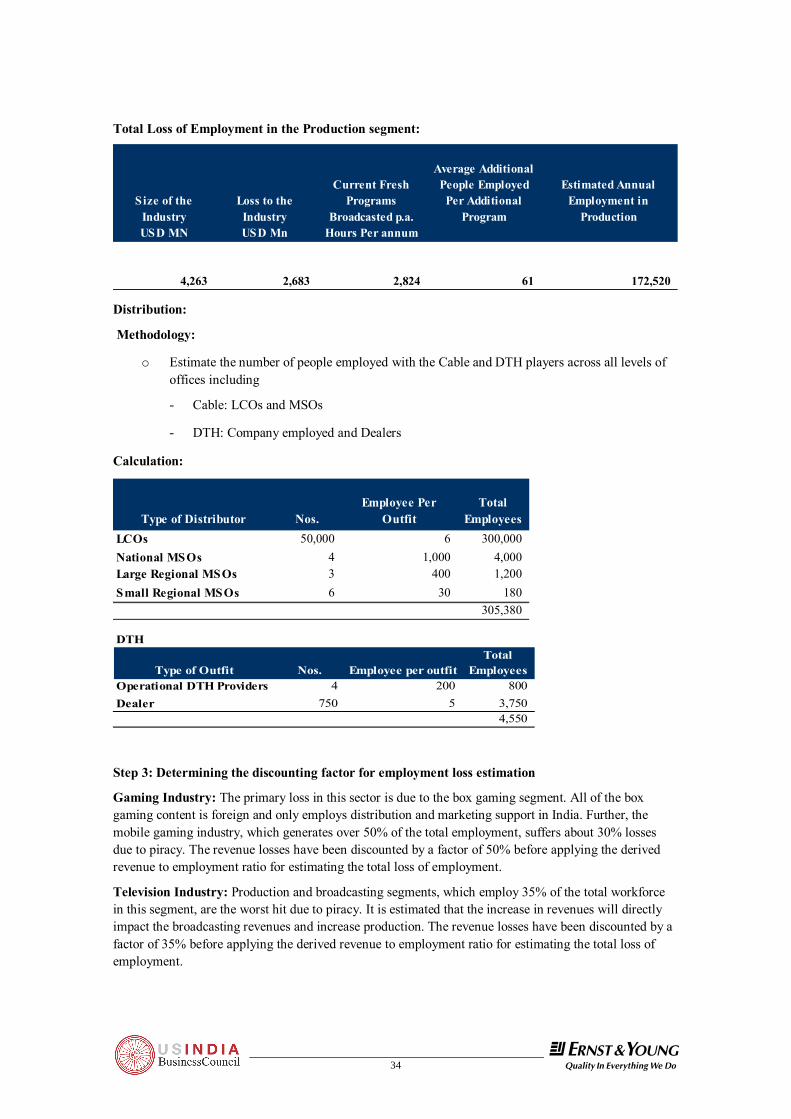
Total Loss of Employment in the Production segment:
Size of the Industry
Loss to the Industry
Current Fresh Programs
Broadcasted p.a.
Average Additional People Employed Per Additional
Program
Estimated Annual Employment in
ProductionUSD MN USD Mn Hours Per annum
4,263 2,683 2,824 61 172,520
Distribution:
Methodology:
o Estimate the number of people employed with the Cable and DTH players across all levels of offices including
- Cable: LCOs and MSOs
- DTH: Company employed and Dealers
Calculation:
Type of Distributor Nos.Employee Per
OutfitTotal
EmployeesLCOs 50,000 6 300,000 National MSOs 4 1,000 4,000 Large Regional MSOs 3 400 1,200 Small Regional MSOs 6 30 180
305,380 DTH
Type of Outfit Nos. Employee per outfitTotal
EmployeesOperational DTH Providers 4 200 800 Dealer 750 5 3,750
4,550
Step 3: Determining the discounting factor for employment loss estimation
Gaming Industry: The primary loss in this sector is due to the box gaming segment. All of the box gaming content is foreign and only employs distribution and marketing support in India. Further, the mobile gaming industry, which generates over 50% of the total employment, suffers about 30% losses due to piracy. The revenue losses have been discounted by a factor of 50% before applying the derived revenue to employment ratio for estimating the total loss of employment.
Television Industry: Production and broadcasting segments, which employ 35% of the total workforce in this segment, are the worst hit due to piracy. It is estimated that the increase in revenues will directly impact the broadcasting revenues and increase production. The revenue losses have been discounted by a factor of 35% before applying the derived revenue to employment ratio for estimating the total loss of employment.
35
PIRACY ESTIMATION STUDY
!@#
Film Industry: The impact of loss in the film industry is suffered predominantly by the production segment followed by exhibition and distribution. The industry is currently dealing with a problem of excess funds chasing limited key resources i.e. actors, directors, and producers. It is estimated that the volume production of films in the country is expected to stabilize with higher investment levels in technology and quality of production. The revenue losses have been discounted by a factor of 25% before applying the derived revenues to employment ratio for estimating the total loss of employment.
Music Industry: The music industry has lost large volumes of people especially in the distribution segment and new artists segment. It is estimated that the increase in revenues will increase the promotion of new artists and scale-up distribution operations, however will not have any significant impact on the production segment. The revenue losses have been discounted by a factor of 50% before applying the derived revenue to employment ratio for estimating the total loss of employment.
Key information sources used:
4 Super Cassette Industries
4 Mr. Bharat Bhushan (independent consultant)
4 Excel Home Videos,
4 B.A.G Films Ltd.;
4 Bharat Bala Productions
4 TAM Peoplemeter.
36 !@#
5. The Way Forward
The issue of piracy needs to be dealt holistically in collaboration with all stakeholders of the industry and law enforcement agencies at large. The key drivers of change for the industry are:
• The State; and
• The Industry
Role of the State:
A stringent law framework to protect copyright and tackle infringement supported by judicial infrastructure is imperative to minimize damage to and secure the future growth of the industry. The law makers need to create a robust legal ecosystem with comprehensive laws spanning across all forms of piracy supported by a speedy and low cost judicial infrastructure.
Fear of the law of the land is known to be one of the most effective tools for wiping out piracy. Singapore, in spite of its proximity to Malaysia, has managed to keep piracy levels at 30% due to management of retail piracy. This is entirely attributed to their robust legal framework and corruption free environment. In India, for instance, with the collaborative efforts of the industry, enforcement agencies and the judiciary a major retail piracy hub (Palika Bazaar, Central New Delhi) has been largely dismantled.
Another initiative worth mentioning has been by the Tamil Nadu State Government. The Tamil Nadu Government has taken the lead in tackling film and soundtrack piracy by creating and enforcing an effective and holistic eco-system. This framework has addressed all links in the chain necessary for curbing film piracy. These key links are:
a. Effective legislations:
Around 2004 the Tamil Nadu Government took legal initiatives to curb film piracy-
- Firstly including film pirates under the Goondas Act that allows detention of the offender up to 1 year without trial.
- Secondly by imposing criminal punishments and heavy monetary fines on exhibitors of pirated films.
This works as an effective multi-pronged strategy to tackle the menace at the production, trading and exhibition levels.
b. Dedicated enforcement mechanism: The execution is carried out through a special video piracy cell under the leadership of the Superintendent of Police. This video piracy cell has 12 units functioning across the state.
c. Judicial mechanisms: Special courts were set-up by the state government to tackle video piracy of films.
These efforts by the Tamil Nadu government have been lauded all over the country, particularly since they have been effective in curbing piracy significantly within the short span of their implementation. For this reason, other states like Kerala, Karnataka and Andhra Pradesh are actively considering or are in the process of developing a similar eco-system.
37
PIRACY ESTIMATION STUDY
!@#
Role of the Industry:
The industry needs to act as a facilitator and coordinator of anti-piracy efforts. The industry associations therefore would play an important role by collating information, channelising isolated initiatives and creating a common platform, to advise and assist the state in policy formulation and accelerate the establishment of effective enforcement mechanisms.
Further, sharing of information between various players in the industry would go a long way in consolidating and replicating successful initiatives, which would benefit all players in the long run.
As an illustrative, the Andhra Pradesh Film Chamber of Commerce has created an Anti-Video Piracy (AVP) cell since May 2005. This dedicated cell led by a retired SP of the state (currently led by Mr. Keshava Reddy) along with 59 other retired police officers works in tandem with the Government and the law enforcement agencies to fight piracy.
The activities of this AVP cell are funded by a corpus created from a voluntary charge of US$ 12.20 paid by each producer, distributor, and exhibitor on each print of their films. This seminal effort by the Andhra Pradesh film industry is based on well articulated and scientific methodology, which is reflected in their charter.
The other important illustrative, which underscores the need of sharing, recognizing and emulating the efforts of certain corporates is the Super Cassettes Industries’ (T-Series) initiative to create a comprehensive database of public platforms (discotheques, restaurants, hotels, international radio stations) playing content owned by T-Series. This was done by undertaking extensive ground operations to collect information, followed up by intensive interaction with these entities, educating them about legal rights and restrictions and negotiating licensing agreements with them on mutually beneficial terms. Systematized implementation of this initiative over the last five years has made the revenue collection from PPRs for T-series go up to 10% of its total revenues. The revenues of the music industry at large from these sources are negligible.
The strategy employed and implemented by Moser Baer (a leading Indian optical disc manufacturer) is worth noting. The company has recently launched in the market DVDs and VCDs of Indian filmed content for less than one US dollar. The pricing is at an average 1 to 1.5 times the price of the pirated content DVDs/VCDs. This has significantly shaken the market since it has successfully managed to capture the market i.e. through low-end pricing, which has been traditionally catered to by the pirates. This strategy is reportedly being emulated by other content publishers and distributors as well.
These initiatives have offered some hope for a beleaguered M&E industry. However, one would have to wait and see how these initiatives are rolled out over a period of time and whether they do offer the much needed panacea for the industry.

38 !@#
6. Annexure: List of Company and Association meetings
Sr No. Industry Company 1 Film UTV Software Ltd Sathyam Cinemas Shringar Group Akash Audio Pyramid Saimara GV Films Rockline Productions Rajshri Films Kaleidoscope Entertainment Pvt Ltd Kiran Chatterjee Harnath Chakarborty
Venkatesh Films Bharat Bala Productions
2 Music Lahari Recording Co. Pvt Ltd Super Cassettes Industries Limited Saregama Aditya Audio Times Music Sound Buzz Galata.com
3 Television MA TV Star TV Sahara One Hathway Datacom
Dish TV B.A.G. Films Ltd.
4 Gaming Levelup Games Kreeda Entertainment Indiagames EA India Milestone
Zapak.com Excel Home Videos
5 Industry Associations IMI NASSCOM IMPPA MPAA Andhra Pradesh Film Chamber of Commerce Karnataka Film Chamber of Commerce South India Music Companies Association Eastern India Motion Pictures Association
39
PIRACY ESTIMATION STUDY
!@#
Ernst & Young’s Media & Entertainment Practice
Industry is the cornerstone of Ernst & Young’s approach to professional services. Media and Entertainment is one such significant focus area. Our media and entertainment practice of more than 2,000 professionals across more than 100 countries provides teams of people focused on issues and challenges faced by the industry. Globally, Ernst & Young is the leading provider of professional services to this industry and is the lead auditor of Media & Entertainment companies on the 2006 S&P Global 1200 and the 2006 Fortune 1000 lists Ernst & Young has also developed a Global Media and Entertainment Center to provide a global framework and focused arena where our partners and professionals around the world can share what we are hearing from other media and entertainment companies on a range of issues in assurance, risk, tax, transaction and finance. Ernst & Young India has a dedicated Media and Entertainment practice of more than 100 professionals across various cities who provide services to many of the country’s leading media and entertainment companies and also the global media giants in India. We have developed a width of service offerings that has enabled us to establish a strong presence in at least three of the top five players in each segment of the industry. On behalf of USIBC this study was undertaken by Ernst & Young Pvt. Ltd. The study endeavors to estimate the loss due to piracy in the media and entertainment industry with a special focus on films, television, music and gaming segments. The report is based on available data, extensive market research and anecdotal evidence gathered through industry interviews. As your partners-in-change, we help you respond quickly and effectively to the challenges of today’s entertainment industry. For further information on Ernst & Young’s services for the Media and Entertainment Industry, please contact: Farokh T. Balsara National Sector Leader, Media and Entertainment Jalan Mill Compound, 95, Ganpatrao Kadam Marg, Lower Parel, Mumbai 400 013, India Tel: +91 22 40356500 (Board),
+91 22 40356550 (Direct) Email: [email protected]

40 !@#
About The U.S.-India Business Council The U.S.-India Business Council is the premier business advocacy organization representing America’s top companies investing in India, joined by global Indian companies, promoting deeper trade and stronger commercial ties. Celebrating its 33rd Anniversary in 2008, USIBC was formed in 1975 at the request of the government of the United States and India to involve the private sectors of both countries to enhance investment flows between the United States and India. The U.S.-India Business Council is a participant in the U.S.-India Economic Dialogue (CEO Forum), the U.S.-India High Technology Cooperation Group, the U.S.-India Energy Dialogue, the Defense Procurement & Production Group, and the U.S.-India Trade Policy Forum. USIBC is comprised of 12 sectoral Executive Committees that meet regularly to assess progress on-the-ground and to devise strategies and prepare representations to advance sector-specific reforms in India. In addition, USIBC’s Executive Committees organize industry missions to India to present to counterparts and the Government of India a united front to advance policy reforms. USIBC is partnered with the premier industry & trade associations in India, including the Confederation of Indian Industry (CII), the Federation of Indian Chambers of Commerce and Industry (FICCI), the American Chamber of Commerce in India (AmCham India), National Association of Software and Service Companies (NASSCOM), The Indus Entrepreneurs (TiE), and the Indo-American Chamber of Commerce (IACC). These relationships provide USIBC-member companies with invaluable expertise and contacts throughout the U.S. and India. USIBC organizes major policy and business development conferences in the U.S. and India. USIBC facilitates for its members key meetings with Indian Industry and Government of India officials to provide business leaders with direct access to top Indian decision-makers. The USIBC offers a daily information service that includes sector-specific updates, and provides a monthly newsletter and calendar of events to keep members apprised of important activities. The current Chairman of USIBC is Indra K. Nooyi, Chairman & CEO of PepsiCo. USIBC’s Chairman is supported by a prestigious Board of Directors, whose combined experience investing in India is significant. Day-to-day operations at USIBC are conducted from its headquarters at the U.S. Chamber of Commerce in Washington, D.C. USIBC has established presence in New York through the Manhattan-India Investment Roundtable, as well as in the Silicon Valley in California, and in New Delhi. Your interest in USIBC is most welcome; please visit our website at www.usibc.com