body mass index: bmi for children and teens - guam
TRANSCRIPT

:li i t ;
! O Health & safety Topin - -
O Publications & Products D Data & Statistics Q Confclrencc .-
BMI - Body Mass Index: BMI for Children and Teens BMI - B O ~ I
, Home
(BMI for Children and Teens is sometimes referred to as "BMI-for-age.")
BMI is Used Differently with Children Than it is With Adults
. - - --- > BMI for Ad
BMI Calcu BMl for CI Teens , Frequently ' - Questions -- - - - - - -.
In children and teens, body mass index is used to assess underweight, overweight, and risk for j Relatedx j
overweight. Children's body fatness changes over the years as they grow. Also, girls and boys differ in their body fatness as they mature. This is why BMI for children, also referred to as BMI-for-age, is
i Ove ? ~ e ig h gender and age specific. BMI-for-age is plotted on gender specific growth charts. These charts are used for children and teens 2 - 20 years of age. For the 2000 CDC Growth Charts and Addtional Information visit CDC's National Center for Health-Statistics.
Nutrition and
Each of the CDC BMl-for-age gender specific charts contains a series of curved lines indicating specific . H~~~+,-~ percentiles. Healthcare professionals use the following established percentile cutoff points to identify ? About Us underweight and overweight in children. Prcgrarns
~ o : ~ s a n d Publrcat~or S ~ t e Map
: Top~c tncie
I \ Contact Ua
Underweight
Normal
At risk of overweight
Overweight
BMI decreases during the preschool years, then increases into adulthood. The percentile curves show this pattern of growth.
%MI-for-age < 5th percentile
BMI-for-age 5th percentile to < 85th percentile
BMI-for-age 85th percentile to c 95th percentile
BMI-for-age 2 95th percentile
What does it mean if my child is in the 60th percentile?
The 60th percentile means that compared to children of the same gender and age. 60% have a lower BMI.
Example Let's look at the BMI for a boy as he grows. While his BMI changes, he remains at the 95th percentile BMI-for-age.
Food Nutrition Services Manangement Division
Age
2 years
4 years
9 years
13 years
6 Ml
19.3
17.8
21 .O
25.1
Percentile
95'"
95*
95fh
95*

We see how the boy's BMI dedines during his preschool years and increases as he gets dder.
Boys: 2 to 20 years
Why is BMl-for-age a useful tool? BMI-for-Age is used for children and teens because of their rate of growth and development. It is a useful tool because
BMI-for-age provides a reference for adolescents that can be used beyond puberty. BMI-for-age in children and adolescents compares well to laboratory measures of body fat. BMI-for-age can be used to track body size throughout life.
For the 2000 CDC Growth Charts and Adcfitional Information visit CDC'S PJationaI center for Health Statistics. . - - . -- - -
For more information on how to use the growth charts visit The Gr,o:Mh Chart,Training.,Modg!es.
References
Hammer LD, Kraemer HC, V\lilson DM, Ritter PL, Dornbusch SM. Standardized percentile curves of body-mass index for children and adolescents. American Journal of Disease of Child. 1991; 145:25!3- 263.
Pietrobelli A, Faith MS, Allison DB, Gallagher D, Chiurnello G, Heymsfiefd, SB. Body mass index as a measure of adiposity among children and adolescents: A validation study. Journal of Pediairics. 1998; 132:204-210.
Date last reviewed: 06/08/2005
Food Nutrition Services Manangement Division
- -
P 2 to 20 ~rs : Girls Stature-for-age and Weight-for-age percentiles
n E
RECORD +
2 to 20 years: W. Length-for-age snd Weight-fw-age percentiles. Soum: Developed by the National Center for (Xlronlc Disease
Prevention and He&h f3crnotbn (2000).
Notifying Parents/Caregivers The following is a sample letter which could be used to notify parents about a child's weight status.
Dear Parent, We recently weighed and measured the children in our school to determine how they are
growing. Your child's weight was found to be lowhigh for hisher height and age. This does not necessarily mean your child is undenveightfovenveight, but your child may be at risk for this condi- tion. The best person to evaluate your child's weight status is hisher regular doctor or health care provider.
We encourage you to make sure your child has annual medical checkups by aphysician. The doctor will weigh and measure your child, may ask questions about your child's growth since birth, and may ask about the heights and weights of your child's close biological relatives. If your child is too thinheavy, your doctor will tell you so. Ask your doctor for advice about good nutrition and physical activity.
If you do not have health insurance or access to health care, please contact us for information about possible medical services.
Please do not put your child on a weight gaidloss diet. For information on helping an under- weight'ovenveight child, [insert information on obtaining a pamphlet].
If you have questions, please call me at [ 1. Cordially, School Nurse
Pamphlets for Parents "Childhood and Adolescent Obesity in America: What's a Parent to Do?" a pamphlet by Betty Holmes, MS, RD. June 1998. The cost is $1.25 per copy. For more information or to place an order, contact the Office of Commu- nications and Technology Resource Center, University of Wyoming: Phone (307) 766-2115. Fax (307) 766- 2800. Available at the following website: htto://www.uwo.e~u/adces~UBS/bI066.~df~
"If My Child is Overweight, What Should I Do About It?" a pamphlet by Joanne P. Ikeda, MA, RD. 1998. The cost is $4.00 per copy. For more information or to place an order, contact Division of Agriculture and Natural Resources, Communications Services & Publications, 6701 San Pablo Avenue, 2nd Floor, Oakland, CA 94608- 1239 or call (800) 994-8849. See website: -. "Helping Your Overweight Child" a pamphlet by the National Institutes of Health. Contact The Weight-control Information Nctwork, 1 WM Way, Bethesda, MD 20892-3665. Tel: (202) 828-1025 or (877) 946-4627, Email: [email protected]. Available at: httD.//www.nlddk.nlh.eov/healtNnutrit/Du. . .
The authors of this publication are Joanne P. Ikeda, MA, RD and Dr. Pat Crawford, DrPH, RD, Co-Directors of the Center for Weight and Health. Comments on this publication can be directed to [email protected], (510) 642-2790 or [email protected], (5 10) 642-5572. Funded in part by the California Nutrition Network. O September, 2000 Re U m t m l a aro1tfa.m a k b t ~ d i r m n w t a .oam rn hhrmrm 01 f y p r m by )I ) ~ h l ~ - md Ilr Uuuumrtj m me h a m d- ~ I I , mwrvl o d ~ k MI* -,pSml ol naxml6'isbdiCI. dial c m d m a l o a m - m l a r d a mmc W c n h ) . mom. mnf.l .rmr .a m-1 arnbk e l a d o . w - a. -4 ~ m . (--I
Introduction It may sometimes be necessary to weigh and measure children in school settings. In these situations, it is important to obtain accurate information. At the same time, it is important to avoid encouraging
J1,
unrealistically thin body images and stigmatizing children as "fat," "heavy," or "skinny." Consider the question, "How can this task be done in a way that will promote body satisfaction, a positive body image, and high self-esteem in youngsters of all sizes and shapes?'The following guidelines were developed to help you measure students in a way that is sensitive and supportive as well as accurate.
Growth Charts The purpose of weighing and measuring children is to determine if they are growing "normally." There is a wide range of heights and weights that are considered "normal" since children grow at very different rates even when they are the same age. The Centers for Disease Control and Pre- vention and the National Center for Health Sta- tistics issued new growth charts for children in June, 2000. The revised growth charts consist of 16 charts (8 for girls and 8 for boys) including two new body mass index (BMI) charts. The charts can be accessed at the following website: & : / / w w w . c d ~ g ~ v / g r o w t ~ . Be sure you have the new growth charts before beginning this task.
of heights and weights
since c
Setting f?
Each child should be weighed and measured in private with no other children present. Recruit an adult to record the measurements or do it yourself. Do not have another child do it. Con- sider having the child face away from the scale if slhe appears anxious about being weighed.
Comments to Children Not Making Do not comment on the height or weight of a child a Medical Diagnosis at the time the measurements are being taken. Unless you are a licensed health care profes- Neutral c ~ n ~ m e n t s such as "Thanks, you can get sional whose scope of practice includes diag- off the scalenow" are appropriate. If a childmakes nosing medical conditions, refrain from rnak- a negative comment about hisher ing a diagnosis of body, it is appropriate to say, overweight or obesity. "Kids' bodies come in lots of dif- Labeling a child as ferent sizes and shapes. If other "overweight," "too kids are teasing you about your fat.97 '.to,, thin,fl or body, let's talk and see what we can do about it." Teachers and other school staff should dis-
]en even though "skinny" based on a single heighvweight re 'from measurement at one
" actions
courage teasing by modeling point in time is inap- and promoting respectful be- propriate. In order to havior. The philosophy "We re- determine if a child is spect the bodies of others even underweight, over- though they are different from weight or at risk of our own" should guide words and these conditions, standard practice is for a phy- actions. If a child asks, "Am 1 to0 fat?'or "Am 1 sician to gather additional medical infoma- too skinny?'say that you don't know and suggest tion necessary for making a diagnosis. the child ask hisher doctor this question.
Measuring Weight Children should be weighed using a platform scale. This may be a beam balance scale or a digital (electronic load cell or strain gauge) scale. Check your equipment regularly to make sure you are getting accurate measurements. Scales should be calibrated on a routine basis. Calibration involves putting known weights on the scale to check accuracy.
Procedure: 1. Ask child to remove outer clothing and shoes. 2. Place the scale in the "zero" position before the child steps on the scale. 3. Ask the child to stand still with both feet in the center of the platform. 4. Record the measurement to the nearest 114 pound or 100 grams. 5. Have the child step off the scale.
Measuring Height
A standing height board or stadiometer is required. This device has a flat vertical surface on which a measuring rule is attached. It also has a moveable headpiece and either a permanent surface to stand on or the entire device is mounted on the wall of a room with a level floor.
Procedure: 1. Before you begin, ask child to remove shoes, hat, and bulky clothing such as coats and sweat-
ers. Ask the child to remove or undo hair styles and hair accessories that interfere with taking a measurement. In rare cases, a child may be unwilling to undo an intricate or costly hairstyle. In these situations, care should be taken to locate the actual crown of the head.
2. Direct the child to stand erect with shoulders level, hands at sides, thighs together, and weight evenly distributed on both feet. The child's feet should be flat on the floor or foot piece, with heels comfortably together and touching the base of the vertical board. There are four contact points between the body and the stadoimeter: head, upper back, buttocks and heels (see arrows 1-4 on diagram).
3. Ask the child to adjust the angle of hisher head by moving gg the chin up or down in order to align head into the Frankfort Plane. The Frankfort Plane is an imaginary line from the lower margin of the eye socket to the notch above the tragus of the ear (the fleshy cartilage partly extending over the opening of the ear). This is best viewed and aligned when the viewer is directly to the side of and at the eye level of the child. When aligned correctly, the Frankfort Plane is parallel to the hori- zontal headpiece and perpendicular to the vertical back piece of the stadiometer. NOTE: When the chin is correctly posi- tioned, the back of the head may not make contact with the IC"p board. In fact, in a very few individuals, only two points will make contact with the vertical backpiece.
4. Ask the child to breathe in and maintain hisher position. Lower the headpiece until it firmly touches the crown of the head and is at a right angle with the measurement surface. Check contact points to ensure that the lower body stays in the proper position and the heels remain flat. Some children may stand up on their toes, but verbal re- minders are usually sufficient to get them in proper position.
5. Record height to the nearest 118th inch or 0. lcm.

Childhood Overweight Definitions Children at or above the 95" percentile of body mass index (BMI) by sex and age are considered overweight. Many call this group obese, although technically the term obesity refers to an excess in body fat relative to lean muscle mass. BMI measures how heavy the body is. There is a good, but not perfect, correlation between body fat and body heaviness.
Children between the 85" and 94th percentile of BMI are considered at risk of being overweight. Body mass index @MI) is weight (in kilograms) divided by height squared (in meters).
Consequences of Childhood Overweight Correlation between childhood and adult overweight 9 Fifty percent of overweight childrenlteens remain overweight as adults (1). 9 Approximately 26-41% of overweight preschool children will become overweight adults (2). 9 Obesity is associated with the development of diabetes, heart disease, hypertension and some
cancers.
Medical complications of extreme overweight in children (3): 9 Increased stress on weight bearing joints 9 Increased blood pressure 9 Risk of diabetes mellitus
Psychological consequences of overweight: 9 Children are at increased risk for discrimination, low self-esteem and poor body image. 9 Adolescent girls are less likely to be accepted into college, less likely to be mamed, and less
likely to be economically well off in adulthood (4).
Growing Prevalence of Child hood Overweight Nationally(5) There has been a substantial increase in the number of children who are overweight in the United States over the last 30 years, from 5% in the 60s to 11% in the 90s. Differences by age, race and sex in overweight prevalence in the 90s are as follows:
Children Aged 6 to 11 Females Males White 9.2% 10.3% Black 16.4% 11.9% Mexican-American 14.3% 14.6%
Children Aged 12 to 17 White 8.5% 11.1% Black 15.7% 10.7% Mexican-American 14.3% 13.7%

Risk Factors for Childhood Overweight Which Cannot Be Changed Parental obesity 9 Children with two obese parents are more than six times as likely to become obese than children
with non-obese parents (6). Children with only one obese parent are twice as likely to become obese as adults (7).
Socio-demographic factors 9 Among white children, those with parents of lower socioeconomic status are more likely to be
overweight (8). 9 Girls without siblings are at greater risk for becoming overweight. For each sibling there is
a 14% decreased likelihood (8). 9 Girls with older mothers are at increased risk of being overweight (8).
Risk Factors for Childhood Overweight Which Can Be Changed Parenting style: A high degree of parental control of diet is linked to a child's inability to regulate food intake, and to the amount of body fat in girls (9). Physical activity: Starting in adolescence, girls' physical activity declines 7.4% per year, while boys' activity decreases 2.7% per year (10). Television watching: Hours of television watching is associated with overweight in children (1 1,12). Over one fourth of children report watching four or more hours of television per day (13). Skipping meals: Children who ate more times per day were less likely to be heavy than children who ate fewer times per day (kilocalories were the same in both groups) (14). Eating patterns: Girls who ate while doing homework, ate while watching television, bought snacks, or ate when not hungry had higher caloric intakes than girls who did not report these behaviors (15).
Dietz WH. Childhood Weight affects adult morbidity and morality. J Nutr, 1998; 128 (2): 41 lS-414S. Serdula MK, Ivery D, Coates RJ, Freedman DS, Williamson DF, Byers T. Do obese children become obese adults? A review of the literature. Preventative Medicine, 1993; 22: 163-1 77. Bray GA. Complications of obesity. Annals of Internal Medicine, 1985; 103 (6 (Pt 2)): 1052-62. Gortrnaker SL, Must A, Perrin JM, Sob01 AM, Dietz WH. Social and economic consequences of overweight in adolescence and young adulthood. New Engl J Med, 1993; 329 (14):1008-12. Troiano R, Flegal KM. Overweight children and adolescents: Description, Epidemiology and Demographics. Pediatrics, 1998; 101 (3): 497-503. Lake, JK, Power C, Cole TJ. Child to adult body mass index values in the 1958 British birth cohort: associations with parental obesity. Arch Dis Child, 1997. 77:376-380. Whitaker, RC and e.al. Predicting obesity in young adulthood from childhood and parental obesity. New Engl J Med, 1997; 337:869-973. Patterson ML, Stem S, Crawford PB, MacMahon RP, Similo SL, Screiber GB, Morrison JA, Waclawiw MA. Sociodemographic factors and obesity in preadolescent black and white girls: NHLBI's Growth and Health Study. J National Med Assn, 1997; 89:594-600. Johnson SL, Birch LL. Parents' and children's adipostity and eating style. Pediatrics, 1994; 94:653-661. Sallis JF. Epidemiology of physical activity and fitness and adolescents. Critical Reviews in Food Science and Nutrition, 1993;33 (4/5):403-408. Obarzanek E, Schreiber, GB, Crawford, PB, Goldman, SR, Barrier, PM, Frederick, MM, and Lakatos, E, "Energy intake and physical activity in relation to indexes of body fat: The NHLBI Growth and Health Study," Am J Clin Nutr, 60:15-22, 1994. Robinson, TN. Does Television cause childhood obesity? JAMA 1998, March 25,279 (12): 959-60. Dietz WH, JR, Gortmaker SL. Do we fatten our children at the television set? Obesity and television viewing in children and adolescents. Pediatrics, 1985; 75 (5); 807-812. Fabry P, Fodor J, Hejl Z, Braun T, Zvolankova K. The frequency of meals: Its relations to overweight in school children. Changes in weight-height proportion and skinfold thickness. Am J Clin Nutr, 1966; 18 (5): 358-361. McNutt SW, Hu Y, Schreiber GB, Crawford PB, Obarzanek E, Mellin L. A longitudinal study of the dietary practice of black and white girls 9 and 10-year-old at enrollment: the NHLBI Growth and Health Study. J Adolescent Health, 1997; 20 27-37.
Prepared by Pat Crawford, Rita Mitchell and Joanne Ikeda 0 January, 2000

Descriptor Descriptor Code: Issued Date: 705
FOOD AND NUTRITION SERVICES MANAGEMENT Rescinds: Issued: 610,705, & 705.1
BOARD POLICY
As we progress in promoting a sound Nutrition Education and healthy eating life style to our students and their families, the following policy and guidelines in the area of Food Service Operations and Nutritional Content shall be in effect:
The Guam Public School System, as the State Agency, shall seek to maintain participation in the United States Department of Agriculture, Food and Nutrition Service (USDA, FNS) Programs in accordance with the "Child Nutrition and WIC Reauthorization Act of 2004" (U.S. P.L. 108- 269) and the "Child Nutrition Act of 1966" for all institutions, public and private, that participate in the Child Nutrition Programs and Food Distribution Programs. These Programs shall be supported by the Food and Nutrition Services Administrator who shall be held accountable for the effective support of the aforementioned programs. The Programs, as it applies at the school level, shall be held under the direct supervision of the Principal.
The Guam Public School System shall ensure the following regulations, as revised from time to time, are adhered and uniformly implemented in accordance with the respective Programs:
National School Lunch Program School Breakfast Program Summer Food Service Program Child and Adult Care Food Program Nutrition Education and Training Program State Administrative Expense Program Cash in Lieu of Donated Food Program Determining Eligibility for Free and Reduced Price Meals and Free Milk in Schools
Donation of Foods for use in the U.S., its Territories and Possessions, and areas under its Jurisdiction
The Emergency Food Assistance Program
7 CFR Chapter 11, Part 210 7 CFR, Chapter 11, Part 220 7 CFR, Chapter 11, Part 225 7 CFR, Chapter 11, Part 226 7 CFR, Chapter 11, Part 227 7 CFR, Chapter 11, Part 235 7 CFR, Chapter 11, Part 240
7 CFR, Chapter 11, Part 245
7 CFR, Chapter 11, Part 250 7 CFR, Chapter 11, Part 251
FOOD AND NUTRITION SERVICES MANAGEMENT

NUTRITIONAL CONTENT AND FOOD SERIVCE OPERATIONS (School Food Authority)
Meal & Milk Pricing
The prices set for meals, snacks, and the price for milk shall be submitted to the ~ o & d for approval one (1) month prior to the opening of each School Year.
Operations
The daily operation of the cafeteria shall be the responsibility of the cafeteria Manager. The school principal shall be held accountable for the overall effective leadership and management of the cafeteria's operation. The Food and Nutrition Services Administrator shall p ~ ~ v i d e guidpi- and support to the School Food Authority.
Nutrition Advisory Council
A Nutrition Advisory Council appointed by the Superintendent of Education shali be responsible for advising and making recommendations to the Superintendehi ofi fM. and nutrition education opportunities and requirements. The Council shall consid "of &&en% students, schoof administrators, teachers, and industry professionals. The council shall be chaired by the Food and Nutrition Services Administrator.
Food with Minimal Nutritional Values
A. Food and beverages listed a Foods of Minimal Nutritional Value
Food and beverages listed as Foods of Minimal Nutritional Value (FMNV), as defined by the regulations of the Food and Nutrition Service (FNS) of the U.S. Department of Agriculture (7 CFR, Parts 210 & 220) are prohibited from being sold (to include vending machines), given away, or promoted at anytime during school hours of operation. Such a provision specifically precludes at anytime the sale or promotion of carbonated beverages, water-ices unless made with fruit 100% juice, ice cream or similar products, licorice, marshmallow candies, chewing gum, candies, fondant, spun candy and candy- coated popcorn, or related food items with minimal nutritional content. Foods with minimal nutritional values shall be identified by the Food and Nutrition Services Administrator in collaboration with the Nutrition Advisory Council consisting of parents, students, school administrators, teachers, and industry professionals.
FOOD AND NUTRITION SERVICES MANAGEMENT

B. Foods and beverages that meet the Minimum Nutritional Values
Foods that meet the minimum nutrition values include, but are not limited to, corn chips, beef jerky, popcorn, fruit, cheese & crackers, 100% fruit juices, peanuts, sunflower seeds, granola bars, low fat yogurt, pretzels, trail mix, low-fat and fat-free fluid milk, and similar food groups approved by USDA, FNS and the Food & Nutritiog Services Administrator. Foods that meet the minimum nutritional values shall be identified by the Nutrition and Food Services Administrator in collaboration with the Nutritiod Advisory Council consisting of parents, students, school administrators, teachers, and industry professionals.
C. Student Stores
Those Student Stores whose proceeds benefit the school or student organization approved by the school administrator, may sell food items of nutritional value as per 7 CFR, Parts 210 and 220, and approved for sell by the Food and Nutrition Services Adrninistratpr, after thirty (30) minutes after the last lunch period until the end of the school day.
D. Food Sales and Distribution
Food sales and distribution, by school approved school organizations for the benefit of these organizations may be allowed, but only after written permission is granted by the principal of the particular school. The student organization must prove that the food sold or distributed contains the minimum nutritional values so as to comply with the Federal Regulations contained in 7 CFR, Parts 210 and 220. The principal shall consult in writing with the Food and Nutrition Services Administrator to determine if the food sold or distributed is of sufficient nutritional value so as to comply with the Federal Regulations. Food sales or distribution shall occur only after the end of the last lunch period until the end of the school day.
E. Food Ticket Sales
Sales of tickets or other items are permissible provided all proceeds are used for the approved purposes of a school student organization and comply with the aforementioned policies.
Sales of tickets or other items by teachers, the administration or other individuals for purposes of generating funds for purposes other than use by school sponsored student organization are permitted only if approved by the Superintendent of Education.
F. Food Service Area
Schools must not design their food service area in such a way as to encourage or facilitate the choice or purchase of food with minimal nutritional value as a ready substitute for the program meals.
FOOD AND NUTRITION SERVICES MANAGEMENT

. G, Compliance with US Dietary Guidelines
Foods sold or served in schools should assist students to comply with the dietary guidelines for Americans, by providing a variety of grains, fruits, vegetables, food low in saturated fat, trans-fat, cholesterol, sugars and salt.
H. Fresh FruitsNegetables and 100% Juice Machines
Fresh fruits and vegetables and other fresh fruit and vegetable (100% juice) juice machines are acceptable at all times.
I. Sale and Distribution of Food and Beverages
All food and beverages sold or distributed on campus at anytime must meet the Department of Public Health and Social Services' standards in regard to storage, preparation and serving; and must be approved by the Food and ~u@$on Services Administrator.
J. Access to Safe Drinking Water Students and staff will have access to safe, fresh drinking water throughout the school day. Fluoridated or bottled water should be made available for purchase by staff and students.
K. Non-Food Alternatives
School staff should encourage non-food alternatives as student rewards.
To ensure that our students receive a variety to include low-fat and non-fat fluid milk, schools shall include with every program meal served, half pint disposable container of fluid milk. The fluid milk's nutritional content shall at a minimum:
A. Milk Fluid Unflavored (white):
a. Two percent (2%) reduced fat.
b. Pasteurized.
c. Must contain Vitamins A & D at levels specified by the US Food and Drug Administration.
B. Chocolate, S trawberrv, and Vanilla Milk:
a. One percent (1 %) reduced fat.
b. Pasteurized.
c. Must contain Vitamins A & D at levels specified by the US Food and Drug Administration.
FOOD A N D NUTRITION SERVICES MANAGEMENT

School Cafeterias
A. Designation of Eating Areas
Any student may eat in the school cafeteria or other designated place on campus.
B. Meal Prices
Meal prices will be established by the Superintendent in consultation with the Food and Nutrition Services Administrator and with the approval of the Board at the beginning of each school year.
C. Pricing of Healthy Foods
Healthy option foods should be competitively priced.
D. Posting of Meal Prices and Menus
Meal prices and menus will be conspicuously posted in each cafeteria or designated meal area.
E. Promotion of Nutrition and Nutrition Education
School Cafeteria and food service staff shall promote good nutrition and nutrition education by offering healthy food choices. Schools and the Food and Nutrition Services Division shall reinforce the promotion of good nutrition by reinforcing programs, paraphernalia, and activities to classrooms such as decorations, special promotions, and themes.
Nutrition and Food Services Operation
In order to support the school's nutrition and food services' operation as an essential partner in the educational mission of the district and its role in the district's comprehensive nutrition program, school administrators and in collaboration with the Food and Nutrition Services Administrator shall be responsible for:
A. Encouraging all students to participate in the school's Nutrition Meal Programs.
B. Providing varied and nutritious food choices consistent with the applicable federal government Dietary Guidelines for Americans.
C. Providing adequate time and space to eat meals in a pleasant and safe environment. Schools shall ensure:
a. Seating is not overcrowded;
b. Rules for safe behavior are consistently enforced;
FOOD AND NUTRITION SERVICES MANAGEMENT

c. ervision is provided; and d. For recess held in conjunction with the lunch period, recess should be scheduled
prior to the lunch period for elementary students.
Family and Community Involvement
In order to promote family and community involvement in supporting and reinforcing nutrition education in the schools, the school administrator is responsible for ensuring:
A. Nutrition education materials and meal menus are made available to parents;
B. Parents are encouraged to promote their child's participation in the school meals program. If their children do not participate in the school meal program, parents should provide their children with healthy snacks/meals;
C. Families are invited to attend exhibitions of student nutrition projects or health fairs;
D. Nutrition education curriculum includes homework that students can do with their families (e.g., reading and interpreting food labels, reading nutrition-related newsletters, preparing healthy recipes, etc);
E. School staff are encouraged to cooperate with other agencies and community groups to provide opportunities for student projects related to nutrition, as appropriate; and
F. School staff considers the various cultural preferences in development of nutrition education programs and food options.
Staff Development
Ongoing in-service and professional development training opportunities for staff in the area of food nutrition will be encouraged.
Program Evaluation
In order to evaluate the effectiveness of the school health program in promoting healthy eating and to implement program changes as necessary to increase its effectiveness, the Food and Nutrition Services Administrator shall be responsible for evaluating and assessing annually the Board Policy and Procedures are implemented, including a periodic assessment of the school meal program with input from students, parents and staff. The evaluation and assessment shall be submitted annually in report form to the Superintendent of Education and the Guam Education Policy Board one month prior to the opening of each school year.
FOOD AND NUTRITION SERVICES MANAGEMENT
Oct-17-2005 03:OZpm From-GPSS FOOD p N U T R l T l O N SERVICES t6714775394 r\ T-501 P.001 F-212
GUAM PUBLIC SCHOOL SYSTEM F o o d and Nutri t ion Services
Management Div i s ion P.O. Box DE
H&akiia, Guam 96932 Telephone: (671) 475-640019
Fax: (671) 477-5394
- F A X COVERSHEET
TO: THE OFFICE OF SENATOR FROM: Shelly Blas, Food & Nutrition MIKE CRUZ, MD Services Aitn: Ms Elaine DeUTsda
FAX NUMBER: 477-5984 TOTAL NO- OF PAGES INCLUDING COVER:
30
DATE: OCTOBER 17,2005
RE: CDC BMI INFORMAT1ON
0 URGENT d FOR REVIEW PLEASE COMMENT PLEASE REPLY PLEASE RECYCLE
Baerms y ~ n H*aAdtdl EndosEd is'& BMI ~~n Grom the US. Deparbnent of Health aod Haman Semices' Genterr for D b w c Control and Pnweatiorrc Sbald p6u bstPe any additional questions or an- please contact the Food and nutrition Seavices Management Division at 47-9. Thank you very much!
R E C E I V E D DATE :lolnln7,
IM711
Oct-17-2005 03:02pm From-GPSS FOOD NUTRITION SERVICES e t6714775394 Q T-501 P.002 F-212
CDC: Safer - Healthler - People - 1
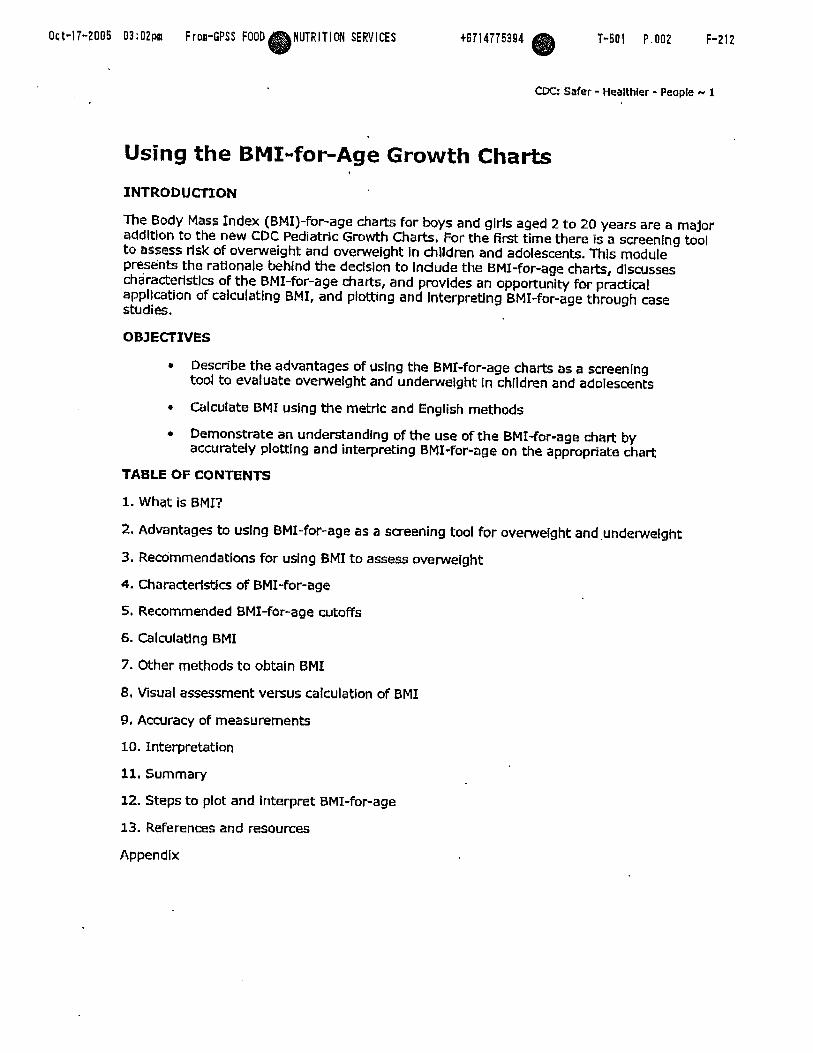
Using the BMI-for-Age Growth Charts
The Body Mass Index (BM1)-for-age charts for boys and glrls aged 2 t o 20 years are a major addition to the new CDC Pediatric Growth Charts. For the first time there is a screenlng tool to assess rlsk of overweight and ovewelght In chlldren and adolescents. This module presents the rationale behlnd the declslon to lndude the BMI-for-age charts, discusses characterlstlcs of the BMI-for-age charts, and provides an opportunity for practical application of calculating BMI, and plotting and lnterpretlng BMI-for-age through case studies.
Describe the advantages of using the BMI-for-age charts as a screening t o d to evaluate overweight and underweight In chlldren and adolescents
Calculate BMI uslng the metric and English methods
Demonstrate an understanding of the use of the BMI-for-age chatT by accurately plotfing and interpreting BMI-for-age on the appropriate chart
TABLE OF CONTENTS
1. What is BMI?
2, Advantages to using BMI-for-age as a screening tool for ovewelght and.underwelght
3. Recommendations for using BMI t o assess ovewelght
5. Recommended BMI-for-age cutoffs
6. Calculating BMI
7. Other methods to obtain BMI
8, Visual assessment versus calculation of BMI
9. Accuracy of measurements
10. Interpretation
11. Summary
12. Steps to plot and interpret BMI-for-age
13. References and resources
Appendlx
Oct-17-2005 03:02pm Frm-CPSS FOOD UTRITION SERVICES F CDC: Safer - Healthier - People - 2
2. WHAT IS BMI? . An anthropornetric index of weight and height
Body Mass Index (BMI) is an anthropometriclndex of welght and helght that is deflned as body welght In kllograrns dlvlded by helght In meters squared (Keys et al., 1972).
EM1 = weight (kg) / height (m)2
BMI Is the brnrnonly accepted index for classiwng adiposity In adults and It Is recommended for use with children and adolescents.
A screening tool
Like welght-for-stature, BMI is a screening tool used to Identify lndlviduals who are underweight or overweight. BMI Is NOT a diagnostic tool (Barlow and Dletz, 1998).
For example, a child hho is relaUvely heavy may have a high BMI for his or her age or high weight-for-stature. To determine whether the child has excess fat, further assessment would be needed and that might indude sWnfold measurements. To determine a counseling strategy, assessments of diet, health, and physlcal activity are needed.
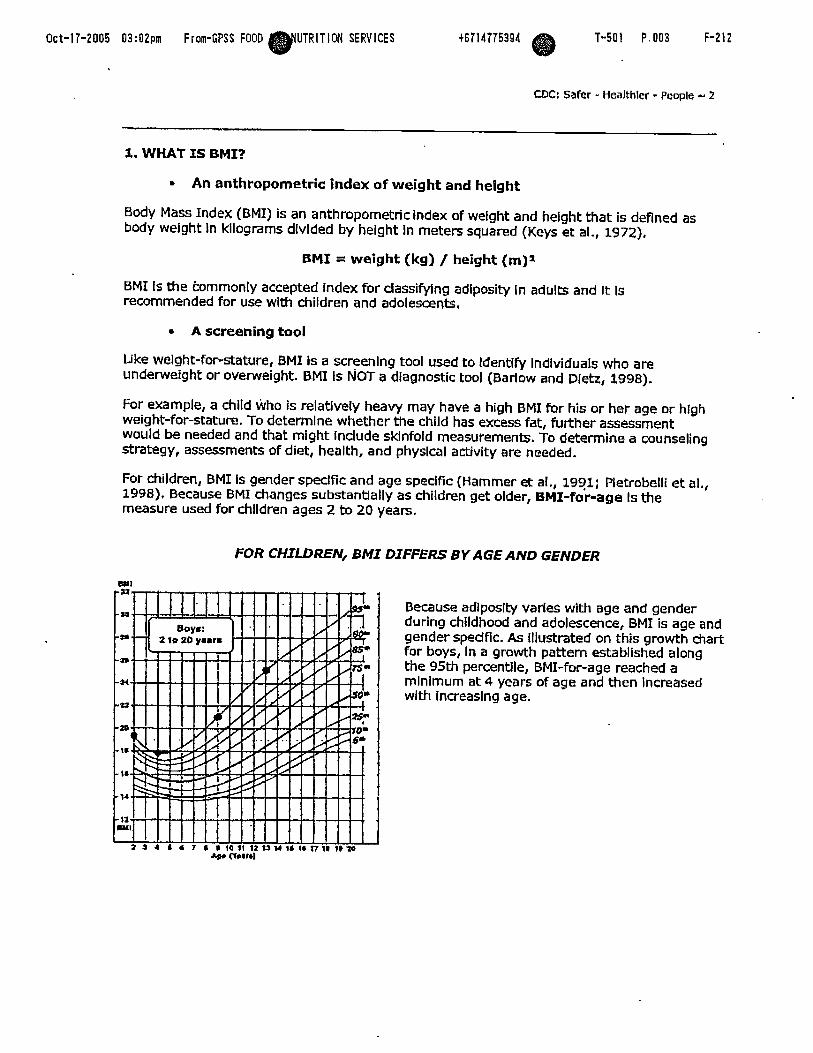
For children, BMI is gender spedfic and age spedfic (Hammer et al., 1991; Wetrobelli et al,, 1998). Because BMI changes substantially as children get older, BMI-for-age Is the measure used for children ages 2 to 20 years.
FOR CHILDREN, BMI DIFFERS BY AGE AND GENDER
8 P l
Because adiposity varies with age and gender during childhood and adolescence, BMI is age and gender spedflc. As Illustrated on this growth chart for boys, In a growth pattern established along the 95th percentile, BMI-for-age reached a rnlnlmurn at 4 years of age and then Increased with Increasing age.
t 4 1 6 7 8 S 1 Q H 1 2 % % ~ 1 1 I * X 7 W i ~ t o yr nwfbl

Oct-17-2005 03:02pm F rom-GPSS FOOD PNUTRITION SERVICES 16714775391 r\ T-501 P.004 F-212
CDC: Safer - Healthier - People - 3
An indirect measure of body fatness
BMI Is not a direct measure of body fatness. However, BMI parallels changes obtalned by direct measures of body fat such as underwater welghing and dual energy x-ray absorptlornetry (DXA). BMI can be considered a proxy for measures of body fat.
2, ADVANTAGES TO USING BMI-FOR-AGE AS A SCREENING TOOL FOR OVERWEIGHT AND UNDERWEXGHT
There are several advantages to using BMI-hr-age a s a screening tool for overweight and underweight.
BMI-forage provides e reference for adolescents not previausly available. When the 1977 NCHS growth charts were developed, weight-for- height percentiles were provlded only for prepubescent girls up to 10 years and for boys up to 11.5 years (Hamill et al,, 1979). BMI-for-age is the only Indicator that allows us to plot a measure of welght and height with age on the same chart. BMI-for-age was not available in the 1977 charts. Age as well as stage of sexual rnaturlty Is hlghly correlated wlth body fatness (Daniels et al,, 1997).
BMI-for-age is the measure that is consistent with the adult index so It can be used continuously fmm 2 years of age to adulthood.
BMT-for-age is not used In the Unlted States before 2 yeats of ageto screen for growth. BMI values at younger ages have a weak assodatlon wlth adolescent or adult obesity (Whltaker et at., 1997; Guo et al., 1994).
BMI can be used to track body slze throughout the life cycle. Thls Is Important because BMI-for-age In childhood is a determinant of adulthood BMI.
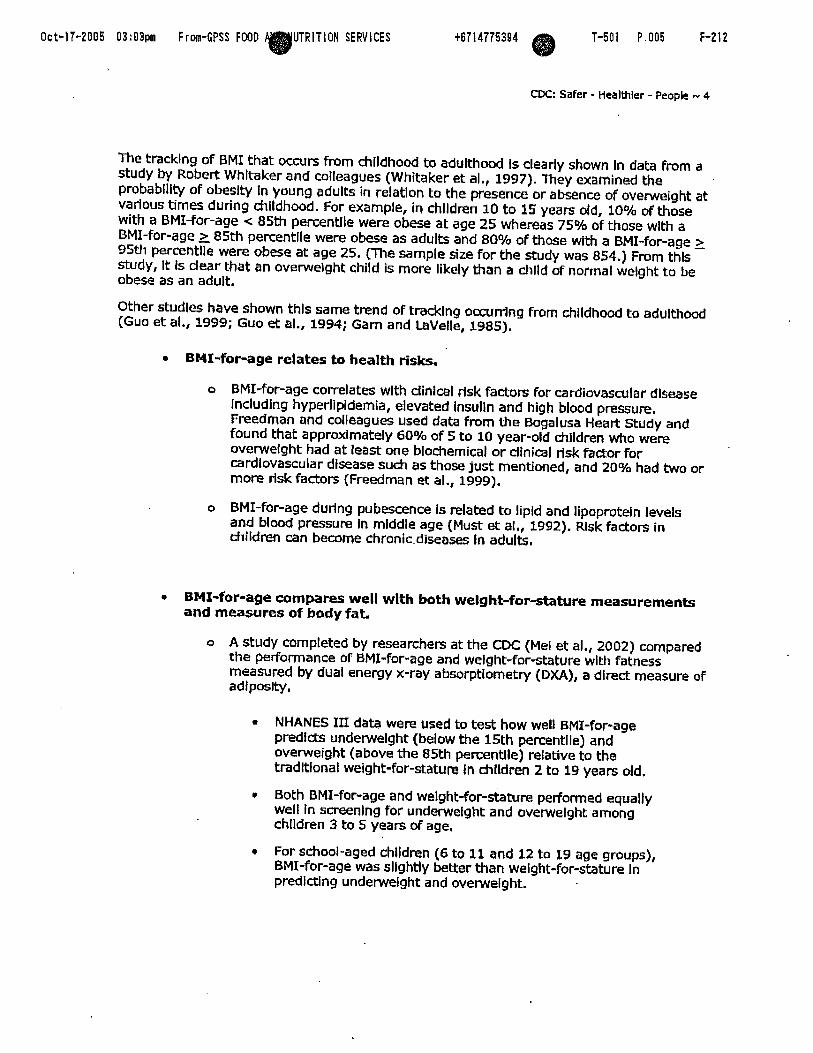
Oct-17-2005 03:03pm Frm-GPSS FOOD UTRiTlON SERVICES w CM=: Safer - Healthler - Peopk - 4
The tracklng of BMI that occurs from chlldhood to adulthood Is clearly shown In data from a study by Robert Whltaker and colleagues (Whitaker et al,, 1997). They examined the probablllty of obesity In young adults in relation to the presence or absence of overweight at various times during rhildhood. For example, in chlldren 10 to 15 years old, 10% of those with a BMI-far-age < 85th percentlle were obese at age 25 whereas 75% of those wlth a BMI-for-age 2 85th percentlle were obese as adults and 80% of those with a BMI-for-age 3 95th percentlle were obese at age 25. (The sample size for the study was 854.) From thls study, It is dear that an overwelght child is more likely than a child of normal welght to be obese as an adult,
Other studies have shown this same bend of tracking occurring from chlldhood to adulthood (Guo et al., 1999; Guo et al., 1994; Garn and LaVelle, 1985).
r BWI-forage relates to health risks.
o BMI-for-age correlates wlth dinical rlsk factors for cardiovascular disease Including hyperllpldemia, elevated lnsulln and high blood pressure. Freedman and colleagues used data from the Bogalusa Heart Study and found that approximately 60V0 of 5 to 10 year-old children who were ovenvelght had at least one blochernical or dtnical rlsk factor for cardlovascular dlsease such as those just mentioned, and 20Y0 had two or more rlsk factors (Freedman et dl., 1999).
o BMI-for-age durlng pubescence Is related to lipid and lipoprotdn levels and blood pressure in middle age (Must et al,, 1992). Risk factors in children can become chronic-diseases In adults.
BMX-for-age compares well wlth bath welght-for-stature measurements and measures of body fat.
o A study completed by researchers at the CDC (Mel et al,, 2002) compared the performance of BMX-for-age and welght-forstature with fatness measured by dual energy x-ray absorptlometry (DXA), a direct measure of adlposlty,
NHANES 111 data were used to test how well BMI-for-age predlcts undetwelght (below the 15th percentlle) and overweight (above the 85th percentlle) relative to the tradltlonal weight-for-stature In chlldren 2 to 19 years dd.
r Both BMI-for-age and welght-for-stature performed equally well In screening for underwelght and overwelght among children 3 to 5 years of age,
r For school-aged children (6 to 11 and 12 to 19 age groups), BMI-for-age was slightly better than welght-for-stature In predldlng underwelght and overwelght.
Oct-17-2005 03:03m From-GPSS FOOD PIIUTRITION SERVICES t6714775394 T-501 P.006 F-212
CDC: Safer - Hcalthler - People - 5
Ratios of weight relatlve to stature such as BMI-for-age and welght-for-stature may be used as Indirect measures of overwelght that correlate with dIrPct measures.
CPC recommends the use of BMI-for-age for chlldren aged 2 years and older. However, weight-for-stature p e r f o m . equally well In pte-scfi~l aged children and can be used In this age group.
BMI-forage Is significantly correlated with subcutaneous and total body fatness In adolescents (Barlow and Dietz, 1998).
3. RECOMMENDATIONS FOR USZNG EM1 TO ASSESS OVERWEIGHT
Because of the numerous advantages of using BMI-for-age to assess overweight in cfilldren and adolescents, expert committees and advisory groups have recommended BMI-for-age as the accepted measure.
In 1994, an expert committee on Clinical Guldellnes for Ovewdght in Adolescent Preventive Servlces was convened by the Maternal and Child Health l3ureau (MCHB), Amerlcan Academy of Pediatrics and the Arnetlcan Medlcal Association with support from the Centers for Disease Control and Prevention, to advise Bright Futures: National Guldeltnes for Health Supervision of Infants, Children and Adolescents and Guidelines for Adolescent Preventive Services (GAPS) on the criterla for the Identification of adolescent obeslty. The committee recommended that BMI-for-age be used to routinely screen for overweight In adolescents (Himes and Dietz, 1994). - I n 1997, a consensus panel recommended that BMI for age be used routinely to screen chlldren for overwelght. They also recommended cutpoints of between the 85th and 95th percentiles to Identih children and adolescents as at risk of overweight and at or above the 95th percentile to identify chlldren and adolescents as overweight. (Barlow and Dletz, 1998).
Also, In 1997, an intematlonal conference convened by the Internatlonal Obesity Task Force conduded that BMI Is a reasonable measure for assesslng overweight in children and adolescents worldwide. (Dletz and Bellint, 1999; Bellltti and Dietz, 1999).
Dr. William Dietz discusses the rationale for the BMI cutpolnts, the limitations and sensltlvlry of BMI-for-age. Dr. Dletz Is the Dlrector of the Dlvislon of NutriUon and Physlcal Adlvlty, National Center for Chronic Disease Prevenclon and Health Prornotlon, Centers for Disease Control and Prevention, and was a member of the various expert commltrees on obesity. Full text is included In the Appendix.
Oct-17-2DD5 03:D3pa From-GPSS FOOD ~ N U T R I T I D # SERVICES t6714775394 T-501 P.007 F-212
CDC: Safer - Healthier - Peaple - 6
4. CHARACTERISlTCS OF BMZ-FOR-AGE
+ The shape of the weight-for-stature curve versus the BMI-for-age curve
The shapes of the weight-forstature and Ihe BMI-for-age growth curves dlffer, as you can see. The weight-for-stature curve shows how welght increases in relatlon to stature. The 1977 welght-for-stature char& are llmlted to prepubescent boys under 11.5 years of age and statures of less than 145 cm and to prepubescent glrls under 10 years of age and statures less than 137 cm (Ham111 et al., 1979). The BMI-for-age chart shows age-related changes In growth and can be used up to age 20. Wlth the BMI-for-age chart: weight, stature and age of a chlld are considered whereas with the weight-for-stature hart , only welght and helght are used.
The shape of the BMI-for-age chart clearly illustrates "adiposity" rebound
BMI changes substantially with age. After about 1 year of age, BMI-forage begins to dedlne and It continues falflng during the preschool years until It reaches a rnlnirnum around 4 to 6 years of age. After 4 to 6 years of age, BMI-for-age begfns a gradual Increase through adolescence and most of adulthood. The rebound or Increase In f3MI that occurs after it reaches Its lowest point Is referred to as "adlposity4 rebound (Whltaker et al., 1998; Roiland-Cachera et al., 1991; Rolland-Cachem et al., 1984). This Is a normal pattern of growth that occurs In all children.
Age (moltthe) BHX 26 18.2 32 17.4 38 1R.S 41 18.7
Oct-17-2005 03:03pm From-GPSS FOOD WUTRITION SERVICES +6714775394 F-212
C K : Safer - nealthier - People 7
Here you see a e l o n of the BMI-for-age chart for boys enlarged to show the shape of the curve in more detall, After 4 to 6 years of age, BMI-for-age beglns a gradual increase through adolescence and most of adulthood, The rebound or Increase In BMI that occurs after It reaches its lowest polnt Is referred to as "adiposity" rebound (Whitaker et al., 1998; Rolland-Cachera et al., 1991; Rolland-Cachera et at., 1984). This Is a normal pattern of growth that occurs In all chtldren.
Recent research has shown that the age when the *adlposlo/* rebound occurs may be a crttlcal period in childhood for the development of: obeslty as an adutt (Whitaker et at., 1998). An early "adiposity" rebound, occurring before ages 4 to 6, Is assodated with obeslty In adulthood. In the example shown here, adiposity rebound occurred at around age 3. BMI reached the lowest point a t 32 months (2 years 8 months) and then began to Increase.
However, studles have yet to deterrnlne whether the hlgher BMI in chlldhmd is truly adipose tissue versus lean body mass or bone. AddltIonal research Is needed to fumer understand the impact af early adlpostty rebound on adult obesity, (Note that we put the word adlpostty in quotations when using It In thls contefi since we do not know If It Is truly adipose tissue.)
5. RECOMMENDED BMI-FOR-AGE CUTOFFS
> 95th percentile Overweight - 85th to < 95th percentile Rllsk of overweight
< 5th percentile Underweight
The expert commlrtees' recorhmendatlons are to classlfy BMI-for-age at or above the 95th percentlle as overweight and between the 85th and 95th percentile as at risk of overweight (Hlmes and Die&, 1994).
"Overweight" rather than obeslty Is the term peFerred for desmCnbin@ children and adolescents with a BMI-for-age equal to or greater than the 95th percentile of BMI-for-age or weigh t-for-length.
The 85th percentile Is Included on the BMI-for-age and the weight-for-stature charts to identify those at risk of overweight.
The cutoff for underwelght of less than the 5th percentile IS bas& on recommendations by the World Health Organfzation Expert Committee on Phydcal Status (World Health Organlzatlon, 1996).

Oct-17-2005 03:03pm F rom-CPSS FOOD NUTRITION SERVICES Ilb CDC: Safer - Healthier - People w 6
Classifications of Overweight and Undennrelght for Adults
Classlflcation of overweight and underweight is different for adults than it Is for children and adolescents. For adults, overweight and underweight categories are defined by fixed BMI curpoints derived from morbldlty and mortalfty data. Adults with low and very hlgh BMIs are at a higher relative mortality risk compared to those wlth BMk of 18.5 or greater and less than 30.0 (Strawbridge et al., 2000), For adults, BMT Is not age- or gender-specific as It Is for children and adolescents.
Uinlcal guidelines established In 1998 by the Natlonal Heart, Lung, and Blood Institute are as follows:
BMI less than 18.5 underweight
BMI of 18.5 through 24,9 normal
BMI of 25,O through 29.9 ovennreight
BMI of 30.0 or greater obese
Performance of BMI-far-Age As A Screening Tool
The valldlty of selected cutoff points to ldentlfy adolescents with the hlghest percentage of body fat has been Investigated. In general, common cutoff points for BMI and relatlve welght have low sensitlvltles but high spedficltles. For example, BMIs 2 . 8 ~ ~ percentile has a sensltlvity of 29% and 23% for IdentlQlng adolescent males and females, respectively, who are above the ?om percentile for percentage body fat; corresponding spetificitles are 99% and 100% (Hlmes and Bouchard, 1989). In screening for adolescent overweight, speclflcity may be more important than sensltlvity. Maxlmlzing speclfidty minirnlzes the proportion of adolescents who will be Incorrectly considered overwelght by the screen" (Hirnes and Dietz, 1994).
Recently It has been shown that cardlovascular tlsk factors are associated with the established BMI-for-age cutoffs. Freedman et at., (1999) found that approximately 60% of: 5 to 10 year-old chlldren with BMI-for-age values 2 the 9~~percen t l le had at least: one biochemical or dinlcal risk factor for cardiovascular disease such as hypertension, elevated insulin levels, and hyperllpidemia. Twenty percent of children had two or more rlsk factors.
6. CALCULATTNG BMI
BMI can be calculated using either the metric system or the English system.

Oct-17-2005 03:03pm From-GPSS FOOD NUTRITION SERVICES 0 CDC: Safer - Healthier - People - 9
CALCULATXNG BMI USING THE METRIC SYSTEM
formula: weight (kg) / [height (IN)]'
Calculation: [weight (kg) / height (ern) / helght (cm)] x 10,000
WKh the metrlc system, the formula for BMI is weight In kitograms dlvlded by helght In meters squared. Since height is commonly measured In centimeters, an alternate calculation formula, dividing the welght In kilograms by the height in centimeters squared, and then multiplying the result by 10,000, can be used, It is necessary to multiply'by 10,000 to convert BMI to meters since stature measurements are generally taken in centimeters. There are 100 centlmeten in a meter and since stature is squared we must convert as such: 100 x 100 = 10,000.
When uslng a hand-held calculator:
If your calculator has a square function, divide weight (kg) by height (cm) squared, multlply by 10,000 and round to one dedmal place.
if your calculator does not have a square function, dlvlde welght by height twice as shown In the calcuiatlon formula above, multiply by 10,000 and round to one dedrnal place.
Calculations for BMI can be completed as a conrinuws equation. (Note that the fomula for the latter calculation Is on the CDC Uinlcal Growth Charts and will be the calculation used In this module).
Example: We know that Sam's welght is 16.9 kg and his height is 105.4 em. What is Sam's BMI?
Answer: (16.9 kg / 105.4 cm / 105.4 cm ) x 10,000 = 15.2
Practice calculating BMI using the metric system
Complete the following two calculations, rounding to one dedmal place.
Calculalon 1: Georgla's welght Is 16.6 kg and her height Is 99.1 crn. What Is Georgia's BMI?
Answer: (16.6 kg / 99.1 cm / 99.1 cm) x 10,000 = 16.9
Calculation 2: Jose's welght Is 18.3 kg and his height is 103.5 m. What is lose's BMI?
Answer: (18.3 kg / 103.5 cm / 103.5 cm) x 10,000 = 17.1
CALCULATING BMI USING THE ENGLISH SYSTEM
Formula: weight (Ib) / [height (in)]' x 703
Calculation: [weight. (Ib) / height (in) / height (In)] x 703
Oct-17-2005 03:03pm From-GPSS FOOD NUTRITION SERVICES e CDC: Safer - Healthier - People -- 10
When using Engllsh measurements, ounces (oz) and fractions must be changed to decimal values. Then, calculate BMI by dividlng weight in pounds (Ibs) by height In inches (In) squared and multlplylng by a conversion factor of 703,
When using a hand-held calculator, if your calculator has a square function, divide weight (Ibs) by height (in) squared, mul#ply by 703 and round to one decimal place.
If your calculator does not have a square function, dlvide welght by height twice as shown In the calculation above, rnultlpiy by 703 and round to one decimal place.
Calculations for BMI can be completed as a continuous equation, Note that the formula for the latter calculation is on the CDC Ulnlcal Growth Charts and will be the calculation used in this module.
Example: Let's calarlate Sam '3 BMI using the English numeric system. His welght is 37 pounds and 4 ounces and his height is 41 1/2 inches.
Conveit ounces and fraalons to dedmals:
Weight of 37 lbs and 4 ot = 37.25 Ibs (16 ounces = 1 pound so 4 oJ16 oz = 0.25).
Helght = 41.5 in.
(37.25 Ibs / 41.5 in / 41.5 in) x 703 = 15.2
Practica calculating B M I using the EnglFsh system
Complete the following two calculations, rounding to one decimal place.
Calculation I: Georgia's welght is 36 Y2 pounds and her height Is 39 Inches. What Is Georgia's BMI?
Answer: Convert fractlons to dedmals: Welght of 36 Ih Ibs = 36.5 lbs
(36.5 Ibs / 39 In / 39 in) x 703 = 16.9
Calculation 2: Jose's welght Is 40 1/4 pounds and hls height Is 40 % Inches. What is Jose's BMZ?
Answer: Convert fractlons to dedmals: Weight of 40 Y4 Ibs = 40.25 Ibs Height of 40 % In = 40,75 In
(40.25 Ibs / 40.75 / 40.75) x 703 = 17.0
Note: There is a difference of 0.1 between BMl calculations when using the metric system (1 7.1) versus the English system (17.0). Thls is due to the conversion factor.

Oct-17-2005 03:03pm Frwn-GPSS FOOD NUTRITION SERVICES e t6714775394 @ T-501 P.012 F-212
CDC: Safer - Healthier - People - 11 7. OTHER METHODS TO OBTAIN BMI
CDC Table for Calculated Body Mass Index Values for Selected Heights and Weights for Ages 2 to 20
In addltlon to calculations, BMI can also be determined by looking it up on the CDC Table for Calmlated Body Mass Index Values for Selected Heights and Weights for Ages 2 to 20 in which BMI has been calculated.
Example:
Using the meWc system, flnd the BMI for a &ild with a welght of 17.0 kg and a height of 105.4 cm.
Using the English system, find the BMI for a child with a weight of 37.5 Ib and a height of 41.5 in.
, See BMI TABLE in Appendix.
Epi Info 2000 has an anthropometric data component called NUTSTAT that can be used to look at population-based data or graup data.
SAS program to calculate BMI and percentiles for all indices.
8. VTSUAL ASSESSMENT VERSUS CALCULATION OF BMI
How accurately can you screen for risk of overweight In chlldren by looking?
I t has been sald that 'few medlcal condltlons can be diagnosed as confidently by untrained Individuals as gross obesity.* Yet it is very difficult to dlstlngulsh children who are at risk of overweight from normal chlldren. In chlldhood, the distinction is made more difficult by age- related physlologlcal variations (Poskltt, 1995).
Take a look at three photos o f preschool aged chlldren to see how accurately you can screen for risk of overwelght In children solely by IooWng at them. We want you to try to identify children with a BMI-for-age equal to or greater than the 85th percentlte and less than the 95th percentile.
Oct-17-2005 03:03pm From-GPSS F O O Q ~ ~ NUTRITION SERVICES t6714775394 (? T-501 P.013/030 F-212
- W: Safer - Healthier - People - 12
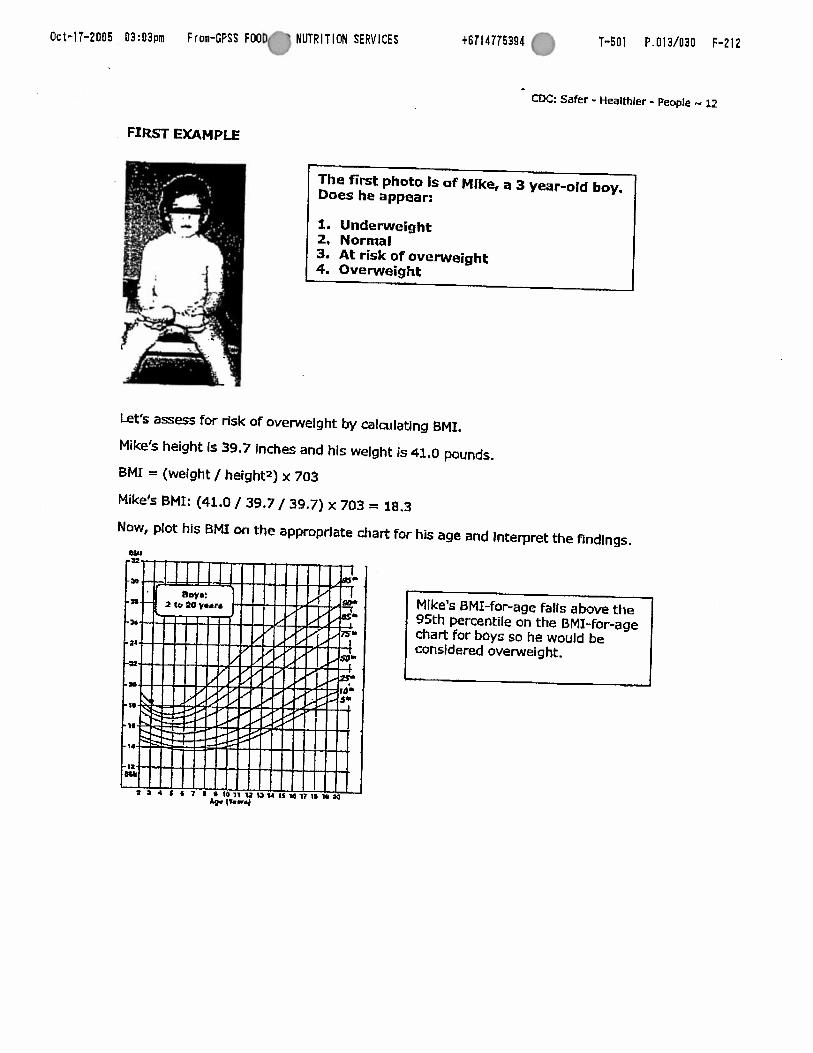
FIRST EXAMPLE
The first photo is of Mike, a 3 year-old boy. Does he appear:
1. Underweight 2, Normal 3. At risk of overweight 4. Overweight
kt's assess for risk of overwelght by calculaUng BMI,
Mike's height Is 39.7 Inches and his weight is 41.0 por
BMI = (weight / heights) x 703
Mike's BMI: (41.0 / 39.7 / 39.7) x 703 = 18.3
Now, plot his BMI on the appropriate chart for his age
wu
t P 4 I 6 I I 0 i o ~ ~ u ~ u 1 s r d 1 ; m 1 e ; r o * v-4
~ n d s
and Interpret the findings.
95th percentile on the 0M3-for-age chae for boys so he would be considered overweight.

Oct-17-2005 03:04prm From-GPSS FOOD n # U T R I T I O N SERVICES +6714775394 f? T-501 P.014/030 F-212
CDC: Safer - Healmler - People - 13 SECOND EXAMPLE
1
Here is Mindy, a 4 year-old girl. Does she appear:
I. Underweight 2. Normal 3. At risk of overweight 4. Overweight
Let's assess for risk of ove~letght by calculating BMI.
Mindy's height Is 41.9 Inches and her welght Is 35.5 pounds.
BMI = (welght / helghta) x 703
Mindy's BMI: (35.5 Ibs / 41.9 In / 41.9 in) x 703 = 14.2
Now, plot her BMI on the appropriate hart for her age and Interpret the findings.
Plotted on the BMI-for-age chart for girls, Mindy's BMI-for-age falls just above the 10th percentile indicating that her BMI Is withln normal range.
Oct-17-2005 03:04pm Frm-GPSS FOOD ( a # U T R I T I O N SERVICES t6714775394 T-501 P.015/030 F-212
a: Safer - HeaM'tlcr - People c 14
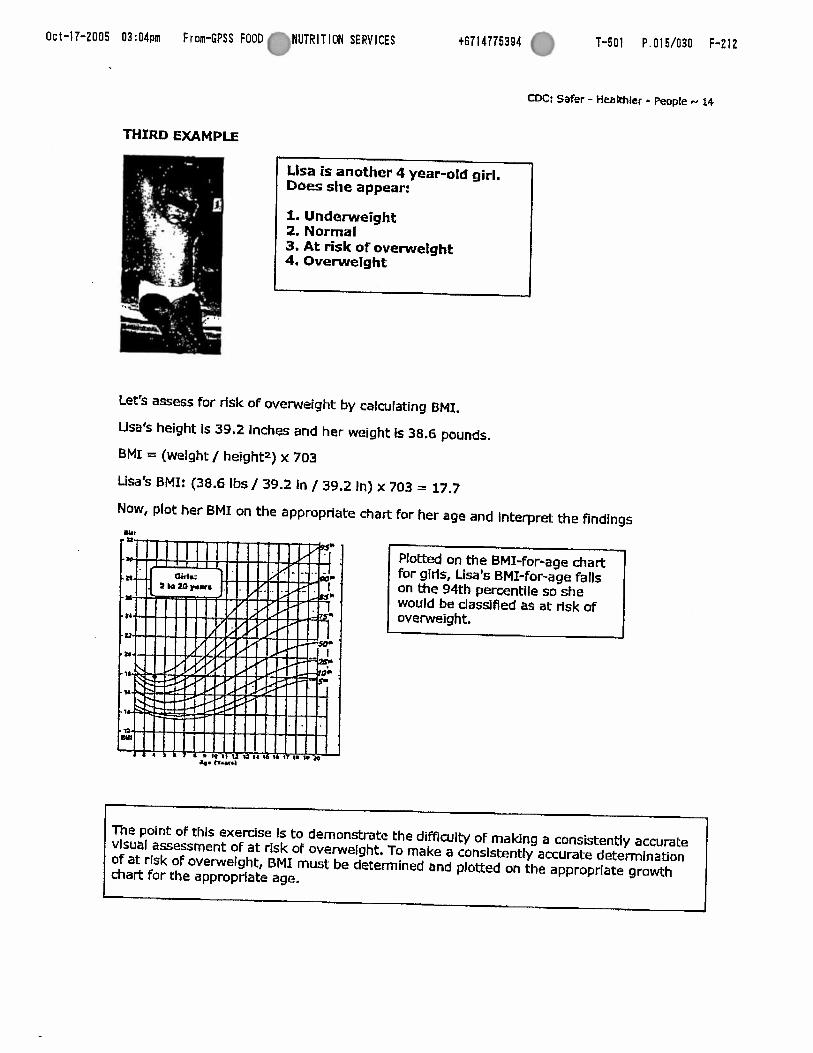
THIRD EXAMPLE
Lisa is another 4 year-old girl. Does she appear:
A. Underweight 2. Normal 3. At risk of overweight 4. Overwelght
*
Let's assess for rfsk of overweight by calculating BMI.
Usa's height Is 39.2 Inches and her weight Is 38.6 pounds.
BMK = (welght / height2) x 703
Lisa's BMI: (38.6 Ibs / 39.2 in / 39.2 In) x 703 = 17.7
Now, plot her BMI on the appropriate chart for her age and Interpret the findings
The point of thls exercise Is to demonstrate the difficulty of making a consistentiy accurate visual assessment OF at rlsk of overweight. To make a consistently accurate determination of at risk of overweight, BMI must be determined and plotted on the appropriate growth chart for the approprlate age.

Oct-17-2005 03:04pm From-GPSS FOOD NUTRITION SERVICES e CDC: Safer - Healthlcr - People - 15
9. ACCURACY OF MEASUREMENTS
Measurements must be obtained and recorded accurately if they are to be used as an effective screening tool. Stature and weight should be measured following recommended protocols;
The following examples illustrate the importance of accurate measurements and shows that inaccurate measurements can result In an inaccurate growth assessment.
EXAMPLE I: Sanjay Is a 5.5-year-old boy, weighing 41.5 pounds with a height of 43.0 Inches. His calculated BMI is 15.8. When plotted on the BMI-for-age &art for boys, hls BMI falls just above the 50th percentile (shown by the green dot).
Inaccurate measurement
If his height were measured or recorded Inaccurately at 42.25 lnches (3/4 inch below his actual height of 43.0 Inches), his BMT-for-age would be 16,3 and fall on the 75th percentlie (shown by the red dot). In this example, the measurement error did not cause a change In dass!fication because growth remalned withln the normal range but you see what could happen.
EXAMPLE 2:
Marla is an 8.5-year old glrl with a weight of 58.0 pounds and a height of 47.5 Inches. Her BMI is 18.1. When plotted on the BMI-for-age chart for girls, her BMI falls between the 7sth and 85t"percent11es (shown by the green dot).
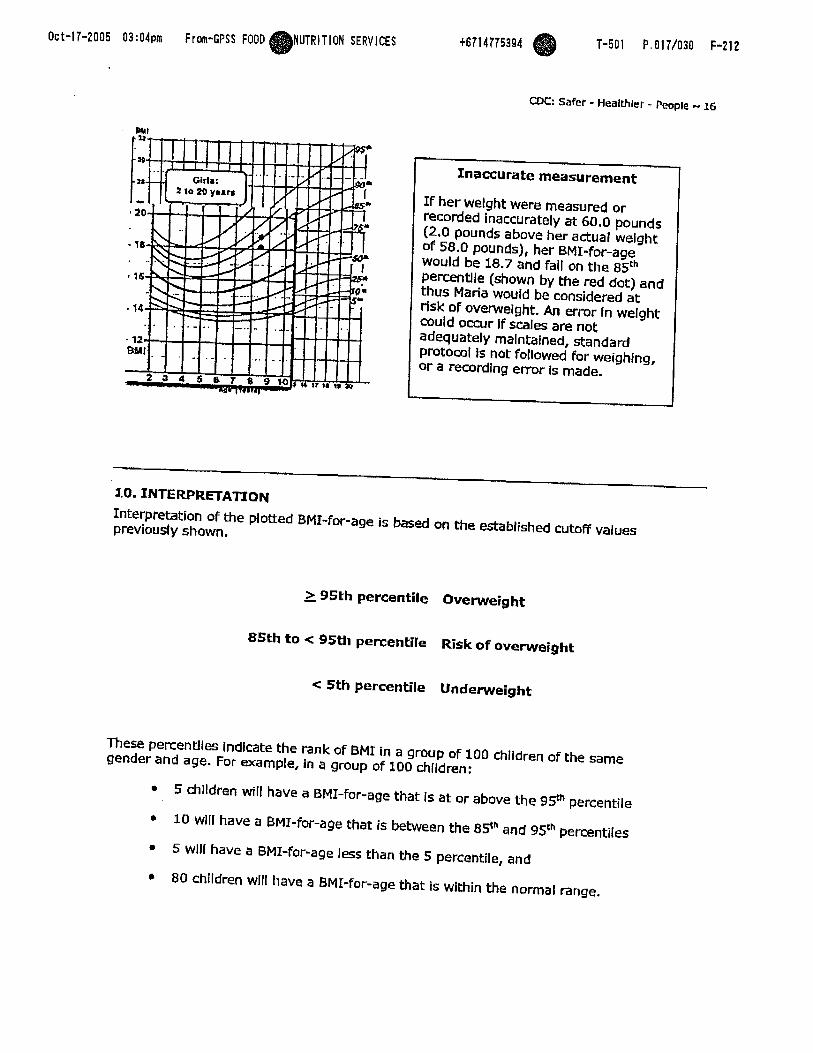
Oct-17-2005 03:04pm From-GPSS FOOD NUTRITION SERVICES @ t6714775394 @ T-SO1 P. 017/030 F-212
WC: Safer - Healthier - People - 16
3.0. INTERPRETATION
Inaccurate measurement
I f her weight were measured or recorded inaccurately at 60.0 pounds (2.0 pounds above her actual weight d 58.0 pounds), her BMI-for-age would be 18.7 and fall on the 8sth p e r m t l l e (shown by the red dot) and thus Maria would be considered a t risk of overweight. An error In welght could occur If scales are not adequately maintained, standard protocol Is not followed for weighing, or a recording error Is made.
Interpretation of the plotted BMI-for-age is based on the established cutoff values previously shown.
I
> 95th percentile Overweight - 85th to < 95th percentile Risk of overweight
c 5th percentile Underweight
These percentiles Indicate the rank of BMT in a group OF 100 chlldren of the same gender and age. For example, in a group of 100 chlldren:
5 children will have a BMI-for-age that Is at or above the 9!P percentile
10 wlll have a BMI-for-age that is between the 8.Sn and 9Sc"percentiles
5 wlll have a BMI-f~r-age less than the 5 percentile, and
80 children wlll have a BMI-for-age that is within the normal range,
Oct-17-2005 03:04p From-GPSS FOOD NUTRITION SERVICES 8 CDC: Safer - Healthier - People - 17
When assessing physical growth, it is desirable to have a series of accurate measurements to establish an observed growth pattern. having a sedes of measurements takes Into considemtlon short- and longer-term conditions and provides a context for individual measurements In Interpretation.
Growth patterns that fall outside the established parameters, the 5th and 95th percentile for any given anthropornetric indices, suggest the need to recheck measurements, plots, and calculations and make any necessary corrections or adjustments. If measurements are correct, further evaluaUon is needed to determine the cause.
3.1. SUMMARY
BMI-for-age Is the method recommended for screening overwelght and underweight In children and adolescents from 2 to 20 years of age.
BMI-for-age Is a screening tool that may lead to further assessment to diagnose a speclfic health condition.
For children, BMT is age and gender speclflc and nutritional status Is Identified based on percentiles. For adults, BMI Is neither age nor gender specific and nutritlonai status Is defined by fixed cut points.
r Periodic, accurate measurements and growth records are Important elements of growth screening. An accurate Interpretation of growth depends on the accuracy of weighing and measuring.
22. STEPS TO PLOT AND INTERPRET BMI-MR-AGE
The six steps wtllned here to plot and Interpret BMI-for-age are slrnllar to those used for a general growth assessment,
Step 1: Obtain accurate weights and height measurements Step 2: Select the appropriate growth chart
(based on the age and gender of the chHd being weighed and measured) Step 3: Record the data Step 4: Calculate BMI Step 5: Plot measurements Step 6: Interpret the plotted measurements
An Instruction sheet on Using and Interpreting the CDC Growth Charts contalns detaited lnstrudlons for the above steps.
Example Case Study
Oct-17-2005 03:04pm From-CPSS FOOD NUTRITION SERVICES 0 coC: Safer - Healthier - People N 18
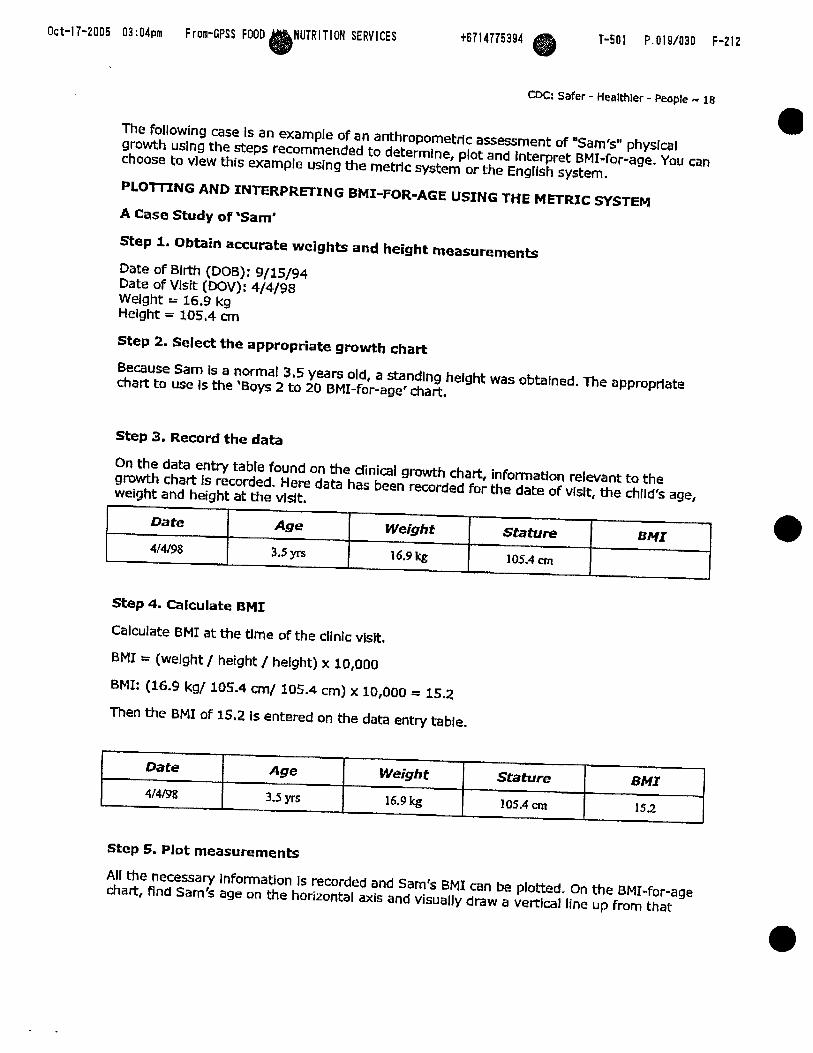
The following case Is an example of an anthropometric assessment of "Sam's" physical growth using the steps recommended to determine, plot and Interpret BMI-for-age. You can choose to vlew this example using the metric system or the English system.
P L O m N G AND JNTERPRETING BMI-FOR-AGE USING THE METRIC SYSTEM
A Case Study of 'Sam'
Step I. Obtain accurate weights and height measurements
Date of Blrth (DOB): 9/15/94 Date of Visit (DOV): 4/4/98 Welght = 16.9 kg Helght = 105.4 cm
Step 2. Select the appropriate growth chart
Because Sam Is a normal 3.5 years old, a standing height was obtained. The appmptiate chart to use Is the 'Boys 2 to 20 BMI-for-age' chart.
Step 3. Record the data
On the data entty table found on the dinical growth chart, information relevant to the growth chart Is recorded. Here data has been recorded for the date of vlslt, the child's age, weight and height at the vlslt,
Step 4. Calculate BMI
Calculate BMI at the tlme of the cllnic vlslt.
BMI = (weight / height / helght) x 10,000
BMI: (16.9 kg/ 105.4 an/ 105.4 cm) x 10,000 = 15.2
Then the BMI of 15.2 Is entered on the data entry table.
Date
4/4/98
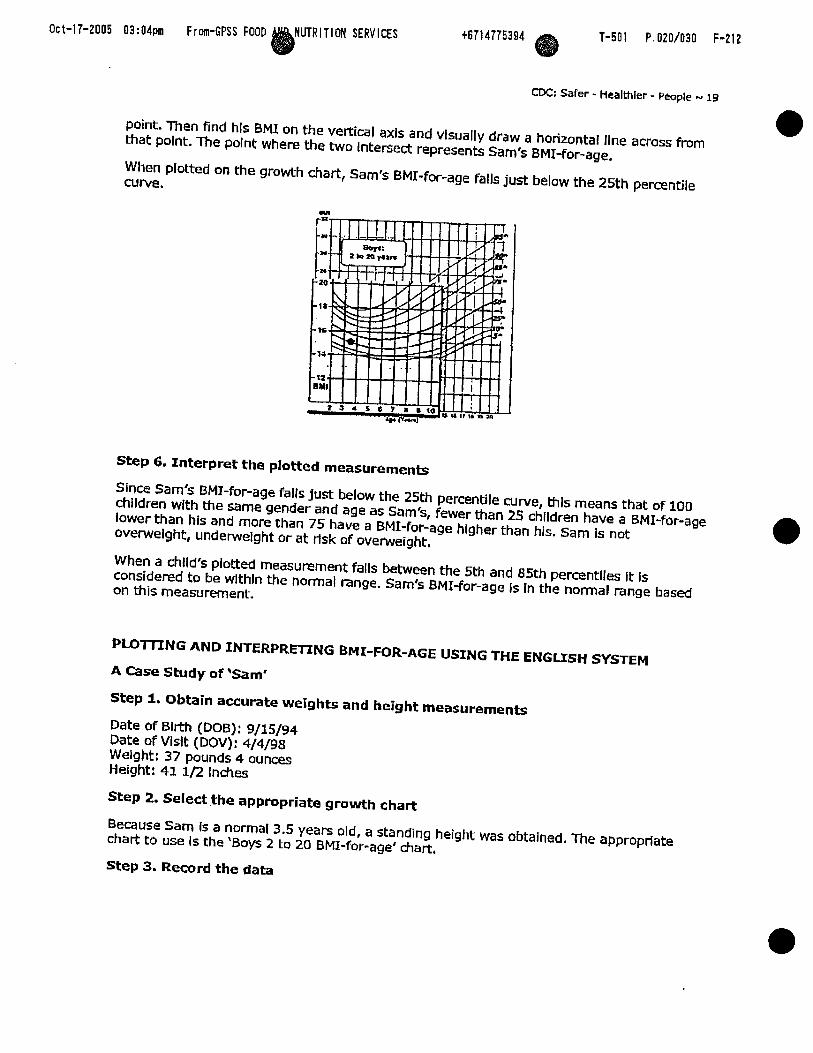
Step 5. Plot measurements
Age
3.5 yrs
All the necessary information Is recorded and Sam's BMI can be plotted. On the BMI-for-age chart, Rnd Sam's age on the horizontal axis and visually draw a vertical line up from that
@MI
1 5 2
Weight
16.9 kg
Date
4/4/98
Age
3.5 yrs
Weight
16.9 kg
Stature
105.4 an
Stature
105.4 cm
- BMI
Oct-17-2005 03:04pm From-GPSS FOOD NUTRITION SERVICES 0 CDC; Safer - Healthier - People - 19
point. Then find his BMI on the vertical axls and vlsually draw a horizontal llne across from that point. The point where the two Intersect represents Sam's BMI-for-age.
When plotted on the growth chart, Sam's BMX-for-age falls just below the 25th percentile curve.
Step 6. Interpret the plotted measurements
Since Sam's BM1-for-age fails just below the 25th percentile curve, thls means that of 100 chlldren with the same gender and age as Sam's, fewer than 25 children have a BMI-for-age lower than his and more than 75 have a BMI-for-age hlgher than his. Sam is not overweight, underwelght or at risk of overweight.
When a chlld's plotted measurement falls between the 5th and 85th pemnrlles it is considered to be wlthln the normal mnge. Sam's BMI-for-age Is In the normal range based on this measurement.
PLOTITNG AND INTERPRETING BMI-FOR-AGE USING THE ENGUSH SYSTEM
4 Case Study of 'Sam'
Step 1. Obtain accurate weights and height measurements
Date of Birth (Doe): 9/15/94 Date of Vldt (DOV): 4/4/98 Weight: 37 pounds 4 ounces Height: 41 1/2 Inches
Step 2. Select the appropriate growth chart
Because Sam Is a normal 3.5 years old, a standing height was obtalned. The appropriate chart to use Is the 'Boys 2 to 20 BMI-for-age' chart,
Step 3. Record the data

Oct-17-2005 03:04pm From-GPSS FWD NUTRITION SERVICES e Safer - Healthier - People *. 20
On the data entry table found on the clinical growth chart, Information relevant to the growth chart Is recorded. Here data has been recorded for the date of visit, the child's age, weight and helght at the vislt,
Step 4. Calculate BMI
Calculate BMZ at the time of the dinic vklt.
Convert ounces and fraaions to decimals:
Weight of 37 Jbs and 4 0 Z = 37.25 Ibs (16 ounces == 1 pound so 4-02/12 oz = 0.25).
Height = 41.5 In
BMI = (weight / helght / height) x 703
BMI: (37.25 lbs/41,5 in/41.5 in) x 703 = 15.2
Then the BMI of 15.2 Is entered on the data entry table.
Date
4/4/98
Step 5. Plot measurements
Age
3.5 yrs;
All the necessary Information Is recorded and Sam's BMI can be plotted. On the BMI-for-age chart, find Sarn's age on the horizontal axis and visually draw a vertical line up from that point, Then find hls BMI on the vertfcal axis and visually draw a horizontal line across from that point. The point where the two intersect represents Sam's BMI-for-age.
Date
4/4/98
When plotted on the growth chart, Sam's BMI-for-age falls just below the 25th percentile curve.
Weight
37.25 Ibs
Age
35YrS
BMI
152
Weight
37.25 1bs
Stature
41.5 in
Stature
41.5 in
BMI

Oct-17-2005 03:04pm From-GPSS FOOD NUTRITION SERVICES 0 t6714775394 T-501 P.022/030 F-212
CDC: Safer - Healthier - People .-. 21
Step 6. Interpret the plotted measurements
Slnce Sam's BMP-for-age falls just below Ule 25th percentile curve, this means that of 100 children with the same gender and age as Sam, fewer than 25 children have a BMI lower than hls. Sam Is neither overweight, undewelght nor at risk of overweight.
When a child's plotted measurement falls between the 5th and 85th percentiles it is coosidered to be In the normal range. Sam's BMI-for-age is In the normal range based on this measurement.

O c t - 1 7 - 2 0 0 5 03:OSpm From-GPSS FOOD UTRITION SERVICES
CDC: Safer - Healthier - People - 22
13. REFERENCES AND RESOURCES
REFERENCES
Barlow, SE and Dletz, WH. Obeslty evaluation and treatment: expert committee recommendations. Joumal of Pediatrics 1998; 102(3): e29.
Bellizni MC and Dietz WH, Workshop on chlidhood obestty: Summary of the discussion. American Journal of Clinical Nupition 1999: 70: 173s-175s.
Danlels SR, Khoury PR, Morrison JA. The utility of body mass Index as a measure of body fatness in chlldren and adolescents: differences by race and gender, Pediatrics 1997; 99 (6); 804-807,
Dletz, WH and Belllzzl, MC. Introduction: the use of BMI to assess obesity in children, American Journal of Clinical NuWtion 1999; 70(suppl) : 123s-5s.
Freedman DS, Dietz WH, Srinivasan SR, Berenson GS. The relatlon of overwelght to cardlovascular risk factors among chlldren and adolescents: the Bogalusa Heart Study. Pediatdcs 1999; 103: 1175-1182
Gam SM, LaVelle M. Tho-decade follow-up of fatness in early childhood. Amerlcan Iwrnal of Diseases of Child 1985; 139: 181-185.
Guo SS, Roche AF, Chumlea WC, Gardner ID, Slervogel RM. The predictive value of childhood body mass index values for overwelght at age 35 y. American Journal of Uinical Nutfition 1994; 59:810-819.
Guo SS and Chumlea, WC. Tracking OF BMI In children In relation to overweight in adutthoad. American Joumal of Clinical Nutri#on 1999; 7O(suppl): 145s-148s.
Hamill, PW, Drizd TA, Johnson CL, Reed RBI Roche AF, Moore WM. Physlcal growth: National Center for Health Statistics percentlles. Amerlcan Joumal of Clinical Nutrition 1979; 32,607-629.
Hammer LD, Kraerner HC, Wilson DM, Rltter PL, Dombusch SM, Standardized percentlie curves of body-mass index for chlldren and adolescents, Amenian Journal of Diseases of Child 1991; 145:259-263.
Hlmes JH and Bouchard C. Vatidlty of anthropometry in dasslfylng youths as obese. International Journal of Obesity 1989; 13:183-193.
Himes, JH and Deltz, WH. Guldellnes for ovewelght in adolescent preventive services: recomrnendatlons form an expert committee. American Journal of Clinical Nutrition, 1994; 59:307-316.
Keys A, Fidanza F, Karvonen MJ, Klmura N, Taylor HL. Indices of relative welght and obesity. Journal of Chronic Disease 1972; 25:329-343.
Mel 2, Grummer-Strawn LM, Pietrobelll A, Goulding A, Goran MI, Dletz WH, Validity of body mass index compared with other body-composition screening indexes for the assessment of body fatness in children and adolescents. American Journal of Clinical Nutnbon, 2002; 75:978-985.
Oct-17-2005 03:05pm From-GPSS FOOD UTRlTlOM SERVICES w cDC: Safer - Heamler - People 23
Must A, Jacques PF, Dallal GE, Bajema U, Dletz WH, Long-term rnorbldlty and mortality of overwelght adolescents. New England Journal of Medldne 1992: 3221350-1355.
Pietrobelll A, Faith MS, Alllson DB, Gallagher D, Chlumello G, Heymsfield SB. Body mass index as a measure of adiposity among children and adolescents: A valldatlon study, Joumal of Pediatn-cs 1998: 132:204-210.
Poskitt EME. Deflnlng childhood obesity: the relative body mass index (BMI). Acta Paediatrica 1995; 84:961-963.
Rolland-Cachera MF, Cde 77, Sernpe M, Tlchet I, Rosslgnd C, Chanaud A. Body mass Index varlatlon: centiles from birth to 87 years; European Journal of Clinical Nutrition 1991. 45:13-21.
Rolland-fachera MF, Deheeger M, Belllsle F, Sernpe M, Gullloud-Batallle M, Avons P, Patois E. Adiposity rebound in children: a simple indlcator for predicting obeslty. Arnen'can Journal of CIinical Nutrition 1984; 39:129-135,
Strawbridge WJ, Wallhagen MI, Shema SJ. New NHLBI clinical guidelines for obeslty and overwelght: Will they promote health? American Joumal of Public Health 2000; 90:340-343,
Whitaker RC, Pepe MS, Wrlght JA, Seldel KD, Dietz WH. Early adiposity rebound and the risk of adult obeslty. Pediatrics 1998; 101(5): URL: http://www.pedlatrlcs.org/cgl/contentlfu1I/1O1-3/e5.
Whitaker RC, Wright JA, Pepe EIS, Seldel KD, Die& WH. Predicting obesity in young adulthood from childhood and parental obesity. New England Joumal of Medicine 1997; 37(13) ~869-873.
World Health Organlzatlon Expert Comrnlrree on Physical Status. The Use and Interpretation of Anthmpornetry. Phvsical Status: Report of a WHO Exoert Commitlee: WHO Technical R e ~ o r t Seties-854, WHO, Geneva, 1996.
RESOURCES
W C Table for Calculated Body Mass Index Values for Selected Helghts and Weights for Ages 2 to 20: http://www.cdc.gov/nccdphp/dnpa/bmi/OObinanes/bml-ta~~.~f
Epi Info 2000 with NUTSTAT: http:Nwww.cdc.gov/epIlnfo/
Instruction sheet for CDC Growth Cha*
Measuring welght: h.ttp://www,cdc.gov/nccdphp/dnpa/bml/meas-welght,hm
Unks to non-Fcdeml wganlzallons are pmvlded solely as a service ta our m. m l s llnk does not constlkrte an cndorfement of thls organlzatlon by CDC or the Federal Government, and none should be Inferred. The CDC Is not responsible for me content of the Indlvldual organlzatlon Web pages found at thls Ilnk.
Oct-17-2005 03:05pn From-GPSS FOOD A ~ T R I T I M I SERVICES
CDC: Safer - Healthlw - People - 24
GLOSSARY
Anthropometric/Anthropometry: the science that deals with the measurement of the size, weight, and proportions of the human body.
Adiposity: the amount of fat in the body, expressed either as total fat mass (in kg) or the fradlon (percentage) of total body fat.
Dual energy x-ray asorptiometry (DXA): a relatively new technology to directly measure body compositlon, DXA uses two x-ray energies to measure body fat, musde, and bone mineral; considered more accurate and valld than underwater weighing.
Height: also referred to as stature; distance from the crown of the head to the surface on which the Individual Is standing; measured when the child/adolescent is not wearing shoes.
Hyperlipidemia: a general tm for elevated concentrations of any or all of the liplds In plasma, e.g., hypercholesterolemia; a risk factor for cardiovascular dlsease.
Lipids: a family of compounds that includes trlglycerldes, phosphollplds, and sterols.
Lipoprotein: a diverse class of particles containing varying amounts of triglycerldes, cholesterol, phospholipids, and protdn that sofublllze llplds for blood transport.
OvennreOght: describes excess body welght; preferred term for deswiblng excess body welght in children and adolescents.
Oct-17-2005 03 :05pm Frw-CPSS FOOD WUTRITIWI SERVICES
CDC: Safer - Healthier - People * 25
APPENDIX
WILUAM DIDZ, MD, PHD Director, Division of Nutrftlon and Physical Activity Centers for Disease Control and Prevention
The Body Mass Index (or BMI) Is used to identify ovetwelght and at risk of ovetwelght in children and adolescents. The criteria we use are that a BMI between the 85* and 95e" percentiles for age and ender ldentlfles chlldren at rlsk of overwelght, and a BMI greater ? than or equal to the 9st percentile Identifies children or teenagen who are overweight, The rationale for the use of these criteria is that a BMI at the 9!9" percentile in the U,S, population corresponds to a BMI of 30 in a young adult. I n a young adult, a BMI greater than or equal to 30 Is consldered obeslty. .
I n addition, a BMI at the 85* percentile in a young adult Identifies a young adult with a BMI of 25, which is considered the top end of normal weight.
Therefore, the alterla used in children and teenagers do correspond (roughly) to the criteria used In adults for the identificauon of obeslty and overwelght.
There are several potential lirnltatlons to Body Mass Index which require that It not be used as the excluslva standard by which to judge a dlild at risk of ovewelght or overweight, The first llrnltatlon is that, as you know, BMI Is welght divided by helght squared.
Welght and height do not directly measure body fatness, so that an addltlonal criteria that should be used for determining whether somebody who Is overwelght (as Indicated by BMI greater than the 95* percentile) Is also overfat, is a measure of a skinfold thickness -- llke the tricep skinfold thlckness. This will help differentiate children and teenagers who are both overwelght and overfat from those who are ovewelght because of Increased musde mass or bone mass.
One of the questions is how sensitive and specific the BMI is for the identification of chlldren with lncreased fatness. We compared body fatness In chlldren and teenagers measured by DEXA (which Is a definltlve measure of body composltlon) with children with a BMI over the 99" percentile. The ovenvhelmlng majority of those children -- 95 percent of those children wlth a BMI greater than the 95" percentile -- also had increases in percent body fat compared to the general population.
The second consideration Is how valid Body Mass Index Is as a predictor of risk.
We know, from studies of 5 to 10 year-old children whose BMI Is greater than the 9sth percentile, that 60 percent have at least one addltlonal cardiovascular dlsease risk factor -- like elevated systollc or dlastollc blood pressure, elevated cholesterol or triglycerides, or elevated insulin levels. In addltlon about 15 percent of those same children (wlth a BMI greater than the 9sth percentile) have two or more risk factors.
Therefore, BMI not only ldentlfies children who have increased body fatness, but In additlon BMI also indicates that those children who are overweight have assoclated rlsk factors.

Oct-17-2005 03:05pm From-GPSS FOOD TRlTlON SERVICES t6714775394 T-501 P.027/030 F-212
CDC: Safer - Healthier - People 26
BMI TABLE
Calculated Body Mass Index 29"-4SW and 3s lb .43 I ~ S .

Oct-17-2005 Ol:O5pin From-GPSS FOOD ~~~) IUTRIT ION SERVICES
CDC: Safer - Healthier - People - 27
Self-Test Questions (Answers are provided on the following page)
1. True or false: BMI-for-age is a dlagnostlc tool used to ldentlfjr children and adolescents who are underwelght and overweight,
2. T N ~ or false: BMI is age specific for chlldren and adolescents, ages 2 to 20. Thus, BMI- for-age Is the measure used to dassify chlldren and adolescents as underweight or overwelght.
3. True or false: John Is 22 months old, BMI-for-age can be used to determine If he is undenvelght or overweight?
4. True or false: The BMI-for-age chart provldes a reference for adolescents that prevlously did not exist.
5. Which statement does NOT aaurately describe an advantage of using BMI-for-age to screen for overwelght and underweight In children and adolescents. a. BMI-for-age can be used to track overweight fmm d~lldhoad Into adulthood b. BM1-for-age correlates well wlth dinlcal rlsk factors for cardlovasarlar dlsease c, BMI-for-age measures body fat d. BMI-for-age provldes a reference for adolescents not previously available
6. The weight-for-stature curve dlffers from the BMI-for-age curve in the following ways: (check all that apply) a. the weight-for-stature curve does not: show age-related changes whlle the BMI-for-age
chart does show age related changes. b. the weight-for-stature chart can be used to dasslfy chlldren as overwelght or
underwelght while the BMI-for-age chart can be used to dassify children as overweight only,
c. the welght-for-stature curve does not show the decllne in welght relative to age that occurs In early childhood whlle the BMI-for-age chart dearly shows this decline.
7, True or false: "Adiposity" rebound usually occurs between 2 to 6 years of age,

Oct-I 7-2005 03:05pm From-GPSS FWD A ~ U T R I T I O H SERVICES
tDC: Safer - Healthler - People - 28
Answers to Self-Test Questlons 1. Tme or false: BMI-for-age Is a diagnostic tool used to Identify chlldren and adolescenb who are undetwelght and overweight.
Answer: False BMI-for-age is a SCREENING tool used to identify children and adolescents who are underweight and overweight. It is not a dlagnostlc tool,
2. True or false: BMI Is age specific for children and adolescents, ages 2 to 20. Thus, BMI- for-age Is the measure used to dasslfy children and adolescents as underweight or overwelght.
AnsweC Tme BMI changes substantially for chlldren as age Increases so the measure used to screen for overwelght and underweight is BMI-for-age. BMI-for-age is gender spedflc for children and adolescents, This Is unlike BMI for adults that Is neither age nor gender specific and for which cutoff points of BMI of 25 and 30 have been estebllshed to Identify overweight and obeslty, respedlvely.
3. True or false: John is 22 months old. BMI-for-age can be used to deterrnlne if he is underweight or overwelght?
Answer: False BMI-for-age is used to screen children and adolescents age 2 to 20 years for underweight or overwelght. BMI is not used N t h chlldren younger than 2 years as there Is not suffIdent evidence to suggest that there is an assodation between BMI at ages younger than 2 years and BMI in adolescence or adults.
4. True or false: The BMI-for-age chart provldes a reference for adolescenrs that previously did not exist.
Answer: True BMI-for-age was not available In the 1977 growth charts and the 1977 weight-for-stature charts were limited to use wlth prepubescent boys under 11.5 years of age and to prepubescent girls under 10 years of age,
Ost-17-2005 O3:05pm From-GPSS FOOD IQ)UTRITI(XI SERVICES
C K : Sarer - Healwter - People - 29
5,. Which statement does NOT accurately describe an advantage of using BMI-for-age to screen for overweight and underweight In children and adolescents. a. BMI-for-age can be used to track ovetwelght from chlldhood Into adulthood b, BMI-for-age correlates well with dinIcal risk factors for cardiovascular disease c. BMI-for-age measures body fat d. BMI-for-age provides a reference for adolescents not previously avallable
Answer: C BMI-for-age Is not a direct measure of body fat but rather it is a proxy for body fat. One d the advantages of uslng BMf-for-age Is that It compares well wlth direct measures of body fat such as dual energy x-ray asorptometry (DEXA).
6. The weight-for-stature curve differs fmm the BMI-for-age curve In the following ways: (check all that apply) a. the weight-for-stature curve does not show age-related changes while the BMX-for-age
chart does show age related changes, '
b. the welght-for-stature chart can be used to dasslfy children as overweight or underweight whlle the BMI-for-age chart can be used to dassify children as overweight only.
c. the welght-for-stature curve does not show the decline in weight relative to age that occurs In early childhood whlle the BMI-for-age chart dearly shows this decline.
Answec a and c accurately descrlbe the dtfferences between the weight-forstature chart and the BMI-for-age chart:
7 . True or false: "AdIposltyn rebound usually occurs between 2 to 6 years of age.
Answec False "Adiposity" rebound usually occurs between 4 to 6 years of age when BMI-for-age reaches a mlnimum before beginning a gradual increase into adulthood. However, 'adiposity" rebound can occur earlier than 4. Research rndlcates that an early "adlposlty* rebound Is associated with an lncreased'risk of adult obesity.
[END OF MODULE]
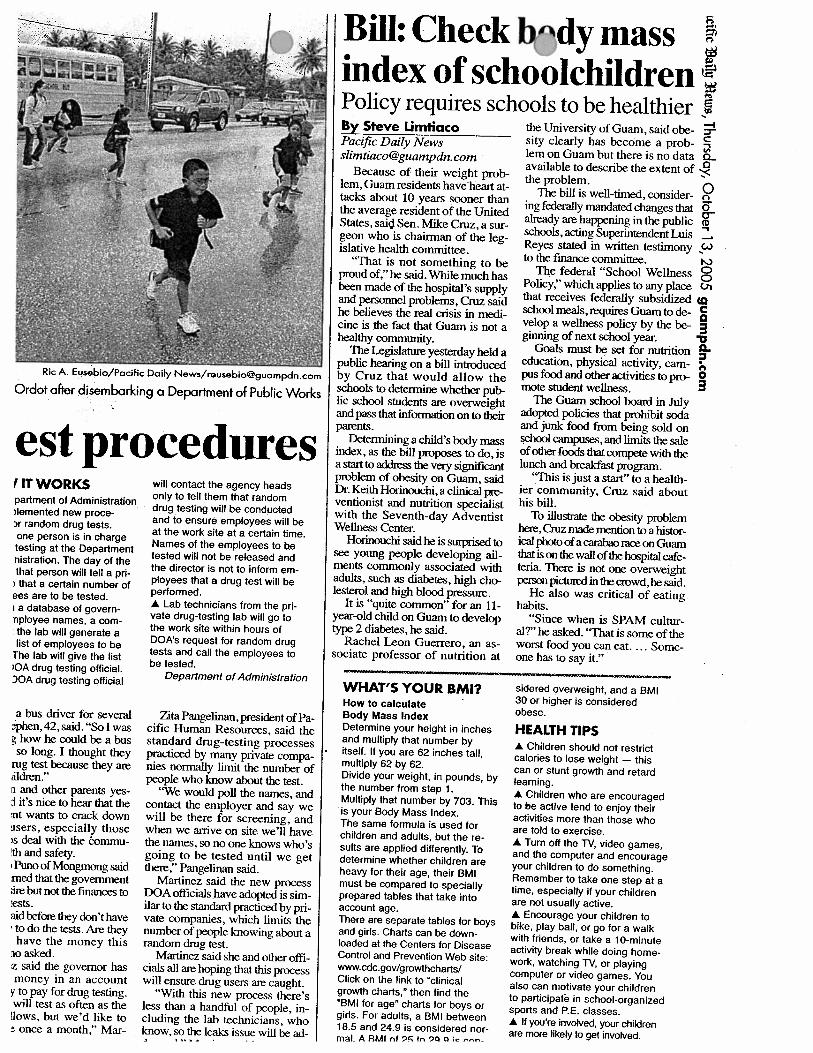
Ric A. Eusebio/Pacific Daily News/reusebioOguampdn.com
Ordot after disembarking a Department of Public Works
est procedures I IT WORKS will contact the agency heads - - -
partment of Administration )lemented new proce- ,r random drug tests. one person is in charge testing at the Department nistration. The day of the that person will tell a pri- ) that a certain number of ees are to be tested. I a database of govern- nployee names, a com- the lab will generate a list of employees to be
The lab will give the list iOA drug testing official. IOA drug testing official
a bus driver for several ,$en, 42, said. "So I was g how he could be a bus so long. I thought they
rug test because they are ilkn.'' n and other parents yes- $ it's nice to hear that the :nt wants to crack down gsers, especially those 6 deal with the brnmu- !th and safety. 1 Pun0 of Mongmong said med that the government ;ire but not the fhanca to tests. aid befose they don't have , todothe tests.Arethey have the money this lo asked. z said the governor has money in an account
y to pay for drug testing. will test as often as the lows, but we'd like to : once a month," Mar-
only to tell them that random drug testing will be conducted and to ensure employees will be at the work site at a certain time. Names of the employees to be tested will not be released and the director is not to inform em- ployees that a drug test will be performed. A Lab technicians from the pri- vate drug-testing lab will go to the work site within hours of DOA's request for random drug tests and call the employees to be tested.
Department of Administration
Zita Pangelinan, president of Pa- cific Human Resources, said the standard drug-testing processes practiced by many private compa- nies normally limit the number of people who know about the test.
'We would poll the names, and contact the employer and say we will be there for screening, and when we arrive on site we'll have the names, so no one knows who's going to be tested until we get there ," Pangelinan said.
Martinez said the new process DOA officials have adopted is sim- ilar to the standard practiced by pri- vate companies, which limits the number of people knowing about a random drug test.
Martinez said she and other offi- cials all are hoping that this prmss will ensure drug users are caught.
"With this new process there's less than a handful of people, in- cluding the lab technicians, who know, so the leaks issue will be ad- .,..* . . .
Bill: Check bndy mass index of schoolchildren Policy requires schools to be healthier By Steve Limtiaco the University of Guam, said obe- Pacific Dailv News sity clearly has become a prob-
Because of their weight prob- lem, Guam residents have heart at- tacks about 10 years sooner than the average resident of the United States, said Sen. Mike Cruz, a sur- geon who is chairman of the leg- islative health committee.
"That is not something to be proud of," he said. While much has been made of the hospital's supply and personnel problems, Cruz said he believes the real crisis in medi- cine is the fact that Guam is not a healthy community.
The Legislature yesterday held a public hearing on a bill introduced by Cruz that would allow the schools to detennine whether pub lic school students are overweight and pass that infbrmation on to their parents.
Determining a child's body mass index, as the bill proposes to do, is a s t a r t t o ~ t h e v e r y s i ~ a n t problem of obesity on Guam, said Dr. Keith Horhowhi, a clinical pre- ventionist and nutrition specialist with the Seventh-day Adventist Wellness Center.
Horinouchisaidheissurprisedto see young people developing ail- ments commonly associated with adults, such as diabetes, high cho- lesterol and high blood pressure.
It is "quite common" for an 11- year-old child on Guam to develop type 2 diabetes, he said.
Rachel Leon Guerrero, an as- sociate professor of nutrition at
lem on Guam but there is no data available to describe the extent of the problem.
The bill is well-timed, consider- ing federally mandated changes that already are happening in the public schools, acting Superintendent Luis Reyes stated in written testimony to the finance committee.
The federal "School Wellness Policy," which applies to any place that receives federally subsidized school meals, r e q W Guam to de- velop a w e h policy by the be- ginning of next school year.
Goals must be set for nutrition education, physical activity, cam- pus food and other activities to pro- mote student wellness.
The Guam school board in July adopted policies that prohibit soda and junk food from being sold on school campms, and limits the sale of other foods that compete with the lunch and W a s t program.
'rPlis is just a start'' to a health- ier community. Cruz said about his bill.
To illustrate the obesity problem here, Guz made mention to a histor- ical photo of a carahm race on Guam thatisontkwallofthe~talcafe- teria. There is not one overweight personpi~intheaowd,hesaid.
He also was critical of eating habits.
"Since when is SPAM cultur- al?" he asked. '"That is some of the worst food you can eat. . . . Some- one has to say it."
WHAT'S YOUR BMI? sidered overweight, and a BMI
How to calculate 30 or higher is considered
Body Mass Index obese.
Determine your height in inches HEALTH TIPS and multiply that number by itself. If you are 62 inches tall, multiply 62 by 62. Divide your weight, in pounds, by the number from step 1. Multiply that number by 703. This is your Body Mass Index. The same formula is used for children and adults, but the re- sults are applied differently. To determine whether children are heavy for their age, their BMI must be compared to specially prepared tables that take into account age. There are separate tables for boys and girls. Charts can be down- loaded at the Centers for Disease Control and Prevention Web site: www.cdc.gov/growthcharts/ Click on the link to 'clinical growth charts," then find the 'BMI for age" charts for boys or girls. For adults, a BMI between 18.5 and 24.9 is considered nor- mal. A RMI nf 9r; tn 90 0 ic ---
A Children should not restrict calories to lose weight - this can or stunt growth and retard learning. A Children who are encouraged to be active tend to enjoy their activities more than those who are told to exercise. A Turn off the N, video games, and the computer and encourage your children to do something. Remember to take one step at a time, especially if your children are not usually active. A Encourage your children to bike, play ball, or go for a walk with friends, or take a 10-minute activity break while doing home- work, watching N, or playing computer or video games. You also can motivate your children to participate in school-organized sports and P.E. classes. A If you're invdved, your children are more likely to get invoked.

Anti-obesity bill gets wide support By Gerardo R. Partido Cuurn. Variety News Staff At least 15 percent of chilclrcn
MEMBERS oi'thc islancl's mcdi- ruicl adolescents in tllc U.S. alone cal community ycstclvlay cx- prcssctl support for Bill 164. which proviclcs for mcasurcs to comhat ohcsity aliiong stuclcnts ancl young pcoplb on islarlcl.
Dr. Maria Tcrcsn M. Bondoc. provider services tnanagcr I'or Staywell's hcalthwatcli program. sttplx)rts tlic hill. tcstilying that Typc 2 cliahclcs. previously con- siclcrccl an aclult cliscr~sc. has in- crcascd clrruiiatically in chilclrcn ant1 adolcsccnts.
"Ovcrwciglit r~dolesccntsliave a 70 pcrccnt chance o f hccorning overweight orohcsc uciults. This incrcascs to 80 percent if one or more parent is ovcrwcight or obese. Overweight or ohcsc adults arc at risk Sor a numher ol' health prohlcms including heart cliscasc. Typc 2 cliahctcs. high hlood prcssurc. and some I'orms of cancer." Boncloc sr~icl during yesterday's puhlic hearing on tlic hill.
I n addition. Boncloc said there itre also p~ycliologicr~l cfSects such as pcrccivccl social discrirnina- tion. poor scll~estcc~ii. and dc- pression.
Dr. Lee H. Meadows of the Guruii SDA Clinic tcstilictl that thcrc is nri cpiclcmic ol' ohcsity not only in Ithe 'U!S:hUr HI SO^ in
arc ovcrwcight. three times as Iiinny as i n the 1980s.
Tlic prevalence is liiglicrariiong ethnic groups. of which the pcr- ccntagc could go up to as high as 30 pcrccnt.
"We niust rccogniLc [hat we have a prohlc~ii both i n the pi~hlic .licalth Icvcl nncl the incliviclual
"ranls Icvcl. Current insurance pro, tlo not cvcn include trcatriicrtt ol' ohcsity. We clon't even cull chil- dren 1;1t or ohcsc. Wc call them overweight to he politically cor- rect. This hill provides for hot11 the recognition t~l'thc prohlcrn at the government lcvcl and the in- clividual, lcvcl." Meadows said.
He added that many cloctors arc trnincd to rccognizcnn ovcrwcight cliilcl. hut not what 1 0 do with the problem in tcr~tis of nutritionill change or hchavioral modilica- tion.
"Doctors also c1on"t have much access to chilclrcn. Olicn. they come in every ti.w years or so li)r :I physical examination," Mcad- ows saicl.
Ideally. Mcadowssaicl the prob- Icm should he adrlrcsscd hy the Department ol' Puhlic Hmlth r~ncl Social Services.
"But again. DPHSS lacks rc- !s&rcb%.;..': l~c,sai(l:! I , . i . ! 1
GPSS makes strides m scnool nur;riLlull
GPSS seeks to achieve optimal nutrition through its school breakfast, lunch, and after-school snack programs sewed in public school cafeterias. Photo by Gerardo I?. Pa* ' \
By Gerardo R. Partido Variety News Staff
THE Guam Puhlic School Sys- tem has maclc great strides in im- proving school nutrition.
This was the assurance given yesterday hy acting Supcrintcn- dent ofEducation LuisS. N. Rcycs in a written testimony submitted to the Legislature suppor!ing Bill 164. which sccks to comhat ohc- sity among students.
Accortling to Rcycs. the Guo~ii Ecfucation Policy Board already passed a policy that pli~ccs clc- tailed requirements li)r a11 puhlic schools to promote sound nutri- tion education anti hcafthy ei~ting Iili.stylcsamongstudcnts ancl their f:~niilics.
? I Wkcsc1yuiddi11e.u re:equirc.nutri-
(ion education at all gradc levels liom prc-school tlirottgli gradc 12, non-lixd rcwr~rds and incentives used to encourage student uchicvcment. and optimal nutri- tion through school hrcakli~st. lunch. anctal'ter-school snack pro- grams.
In acldition. GPSS now prohih- its foods ol' niininial nutrition v:~luc Srom hcing solel. clistrih- utcd, or promoted at anytimcdur- ing school hours of operation. in- cludingthosc in vending niacliincs arid ready-to-cat li)ods.
Moreover. an advisory council' has heen Ihrmcd that shall hc rc- sponsihlc Ihr aclvising r~ncl mak- ing rccomtiicndatiotis.on li)cd and nutrition education opportirnitics.
; ,T1;1is: counc.il, oonslsls, of. par-
ents. stuclcnts. school adriiinistrh- tors. reachers. school Iicalth coun- selors. nurses and induslry pro- l'cssionals.
At Gcorgc Washington High School i n school year 2002. the averope daily number ol' partici- pants i n the school lunch progrrjrn was about 1 12 students.
But as n result ol'the implemcn- tntionoS"My Hcaltliy Mculs"anc1 "My Healthy Mcrlls Plus" pro- gritms. the school has seen an inclcasc of over 1.000 students participating daily i n the child nutrition program this school year.
'The increase in the a v f i daily participation is widcsplclld throughout Guam'spuhlicschools. most especially in our secondary
!~sc,lib)ols5 Rcycr ,tcaificcl. ; . . I
'I' .- . . .. . . -. . -. - - - A - .-A -. . ..---

KUAM Printable News: for measure to curb child obesi
Print this story
Support strong for measure to curb child obesity
by Sabrina Salas Matanane, KUAM News Wednesday, October 12,2005
Those who testified on legislation that would help curb childhood obesity for the most part were in support of the measure. Bill 164 would require the Guam Public School System to implement the body mass index. It furthermore would mandate the school system to provide a confidential report to the student's parents or legal guardians.
Additionally the BMI would be used as a tool to collect data for health officials to assess the general health of students by developing a comprehensive nutrition and physical fitness plan. National statistics show that childhood obesity is an epidemic, being not only a concern in the U.S. mainland, but also locally.
"This problem provides both the recognition of this problem at the government level and at the individual level and I think that's a very strong positive," said Dr. Lee Meadows. Also commenting on the matter was dietician Dr. Rachel Taitano Leon Guerrero, who said, "Here on Guam we see the problem growing but we actually don't have any hard data to show that this happening this bill would actually allow for us to get a baseline on how many children are actually obese."
The GPSS testified in support of the intent of the legislation. Ike Santos, testifying on behalf of acting superintendent Luis Reyes, said that the bill was timely since the School System is in the midst of fully implementing the U.S. Department of Agriculture's school wellness policy. The BMI is used to assess underweight, overweight and at risk for overweight children and teens.
Page 1 of 2
KUAM Printable News: Suppo strong for measure to curb child obesity e Page 2 of 2 ( r
Copyright O 2000-2005 by Pacific Telestations, Inc.
Print this story

. Mike Cruz proposes bill to ad s obesity in local schoolchildren P" n Page 1 of 3
KUAM.COM Keyword Search - Get exactly what you're looking for - better search rt FAQs for KUAM.COM Keyword Search
BREAKING NEWS >>> . . . Two-car collision on Ysengsong Road in De< of 2005 . . .
Mike Cruz proposes bill to address obesity schoolchildren
by Sabrina Salas Matanane, KUAM News
Monday, July 11, 2005
E-mail t t Printablt Get RSS
A new bill was introduced last week that seeks to open parents' eyes. dangerous obesity epidemic on Guam. It 's no secret that being overw concern in America, but what many don't realize is that Guam leads th cases.
According to statistics provided by the Department of Public Health ar diabetes (an obesity-related illness) has been one of the top ten causc territory from 1985-2002. Local doctor and senator Mike Cruz (R)

. Mike Cruz proposes bill to obesity in local schoolchildren n Page 2 of 3
Have a hot news tip? Want us to
work on a story or cover an
event? Let us know
about it!
WXIUS RAY,
"Obesity is a major epidemic not only in the nation or the United St, here on Guam. And on Guam we lead the nation some of the obesit such as diabetes, hypertension, and myocardial disease such as heart i
What many find alarming is the fact that obesity is a growing trer adolescents. Nationwide, obesity in children has tripled in just the lasi a result, children as young as 11 years old have been diagnosed with c
Senator Cruz, who sits as chairman of the Legislative Committee or support of fellow physicians and Guam Public School System superinte is proposing a bill that would shed light on obesity in local school modeled after similar legislation passed in Arkansas, would require th private health reports to parents of public school children.
"A report on a student's body mass index in a very confidential or parents or legal guardians to help them in understanding where thc regards to their peers in regards to their weight," the senator added.
Dr. Keith Horinouchi, a nutritionist at Guam Seventh-Day Adventist said, "We need to think prevention and there is no better opportunity our children and youth."
KUAM's Janjeera Hail contributed to this report

Calendar Results
Other Date(s): 10/12/2005
Page 2 of 3
Time: 5 p.m. Contact Info: 475-1 802
Committee on Finance, Taxation and Commerce public hearing Where: 28th Guam Legislature Legislature's public hearing room undefined,
Description: 9:30 a.m. Oct. 12, Legislature's public hearing room, Hagatna. Bill 156 postponed; Bill 162, relative to emergency and non-emergency use of an ambulance primarily for transportation, conducting building inspections, review of building plans and issuing Guam Fire Department permits; Bill 164, relative to providing confidential report of a student's body mass index and written information to parents or legal guardians of students who have a BMI above normal range and provide for a comprehensive nutrition and physical fitness plan utilizing the BMI; Bill 166, streamlining the process to make available existing funding for Guam Memorial Hospital Authority; Bill 167, an act to subdivide and transfer a portion of Block 1, Tract 268, Yona from Guam Waterworks Authority and to the Guam Public School System to establish a satellite school campus and to appropriate $1 50,000 from the General Fund fiscal 2005 appropriations to GPSS for the transfer of the chattel interest of eight buildings containing 16 classrooms and other ancillary structures from St. Francis School to GPSS and for site work repair, renovation and outfiting of structures in preparation for 2005-2006 school year and to further subdivide and transfer a portion of the parcel to the Yona mayor's office for maintaining excisting multi- purpose field and providing the Yona community with additional park and recreational opportunities. Copies of these bills are avaiolable at the Legislature's Web site: http://guamlegislature.com/28th~G~am~Legislature/Bills- Introduced-28th.htm. For written testimony or special accommodations, call the office of Sen. Edward Calvo, 475-880112 or e-mail: [email protected].
Date: 10/12/2005 through 10/12/2005
Other Date&): 10/12/2005
Time: 9:30 a.m. Contact Info: 475-880 1/2
Previous Page New Search Next Page
Public Hearings 1 0/12/2005
I MINA'BENTE OCHO NA LIHESLATURAN GUAHAN 2005 (FIRST) Regular Session
Bill No. b? ( kc)
Introduced by:
AN ACT TO AMEND SECTION 3207, ARTICLE 2, DIVISION 2, TITLE 17 OF THE GUAM CODE ANNOTATED, RELATIVE TO PROVIDING A CONFIDENTIAL REPORT OF A STUDENT'S BODY MASS INDEX AND WRITTEN INFORMATION TO PARENTS OR LEGAL GUARDIANS OF STUDENTS WHO HAVE A BODY MASS INDEX ABOVE THE NORMAL RANGE, AND PROVIDE FOR A COMPREHENSIVE NUTRITION AND PHYSICAL FITNESS PLAN UTILIZING THE BODY MASS INDEX.
1 BE IT ENACTED BY THE PEOPLE OF GUAM:
2 Section 1. Legislative Findings and Intent. I Liheslaturan Gudhan
3 finds that obesity is a major health problem on Guam. I Liheslaturan
4 Gudhan further finds that childhood obesity is a growing health concern on
5 Guam. The Surgeon General of the United States has determined that
6 overweight and obesity in children and adolescents has tripled in the last
7 two decades.
8 Guam leads the nation in heart disease and obesity related ailments,
9 such as diabetes. It impacts not only health, but also the financial expense
10 of treating these illnesses. Steps need to be taken now to improve the
health of our future generation, as well as reduce future health costs for the
coming generation.
Health professionals often use a Body Mass Index (BMI) 'growth
chart' to help them assess whether a child or adolescent is overweight.
Therefore, it is the intent of I Likeslaturan Gudkan to implement the Body
Mass Index in Guam's Public School System and provide a confidential
report to the student's parents or legal guardians. Additionally, the BMI
shall be a tool to collect data for health officials to assess the general health
of students by developing a Comprehensive Nutrition and Physical Fitness
Plan.
Section 2. Section 3207, Article 2, Division 2, Title 17 of the Guam
Code Annotated is hereby amended to read as follows:
5 3207. Physical Fitness. The Board shall develop a physical fitness
program for all students in the elementary and secondary schools, taking
into consideration the age, sex and health condition of students. Such
program shall include a periodical physical fitness achievement test and,
17 as feasible, intramural and other athletic competition. As part of the
18 physical fitness rogram, schools shall provide parents or legal guardians
19 periodic re orts of their child's body mass index (BMI), which shall be
20 computed and distributed to parents or legal guardians in such a manner
21 that respects the student's privacv. The computation of the BMI must be
22 done properly in a uniform standard, such as the Universitv of California
23 Berkeley's 'Guidelines for Collecting Heights and Weights on Children and
1 Adolescents in School Settings.' The report must also include: an
2 explanation that body mass index is only a screening tool, not an
3 evaluative tool for diagnosing a person as overweight; an explanation of
4 the connection between a body mass index that is above the normal range
5 and obesitv, diabetes, and other health problems, together with references
6 to local communitv health programs for nutrition and physical activitv
7 resources; and the suggestion that the parent seek a primarv care
8 provider's evaluation. Such program shall be implemented in accordance
9 with the availability of facilities and personnel.
For purposes of this section, Bodv Mass Index (BMI) is a calculation
that uses a child's height, age, and weight to estimate how much body fat
he or she has compared to population-referenced standards.
Section 3. Comprehensive Nutrition and Physical Fitness Plan.
The Guam Public School System shall utilize the BMI to develop a
Comprehensive Nutrition and Physical Fitness Plan, which shall be
approved bv the Guam Education Policv Board. The objectives of this plan
may include, but are not limited to, the adoption of rules and training for
the physical activity of students, nutrition education, the school lunch
program, increasing awareness of healthy eating choices, and studv the
healthfulness of the school environment.
The Guam Education Policy Board shall submit the plan to I
Liheslaturan Gudhan with recommendations for anv legislation bv June 1,
2006.

Section 5. Appropriation. The sum of $150,000.00 shall be
ropriated from the Healthy Futures Funds to the Guam Public School
Systems to develo a Comprehensive Nutrition and Phvsical Fitness Plan.
Section 6. Severability. If any provision of this Law or its
application to any person or circumstance is found to be invalid or contrary
to law, such invalidity shall not affect other provisions or applications of
this Law, which can be given effect without the invalid provisions or
application, and to this end the provisions of this Law are severable.