board room purpose - school district 49
TRANSCRIPT
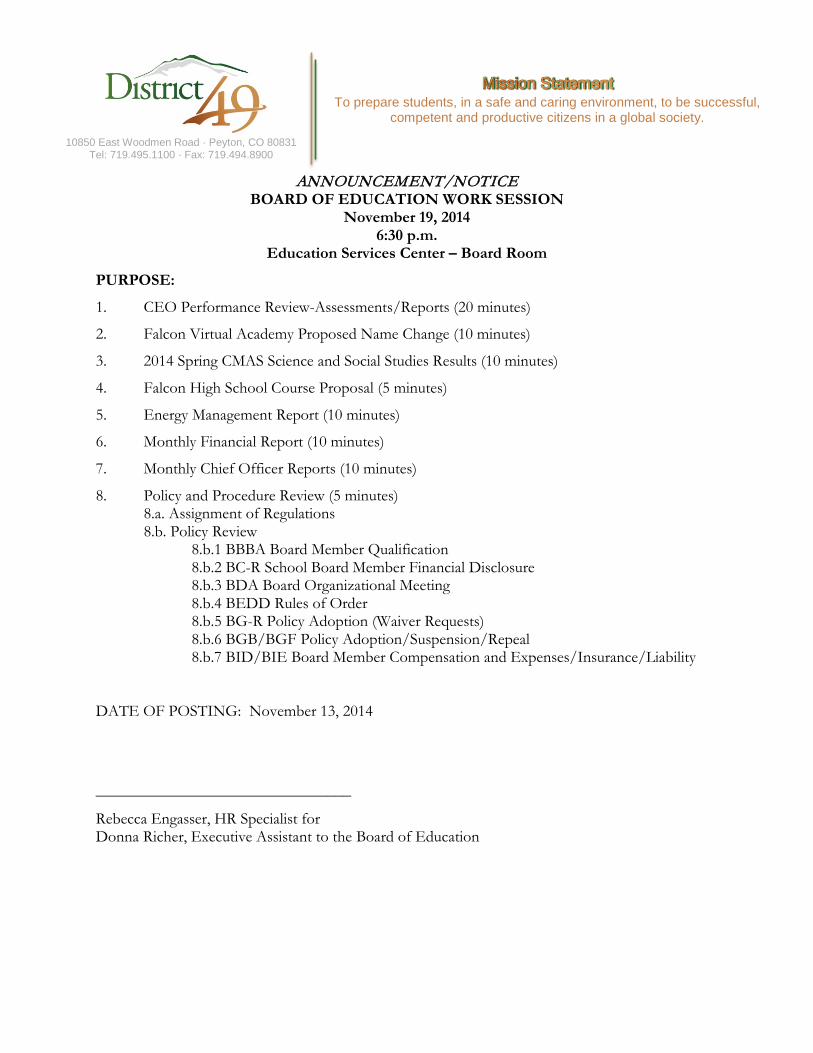
ANNOUNCEMENT/NOTICE
BOARD OF EDUCATION WORK SESSION November 19, 2014
6:30 p.m. Education Services Center – Board Room
PURPOSE:
1. CEO Performance Review-Assessments/Reports (20 minutes)
2. Falcon Virtual Academy Proposed Name Change (10 minutes)
3. 2014 Spring CMAS Science and Social Studies Results (10 minutes)
4. Falcon High School Course Proposal (5 minutes)
5. Energy Management Report (10 minutes)
6. Monthly Financial Report (10 minutes)
7. Monthly Chief Officer Reports (10 minutes)
8. Policy and Procedure Review (5 minutes) 8.a. Assignment of Regulations 8.b. Policy Review 8.b.1 BBBA Board Member Qualification 8.b.2 BC-R School Board Member Financial Disclosure 8.b.3 BDA Board Organizational Meeting 8.b.4 BEDD Rules of Order 8.b.5 BG-R Policy Adoption (Waiver Requests) 8.b.6 BGB/BGF Policy Adoption/Suspension/Repeal 8.b.7 BID/BIE Board Member Compensation and Expenses/Insurance/Liability DATE OF POSTING: November 13, 2014
________________________________
Rebecca Engasser, HR Specialist for Donna Richer, Executive Assistant to the Board of Education
10850 East Woodmen Road · Peyton, CO 80831 Tel: 719.495.1100 · Fax: 719.494.8900
To prepare students, in a safe and caring environment, to be successful,
competent and productive citizens in a global society.
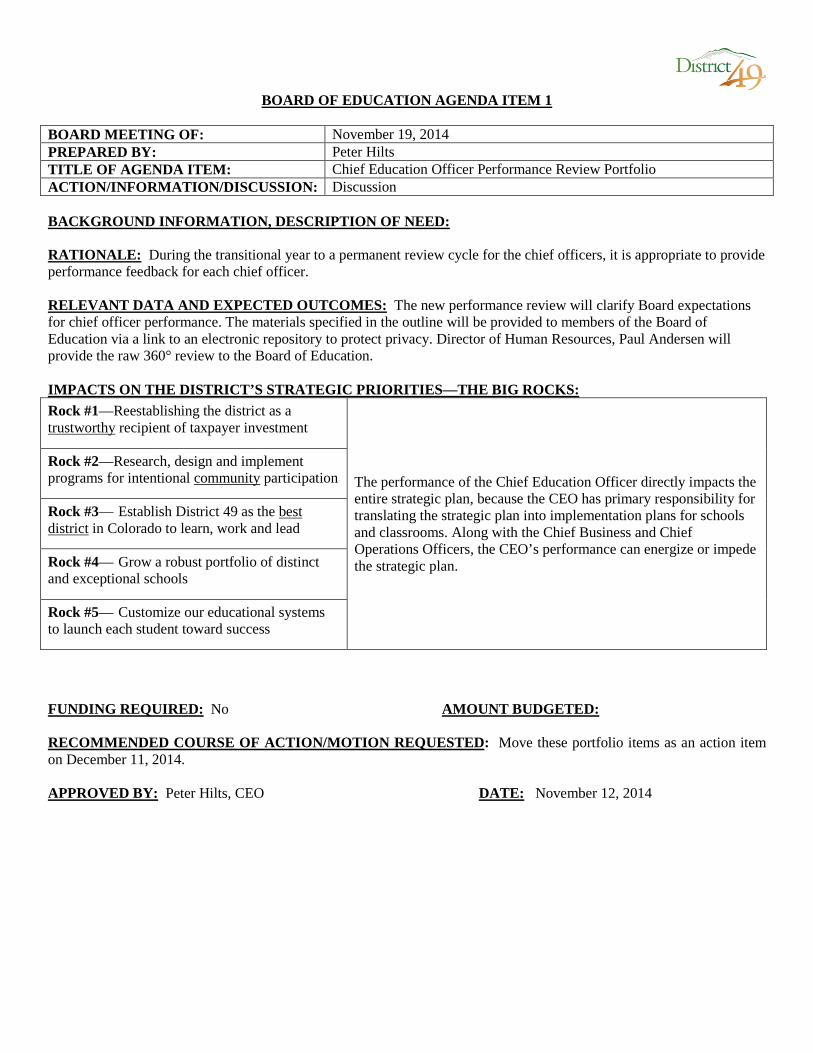
BOARD OF EDUCATION AGENDA ITEM 1
BOARD MEETING OF: November 19, 2014 PREPARED BY: Peter Hilts TITLE OF AGENDA ITEM: Chief Education Officer Performance Review Portfolio ACTION/INFORMATION/DISCUSSION: Discussion BACKGROUND INFORMATION, DESCRIPTION OF NEED: RATIONALE: During the transitional year to a permanent review cycle for the chief officers, it is appropriate to provide performance feedback for each chief officer. RELEVANT DATA AND EXPECTED OUTCOMES: The new performance review will clarify Board expectations for chief officer performance. The materials specified in the outline will be provided to members of the Board of Education via a link to an electronic repository to protect privacy. Director of Human Resources, Paul Andersen will provide the raw 360° review to the Board of Education. IMPACTS ON THE DISTRICT’S STRATEGIC PRIORITIES—THE BIG ROCKS: Rock #1—Reestablishing the district as a trustworthy recipient of taxpayer investment
The performance of the Chief Education Officer directly impacts the entire strategic plan, because the CEO has primary responsibility for translating the strategic plan into implementation plans for schools and classrooms. Along with the Chief Business and Chief Operations Officers, the CEO’s performance can energize or impede the strategic plan.
Rock #2—Research, design and implement programs for intentional community participation
Rock #3— Establish District 49 as the best district in Colorado to learn, work and lead
Rock #4— Grow a robust portfolio of distinct and exceptional schools
Rock #5— Customize our educational systems to launch each student toward success
FUNDING REQUIRED: No AMOUNT BUDGETED: RECOMMENDED COURSE OF ACTION/MOTION REQUESTED: Move these portfolio items as an action item on December 11, 2014. APPROVED BY: Peter Hilts, CEO DATE: November 12, 2014
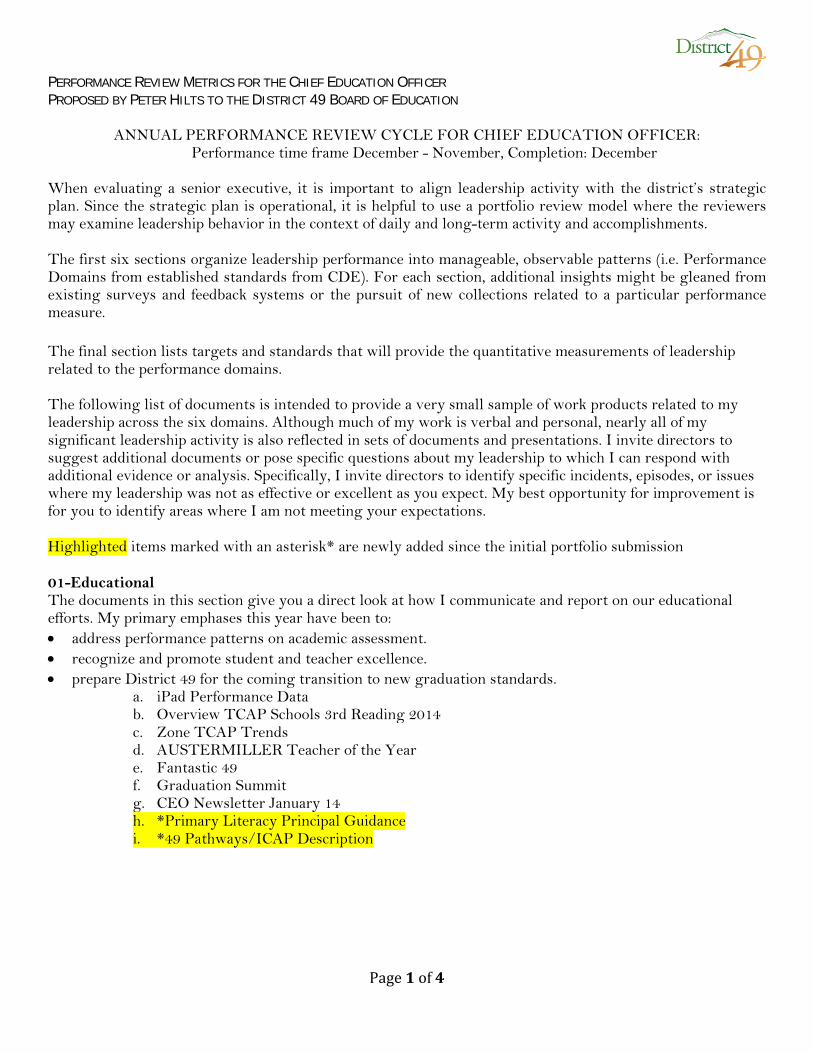
PERFORMANCE REVIEW METRICS FOR THE CHIEF EDUCATION OFFICER PROPOSED BY PETER HILTS TO THE DISTRICT 49 BOARD OF EDUCATION
ANNUAL PERFORMANCE REVIEW CYCLE FOR CHIEF EDUCATION OFFICER:
Performance time frame December - November, Completion: December When evaluating a senior executive, it is important to align leadership activity with the district’s strategic plan. Since the strategic plan is operational, it is helpful to use a portfolio review model where the reviewers may examine leadership behavior in the context of daily and long-term activity and accomplishments. The first six sections organize leadership performance into manageable, observable patterns (i.e. Performance Domains from established standards from CDE). For each section, additional insights might be gleaned from existing surveys and feedback systems or the pursuit of new collections related to a particular performance measure. The final section lists targets and standards that will provide the quantitative measurements of leadership related to the performance domains. The following list of documents is intended to provide a very small sample of work products related to my leadership across the six domains. Although much of my work is verbal and personal, nearly all of my significant leadership activity is also reflected in sets of documents and presentations. I invite directors to suggest additional documents or pose specific questions about my leadership to which I can respond with additional evidence or analysis. Specifically, I invite directors to identify specific incidents, episodes, or issues where my leadership was not as effective or excellent as you expect. My best opportunity for improvement is for you to identify areas where I am not meeting your expectations. Highlighted items marked with an asterisk* are newly added since the initial portfolio submission 01-Educational The documents in this section give you a direct look at how I communicate and report on our educational efforts. My primary emphases this year have been to: • address performance patterns on academic assessment. • recognize and promote student and teacher excellence. • prepare District 49 for the coming transition to new graduation standards. a. iPad Performance Data b. Overview TCAP Schools 3rd Reading 2014 c. Zone TCAP Trends d. AUSTERMILLER Teacher of the Year e. Fantastic 49 f. Graduation Summit g. CEO Newsletter January 14 h. *Primary Literacy Principal Guidance i. *49 Pathways/ICAP Description
Page 1 of 4
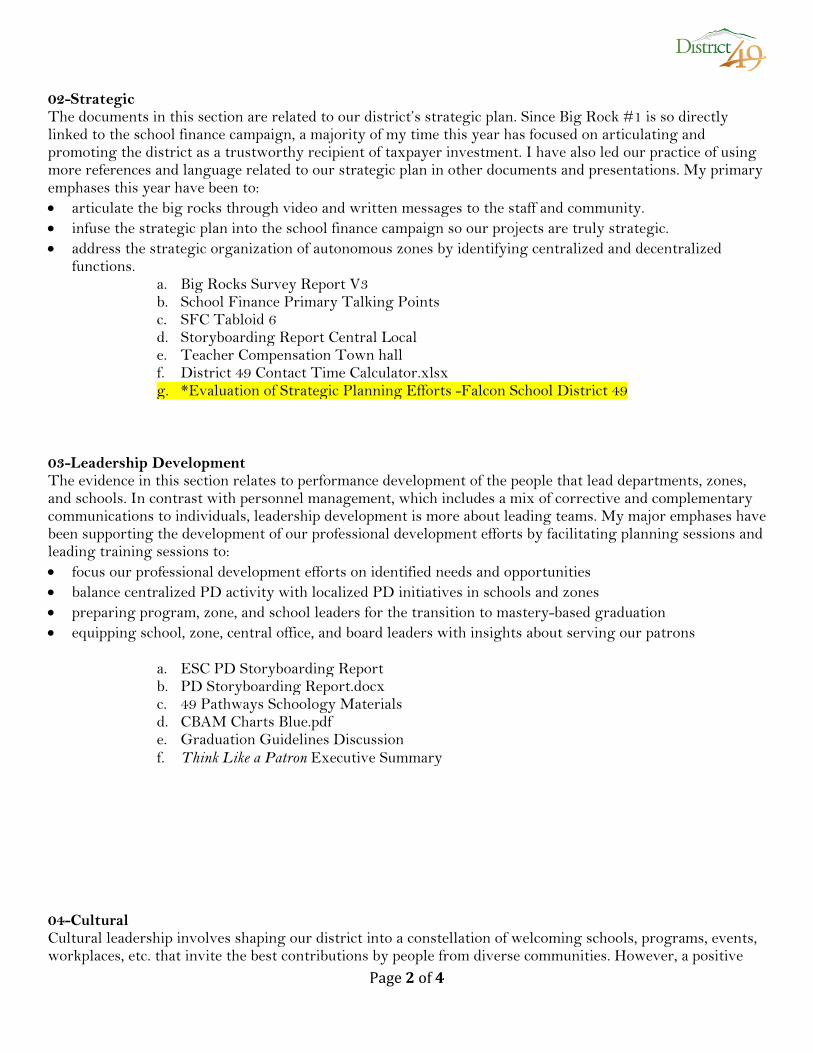
02-Strategic The documents in this section are related to our district’s strategic plan. Since Big Rock #1 is so directly linked to the school finance campaign, a majority of my time this year has focused on articulating and promoting the district as a trustworthy recipient of taxpayer investment. I have also led our practice of using more references and language related to our strategic plan in other documents and presentations. My primary emphases this year have been to: • articulate the big rocks through video and written messages to the staff and community. • infuse the strategic plan into the school finance campaign so our projects are truly strategic. • address the strategic organization of autonomous zones by identifying centralized and decentralized
functions. a. Big Rocks Survey Report V3 b. School Finance Primary Talking Points c. SFC Tabloid 6 d. Storyboarding Report Central Local e. Teacher Compensation Town hall f. District 49 Contact Time Calculator.xlsx g. *Evaluation of Strategic Planning Efforts -Falcon School District 49 03-Leadership Development The evidence in this section relates to performance development of the people that lead departments, zones, and schools. In contrast with personnel management, which includes a mix of corrective and complementary communications to individuals, leadership development is more about leading teams. My major emphases have been supporting the development of our professional development efforts by facilitating planning sessions and leading training sessions to: • focus our professional development efforts on identified needs and opportunities • balance centralized PD activity with localized PD initiatives in schools and zones • preparing program, zone, and school leaders for the transition to mastery-based graduation • equipping school, zone, central office, and board leaders with insights about serving our patrons a. ESC PD Storyboarding Report b. PD Storyboarding Report.docx c. 49 Pathways Schoology Materials d. CBAM Charts Blue.pdf e. Graduation Guidelines Discussion f. Think Like a Patron Executive Summary 04-Cultural Cultural leadership involves shaping our district into a constellation of welcoming schools, programs, events, workplaces, etc. that invite the best contributions by people from diverse communities. However, a positive
Page 2 of 4
culture can exist even in a community with limited diversity. So, my leadership in this area has focused on promoting a strong culture in the diverse communities that make up District 49. Because of some past missteps, the majority of my efforts this year have been to: • reset our leadership culture by explicitly holding principals accountable for the local school culture. • bringing our district closer to compliance with the expectations of our larger community. • adding dedicated program leadership to help build a positive and high-performing culture. • correcting noncompliance with the Department of Justice agreement. a. CEO Blog October.docx b. Cultural Capacity Initiative c. Coordinator of Cultural Capacity 4-14.pdf d. Continuum of Collaboration e. District 49 Timetable for Agreement with f. DOJ Outline g. Comm with DOJ[2].pdf h. *District 49 Designated Administrator Report Format i. *All Together Now CEO Blog 05-Communication Leadership through communication is probably the most broad category and the area where we still have the most room to grow. I have made anticipatory communications one of my priorities but my overall efforts still tend to be responsive to emerging concerns or opportunities. I’ve included a sample of written communications as well as links to some online multimedia materials. a. Cold Weather Calls b. Critical of Contractor c. TCAP Press Release.docx d. Letter to Concerned Parent in Support of Staff e. Ritz Response to Support Letter f. Austermiller Response to Support Letter g. Andersen Response to Support Letter h. What we learn by losing i. Parent Communication re iPads 1 j. Parent Communication re iPads 2 k. Response to Parent on Cultural Insensitivity l. Comments at Duncan Event m. Response to Mr. Murphy re- School Finance n. CEO Article May 14
Page 3 of 4
06-Personnel Leadership of Personnel is one of the most important aspects of my role. I see personnel as having three phases, 1-recruiting and hiring excellent leaders to properly defined roles, 2-directing and affirming leadership performance, and 3-correcting or challenging/shaping performance that doesn’t meet expectations. The following document samples represent evidence of all three phases. a. Working Together Education Office .docx b. Summary and recommendations in response to an employee complaint.docx c. Personnel PIP Notice of Completion.docx d. Hilts Meeting Summary DC e. EDIE Task Packet .docx f. Final Executive Director of Individualized Education 2013 g. DoC Interview Questions h. DoC Task Elaboration i. DCE Task Elaboration j. Director of Concurrent Enrollment 4-14 k. Evaluation Evidence for Zone Leaders l. Directive re- Best and Brightest m. *Full Evaluation of Senior Leader n. *Corrective Communication to Building Leader
Page 4 of 4
BOARD OF EDUCATION AGENDA ITEM 2
BOARD MEETING OF: November 19, 2014 PREPARED BY: Peter Hilts TITLE OF AGENDA ITEM: Falcon Virtual Academy Proposed Name Change ACTION/INFORMATION/DISCUSSION: Discussion BACKGROUND INFORMATION, DESCRIPTION OF NEED: RATIONALE: Effective branding is a crucial component in our educational model and we have successfully branded FVA, however we believe it is our school’s climate and culture that is more recognizable than our actual name. RELEVANT DATA AND EXPECTED OUTCOMES: Our mission and vision will be finalized once the name change is adopted and released but until then our focus is to directly align with D49’s strategic plan and the big rocks. Our new strategic plan will place a greater focus on rigor, individualized pathways, family choice, project based learning, concurrent enrollment, post-secondary readiness and educational opportunity made possible through mobility. IMPACTS ON THE DISTRICT’S STRATEGIC PRIORITIES—THE BIG ROCKS:
Rock #1—Reestablishing the district as a trustworthy recipient of taxpayer investment
Rock #2—Research, design and implement programs for intentional community participation
Rock #3— Establish District 49 as the best district in Colorado to learn, work and lead
Rock #4— Grow a robust portfolio of distinct and exceptional schools
As one school in our portfolio, FVA is poised to adopt an identity that reflects its true identity.
Rock #5— Customize our educational systems to launch each student toward success
The Springs Studio for Academic Excellence will personalize learning for all types students to launch them toward success.
FUNDING REQUIRED: No AMOUNT BUDGETED: RECOMMENDED COURSE OF ACTION/MOTION REQUESTED: Move this proposal as an action item on December 11, 2014. APPROVED BY: Peter Hilts, CEO DATE: November 12, 2014
Falcon Virtual Academy’s blended learning model has prompted many new enrollees to ask the question- Why do you call yourself Falcon Virtual Academy when your building is not in Falcon and you’re not really virtual? This question has sparked many “Hummm” moments without a solid answer. Effective branding is a crucial component in our educational model and we have successfully branded FVA, however we believe it is our school’s climate and culture that is more recognizable than our actual name. With that knowledge, we are making a formal request to change our name. Below is a timeline of the events leading up to our potential name change and they stakeholders included in this community endeavor:
● Staff Meetings 2012-2013- Initial discussion on a potential name change with our new facility. Discussed that our
logo actually had negative connotation as it was a pixelated Falcon which eluded to a digital experience which was of poor quality. Our discussions also revolved around “Virtual” having a negative and outdated connotation due to full virtual schools having poor academic achievement.
● SAC Meetings 2013-2014- we had multiple discussion about the possibility of a name change and the potential impact. Consensus was that we would not have a significant backlash and it would not hurt our enrollments but we could better illustrate what we do with a name change.
● Face to Face conversations 2013-2014- engaged one on one with parents and community members to garner input and response
● April 2014 Social Media (Facebook, Twitter) to reach out and probe our stakeholders regarding perceptions of the current name and potential concerns with a change. We had minimal responses opposing a name change which were due to familiarity than community connection.
● April 2014- Peter Hilts facilitated a storyboarding session with our staff, a representative sample of students, parents and SAC members. Our mission was to clarify and revisit the mission and vision of our school. Re-naming the school was a significant topic as we have moved away from full virtual and embraced a blended model. We identified that FVA should not be identified in the following ways:
● An Alternative School, Online School, Homeschool program or Charter School
However we should be identified for these attributes: ● Flexible, Opportunity, Rigorous, Relationship builders, Collaborative, Engaged, and a launch pad for kids
● May 2014- Worked with Lunch Bucket Creative to conduct a SWOT analysis of our re-naming which revealed that the issues we believed our name portrayed were true and that our new name ideas were sound in the educational market-place.
● August 2014-2105- Sought input from outside business partners including Herff Jones who has dealt with school identities for nearly 40 years.
Our mission and vision will be finalized once the name change is adopted and released but until then our focus is to directly align with D49’s strategic plan and the big rocks. Our new strategic plan will place a greater focus on rigor, individualized pathways, family choice, project based learning, concurrent enrollment, post-secondary readiness and educational opportunity made possible through mobility. All of this will stem from our “Springs Studio for Academic Excellence”, best described as a workspace where students do highly engaging work in an open environment. This time and space is beyond that of instructional time and faculty guidance is not constantly available. It allows for students to engage each other, help each other, and inspire each other while working on their passions. (adapted from a Carleton University description of Studio Teaching)
BOARD OF EDUCATION AGENDA ITEM 3
BOARD MEETING OF: November 19, 2014 PREPARED BY: Kristy Rigdon TITLE OF AGENDA ITEM: 2014 Spring CMAS Results ACTION/INFORMATION/DISCUSSION: Discussion BACKGROUND INFORMATION, DESCRIPTION OF NEED: Last spring, elementary and middle school students took the first round of the new Colorado Measures of Academic Success (CMAS) state assessments in Science and Social Studies. Social Studies was administered to 4th and 7th grade. Science was administered to 5th and 8th grade. These state developed assessments are based on Colorado Academic Standards adopted in December of 2009. After a long process of standard setting we now have district results. This new assessment has different Performance Level Descriptors and are much more rigorous than the assessments we have seen in the past which necessitates educating our community about these new assessments and the results. RATIONALE: New assessments require reeducation about the state assessment system and the results. RELEVANT DATA AND EXPECTED OUTCOMES: State, district and school results will be presented. IMPACTS ON THE DISTRICT’S STRATEGIC PRIORITIES—THE BIG ROCKS: Rock #1—Reestablishing the district as a trustworthy recipient of taxpayer investment
Rock #2—Research, design and implement programs for intentional community participation
Rock #3— Establish District 49 as the best district in Colorado to learn, work and lead
Understanding how students are performing guides the D49 in providing students targeted instruction to ensure they graduate college and career ready.
Rock #4— Grow a robust portfolio of distinct and exceptional schools
Rock #5— Customize our educational systems to launch each student toward success
Understanding how students are performing guides the D49 in providing students targeted instruction to ensure they graduate college and career ready.
FUNDING REQUIRED: N/A AMOUNT BUDGETED: N/A RECOMMENDED COURSE OF ACTION/MOTION REQUESTED: N/A APPROVED BY: Peter Hilts, Chief Education Officer DATE: November 7, 2014
2014 Spring CMAS: Science and Social Studies Results
Board Report
November 19, 2014
Presented by Kristy Rigdon Coordinator of Curriculum, Instruction and Assessment
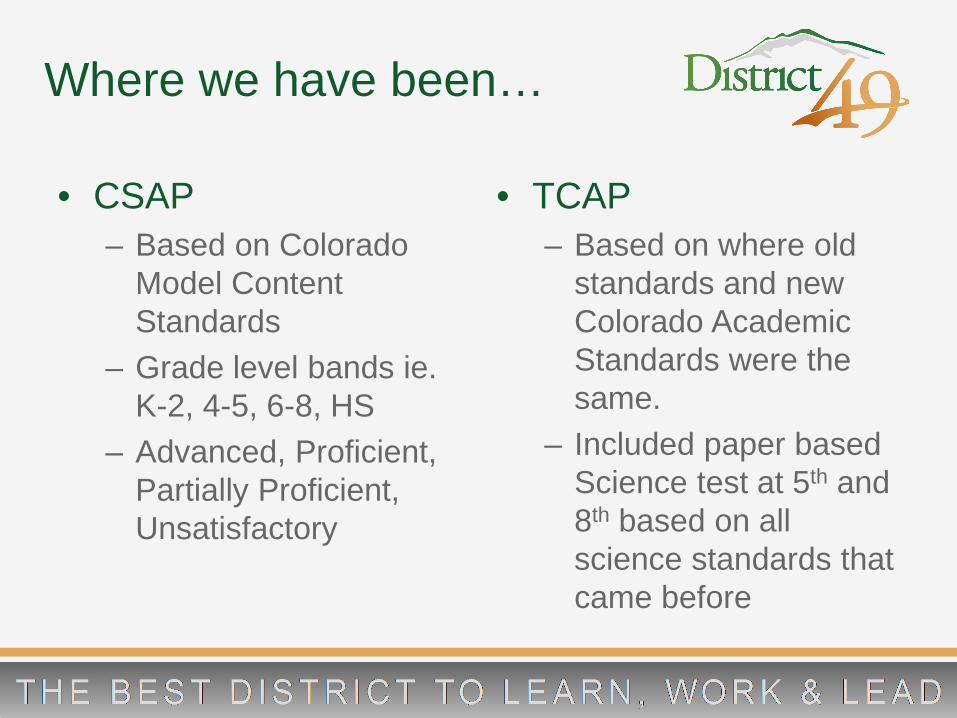
Where we have been…
• CSAP – Based on Colorado
Model Content Standards
– Grade level bands ie. K-2, 4-5, 6-8, HS
– Advanced, Proficient, Partially Proficient, Unsatisfactory
• TCAP – Based on where old
standards and new Colorado Academic Standards were the same.
– Included paper based Science test at 5th and 8th based on all science standards that came before
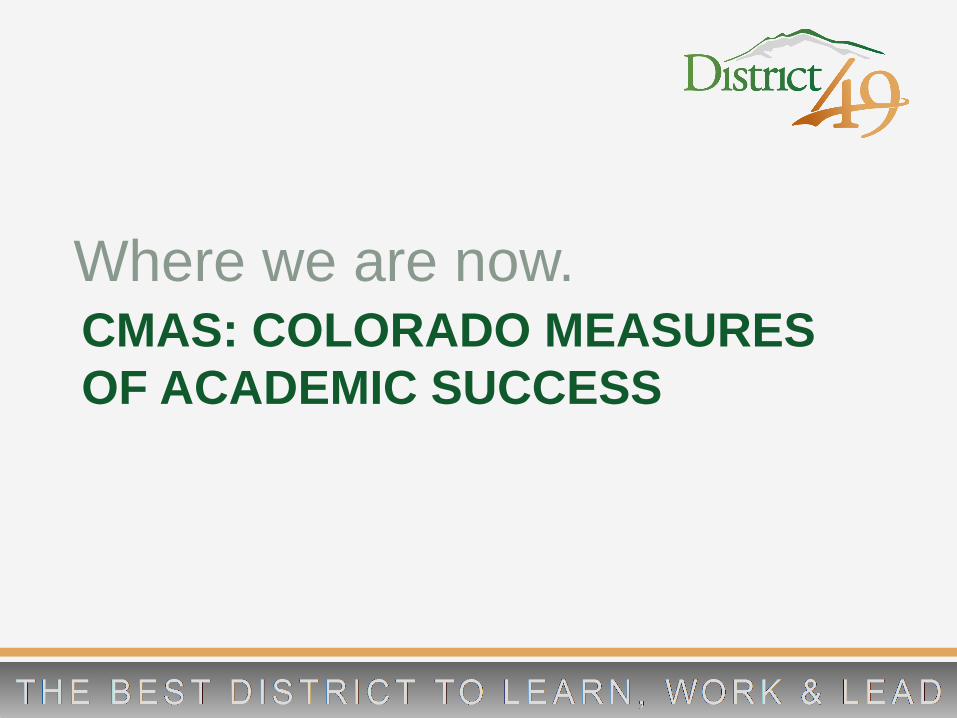
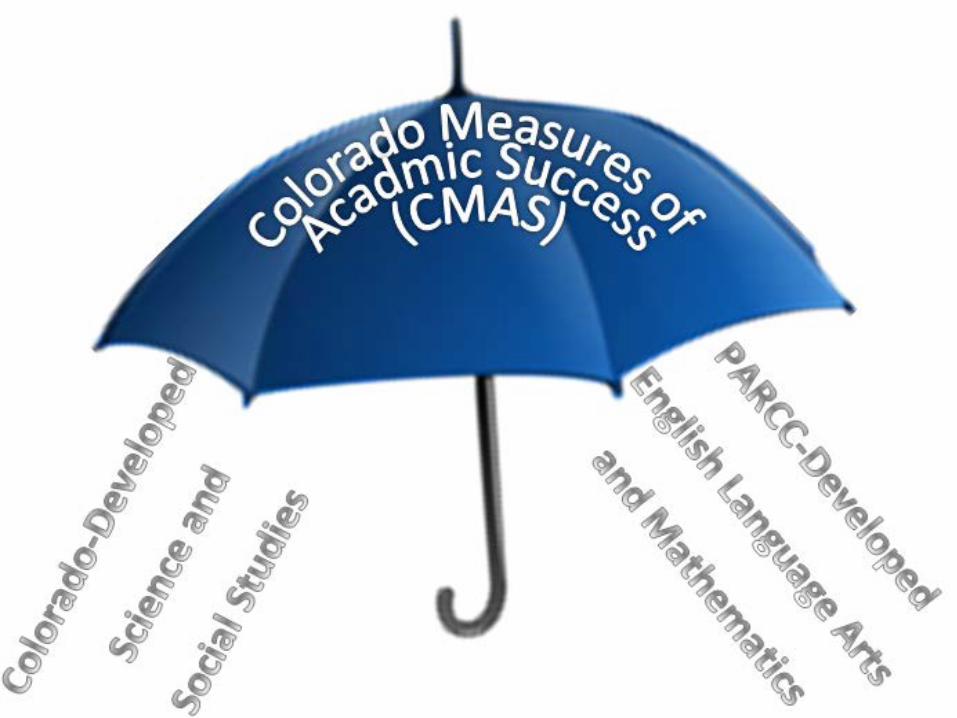
CMAS: COLORADO MEASURES OF ACADEMIC SUCCESS
Where we are now.
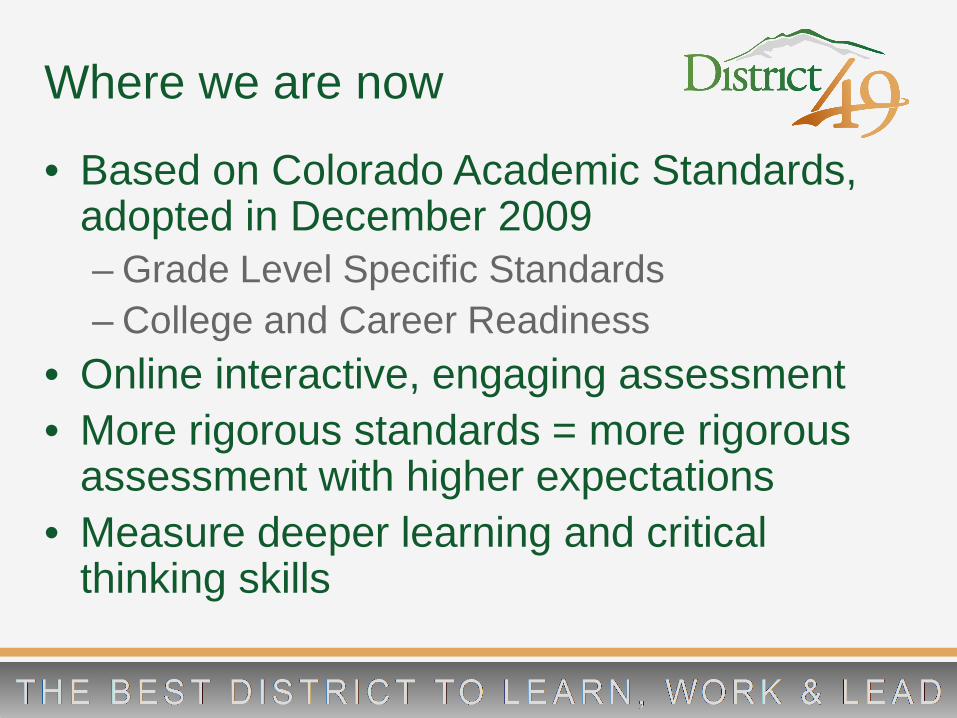
Where we are now
• Based on Colorado Academic Standards, adopted in December 2009 – Grade Level Specific Standards – College and Career Readiness
• Online interactive, engaging assessment • More rigorous standards = more rigorous
assessment with higher expectations • Measure deeper learning and critical
thinking skills
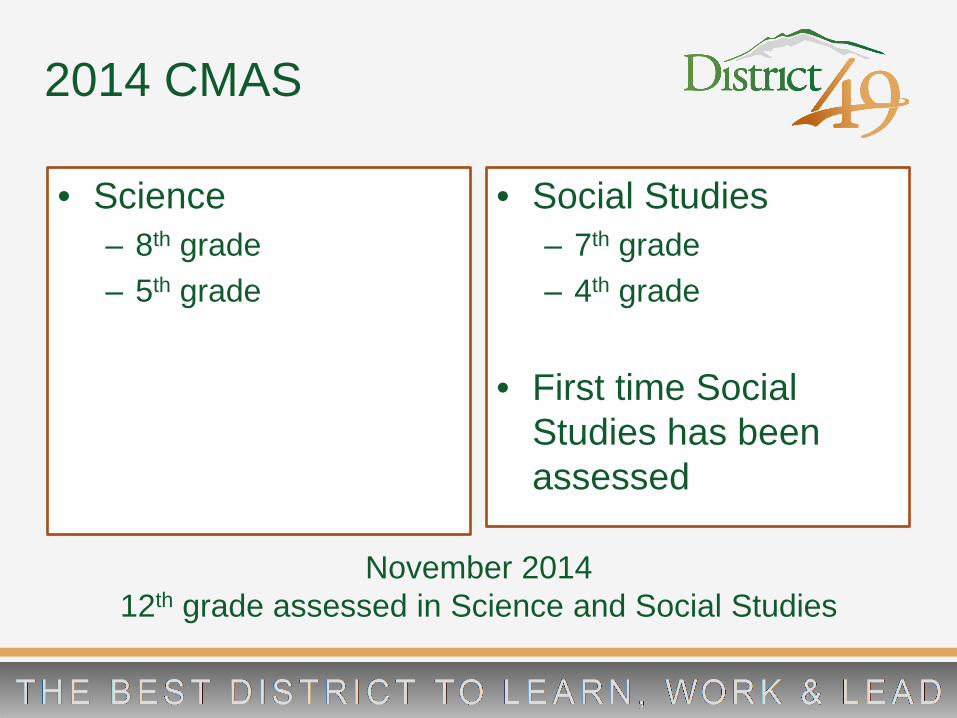
2014 CMAS
• Science – 8th grade – 5th grade
• Social Studies – 7th grade – 4th grade
• First time Social
Studies has been assessed
November 2014 12th grade assessed in Science and Social Studies
4TH GRADE SAMPLE ITEM
ePAT’s Electronic Assessment Practice Exam http://www.pearsonaccess.com/cs/Satellite?c=Page&childpagename=Colorado%2FcoPALPLayout_v2&cid=1205794393643&pagename=coPALPWrapper
8
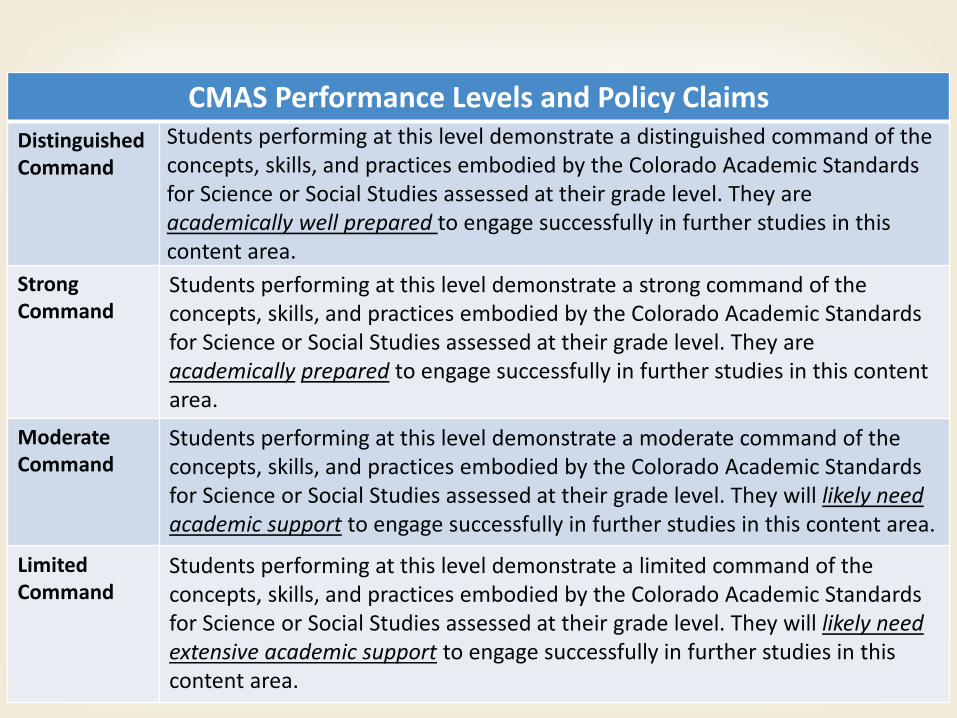
CMAS Performance Levels and Policy Claims Distinguished Command
Students performing at this level demonstrate a distinguished command of the concepts, skills, and practices embodied by the Colorado Academic Standards for Science or Social Studies assessed at their grade level. They are academically well prepared to engage successfully in further studies in this content area.
Strong Command
Students performing at this level demonstrate a strong command of the concepts, skills, and practices embodied by the Colorado Academic Standards for Science or Social Studies assessed at their grade level. They are academically prepared to engage successfully in further studies in this content area.
Moderate Command
Students performing at this level demonstrate a moderate command of the concepts, skills, and practices embodied by the Colorado Academic Standards for Science or Social Studies assessed at their grade level. They will likely need academic support to engage successfully in further studies in this content area.
Limited Command
Students performing at this level demonstrate a limited command of the concepts, skills, and practices embodied by the Colorado Academic Standards for Science or Social Studies assessed at their grade level. They will likely need extensive academic support to engage successfully in further studies in this content area.
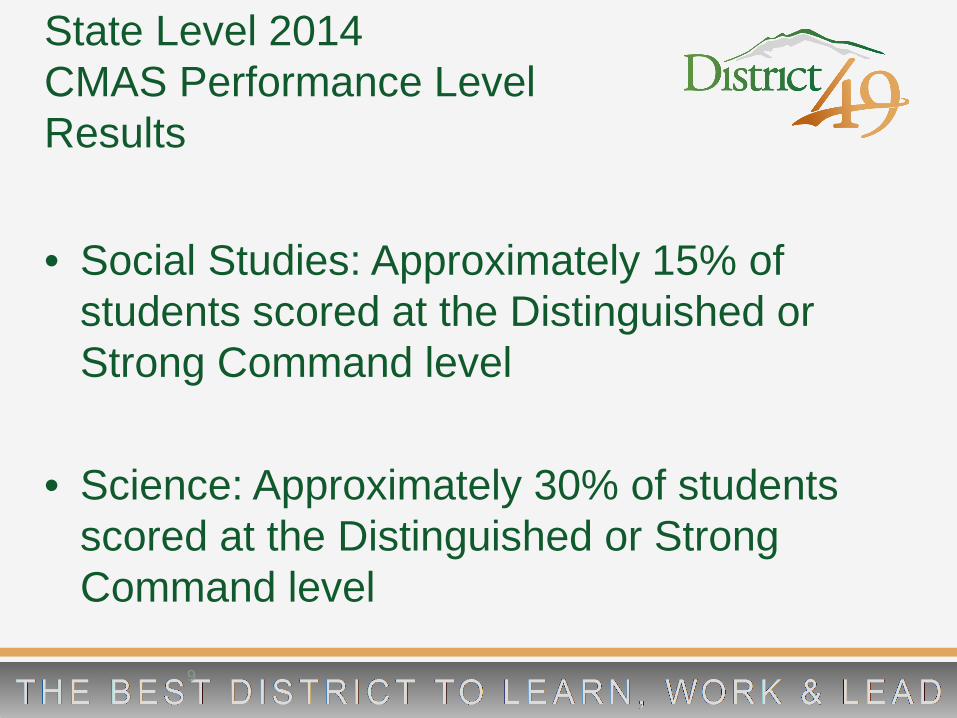
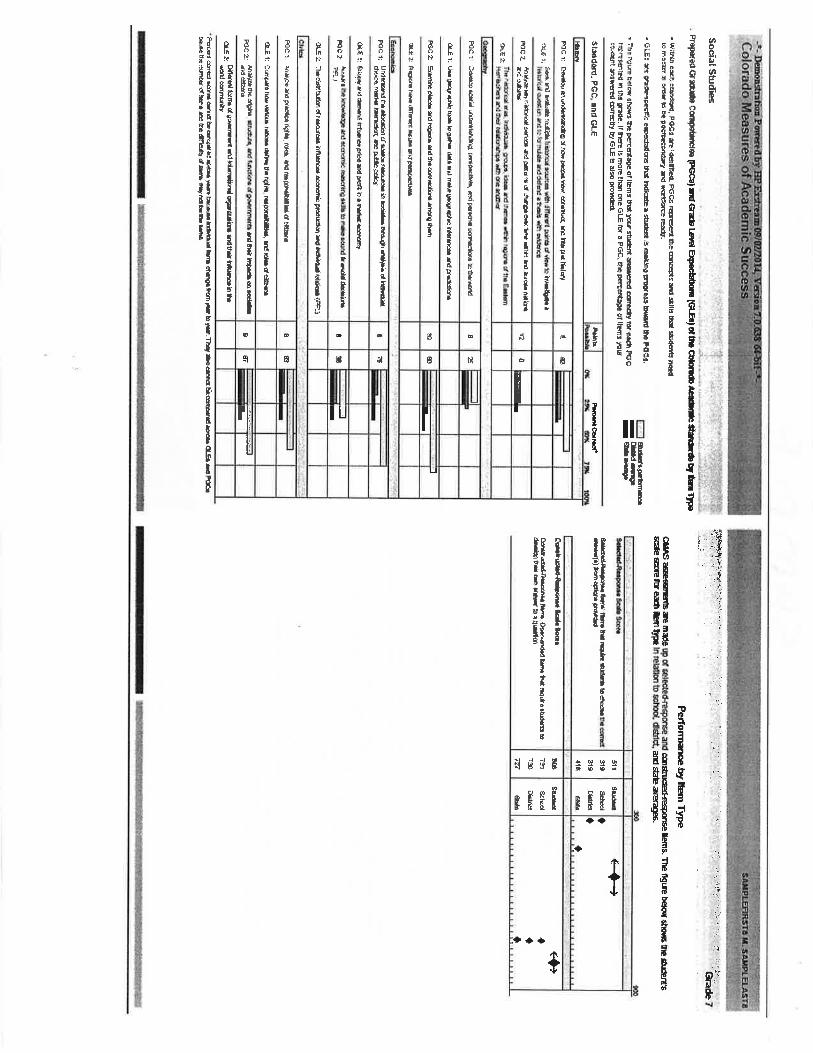
• Social Studies: Approximately 15% of
students scored at the Distinguished or Strong Command level
• Science: Approximately 30% of students
scored at the Distinguished or Strong Command level
State Level 2014 CMAS Performance Level Results
9
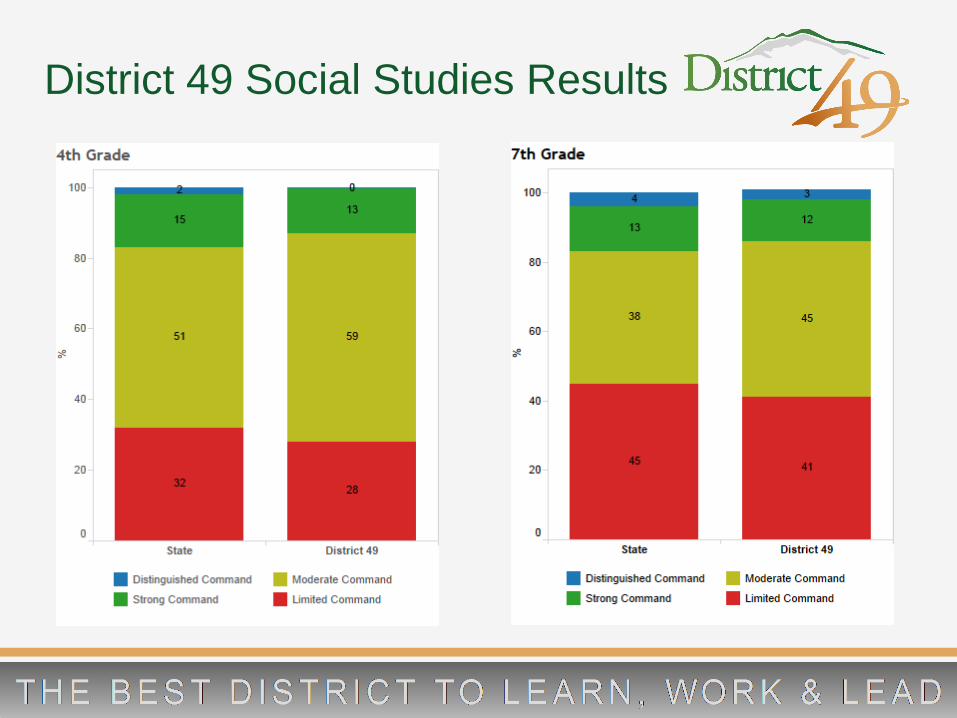
District 49 Social Studies Results
• 4th Grade
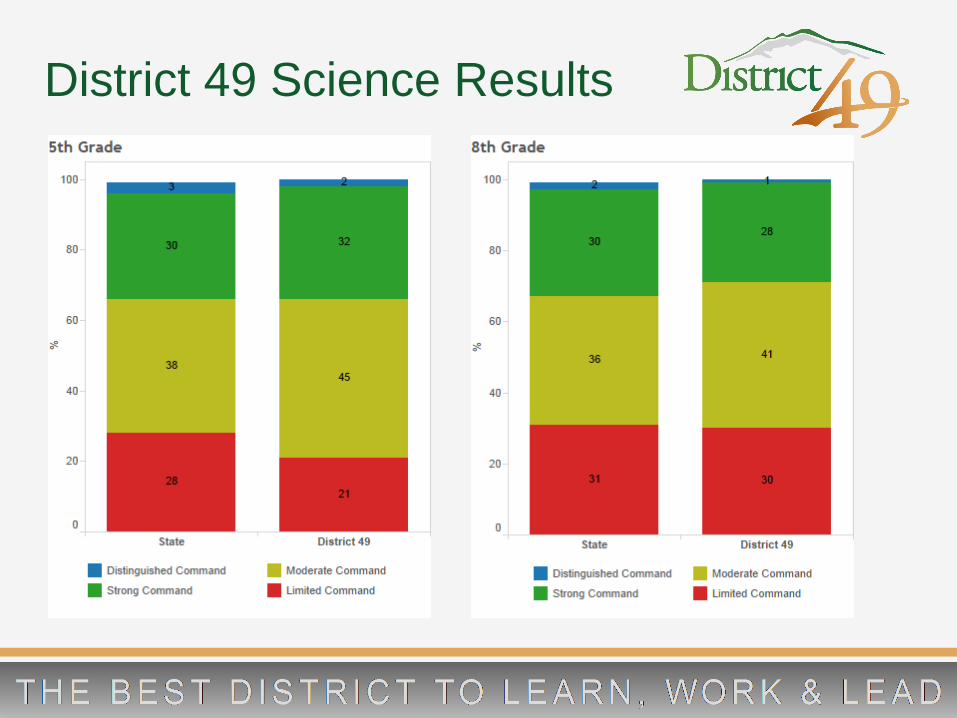
District 49 Science Results
• 5th Grade • 8th Grade
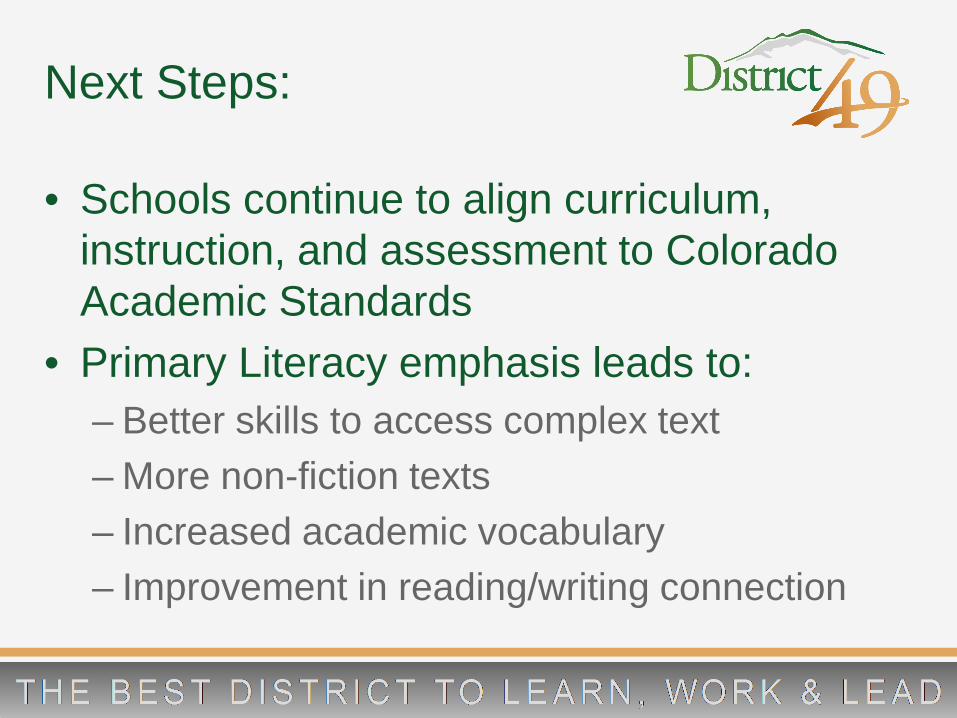
Next Steps:
• Schools continue to align curriculum, instruction, and assessment to Colorado Academic Standards
• Primary Literacy emphasis leads to: – Better skills to access complex text – More non-fiction texts – Increased academic vocabulary – Improvement in reading/writing connection

Totals may not equal 100 due to rounding.
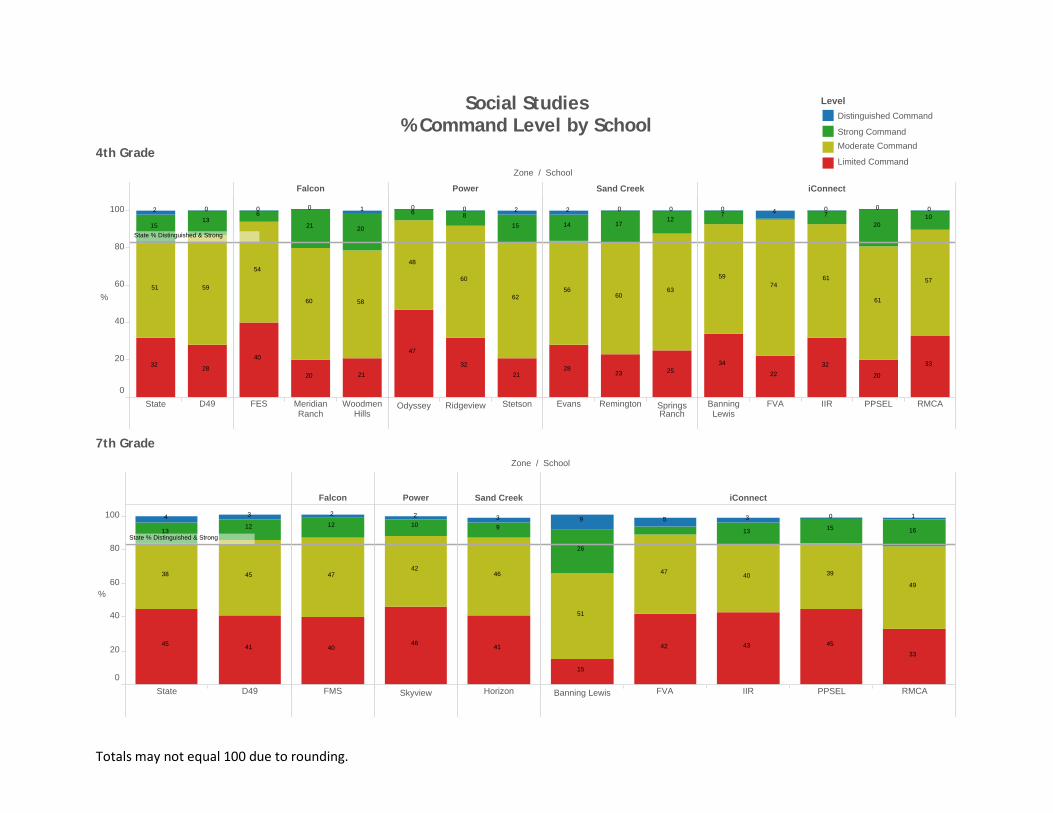
Social Studies% Command Level by School
Zone / School
Falcon Power Sand Creek iConnect
State D49 FES MeridianRanch
WoodmenHills
Odyssey Ridgeview Stetson Evans Remington SpringsRanch
BanningLewis
FVA IIR PPSEL RMCA0
20
40
60
80
100
%
15
59
28
13
32
51
02
State % Distinguished & Strong
58
20
60
40
20
54
21
21
60 0 1
15
48
47
60
62
3221
860 0 2
2528
17
63
23
5660
1412
0 02
59 57
33
2010
20
74
34
2232
61
61
7 70 0 0 04
4th Grade
Zone / School
Falcon Power Sand Creek iConnect
State D49 FMS Skyview Horizon Banning Lewis FVA IIR PPSEL RMCA0
20
40
60
80
100
%
45
45
38
1312
41
34
State % Distinguished & Strong
47
40
12
2
46
10
42
2
46
41
93
15
15
45
39
49
13
47
4333
26
16
40
42
51
59 3 0 1
7th Grade
LevelDistinguished Command
Strong CommandModerate Command
Limited Command
Totals may not equal 100 due to rounding.
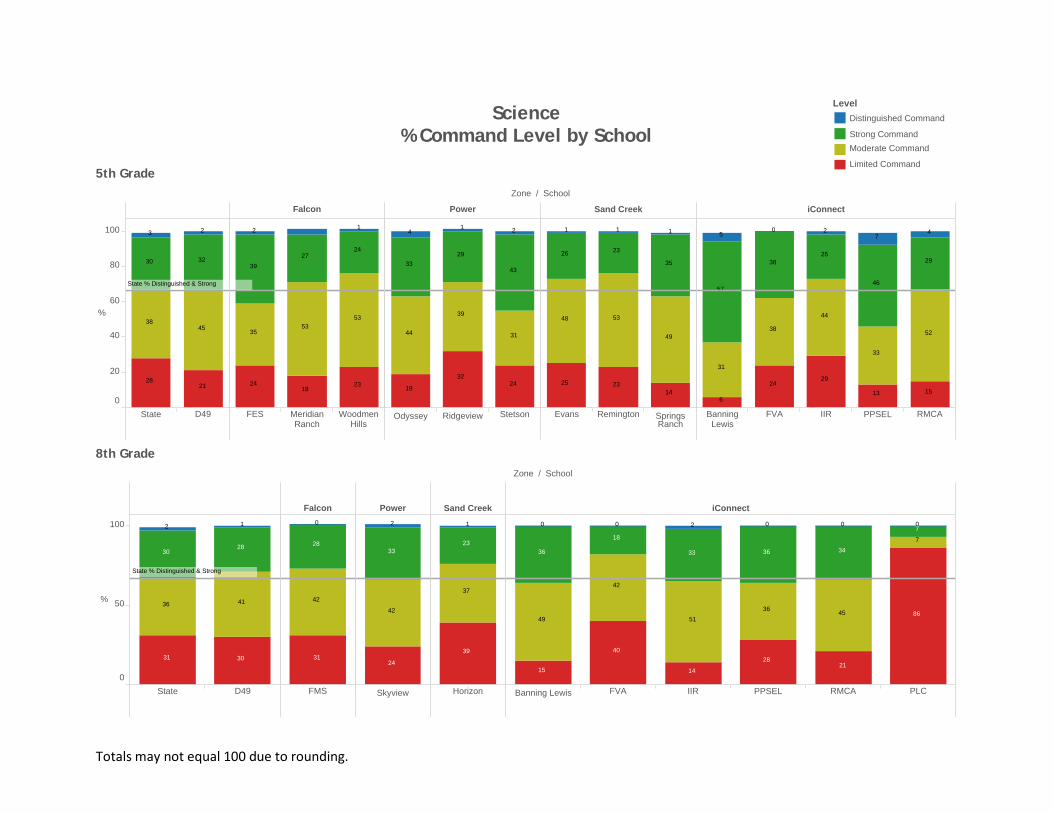
Science % Command Level by School
Zone / School
Falcon Power Sand Creek iConnect
State D49 FES MeridianRanch
WoodmenHills
Odyssey Ridgeview Stetson Evans Remington SpringsRanch
BanningLewis
FVA IIR PPSEL RMCA0
20
40
60
80
100
%
4538
28
30 32
21
3 2
State % Distinguished & Strong
35
39
18
27
5353
23
24
24
2 1
29
39
19
3343
44
2432
31
4 21
35
25
48
49
23
53
23
26
14
1 1 1
25
15
38 29
38
29
57
33
13
46
44
24
52
31
5 7
6
0 42
5th Grade
Zone / School
Falcon Power Sand Creek iConnect
State D49 FMS Skyview Horizon Banning Lewis FVA IIR PPSEL RMCA PLC0
50
100
%
28
36
30
30
41
31
2 1
State % Distinguished & Strong
28
42
31
0
33
24
42
2
39
23
37
1
45
15
18
49
28
3336 36
3686
40
34
14
42
51
21
7
7
0 0 0 0 02
8th Grade
LevelDistinguished Command
Strong CommandModerate Command
Limited Command
Totals may not equal 100 due to rounding.
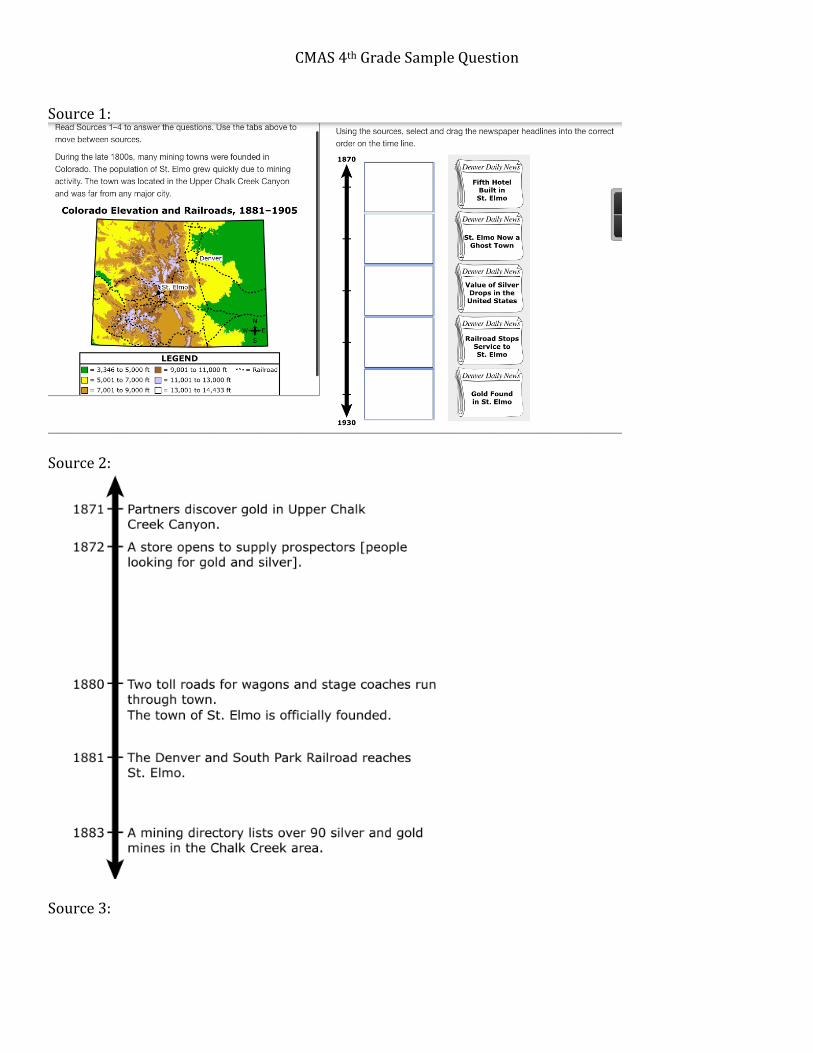
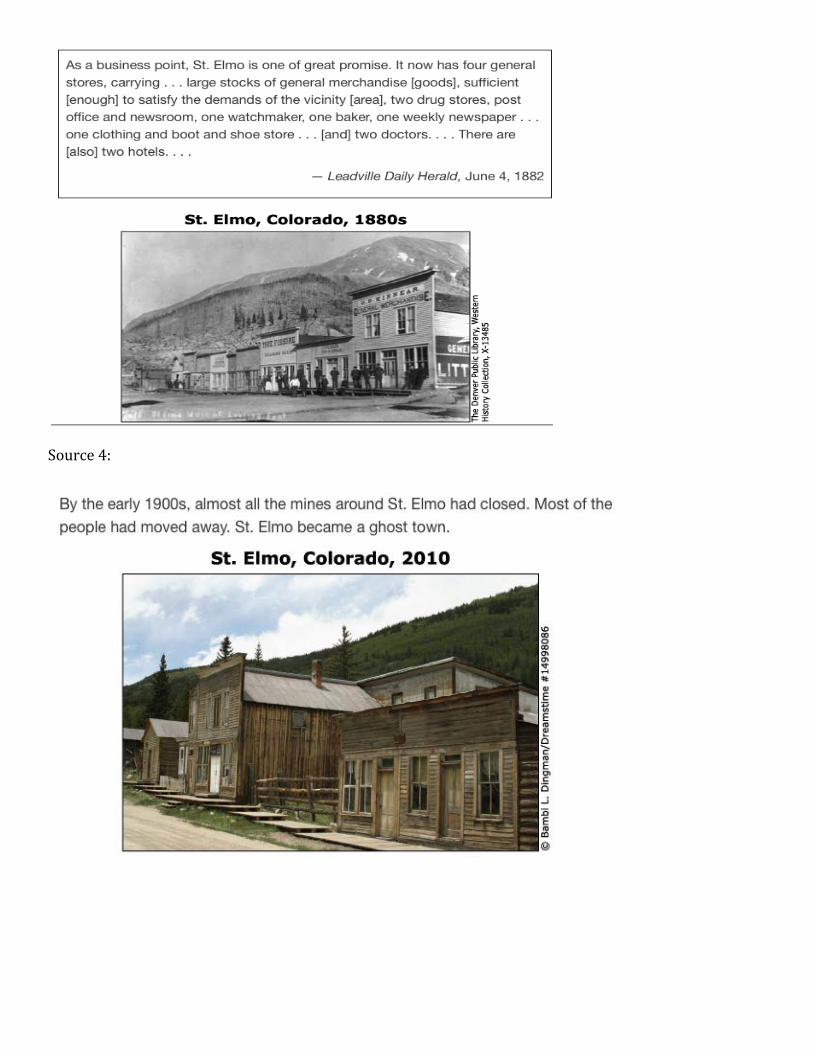
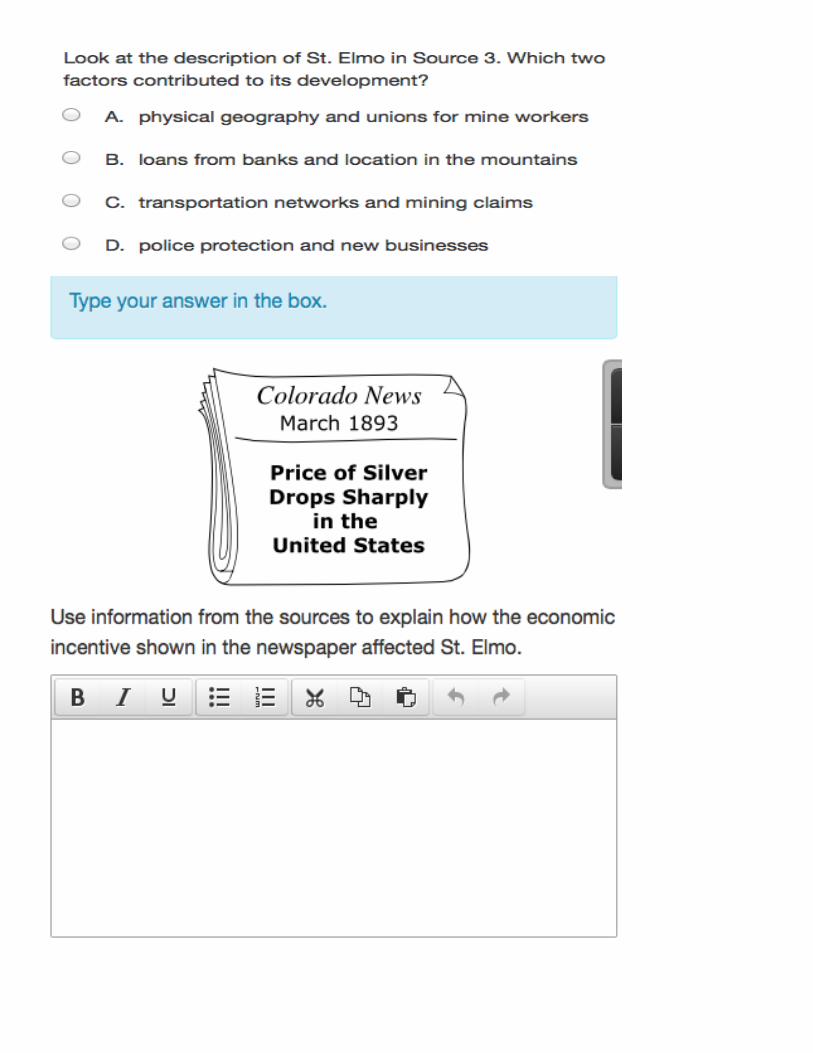
CMAS 4th Grade Sample Question Source 1:
Source 2:
Source 3:
Source 4:


BOARD OF EDUCATION AGENDA ITEM 4
BOARD MEETING OF: November 19, 2014 PREPARED BY: Erica Mason TITLE OF AGENDA ITEM: Falcon Zone Agricultural Careers Course Proposal ACTION/INFORMATION/DISCUSSION: Discussion BACKGROUND INFORMATION, DESCRIPTION OF NEED: RATIONALE: This course will consist of in-class work and field experience through a partnership with a local equestrian center. Students will explore an overview of Agriculture, their role as consumers and stewards, and the scientific connection between each of the learning objectives to include, but not limited to: Evaluating how agriculture supports life, applying foundational and life skills learned through agriculture in the school and community setting, analyzing common agricultural perceptions, recognizing local, state, national and global scope of agriculture, and consumer knowledge. Additionally, field work will give students hands on experience with components of managing and maintaining a working ranch, including work with farm equipment, cattle care and disciplines, livestock nutrition, performance show and productions, horse training, and veterinarian services. Class objectives will also reflect what students are learning as part of the field experience. RELEVANT DATA AND EXPECTED OUTCOMES: IMPACTS ON THE DISTRICT’S STRATEGIC PRIORITIES—THE BIG ROCKS: Rock #1—Reestablishing the district as a trustworthy recipient of taxpayer investment
Rock #2—Research, design and implement programs for intentional community participation
Rock #3— Establish District 49 as the best district in Colorado to learn, work and lead
Rock #4— Grow a robust portfolio of distinct and exceptional schools
Approval of additional CTE courses supports the continued need for development of various academic pathways for Falcon High School Students
Rock #5— Customize our educational systems to launch each student toward success
FUNDING REQUIRED: No AMOUNT BUDGETED: Supported through CTE Funding RECOMMENDED COURSE OF ACTION/MOTION REQUESTED: Move to an action item at the December 11th board meeting. APPROVED BY: Peter Hilts, Chief Education Officer DATE: November 7, 2014
Falcon District 49 Course Proposal Proposals must be received by DCPC no later than January 25, 2015
(fill in the yellow sections) Building Administrator Approval
Date: _____________ Administrator: _____________________ Comments:
DCPC Use Only Date Received: _____________ Date Reviewed: ____________ ____ Yes ___ No, Reason: ____________________________________ ____ Further review: ___________________________________________________
Before submitting any course proposal, be sure it meets the following:
• Course must be sustainable, not teacher dependent (course does not end if teacher leaves) • Course topic appeals to a variety of students • Course does not already exist in the district
Course Name: Introduction to Agricultural Careers
Building: Falcon High School Requestor: Cheryl DeGeorge
Subject: ___ Core _X_ Elective Length: _ Sem. __ Year 1 Grade: _9/12
Class Size: 14 Min _24 Max HERE(HS): _X_ Yes ___ No FTE: _0.2__
COURSE CONTENT Course description:
This class, consisting of 28 lessons/units, plants the seed of discovery by giving an overview of agriculture and the related careers that are possible related to agriculture. It will help students grow into confident speakers, team builders, and learners as they examine their perceptions of agriculture, their role as consumers and stewards and the science behind it all. They will also learn about the different careers in agriculture and have opportunities for hands on experiences and working with professionals in many of the careers presented.
This is a request that we introduce a new class into the Falcon High School Career and Tech Education Department: Introduction to Agricultural Careers. This course will be a new course at Falcon High School.
Rational for Course:
What standards/benchmarks will be met in this course?
Evidence of student interest:
Teacher training/qualifications needed:
Space/Resources needed:
This course will consist of in-class work and field experience through a partnership with a local equestrian center. Students will explore an overview of Agriculture, their role as consumers and stewards, and the scientific connection between each of the learning objectives to include, but not limited to: Evaluating how agriculture supports life, applying foundational and life skills learned through agriculture in the school and community setting, analyzing common agricultural perceptions, recognizing local, state, national and global scope of agriculture, and consumer knowledge. Additionally, field work will give students hands on experience with components of managing and maintaining a working ranch, including work with farm equipment, cattle care and disciplines, livestock nutrition, performance show and productions, horse training, and veterinarian services. Class objectives will also reflect what students are learning as part of the field experience.
This course will be one year long. Standard will be based on Colorado Academic Standards in Science as well as OSHA, Agricultural Information Management Standards, among others, which will lead students to not only learn, but to analyze and explore. Students will not use a traditional textbook. Without the rigid structure of a textbook, the course will more resemble an open, free flowing stream of instruction and information that allows for the real world applications they will use every day. Lesson plans and instructions will be posted on a website along with all of the documents and images they’ll need to complete an assignment. The lessons will consist of lectures, videos, exercises, research, hands-on labs, and case analysis. Writing will be a major part of this course, as students will be required to make in-depth analysis of the cases they read. Labs at the school and offsite at an equestrian center will guide students to learn from professionals in the various fields of agriculture. In addition, students will have many hands-on assignments.
Many students at Falcon High School still come from a rural environment and many participate in various equestrian and agricultural activities. We also have students from other schools that have already asked to secure spots in this class should it be offered. FFA is a club organization that students in the Falcon area have been interested in for some time and this class is also a great introduction to that organization.
The instructor will need to be CTE certified in agriculture to teach this class and we have at least one teacher eligible and willing to attain that certification.
Will there be a cost involved? Yes No (If yes, must attach budget)
Is this course taught in another school? Yes No Not Sure If yes, where? CURRICULUM ALIGNMENT Describe how this course fits into the current curriculum offered. (i.e. Is it part of a sequence? How is it similar/different from existing courses? Is it part of a focus/academy program? What other courses might be impacted?)
Prerequisites:
ASSESSMENT What are the measured student outcomes/learnings for this course?
How will students demonstrate their learning? What types of assessments will be used?
In addition to answering the questions above, please attach the following:
• A course syllabus (Attached in separate document)
Textbook: Lessons will be conducted via online lesson plans, videos, lectures, hands-on and research.
Some portions taught at Latigo Equestrian Center
This course will be the first of and Agriculture CTE and concurrent enrollment pathway. Follow up classes may include Agricultural Business, Natural Resources, Basic and Advanced Horticulture, and Animal Science. Some science electives may be impacted, but this course will allow students to follow a pathway that we will work to ensure that it eventually leads to articulation with college programs such as those offered at local colleges.
Students should have already taken or be currently enrolled in Biology.
Students will : • demonstrate a knowledge of agriculture in the United States and the various career
opportunities within the field of agriculture. • Evaluate how agriculture supports all life (i.e. agriculture is an “everything industry”) • Apply foundational and life skills learned through agriculture in the school and community
setting. • Analyze common agriculture perceptions. • Create informed, educated, and confident consumers of agricultural products. • Explore practices, procedures, and methods of environmental stewardship • Examine the components of the Food and Agricultural Literacy: Applying Mathematics and
Science Concepts Curriculum.
Students will demonstrate their knowledge through written papers, class presentations, hand-on demonstrations, projects, tests and quizzes. The assessment in this class will be as varied as the areas and careers that students are learning about.

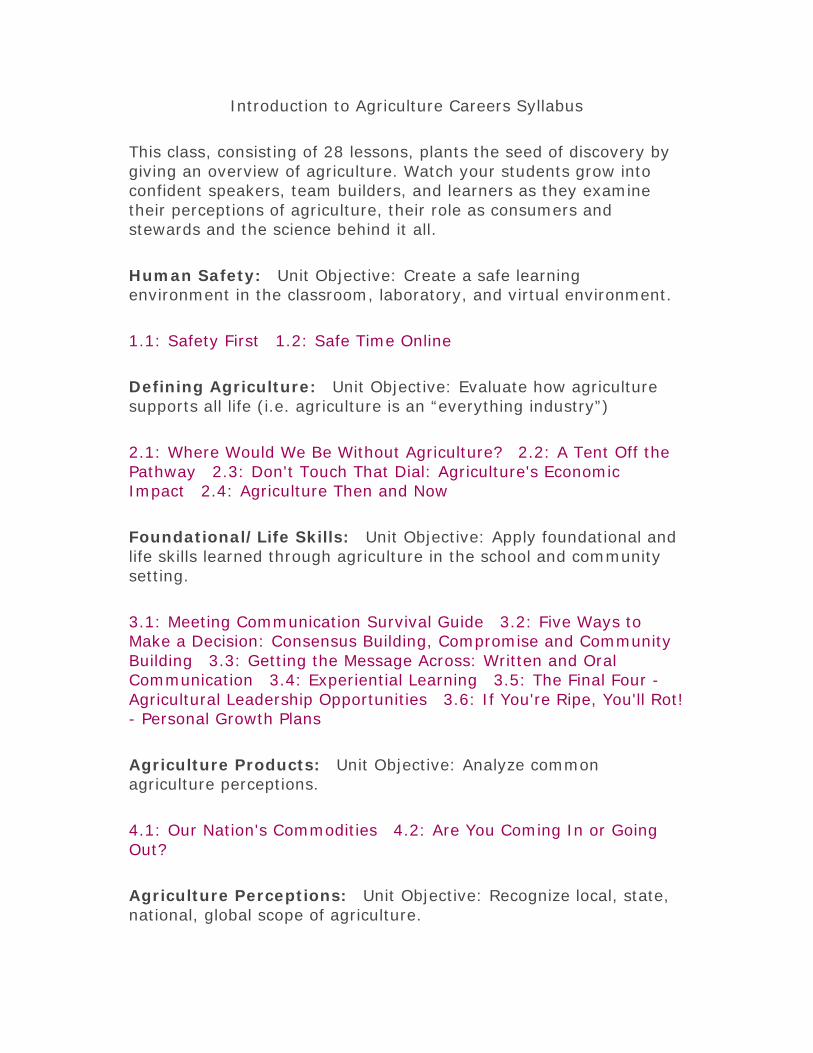
Introduction to Agriculture Careers Syllabus
This class, consisting of 28 lessons, plants the seed of discovery by giving an overview of agriculture. Watch your students grow into confident speakers, team builders, and learners as they examine their perceptions of agriculture, their role as consumers and stewards and the science behind it all.
Human Safety: Unit Objective: Create a safe learning environment in the classroom, laboratory, and virtual environment.
1.1: Safety First 1.2: Safe Time Online
Defining Agriculture: Unit Objective: Evaluate how agriculture supports all life (i.e. agriculture is an “everything industry”)
2.1: Where Would We Be Without Agriculture? 2.2: A Tent Off the Pathway 2.3: Don't Touch That Dial: Agriculture's Economic Impact 2.4: Agriculture Then and Now
Foundational/Life Skills: Unit Objective: Apply foundational and life skills learned through agriculture in the school and community setting.
3.1: Meeting Communication Survival Guide 3.2: Five Ways to Make a Decision: Consensus Building, Compromise and Community Building 3.3: Getting the Message Across: Written and Oral Communication 3.4: Experiential Learning 3.5: The Final Four - Agricultural Leadership Opportunities 3.6: If You're Ripe, You'll Rot! - Personal Growth Plans
Agriculture Products: Unit Objective: Analyze common agriculture perceptions.
4.1: Our Nation's Commodities 4.2: Are You Coming In or Going Out?
Agriculture Perceptions: Unit Objective: Recognize local, state, national, global scope of agriculture.

5.1: Perceptions vs Reality 5.2: Characterisitics of Agriculturalists 5.3: Myths about Food Productions
Consumer Knowledge: Unit Objective: Create informed, educated, and confident consumers of agricultural products.
6.1: Reading Between the Lines 6.2: "Role" With It!
Stewardship: Unit Objective: Explore practices, procedures, and methods of environmental stewardship.
7.1: Stewardship and Accountability 7.2: Production Agriculture and the Environment
Overview: Unit Objective: Examine the components of the Food and Agricultural Literacy: Applying Mathematics and Science Concepts Curriculum.
8.1: The Process of Producing 8.2: Plants Have Issues Too - Issues Related to Plant Production 8.3: Prime Rib Please! - Issues Related to Animal Production 8.4: Natural Resources in the Agriculture Industry 8.5: Advancing Through Time 8.6: Issues Beware!
8.2: Exploring Careers in Agriculture – See below for sample career unit
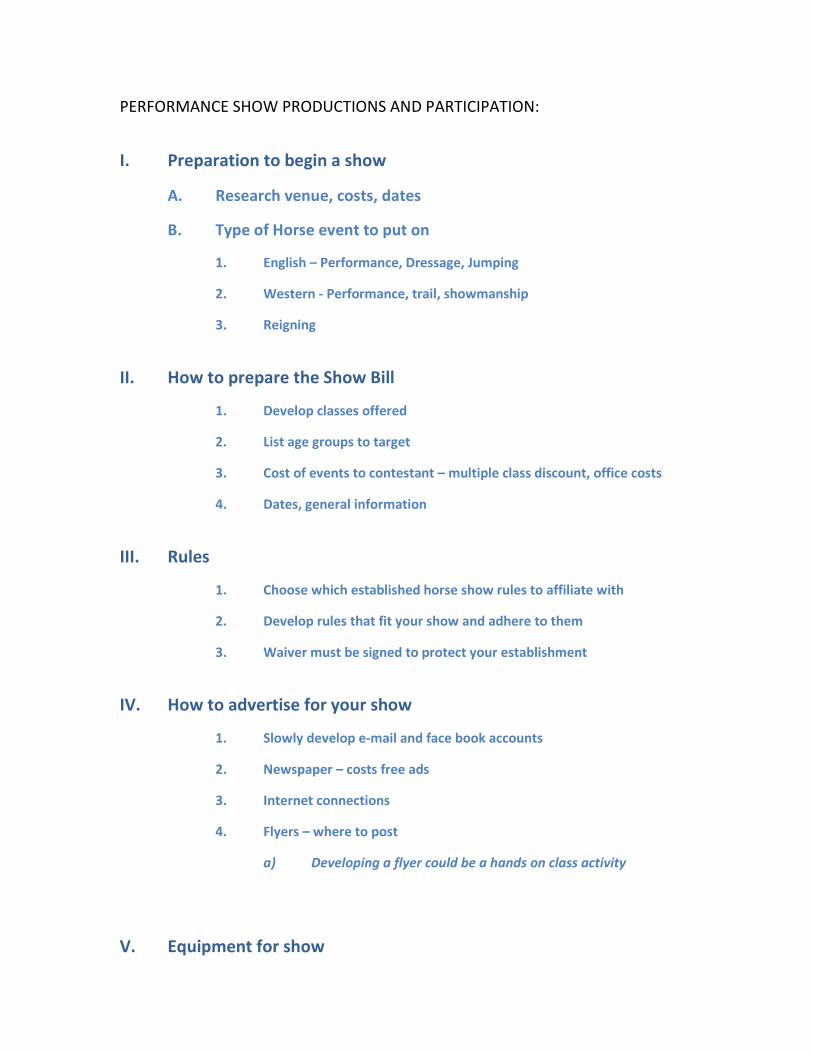
PERFORMANCE SHOW PRODUCTIONS AND PARTICIPATION:
I. Preparation to begin a show
A. Research venue, costs, dates
B. Type of Horse event to put on
1. English – Performance, Dressage, Jumping
2. Western - Performance, trail, showmanship
3. Reigning
II. How to prepare the Show Bill
1. Develop classes offered
2. List age groups to target
3. Cost of events to contestant – multiple class discount, office costs
4. Dates, general information
III. Rules
1. Choose which established horse show rules to affiliate with
2. Develop rules that fit your show and adhere to them
3. Waiver must be signed to protect your establishment
IV. How to advertise for your show
1. Slowly develop e-mail and face book accounts
2. Newspaper – costs free ads
3. Internet connections
4. Flyers – where to post
a) Developing a flyer could be a hands on class activity
V. Equipment for show
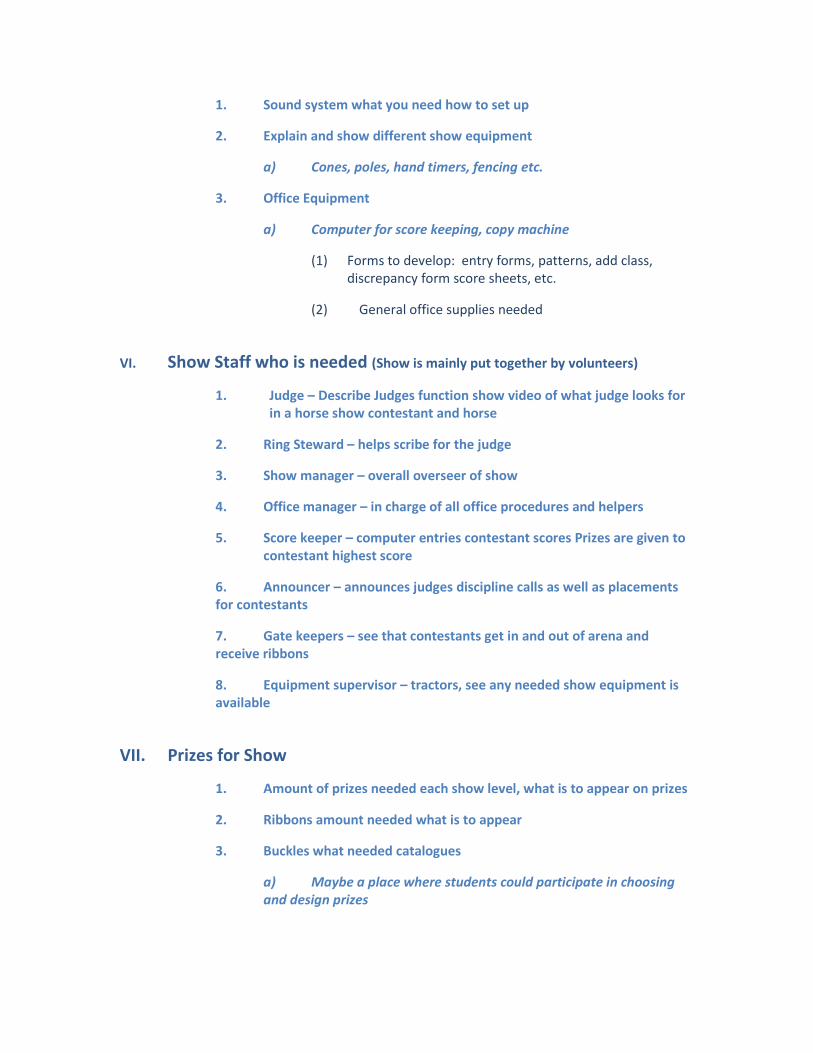
1. Sound system what you need how to set up
2. Explain and show different show equipment
a) Cones, poles, hand timers, fencing etc.
3. Office Equipment
a) Computer for score keeping, copy machine
(1) Forms to develop: entry forms, patterns, add class, discrepancy form score sheets, etc.
(2) General office supplies needed
VI. Show Staff who is needed (Show is mainly put together by volunteers)
1. Judge – Describe Judges function show video of what judge looks for in a horse show contestant and horse
2. Ring Steward – helps scribe for the judge
3. Show manager – overall overseer of show
4. Office manager – in charge of all office procedures and helpers
5. Score keeper – computer entries contestant scores Prizes are given to contestant highest score
6. Announcer – announces judges discipline calls as well as placements for contestants
7. Gate keepers – see that contestants get in and out of arena and receive ribbons
8. Equipment supervisor – tractors, see any needed show equipment is available
VII. Prizes for Show
1. Amount of prizes needed each show level, what is to appear on prizes
2. Ribbons amount needed what is to appear
3. Buckles what needed catalogues
a) Maybe a place where students could participate in choosing and design prizes
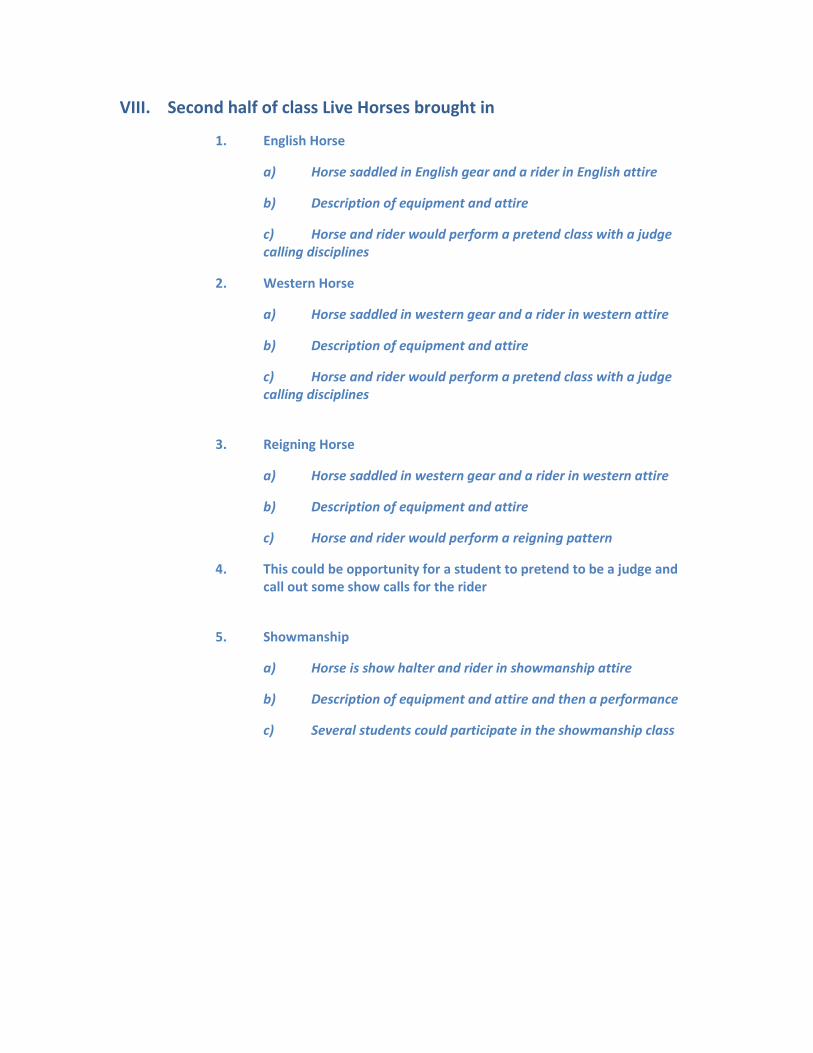
VIII. Second half of class Live Horses brought in
1. English Horse
a) Horse saddled in English gear and a rider in English attire
b) Description of equipment and attire
c) Horse and rider would perform a pretend class with a judge calling disciplines
2. Western Horse
a) Horse saddled in western gear and a rider in western attire
b) Description of equipment and attire
c) Horse and rider would perform a pretend class with a judge calling disciplines
3. Reigning Horse
a) Horse saddled in western gear and a rider in western attire
b) Description of equipment and attire
c) Horse and rider would perform a reigning pattern
4. This could be opportunity for a student to pretend to be a judge and call out some show calls for the rider
5. Showmanship
a) Horse is show halter and rider in showmanship attire
b) Description of equipment and attire and then a performance
c) Several students could participate in the showmanship class
BOARD OF EDUCATION AGENDA ITEM 5
BOARD MEETING OF: November 18, 2014 PREPARED BY: Jack W. Bay TITLE OF AGENDA ITEM: Energy Management Annual Report ACTION/INFORMATION/DISCUSSION: Discussion BACKGROUND INFORMATION, DESCRIPTION OF NEED: Although, Falcon School District 49 does not have a formal energy/natural resource management program or dedicated staff member to manage our energy/natural resources usage we have been managing these resources to reduce our costs. Our goal is to establish a formal energy program to bring forth operational excellence in the management and stewardship of district energy & natural resources in the facilities, maintenance and operations departments. We are planning to kick off this program in 2015. There are a number of initiatives planned if the November election results are favorable. In any case, we plan to kick off an Energy and Natural Resource Management program. Energy and natural resource management will be educational, proactive, organized, and include a systematic coordination effort for procurement. The managed distribution and use of energy will take into account environmental and economic objectives in order to meet the needs of the organization. RATIONALE: As part of any facilities management best practices operating model in medium to large organizations, it is important to integrate the energy management into the organizational structure, so that the energy management can be implemented. A comprehensive and coordinated energy resource program can lead to a significant amount of financial resources being saved annually. As a result, the individual that is assigned this task will be an engineer that has extensive knowledge and experience in this specialty. A program of this nature will ensure that the Facilities, Operations and Maintenance Departments efficiently manage its precious energy and natural resources. This leads to the district gaining the trust of its community stakeholders as noted in the Strategic Plan Big Rock #1 and moves the District closer to the attainment of Big Rock Goal #3 or the desire to become one of the best districts to learn, work and lead. RELEVANT DATA AND EXPECTED OUTCOMES: Several of our neighboring school districts are generating significant annual savings as the result of implementing a comprehensive Energy-Resource Management Program. As a result of the significant savings that can be reaped from managing these resources, Falcon School District 49 will be implementing a comprehensive energy – resource management program lead by a qualified staff member dedicated to managing this program in 2015. Given the Falcon School District 49 is smaller than neighboring peer districts our annual savings may be less than their financial returns. However, District 49 could still generate significant annual savings by implementing a program of this nature. IMPACTS ON THE DISTRICT’S STRATEGIC PRIORITIES—THE BIG ROCKS: Rock #1—Reestablishing the district as a trustworthy recipient of taxpayer investment
The development of an intentional well managed energy and natural resources program the district will move the District in the direction of reestablishing us as a trustworthy recipient of taxpayers funds
Rock #2—Research, design and implement programs for intentional community participation
Although the main intent of an energy management program is saving natural resources we need to develop a comprehensive outreach program for our stakeholders to communicate the value of managing precious resources.
Rock #3— Establish District 49 as the best district in Colorado to learn, work and lead
Utility costs represent a significant component of our annual operating costs. Through professional management of this key area suing performance metrics, benchmarking performance and continually reviewing operational performance the District will
BOE Regular Meeting November 18, 2014 Item 5 continued
move closer to attaining this goal.
Rock #4— Grow a robust portfolio of distinct and exceptional schools
Rock #5— Customize our educational systems to launch each student toward success
FUNDING REQUIRED: None AMOUNT BUDGETED: N/A RECOMMENDED COURSE OF ACTION/MOTION REQUESTED: APPROVED BY: Jack W. Bay, Chief Operations Officer DATE: November 7, 2014
Page 1 of 10
Annual
Energy & Resource
Management
Report By Jack W. Bay, MBA
Chief Operations Officer
Wednesday, November 19, 2014
Page 2 of 10
EXECUTIVE SUMMARY Currently, District 49 does not have a formal energy/natural resource management program or dedicated staff member to manage our energy/natural resources usage. The manager of facilities, Ron Lee, has implemented several energy saving measures in his former role as the building automation specialists that have allowed the District to derive some conservation of energy. Incorporated in the bond campaign was the implementation for a formal energy management program along with a dedicated staff member to direct the program. However, since the 3B bond campaign did not pass we are in the process of re-evaluating how to implement an energy program without the needed capital funds to kick start the program. We believe we can implement some additional energy/natural resource measures that will allow us to reap some benefits with a minimal investment of less than $10,000. This investment would allow the District to update our Web Control system that links to our Automated Logic system control equipment. In order to reap any significant energy and or natural resource savings we would need to evaluate other mechanisms to provide the needed capital investment for upgraded LED lighting and automated shutoffs for interior water devices. As part of our facilities management best practices operating model we are revamping our current SchoolDude Utility Direct operating program to provide the key performance indicators regarding energy usage at each of our school facilities. Through this process we will ensure the facilities, operations and maintenance departments efficiently manage our precious energy and natural resources. As a result, we will be able to derive and publish a dash board of KPI’s directly from the system in real time. This transparency will lead to the District regaining the trust of our community stakeholders as noted in the Strategic Plan Big Rock #1 and moves the District closer to the attainment of Big Rock Goal #3 or the desire to become one of the best districts to learn, work and lead. This report will provide an overview of the District’s historical consumption and outline some of the steps we have taken to manage our energy resources.
Page 3 of 10
OVERVIEW OF ENERGY MANAGEMENT
Why Energy Management
A long-term energy strategy should be part of the overall strategy of a company. Annually we spend about $2.2 million in energy and natural resources to heat, cool and maintain our facilities. Although this energy/natural resource expenditure represents only about 2.6% of our annual general funds expenditures it is an area that through proper management we can save anywhere from 15 to 30% annually or approximately $330,000 to $660,000.
Our strategy includes the objective of automating consumption and demand, integrating energy saving technology, equipment or materials in the construction or remodeling of facilities and increasing the use of renewable energies. In developing an energy management strategy for our District we can provide key performance indicators in a simple to read dash board and thereby begin to regain the trust of our stakeholders as we showcase that we are a trustworthy recipient of tax investment for our facilities.
Our plan is to develop a proactive energy/natural resource management program that protects the monitors and actively manages consumption. Our strategy has four principles: (1) restoring and preserving the environment, (2) reducing waste and pollutants, (3) educating our students about environmental conservation, and (4) managing the District energy and natural resource consumption annually.
Peer District Effectiveness in Energy Management Several of our peer school districts in Colorado are doing a fantastic job in managing their energy usage. Listed below are summaries of the performance in this area.
1. In FY 2011-2012, Colorado Springs District 11 (D11) experienced continued success in decreasing energy use and costs throughout its district. They offset costs for electricity and natural gas for FY11-12 in the amount of approximately $1.8M. Their cumulative program energy cost avoidance compared to the program baseline FY 98-99 is estimated at $15.1M. D11 has been able to implement several programs ranging from natural gas private purchase contracts, installation of solar and automated irrigation controls that have generated this significant annual savings for their district.
2. Douglas County implemented an energy management program approximately seven years ago. Through
effective management of a former dedicated staff member, Lee Smit, Douglas County generated approximately $6.5 million annually. Through 2012-2013, the program generated approximately $27 million of accumulated savings.
Obviously, there are some significant savings that can be generated by implementing energy and natural resource management initiatives.
Energy Saving Measures we can Implement
Listed below are several ways that our District can manage our energy consumption and demand.
1. Implementation of HVAC control systems in a facility is a conservation project that yields both a rapid
project completion – and fast return on investment. HVAC control systems can save 30-40% of heat/cool
costs per month. The HVAC Control process includes:
a. Replacement of numerous thermostats and switches with electronic sensors that eliminate
thermostat tampering.
b. Temperature set-back during non-production times and moderate weather.
c. Information and training that will foster energy awareness within all levels of our organization.
Page 4 of 10
d. Synchronization of all heat/cool equipment into a single, user-friendly computer that allows you to
view run times by piece, control areas by zone, and decrease energy usage during demand peak rates.
e. Upgrade our current Web Control energy management software and reset our pulse meters in order
to manage usage.
f. Coordinate our facility rental management program with our SchoolDude facilities automation
program.
2. Install LED lighting upgrades. These types of upgrades are considered a "low-hanging fruit" energy-
efficiency project as it yields a rapid transition to energy savings.
a. Lighting upgrades- district wide investment of $2,000,000 will reap an annual savings of $350,000
conservatively.
i. Save 50-70% of energy costs.
ii. Replace obsolete fixtures that are no longer in existence.
iii. Increase employee safety, productivity, and product quality.
iv. Improve the overall appearance of your facility.
v. Increase student productivity.
b. Effective lighting solutions include design and installation of fixtures with:
i. High-efficiency ratings = substantially reduce energy load.
ii. Longer bulb-life = less maintenance costs.
iii. Less carbon emissions = better for the environment.
iv. Special task lighting = improved quality control.
v. Motion sensors = elimination of manual controls within designated areas.
3. Energy audits are an inspection, survey, and analysis of energy consumption in a building process or system.
The end-goal of an energy audit is to identify areas of high usage and waste and determine services and/or
systems that will reduce your energy demand or control usage - without decreasing your production.
a. Depending on the level of audit you need, a professional energy audit will:
i. Determine where and how energy is used within a facility and areas of waste.
ii. Identify potential opportunities to save money.
iii. Quantify energy savings with implementation of energy-saving projects for investors and
utility rebates qualifications.
iv. Prioritize energy conservation projects by time, cost, and return on investment.
v. Identify existing pollution levels and forecast improvement with new systems.
b. The two most typically performed audits are General Audits and Investment-Grade Audits.
i. General Audit: This audit examines both operating costs and energy usage analysis (generally
12-26 months of utility reports). It addresses demand rates and usage profiles, and provides
sufficient data to support implementation of energy efficiency projects.
ii. Investment Grade Audit: This audit addresses financial investment on a more detailed level
and determines facility upgrades based on costs and return on investment. This level of audit
is imperative to quantify guaranteed savings for investors/shareholders.
c. Organizations that provide this service
i. There are a number of companies that are dedicating high trained staff members to
providing this service.
1. Chevron - Comprehensive consulting, implementation and monitoring
Page 5 of 10
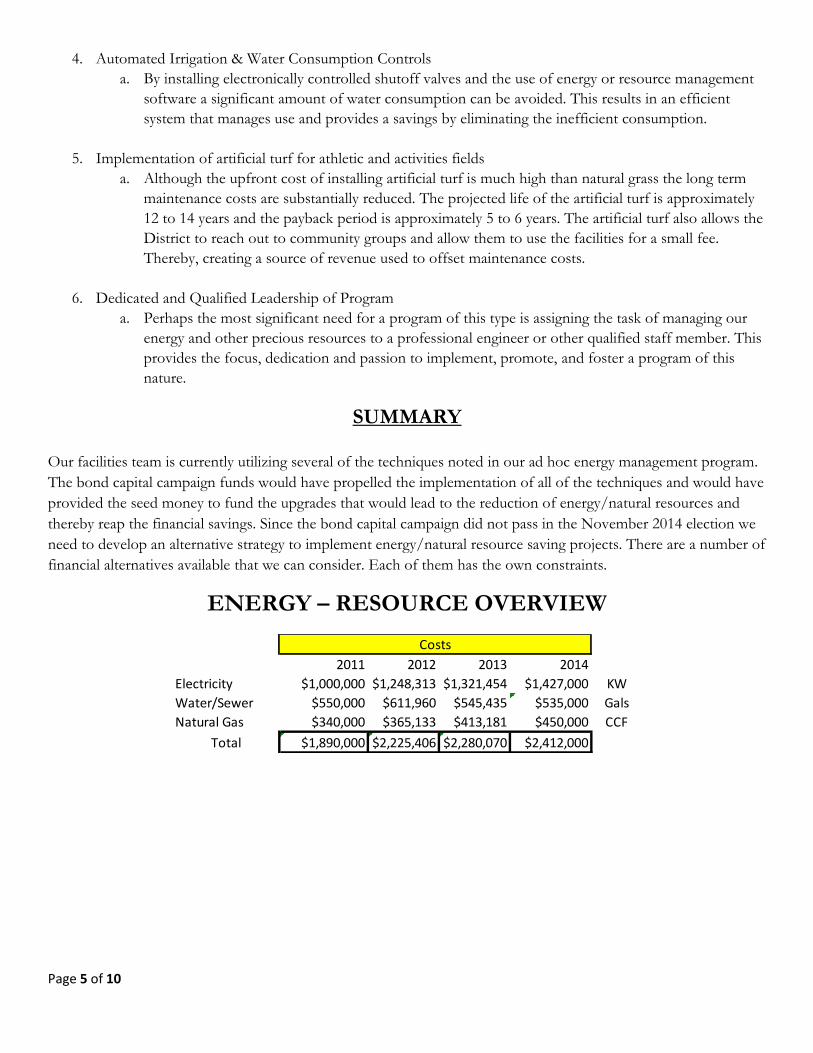
4. Automated Irrigation & Water Consumption Controls
a. By installing electronically controlled shutoff valves and the use of energy or resource management
software a significant amount of water consumption can be avoided. This results in an efficient
system that manages use and provides a savings by eliminating the inefficient consumption.
5. Implementation of artificial turf for athletic and activities fields
a. Although the upfront cost of installing artificial turf is much high than natural grass the long term
maintenance costs are substantially reduced. The projected life of the artificial turf is approximately
12 to 14 years and the payback period is approximately 5 to 6 years. The artificial turf also allows the
District to reach out to community groups and allow them to use the facilities for a small fee.
Thereby, creating a source of revenue used to offset maintenance costs.
6. Dedicated and Qualified Leadership of Program
a. Perhaps the most significant need for a program of this type is assigning the task of managing our
energy and other precious resources to a professional engineer or other qualified staff member. This
provides the focus, dedication and passion to implement, promote, and foster a program of this
nature.
SUMMARY
Our facilities team is currently utilizing several of the techniques noted in our ad hoc energy management program.
The bond capital campaign funds would have propelled the implementation of all of the techniques and would have
provided the seed money to fund the upgrades that would lead to the reduction of energy/natural resources and
thereby reap the financial savings. Since the bond capital campaign did not pass in the November 2014 election we
need to develop an alternative strategy to implement energy/natural resource saving projects. There are a number of
financial alternatives available that we can consider. Each of them has the own constraints.
ENERGY – RESOURCE OVERVIEW
Costs
2011 2012 2013 2014
Electricity $1,000,000 $1,248,313 $1,321,454 $1,427,000 KW
Water/Sewer $550,000 $611,960 $545,435 $535,000 Gals
Natural Gas $340,000 $365,133 $413,181 $450,000 CCF
Total $1,890,000 $2,225,406 $2,280,070 $2,412,000
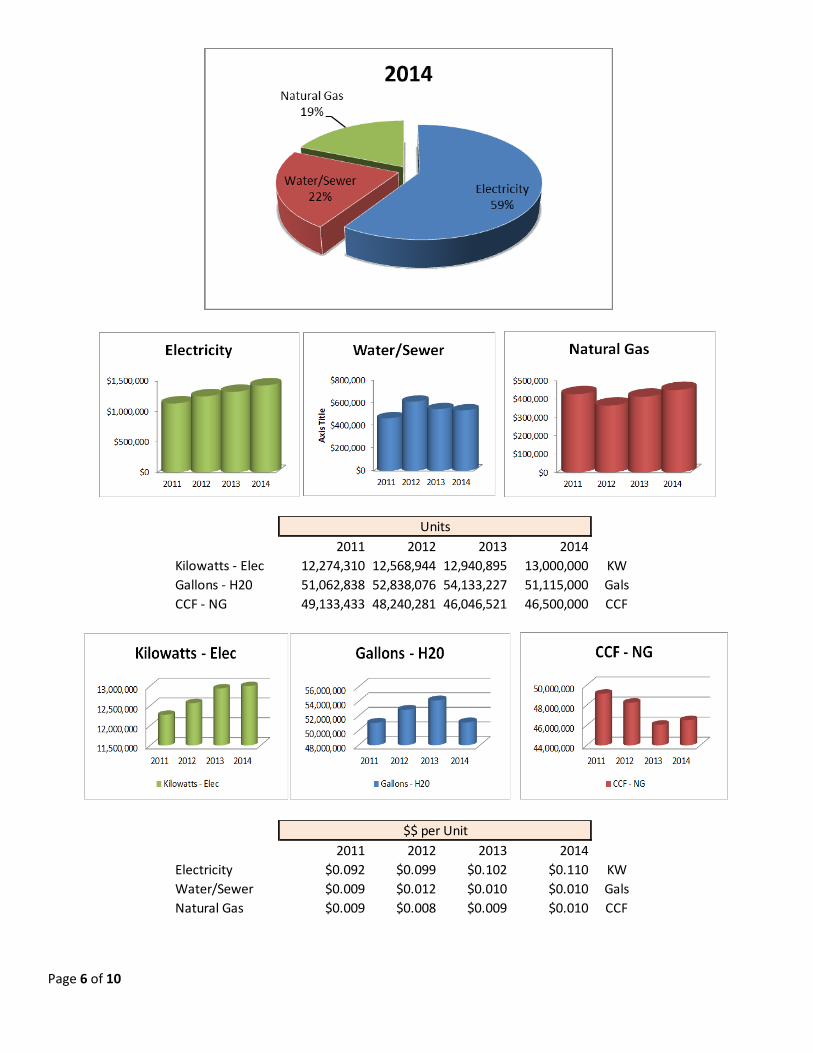
Page 6 of 10
Units
2011 2012 2013 2014
Kilowatts - Elec 12,274,310 12,568,944 12,940,895 13,000,000 KW
Gallons - H20 51,062,838 52,838,076 54,133,227 51,115,000 Gals
CCF - NG 49,133,433 48,240,281 46,046,521 46,500,000 CCF
$$ per Unit
2011 2012 2013 2014
Electricity $0.092 $0.099 $0.102 $0.110 KW
Water/Sewer $0.009 $0.012 $0.010 $0.010 Gals
Natural Gas $0.009 $0.008 $0.009 $0.010 CCF
Page 7 of 10
D49’s Energy Related Characteristics are: 1. Approximately 1,533,053 square feet (SF) of space 2. Approximately 426 acres of land 3. 18 schools (3 HS, 3 MS, 9 ES, & 3 other facilities) 4. The majority of our facilities systems have a pulse meter system that allows the District to monitor and
manage our demand and consumption of electricity. a. This system is outdated and needs to be upgraded.
5. The District does have automated systems for HVAC and irrigation management of our heating/cooling systems and water consumption.
a. This allows the District to remotely manage consumption. The system is in need of an upgrade. 6. The District does not utilize automated controls to manage our lighting systems. 7. Approximately 70% of our facilities utilize automated controls for sensor controls to shut off lights while
not in use. 8. Approximately 45% of our facilities utilize automated controls for sensor controls to shut off water while
not in use (faucets, etc). Sand Creek, Skyview, Odyessey and Meridian Ranch 9. The District does purchase natural gas in the open market leading to substantial savings through Seminole. 10. Fully air conditioned schools (3 HS, 3 MS, 9 ES)
D49’s Energy Performance statistics were: Electrical Energy:
1. 2012-2013 - 12,940,895 Kilowatts per Hour KWH in the amount of $1,321,454. 2. 2011-2012 - 12,568,944 Kilowatts per Hour KWH in the amount of $1,248,313 3. 2010-2011 - 12,274,310 Kilowatts per Hour KWH in the amount of $1,132,128 4. Over the past three years electrical rates have increased 28.2%
a. Energy use averaged $.77 KWH per sq ft
Natural Gas Energy: 1. 2012-2013 – 46,046,521 CCF’s (100 Cubic Feet) in the amount of $413,181. 2. 2011-2012 – 48,240,281 CCF’s (100 Cubic Feet) in the amount of $365,133. 3. 2010-2011 – 49,133,433 CCF’s (100 Cubic Feet) in the amount of $426,729 4. Energy costs averaged $0.009 in 2012 versus $0.008 per sq ft in 2011. 5. In 2009, the District began an initiative to purchase natural gas direct from the natural gas
producers. The initiative was not unique to D49.
Water & Irrigation Use Information: 1. 2012-2013 – 54,133,227 gallons at a cost of $545,435. 2. 2011-2012 – 52,838,076 gallons at a cost of $611,960 3. 2010-2011 – 51,062,838 gallons at a cost of $465,589 4. Approximately 85% to 88% of the water is used for irrigation. 5. The District does employ managed irrigation controls to monitor usage remotely. 6. Approximately 50% of the District’s schools utilized sensor monitoring to regulate usage in the
buildings.
UTILITY RATES
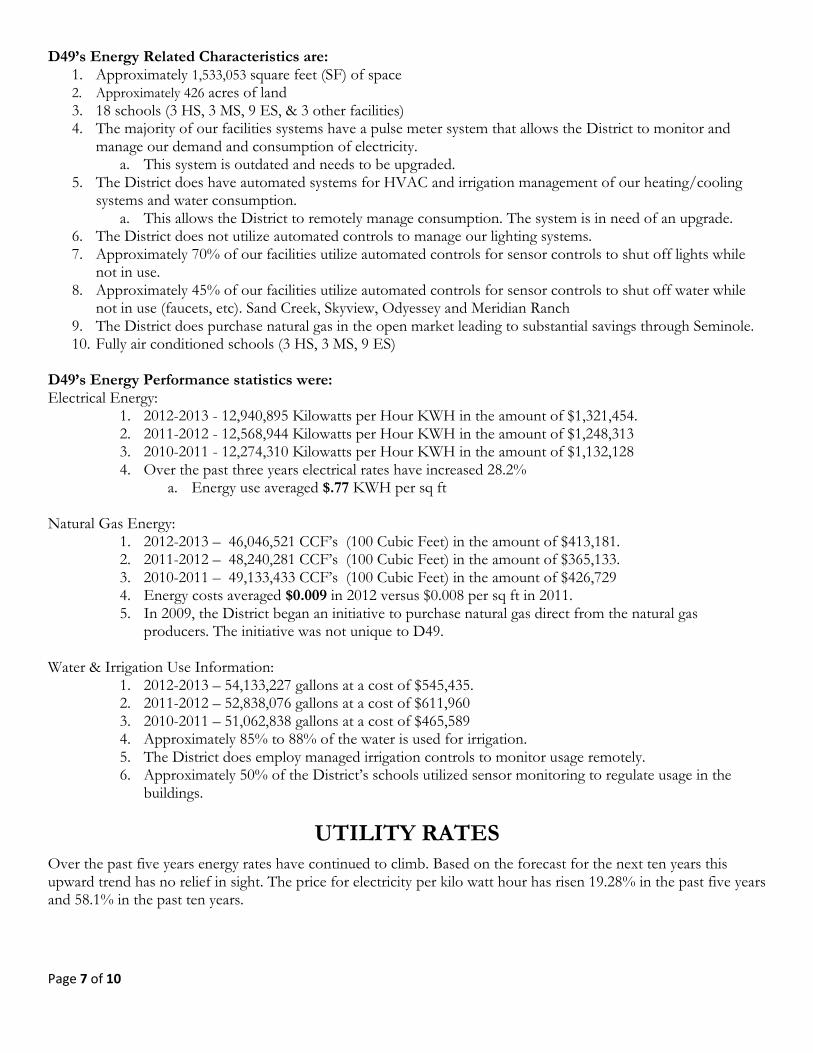
Over the past five years energy rates have continued to climb. Based on the forecast for the next ten years this upward trend has no relief in sight. The price for electricity per kilo watt hour has risen 19.28% in the past five years and 58.1% in the past ten years.
Page 8 of 10
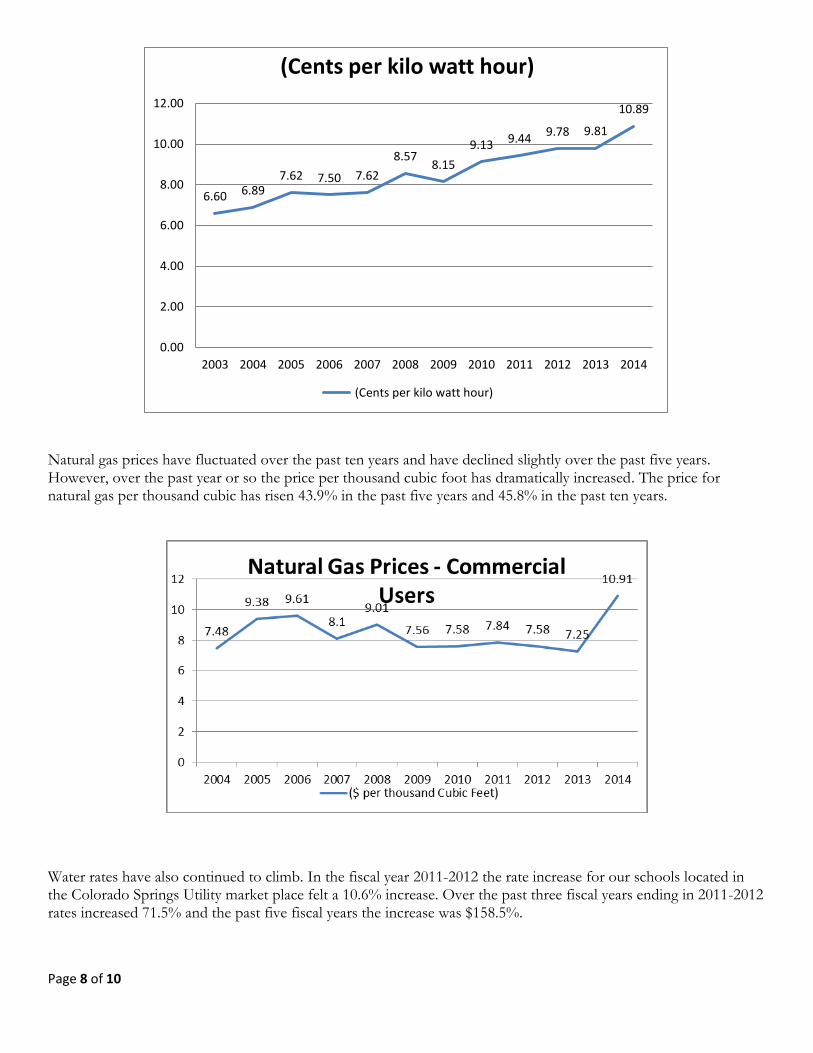
Natural gas prices have fluctuated over the past ten years and have declined slightly over the past five years. However, over the past year or so the price per thousand cubic foot has dramatically increased. The price for natural gas per thousand cubic has risen 43.9% in the past five years and 45.8% in the past ten years.
Water rates have also continued to climb. In the fiscal year 2011-2012 the rate increase for our schools located in the Colorado Springs Utility market place felt a 10.6% increase. Over the past three fiscal years ending in 2011-2012 rates increased 71.5% and the past five fiscal years the increase was $158.5%.
6.60 6.89 7.62 7.50 7.62
8.57 8.15
9.13 9.44 9.78 9.81
10.89
0.00
2.00
4.00
6.00
8.00
10.00
12.00
2003 2004 2005 2006 2007 2008 2009 2010 2011 2012 2013 2014
(Cents per kilo watt hour)
(Cents per kilo watt hour)

Page 9 of 10
Program Initiatives
Benchmarking One of the first initiatives for the energy resource management program will be the benchmarking overall use per school and generating a comparison by High School, Middle School and Elementary School. This bench marking will formulate the data base lines for annual comparison of consumption and price. The District’s energy comes from a combination of electric and natural gas. The planned District standard for benchmarking is to compare the current year to our previous three year average. This method of benchmarking has proven to be an effective tool for identifying energy saving opportunities and verifying the success of efficiency improvements in other districts that have an energy-resource management program. Also, through the use of our new SchoolDude utility program we will be able to benchmark our performance across 4,600 school districts throughout the nation.
POTENTIAL ENERGY PROJECTS AND INITIATIVES Behavioral & Educational Awareness
1. Organizational Awareness 2. Reporting to BOE and other Stakeholders 3. Energy Star Awards 4. Weekly Conservation Tips 5. Building Manager Training
User Controlled
1. Energy Dashboard and Alerts 2. Coordination with Rentals 3. Holiday Shutdown Checklists 4. Energy Audits
Facilities Controlled
1. Scheduling 2. Work Orders 3. Controls 4. Construction Standard 5. Commissioning 6. Energy Audits
Utility Rate
1. Natural Gas Purchasing 2. Water Conservation 3. Time of use 4. Power Factor Correction 5. Demand Management
Potential Projects
1. Artificial Turf for all athletic – activity fields 2. Solar panels 3. Heat pump systems 4. Fully integrated and computerized controls for heat, electricity and water consumption 5. District wide LED light retrofit 6. System Automation
Page 10 of 10
Next Steps
1. Implement a planned comprehensive energy – resource management program.
2. Identify a funding source to implement modifications.
3. Decide if the District would be open to a third party arrangement to provide needed capital
funds for the lighting retrofit and the turf installation projects. These two projects will
provide a significant return on investment.
4. Identify potential areas for improvement with a comprehensive energy audit.
5. Implement SchoolDude Utility Direct module to automate the consumption and costs spent
at each location.
a. Monitor and report on progress.
b. Redeploy resources back into other areas of need for the District.
6. Develop educational programs with student involvement.
BOARD OF EDUCATION AGENDA ITEM 6
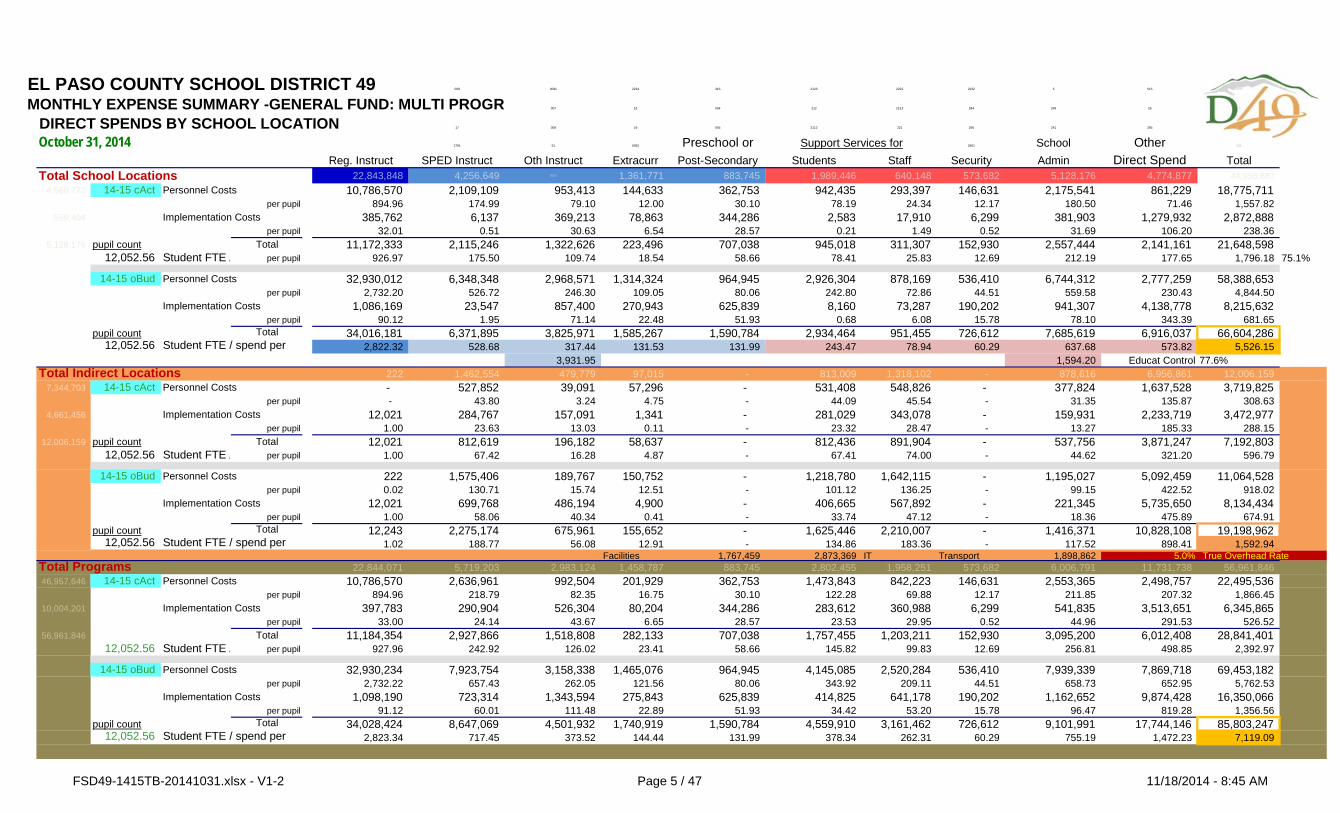
BOARD MEETING OF: November 19, 2014 PREPARED BY: Brett Ridgway, Chief Business Officer TITLE OF AGENDA ITEM: Monthly Financial Update ACTION/INFORMATION/DISCUSSION: Discussion BACKGROUND INFORMATION, DESCRIPTION OF NEED: Report to the Board of Education the performance of actual revenues and expenditures versus budgeted revenues and expenditures in all funds with comparison to prior year. Reference the first attached spreadsheet: the first column is the list of each fund the District has. The 2013-2014 columns start with the approved budget for the entire year compared to revenues and expenditures through June. Percentages over 100% on a revenue line are good in that we received more revenue than was anticipated. If any of the expenditure lines were higher than the percentage of year concluded, that fund could be an area of possible concern depending upon why it was high. The 2013-2014 year-end fund balance columns are required by statute. This is showing you the budgeted and anticipated end-of-year fund balance. The 2012-2013 columns are the prior year’s total budget and the actual through June 2013. These amounts are provided for comparison to the current year amounts. RATIONALE: This report is to keep the BOE informed of spending. It is required quarterly by law, however, it is being provided monthly in D49 in keeping with the Board’s goal of financial transparency and fiscal responsibility. RELEVANT DATA AND EXPECTED OUTCOMES: It is expected that the monitoring of expenditures will result in keeping spending in line with the Board’s goals and direction as budgeted. IMPACTS ON THE DISTRICT’S STRATEGIC PRIORITIES—THE BIG ROCKS: Rock #1—Reestablishing the district as a trustworthy recipient of taxpayer investment
Clarity and transparency in financial management strategy and decisions.
Rock #2—Research, design and implement programs for intentional community participation
.
Rock #3— Establish District 49 as the best district in Colorado to learn, work and lead
Rock #4— Grow a robust portfolio of distinct and exceptional schools
Rock #5— Customize our educational systems to launch each student toward success
FUNDING REQUIRED: Yes AMOUNT BUDGETED: 2013/14 = $87.5mm (General fund) RECOMMENDED COURSE OF ACTION/MOTION REQUESTED: No specific action necessary beyond recognizing the receipt of these reports and this information. APPROVED BY: Brett Ridgway, Chief Business Officer DATE: November 13, 2014
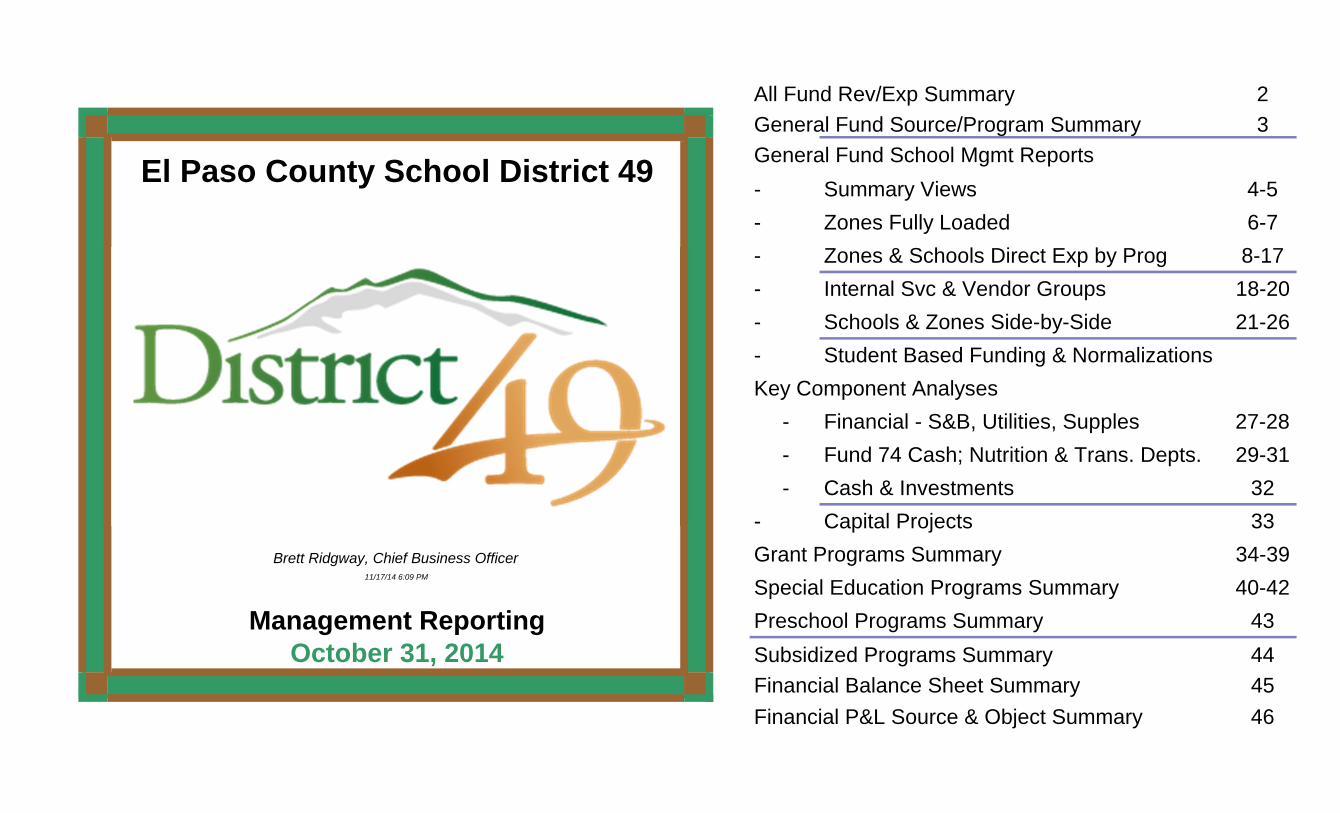
All Fund Rev/Exp Summary 2General Fund Source/Program Summary 3General Fund School Mgmt Reports- Summary Views 4-5- Zones Fully Loaded 6-7- Zones & Schools Direct Exp by Prog 8-17- Internal Svc & Vendor Groups 18-20- Schools & Zones Side-by-Side 21-26- Student Based Funding & NormalizationsKey Component Analyses
- Financial - S&B, Utilities, Supples 27-28- Fund 74 Cash; Nutrition & Trans. Depts. 29-31- Cash & Investments 32
- Capital Projects 33Grant Programs Summary 34-39Special Education Programs Summary 40-42Preschool Programs Summary 43Subsidized Programs Summary 44Financial Balance Sheet Summary 45Financial P&L Source & Object Summary 46
Brett Ridgway, Chief Business Officer
El Paso County School District 49
Management ReportingOctober 31, 2014
11/17/14 6:09 PM
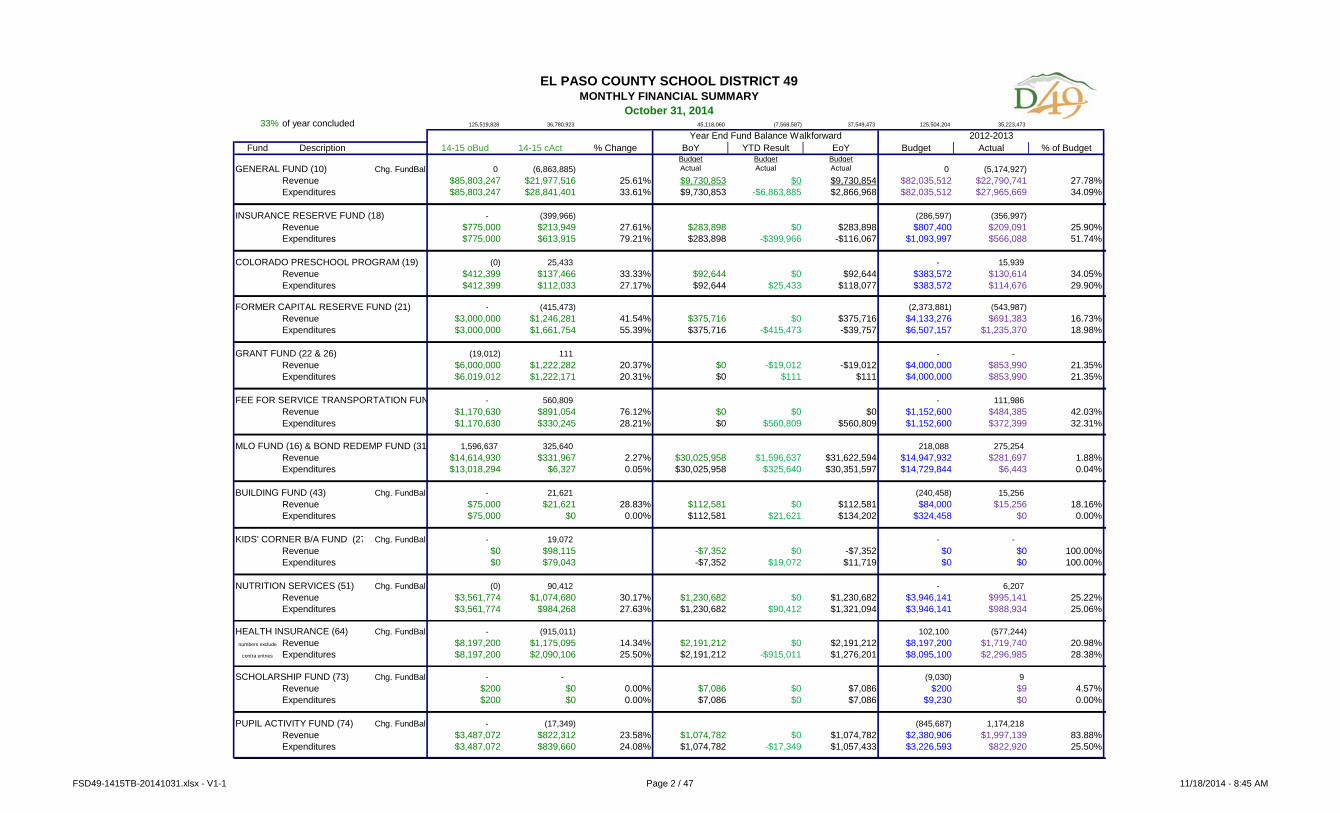
33% of year concluded 125,519,828 36,780,923 45,118,060 (7,568,587) 37,549,473 125,504,204 35,223,473
Fund Description 14-15 oBud 14-15 cAct % Change BoY YTD Result EoY Budget Actual % of BudgetBudget Budget Budget
GENERAL FUND (10) Chg. FundBal 0 (6,863,885) Actual Actual Actual 0 (5,174,927) Revenue $85,803,247 $21,977,516 25.61% $9,730,853 $0 $9,730,854 $82,035,512 $22,790,741 27.78%Expenditures $85,803,247 $28,841,401 33.61% $9,730,853 -$6,863,885 $2,866,968 $82,035,512 $27,965,669 34.09%
INSURANCE RESERVE FUND (18) - (399,966) (286,597) (356,997) Revenue $775,000 $213,949 27.61% $283,898 $0 $283,898 $807,400 $209,091 25.90%Expenditures $775,000 $613,915 79.21% $283,898 -$399,966 -$116,067 $1,093,997 $566,088 51.74%
COLORADO PRESCHOOL PROGRAM (19) (0) 25,433 - 15,939 Revenue $412,399 $137,466 33.33% $92,644 $0 $92,644 $383,572 $130,614 34.05%Expenditures $412,399 $112,033 27.17% $92,644 $25,433 $118,077 $383,572 $114,676 29.90%
FORMER CAPITAL RESERVE FUND (21) - (415,473) (2,373,881) (543,987) Revenue $3,000,000 $1,246,281 41.54% $375,716 $0 $375,716 $4,133,276 $691,383 16.73%Expenditures $3,000,000 $1,661,754 55.39% $375,716 -$415,473 -$39,757 $6,507,157 $1,235,370 18.98%
GRANT FUND (22 & 26) (19,012) 111 - - Revenue $6,000,000 $1,222,282 20.37% $0 -$19,012 -$19,012 $4,000,000 $853,990 21.35%Expenditures $6,019,012 $1,222,171 20.31% $0 $111 $111 $4,000,000 $853,990 21.35%
FEE FOR SERVICE TRANSPORTATION FUN - 560,809 - 111,986 Revenue $1,170,630 $891,054 76.12% $0 $0 $0 $1,152,600 $484,385 42.03%Expenditures $1,170,630 $330,245 28.21% $0 $560,809 $560,809 $1,152,600 $372,399 32.31%
MLO FUND (16) & BOND REDEMP FUND (31 1,596,637 325,640 218,088 275,254 Revenue $14,614,930 $331,967 2.27% $30,025,958 $1,596,637 $31,622,594 $14,947,932 $281,697 1.88%Expenditures $13,018,294 $6,327 0.05% $30,025,958 $325,640 $30,351,597 $14,729,844 $6,443 0.04%
BUILDING FUND (43) Chg. FundBal - 21,621 (240,458) 15,256 Revenue $75,000 $21,621 28.83% $112,581 $0 $112,581 $84,000 $15,256 18.16%Expenditures $75,000 $0 0.00% $112,581 $21,621 $134,202 $324,458 $0 0.00%
KIDS' CORNER B/A FUND (27 Chg. FundBal - 19,072 - - Revenue $0 $98,115 -$7,352 $0 -$7,352 $0 $0 100.00%Expenditures $0 $79,043 -$7,352 $19,072 $11,719 $0 $0 100.00%
NUTRITION SERVICES (51) Chg. FundBal (0) 90,412 - 6,207 Revenue $3,561,774 $1,074,680 30.17% $1,230,682 $0 $1,230,682 $3,946,141 $995,141 25.22%Expenditures $3,561,774 $984,268 27.63% $1,230,682 $90,412 $1,321,094 $3,946,141 $988,934 25.06%
HEALTH INSURANCE (64) Chg. FundBal - (915,011) 102,100 (577,244) numbers exclude Revenue $8,197,200 $1,175,095 14.34% $2,191,212 $0 $2,191,212 $8,197,200 $1,719,740 20.98%
contra entries Expenditures $8,197,200 $2,090,106 25.50% $2,191,212 -$915,011 $1,276,201 $8,095,100 $2,296,985 28.38%
SCHOLARSHIP FUND (73) Chg. FundBal - - (9,030) 9 Revenue $200 $0 0.00% $7,086 $0 $7,086 $200 $9 4.57%Expenditures $200 $0 0.00% $7,086 $0 $7,086 $9,230 $0 0.00%
PUPIL ACTIVITY FUND (74) Chg. FundBal - (17,349) (845,687) 1,174,218 Revenue $3,487,072 $822,312 23.58% $1,074,782 $0 $1,074,782 $2,380,906 $1,997,139 83.88%Expenditures $3,487,072 $839,660 24.08% $1,074,782 -$17,349 $1,057,433 $3,226,593 $822,920 25.50%
EL PASO COUNTY SCHOOL DISTRICT 49MONTHLY FINANCIAL SUMMARY
October 31, 2014
Year End Fund Balance Walkforward 2012-2013
FSD49-1415TB-20141031.xlsx - V1-1 Page 2 / 47 11/18/2014 - 8:45 AM
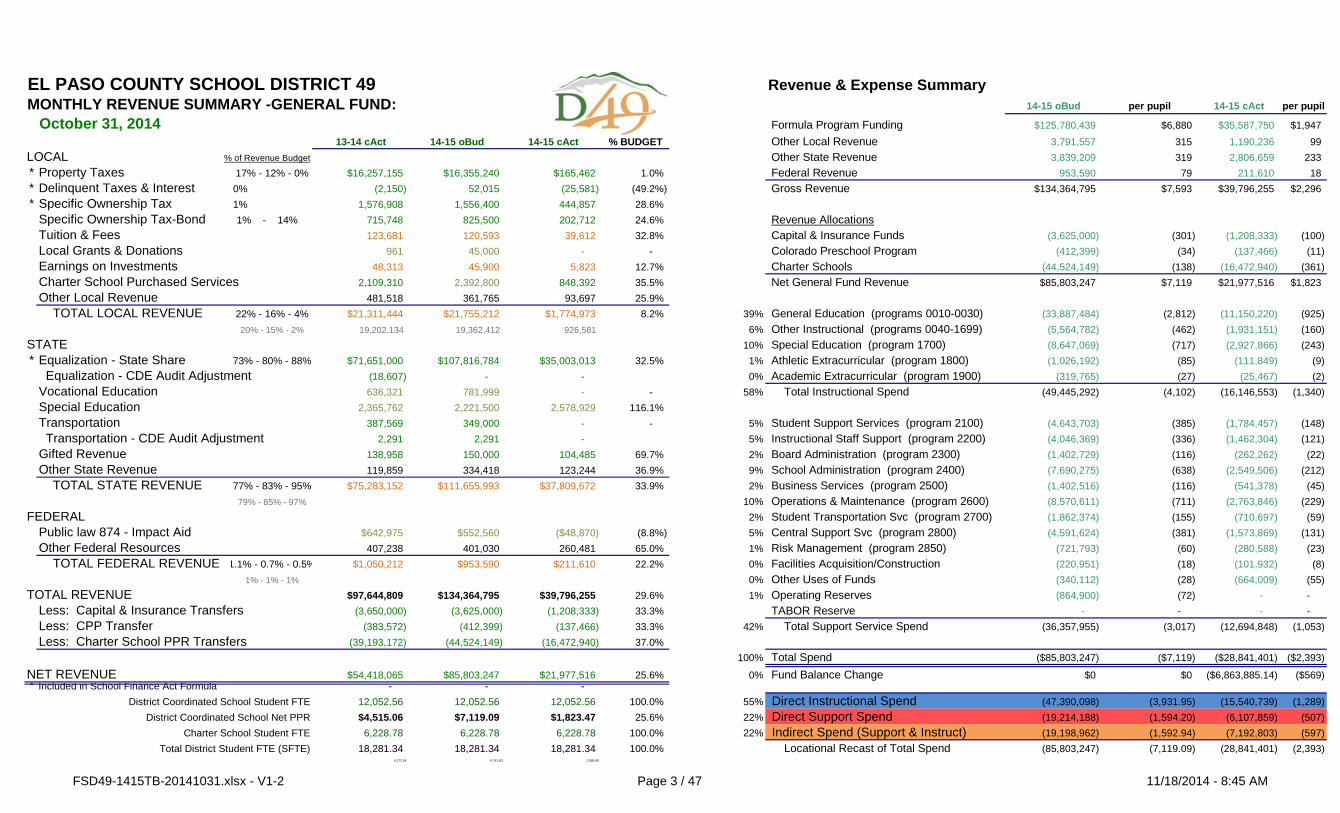
EL PASO COUNTY SCHOOL DISTRICT 49 Revenue & Expense SummaryMONTHLY REVENUE SUMMARY -GENERAL FUND: 14-15 oBud per pupil 14-15 cAct per pupil
Formula Program Funding $125,780,439 $6,880 $35,587,750 $1,94713-14 cAct 14-15 oBud 14-15 cAct % BUDGET Other Local Revenue 3,791,557 315 1,190,236 99
LOCAL % of Revenue Budget Other State Revenue 3,839,209 319 2,806,659 233 * Property Taxes $16,257,155 $16,355,240 $165,462 1.0% Federal Revenue 953,590 79 211,610 18 * Delinquent Taxes & Interest 0% (2,150) 52,015 (25,581) (49.2%) Gross Revenue $134,364,795 $7,593 $39,796,255 $2,296* Specific Ownership Tax 1% 1,576,908 1,556,400 444,857 28.6%
Specific Ownership Tax-Bond 1% - 14% 715,748 825,500 202,712 24.6% Revenue AllocationsTuition & Fees 123,681 120,593 39,612 32.8% Capital & Insurance Funds (3,625,000) (301) (1,208,333) (100) Local Grants & Donations 961 45,000 - - Colorado Preschool Program (412,399) (34) (137,466) (11) Earnings on Investments 48,313 45,900 5,823 12.7% Charter Schools (44,524,149) (138) (16,472,940) (361) Charter School Purchased Services 2,109,310 2,392,800 848,392 35.5% Net General Fund Revenue $85,803,247 $7,119 $21,977,516 $1,823Other Local Revenue 481,518 361,765 93,697 25.9% TOTAL LOCAL REVENUE $21,311,444 $21,755,212 $1,774,973 8.2% 39% General Education (programs 0010-0030) (33,887,484) (2,812) (11,150,220) (925)
19,202,134 19,362,412 926,581 6% Other Instructional (programs 0040-1699) (5,564,782) (462) (1,931,151) (160) STATE 10% Special Education (program 1700) (8,647,069) (717) (2,927,866) (243) * Equalization - State Share $71,651,000 $107,816,784 $35,003,013 32.5% 1% Athletic Extracurricular (program 1800) (1,026,192) (85) (111,849) (9)
Equalization - CDE Audit Adjustment (18,607) - - 0% Academic Extracurricular (program 1900) (319,765) (27) (25,467) (2) Vocational Education 636,321 781,999 - - 58% Total Instructional Spend (49,445,292) (4,102) (16,146,553) (1,340) Special Education 2,365,762 2,221,500 2,578,929 116.1% Transportation 387,569 349,000 - - 5% Student Support Services (program 2100) (4,643,703) (385) (1,784,457) (148) Transportation - CDE Audit Adjustment 2,291 2,291 - 5% Instructional Staff Support (program 2200) (4,046,369) (336) (1,462,304) (121) Gifted Revenue 138,958 150,000 104,485 69.7% 2% Board Administration (program 2300) (1,402,729) (116) (262,262) (22) Other State Revenue 119,859 334,418 123,244 36.9% 9% School Administration (program 2400) (7,690,275) (638) (2,549,506) (212) TOTAL STATE REVENUE $75,283,152 $111,655,993 $37,809,672 33.9% 2% Business Services (program 2500) (1,402,516) (116) (541,378) (45)
10% Operations & Maintenance (program 2600) (8,570,611) (711) (2,763,846) (229) FEDERAL 2% Student Transportation Svc (program 2700) (1,862,374) (155) (710,697) (59)
Public law 874 - Impact Aid $642,975 $552,560 ($48,870) (8.8%) 5% Central Support Svc (program 2800) (4,591,624) (381) (1,573,869) (131) Other Federal Resources 407,238 401,030 260,481 65.0% 1% Risk Management (program 2850) (721,793) (60) (280,588) (23) TOTAL FEDERAL REVENUE $1,050,212 $953,590 $211,610 22.2% 0% Facilities Acquisition/Construction (220,951) (18) (101,932) (8)
0% Other Uses of Funds (340,112) (28) (664,009) (55) TOTAL REVENUE $97,644,809 $134,364,795 $39,796,255 29.6% 1% Operating Reserves (864,900) (72) - -
Less: Capital & Insurance Transfers (3,650,000) (3,625,000) (1,208,333) 33.3% TABOR Reserve - - - - Less: CPP Transfer (383,572) (412,399) (137,466) 33.3% 42% Total Support Service Spend (36,357,955) (3,017) (12,694,848) (1,053) Less: Charter School PPR Transfers (39,193,172) (44,524,149) (16,472,940) 37.0%
100% Total Spend ($85,803,247) ($7,119) ($28,841,401) ($2,393)
NET REVENUE $54,418,065 $85,803,247 $21,977,516 25.6% 0% Fund Balance Change $0 $0 ($6,863,885.14) ($569)* Included in School Finance Act Formula - - -
District Coordinated School Student FTE 12,052.56 12,052.56 12,052.56 100.0% 55% Direct Instructional Spend (47,390,098) (3,931.95) (15,540,739) (1,289) District Coordinated School Net PPR $4,515.06 $7,119.09 $1,823.47 25.6% 22% Direct Support Spend (19,214,188) (1,594.20) (6,107,859) (507)
Charter School Student FTE 6,228.78 6,228.78 6,228.78 100.0% 22% Indirect Spend (Support & Instruct) (19,198,962) (1,592.94) (7,192,803) (597) Total District Student FTE (SFTE) 18,281.34 18,281.34 18,281.34 100.0% Locational Recast of Total Spend (85,803,247) (7,119.09) (28,841,401) (2,393)
4,172.54 6,741.83 1,585.95
73% - 80% - 88%
1.1% - 0.7% - 0.5%
77% - 83% - 95%
22% - 16% - 4%20% - 15% - 2%
79% - 85% - 97%
1% - 1% - 1%
October 31, 2014
17% - 12% - 0%
FSD49-1415TB-20141031.xlsx - V1-2 Page 3 / 47 11/18/2014 - 8:45 AM
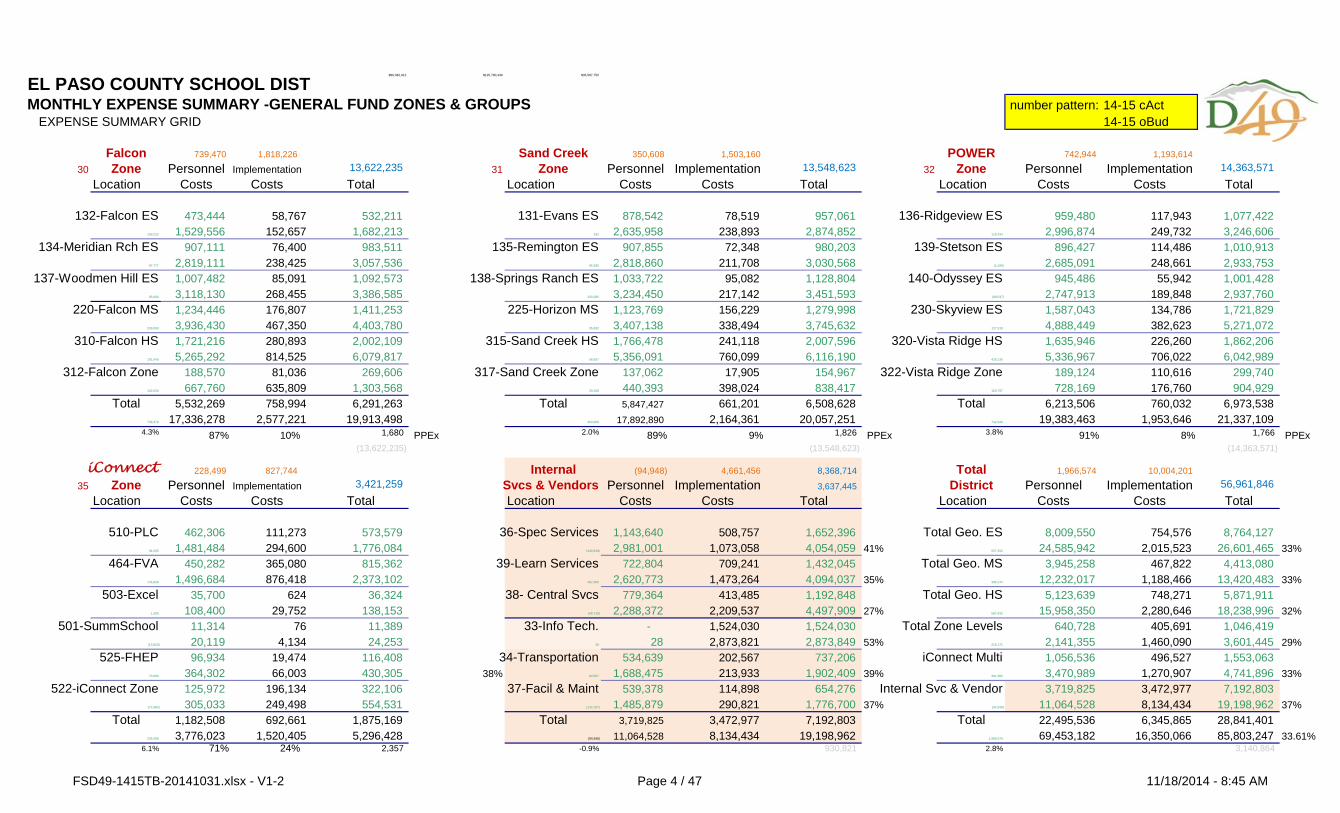
EL PASO COUNTY SCHOOL DISTR$89,482,912 $125,780,439 $35,587,750
MONTHLY EXPENSE SUMMARY -GENERAL FUND ZONES & GROUPS number pattern: 14-15 cActEXPENSE SUMMARY GRID 14-15 oBud
Falcon 739,470 1,818,226 Sand Creek 350,608 1,503,160 POWER 742,944 1,193,614
30 Zone Personnel Implementation 13,622,235 31 Zone Personnel Implementation 13,548,623 32 Zone Personnel Implementation 14,363,571 Location Costs Costs Total Location Costs Costs Total Location Costs Costs Total
132-Falcon ES 473,444 532,211 131-Evans ES 878,542 78,519 957,061 136-Ridgeview ES 959,480 117,943 1,077,422 109,222 1,529,556 1,682,213 332 2,635,958 238,893 2,874,852 118,434 2,996,874 249,732 3,246,606
134-Meridian Rch ES 907,111 983,511 135-Remington ES 907,855 72,348 980,203 139-Stetson ES 896,427 114,486 1,010,913 97,777 2,819,111 3,057,536 95,295 2,818,860 211,708 3,030,568 (4,190) 2,685,091 248,661 2,933,753
137-Woodmen Hill ES 1,007,482 1,092,573 138-Springs Ranch ES 1,033,722 95,082 1,128,804 140-Odyssey ES 945,486 55,942 1,001,428 95,684 3,118,130 3,386,585 133,285 3,234,450 217,142 3,451,593 (88,547) 2,747,913 189,848 2,937,760
220-Falcon MS 1,234,446 1,411,253 225-Horizon MS 1,123,769 156,229 1,279,998 230-Skyview ES 1,587,043 134,786 1,721,829 233,093 3,936,430 4,403,780 35,832 3,407,138 338,494 3,745,632 127,319 4,888,449 382,623 5,271,072
310-Falcon HS 1,721,216 2,002,109 315-Sand Creek HS 1,766,478 241,118 2,007,596 320-Vista Ridge HS 1,635,946 226,260 1,862,206 101,645 5,265,292 6,079,817 56,657 5,356,091 760,099 6,116,190 429,130 5,336,967 706,022 6,042,989
312-Falcon Zone 188,570 269,606 317-Sand Creek Zone 137,062 17,905 154,967 322-Vista Ridge Zone 189,124 110,616 299,740 102,050 667,760 1,303,568 29,208 440,393 398,024 838,417 160,797 728,169 176,760 904,929
Total 5,532,269 6,291,263 Total 5,847,427 661,201 6,508,628 Total 6,213,506 760,032 6,973,538 739,470 17,336,278 19,913,498 350,608 17,892,890 2,164,361 20,057,251 742,944 19,383,463 1,953,646 21,337,109
4.3% 87% 10% 1,680 PPEx 2.0% 89% 9% 1,826 PPEx 3.8% 91% 8% 1,766 PPEx(13,622,235) (13,548,623) (14,363,571)
iConnect 228,499 827,744 Internal (94,948) 4,661,456 8,368,714 Total 1,966,574 10,004,201
35 Zone Personnel Implementation 3,421,259 Svcs & Vendors Personnel Implementation 3,637,445 District Personnel Implementation 56,961,846 Location Costs Costs Total Location Costs Costs Total Location Costs Costs Total
510-PLC 462,306 573,579 36-Spec Services 1,143,640 508,757 1,652,396 Total Geo. ES 8,009,550 754,576 8,764,127 94,565 1,481,484 1,776,084 (449,918) 2,981,001 1,073,058 4,054,059 41% 557,292 24,585,942 2,015,523 26,601,465 33%
464-FVA 450,282 815,362 39-Learn Services 722,804 709,241 1,432,045 Total Geo. MS 3,945,258 467,822 4,413,080 145,839 1,496,684 2,373,102 452,360 2,620,773 1,473,264 4,094,037 35% 396,244 12,232,017 1,188,466 13,420,483 33%
503-Excel 35,700 36,324 38- Central Svcs 779,364 413,485 1,192,848 Total Geo. HS 5,123,639 748,271 5,871,911 1,300 108,400 138,153 (49,719) 2,288,372 2,209,537 4,497,909 27% 587,432 15,958,350 2,280,646 18,238,996 32%
501-SummSchool 11,314 11,389 33-Info Tech. - 1,524,030 1,524,030 Total Zone Levels 640,728 405,691 1,046,419 (13,823) 20,119 24,253 28 28 2,873,821 2,873,849 53% 219,171 2,141,355 1,460,090 3,601,445 29%
525-FHEP 96,934 116,408 34-Transportation 534,639 202,567 737,206 iConnect Multi 1,056,536 496,527 1,553,063 73,500 364,302 430,305 38% 84,557 1,688,475 213,933 1,902,409 39% 301,382 3,470,989 1,270,907 4,741,896 33%
522-iConnect Zone 125,972 322,106 37-Facil & Maint 539,378 114,898 654,276 Internal Svc & Vendor 3,719,825 3,472,977 7,192,803 (72,884) 305,033 554,531 (132,257) 1,485,879 290,821 1,776,700 37% (94,948) 11,064,528 8,134,434 19,198,962 37%
Total 1,182,508 1,875,169 Total 3,719,825 3,472,977 7,192,803 Total 22,495,536 6,345,865 28,841,401 228,499 3,776,023 5,296,428 (94,948) 11,064,528 8,134,434 19,198,962 1,966,574 69,453,182 16,350,066 85,803,247 33.61%
6.1% 71% 24% 2,357 -0.9% 930,821 2.8% 3,140,864
111,273 294,600 365,080 876,418
814,525 280,893 467,350 176,807 268,455
1,520,405
624 29,752
76 4,134
19,474 66,003
196,134 249,498 692,661
58,767
81,036 635,809 758,994
2,577,221
85,091 238,425 76,400
152,657
FSD49-1415TB-20141031.xlsx - V1-2 Page 4 / 47 11/18/2014 - 8:45 AM
EL PASO COUNTY SCHOOL DISTRICT 49 009 0091 2234 315 2123 2222 2232 5 515 2691
MONTHLY EXPENSE SUMMARY -GENERAL FUND: MULTI PROGR 007 18 004 212 2213 284 249 26 4
DIRECT SPENDS BY SCHOOL LOCATION 17 008 19 005 2112 221 266 241 285 6
1791 51 0092 Preschool or 2661 School Other 231
Reg. Instruct SPED Instruct Oth Instruct Extracurr Post-Secondary Students Staff Security Admin Direct Spend TotalTotal School Locations 22,843,848 4,256,649 0093 1,361,771 883,745 1,989,446 640,148 573,682 5,128,176 4,774,877 44,955,687
4,568,772 14-15 cAct Personnel Costs 10,786,570 2,109,109 953,413 144,633 362,753 942,435 293,397 146,631 2,175,541 861,229 18,775,711 per pupil 894.96 174.99 79.10 12.00 30.10 78.19 24.34 12.17 180.50 71.46 1,557.82
559,404 Implementation Costs 385,762 6,137 369,213 78,863 344,286 2,583 17,910 6,299 381,903 1,279,932 2,872,888 per pupil 32.01 0.51 30.63 6.54 28.57 0.21 1.49 0.52 31.69 106.20 238.36
5,128,176 pupil count Total 11,172,333 2,115,246 1,322,626 223,496 707,038 945,018 311,307 152,930 2,557,444 2,141,161 21,648,598 12,052.56 Student FTE / per pupil 926.97 175.50 109.74 18.54 58.66 78.41 25.83 12.69 212.19 177.65 1,796.18 75.1%
14-15 oBud Personnel Costs 32,930,012 6,348,348 2,968,571 1,314,324 964,945 2,926,304 878,169 536,410 6,744,312 2,777,259 58,388,653 per pupil 2,732.20 526.72 246.30 109.05 80.06 242.80 72.86 44.51 559.58 230.43 4,844.50
Implementation Costs 1,086,169 23,547 857,400 270,943 625,839 8,160 73,287 190,202 941,307 4,138,778 8,215,632 per pupil 90.12 1.95 71.14 22.48 51.93 0.68 6.08 15.78 78.10 343.39 681.65
pupil count Total 34,016,181 6,371,895 3,825,971 1,585,267 1,590,784 2,934,464 951,455 726,612 7,685,619 6,916,037 66,604,286 12,052.56 Student FTE / spend per 2,822.32 528.68 317.44 131.53 131.99 243.47 78.94 60.29 637.68 573.82 5,526.15
3,931.95 1,594.20 Educat Control 77.6%Total Indirect Locations 222 1,462,554 479,779 97,015 - 813,009 1,318,102 - 878,616 6,956,861 12,006,159
7,344,703 14-15 cAct Personnel Costs - 527,852 39,091 57,296 - 531,408 548,826 - 377,824 1,637,528 3,719,825 per pupil - 43.80 3.24 4.75 - 44.09 45.54 - 31.35 135.87 308.63
4,661,456 Implementation Costs 12,021 284,767 157,091 1,341 - 281,029 343,078 - 159,931 2,233,719 3,472,977 per pupil 1.00 23.63 13.03 0.11 - 23.32 28.47 - 13.27 185.33 288.15
12,006,159 pupil count Total 12,021 812,619 196,182 58,637 - 812,436 891,904 - 537,756 3,871,247 7,192,803 12,052.56 Student FTE / per pupil 1.00 67.42 16.28 4.87 - 67.41 74.00 - 44.62 321.20 596.79
14-15 oBud Personnel Costs 222 1,575,406 189,767 150,752 - 1,218,780 1,642,115 - 1,195,027 5,092,459 11,064,528 per pupil 0.02 130.71 15.74 12.51 - 101.12 136.25 - 99.15 422.52 918.02
Implementation Costs 12,021 699,768 486,194 4,900 - 406,665 567,892 - 221,345 5,735,650 8,134,434 per pupil 1.00 58.06 40.34 0.41 - 33.74 47.12 - 18.36 475.89 674.91
pupil count Total 12,243 2,275,174 675,961 155,652 - 1,625,446 2,210,007 - 1,416,371 10,828,108 19,198,962 12,052.56 Student FTE / spend per 1.02 188.77 56.08 12.91 - 134.86 183.36 - 117.52 898.41 1,592.94
Facilities 1,767,459 2,873,369 IT Transport 1,898,862 5.0% True Overhead RateTotal Programs 22,844,071 5,719,203 2,983,124 1,458,787 883,745 2,802,455 1,958,251 573,682 6,006,791 11,731,738 56,961,846 46,957,646 14-15 cAct Personnel Costs 10,786,570 2,636,961 992,504 201,929 362,753 1,473,843 842,223 146,631 2,553,365 2,498,757 22,495,536
per pupil 894.96 218.79 82.35 16.75 30.10 122.28 69.88 12.17 211.85 207.32 1,866.45 10,004,201 Implementation Costs 397,783 290,904 526,304 80,204 344,286 283,612 360,988 6,299 541,835 3,513,651 6,345,865
per pupil 33.00 24.14 43.67 6.65 28.57 23.53 29.95 0.52 44.96 291.53 526.52 56,961,846 Total 11,184,354 2,927,866 1,518,808 282,133 707,038 1,757,455 1,203,211 152,930 3,095,200 6,012,408 28,841,401
12,052.56 Student FTE / per pupil 927.96 242.92 126.02 23.41 58.66 145.82 99.83 12.69 256.81 498.85 2,392.97
14-15 oBud Personnel Costs 32,930,234 7,923,754 3,158,338 1,465,076 964,945 4,145,085 2,520,284 536,410 7,939,339 7,869,718 69,453,182 per pupil 2,732.22 657.43 262.05 121.56 80.06 343.92 209.11 44.51 658.73 652.95 5,762.53
Implementation Costs 1,098,190 723,314 1,343,594 275,843 625,839 414,825 641,178 190,202 1,162,652 9,874,428 16,350,066 per pupil 91.12 60.01 111.48 22.89 51.93 34.42 53.20 15.78 96.47 819.28 1,356.56
pupil count Total 34,028,424 8,647,069 4,501,932 1,740,919 1,590,784 4,559,910 3,161,462 726,612 9,101,991 17,744,146 85,803,247 12,052.56 Student FTE / spend per 2,823.34 717.45 373.52 144.44 131.99 378.34 262.31 60.29 755.19 1,472.23 7,119.09
Support Services forOctober 31, 2014
FSD49-1415TB-20141031.xlsx - V1-2 Page 5 / 47 11/18/2014 - 8:45 AM
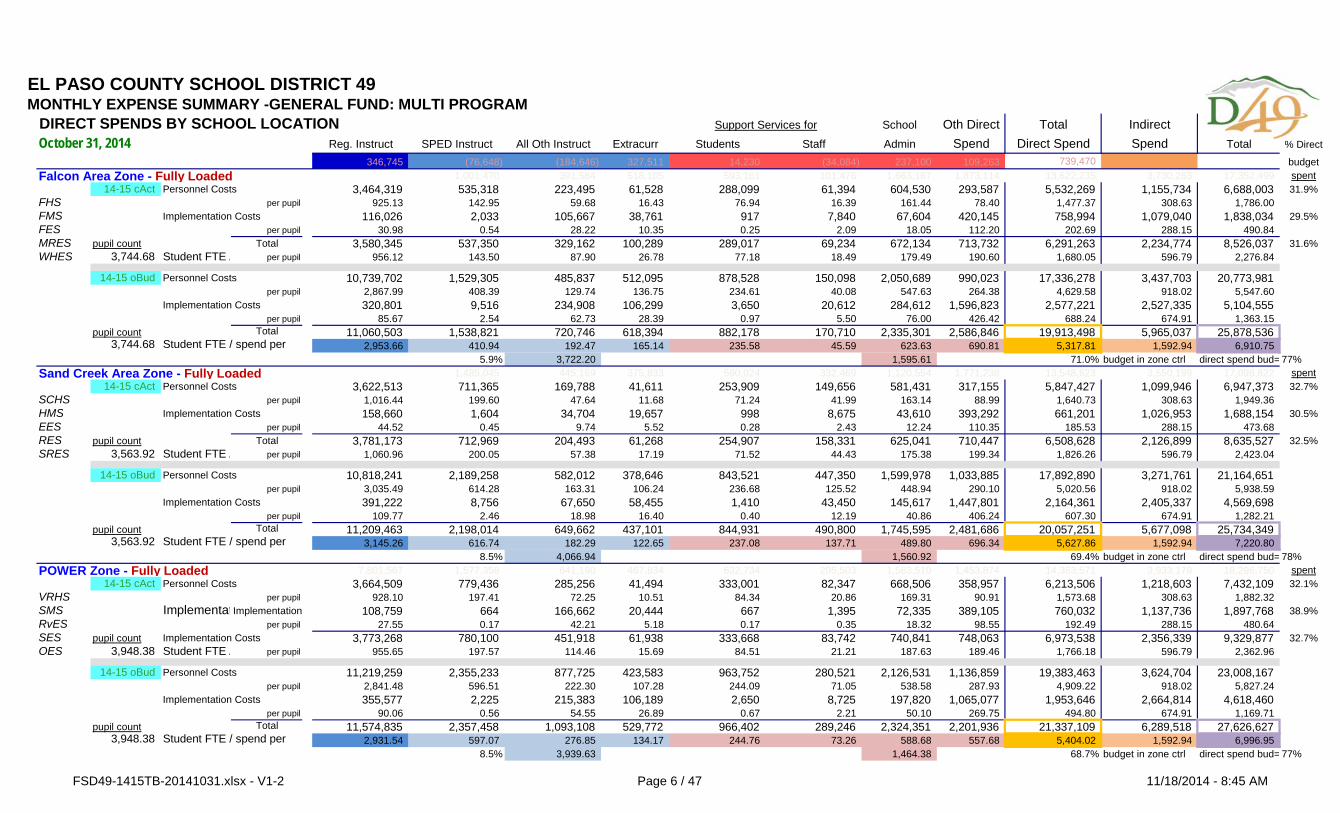
EL PASO COUNTY SCHOOL DISTRICT 49MONTHLY EXPENSE SUMMARY -GENERAL FUND: MULTI PROGRAM
DIRECT SPENDS BY SCHOOL LOCATION School Oth Direct Total IndirectReg. Instruct SPED Instruct All Oth Instruct Extracurr Students Staff Admin Spend Direct Spend Spend Total % Direct
346,745 (76,648) (184,646) 327,511 14,230 (34,084) 237,100 109,263 739,470 budgetFalcon Area Zone - Fully Loaded 1,001,470 391,584 518,105 593,161 101,476 1,663,167 1,873,114 13,622,235 3,730,263 17,352,499 spent
14-15 cAct Personnel Costs 3,464,319 535,318 223,495 61,528 288,099 61,394 604,530 293,587 5,532,269 1,155,734 6,688,003 31.9%FHS per pupil 925.13 142.95 59.68 16.43 76.94 16.39 161.44 78.40 1,477.37 308.63 1,786.00 FMS Implementation Costs 116,026 2,033 105,667 38,761 917 7,840 67,604 420,145 758,994 1,079,040 1,838,034 29.5%FES per pupil 30.98 0.54 28.22 10.35 0.25 2.09 18.05 112.20 202.69 288.15 490.84 MRES pupil count Total 3,580,345 537,350 329,162 100,289 289,017 69,234 672,134 713,732 6,291,263 2,234,774 8,526,037 31.6%WHES 3,744.68 Student FTE / per pupil 956.12 143.50 87.90 26.78 77.18 18.49 179.49 190.60 1,680.05 596.79 2,276.84
14-15 oBud Personnel Costs 10,739,702 1,529,305 485,837 512,095 878,528 150,098 2,050,689 990,023 17,336,278 3,437,703 20,773,981 per pupil 2,867.99 408.39 129.74 136.75 234.61 40.08 547.63 264.38 4,629.58 918.02 5,547.60
Implementation Costs 320,801 9,516 234,908 106,299 3,650 20,612 284,612 1,596,823 2,577,221 2,527,335 5,104,555 per pupil 85.67 2.54 62.73 28.39 0.97 5.50 76.00 426.42 688.24 674.91 1,363.15
pupil count Total 11,060,503 1,538,821 720,746 618,394 882,178 170,710 2,335,301 2,586,846 19,913,498 5,965,037 25,878,536 3,744.68 Student FTE / spend per 2,953.66 410.94 192.47 165.14 235.58 45.59 623.63 690.81 5,317.81 1,592.94 6,910.75
5.9% 3,722.20 1,595.61 71.0% budget in zone ctrl direct spend bud= 77%Sand Creek Area Zone - Fully Loaded 1,485,045 445,169 375,833 590,024 332,469 1,120,554 1,771,238 13,548,623 3,550,199 17,098,822 spent
14-15 cAct Personnel Costs 3,622,513 711,365 169,788 41,611 253,909 149,656 581,431 317,155 5,847,427 1,099,946 6,947,373 32.7%SCHS per pupil 1,016.44 199.60 47.64 11.68 71.24 41.99 163.14 88.99 1,640.73 308.63 1,949.36 HMS Implementation Costs 158,660 1,604 34,704 19,657 998 8,675 43,610 393,292 661,201 1,026,953 1,688,154 30.5%EES per pupil 44.52 0.45 9.74 5.52 0.28 2.43 12.24 110.35 185.53 288.15 473.68 RES pupil count Total 3,781,173 712,969 204,493 61,268 254,907 158,331 625,041 710,447 6,508,628 2,126,899 8,635,527 32.5%SRES 3,563.92 Student FTE / per pupil 1,060.96 200.05 57.38 17.19 71.52 44.43 175.38 199.34 1,826.26 596.79 2,423.04
14-15 oBud Personnel Costs 10,818,241 2,189,258 582,012 378,646 843,521 447,350 1,599,978 1,033,885 17,892,890 3,271,761 21,164,651 per pupil 3,035.49 614.28 163.31 106.24 236.68 125.52 448.94 290.10 5,020.56 918.02 5,938.59
Implementation Costs 391,222 8,756 67,650 58,455 1,410 43,450 145,617 1,447,801 2,164,361 2,405,337 4,569,698 per pupil 109.77 2.46 18.98 16.40 0.40 12.19 40.86 406.24 607.30 674.91 1,282.21
pupil count Total 11,209,463 2,198,014 649,662 437,101 844,931 490,800 1,745,595 2,481,686 20,057,251 5,677,098 25,734,349 3,563.92 Student FTE / spend per 3,145.26 616.74 182.29 122.65 237.08 137.71 489.80 696.34 5,627.86 1,592.94 7,220.80
8.5% 4,066.94 1,560.92 69.4% budget in zone ctrl direct spend bud= 78%POWER Zone - Fully Loaded 7,801,567 1,577,358 641,190 467,834 632,734 205,503 1,583,510 1,453,874 14,363,571 3,933,179 18,296,750 spent
14-15 cAct Personnel Costs 3,664,509 779,436 285,256 41,494 333,001 82,347 668,506 358,957 6,213,506 1,218,603 7,432,109 32.1%VRHS per pupil 928.10 197.41 72.25 10.51 84.34 20.86 169.31 90.91 1,573.68 308.63 1,882.32 SMS ImplementatImplementation 108,759 664 166,662 20,444 667 1,395 72,335 389,105 760,032 1,137,736 1,897,768 38.9%RvES per pupil 27.55 0.17 42.21 5.18 0.17 0.35 18.32 98.55 192.49 288.15 480.64 SES pupil count Implementation Costs 3,773,268 780,100 451,918 61,938 333,668 83,742 740,841 748,063 6,973,538 2,356,339 9,329,877 32.7%OES 3,948.38 Student FTE / per pupil 955.65 197.57 114.46 15.69 84.51 21.21 187.63 189.46 1,766.18 596.79 2,362.96
14-15 oBud Personnel Costs 11,219,259 2,355,233 877,725 423,583 963,752 280,521 2,126,531 1,136,859 19,383,463 3,624,704 23,008,167 per pupil 2,841.48 596.51 222.30 107.28 244.09 71.05 538.58 287.93 4,909.22 918.02 5,827.24
Implementation Costs 355,577 2,225 215,383 106,189 2,650 8,725 197,820 1,065,077 1,953,646 2,664,814 4,618,460 per pupil 90.06 0.56 54.55 26.89 0.67 2.21 50.10 269.75 494.80 674.91 1,169.71
pupil count Total 11,574,835 2,357,458 1,093,108 529,772 966,402 289,246 2,324,351 2,201,936 21,337,109 6,289,518 27,626,627 3,948.38 Student FTE / spend per 2,931.54 597.07 276.85 134.17 244.76 73.26 588.68 557.68 5,404.02 1,592.94 6,996.95
8.5% 3,939.63 1,464.38 68.7% budget in zone ctrl direct spend bud= 77%
Support Services for
October 31, 2014
FSD49-1415TB-20141031.xlsx - V1-2 Page 6 / 47 11/18/2014 - 8:45 AM
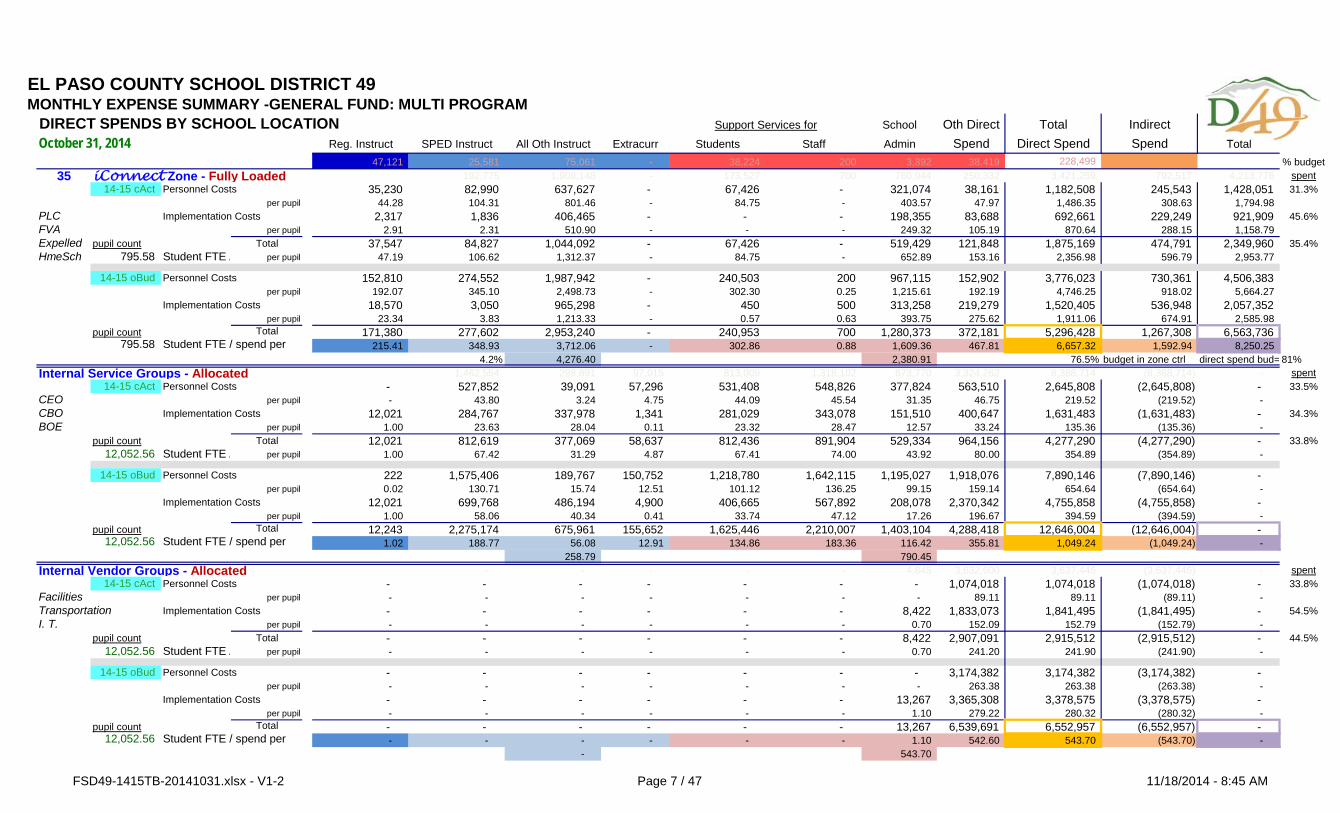
EL PASO COUNTY SCHOOL DISTRICT 49MONTHLY EXPENSE SUMMARY -GENERAL FUND: MULTI PROGRAM
DIRECT SPENDS BY SCHOOL LOCATION School Oth Direct Total IndirectReg. Instruct SPED Instruct All Oth Instruct Extracurr Students Staff Admin Spend Direct Spend Spend Total
47,121 25,581 75,061 - 38,224 200 3,892 38,419 228,499 % budget35 iConnect Zone - Fully Loaded 192,775 1,909,148 - 173,527 700 760,944 250,332 3,421,259 792,517 4,213,776 spent
14-15 cAct Personnel Costs 35,230 82,990 637,627 - 67,426 - 321,074 38,161 1,182,508 245,543 1,428,051 31.3%per pupil 44.28 104.31 801.46 - 84.75 - 403.57 47.97 1,486.35 308.63 1,794.98
PLC Implementation Costs 2,317 1,836 406,465 - - - 198,355 83,688 692,661 229,249 921,909 45.6%FVA per pupil 2.91 2.31 510.90 - - - 249.32 105.19 870.64 288.15 1,158.79 Expelled pupil count Total 37,547 84,827 1,044,092 - 67,426 - 519,429 121,848 1,875,169 474,791 2,349,960 35.4%HmeSch 795.58 Student FTE / per pupil 47.19 106.62 1,312.37 - 84.75 - 652.89 153.16 2,356.98 596.79 2,953.77
14-15 oBud Personnel Costs 152,810 274,552 1,987,942 - 240,503 200 967,115 152,902 3,776,023 730,361 4,506,383 per pupil 192.07 345.10 2,498.73 - 302.30 0.25 1,215.61 192.19 4,746.25 918.02 5,664.27
Implementation Costs 18,570 3,050 965,298 - 450 500 313,258 219,279 1,520,405 536,948 2,057,352 per pupil 23.34 3.83 1,213.33 - 0.57 0.63 393.75 275.62 1,911.06 674.91 2,585.98
pupil count Total 171,380 277,602 2,953,240 - 240,953 700 1,280,373 372,181 5,296,428 1,267,308 6,563,736 795.58 Student FTE / spend per 215.41 348.93 3,712.06 - 302.86 0.88 1,609.36 467.81 6,657.32 1,592.94 8,250.25
4.2% 4,276.40 2,380.91 76.5% budget in zone ctrl direct spend bud= 81%Internal Service Groups - Allocated 1,462,554 298,891 97,015 813,009 1,318,102 873,770 3,324,262 8,368,714 (8,368,714) - spent
14-15 cAct Personnel Costs - 527,852 39,091 57,296 531,408 548,826 377,824 563,510 2,645,808 (2,645,808) - 33.5%CEO per pupil - 43.80 3.24 4.75 44.09 45.54 31.35 46.75 219.52 (219.52) - CBO Implementation Costs 12,021 284,767 337,978 1,341 281,029 343,078 151,510 400,647 1,631,483 (1,631,483) - 34.3%BOE per pupil 1.00 23.63 28.04 0.11 23.32 28.47 12.57 33.24 135.36 (135.36) -
pupil count Total 12,021 812,619 377,069 58,637 812,436 891,904 529,334 964,156 4,277,290 (4,277,290) - 33.8%12,052.56 Student FTE / per pupil 1.00 67.42 31.29 4.87 67.41 74.00 43.92 80.00 354.89 (354.89) -
14-15 oBud Personnel Costs 222 1,575,406 189,767 150,752 1,218,780 1,642,115 1,195,027 1,918,076 7,890,146 (7,890,146) - per pupil 0.02 130.71 15.74 12.51 101.12 136.25 99.15 159.14 654.64 (654.64) -
Implementation Costs 12,021 699,768 486,194 4,900 406,665 567,892 208,078 2,370,342 4,755,858 (4,755,858) - per pupil 1.00 58.06 40.34 0.41 33.74 47.12 17.26 196.67 394.59 (394.59) -
pupil count Total 12,243 2,275,174 675,961 155,652 1,625,446 2,210,007 1,403,104 4,288,418 12,646,004 (12,646,004) - 12,052.56 Student FTE / spend per 1.02 188.77 56.08 12.91 134.86 183.36 116.42 355.81 1,049.24 (1,049.24) -
258.79 790.45 Internal Vendor Groups - Allocated - - - - - 4,845 3,632,600 3,637,445 (3,637,445) - spent
14-15 cAct Personnel Costs - - - - - - - 1,074,018 1,074,018 (1,074,018) - 33.8%Facilities per pupil - - - - - - - 89.11 89.11 (89.11) - Transportation Implementation Costs - - - - - - 8,422 1,833,073 1,841,495 (1,841,495) - 54.5%I. T. per pupil - - - - - - 0.70 152.09 152.79 (152.79) -
pupil count Total - - - - - - 8,422 2,907,091 2,915,512 (2,915,512) - 44.5%12,052.56 Student FTE / per pupil - - - - - - 0.70 241.20 241.90 (241.90) -
14-15 oBud Personnel Costs - - - - - - - 3,174,382 3,174,382 (3,174,382) - per pupil - - - - - - - 263.38 263.38 (263.38) -
Implementation Costs - - - - - - 13,267 3,365,308 3,378,575 (3,378,575) - per pupil - - - - - - 1.10 279.22 280.32 (280.32) -
pupil count Total - - - - - - 13,267 6,539,691 6,552,957 (6,552,957) - 12,052.56 Student FTE / spend per - - - - - - 1.10 542.60 543.70 (543.70) -
- 543.70
Support Services for
October 31, 2014
FSD49-1415TB-20141031.xlsx - V1-2 Page 7 / 47 11/18/2014 - 8:45 AM
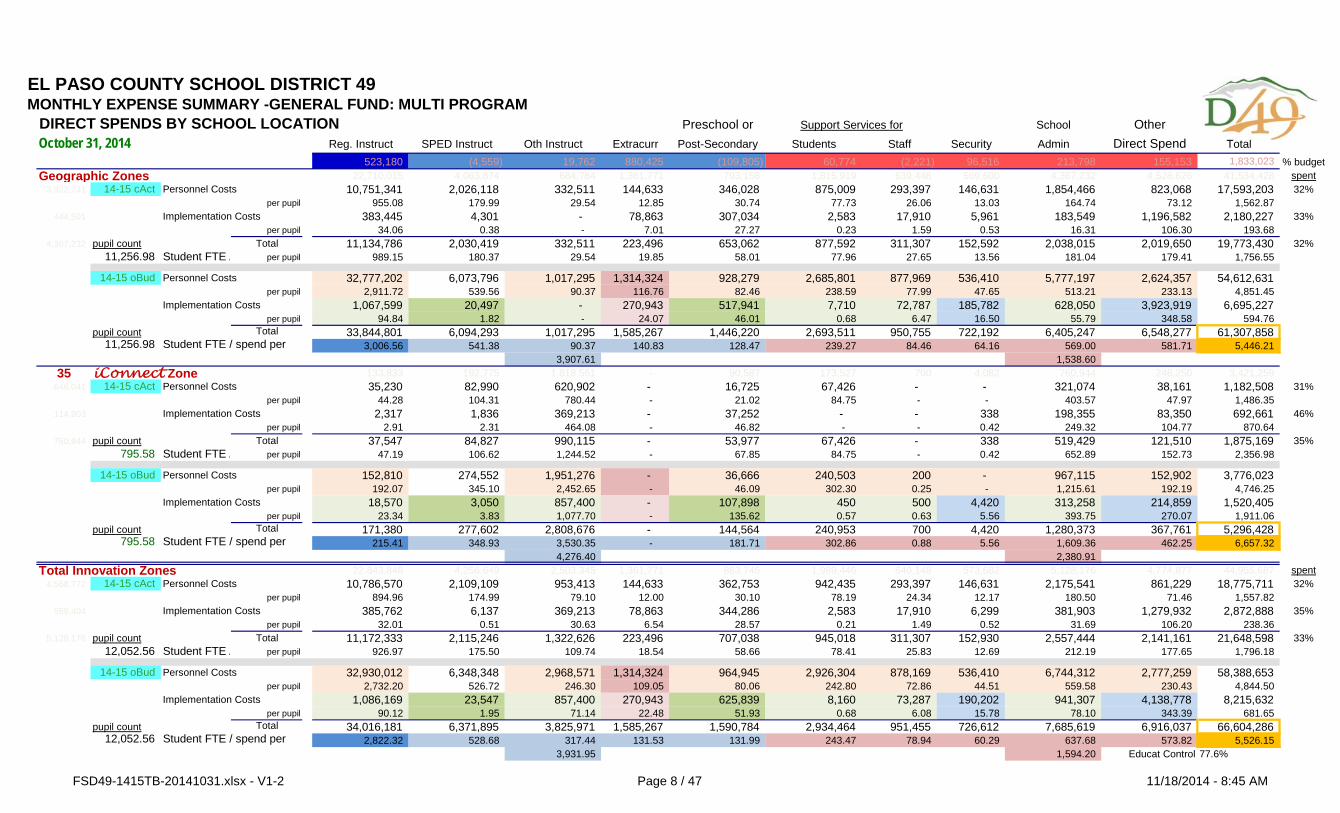
EL PASO COUNTY SCHOOL DISTRICT 49MONTHLY EXPENSE SUMMARY -GENERAL FUND: MULTI PROGRAM
DIRECT SPENDS BY SCHOOL LOCATION Preschool or School OtherReg. Instruct SPED Instruct Oth Instruct Extracurr Post-Secondary Students Staff Security Admin Direct Spend Total
523,180 (4,559) 19,762 880,425 (109,805) 60,774 (2,221) 96,516 213,798 155,153 1,833,023 % budgetGeographic Zones 22,710,015 4,063,874 684,784 1,361,771 793,158 1,815,919 639,448 569,600 4,367,232 4,528,626 41,534,428 spent
3,922,731 14-15 cAct Personnel Costs 10,751,341 2,026,118 332,511 144,633 346,028 875,009 293,397 146,631 1,854,466 823,068 17,593,203 32%per pupil 955.08 179.99 29.54 12.85 30.74 77.73 26.06 13.03 164.74 73.12 1,562.87
444,501 Implementation Costs 383,445 4,301 - 78,863 307,034 2,583 17,910 5,961 183,549 1,196,582 2,180,227 33%per pupil 34.06 0.38 - 7.01 27.27 0.23 1.59 0.53 16.31 106.30 193.68
4,367,232 pupil count Total 11,134,786 2,030,419 332,511 223,496 653,062 877,592 311,307 152,592 2,038,015 2,019,650 19,773,430 32%11,256.98 Student FTE / per pupil 989.15 180.37 29.54 19.85 58.01 77.96 27.65 13.56 181.04 179.41 1,756.55
14-15 oBud Personnel Costs 32,777,202 6,073,796 1,017,295 1,314,324 928,279 2,685,801 877,969 536,410 5,777,197 2,624,357 54,612,631 per pupil 2,911.72 539.56 90.37 116.76 82.46 238.59 77.99 47.65 513.21 233.13 4,851.45
Implementation Costs 1,067,599 20,497 - 270,943 517,941 7,710 72,787 185,782 628,050 3,923,919 6,695,227 per pupil 94.84 1.82 - 24.07 46.01 0.68 6.47 16.50 55.79 348.58 594.76
pupil count Total 33,844,801 6,094,293 1,017,295 1,585,267 1,446,220 2,693,511 950,755 722,192 6,405,247 6,548,277 61,307,858 11,256.98 Student FTE / spend per 3,006.56 541.38 90.37 140.83 128.47 239.27 84.46 64.16 569.00 581.71 5,446.21
3,907.61 1,538.60 35 iConnect Zone 133,833 192,775 1,818,561 - 90,587 173,527 700 4,082 760,944 246,250 3,421,259
646,041 14-15 cAct Personnel Costs 35,230 82,990 620,902 - 16,725 67,426 - - 321,074 38,161 1,182,508 31%per pupil 44.28 104.31 780.44 - 21.02 84.75 - - 403.57 47.97 1,486.35
114,903 Implementation Costs 2,317 1,836 369,213 - 37,252 - - 338 198,355 83,350 692,661 46%per pupil 2.91 2.31 464.08 - 46.82 - - 0.42 249.32 104.77 870.64
760,944 pupil count Total 37,547 84,827 990,115 - 53,977 67,426 - 338 519,429 121,510 1,875,169 35%795.58 Student FTE / per pupil 47.19 106.62 1,244.52 - 67.85 84.75 - 0.42 652.89 152.73 2,356.98
14-15 oBud Personnel Costs 152,810 274,552 1,951,276 - 36,666 240,503 200 - 967,115 152,902 3,776,023 per pupil 192.07 345.10 2,452.65 - 46.09 302.30 0.25 - 1,215.61 192.19 4,746.25
Implementation Costs 18,570 3,050 857,400 - 107,898 450 500 4,420 313,258 214,859 1,520,405 per pupil 23.34 3.83 1,077.70 - 135.62 0.57 0.63 5.56 393.75 270.07 1,911.06
pupil count Total 171,380 277,602 2,808,676 - 144,564 240,953 700 4,420 1,280,373 367,761 5,296,428 795.58 Student FTE / spend per 215.41 348.93 3,530.35 - 181.71 302.86 0.88 5.56 1,609.36 462.25 6,657.32
4,276.40 2,380.91 Total Innovation Zones 22,843,848 4,256,649 2,503,345 1,361,771 883,745 1,989,446 640,148 573,682 5,128,176 4,774,877 44,955,687 spent
4,568,772 14-15 cAct Personnel Costs 10,786,570 2,109,109 953,413 144,633 362,753 942,435 293,397 146,631 2,175,541 861,229 18,775,711 32%per pupil 894.96 174.99 79.10 12.00 30.10 78.19 24.34 12.17 180.50 71.46 1,557.82
559,404 Implementation Costs 385,762 6,137 369,213 78,863 344,286 2,583 17,910 6,299 381,903 1,279,932 2,872,888 35%per pupil 32.01 0.51 30.63 6.54 28.57 0.21 1.49 0.52 31.69 106.20 238.36
5,128,176 pupil count Total 11,172,333 2,115,246 1,322,626 223,496 707,038 945,018 311,307 152,930 2,557,444 2,141,161 21,648,598 33%12,052.56 Student FTE / per pupil 926.97 175.50 109.74 18.54 58.66 78.41 25.83 12.69 212.19 177.65 1,796.18
14-15 oBud Personnel Costs 32,930,012 6,348,348 2,968,571 1,314,324 964,945 2,926,304 878,169 536,410 6,744,312 2,777,259 58,388,653 per pupil 2,732.20 526.72 246.30 109.05 80.06 242.80 72.86 44.51 559.58 230.43 4,844.50
Implementation Costs 1,086,169 23,547 857,400 270,943 625,839 8,160 73,287 190,202 941,307 4,138,778 8,215,632 per pupil 90.12 1.95 71.14 22.48 51.93 0.68 6.08 15.78 78.10 343.39 681.65
pupil count Total 34,016,181 6,371,895 3,825,971 1,585,267 1,590,784 2,934,464 951,455 726,612 7,685,619 6,916,037 66,604,286 12,052.56 Student FTE / spend per 2,822.32 528.68 317.44 131.53 131.99 243.47 78.94 60.29 637.68 573.82 5,526.15
3,931.95 1,594.20 Educat Control 77.6%
October 31, 2014Support Services for
FSD49-1415TB-20141031.xlsx - V1-2 Page 8 / 47 11/18/2014 - 8:45 AM
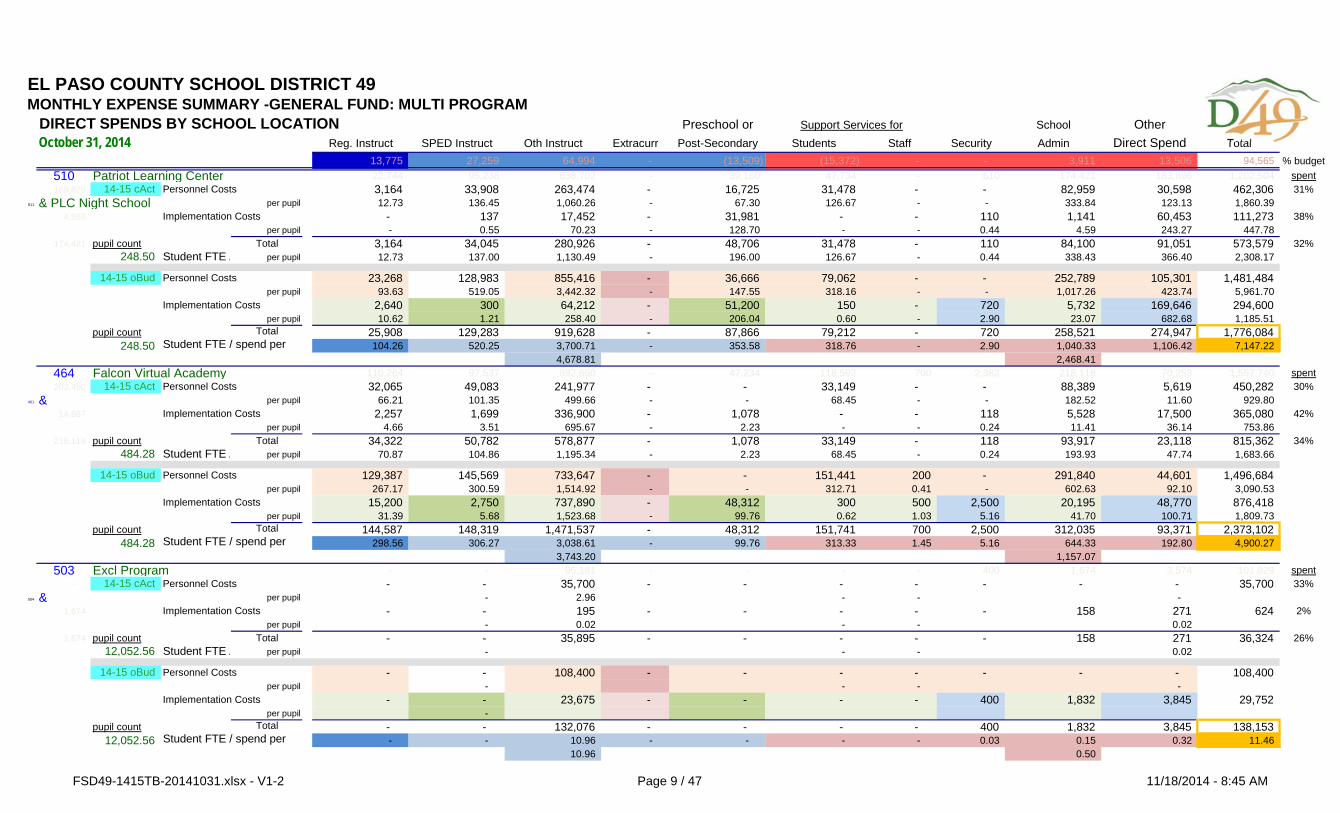
EL PASO COUNTY SCHOOL DISTRICT 49MONTHLY EXPENSE SUMMARY -GENERAL FUND: MULTI PROGRAM
DIRECT SPENDS BY SCHOOL LOCATION Preschool or School OtherReg. Instruct SPED Instruct Oth Instruct Extracurr Post-Secondary Students Staff Security Admin Direct Spend Total
13,775 27,259 64,994 - (13,509) (15,372) - - 3,911 13,506 94,565 % budget510 Patriot Learning Center 22,744 95,238 638,702 - 39,160 47,734 - 610 174,421 183,896 1,202,504 spent169,829 14-15 cAct Personnel Costs 3,164 33,908 263,474 - 16,725 31,478 - - 82,959 30,598 462,306 31%
511 & PLC Night School per pupil 12.73 136.45 1,060.26 - 67.30 126.67 - - 333.84 123.13 1,860.39 4,592 Implementation Costs - 137 17,452 - 31,981 - - 110 1,141 60,453 111,273 38%
per pupil - 0.55 70.23 - 128.70 - - 0.44 4.59 243.27 447.78 174,421 pupil count Total 3,164 34,045 280,926 - 48,706 31,478 - 110 84,100 91,051 573,579 32%
248.50 Student FTE / per pupil 12.73 137.00 1,130.49 - 196.00 126.67 - 0.44 338.43 366.40 2,308.17
14-15 oBud Personnel Costs 23,268 128,983 855,416 - 36,666 79,062 - - 252,789 105,301 1,481,484 per pupil 93.63 519.05 3,442.32 - 147.55 318.16 - - 1,017.26 423.74 5,961.70
Implementation Costs 2,640 300 64,212 - 51,200 150 - 720 5,732 169,646 294,600 per pupil 10.62 1.21 258.40 - 206.04 0.60 - 2.90 23.07 682.68 1,185.51
pupil count Total 25,908 129,283 919,628 - 87,866 79,212 - 720 258,521 274,947 1,776,084 248.50 Student FTE / spend per 104.26 520.25 3,700.71 - 353.58 318.76 - 2.90 1,040.33 1,106.42 7,147.22
4,678.81 2,468.41 464 Falcon Virtual Academy 110,264 97,537 892,660 - 47,234 118,592 700 2,382 218,118 70,253 1,557,740 spent203,450 14-15 cAct Personnel Costs 32,065 49,083 241,977 - - 33,149 - - 88,389 5,619 450,282 30%
461 & per pupil 66.21 101.35 499.66 - - 68.45 - - 182.52 11.60 929.80 14,667 Implementation Costs 2,257 1,699 336,900 - 1,078 - - 118 5,528 17,500 365,080 42%
per pupil 4.66 3.51 695.67 - 2.23 - - 0.24 11.41 36.14 753.86 218,118 pupil count Total 34,322 50,782 578,877 - 1,078 33,149 - 118 93,917 23,118 815,362 34%
484.28 Student FTE / per pupil 70.87 104.86 1,195.34 - 2.23 68.45 - 0.24 193.93 47.74 1,683.66
14-15 oBud Personnel Costs 129,387 145,569 733,647 - - 151,441 200 - 291,840 44,601 1,496,684 per pupil 267.17 300.59 1,514.92 - - 312.71 0.41 - 602.63 92.10 3,090.53
Implementation Costs 15,200 2,750 737,890 - 48,312 300 500 2,500 20,195 48,770 876,418 per pupil 31.39 5.68 1,523.68 - 99.76 0.62 1.03 5.16 41.70 100.71 1,809.73
pupil count Total 144,587 148,319 1,471,537 - 48,312 151,741 700 2,500 312,035 93,371 2,373,102 484.28 Student FTE / spend per 298.56 306.27 3,038.61 - 99.76 313.33 1.45 5.16 644.33 192.80 4,900.27
3,743.20 1,157.07 503 Excl Program - - 96,181 - - - - 400 1,674 3,574 101,829 spent
- 14-15 cAct Personnel Costs - - 35,700 - - - - - - - 35,700 33%504 & per pupil - 2.96 - - -
1,674 Implementation Costs - - 195 - - - - - 158 271 624 2%per pupil - 0.02 - - 0.02
1,674 pupil count Total - - 35,895 - - - - - 158 271 36,324 26%12,052.56 Student FTE / per pupil - - - 0.02
14-15 oBud Personnel Costs - - 108,400 - - - - - - - 108,400 per pupil - - - -
Implementation Costs - - 23,675 - - - - 400 1,832 3,845 29,752 per pupil -
pupil count Total - - 132,076 - - - - 400 1,832 3,845 138,153 12,052.56 Student FTE / spend per - - 10.96 - - - - 0.03 0.15 0.32 11.46
10.96 0.50
October 31, 2014Support Services for
FSD49-1415TB-20141031.xlsx - V1-2 Page 9 / 47 11/18/2014 - 8:45 AM
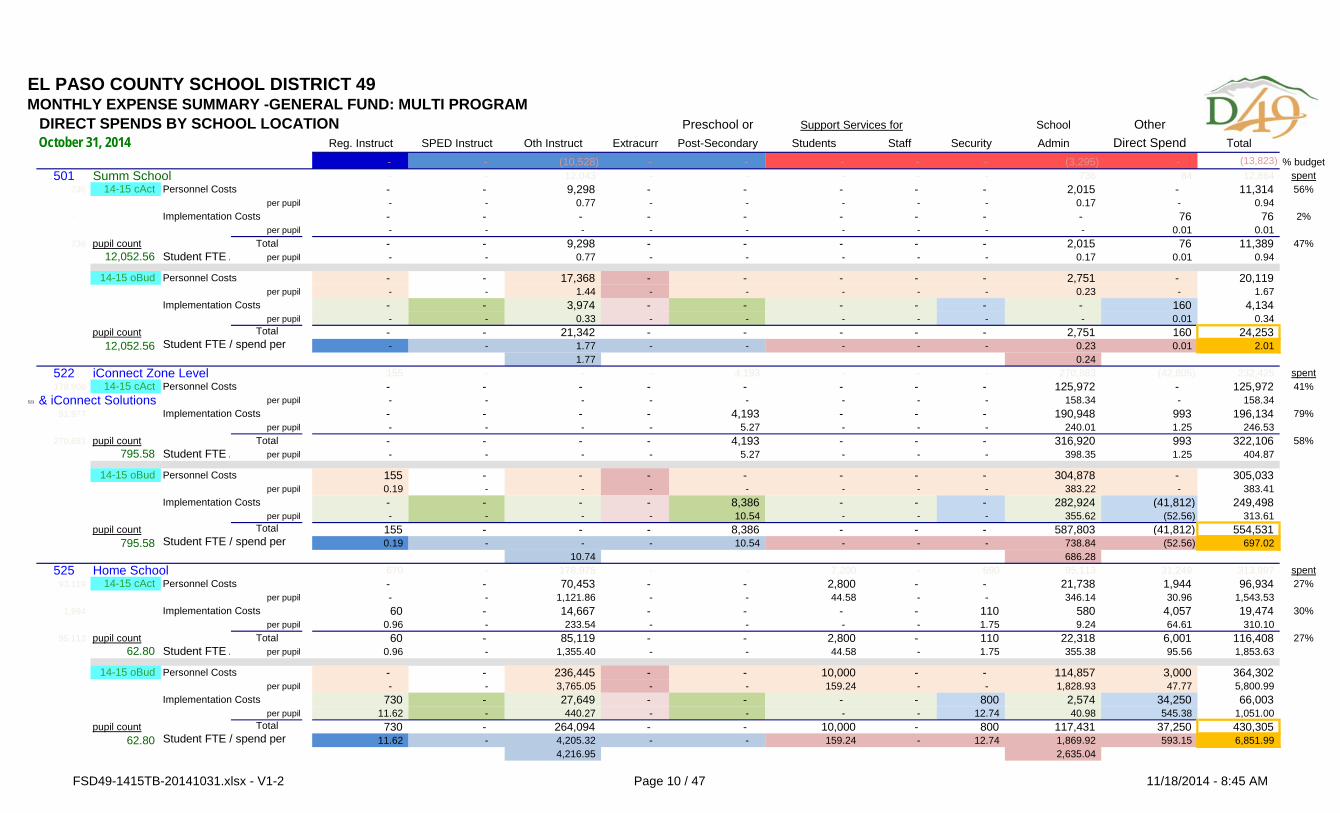
EL PASO COUNTY SCHOOL DISTRICT 49MONTHLY EXPENSE SUMMARY -GENERAL FUND: MULTI PROGRAM
DIRECT SPENDS BY SCHOOL LOCATION Preschool or School OtherReg. Instruct SPED Instruct Oth Instruct Extracurr Post-Secondary Students Staff Security Admin Direct Spend Total
- - (10,528) - - - - - (3,295) - (13,823) % budget501 Summ School - - 12,043 - - - - - 736 84 12,864 spent
736 14-15 cAct Personnel Costs - - 9,298 - - - - - 2,015 - 11,314 56%per pupil - - 0.77 - - - - - 0.17 - 0.94
- Implementation Costs - - - - - - - - - 76 76 2%per pupil - - - - - - - - - 0.01 0.01
736 pupil count Total - - 9,298 - - - - - 2,015 76 11,389 47%12,052.56 Student FTE / per pupil - - 0.77 - - - - - 0.17 0.01 0.94
14-15 oBud Personnel Costs - - 17,368 - - - - - 2,751 - 20,119 per pupil - - 1.44 - - - - - 0.23 - 1.67
Implementation Costs - - 3,974 - - - - - - 160 4,134 per pupil - - 0.33 - - - - - - 0.01 0.34
pupil count Total - - 21,342 - - - - - 2,751 160 24,253 12,052.56 Student FTE / spend per - - 1.77 - - - - - 0.23 0.01 2.01
1.77 0.24 522 iConnect Zone Level 155 - - - 4,193 - - - 270,883 (42,805) 232,425 spent178,906 14-15 cAct Personnel Costs - - - - - - - - 125,972 - 125,972 41%
523 & iConnect Solutions per pupil - - - - - - - - 158.34 - 158.34 91,977 Implementation Costs - - - - 4,193 - - - 190,948 993 196,134 79%
per pupil - - - - 5.27 - - - 240.01 1.25 246.53 270,883 pupil count Total - - - - 4,193 - - - 316,920 993 322,106 58%
795.58 Student FTE / per pupil - - - - 5.27 - - - 398.35 1.25 404.87
14-15 oBud Personnel Costs 155 - - - - - - - 304,878 - 305,033 per pupil 0.19 - - - - - - - 383.22 - 383.41
Implementation Costs - - - - 8,386 - - - 282,924 (41,812) 249,498 per pupil - - - - 10.54 - - - 355.62 (52.56) 313.61
pupil count Total 155 - - - 8,386 - - - 587,803 (41,812) 554,531 795.58 Student FTE / spend per 0.19 - - - 10.54 - - - 738.84 (52.56) 697.02
10.74 686.28 525 Home School 670 - 178,975 - - 7,200 - 690 95,113 31,249 313,897 spent
93,119 14-15 cAct Personnel Costs - - 70,453 - - 2,800 - - 21,738 1,944 96,934 27%per pupil - - 1,121.86 - - 44.58 - - 346.14 30.96 1,543.53
1,994 Implementation Costs 60 - 14,667 - - - - 110 580 4,057 19,474 30%per pupil 0.96 - 233.54 - - - - 1.75 9.24 64.61 310.10
95,113 pupil count Total 60 - 85,119 - - 2,800 - 110 22,318 6,001 116,408 27%62.80 Student FTE / per pupil 0.96 - 1,355.40 - - 44.58 - 1.75 355.38 95.56 1,853.63
14-15 oBud Personnel Costs - - 236,445 - - 10,000 - - 114,857 3,000 364,302 per pupil - - 3,765.05 - - 159.24 - - 1,828.93 47.77 5,800.99
Implementation Costs 730 - 27,649 - - - - 800 2,574 34,250 66,003 per pupil 11.62 - 440.27 - - - - 12.74 40.98 545.38 1,051.00
pupil count Total 730 - 264,094 - - 10,000 - 800 117,431 37,250 430,305 62.80 Student FTE / spend per 11.62 - 4,205.32 - - 159.24 - 12.74 1,869.92 593.15 6,851.99
4,216.95 2,635.04
October 31, 2014Support Services for
FSD49-1415TB-20141031.xlsx - V1-2 Page 10 / 47 11/18/2014 - 8:45 AM
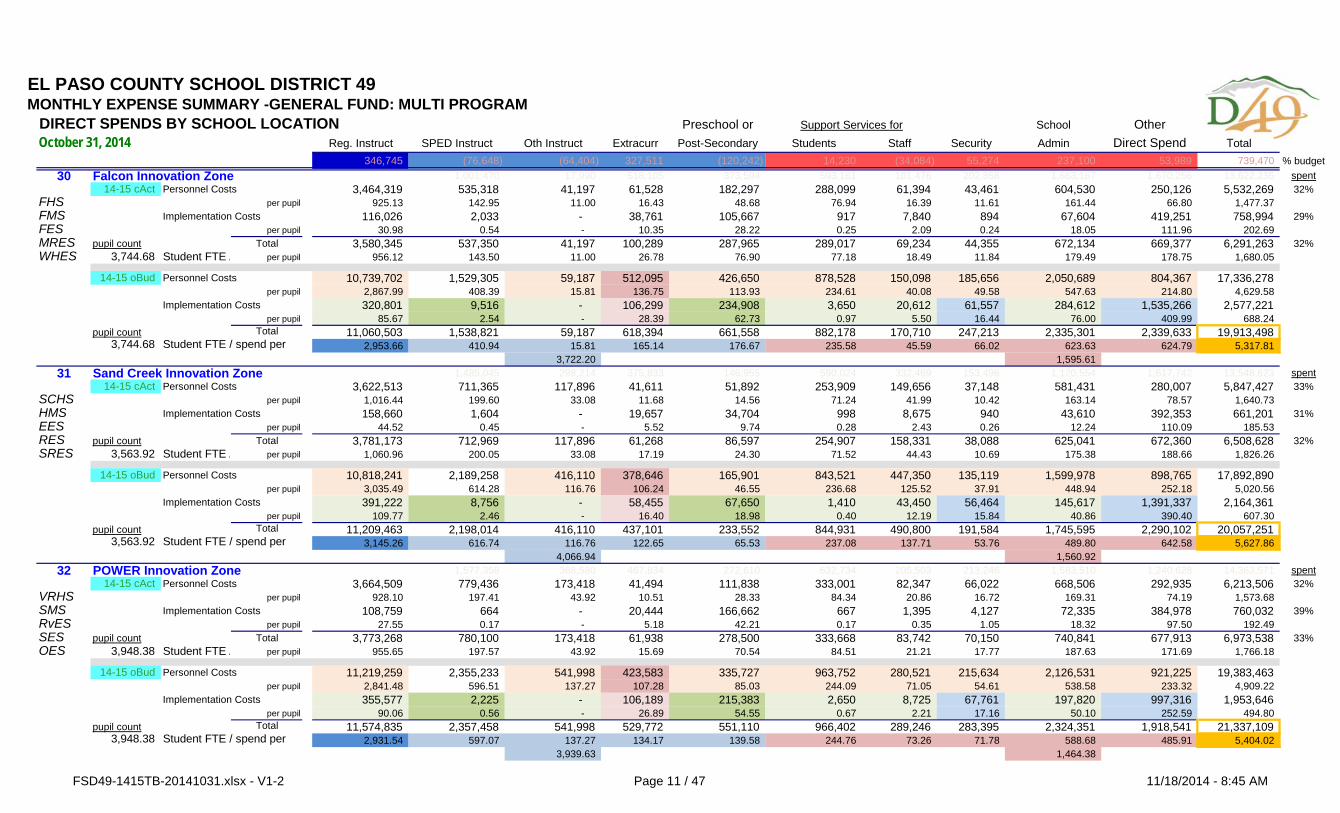
EL PASO COUNTY SCHOOL DISTRICT 49MONTHLY EXPENSE SUMMARY -GENERAL FUND: MULTI PROGRAM
DIRECT SPENDS BY SCHOOL LOCATION Preschool or School OtherReg. Instruct SPED Instruct Oth Instruct Extracurr Post-Secondary Students Staff Security Admin Direct Spend Total
346,745 (76,648) (64,404) 327,511 (120,242) 14,230 (34,084) 55,274 237,100 53,989 739,470 % budget30 Falcon Innovation Zone 1,001,470 17,990 518,105 373,594 593,161 101,476 202,858 1,663,167 1,670,256 13,622,235 spent
14-15 cAct Personnel Costs 3,464,319 535,318 41,197 61,528 182,297 288,099 61,394 43,461 604,530 250,126 5,532,269 32%FHS per pupil 925.13 142.95 11.00 16.43 48.68 76.94 16.39 11.61 161.44 66.80 1,477.37 FMS Implementation Costs 116,026 2,033 - 38,761 105,667 917 7,840 894 67,604 419,251 758,994 29%FES per pupil 30.98 0.54 - 10.35 28.22 0.25 2.09 0.24 18.05 111.96 202.69 MRES pupil count Total 3,580,345 537,350 41,197 100,289 287,965 289,017 69,234 44,355 672,134 669,377 6,291,263 32%WHES 3,744.68 Student FTE / per pupil 956.12 143.50 11.00 26.78 76.90 77.18 18.49 11.84 179.49 178.75 1,680.05
14-15 oBud Personnel Costs 10,739,702 1,529,305 59,187 512,095 426,650 878,528 150,098 185,656 2,050,689 804,367 17,336,278 per pupil 2,867.99 408.39 15.81 136.75 113.93 234.61 40.08 49.58 547.63 214.80 4,629.58
Implementation Costs 320,801 9,516 - 106,299 234,908 3,650 20,612 61,557 284,612 1,535,266 2,577,221 per pupil 85.67 2.54 - 28.39 62.73 0.97 5.50 16.44 76.00 409.99 688.24
pupil count Total 11,060,503 1,538,821 59,187 618,394 661,558 882,178 170,710 247,213 2,335,301 2,339,633 19,913,498 3,744.68 Student FTE / spend per 2,953.66 410.94 15.81 165.14 176.67 235.58 45.59 66.02 623.63 624.79 5,317.81
3,722.20 1,595.61 31 Sand Creek Innovation Zone 1,485,045 298,214 375,833 146,955 590,024 332,469 153,496 1,120,554 1,617,742 13,548,623 spent
14-15 cAct Personnel Costs 3,622,513 711,365 117,896 41,611 51,892 253,909 149,656 37,148 581,431 280,007 5,847,427 33%SCHS per pupil 1,016.44 199.60 33.08 11.68 14.56 71.24 41.99 10.42 163.14 78.57 1,640.73 HMS Implementation Costs 158,660 1,604 - 19,657 34,704 998 8,675 940 43,610 392,353 661,201 31%EES per pupil 44.52 0.45 - 5.52 9.74 0.28 2.43 0.26 12.24 110.09 185.53 RES pupil count Total 3,781,173 712,969 117,896 61,268 86,597 254,907 158,331 38,088 625,041 672,360 6,508,628 32%SRES 3,563.92 Student FTE / per pupil 1,060.96 200.05 33.08 17.19 24.30 71.52 44.43 10.69 175.38 188.66 1,826.26
14-15 oBud Personnel Costs 10,818,241 2,189,258 416,110 378,646 165,901 843,521 447,350 135,119 1,599,978 898,765 17,892,890 per pupil 3,035.49 614.28 116.76 106.24 46.55 236.68 125.52 37.91 448.94 252.18 5,020.56
Implementation Costs 391,222 8,756 - 58,455 67,650 1,410 43,450 56,464 145,617 1,391,337 2,164,361 per pupil 109.77 2.46 - 16.40 18.98 0.40 12.19 15.84 40.86 390.40 607.30
pupil count Total 11,209,463 2,198,014 416,110 437,101 233,552 844,931 490,800 191,584 1,745,595 2,290,102 20,057,251 3,563.92 Student FTE / spend per 3,145.26 616.74 116.76 122.65 65.53 237.08 137.71 53.76 489.80 642.58 5,627.86
4,066.94 1,560.92 32 POWER Innovation Zone 1,577,358 368,580 467,834 272,610 632,734 205,503 213,246 1,583,510 1,240,628 14,363,571 spent
14-15 cAct Personnel Costs 3,664,509 779,436 173,418 41,494 111,838 333,001 82,347 66,022 668,506 292,935 6,213,506 32%VRHS per pupil 928.10 197.41 43.92 10.51 28.33 84.34 20.86 16.72 169.31 74.19 1,573.68 SMS Implementation Costs 108,759 664 - 20,444 166,662 667 1,395 4,127 72,335 384,978 760,032 39%RvES per pupil 27.55 0.17 - 5.18 42.21 0.17 0.35 1.05 18.32 97.50 192.49 SES pupil count Total 3,773,268 780,100 173,418 61,938 278,500 333,668 83,742 70,150 740,841 677,913 6,973,538 33%OES 3,948.38 Student FTE / per pupil 955.65 197.57 43.92 15.69 70.54 84.51 21.21 17.77 187.63 171.69 1,766.18
14-15 oBud Personnel Costs 11,219,259 2,355,233 541,998 423,583 335,727 963,752 280,521 215,634 2,126,531 921,225 19,383,463 per pupil 2,841.48 596.51 137.27 107.28 85.03 244.09 71.05 54.61 538.58 233.32 4,909.22
Implementation Costs 355,577 2,225 - 106,189 215,383 2,650 8,725 67,761 197,820 997,316 1,953,646 per pupil 90.06 0.56 - 26.89 54.55 0.67 2.21 17.16 50.10 252.59 494.80
pupil count Total 11,574,835 2,357,458 541,998 529,772 551,110 966,402 289,246 283,395 2,324,351 1,918,541 21,337,109 3,948.38 Student FTE / spend per 2,931.54 597.07 137.27 134.17 139.58 244.76 73.26 71.78 588.68 485.91 5,404.02
3,939.63 1,464.38
October 31, 2014Support Services for
FSD49-1415TB-20141031.xlsx - V1-2 Page 11 / 47 11/18/2014 - 8:45 AM
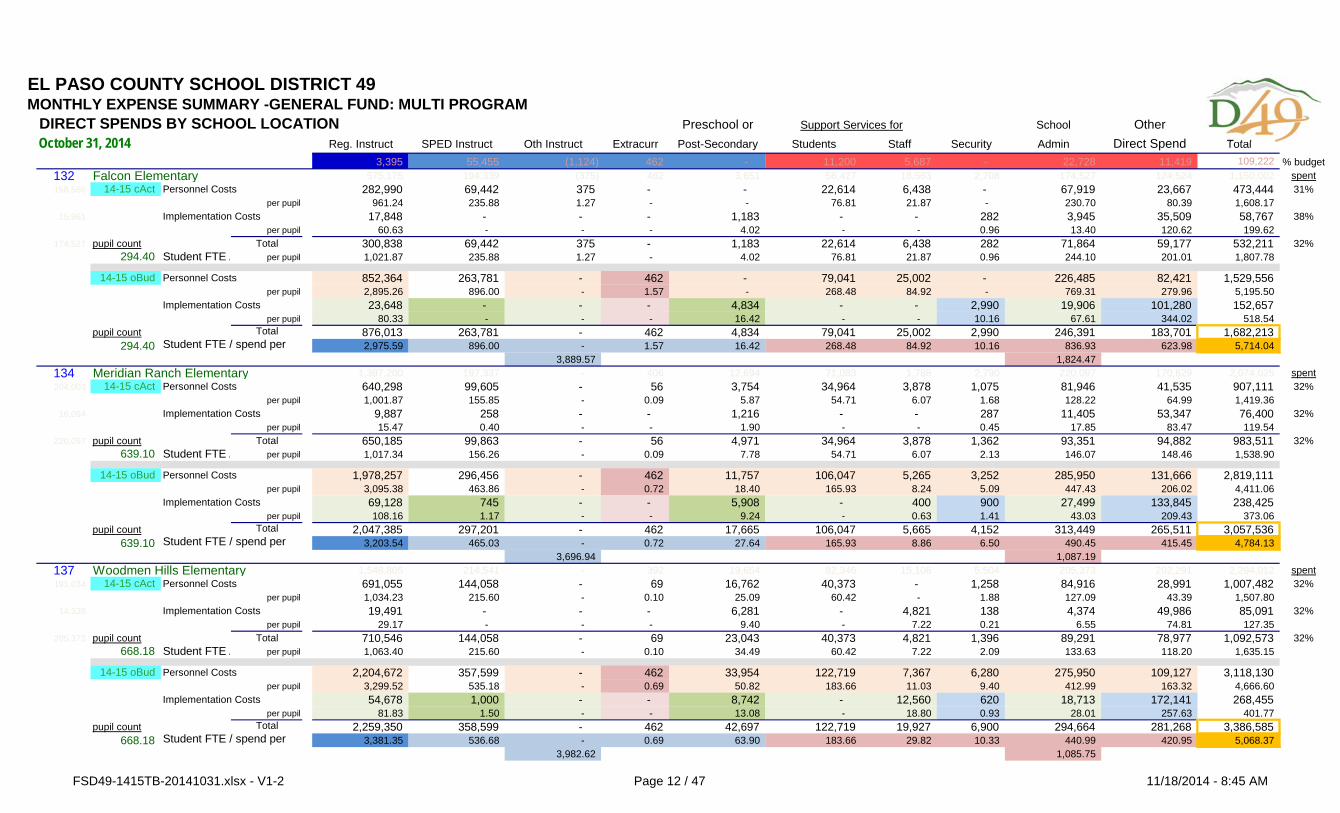
EL PASO COUNTY SCHOOL DISTRICT 49MONTHLY EXPENSE SUMMARY -GENERAL FUND: MULTI PROGRAM
DIRECT SPENDS BY SCHOOL LOCATION Preschool or School OtherReg. Instruct SPED Instruct Oth Instruct Extracurr Post-Secondary Students Staff Security Admin Direct Spend Total
3,395 55,455 (1,124) 462 - 11,200 5,687 - 22,728 11,419 109,222 % budget132 Falcon Elementary 575,175 194,339 (375) 462 3,651 56,427 18,563 2,708 174,527 124,524 1,150,002 spent158,566 14-15 cAct Personnel Costs 282,990 69,442 375 - - 22,614 6,438 - 67,919 23,667 473,444 31%
per pupil 961.24 235.88 1.27 - - 76.81 21.87 - 230.70 80.39 1,608.17 15,961 Implementation Costs 17,848 - - - 1,183 - - 282 3,945 35,509 58,767 38%
per pupil 60.63 - - - 4.02 - - 0.96 13.40 120.62 199.62 174,527 pupil count Total 300,838 69,442 375 - 1,183 22,614 6,438 282 71,864 59,177 532,211 32%
294.40 Student FTE / per pupil 1,021.87 235.88 1.27 - 4.02 76.81 21.87 0.96 244.10 201.01 1,807.78
14-15 oBud Personnel Costs 852,364 263,781 - 462 - 79,041 25,002 - 226,485 82,421 1,529,556 per pupil 2,895.26 896.00 - 1.57 - 268.48 84.92 - 769.31 279.96 5,195.50
Implementation Costs 23,648 - - - 4,834 - - 2,990 19,906 101,280 152,657 per pupil 80.33 - - - 16.42 - - 10.16 67.61 344.02 518.54
pupil count Total 876,013 263,781 - 462 4,834 79,041 25,002 2,990 246,391 183,701 1,682,213 294.40 Student FTE / spend per 2,975.59 896.00 - 1.57 16.42 268.48 84.92 10.16 836.93 623.98 5,714.04
3,889.57 1,824.47 134 Meridian Ranch Elementary 1,397,200 197,337 - 406 12,694 71,083 1,788 2,790 220,097 170,629 2,074,025 spent204,003 14-15 cAct Personnel Costs 640,298 99,605 - 56 3,754 34,964 3,878 1,075 81,946 41,535 907,111 32%
per pupil 1,001.87 155.85 - 0.09 5.87 54.71 6.07 1.68 128.22 64.99 1,419.36 16,094 Implementation Costs 9,887 258 - - 1,216 - - 287 11,405 53,347 76,400 32%
per pupil 15.47 0.40 - - 1.90 - - 0.45 17.85 83.47 119.54 220,097 pupil count Total 650,185 99,863 - 56 4,971 34,964 3,878 1,362 93,351 94,882 983,511 32%
639.10 Student FTE / per pupil 1,017.34 156.26 - 0.09 7.78 54.71 6.07 2.13 146.07 148.46 1,538.90
14-15 oBud Personnel Costs 1,978,257 296,456 - 462 11,757 106,047 5,265 3,252 285,950 131,666 2,819,111 per pupil 3,095.38 463.86 - 0.72 18.40 165.93 8.24 5.09 447.43 206.02 4,411.06
Implementation Costs 69,128 745 - - 5,908 - 400 900 27,499 133,845 238,425 per pupil 108.16 1.17 - - 9.24 - 0.63 1.41 43.03 209.43 373.06
pupil count Total 2,047,385 297,201 - 462 17,665 106,047 5,665 4,152 313,449 265,511 3,057,536 639.10 Student FTE / spend per 3,203.54 465.03 - 0.72 27.64 165.93 8.86 6.50 490.45 415.45 4,784.13
3,696.94 1,087.19 137 Woodmen Hills Elementary 1,548,805 214,541 - 392 19,654 82,346 15,106 5,504 205,373 202,291 2,294,012 spent191,034 14-15 cAct Personnel Costs 691,055 144,058 - 69 16,762 40,373 - 1,258 84,916 28,991 1,007,482 32%
per pupil 1,034.23 215.60 - 0.10 25.09 60.42 - 1.88 127.09 43.39 1,507.80 14,339 Implementation Costs 19,491 - - - 6,281 - 4,821 138 4,374 49,986 85,091 32%
per pupil 29.17 - - - 9.40 - 7.22 0.21 6.55 74.81 127.35 205,373 pupil count Total 710,546 144,058 - 69 23,043 40,373 4,821 1,396 89,291 78,977 1,092,573 32%
668.18 Student FTE / per pupil 1,063.40 215.60 - 0.10 34.49 60.42 7.22 2.09 133.63 118.20 1,635.15
14-15 oBud Personnel Costs 2,204,672 357,599 - 462 33,954 122,719 7,367 6,280 275,950 109,127 3,118,130 per pupil 3,299.52 535.18 - 0.69 50.82 183.66 11.03 9.40 412.99 163.32 4,666.60
Implementation Costs 54,678 1,000 - - 8,742 - 12,560 620 18,713 172,141 268,455 per pupil 81.83 1.50 - - 13.08 - 18.80 0.93 28.01 257.63 401.77
pupil count Total 2,259,350 358,599 - 462 42,697 122,719 19,927 6,900 294,664 281,268 3,386,585 668.18 Student FTE / spend per 3,381.35 536.68 - 0.69 63.90 183.66 29.82 10.33 440.99 420.95 5,068.37
3,982.62 1,085.75
Support Services for
October 31, 2014
FSD49-1415TB-20141031.xlsx - V1-2 Page 12 / 47 11/18/2014 - 8:45 AM
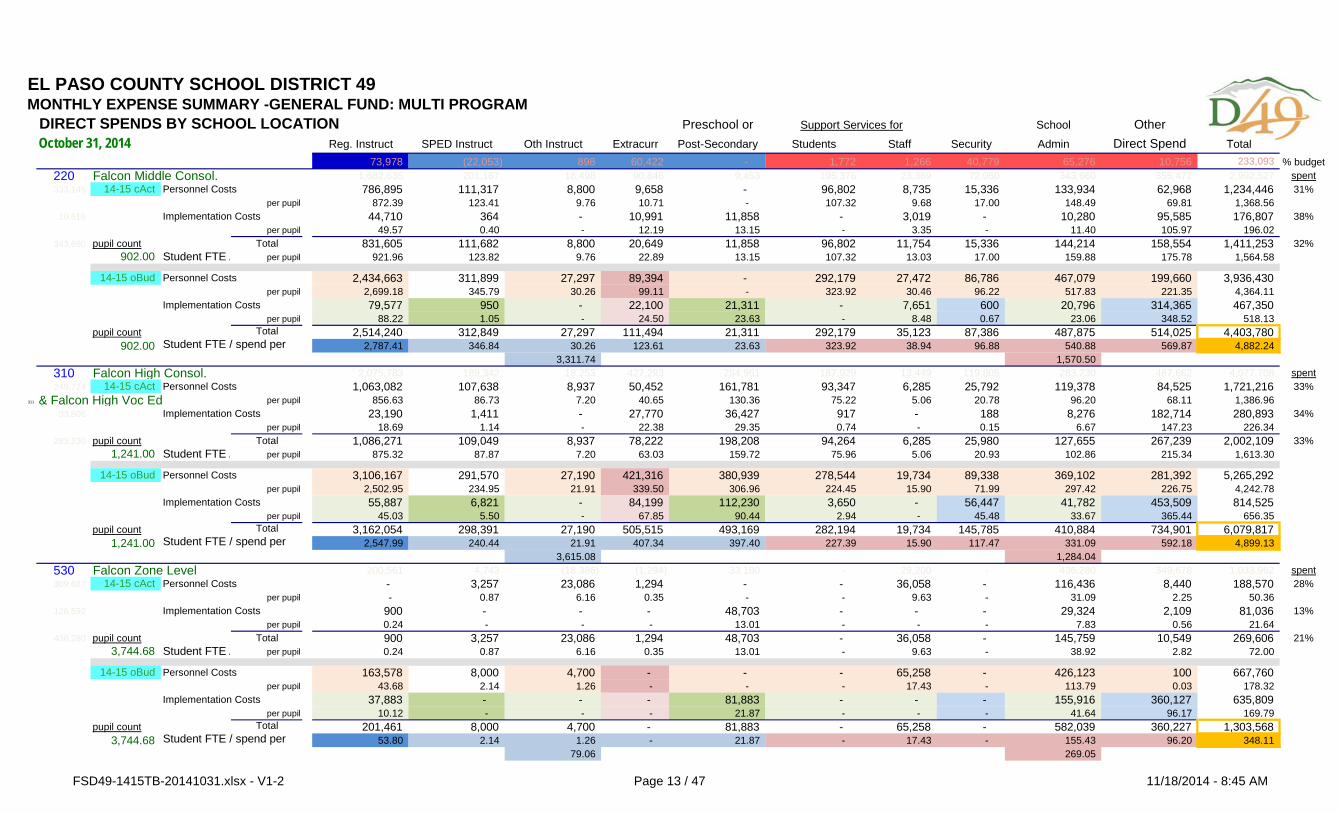
EL PASO COUNTY SCHOOL DISTRICT 49MONTHLY EXPENSE SUMMARY -GENERAL FUND: MULTI PROGRAM
DIRECT SPENDS BY SCHOOL LOCATION Preschool or School OtherReg. Instruct SPED Instruct Oth Instruct Extracurr Post-Secondary Students Staff Security Admin Direct Spend Total
73,978 (22,053) 898 60,422 - 1,772 1,266 40,779 65,276 10,756 233,093 % budget220 Falcon Middle Consol. 1,682,635 201,167 18,498 90,846 9,453 195,376 23,369 72,050 343,660 355,472 2,992,527 spent333,145 14-15 cAct Personnel Costs 786,895 111,317 8,800 9,658 - 96,802 8,735 15,336 133,934 62,968 1,234,446 31%
per pupil 872.39 123.41 9.76 10.71 - 107.32 9.68 17.00 148.49 69.81 1,368.56 10,516 Implementation Costs 44,710 364 - 10,991 11,858 - 3,019 - 10,280 95,585 176,807 38%
per pupil 49.57 0.40 - 12.19 13.15 - 3.35 - 11.40 105.97 196.02 343,660 pupil count Total 831,605 111,682 8,800 20,649 11,858 96,802 11,754 15,336 144,214 158,554 1,411,253 32%
902.00 Student FTE / per pupil 921.96 123.82 9.76 22.89 13.15 107.32 13.03 17.00 159.88 175.78 1,564.58
14-15 oBud Personnel Costs 2,434,663 311,899 27,297 89,394 - 292,179 27,472 86,786 467,079 199,660 3,936,430 per pupil 2,699.18 345.79 30.26 99.11 - 323.92 30.46 96.22 517.83 221.35 4,364.11
Implementation Costs 79,577 950 - 22,100 21,311 - 7,651 600 20,796 314,365 467,350 per pupil 88.22 1.05 - 24.50 23.63 - 8.48 0.67 23.06 348.52 518.13
pupil count Total 2,514,240 312,849 27,297 111,494 21,311 292,179 35,123 87,386 487,875 514,025 4,403,780 902.00 Student FTE / spend per 2,787.41 346.84 30.26 123.61 23.63 323.92 38.94 96.88 540.88 569.87 4,882.24
3,311.74 1,570.50 310 Falcon High Consol. 2,075,783 189,342 18,253 427,293 294,961 187,929 13,449 119,805 283,230 467,662 4,077,708 spent249,724 14-15 cAct Personnel Costs 1,063,082 107,638 8,937 50,452 161,781 93,347 6,285 25,792 119,378 84,525 1,721,216 33%
311 & Falcon High Voc Ed per pupil 856.63 86.73 7.20 40.65 130.36 75.22 5.06 20.78 96.20 68.11 1,386.96 33,506 Implementation Costs 23,190 1,411 - 27,770 36,427 917 - 188 8,276 182,714 280,893 34%
per pupil 18.69 1.14 - 22.38 29.35 0.74 - 0.15 6.67 147.23 226.34 283,230 pupil count Total 1,086,271 109,049 8,937 78,222 198,208 94,264 6,285 25,980 127,655 267,239 2,002,109 33%
1,241.00 Student FTE / per pupil 875.32 87.87 7.20 63.03 159.72 75.96 5.06 20.93 102.86 215.34 1,613.30
14-15 oBud Personnel Costs 3,106,167 291,570 27,190 421,316 380,939 278,544 19,734 89,338 369,102 281,392 5,265,292 per pupil 2,502.95 234.95 21.91 339.50 306.96 224.45 15.90 71.99 297.42 226.75 4,242.78
Implementation Costs 55,887 6,821 - 84,199 112,230 3,650 - 56,447 41,782 453,509 814,525 per pupil 45.03 5.50 - 67.85 90.44 2.94 - 45.48 33.67 365.44 656.35
pupil count Total 3,162,054 298,391 27,190 505,515 493,169 282,194 19,734 145,785 410,884 734,901 6,079,817 1,241.00 Student FTE / spend per 2,547.99 240.44 21.91 407.34 397.40 227.39 15.90 117.47 331.09 592.18 4,899.13
3,615.08 1,284.04 530 Falcon Zone Level 200,561 4,743 (18,386) (1,294) 33,180 - 29,200 - 436,280 349,678 1,033,962 spent309,687 14-15 cAct Personnel Costs - 3,257 23,086 1,294 - - 36,058 - 116,436 8,440 188,570 28%
per pupil - 0.87 6.16 0.35 - - 9.63 - 31.09 2.25 50.36 126,592 Implementation Costs 900 - - - 48,703 - - - 29,324 2,109 81,036 13%
per pupil 0.24 - - - 13.01 - - - 7.83 0.56 21.64 436,280 pupil count Total 900 3,257 23,086 1,294 48,703 - 36,058 - 145,759 10,549 269,606 21%
3,744.68 Student FTE / per pupil 0.24 0.87 6.16 0.35 13.01 - 9.63 - 38.92 2.82 72.00
14-15 oBud Personnel Costs 163,578 8,000 4,700 - - - 65,258 - 426,123 100 667,760 per pupil 43.68 2.14 1.26 - - - 17.43 - 113.79 0.03 178.32
Implementation Costs 37,883 - - - 81,883 - - - 155,916 360,127 635,809 per pupil 10.12 - - - 21.87 - - - 41.64 96.17 169.79
pupil count Total 201,461 8,000 4,700 - 81,883 - 65,258 - 582,039 360,227 1,303,568 3,744.68 Student FTE / spend per 53.80 2.14 1.26 - 21.87 - 17.43 - 155.43 96.20 348.11
79.06 269.05
Support Services for
October 31, 2014
FSD49-1415TB-20141031.xlsx - V1-2 Page 13 / 47 11/18/2014 - 8:45 AM
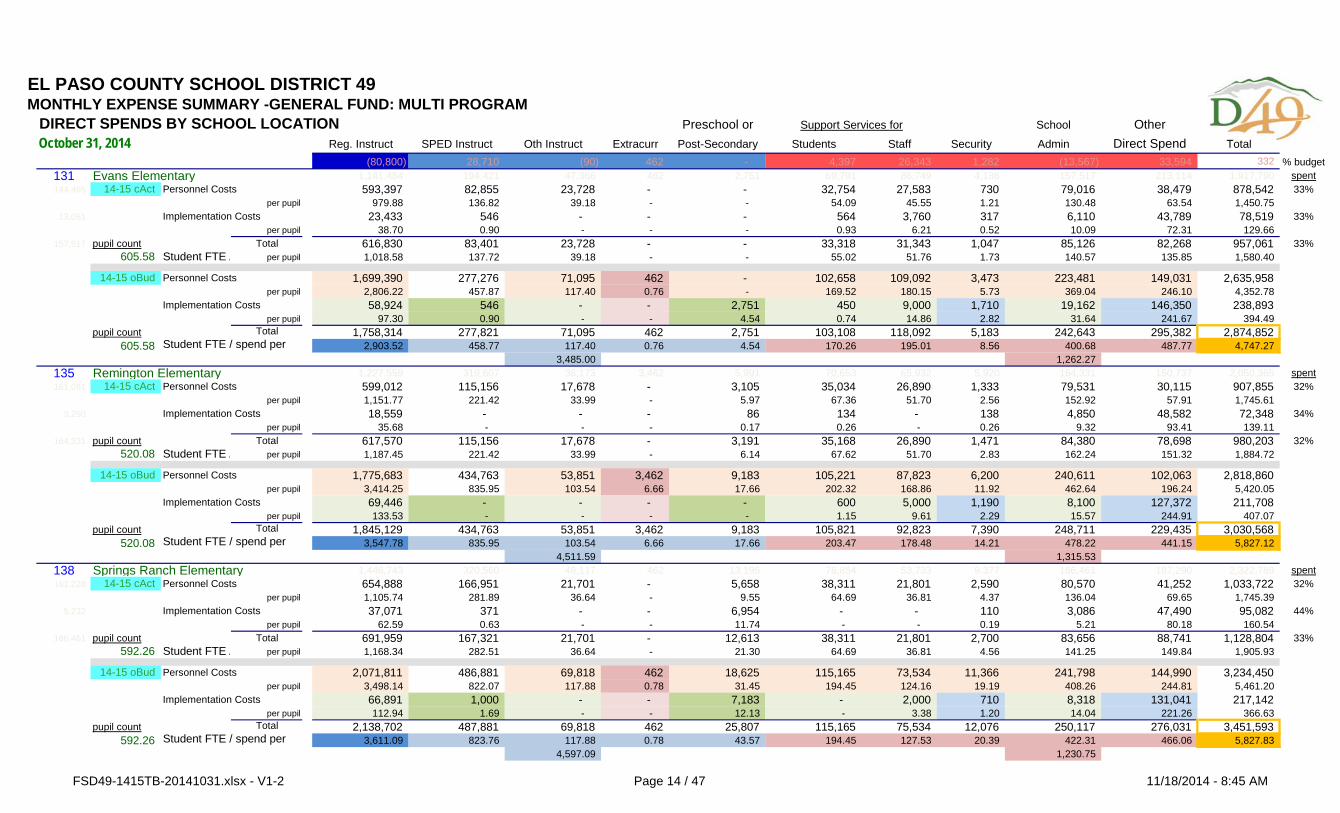
EL PASO COUNTY SCHOOL DISTRICT 49MONTHLY EXPENSE SUMMARY -GENERAL FUND: MULTI PROGRAM
DIRECT SPENDS BY SCHOOL LOCATION Preschool or School OtherReg. Instruct SPED Instruct Oth Instruct Extracurr Post-Secondary Students Staff Security Admin Direct Spend Total
(80,800) 28,710 (90) 462 - 4,397 26,343 1,282 (13,567) 33,594 332 % budget131 Evans Elementary 1,141,484 194,421 47,366 462 2,751 69,791 86,749 4,136 157,517 213,114 1,917,790 spent144,465 14-15 cAct Personnel Costs 593,397 82,855 23,728 - - 32,754 27,583 730 79,016 38,479 878,542 33%
per pupil 979.88 136.82 39.18 - - 54.09 45.55 1.21 130.48 63.54 1,450.75 13,051 Implementation Costs 23,433 546 - - - 564 3,760 317 6,110 43,789 78,519 33%
per pupil 38.70 0.90 - - - 0.93 6.21 0.52 10.09 72.31 129.66 157,517 pupil count Total 616,830 83,401 23,728 - - 33,318 31,343 1,047 85,126 82,268 957,061 33%
605.58 Student FTE / per pupil 1,018.58 137.72 39.18 - - 55.02 51.76 1.73 140.57 135.85 1,580.40
14-15 oBud Personnel Costs 1,699,390 277,276 71,095 462 - 102,658 109,092 3,473 223,481 149,031 2,635,958 per pupil 2,806.22 457.87 117.40 0.76 - 169.52 180.15 5.73 369.04 246.10 4,352.78
Implementation Costs 58,924 546 - - 2,751 450 9,000 1,710 19,162 146,350 238,893 per pupil 97.30 0.90 - - 4.54 0.74 14.86 2.82 31.64 241.67 394.49
pupil count Total 1,758,314 277,821 71,095 462 2,751 103,108 118,092 5,183 242,643 295,382 2,874,852 605.58 Student FTE / spend per 2,903.52 458.77 117.40 0.76 4.54 170.26 195.01 8.56 400.68 487.77 4,747.27
3,485.00 1,262.27 135 Remington Elementary 1,227,559 319,607 36,173 3,462 5,991 70,653 65,932 5,920 164,331 150,737 2,050,365 spent161,081 14-15 cAct Personnel Costs 599,012 115,156 17,678 - 3,105 35,034 26,890 1,333 79,531 30,115 907,855 32%
per pupil 1,151.77 221.42 33.99 - 5.97 67.36 51.70 2.56 152.92 57.91 1,745.61 3,250 Implementation Costs 18,559 - - - 86 134 - 138 4,850 48,582 72,348 34%
per pupil 35.68 - - - 0.17 0.26 - 0.26 9.32 93.41 139.11 164,331 pupil count Total 617,570 115,156 17,678 - 3,191 35,168 26,890 1,471 84,380 78,698 980,203 32%
520.08 Student FTE / per pupil 1,187.45 221.42 33.99 - 6.14 67.62 51.70 2.83 162.24 151.32 1,884.72
14-15 oBud Personnel Costs 1,775,683 434,763 53,851 3,462 9,183 105,221 87,823 6,200 240,611 102,063 2,818,860 per pupil 3,414.25 835.95 103.54 6.66 17.66 202.32 168.86 11.92 462.64 196.24 5,420.05
Implementation Costs 69,446 - - - - 600 5,000 1,190 8,100 127,372 211,708 per pupil 133.53 - - - - 1.15 9.61 2.29 15.57 244.91 407.07
pupil count Total 1,845,129 434,763 53,851 3,462 9,183 105,821 92,823 7,390 248,711 229,435 3,030,568 520.08 Student FTE / spend per 3,547.78 835.95 103.54 6.66 17.66 203.47 178.48 14.21 478.22 441.15 5,827.12
4,511.59 1,315.53 138 Springs Ranch Elementary 1,446,743 320,560 48,117 462 13,195 76,854 53,733 9,377 166,461 187,290 2,322,789 spent161,228 14-15 cAct Personnel Costs 654,888 166,951 21,701 - 5,658 38,311 21,801 2,590 80,570 41,252 1,033,722 32%
per pupil 1,105.74 281.89 36.64 - 9.55 64.69 36.81 4.37 136.04 69.65 1,745.39 5,232 Implementation Costs 37,071 371 - - 6,954 - - 110 3,086 47,490 95,082 44%
per pupil 62.59 0.63 - - 11.74 - - 0.19 5.21 80.18 160.54 166,461 pupil count Total 691,959 167,321 21,701 - 12,613 38,311 21,801 2,700 83,656 88,741 1,128,804 33%
592.26 Student FTE / per pupil 1,168.34 282.51 36.64 - 21.30 64.69 36.81 4.56 141.25 149.84 1,905.93
14-15 oBud Personnel Costs 2,071,811 486,881 69,818 462 18,625 115,165 73,534 11,366 241,798 144,990 3,234,450 per pupil 3,498.14 822.07 117.88 0.78 31.45 194.45 124.16 19.19 408.26 244.81 5,461.20
Implementation Costs 66,891 1,000 - - 7,183 - 2,000 710 8,318 131,041 217,142 per pupil 112.94 1.69 - - 12.13 - 3.38 1.20 14.04 221.26 366.63
pupil count Total 2,138,702 487,881 69,818 462 25,807 115,165 75,534 12,076 250,117 276,031 3,451,593 592.26 Student FTE / spend per 3,611.09 823.76 117.88 0.78 43.57 194.45 127.53 20.39 422.31 466.06 5,827.83
4,597.09 1,230.75
Support Services for
October 31, 2014
FSD49-1415TB-20141031.xlsx - V1-2 Page 14 / 47 11/18/2014 - 8:45 AM
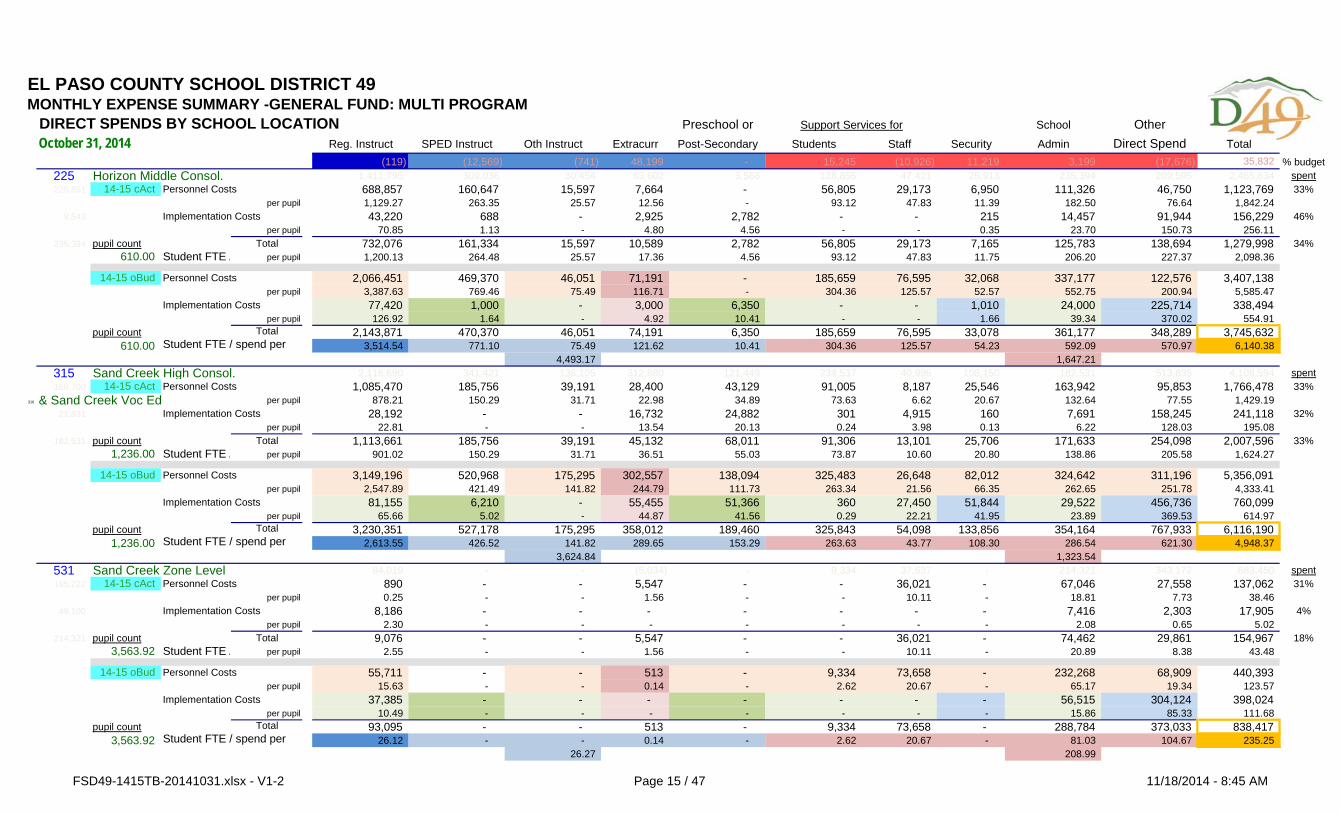
EL PASO COUNTY SCHOOL DISTRICT 49MONTHLY EXPENSE SUMMARY -GENERAL FUND: MULTI PROGRAM
DIRECT SPENDS BY SCHOOL LOCATION Preschool or School OtherReg. Instruct SPED Instruct Oth Instruct Extracurr Post-Secondary Students Staff Security Admin Direct Spend Total
(119) (12,569) (741) 48,199 - 15,245 (10,926) 11,219 3,199 (17,676) 35,832 % budget225 Horizon Middle Consol. 1,411,795 309,036 30,454 63,602 3,568 128,855 47,421 25,913 235,394 209,595 2,465,634 spent225,851 14-15 cAct Personnel Costs 688,857 160,647 15,597 7,664 - 56,805 29,173 6,950 111,326 46,750 1,123,769 33%
per pupil 1,129.27 263.35 25.57 12.56 - 93.12 47.83 11.39 182.50 76.64 1,842.24 9,543 Implementation Costs 43,220 688 - 2,925 2,782 - - 215 14,457 91,944 156,229 46%
per pupil 70.85 1.13 - 4.80 4.56 - - 0.35 23.70 150.73 256.11 235,394 pupil count Total 732,076 161,334 15,597 10,589 2,782 56,805 29,173 7,165 125,783 138,694 1,279,998 34%
610.00 Student FTE / per pupil 1,200.13 264.48 25.57 17.36 4.56 93.12 47.83 11.75 206.20 227.37 2,098.36
14-15 oBud Personnel Costs 2,066,451 469,370 46,051 71,191 - 185,659 76,595 32,068 337,177 122,576 3,407,138 per pupil 3,387.63 769.46 75.49 116.71 - 304.36 125.57 52.57 552.75 200.94 5,585.47
Implementation Costs 77,420 1,000 - 3,000 6,350 - - 1,010 24,000 225,714 338,494 per pupil 126.92 1.64 - 4.92 10.41 - - 1.66 39.34 370.02 554.91
pupil count Total 2,143,871 470,370 46,051 74,191 6,350 185,659 76,595 33,078 361,177 348,289 3,745,632 610.00 Student FTE / spend per 3,514.54 771.10 75.49 121.62 10.41 304.36 125.57 54.23 592.09 570.97 6,140.38
4,493.17 1,647.21 315 Sand Creek High Consol. 2,116,690 341,421 136,105 312,880 121,449 234,537 40,996 108,150 182,531 513,835 4,108,594 spent160,700 14-15 cAct Personnel Costs 1,085,470 185,756 39,191 28,400 43,129 91,005 8,187 25,546 163,942 95,853 1,766,478 33%
316 & Sand Creek Voc Ed per pupil 878.21 150.29 31.71 22.98 34.89 73.63 6.62 20.67 132.64 77.55 1,429.19 21,831 Implementation Costs 28,192 - - 16,732 24,882 301 4,915 160 7,691 158,245 241,118 32%
per pupil 22.81 - - 13.54 20.13 0.24 3.98 0.13 6.22 128.03 195.08 182,531 pupil count Total 1,113,661 185,756 39,191 45,132 68,011 91,306 13,101 25,706 171,633 254,098 2,007,596 33%
1,236.00 Student FTE / per pupil 901.02 150.29 31.71 36.51 55.03 73.87 10.60 20.80 138.86 205.58 1,624.27
14-15 oBud Personnel Costs 3,149,196 520,968 175,295 302,557 138,094 325,483 26,648 82,012 324,642 311,196 5,356,091 per pupil 2,547.89 421.49 141.82 244.79 111.73 263.34 21.56 66.35 262.65 251.78 4,333.41
Implementation Costs 81,155 6,210 - 55,455 51,366 360 27,450 51,844 29,522 456,736 760,099 per pupil 65.66 5.02 - 44.87 41.56 0.29 22.21 41.95 23.89 369.53 614.97
pupil count Total 3,230,351 527,178 175,295 358,012 189,460 325,843 54,098 133,856 354,164 767,933 6,116,190 1,236.00 Student FTE / spend per 2,613.55 426.52 141.82 289.65 153.29 263.63 43.77 108.30 286.54 621.30 4,948.37
3,624.84 1,323.54 531 Sand Creek Zone Level 84,019 - - (5,034) - 9,334 37,637 - 214,321 343,172 683,450 spent165,222 14-15 cAct Personnel Costs 890 - - 5,547 - - 36,021 - 67,046 27,558 137,062 31%
per pupil 0.25 - - 1.56 - - 10.11 - 18.81 7.73 38.46 49,100 Implementation Costs 8,186 - - - - - - - 7,416 2,303 17,905 4%
per pupil 2.30 - - - - - - - 2.08 0.65 5.02 214,321 pupil count Total 9,076 - - 5,547 - - 36,021 - 74,462 29,861 154,967 18%
3,563.92 Student FTE / per pupil 2.55 - - 1.56 - - 10.11 - 20.89 8.38 43.48
14-15 oBud Personnel Costs 55,711 - - 513 - 9,334 73,658 - 232,268 68,909 440,393 per pupil 15.63 - - 0.14 - 2.62 20.67 - 65.17 19.34 123.57
Implementation Costs 37,385 - - - - - - - 56,515 304,124 398,024 per pupil 10.49 - - - - - - - 15.86 85.33 111.68
pupil count Total 93,095 - - 513 - 9,334 73,658 - 288,784 373,033 838,417 3,563.92 Student FTE / spend per 26.12 - - 0.14 - 2.62 20.67 - 81.03 104.67 235.25
26.27 208.99
Support Services for
October 31, 2014
FSD49-1415TB-20141031.xlsx - V1-2 Page 15 / 47 11/18/2014 - 8:45 AM
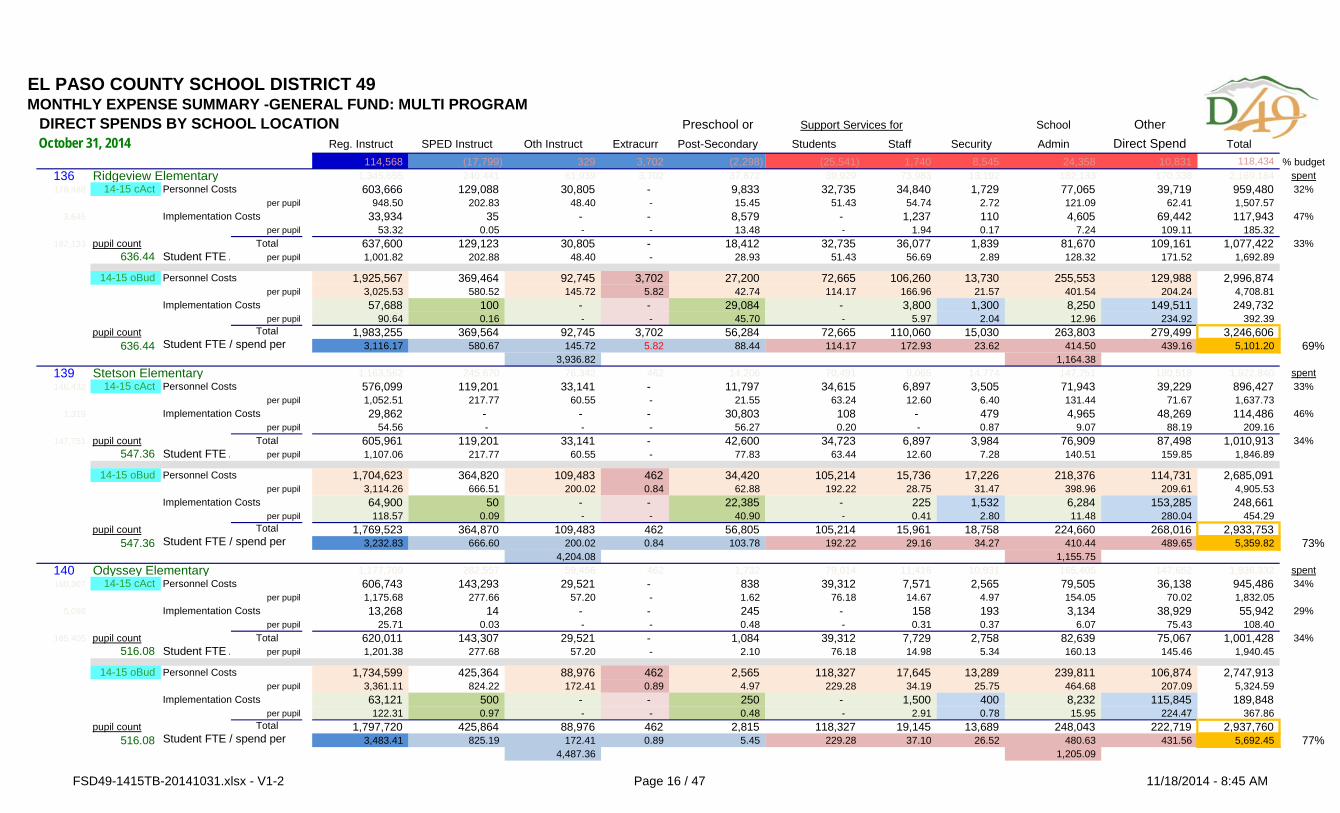
EL PASO COUNTY SCHOOL DISTRICT 49MONTHLY EXPENSE SUMMARY -GENERAL FUND: MULTI PROGRAM
DIRECT SPENDS BY SCHOOL LOCATION Preschool or School OtherReg. Instruct SPED Instruct Oth Instruct Extracurr Post-Secondary Students Staff Security Admin Direct Spend Total
114,568 (17,799) 329 3,702 (2,298) (25,541) 1,740 8,545 24,358 10,831 118,434 % budget136 Ridgeview Elementary 1,345,655 240,441 61,939 3,702 37,872 39,929 73,983 13,192 182,133 170,338 2,169,184 spent178,488 14-15 cAct Personnel Costs 603,666 129,088 30,805 - 9,833 32,735 34,840 1,729 77,065 39,719 959,480 32%
per pupil 948.50 202.83 48.40 - 15.45 51.43 54.74 2.72 121.09 62.41 1,507.57 3,645 Implementation Costs 33,934 35 - - 8,579 - 1,237 110 4,605 69,442 117,943 47%
per pupil 53.32 0.05 - - 13.48 - 1.94 0.17 7.24 109.11 185.32 182,133 pupil count Total 637,600 129,123 30,805 - 18,412 32,735 36,077 1,839 81,670 109,161 1,077,422 33%
636.44 Student FTE / per pupil 1,001.82 202.88 48.40 - 28.93 51.43 56.69 2.89 128.32 171.52 1,692.89
14-15 oBud Personnel Costs 1,925,567 369,464 92,745 3,702 27,200 72,665 106,260 13,730 255,553 129,988 2,996,874 per pupil 3,025.53 580.52 145.72 5.82 42.74 114.17 166.96 21.57 401.54 204.24 4,708.81
Implementation Costs 57,688 100 - - 29,084 - 3,800 1,300 8,250 149,511 249,732 per pupil 90.64 0.16 - - 45.70 - 5.97 2.04 12.96 234.92 392.39
pupil count Total 1,983,255 369,564 92,745 3,702 56,284 72,665 110,060 15,030 263,803 279,499 3,246,606 636.44 Student FTE / spend per 3,116.17 580.67 145.72 5.82 88.44 114.17 172.93 23.62 414.50 439.16 5,101.20 69%
3,936.82 1,164.38 139 Stetson Elementary 1,163,562 245,670 76,342 462 14,206 70,491 9,065 14,774 147,751 180,518 1,922,840 spent146,432 14-15 cAct Personnel Costs 576,099 119,201 33,141 - 11,797 34,615 6,897 3,505 71,943 39,229 896,427 33%
per pupil 1,052.51 217.77 60.55 - 21.55 63.24 12.60 6.40 131.44 71.67 1,637.73 1,319 Implementation Costs 29,862 - - - 30,803 108 - 479 4,965 48,269 114,486 46%
per pupil 54.56 - - - 56.27 0.20 - 0.87 9.07 88.19 209.16 147,751 pupil count Total 605,961 119,201 33,141 - 42,600 34,723 6,897 3,984 76,909 87,498 1,010,913 34%
547.36 Student FTE / per pupil 1,107.06 217.77 60.55 - 77.83 63.44 12.60 7.28 140.51 159.85 1,846.89
14-15 oBud Personnel Costs 1,704,623 364,820 109,483 462 34,420 105,214 15,736 17,226 218,376 114,731 2,685,091 per pupil 3,114.26 666.51 200.02 0.84 62.88 192.22 28.75 31.47 398.96 209.61 4,905.53
Implementation Costs 64,900 50 - - 22,385 - 225 1,532 6,284 153,285 248,661 per pupil 118.57 0.09 - - 40.90 - 0.41 2.80 11.48 280.04 454.29
pupil count Total 1,769,523 364,870 109,483 462 56,805 105,214 15,961 18,758 224,660 268,016 2,933,753 547.36 Student FTE / spend per 3,232.83 666.60 200.02 0.84 103.78 192.22 29.16 34.27 410.44 489.65 5,359.82 73%
4,204.08 1,155.75 140 Odyssey Elementary 1,177,709 282,557 59,456 462 1,732 79,014 11,416 10,931 165,405 147,652 1,936,332 spent160,307 14-15 cAct Personnel Costs 606,743 143,293 29,521 - 838 39,312 7,571 2,565 79,505 36,138 945,486 34%
per pupil 1,175.68 277.66 57.20 - 1.62 76.18 14.67 4.97 154.05 70.02 1,832.05 5,098 Implementation Costs 13,268 14 - - 245 - 158 193 3,134 38,929 55,942 29%
per pupil 25.71 0.03 - - 0.48 - 0.31 0.37 6.07 75.43 108.40 165,405 pupil count Total 620,011 143,307 29,521 - 1,084 39,312 7,729 2,758 82,639 75,067 1,001,428 34%
516.08 Student FTE / per pupil 1,201.38 277.68 57.20 - 2.10 76.18 14.98 5.34 160.13 145.46 1,940.45
14-15 oBud Personnel Costs 1,734,599 425,364 88,976 462 2,565 118,327 17,645 13,289 239,811 106,874 2,747,913 per pupil 3,361.11 824.22 172.41 0.89 4.97 229.28 34.19 25.75 464.68 207.09 5,324.59
Implementation Costs 63,121 500 - - 250 - 1,500 400 8,232 115,845 189,848 per pupil 122.31 0.97 - - 0.48 - 2.91 0.78 15.95 224.47 367.86
pupil count Total 1,797,720 425,864 88,976 462 2,815 118,327 19,145 13,689 248,043 222,719 2,937,760 516.08 Student FTE / spend per 3,483.41 825.19 172.41 0.89 5.45 229.28 37.10 26.52 480.63 431.56 5,692.45 77%
4,487.36 1,205.09
Support Services for
October 31, 2014
FSD49-1415TB-20141031.xlsx - V1-2 Page 16 / 47 11/18/2014 - 8:45 AM
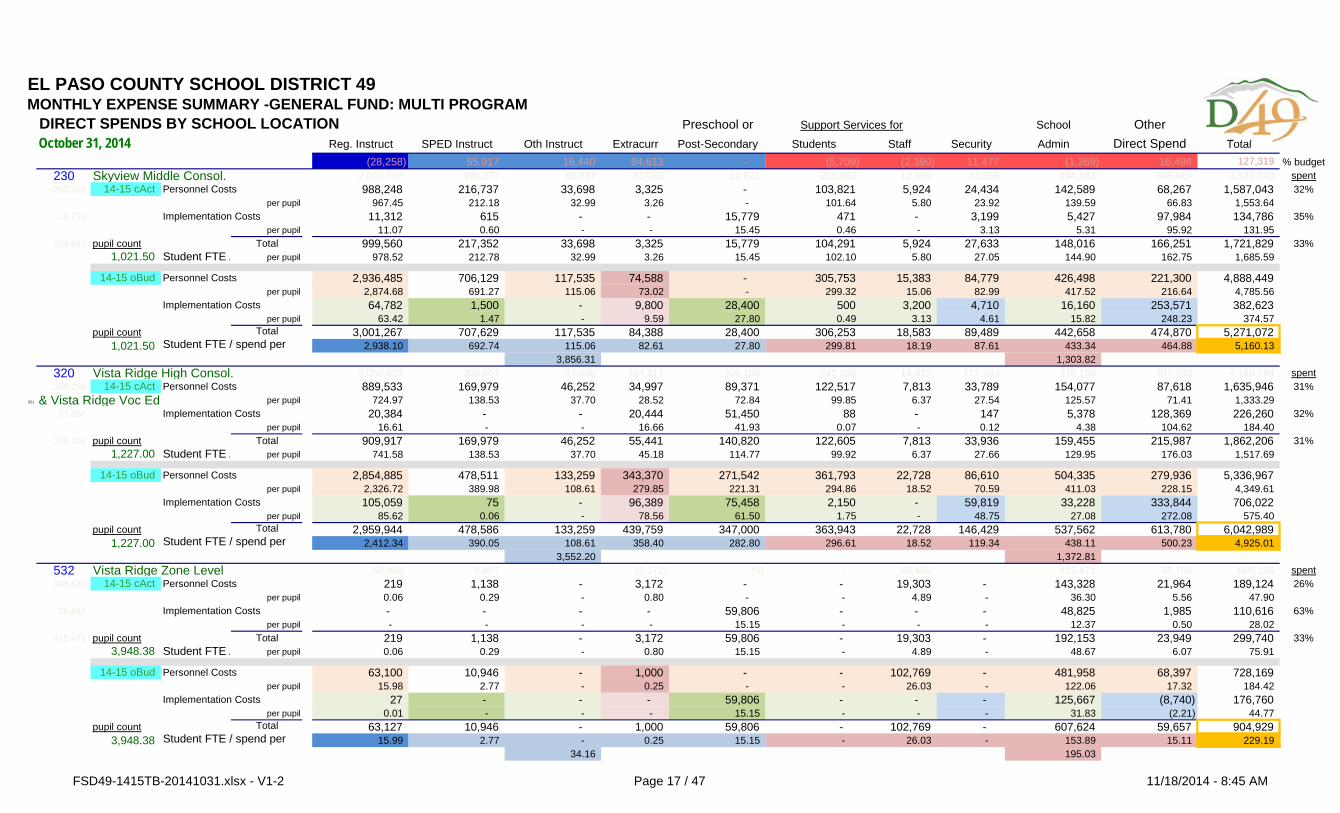
EL PASO COUNTY SCHOOL DISTRICT 49MONTHLY EXPENSE SUMMARY -GENERAL FUND: MULTI PROGRAM
DIRECT SPENDS BY SCHOOL LOCATION Preschool or School OtherReg. Instruct SPED Instruct Oth Instruct Extracurr Post-Secondary Students Staff Security Admin Direct Spend Total
(28,258) 55,917 16,440 64,613 - (5,709) (2,390) 11,477 (1,269) 16,498 127,319 % budget230 Skyview Middle Consol. 2,001,707 490,277 83,837 81,063 12,621 201,962 12,659 61,856 294,642 308,619 3,549,243 spent283,909 14-15 cAct Personnel Costs 988,248 216,737 33,698 3,325 - 103,821 5,924 24,434 142,589 68,267 1,587,043 32%
per pupil 967.45 212.18 32.99 3.26 - 101.64 5.80 23.92 139.59 66.83 1,553.64 10,733 Implementation Costs 11,312 615 - - 15,779 471 - 3,199 5,427 97,984 134,786 35%
per pupil 11.07 0.60 - - 15.45 0.46 - 3.13 5.31 95.92 131.95 294,642 pupil count Total 999,560 217,352 33,698 3,325 15,779 104,291 5,924 27,633 148,016 166,251 1,721,829 33%
1,021.50 Student FTE / per pupil 978.52 212.78 32.99 3.26 15.45 102.10 5.80 27.05 144.90 162.75 1,685.59
14-15 oBud Personnel Costs 2,936,485 706,129 117,535 74,588 - 305,753 15,383 84,779 426,498 221,300 4,888,449 per pupil 2,874.68 691.27 115.06 73.02 - 299.32 15.06 82.99 417.52 216.64 4,785.56
Implementation Costs 64,782 1,500 - 9,800 28,400 500 3,200 4,710 16,160 253,571 382,623 per pupil 63.42 1.47 - 9.59 27.80 0.49 3.13 4.61 15.82 248.23 374.57
pupil count Total 3,001,267 707,629 117,535 84,388 28,400 306,253 18,583 89,489 442,658 474,870 5,271,072 1,021.50 Student FTE / spend per 2,938.10 692.74 115.06 82.61 27.80 299.81 18.19 87.61 433.34 464.88 5,160.13
3,856.31 1,303.82 320 Vista Ridge High Consol. 2,050,027 308,607 87,006 384,317 206,180 241,338 14,915 112,493 378,108 397,793 4,180,784 spent350,258 14-15 cAct Personnel Costs 889,533 169,979 46,252 34,997 89,371 122,517 7,813 33,789 154,077 87,618 1,635,946 31%
321 & Vista Ridge Voc Ed per pupil 724.97 138.53 37.70 28.52 72.84 99.85 6.37 27.54 125.57 71.41 1,333.29 27,850 Implementation Costs 20,384 - - 20,444 51,450 88 - 147 5,378 128,369 226,260 32%
per pupil 16.61 - - 16.66 41.93 0.07 - 0.12 4.38 104.62 184.40 378,108 pupil count Total 909,917 169,979 46,252 55,441 140,820 122,605 7,813 33,936 159,455 215,987 1,862,206 31%
1,227.00 Student FTE / per pupil 741.58 138.53 37.70 45.18 114.77 99.92 6.37 27.66 129.95 176.03 1,517.69
14-15 oBud Personnel Costs 2,854,885 478,511 133,259 343,370 271,542 361,793 22,728 86,610 504,335 279,936 5,336,967 per pupil 2,326.72 389.98 108.61 279.85 221.31 294.86 18.52 70.59 411.03 228.15 4,349.61
Implementation Costs 105,059 75 - 96,389 75,458 2,150 - 59,819 33,228 333,844 706,022 per pupil 85.62 0.06 - 78.56 61.50 1.75 - 48.75 27.08 272.08 575.40
pupil count Total 2,959,944 478,586 133,259 439,759 347,000 363,943 22,728 146,429 537,562 613,780 6,042,989 1,227.00 Student FTE / spend per 2,412.34 390.05 108.61 358.40 282.80 296.61 18.52 119.34 438.11 500.23 4,925.01
3,552.20 1,372.81 532 Vista Ridge Zone Level 62,908 9,807 - (2,172) (0) - 83,466 - 415,471 35,708 605,188 spent338,630 14-15 cAct Personnel Costs 219 1,138 - 3,172 - - 19,303 - 143,328 21,964 189,124 26%
per pupil 0.06 0.29 - 0.80 - - 4.89 - 36.30 5.56 47.90 76,841 Implementation Costs - - - - 59,806 - - - 48,825 1,985 110,616 63%
per pupil - - - - 15.15 - - - 12.37 0.50 28.02 415,471 pupil count Total 219 1,138 - 3,172 59,806 - 19,303 - 192,153 23,949 299,740 33%
3,948.38 Student FTE / per pupil 0.06 0.29 - 0.80 15.15 - 4.89 - 48.67 6.07 75.91
14-15 oBud Personnel Costs 63,100 10,946 - 1,000 - - 102,769 - 481,958 68,397 728,169 per pupil 15.98 2.77 - 0.25 - - 26.03 - 122.06 17.32 184.42
Implementation Costs 27 - - - 59,806 - - - 125,667 (8,740) 176,760 per pupil 0.01 - - - 15.15 - - - 31.83 (2.21) 44.77
pupil count Total 63,127 10,946 - 1,000 59,806 - 102,769 - 607,624 59,657 904,929 3,948.38 Student FTE / spend per 15.99 2.77 - 0.25 15.15 - 26.03 - 153.89 15.11 229.19
34.16 195.03
October 31, 2014Support Services for
FSD49-1415TB-20141031.xlsx - V1-2 Page 17 / 47 11/18/2014 - 8:45 AM
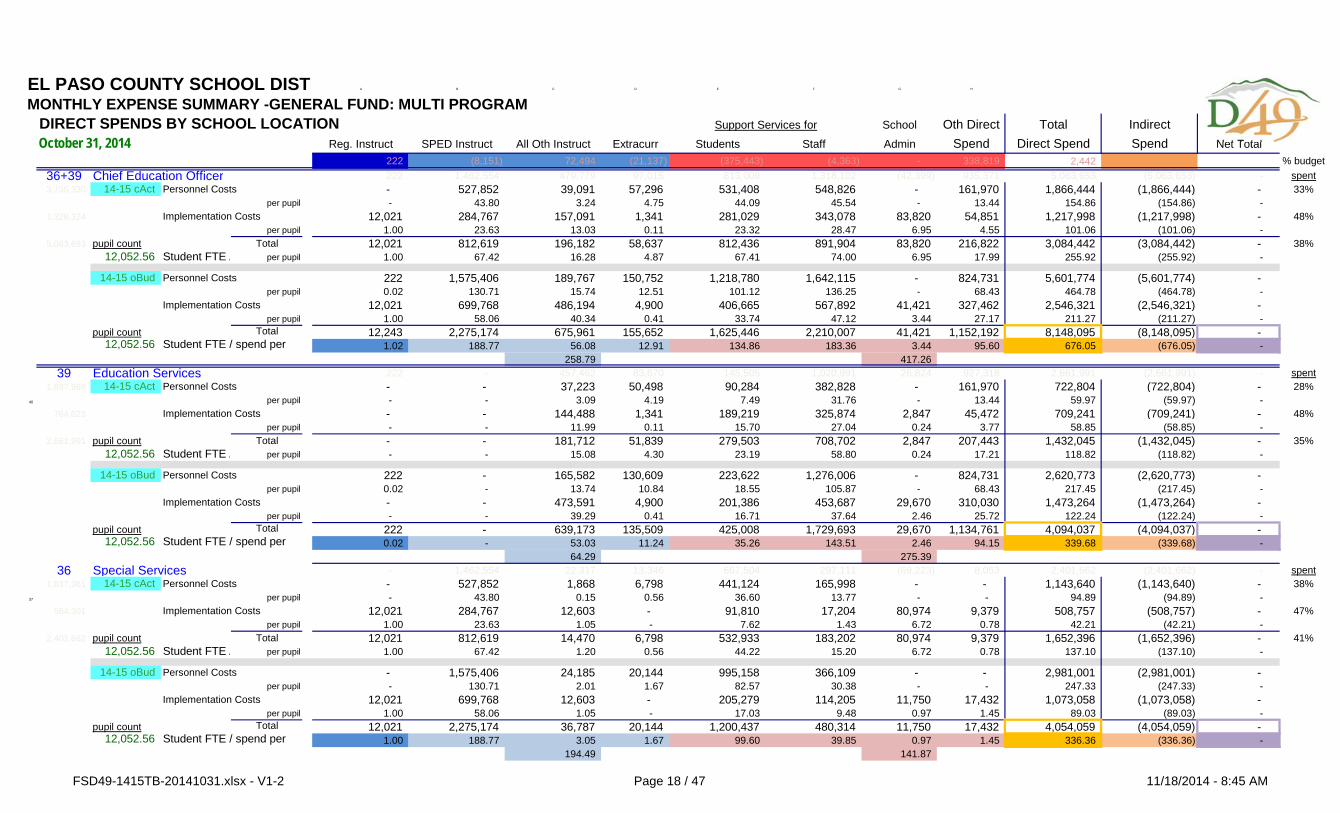
EL PASO COUNTY SCHOOL DISTR A B C D E F G H
MONTHLY EXPENSE SUMMARY -GENERAL FUND: MULTI PROGRAMDIRECT SPENDS BY SCHOOL LOCATION School Oth Direct Total Indirect
Reg. Instruct SPED Instruct All Oth Instruct Extracurr Students Staff Admin Spend Direct Spend Spend Net Total222 (8,151) 72,494 (21,137) (375,443) (4,363) - 338,819 2,442 % budget
36+39 Chief Education Officer 222 1,462,554 479,779 97,015 813,009 1,318,102 (42,399) 935,371 5,063,653 (5,063,653) - spent3,735,330 14-15 cAct Personnel Costs - 527,852 39,091 57,296 531,408 548,826 - 161,970 1,866,444 (1,866,444) - 33%
per pupil - 43.80 3.24 4.75 44.09 45.54 - 13.44 154.86 (154.86) - 1,328,324 Implementation Costs 12,021 284,767 157,091 1,341 281,029 343,078 83,820 54,851 1,217,998 (1,217,998) - 48%
per pupil 1.00 23.63 13.03 0.11 23.32 28.47 6.95 4.55 101.06 (101.06) - 5,063,653 pupil count Total 12,021 812,619 196,182 58,637 812,436 891,904 83,820 216,822 3,084,442 (3,084,442) - 38%
12,052.56 Student FTE / per pupil 1.00 67.42 16.28 4.87 67.41 74.00 6.95 17.99 255.92 (255.92) -
14-15 oBud Personnel Costs 222 1,575,406 189,767 150,752 1,218,780 1,642,115 - 824,731 5,601,774 (5,601,774) - per pupil 0.02 130.71 15.74 12.51 101.12 136.25 - 68.43 464.78 (464.78) -
Implementation Costs 12,021 699,768 486,194 4,900 406,665 567,892 41,421 327,462 2,546,321 (2,546,321) - per pupil 1.00 58.06 40.34 0.41 33.74 47.12 3.44 27.17 211.27 (211.27) -
pupil count Total 12,243 2,275,174 675,961 155,652 1,625,446 2,210,007 41,421 1,152,192 8,148,095 (8,148,095) - 12,052.56 Student FTE / spend per 1.02 188.77 56.08 12.91 134.86 183.36 3.44 95.60 676.05 (676.05) -
258.79 417.26 39 Education Services 222 - 457,462 83,670 145,505 1,020,991 26,824 927,318 2,661,991 (2,661,991) - spent
1,897,969 14-15 cAct Personnel Costs - - 37,223 50,498 90,284 382,828 - 161,970 722,804 (722,804) - 28%40 per pupil - - 3.09 4.19 7.49 31.76 - 13.44 59.97 (59.97) -
764,023 Implementation Costs - - 144,488 1,341 189,219 325,874 2,847 45,472 709,241 (709,241) - 48%per pupil - - 11.99 0.11 15.70 27.04 0.24 3.77 58.85 (58.85) -
2,661,991 pupil count Total - - 181,712 51,839 279,503 708,702 2,847 207,443 1,432,045 (1,432,045) - 35%12,052.56 Student FTE / per pupil - - 15.08 4.30 23.19 58.80 0.24 17.21 118.82 (118.82) -
14-15 oBud Personnel Costs 222 - 165,582 130,609 223,622 1,276,006 - 824,731 2,620,773 (2,620,773) - per pupil 0.02 - 13.74 10.84 18.55 105.87 - 68.43 217.45 (217.45) -
Implementation Costs - - 473,591 4,900 201,386 453,687 29,670 310,030 1,473,264 (1,473,264) - per pupil - - 39.29 0.41 16.71 37.64 2.46 25.72 122.24 (122.24) -
pupil count Total 222 - 639,173 135,509 425,008 1,729,693 29,670 1,134,761 4,094,037 (4,094,037) - 12,052.56 Student FTE / spend per 0.02 - 53.03 11.24 35.26 143.51 2.46 94.15 339.68 (339.68) -
64.29 275.39 36 Special Services - 1,462,554 22,317 13,346 667,504 297,111 (69,223) 8,053 2,401,662 (2,401,662) - spent
1,837,361 14-15 cAct Personnel Costs - 527,852 1,868 6,798 441,124 165,998 - - 1,143,640 (1,143,640) - 38%37 per pupil - 43.80 0.15 0.56 36.60 13.77 - - 94.89 (94.89) -
564,301 Implementation Costs 12,021 284,767 12,603 - 91,810 17,204 80,974 9,379 508,757 (508,757) - 47%per pupil 1.00 23.63 1.05 - 7.62 1.43 6.72 0.78 42.21 (42.21) -
2,401,662 pupil count Total 12,021 812,619 14,470 6,798 532,933 183,202 80,974 9,379 1,652,396 (1,652,396) - 41%12,052.56 Student FTE / per pupil 1.00 67.42 1.20 0.56 44.22 15.20 6.72 0.78 137.10 (137.10) -
14-15 oBud Personnel Costs - 1,575,406 24,185 20,144 995,158 366,109 - - 2,981,001 (2,981,001) - per pupil - 130.71 2.01 1.67 82.57 30.38 - - 247.33 (247.33) -
Implementation Costs 12,021 699,768 12,603 - 205,279 114,205 11,750 17,432 1,073,058 (1,073,058) - per pupil 1.00 58.06 1.05 - 17.03 9.48 0.97 1.45 89.03 (89.03) -
pupil count Total 12,021 2,275,174 36,787 20,144 1,200,437 480,314 11,750 17,432 4,054,059 (4,054,059) - 12,052.56 Student FTE / spend per 1.00 188.77 3.05 1.67 99.60 39.85 0.97 1.45 336.36 (336.36) -
194.49 141.87
October 31, 2014Support Services for
FSD49-1415TB-20141031.xlsx - V1-2 Page 18 / 47 11/18/2014 - 8:45 AM
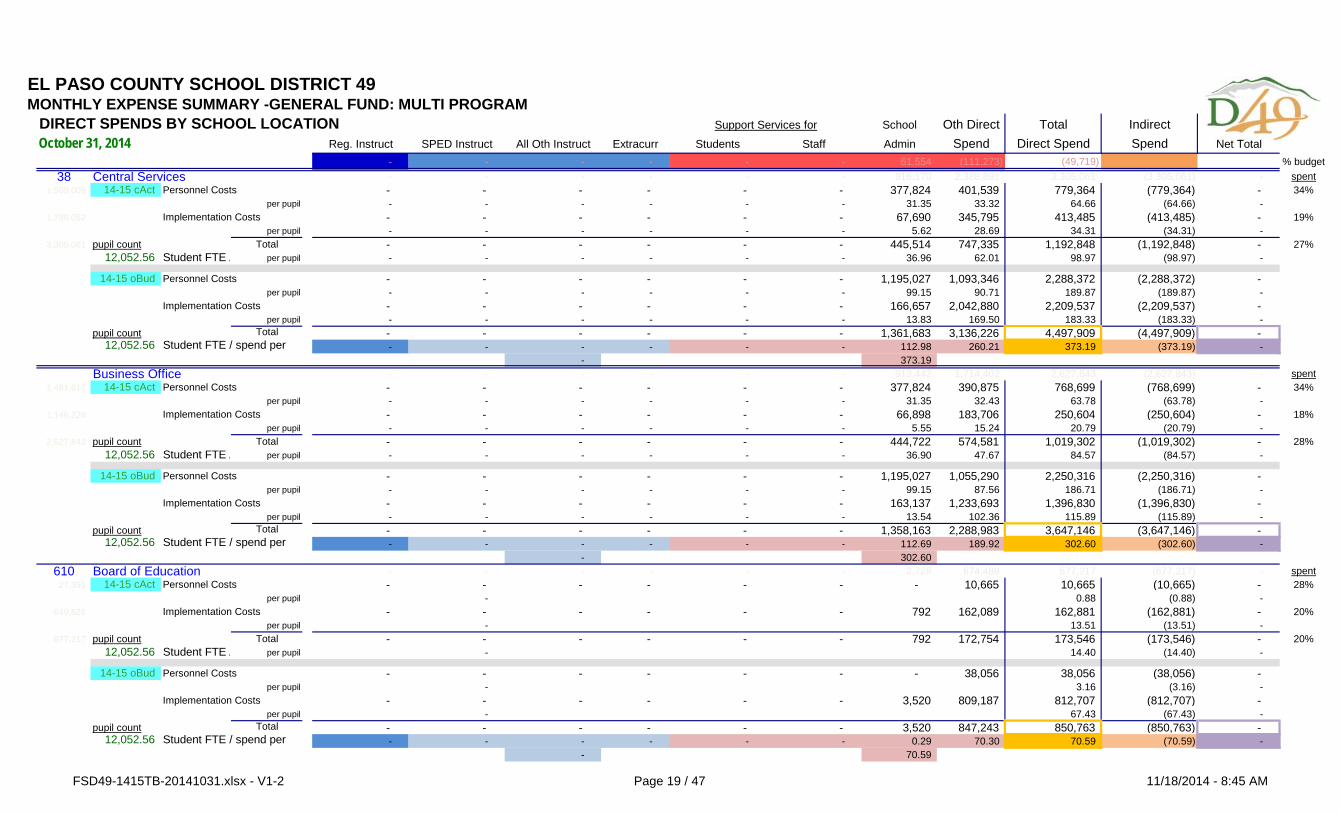
EL PASO COUNTY SCHOOL DISTRICT 49MONTHLY EXPENSE SUMMARY -GENERAL FUND: MULTI PROGRAM
DIRECT SPENDS BY SCHOOL LOCATION School Oth Direct Total IndirectReg. Instruct SPED Instruct All Oth Instruct Extracurr Students Staff Admin Spend Direct Spend Spend Net Total
- - - - - - 61,554 (111,273) (49,719) % budget38 Central Services - - - - - - 916,170 2,388,891 3,305,061 (3,305,061) - spent
1,509,009 14-15 cAct Personnel Costs - - - - - - 377,824 401,539 779,364 (779,364) - 34%per pupil - - - - - - 31.35 33.32 64.66 (64.66) -
1,796,052 Implementation Costs - - - - - - 67,690 345,795 413,485 (413,485) - 19%per pupil - - - - - - 5.62 28.69 34.31 (34.31) -
3,305,061 pupil count Total - - - - - - 445,514 747,335 1,192,848 (1,192,848) - 27%12,052.56 Student FTE / per pupil - - - - - - 36.96 62.01 98.97 (98.97) -
14-15 oBud Personnel Costs - - - - - - 1,195,027 1,093,346 2,288,372 (2,288,372) - per pupil - - - - - - 99.15 90.71 189.87 (189.87) -
Implementation Costs - - - - - - 166,657 2,042,880 2,209,537 (2,209,537) - per pupil - - - - - - 13.83 169.50 183.33 (183.33) -
pupil count Total - - - - - - 1,361,683 3,136,226 4,497,909 (4,497,909) - 12,052.56 Student FTE / spend per - - - - - - 112.98 260.21 373.19 (373.19) -
- 373.19 Business Office - - - - - - 913,442 1,714,402 2,627,843 (2,627,843) - spent
1,481,617 14-15 cAct Personnel Costs - - - - - - 377,824 390,875 768,699 (768,699) - 34%per pupil - - - - - - 31.35 32.43 63.78 (63.78) -
1,146,226 Implementation Costs - - - - - - 66,898 183,706 250,604 (250,604) - 18%per pupil - - - - - - 5.55 15.24 20.79 (20.79) -
2,627,843 pupil count Total - - - - - - 444,722 574,581 1,019,302 (1,019,302) - 28%12,052.56 Student FTE / per pupil - - - - - - 36.90 47.67 84.57 (84.57) -
14-15 oBud Personnel Costs - - - - - - 1,195,027 1,055,290 2,250,316 (2,250,316) - per pupil - - - - - - 99.15 87.56 186.71 (186.71) -
Implementation Costs - - - - - - 163,137 1,233,693 1,396,830 (1,396,830) - per pupil - - - - - - 13.54 102.36 115.89 (115.89) -
pupil count Total - - - - - - 1,358,163 2,288,983 3,647,146 (3,647,146) - 12,052.56 Student FTE / spend per - - - - - - 112.69 189.92 302.60 (302.60) -
- 302.60 610 Board of Education - - - - - - 2,728 674,489 677,217 (677,217) - spent
27,391 14-15 cAct Personnel Costs - - - - - - - 10,665 10,665 (10,665) - 28%per pupil - 0.88 (0.88) -
649,826 Implementation Costs - - - - - - 792 162,089 162,881 (162,881) - 20%per pupil - 13.51 (13.51) -
677,217 pupil count Total - - - - - - 792 172,754 173,546 (173,546) - 20%12,052.56 Student FTE / per pupil - 14.40 (14.40) -
14-15 oBud Personnel Costs - - - - - - - 38,056 38,056 (38,056) - per pupil - 3.16 (3.16) -
Implementation Costs - - - - - - 3,520 809,187 812,707 (812,707) - per pupil - 67.43 (67.43) -
pupil count Total - - - - - - 3,520 847,243 850,763 (850,763) - 12,052.56 Student FTE / spend per - - - - - - 0.29 70.30 70.59 (70.59) -
- 70.59
Support Services for
October 31, 2014
FSD49-1415TB-20141031.xlsx - V1-2 Page 19 / 47 11/18/2014 - 8:45 AM
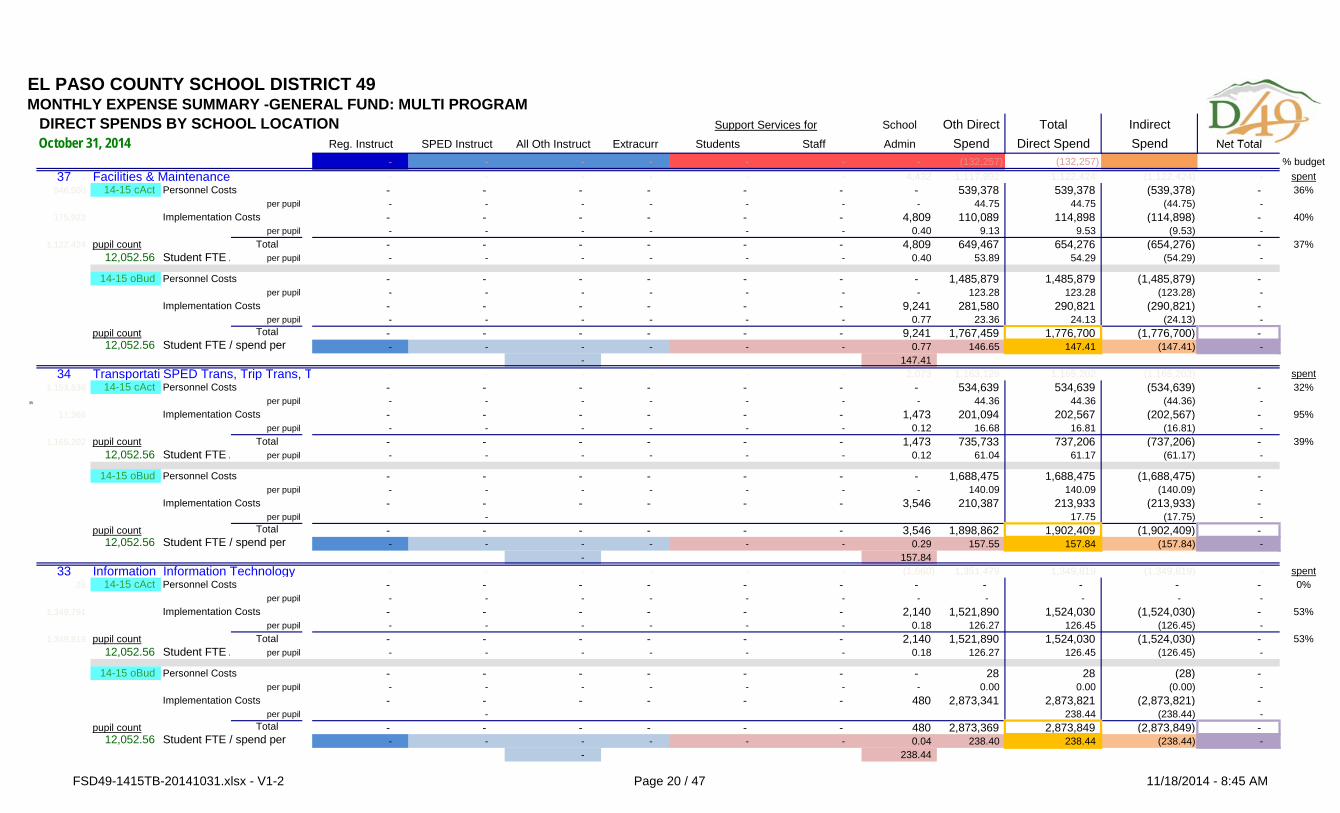
EL PASO COUNTY SCHOOL DISTRICT 49MONTHLY EXPENSE SUMMARY -GENERAL FUND: MULTI PROGRAM
DIRECT SPENDS BY SCHOOL LOCATION School Oth Direct Total IndirectReg. Instruct SPED Instruct All Oth Instruct Extracurr Students Staff Admin Spend Direct Spend Spend Net Total
- - - - - - - (132,257) (132,257) % budget37 Facilities & Maintenance - - - - - - 4,432 1,117,992 1,122,424 (1,122,424) - spent
946,500 14-15 cAct Personnel Costs - - - - - - - 539,378 539,378 (539,378) - 36%per pupil - - - - - - - 44.75 44.75 (44.75) -
175,923 Implementation Costs - - - - - - 4,809 110,089 114,898 (114,898) - 40%per pupil - - - - - - 0.40 9.13 9.53 (9.53) -
1,122,424 pupil count Total - - - - - - 4,809 649,467 654,276 (654,276) - 37%12,052.56 Student FTE / per pupil - - - - - - 0.40 53.89 54.29 (54.29) -
14-15 oBud Personnel Costs - - - - - - - 1,485,879 1,485,879 (1,485,879) - per pupil - - - - - - - 123.28 123.28 (123.28) -
Implementation Costs - - - - - - 9,241 281,580 290,821 (290,821) - per pupil - - - - - - 0.77 23.36 24.13 (24.13) -
pupil count Total - - - - - - 9,241 1,767,459 1,776,700 (1,776,700) - 12,052.56 Student FTE / spend per - - - - - - 0.77 146.65 147.41 (147.41) -
- 147.41 34 Transportati SPED Trans, Trip Trans, T - - - - - - 2,073 1,163,129 1,165,202 (1,165,202) - spent
1,153,836 14-15 cAct Personnel Costs - - - - - - - 534,639 534,639 (534,639) - 32%35 per pupil - - - - - - - 44.36 44.36 (44.36) -
11,366 Implementation Costs - - - - - - 1,473 201,094 202,567 (202,567) - 95%per pupil - - - - - - 0.12 16.68 16.81 (16.81) -
1,165,202 pupil count Total - - - - - - 1,473 735,733 737,206 (737,206) - 39%12,052.56 Student FTE / per pupil - - - - - - 0.12 61.04 61.17 (61.17) -
14-15 oBud Personnel Costs - - - - - - - 1,688,475 1,688,475 (1,688,475) - per pupil - - - - - - - 140.09 140.09 (140.09) -
Implementation Costs - - - - - - 3,546 210,387 213,933 (213,933) - per pupil - 17.75 (17.75) -
pupil count Total - - - - - - 3,546 1,898,862 1,902,409 (1,902,409) - 12,052.56 Student FTE / spend per - - - - - - 0.29 157.55 157.84 (157.84) -
- 157.84 33 Information TInformation Technology - - - - - - (1,660) 1,351,479 1,349,819 (1,349,819) - spent
28 14-15 cAct Personnel Costs - - - - - - - - - - - 0%per pupil - - - - - - - - - - -
1,349,791 Implementation Costs - - - - - - 2,140 1,521,890 1,524,030 (1,524,030) - 53%per pupil - - - - - - 0.18 126.27 126.45 (126.45) -
1,349,819 pupil count Total - - - - - - 2,140 1,521,890 1,524,030 (1,524,030) - 53%12,052.56 Student FTE / per pupil - - - - - - 0.18 126.27 126.45 (126.45) -
14-15 oBud Personnel Costs - - - - - - - 28 28 (28) - per pupil - - - - - - - 0.00 0.00 (0.00) -
Implementation Costs - - - - - - 480 2,873,341 2,873,821 (2,873,821) - per pupil - 238.44 (238.44) -
pupil count Total - - - - - - 480 2,873,369 2,873,849 (2,873,849) - 12,052.56 Student FTE / spend per - - - - - - 0.04 238.40 238.44 (238.44) -
- 238.44
Support Services for
October 31, 2014
FSD49-1415TB-20141031.xlsx - V1-2 Page 20 / 47 11/18/2014 - 8:45 AM

EL PASO COUNTY SCHOOL DISTRICT 49MONTHLY EXPENSE SUMMARY -GENERAL FUND: MULTI PROGRAM
PERSONNEL COSTS BY SCHOOL LOCATION - TOTAL & PER PUPIL Preschool or School OtherReg. Instruct SPED Instruct Oth Instruct Extracurr Post-Secondary Students Staff Security Admin Direct Spend Total
14-15 cAct SFTEzone
132 Falcon ElementarPersonnel Costs 294.40 30 282,990 69,442 375 - - 22,614 6,438 - 67,919 23,667 473,444 31
134 Meridian Ranch EPersonnel Costs 639.10 30 640,298 99,605 - 56 3,754 34,964 3,878 1,075 81,946 41,535 907,111 36
137 Woodmen Hills E Personnel Costs 668.18 30 691,055 144,058 - 69 16,762 40,373 - 1,258 84,916 28,991 1,007,482 41
220 Falcon Middle Co Personnel Costs 902.00 30 786,895 111,317 8,800 9,658 - 96,802 8,735 15,336 133,934 62,968 1,234,446 46
310 Falcon High ConsPersonnel Costs 1,241.00 30 1,063,082 107,638 8,937 50,452 161,781 93,347 6,285 25,792 119,378 84,525 1,721,216 51
530 Falcon Zone LevePersonnel Costs 3,744.68 30 - 3,257 23,086 1,294 - - 36,058 - 116,436 8,440 188,570 56
131 Evans ElementaryPersonnel Costs 605.58 31 593,397 82,855 23,728 - - 32,754 27,583 730 79,016 38,479 878,542 61
135 Remington ElemePersonnel Costs 520.08 31 599,012 115,156 17,678 - 3,105 35,034 26,890 1,333 79,531 30,115 907,855 66
138 Springs Ranch El Personnel Costs 592.26 31 654,888 166,951 21,701 - 5,658 38,311 21,801 2,590 80,570 41,252 1,033,722 71
225 Horizon Middle CoPersonnel Costs 610.00 31 688,857 160,647 15,597 7,664 - 56,805 29,173 6,950 111,326 46,750 1,123,769 76
315 Sand Creek High Personnel Costs 1,236.00 31 1,085,470 185,756 39,191 28,400 43,129 91,005 8,187 25,546 163,942 95,853 1,766,478 81
531 Sand Creek ZonePersonnel Costs 3,563.92 31 890 - - 5,547 - - 36,021 - 67,046 27,558 137,062 86
136 Ridgeview Eleme Personnel Costs 636.44 32 603,666 129,088 30,805 - 9,833 32,735 34,840 1,729 77,065 39,719 959,480 91
139 Stetson ElementaPersonnel Costs 547.36 32 576,099 119,201 33,141 - 11,797 34,615 6,897 3,505 71,943 39,229 896,427 96
140 Odyssey ElementPersonnel Costs 516.08 32 606,743 143,293 29,521 - 838 39,312 7,571 2,565 79,505 36,138 945,486 101
230 Skyview Middle C Personnel Costs 1,021.50 32 988,248 216,737 33,698 3,325 - 103,821 5,924 24,434 142,589 68,267 1,587,043 106
320 Vista Ridge High Personnel Costs 1,227.00 32 889,533 169,979 46,252 34,997 89,371 122,517 7,813 33,789 154,077 87,618 1,635,946 111
532 Vista Ridge Zone Personnel Costs 3,948.38 32 219 1,138 - 3,172 - - 19,303 - 143,328 21,964 189,124 116
464 Falcon Virtual AcaPersonnel Costs 484.28 35 32,065 49,083 241,977 - - 33,149 - - 88,389 5,619 450,282 6
525 Home School Personnel Costs 62.80 35 - - 70,453 - - 2,800 - - 21,738 1,944 96,934 26
501 Summ School Personnel Costs 12,052.56 35 - - 9,298 - - - - - 2,015 - 11,314 16
510 Patriot Learning CPersonnel Costs 248.50 35 3,164 33,908 263,474 - 16,725 31,478 - - 82,959 30,598 462,306 1
522 iConnect Zone LePersonnel Costs 795.58 35 - - - - - - - - 125,972 - 125,972 21
503 Excl Program Personnel Costs 12,052.56 35 - - 35,700 - - - - - - - 35,700 11
132 Falcon ElementarPersCost / sFTE 294.40 30 961.24 235.88 1.27 - - 76.81 21.87 - 230.70 80.39 1,608.17 32
134 Meridian Ranch EPersCost / sFTE 639.10 30 1,001.87 155.85 - 0.09 5.87 54.71 6.07 1.68 128.22 64.99 1,419.36 37
137 Woodmen Hills E PersCost / sFTE 668.18 30 1,034.23 215.60 - 0.10 25.09 60.42 - 1.88 127.09 43.39 1,507.80 42
220 Falcon Middle Co PersCost / sFTE 902.00 30 872.39 123.41 9.76 10.71 - 107.32 9.68 17.00 148.49 69.81 1,368.56 47
310 Falcon High ConsPersCost / sFTE 1,241.00 30 856.63 86.73 7.20 40.65 130.36 75.22 5.06 20.78 96.20 68.11 1,386.96 52
530 Falcon Zone LevePersCost / sFTE 3,744.68 30 - 0.87 6.16 0.35 - - 9.63 - 31.09 2.25 50.36 57
131 Evans ElementaryPersCost / sFTE 605.58 31 979.88 136.82 39.18 - - 54.09 45.55 1.21 130.48 63.54 1,450.75 62
135 Remington ElemePersCost / sFTE 520.08 31 1,151.77 221.42 33.99 - 5.97 67.36 51.70 2.56 152.92 57.91 1,745.61 67
138 Springs Ranch El PersCost / sFTE 592.26 31 1,105.74 281.89 36.64 - 9.55 64.69 36.81 4.37 136.04 69.65 1,745.39 72
225 Horizon Middle CoPersCost / sFTE 610.00 31 1,129.27 263.35 25.57 12.56 - 93.12 47.83 11.39 182.50 76.64 1,842.24 77
315 Sand Creek High PersCost / sFTE 1,236.00 31 878.21 150.29 31.71 22.98 34.89 73.63 6.62 20.67 132.64 77.55 1,429.19 82
531 Sand Creek ZonePersCost / sFTE 3,563.92 31 0.25 - - 1.56 - - 10.11 - 18.81 7.73 38.46 87
136 Ridgeview Eleme PersCost / sFTE 636.44 32 948.50 202.83 48.40 - 15.45 51.43 54.74 2.72 121.09 62.41 1,507.57 92
139 Stetson ElementaPersCost / sFTE 547.36 32 1,052.51 217.77 60.55 - 21.55 63.24 12.60 6.40 131.44 71.67 1,637.73 97
140 Odyssey ElementPersCost / sFTE 516.08 32 1,175.68 277.66 57.20 - 1.62 76.18 14.67 4.97 154.05 70.02 1,832.05 102
230 Skyview Middle C PersCost / sFTE 1,021.50 32 967.45 212.18 32.99 3.26 - 101.64 5.80 23.92 139.59 66.83 1,553.64 107
320 Vista Ridge High PersCost / sFTE 1,227.00 32 724.97 138.53 37.70 28.52 72.84 99.85 6.37 27.54 125.57 71.41 1,333.29 112
532 Vista Ridge Zone PersCost / sFTE 3,948.38 32 0.06 0.29 - 0.80 - - 4.89 - 36.30 5.56 47.90 117
464 Falcon Virtual AcaPersCost / sFTE 484.28 35 66.21 101.35 499.66 - - 68.45 - - 182.52 11.60 929.80 7
525 Home School PersCost / sFTE 62.80 35 - - 1,121.86 - - 44.58 - - 346.14 30.96 1,543.53 27
501 Summ School PersCost / sFTE 12,052.56 35 - - 0.77 - - - - - 0.17 - 0.94 17
510 Patriot Learning CPersCost / sFTE 248.50 35 12.73 136.45 1,060.26 - 67.30 126.67 - - 333.84 123.13 1,860.39 2
522 iConnect Zone LePersCost / sFTE 795.58 35 - - - - - - - - 158.34 - 158.34 22
503 Excl Program PersCost / sFTE 12,052.56 35 - - 2.96 - - - - - - - - 12
October 31, 2014Support Services for
FSD49-1415TB-20141031.xlsx - V1-2 Page 21 / 47 11/18/2014 - 8:45 AM
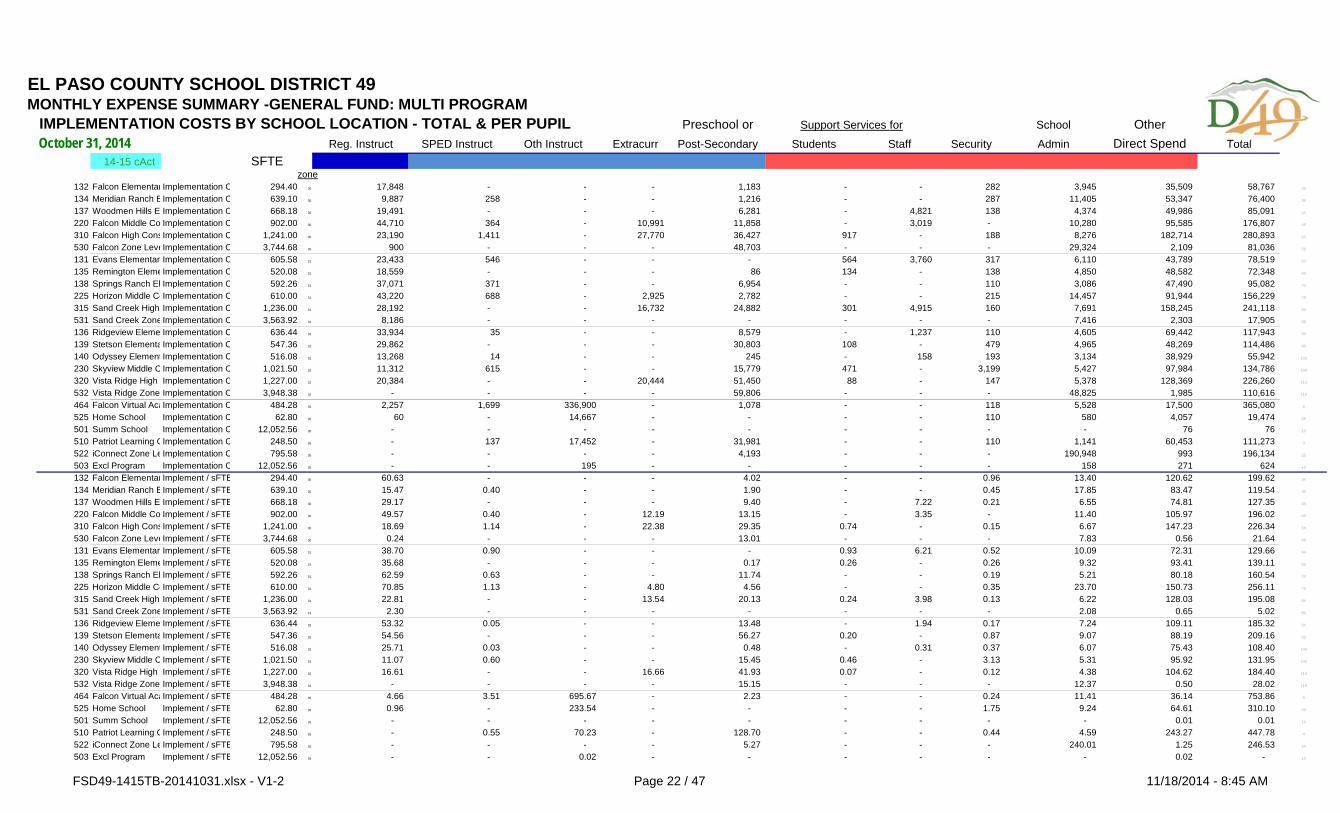
EL PASO COUNTY SCHOOL DISTRICT 49MONTHLY EXPENSE SUMMARY -GENERAL FUND: MULTI PROGRAM
IMPLEMENTATION COSTS BY SCHOOL LOCATION - TOTAL & PER PUPIL Preschool or School OtherReg. Instruct SPED Instruct Oth Instruct Extracurr Post-Secondary Students Staff Security Admin Direct Spend Total
14-15 cAct SFTEzone
132 Falcon Elementar Implementation C 294.40 30 17,848 - - - 1,183 - - 282 3,945 35,509 58,767 33
134 Meridian Ranch EImplementation C 639.10 30 9,887 258 - - 1,216 - - 287 11,405 53,347 76,400 38
137 Woodmen Hills E Implementation C 668.18 30 19,491 - - - 6,281 - 4,821 138 4,374 49,986 85,091 43
220 Falcon Middle Co Implementation C 902.00 30 44,710 364 - 10,991 11,858 - 3,019 - 10,280 95,585 176,807 48
310 Falcon High ConsImplementation C 1,241.00 30 23,190 1,411 - 27,770 36,427 917 - 188 8,276 182,714 280,893 53
530 Falcon Zone LeveImplementation C 3,744.68 30 900 - - - 48,703 - - - 29,324 2,109 81,036 58
131 Evans ElementaryImplementation C 605.58 31 23,433 546 - - - 564 3,760 317 6,110 43,789 78,519 63
135 Remington ElemeImplementation C 520.08 31 18,559 - - - 86 134 - 138 4,850 48,582 72,348 68
138 Springs Ranch El Implementation C 592.26 31 37,071 371 - - 6,954 - - 110 3,086 47,490 95,082 73
225 Horizon Middle CoImplementation C 610.00 31 43,220 688 - 2,925 2,782 - - 215 14,457 91,944 156,229 78
315 Sand Creek High Implementation C 1,236.00 31 28,192 - - 16,732 24,882 301 4,915 160 7,691 158,245 241,118 83
531 Sand Creek ZoneImplementation C 3,563.92 31 8,186 - - - - - - - 7,416 2,303 17,905 88
136 Ridgeview Eleme Implementation C 636.44 32 33,934 35 - - 8,579 - 1,237 110 4,605 69,442 117,943 93
139 Stetson ElementaImplementation C 547.36 32 29,862 - - - 30,803 108 - 479 4,965 48,269 114,486 98
140 Odyssey Element Implementation C 516.08 32 13,268 14 - - 245 - 158 193 3,134 38,929 55,942 103
230 Skyview Middle C Implementation C 1,021.50 32 11,312 615 - - 15,779 471 - 3,199 5,427 97,984 134,786 108
320 Vista Ridge High Implementation C 1,227.00 32 20,384 - - 20,444 51,450 88 - 147 5,378 128,369 226,260 113
532 Vista Ridge Zone Implementation C 3,948.38 32 - - - - 59,806 - - - 48,825 1,985 110,616 118
464 Falcon Virtual AcaImplementation C 484.28 35 2,257 1,699 336,900 - 1,078 - - 118 5,528 17,500 365,080 8
525 Home School Implementation C 62.80 35 60 - 14,667 - - - - 110 580 4,057 19,474 28
501 Summ School Implementation C 12,052.56 35 - - - - - - - - - 76 76 18
510 Patriot Learning CImplementation C 248.50 35 - 137 17,452 - 31,981 - - 110 1,141 60,453 111,273 3
522 iConnect Zone LeImplementation C 795.58 35 - - - - 4,193 - - - 190,948 993 196,134 23
503 Excl Program Implementation C 12,052.56 35 - - 195 - - - - - 158 271 624 13
132 Falcon Elementar Implement / sFTE 294.40 30 60.63 - - - 4.02 - - 0.96 13.40 120.62 199.62 34
134 Meridian Ranch EImplement / sFTE 639.10 30 15.47 0.40 - - 1.90 - - 0.45 17.85 83.47 119.54 39
137 Woodmen Hills E Implement / sFTE 668.18 30 29.17 - - - 9.40 - 7.22 0.21 6.55 74.81 127.35 44
220 Falcon Middle Co Implement / sFTE 902.00 30 49.57 0.40 - 12.19 13.15 - 3.35 - 11.40 105.97 196.02 49
310 Falcon High ConsImplement / sFTE 1,241.00 30 18.69 1.14 - 22.38 29.35 0.74 - 0.15 6.67 147.23 226.34 54
530 Falcon Zone LeveImplement / sFTE 3,744.68 30 0.24 - - - 13.01 - - - 7.83 0.56 21.64 59
131 Evans ElementaryImplement / sFTE 605.58 31 38.70 0.90 - - - 0.93 6.21 0.52 10.09 72.31 129.66 64
135 Remington ElemeImplement / sFTE 520.08 31 35.68 - - - 0.17 0.26 - 0.26 9.32 93.41 139.11 69
138 Springs Ranch El Implement / sFTE 592.26 31 62.59 0.63 - - 11.74 - - 0.19 5.21 80.18 160.54 74
225 Horizon Middle CoImplement / sFTE 610.00 31 70.85 1.13 - 4.80 4.56 - - 0.35 23.70 150.73 256.11 79
315 Sand Creek High Implement / sFTE 1,236.00 31 22.81 - - 13.54 20.13 0.24 3.98 0.13 6.22 128.03 195.08 84
531 Sand Creek ZoneImplement / sFTE 3,563.92 31 2.30 - - - - - - - 2.08 0.65 5.02 89
136 Ridgeview Eleme Implement / sFTE 636.44 32 53.32 0.05 - - 13.48 - 1.94 0.17 7.24 109.11 185.32 94
139 Stetson ElementaImplement / sFTE 547.36 32 54.56 - - - 56.27 0.20 - 0.87 9.07 88.19 209.16 99
140 Odyssey Element Implement / sFTE 516.08 32 25.71 0.03 - - 0.48 - 0.31 0.37 6.07 75.43 108.40 104
230 Skyview Middle C Implement / sFTE 1,021.50 32 11.07 0.60 - - 15.45 0.46 - 3.13 5.31 95.92 131.95 109
320 Vista Ridge High Implement / sFTE 1,227.00 32 16.61 - - 16.66 41.93 0.07 - 0.12 4.38 104.62 184.40 114
532 Vista Ridge Zone Implement / sFTE 3,948.38 32 - - - - 15.15 - - - 12.37 0.50 28.02 119
464 Falcon Virtual AcaImplement / sFTE 484.28 35 4.66 3.51 695.67 - 2.23 - - 0.24 11.41 36.14 753.86 9
525 Home School Implement / sFTE 62.80 35 0.96 - 233.54 - - - - 1.75 9.24 64.61 310.10 29
501 Summ School Implement / sFTE 12,052.56 35 - - - - - - - - - 0.01 0.01 19
510 Patriot Learning CImplement / sFTE 248.50 35 - 0.55 70.23 - 128.70 - - 0.44 4.59 243.27 447.78 4
522 iConnect Zone LeImplement / sFTE 795.58 35 - - - - 5.27 - - - 240.01 1.25 246.53 24
503 Excl Program Implement / sFTE 12,052.56 35 - - 0.02 - - - - - - 0.02 - 14
Support Services for
October 31, 2014
FSD49-1415TB-20141031.xlsx - V1-2 Page 22 / 47 11/18/2014 - 8:45 AM
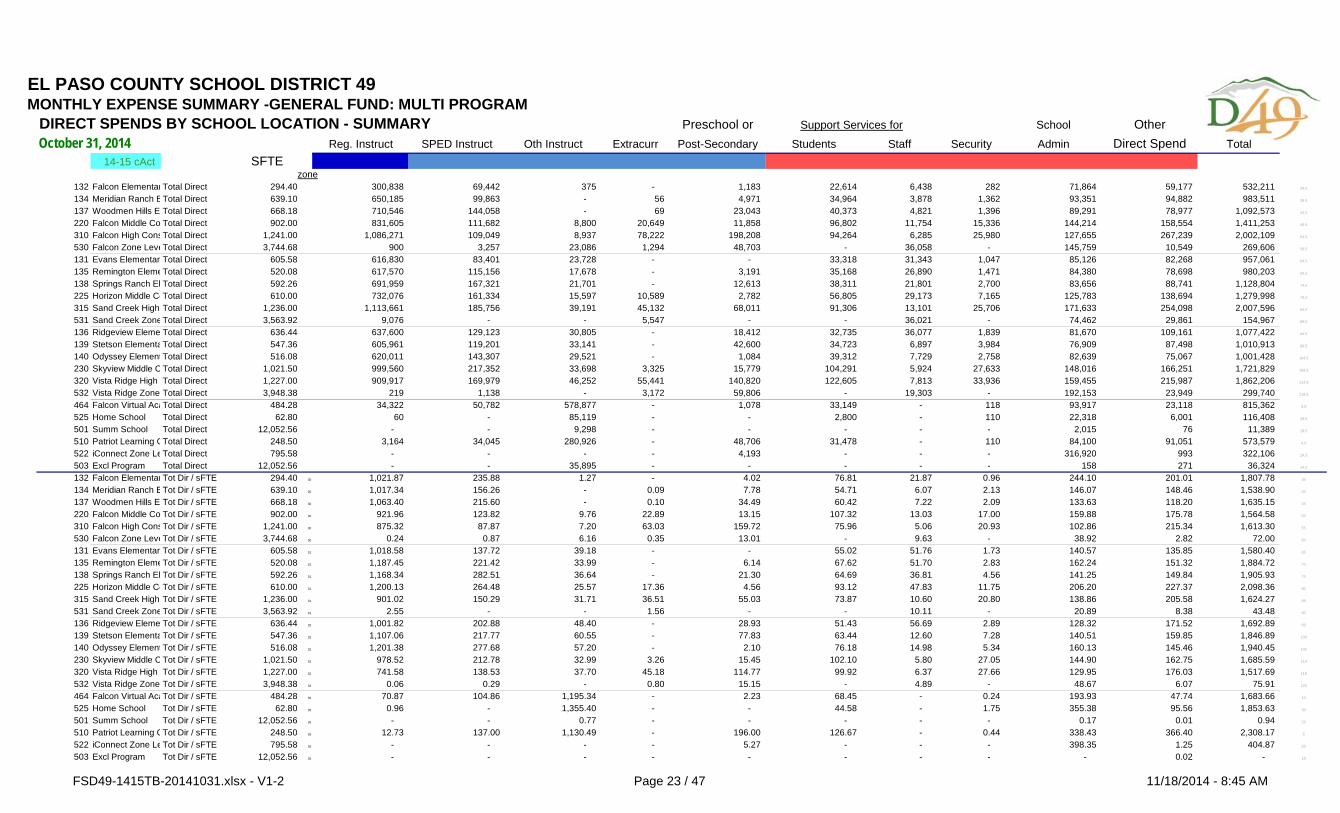
EL PASO COUNTY SCHOOL DISTRICT 49MONTHLY EXPENSE SUMMARY -GENERAL FUND: MULTI PROGRAM
DIRECT SPENDS BY SCHOOL LOCATION - SUMMARY Preschool or School OtherReg. Instruct SPED Instruct Oth Instruct Extracurr Post-Secondary Students Staff Security Admin Direct Spend Total
14-15 cAct SFTEzone
132 Falcon ElementarTotal Direct 294.40 300,838 69,442 375 - 1,183 22,614 6,438 282 71,864 59,177 532,211 34.5
134 Meridian Ranch ETotal Direct 639.10 650,185 99,863 - 56 4,971 34,964 3,878 1,362 93,351 94,882 983,511 39.5
137 Woodmen Hills E Total Direct 668.18 710,546 144,058 - 69 23,043 40,373 4,821 1,396 89,291 78,977 1,092,573 44.5
220 Falcon Middle Co Total Direct 902.00 831,605 111,682 8,800 20,649 11,858 96,802 11,754 15,336 144,214 158,554 1,411,253 49.5
310 Falcon High ConsTotal Direct 1,241.00 1,086,271 109,049 8,937 78,222 198,208 94,264 6,285 25,980 127,655 267,239 2,002,109 54.5
530 Falcon Zone LeveTotal Direct 3,744.68 900 3,257 23,086 1,294 48,703 - 36,058 - 145,759 10,549 269,606 59.5
131 Evans ElementaryTotal Direct 605.58 616,830 83,401 23,728 - - 33,318 31,343 1,047 85,126 82,268 957,061 64.5
135 Remington ElemeTotal Direct 520.08 617,570 115,156 17,678 - 3,191 35,168 26,890 1,471 84,380 78,698 980,203 69.5
138 Springs Ranch El Total Direct 592.26 691,959 167,321 21,701 - 12,613 38,311 21,801 2,700 83,656 88,741 1,128,804 74.5
225 Horizon Middle CoTotal Direct 610.00 732,076 161,334 15,597 10,589 2,782 56,805 29,173 7,165 125,783 138,694 1,279,998 79.5
315 Sand Creek High Total Direct 1,236.00 1,113,661 185,756 39,191 45,132 68,011 91,306 13,101 25,706 171,633 254,098 2,007,596 84.5
531 Sand Creek ZoneTotal Direct 3,563.92 9,076 - - 5,547 - - 36,021 - 74,462 29,861 154,967 89.5
136 Ridgeview Eleme Total Direct 636.44 637,600 129,123 30,805 - 18,412 32,735 36,077 1,839 81,670 109,161 1,077,422 94.5
139 Stetson ElementaTotal Direct 547.36 605,961 119,201 33,141 - 42,600 34,723 6,897 3,984 76,909 87,498 1,010,913 99.5
140 Odyssey ElementTotal Direct 516.08 620,011 143,307 29,521 - 1,084 39,312 7,729 2,758 82,639 75,067 1,001,428 104.5
230 Skyview Middle C Total Direct 1,021.50 999,560 217,352 33,698 3,325 15,779 104,291 5,924 27,633 148,016 166,251 1,721,829 109.5
320 Vista Ridge High Total Direct 1,227.00 909,917 169,979 46,252 55,441 140,820 122,605 7,813 33,936 159,455 215,987 1,862,206 114.5
532 Vista Ridge Zone Total Direct 3,948.38 219 1,138 - 3,172 59,806 - 19,303 - 192,153 23,949 299,740 119.5
464 Falcon Virtual AcaTotal Direct 484.28 34,322 50,782 578,877 - 1,078 33,149 - 118 93,917 23,118 815,362 9.5
525 Home School Total Direct 62.80 60 - 85,119 - - 2,800 - 110 22,318 6,001 116,408 29.5
501 Summ School Total Direct 12,052.56 - - 9,298 - - - - - 2,015 76 11,389 19.5
510 Patriot Learning CTotal Direct 248.50 3,164 34,045 280,926 - 48,706 31,478 - 110 84,100 91,051 573,579 4.5
522 iConnect Zone LeTotal Direct 795.58 - - - - 4,193 - - - 316,920 993 322,106 24.5
503 Excl Program Total Direct 12,052.56 - - 35,895 - - - - - 158 271 36,324 14.5
132 Falcon ElementarTot Dir / sFTE 294.40 30 1,021.87 235.88 1.27 - 4.02 76.81 21.87 0.96 244.10 201.01 1,807.78 35
134 Meridian Ranch ETot Dir / sFTE 639.10 30 1,017.34 156.26 - 0.09 7.78 54.71 6.07 2.13 146.07 148.46 1,538.90 40
137 Woodmen Hills E Tot Dir / sFTE 668.18 30 1,063.40 215.60 - 0.10 34.49 60.42 7.22 2.09 133.63 118.20 1,635.15 45
220 Falcon Middle Co Tot Dir / sFTE 902.00 30 921.96 123.82 9.76 22.89 13.15 107.32 13.03 17.00 159.88 175.78 1,564.58 50
310 Falcon High ConsTot Dir / sFTE 1,241.00 30 875.32 87.87 7.20 63.03 159.72 75.96 5.06 20.93 102.86 215.34 1,613.30 55
530 Falcon Zone LeveTot Dir / sFTE 3,744.68 30 0.24 0.87 6.16 0.35 13.01 - 9.63 - 38.92 2.82 72.00 60
131 Evans ElementaryTot Dir / sFTE 605.58 31 1,018.58 137.72 39.18 - - 55.02 51.76 1.73 140.57 135.85 1,580.40 65
135 Remington ElemeTot Dir / sFTE 520.08 31 1,187.45 221.42 33.99 - 6.14 67.62 51.70 2.83 162.24 151.32 1,884.72 70
138 Springs Ranch El Tot Dir / sFTE 592.26 31 1,168.34 282.51 36.64 - 21.30 64.69 36.81 4.56 141.25 149.84 1,905.93 75
225 Horizon Middle CoTot Dir / sFTE 610.00 31 1,200.13 264.48 25.57 17.36 4.56 93.12 47.83 11.75 206.20 227.37 2,098.36 80
315 Sand Creek High Tot Dir / sFTE 1,236.00 31 901.02 150.29 31.71 36.51 55.03 73.87 10.60 20.80 138.86 205.58 1,624.27 85
531 Sand Creek ZoneTot Dir / sFTE 3,563.92 31 2.55 - - 1.56 - - 10.11 - 20.89 8.38 43.48 90
136 Ridgeview Eleme Tot Dir / sFTE 636.44 32 1,001.82 202.88 48.40 - 28.93 51.43 56.69 2.89 128.32 171.52 1,692.89 95
139 Stetson ElementaTot Dir / sFTE 547.36 32 1,107.06 217.77 60.55 - 77.83 63.44 12.60 7.28 140.51 159.85 1,846.89 100
140 Odyssey ElementTot Dir / sFTE 516.08 32 1,201.38 277.68 57.20 - 2.10 76.18 14.98 5.34 160.13 145.46 1,940.45 105
230 Skyview Middle C Tot Dir / sFTE 1,021.50 32 978.52 212.78 32.99 3.26 15.45 102.10 5.80 27.05 144.90 162.75 1,685.59 110
320 Vista Ridge High Tot Dir / sFTE 1,227.00 32 741.58 138.53 37.70 45.18 114.77 99.92 6.37 27.66 129.95 176.03 1,517.69 115
532 Vista Ridge Zone Tot Dir / sFTE 3,948.38 32 0.06 0.29 - 0.80 15.15 - 4.89 - 48.67 6.07 75.91 120
464 Falcon Virtual AcaTot Dir / sFTE 484.28 35 70.87 104.86 1,195.34 - 2.23 68.45 - 0.24 193.93 47.74 1,683.66 10
525 Home School Tot Dir / sFTE 62.80 35 0.96 - 1,355.40 - - 44.58 - 1.75 355.38 95.56 1,853.63 30
501 Summ School Tot Dir / sFTE 12,052.56 35 - - 0.77 - - - - - 0.17 0.01 0.94 20
510 Patriot Learning CTot Dir / sFTE 248.50 35 12.73 137.00 1,130.49 - 196.00 126.67 - 0.44 338.43 366.40 2,308.17 5
522 iConnect Zone LeTot Dir / sFTE 795.58 35 - - - - 5.27 - - - 398.35 1.25 404.87 25
503 Excl Program Tot Dir / sFTE 12,052.56 35 - - - - - - - - - 0.02 - 15
Support Services for
October 31, 2014
FSD49-1415TB-20141031.xlsx - V1-2 Page 23 / 47 11/18/2014 - 8:45 AM
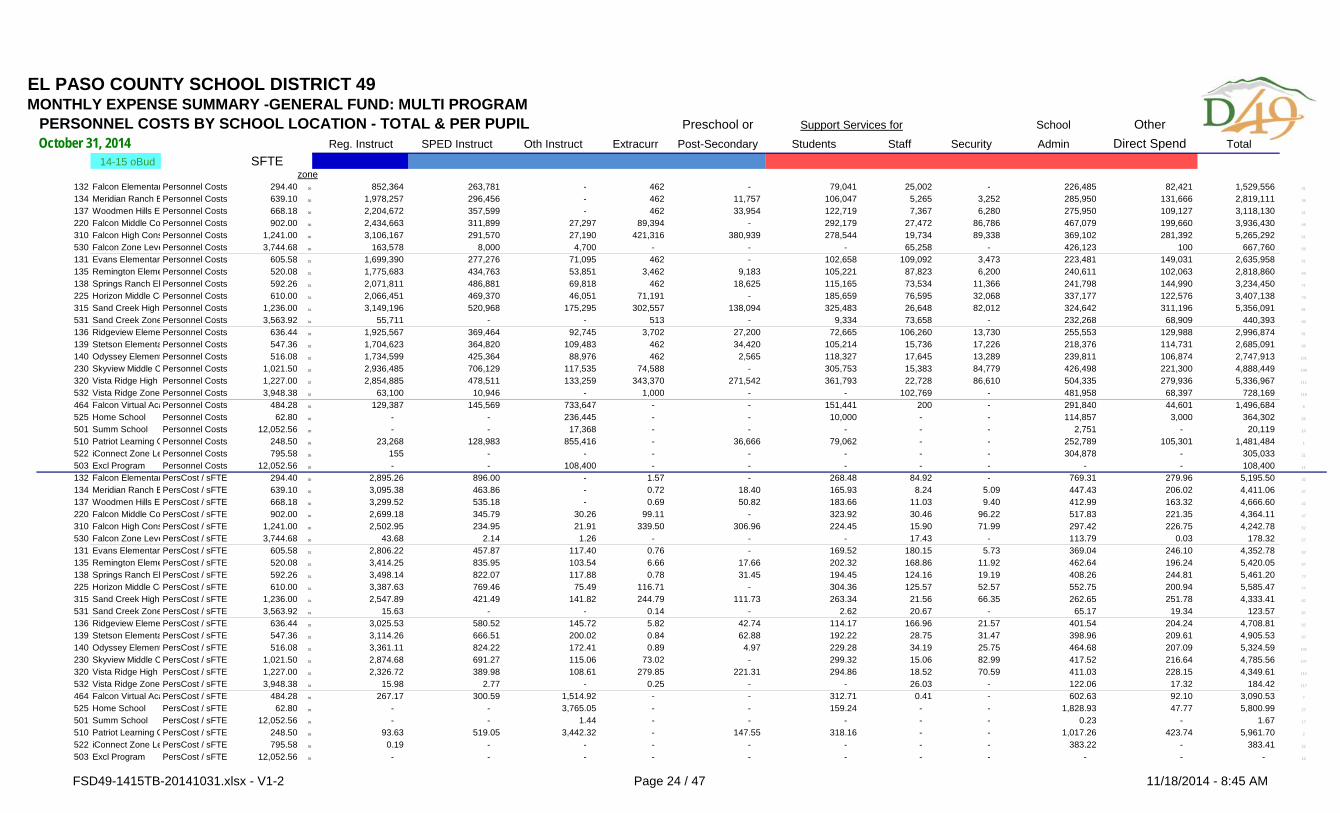
EL PASO COUNTY SCHOOL DISTRICT 49MONTHLY EXPENSE SUMMARY -GENERAL FUND: MULTI PROGRAM
PERSONNEL COSTS BY SCHOOL LOCATION - TOTAL & PER PUPIL Preschool or School OtherReg. Instruct SPED Instruct Oth Instruct Extracurr Post-Secondary Students Staff Security Admin Direct Spend Total
14-15 oBud SFTEzone
132 Falcon ElementarPersonnel Costs 294.40 30 852,364 263,781 - 462 - 79,041 25,002 - 226,485 82,421 1,529,556 31
134 Meridian Ranch EPersonnel Costs 639.10 30 1,978,257 296,456 - 462 11,757 106,047 5,265 3,252 285,950 131,666 2,819,111 36
137 Woodmen Hills E Personnel Costs 668.18 30 2,204,672 357,599 - 462 33,954 122,719 7,367 6,280 275,950 109,127 3,118,130 41
220 Falcon Middle Co Personnel Costs 902.00 30 2,434,663 311,899 27,297 89,394 - 292,179 27,472 86,786 467,079 199,660 3,936,430 46
310 Falcon High ConsPersonnel Costs 1,241.00 30 3,106,167 291,570 27,190 421,316 380,939 278,544 19,734 89,338 369,102 281,392 5,265,292 51
530 Falcon Zone LevePersonnel Costs 3,744.68 30 163,578 8,000 4,700 - - - 65,258 - 426,123 100 667,760 56
131 Evans ElementaryPersonnel Costs 605.58 31 1,699,390 277,276 71,095 462 - 102,658 109,092 3,473 223,481 149,031 2,635,958 61
135 Remington ElemePersonnel Costs 520.08 31 1,775,683 434,763 53,851 3,462 9,183 105,221 87,823 6,200 240,611 102,063 2,818,860 66
138 Springs Ranch El Personnel Costs 592.26 31 2,071,811 486,881 69,818 462 18,625 115,165 73,534 11,366 241,798 144,990 3,234,450 71
225 Horizon Middle CoPersonnel Costs 610.00 31 2,066,451 469,370 46,051 71,191 - 185,659 76,595 32,068 337,177 122,576 3,407,138 76
315 Sand Creek High Personnel Costs 1,236.00 31 3,149,196 520,968 175,295 302,557 138,094 325,483 26,648 82,012 324,642 311,196 5,356,091 81
531 Sand Creek ZonePersonnel Costs 3,563.92 31 55,711 - - 513 - 9,334 73,658 - 232,268 68,909 440,393 86
136 Ridgeview Eleme Personnel Costs 636.44 32 1,925,567 369,464 92,745 3,702 27,200 72,665 106,260 13,730 255,553 129,988 2,996,874 91
139 Stetson ElementaPersonnel Costs 547.36 32 1,704,623 364,820 109,483 462 34,420 105,214 15,736 17,226 218,376 114,731 2,685,091 96
140 Odyssey ElementPersonnel Costs 516.08 32 1,734,599 425,364 88,976 462 2,565 118,327 17,645 13,289 239,811 106,874 2,747,913 101
230 Skyview Middle C Personnel Costs 1,021.50 32 2,936,485 706,129 117,535 74,588 - 305,753 15,383 84,779 426,498 221,300 4,888,449 106
320 Vista Ridge High Personnel Costs 1,227.00 32 2,854,885 478,511 133,259 343,370 271,542 361,793 22,728 86,610 504,335 279,936 5,336,967 111
532 Vista Ridge Zone Personnel Costs 3,948.38 32 63,100 10,946 - 1,000 - - 102,769 - 481,958 68,397 728,169 116
464 Falcon Virtual AcaPersonnel Costs 484.28 35 129,387 145,569 733,647 - - 151,441 200 - 291,840 44,601 1,496,684 6
525 Home School Personnel Costs 62.80 35 - - 236,445 - - 10,000 - - 114,857 3,000 364,302 26
501 Summ School Personnel Costs 12,052.56 35 - - 17,368 - - - - - 2,751 - 20,119 16
510 Patriot Learning CPersonnel Costs 248.50 35 23,268 128,983 855,416 - 36,666 79,062 - - 252,789 105,301 1,481,484 1
522 iConnect Zone LePersonnel Costs 795.58 35 155 - - - - - - - 304,878 - 305,033 21
503 Excl Program Personnel Costs 12,052.56 35 - - 108,400 - - - - - - - 108,400 11
132 Falcon ElementarPersCost / sFTE 294.40 30 2,895.26 896.00 - 1.57 - 268.48 84.92 - 769.31 279.96 5,195.50 32
134 Meridian Ranch EPersCost / sFTE 639.10 30 3,095.38 463.86 - 0.72 18.40 165.93 8.24 5.09 447.43 206.02 4,411.06 37
137 Woodmen Hills E PersCost / sFTE 668.18 30 3,299.52 535.18 - 0.69 50.82 183.66 11.03 9.40 412.99 163.32 4,666.60 42
220 Falcon Middle Co PersCost / sFTE 902.00 30 2,699.18 345.79 30.26 99.11 - 323.92 30.46 96.22 517.83 221.35 4,364.11 47
310 Falcon High ConsPersCost / sFTE 1,241.00 30 2,502.95 234.95 21.91 339.50 306.96 224.45 15.90 71.99 297.42 226.75 4,242.78 52
530 Falcon Zone LevePersCost / sFTE 3,744.68 30 43.68 2.14 1.26 - - - 17.43 - 113.79 0.03 178.32 57
131 Evans ElementaryPersCost / sFTE 605.58 31 2,806.22 457.87 117.40 0.76 - 169.52 180.15 5.73 369.04 246.10 4,352.78 62
135 Remington ElemePersCost / sFTE 520.08 31 3,414.25 835.95 103.54 6.66 17.66 202.32 168.86 11.92 462.64 196.24 5,420.05 67
138 Springs Ranch El PersCost / sFTE 592.26 31 3,498.14 822.07 117.88 0.78 31.45 194.45 124.16 19.19 408.26 244.81 5,461.20 72
225 Horizon Middle CoPersCost / sFTE 610.00 31 3,387.63 769.46 75.49 116.71 - 304.36 125.57 52.57 552.75 200.94 5,585.47 77
315 Sand Creek High PersCost / sFTE 1,236.00 31 2,547.89 421.49 141.82 244.79 111.73 263.34 21.56 66.35 262.65 251.78 4,333.41 82
531 Sand Creek ZonePersCost / sFTE 3,563.92 31 15.63 - - 0.14 - 2.62 20.67 - 65.17 19.34 123.57 87
136 Ridgeview Eleme PersCost / sFTE 636.44 32 3,025.53 580.52 145.72 5.82 42.74 114.17 166.96 21.57 401.54 204.24 4,708.81 92
139 Stetson ElementaPersCost / sFTE 547.36 32 3,114.26 666.51 200.02 0.84 62.88 192.22 28.75 31.47 398.96 209.61 4,905.53 97
140 Odyssey ElementPersCost / sFTE 516.08 32 3,361.11 824.22 172.41 0.89 4.97 229.28 34.19 25.75 464.68 207.09 5,324.59 102
230 Skyview Middle C PersCost / sFTE 1,021.50 32 2,874.68 691.27 115.06 73.02 - 299.32 15.06 82.99 417.52 216.64 4,785.56 107
320 Vista Ridge High PersCost / sFTE 1,227.00 32 2,326.72 389.98 108.61 279.85 221.31 294.86 18.52 70.59 411.03 228.15 4,349.61 112
532 Vista Ridge Zone PersCost / sFTE 3,948.38 32 15.98 2.77 - 0.25 - - 26.03 - 122.06 17.32 184.42 117
464 Falcon Virtual AcaPersCost / sFTE 484.28 35 267.17 300.59 1,514.92 - - 312.71 0.41 - 602.63 92.10 3,090.53 7
525 Home School PersCost / sFTE 62.80 35 - - 3,765.05 - - 159.24 - - 1,828.93 47.77 5,800.99 27
501 Summ School PersCost / sFTE 12,052.56 35 - - 1.44 - - - - - 0.23 - 1.67 17
510 Patriot Learning CPersCost / sFTE 248.50 35 93.63 519.05 3,442.32 - 147.55 318.16 - - 1,017.26 423.74 5,961.70 2
522 iConnect Zone LePersCost / sFTE 795.58 35 0.19 - - - - - - - 383.22 - 383.41 22
503 Excl Program PersCost / sFTE 12,052.56 35 - - - - - - - - - - - 12
Support Services for
October 31, 2014
FSD49-1415TB-20141031.xlsx - V1-2 Page 24 / 47 11/18/2014 - 8:45 AM
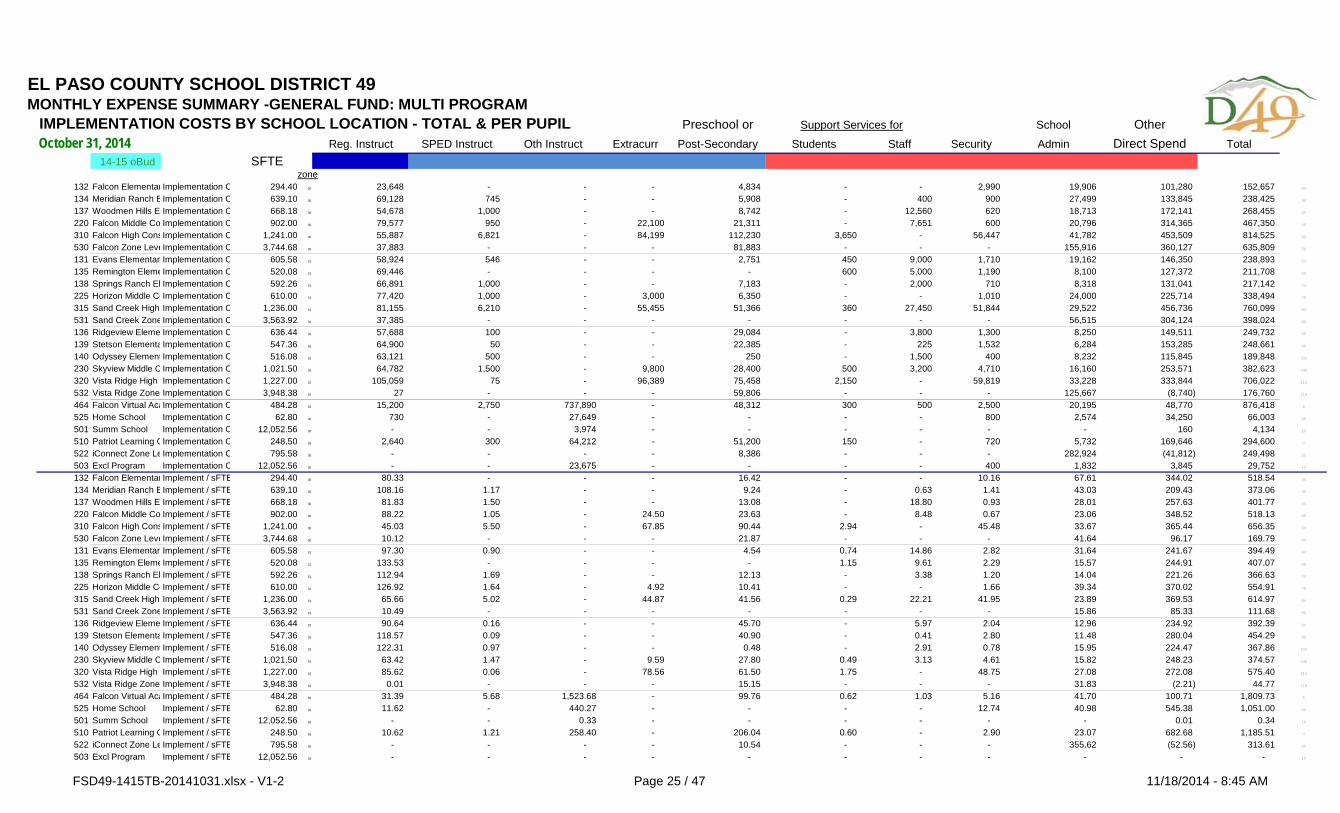
EL PASO COUNTY SCHOOL DISTRICT 49MONTHLY EXPENSE SUMMARY -GENERAL FUND: MULTI PROGRAM
IMPLEMENTATION COSTS BY SCHOOL LOCATION - TOTAL & PER PUPIL Preschool or School OtherReg. Instruct SPED Instruct Oth Instruct Extracurr Post-Secondary Students Staff Security Admin Direct Spend Total
14-15 oBud SFTEzone
132 Falcon Elementar Implementation C 294.40 30 23,648 - - - 4,834 - - 2,990 19,906 101,280 152,657 33
134 Meridian Ranch EImplementation C 639.10 30 69,128 745 - - 5,908 - 400 900 27,499 133,845 238,425 38
137 Woodmen Hills E Implementation C 668.18 30 54,678 1,000 - - 8,742 - 12,560 620 18,713 172,141 268,455 43
220 Falcon Middle Co Implementation C 902.00 30 79,577 950 - 22,100 21,311 - 7,651 600 20,796 314,365 467,350 48
310 Falcon High ConsImplementation C 1,241.00 30 55,887 6,821 - 84,199 112,230 3,650 - 56,447 41,782 453,509 814,525 53
530 Falcon Zone LeveImplementation C 3,744.68 30 37,883 - - - 81,883 - - - 155,916 360,127 635,809 58
131 Evans ElementaryImplementation C 605.58 31 58,924 546 - - 2,751 450 9,000 1,710 19,162 146,350 238,893 63
135 Remington ElemeImplementation C 520.08 31 69,446 - - - - 600 5,000 1,190 8,100 127,372 211,708 68
138 Springs Ranch El Implementation C 592.26 31 66,891 1,000 - - 7,183 - 2,000 710 8,318 131,041 217,142 73
225 Horizon Middle CoImplementation C 610.00 31 77,420 1,000 - 3,000 6,350 - - 1,010 24,000 225,714 338,494 78
315 Sand Creek High Implementation C 1,236.00 31 81,155 6,210 - 55,455 51,366 360 27,450 51,844 29,522 456,736 760,099 83
531 Sand Creek ZoneImplementation C 3,563.92 31 37,385 - - - - - - - 56,515 304,124 398,024 88
136 Ridgeview Eleme Implementation C 636.44 32 57,688 100 - - 29,084 - 3,800 1,300 8,250 149,511 249,732 93
139 Stetson ElementaImplementation C 547.36 32 64,900 50 - - 22,385 - 225 1,532 6,284 153,285 248,661 98
140 Odyssey Element Implementation C 516.08 32 63,121 500 - - 250 - 1,500 400 8,232 115,845 189,848 103
230 Skyview Middle C Implementation C 1,021.50 32 64,782 1,500 - 9,800 28,400 500 3,200 4,710 16,160 253,571 382,623 108
320 Vista Ridge High Implementation C 1,227.00 32 105,059 75 - 96,389 75,458 2,150 - 59,819 33,228 333,844 706,022 113
532 Vista Ridge Zone Implementation C 3,948.38 32 27 - - - 59,806 - - - 125,667 (8,740) 176,760 118
464 Falcon Virtual AcaImplementation C 484.28 35 15,200 2,750 737,890 - 48,312 300 500 2,500 20,195 48,770 876,418 8
525 Home School Implementation C 62.80 35 730 - 27,649 - - - - 800 2,574 34,250 66,003 28
501 Summ School Implementation C 12,052.56 35 - - 3,974 - - - - - - 160 4,134 18
510 Patriot Learning CImplementation C 248.50 35 2,640 300 64,212 - 51,200 150 - 720 5,732 169,646 294,600 3
522 iConnect Zone LeImplementation C 795.58 35 - - - - 8,386 - - - 282,924 (41,812) 249,498 23
503 Excl Program Implementation C 12,052.56 35 - - 23,675 - - - - 400 1,832 3,845 29,752 13
132 Falcon Elementar Implement / sFTE 294.40 30 80.33 - - - 16.42 - - 10.16 67.61 344.02 518.54 34
134 Meridian Ranch EImplement / sFTE 639.10 30 108.16 1.17 - - 9.24 - 0.63 1.41 43.03 209.43 373.06 39
137 Woodmen Hills E Implement / sFTE 668.18 30 81.83 1.50 - - 13.08 - 18.80 0.93 28.01 257.63 401.77 44
220 Falcon Middle Co Implement / sFTE 902.00 30 88.22 1.05 - 24.50 23.63 - 8.48 0.67 23.06 348.52 518.13 49
310 Falcon High ConsImplement / sFTE 1,241.00 30 45.03 5.50 - 67.85 90.44 2.94 - 45.48 33.67 365.44 656.35 54
530 Falcon Zone LeveImplement / sFTE 3,744.68 30 10.12 - - - 21.87 - - - 41.64 96.17 169.79 59
131 Evans ElementaryImplement / sFTE 605.58 31 97.30 0.90 - - 4.54 0.74 14.86 2.82 31.64 241.67 394.49 64
135 Remington ElemeImplement / sFTE 520.08 31 133.53 - - - - 1.15 9.61 2.29 15.57 244.91 407.07 69
138 Springs Ranch El Implement / sFTE 592.26 31 112.94 1.69 - - 12.13 - 3.38 1.20 14.04 221.26 366.63 74
225 Horizon Middle CoImplement / sFTE 610.00 31 126.92 1.64 - 4.92 10.41 - - 1.66 39.34 370.02 554.91 79
315 Sand Creek High Implement / sFTE 1,236.00 31 65.66 5.02 - 44.87 41.56 0.29 22.21 41.95 23.89 369.53 614.97 84
531 Sand Creek ZoneImplement / sFTE 3,563.92 31 10.49 - - - - - - - 15.86 85.33 111.68 89
136 Ridgeview Eleme Implement / sFTE 636.44 32 90.64 0.16 - - 45.70 - 5.97 2.04 12.96 234.92 392.39 94
139 Stetson ElementaImplement / sFTE 547.36 32 118.57 0.09 - - 40.90 - 0.41 2.80 11.48 280.04 454.29 99
140 Odyssey Element Implement / sFTE 516.08 32 122.31 0.97 - - 0.48 - 2.91 0.78 15.95 224.47 367.86 104
230 Skyview Middle C Implement / sFTE 1,021.50 32 63.42 1.47 - 9.59 27.80 0.49 3.13 4.61 15.82 248.23 374.57 109
320 Vista Ridge High Implement / sFTE 1,227.00 32 85.62 0.06 - 78.56 61.50 1.75 - 48.75 27.08 272.08 575.40 114
532 Vista Ridge Zone Implement / sFTE 3,948.38 32 0.01 - - - 15.15 - - - 31.83 (2.21) 44.77 119
464 Falcon Virtual AcaImplement / sFTE 484.28 35 31.39 5.68 1,523.68 - 99.76 0.62 1.03 5.16 41.70 100.71 1,809.73 9
525 Home School Implement / sFTE 62.80 35 11.62 - 440.27 - - - - 12.74 40.98 545.38 1,051.00 29
501 Summ School Implement / sFTE 12,052.56 35 - - 0.33 - - - - - - 0.01 0.34 19
510 Patriot Learning CImplement / sFTE 248.50 35 10.62 1.21 258.40 - 206.04 0.60 - 2.90 23.07 682.68 1,185.51 4
522 iConnect Zone LeImplement / sFTE 795.58 35 - - - - 10.54 - - - 355.62 (52.56) 313.61 24
503 Excl Program Implement / sFTE 12,052.56 35 - - - - - - - - - - - 14
October 31, 2014Support Services for
FSD49-1415TB-20141031.xlsx - V1-2 Page 25 / 47 11/18/2014 - 8:45 AM
EL PASO COUNTY SCHOOL DISTRICT 49MONTHLY EXPENSE SUMMARY -GENERAL FUND: MULTI PROGRAM
DIRECT SPENDS BY SCHOOL LOCATION - SUMMARY Preschool or School OtherReg. Instruct SPED Instruct Oth Instruct Extracurr Post-Secondary Students Staff Security Admin Direct Spend Total
14-15 oBud SFTEzone
132 Falcon ElementarTotal Direct 294.40 30 876,013 263,781 - 462 4,834 79,041 25,002 2,990 246,391 183,701 1,682,213 34.5
134 Meridian Ranch ETotal Direct 639.10 30 2,047,385 297,201 - 462 17,665 106,047 5,665 4,152 313,449 265,511 3,057,536 39.5
137 Woodmen Hills E Total Direct 668.18 30 2,259,350 358,599 - 462 42,697 122,719 19,927 6,900 294,664 281,268 3,386,585 44.5
220 Falcon Middle Co Total Direct 902.00 30 2,514,240 312,849 27,297 111,494 21,311 292,179 35,123 87,386 487,875 514,025 4,403,780 49.5
310 Falcon High ConsTotal Direct 1,241.00 30 3,162,054 298,391 27,190 505,515 493,169 282,194 19,734 145,785 410,884 734,901 6,079,817 54.5
530 Falcon Zone LeveTotal Direct 3,744.68 30 201,461 8,000 4,700 - 81,883 - 65,258 - 582,039 360,227 1,303,568 59.5
131 Evans ElementaryTotal Direct 605.58 31 1,758,314 277,821 71,095 462 2,751 103,108 118,092 5,183 242,643 295,382 2,874,852 64.5
135 Remington ElemeTotal Direct 520.08 31 1,845,129 434,763 53,851 3,462 9,183 105,821 92,823 7,390 248,711 229,435 3,030,568 69.5
138 Springs Ranch El Total Direct 592.26 31 2,138,702 487,881 69,818 462 25,807 115,165 75,534 12,076 250,117 276,031 3,451,593 74.5
225 Horizon Middle CoTotal Direct 610.00 31 2,143,871 470,370 46,051 74,191 6,350 185,659 76,595 33,078 361,177 348,289 3,745,632 79.5
315 Sand Creek High Total Direct 1,236.00 31 3,230,351 527,178 175,295 358,012 189,460 325,843 54,098 133,856 354,164 767,933 6,116,190 84.5
531 Sand Creek ZoneTotal Direct 3,563.92 31 93,095 - - 513 - 9,334 73,658 - 288,784 373,033 838,417 89.5
136 Ridgeview Eleme Total Direct 636.44 32 1,983,255 369,564 92,745 3,702 56,284 72,665 110,060 15,030 263,803 279,499 3,246,606 94.5
139 Stetson ElementaTotal Direct 547.36 32 1,769,523 364,870 109,483 462 56,805 105,214 15,961 18,758 224,660 268,016 2,933,753 99.5
140 Odyssey ElementTotal Direct 516.08 32 1,797,720 425,864 88,976 462 2,815 118,327 19,145 13,689 248,043 222,719 2,937,760 104.5
230 Skyview Middle C Total Direct 1,021.50 32 3,001,267 707,629 117,535 84,388 28,400 306,253 18,583 89,489 442,658 474,870 5,271,072 109.5
320 Vista Ridge High Total Direct 1,227.00 32 2,959,944 478,586 133,259 439,759 347,000 363,943 22,728 146,429 537,562 613,780 6,042,989 114.5
532 Vista Ridge Zone Total Direct 3,948.38 32 63,127 10,946 - 1,000 59,806 - 102,769 - 607,624 59,657 904,929 119.5
464 Falcon Virtual AcaTotal Direct 484.28 35 144,587 148,319 1,471,537 - 48,312 151,741 700 2,500 312,035 93,371 2,373,102 9.5
525 Home School Total Direct 62.80 35 730 - 264,094 - - 10,000 - 800 117,431 37,250 430,305 29.5
501 Summ School Total Direct 12,052.56 35 - - 21,342 - - - - - 2,751 160 24,253 19.5
510 Patriot Learning CTotal Direct 248.50 35 25,908 129,283 919,628 - 87,866 79,212 - 720 258,521 274,947 1,776,084 4.5
522 iConnect Zone LeTotal Direct 795.58 35 155 - - - 8,386 - - - 587,803 (41,812) 554,531 24.5
503 Excl Program Total Direct 12,052.56 35 - - 132,076 - - - - 400 1,832 3,845 138,153 14.5
132 Falcon ElementarTot Dir / sFTE 294.40 30 2,975.59 896.00 - 1.57 16.42 268.48 84.92 10.16 836.93 623.98 5,714.04 35
134 Meridian Ranch ETot Dir / sFTE 639.10 30 3,203.54 465.03 - 0.72 27.64 165.93 8.86 6.50 490.45 415.45 4,784.13 40
137 Woodmen Hills E Tot Dir / sFTE 668.18 30 3,381.35 536.68 - 0.69 63.90 183.66 29.82 10.33 440.99 420.95 5,068.37 45
220 Falcon Middle Co Tot Dir / sFTE 902.00 30 2,787.41 346.84 30.26 123.61 23.63 323.92 38.94 96.88 540.88 569.87 4,882.24 50
310 Falcon High ConsTot Dir / sFTE 1,241.00 30 2,547.99 240.44 21.91 407.34 397.40 227.39 15.90 117.47 331.09 592.18 4,899.13 55
530 Falcon Zone LeveTot Dir / sFTE 3,744.68 30 53.80 2.14 1.26 - 21.87 - 17.43 - 155.43 96.20 348.11 60
131 Evans ElementaryTot Dir / sFTE 605.58 31 2,903.52 458.77 117.40 0.76 4.54 170.26 195.01 8.56 400.68 487.77 4,747.27 65
135 Remington ElemeTot Dir / sFTE 520.08 31 3,547.78 835.95 103.54 6.66 17.66 203.47 178.48 14.21 478.22 441.15 5,827.12 70
138 Springs Ranch El Tot Dir / sFTE 592.26 31 3,611.09 823.76 117.88 0.78 43.57 194.45 127.53 20.39 422.31 466.06 5,827.83 75
225 Horizon Middle CoTot Dir / sFTE 610.00 31 3,514.54 771.10 75.49 121.62 10.41 304.36 125.57 54.23 592.09 570.97 6,140.38 80
315 Sand Creek High Tot Dir / sFTE 1,236.00 31 2,613.55 426.52 141.82 289.65 153.29 263.63 43.77 108.30 286.54 621.30 4,948.37 85
531 Sand Creek ZoneTot Dir / sFTE 3,563.92 31 26.12 - - 0.14 - 2.62 20.67 - 81.03 104.67 235.25 90
136 Ridgeview Eleme Tot Dir / sFTE 636.44 32 3,116.17 580.67 145.72 5.82 88.44 114.17 172.93 23.62 414.50 439.16 5,101.20 95
139 Stetson ElementaTot Dir / sFTE 547.36 32 3,232.83 666.60 200.02 0.84 103.78 192.22 29.16 34.27 410.44 489.65 5,359.82 100
140 Odyssey ElementTot Dir / sFTE 516.08 32 3,483.41 825.19 172.41 0.89 5.45 229.28 37.10 26.52 480.63 431.56 5,692.45 105
230 Skyview Middle C Tot Dir / sFTE 1,021.50 32 2,938.10 692.74 115.06 82.61 27.80 299.81 18.19 87.61 433.34 464.88 5,160.13 110
320 Vista Ridge High Tot Dir / sFTE 1,227.00 32 2,412.34 390.05 108.61 358.40 282.80 296.61 18.52 119.34 438.11 500.23 4,925.01 115
532 Vista Ridge Zone Tot Dir / sFTE 3,948.38 32 15.99 2.77 - 0.25 15.15 - 26.03 - 153.89 15.11 229.19 120
464 Falcon Virtual AcaTot Dir / sFTE 484.28 35 298.56 306.27 3,038.61 - 99.76 313.33 1.45 5.16 644.33 192.80 4,900.27 10
525 Home School Tot Dir / sFTE 62.80 35 11.62 - 4,205.32 - - 159.24 - 12.74 1,869.92 593.15 6,851.99 30
501 Summ School Tot Dir / sFTE 12,052.56 35 - - 1.77 - - - - - 0.23 0.01 2.01 20
510 Patriot Learning CTot Dir / sFTE 248.50 35 104.26 520.25 3,700.71 - 353.58 318.76 - 2.90 1,040.33 1,106.42 7,147.22 5
522 iConnect Zone LeTot Dir / sFTE 795.58 35 0.19 - - - 10.54 - - - 738.84 (52.56) 697.02 25
503 Excl Program Tot Dir / sFTE 12,052.56 35 - - 10.96 - - - - 0.03 0.15 0.32 11.46 15
Support Services for
October 31, 2014
FSD49-1415TB-20141031.xlsx - V1-2 Page 26 / 47 11/18/2014 - 8:45 AM
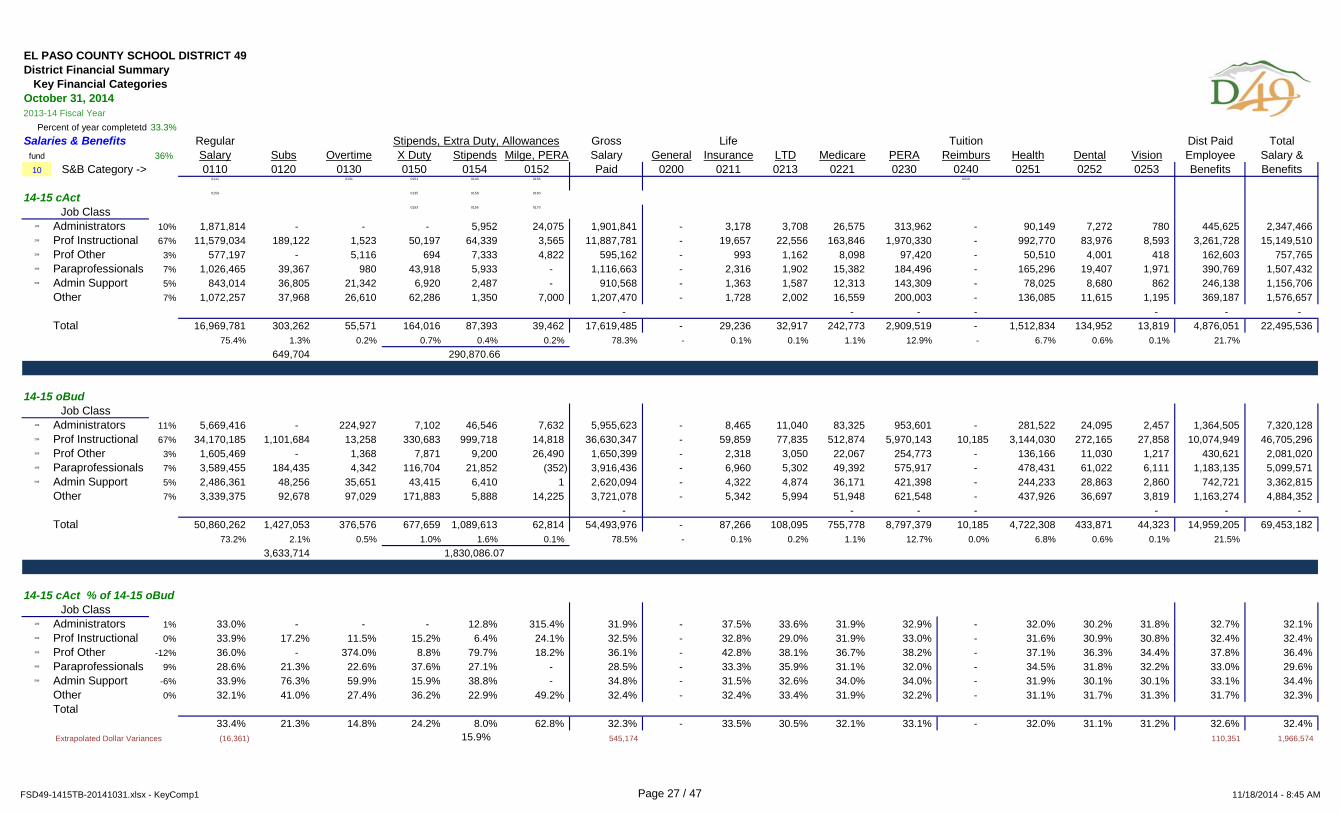
EL PASO COUNTY SCHOOL DISTRICT 49District Financial Summary Key Financial Categories
2013-14 Fiscal YearPercent of year completetd
Salaries & Benefits Regular Gross Life Tuition Dist Paid Totalfund 36% Salary Subs Overtime X Duty Stipends Milge, PERA Salary General Insurance LTD Medicare PERA Reimburs Health Dental Vision Employee Salary &10 S&B Category -> 0110 0120 0130 0150 0154 0152 Paid 0200 0211 0213 0221 0230 0240 0251 0252 0253 Benefits Benefits
0111 0131 0151 0140 0156 0210
14-15 cAct 0159 0135 0158 0160
0153 0155 0170
199 Administrators 10% 1,871,814 - - - 5,952 24,075 1,901,841 - 3,178 3,708 26,575 313,962 - 90,149 7,272 780 445,625 2,347,466 299 Prof Instructional 67% 11,579,034 189,122 1,523 50,197 64,339 3,565 11,887,781 - 19,657 22,556 163,846 1,970,330 - 992,770 83,976 8,593 3,261,728 15,149,510 399 Prof Other 3% 577,197 - 5,116 694 7,333 4,822 595,162 - 993 1,162 8,098 97,420 - 50,510 4,001 418 162,603 757,765 499 Paraprofessionals 7% 1,026,465 39,367 980 43,918 5,933 - 1,116,663 - 2,316 1,902 15,382 184,496 - 165,296 19,407 1,971 390,769 1,507,432 599 Admin Support 5% 843,014 36,805 21,342 6,920 2,487 - 910,568 - 1,363 1,587 12,313 143,309 - 78,025 8,680 862 246,138 1,156,706
Other 7% 1,072,257 37,968 26,610 62,286 1,350 7,000 1,207,470 - 1,728 2,002 16,559 200,003 - 136,085 11,615 1,195 369,187 1,576,657 - - - - - - -
Total 16,969,781 303,262 55,571 164,016 87,393 39,462 17,619,485 - 29,236 32,917 242,773 2,909,519 - 1,512,834 134,952 13,819 4,876,051 22,495,536 75.4% 1.3% 0.2% 0.7% 0.4% 0.2% 78.3% - 0.1% 0.1% 1.1% 12.9% - 6.7% 0.6% 0.1% 21.7%
649,704
14-15 oBud
199 Administrators 11% 5,669,416 - 224,927 7,102 46,546 7,632 5,955,623 - 8,465 11,040 83,325 953,601 - 281,522 24,095 2,457 1,364,505 7,320,128 299 Prof Instructional 67% 34,170,185 1,101,684 13,258 330,683 999,718 14,818 36,630,347 - 59,859 77,835 512,874 5,970,143 10,185 3,144,030 272,165 27,858 10,074,949 46,705,296 399 Prof Other 3% 1,605,469 - 1,368 7,871 9,200 26,490 1,650,399 - 2,318 3,050 22,067 254,773 - 136,166 11,030 1,217 430,621 2,081,020 499 Paraprofessionals 7% 3,589,455 184,435 4,342 116,704 21,852 (352) 3,916,436 - 6,960 5,302 49,392 575,917 - 478,431 61,022 6,111 1,183,135 5,099,571 599 Admin Support 5% 2,486,361 48,256 35,651 43,415 6,410 1 2,620,094 - 4,322 4,874 36,171 421,398 - 244,233 28,863 2,860 742,721 3,362,815
Other 7% 3,339,375 92,678 97,029 171,883 5,888 14,225 3,721,078 - 5,342 5,994 51,948 621,548 - 437,926 36,697 3,819 1,163,274 4,884,352 - - - - - - -
Total 50,860,262 1,427,053 376,576 677,659 1,089,613 62,814 54,493,976 - 87,266 108,095 755,778 8,797,379 10,185 4,722,308 433,871 44,323 14,959,205 69,453,182 73.2% 2.1% 0.5% 1.0% 1.6% 0.1% 78.5% - 0.1% 0.2% 1.1% 12.7% 0.0% 6.8% 0.6% 0.1% 21.5%
3,633,714
14-15 cAct % of 14-15 oBud
199 Administrators 1% 33.0% - - - 12.8% 315.4% 31.9% - 37.5% 33.6% 31.9% 32.9% - 32.0% 30.2% 31.8% 32.7% 32.1% 299 Prof Instructional 0% 33.9% 17.2% 11.5% 15.2% 6.4% 24.1% 32.5% - 32.8% 29.0% 31.9% 33.0% - 31.6% 30.9% 30.8% 32.4% 32.4% 399 Prof Other -12% 36.0% - 374.0% 8.8% 79.7% 18.2% 36.1% - 42.8% 38.1% 36.7% 38.2% - 37.1% 36.3% 34.4% 37.8% 36.4% 499 Paraprofessionals 9% 28.6% 21.3% 22.6% 37.6% 27.1% - 28.5% - 33.3% 35.9% 31.1% 32.0% - 34.5% 31.8% 32.2% 33.0% 29.6% 599 Admin Support -6% 33.9% 76.3% 59.9% 15.9% 38.8% - 34.8% - 31.5% 32.6% 34.0% 34.0% - 31.9% 30.1% 30.1% 33.1% 34.4%
Other 0% 32.1% 41.0% 27.4% 36.2% 22.9% 49.2% 32.4% - 32.4% 33.4% 31.9% 32.2% - 31.1% 31.7% 31.3% 31.7% 32.3% Total
33.4% 21.3% 14.8% 24.2% 8.0% 62.8% 32.3% - 33.5% 30.5% 32.1% 33.1% - 32.0% 31.1% 31.2% 32.6% 32.4% Extrapolated Dollar Variances (16,361) 545,174 110,351 1,966,574
October 31, 2014
Job Class
Job Class
Stipends, Extra Duty, Allowances
290,870.66
1,830,086.07
15.9%
33.3%
Job Class
FSD49-1415TB-20141031.xlsx - KeyComp1 Page 27 / 47 11/18/2014 - 8:45 AM
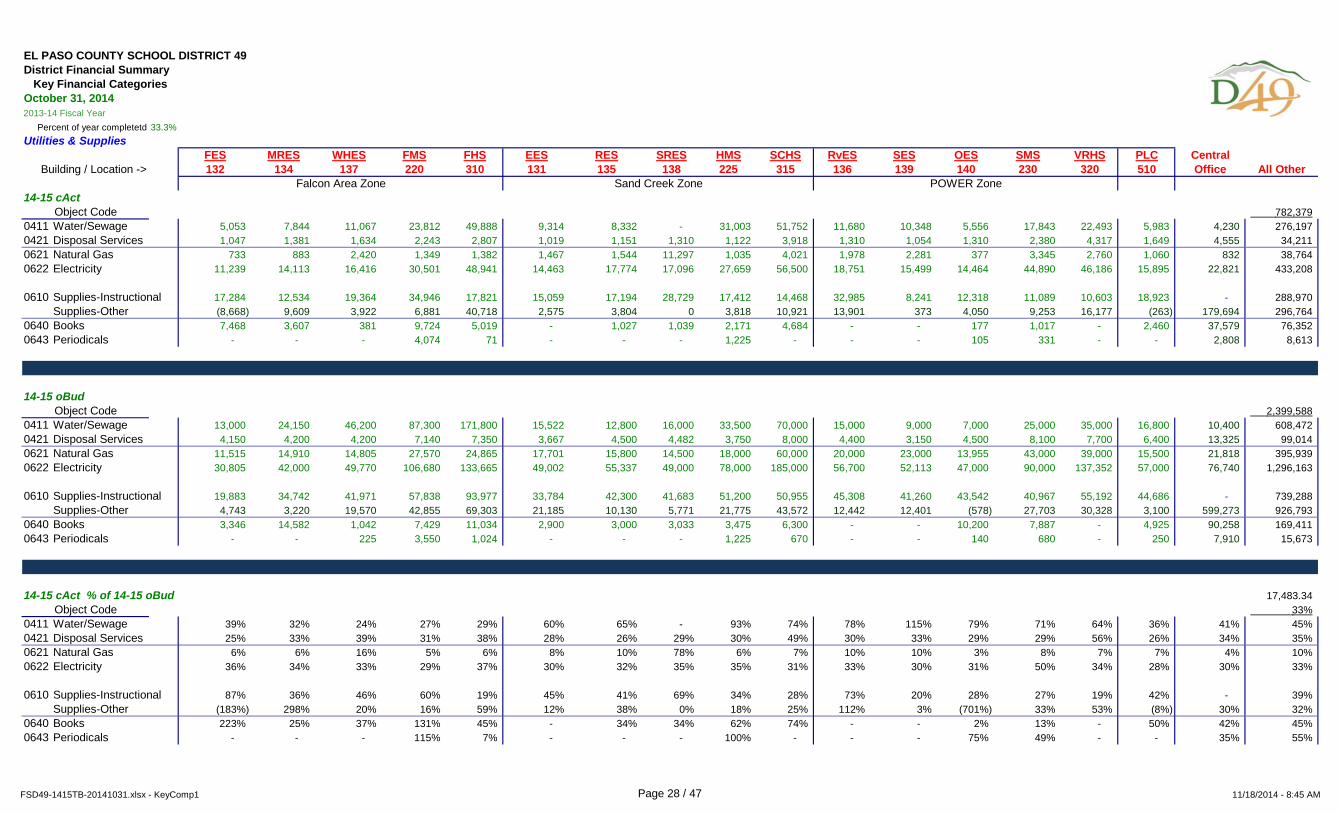
EL PASO COUNTY SCHOOL DISTRICT 49District Financial Summary Key Financial Categories
2013-14 Fiscal YearPercent of year completetd
October 31, 2014
33.3%Utilities & Supplies
FES MRES WHES FMS FHS EES RES SRES HMS SCHS RvES SES OES SMS VRHS PLC CentralBuilding / Location -> 132 134 137 220 310 131 135 138 225 315 136 139 140 230 320 510 Office All Other
14-15 cAct782,379
0411 Water/Sewage 5,053 7,844 11,067 23,812 49,888 9,314 8,332 - 31,003 51,752 11,680 10,348 5,556 17,843 22,493 5,983 4,230 276,197 0421 Disposal Services 1,047 1,381 1,634 2,243 2,807 1,019 1,151 1,310 1,122 3,918 1,310 1,054 1,310 2,380 4,317 1,649 4,555 34,211 0621 Natural Gas 733 883 2,420 1,349 1,382 1,467 1,544 11,297 1,035 4,021 1,978 2,281 377 3,345 2,760 1,060 832 38,764 0622 Electricity 11,239 14,113 16,416 30,501 48,941 14,463 17,774 17,096 27,659 56,500 18,751 15,499 14,464 44,890 46,186 15,895 22,821 433,208
0610 Supplies-Instructional 17,284 12,534 19,364 34,946 17,821 15,059 17,194 28,729 17,412 14,468 32,985 8,241 12,318 11,089 10,603 18,923 - 288,970 Supplies-Other (8,668) 9,609 3,922 6,881 40,718 2,575 3,804 0 3,818 10,921 13,901 373 4,050 9,253 16,177 (263) 179,694 296,764
0640 Books 7,468 3,607 381 9,724 5,019 - 1,027 1,039 2,171 4,684 - - 177 1,017 - 2,460 37,579 76,352 0643 Periodicals - - - 4,074 71 - - - 1,225 - - - 105 331 - - 2,808 8,613
14-15 oBud2,399,588
0411 Water/Sewage 13,000 24,150 46,200 87,300 171,800 15,522 12,800 16,000 33,500 70,000 15,000 9,000 7,000 25,000 35,000 16,800 10,400 608,472 0421 Disposal Services 4,150 4,200 4,200 7,140 7,350 3,667 4,500 4,482 3,750 8,000 4,400 3,150 4,500 8,100 7,700 6,400 13,325 99,014 0621 Natural Gas 11,515 14,910 14,805 27,570 24,865 17,701 15,800 14,500 18,000 60,000 20,000 23,000 13,955 43,000 39,000 15,500 21,818 395,939 0622 Electricity 30,805 42,000 49,770 106,680 133,665 49,002 55,337 49,000 78,000 185,000 56,700 52,113 47,000 90,000 137,352 57,000 76,740 1,296,163
0610 Supplies-Instructional 19,883 34,742 41,971 57,838 93,977 33,784 42,300 41,683 51,200 50,955 45,308 41,260 43,542 40,967 55,192 44,686 - 739,288 Supplies-Other 4,743 3,220 19,570 42,855 69,303 21,185 10,130 5,771 21,775 43,572 12,442 12,401 (578) 27,703 30,328 3,100 599,273 926,793
0640 Books 3,346 14,582 1,042 7,429 11,034 2,900 3,000 3,033 3,475 6,300 - - 10,200 7,887 - 4,925 90,258 169,411 0643 Periodicals - - 225 3,550 1,024 - - - 1,225 670 - - 140 680 - 250 7,910 15,673
14-15 cAct % of 14-15 oBud 17,483.34 33%
0411 Water/Sewage 39% 32% 24% 27% 29% 60% 65% - 93% 74% 78% 115% 79% 71% 64% 36% 41% 45% 0421 Disposal Services 25% 33% 39% 31% 38% 28% 26% 29% 30% 49% 30% 33% 29% 29% 56% 26% 34% 35% 0621 Natural Gas 6% 6% 16% 5% 6% 8% 10% 78% 6% 7% 10% 10% 3% 8% 7% 7% 4% 10% 0622 Electricity 36% 34% 33% 29% 37% 30% 32% 35% 35% 31% 33% 30% 31% 50% 34% 28% 30% 33%
0610 Supplies-Instructional 87% 36% 46% 60% 19% 45% 41% 69% 34% 28% 73% 20% 28% 27% 19% 42% - 39% Supplies-Other (183%) 298% 20% 16% 59% 12% 38% 0% 18% 25% 112% 3% (701%) 33% 53% (8%) 30% 32%
0640 Books 223% 25% 37% 131% 45% - 34% 34% 62% 74% - - 2% 13% - 50% 42% 45% 0643 Periodicals - - - 115% 7% - - - 100% - - - 75% 49% - - 35% 55%
POWER ZoneSand Creek Zone
Object Code
Object Code
Object Code
Falcon Area Zone
FSD49-1415TB-20141031.xlsx - KeyComp1 Page 28 / 47 11/18/2014 - 8:45 AM
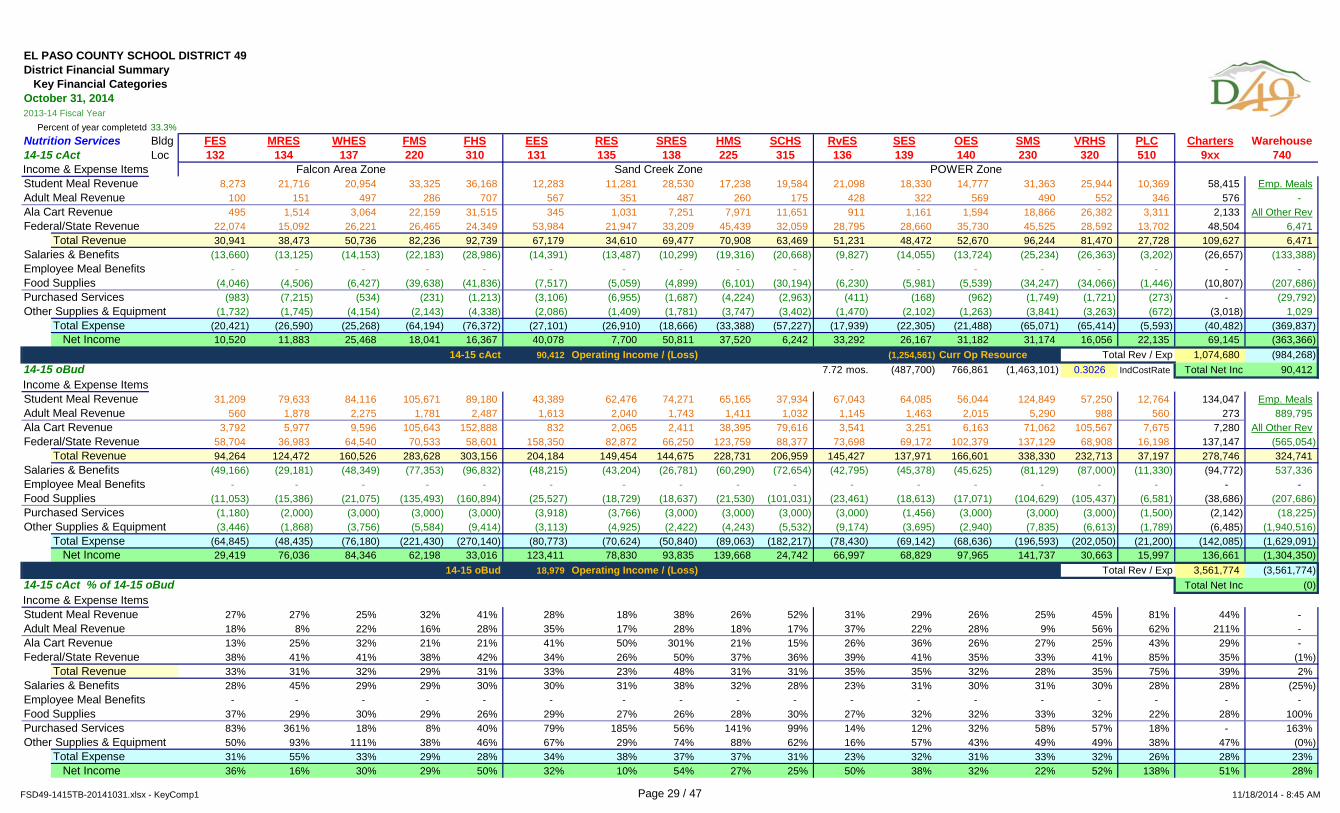
EL PASO COUNTY SCHOOL DISTRICT 49District Financial Summary Key Financial Categories
2013-14 Fiscal YearPercent of year completetd
October 31, 2014
33.3%Nutrition Services Bldg FES MRES WHES FMS FHS EES RES SRES HMS SCHS RvES SES OES SMS VRHS PLC Charters Warehouse14-15 cAct Loc 132 134 137 220 310 131 135 138 225 315 136 139 140 230 320 510 9xx 740
Student Meal Revenue 8,273 21,716 20,954 33,325 36,168 12,283 11,281 28,530 17,238 19,584 21,098 18,330 14,777 31,363 25,944 10,369 58,415 Emp. MealsAdult Meal Revenue 100 151 497 286 707 567 351 487 260 175 428 322 569 490 552 346 576 - Ala Cart Revenue 495 1,514 3,064 22,159 31,515 345 1,031 7,251 7,971 11,651 911 1,161 1,594 18,866 26,382 3,311 2,133 All Other RevFederal/State Revenue 22,074 15,092 26,221 26,465 24,349 53,984 21,947 33,209 45,439 32,059 28,795 28,660 35,730 45,525 28,592 13,702 48,504 6,471
Total Revenue 30,941 38,473 50,736 82,236 92,739 67,179 34,610 69,477 70,908 63,469 51,231 48,472 52,670 96,244 81,470 27,728 109,627 6,471 Salaries & Benefits (13,660) (13,125) (14,153) (22,183) (28,986) (14,391) (13,487) (10,299) (19,316) (20,668) (9,827) (14,055) (13,724) (25,234) (26,363) (3,202) (26,657) (133,388) Employee Meal Benefits - - - - - - - - - - - - - - - - - - Food Supplies (4,046) (4,506) (6,427) (39,638) (41,836) (7,517) (5,059) (4,899) (6,101) (30,194) (6,230) (5,981) (5,539) (34,247) (34,066) (1,446) (10,807) (207,686) Purchased Services (983) (7,215) (534) (231) (1,213) (3,106) (6,955) (1,687) (4,224) (2,963) (411) (168) (962) (1,749) (1,721) (273) - (29,792) Other Supplies & Equipment (1,732) (1,745) (4,154) (2,143) (4,338) (2,086) (1,409) (1,781) (3,747) (3,402) (1,470) (2,102) (1,263) (3,841) (3,263) (672) (3,018) 1,029
Total Expense (20,421) (26,590) (25,268) (64,194) (76,372) (27,101) (26,910) (18,666) (33,388) (57,227) (17,939) (22,305) (21,488) (65,071) (65,414) (5,593) (40,482) (369,837) Net Income 10,520 11,883 25,468 18,041 16,367 40,078 7,700 50,811 37,520 6,242 33,292 26,167 31,182 31,174 16,056 22,135 69,145 (363,366)
14-15 cAct 90,412 Operating Income / (Loss) Curr Op Resource Total Rev / Exp 1,074,680 (984,268) 14-15 oBud (487,700) 766,861 (1,463,101) 0.3026 IndCostRate Total Net Inc 90,412
Student Meal Revenue 31,209 79,633 84,116 105,671 89,180 43,389 62,476 74,271 65,165 37,934 67,043 64,085 56,044 124,849 57,250 12,764 134,047 Emp. MealsAdult Meal Revenue 560 1,878 2,275 1,781 2,487 1,613 2,040 1,743 1,411 1,032 1,145 1,463 2,015 5,290 988 560 273 889,795 Ala Cart Revenue 3,792 5,977 9,596 105,643 152,888 832 2,065 2,411 38,395 79,616 3,541 3,251 6,163 71,062 105,567 7,675 7,280 All Other RevFederal/State Revenue 58,704 36,983 64,540 70,533 58,601 158,350 82,872 66,250 123,759 88,377 73,698 69,172 102,379 137,129 68,908 16,198 137,147 (565,054)
Total Revenue 94,264 124,472 160,526 283,628 303,156 204,184 149,454 144,675 228,731 206,959 145,427 137,971 166,601 338,330 232,713 37,197 278,746 324,741 Salaries & Benefits (49,166) (29,181) (48,349) (77,353) (96,832) (48,215) (43,204) (26,781) (60,290) (72,654) (42,795) (45,378) (45,625) (81,129) (87,000) (11,330) (94,772) 537,336 Employee Meal Benefits - - - - - - - - - - - - - - - - - - Food Supplies (11,053) (15,386) (21,075) (135,493) (160,894) (25,527) (18,729) (18,637) (21,530) (101,031) (23,461) (18,613) (17,071) (104,629) (105,437) (6,581) (38,686) (207,686) Purchased Services (1,180) (2,000) (3,000) (3,000) (3,000) (3,918) (3,766) (3,000) (3,000) (3,000) (3,000) (1,456) (3,000) (3,000) (3,000) (1,500) (2,142) (18,225) Other Supplies & Equipment (3,446) (1,868) (3,756) (5,584) (9,414) (3,113) (4,925) (2,422) (4,243) (5,532) (9,174) (3,695) (2,940) (7,835) (6,613) (1,789) (6,485) (1,940,516)
Total Expense (64,845) (48,435) (76,180) (221,430) (270,140) (80,773) (70,624) (50,840) (89,063) (182,217) (78,430) (69,142) (68,636) (196,593) (202,050) (21,200) (142,085) (1,629,091) Net Income 29,419 76,036 84,346 62,198 33,016 123,411 78,830 93,835 139,668 24,742 66,997 68,829 97,965 141,737 30,663 15,997 136,661 (1,304,350)
14-15 oBud 18,979 Operating Income / (Loss) Total Rev / Exp 3,561,774 (3,561,774) 14-15 cAct % of 14-15 oBud Total Net Inc (0)
Student Meal Revenue 27% 27% 25% 32% 41% 28% 18% 38% 26% 52% 31% 29% 26% 25% 45% 81% 44% - Adult Meal Revenue 18% 8% 22% 16% 28% 35% 17% 28% 18% 17% 37% 22% 28% 9% 56% 62% 211% - Ala Cart Revenue 13% 25% 32% 21% 21% 41% 50% 301% 21% 15% 26% 36% 26% 27% 25% 43% 29% - Federal/State Revenue 38% 41% 41% 38% 42% 34% 26% 50% 37% 36% 39% 41% 35% 33% 41% 85% 35% (1%)
Total Revenue 33% 31% 32% 29% 31% 33% 23% 48% 31% 31% 35% 35% 32% 28% 35% 75% 39% 2% Salaries & Benefits 28% 45% 29% 29% 30% 30% 31% 38% 32% 28% 23% 31% 30% 31% 30% 28% 28% (25%) Employee Meal Benefits - - - - - - - - - - - - - - - - - - Food Supplies 37% 29% 30% 29% 26% 29% 27% 26% 28% 30% 27% 32% 32% 33% 32% 22% 28% 100% Purchased Services 83% 361% 18% 8% 40% 79% 185% 56% 141% 99% 14% 12% 32% 58% 57% 18% - 163% Other Supplies & Equipment 50% 93% 111% 38% 46% 67% 29% 74% 88% 62% 16% 57% 43% 49% 49% 38% 47% (0%)
Total Expense 31% 55% 33% 29% 28% 34% 38% 37% 37% 31% 23% 32% 31% 33% 32% 26% 28% 23% Net Income 36% 16% 30% 29% 50% 32% 10% 54% 27% 25% 50% 38% 32% 22% 52% 138% 51% 28%
POWER Zone
7.72 mos. Income & Expense Items
Income & Expense Items
Income & Expense Items Falcon Area Zone Sand Creek Zone
(1,254,561)
FSD49-1415TB-20141031.xlsx - KeyComp1 Page 29 / 47 11/18/2014 - 8:45 AM
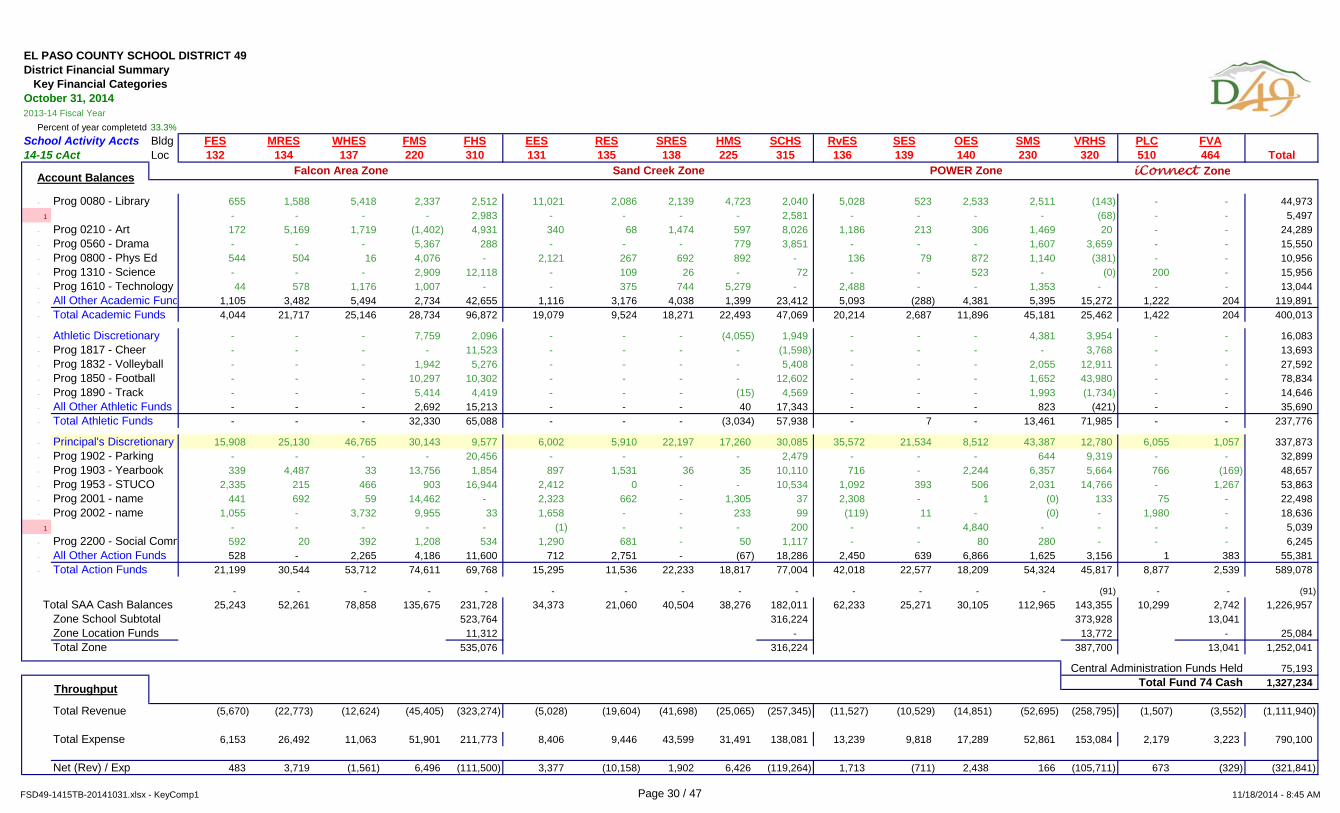
EL PASO COUNTY SCHOOL DISTRICT 49District Financial Summary Key Financial Categories
2013-14 Fiscal YearPercent of year completetd
October 31, 2014
33.3%School Activity Accts Bldg FES MRES WHES FMS FHS EES RES SRES HMS SCHS RvES SES OES SMS VRHS PLC FVA14-15 cAct Loc 132 134 137 220 310 131 135 138 225 315 136 139 140 230 320 510 464 Total
- Prog 0080 - Library 655 1,588 5,418 2,337 2,512 11,021 2,086 2,139 4,723 2,040 5,028 523 2,533 2,511 (143) - - 44,973 1 - - - - 2,983 - - - - 2,581 - - - - (68) - - 5,497
- Prog 0210 - Art 172 5,169 1,719 (1,402) 4,931 340 68 1,474 597 8,026 1,186 213 306 1,469 20 - - 24,289 - Prog 0560 - Drama - - - 5,367 288 - - - 779 3,851 - - - 1,607 3,659 - - 15,550 - Prog 0800 - Phys Ed 544 504 16 4,076 - 2,121 267 692 892 - 136 79 872 1,140 (381) - - 10,956 - Prog 1310 - Science - - - 2,909 12,118 - 109 26 - 72 - - 523 - (0) 200 - 15,956 - Prog 1610 - Technology 44 578 1,176 1,007 - - 375 744 5,279 - 2,488 - - 1,353 - - - 13,044 - All Other Academic Fund 1,105 3,482 5,494 2,734 42,655 1,116 3,176 4,038 1,399 23,412 5,093 (288) 4,381 5,395 15,272 1,222 204 119,891 - Total Academic Funds 4,044 21,717 25,146 28,734 96,872 19,079 9,524 18,271 22,493 47,069 20,214 2,687 11,896 45,181 25,462 1,422 204 400,013
- Athletic Discretionary - - - 7,759 2,096 - - - (4,055) 1,949 - - - 4,381 3,954 - - 16,083 - Prog 1817 - Cheer - - - - 11,523 - - - - (1,598) - - - - 3,768 - - 13,693 - Prog 1832 - Volleyball - - - 1,942 5,276 - - - - 5,408 - - - 2,055 12,911 - - 27,592 - Prog 1850 - Football - - - 10,297 10,302 - - - - 12,602 - - - 1,652 43,980 - - 78,834 - Prog 1890 - Track - - - 5,414 4,419 - - - (15) 4,569 - - - 1,993 (1,734) - - 14,646 - All Other Athletic Funds - - - 2,692 15,213 - - - 40 17,343 - - - 823 (421) - - 35,690 - Total Athletic Funds - - - 32,330 65,088 - - - (3,034) 57,938 - 7 - 13,461 71,985 - - 237,776
- Principal's Discretionary 15,908 25,130 46,765 30,143 9,577 6,002 5,910 22,197 17,260 30,085 35,572 21,534 8,512 43,387 12,780 6,055 1,057 337,873 - Prog 1902 - Parking - - - - 20,456 - - - - 2,479 - - - 644 9,319 - - 32,899 - Prog 1903 - Yearbook 339 4,487 33 13,756 1,854 897 1,531 36 35 10,110 716 - 2,244 6,357 5,664 766 (169) 48,657 - Prog 1953 - STUCO 2,335 215 466 903 16,944 2,412 0 - - 10,534 1,092 393 506 2,031 14,766 - 1,267 53,863 - Prog 2001 - name 441 692 59 14,462 - 2,323 662 - 1,305 37 2,308 - 1 (0) 133 75 - 22,498 - Prog 2002 - name 1,055 - 3,732 9,955 33 1,658 - - 233 99 (119) 11 - (0) - 1,980 - 18,636
1 - - - - - (1) - - - 200 - - 4,840 - - - - 5,039 - Prog 2200 - Social Comm 592 20 392 1,208 534 1,290 681 - 50 1,117 - - 80 280 - - - 6,245 - All Other Action Funds 528 - 2,265 4,186 11,600 712 2,751 - (67) 18,286 2,450 639 6,866 1,625 3,156 1 383 55,381 - Total Action Funds 21,199 30,544 53,712 74,611 69,768 15,295 11,536 22,233 18,817 77,004 42,018 22,577 18,209 54,324 45,817 8,877 2,539 589,078
- - - - - - - - - - - - - - (91) - - (91) Total SAA Cash Balances 25,243 52,261 78,858 135,675 231,728 34,373 21,060 40,504 38,276 182,011 62,233 25,271 30,105 112,965 143,355 10,299 2,742 1,226,957
Zone School Subtotal 523,764 316,224 373,928 13,041 Zone Location Funds 11,312 - 13,772 - 25,084 Total Zone 535,076 316,224 387,700 13,041 1,252,041
Central Administration Funds Held 75,193 Total Fund 74 Cash 1,327,234
Total Revenue (5,670) (22,773) (12,624) (45,405) (323,274) (5,028) (19,604) (41,698) (25,065) (257,345) (11,527) (10,529) (14,851) (52,695) (258,795) (1,507) (3,552) (1,111,940)
Total Expense 6,153 26,492 11,063 51,901 211,773 8,406 9,446 43,599 31,491 138,081 13,239 9,818 17,289 52,861 153,084 2,179 3,223 790,100
Net (Rev) / Exp 483 3,719 (1,561) 6,496 (111,500) 3,377 (10,158) 1,902 6,426 (119,264) 1,713 (711) 2,438 166 (105,711) 673 (329) (321,841)
POWER Zone iConnect ZoneAccount Balances
Throughput
Falcon Area Zone Sand Creek Zone
FSD49-1415TB-20141031.xlsx - KeyComp1 Page 30 / 47 11/18/2014 - 8:45 AM
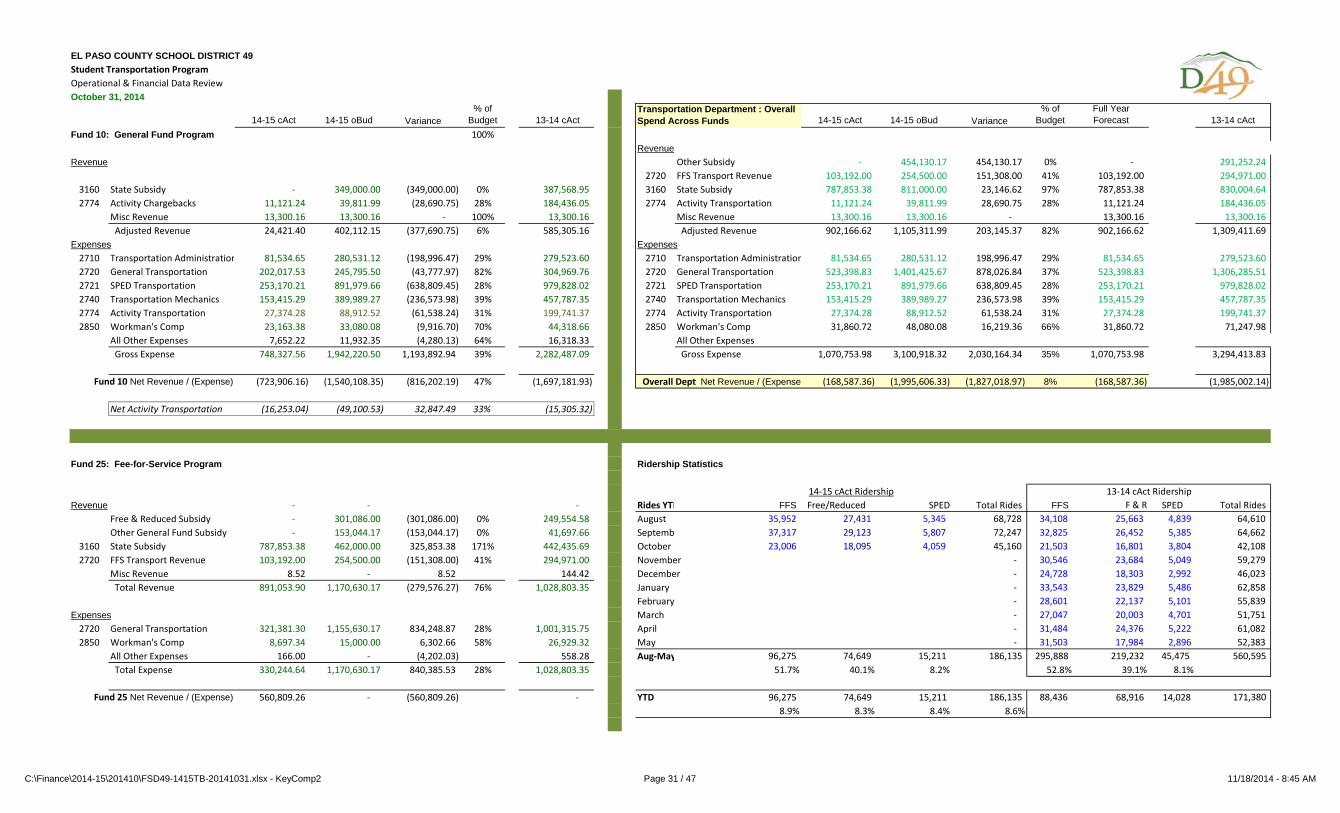
EL PASO COUNTY SCHOOL DISTRICT 49Student Transportation ProgramOperational & Financial Data Review
14-15 cAct 14-15 oBud Variance% of
Budget 13-14 cAct 14-15 cAct 14-15 oBud Variance% of
BudgetFull Year Forecast 13-14 cAct
Fund 10: General Fund Program 100%Revenue
Revenue Other Subsidy ‐ 454,130.17 454,130.17 0% ‐ 291,252.24 2720 FFS Transport Revenue 103,192.00 254,500.00 151,308.00 41% 103,192.00 294,971.00
3160 State Subsidy ‐ 349,000.00 (349,000.00) 0% 387,568.95 3160 State Subsidy 787,853.38 811,000.00 23,146.62 97% 787,853.38 830,004.64 2774 Activity Chargebacks 11,121.24 39,811.99 (28,690.75) 28% 184,436.05 2774 Activity Transportation 11,121.24 39,811.99 28,690.75 28% 11,121.24 184,436.05
Misc Revenue 13,300.16 13,300.16 ‐ 100% 13,300.16 Misc Revenue 13,300.16 13,300.16 ‐ 13,300.16 13,300.16 Adjusted Revenue 24,421.40 402,112.15 (377,690.75) 6% 585,305.16 Adjusted Revenue 902,166.62 1,105,311.99 203,145.37 82% 902,166.62 1,309,411.69
Expenses Expenses2710 Transportation Administration 81,534.65 280,531.12 (198,996.47) 29% 279,523.60 2710 Transportation Administration 81,534.65 280,531.12 198,996.47 29% 81,534.65 279,523.60 2720 General Transportation 202,017.53 245,795.50 (43,777.97) 82% 304,969.76 2720 General Transportation 523,398.83 1,401,425.67 878,026.84 37% 523,398.83 1,306,285.51 2721 SPED Transportation 253,170.21 891,979.66 (638,809.45) 28% 979,828.02 2721 SPED Transportation 253,170.21 891,979.66 638,809.45 28% 253,170.21 979,828.02 2740 Transportation Mechanics 153,415.29 389,989.27 (236,573.98) 39% 457,787.35 2740 Transportation Mechanics 153,415.29 389,989.27 236,573.98 39% 153,415.29 457,787.35 2774 Activity Transportation 27,374.28 88,912.52 (61,538.24) 31% 199,741.37 2774 Activity Transportation 27,374.28 88,912.52 61,538.24 31% 27,374.28 199,741.37 2850 Workman's Comp 23,163.38 33,080.08 (9,916.70) 70% 44,318.66 2850 Workman's Comp 31,860.72 48,080.08 16,219.36 66% 31,860.72 71,247.98
All Other Expenses 7,652.22 11,932.35 (4,280.13) 64% 16,318.33 All Other Expenses Gross Expense 748,327.56 1,942,220.50 1,193,892.94 39% 2,282,487.09 Gross Expense 1,070,753.98 3,100,918.32 2,030,164.34 35% 1,070,753.98 3,294,413.83
Fund 10 Net Revenue / (Expense) (723,906.16) (1,540,108.35) (816,202.19) 47% (1,697,181.93) (168,587.36) (1,995,606.33) (1,827,018.97) 8% (168,587.36) (1,985,002.14)
Net Activity Transportation (16,253.04) (49,100.53) 32,847.49 33% (15,305.32)
Fund 25: Fee-for-Service Program Ridership Statistics
Revenue ‐ ‐ ‐ Rides YTD FFS Free/Reduced SPED Total Rides FFS F & R SPED Total RidesFree & Reduced Subsidy ‐ 301,086.00 (301,086.00) 0% 249,554.58 August 35,952 27,431 5,345 68,728 34,108 25,663 4,839 64,610 Other General Fund Subsidy ‐ 153,044.17 (153,044.17) 0% 41,697.66 Septemb 37,317 29,123 5,807 72,247 32,825 26,452 5,385 64,662
3160 State Subsidy 787,853.38 462,000.00 325,853.38 171% 442,435.69 October 23,006 18,095 4,059 45,160 21,503 16,801 3,804 42,108 2720 FFS Transport Revenue 103,192.00 254,500.00 (151,308.00) 41% 294,971.00 November ‐ 30,546 23,684 5,049 59,279
Misc Revenue 8.52 ‐ 8.52 144.42 December ‐ 24,728 18,303 2,992 46,023 Total Revenue 891,053.90 1,170,630.17 (279,576.27) 76% 1,028,803.35 January ‐ 33,543 23,829 5,486 62,858
February ‐ 28,601 22,137 5,101 55,839 Expenses March ‐ 27,047 20,003 4,701 51,751 2720 General Transportation 321,381.30 1,155,630.17 834,248.87 28% 1,001,315.75 April ‐ 31,484 24,376 5,222 61,082 2850 Workman's Comp 8,697.34 15,000.00 6,302.66 58% 26,929.32 May ‐ 31,503 17,984 2,896 52,383
All Other Expenses 166.00 ‐ (4,202.03) 558.28 Aug‐May 96,275 74,649 15,211 186,135 295,888 219,232 45,475 560,595 Total Expense 330,244.64 1,170,630.17 840,385.53 28% 1,028,803.35 51.7% 40.1% 8.2% 52.8% 39.1% 8.1%
Fund 25 Net Revenue / (Expense) 560,809.26 ‐ (560,809.26) ‐ YTD 96,275 74,649 15,211 186,135 88,436 68,916 14,028 171,380 8.9% 8.3% 8.4% 8.6%
Overall Dept Net Revenue / (Expense
13‐14 cAct Ridership
October 31, 2014
14‐15 cAct Ridership
Transportation Department : Overall Spend Across Funds
C:\Finance\2014-15\201410\FSD49-1415TB-20141031.xlsx - KeyComp2 Page 31 / 47 11/18/2014 - 8:45 AM
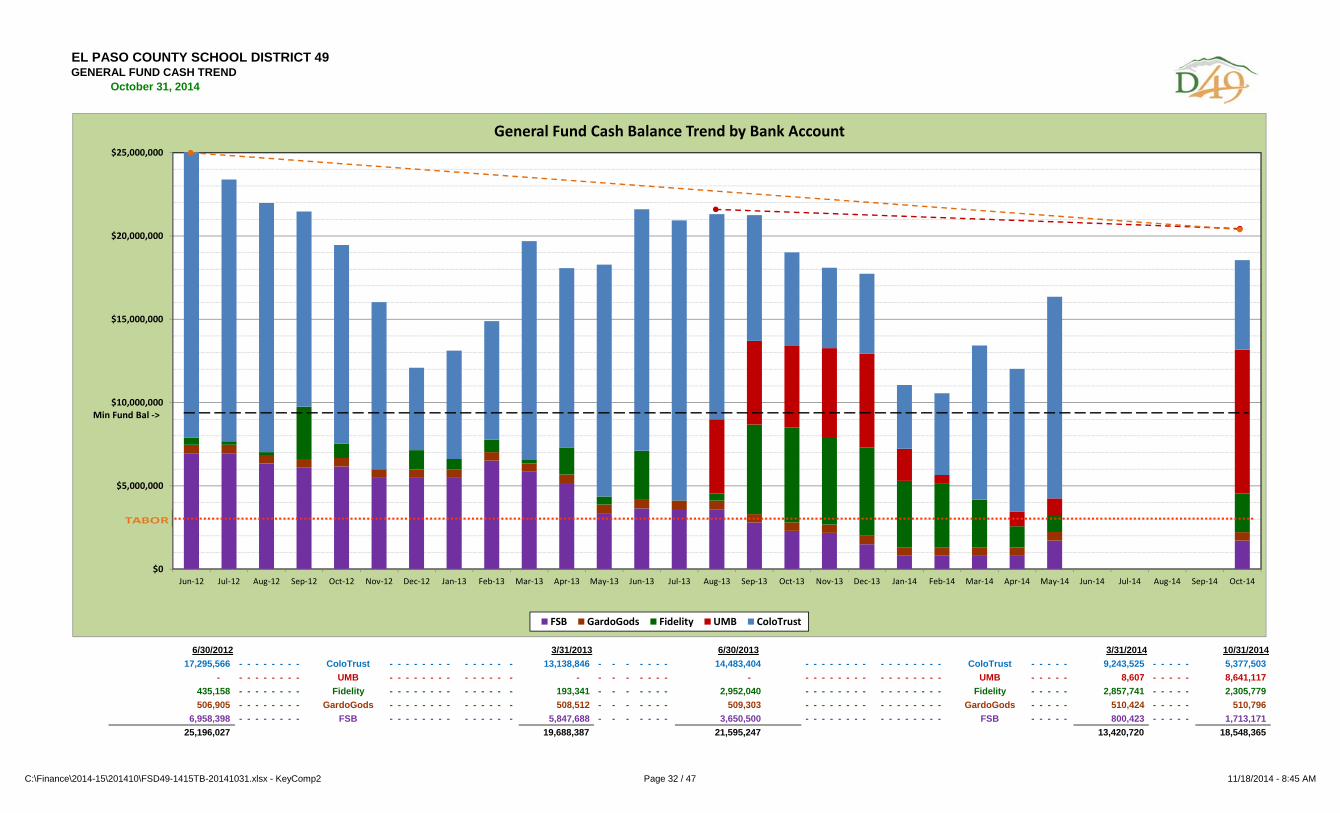
EL PASO COUNTY SCHOOL DISTRICT 49GENERAL FUND CASH TREND
6/30/2012 3/31/2013 6/30/2013 3/31/2014 10/31/201417,295,566 - - - - - - - - ColoTrust - - - - - - - - - - - - - - 13,138,846 - - - - - - - 14,483,404 - - - - - - - - - - - - - - - - ColoTrust - - - - - 9,243,525 - - - - - 5,377,503
- - - - - - - - - UMB - - - - - - - - - - - - - - - - - - - - - - - - - - - - - - - - - - - - - - - UMB - - - - - 8,607 - - - - - 8,641,117 435,158 - - - - - - - - Fidelity - - - - - - - - - - - - - - 193,341 - - - - - - - 2,952,040 - - - - - - - - - - - - - - - - Fidelity - - - - - 2,857,741 - - - - - 2,305,779 506,905 - - - - - - - - GardoGods - - - - - - - - - - - - - - 508,512 - - - - - - - 509,303 - - - - - - - - - - - - - - - - GardoGods - - - - - 510,424 - - - - - 510,796
6,958,398 - - - - - - - - FSB - - - - - - - - - - - - - - 5,847,688 - - - - - - - 3,650,500 - - - - - - - - - - - - - - - - FSB - - - - - 800,423 - - - - - 1,713,171 25,196,027 19,688,387 21,595,247 13,420,720 18,548,365
October 31, 2014
$0
$5,000,000
$10,000,000
$15,000,000
$20,000,000
$25,000,000
Jun‐12 Jul‐12 Aug‐12 Sep‐12 Oct‐12 Nov‐12 Dec‐12 Jan‐13 Feb‐13 Mar‐13 Apr‐13 May‐13 Jun‐13 Jul‐13 Aug‐13 Sep‐13 Oct‐13 Nov‐13 Dec‐13 Jan‐14 Feb‐14 Mar‐14 Apr‐14 May‐14 Jun‐14 Jul‐14 Aug‐14 Sep‐14 Oct‐14
General Fund Cash Balance Trend by Bank Account
FSB GardoGods Fidelity UMB ColoTrust
Min Fund Bal ‐>
C:\Finance\2014-15\201410\FSD49-1415TB-20141031.xlsx - KeyComp2 Page 32 / 47 11/18/2014 - 8:45 AM

Total District Investment Portfolio
This Report not currently available
C:\Finance\2014-15\201410\FSD49-1415TB-20141031.xlsx - KeyComp2 Page 33 / 47 11/18/2014 - 8:45 AM
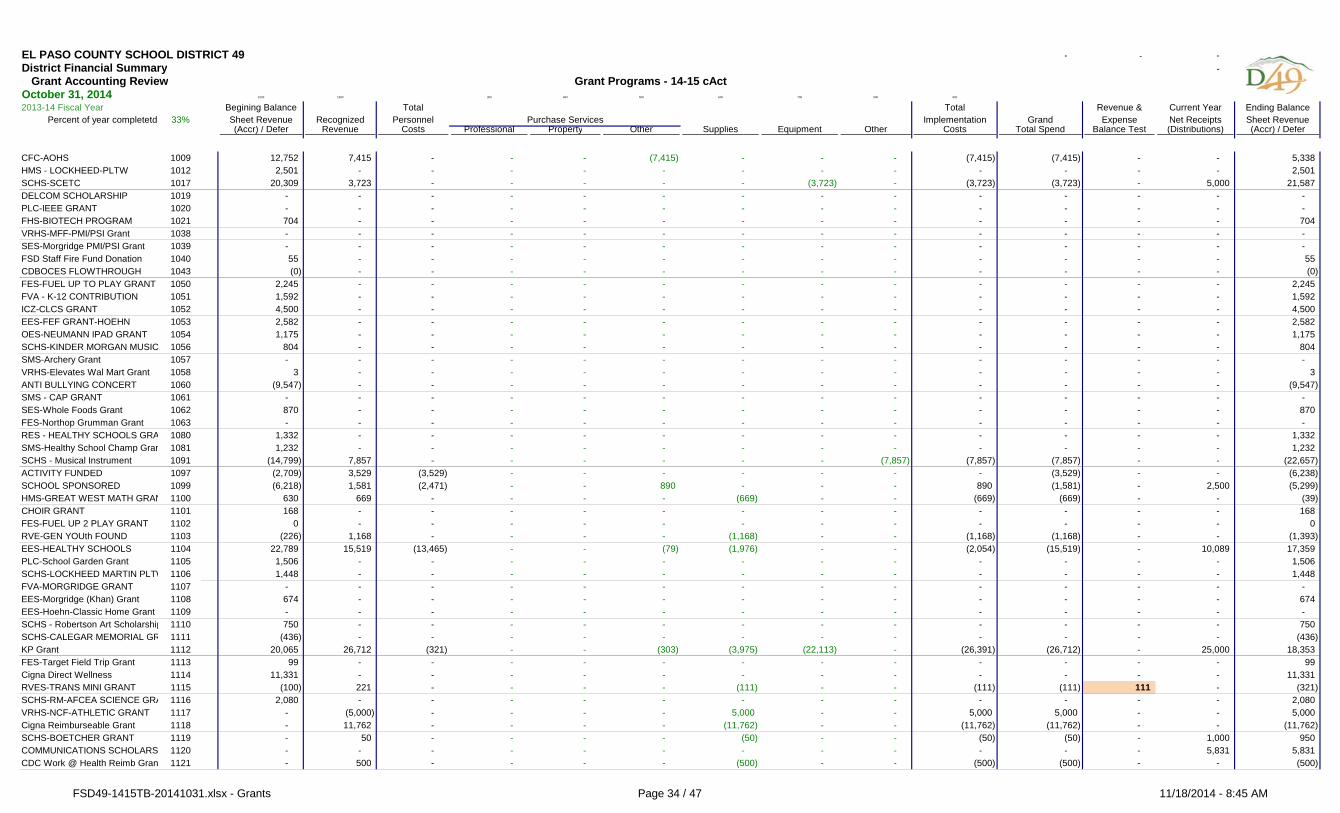
EL PASO COUNTY SCHOOL DISTRICT 49 - - - District Financial Summary - Grant Accounting Review
8100 1900 300 400 500 600 700 800 900
2013-14 Fiscal Year Begining Balance Total Total Revenue & Current Year Ending BalancePercent of year completetd 33% Sheet Revenue Recognized Personnel Implementation Grand Expense Net Receipts Sheet Revenue
(Accr) / Defer Revenue Costs Professional Property Other Supplies Equipment Other Costs Total Spend Balance Test (Distributions) (Accr) / Defer
CFC-AOHS 1009 12,752 7,415 - - - (7,415) - - - (7,415) (7,415) - - 5,338 HMS - LOCKHEED-PLTW 1012 2,501 - - - - - - - - - - - - 2,501 SCHS-SCETC 1017 20,309 3,723 - - - - - (3,723) - (3,723) (3,723) - 5,000 21,587 DELCOM SCHOLARSHIP 1019 - - - - - - - - - - - - - - PLC-IEEE GRANT 1020 - - - - - - - - - - - - - - FHS-BIOTECH PROGRAM 1021 704 - - - - - - - - - - - - 704 VRHS-MFF-PMI/PSI Grant 1038 - - - - - - - - - - - - - - SES-Morgridge PMI/PSI Grant 1039 - - - - - - - - - - - - - - FSD Staff Fire Fund Donation 1040 55 - - - - - - - - - - - - 55 CDBOCES FLOWTHROUGH 1043 (0) - - - - - - - - - - - - (0) FES-FUEL UP TO PLAY GRANT 1050 2,245 - - - - - - - - - - - - 2,245 FVA - K-12 CONTRIBUTION 1051 1,592 - - - - - - - - - - - - 1,592 ICZ-CLCS GRANT 1052 4,500 - - - - - - - - - - - - 4,500 EES-FEF GRANT-HOEHN 1053 2,582 - - - - - - - - - - - - 2,582 OES-NEUMANN IPAD GRANT 1054 1,175 - - - - - - - - - - - - 1,175 SCHS-KINDER MORGAN MUSIC 1056 804 - - - - - - - - - - - - 804 SMS-Archery Grant 1057 - - - - - - - - - - - - - - VRHS-Elevates Wal Mart Grant 1058 3 - - - - - - - - - - - - 3 ANTI BULLYING CONCERT 1060 (9,547) - - - - - - - - - - - - (9,547) SMS - CAP GRANT 1061 - - - - - - - - - - - - - - SES-Whole Foods Grant 1062 870 - - - - - - - - - - - - 870 FES-Northop Grumman Grant 1063 - - - - - - - - - - - - - - RES - HEALTHY SCHOOLS GRA 1080 1,332 - - - - - - - - - - - - 1,332 SMS-Healthy School Champ Gran 1081 1,232 - - - - - - - - - - - - 1,232 SCHS - Musical Instrument 1091 (14,799) 7,857 - - - - - - (7,857) (7,857) (7,857) - - (22,657) ACTIVITY FUNDED 1097 (2,709) 3,529 (3,529) - - - - - - - (3,529) - - (6,238) SCHOOL SPONSORED 1099 (6,218) 1,581 (2,471) - - 890 - - - 890 (1,581) - 2,500 (5,299) HMS-GREAT WEST MATH GRAN 1100 630 669 - - - - (669) - - (669) (669) - - (39) CHOIR GRANT 1101 168 - - - - - - - - - - - - 168 FES-FUEL UP 2 PLAY GRANT 1102 0 - - - - - - - - - - - - 0 RVE-GEN YOUth FOUND 1103 (226) 1,168 - - - - (1,168) - - (1,168) (1,168) - - (1,393) EES-HEALTHY SCHOOLS 1104 22,789 15,519 (13,465) - - (79) (1,976) - - (2,054) (15,519) - 10,089 17,359 PLC-School Garden Grant 1105 1,506 - - - - - - - - - - - - 1,506 SCHS-LOCKHEED MARTIN PLTW 1106 1,448 - - - - - - - - - - - - 1,448 FVA-MORGRIDGE GRANT 1107 - - - - - - - - - - - - - - EES-Morgridge (Khan) Grant 1108 674 - - - - - - - - - - - - 674 EES-Hoehn-Classic Home Grant 1109 - - - - - - - - - - - - - - SCHS - Robertson Art Scholarship 1110 750 - - - - - - - - - - - - 750 SCHS-CALEGAR MEMORIAL GR 1111 (436) - - - - - - - - - - - - (436) KP Grant 1112 20,065 26,712 (321) - - (303) (3,975) (22,113) - (26,391) (26,712) - 25,000 18,353 FES-Target Field Trip Grant 1113 99 - - - - - - - - - - - - 99 Cigna Direct Wellness 1114 11,331 - - - - - - - - - - - - 11,331 RVES-TRANS MINI GRANT 1115 (100) 221 - - - - (111) - - (111) (111) 111 - (321) SCHS-RM-AFCEA SCIENCE GRA 1116 2,080 - - - - - - - - - - - - 2,080 VRHS-NCF-ATHLETIC GRANT 1117 - (5,000) - - - - 5,000 - - 5,000 5,000 - - 5,000 Cigna Reimburseable Grant 1118 - 11,762 - - - - (11,762) - - (11,762) (11,762) - - (11,762) SCHS-BOETCHER GRANT 1119 - 50 - - - - (50) - - (50) (50) - 1,000 950 COMMUNICATIONS SCHOLARS 1120 - - - - - - - - - - - - 5,831 5,831 CDC Work @ Health Reimb Grant 1121 - 500 - - - - (500) - - (500) (500) - - (500)
October 31, 2014Grant Programs - 14-15 cAct
Purchase Services
FSD49-1415TB-20141031.xlsx - Grants Page 34 / 47 11/18/2014 - 8:45 AM
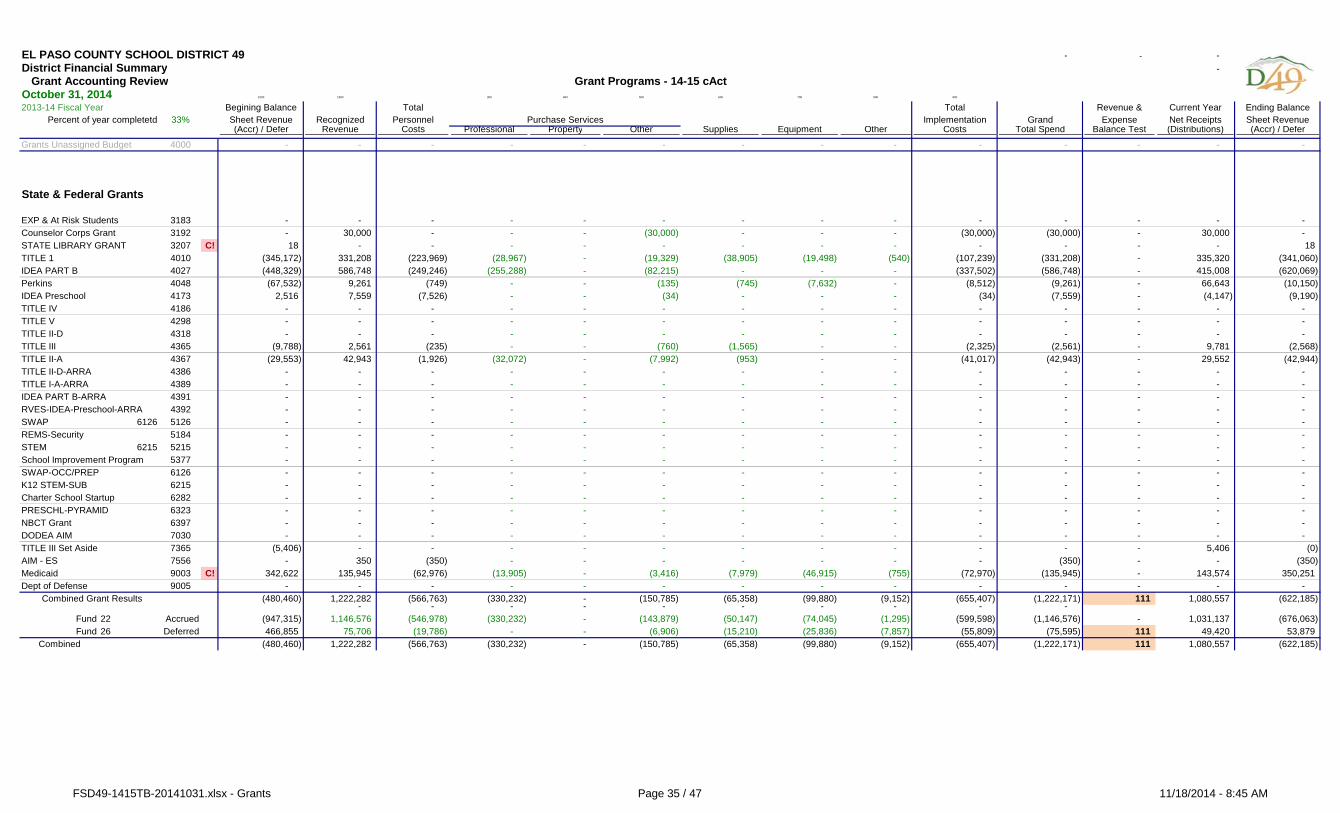
EL PASO COUNTY SCHOOL DISTRICT 49 - - - District Financial Summary - Grant Accounting Review
8100 1900 300 400 500 600 700 800 900
2013-14 Fiscal Year Begining Balance Total Total Revenue & Current Year Ending BalancePercent of year completetd 33% Sheet Revenue Recognized Personnel Implementation Grand Expense Net Receipts Sheet Revenue
(Accr) / Defer Revenue Costs Professional Property Other Supplies Equipment Other Costs Total Spend Balance Test (Distributions) (Accr) / Defer
October 31, 2014Grant Programs - 14-15 cAct
Purchase Services
Grants Unassigned Budget 4000 - - - - - - - - - - - - - -
State & Federal Grants
EXP & At Risk Students 3183 - - - - - - - - - - - - - - Counselor Corps Grant 3192 - 30,000 - - - (30,000) - - - (30,000) (30,000) - 30,000 - STATE LIBRARY GRANT 3207 C! 18 - - - - - - - - - - - - 18 TITLE 1 4010 (345,172) 331,208 (223,969) (28,967) - (19,329) (38,905) (19,498) (540) (107,239) (331,208) - 335,320 (341,060) IDEA PART B 4027 (448,329) 586,748 (249,246) (255,288) - (82,215) - - - (337,502) (586,748) - 415,008 (620,069) Perkins 4048 (67,532) 9,261 (749) - - (135) (745) (7,632) - (8,512) (9,261) - 66,643 (10,150) IDEA Preschool 4173 2,516 7,559 (7,526) - - (34) - - - (34) (7,559) - (4,147) (9,190) TITLE IV 4186 - - - - - - - - - - - - - - TITLE V 4298 - - - - - - - - - - - - - - TITLE II-D 4318 - - - - - - - - - - - - - - TITLE III 4365 (9,788) 2,561 (235) - - (760) (1,565) - - (2,325) (2,561) - 9,781 (2,568) TITLE II-A 4367 (29,553) 42,943 (1,926) (32,072) - (7,992) (953) - - (41,017) (42,943) - 29,552 (42,944) TITLE II-D-ARRA 4386 - - - - - - - - - - - - - - TITLE I-A-ARRA 4389 - - - - - - - - - - - - - - IDEA PART B-ARRA 4391 - - - - - - - - - - - - - - RVES-IDEA-Preschool-ARRA 4392 - - - - - - - - - - - - - - SWAP 6126 5126 - - - - - - - - - - - - - - REMS-Security 5184 - - - - - - - - - - - - - - STEM 6215 5215 - - - - - - - - - - - - - - School Improvement Program 5377 - - - - - - - - - - - - - - SWAP-OCC/PREP 6126 - - - - - - - - - - - - - - K12 STEM-SUB 6215 - - - - - - - - - - - - - - Charter School Startup 6282 - - - - - - - - - - - - - - PRESCHL-PYRAMID 6323 - - - - - - - - - - - - - - NBCT Grant 6397 - - - - - - - - - - - - - - DODEA AIM 7030 - - - - - - - - - - - - - - TITLE III Set Aside 7365 (5,406) - - - - - - - - - - - 5,406 (0) AIM - ES 7556 - 350 (350) - - - - - - - (350) - - (350) Medicaid 9003 C! 342,622 135,945 (62,976) (13,905) - (3,416) (7,979) (46,915) (755) (72,970) (135,945) - 143,574 350,251 Dept of Defense 9005 - - - - - - - - - - - - - - Combined Grant Results (480,460) 1,222,282 (566,763) (330,232) - (150,785) (65,358) (99,880) (9,152) (655,407) (1,222,171) 111 1,080,557 (622,185)
- - - - - - - - - - Fund 22 Accrued (947,315) 1,146,576 (546,978) (330,232) - (143,879) (50,147) (74,045) (1,295) (599,598) (1,146,576) - 1,031,137 (676,063) Fund 26 Deferred 466,855 75,706 (19,786) - - (6,906) (15,210) (25,836) (7,857) (55,809) (75,595) 111 49,420 53,879
Combined (480,460) 1,222,282 (566,763) (330,232) - (150,785) (65,358) (99,880) (9,152) (655,407) (1,222,171) 111 1,080,557 (622,185)
FSD49-1415TB-20141031.xlsx - Grants Page 35 / 47 11/18/2014 - 8:45 AM
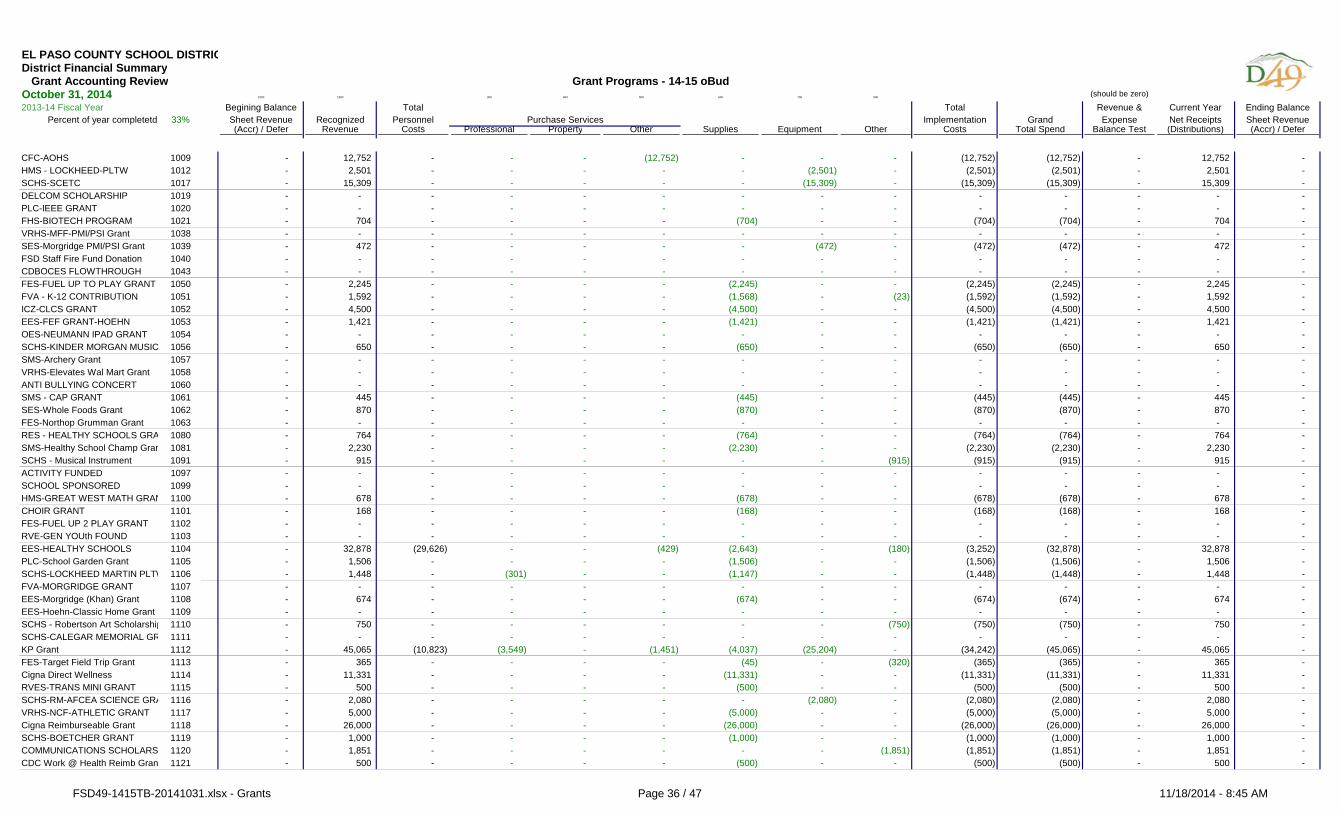
EL PASO COUNTY SCHOOL DISTRICDistrict Financial Summary Grant Accounting Review
2013-14 Fiscal YearPercent of year completetd 33%
CFC-AOHS 1009HMS - LOCKHEED-PLTW 1012SCHS-SCETC 1017DELCOM SCHOLARSHIP 1019PLC-IEEE GRANT 1020FHS-BIOTECH PROGRAM 1021VRHS-MFF-PMI/PSI Grant 1038SES-Morgridge PMI/PSI Grant 1039FSD Staff Fire Fund Donation 1040CDBOCES FLOWTHROUGH 1043FES-FUEL UP TO PLAY GRANT 1050FVA - K-12 CONTRIBUTION 1051ICZ-CLCS GRANT 1052EES-FEF GRANT-HOEHN 1053OES-NEUMANN IPAD GRANT 1054SCHS-KINDER MORGAN MUSIC 1056SMS-Archery Grant 1057VRHS-Elevates Wal Mart Grant 1058ANTI BULLYING CONCERT 1060SMS - CAP GRANT 1061SES-Whole Foods Grant 1062FES-Northop Grumman Grant 1063RES - HEALTHY SCHOOLS GRA 1080SMS-Healthy School Champ Gran 1081SCHS - Musical Instrument 1091ACTIVITY FUNDED 1097SCHOOL SPONSORED 1099HMS-GREAT WEST MATH GRAN 1100CHOIR GRANT 1101FES-FUEL UP 2 PLAY GRANT 1102RVE-GEN YOUth FOUND 1103EES-HEALTHY SCHOOLS 1104PLC-School Garden Grant 1105SCHS-LOCKHEED MARTIN PLTW 1106FVA-MORGRIDGE GRANT 1107EES-Morgridge (Khan) Grant 1108EES-Hoehn-Classic Home Grant 1109SCHS - Robertson Art Scholarship 1110SCHS-CALEGAR MEMORIAL GR 1111KP Grant 1112FES-Target Field Trip Grant 1113Cigna Direct Wellness 1114RVES-TRANS MINI GRANT 1115SCHS-RM-AFCEA SCIENCE GRA 1116VRHS-NCF-ATHLETIC GRANT 1117Cigna Reimburseable Grant 1118SCHS-BOETCHER GRANT 1119COMMUNICATIONS SCHOLARS 1120CDC Work @ Health Reimb Grant 1121
October 31, 2014 8100 1900 300 400 500 600 700 800 (should be zero)
Begining Balance Total Total Revenue & Current Year Ending BalanceSheet Revenue Recognized Personnel Implementation Grand Expense Net Receipts Sheet Revenue(Accr) / Defer Revenue Costs Professional Property Other Supplies Equipment Other Costs Total Spend Balance Test (Distributions) (Accr) / Defer
- 12,752 - - - (12,752) - - - (12,752) (12,752) - 12,752 - - 2,501 - - - - - (2,501) - (2,501) (2,501) - 2,501 - - 15,309 - - - - - (15,309) - (15,309) (15,309) - 15,309 - - - - - - - - - - - - - - - - - - - - - - - - - - - - - - 704 - - - - (704) - - (704) (704) - 704 - - - - - - - - - - - - - - - - 472 - - - - - (472) - (472) (472) - 472 - - - - - - - - - - - - - - - - - - - - - - - - - - - - - - 2,245 - - - - (2,245) - - (2,245) (2,245) - 2,245 - - 1,592 - - - - (1,568) - (23) (1,592) (1,592) - 1,592 - - 4,500 - - - - (4,500) - - (4,500) (4,500) - 4,500 - - 1,421 - - - - (1,421) - - (1,421) (1,421) - 1,421 - - - - - - - - - - - - - - - - 650 - - - - (650) - - (650) (650) - 650 - - - - - - - - - - - - - - - - - - - - - - - - - - - - - - - - - - - - - - - - - - - - 445 - - - - (445) - - (445) (445) - 445 - - 870 - - - - (870) - - (870) (870) - 870 - - - - - - - - - - - - - - - - 764 - - - - (764) - - (764) (764) - 764 - - 2,230 - - - - (2,230) - - (2,230) (2,230) - 2,230 - - 915 - - - - - - (915) (915) (915) - 915 - - - - - - - - - - - - - - - - - - - - - - - - - - - - - - 678 - - - - (678) - - (678) (678) - 678 - - 168 - - - - (168) - - (168) (168) - 168 - - - - - - - - - - - - - - - - - - - - - - - - - - - - - - 32,878 (29,626) - - (429) (2,643) - (180) (3,252) (32,878) - 32,878 - - 1,506 - - - - (1,506) - - (1,506) (1,506) - 1,506 - - 1,448 - (301) - - (1,147) - - (1,448) (1,448) - 1,448 - - - - - - - - - - - - - - - - 674 - - - - (674) - - (674) (674) - 674 - - - - - - - - - - - - - - - - 750 - - - - - - (750) (750) (750) - 750 - - - - - - - - - - - - - - - - 45,065 (10,823) (3,549) - (1,451) (4,037) (25,204) - (34,242) (45,065) - 45,065 - - 365 - - - - (45) - (320) (365) (365) - 365 - - 11,331 - - - - (11,331) - - (11,331) (11,331) - 11,331 - - 500 - - - - (500) - - (500) (500) - 500 - - 2,080 - - - - - (2,080) - (2,080) (2,080) - 2,080 - - 5,000 - - - - (5,000) - - (5,000) (5,000) - 5,000 - - 26,000 - - - - (26,000) - - (26,000) (26,000) - 26,000 - - 1,000 - - - - (1,000) - - (1,000) (1,000) - 1,000 - - 1,851 - - - - - - (1,851) (1,851) (1,851) - 1,851 - - 500 - - - - (500) - - (500) (500) - 500 -
Grant Programs - 14-15 oBud
Purchase Services
FSD49-1415TB-20141031.xlsx - Grants Page 36 / 47 11/18/2014 - 8:45 AM
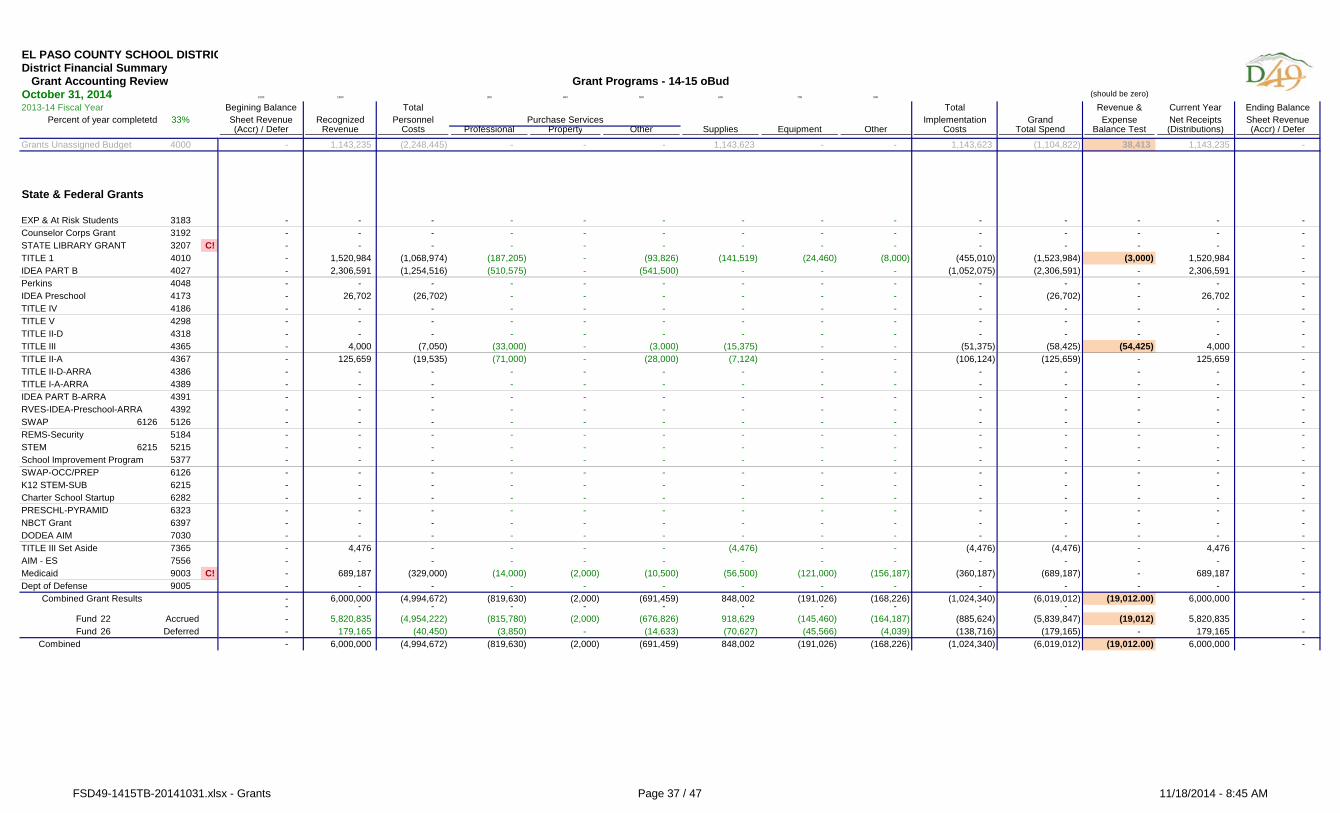
EL PASO COUNTY SCHOOL DISTRICDistrict Financial Summary Grant Accounting Review
2013-14 Fiscal YearPercent of year completetd 33%
October 31, 2014
Grants Unassigned Budget 4000
State & Federal Grants
EXP & At Risk Students 3183Counselor Corps Grant 3192STATE LIBRARY GRANT 3207 C!TITLE 1 4010IDEA PART B 4027Perkins 4048IDEA Preschool 4173TITLE IV 4186TITLE V 4298TITLE II-D 4318TITLE III 4365TITLE II-A 4367TITLE II-D-ARRA 4386TITLE I-A-ARRA 4389IDEA PART B-ARRA 4391RVES-IDEA-Preschool-ARRA 4392SWAP 6126 5126REMS-Security 5184STEM 6215 5215School Improvement Program 5377SWAP-OCC/PREP 6126K12 STEM-SUB 6215Charter School Startup 6282PRESCHL-PYRAMID 6323NBCT Grant 6397DODEA AIM 7030TITLE III Set Aside 7365AIM - ES 7556Medicaid 9003 C!Dept of Defense 9005 Combined Grant Results
Fund 22 AccruedFund 26 Deferred
Combined
8100 1900 300 400 500 600 700 800 (should be zero)
Begining Balance Total Total Revenue & Current Year Ending BalanceSheet Revenue Recognized Personnel Implementation Grand Expense Net Receipts Sheet Revenue(Accr) / Defer Revenue Costs Professional Property Other Supplies Equipment Other Costs Total Spend Balance Test (Distributions) (Accr) / Defer
Grant Programs - 14-15 oBud
Purchase Services
- 1,143,235 (2,248,445) - - - 1,143,623 - - 1,143,623 (1,104,822) 38,413 1,143,235 -
- - - - - - - - - - - - - - - - - - - - - - - - - - - - - - - - - - - - - - - - - - - 1,520,984 (1,068,974) (187,205) - (93,826) (141,519) (24,460) (8,000) (455,010) (1,523,984) (3,000) 1,520,984 - - 2,306,591 (1,254,516) (510,575) - (541,500) - - - (1,052,075) (2,306,591) - 2,306,591 - - - - - - - - - - - - - - - - 26,702 (26,702) - - - - - - - (26,702) - 26,702 - - - - - - - - - - - - - - - - - - - - - - - - - - - - - - - - - - - - - - - - - - - - 4,000 (7,050) (33,000) - (3,000) (15,375) - - (51,375) (58,425) (54,425) 4,000 - - 125,659 (19,535) (71,000) - (28,000) (7,124) - - (106,124) (125,659) - 125,659 - - - - - - - - - - - - - - - - - - - - - - - - - - - - - - - - - - - - - - - - - - - - - - - - - - - - - - - - - - - - - - - - - - - - - - - - - - - - - - - - - - - - - - - - - - - - - - - - - - - - - - - - - - - - - - - - - - - - - - - - - - - - - - - - - - - - - - - - - - - - - - - - - - - - - - - - - - - - - - - - - - - - - - - - - - - - - - - - - - - - - - - - - - - - - - - - - - - - - - 4,476 - - - - (4,476) - - (4,476) (4,476) - 4,476 - - - - - - - - - - - - - - - - 689,187 (329,000) (14,000) (2,000) (10,500) (56,500) (121,000) (156,187) (360,187) (689,187) - 689,187 - - - - - - - - - - - - - - - - 6,000,000 (4,994,672) (819,630) (2,000) (691,459) 848,002 (191,026) (168,226) (1,024,340) (6,019,012) (19,012.00) 6,000,000 - - - - - - - - - - - - - 5,820,835 (4,954,222) (815,780) (2,000) (676,826) 918,629 (145,460) (164,187) (885,624) (5,839,847) (19,012) 5,820,835 - - 179,165 (40,450) (3,850) - (14,633) (70,627) (45,566) (4,039) (138,716) (179,165) - 179,165 - - 6,000,000 (4,994,672) (819,630) (2,000) (691,459) 848,002 (191,026) (168,226) (1,024,340) (6,019,012) (19,012.00) 6,000,000 -
FSD49-1415TB-20141031.xlsx - Grants Page 37 / 47 11/18/2014 - 8:45 AM
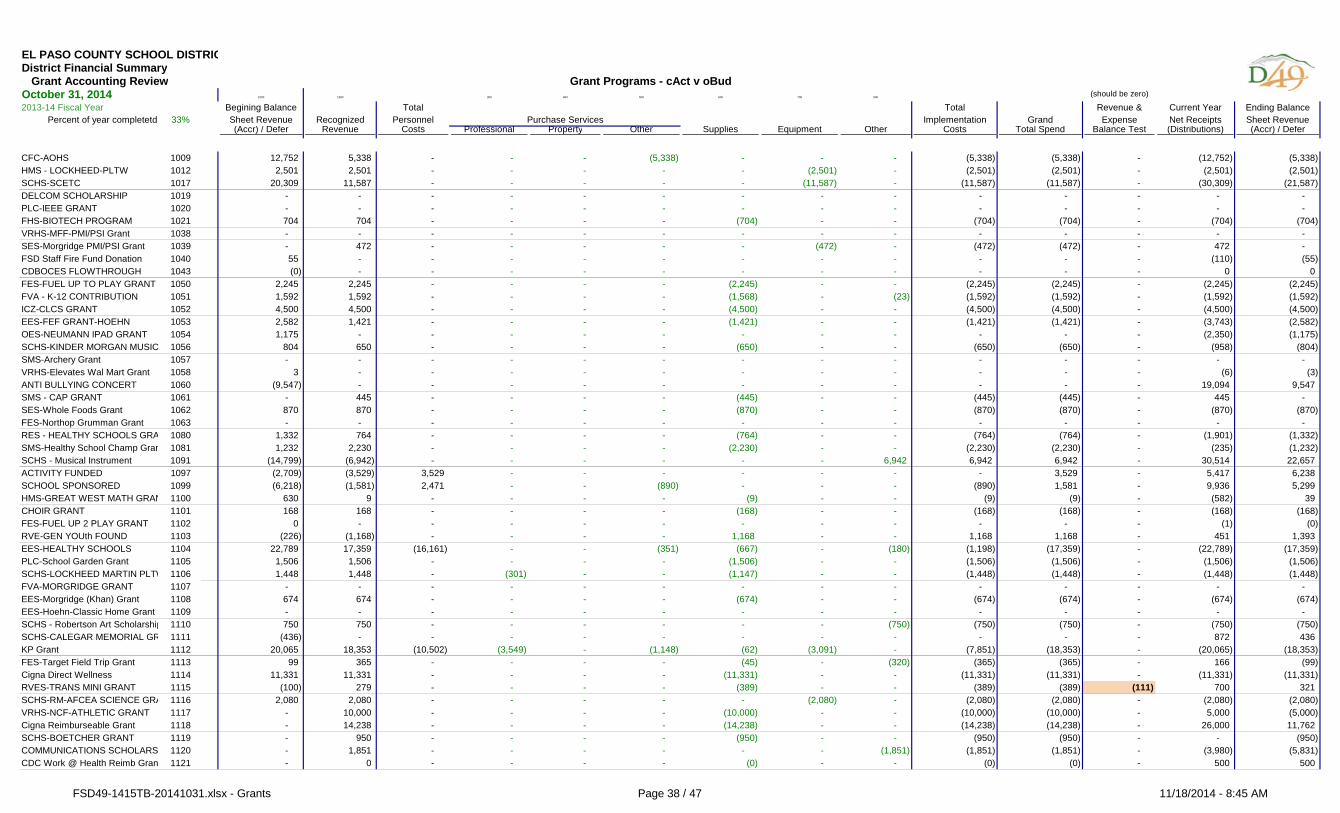
EL PASO COUNTY SCHOOL DISTRICDistrict Financial Summary Grant Accounting Review
2013-14 Fiscal YearPercent of year completetd 33%
CFC-AOHS 1009HMS - LOCKHEED-PLTW 1012SCHS-SCETC 1017DELCOM SCHOLARSHIP 1019PLC-IEEE GRANT 1020FHS-BIOTECH PROGRAM 1021VRHS-MFF-PMI/PSI Grant 1038SES-Morgridge PMI/PSI Grant 1039FSD Staff Fire Fund Donation 1040CDBOCES FLOWTHROUGH 1043FES-FUEL UP TO PLAY GRANT 1050FVA - K-12 CONTRIBUTION 1051ICZ-CLCS GRANT 1052EES-FEF GRANT-HOEHN 1053OES-NEUMANN IPAD GRANT 1054SCHS-KINDER MORGAN MUSIC 1056SMS-Archery Grant 1057VRHS-Elevates Wal Mart Grant 1058ANTI BULLYING CONCERT 1060SMS - CAP GRANT 1061SES-Whole Foods Grant 1062FES-Northop Grumman Grant 1063RES - HEALTHY SCHOOLS GRA 1080SMS-Healthy School Champ Gran 1081SCHS - Musical Instrument 1091ACTIVITY FUNDED 1097SCHOOL SPONSORED 1099HMS-GREAT WEST MATH GRAN 1100CHOIR GRANT 1101FES-FUEL UP 2 PLAY GRANT 1102RVE-GEN YOUth FOUND 1103EES-HEALTHY SCHOOLS 1104PLC-School Garden Grant 1105SCHS-LOCKHEED MARTIN PLTW 1106FVA-MORGRIDGE GRANT 1107EES-Morgridge (Khan) Grant 1108EES-Hoehn-Classic Home Grant 1109SCHS - Robertson Art Scholarship 1110SCHS-CALEGAR MEMORIAL GR 1111KP Grant 1112FES-Target Field Trip Grant 1113Cigna Direct Wellness 1114RVES-TRANS MINI GRANT 1115SCHS-RM-AFCEA SCIENCE GRA 1116VRHS-NCF-ATHLETIC GRANT 1117Cigna Reimburseable Grant 1118SCHS-BOETCHER GRANT 1119COMMUNICATIONS SCHOLARS 1120CDC Work @ Health Reimb Grant 1121
October 31, 2014 8100 1900 300 400 500 600 700 800 (should be zero)
Begining Balance Total Total Revenue & Current Year Ending BalanceSheet Revenue Recognized Personnel Implementation Grand Expense Net Receipts Sheet Revenue(Accr) / Defer Revenue Costs Professional Property Other Supplies Equipment Other Costs Total Spend Balance Test (Distributions) (Accr) / Defer
12,752 5,338 - - - (5,338) - - - (5,338) (5,338) - (12,752) (5,338) 2,501 2,501 - - - - - (2,501) - (2,501) (2,501) - (2,501) (2,501)
20,309 11,587 - - - - - (11,587) - (11,587) (11,587) - (30,309) (21,587) - - - - - - - - - - - - - - - - - - - - - - - - - - - - 704 704 - - - - (704) - - (704) (704) - (704) (704) - - - - - - - - - - - - - - - 472 - - - - - (472) - (472) (472) - 472 - 55 - - - - - - - - - - - (110) (55) (0) - - - - - - - - - - - 0 0
2,245 2,245 - - - - (2,245) - - (2,245) (2,245) - (2,245) (2,245) 1,592 1,592 - - - - (1,568) - (23) (1,592) (1,592) - (1,592) (1,592) 4,500 4,500 - - - - (4,500) - - (4,500) (4,500) - (4,500) (4,500) 2,582 1,421 - - - - (1,421) - - (1,421) (1,421) - (3,743) (2,582) 1,175 - - - - - - - - - - - (2,350) (1,175)
804 650 - - - - (650) - - (650) (650) - (958) (804) - - - - - - - - - - - - - -
3 - - - - - - - - - - - (6) (3) (9,547) - - - - - - - - - - - 19,094 9,547
- 445 - - - - (445) - - (445) (445) - 445 - 870 870 - - - - (870) - - (870) (870) - (870) (870) - - - - - - - - - - - - - -
1,332 764 - - - - (764) - - (764) (764) - (1,901) (1,332) 1,232 2,230 - - - - (2,230) - - (2,230) (2,230) - (235) (1,232)
(14,799) (6,942) - - - - - - 6,942 6,942 6,942 - 30,514 22,657 (2,709) (3,529) 3,529 - - - - - - - 3,529 - 5,417 6,238 (6,218) (1,581) 2,471 - - (890) - - - (890) 1,581 - 9,936 5,299
630 9 - - - - (9) - - (9) (9) - (582) 39 168 168 - - - - (168) - - (168) (168) - (168) (168)
0 - - - - - - - - - - - (1) (0) (226) (1,168) - - - - 1,168 - - 1,168 1,168 - 451 1,393
22,789 17,359 (16,161) - - (351) (667) - (180) (1,198) (17,359) - (22,789) (17,359) 1,506 1,506 - - - - (1,506) - - (1,506) (1,506) - (1,506) (1,506) 1,448 1,448 - (301) - - (1,147) - - (1,448) (1,448) - (1,448) (1,448)
- - - - - - - - - - - - - - 674 674 - - - - (674) - - (674) (674) - (674) (674) - - - - - - - - - - - - - - 750 750 - - - - - - (750) (750) (750) - (750) (750)
(436) - - - - - - - - - - - 872 436 20,065 18,353 (10,502) (3,549) - (1,148) (62) (3,091) - (7,851) (18,353) - (20,065) (18,353)
99 365 - - - - (45) - (320) (365) (365) - 166 (99) 11,331 11,331 - - - - (11,331) - - (11,331) (11,331) - (11,331) (11,331)
(100) 279 - - - - (389) - - (389) (389) (111) 700 321 2,080 2,080 - - - - - (2,080) - (2,080) (2,080) - (2,080) (2,080)
- 10,000 - - - - (10,000) - - (10,000) (10,000) - 5,000 (5,000) - 14,238 - - - - (14,238) - - (14,238) (14,238) - 26,000 11,762 - 950 - - - - (950) - - (950) (950) - - (950) - 1,851 - - - - - - (1,851) (1,851) (1,851) - (3,980) (5,831) - 0 - - - - (0) - - (0) (0) - 500 500
Grant Programs - cAct v oBud
Purchase Services
FSD49-1415TB-20141031.xlsx - Grants Page 38 / 47 11/18/2014 - 8:45 AM
EL PASO COUNTY SCHOOL DISTRICDistrict Financial Summary Grant Accounting Review
2013-14 Fiscal YearPercent of year completetd 33%
October 31, 2014
Grants Unassigned Budget 4000
State & Federal Grants
EXP & At Risk Students 3183Counselor Corps Grant 3192STATE LIBRARY GRANT 3207 C!TITLE 1 4010IDEA PART B 4027Perkins 4048IDEA Preschool 4173TITLE IV 4186TITLE V 4298TITLE II-D 4318TITLE III 4365TITLE II-A 4367TITLE II-D-ARRA 4386TITLE I-A-ARRA 4389IDEA PART B-ARRA 4391RVES-IDEA-Preschool-ARRA 4392SWAP 6126 5126REMS-Security 5184STEM 6215 5215School Improvement Program 5377SWAP-OCC/PREP 6126K12 STEM-SUB 6215Charter School Startup 6282PRESCHL-PYRAMID 6323NBCT Grant 6397DODEA AIM 7030TITLE III Set Aside 7365AIM - ES 7556Medicaid 9003 C!Dept of Defense 9005 Combined Grant Results
Fund 22 AccruedFund 26 Deferred
Combined
8100 1900 300 400 500 600 700 800 (should be zero)
Begining Balance Total Total Revenue & Current Year Ending BalanceSheet Revenue Recognized Personnel Implementation Grand Expense Net Receipts Sheet Revenue(Accr) / Defer Revenue Costs Professional Property Other Supplies Equipment Other Costs Total Spend Balance Test (Distributions) (Accr) / Defer
Grant Programs - cAct v oBud
Purchase Services
- 1,143,235 (2,248,445) - - - 1,143,623 - - 1,143,623 (1,104,822) 38,413 1,143,235 -
- - - - - - - - - - - - - - - (30,000) - - - 30,000 - - - 30,000 30,000 - (30,000) - 18 - - - - - - - - - - - (36) (18)
(345,172) 1,189,776 (845,005) (158,238) - (74,497) (102,614) (4,962) (7,460) (347,771) (1,192,776) (3,000) 1,876,008 341,060 (448,329) 1,719,843 (1,005,270) (255,288) - (459,285) - - - (714,573) (1,719,843) - 2,788,241 620,069
(67,532) (9,261) 749 - - 135 745 7,632 - 8,512 9,261 - 68,421 10,150 2,516 19,143 (19,176) - - 34 - - - 34 (19,143) - 25,817 9,190
- - - - - - - - - - - - - - - - - - - - - - - - - - - - - - - - - - - - - - - - - -
(9,788) 1,439 (6,815) (33,000) - (2,240) (13,810) - - (49,050) (55,864) (54,425) 13,795 2,568 (29,553) 82,716 (17,609) (38,928) - (20,008) (6,171) - - (65,107) (82,716) - 155,213 42,944
- - - - - - - - - - - - - - - - - - - - - - - - - - - - - - - - - - - - - - - - - - - - - - - - - - - - - - - - - - - - - - - - - - - - - - - - - - - - - - - - - - - - - - - - - - - - - - - - - - - - - - - - - - - - - - - - - - - - - - - - - - - - - - - - - - - - - - - - - - - - - - - - - - - - - - - - - - - - - - - - - - - - - - - - - - - - - - - - - - - - - - - - - - - - - - - - - - - -
(5,406) 4,476 - - - - (4,476) - - (4,476) (4,476) - 9,883 0 - (350) 350 - - - - - - - 350 - - 350
342,622 553,242 (266,024) (95) (2,000) (7,084) (48,521) (74,085) (155,432) (287,218) (553,242) - (139,631) (350,251) - - - - - - - - - - - - - -
(480,460) 4,777,718 (4,427,909) (489,398) (2,000) (540,674) 913,360 (91,146) (159,074) (368,933) (4,796,841) (19,123) 5,880,363 622,185 - - - - - - - - - - -
(947,315) 4,674,259 (4,407,245) (485,548) (2,000) (532,947) 968,776 (71,415) (162,892) (286,025.88) (4,693,270.82) (19,012.00) 5,910,946 1,092,024 466,855 103,460 (20,664) (3,850) - (7,727) (55,417) (19,731) 3,818 (82,907) (103,570) (111) (30,583) (469,839)
(480,460) 4,777,718 (4,427,909) (489,398) (2,000) (540,674) 913,360 (91,146) (159,074) (368,933) (4,796,841) (19,123) 5,880,363 622,185
FSD49-1415TB-20141031.xlsx - Grants Page 39 / 47 11/18/2014 - 8:45 AM
EL PASO COUNTY SCHOOL DISTRICT 49District Financial Summary Special Programs Review
Begining Balance Total Total Current Year2013-14 Fiscal Year Sheet Revenue Recognized Personnel Implementation Grand Net Receipts Net Cost
Percent of year completetd 33% (Accr) / Defer Revenue Costs Professional Property Other Supplies Equipment Other Costs Total Spend Net Cost (Distributions) per total sFTE
8100 1900 300 400 500 600 700 800 900
Special Education Programs & Special Education Component of General Programs SPED ct. Spec. sFTE Gross / SPED Net / SPED14-15 cAct 1,539 369 (2,532.55) (817.49) Designated Funding Grant Code (10,562.57) (3,409.54)
ECEA Fund 10 3130 - 2,639,469 (3,468,486) (252,997) (1,235) (114,673) (29,928) (19,198) (11,072) (429,103) (3,897,588) (1,258,119) (257.28) (83.05) Prog # - - - - - - - - - (88.86)
General 1700 17.00 - (78,963) - - - - - - - (78,963) (25,489) (1.68) Total SPED School Levels 170X - (919,534) (78,634) - (30,930) (11,866) (247) - (121,678) (1,041,211) (336,097) (22.19) Adaptive Pysical Disability 1710 17.00 - (44,512) - - (783) (49) - - (832) (45,343) (14,637) (0.97) SLIC - Sig Lim Intell Cap 1740 17.00 - (266,984) - - - - - - - (266,984) (86,181) (5.69) SIED - Sig ID Emot Disab 1750 17.00 - (239,482) - - - - - - - (239,482) (77,303) (5.10) SOCO - Autism (Soc/Comm 1760 17.00 - (184,142) - - - - - - - (184,142) (59,440) (3.92) SLD - Speech/Lang Disab 1770 17.00 - (17,021) - - - - - - - (17,021) (5,494) (0.36) Speech Path / Language 1771 17.00 - (255,937) (100,546) - (378) (943) - - (101,867) (357,804) (115,497) (7.62) MH - Multiple Handicap 1780 17.00 - (419,620) - (379) (1,142) (2,801) (18,913) - (23,235) (442,854) (142,951) (9.44) Preschool 1791 1,791.00 - (162,035) (280) (60) (27,614) (3,691) - (250) (31,894) (193,929) (62,599) (4.13) Extended School Year 1798 17.00 - (182) - - - - - - - (182) (59) (0.00) Summer School 1799 17.00 - (48,550) - - (8,680) - - - (8,680) (57,230) (18,473) (1.22) Social Work / Behavioral Sp 2113 2,113.00 - (111,612) - - - - - - - (111,612) (36,028) (2.38) SWAAAC Admin 2126 2,123.00 - - - - - - - - - - - - Health Svc / Nurses 2130 2,123.00 - (100,763) - - (2,203) (3,204) (37) (73) (5,516) (106,279) (34,306) (2.26) Psychologist 2140 2,123.00 - (90,838) - - (997) (2,792) - - (3,789) (94,628) (30,545) (2.02) Deaf & HH 2150 2,123.00 - (13,350) - - - - - - - (13,350) (4,309.25) (0.28) Occupational/Physical Ther 2160 2,123.00 - (95,793) (72,785) - (1,489) (1,677) - - (75,951) (171,744) (55,438) Admin for All (3.66) Administration 2231 2,231.00 - (165,998) - (600) (2,992) (2,862) - (10,750) (17,204) (183,202) (59,137) (9.71) (3.90) Legal 2315 231.00 - - (753) - - - - - (753) (753) (243) per pupil (0.02) Transportation 2721 27.00 - (253,170) - - - - - - - (253,170) (81,722) (5.39) Other Miscellaneous - - - - (37,465) (43) - - - - - Specific Administration 2410 241.00 - - - (196) - - - - (196) (196) (63) (0.00)
Grant Grant CodeIDEA Title VIB 22 4027 (448,329) 586,748 (249,246) (255,288) - (82,215) - - - (337,502) (586,748) - 415,008 (620,069)
Prog # - - - - - - - - - General 1700 17.00 - - - - - - - - - - - Total School Programs 170X - (248,511) (175,808) - (78,250) - - - (254,057) (502,568) (502,568) Preschool 1740 17.00 - - - - - - - - - - - SWAAAC 1780 17.00 - - - - - - - - - - - Psychologist 2140 2,123.00 - - - - - - - - - - - Occupational/Physical Ther 2160 2,123.00 - - - - - - - - - - - Administration 2231 2,231.00 - (735) (79,480) - (2,983) - - - (82,463) (83,198) (83,198) Workman's Comp 2850 285.00 - - - - (982) - - - (982) (982) (982)
Grant Grant CodeIDEA Title VIB PS 22 4173 2,516 7,559 (7,526) - - (34) - - - (34) (7,559) - (4,147) (9,190)
Prog # - - - - - - - - - - Preschool 0041 004 - - - - - - - - - - - Preschool 1791 1,791.00 - (7,526) - - - - - - - (7,526) (7,526) Workman's Comp 2850 285.00 - - - - (34) - - - (34) (34) (34)
Grand Total Consolidated 3,233,777 (3,725,258) (508,285) (1,235) (196,921) (29,928) (19,198) (11,072) (766,638) (4,491,896) (1,258,119) 410,604 (629,343)
October 31, 2014Purchase Services
Program Name
Program Name
Program Name
FSD49-1415TB-20141031.xlsx - SPED-PS-Subs Page 40 / 47 11/18/2014 - 8:45 AM
EL PASO COUNTY SCHOOL DISTRICT 49District Financial Summary Special Programs Review
Begining Balance Total Total Current Year2013-14 Fiscal Year Sheet Revenue Recognized Personnel Implementation Grand Net Receipts Net Cost
Percent of year completetd 33% (Accr) / Defer Revenue Costs Professional Property Other Supplies Equipment Other Costs Total Spend Net Cost (Distributions) per total sFTE
8100 1900 300 400 500 600 700 800 900
October 31, 2014Purchase Services
Special Education Programs & Special Education Component of General Programs SPED ct. Spec. sFTE Gross / SPED Net / SPED14-15 oBud 1,539 373 (7,302.34) (5,858.87) Designated Funding Grant Code (30,129.50) (24,173.74)
ECEA Fund 10 3130 - 2,221,500 (10,059,131) (630,758) (849) (283,417) (51,790) (28,941) (183,418) (1,179,174) (11,238,305) (9,016,805) (741.83) (595.19) Prog # - - - - - - - - -
General 1700 17.00 - (489,775) - - - - - - - (489,775) (392,960) (25.94) Total School Programs 170X - (2,768,240) (187,620) - (54,680) (21,593) (220) (6,541) (270,654) (3,038,894) (2,438,189) (160.94) Adaptive Pysical Disability 1710 17.00 - (133,003) - - (5,850) (880) - - (6,730) (139,733) (112,112) (776,294.44) (7.40) SLIC - Sig Lim Intell Cap 1740 17.00 - (758,719) - - - - - - - (758,719) (608,741) (40.18) SIED - Sig ID Emot Disab 1750 17.00 - (741,057) - - - - - - - (741,057) (594,570) (39.25) SOCO - Autism (Soc/Comm 1760 17.00 - (634,225) - - - - - - - (634,225) (508,856) (33.59) SLD - Speech/Lang Disab 1770 17.00 - - - - - - - - - - - - Speech Path / Language 1771 17.00 - (703,923) (249,750) - (1,588) (2,312) - - (253,650) (957,573) (768,288) (50.71) MH - Multiple Handicap 1780 17.00 - (1,093,691) (20,337) (395) (2,280) (3,105) (15,595) (70) (41,781) (1,135,472) (911,021) (60.14) Preschool 1791 1,791.00 - (490,606) (745) (200) (102,043) (6,860) (150) (2,961) (112,958) (603,564) (484,256) (31.97) Extended School Year 1798 17.00 - (16,406) - - (3,281) (300) - - (3,581) (19,987) (16,036) (1.06) Summer School 1799 17.00 - (94,111) - - (21,310) (300) - - (21,610) (115,721) (92,846) (6.13) Social Work / Behavioral Sp 2113 2,113.00 - (248,336) - - - - - - - (248,336) (199,247) (13.15) SWAAAC Admin 2126 2,123.00 - - - - - - - - - - - - Health Svc / Nurses 2130 2,123.00 - (249,160) - (111) (4,063) (4,011) (89) - (8,274) (257,434) (206,546) (13.63) Psychologist 2140 2,123.00 - (237,303) (35,068) - (5,500) (5,190) - - (45,758) (283,061) (227,108) (14.99) Deaf & HH 2150 2,123.00 - - - - - - - - - - - - Occupational/Physical Ther 2160 2,123.00 - (218,868) (133,058) - (4,600) (3,215) - - (140,873) (359,741) (288,630) All charters (19.05) Administration 2231 2,231.00 - (366,109) (40) - (11,370) (3,021) (802) (98,973) (114,205) (480,314) (385,369) (21.08) (25.44) Legal 2315 231.00 - - (4,140) - - - - - (4,140) (4,140) (3,322) (0.22) Transportation 2721 27.00 - (815,602) - - - (1,004) (500) (74,874) (76,378) (891,980) (715,660) (47.24) Other Miscellaneous - - - - (66,853) - - - (66,853) (66,853) (53,638.11) (3.54) Administration 2410 241.00 - - - (143) - - (11,585) - (11,728) (11,728) (9,410) (0.62)
Grant Grant CodeIDEA Title VIB 22 4027 - 2,306,591 (1,254,516) (510,575) - (541,500) - - - (1,052,075) (2,306,591) - 2,306,591 -
Prog # - - - - - - - - - General 1700 17.00 - - - - - - - - - - - Total School Programs 170X - (1,254,516) (351,615) - (529,500) - - - (881,115) (2,135,631) (2,135,631) Preschool 1740 17.00 - - - - - - - - - - - SWAAAC 1780 17.00 - - - - - - - - - - - Psychologist 2140 2,123.00 - - - - - - - - - - - Occupational/Physical Ther 2160 2,123.00 - - - - - - - - - - - Administration 2231 2,231.00 - - (158,960) - (12,000) - - - (170,960) (170,960) (170,960) Workman's Comp 2850 285.00 - - - - - - - - - - -
Grant Grant CodeIDEA Title VIB PS 22 4173 - 26,702 (26,702) - - - - - - - (26,702) - 26,702 -
Prog # - - - - - - - - - - Preschool 0041 004 - - - - - - - - - - - Preschool 1791 1,791.00 - (26,702) - - - - - - - (26,702) (26,702) Workman's Comp 2850 285.00 - - - - - - - - - - -
Grand Total Consolidated 4,554,793 (11,340,349) (1,141,333) (849) (824,917) (51,790) (28,941) (183,418) (2,231,249) (13,571,598) (9,016,805) 2,332,551 (595)
Program Name
Program Name
Program Name
FSD49-1415TB-20141031.xlsx - SPED-PS-Subs Page 41 / 47 11/18/2014 - 8:45 AM
EL PASO COUNTY SCHOOL DISTRICT 49District Financial Summary Special Programs Review
Begining Balance Total Total Current Year2013-14 Fiscal Year Sheet Revenue Recognized Personnel Implementation Grand Net Receipts Net Cost
Percent of year completetd 33% (Accr) / Defer Revenue Costs Professional Property Other Supplies Equipment Other Costs Total Spend Net Cost (Distributions) per total sFTE
8100 1900 300 400 500 600 700 800 900
October 31, 2014Purchase Services
Special Education Programs & Special Education Component of General Programs SPED ct. Spec. sFTE Gross / SPED Net / SPEDcAct v oBud - (4) 4,769.80 2,449.33 Designated Funding Grant Code 19,566.93 24,090.69
ECEA Fund 10 3130 - 417,969 6,590,645 377,761 (385) 168,744 21,862 9,743 172,346 750,071 7,340,717 7,758,686 485 512 Prog # - - - - - - - - - -
General 1700 17.00 - 410,812 - - - - - - - 410,812 410,812 24 Total School Programs 170X - 1,848,706 108,986 - 23,750 9,727 (27) 6,541 148,977 1,997,682 1,997,682 139 Adaptive Pysical Disability 1710 17.00 - 88,491 - - 5,067 831 - - 5,898 94,390 94,390 6 SLIC - Sig Lim Intell Cap 1740 17.00 - 491,735 - - - - - - - 491,735 491,735 34 SIED - Sig Id Emot Disab 1750 17.00 - 501,575 - - - - - - - 501,575 501,575 34 SOCO - Autism (Soc/Comm 1760 17.00 - 450,082 - - - - - - - 450,082 450,082 30 SLD - Speech/Lang Disab 1770 17.00 - (17,021) - - - - - - - (17,021) (17,021) (0) Speech Path / Language 1771 17.00 - 447,986 149,204 - 1,210 1,369 - - 151,783 599,769 599,769 43 MH - Multiple Handicap 1780 17.00 - 674,071 20,337 16 1,138 303 (3,318) 70 18,546 692,618 692,618 51 Preschool 1791 1,791.00 - 328,571 465 140 74,429 3,169 150 2,711 81,064 409,635 409,635 28 Extended School Year 1798 17.00 - 16,223 - - 3,281 300 - - 3,581 19,804 19,804 1 Summer School 1799 17.00 - 45,561 - - 12,630 300 - - 12,930 58,491 58,491 5 Social Work / Behavioral Sp 2113 2,113.00 - 136,723 - - - - - - - 136,723 136,723 11 SWAAAC Admin 2126 2,123.00 - - - - - - - - - - - - Health Svc / Nurses 2130 2,123.00 - 148,397 - 111 1,861 807 52 (73) 2,758 151,155 151,155 11 Psychologist 2140 2,123.00 - 146,465 35,068 - 4,503 2,398 - - 41,969 188,433 188,433 13 Deaf & HH 2150 2,123.00 - (13,350) - - - - - - - (13,350) (13,350) (0) Occupational/Physical Ther 2160 2,123.00 - 123,075 60,274 - 3,111 1,538 - - 64,922 187,998 187,998 All charters 15 Administration 2231 2,231.00 - 200,111 40 (600) 8,377 159 802 88,223 97,001 297,111 297,111 11.37 22 Legal 2315 231.00 - - 3,388 - - - - - 3,388 3,388 3,388 0 Transportation 2721 27.00 - 562,432 - - - 1,004 500 74,874 76,378 638,809 638,809 42 Other Miscellaneous several 27.00 - - - - 29,388 (43) - - 29,344 29,344 29,344 4 Administration 2410 241.00 - - - (53) - - 11,585 - 11,532 11,532 11,532 1
Grant Grant CodeIDEA Title VIB 22 4027 #REF! (1,719,843) 1,005,270 255,288 - 459,285 - - - 714,573 1,719,843 - (1,891,583) (620,069)
Prog # - - - - - - - - - General 1700 17.00 - - - - - - - - - - - Total School Programs 170X - 1,006,005 175,808 - 451,250 - - - 627,058 1,633,063 1,633,063 Preschool 1740 17.00 - - - - - - - - - - - SWAAAC 1780 17.00 - - - - - - - - - - - Psychologist 2140 2,123.00 - - - - - - - - - - - Occupational/Physical Ther 2160 2,123.00 - - - - - - - - - - - Administration 2231 2,231.00 - (735) 79,480 - 9,017 - - - 88,497 87,762 87,762 Workman's Comp 2850 285.00 - - - - (982) - - - (982) (982) (982)
Grant Grant CodeIDEA Title VIB PS 22 4173 2,516 (19,143) 19,176 - - (34) - - - (34) 19,143 - (30,849) (9,190)
Prog # - - - - - - - - - - Preschool 0041 004 - - - - - - - - - - - Preschool 1791 1,791.00 - 19,176 - - - - - - - 19,176 19,176 Workman's Comp 2850 285.00 - - - - (34) - - - (34) (34) (34)
Grand Total Consolidated (1,321,016) 7,615,091 633,048 (385) 627,996 21,862 9,743 172,346 1,464,611 9,079,702 7,758,686
Program Name
Program Name
Program Name
FSD49-1415TB-20141031.xlsx - SPED-PS-Subs Page 42 / 47 11/18/2014 - 8:45 AM
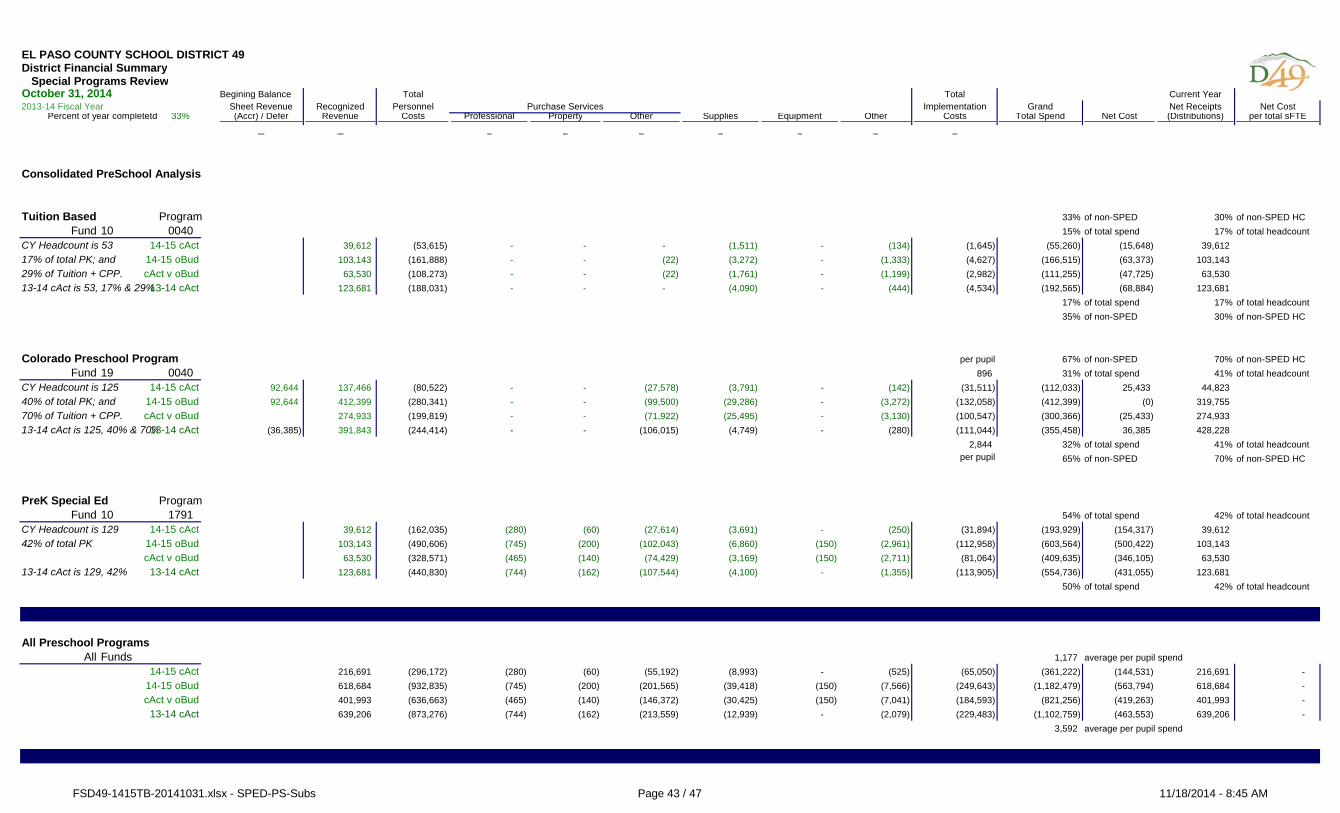
EL PASO COUNTY SCHOOL DISTRICT 49District Financial Summary Special Programs Review
Begining Balance Total Total Current Year2013-14 Fiscal Year Sheet Revenue Recognized Personnel Implementation Grand Net Receipts Net Cost
Percent of year completetd 33% (Accr) / Defer Revenue Costs Professional Property Other Supplies Equipment Other Costs Total Spend Net Cost (Distributions) per total sFTE
8100 1900 300 400 500 600 700 800 900
October 31, 2014Purchase Services
Consolidated PreSchool Analysis
Tuition Based Program 33% of non-SPED 30% of non-SPED HCFund 10 0040 15% of total spend 17% of total headcount
CY Headcount is 53 14-15 cAct 39,612 (53,615) - - - (1,511) - (134) (1,645) (55,260) (15,648) 39,612 17% of total PK; and 14-15 oBud 103,143 (161,888) - - (22) (3,272) - (1,333) (4,627) (166,515) (63,373) 103,143 29% of Tuition + CPP. cAct v oBud 63,530 (108,273) - - (22) (1,761) - (1,199) (2,982) (111,255) (47,725) 63,530 13-14 cAct is 53, 17% & 29%13-14 cAct 123,681 (188,031) - - - (4,090) - (444) (4,534) (192,565) (68,884) 123,681
17% of total spend 17% of total headcount35% of non-SPED 30% of non-SPED HC
Colorado Preschool Program per pupil 67% of non-SPED 70% of non-SPED HCFund 19 0040 896 31% of total spend 41% of total headcount
CY Headcount is 125 14-15 cAct 92,644 137,466 (80,522) - - (27,578) (3,791) - (142) (31,511) (112,033) 25,433 44,823 40% of total PK; and 14-15 oBud 92,644 412,399 (280,341) - - (99,500) (29,286) - (3,272) (132,058) (412,399) (0) 319,755 70% of Tuition + CPP. cAct v oBud 274,933 (199,819) - - (71,922) (25,495) - (3,130) (100,547) (300,366) (25,433) 274,933 13-14 cAct is 125, 40% & 70%13-14 cAct (36,385) 391,843 (244,414) - - (106,015) (4,749) - (280) (111,044) (355,458) 36,385 428,228
2,844 32% of total spend 41% of total headcountper pupil 65% of non-SPED 70% of non-SPED HC
PreK Special Ed ProgramFund 10 1791 54% of total spend 42% of total headcount
CY Headcount is 129 14-15 cAct 39,612 (162,035) (280) (60) (27,614) (3,691) - (250) (31,894) (193,929) (154,317) 39,612 42% of total PK 14-15 oBud 103,143 (490,606) (745) (200) (102,043) (6,860) (150) (2,961) (112,958) (603,564) (500,422) 103,143
cAct v oBud 63,530 (328,571) (465) (140) (74,429) (3,169) (150) (2,711) (81,064) (409,635) (346,105) 63,530 13-14 cAct is 129, 42% 13-14 cAct 123,681 (440,830) (744) (162) (107,544) (4,100) - (1,355) (113,905) (554,736) (431,055) 123,681
50% of total spend 42% of total headcount
All Preschool ProgramsAll Funds 1,177 average per pupil spend
14-15 cAct 216,691 (296,172) (280) (60) (55,192) (8,993) - (525) (65,050) (361,222) (144,531) 216,691 - 14-15 oBud 618,684 (932,835) (745) (200) (201,565) (39,418) (150) (7,566) (249,643) (1,182,479) (563,794) 618,684 - cAct v oBud 401,993 (636,663) (465) (140) (146,372) (30,425) (150) (7,041) (184,593) (821,256) (419,263) 401,993 -
13-14 cAct 639,206 (873,276) (744) (162) (213,559) (12,939) - (2,079) (229,483) (1,102,759) (463,553) 639,206 - 3,592 average per pupil spend
FSD49-1415TB-20141031.xlsx - SPED-PS-Subs Page 43 / 47 11/18/2014 - 8:45 AM
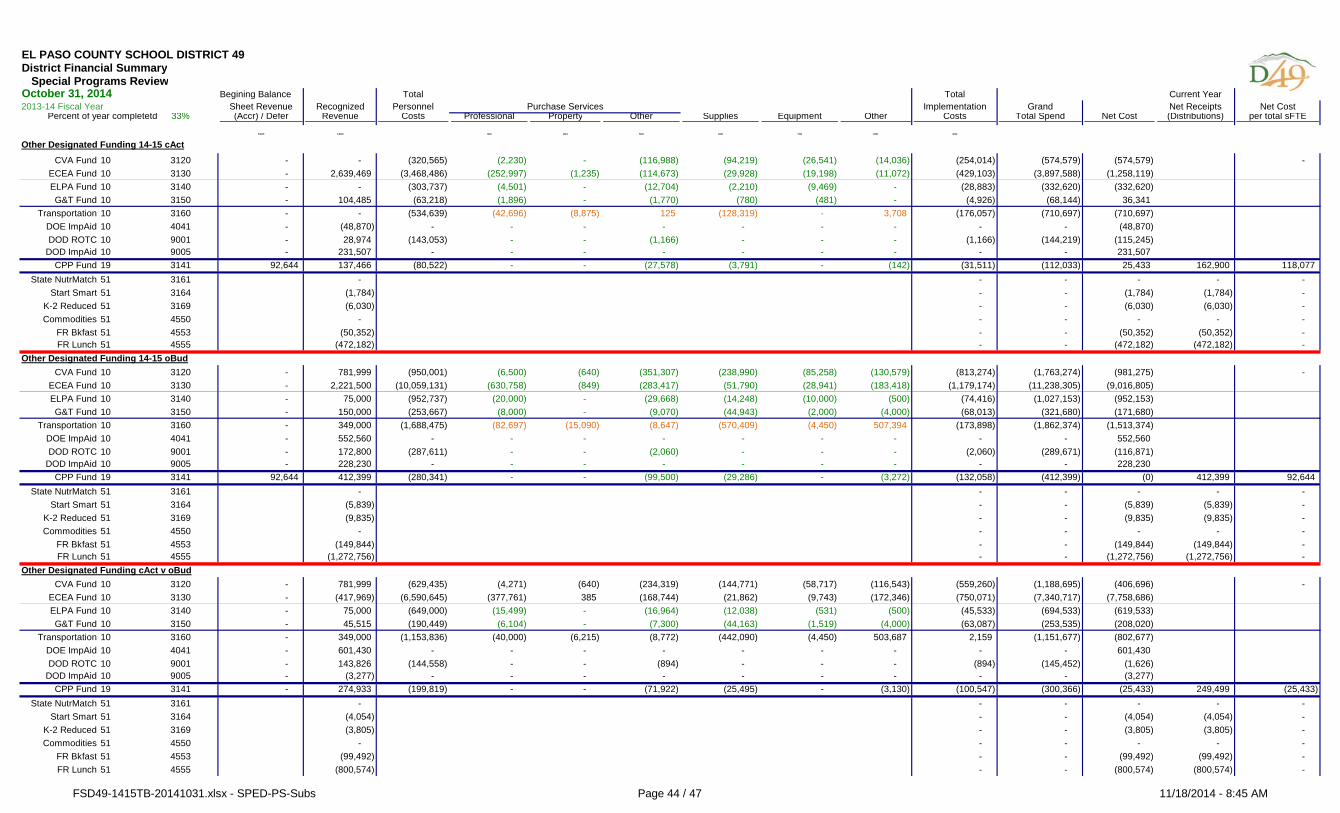
EL PASO COUNTY SCHOOL DISTRICT 49District Financial Summary Special Programs Review
Begining Balance Total Total Current Year2013-14 Fiscal Year Sheet Revenue Recognized Personnel Implementation Grand Net Receipts Net Cost
Percent of year completetd 33% (Accr) / Defer Revenue Costs Professional Property Other Supplies Equipment Other Costs Total Spend Net Cost (Distributions) per total sFTE
8100 1900 300 400 500 600 700 800 900
October 31, 2014Purchase Services
Other Designated Funding 14-15 cActCVA Fund 10 3120 - - (320,565) (2,230) - (116,988) (94,219) (26,541) (14,036) (254,014) (574,579) (574,579) -
ECEA Fund 10 3130 - 2,639,469 (3,468,486) (252,997) (1,235) (114,673) (29,928) (19,198) (11,072) (429,103) (3,897,588) (1,258,119) ELPA Fund 10 3140 - - (303,737) (4,501) - (12,704) (2,210) (9,469) - (28,883) (332,620) (332,620) G&T Fund 10 3150 - 104,485 (63,218) (1,896) - (1,770) (780) (481) - (4,926) (68,144) 36,341
Transportation 10 3160 - - (534,639) (42,696) (8,875) 125 (128,319) - 3,708 (176,057) (710,697) (710,697) DOE ImpAid 10 4041 - (48,870) - - - - - - - - - (48,870) DOD ROTC 10 9001 - 28,974 (143,053) - - (1,166) - - - (1,166) (144,219) (115,245)
DOD ImpAid 10 9005 - 231,507 - - - - - - - - - 231,507 CPP Fund 19 3141 92,644 137,466 (80,522) - - (27,578) (3,791) - (142) (31,511) (112,033) 25,433 162,900 118,077
State NutrMatch 51 3161 - - - - - - Start Smart 51 3164 (1,784) - - (1,784) (1,784) -
K-2 Reduced 51 3169 (6,030) - - (6,030) (6,030) - Commodities 51 4550 - - - - - -
FR Bkfast 51 4553 (50,352) - - (50,352) (50,352) - FR Lunch 51 4555 (472,182) - - (472,182) (472,182) -
Other Designated Funding 14-15 oBudCVA Fund 10 3120 - 781,999 (950,001) (6,500) (640) (351,307) (238,990) (85,258) (130,579) (813,274) (1,763,274) (981,275) -
ECEA Fund 10 3130 - 2,221,500 (10,059,131) (630,758) (849) (283,417) (51,790) (28,941) (183,418) (1,179,174) (11,238,305) (9,016,805) ELPA Fund 10 3140 - 75,000 (952,737) (20,000) - (29,668) (14,248) (10,000) (500) (74,416) (1,027,153) (952,153) G&T Fund 10 3150 - 150,000 (253,667) (8,000) - (9,070) (44,943) (2,000) (4,000) (68,013) (321,680) (171,680)
Transportation 10 3160 - 349,000 (1,688,475) (82,697) (15,090) (8,647) (570,409) (4,450) 507,394 (173,898) (1,862,374) (1,513,374) DOE ImpAid 10 4041 - 552,560 - - - - - - - - - 552,560 DOD ROTC 10 9001 - 172,800 (287,611) - - (2,060) - - - (2,060) (289,671) (116,871)
DOD ImpAid 10 9005 - 228,230 - - - - - - - - - 228,230 CPP Fund 19 3141 92,644 412,399 (280,341) - - (99,500) (29,286) - (3,272) (132,058) (412,399) (0) 412,399 92,644
State NutrMatch 51 3161 - - - - - - Start Smart 51 3164 (5,839) - - (5,839) (5,839) -
K-2 Reduced 51 3169 (9,835) - - (9,835) (9,835) - Commodities 51 4550 - - - - - -
FR Bkfast 51 4553 (149,844) - - (149,844) (149,844) - FR Lunch 51 4555 (1,272,756) - - (1,272,756) (1,272,756) -
Other Designated Funding cAct v oBudCVA Fund 10 3120 - 781,999 (629,435) (4,271) (640) (234,319) (144,771) (58,717) (116,543) (559,260) (1,188,695) (406,696) -
ECEA Fund 10 3130 - (417,969) (6,590,645) (377,761) 385 (168,744) (21,862) (9,743) (172,346) (750,071) (7,340,717) (7,758,686) ELPA Fund 10 3140 - 75,000 (649,000) (15,499) - (16,964) (12,038) (531) (500) (45,533) (694,533) (619,533) G&T Fund 10 3150 - 45,515 (190,449) (6,104) - (7,300) (44,163) (1,519) (4,000) (63,087) (253,535) (208,020)
Transportation 10 3160 - 349,000 (1,153,836) (40,000) (6,215) (8,772) (442,090) (4,450) 503,687 2,159 (1,151,677) (802,677) DOE ImpAid 10 4041 - 601,430 - - - - - - - - - 601,430 DOD ROTC 10 9001 - 143,826 (144,558) - - (894) - - - (894) (145,452) (1,626)
DOD ImpAid 10 9005 - (3,277) - - - - - - - - - (3,277) CPP Fund 19 3141 - 274,933 (199,819) - - (71,922) (25,495) - (3,130) (100,547) (300,366) (25,433) 249,499 (25,433)
State NutrMatch 51 3161 - - - - - - Start Smart 51 3164 (4,054) - - (4,054) (4,054) -
K-2 Reduced 51 3169 (3,805) - - (3,805) (3,805) - Commodities 51 4550 - - - - - -
FR Bkfast 51 4553 (99,492) - - (99,492) (99,492) - FR Lunch 51 4555 (800,574) - - (800,574) (800,574) -
FSD49-1415TB-20141031.xlsx - SPED-PS-Subs Page 44 / 47 11/18/2014 - 8:45 AM
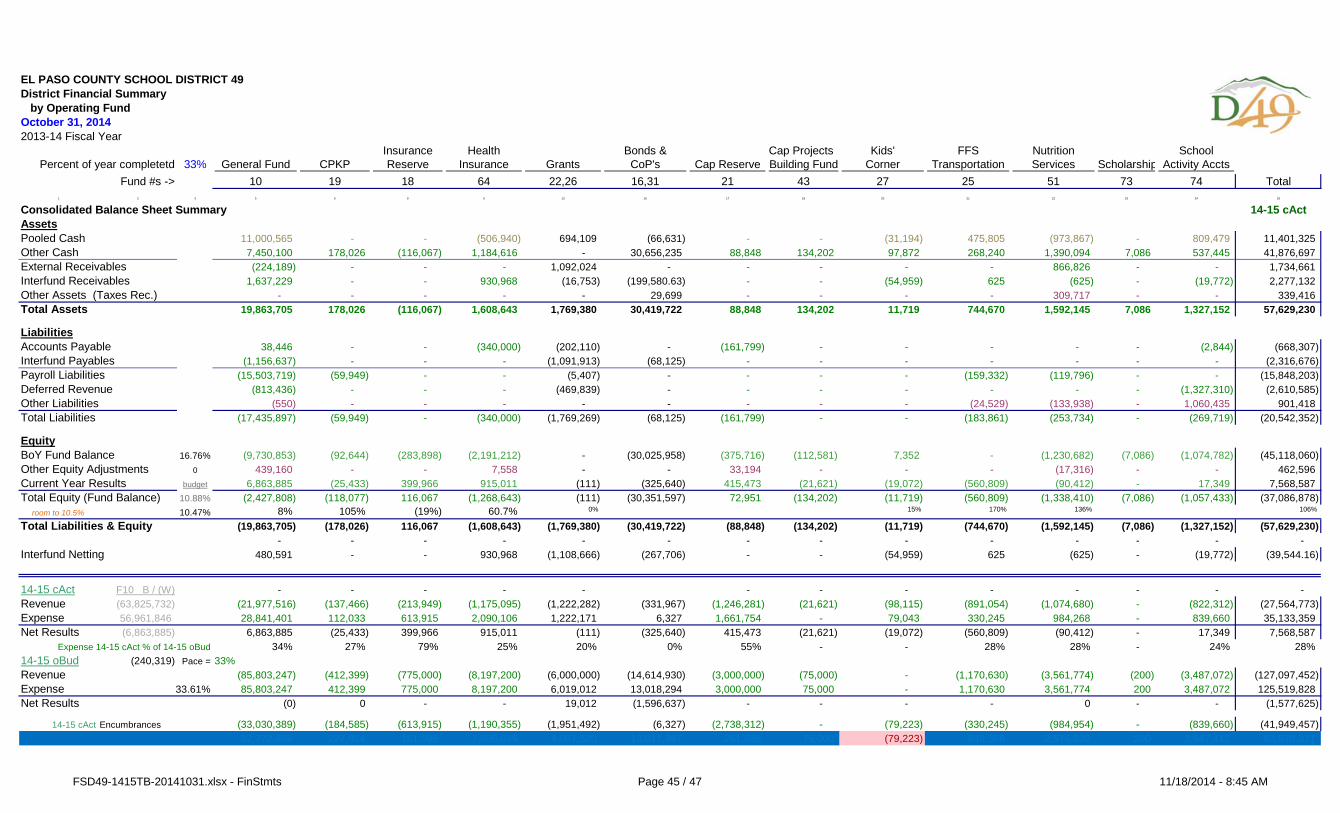
EL PASO COUNTY SCHOOL DISTRICT 49District Financial Summary by Operating Fund
2013-14 Fiscal YearInsurance Health Bonds & Cap Projects Kids' FFS Nutrition School
Percent of year completetd 33% General Fund CPKP Reserve Insurance Grants CoP's Cap Reserve Building Fund Corner Transportation Services Scholarship Activity AcctsFund #s -> 10 19 18 64 22,26 16,31 21 43 27 25 51 73 74 Total
1 2 3 5 6 8 9 13 16 17 18 20 21 22 23 24 26
Consolidated Balance Sheet Summary 14-15 cActAssetsPooled Cash 11,000,565 - - (506,940) 694,109 (66,631) - - (31,194) 475,805 (973,867) - 809,479 11,401,325 Other Cash 7,450,100 178,026 (116,067) 1,184,616 - 30,656,235 88,848 134,202 97,872 268,240 1,390,094 7,086 537,445 41,876,697 External Receivables (224,189) - - - 1,092,024 - - - - - 866,826 - - 1,734,661 Interfund Receivables 1,637,229 - - 930,968 (16,753) (199,580.63) - - (54,959) 625 (625) - (19,772) 2,277,132 Other Assets (Taxes Rec.) - - - - - 29,699 - - - - 309,717 - - 339,416 Total Assets 19,863,705 178,026 (116,067) 1,608,643 1,769,380 30,419,722 88,848 134,202 11,719 744,670 1,592,145 7,086 1,327,152 57,629,230
LiabilitiesAccounts Payable 38,446 - - (340,000) (202,110) - (161,799) - - - - - (2,844) (668,307) Interfund Payables (1,156,637) - - - (1,091,913) (68,125) - - - - - - - (2,316,676) Payroll Liabilities (15,503,719) (59,949) - - (5,407) - - - - (159,332) (119,796) - - (15,848,203) Deferred Revenue (813,436) - - - (469,839) - - - - - - - (1,327,310) (2,610,585) Other Liabilities (550) - - - - - - - - (24,529) (133,938) - 1,060,435 901,418 Total Liabilities (17,435,897) (59,949) - (340,000) (1,769,269) (68,125) (161,799) - - (183,861) (253,734) - (269,719) (20,542,352)
EquityBoY Fund Balance 16.76% (9,730,853) (92,644) (283,898) (2,191,212) - (30,025,958) (375,716) (112,581) 7,352 - (1,230,682) (7,086) (1,074,782) (45,118,060) Other Equity Adjustments 0 439,160 - - 7,558 - - 33,194 - - - (17,316) - - 462,596 Current Year Results budget 6,863,885 (25,433) 399,966 915,011 (111) (325,640) 415,473 (21,621) (19,072) (560,809) (90,412) - 17,349 7,568,587 Total Equity (Fund Balance) 10.88% (2,427,808) (118,077) 116,067 (1,268,643) (111) (30,351,597) 72,951 (134,202) (11,719) (560,809) (1,338,410) (7,086) (1,057,433) (37,086,878)
room to 10.5% 10.47% 8% 105% (19%) 60.7% 0% 15% 170% 136% 106%
Total Liabilities & Equity (19,863,705) (178,026) 116,067 (1,608,643) (1,769,380) (30,419,722) (88,848) (134,202) (11,719) (744,670) (1,592,145) (7,086) (1,327,152) (57,629,230) - - - - - - - - - - - - - -
Interfund Netting 480,591 - - 930,968 (1,108,666) (267,706) - - (54,959) 625 (625) - (19,772) (39,544.16)
14-15 cAct F10 B / (W) - - - - - - - - - - - - - Revenue (63,825,732) (21,977,516) (137,466) (213,949) (1,175,095) (1,222,282) (331,967) (1,246,281) (21,621) (98,115) (891,054) (1,074,680) - (822,312) (27,564,773) Expense 56,961,846 28,841,401 112,033 613,915 2,090,106 1,222,171 6,327 1,661,754 - 79,043 330,245 984,268 - 839,660 35,133,359 Net Results (6,863,885) 6,863,885 (25,433) 399,966 915,011 (111) (325,640) 415,473 (21,621) (19,072) (560,809) (90,412) - 17,349 7,568,587
Expense 14-15 cAct % of 14-15 oBud 34% 27% 79% 25% 20% 0% 55% - - 28% 28% - 24% 28% 14-15 oBud (240,319) Pace = 33%Revenue (85,803,247) (412,399) (775,000) (8,197,200) (6,000,000) (14,614,930) (3,000,000) (75,000) - (1,170,630) (3,561,774) (200) (3,487,072) (127,097,452) Expense 85,803,247 412,399 775,000 8,197,200 6,019,012 13,018,294 3,000,000 75,000 - 1,170,630 3,561,774 200 3,487,072 125,519,828 Net Results (0) 0 - - 19,012 (1,596,637) - - - - 0 - - (1,577,625)
14-15 cAct Encumbrances (33,030,389) (184,585) (613,915) (1,190,355) (1,951,492) (6,327) (2,738,312) - (79,223) (330,245) (984,954) - (839,660) (41,949,457) 52,772,859 227,814 161,085 7,006,845 4,067,520 13,011,967 261,688 75,000 (79,223) 840,386 2,576,820 200 2,647,412 83,570,371
October 31, 2014
33.61%
FSD49-1415TB-20141031.xlsx - FinStmts Page 45 / 47 11/18/2014 - 8:45 AM
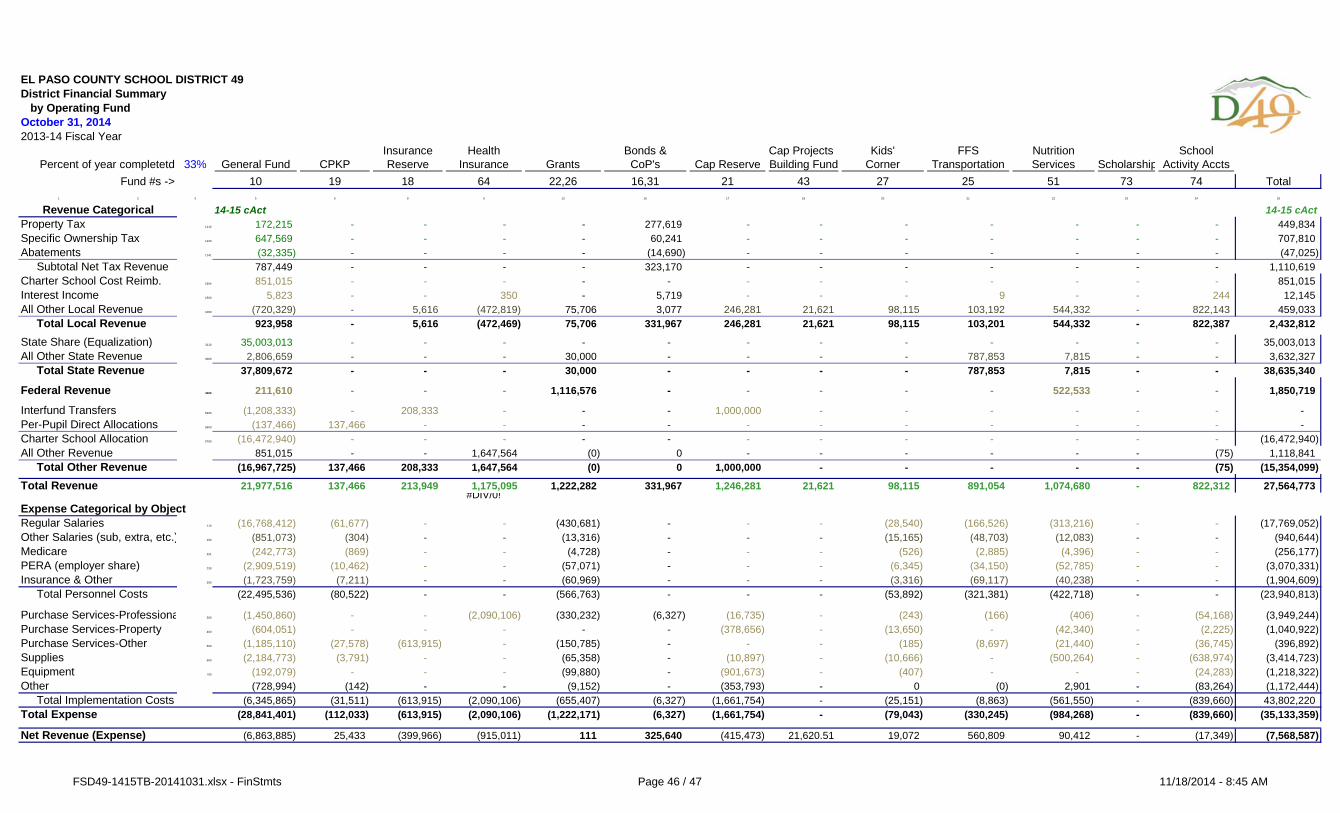
EL PASO COUNTY SCHOOL DISTRICT 49District Financial Summary by Operating Fund
2013-14 Fiscal YearInsurance Health Bonds & Cap Projects Kids' FFS Nutrition School
Percent of year completetd 33% General Fund CPKP Reserve Insurance Grants CoP's Cap Reserve Building Fund Corner Transportation Services Scholarship Activity AcctsFund #s -> 10 19 18 64 22,26 16,31 21 43 27 25 51 73 74 Total
1 2 3 5 6 8 9 13 16 17 18 20 21 22 23 24 26
October 31, 2014
14-15 cAct 14-15 cActProperty Tax 1110 172,215 - - - - 277,619 - - - - - - - 449,834 Specific Ownership Tax 1120 647,569 - - - - 60,241 - - - - - - - 707,810 Abatements 1141 (32,335) - - - - (14,690) - - - - - - - (47,025) Subtotal Net Tax Revenue 787,449 - - - - 323,170 - - - - - - - 1,110,619 Charter School Cost Reimb. 1954 851,015 - - - - - - - - - - - - 851,015 Interest Income 1500 5,823 - - 350 - 5,719 - - - 9 - - 244 12,145 All Other Local Revenue 1000 (720,329) - 5,616 (472,819) 75,706 3,077 246,281 21,621 98,115 103,192 544,332 - 822,143 459,033 Total Local Revenue 923,958 - 5,616 (472,469) 75,706 331,967 246,281 21,621 98,115 103,201 544,332 - 822,387 2,432,812
State Share (Equalization) 3110 35,003,013 - - - - - - - - - - - - 35,003,013 All Other State Revenue 3000 2,806,659 - - - 30,000 - - - - 787,853 7,815 - - 3,632,327 Total State Revenue 37,809,672 - - - 30,000 - - - - 787,853 7,815 - - 38,635,340
Federal Revenue 4000 211,610 - - - 1,116,576 - - - - - 522,533 - - 1,850,719
Interfund Transfers 5200 (1,208,333) - 208,333 - - - 1,000,000 - - - - - - - Per-Pupil Direct Allocations 5600 (137,466) 137,466 - - - - - - - - - - - - Charter School Allocation 5700 (16,472,940) - - - - - - - - - - - - (16,472,940) All Other Revenue 851,015 - - 1,647,564 (0) 0 - - - - - - (75) 1,118,841 Total Other Revenue (16,967,725) 137,466 208,333 1,647,564 (0) 0 1,000,000 - - - - - (75) (15,354,099) Total Revenue 21,977,516 137,466 213,949 1,175,095 1,222,282 331,967 1,246,281 21,621 98,115 891,054 1,074,680 - 822,312 27,564,773
#DIV/0!Expense Categorical by ObjectRegular Salaries 110 (16,768,412) (61,677) - - (430,681) - - - (28,540) (166,526) (313,216) - - (17,769,052) Other Salaries (sub, extra, etc.) 100 (851,073) (304) - - (13,316) - - - (15,165) (48,703) (12,083) - - (940,644) Medicare 221 (242,773) (869) - - (4,728) - - - (526) (2,885) (4,396) - - (256,177) PERA (employer share) 230 (2,909,519) (10,462) - - (57,071) - - - (6,345) (34,150) (52,785) - - (3,070,331) Insurance & Other 200 (1,723,759) (7,211) - - (60,969) - - - (3,316) (69,117) (40,238) - - (1,904,609) Total Personnel Costs (22,495,536) (80,522) - - (566,763) - - - (53,892) (321,381) (422,718) - - (23,940,813)
Purchase Services-Professiona 300 (1,450,860) - - (2,090,106) (330,232) (6,327) (16,735) - (243) (166) (406) - (54,168) (3,949,244) Purchase Services-Property 400 (604,051) - - - - - (378,656) - (13,650) - (42,340) - (2,225) (1,040,922) Purchase Services-Other 500 (1,185,110) (27,578) (613,915) - (150,785) - - - (185) (8,697) (21,440) - (36,745) (396,892) Supplies 600 (2,184,773) (3,791) - - (65,358) - (10,897) - (10,666) - (500,264) - (638,974) (3,414,723) Equipment 700 (192,079) - - - (99,880) - (901,673) - (407) - - - (24,283) (1,218,322) Other (728,994) (142) - - (9,152) - (353,793) - 0 (0) 2,901 - (83,264) (1,172,444) Total Implementation Costs (6,345,865) (31,511) (613,915) (2,090,106) (655,407) (6,327) (1,661,754) - (25,151) (8,863) (561,550) - (839,660) 43,802,220 Total Expense (28,841,401) (112,033) (613,915) (2,090,106) (1,222,171) (6,327) (1,661,754) - (79,043) (330,245) (984,268) - (839,660) (35,133,359)
Net Revenue (Expense) (6,863,885) 25,433 (399,966) (915,011) 111 325,640 (415,473) 21,620.51 19,072 560,809 90,412 - (17,349) (7,568,587)
Revenue Categorical
FSD49-1415TB-20141031.xlsx - FinStmts Page 46 / 47 11/18/2014 - 8:45 AM
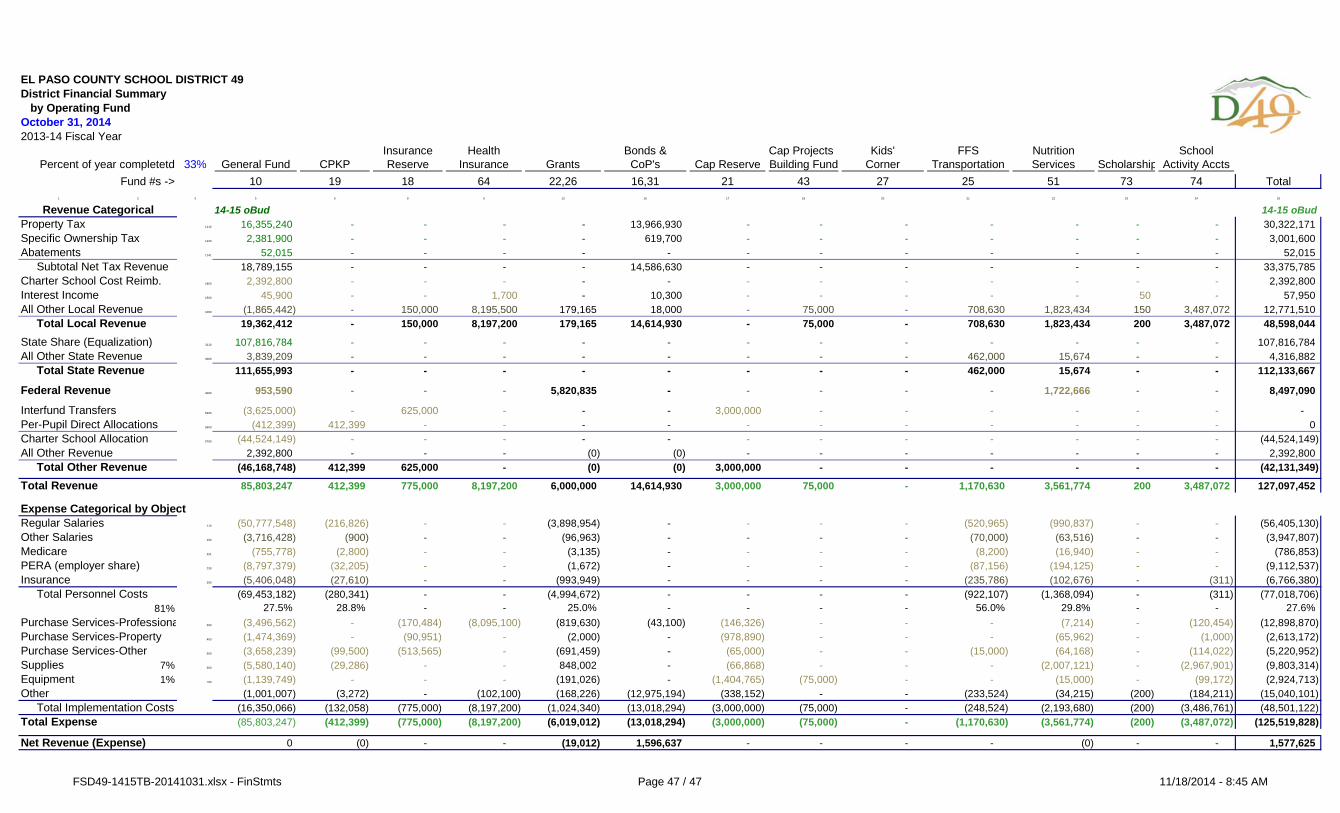
EL PASO COUNTY SCHOOL DISTRICT 49District Financial Summary by Operating Fund
2013-14 Fiscal YearInsurance Health Bonds & Cap Projects Kids' FFS Nutrition School
Percent of year completetd 33% General Fund CPKP Reserve Insurance Grants CoP's Cap Reserve Building Fund Corner Transportation Services Scholarship Activity AcctsFund #s -> 10 19 18 64 22,26 16,31 21 43 27 25 51 73 74 Total
1 2 3 5 6 8 9 13 16 17 18 20 21 22 23 24 26
October 31, 2014
14-15 oBud 14-15 oBudProperty Tax 1110 16,355,240 - - - - 13,966,930 - - - - - - - 30,322,171 Specific Ownership Tax 1120 2,381,900 - - - - 619,700 - - - - - - - 3,001,600 Abatements 1141 52,015 - - - - - - - - - - - - 52,015 Subtotal Net Tax Revenue 18,789,155 - - - - 14,586,630 - - - - - - - 33,375,785 Charter School Cost Reimb. 1850 2,392,800 - - - - - - - - - - - - 2,392,800 Interest Income 1500 45,900 - - 1,700 - 10,300 - - - - - 50 - 57,950 All Other Local Revenue 1000 (1,865,442) - 150,000 8,195,500 179,165 18,000 - 75,000 - 708,630 1,823,434 150 3,487,072 12,771,510 Total Local Revenue 19,362,412 - 150,000 8,197,200 179,165 14,614,930 - 75,000 - 708,630 1,823,434 200 3,487,072 48,598,044
State Share (Equalization) 3110 107,816,784 - - - - - - - - - - - - 107,816,784 All Other State Revenue 3000 3,839,209 - - - - - - - - 462,000 15,674 - - 4,316,882 Total State Revenue 111,655,993 - - - - - - - - 462,000 15,674 - - 112,133,667
Federal Revenue 4000 953,590 - - - 5,820,835 - - - - - 1,722,666 - - 8,497,090
Interfund Transfers 5200 (3,625,000) - 625,000 - - - 3,000,000 - - - - - - - Per-Pupil Direct Allocations 5600 (412,399) 412,399 - - - - - - - - - - - 0 Charter School Allocation 5700 (44,524,149) - - - - - - - - - - - - (44,524,149) All Other Revenue 2,392,800 - - - (0) (0) - - - - - - - 2,392,800 Total Other Revenue (46,168,748) 412,399 625,000 - (0) (0) 3,000,000 - - - - - - (42,131,349)
Total Revenue 85,803,247 412,399 775,000 8,197,200 6,000,000 14,614,930 3,000,000 75,000 - 1,170,630 3,561,774 200 3,487,072 127,097,452
Expense Categorical by ObjectRegular Salaries 110 (50,777,548) (216,826) - - (3,898,954) - - - - (520,965) (990,837) - - (56,405,130) Other Salaries 100 (3,716,428) (900) - - (96,963) - - - - (70,000) (63,516) - - (3,947,807) Medicare 221 (755,778) (2,800) - - (3,135) - - - - (8,200) (16,940) - - (786,853) PERA (employer share) 230 (8,797,379) (32,205) - - (1,672) - - - - (87,156) (194,125) - - (9,112,537) Insurance 200 (5,406,048) (27,610) - - (993,949) - - - - (235,786) (102,676) - (311) (6,766,380) Total Personnel Costs (69,453,182) (280,341) - - (4,994,672) - - - - (922,107) (1,368,094) - (311) (77,018,706)
81% 27.5% 28.8% - - 25.0% - - - - 56.0% 29.8% - - 27.6% Purchase Services-Professiona 300 (3,496,562) - (170,484) (8,095,100) (819,630) (43,100) (146,326) - - - (7,214) - (120,454) (12,898,870) Purchase Services-Property 400 (1,474,369) - (90,951) - (2,000) - (978,890) - - - (65,962) - (1,000) (2,613,172) Purchase Services-Other 500 (3,658,239) (99,500) (513,565) - (691,459) - (65,000) - - (15,000) (64,168) - (114,022) (5,220,952) Supplies 7% 600 (5,580,140) (29,286) - - 848,002 - (66,868) - - - (2,007,121) - (2,967,901) (9,803,314) Equipment 1% 700 (1,139,749) - - - (191,026) - (1,404,765) (75,000) - - (15,000) - (99,172) (2,924,713) Other (1,001,007) (3,272) - (102,100) (168,226) (12,975,194) (338,152) - - (233,524) (34,215) (200) (184,211) (15,040,101) Total Implementation Costs (16,350,066) (132,058) (775,000) (8,197,200) (1,024,340) (13,018,294) (3,000,000) (75,000) - (248,524) (2,193,680) (200) (3,486,761) (48,501,122) Total Expense (85,803,247) (412,399) (775,000) (8,197,200) (6,019,012) (13,018,294) (3,000,000) (75,000) - (1,170,630) (3,561,774) (200) (3,487,072) (125,519,828)
Net Revenue (Expense) 0 (0) - - (19,012) 1,596,637 - - - - (0) - - 1,577,625
Revenue Categorical
FSD49-1415TB-20141031.xlsx - FinStmts Page 47 / 47 11/18/2014 - 8:45 AM
BOARD OF EDUCATION AGENDA ITEM 7
BOARD MEETING OF: November 19, 2014 PREPARED BY: Chief Officers TITLE OF AGENDA ITEM: Monthly Chief Officer Reports ACTION/INFORMATION/DISCUSSION: Information BACKGROUND INFORMATION, DESCRIPTION OF NEED: The chief officers will provide an update to the board on district activity in their respective areas. RATIONALE: To provide timely information to the board. RELEVANT DATA AND EXPECTED OUTCOMES: IMPACTS ON THE DISTRICT’S STRATEGIC PRIORITIES—THE BIG ROCKS: Rock #1—Reestablishing the district as a trustworthy recipient of taxpayer investment
Major Impact
Rock #2—Research, design and implement programs for intentional community participation
Major Impact
Rock #3— Establish District 49 as the best district in Colorado to learn, work and lead
Major Impact
Rock #4— Grow a robust portfolio of distinct and exceptional schools
Major Impact
Rock #5— Customize our educational systems to launch each student toward success
Major Impact
FUNDING REQUIRED: No AMOUNT BUDGETED: RECOMMENDED COURSE OF ACTION/MOTION REQUESTED: APPROVED BY: Jack Bay, COO, Peter Hilts, CEO, Brett Ridgway, CBO DATE: November 7, 2014
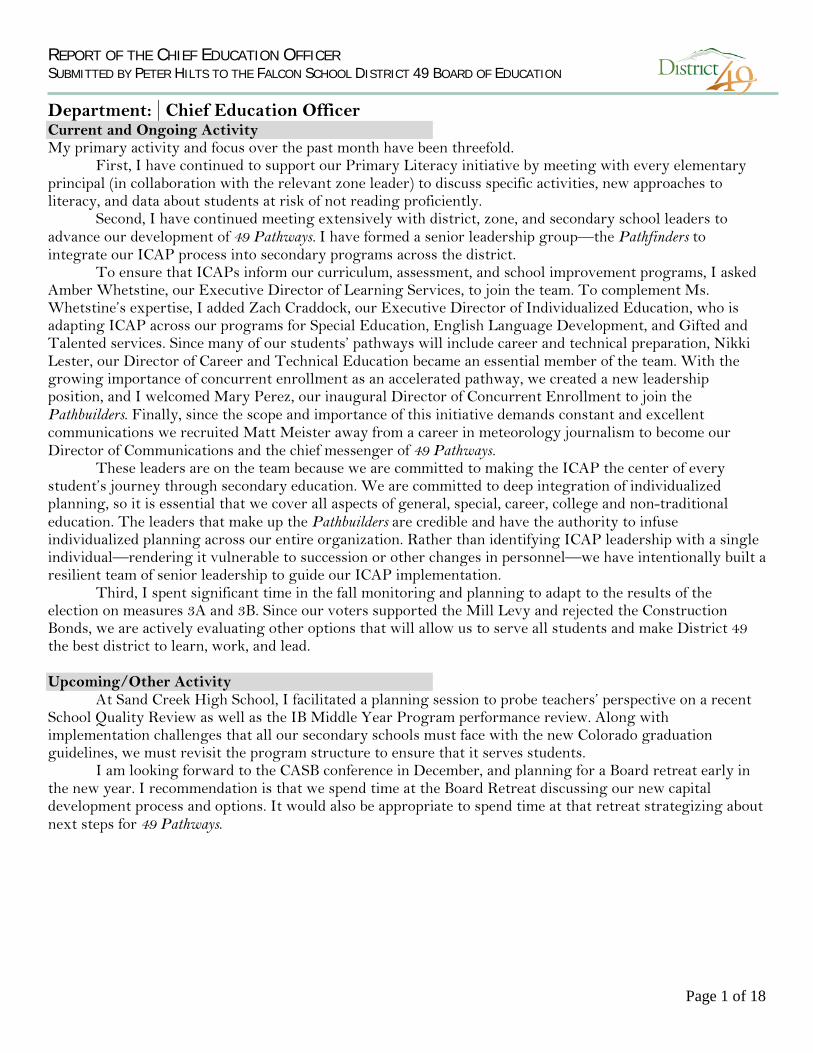
REPORT OF THE CHIEF EDUCATION OFFICER SUBMITTED BY PETER HILTS TO THE FALCON SCHOOL DISTRICT 49 BOARD OF EDUCATION Department: Chief Education Officer Current and Ongoing Activity My primary activity and focus over the past month have been threefold.
First, I have continued to support our Primary Literacy initiative by meeting with every elementary principal (in collaboration with the relevant zone leader) to discuss specific activities, new approaches to literacy, and data about students at risk of not reading proficiently.
Second, I have continued meeting extensively with district, zone, and secondary school leaders to advance our development of 49 Pathways. I have formed a senior leadership group—the Pathfinders to integrate our ICAP process into secondary programs across the district.
To ensure that ICAPs inform our curriculum, assessment, and school improvement programs, I asked Amber Whetstine, our Executive Director of Learning Services, to join the team. To complement Ms. Whetstine’s expertise, I added Zach Craddock, our Executive Director of Individualized Education, who is adapting ICAP across our programs for Special Education, English Language Development, and Gifted and Talented services. Since many of our students’ pathways will include career and technical preparation, Nikki Lester, our Director of Career and Technical Education became an essential member of the team. With the growing importance of concurrent enrollment as an accelerated pathway, we created a new leadership position, and I welcomed Mary Perez, our inaugural Director of Concurrent Enrollment to join the Pathbuilders. Finally, since the scope and importance of this initiative demands constant and excellent communications we recruited Matt Meister away from a career in meteorology journalism to become our Director of Communications and the chief messenger of 49 Pathways.
These leaders are on the team because we are committed to making the ICAP the center of every student’s journey through secondary education. We are committed to deep integration of individualized planning, so it is essential that we cover all aspects of general, special, career, college and non-traditional education. The leaders that make up the Pathbuilders are credible and have the authority to infuse individualized planning across our entire organization. Rather than identifying ICAP leadership with a single individual—rendering it vulnerable to succession or other changes in personnel—we have intentionally built a resilient team of senior leadership to guide our ICAP implementation.
Third, I spent significant time in the fall monitoring and planning to adapt to the results of the election on measures 3A and 3B. Since our voters supported the Mill Levy and rejected the Construction Bonds, we are actively evaluating other options that will allow us to serve all students and make District 49 the best district to learn, work, and lead. Upcoming/Other Activity
At Sand Creek High School, I facilitated a planning session to probe teachers’ perspective on a recent School Quality Review as well as the IB Middle Year Program performance review. Along with implementation challenges that all our secondary schools must face with the new Colorado graduation guidelines, we must revisit the program structure to ensure that it serves students.
I am looking forward to the CASB conference in December, and planning for a Board retreat early in the new year. I recommendation is that we spend time at the Board Retreat discussing our new capital development process and options. It would also be appropriate to spend time at that retreat strategizing about next steps for 49 Pathways.
Page 1 of 18
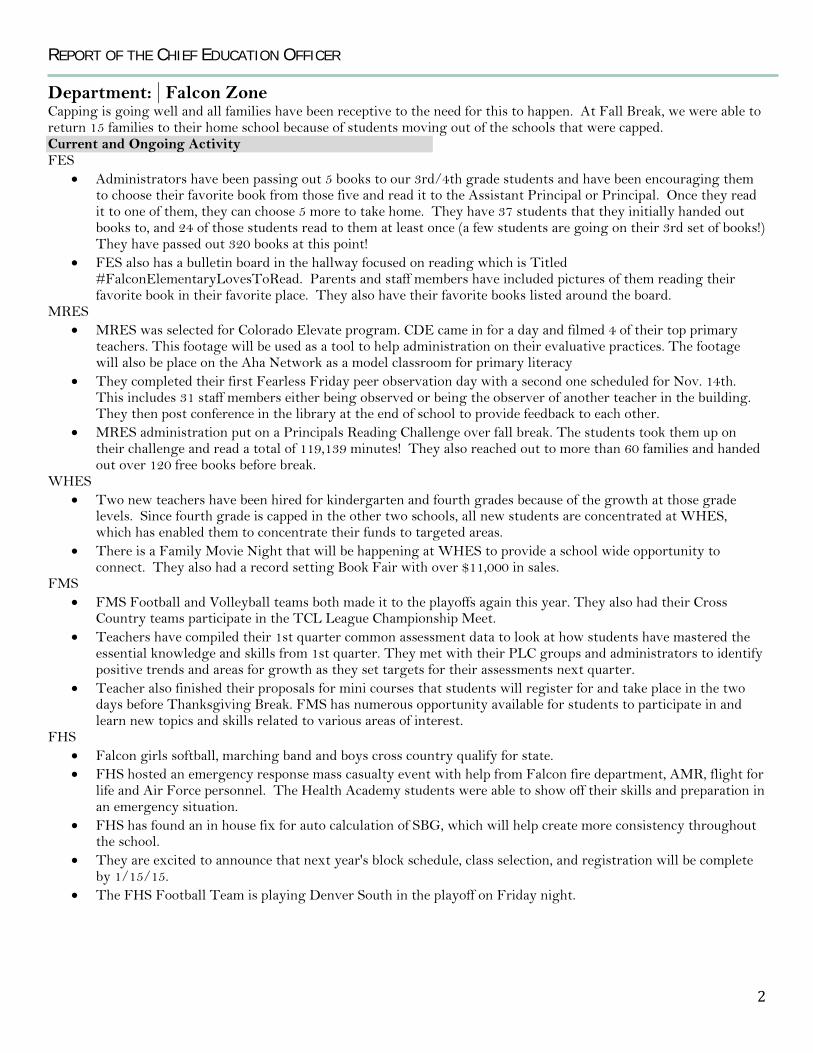
REPORT OF THE CHIEF EDUCATION OFFICER Department: Falcon Zone Capping is going well and all families have been receptive to the need for this to happen. At Fall Break, we were able to return 15 families to their home school because of students moving out of the schools that were capped. Current and Ongoing Activity FES
• Administrators have been passing out 5 books to our 3rd/4th grade students and have been encouraging them to choose their favorite book from those five and read it to the Assistant Principal or Principal. Once they read it to one of them, they can choose 5 more to take home. They have 37 students that they initially handed out books to, and 24 of those students read to them at least once (a few students are going on their 3rd set of books!) They have passed out 320 books at this point!
• FES also has a bulletin board in the hallway focused on reading which is Titled #FalconElementaryLovesToRead. Parents and staff members have included pictures of them reading their favorite book in their favorite place. They also have their favorite books listed around the board.
MRES • MRES was selected for Colorado Elevate program. CDE came in for a day and filmed 4 of their top primary
teachers. This footage will be used as a tool to help administration on their evaluative practices. The footage will also be place on the Aha Network as a model classroom for primary literacy
• They completed their first Fearless Friday peer observation day with a second one scheduled for Nov. 14th. This includes 31 staff members either being observed or being the observer of another teacher in the building. They then post conference in the library at the end of school to provide feedback to each other.
• MRES administration put on a Principals Reading Challenge over fall break. The students took them up on their challenge and read a total of 119,139 minutes! They also reached out to more than 60 families and handed out over 120 free books before break.
WHES • Two new teachers have been hired for kindergarten and fourth grades because of the growth at those grade
levels. Since fourth grade is capped in the other two schools, all new students are concentrated at WHES, which has enabled them to concentrate their funds to targeted areas.
• There is a Family Movie Night that will be happening at WHES to provide a school wide opportunity to connect. They also had a record setting Book Fair with over $11,000 in sales.
FMS • FMS Football and Volleyball teams both made it to the playoffs again this year. They also had their Cross
Country teams participate in the TCL League Championship Meet. • Teachers have compiled their 1st quarter common assessment data to look at how students have mastered the
essential knowledge and skills from 1st quarter. They met with their PLC groups and administrators to identify positive trends and areas for growth as they set targets for their assessments next quarter.
• Teacher also finished their proposals for mini courses that students will register for and take place in the two days before Thanksgiving Break. FMS has numerous opportunity available for students to participate in and learn new topics and skills related to various areas of interest.
FHS • Falcon girls softball, marching band and boys cross country qualify for state. • FHS hosted an emergency response mass casualty event with help from Falcon fire department, AMR, flight for
life and Air Force personnel. The Health Academy students were able to show off their skills and preparation in an emergency situation.
• FHS has found an in house fix for auto calculation of SBG, which will help create more consistency throughout the school.
• They are excited to announce that next year's block schedule, class selection, and registration will be complete by 1/15/15.
• The FHS Football Team is playing Denver South in the playoff on Friday night.
2
REPORT OF THE CHIEF EDUCATION OFFICER Department: POWER Zone Values: Climb with Care and Confidence * Create a Loyalty Effect * The Most Important Person in the World * Family First * Serving our Community Mission: Purposeful Risk * Ownership of Learning * Whole Child/Student Concept * Engaging Inquiry * Respectful Relationships Current and Ongoing Activity The Gift of Focus - Resources & Training for Primary Literacy & HS Pathways POWER Zone is beginning to truly see the advantages of being given permission to focus time, energy, and resources in the areas of primary literacy and HS pathway programming specifically. With our elementary educators being responsible for at least 4 core content areas in their daily instruction it is proving beneficial to concentrate efforts in the area that is most fundamental and critical for all learners, reading. Two new specific programs have come into the zone this year in addition to the Take Flight programming at OES. Right Flight and Sonday Reading has been introduced at different levels across all three zone elementary schools. Between these two programs there is a focus on reading rate, comprehension, phonemic awareness, vocabulary, and phonics. Curriculum Pathway Work Sherry Kyle will complete facilitation on prioritizing and understanding our state evidence outcomes within the C.A.S. in the areas of reading and writing at the elementary level and across all standards based content areas at the secondary level by mid December. The next step is to begin facilitating unit and lesson planning across the zone in these areas. Growth Based Evaluation Tool There have been some changes to the reporting with the evaluation tool this year. In order to gain a more realistic view of how teachers are performing on their performance plans relative to their growth plans two separate scores are being generated with their observation system. Rather than just receiving an individual score per quality teacher and principal standard educators will now see an aggregate performance score across all standards that can be more easily compared to the student performance within their classrooms and schools. POWER Zone Accountability Plan Four meetings have taken place with staff and parents regarding the creation of a POWER Zone accountability plan. In December the work that has been completed so far will be messaged out to staff and parents for collaborative feedback. The zone aims to develop a plan that is community created and supported that will include external measures such as our state standardized assessment data, local measures to include grade level/department common assessments and qualitative survey data such as our District Climate Survey, and teacher discretion which includes classroom based assessments and teacher observation. Upcoming/Other Activity The instructional tool/formative assessment programming occurring with eight 3rd grade and eight 5th grade classrooms across the zone will continue into second semester. Teams will begin to hold collaborative work sessions after each tool is delivered in order to individualize instruction based off of groups of students, and individual students, levels of understanding across the content areas of reading and math. Department: iConnect Zone The iConnect Zone had a wonderful October. Fall break was a much-needed break for the schools and they are all back and recharged. Kim has continued to represent the CD BOCES and Falcon with the online commission work and making progress. Maria, Jim and Kim have been finalizing work on NACSA standards and practices including a work flow document to ensure compliance of our practices as an authorizer. Kim and Maria attended the NACSA yearly conference as well to pick up new ideas on quality authorizing.
3
REPORT OF THE CHIEF EDUCATION OFFICER Twenty-Five blended and virtual school leaders from around the country attended a joint tour/learning opportunity hosted by FVA. They spent an entire day sharing their experiences and continuing to explore collaborative opportunities around the country. Current and Ongoing Activity FVA/StuCo kicked off our Harvest of Love Campaign with a Fall Festival. FVA’s 7th & 8th Grade iLearning students traveled to Mesa Verde National Park, where they explored how the lessons of the past can improve the structure of their society today. FVA K-6 has implemented an hour of tinkering into our iLearning days. Check out their video. http://youtu.be/HdbcT5lNspA?list=PLWJerO2UT7CP4jhwK2_e8ze4L6xg8yg76 FVA submitted a grant through GoCo organization for a $100,000 outdoor learning spaces grant. Still waiting for a response. PLC and iConnect TEAM Coach- Tom Wilke and Paul Austin met with Rochelle to assist in their efforts to create a MOOC (Massive Open Online Course) for their alternative program. This program will service student interests, career pathways, and of course graduation credit requirements. Paul and Rochelle are working on developing this through Schoology as a pilot program to implement after the Winter Break. They will create one elective Science course using Schoology and the FutureLearn.com general science curriculum. GOAL Academy received the Pueblo Chieftain best Home School Program of 2014 award GOAL Academy has partnered with Aurora’s Gang Reduction Impact Program (A-GRIP) to support students in the Denver area. Upcoming Activity FVA In November, the students will visit the Space Foundation to complete a mock mission to Mars using robotics. FVA is sending a few staff members to the biggest online education conference in the country, iNACOL. Their mission will be to explore the evolution of blended models around the country, evaluate curriculum options and develop PLC connections to schools around the world. iConnect TEAM Coach developed an online/blended walk-through form that Jim Bonavita and Rochelle can use to when we do their site visits. Rochelle based this walk-through on the one developed by Falcon Virtual Academy. Rochelle continues to develop professional development for online/blended and recruiting teacher who are currently working in this type of learning environment to assist her with developing courses. PLC is working to further develop their blended MS program and help the best meet the needs of their students. With the help of Rochelle they have done walkthroughs with Jim Bonavita and continue coaching the teachers on what their pull-out and large group instructional times look like. GOAL Academy has partnered with CBR Connect to form new Colorado programs and initiatives to support Colorado’s youth in need. Department: Remington Elementary Current and Ongoing Activity Curriculum Remington continues to use Engage NY curriculum to develop students math concepts and support the increased rigor found in current Common Core depth of knowledge questioning. Intermediate level teachers are continuing to use DBQ’s (Document Based Questioning) as an approach to reach the increased rigor in Language Arts. School Improvements Remington had artificial turf installed over fall break. We also added an additional computer lab in the room off the library. Computer lines and electric lines were run across the ceiling and down the walls. 34 computers are up and ready for student use.
4
REPORT OF THE CHIEF EDUCATION OFFICER RES is also under way with a new roof project to be completed in December. Upcoming Activity PTA Remington PTA will host Winterfest November 14th for RES families. After School Programs Remington offers several after school activities to include: art club, guitar lessons, reading / math tutoring, Girls on the Run, Land Sharks, and intermediate level book club supporting Battle of the Books. Department: Horizon Middle School Current and Ongoing Activity On Thursday October 30th Horizon Middle School held their first quarter renaissance assembly for all students. Sticking with the “Hunger Games” theme, students that made renaissance were specially recognized and also received a free t-shirt. During the assembly students enjoyed fun games including a cash prize wheel and pie contest. At the end of the celebration students enjoyed a surprise flash mob performance of Michael Jackson’s “Thriller” performed by staff members. Upcoming Activity On Tuesday, November 11th, Horizon Middle School will be holding our Veterans Day Assembly. All veterans, active military personnel, and members of the community are cordially invited to attend. The assembly will include the following: Guest Speaker- Lt Colonel Mike Kinslow USAF Stellar Brass P.O.W. Flag ceremony Reception following the assembly. If you will be joining us please RSVP to Kim Miller at [email protected] or by calling 495-5210 ext. 4102 prior to November 11th. Horizon will be participating in the Harvest of Love food drive for Care and Share. The drive will be held Monday, November 10th until Friday, November 14th. Department: Learning Services Current and Ongoing Activity Assessment and Reporting: CMAS Science and Social Studies Assessments will be administered to all 12th graders, November 3-21. CoAlt training for special education staff will take place on November 5. We have submitted the CogAT tests from 3rd and 6th graders for scoring. The assessment team is preparing for the Annual English Language Proficiency Assessment (ACCESS) which will be administered January 12 through February 13. Kristy Rigdon, Martina Meadows and Inez Stabler attended ACCESS training in Pueblo, CO on October 20. Lynette Fandrei, Data and Reporting Analyst, is finalizing October Count, which is on schedule for final submission November 7.
Primary Literacy: The Learning Services team, along with Individualized Education leaders, Zone leaders and principals have been visiting high performing schools in the Pikes Peak Region. The purpose of these visits is to identify effective strategies which support primary literacy resulting in reading proficiency rates of 90% or higher. D49 and the CDE Office of Literacy are partnering to bring a READing Foundations Academy to our K-3 teachers and leaders. This academy will provide participants an opportunity to deepen
5
REPORT OF THE CHIEF EDUCATION OFFICER their understanding of foundational reading skills to support students in developing and advancing in reading. This 7 module (21 hour) training begins November 3 and is no cost for participants.
Title Programs: On November 20, Darcy Hutchins, Family Partnership Director for CDE will join Title I principals to discuss ideas for improving parent engagement. Principals will also participate in a UIP peer-review process to ensure that identified strategies are research-proven to improve achievement for students of poverty. Title I, II and III post award revisions are due at the end of November. Lorretta Grimaldo, Title Programs Specialist is compiling data for the 2014-15 comparability report.
Health and Wellness: A combined Zone Leader, Principal and District-wide Wellness Advisory Council meeting was held on October 6, with a focus on improving employee wellness and revising the wellness policy guidelines. Updates on the wellness policy guideline revisions will be presented to the Board after they are finalized. Our most recent Shape-Up European Expedition Challenge included 375 participants achieving a total of 185,878,154 steps! Fitness stations were installed over fall break at Odyssey Elementary School and Evans International Elementary School through generous support of the Kaiser Permanente Thriving Schools grant, (photo attached). Springs Ranch Elementary School’s Walk-A-Thon success story was highlighted at the American School Health Association (ASHA) conference in Portland, OR on 10/10/14. View the video at https://www.youtube.com/watch?v=yBjfhA-ecAA&feature=youtube Our contract with Shape Up will end on 10/31/14. The District-wide Wellness Advisory Council voted to partner with Penrose-St. Francis Hospital to coordinate wellness challenges for 2015. Each school will submit their draft School Health Improvement Plans (SHIPs) by 11/21/14. Schoology: The first annual District 49 Schoology Users Conference was held over fall break. District 49 teachers and leaders shared their experiences in a mini-conference format with other colleagues from around the district. Special thanks to Brian Green for coordinating this event and to the following presenters for sharing how they use Schoology to make district 49 the best place to learn, work and lead: Jennifer Breeding, Ami Craig, John Sabell, Melissa Riggs, Margaret Jurek, and Rochelle Kolhouse. Leadership Academy: The second session of this year’s principal induction leadership academy was held on October 27. Leaders participated in presentations delivered by Zach Craddock, Individualized Education and Sean Dorsey, Sand Creek Zone Leader. Evaluator Training: New evaluators from District 49 and across the Pikes Peak region will meet back on November 13 to continue certification work on the Colorado Model Evaluation System. Currently 34 leaders are participating in this state-approved certification training delivered by District 49 administrators. Instructional Coaching: During the month of October instructional coaches from across the district attended the Teaching, Learning, Coaching, Annual Instructional Coaching Conference in Lawrence, Kansas. These leaders will share their professional learning at our next Teach, Empower and Mentor (TEAM) Coach meeting on November 5. Upcoming Activity Assessment and Reporting: The Special Education December Count has begun. District 49 has requested an early window for administration of the PARCC Performance Based Assessment. Model Classroom: The next season of the Model Classroom Project is underway. District 49 is partnering with CDE to film and produce modules focused on primary literacy instruction at Meridian Ranch
6
REPORT OF THE CHIEF EDUCATION OFFICER International Elementary School. Additional Model Classroom modules are scheduled to be filmed throughout Sand Creek Zone. Schoology: The departments of Assessment, Human Resources, Special Education and Cultural Capacity are recognizing the power of Schoology as a tool to deliver meaningful compliancy training. Modules are being created and will be distributed as a way to deliver training and for purposes of accountability. Professional Development: Online professional development on Schoology continues to be a popular, effective and efficient way to learn in District 49. Examples of new courses rolling out soon include: Love & Logic, Mentoring in the 21st Century, Overcoming Dyslexia, Teaching With Video, Career and Technical Education Certification, Schoology 101 & 201, Differentiation Strategies, and Google Sites. Unified Improvement Planning: Amber Whetstine, Learning Services is facilitating improvement planning with Education Office leaders and principals. Unified Improvement Plans will be presented during the December Board meeting. Registration Processes: The professional development team is currently researching systems to improve our current professional development registration and tracking processes. The Electronic Registrar Online (ERO) which has been used for staff development registration and tracking was implemented in 2008. As we continue to develop the District 49 Aha! Network, we will work to improve efficiencies of registration and credit tracking for our staff.
7
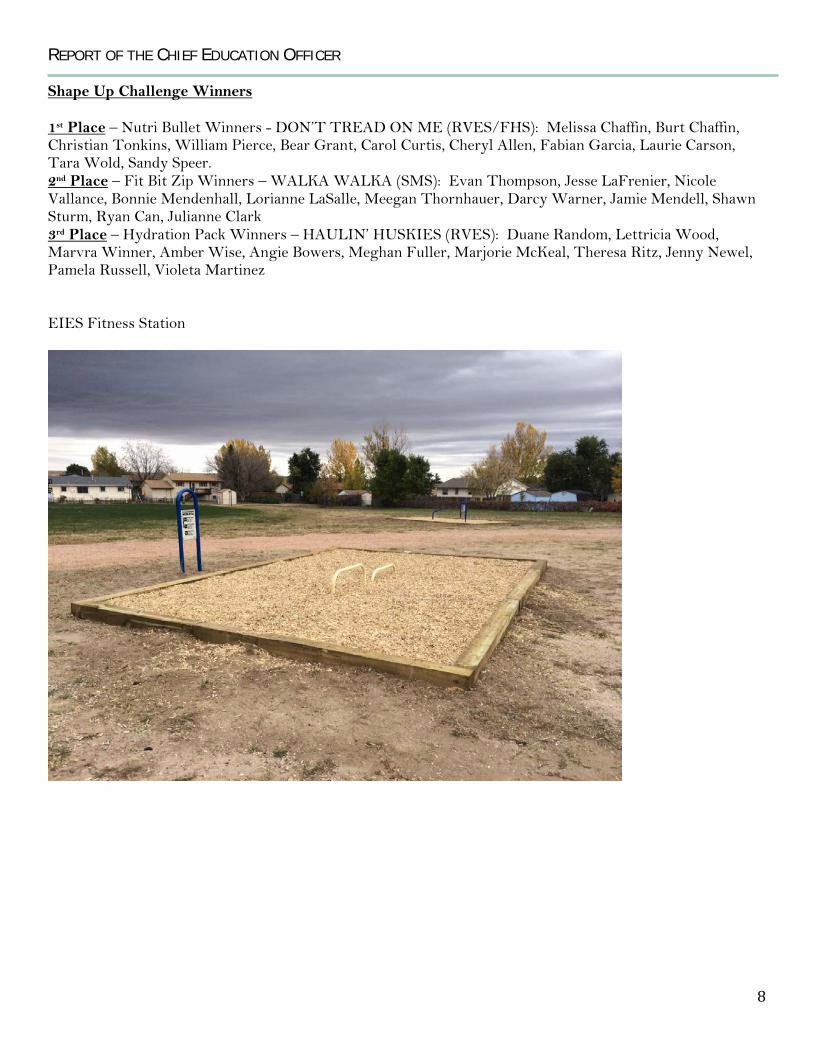
REPORT OF THE CHIEF EDUCATION OFFICER Shape Up Challenge Winners 1st Place – Nutri Bullet Winners - DON’T TREAD ON ME (RVES/FHS): Melissa Chaffin, Burt Chaffin, Christian Tonkins, William Pierce, Bear Grant, Carol Curtis, Cheryl Allen, Fabian Garcia, Laurie Carson, Tara Wold, Sandy Speer. 2nd Place – Fit Bit Zip Winners – WALKA WALKA (SMS): Evan Thompson, Jesse LaFrenier, Nicole Vallance, Bonnie Mendenhall, Lorianne LaSalle, Meegan Thornhauer, Darcy Warner, Jamie Mendell, Shawn Sturm, Ryan Can, Julianne Clark 3rd Place – Hydration Pack Winners – HAULIN’ HUSKIES (RVES): Duane Random, Lettricia Wood, Marvra Winner, Amber Wise, Angie Bowers, Meghan Fuller, Marjorie McKeal, Theresa Ritz, Jenny Newel, Pamela Russell, Violeta Martinez EIES Fitness Station
8
REPORT OF THE CHIEF EDUCATION OFFICER Department: Individualized Education Current and Ongoing Activity English Language Development:
• Alignment of WIDA/CELP Standards – creation of roadmap/guidance • Completion of English Language Plans, Language Benchmark Assessments, etc. • ELD Spot Observations/Schoology work with the ELD Team • ELD/Charter School collaboration with ELD services – attended iConnect Admin Round Table • Assessment conversations regarding appropriate accommodations for ELs • Beginning conversations/planning for 2015 ACCESS for D49 – attended CDE’s required ACCESS
training • Coordinated interpreters for Fall Parent/Teacher Conferences • Coordinated upcoming Professional Development for D49 teachers/administrators – KAGAN and
SIOP (Sheltered Instruction Observation Protocol) • Beginning conversations with Family Literacy Coalition to integrate the ‘Family’ component into
Adult ESL programs (HMS/RVES) Special Education:
• Most of October was spent supporting district initiatives by participating in trainings and webinars. For example, Standards Based IEP’s, Accommodations for State Assessments, CDE Record/File Review, State Directors meetings. The State Directors meeting provided an opportunity to hear what other districts across the country are doing. The most exciting training was the Standards Based IEP training. This will provide us an opportunity to integrate the Colorado Academic Standards more thoroughly into the student’s Individual Education Program which continues to support IE’s Area of Focus of Effective Differentiated Instruction.
• Fall Break Literacy Camp was a success. Sixty eight students received 18 hours of targeted literacy instruction on three campuses across Zones. A detailed report will be provided at a later date.
• Out of District Placement visits were conducted over Fall Break. Multiple sites were observed to look at services provided to our students and instructional rigor.
EXCEL, Expulsions and Athletics:
• The EXCEL program made a successful transition to its new location on Pony Tracks. There is more room for the students and a professional area for expulsion hearings. Everything is working fine at this point and we are tweaking a few internet issues.
• There are currently 8 students in the EXCEL program, which has now been in session for 10 weeks. The students are continuing to exceed expectations
• EXCEL is starting the process of getting 6 of the students ready to transition back to a traditional school at the semester. Expulsions will be over for 4 of the students and 2 of them have the opportunity to return on deferments.
• There were 3 expulsion hearings in October, 1 student was expelled and is in the EXCEL program, 1 student was sent back to school on a deferment and one expulsion was overturned on appeal.
• New coaches were hired in the district in the past month. Jay was a part of some of those and the process went well.
• Per a CORA request, football helmets from all secondary schools were reported through inventory, to the media department of D49. This included, the number of helmets, their make and model, the age of the helmets and if they were new or refurbished. D49 is in front of expectations for helmet safety. Inventory will be provided if requested.
9
REPORT OF THE CHIEF EDUCATION OFFICER
• Jay continues to attend fall sporting events at all of the schools. These events seem to be running very smoothly with little to no problems.
Counseling: • The district counselor continued working with Mary Perez on ICAPs and introducing Concurrent
Enrollment to the district. • The district counselor continued working with Nikki Lester on CTE related items. • The district counselor assisted with implementing ICAP at FHEP, SMS and SCHS. • The district counselor provided training for all counselors on district threat assessments and grief/loss
procedures. • The district counselor attended a Career & College Readiness Symposium that focused on ICAP.
Gifted and Talented:
• CogAT Screeners have been completed for all coordinated schools in grades three and six. • Differentiation training was provided to faculty and staff of MRIS and WHES. • Individual support of GT students has been provided as requested by school staff
Nurses:
• District Nurses provided medical care to over 10,000 students during the month of September. We will begin tracking this monthly to review lost instructional time
• Amy Dreher coordinated our Boo to the Flu event and over 350 flu vaccinations were given out to students and community members. This inaugural event was well attended and a big success.
Upcoming Activity English Language Development:
• WIDA ACCESS – order due to CIA Coordinator – Nov. 7th • Continue conversations with D49 staff/Family Literacy Coalition to add the ‘Family’ component to
Adult ESL programs • ELD PLC – continue the curriculum work that we started 13-14 SY – next ELD PLC – Nov. 11th • ELD Parent Advisory Committee – meeting – November 12, 2014 – HMS (host school)
Special Education:
• We will be supporting teachers through the upcoming months with regard to the new state assessment model, as well as being able to collaborate with the CIA Coordinator.
• Our SEAC is launching two trainings, Oct. 29th and November 10th. These support a SEAC focus of increasing information and opportunities for parents of special needs students.
Counseling: • The district counselor will continue to assist secondary schools with ICAP implementation. • The district counselor will be working with a representative from the school psychology department
on a presentation regarding the correlation between ICAP and Transition Plans. Gifted and Talented
• Second Quarter GT Parent Advisory Council meeting to occur at Falcon High School on November 18 at 6:00.
10
REPORT OF THE CHIEF EDUCATION OFFICER
• CogAT screening to begin this month and finalize before Thanksgiving break with all Charter Schools.
EXCEL, Expulsions and Athletics: • CPR training is being organized for all coaches in D49. This is a new requirement from the state that
all coaches fulfill this training by the first of the year. Mr. Hahn is currently looking at some on line training sites that might fulfill this requirement.
• All ADs will need to get proof of certification for all coaches on: 1. Completed concussion training and 2. Completer CPR training
11
REPORT OF THE CHIEF EDUCATION OFFICER Department: Human Resources With schools open and operating, you will notice a sharp increase in the activities in this report. As you know, we are managing some major personnel and organizational changes this year, so you can expect to see additional full reports into the future. Current and Ongoing Activity Stakeholder Grievance Human Resources is coordinating the rollout of the new stakeholder grievance policy. The Communications Department developed an online grievance initiation form, which can be viewed here: Stakeholder Grievance Form (near the bottom of the web page). Human Resources distributed a policy brief to introduce the new policy and associated resources to our staff. CDE Report Every year, all school districts in Colorado are required to compile and submit to the Colorado Department of Education a report referred to as “the Human Resources snapshot”. Among the many pieces of information reported in the snapshot are verification of the highly-qualified status of educators and teacher performance ratings. Becky Engasser, Human Resources Generalist, leads the reporting work for District 49 and is currently in the thick of this work. She and others in HR commit many hours to this task, starting in October and concluding in February. FRISK Training Paul Andersen, Director of Human Resources, and Sally McDermott, Human Resources Manager, facilitated training sessions for approximately 40 leaders on October 28, 2014. The training focused on corrective communications with staff and the use of a documentation model referred to as “FRISK”. FRISK is short for Facts, Rules, Impacts, Suggestions/Directives and Knowledge). This training is intended to equip supervisors to effectively set clear expectations for staff and address performance concerns. Recruitment From November 1-4, 2014, Paul Andersen, Director of Human Resources and Dr. Lou Fletcher, Coordinator of Cultural Capacity, attended an educator recruiting fair and conference in Raleigh, North Carolina. At the recruiting fair, they met diverse teacher candidates from universities in North Carolina and nearby states. This was useful in getting a sense of student interest in relocating to Colorado. A two-day conference followed, providing excellent learning opportunities to improve our practices as well as opportunities to establish direct contacts with universities from around the U.S. Overall, this will help inform our recruiting strategies for the future. Upcoming Activity Supervisor Training Paul Andersen, Director of Human Resources, is beginning the development of professional development aimed at helping administrators improve their interviewing and selection practices. Planned for late January, Mr. Andersen and Peter Hilts, Chief Education Office will co-facilitate this highly interactive and practical session.
12
REPORT OF THE CHIEF EDUCATION OFFICER Department: Instructional Technology Wayne John Current and Ongoing Activity The technical setup for our 12th Grade CMAS testing is complete and testing has begun. Wayne coordinated with our tech company to provide technical support for 18 labs / libraries during testing. During the first week of testing no major issues were reported. Student computers used during this round of testing were desktops and laptops with the window operating system, Apple Mac Pro OS X and Apple iPads running IOS 7. The new Proctor Servers perform extremely well. No drop offs or lockups like last year. Wayne met with and provided technical briefings to Goal Academy technology staff during their setup of their 23 sites for CMAS testing. Upcoming Activity Our District will complete the CMAS testing cycle for HS 12th Graders on Nov 21st. We expect all testing to be completed with no issues. An after action review will be completed by the District Assessment Coordinator, District Technology Coordinator and all School Assessment Coordinators. Wayne continues supporting teacher laptops, interactive white boards, and the district’s migration to Gmail. John Litchenberg Current and Ongoing Activity John is working with CCS to improve the way we filter Internet content and keep the district safe. The goal is to strike a balance of speed, security, and accessibility. We have discovered that all school districts are struggling with this balance. A measure of success will be finding a solution that sets the standard that other districts can use as a model. John has been working with new ELD iPads and the management system. The benefit’s of the new system include better tracking of devices, the ability to re-assign apps to users, and the ability to permanently assign the management software. John has been working with the admin at SCHS to create a pilot student network. He met with a group of 50 students to discuss the goals and problem solve potential problems. John is working with CCS to complete the educational staffs transition to Gmail. He is also working with schools to identify technology needs and plan for them. This includes setting up Android tablets, iPads, Chrome books, MacBook Air labs, and changing wireless infrastructure to make it all work together. Upcoming Activity John is collaborating with Apple, Cherry Hills Christian School, and St Vrain school district to host an iOS admin conference. We are inviting other schools and districts to share best practices and learn from each other’s mistakes. John has arranged for Falcon School District to host the December meeting for the mLearning Collaborative. The Colorado mLearning Collaborative consists of educators working to support 1:1 learning initiatives in schools. The purpose of the collaborative will be to share ideas and strategies as they relate to supporting technology integration and instruction.
13
REPORT OF THE CHIEF EDUCATION OFFICER Department: Communications Post election the communications team is re-focusing choice window marketing messages and working on staff and community communication pieces. Additionally, we continue to provide daily support across the district to all schools, programs and departments. Current and Ongoing Activity Post-Election Helping to develop messages about 3A funding, including teacher compensation and longer term impacts. Analyzing voter feedback to integrate into long term marketing strategies regarding positive brand awareness within the district. Volunteer 49 Merging IC database with new volunteer system. Falcon Elementary School of Technology has been selected as test bed/initial rollout site due to enrollment and proximity to central office. Incident Messaging Education office leadership has provided feedback on working document. Will present to principals later in November. Cultural Compass Webpage is up at d49.org/culture. Continuing to develop content with Dr. Fletcher. Also working on a visual representation for the board room and schools. Choice Marketing Enrollment guide is in production. Developing marketing campaign through choice window. Department: Concurrent Enrollment Best District: Spring Pilot is underway and we have begun to receive inquiries from parents in and out of the district, as well as homeschool families.
14
REPORT OF THE CHIEF EDUCATION OFFICER D49 Policy revisions have been approved and posted on our D49 website: IHCDA – Concurrent Enrollment IHCDA-R – Concurrent Enrollment IHCDA-R2 – ASCENT (New) IKCA – Weighted Grading Every Student: College Advising for our Concurrent Enrollment Spring Pilot has begun and approximately 50 D49 students will participate. PPCC registration begins November 10. High school counselors selected Spring CE candidates based on academic record and possible ASCENT qualifications for next year. ASCENT will provide one extra year of Concurrent Enrollment to approximately 20 students. Community: PPCC and D49 Math Faculty collaborative meetings will continue in November. D49 English faculty requested collaborative meetings with PPCC English professors. Received authorization and will schedule these sessions. The New Falcon Herald has requested an interview to publish an article on Concurrent Enrollment in the coming weeks. Trust: Financial review for Concurrent Enrollment scheduled with zone leadership on November 11. NACEP National Conference in Chicago provided opportunities to hear how other states are creating solutions to challenges regarding the shortage of certified high school teachers as college adjuncts. Some examples are: Purdue University was awarded a two-year grant for creating online graduate level courses for high school teachers and for subsidizing the first year of their course tuition. Montana universities award high school teachers free tuition for a 3-credit college course, for every Concurrent Enrollment college course they teach on the high school campus.
15
REPORT OF THE CHIEF EDUCATION OFFICER Department: Career & Technical Education Current and Ongoing Activity FHS DECA Chapter students are taking the written portion of their District Competition at Doherty HS. They and other high schools in DECA District 8 will converge on UCCS, November 17th, for the annual Colorado DECA District 8 Role-Play Competition. Twenty-four (24) FHS students will be competing for the opportunity to go on to the State competition at the Broadmoor Hotel in February. VRHS and FHS HOSA took students to the Fall Leadership conference at the Pepsi center in Denver. VRHS Biomed - Held numerous workshops from EMT to Nursing run by certified community volunteers. FHS AOHS was given the opportunity to gain hundreds of dollars of supplies and equipment for PPCC to help supplement the program. VRHS & FHS are currently both underway in the cycbersecurity competitions. SCHS and HMS multiple teachers attended the national PLTW conference in Indianapolis FVA Drawing I class was granted articulation from PPCC. So students taking this class and receive an A or B for the semester is now eligible for PPCC college credit. VRHS Engineering students visited Wings over the Rockies in Denver on 11/6/2014 VRHS, SCHS, HMS, and SMS – approximately 400 students attended the Manufacturing Expo FHS AOHS EMS and EMT students took part in a mock disaster located at FHS Many CTE instructors (district wide) attended a CTE staff development during Oct break. The Catering students at PLC provided breakfast for this training for staff.
Upcoming Activity FHS AOHS will be hosting a blood drive in Jan 2015 FBLA students will be competing in districts in Feb 2015 VRHS Early Childhood education students will take part in internships beginning in Jan 2015 VRHS Engineering students will be taking a field trip to the Las Vegas Waste Treatment plant on Dec 3rd
16
REPORT OF THE CHIEF EDUCATION OFFICER Department: Safety and Security Current and Ongoing Activity Central Office (CO) Staff training Mr. Watson conducted a one-hour training staff with most Central Office Staff over Fall Break. A training video was filmed for those who could not make the training. In addition, Mr. Watson will schedule a one-hour make-up session for those who would like the in person training option, which is the preferred method. New Vista Ridge Traffic/ Parking update The new parent drop off and pick up was implemented this week. The first day could be described as slow, and daunting. The second day showed remarkable gains in time during the morning drop off, with afternoons presenting a challenge. After school pickups will continue to be improved with additional revisions and implementations of procedures. Additional observations will be made during the first week. An analysis will be conducted as to the feasibility of sustainment of the new traffic procedures. Please Note: This is a pre cursor to what we will be doing throughout the entire district once the Bond/ Mill initiatives pass. All locations will have a study conducted to see how improvements can be made. We used Vista as a test run prior to the election. Capital Improvement Project As you were made aware in the Board of Education update at the last work session, Mr. Watson and his team are awaiting the election results to move forward with the District Classroom Door Lock project. Once the voters have decided, we will go out to RFP for new door lock hardware. Upcoming Activity Substitute Training Video Training outline has been completed. Filming with Amy Bremser in the Communications Department will begin soon. A 15-20 minute will be created to show during Substitute Teacher training facilitated by the Human Resources Department. Unannounced on Spot School Building Inspections Mr. Watson will begin to conduct weekly on the spot facility inspections. During the inspections, Mr. Watson will be looking for open and or propped exterior doors; observations of the buzz in entry systems, and additional traffic, parent pick up and drop off procedures. Board of Education (BOE) Members Training Mr. Watson is planning a brief training for BOE Members, which will cover School District 49 Emergency Procedures. This training will most likely take place at a BOE work session in the near future.
17
REPORT OF THE CHIEF EDUCATION OFFICER Department: Cultural Capacity The Cultural Capacity paradigm is a continuous process that requires buy-in from the Falcon School district 49 Community of Practice. Intentional exposure and deliberate purposeful interaction sets the stage for intervention and implementation of a multilevel multicultural education program. Current and Ongoing Activity Cultural Framework The “Building Cultural Capacity” course is ready for deployment using the Schoology Learning Management System. The student code of conduct has been revised and rebranded for review by the District Accountability Advisory Committee (DAAC). The DAAC will review the updates and devise a way ahead for implementation; the document now includes the Common Discipline Matrix and the Due Process Worksheet. The Cultural Compass survey is still currently open and it will collect climate data for the district; the addition of demographic categories and two new questions should increase insight. Department of Justice The District and the DOJ reached agreement on 14 October 2014. The parties countersigned the agreement and implementation is underway. The District’s action plan was discussed in a follow on teleconference and the DOJ was very supportive of the District’s engagement strategy. Community Outreach Registration, recognition, and logistical support for the District’s participation in the Educating Children of Color (ECOC) conference are in the implementation stage. The ECOC event will be publicized to employees and the District will pay for their attendance. Transportation to and from the ECOC conference will be provided for students and parents. The District will also provide and transport at least 45 student ambassadors. A Restorative Justice action plan is an expected District outcome from ECOC. Upcoming Activity 1) Creating a deployment plan for “Building Cultural Capacity”. 2) Data analysis and reporting for the Cultural Compass Survey 3) Designated Administrator training in mediation provided by the DOJ. Department: Enrollment Management and Infinite Campus (IC) Central Enrollment is the doorway to the district; therefore, processes are being reviewed daily to add efficiency and customer focus. IC is a cog in the process of creating efficiency in the district. Current and Ongoing Activity Enrollment Reform Staff training on customer relations is imminent. The streamlining of processes to reduce procedural steps and the need for consumable resources is also ongoing. Upcoming Activity Process Documentation & Customer Service Training The cloud migration of Infinite Campus (IC) was a complete success. The firewall of CCS had to be reconfigured to maintain full IC functionality within the District.
18
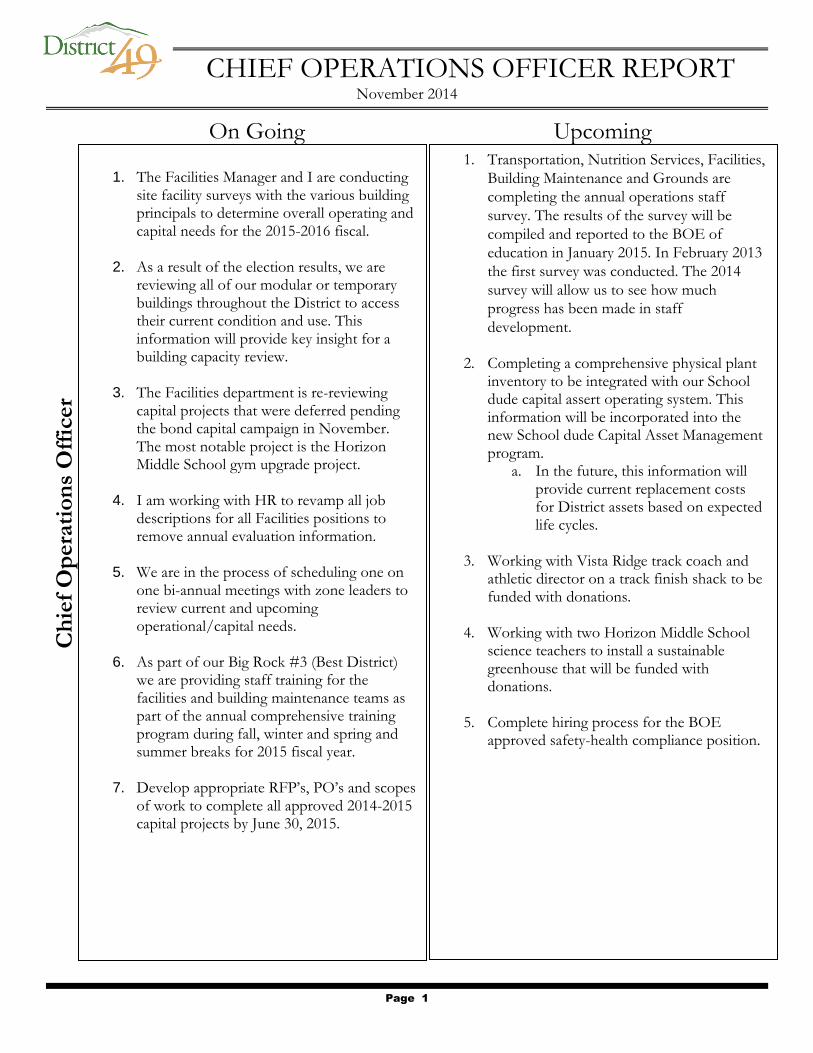
Page 1
Ch
ief
Op
era
tio
ns
Off
icer
CHIEF OPERATIONS OFFICER REPORT November 2014
On Going Upcoming
1. The Facilities Manager and I are conducting
site facility surveys with the various building principals to determine overall operating and capital needs for the 2015-2016 fiscal.
2. As a result of the election results, we are reviewing all of our modular or temporary buildings throughout the District to access their current condition and use. This information will provide key insight for a building capacity review.
3. The Facilities department is re-reviewing
capital projects that were deferred pending the bond capital campaign in November. The most notable project is the Horizon Middle School gym upgrade project.
4. I am working with HR to revamp all job descriptions for all Facilities positions to remove annual evaluation information.
5. We are in the process of scheduling one on one bi-annual meetings with zone leaders to review current and upcoming operational/capital needs.
6. As part of our Big Rock #3 (Best District) we are providing staff training for the facilities and building maintenance teams as part of the annual comprehensive training program during fall, winter and spring and summer breaks for 2015 fiscal year.
7. Develop appropriate RFP’s, PO’s and scopes
of work to complete all approved 2014-2015 capital projects by June 30, 2015.
1. Transportation, Nutrition Services, Facilities,
Building Maintenance and Grounds are
completing the annual operations staff
survey. The results of the survey will be
compiled and reported to the BOE of
education in January 2015. In February 2013
the first survey was conducted. The 2014
survey will allow us to see how much
progress has been made in staff
development.
2. Completing a comprehensive physical plant
inventory to be integrated with our School dude capital assert operating system. This information will be incorporated into the new School dude Capital Asset Management program.
a. In the future, this information will provide current replacement costs for District assets based on expected life cycles.
3. Working with Vista Ridge track coach and athletic director on a track finish shack to be funded with donations.
4. Working with two Horizon Middle School science teachers to install a sustainable greenhouse that will be funded with donations.
5. Complete hiring process for the BOE approved safety-health compliance position.
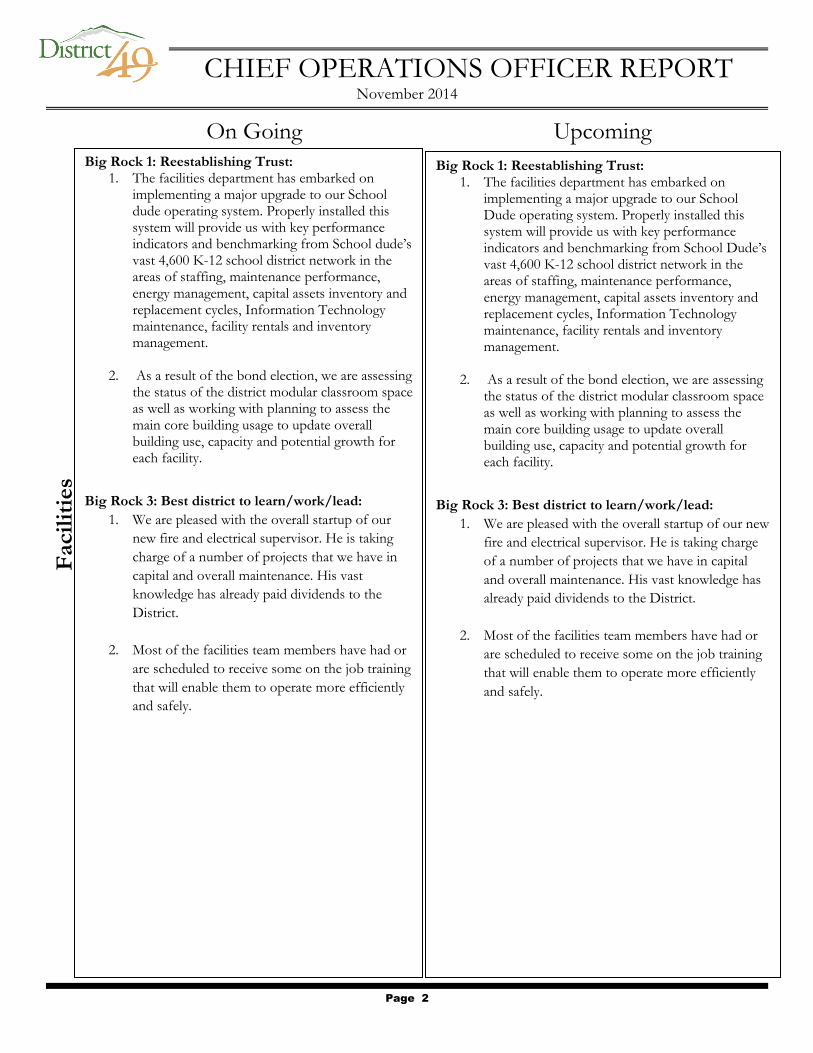
Page 2
Facil
itie
s CHIEF OPERATIONS OFFICER REPORT
November 2014
On Going Upcoming
Big Rock 1: Reestablishing Trust: 1. The facilities department has embarked on
implementing a major upgrade to our School dude operating system. Properly installed this system will provide us with key performance indicators and benchmarking from School dude’s vast 4,600 K-12 school district network in the areas of staffing, maintenance performance, energy management, capital assets inventory and replacement cycles, Information Technology maintenance, facility rentals and inventory management.
2. As a result of the bond election, we are assessing the status of the district modular classroom space as well as working with planning to assess the main core building usage to update overall building use, capacity and potential growth for each facility.
Big Rock 3: Best district to learn/work/lead:
1. We are pleased with the overall startup of our
new fire and electrical supervisor. He is taking
charge of a number of projects that we have in
capital and overall maintenance. His vast
knowledge has already paid dividends to the
District.
2. Most of the facilities team members have had or
are scheduled to receive some on the job training
that will enable them to operate more efficiently
and safely.
Big Rock 1: Reestablishing Trust:
There are a number of capital and overall maintenance projects planned in 2014-2015. These are designed to upgrade the aesthetics, reduce or minimize costs and or allow for an IT users more interact with the network more efficiently.
Big Rock 2: Community Participation and Engagement:
The facilities and finance departments are
implementing facility use software that will
automate the scheduling, building HVAC,
electrical and staging needs for each event in
a proactive manner.
Big Rock 3: Best district to learn/work/lead:
Big Rock 1: Reestablishing Trust: 1. The facilities department has embarked on
implementing a major upgrade to our School Dude operating system. Properly installed this system will provide us with key performance indicators and benchmarking from School Dude’s vast 4,600 K-12 school district network in the areas of staffing, maintenance performance, energy management, capital assets inventory and replacement cycles, Information Technology maintenance, facility rentals and inventory management.
2. As a result of the bond election, we are assessing the status of the district modular classroom space as well as working with planning to assess the main core building usage to update overall building use, capacity and potential growth for each facility.
Big Rock 3: Best district to learn/work/lead:
1. We are pleased with the overall startup of our new
fire and electrical supervisor. He is taking charge
of a number of projects that we have in capital
and overall maintenance. His vast knowledge has
already paid dividends to the District.
2. Most of the facilities team members have had or
are scheduled to receive some on the job training
that will enable them to operate more efficiently
and safely.
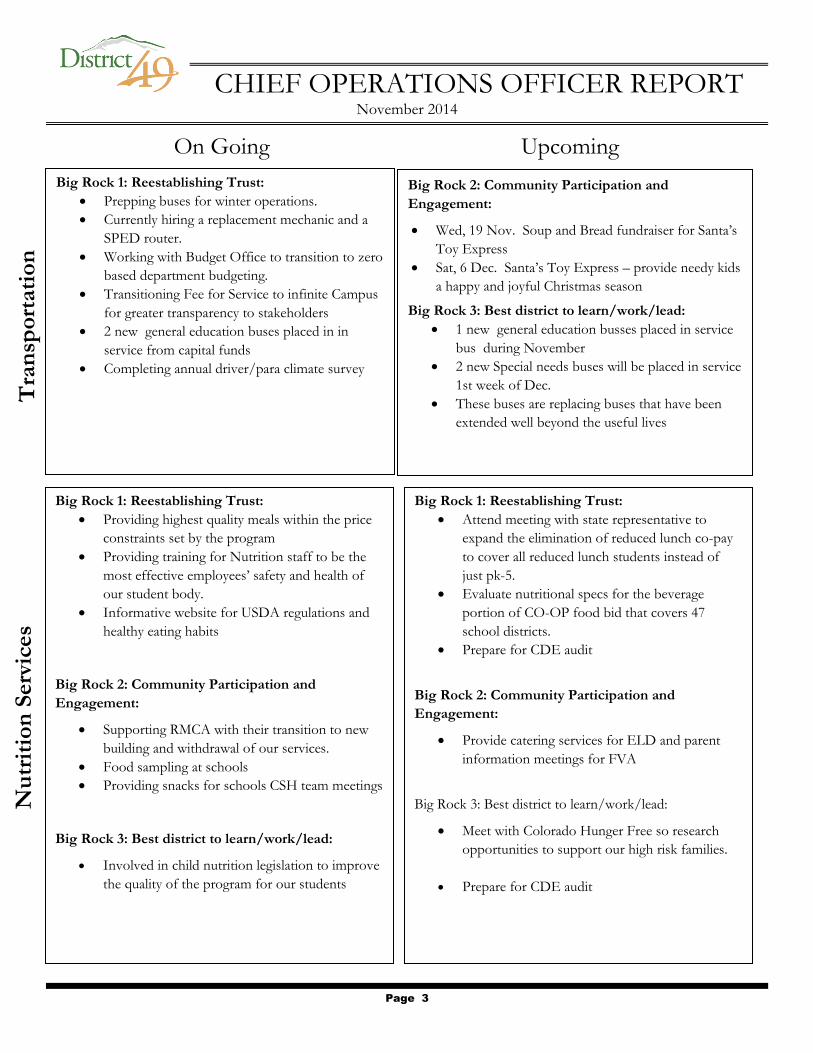
Page 3
Tra
nsp
ort
ati
on
N
utr
itio
n S
erv
ices
CHIEF OPERATIONS OFFICER REPORT November 2014
On Going Upcoming
Big Rock 1: Reestablishing Trust:
Prepping buses for winter operations.
Currently hiring a replacement mechanic and a
SPED router.
Working with Budget Office to transition to zero
based department budgeting.
Transitioning Fee for Service to infinite Campus
for greater transparency to stakeholders
2 new general education buses placed in in
service from capital funds
Completing annual driver/para climate survey
Big Rock 2: Community Participation and
Engagement:
Wed, 19 Nov. Soup and Bread fundraiser for Santa’s
Toy Express
Sat, 6 Dec. Santa’s Toy Express – provide needy kids
a happy and joyful Christmas season
Big Rock 3: Best district to learn/work/lead:
1 new general education busses placed in service
bus during November
2 new Special needs buses will be placed in service
1st week of Dec.
These buses are replacing buses that have been
extended well beyond the useful lives
Big Rock 1: Reestablishing Trust:
Providing highest quality meals within the price
constraints set by the program
Providing training for Nutrition staff to be the
most effective employees’ safety and health of
our student body.
Informative website for USDA regulations and
healthy eating habits
Big Rock 2: Community Participation and
Engagement:
Supporting RMCA with their transition to new
building and withdrawal of our services.
Food sampling at schools
Providing snacks for schools CSH team meetings
Big Rock 3: Best district to learn/work/lead:
Involved in child nutrition legislation to improve
the quality of the program for our students
Big Rock 1: Reestablishing Trust:
Attend meeting with state representative to
expand the elimination of reduced lunch co-pay
to cover all reduced lunch students instead of
just pk-5.
Evaluate nutritional specs for the beverage
portion of CO-OP food bid that covers 47
school districts.
Prepare for CDE audit
Big Rock 2: Community Participation and
Engagement:
Provide catering services for ELD and parent
information meetings for FVA
Big Rock 3: Best district to learn/work/lead:
Meet with Colorado Hunger Free so research
opportunities to support our high risk families.
Prepare for CDE audit
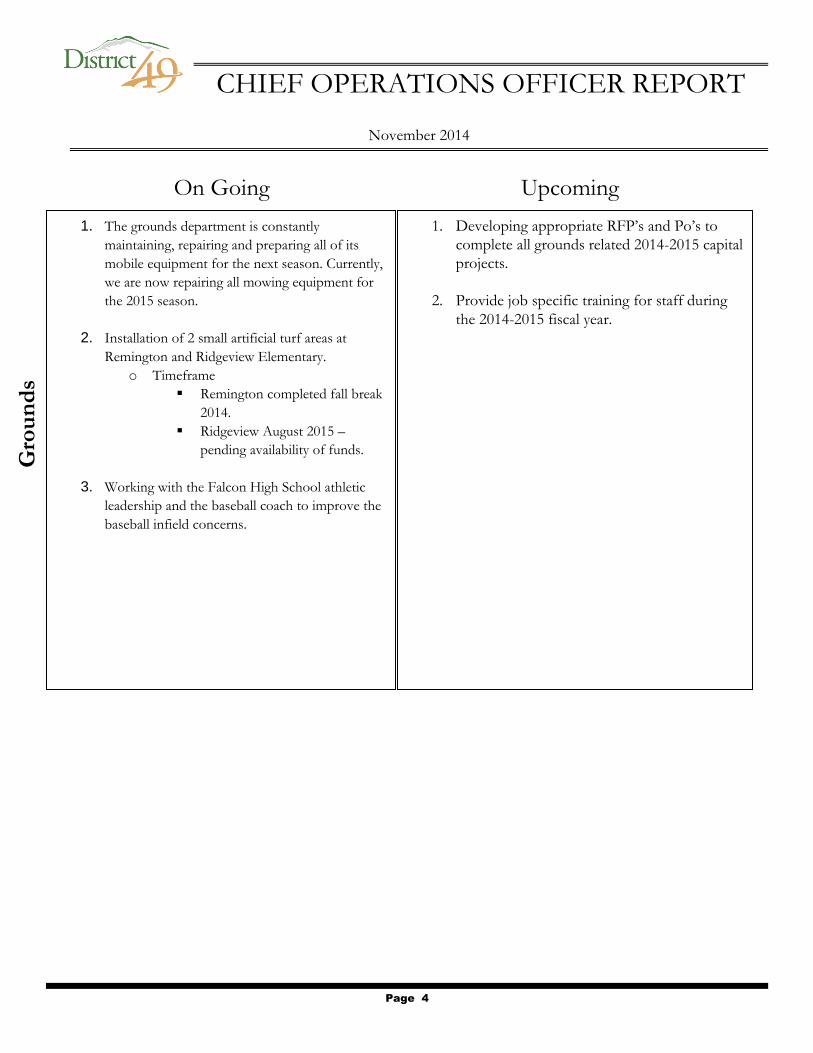
Page 4
Gro
un
ds
CHIEF OPERATIONS OFFICER REPORT
November 2014
On Going Upcoming
1. The grounds department is constantly
maintaining, repairing and preparing all of its
mobile equipment for the next season. Currently,
we are now repairing all mowing equipment for
the 2015 season.
2. Installation of 2 small artificial turf areas at
Remington and Ridgeview Elementary.
o Timeframe
Remington completed fall break
2014.
Ridgeview August 2015 –
pending availability of funds.
3. Working with the Falcon High School athletic
leadership and the baseball coach to improve the
baseball infield concerns.
1. Developing appropriate RFP’s and Po’s to
complete all grounds related 2014-2015 capital
projects.
2. Provide job specific training for staff during
the 2014-2015 fiscal year.
BOARD OF EDUCATION AGENDA ITEM 8.a
BOARD MEETING OF: November 19, 2014 PREPARED BY: Donna Richer, Executive Assistant to BOE TITLE OF AGENDA ITEM: Policy and Procedure Review-Assignment of Regulations ACTION/INFORMATION/DISCUSSION: Discussion BACKGROUND INFORMATION, DESCRIPTION OF NEED: We seek to improve our policy management system by reviewing policies and regulations on a regular basis. RATIONALE: Policy and administrative regulation development and revision are designed to increase the probability of an effective and efficient school system. RELEVANT DATA AND EXPECTED OUTCOMES: The attached administrative regulations and exhibits shall be assigned to specific offices and custodians listed. The Board will be informed of changes to regulations and exhibits. The Board will approve all policies and those regulations and exhibits that are assigned to the Board. IMPACTS ON THE DISTRICT’S STRATEGIC PRIORITIES—THE BIG ROCKS: Rock #1—Reestablishing the district as a trustworthy recipient of taxpayer investment
Rock #2—Research, design and implement programs for intentional community participation
Rock #3— Establish District 49 as the best district in Colorado to learn, work and lead
This action will allow the administrative team to carry out board policies with improved efficiency and intention.
Rock #4— Grow a robust portfolio of distinct and exceptional schools
Rock #5— Customize our educational systems to launch each student toward success
FUNDING REQUIRED: No AMOUNT BUDGETED: N/A RECOMMENDED COURSE OF ACTION/MOTION REQUESTED: After review and discussion, move the attached administrative regulations and exhibits to the assigned offices and custodians. APPROVED BY: Brett Ridgway, CBO, Peter Hilts, CEO, Jack Bay, COO DATE: November 7, 2014
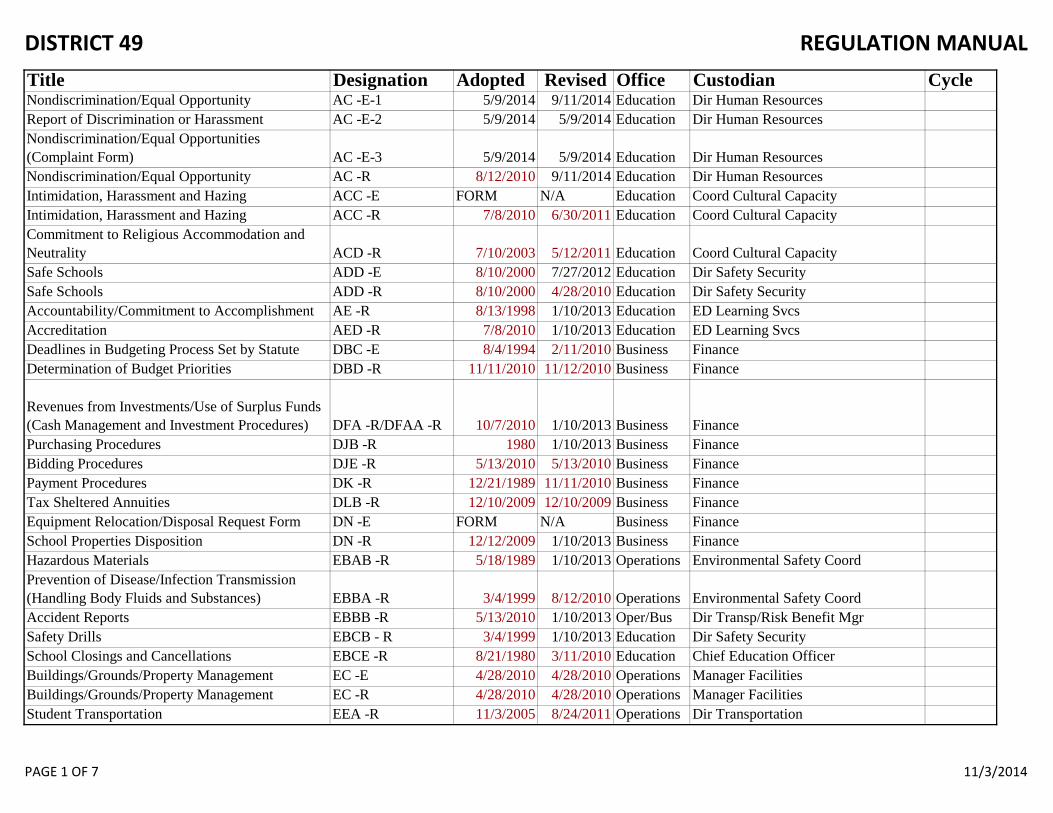
DISTRICT 49 REGULATION MANUAL
PAGE 1 OF 7 11/3/2014
Title Designation Adopted Revised Office Custodian CycleNondiscrimination/Equal Opportunity AC -E-1 5/9/2014 9/11/2014 Education Dir Human ResourcesReport of Discrimination or Harassment AC -E-2 5/9/2014 5/9/2014 Education Dir Human ResourcesNondiscrimination/Equal Opportunities (Complaint Form) AC -E-3 5/9/2014 5/9/2014 Education Dir Human ResourcesNondiscrimination/Equal Opportunity AC -R 8/12/2010 9/11/2014 Education Dir Human ResourcesIntimidation, Harassment and Hazing ACC -E FORM N/A Education Coord Cultural CapacityIntimidation, Harassment and Hazing ACC -R 7/8/2010 6/30/2011 Education Coord Cultural CapacityCommitment to Religious Accommodation and Neutrality ACD -R 7/10/2003 5/12/2011 Education Coord Cultural CapacitySafe Schools ADD -E 8/10/2000 7/27/2012 Education Dir Safety SecuritySafe Schools ADD -R 8/10/2000 4/28/2010 Education Dir Safety SecurityAccountability/Commitment to Accomplishment AE -R 8/13/1998 1/10/2013 Education ED Learning SvcsAccreditation AED -R 7/8/2010 1/10/2013 Education ED Learning SvcsDeadlines in Budgeting Process Set by Statute DBC -E 8/4/1994 2/11/2010 Business FinanceDetermination of Budget Priorities DBD -R 11/11/2010 11/12/2010 Business Finance
Revenues from Investments/Use of Surplus Funds (Cash Management and Investment Procedures) DFA -R/DFAA -R 10/7/2010 1/10/2013 Business FinancePurchasing Procedures DJB -R 1980 1/10/2013 Business FinanceBidding Procedures DJE -R 5/13/2010 5/13/2010 Business FinancePayment Procedures DK -R 12/21/1989 11/11/2010 Business FinanceTax Sheltered Annuities DLB -R 12/10/2009 12/10/2009 Business FinanceEquipment Relocation/Disposal Request Form DN -E FORM N/A Business FinanceSchool Properties Disposition DN -R 12/12/2009 1/10/2013 Business FinanceHazardous Materials EBAB -R 5/18/1989 1/10/2013 Operations Environmental Safety CoordPrevention of Disease/Infection Transmission (Handling Body Fluids and Substances) EBBA -R 3/4/1999 8/12/2010 Operations Environmental Safety CoordAccident Reports EBBB -R 5/13/2010 1/10/2013 Oper/Bus Dir Transp/Risk Benefit MgrSafety Drills EBCB - R 3/4/1999 1/10/2013 Education Dir Safety SecuritySchool Closings and Cancellations EBCE -R 8/21/1980 3/11/2010 Education Chief Education OfficerBuildings/Grounds/Property Management EC -E 4/28/2010 4/28/2010 Operations Manager FacilitiesBuildings/Grounds/Property Management EC -R 4/28/2010 4/28/2010 Operations Manager FacilitiesStudent Transportation EEA -R 11/3/2005 8/24/2011 Operations Dir Transportation
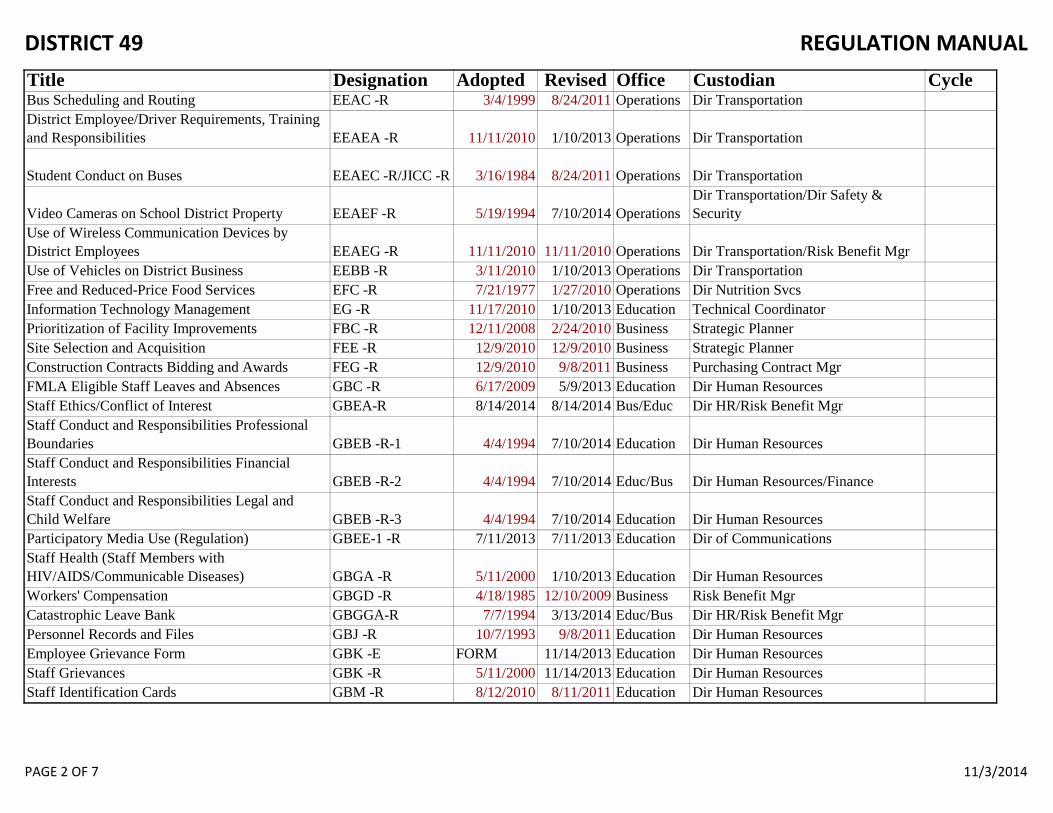
DISTRICT 49 REGULATION MANUAL
PAGE 2 OF 7 11/3/2014
Title Designation Adopted Revised Office Custodian CycleBus Scheduling and Routing EEAC -R 3/4/1999 8/24/2011 Operations Dir TransportationDistrict Employee/Driver Requirements, Training and Responsibilities EEAEA -R 11/11/2010 1/10/2013 Operations Dir Transportation
Student Conduct on Buses EEAEC -R/JICC -R 3/16/1984 8/24/2011 Operations Dir Transportation
Video Cameras on School District Property EEAEF -R 5/19/1994 7/10/2014 OperationsDir Transportation/Dir Safety & Security
Use of Wireless Communication Devices by District Employees EEAEG -R 11/11/2010 11/11/2010 Operations Dir Transportation/Risk Benefit MgrUse of Vehicles on District Business EEBB -R 3/11/2010 1/10/2013 Operations Dir TransportationFree and Reduced-Price Food Services EFC -R 7/21/1977 1/27/2010 Operations Dir Nutrition SvcsInformation Technology Management EG -R 11/17/2010 1/10/2013 Education Technical CoordinatorPrioritization of Facility Improvements FBC -R 12/11/2008 2/24/2010 Business Strategic PlannerSite Selection and Acquisition FEE -R 12/9/2010 12/9/2010 Business Strategic PlannerConstruction Contracts Bidding and Awards FEG -R 12/9/2010 9/8/2011 Business Purchasing Contract MgrFMLA Eligible Staff Leaves and Absences GBC -R 6/17/2009 5/9/2013 Education Dir Human ResourcesStaff Ethics/Conflict of Interest GBEA-R 8/14/2014 8/14/2014 Bus/Educ Dir HR/Risk Benefit MgrStaff Conduct and Responsibilities Professional Boundaries GBEB -R-1 4/4/1994 7/10/2014 Education Dir Human ResourcesStaff Conduct and Responsibilities Financial Interests GBEB -R-2 4/4/1994 7/10/2014 Educ/Bus Dir Human Resources/FinanceStaff Conduct and Responsibilities Legal and Child Welfare GBEB -R-3 4/4/1994 7/10/2014 Education Dir Human ResourcesParticipatory Media Use (Regulation) GBEE-1 -R 7/11/2013 7/11/2013 Education Dir of CommunicationsStaff Health (Staff Members with HIV/AIDS/Communicable Diseases) GBGA -R 5/11/2000 1/10/2013 Education Dir Human ResourcesWorkers' Compensation GBGD -R 4/18/1985 12/10/2009 Business Risk Benefit MgrCatastrophic Leave Bank GBGGA-R 7/7/1994 3/13/2014 Educ/Bus Dir HR/Risk Benefit MgrPersonnel Records and Files GBJ -R 10/7/1993 9/8/2011 Education Dir Human ResourcesEmployee Grievance Form GBK -E FORM 11/14/2013 Education Dir Human ResourcesStaff Grievances GBK -R 5/11/2000 11/14/2013 Education Dir Human ResourcesStaff Identification Cards GBM -R 8/12/2010 8/11/2011 Education Dir Human Resources
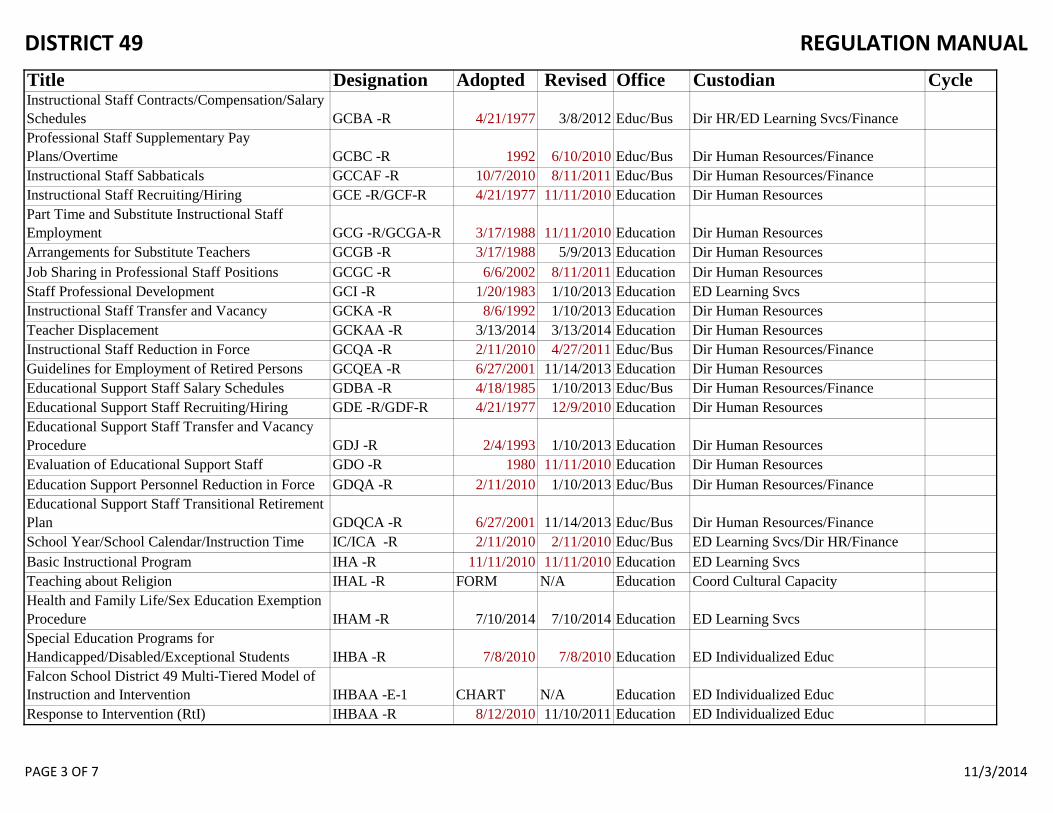
DISTRICT 49 REGULATION MANUAL
PAGE 3 OF 7 11/3/2014
Title Designation Adopted Revised Office Custodian CycleInstructional Staff Contracts/Compensation/Salary Schedules GCBA -R 4/21/1977 3/8/2012 Educ/Bus Dir HR/ED Learning Svcs/FinanceProfessional Staff Supplementary Pay Plans/Overtime GCBC -R 1992 6/10/2010 Educ/Bus Dir Human Resources/FinanceInstructional Staff Sabbaticals GCCAF -R 10/7/2010 8/11/2011 Educ/Bus Dir Human Resources/FinanceInstructional Staff Recruiting/Hiring GCE -R/GCF-R 4/21/1977 11/11/2010 Education Dir Human ResourcesPart Time and Substitute Instructional Staff Employment GCG -R/GCGA-R 3/17/1988 11/11/2010 Education Dir Human ResourcesArrangements for Substitute Teachers GCGB -R 3/17/1988 5/9/2013 Education Dir Human ResourcesJob Sharing in Professional Staff Positions GCGC -R 6/6/2002 8/11/2011 Education Dir Human ResourcesStaff Professional Development GCI -R 1/20/1983 1/10/2013 Education ED Learning SvcsInstructional Staff Transfer and Vacancy GCKA -R 8/6/1992 1/10/2013 Education Dir Human ResourcesTeacher Displacement GCKAA -R 3/13/2014 3/13/2014 Education Dir Human ResourcesInstructional Staff Reduction in Force GCQA -R 2/11/2010 4/27/2011 Educ/Bus Dir Human Resources/FinanceGuidelines for Employment of Retired Persons GCQEA -R 6/27/2001 11/14/2013 Education Dir Human ResourcesEducational Support Staff Salary Schedules GDBA -R 4/18/1985 1/10/2013 Educ/Bus Dir Human Resources/FinanceEducational Support Staff Recruiting/Hiring GDE -R/GDF-R 4/21/1977 12/9/2010 Education Dir Human ResourcesEducational Support Staff Transfer and Vacancy Procedure GDJ -R 2/4/1993 1/10/2013 Education Dir Human ResourcesEvaluation of Educational Support Staff GDO -R 1980 11/11/2010 Education Dir Human ResourcesEducation Support Personnel Reduction in Force GDQA -R 2/11/2010 1/10/2013 Educ/Bus Dir Human Resources/FinanceEducational Support Staff Transitional Retirement Plan GDQCA -R 6/27/2001 11/14/2013 Educ/Bus Dir Human Resources/FinanceSchool Year/School Calendar/Instruction Time IC/ICA -R 2/11/2010 2/11/2010 Educ/Bus ED Learning Svcs/Dir HR/FinanceBasic Instructional Program IHA -R 11/11/2010 11/11/2010 Education ED Learning SvcsTeaching about Religion IHAL -R FORM N/A Education Coord Cultural CapacityHealth and Family Life/Sex Education Exemption Procedure IHAM -R 7/10/2014 7/10/2014 Education ED Learning SvcsSpecial Education Programs for Handicapped/Disabled/Exceptional Students IHBA -R 7/8/2010 7/8/2010 Education ED Individualized EducFalcon School District 49 Multi-Tiered Model of Instruction and Intervention IHBAA -E-1 CHART N/A Education ED Individualized EducResponse to Intervention (RtI) IHBAA -R 8/12/2010 11/10/2011 Education ED Individualized Educ
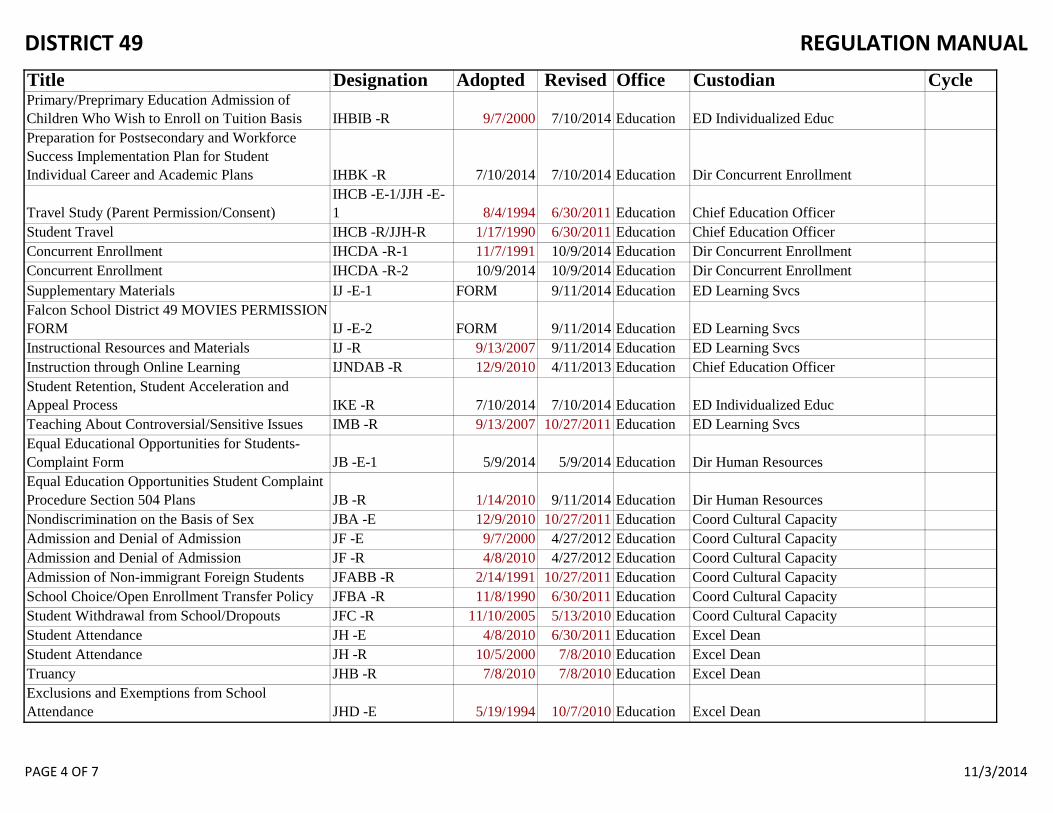
DISTRICT 49 REGULATION MANUAL
PAGE 4 OF 7 11/3/2014
Title Designation Adopted Revised Office Custodian CyclePrimary/Preprimary Education Admission of Children Who Wish to Enroll on Tuition Basis IHBIB -R 9/7/2000 7/10/2014 Education ED Individualized EducPreparation for Postsecondary and Workforce Success Implementation Plan for Student Individual Career and Academic Plans IHBK -R 7/10/2014 7/10/2014 Education Dir Concurrent Enrollment
Travel Study (Parent Permission/Consent)IHCB -E-1/JJH -E-1 8/4/1994 6/30/2011 Education Chief Education Officer
Student Travel IHCB -R/JJH-R 1/17/1990 6/30/2011 Education Chief Education OfficerConcurrent Enrollment IHCDA -R-1 11/7/1991 10/9/2014 Education Dir Concurrent EnrollmentConcurrent Enrollment IHCDA -R-2 10/9/2014 10/9/2014 Education Dir Concurrent Enrollment Supplementary Materials IJ -E-1 FORM 9/11/2014 Education ED Learning SvcsFalcon School District 49 MOVIES PERMISSION FORM IJ -E-2 FORM 9/11/2014 Education ED Learning SvcsInstructional Resources and Materials IJ -R 9/13/2007 9/11/2014 Education ED Learning SvcsInstruction through Online Learning IJNDAB -R 12/9/2010 4/11/2013 Education Chief Education OfficerStudent Retention, Student Acceleration and Appeal Process IKE -R 7/10/2014 7/10/2014 Education ED Individualized EducTeaching About Controversial/Sensitive Issues IMB -R 9/13/2007 10/27/2011 Education ED Learning SvcsEqual Educational Opportunities for Students-Complaint Form JB -E-1 5/9/2014 5/9/2014 Education Dir Human ResourcesEqual Education Opportunities Student Complaint Procedure Section 504 Plans JB -R 1/14/2010 9/11/2014 Education Dir Human ResourcesNondiscrimination on the Basis of Sex JBA -E 12/9/2010 10/27/2011 Education Coord Cultural CapacityAdmission and Denial of Admission JF -E 9/7/2000 4/27/2012 Education Coord Cultural CapacityAdmission and Denial of Admission JF -R 4/8/2010 4/27/2012 Education Coord Cultural CapacityAdmission of Non-immigrant Foreign Students JFABB -R 2/14/1991 10/27/2011 Education Coord Cultural CapacitySchool Choice/Open Enrollment Transfer Policy JFBA -R 11/8/1990 6/30/2011 Education Coord Cultural CapacityStudent Withdrawal from School/Dropouts JFC -R 11/10/2005 5/13/2010 Education Coord Cultural CapacityStudent Attendance JH -E 4/8/2010 6/30/2011 Education Excel DeanStudent Attendance JH -R 10/5/2000 7/8/2010 Education Excel DeanTruancy JHB -R 7/8/2010 7/8/2010 Education Excel DeanExclusions and Exemptions from School Attendance JHD -E 5/19/1994 10/7/2010 Education Excel Dean
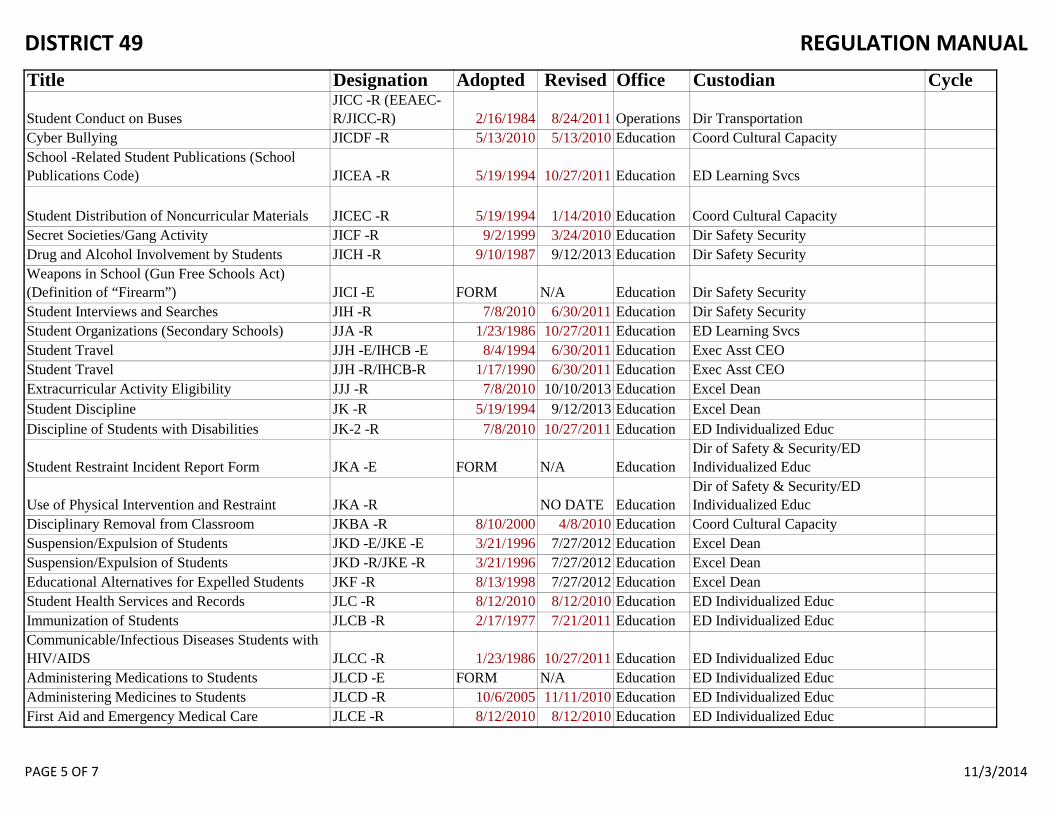
DISTRICT 49 REGULATION MANUAL
PAGE 5 OF 7 11/3/2014
Title Designation Adopted Revised Office Custodian Cycle
Student Conduct on BusesJICC -R (EEAEC-R/JICC-R) 2/16/1984 8/24/2011 Operations Dir Transportation
Cyber Bullying JICDF -R 5/13/2010 5/13/2010 Education Coord Cultural CapacitySchool -Related Student Publications (School Publications Code) JICEA -R 5/19/1994 10/27/2011 Education ED Learning Svcs
Student Distribution of Noncurricular Materials JICEC -R 5/19/1994 1/14/2010 Education Coord Cultural CapacitySecret Societies/Gang Activity JICF -R 9/2/1999 3/24/2010 Education Dir Safety SecurityDrug and Alcohol Involvement by Students JICH -R 9/10/1987 9/12/2013 Education Dir Safety SecurityWeapons in School (Gun Free Schools Act) (Definition of “Firearm”) JICI -E FORM N/A Education Dir Safety SecurityStudent Interviews and Searches JIH -R 7/8/2010 6/30/2011 Education Dir Safety SecurityStudent Organizations (Secondary Schools) JJA -R 1/23/1986 10/27/2011 Education ED Learning SvcsStudent Travel JJH -E/IHCB -E 8/4/1994 6/30/2011 Education Exec Asst CEOStudent Travel JJH -R/IHCB-R 1/17/1990 6/30/2011 Education Exec Asst CEOExtracurricular Activity Eligibility JJJ -R 7/8/2010 10/10/2013 Education Excel Dean Student Discipline JK -R 5/19/1994 9/12/2013 Education Excel DeanDiscipline of Students with Disabilities JK-2 -R 7/8/2010 10/27/2011 Education ED Individualized Educ
Student Restraint Incident Report Form JKA -E FORM N/A EducationDir of Safety & Security/ED Individualized Educ
Use of Physical Intervention and Restraint JKA -R NO DATE EducationDir of Safety & Security/ED Individualized Educ
Disciplinary Removal from Classroom JKBA -R 8/10/2000 4/8/2010 Education Coord Cultural CapacitySuspension/Expulsion of Students JKD -E/JKE -E 3/21/1996 7/27/2012 Education Excel DeanSuspension/Expulsion of Students JKD -R/JKE -R 3/21/1996 7/27/2012 Education Excel DeanEducational Alternatives for Expelled Students JKF -R 8/13/1998 7/27/2012 Education Excel DeanStudent Health Services and Records JLC -R 8/12/2010 8/12/2010 Education ED Individualized EducImmunization of Students JLCB -R 2/17/1977 7/21/2011 Education ED Individualized EducCommunicable/Infectious Diseases Students with HIV/AIDS JLCC -R 1/23/1986 10/27/2011 Education ED Individualized EducAdministering Medications to Students JLCD -E FORM N/A Education ED Individualized EducAdministering Medicines to Students JLCD -R 10/6/2005 11/11/2010 Education ED Individualized EducFirst Aid and Emergency Medical Care JLCE -R 8/12/2010 8/12/2010 Education ED Individualized Educ
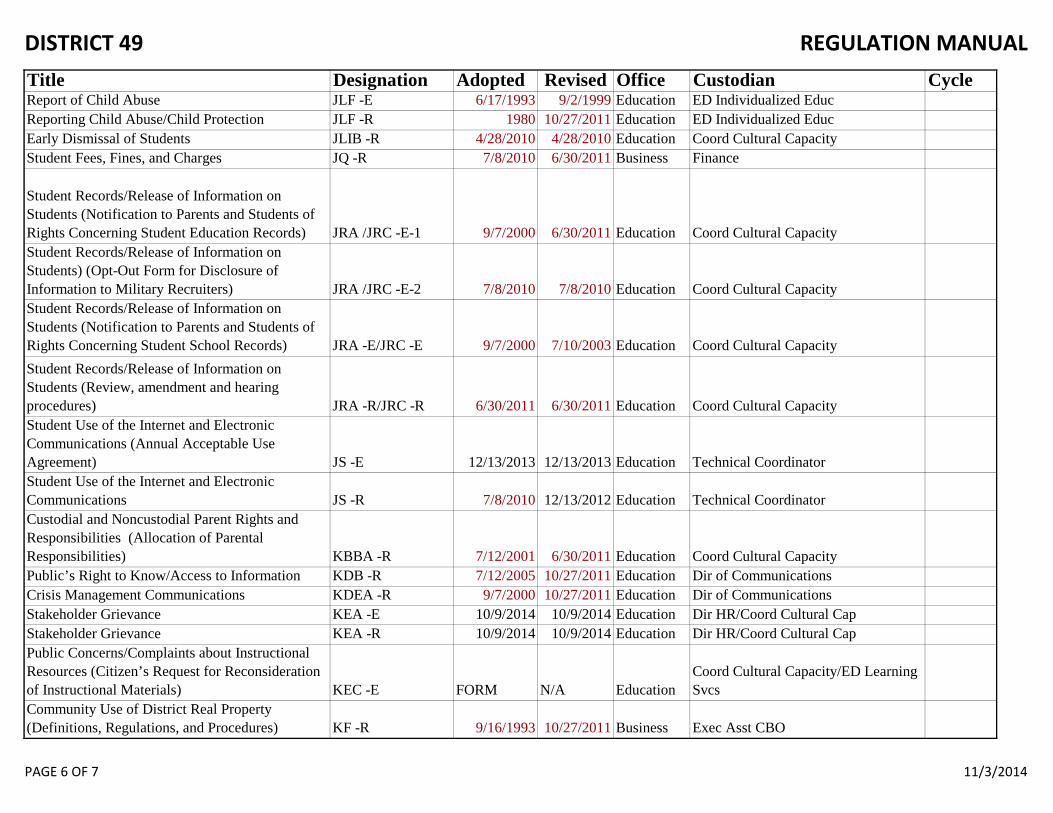
DISTRICT 49 REGULATION MANUAL
PAGE 6 OF 7 11/3/2014
Title Designation Adopted Revised Office Custodian CycleReport of Child Abuse JLF -E 6/17/1993 9/2/1999 Education ED Individualized EducReporting Child Abuse/Child Protection JLF -R 1980 10/27/2011 Education ED Individualized EducEarly Dismissal of Students JLIB -R 4/28/2010 4/28/2010 Education Coord Cultural CapacityStudent Fees, Fines, and Charges JQ -R 7/8/2010 6/30/2011 Business Finance
Student Records/Release of Information on Students (Notification to Parents and Students of Rights Concerning Student Education Records) JRA /JRC -E-1 9/7/2000 6/30/2011 Education Coord Cultural CapacityStudent Records/Release of Information on Students) (Opt-Out Form for Disclosure of Information to Military Recruiters) JRA /JRC -E-2 7/8/2010 7/8/2010 Education Coord Cultural CapacityStudent Records/Release of Information on Students (Notification to Parents and Students of Rights Concerning Student School Records) JRA -E/JRC -E 9/7/2000 7/10/2003 Education Coord Cultural CapacityStudent Records/Release of Information on Students (Review, amendment and hearing procedures) JRA -R/JRC -R 6/30/2011 6/30/2011 Education Coord Cultural CapacityStudent Use of the Internet and Electronic Communications (Annual Acceptable Use Agreement) JS -E 12/13/2013 12/13/2013 Education Technical CoordinatorStudent Use of the Internet and Electronic Communications JS -R 7/8/2010 12/13/2012 Education Technical CoordinatorCustodial and Noncustodial Parent Rights and Responsibilities (Allocation of Parental Responsibilities) KBBA -R 7/12/2001 6/30/2011 Education Coord Cultural CapacityPublic’s Right to Know/Access to Information KDB -R 7/12/2005 10/27/2011 Education Dir of CommunicationsCrisis Management Communications KDEA -R 9/7/2000 10/27/2011 Education Dir of CommunicationsStakeholder Grievance KEA -E 10/9/2014 10/9/2014 Education Dir HR/Coord Cultural CapStakeholder Grievance KEA -R 10/9/2014 10/9/2014 Education Dir HR/Coord Cultural CapPublic Concerns/Complaints about Instructional Resources (Citizen’s Request for Reconsideration of Instructional Materials) KEC -E FORM N/A Education
Coord Cultural Capacity/ED Learning Svcs
Community Use of District Real Property (Definitions, Regulations, and Procedures) KF -R 9/16/1993 10/27/2011 Business Exec Asst CBO
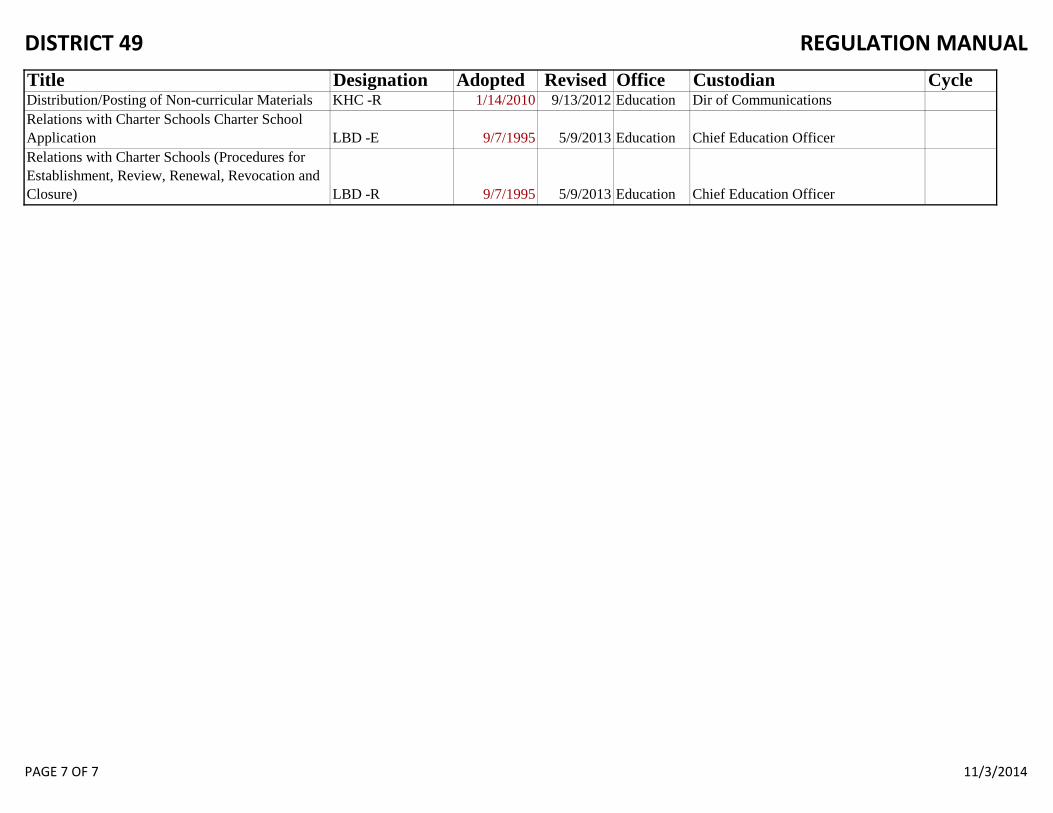
DISTRICT 49 REGULATION MANUAL
PAGE 7 OF 7 11/3/2014
Title Designation Adopted Revised Office Custodian CycleDistribution/Posting of Non-curricular Materials KHC -R 1/14/2010 9/13/2012 Education Dir of CommunicationsRelations with Charter Schools Charter School Application LBD -E 9/7/1995 5/9/2013 Education Chief Education OfficerRelations with Charter Schools (Procedures for Establishment, Review, Renewal, Revocation and Closure) LBD -R 9/7/1995 5/9/2013 Education Chief Education Officer
BOARD OF EDUCATION AGENDA ITEM 8.b
BOARD MEETING OF: November 19, 2014 PREPARED BY: Donna Richer, Executive Assistant to BOE TITLE OF AGENDA ITEM: Policy and Procedure Review-Policy Review ACTION/INFORMATION/DISCUSSION: Discussion BACKGROUND INFORMATION, DESCRIPTION OF NEED: We seek to improve our policy management system by reviewing policies and regulations on a regular basis. RATIONALE: Policy and administrative regulation development and revision are designed to increase the probability of an effective and efficient school system. RELEVANT DATA AND EXPECTED OUTCOMES: The following policies and regulations are assigned to the Board rather than a Chief Officer. They have been reviewed, compared to CASB versions and revised as necessary: 13.b.1 BBBA Board Member Qualification 13.b.2 BC-R School Board Member Financial Disclosure 13.b.3 BDA Board Organizational Meeting 13.b.4 BEDD Rules of Order 13.b.5 BG-R Policy Adoption (Waiver Requests) 13.b.6 BGB/BGF Policy Adoption/Suspension/Repeal 13.b.7 BID/BIE Board Member Compensation and Expenses/Insurance/Liability IMPACTS ON THE DISTRICT’S STRATEGIC PRIORITIES—THE BIG ROCKS: Rock #1—Reestablishing the district as a trustworthy recipient of taxpayer investment
Rock #2—Research, design and implement programs for intentional community participation
Rock #3— Establish District 49 as the best district in Colorado to learn, work and lead
Reviewing and revising policies on a regular basis will increase the probability of an effective and efficient school system.
Rock #4— Grow a robust portfolio of distinct and exceptional schools
Rock #5— Customize our educational systems to launch each student toward success
FUNDING REQUIRED: No AMOUNT BUDGETED: N/A RECOMMENDED COURSE OF ACTION/MOTION REQUESTED: After review and discussion, move the attached revised policies and regulations for action at the December regular meeting. APPROVED BY: Donna Richer, Executive Assistant to the BOE DATE: November 12, 2014
BOARD-APPROVED POLICY OF DISTRICT 49 ________________________________________________________________________________________
Title Board Member Qualifications Designation BBBA
Office/Custodian Board of Education/Executive Assistant to the BOE A candidate for the office of school director shall be:
1. A resident of the school district and a registered voter, as shown on the books of the county clerk and recorder, for at least 12 consecutive months prior to the election.
2. Eighteen (18) years or older by the date of the election.
3. A citizen of the United States.
No candidate may run representing a political party. In addition, any person who has been convicted of, pled guilty or nolo contendere to, or received a deferred judgment of sentence for commission of a sexual offense against a child is ineligible for election to a school district board of education. Similarly, any board member who is convicted of, pleads guilty or nolo contendere to, or receives a deferred judgment for a sexual offense against a child while serving on a board shall become ineligible to serve and a vacancy shall be created. Any person who is the subject of a pending charge of commission of a sexual offense against a child at the time of election is ineligible for election to a school district board of education. • Adopted: October 8, 2009 • Reviewed: December 11, 2014 LEGAL REFS: • C.R.S. 22-31-107 (qualifications and nomination of candidates for school director) • C.R.S. 1-2-101, 102 (qualification and registration of elections) • C.R.S. 1-4-803 (petitions for nominating school directors)
District 49, El Paso County, Colorado Page 1 of 1
BOARD-APPROVED POLICY OF DISTRICT 49 ________________________________________________________________________________________
Title School Board Member Financial Disclosure Designation BC-R
Office/Custodian BOE/Executive Assistant/Legal Counsel
Board of Education members are required by law to disclose certain items received in connection with serving on the Board. If Board members receive such items, they must file a report for the preceding calendar year with the County Clerk and Recorder on forms supplied by the Secretary of State on forms prescribed by the Secretary of State. Such report must be filed on or before January 15, April 15, July 15 and October 15 of each year and shall cover the period since the last report. The report must contain the name of the person from whom the reportable item was received, its value, and the date of receipt. Board members who do not receive any items that must be reported are not required to file a report. Items which must be reported include the following:
1. Any money received including a loan, pledge, advance, or guarantee of a loan or any forbearance or forgiveness of indebtedness from any person with a value of greater than $5325 or more.
2. Any gift of any item of real or personal property other than money with a value of greater than $530
or more.
3. Any loan of real or personal property if the value of the loan is greater than $530 or more. "Value of the loan" means the cost saved or avoided by the Board member by not borrowing, leasing, or purchasing comparable property from a source available to the general public.
4. Any payment for a speech, appearance, or publication.
5. Tickets to a sporting, recreational, educational, or cultural event with a value greater than of $530 or
more for any single event or a series of tickets to sporting events of a specific team during a season or to cultural events of a specific company with a total value of $100 or more.
6. Payment of or reimbursement for actual and necessary expenses for travel and lodging for attendance at
a convention, fact-finding mission or trip, or other meeting at which the Board member or candidate for the Board is scheduled to deliver a speech, make a presentation, participate on a panel or represent the school districtparticipate unless the payment for such expenditures is made from public funds or from the funds of any association of public officials or public entities such at the Colorado Association of School Boards (CASB).
7. Any gift of a meal to a fund-raising event of a political party.
The financial disclosure need not include the following:
1. A contribution or contribution in kind that already has been reported pursuant to the Fair Campaign Practices Act.
2. Any item of perishable or nonpermanent value including meals unless such item is required to be
reported under #5 or #7 above. District 49, El Paso County, Colorado Page 1 of 2
BOARD-APPROVED POLICY OF SCHOOL DISTRICT 49 Designation: BC-R ________________________________________________________________________________________
3. A non-pecuniary award publicly presented by a nonprofit organization in recognition of public service.
4. Payment or reimbursement for actual and necessary expenditures for travel and lodging for attendance
at a convention in which the individual is scheduled to participate if the payment or reimbursement is made from public funds or from the funds of any association of public officials or entities such as CASB.
5. Payment of salary from employment including other government employment.
To avoid misunderstanding about the value of an item, the donor must furnish the Board member with a written statement of the dollar value of the item when it is given. Board members who do not receive any items which must be reported are not required to file a report. • Adopted: September 3, 1998 • Revised: October 8, 2009 • Revised: December 11, 2014
LEGAL REFS: • C.R.S. 24-6-201 et seq.(Public Official Disclosure LawColorado Sunshine Act – public official disclosure)
School District 49, El Paso County, Colorado Page 2 of 2
BOARD-APPROVED POLICY OF DISTRICT 49 ________________________________________________________________________________________
Title Board Organizational Meeting Designation BDA
Office/Custodian Board of Education/Executive Assistant to the BOE Within fifteen (15) days after the school district receives the official abstract of votesregular biennial election, the Board of Education shall meet in an organizational session at a regular or special meeting for the purpose of selecting officers. The incumbent president of the Board shall preside until a successor is elected, whereupon the successor will assume the chair. Following the swearing in of the newly-elected Board member or members, the following officers, in order, shall be elected or appointed: president, vice president, secretary, and treasurer. Nominations for president and vice president shall be made from the floor and voting shall be by roll call or secret ballot after a vote to do so by the majority of the Board members present. Should no nominee receive a majority vote of Board members, the election shall be declared null and void, further nominations may be made and the roll call or secret ballot vote shall be retaken. The president and vice president shall serve two-year terms and shall hold office until their successors are elected. The Board shall then appoint a secretary and treasurer who may or may not be members of the Board. The secretary and treasurer shall hold their offices for terms at the pleasure of the Board. Following election and appointment of the officers, the Board shall appoint the staff members who will fill the offices of secretary to the Board and assistant treasurer. Then such other items of business shall be considered by the Board as are scheduled on the agenda. Officer resignation Should one or more officers of the Board resign, the Board shall select another member or members to fill the vacant office or offices as provided by law, using the procedures described above. A newly-selected officer shall assume the duties immediately upon selection. Inasmuch as the selection of a new officer on a four- officer, five-member board frequently requires a shifting of officers it shall be permissible for a member to be nominated for another office without resigning the current office. Upon acceptance of the nomination and election to the new office, the former office shall be declared vacant and another member elected to fill that position. • Adopted: April 21, 1977 • Revised: August 4, 1994 • Revised: September 3, 1998 • Revised: October 8, 2009 • Revised: December 11, 2014 LEGAL REFS: • C.R.S. 22-31-104 (3) (biennial school elections) • C.R.S. 22-32-104 (1),(2),(3),(4) (organization of the board)
District 49, El Paso County, Colorado Page 1 of 2
BOARD-APPROVED POLICY OF DISTRICT 49 Designation: BDA ________________________________________________________________________________________
• C.R.S. 22-32-108(5) (meetings of the board) • C.R.S. 22-32-108 (6) (meetings of the board – voting procedure)
School District 49, El Paso County, Colorado Page 2 of 2
BOARD-APPROVED POLICY OF DISTRICT 49 ________________________________________________________________________________________
Title Rules of Order Designation BEDD
Office/Custodian Board of Education/Executive Assistant to the BOE Except as otherwise specified by state law or Board policies pertaining to its own operating procedures, the Board shall operate by the rules prescribed in Robert's Rules of Order, Newly Revised as those rules can reasonably be applied to the conduct of school board business. It shall be the responsibility of the Board president to utilize such rules when appropriate to do so. • Adopted: April 21, 1977 • Revised: September 3, 1998 • Revised: November 3, 2005 • Reviewed: January 14, 2010 • Reviewed: December 11, 2014
District 49, El Paso County, Colorado Page 1 of 1
BOARD-APPROVED POLICY OF DISTRICT 49 ________________________________________________________________________________________
Title Policy Adoption (Waiver Requests) Designation BG-R
Office/Custodian Board of Education/Executive Assistant to the BOE School-level accountability committees may request a waiver of Board policy to facilitate attainment of a school-level goal by submitting a written application to the Board of Education. The request for waiver or renewal of an existing waiver must be supported by a majority of committee members and the building principal. Waivers will be good for two years and may be renewed without limit for additional two-year periods after review by the Board. The waiver or waiver renewal request must include: 1. Coding and title of the policy to be waived.
2. Specific documentation demonstrating how the policy prohibits the school from achieving a school goal.
3. Expected outcome of the waiver or waiver renewal.
4. Duration requested for the waiver or waiver renewal.
5. Explanation of how the waiver or waiver renewal would assist the school in reaching its goal.
6. Financial impact of the waiver.
The written request for a waiver or waiver renewal must be received by the Board at least 30 days prior to proposed implementation. The waiver or waiver renewal will be granted if the Board determines that the school has clearly demonstrated that the waiver or waiver renewal will result in the school’s accomplishing its goal. The Board will provide a written response to the waiver or waiver renewal request within 5 days of receipt of the request. • Adopted: September 3, 1998 • Reviewed: September 10, 2009 • Reviewed: December 11, 2014
District 49, El Paso County, Colorado Page 1 of 1
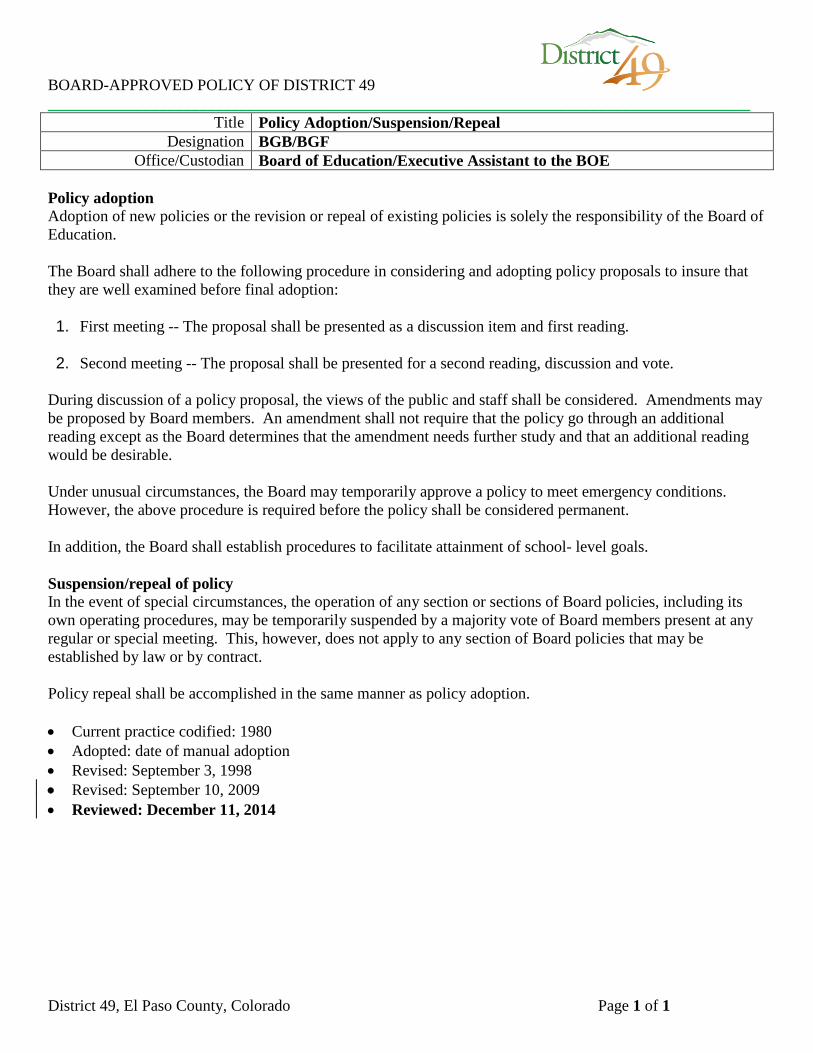
BOARD-APPROVED POLICY OF DISTRICT 49 ________________________________________________________________________________________
Title Policy Adoption/Suspension/Repeal Designation BGB/BGF
Office/Custodian Board of Education/Executive Assistant to the BOE Policy adoption Adoption of new policies or the revision or repeal of existing policies is solely the responsibility of the Board of Education. The Board shall adhere to the following procedure in considering and adopting policy proposals to insure that they are well examined before final adoption: 1. First meeting -- The proposal shall be presented as a discussion item and first reading.
2. Second meeting -- The proposal shall be presented for a second reading, discussion and vote.
During discussion of a policy proposal, the views of the public and staff shall be considered. Amendments may be proposed by Board members. An amendment shall not require that the policy go through an additional reading except as the Board determines that the amendment needs further study and that an additional reading would be desirable. Under unusual circumstances, the Board may temporarily approve a policy to meet emergency conditions. However, the above procedure is required before the policy shall be considered permanent. In addition, the Board shall establish procedures to facilitate attainment of school- level goals. Suspension/repeal of policy In the event of special circumstances, the operation of any section or sections of Board policies, including its own operating procedures, may be temporarily suspended by a majority vote of Board members present at any regular or special meeting. This, however, does not apply to any section of Board policies that may be established by law or by contract. Policy repeal shall be accomplished in the same manner as policy adoption. • Current practice codified: 1980 • Adopted: date of manual adoption • Revised: September 3, 1998 • Revised: September 10, 2009 • Reviewed: December 11, 2014
District 49, El Paso County, Colorado Page 1 of 1
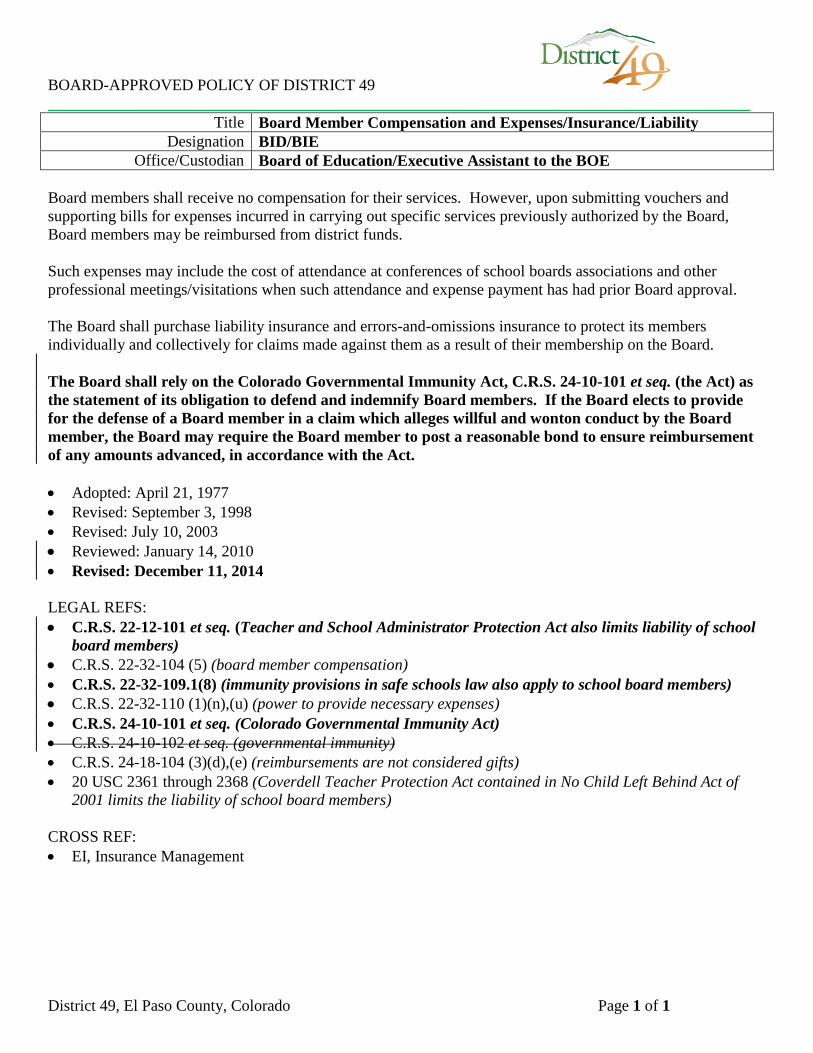
BOARD-APPROVED POLICY OF DISTRICT 49 ________________________________________________________________________________________
Title Board Member Compensation and Expenses/Insurance/Liability Designation BID/BIE
Office/Custodian Board of Education/Executive Assistant to the BOE Board members shall receive no compensation for their services. However, upon submitting vouchers and supporting bills for expenses incurred in carrying out specific services previously authorized by the Board, Board members may be reimbursed from district funds. Such expenses may include the cost of attendance at conferences of school boards associations and other professional meetings/visitations when such attendance and expense payment has had prior Board approval. The Board shall purchase liability insurance and errors-and-omissions insurance to protect its members individually and collectively for claims made against them as a result of their membership on the Board. The Board shall rely on the Colorado Governmental Immunity Act, C.R.S. 24-10-101 et seq. (the Act) as the statement of its obligation to defend and indemnify Board members. If the Board elects to provide for the defense of a Board member in a claim which alleges willful and wonton conduct by the Board member, the Board may require the Board member to post a reasonable bond to ensure reimbursement of any amounts advanced, in accordance with the Act. • Adopted: April 21, 1977 • Revised: September 3, 1998 • Revised: July 10, 2003 • Reviewed: January 14, 2010 • Revised: December 11, 2014 LEGAL REFS: • C.R.S. 22-12-101 et seq. (Teacher and School Administrator Protection Act also limits liability of school
board members) • C.R.S. 22-32-104 (5) (board member compensation) • C.R.S. 22-32-109.1(8) (immunity provisions in safe schools law also apply to school board members) • C.R.S. 22-32-110 (1)(n),(u) (power to provide necessary expenses) • C.R.S. 24-10-101 et seq. (Colorado Governmental Immunity Act) • C.R.S. 24-10-102 et seq. (governmental immunity) • C.R.S. 24-18-104 (3)(d),(e) (reimbursements are not considered gifts) • 20 USC 2361 through 2368 (Coverdell Teacher Protection Act contained in No Child Left Behind Act of
2001 limits the liability of school board members) CROSS REF: • EI, Insurance Management
District 49, El Paso County, Colorado Page 1 of 1