board remuneration, company performance, and ownership concentration: evidence from publicly listed...
TRANSCRIPT
MONASH UNIVERSITY
AUSTRALIA
Department of Economics Discussion Papers ISSN 1441-5429
Board Remuneration, Company Performance, and Corporate Governance:
Evidence from Publicly Listed Malaysian Companies
Ergun Dogan and Russell Smyth
No. 10101
Monash University Victoria 3800
Australia

O 200 1 Ergun Dogan and Russell Smyth All rights reserved. No part of this paper may be reproduced in any form, or stored in a retrieval system, without the prior written permission of the author.
BOARD REMUNERATION, COMPANY PERFORMANCE, AND CORPORATE GOVERNANCE: EVIDENCE FROM PUBLICLY
-
LISTED MALAYSIAN COMPANIES
Ergun Dogan '
and
Russell smythtf
School of Business and Information Technology, Monash University, Malaysia Department of Economics, Monash University, Australia Earlier versions of this paper were presented at "Whose Milleniurn?" the 13'
Biennial Conference of the Asian Studies Association of Australia (ASAA), University of Melbourne, July 2000 and the National Workshop on Capacity Building Towards Excellence in Economic Research and Policy Formulation, Universiti Utara, Malaysia, April 2001. We thank participants at these conferences, Mita Bhattacharya and Dietrich Fausten for helpful comments that have improved the final version. Funding for this project was supplied by a grant from Monash University, Malaysia.
Abstract
Corporate governance is hotly debated in Malaysia and elsewhere in the
Asian-Pacific region. The reason for this is that several of the problems
that Asian-Pacific countries faced during the crisis of 1997-1 999 are
blamed on weak corporate governance structures. In this study we
examine the determinants of Board compensation in Malaysian
companies listed on the Kuala Lumpur Stock Exchange over the period
1989 to 2000. Our objective is to examine whether corporate governance
affects the relationship between performance and remuneration. We find
evidence of a statistically significant positive relationship between Board
remuneration and sales turnover and a statistically significant negative
relationship between Board remuneration and ownership concentration.
However, the relationship between Board remuneration and firm
performance is ambiguous, while there is no evidence of a significant.
relationship between Board remuneration and sector performance.
JEL: L1
Keywords: Malaysia, Board Remuneration, Corporate Governance
1. INTRODUCTION
This study investigates the relationship between total board remuneration
and corporate performance in a sample of firms listed on the Kuala
Lumpur Stock Exchange (KLSE). Our objective is to examine whether
corporate governance affects the relationship between performance and
executive salaries. This has been a widely debated issue in Malaysia and
elsewhere in Asia, particularly following the Asian financial crisis. This
,paper makes two main contributions to the existing literature on executive
compensation and corporate performance. First, there are several studies
that investigate the relationship between executive compensation and
corporate performance in Europe and the United States (USA) (see eg
Murphy 1985, Main et a1 1996, Brunello et a1 1997, Conyon 1997, Crespi
and Gispert 1998). There has, however, been little investigation of the
relationship between corporate performance, performance criteria and
executive compensation in firms in Asian countries.
This is an important gap in the literature. As Schleifer and Vishny (1997)
point out, there is a pressing need for studies of corporate governance
arrangements in countries other than the United Kingdom (UK) and USA.
This reflects the fact that corporate governance arrangements in other
parts of the world, including Asia, are often different from those in the
UK or USA. Berle and Means' (1932) classic description suggests that
ownership in the USA is dispersed among small shareholders with control
concentrated in the hands of managers. This description has been
questioned in more recent research. La Porta et a1 (1999) found that
ownership in countries other than the USA is more concentrated than
depicted in Berle and Means (1932). There is some evidence to suggest
that even in the USA ownership is more concentrated than when Berle
and Means (1932) wrote. Studies such as Morck et a1 (1988) and Shleifer
and Vishny (1986) have found at least a moderate degree of ownership
concentration in the USA. Nevertheless, it is clear that concentration of
ownership is greater in most Asian countries than in either the UK or the
USA (see eg Claessens et a1 1999, OECD 1999). In governance structures
where ownership is more dispersed there is greater potential for takeovers
to act as a disciplining mechanism relative to the contractual relationship
between management and shareholders.
A second contribution of this paper is to use total board remuneration as a
proxy for executive compensation. There are only a couple of studies
that look at the relationship between total board remuneration and
corporate performance (Main et a1 1996, Brunello et a1 1997). Most
studies, instead, use compensation of the highest paid director or chief
executive officer (CEO). Main et a1 (1996 p. 1634) suggest that in most
cases this has been because data has not been available for the board as a
whole. Where data is available, total board remuneration is a better proxy
for executive compensation. This is because, in terms of agency it is the
board collectively, rather than the CEO or individual directors that act on
behalf of the principals or shareholders (Main et a1 1996 p. 1634, Crespi
and Gispert 1998, p. 2).
The paper is set out as follows. The next section sets out several
hypotheses based on previous research on firms in the UK and USA and
considers the implications of these hypotheses for Asian corporate
governance arrangements. Section three discusses the data set and
empirical specification used in the study. The results are examined in
section four. The last section contains some concluding comments.
2. CONCEPTUAL FRAMEWORK
Hypotheses Based on Studies in Anglo-American Economies
The design of compensation contracts for managers has been an
important topic of investigation in the principal-agent literature. The
objective is to formulate an optimal compensation scheme that motivates
managers to maximise firm performance, taking into account governance
arrangements. The specific governance conditions depend on the
institutional rules and markets in which the firm operates, which are
related, among other things, to factors such as industry or sector
performance, firm size and the structure and composition of ownership.
These factors are able to influence the board-shareholder relationship,
impacting on problems of information asymmetries. This, in turn,
influences the manner in which control and supervision of managers is
exerted (Crespi and Gispert, 1998, p. 8). The existing theoretical and
empirical literature, based primarily on corporate governance
arrangements in Anglo-American economies, suggests several hypotheses
about the relationship between executive compensation and each of
corporate performance, firm size, industry or sector performance and the
degree of ownership concentration.
The first hypothesis is that there is a positive relationship between firm
performance and board remuneration. Principal-agent models of the firm
explain firm performance in terms of manager's effort and a set of
randomly distributed variables that are outside the manager's control and
not observable (see eg Tirole 1988 and Rosen 1992). These models.
suggest that in order to increase manager's effort, compensation should
be sensitive to performance. This assumes that effort and firm
performance move in the same direction, otherwise the observability of
performance would be irrelevant in motivating managers to increase
effort (Crespi and Gispert 1998). While the existing literature is far from
definitive on the point, several empirical studies support the existence of
a positive relationship between executive compensation and performance
(see eg Murphy 1985, Main et a1 1996, Gibbons and Murphy 1990).
The second hypothesis is that there is a positive relationship between
board remuneration and firm size. The theoretical underpinning of this
hypothesis is the notion that there are complementarities between
individual talent and the productivity of control. Hence, it is efficient to
assign greater control to more talented individuals (Brunello et a1 1997 p.
2). Most studies have used firm size as a control variable because larger
firms pay higher salaries (see eg Murphy 1985, Crespi and Gispert 1998).
Firm size could also be considered as another measure by which
companies judge the performance of their managers. Since firm size is
typically measured by sales or turnover, managers who have increased
company sales are viewed as more successful. There are a number of
empirical studies which support the contention that there is a positive
relationship between firm size and executive compensation (see eg
Murphy 1985, Baker et a1 1988, Gregg et a1 1993, Main et a1 1996). In a
relatively recent study Murphy (1998) also found a positive relationship
between compensation paid to CEOs and firm size, but suggests that the
relationship has weakened over time.
The third hypothesis is that there is an inverse relationship between board
remuneration and sector performance. The performance of other
managers in the same sector provides additional information that can be
used to decide appropriate compensation. Principal-agent models suggest
that a more accurate picture of manager's effort decreases the variance of
observable outcomes. This reduces the risk differential that needs to be
built into the contract (see eg Holmstrom 1979, Zwiebel 1995). Empirical
studies that have found a statistically significant inverse relationship
between executive compensation and either industry or sector
performance include Conyon and Leech (1994) and Gibbons and Murphy
(1990).'
The fourth hypothesis is that there is an inverse relationship between
board remuneration and ownership concentration. In companies where
ownership is dispersed, the discretionary power of managers will be
higher. Thus higher levels of compensation will be needed to increase
manager effort. However, when ownership is concentrated shareholders
have better information and are better placed to monitor manager effort.
In these cases compensation can be tied more closely to actual effort.
Using data on Spanish listed companies, Crespi and Gispert (1998) found
that ownership concentration had a negative and significant effect on
remuneration.

Malaysian Corporate Governance and Implications for Board Remuneration
Ownership is generally more concentrated in Asia than the UK or USA.
Ownership concentration in Malaysia is indicative of most Asian
countries (Lim 1981). In Malaysia, the three largest shareholders own 54
per cent of the shares in the ten largest non-financial private firms and 46
per cent of the ten largest firms (OECD 1999 p. 7). One reason for this is
that family control of listed companies is more prevalent in Asia than
. Anglo-American economies. Claessens et a1 (1 999) examined ownership
concentration in 2,980 publicly listed companies in nine East Asian
countries (Hong Kong, Indonesia, Japan, Malaysia, the Philippines,
Singapore, South Korea, Taiwan and Thailand). Their conclusion was
that there was significant family control in more than half of East Asia's
corporations. This is certainly true for Malaysia. According to Claessens
et a1 (1999), in 1998 in Malaysia, the top five families controlled 17.3 per
cent of market capitalization; the top ten families controlled 24.8 per cent
of market capitalization and the fifteen families with the largest
shareholding controlled 28.3 per cent of market capitalization on the
KLSE.
Another reason for ownership concentration in countries such as
Indonesia Korea, Malaysia, Singapore and Thailand is significant
amounts of state control of listed firms. In Malaysia both of the main
political parties - United Malay National Organization and the Malaysian
Indian Congress - have substantial business holdings. Claessens et a1
(1 999) report that using the percentage of shares owned by the largest ten
shareholders as a benchmark the State controls 17.8 per cent of publicly
listed companies in Malaysia. If we focus on the 20 largest publicly
listed companies this figure increases to 36.3 per cent. This is the second
highest figure in the Claessens et a1 (1999) study after Singapore, where
the comparable figure is 45.8 per cent.
An important implication of ownership concentration in Malaysia, and
Asia more generally, is that the agency problems arising from the
separation of ownership and control are not as pronounced as in Anglo-
American economies. his suggests that the relationship between board
remuneration and firm performance should be weaker than in the UK or
USA. Whether this is in fact the case is an empirical question. Studies of
firms in continental Europe, where ownership is also more concentrated
than the UK or the USA have still found a positive relationship between
compensation and firm performance. Crespi & Gispert (1998) found a
strong relationship between board remuneration and firm performance in
a sample of 113 Spanish listed companies. Brunello et a1 (1997) also
found a positive relationship between board remuneration and firm
performance in a sample of Italian listed companies, where there was a
large proportion of State-controlled firms in the sample.
3. DATA, METHODOLOGY AND SPECIFICATION
We used total Board remuneration as our measure of pay (denoted as
REM).* This includes salaries and fees paid to all directors. We regressed
this variable on measures of firm performance, sector performance and
firm size. We used two alternative measures of firm and sector
performance. In the first set of regressions we defined firm and sector
performance in terms of stockholder wealth (SHW) and sector
stockholder wealth (SSHW) respectively. Stockholder wealth is defined
as [(P, + dt)/Pt-l)]*MVt-I, where P, is the current period stock market
price, d, is the dividend per share, is the previous period stock market
price, and MV,, is the market value of the firm. This definition is
consistent with that used in Conyon and Leech (1994) for their study
using data on UK listed companies and is similar to that used by Murphy
(1985) and Jensen and Murphy (1990) for US listed companies. The
sector performance measure is stockholder wealth averaged over firms in
each sector.
The advantage of using shareholder wealth rather than accounting profits
to measure firm performance is that in principal-agent theories,
shareholders are generally considered to be the principals (Murphy 1985,
p. 21). This, of course, assumes that share price movements always
dominate fm performance. Thus, for comparative purposes, in the
second set of regressions we used return on assets and sector return on
assets as alternative measures of firm and sector performance
respectively. These variables were entered into the regressions as
(l+ROA) and (l+SROA), which is the standard practice in the literature
(see eg Crespi and Gispert, 1998). Following the definition used by the
KLSE, return on assets was calculated by dividing either the firm's profit
or loss before extraordinary items by total assets. The sector performance
measure in the second set of regressions was return on assets averaged
over firms in each sector. We used the sector classification guidelines in
KLSE publications to determine which firms are in each sector. In both
sets of regressions, firm size was measured using sales turnover (TRN).
LNREM, LNSHW, LNSSHW, LN(1 +ROA), LN(1 +SROA) and LNTRN
are the natural logs of REM, SHW, SSHW, (l+ROA), (l+SROA) and
TRN. Table l provides some basic descriptive statistics for LNREM,
LNSHW, LNTRN and LNSSHW, LN(l+ROA), and LN(l+SROA).
Ownership concentration is employed to measure the effect of corporate
governance on board remuneration. Following Crespi and Gispert (1998)
we use the percentage of shares owned by the largest stockholder (CRl)
to measure concentration." Consistent with Crespi and Gispert (1998), a
dummy variable (denoted by DCR1) is used, which takes the value of one
if the concentration measure is above the median level and is otherwise
zero. This dummy variable is entered as time invariant. We used the latest
ownership data available to construct this dummy variable. Time
dummies were included in all initial regressions (reported in table 2) to
control for the effects of economy wide shocks. However, in later
specifications (reported in table 3) we examine the impact of the financial
crisis on remuneration. In these specifications, instead of using time
dummies, we substituted a crisis dummy variable (denoted as DCRISIS),
set equal to one for the period 1997 to 2000 and was zero otherwise.
To test the hypotheses in section two we used the first-differences model,
which is standard in the literature (see eg Conyon and Leech, 1994,
Crespi and Gispert, 1998). Specifically, in the first set of regressions we
regressed DLNREMi, on different combinations of DLNSHW,
DLNSSHW and DLNTRN in period t and period t-l and DCRl. In the
second set of regressions we used DLN(l+ROA) and DLN(l+SROA)
instead of DLNSHW and DLNSSHW as proxies for firm and sector
performance, where for a variable X, DLNX, is LNXt- L W I and
DLNX(t- 1) is LNX,-,- LN&.
We used pooled cross sectional and time series data for companies listed
on the KLSE over the period 1989-2000. The number of companies and
observation vary according to which specification is used with the
maximum number of companies and observations being 223 and 1092
respectively. Our sample only includes those companies for which we
have data on remuneration, performance variables and sales turnover for
at least three consecutive years over the sample period. There were 307
companies listed on the KLSE in 1989 and this number increased to 795
by 2000.
Financial data are available for most of these firms, but it was not
possible to collect ownership data on all of these companies for pooled
consecutive time series over the sample period. We also excluded fiom
the sample firms that operate in the finance, plantation and mining
sectors. These sectors use different accounting procedures than the ones
in other sectors. In addition, firms in the infrastructure (6), technology
(1 l), hotels (6) and closed end funds (1) sectors as well as trusts (4) have
also been excluded since there are only a handfd of companies listed on
the KLSE board for these sectors. Thus our sample includes those
companies operating in the consumer products, industrial products,
construction, trading/services, and property sectors.
Financial data such as sales turnover, last transacted price4 and market
value are measured at financial year-ends. Ownership data are measured
as of any month during the financial year (there is no fixed date at which
to report these data). Financial year-ends are not the same for all firms.
Since we define turnover and shareholder wealth consistently by financial
year, this should not be a problem for these variables. However, for sector
performance we use calendar years, that is, when we calculate the sector
performance measure for a given firm we include not just the firms with
the same financial year as the given firm, but all firms on which we have
data in our ca1cu1ations.' All data in ringgits are expressed in 1994
ringgits. The Consumer Price Index (CPI) has been used to convert the
nominal values to real values using 1994 as the base year. In the cases
where a firm is owned by a holding company, we have included only the
holding company to prevent double counting as holding company'
accounts consolidate the accounts of subsidiaries. In cases where we have
data on several subsidiaries and data on the holding company itself, we
have excluded the holding company from the sample to increase the
number of observations.
All data come from various KLSE publications. The main sources are the
KLSE Annual Companies Handbook and KLSE on Disc (which is the
electronic version of the Handbook). For Directors' Remuneration we
used the data provided on the web site of the KLSE Research Institute of
Investment Analysts Information ~ ~ s t e m s ! Data on this web site as well
as that in the KLSE handbook and KLSE on Disc are derived from the
annual reports of companies listed on the KLSE.
4. RESULTS
The results of various specifications using either stakeholder wealth or
return on assets as a proxy for performance, with time dummies to control
for shocks are reported in table 2. With the exception of the fourth
regression reported in table 2, both the Wald (time) and Wald (joint)
statistics are significant in each specification,which rejects the null
hypothesis that the tested coefficients are simultaneously zero. All
estimates were obtained using the Dynamic Panel Data (DPD) package of
Doornik et a1 (1999). These are one-step estimates obtained by using the
robust variance covariance matrix. In table 2 tests for the absence of first-
order and second-order serial correlation in the first-differenced residuals
are reported as AR(1) and AR(2) respectively. In the second, third, fifth
and seventh specification AR(1) is negative and significant and AR(2) is
insignificant, meaning that we can accept the null hypothesis that the
disturbance terms are not serially correlated in these ~~ecifications.~ For

this reason, we concentrate on the results in these specifications when
interpreting our findings in the following discus~ion.~
The first hypothesis, based on studies in the UK and USA, is that there is
a positive relationship between firm performance and board
remuneration. However, we noted above that the relationship between
board remuneration and firm performance might be weaker in Malaysia
than in the UK or USA because ownership is more concentrated. Our
results suggest that the relationship between board remuneration and firm
performance is ambiguous in Malaysia. In table 2 DLNSHWi,t-I is positive
and significant at 10 per cent in the first specification, but here we cannot
accept the null hypothesis that the disturbance terms are not serially
correlated. Turning to measures of accounting performance, in the third
specification in table 2, which does satisfy the null hypothesis that the
disturbance terms are not serially correlated DLN(l+ROA)i,t is significant
at the 10 per cent level with a perverse negative sign.
The second hypothesis is that there is a positive relationship between
remuneration and firm size. Our results provide strong evidence for this
hypothesis. In the second, third, fifth and seventh specification in table 2,
DLNTRNi, has a positive sign and is statistically significant at the 1 per
cent level. The magnitude of the coefficient on DLNTRNi,t varies
between .24 and .28, which is consistent with the findings of US studies
that have repeatedly found the elasticity of pay with respect to sales to be
around .3 (see Rosen 1992). Baker et a1 (1998, p. 609) suggest that this is
"the best documented empirical regularity regarding levels of executive
compensation". The magnitude on DLNTRNi,t-l in the first and fourth
specification is in the range .05 to .07. This result is consistent with that
of Conyon and Leech (1994) who estimate that the elasticity of the
highest paid director with respect to lagged turnover is .07 for the UK.
However, it is lower than Main et a1 (1996) who estimate the elasticity of
total board remuneration with respect to lagged turnover to be .28 for the
UK.
The third hypothesis is that there is an inverse relationship between board
remuneration and sector performance. Our results reject this hypothesis.
In table 2, DLNSSHWi, has a negative sign but is insignificant in the
second specification, while DLNS(l+SROA)i, has a negative sign, but is
insignificant in the third, fifth and seventh specification. Our results
suggest that those who set Board remuneration in Malaysia do not take
account of contemporaneous sector performance. Conyon and Leech's
(1994) findings for the UK suggest that pay setters take account of lagged
industry performance. However, we note that in one of the few existing
studies to use sector performance rather than industry performance to
measure relative performance, Main et a1 (1996) also found that
contemporaneous sector performance had a statistically insignificant
effect on Board remuneration in UK listed companies.
The fourth hypothesis is that there is an inverse relationship between
board remuneration and ownership concentration. In the seventh
specification in table 3, DCRl is negative and significant at 10 per cent.9
This suggests that ownership concentration has a negative and at least a
weakly significant effect on remuneration. This result differs from that of
Conyon and Leech (1994) who found that ownership concentration has
no effect on executive compensation in the UK. Our results, though, are
not surprising, given the higher levels of ownership concentration in
Malaysia than the UK. Because ownership is more concentrated, one
would expect that shareholders would have better information and be
better placed to monitor manager effort in Malaysia than in the UK. Our
findings are consistent with those of Crespi and Gispert (1998) for
Spanish listed companies. In Spain, where ownership concentration is
also much higher than the UK, Crespi and Gispert (1998) found that
ownership concentration had a negative and significant effect on
remuneration.
Table 3 examines the impact of the 1997 Asian financial crisis on Board
remuneration. It substitutes a crisis dummy variable (DCRISIS), which is
set equal to 1 for the period 1997 to 2000, for the time dummies in table
2. Table 3 also considers the effect of interactive variables - DCRISIS*DLNSHWi,t-I, DCRISIS*DLN( 1 +ROA)i,t and
DCRISIS*DLNTRNit - on Board remuneration. The Wald (joint) test is
significant at 1 per cent in each specification in table 3, while AR(1) is
negative and significant and AR(2) is insignificant in specifications three
through to six, which means that we can accept the null hypothesis that
the disturbance terms are not serially correlated in four of the six
specifications.
Focusing on these four specifications, the results in table 3 are generally
consistent with the findings with respect to the four hypotheses based on
table 2. The coefficient on the crisis dummy variable is negative and
significant at 5 per cent in specifications four and six, but insignificant in
specification five. In table 3, none of the crisis interactive variables are
significant. This suggests that as one would expect the Asian crisis had a
statistically significant negative effect on Board remuneration, but the
Asian financial crisis did not affect the role of either stockholder wealth,

return on assets or sales turnover as potential factors determining Board
remuneration.
5. CONCLUSIONS AND FUTURE RESEARCH
Most existing studies examine executive compensation in the UK or
USA. This study contributes to the literature through examining the
determinants of executive compensation in Malaysia, where ownership is
usually much more concentrated than in either of these countries. In
, addition, while most studies use the remuneration of the CEO or highest
paid director, we use Board remuneration which is more justifiable in
terms of principal-agent theory because it is the Board as a whole rather
than the highest paid director which can be best regarded as the
shareholders' agent. In section four, we tested four hypotheses based on
the existing literature. Our results provide support for two of the four
hypotheses. We found evidence of a statistically significant positive
relationship between Board remuneration and sales turnover and a
statistically significant negative relationship between Board remuneration
and ownership concentration. Our results suggest that the relationship
between Board remuneration and firm performance is ambiguous, while
there is no evidence of a significant relationship between Board
remuneration and sector performance.
Future research could extend this study in several ways. First, the
reference period for the concentration dummies could be changed fiom
later years to earlier years. If ownership has become more dispersed after
the crisis the pay performance relationship should have strengthened.
Second, by using data on share distribution it should be possible to
determine, for example, whether or not the pay performance relationship
differs between firms where ownership is concentrated in the hands of
Malaysian owners and the firms where there is a high proportion of
foreign ownership. Third, it might be desirable to use a dynamic model,
in the sense this term is used in panel data estimation, employed in Main
et a1 (1996) instead of the static one we use in order to account for the
delay in the administration of pay. To do this it would necessary to
include a lagged dependent variable on the right hand side.
References
Baker, G., M. Jensen and K. Murphy, 1988, Compensation and
Incentives: Practice vs Theory, Journal of Finance 43, 593-61 6.
Berle, A and G. Means, 1932, The Modern Corporation and Private
Property (Harcourt, New York)
Brunello,G., C. Graziano and B. Parigi, 1997, Executive Compensation
and Firm Performance in Italy, Unpublished manuscript, Department of
Economics, University of Udine, Udine, Italy.
Claessens, S., S. Djankov and L. Lang, 1'999, Who Controls East Asian
Corporations?, Unpublished manuscript, World Bank and the University
of Chicago.
Conyon, M.J., 1997, Corporate Governance and Executive
Compensation, International Journal of Industrial Organization 15, 493-
509.
Conyon, M.J., and D. Leech, 1994, Top Pay, Company Performance and
Corporate Governance, Oxford Bulletin of Economics and Statistics 56,
Crespi, R and C. Gispert, 1998, Board Remuneration, Performance and
Corporate Governance in Large Spanish Companies, Unpublished
manuscript, Department d'Economia de I'Empresa, Universitat
Autonoma de Barcelona.
Doornik, J.A., M. Arellano and S. Bond, 1999, Panel Data Estimation
using DPD for Ox, Unpublished.
Gibbons, R and K. Murphy, 1990, Relative Performance Evaluation for
Chief Executive Officers, Industrial and Labor Relations Review 43, 30-
49
Gregg, P., S. Machin and S. Szymanski, 1993, The Disappearing
Relationship Between Directors' Pay and Corporate Performance, British
Journal of Industrial Relations 30, 1 - 1 0.
Holmstrom, B. 1979, Moral Hazard and Observability, Bell Journal of
Economics 10,74-9 1.
Jensen, M. and K. Murphy, 1990, Performance Pay and Top Management
Incentives, Journal of Political Economy 98,225-264
La Porta, R., F. Lopez-De-Silanes and A Shleifer, 1999, Corporate
Ownership Around the World, Journal of Finance 54,47 1-5 13
Lim, M.H., 1981, Ownership and Control of the One Hundred Largest
Corporations in Malaysia (Oxford University Press, Oxford).
Main, B., A. Bruce and T. Buck, 1996, Total Board Remuneration and
Company Performance, Economic Journal 106, 1 627- 1 644.
Morck, R., A. Shleifer and R. Vishny, 1988, Management, Ownership
and Market Valuation: An Empirical Analysis, Journal of Financial
Economics 20,293-3 15.
Murphy, K, 1985, Corporate Performance Pay and Managerial
Remuneration: An Empirical Analysis, Journal of Accounting and
Economics 7,ll-42.
Murphy, K., 1998, Executive Compensation, in: 0. Ashenfelter and D.
Card, eds, Handbook of Labor Economics, Vol. 3 (North Holland,
Amsterdam).
Organisation of Economic Cooperation and Development (OECD), 1999,
Corporate Governance in Asia: A Comparative Perspective (OECD and
World Bank, Seoul)
Rosen, S., 1992, Contracts and the Market for Executives, in: L. Werin
and H. Wijkander, eds, Contract Economics (Basil Blackwell, Oxford)
181-217.
Shleifer, A and R. Vishny, 1986, Large Shareholders and Corporate
Control, Journal of Political Economy 94,46 1-488.
Schleifer, A and R. Vishny, 1997, A Survey of Corporate Governance,
Journal of Finance 94,461 -488.
Tirole, J., 1988, The Theory of Industrial Organization (MIT Press,
Cambridge Mass.)
Zwiebel, J., 1995, Corporate Conservatism and Relative Compensation,
Journal of Political Economy 103, 1-25.
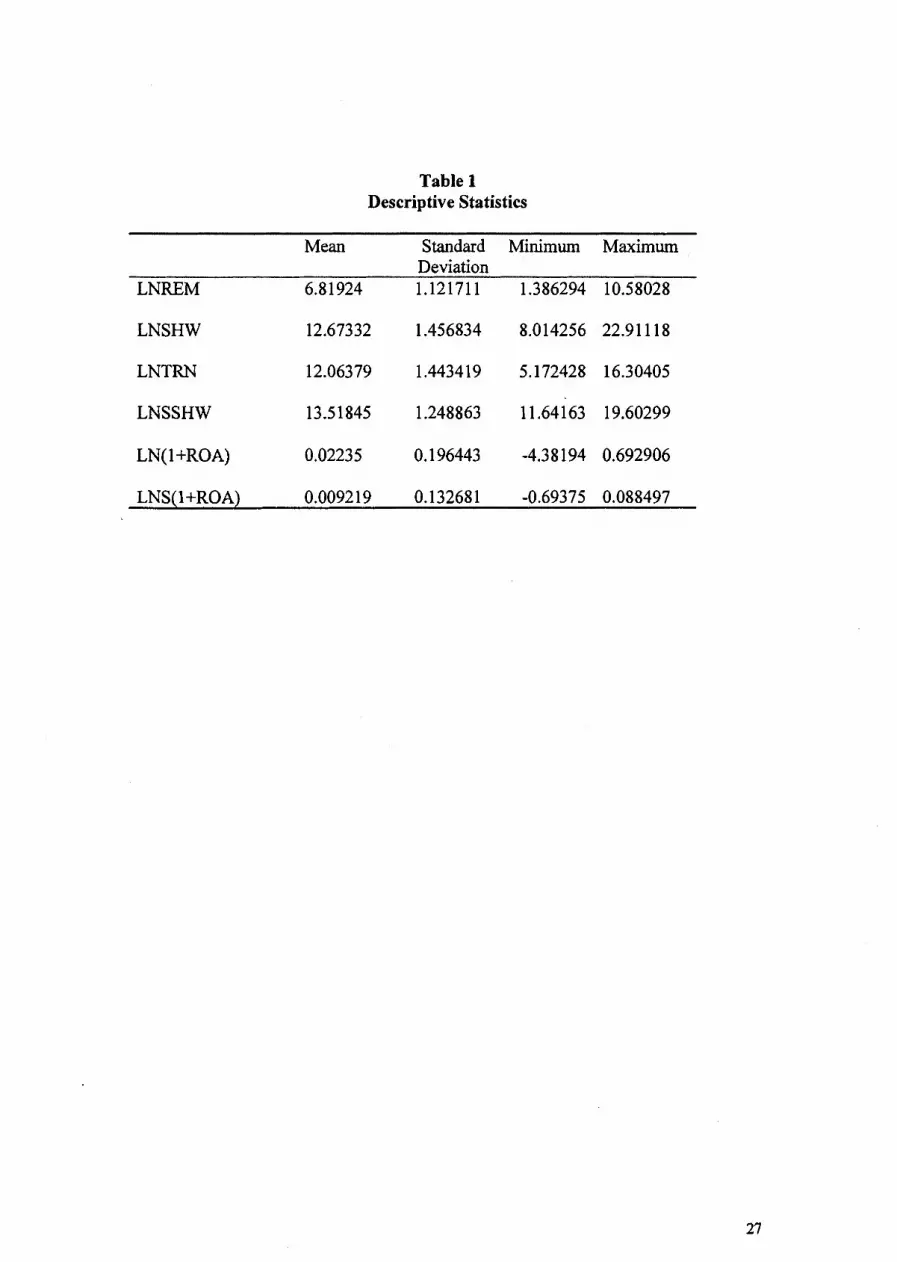
Table 1 Descriptive Statistics
Mean Standard Minimum Maximum Deviation
LNREM 6.8 1924 1.121711 1 .386294 10.58028
LNSHW 12.67332 1.456834 8.014256 22.91 1 18
LNTRN 12.06379 1 .443419 5.172428 16.30405
LNSSHW 13.51845 1 .248863 1 1.641 63 19.60299
LN(1 +ROA) 0.02235 0.196443 -4.38 194 0.692906
LNS(1 +ROA) 0.0092 19 0.13268 1 -0.69375 0.088497
Table 2 Ownership Concentration, Directors' Remuneration and Company Performance
(Standard errors in parentheses)
Constant
DLNSHWi,t-l
DLN(1 +ROA)i,t
DLN(1 +ROA)i,t-I
DLNTRNi,t
DLNTRNi,t-l
DLNSSH WiVt
DLNSSHWi,t-l
DLNS(1 +SROA)i,t
Variable 1 2 3 4 5 6 7 -0.0862 139 0.0 169897 0.0301 743 -0.0421 7 16 0.03 16285 0,04980 19 0.0520582
Table 2 continued
DCRl
Time Dummies YES YES YES YES YES YES YES
Wald (time) 19.6 1 18.91 20.79 (7)*** 28.00 19.91 (7)*** 20.65 (7)*** 19.80 (7)*** (7)* * * (7)* * * (7)* * *
Wald (joint) 7.930 19.2 1 15.49 (3) *** 5.761 (3) 11.84 (2) *** 16.45 (4)*** 12.94 (3) *** (3)** (2)* * *
AR(1) test -1.014 -2.055 ** -2.156 ** -2.062** -2.172** -2.188** -2.213** AR(2) test -2.679*** -1.893 -1.724 -2.672*** -1.783 -1.768** -1.822
Observations 909 966 1082 1152 1092 1082 1092 No. companies 223 223 222 223 222 222 222 Notes: Dependent variable is DLNREI4i.p
wild (time): Wald test on time dummies only. Wald (joint): Wald test on all regressors except the dummies. For both Wald tests we report the Chi square statistic and degrees of freedom (in the parentheses next to each statistic). AR(1) and AR(2) are tests for first and second order serial correlation, which are distributed as
N(0,I) under the null of no autocorrelation. *** Significant at 1% level, **Significant at 5% level , *Significant at 10% level.
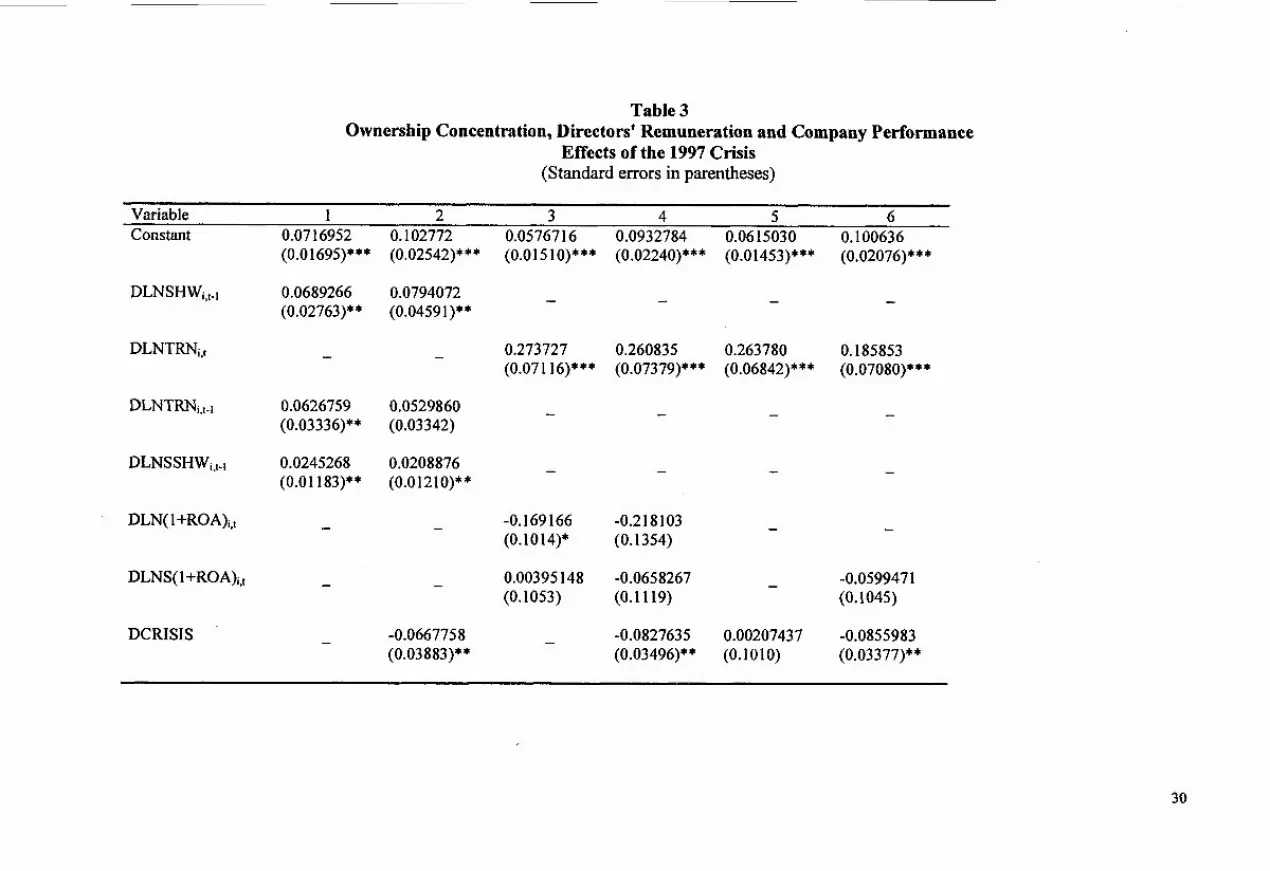
Table 3 Ownership Concentration, Directors' Remuneration and Company Performance
Effects of the 1997 Crisis (Standard errors in parentheses)
Variable 1 2 3 4 5 6 Constant 0.07 16952 0.102772 0.057671 6 0.0932784
DLNSHWi,,.,
DLNTRNi,t
DLNTRNi,,.,
DLNSSHWi,t.l
DLN( l +ROA)i,t
DLNS(1 +ROA)i,t
DCRISIS
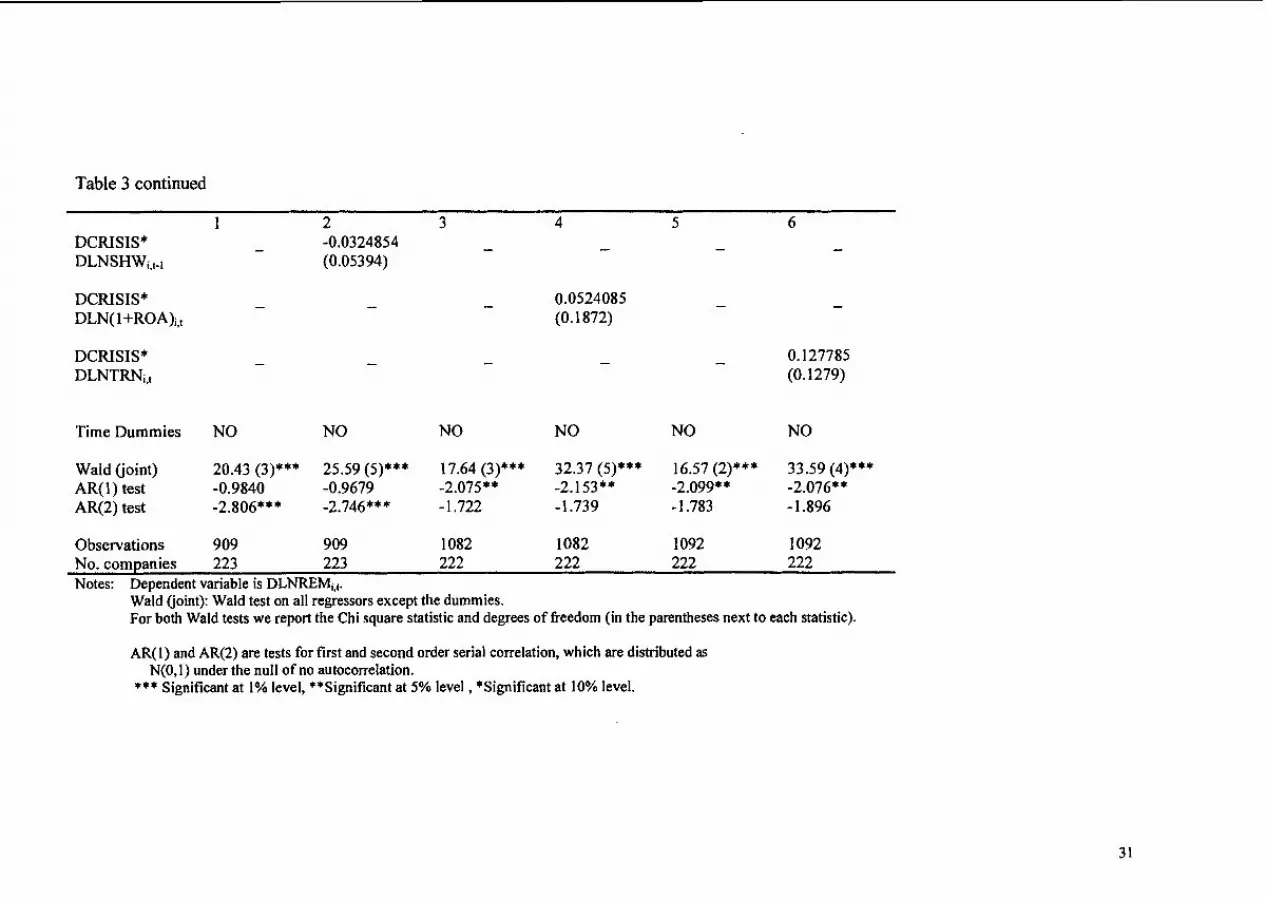
Table 3 continued
1 2 3 4 5 6 DCRISIS* - -0.0324854 - - - - DLNSHWis+l (0.05394)
DCRISIS* - - - 0.0524085 - - DLN( l +ROA)i,l (0.1872)
Time Dummies NO NO NO NO NO NO
Wald (joint) 20.43 (3)*** 25.59 (5)*** 17.64 (3)*** 32.37 (5)*** 16.57 (2)*** 33.59 (4)*** AR(1) test -0.9840 -0.9679 -2.075** -2.153** -2.099** -2.076** AR(2) test -2.806*** -2.746*** - 1.722 -1.739 - 1.783 - 1 .S96
Observations 909 909 1082 1082 1092 1092 No. companies 223 223 222 222 222 222 Notes: Dependent variable is DLNREMi,,.
Wald (joint): Wald test on all regressors except the dummies. For both Wald tests we report the Chi square statistic and degrees of freedom (in the parentheses next to each statistic).
AR(I) and AR(2) are tests for first and second order serial correlation, which are distributed as N(0,l) under the null of no autocorrelation.
*** Significant at 1% level, **Significant at 5% level , *Significant at 10% level.
Notes
' In the regressions reported later in the paper we use sectors rather than industries.
Companies listed on the KLSE board are grouped into 12 sectors: construction,
consumer products, finance, industrial products, trading and services, hotel,
infrastructure, mining, plantation, properties, trusts and closed end h d s . Each sector
is divided into a number of industries. Some previous studies use industries and
others use sectors to get a comparative performance measure. Typically, the choice of
measure depends on the availability of data; industry data is not always available. In
this study it was not possible to use industries because we needed data for at least
three firms in one sector or industry to be able to calculate a comparative performance
measure and in many cases we did not have that many at the industry level. By
including a sector performance measure instead of an industry one we assume that
when directors' salaries are set, the former is used.
The median level of directors' remuneration in real terms was Rh4 679 536 in 1991,
Rh4 1 099 000 in 1995, and RM 1 127 508 in1 999 for the companies in the sample.
We also experimented with alternative concentration measures such as the
percentage of shares owned by the largest five and largest 10 shareholders. The
results were similar to those reported below using the largest shareholder.
For some companies the stock market data for earlier years provided in the latest
issue of KLSE on Disc (Volume 1 : No.4) are inconsistent with the ones provided in
previous issues. (For example for certain companies 1993 data on latest transacted
price in volume 4 do not match the 1993 data in earlier discs). We used the latest data
in these cases.
In our data set data from, say, 1999-2000 financial year appears as year 2000
information. To calculate sector returns for a year we use all data available for that
year, no matter when the financial year ends.
http://www.klse-ris.com.mv/
According to the DPD manual: "If the disturbances v,, are not serially correlated,
there should be evidence of significant negative first order serial correlation in
.. .. differenced residuals, (Le v ,,- v and no evidence of second order serial
correlation in the differenced residuals. These tests are based on the standardized
average residual autocovariances which are asymptotically N(0; l) variables under the
null of no autocorrelation" (Doornik et. al., 1999, p.8).
We experimented with a number of different lag structures to remove serial
correlation in the first fourth and six specifications without success. We report the
results even though they are impaired by serial correlation to allow the reader to
compare our results with those in the previous literature.
We have not reported the results with DCRl from the first and second specification
in table 2 because they are impaired by serial correlation.
Titles in the Department of Economics Discussion Papers (New Series commenced October 1999)
01-99 Should China be Promoting Large-scale Enterprises and Enterprise Groups? Russell Smyth
02-99 Division of Labor, Coordination, and Underemployment Heling Shi
03-99 Attitude Choice, Economic Change, and Welfare Yew-Kwang Ng and Jianguo Wang
04-99 Economic Reform, Overlapping Property Rights, and Polarisation in the Real Estate Market J. Ram Pillarisetti
05-99 Economic Reform, Growth and Inequality in Human Development in Transitional Economies J. Ram Pillarisetti and Mark Mcgillivray
, 06-99 Efficiency and Liquidity in the Electricity Market: A Preliminary Analysis Barry A. Goss and S. Gulay Avsar
01-00 Effects of Externality-Corrective Taxation on the Extent of the Market and Network Size of Division of Labor Yew-Kwang Ng and Xiaokai Yang
02-00 Incomplete Contingent Labor Contract, Asymmetric Residual Rights and Authority, and the Theory of the Firm Xiaokai Yang
03-00 The Effects of Education on the Timing of Marriage and First Conception in Pakistan Lata Gangadharan and Ptrshkar Maitra
04-00 A Production Theory Approach to the Imports and Wage Inequality Nexus Christis G. Tombazos
05-00 Simultaneity, Rationality and Price Determination in US Live Cattle Barry A. Goss, S. Gulay Avsar and Brett A. Inder
06-00 Free Riding and the Welfare Effects of Parallel Imports Jong-Say Yong
07-00 The Determinants of Judicial Prestige and Influence: Some Empirical Evidence from the High Court of Australia Mita Bhattacharya and Russell Smyth
08-00 Causality in International Capital Movements: The Income Mobility of Australian Investment Abroad Robert D Brooks, Dietrich K Fausten and Param Silvapulle
01-01 Outside Options and the Competitiveness of Vertical Alliances: A Core Theoretic Approach Jong-Say Yong
02-01 Resource Inflows and Household Composition: Evidence From South African Panel Data Pushkar Maitra and Ranjan Ray
03-0 1 School Dropouts and Economic Growth: A Cross-Country Analysis Kausik Chaudhuri and Pushkar Maitra
04-0 1 HOGLEX demand systems and welfare policy in major ASEAN developing countries: A Bayesian analysis using expenditure unit records Hikaru Hasegawa, Tran Van Hoa, Ma. Rebecca Valenzuela
05-01 Unprotective Tariffs, Ineffective Liberalization and Other Mysteries: An Investigation of the Endogenous Dimensions of Trade Policy Formation in Australia Christis G. Tombazos
06-0 1 Strategic FDI and Industrial Ownership Structure Christopher J. Ellis and Dietrich Fausten
07-0 1 Forecast Errors and Efficiency in the US Electricity Futures Market S. Gulay Avsar and Barry A. Goss
08-0 1 Good Capitalism Versus Bad Capitalism: Effects of Political Monopoly of the Ruling Elite on the Extent of the Market, Income Distribution, and Development Wai-Man Liu and Xiaokai Yang
09-0 1 Birth-spacing and Child Survival: Comparative Evidence fiom India and Pakistan Pushkar Maitra and Sarmistha Pal
10-01 Board remuneration, Company Performance and Corporate Governance: Evidence fiom Publicly Listed Malaysian Companies Ergun Dogan and Russell Smyth
11-01 Externality, Pigou and Coase: A Case for Bilateral Taxation and Amenity Rights Yew-Kwang Ng
12-0 1 Division of Labour, Specialisation and the Enforcement of a System of Property Rights: A General Equilibrium Analysis Li Ke and Russell Smyth
1 3-0 1 Optimal Environmental ChargeslTaxes: Easy to Estimate and Surplus Yielding Yew-Kwang Ng