bmcg ecb welcome remarks isabel schnabel
TRANSCRIPT

The monetary policy non-puzzle in bond markets
Isabel Schnabel, Member of the ECB’s Executive BoardBond Market Contact Group, Frankfurt am Main, 15 September 2021

Rubric
www.ecb.europa.eu ©
Exceptionally low yield environment proves persistent despite recovery
10-year US Treasury and euro area GDP-weighted yield
(percentage)
Source: ECB calculations and Bloomberg.Latest observation: 10 September 2021.
Source: ECB calculations.Latest observation: 10 September 2021.
10-year sovereign bond spreads over German Bunds
(basis points)
2
-1
0
1
2
3
4
Jan-18 Jan-19 Jan-20 Jan-21
Euro area US
0
50
100
150
200
250
300
350
400
450
Jan-18 Jan-19 Jan-20 Jan-21
Italy Greece Portugal Spain

Rubric
www.ecb.europa.eu ©
Inflation expectations are rising, putting upward pressure on nominal rates…
Sources: ECB calculations.Latest observation: 10 September 2021.
Decomposition of nominal 10-year euro area OIS rate
(cumulative change since January 2021; percentage points)
Euro area 5y5y inflation swap forward rate
(percent)
3
Source: Bloomberg.Latest observation: 10 September 2021.
-0.6
-0.4
-0.2
0.0
0.2
0.4
0.6
0.8
Jan-21 Apr-21 Jul-21
10Y real OIS rate10Y inflation swap rate10Y nominal OIS rate
Could you start the chart in Jan-17?
0.6
0.8
1.0
1.2
1.4
1.6
1.8
2.0
Jan-17 Nov-17 Sep-18 Jul-19 May-20 Mar-21
Pre-pandemic level
Rubric
www.ecb.europa.eu ©
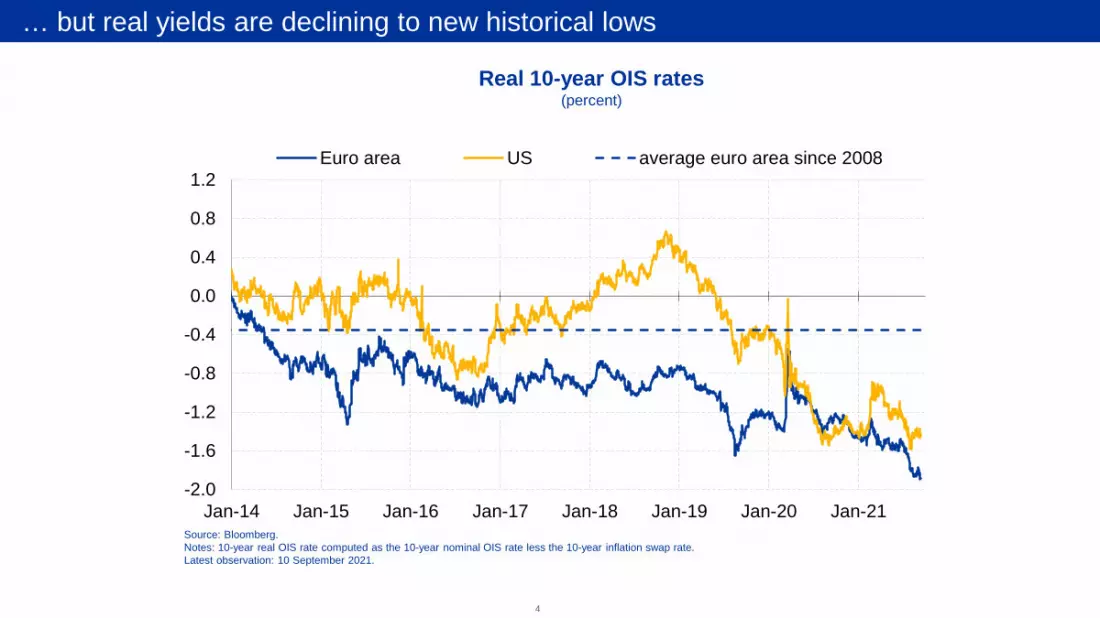
… but real yields are declining to new historical lows
Source: Bloomberg.Notes: 10-year real OIS rate computed as the 10-year nominal OIS rate less the 10-year inflation swap rate.Latest observation: 10 September 2021.
Real 10-year OIS rates(percent)
4
-2.0
-1.6
-1.2
-0.8
-0.4
0.0
0.4
0.8
1.2
Jan-14 Jan-15 Jan-16 Jan-17 Jan-18 Jan-19 Jan-20 Jan-21
Euro area US average euro area since 2008

Rubric
www.ecb.europa.eu ©
Delta variant affects bond yields and prolongs supply bottlenecks
5
Euro area PMI manufacturing: suppliers’ delivery times
(50 indicates no change over previous month)
Source: MarkitLatest observation: August 2021
0
10
20
30
40
50
60
70
1999 2003 2007 2011 2015 20190
10
20
30
40
50
60
70
2019 2020 2021-1.0
-0.8
-0.6
-0.4
-0.2
0.0
0.2
0.4
0.6
May-21 Jun-21 Jul-21 Aug-21 Sep-21
10-year Treasurydomestic macrodomestic policy
foreign macroforeign policyglobal risk
Sources: Sources: Refinitiv Datastream and ECB.Note: Shock contributions are estimated using a daily BVAR model for the US using a combinationof sign, magnitude and narrative restrictions.Latest observation: 10/09/2021.
Drivers of 10-year US Treasury yield(contribution in basis points)
Rubric
www.ecb.europa.eu ©
0
1
2
3
4
Jan-17 Jan-19 Jan-21
US
0
1
2
3
4
Jan-17 Jan-19 Jan-21
Europe
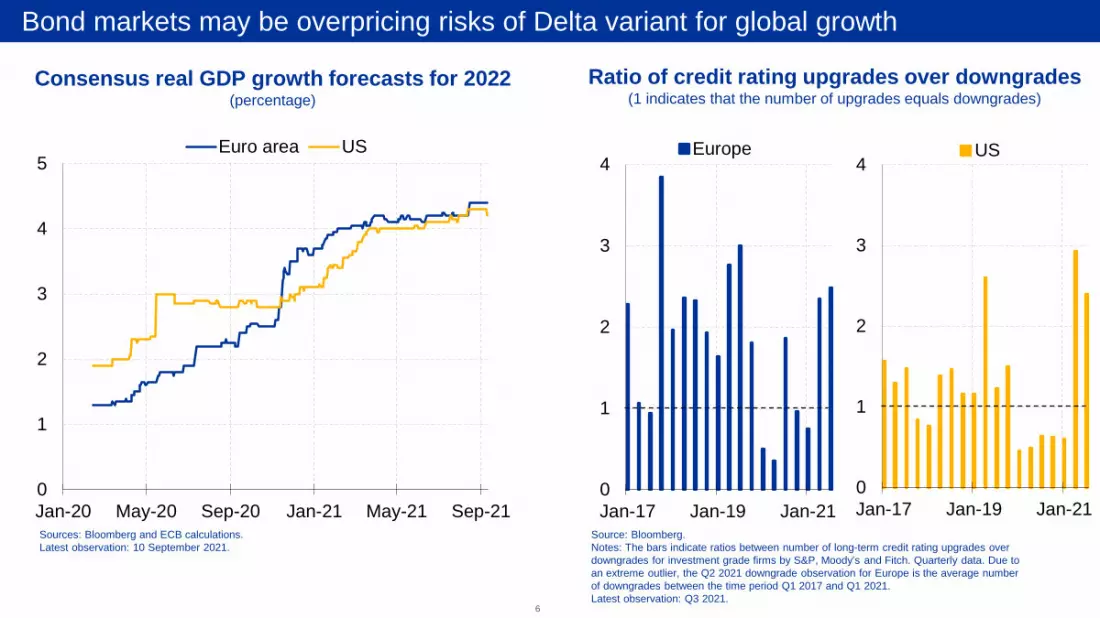
Bond markets may be overpricing risks of Delta variant for global growth
Consensus real GDP growth forecasts for 2022(percentage)
Sources: Bloomberg and ECB calculations.Latest observation: 10 September 2021.
6
Ratio of credit rating upgrades over downgrades(1 indicates that the number of upgrades equals downgrades)
Source: Bloomberg.Notes: The bars indicate ratios between number of long-term credit rating upgrades over downgrades for investment grade firms by S&P, Moody’s and Fitch. Quarterly data. Due to an extreme outlier, the Q2 2021 downgrade observation for Europe is the average number of downgrades between the time period Q1 2017 and Q1 2021.Latest observation: Q3 2021.
0
1
2
3
4
5
Jan-20 May-20 Sep-20 Jan-21 May-21 Sep-21
Euro area US

Rubric
www.ecb.europa.eu ©
60
70
80
90
100
110
120
130
140
150
Jan-20 May-20 Sep-20 Jan-21 May-21 Sep-21
EURO STOXX S&P 500
Continued rally in stock markets is mainly driven by better earnings outlook
7
Source: Bloomberg.Latest observation: 10 September 2021.
Equity market developments(index: Jan-20 = 100)
Drivers of equity prices in the euro area(cumulative change since January 2020, percentages)
Sources: Refinitiv, IBES, Consensus Economics, Bloomberg and ECB calculations.Notes: The decomposition is based on a dividend discount model. The model includes share-buybacks, discounts future cash-flows with interest rates of appropriate maturity, and includes fiveexpected dividend growth horizons. See ECB Economic Bulletin, Issue 4/2018 for more details.Latest observation: 3 September 2021 (weekly data).
Please remove vertical line and change bar on the right side
-80
-60
-40
-20
0
20
40
60
80
Jan-20 Jul-20 Jan-21 Jul-21
Equity risk premiumRisk-free discount ratesLonger-term earnings expectationsShort-term earnings expectationsDividends and share buybacksEA Total Economy Index
38%
16%

Rubric
www.ecb.europa.eu ©
Stock of acquired assets is putting persistent downward pressure on bond yields
30
35
40
45
50
55
2009 2011 2013 2015 2017 2019
Free-floating EA-4 bond supply(percent)
Sources: ECB.Notes: The free-float measure for the four largest euro area economies (Germany, France, Italy and Spain) isdefined as holdings of general government bonds by price-sensitive private-sector investors as a share of totaloutstanding bond supply, both expressed in ten-year maturity equivalents. Price sensitive investors are defined asall sectors other than the foreign official sector, insurance companies and pension funds, and the Eurosystem.Latest observation: March 2021 (quarterly data).
8
Sources: ECB calculations.Notes: Impacts derived from the model of Eser et al. (2019) and a recalibrated version of the model so that the model-implied yield reactions to the March PEPP announcement match the two-day yield changes observed after 18 March(average estimates). Results refer to GDP-weighted averages of the zero-coupon yields of the big-four sovereign issuers(DE, FR, IT, ES). Future assumptions are based on results from the ECB’s survey of monetary analysts, i.e. APP (PEPP)end of net purchases: June 2024 (March 2022); APP (PEPP) end of reinvestments: June 2026 (December 2024).Latest observation: March 2021 for past estimates.
Estimates of APP and PEPP holdings on EA-4 sovereign term premia
(basis points)
-200-180-160-140-120-100-80-60-40-20
0
2015 2017 2019 2021 2023 2025
2y 5y 10y
Rubric
www.ecb.europa.eu ©
-1
0
1
2
3
4
0 1 2 3 4
2010-Feb 2020March 2020-todayLast obs (10-Sep-21)
-1
0
1
2
3
4
0 1 2 3 4
2010-Feb 2020 (ex. 2012-13)March 2020-todayLast obs (10-Sep-21)
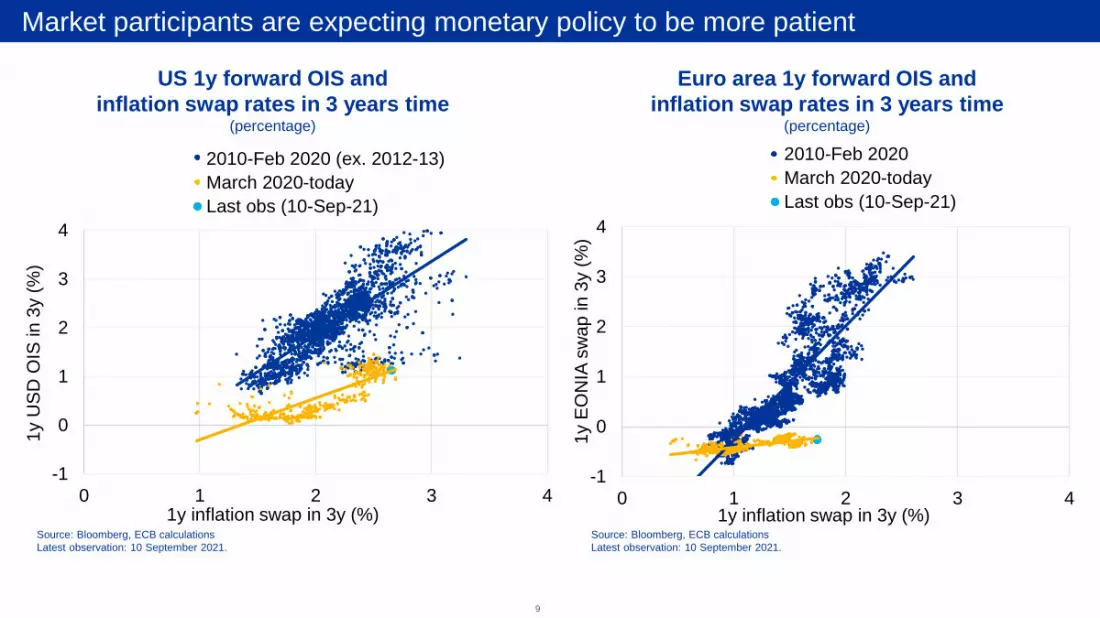
Market participants are expecting monetary policy to be more patient
US 1y forward OIS and inflation swap rates in 3 years time
(percentage)
Euro area 1y forward OIS and inflation swap rates in 3 years time
(percentage)
Source: Bloomberg, ECB calculationsLatest observation: 10 September 2021.
Source: Bloomberg, ECB calculationsLatest observation: 10 September 2021.
9
1y E
ON
IA s
wap
in 3
y (%
)
1y inflation swap in 3y (%)1y inflation swap in 3y (%)
1y U
SD O
IS in
3y
(%)

Rubric
www.ecb.europa.eu ©
New strategy and revised forward guidance truncate risk distribution from the top
10
Source: ECB calculations.
Probabilities of future evolution of 3-month Euribor(percentage)
Source: ECB calculations.
7 July 2021 (pre-strategy announcement) 23 July 2021 (post-July GovC)

Rubric
www.ecb.europa.eu ©
Markets increasingly price risks of higher inflation
11
Probability of inflation exceeding 2% over the next five years
(percentage)
Sources: Bloomberg and ECB calculations.Notes: Probabilities implied by five-year zero-coupon inflation options, smoothed over five businessdays. Risk-neutral probabilities may differ significantly from physical, or true, probabilities.Latest observation: 10 September 2021.
0
10
20
30
40
50
60
70
80
90
100
Jan-14 Jan-16 Jan-18 Jan-20
Euro area US
10-year inflation risk premium(percentage)
Source: Refinitiv, Haver and ECB calculations.Notes: The euro area inflation risk premium represents average estimates based on two affine term structure models applied to ILS rates adjusted for the indexation lag as in Camba-Mendez and Werner (2017). This estimation method follows Joslin, Singleton and Zhu (2011). The US inflation risk premium is estimated by the Federal Reserve Board DKW Model.Latest observation: August 2021.
-1.0
-0.5
0.0
0.5
1.0
Jan-06 Jan-09 Jan-12 Jan-15 Jan-18 Jan-21
Euro area US

Rubric
www.ecb.europa.eu ©
Thank you for your attention!