bloomberg activism screening model
TRANSCRIPT

A Bloomberg Professional Services OfferingQ
uan
tC
on
tent &
Data So
lutio
ns
A Bloomberg Professional Services OfferingO
verviewB
loo
mb
erg Term
inalBloomberg Activism Screening ModelIdentifying potential activism targets.by Adam Kommel and Arun Verma

Contents
02 Introductions
03 Training and testing the model
03 Results
04 Factors
08 On the Terminal
10 Appendix
This white paper investigates the results of the Bloomberg Activism Screening Model. The model’s goal is to answer a basic question: Which companies in a list of equities may become targets for activist investors? This model has been requested frequently by Bloomberg clients. Advisers to activists and targets as well as internal experts recommended the screening criteria.
The model selected 17 factors from a pool of 60 candidate factors. These factors fall into 5 categories: Returns (5), Valuation (4), Ownership (3), Governance (3) and Operations (2). Some factors are based on market data, including returns over 6 months, 1, 2, 3 and 5 years. Some are derived, including price/earnings ratio relative to peers and margins relative to peers. Others are compiled by Bloomberg, including CEO tenure and whether the company has dual-class unequal voting rights. Each criterion, scaled from 0 to 100, is applied to all the companies in a list (for this investigation, the Russell 3000 Index was used). Companies are ranked by the outcomes, with those higher on the list considered more likely to draw the interest of activists.
The examination looked at four years of data and found that, on an out-of-sample basis, 20% of companies in the top one percent of the ranking may face activist campaigns in the next 12 months. The average base rate for the entire Russell 3000 is 4.5%.
The results of the screening may differ for lists outside the Russell 3000. The criteria are available to Bloomberg clients in the (EQS<GO>) Equity Screening function under Popular Screens, which allows clients to save the screen and change the criteria.
Abstract
In this paper, we propose a combination of factors that may be used to anticipate activist campaigns. Results demonstrate that it is possible to order companies by their likelihood of facing campaigns using data points on returns, valuation, operations, governance and ownership.
The study is conducted by collecting a list of 60 factors we expect should correlate to activist targets. We determine out-of-sample values by finding the best-performing factor combinations for 80% of our 2017-2020 dataset and testing those combinations on the remaining 20%. Finally, we use this data to produce a ranking that clients can access in EQS <GO>.
Bloomberg Activism Screening Model
Bloomberg Activism Screening ModelIdentifying potential activism targets
2
Introduction
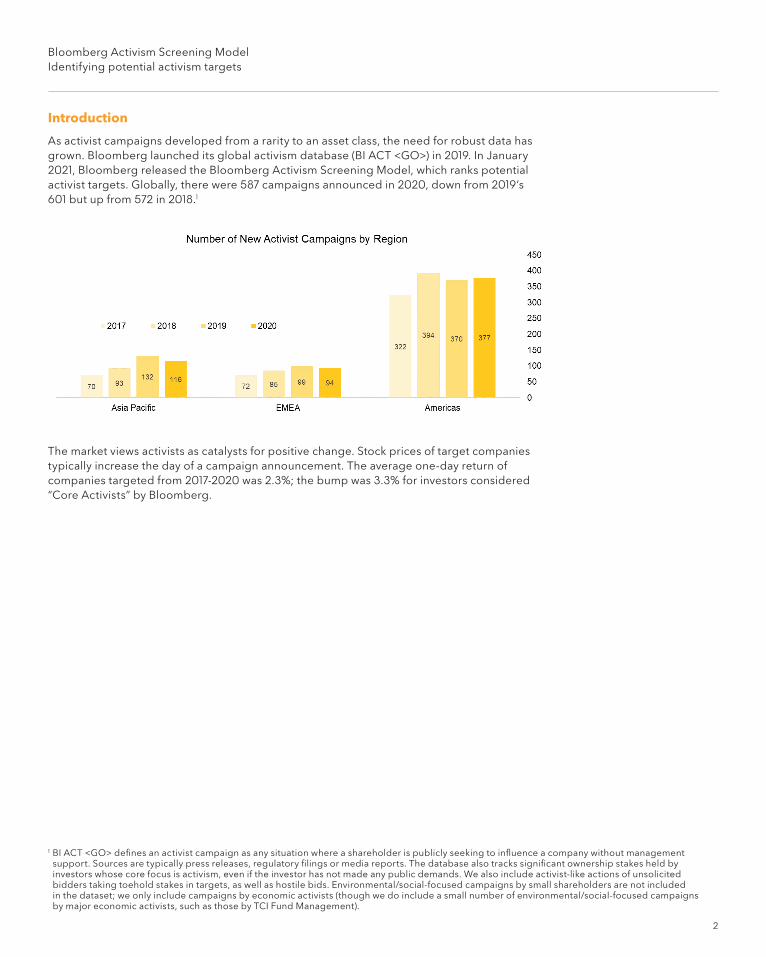
As activist campaigns developed from a rarity to an asset class, the need for robust data has grown. Bloomberg launched its global activism database (BI ACT <GO>) in 2019. In January 2021, Bloomberg released the Bloomberg Activism Screening Model, which ranks potential activist targets. Globally, there were 587 campaigns announced in 2020, down from 2019’s 601 but up from 572 in 2018.1
The market views activists as catalysts for positive change. Stock prices of target companies typically increase the day of a campaign announcement. The average one-day return of companies targeted from 2017-2020 was 2.3%; the bump was 3.3% for investors considered “Core Activists” by Bloomberg.
1 BI ACT <GO> defines an activist campaign as any situation where a shareholder is publicly seeking to influence a company without management support. Sources are typically press releases, regulatory filings or media reports. The database also tracks significant ownership stakes held by investors whose core focus is activism, even if the investor has not made any public demands. We also include activist-like actions of unsolicited bidders taking toehold stakes in targets, as well as hostile bids. Environmental/social-focused campaigns by small shareholders are not included in the dataset; we only include campaigns by economic activists (though we do include a small number of environmental/social-focused campaigns by major economic activists, such as those by TCI Fund Management).
Bloomberg Activism Screening ModelIdentifying potential activism targets
3
Training and testing the model
The goal of the Bloomberg Activism Screening Model is to rank companies based on their likelihood of becoming activist targets by using datasets available through Bloomberg’s standard API.
To optimize our rankings, we trained the model on activist campaigns in the Russell 3000 announced from 2017-2020. We exclude companies that already face activist campaigns, which reduces our list to about 2,700-2,800 companies.2 On average, 4.5% of such Russell 3000 companies are targeted by activist campaigns over the following 12 months (approximately 120 companies).
We determined the optimal combination of factors by testing the performance of thousands of possible equally weighted combinations of the 60 factors to determine which most accurately anticipated future campaigns.
We performed each test using company data from four point-in-time reference dates: year-end dates from 2016 to 2019. We then combined the data from the four years into a single table of 11,000 rows, representing companies at a given point in time; and 60 columns, representing data points for each company and date. We shuffled this table 100 times and created 100 pairs of training sets (80% of the table) and testing sets (remaining 20% of the table).
We can determine expected out-of-sample (go-forward) precision by observing average out-of-sample results of the best in-sample combination for each of our 100 random shuffles.3
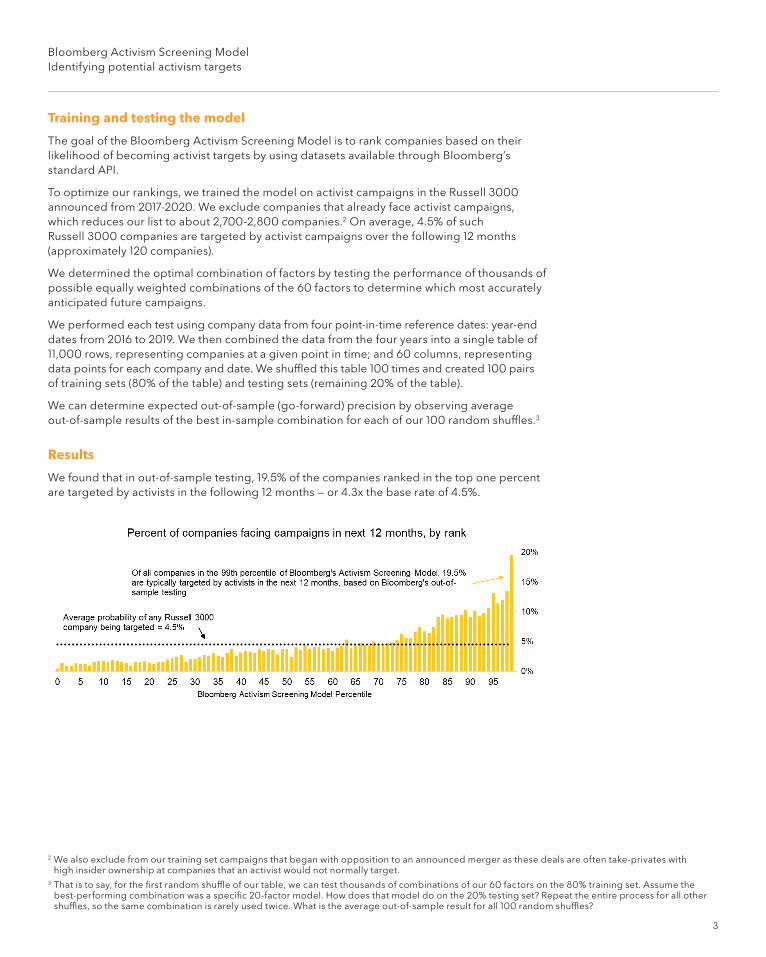
Results
We found that in out-of-sample testing, 19.5% of the companies ranked in the top one percent are targeted by activists in the following 12 months — or 4.3x the base rate of 4.5%.
2 We also exclude from our training set campaigns that began with opposition to an announced merger as these deals are often take-privates with high insider ownership at companies that an activist would not normally target.
3 That is to say, for the first random shuffle of our table, we can test thousands of combinations of our 60 factors on the 80% training set. Assume the best-performing combination was a specific 20-factor model. How does that model do on the 20% testing set? Repeat the entire process for all other shuffles, so the same combination is rarely used twice. What is the average out-of-sample result for all 100 random shuffles?
Bloomberg Activism Screening ModelIdentifying potential activism targets
4
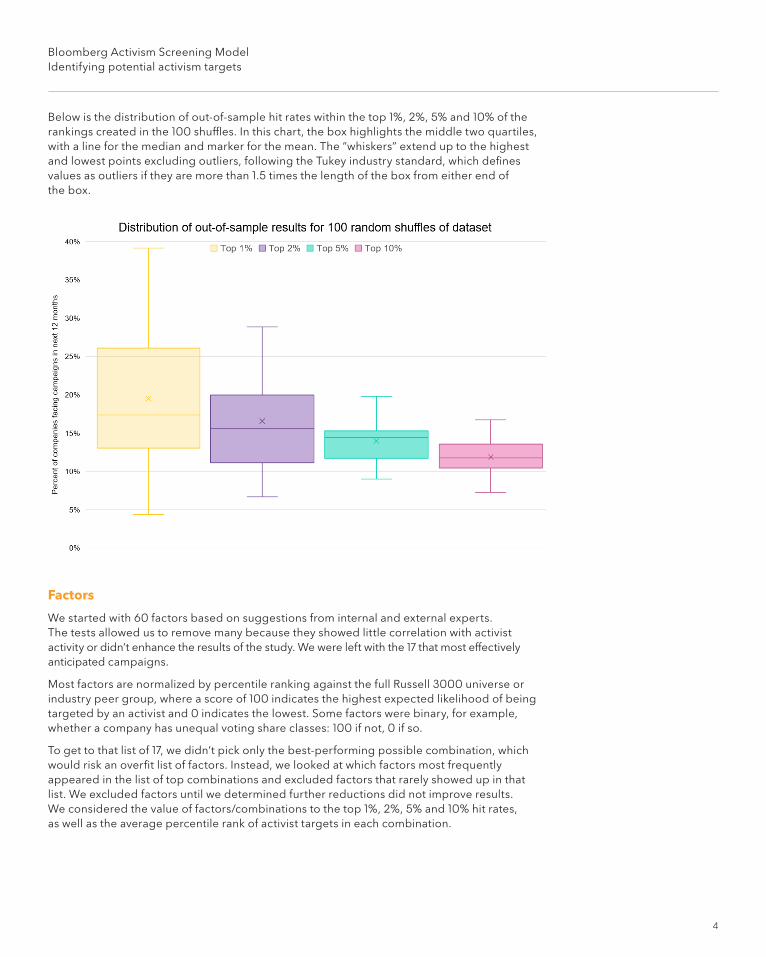
Below is the distribution of out-of-sample hit rates within the top 1%, 2%, 5% and 10% of the rankings created in the 100 shuffles. In this chart, the box highlights the middle two quartiles, with a line for the median and marker for the mean. The “whiskers” extend up to the highest and lowest points excluding outliers, following the Tukey industry standard, which defines values as outliers if they are more than 1.5 times the length of the box from either end of the box.
Factors
We started with 60 factors based on suggestions from internal and external experts. The tests allowed us to remove many because they showed little correlation with activist activity or didn’t enhance the results of the study. We were left with the 17 that most effectively anticipated campaigns.
Most factors are normalized by percentile ranking against the full Russell 3000 universe or industry peer group, where a score of 100 indicates the highest expected likelihood of being targeted by an activist and 0 indicates the lowest. Some factors were binary, for example, whether a company has unequal voting share classes: 100 if not, 0 if so.
To get to that list of 17, we didn’t pick only the best-performing possible combination, which would risk an overfit list of factors. Instead, we looked at which factors most frequently appeared in the list of top combinations and excluded factors that rarely showed up in that list. We excluded factors until we determined further reductions did not improve results. We considered the value of factors/combinations to the top 1%, 2%, 5% and 10% hit rates, as well as the average percentile rank of activist targets in each combination.
Bloomberg Activism Screening ModelIdentifying potential activism targets
5
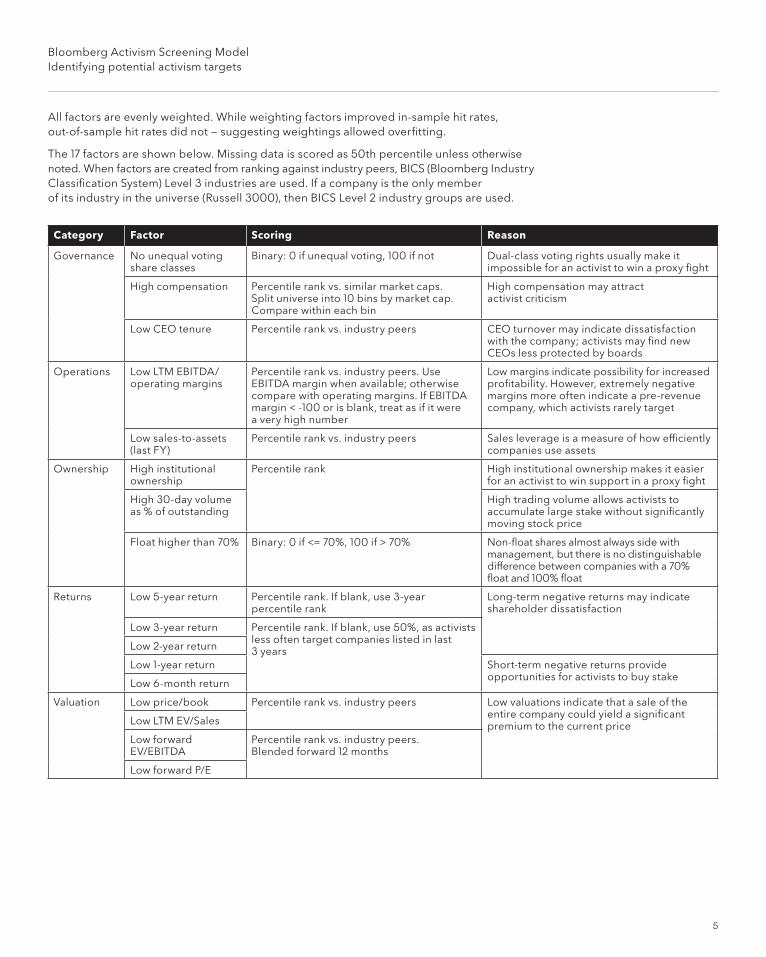
All factors are evenly weighted. While weighting factors improved in-sample hit rates, out-of-sample hit rates did not — suggesting weightings allowed overfitting.
The 17 factors are shown below. Missing data is scored as 50th percentile unless otherwise noted. When factors are created from ranking against industry peers, BICS (Bloomberg Industry Classification System) Level 3 industries are used. If a company is the only member of its industry in the universe (Russell 3000), then BICS Level 2 industry groups are used.
Category Factor Scoring Reason
Governance No unequal voting share classes
Binary: 0 if unequal voting, 100 if not Dual-class voting rights usually make it impossible for an activist to win a proxy fight
High compensation Percentile rank vs. similar market caps. Split universe into 10 bins by market cap. Compare within each bin
High compensation may attract activist criticism
Low CEO tenure Percentile rank vs. industry peers CEO turnover may indicate dissatisfaction with the company; activists may find new CEOs less protected by boards
Operations Low LTM EBITDA/operating margins
Percentile rank vs. industry peers. Use EBITDA margin when available; otherwise compare with operating margins. If EBITDA margin < -100 or is blank, treat as if it were a very high number
Low margins indicate possibility for increased profitability. However, extremely negative margins more often indicate a pre-revenue company, which activists rarely target
Low sales-to-assets (last FY)
Percentile rank vs. industry peers Sales leverage is a measure of how efficiently companies use assets
Ownership High institutional ownership
Percentile rank High institutional ownership makes it easier for an activist to win support in a proxy fight
High 30-day volume as % of outstanding
High trading volume allows activists to accumulate large stake without significantly moving stock price
Float higher than 70% Binary: 0 if <= 70%, 100 if > 70% Non-float shares almost always side with management, but there is no distinguishable difference between companies with a 70% float and 100% float
Returns Low 5-year return Percentile rank. If blank, use 3-year percentile rank
Long-term negative returns may indicate shareholder dissatisfaction
Low 3-year return Percentile rank. If blank, use 50%, as activists less often target companies listed in last 3 yearsLow 2-year return
Low 1-year return Short-term negative returns provide opportunities for activists to buy stake
Low 6-month return
Valuation Low price/book Percentile rank vs. industry peers Low valuations indicate that a sale of the entire company could yield a significant premium to the current priceLow LTM EV/Sales
Low forward EV/EBITDA
Percentile rank vs. industry peers. Blended forward 12 months
Low forward P/E
Bloomberg Activism Screening ModelIdentifying potential activism targets
6
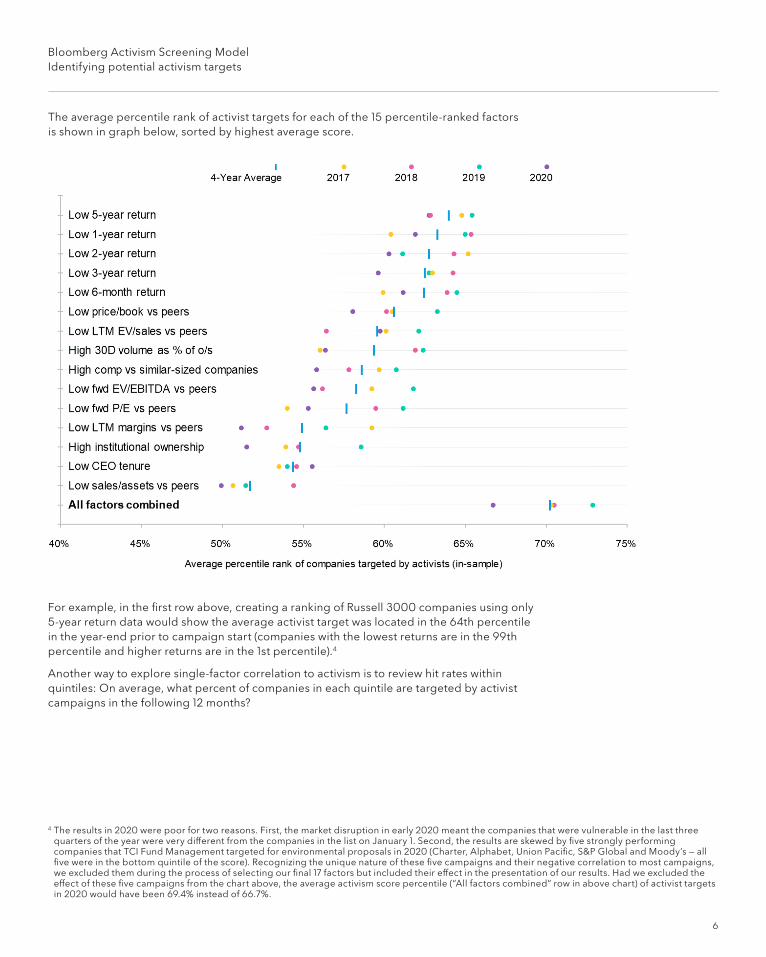
The average percentile rank of activist targets for each of the 15 percentile-ranked factors is shown in graph below, sorted by highest average score.
For example, in the first row above, creating a ranking of Russell 3000 companies using only 5-year return data would show the average activist target was located in the 64th percentile in the year-end prior to campaign start (companies with the lowest returns are in the 99th percentile and higher returns are in the 1st percentile).4
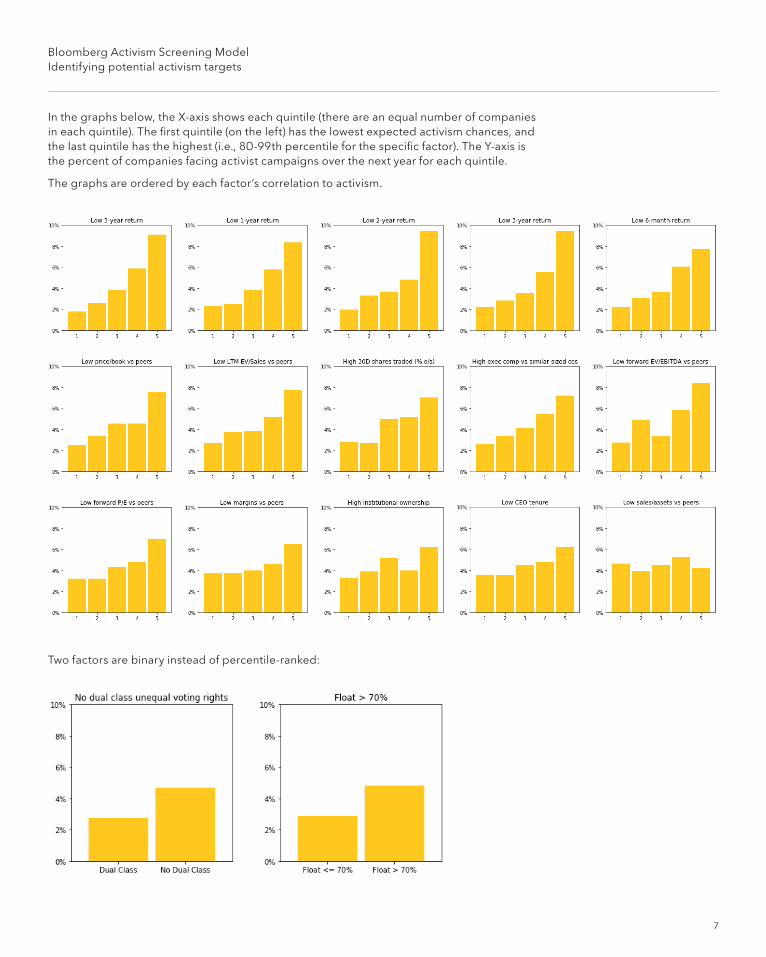
Another way to explore single-factor correlation to activism is to review hit rates within quintiles: On average, what percent of companies in each quintile are targeted by activist campaigns in the following 12 months?
4 The results in 2020 were poor for two reasons. First, the market disruption in early 2020 meant the companies that were vulnerable in the last three quarters of the year were very different from the companies in the list on January 1. Second, the results are skewed by five strongly performing companies that TCI Fund Management targeted for environmental proposals in 2020 (Charter, Alphabet, Union Pacific, S&P Global and Moody’s — all five were in the bottom quintile of the score). Recognizing the unique nature of these five campaigns and their negative correlation to most campaigns, we excluded them during the process of selecting our final 17 factors but included their effect in the presentation of our results. Had we excluded the effect of these five campaigns from the chart above, the average activism score percentile (“All factors combined” row in above chart) of activist targets in 2020 would have been 69.4% instead of 66.7%.
Bloomberg Activism Screening ModelIdentifying potential activism targets
7
In the graphs below, the X-axis shows each quintile (there are an equal number of companies in each quintile). The first quintile (on the left) has the lowest expected activism chances, and the last quintile has the highest (i.e., 80-99th percentile for the specific factor). The Y-axis is the percent of companies facing activist campaigns over the next year for each quintile.
The graphs are ordered by each factor’s correlation to activism.
Two factors are binary instead of percentile-ranked:
Bloomberg Activism Screening ModelIdentifying potential activism targets
8
Although some factors (such as sales/assets ratio) have only minimal correlation to activist campaigns by themselves, we found that these factors are useful contributors when combined with the other factors in the score.
In addition, some factors may not be items that activists look for, but serve as a proxy for a less measurable item. For example, few activists are looking for companies with new CEOs, but a short CEO tenure may indicate significant change or recent disruptions.
Below is a sampling of factors we discarded. Exclusion did not necessarily mean the factor was not correlated with activism, but rather that it did not improve results when combined with the other 17 factors.
Governance
• Director support, say-on-pay support
• Percent of non-executive directors on 3+ boards
• Board size vs. similar size (market cap) companies
• Poison pill, staggered board
Operations
• Net cash as percent of market cap, net debt/EBITDA, assets to equity
• Return on equity, return on invested capital, Economic Value Added (EVA)
• Earnings per share (EPS) growth, sales growth, employee growth
• Gross margin, operating margin
• Capital expenditures/sales, working capital/sales, cash conversion cycle
• Dividend, dividend payout, total payout ratio
Ownership
• Hedge fund ownership, short interest
• Insider ownership
Returns
• Returns vs. peers over various timeframes
• Relative Strength Index (RSI), volatility
Valuation
• Number of analyst ratings, average analyst rating
• Free cash flow yields (levered and unlevered), EV/EBIT
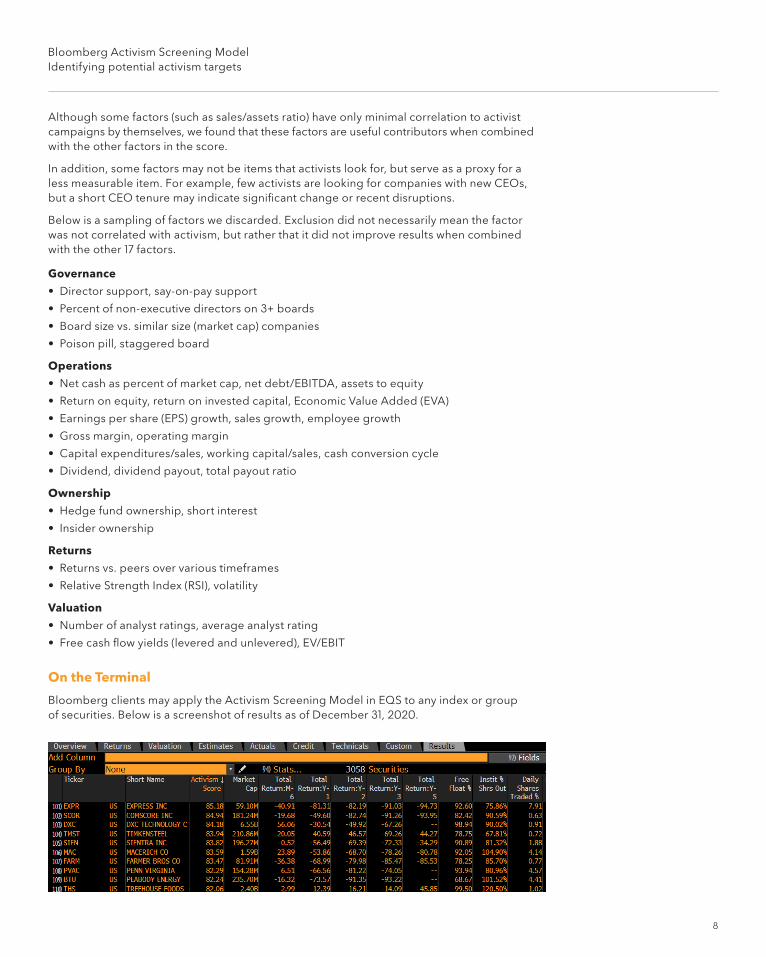
On the Terminal
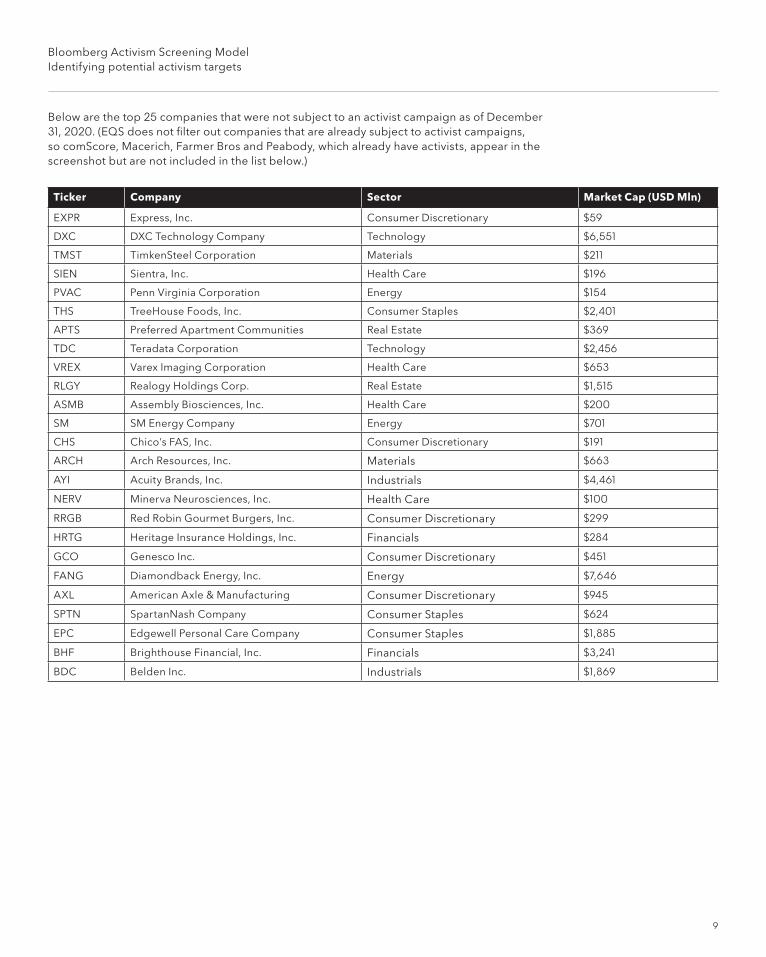
Bloomberg clients may apply the Activism Screening Model in EQS to any index or group of securities. Below is a screenshot of results as of December 31, 2020.
Bloomberg Activism Screening ModelIdentifying potential activism targets
9
Ticker Company Sector Market Cap (USD Mln)
EXPR Express, Inc. Consumer Discretionary $59
DXC DXC Technology Company Technology $6,551
TMST TimkenSteel Corporation Materials $211
SIEN Sientra, Inc. Health Care $196
PVAC Penn Virginia Corporation Energy $154
THS TreeHouse Foods, Inc. Consumer Staples $2,401
APTS Preferred Apartment Communities Real Estate $369
TDC Teradata Corporation Technology $2,456
VREX Varex Imaging Corporation Health Care $653
RLGY Realogy Holdings Corp. Real Estate $1,515
ASMB Assembly Biosciences, Inc. Health Care $200
SM SM Energy Company Energy $701
CHS Chico's FAS, Inc. Consumer Discretionary $191
ARCH Arch Resources, Inc. Materials $663
AYI Acuity Brands, Inc. Industrials $4,461
NERV Minerva Neurosciences, Inc. Health Care $100
RRGB Red Robin Gourmet Burgers, Inc. Consumer Discretionary $299
HRTG Heritage Insurance Holdings, Inc. Financials $284
GCO Genesco Inc. Consumer Discretionary $451
FANG Diamondback Energy, Inc. Energy $7,646
AXL American Axle & Manufacturing Consumer Discretionary $945
SPTN SpartanNash Company Consumer Staples $624
EPC Edgewell Personal Care Company Consumer Staples $1,885
BHF Brighthouse Financial, Inc. Financials $3,241
BDC Belden Inc. Industrials $1,869
Below are the top 25 companies that were not subject to an activist campaign as of December 31, 2020. (EQS does not filter out companies that are already subject to activist campaigns, so comScore, Macerich, Farmer Bros and Peabody, which already have activists, appear in the screenshot but are not included in the list below.)
Bloomberg Activism Screening ModelIdentifying potential activism targets
10
Appendix
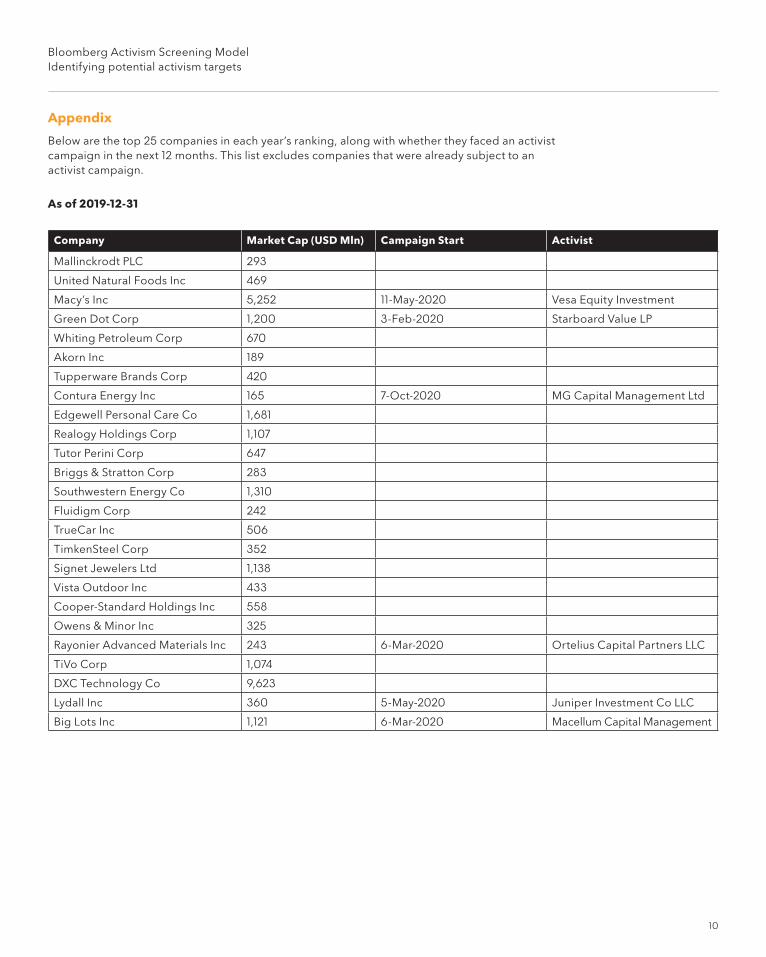
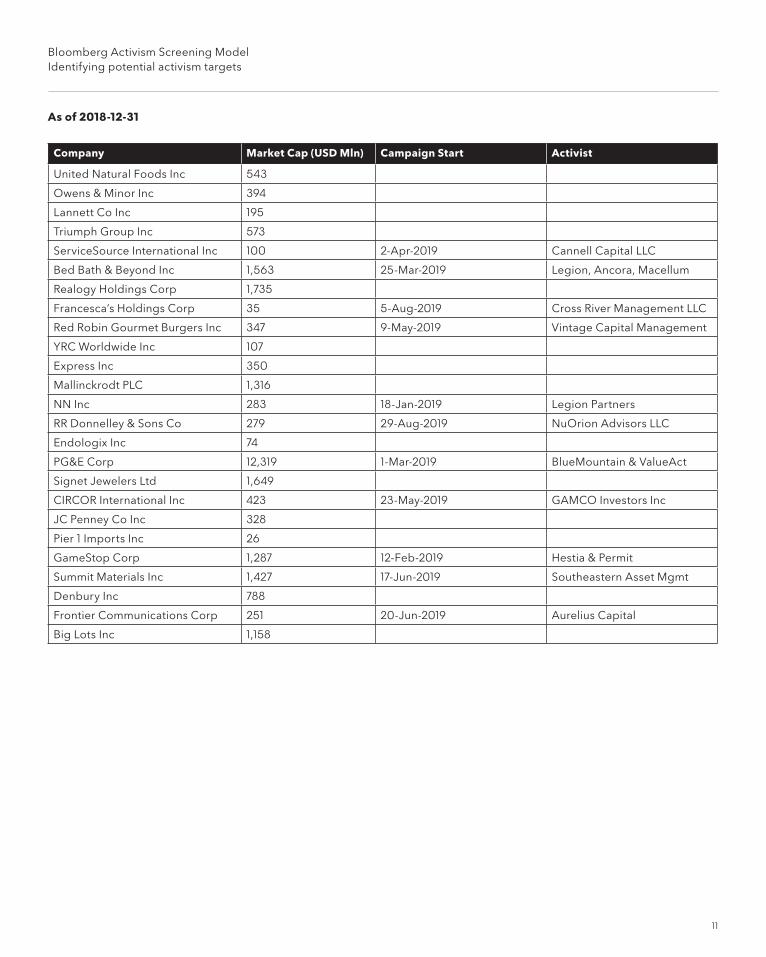
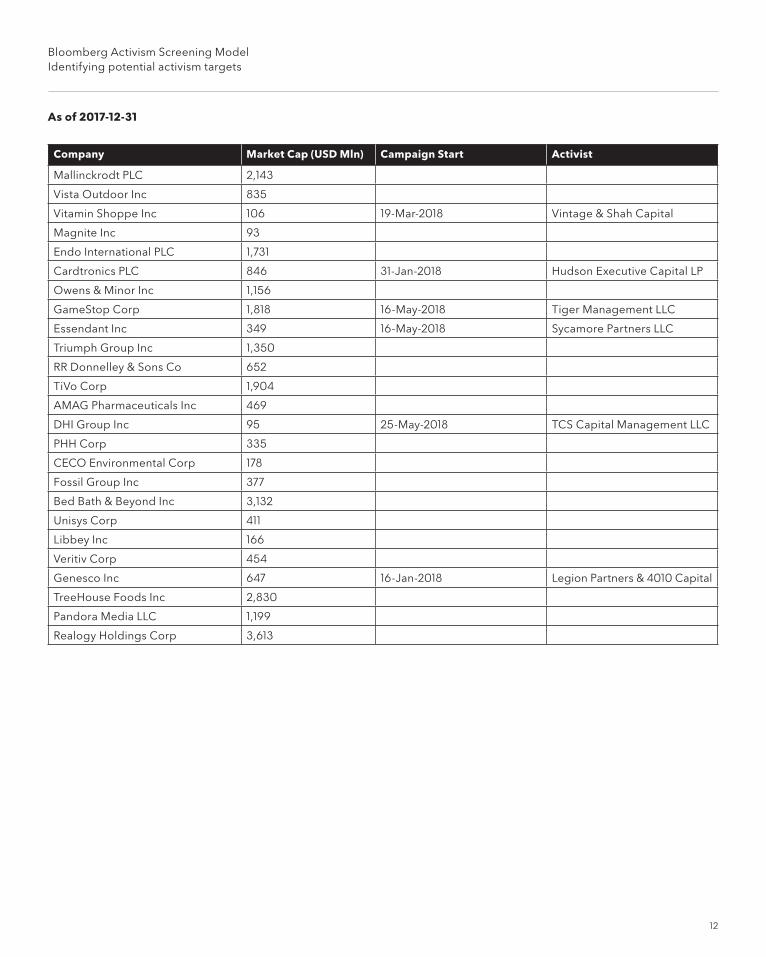
Below are the top 25 companies in each year’s ranking, along with whether they faced an activist campaign in the next 12 months. This list excludes companies that were already subject to an activist campaign.
As of 2019-12-31
Company Market Cap (USD Mln) Campaign Start Activist
Mallinckrodt PLC 293
United Natural Foods Inc 469
Macy’s Inc 5,252 11-May-2020 Vesa Equity Investment
Green Dot Corp 1,200 3-Feb-2020 Starboard Value LP
Whiting Petroleum Corp 670
Akorn Inc 189
Tupperware Brands Corp 420
Contura Energy Inc 165 7-Oct-2020 MG Capital Management Ltd
Edgewell Personal Care Co 1,681
Realogy Holdings Corp 1,107
Tutor Perini Corp 647
Briggs & Stratton Corp 283
Southwestern Energy Co 1,310
Fluidigm Corp 242
TrueCar Inc 506
TimkenSteel Corp 352
Signet Jewelers Ltd 1,138
Vista Outdoor Inc 433
Cooper-Standard Holdings Inc 558
Owens & Minor Inc 325
Rayonier Advanced Materials Inc 243 6-Mar-2020 Ortelius Capital Partners LLC
TiVo Corp 1,074
DXC Technology Co 9,623
Lydall Inc 360 5-May-2020 Juniper Investment Co LLC
Big Lots Inc 1,121 6-Mar-2020 Macellum Capital Management
Bloomberg Activism Screening ModelIdentifying potential activism targets
11
Company Market Cap (USD Mln) Campaign Start Activist
United Natural Foods Inc 543
Owens & Minor Inc 394
Lannett Co Inc 195
Triumph Group Inc 573
ServiceSource International Inc 100 2-Apr-2019 Cannell Capital LLC
Bed Bath & Beyond Inc 1,563 25-Mar-2019 Legion, Ancora, Macellum
Realogy Holdings Corp 1,735
Francesca’s Holdings Corp 35 5-Aug-2019 Cross River Management LLC
Red Robin Gourmet Burgers Inc 347 9-May-2019 Vintage Capital Management
YRC Worldwide Inc 107
Express Inc 350
Mallinckrodt PLC 1,316
NN Inc 283 18-Jan-2019 Legion Partners
RR Donnelley & Sons Co 279 29-Aug-2019 NuOrion Advisors LLC
Endologix Inc 74
PG&E Corp 12,319 1-Mar-2019 BlueMountain & ValueAct
Signet Jewelers Ltd 1,649
CIRCOR International Inc 423 23-May-2019 GAMCO Investors Inc
JC Penney Co Inc 328
Pier 1 Imports Inc 26
GameStop Corp 1,287 12-Feb-2019 Hestia & Permit
Summit Materials Inc 1,427 17-Jun-2019 Southeastern Asset Mgmt
Denbury Inc 788
Frontier Communications Corp 251 20-Jun-2019 Aurelius Capital
Big Lots Inc 1,158
As of 2018-12-31
Bloomberg Activism Screening ModelIdentifying potential activism targets
12
Company Market Cap (USD Mln) Campaign Start Activist
Mallinckrodt PLC 2,143
Vista Outdoor Inc 835
Vitamin Shoppe Inc 106 19-Mar-2018 Vintage & Shah Capital
Magnite Inc 93
Endo International PLC 1,731
Cardtronics PLC 846 31-Jan-2018 Hudson Executive Capital LP
Owens & Minor Inc 1,156
GameStop Corp 1,818 16-May-2018 Tiger Management LLC
Essendant Inc 349 16-May-2018 Sycamore Partners LLC
Triumph Group Inc 1,350
RR Donnelley & Sons Co 652
TiVo Corp 1,904
AMAG Pharmaceuticals Inc 469
DHI Group Inc 95 25-May-2018 TCS Capital Management LLC
PHH Corp 335
CECO Environmental Corp 178
Fossil Group Inc 377
Bed Bath & Beyond Inc 3,132
Unisys Corp 411
Libbey Inc 166
Veritiv Corp 454
Genesco Inc 647 16-Jan-2018 Legion Partners & 4010 Capital
TreeHouse Foods Inc 2,830
Pandora Media LLC 1,199
Realogy Holdings Corp 3,613
As of 2017-12-31
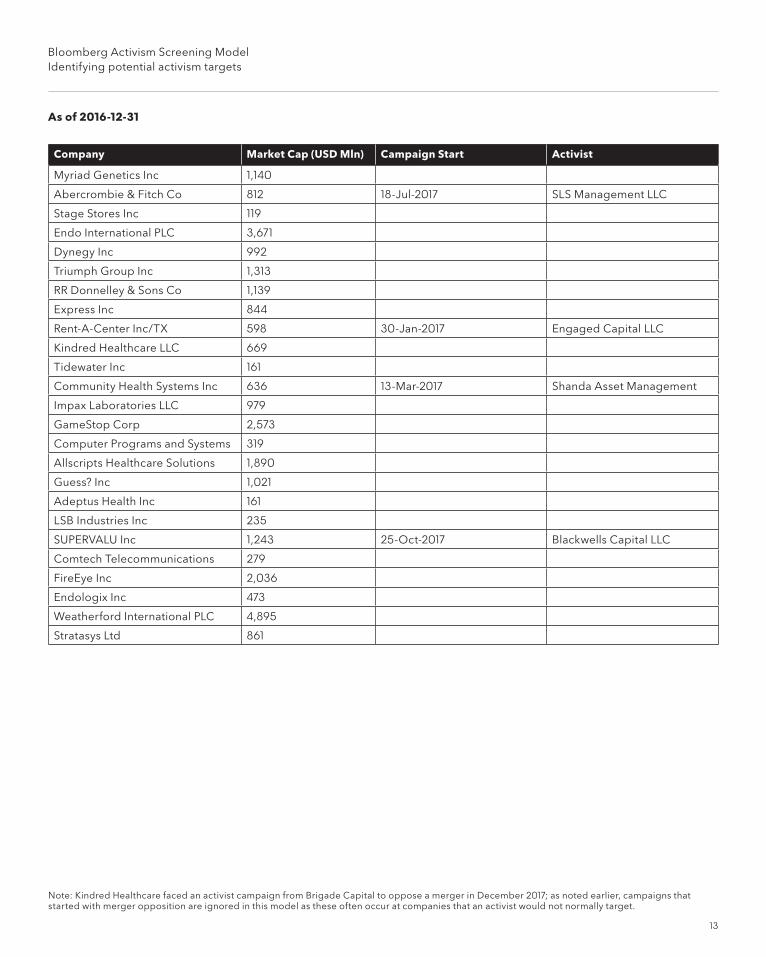
Bloomberg Activism Screening ModelIdentifying potential activism targets
13
Company Market Cap (USD Mln) Campaign Start Activist
Myriad Genetics Inc 1,140
Abercrombie & Fitch Co 812 18-Jul-2017 SLS Management LLC
Stage Stores Inc 119
Endo International PLC 3,671
Dynegy Inc 992
Triumph Group Inc 1,313
RR Donnelley & Sons Co 1,139
Express Inc 844
Rent-A-Center Inc/TX 598 30-Jan-2017 Engaged Capital LLC
Kindred Healthcare LLC 669
Tidewater Inc 161
Community Health Systems Inc 636 13-Mar-2017 Shanda Asset Management
Impax Laboratories LLC 979
GameStop Corp 2,573
Computer Programs and Systems 319
Allscripts Healthcare Solutions 1,890
Guess? Inc 1,021
Adeptus Health Inc 161
LSB Industries Inc 235
SUPERVALU Inc 1,243 25-Oct-2017 Blackwells Capital LLC
Comtech Telecommunications 279
FireEye Inc 2,036
Endologix Inc 473
Weatherford International PLC 4,895
Stratasys Ltd 861
As of 2016-12-31
Note: Kindred Healthcare faced an activist campaign from Brigade Capital to oppose a merger in December 2017; as noted earlier, campaigns that started with merger opposition are ignored in this model as these often occur at companies that an activist would not normally target.
About the Bloomberg Terminal.Since 1981, business and financial professionals have depended on the Bloomberg Terminal® for the real-time data, news and analytics they need to make the decisions that matter. The Terminal provides information on every asset class — from fixed income to equities, foreign exchange to commodities, derivatives to mortgages — all seamlessly integrated with on-demand multimedia content, extensive electronic-trading capabilities and a superior communications network.
About the Bloomberg Terminal.Since 1981, business and financial professionals have depended on the Bloomberg Terminal® for the real-time data, news and analytics they need to make the decisions that matter. The Terminal provides information on every asset class — from fixed income to equities, foreign exchange to commodities, derivatives to mortgages — all seamlessly integrated with on-demand multimedia content, extensive electronic-trading capabilities and a superior communications network.

Take the next step.
For additional information, press the <HELP> key twice on the Bloomberg Terminal®.
Beijing +86 10 6649 7500
Dubai +971 4 364 1000
Frankfurt +49 69 9204 1210
Hong Kong +852 2977 6000
London +44 20 7330 7500
Mumbai +91 22 6120 3600
New York +1 212 318 2000
San Francisco +1 415 912 2960
São Paulo +55 11 2395 9000
Singapore +65 6212 1000
Sydney +61 2 9777 8600
Tokyo +81 3 4565 8900
bloomberg.com/professional
The data included in these materials are for illustrative purposes only. The BLOOMBERG TERMINAL service and Bloomberg data products (the “Services”) are owned and distributed by Bloomberg Finance L.P. (“BFLP”) except (i) in Argentina, Australia and certain jurisdictions in the Pacific islands, Bermuda, China, India, Japan, Korea and New Zealand, where Bloomberg L.P. and its subsidiaries (“BLP”) distribute these products, and (ii) in Singapore and the jurisdictions serviced by Bloomberg’s Singapore office, where a subsidiary of BFLP distributes these products. BLP provides BFLP and its subsidiaries with global marketing and operational support and service. Certain features, functions, products and services are available only to sophisticated investors and only where permitted. BFLP, BLP and their affiliates do not guarantee the accuracy of prices or other information in the Services. Nothing in the Services shall constitute or be construed as an offering of financial instruments by BFLP, BLP or their affiliates, or as investment advice or recommendations by BFLP, BLP or their affiliates of an investment strategy or whether or not to “buy”, “sell” or “hold” an investment. Information available via the Services should not be considered as information sufficient upon which to base an investment decision. The following are trademarks and service marks of BFLP, a Delaware limited partnership, or its subsidiaries: BLOOMBERG, BLOOMBERG ANYWHERE, BLOOMBERG MARKETS, BLOOMBERG NEWS, BLOOMBERG PROFESSIONAL, BLOOMBERG TERMINAL and BLOOMBERG.COM. Absence of any trademark or service mark from this list does not waive Bloomberg’s intellectual property rights in that name, mark or logo. All rights reserved. ©2021 Bloomberg. 984191 DIG 0121