blood model plasma separation in a microfabricated pdms
TRANSCRIPT
Blood Model Plasma Separation in a Microfabricated PDMS Device Exploiting Capillary
Action Driving Forces
A Thesis
Submitted to the Faculty
of
Drexel University
by
Tyler Nathaniel Hinkle
in partial fulfillment of the
requirements for the degree
of
Master of Science in Biomedical Engineering
May 2008

ii
© Copyright 2008
Tyler N. Hinkle. All Rights Reserved.
iii
ACKNOWLEDGEMENTS
This research would not have been possible without the guidance and direction of Dr. Elisabeth
Papazoglou. She not only served as my advisor and supervisor but also encouraged and
challenged me throughout my academic career. The effort and input of several other people also
made this work possible. Lisa Hughes, currently employed at Synthes (USA), provided essential
input on the development of the plasma-free hydrophilic surface treatment for PDMS. My
defense committee members, comprised of Dr. Fontecchio, Dr. Kriete, and Dr. McEachron,
contributed in aspects of my research including microfluidics, sample size, and relevance
strategies, respectively. Microfabrication and lithography assistance by Anna Fox, Derek
Halverson, and Dr. Finkel were also essential in the success of this research. Also, Peter
Schaut’s assistance in PDMS molding device fabrication and Tom Cachaza’s glass blowing
expertise for the bottom of the device also assisted in the success of this work. Finally, Dr.
Sundar Babu’s expert advice and training as a newcomer to the group were essential in setting
the path toward the completion of this thesis.

iv
DEDICATIONS
To my family and my loving girlfriend, Anjuli.
Without their patience, understanding, and support, none of this would have been possible.
v
TABLE OF CONTENTS
LIST OF TABLES ......................................................................................................................... ix
LIST OF FIGURES ......................................................................................................................... x
ABSTRACT ................................................................................................................................. xvi
1. BACKGROUND AND INTRODUCTION ............................................................................ 1
1.1 Overall Objective ................................................................................................................... 1
1.2 Whole Human Blood ............................................................................................................. 2
1.3 Importance of Blood Plasma in Blood Tests ......................................................................... 4
1.4 Blood Models ........................................................................................................................ 5
1.5 Capillary Action in Microfluidics.......................................................................................... 7
1.6 Importance of Separations in Blood Samples ....................................................................... 9
1.7 Point-of-Care Relevance ..................................................................................................... 11
1.8 Current Microfluidic Separation Methods ........................................................................... 12
1.8.1 Micropillar Arrays ........................................................................................................ 12
1.8.2 Longitudinal Filtration .................................................................................................. 15
1.8.3 Gravitational Separation ............................................................................................... 17
1.8.4 Acoustophoresis ............................................................................................................ 18
1.8.5 T-Filtration .................................................................................................................... 19
1.8.6 Summary of Current Separation Techniques ................................................................ 20
1.9 Microfabrication .................................................................................................................. 21
vi
1.10 Microfluidics ..................................................................................................................... 23
1.11 Photolithography ............................................................................................................... 26
1.12 Photoresists ........................................................................................................................ 28
1.12.1 SU-8 ............................................................................................................................ 30
1.13 Silicone and Glass ............................................................................................................. 37
2. DESIGN AND DEVELOPMENT ......................................................................................... 40
2.1 Design Requirements ........................................................................................................... 40
2.1.1 Design Criteria .............................................................................................................. 40
2.1.2 Design Constraints ........................................................................................................ 41
2.2 Lithographic Technique ....................................................................................................... 42
2.3 Lithographic Mask ............................................................................................................... 45
2.3.1 Mask Type and Resolution ........................................................................................... 45
2.3.2 Mask CAD Design ........................................................................................................ 49
2.4 Lithography Equipment ....................................................................................................... 57
2.5 Molding ............................................................................................................................... 61
2.5.1 Molding Apparatus Design ........................................................................................... 61
2.5.2 Device Port Creation ..................................................................................................... 65
2.5.3 PDMS Removal ............................................................................................................ 68
2.6 Driving Forces ..................................................................................................................... 70
2.7 Contact Angle ...................................................................................................................... 73
vii
2.7.1 Chemical Hydrophilic Surface Treatment .................................................................... 75
2.8 Lithographic Parameters ...................................................................................................... 83
2.8.1 Exposure Time .............................................................................................................. 85
2.8.2 Soft Bake Time ............................................................................................................. 89
2.8.3 Developing Type and Time .......................................................................................... 90
2.9 Adhesion Promotion ............................................................................................................ 92
2.10 Blood Model Design .......................................................................................................... 94
3. RESULTS AND DISCUSSION ............................................................................................ 95
3.1 Final PDMS Device ............................................................................................................. 95
3.2 Calculations ......................................................................................................................... 96
3.2.1 Blood Viscosity Simulation using Glycerol ................................................................. 96
3.2.2 Reynold’s Number Estimation ...................................................................................... 99
3.2.3 Dead Volume Estimation ............................................................................................ 101
3.3 Blood Model Separation .................................................................................................... 102
3.3.1 Preliminary Separation................................................................................................ 102
3.3.2 Time Step Separation .................................................................................................. 106
3.3.3 Repeatability ............................................................................................................... 107
3.3.4 Separation Quantification and Efficiency ................................................................... 108
3.4 Summary of Developed Methods and Design ................................................................... 111
3.5 Conclusions ....................................................................................................................... 116
viii
3.5.1 Possible Applications .................................................................................................. 117
3.5.2 Resolution of Mask Aligner ........................................................................................ 118
3.5.2 Possible Environmental Effects .................................................................................. 119
3.5.3 Challenges Overcome ................................................................................................. 120
3.5.4 Innovation ................................................................................................................... 121
3.6 Future Development ..................................................................................................... 122
LIST OF REFERENCES ............................................................................................................ 123
ix
LIST OF TABLES
Table 1: Summary of current microfluidic separation strategies ................................................. 20
Table 2: MicroCHEM’s recommended spin coating speeds to achieve desired thickness for
specific photoresists ...................................................................................................................... 33
Table 3: MicroCHEM’s recommended prebake and soft bake parameters for desired thicknesses
of specific photoresists .................................................................................................................. 34
Table 4: MicroCHEM’s recommended post exposure bake duration for desired thicknesses of
specific photoresists ...................................................................................................................... 35
Table 5: MicroCHEM’s recommended developing for desired thicknesses of specific
photoresists with hand agitation .................................................................................................... 36
Table 6: Details of blood model design ........................................................................................ 94
Table 7: Separation quantification of blood model input for N=5 .............................................. 109
Table 8: Separation quantification of blood model plasma separation output for N=5 .............. 109
Table 9: Average separation efficiency for N=5 ......................................................................... 109
x
LIST OF FIGURES
Figure 1 SEM image of Chen's rounded micropillar simple filtration .......................................... 13
Figure 2: Design and PDMS mold of Fernadez’s muti-step forced filtration ............................... 16
Figure 3: Imaging and theory behind Huh’s gravitational separation ........................................... 17
Figure 4: Conceptual design of Peterson’s acoustophoresis separation ........................................ 18
Figure 5: Yang’s T-filtration successfully separating blood plasma with pumping to induce
gradients ........................................................................................................................................ 19
Figure 6: Unmodified epoxy prepolymer structure ....................................................................... 28
Figure 7: SU-8 Chemical Structure ............................................................................................... 30
Figure 8: Example of the process of SU-8 UV photofunctionalization ........................................ 32
Figure 9: MicroCHEM’s spin speed curve for spin coating to achieve desired thickness for
specific photoresists ...................................................................................................................... 33
Figure 10: MicroCHEM’s exposure curve to achieve optimal profile for specific thicknesses ... 34
Figure 11: MicroCHEM’s exposure energy curve for desired features with upper and lower
limits .............................................................................................................................................. 35
Figure 12: Mechanism for PDMS catalysis and crosslinking ....................................................... 38
Figure 13: “Pillars” lithography mask concept (left) and “channels” lithography mask concept
(right) ............................................................................................................................................. 42
Figure 14: “Channel” method leaving channels in the SU-8 coating. The channels seem less
defined and non-uniform. .............................................................................................................. 43
Figure 15: “Channel” method leaves some channels clogged with undeveloped SU-8 due to the
difficulty in hand agitation getting the developer into the small features ..................................... 43
xi Figure 16: Electron Microscope image of “pillar” method using poor resolution inkjet mask.
Port on the right with raised channel on the left. .......................................................................... 44
Figure 17: Lithographic output of “pillar” method using Ultra High Resolution Printed Mask by
OutputCity CAD Services showing smooth continuous features ................................................. 44
Figure 18: Dark field microscope image of an inkjet-printed mask on a Hewlet Packard
commercial transparency with the black ink being the round light areas and the rest being clear
transparency. ................................................................................................................................. 46
Figure 19: Scanning Electron Microscope image of the edge of raised SU-8 on a glass slide using
a mask printed on an Inkjet Transparency. ................................................................................... 46
Figure 20: Lithographic output slide of a triangle of SU-8 shown on top of the X-ray film used as
a mask. ........................................................................................................................................... 47
Figure 21: Microscope 10X image of the OutputCity Ultra High Resolution Photomask Printing
with 10um gaps ............................................................................................................................. 48
Figure 22: Example design of H-filter using OpenOffice 2.2 with 500um center channel and
250um outer channels.................................................................................................................... 49
Figure 23: Example design of T-filter using OpenOffice 2.2 with 1000um center channel and
250um outer channels.................................................................................................................... 50
Figure 24: Preliminary AutoCad 2004 design of a separation device with large 100um gaps,
angled walls to force interactions, and dual exit ports based on the Fernandez design. ............... 51
Figure 25: Close-up of preliminary AutoCad 2004 design of a separation device with large
100um gaps, angled walls to force interactions, and dual exit ports. ............................................ 51
xii Figure 26: AutoCad 2004 design of a separation device with moderate 10um gaps, angled walls
to force interactions, and dual exit ports. The 10um features were guaranteed by OutputCity
printers. .......................................................................................................................................... 52
Figure 27: Close up of AutoCad 2004 design of a separation device with moderate 10um gaps,
angled walls to force interactions, and dual exit ports. ................................................................. 52
Figure 28: AutoCAD 2004 designs with different separation lay geometries; square (top) and
round (bottom)............................................................................................................................... 53
Figure 29: Close ups of AutoCad 2004designed features for possible separation devices with A)
Regular Squares, B) Wide Squares, C) Regular Rounded, and D) Wide Rounded features ........ 54
Figure 30: Theory for printing resolution compensation where the black lines are the AutoCAD
designed edges of the separation gaps and the gray areas represent the printing resolution of
OutputCity ..................................................................................................................................... 55
Figure 31: Details of final design .................................................................................................. 56
Figure 32: Drexel University Electrical Engineering Microfabrication Facility’s SGS G3P-8
Spincoater ...................................................................................................................................... 57
Figure 33: Drexel University Electrical Engineering Microfabrication Facility’s Programmable
Hot Plate ........................................................................................................................................ 58
Figure 34: Drexel University Electrical Engineering Microfabrication Facility’s Blue M Gravity
Convection Oven ........................................................................................................................... 59
Figure 35: Drexel University Electrical Engineering Microfabrication Facility’s Karl Suss MJB-3
Mask Aligner ................................................................................................................................. 60
Figure 36: Drexel University Electrical Engineering Microfabrication Facility’s Branson 2510
Sonicator........................................................................................................................................ 60
xiii Figure 37: Preliminary execution of a PDMS molding fixture ..................................................... 61
Figure 38: More refined execution of a PDMS molding fixture ................................................... 62
Figure 39: Pro/Engineer design of overall molding fixture concept ............................................. 62
Figure 40: Pro/Engineer detailed design of upper assembly in mm ............................................. 63
Figure 41: Pro/Engineer detailed design of lower assembly in mm ............................................. 63
Figure 42: Four identical molding fixtures created from Pro/Engineer designs made out of ¼”
thick PMMA sheets from McMaster-Carr. ................................................................................... 64
Figure 43: ¼” diameter hand punch used to cut ports in PDMS ................................................... 65
Figure 44: Conical port cut in PDMS using hand punch with opening at the top ........................ 66
Figure 45: Example of glass rods being glued onto SU-8 port before molding............................ 66
Figure 46: PDMS mold artifacts caused by PDMS attraction to the rods..................................... 67
Figure 47: Transverse removal of PDMS from molding fixture ................................................... 68
Figure 48: Parallel removal of PDMS from molding fixture ........................................................ 69
Figure 49: Experimental setup for pumping in a microfluidic device where a liquid reservoir
feeds into a peristaltic pump feeding into a secured device assembly .......................................... 70
Figure 50: Output port leakage during pumping ........................................................................... 71
Figure 51: Input port leakage during pumping.............................................................................. 72
Figure 52: Example of a hydrophilic surface with a contact angle of less than 5 degrees. .......... 73
Figure 53: Example of a hydrophobic surface with a contact angle of about 50 degrees ............. 73
Figure 54: Mechanism behind plasma-free chemical hydrophilic surface treatment (Lateef, 2005)
....................................................................................................................................................... 76
Figure 55: Comparison of untreated PDMS (left) with 5% and long duration glutaraldehyde
treatment (right)............................................................................................................................. 77
xiv Figure 56: Comparison of 1% glutaraldehyde treatment (left) and 5% glutaraldehyde treatment
(right) ............................................................................................................................................. 78
Figure 57: Post chemical treatment PDMS with one output port ................................................. 79
Figure 58: Open and functional separation channels successfully separating suspended 10um
diameter Polysciences Polybead polystyrene microspheres with a 10um gap design .................. 80
Figure 59: From top to bottom progression of separated media even with only a few open
separation channels ....................................................................................................................... 81
Figure 60: Separation continuing after more than 15 minutes of success ..................................... 82
Figure 61: PDMS device appearance during separation showing the open channels near the
center of the device ....................................................................................................................... 82
Figure 62: Visual representation of the photolithography process ............................................... 84
Figure 63: Visual representation of PDMS mold removal and post-hydrophilic surface treatment
assembly ........................................................................................................................................ 84
Figure 64: SU-8 on glass slide after lithography with 60 second exposure time (405nm
wavelength and 10mW/cm2 intensity) .......................................................................................... 86
Figure 65: ZYGO NewView 6000 Optical Profiler output of SU-8 on glass slide after
lithography with 60 second exposure time .................................................................................... 86
Figure 66: SU-8 on glass slide after lithography with 30 second exposure time .......................... 87
Figure 67: SU-8 on glass slides after lithography with various exposure times (405nm
wavelength and 10mW/cm2 intensity) .......................................................................................... 88
Figure 68: PDMS after removal showing SU-8 clogging the separation channels. The
lithographic process had a soft bake time of only 20 minutes ...................................................... 89
xv Figure 69: Comparison of SU-8 on glass slide after lithography varying developing types and
times .............................................................................................................................................. 91
Figure 70: SU-8 on glass slide after lithography with HMDS preconditioning............................ 92
Figure 71: Comparison of SU-8 and PDMS molds ...................................................................... 93
Figure 72: Final developed separation device ............................................................................... 95
Figure 73: Dimensionality of the Dead Volume Estimation with the area of interest in yellow 101
Figure 74: SU-8 on glass slide and PDMS mold after lithography with 4um mask design........ 102
Figure 75: Successful separation focused on the suspended beads ............................................. 103
Figure 76: Successful separation focused on the filtration layer PDMS features ....................... 104
Figure 77: Comparison of the blood model input (left) with the separated output (right) .......... 104
Figure 78: Summary of separation testing .................................................................................. 105
Figure 79: Same separation in the same device from T=0.5min to T=5min ............................... 106
Figure 80: Four separate separation examples to show repeatability in device fabrication ........ 107
Figure 81: Comparison of the blood model input (left) with the separated output (right) .......... 108
Figure 82: Separation Quantification comparing blood model input to separated output with N=5
by visual counting ....................................................................................................................... 110
Figure 83: Separation efficiency of separated output with N=5 by visual counting ................... 110
xvi
ABSTRACT
Blood Model Plasma Separation in a Microfabricated PDMS Device Exploiting Capillary Action Driving Forces
Tyler Nathaniel Hinkle Dr. Elisabeth Papazoglou
The goal of this thesis was to successfully design and fabricate a point-of-care microfluidic
device that effectively separates plasma from a blood model without external pumping or other
applied driving forces. There is currently no commercially available or published microfluidic
device that accomplishes blood plasma separation without pumping or externally applied driving
forces. This pump-free device will decrease size and cost while increasing the number of
possible applications. The final separated plasma could be further used for detection of
biomarkers linked to specific diseases and conditions through tailored antibody based assays by
future researchers. The separation device was fabricated using known lithography masking
techniques to create a negative to be molded in PDMS using standardized molding fixtures to
ensure device uniformity. Fluid flow through the device was promoted by using a plasma-free
hydrophilic surface treatment greatly reducing the contact angle of PDMS from about 90 degrees
to about 50 degrees. The effectiveness of this device was tested and validated using water
emulsions of polystyrene beads adjusted to a viscosity equivalent to that of blood (4.0 +/- 0.5 cP)
to represent a simple blood model. The final device is able to separate the model plasma cells
(1-3um diameter) from the red (3-8um diameter) and white (8-12um diameter) blood cells with
greater than 85% efficiency with a low filtration dead-volume of less than 10ul.

xvii
1
1. BACKGROUND AND INTRODUCTION
1.1 Overall Objective
The goal of this research is to successfully fabricate a point-of-care microfluidic device
that effectively separates plasma from a blood model without external pumping or other
applied driving forces. There is currently no commercially available or published
microfluidic device that accomplishes blood plasma separation without any form of
pumping. The device may be similar to current microfluidic devices that achieve fluid
separations, but will be tailored for the specific use of blood plasma separation. As
mentioned, this will be accomplished by manipulating microfluidic flow without
application of an external driving force. The final separated plasma could be further used
for detection of biomarkers linked to specific diseases and conditions through tailored
antibody based assays by future researchers. The device should be fabricated using
known lithography masking techniques to create a negative to be molded in PDMS using
standardized molding fixtures to ensure device uniformity. The effectiveness of this
device should be tested and validated using blood models such as water emulsions of
polystyrene beads adjusted to a viscosity equivalent to that of human blood (4.0 +/- 0.5
cP). The final device should be able to separate the model plasma cells (1-3um diameter)
from the red (3-8um diameter) and white (8-12um diameter) blood cells.
2
1.2 Whole Human Blood
Blood is the most abundant connective tissue in the human body composed of cells
suspended in plasma. The main constantly circulating constituents in plasma include
erythrocytes (red blood cells), leukocytes (white blood cells) and thrombocytes
(platelets). The red blood cells (3-8um in diameter) contain hemoglobin to assist in the
transport of respiratory gases. White blood cells (8-12um in diameter) are immune
response cells that combat infection and disease. Platelets aggregate to form blood clots
(VanDelinder, 2007).
The majority of blood is composed of blood plasma. Blood plasma is 92% water and is
yellow in color. Plasma is comprised of components 1-3um in diameter, including serum
albumin, clotting factors, hormones, carbon dioxide, proteins, electrolytes, and
immunoglobin. These immunoglobin or antibodies, are the components of particular
interest in this case. The rest of normal blood is comprised of 45% red blood cells, 1%
white blood cells, and 0.5% platelets (Kokoris, 2005).
The multiple functions of blood include oxygenation, nutrition supply, waste removal,
immune system transport, coagulation, messaging, pH regulation, temperature regulation,
and hydraulic support. With an estimated density of 1060kg/m3, blood accounts for 7%
of the body’s weight (Faivre, 2006)
3
Plasma is a non-Newtonian fluid with unique flow properties that yield to the demands of
the various blood vessel geometries with dynamic contact angles (Chakraborty, 2005).
Chakraborty used mathematics to explain that the microfluidic blood flow advancement
is not linear due to the instantaneous viscosity, capillary force interactions, and
resistance. The driving forces are known to increase with time since the contact angle
decreases with increasing blood’s flow velocities. Red blood cells suspended in plasma
are also known to influence the flow by increasing the driving forces due to increased
viscosities (Chakraborty, 2005).
Serum is plasma with platelets and clotting factors, such as fibrin, removed leaving
mostly albumin and immunoglobins. Plasmaphoresis is a common therapy that removes
plasma from red blood cells (Gratten, 1992).
4
1.3 Importance of Blood Plasma in Blood Tests
Blood tests are the most common diagnostic tests utilized in classical and modern
healthcare. Blood samples are acquired via venipuncture and are tested to find traces of
diseases or indications of organ function (Cousins, 2000). Blood is the most useful
medium for diagnostic testing since it comes into contact with virtually every aspect of
the body while providing oxygen and nutrients. For this reason, it can act as a “universal
indicator” for any number of diagnoses of medical conditions.
These tests are not usually performed on the blood cells themselves but actually on the
separated plasma or serum, which is commonly separated by 10-30 minutes of high-
speed centrifugation (Cousins, 2000). Common factors tested in a separated plasma
sample include electrolytes, urea, glucose, proteins, antigens, and antibodies. This
demonstrates that the “indicators” in blood are most often in the plasma itself. In order to
avoid testing errors, false positives, false negatives, blockage of active sites, lack of
visibility, and contaminations during diagnostic testing, the isolation of plasma from the
red and white blood cells is required.
5
1.4 Blood Models
In order to understand any blood theory or device, an appropriate blood model must be
utilized. Historically, blood models are specific to a desired device, property, or
observation. For example, if clotting profiles are being investigated, the blood model
should have similar clotting profiles and properties to human blood.
In microfluidic blood plasma separations, common blood models include latex beads,
polystyrene beads, and sheep or bovine serum. These models can be tailored to have
specific diameters of suspended particles corresponding to the constituents of whole
blood (Yamada, 2005). Red blood cells have diameters ranging from 3-8um. White
blood cells have diameters ranging from 8-12um in diameter. Plasma cells (including
antibodies) have diameters ranging from <1-3um. The constituents of the blood models
should emulate those sizes (VanDelinder, 2007).
The viscosity of whole human blood is about 4.0 +/- 0.5 cP at 37C while distilled
deionized water is about 0.7 cP at 37C (Fåhræus, 1931). The viscosity of a solution of
polystyrene or latex beads in water can be increased by adding medical grade glycerine
dropwise.

6 These models can also mimic modified blood. For example, normal blood may be too
viscous to achieve effective separation in microfluidic channels. Its viscosity could be
reduced by diluting the blood sample. This in turn can be modeled using a bead solution
adjusted to a lower viscosity.
7
1.5 Capillary Action in Microfluidics
Microfludics is based on the theories of capillary action. When a fluid interacts with the
interface of a hydrophilic microcapillary channel, the surface tension induces
advancement and the fluid is drawn into the channel (Chakraborty, 2005). Capillary
action is the tendency and ability of a material to draw another material into it. This is
due to adhesive intermolecular forces being stronger in the interface between the liquid
and the material than the cohesive intermolecular forces inside the liquid. This
phenomenon is exemplified by a concave meniscus that forms when a liquid is in contact
with a vertical surface (Hocking, 1982).
Another instance of capillary action can be observed in human eyes. In this case,
capillary action is used to clear tears every time the eyes blink and the tears pass to the
canalicular in the inner corner of each eyelid. Other common examples are absorbent
paper towels, candle wicks, and thin layer chromatography (Hocking, 1982).
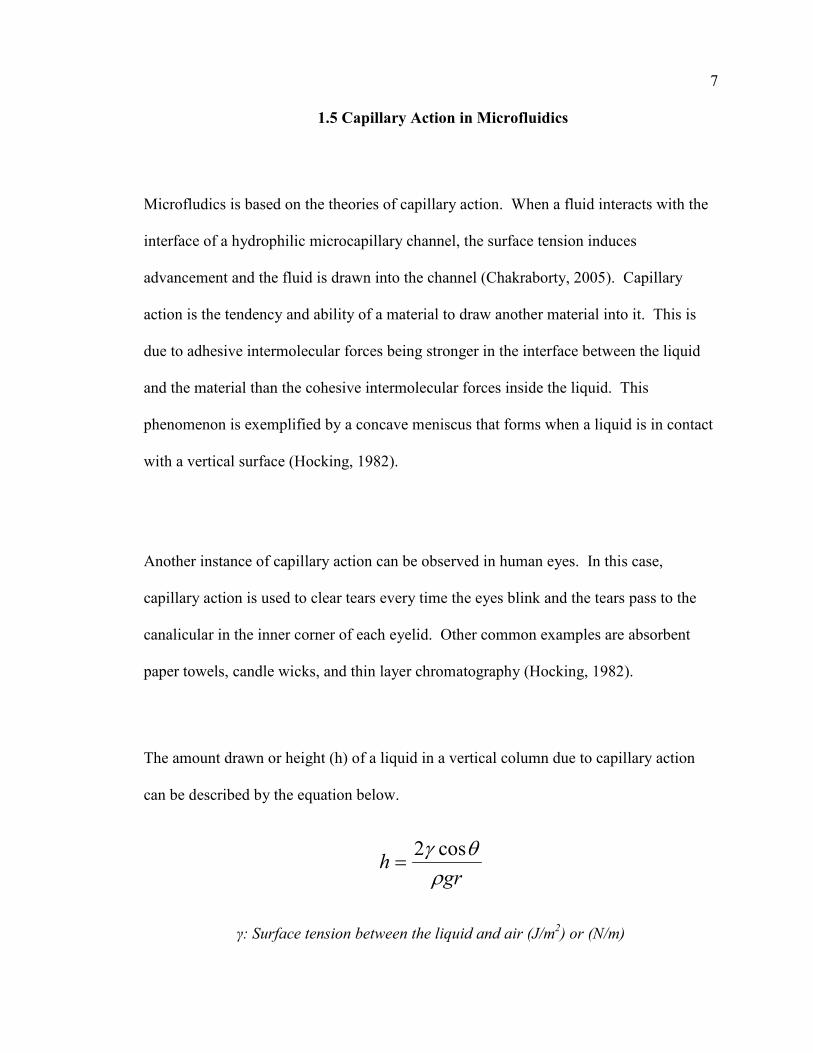
The amount drawn or height (h) of a liquid in a vertical column due to capillary action
can be described by the equation below.
grh
ρθγ cos2
=
γ: Surface tension between the liquid and air (J/m2) or (N/m)
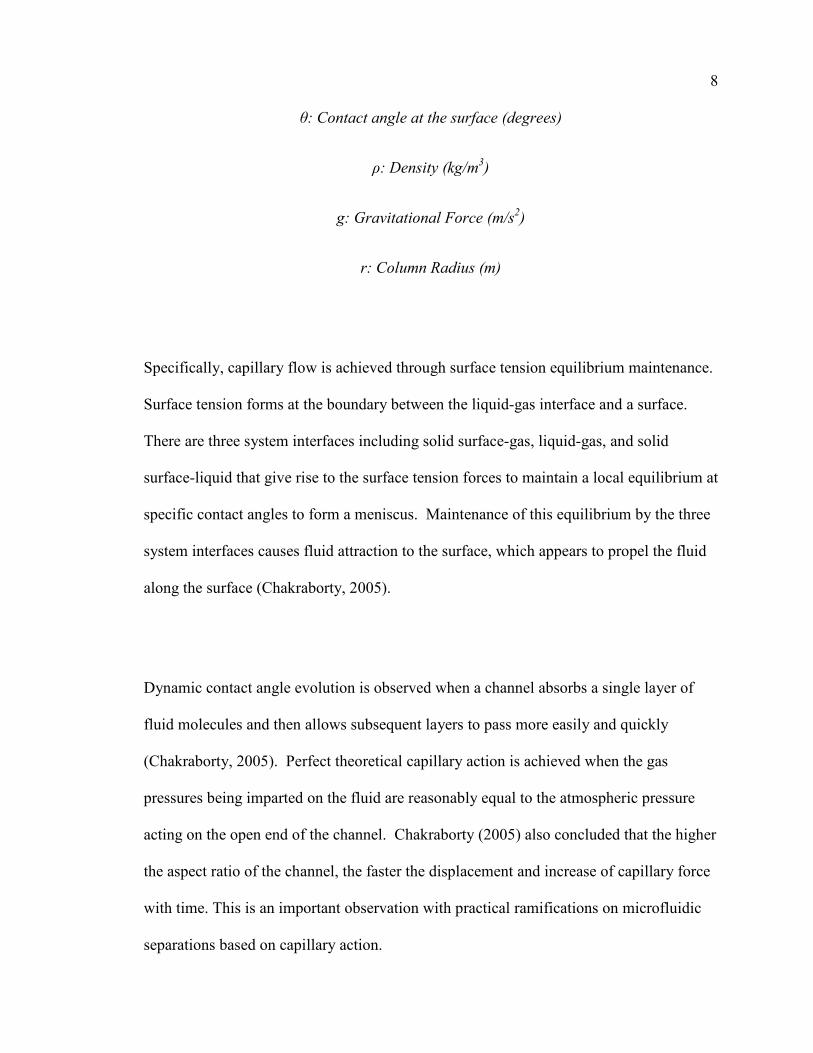
8
θ: Contact angle at the surface (degrees)
ρ: Density (kg/m3)
g: Gravitational Force (m/s2)
r: Column Radius (m)
Specifically, capillary flow is achieved through surface tension equilibrium maintenance.
Surface tension forms at the boundary between the liquid-gas interface and a surface.
There are three system interfaces including solid surface-gas, liquid-gas, and solid
surface-liquid that give rise to the surface tension forces to maintain a local equilibrium at
specific contact angles to form a meniscus. Maintenance of this equilibrium by the three
system interfaces causes fluid attraction to the surface, which appears to propel the fluid
along the surface (Chakraborty, 2005).
Dynamic contact angle evolution is observed when a channel absorbs a single layer of
fluid molecules and then allows subsequent layers to pass more easily and quickly
(Chakraborty, 2005). Perfect theoretical capillary action is achieved when the gas
pressures being imparted on the fluid are reasonably equal to the atmospheric pressure
acting on the open end of the channel. Chakraborty (2005) also concluded that the higher
the aspect ratio of the channel, the faster the displacement and increase of capillary force
with time. This is an important observation with practical ramifications on microfluidic
separations based on capillary action.
9
1.6 Importance of Separations in Blood Samples
Clinical diagnosis relies largely on the preliminary conclusions provided by blood testing.
Blood tests are not usually point-of-care. It can take hours or days to purify blood plasma
and complete tests utilizing sample volumes of at least 3-5ml. Common tests attempt to
identify disease markers, infection (pathogen detection), cholesterol levels, blood type, or
organ function (VanDelinder, 2006). Accurate disease testing exemplifies the importance
of proper separation by requiring the blood plasma, complete with antibodies and
proteins, to be isolated from the red and white blood cells before testing.
Venipuncture is the most common method for extracting blood by simply drawing the
required amount of blood into a syringe from a blood vessel through the skin. This blood
would then be separated and tested (Larsson, 1998).
The most common method of clinical blood separation is via centrifugation. This process
however is both space and time consuming in terms of the size and amount of equipment
needed as well as the duration needed for accuracy. A relatively high sample volume
must be used and centrifuged in a large device (Arndt, 2002).

10 Microfluidics allow for small scale point-of-care blood plasma separation using
disposable chip systems with low dead volumes far superior to passive filters. These
devices may then be able to combine separation with diagnostics in the future to form
micro-analysis systems (VanDelinder, 2006).
11
1.7 Point-of-Care Relevance
Point-of-care is a growing trend in modern healthcare. This concept allows diagnostic
testing to be executed at the site of patient care, which limits the need to travel to varying
medical offices or the need to send out samples for testing. This not only increases
convenience, but also expedites results to reduce the time before the initiation of relevant
treatment. A standard example of a point-of-care device is a handheld blood-glucose
monitor for diabetic patients. There are countless benefits to a point-of-care strategy
including quick diagnosis, dynamic monitoring and reporting, real-time analysis, ease of
availability and sharing, and reduction of the diagnostic burden on the medical
community. (Kost, 2002)
12
1.8 Current Microfluidic Separation Methods
1.8.1 Micropillar Arrays
Micropillar arrays are normally used to separate particles with large diameter variations.
It is a nondestructive method that can be relatively simple in conception. This “dead-
end” filtration method employs a flow direction perpendicular to the filter features and is
the most common, however is also prone to clogging within seconds. Cross flow
filtration has been accepted as a filtration method in which clogging is far less likely.
Cross flow filtration requires pumping at varying speeds as a driving force (Chen, 2007).
Chen used 30um tall features with 200um wide channels snaking to a length of more than
160mm. The filtration pillars were 20um in diameter and 6.5um apart as below in Figure
1. The blood sample was greatly diluted to eliminate any viscosity hindrances to the
capillary flow caused by the relatively high viscosity of concentrated samples. This
method proved successful in separating out the large white blood cells as desired by the
research team.
13
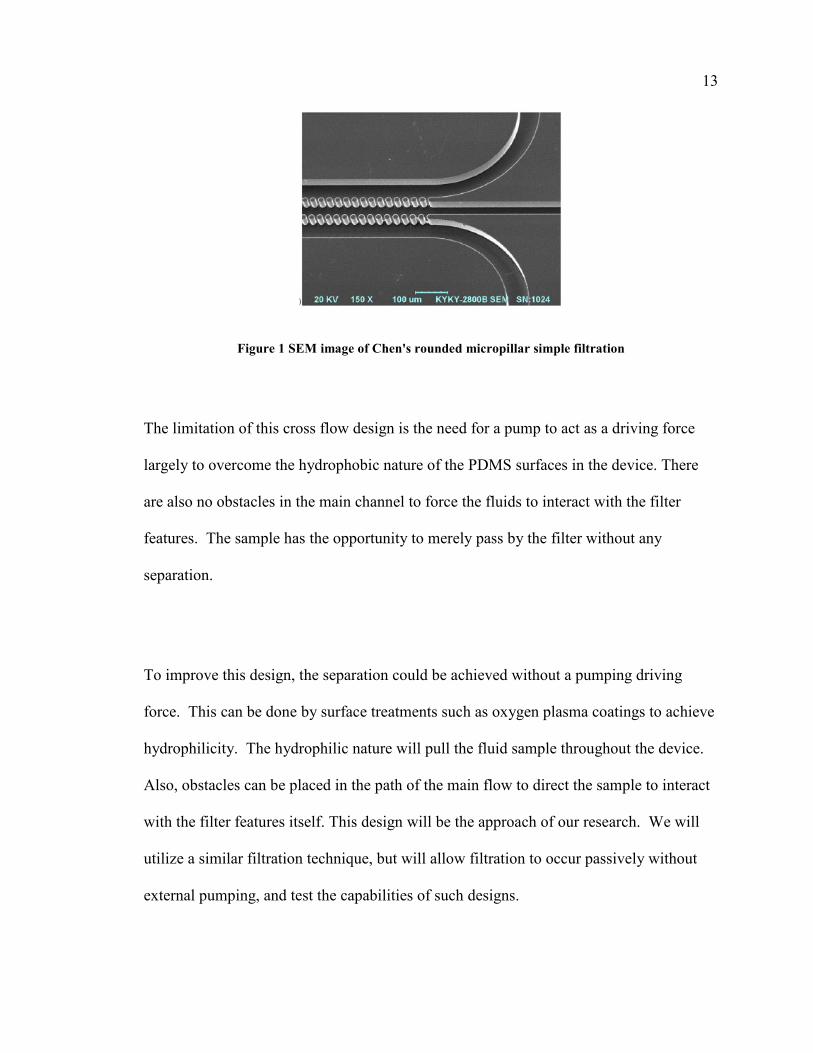
Figure 1 SEM image of Chen's rounded micropillar simple filtration
The limitation of this cross flow design is the need for a pump to act as a driving force
largely to overcome the hydrophobic nature of the PDMS surfaces in the device. There
are also no obstacles in the main channel to force the fluids to interact with the filter
features. The sample has the opportunity to merely pass by the filter without any
separation.
To improve this design, the separation could be achieved without a pumping driving
force. This can be done by surface treatments such as oxygen plasma coatings to achieve
hydrophilicity. The hydrophilic nature will pull the fluid sample throughout the device.
Also, obstacles can be placed in the path of the main flow to direct the sample to interact
with the filter features itself. This design will be the approach of our research. We will
utilize a similar filtration technique, but will allow filtration to occur passively without
external pumping, and test the capabilities of such designs.
14 This micropillar approach has been used in a variety of applications. Researchers at the
University of Pennsylvania used rows of 667 pillars that were 10um by 20um in cross-
section and 80um tall in a white blood cell isolation chip for subsequent PCR targeting.
They were able to achieve a 40% separation efficiency and utilized a syringe pump as
their driving force (Panaro, 2005). Researchers at the Rensselaer Polytechnic Institute
used an array of 72 pillars that were 35nm in diameter, 60nm tall, and 160nm apart to
separate DNA in an electric field (Ashton, 2003). Another research team used an array of
40um tall square pillars (25um x 25um in cross-section) and an array of slender offset
pillars coated with IgG. The coated pillars were used to capture cells from a continuously
flowing medium that could later be resuspended in higher concentrations (Chang, 2005).
High aspect ratio “super arrays” have also been used for highly selective microfluidic
separations (Pra, 2007). The resolution and techniques needed for nanopillars are far
more advanced and expensive than necessary for blood model plasma separation. The
frequent use of micropillars, however, for separations in the industry as well as the
increased stability brought by their larger than nanosized cross-sections validates and
justifies the feasibility of using micropillars in our research.
15
1.8.2 Longitudinal Filtration
This device utilizes pumping flux to drive the fluids. The filtration features run parallel
to the flux. This has the benefit of decreasing total blockage because even if one gap
becomes blocked, the flux still continues to the next gap. The total number of gaps per
separation channel used by a recent research team was totaling more than 50 (Fernadez,
2006). Their method focused on large particles successfully separating 45um diameter
from 90um diameter latex beads. They did not choose to attempt smaller separations due
to their use of 50um tall features and their mask resolution limitations from using inkjet
printed transparencies as seen below in Figure 2. They noticed SU-8 integrity failures
when the aspect ratio of the structures was increased to approximately 2:1 (Fernadez,
2006).
Complete lithographic development was ensured by using sonication instead of simple
agitation. This sonication strategy while developing greatly decreased the development
times from about 6 minutes to less than 3 minutes. They also noticed appearance of a
white precipitate when isopropanol was sprayed on resists that were not fully developed
(Fernadez, 2006).
The above paper performed separations of particles from “any” solution into five size
groups using standard lithography practices. They used SU-8 50 lithography with high
16 resolution printed masks to mold into PDMS. They then plasma sealed the PDMS mold
to a flat PDMS sheet. The oxygen plasma exposure was 10-15 seconds. The plasma
caused ablation, cleaning, cross linking, and chemical modification. This means that the
surface contaminations were removed and the surfaces became temporarily hydrophilic to
allow effective sealing when desired (Fernadez, 2006).
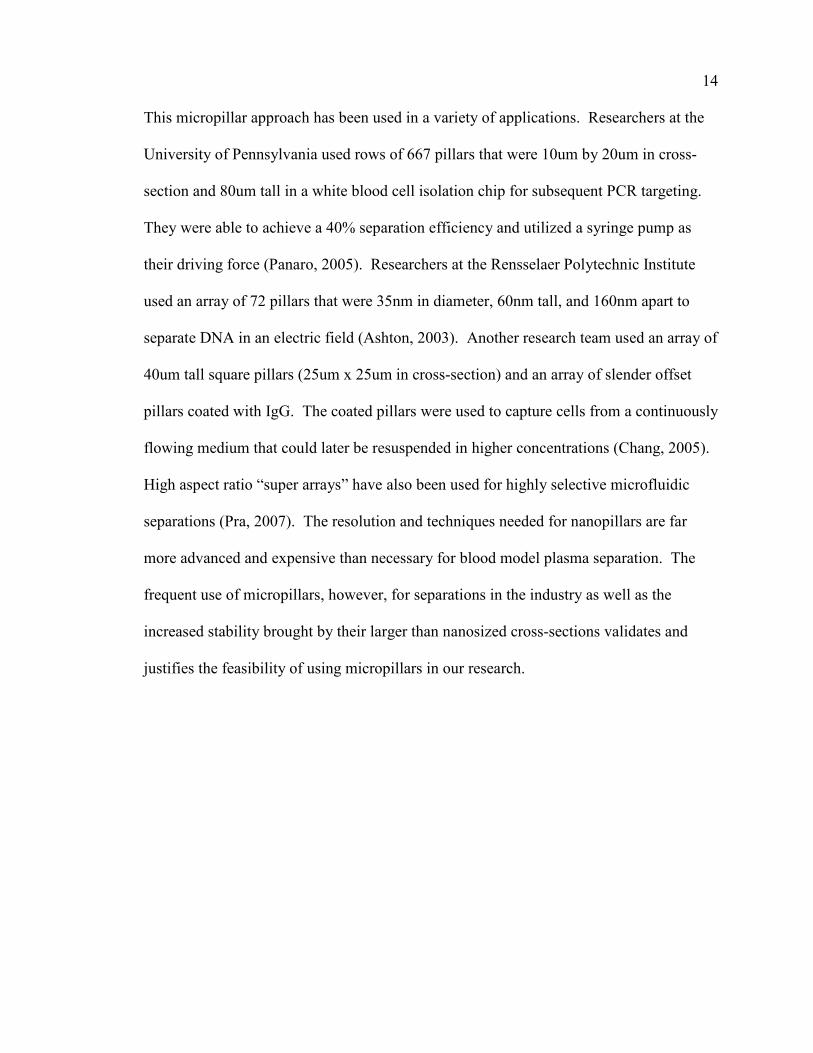
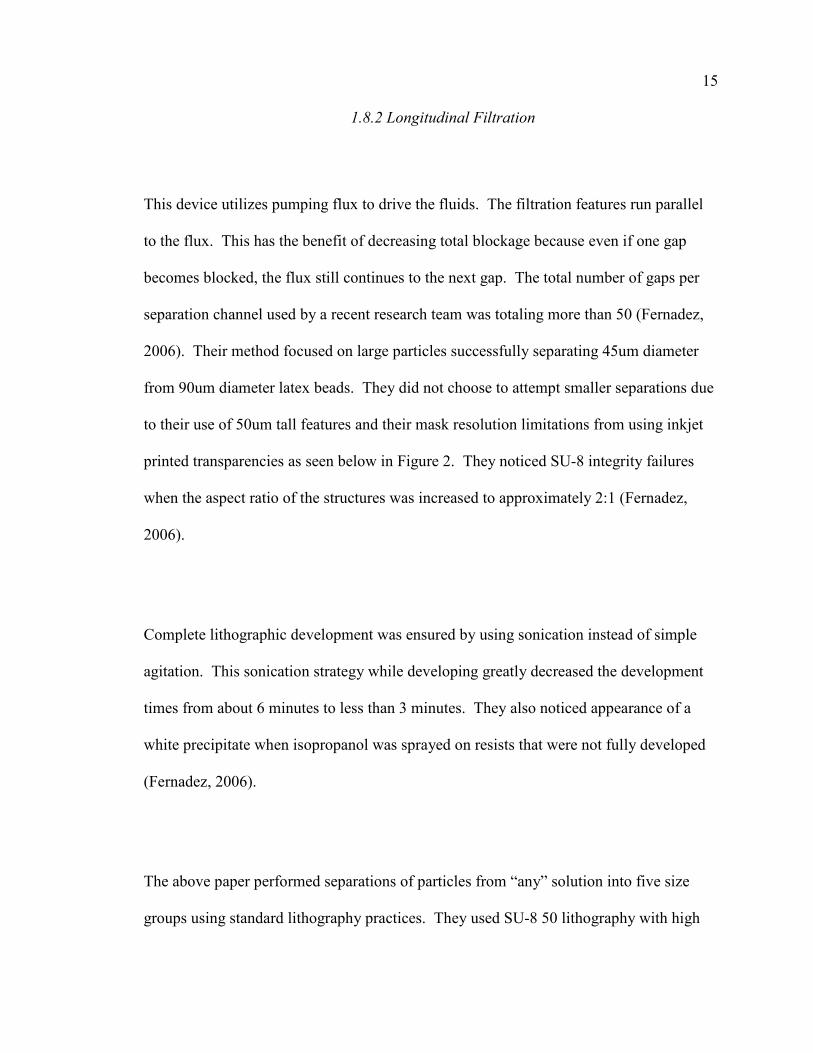
Figure 2: Design and PDMS mold of Fernadez’s muti-step forced filtration
Fernandez also used pumping as a driving force. Their 50um tall features limited their
separation abilities because of the SU-8 aspect ratio limitations. We propose to utilize
the Chen rounded filtration features with the Fernandez longitudinal approach by
maximizing the number of features and keeping them 50um tall.
17
1.8.3 Gravitational Separation
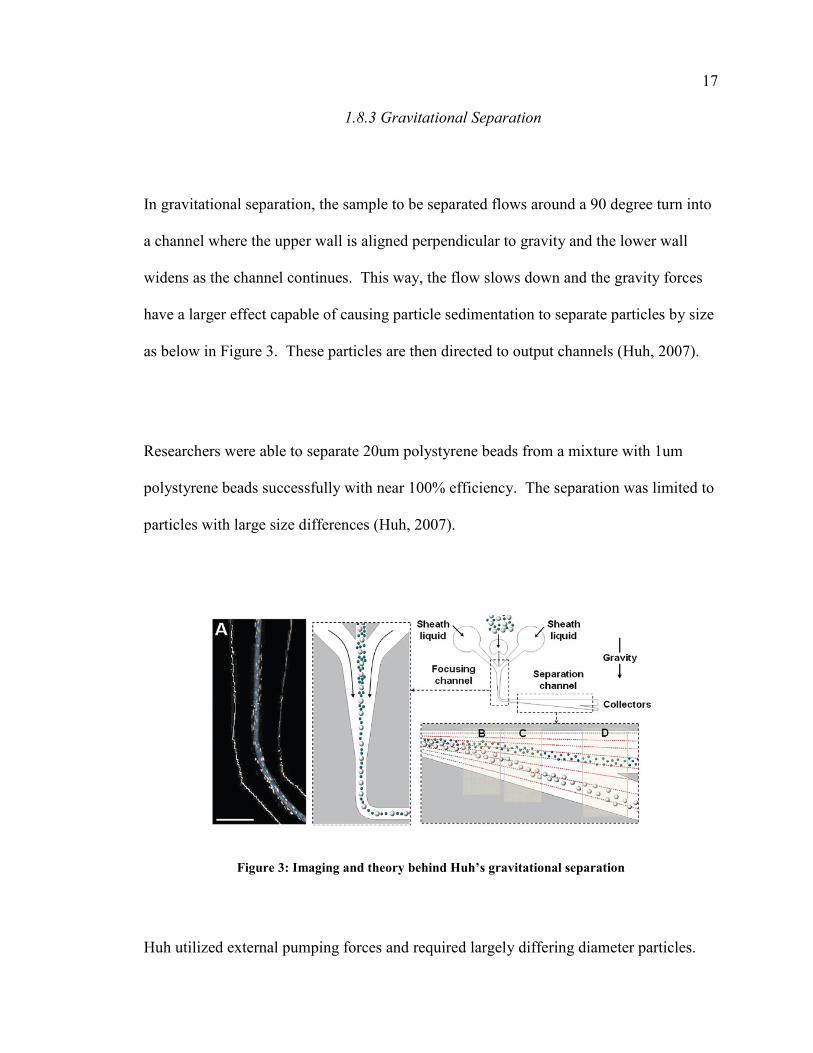
In gravitational separation, the sample to be separated flows around a 90 degree turn into
a channel where the upper wall is aligned perpendicular to gravity and the lower wall
widens as the channel continues. This way, the flow slows down and the gravity forces
have a larger effect capable of causing particle sedimentation to separate particles by size
as below in Figure 3. These particles are then directed to output channels (Huh, 2007).
Researchers were able to separate 20um polystyrene beads from a mixture with 1um
polystyrene beads successfully with near 100% efficiency. The separation was limited to
particles with large size differences (Huh, 2007).
Figure 3: Imaging and theory behind Huh’s gravitational separation
Huh utilized external pumping forces and required largely differing diameter particles.
18
1.8.4 Acoustophoresis
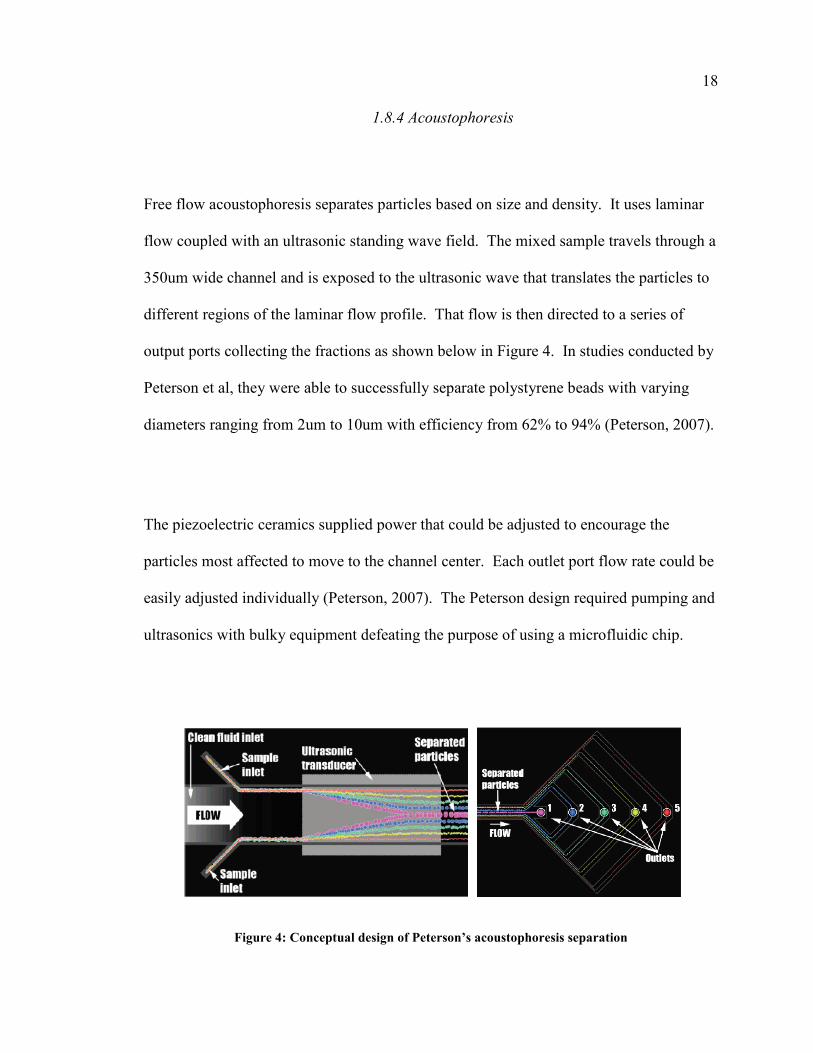
Free flow acoustophoresis separates particles based on size and density. It uses laminar
flow coupled with an ultrasonic standing wave field. The mixed sample travels through a
350um wide channel and is exposed to the ultrasonic wave that translates the particles to
different regions of the laminar flow profile. That flow is then directed to a series of
output ports collecting the fractions as shown below in Figure 4. In studies conducted by
Peterson et al, they were able to successfully separate polystyrene beads with varying
diameters ranging from 2um to 10um with efficiency from 62% to 94% (Peterson, 2007).
The piezoelectric ceramics supplied power that could be adjusted to encourage the
particles most affected to move to the channel center. Each outlet port flow rate could be
easily adjusted individually (Peterson, 2007). The Peterson design required pumping and
ultrasonics with bulky equipment defeating the purpose of using a microfluidic chip.
Figure 4: Conceptual design of Peterson’s acoustophoresis separation
19
1.8.5 T-Filtration
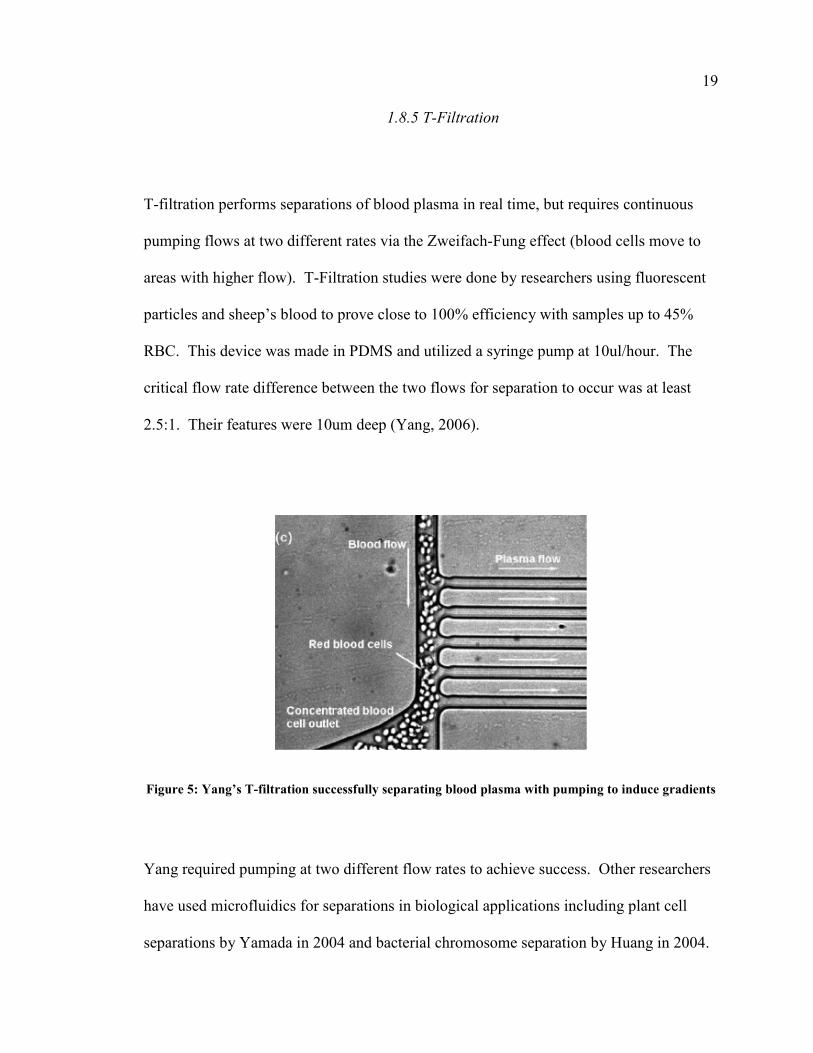
T-filtration performs separations of blood plasma in real time, but requires continuous
pumping flows at two different rates via the Zweifach-Fung effect (blood cells move to
areas with higher flow). T-Filtration studies were done by researchers using fluorescent
particles and sheep’s blood to prove close to 100% efficiency with samples up to 45%
RBC. This device was made in PDMS and utilized a syringe pump at 10ul/hour. The
critical flow rate difference between the two flows for separation to occur was at least
2.5:1. Their features were 10um deep (Yang, 2006).
Figure 5: Yang’s T-filtration successfully separating blood plasma with pumping to induce gradients
Yang required pumping at two different flow rates to achieve success. Other researchers
have used microfluidics for separations in biological applications including plant cell
separations by Yamada in 2004 and bacterial chromosome separation by Huang in 2004.
20
1.8.6 Summary of Current Separation Techniques
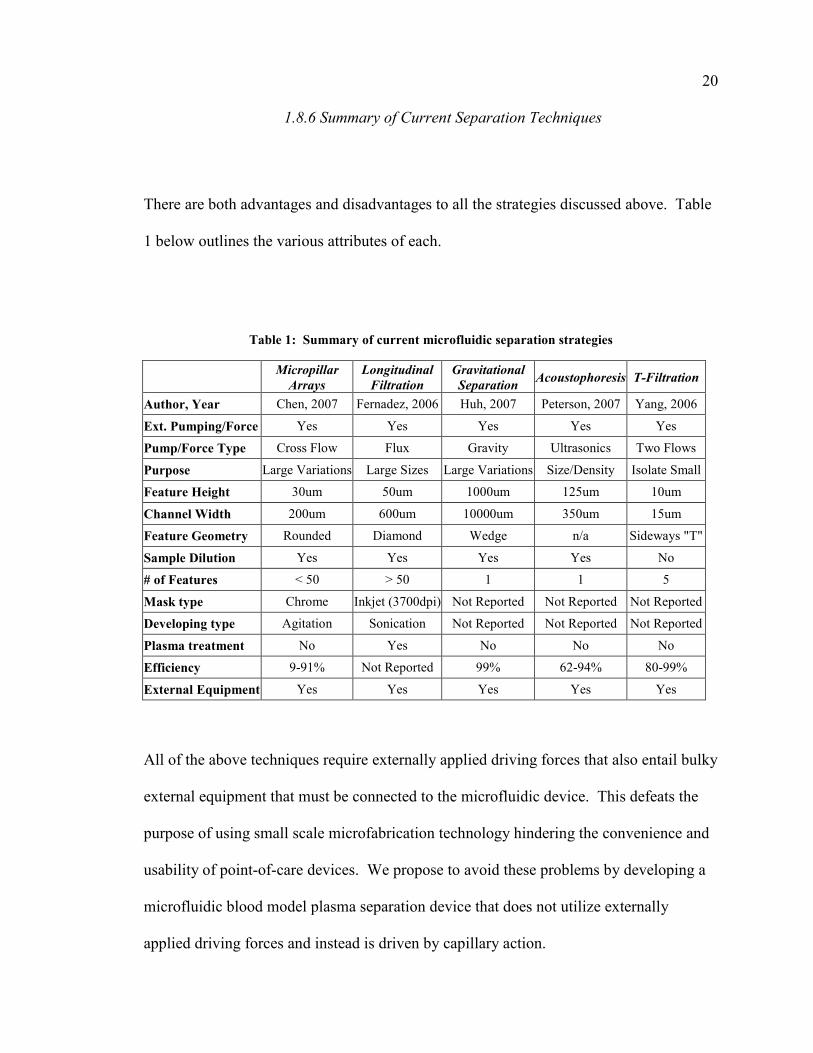
There are both advantages and disadvantages to all the strategies discussed above. Table
1 below outlines the various attributes of each.
Table 1: Summary of current microfluidic separation strategies
Micropillar
Arrays
Longitudinal
Filtration
Gravitational
Separation Acoustophoresis T-Filtration
Author, Year Chen, 2007 Fernadez, 2006 Huh, 2007 Peterson, 2007 Yang, 2006
Ext. Pumping/Force Yes Yes Yes Yes Yes
Pump/Force Type Cross Flow Flux Gravity Ultrasonics Two Flows
Purpose Large Variations Large Sizes Large Variations Size/Density Isolate Small
Feature Height 30um 50um 1000um 125um 10um
Channel Width 200um 600um 10000um 350um 15um
Feature Geometry Rounded Diamond Wedge n/a Sideways "T"
Sample Dilution Yes Yes Yes Yes No
# of Features < 50 > 50 1 1 5
Mask type Chrome Inkjet (3700dpi) Not Reported Not Reported Not Reported
Developing type Agitation Sonication Not Reported Not Reported Not Reported
Plasma treatment No Yes No No No
Efficiency 9-91% Not Reported 99% 62-94% 80-99%
External Equipment Yes Yes Yes Yes Yes
All of the above techniques require externally applied driving forces that also entail bulky
external equipment that must be connected to the microfluidic device. This defeats the
purpose of using small scale microfabrication technology hindering the convenience and
usability of point-of-care devices. We propose to avoid these problems by developing a
microfluidic blood model plasma separation device that does not utilize externally
applied driving forces and instead is driven by capillary action.
21
1.9 Microfabrication
Microfabrication broadly describes fabrication technologies used to make components
and technology that are on the micrometer scale. Microfabrication began due to the
increasing need for microelectronics commonly made from silicon wafers, glass, or
plastics (Xia, 1998). Modern microfabrication can be seen in microchips, microsensors,
inkjet printing, flat panel televisions, compact discs, laser diodes, semiconductors, and
point of care microfluidic chips. The core principles of microfabrication involve the
rapid and parallel replication and fabrication of thousands of identical features or
structures accomplished by imprint, casting, lithography, or molding techniques (Qin,
1998).
Not all the principles of microfabrication are modern. Lithography and etching principles
date back to the 19th century. Electroplating for example began in the 19th century and
has since evolved to have the capability of producing microstructures (Mehdizadeh,
1992). The standard computer RAM chip fabrication utilizes more than 30 lithography
cycles with 10 oxidation protocols as well as 20 different etching cycles complete with 10
doping cycles. The number of layer patterns used is quantified using a value called the
mask count. Microprocessors have a mask count of at least 30 while laser diodes or
microfluidic devices tend to have a mask count of less than 3-5 (Rajsuman, 2001).
22 A cleanroom environment of at least class 100,000, where the air is deemed clean by
being filtered through HEPA filters and regulated for particle contamination, temperature,
humidity, vibrations, and electrical interferences, is necessary for microfabrication.
Device fabrication in the presence of smoke, dust, bacteria, or cells render the
microdevice useless and unable to be validated or effectively used in clinical practice
(Kim, 2004).
23
1.10 Microfluidics
Microfluidics is arguably the most rapidly expanding and researched discipline in all of
microfabrication and microtechnology. As each new technology emerges, the demand
for more technical and complicated applications with unique requirements quickly rises.
Some specific requirements may include rapid manufacture, low cost, high resistance to
chemicals, biocompatibility, size, or ability to be integrated with other systems (Duffy,
1998).
The control, manipulation, and understanding of the behavior of fluids less than a few
microliters in volume is termed microfluidics and merges the principals of chemistry,
biology, MEMS, and mechanics (Duffy, 1998). Microfluidics first emerged in the early
1990s to satisfy the need for devices utilizing fluids with low volumes such as DNA
chips, micropropulsion units, lab on a chip technology, and microthermals. The most
popular use for microfluidic technologies was needed for the separation and analysis of
chemical or biological substances (Qin, 1998).
Microfluidics is the unique method of manipulating fluids of a small volume considering
that the behavior of fluids on the microscale is far different than their macro relatives. In
microsystems, forces and factors such as surface tension, dissipation of energy,
resistance, and viscosity dominate. For example, a capillary tube with a 100um diameter
24 has an extremely low Reynold’s number keeping the flow laminar. Flow that is laminar
inhibits the mixing of two dissimilar fluids normally caused by turbulence. All mixing
and interaction that occurs is solely diffusion based (Groisman, 2004). This increase in
interface force creates new considerations for the simple manipulation of flow.
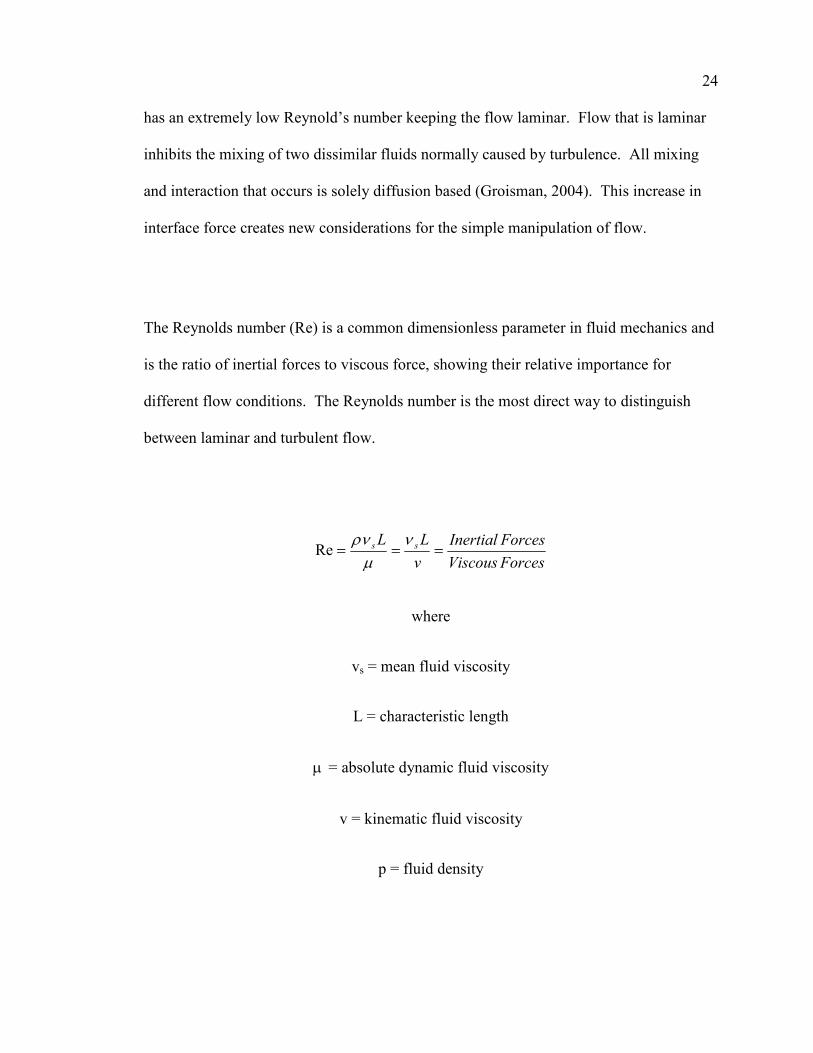
The Reynolds number (Re) is a common dimensionless parameter in fluid mechanics and
is the ratio of inertial forces to viscous force, showing their relative importance for
different flow conditions. The Reynolds number is the most direct way to distinguish
between laminar and turbulent flow.
ForcesViscous
ForcesInertial
v
LL ss ===ν
µρν
Re
where
vs = mean fluid viscosity
L = characteristic length
µ = absolute dynamic fluid viscosity
v = kinematic fluid viscosity
p = fluid density
25 Laminar flow is identified by a Reynolds number less than 2300. It is common in
microfluidics for the Reynolds number to be less than 25 due to the small volumes.
Laminar flow has dominating viscous forces and expresses smooth fluid motion. High
Reynolds numbers represent dominant inertial forces, flow variations and turbulence
(Tice, 2003). The critical transition point varies based on channel cross section
geometry.
If
Re < 2300 � Laminar
2300 < Re < 4000 � Transient
Re > 4000 � Turbulent
26
1.11 Photolithography
The process to fabricate microfluidic systems by removal of specific features of a thin
film though UV light exposure and chemical developing is termed photolithography.
Photolithography has been the backbone of the semiconductor manufacturing process
since it was first developed in 1959 (Xia, 1998). This process manipulates printed
patterns to form a mask that transfers desired light to a light-sensitive photoresist on a
substrate. Usually, the area exposed to light, crosslinks which keeps it from being
washed away in the developing process along with the unexposed areas.
Photolithography is commonly used due to its controllability on planar objects and it
ability to process a relatively large area simultaneously (Qin, 1998). These features can
then be “stacked” to form 3 dimensional structures.
Photolithography, however, requires a clean room environments and contaminant free
substrates limited to flat surfaces (Bilenberg, 2003).
The common photolithography procedure includes (Duffy, 1998):
1. Cleaning and subsequent heating of the wafer to remove moisture
2. Application of a viscous photoresist by spin coating to create a uniform thin
film layer (usually 1000-3000rpm for 30 seconds)
27
3. Pre-bake and Soft-bake at elevated temperatures to remove solvents to cause
the layer to solidify
4. Aligning mask over substrate and placing them in “contact”
5. Causing a chemical change by exposure to high powered uniform UV light
through a contact mask
6. Post exposure baking to promote crosslinking and remove incident light
interference patterns
7. Develop in specifically tailored chemical solution to remove excess
photoresist leaving only the desired features
8. Optional hard bake to create feature stability for future processes
Photolithography is performed in a cleanroom under controlled lighting systems to avoid
undesirable photoresist exposures (Chan-Park, 2004). The fluorescent lighting is filtered
to allow only the yellow spectrum, completely removing ultraviolet and blue light.
Developments in photolithography have propelled the success of Moore’s Law which
states that “the number of transistors in a single integrated circuit will double every 18
months to effectively double the computing capacity or halve the cost.” Research and
development has also effectively halved the minimum allowable photolithographic
resolution every three years (Xia, 1998).
28
1.12 Photoresists
Photoresists are light sensitive viscous materials that are commonly used in industry to
form raised patterns (Qin, 1998). Photoresists are separated into two types: positive or
negative photoresists. Positive photoresists’ UV light exposed regions become soluble to
the developer chemical solution while the opposite is true for negative photoresists where
the unexposed regions remain soluble (Shaw, 1997).
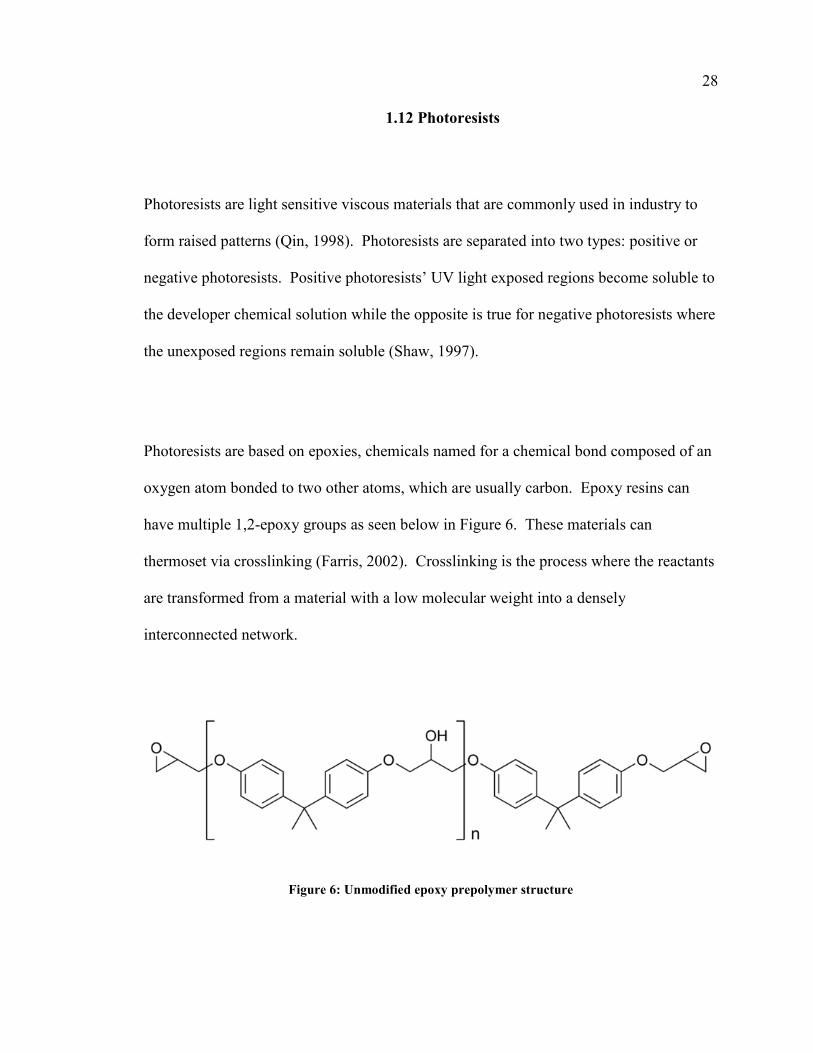
Photoresists are based on epoxies, chemicals named for a chemical bond composed of an
oxygen atom bonded to two other atoms, which are usually carbon. Epoxy resins can
have multiple 1,2-epoxy groups as seen below in Figure 6. These materials can
thermoset via crosslinking (Farris, 2002). Crosslinking is the process where the reactants
are transformed from a material with a low molecular weight into a densely
interconnected network.
Figure 6: Unmodified epoxy prepolymer structure

29 Photoresists are commonly catalyzed by cationic polymerization. The induction is
caused by Lewis acids formed by UV exposure when the 1,2-epoxy ring is opened
(Naitoh, 2003). This will be discussed further below in Figure 8.
30
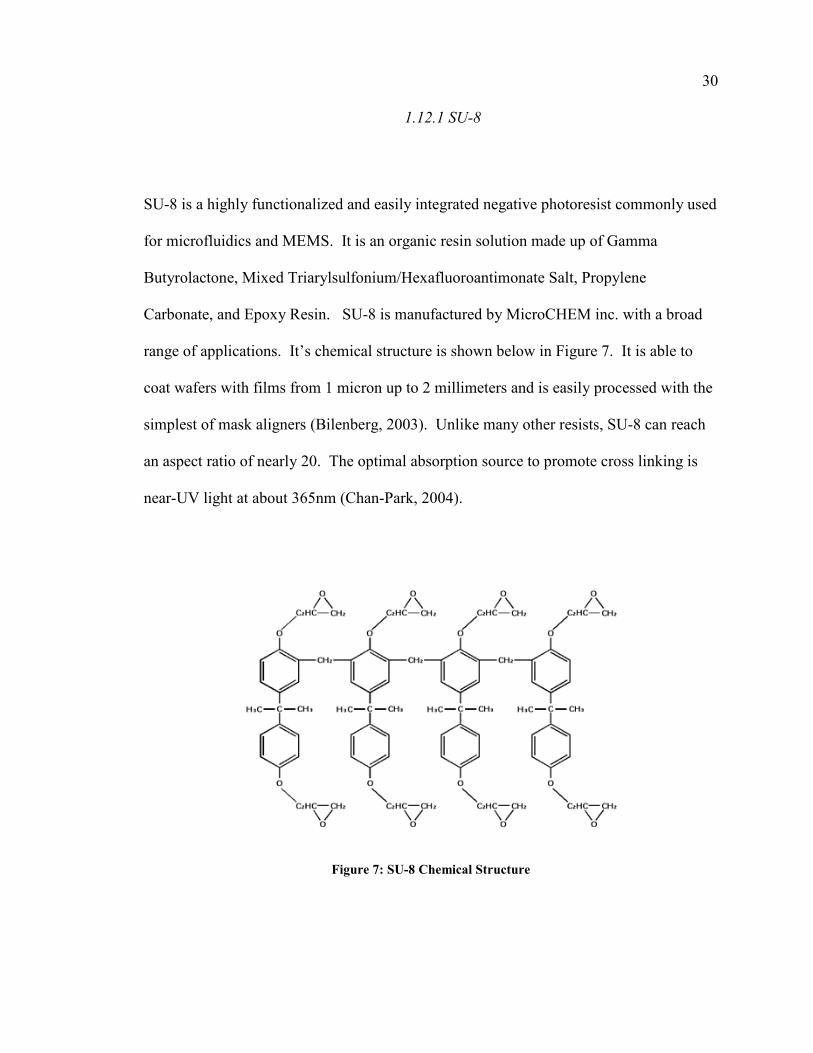
1.12.1 SU-8
SU-8 is a highly functionalized and easily integrated negative photoresist commonly used
for microfluidics and MEMS. It is an organic resin solution made up of Gamma
Butyrolactone, Mixed Triarylsulfonium/Hexafluoroantimonate Salt, Propylene
Carbonate, and Epoxy Resin. SU-8 is manufactured by MicroCHEM inc. with a broad
range of applications. It’s chemical structure is shown below in Figure 7. It is able to
coat wafers with films from 1 micron up to 2 millimeters and is easily processed with the
simplest of mask aligners (Bilenberg, 2003). Unlike many other resists, SU-8 can reach
an aspect ratio of nearly 20. The optimal absorption source to promote cross linking is
near-UV light at about 365nm (Chan-Park, 2004).
Figure 7: SU-8 Chemical Structure
31 SU-8 was developed and patented in 1989 by IBM and adapted for MEMS in 1996
(Zhang, 2001). SU-8 has an elastic modulus of 4.4GPa, a Poisson’s coefficient of 0.22, a
coefficient of thermal expansion of 50 ppm/K, a thermal conductivity of 0.2W/m K, a
glass transition temperature of 200C, a degradation temperature of 380C, a refractive
index of 1.8 at 100GHz and 1.7 at 1.6THz, and a relative dielectric constant of 3 at
10MHz (Farris, 2003).
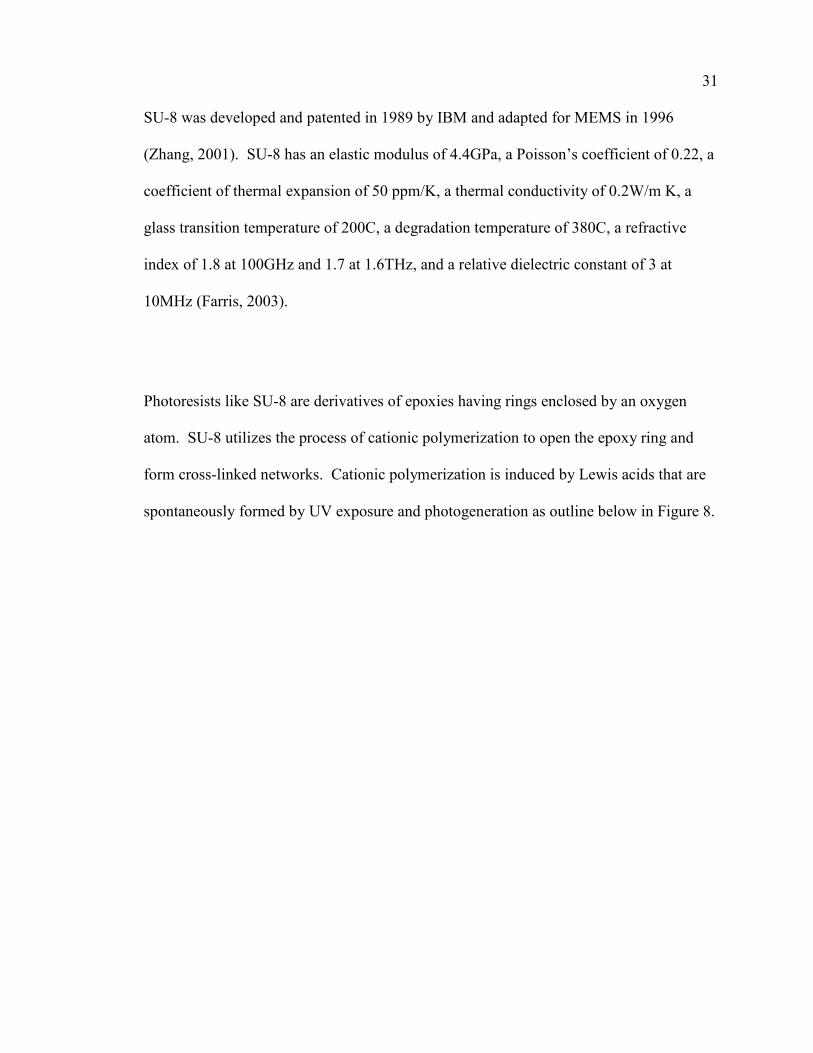
Photoresists like SU-8 are derivatives of epoxies having rings enclosed by an oxygen
atom. SU-8 utilizes the process of cationic polymerization to open the epoxy ring and
form cross-linked networks. Cationic polymerization is induced by Lewis acids that are
spontaneously formed by UV exposure and photogeneration as outline below in Figure 8.
32
Figure 8: Example of the process of SU-8 UV photofunctionalization
SU-8 adhesion to wafers can be promoted using classical promoters such as
Hexamethyldisilazane (HMDS), which is known to have an adverse effect when the
wafer is glass by causing the SU-8 to “bead up” and pull away from the edges (Mouaziz,
2006). Another adhesion promotion method utilizes an epoxy molecule with methyl
groups on one side to interact with the wafer and epoxy groups on the other to interact
with the SU-8 (Carlier, 2004). Promoters are valuable in allowing for increased adhesive
stability of small features during the harsh environment of developing. The MicroCHEM
recommended parameters for SU-8 lithography are summarized below in Table 2 through
Table 5 and Figure 9 through Figure 11.
33
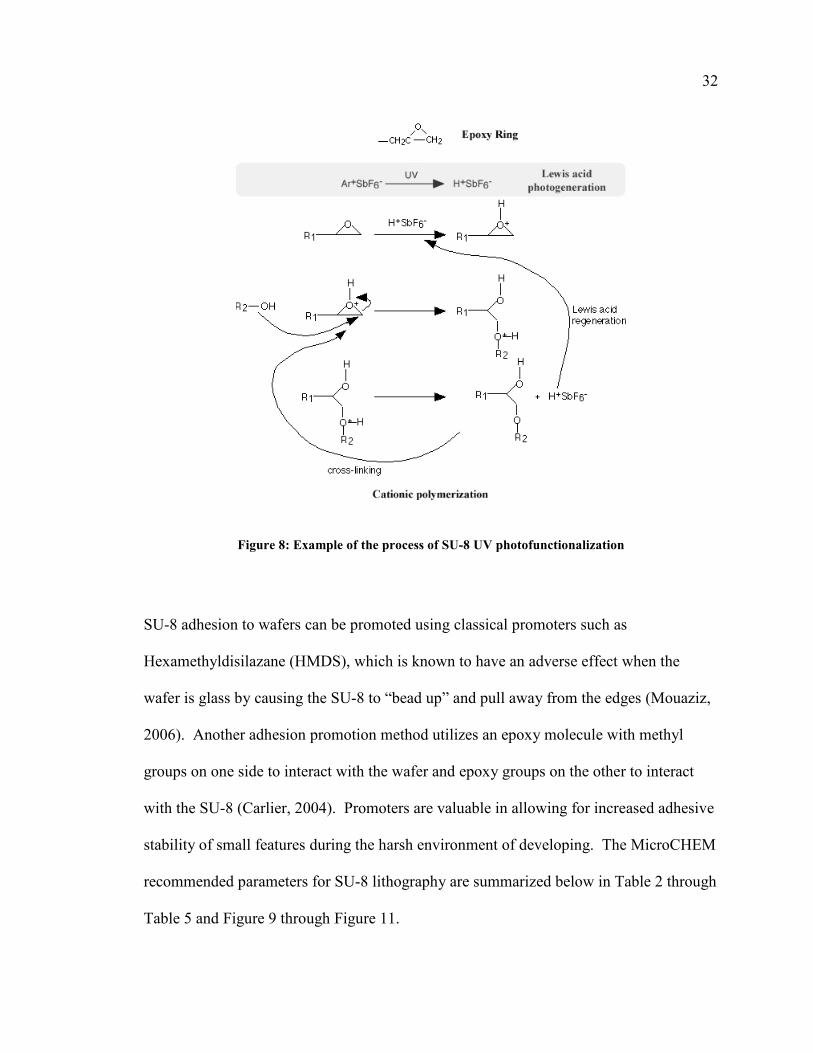
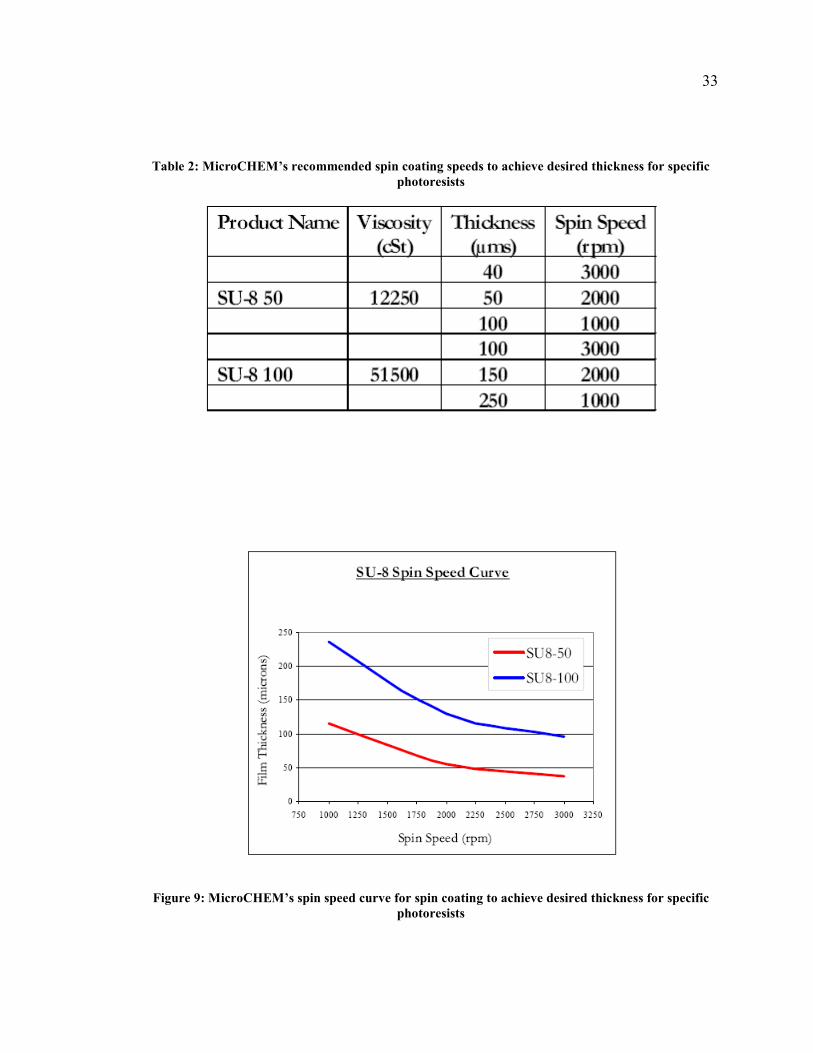
Table 2: MicroCHEM’s recommended spin coating speeds to achieve desired thickness for specific
photoresists
Figure 9: MicroCHEM’s spin speed curve for spin coating to achieve desired thickness for specific
photoresists
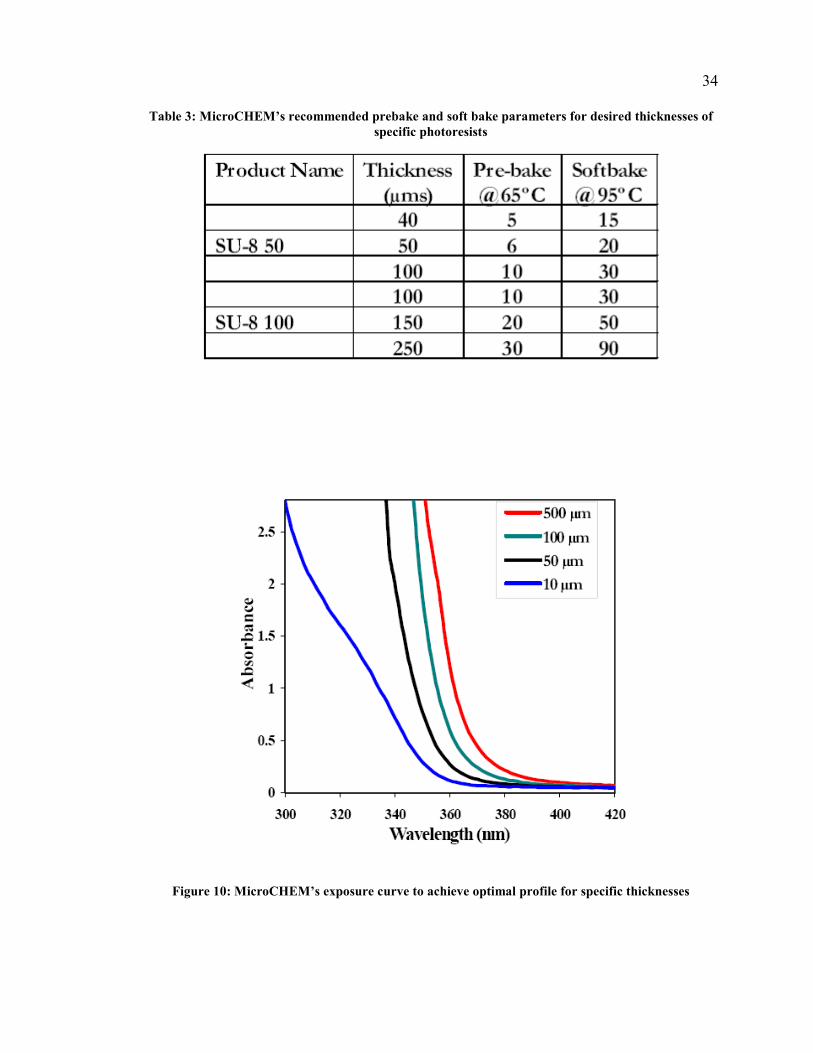
34 Table 3: MicroCHEM’s recommended prebake and soft bake parameters for desired thicknesses of
specific photoresists
Figure 10: MicroCHEM’s exposure curve to achieve optimal profile for specific thicknesses
35
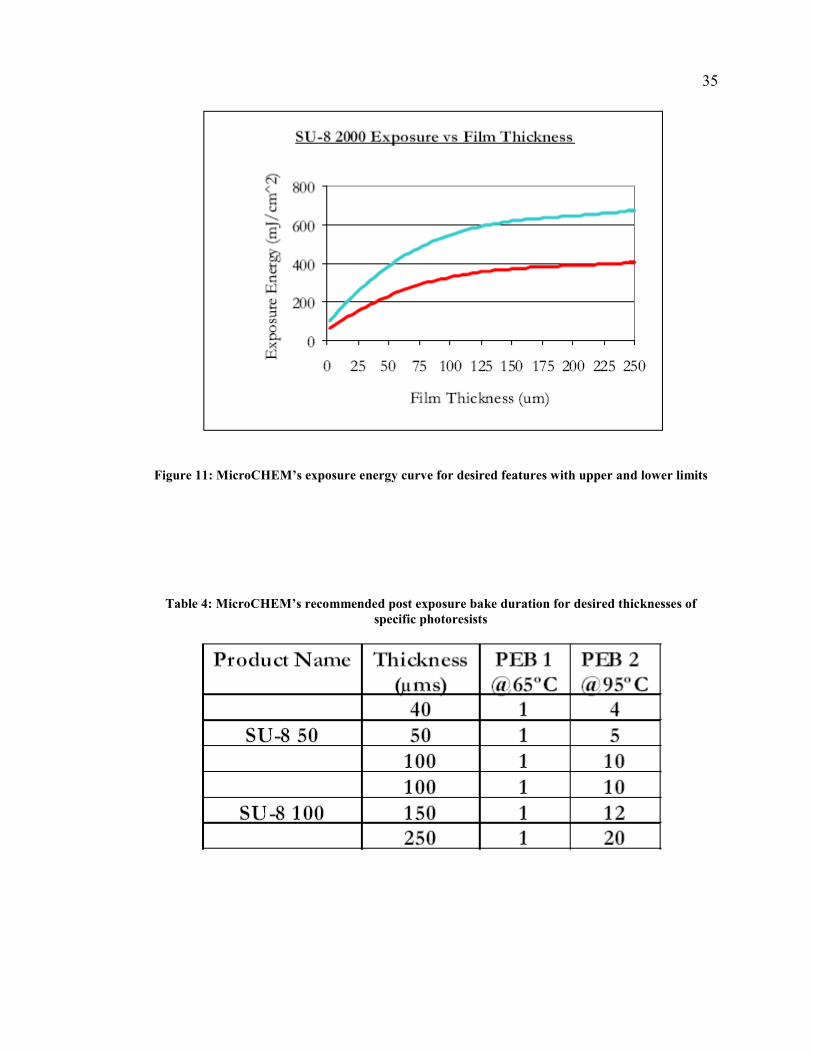
Figure 11: MicroCHEM’s exposure energy curve for desired features with upper and lower limits
Table 4: MicroCHEM’s recommended post exposure bake duration for desired thicknesses of
specific photoresists
36
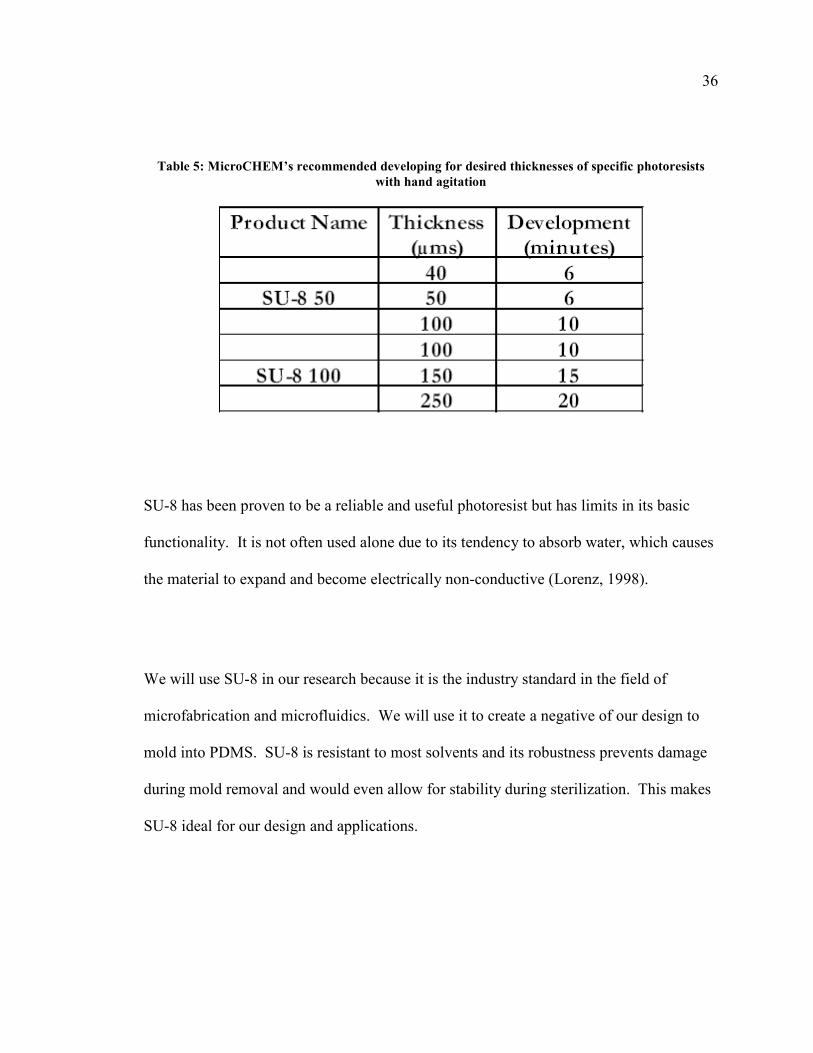
Table 5: MicroCHEM’s recommended developing for desired thicknesses of specific photoresists
with hand agitation
SU-8 has been proven to be a reliable and useful photoresist but has limits in its basic
functionality. It is not often used alone due to its tendency to absorb water, which causes
the material to expand and become electrically non-conductive (Lorenz, 1998).
We will use SU-8 in our research because it is the industry standard in the field of
microfabrication and microfluidics. We will use it to create a negative of our design to
mold into PDMS. SU-8 is resistant to most solvents and its robustness prevents damage
during mold removal and would even allow for stability during sterilization. This makes
SU-8 ideal for our design and applications.
37
1.13 Silicone and Glass
Silicone and glass are commonly used when the microfluidic system requires small
channels with high repeatability and resolution. These materials are of high quality and
are easily integrated into clean room environments, utilizing common technologies
incorporated from decades of understanding and practice.
The most common silicone used in microfluidic applications is polydimethylsiloxane
(PDMS) under the product name of Sylgard 184. It is inert, non-flammable, and optically
transparent (Qin, 1998). PDMS is known to be stable and inert when in contact with
chemicals while also being able to fuse with glass to form channels (Qin, 1998).
Disposable devices use silicone and glass as their “classical” materials for both ease-of-
use and low cost.
38
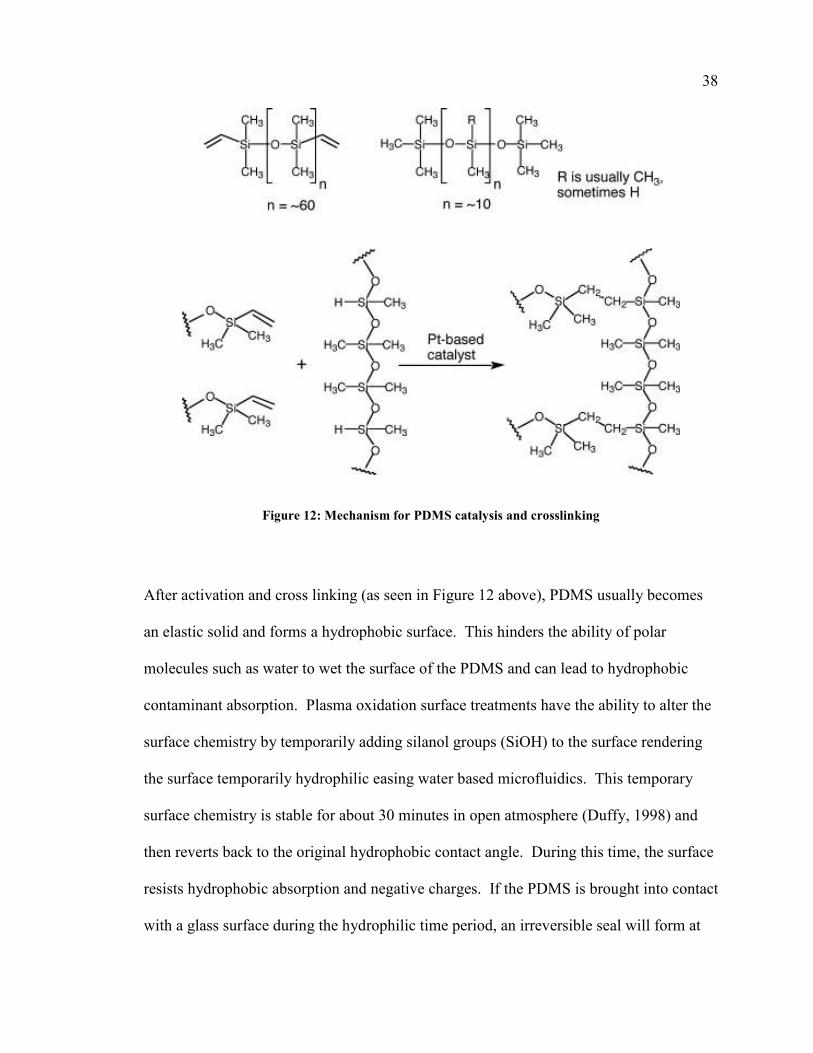
Figure 12: Mechanism for PDMS catalysis and crosslinking
After activation and cross linking (as seen in Figure 12 above), PDMS usually becomes
an elastic solid and forms a hydrophobic surface. This hinders the ability of polar
molecules such as water to wet the surface of the PDMS and can lead to hydrophobic
contaminant absorption. Plasma oxidation surface treatments have the ability to alter the
surface chemistry by temporarily adding silanol groups (SiOH) to the surface rendering
the surface temporarily hydrophilic easing water based microfluidics. This temporary
surface chemistry is stable for about 30 minutes in open atmosphere (Duffy, 1998) and
then reverts back to the original hydrophobic contact angle. During this time, the surface
resists hydrophobic absorption and negative charges. If the PDMS is brought into contact
with a glass surface during the hydrophilic time period, an irreversible seal will form at
39 all contact points (Rotting, 2001). Even under vacuum, the hydrophobicity of the surface
will return over lengths of time greater than one week. Weak temporary bonding is
spontaneous when the PDMS is brought into contact with a flat substrate (Fujii, 2002).
PDMS structures have the distinct advantage of not swelling in the presence of water or
alcohols allowing for reliable channel geometry. Organic solvents, however, do cause
swelling and are not commonly used in contact with PDMS with the exception of
isopropanol, acetone, and pyridine which have low solubility parameters with silicone
leading to only small amounts of swelling (Qin, 1998).
The above discussion demonstrates how PDMS could be used with a reusable SU-8
master mold to form a stable and reliable microfluidic soft lithography device (Chan-
Park, 2004 and Qin, 1998). The elastomeric properties of PDMS, however, may lend a
vulnerability to specific problems including gravitational deformations or pressure
gradients spontaneously closing channels (Xia, 1998).
In this work, we will utilize the industry standard Sylgard 184 PDMS as our main
material in our final separation device. It is inert, sterilizable, allows for rapid
fabrication, and is widely accepted in the scientific community. The PDMS instantly
forms a reversible seal with glass when in contact allowing for quick and easy final
device assembly.
40
2. DESIGN AND DEVELOPMENT
2.1 Design Requirements
2.1.1 Design Criteria
This device should integrate the theories of microfluidics with the theories of standard
filtration techniques by successfully separating blood model plasma from a whole blood
model with no external driving forces such as conventional pumping. The separated
output should consist of suspended particles smaller than 3um in diameter. The “dead
volume” of the filtration technique should be less than 10ul and be able to facilitate
measurable output of at least 100ul in less than 5 minutes. This device must be small in
size allowing for single drop separation while also being disposable for easy
incorporation into healthcare strategies. It must be able to be easily fabricated using
industry standard techniques and materials, as well as be able to be integrated into future
biomarker detection devices of similar size and flows.
41
2.1.2 Design Constraints
The final developed separation device should utilize the theories of rapid prototyping
allowing for the creation of multiple devices per manufacturing run. The successful
separation of a final device should be least 75% efficient to be considered a success. The
device should be developed such that it would cost less than the average fee associated
with current blood plasma separation testing that is approximately $70. It must be able
to be easily fabricated using industry standards in terms of techniques such as lithography
and materials. It should also allow for future integration into biomarker detection devices
of similar size and flows. The final production materials should be inert when in contact
with human fluids allowing for contamination-free separations.
42
2.2 Lithographic Technique
As outlined above, in the photolithography of the industry standard SU-8 50 photoresist,
areas exposed to a sufficient dose of UV light irradiation will crosslink and resist
developing. During the developing process, uncrosslinked photoresist will be washed
away. There are two possible photolithographic strategies; positive or negative
lithography. SU-8 is a negative photoresist. This means that what is exposed to light
“stays” and what is not, “washes away.”
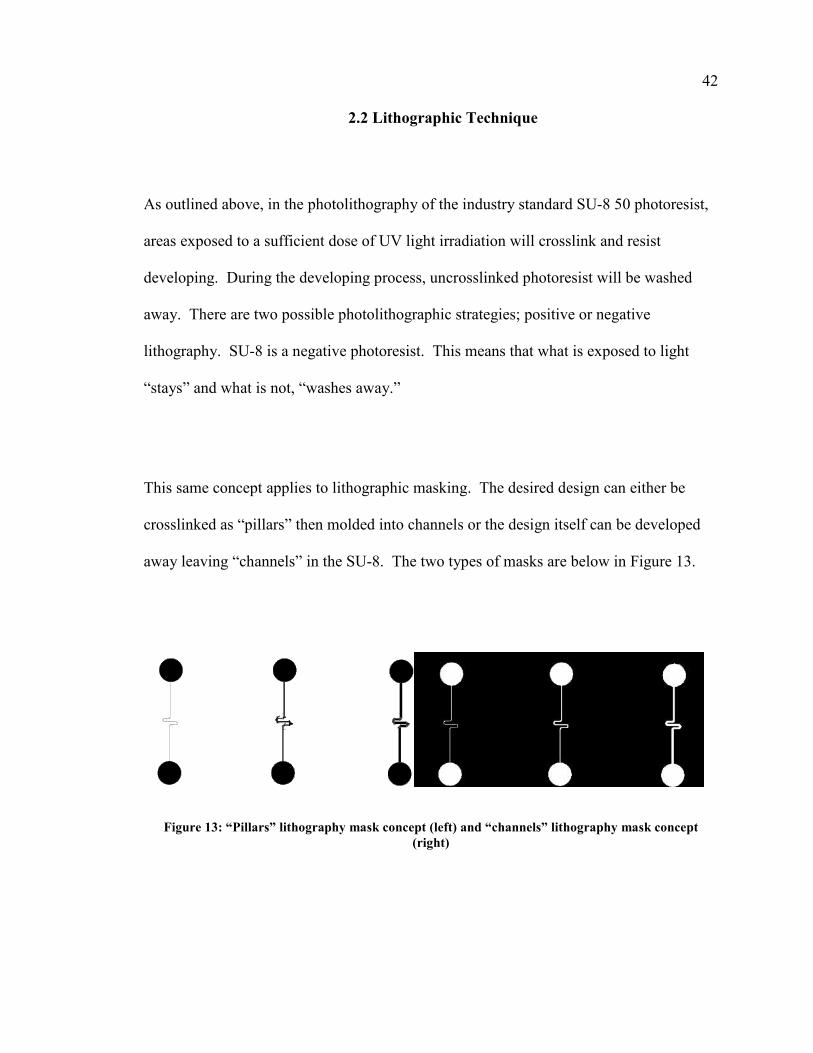
This same concept applies to lithographic masking. The desired design can either be
crosslinked as “pillars” then molded into channels or the design itself can be developed
away leaving “channels” in the SU-8. The two types of masks are below in Figure 13.
Figure 13: “Pillars” lithography mask concept (left) and “channels” lithography mask concept
(right)
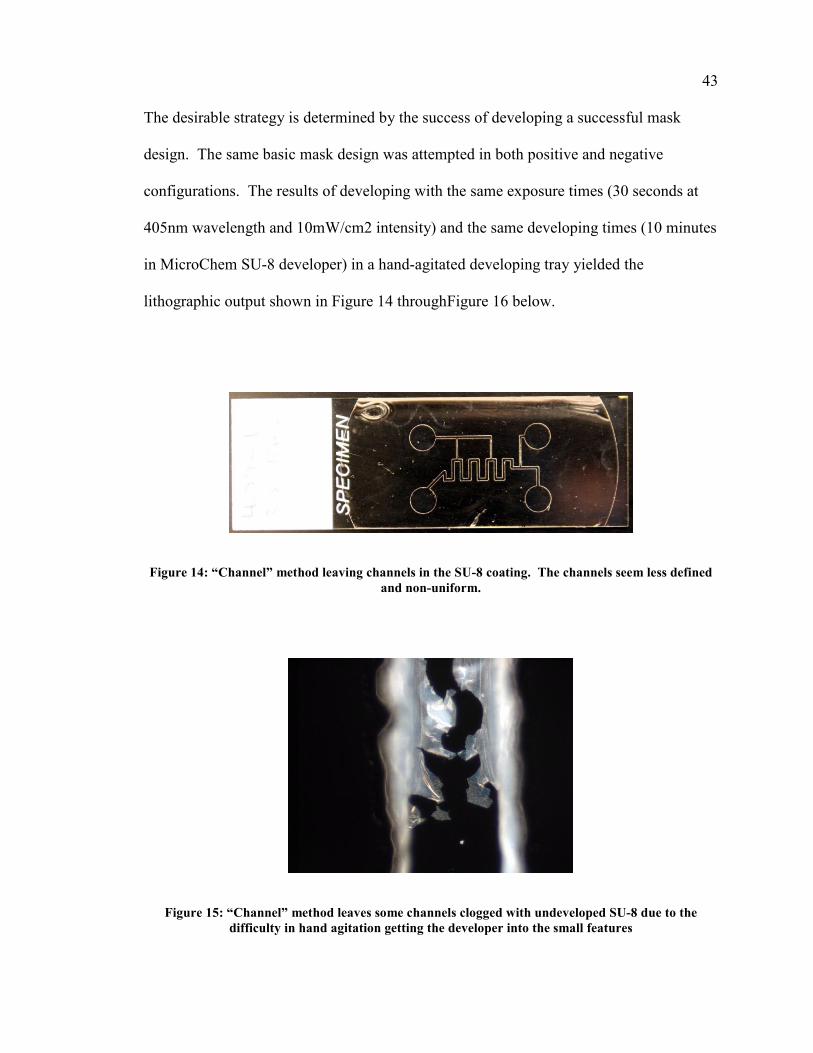
43 The desirable strategy is determined by the success of developing a successful mask
design. The same basic mask design was attempted in both positive and negative
configurations. The results of developing with the same exposure times (30 seconds at
405nm wavelength and 10mW/cm2 intensity) and the same developing times (10 minutes
in MicroChem SU-8 developer) in a hand-agitated developing tray yielded the
lithographic output shown in Figure 14 throughFigure 16 below.
Figure 14: “Channel” method leaving channels in the SU-8 coating. The channels seem less defined
and non-uniform.
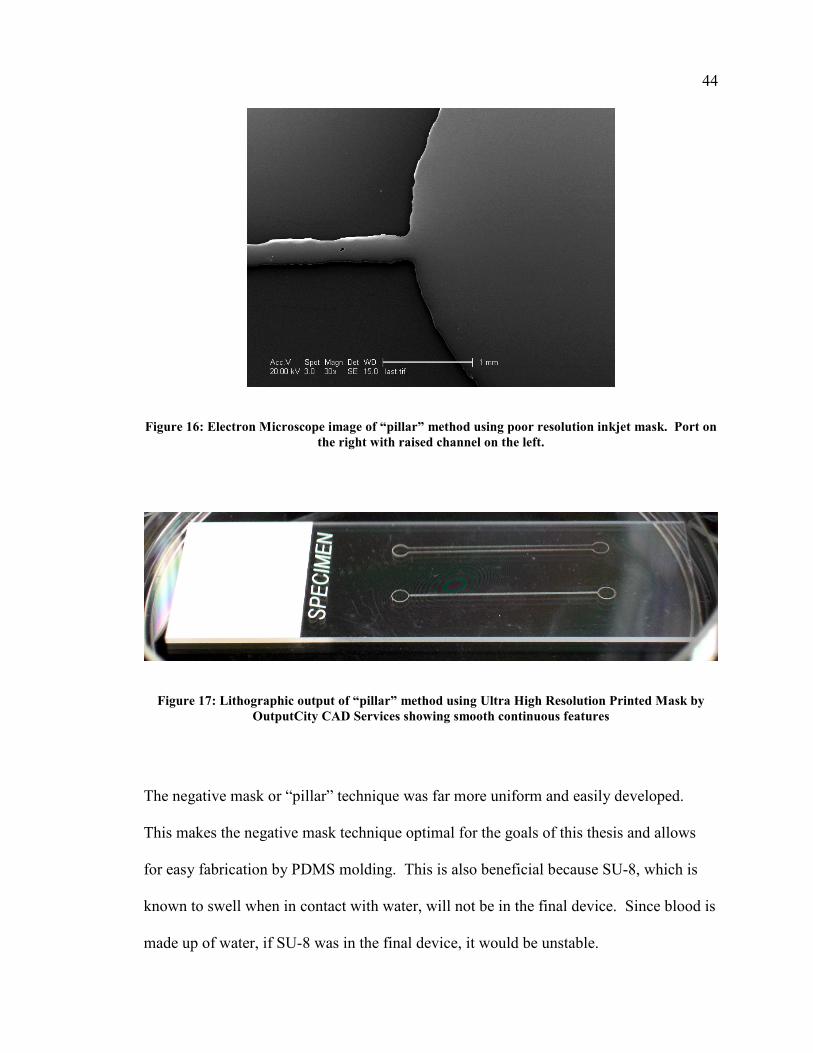
Figure 15: “Channel” method leaves some channels clogged with undeveloped SU-8 due to the
difficulty in hand agitation getting the developer into the small features
44
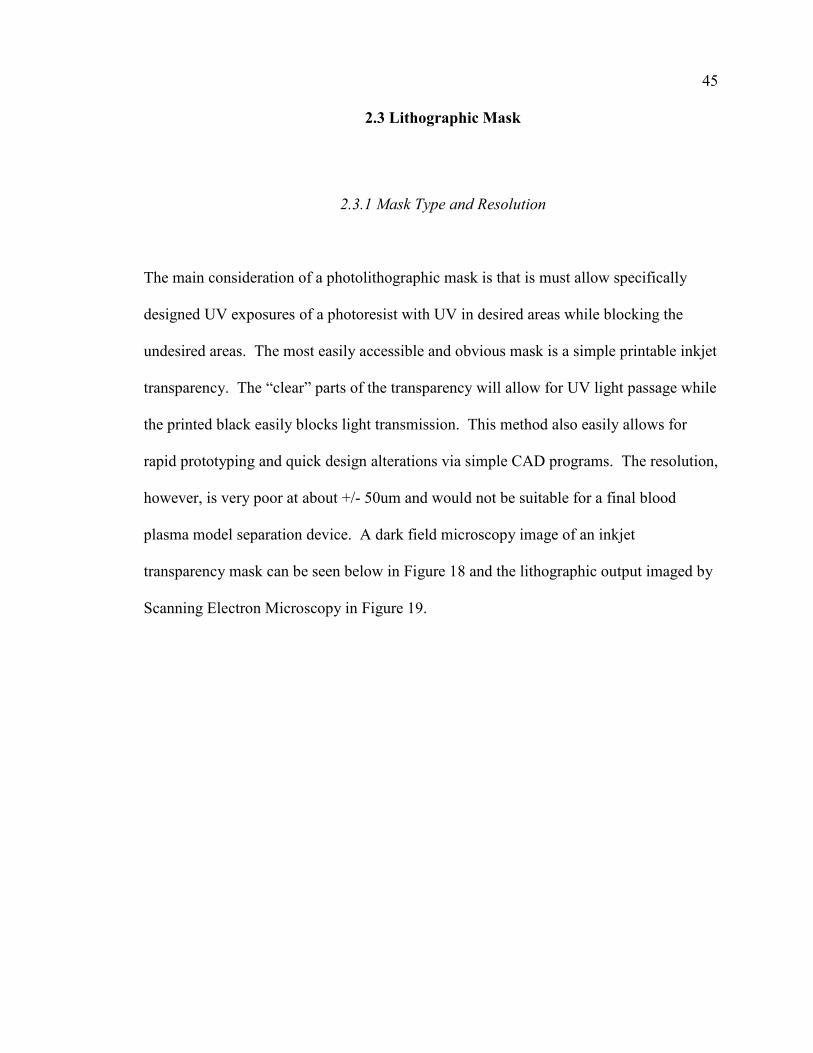
Figure 16: Electron Microscope image of “pillar” method using poor resolution inkjet mask. Port on
the right with raised channel on the left.
Figure 17: Lithographic output of “pillar” method using Ultra High Resolution Printed Mask by
OutputCity CAD Services showing smooth continuous features
The negative mask or “pillar” technique was far more uniform and easily developed.
This makes the negative mask technique optimal for the goals of this thesis and allows
for easy fabrication by PDMS molding. This is also beneficial because SU-8, which is
known to swell when in contact with water, will not be in the final device. Since blood is
made up of water, if SU-8 was in the final device, it would be unstable.
45
2.3 Lithographic Mask
2.3.1 Mask Type and Resolution
The main consideration of a photolithographic mask is that is must allow specifically
designed UV exposures of a photoresist with UV in desired areas while blocking the
undesired areas. The most easily accessible and obvious mask is a simple printable inkjet
transparency. The “clear” parts of the transparency will allow for UV light passage while
the printed black easily blocks light transmission. This method also easily allows for
rapid prototyping and quick design alterations via simple CAD programs. The resolution,
however, is very poor at about +/- 50um and would not be suitable for a final blood
plasma model separation device. A dark field microscopy image of an inkjet
transparency mask can be seen below in Figure 18 and the lithographic output imaged by
Scanning Electron Microscopy in Figure 19.
46
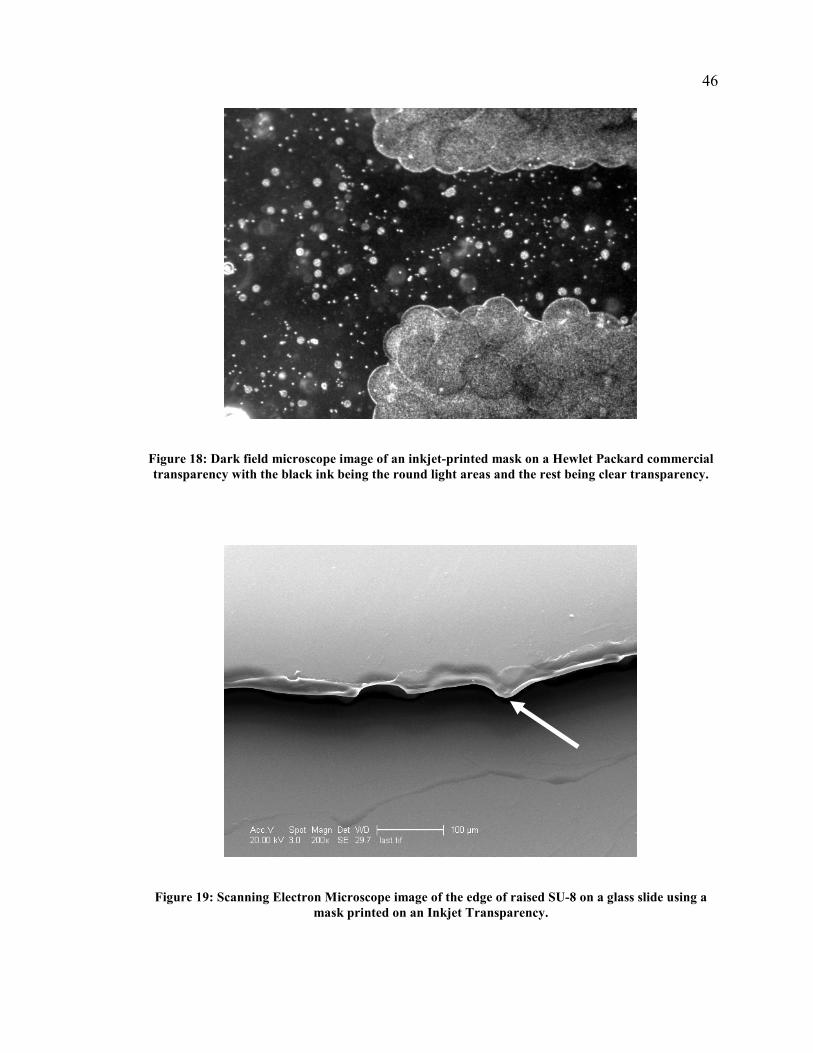
Figure 18: Dark field microscope image of an inkjet-printed mask on a Hewlet Packard commercial
transparency with the black ink being the round light areas and the rest being clear transparency.
Figure 19: Scanning Electron Microscope image of the edge of raised SU-8 on a glass slide using a
mask printed on an Inkjet Transparency.
47 Commercially available and professionally printed 35mm photographic slides were also
attempted, however, UV transmission was unsuccessful and did not cause photoresist
crosslinking. This was likely caused by a UV-blocking protective layer on the slide to
resist color-fading over time. The resulting slide was completely free of photoresist due
to the developing of uncrosslinked SU-8.
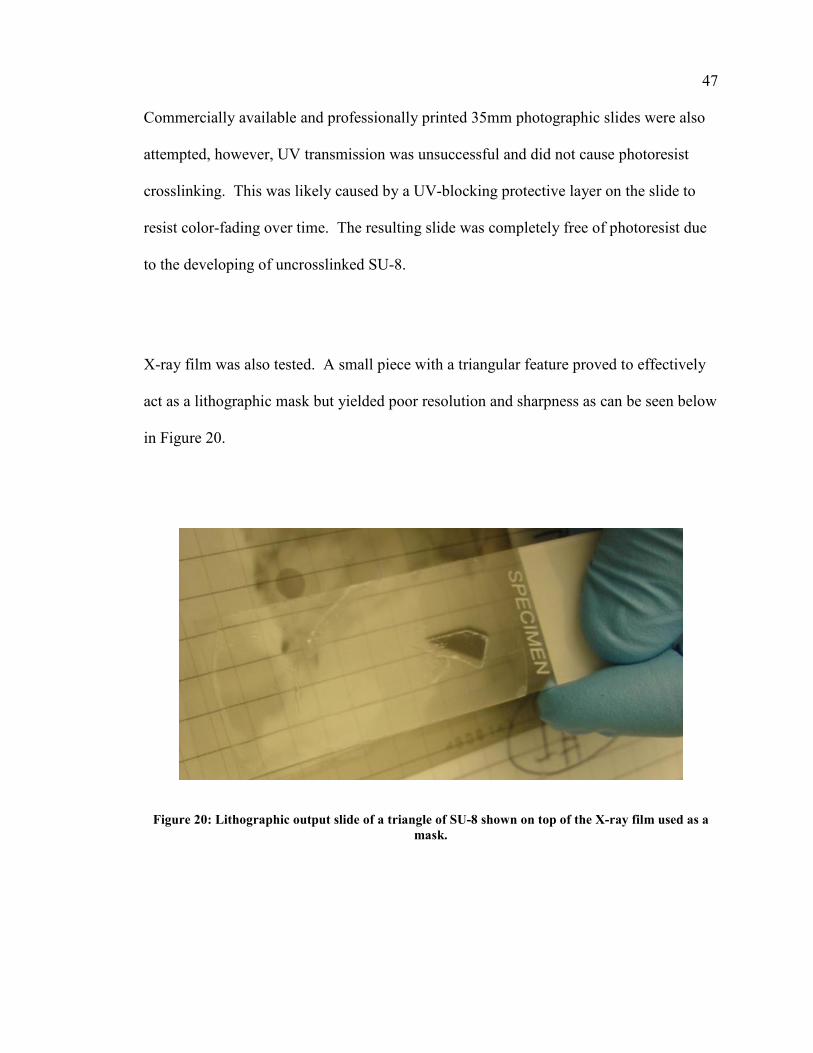
X-ray film was also tested. A small piece with a triangular feature proved to effectively
act as a lithographic mask but yielded poor resolution and sharpness as can be seen below
in Figure 20.
Figure 20: Lithographic output slide of a triangle of SU-8 shown on top of the X-ray film used as a
mask.
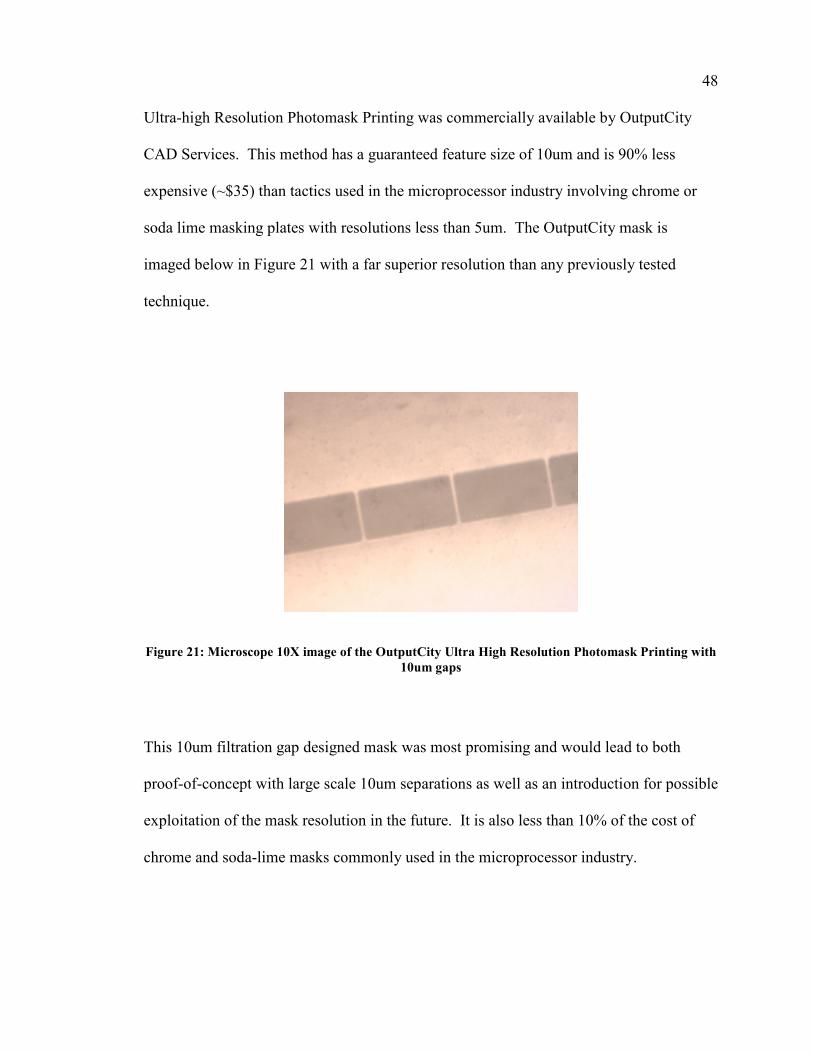
48 Ultra-high Resolution Photomask Printing was commercially available by OutputCity
CAD Services. This method has a guaranteed feature size of 10um and is 90% less
expensive (~$35) than tactics used in the microprocessor industry involving chrome or
soda lime masking plates with resolutions less than 5um. The OutputCity mask is
imaged below in Figure 21 with a far superior resolution than any previously tested
technique.
Figure 21: Microscope 10X image of the OutputCity Ultra High Resolution Photomask Printing with
10um gaps
This 10um filtration gap designed mask was most promising and would lead to both
proof-of-concept with large scale 10um separations as well as an introduction for possible
exploitation of the mask resolution in the future. It is also less than 10% of the cost of
chrome and soda-lime masks commonly used in the microprocessor industry.
49
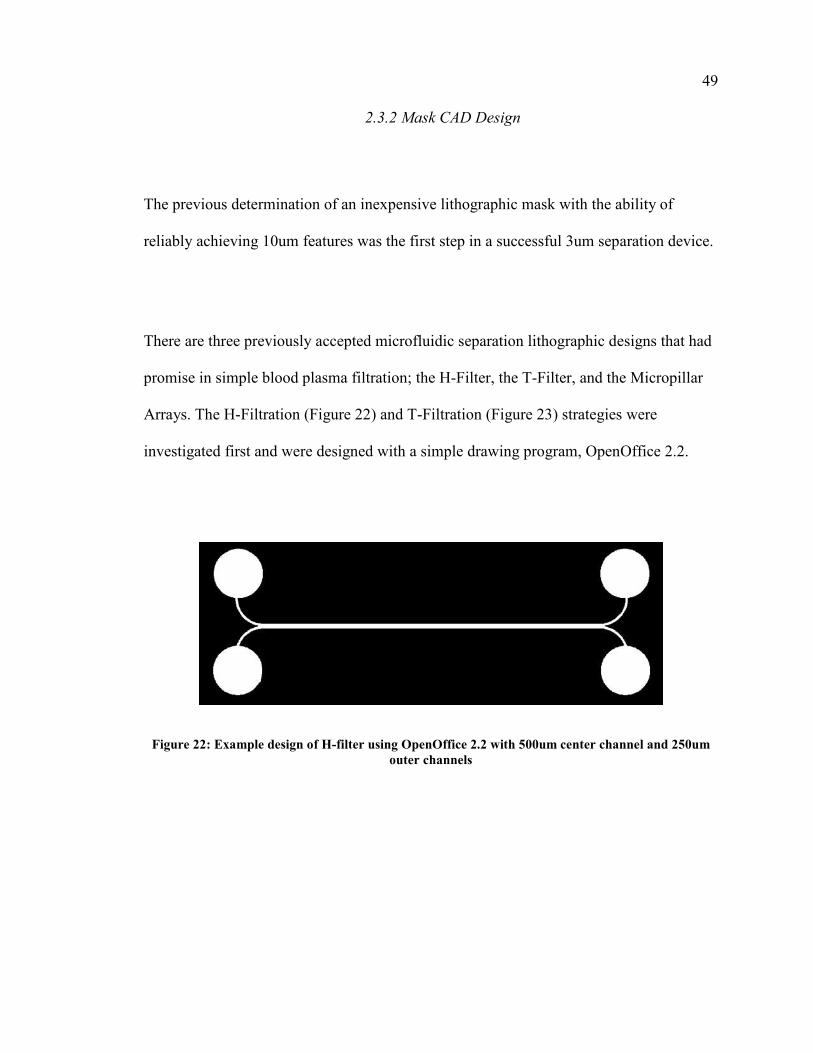
2.3.2 Mask CAD Design
The previous determination of an inexpensive lithographic mask with the ability of
reliably achieving 10um features was the first step in a successful 3um separation device.
There are three previously accepted microfluidic separation lithographic designs that had
promise in simple blood plasma filtration; the H-Filter, the T-Filter, and the Micropillar
Arrays. The H-Filtration (Figure 22) and T-Filtration (Figure 23) strategies were
investigated first and were designed with a simple drawing program, OpenOffice 2.2.
Figure 22: Example design of H-filter using OpenOffice 2.2 with 500um center channel and 250um
outer channels
50
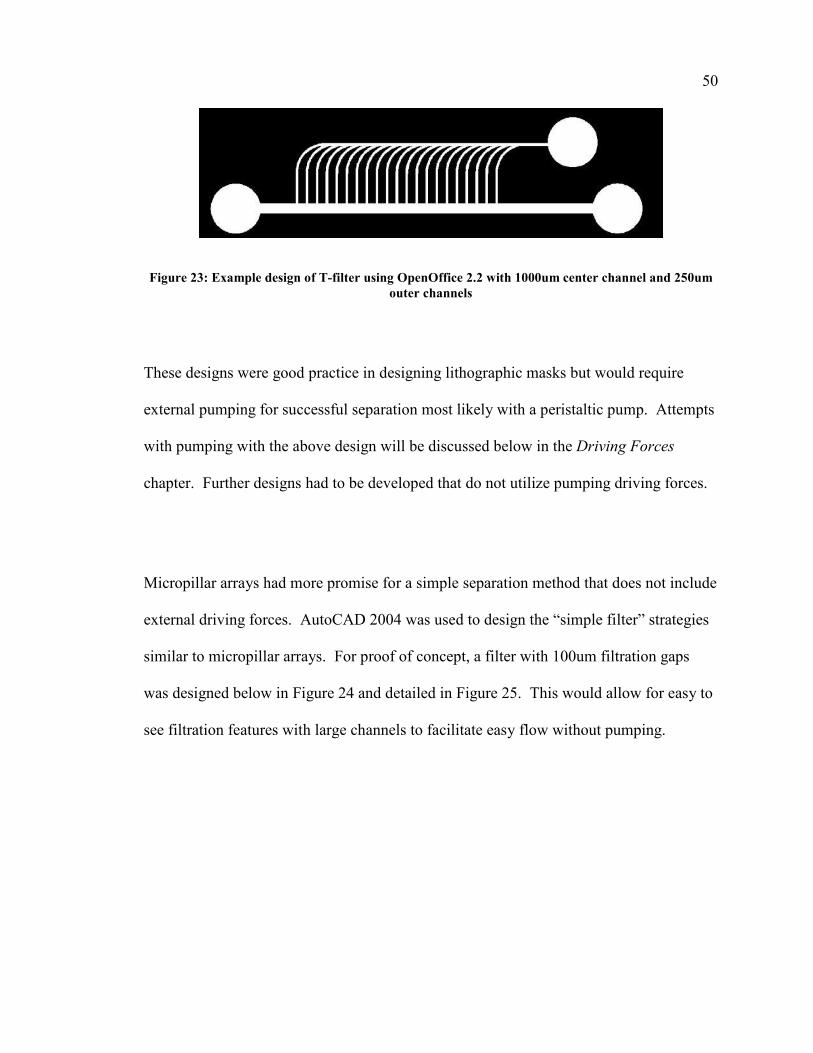
Figure 23: Example design of T-filter using OpenOffice 2.2 with 1000um center channel and 250um
outer channels
These designs were good practice in designing lithographic masks but would require
external pumping for successful separation most likely with a peristaltic pump. Attempts
with pumping with the above design will be discussed below in the Driving Forces
chapter. Further designs had to be developed that do not utilize pumping driving forces.
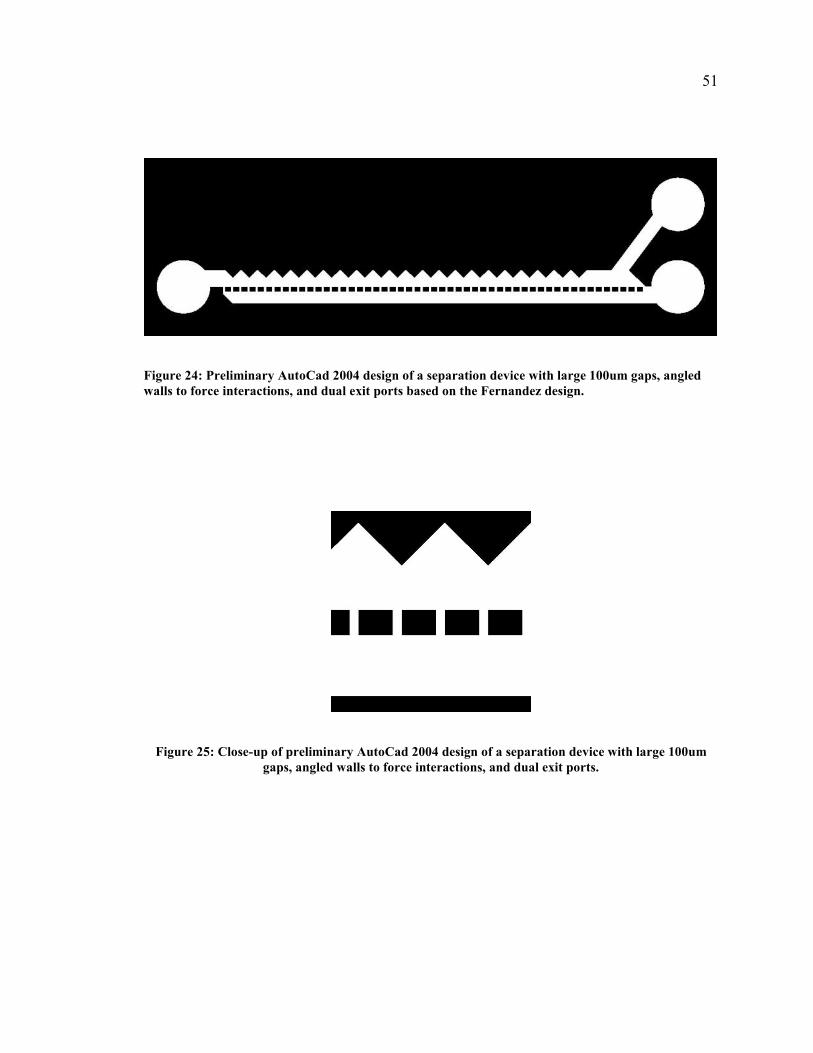
Micropillar arrays had more promise for a simple separation method that does not include
external driving forces. AutoCAD 2004 was used to design the “simple filter” strategies
similar to micropillar arrays. For proof of concept, a filter with 100um filtration gaps
was designed below in Figure 24 and detailed in Figure 25. This would allow for easy to
see filtration features with large channels to facilitate easy flow without pumping.
51
Figure 24: Preliminary AutoCad 2004 design of a separation device with large 100um gaps, angled
walls to force interactions, and dual exit ports based on the Fernandez design.
Figure 25: Close-up of preliminary AutoCad 2004 design of a separation device with large 100um
gaps, angled walls to force interactions, and dual exit ports.
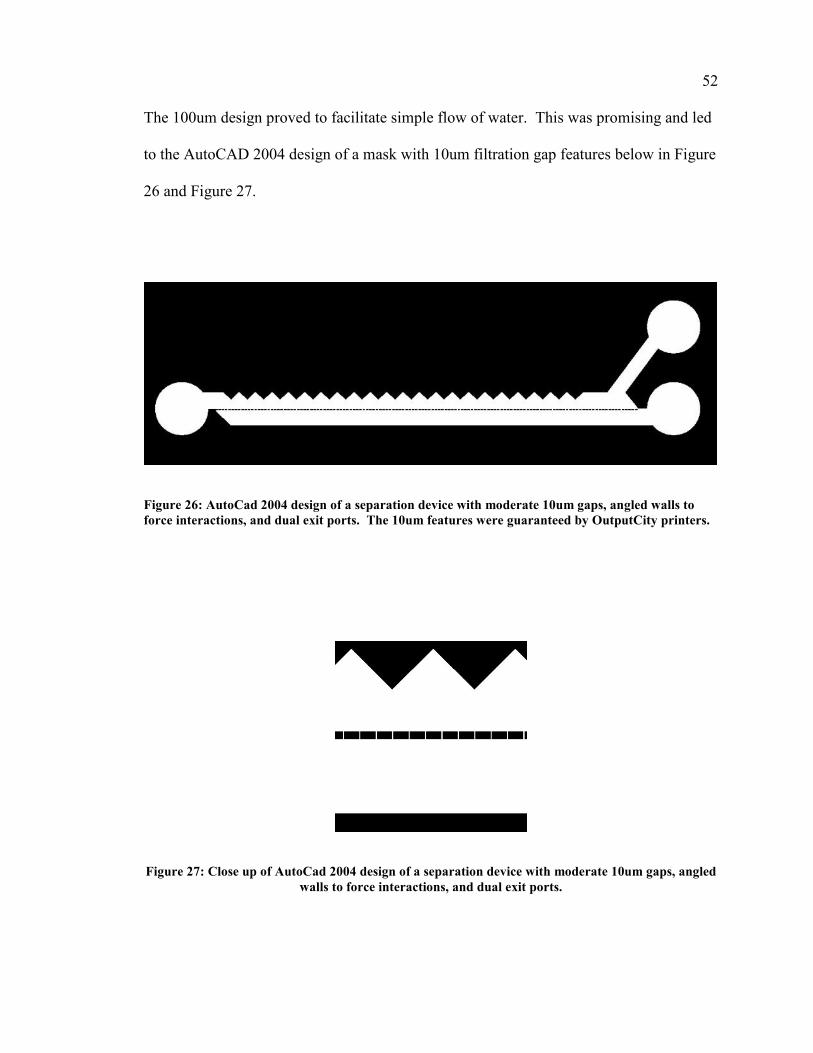
52 The 100um design proved to facilitate simple flow of water. This was promising and led
to the AutoCAD 2004 design of a mask with 10um filtration gap features below in Figure
26 and Figure 27.
Figure 26: AutoCad 2004 design of a separation device with moderate 10um gaps, angled walls to
force interactions, and dual exit ports. The 10um features were guaranteed by OutputCity printers.
Figure 27: Close up of AutoCad 2004 design of a separation device with moderate 10um gaps, angled
walls to force interactions, and dual exit ports.
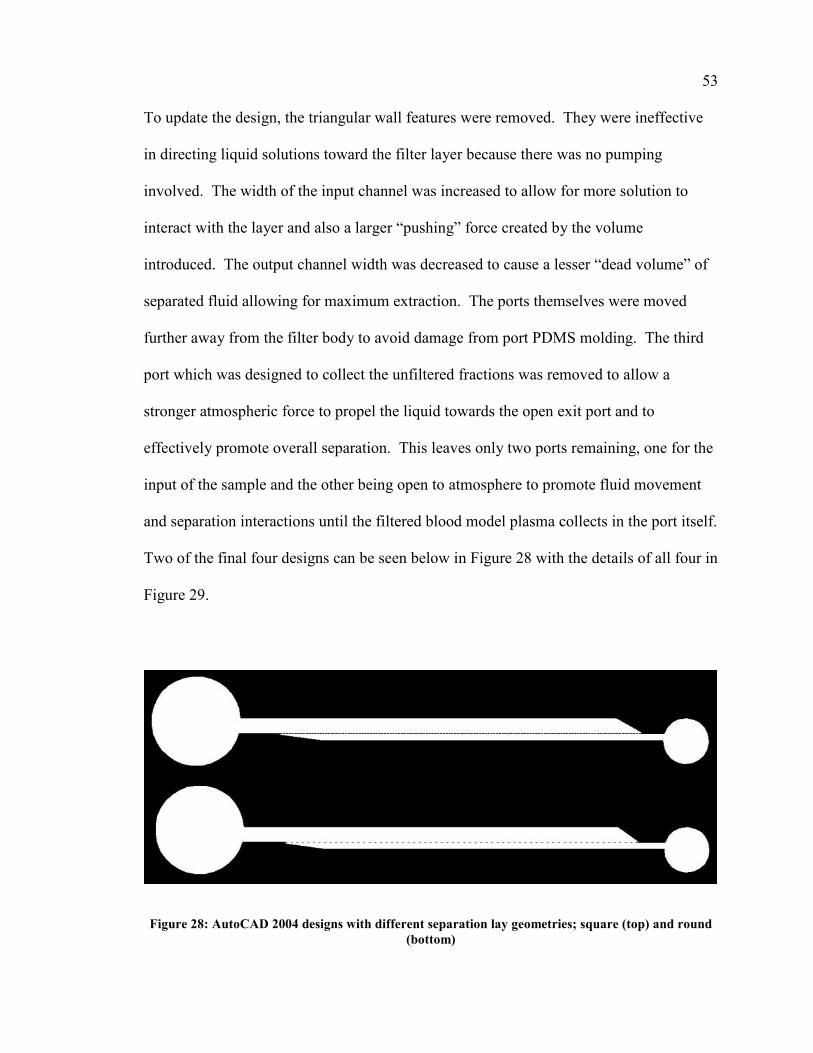
53 To update the design, the triangular wall features were removed. They were ineffective
in directing liquid solutions toward the filter layer because there was no pumping
involved. The width of the input channel was increased to allow for more solution to
interact with the layer and also a larger “pushing” force created by the volume
introduced. The output channel width was decreased to cause a lesser “dead volume” of
separated fluid allowing for maximum extraction. The ports themselves were moved
further away from the filter body to avoid damage from port PDMS molding. The third
port which was designed to collect the unfiltered fractions was removed to allow a
stronger atmospheric force to propel the liquid towards the open exit port and to
effectively promote overall separation. This leaves only two ports remaining, one for the
input of the sample and the other being open to atmosphere to promote fluid movement
and separation interactions until the filtered blood model plasma collects in the port itself.
Two of the final four designs can be seen below in Figure 28 with the details of all four in
Figure 29.
Figure 28: AutoCAD 2004 designs with different separation lay geometries; square (top) and round
(bottom)
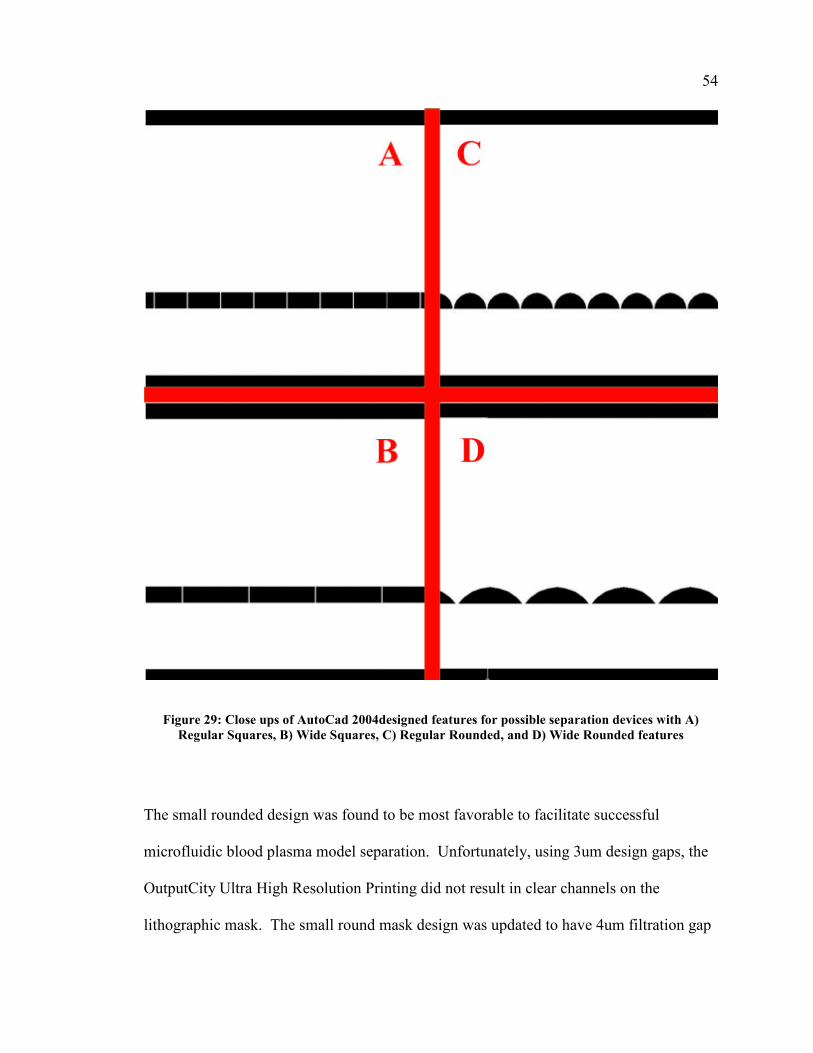
54
Figure 29: Close ups of AutoCad 2004designed features for possible separation devices with A)
Regular Squares, B) Wide Squares, C) Regular Rounded, and D) Wide Rounded features
The small rounded design was found to be most favorable to facilitate successful
microfluidic blood plasma model separation. Unfortunately, using 3um design gaps, the
OutputCity Ultra High Resolution Printing did not result in clear channels on the
lithographic mask. The small round mask design was updated to have 4um filtration gap
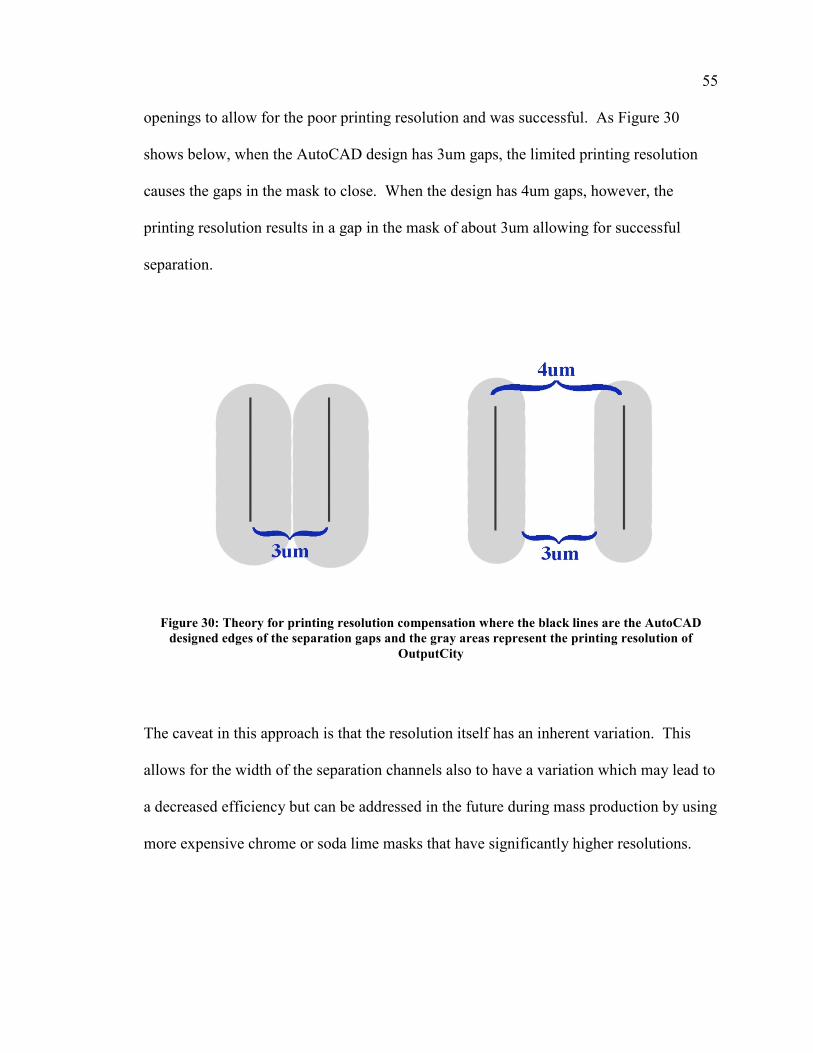
55 openings to allow for the poor printing resolution and was successful. As Figure 30
shows below, when the AutoCAD design has 3um gaps, the limited printing resolution
causes the gaps in the mask to close. When the design has 4um gaps, however, the
printing resolution results in a gap in the mask of about 3um allowing for successful
separation.
Figure 30: Theory for printing resolution compensation where the black lines are the AutoCAD
designed edges of the separation gaps and the gray areas represent the printing resolution of
OutputCity
The caveat in this approach is that the resolution itself has an inherent variation. This
allows for the width of the separation channels also to have a variation which may lead to
a decreased efficiency but can be addressed in the future during mass production by using
more expensive chrome or soda lime masks that have significantly higher resolutions.
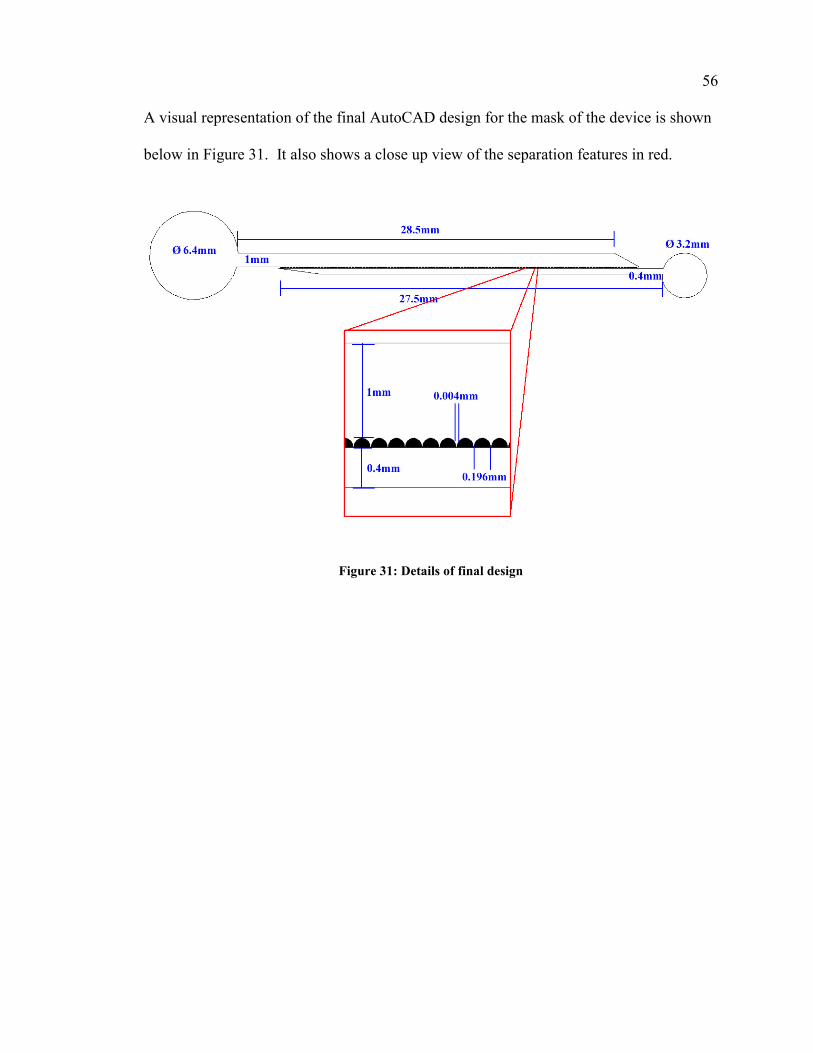
56 A visual representation of the final AutoCAD design for the mask of the device is shown
below in Figure 31. It also shows a close up view of the separation features in red.
Figure 31: Details of final design
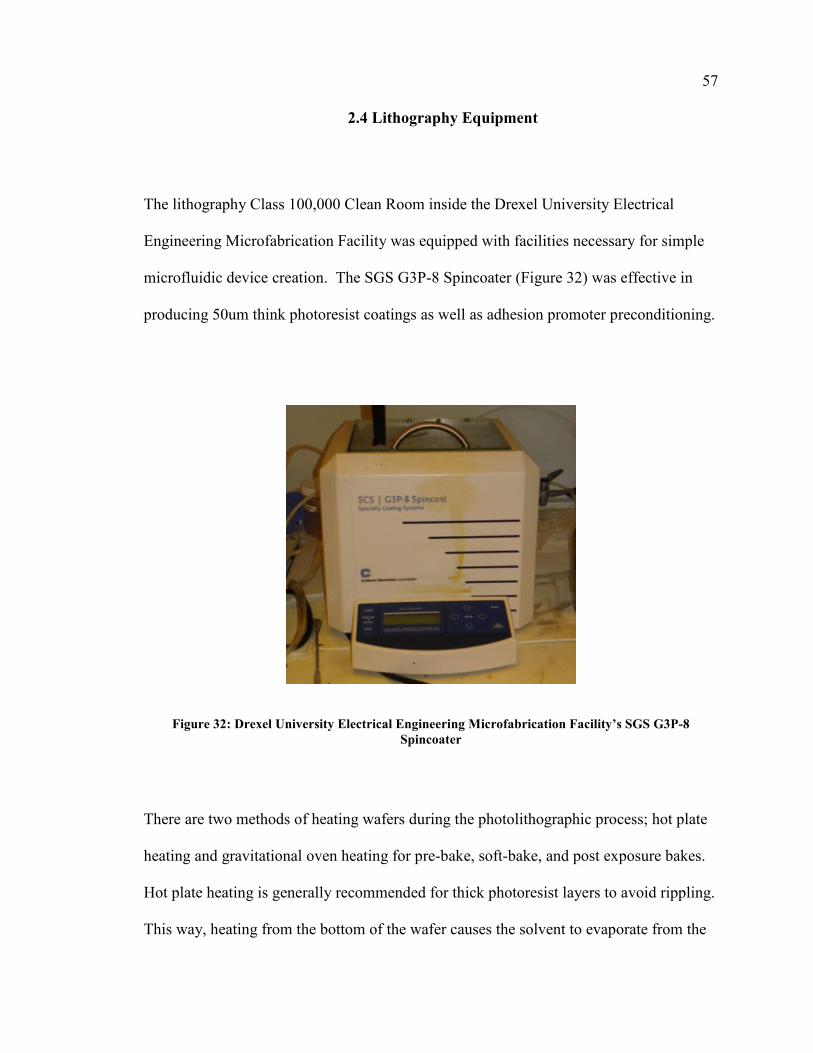
57
2.4 Lithography Equipment
The lithography Class 100,000 Clean Room inside the Drexel University Electrical
Engineering Microfabrication Facility was equipped with facilities necessary for simple
microfluidic device creation. The SGS G3P-8 Spincoater (Figure 32) was effective in
producing 50um think photoresist coatings as well as adhesion promoter preconditioning.
Figure 32: Drexel University Electrical Engineering Microfabrication Facility’s SGS G3P-8
Spincoater
There are two methods of heating wafers during the photolithographic process; hot plate
heating and gravitational oven heating for pre-bake, soft-bake, and post exposure bakes.
Hot plate heating is generally recommended for thick photoresist layers to avoid rippling.
This way, heating from the bottom of the wafer causes the solvent to evaporate from the
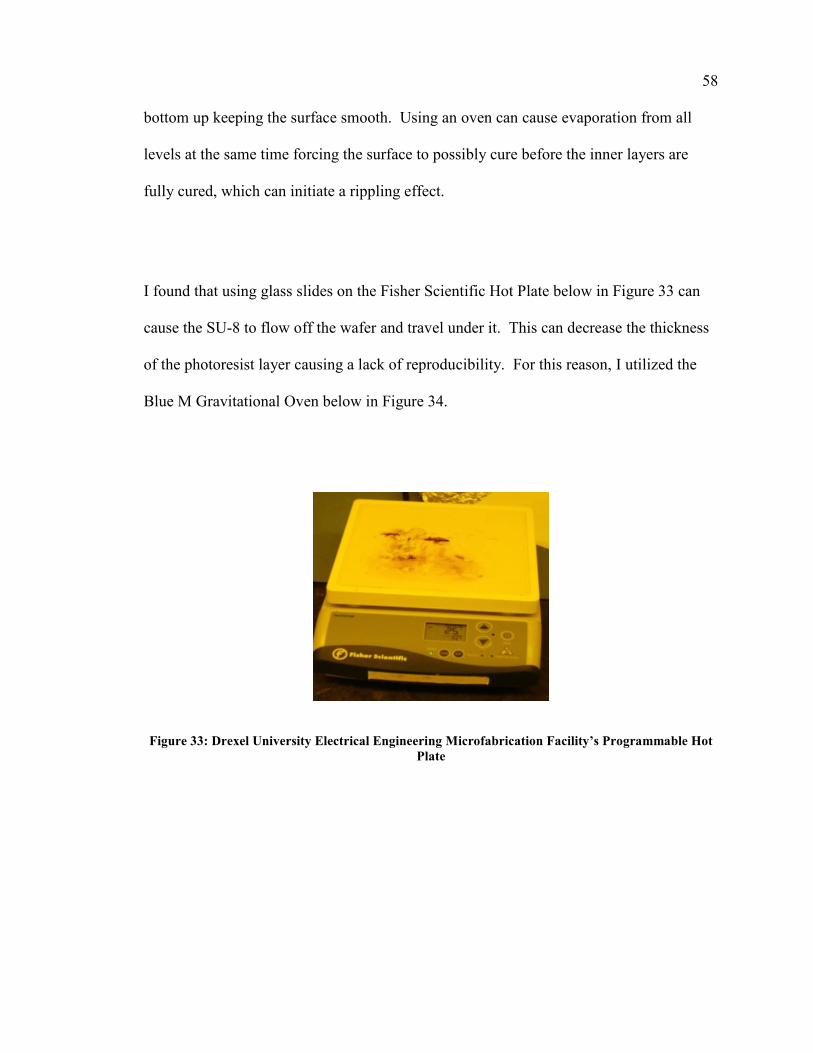
58 bottom up keeping the surface smooth. Using an oven can cause evaporation from all
levels at the same time forcing the surface to possibly cure before the inner layers are
fully cured, which can initiate a rippling effect.
I found that using glass slides on the Fisher Scientific Hot Plate below in Figure 33 can
cause the SU-8 to flow off the wafer and travel under it. This can decrease the thickness
of the photoresist layer causing a lack of reproducibility. For this reason, I utilized the
Blue M Gravitational Oven below in Figure 34.
Figure 33: Drexel University Electrical Engineering Microfabrication Facility’s Programmable Hot
Plate
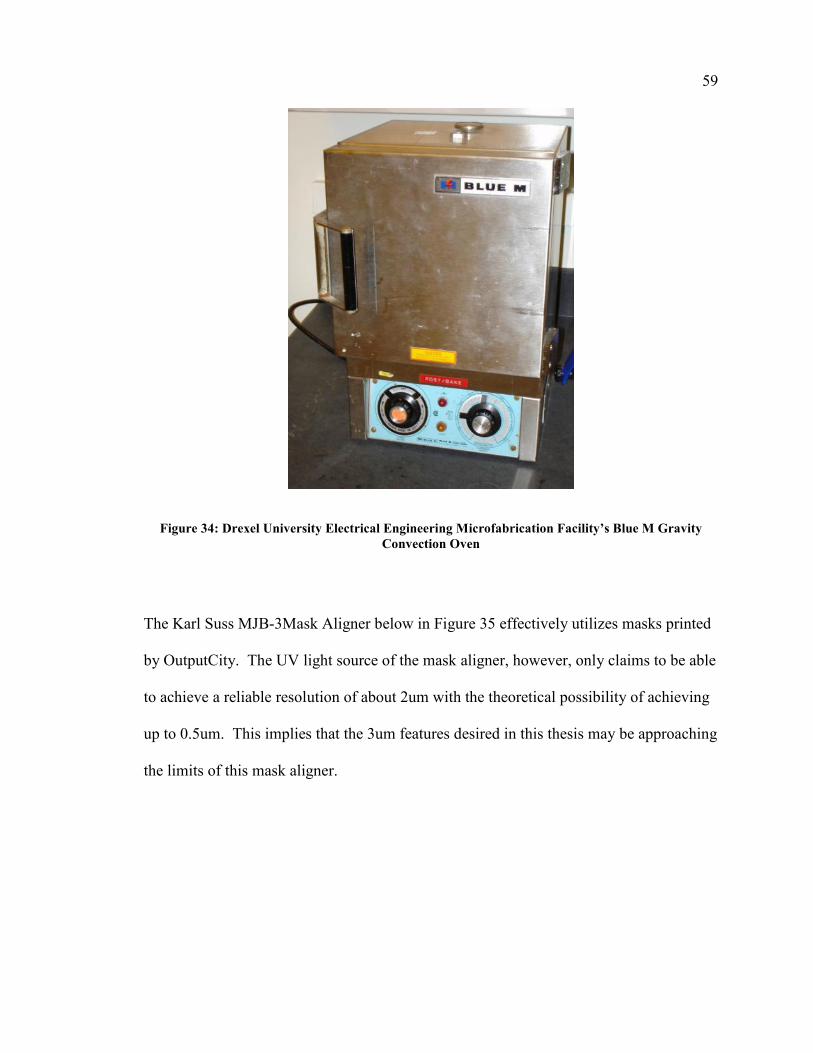
59
Figure 34: Drexel University Electrical Engineering Microfabrication Facility’s Blue M Gravity
Convection Oven
The Karl Suss MJB-3Mask Aligner below in Figure 35 effectively utilizes masks printed
by OutputCity. The UV light source of the mask aligner, however, only claims to be able
to achieve a reliable resolution of about 2um with the theoretical possibility of achieving
up to 0.5um. This implies that the 3um features desired in this thesis may be approaching
the limits of this mask aligner.
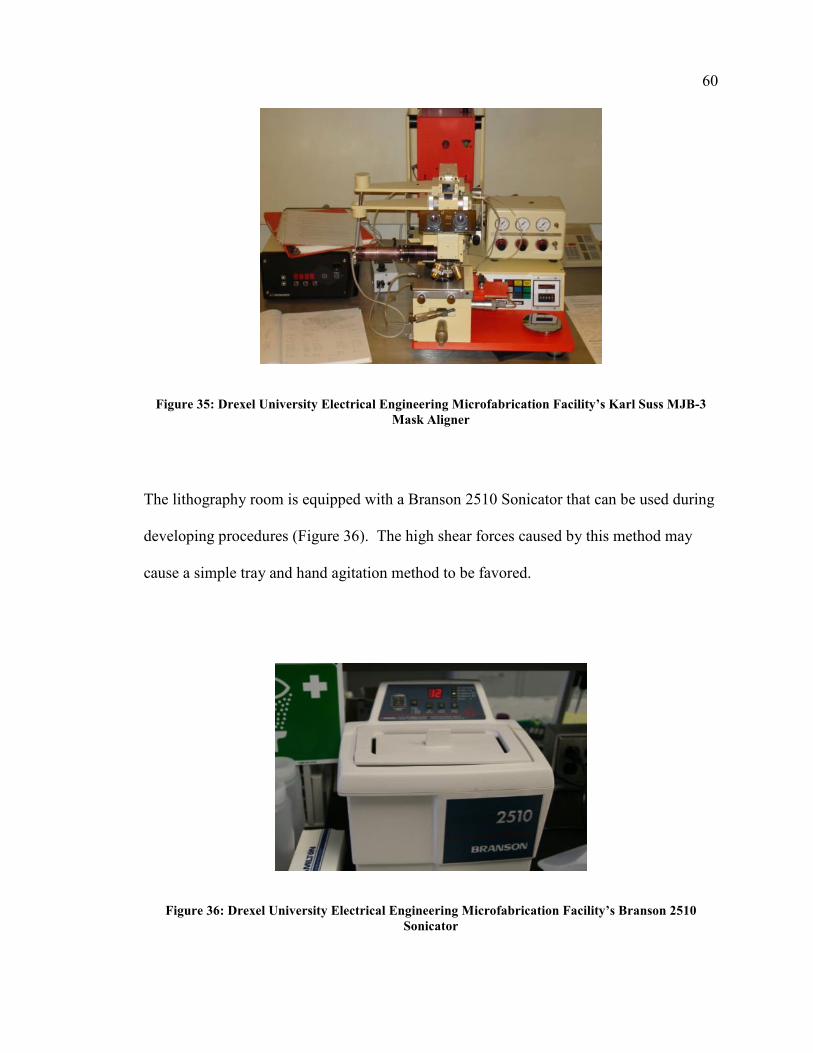
60
Figure 35: Drexel University Electrical Engineering Microfabrication Facility’s Karl Suss MJB-3
Mask Aligner
The lithography room is equipped with a Branson 2510 Sonicator that can be used during
developing procedures (Figure 36). The high shear forces caused by this method may
cause a simple tray and hand agitation method to be favored.
Figure 36: Drexel University Electrical Engineering Microfabrication Facility’s Branson 2510
Sonicator
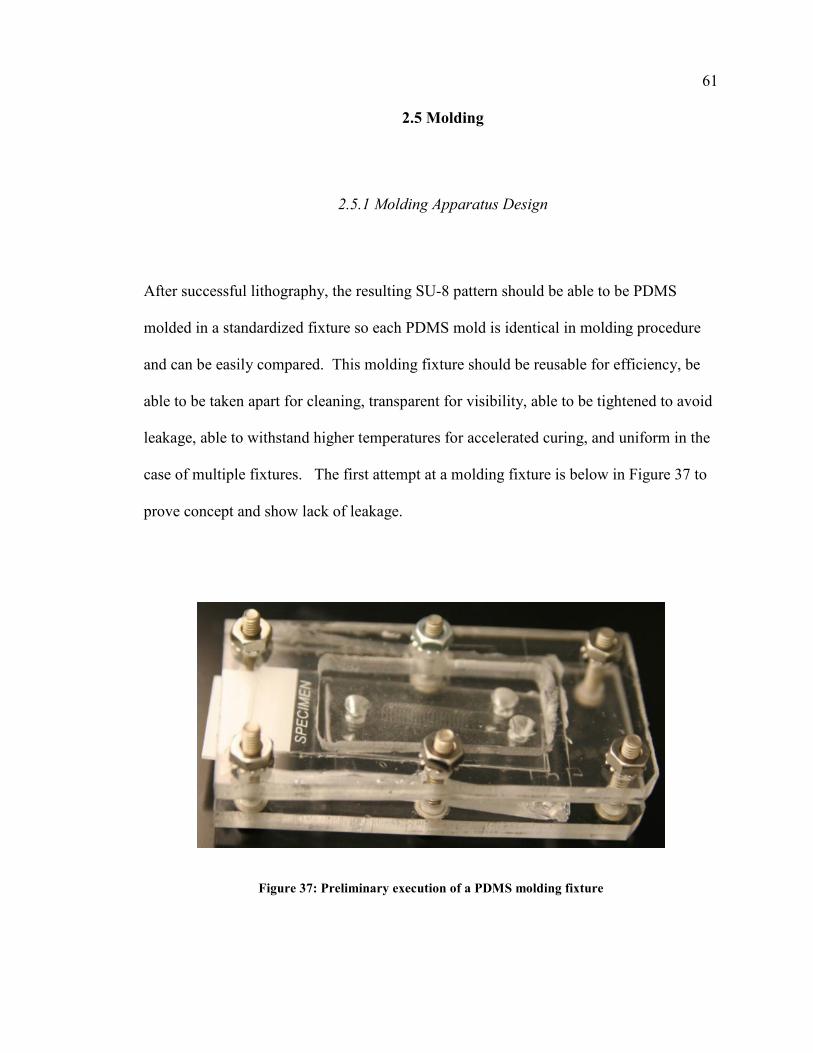
61
2.5 Molding
2.5.1 Molding Apparatus Design
After successful lithography, the resulting SU-8 pattern should be able to be PDMS
molded in a standardized fixture so each PDMS mold is identical in molding procedure
and can be easily compared. This molding fixture should be reusable for efficiency, be
able to be taken apart for cleaning, transparent for visibility, able to be tightened to avoid
leakage, able to withstand higher temperatures for accelerated curing, and uniform in the
case of multiple fixtures. The first attempt at a molding fixture is below in Figure 37 to
prove concept and show lack of leakage.
Figure 37: Preliminary execution of a PDMS molding fixture
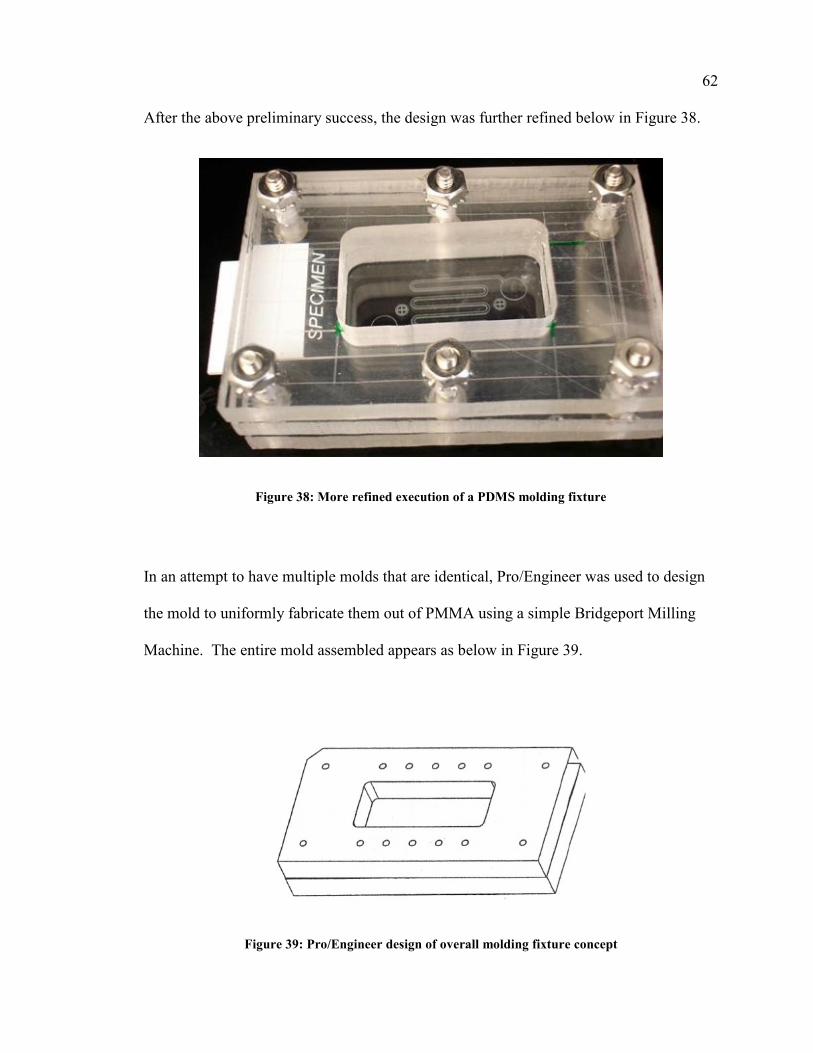
62 After the above preliminary success, the design was further refined below in Figure 38.
Figure 38: More refined execution of a PDMS molding fixture
In an attempt to have multiple molds that are identical, Pro/Engineer was used to design
the mold to uniformly fabricate them out of PMMA using a simple Bridgeport Milling
Machine. The entire mold assembled appears as below in Figure 39.
Figure 39: Pro/Engineer design of overall molding fixture concept
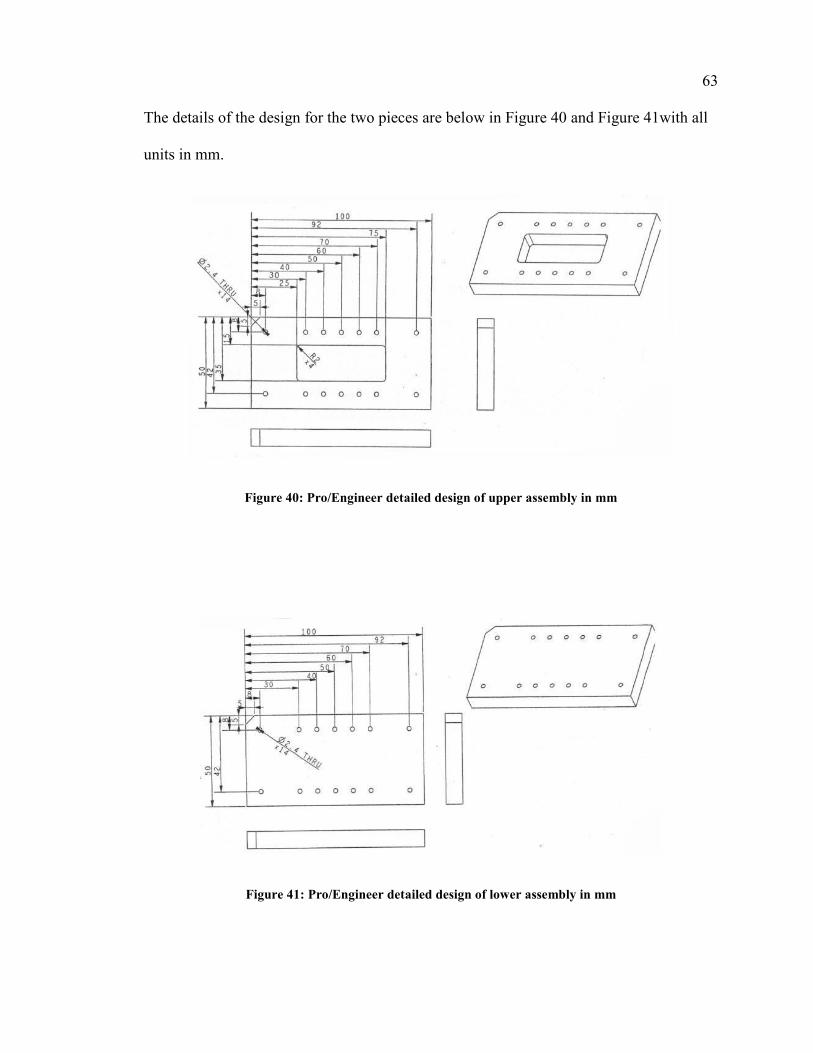
63 The details of the design for the two pieces are below in Figure 40 and Figure 41with all
units in mm.
Figure 40: Pro/Engineer detailed design of upper assembly in mm
Figure 41: Pro/Engineer detailed design of lower assembly in mm
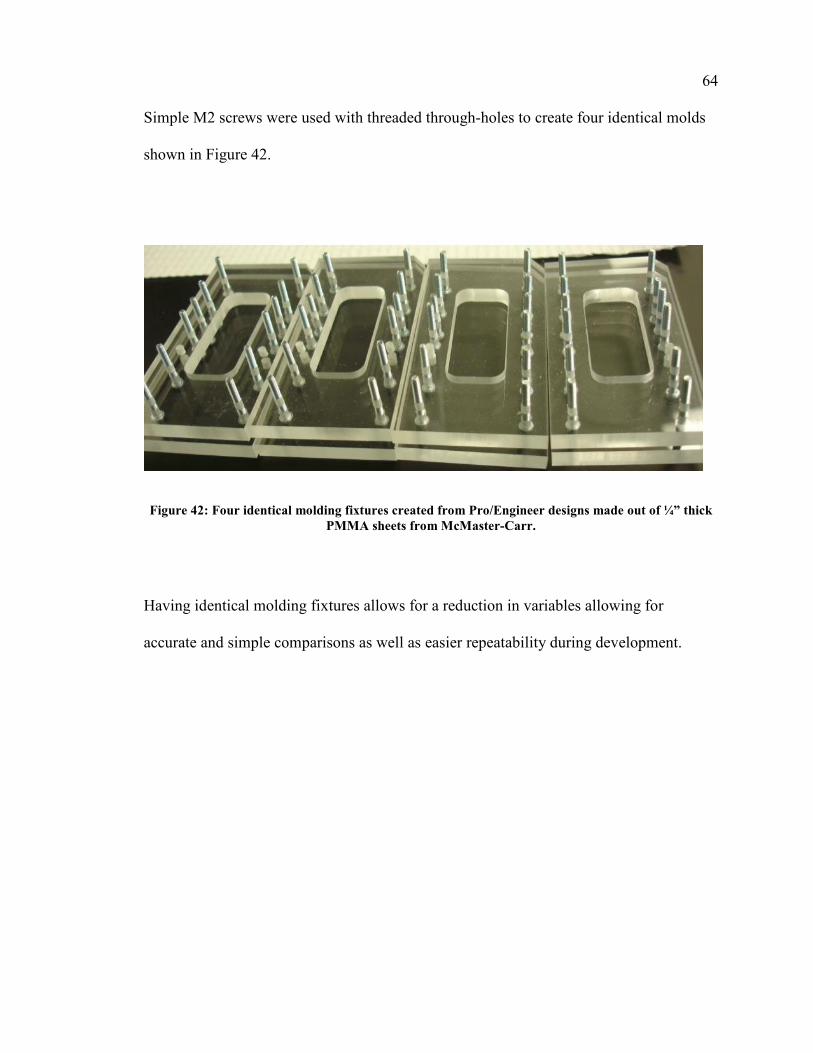
64 Simple M2 screws were used with threaded through-holes to create four identical molds
shown in Figure 42.
Figure 42: Four identical molding fixtures created from Pro/Engineer designs made out of ¼” thick
PMMA sheets from McMaster-Carr.
Having identical molding fixtures allows for a reduction in variables allowing for
accurate and simple comparisons as well as easier repeatability during development.
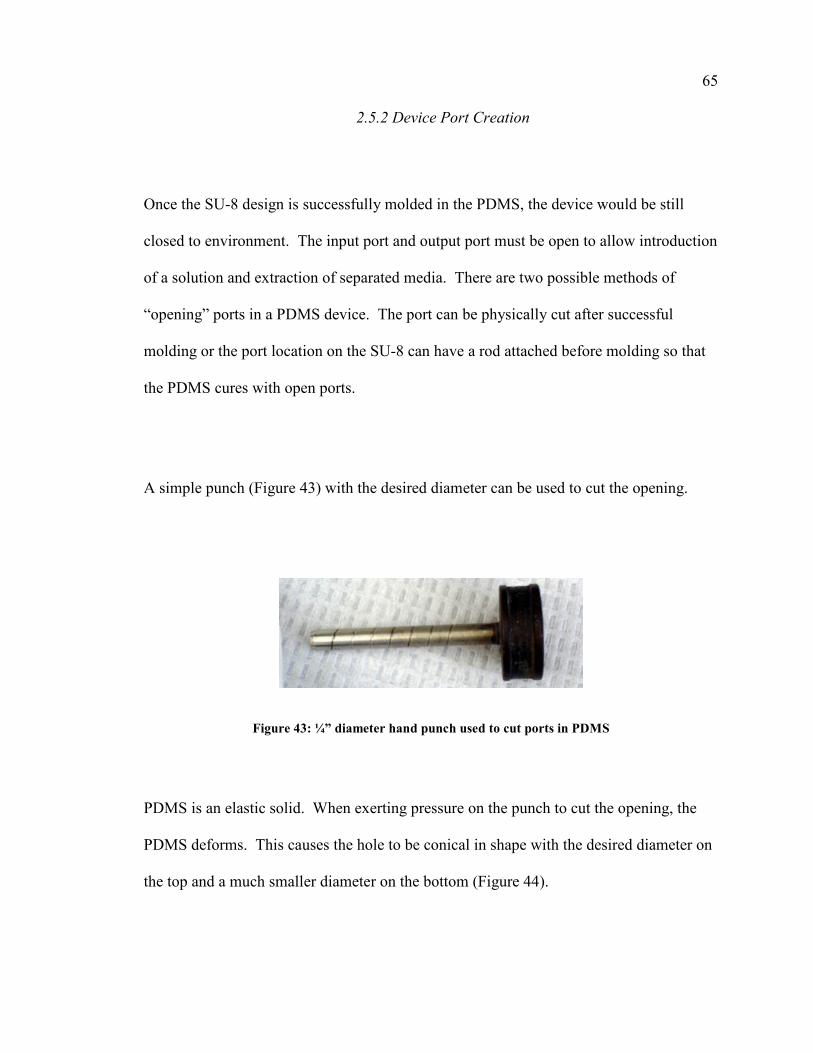
65
2.5.2 Device Port Creation
Once the SU-8 design is successfully molded in the PDMS, the device would be still
closed to environment. The input port and output port must be open to allow introduction
of a solution and extraction of separated media. There are two possible methods of
“opening” ports in a PDMS device. The port can be physically cut after successful
molding or the port location on the SU-8 can have a rod attached before molding so that
the PDMS cures with open ports.
A simple punch (Figure 43) with the desired diameter can be used to cut the opening.
Figure 43: ¼” diameter hand punch used to cut ports in PDMS
PDMS is an elastic solid. When exerting pressure on the punch to cut the opening, the
PDMS deforms. This causes the hole to be conical in shape with the desired diameter on
the top and a much smaller diameter on the bottom (Figure 44).
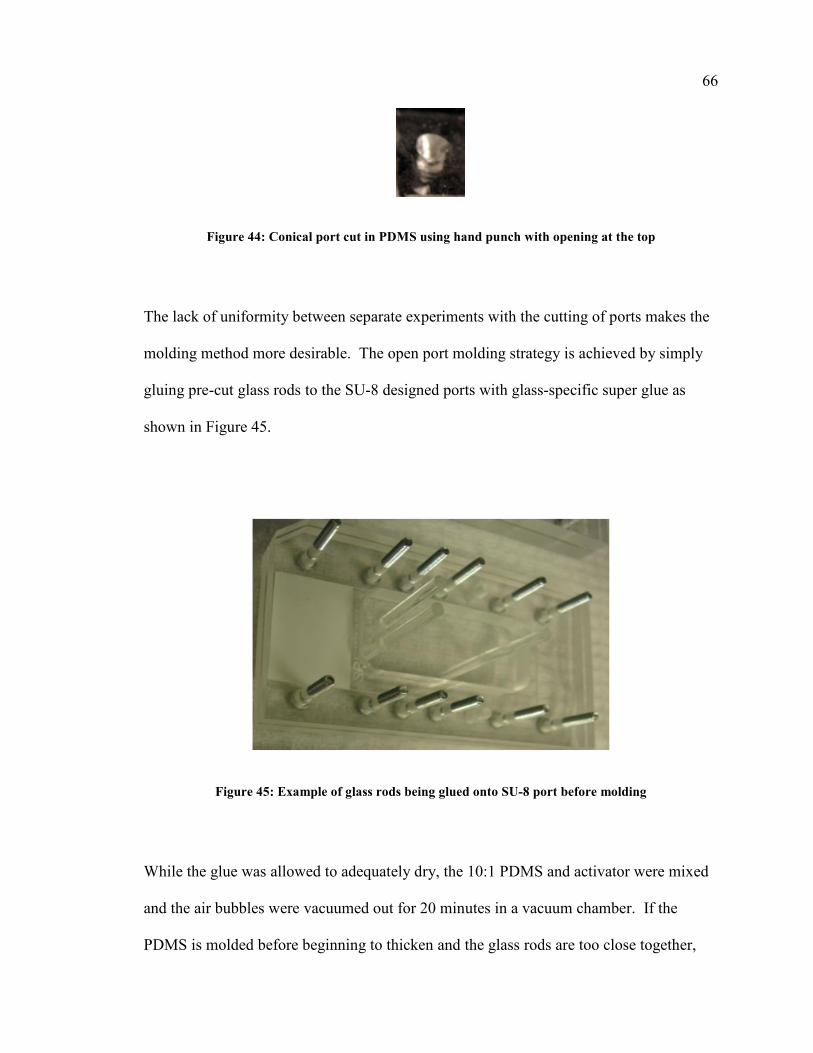
66
Figure 44: Conical port cut in PDMS using hand punch with opening at the top
The lack of uniformity between separate experiments with the cutting of ports makes the
molding method more desirable. The open port molding strategy is achieved by simply
gluing pre-cut glass rods to the SU-8 designed ports with glass-specific super glue as
shown in Figure 45.
Figure 45: Example of glass rods being glued onto SU-8 port before molding
While the glue was allowed to adequately dry, the 10:1 PDMS and activator were mixed
and the air bubbles were vacuumed out for 20 minutes in a vacuum chamber. If the
PDMS is molded before beginning to thicken and the glass rods are too close together,
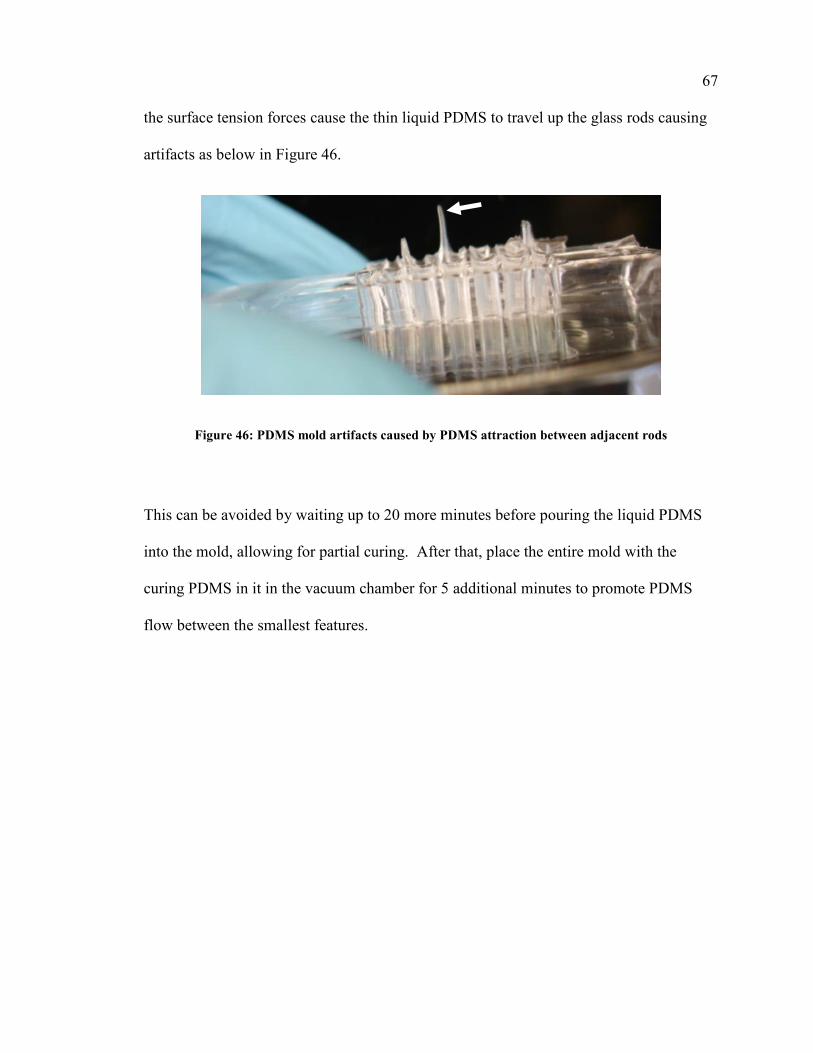
67 the surface tension forces cause the thin liquid PDMS to travel up the glass rods causing
artifacts as below in Figure 46.
Figure 46: PDMS mold artifacts caused by PDMS attraction between adjacent rods
This can be avoided by waiting up to 20 more minutes before pouring the liquid PDMS
into the mold, allowing for partial curing. After that, place the entire mold with the
curing PDMS in it in the vacuum chamber for 5 additional minutes to promote PDMS
flow between the smallest features.
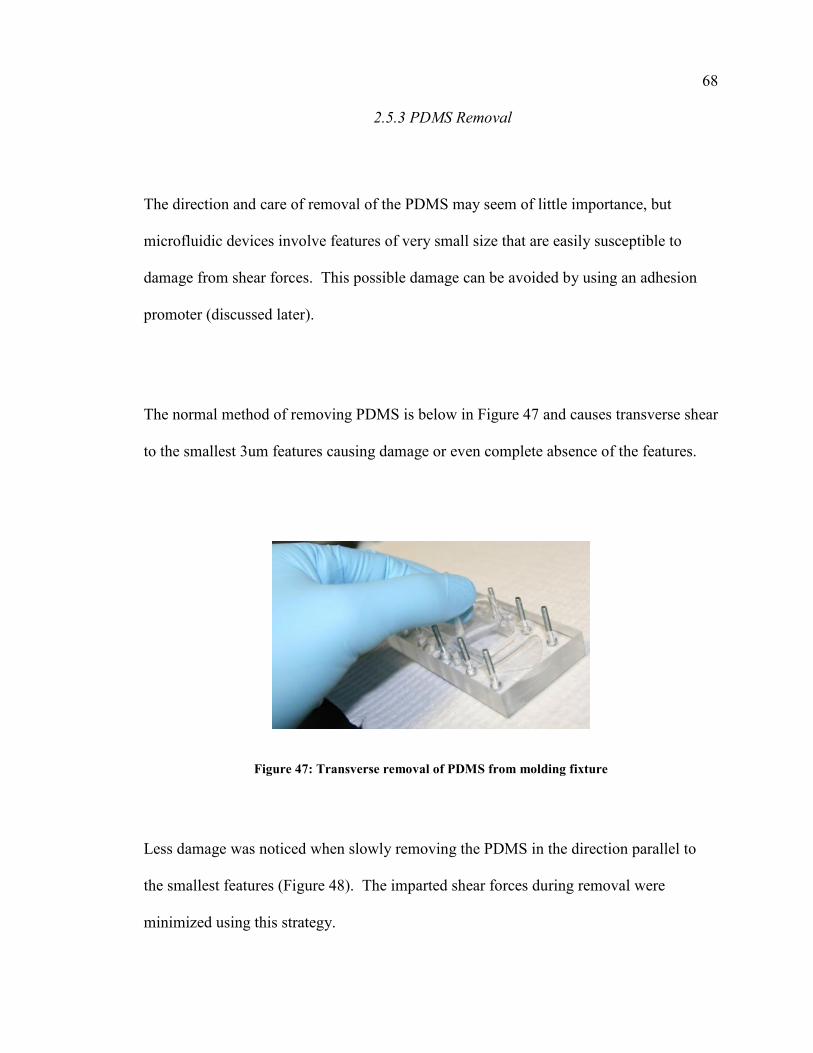
68
2.5.3 PDMS Removal
The direction and care of removal of the PDMS may seem of little importance, but
microfluidic devices involve features of very small size that are easily susceptible to
damage from shear forces. This possible damage can be avoided by using an adhesion
promoter (discussed later).
The normal method of removing PDMS is below in Figure 47 and causes transverse shear
to the smallest 3um features causing damage or even complete absence of the features.
Figure 47: Transverse removal of PDMS from molding fixture
Less damage was noticed when slowly removing the PDMS in the direction parallel to
the smallest features (Figure 48). The imparted shear forces during removal were
minimized using this strategy.
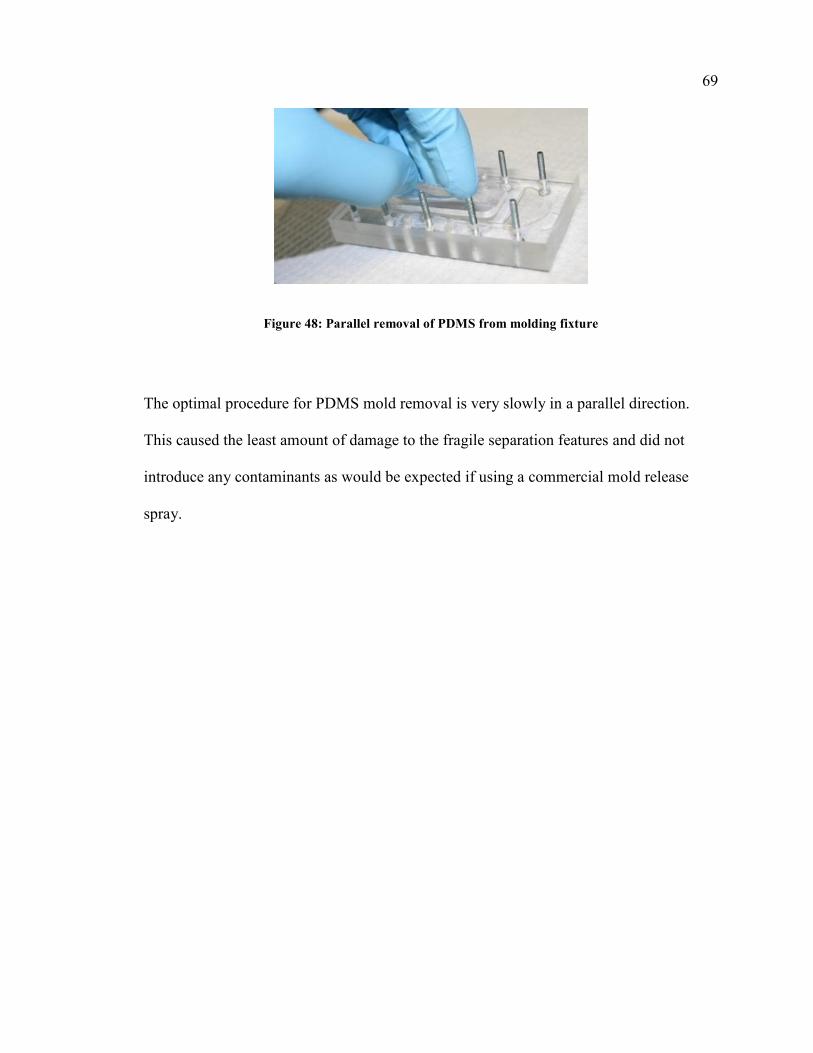
69
Figure 48: Parallel removal of PDMS from molding fixture
The optimal procedure for PDMS mold removal is very slowly in a parallel direction.
This caused the least amount of damage to the fragile separation features and did not
introduce any contaminants as would be expected if using a commercial mold release
spray.
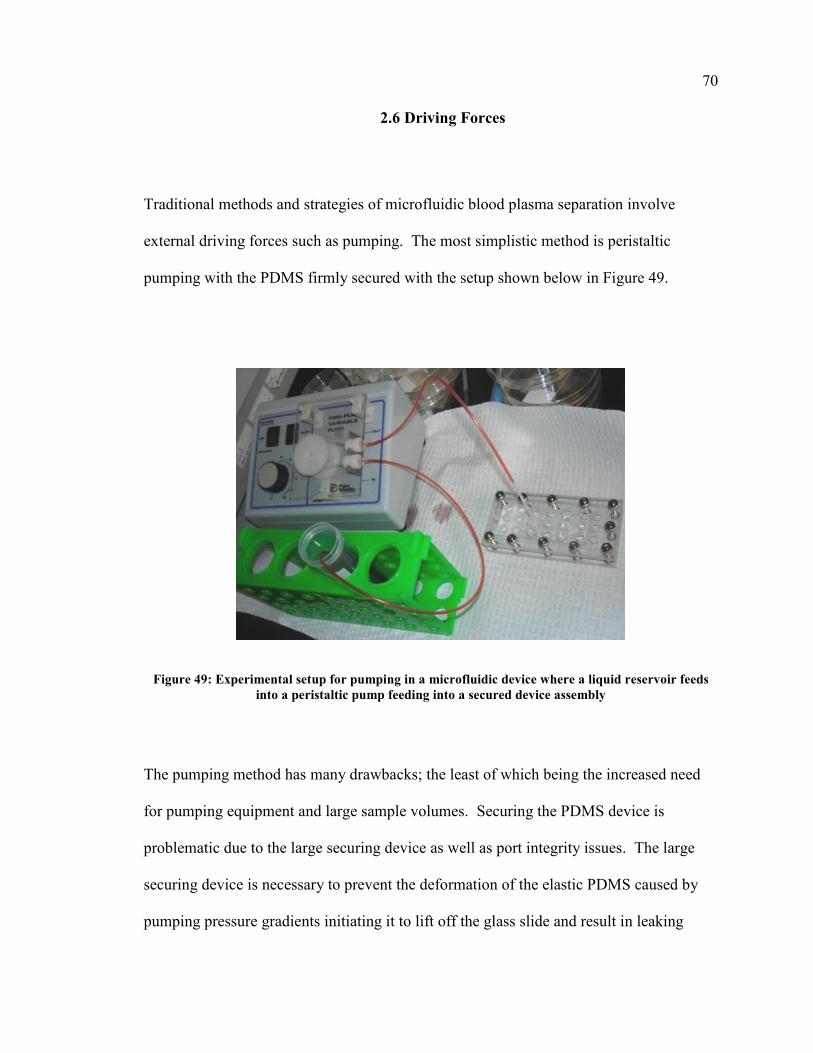
70
2.6 Driving Forces
Traditional methods and strategies of microfluidic blood plasma separation involve
external driving forces such as pumping. The most simplistic method is peristaltic
pumping with the PDMS firmly secured with the setup shown below in Figure 49.
Figure 49: Experimental setup for pumping in a microfluidic device where a liquid reservoir feeds
into a peristaltic pump feeding into a secured device assembly
The pumping method has many drawbacks; the least of which being the increased need
for pumping equipment and large sample volumes. Securing the PDMS device is
problematic due to the large securing device as well as port integrity issues. The large
securing device is necessary to prevent the deformation of the elastic PDMS caused by
pumping pressure gradients initiating it to lift off the glass slide and result in leaking
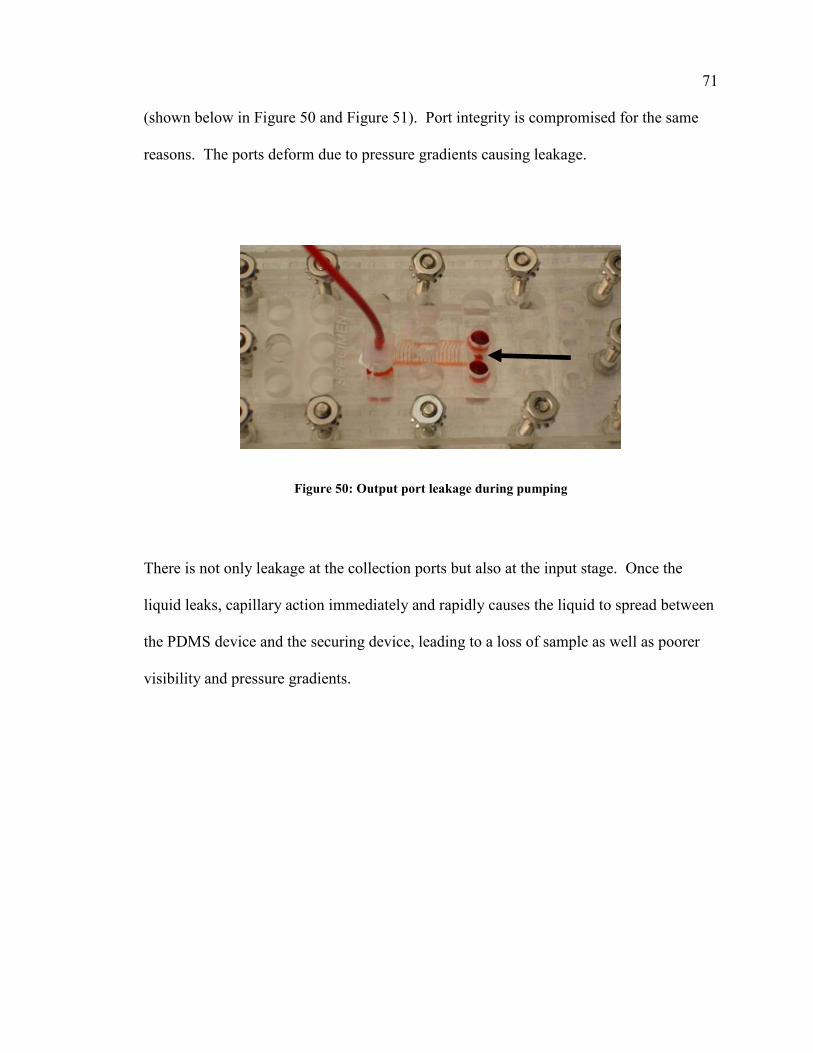
71 (shown below in Figure 50 and Figure 51). Port integrity is compromised for the same
reasons. The ports deform due to pressure gradients causing leakage.
Figure 50: Output port leakage during pumping
There is not only leakage at the collection ports but also at the input stage. Once the
liquid leaks, capillary action immediately and rapidly causes the liquid to spread between
the PDMS device and the securing device, leading to a loss of sample as well as poorer
visibility and pressure gradients.
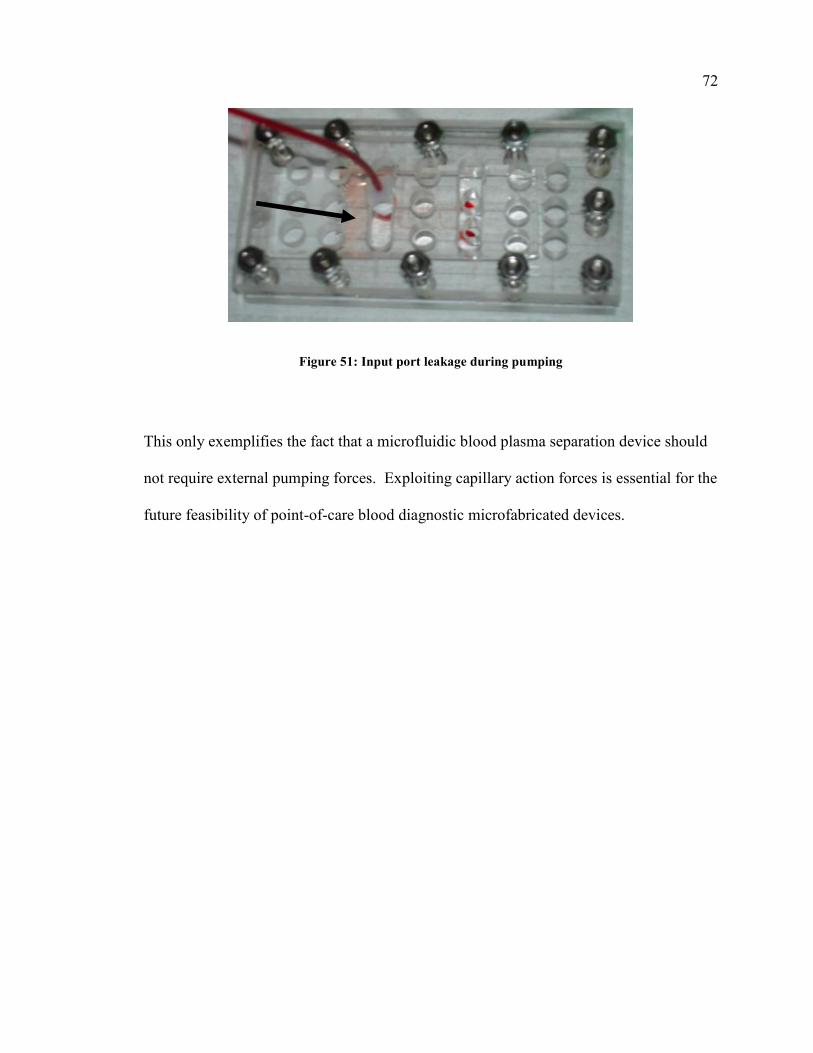
72
Figure 51: Input port leakage during pumping
This only exemplifies the fact that a microfluidic blood plasma separation device should
not require external pumping forces. Exploiting capillary action forces is essential for the
future feasibility of point-of-care blood diagnostic microfabricated devices.
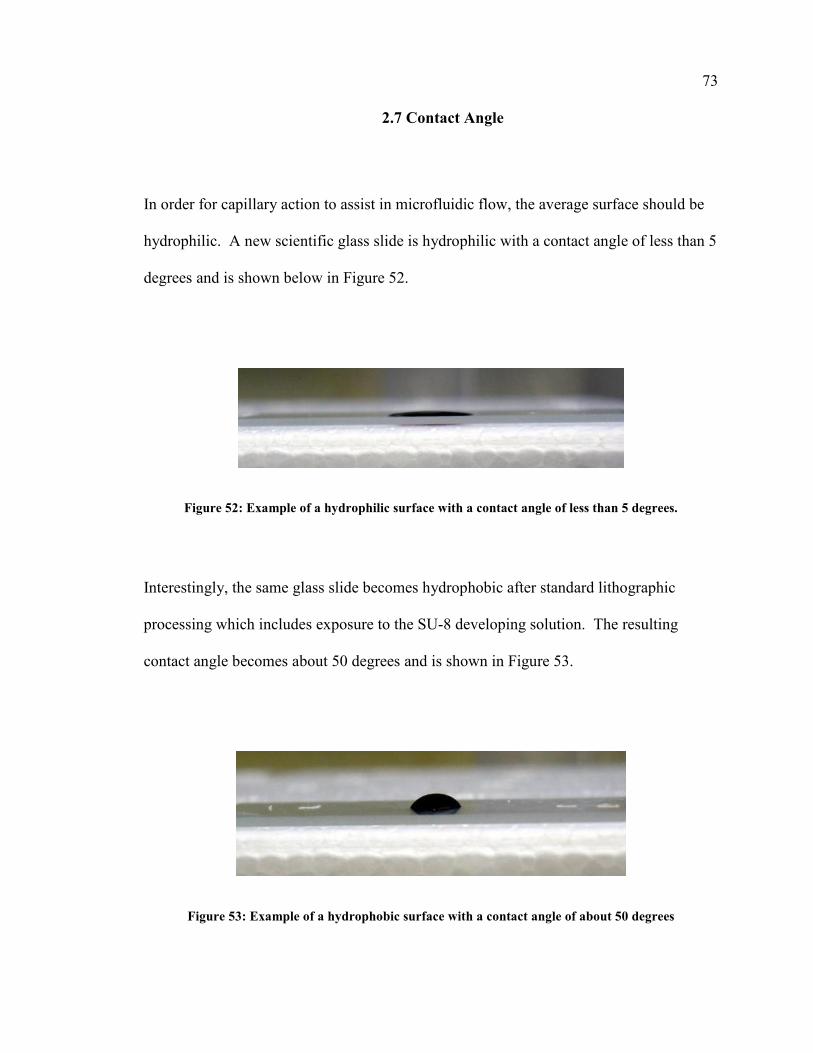
73
2.7 Contact Angle
In order for capillary action to assist in microfluidic flow, the average surface should be
hydrophilic. A new scientific glass slide is hydrophilic with a contact angle of less than 5
degrees and is shown below in Figure 52.
Figure 52: Example of a hydrophilic surface with a contact angle of less than 5 degrees.
Interestingly, the same glass slide becomes hydrophobic after standard lithographic
processing which includes exposure to the SU-8 developing solution. The resulting
contact angle becomes about 50 degrees and is shown in Figure 53.
Figure 53: Example of a hydrophobic surface with a contact angle of about 50 degrees
74 This implies that in order to assist flow with the most hydrophilic surface possible, after
PDMS molding, the PDMS should always be placed on a new hydrophilic glass slide.
PDMS itself is hydrophobic with a contact angle of about 90 degrees. When the PDMS
mold is placed on a glass slide to complete the microfluidic channels, a square “tube” is
created with a glass “floor” and PDMS “walls” and “roof.” With large features, the
hydrophilic “floor” overcomes the hydrophobic “walls” and the fluid advances
(visualized later in Figure 63). However, in cases where the channel widths are small, the
hydrophobic nature resists flow and successful separation. This may be why currently
available microfluidic separators utilize pumping forces to overcome the opposing
hydrophobic material properties. In order to have success without pumping, the channels
need to undergo treatment to increase the hydrophilic nature of the surface.
75
2.7.1 Chemical Hydrophilic Surface Treatment
It is known that a temporary hydrophilic surface layer can be achieved on PDMS by
oxygen plasma treatment. This temporary effect lasts about 30 minutes and can be
lengthened to about a week when stored under vacuum. The hydrophilicity of the surface
is maximized immediately after treatment and fades with time. This strategy is
undesirable for point-of-care devices that would require longer shelf lives of at least 6-12
months.
After an extensive literature search and consultation with Ms. Lisa Hughes, an
experienced field-professional, a plasma-free chemical PDMS surface treatment was
considered. This treatment would include a concentrated HCl treatment to oxidize the
surface, an aminosilane treatment creating a hydrophilic surface layer, and a
glutaraldehyde treatment to crosslink the complex for added stability and increased shelf
life in successive order. Lateef in 2005 reported on a method to increase wettability
promoting bead adhesion. This increased wettability can be used in microfluidics to
promote fluid advancement.
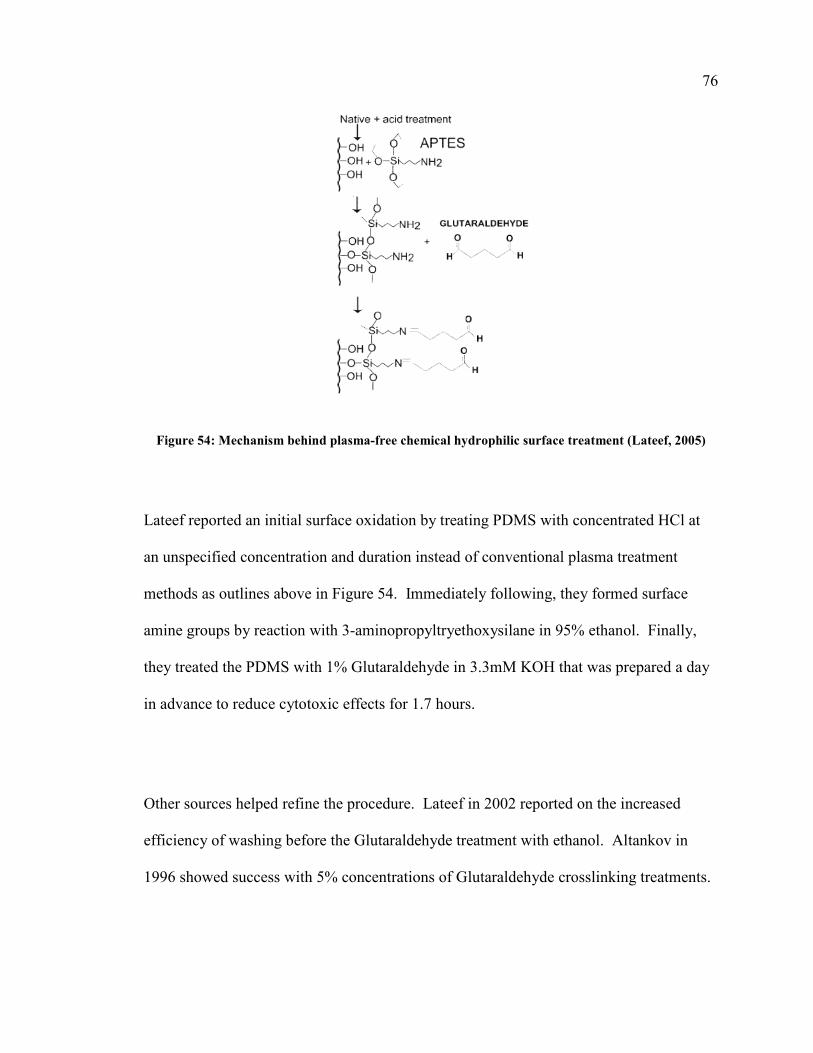
76
Figure 54: Mechanism behind plasma-free chemical hydrophilic surface treatment (Lateef, 2005)
Lateef reported an initial surface oxidation by treating PDMS with concentrated HCl at
an unspecified concentration and duration instead of conventional plasma treatment
methods as outlines above in Figure 54. Immediately following, they formed surface
amine groups by reaction with 3-aminopropyltryethoxysilane in 95% ethanol. Finally,
they treated the PDMS with 1% Glutaraldehyde in 3.3mM KOH that was prepared a day
in advance to reduce cytotoxic effects for 1.7 hours.
Other sources helped refine the procedure. Lateef in 2002 reported on the increased
efficiency of washing before the Glutaraldehyde treatment with ethanol. Altankov in
1996 showed success with 5% concentrations of Glutaraldehyde crosslinking treatments.
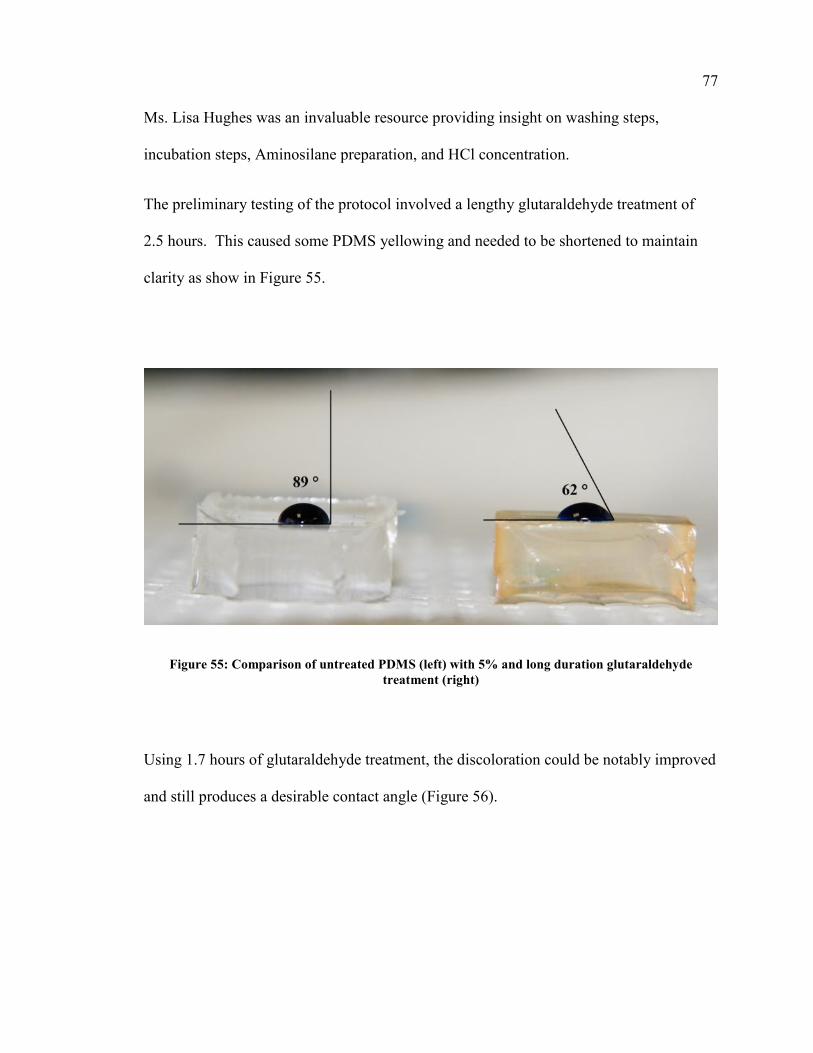
77 Ms. Lisa Hughes was an invaluable resource providing insight on washing steps,
incubation steps, Aminosilane preparation, and HCl concentration.
The preliminary testing of the protocol involved a lengthy glutaraldehyde treatment of
2.5 hours. This caused some PDMS yellowing and needed to be shortened to maintain
clarity as show in Figure 55.
Figure 55: Comparison of untreated PDMS (left) with 5% and long duration glutaraldehyde
treatment (right)
Using 1.7 hours of glutaraldehyde treatment, the discoloration could be notably improved
and still produces a desirable contact angle (Figure 56).
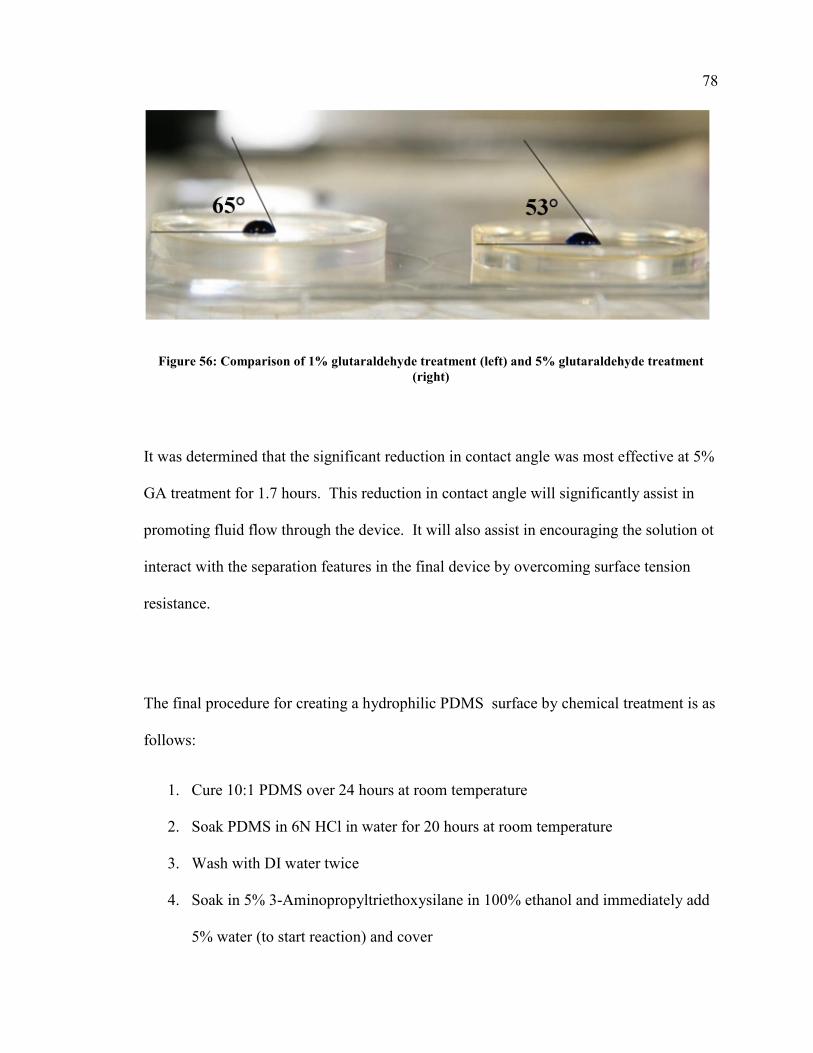
78
Figure 56: Comparison of 1% glutaraldehyde treatment (left) and 5% glutaraldehyde treatment
(right)
It was determined that the significant reduction in contact angle was most effective at 5%
GA treatment for 1.7 hours. This reduction in contact angle will significantly assist in
promoting fluid flow through the device. It will also assist in encouraging the solution ot
interact with the separation features in the final device by overcoming surface tension
resistance.
The final procedure for creating a hydrophilic PDMS surface by chemical treatment is as
follows:
1. Cure 10:1 PDMS over 24 hours at room temperature
2. Soak PDMS in 6N HCl in water for 20 hours at room temperature
3. Wash with DI water twice
4. Soak in 5% 3-Aminopropyltriethoxysilane in 100% ethanol and immediately add
5% water (to start reaction) and cover
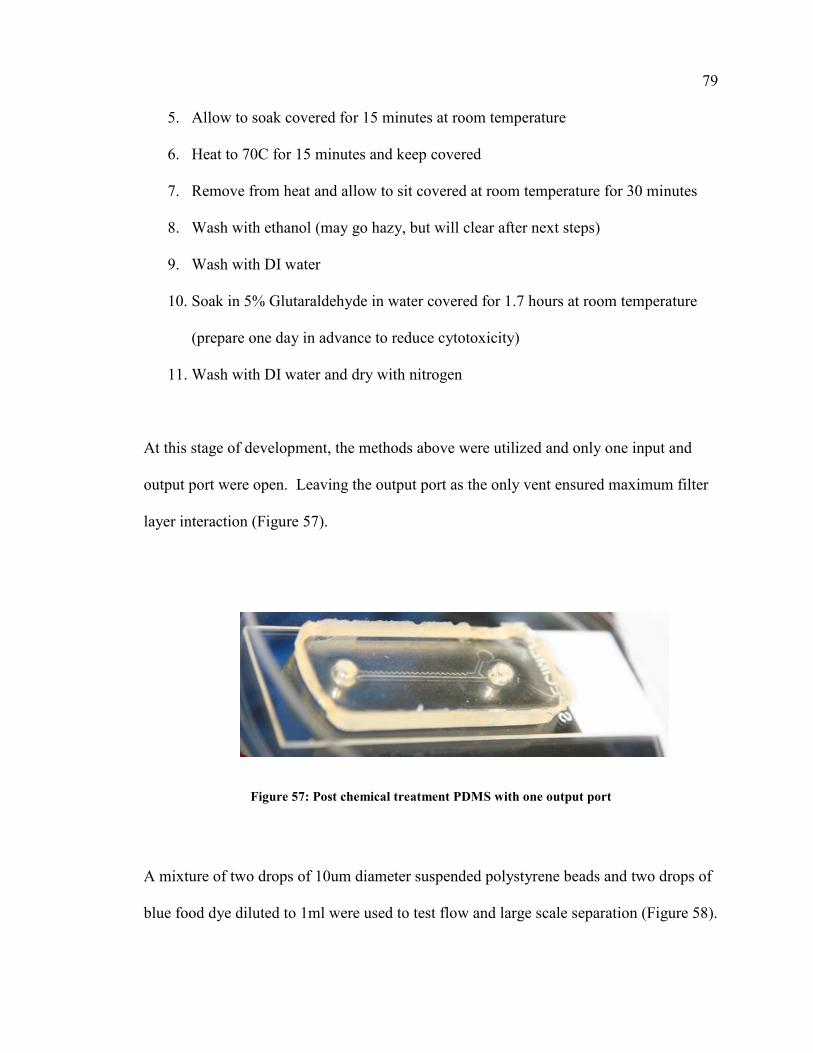
79
5. Allow to soak covered for 15 minutes at room temperature
6. Heat to 70C for 15 minutes and keep covered
7. Remove from heat and allow to sit covered at room temperature for 30 minutes
8. Wash with ethanol (may go hazy, but will clear after next steps)
9. Wash with DI water
10. Soak in 5% Glutaraldehyde in water covered for 1.7 hours at room temperature
(prepare one day in advance to reduce cytotoxicity)
11. Wash with DI water and dry with nitrogen
At this stage of development, the methods above were utilized and only one input and
output port were open. Leaving the output port as the only vent ensured maximum filter
layer interaction (Figure 57).
Figure 57: Post chemical treatment PDMS with one output port
A mixture of two drops of 10um diameter suspended polystyrene beads and two drops of
blue food dye diluted to 1ml were used to test flow and large scale separation (Figure 58).
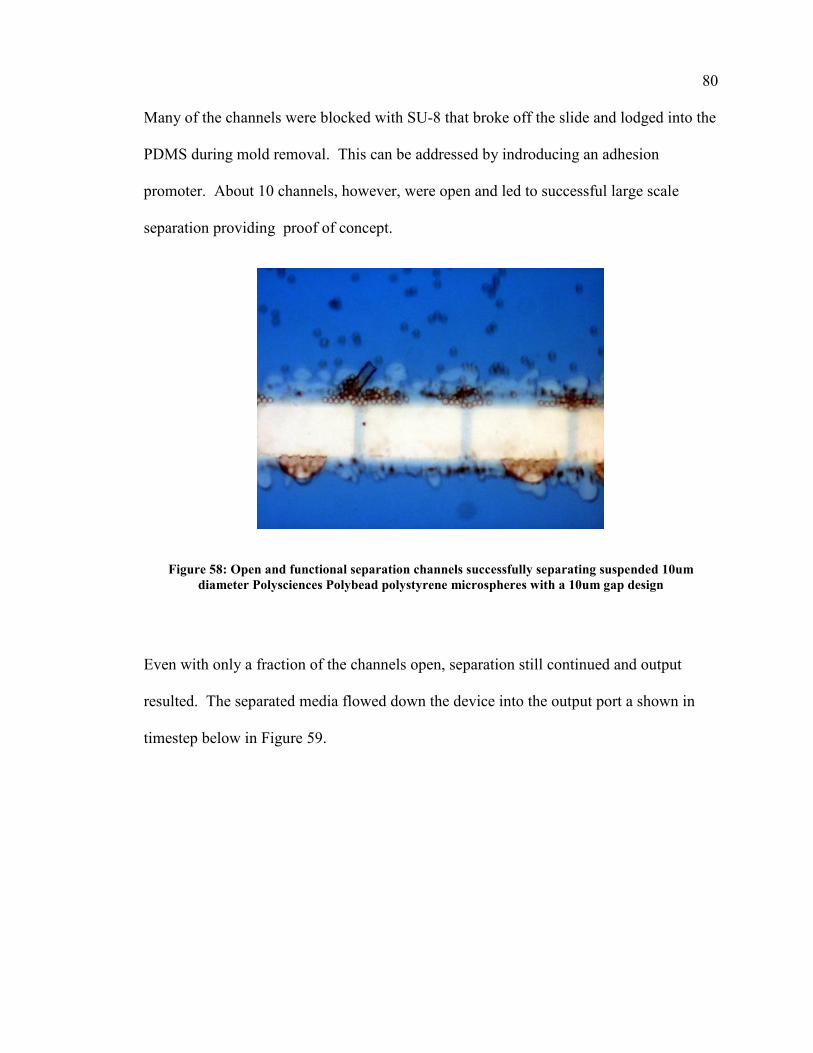
80 Many of the channels were blocked with SU-8 that broke off the slide and lodged into the
PDMS during mold removal. This can be addressed by indroducing an adhesion
promoter. About 10 channels, however, were open and led to successful large scale
separation providing proof of concept.
Figure 58: Open and functional separation channels successfully separating suspended 10um
diameter Polysciences Polybead polystyrene microspheres with a 10um gap design
Even with only a fraction of the channels open, separation still continued and output
resulted. The separated media flowed down the device into the output port a shown in
timestep below in Figure 59.
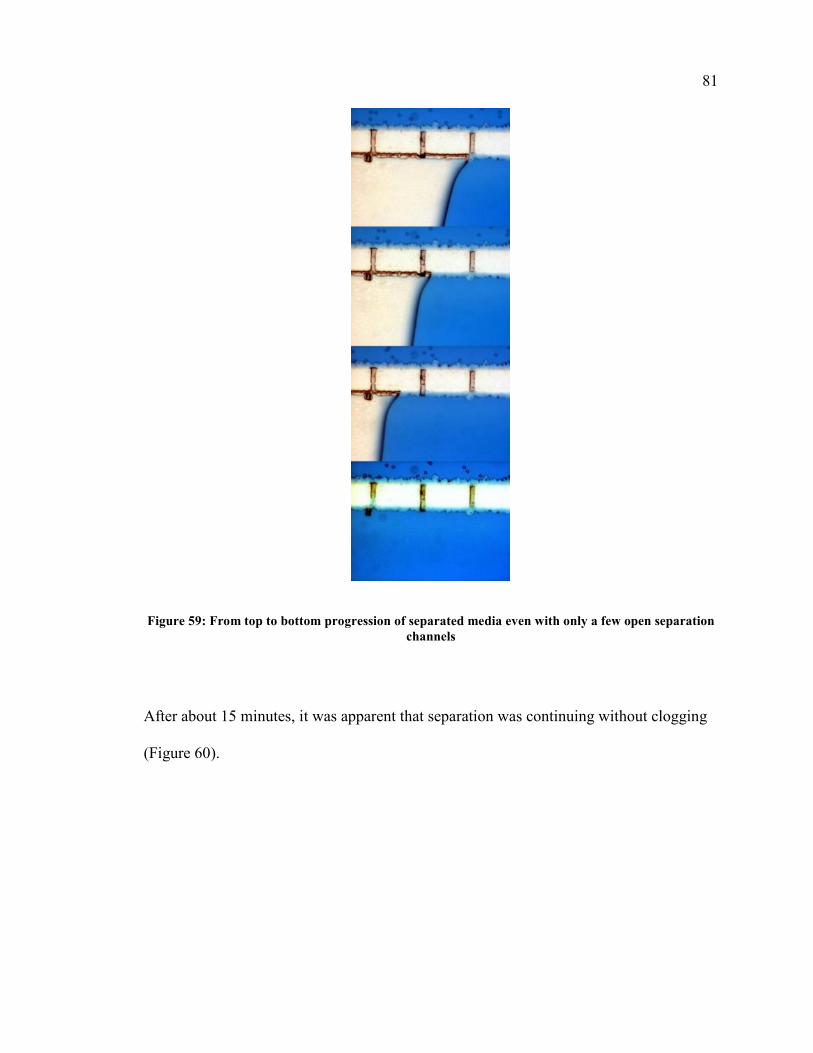
81
Figure 59: From top to bottom progression of separated media even with only a few open separation
channels
After about 15 minutes, it was apparent that separation was continuing without clogging
(Figure 60).
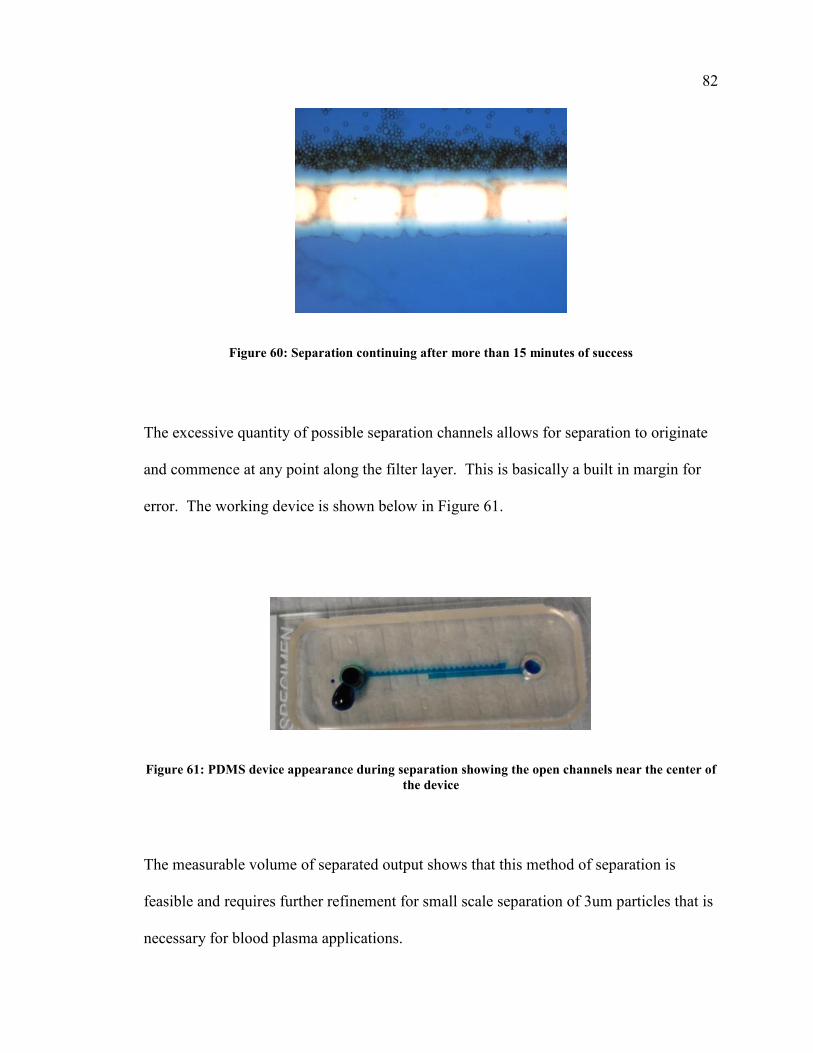
82
Figure 60: Separation continuing after more than 15 minutes of success
The excessive quantity of possible separation channels allows for separation to originate
and commence at any point along the filter layer. This is basically a built in margin for
error. The working device is shown below in Figure 61.
Figure 61: PDMS device appearance during separation showing the open channels near the center of
the device
The measurable volume of separated output shows that this method of separation is
feasible and requires further refinement for small scale separation of 3um particles that is
necessary for blood plasma applications.
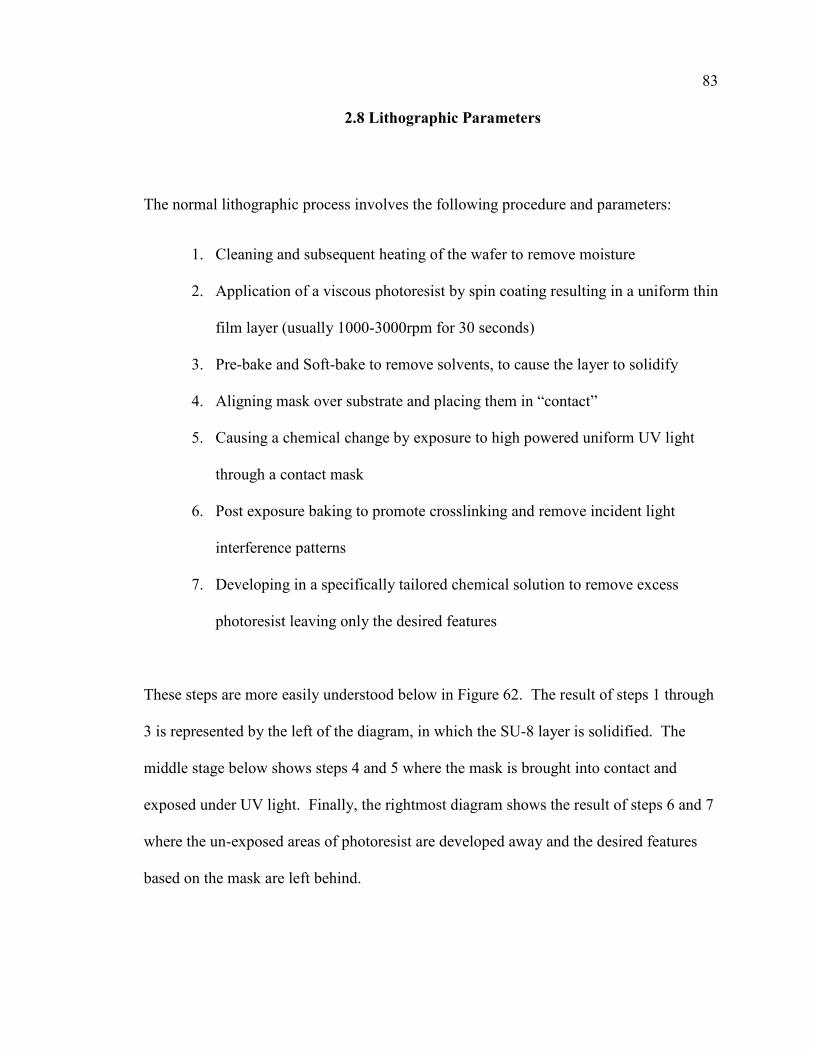
83
2.8 Lithographic Parameters
The normal lithographic process involves the following procedure and parameters:
1. Cleaning and subsequent heating of the wafer to remove moisture
2. Application of a viscous photoresist by spin coating resulting in a uniform thin
film layer (usually 1000-3000rpm for 30 seconds)
3. Pre-bake and Soft-bake to remove solvents, to cause the layer to solidify
4. Aligning mask over substrate and placing them in “contact”
5. Causing a chemical change by exposure to high powered uniform UV light
through a contact mask
6. Post exposure baking to promote crosslinking and remove incident light
interference patterns
7. Developing in a specifically tailored chemical solution to remove excess
photoresist leaving only the desired features
These steps are more easily understood below in Figure 62. The result of steps 1 through
3 is represented by the left of the diagram, in which the SU-8 layer is solidified. The
middle stage below shows steps 4 and 5 where the mask is brought into contact and
exposed under UV light. Finally, the rightmost diagram shows the result of steps 6 and 7
where the un-exposed areas of photoresist are developed away and the desired features
based on the mask are left behind.
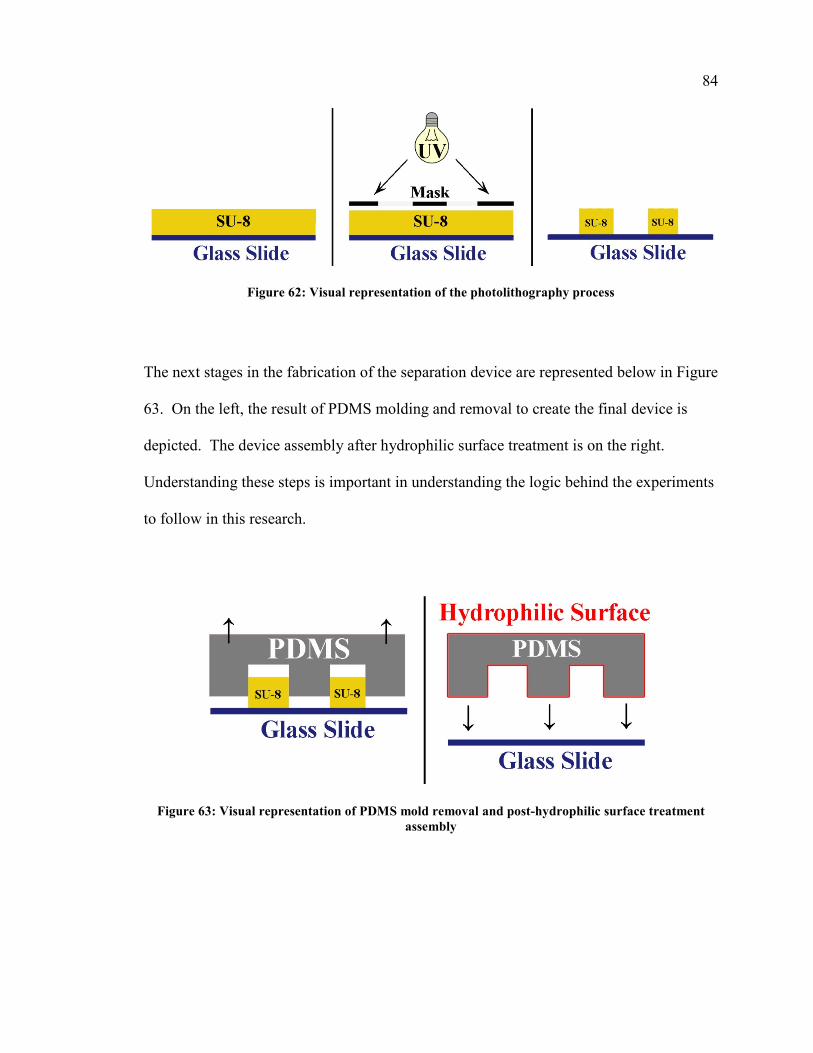
84
Figure 62: Visual representation of the photolithography process
The next stages in the fabrication of the separation device are represented below in Figure
63. On the left, the result of PDMS molding and removal to create the final device is
depicted. The device assembly after hydrophilic surface treatment is on the right.
Understanding these steps is important in understanding the logic behind the experiments
to follow in this research.
Figure 63: Visual representation of PDMS mold removal and post-hydrophilic surface treatment
assembly
85
2.8.1 Exposure Time
Lithographic exposure is when a photosensitive resist is exposed to a short burst of UV
light promoting crosslinking. The amount of UV exposure can be adjusted by increasing
or decreasing the duration of exposure using a standard mask aligner. In our case with a
negative photoresist, the area of resist that is exposed to UV light crosslinks and resists
the developing process. The unexposed areas do not crosslink and are easily developed
away. The thickness of the photoresist is directly related to the duration of exposure
needed to fully crosslink, hence a thicker layer requires longer exposure.
One possible problem is overexposing the photoresist. This may also cause additive stray
light from scattering and could result in indistinct features and incomplete developing.
Lithographic output resulting from SU-8 UV overexposure is shown below in Figure 64.
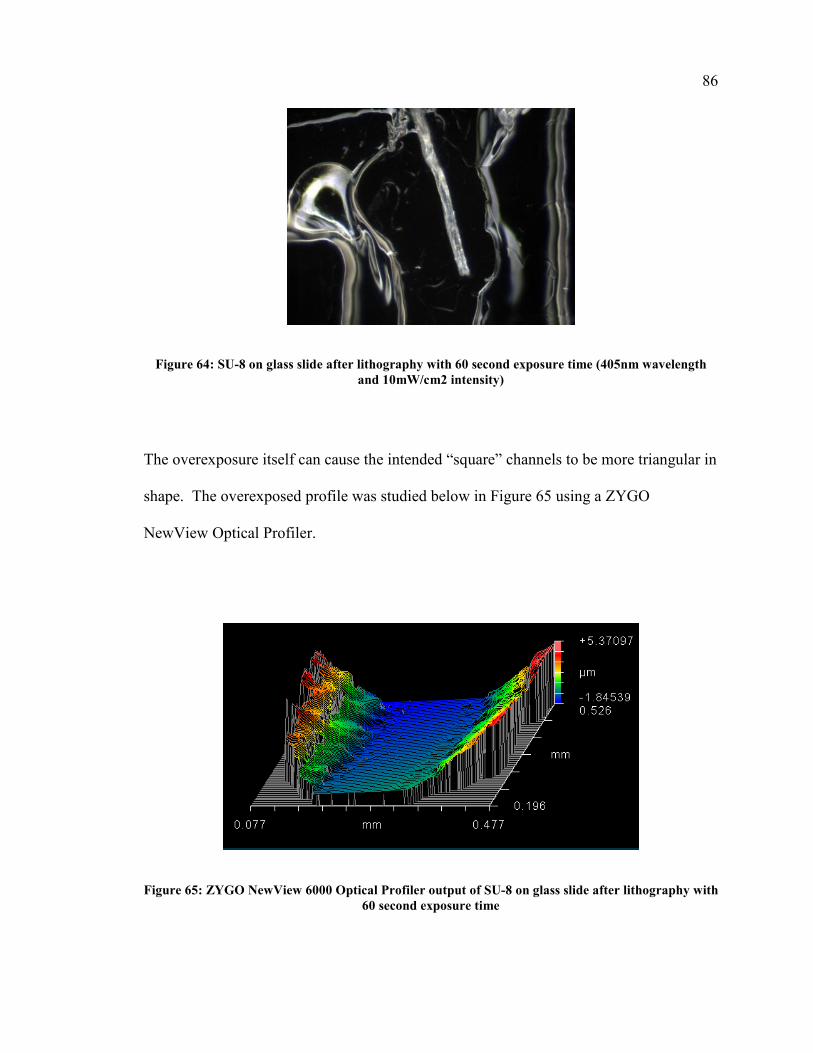
86
Figure 64: SU-8 on glass slide after lithography with 60 second exposure time (405nm wavelength
and 10mW/cm2 intensity)
The overexposure itself can cause the intended “square” channels to be more triangular in
shape. The overexposed profile was studied below in Figure 65 using a ZYGO
NewView Optical Profiler.
Figure 65: ZYGO NewView 6000 Optical Profiler output of SU-8 on glass slide after lithography with
60 second exposure time
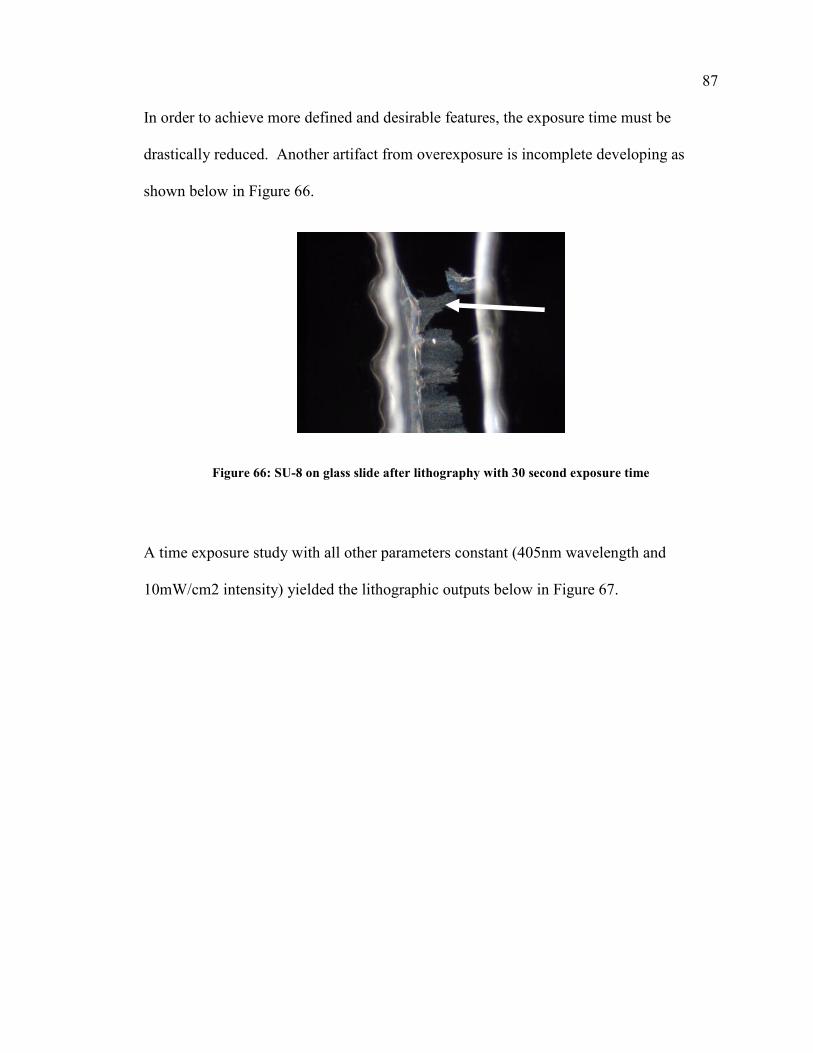
87 In order to achieve more defined and desirable features, the exposure time must be
drastically reduced. Another artifact from overexposure is incomplete developing as
shown below in Figure 66.
Figure 66: SU-8 on glass slide after lithography with 30 second exposure time
A time exposure study with all other parameters constant (405nm wavelength and
10mW/cm2 intensity) yielded the lithographic outputs below in Figure 67.
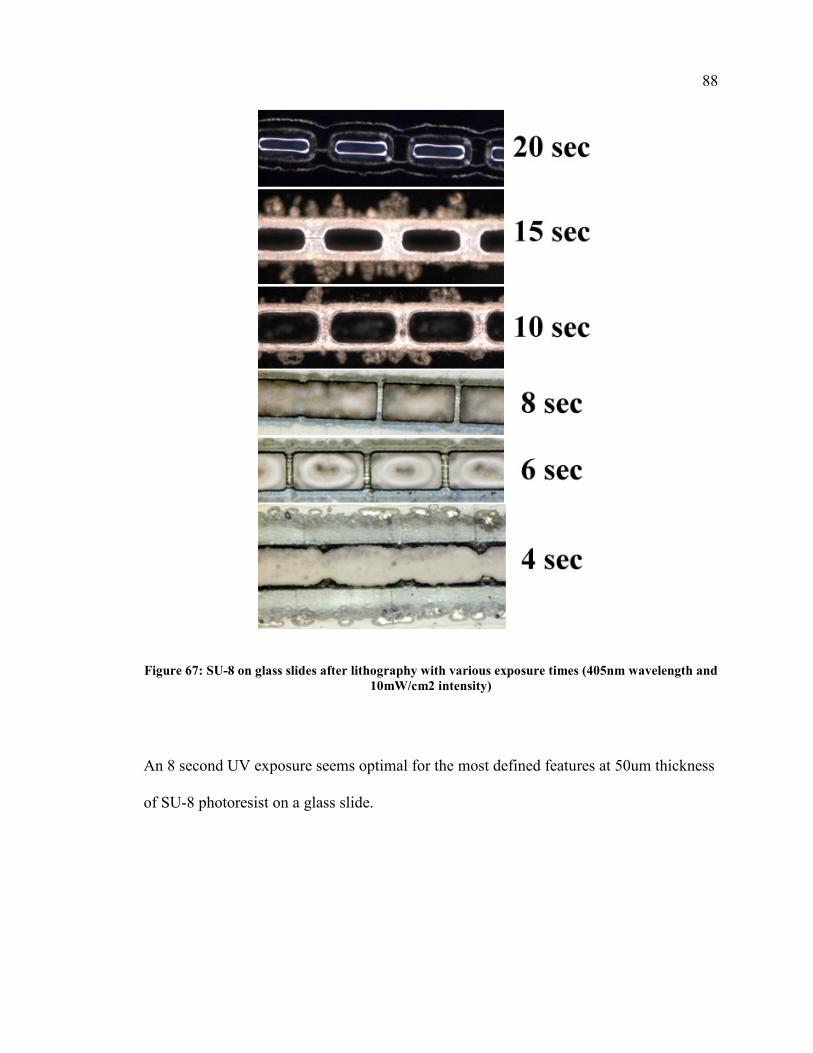
88
Figure 67: SU-8 on glass slides after lithography with various exposure times (405nm wavelength and
10mW/cm2 intensity)
An 8 second UV exposure seems optimal for the most defined features at 50um thickness
of SU-8 photoresist on a glass slide.
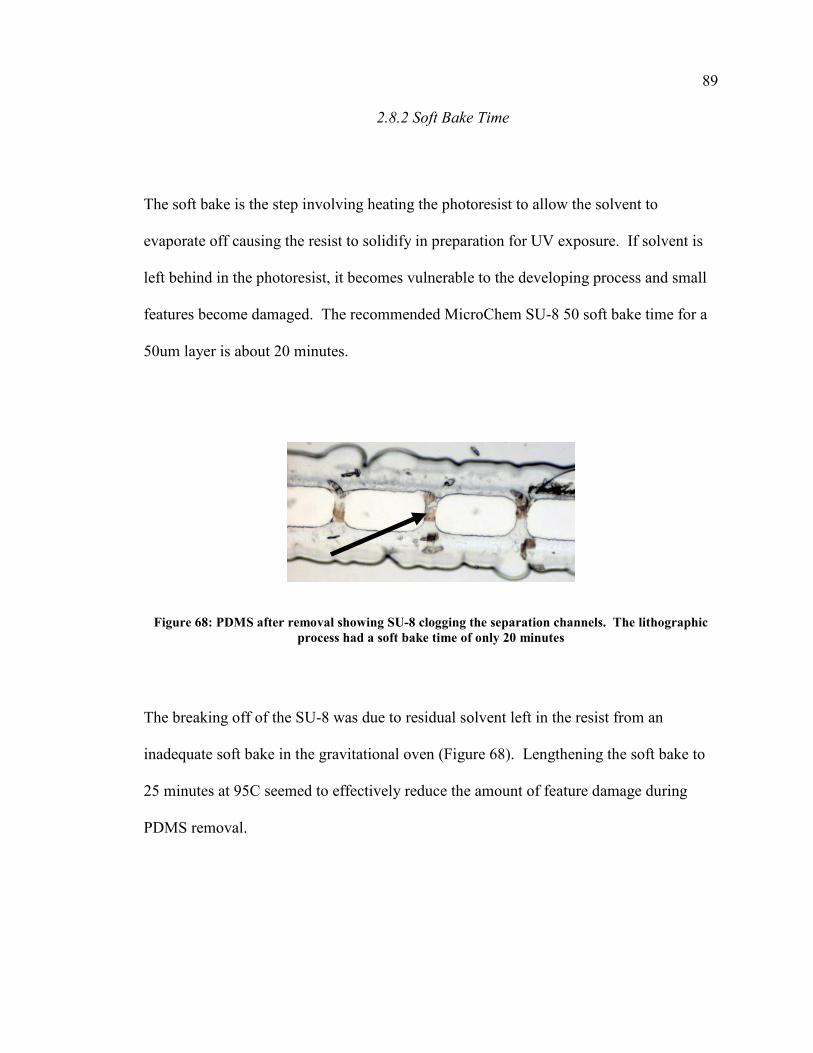
89
2.8.2 Soft Bake Time
The soft bake is the step involving heating the photoresist to allow the solvent to
evaporate off causing the resist to solidify in preparation for UV exposure. If solvent is
left behind in the photoresist, it becomes vulnerable to the developing process and small
features become damaged. The recommended MicroChem SU-8 50 soft bake time for a
50um layer is about 20 minutes.
Figure 68: PDMS after removal showing SU-8 clogging the separation channels. The lithographic
process had a soft bake time of only 20 minutes
The breaking off of the SU-8 was due to residual solvent left in the resist from an
inadequate soft bake in the gravitational oven (Figure 68). Lengthening the soft bake to
25 minutes at 95C seemed to effectively reduce the amount of feature damage during
PDMS removal.
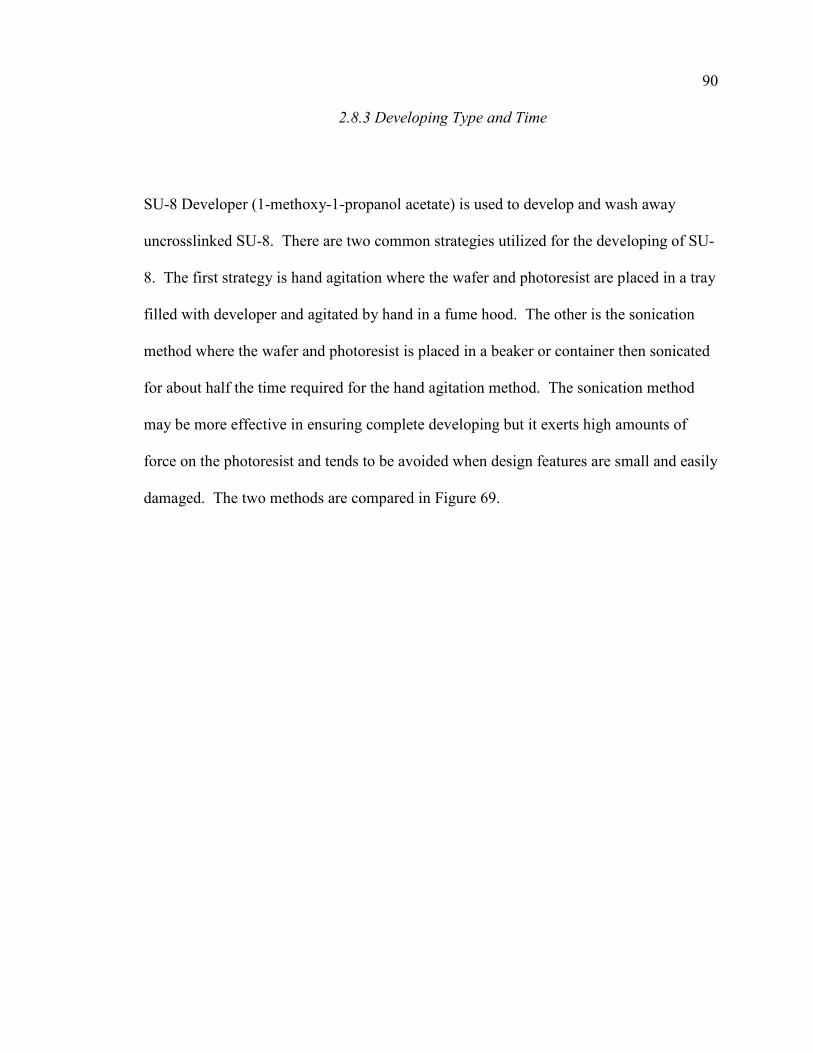
90
2.8.3 Developing Type and Time
SU-8 Developer (1-methoxy-1-propanol acetate) is used to develop and wash away
uncrosslinked SU-8. There are two common strategies utilized for the developing of SU-
8. The first strategy is hand agitation where the wafer and photoresist are placed in a tray
filled with developer and agitated by hand in a fume hood. The other is the sonication
method where the wafer and photoresist is placed in a beaker or container then sonicated
for about half the time required for the hand agitation method. The sonication method
may be more effective in ensuring complete developing but it exerts high amounts of
force on the photoresist and tends to be avoided when design features are small and easily
damaged. The two methods are compared in Figure 69.
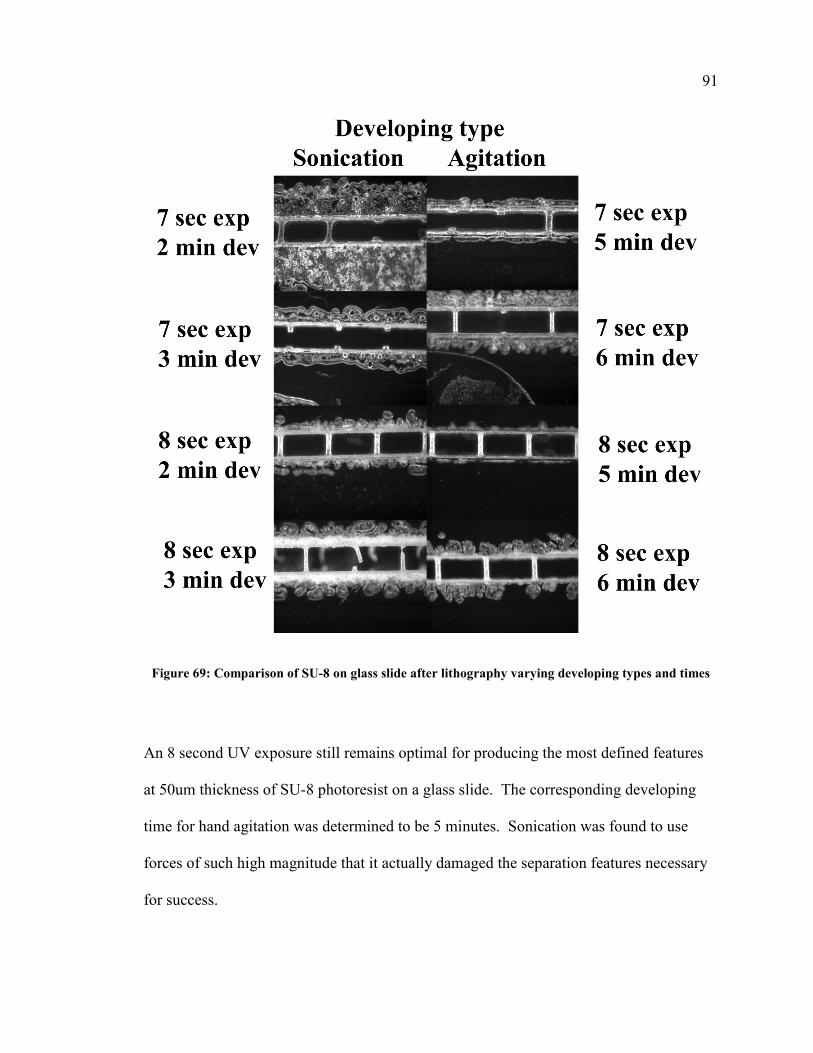
91
Figure 69: Comparison of SU-8 on glass slide after lithography varying developing types and times
An 8 second UV exposure still remains optimal for producing the most defined features
at 50um thickness of SU-8 photoresist on a glass slide. The corresponding developing
time for hand agitation was determined to be 5 minutes. Sonication was found to use
forces of such high magnitude that it actually damaged the separation features necessary
for success.
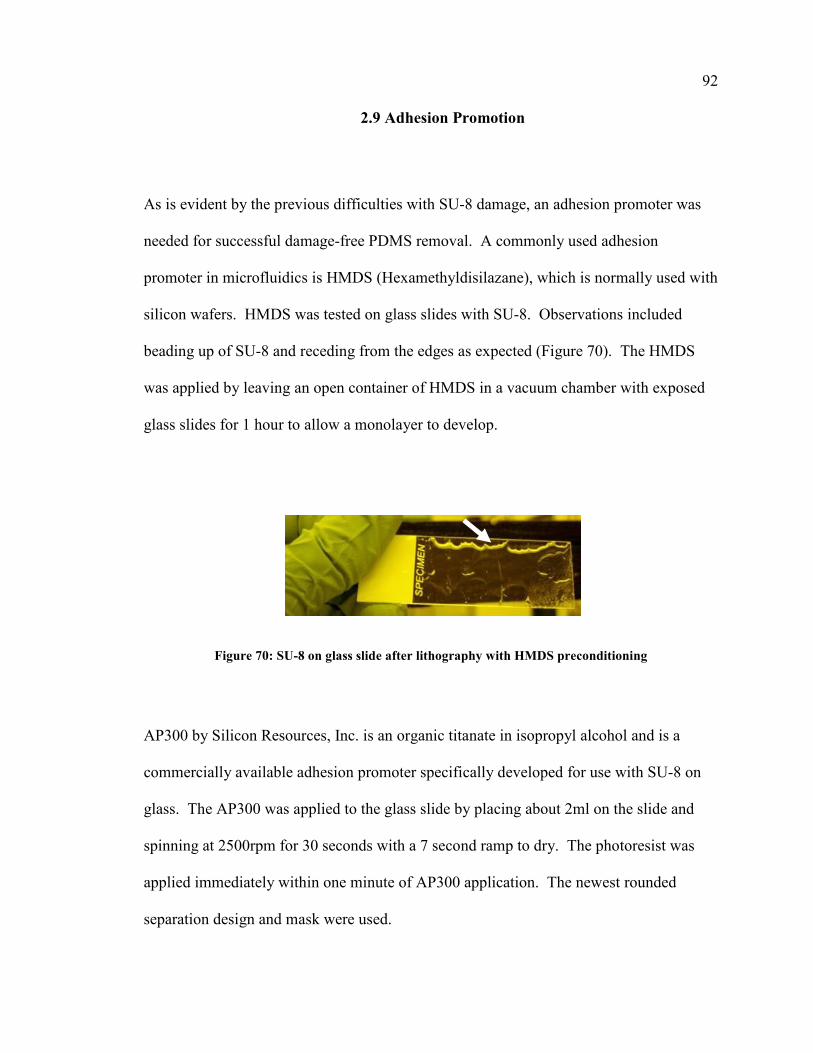
92
2.9 Adhesion Promotion
As is evident by the previous difficulties with SU-8 damage, an adhesion promoter was
needed for successful damage-free PDMS removal. A commonly used adhesion
promoter in microfluidics is HMDS (Hexamethyldisilazane), which is normally used with
silicon wafers. HMDS was tested on glass slides with SU-8. Observations included
beading up of SU-8 and receding from the edges as expected (Figure 70). The HMDS
was applied by leaving an open container of HMDS in a vacuum chamber with exposed
glass slides for 1 hour to allow a monolayer to develop.
Figure 70: SU-8 on glass slide after lithography with HMDS preconditioning
AP300 by Silicon Resources, Inc. is an organic titanate in isopropyl alcohol and is a
commercially available adhesion promoter specifically developed for use with SU-8 on
glass. The AP300 was applied to the glass slide by placing about 2ml on the slide and
spinning at 2500rpm for 30 seconds with a 7 second ramp to dry. The photoresist was
applied immediately within one minute of AP300 application. The newest rounded
separation design and mask were used.
93
Figure 71: Comparison of SU-8 and PDMS molds
The AP300 allowed for open channels even on the small scale with features less than the
guaranteed resolution of the mask printer (Figure 71). This rounded design allows for
less opportunity for sheer breakage while increasing the exposed hydrophilic glass. This
design is optimal for PDMS molding and subsequent separation testing.
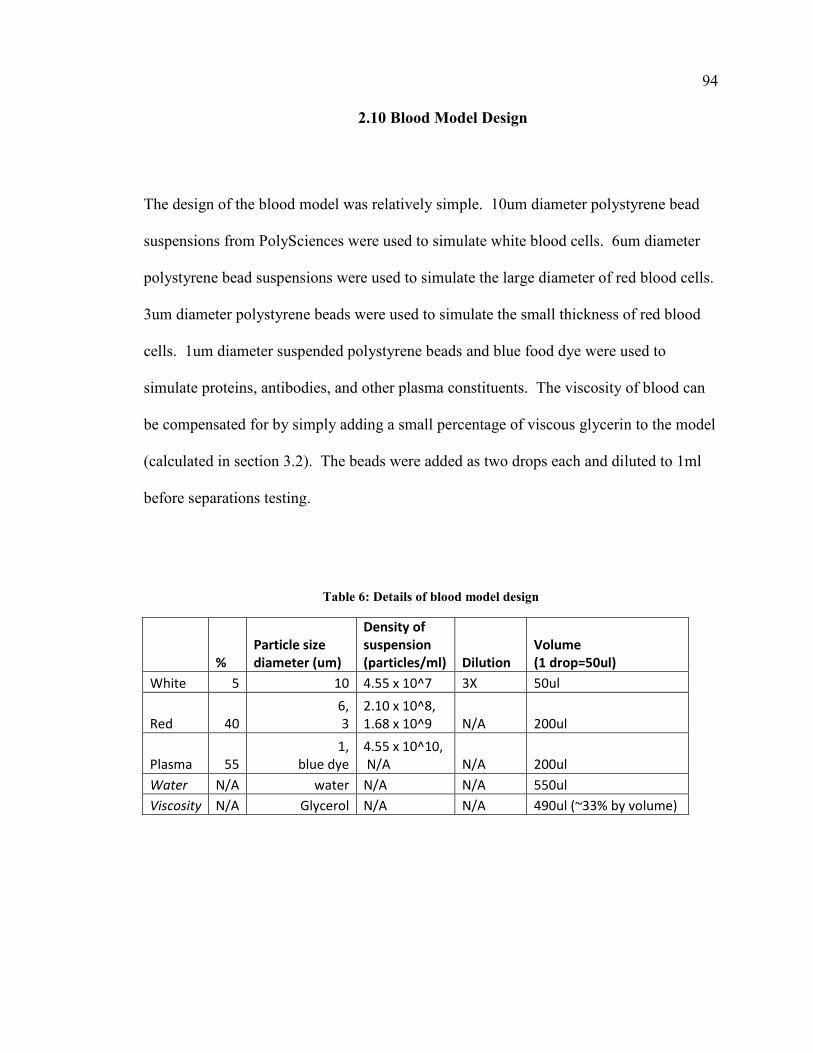
94
2.10 Blood Model Design
The design of the blood model was relatively simple. 10um diameter polystyrene bead
suspensions from PolySciences were used to simulate white blood cells. 6um diameter
polystyrene bead suspensions were used to simulate the large diameter of red blood cells.
3um diameter polystyrene beads were used to simulate the small thickness of red blood
cells. 1um diameter suspended polystyrene beads and blue food dye were used to
simulate proteins, antibodies, and other plasma constituents. The viscosity of blood can
be compensated for by simply adding a small percentage of viscous glycerin to the model
(calculated in section 3.2). The beads were added as two drops each and diluted to 1ml
before separations testing.
Table 6: Details of blood model design
% Particle size
diameter (um)
Density of
suspension
(particles/ml) Dilution Volume
(1 drop=50ul)
White 5 10 4.55 x 10^7 3X 50ul
Red 40 6,
3 2.10 x 10^8,
1.68 x 10^9 N/A 200ul
Plasma 55 1,
blue dye 4.55 x 10^10,
N/A N/A 200ul
Water N/A water N/A N/A 550ul
Viscosity N/A Glycerol N/A N/A 490ul (~33% by volume)
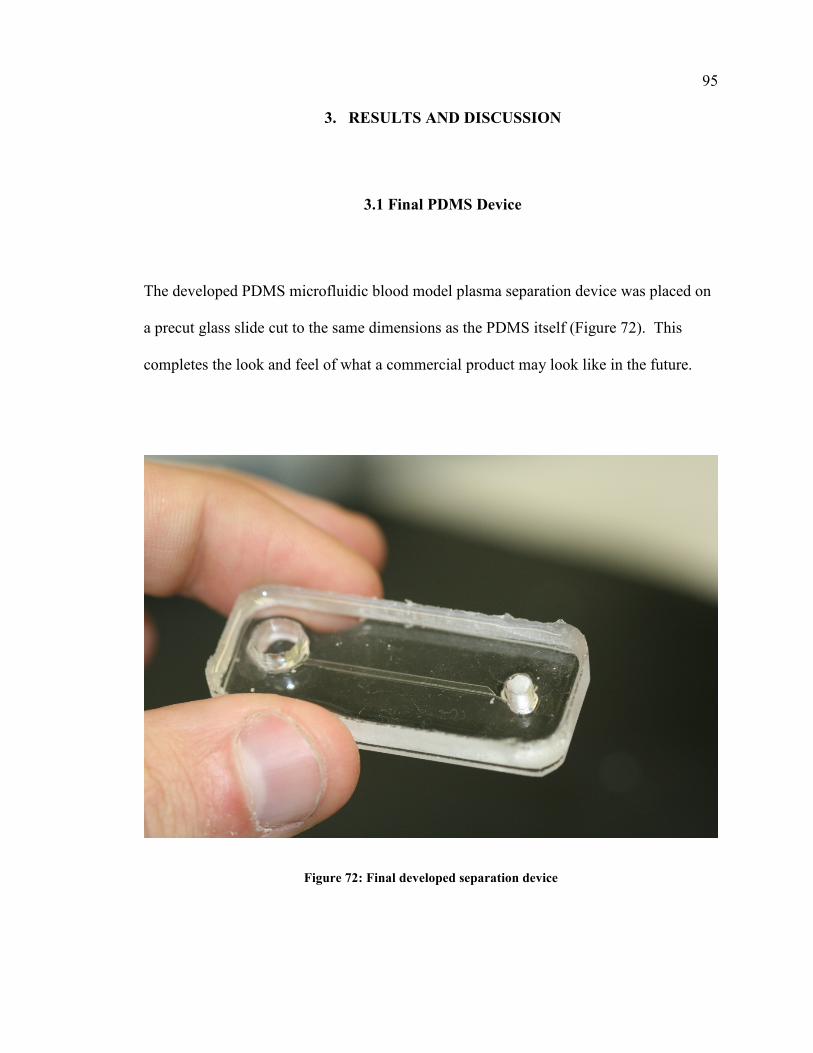
95
3. RESULTS AND DISCUSSION
3.1 Final PDMS Device
The developed PDMS microfluidic blood model plasma separation device was placed on
a precut glass slide cut to the same dimensions as the PDMS itself (Figure 72). This
completes the look and feel of what a commercial product may look like in the future.
Figure 72: Final developed separation device
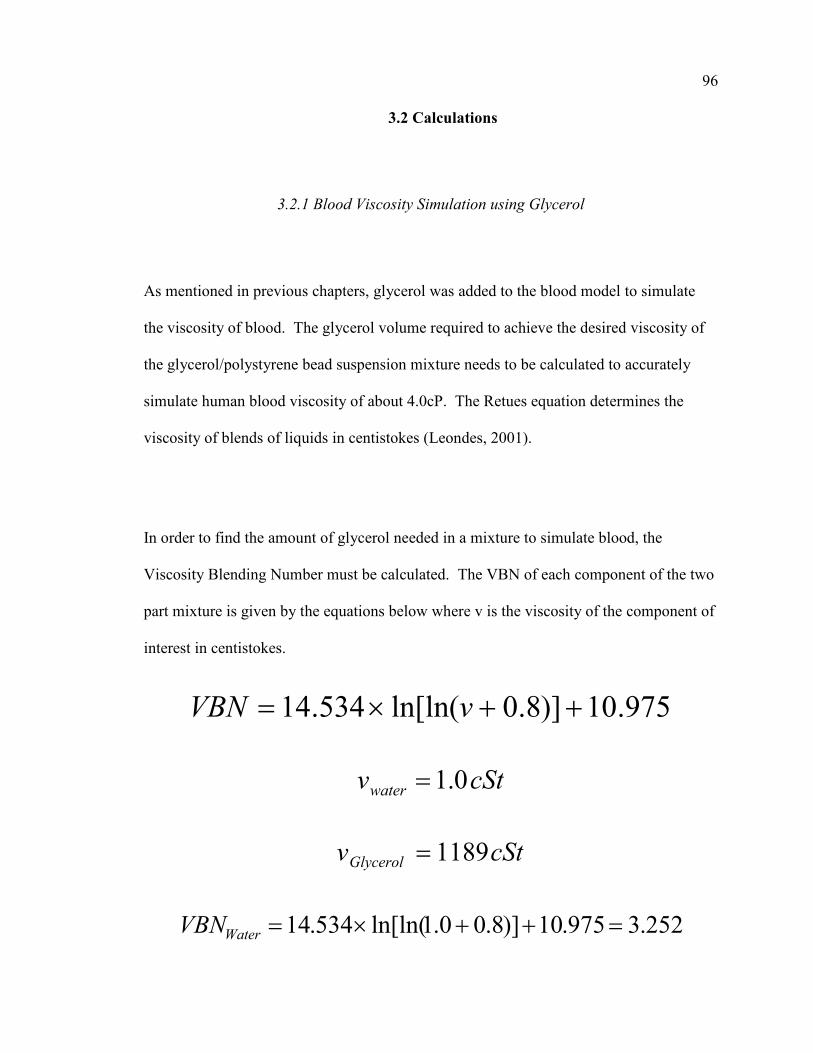
96
3.2 Calculations
3.2.1 Blood Viscosity Simulation using Glycerol
As mentioned in previous chapters, glycerol was added to the blood model to simulate
the viscosity of blood. The glycerol volume required to achieve the desired viscosity of
the glycerol/polystyrene bead suspension mixture needs to be calculated to accurately
simulate human blood viscosity of about 4.0cP. The Retues equation determines the
viscosity of blends of liquids in centistokes (Leondes, 2001).
In order to find the amount of glycerol needed in a mixture to simulate blood, the
Viscosity Blending Number must be calculated. The VBN of each component of the two
part mixture is given by the equations below where v is the viscosity of the component of
interest in centistokes.
975.10)]8.0ln[ln(534.14 ++×= vVBN
cStvwater 0.1=
cStvGlycerol 1189=
252.3975.10)]8.00.1ln[ln(534.14 =++×=WaterVBN
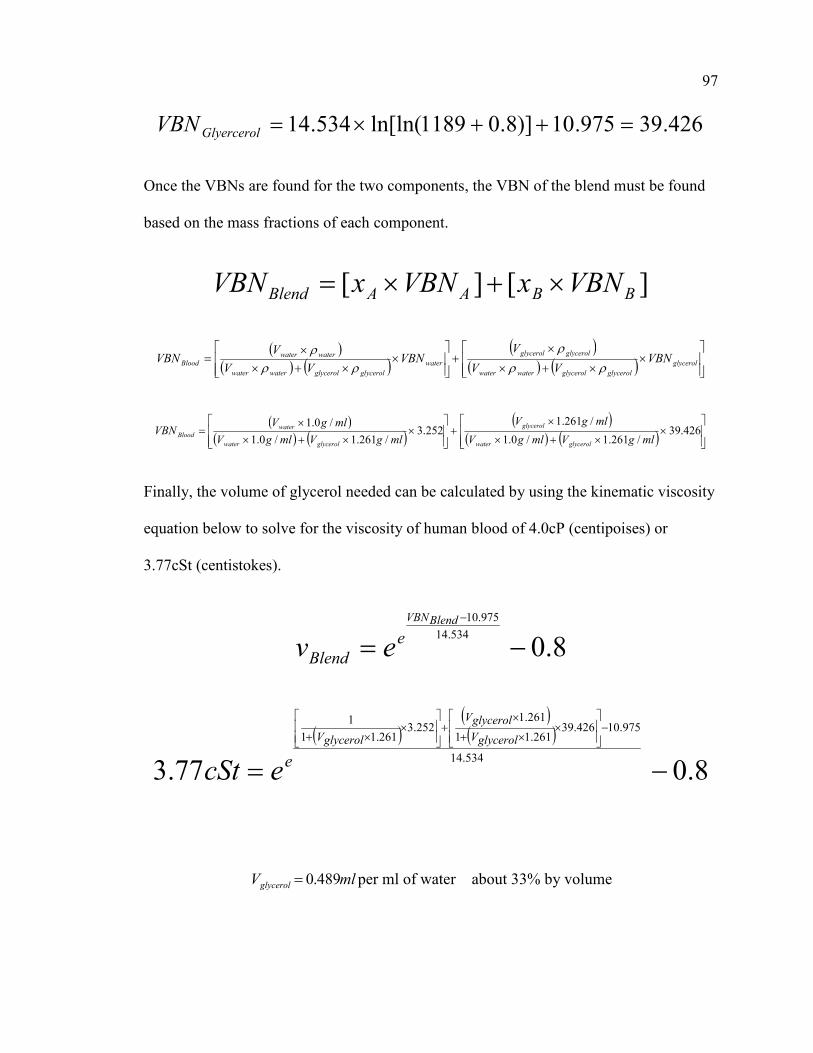
97
426.39975.10)]8.01189ln[ln(534.14 =++×=GlyercerolVBN
Once the VBNs are found for the two components, the VBN of the blend must be found
based on the mass fractions of each component.
][][ BBAABlend VBNxVBNxVBN ×+×=
( )( ) ( )
( )( ) ( )
×
×+×
×+
×
×+×
×= glycerol
glycerolglycerolwaterwater
glycerolglycerol
water
glycerolglycerolwaterwater
waterwater
Blood VBNVV
VVBN
VV
VVBN
ρρ
ρ
ρρρ
( )( ) ( )
( )( ) ( )
×
×+×
×+
×
×+×
×= 426.39
/261.1/0.1
/261.1252.3
/261.1/0.1
/0.1
mlgVmlgV
mlgV
mlgVmlgV
mlgVVBN
glycerolwater
glycerol
glycerolwater
water
Blood
Finally, the volume of glycerol needed can be calculated by using the kinematic viscosity
equation below to solve for the viscosity of human blood of 4.0cP (centipoises) or
3.77cSt (centistokes).
8.0534.14
975.10
−=−BlendVBN
e
Blend ev
( )( )( )
8.077.3534.14
975.10426.39261.11
261.1252.3
261.11
1
−=
−
×
×+
×+
×
×+ glycerolV
glycerolV
glycerolV
eecSt
mlVglycerol 489.0= per ml of water about 33% by volume

98 Adding 33% by volume of glycerol to the blood model polystyrene microsphere mixture
will effectively simulate the viscosity of human blood. Previous studies have used
gylcerol at a 36% by volume solution to achieve a viscosity effectively similar to that of
human blood (Leondes, 2001).
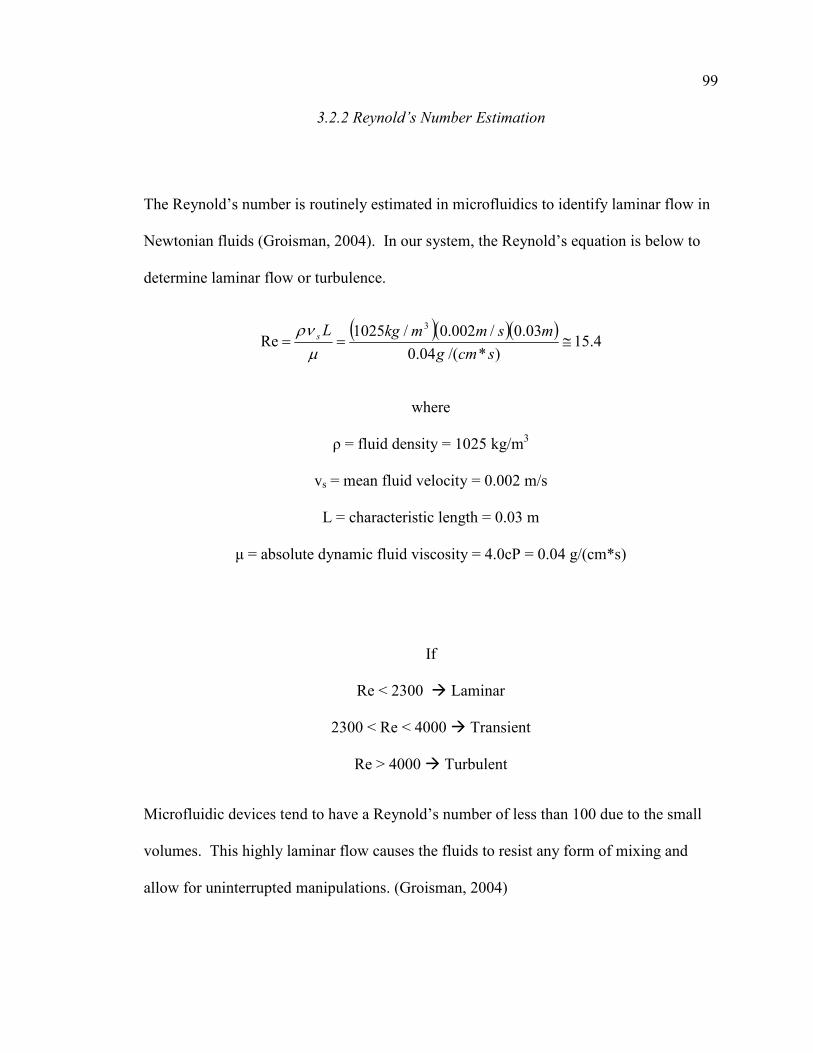
99
3.2.2 Reynold’s Number Estimation
The Reynold’s number is routinely estimated in microfluidics to identify laminar flow in
Newtonian fluids (Groisman, 2004). In our system, the Reynold’s equation is below to
determine laminar flow or turbulence.
( )( )( )4.15
)*/(04.0
03.0/002.0/1025Re
3
≅==scmg
msmmkgLs
µρν
where
ρ = fluid density = 1025 kg/m3
vs = mean fluid velocity = 0.002 m/s
L = characteristic length = 0.03 m
µ = absolute dynamic fluid viscosity = 4.0cP = 0.04 g/(cm*s)
If
Re < 2300 � Laminar
2300 < Re < 4000 � Transient
Re > 4000 � Turbulent
Microfluidic devices tend to have a Reynold’s number of less than 100 due to the small
volumes. This highly laminar flow causes the fluids to resist any form of mixing and
allow for uninterrupted manipulations. (Groisman, 2004)
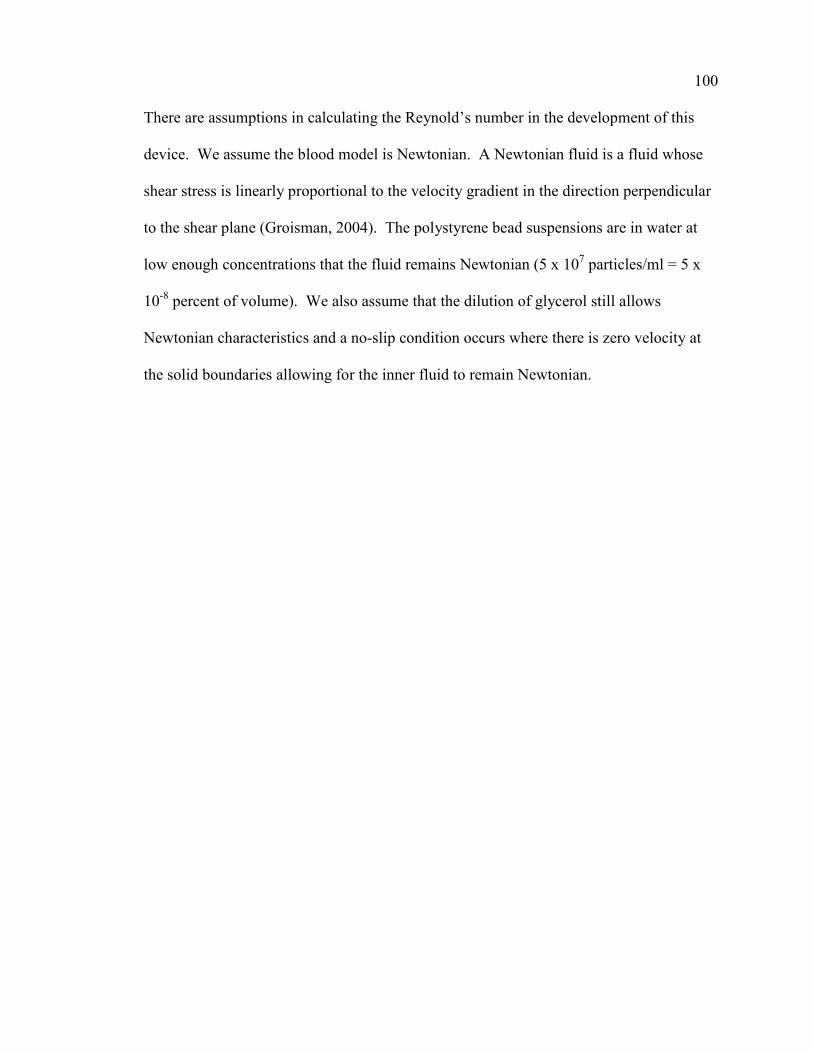
100 There are assumptions in calculating the Reynold’s number in the development of this
device. We assume the blood model is Newtonian. A Newtonian fluid is a fluid whose
shear stress is linearly proportional to the velocity gradient in the direction perpendicular
to the shear plane (Groisman, 2004). The polystyrene bead suspensions are in water at
low enough concentrations that the fluid remains Newtonian (5 x 10⁷ particles/ml = 5 x
10-8 percent of volume). We also assume that the dilution of glycerol still allows
Newtonian characteristics and a no-slip condition occurs where there is zero velocity at
the solid boundaries allowing for the inner fluid to remain Newtonian.
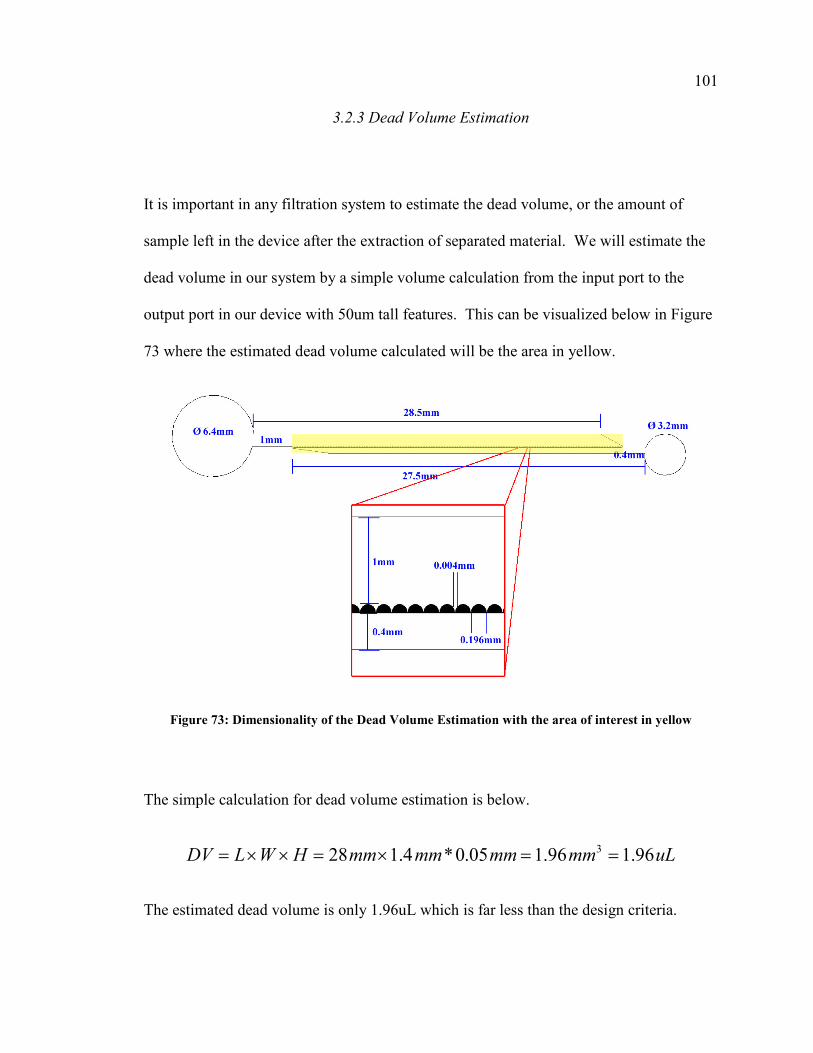
101
3.2.3 Dead Volume Estimation
It is important in any filtration system to estimate the dead volume, or the amount of
sample left in the device after the extraction of separated material. We will estimate the
dead volume in our system by a simple volume calculation from the input port to the
output port in our device with 50um tall features. This can be visualized below in Figure
73 where the estimated dead volume calculated will be the area in yellow.
Figure 73: Dimensionality of the Dead Volume Estimation with the area of interest in yellow
The simple calculation for dead volume estimation is below.
uLmmmmmmmmHWLDV 96.196.105.0*4.128 3 ==×=××=
The estimated dead volume is only 1.96uL which is far less than the design criteria.
102
3.3 Blood Model Separation
3.3.1 Preliminary Separation
After understanding the need for resolution compensation, the 4um gap design was used
(Figure 74). We anticipated that the limited resolution of the mask printer would allow
for the 4um gap to actually be closer to the desired 3um. This 3um feature size would
also be approaching the limits of the mask aligner UV exposure resolution.
Figure 74: SU-8 on glass slide and PDMS mold after lithography with 4um mask design
There were successful filtration gap openings in the PDMS after molding and removal.
The PDMS mold was placed on a new glass slide and tested by adding the blood model
solution to the input port with a transfer pipette. Almost instantly, the solution filled in
the input channel and began to interact with the filter layer. Separation commenced
without stopping for more than 20 minutes as long as the input port was full of solution.
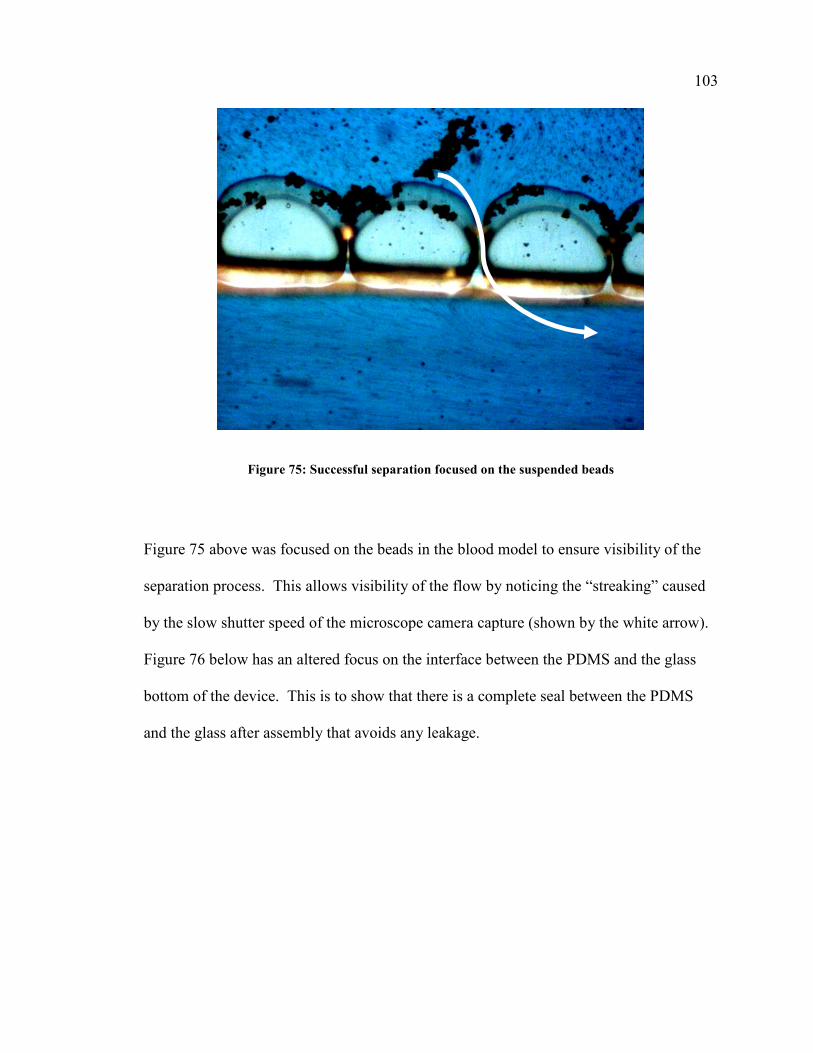
103
Figure 75: Successful separation focused on the suspended beads
Figure 75 above was focused on the beads in the blood model to ensure visibility of the
separation process. This allows visibility of the flow by noticing the “streaking” caused
by the slow shutter speed of the microscope camera capture (shown by the white arrow).
Figure 76 below has an altered focus on the interface between the PDMS and the glass
bottom of the device. This is to show that there is a complete seal between the PDMS
and the glass after assembly that avoids any leakage.
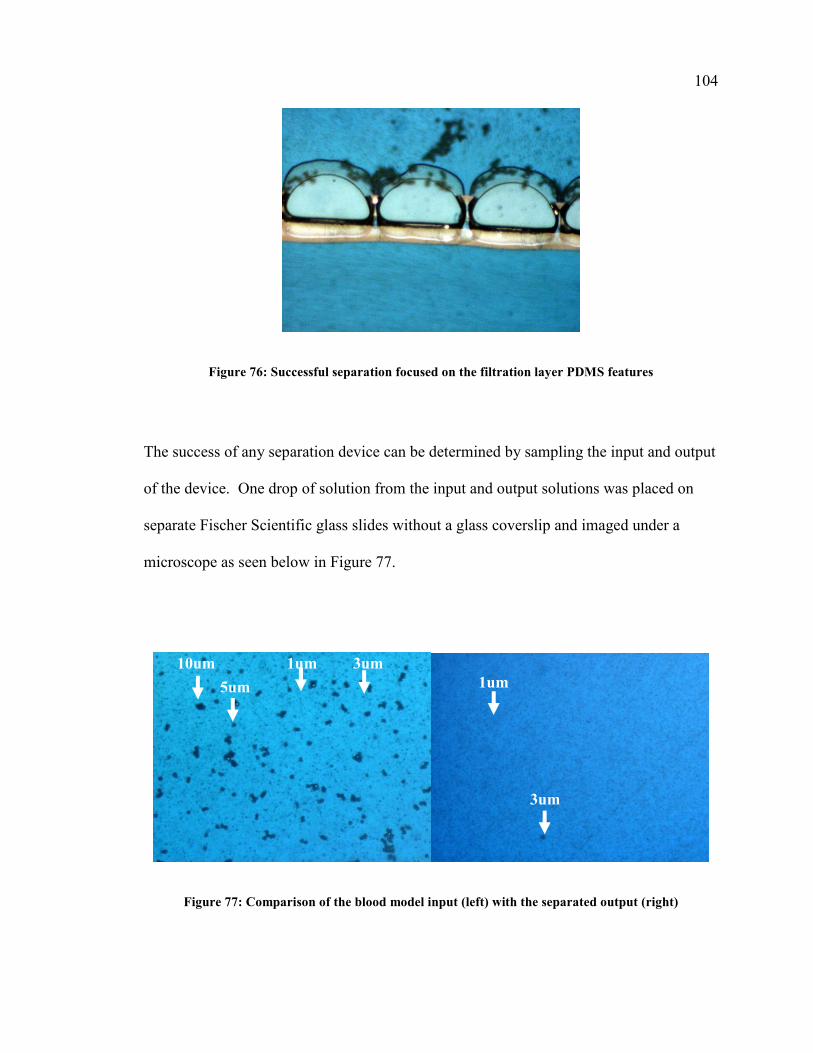
104
Figure 76: Successful separation focused on the filtration layer PDMS features
The success of any separation device can be determined by sampling the input and output
of the device. One drop of solution from the input and output solutions was placed on
separate Fischer Scientific glass slides without a glass coverslip and imaged under a
microscope as seen below in Figure 77.
Figure 77: Comparison of the blood model input (left) with the separated output (right)
10um 1um 3um
5um 1um
3um
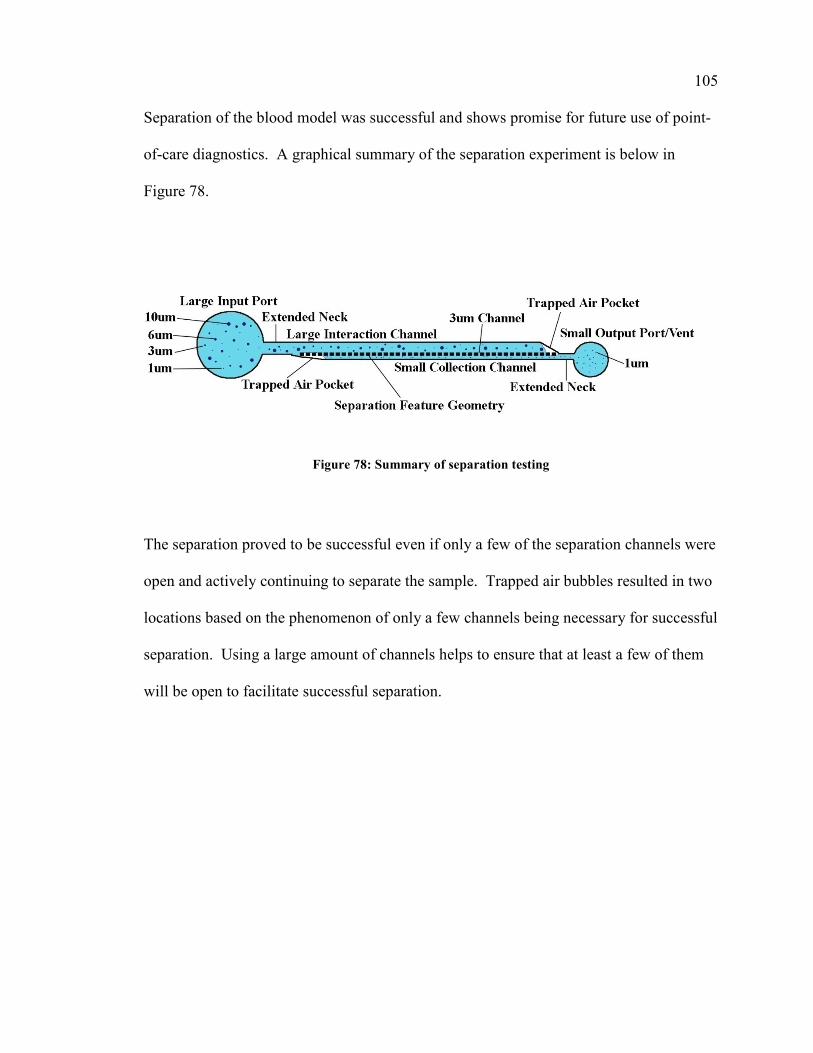
105 Separation of the blood model was successful and shows promise for future use of point-
of-care diagnostics. A graphical summary of the separation experiment is below in
Figure 78.
Figure 78: Summary of separation testing
The separation proved to be successful even if only a few of the separation channels were
open and actively continuing to separate the sample. Trapped air bubbles resulted in two
locations based on the phenomenon of only a few channels being necessary for successful
separation. Using a large amount of channels helps to ensure that at least a few of them
will be open to facilitate successful separation.
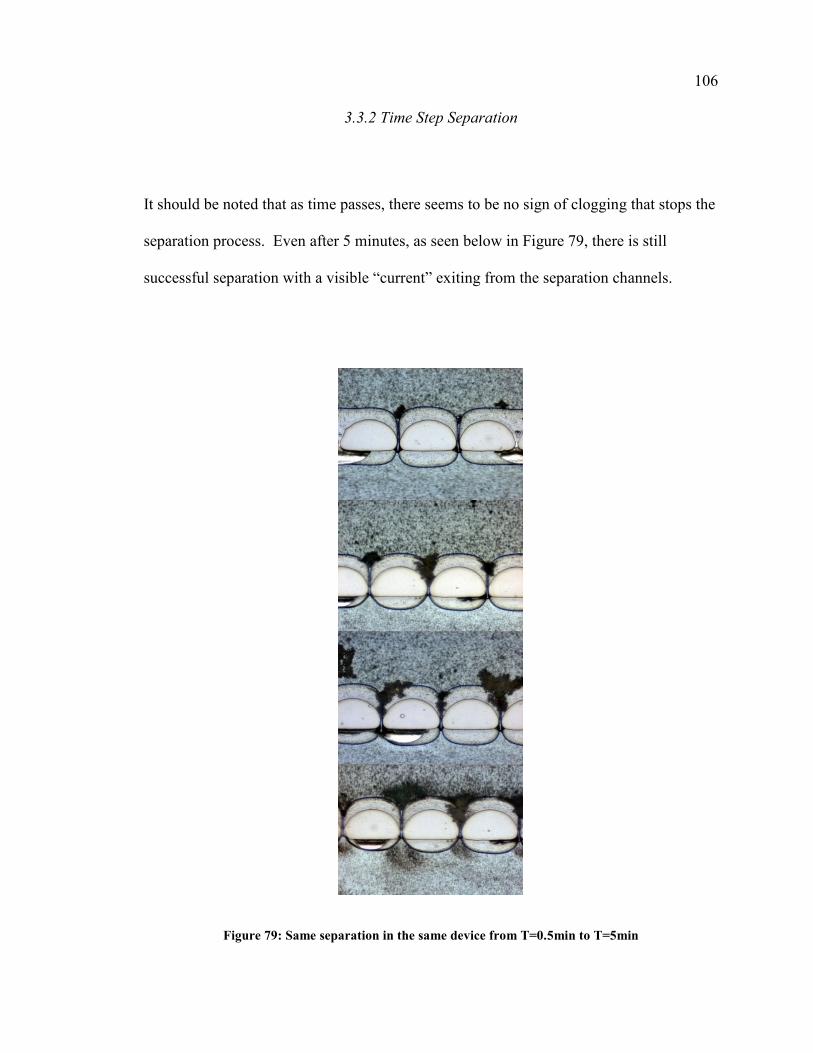
106
3.3.2 Time Step Separation
It should be noted that as time passes, there seems to be no sign of clogging that stops the
separation process. Even after 5 minutes, as seen below in Figure 79, there is still
successful separation with a visible “current” exiting from the separation channels.
Figure 79: Same separation in the same device from T=0.5min to T=5min
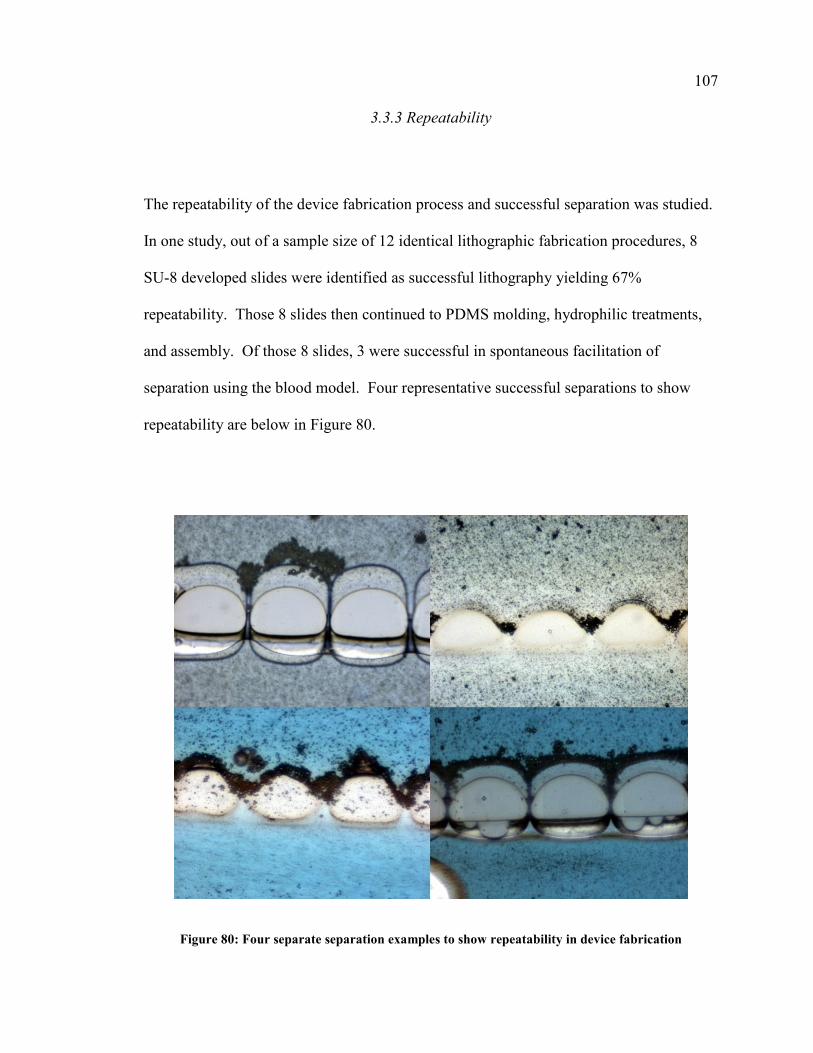
107
3.3.3 Repeatability
The repeatability of the device fabrication process and successful separation was studied.
In one study, out of a sample size of 12 identical lithographic fabrication procedures, 8
SU-8 developed slides were identified as successful lithography yielding 67%
repeatability. Those 8 slides then continued to PDMS molding, hydrophilic treatments,
and assembly. Of those 8 slides, 3 were successful in spontaneous facilitation of
separation using the blood model. Four representative successful separations to show
repeatability are below in Figure 80.
Figure 80: Four separate separation examples to show repeatability in device fabrication
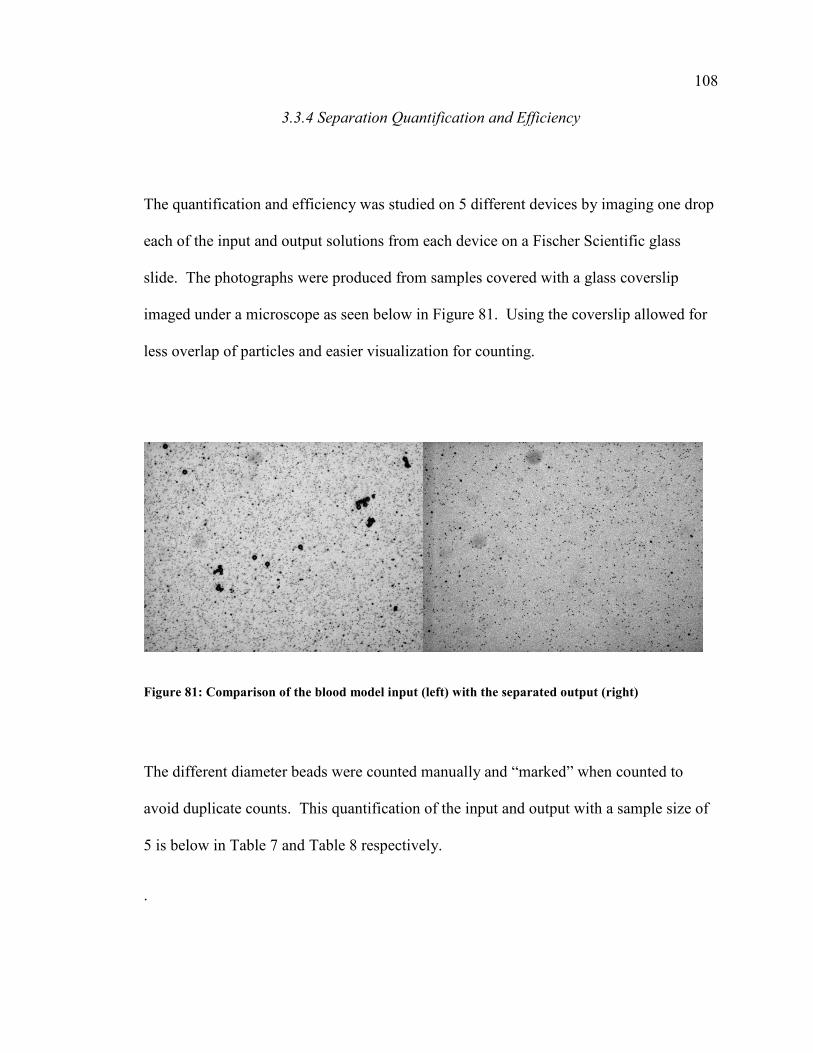
108
3.3.4 Separation Quantification and Efficiency
The quantification and efficiency was studied on 5 different devices by imaging one drop
each of the input and output solutions from each device on a Fischer Scientific glass
slide. The photographs were produced from samples covered with a glass coverslip
imaged under a microscope as seen below in Figure 81. Using the coverslip allowed for
less overlap of particles and easier visualization for counting.
Figure 81: Comparison of the blood model input (left) with the separated output (right)
The different diameter beads were counted manually and “marked” when counted to
avoid duplicate counts. This quantification of the input and output with a sample size of
5 is below in Table 7 and Table 8 respectively.
.
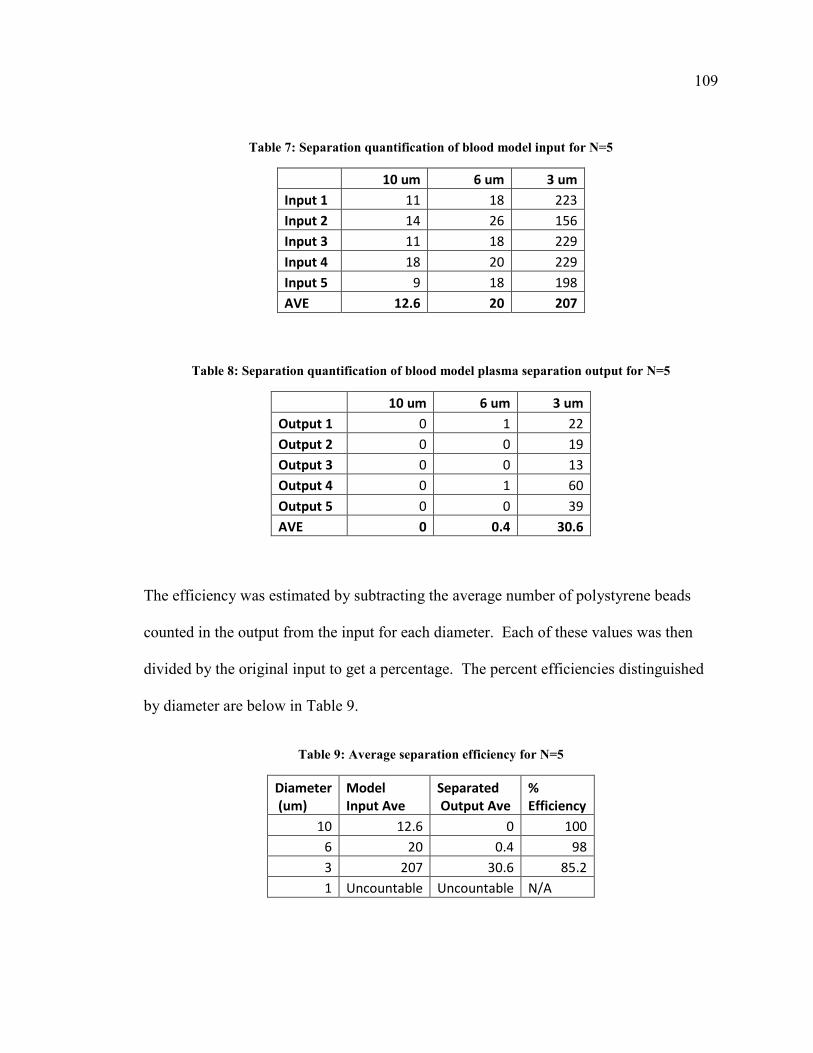
109
Table 7: Separation quantification of blood model input for N=5
10 um 6 um 3 um
Input 1 11 18 223
Input 2 14 26 156
Input 3 11 18 229
Input 4 18 20 229
Input 5 9 18 198
AVE 12.6 20 207
Table 8: Separation quantification of blood model plasma separation output for N=5
10 um 6 um 3 um
Output 1 0 1 22
Output 2 0 0 19
Output 3 0 0 13
Output 4 0 1 60
Output 5 0 0 39
AVE 0 0.4 30.6
The efficiency was estimated by subtracting the average number of polystyrene beads
counted in the output from the input for each diameter. Each of these values was then
divided by the original input to get a percentage. The percent efficiencies distinguished
by diameter are below in Table 9.
Table 9: Average separation efficiency for N=5
Diameter
(um) Model
Input Ave Separated
Output Ave %
Efficiency
10 12.6 0 100
6 20 0.4 98
3 207 30.6 85.2
1 Uncountable Uncountable N/A
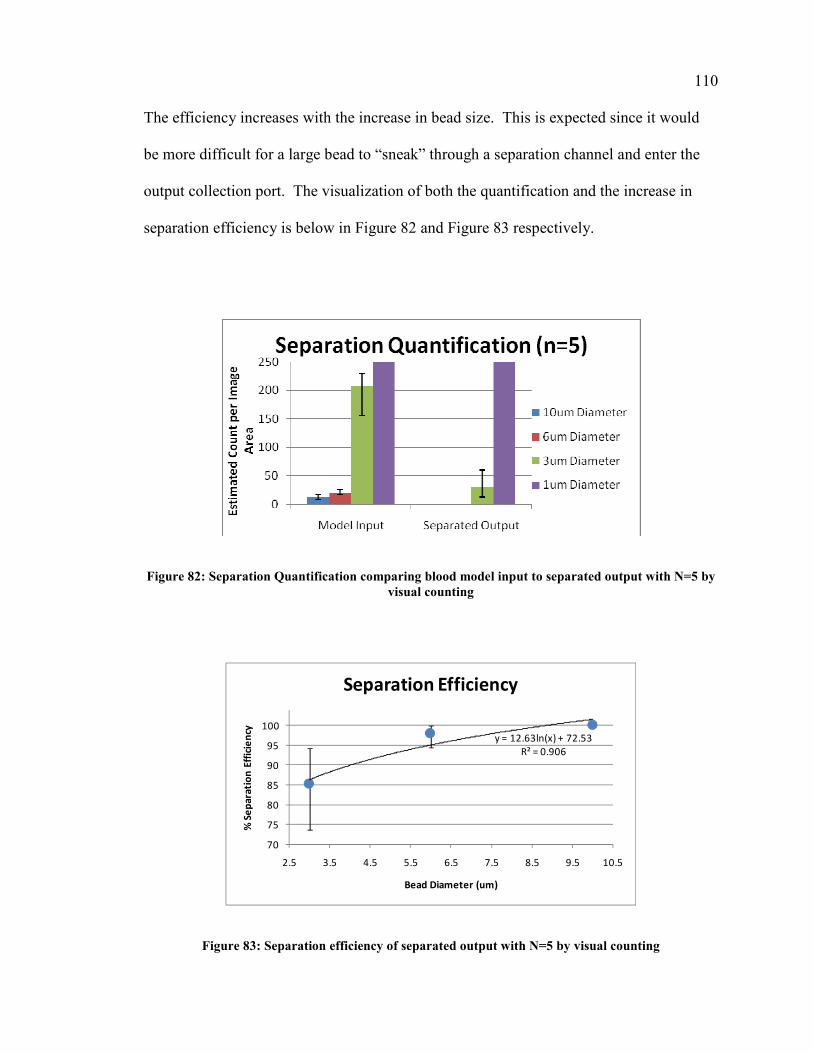
110 The efficiency increases with the increase in bead size. This is expected since it would
be more difficult for a large bead to “sneak” through a separation channel and enter the
output collection port. The visualization of both the quantification and the increase in
separation efficiency is below in Figure 82 and Figure 83 respectively.
Figure 82: Separation Quantification comparing blood model input to separated output with N=5 by
visual counting
y = 12.63ln(x) + 72.53
R² = 0.906
70
75
80
85
90
95
100
2.5 3.5 4.5 5.5 6.5 7.5 8.5 9.5 10.5
% S
ep
ara
tio
n E
ffic
ien
cy
Bead Diameter (um)
Separation Efficiency
Figure 83: Separation efficiency of separated output with N=5 by visual counting
111
3.4 Summary of Developed Methods and Design
In order to summarize the final methods of the developed device in a clear manner, the
final approach is outlined below.
1. Prepare mask with a 4um rounded separation gap design to yield a 3um gap due
to the poor mask printing resolution of OutputCity CAD Services Ultra High
Resolution Photoplotting
2. Remove MicroChem SU-8 50 Photoresist from the refrigerator and place in the
fume hood in a light-tight lithography class 100,000 clean room to get to room
temperature before opening
3. Record room temperature and percent relative humidity
4. Replace protective aluminum foil in the SGS G3P-8 Spincoater.
5. Place the calibrated dial thermometer in the gravitational oven and preheat to 65C
6. Clean Fisher Scientific glass slide with Acetone to remove organics.
7. Clean with Isopropanol to remove acetone
8. Clean with DI Water
9. Dry by placing on hotplate and ramping up the temperature to 200C for 5 minutes
10. Remove from hotplate and place on lint-free surface inside the fume hood where
the SGS G3P-8 Spincoater is located
11. Turn on the Nitrogen and Vacuum to the SGS G3P-8 Spincoater and save two
Recipes into memory
a. Recipe 1: Adhesion promoter application and drying
112
i. Step 1: 7 second ramp, 2500 RPM, 30 second dwell
b. Recipe 2: SU-8 spin coating
i. Step 1: 5 second ramp, 500 RPM, 5 second Dwell
ii. Step 2: 7 second ramp, 2000 RPM, 30 second Dwell
12. Place clean glass slide on the chuck inside the SGS G3P-8 Spincoater
13. Using a new transfer pipette, drop 2-3ml of the AP300 adhesion promoter all over
the glass slide and close the spin coater lid
14. Start Recipe 1
15. Immediately (within 1 minute) using a new large plastic disposable spatula, place
1ml/sq.in. on the center of the slide carefully to avoid introducing bubbles
16. If bubble were introduced, quickly remove them by “sucking” them out with a
new transfer pipette
17. Start Recipe 2
18. Upon completion, place coated slide in preheated Gravitational Oven at 65C for
Pre-bake
19. After 1 minute, set oven to 95C (the ramp to 95C will take about 5 minutes)
20. Leave slide in oven for 25 minutes at 95C for Soft Bake
21. Meanwhile, turn off Nitrogen and Vacuum to SGS G3P-8 Spincoater. Turn on
Compressed Air, Nitrogen, and Vacuum to Mask Aligner. Return SU-8 to the
refrigerator and AP300 to storage
22. Turn on Mask Aligner main Power Switch and let bulb warm up
23. Turn on Mask Aligner control assembly and place desired mask in the vacuum
mask holder

113
24. Set the exposure time to 8.0 seconds on Ch 2
25. Adjust the stage height to allow stable contact with the glass slide (test with a new
glass slide if necessary)
26. At the end of the 25 minute soft bake. Remove the slide and place on a lint-free
surface to cool to room temperature. Reset the oven back to 65C
27. When the slide is cool, place on movable stage on the Mask Aligner and push
stage in line with the mask
28. Press Expose allowing the Mask Aligner to expose the slide for the set 8.0
seconds
29. When complete, return slide inside the Gravitational Oven and set to 95C. After
the ramp to 95C, let stay in oven for 5 minutes to crosslink during Post Exposure
Bake
30. Meanwhile, turn off the main power to the Mask Aligner and let the bulb cool 10
minutes before turning off the Compress Air, Nitrogen, or Vacuum
31. Remove slide from the oven and turn the oven off. Place slide on lint-free surface
to cool to room temperature
32. Prepare a developing tray in the fume hood with SU-8 Developer
33. Place slide in the tray and moderately hand agitate for 5 minutes
34. Using tongs, remove from developer and wash with isopropanol. If a white
precipitate forms, developing is not complete and return to developer for an
additional 30 seconds
35. Dry with Nitrogen.

114
36. Place slide in a petri dish for temporary storage and transport out of the
lithography room
37. Place slide with SU-8 design facing up in a fabricated PDMS molding apparatus
and tighten securing screws
38. Glue a pre-cut 1” long 1/8” diameter glass rod onto the input port and a 1” long
½” diameter glass rod onto the output port with Glass-Specific Super Glue.
39. In a disposable beaker, mix 10g of 10:1 Sylgard 184 PDMS to Activator and mix
aggressively for 5 minutes
40. Place beaker in vacuum chamber and induce vacuum for 20 minutes to remove
bubbles
41. Restore atmospheric pressure and wait 20 minutes to allow PDMS to thicken
42. Fill mold about half way to the top with the mixed PDMS
43. Place mold with PDMS back in vacuum chamber under vacuum for an additional
5 minutes
44. Remove from vacuum, cover, and allow to cure slowly overnight at room
temperature for at least 20 hours
45. Carefully cut along the edges of the PDMS with a sterile scalpel to assist in
PDMS removal
46. Carefully and slowly remove PDMS in a parallel direction to the small separation
features to avoid added shear stresses
47. Place in petri dish for temporary storage
48. Prepare chemical treatment chamber by super-gluing glass slides together in a
“rectangular box” configuration

115
49. Soak PDMS in 6N HCl in Water for 20 hours at room temperature
50. Wash with DI Water Twice
51. Soak in 5% 3-Aminopropyltriethoxysilane in 100% ethanol and immediately add
5% by volume of DI water (to start reaction) and cover
52. Allow to soak covered for 15 minutes at room temperature
53. Heat to 70C for 15 minutes and keep covered
54. Remove from heat and allow to sit covered at room temperature for 30 minutes
55. Wash with Ethanol (may go hazy, but will clear after next steps)
56. Wash with DI Water
57. Soak in 5% Glutaraldehyde in water covered for 1.7 hours at room temperature
(prepare one day in advance to reduce cytotoxicity)
58. Wash with DI Water and dry with Nitrogen
59. Place in petri dish for temporary storage
60. Prepare blood model for separation by placing 2 drops each of 10um diameter
polystyrene beads, 6um diameter polystyrene beads, 3um diameter polystyreme
beads, 1um diameter polystyrene beads, and blue food dye diluted to 1m in a
small falcon tube
61. Put PDMS face down on a new glass slide
62. Using a new transfer pipette, introduce blood model to input port
63. Observe separation and collect separated output from output port with a simple
automatic pipette
116
3.5 Conclusions
This research successfully designed and fabricated a point-of-care microfluidic device
that effectively separates plasma from a blood model without external pumping or other
externally applied driving forces. There is currently no commercially available or
published microfluidic device that accomplishes blood plasma separation without
pumping or externally applied driving forces. This pump-free device is less than 50mm
in total length allowing for easy integration with future devices. The separation device
was fabricated using standard lithography masking techniques to create a negative. This
negative was then molded in PDMS using standardized molding fixtures to ensure device
uniformity. The limited resolution of the OutputCity mask was compensated for by
increasing the gap width in the mask design. Fluid flow through the device was
promoted by using a plasma-free hydrophilic surface treatment greatly reducing the
contact angle of PDMS from about 90 degrees to about 50 degrees. The effectiveness of
this device was tested and validated using blood models such as water emulsions of
polystyrene beads from PolySciences adjusted to a viscosity equivalent to that of blood
(4.0 +/- 0.5 cP) using glycerol. The device yielded separation efficiency greater than
85% with a low filtration dead-volume of less than 10ul. The lithographic fabrication
was 67% repeatable, while successful separation was about 38% repeatable using the
facilities at the Drexel University Microfabrication Facility. The Reynold’s number was
estimated to be about 15.4 showing laminar flow as expected.
117
3.5.1 Possible Applications
The possible applications of this device are numerous. The trend in modern healthcare
innovation is toward point-of-care devices and strategies. The increase of point-of-care
developments carries benefits ranging from convenience to prevention to reduced costs.
This device can lead to the further development of innovative point-of-care diagnosis and
risk assessment devices that detect various biomarkers. These biomarkers may include
but are not limited to myeloperoxidase as a marker for inflammation, troponin and CRP
as biomarkers for heart disease, and/or insulin as a biomarker for diabetes. It may be
used as a more accurate blood based home pregnancy test or even to detect cancer. This
separation device can be used for very low volume separations with very low dead
volumes. The further development of this separation device can and will contribute to
the future of point-of-care medical treatments and strategies.
118
3.5.2 Resolution of Mask Aligner
It is important to note that the device fabrication and successful separation repeatability
may be increased by using higher resolution methods. For example, the Karl Suss MJB-3
Mask Aligner only claims to be able to achieve a reliable resolution of about 2um with
the theoretical possibility of achieving up to 0.5um. This implies that the 3um features
desired in this thesis may be approaching the limits of this mask aligner. This mask
aligner has been heavily used and may not be able to reliably achieve this resolution.
Additionally, the Drexel University Electrical Engineering Microfabrication Facility’s
Karl Suss mask aligner has been noted to have more than a 10% UV intensity variation
across the exposure field. This, in conjunction with the Ultra High Resolution Printing
limitations of the inexpensive OutputCity mask (~$35) contributed to the lack of
repeatability.
The desired resolution could be achieved by professionally servicing the mask aligner to
reduce the UV field variation while replacing the stage to allow for greater stability at a
cost of under $1000. A 2.5” diameter chrome photomask with better than 1um resolution
can be purchased for about $525 or a 2.5” diameter soda lime photomask with about
3um resolution can be purchased for about $275. These infrastructure changes along
with the use of a highly regulated cleanroom can greatly assist in improving the
manufacturing resolution without the need for resolution compensation strategies.
119
3.5.2 Possible Environmental Effects
There may be environmental effects that can alter the probability for success when
working with microfluidics in the Drexel University lithography room. For example, I
achieved my greatest successes in the winter when the air in the lithography room had a
percent relative humidity of between 13-15%. In the summer, these %RH values have
exceeded 80%. This may be a factor in successful solvent removal of the SU-8 as well as
in SU-8 adhesion to glass. Other environmental parameters have fluctuated including
room temperature from about 23-27C. These are factors to always consider when
performing research.
120
3.5.3 Challenges Overcome
The challenges overcome in this research were evident in the preceding chapters. The
most notably would be the two resolution issues discussed above. The non-uniformity
(+/- 10% UV intensity) and heavy usage of the mask aligner, resulting in fabrication
close to the resolution limit had to be overcome by attempting many repeats. The limited
resolution of the affordable OutputCity Ultra High Resolution Printed Mask had to be
overcome by adjusting the AutoCAD 2004 design to compensate allowing for a 3um
separation channel opening as shown in Figure 30. The hydrophobic nature of the PDMS
(main material in final device) with a contact angle near 90 degrees had to be modified
and altered by developing and implementing a plasma-free hydrophilic surface treatment
as shown in Figure 54 resulting in a significant reduction of the contact angle to 53
degrees. The variations in relative humidity and temperature in the Lithography Room of
the Manufacturing Facility had a range of 70% RH and 5 degrees centigrade. This had to
be overcome by increasing repetitions and avoiding lengthy openings of raw material
containers. The SU-8 photoresist tended to “lift-off” the glass possibly due to high
humidity levels. This was overcome by the addition of the AP300 adhesion promoter
specifically designed by Silicon Resources, Inc for use with glass. PDMS artifacts
caused by low viscosity molding were overcome by allowing the PDMS to start to cure
for 20 minutes before pouring the now more viscous solution into the molds. Also,
feature damage during PDMS removal was overcome by simply removing the PDMS
parallel to the features instead of transversely to effectively reduce the shear forces
imposed.
121
3.5.4 Innovation
The innovation in this research is realized by the fact that there is currently no
commercially available or published microfluidic device that accomplishes blood plasma
separation without pumping or externally applied driving forces. The methods described
in this thesis produce a pump-free device that will decrease size and cost of blood plasma
separation while increasing the number of possible applications. Fluid flow through the
device was promoted by using a plasma-free hydrophilic surface treatment greatly
reducing the contact angle of PDMS from about 90 degrees to about 50 degrees. This
device achieves continuous separation for more than 5 minutes without clogging using a
blood model. Innovative strategies were devised to compensate for the borderline lack of
resolution to achieve 3um open separation channels by slightly increasing the separation
gap width of the AutoCAD 2004 device mask designs.
122
3.6 Future Development
There is extensive future development to be made on this device; most notably being to
obtain IRB approval for testing and validation of the device with human blood allowing
for eventual integration with a biomarker detection device. The efficiency of integration
may be able to be increased by optimizing the number of open separation channels. The
sample introduction may be improved by developing better port creation methods. In the
case of future clogging by coagulation or blood clotting, Heparin may be studied as a
thinning agent. The effectiveness may be increased by understanding the time
dependency on separation efficiency. Less hydrophobic molding materials may be
studied to replace the use of PDMS. Repeatability may be increased by utilizing a
controlled and constant clean room environment for lithography without temperature and
humidity variations. Alternative wafer materials may be studied to replace the use of
scientific glass. Finally, the overall size of the device may be able to be reduced once
repeatability is increased to allow for more nano-applications. All of these possible
future developments will help lead to more successful point-of-care strategies in
healthcare.
123
LIST OF REFERENCES
Alper, J. (2007). "Gene analysis on a single chip: integrated microfluidic analysis of blood identifies pathogens and cancer in <1 hour." Anal Chem 79(3): 809.
Ashton, R., C. Padala, et al. (2003). "Microfluidic separation of DNA." Curr Opin Biotechnol 14(5): 497-504.
Bilenberg, B.; Nielsen, T.; Clausen, B.; Kristensen, A. PMMA to SU-8 bonding for polymer based lab-on-a-chip systems with integrated optics. Journal of Micromechanics and Microengineering (2004), 14(6), 814-818.
Broyles, B. S., S. C. Jacobson, et al. (2003). "Sample filtration, concentration, and separation integrated on microfluidic devices." Anal Chem 75(11): 2761-7.
Chakraborty, S. (2005). "Dynamics of capillary flow of blood into a microfluidic channel." Lab Chip 5(4): 421-30.
Chan-Park, Mary B.; Zhang, Jun; Yan, Yehai; Yue, C. Y. Fabrication of large SU-8 mold with high aspect ratio microchannels by UV exposure dose reduction. Sensors and Actuators, B: Chemical (2004), B101(1-2), 175-182.
Chang, W. C., L. P. Lee, et al. (2005). "Biomimetic technique for adhesion-based collection and separation of cells in a microfluidic channel." Lab Chip 5(1): 64-73.
Chen, X., D. Cui, et al. (2007). "Continuous flow microfluidic device for cell separation, cell lysis and DNA purification." Anal Chim Acta 584(2): 237-43.
Chen, Z., S. Zhang, et al. (2005). "Theoretical and Experimental Studies on Filtering Tumor Cells from Blood Cell Mixtures with Dam Structure in Microfluidic Devices." Conf Proc IEEE Eng Med Biol Soc 7(1): 7497-7500.
Cho, B. S., T. G. Schuster, et al. (2003). "Passively driven integrated microfluidic system for separation of motile sperm." Anal Chem 75(7): 1671-5.
Cousins C M; Holownia P; Hawkes J J; Limaye M S; Price C P; Keay P J; Coakley W T Plasma preparation from whole blood using ultrasound. Ultrasound in medicine & biology (2000), 26(5), 881-8.
Das, C. and Z. H. Fan (2006). "Effects of separation length and voltage on isoelectric focusing in a plastic microfluidic device." Electrophoresis 27(18): 3619-26.
De Pra, M., W. T. Kok, et al. (2008). "Topographic structures and chromatographic supports in microfluidic separation devices." J Chromatogr A 1184(1-2): 560-572.
Duffy, David C.; McDonald, J. Cooper; Schueller, Olivier J. A.; Whitesides, George M. Rapid Prototyping of Microfluidic Systems in Poly(dimethylsiloxane). Analytical Chemistry (1998), 70(23), 4974-4984.
124 Faivre, M., M. Abkarian, et al. (2006). "Geometrical focusing of cells in a microfluidic
device: an approach to separate blood plasma." Biorheology 43(2): 147-59.
Fernandez, Javier G., Christopher A. Mills, Romen Rodríguez, Gabriel Gomila, and Josep Samitier. All-polymer microfluidic particle size sorter for biomedical applications. phys. stat. sol. (a) 203, No. 6, 1476–1480 (2006) / DOI 10.1002/pssa.200566111
Fuchiwaki, M. and K. Tanaka (2002). "Vortex scale of unsteady separation on a pitching airfoil." Ann N Y Acad Sci 972: 61-6.
Fujii, Teruo. PDMS-based microfluidic devices for biomedical applications. Microelectronic Engineering (2002), 61-62 907-914.
Huh, D., J. H. Bahng, et al. (2007). "Gravity-driven microfluidic particle sorting device with hydrodynamic separation amplification." Anal Chem 79(4): 1369-76.
Kokoris, M., M. Nabavi, et al. (2005). "Rare cancer cell analyzer for whole blood applications: automated nucleic acid purification in a microfluidic disposable card." Methods 37(1): 114-9.
Kost GJ. Goals, guidelines and principles for point-of-care testing. In: Kost GJ, ed. Principles and practice of point-of-care testing. Philadelphia: Lippincott Williams and Wilkins. 2002, Chapter 1, pp3-12.
Leondes, Cornelius T. Biomechanical Systems: Techniques and Applications. Page 2-
36. CRC: 2001.
Li, Y., C. Dalton, et al. (2007). "Continuous dielectrophoretic cell separation microfluidic device." Lab Chip 7(2): 239-48.
Lorenz, H.; Despont, M.; Fahrni, N.; Labianca, N.; Renaud, P.; Vettiger, P. SU-8: a low-cost negative resist for MEMS. Journal of Micromechanics and Microengineering (1997), 7(3), 121-124
Mehdizadeh, S.; Dukovic, J. O.; Andricacos, P. C.; Romankiw, L. T.; Cheh, H. Y. The influence of lithographic patterning on current distribution: a model for microfabrication by electrodeposition. Journal of the Electrochemical Society (1992), 139(1), 78-91.
Miyajima, Hiroshi; Mehregany, Mehran. High-aspect-ratio photolithography for MEMS applications. Journal of Microelectromechanical Systems (1995), 4(4), 220-9.
Mu, L., Y. Liu, et al. (2007). "A Smart Surface in a Microfluidic Chip for Controlled Protein Separation." Chemistry 13(18): 5113-5120.
Panaro, N. J., X. J. Lou, et al. (2005). "Micropillar array chip for integrated white blood cell isolation and PCR." Biomol Eng 21(6): 157-62.
125 Petersson, F., L. Aberg, et al. (2007). "Free Flow Acoustophoresis: Microfluidic-Based
Mode of Particle and Cell Separation." Anal Chem.
Petersson, F., A. Nilsson, et al. (2004). "Separation of lipids from blood utilizing ultrasonic standing waves in microfluidic channels." Analyst 129(10): 938-43.
Qin, Dong; Xia, Younan; Rogers, John A.; Jackman, Rebecca J.; Zhao, Xiao-Mei; Whitesides, George M. Microfabrication , microstructures and microsystems. Topics in Current Chemistry (1998), 194(Microsystem Technology in Chemistry and Life Science), 1-20.
Ramadan, Q., V. Samper, et al. (2006). "Magnetic-based microfluidic platform for biomolecular separation." Biomed Microdevices 8(2): 151-8.
Regtmeier, J., R. Eichhorn, et al. (2007). "Pulsed-field separation of particles in a microfluidic device." Eur Phys J E Soft Matter 22(4): 335-40.
Roth, S.; Dellmann, L.; Racine, G-A.; De Rooij, N. F. High aspect ratio UV photolithography for electroplated structures. Journal of Micromechanics and Microengineering (1999), 9(2), 105-108.
Rotting, O.; Ropke, W.; Becker, H.; Gartner, C. Polymer microfabrication technologies. Microsystem Technologies (2002), 8(1), 32-36.
Sai, Y., M. Yamada, et al. (2006). "Continuous separation of particles using a microfluidic device equipped with flow rate control valves." J Chromatogr A 1127(1-2): 214-20.
Sethu, P., L. L. Moldawer, et al. (2006). "Microfluidic isolation of leukocytes from whole blood for phenotype and gene expression analysis." Anal Chem 78(15): 5453-61.
Shaw, J. M.; Gelorme, J. D.; Labianca, N. C.; Conley, W. E.; Holmes, S. J. Negative photoresists for optical lithography. IBM Journal of Research and Development (1997), 41(1/2), 81-94.
Shevkoplyas, S. S., T. Yoshida, et al. (2005). "Biomimetic autoseparation of leukocytes from whole blood in a microfluidic device." Anal Chem 77(3): 933-7.
Tai, C. H., S. K. Hsiung, et al. (2007). "Automatic microfluidic platform for cell separation and nucleus collection." Biomed Microdevices.
Tan, Y. C. and A. P. Lee (2005). "Microfluidic separation of satellite droplets as the basis of a monodispersed micron and submicron emulsification system." Lab Chip 5(10): 1178-83.
Tulock, J. J., M. A. Shannon, et al. (2004). "Microfluidic separation and gateable fraction collection for mass-limited samples." Anal Chem 76(21): 6419-25.
126 VanDelinder, V. and A. Groisman (2006). "Separation of plasma from whole human
blood in a continuous cross-flow in a molded microfluidic device." Anal Chem 78(11): 3765-71.
VanDelinder, V. and A. Groisman (2007). "Perfusion in microfluidic cross-flow: separation of white blood cells from whole blood and exchange of medium in a continuous flow." Anal Chem 79(5): 2023-30.
Wang, S. L., X. F. Fan, et al. (2005). "A simple microfluidic system for efficient capillary electrophoretic separation and sensitive fluorimetric detection of DNA fragments using light-emitting diode and liquid-core waveguide techniques." Electrophoresis 26(19): 3602-8.
Wu, D., Y. Luo, et al. (2005). "Multilayer poly(vinyl alcohol)-adsorbed coating on poly(dimethylsiloxane) microfluidic chips for biopolymer separation." Electrophoresis 26(1): 211-8.
Xia, Younan; Whitesides, George M. Soft lithography. Annual Review of Materials Science (1998), 28 153-184.
Yamada, M., K. Kano, et al. (2007). "Microfluidic devices for size-dependent separation of liver cells." Biomed Microdevices.
Yamada, M. and M. Seki (2006). "Microfluidic particle sorter employing flow splitting and recombining." Anal Chem 78(4): 1357-62.
Yang, S., A. Undar, et al. (2005). "Blood plasma separation in microfluidic channels using flow rate control." Asaio J 51(5): 585-90.
Yang, S., A. Undar, et al. (2006). "A microfluidic device for continuous, real time blood plasma separation." Lab Chip 6(7): 871-80.
Zhang, S., X. Guo, et al. (2005). "A Simple Method of Fabricating Weir-type Filters with Interdigital Aligned Full-polymer Microfluidic Channels for Blood Cell Fractionation." Conf Proc IEEE Eng Med Biol Soc 7(1): 7122-7125.
Zhang, X., J. M. Cooper, et al. (2006). "Continuous flow separation of particles within an asymmetric microfluidic device." Lab Chip 6(4): 561-6.
Zhang, J.; Tan, K. L.; Hong, G. D.; Yang, L. J.; Gong, H. Q. Polymerization optimization of SU-8 photoresist and its applications in microfluidic systems and MEMS. Journal of Micromechanics and Microengineering (2001), 11(1), 20-26.
Zhang, J.; Tan, K. L.; Gong, H. Q. Characterization of the polymerization of SU-8 photoresist and its applications in micro-electro-mechanical systems (MEMS). Polymer Testing (2001), 20(6), 693-701.

127