biochar production through slow pyrolysis of different biomass
TRANSCRIPT
1
Biochar production through slow pyrolysis of
different biomass materials: Seeking the best
operating conditions
Joan J. Manyàa,b,*, Manuel Azuarab,c, José A. Mansob
a Aragón Institute of Engineering Research (I3A), b Technological College of Huesca, and c Institute
of Nanoscience of Aragón (INA), University of Zaragoza, crta. Cuarte s/n, Huesca E-22071, Spain
* Corresponding author. Aragón Institute of Engineering Research (I3A), Technological College
of Huesca, University of Zaragoza, crta. Cuarte s/n, Huesca E-22071, Spain.
E-mail: [email protected] (Joan J. Manyà).
2
Keywords
Biochar; Residual biomass; Pressurized slow pyrolysis; Carbon sequestration potential; Produced
gas
ABSTRACT
The effect of three operating parameters (peak temperature, pressure, and pyrolysis atmosphere)
during the slow pyrolysis of three biomass sources (corn stover, vine shoots, and two-phase olive
mill waste) was extensively analyzed. A 2-level full factorial design of experiments was adopted to
assess the effect of the above-mentioned factors on the potential stability of biochar as well as the
yields of the main pyrolysis products. To evaluate the effect of the biomass feedstock, the design
was divided into three blocks (one per biomass feedstock). Results from the statistical analyses
indicated that the properties of biochar related to its potential stability were mainly affected by the
peak temperature and, to a lesser extent, the biomass feedstock. A significant increase in the yield
of produced gas was observed when pressure was raised. This increase in the total gas yield was in
part due to a higher release of CO, CH4, and H2. Using a pyrolysis atmosphere of CO2 (instead of
N2) did not result in any remarkable change in neither the distribution of the pyrolysis products nor
the potential stability of biochar. However, when CO2 was used as carrier gas, a significant increase
in the yield of CO, at the expense of produced CO2, was observed. The findings reported herein
suggest that processing biomass through pressurized slow pyrolysis under CO2 atmosphere is
interesting to simultaneously obtain two valuable products: a biochar with an appropriate carbon
sequestration potential, and a produced gas with an appropriate composition for energy recovery
purposes.
3
1. Introduction
Concerns about climate change and improvement of soil quality in a sustainable manner have
generated much interest in biochar, a form of charred organic matter derived from biomass, which
when applied to soil in a deliberate manner has the potential to improve carbon sequestration as
well as soil productivity [1]. Biochar could enhance the capacity of soils for holding water and
nutrients and, thus, reducing the use of chemical fertilizers. Nevertheless, the effects of biochar and
the requirements on its properties for soil amendment and carbon sequestration purposes have not
fully been established [2]. The influence of numerous parameters (such as biochar production
process and operating conditions, soil properties, and biomass feedstock) on the carbon
sequestration potential as well as soil-biochar interactions is still not well understood.
The economic feasibility of biochar systems for agronomic benefits depends on numerous factors
including the biomass feedstock selection and transportation requirements. There is increasing
uncertainty about the potential of such systems for commercial exploitation. Thus, developing more
efficient production processes and novel alternative or added-value uses for biochar can lead to a
more competitive technology.
Pyrolysis is a thermochemical decomposition process during which biomass is heated at
moderate temperature (typically 350–650 °C) in the absence of oxygen. The process results in the
formation of three main products: charcoal (i.e., biochar), a volatile matter which can further be
condensed to liquid phase (bio-oil), and the remaining so-called “non-condensable” gases, like CO,
CO2, CH4, and H2. Depending upon the residence time, peak temperature, and heating rate the
pyrolysis process is sub-divided into three categories: slow, intermediate and fast pyrolysis. Slow
pyrolysis is usually preferred to produce biochar, with gas as co-product. It is a relatively simple
4
and robust process which can be applicable to small-scale and farm-based production of biochar
[3,4].
In spite of the relatively simplicity of the slow pyrolysis process, the yields and properties of
products (including those of biochar) can be largely affected by the operating conditions (e.g., peak
temperature, residence time of the vapor phase, pressure, and particle size). In addition, the nature
of the biomass source also plays a key role in determining the yield and properties of produced
biochar.
An interesting option to improve the carbonization efficiency (i.e., fixed-carbon yield [5]) is to
increase pressure. In this sense, most of the previous studies on pressurized pyrolysis reported on
an increase in both the biochar and gas yields, at the expense of the organic condensable fraction
[6–8]. In these studies, however, the effect of a moderate pressure (0.5−5.0 MPa) was measured
without keeping constant the residence time of the inert gas within the reactor. In order to investigate
the true effect of pressure, some researchers conducted pressurized pyrolysis experiments at
constant gas residence time [4,9–12]. Results from these alternative studies indicated that the effect
of pressure on the biochar yield is still unclear, since negligible [11,12], positive [9] and event
negative [4,10] correlations were found.
Another interesting option to improve the efficiency of the slow pyrolysis process, especially in
terms of economics saving, is replacing the use of a relatively expensive inert gas (e.g., N2) with
CO2 coming from residual flue gases [13]. In other words, the flue gas generated after combustion
of pyrolysis gas can be used as pyrolysis gas environment. Nevertheless, research is required to
understand the effects of modifying the pyrolysis environment (i.e., from pure N2 to a flue gas
containing CO2) on the distribution of the pyrolysis products as well as on the properties of produced
biochar (e.g., the properties related to its carbon sequestration potential). In this sense, results from
5
a preliminary study [14] indicated that the use of CO2 instead of N2 did not significantly affect the
properties of biochar related to its carbon sequestration potential (e.g., fixed-carbon content and
molar H:C and O:C ratios).
In addition to the fixed carbon content and molar H:C and O:C ratios, several approaches have
been proposed to estimate the long-term stability of biochar. Among them, two relatively easy
techniques have recently gained attention: (1) the recalcitrance index (R50), which was proposed by
Harvey et al. [15] and is based on the relative thermal stability of a given biochar to that of graphite;
and (2) a method developed at the UK Biochar Research Center, which is based on the oxidation of
biochars using H2O2 to accelerate the “aging” and, hence, the oxidative loss of carbon [16,17].
The specific aim of this study is to determine the effect of certain operating conditions (peak
temperature, pressure at constant gas residence time, and pyrolysis environment) on several
properties of biochar produced through slow pyrolysis of three different sources: corn stover, vine
shoots, and two-phase olive mill waste. Special attention is focused on how the operating conditions
can affect the properties of biochar related to its potential stability (i.e., carbon sequestration
potential). In addition, the yield and composition of the pyrolysis gas was also determined as a
function of the tested operating conditions.
2. Experimental section
2.1. Materials
Three waste biomass materials, all of them generated in the province of Huesca (Spain), were
used in the present study: (i) corn stover (CS) containing corncob (15.5 wt.%), leaf (4.3 wt.%) and
stalk (80.2 wt.%); (ii) two-phase olive mill waste (TPOMW), which was sun-dried in the field for
several months at the premises of an extra-virgin olive oil factory; and (iii) vine shoots (VS)
supplied by a local winery.
6
Proximate analyses were performed in quadruplicate according to ASTM standards (D3173 for
moisture, D3174 for ash, and D3175 or volatile matter), whereas elemental analyses were carried
out using a CHNS analyzer from Leco Corporation (USA). In addition, the ash composition
expressed as weight percentages of the equivalent oxides was measured using an ADVANT’XP+
XRF spectrometer from Thermo ARL (Switzerland).
2.2. Experimental devices and procedures
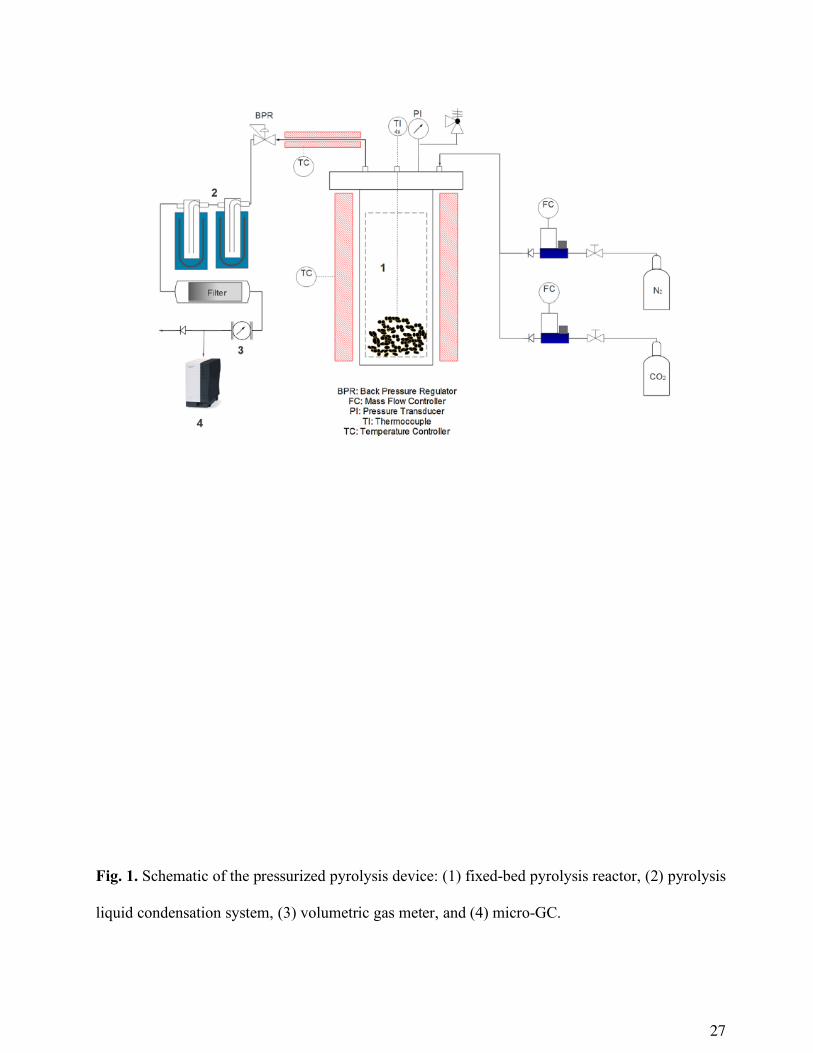
The fixed-bed pyrolysis reactor consisted of a cylindrical and vertical reactor (140 mm inside
diameter and 465 mm long) made of Sandvik 253 MA stainless steel (EN 1.4835; X9CrNiSiNCe21-
11-2). The reactor was heated by two electric resistances of 2.1 kW. A basket of 4 L, made of Monel
400 alloy (Ni65Cu33Fe2) wire mesh, was used to put the biomass into the reactor. The temperature
inside the bed was measured using four thermocouples placed in a thermowell at different heights.
More details regarding the configuration of the reactor are available elsewhere [4,12,14]. The
pressure of the system was controlled through a back-pressure regulator. A schematic diagram of
the experimental setup is given in Fig. 1.
The mass flow rate at STP conditions of the carrier gas (N2 or CO2) was adjusted as a function
of the absolute pressure (0.1–1.0 MPa) to keep the real flow rate of the carrier gas within the reactor
(at the highest temperature) at a constant value of 1.85 L min−1. After each experiment, the
condensed fraction was recovered directly from the condensers without using any solvent as wash
liquid. The glass traps were weighted before and after each experimental run to determine the total
mass of liquid. The content of water in the condensable fraction was measured using a Karl-Fischer
volumetric titrator from Metrohm (Switzerland). The composition of the gas fraction (N2, CO2, CO,
CH4, C2Hx and H2) was determined using an Agilent micro-GC equipped with two analytical
7
columns: a PoraPlot Q (using He as carrier gas) and a Molsieve 5A (using Ar as carrier gas). The
mass of produced gas was calculated from the N2 mass balances.
The initial sample mass of biomass, which depends on the bulk density of the feedstock, was
approximately of 250, 400, and 750 g for CS, VS, and TPOMW; respectively. Particle size
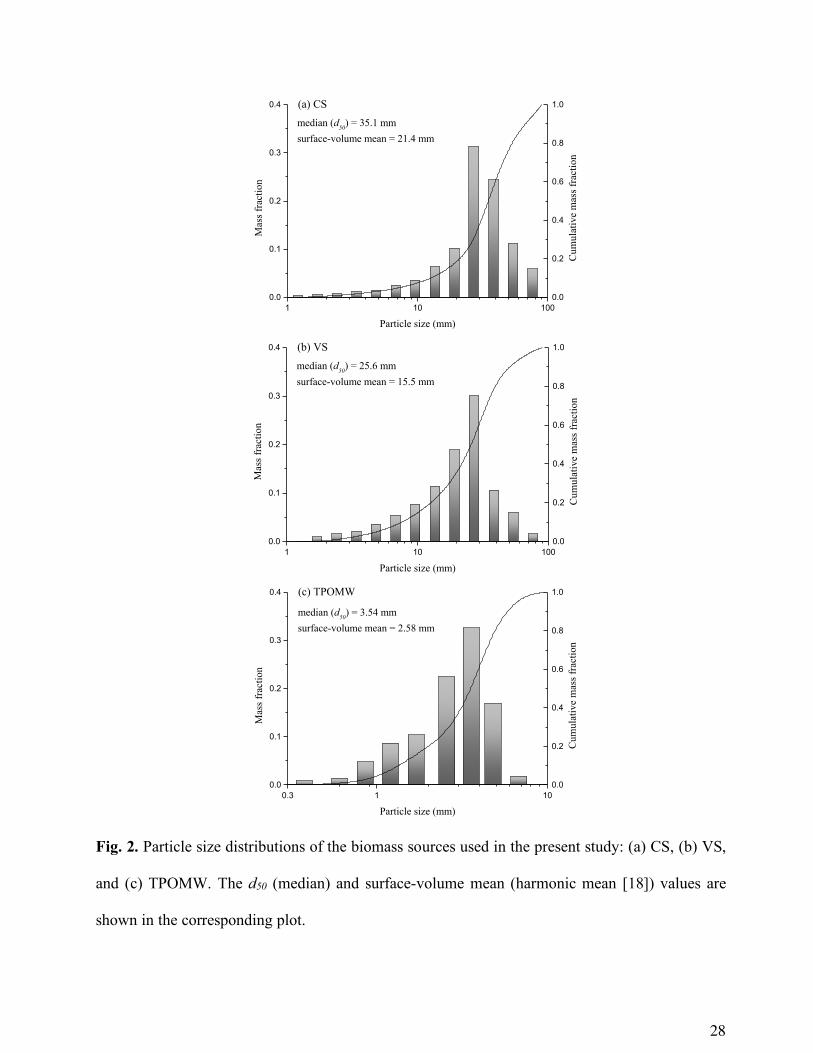
distributions were determined by sieving according to ISO 3310-1 standard. Fig. 2 displays the
differential and cumulative distributions for each biomass feedstock. The median (d50) and surface-
volume mean (calculated as the harmonic mean of the cumulative mass fraction [18]) diameters for
each biomass feedstock are also given in Fig. 2. In the case of CS and VS, we used large particles
with the aim of avoiding the high energy-consuming milling pre-treatments. Furthermore, using
large biomass particles can lead to an improvement in carbonization efficiency (i.e., biochars with
higher fixed-carbon contents) as a consequence of an enhancement of the secondary charring
reactions at intra-particle level [19].
The void-volume fractions in the pyrolysis reactor were estimated to be in the range of 0.85–
0.90. These estimates were calculated using the experimentally measured bulk densities (268, 111,
and 70 kg m–3 for TPOMW, VS, and CS; respectively) and the particle densities available in the
literature (1394, 1250, and 1170 kg m–3 for TPOMW [20], VS [21], and CS [22]; respectively).
Given that the void-volume fraction was almost constant regardless of the biomass feedstock, an
almost constant gas-hourly space velocity (GHSV) of 17.2 h–1 can be assumed for all the
experiments.
Pyrolysis experiments were conducted according to a 2-level full factorial design with three
factors: peak temperature (400–600 °C), absolute pressure (0.1–1.0 MPa), and carrier gas (measured
as the mole fraction of CO2 in a mixture N2/CO2, and ranging from 0 to 0.95). Three replicates at
the center point (500 °C, 0.55 MPa, and a CO2 mole fraction of 0.48) were conducted for each
8
biomass feedstock to simultaneously estimate the experimental error and the overall curvature effect
[23]. Three blocks (one per each feedstock) were added to the design in order to analyze the effect
of the biomass source on the average values. All the statistical calculations were conducted using R
software (version 3.3.3). The matrix of the design of experiments is shown in Table S1
(Supplementary Data).
In order to get an estimate of the concentration of the main biomass constituents, additional
pyrolysis tests were conducted in an atmospheric thermobalance (a MK2 microbalance with a
readability of 0.1 µg from CI Precision, UK). Initial sample masses of 25 mg were heated at a linear
heating rate of 5 °C min–1 (highest temperature = 600 °C) under an atmosphere of N2 at a flow rate
of 200 mL (STP) min–1.
2.3. Characterization of the pyrolysis products
The mass yields of biochar, water, condensable organics and produced gas (ychar, ywater, yorg and
ygas, respectively) were calculated in a dry-ash-free (daf) basis. Biochar samples were characterized
by proximate and elemental analyses according to the same procedures described in Section 2.1.
The mass fraction of fixed carbon in the biochar (xFC) was calculated from the proximate analysis
data, whereas the molar H:C and O:C ratios were calculated from the elemental analysis data.
Temperature-programmed oxidation (TPO) of the biochars was conducted using the same
thermobalance described above. Approximately 10 mg of sample was heated in N2-diluted air (100
mL STP min−1) from room temperature to 950 °C at a linear heating rate of 10 °C min−1. The R50
index was then calculated from the TPO data using the following equation:
R50,x=T50,x/T50,g (1)
where T50,x and T50,g are the temperatures corresponding to 50% of mass loss of biochar and graphite,
respectively.
9
Direct oxidation of biochars was performed according to the procedure described by Cross and
Sohi (Edinburgh stability tool) [17]. Briefly: biochar samples containing 0.1 g of C were milled to
a fine powder in a ball mill and then treated in a test tube with 7 mL of an aqueous solution of 5%
H2O2, initially at room temperature and then at 80 °C for 48 h. The samples were then dried in an
oven at 105 °C overnight. The “stable C” was expressed as the percentage of the initial 0.1 g of C
that remains after oxidation.
3. Results and discussion
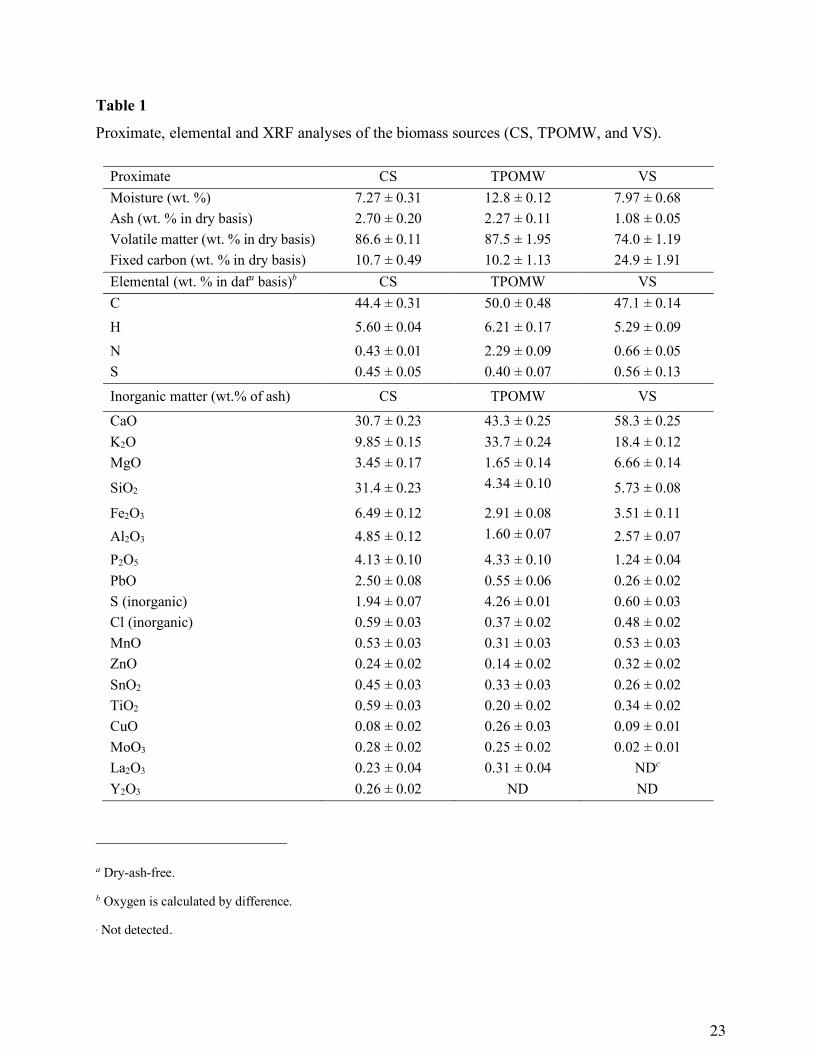
Results from proximate, elemental and ash analyses are summarized in Table 1. The
experimental results obtained from the factorial design of experiments are given in Supplementary
Data (Tables S2 and S3). The mass-balance closures for all the pyrolysis tests (above 95%) are
given in Table S2. The mass yields of the different pyrolysis products (ychar, ywater, yorg and ygas)
were then calculated attributing the error in the mass-balance closure to minor inaccuracies in
determining the mass of produced gas.
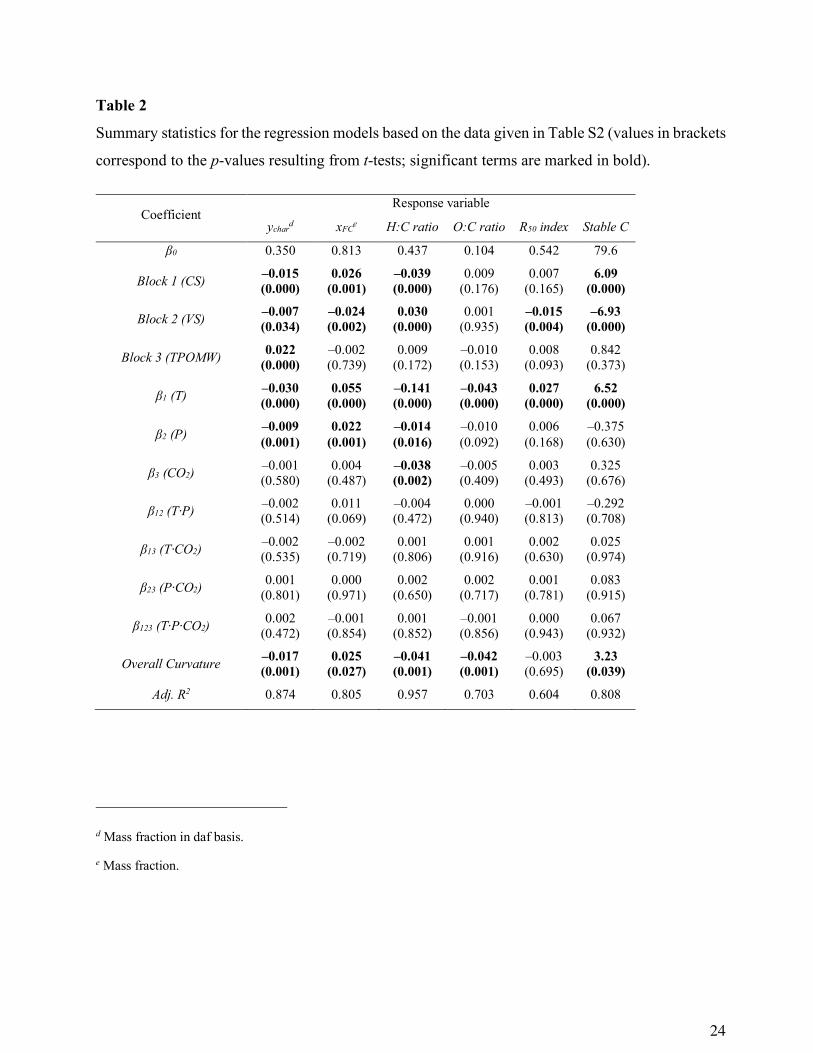
3.1. Effects on the yield of biochar and its potential stability
For the response variables which are related to the biochar yield as well as carbon sequestration
potential (i.e., ychar, xFC, molar H:C and O:C ratios, R50 index, and “stable C”), Table S2 shows the
data obtained for each experimental run (a total of 11 per block).
The structure of the regression model, which was used as an approximation for statistical testing,
was the following:
y! = β0 + β1T + β2P + β3CO2 + β12T·P + β13T·CO2 + β23P·CO2 + β123P·T·CO2 (2)
where β0, βi, βij, and βijk are the intercept, linear, 2-way interaction, and 3-way interaction
coefficients; respectively.
10
Table 2 lists, for each response variable, the estimated regression coefficients for coded factors
(–1, +1) and associated p-values (from t-tests), as well as the adjusted R2 values. In the event that
the regression coefficient for the overall curvature term becomes significant, a second-order
regression model (including pure quadratic terms for each factor) is needed in order to improve the
accuracy of model predictions. In addition, the regression coefficients estimated for the blocks are
also presented in Table 2. The regression coefficient for a given block represents the difference
between the mean of the response for this block and the overall mean of the response.
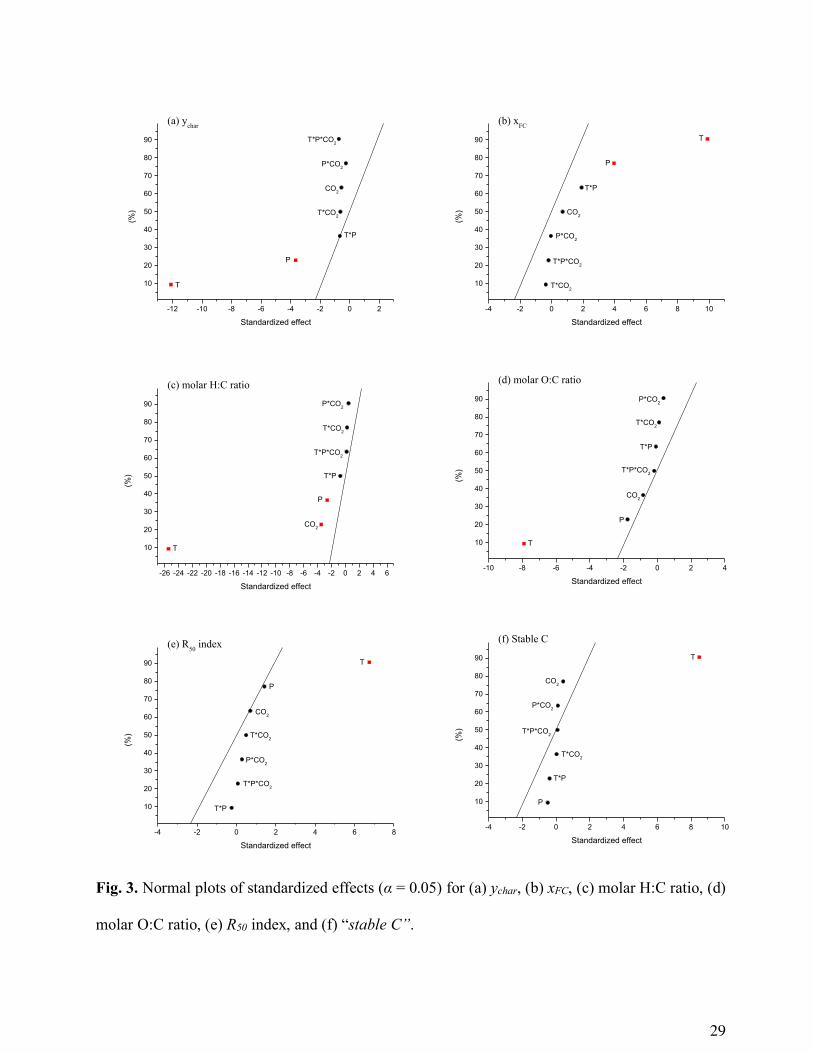
To get a graphical interpretation of the results, the normal plots of standardized effects (for a
significance level of 0.05) for the above-mentioned response variables are shown in Fig. 3. From
these plots, and also from the statistical data listed in Table 2, it can be concluded that the peak
temperature was the most influential factor on the potential stability of biochar, since its effect was
statistically significant for all the response variables analyzed in this section. As expected, an
increase in the peak temperature led to an increase in xFC, R50 index and “stable C” as well as a
decrease in both the H:C and O:C molar ratios. The direction of these significant effects is consistent
with the idea that any of these variables related to the potential stability of biochar can be taken as
a rough indicator of the carbon sequestration potential.
It should be emphasized that the significant effects of the peak temperature were found from the
experimental data obtained using three different biomass sources (CS, VS, and TPOMW). In other
words, increasing the peak temperature from 400 to 600 °C led to biochars with higher carbon
sequestration potential, regardless of the biomass processed in the present study. This finding is not
contradictory to the fact that the regression coefficients for the block terms were significant in
several cases (see Table 2). This means that, as expected, the potential stability of biochar is
dependent on the type of biomass feedstock. As an example, the percentages of “stable C” and
11
fixed-carbon contents (xFC) obtained for corn stover-derived biochars were, on average,
significantly higher than those obtained for the other two biomass sources.
From the statistics shown in Table 2 and Fig. 3, it can also be deduced that an increase in the
absolute pressure led to a significant increase in xFC and a significant decrease in the molar H:C
ratio. However, the improvement of these indicators of the potential stability of biochar was
quantitatively much lower than that observed for an increase in the peak temperature. In regard to
the effect of the pyrolysis atmosphere, a slightly significant decrease in the molar H:C ratio was
observed when the carrier gas was mainly composed of CO2.
It is also interesting to highlight that the curvature term was significant for all response variables
with the exception of the R50 index. This finding means that an augmentation to a central composite
design should be considered in further studies in order to define more accurately the location of the
optimal conditions (via Response Surface Methodology) [23]. In regard with this, it can be possible
that the optimal value for a given factor (e.g., the peak temperature that minimizes the molar H:C
ratio) could be lower than the highest level (e.g., below 600 °C for the peak temperature factor
and/or below 1.0 MPa for the absolute pressure factor).
Regarding the biochar yield (ychar), the peak temperature was also the most influential factor. As
expected and in agreement with a number of previous studies [6,7,24–28], a decrease in the
production of biochar was associated to an increase in the peak temperature. The biochar yield was
also significantly affected by an increase in the absolute pressure, resulting in a slightly decrease in
ychar. This finding, which was already observed in previous studies [4,10], can be explained by two
main reasons. First, pressurized pyrolysis can cause an enhancement of the steam gasification
reaction kinetics leading to non-negligible reaction rates, even at relatively low temperatures.
Second, an increase in the mass flow rate of carrier gas for pressurized pyrolysis can lead to a
12
reduction of the concentration of volatiles within the reactor (i.e., dilution effect), possibly resulting
in a lower extent of the secondary charring reactions. No significant effect of the composition of
the carrier gas on the yield of biochar was found.
As can be seen from the regression coefficients for the block terms listed in Table 2, the biochar
yield was also dependent on the type of biomass feedstock. Higher mass yields of biochar than
average were obtained when TPOMW was pyrolyzed. This fact could be explained by differences
in the concentration of the biomass constituents (hemicelluloses, cellulose and lignin).
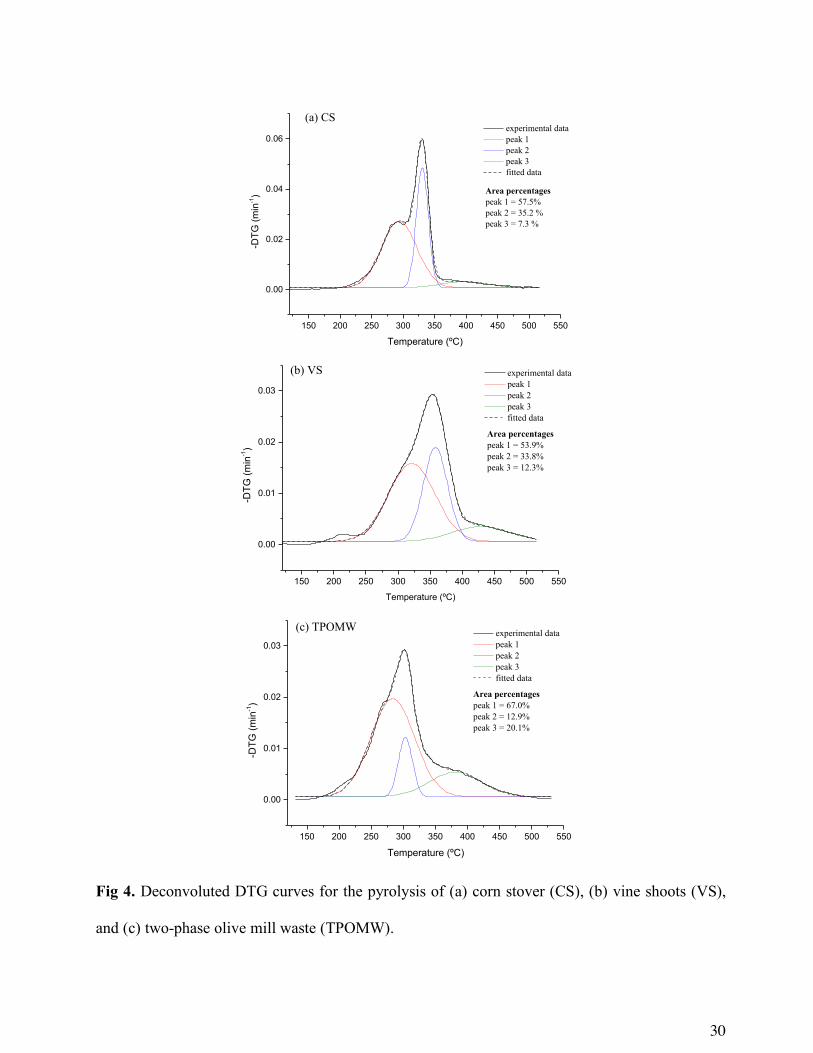
Thermogravimetric measurements under dynamic heating conditions were conducted for the three
biomass sources in order to estimate the contents of the biomass constituents. The experimental
differential thermogravimetric (DTG) curves were deconvoluted into three peaks using the “Peak
Analyzer” tool implemented in OriginPro version 9.0 (OriginLab, USA). These three peaks are
associated to the devolatilization of hemicelluloses (peak 1), cellulose (peak 2), and lignin (peak 3).
Fig. 4 shows the deconvoluted DTG curves obtained for the three biomass sources (CS, VS, and
TPOMW). From Fig. 4, it can be deduced that the apparent lignin content (which is associated to
peak 3) for TPOMW is considerably higher than that determined for CS and VS. This is consistent
with the fact that lignin is the biomass constituent which leads to the highest char yield [29]. In
summary, the composition of the biomass source in terms of its main lignocellulosic biomass
constituents appears to be a key parameter in explaining the differences observed in the biochar
yield.
Regarding the possible effects of alkali and alkaline earth metal species AAEMs, the differences
in the content of Ca and K between the three biomass sources (deduced from Table 1) were probably
too low to observe any quantitative effect on the biochar yield. Nevertheless, as evidenced in Fig.
4, the temperature corresponding to the highest devolatilization rate (for the thermogravimetric
13
pyrolysis tests) was dependent on the biomass feedstock (303 °C for TPOMW, 330 °C for CS, and
353 °C for VS). This fact could be related to the role of the AAEMs, which can promote the biomass
decomposition at lower temperatures. In this sense, it should be noted that the temperature for the
highest devolatilization rate decreased as the content of Ca plus K in the biomass feedstock
increased (1.17, 0.752, and 0.563 g for each 100 g of raw biomass for TPOMW, CS, and VS;
respectively).
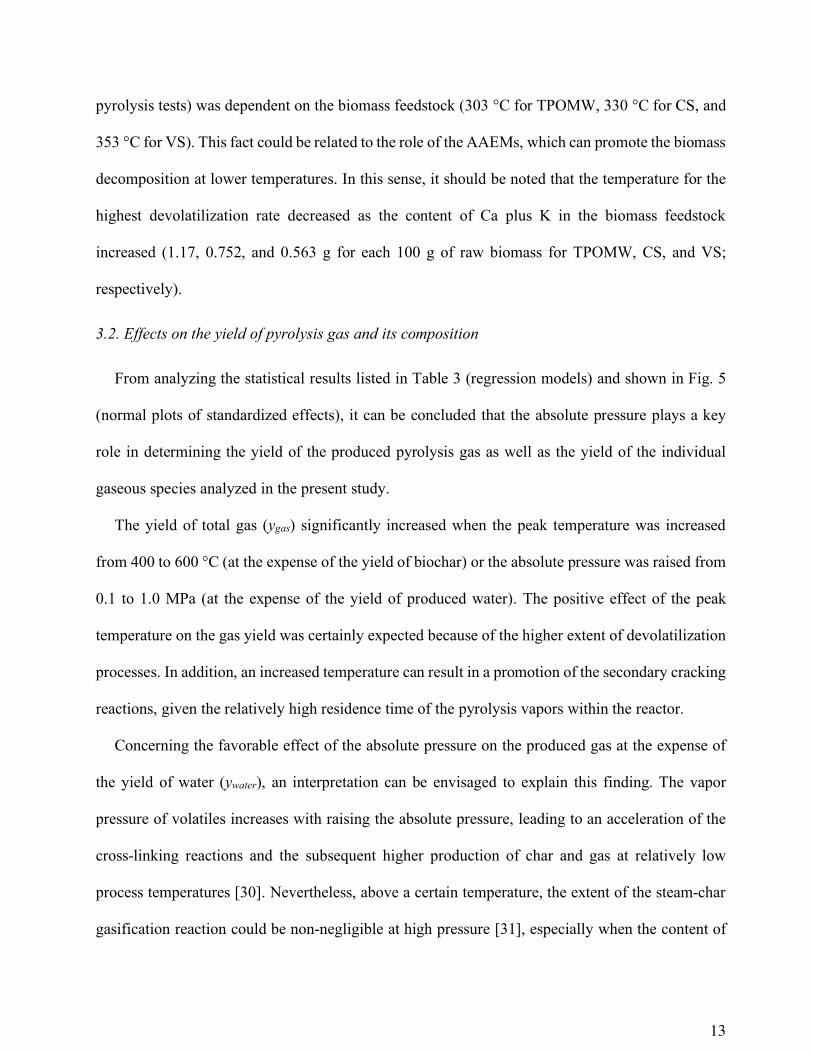
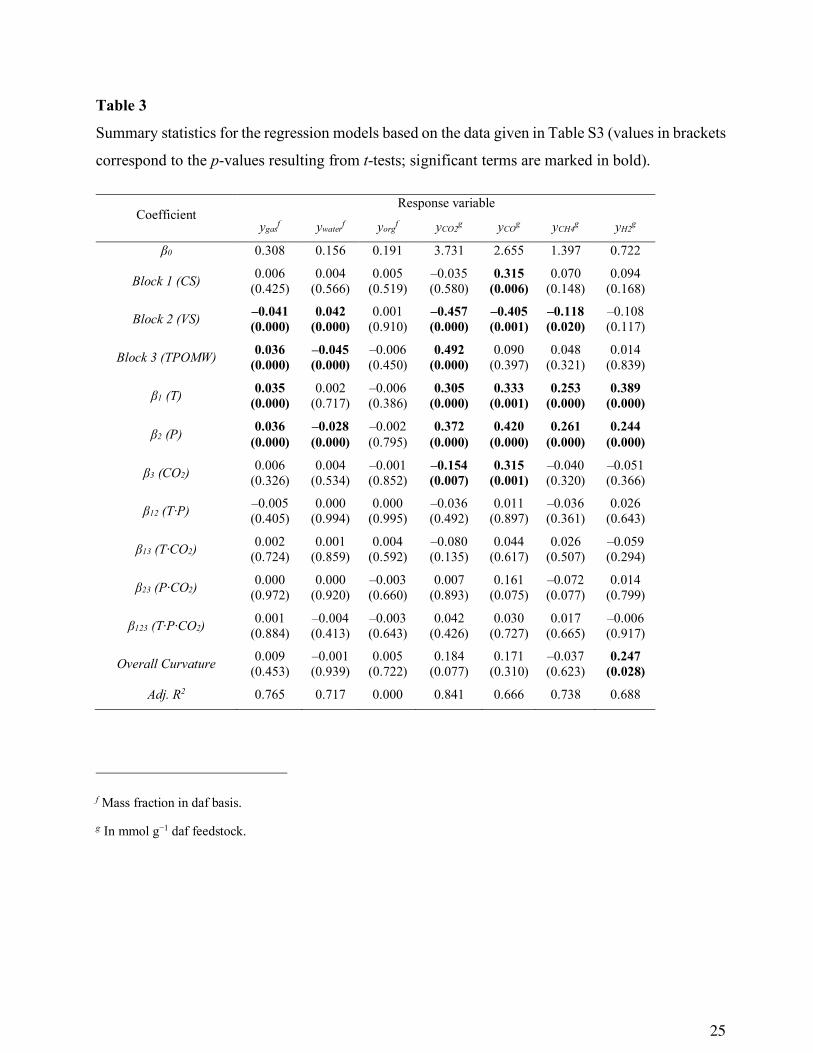
3.2. Effects on the yield of pyrolysis gas and its composition
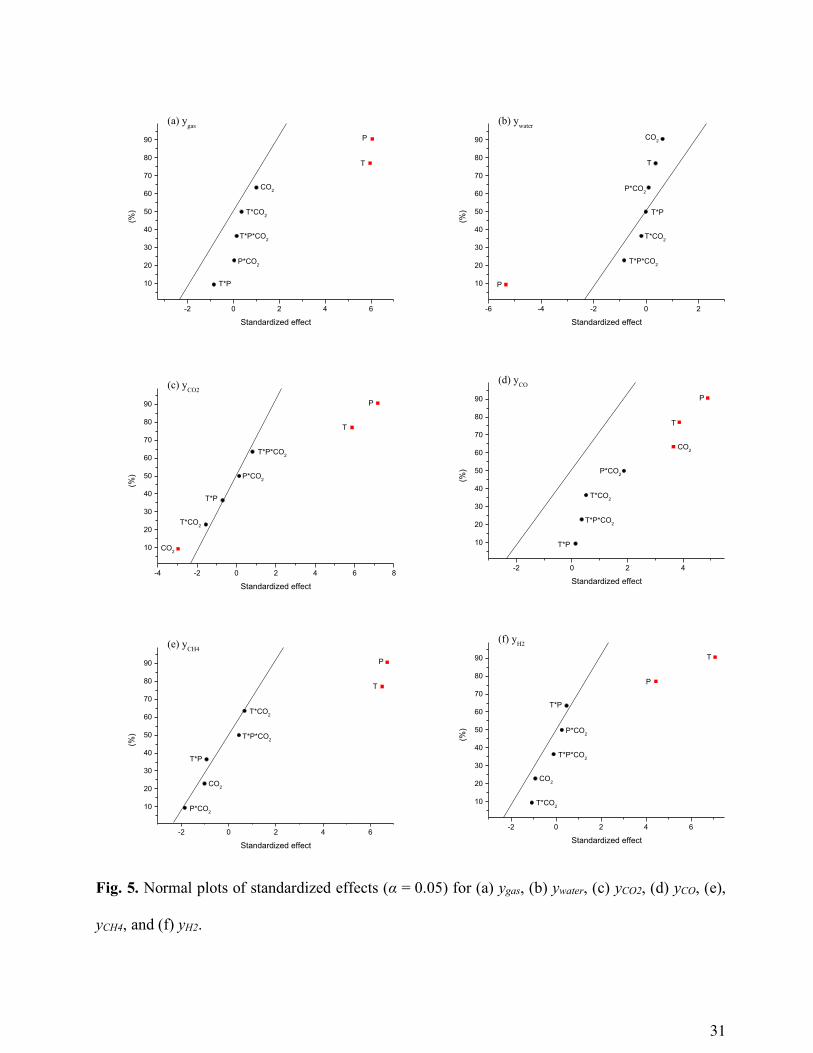
From analyzing the statistical results listed in Table 3 (regression models) and shown in Fig. 5
(normal plots of standardized effects), it can be concluded that the absolute pressure plays a key
role in determining the yield of the produced pyrolysis gas as well as the yield of the individual
gaseous species analyzed in the present study.
The yield of total gas (ygas) significantly increased when the peak temperature was increased
from 400 to 600 °C (at the expense of the yield of biochar) or the absolute pressure was raised from
0.1 to 1.0 MPa (at the expense of the yield of produced water). The positive effect of the peak
temperature on the gas yield was certainly expected because of the higher extent of devolatilization
processes. In addition, an increased temperature can result in a promotion of the secondary cracking
reactions, given the relatively high residence time of the pyrolysis vapors within the reactor.
Concerning the favorable effect of the absolute pressure on the produced gas at the expense of
the yield of water (ywater), an interpretation can be envisaged to explain this finding. The vapor
pressure of volatiles increases with raising the absolute pressure, leading to an acceleration of the
cross-linking reactions and the subsequent higher production of char and gas at relatively low
process temperatures [30]. Nevertheless, above a certain temperature, the extent of the steam-char
gasification reaction could be non-negligible at high pressure [31], especially when the content of
14
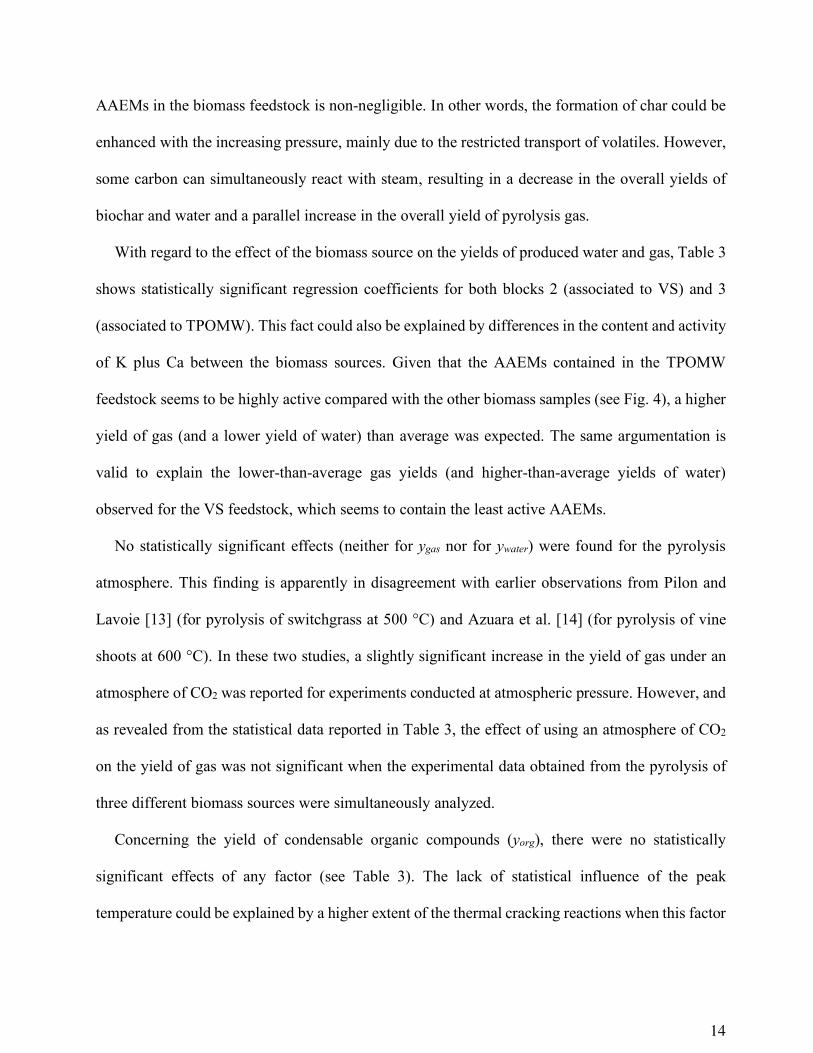
AAEMs in the biomass feedstock is non-negligible. In other words, the formation of char could be
enhanced with the increasing pressure, mainly due to the restricted transport of volatiles. However,
some carbon can simultaneously react with steam, resulting in a decrease in the overall yields of
biochar and water and a parallel increase in the overall yield of pyrolysis gas.
With regard to the effect of the biomass source on the yields of produced water and gas, Table 3
shows statistically significant regression coefficients for both blocks 2 (associated to VS) and 3
(associated to TPOMW). This fact could also be explained by differences in the content and activity
of K plus Ca between the biomass sources. Given that the AAEMs contained in the TPOMW
feedstock seems to be highly active compared with the other biomass samples (see Fig. 4), a higher
yield of gas (and a lower yield of water) than average was expected. The same argumentation is
valid to explain the lower-than-average gas yields (and higher-than-average yields of water)
observed for the VS feedstock, which seems to contain the least active AAEMs.
No statistically significant effects (neither for ygas nor for ywater) were found for the pyrolysis
atmosphere. This finding is apparently in disagreement with earlier observations from Pilon and
Lavoie [13] (for pyrolysis of switchgrass at 500 °C) and Azuara et al. [14] (for pyrolysis of vine
shoots at 600 °C). In these two studies, a slightly significant increase in the yield of gas under an
atmosphere of CO2 was reported for experiments conducted at atmospheric pressure. However, and
as revealed from the statistical data reported in Table 3, the effect of using an atmosphere of CO2
on the yield of gas was not significant when the experimental data obtained from the pyrolysis of
three different biomass sources were simultaneously analyzed.
Concerning the yield of condensable organic compounds (yorg), there were no statistically
significant effects of any factor (see Table 3). The lack of statistical influence of the peak
temperature could be explained by a higher extent of the thermal cracking reactions when this factor
15
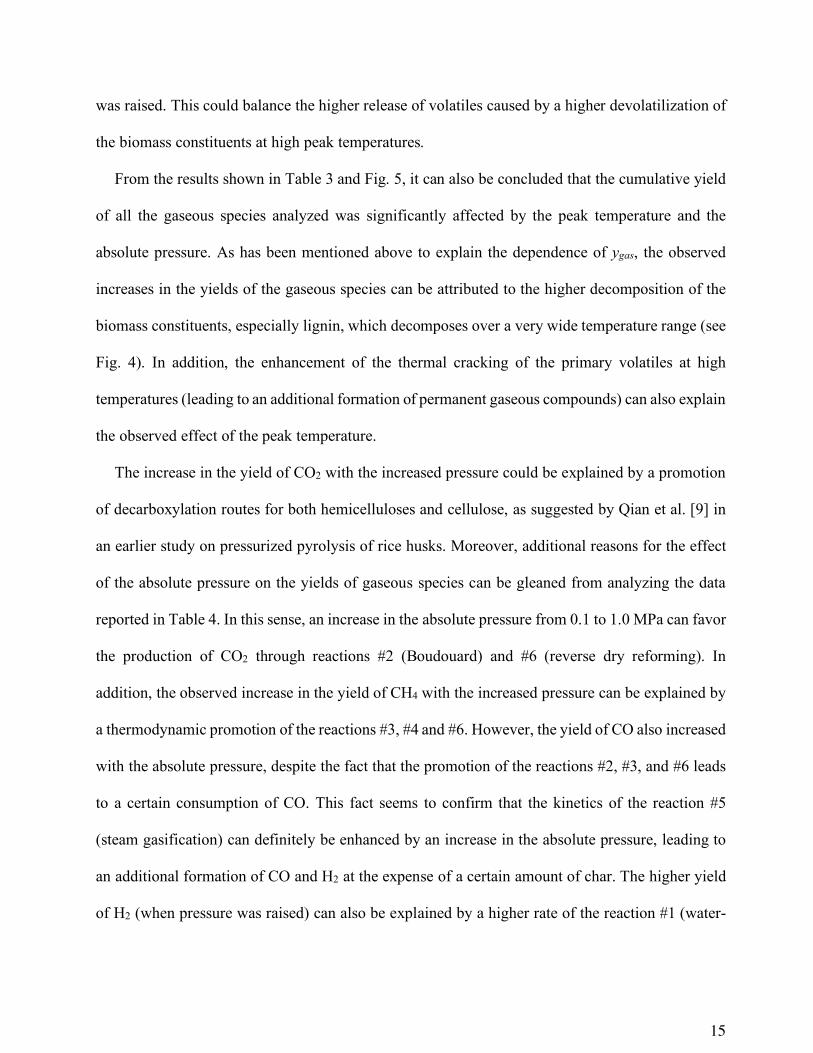
was raised. This could balance the higher release of volatiles caused by a higher devolatilization of
the biomass constituents at high peak temperatures.
From the results shown in Table 3 and Fig. 5, it can also be concluded that the cumulative yield
of all the gaseous species analyzed was significantly affected by the peak temperature and the
absolute pressure. As has been mentioned above to explain the dependence of ygas, the observed
increases in the yields of the gaseous species can be attributed to the higher decomposition of the
biomass constituents, especially lignin, which decomposes over a very wide temperature range (see
Fig. 4). In addition, the enhancement of the thermal cracking of the primary volatiles at high
temperatures (leading to an additional formation of permanent gaseous compounds) can also explain
the observed effect of the peak temperature.
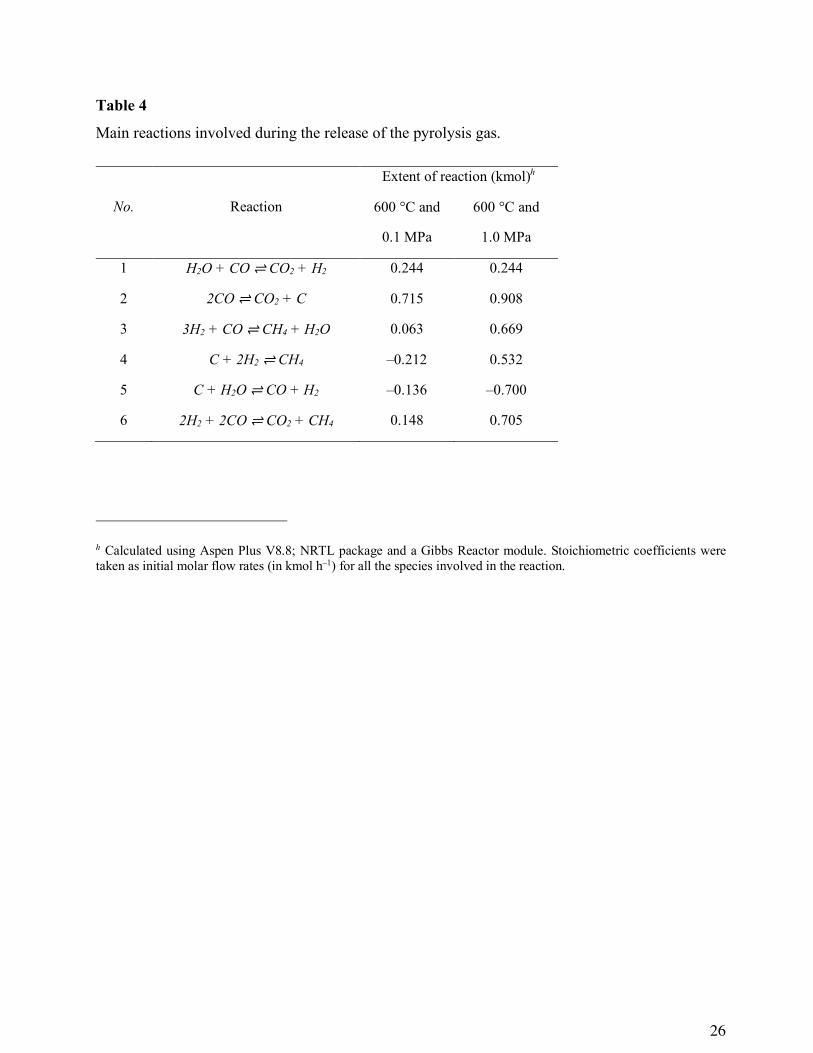
The increase in the yield of CO2 with the increased pressure could be explained by a promotion
of decarboxylation routes for both hemicelluloses and cellulose, as suggested by Qian et al. [9] in
an earlier study on pressurized pyrolysis of rice husks. Moreover, additional reasons for the effect
of the absolute pressure on the yields of gaseous species can be gleaned from analyzing the data
reported in Table 4. In this sense, an increase in the absolute pressure from 0.1 to 1.0 MPa can favor
the production of CO2 through reactions #2 (Boudouard) and #6 (reverse dry reforming). In
addition, the observed increase in the yield of CH4 with the increased pressure can be explained by
a thermodynamic promotion of the reactions #3, #4 and #6. However, the yield of CO also increased
with the absolute pressure, despite the fact that the promotion of the reactions #2, #3, and #6 leads
to a certain consumption of CO. This fact seems to confirm that the kinetics of the reaction #5
(steam gasification) can definitely be enhanced by an increase in the absolute pressure, leading to
an additional formation of CO and H2 at the expense of a certain amount of char. The higher yield
of H2 (when pressure was raised) can also be explained by a higher rate of the reaction #1 (water-
16
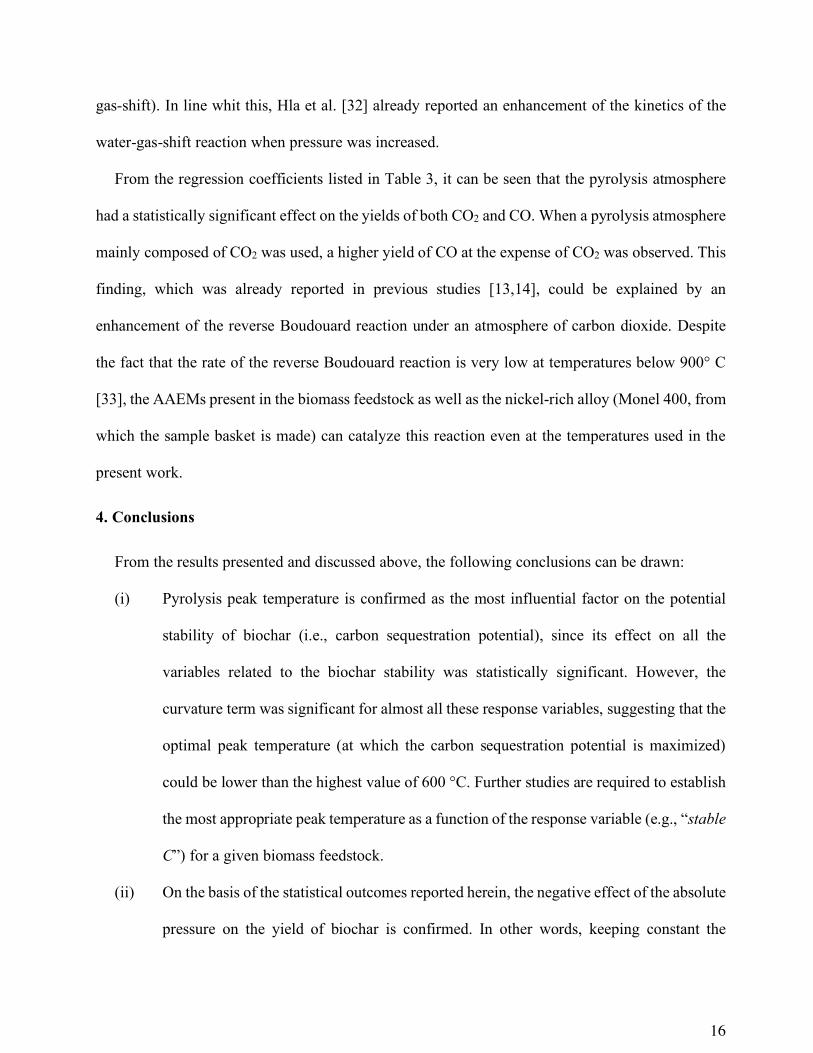
gas-shift). In line whit this, Hla et al. [32] already reported an enhancement of the kinetics of the
water-gas-shift reaction when pressure was increased.
From the regression coefficients listed in Table 3, it can be seen that the pyrolysis atmosphere
had a statistically significant effect on the yields of both CO2 and CO. When a pyrolysis atmosphere
mainly composed of CO2 was used, a higher yield of CO at the expense of CO2 was observed. This
finding, which was already reported in previous studies [13,14], could be explained by an
enhancement of the reverse Boudouard reaction under an atmosphere of carbon dioxide. Despite
the fact that the rate of the reverse Boudouard reaction is very low at temperatures below 900° C
[33], the AAEMs present in the biomass feedstock as well as the nickel-rich alloy (Monel 400, from
which the sample basket is made) can catalyze this reaction even at the temperatures used in the
present work.
4. Conclusions
From the results presented and discussed above, the following conclusions can be drawn:
(i) Pyrolysis peak temperature is confirmed as the most influential factor on the potential
stability of biochar (i.e., carbon sequestration potential), since its effect on all the
variables related to the biochar stability was statistically significant. However, the
curvature term was significant for almost all these response variables, suggesting that the
optimal peak temperature (at which the carbon sequestration potential is maximized)
could be lower than the highest value of 600 °C. Further studies are required to establish
the most appropriate peak temperature as a function of the response variable (e.g., “stable
C”) for a given biomass feedstock.
(ii) On the basis of the statistical outcomes reported herein, the negative effect of the absolute
pressure on the yield of biochar is confirmed. In other words, keeping constant the
17
residence time of the gaseous phase within the pyrolysis reactor, an increase in pressure
leads to a slightly decrease in the yield of biochar. Nevertheless, the most significant
effect of increasing the absolute pressure was the higher production of pyrolysis gas at
the expense of the produced water.
(iii) The use of a pyrolysis atmosphere manly composed of CO2 instead of N2 did not result
in any remarkable change in neither the distribution of the pyrolysis products nor the
potential stability of the produced biochar. However, working under an atmosphere of
CO2 resulted in a significant increase in the cumulative yield of CO at the expense of
produced CO2, leading to an interesting improvement in the composition of the produced
gas.
(iv) In summary, it seems reasonable to further explore the possibility of processing biomass
through pressurized slow pyrolysis under an atmosphere of CO2 (or the typical
composition of an exhaust gas), since this process can lead to important benefits for
scaling-up purposes. In this context, further research is needed in determining the optimal
set of operating conditions for a given purpose (e.g., carbon sequestration potential) and
for a given biomass feedstock.
Acknowledgements
The authors wish to acknowledge financial support from the Spanish MINECO-DGI (Project
ENE2013-47880-C3-1-R). JJM also express his gratitude to the Aragon Government (GPT group)
and the European Social Fund for additional financial support.
18
Appendix A. Supplementary data
Table S1: Matrix of the factorial design adopted in the present study.
Table S2: Experimental results obtained from the factorial design of experiments for the biochar
yield and the response variables related to the carbon sequestration potential (xFC, molar H:C ratio,
molar O:C ratio, R50 index, and “stable C”).
Table S3: Experimental results for the yield of gas (ygas), yield of produced water (ywater), yield of
condensable organic fraction (yorg), and cumulative yields of the main gaseous species (CO2, CO,
CH4 and H2).
References
[1] F. Verheijen, S. Jeffery, A.C. Bastos, M. van der Velde, I. Diafas, Biochar Application to
Soils – A Critical Scientific Review of Effects on Soil Properties, Processes and Functions,
Office for the Official Publications of the European Communities, Luxembourg, 2010.
[2] J.J. Manyà, Pyrolysis for Biochar Purposes: A Review to Establish Current Knowledge Gaps
and Research Needs, Environ. Sci. Technol. 46 (2012) 7939–7954.
[3] W. Song, M. Guo, Quality variations of poultry litter biochar generated at different pyrolysis
temperatures, J. Anal. Appl. Pyrolysis 94 (2012) 138–145.
[4] J.J. Manyà, D. Alvira, M. Azuara, D. Bernin, N. Hedin, Effects of Pressure and the Addition
of a Rejected Material from Municipal Waste Composting on the Pyrolysis of Two-Phase
Olive Mill Waste, Energy Fuels 30 (2016) 8055–8064.
[5] M.J. Antal, S.G. Allen, X. Dai, B. Shimizu, M.S. Tam, M. Gronli, Attainment of the
Theoretical Yield of Carbon from Biomass, Ind. Eng. Chem. Res. 39 (2000) 4024–4031.
[6] E.S. Noumi, J. Blin, J. Valette, P. Rousset, Combined Effect of Pyrolysis Pressure and
19
Temperature on the Yield and CO2 Gasification Reactivity of Acacia Wood in macro-TG,
Energy Fuels 29 (2015) 7301–7308.
[7] J. Recari, C. Berrueco, S. Abelló, D. Montané, X. Farriol, Effect of temperature and pressure
on characteristics and reactivity of biomass-derived chars, Bioresour. Technol. 170 (2014)
204–210.
[8] P. Rousset, C. Figueiredo, M. De Souza, W. Quirino, Pressure effect on the quality of
eucalyptus wood charcoal for the steel industry: A statistical analysis approach, Fuel Process.
Technol. 92 (2011) 1890–1897.
[9] Y. Qian, J. Zhang, J. Wang, Pressurized pyrolysis of rice husk in an inert gas sweeping fixed-
bed reactor with a focus on bio-oil deoxygenation, Bioresour. Technol. 174 (2014) 95–102.
[10] J.J. Manyà, S. Laguarta, M.A. Ortigosa, J.A. Manso, Biochar from Slow Pyrolysis of Two-
Phase Olive Mill Waste: Effect of Pressure and Peak Temperature on its Potential Stability,
Energy Fuels 28 (2014) 3271–3280.
[11] J.J. Manyà, M.A. Ortigosa, S. Laguarta, J.A. Manso, Experimental study on the effect of
pyrolysis pressure, peak temperature, and particle size on the potential stability of vine
shoots-derived biochar, Fuel 133 (2014) 163–172.
[12] M. Azuara, B. Baguer, J.I. Villacampa, N. Hedin, J.J. Manyà, Influence of pressure and
temperature on key physicochemical properties of corn stover-derived biochar, Fuel. 186
(2016) 525–533.
[13] G. Pilon, J.M. Lavoie, Pyrolysis of Switchgrass (Panicum virgatum L.) at Low Temperatures
within N2 and CO2 Environments: Product Yield Study., ACS Sustain. Chem. Eng. 1 (2013)
198–204.
[14] M. Azuara, E. Sáiz, J.A. Manso, F.J. García-Ramos, J.J. Manyà, Study on the effects of using
20
a carbon dioxide atmosphere on the properties of vine shoots-derived biochar, J. Anal. Appl.
Pyrolysis 124 (2017) 719–725.
[15] O.R. Harvey, L.J. Kuo, A.R. Zimmerman, P. Louchouarn, J.E. Amonette, B.E. Herbert, An
Index-Based Approach to Assessing Recalcitrance and Soil Carbon Sequestration Potential
of Engineered Black Carbons (Biochars), Environ. Sci. Technol. 46 (2012) 1415–1421.
[16] K. Crombie, O. Masek, S.P. Sohi, P. Brownsort, A. Cross, The effect of pyrolysis conditions
on biochar stability as determined by three methods, GCB Bioenergy 5 (2013) 122–131.
[17] A. Cross, S.P. Sohi, A method for screening the relative long-term stability of biochar, GCB
Bioenergy 5 (2013) 215–220.
[18] M. Rhodes, Introduction to Particle Technology: Second Edition, John Wiley & Sons, Ltd,
Chichester, UK, 2008.
[19] L. Wang, O. Skreiberg, M. Gronli, G.P. Specht, M.J. Antal, Is Elevated Pressure Required to
Achieve a High Fixed-Carbon Yield of Charcoal from Biomass? Part 2: The Importance of
Particle Size, Energy Fuels 27 (2013) 2146–2156.
[20] G.B. García, M. Calero De Hoces, C. Martínez García, M.T. Cotes Palomino, A.R. Gálvez,
M.Á. Martín-Lara, Characterization and modeling of pyrolysis of the two-phase olive mill
solid waste, Fuel Process. Technol. 126 (2014) 104–111.
[21] I. Mediavilla, M.J. Fernández, L.S. Esteban, Optimization of pelletisation and combustion in
a boiler of 17.5 kWth for vine shoots and industrial cork residue, Fuel Process. Technol. 90
(2009) 621–628.
[22] S. Mani, L.G. Tabil, S. Sokhansanj, Grinding performance and physical properties of wheat
and barley straws, corn stover and switchgrass, Biomass Bioenergy 27 (2004) 339–352.
[23] D.C. Montgomery, Design and analysis of experiments: 6th ed., John Wiley & Sons,
21
Hoboken, NJ, 2005.
[24] C. Di Blasi, G. Signorelli, C. Di Russo, G. Rea, Product Distribution from Pyrolysis of Wood
and Agricultural Residues, Ind. Eng. Chem. Res. 38 (1999) 2216–2224.
[25] O. Mašek, P. Brownsort, A. Cross, S. Sohi, Influence of production conditions on the yield
and environmental stability of biochar, Fuel 103 (2013) 151–155.
[26] F. Ronsse, S. van Hecke, D. Dickinson, W. Prins, Production and characterization of slow
pyrolysis biochar: influence of feedstock type and pyrolysis conditions, GCB Bioenergy 5
(2013) 104–115..
[27] Y. Wang, Y. Hu, X. Zhao, S. Wang, G. Xing, Comparisons of Biochar Properties from Wood
Material and Crop Residues at Different Temperatures and Residence Times, Energy Fuels
27 (2013) 5890–5899.
[28] L. Zhao, X. Cao, O. Mašek, A. Zimmerman, Heterogeneity of biochar properties as a function
of feedstock sources and production temperatures, J. Hazard. Mater. 256–257 (2013) 1–9.
[29] F.-X. Collard, J. Blin, A review on pyrolysis of biomass constituents: Mechanisms and
composition of the products obtained from the conversion of cellulose, hemicelluloses and
lignin, Renew. Sustain. Energy Rev. 38 (2014) 594–608.
[30] R. Ragucci, P. Giudicianni, A. Cavaliere, Cellulose slow pyrolysis products in a pressurized
steam flow reactor, Fuel 107 (2013) 122–130.
[31] K. Matsuoka, D. Kajiwara, K. Kuramoto, A. Sharma, Y. Suzuki, Factors affecting steam
gasification rate of low rank coal char in a pressurized fluidized bed, Fuel Process. Technol.
90 (2009) 895–900.
[32] S.S. Hla, G.J. Duffy, L.D. Morpeth, A. Cousins, D.G. Roberts, J.H. Edwards, Investigation
of the effect of total pressure on performance of the catalytic water–gas shift reaction using

22
simulated coal-derived syngases, Catal. Commun. 11 (2009) 272–275.
[33] P. Lahijani, Z.A. Zainal, M. Mohammadi, A.R. Mohamed, Conversion of the greenhouse gas
CO2 to the fuel gas CO via the Boudouard reaction: A review, Renew. Sustain. Energy Rev.
41 (2015) 615–632.
23
Table 1
Proximate, elemental and XRF analyses of the biomass sources (CS, TPOMW, and VS).
Proximate CS TPOMW VS Moisture (wt. %) 7.27 ± 0.31 12.8 ± 0.12 7.97 ± 0.68 Ash (wt. % in dry basis) 2.70 ± 0.20 2.27 ± 0.11 1.08 ± 0.05 Volatile matter (wt. % in dry basis) 86.6 ± 0.11 87.5 ± 1.95 74.0 ± 1.19 Fixed carbon (wt. % in dry basis) 10.7 ± 0.49 10.2 ± 1.13 24.9 ± 1.91 Elemental (wt. % in dafa basis)b CS TPOMW VS C 44.4 ± 0.31 50.0 ± 0.48 47.1 ± 0.14 H 5.60 ± 0.04 6.21 ± 0.17 5.29 ± 0.09 N 0.43 ± 0.01 2.29 ± 0.09 0.66 ± 0.05 S 0.45 ± 0.05 0.40 ± 0.07 0.56 ± 0.13
Inorganic matter (wt.% of ash) CS TPOMW VS
CaO 30.7 ± 0.23 43.3 ± 0.25 58.3 ± 0.25 K2O 9.85 ± 0.15 33.7 ± 0.24 18.4 ± 0.12 MgO 3.45 ± 0.17 1.65 ± 0.14 6.66 ± 0.14
SiO2 31.4 ± 0.23 4.34 ± 0.10 5.73 ± 0.08
Fe2O3 6.49 ± 0.12 2.91 ± 0.08 3.51 ± 0.11 Al2O3 4.85 ± 0.12 1.60 ± 0.07 2.57 ± 0.07 P2O5 4.13 ± 0.10 4.33 ± 0.10 1.24 ± 0.04 PbO 2.50 ± 0.08 0.55 ± 0.06 0.26 ± 0.02 S (inorganic) 1.94 ± 0.07 4.26 ± 0.01 0.60 ± 0.03 Cl (inorganic) 0.59 ± 0.03 0.37 ± 0.02 0.48 ± 0.02 MnO 0.53 ± 0.03 0.31 ± 0.03 0.53 ± 0.03 ZnO 0.24 ± 0.02 0.14 ± 0.02 0.32 ± 0.02 SnO2 0.45 ± 0.03 0.33 ± 0.03 0.26 ± 0.02 TiO2 0.59 ± 0.03 0.20 ± 0.02 0.34 ± 0.02 CuO 0.08 ± 0.02 0.26 ± 0.03 0.09 ± 0.01 MoO3 0.28 ± 0.02 0.25 ± 0.02 0.02 ± 0.01 La2O3 0.23 ± 0.04 0.31 ± 0.04 NDc Y2O3 0.26 ± 0.02 ND ND
a Dry-ash-free.
b Oxygen is calculated by difference.
c Not detected.
24
Table 2
Summary statistics for the regression models based on the data given in Table S2 (values in brackets
correspond to the p-values resulting from t-tests; significant terms are marked in bold).
Coefficient Response variable
ychard xFCe H:C ratio O:C ratio R50 index Stable C
β0 0.350 0.813 0.437 0.104 0.542 79.6
Block 1 (CS) –0.015 0.026 –0.039 0.009 0.007 6.09 (0.000) (0.001) (0.000) (0.176) (0.165) (0.000)
Block 2 (VS) –0.007 –0.024 0.030 0.001 –0.015 –6.93 (0.034) (0.002) (0.000) (0.935) (0.004) (0.000)
Block 3 (TPOMW) 0.022 –0.002 0.009 –0.010 0.008 0.842 (0.000) (0.739) (0.172) (0.153) (0.093) (0.373)
β1 (T) –0.030 0.055 –0.141 –0.043 0.027 6.52 (0.000) (0.000) (0.000) (0.000) (0.000) (0.000)
β2 (P) –0.009 0.022 –0.014 –0.010 0.006 –0.375 (0.001) (0.001) (0.016) (0.092) (0.168) (0.630)
β3 (CO2) –0.001 0.004 –0.038 –0.005 0.003 0.325 (0.580) (0.487) (0.002) (0.409) (0.493) (0.676)
β12 (T·P) –0.002 0.011 –0.004 0.000 –0.001 –0.292 (0.514) (0.069) (0.472) (0.940) (0.813) (0.708)
β13 (T·CO2) –0.002 –0.002 0.001 0.001 0.002 0.025 (0.535) (0.719) (0.806) (0.916) (0.630) (0.974)
β23 (P·CO2) 0.001 0.000 0.002 0.002 0.001 0.083 (0.801) (0.971) (0.650) (0.717) (0.781) (0.915)
β123 (T·P·CO2) 0.002 –0.001 0.001 –0.001 0.000 0.067 (0.472) (0.854) (0.852) (0.856) (0.943) (0.932)
Overall Curvature –0.017 0.025 –0.041 –0.042 –0.003 3.23 (0.001) (0.027) (0.001) (0.001) (0.695) (0.039)
Adj. R2 0.874 0.805 0.957 0.703 0.604 0.808
d Mass fraction in daf basis.
e Mass fraction.
25
Table 3
Summary statistics for the regression models based on the data given in Table S3 (values in brackets
correspond to the p-values resulting from t-tests; significant terms are marked in bold).
Coefficient Response variable
ygasf ywaterf yorgf yCO2g yCOg yCH4g yH2g
β0 0.308 0.156 0.191 3.731 2.655 1.397 0.722
Block 1 (CS) 0.006 0.004 0.005 –0.035 0.315 0.070 0.094 (0.425) (0.566) (0.519) (0.580) (0.006) (0.148) (0.168)
Block 2 (VS) –0.041 0.042 0.001 –0.457 –0.405 –0.118 –0.108 (0.000) (0.000) (0.910) (0.000) (0.001) (0.020) (0.117)
Block 3 (TPOMW) 0.036 –0.045 –0.006 0.492 0.090 0.048 0.014 (0.000) (0.000) (0.450) (0.000) (0.397) (0.321) (0.839)
β1 (T) 0.035 0.002 –0.006 0.305 0.333 0.253 0.389 (0.000) (0.717) (0.386) (0.000) (0.001) (0.000) (0.000)
β2 (P) 0.036 –0.028 –0.002 0.372 0.420 0.261 0.244 (0.000) (0.000) (0.795) (0.000) (0.000) (0.000) (0.000)
β3 (CO2) 0.006 0.004 –0.001 –0.154 0.315 –0.040 –0.051 (0.326) (0.534) (0.852) (0.007) (0.001) (0.320) (0.366)
β12 (T·P) –0.005 0.000 0.000 –0.036 0.011 –0.036 0.026 (0.405) (0.994) (0.995) (0.492) (0.897) (0.361) (0.643)
β13 (T·CO2) 0.002 0.001 0.004 –0.080 0.044 0.026 –0.059 (0.724) (0.859) (0.592) (0.135) (0.617) (0.507) (0.294)
β23 (P·CO2) 0.000 0.000 –0.003 0.007 0.161 –0.072 0.014 (0.972) (0.920) (0.660) (0.893) (0.075) (0.077) (0.799)
β123 (T·P·CO2) 0.001 –0.004 –0.003 0.042 0.030 0.017 –0.006 (0.884) (0.413) (0.643) (0.426) (0.727) (0.665) (0.917)
Overall Curvature 0.009 –0.001 0.005 0.184 0.171 –0.037 0.247 (0.453) (0.939) (0.722) (0.077) (0.310) (0.623) (0.028)
Adj. R2 0.765 0.717 0.000 0.841 0.666 0.738 0.688
f Mass fraction in daf basis.
g In mmol g−1 daf feedstock.
26
Table 4
Main reactions involved during the release of the pyrolysis gas.
No. Reaction
Extent of reaction (kmol)h
600 °C and
0.1 MPa
600 °C and
1.0 MPa
1 H2O + CO ⇌ CO2 + H2 0.244 0.244
2 2CO ⇌ CO2 + C 0.715 0.908
3 3H2 + CO ⇌ CH4 + H2O 0.063 0.669
4 C + 2H2 ⇌ CH4 –0.212 0.532
5 C + H2O ⇌ CO + H2 –0.136 –0.700
6 2H2 + 2CO ⇌ CO2 + CH4 0.148 0.705
h Calculated using Aspen Plus V8.8; NRTL package and a Gibbs Reactor module. Stoichiometric coefficients were taken as initial molar flow rates (in kmol h–1) for all the species involved in the reaction.
27
Fig. 1. Schematic of the pressurized pyrolysis device: (1) fixed-bed pyrolysis reactor, (2) pyrolysis
liquid condensation system, (3) volumetric gas meter, and (4) micro-GC.
28
Fig. 2. Particle size distributions of the biomass sources used in the present study: (a) CS, (b) VS,
and (c) TPOMW. The d50 (median) and surface-volume mean (harmonic mean [18]) values are
shown in the corresponding plot.
1 10 1000.0
0.1
0.2
0.3
0.4
Mas
s fra
ctio
n
Particle size (mm)
(a) CS
0.0
0.2
0.4
0.6
0.8
1.0
Cum
ulat
ive
mas
s fra
ctio
n
median (d50) = 35.1 mm surface-volume mean = 21.4 mm
1 10 1000.0
0.1
0.2
0.3
0.4
Mas
s fra
ctio
n
Particle size (mm)
(b) VS
0.0
0.2
0.4
0.6
0.8
1.0
Cum
ulat
ive
mas
s fra
ctio
n
median (d50) = 25.6 mm surface-volume mean = 15.5 mm
0.3 1 100.0
0.1
0.2
0.3
0.4
Mas
s fra
ctio
n
Particle size (mm)
(c) TPOMW
0.0
0.2
0.4
0.6
0.8
1.0
median (d50) = 3.54 mm surface-volume mean = 2.58 mm
Cum
ulat
ive
mas
s fra
ctio
n
29
Fig. 3. Normal plots of standardized effects (α = 0.05) for (a) ychar, (b) xFC, (c) molar H:C ratio, (d)
molar O:C ratio, (e) R50 index, and (f) “stable C”.
-12 -10 -8 -6 -4 -2 0 2
10
20
30
40
50
60
70
80
90 T*P*CO2
P*CO2
T*CO2
CO2
T*P
P
(%)
Standardized effect
T
(a) ychar
-26 -24 -22 -20 -18 -16 -14 -12 -10 -8 -6 -4 -2 0 2 4 6
10
20
30
40
50
60
70
80
90
P
T*P*CO2
P*CO2
T*CO2
CO2
T*P
T
(%)
Standardized effect
(c) molar H:C ratio
-4 -2 0 2 4 6 8
10
20
30
40
50
60
70
80
90
P
T*P*CO2
P*CO2
T*CO2
CO2
T*P
T
(%)
Standardized effect
(e) R50 index
-4 -2 0 2 4 6 8 10
10
20
30
40
50
60
70
80
90
P
T*P*CO2
P*CO2
T*CO2
CO2
T*P
T
(%)
Standardized effect
(b) xFC
-10 -8 -6 -4 -2 0 2 4
10
20
30
40
50
60
70
80
90
P
T*P*CO2
P*CO2
T*CO2
CO2
T*P
T
(%)
Standardized effect
(d) molar O:C ratio
-4 -2 0 2 4 6 8 10
10
20
30
40
50
60
70
80
90
P
T*P*CO2
P*CO2
T*CO2
CO2
T*P
T
(%)
Standardized effect
(f) Stable C
30
Fig 4. Deconvoluted DTG curves for the pyrolysis of (a) corn stover (CS), (b) vine shoots (VS),
and (c) two-phase olive mill waste (TPOMW).
150 200 250 300 350 400 450 500 550
0.00
0.02
0.04
0.06 experimental data peak 1 peak 2 peak 3 fitted data
-DTG
(min
-1)
Temperature (ºC)
(a) CS
Area percentagespeak 1 = 57.5%peak 2 = 35.2 %peak 3 = 7.3 %
150 200 250 300 350 400 450 500 550
0.00
0.01
0.02
0.03
experimental data peak 1 peak 2 peak 3 fitted data
-DTG
(min
-1)
Temperature (ºC)
Area percentagespeak 1 = 53.9%peak 2 = 33.8%peak 3 = 12.3%
(b) VS
150 200 250 300 350 400 450 500 550
0.00
0.01
0.02
0.03 experimental data peak 1 peak 2 peak 3 fitted data
-DTG
(min
-1)
Temperature (ºC)
Area percentagespeak 1 = 67.0%peak 2 = 12.9%peak 3 = 20.1%
(c) TPOMW
31
Fig. 5. Normal plots of standardized effects (α = 0.05) for (a) ygas, (b) ywater, (c) yCO2, (d) yCO, (e),
yCH4, and (f) yH2.
-2 0 2 4 6
10
20
30
40
50
60
70
80
90
T*P*CO2
P*CO2
T*CO2
CO2
T*P
P(%
)
Standardized effect
T
(a) ygas
-4 -2 0 2 4 6 8
10
20
30
40
50
60
70
80
90
T*P*CO2
P*CO2
T*CO2
CO2
T*P
P
(%)
Standardized effect
T
(c) yCO2
-2 0 2 4 6
10
20
30
40
50
60
70
80
90
T*P*CO2
P*CO2
T*CO2
CO2
T*P
P
(%)
Standardized effect
T
(e) yCH4
-6 -4 -2 0 2
10
20
30
40
50
60
70
80
90
T*P*CO2
P*CO2
T*CO2
CO2
T*P
P
(%)
Standardized effect
T
(b) ywater
-2 0 2 4
10
20
30
40
50
60
70
80
90
T*P*CO2
P*CO2
T*CO2
CO2
T*P
P
(%)
Standardized effect
T
(d) yCO
-2 0 2 4 6
10
20
30
40
50
60
70
80
90
T*P*CO2
P*CO2
T*CO2
CO2
T*P
P
(%)
Standardized effect
T
(f) yH2