eucheuma cottonii seaweed-based biochar for adsorption of
TRANSCRIPT
sustainability
Article
Eucheuma cottonii Seaweed-Based Biochar forAdsorption of Methylene Blue Dye
Anwar Ameen Hezam Saeed 1,2 , Noorfidza Yub Harun 1,2,*, Suriati Sufian 1,Ahmer Ali Siyal 1 , Muhammad Zulfiqar 1, Muhammad Roil Bilad 1 , Arvind Vagananthan 1,Amin Al-Fakih 3 , Aiban Abdulhakim Saeed Ghaleb 2 and Najib Almahbashi 3
1 Department of Chemical Engineering, Universiti Teknologi PETRONAS,Seri Iskandar 32610, Perak, Malaysia; [email protected] (A.A.H.S.); [email protected] (S.S.);[email protected] (A.A.S.); [email protected] (M.Z.);[email protected] (M.R.B.); [email protected] (A.V.)
2 Centre of Urban Resource Sustainability, Universiti Teknologi PETRONAS,Seri Iskandar 32610, Perak, Malaysia; [email protected]
3 Department of Civil and Environmental Engineering, Universiti Teknologi PETRONAS,Seri Iskandar 32610, Perak, Malaysia; [email protected] (A.A.-F.);[email protected] (N.A.)
* Correspondence: [email protected]
Received: 12 October 2020; Accepted: 3 November 2020; Published: 10 December 2020�����������������
Abstract: Pollution from dye containing wastewater leads to a variety of environmental problems,which can destroy plant life and eco-systems. This study reports development of a seaweed-basedbiochar as an adsorbent material for efficient adsorption of methylene blue (MB) dye from syntheticwastewater. The Eucheuma cottonii seaweed biochar was developed through pyrolysis using a tubefurnace with N2 gas, and the properties were later improved by sulfuric acid treatment. The adsorptionstudies were conducted in a batch experimental setup under initial methylene blue concentrations of50 to 200 mg/L, solution pH of 2 to 10, and temperature of 25 to 75 ◦C. The characterization results showthat the developed biochar had a mesoporous pore morphology. The adsorbent possessed the surfacearea, pore size, and pore volume of 640 m2/g, 2.32 nm, and 0.54 cm3/g, respectively. An adsorptiontest for 200 mg/L of initial methylene blue at pH 4 showed the best performance. The adsorptiondata of the seaweed-based biochar followed the Langmuir isotherm adsorption model and thepseudo-second-order kinetic model, with the corresponding R2 of 0.994 and 0.995. The maximumadsorption capacity of methylene blue using the developed seaweed-based biochar was 133.33 mg/g.The adsorption followed the chemisorption mechanism, which occurred via the formation of amonolayer of methylene blue dye on the seaweed-based biochar surface. The adsorption performanceof the produced seaweed biochar is comparable to that of other commercial adsorbents, suggestingits potential for large-scale applications.
Keywords: biochar; pyrolysis; methylene blue; adsorption; seaweed
1. Introduction
A variety of harmful contaminants, such as phenols, dyes, surfactants, heavy metals, and severalother personal-care-related chemicals, have been polluting water bodies [1]. Many types of dyesare harmful compounds that cause a variety of diseases and disorders, such as nausea, asthma,vomiting, blindness, and mental confusion [2,3]. Annually, 0.7 million tons of dyes are produced [4].Dyes contained in wastewater (such as from textile processing industries) must be removed from theeffluents before the treated water is discharged into water bodies. Development of eco-friendly andeffective technologies for dye removal from industrial wastewater has thus become a pressing issue.
Sustainability 2020, 12, 10318; doi:10.3390/su122410318 www.mdpi.com/journal/sustainability
Sustainability 2020, 12, 10318 2 of 15
A variety of technologies can be implemented for dye removal from wastewater, such as reverseosmosis, photodegradation, adsorption, coagulation, electrochemical, biochemical degradation, and ionexchange [5]. Adsorption is considered as a very simple, economical, and effective technique forthe complete removal of dyes from synthetic waste effluent [6]. The adsorbent can be made fromreadily available materials, such as activated carbons, bio-sorbents, rice husk ash (RHA), fly ash,zeolites, chitosan, kapok, cellulose, cotton, geopolymers, etc. [5,7–10]. Biochar has recently gainedattention as an adsorbent, especially the ones derived from agricultural residues like rice husk [11,12],Kenaf [13], coconut coir [14], sawdust [15], corn straws [16], pineapple bark [17], durian husk [18],hickory wood [19], and tea waste [12]. Biochar is an effective, affordable, and environmentallyfriendly adsorbent material for dye removal from wastewater [20]. Adsorption onto biochar-basedadsorbents derived from seaweed and algae, such as Gracilaria corticate [21], Asparagopsis armata [22],Pterocladia capillacea [23], Ascophyllum nodosum [22], and Gracilaria changii [24], has also shownpositive outcomes for dye removals [25].
Eucheuma cottonii seaweed is abundant in countries in Asia, Africa, and Oceania [24], and hasshown potential as a base material for biochar. In comparison to land crops, seaweed grows rapidly,with a high carbon dioxide fixation rate. Seaweed is readily available and abundant, and it grows wellin an aquatic ecosystem [26,27]. In Malaysia, the production of seaweed was about 14,900 metric tonsin 2010 and is estimated to reach about 22 metric tons in 2022 [28].
The composition of seaweed is completely different from that of land weeds. It mainly containscellulose in the form of lignocellulosic biomass. Therefore, the seaweed is exposed to a high-energy-consumption pre-treatment step [29], which make it less attractive for conversion into bio-fuels [30,31].The lignocellulose component is attractive as a base material for biochar adsorbent, which is addressed inthis study. To the best of our knowledge, the development of seaweed-based bio-sorbents for methyleneblue (MB) removal has been rarely reported, which conveys the originality of this research work.
This study investigates the development of seaweed-based biochar using the pyrolysis methodfor MB removal from synthetic wastewater through an adsorption technique. After fabrication andcharacterization, the impact of solution pH and the initial concentration of MB on the adsorption rateand capacity was assessed. Later, the isotherms and kinetics of dye adsorption were also assessed.
2. Experimental Details
2.1. Materials
Eucheuma cottonii seaweed was obtained from Sabah, Malaysia. The MB dye, sulphuric acid(H2SO4), hydrochloric acid (HCl), and sodium hydroxide (NaOH) were procured from Sigma-Aldrich.The chemicals were used as received without any treatment.
2.2. Methods
2.2.1. Biochar Preparation
Eucheuma cottonii seaweed was pulverized using a mortar and pestle, followed by screening to thesize range of 1–2 mm using a sieve shaker. Subsequently, it was washed using tap water and dried at343 K in an electric oven for two days (48 h). The chemical activation of seaweed was carried out byputting 100 g of dry and sieved seaweed into a 10% sulfuric acid solution for 2 h. The liquid solutionwas then drained, and the product was continuously washed using the distilled water until all acidwas removed, which was indicated by the neutral pH of the washing solution. The dried seaweed waspyrolyzed at two different temperatures of 550 and 450 ◦C under a N2 environment purged at a flowrate of 0.0042 bar per min for 120 min [32,33].
Sustainability 2020, 12, 10318 3 of 15
2.2.2. Characterizations of Seaweed-Based Biochar
The standard methods of the American Society for Testing and Materials (ASTM) and a VarioMicro Element Analyzer were applied to determine both proximate and ultimate compositions of theseaweed biochar, respectively. In the proximate analysis, moisture content, volatile matter, ash content,and fixed carbon were determined using ASTM D7582-10 methods, while in the ultimate analysis,as the contents of carbon (C), nitrogen (N), hydrogen (H), sulphur (S), oxygen (O), H/C, and O/Cwere determined using the Vario Micro Element Analyzer. Before analysis, the seaweed samples werewashed and dried. The samples were placed in the oven at 105 ◦C for 3 h for the measurement ofmoisture content. The volatile matter was determined by putting a closed crucible containing 2 gof seaweed samples in a carbolite furnace at 950 ◦C for 10 min. The ash content was determined byputting a crucible containing 2 g of seaweed sample in the furnace at 850 ◦C for 1 h. All these amountswere assessed using the difference between the initial and final weights.
The functional group analysis of seaweed was determined using Fourier-transform infraredspectroscopy (FTIR; Operant LLC, Madison, WI, USA). The FTIR spectra were recorded in wavelengthsranging from 400 to 4000 cm−1. Scanning electron microscopy–energy-dispersive spectroscopy(SEM-EDS) was used to confirm the microstructure of seaweed-based biochar and the elemental surfacecomposition of the samples. The specific surface area and the pore size of seaweed biochar wereassessed using a Micromeritics ASAP 2020 analyzer.
2.3. Batch Adsorption Experiment
Adsorption experiments of MB were performed in a glass beaker. A total of 1000 mg of MB wasmixed in 1000 mL of distilled water to prepare a MB stock solution. The stock solution was later used toprepare different MB concentrations ranging from 50 to 200 mg/L. The seaweed-based biochar (300 mg)was mixed into an MB aqueous solution under continuous stirring at 300 rpm for 6 h. The solutionpH was maintained in the range from 2 to 10 through dropwise addition of HCl or NaOH solutions.Some of the solution was taken every 30 min during the test. The sample was filtered using syringefilters and was analyzed for absorbance using a UV–Vis spectrophotometer (Shimadzu, Model UV1700). The removal efficiency (η, %) and adsorption capacity of seaweed biochar were determinedusing Equations (1) and (2):
η =
(Ci − C f
)Ci
× 100 (1)
qe =
(Ci − C f
)V
m(2)
where Ci and Cf are MB concentrations (mg/L) at the initial and final stage, qe is the adsorption capacityin mg/g, m denotes the quantity of seaweed-based biochar (g), and V expresses the volume of theMB solution (L).
2.4. Isotherm and Kinetic Analysis
Three different temperatures of 25, 50, and 75 ◦C were selected for adsorption isotherm analysistests. Table 1 specifies linearized forms of several isotherms of the Temkin, the Freundlich, and theLangmuir models [34]. For adsorption kinetic analysis, four concentrations of MB of 50, 100, 150,and 200 mg/L were selected for the pseudo-first-order and pseudo-second-order kinetic models [35],as provided in Table 1. Equations (3) and (4) were used to determine the root-mean square error(RMSE) and the coefficient of determination, R2, to validate the model for the experimental data.
R2 = 1−
∑ni=1
(qe,obs − qe,pred
)2∑n
i=1
(qe,obs
)2−
[(∑ni=1 qe,obs
)2/n
] (3)
Sustainability 2020, 12, 10318 4 of 15
RMSE =
√√1
n− 1∗
n∑i=1
(qe,obs − qe,pred
)2 (4)
where qm is the maximum adsorption capacity (mg/g) and qe is the adsorption capacity at the equilibrium(mg/g). The Temkin, the Freundlich, and the Langmuir constants are denoted by KT, KF, and KL,with corresponding units of L/mg, mg/g, and L/mg. Parameter B denotes the Temkin constant (J/mol).The factor n is the input data, qe, obs is the observed adsorption capability (mg/g), and qe, pred is thepredicted adsorption capability (mg/g).
Table 1. Equilibrium and linearized equations of isotherm and kinetic models.
Models Equilibrium Linearized Ref.
Langmuir Qe =qmbCe1+bCe
Ceqe
= 1qmb + Ce
qm[36]
Freundlich Qe = K f Cne log qe = Log KF +
1n log Ce [37]
Temkin qe =RTb ln(KTCe) Qe = B Ln KT + B Ln Ce [38]
Pseudo-first order qt = qe(1− e−k1t
)ln(qe − qt) = lnqe − k1t [39]
Pseudo-second order qt =q2
e k2t(1 + qek2t) qt = qe
(1− e−k1t
)[40]
3. Results and Discussion
3.1. Ultimate and Proximate Analysis
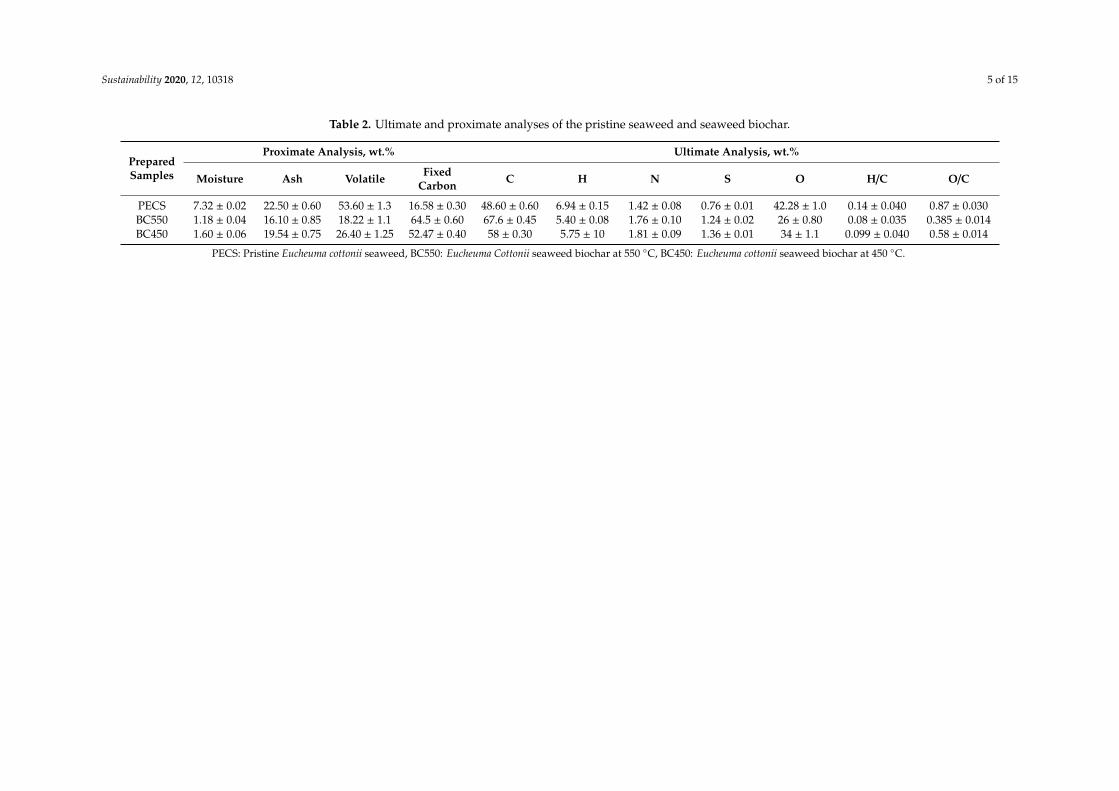
Table 2 explains both the ultimate and proximate analyses of the raw Eucheuma cottonii seaweed andits biochar. The moisture content of the untreated raw seaweed is 7.32 wt.%, which is higher than thoseof its biochar (Eucheuma Cottonii seaweed biochar at 450 ◦C (BC450) and Eucheuma Cottonii seaweedbiochar at 550 ◦C (BC550)). The p-values corresponding to the F-statistic of one-way analysis of variance(ANOVA) between moisture content, ash, and a volatile component of the pristine Eucheuma cottoniiseaweed (PECS) and the biochar are lower than 0.05, suggesting that the heat treatment significantlylowered their contents. However, the effect of temperature is not significant when comparing BC550and BC450, with p-values for all corresponding parameters of >0.05. The pyrolysis process causesdehydration of the samples in the first stage, which removes moisture [41]. The p-values correspondingto the F-statistic of one-way ANOVA between carbon, hydrogen, oxygen, O/C, and H/C of BC550 andBC450 are lower than 0.05, suggesting that nitrogen is purged during pyrolysis and that the absence ofoxygen significantly improves biochar quality and keeps the biochar stable. The volatile matter ofthe raw seaweed is 53.60%, which is relatively lower than other biomass waste materials. The lowcontent of volatile matter suggests that the seaweed is also suitable as a solid fuel, unlike other biomasswaste [42]. The volatile matter drops to 18.22 for BC550 and 26.40 for BC450, which is half of thevalue obtained in the raw seaweed. The fixed carbon of the raw seaweed is 16.58%, while the fixedcarbon for the biochar is 64.5% for BC550 and 52.47% for BC450. The higher differences in the carboncontent of the raw seaweed and its biochar can be attributed to the influence of physical and chemicaltransformations as well as the parameters of temperature, pyrolysis time, and nitrogen gas flow rateduring the pyrolysis process [43].
The ultimate analysis data show that carbon contents increased from 48.60% to 58% at a pyrolysistemperature of 450 ◦C and from 48.60% to 67.6% at a pyrolysis temperature of 550 ◦C. The variations incarbon content between the BC550 and BC450 samples demonstrate the significant impact of pyrolysistemperatures on the carbonization process. As shown in Table 2, the ultimate evaluation highlightedthat the raw seaweed and its biochar showed comparatively lower H, S, and N contents along withhigher C and O contents. The decrease in oxygen content at the higher temperature shows that thebiochar is highly hydrophobic. The hydrophobic property of the biochar can be attributed to theformation or presence of aromatic compounds.
Sustainability 2020, 12, 10318 5 of 15
Table 2. Ultimate and proximate analyses of the pristine seaweed and seaweed biochar.
PreparedSamples
Proximate Analysis, wt.% Ultimate Analysis, wt.%
Moisture Ash Volatile FixedCarbon C H N S O H/C O/C
PECS 7.32 ± 0.02 22.50 ± 0.60 53.60 ± 1.3 16.58 ± 0.30 48.60 ± 0.60 6.94 ± 0.15 1.42 ± 0.08 0.76 ± 0.01 42.28 ± 1.0 0.14 ± 0.040 0.87 ± 0.030BC550 1.18 ± 0.04 16.10 ± 0.85 18.22 ± 1.1 64.5 ± 0.60 67.6 ± 0.45 5.40 ± 0.08 1.76 ± 0.10 1.24 ± 0.02 26 ± 0.80 0.08 ± 0.035 0.385 ± 0.014BC450 1.60 ± 0.06 19.54 ± 0.75 26.40 ± 1.25 52.47 ± 0.40 58 ± 0.30 5.75 ± 10 1.81 ± 0.09 1.36 ± 0.01 34 ± 1.1 0.099 ± 0.040 0.58 ± 0.014
PECS: Pristine Eucheuma cottonii seaweed, BC550: Eucheuma Cottonii seaweed biochar at 550 ◦C, BC450: Eucheuma cottonii seaweed biochar at 450 ◦C.
Sustainability 2020, 12, 10318 6 of 15
According to the IBI Biochar Standard [44], the optimal O/C ratio ranges from 0.40 to 0.50.This ratio keeps the lignin and maintains the quality of the biochar. An increase in the O/C ratio to0.90 decreases the quality and stability of a biochar. On the other hand, decreasing the O/C ratio to0.20 results in the loss of functional groups. The ratio between O and C of the raw seaweed and itsbiochar ranges from 0.38 to 0.87, which indicates that the biochar adsorbent is polar and contains alarge number of surface functional groups, including polar oxygen. The higher the O/C ratio, thegreater the number of polar functional groups of the biochar. It has been observed that these functionalgroups actively take part for the treatment of heavy metals as well as dyes [45].
3.2. Microstructure Analysis of the Seaweed-Based Biochar
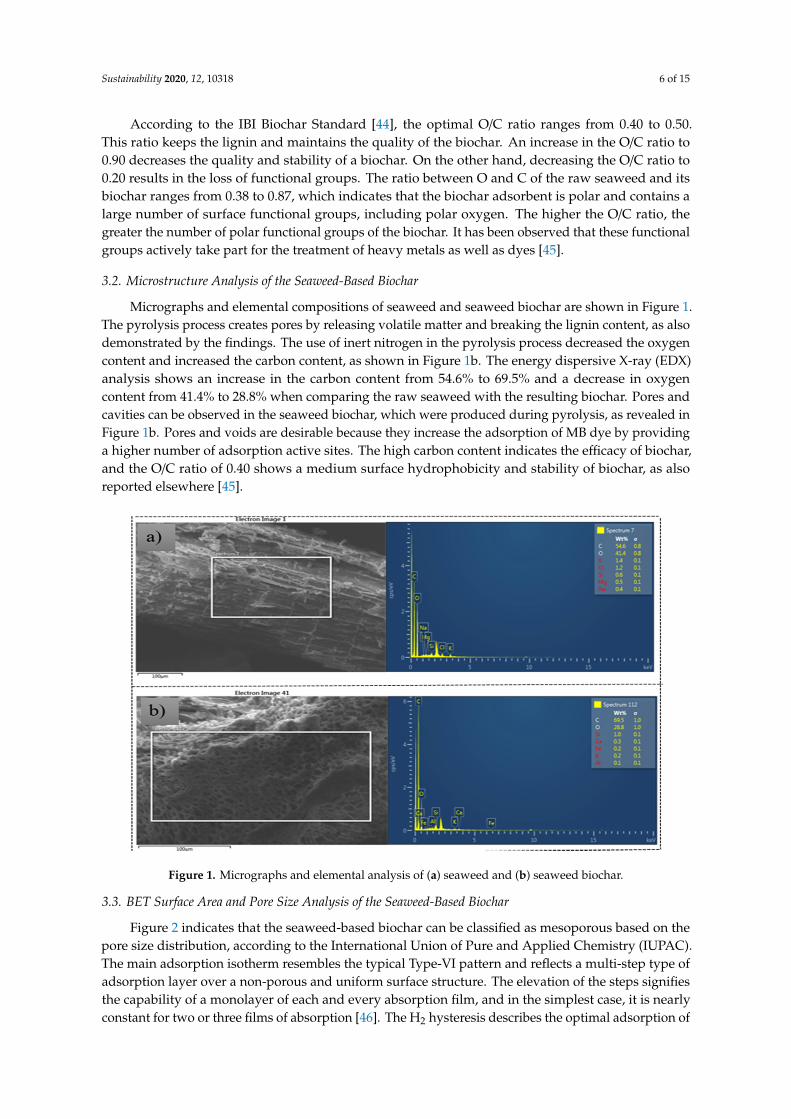
Micrographs and elemental compositions of seaweed and seaweed biochar are shown in Figure 1.The pyrolysis process creates pores by releasing volatile matter and breaking the lignin content, as alsodemonstrated by the findings. The use of inert nitrogen in the pyrolysis process decreased the oxygencontent and increased the carbon content, as shown in Figure 1b. The energy dispersive X-ray (EDX)analysis shows an increase in the carbon content from 54.6% to 69.5% and a decrease in oxygencontent from 41.4% to 28.8% when comparing the raw seaweed with the resulting biochar. Pores andcavities can be observed in the seaweed biochar, which were produced during pyrolysis, as revealed inFigure 1b. Pores and voids are desirable because they increase the adsorption of MB dye by providinga higher number of adsorption active sites. The high carbon content indicates the efficacy of biochar,and the O/C ratio of 0.40 shows a medium surface hydrophobicity and stability of biochar, as alsoreported elsewhere [45].
Sustainability 2020, 12, x FOR PEER REVIEW 6 of 15
The ultimate analysis data show that carbon contents increased from 48.60% to 58% at a pyrolysis temperature of 450 °C and from 48.60% to 67.6% at a pyrolysis temperature of 550 °C. The variations in carbon content between the BC550 and BC450 samples demonstrate the significant impact of pyrolysis temperatures on the carbonization process. As shown in Table 2, the ultimate evaluation highlighted that the raw seaweed and its biochar showed comparatively lower H, S, and N contents along with higher C and O contents. The decrease in oxygen content at the higher temperature shows that the biochar is highly hydrophobic. The hydrophobic property of the biochar can be attributed to the formation or presence of aromatic compounds.
According to the IBI Biochar Standard [44], the optimal O/C ratio ranges from 0.40 to 0.50. This ratio keeps the lignin and maintains the quality of the biochar. An increase in the O/C ratio to 0.90 decreases the quality and stability of a biochar. On the other hand, decreasing the O/C ratio to 0.20 results in the loss of functional groups. The ratio between O and C of the raw seaweed and its biochar ranges from 0.38 to 0.87, which indicates that the biochar adsorbent is polar and contains a large number of surface functional groups, including polar oxygen. The higher the O/C ratio, the greater the number of polar functional groups of the biochar. It has been observed that these functional groups actively take part for the treatment of heavy metals as well as dyes [45].
3.2. Microstructure Analysis of the Seaweed-Based Biochar
Micrographs and elemental compositions of seaweed and seaweed biochar are shown in Figure 1. The pyrolysis process creates pores by releasing volatile matter and breaking the lignin content, as also demonstrated by the findings. The use of inert nitrogen in the pyrolysis process decreased the oxygen content and increased the carbon content, as shown in Figure 1b. The energy dispersive x-ray (EDX) analysis shows an increase in the carbon content from 54.6% to 69.5% and a decrease in oxygen content from 41.4% to 28.8% when comparing the raw seaweed with the resulting biochar. Pores and cavities can be observed in the seaweed biochar, which were produced during pyrolysis, as revealed in Figure 1b. Pores and voids are desirable because they increase the adsorption of MB dye by providing a higher number of adsorption active sites. The high carbon content indicates the efficacy of biochar, and the O/C ratio of 0.40 shows a medium surface hydrophobicity and stability of biochar, as also reported elsewhere [45].
Figure 1. Micrographs and elemental analysis of (a) seaweed and (b) seaweed biochar.
Figure 1. Micrographs and elemental analysis of (a) seaweed and (b) seaweed biochar.
3.3. BET Surface Area and Pore Size Analysis of the Seaweed-Based Biochar
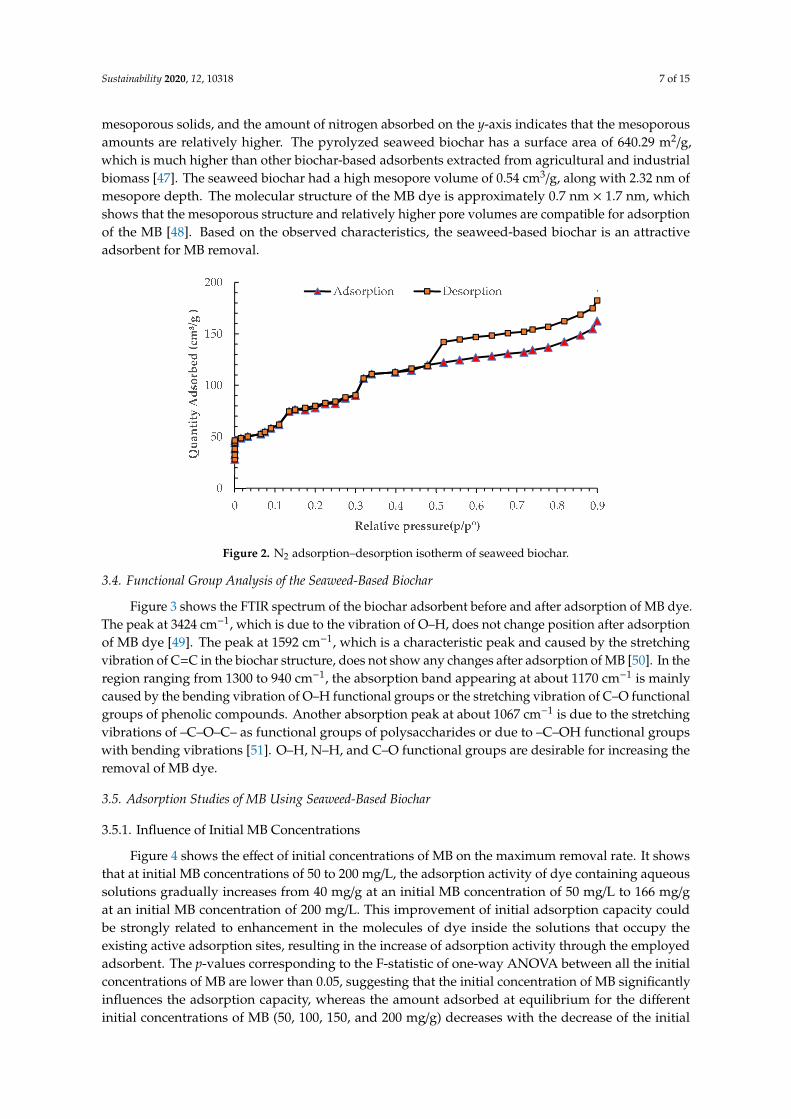
Figure 2 indicates that the seaweed-based biochar can be classified as mesoporous based on thepore size distribution, according to the International Union of Pure and Applied Chemistry (IUPAC).The main adsorption isotherm resembles the typical Type-VI pattern and reflects a multi-step type ofadsorption layer over a non-porous and uniform surface structure. The elevation of the steps signifiesthe capability of a monolayer of each and every absorption film, and in the simplest case, it is nearlyconstant for two or three films of absorption [46]. The H2 hysteresis describes the optimal adsorption of
Sustainability 2020, 12, 10318 7 of 15
mesoporous solids, and the amount of nitrogen absorbed on the y-axis indicates that the mesoporousamounts are relatively higher. The pyrolyzed seaweed biochar has a surface area of 640.29 m2/g,which is much higher than other biochar-based adsorbents extracted from agricultural and industrialbiomass [47]. The seaweed biochar had a high mesopore volume of 0.54 cm3/g, along with 2.32 nm ofmesopore depth. The molecular structure of the MB dye is approximately 0.7 nm × 1.7 nm, whichshows that the mesoporous structure and relatively higher pore volumes are compatible for adsorptionof the MB [48]. Based on the observed characteristics, the seaweed-based biochar is an attractiveadsorbent for MB removal.
Sustainability 2020, 12, x FOR PEER REVIEW 7 of 15
3.3. BET Surface Area and Pore Size Analysis of the Seaweed-Based Biochar
Figure 2 indicates that the seaweed-based biochar can be classified as mesoporous based on the pore size distribution, according to the International Union of Pure and Applied Chemistry (IUPAC). The main adsorption isotherm resembles the typical Type-VI pattern and reflects a multi-step type of adsorption layer over a non-porous and uniform surface structure. The elevation of the steps signifies the capability of a monolayer of each and every absorption film, and in the simplest case, it is nearly constant for two or three films of absorption [46]. The H2 hysteresis describes the optimal adsorption of mesoporous solids, and the amount of nitrogen absorbed on the y-axis indicates that the mesoporous amounts are relatively higher. The pyrolyzed seaweed biochar has a surface area of 640.29 m2/g, which is much higher than other biochar-based adsorbents extracted from agricultural and industrial biomass [47]. The seaweed biochar had a high mesopore volume of 0.54 cm3/g, along with 2.32 nm of mesopore depth. The molecular structure of the MB dye is approximately 0.7 nm × 1.7 nm, which shows that the mesoporous structure and relatively higher pore volumes are compatible for adsorption of the MB [48]. Based on the observed characteristics, the seaweed-based biochar is an attractive adsorbent for MB removal.
Figure 2. N2 adsorption–desorption isotherm of seaweed biochar.
3.4. Functional Group Analysis of the Seaweed-Based Biochar
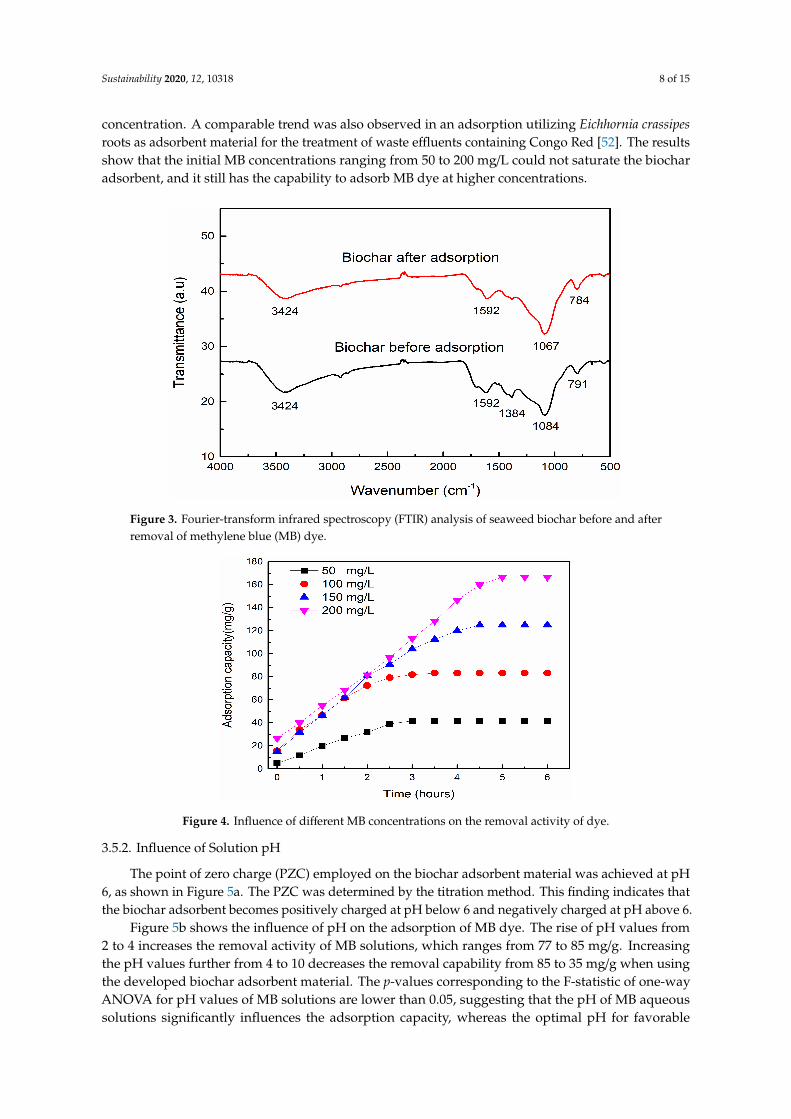
Figure 3 shows the FTIR spectrum of the biochar adsorbent before and after adsorption of MB dye. The peak at 3424 cm−1, which is due to the vibration of O–H, does not change position after adsorption of MB dye [49]. The peak at 1592 cm−1, which is a characteristic peak and caused by the stretching vibration of C=C in the biochar structure, does not show any changes after adsorption of MB [50]. In the region ranging from 1300 to 940 cm−1, the absorption band appearing at about 1170 cm−1 is mainly caused by the bending vibration of O–H functional groups or the stretching vibration of C–O functional groups of phenolic compounds. Another absorption peak at about 1067 cm−1 is due to the stretching vibrations of –C–O–C– as functional groups of polysaccharides or due to –C–OH functional groups with bending vibrations [51]. O–H, N–H, and C–O functional groups are desirable for increasing the removal of MB dye.
Figure 2. N2 adsorption–desorption isotherm of seaweed biochar.
3.4. Functional Group Analysis of the Seaweed-Based Biochar
Figure 3 shows the FTIR spectrum of the biochar adsorbent before and after adsorption of MB dye.The peak at 3424 cm−1, which is due to the vibration of O–H, does not change position after adsorptionof MB dye [49]. The peak at 1592 cm−1, which is a characteristic peak and caused by the stretchingvibration of C=C in the biochar structure, does not show any changes after adsorption of MB [50]. In theregion ranging from 1300 to 940 cm−1, the absorption band appearing at about 1170 cm−1 is mainlycaused by the bending vibration of O–H functional groups or the stretching vibration of C–O functionalgroups of phenolic compounds. Another absorption peak at about 1067 cm−1 is due to the stretchingvibrations of –C–O–C– as functional groups of polysaccharides or due to –C–OH functional groupswith bending vibrations [51]. O–H, N–H, and C–O functional groups are desirable for increasing theremoval of MB dye.
3.5. Adsorption Studies of MB Using Seaweed-Based Biochar
3.5.1. Influence of Initial MB Concentrations
Figure 4 shows the effect of initial concentrations of MB on the maximum removal rate. It showsthat at initial MB concentrations of 50 to 200 mg/L, the adsorption activity of dye containing aqueoussolutions gradually increases from 40 mg/g at an initial MB concentration of 50 mg/L to 166 mg/gat an initial MB concentration of 200 mg/L. This improvement of initial adsorption capacity couldbe strongly related to enhancement in the molecules of dye inside the solutions that occupy theexisting active adsorption sites, resulting in the increase of adsorption activity through the employedadsorbent. The p-values corresponding to the F-statistic of one-way ANOVA between all the initialconcentrations of MB are lower than 0.05, suggesting that the initial concentration of MB significantlyinfluences the adsorption capacity, whereas the amount adsorbed at equilibrium for the differentinitial concentrations of MB (50, 100, 150, and 200 mg/g) decreases with the decrease of the initial
Sustainability 2020, 12, 10318 8 of 15
concentration. A comparable trend was also observed in an adsorption utilizing Eichhornia crassipesroots as adsorbent material for the treatment of waste effluents containing Congo Red [52]. The resultsshow that the initial MB concentrations ranging from 50 to 200 mg/L could not saturate the biocharadsorbent, and it still has the capability to adsorb MB dye at higher concentrations.Sustainability 2020, 12, x FOR PEER REVIEW 8 of 15
Figure 3. Fourier-transform infrared spectroscopy (FTIR) analysis of seaweed biochar before and after removal of methylene blue (MB) dye.
3.5. Adsorption Studies of MB Using Seaweed-Based Biochar
3.5.1. Influence of Initial MB Concentrations
Figure 4 shows the effect of initial concentrations of MB on the maximum removal rate. It shows that at initial MB concentrations of 50 to 200 mg/L, the adsorption activity of dye containing aqueous solutions gradually increases from 40 mg/g at an initial MB concentration of 50 mg/L to 166 mg/g at an initial MB concentration of 200 mg/L. This improvement of initial adsorption capacity could be strongly related to enhancement in the molecules of dye inside the solutions that occupy the existing active adsorption sites, resulting in the increase of adsorption activity through the employed adsorbent. The p-values corresponding to the F-statistic of one-way ANOVA between all the initial concentrations of MB are lower than 0.05, suggesting that the initial concentration of MB significantly influences the adsorption capacity, whereas the amount adsorbed at equilibrium for the different initial concentrations of MB (50, 100, 150, and 200 mg/g) decreases with the decrease of the initial concentration. A comparable trend was also observed in an adsorption utilizing Eichhornia crassipes roots as adsorbent material for the treatment of waste effluents containing Congo Red [52]. The results show that the initial MB concentrations ranging from 50 to 200 mg/L could not saturate the biochar adsorbent, and it still has the capability to adsorb MB dye at higher concentrations.
Figure 4. Influence of different MB concentrations on the removal activity of dye.
Figure 3. Fourier-transform infrared spectroscopy (FTIR) analysis of seaweed biochar before and afterremoval of methylene blue (MB) dye.
Sustainability 2020, 12, x FOR PEER REVIEW 8 of 15
Figure 3. Fourier-transform infrared spectroscopy (FTIR) analysis of seaweed biochar before and after removal of methylene blue (MB) dye.
3.5. Adsorption Studies of MB Using Seaweed-Based Biochar
3.5.1. Influence of Initial MB Concentrations
Figure 4 shows the effect of initial concentrations of MB on the maximum removal rate. It shows that at initial MB concentrations of 50 to 200 mg/L, the adsorption activity of dye containing aqueous solutions gradually increases from 40 mg/g at an initial MB concentration of 50 mg/L to 166 mg/g at an initial MB concentration of 200 mg/L. This improvement of initial adsorption capacity could be strongly related to enhancement in the molecules of dye inside the solutions that occupy the existing active adsorption sites, resulting in the increase of adsorption activity through the employed adsorbent. The p-values corresponding to the F-statistic of one-way ANOVA between all the initial concentrations of MB are lower than 0.05, suggesting that the initial concentration of MB significantly influences the adsorption capacity, whereas the amount adsorbed at equilibrium for the different initial concentrations of MB (50, 100, 150, and 200 mg/g) decreases with the decrease of the initial concentration. A comparable trend was also observed in an adsorption utilizing Eichhornia crassipes roots as adsorbent material for the treatment of waste effluents containing Congo Red [52]. The results show that the initial MB concentrations ranging from 50 to 200 mg/L could not saturate the biochar adsorbent, and it still has the capability to adsorb MB dye at higher concentrations.
Figure 4. Influence of different MB concentrations on the removal activity of dye. Figure 4. Influence of different MB concentrations on the removal activity of dye.
3.5.2. Influence of Solution pH
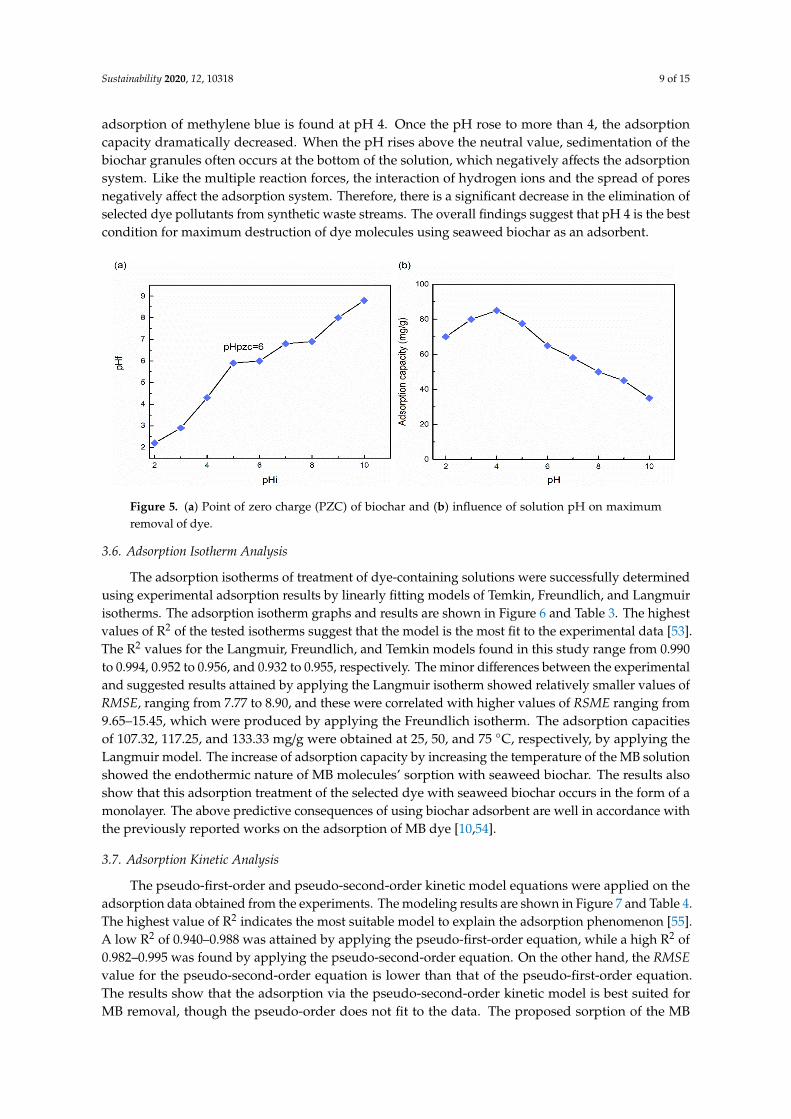
The point of zero charge (PZC) employed on the biochar adsorbent material was achieved at pH6, as shown in Figure 5a. The PZC was determined by the titration method. This finding indicates thatthe biochar adsorbent becomes positively charged at pH below 6 and negatively charged at pH above 6.
Figure 5b shows the influence of pH on the adsorption of MB dye. The rise of pH values from2 to 4 increases the removal activity of MB solutions, which ranges from 77 to 85 mg/g. Increasingthe pH values further from 4 to 10 decreases the removal capability from 85 to 35 mg/g when usingthe developed biochar adsorbent material. The p-values corresponding to the F-statistic of one-wayANOVA for pH values of MB solutions are lower than 0.05, suggesting that the pH of MB aqueoussolutions significantly influences the adsorption capacity, whereas the optimal pH for favorable
Sustainability 2020, 12, 10318 9 of 15
adsorption of methylene blue is found at pH 4. Once the pH rose to more than 4, the adsorptioncapacity dramatically decreased. When the pH rises above the neutral value, sedimentation of thebiochar granules often occurs at the bottom of the solution, which negatively affects the adsorptionsystem. Like the multiple reaction forces, the interaction of hydrogen ions and the spread of poresnegatively affect the adsorption system. Therefore, there is a significant decrease in the elimination ofselected dye pollutants from synthetic waste streams. The overall findings suggest that pH 4 is the bestcondition for maximum destruction of dye molecules using seaweed biochar as an adsorbent.
Sustainability 2020, 12, x FOR PEER REVIEW 9 of 15
3.5.2. Influence of Solution pH
The point of zero charge (PZC) employed on the biochar adsorbent material was achieved at pH 6, as shown in Figure 5a. The PZC was determined by the titration method. This finding indicates that the biochar adsorbent becomes positively charged at pH below 6 and negatively charged at pH above 6.
Figure 5b shows the influence of pH on the adsorption of MB dye. The rise of pH values from 2 to 4 increases the removal activity of MB solutions, which ranges from 77 to 85 mg/g. Increasing the pH values further from 4 to 10 decreases the removal capability from 85 to 35 mg/g when using the developed biochar adsorbent material. The p-values corresponding to the F-statistic of one-way ANOVA for pH values of MB solutions are lower than 0.05, suggesting that the pH of MB aqueous solutions significantly influences the adsorption capacity, whereas the optimal pH for favorable adsorption of methylene blue is found at pH 4. Once the pH rose to more than 4, the adsorption capacity dramatically decreased. When the pH rises above the neutral value, sedimentation of the biochar granules often occurs at the bottom of the solution, which negatively affects the adsorption system. Like the multiple reaction forces, the interaction of hydrogen ions and the spread of pores negatively affect the adsorption system. Therefore, there is a significant decrease in the elimination of selected dye pollutants from synthetic waste streams. The overall findings suggest that pH 4 is the best condition for maximum destruction of dye molecules using seaweed biochar as an adsorbent.
Figure 5. (a) Point of zero charge (PZC) of biochar and (b) influence of solution pH on maximum removal of dye.
3.6. Adsorption Isotherm Analysis
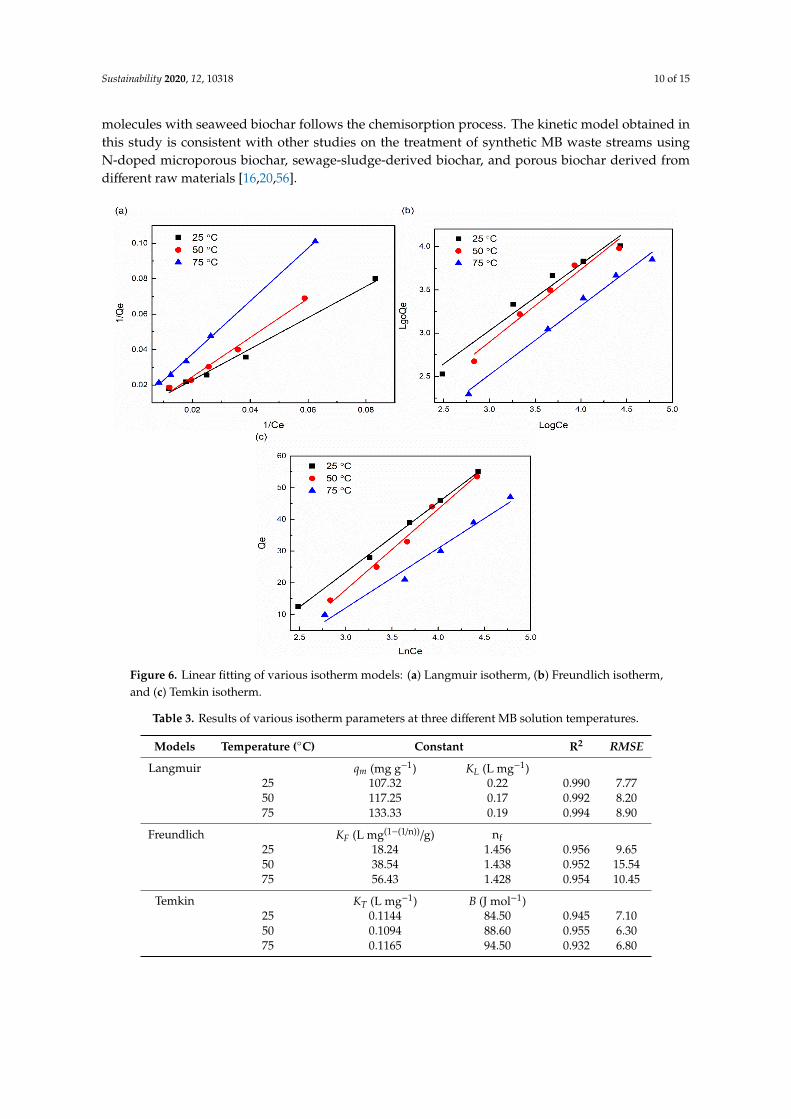
The adsorption isotherms of treatment of dye-containing solutions were successfully determined using experimental adsorption results by linearly fitting models of Temkin, Freundlich, and Langmuir isotherms. The adsorption isotherm graphs and results are shown in Figure 6 and Table 3. The highest values of R2 of the tested isotherms suggest that the model is the most fit to the experimental data [53]. The R2 values for the Langmuir, Freundlich, and Temkin models found in this study range from 0.990 to 0.994, 0.952 to 0.956, and 0.932 to 0.955, respectively. The minor differences between the experimental and suggested results attained by applying the Langmuir isotherm showed relatively smaller values of RMSE, ranging from 7.77 to 8.90, and these were correlated with higher values of RSME ranging from 9.65–15.45, which were produced by applying the Freundlich isotherm. The adsorption capacities of 107.32, 117.25, and 133.33 mg/g were obtained at 25, 50, and 75 °C, respectively, by applying the Langmuir model. The increase of adsorption capacity by increasing the temperature of the MB solution showed the endothermic nature of MB molecules’ sorption with seaweed biochar. The results also show that this adsorption treatment of the selected dye with seaweed biochar occurs in the form of a monolayer. The above predictive consequences of using biochar adsorbent are well in accordance with the previously reported works on the adsorption of MB dye [10,54].
Figure 5. (a) Point of zero charge (PZC) of biochar and (b) influence of solution pH on maximumremoval of dye.
3.6. Adsorption Isotherm Analysis
The adsorption isotherms of treatment of dye-containing solutions were successfully determinedusing experimental adsorption results by linearly fitting models of Temkin, Freundlich, and Langmuirisotherms. The adsorption isotherm graphs and results are shown in Figure 6 and Table 3. The highestvalues of R2 of the tested isotherms suggest that the model is the most fit to the experimental data [53].The R2 values for the Langmuir, Freundlich, and Temkin models found in this study range from 0.990to 0.994, 0.952 to 0.956, and 0.932 to 0.955, respectively. The minor differences between the experimentaland suggested results attained by applying the Langmuir isotherm showed relatively smaller values ofRMSE, ranging from 7.77 to 8.90, and these were correlated with higher values of RSME ranging from9.65–15.45, which were produced by applying the Freundlich isotherm. The adsorption capacitiesof 107.32, 117.25, and 133.33 mg/g were obtained at 25, 50, and 75 ◦C, respectively, by applying theLangmuir model. The increase of adsorption capacity by increasing the temperature of the MB solutionshowed the endothermic nature of MB molecules’ sorption with seaweed biochar. The results alsoshow that this adsorption treatment of the selected dye with seaweed biochar occurs in the form of amonolayer. The above predictive consequences of using biochar adsorbent are well in accordance withthe previously reported works on the adsorption of MB dye [10,54].
3.7. Adsorption Kinetic Analysis
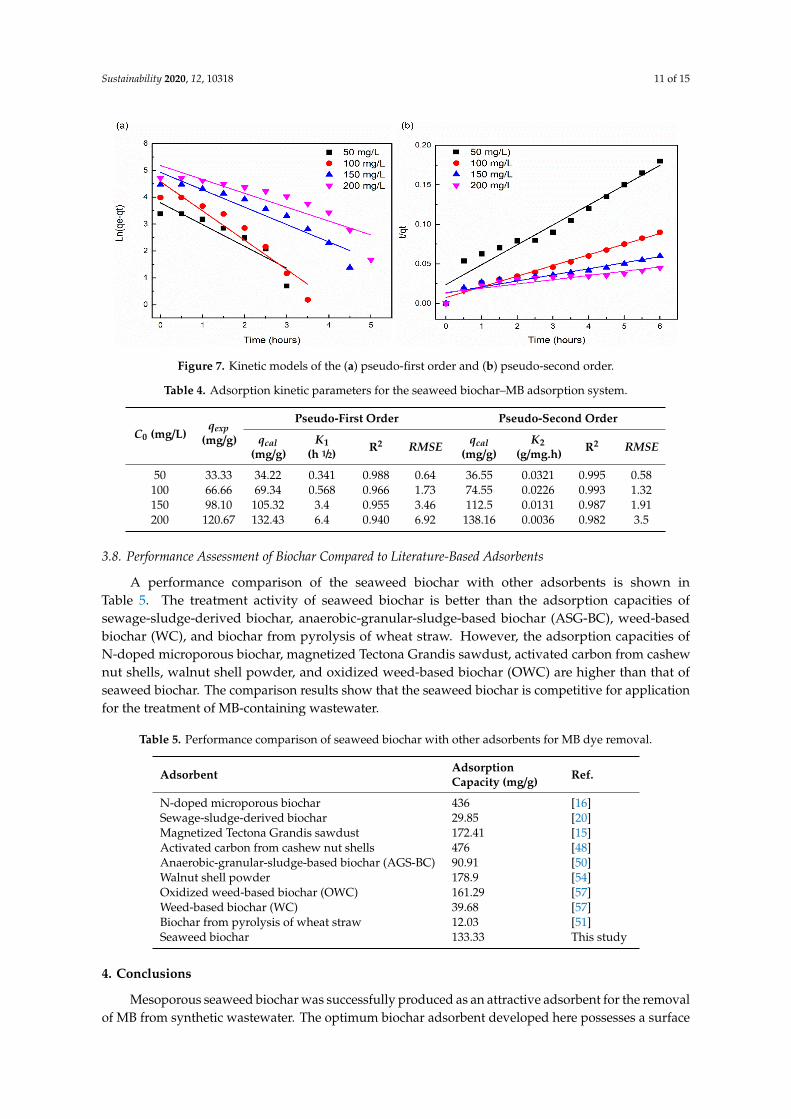
The pseudo-first-order and pseudo-second-order kinetic model equations were applied on theadsorption data obtained from the experiments. The modeling results are shown in Figure 7 and Table 4.The highest value of R2 indicates the most suitable model to explain the adsorption phenomenon [55].A low R2 of 0.940–0.988 was attained by applying the pseudo-first-order equation, while a high R2 of0.982–0.995 was found by applying the pseudo-second-order equation. On the other hand, the RMSEvalue for the pseudo-second-order equation is lower than that of the pseudo-first-order equation.The results show that the adsorption via the pseudo-second-order kinetic model is best suited forMB removal, though the pseudo-order does not fit to the data. The proposed sorption of the MB
Sustainability 2020, 12, 10318 10 of 15
molecules with seaweed biochar follows the chemisorption process. The kinetic model obtained inthis study is consistent with other studies on the treatment of synthetic MB waste streams usingN-doped microporous biochar, sewage-sludge-derived biochar, and porous biochar derived fromdifferent raw materials [16,20,56].
Sustainability 2020, 12, x FOR PEER REVIEW 10 of 15
Table 3. Results of various isotherm parameters at three different MB solution temperatures.
Models Temperature (°C) Constant R2 RMSE Langmuir qm (mg g−1) KL (L mg−1)
25 107.32 0.22 0.990 7.77 50 117.25 0.17 0.992 8.20 75 133.33 0.19 0.994 8.90
Freundlich KF (L mg(1−(1/n))/g) nf 25 18.24 1.456 0.956 9.65 50 38.54 1.438 0.952 15.54 75 56.43 1.428 0.954 10.45
Temkin KT (L mg−1) B (J mol−1) 25 0.1144 84.50 0.945 7.10 50 0.1094 88.60 0.955 6.30 75 0.1165 94.50 0.932 6.80
Figure 6. Linear fitting of various isotherm models: (a) Langmuir isotherm, (b) Freundlich isotherm, and (c) Temkin isotherm.
3.7. Adsorption Kinetic Analysis
The pseudo-first-order and pseudo-second-order kinetic model equations were applied on the adsorption data obtained from the experiments. The modeling results are shown in Figure 7 and Table 4. The highest value of R2 indicates the most suitable model to explain the adsorption phenomenon [55]. A low R2 of 0.940–0.988 was attained by applying the pseudo-first-order equation, while a high R2 of 0.982–0.995 was found by applying the pseudo-second-order equation. On the other hand, the RMSE value for the pseudo-second-order equation is lower than that of the pseudo-first-order equation. The results show that the adsorption via the pseudo-second-order kinetic model
Figure 6. Linear fitting of various isotherm models: (a) Langmuir isotherm, (b) Freundlich isotherm,and (c) Temkin isotherm.
Table 3. Results of various isotherm parameters at three different MB solution temperatures.
Models Temperature (◦C) Constant R2 RMSE
Langmuir qm (mg g−1) KL (L mg−1)25 107.32 0.22 0.990 7.7750 117.25 0.17 0.992 8.2075 133.33 0.19 0.994 8.90
Freundlich KF (L mg(1−(1/n))/g) nf25 18.24 1.456 0.956 9.6550 38.54 1.438 0.952 15.5475 56.43 1.428 0.954 10.45
Temkin KT (L mg−1) B (J mol−1)25 0.1144 84.50 0.945 7.1050 0.1094 88.60 0.955 6.3075 0.1165 94.50 0.932 6.80
Sustainability 2020, 12, 10318 11 of 15
Sustainability 2020, 12, x FOR PEER REVIEW 11 of 15
is best suited for MB removal, though the pseudo-order does not fit to the data. The proposed sorption of the MB molecules with seaweed biochar follows the chemisorption process. The kinetic model obtained in this study is consistent with other studies on the treatment of synthetic MB waste streams using N-doped microporous biochar, sewage-sludge-derived biochar, and porous biochar derived from different raw materials [16,20,56].
Table 4. Adsorption kinetic parameters for the seaweed biochar–MB adsorption system.
Figure 7. Kinetic models of the (a) pseudo-first order and (b) pseudo-second order.
3.8. Performance Assessment of Biochar Compared to Literature-Based Adsorbents
A performance comparison of the seaweed biochar with other adsorbents is shown in Table 5. The treatment activity of seaweed biochar is better than the adsorption capacities of sewage-sludge-derived biochar, anaerobic-granular-sludge-based biochar (ASG-BC), weed-based biochar (WC), and biochar from pyrolysis of wheat straw. However, the adsorption capacities of N-doped microporous biochar, magnetized Tectona Grandis sawdust, activated carbon from cashew nut shells, walnut shell powder, and oxidized weed-based biochar (OWC) are higher than that of seaweed biochar. The comparison results show that the seaweed biochar is competitive for application for the treatment of MB-containing wastewater.
Table 5. Performance comparison of seaweed biochar with other adsorbents for MB dye removal.
Adsorbent Adsorption Capacity(mg/g) Ref.
N-doped microporous biochar 436 [16] Sewage-sludge-derived biochar 29.85 [20] Magnetized Tectona Grandis sawdust 172.41 [15] Activated carbon from cashew nut shells 476 [48] Anaerobic-granular-sludge-based biochar (AGS-BC) 90.91 [50]
Walnut shell powder 178.9 [54] Oxidized weed-based biochar (OWC) 161.29 [57]
C0
(mg/L) qexp
(mg/g)
Pseudo-First Order Pseudo-Second Order qcal
(mg/g) K1
(h ½) R2 RMSE qcal
(mg/g) K2
(g/mg.h) R2 RMSE
50 33.33 34.22 0.341 0.988 0.64 36.55 0.0321 0.995 0.58 100 66.66 69.34 0.568 0.966 1.73 74.55 0.0226 0.993 1.32 150 98.10 105.32 3.4 0.955 3.46 112.5 0.0131 0.987 1.91 200 120.67 132.43 6.4 0.940 6.92 138.16 0.0036 0.982 3.5
Figure 7. Kinetic models of the (a) pseudo-first order and (b) pseudo-second order.
Table 4. Adsorption kinetic parameters for the seaweed biochar–MB adsorption system.
C0 (mg/L)qexp
(mg/g)
Pseudo-First Order Pseudo-Second Order
qcal(mg/g)
K1(h 1/2) R2 RMSE qcal
(mg/g)K2
(g/mg.h) R2 RMSE
50 33.33 34.22 0.341 0.988 0.64 36.55 0.0321 0.995 0.58100 66.66 69.34 0.568 0.966 1.73 74.55 0.0226 0.993 1.32150 98.10 105.32 3.4 0.955 3.46 112.5 0.0131 0.987 1.91200 120.67 132.43 6.4 0.940 6.92 138.16 0.0036 0.982 3.5
3.8. Performance Assessment of Biochar Compared to Literature-Based Adsorbents
A performance comparison of the seaweed biochar with other adsorbents is shown inTable 5. The treatment activity of seaweed biochar is better than the adsorption capacities ofsewage-sludge-derived biochar, anaerobic-granular-sludge-based biochar (ASG-BC), weed-basedbiochar (WC), and biochar from pyrolysis of wheat straw. However, the adsorption capacities ofN-doped microporous biochar, magnetized Tectona Grandis sawdust, activated carbon from cashewnut shells, walnut shell powder, and oxidized weed-based biochar (OWC) are higher than that ofseaweed biochar. The comparison results show that the seaweed biochar is competitive for applicationfor the treatment of MB-containing wastewater.
Table 5. Performance comparison of seaweed biochar with other adsorbents for MB dye removal.
Adsorbent AdsorptionCapacity (mg/g) Ref.
N-doped microporous biochar 436 [16]Sewage-sludge-derived biochar 29.85 [20]Magnetized Tectona Grandis sawdust 172.41 [15]Activated carbon from cashew nut shells 476 [48]Anaerobic-granular-sludge-based biochar (AGS-BC) 90.91 [50]Walnut shell powder 178.9 [54]Oxidized weed-based biochar (OWC) 161.29 [57]Weed-based biochar (WC) 39.68 [57]Biochar from pyrolysis of wheat straw 12.03 [51]Seaweed biochar 133.33 This study
4. Conclusions
Mesoporous seaweed biochar was successfully produced as an attractive adsorbent for the removalof MB from synthetic wastewater. The optimum biochar adsorbent developed here possesses a surface
Sustainability 2020, 12, 10318 12 of 15
area of 640 m2/g, pore volume of 0.54 cm3/g, and pore size of 2.32 nm. The adsorption mechanism isof the chemisorption type, in which a single layer of MB is formed on the surface of the adsorbent.The performance of seaweed biochar is comparable to that of commercial adsorbent materials for thetreatment of MB-containing synthetic wastewater.
Author Contributions: Conceptualization, A.A.H.S., and N.Y.H.; methodology, A.A.H.S., N.Y.H., and S.S.; formalanalysis, A.A.H.S., M.R.B. and A.V.; investigation, A.A.H.S. and N.Y.H.; resources, A.A.H.S. and A.V.; data curation,A.A.H.S. and N.Y.H.; writing—original draft preparation, A.A.H.S., A.A.S., and M.Z.; writing—review and editing,A.A.H.S., A.A.-F., M.R.B. and N.A.; visualization, A.A.H.S., A.A.S.G. and N.Y.H.; supervision, N.Y.H. and S.S.;project administration, N.Y.H. and S.S.; funding acquisition, N.Y.H.; Software design, A.A.S.G. All authors haveread and agreed to the published version of the manuscript.
Funding: This work was funded by the Ministry of Higher Education (MOHE) with the grant code FRGS-015MA0-089.
Acknowledgments: The authors would like to acknowledge the efforts of the Universiti Teknologi Petronas Malaysiafor financing the project through the Ministry of Higher Education (MOHE) with grant code FRGS-015MA0-089.
Conflicts of Interest: The authors declare no conflict of interest.
References
1. Zulfiqar, M.; Samsudin, M.F.R.; Sufian, S. Modelling and optimization of photocatalytic degradation ofphenol via TiO2 nanoparticles: An insight into response surface methodology and artificial neural network.J. Photochem. Photobiol. A Chem. 2019, 384, 112039. [CrossRef]
2. Banerjee, S.; Gautam, R.K.; Jaiswal, A.; Chattopadhyaya, M.C.; Sharma, Y.C. Rapid scavenging of methyleneblue dye from a liquid phase by adsorption on alumina nanoparticles. RSC Adv. 2015, 5, 14425–14440.[CrossRef]
3. Gupta, V.K.; Suhas. Application of low-cost adsorbents for dye removal—A review. J. Environ. Manag. 2009,90, 2313–2342. [CrossRef] [PubMed]
4. Lee, J.-W.; Choi, S.-P.; Thiruvenkatachari, R.; Shim, W.-G.; Moon, H. Evaluation of the performance ofadsorption and coagulation processes for the maximum removal of reactive dyes. Dyes Pigment. 2006, 69,196–203. [CrossRef]
5. Hernandez-Ramirez, O.; Holmes, S.M. Novel and modified materials for wastewater treatment applications.J. Mater. Chem. 2008, 18, 2751–2761. [CrossRef]
6. Siyal, A.A.; Shamsuddin, M.R.; Khan, M.I.; Rabat, N.E.; Zulfiqar, M.; Man, Z.; Siame, J.; Azizli, K.A. A reviewon geopolymers as emerging materials for the adsorption of heavy metals and dyes. J. Environ. Manag. 2018,224, 327–339. [CrossRef] [PubMed]
7. Chatterjee, D.; Patnam, V.R.; Sikdar, A.; Moulik, S.K. Removal of Some Common Textile Dyes from AqueousSolution Using Fly Ash. J. Chem. Eng. Data 2010, 55, 5653–5657. [CrossRef]
8. Li, L.; Wang, S.; Zhu, Z. Geopolymeric adsorbents from fly ash for dye removal from aqueous solution.J. Colloid Interface Sci. 2006, 300, 52–59. [CrossRef]
9. Markovic, S.; Stankovic, A.; Lopicic, Z.R.; Lazarevic, S.; Stojanovic, M.; Uskokovic, D.P. Application of rawpeach shell particles for removal of methylene blue. J. Environ. Chem. Eng. 2015, 3, 716–724. [CrossRef]
10. Khan, M.I.; Min, T.K.; Azizli, K.A.; Sufian, S.; Ullah, H.; Man, Z. Effective removal of methylene bluefrom water using phosphoric acid based geopolymers: Synthesis, characterizations and adsorption studies.RSC Adv. 2015, 5, 61410–61420. [CrossRef]
11. Huong, P.T.; JiTae, K.; Altahtamouni, T.M.; Tri, N.L.M.; Kim, H.-H.; Cho, K.H.; Lee, C. Novel activationof peroxymonosulfate by biochar derived from rice husk toward oxidation of organic contaminants inwastewater. J. Water Process. Eng. 2020, 33, 101037. [CrossRef]
12. Vithanage, M.; Mayakaduwa, S.; Herath, I.; Ok, Y.S.; Mohan, D. Kinetics, thermodynamics and mechanisticstudies of carbofuran removal using biochars from tea waste and rice husks. Chemosphere 2016, 150, 781–789.[CrossRef] [PubMed]
13. Zhou, D.; Xie, G.; Hu, X.; Cai, X.; Zhao, Y.; Hu, X.; Jin, Q.; Fu, X.; Tan, X.; Liang, C.; et al. Coupling of kenafBiochar and Magnetic BiFeO3 onto Cross-Linked Chitosan for Enhancing Separation Performance and Cr(VI)Ions Removal Efficiency. Int. J. Environ. Res. Public Health 2020, 17, 788. [CrossRef] [PubMed]
Sustainability 2020, 12, 10318 13 of 15
14. Li, J.; Wang, S.-L.; Zhang, J.; Zheng, L.; Chen, D.; Wu, Z.; Shaheen, S.M.; Rinklebe, J.; Ok, Y.S.; Wang, H.; et al.Coconut-fiber biochar reduced the bioavailability of lead but increased its translocation rate in rice plants:Elucidation of immobilization mechanisms and significance of iron plaque barrier on roots using spectroscopictechniques. J. Hazard. Mater. 2020, 389, 122117. [CrossRef]
15. Mashkoor, F.; Nasar, A. Magnetized Tectona grandis sawdust as a novel adsorbent: Preparation,characterization, and utilization for the removal of methylene blue from aqueous solution. Cellulose 2020, 27,2613–2635. [CrossRef]
16. Lian, F.; Cui, G.; Liu, Z.; Duo, L.; Zhang, G.; Xing, B. One-step synthesis of a novel N-doped microporousbiochar derived from crop straws with high dye adsorption capacity. J. Environ. Manag. 2016, 176, 61–68.[CrossRef]
17. Guo, H.; Bi, C.; Zeng, C.; Ma, W.; Yan, L.; Li, K.; Wei, K. Camellia oleifera seed shell carbon as an efficientrenewable bio-adsorbent for the adsorption removal of hexavalent chromium and methylene blue fromaqueous solution. J. Mol. Liq. 2018, 249, 629–636. [CrossRef]
18. Ahmad, M.A.; Ahmad, N.; Bello, O.S. Modified durian seed as adsorbent for the removal of methyl red dyefrom aqueous solutions. Appl. Water Sci. 2014, 5, 407–423. [CrossRef]
19. Ding, Z.; Wan, Y.; Xin, H.; Wang, S.; Zimmerman, A.R.; Gao, B. Sorption of lead and methylene blue ontohickory biochars from different pyrolysis temperatures: Importance of physicochemical properties. J. Ind.Eng. Chem. 2016, 37, 261–267. [CrossRef]
20. Fan, S.; Wang, Y.; Wang, Z.; Tang, J.; Tang, J.; Li, X. Removal of methylene blue from aqueous solutionby sewage sludge-derived biochar: Adsorption kinetics, equilibrium, thermodynamics and mechanism.J. Environ. Chem. Eng. 2017, 5, 601–611. [CrossRef]
21. Jalali, R.; Ghafourian, H.; Asef, Y.; Davarpanah, S.; Sepehr, S. Removal and recovery of lead using nonlivingbiomass of marine algae. J. Hazard. Mater. 2002, 92, 253–262. [CrossRef]
22. Romera, E.; González, F.; Ballester, A.; Blázquez, M.; Muñoz, J. Comparative study of biosorption of heavymetals using different types of algae. Bioresour. Technol. 2007, 98, 3344–3353. [CrossRef]
23. Ibrahim, W.M. Biosorption of heavy metal ions from aqueous solution by red macroalgae. J. Hazard. Mater.2011, 192, 1827–1835. [CrossRef] [PubMed]
24. Isam, M.; Baloo, L.; Kutty, S.R.M.; Yavari, S. Optimisation and Modelling of Pb (II) and Cu (II) Biosorptiononto Red Algae (Gracilaria changii) by Using Response Surface Methodology. Water 2019, 11, 2325. [CrossRef]
25. Cheng, S.Y.; Show, P.-L.; Lau, B.F.; Chang, J.-S.; Ling, T.C. New Prospects for Modified Algae in Heavy MetalAdsorption. Trends Biotechnol. 2019, 37, 1255–1268. [CrossRef]
26. Tabassum, M.R.; Xia, A.; Murphy, J.D. Potential of seaweed as a feedstock for renewable gaseous fuelproduction in Ireland. Renew. Sustain. Energy Rev. 2017, 68, 136–146. [CrossRef]
27. Saeed, A.A.H.; Harun, N.Y.; Zulfani, N. Heavy Metals Capture from Water Sludge by Kenaf Fibre ActivatedCarbon in Batch Adsorption. J. Ecol. Eng. 2020, 21, 102–115. [CrossRef]
28. Chung, I.K.; Oak, J.H.; Lee, J.A.; Shin, J.A.; Kim, J.G.; Park, K.-S. Installing kelp forests/seaweed beds formitigation and adaptation against global warming: Korean Project Overview. ICES J. Mar. Sci. 2013, 70,1038–1044. [CrossRef]
29. Hou, X.; From, N.; Angelidaki, I.; Huijgen, W.J.; Bjerre, A.-B. Butanol fermentation of the brown seaweedLaminaria digitata by Clostridium beijerinckii DSM-6422. Bioresour. Technol. 2017, 238, 16–21. [CrossRef]
30. Li, S.; Han, K.; Li, J.; Li, M.; Lu, C. Preparation and characterization of super activated carbon produced fromgulfweed by KOH activation. Microporous Mesoporous Mater. 2017, 243, 291–300. [CrossRef]
31. Harun, N.Y.; Han, T.J.; Vijayakumar, T.; Saeed, A.; Afzal, M. Ash Deposition Characteristics of IndustrialBiomass Waste and Agricultural Residues. Mater. Today Proc. 2019, 19, 1712–1721. [CrossRef]
32. Rathinam, A.; Rao, J.R.; Nair, B.U. Adsorption of phenol onto activated carbon from seaweed: Determinationof the optimal experimental parameters using factorial design. J. Taiwan Inst. Chem. Eng. 2011, 42, 952–956.[CrossRef]
33. Saeed, A.A.H.; Harun, N.Y.; Nasef, M.M. Physicochemical Characterization of Different Agricultural Residuesin Malaysia for Bio Char Production. Int. J. Civ. Eng. Technol. 2019, 10, 213–225.
34. Zulfiqar, M.; Sufian, S.; Mansor, N.; Rabat, N.E. Synthesis and characterization of TiO2-based nanostructuresvia fluorine-free solvothermal method for enhancing visible light photocatalytic activity: Experimental andtheoretical approach. J. Photochem. Photobiol. A Chem. 2020, 112834. [CrossRef]
Sustainability 2020, 12, 10318 14 of 15
35. Zulfiqar, M.; Sufian, S.; Rabat, N.E.; Mansor, N. Photocatalytic degradation and adsorption of phenol bysolvent-controlled TiO2 nanosheets assisted with H2O2 and FeCl3: Kinetic, isotherm and thermodynamicanalysis. J. Mol. Liq. 2020, 308, 112941. [CrossRef]
36. Langmuir, I. The Adsorption of Gases on Plane Surfaces of Glass, Mica and Platinum. J. Am. Chem. Soc.1918, 40, 1361–1403. [CrossRef]
37. Freundlich, H. Über die Adsorption in Lösungen. Z. Phys. Chem. 1907, 57, 385–470. [CrossRef]38. Temkin, M.I. Adsorption equilibrium and the kinetics of processes on nonhomogeneous surfaces and in the
interaction between adsorbed molecules. Zh. Fiz. Chim. 1941, 15, 296–332.39. Lagergren, S. About the theory of so-called adsorption of soluble substances. Sven. Vetenskapsakad. Handingarl.
1898, 24, 1–39.40. Ho, Y.S.; McKay, G. Pseudo-second order model for sorption processes. Process. Biochem. 1999, 34, 451–465.
[CrossRef]41. Zaman, C.Z.; Pal, K.; Yehye, W.A.; Sagadevan, S.; Shah, S.T.; Adebisi, G.A.; Marliana, E.; Rafique, R.F.;
Bin Johan, R. Pyrolysis: A Sustainable Way to Generate Energy from Waste. In Pyrolysis; IntechOpen: Rijeka,Croatia, 2017; p. 1.
42. Demirbas, A. Combustion characteristics of different biomass fuels. Prog. Energy Combust. Sci. 2004, 30,219–230. [CrossRef]
43. Liu, Z.; Yang, W.; Xu, W.; Liu, Y. Removal of elemental mercury by bio-chars derived from seaweedimpregnated with potassium iodine. Chem. Eng. J. 2018, 339, 468–478. [CrossRef]
44. International Biochar Initiative. Standardized Product Definition and Product Testing Guidelines for Biochar ThatIs Used in Soil; IBI: Philadelphia, PA, USA, 2012.
45. Rafiq, M.K.; Bachmann, R.T.; Shang, Z.; Joseph, S.; Long, R. Influence of Pyrolysis Temperature onPhysico-Chemical Properties of Corn Stover (Zea mays L.) Biochar and Feasibility for Carbon Capture andEnergy Balance. PLoS ONE 2016, 11, e0156894. [CrossRef] [PubMed]
46. Yahia, M.B.; Torkia, Y.B.; Knani, S.; Hachicha, M.A.; Khalfaoui, M.; Lamine, A.B. Models for Type VIAdsorption Isotherms from a Statistical Mechanical Formulation. Adsorpt. Sci. Technol. 2013, 31, 341–357.[CrossRef]
47. Ahmad, M.; Rajapaksha, A.U.; Lim, J.E.; Zhang, M.; Bolan, N.; Mohan, D.; Vithanage, M.; Lee, S.S.; Ok, Y.S.Biochar as a sorbent for contaminant management in soil and water: A review. Chemosphere 2014, 99, 19–33.[CrossRef]
48. Spagnoli, A.A.; Giannakoudakis, D.A.; Bashkova, S. Adsorption of methylene blue on cashew nut shellbased carbons activated with zinc chloride: The role of surface and structural parameters. J. Mol. Liq. 2017,229, 465–471. [CrossRef]
49. Wang, Y.; Liu, R. Comparison of characteristics of twenty-one types of biochar and their ability to removemulti-heavy metals and methylene blue in solution. Fuel Process. Technol. 2017, 160, 55–63. [CrossRef]
50. Shi, L.; Zhang, G.; Wei, D.; Yan, L.; Xue, X.; Shi, S.; Wei, Q. Preparation and utilization of anaerobic granularsludge-based biochar for the adsorption of methylene blue from aqueous solutions. J. Mol. Liq. 2014, 198,334–340. [CrossRef]
51. Liu, Y.; Zhao, X.; Li, J.; Ma, D.; Han, R. Characterization of bio-char from pyrolysis of wheat straw and itsevaluation on methylene blue adsorption. Desalination Water Treat. 2012, 46, 115–123. [CrossRef]
52. Wanyonyi, W.C.; Onyari, J.M.; Shiundu, P.M. Adsorption of Congo Red Dye from Aqueous Solutions UsingRoots of Eichhornia Crassipes: Kinetic and Equilibrium Studies. Energy Procedia 2014, 50, 862–869. [CrossRef]
53. Zulfiqar, M.; Lee, S.Y.; Mafize, A.A.; Kahar, N.A.M.A.; Johari, K.; Rabat, N.E. Efficient Removal of Pb(II) fromAqueous Solutions by Using Oil Palm Bio-Waste/MWCNTs Reinforced PVA Hydrogel Composites: Kinetic,Isotherm and Thermodynamic Modeling. Polymers 2020, 12, 430. [CrossRef]
54. Miyah, Y.; Lahrichi, A.; Idrissi, M.; Khalil, A.; Zerrouq, F. Adsorption of methylene blue dye from aqueoussolutions onto walnut shells powder: Equilibrium and kinetic studies. Surf. Interfaces 2018, 11, 74–81.[CrossRef]
55. Zulfiqar, M.; Chowdhury, S.; Samsudin, M.F.R.; Siyal, A.A.; Omar, A.A.; Ahmad, T.; Sufian, S. Effect oforganic solvents on the growth of TiO2 nanotubes: An insight into photocatalytic degradation and adsorptionstudies. J. Water Process. Eng. 2020, 37, 101491. [CrossRef]

Sustainability 2020, 12, 10318 15 of 15
56. Ahmed, M.; Okoye, P.; Hummadi, E.; Hameed, B. High-performance porous biochar from the pyrolysis ofnatural and renewable seaweed (Gelidiella acerosa) and its application for the adsorption of methylene blue.Bioresour. Technol. 2019, 278, 159–164. [CrossRef]
57. Güzel, F.; Saygılı, H.; Saygılı, G.A.; Koyuncu, F.; Yılmaz, C. Optimal oxidation with nitric acid of biocharderived from pyrolysis of weeds and its application in removal of hazardous dye methylene blue fromaqueous solution. J. Clean. Prod. 2017, 144, 260–265. [CrossRef]
Publisher’s Note: MDPI stays neutral with regard to jurisdictional claims in published maps and institutionalaffiliations.
© 2020 by the authors. Licensee MDPI, Basel, Switzerland. This article is an open accessarticle distributed under the terms and conditions of the Creative Commons Attribution(CC BY) license (http://creativecommons.org/licenses/by/4.0/).