bibliometric evaluation of sepa-funded large research programs 2003-2013
TRANSCRIPT
Bibliometric evaluation of SEPA-funded large research
programs 2003–2013ULF SANDSTRÖM
REPORT 6636 • DECEMBER 2014
Bibliometric evaluation of SEPA-funded large research programs 2003–2013ULF SANDSTRÖM
REPORT 6636
SWEDISH EPA
ISBN 978-91-620-6636-9
ISSN 0282-7298
Naturvårdsverket utvärderar återkommande sin forsk-
ning. Denna rapport är skriven på engelska med svensk
samman fattning, och presenterar en bibliometrisk utvärde-
ring av sju forskningsprograms vetenskapliga publicerings-
och citeringsresultat. Programmen startade någon gång
under 2001-2007 och avslutades någon gång mellan 2006
och 2012. Sammantaget citerades de sju programmens
artiklar ca 50 % mer än artiklar i genomsnitt inom respek-
tive ämnesområde globalt, tre av programmen uppvisade
svagare resultat.
The Swedish Environmental Protection Agency (SEPA)
evaluates its funded research continuously. This report
presents the results of a bibliometric evaluation of the
scientific citation performance of seven SEPA research
programs, which started sometime during 2001–2007 and
ended sometime during 2006–2012. Overall, the relative
citation performance was ca. 50% above international
reference levels. Three programs had weaker impacts.
Swedish EPA SE-106 48 Stockholm. Visiting address: Stockholm – Valhallavägen 195, Östersund – Forskarens väg 5 hus Ub. Tel: +46 10-698 10 00, fax: +46 10-698 10 99, e-mail: [email protected] Internet: www.naturvardsverket.se Orders Ordertel: +46 8-505 933 40, orderfax: +46 8-505 933 99, e-post: [email protected] Adress: Arkitektkopia AB, Box 110 93, SE-161 11 Bromma. Internet: www.naturvardsverket.se/publikationer
The author assumes soleresponsibility for the contents
of this report, whichtherefore cannot be citedas representing the views
of the Swedish EPA.
SWEDISH ENVIRONMENTAL PROTECTION AGENCY
Bibliometric evaluation of SEPA-funded large research
programs 2003–2013
Ulf Sandström
OrderPhone: + 46 (0)8-505 933 40
Fax: + 46 (0)8-505 933 99 E-mail: [email protected]
Address: Arkitektkopia AB, Box 110 93, SE-161 11 Bromma, Sweden Internet: www.naturvardsverket.se/publikationer
The Swedish Environmental Protection AgencyPhone: + 46 (0)10-698 10 00, Fax: + 46 (0)10-698 10 99
E-mail: [email protected] Address: Naturvårdsverket, SE-106 48 Stockholm, Sweden
Internet: www.naturvardsverket.se
ISBN 978-91-620-6636-9 ISSN 0282-7298
© Naturvårdsverket 2014
Print: Arkitektkopia AB, Bromma 2015Cover photos: Jesper Johansson, Örebro University
N
ORDIC ECOLABEL
Printed Matter
SWEDISH ENVIRONMENTAL PROTECTION AGENCY REPORT 6636Bibliometric evaluation of SEPA-funded large research programs 2003–2013
3
PrefaceThe Swedish Environmental Protection Agency (SEPA) continuously evaluates its research according to the following criteria: 1) Process 2) Relevance in rela-tion to 16 National Environmental Quality Objectives and 3) Scientific quality.
Bibliometric methods concerning publication and citation performance were applied for the last criterion and the results are presented in this report. Seven research programs which started sometime during 2001–2007 and finalized during 2006–2012 were investigated. The research programs reach over subject areas and issues such as climate change adaptation, methods for public participation, enforcement of environmental law, statistical methods to assess and discern environmental change, life-cycle based decision support systems, wildlife and fish management, and how environmental policies and intentions are perceived by citizens.
Professor Ulf Sandström – Örebro University – who also carried out a similar bibliometric evaluation of SEPA research programs in 2009, was com-missioned by the SEPA to undertake the analysis. He alone is responsible for all evaluations in the report. Dr Per Sjögren-Gulve, principal research officer at the Research & Assessment Department, has been the SEPA project leader of the study.
The Swedish Environmental Protection Agency in December, 2014.
Eva Thörnelöf, DirectorResearch & Assessment Department

SWEDISH ENVIRONMENTAL PROTECTION AGENCY REPORT 6636Bibliometric evaluation of SEPA-funded large research programs 2003–2013
SWEDISH ENVIRONMENTAL PROTECTION AGENCY REPORT 6636Bibliometric evaluation of SEPA-funded large research programs 2003–2013
5
ContentsPREFACE 3
SAMMANFATTNING 6
SUMMARY 7
THE BIBLIOMETRIC STUDY 8
SEVEN RESEARCH PROGRAMS 9
QUESTIONS FOR THE EVALUATION 13
DATA – VALIDATION AND CONCERNS 16
PROGRAM OUTPUT ANALYSIS 21
1. ALL TEAM MEMBER SCHOLARLY PUBLICATIONS 22
2. TEAM MEMBER SCHOLARLY PUBLICATIONS REPORTED TO SEPA 49
3. GOOGLE SCHOLAR DOCUMENTS AND CITATIONS 54
CONCLUSIONS 56
APPENDIX 1: THEORIES AND METHODS IN EVALUATIVE BIBLIOMETRICS 57
APPENDIX 2: PUBLISH OR PERISH 71
REFERENCES 72
SWEDISH ENVIRONMENTAL PROTECTION AGENCY REPORT 6636Bibliometric evaluation of SEPA-funded large research programs 2003–2013
6
SammanfattningNaturvårdsverket inledde 2001–2002 en satsning på större forsknings-program, vilka finansierades över en femårsperiod. I denna rapport utvärde-ras, med tonvikt på bibliometriska metoder, sju av de program som startades i slutfasen av denna programsatsning.
Inledningsvis kan konstateras att en huvudsaklig effekt har varit att ge förutsättningar för ett 30-tal nya forskare att med sina avhandlingar bidra till forskningsområdets expansion. I takt med att ett antal av dessa flyttar till andra verksamheter i företag och myndigheter kommer samhällets absorp-tionsförmåga av ny kunskap inom området att förbättras.
Publiceringar i vetenskapliga tidskrifter utgör navet för utvärderingen och de specifika metoder som tillämpas bygger på idén att normalisera antalet artiklar och antalet erhållna citeringar till jämförbara områden.
Analysen har i första hand inriktats på de artiklar som forskarna själva, enligt sina slutrapporter (eller motsvarande), redovisat som resultat av pro-gramrelaterade aktiviteter. Utöver detta har analyser utförts dels på publice-ringar som hänför sig till programandeltagarnas samtliga publiceringar under programperioden dels på de publiceringar som på motsvarande sätt indexerats i Google Scholar. Dessa båda senare undersökningar ger i huvudsak resultat som är något svagare än analysen på basis av egenrapporterade publiceringar.
Noterbart är att påfallande få av de publiceringar som programmen uppger vara relaterade till Naturvårdsverkets finansiering har uppgett finan-siären i sina tack och tillkännagivanden, dvs. funding acknowledgements.
Vad gäller produktivitet, dvs. antalet producerade artiklar i relation till nordiska referensvärden, uppvisar programmen en nivå som ligger i paritet med eller högre än vad som kunde förväntas av forskare inom dessa områden. I klara verba betyder det att Naturvårdsverket fått förhållandevis god utväx-ling på insatta resurser.
Med avseende på citeringsgrad – påverkan på internationella kolleger inom de vetenskapliga nätverken – har utfallet varit likaledes gott om vi ser till den generella nivån. Med en citeringsgrad som uppgår till närmare 50 procent över världsgenomsnittet har Naturvårdsverket finansierat starka forskar grupper även om intrycket dras ned av att tre av sju program har förhållandevis svaga prestationer.
Tar vi forskningsprogrammen inrapporterade publikationer till utgångs-punkt erhåller vi följande: Ett program uppnår en nivå som motsvarar högsta betyg, dvs. Outstanding. Ett annat program uppnår nivån Excellent och ytterligare två program får betyget Very Good. Vidare har två program en citeringsgrad som motsvarar betyget Good. Slutligen ges ett program, som till följd av låg aktivitet inte når tillfredsställande nivåer, betyget. Insufficient. Betygssättningen bygger på drygt trehundra svenska forskargrupper som varit inbegripna i olika finansieringsprogram för excellens och starka forsknings-miljöer (se nedan sid. 66–67).
SWEDISH ENVIRONMENTAL PROTECTION AGENCY REPORT 6636Bibliometric evaluation of SEPA-funded large research programs 2003–2013
7
SummaryIn 2001–2002 the Swedish Environmental Protection Agency (SEPA) initiated an investment in larger research programs, funded over periods of six years. This report evaluates, with emphasis on bibliometric methods, seven of the programs established in the final phase of this initiative. The programs started around 2003–2004, in one case a bit later, and ended around and after 2010.
Initially, it can be stated that one of the program’s primary effect has been to allow for more than 30 young scientists to contribute to the expansive research area with their dissertations. A number of these PhDs will in due time move to other activities in companies and government agencies and at the same time society’s absorptive capacity for new knowledge in the environ-mental field will be expanded and transformed.
This main message of this report concerns the publication production and citation performance of researchers within the above mentioned seven research programs. Papers published by more than 100 researchers are com-pared with papers published by their international colleagues during the same time period and in the same areas of science.
The analysis primarily focuses on those scientific papers the researchers themselves have reported as a result of program-related activities. In addition, analyses have been carried out based on (1) all publications from all program members in the Web of Science database, and (2) on all team member publi-cations similarly indexed in Google Scholar. These latter two studies provide results which basically indicate lower performances than the analysis based on self-reported publications.
It is worth noting that remarkably few of the publications specifically men-tioned the SEPA as financier in the respective “funding acknowledgements” in the articles.
Concerning publication productivity, i.e. production of papers in relation to Nordic reference values, the SEPA funded programs exhibit an activity at levels that would be expected by researchers in these areas. This implicates that the Swedish Environmental Protection Agency is likely to have received results in parity with the resources invested.
With respect to the relative citation performance, the outcome was even better, about 50 per cent above international reference levels. Therefore, the impression is generally very good but the evaluation points out that three out of seven programs have weak impact.
Concerning the grading of each programme based on self-reported publi-cations: One of the research programs achieved levels equivalent to the high-est rating, i.e. Outstanding. Another program reached the level of Excellent. Two programs had a citation score that corresponds to the grade Very Good and two programs were rated as Good. Finally, one program with low level of activity, did not achieve satisfactory levels, i.e. Insufficient.
SWEDISH ENVIRONMENTAL PROTECTION AGENCY REPORT 6636Bibliometric evaluation of SEPA-funded large research programs 2003–2013
8
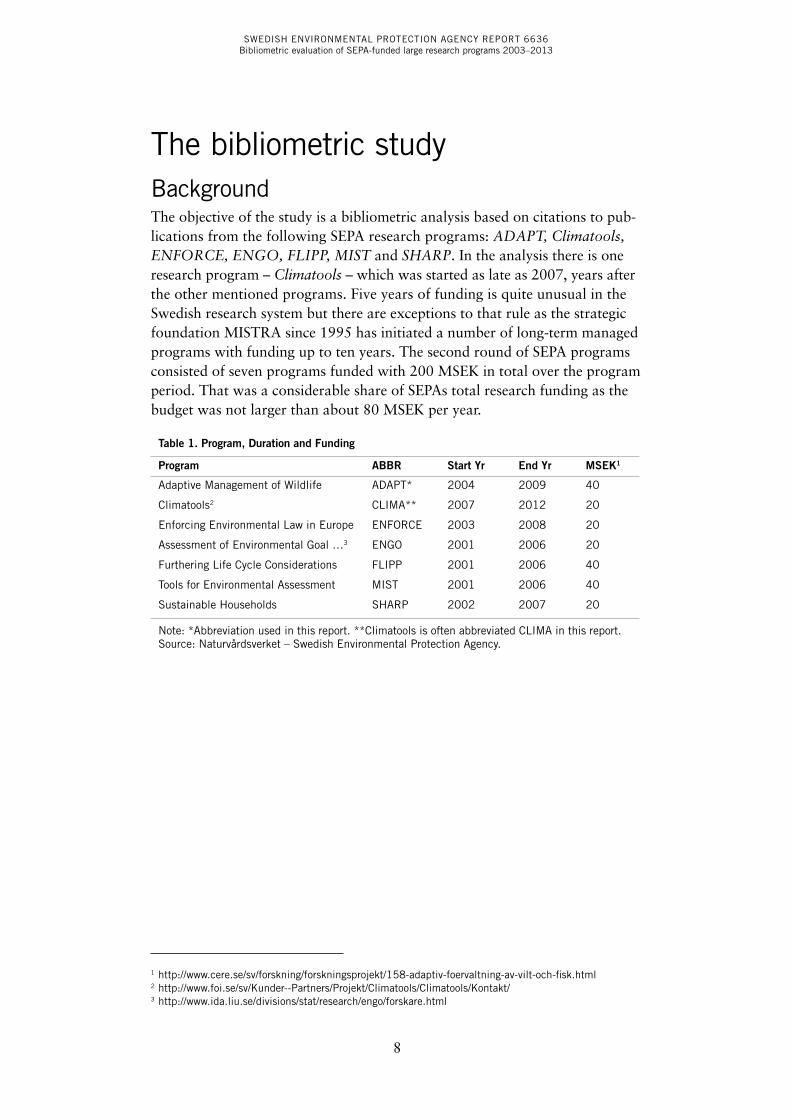
The bibliometric studyBackgroundThe objective of the study is a bibliometric analysis based on citations to pub-lications from the following SEPA research programs: ADAPT, Climatools, ENFORCE, ENGO, FLIPP, MIST and SHARP. In the analysis there is one research program – Climatools – which was started as late as 2007, years after the other mentioned programs. Five years of funding is quite unusual in the Swedish research system but there are exceptions to that rule as the strategic foundation MISTRA since 1995 has initiated a number of long-term managed programs with funding up to ten years. The second round of SEPA programs consisted of seven programs funded with 200 MSEK in total over the program period. That was a considerable share of SEPAs total research funding as the budget was not larger than about 80 MSEK per year.
Table 1. Program, Duration and Funding123
Program ABBR Start Yr End Yr MSEK1
Adaptive Management of Wildlife ADAPT* 2004 2009 40
Climatools2 CLIMA** 2007 2012 20
Enforcing Environmental Law in Europe ENFORCE 2003 2008 20
Assessment of Environmental Goal …3 ENGO 2001 2006 20
Furthering Life Cycle Considerations FLIPP 2001 2006 40
Tools for Environmental Assessment MIST 2001 2006 40
Sustainable Households SHARP 2002 2007 20
Note: *Abbreviation used in this report. **Climatools is often abbreviated CLIMA in this report. Source: Naturvårdsverket – Swedish Environmental Protection Agency.
1 http://www.cere.se/sv/forskning/forskningsprojekt/158-adaptiv-foervaltning-av-vilt-och-fisk.html2 http://www.foi.se/sv/Kunder--Partners/Projekt/Climatools/Climatools/Kontakt/3 http://www.ida.liu.se/divisions/stat/research/engo/forskare.html
SWEDISH ENVIRONMENTAL PROTECTION AGENCY REPORT 6636Bibliometric evaluation of SEPA-funded large research programs 2003–2013
9
Seven Research ProgramsThis section goes a little further into the specific research programs to reflect the specific objectives that they worked with. The following is entirely based on text from their funding applications, from websites or from reports to the financier:
ADAPT (Adaptiv förvaltning av vilt och fisk)“The program’s overall objective can be summarized as follows, namely: developing: (1) a scientific basis for adaptive management of wildlife and fish populations, (2) an integrated communication between management and research. Stimulate: (1) scientific collaboration between researchers in wildlife and fish oriented disciplines, (2) close cooperation between different scientific disciplines in the natural and social sciences, (3) international coop-eration. (4) Transferring knowledge to local, regional and national manage-ment of fish and wildlife. (5) Taking a national perspective and responsibility. (6) Educating a new generation of researchers with a broad scientific base.” (From the program proposal/application)4
Unfortunately, the program web site is no longer available.5
“Perhaps Sweden has never before had more wildlife animals than now. Swedes are a growing population, but fewer and fewer people live in rural areas in close contact with wildlife and its habitats. Yet engagement in wild-life policy questions getting stronger, and many issues are both important and controversial. How big the Swedish moose population should be is a matter of great socio-economic importance. The large carnivores evoke strong emo-tions. The book “Wildlife, Man, Society” is aimed at anyone who is interested in hunting and wildlife issues in a changing environment.” 6 [from one of the main results from the project: a book published by Liber Publishing House (2010) with the title: Vilt, människa, samhälle. 320 pp.; Eng.: “Wildlife, Man, Society”.]
4 Programmets övergripande målsättning kan sammanfattas på följande sätt, nämligen att: Utveckla: (1) en vetenskaplig bas för adaptiv förvaltning (AF) av vilt- och fiskpopulationer; (2) en integrerad kommu-nikation mellan förvaltning och forskning. Stimulera: (1) vetenskapligt samarbete mellan forskare inom vilt- och fiskorienterade discipliner; (2) nära samarbete mellan olika vetenskapliga discipliner inom natur- och samhällsvetenskap; (3) internationellt samarbete. Överföra kunskap till lokal, regional och nationell förvaltning av vilt och fisk. Ta ett nationellt perspektiv och ansvar. Utbilda en ny generation forskare med en bred vetenskaplig bas.” (Ansökan)5 http://www.cere.se/sv/forskning/forskningsprojekt/158-adaptiv-foervaltning-av-vilt-och-fisk.html6 “Sverige har kanske aldrig haft mer vilt än nu. Vi svenskar är också fler än någonsin, men allt färre bor på landsbygden i nära kontakt med viltet och dess livsmiljöer. Ändå engagerar viltet allt fler och många frågeställningar är både viktiga och kontroversiella. Hur stor den svenska älgstammen ska vara är en fråga av stor samhällsekonomisk betydelse. De stora rovdjuren väcker starka känslor. Vilt, människa, samhälle vänder sig till alla som är intresserade av jakt- och viltfrågor i en föränderlig miljö.”
SWEDISH ENVIRONMENTAL PROTECTION AGENCY REPORT 6636Bibliometric evaluation of SEPA-funded large research programs 2003–2013
10
Climatools“In short: The aim is to develop tools for climate change adaptation.”
“The main task of CLIMATOOLS is to develop new tools that can be used for climate adaptation work by sectors and local/regional authorities. The main focus is the capacity to handle uncertainties relating to climate change in the short-term and the long-term. (The program) plan to develop the following eight new tools and test these out in collaboration with practitioners: 1) A new decision support tool – scenario-based convergence seminars – designed to deal with adaptation to climate change. 2) Scenario templates that facilitate the development of local scenarios for decision support to local and regional decision-makers. 3) Methods for adaptability analyses, based on vulnerability methods. 4) Guidelines for assessment of health impacts associated with cli-mate change. 5) Guidelines for economic analysis of climate change and adap-tation to it. 6) A manual describing the methods that can be used to handle goal conflicts that arise as society adapts to climate change. 7) A manual for the inclusion of gender issues in climate adaptation work. 8) A checklist that can be used to detect and handle ethical problems that arise as society takes measures to adapt to climate change.” (From proposal/application)7
ENFORCE“The overall objective of the programme is to find appropriate public law instruments and procedures for the purpose of enforcing environmental law, including both the means for supervisory authorities and criminal sanctions and, not least important, the interaction between supervisory means and the sanctions. The methodology is comparative: Analyses of different European administrative and criminal law systems on the environmental area, concen-trating on organisational matters and the authorities’ access to instruments for enforcing. As indicated above, a thorough comparison of different national systems would surely reveal both similarities and differences and give rise to fruitful general discussions on the appropriateness of different alternatives.”
“The programme will put much effort on the comparison of the role of environmental authorities. Firstly, the programme will focus on the authori-ties’ use of classic tools of administrative law and criminal law and the inter-action between these rules. The relation between the supervisory authorities and the courts will be discussed. Also the authorities’ possibility to use civil law instruments will be analysed. Secondly, the programme will discuss how the public law instruments could be developed and improved in order to more efficiently reach the environmental objectives, reflected in the basic material legal instruments. A vital part of this discussion will of course be the relation between national enforcement instruments and the demands from EC-law and the European Convention on Human Rights.” (From proposal/application)
7 At <http://www.foi.se/sv/Kunder--Partners/Projekt/Climatools/Climatools/Kontakt/ > information on the program is available.
SWEDISH ENVIRONMENTAL PROTECTION AGENCY REPORT 6636Bibliometric evaluation of SEPA-funded large research programs 2003–2013
11
ENGO“ENGO is an interdisciplinary research programme in which the development of tools and procedures for data analysis are integrated with studies of com-munication processes between scientists and practitioners and between different levels of the environmental administration. More specifically, the programme aims to:(I) develop generic principles and user-friendly software for extracting anthro-
pogenic signals from environmental data influenced by natural variation;(ii) develop cost-effective procedures for the collection of multivariate environ-
mental data and the evaluation of temporal changes in such data;(iii) identify and handle obstacles for communicating progress or lack of pro-
gress towards environmental quality objectives.
Special attention will be paid to the handling of different forms of uncertainty that may impair the estimation, interpretation and communication of tempo-ral changes in the indicators that shall be used to follow up and assess goal achievement.” (From proposal/application)8
MIST“The MiSt-programme is applied, multidisciplinary striving towards interdis-ciplinarity. Research is carried out in co-operation and interaction with agen-cies, organisations and other stakeholders. The programme is proposed as an integrated network with major other research projects giving an added value. Projects in three themes: SEA-implementation: processes and tools for assess-ment of programme and plans but also of national policy for sustainability and implementation at regional and local level. Scenario techniques: application in strategic decision-making, policy and regional/ local planning. Effectiveness of tools and combinations of tools in complex processes of policy, planning and implementation; especially the use of environmental systems analytical tools.
There are two “horizontal perspectives”: (1) Public participation: Methods of effective and efficient public participation at different levels; the problem of openness and transparency in pursuing complex scientific or technical tools and in complex processes of decision-making; the meaning of participation at different levels of decision making. (2) The issue of effectiveness of regulation of tools and processes. The programme addresses decision-making in existing decision structures and under change. There are four components: Concurrent programme activities aiming at integrating projects; concrete, empirical research projects; Future research preceded by exploratory projects; Synthesis and sum-mary including communication with users.” (From proposal/application)
8 At <http://www.ida.liu.se/divisions/stat/research/engo/forskare.html > some very basic information about the research program is available.
SWEDISH ENVIRONMENTAL PROTECTION AGENCY REPORT 6636Bibliometric evaluation of SEPA-funded large research programs 2003–2013
12
FLIPP“The FLIPP program aims at developing knowledge and understanding of the dynamics, mechanisms and interactions in complex product chains necessary to underpin life cycle based decision support systems. The knowledge gener-ated from its multidisciplinary applied research approach aims to support poli-cymakers in decisions on how and when to intervene in product chains, when to facilitate processes already set in motion by market actors and when to leave be. It will also support the actors in the product chains, in their chain-related decisions, such as procurement, product design, production and marketing.
The program will strengthen Swedish research on product-oriented envi-ronmental policy. The research projects are adjusted to the needs of relevant users, primarily policymakers and businesses. The program will create a national competence centre for Swedish research within the field, and be a main actor on the international arena. The research will have two main focus areas: 1) the relations between different actors within the product chain (the industry perspective), and 2) the possibilities of governments to control the environmental impacts in the product chain (the policy perspective). Research in these two areas has traditionally been divided, and FLIPP aims to better integrate the two perspectives.” (From proposal/application)
SHARP“The multi-disciplinary SHARP Program combines political, economic, legal, psychological and time-geographical methods and employs a bottom-up per-spective to understand how environmental policies and intentions are per-ceived and implemented within Swedish households. The overall objectives of the proposed project are to: (a) investigate the correspondence between environmental policy intentions and the environmental values and attitudes held by households; (b) explore the resource constraints that people face when engaging in ‘sustainability’-promoting activities in their daily life, and how they choose to organize their activities given these constraints; and (c) use this information to clarify under what circumstances different environmen-tal policies will be effective and perceived as legitimate.” (From proposal/application)9
The program produced one edited book published by the Earthscan publishing company: Environmental policy and household behaviour : sustainability and everyday life / edited by Patrik Söderholm and with chap-ter contributions from each of the team members. The book was published in 2010.
9 [The webpage sharpprogram.se is closed down].
SWEDISH ENVIRONMENTAL PROTECTION AGENCY REPORT 6636Bibliometric evaluation of SEPA-funded large research programs 2003–2013
13
Questions for the evaluationThis evaluation was commissioned by SEPA to undertake a bibliomet-ric investigation of the above mentioned programs. The report presents a detailed bibliometric analysis based on publication data from 2003–2012. The main question to be answered through the analysis concerns the perfor-mance of groups in two dimensions: 1) production performance (productivity of research); and 2) citation performance (“quality” of research)10.
This is the second bibliometric evaluation of SEPA long-term programs. The first report (Sandström 2009) also evaluated seven programs; the results were overall promising and positive. However, due to different publication cultures an additional approach to the performance question is used in this report. This subsequent report will add Google Scholar metrics in order to be able to evaluate other types of output than the usual scientific publications indexed in Web of Science.
Output and Impact of researchThe evaluation is based mainly on a quantitative analysis of scientific articles in international journals and serials processed for the Web of Science versions of the Citation Indices (SCI, SSCI and A&HCI). Therefore, the first part of the report is not a bibliographic exercise trying to cover all publications from the SEPA-funded researchers. Instead, the focus is put on contribution in scientific journals which are indexed by their references and thereby making it possible to measure impact and use by colleagues all over the world.
The Web of Science database represents roughly 90 per cent of the most prestigious journals and serials in major fields of science. The database was set up in the early 1960s by an independent research-oriented company in order to meet the needs of modern science in library and information services. Evidently, the database is also a valuable asset for evaluative bibliometrics as it indexes the references in articles and connects references to articles (cita-tions).
With the Web of Science it is known what types of material are included, scholarly (refereed) journals and no more, with all other databases (except for Scopus) there are included many different types of data, which makes it more or less impossible to judge whether the impact is coming from the scholarly side or from any other side. As will be dwelled upon in the theoreti-cal chapter, scholarly contributions cannot be judged by stakeholder groups but has to be scrutinized in a peer process before it is concerned as accepted (core) knowledge.11
10 See Cole & Cole (1973) ch. 2 on the question whether citations is a viable proxy for quality.11 C.f. Cole & Cole (1973), see esp. chapter 2.
SWEDISH ENVIRONMENTAL PROTECTION AGENCY REPORT 6636Bibliometric evaluation of SEPA-funded large research programs 2003–2013
14
Another consideration that has guided the evaluation approach is a require-ment to make use of multiple indicators in order to describe the complex pat-terns of publications from research programs performed by universities and research institutes. The study makes use of several methods, each deepening the understanding generated by the publication output from a different angel of incidence. No single indices should be considered in isolation.
Publications and citations form the basis of indicators used. Citations are a direct measure of impact; however, they measure the quality of an article only indirectly and imperfectly. Whilst we can undoubtedly measure the impact of a research unit by looking at the number of times its publications have been cited; there are limitations. Citation-based methods enable us to identify excel-lence in research; these methods cannot, with certainty, identify the absence of excellence (or quality).
However, the research programs scrutinized in this evaluation are not only scientific exercises, they are to a large extent devoted to and understood as applied research undertakings. Therefore, it is necessary to put forward the question on what other types of results and outputs are there from the respec-tive programs. Partly, this will be answered in a companion evaluation report (Professional Management, 2015), but, here, is first to be discussed whether it is possible to evaluate research without taking these results into considera-tion? To answer that question we go to the theory of bibliometric peer review.
Bibliometric peer reviewWhy bibliometric peer review? The reason is simple and alludes on everyday scholarly behavior; every time a scientific colleague uses an article produced by a SEPA-funded researcher comprises a valuation of the article; is it valuable and instrumental for that specific peer? The stream of articles is thus forming a base for calculations on the number of such collegial decisions made by the respective researchers. Together, these decision processes build a large amount of material that can be normalized and calculated so that it can form the basis for a scientific evaluation. This valuation is based on systematic methods and does not lend itself to random factors like selection of assessors or alike. Bibliometric peer review is the only way to implement peer review in a way that is stable over time, comparable over time, and should be fair and provide interpretable results. Bornmann & Marx (2013) calls it the wisdom of crowds and this wisdom can only be held by the large group of peers. In the words of Thomas Kuhn: ”For a scientist, the solution of a difficult conceptual or instru-mental puzzle is a principal goal. His success in that endeavor is rewarded through recognition by other members of his professional group and by them alone.” (Kuhn, 1970, p.21).
This study is based on a quantitative analysis of scientific articles pub-lished in journals and serials processed for the Web of Science (WoS) versions of the Science Citation Index and associated citation indices: the Science
SWEDISH ENVIRONMENTAL PROTECTION AGENCY REPORT 6636Bibliometric evaluation of SEPA-funded large research programs 2003–2013
15
Citation Index (SCI), the Social Science Citation Index (SSCI), and the Arts & Humanities Citation Index (A&HCI). Using advanced bibliometric tech-niques, it assesses the publication output and citation impact of research performed within the above mentioned SEPA funded programs. Non-serial literature is included in the alternative analysis (part three) based on Google Scholar.
Impact, as measured by citations, is compared with worldwide reference values. Citations to articles until August, 2014 are used for the analysis. The investigations reported here use a decreasing time-window from the year of publication until August, 2014. However, some of the indicators are used for time-series and in these cases a fixed two year citation window is applied. Publications from year 2003 receive citations until 2005; publications from 2004 receive citations until 2006 and so on.
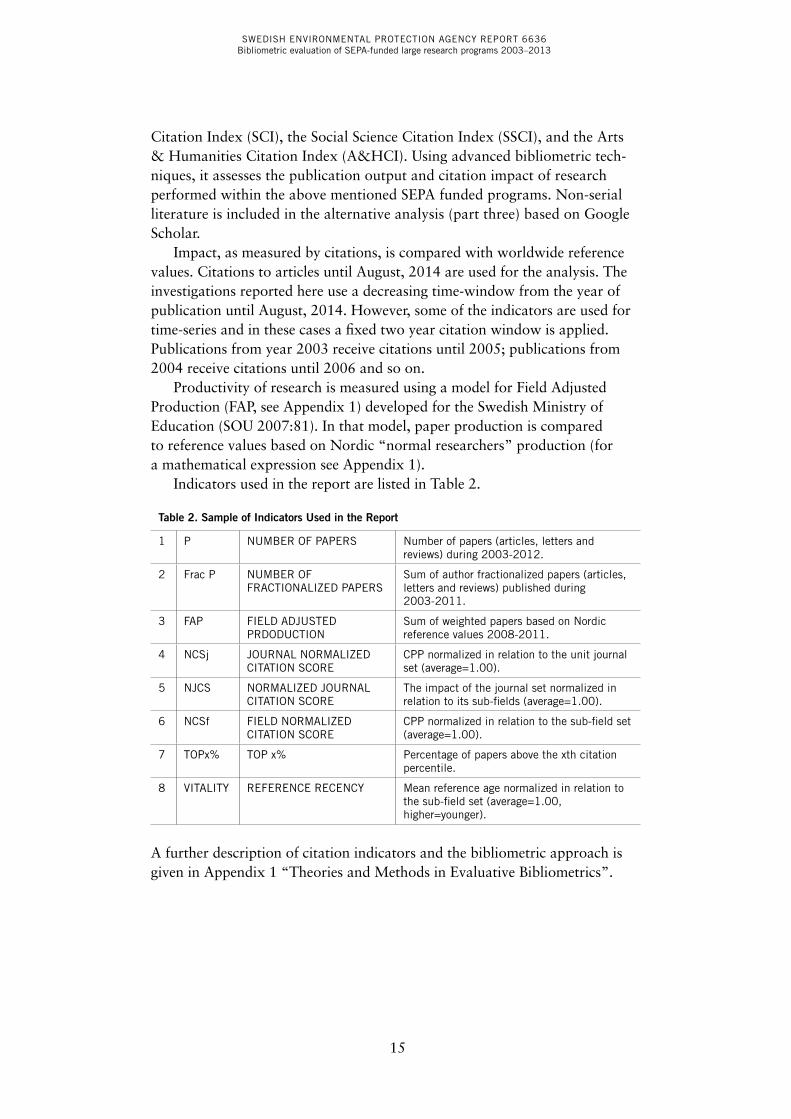
Productivity of research is measured using a model for Field Adjusted Production (FAP, see Appendix 1) developed for the Swedish Ministry of Education (SOU 2007:81). In that model, paper production is compared to reference values based on Nordic “normal researchers” production (for a mathematical expression see Appendix 1).
Indicators used in the report are listed in Table 2.
Table 2. Sample of Indicators Used in the Report
1 P NUMBER OF PAPERS Number of papers (articles, letters and reviews) during 2003-2012.
2 Frac P NUMBER OF FRACTIONALIZED PAPERS
Sum of author fractionalized papers (articles, letters and reviews) published during 2003-2011.
3 FAP FIELD ADJUSTED PRDODUCTION
Sum of weighted papers based on Nordic reference values 2008-2011.
4 NCSj JOURNAL NORMALIZED CITATION SCORE
CPP normalized in relation to the unit journal set (average=1.00).
5 NJCS NORMALIZED JOURNAL CITATION SCORE
The impact of the journal set normalized in relation to its sub-fields (average=1.00).
6 NCSf FIELD NORMALIZED CITATION SCORE
CPP normalized in relation to the sub-field set (average=1.00).
7 TOPx% TOP x% Percentage of papers above the xth citation percentile.
8 VITALITY REFERENCE RECENCY Mean reference age normalized in relation to the sub-field set (average=1.00, higher=younger).
A further description of citation indicators and the bibliometric approach is given in Appendix 1 “Theories and Methods in Evaluative Bibliometrics”.
SWEDISH ENVIRONMENTAL PROTECTION AGENCY REPORT 6636Bibliometric evaluation of SEPA-funded large research programs 2003–2013
16
Data – validation and concernsThe SEPA administration made available the applications and final reports from each program. How is research done in each program adequately repre-sented? Should we focus on program leader’s activities or all researchers that has been involved? Should the focus be put on program-related activities only, distinguishing to other activities? If the latter is the case, then a full analysis of all papers from researchers would cover too much as some probably have been involved in work not funded by SEPA. Several other financing arrange-ments are usually set in motion together with (almost) any program fund-ing. Accordingly, it is necessary to clarify the options for a more delimited approach.
In the current bibliometric evaluation, lists of publications from the respective programs final reports and/or the program websites are used. In consequence, for some programs PhD students and other research personnel are among the personnel publishing from the programs as they are presented as researchers with a connection to the program. In all, the list of researchers consists of more than 100 researchers from the seven research programs. The former evaluation report (Sandström, 2009) made a more detailed analysis of data and material and could show that there were only small parts of the publishing activities that would be missed with a strategy focussing on the senior personnel but that does not seem to be the case in the current evalua-tion. Furthermore, an exclusive focus on the senior personnel would include too many publications without relevance for the SEPA initiative. Therefore, in this report results are shown using several different and complementary strategies.
Limiting the exercise to publications related to SEPA funded research only is, of course, a question of highest sensitivity. It has been possible to identify a list of publications from each program even though some have been more challenging to find than others. Combinations of reports to SEPA and docu-ments on web pages have made it possible.
Still, there are problems concerning how to interpret the question of what to evaluate. One example: the ADAPT program, which is one of the two largest considering the level of funding (40 MSEK), have listed about 100 publications in their final report. When searching for all their Web of Science papers many more papers from these researchers show up. Numbers indicate that only 40 per cent of the total production from the group is listed in the final report. Consequently, this can be taken as an indication that researchers reports can be trusted and that researchers do not play the game.
At the same time there are room for using the margins as there are no clear-cut distinctions between different projects and programs. The actual time period for the SEPA initiative can be characterized as a moment in Swedish research policy when almost all financiers, public and private, joined
SWEDISH ENVIRONMENTAL PROTECTION AGENCY REPORT 6636Bibliometric evaluation of SEPA-funded large research programs 2003–2013
17
the bandwagon and went for large-scale funding. Strategic research centres, Linnaeus grants, strong research environments etc. are all examples of this Zeitgeist (for further discussion, see Sandström, Wold et al. 2010).
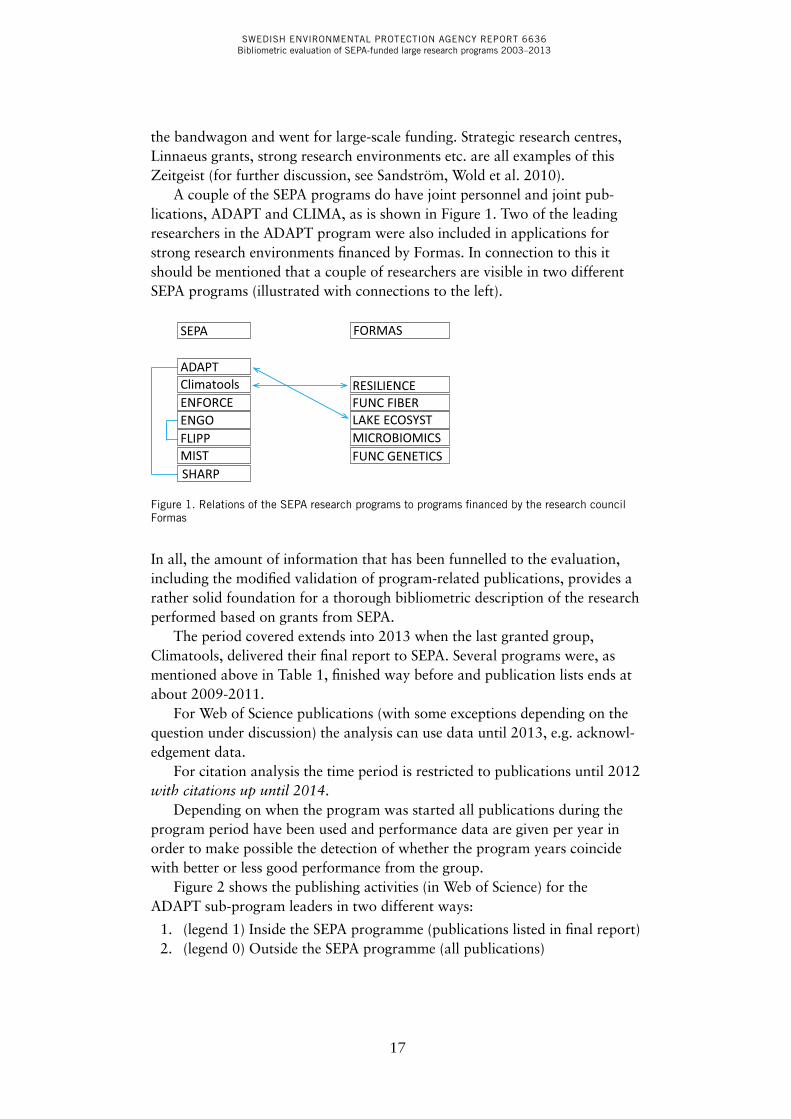
A couple of the SEPA programs do have joint personnel and joint pub-lications, ADAPT and CLIMA, as is shown in Figure 1. Two of the leading researchers in the ADAPT program were also included in applications for strong research environments financed by Formas. In connection to this it should be mentioned that a couple of researchers are visible in two different SEPA programs (illustrated with connections to the left).
SEPA FORMAS
ADAPTClimatoolsENFORCEENGOFLIPPMISTSHARP
RESILIENCEFUNC FIBERLAKE ECOSYSTMICROBIOMICSFUNC GENETICS
Figure 1. Relations of the SEPA research programs to programs financed by the research council Formas
In all, the amount of information that has been funnelled to the evaluation, including the modified validation of program-related publications, provides a rather solid foundation for a thorough bibliometric description of the research performed based on grants from SEPA.
The period covered extends into 2013 when the last granted group, Climatools, delivered their final report to SEPA. Several programs were, as mentioned above in Table 1, finished way before and publication lists ends at about 2009-2011.
For Web of Science publications (with some exceptions depending on the question under discussion) the analysis can use data until 2013, e.g. acknowl-edgement data.
For citation analysis the time period is restricted to publications until 2012 with citations up until 2014.
Depending on when the program was started all publications during the program period have been used and performance data are given per year in order to make possible the detection of whether the program years coincide with better or less good performance from the group.
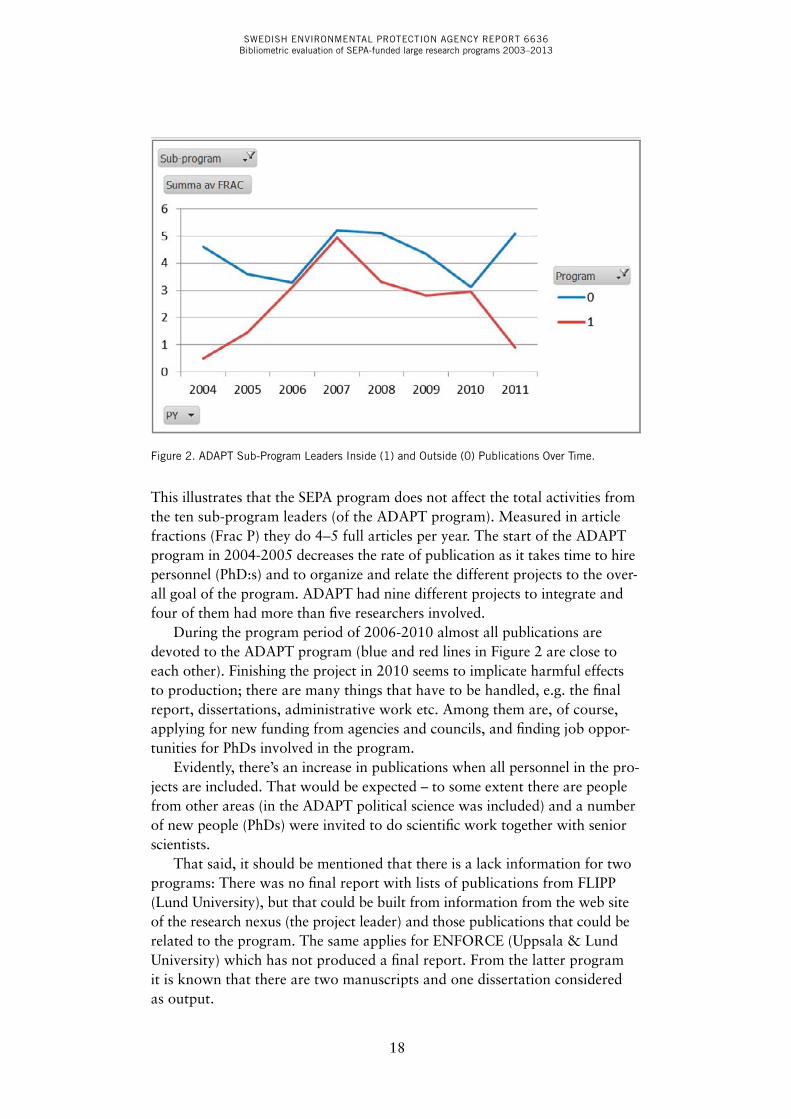
Figure 2 shows the publishing activities (in Web of Science) for the ADAPT sub-program leaders in two different ways:
1. (legend 1) Inside the SEPA programme (publications listed in final report)2. (legend 0) Outside the SEPA programme (all publications)
SWEDISH ENVIRONMENTAL PROTECTION AGENCY REPORT 6636Bibliometric evaluation of SEPA-funded large research programs 2003–2013
18
Figure 2. ADAPT Sub-Program Leaders Inside (1) and Outside (0) Publications Over Time.
This illustrates that the SEPA program does not affect the total activities from the ten sub-program leaders (of the ADAPT program). Measured in article fractions (Frac P) they do 4–5 full articles per year. The start of the ADAPT program in 2004-2005 decreases the rate of publication as it takes time to hire personnel (PhD:s) and to organize and relate the different projects to the over-all goal of the program. ADAPT had nine different projects to integrate and four of them had more than five researchers involved.
During the program period of 2006-2010 almost all publications are devoted to the ADAPT program (blue and red lines in Figure 2 are close to each other). Finishing the project in 2010 seems to implicate harmful effects to production; there are many things that have to be handled, e.g. the final report, dissertations, administrative work etc. Among them are, of course, applying for new funding from agencies and councils, and finding job oppor-tunities for PhDs involved in the program.
Evidently, there’s an increase in publications when all personnel in the pro-jects are included. That would be expected – to some extent there are people from other areas (in the ADAPT political science was included) and a number of new people (PhDs) were invited to do scientific work together with senior scientists.
That said, it should be mentioned that there is a lack information for two programs: There was no final report with lists of publications from FLIPP (Lund University), but that could be built from information from the web site of the research nexus (the project leader) and those publications that could be related to the program. The same applies for ENFORCE (Uppsala & Lund University) which has not produced a final report. From the latter program it is known that there are two manuscripts and one dissertation considered as output.
SWEDISH ENVIRONMENTAL PROTECTION AGENCY REPORT 6636Bibliometric evaluation of SEPA-funded large research programs 2003–2013
19
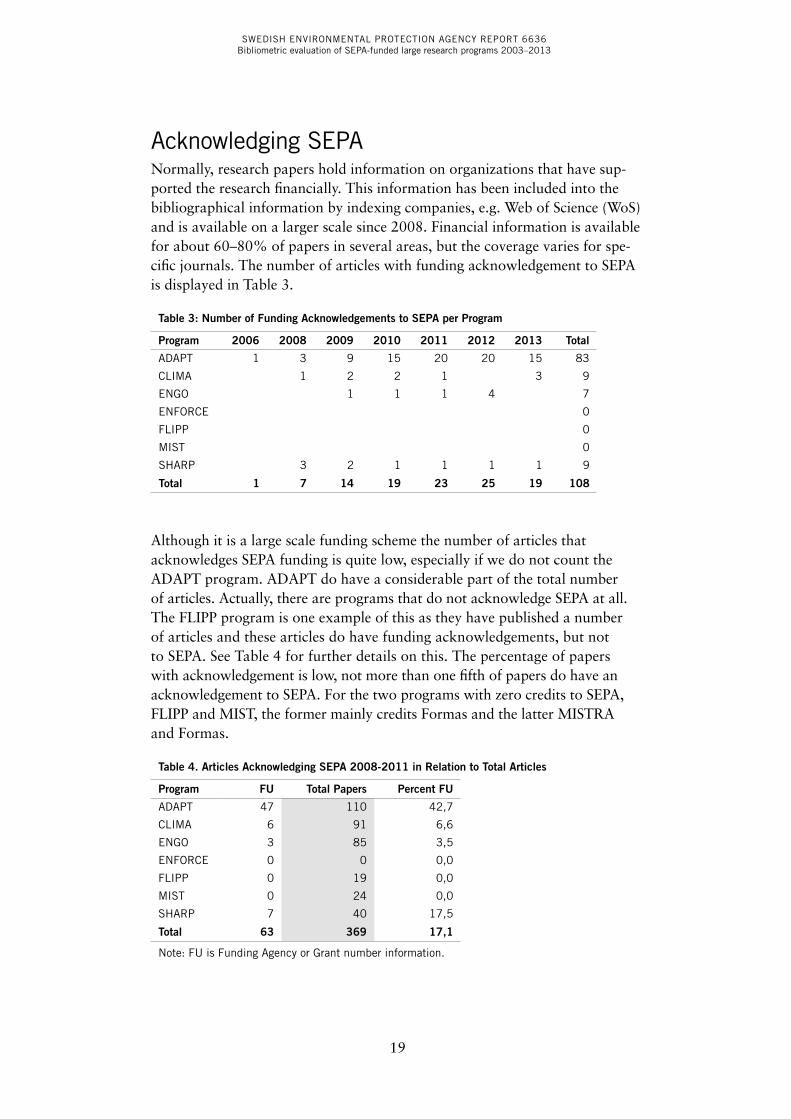
Acknowledging SEPANormally, research papers hold information on organizations that have sup-ported the research financially. This information has been included into the bibliographical information by indexing companies, e.g. Web of Science (WoS) and is available on a larger scale since 2008. Financial information is available for about 60–80% of papers in several areas, but the coverage varies for spe-cific journals. The number of articles with funding acknowledgement to SEPA is displayed in Table 3.
Table 3: Number of Funding Acknowledgements to SEPA per Program
Program 2006 2008 2009 2010 2011 2012 2013 Total
ADAPT 1 3 9 15 20 20 15 83
CLIMA 1 2 2 1 3 9
ENGO 1 1 1 4 7
ENFORCE 0
FLIPP 0
MIST 0
SHARP 3 2 1 1 1 1 9
Total 1 7 14 19 23 25 19 108
Although it is a large scale funding scheme the number of articles that acknowledges SEPA funding is quite low, especially if we do not count the ADAPT program. ADAPT do have a considerable part of the total number of articles. Actually, there are programs that do not acknowledge SEPA at all. The FLIPP program is one example of this as they have published a number of articles and these articles do have funding acknowledgements, but not to SEPA. See Table 4 for further details on this. The percentage of papers with acknowledgement is low, not more than one fifth of papers do have an acknowledgement to SEPA. For the two programs with zero credits to SEPA, FLIPP and MIST, the former mainly credits Formas and the latter MISTRA and Formas.
Table 4. Articles Acknowledging SEPA 2008‑2011 in Relation to Total Articles
Program FU Total Papers Percent FU
ADAPT 47 110 42,7
CLIMA 6 91 6,6
ENGO 3 85 3,5
ENFORCE 0 0 0,0
FLIPP 0 19 0,0
MIST 0 24 0,0
SHARP 7 40 17,5
Total 63 369 17,1
Note: FU is Funding Agency or Grant number information.
SWEDISH ENVIRONMENTAL PROTECTION AGENCY REPORT 6636Bibliometric evaluation of SEPA-funded large research programs 2003–2013
20
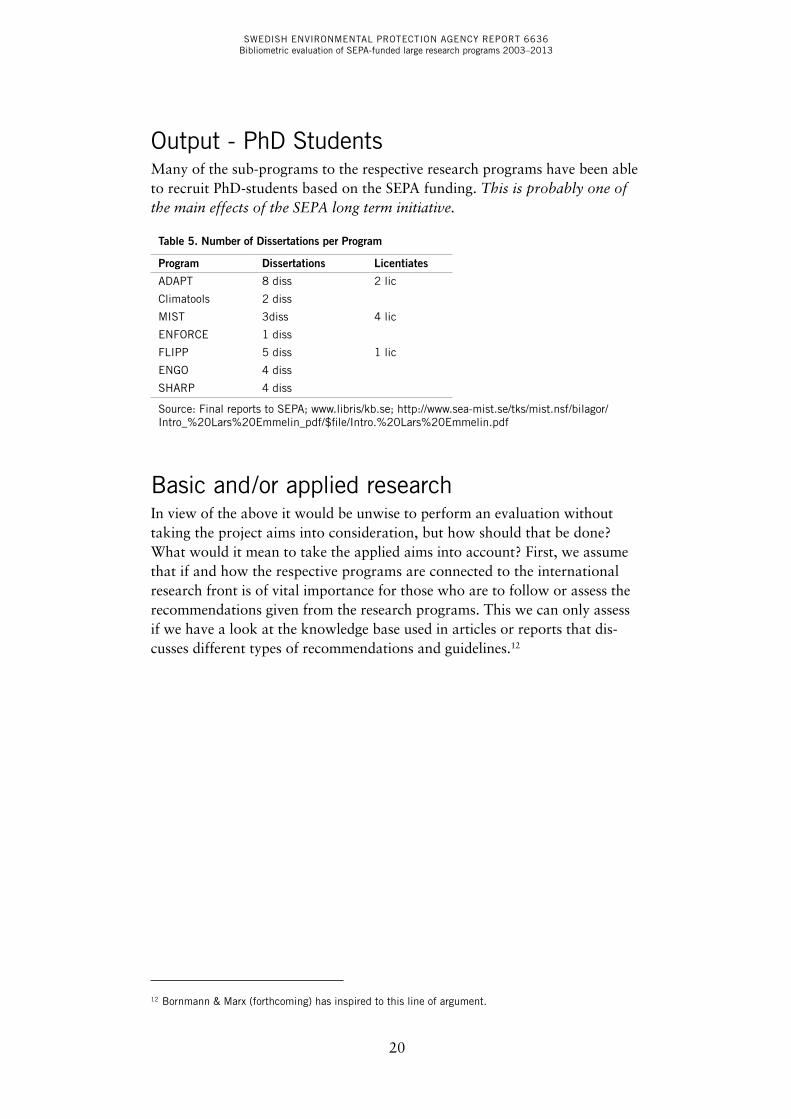
Output - PhD StudentsMany of the sub-programs to the respective research programs have been able to recruit PhD-students based on the SEPA funding. This is probably one of the main effects of the SEPA long term initiative.
Table 5. Number of Dissertations per Program
Program Dissertations Licentiates
ADAPT 8 diss 2 lic
Climatools 2 diss
MIST 3diss 4 lic
ENFORCE 1 diss
FLIPP 5 diss 1 lic
ENGO 4 diss
SHARP 4 diss
Source: Final reports to SEPA; www.libris/kb.se; http://www.sea-mist.se/tks/mist.nsf/bilagor/Intro_%20Lars%20Emmelin_pdf/$file/Intro.%20Lars%20Emmelin.pdf
Basic and/or applied researchIn view of the above it would be unwise to perform an evaluation without taking the project aims into consideration, but how should that be done? What would it mean to take the applied aims into account? First, we assume that if and how the respective programs are connected to the international research front is of vital importance for those who are to follow or assess the recommendations given from the research programs. This we can only assess if we have a look at the knowledge base used in articles or reports that dis-cusses different types of recommendations and guidelines.12
12 Bornmann & Marx (forthcoming) has inspired to this line of argument.
SWEDISH ENVIRONMENTAL PROTECTION AGENCY REPORT 6636Bibliometric evaluation of SEPA-funded large research programs 2003–2013
21
Program output analysisThe output analysis will be organised into three different parts:
1. Scholarly WoS publications from all team members of the respective SEPA programs over the actual program period (starting 2003 and end-ing 2012);
2. Scholarly WoS publications listed in the final reports to SEPA;3. Publish or Perish registered publications (based on Google Scholar) from
all team members of the SEPA program.
SWEDISH ENVIRONMENTAL PROTECTION AGENCY REPORT 6636Bibliometric evaluation of SEPA-funded large research programs 2003–2013
22
1. All team member scholarly publications
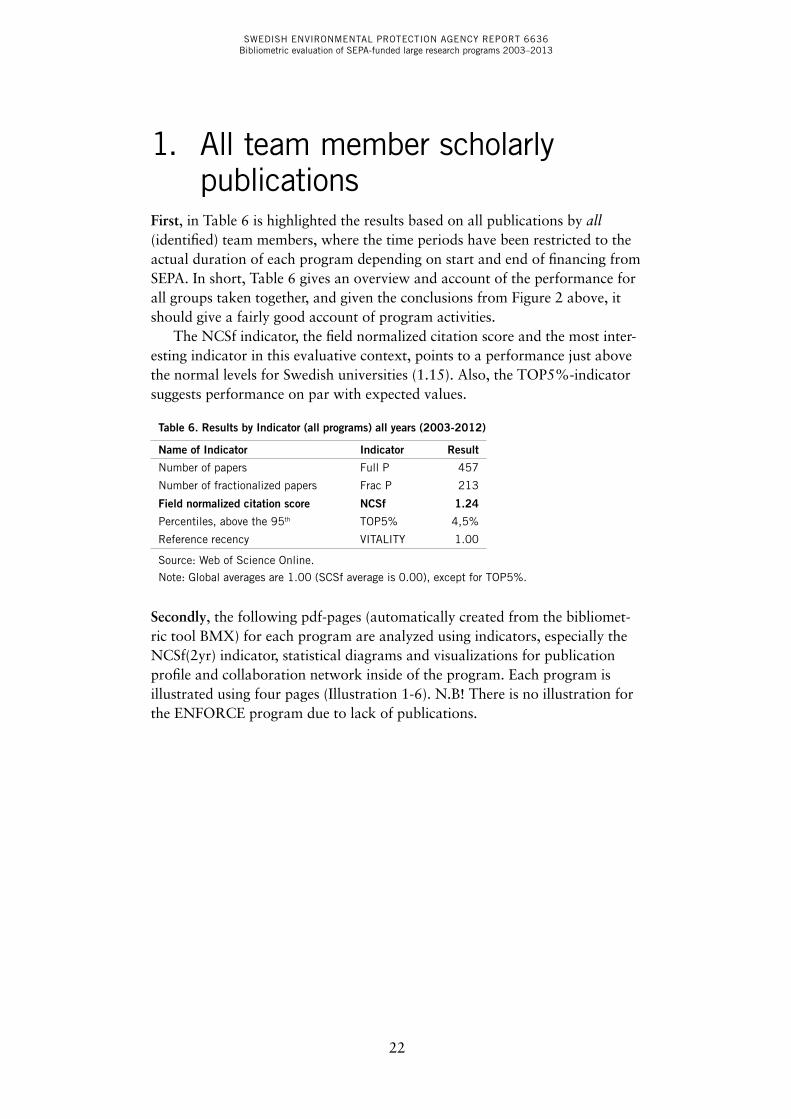
First, in Table 6 is highlighted the results based on all publications by all (identified) team members, where the time periods have been restricted to the actual duration of each program depending on start and end of financing from SEPA. In short, Table 6 gives an overview and account of the performance for all groups taken together, and given the conclusions from Figure 2 above, it should give a fairly good account of program activities.
The NCSf indicator, the field normalized citation score and the most inter-esting indicator in this evaluative context, points to a performance just above the normal levels for Swedish universities (1.15). Also, the TOP5%-indicator suggests performance on par with expected values.
Table 6. Results by Indicator (all programs) all years (2003‑2012)
Name of Indicator Indicator Result
Number of papers Full P 457
Number of fractionalized papers Frac P 213
Field normalized citation score NCSf 1.24
Percentiles, above the 95th TOP5% 4,5%
Reference recency VITALITY 1.00
Source: Web of Science Online.
Note: Global averages are 1.00 (SCSf average is 0.00), except for TOP5%.
Secondly, the following pdf-pages (automatically created from the bibliomet-ric tool BMX) for each program are analyzed using indicators, especially the NCSf(2yr) indicator, statistical diagrams and visualizations for publication profile and collaboration network inside of the program. Each program is illustrated using four pages (Illustration 1-6). N.B! There is no illustration for the ENFORCE program due to lack of publications.
SWEDISH ENVIRONMENTAL PROTECTION AGENCY REPORT 6636Bibliometric evaluation of SEPA-funded large research programs 2003–2013
23
2005 2006 2007 2008 2009 2010 2011
5101520253035404550
2005 2006 2007 2008 2009 2010 2011
0.250.50.751.001.251.501.752.002.252.50
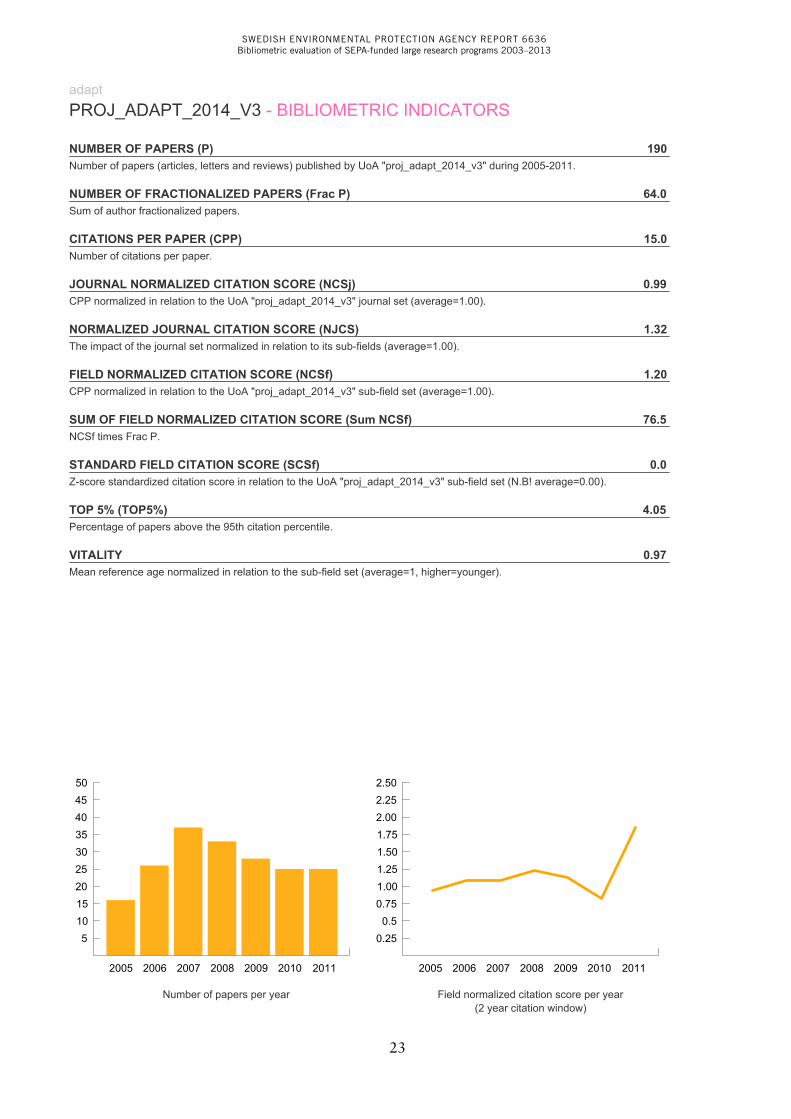
adaptPROJ_ADAPT_2014_V3 - BIBLIOMETRIC INDICATORS
NUMBER OF PAPERS (P) 190Number of papers (articles, letters and reviews) published by UoA "proj_adapt_2014_v3" during 2005-2011.
NUMBER OF FRACTIONALIZED PAPERS (Frac P) 64.0Sum of author fractionalized papers.
CITATIONS PER PAPER (CPP) 15.0Number of citations per paper.
JOURNAL NORMALIZED CITATION SCORE (NCSj) 0.99CPP normalized in relation to the UoA "proj_adapt_2014_v3" journal set (average=1.00).
NORMALIZED JOURNAL CITATION SCORE (NJCS) 1.32The impact of the journal set normalized in relation to its sub-fields (average=1.00).
FIELD NORMALIZED CITATION SCORE (NCSf) 1.20CPP normalized in relation to the UoA "proj_adapt_2014_v3" sub-field set (average=1.00).
SUM OF FIELD NORMALIZED CITATION SCORE (Sum NCSf) 76.5NCSf times Frac P.
STANDARD FIELD CITATION SCORE (SCSf) 0.0Z-score standardized citation score in relation to the UoA "proj_adapt_2014_v3" sub-field set (N.B! average=0.00).
TOP 5% (TOP5%) 4.05Percentage of papers above the 95th citation percentile.
VITALITY 0.97Mean reference age normalized in relation to the sub-field set (average=1, higher=younger).
Number of papers per year Field normalized citation score per year(2 year citation window)
SWEDISH ENVIRONMENTAL PROTECTION AGENCY REPORT 6636Bibliometric evaluation of SEPA-funded large research programs 2003–2013
24
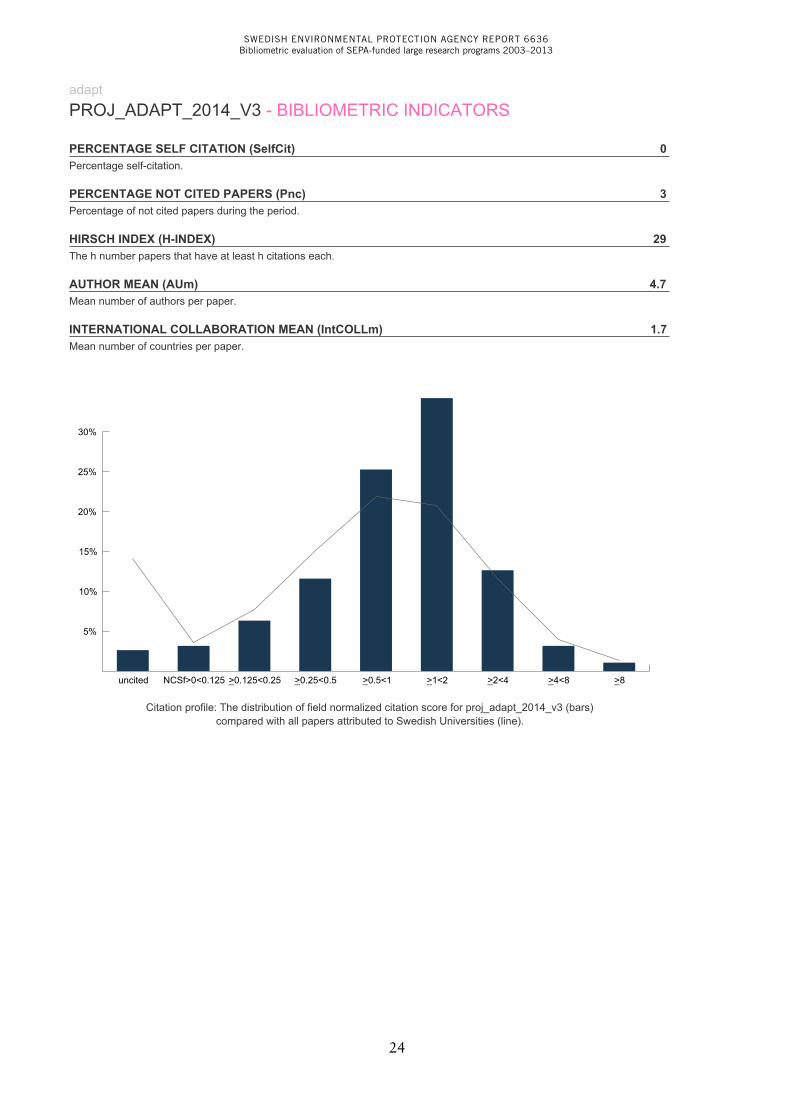
adaptPROJ_ADAPT_2014_V3 - BIBLIOMETRIC INDICATORS
PERCENTAGE SELF CITATION (SelfCit) 0Percentage self-citation.
PERCENTAGE NOT CITED PAPERS (Pnc) 3Percentage of not cited papers during the period.
HIRSCH INDEX (H-INDEX) 29The h number papers that have at least h citations each.
AUTHOR MEAN (AUm) 4.7Mean number of authors per paper.
INTERNATIONAL COLLABORATION MEAN (IntCOLLm) 1.7Mean number of countries per paper.
uncited NCSf>0<0.125 >0.125<0.25_ >0.25<0.5_ >0.5<1_ >1<2_ >2<4_ >4<8_ >8_
5%
10%
15%
20%
25%
30%
Citation profile: The distribution of field normalized citation score for proj_adapt_2014_v3 (bars)compared with all papers attributed to Swedish Universities (line).
SWEDISH ENVIRONMENTAL PROTECTION AGENCY REPORT 6636Bibliometric evaluation of SEPA-funded large research programs 2003–2013
25
competitiondynamics
cannibalism
herbivoryboreal forestswoody-plants
predationlynx lynx
conservation
contingent valuationattitudes
public-goods
northern swedendead wood
saproxylic beetles
conservationwinter
ungulates
moose
policy networksweak tiesstrength
selectionfitness
dynamics
riskextinction
effective size
ursus arctos
hunter observationsaerial counts
insect harassment
upstream migrationtravel time
transmitters
trophic interactionssongbirdprotandry
softwaresea
salinity gradient
environmental kuznets curvetrade
structural-change models
habitat selection
herbivoreswildlife
savanna
water partition-coefficientspopulation-dynamicspontoporeia-femorata
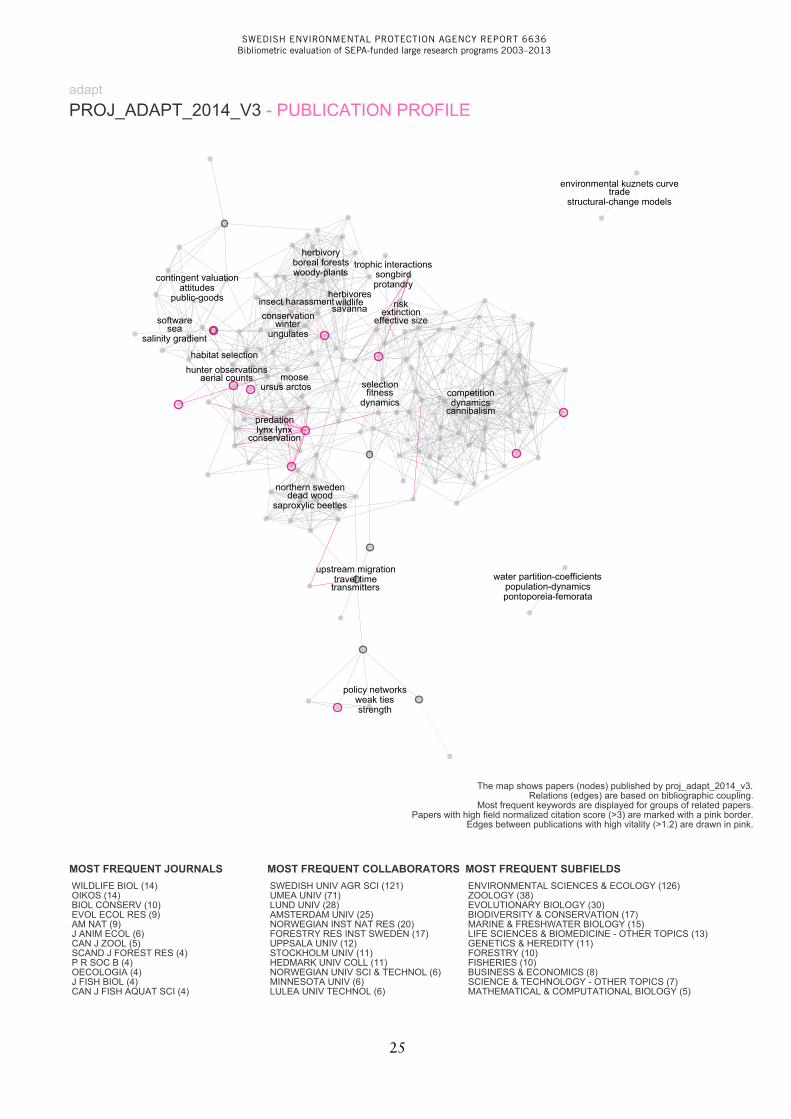
adaptPROJ_ADAPT_2014_V3 - PUBLICATION PROFILE
The map shows papers (nodes) published by proj_adapt_2014_v3.Relations (edges) are based on bibliographic coupling.
Most frequent keywords are displayed for groups of related papers.Papers with high field normalized citation score (>3) are marked with a pink border.
Edges between publications with high vitality (>1.2) are drawn in pink.
MOST FREQUENT JOURNALS WILDLIFE BIOL (14) OIKOS (14) BIOL CONSERV (10) EVOL ECOL RES (9) AM NAT (9) J ANIM ECOL (6) CAN J ZOOL (5) SCAND J FOREST RES (4) P R SOC B (4) OECOLOGIA (4) J FISH BIOL (4) CAN J FISH AQUAT SCI (4)
MOST FREQUENT COLLABORATORS SWEDISH UNIV AGR SCI (121) UMEA UNIV (71) LUND UNIV (28) AMSTERDAM UNIV (25) NORWEGIAN INST NAT RES (20) FORESTRY RES INST SWEDEN (17) UPPSALA UNIV (12) STOCKHOLM UNIV (11) HEDMARK UNIV COLL (11) NORWEGIAN UNIV SCI & TECHNOL (6) MINNESOTA UNIV (6) LULEA UNIV TECHNOL (6)
MOST FREQUENT SUBFIELDS ENVIRONMENTAL SCIENCES & ECOLOGY (126) ZOOLOGY (38) EVOLUTIONARY BIOLOGY (30) BIODIVERSITY & CONSERVATION (17) MARINE & FRESHWATER BIOLOGY (15) LIFE SCIENCES & BIOMEDICINE - OTHER TOPICS (13) GENETICS & HEREDITY (11) FORESTRY (10) FISHERIES (10) BUSINESS & ECONOMICS (8) SCIENCE & TECHNOLOGY - OTHER TOPICS (7) MATHEMATICAL & COMPUTATIONAL BIOLOGY (5)
adaptPROJ_ADAPT_2014_V3 - BIBLIOMETRIC INDICATORS
PERCENTAGE SELF CITATION (SelfCit) 0Percentage self-citation.
PERCENTAGE NOT CITED PAPERS (Pnc) 3Percentage of not cited papers during the period.
HIRSCH INDEX (H-INDEX) 29The h number papers that have at least h citations each.
AUTHOR MEAN (AUm) 4.7Mean number of authors per paper.
INTERNATIONAL COLLABORATION MEAN (IntCOLLm) 1.7Mean number of countries per paper.
uncited NCSf>0<0.125 >0.125<0.25_ >0.25<0.5_ >0.5<1_ >1<2_ >2<4_ >4<8_ >8_
5%
10%
15%
20%
25%
30%
Citation profile: The distribution of field normalized citation score for proj_adapt_2014_v3 (bars)compared with all papers attributed to Swedish Universities (line).
SWEDISH ENVIRONMENTAL PROTECTION AGENCY REPORT 6636Bibliometric evaluation of SEPA-funded large research programs 2003–2013
26
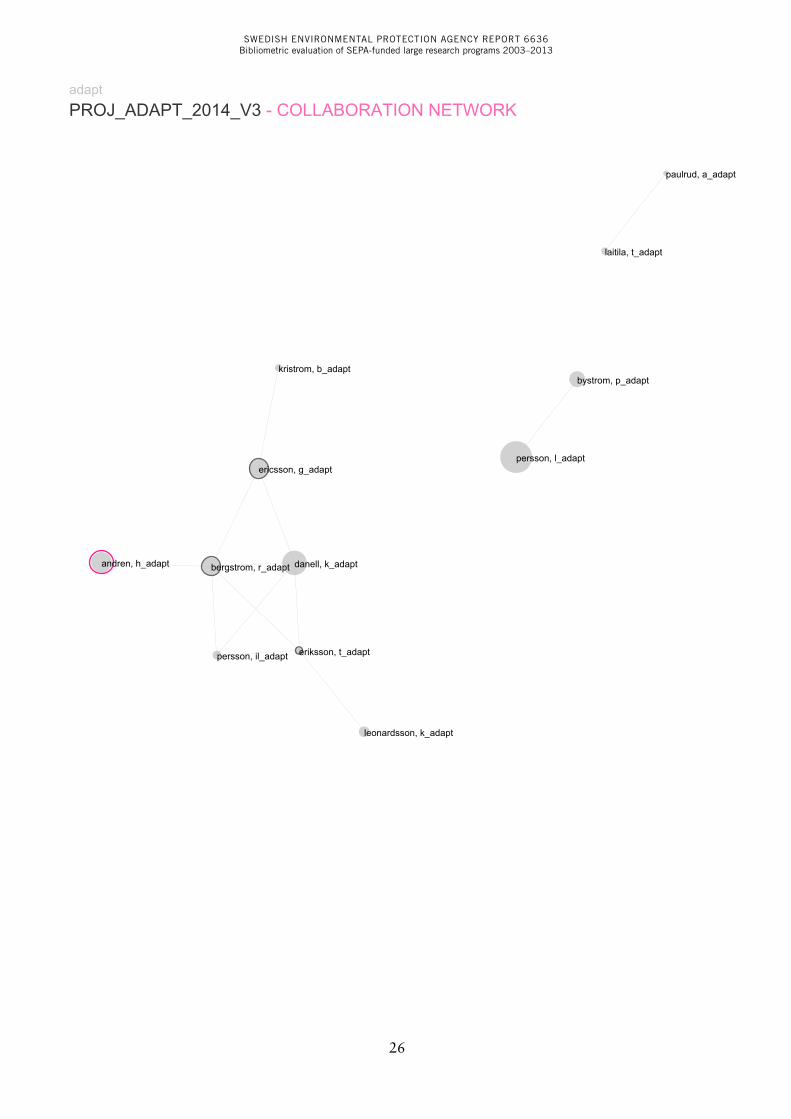
persson, l_adapt
danell, k_adaptandren, h_adapt
ericsson, g_adapt
bergstrom, r_adapt
bystrom, p_adapt
leonardsson, k_adapt
persson, il_adapt
laitila, t_adapt
kristrom, b_adapt
eriksson, t_adapt
paulrud, a_adapt
adaptPROJ_ADAPT_2014_V3 - COLLABORATION NETWORK
SWEDISH ENVIRONMENTAL PROTECTION AGENCY REPORT 6636Bibliometric evaluation of SEPA-funded large research programs 2003–2013
27
2007 2008 2009 2010 2011 2012
5101520253035404550
2007 2008 2009 2010 2011 2012
0.250.50.751.001.251.501.752.002.252.50
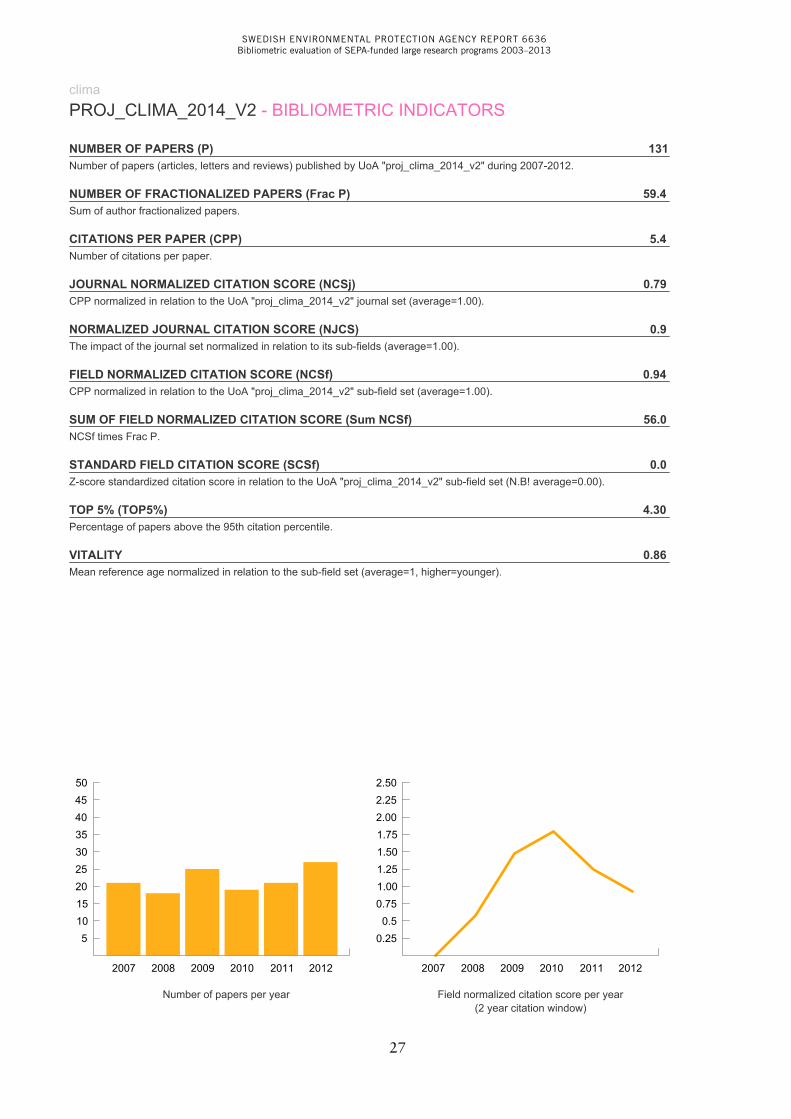
climaPROJ_CLIMA_2014_V2 - BIBLIOMETRIC INDICATORS
NUMBER OF PAPERS (P) 131Number of papers (articles, letters and reviews) published by UoA "proj_clima_2014_v2" during 2007-2012.
NUMBER OF FRACTIONALIZED PAPERS (Frac P) 59.4Sum of author fractionalized papers.
CITATIONS PER PAPER (CPP) 5.4Number of citations per paper.
JOURNAL NORMALIZED CITATION SCORE (NCSj) 0.79CPP normalized in relation to the UoA "proj_clima_2014_v2" journal set (average=1.00).
NORMALIZED JOURNAL CITATION SCORE (NJCS) 0.9The impact of the journal set normalized in relation to its sub-fields (average=1.00).
FIELD NORMALIZED CITATION SCORE (NCSf) 0.94CPP normalized in relation to the UoA "proj_clima_2014_v2" sub-field set (average=1.00).
SUM OF FIELD NORMALIZED CITATION SCORE (Sum NCSf) 56.0NCSf times Frac P.
STANDARD FIELD CITATION SCORE (SCSf) 0.0Z-score standardized citation score in relation to the UoA "proj_clima_2014_v2" sub-field set (N.B! average=0.00).
TOP 5% (TOP5%) 4.30Percentage of papers above the 95th citation percentile.
VITALITY 0.86Mean reference age normalized in relation to the sub-field set (average=1, higher=younger).
Number of papers per year Field normalized citation score per year(2 year citation window)
persson, l_adapt
danell, k_adaptandren, h_adapt
ericsson, g_adapt
bergstrom, r_adapt
bystrom, p_adapt
leonardsson, k_adapt
persson, il_adapt
laitila, t_adapt
kristrom, b_adapt
eriksson, t_adapt
paulrud, a_adapt
adaptPROJ_ADAPT_2014_V3 - COLLABORATION NETWORK
SWEDISH ENVIRONMENTAL PROTECTION AGENCY REPORT 6636Bibliometric evaluation of SEPA-funded large research programs 2003–2013
28
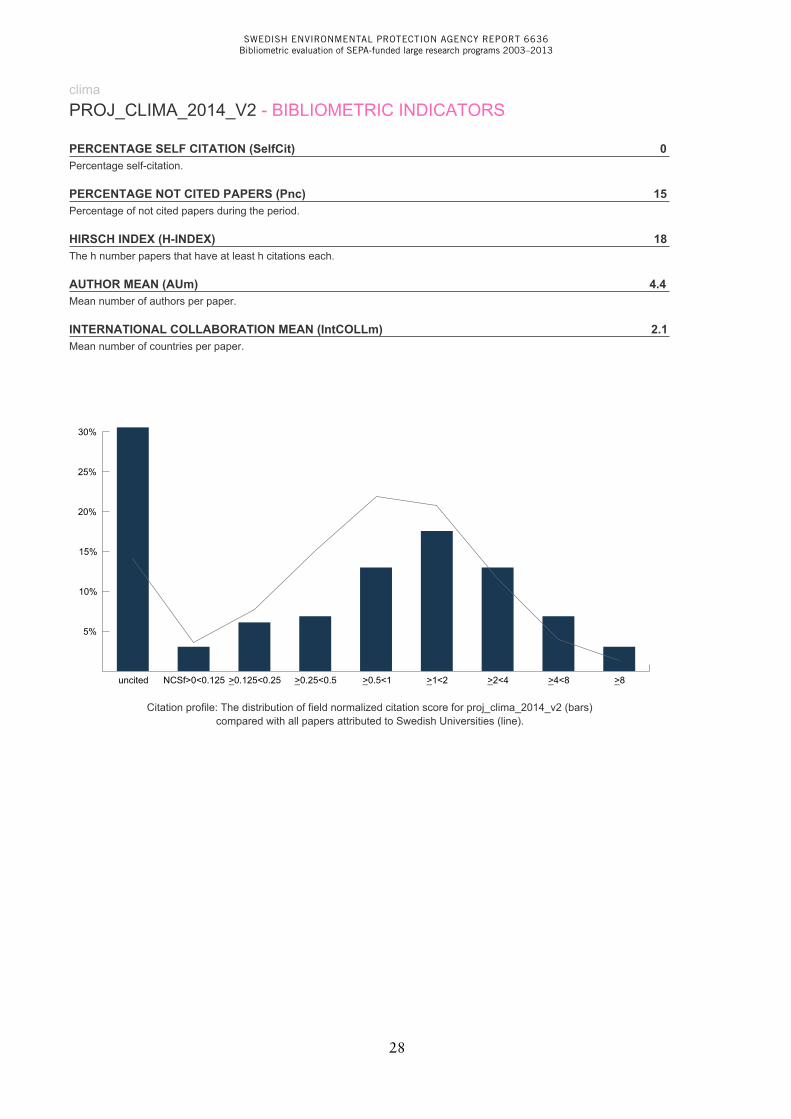
climaPROJ_CLIMA_2014_V2 - BIBLIOMETRIC INDICATORS
PERCENTAGE SELF CITATION (SelfCit) 0Percentage self-citation.
PERCENTAGE NOT CITED PAPERS (Pnc) 15Percentage of not cited papers during the period.
HIRSCH INDEX (H-INDEX) 18The h number papers that have at least h citations each.
AUTHOR MEAN (AUm) 4.4Mean number of authors per paper.
INTERNATIONAL COLLABORATION MEAN (IntCOLLm) 2.1Mean number of countries per paper.
uncited NCSf>0<0.125 >0.125<0.25_ >0.25<0.5_ >0.5<1_ >1<2_ >2<4_ >4<8_ >8_
5%
10%
15%
20%
25%
30%
Citation profile: The distribution of field normalized citation score for proj_clima_2014_v2 (bars)compared with all papers attributed to Swedish Universities (line).
SWEDISH ENVIRONMENTAL PROTECTION AGENCY REPORT 6636Bibliometric evaluation of SEPA-funded large research programs 2003–2013
29
riskethics
uncertainty
temperaturemortalityweather
asthmaexposure
logicbelief revision
revision functions
particulate matterhealth
air pollution
swedenhouseholds
remediationcontaminated sites
tournaments
particulate air-pollutionhealth
vehicle emissions
rationalityobjectives
management
climate changemodelfuture
weathervector
transmission
values
toxicity datareach
chemicals
pollen
uncertaintysubjective riskstrong program
susceptibilityshared epitope alleles
risk-factor
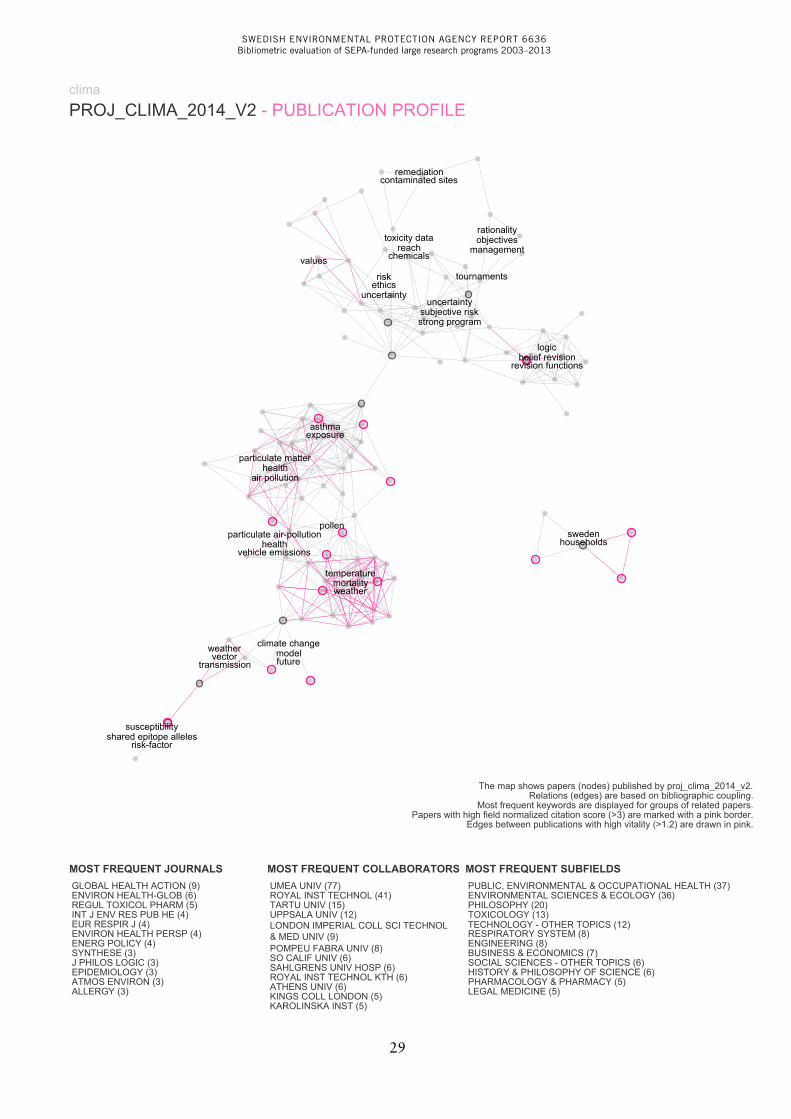
climaPROJ_CLIMA_2014_V2 - PUBLICATION PROFILE
The map shows papers (nodes) published by proj_clima_2014_v2.Relations (edges) are based on bibliographic coupling.
Most frequent keywords are displayed for groups of related papers.Papers with high field normalized citation score (>3) are marked with a pink border.
Edges between publications with high vitality (>1.2) are drawn in pink.
MOST FREQUENT JOURNALS GLOBAL HEALTH ACTION (9) ENVIRON HEALTH-GLOB (6) REGUL TOXICOL PHARM (5) INT J ENV RES PUB HE (4) EUR RESPIR J (4) ENVIRON HEALTH PERSP (4) ENERG POLICY (4) SYNTHESE (3) J PHILOS LOGIC (3) EPIDEMIOLOGY (3) ATMOS ENVIRON (3) ALLERGY (3)
MOST FREQUENT COLLABORATORS UMEA UNIV (77) ROYAL INST TECHNOL (41) TARTU UNIV (15) UPPSALA UNIV (12) LONDON IMPERIAL COLL SCI TECHNOL & MED UNIV (9) POMPEU FABRA UNIV (8) SO CALIF UNIV (6) SAHLGRENS UNIV HOSP (6) ROYAL INST TECHNOL KTH (6) ATHENS UNIV (6) KINGS COLL LONDON (5) KAROLINSKA INST (5)
MOST FREQUENT SUBFIELDS PUBLIC, ENVIRONMENTAL & OCCUPATIONAL HEALTH (37) ENVIRONMENTAL SCIENCES & ECOLOGY (36) PHILOSOPHY (20) TOXICOLOGY (13)TECHNOLOGY - OTHER TOPICS (12) RESPIRATORY SYSTEM (8) ENGINEERING (8) BUSINESS & ECONOMICS (7) SOCIAL SCIENCES - OTHER TOPICS (6) HISTORY & PHILOSOPHY OF SCIENCE (6) PHARMACOLOGY & PHARMACY (5) LEGAL MEDICINE (5)
climaPROJ_CLIMA_2014_V2 - BIBLIOMETRIC INDICATORS
PERCENTAGE SELF CITATION (SelfCit) 0Percentage self-citation.
PERCENTAGE NOT CITED PAPERS (Pnc) 15Percentage of not cited papers during the period.
HIRSCH INDEX (H-INDEX) 18The h number papers that have at least h citations each.
AUTHOR MEAN (AUm) 4.4Mean number of authors per paper.
INTERNATIONAL COLLABORATION MEAN (IntCOLLm) 2.1Mean number of countries per paper.
uncited NCSf>0<0.125 >0.125<0.25_ >0.25<0.5_ >0.5<1_ >1<2_ >2<4_ >4<8_ >8_
5%
10%
15%
20%
25%
30%
Citation profile: The distribution of field normalized citation score for proj_clima_2014_v2 (bars)compared with all papers attributed to Swedish Universities (line).
SWEDISH ENVIRONMENTAL PROTECTION AGENCY REPORT 6636Bibliometric evaluation of SEPA-funded large research programs 2003–2013
30
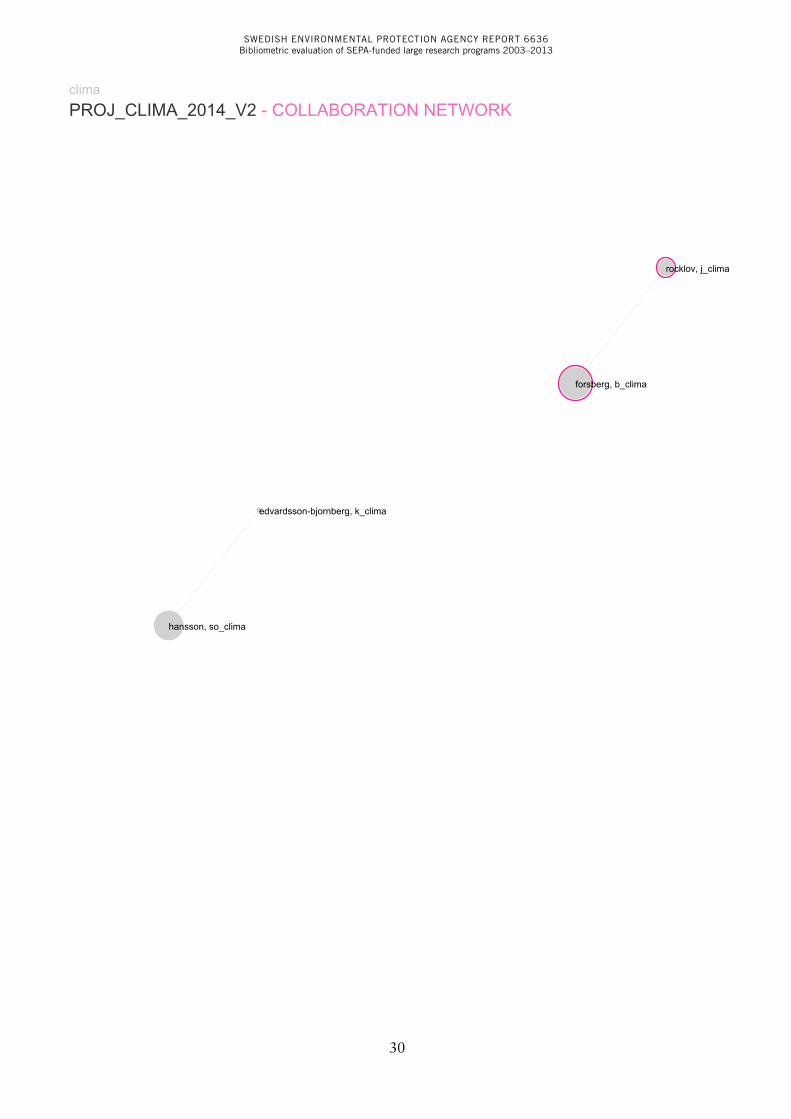
forsberg, b_clima
hansson, so_clima
rocklov, j_clima
edvardsson-bjornberg, k_clima
climaPROJ_CLIMA_2014_V2 - COLLABORATION NETWORK
SWEDISH ENVIRONMENTAL PROTECTION AGENCY REPORT 6636Bibliometric evaluation of SEPA-funded large research programs 2003–2013
31
2003 2004 2005 2006 2007 2008
5101520253035404550
2003 2004 2005 2006 2007 2008
0.250.50.751.001.251.501.752.002.252.50
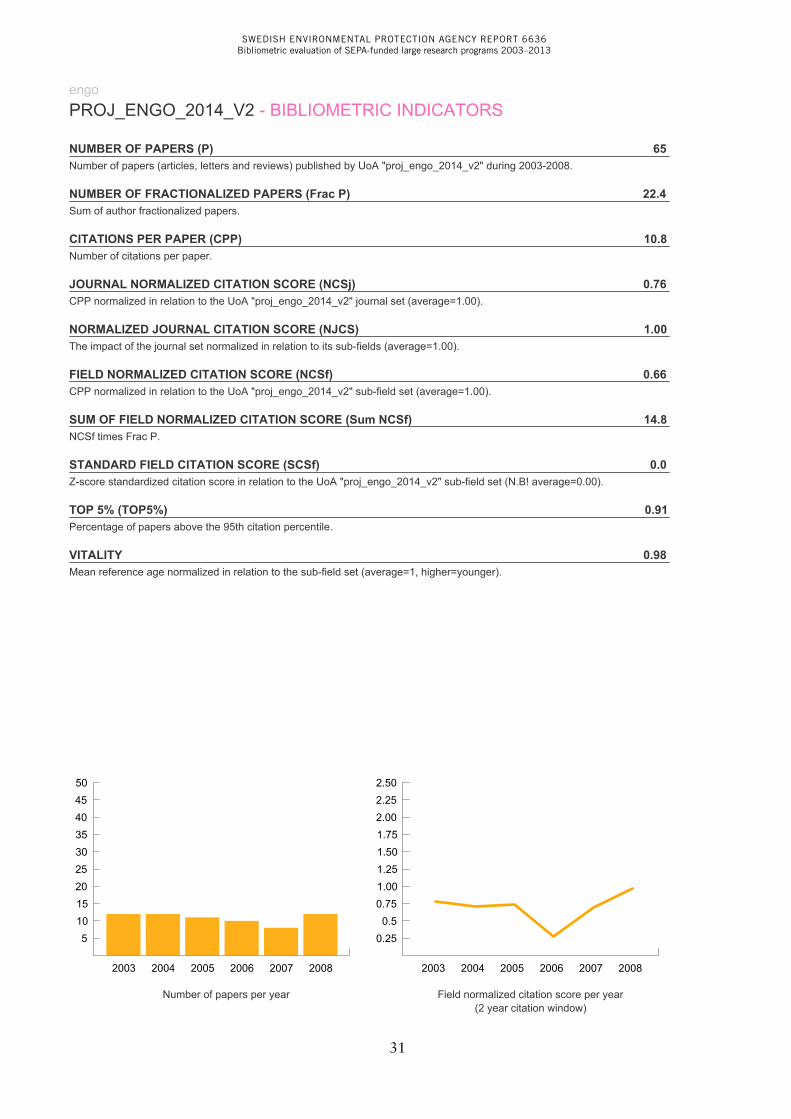
engoPROJ_ENGO_2014_V2 - BIBLIOMETRIC INDICATORS
NUMBER OF PAPERS (P) 65Number of papers (articles, letters and reviews) published by UoA "proj_engo_2014_v2" during 2003-2008.
NUMBER OF FRACTIONALIZED PAPERS (Frac P) 22.4Sum of author fractionalized papers.
CITATIONS PER PAPER (CPP) 10.8Number of citations per paper.
JOURNAL NORMALIZED CITATION SCORE (NCSj) 0.76CPP normalized in relation to the UoA "proj_engo_2014_v2" journal set (average=1.00).
NORMALIZED JOURNAL CITATION SCORE (NJCS) 1.00The impact of the journal set normalized in relation to its sub-fields (average=1.00).
FIELD NORMALIZED CITATION SCORE (NCSf) 0.66CPP normalized in relation to the UoA "proj_engo_2014_v2" sub-field set (average=1.00).
SUM OF FIELD NORMALIZED CITATION SCORE (Sum NCSf) 14.8NCSf times Frac P.
STANDARD FIELD CITATION SCORE (SCSf) 0.0Z-score standardized citation score in relation to the UoA "proj_engo_2014_v2" sub-field set (N.B! average=0.00).
TOP 5% (TOP5%) 0.91Percentage of papers above the 95th citation percentile.
VITALITY 0.98Mean reference age normalized in relation to the sub-field set (average=1, higher=younger).
Number of papers per year Field normalized citation score per year(2 year citation window)
forsberg, b_clima
hansson, so_clima
rocklov, j_clima
edvardsson-bjornberg, k_clima
climaPROJ_CLIMA_2014_V2 - COLLABORATION NETWORK
SWEDISH ENVIRONMENTAL PROTECTION AGENCY REPORT 6636Bibliometric evaluation of SEPA-funded large research programs 2003–2013
32
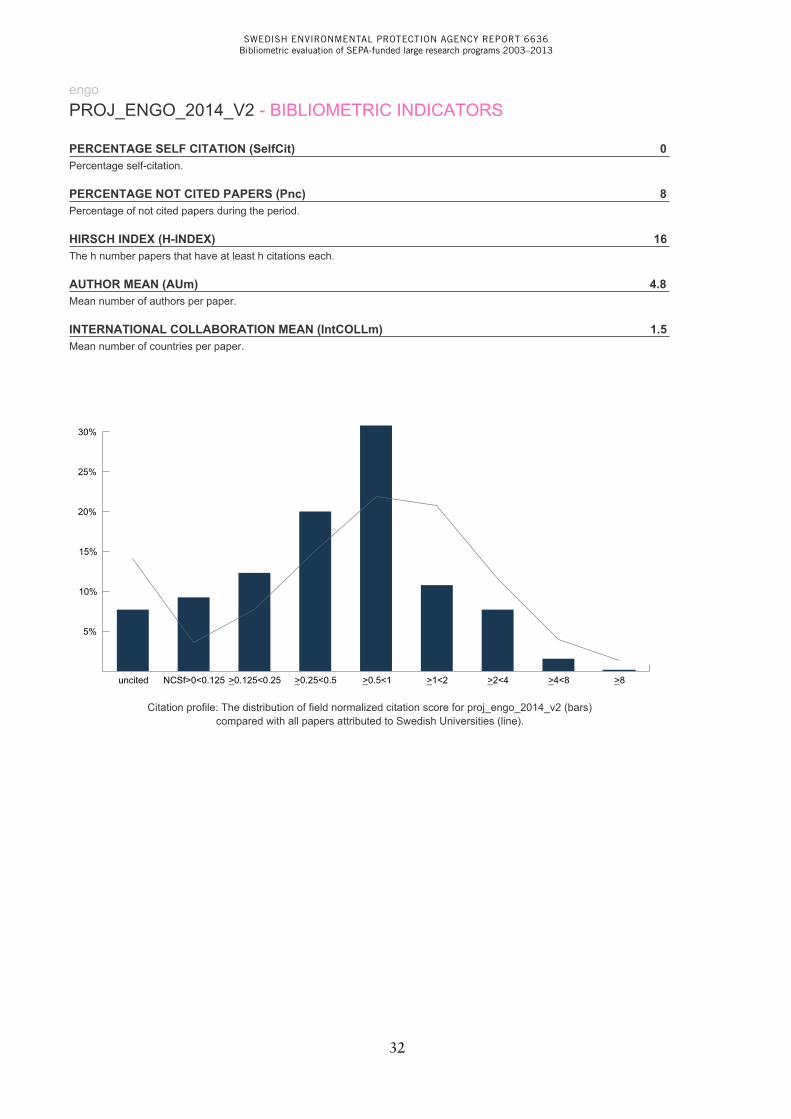
engoPROJ_ENGO_2014_V2 - BIBLIOMETRIC INDICATORS
PERCENTAGE SELF CITATION (SelfCit) 0Percentage self-citation.
PERCENTAGE NOT CITED PAPERS (Pnc) 8Percentage of not cited papers during the period.
HIRSCH INDEX (H-INDEX) 16The h number papers that have at least h citations each.
AUTHOR MEAN (AUm) 4.8Mean number of authors per paper.
INTERNATIONAL COLLABORATION MEAN (IntCOLLm) 1.5Mean number of countries per paper.
uncited NCSf>0<0.125 >0.125<0.25_ >0.25<0.5_ >0.5<1_ >1<2_ >2<4_ >4<8_ >8_
5%
10%
15%
20%
25%
30%
Citation profile: The distribution of field normalized citation score for proj_engo_2014_v2 (bars)compared with all papers attributed to Swedish Universities (line).
SWEDISH ENVIRONMENTAL PROTECTION AGENCY REPORT 6636Bibliometric evaluation of SEPA-funded large research programs 2003–2013
33
organic chlorinechloride
organohalogens
tropospheric ozonephosphorus
trends
morphophysiological dormancyweedssweden
sweden
plantsdiversity
conservation
spatially explicitpopulationpatterns
interferon-alphahydroxyureacytarabine
yieldwild oat
wheat triticum-aestivum
soilscale
watershed
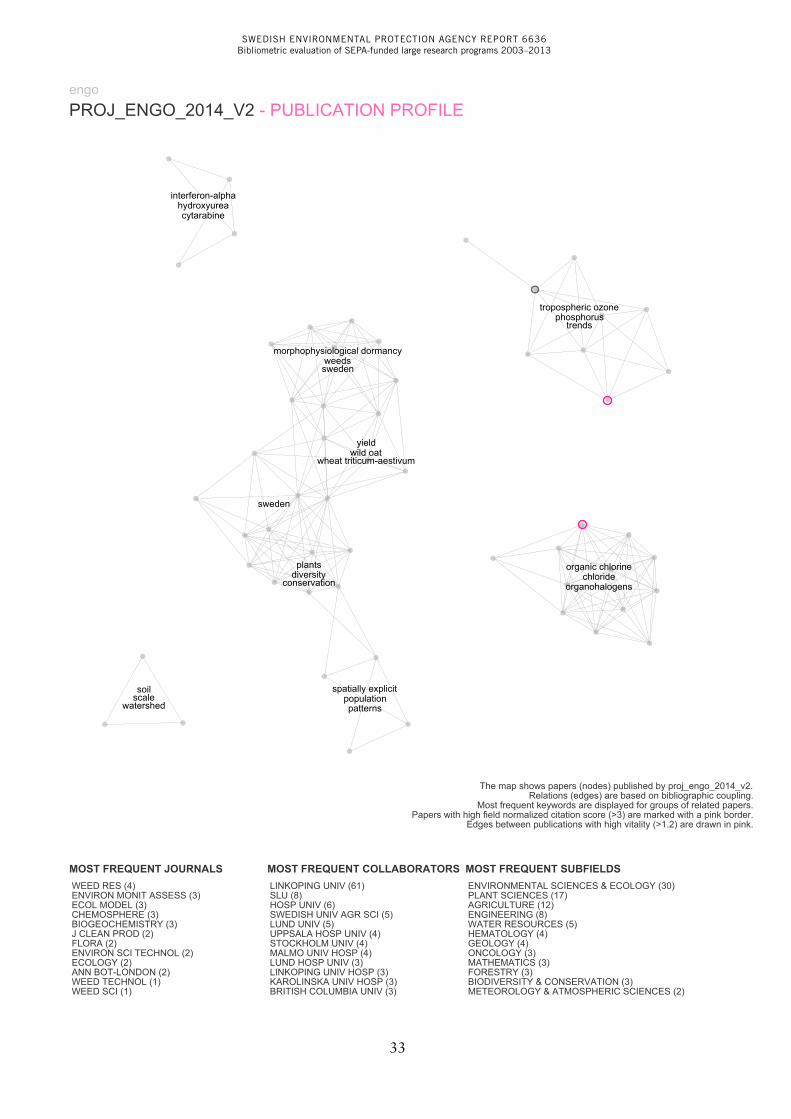
engoPROJ_ENGO_2014_V2 - PUBLICATION PROFILE
The map shows papers (nodes) published by proj_engo_2014_v2.Relations (edges) are based on bibliographic coupling.
Most frequent keywords are displayed for groups of related papers.Papers with high field normalized citation score (>3) are marked with a pink border.
Edges between publications with high vitality (>1.2) are drawn in pink.
MOST FREQUENT JOURNALS WEED RES (4) ENVIRON MONIT ASSESS (3) ECOL MODEL (3) CHEMOSPHERE (3) BIOGEOCHEMISTRY (3) J CLEAN PROD (2) FLORA (2) ENVIRON SCI TECHNOL (2) ECOLOGY (2) ANN BOT-LONDON (2) WEED TECHNOL (1) WEED SCI (1)
MOST FREQUENT COLLABORATORS LINKOPING UNIV (61) SLU (8) HOSP UNIV (6) SWEDISH UNIV AGR SCI (5) LUND UNIV (5) UPPSALA HOSP UNIV (4) STOCKHOLM UNIV (4) MALMO UNIV HOSP (4) LUND HOSP UNIV (3) LINKOPING UNIV HOSP (3) KAROLINSKA UNIV HOSP (3) BRITISH COLUMBIA UNIV (3)
MOST FREQUENT SUBFIELDS ENVIRONMENTAL SCIENCES & ECOLOGY (30) PLANT SCIENCES (17) AGRICULTURE (12) ENGINEERING (8) WATER RESOURCES (5) HEMATOLOGY (4) GEOLOGY (4) ONCOLOGY (3) MATHEMATICS (3) FORESTRY (3) BIODIVERSITY & CONSERVATION (3) METEOROLOGY & ATMOSPHERIC SCIENCES (2)
engoPROJ_ENGO_2014_V2 - BIBLIOMETRIC INDICATORS
PERCENTAGE SELF CITATION (SelfCit) 0Percentage self-citation.
PERCENTAGE NOT CITED PAPERS (Pnc) 8Percentage of not cited papers during the period.
HIRSCH INDEX (H-INDEX) 16The h number papers that have at least h citations each.
AUTHOR MEAN (AUm) 4.8Mean number of authors per paper.
INTERNATIONAL COLLABORATION MEAN (IntCOLLm) 1.5Mean number of countries per paper.
uncited NCSf>0<0.125 >0.125<0.25_ >0.25<0.5_ >0.5<1_ >1<2_ >2<4_ >4<8_ >8_
5%
10%
15%
20%
25%
30%
Citation profile: The distribution of field normalized citation score for proj_engo_2014_v2 (bars)compared with all papers attributed to Swedish Universities (line).
SWEDISH ENVIRONMENTAL PROTECTION AGENCY REPORT 6636Bibliometric evaluation of SEPA-funded large research programs 2003–2013
34
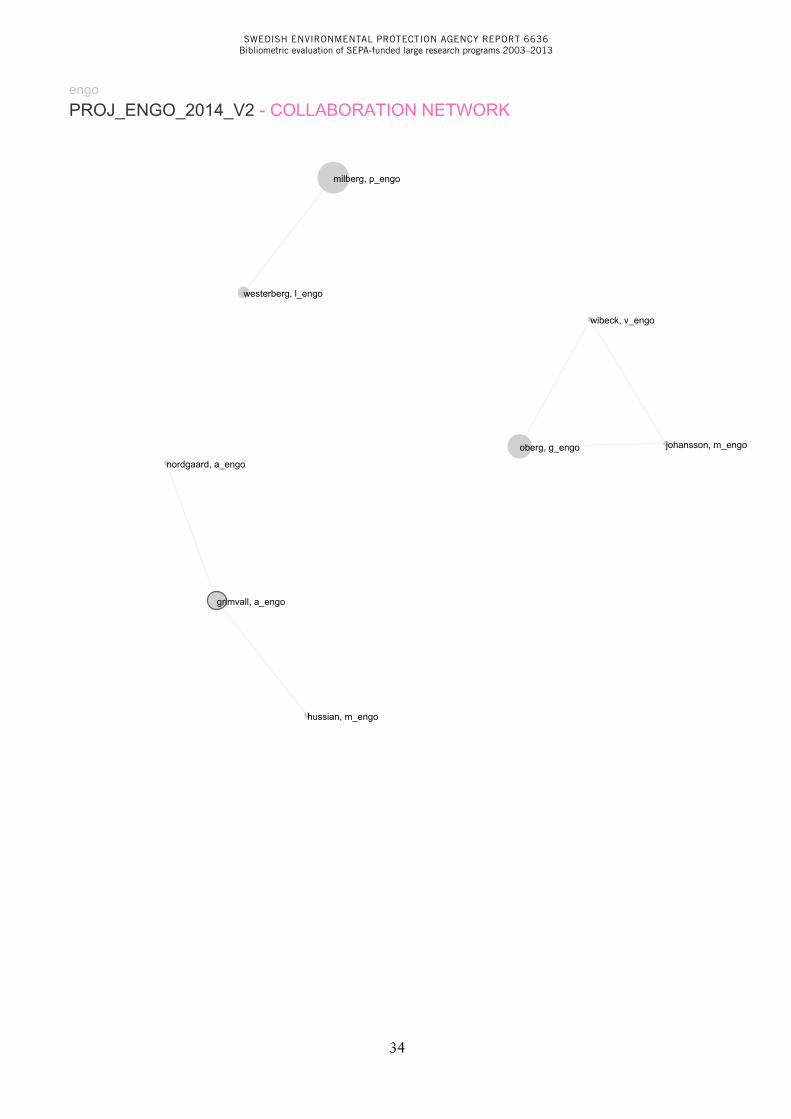
milberg, p_engo
oberg, g_engo
grimvall, a_engo
westerberg, l_engo
hussian, m_engo
johansson, m_engo
wibeck, v_engo
nordgaard, a_engo
engoPROJ_ENGO_2014_V2 - COLLABORATION NETWORK
SWEDISH ENVIRONMENTAL PROTECTION AGENCY REPORT 6636Bibliometric evaluation of SEPA-funded large research programs 2003–2013
35
2003 2004 2005 2006 2007 2008
5101520253035404550
2003 2004 2005 2006 2007 2008
0.250.50.751.001.251.501.752.002.252.50
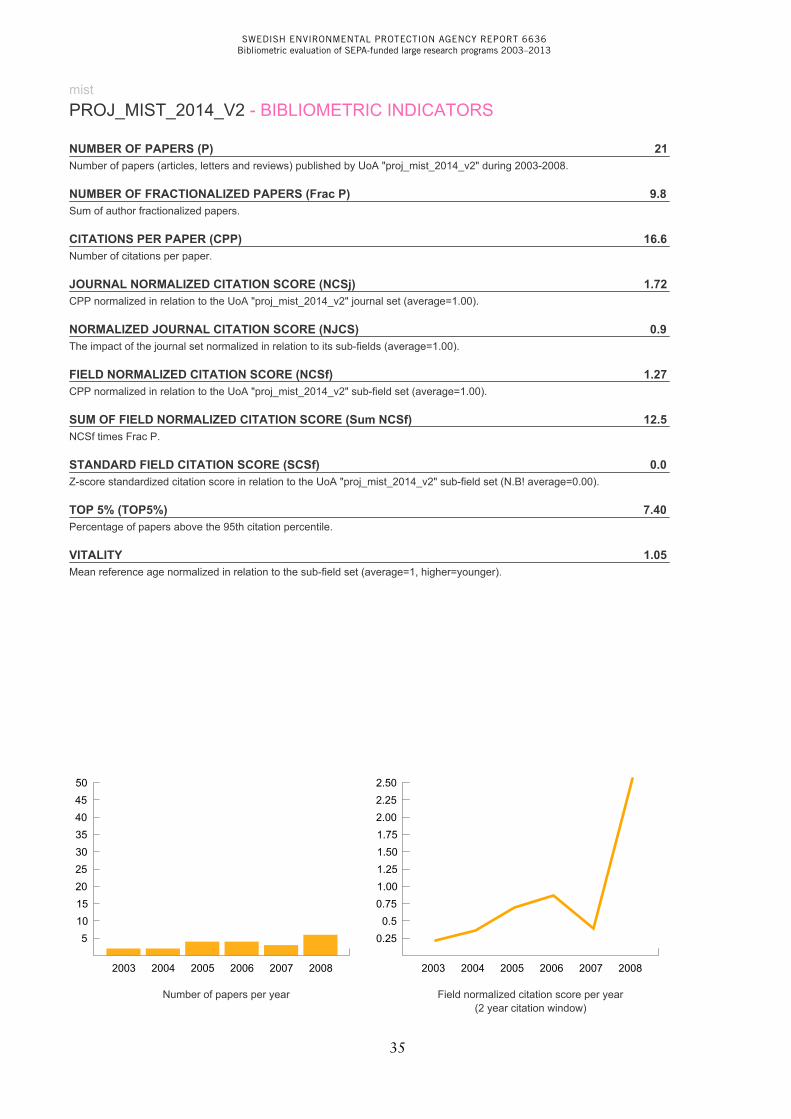
mistPROJ_MIST_2014_V2 - BIBLIOMETRIC INDICATORS
NUMBER OF PAPERS (P) 21Number of papers (articles, letters and reviews) published by UoA "proj_mist_2014_v2" during 2003-2008.
NUMBER OF FRACTIONALIZED PAPERS (Frac P) 9.8Sum of author fractionalized papers.
CITATIONS PER PAPER (CPP) 16.6Number of citations per paper.
JOURNAL NORMALIZED CITATION SCORE (NCSj) 1.72CPP normalized in relation to the UoA "proj_mist_2014_v2" journal set (average=1.00).
NORMALIZED JOURNAL CITATION SCORE (NJCS) 0.9The impact of the journal set normalized in relation to its sub-fields (average=1.00).
FIELD NORMALIZED CITATION SCORE (NCSf) 1.27CPP normalized in relation to the UoA "proj_mist_2014_v2" sub-field set (average=1.00).
SUM OF FIELD NORMALIZED CITATION SCORE (Sum NCSf) 12.5NCSf times Frac P.
STANDARD FIELD CITATION SCORE (SCSf) 0.0Z-score standardized citation score in relation to the UoA "proj_mist_2014_v2" sub-field set (N.B! average=0.00).
TOP 5% (TOP5%) 7.40Percentage of papers above the 95th citation percentile.
VITALITY 1.05Mean reference age normalized in relation to the sub-field set (average=1, higher=younger).
Number of papers per year Field normalized citation score per year(2 year citation window)
milberg, p_engo
oberg, g_engo
grimvall, a_engo
westerberg, l_engo
hussian, m_engo
johansson, m_engo
wibeck, v_engo
nordgaard, a_engo
engoPROJ_ENGO_2014_V2 - COLLABORATION NETWORK
SWEDISH ENVIRONMENTAL PROTECTION AGENCY REPORT 6636Bibliometric evaluation of SEPA-funded large research programs 2003–2013
36
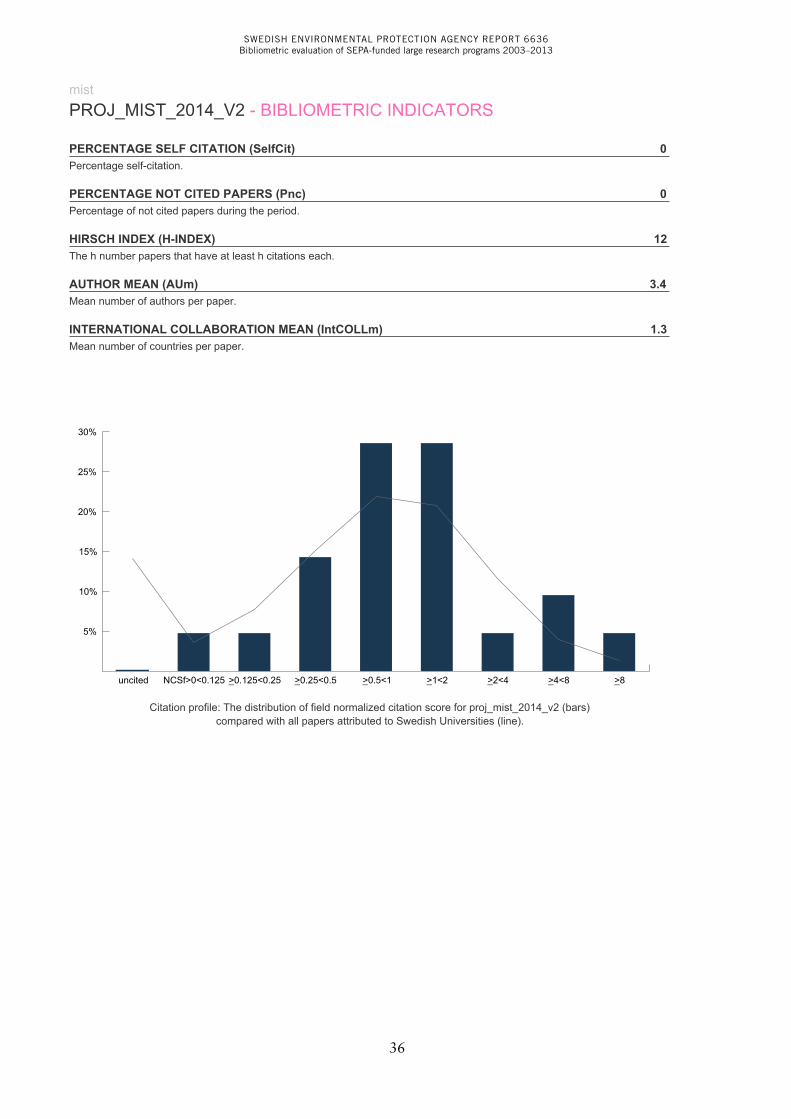
mistPROJ_MIST_2014_V2 - BIBLIOMETRIC INDICATORS
PERCENTAGE SELF CITATION (SelfCit) 0Percentage self-citation.
PERCENTAGE NOT CITED PAPERS (Pnc) 0Percentage of not cited papers during the period.
HIRSCH INDEX (H-INDEX) 12The h number papers that have at least h citations each.
AUTHOR MEAN (AUm) 3.4Mean number of authors per paper.
INTERNATIONAL COLLABORATION MEAN (IntCOLLm) 1.3Mean number of countries per paper.
uncited NCSf>0<0.125 >0.125<0.25_ >0.25<0.5_ >0.5<1_ >1<2_ >2<4_ >4<8_ >8_
5%
10%
15%
20%
25%
30%
Citation profile: The distribution of field normalized citation score for proj_mist_2014_v2 (bars)compared with all papers attributed to Swedish Universities (line).
SWEDISH ENVIRONMENTAL PROTECTION AGENCY REPORT 6636Bibliometric evaluation of SEPA-funded large research programs 2003–2013
37
waste bioenergy, tree-rings
risk assessment, waste
reframing, policy
sustainability
sweden, power
sweden, construction
sustainability, products
travel, projects
typology, systems
strategic environmental assessment, sea
waste management strategies, sweden
sweden, policy
waste incineration, system of economic and environmental accounts
policy attention, environmental systems analysis
sustainable development, sustainability
model, tool
industrial ecology, impact
sweden, options
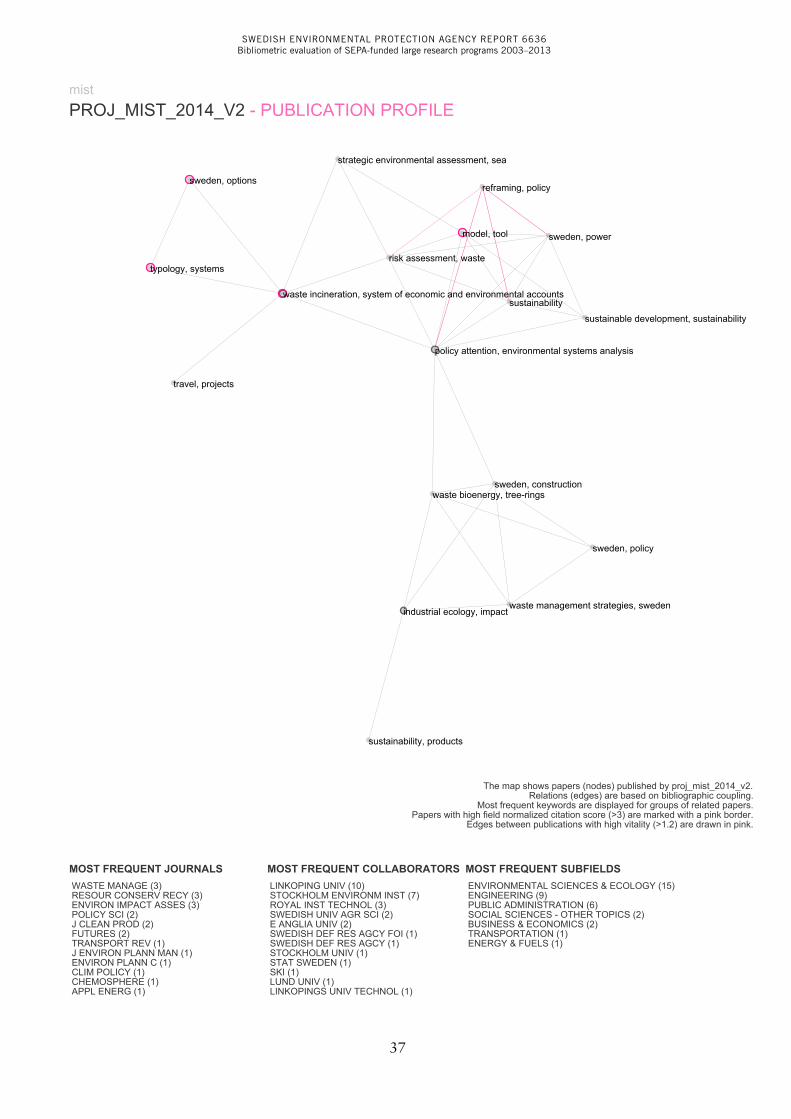
mistPROJ_MIST_2014_V2 - PUBLICATION PROFILE
The map shows papers (nodes) published by proj_mist_2014_v2.Relations (edges) are based on bibliographic coupling.
Most frequent keywords are displayed for groups of related papers.Papers with high field normalized citation score (>3) are marked with a pink border.
Edges between publications with high vitality (>1.2) are drawn in pink.
MOST FREQUENT JOURNALS WASTE MANAGE (3) RESOUR CONSERV RECY (3) ENVIRON IMPACT ASSES (3) POLICY SCI (2) J CLEAN PROD (2) FUTURES (2) TRANSPORT REV (1) J ENVIRON PLANN MAN (1) ENVIRON PLANN C (1) CLIM POLICY (1) CHEMOSPHERE (1) APPL ENERG (1)
MOST FREQUENT COLLABORATORS LINKOPING UNIV (10) STOCKHOLM ENVIRONM INST (7) ROYAL INST TECHNOL (3) SWEDISH UNIV AGR SCI (2) E ANGLIA UNIV (2) SWEDISH DEF RES AGCY FOI (1) SWEDISH DEF RES AGCY (1) STOCKHOLM UNIV (1) STAT SWEDEN (1) SKI (1) LUND UNIV (1) LINKOPINGS UNIV TECHNOL (1)
MOST FREQUENT SUBFIELDS ENVIRONMENTAL SCIENCES & ECOLOGY (15) ENGINEERING (9) PUBLIC ADMINISTRATION (6) SOCIAL SCIENCES - OTHER TOPICS (2) BUSINESS & ECONOMICS (2) TRANSPORTATION (1) ENERGY & FUELS (1)
mistPROJ_MIST_2014_V2 - BIBLIOMETRIC INDICATORS
PERCENTAGE SELF CITATION (SelfCit) 0Percentage self-citation.
PERCENTAGE NOT CITED PAPERS (Pnc) 0Percentage of not cited papers during the period.
HIRSCH INDEX (H-INDEX) 12The h number papers that have at least h citations each.
AUTHOR MEAN (AUm) 3.4Mean number of authors per paper.
INTERNATIONAL COLLABORATION MEAN (IntCOLLm) 1.3Mean number of countries per paper.
uncited NCSf>0<0.125 >0.125<0.25_ >0.25<0.5_ >0.5<1_ >1<2_ >2<4_ >4<8_ >8_
5%
10%
15%
20%
25%
30%
Citation profile: The distribution of field normalized citation score for proj_mist_2014_v2 (bars)compared with all papers attributed to Swedish Universities (line).
SWEDISH ENVIRONMENTAL PROTECTION AGENCY REPORT 6636Bibliometric evaluation of SEPA-funded large research programs 2003–2013
38
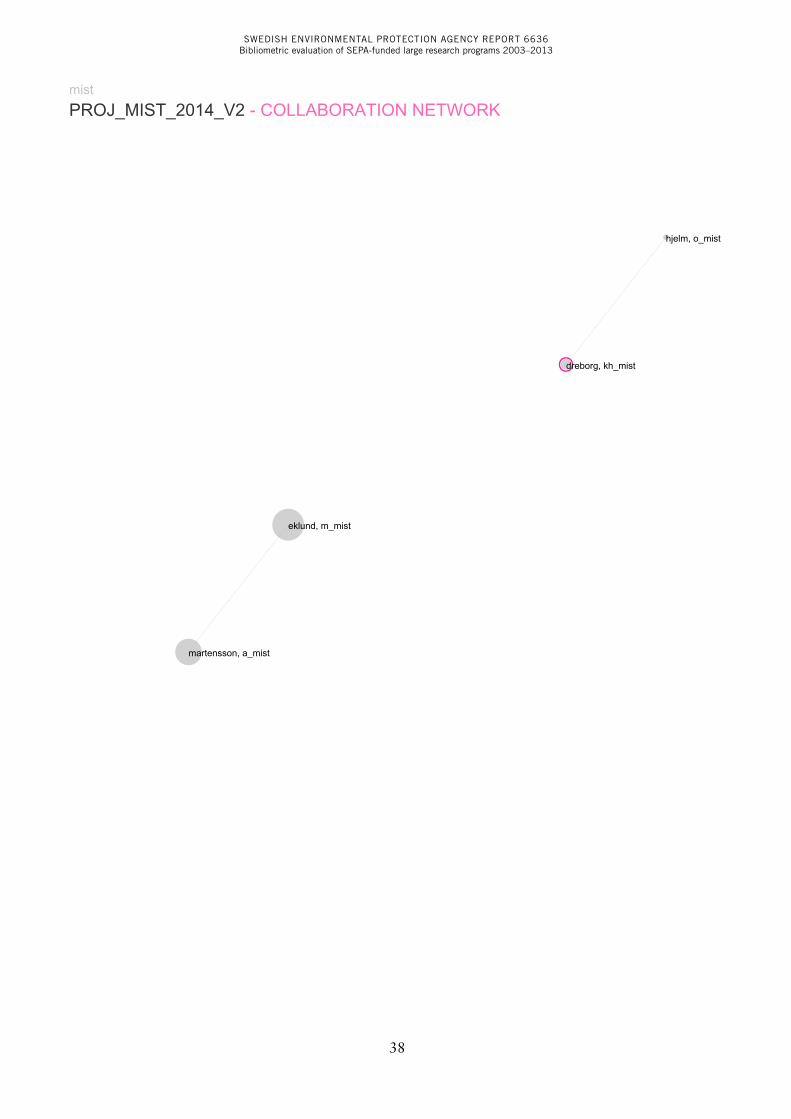
eklund, m_mist
martensson, a_mist
dreborg, kh_mist
hjelm, o_mist
mistPROJ_MIST_2014_V2 - COLLABORATION NETWORK
SWEDISH ENVIRONMENTAL PROTECTION AGENCY REPORT 6636Bibliometric evaluation of SEPA-funded large research programs 2003–2013
39
2003 2004 2005 2006 2007 2008
5101520253035404550
2003 2004 2005 2006 2007 2008
0.250.50.751.001.251.501.752.002.252.50
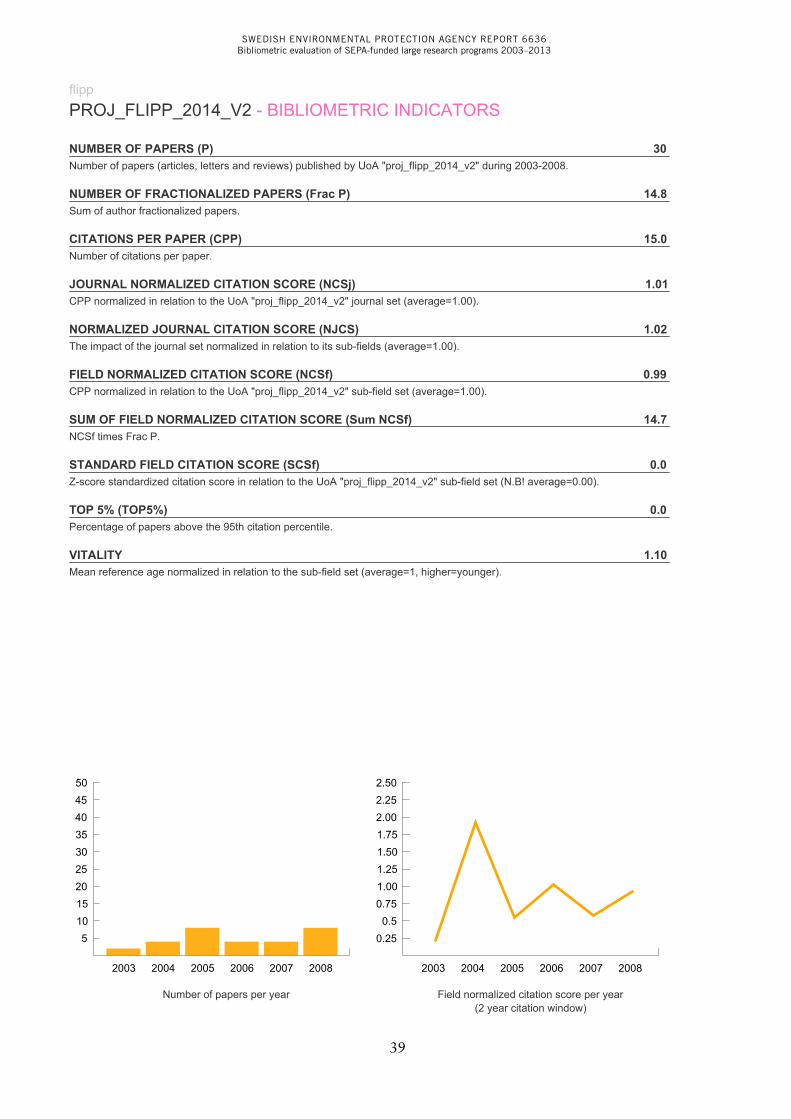
flippPROJ_FLIPP_2014_V2 - BIBLIOMETRIC INDICATORS
NUMBER OF PAPERS (P) 30Number of papers (articles, letters and reviews) published by UoA "proj_flipp_2014_v2" during 2003-2008.
NUMBER OF FRACTIONALIZED PAPERS (Frac P) 14.8Sum of author fractionalized papers.
CITATIONS PER PAPER (CPP) 15.0Number of citations per paper.
JOURNAL NORMALIZED CITATION SCORE (NCSj) 1.01CPP normalized in relation to the UoA "proj_flipp_2014_v2" journal set (average=1.00).
NORMALIZED JOURNAL CITATION SCORE (NJCS) 1.02The impact of the journal set normalized in relation to its sub-fields (average=1.00).
FIELD NORMALIZED CITATION SCORE (NCSf) 0.99CPP normalized in relation to the UoA "proj_flipp_2014_v2" sub-field set (average=1.00).
SUM OF FIELD NORMALIZED CITATION SCORE (Sum NCSf) 14.7NCSf times Frac P.
STANDARD FIELD CITATION SCORE (SCSf) 0.0Z-score standardized citation score in relation to the UoA "proj_flipp_2014_v2" sub-field set (N.B! average=0.00).
TOP 5% (TOP5%) 0.0Percentage of papers above the 95th citation percentile.
VITALITY 1.10Mean reference age normalized in relation to the sub-field set (average=1, higher=younger).
Number of papers per year Field normalized citation score per year(2 year citation window)
eklund, m_mist
martensson, a_mist
dreborg, kh_mist
hjelm, o_mist
mistPROJ_MIST_2014_V2 - COLLABORATION NETWORK
SWEDISH ENVIRONMENTAL PROTECTION AGENCY REPORT 6636Bibliometric evaluation of SEPA-funded large research programs 2003–2013
40
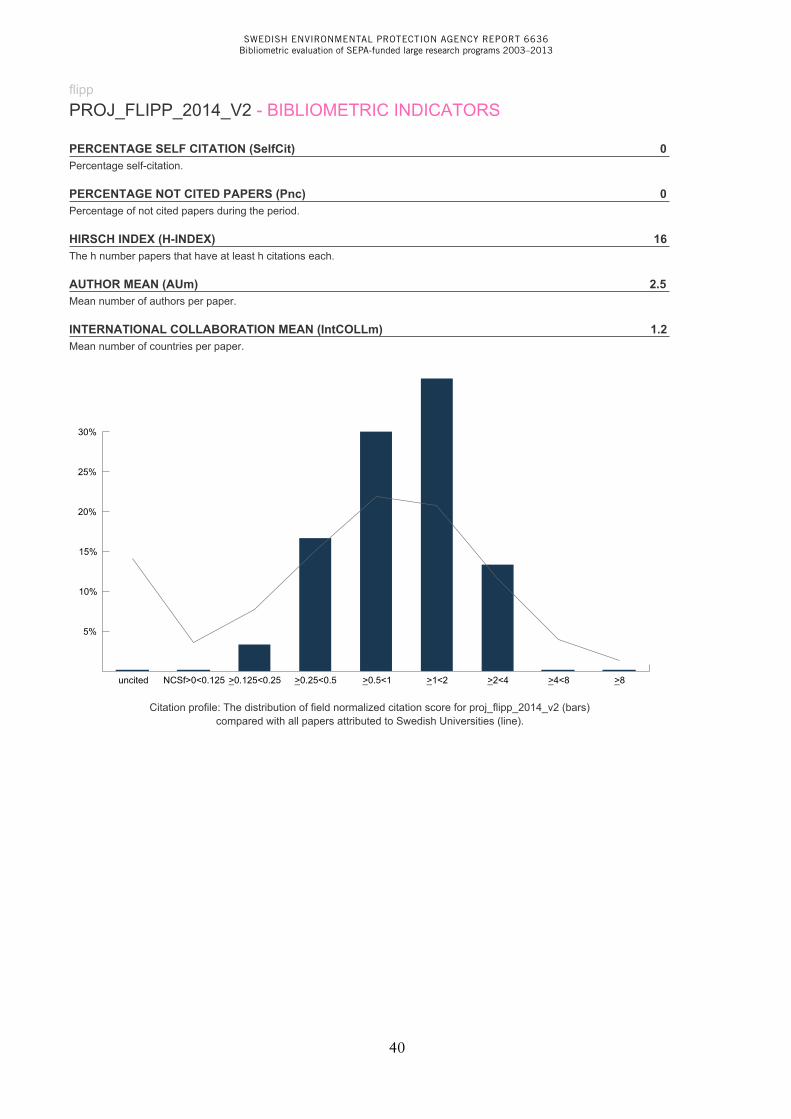
flippPROJ_FLIPP_2014_V2 - BIBLIOMETRIC INDICATORS
PERCENTAGE SELF CITATION (SelfCit) 0Percentage self-citation.
PERCENTAGE NOT CITED PAPERS (Pnc) 0Percentage of not cited papers during the period.
HIRSCH INDEX (H-INDEX) 16The h number papers that have at least h citations each.
AUTHOR MEAN (AUm) 2.5Mean number of authors per paper.
INTERNATIONAL COLLABORATION MEAN (IntCOLLm) 1.2Mean number of countries per paper.
uncited NCSf>0<0.125 >0.125<0.25_ >0.25<0.5_ >0.5<1_ >1<2_ >2<4_ >4<8_ >8_
5%
10%
15%
20%
25%
30%
Citation profile: The distribution of field normalized citation score for proj_flipp_2014_v2 (bars)compared with all papers attributed to Swedish Universities (line).
SWEDISH ENVIRONMENTAL PROTECTION AGENCY REPORT 6636Bibliometric evaluation of SEPA-funded large research programs 2003–2013
41
wave exposure, topography
wave exposure, spatial dependence
process model, predict
moral philosophy, methodology
third-party assurance, sustainability report
wastewater systems, sustainable development
species richness, community structure
snail, siphonaria gastropoda
reproductive isolation, speciation
yoghurt, system
swedish forest products industry, organisation theory
wave exposure, temporal variability
urban water systems, tool
university, training
south-africa, shores
yogurt, life cycle assessment (lca)
supplier, iso 14001
rohs directive, iso 14001
wave exposure, tidal height
wave exposure, topography
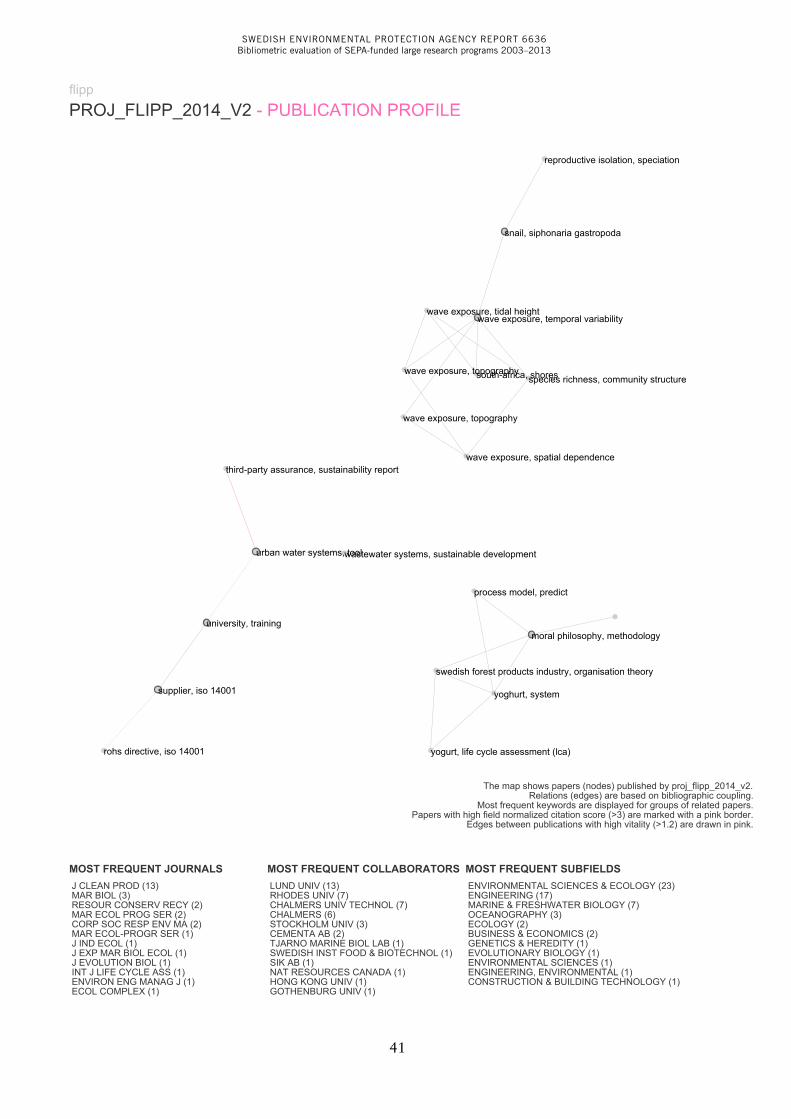
flippPROJ_FLIPP_2014_V2 - PUBLICATION PROFILE
The map shows papers (nodes) published by proj_flipp_2014_v2.Relations (edges) are based on bibliographic coupling.
Most frequent keywords are displayed for groups of related papers.Papers with high field normalized citation score (>3) are marked with a pink border.
Edges between publications with high vitality (>1.2) are drawn in pink.
MOST FREQUENT JOURNALS J CLEAN PROD (13) MAR BIOL (3) RESOUR CONSERV RECY (2) MAR ECOL PROG SER (2) CORP SOC RESP ENV MA (2) MAR ECOL-PROGR SER (1) J IND ECOL (1) J EXP MAR BIOL ECOL (1) J EVOLUTION BIOL (1) INT J LIFE CYCLE ASS (1) ENVIRON ENG MANAG J (1) ECOL COMPLEX (1)
MOST FREQUENT COLLABORATORS LUND UNIV (13) RHODES UNIV (7) CHALMERS UNIV TECHNOL (7) CHALMERS (6) STOCKHOLM UNIV (3) CEMENTA AB (2) TJARNO MARINE BIOL LAB (1) SWEDISH INST FOOD & BIOTECHNOL (1) SIK AB (1) NAT RESOURCES CANADA (1) HONG KONG UNIV (1) GOTHENBURG UNIV (1)
MOST FREQUENT SUBFIELDS ENVIRONMENTAL SCIENCES & ECOLOGY (23) ENGINEERING (17) MARINE & FRESHWATER BIOLOGY (7) OCEANOGRAPHY (3) ECOLOGY (2) BUSINESS & ECONOMICS (2) GENETICS & HEREDITY (1) EVOLUTIONARY BIOLOGY (1) ENVIRONMENTAL SCIENCES (1) ENGINEERING, ENVIRONMENTAL (1) CONSTRUCTION & BUILDING TECHNOLOGY (1)
flippPROJ_FLIPP_2014_V2 - BIBLIOMETRIC INDICATORS
PERCENTAGE SELF CITATION (SelfCit) 0Percentage self-citation.
PERCENTAGE NOT CITED PAPERS (Pnc) 0Percentage of not cited papers during the period.
HIRSCH INDEX (H-INDEX) 16The h number papers that have at least h citations each.
AUTHOR MEAN (AUm) 2.5Mean number of authors per paper.
INTERNATIONAL COLLABORATION MEAN (IntCOLLm) 1.2Mean number of countries per paper.
uncited NCSf>0<0.125 >0.125<0.25_ >0.25<0.5_ >0.5<1_ >1<2_ >2<4_ >4<8_ >8_
5%
10%
15%
20%
25%
30%
Citation profile: The distribution of field normalized citation score for proj_flipp_2014_v2 (bars)compared with all papers attributed to Swedish Universities (line).
SWEDISH ENVIRONMENTAL PROTECTION AGENCY REPORT 6636Bibliometric evaluation of SEPA-funded large research programs 2003–2013
42
baumann, h_flipp
rex, e_flipp
flippPROJ_FLIPP_2014_V2 - COLLABORATION NETWORK
SWEDISH ENVIRONMENTAL PROTECTION AGENCY REPORT 6636Bibliometric evaluation of SEPA-funded large research programs 2003–2013
43
2004 2005 2006 2007 2008 2009
5101520253035404550
2004 2005 2006 2007 2008 2009
0.250.50.751.001.251.501.752.002.252.50
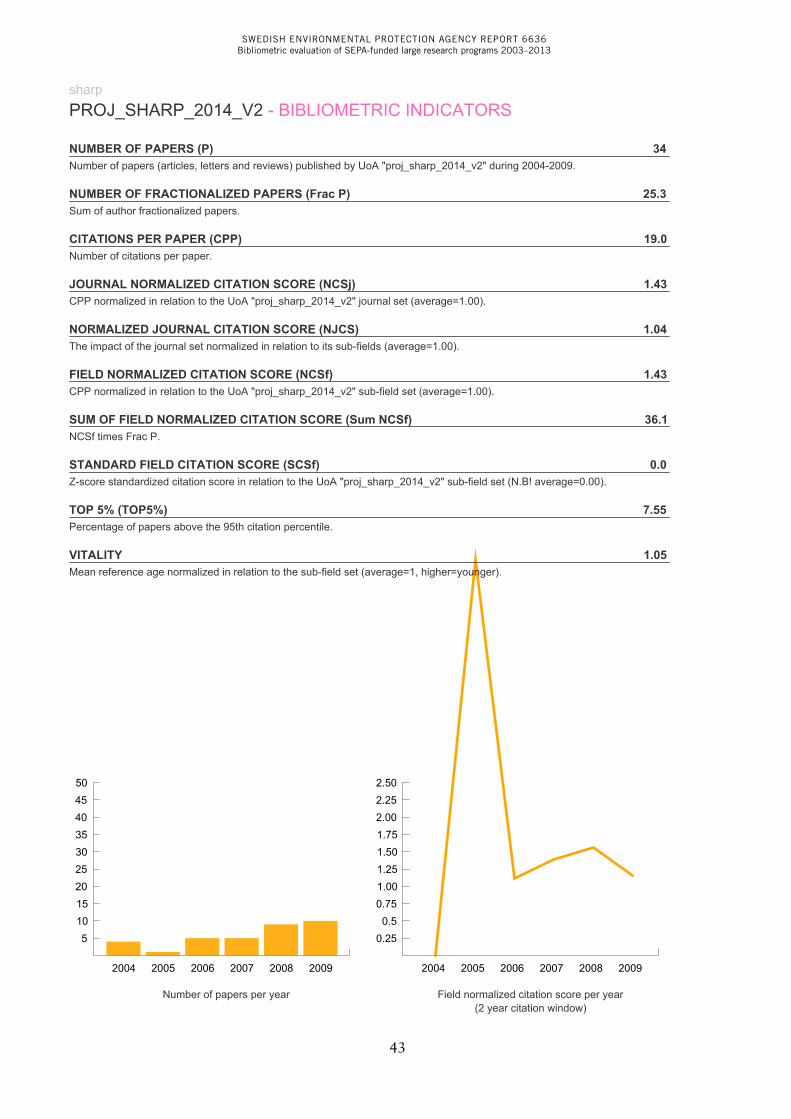
sharpPROJ_SHARP_2014_V2 - BIBLIOMETRIC INDICATORS
NUMBER OF PAPERS (P) 34Number of papers (articles, letters and reviews) published by UoA "proj_sharp_2014_v2" during 2004-2009.
NUMBER OF FRACTIONALIZED PAPERS (Frac P) 25.3Sum of author fractionalized papers.
CITATIONS PER PAPER (CPP) 19.0Number of citations per paper.
JOURNAL NORMALIZED CITATION SCORE (NCSj) 1.43CPP normalized in relation to the UoA "proj_sharp_2014_v2" journal set (average=1.00).
NORMALIZED JOURNAL CITATION SCORE (NJCS) 1.04The impact of the journal set normalized in relation to its sub-fields (average=1.00).
FIELD NORMALIZED CITATION SCORE (NCSf) 1.43CPP normalized in relation to the UoA "proj_sharp_2014_v2" sub-field set (average=1.00).
SUM OF FIELD NORMALIZED CITATION SCORE (Sum NCSf) 36.1NCSf times Frac P.
STANDARD FIELD CITATION SCORE (SCSf) 0.0Z-score standardized citation score in relation to the UoA "proj_sharp_2014_v2" sub-field set (N.B! average=0.00).
TOP 5% (TOP5%) 7.55Percentage of papers above the 95th citation percentile.
VITALITY 1.05Mean reference age normalized in relation to the sub-field set (average=1, higher=younger).
Number of papers per year Field normalized citation score per year(2 year citation window)
baumann, h_flipp
rex, e_flipp
flippPROJ_FLIPP_2014_V2 - COLLABORATION NETWORK
SWEDISH ENVIRONMENTAL PROTECTION AGENCY REPORT 6636Bibliometric evaluation of SEPA-funded large research programs 2003–2013
44
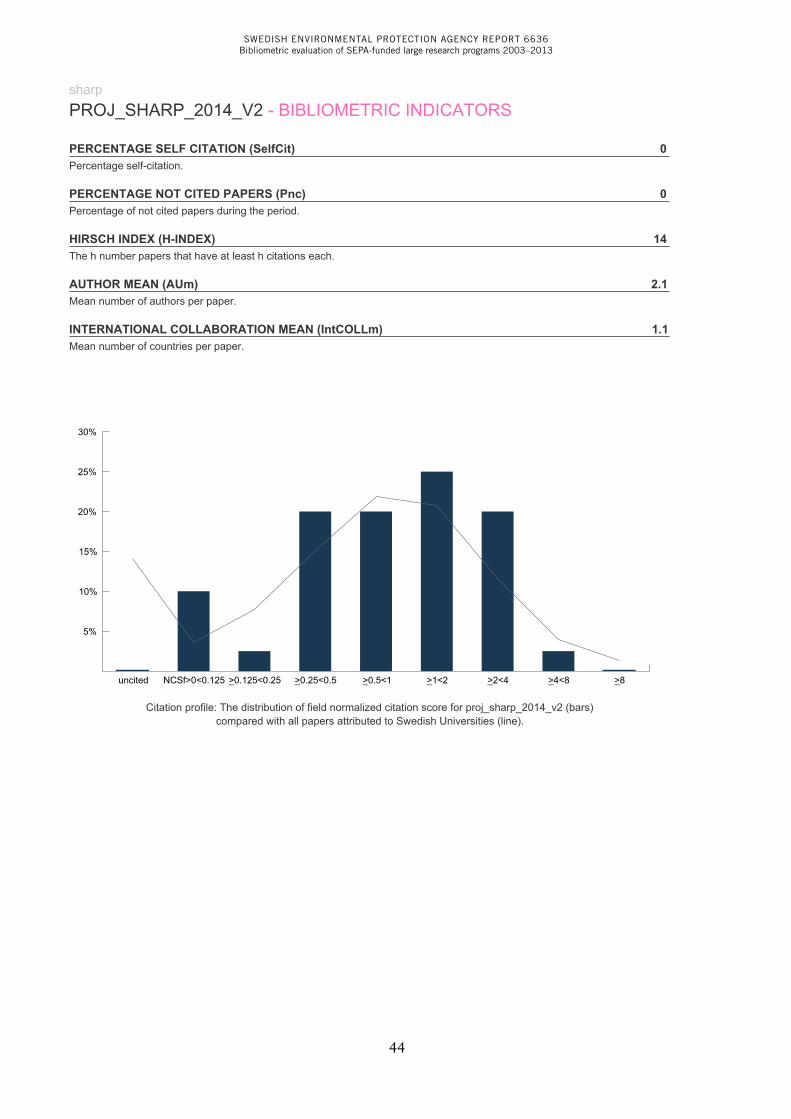
sharpPROJ_SHARP_2014_V2 - BIBLIOMETRIC INDICATORS
PERCENTAGE SELF CITATION (SelfCit) 0Percentage self-citation.
PERCENTAGE NOT CITED PAPERS (Pnc) 0Percentage of not cited papers during the period.
HIRSCH INDEX (H-INDEX) 14The h number papers that have at least h citations each.
AUTHOR MEAN (AUm) 2.1Mean number of authors per paper.
INTERNATIONAL COLLABORATION MEAN (IntCOLLm) 1.1Mean number of countries per paper.
uncited NCSf>0<0.125 >0.125<0.25_ >0.25<0.5_ >0.5<1_ >1<2_ >2<4_ >4<8_ >8_
5%
10%
15%
20%
25%
30%
Citation profile: The distribution of field normalized citation score for proj_sharp_2014_v2 (bars)compared with all papers attributed to Swedish Universities (line).
SWEDISH ENVIRONMENTAL PROTECTION AGENCY REPORT 6636Bibliometric evaluation of SEPA-funded large research programs 2003–2013
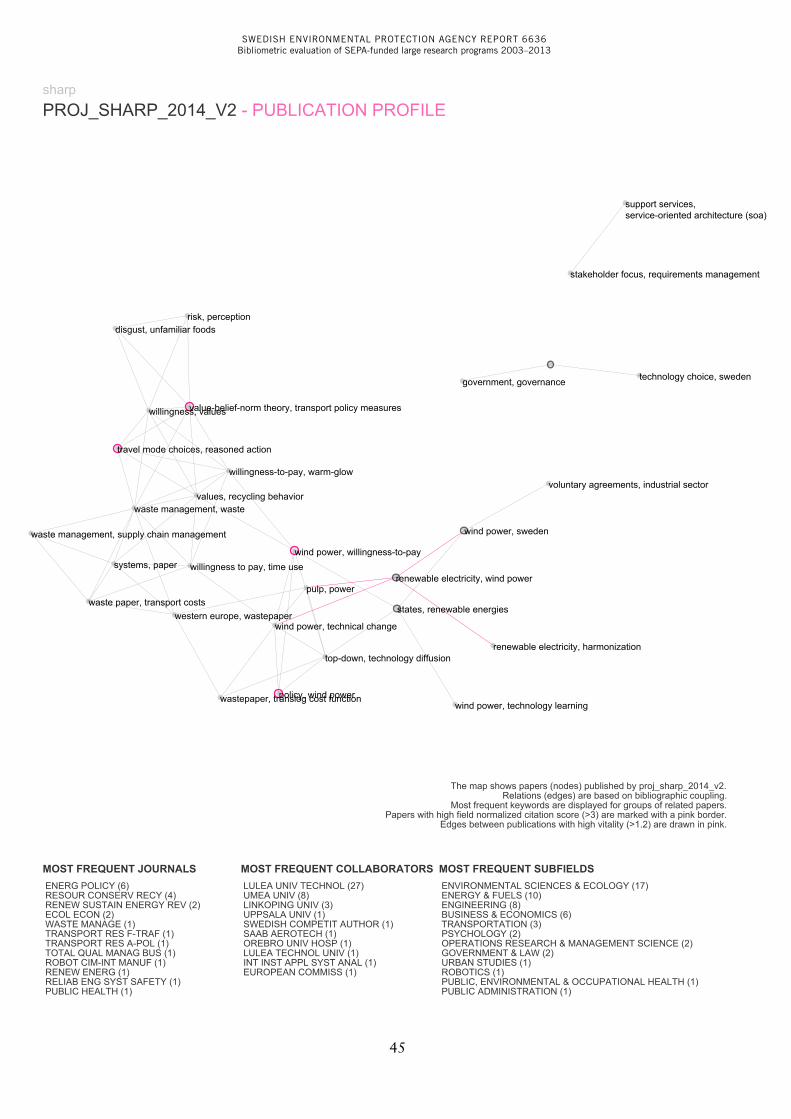
45
states, renewable energies
wind power, technology learning
waste management, waste
pulp, power
technology choice, sweden
risk, perception
western europe, wastepaper
wind power, sweden
support services, service-oriented architecture (soa)
voluntary agreements, industrial sector
stakeholder focus, requirements management
wastepaper, translog cost function
waste paper, transport costs
disgust, unfamiliar foods
wind power, willingness-to-pay
willingness, values
willingness to pay, time use
values, recycling behavior
top-down, technology diffusion
waste management, supply chain management
wind power, technical change
systems, paper
travel mode choices, reasoned action
government, governance
renewable electricity, harmonization
renewable electricity, wind power
value-belief-norm theory, transport policy measures
willingness-to-pay, warm-glow
policy, wind power
sharpPROJ_SHARP_2014_V2 - PUBLICATION PROFILE
The map shows papers (nodes) published by proj_sharp_2014_v2.Relations (edges) are based on bibliographic coupling.
Most frequent keywords are displayed for groups of related papers.Papers with high field normalized citation score (>3) are marked with a pink border.
Edges between publications with high vitality (>1.2) are drawn in pink.
MOST FREQUENT JOURNALS ENERG POLICY (6) RESOUR CONSERV RECY (4) RENEW SUSTAIN ENERGY REV (2) ECOL ECON (2) WASTE MANAGE (1) TRANSPORT RES F-TRAF (1) TRANSPORT RES A-POL (1) TOTAL QUAL MANAG BUS (1) ROBOT CIM-INT MANUF (1) RENEW ENERG (1) RELIAB ENG SYST SAFETY (1) PUBLIC HEALTH (1)
MOST FREQUENT COLLABORATORS LULEA UNIV TECHNOL (27) UMEA UNIV (8) LINKOPING UNIV (3) UPPSALA UNIV (1) SWEDISH COMPETIT AUTHOR (1) SAAB AEROTECH (1) OREBRO UNIV HOSP (1) LULEA TECHNOL UNIV (1) INT INST APPL SYST ANAL (1) EUROPEAN COMMISS (1)
MOST FREQUENT SUBFIELDS ENVIRONMENTAL SCIENCES & ECOLOGY (17) ENERGY & FUELS (10) ENGINEERING (8) BUSINESS & ECONOMICS (6) TRANSPORTATION (3) PSYCHOLOGY (2) OPERATIONS RESEARCH & MANAGEMENT SCIENCE (2) GOVERNMENT & LAW (2) URBAN STUDIES (1) ROBOTICS (1) PUBLIC, ENVIRONMENTAL & OCCUPATIONAL HEALTH (1) PUBLIC ADMINISTRATION (1)
sharpPROJ_SHARP_2014_V2 - BIBLIOMETRIC INDICATORS
PERCENTAGE SELF CITATION (SelfCit) 0Percentage self-citation.
PERCENTAGE NOT CITED PAPERS (Pnc) 0Percentage of not cited papers during the period.
HIRSCH INDEX (H-INDEX) 14The h number papers that have at least h citations each.
AUTHOR MEAN (AUm) 2.1Mean number of authors per paper.
INTERNATIONAL COLLABORATION MEAN (IntCOLLm) 1.1Mean number of countries per paper.
uncited NCSf>0<0.125 >0.125<0.25_ >0.25<0.5_ >0.5<1_ >1<2_ >2<4_ >4<8_ >8_
5%
10%
15%
20%
25%
30%
Citation profile: The distribution of field normalized citation score for proj_sharp_2014_v2 (bars)compared with all papers attributed to Swedish Universities (line).
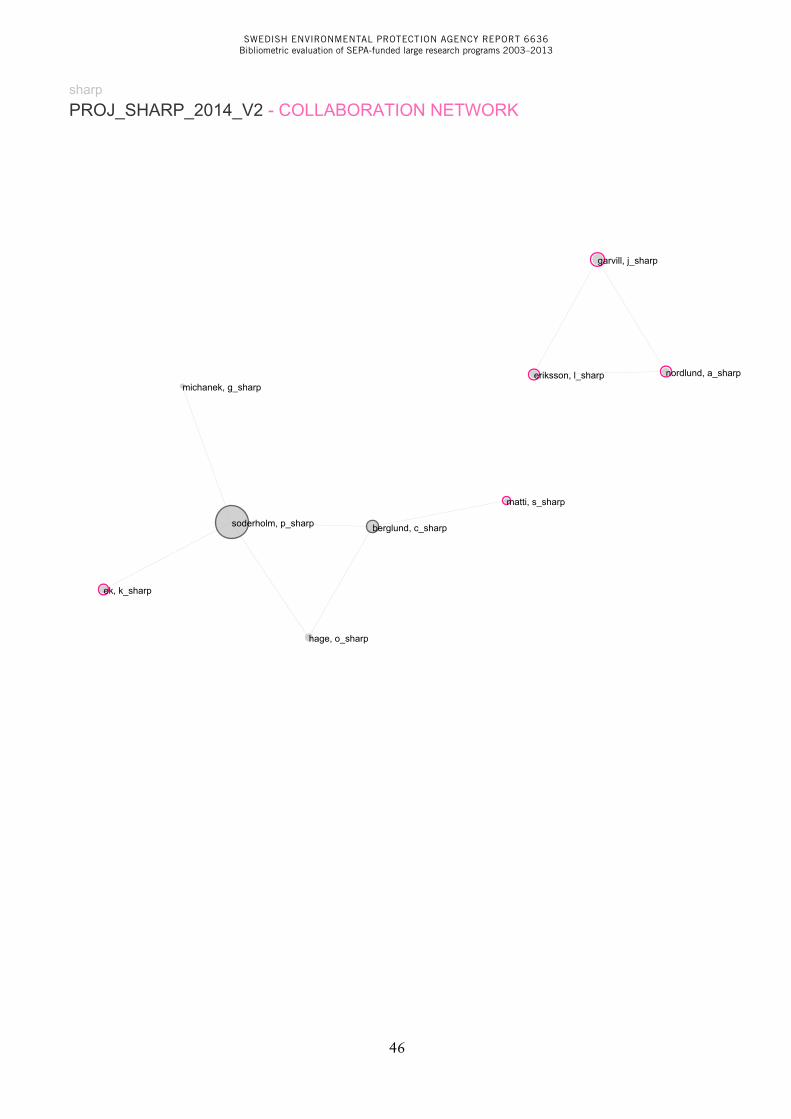
SWEDISH ENVIRONMENTAL PROTECTION AGENCY REPORT 6636Bibliometric evaluation of SEPA-funded large research programs 2003–2013
46
soderholm, p_sharp berglund, c_sharp
garvill, j_sharp
hage, o_sharp
nordlund, a_sharperiksson, l_sharp
ek, k_sharp
michanek, g_sharp
matti, s_sharp
sharpPROJ_SHARP_2014_V2 - COLLABORATION NETWORK
SWEDISH ENVIRONMENTAL PROTECTION AGENCY REPORT 6636Bibliometric evaluation of SEPA-funded large research programs 2003–2013
47
Analysis of results displayed on page 23–46ADAPT, with a large budget and a huge team of researchers, has a substantial production per year. The number of papers raises a couple of years after the introduction of the program. Publishing in prestigious journals (NJCS) is very good, but citation performance in these journals is at average only (NCSj). The field normalized indicator (NCSf) is stable above international average, probably due to some very good publications in the higher level of impact. Vitality, or reference recency, is about average. Top5% is fairly good, in the area of expected values. Even though there are several groups of collaborators (see collaboration network) the Publication Profile (map on page 25) indicates an integrated program concentrated on the subject of wildlife management. However, there are a least three different groupings within the team. Results over the whole period of time from 2005-2011 would overall be considered as Very Good.13
CLIMA is a special case, the program started in 2007, later than most other programs. Therefore, this program mainly consists of scientific results reported in journals from 2009 and up to 2012. It is evident that the program consists of highly productive researchers, with many publications related to health and environmental risk. One of the members, SO Hansson, was also part of one of the large grants evaluated in the 2009 report (SNAP), which to some extent illustrate the problem of using all publications from senior researchers.
The CLIMA program has a good publication record, and does well in many bibliometric aspects, but there are no results that stand out. This group of researchers does not receive unusual recognition for their work, but they constantly try to find ways to deal with the issue of the environment and health effects. Program members seem to have very good performances during the peak years of the CLIMA program but seem to fall down to normal levels below international average after 2011. The collaboration network reveals that there are at least two separate groups and this turns out as three different clusters of papers in the Publication Profile (see page 29). Consequently, the integration and concentration found in this program is quite low as long as focus is put on publications indexed by Web of Science. Overall, using the full period of 2007-2011, team results are considered as Good.
ENFORCE, a program in environmental law studies is lacking papers in scholarly journals, therefore the program cannot be evaluated using Web of Science. Team results are considered as Insufficient.
ENGO, a program dealing with assessment of environmental goal achieve-ment under uncertainty combines statistical, biological and communicative expertise. Publication-wise the program first and foremost has integrated statistics with environmental issues. Additionally, the program supported a
13 The grading of each team refers to the classification of research group performances in five different classes outlined in the methodological appendix on pages 66–67.
soderholm, p_sharp berglund, c_sharp
garvill, j_sharp
hage, o_sharp
nordlund, a_sharperiksson, l_sharp
ek, k_sharp
michanek, g_sharp
matti, s_sharp
sharpPROJ_SHARP_2014_V2 - COLLABORATION NETWORK
SWEDISH ENVIRONMENTAL PROTECTION AGENCY REPORT 6636Bibliometric evaluation of SEPA-funded large research programs 2003–2013
48
profile of communication studies focusing on laymen understanding of sci-entific statistical messages. Performance figures indicate fairly low levels, a bit below international average. Several other indicators are at about inter-national level, but the TOP5-indicator implicates low performance. The col-laboration network reveals three different groups with low level of integration when displayed as a “Publication Profile” (page 33). The analysis indicates that the program concentrates and integrates knowledge around the circle of core statistical competence held by the program leaders. Team results over the period 2003-2008 are considered as a low Good.
FLIPP has a quite low production of papers over the period 2003-2008. One of the goals set out from the beginning was to “create a national com-petence centre for Swedish research within the field” and such a goal would probably implicate a greater degree of internationalization, especially in terms of publications. In order to be able to understand and follow what is going on at the international research front you need to be part of relevant scien-tific networks and have a constant dialogue with other researchers. It is not enough to send information about intentions, they have to be implemented. Overall, performance figures are weak although the reference recency figure is quite good (see page 39). The FLIPP team consists of several separate groups that seem to produce papers without a single concentrated focus. Team results over the full period are considered as Good.
MIST as a program promises to carry out research “in co-operation and interaction with agencies, organisations and other stakeholders”. Whether that implicates other types of research than what is normally published in scholarly journals is not explicitly declared. Although there are few papers the MIST team do have an impact above the expected reference values. The trend is positive and more papers are added each year (see page 36). The team has a focus on an integrated subject area even if there are several groups col-laborating for the common theme (page 38). Team results are considered as Very Good.
SHARP, a team of researchers centered at Luleå Technical University pro-duces highly recognized research, but typically social science style with a fairly low penetration of the international journals. Results are very good with a number of prestigious publications that have received a very high recognition from colleagues (page 43). The focus on energy technologies and household behavior seems to have been a theme that has been jointly supported by the two groups of researchers that were involved in the program. Team results over the period 2004-2009 are considered as Very Good.
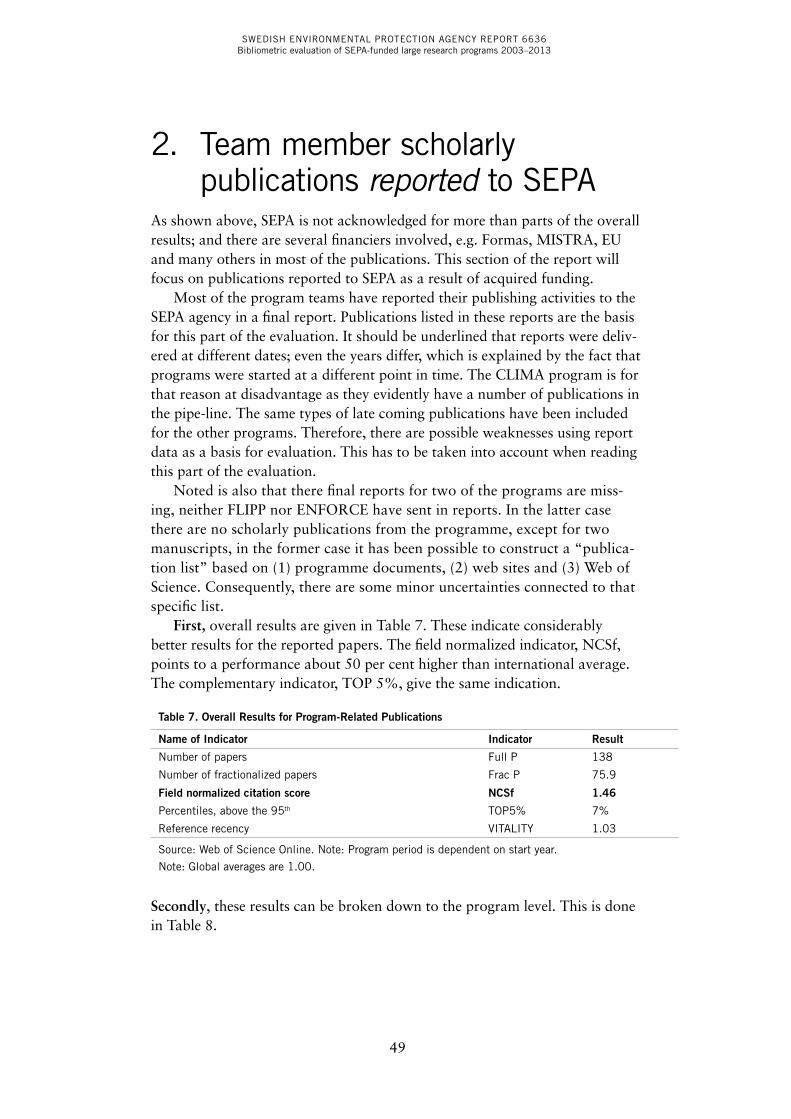
SWEDISH ENVIRONMENTAL PROTECTION AGENCY REPORT 6636Bibliometric evaluation of SEPA-funded large research programs 2003–2013
49
2. Team member scholarly publications reported to SEPA
As shown above, SEPA is not acknowledged for more than parts of the overall results; and there are several financiers involved, e.g. Formas, MISTRA, EU and many others in most of the publications. This section of the report will focus on publications reported to SEPA as a result of acquired funding.
Most of the program teams have reported their publishing activities to the SEPA agency in a final report. Publications listed in these reports are the basis for this part of the evaluation. It should be underlined that reports were deliv-ered at different dates; even the years differ, which is explained by the fact that programs were started at a different point in time. The CLIMA program is for that reason at disadvantage as they evidently have a number of publications in the pipe-line. The same types of late coming publications have been included for the other programs. Therefore, there are possible weaknesses using report data as a basis for evaluation. This has to be taken into account when reading this part of the evaluation.
Noted is also that there final reports for two of the programs are miss-ing, neither FLIPP nor ENFORCE have sent in reports. In the latter case there are no scholarly publications from the programme, except for two manuscripts, in the former case it has been possible to construct a “publica-tion list” based on (1) programme documents, (2) web sites and (3) Web of Science. Consequently, there are some minor uncertainties connected to that specific list.
First, overall results are given in Table 7. These indicate considerably better results for the reported papers. The field normalized indicator, NCSf, points to a performance about 50 per cent higher than international average. The complementary indicator, TOP 5%, give the same indication.
Table 7. Overall Results for Program‑Related Publications
Name of Indicator Indicator Result
Number of papers Full P 138
Number of fractionalized papers Frac P 75.9
Field normalized citation score NCSf 1.46
Percentiles, above the 95th TOP5% 7%
Reference recency VITALITY 1.03
Source: Web of Science Online. Note: Program period is dependent on start year.
Note: Global averages are 1.00.
Secondly, these results can be broken down to the program level. This is done in Table 8.
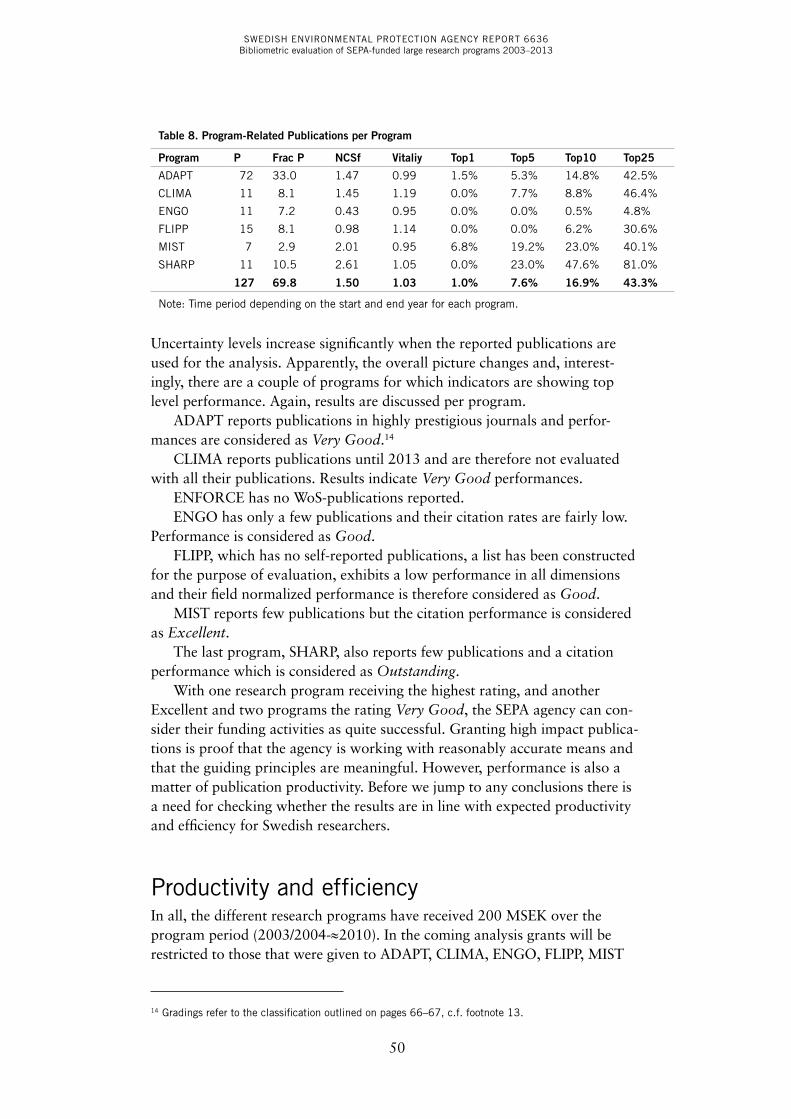
SWEDISH ENVIRONMENTAL PROTECTION AGENCY REPORT 6636Bibliometric evaluation of SEPA-funded large research programs 2003–2013
50
Table 8. Program‑Related Publications per Program
Program P Frac P NCSf Vitaliy Top1 Top5 Top10 Top25
ADAPT 72 33.0 1.47 0.99 1.5% 5.3% 14.8% 42.5%
CLIMA 11 8.1 1.45 1.19 0.0% 7.7% 8.8% 46.4%
ENGO 11 7.2 0.43 0.95 0.0% 0.0% 0.5% 4.8%
FLIPP 15 8.1 0.98 1.14 0.0% 0.0% 6.2% 30.6%
MIST 7 2.9 2.01 0.95 6.8% 19.2% 23.0% 40.1%
SHARP 11 10.5 2.61 1.05 0.0% 23.0% 47.6% 81.0%
127 69.8 1.50 1.03 1.0% 7.6% 16.9% 43.3%
Note: Time period depending on the start and end year for each program.
Uncertainty levels increase significantly when the reported publications are used for the analysis. Apparently, the overall picture changes and, interest-ingly, there are a couple of programs for which indicators are showing top level performance. Again, results are discussed per program.
ADAPT reports publications in highly prestigious journals and perfor-mances are considered as Very Good.14
CLIMA reports publications until 2013 and are therefore not evaluated with all their publications. Results indicate Very Good performances.
ENFORCE has no WoS-publications reported. ENGO has only a few publications and their citation rates are fairly low.
Performance is considered as Good.FLIPP, which has no self-reported publications, a list has been constructed
for the purpose of evaluation, exhibits a low performance in all dimensions and their field normalized performance is therefore considered as Good.
MIST reports few publications but the citation performance is considered as Excellent.
The last program, SHARP, also reports few publications and a citation performance which is considered as Outstanding.
With one research program receiving the highest rating, and another Excellent and two programs the rating Very Good, the SEPA agency can con-sider their funding activities as quite successful. Granting high impact publica-tions is proof that the agency is working with reasonably accurate means and that the guiding principles are meaningful. However, performance is also a matter of publication productivity. Before we jump to any conclusions there is a need for checking whether the results are in line with expected productivity and efficiency for Swedish researchers.
Productivity and efficiencyIn all, the different research programs have received 200 MSEK over the program period (2003/2004-≈2010). In the coming analysis grants will be restricted to those that were given to ADAPT, CLIMA, ENGO, FLIPP, MIST
14 Gradings refer to the classification outlined on pages 66–67, c.f. footnote 13.
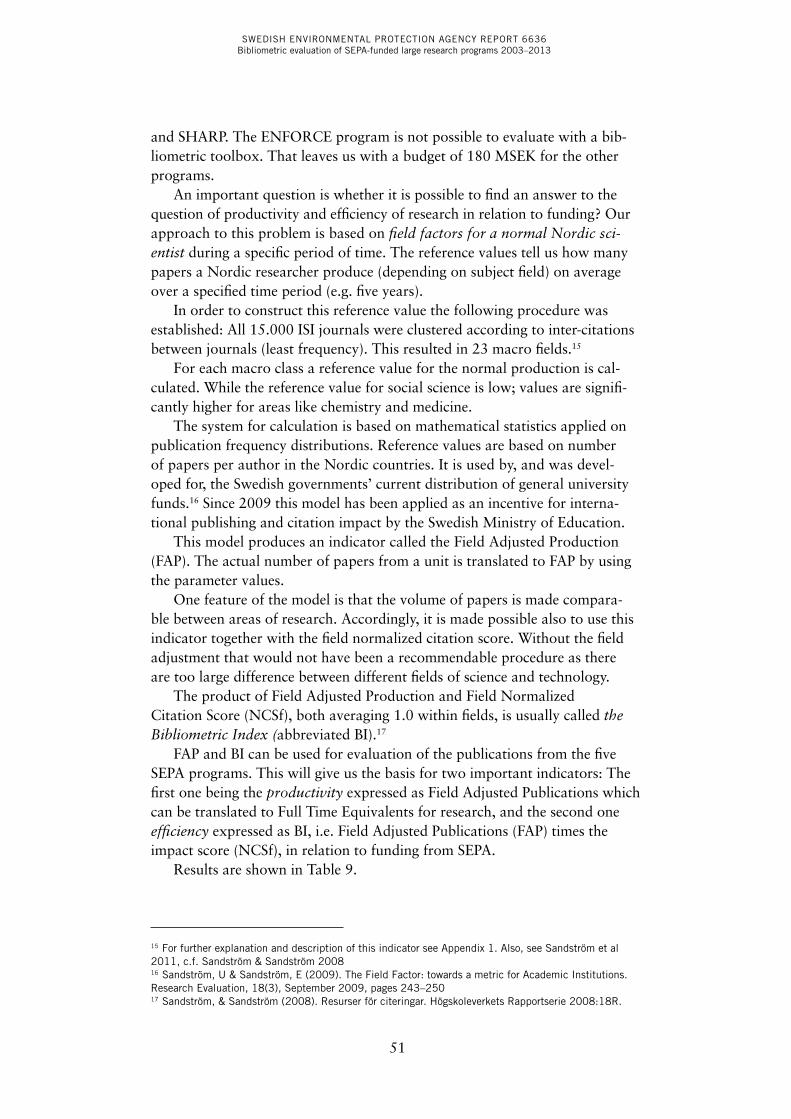
SWEDISH ENVIRONMENTAL PROTECTION AGENCY REPORT 6636Bibliometric evaluation of SEPA-funded large research programs 2003–2013
51
and SHARP. The ENFORCE program is not possible to evaluate with a bib-liometric toolbox. That leaves us with a budget of 180 MSEK for the other programs.
An important question is whether it is possible to find an answer to the question of productivity and efficiency of research in relation to funding? Our approach to this problem is based on field factors for a normal Nordic scientist during a specific period of time. The reference values tell us how many papers a Nordic researcher produce (depending on subject field) on average over a specified time period (e.g. five years).
In order to construct this reference value the following procedure was established: All 15.000 ISI journals were clustered according to inter-citations between journals (least frequency). This resulted in 23 macro fields.15
For each macro class a reference value for the normal production is cal-culated. While the reference value for social science is low; values are signifi-cantly higher for areas like chemistry and medicine.
The system for calculation is based on mathematical statistics applied on publication frequency distributions. Reference values are based on number of papers per author in the Nordic countries. It is used by, and was devel-oped for, the Swedish governments’ current distribution of general university funds.16 Since 2009 this model has been applied as an incentive for interna-tional publishing and citation impact by the Swedish Ministry of Education.
This model produces an indicator called the Field Adjusted Production (FAP). The actual number of papers from a unit is translated to FAP by using the parameter values.
One feature of the model is that the volume of papers is made compara-ble between areas of research. Accordingly, it is made possible also to use this indicator together with the field normalized citation score. Without the field adjustment that would not have been a recommendable procedure as there are too large difference between different fields of science and technology.
The product of Field Adjusted Production and Field Normalized Citation Score (NCSf), both averaging 1.0 within fields, is usually called the Bibliometric Index (abbreviated BI).17
FAP and BI can be used for evaluation of the publications from the five SEPA programs. This will give us the basis for two important indicators: The first one being the productivity expressed as Field Adjusted Publications which can be translated to Full Time Equivalents for research, and the second one efficiency expressed as BI, i.e. Field Adjusted Publications (FAP) times the impact score (NCSf), in relation to funding from SEPA.
Results are shown in Table 9.
15 For further explanation and description of this indicator see Appendix 1. Also, see Sandström et al 2011, c.f. Sandström & Sandström 200816 Sandström, U & Sandström, E (2009). The Field Factor: towards a metric for Academic Institutions. Research Evaluation, 18(3), September 2009, pages 243–25017 Sandström, & Sandström (2008). Resurser för citeringar. Högskoleverkets Rapportserie 2008:18R.
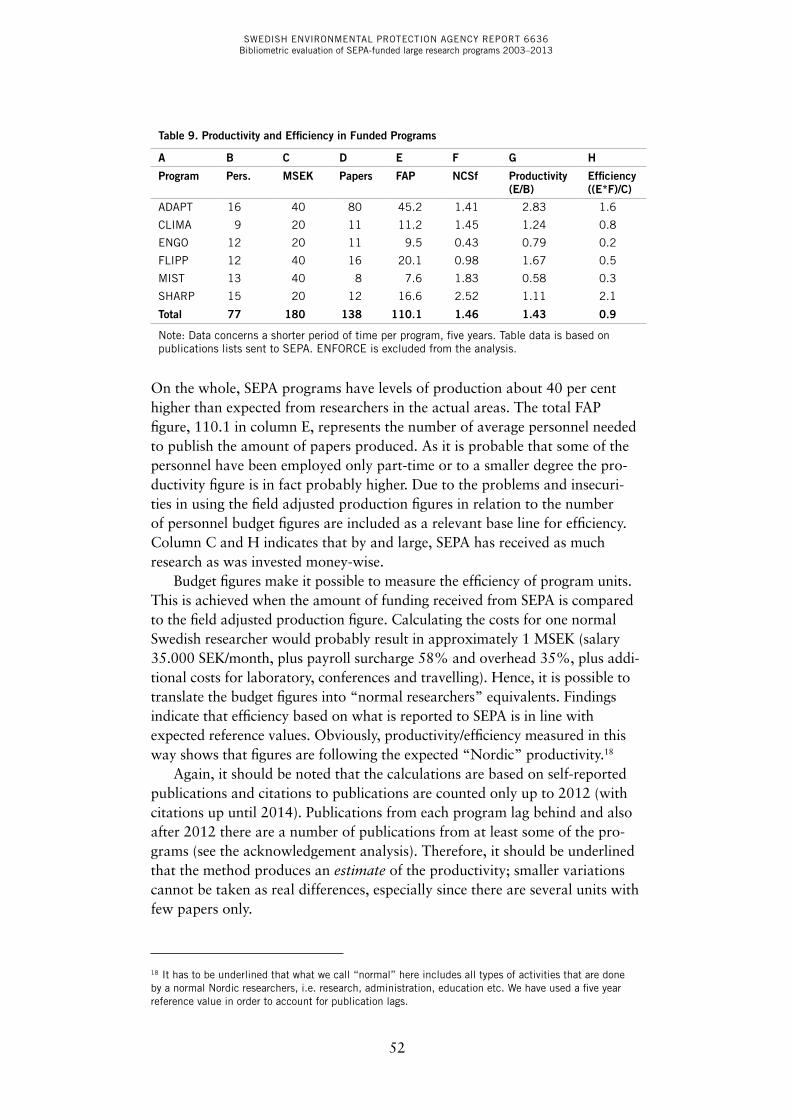
SWEDISH ENVIRONMENTAL PROTECTION AGENCY REPORT 6636Bibliometric evaluation of SEPA-funded large research programs 2003–2013
52
Table 9. Productivity and Efficiency in Funded Programs
A B C D E F G H
Program Pers. MSEK Papers FAP NCSf Productivity (E/B)
Efficiency ((E*F)/C)
ADAPT 16 40 80 45.2 1.41 2.83 1.6
CLIMA 9 20 11 11.2 1.45 1.24 0.8
ENGO 12 20 11 9.5 0.43 0.79 0.2
FLIPP 12 40 16 20.1 0.98 1.67 0.5
MIST 13 40 8 7.6 1.83 0.58 0.3
SHARP 15 20 12 16.6 2.52 1.11 2.1
Total 77 180 138 110.1 1.46 1.43 0.9
Note: Data concerns a shorter period of time per program, five years. Table data is based on publications lists sent to SEPA. ENFORCE is excluded from the analysis.
On the whole, SEPA programs have levels of production about 40 per cent higher than expected from researchers in the actual areas. The total FAP figure, 110.1 in column E, represents the number of average personnel needed to publish the amount of papers produced. As it is probable that some of the personnel have been employed only part-time or to a smaller degree the pro-ductivity figure is in fact probably higher. Due to the problems and insecuri-ties in using the field adjusted production figures in relation to the number of personnel budget figures are included as a relevant base line for efficiency. Column C and H indicates that by and large, SEPA has received as much research as was invested money-wise.
Budget figures make it possible to measure the efficiency of program units. This is achieved when the amount of funding received from SEPA is compared to the field adjusted production figure. Calculating the costs for one normal Swedish researcher would probably result in approximately 1 MSEK (salary 35.000 SEK/month, plus payroll surcharge 58% and overhead 35%, plus addi-tional costs for laboratory, conferences and travelling). Hence, it is possible to translate the budget figures into “normal researchers” equivalents. Findings indicate that efficiency based on what is reported to SEPA is in line with expected reference values. Obviously, productivity/efficiency measured in this way shows that figures are following the expected “Nordic” productivity.18
Again, it should be noted that the calculations are based on self-reported publications and citations to publications are counted only up to 2012 (with citations up until 2014). Publications from each program lag behind and also after 2012 there are a number of publications from at least some of the pro-grams (see the acknowledgement analysis). Therefore, it should be underlined that the method produces an estimate of the productivity; smaller variations cannot be taken as real differences, especially since there are several units with few papers only.
18 It has to be underlined that what we call “normal” here includes all types of activities that are done by a normal Nordic researchers, i.e. research, administration, education etc. We have used a five year reference value in order to account for publication lags.
SWEDISH ENVIRONMENTAL PROTECTION AGENCY REPORT 6636Bibliometric evaluation of SEPA-funded large research programs 2003–2013
53
Another impression from the evaluation of the SEPA programs is that at least three of the programs do underperform when it comes to international publications. This conclusion builds on the assumption that a program with a higher number of field adjusted papers will have a higher impact on col-leagues and on society than a program with fewer field adjusted papers.
In summary, this part of the evaluation indicates that SEPA has received an amount of activity that is in line with what could be expected (not count-ing the ENFORCE program).
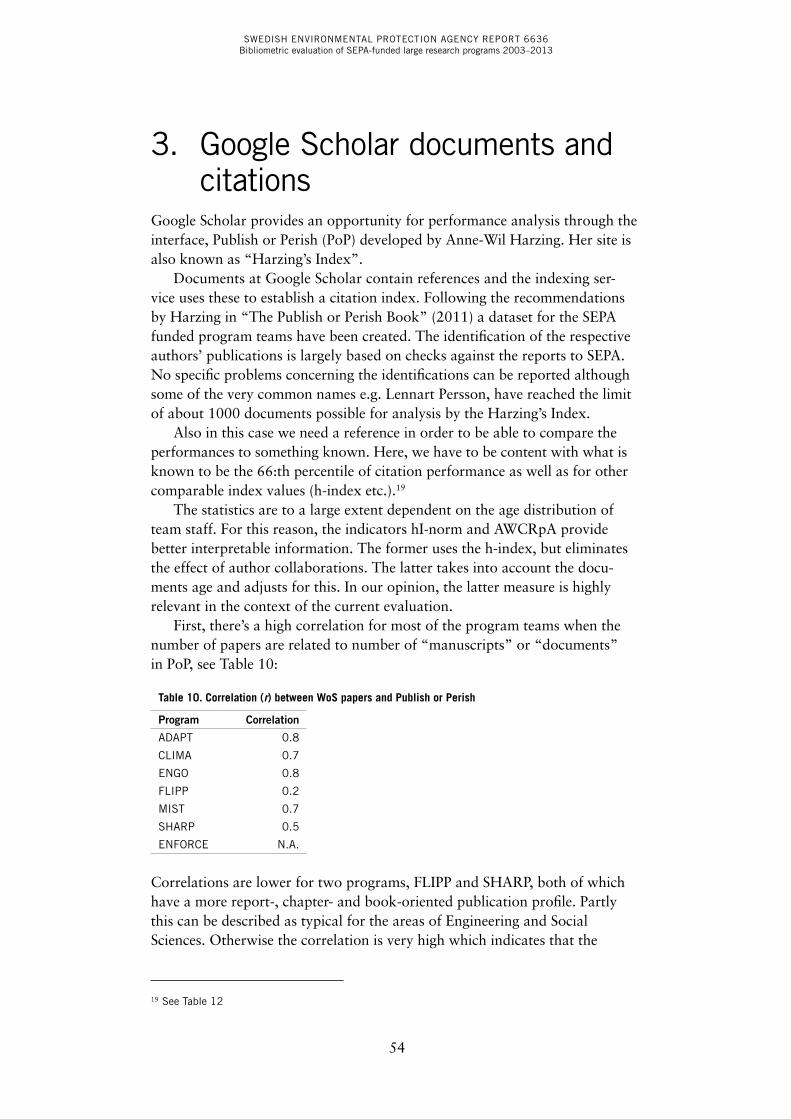
SWEDISH ENVIRONMENTAL PROTECTION AGENCY REPORT 6636Bibliometric evaluation of SEPA-funded large research programs 2003–2013
54
3. Google Scholar documents and citations
Google Scholar provides an opportunity for performance analysis through the interface, Publish or Perish (PoP) developed by Anne-Wil Harzing. Her site is also known as “Harzing’s Index”.
Documents at Google Scholar contain references and the indexing ser-vice uses these to establish a citation index. Following the recommendations by Harzing in “The Publish or Perish Book” (2011) a dataset for the SEPA funded program teams have been created. The identification of the respective authors’ publications is largely based on checks against the reports to SEPA. No specific problems concerning the identifications can be reported although some of the very common names e.g. Lennart Persson, have reached the limit of about 1000 documents possible for analysis by the Harzing’s Index.
Also in this case we need a reference in order to be able to compare the performances to something known. Here, we have to be content with what is known to be the 66:th percentile of citation performance as well as for other comparable index values (h-index etc.).19
The statistics are to a large extent dependent on the age distribution of team staff. For this reason, the indicators hI-norm and AWCRpA provide better interpretable information. The former uses the h-index, but eliminates the effect of author collaborations. The latter takes into account the docu-ments age and adjusts for this. In our opinion, the latter measure is highly relevant in the context of the current evaluation.
First, there’s a high correlation for most of the program teams when the number of papers are related to number of “manuscripts” or “documents” in PoP, see Table 10:
Table 10. Correlation (r) between WoS papers and Publish or Perish
Program Correlation
ADAPT 0.8
CLIMA 0.7
ENGO 0.8
FLIPP 0.2
MIST 0.7
SHARP 0.5
ENFORCE N.A.
Correlations are lower for two programs, FLIPP and SHARP, both of which have a more report-, chapter- and book-oriented publication profile. Partly this can be described as typical for the areas of Engineering and Social Sciences. Otherwise the correlation is very high which indicates that the
19 See Table 12
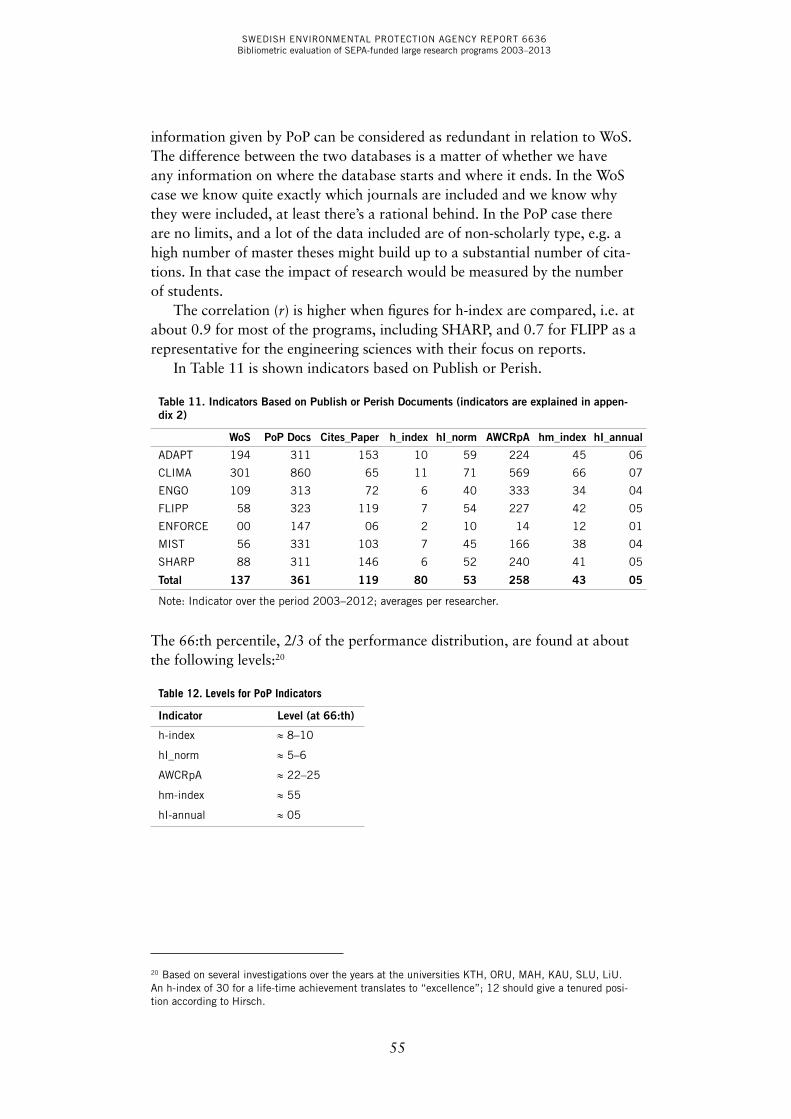
SWEDISH ENVIRONMENTAL PROTECTION AGENCY REPORT 6636Bibliometric evaluation of SEPA-funded large research programs 2003–2013
55
information given by PoP can be considered as redundant in relation to WoS. The difference between the two databases is a matter of whether we have any information on where the database starts and where it ends. In the WoS case we know quite exactly which journals are included and we know why they were included, at least there’s a rational behind. In the PoP case there are no limits, and a lot of the data included are of non-scholarly type, e.g. a high number of master theses might build up to a substantial number of cita-tions. In that case the impact of research would be measured by the number of students.
The correlation (r) is higher when figures for h-index are compared, i.e. at about 0.9 for most of the programs, including SHARP, and 0.7 for FLIPP as a representative for the engineering sciences with their focus on reports.
In Table 11 is shown indicators based on Publish or Perish.
Table 11. Indicators Based on Publish or Perish Documents (indicators are explained in appen‑dix 2)
WoS PoP Docs Cites_Paper h_index hI_norm AWCRpA hm_index hI_annual
ADAPT 194 311 153 10 59 224 45 06
CLIMA 301 860 65 11 71 569 66 07
ENGO 109 313 72 6 40 333 34 04
FLIPP 58 323 119 7 54 227 42 05
ENFORCE 00 147 06 2 10 14 12 01
MIST 56 331 103 7 45 166 38 04
SHARP 88 311 146 6 52 240 41 05
Total 137 361 119 80 53 258 43 05
Note: Indicator over the period 2003–2012; averages per researcher.
The 66:th percentile, 2/3 of the performance distribution, are found at about the following levels:20
Table 12. Levels for PoP Indicators
Indicator Level (at 66:th)
h-index ≈ 8–10
hI_norm ≈ 5–6
AWCRpA ≈ 22–25
hm-index ≈ 55
hI-annual ≈ 05
20 Based on several investigations over the years at the universities KTH, ORU, MAH, KAU, SLU, LiU. An h-index of 30 for a life-time achievement translates to “excellence”; 12 should give a tenured posi-tion according to Hirsch.
SWEDISH ENVIRONMENTAL PROTECTION AGENCY REPORT 6636Bibliometric evaluation of SEPA-funded large research programs 2003–2013
56
ConclusionsA general observation is that each senior researcher has had at least another doctoral student financed during the period, plus some additional money for other project means. That is a considerable part of the program effect. Besides that, the following discussion points out some specific results from this evalu-ation.
First, the SEPA research programs are a substantial initiative and have cre-ated a soil ground for environmental research. Publications are themselves the primary mechanism through which knowledge is transmitted within the sci-entific community. The existence of a number of articles based on SEPA pro-grams is therefore direct evidence that the results of these programs are being disseminated widely. Having this said, it should be stressed that at least three of the seven programs in this round could probably have had more focus on producing papers in international scientific journals.
Secondly, the round of SEPA programs evaluated in this report give another example of productivity and efficiency in line with the former evalu-ation (2009). Productivity were on par with normal university production in the first round and this time production levels are generally a bit higher; the same is indicated by the Bibliometric Index (FAP*NCSf) in relation to the research budget. Even if there is a more applied character of research in this round, at the same time it would be expected that also applied research-ers should publish in order to follow their respective research fronts. Furthermore, it should be underlined that relative production figures are used and that researchers in this report are measured in relation to their nearby col-leagues, i.e. other applied researchers.
Thirdly, in this report the question of different publication cultures (e.g. social science vs. natural science) is investigated by using all types of publica-tions available at Google Scholar. Results indicate normal production and citation levels for most of the programs with two outliers: ENFORCE at the lower end and CLIMA at the higher end (based on the AWCRpA indicator). Also using these indicators the correlation to the Web of Science citation indi-cator (NCSf) is considerably high (r at about 0.7–0.9), which points to the conclusion that an expanded database would not change the overall impres-sion.
Fourthly, based on citation figures, it should be underlined that the pro-grams under evaluation do have a relative performance of about 50 per cent above world average. At the end of the day, impact is measured as total impact on society, and from that point of view a small number of papers can produce a huge influence also on societal processes. It might be that papers from a couple of the high impact programs funded by SEPA have had or will have such an impact in the future to come.
SWEDISH ENVIRONMENTAL PROTECTION AGENCY REPORT 6636Bibliometric evaluation of SEPA-funded large research programs 2003–2013
57
Appendix 1: Theories and methods in evaluative bibliometricsImportance of citationsBibliometric approaches, whereby the scientific communication process can be analyzed, are based on the notion that the essence of scientific research is the production of “new knowledge”. Researchers that have theoretical ideas or empirical results to communicate publish their contributions in journals and books. Scientific and technical literature is the constituent manifestation of that knowledge and it can be considered as an obligation for the researcher to publish their results, especially if public sector funding is involved.
Journals are in almost all areas the most important medium for communi-cation of results. The process of publication of scientific and technical results involves referee procedures established by academic and scholarly journals. Therefore, international refereed journals implicates that the research pub-lished has been under quality control and that the author has taken criticism from peers within the specialty. These procedures are a tremendous resource for the bettering of research, and are set in motion for free or to a very low cost. A researcher that choose not to use these resources may seem to be very much aside of the international research community.
The reward system in science is based on recognition, and this emphasizes the importance of publications to the science system. Because authors cite earlier work in order to substantiate particular points in their own work, the citation of a scientific paper is an indication of the importance that the com-munity attaches to the research.21
Essentially, this is the point of departure of all bibliometric studies; if the above assumption holds, then we should concentrate on finding the best meth-ods for describing and analyzing all publications from research groups under consideration.22 When we are searching for such methods our emphasis is on one specific layer of research activities. There are several more layers that can be studied and evaluated, but our focus is on research, basic and applied, and especially on excellence in research. Hence, publications are at the center of attention. To the family of publications we could have included patents. They indicate a transfer of knowledge to industrial innovation, i.e. into commodi-ties of commercial and social value.
A number of misconceptions about bibliometric analysis are in circula-tion, partly due to the misuse of journal indicators, partly because a perceived lack of transparency. Certainly, we will not be able to answer all questions and possible remarks to the analysis, but hopefully some of the most common
21 CWTS (2008). See the extensive list of references which points to a serious discourse on issues in scientometrics.22 Narin (1996) ; CWTS (2008).
SWEDISH ENVIRONMENTAL PROTECTION AGENCY REPORT 6636Bibliometric evaluation of SEPA-funded large research programs 2003–2013
58
misinterpretations. One important conclusion of our discussion is that the use of bibliometric indicators requires far greater watchfulness when applied to a research group or an individual than for a general description of science at the country or university level.
Basics of bibliometricsInternational scientific influence (impact) is an often used parameter in assess-ments of research performance. Impact on others research can be considered as an important and measurable aspect of scientific quality, but, of course, not the only one. Within most of international bibliometric analyses there are a series of basic indicators that are widely accepted.
In most bibliometric studies of science and engineering, data is confined to the following document types: articles, letters, proceedings papers and reviews in refereed research journals or serials. The impact of a paper is often assumed to be judged by the reputation of the journal in which it was published. This can be misleading because the rate of manuscript rejection is generally low even for the most reputable journals. Of course, it is reasonable to assume that the average paper in a prestigious journal will, in general, be of a higher quality than one in a less reputable journal. 23 However, the quality of a jour-nal is not necessarily easy to determine24 and, therefore, only counting the number of articles in refereed journals will produce a disputable result (Butler, 2002; Butler, 2003).
The question arises whether a person who has published more papers than his or her colleagues has necessarily made a greater contribution to the research front in that field. All areas of research have their own institutional “rules”, e.g. the rejection rate of manuscripts differs between disciplines; while some areas accept 30–40 per cent of submitted manuscripts due to per-ceived quality and space shortages other areas can accept up to 80–90 per cent. Therefore, a differentiation between quantity of production and quality (impact) of production has to be established. Several bibliometric indicators are relevant in a study of “academic impact”: number of citations received by the papers, as well as various influence and impact indicators based on field normalized citation rates. Accordingly, we will not use the number of papers as an indicator of performance, but we have to keep in mind that few papers indicate a low general impact, while a high number of cited papers indicate a higher total impact.
23 Cole et al. (1988).24 Hansson (1995), Moed (2005), ch. 5.
SWEDISH ENVIRONMENTAL PROTECTION AGENCY REPORT 6636Bibliometric evaluation of SEPA-funded large research programs 2003–2013
59
Citations and theories of citingThe choice of citations as the central indicator calls for a theory of citing; a theory that makes it possible to explain why author x cite article a at time t? What factors should be considered when we discuss why researchers cite back to former literature? The need for a theoretical underpinning of citation analysis has been acknowledged for a long time and several theories have been put forward.25 In summary, there are three types of theories: 1) Normative theories, 2) Constructivist theories, and 3) Pragmatic theories. Normative theories are based on a naïve functionalist sociology, and constructivist theo-ries are based on an opposition against these assumptions. According to the pragmatist school, which seems to be a predominantly Nordic school (e.g. Seglen, 1998, Luukonen, 1997, Amsterdamska & Leydesdorff, 1989; Aksnes 2003), utility in research is an important aspect, as well as cognitive quality, and together they are criterions for reference selection. Based on Cole (1992) the Norwegian Aksnes (2003b) introduces the concepts quality and visibility dynamics in order to depict the mechanisms involved.
Factors like journal space limitations prevent researchers from citing all the sources they draw on; it has been estimated that only a third of the litera-ture base of a scientific paper is rewarded with citations. A citation does not implicate that the cited author was necessarily “correct”, but that the research was seen as useful from the citing side. Do not forget that negative findings can be of considerable value in terms of direction and method. If a paper is used by others, it has some importance. In retrospect the idea or method may be totally rejected; yet use of the citation is clearly closer to “important contribution to knowledge” than just the publication count in itself. The citation signifies recognition and typically bestows prestige, symbolizing influ-ence and continuity.26 There is no doubt citations can be based on irrational criteria, e.g. some citations may reflect poor judgment, rhetoric or friend-ship. Nevertheless, the frequency with which an article is cited would appear to establish a better approximation of “quality” than the sheer quantity of production.27 Furthermore, citations may indicate an important sociological process: continuity of the discipline. From this perspective, either a positive or negative citation means that the authors citing and the author cited have formed a cognitive relationship.28
Citation practices can be described as results of stochastic processes with accidental effects (Nederhof, 1988:207). Many random factors contribute to the final outcome (e.g. structural factors such as publication time-lags etc.) and the situation can be described in terms of probability distributions: there
25 For an excellent review of this topic, see Borgmann & Furner (2002). 26 Roche & Smith (1980), p. 344.27 Martin & Irvine, 1983; Cole and Cole, 1973; Moed et al 1985. Butler 2003.28 Cf. Small (1978) proposed the view that citations act as “concept symbols” for the ideas that are referenced in papers.
SWEDISH ENVIRONMENTAL PROTECTION AGENCY REPORT 6636Bibliometric evaluation of SEPA-funded large research programs 2003–2013
60
are many potential citers each with a small probability of actually giving a reference, but the chance gets higher with each former reference (Dieks & Chang, 1976: 250).
This also creates difficulties when it comes to levels of significance:29 “(…) when one paper is cited zero times, another paper, of the same age, has to be cited at least by five different authors or groups of authors, for the differ-ence to be statistically significant. (…) This implies that when small numbers of papers are involved, chance factors may obscure a real difference in impact. However, as the number of papers involved in comparisons increase, the rela-tive contribution of chance factors is reduced, and that of real differences is increased” (Nederhof, 1988:207). Accordingly, we have to be very careful in citation analysis when comparing small research groups. Chance factors and technical problems with citations have too pronounced an influence.
Principle of anti-diagnosticsThe type of insecurities involved in bibliometrics make it necessary to under-score the principle of anti-diagnostics: “(…) while in medical diagnosis numeri-cal laboratory results can indicate only pathological status but not health, in scientometrics, numerical indicators can reliably suggest only eminence but never worthlessness. The level of citedness, for instance, may be affected by numerous factors other than inherent scientific merits, but without such merits no statistically significant eminence in citedness can be achieved.” (Braun & Schubert, 1997: 177).
The meaning of this principle is that it is easier with citation analysis to identify excellence than to diagnose low quality in research. The reasons for absence of citations might be manifold: the research community has not yet observed this line of research; publications might not be addressed to the research community but to society etc. Clearly, results for a unit of assessment that are clearly above the international average (=1.0), e.g. relative citation levels of 2,0–3,0 or higher indicates a strong group and a lively research, but citation levels below 1,0 does not necessarily indicate a poorly performing group.
Citation indicatorsThe above review of the literature reveals that there are limitations to all theo-ries and all methods for finding excellence in research. According to Martin & Irvine (1983:70) we have to consider three related concepts: Quality, Importance and Impact. Quality refers to the inherent properties of the research itself, and the other two concepts are more external. Importance and impact
29 Cf. Schubert & Glänzel (1983).
SWEDISH ENVIRONMENTAL PROTECTION AGENCY REPORT 6636Bibliometric evaluation of SEPA-funded large research programs 2003–2013
61
are concepts that refer to the relations between the research and other researchers/ research areas. The latter also describes the strength of the links to other research activities.
We can discuss the quality of a research paper without considering the number of times it has been cited by others or how many different research-ers that cited it. It is not an absolute, but a relative characteristic; it is socially as well as cognitively determined, and can, of course, be judged by many other individuals. Importance refers to the potential influence30 on surround-ing research and should not be confused with “correct”, as an idea “must not be correct to be important” (Garfield et al. 1978: 182).31 Due to the inherent imperfections in the scientific communication system the actual impact is not identical with the importance of a paper. Then, it is clear that impact describes the actual influence on surrounding research: “while this will depend partly on its importance, it may also be affected by such factors as the location of the author, and the prestige, language, and availability, of the publishing journal” (Martin & Irvine 1983: 70; cf. Dieks and Chang 1976). Hence, while impact is an imperfect measure it is clearly linked to the scientific work process; used in a prudent and pragmatic approach measures based on impact give impor-tant information on the performance of research groups.
Validation of bibliographic dataOne of the practical problems is that of constructing the basic bibliography of the units of assessments production. This is not a trivial question as papers from one institution might be headed under several different names (de Bruin & Moed, 1990). The identification of papers included in this exercise has been done on the individual level. Each researcher was identified using mainly Internet sources; e.g. searches for publications and CVs. On the basis of this material an Author Finder search was performed in the Web of Science data-base. After presenting the first results there was a round of validation were the underlying data was scrutinized by program leaders and/or each program researcher.
Coverage of scientific and technical publicationsExplorations made by Carpenter & Narin (1981), and by Moed (2005), have shown that the Thomson Reuters database is representative of scientific pub-lishing activities for most major countries and fields: “In the total collection
30 Zuckerman (1987). Of course, some of the influences (and even facts) may be embedded in the au-thor’s mind and not easily attributable. 31 Again, negative citations are also important: “The high negative citation rate to some of the polywater papers is testimony to the fundamental importance of this substance if it could have been shown to exist” (Garfield et al. 1978.). We assume that the same apply for negative citations to cold fusion papers.
SWEDISH ENVIRONMENTAL PROTECTION AGENCY REPORT 6636Bibliometric evaluation of SEPA-funded large research programs 2003–2013
62
of cited references in 2002 ISI source journals items published during 1980–2002, it was found that about 9 out of 10 cited journal references were to ISI source journals” (Moed 2005:134). It should be emphasized that Thomson mainly covers international journals, and that citations analysis is viable only in the context of international research communities. National journals and national monographs/anthologies cannot be accessed by international col-leagues. Consequently, publications in these journals are of less interest in a citation exercise of the type. As long as we are calculating relative citation fig-ures based on fields and sub-fields in the ISI database the inclusion of national or low cited journals will only have the effect of lowering the citation scores, and is, therefore not an alternative.
In some studies it has been suggested that there are two distinct popula-tions of highly cited scholars in social science subfields — one consisting of authors cited in the journal literature, another of authors cited in the mono-graphic literature (Butler, 2008; Cronin et al., 1997). As the Web of Science has a limited coverage of monographic citing material, the latter popula-tion will hardly be recognized in the database (Borgmann & Furner, 2002). Related to this question is the language-bias in the citation index. Several studies have evidenced that journal articles written in other languages than English reach a lower relative citation score than articles in English (van Leeuwen et al., 2000). In this specific SEPA research program evaluation the data consists of articles written in English only. Therefore, there is no lan-guage bias to consider in the analysis.
The Web of Science works well and covers most of the relevant informa-tion in a large majority of the natural sciences and medical fields, and quite well in applied research fields and behavioral sciences (CWTS, 2007:13). However, there are exceptions from that rule. Considerable parts of the social sciences and large parts of the humanities are either not very well covered in the Web of Science or have citations patterns that do not apply for studies based on advanced bibliometrics (Butler, 2008; Hicks, 1999; Hicks, 2004).
Matching of references to articlesThe Thomson Reuters database consists of articles and their references. Citation indexing is the result of a linking between references and source (journals covered in the database). This linking is done with an algorithm, but the one used by Thomson Reuters is conservative and the consequence is non-matching between reference and article. Several of the non-matching problems relate to publications written by ‘consortia’ (large groups of authors), to vari-ations and errors in author names authors, errors in initial page numbers, dis-crepancies due to journals with dual volume-numbering systems or combined volumes, to journals applying different article numbering systems or multiple
SWEDISH ENVIRONMENTAL PROTECTION AGENCY REPORT 6636Bibliometric evaluation of SEPA-funded large research programs 2003–2013
63
versions due to e-publishing.32 Approximations indicate that about seven per cent of citations are lost due to this conservative strategy. Thomson Reuters seem anxious not to over-credit authors with citations. In the analysis an alter-native algorithm that addresses a larger number of the missing links have been applied.
Self-citations Self-citations can be defined in several ways; usually with a focus on co-occur-rence of authors or institutions in the citing and cited publications. In this report the recommendation to eliminate citations where the first-author coin-cides between citing and cited document is applied (Aksnes, 2003a). If an author’s name can be found at other positions, as last author or middle author, it will not count as a self-citation. This more limited method is applied for one reason: if the whole list of authors is used the risk for eliminating the wrong citations will be large. On the down-side we will probably have a senior- bias with this method; this will probably not affect units of assessments, but cau-tion is needed in analysis on the individual level (Adams, 2007: 23; Aksnes, 2003b; Glänzel et al., 2004; Thijs & Glänzel, 2005).
Time window for citationsAn important factor that has to be accounted for is the time effects of cita-tions. Citations accumulate over time, and citation data has to cover compara-ble time periods (and within the same subfield or area of science, see below). However, in addition to that, the time patterns of citation are far from uni-form and any valid evaluative indicator must use a fixed window or a time frame that is equal for all papers. The reason for this is that citations have to be appropriately normalized. Most of our investigations use a decreasing time-window from the year of publication until August, 2014. However, some of our indicators are used for time-series and in these cases a fixed two year cita-tion window is applied. Publications from year 2003 receive citations until 2005; publications from 2004 receive citations until 2006 and so on.
Fractional counts and whole countsIn most fields of research scientific work is done in a collaborative manner. Collaborations make it necessary to differentiate between whole counts and fractional counts of papers and citations. Fractional counts give a figure of weight for the contribution of the group to the quantitative indicators of all
32 Moed (2002) summarizes the major problems found with the citation algorithm, c.f. Moed (2005), ch. 14 “Accuracy of citation counts”.
SWEDISH ENVIRONMENTAL PROTECTION AGENCY REPORT 6636Bibliometric evaluation of SEPA-funded large research programs 2003–2013
64
their papers. By dividing the number of authors from the unit under consid-eration with the number of all authors on a paper we introduce a fractional counting procedure. Fractional counting is a way of controlling for the effect of collaboration when measuring output and impact. In consequence, from Frac P-figures we can see to what extent the group receives many citations on collaborative papers only, or if all papers from the group are cited in the same manner.
Fields and sub-fieldsIn bibliometric studies the definition of fields is generally based on the clas-sification of scientific journals into more than 250 sub-fields, developed by Thomson Reuters. Although this classification is not perfect, it provides a clear and consistent definition of fields suitable for automated proce-dures. However, this proposition has been challenged by several scholars (e.g. Leydes dorff, 2008; Bornmann et al. 2008). Two limitations have been pointed out: (1) multidisciplinary journals (e.g. Nature; Science); and (2) highly specialized fields of research.
The Thomson Reuters classification of journals includes one sub-field category named “Multidisciplinary Sciences” for journals like PNAS, Nature and Science. More than 50 journals are classified as multidisciplinary since they publish research reports in many different fields. Fortunately, each of the papers published in this sub-field are subject specific, and, therefore, it is pos-sible to assign a subject category to these on the article level – what Glänzel et al. (1999) calls “item by item reclassification”. That strategy has been used in this report.
Normalized indicatorsDuring the latest decades standardized bibliometric procedures have been developed to assess research performance.33 Relative indicators or rebased citation counts, as an index of research impact, is widely-used by the sciento-metrics research community. They have been employed extensively for many years by Thomson Reuters in the Essential Science Indicators. Research teams in the United States and in Hungary popularized the central concepts of nor-malization during the 1980s.34 More recently, field normalized citations has been used in, for example, the European science and technology indicators, by the bibliometrics research group at the University of Leiden (labeling it the “crown indicator”), by the Evidence group in the U.K.35, by the leading higher
33 Schubert et al (1988), Glänzel (1996), Narin &Hamilton (1996), van Raan (1996), Zitt et al. (2005).34 Cf. Zitt (2005: 43). 35 C.f. Adams et al. (2007).
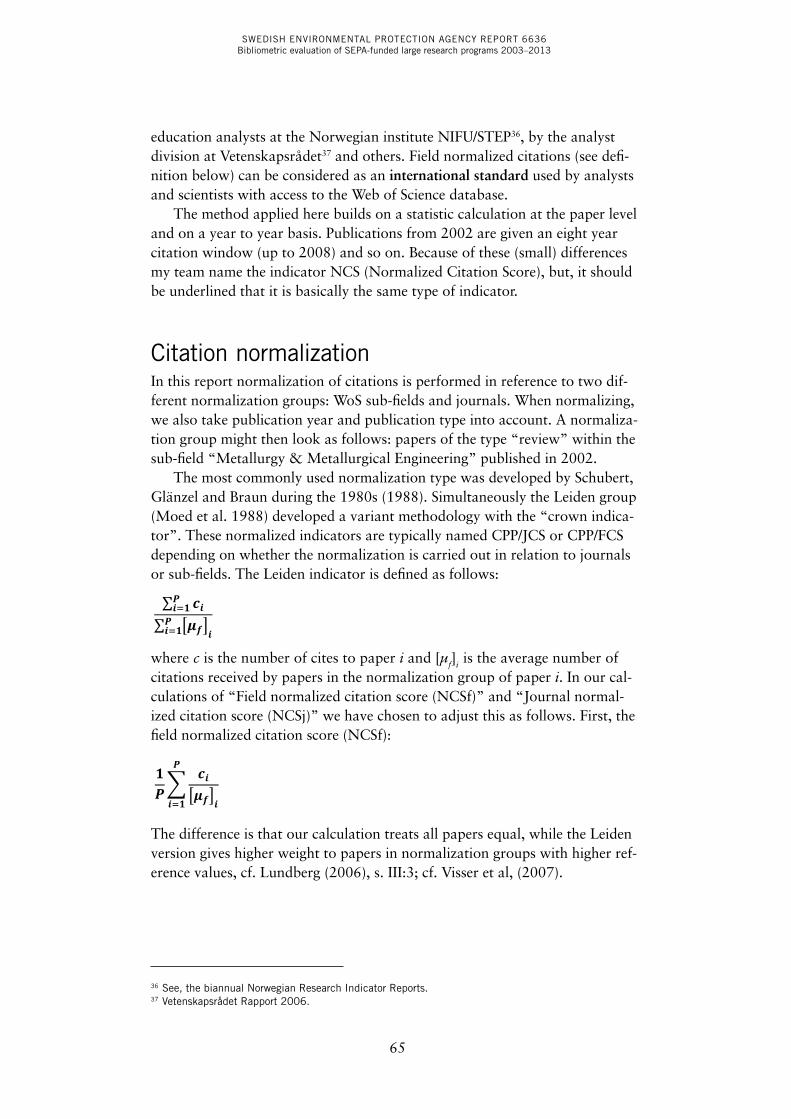
SWEDISH ENVIRONMENTAL PROTECTION AGENCY REPORT 6636Bibliometric evaluation of SEPA-funded large research programs 2003–2013
65
education analysts at the Norwegian institute NIFU/STEP36, by the analyst division at Vetenskapsrådet37 and others. Field normalized citations (see defi-nition below) can be considered as an international standard used by analysts and scientists with access to the Web of Science database.
The method applied here builds on a statistic calculation at the paper level and on a year to year basis. Publications from 2002 are given an eight year citation window (up to 2008) and so on. Because of these (small) differences my team name the indicator NCS (Normalized Citation Score), but, it should be underlined that it is basically the same type of indicator.
Citation normalizationIn this report normalization of citations is performed in reference to two dif-ferent normalization groups: WoS sub-fields and journals. When normalizing, we also take publication year and publication type into account. A normaliza-tion group might then look as follows: papers of the type “review” within the sub-field “Metallurgy & Metallurgical Engineering” published in 2002.
The most commonly used normalization type was developed by Schubert, Glänzel and Braun during the 1980s (1988). Simultaneously the Leiden group (Moed et al. 1988) developed a variant methodology with the “crown indica-tor”. These normalized indicators are typically named CPP/JCS or CPP/FCS depending on whether the normalization is carried out in relation to journals or sub-fields. The Leiden indicator is defined as follows:
∑ ������∑ ���������
where c is the number of cites to paper i and [μf]i is the average number of citations received by papers in the normalization group of paper i. In our cal-culations of “Field normalized citation score (NCSf)” and “Journal normal-ized citation score (NCSj)” we have chosen to adjust this as follows. First, the field normalized citation score (NCSf):
The difference is that our calculation treats all papers equal, while the Leiden version gives higher weight to papers in normalization groups with higher ref-erence values, cf. Lundberg (2006), s. III:3; cf. Visser et al, (2007).
36 See, the biannual Norwegian Research Indicator Reports.37 Vetenskapsrådet Rapport 2006.
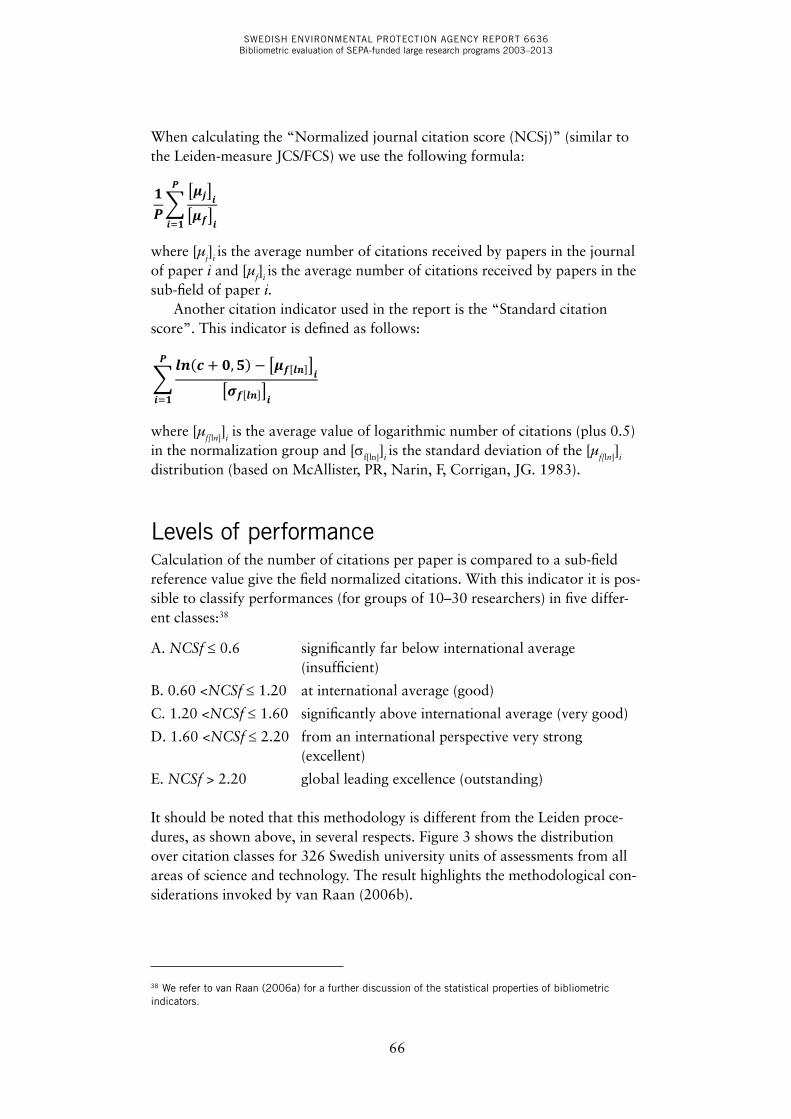
SWEDISH ENVIRONMENTAL PROTECTION AGENCY REPORT 6636Bibliometric evaluation of SEPA-funded large research programs 2003–2013
66
When calculating the “Normalized journal citation score (NCSj)” (similar to the Leiden-measure JCS/FCS) we use the following formula:
where [μj]i is the average number of citations received by papers in the journal of paper i and [μf]i is the average number of citations received by papers in the sub-field of paper i.
Another citation indicator used in the report is the “Standard citation score”. This indicator is defined as follows:
where [μf[ln]]i is the average value of logarithmic number of citations (plus 0.5) in the normalization group and [σf[ln]]i is the standard deviation of the [μf[ln]]i
distribution (based on McAllister, PR, Narin, F, Corrigan, JG. 1983).
Levels of performanceCalculation of the number of citations per paper is compared to a sub-field reference value give the field normalized citations. With this indicator it is pos-sible to classify performances (for groups of 10–30 researchers) in five differ-ent classes:38
A. NCSf ≤ 0.6 significantly far below international average (insufficient)
B. 0.60 <NCSf ≤ 1.20 at international average (good)
C. 1.20 <NCSf ≤ 1.60 significantly above international average (very good)
D. 1.60 <NCSf ≤ 2.20 from an international perspective very strong (excellent)
E. NCSf > 2.20 global leading excellence (outstanding)
It should be noted that this methodology is different from the Leiden proce-dures, as shown above, in several respects. Figure 3 shows the distribution over citation classes for 326 Swedish university units of assessments from all areas of science and technology. The result highlights the methodological con-siderations invoked by van Raan (2006b).
38 We refer to van Raan (2006a) for a further discussion of the statistical properties of bibliometric indicators.
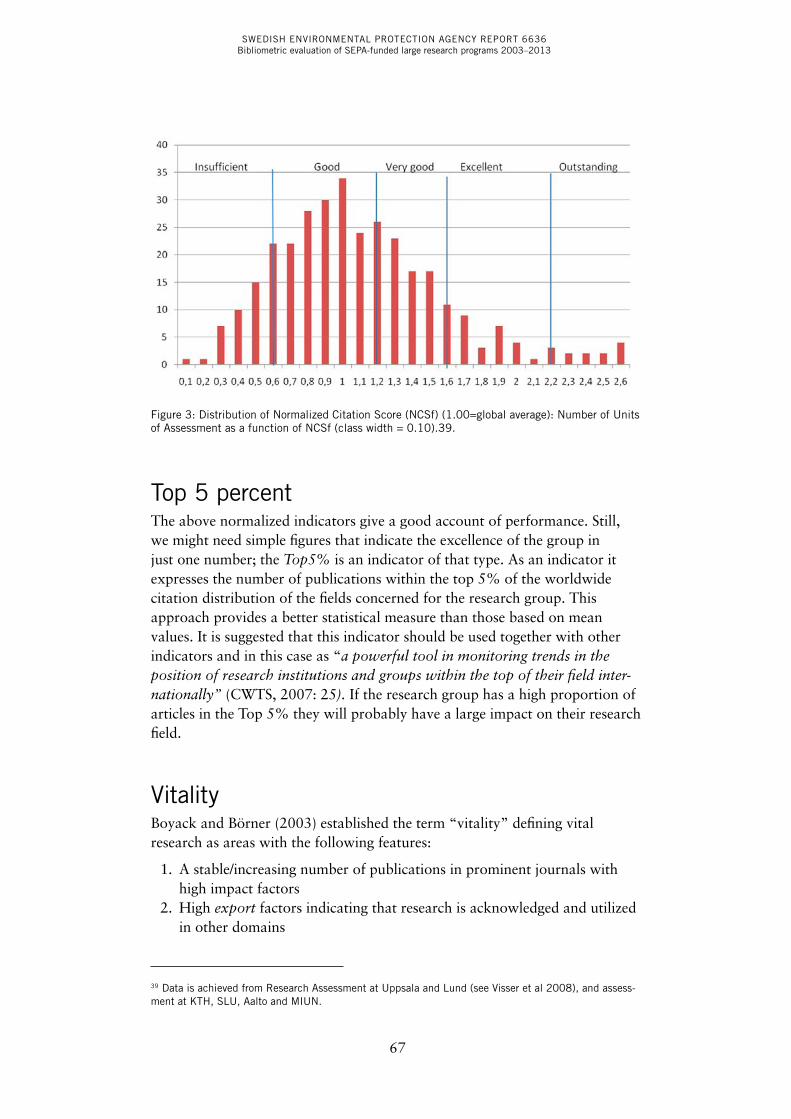
SWEDISH ENVIRONMENTAL PROTECTION AGENCY REPORT 6636Bibliometric evaluation of SEPA-funded large research programs 2003–2013
67
Figure 3: Distribution of Normalized Citation Score (NCSf) (1.00=global average): Number of Units of Assessment as a function of NCSf (class width = 0.10).39.
Top 5 percentThe above normalized indicators give a good account of performance. Still, we might need simple figures that indicate the excellence of the group in just one number; the Top5% is an indicator of that type. As an indicator it expresses the number of publications within the top 5% of the worldwide citation distribution of the fields concerned for the research group. This approach provides a better statistical measure than those based on mean values. It is suggested that this indicator should be used together with other indicators and in this case as “a powerful tool in monitoring trends in the position of research institutions and groups within the top of their field internationally” (CWTS, 2007: 25). If the research group has a high proportion of articles in the Top 5% they will probably have a large impact on their research field.
VitalityBoyack and Börner (2003) established the term “vitality” defining vital research as areas with the following features:
1. A stable/increasing number of publications in prominent journals with high impact factors
2. High export factors indicating that research is acknowledged and utilized in other domains
39 Data is achieved from Research Assessment at Uppsala and Lund (see Visser et al 2008), and assess-ment at KTH, SLU, Aalto and MIUN.
SWEDISH ENVIRONMENTAL PROTECTION AGENCY REPORT 6636Bibliometric evaluation of SEPA-funded large research programs 2003–2013
68
3. A tightly knit co-authorship network leading to efficient diffusion of knowledge
4. Funding resulting in larger numbers of high impact publications 5. New emerging research fields
Later Boyack (2007) and Klavans & Boyack (2008) operationalized the con-cept of vitality as field normalized reference age of articles. Even if there is a lack of consensus in the field of bibliometrics on how to measure reference age, there not too many options. Price defines the so-called Price Index as ‘‘the proportion of the references that are to the last five years of literature” (Price, 1979; Egghe, 1997). Klavans and Boyack (2008) suggest the use of mean or average age of references with normalization to the field, and their recommen-dations is followed here. The indicator then varies around 1.00, and values above the international mean indicate a higher vitality.
Vitality, reference age of cited literature, is an interesting factor in assess-ments of research performance. This observation rests on the hypothesis that researchers at the front use the most recent references and that they “are com-mitted to participating at the forefront of science rather than on older science” (ibid.). Typically, they are willing to shift their emphasis from older ideas to newer ideas when warranted. Researchers with an older average reference age are far less committed to focusing on new science. Remember that there are differences between fields of science40 that have to be accounted for and, therefore, the proposed method uses normalization in relation to WoS sub-fields. Nevertheless vitality is, as an index very simple, and, hence, the socio-logical interpretation is rather ambiguous.
Field Adjusted Production (Waring)It is well known that medical researchers tend to produce more, often shorter papers where methodology and prior knowledge is codified in citations and engineering scientists produce less frequently and have fewer cross-references (Narin and Hamilton, 1996; Glänzel, 1996) These field differences affect both citation rates and mean number of papers per author, and the differences are to some extent explained by shifting coverage of fields in the ISI database.
In order to compute a field adjusted factor we have to meet certain obsta-cles: publication databases give information on the authors that are active during a given period, not all the potential authors. As the non-contributors (non-publishing authors) are unknown it is difficult to create an average pub-lication rate per author taking all potential authors into account. But, there is a proposed mathematical solution to this problem: bibliometric data are characteristically “Waring distributions” (Schubert and Glänzel, 1984). With
40 Originally, the motive for Price’s research on this was to demonstrate these differences between areas. Moed (1989) has showed that Price statement might be an oversimplification.
SWEDISH ENVIRONMENTAL PROTECTION AGENCY REPORT 6636Bibliometric evaluation of SEPA-funded large research programs 2003–2013
69
information on the distribution of author publication frequencies an estimate of the average publication rate per researchers (contributors and non-contrib-utors) in a given field, country or such can be computed (Telcs, Glänzel and Schubert, 1985).
The approach is based in mathematical statistics and a theoretical discus-sion can be found in papers by Braun, Glänzel, Schubert and Telcs during the second half of the 1980s. Inspired by Irwin (1963) they showed that bib-liometric material had the properties of “Waring distributions”. A straight line should be obtained by plotting the truncated sample mean of these dis-tributions (Telcs, Glänzel and Schubert, 1985). By extrapolating this series to Origo, the numbers of non-contributors are included. The intercept of this line is the average productivity of all potential authors during a given period of time (Braun, Glänzel and Schubert, 1990). In our model this value is used as a reference value and is computed per field for Nordic data. Several suc-cessful empirical tests using the Field Adjusted Production (FAP) model have been implemented (e.g. Schubert and Glänzel 1984; Schubert and Telcs, 1986; Buxenbaum, Pivinski and Ruberg, 1987; Schubert and Telcs, 1989; Sandström and Sandström, 2008b).
The Field Adjusted Production is calculated as follows:
�����
�
���
∑ �������∑ ������
where Pi is the number of papers in field i and ri is the (estimated) average number of papers per researcher in field i. The estimation of the reference values is performed for each field by first calculating the s-truncated sample mean of each field as follows:
�����
�
���
∑ �������∑ ������
Where ni is the number of authors having exactly i papers. The truncated sample means are plotted versus s and the intercept of the fitted line, using weighted least squares linear regression, is used as an estimate for number of papers per author for the entire population The regression is weighted using weights proposed by Telcs et al. (1985).
When applying this model authors with an address at Nordic universities are used as data. Homonyms and similar problems are taken care for by auto-matic in combination with manual procedures. This was done for all Nordic universities (Sweden, Finland, Denmark and Norway) and the operation yielded almost 400 000 unique authors for the period 2008–2011.
Field delineation is an important issue. For citations the Thomson/ISI subject categories are used, but these 250 categories create too small sam-ples when Nordic authors are used to create productivity data. There are several alternative ways of producing macro classes (e.g. SPRU classes or the
SWEDISH ENVIRONMENTAL PROTECTION AGENCY REPORT 6636Bibliometric evaluation of SEPA-funded large research programs 2003–2013
70
Thomson ESI field categories). In this case all journals were clustered using inter-citations as proximity values (Boyack and Klavans, 2006), and the least frequent relation were decisive in order to distinguish, as far as possible, between basic and applied sciences. It has been shown by Rinia, van Leeuwen, Bruins, van Vuren and van Raan (2002) that applied sciences tend to cite back to more basic sciences, not the other way around. The clustering procedure was based on the SLM (smart loval moving) algorithm (Waltman &, van Eck 2013) and created 23 macro classes (fields).
The methodology described above was used to establish a reference value based on all Nordic universities. By using the number of articles per unit divided by the reference value (the field factor) we obtain the relative quan-tity of production performed by the unit. This indicator is called the “Field Adjusted Production (FAP)”. Then, simply by multiplying the specific produc-tion by the field-normalized citation score (NCSf) we establish a combined value incorporating production and “quality”. The resulting total sum repre-sents the production from the unit and should be related to the research fund-ing obtained by the unit. The advantage of using this method is that units are made comparable although they have their main activities in separate fields of science.
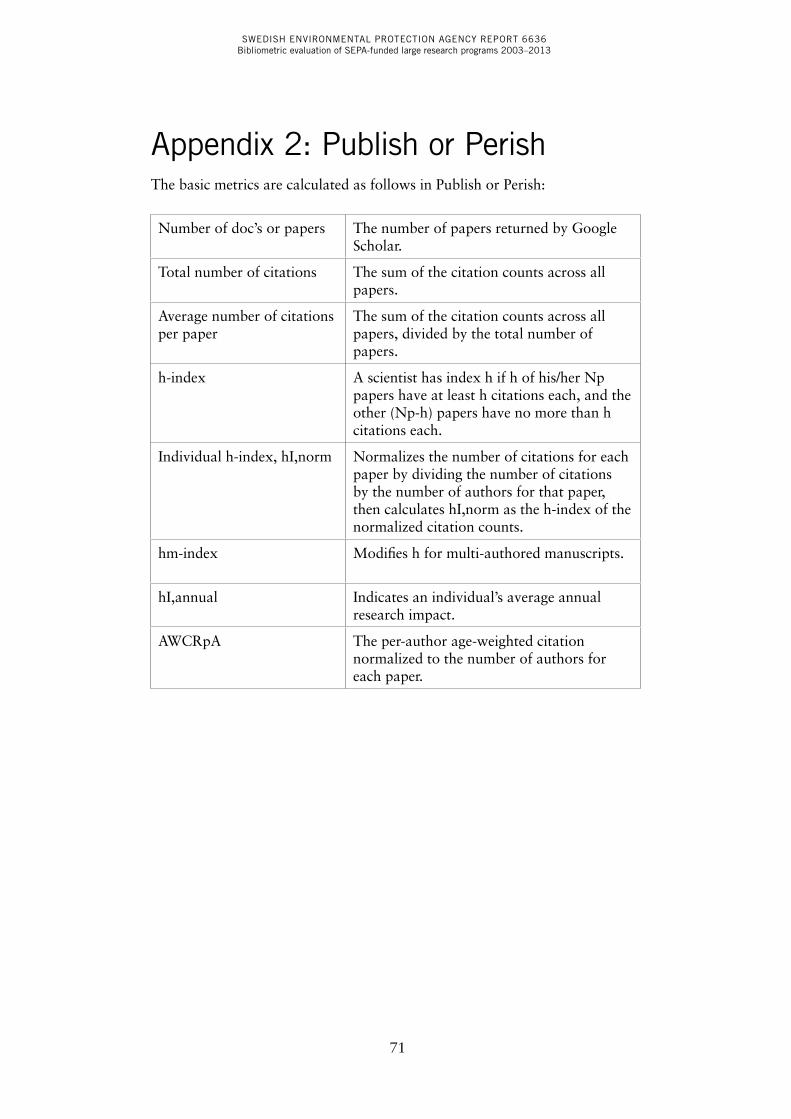
SWEDISH ENVIRONMENTAL PROTECTION AGENCY REPORT 6636Bibliometric evaluation of SEPA-funded large research programs 2003–2013
71
Appendix 2: Publish or PerishThe basic metrics are calculated as follows in Publish or Perish:
Number of doc’s or papers The number of papers returned by Google Scholar.
Total number of citations The sum of the citation counts across all papers.
Average number of citations per paper
The sum of the citation counts across all papers, divided by the total number of papers.
h-index A scientist has index h if h of his/her Np papers have at least h citations each, and the other (Np-h) papers have no more than h citations each.
Individual h-index, hI,norm Normalizes the number of citations for each paper by dividing the number of citations by the number of authors for that paper, then calculates hI,norm as the h-index of the normalized citation counts.
hm-index Modifies h for multi-authored manuscripts.
hI,annual Indicates an individual’s average annual research impact.
AWCRpA The per-author age-weighted citation normalized to the number of authors for each paper.
SWEDISH ENVIRONMENTAL PROTECTION AGENCY REPORT 6636Bibliometric evaluation of SEPA-funded large research programs 2003–2013
72
ReferencesAdams J, Jackson L, Marshall S (2007). Bibliometric analysis of interdisci-plinary research. Report to Higher Education Funding Council for England. November 2007. Evidence/HEFCE.
Adams, J et al. (2007). The use of bibliometrics to measure research quality in UK higher education institutions. Universities UK, Research Report. Evidence.
Aksnes, DW & Taxt, RE (2004). Peer reviews and bibliometric indicators: a comparative study at a Norwegian university. Research Evaluation, 13 (1): 33–41.
Aksnes, DW (2003a). A macro study of self-citations. Scientometrics 56(2): 235–246.
Aksnes, DW (2003b). Characteristics of highly cited papers. Research Evaluation 12 (3): 159–170.
Amsterdamska, O & Leydesdorff, L (1989). Citations: indicators of signifi-cance? Scientometrics 15 (5–6): 449–471.
Böhme, van den Daele, Krohn (1978). The ’Scientification’ of Technology. In: (Eds) Krohn, Layton & Weingart, The dynamics of Science and Technology. Sociology of the Sciences Yearbook 1978, pp. 219–250.
Borgmann, CL & Furner, J (2002). Scholarly Communication and Bibliometrics. Annual Review of Information Science and Technology: Vol. 36, pp. 2–72.
Bornmann, L & Daniel HD (2008). What do citation counts measure? A review of studies on citing behavior. Journal of Documentation, 64(1), 45–80.
Bornmann L & Marx, W (2013 forthcoming). The Wisdom of Citing Scientist [Early View, Article first published online: 8 NOV 2013]. DOI: 10.1002/asi
Boyack, KW (2007). Using detailed maps of science to identify potential col-laborations. Proceedings of ISSI 2007, edited by Torres-Salinas & Moed. Madrid, Spain June 25–27, 2007. Vol 1, s. 124–135.
Boyack KW (2009). Using detailed maps of science to identify potential col-laborations. Scientometrics 79 (1): 27–44.
Boyack KW and Klavans R (2006). Identifying a better measure of relatedness for mapping science. Journal of the American Society for Information Science and Technology 57(2): 251–263.
Braun T, Glänzel W and Schubert A (1990). Publication productivity: from frequency distributions to scientometric indicators. Journal of Information Science 16: 37–44.
SWEDISH ENVIRONMENTAL PROTECTION AGENCY REPORT 6636Bibliometric evaluation of SEPA-funded large research programs 2003–2013
73
Butler, L (2002). A list of published papers is no measure of value. Nature vol 419 (31 OCTOBER).
Butler L (2003). Explaining Australia’s increased share of ISI publications – the effects of funding formula based on publication counts. Research Policy 32: 143–155.
Butler L (2008). Using a balanced approach to bibliometrics: quantitative per-formance measures in the Australian Research Quality Framework. Ethics in Science and Environmental politics, vol 8, preprint doi: 10.3354/esep00077.
Buxenbaum H, Pivinski F and Ruberg SJ (1987). Publication rates of pharma-ceutical scientists: application of the Waring distribution. Drug Metabolism Reviews 18(4): 553–571.
Campiteli, M. Batista, P.D. & Martinez, A.S. (2007). A research productivity index to account for different scientific disciplines. In: Proceedings of the ISSI 2007, pp. 185–188.
Carpenter, M. & Narin, F. (1981). The adequacy of the Science Citation Index (SCI) as an indicator of international scientific activity. Journal of the American Society for Information Science, 32 (6): 430–439.
Cole, JR & Cole, S (1973). Social stratification in science. Chicago, Ill.: University of Chicago Press.
Cole, S (1992). Making science: between nature and society. Cambridge, Mass.: Harvard University Press.
Cole, S., Simon, G & Cole JR (1988). Do Journal Rejection Rates Index Consensus? American Sociological Review, Vol. 53, No. 1 (Feb., 1988), pp. 152–156
CWTS (2007). Scoping study on the use of bibliometric analysis to meas-ure the quality of research in UK higher education institutions. Report to HEFCE by the Leiden group. November 2007. [http://www.hefce.ac.uk/pubs/rdreports/2007/rd18_07/rd18_07.pdf]
de Bruin, RE & Moed HF (1990). The unification of addresses in scientific publications. Informetrics 89/90: 65–78 <https://doclib.uhasselt.be/dspace/>
Dieks D. & Chang H. (1976). Differences in Impact of Scientific Publications: some indices derived from a citation analysis. Social Studies of Science, 6: 247–267.
Egghe L (1997). Price index and its relation to the mean and median reference age. JASIS, 48 (6): 564–573.
Frame, JD & Narin, F (1976). NIH funding and biomedical publication output. Federation Proceedings, 35 (14): 2529–2532.
SWEDISH ENVIRONMENTAL PROTECTION AGENCY REPORT 6636Bibliometric evaluation of SEPA-funded large research programs 2003–2013
74
Garfield, E (1979). Citation indexing – its theory and application in science, technology, and humanities. New York: Wiley.
Garfield, E, Malin, MV, Small, H (1978). Citation Data as Science Indicators. In: (Eds.( Elkana et al. Toward a Metric of Science: the advent of science indicators. New York: John Wiley & Sons, pp. 179–208.
Giske J (2008). Benefitting from bibliometrics. Ethics in Science and Environmental Politics, 8: 93–102.
Glänzel W (1996). The need for standards in bibliometric research and tech-nology. Scientometrics, 35: 167–176.
Glänzel W and Schubert A (2003). A new classification scheme of sci-ence fields and subfields designed for scientometric evaluation purposes. Scientometrics 56(3): 357–367.
Glänzel W, Schubert A and Telcs A (1984). Characterization by Truncated Moments and its Application to Pearson-Type Distributions. Zeitschrift für Warscheinlichkeitstheorie und verwandte Gebiete 66: 173–183. (Correction: Ibid. 74: 317 (1987)).
Glänzel W, Schubert A, Schoepflin U, et al. (1999). An item-by-item subject classification of papers published in journals covered by the SSCI database using reference analysis. Scientometrics, 46 (3): 431–441.
Glänzel W, Thijs, B., Schlemmer, B. (2004). A bibliometric approach to the role of author self-citations in scientific communication, Scientometrics, 59 (1): 63–77.
Hansson S (1995). Impact factor as a misleading tool in evaluation of medical journals. Lancet, Sep 30, 346(8979): 906.
Harzing, A-W (2011). The Publish or Perish Book: Your Guide to Effective and Responsible Citation Analysis. Tarma Software Research. Melbourne, Australia.
Hicks D (1999). The difficulty of achieving full coverage of inter-national social science literature and the bibliometric consequences. Scientometrics, 44(2): 193–215.
Hicks D (2004). The four literatures of social science. (Eds.) Moed et. al. Handbook of Quantitative Science and Technology Research: The use of pub-lication and patent statistics in studies of S&T systems. Dordrecht/Boston/London: Kluwer Academic Publishers 2004, pp. 473–496.
Hirsch, JE (2005). An index to quantify an individual’s scientific research output. Proceedings of the National Academy of Sciences of the United States of America, 102 (46): 16569–16572.
Irwin JO (1963). The place of mathematics in medical and biological sciences. J R Statistic Soc. A. 126: 1–44.
SWEDISH ENVIRONMENTAL PROTECTION AGENCY REPORT 6636Bibliometric evaluation of SEPA-funded large research programs 2003–2013
75
Jansz, M.C.N. (2000). Some thoughts on the interaction between scientomet-rics and science and technology policy. Scientometrics 47 (2): 253–264.
Kaplan, N (1965). The norms of citation behavior: Prolegomena to the foot-note. American Documentation 16: 179–187.
Klavans, R & Boyack, KW (2008). Thought leadership: A new indicator for national and institutional comparison. Scientometrics , 75 (2): 239–252.
Knothe G (2006). Comparative citation analysis of duplicate or highly related publications. JASIST, 57 (13): 1830–1839.
Latour, B (1987). Science in Action: how to follow scientists and engineers through society. Milton Keynes (UK): Open University Press.
Le Pair, C. (1988). The citation gap of applicable science, In: A. F. J. Van Raan (Ed.), Handbook of Quantitative Studies of Science and Technology, Elsevier Science/North-Holland, Amsterdam, pp. 537–553.
Lehmann, S, Jackson, A & Lautrup, BE (2006). Measures for measures. Nature, 444 (21/28 december), pp. 1003–1004.
Leydesdorff, L. (2008). Caveats for the Use of Citation Indicators in Research and Journal Evaluations. Journal of the American Society for Information Science and Technology, 59(2): 278–287.
Leydesdorff L & Cozzens SE (1993). The delineation of specialties in terms of journals using the dynamic journal se to the ISI. Scientometrics 26 (1): 135–156.
Leydesdorff, L & Amsterdamska, O (1990). Dimensions of citation analysis. Science, Technology & Human Values 15 (3): 305–315.
Lundberg, J (2006). Bibliometrics as a research assessment tool – impact beyond the impact factor. PhD-thesis, Karolinska Institute. Stockholm.
Luukonen, T (1997). Why has Latour’s theory of citations been ignored by the bibliometric community? Scientometrics 38 (1): 27–37.
Martin, B.R. & Irvine J. (1983). Assessing basic research: some partial indica-tors of scientific progress in radio astronomy. Research Policy, 12: 61–90.
McAllister, PR, Narin, F, Corrigan, JG. (1983). Programmatic evaluation and comparison based on standardized citation scores. IEEE Transactions on Engineering Management, 30: 205–211.
Merton, RK (1973). The Sociology of Science: theoretical and empirical inves-tigations. Chicago: Chicago University Press.
Moed HF (2002). The impact-factors debate: the ISI’s uses and limits. Nature vol 415, 14 feb p. 731–732.
SWEDISH ENVIRONMENTAL PROTECTION AGENCY REPORT 6636Bibliometric evaluation of SEPA-funded large research programs 2003–2013
76
Moed HF (2005). Citation Analysis in Research Evaluation. Dordrecht: Springer Verlag.
Moed HF, van Leeuwen TN (1995). Improving the Accuracy of Institute for Scientific Information’s Journal Impact Factors. JASIS 46(6): 461–467.
Moed, H & Visser, MS (2007). Developing Bibliometric Indicators of Research Performance in Computer Science: An Exploratory Study. CWTS, Leiden.
Moed HF, Vriens M (1989). Possible inaccuracies occurring in citation analy-sis. Journal of Information Science 15;95–107.
Moed, HF. & van Raan, A.F.J. (1988). Indicators of research performance: applications in university research policy. In: van Raan, (Ed.) Handbook of Quantitative Studies of Science and Technology. Amsterdam: North-Holland, pp. 177–206.
Narin, F. (1976). Evaluative bibliometrics: the use of publication and cita-tion analysis in the evaluation of scientific activity. New Jersey: Computer Horizons, Inc.
Narin, F. & Hamilton, KS (1996). Bibliometric performance measures. Scientometrics, 36 (3): 293–310.
Narin F. & Toma E. (1985). Is technology becoming science? Scientometrics 7 (3–6): 369–381.
Nederhof, A.J. (1988). Evaluation of Scholarly Performance. In: van Raan, (Ed.) Handbook of Quantitative Studies of Science and Technology. Amsterdam: North-Holland, pp. 207–228.
Price, D. (1965). Networks of scientific papers. Science, 149(3683), 510–515.
Price, D. (1976). A general theory of bibliometric and other cumulative advantage processes. Journal of the American Society for Information Science, 27(5–6), 292–306.
Price, D. (1986). Little science, big science ... and beyond. New York: Columbia University Press.
Price DJS (1965). Is technology historically independent of science? Technology and Culture, 6(4), 553-568.
Professional Management AB (2015). Utvärdering av Naturvårdsverkets forskningsprogram. Naturvårdsverket rapport, (in preparation).Naturvårdsverket rapport.
Roche, T., Smith, D. L. (1978). Frequency of citations as criterion for the ranking of departments, journals and individuals. Sociological Inquiry, 48(1), 49–57.
SWEDISH ENVIRONMENTAL PROTECTION AGENCY REPORT 6636Bibliometric evaluation of SEPA-funded large research programs 2003–2013
77
Sandström E, Koski T & Sandström U (2011). Estimating Research Productivity from a Zero-Truncated Distribution. Paper to the 13th ISSI Conference in Durban (South Africa) July 2011.
Sandström U (2009). Bibliometric evaluation of research programs – A study of scientific quality. Swedish Environmental Protection Agency Report 6321. 79 pp. ISBN 91-620-5943-9.
Sandström U & Sandström E (2007). A Metrics for Academic Science applied to Australian Universities. [http://eprints.rclis.org/archive/00011776/]
Sandström U & Sandström E (2008). Resurser för citeringar. Högskoleverket Rapport 2008:18R.
Sandström U & Sandström E (2009). The Field Factor: towards a metric for Academic Institutions. Research Evaluation, 18(3), September 2009, pages 243–250.
Sandström U, Wold A, Jordansson B, Ohlsson B & Smedberg Å. (2010). Hans excellens: om miljardsatsningar på starka forskningsmiljöer. Delegationen för jämställdhet i högskolan Rapport 2010:4.
Schubert A and Braun T (1992). Three scientometric etudes on developing countries as a tribute to Michael Moravcsik. Scientometrics 23(1): 3–19.
Schubert A and Braun T (1996). Cross–field normalization of scientometric indicators. Scientometrics 36: 311–324.
Schubert A and Glänzel W (1984). A dynamic look at a class of skew distribu-tions: a model with scientometric applications. Scientometrics 3: 149–167.
Schubert A and Telcs A (1986). Publication Potential – an indicator of scien-tific strength for cross-national comparison. Scientometrics 9(5–6): 231–238.
Schubert A, Glänzel W, Braun T. (1987). Subject field characteristic citation scores and scales for assessing research performance. Scientometrics 12 (5–6): 267–292.
Schubert, A, Glänzel, W, Thijs, B (2006). The weight of author self-citations: a fractional approach to self-citation counting. Scientometrics, 67 (3): 503–514.
Schubert, A. Glänzel, W. Braun, T. (1988). Against absolute methods: rela-tive scientometric indicators and relational charts as evaluation tools. In: van Raan, (Ed.) Handbook of Quantitative Studies of Science and Technology. Amsterdam: North-Holland, pp. 137–176.
Seglen, P. O. (1992). The skewness of science. Journal of the American Society for Information Science, 43(9), 628–638.
Seglen, P.O. (1994). Causal relationship between article citedness and journal impact. Journal of the American Society for Information Science 45, 1–11.
SWEDISH ENVIRONMENTAL PROTECTION AGENCY REPORT 6636Bibliometric evaluation of SEPA-funded large research programs 2003–2013
78
Seglen, PO (1998). Citation rates and journal impact factors are not suitable for evaluation of research . Acta Orthop Scand 69 (3): 224–229.
Small, H. (1978). Cited documents as concept symbols. Social Studies of Science, 8, 327–340.
Telcs A, Glänzel W and Schubert A (1985). Characterization and statis-tical test using truncated expectations for a class of skew distributions. Mathematical Social Sciences 10: 169–178.
Thijs B, & Glanzel W (2005). The influence of author self-citations on biblio-metric meso-indicators. The case of European universities. Scientometrics, 66 (1): 71–80.
van Els, W.P., C.N.M. Jansz & C. Le Pair (1989). The citation gap between printed and instrumental output of technological research: the case of the elec-tron microscope, Scientometrics, 17, 415–425.
van Leeuwen, TN (2008). Testing the validity of the Hirsch-index for research assessments purposes. Research Evaluation, 17(2): 157–160.
van Leeuwen, TN, Moed, HF, Tijssen, RJW, Visser, MS, van Raan, AFJ (2000). First evidence of serious language-bias in the use of citation analy-sis for the evaluation of national science systems. Research Evaluation, 9 (2): 155–156.
van Raan AFJ (1996). Advanced bibliometric methods as quantitative core of peer review based evaluation and foresight exercises. Scientometrics 36(3): 397–420.
van Raan, AFJ (2004). Measuring Science: Capita Selecta of Current Main Issues. (Eds.) Moed et. al. Handbook of Quantitative Science and Technology Research: The use of publication and patent statistics in studies of S&T systems. Dordrecht/Boston/London: Kluwer Academic Publishers 2004, pp. 19–50
van Raan, AFJ (2006a). Statistical properties of Bibliometric indicators: Research group indicator distributions and correlations. Journal of the American Society for Information Science and Technology 57 (3), 408–430.
van Raan, AFJ (2006b). Performance-related differences of bibliometric statis-tical properties of research groups: cumulative advantages and hierarchically layered networks. Journal of the American Society for Information Science and Technology 57 (14), 1919–1935.
Vetenskapsrådet. (2006). Hur mycket citeras svenska publikationer? Vetenskapsrådets rapportserie 13:2006.
Visser, M.S. Nederhof, A.J. (2007). Bibliometric study of the Uppsala University, Sweden, 2002–2006. In: Quality and renewal 2007: An overall evaluation of research at Uppsala University 2006/2007. Uppsala: Uppsala University.
SWEDISH ENVIRONMENTAL PROTECTION AGENCY REPORT 6636Bibliometric evaluation of SEPA-funded large research programs 2003–2013
79
Waltman, L., & Van Eck, N.J. (2013). A smart local moving algorithm for large-scale modularity-based community detection. European Physical Journal B, 86(11), 471.
Whitley, R. (2000). The intellectual and social organization of the sciences. Second Edition (First ed. 1984). Oxford: Oxford University Press.
Zitt, M, Ramanana-Rahary S, Bassecoulard E (2005). Relativity of citation performance and excellence measures: from cross-field to cross-scale effects of field-normalisation. Scientometrics, 63 (2): 373–401.
Zitt, M. (2005). Facing diversity of science: a challenge for bibliometric indi-cators. Measurement, 3(1): 38–49.
Bibliometric evaluation of SEPA-funded large research
programs 2003–2013ULF SANDSTRÖM
REPORT 6636 • DECEMBER 2014
Bibliometric evaluation of SEPA-funded large research programs 2003–2013ULF SANDSTRÖM
REPORT 6636
SWEDISH EPA
ISBN 978-91-620-6636-9
ISSN 0282-7298
Naturvårdsverket utvärderar återkommande sin forsk-
ning. Denna rapport är skriven på engelska med svensk
samman fattning, och presenterar en bibliometrisk utvärde-
ring av sju forskningsprograms vetenskapliga publicerings-
och citeringsresultat. Programmen startade någon gång
under 2001-2007 och avslutades någon gång mellan 2006
och 2012. Sammantaget citerades de sju programmens
artiklar ca 50 % mer än artiklar i genomsnitt inom respek-
tive ämnesområde globalt, tre av programmen uppvisade
svagare resultat.
The Swedish Environmental Protection Agency (SEPA)
evaluates its funded research continuously. This report
presents the results of a bibliometric evaluation of the
scientific citation performance of seven SEPA research
programs, which started sometime during 2001–2007 and
ended sometime during 2006–2012. Overall, the relative
citation performance was ca. 50% above international
reference levels. Three programs had weaker impacts.
Swedish EPA SE-106 48 Stockholm. Visiting address: Stockholm – Valhallavägen 195, Östersund – Forskarens väg 5 hus Ub. Tel: +46 10-698 10 00, fax: +46 10-698 10 99, e-mail: [email protected] Internet: www.naturvardsverket.se Orders Ordertel: +46 8-505 933 40, orderfax: +46 8-505 933 99, e-post: [email protected] Adress: Arkitektkopia AB, Box 110 93, SE-161 11 Bromma. Internet: www.naturvardsverket.se/publikationer
The author assumes soleresponsibility for the contents
of this report, whichtherefore cannot be citedas representing the views
of the Swedish EPA.