bibliometric dimensions of research in social sciences
TRANSCRIPT
University of Nebraska - Lincoln University of Nebraska - Lincoln
DigitalCommons@University of Nebraska - Lincoln DigitalCommons@University of Nebraska - Lincoln
Library Philosophy and Practice (e-journal) Libraries at University of Nebraska-Lincoln
2021
Bibliometric Dimensions of Research in Social Sciences: An Bibliometric Dimensions of Research in Social Sciences: An
Empirical Analysis of Indian Central Universities Empirical Analysis of Indian Central Universities
Namita Mahapatra Kiit University, [email protected]
Jyotshna Sahoo Khallikote University, [email protected]
Follow this and additional works at: https://digitalcommons.unl.edu/libphilprac
Part of the Library and Information Science Commons
Mahapatra, Namita and Sahoo, Jyotshna, "Bibliometric Dimensions of Research in Social Sciences: An Empirical Analysis of Indian Central Universities" (2021). Library Philosophy and Practice (e-journal). 4844. https://digitalcommons.unl.edu/libphilprac/4844
Bibliometric Dimensions of Research in Social Sciences: An Empirical
Analysis of Indian Central Universities
Namita Mahapatra
Asst. Librarian, KIIT Deemed University, Bhubaneswar, Odisha, India
Email: [email protected],
Dr. Jyotshna Sahoo
HoD, Department of Library and Information Science, Dean, Faculty of Social Science and
Humanities, Khallikote University, Berhampur, Odisha
Email: [email protected], 7064419608
Abstract:
This paper evaluates the performance of the 14 most productive Central Universities in Social
Sciences research. The study is based on the Scopus Indexing database for the period from 2009
to 2018 where the total records retrieved were 7278. Results revealed that journal articles were
the most preferred form of publication with 4293 (59%) research papers and the mean annual
growth rate of publications was 1.01 while the Mean RGR (Relative Growth Rate) and DT
(Doubling Time) were 0.314 and 2.751 respectively. The total number of citations received was
38456 with 5.77 mean citations per paper. Out of the total retrieved records, 4504 papers were
cited and the share of open access citation was 71.9 percentage. Jawaharlal Nehru University
(JNU), Delhi University (DU), and Aligarh Muslim University (AMU) emerged as the top three
universities in Social Sciences research based on Total Publications (TP), Total Citations (TC),
Highly Cited Papers (HCP), h-index and g-index. The p index of JNU, AMU, and DU are 35.68,
34.53, and 33.64 respectively. The mean of various bibliometric indicators namely, DC, CI, CC,
and MCC were found to be 0.605, 2.306, 0.393, and 0.394 respectively. Economic and Political
Weekly was the most prolific journal and R. H. Khan of AMU was the most productive author
during the study period with 42 papers and with an h-index of 18.
Keyword: Social Sciences Research, Central Universities, Bibliometric Indicators, Authorship
Pattern, Highly Cited Papers.
1. Introduction:
Higher Education (HE) is the most fundamental constituent, which demands careful attention
and assessment to forecast forthcoming outcomes in a given country. Indian higher education
system is the third-largest in the world after the United States and China, and it has great
potential to compete with global universities (Rienda & et al., 2011). Among all the Higher
Education Institutions (HEIs) of India, the Central Universities play an important role in carrying
out research, maintaining the balance between teaching and research, and creating innovative
ways of linking research with teaching. In the process of indulging in research, students enhance
their essential skills for creating, synthesizing, and gathering knowledge and information. The
researchers get fresh insight into research conventions, habits, and simultaneously learn effective
teaching skills (Raychaudhury, 2018). The performance of the institutions can be analyzed by a
system inside or outside the institution. It is also essential for the institutions to know where it
stands in the national or global scenario. Research and publications are one of the key factors for
ranking by the Ministry of Human Resource Development (MHRD), Government of India. This
parameter is described by the National Institute of Ranking Framework (NIRF) as research and
professional practice (RP) which includes the combined metric for publications (PU) and
combined metric for quality of publication (QP) (https://www.nirfindia.org/Parameter). There are
various tools that are used to analyze the research productivity such as bibliometrics,
scientometrics, informetrics, citation analysis, webometrics, etc. Among these tools, bibliometric
analysis is the most popular and widely used technique to map research productivity. In this
context, the present paper is modeled to map the productivity of Central Universities of India in
Social Sciences research using various bibliometric indicators.
2. Literature Review:
A number of studies have been carried out to analyze the productivity of institutions, countries,
and scientists using various metrics like growth metrics, collaborative metrics, and
author/institute level metrics. As the present study is about mapping of Social Science Research
(SSR) performance of selected Central Universities in India, studies related to this aspect are
reviewed as follows.
Baskaran (2013) undertook the bibliometric study of Alagappa University during 1999-2011
based on the Web of Science database. An increasing trend in the productivity of Alagappan
University is observed which increases from 31 publications in 1999 to 97 papers in 2011. RGR
and DT are fluctuating and the mean DT is 0.96 during this period. The multi-authored papers
(750 papers with 96.64% share) outnumber the single-authored papers (26 papers with 3.35%
share). Out of the total publications, 776 papers were published in Indian journals (73.69%), 97
papers from South Korea (8.83%), and 84 papers (7.99%) from Taiwan. Material Science,
Physics and Chemistry are the most preferred subject areas producing 257, 208 and 157 papers
respectively. Kumar, Dora, & Desai (2015) studied the bibliometric profile of Gujarat
University based on the Scopus database. Total 760 numbers papers retrieved from the database
during 2004-2013. Journal articles (631 papers, 83%) are found to be the most preferred form of
publication used by the researchers. V K Jain was the most prolific author whereas 67% of the
total papers were cited. Nagarkar, Veer, & Kumbhar (2015) explored the research productivity
of faculty of the Department of Life Sciences of Savitribai Phule Pune University during the
period from 1999-2013 based on the Web of Science database. Out of the total papers produced,
356 were on the subject area “Biology”, BARC, Mumbai was the most collaborative national
institute and among collaborative countries, USA contributed highest 41 papers with 590
citations and Current Science was the most preferred journal. Singh (2013) studied the research
output of Banaras Hindu University in the field of Physics during 1970-2010. Decade wise
growth is highest during 2001-2010. A total of 960 papers were published in the field of
Condensed Matter Physics, 571 papers in Molecular Structure and Spectroscopy, and 324 in
High Energy Particle Physics. Single author contribution is 348, three authored papers are 481.
O.N. Srivastava was the most productive author with 348 papers (15.13%). Spectro Chim Acta
was the most preferred journal with 35 publications. Siwach & Kumar (2015) carried research
for Maharshi Dayanand University (Rohtak) for the period from 2000-2013 based on the Scopus
database. The university produced 1247 papers with 6959 citations in 14 years of research
assessment, ACPP is 5.58, Guru Jambeshwar University of Science and Technology, Hisar was
the major collaborator at the national level and South Korea (66) and United States (26) were the
major collaborative countries.
3. Objectives of the Study:
The objectives of the study are delineated as follows:
• To find out the distribution of papers as per the type of documents;
• To provide the year wise growth of publications ;
• To map the bibliometric profiles of the Central Universities in Social Sciences research ;
• To analyze the citation impact of publications by access type ;
• To calculate Relative Growth Rate (RGR) and Doubling Time (DT) of publications ;
• To study the authorship pattern of publications and 10 most prolific authors in SSR;
• To Identify the top 10 journals in SSR and
• To assess the country network and keyword network of SSR
4. Methodology:
4.1 Scope - The data for the current study was exported from Scopus Indexing Database using
the affiliation search for the selected Central Universities. Only those Central Universities which
has a publication count of more than 100 in the chosen disciplines have been included in the
study. The filters that are used are, publication year (2009-2018), subjects covered are (Social
Sciences, Economics, Econometrics, and Finance) and document types are (journal articles,
conference papers, reviews, books, and book chapters).
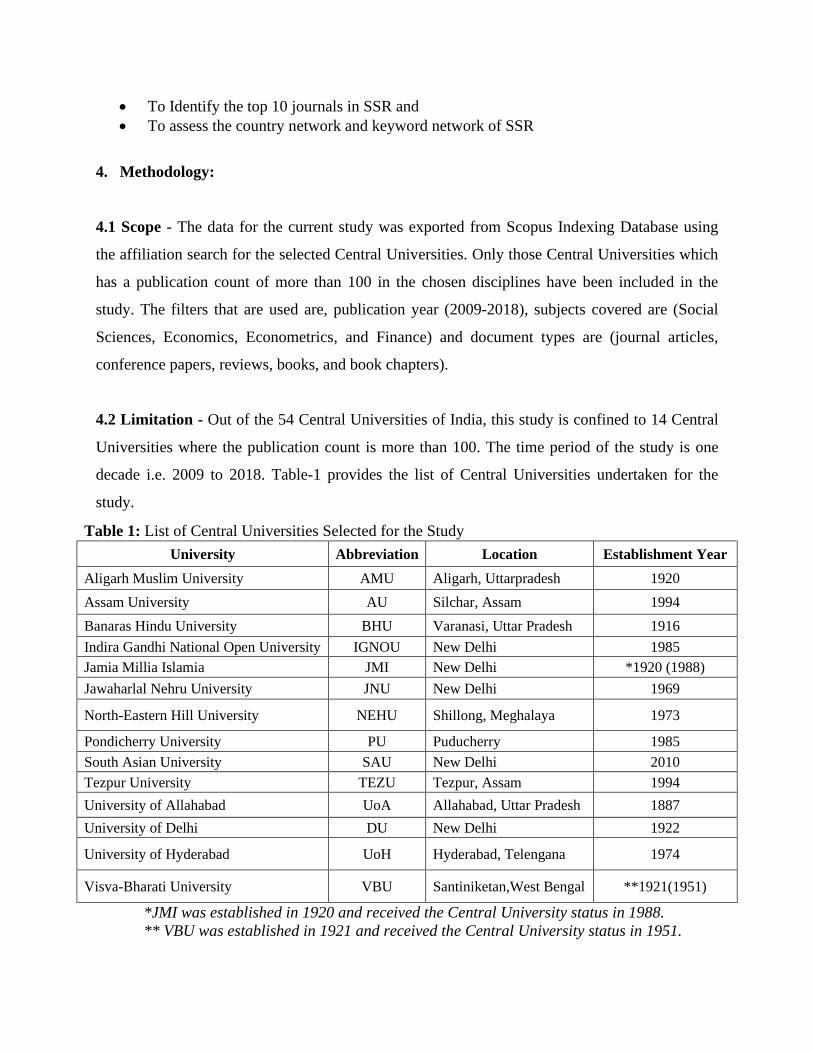
4.2 Limitation - Out of the 54 Central Universities of India, this study is confined to 14 Central
Universities where the publication count is more than 100. The time period of the study is one
decade i.e. 2009 to 2018. Table-1 provides the list of Central Universities undertaken for the
study.
Table 1: List of Central Universities Selected for the Study
University Abbreviation Location Establishment Year
Aligarh Muslim University AMU Aligarh, Uttarpradesh 1920
Assam University AU Silchar, Assam 1994
Banaras Hindu University BHU Varanasi, Uttar Pradesh 1916
Indira Gandhi National Open University IGNOU New Delhi 1985
Jamia Millia Islamia JMI New Delhi *1920 (1988)
Jawaharlal Nehru University JNU New Delhi 1969
North-Eastern Hill University NEHU Shillong, Meghalaya 1973
Pondicherry University PU Puducherry 1985
South Asian University SAU New Delhi 2010
Tezpur University TEZU Tezpur, Assam 1994
University of Allahabad UoA Allahabad, Uttar Pradesh 1887
University of Delhi DU New Delhi 1922
University of Hyderabad UoH Hyderabad, Telengana 1974
Visva-Bharati University VBU Santiniketan,West Bengal **1921(1951)
*JMI was established in 1920 and received the Central University status in 1988.
** VBU was established in 1921 and received the Central University status in 1951.
4.3 Development of a database and Data Analysis Tools used - In relation to the search
criteria, a total of 7278 papers were retrieved from the Scopus database. The required metadata
was incorporated into an excel sheet and the analysis is computed based on bibliometric
indicators and aligning to the objectives of the study. VOSviewer Visualization tool was used to
gain insight into the country network and network of keywords in SSR.
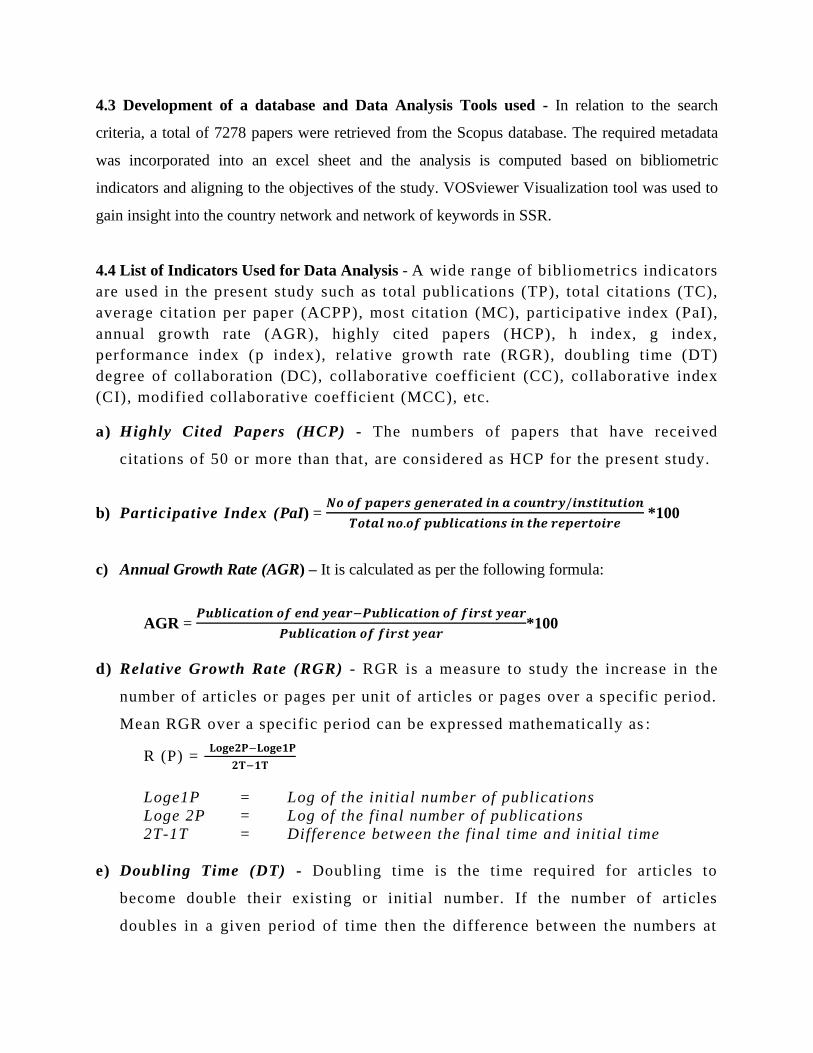
4.4 List of Indicators Used for Data Analysis - A wide range of bibliometrics indicators
are used in the present study such as total publications (TP), total citations (TC),
average citation per paper (ACPP), most citation (MC), participative index (PaI),
annual growth rate (AGR), highly cited papers (HCP), h index, g index,
performance index (p index), relative growth rate (RGR), doubling time (DT)
degree of collaboration (DC), collaborative coefficient (CC), collaborative index
(CI), modified collaborative coefficient (MCC), etc.
a) Highly Cited Papers (HCP) - The numbers of papers that have received
citations of 50 or more than that, are considered as HCP for the present study.
b) Participative Index (PaI) = 𝑵𝒐 𝒐𝒇 𝒑𝒂𝒑𝒆𝒓𝒔 𝒈𝒆𝒏𝒆𝒓𝒂𝒕𝒆𝒅 𝒊𝒏 𝒂 𝒄𝒐𝒖𝒏𝒕𝒓𝒚/𝒊𝒏𝒔𝒕𝒊𝒕𝒖𝒕𝒊𝒐𝒏
𝑻𝒐𝒕𝒂𝒍 𝒏𝒐.𝒐𝒇 𝒑𝒖𝒃𝒍𝒊𝒄𝒂𝒕𝒊𝒐𝒏𝒔 𝒊𝒏 𝒕𝒉𝒆 𝒓𝒆𝒑𝒆𝒓𝒕𝒐𝒊𝒓𝒆 *100
c) Annual Growth Rate (AGR) – It is calculated as per the following formula:
AGR = 𝑷𝒖𝒃𝒍𝒊𝒄𝒂𝒕𝒊𝒐𝒏 𝒐𝒇 𝒆𝒏𝒅 𝒚𝒆𝒂𝒓−𝑷𝒖𝒃𝒍𝒊𝒄𝒂𝒕𝒊𝒐𝒏 𝒐𝒇 𝒇𝒊𝒓𝒔𝒕 𝒚𝒆𝒂𝒓
𝑷𝒖𝒃𝒍𝒊𝒄𝒂𝒕𝒊𝒐𝒏 𝒐𝒇 𝒇𝒊𝒓𝒔𝒕 𝒚𝒆𝒂𝒓*100
d) Relative Growth Rate (RGR) - RGR is a measure to study the increase in the
number of articles or pages per unit of articles or pages over a specific period.
Mean RGR over a specific period can be expressed mathematically as :
R (P) = 𝐋𝐨𝐠𝐞𝟐𝐏−𝐋𝐨𝐠𝐞𝟏𝐏
𝟐𝐓−𝟏𝐓
Loge1P = Log of the initial number of publications
Loge 2P = Log of the final number of publications
2T-1T = Difference between the final time and initial time
e) Doubling Time (DT) - Doubling time is the time required for articles to
become double their existing or initial number. If the number of articles
doubles in a given period of time then the difference between the numbers at
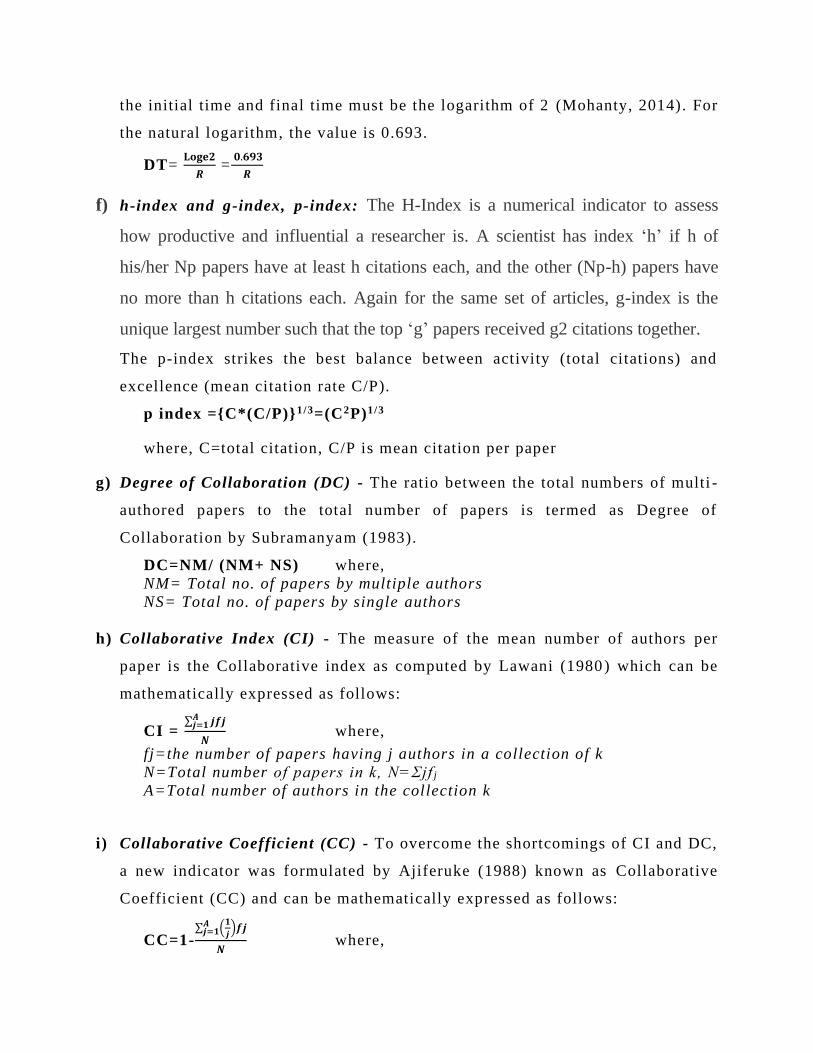
the initial time and final time must be the logarithm of 2 (Mohanty, 2014). For
the natural logarithm, the value is 0.693.
DT= 𝐋𝐨𝐠𝐞𝟐
𝑹 =
𝟎.𝟔𝟗𝟑
𝑹
f) h-index and g-index, p-index: The H-Index is a numerical indicator to assess
how productive and influential a researcher is. A scientist has index ‘h’ if h of
his/her Np papers have at least h citations each, and the other (Np-h) papers have
no more than h citations each. Again for the same set of articles, g-index is the
unique largest number such that the top ‘g’ papers received g2 citations together.
The p-index strikes the best balance between activity (total citations) and
excellence (mean citation rate C/P).
p index ={C*(C/P)}1/3=(C2P)1/3
where, C=total citation, C/P is mean citation per paper
g) Degree of Collaboration (DC) - The ratio between the total numbers of multi -
authored papers to the total number of papers is termed as Degree of
Collaboration by Subramanyam (1983).
DC=NM/ (NM+ NS) where,
NM= Total no. of papers by multiple authors
NS= Total no. of papers by single authors
h) Collaborative Index (CI) - The measure of the mean number of authors per
paper is the Collaborative index as computed by Lawani (1980) which can be
mathematically expressed as follows:
CI = ∑ 𝒋𝒇𝒋𝑨
𝒋=𝟏
𝑵 where,
fj=the number of papers having j authors in a collection of k
N=Total number of papers in k, N=Ʃjf j
A=Total number of authors in the collection k
i) Collaborative Coefficient (CC) - To overcome the shortcomings of CI and DC,
a new indicator was formulated by Ajiferuke (1988) known as Collaborative
Coefficient (CC) and can be mathematically expressed as follows:
CC=1-∑ (
𝟏
𝒋)𝒇𝒋𝑨
𝒋=𝟏
𝑵 where,
N= Total number of research papers
j=No of j authored papers
A=greater no of j authored papers
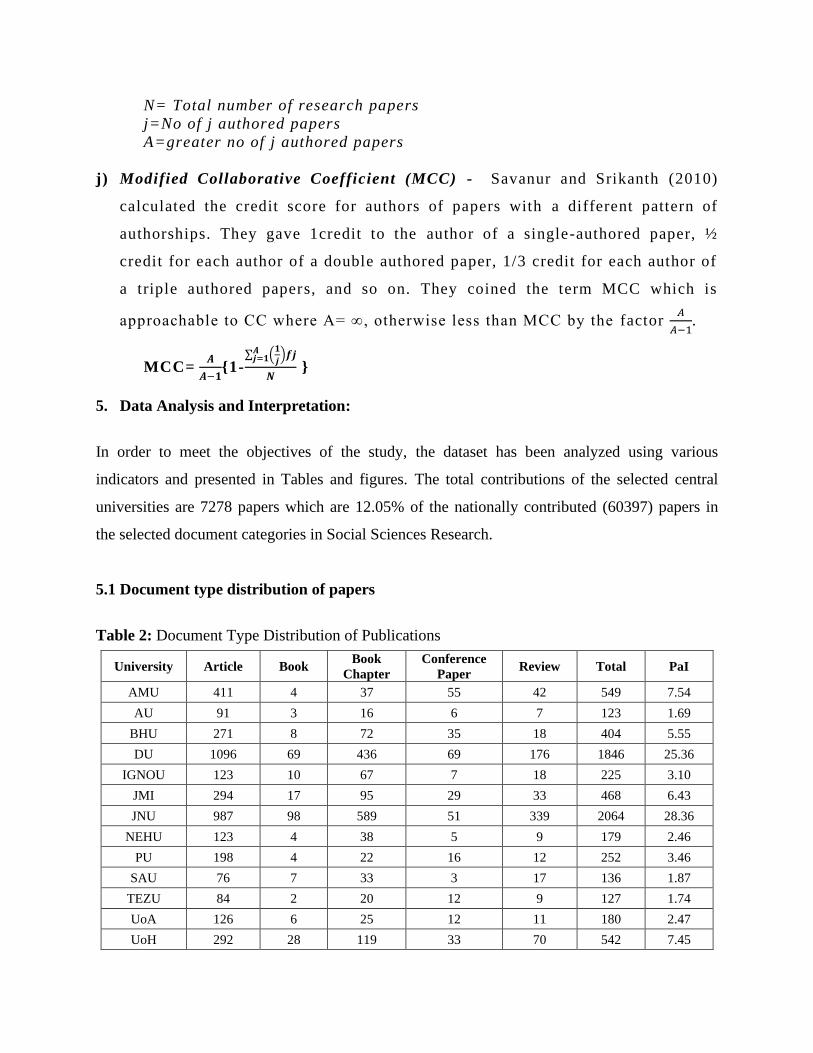
j) Modified Collaborative Coefficient (MCC) - Savanur and Srikanth (2010)
calculated the credit score for authors of papers with a different pattern of
authorships. They gave 1credit to the author of a single-authored paper, ½
credit for each author of a double authored paper, 1/3 credit for each author of
a triple authored papers, and so on. They coined the term MCC which is
approachable to CC where A= ∞, otherwise less than MCC by the factor 𝐴
𝐴−1.
MCC= 𝑨
𝑨−𝟏{1-
∑ (𝟏
𝒋)𝒇𝒋𝑨
𝒋=𝟏
𝑵 }
5. Data Analysis and Interpretation:
In order to meet the objectives of the study, the dataset has been analyzed using various
indicators and presented in Tables and figures. The total contributions of the selected central
universities are 7278 papers which are 12.05% of the nationally contributed (60397) papers in
the selected document categories in Social Sciences Research.
5.1 Document type distribution of papers
Table 2: Document Type Distribution of Publications
University Article Book Book
Chapter
Conference
Paper Review Total PaI
AMU 411 4 37 55 42 549 7.54
AU 91 3 16 6 7 123 1.69
BHU 271 8 72 35 18 404 5.55
DU 1096 69 436 69 176 1846 25.36
IGNOU 123 10 67 7 18 225 3.10
JMI 294 17 95 29 33 468 6.43
JNU 987 98 589 51 339 2064 28.36
NEHU 123 4 38 5 9 179 2.46
PU 198 4 22 16 12 252 3.46
SAU 76 7 33 3 17 136 1.87
TEZU 84 2 20 12 9 127 1.74
UoA 126 6 25 12 11 180 2.47
UoH 292 28 119 33 70 542 7.45
VBU 121 3 43 3 13 183 2.51
TOTAL 4293
(58.99%)
263
(3.61%)
1612
(22.15%) 336 (4.62%) 774 (10.63%)
7278
(100%) 100
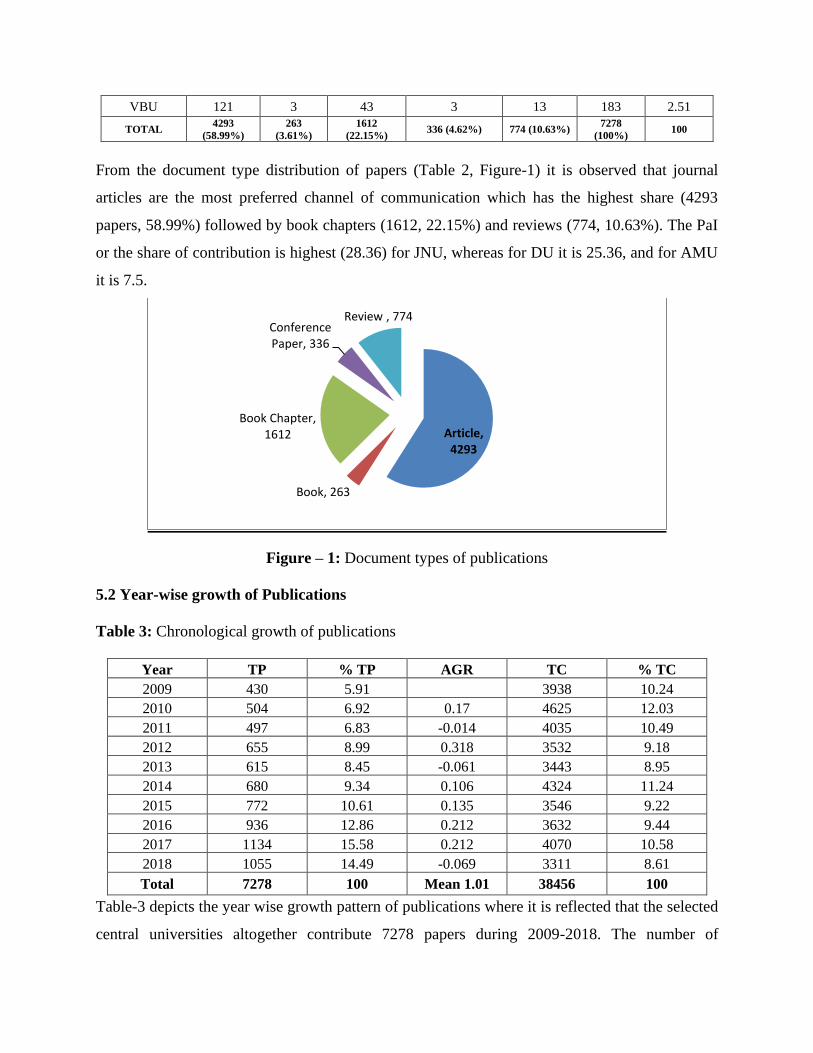
From the document type distribution of papers (Table 2, Figure-1) it is observed that journal
articles are the most preferred channel of communication which has the highest share (4293
papers, 58.99%) followed by book chapters (1612, 22.15%) and reviews (774, 10.63%). The PaI
or the share of contribution is highest (28.36) for JNU, whereas for DU it is 25.36, and for AMU
it is 7.5.
Figure – 1: Document types of publications
5.2 Year-wise growth of Publications
Table 3: Chronological growth of publications
Year TP % TP AGR TC % TC
2009 430 5.91 3938 10.24
2010 504 6.92 0.17 4625 12.03
2011 497 6.83 -0.014 4035 10.49
2012 655 8.99 0.318 3532 9.18
2013 615 8.45 -0.061 3443 8.95
2014 680 9.34 0.106 4324 11.24
2015 772 10.61 0.135 3546 9.22
2016 936 12.86 0.212 3632 9.44
2017 1134 15.58 0.212 4070 10.58
2018 1055 14.49 -0.069 3311 8.61
Total 7278 100 Mean 1.01 38456 100
Table-3 depicts the year wise growth pattern of publications where it is reflected that the selected
central universities altogether contribute 7278 papers during 2009-2018. The number of
Article, 4293
Book, 263
Book Chapter, 1612
Conference Paper, 336
Review , 774
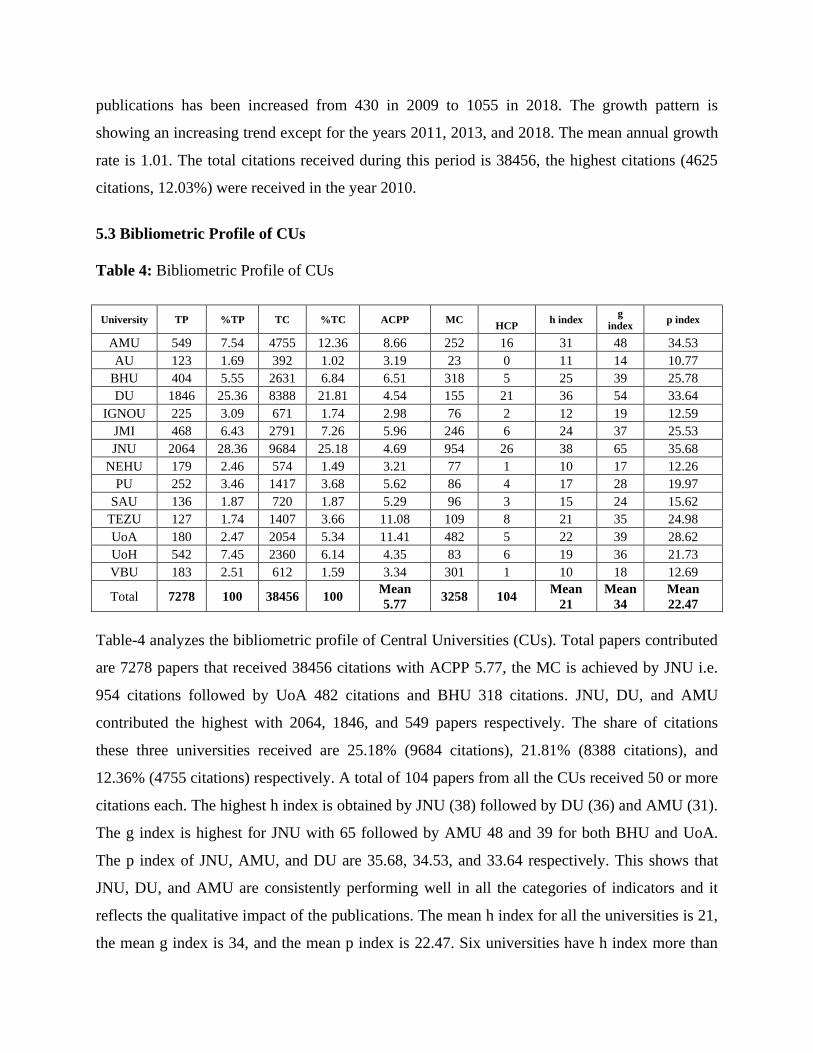
publications has been increased from 430 in 2009 to 1055 in 2018. The growth pattern is
showing an increasing trend except for the years 2011, 2013, and 2018. The mean annual growth
rate is 1.01. The total citations received during this period is 38456, the highest citations (4625
citations, 12.03%) were received in the year 2010.
5.3 Bibliometric Profile of CUs
Table 4: Bibliometric Profile of CUs
University TP %TP TC %TC ACPP MC
HCP h index
g
index p index
AMU 549 7.54 4755 12.36 8.66 252 16 31 48 34.53
AU 123 1.69 392 1.02 3.19 23 0 11 14 10.77
BHU 404 5.55 2631 6.84 6.51 318 5 25 39 25.78
DU 1846 25.36 8388 21.81 4.54 155 21 36 54 33.64
IGNOU 225 3.09 671 1.74 2.98 76 2 12 19 12.59
JMI 468 6.43 2791 7.26 5.96 246 6 24 37 25.53
JNU 2064 28.36 9684 25.18 4.69 954 26 38 65 35.68
NEHU 179 2.46 574 1.49 3.21 77 1 10 17 12.26
PU 252 3.46 1417 3.68 5.62 86 4 17 28 19.97
SAU 136 1.87 720 1.87 5.29 96 3 15 24 15.62
TEZU 127 1.74 1407 3.66 11.08 109 8 21 35 24.98
UoA 180 2.47 2054 5.34 11.41 482 5 22 39 28.62
UoH 542 7.45 2360 6.14 4.35 83 6 19 36 21.73
VBU 183 2.51 612 1.59 3.34 301 1 10 18 12.69
Total 7278 100 38456 100 Mean
5.77 3258 104
Mean
21
Mean
34
Mean
22.47
Table-4 analyzes the bibliometric profile of Central Universities (CUs). Total papers contributed
are 7278 papers that received 38456 citations with ACPP 5.77, the MC is achieved by JNU i.e.
954 citations followed by UoA 482 citations and BHU 318 citations. JNU, DU, and AMU
contributed the highest with 2064, 1846, and 549 papers respectively. The share of citations
these three universities received are 25.18% (9684 citations), 21.81% (8388 citations), and
12.36% (4755 citations) respectively. A total of 104 papers from all the CUs received 50 or more
citations each. The highest h index is obtained by JNU (38) followed by DU (36) and AMU (31).
The g index is highest for JNU with 65 followed by AMU 48 and 39 for both BHU and UoA.
The p index of JNU, AMU, and DU are 35.68, 34.53, and 33.64 respectively. This shows that
JNU, DU, and AMU are consistently performing well in all the categories of indicators and it
reflects the qualitative impact of the publications. The mean h index for all the universities is 21,
the mean g index is 34, and the mean p index is 22.47. Six universities have h index more than
the average value, 8 universities have their g index value more than the average and 7
universities have achieved p-index higher than the average value.
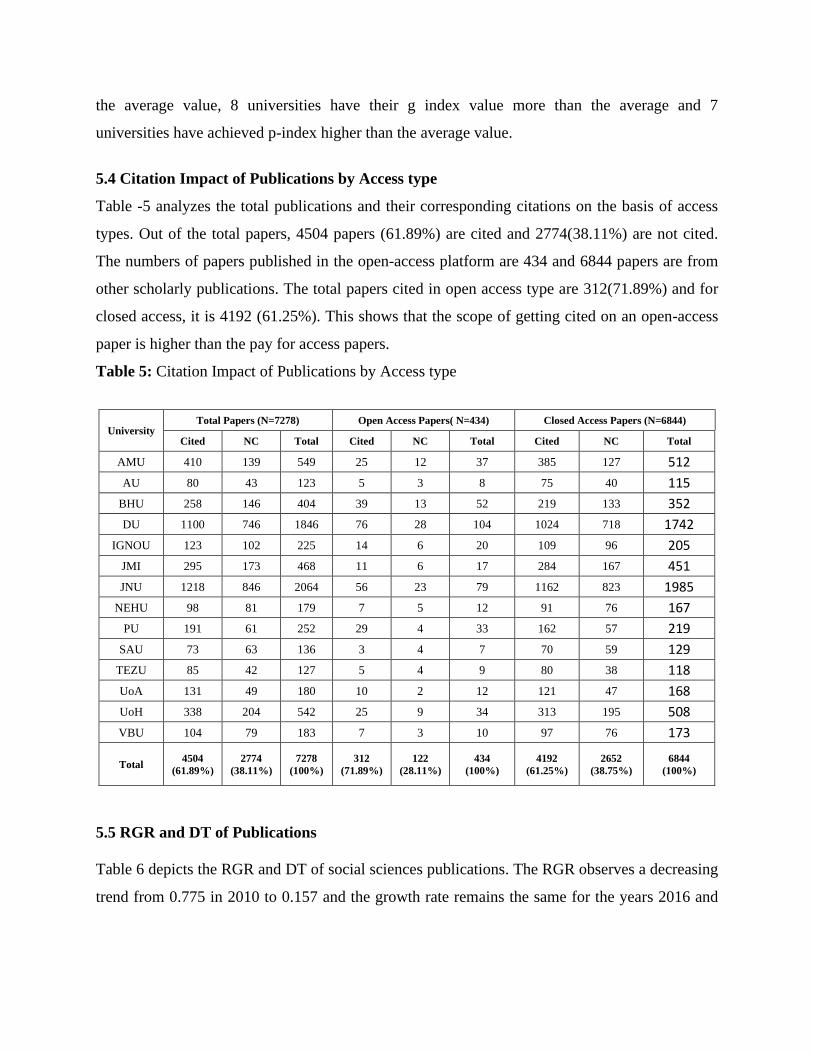
5.4 Citation Impact of Publications by Access type
Table -5 analyzes the total publications and their corresponding citations on the basis of access
types. Out of the total papers, 4504 papers (61.89%) are cited and 2774(38.11%) are not cited.
The numbers of papers published in the open-access platform are 434 and 6844 papers are from
other scholarly publications. The total papers cited in open access type are 312(71.89%) and for
closed access, it is 4192 (61.25%). This shows that the scope of getting cited on an open-access
paper is higher than the pay for access papers.
Table 5: Citation Impact of Publications by Access type
University Total Papers (N=7278) Open Access Papers( N=434) Closed Access Papers (N=6844)
Cited NC Total Cited NC Total Cited NC Total
AMU 410 139 549 25 12 37 385 127 512
AU 80 43 123 5 3 8 75 40 115
BHU 258 146 404 39 13 52 219 133 352
DU 1100 746 1846 76 28 104 1024 718 1742
IGNOU 123 102 225 14 6 20 109 96 205
JMI 295 173 468 11 6 17 284 167 451
JNU 1218 846 2064 56 23 79 1162 823 1985
NEHU 98 81 179 7 5 12 91 76 167
PU 191 61 252 29 4 33 162 57 219
SAU 73 63 136 3 4 7 70 59 129
TEZU 85 42 127 5 4 9 80 38 118
UoA 131 49 180 10 2 12 121 47 168
UoH 338 204 542 25 9 34 313 195 508
VBU 104 79 183 7 3 10 97 76 173
Total 4504
(61.89%)
2774
(38.11%)
7278
(100%)
312
(71.89%)
122
(28.11%)
434
(100%)
4192
(61.25%)
2652
(38.75%)
6844
(100%)
5.5 RGR and DT of Publications
Table 6 depicts the RGR and DT of social sciences publications. The RGR observes a decreasing
trend from 0.775 in 2010 to 0.157 and the growth rate remains the same for the years 2016 and
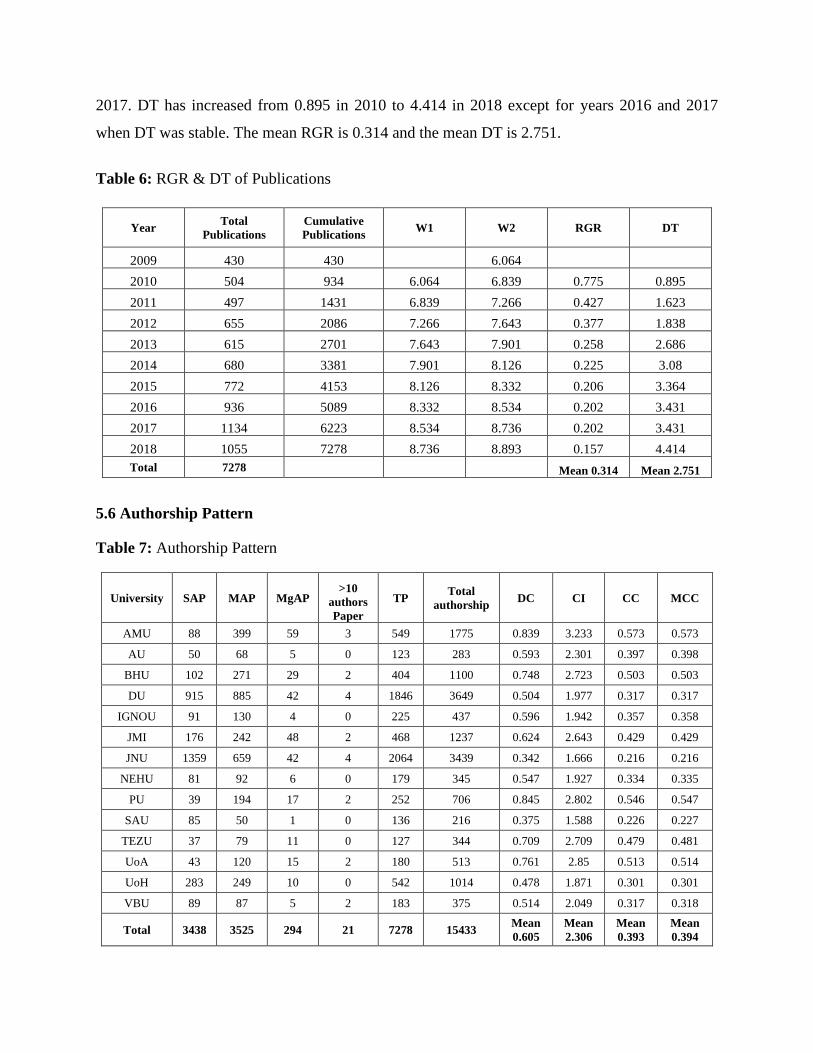
2017. DT has increased from 0.895 in 2010 to 4.414 in 2018 except for years 2016 and 2017
when DT was stable. The mean RGR is 0.314 and the mean DT is 2.751.
Table 6: RGR & DT of Publications
Year Total
Publications
Cumulative
Publications W1 W2 RGR DT
2009 430 430 6.064
2010 504 934 6.064 6.839 0.775 0.895
2011 497 1431 6.839 7.266 0.427 1.623
2012 655 2086 7.266 7.643 0.377 1.838
2013 615 2701 7.643 7.901 0.258 2.686
2014 680 3381 7.901 8.126 0.225 3.08
2015 772 4153 8.126 8.332 0.206 3.364
2016 936 5089 8.332 8.534 0.202 3.431
2017 1134 6223 8.534 8.736 0.202 3.431
2018 1055 7278 8.736 8.893 0.157 4.414
Total 7278 Mean 0.314 Mean 2.751
5.6 Authorship Pattern
Table 7: Authorship Pattern
University SAP MAP MgAP >10
authors
Paper
TP Total
authorship DC CI CC MCC
AMU 88 399 59 3 549 1775 0.839 3.233 0.573 0.573
AU 50 68 5 0 123 283 0.593 2.301 0.397 0.398
BHU 102 271 29 2 404 1100 0.748 2.723 0.503 0.503
DU 915 885 42 4 1846 3649 0.504 1.977 0.317 0.317
IGNOU 91 130 4 0 225 437 0.596 1.942 0.357 0.358
JMI 176 242 48 2 468 1237 0.624 2.643 0.429 0.429
JNU 1359 659 42 4 2064 3439 0.342 1.666 0.216 0.216
NEHU 81 92 6 0 179 345 0.547 1.927 0.334 0.335
PU 39 194 17 2 252 706 0.845 2.802 0.546 0.547
SAU 85 50 1 0 136 216 0.375 1.588 0.226 0.227
TEZU 37 79 11 0 127 344 0.709 2.709 0.479 0.481
UoA 43 120 15 2 180 513 0.761 2.85 0.513 0.514
UoH 283 249 10 0 542 1014 0.478 1.871 0.301 0.301
VBU 89 87 5 2 183 375 0.514 2.049 0.317 0.318
Total 3438 3525 294 21 7278 15433 Mean
0.605
Mean
2.306
Mean
0.393
Mean
0.394
SAP=single authored papers, MAP-multiple authored papers(2 to 5 authors), MgAP-Mega authored
papers (6 to 10 authors)
It is observed from Table -7 that the number of multiple-authored papers (2 to 5 authors) is 3525
which is slightly higher than the single author papers (3438). The mean DC, CI, CC, and MCC
are derived as 0.605, 2.306, 0.393, and 0.394 respectively. The DC is highest for PU (0.845)
followed by AMU 0.839 and UoA 0.761. The DC is the lowest 0.342 for JNU which means that
the single authorship pattern is predominant in JNU. The mean CI for all the universities found
to be is 2.306. The CI for six universities are higher than the average CI. The CC for AMU, PU,
and UoA are 0.573, 0.546, and 0.513 respectively. MCC is highest 0.573 for AMU and lowest
0.216 for JNU.
5.7 Most Productive Journals
Table-8 represents the top ten most productive journals in the field of Social Sciences. Economic
and Political Weekly (Economics & Econometrics is covered as one subject area), International
Journal of Biological Macromolecules, Advanced Science Letters (Social Sciences: Education is
covered as one subject area), DESIDOC Journal of Library and Information Technology and
Library Philosophy and Practice are the most prolific journals in the fields of Social Sciences.
Table 8: Top Ten Journals
Sl. No. Journal Name No. of Papers
1 Economic and Political Weekly 828
2 International Journal of Biological Macromolecules 387
3 Advanced Science Letters 126
4 DESIDOC Journal of Library and Information Technology 74
5 Library Philosophy and Practice 58
6 Eastern Anthropologist 55
7 Man in India 53
8 Journal of Fluorescence 49
9 Indian Journal of Labour Economics 48
10 Transactions of the Institute of Indian Geographers 47
5.8 Most Prolific Authors
Among the top ten most influential authors, 3 authors are from JNU, 3 are from JMI, 2 authors
from Delhi University, and 1 each from AMU and University of Hyderabad. R. H. Khan is the
most prolific author with 42 papers and h index of 18. C.P. Chandrasekhar has contributed 39
papers with h index 5 and J. Ghosh has 38 publications with h index 8. F. Ahmad (28 papers) and
M.I. Hassan (26 papers) of JMI have achieved h index 13.
Table 9: Top Ten Most Prolific Authors
Sl. No. Name of the Authors University No. of Contribution h index
1 R. H. Khan Aligarh Muslim University 42 18
2 C. P. Chandrasekhar Jawaharlal NehruUniversity 39 5
3 J. Ghosh Jawaharlal Nehru University 38 8
4 P. K. Nayar University of Hyderabad 36 6
5 P. Patnaik Jawaharlal NehruUniversity 32 6
6 F. Ahmad Jamia Milia Islamia 28 13
7 M.I. Hassan Jamia Milia Islamia 26 13
8 A. Mitra Delhi University 26 9
9 S. Sehgal Delhi University 26 9
10 A. Islam Jamia Milia Islamia 23 12
5.9 Network of Collaborative Countries
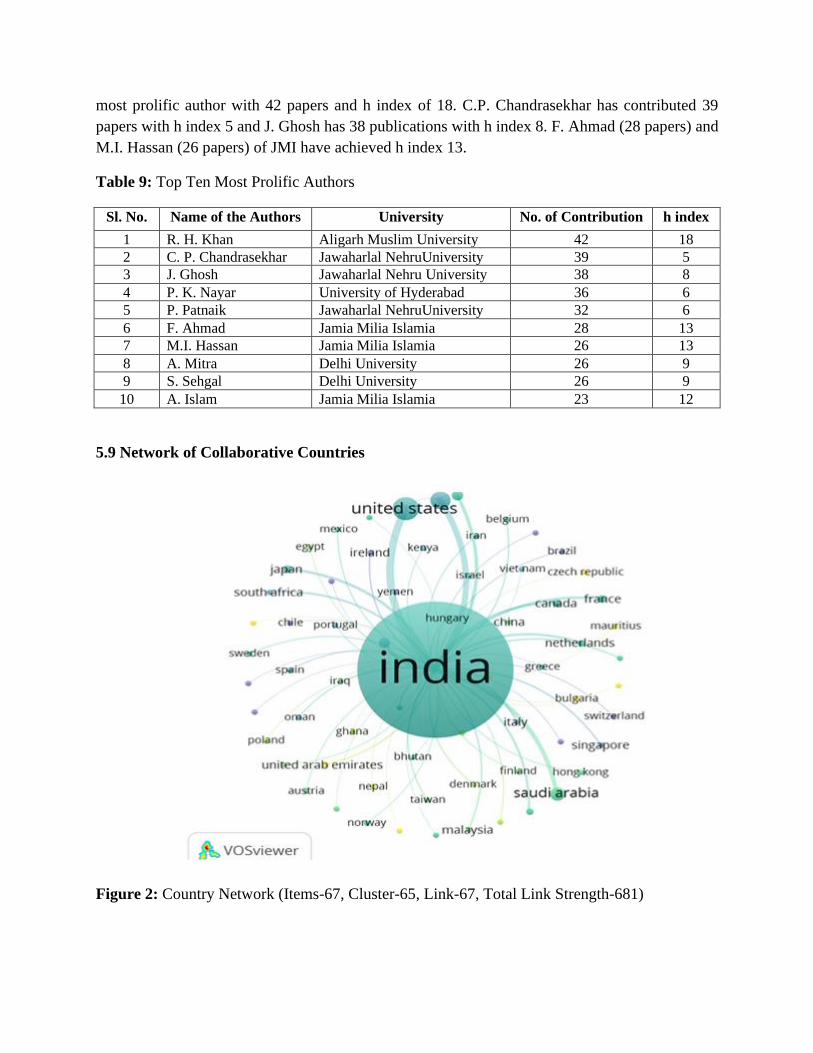
Figure 2: Country Network (Items-67, Cluster-65, Link-67, Total Link Strength-681)
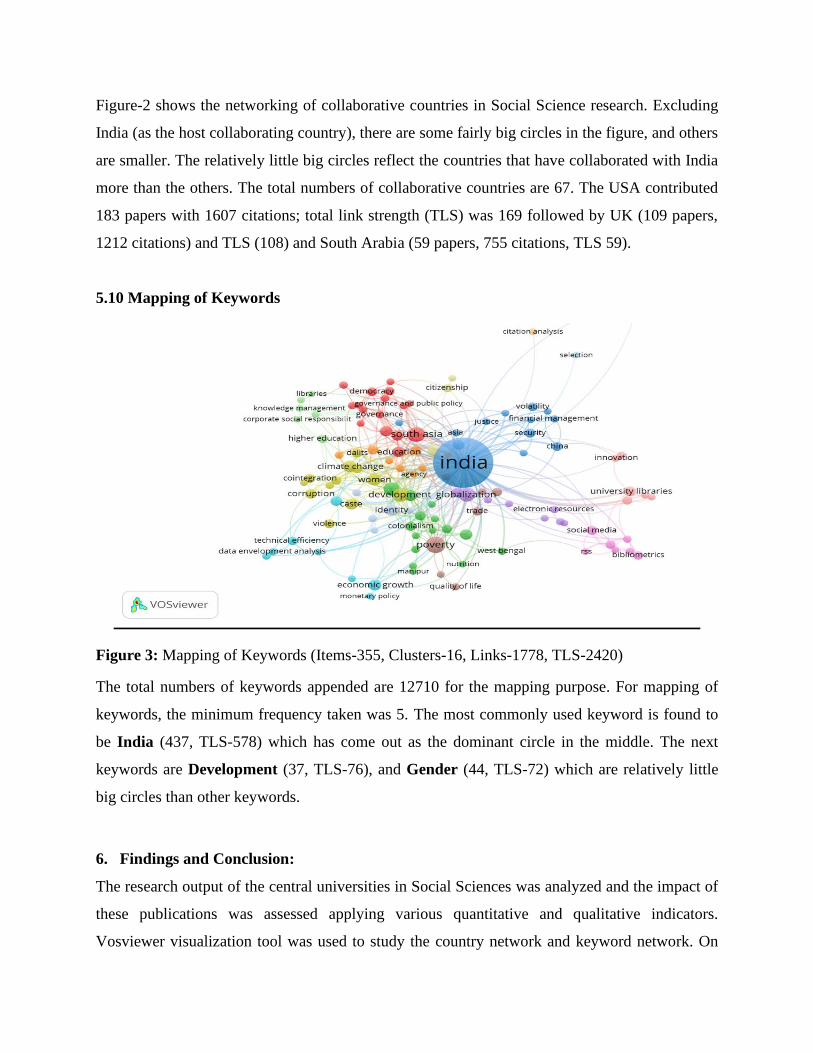
Figure-2 shows the networking of collaborative countries in Social Science research. Excluding
India (as the host collaborating country), there are some fairly big circles in the figure, and others
are smaller. The relatively little big circles reflect the countries that have collaborated with India
more than the others. The total numbers of collaborative countries are 67. The USA contributed
183 papers with 1607 citations; total link strength (TLS) was 169 followed by UK (109 papers,
1212 citations) and TLS (108) and South Arabia (59 papers, 755 citations, TLS 59).
5.10 Mapping of Keywords
Figure 3: Mapping of Keywords (Items-355, Clusters-16, Links-1778, TLS-2420)
The total numbers of keywords appended are 12710 for the mapping purpose. For mapping of
keywords, the minimum frequency taken was 5. The most commonly used keyword is found to
be India (437, TLS-578) which has come out as the dominant circle in the middle. The next
keywords are Development (37, TLS-76), and Gender (44, TLS-72) which are relatively little
big circles than other keywords.
6. Findings and Conclusion:
The research output of the central universities in Social Sciences was analyzed and the impact of
these publications was assessed applying various quantitative and qualitative indicators.
Vosviewer visualization tool was used to study the country network and keyword network. On
the basis of analysis, articles are the most preferred document type contributing 4293 papers
(58.99%) followed by 1612 book chapters with 22.15% share. The total contribution made by
JNU is highest (2064 papers, 9684 citations, 28.36%) followed by DU (1846 papers, 8388
citations, 25.36%) and AMU (549 papers, 4755 citations, 7.54%). The mean citation received by
JNU was the highest which is 954. JNU, DU, and AMU ranked at the top three positions in
receiving the highest number of HCP. HCP for these universities are 26, 21, and 16, h index are
38, 36, and 31, and the g index is found to be 65, 54, and 48 respectively. Regarding p-index
JNU has the highest value 35.68 followed by AMU 34.53 and DU 33.64. The ACPP was highest
for UoA (11.41), TEZU (11.08), and AMU (8.66). Out of the total publications, 4504 papers
were cited, the share of open access papers citation was 71.9% while for the pay for access it was
61.3%. The mean RGR and DT of publications are 0.314 and 2.751. Mean DC, CI, CC, and
MCC for these central universities are found to be 0.605, 2.306, 0.393, and 0.394. Economic and
Political Weekly is the most prolific journal. R.H. Khan of AMU is the most productive author
with 42 papers. The most collaborative countries that have collaborated with India are found to
be the USA, UK, and South Arabia. This paper provides the relative standing of the prominent
Central Universities of Indian context along with valuable insights into the Indian Social
Sciences Research. The study also signposts the ample scope of collaboration with the other
countries as well as institutions in the field of Social Sciences.
References:
1. Baskaran, C. (2013). Research productivity of Alagappa University during 1999-2011: A
bibliometric study. DESIDOC Journal of Library and Information Technology, 33(3), 236–
242. https://doi.org/10.14429/djlit.33.3.4609
2. Kumar, H. A., Dora, M., and Desai, A. (2015). A Bibliometric profile of Gujarat University,
Ahmadabad during 2004-2013. DESIDOC Journal of Library and Information Technology,
35(1), 9–16. https://doi.org/10.14429/djlit.35.1.7699.
3. Mohanty, B. (2014). Management Information Systems Quarterly (MISQ): A Bibliometric
Study, Library Philosophy and Practice (e-journal), 1119.
http://digitalcommons.unl.edu/libphilprac/1119.
4. Nagarkar, S., Veer, C., and Kumbhar, R. (2015). Bibliometric analysis of papers published
by faculty of life science departments of Savitribai Phule Pune University during 1999-2013.
DESIDOC Journal of Library and Information Technology, 35(5), 368–375.
https://doi.org/10.14429/djlit.35.5.8429.
5. National Institutional Ranking Framework at https://www.nirfindia.org/Parameter (accessed
on 01.12.2020).
6. Prathap, G. (2010). The 100 most prolific economists using the p–index. Scientometrics, 84,
167–172. https://doi.org/10.1007/s11192-009-0068-0.
7. Sahoo, J., Mohanty, B., and Sahoo, L. P. (2017). Indian Contribution To Open Access
Scholarly Publishing in DOAJ. (2017). Library Philosophy and Practice (e-journal), 1567.
http://digitalcommons.unl.edu/libphilprac/1567.
8. Savanur, K., and Konnur, P. V. (2012). Growth and Impact of Research Output of Bangalore
University, 1971-2010: A Scientometric Study. International Journal of Library and
Information Science, 4(5), 71–80. https://doi.org/10.5897/IJLIS11.080.
9. Singh, J. K. (2013). Contribution of Scholarly Research Output in Physics: A Study with
Special Reference to the Banaras Hindu University. International Journal of Information
Dissemination and Technology, 3(1), 15-21.
10. Siwach, A. K., and Kumar, S. (2015). Bibliometric analysis of research publications of
Maharshi Dayanand University (Rohtak) during 2000-2013. DESIDOC Journal of Library
and Information Technology, 35(1), 17–24. https://doi.org/10.14429/djlit.35.1.7789.
11. Reddy, K. S., Xie, E., and Tang, Q. (2016). Pacific Science Review B : Humanities and
Social Sciences rankings : A case of India and comparison with China. Pacific Science
Review A: Natural Science and Engineering, 2(1), 1–21.
https://doi.org/10.1016/j.psrb.2016.09.004.
12. Rienda, L., et al. (2014). Doing business in India : a review of research in leading
international journals”, Journal of Indian Business Research, 3(3), 192–216.
https://doi.org/10.1108/4191111157056.