ber measurement in software defined radio systems
TRANSCRIPT
PRZEGLĄD ELEKTROTECHNICZNY, ISSN 0033-2097, R. 89 NR 2b/2013 205
Radek MARTINEK, Jan ZIDEK, Karel TOMALA
VSB-Technical University of Ostrava
BER Measurement in Software Defined Radio Systems
Abstract. The article describes a flexible concept of measuring system consisting of PXI-5670 RF vector signal generator and PXI 5661 RF vector signal analyzer. The measuring system structure is based on PXI modular system that applies synthetic instrumentation concept - software-based approach to measurement of wireless transmission systems basic parameters. Synthetic instrumentation is the future, particularly in sectors where the demand for fast evolution and increased flexibility of electronics systems has driven the trend for increasing software content of electronics systems. Authors of this article created with LabVIEW 2010 SP1 synthetic measuring instruments for measuring the real bit error rate BER, applicable in the field of advanced wireless transmission systems. The main goal of the authors was to design a flexible measurement system that is able to adapt to new technologies and new modulation techniques. Streszczenie. W artykule opisano układ pomiarowy, zbudowany na bazie generator wektorowego PXI-5670 RF oraz analizatora wektorowego PXI-5661 RF, na potrzeby pomiaru parametrów sieci bezprzewodowej. Wykorzystany został modułowy, syntetycznym przyrząd metrologiczny PXI, który może pozwolić w przyszłości na szybki rozwój układów elektronicznych o dużej zawartości software’owej. Wykorzystane w pracy oprogramowanie LabVIEW 2010 SP1, posłużyło do określenia dopuszczalnej, rzeczywistej stopy błędów (BER) w zaawansowanych sieciach bezprzewodowych. (Pomiary BER w systemie radia programowalnego). Keywords: SDR - software defined radio, PXI modular system, LabVIEW, digital communication system. Słowa kluczowe: radio programowalne (SDR), PXI, LabVIEW, komunikacja cyfrowa. Introduction
Development of measuring systems in digital communication area generally and globally follows the trend of increasing the flexibility of measuring systems. The constant need to transfer an increasing amount of information increases the requirements for particular channels. If we want to transmit information through the communication chain, it is important to understand what processes take place in the transmission medium. It is also important to realize which types of interference and distortion can be found and what are their basic properties. Testing of error rate is a very important parameter of transmission media, especially for its diagnostics and maintenance. The measurement results can also be used for design and optimization of used encryption and security for the data transmission channel [1].
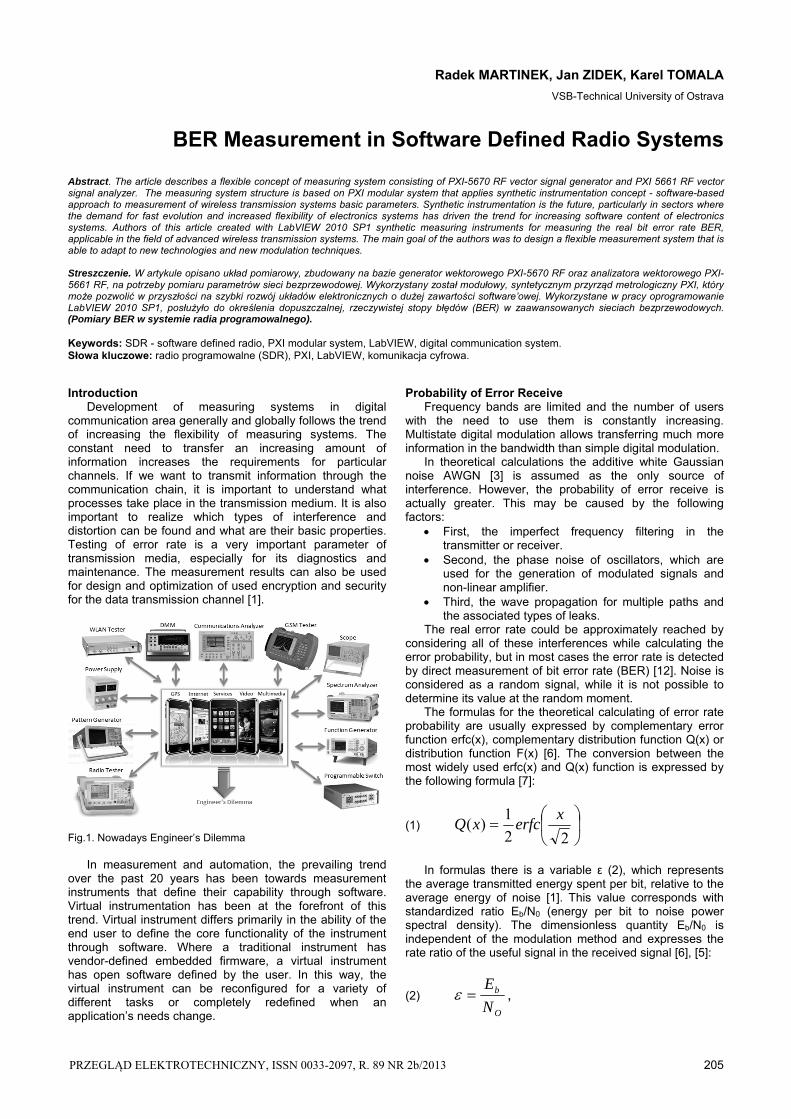
Fig.1. Nowadays Engineer’s Dilemma
In measurement and automation, the prevailing trend over the past 20 years has been towards measurement instruments that define their capability through software. Virtual instrumentation has been at the forefront of this trend. Virtual instrument differs primarily in the ability of the end user to define the core functionality of the instrument through software. Where a traditional instrument has vendor-defined embedded firmware, a virtual instrument has open software defined by the user. In this way, the virtual instrument can be reconfigured for a variety of different tasks or completely redefined when an application’s needs change.
Probability of Error Receive Frequency bands are limited and the number of users
with the need to use them is constantly increasing. Multistate digital modulation allows transferring much more information in the bandwidth than simple digital modulation.
In theoretical calculations the additive white Gaussian noise AWGN [3] is assumed as the only source of interference. However, the probability of error receive is actually greater. This may be caused by the following factors:
First, the imperfect frequency filtering in the transmitter or receiver.
Second, the phase noise of oscillators, which are used for the generation of modulated signals and non-linear amplifier.
Third, the wave propagation for multiple paths and the associated types of leaks.
The real error rate could be approximately reached by considering all of these interferences while calculating the error probability, but in most cases the error rate is detected by direct measurement of bit error rate (BER) [12]. Noise is considered as a random signal, while it is not possible to determine its value at the random moment.
The formulas for the theoretical calculating of error rate probability are usually expressed by complementary error function erfc(x), complementary distribution function Q(x) or distribution function F(x) [6]. The conversion between the most widely used erfc(x) and Q(x) function is expressed by the following formula [7]:
(1)
22
1)(
xerfcxQ
In formulas there is a variable ε (2), which represents
the average transmitted energy spent per bit, relative to the average energy of noise [1]. This value corresponds with standardized ratio Eb/N0 (energy per bit to noise power spectral density). The dimensionless quantity Eb/N0 is independent of the modulation method and expresses the rate ratio of the useful signal in the received signal [6], [5]:
(2) O
b
N
E ,
206 PRZEGLĄD ELEKTROTECHNICZNY, ISSN 0033-2097, R. 89 NR 2b/2013
where: Eb – mean value of energy per bit, No - power spectral density of noise. PSK Modulation
The resulting formula of error probability for PSK is the same as for QPSK modulation [6]:
(3)
0
0
2
2
1
)(2
1
22
1
N
Eerfc
erfcN
TPerfcP
b
be
,
where: Pe – probability of bit error, P - mean power of signal, Tb - time duration of binary symbol.
For multistate variants of keying the following formula for the error rate of symbols is applicable then [2, 4, 6]:
(4)
MN
EerfcP s
s
sin.
0
,
where: Ps – probability of symbol error, Es - mean value of energy per symbol, Es / No - standardized signal-to-noise ratio related to the energy per symbol, M is the number of symbols.
For the bit error rate the formula (5) is relevant. More detail in [6]:
(5)
MN
MEerfc
MP b
e
sin.
log
log
1
0
2
2
QAM Modulation
While using the M-QAM modulation, during the transmission by channel with AWGN noise or during coherent demodulation, the probability of error in the transmission of symbols is determined approximately by formula (6), [2, 3, 6].
(6)
0
0112
N
Eerfc
MPe
BER – bit error ratio In digital transmission, the number of bit errors is the number of not delivered or incorrectly delivered bits of a data stream over a communication channel that has been altered due to noise, interference, distortion or bit synchronization errors. The bit error rate or bit error ratio (BER) is the number of bit errors be divided by the total number of transferred bits during a studied time interval t. BER is a unitless performance measure, often expressed as a percentage. The smaller number comes out of error, the higher quality signal is received. Bit error rate is calculated using the following formula (7).
(7) tv
bBER
p
e
,
where: vb is transmission rate.
Different concepts of measuring systems Modern measuring systems are designed to best meet
the needs of end users. In measuring systems, the prevailing trend over the past 20 years has been towards instruments that define their capability through software. Standalone or traditional instruments
Traditional or standalone instruments have all the components for one instrument in one case. Functionality for measuring, analysis or representation of measured signal is determined by the manufacturer – a traditional instrument has vendor-defined embedded firmware. Architecture of such measuring instruments is closed and uses this fixed set of functions. The user is therefore limited in his requirements.
These measuring instruments are used mostly separately with limited connectivity; orientation of such devices is specific to the function. Hardware is a key component which leads to high cost of production and application repeatability [7, 8]. Synthetic or virtual instruments
Virtual Instrumentation (VI) is defined as a software-defined system, where software based on user requirements defines the functionality of generic measurement hardware. This concept is very progressive, since it allows designing devices which keep the performance parameters of classical measuring instruments. The devices designed this way exactly match the requirements of end-user, as the functions are implemented in the software and are defined by the user. Software is then a key component. Difference between traditional and synthetic instruments
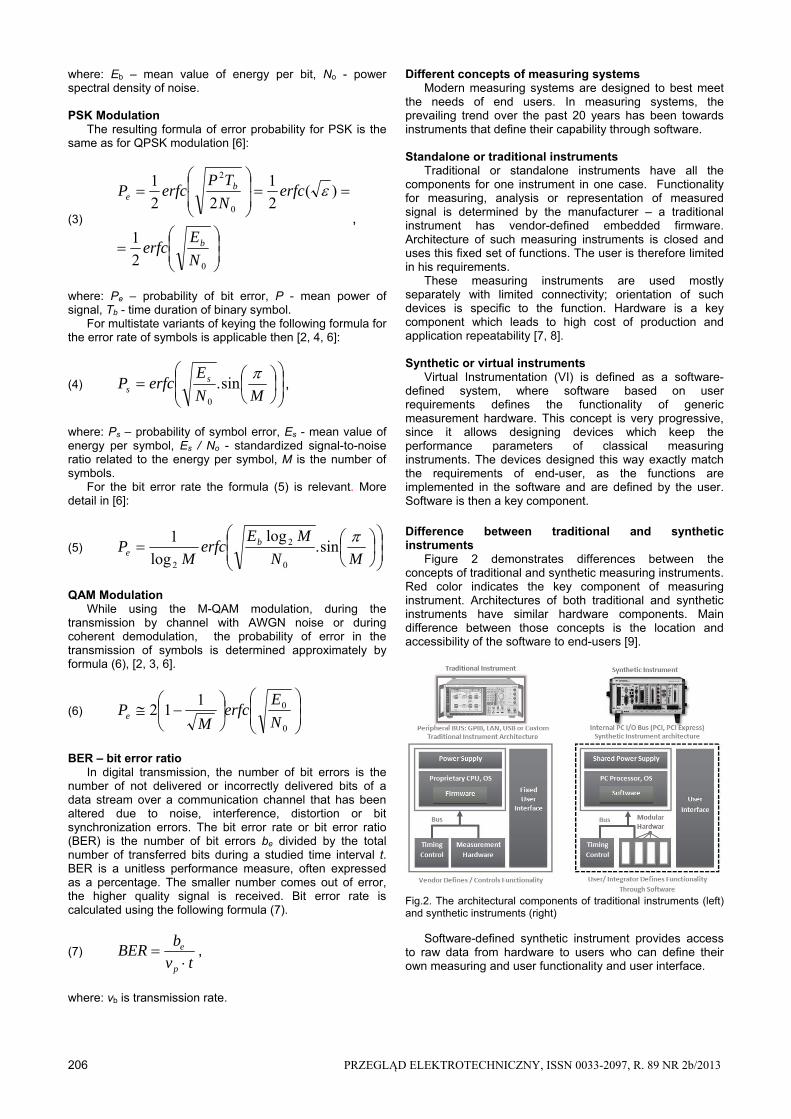
Figure 2 demonstrates differences between the concepts of traditional and synthetic measuring instruments. Red color indicates the key component of measuring instrument. Architectures of both traditional and synthetic instruments have similar hardware components. Main difference between those concepts is the location and accessibility of the software to end-users [9].
Fig.2. The architectural components of traditional instruments (left) and synthetic instruments (right)
Software-defined synthetic instrument provides access to raw data from hardware to users who can define their own measuring and user functionality and user interface.
PRZEGLĄD ELEKTROTECHNICZNY, ISSN 0033-2097, R. 89 NR 2b/2013 207
Concept of Measuring Equipment in the form of Synthetic Instrumentation
In recent years, the number of new protocols used in digital transmission systems has increased dramatically. Some of them are completely new; others are gradually replacing the existing ones. Introduction of digital transmission systems of new generations accompanied by new and new standards creates a need for flexible test platform, both in their development stage and in their use. The authors of this article present a solution in the form of a test system based on the synthetic instrumentation. The concept of the measuring apparatus is shown in Figure 3.
Fig.3. The concept of measuring equipment in the form of synthetic instrumentation: RF Vector Signal Generator and PXI-5670 RF Vector Signal Analyzer PXI 5661
One of the biggest advantages of this test platform is the ability to respond flexibly to new requirements in the area of testing. In this article the RF vector signal generator and PXI-5670 RF vector signal analyzer PXI-5661 have been used. These two modules are highly flexible solutions for testing of new digital transmission systems [12, 13]. The roles of software and hardware are shown in Figure 4.
Fig.4. The role of software and hardware in the utilized test system Vector Signal Generator - NI PXI 5670
Along with the development environment LabVIEW, complemented by extended Modulation Toolkit library, the PXI module could be used to generate the required test signals for verifying the possibilities of digital transmission systems which use the new standards. The whole test system can be easily adapted to new requirements, while
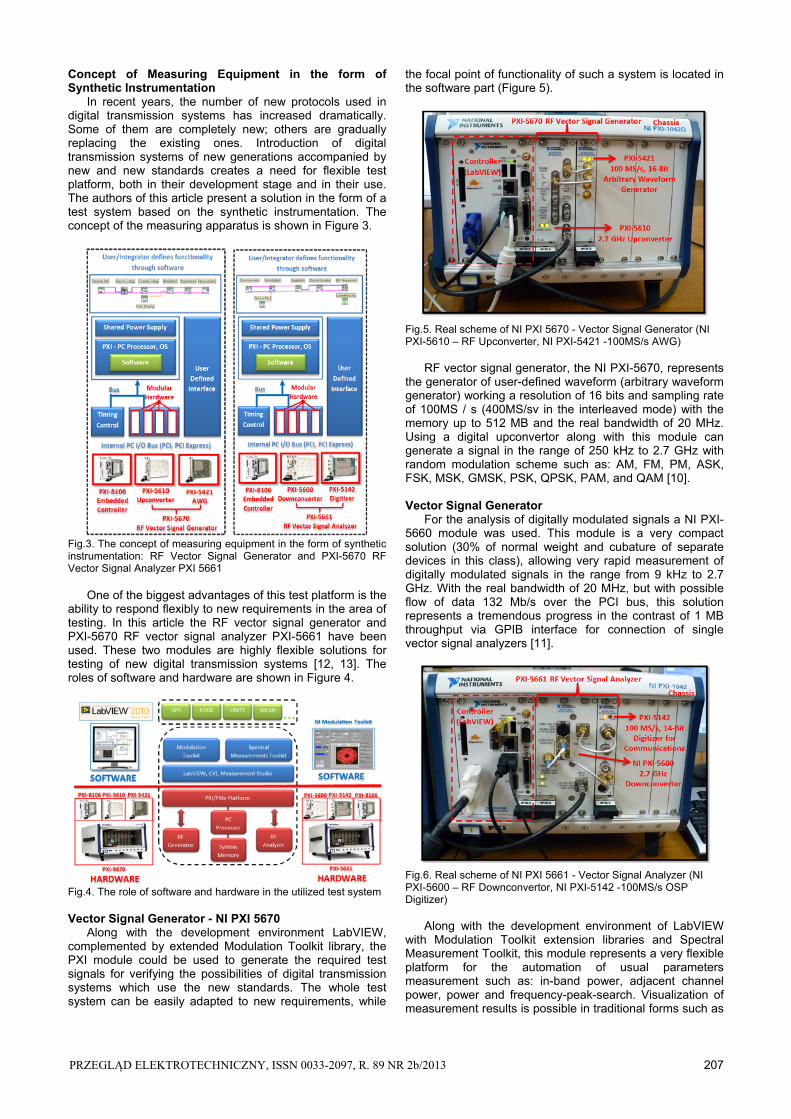
the focal point of functionality of such a system is located in the software part (Figure 5).
Fig.5. Real scheme of NI PXI 5670 - Vector Signal Generator (NI PXI-5610 – RF Upconverter, NI PXI-5421 -100MS/s AWG)
RF vector signal generator, the NI PXI-5670, represents the generator of user-defined waveform (arbitrary waveform generator) working a resolution of 16 bits and sampling rate of 100MS / s (400MS/sv in the interleaved mode) with the memory up to 512 MB and the real bandwidth of 20 MHz. Using a digital upconvertor along with this module can generate a signal in the range of 250 kHz to 2.7 GHz with random modulation scheme such as: AM, FM, PM, ASK, FSK, MSK, GMSK, PSK, QPSK, PAM, and QAM [10]. Vector Signal Generator
For the analysis of digitally modulated signals a NI PXI-5660 module was used. This module is a very compact solution (30% of normal weight and cubature of separate devices in this class), allowing very rapid measurement of digitally modulated signals in the range from 9 kHz to 2.7 GHz. With the real bandwidth of 20 MHz, but with possible flow of data 132 Mb/s over the PCI bus, this solution represents a tremendous progress in the contrast of 1 MB throughput via GPIB interface for connection of single vector signal analyzers [11].
Fig.6. Real scheme of NI PXI 5661 - Vector Signal Analyzer (NI PXI-5600 – RF Downconvertor, NI PXI-5142 -100MS/s OSP Digitizer)
Along with the development environment of LabVIEW with Modulation Toolkit extension libraries and Spectral Measurement Toolkit, this module represents a very flexible platform for the automation of usual parameters measurement such as: in-band power, adjacent channel power, power and frequency-peak-search. Visualization of measurement results is possible in traditional forms such as
208 PRZEGLĄD ELEKTROTECHNICZNY, ISSN 0033-2097, R. 89 NR 2b/2013
3D spectrograms and constellation diagrams for analysis of digitally modulated signals (I/Q Modulation for Data Analysis). Verification of Designed Transmission Wireless SYSTEM Functionality
The data, which are transmitted from one user to another, must pass through a transmission chain composed of several important basic blocks (Figure 7).
Fig.7. Block diagram of the realized digital transmission chain
In the block of channels three aspects have been used: a simulated channel, interconnection by the cable and real wireless connection. The verification of functionality of the designed system was done in two ways. First, the ideal signal was generated; second, the degradation of the signal in the form of MER was added to the generator. The signal to noise ratio was influenced by MER values with error rate Eb/N0. In order to eliminate the environmental effects on degradation and transfer of the signal, a 50 Ω coaxial cable was used (instead of antenna) to connect equipment at the first step of authentication [14]. Evaluation of the Measuring
Measurements were carried out during the whole modulation under the same conditions (i.e. the spacing between symbols in different modulation had to be adapted with the same power), so that they could credibly be compared.
Verification of real function of the proposed system
For verification of the real features of the designed system NI PXI, a passive omnidirectional WiFi Antenna TP-LINK TL ANT2405C with 5 dBi gain – was connected to the output of the broadcast part of the system and the receiver was attached to the passive panel sector WiFi Antenna Centurion Wireless Technologies with 9 dBi of gain. In the transmitter the signal was generated by the studied modulations on the carrier frequency 1.96 GHz, power level of 10 dBm signal with a bandwidth 3.84 MHz, Roll factor α of the root raised cosine filter 0.33 and symbol rate 2.625 MS/s. On the receiver side, the quality of the received signal was evaluated by the BER measurement [15]. Graphical representation of the experiment results There are a number of different ways to analyze and view digitally modulated signals. The most common way is a polar diagram of magnitude and phase – constellation diagram. The constellation diagram shows a repetitive “snapshot”, with values shown only at the decision points. The constellation diagram displays phase errors, as well as amplitude errors, at the decision points.
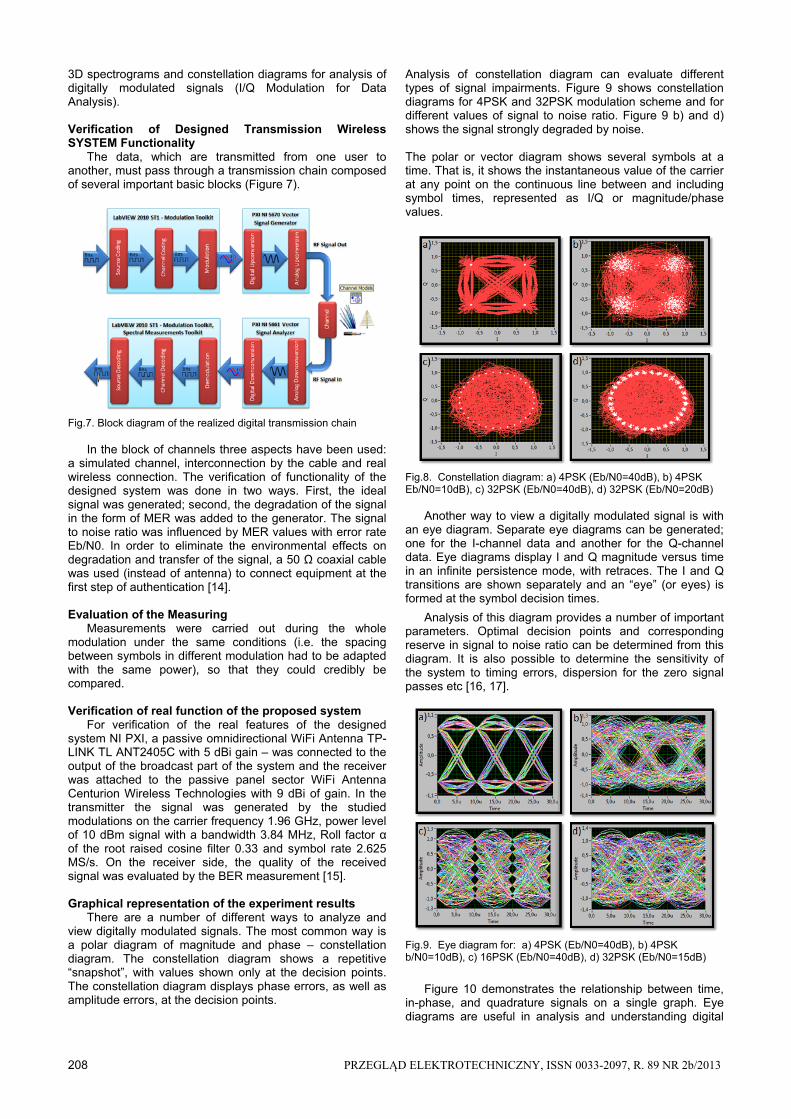
Analysis of constellation diagram can evaluate different types of signal impairments. Figure 9 shows constellation diagrams for 4PSK and 32PSK modulation scheme and for different values of signal to noise ratio. Figure 9 b) and d) shows the signal strongly degraded by noise. The polar or vector diagram shows several symbols at a time. That is, it shows the instantaneous value of the carrier at any point on the continuous line between and including symbol times, represented as I/Q or magnitude/phase values.
Fig.8. Constellation diagram: a) 4PSK (Eb/N0=40dB), b) 4PSK Eb/N0=10dB), c) 32PSK (Eb/N0=40dB), d) 32PSK (Eb/N0=20dB)
Another way to view a digitally modulated signal is with an eye diagram. Separate eye diagrams can be generated; one for the I-channel data and another for the Q-channel data. Eye diagrams display I and Q magnitude versus time in an infinite persistence mode, with retraces. The I and Q transitions are shown separately and an “eye” (or eyes) is formed at the symbol decision times.
Analysis of this diagram provides a number of important parameters. Optimal decision points and corresponding reserve in signal to noise ratio can be determined from this diagram. It is also possible to determine the sensitivity of the system to timing errors, dispersion for the zero signal passes etc [16, 17].
Fig.9. Eye diagram for: a) 4PSK (Eb/N0=40dB), b) 4PSK b/N0=10dB), c) 16PSK (Eb/N0=40dB), d) 32PSK (Eb/N0=15dB)
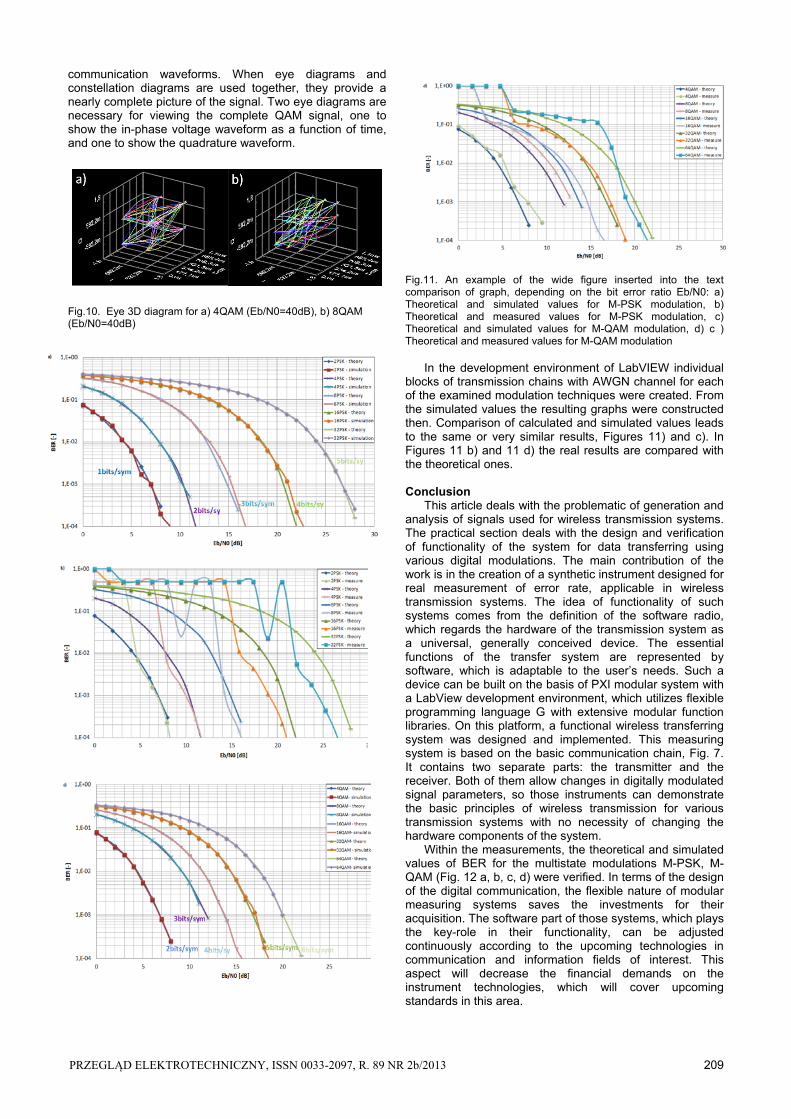
Figure 10 demonstrates the relationship between time, in-phase, and quadrature signals on a single graph. Eye diagrams are useful in analysis and understanding digital
PRZEGLĄD ELEKTROTECHNICZNY, ISSN 0033-2097, R. 89 NR 2b/2013 209
communication waveforms. When eye diagrams and constellation diagrams are used together, they provide a nearly complete picture of the signal. Two eye diagrams are necessary for viewing the complete QAM signal, one to show the in-phase voltage waveform as a function of time, and one to show the quadrature waveform.
Fig.10. Eye 3D diagram for a) 4QAM (Eb/N0=40dB), b) 8QAM (Eb/N0=40dB)
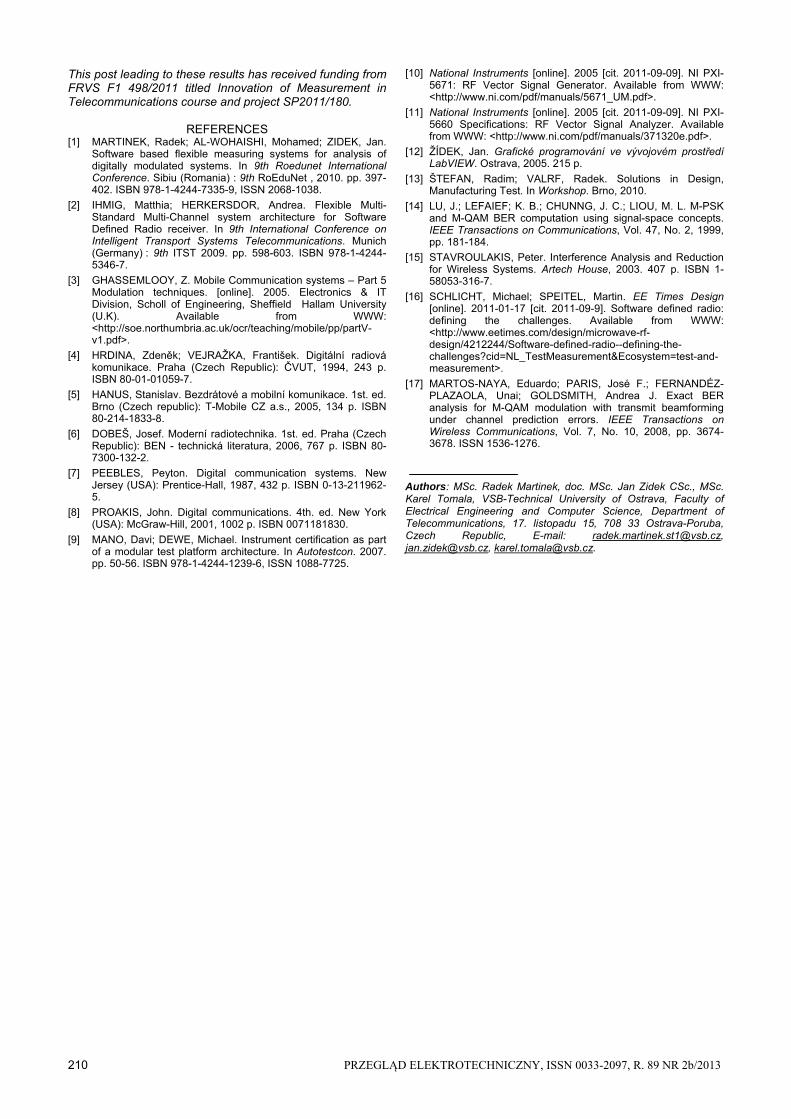
Fig.11. An example of the wide figure inserted into the text comparison of graph, depending on the bit error ratio Eb/N0: a) Theoretical and simulated values for M-PSK modulation, b) Theoretical and measured values for M-PSK modulation, c) Theoretical and simulated values for M-QAM modulation, d) c ) Theoretical and measured values for M-QAM modulation
In the development environment of LabVIEW individual
blocks of transmission chains with AWGN channel for each of the examined modulation techniques were created. From the simulated values the resulting graphs were constructed then. Comparison of calculated and simulated values leads to the same or very similar results, Figures 11) and c). In Figures 11 b) and 11 d) the real results are compared with the theoretical ones.
Conclusion
This article deals with the problematic of generation and analysis of signals used for wireless transmission systems. The practical section deals with the design and verification of functionality of the system for data transferring using various digital modulations. The main contribution of the work is in the creation of a synthetic instrument designed for real measurement of error rate, applicable in wireless transmission systems. The idea of functionality of such systems comes from the definition of the software radio, which regards the hardware of the transmission system as a universal, generally conceived device. The essential functions of the transfer system are represented by software, which is adaptable to the user’s needs. Such a device can be built on the basis of PXI modular system with a LabView development environment, which utilizes flexible programming language G with extensive modular function libraries. On this platform, a functional wireless transferring system was designed and implemented. This measuring system is based on the basic communication chain, Fig. 7. It contains two separate parts: the transmitter and the receiver. Both of them allow changes in digitally modulated signal parameters, so those instruments can demonstrate the basic principles of wireless transmission for various transmission systems with no necessity of changing the hardware components of the system.
Within the measurements, the theoretical and simulated values of BER for the multistate modulations M-PSK, M-QAM (Fig. 12 a, b, c, d) were verified. In terms of the design of the digital communication, the flexible nature of modular measuring systems saves the investments for their acquisition. The software part of those systems, which plays the key-role in their functionality, can be adjusted continuously according to the upcoming technologies in communication and information fields of interest. This aspect will decrease the financial demands on the instrument technologies, which will cover upcoming standards in this area.
210 PRZEGLĄD ELEKTROTECHNICZNY, ISSN 0033-2097, R. 89 NR 2b/2013
This post leading to these results has received funding from FRVS F1 498/2011 titled Innovation of Measurement in Telecommunications course and project SP2011/180.
REFERENCES [1] MARTINEK, Radek; AL-WOHAISHI, Mohamed; ZIDEK, Jan.
Software based flexible measuring systems for analysis of digitally modulated systems. In 9th Roedunet International Conference. Sibiu (Romania) : 9th RoEduNet , 2010. pp. 397-402. ISBN 978-1-4244-7335-9, ISSN 2068-1038.
[2] IHMIG, Matthia; HERKERSDOR, Andrea. Flexible Multi-Standard Multi-Channel system architecture for Software Defined Radio receiver. In 9th International Conference on Intelligent Transport Systems Telecommunications. Munich (Germany) : 9th ITST 2009. pp. 598-603. ISBN 978-1-4244-5346-7.
[3] GHASSEMLOOY, Z. Mobile Communication systems – Part 5 Modulation techniques. [online]. 2005. Electronics & IT Division, Scholl of Engineering, Sheffield Hallam University (U.K). Available from WWW: <http://soe.northumbria.ac.uk/ocr/teaching/mobile/pp/partV-v1.pdf>.
[4] HRDINA, Zdeněk; VEJRAŽKA, František. Digitální radiová komunikace. Praha (Czech Republic): ČVUT, 1994, 243 p. ISBN 80-01-01059-7.
[5] HANUS, Stanislav. Bezdrátové a mobilní komunikace. 1st. ed. Brno (Czech republic): T-Mobile CZ a.s., 2005, 134 p. ISBN 80-214-1833-8.
[6] DOBEŠ, Josef. Moderní radiotechnika. 1st. ed. Praha (Czech Republic): BEN - technická literatura, 2006, 767 p. ISBN 80-7300-132-2.
[7] PEEBLES, Peyton. Digital communication systems. New Jersey (USA): Prentice-Hall, 1987, 432 p. ISBN 0-13-211962-5.
[8] PROAKIS, John. Digital communications. 4th. ed. New York (USA): McGraw-Hill, 2001, 1002 p. ISBN 0071181830.
[9] MANO, Davi; DEWE, Michael. Instrument certification as part of a modular test platform architecture. In Autotestcon. 2007. pp. 50-56. ISBN 978-1-4244-1239-6, ISSN 1088-7725.
[10] National Instruments [online]. 2005 [cit. 2011-09-09]. NI PXI-5671: RF Vector Signal Generator. Available from WWW: <http://www.ni.com/pdf/manuals/5671_UM.pdf>.
[11] National Instruments [online]. 2005 [cit. 2011-09-09]. NI PXI-5660 Specifications: RF Vector Signal Analyzer. Available from WWW: <http://www.ni.com/pdf/manuals/371320e.pdf>.
[12] ŽÍDEK, Jan. Grafické programování ve vývojovém prostředí LabVIEW. Ostrava, 2005. 215 p.
[13] ŠTEFAN, Radim; VALRF, Radek. Solutions in Design, Manufacturing Test. In Workshop. Brno, 2010.
[14] LU, J.; LEFAIEF; K. B.; CHUNNG, J. C.; LIOU, M. L. M-PSK and M-QAM BER computation using signal-space concepts. IEEE Transactions on Communications, Vol. 47, No. 2, 1999, pp. 181-184.
[15] STAVROULAKIS, Peter. Interference Analysis and Reduction for Wireless Systems. Artech House, 2003. 407 p. ISBN 1-58053-316-7.
[16] SCHLICHT, Michael; SPEITEL, Martin. EE Times Design [online]. 2011-01-17 [cit. 2011-09-9]. Software defined radio: defining the challenges. Available from WWW: <http://www.eetimes.com/design/microwave-rf-design/4212244/Software-defined-radio--defining-the-challenges?cid=NL_TestMeasurement&Ecosystem=test-and-measurement>.
[17] MARTOS-NAYA, Eduardo; PARIS, José F.; FERNANDÉZ-PLAZAOLA, Unai; GOLDSMITH, Andrea J. Exact BER analysis for M-QAM modulation with transmit beamforming under channel prediction errors. IEEE Transactions on Wireless Communications, Vol. 7, No. 10, 2008, pp. 3674-3678. ISSN 1536-1276.
Authors: MSc. Radek Martinek, doc. MSc. Jan Zidek CSc., MSc. Karel Tomala, VSB-Technical University of Ostrava, Faculty of Electrical Engineering and Computer Science, Department of Telecommunications, 17. listopadu 15, 708 33 Ostrava-Poruba, Czech Republic, E-mail: [email protected], [email protected], [email protected].