benthic nitrogen fluxes along a depth gradient in a microtidal fjord: the role of denitrification...
TRANSCRIPT
Seediscussions,stats,andauthorprofilesforthispublicationat:https://www.researchgate.net/publication/251817658
Benthicnitrogenfluxesalongadepthgradientinamicrotidalfjord:Theroleofdenitrificationandmicrophytobenthos
ARTICLEinLIMNOLOGYANDOCEANOGRAPHY·JULY2004
ImpactFactor:3.79·DOI:10.4319/lo.2004.49.4.1095
CITATIONS
75
READS
24
5AUTHORS,INCLUDING:
KristinaSundbäck
UniversityofGothenburg
56PUBLICATIONS2,090CITATIONS
SEEPROFILE
AngelaWulff
UniversityofGothenburg
74PUBLICATIONS1,260CITATIONS
SEEPROFILE
Availablefrom:AngelaWulff
Retrievedon:10February2016

1095
Limnol. Oceanogr., 49(4), 2004, 1095–1107q 2004, by the American Society of Limnology and Oceanography, Inc.
Benthic nitrogen fluxes along a depth gradient in a microtidal fjord: The role ofdenitrification and microphytobenthos
Kristina Sundback,1 Frank Linares, Fredrik Larson, and Angela WulffDepartment of Marine Ecology, Marine Botany, Goteborg University, P.O. Box 461, SE 405 30 Goteborg, Sweden
Anna EngelsenDepartment of Marine Ecology, Kristineberg Marine Research Station, Goteborg University, SE 450 34 Fiskebackskil,Sweden
Abstract
In littoral sediments, microphytobenthic (MPB) nitrogen assimilation often exceeds nitrogen removal by denitri-fication, partly because MPB activity suppresses denitrification. Little is known about the balance between thesetwo processes at sublittoral depths. Benthic pigment composition, light and dark oxygen, and nutrient fluxes (NO3
2,NH4
1, dissolved organic nitrogen (DON), PO , Si(OH)4), as well as denitrification were measured between 1 and324
15 m in depth in Gullmar Fjord (Skagerrak) in spring and autumn. The hypothesis was that the assimilation/denitrification ratio would decrease with depth, along with decreasing MPB activity caused by light limitation. MPBphotosynthesis occurred along the entire depth gradient, although sediments were net autotrophic only above 5 m.Inorganic nitrogen (DIN) (and silica) flux changed along the depth gradient, the general pattern being sedimentuptake at #5 m and efflux at $10 m depth. DON flux (;50% of total dissolved nitrogen flux) showed a less clearpattern. Two trends regarding DIN fluxes and denitrification—significant light effects and negative correlations withgross primary productivity—showed that MPB activity influenced nitrogen (N) turnover. Although denitrificationincreased with depth, rates remained low (,0.4 mmol N m22 d21), and MPB assimilation (0.2–3.6 mmol N m22
d21) exceeded or equaled denitrification. MPB incorporated ;35% of the remineralized N along the depth gradient,whereas denitrification removed ;20%. Thus, the influence of MPB on benthic nitrogen turnover, denitrificationincluded, extends to sublittoral depths. Further, denitrification does not necessarily remove more N in the deeper,heterotrophic part of the photic zone, compared to the littoral, autotrophic zone.
In the coastal zone, sediments are important sites for re-mineralization of nutrients, and their role as nutrient sourcesfor neritic production is well documented (Cowan and Boyn-ton 1996). Substantial removal of nitrogen (N) by denitrifi-cation also occurs in these sediments (Laursen and Seitzinger2002). In shallow-water sediments that are illuminated, nu-trient turnover is complicated by the presence of benthicprimary producers. Although denitrification is, along withanaerobic ammonium oxidation (Thamdrup and Dalsgaard2002), the only known process that removes N permanentlyfrom the ecosystem, a potentially important internal sink ofN in shallow land-margin areas is temporal retention by ben-thic primary producers (e.g., Dudley et al. 2001; McGlatheryet al. 2001).
In cool microtidal areas, microphytobenthos (MPB) are,in contrast to macroscopic primary producers such as sea-grasses and macroalgal mats, active throughout the year
1 Corresponding author ([email protected]).
AcknowledgmentsFunding was received from the MISTRA Foundation; the Swed-
ish Research Council for Environment, Agricultural Sciences andSpecial Planning (FORMAS); the Royal Society of Arts and Sci-ences in Goteborg; the Foundation in Memory of Birgit and BirgerWahlstrom; and the Captain Stenholm Fund. We thank ChristianNohr and Lars Gamfeldt for assisting during the fieldwork, as wellas the crew of RV Oscar von Sydow (Kristineberg Marine ResearchStation, Fiskebackskil) during the spring sampling. Stefan Hulth(Analytical and Marine Chemistry, Goteborg University) and twoanonymous reviewers are acknowledged for valuable comments.
(e.g., Kristensen 1993, Sundback and Miles 2000). There-fore, N incorporation in MPB can be an important N-retain-ing mechanism on an annual scale (Sundback and Miles2000; Risgaard-Petersen 2003). Efficient N retention byMPB and low denitrification rates seems to be a combinationparticularly likely in low-nitrogen, northern-climate micro-tidal areas. Generally, the effect of light and MPB activityon denitrification is complicated. Oxygen production byMPB photosynthesis can stimulate nitrification-coupled de-nitrification in the sediment by stimulating nitrification (Ris-gaard-Petersen et al. 1994; An and Joye 2001). However, ifnitrogen levels are low, coupled denitrification is insteadsuppressed by MPB, because they compete with nitrifyingbacteria for the limited nitrogen (Rysgaard et al. 1995; Ris-gaard-Petersen 2003). This latter scenario occurs in cool mi-crotidal areas, especially in sandy sediments, where assimi-lation by MPB may exceed denitrification by one to twoorders of magnitude (Sundback and Miles 2000). This is incontrast to what has been found for muddy intertidal sedi-ments, where denitrification often equals or exceeds N as-similation by MPB (Ogilvie et al. 1997; Cabrita and Brotas2000; Dong et al. 2000). However, the tentative conclusionthat predicts a high MPB assimilation/denitrification ratio(A/D) in cool microtidal waters is based on measurementsin the littoral zone (,1 m), and it is not known whether highA/D ratios also apply in the deeper parts of the photic zone.
In clear waters, substantial MPB activity can occur atdepths far below 10 m (Cahoon 1999; Nelson et al. 1999;Gillespie et al. 2000; Welker et al. 2002). Not only does

1096 Sundback et al.
Fig. 1. The study site in Gullmar Fjord, Skagerrak.
MPB influence benthic oxygen exchange at sublittoral andsubtidal depths (Graneli and Sundback 1986; Glud et al.2002), but it also has an impact on the sediment–water nu-trient fluxes (Sundback et al. 1991; Jahnke et al. 2000). Be-cause MPB activity has been found to depress denitrificationrates (Risgaard-Petersen 2003 and references therein), it ishypothesized that the importance of denitrification, relativeto MPB retention of nitrogen, will gradually increase withdepth, as a result of light limitation of benthic photosynthe-sis.
Our aim was to study the role of MPB and denitrificationfor nutrient turnover along a depth gradient in a temperatemicrotidal water body, Gullmar Fjord in the Skagerrak (Fig.1). Although Gullmar Fjord is a well-studied marine waterbody, in which research has been ongoing since the late 19thcentury, the functional role of benthic microbiota for theecosystem has rarely been studied. Our working hypothesiswas that there is a shift in the balance between MPB assim-ilation and denitrification in the sediment along the depthgradient, so that denitrification becomes more importantwhen nearing the lower parts of the photic zone. Our ap-
proach was to measure nutrient and oxygen fluxes across thesediment–water interface and to compare denitrification inthe light versus dark; we also measured the content of pho-tosynthetic pigments in the sediment and concentrations ofcarbon and nitrogen. These measurements were performedalong a depth gradient from 1 to 15 m in both cold (spring)and warm (early autumn) seasons.
Material and methods
Site and sampling—Gullmar Fjord, on the west coast ofSweden, is microtidal (amplitude 20–30 cm) and stratified,with pycnoclines (at 10 to 20 and ;50 m in depth) separat-ing three water layers. A depth gradient from 1 to 15 m wassampled at Sandviken (588229N, 118379E), a bay located onthe east side of the fjord (Fig. 1). This site was chosen be-cause all sampling depths could be easily reached by divers(#100 m from shore) and because a previous study alongthe same gradient had revealed a vital microbenthic com-munity to a depth of at least 17 m (Wulff et al. in press).
Sediment cores were taken in spring (24 and 26 April)and in autumn (18 and 24 September) in 2001 (two depthscould be sampled on the same day). The two seasons werechosen to provide conditions with cold and warm water, re-spectively, and these dates gave sufficient incident irradianceto support MPB activity below the littoral zone. Cores weretaken by SCUBA divers, who used Plexiglas core barrels(see below) at 1, 5, 10, and 15 m depths. The samplingdesign was hierarchical: At each depth, two stations (Sta. Aand Sta. B) were sampled; at each station divers took twoto five cores per measuring variable and station. For flux anddenitrification measurements, sediment was collected with24-cm–long Plexiglas tubes (inner diameter [i.d. 8 cm; 12cm of overlying water, 5 cores per station, 40 cores for theentire gradient), whereas samples for pigments (3 mm deep)and sediment characteristics (5 mm deep) were taken fromsmaller corers (i.d. 4.6 or 6.7 cm). Bottom water was col-lected at each sampling depth for flux incubations in thelaboratory. In situ light (PAR) was measured using a LiCORLI-1400 light meter. Subsamples for pigments and sedimentcharacteristics were taken immediately in the field, whereascores for flux measurements were kept cool while they weretransported to the laboratory in insulated boxes.
Pigments and algal composition—For analyses of photo-synthetic pigments, two small cores (i.d. 4.7 cm) were sam-pled from each station. From each core, two samples of thetop 3 mm (ca. maximum depth of the sediment photic zone;Kuhl et al. 1994) were taken with a cut-off 2-ml (i.d. 8.7mm) disposable syringe. Samples were immediately frozenin liquid nitrogen (21968C) and transferred to a low-tem-perature freezer (2808C). These were later analyzed by high-performance liquid chromatography (HPLC) (Wright andJeffrey 1997) using a diode-array detector (SpectraphysicsUV6000LP). The samples were extracted in a 2-ml mixtureof 80% acetone and 20% methanol for 36 h at 2208C andwere ultrasonicated for 5 min (continuous cooling with ice).Samples from 1–10 m were diluted by adding 500 ml MeOHto 1 ml of sample, and samples from 15 m were diluted byadding 500 ml to 500 ml of sample. Pigments were identified

1097Nitrogen flux along a depth gradient
and quantified as described in Wright and Jeffrey (1997)using commercial standards (International Agency for 14CDetermination, Hørsholm, Denmark).
To check for dominating species of MPB, thin surface-sediment samples were scanned under an epifluorescencemicroscope. No attempt was made to count algal cells.
Flux measurements—For practical reasons, we used in-cubations under controlled laboratory conditions followingthe recommendations of Dalsgaard et al. (2000). Moreover,in a previous study, simultaneous laboratory and in situ in-cubations yielded similar results (Sundback et al. 2003). Oxygen and nutrient fluxes (NO 1NO (referred to as NO ),2 2 2
3 2 3
NH , DON, PO , and Si(OH)4), as well as denitrification,+ 324 4
were measured at in situ temperature under light and darkconditions. The incubation system was previously describedin detail (Sundback and Miles 2000). Upon delivery to thelaboratory, cores were placed into incubation tanks with cir-culating (20 L min21) unfiltered site water, with stirring(magnets, ;60 rpm) but without lids, and were left overnightin a temperature-controlled room. Before incubation started,cores were preincubated at the experimental light level (seebelow) for 1 h, and the headwater in the cores was ex-changed. Three replicate cores and two blank cores (site wa-ter only) were incubated for each station (two stations withthree replicates 5 six replicates per depth). Light and darkincubations were made using the same cores. Oxygen wasmeasured three to four times during the incubation, and theincubation time for nutrient flux (samples taken at the startand end of incubation) was set so that changes in O2 con-centration did not exceed 20% (between 3 and 6 h, depend-ing on sediment type and temperature). Oxygen sampleswere taken with 20-ml glass syringes, and nutrient sampleswith 50-ml disposable syringes through a tube in the trans-parent Plexiglas lid. Nutrient samples were immediately fro-zen at 2808C. Light intensities used during the light incu-bations were set to match the daily mean incident radiationfor the specific time period (Danish Institute of AgriculturalSciences, Research Center Foulum, Denmark) by applyingextinction coefficients from in situ light measurements ob-tained during sediment sampling. In April, incubation lights(individual halogen bulbs over each core) were adjusted togive approximately 25, 10, 10, and 5 mmol photons m22 s21
at the sediment surface for the 1-, 5-, 10-, and 15-m depths,respectively. These low light levels were due to high turbid-ity in the surface layer close to the shore during the springsampling period (see Results). In September, the incubationirradiances were 120, 40, 22, and 6 mmol photons m22 s21,respectively.
Oxygen concentrations were measured using Winkler ti-tration. Oxygen flux in the light was used as a measure ofnet primary production (NPP), and gross primary production(GPP) was calculated by subtracting community respirationin the dark (CR is a negative value) from NPP, assuming forpractical reasons that respiration in the light equaled respi-ration in the dark. Because the irradiance used for the in-cubations represented a daily mean of the light hours of eachmonth, daily values of NPP and GPP were calculated bymultiplying hourly values by the number of daylight hours.Daily CR was calculated by multiplying hourly values by
24. The trophic status (balance between autotrophy and het-erotrophy) of the sediment at each depth was assessed byapplying the Trophic Oxygen Status Index (TOSI) (Viaroliand Christian 2004), derived from the four-scale BenthicTrophic Status Index (BTSI) (Rizzo et al. 1996, see alsoRisgaard-Petersen 2003), where a score of 3 is fully auto-trophic, 2 is net autotrophic, 1 is net heterotrophic, and 0 isfully heterotrophic. In practice, TOSI is derived graphicallyby plotting individual core values of NPP against CR (Vi-aroli and Christian 2004).
Nutrients were analyzed on a TRAACS autoanalyzer(Braun-Lubbe). Total dissolved nitrogen (TDN) was mea-sured by oxidation to NO (Valderrama 1981), and DON2
3
was calculated by subtracting DIN from TDN. Daily (24-h)rates of nutrient fluxes were calculated by multiplying thehourly rate in light times the number of daylight hours andthe hourly rate in the dark times the number of dark hoursand adding these two values.
Calculation of MPB assimilation of N—Calculation of ac-tual algal assimilation is difficult because of excess uptake,as well as leakage of carbon (C) and N by living cells. Wecalculated N assimilation by MPB in a two-step calculation.Daily oxygen production was converted to fixed C using aphotosynthetic quotient (PQ) of 1.2 (for justification of thisquotient, see Kirk 1994; Glud et al. 2002). Fixed C wasfurther converted to assimilated N by assuming a C : N molarratio of 9, the average found for natural benthic microalgalcommunities (Sundback and Miles 2000; Hillebrand andKahlert 2002). Assimilation values calculated from NPP(ANPP) provide a conservative measure of the MPB net Ndemand (Sundback and Miles 2000), but most probably un-derestimate the actual N uptake, since the NPP value is notonly affected by algal respiration, but also by the respirationof the whole benthic community (CR). Therefore, we willhere base the calculation of microphytobenthic N assimila-tion on 80% of GPP (AGPP80), assuming that algal respirationis 20% of GPP (Brotas and Catarino 1995). However, forautotrophic sites, we will also show values of ANPP, to makeit possible to compare with previously published ANPP valuesfor littoral sites (Sundback and Miles 2000, 2002).
Denitrification—Sediment denitrification was measuredusing the isotope-pairing technique (Nielsen 1992). Al-though this method was originally developed to discriminatebetween denitrification supported by NO from the water2
3
column (Dw) and nitrification-coupled denitrification (Dn) inthe sediment, for the purpose of this study, only total deni-trification rates (Dtot) will be considered. Denitrification inlight and dark was measured on separate cores (two coreseach), since the method involves destructive sampling. Thecores were incubated in the same system used for the nutri-ent fluxes, and samples were treated as described by Dals-gaard et al. (2000). In short, 15NO (20 mmol L21 Na15NO3,2
3
99.6 atom %, Europa Scientific Ltd.) was added to the head-space water to a final concentration of ;40 mmol L21
15NO . The NO concentration was measured prior to the2 23 3
addition of 15NO and at the time that the cores were closed23
(after ;0.5 h of the addition of 15NO to allow the label to23
diffuse into the anoxic layer) in order to calculate the 14N :

1098 Sundback et al.
Table 1. Characteristics of the sites during the sampling periods in April and September. Water column characteristics are for wateroverlying the sediment surface. Shown are mean values. TDN 5 total dissolved nitrogen.
Depth (in m)
Apr
1 5 10 15
Sep
1 5 10 15
Water columnSalinityTemperature (8C)TDN (mmol L21)NH41 (mmol L21)NO3
2 1 NO22 (mmol L21)
229
38.91.69.8
308
50.21.30.82
318
28.50.73.4
337
23.90.89.3
301422.8
0.47.0
301426.4
0.34.8
301425.6
0.21.1
301416.7
,0.11.2
DON (mmol L21)DON as % of TDNPO4
32 (mmol L21)Si(OH)4 (mmol L21)
27.571
,0.122.7
48.196
,0.11.7
25.486
,0.15.4
14.058
0.98.7
15.468
,0.18.6
21.381
,0.18.8
24.395
0.24.5
15.593
0.34.2
Sediment (top 5 mm)Water content (% weight)C content (% weight)N content (% weight)C : N ratio (molar)% silt (,63mm)
0.331.640.11
17.430.5
0.401.730.16
12.918
0.331.580.16
11.217.5
0.240.670.03
23.817
0.360.70.06
13.4
0.400.90.1
10.6
0.370.860.175.9
0.220.40.067.7
15N ratio in the NO pool. For the extraction of the N223
samples, 2 ml ZnCl2 (1 g ml21) was added to the waterphase, gently but quickly mixing it with the sediment. Partof the slurry was transferred to a 12.5-ml gas-tight vial. Theisotopic ratio in N2 was analyzed by mass spectrometry atthe National Environmental Research Agency, Silkeborg,Denmark. The rate of denitrification was calculated accord-ing to the procedures and assumptions of Nielsen (1992).Daily denitrification was calculated in the same way as dailynutrient fluxes.
Sediment characteristics—Sediment water content (top 5mm) was estimated gravimetrically by drying sediment to aconstant weight at 608C. Solid-phase total C and N weredetermined on dried samples (top 5 mm) using a Carlo ErbaCHN elemental analyzer. Before analysis, samples for or-ganic C content were treated with HCl to remove carbonates.
Statistical analysis—Spatial variation was analyzed usingnested analysis of variance (ANOVA), with depth and sta-tion (nested within depths) as factors. When no statisticaldifferences for a variable were found between stations withina depth, results will be shown only for depths. Differencesbetween light and dark fluxes were tested using a two-wayANOVA, with treatment (L/D) and depth or station as mainfactors. Homogeneity of variances was checked using Coch-ran’s test, and heterogeneous data were transformed accord-ing to Underwood (1997). When there was a significant in-teraction between factors, pairwise comparison of the meanswas done with Student–Newman–Keul’s (SNK) test. Differ-ences were accepted as significant when P , 0.05. When-ever the words ‘‘significant’’ or ‘‘significantly’’ appear in thetext in connection with ANOVA or SNK, they denote aprobability level of P , 0.05. The Pearson correlation anal-ysis was used to look for correlations between variables,with r and P levels given in the text.
Results
Field conditions—Although the mean daily incident ra-diation during daylight hours in April and September wassimilar (300–400 mmol photons m22 s21), underwater lightconditions at the two shallowest sites were different in Apriland September. As a result of a turbid layer of surface waterin April—caused by runoff—the extinction coefficient (Kd)was much higher close to the shore, ranging from .2 m21
at 1 m to ,0.3 m21 at 15 m. However, light at all samplingdepths was above the 1% level when compared to surfacelight. This resulted in small differences in the in situ (andhence incubation) light conditions along the depth gradientin April. In September, the water was clearer, with Kd vary-ing from 1.2 to 0.28 m21 along the gradient.
Water column and sediment characteristics are shown inTable 1. Vertical differences in temperature (7–98C) and sa-linity (22–33), as well as in nutrient concentrations, reflectthe stratified water column in April (see Nutrient flux). InSeptember, the temperature (148C) and salinity (30) were thesame at all depths as a result of a mixed water column.
The main sediment type (analyzed only in spring) alongthe depth gradient was silty sand, with the highest proportionof silt at 1 m (Table 1). The lower sediment water contentat 15 m reflects a sandier sediment. Both C (0.4–1.7%) andN (0.03–0.17%) contents at the 1-, 5-, and 10-m sites weresignificantly higher in spring than in the autumn (Table 1).The particulate C : N molar ratio varied between 5.9 and 23.8and was generally higher in spring (average 16.4) than inthe autumn (average 9.4), the lowest ratios occurring at 10–15 m in the autumn. Sieving sediment after incubationsshowed the presence of cockles (Cerastoderma sp.) andpolychaetes (Nereis sp.) at 1 and 5 m, while some specimensof Cardioechinus were present at the deeper sites.
Microbenthic community—In April, a community of small(,10 mm) and middle-sized (20–40 mm) pennate benthic

1099Nitrogen flux along a depth gradient
Fig. 2. Pigment concentrations (mg m22) in the top 3 mm ofsediment at four depths in Gullmar Fjord in April and September.Shown are means 1 SE, n 5 8.
Fig. 3. Daily oxygen flux (mean 1 SE, n 5 6) between sedi-ment and water at four depths in Gullmar Fjord in April and Sep-tember. GPP 5 gross primary production, NPP 5 net primary pro-duction, CR 5 community respiration.
diatoms dominated at all depths (e.g., Navicula and Nitzschiaspp.), together with Surirella sp. Deposited, but vital, spec-imens of the planktonic centric diatom Skeletonema costa-tum were common in April, particularly at 10 m. In Septem-ber, well-developed microalgal mats occurred at all depthswith the exception of 15 m. At 1 and 5 m, these mats con-sisted of a mixture of cyanobacteria (Oscillatoria sp.) andlarge-sized diatoms such as Amphora decussata and sigmoidspecies (mainly Gyrosigma balticum), which dominated thediatom biomass. At 10 m, there was a cohesive pure diatommat dominated by Pleurosigma cf. clevei, Pleurosigma for-mosum, and A. decussata. At 15 m, there was no visible mat,but the biomass was dominated by species similar to thosenoted at 10 m.
Photosynthetic pigments—Chlorophyll a (Chl a) content,which is here used as a proxy for MPB biomass, decreasedwith depth, but was within the same range (11–102 mg m22)in both April and September (Fig. 2). The only significantdifference between the two seasons was a higher content ofChl a at 10 m in September. Additional photosynthetic pig-ments were found—the diatom pigments fucoxanthin (fu-cox) and diadinoxanthin (diadinox), the green algal pigmentschlorophyll b (Chl b) and lutein, zeaxanthin (zeax, a markerpigment for both green algae and cyanobacteria), the chlo-rophyll breakdown product pheophytin a (pheophyt a), andbetacarotene (betacar, common for all algal groups) (Fig. 2).As for Chl a, all other pigments had the lowest concentra-tions at 15 m (Fig. 2). Chromatograms revealed that diadinoxfrom 10 and 15 m was subject to interference from uniden-tified chlorophyll breakdown products, and thus these valuesshould be treated with caution. In April, the highest concen-trations for all pigments except diadinox and Chl a werefound at 5 m in depth (Fig. 2). In September, however, thehighest concentrations were found as deep as 10 m for allpigments except Chl a and betacar (Fig. 2). In April, zeaxcorrelated significantly and positively with lutein (r 5 0.99,P , 0.001) and Chl b (r 5 0.95, P , 0.001), indicating thatzeax originated from green algae. In September, however,zeax indicated a cyanobacterial rather than green-algalsource, as it correlated significantly with Chl a (r 5 0.77,P , 0.05) but not with lutein (r 5 0.62, P . 0.1) or Chl b(r 5 0.64, P . 0.1). Fucox correlated well with Chl a inApril (r 5 0.97, P , 0.001) but not in September (r 5 0.47,P . 0.1), when it correlated best with pheophyt a (r 5 0.97,P , 0.001). These varying correlations indicate differentdegradation rates of pigments in spring and autumn.
Oxygen flux and primary productivity—Benthic oxygenproduction occurred at all depths (except at 10 m in April).However, a positive NPP was found only for the 1-m site(Fig. 3). Along the depth gradient, daily GPP varied between49 and 0 mmol O2 m22 d21 (equivalent to 490–0 mg C m22
d21, PQ 1.2), while NPP varied between 26 and 29.3 mmolO2 m22 d21. At 5 and 10 m, GPP was significantly higher in

1100 Sundback et al.
Fig. 4. Hourly nutrient fluxes in light and dark at four depthsin Gullmar Fjord in April and September. Rates for two replicatestations per depth are shown (mean 1 SE, n 5 3). * Denotes asignificant light/dark difference.
Fig. 5. Daily fluxes of dissolved inorganic (DIN), organic(DON), and total nitrogen (TDN) (mean 1 SE, n 5 6) at fourdepths in Gullmar Fjord in April and September. Curves show theconcentration of DIN, DON, and TDN in the overlying water(mean, n 5 3).
September than in April. Daily (24-h) CR (8–45 mmol O2
m22 d21) was significantly higher in autumn than in spring(except at 15 m), but showed no evident pattern along thedepth gradient (Fig. 3). A significantly lower CR was foundat 10 m in April and at 15 m in September.
Applying the trophic status index, TOSI, showed that the1-m site was highly autotrophic (BTSI 3) in both April andSeptember, that the 5-m site was net autotrophic to net het-erotrophic (BTSI 2-1), and that the 10-m site was net het-erotrophic (BTSI 1). The sediment at 15 m varied betweena net autotrophic and a fully heterotrophic state (BTSI 2-0).Thus, no depth could be described as fully heterotrophic(BTSI 0).
Nutrient flux—Water column concentrations: The pool ofTDN in the bottom water was dominated by DON (range14–48 mmol L21), making up ;60–95% of the TDN (Table1). NH concentrations were always ,2 mmol L21 and were+
4
lower in the autumn (Table 1). NO concentrations were23
highest (9–10 mmol L21) at the 1-m and 15-m sites in Aprilbut were significantly lower at the middle depths, reflecting
a stratified water column. In September, NO concentrations23
decreased with depth, from 7 to ;1 mmol L21. Concentra-tions of Si(OH)4 (1.7–22.7 mmol L21) were highest in thesurface water in April. PO concentrations were often be-32
4
low detection (,0.1 mmol L21).General patterns of sediment–water fluxes: Because there
were some statistically significant differences between sta-tions within a depth, hourly nutrient fluxes are shown sep-arately for each station (Fig. 4). The general trends were (1)Both light and dark fluxes of inorganic nitrogen (DIN) andsilica changed along the depth gradient, the most commonpattern being uptake at shallow (autotrophic) sites and effluxat deeper (heterotrophic) sites (exception NH in spring); (2)+
4
DIN flux was dominated by NH in spring and by NO in+ 2;4 3
autumn; (3) DON flux equaled or exceeded DIN flux (cf.Fig. 5); and (4) Significant light effects on flux rates wereobserved, although the pattern was not always consistent(Fig. 4).
Light/dark fluxes: Fluxes of NH , particularly in the dark,+4
were higher in spring (246 to 100 mmol m22 h21) than inautumn (213 to 23 mmol m22 h21) (Fig. 4). Moreover, inspring, NH fluxes deviated from the general trend for DIN+
4
flux along the depth gradient—NH was mainly released in+4
shallow water (with some exceptions in light), but was takenup at 15 m. In autumn, NH fluxes were lower but followed+
4
the general trend for DIN flux, with uptake at shallow sites

1101Nitrogen flux along a depth gradient
Fig. 6. Daily fluxes of (a) DIN and total (b) denitrification versus daily gross primary produc-tivity (GPP), plotted for both sampling periods, as well as separately for April and September.
and efflux at deeper sites. In April, effect of light showed atrend—there was either higher uptake or lower efflux ofNH in light (except at 15 m)—but L/D differences were,+
4
in most cases, not statistically significant (Fig. 4).During both seasons, light and dark fluxes of NO fol-2
3
lowed the pattern of net uptake at shallow depths and releaseat deeper sites. This pattern was particularly clear in Sep-tember, when NO fluxes were higher (292 to 70 mmol m222
3
h21) than in April (276 to 20 mmol m22 h21). Significantlight effects on NO fluxes were found at 1–5 m in depth2
3
(Fig. 4).Light and dark fluxes of DON (2192 and 322 mmol m22
h21, respectively) either equaled or exceeded DIN fluxes.Both efflux and uptake of DON occurred; however, they didso with no clear pattern along the depth gradient (Fig. 4).Interestingly, there were significant light effects on DONflux at deeper sites, although this L/D pattern was not alwaysconsistent.
The general pattern observed for NO was also evident23
for silica, particularly in April, when 65–110 mmol m22 h21
of Si(OH)4 were taken up at the 1-m site (Fig. 4). In Sep-tember, there was an overall release of Si(OH)4, with a ten-dency of increasing rates along the depth gradient. Signifi-cant L/D differences for Si(OH)4 were occasionallyobserved.
Sediment as a sink and source of dissolved N: Whereascomparing light and dark fluxes can tell us whether N fluxis regulated by MPB, comparing daily fluxes gives us a hintabout whether sediments function as sinks or sources of dis-solved N (Fig. 5). Somewhat deviating patterns were foundin April and September. In spring, daily DIN (20.7 to 1.1mmol m22 d21) and DON (21.7 to 1.3 mmol m22 d21) con-tributed equally to the TDN flux and showed the same depth
pattern—the sediments at 1 m and 15 m were sinks, whereasthe middle-depth sediments functioned as sources (Fig. 5).In autumn, the pattern for DIN was opposite that of DON—the shallowest sites were sinks of DIN (uptake ;2.3 mmolm22 d21 at 1 m) and sources of DON (1.4–1.7 mmol m22
d21). Deeper sediments were clearly sources of DIN (1.3–1.5 mmol m22 d21) in the autumn, whereas no or little DONwas released at these depths. Daily DIN flux showed a sig-nificant negative correlation with GPP (Fig. 6a), while nosignificant correlation was found between DON flux andGPP. In terms of TDN (Fig. 5), the sediment was a net sinkat 1 m and a source deeper down, with one exception (15m in spring).
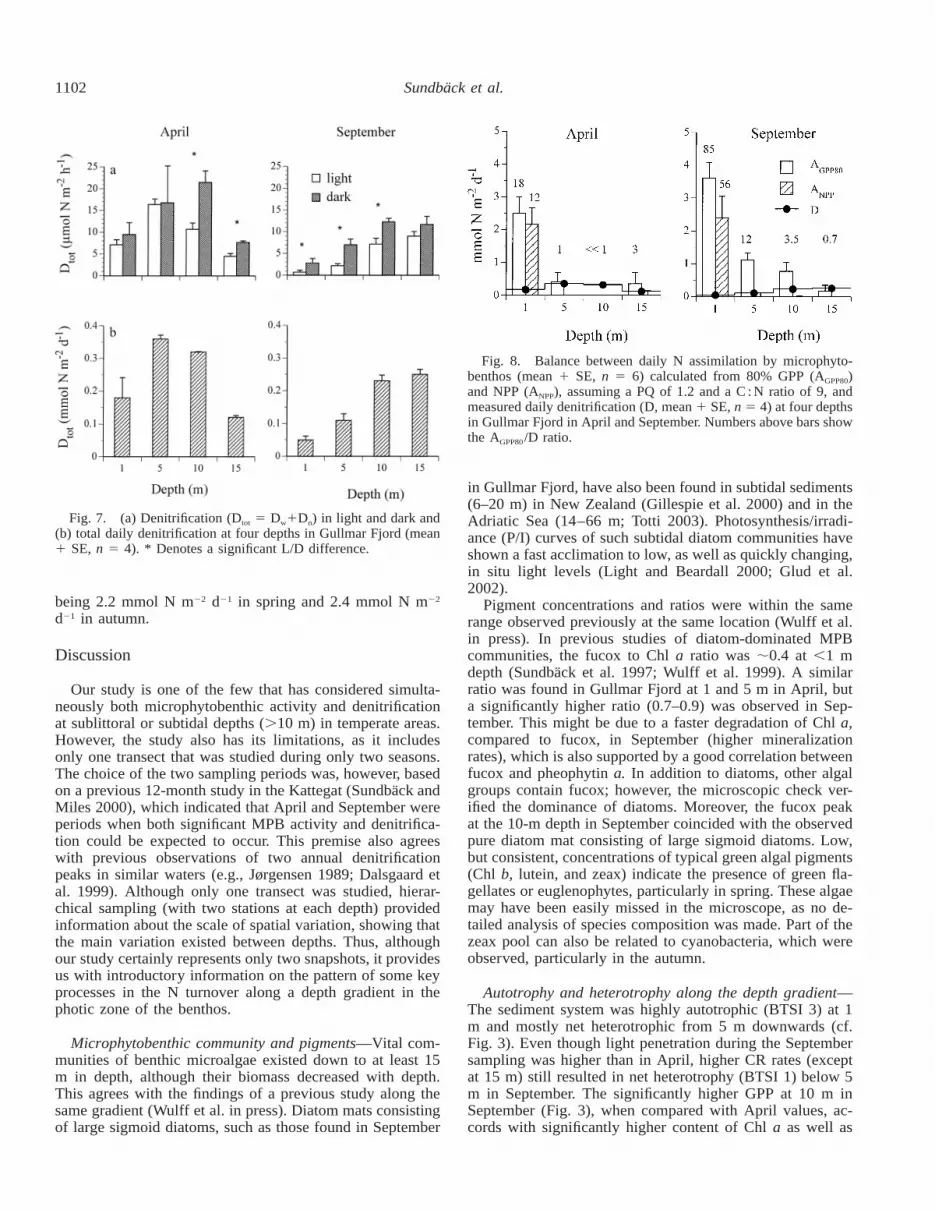
Denitrification—Dtot rates, in light and dark, ranged from0.4 to 23 mmol N m22 h21 (Fig. 7a). In April, rates weresignificantly higher at 5 and 10 m both in light and dark,while in September there was a steady significant increasewith depth. In September, rates were overall significantlylower in light, whereas in spring, significant light effectswere seen only at 10 and 15 m. Daily rates of Dtot (0.04–0.36 mmol N m22 d21) were higher in spring than in theautumn, except for the 15-m site (Fig. 7b). Daily Dtot showeda significant negative correlation with daily GPP (Fig. 6b).
Microphytobenthic assimilation of N—Calculated MPBassimilation based on 80% GPP (AGPP80) varied between 0.2and 2.5 mmol N m22 d21 in spring and between 0.2 and 3.6mmol N m22 d21 in autumn (Fig. 8). The highest values werefound for 1-m depths, rates being generally higher in Sep-tember than in April (no oxygen production was found inApril at 10 m). When adopting the more conservative ap-proach (i.e., basing calculations of N assimilation on NPP),a positive ANPP value was found only for the 1-m station,
1102 Sundback et al.
Fig. 7. (a) Denitrification (Dtot 5 Dw1Dn) in light and dark and(b) total daily denitrification at four depths in Gullmar Fjord (mean1 SE, n 5 4). * Denotes a significant L/D difference.
Fig. 8. Balance between daily N assimilation by microphyto-benthos (mean 1 SE, n 5 6) calculated from 80% GPP (AGPP80)and NPP (ANPP), assuming a PQ of 1.2 and a C : N ratio of 9, andmeasured daily denitrification (D, mean 1 SE, n 5 4) at four depthsin Gullmar Fjord in April and September. Numbers above bars showthe AGPP80/D ratio.
being 2.2 mmol N m22 d21 in spring and 2.4 mmol N m22
d21 in autumn.
Discussion
Our study is one of the few that has considered simulta-neously both microphytobenthic activity and denitrificationat sublittoral or subtidal depths (.10 m) in temperate areas.However, the study also has its limitations, as it includesonly one transect that was studied during only two seasons.The choice of the two sampling periods was, however, basedon a previous 12-month study in the Kattegat (Sundback andMiles 2000), which indicated that April and September wereperiods when both significant MPB activity and denitrifica-tion could be expected to occur. This premise also agreeswith previous observations of two annual denitrificationpeaks in similar waters (e.g., Jørgensen 1989; Dalsgaard etal. 1999). Although only one transect was studied, hierar-chical sampling (with two stations at each depth) providedinformation about the scale of spatial variation, showing thatthe main variation existed between depths. Thus, althoughour study certainly represents only two snapshots, it providesus with introductory information on the pattern of some keyprocesses in the N turnover along a depth gradient in thephotic zone of the benthos.
Microphytobenthic community and pigments—Vital com-munities of benthic microalgae existed down to at least 15m in depth, although their biomass decreased with depth.This agrees with the findings of a previous study along thesame gradient (Wulff et al. in press). Diatom mats consistingof large sigmoid diatoms, such as those found in September
in Gullmar Fjord, have also been found in subtidal sediments(6–20 m) in New Zealand (Gillespie et al. 2000) and in theAdriatic Sea (14–66 m; Totti 2003). Photosynthesis/irradi-ance (P/I) curves of such subtidal diatom communities haveshown a fast acclimation to low, as well as quickly changing,in situ light levels (Light and Beardall 2000; Glud et al.2002).
Pigment concentrations and ratios were within the samerange observed previously at the same location (Wulff et al.in press). In previous studies of diatom-dominated MPBcommunities, the fucox to Chl a ratio was ;0.4 at ,1 mdepth (Sundback et al. 1997; Wulff et al. 1999). A similarratio was found in Gullmar Fjord at 1 and 5 m in April, buta significantly higher ratio (0.7–0.9) was observed in Sep-tember. This might be due to a faster degradation of Chl a,compared to fucox, in September (higher mineralizationrates), which is also supported by a good correlation betweenfucox and pheophytin a. In addition to diatoms, other algalgroups contain fucox; however, the microscopic check ver-ified the dominance of diatoms. Moreover, the fucox peakat the 10-m depth in September coincided with the observedpure diatom mat consisting of large sigmoid diatoms. Low,but consistent, concentrations of typical green algal pigments(Chl b, lutein, and zeax) indicate the presence of green fla-gellates or euglenophytes, particularly in spring. These algaemay have been easily missed in the microscope, as no de-tailed analysis of species composition was made. Part of thezeax pool can also be related to cyanobacteria, which wereobserved, particularly in the autumn.
Autotrophy and heterotrophy along the depth gradient—The sediment system was highly autotrophic (BTSI 3) at 1m and mostly net heterotrophic from 5 m downwards (cf.Fig. 3). Even though light penetration during the Septembersampling was higher than in April, higher CR rates (exceptat 15 m) still resulted in net heterotrophy (BTSI 1) below 5m in September. The significantly higher GPP at 10 m inSeptember (Fig. 3), when compared with April values, ac-cords with significantly higher content of Chl a as well as

1103Nitrogen flux along a depth gradient
other pigments at 10 m in September (Fig. 2). Since we tookno samples between 1 and 5 m, we do not know at whichdepth the autotrophic–heterotrophic transition occurred. Pos-itive NPP at one of the two 5-m stations in September hintsthat the transition zone was closer to 5 m than 1 m, but itis reasonable to expect that the transition depth varies withseason. Most likely the transition point occurs more deeplyduring summer, with high insolation and a clear water col-umn. The fact that in situ 14C-uptake by MPB can be higherat 4 m in depth than at 0.5 m (Sundback et al. 1996) alsoindicates that sediments can be autotrophic at depths of .1m in similar waters. In the microtidal Neuse River estuary(North Carolina), the autotrophic–heterotrophic transitiondepth varied between 1 and 4 m (Rizzo et al. 1992).
How do our primary production values compare withthose from other sublittoral and subtidal areas? If we assumeNPP to be 80% of GPP and adopt a PQ of 1.2, we canroughly compare our values with those measured as 14C up-take. GPP80 rates for the 1- to 5-m sites (44–490 mg C m22
d21) are within the range of those reported for littoral andintertidal sediments in temperate areas (Underwood andKromkamp 1999). However, it is more interesting to com-pare our values for 10- and 15-m depths (GPP80 2–8 mmolO2 m22 d21 5 20–80 mg C m22 d21) with those for similardepths in other temperate areas. Our values agree with thosemeasured at 9–16 m in Laholm Bay, Kattegat, during Apriland September (;10–80 mg C m22 d21; Sundback and Jons-son 1988) and for sandy mid-Atlantic shelf sediments at 11–15 m in May and September (1–4 mmol O2 m22 d21; Laursenand Seitzinger 2002). On the other hand, our values are oftenone order of magnitude lower than those reported for north-east Greenland sediments at 10–20 m (367–172 mg C m22
d21) during the Arctic summer (Glud et al. 2002) and for aNew Zealand bay at 19–20 m in autumn (200 mg C m22
d21; Gillespie et al. 2000), as well as those measured forsandy shelf sediments in North Carolina and Georgia at 14–40 m (250–400 mg C m22 d21) (Cahoon and Cooke 1992;Jahnke et al. 2000). Whether these differences are due todifferences in microphytobenthic biomass (Chl a) we do notknow, since we used HPLC, while most of the cited studiesused spectrophotometry.
Pattern of DIN flux—The observed general pattern of DINflux—uptake at the shallow sites and efflux at the deepersites—supports the idea that autotrophic sediments tend tofunction as N sinks and heterotrophic sediments function asN sources (Eyre and Ferguson 2002; Sundback and Miles2002; Tyler et al. 2003). That the sediment at 1 m is a sinkfor DIN is in agreement with a number of studies from shal-low-water sediments (e.g., Cerco and Seitzinger 1997; Sund-back and Miles 2000; Anderson et al. 2003). The fact thatthe autotrophic state of the sediment is due to MPB photo-synthesis makes MPB a key controlling factor in N flux atthe sediment–water interface (see further discussion below).
The observed pattern of NO flux along the depth gra-23
dient reflects the changing balance between microphyto-benthic and bacterial influence on the N flux. In shallowwater, NO is taken up by MPB; with increasing depth,2
3
nitrification increases as a result of reduced competition be-tween MPB and nitrifiers (cf. Risgaard-Petersen 2003).
Through the concept of coupled denitrification, this is inconcordance with the trend of significantly increasing deni-trification with depth. The lower efflux (or even uptake) ofDIN (particularly of NH ) at 15 m in spring may reflect+
4
hydrodynamics, with less accumulation of organic matter,probably because of higher water flow at the deepest site.This interpretation is supported by the observation of a sand-ier sediment at 15 m (compared to other depths), with sig-nificantly lower C and N contents.
Although DIN fluxes in spring and autumn were withinthe same order of magnitude, there were some differencesbetween the two seasons. Significantly higher NO efflux at2
3
15 m in September reflects more favorable conditions fornitrification in autumn, although the reasons for this are notobvious. Another seasonal difference was that NH domi-+
4
nated the DIN flux in spring, while NO dominated in au-23
tumn. Higher NH dark efflux at 1–5 m in April may be due+4
to a combination of (1) stimulated NH production by de-+4
posited organic matter in spring (e.g., phytoplankton; Jensenet al. 1990) and (2) increased solute transport by shallow-dwelling bivalves. Regarding the first, higher C and N con-tents (top 5 mm) at 1–10 m in spring, when compared withcontent values in autumn, support this interpretation. Hydro-dynamic conditions may also have led to more deposition inthe inner, shallower part of the bay (cf. higher proportion ofsilt at 1 m; Table 1). Some of the highest DON effluxes inthe dark were also found in spring and can reflect hydrolysisof fresh organic material at the sediment surface (see DONflux). An alternative method of NH production could be via+
4
dissimilatory nitrate reduction to ammonium (DNRA). How-ever, as DNRA has been found to be typical of sulphide-richsediments (An and Gardner 2002), this pathway was lessprobable in our shallow-water sediment. As for the second,the presence of cockles (Cerastoderma) at 1 and 5 m mayhave also enhanced NH efflux (e.g., Swanberg 1991). Gen-+
4
erally, animal activity increases solute transport across thesediment–water interface (e.g., Christensen et al. 2000 andreferences therein). A further mechanism that can enhancesediment–water fluxes, particularly in permeable sandy sed-iments, is advection (Huettel et al. 2003). In our laboratoryincubations, with no oscillating boundary flows, this trans-port mechanism was probably not functioning. Because sed-iments at our study sites had rather high silt content (.17%)and well-developed diatom mats, we believe that these sed-iments were dominated by diffusion rather than advection.
The general magnitude of daily DIN fluxes (20.3 to 1.5mmol N m22 d21) at 10 and 15 m in Gullmar Fjord werewithin the range of those measured in July at 15 m in La-holm Bay (Kattegat) (Sundback et al. 1991). They also agreein magnitude with DIN fluxes (0.17–2.2 mmol m22 d21) mea-sured in situ in May and September at 11–15 m in sandymid-Atlantic shelf sediments (Laursen and Seitzinger 2002).
DON flux—Along with the growing awareness of the im-portance of DON in marine nutrient cycling (Bronk andWard 2000), fluxes of DON have started to gain more atten-tion in shallow-water ecosystems (Lomstein et al. 1998; Ty-ler et al. 2003). DON accounted for a large portion ($50%)of the daily TDN flux (Fig. 5), which agrees with previousobservations in shallow-water sediments (Lomstein et al.

1104 Sundback et al.
1998; Anderson et al. 2003). Large fluxes of DON are con-sidered to reflect hydrolysis of freshly produced organic ma-terial at the surface of the sediment (Blackburn and Black-burn 1993), a situation that can be very likely in the presenceof microalgal mats, such as those existing in Gullmar Fjord.
When compared with DIN, the pattern of DON flux alongthe depth gradient was erratic, displaying large variationeven within the same station. For instance, in contrast todaily DIN fluxes, no significant correlation was found be-tween daily GPP and DON fluxes. The lack of a distinctpattern in DON fluxes has been shown to be typical of shal-low coastal sediments (Tyler et al. 2003). However, occa-sional uptake of DON, particularly at the shallow depths inspring, together with some significant light effects, points toDON uptake by MPB. Dissolved free amino acids (DFAA),which can constitute up to 25% of the sediment DON (Guld-berg et al. 2002), are taken up by benthic microalgae (Ad-miraal and Peletier 1979; Nilsson and Sundback 1996), andthe addition of DFAA can significantly stimulate the growthof natural MPB communities (Linares unpubl. data). Thisemphasizes the potential role of DON as an alternative Nsource to sustain MPB growth under conditions with lowDIN concentrations (cf. Lomstein et al. 1998).
Denitrification—As predicted, denitrification increasedwith depth, most clearly during autumn. This pattern agreeswith that of increasing nitrification with depth, which shouldresult in stimulated Dn. Risgaard-Petersen’s (2003) analysisof 18 littoral and intertidal sites in European estuaries indeedshowed that Dn rates are lower in autotrophic sediments (me-dian value 4.2 mmol m22 h21) compared to heterotrophic(median value 20.3 mmol m22 h21) sediments. Our mean Dn
values (including light and dark rates) of 2.3 mmol m22 h21
for the autotrophic 1-m site and 9.3 mmol m22 h21 (notshown) for the deeper heterotrophic sites fit this pattern.Lower denitrification in autotrophic sediments is due toMPB-induced N limitation of nitrifying bacterial popula-tions. This makes MPB a major controlling factor in coupleddenitrification.
Despite increased denitrification with depth, rates re-mained rather low (Dtot , 20 mmol N m22 h21), being com-parable to previously measured rates (isotope-pairing) inshallow-water sediments of other microtidal northern waters(1.6–34 mmol N m22 h21; see table 3 in Sundback and Miles2000). The highest daily value in Gullmar Fjord (;0.4 mmolN m22 d21) roughly equals the mean value for a number ofDanish shallow fjords (;0.6 mmol N m22 d21, recalculatedfrom annual values given by Dalsgaard et al. (1999) andNielsen et al. (2001)). The denitrification rates at 10–15 min Gullmar Fjord were only ;20–30% of those measured insitu by the N2/Ar method (1.2–2 mmol m22 d21) in sandymid-Atlantic shelf sediments at 11–15 m in May and Sep-tember (Laursen and Seitzinger 2002), and they were withinthe lower range of rates for other temperate continentalshelves (0.1–3.2 mmol N m22 d21) measured by a variety oftechniques (see table 2 in Laursen and Seitzinger 2002). De-nitrification (particularly Dn) is positively correlated with O2
consumption (r 5 0.655, P , 0.01 in Gullmar Fjord), whichin turn links to the availability of mineralized NH (Laursen+
4
and Seitzinger 2002; Risgaard-Petersen 2003 and references
therein). The rather low D rates found at greater depths inGullmar Fjord, despite the increasing trend with increasingdepth, could, particularly in April, be due to limited miner-alization—hinted at by low CR values, little or no efflux ofNH , and low sediment N content. A significant linear, pos-+
4
itive correlation between Dtot and the C (r 5 0.567, P ,0.05) and N (r 5 0.560, P , 0.05) contents of the sedimentalso support this interpretation.
Influence of MPB on the pattern of N turnover—One ofour main hypotheses was that the regulating role of MPB onbenthic N turnover, typically found for littoral and intertidalzones, would decrease with depth. The distribution of Chl aand GPP along the depth gradient certainly supported thisassumption, as did the observed pattern of sediment–waterDIN flux. Although sediment uptake of DIN can reflect de-nitrification and bacterial immobilization of N (Anderson etal. 2003), we believe that the N uptake typical for the shal-lowest autotrophic site was mediated primarily by MPB.This conclusion is supported by a concomitant uptake ofsilica, which can only result from uptake by diatoms (cf.Sundback et al. 1991; Sigmon and Cahoon 1997). Despitethe fact that DIN flux changed direction below 5 m, wefound that MPB could still affect the N turnover at the deep-er sites as well. However, because we did not measure theactual N uptake by MPB, we rely on indirect evidence—light effects on fluxes, correlations between variables, andcalculations of the N demand of MPB.
Light effects on N flux pointed to the role of MPB as aregulator of sediment–water nutrient exchange, althoughthese differences were not as consistent, as was previouslynoted for littoral and intertidal zones (Henriksen et al. 1980;Reay et al. 1995; Sundback and Miles 2002 and referencestherein). Interestingly, there were more significant L/D dif-ferences for denitrification than for DIN fluxes, showing thatMPB can indeed suppress denitrification even at low lightlevels. Considering that insolation and water transparencyduring summer is usually higher, the influence of MPB canbe expected to be even greater during summer.
Further support for the regulating role of MPB can begained by plotting GPP against DIN fluxes and denitrifica-tion (Fig. 6). The lower number of n in the Dtot plot is dueto the fact that mean values have been used, as denitrificationand GPP could not be measured in the same cores. Whenvalues for both seasons were plotted together, a significantnegative correlation with GPP was found for both DIN andDtot (Fig. 6). Plotting the two seasons separately revealed nosignificant correlation in spring, but a better (more signifi-cant) correlation in autumn (Fig. 6). This discrepancy maybe related to the differences in water column stratificationbetween the two sampling periods, resulting in different lightand nutrient conditions.
Balance between MPB assimilation and denitrification—We hypothesized that there would be a point of transitionalong the depth gradient at which denitrification would over-ride MPB incorporation of N. Despite net heterotrophic con-ditions at depths $5 m, this did not happen, and at most,the two processes were roughly balanced (Fig. 8). The as-similation/denitrification ratio (A/D; Sundback and Miles

1105Nitrogen flux along a depth gradient
Fig. 9. Percentage of remineralized N consumed by MPB as-similation (calculated from 80% GPP) and denitrification at fourdepths in Gullmar Ford in April and September.
2000) for the different depths varied from 0.7 to 85 (onceno GPP was measured) (Fig. 8). Interestingly, in September,calculated MPB assimilation of N at 5–10 m was still 3.5–12 times greater than N removal by denitrification. However,basing MPB nitrogen demand on 80% of GPP may to someextent overestimate MPB assimilation, because DOC andDON release from the cells is not taken into account (Mid-delburg et al. 2000). If we instead apply ANPP, which on theother hand probably underestimates algal assimilation, A ex-ceeds D only at 1 m (A/D 12 and 56, Fig. 8). These ratiosagree well with those found for littoral sediments (also basedon ANPP) on the west coast of Sweden (Sundback and Miles2000, 2002), supporting the previous conclusion that, inshallow autotrophic sediments, the rate of MPB incorpora-tion of N far exceeds that of denitrification. This also fitsinto the model predicting that, at a low nitrogen load (usuallyimplying a clear water column), N turnover in shallow-watersediments is dominated by benthic microalgae (Christensen1998).
Another approach for comparing MPB assimilation withdenitrification and assessing their relative importance forbenthic N turnover is to calculate the proportion of the re-mineralized N that is used by these two processes. N-remin-eralization rates can be roughly estimated from benthic ox-ygen consumption and sediment C : N ratios (Trimmer et al.2000). Assuming a mean respiratory quotient (RQ) of 1.25(Glud et al. 2002), we calculate an N remineralization of0.6–5.4 (average 1.9) mmol N m22 d21. These values are;50% of those found for a shallow temperate lagoon (Vir-ginia) by using the 15N-technique (Anderson et al. 2003). InGullmar Fjord, MPB assimilated between 0 and 133% (av-erage 37% for both spring and autumn) of the mineralizedN along the depth gradient (excluding one extreme value of.300%) (Fig. 9). Dalsgaard (2003) found that 13–58% ofthe NH4
1 produced by mineralization was retained in thesediment in Limfjorden (Denmark), primarily because of as-similation by the MPB community. At 1 m in Gullmar Fjord,AGPP80 exceeded estimated N mineralization. Anderson et al.(2003) found similar results, and their interpretation was thatdark NH4
1 uptake by MPB may be an important sink formineralized N. In Gullmar Fjord, denitrification used ;30%
(range 7–56%) of the remineralized N during spring and;10% (range 2–21%) during autumn, the percentage in-creasing with depth (Fig. 9). The mean percentage (20%)falls within the range of those calculated for two shallowbays in the same area (10–20%; Sundback and Miles 2002)as well as those found in the Great Ouse estuary (8–26%;Nedwell and Trimmer 1996).
Thus, in terms of actual amounts, denitrification does notremove significantly more N in the deeper (heterotrophic)parts of the photic zone than at the littoral (autotrophic) sites.In terms of amounts relative to mineralized N, however, de-nitrification can remove 20–50% of this N at $10 m indepth. On the other hand, although N assimilation into MPBdecreases with depth, MPB can still incorporate a substantialproportion of the remineralized N at depths $10 m (in ourstudy 15–20%). Remaining, however, is the evaluation of theimportance of alternative N-removal processes in the shal-low coastal zone, such as anaerobic ammonium oxidation(Thamdrup and Dalsgaard 2002).
In summary, our study corroborates previous findings thatMPB dominates the nitrogen turnover in shallow-water (,5m) autotrophic sediments, particularly in clear waters with arelatively low N load (Christensen 1998; Sundback andMiles 2000). However, also at sublittoral depths (.5mdepth), MPB can exert a significant influence on sediment–water N fluxes and denitrification, provided that light reachesthe sediment surface. Fluxes of DIN (and silica) can be ex-pected to change along the depth gradient, with a generalpattern of sediment uptake at shallow autotrophic sites andincreasing efflux deeper down, along with increasing hetero-trophy of the sediment system. But local variation in lightpenetration, deposition of organic matter, and faunal activitycan change this general pattern. DON fluxes, which oftenequal or exceed DIN flux, may also be influenced by MPB,but this needs to be verified in further experiments. The im-portance of denitrification will increase with depth relativeto benthic algal N assimilation. This shift in balance is partlyrelated to increased nitrification with depth, which is a resultof decreased competition from MPB (cf. Risgaard-Petersen2003). Still, algal assimilation may equal or exceed denitri-fication even in the lower part of the photic zone, and de-nitrification does not necessarily remove substantially morenitrogen in the deeper parts of the photic zone than it doesin the littoral, autotrophic zone.
Although our study was made in a microtidal northernwater body, the findings should apply to any water body withclear enough water to allow MPB activity at sublittoral orsubtidal depths. On an ecosystem scale, the regulating roleof MPB should be particularly important in shallow (micro-tidal) areas, where a large portion of the benthos is withinthe photic zone (e.g., in the Adriatic Sea [Blackford 2002]and the Kattegat [Graneli and Sundback 1986; Sundback etal. 1991]). Similar conditions also exist on continental shelfsediments off macrotidal coasts (e.g., Jahnke et al. 2000) andon subtidal sediments in clear-water tropical areas. There-fore, when studying benthic nutrient turnover in such areas,the role of MPB must be taken into account. And this im-plies that in these studies, light versus dark measurementsmust be used, since not only the sediment–water nutrient

1106 Sundback et al.
fluxes, but also denitrification, can be influenced by MPBalso at subtidal and sublittoral depths.
References
ADMIRAAL, W., AND H. PELETIER. 1979. Influence of organic com-pounds and light limitation on the growth rate of estuarinebenthic diatoms. Br. Phycol. J. 14: 197–206.
AN, S., AND W. S. GARDNER. 2002. Dissimilatory nitrate reductionto ammonium (DNRA) as a nitrogen link, versus denitrificationas a sink in a shallow estuary (Laguna Madre/Baffin Bay, Tex-as). Mar. Ecol. Prog. Ser. 237: 41–50.
, AND S. B. JOYE. 2001. Enhancement of coupled nitrifica-tion-denitrification by benthic photosynthesis in shallow estu-arine sediments. Limnol. Oceanogr. 46: 62–74.
ANDERSON, I. C., K. J. MCGLATHERY, AND A. C. TYLER. 2003.Microbial mediation of ‘reactive’ nitrogen transformations ina temperate lagoon. Mar. Ecol. Prog. Ser. 246: 73–84.
BLACKBURN, T. H., AND N. D. BLACKBURN. 1993. Rates of micro-bial processes in sediment. Phil. Trans. R. Soc. London 344:49–58.
BLACKFORD, J. C. 2002. The influence of microphytobenthos on theNorthern Adriatic ecosystem: A modelling study. EstuarineCoastal Shelf Sci. 55: 109–123.
BRONK, D. A., AND B. B. WARD. 2000. Magnitude of dissolvedorganic nitrogen release relative to gross nitrogen uptake inmarine systems. Limnol. Oceanogr. 45: 1879–1883.
BROTAS, V., AND F. CATARINO. 1995. Microphytobenthos primaryproduction of Tagus estuary intertidal flats (Portugal). Neth. J.Aquat. Ecol. 29: 333–339.
CABRITA, M. T., AND V. BROTAS. 2000. Seasonal variation in de-nitrification and dissolved nitrogen fluxes in intertidal sedi-ments of the Tagus Estuary. Mar. Ecol. Prog. Ser. 202: 51–65.
CAHOON, L. B. 1999. The role of benthic microalgae in neritic eco-systems. Oceanogr. Mar. Biol. Ann. Rev. 37: 47–86.
, AND J. E. COOKE. 1992. Benthic microalgal production inOnslow Bay, North Carolina, USA. Mar. Ecol. Prog. Ser. 84:185–196.
CERCO, C. F., AND S. P. SEITZINGER. 1997. Measured and modeledeffects of benthic algae on eutrophication in Indian River–Re-hoboth Bay, Delaware. Estuaries 20: 231.
COWAN, J. L., AND W. R. BOYNTON. 1996. Sediment-water oxygenand nutrient exchanges along the longitudinal axis of Chesa-peake Bay: Seasonal patterns, controlling factors and ecologi-cal significance. Estuaries 19: 562–580.
CHRISTENSEN, P. B. [ED.]. 1998. The Danish marine environment:Has action improved its state. Danish Environmental ProtectionAgency, Report 62.
, A. VEDEL, AND KRISTENSEN, E. 2000. Carbon and nitrogenfluxes in sediment inhabited by suspension-feeding (N. diver-sicolor) and non-suspension-feeding (N. virens) polychaetes.Mar. Ecol. Prog. Ser. 192: 203–217.
DALSGAARD, T. 2003. Benthic primary poroduction and nutrient cy-cling in sediments with benthic microalgae and transient ac-cumulation of macroalgae. Limnol. Oceanogr. 48: 2138–2150.
, AND OTHERS. 2000. Protocol handbook for NICE—Nitro-gen Cycling in Estuaries: A project under the EU research pro-gramme: Marine Science and Technology (MAST III). Nation-al Environmental Research Institute.
, P. B. CHRISTENSEN, S. RYSGAARD, AND N. RISGAARD-PE-TERSEN. 1999. Nitrogen removal in Danish coastal waters: Im-portance and regulation, p. 101–118. In B. A. Lomstein [ed.],Marine Environments into the Millenium. Olsen & Olsen (inDanish).
DONG, L. F., D. C. O. THORNTON, D. B. NEDWELL, AND G. J. C.
UNDERWOOD. 2000. Denitrification in sediments of the RiverColne estuary, England. Mar. Ecol. Prog. Ser. 203: 109–122.
DUDLEY, B. J., A. M. E. GAHNSTROM, AND D. I. WALKER. 2001.The role of benthic vegetation as a sink for elevated inputs ofammonium and nitrate in a mesotrophic estuary. Mar Ecol.Prog. Ser. 219: 99–107.
EYRE, B. D., AND A. J. P. FERGUSON. 2002. Comparison of carbonproduction and decomposition, benthic nutrient fluxes and de-nitrification in seagrass, phytoplankton, benthic microalgae–and macroalgae-dominated warm-temperate Australian la-goons. Mar. Ecol. Prog. Ser. 229: 43–59.
GILLESPIE, P. A., P. D. MAXWELL, AND L. L. RHODES. 2000. Micro-phytobenthic communities of subtidal locations in New Zea-land: Taxonomy, biomass, production, and food-web implica-tions. N. Z. J. Mar. Freshw. Res. 34: 41–53.
GLUD, R. N., M. KUHL, F. WENZHOFER, AND S. RYSGAARD. 2002.Benthic diatoms of a high Arctic fjord (Young Sound, NEGreenland): Importance for ecosystem primary production.Mar. Ecol. Prog. Ser. 238: 15–29.
GRANELI, W., AND K. SUNDBACK. 1986. Can microbenthic photo-synthesis influence below-halocline oxygen conditions in theKattegat? Ophelia 26: 195–206.
GULDBERG, L. B., N. O. G. JøRGENSEN, M. MIDDELBOE, AND B.AA. LOMSTEIN. 2002. Utilization of marine sedimentary dis-solved organic nitrogen by native anaerobic bacteria. Limnol.Oceanogr. 47: 1712–1772.
HENRIKSEN, K., J. HANSEN, AND T. H. BLACKBURN. 1980. The in-fluence of benthic infauna on exchange rates of inorganic ni-trogen between sediment and water. Ophelia (suppl.) 1: 249–256.
HILLEBRAND, H., AND M. KAHLERT. 2002. Effect of grazing andwater column nutrient supply on biomass and nutrient contentof sediment microalgae. Aquat. Bot. 72: 143–159.
HUETTEL, M., H. ROY, E. PRECHT, AND S. EHRENHAUSS. 2003. Hy-drodynamical impact on biogeochemical processes in aquaticsediments. Hyrobiologia 494: 231–236.
JAHNKE, R. A., J. R. NELSON, R. L. MARINELLI, AND J. E. ECKMAN.2000. Benthic flux of biogenic elements of the SoutheasternUS continental shelf: Influence of pore water advective trans-port and benthic microalgae. Cont. Shelf Res. 20: 109–127.
JENSEN, M. H., E. LOMSTEIN, AND J. SøRENSEN. 1990. Benthic NH41
and NO32 flux following sedimentation of a spring phytoplank-
ton bloom in Aarhus Bight, Denmark. Mar. Ecol. Prog. Ser.61: 87–96.
JøRGENSEN, K. S. 1989. Annual pattern of denitrification and nitrateammonification in estuarine sediment. Appl. Environ. Micro-biol. 55: 1841–1847.
KIRK, J. T. O. 1994. Light and photosynthesis in aquatic ecosystems,2nd ed. Cambridge Univ. Press.
KRISTENSEN, E. 1993. Seasonal variations in benthic communitymetabolism and nitrogen dynamics in a shallow, organic-poorDanish lagoon. Estuarine Coastal Shelf Sci. 36: 565–586.
KUHL, M., C. LASSEN, AND B. B. JøRGENSEN. 1994. Light penetra-tion and light intensity in sandy marine sediments measuredwith irradiance and scalar irradiance fiber-optic microprobes.Mar. Ecol. Prog. Ser. 105: 139–148.
LAURSEN, A. E., AND S. P. SEITZINGER. 2002. The role of denitri-fication in nitrogen removal and carbon mineralization in Mid-Atlantic Bight sediments. Cont. Shelf Res. 22: 1397–1416.
LIGHT, B. R., AND J. BEARDALL. 2000. Photosynthetic characteris-tics of sub-tidal benthic microalgal populations from a tem-perate, shallow water marine ecosystem. Aquat. Bot. 70: 9–27.
LOMSTEIN, B. A., AND OTHERS. 1998. Budgets of sediment nitrogenand carbon cycling in the shallow water of Knebel Vig, Den-mark. Aquat. Microb. Ecol. 14: 69–80.
MCGLATHERY, K. J., I. C. ANDERSON, AND A. C. TYLER. 2001.
1107Nitrogen flux along a depth gradient
Magnitude and variability of benthic and pelagic metabolismin a temperate coastal lagoon. Mar. Ecol. Prog. Ser. 216: 1–15.
MIDDELBURG, J. J., C. BARRANGUET, H. T. S. BOSCHKER, P. M. J.HERMAN, T. MOENS, AND C. H. R. HEIP. 2000. The fate ofintertidal microphytobenthos carbon: An in situ 13C-labellingstudy. Limnol. Oceanogr. 45: 1224–1234.
NEDWELL, D. B., AND M. TRIMMER. 1996. Nitrogen fluxes throughthe upper estuary of the Great Ouse, England: The role of thebottom sediments. Mar. Ecol. Prog. Ser. 142: 273–286.
NELSON, J. M., J. E. ECKMAN, C. Y. ROBERTSON, R. L. MARINELLI,AND R. A. JAHNKE. 1999. Benthic microalgal biomass and ir-radiance at the sea floor on the continental shelf of the SouthAtlantic Bight: Spatial and temporal variability and storm ef-fects. Cont. Shelf Res. 19: 477–505.
NIELSEN, K., N. RISGAARD-PETERSEN, B. SøMOD, S. RYSGAARD,AND T. BERGø. 2001. Nitrogen and phosphorus retention esti-mated independently by flux measurements and dynamic mod-elling in the estuary, Randers Fjord, Denmark. Mar. Ecol. Prog.Ser. 219: 25–40.
NIELSEN, L. P. 1992. Denitrification in sediment determined fromnitrogen isotope pairing. FEMS Microbiol. Ecol. 86: 357–362.
NILSSON, C., AND K. SUNDBACK. 1996. Amino acid uptake by nat-ural benthic microalgal assemblages studied by microautora-diography. Hydrobiologia 332: 119–129.
OGILVIE, B., D. B. NEDWELL, R. M. HARRISON, A. ROBINSON, AND
A. SAGE. 1997. High nitrate, muddy estuaries as nitrogen sinks:The nitrogen budget of the River Colne estuary (United King-dom). Mar. Ecol. Prog. Ser. 150: 217–228.
REAY, W. G., D. L. GALLAGHER, AND G. M. J. SIMMONS. 1995.Sediment-water column oxygen and nutrient fluxes in near-shore environments of the lower Delmarva Peninsula, USA.Mar. Ecol. Prog. Ser. 118: 215–227.
RISGAARD-PETERSEN, N. 2003. Coupled nitrification-denitrificationin autotrophic and heterotrophic estuarine sediments: On theinfluence of benthic microalgae. Limnol. Oceanogr. 48: 93–105.
, S. RYSGAARD, L. P. NIELSEN, AND N. P. REVSBECH. 1994.Diurnal variation of denitrification and nitrification in sedi-ments colonized by benthic microphytes. Limnol. Oceanogr.39: 573–579.
RIZZO, W. M., S. K. DAILEY, G. J. LACKEY, R. R. CHRISTIAN, B.E. BERRY, AND R. L. WETZEL. 1996. A metabolism-based tro-phic index for comparing the ecological values of shallow-water sediment habitats. Estuaries 19: 247–256.
, G. J. LACKEY, AND R. R. CHRISTIAN. 1992. Significanceof euphotic, subtidal sediments to oxygen and nutrient cyclingin a temperate estuary. Mar. Ecol. Prog. Ser. 86: 51–61.
RYSGAARD, S., P. B. CHRISTENSEN, AND L. P. NIELSEN. 1995. Sea-sonal variation in nitrification and denitrification in estuarinesediment colonized by benthic microalgae and bioturbating in-fauna. Mar. Ecol. Prog. Ser. 126: 111–121.
SIGMON, D. E., AND L. B. CAHOON. 1997. Comparative effects ofbenthic microalgae and phytoplankton on dissolved silica flux-es. Aquat. Microb. Ecol. 13: 275–284.
SUNDBACK, K., AND OTHERS. 2003. Importance of benthic nutrientregeneration during initiation of macroalgal blooms in shallowbays. Mar. Ecol. Prog. Ser. 246: 115–126.
, V. ENOKSSON, W. GRANELI, AND K. PETTERSSON. 1991.Influence of sublittoral microphytobenthos on the oxygen andnutrient flux between sediment and water: A laboratory con-tinuous-flow study. Mar. Ecol. Prog. Ser. 74: 263–279.
, AND B. JONSSON. 1988. Microphytobenthic productivity
and biomass in sublittoral sediments of a stratified bay, south-eastern Kattegat. J. Exp. Mar. Biol. Ecol. 122: 63–81.
, AND A. MILES. 2000. Balance between denitrification andmicroalgal incorporation of nitrogen in microtidal sediments,NE Kattegat. Aquat. Microb. Ecol. 22: 291–300.
, AND . 2002. Role of microphytobenthos and deni-trification for nutrient turnover in embayments with floatingmacroalgal mats: A spring situation. Aquat. Mar. Ecol. 30: 91–101.
, P. NILSSON, C. NILSSON, AND B. JONSSON. 1996. Balancebetween autotrophic and heterotrophic components and pro-cesses in microbenthic communities of sandy sediments: Afield study. Estuarine Coastal Shelf Sci. 43: 689–706.
, S. ODMARK, A. WULFF, AND C. NILSSON. 1997. Effects ofUVB radiation on a marine benthic diatom mat. Mar. Biol. 128:171–179.
SWANBERG, I. L. 1991. The influence of the filter-feeding bivalveCerastoderma edule L. on microphytobenthos: A laboratorystudy. J. Exp. Mar. Biol. Ecol. 151: 93–111.
THAMDRUP, B., AND T. DALSGAARD. 2002. Production of N2 throughanaerobic ammonium oxidation coupled to nitrate reduction inmarine sediments. Appl. Environ. Microbiol. 68: 1312–1318.
TOTTI, C. 2003. Influence of the plume of the river Po on the dis-tribution of subtidal microphytobenthos in the Northern Adri-atic. Bot. Mar. 46: 161–178.
TRIMMER, M., D. B. NEDWELL, D. B. SIVYER, AND S. J. MALCOLM.2000. Seasonal organic mineralization and denitrification in in-tertidal sediments and their relationship to the abundance ofEnteromorpha sp. and Ulva sp. Mar. Ecol. Prog. Ser. 203: 67–80.
TYLER, A. C., K. MCGLATHERY, AND I. C. ANDERSON. 2003. Ben-thic algae control sediment-water column fluxes of organic andinorganic nitrogen compounds in a temperate lagoon. Limnol.Oceanogr. 48: 2125–2150.
UNDERWOOD, A. J. 1997. Experiments in ecology. Their logicaldesign and interpretation using analysis of variance. CambridgeUniv. Press.
UNDERWOOD, G. J. C., AND J. KROMKAMP. 1999. Primary produc-tion by phytoplankton and microphytobenthos in estuaries.Adv. Ecol. Res. 29: 93–153.
VALDERRAMA, J. C. 1981. The simultaneous analysis of total nitro-gen and total phosphorus in natural water. Mar. Chem. 10:109–122.
VIAROLI, P., AND R. R. CHRISTIAN. 2004. Description of trophicstatus, hyperautotrophy and dystrophy of a coastal lagoonthrough a potential oxygen production and consumption in-dex—TOSI: Trophic Oxygen Status Index. Ecol. Indicators. 3:237–250.
WELKER, C., E. SDRIGOTTI, S. COVELLI, AND J. FAGANELI. 2002.Microphytobenthos in the Gulf of Trieste (Northern AdriaticSea): Relationship with labile sedimentary organic matter andnutrients. Estuarine Coastal Shelf Sci. 55: 259–273.
WRIGHT, S. W., AND S. W. JEFFREY. 1997. High-resolution HPLCsystem for chlorophylls and carotenoids of marine phytoplank-ton, p. 327–360. In S. W. Jeffrey, R. F. C. Mantoura, and S.W. Wright [eds.], Phytoplankton pigments in oceanography.UNESCO.
WULFF, A., C. NILSSON, K. SUNDBACK, S.-A. WANGBERG, AND S.ODMARK. 1999. UV radiation effects on microbenthos—a fourmonth field experiment. Aquat. Microb. Ecol. 19: 269–278.
, S. VILBASTE, AND J. TRUU. In press. Depth distribution ofbenthic diatoms and pigments in a microtidal fjord. Hydro-biologia.
Received: 10 June 2003Accepted: 13 January 2004
Amended: 8 March 2004