benefits and cost implications from integrating small flexible nuclear reactors with off-shore wind...
TRANSCRIPT
Energy Policy 46 (2012) 558–573
Contents lists available at SciVerse ScienceDirect
Energy Policy
0301-42
http://d
n Corr
E-m
Arturs.P
ioulia.p
isabella
journal homepage: www.elsevier.com/locate/enpol
Benefits and cost implications from integrating small flexible nuclearreactors with off-shore wind farms in a virtual power plant
David Shropshire n, Arturs Purvins, Ioulia Papaioannou, Isabella Maschio
European Commission, Joint Research Centre, Institute for Energy and Transport, PO Box 2, 1755 ZG Petten, The Netherlands
a r t i c l e i n f o
Article history:
Received 19 August 2011
Accepted 19 April 2012Available online 8 May 2012
Keywords:
Small medium reactor
Off-shore wind farm
Virtual power plant
15/$ - see front matter & 2012 Elsevier Ltd. A
x.doi.org/10.1016/j.enpol.2012.04.037
esponding author. Tel.: þ31 224 565305.
ail addresses: [email protected] (D. Sh
[email protected] (A. Purvins),
[email protected] (I. Papaioannou),
[email protected] (I. Maschio).
a b s t r a c t
Nuclear power currently supports the goals of the European Union low-carbon society by being a
dependable source of energy, while emitting no CO2. In the future, more flexible nuclear systems could
enable wind to achieve a 50% share of the renewable contribution to the energy mix. Small and
medium-sized reactors (SMRs) could provide firming power generation to back-up the supply from
renewable resources and follow-load. This study involves the hypothetical combination of an off-shore
wind farm and a SMR, operated together as a virtual power plant (VPP). Results using wind data from
the North Sea indicate that the combination results in 80% less wind power variation to the grid,
effectively creating a virtual baseload power plant. This gain comes at the loss of 30% SMR capacity
utilization. The research identified that the reduction of 1000 MW off-shore wind farm variability was
best achieved with 700 MW SMRs using 100 MW modules. In demand-following mode the VPP could
maneuver output to improve synchronization with demand by 60–70% over a wind-only system. Power
variability was indifferent to the SMR module size. The VPP could not reduce 100% of the wind
variation, as additional balancing measures (e.g., smart grid, storage, and hybrid-nuclear systems) are
still needed.
& 2012 Elsevier Ltd. All rights reserved.
1. Introduction
In Holland, the windmill provided a critical technology forremoval of the waters of the North Sea from the polders toreclaim the land now used in agriculture, dairy, and production ofthe world famous tulips. Fleets of up to 50 drainage mills wereput in service to pump the polder water by stages to riverchannels. By 1850 there were 9000 windmills in Holland thatprovided a dependable means for emptying the polders, as ebbs inthe wind could be made up by the flows when the wind wasblowing. However in the second half of the 19th century wind-mills began to be replaced with steam engines which couldperform the work more quickly and on a larger scale. In the yearsfollowing World War I the electrification of the rural districtsultimately led to the use of electric pumps. Nowadays, only 1200windmills survive in the Netherlands, primarily for historicalpreservation.
ll rights reserved.
ropshire),
Today, wind power is an important component of the renewableenergy portfolio that supports the European Commission (EC) road-map for a competitive low carbon economy in 2050 (EC, 2011a).However, for wind to meet the stringent conditions for reliability andgrid safety, it is increasingly becoming dependent on a new smartgrid, energy storage, and flexible low-carbon energy sources. Thisdependency becomes particularly acute when variable renewableenergy systems (RES) exceed �20% of the total power mix. Someresearchers suggests that even at levels greater than 10%, a moreflexible dispatch of different types of power plants will be neededthan what exists today (Greenpeace, 2008).
Electricity power generation forecasts from 2011 to 2050indicate that production from RES could increase from 15% to
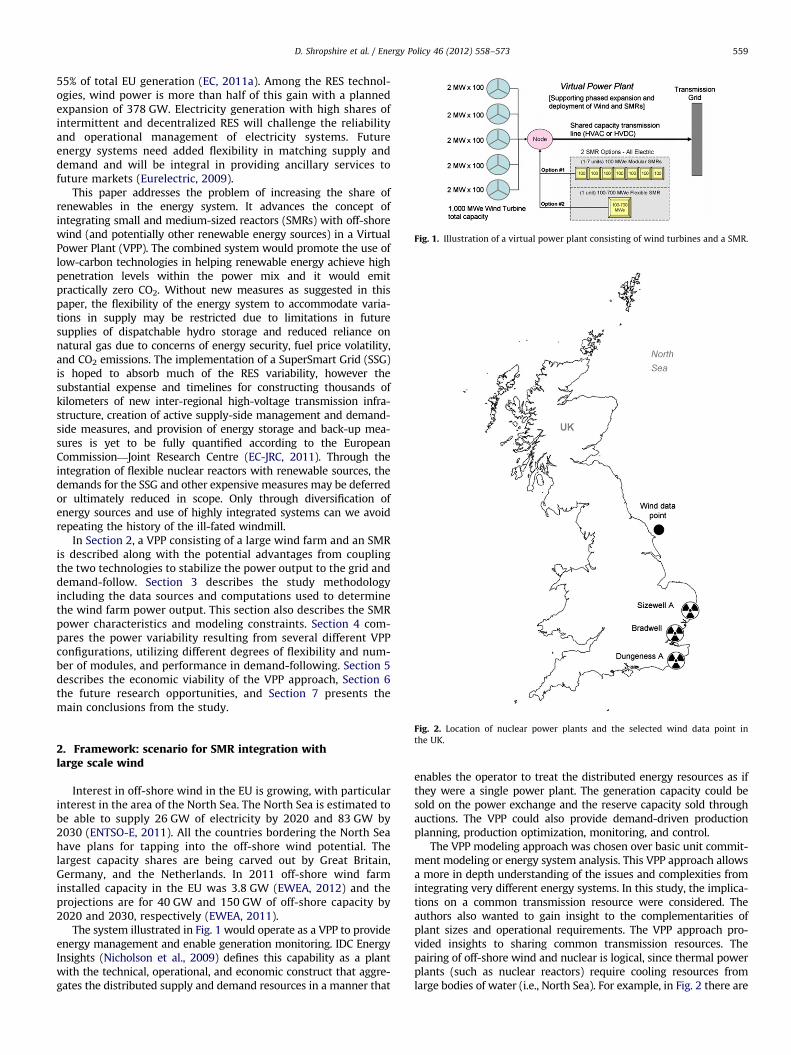
Fig. 1. Illustration of a virtual power plant consisting of wind turbines and a SMR.
D. Shropshire et al. / Energy Policy 46 (2012) 558–573 559
55% of total EU generation (EC, 2011a). Among the RES technol-ogies, wind power is more than half of this gain with a plannedexpansion of 378 GW. Electricity generation with high shares ofintermittent and decentralized RES will challenge the reliabilityand operational management of electricity systems. Futureenergy systems need added flexibility in matching supply anddemand and will be integral in providing ancillary services tofuture markets (Eurelectric, 2009).
This paper addresses the problem of increasing the share ofrenewables in the energy system. It advances the concept ofintegrating small and medium-sized reactors (SMRs) with off-shorewind (and potentially other renewable energy sources) in a VirtualPower Plant (VPP). The combined system would promote the use oflow-carbon technologies in helping renewable energy achieve highpenetration levels within the power mix and it would emitpractically zero CO2. Without new measures as suggested in thispaper, the flexibility of the energy system to accommodate varia-tions in supply may be restricted due to limitations in futuresupplies of dispatchable hydro storage and reduced reliance onnatural gas due to concerns of energy security, fuel price volatility,and CO2 emissions. The implementation of a SuperSmart Grid (SSG)is hoped to absorb much of the RES variability, however thesubstantial expense and timelines for constructing thousands ofkilometers of new inter-regional high-voltage transmission infra-structure, creation of active supply-side management and demand-side measures, and provision of energy storage and back-up mea-sures is yet to be fully quantified according to the EuropeanCommission—Joint Research Centre (EC-JRC, 2011). Through theintegration of flexible nuclear reactors with renewable sources, thedemands for the SSG and other expensive measures may be deferredor ultimately reduced in scope. Only through diversification ofenergy sources and use of highly integrated systems can we avoidrepeating the history of the ill-fated windmill.
In Section 2, a VPP consisting of a large wind farm and an SMRis described along with the potential advantages from couplingthe two technologies to stabilize the power output to the grid anddemand-follow. Section 3 describes the study methodologyincluding the data sources and computations used to determinethe wind farm power output. This section also describes the SMRpower characteristics and modeling constraints. Section 4 com-pares the power variability resulting from several different VPPconfigurations, utilizing different degrees of flexibility and num-ber of modules, and performance in demand-following. Section 5describes the economic viability of the VPP approach, Section 6the future research opportunities, and Section 7 presents themain conclusions from the study.
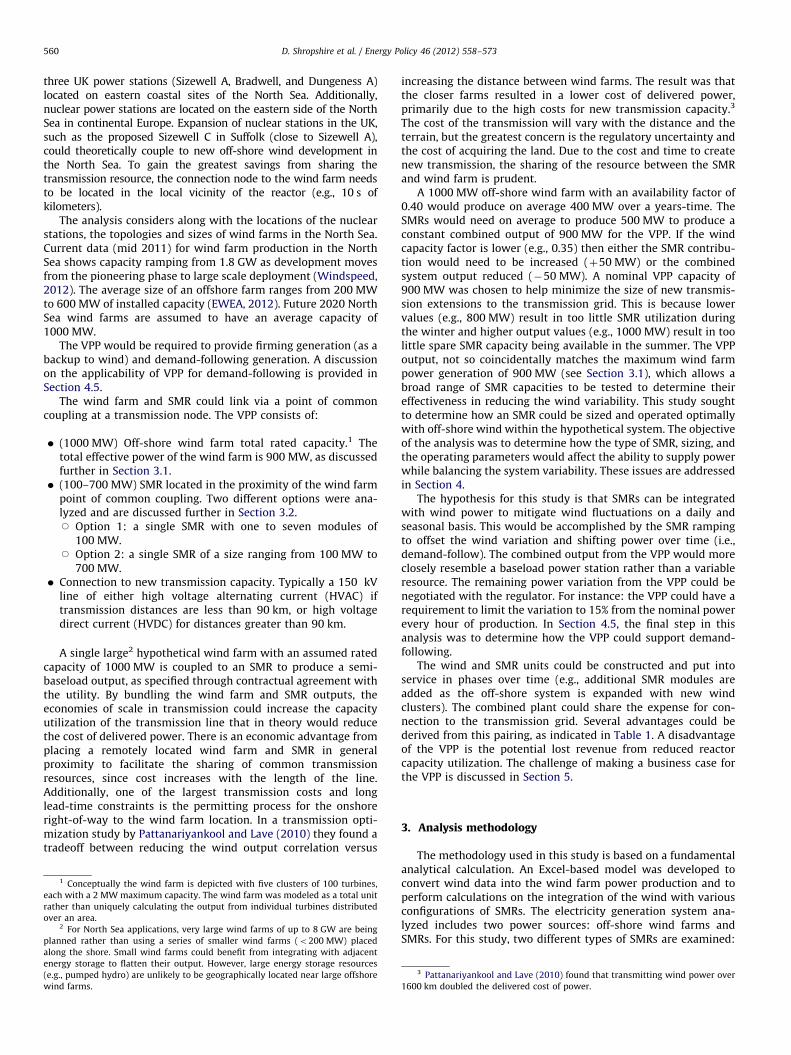
Fig. 2. Location of nuclear power plants and the selected wind data point in
the UK.
2. Framework: scenario for SMR integration withlarge scale windInterest in off-shore wind in the EU is growing, with particularinterest in the area of the North Sea. The North Sea is estimated tobe able to supply 26 GW of electricity by 2020 and 83 GW by2030 (ENTSO-E, 2011). All the countries bordering the North Seahave plans for tapping into the off-shore wind potential. Thelargest capacity shares are being carved out by Great Britain,Germany, and the Netherlands. In 2011 off-shore wind farminstalled capacity in the EU was 3.8 GW (EWEA, 2012) and theprojections are for 40 GW and 150 GW of off-shore capacity by2020 and 2030, respectively (EWEA, 2011).
The system illustrated in Fig. 1 would operate as a VPP to provideenergy management and enable generation monitoring. IDC EnergyInsights (Nicholson et al., 2009) defines this capability as a plantwith the technical, operational, and economic construct that aggre-gates the distributed supply and demand resources in a manner that
enables the operator to treat the distributed energy resources as ifthey were a single power plant. The generation capacity could besold on the power exchange and the reserve capacity sold throughauctions. The VPP could also provide demand-driven productionplanning, production optimization, monitoring, and control.
The VPP modeling approach was chosen over basic unit commit-ment modeling or energy system analysis. This VPP approach allowsa more in depth understanding of the issues and complexities fromintegrating very different energy systems. In this study, the implica-tions on a common transmission resource were considered. Theauthors also wanted to gain insight to the complementarities ofplant sizes and operational requirements. The VPP approach pro-vided insights to sharing common transmission resources. Thepairing of off-shore wind and nuclear is logical, since thermal powerplants (such as nuclear reactors) require cooling resources fromlarge bodies of water (i.e., North Sea). For example, in Fig. 2 there are
D. Shropshire et al. / Energy Policy 46 (2012) 558–573560
three UK power stations (Sizewell A, Bradwell, and Dungeness A)located on eastern coastal sites of the North Sea. Additionally,nuclear power stations are located on the eastern side of the NorthSea in continental Europe. Expansion of nuclear stations in the UK,such as the proposed Sizewell C in Suffolk (close to Sizewell A),could theoretically couple to new off-shore wind development inthe North Sea. To gain the greatest savings from sharing thetransmission resource, the connection node to the wind farm needsto be located in the local vicinity of the reactor (e.g., 10 s ofkilometers).
The analysis considers along with the locations of the nuclearstations, the topologies and sizes of wind farms in the North Sea.Current data (mid 2011) for wind farm production in the NorthSea shows capacity ramping from 1.8 GW as development movesfrom the pioneering phase to large scale deployment (Windspeed,2012). The average size of an offshore farm ranges from 200 MWto 600 MW of installed capacity (EWEA, 2012). Future 2020 NorthSea wind farms are assumed to have an average capacity of1000 MW.
The VPP would be required to provide firming generation (as abackup to wind) and demand-following generation. A discussionon the applicability of VPP for demand-following is provided inSection 4.5.
The wind farm and SMR could link via a point of commoncoupling at a transmission node. The VPP consists of:
�
eac
rath
ove
pla
alon
ene
(e.g
win
(1000 MW) Off-shore wind farm total rated capacity.1 Thetotal effective power of the wind farm is 900 MW, as discussedfurther in Section 3.1.
� (100–700 MW) SMR located in the proximity of the wind farmpoint of common coupling. Two different options were ana-lyzed and are discussed further in Section 3.2.J Option 1: a single SMR with one to seven modules of
100 MW.J Option 2: a single SMR of a size ranging from 100 MW to
700 MW.
1 C
h w
er t
r an2 Fo
nned
g t
rgy
., pu
d fa
�
Connection to new transmission capacity. Typically a 150 kVline of either high voltage alternating current (HVAC) iftransmission distances are less than 90 km, or high voltagedirect current (HVDC) for distances greater than 90 km.A single large2 hypothetical wind farm with an assumed ratedcapacity of 1000 MW is coupled to an SMR to produce a semi-baseload output, as specified through contractual agreement withthe utility. By bundling the wind farm and SMR outputs, theeconomies of scale in transmission could increase the capacityutilization of the transmission line that in theory would reducethe cost of delivered power. There is an economic advantage fromplacing a remotely located wind farm and SMR in generalproximity to facilitate the sharing of common transmissionresources, since cost increases with the length of the line.Additionally, one of the largest transmission costs and longlead-time constraints is the permitting process for the onshoreright-of-way to the wind farm location. In a transmission opti-mization study by Pattanariyankool and Lave (2010) they found atradeoff between reducing the wind output correlation versus
onceptually the wind farm is depicted with five clusters of 100 turbines,
ith a 2 MW maximum capacity. The wind farm was modeled as a total unit
han uniquely calculating the output from individual turbines distributed
area.
r North Sea applications, very large wind farms of up to 8 GW are being
rather than using a series of smaller wind farms (o200 MW) placed
he shore. Small wind farms could benefit from integrating with adjacent
storage to flatten their output. However, large energy storage resources
mped hydro) are unlikely to be geographically located near large offshore
rms.
increasing the distance between wind farms. The result was thatthe closer farms resulted in a lower cost of delivered power,primarily due to the high costs for new transmission capacity.3
The cost of the transmission will vary with the distance and theterrain, but the greatest concern is the regulatory uncertainty andthe cost of acquiring the land. Due to the cost and time to createnew transmission, the sharing of the resource between the SMRand wind farm is prudent.
A 1000 MW off-shore wind farm with an availability factor of0.40 would produce on average 400 MW over a years-time. TheSMRs would need on average to produce 500 MW to produce aconstant combined output of 900 MW for the VPP. If the windcapacity factor is lower (e.g., 0.35) then either the SMR contribu-tion would need to be increased (þ50 MW) or the combinedsystem output reduced (�50 MW). A nominal VPP capacity of900 MW was chosen to help minimize the size of new transmis-sion extensions to the transmission grid. This is because lowervalues (e.g., 800 MW) result in too little SMR utilization duringthe winter and higher output values (e.g., 1000 MW) result in toolittle spare SMR capacity being available in the summer. The VPPoutput, not so coincidentally matches the maximum wind farmpower generation of 900 MW (see Section 3.1), which allows abroad range of SMR capacities to be tested to determine theireffectiveness in reducing the wind variability. This study soughtto determine how an SMR could be sized and operated optimallywith off-shore wind within the hypothetical system. The objectiveof the analysis was to determine how the type of SMR, sizing, andthe operating parameters would affect the ability to supply powerwhile balancing the system variability. These issues are addressedin Section 4.
The hypothesis for this study is that SMRs can be integratedwith wind power to mitigate wind fluctuations on a daily andseasonal basis. This would be accomplished by the SMR rampingto offset the wind variation and shifting power over time (i.e.,demand-follow). The combined output from the VPP would moreclosely resemble a baseload power station rather than a variableresource. The remaining power variation from the VPP could benegotiated with the regulator. For instance: the VPP could have arequirement to limit the variation to 15% from the nominal powerevery hour of production. In Section 4.5, the final step in thisanalysis was to determine how the VPP could support demand-following.
The wind and SMR units could be constructed and put intoservice in phases over time (e.g., additional SMR modules areadded as the off-shore system is expanded with new windclusters). The combined plant could share the expense for con-nection to the transmission grid. Several advantages could bederived from this pairing, as indicated in Table 1. A disadvantageof the VPP is the potential lost revenue from reduced reactorcapacity utilization. The challenge of making a business case forthe VPP is discussed in Section 5.
3. Analysis methodology
The methodology used in this study is based on a fundamentalanalytical calculation. An Excel-based model was developed toconvert wind data into the wind farm power production and toperform calculations on the integration of the wind with variousconfigurations of SMRs. The electricity generation system ana-lyzed includes two power sources: off-shore wind farms andSMRs. For this study, two different types of SMRs are examined:
3 Pattanariyankool and Lave (2010) found that transmitting wind power over
1600 km doubled the delivered cost of power.
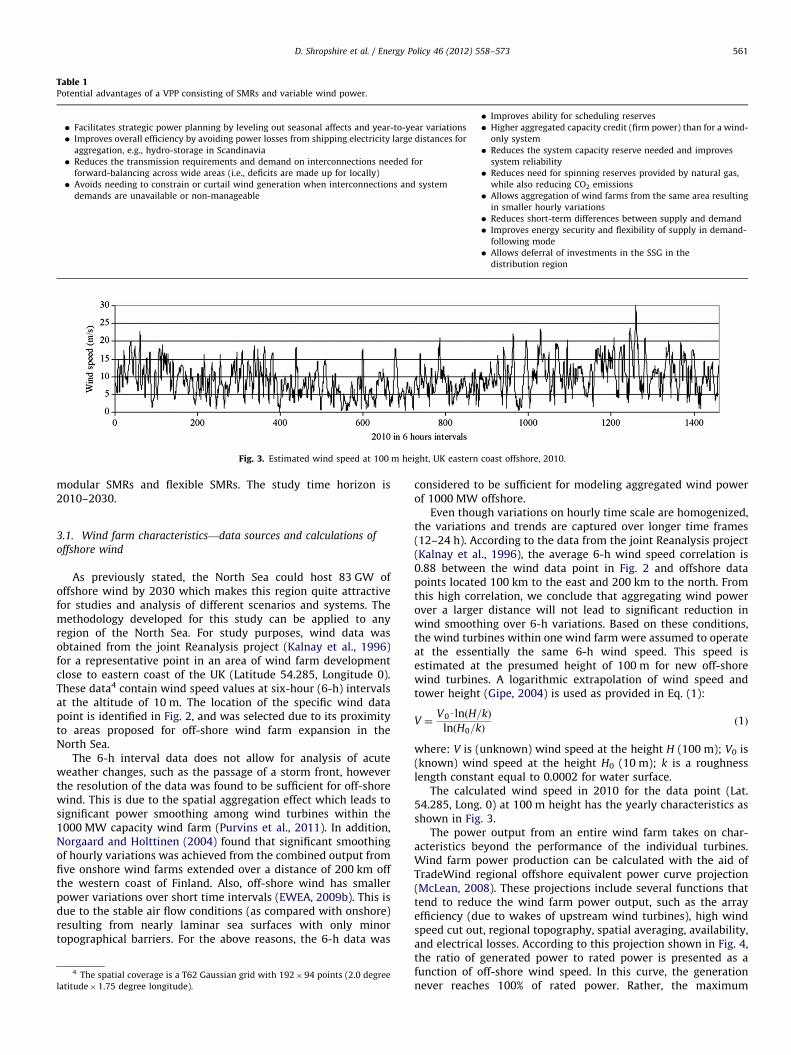
Table 1Potential advantages of a VPP consisting of SMRs and variable wind power.
� Facilitates strategic power planning by leveling out seasonal affects and year-to-year variations
� Improves overall efficiency by avoiding power losses from shipping electricity large distances for
aggregation, e.g., hydro-storage in Scandinavia
� Reduces the transmission requirements and demand on interconnections needed for
forward-balancing across wide areas (i.e., deficits are made up for locally)
� Avoids needing to constrain or curtail wind generation when interconnections and system
demands are unavailable or non-manageable
� Improves ability for scheduling reserves
� Higher aggregated capacity credit (firm power) than for a wind-
only system
� Reduces the system capacity reserve needed and improves
system reliability
� Reduces need for spinning reserves provided by natural gas,
while also reducing CO2 emissions
� Allows aggregation of wind farms from the same area resulting
in smaller hourly variations
� Reduces short-term differences between supply and demand
� Improves energy security and flexibility of supply in demand-
following mode
� Allows deferral of investments in the SSG in the
distribution region
Fig. 3. Estimated wind speed at 100 m height, UK eastern coast offshore, 2010.
D. Shropshire et al. / Energy Policy 46 (2012) 558–573 561
modular SMRs and flexible SMRs. The study time horizon is2010–2030.
3.1. Wind farm characteristics—data sources and calculations of
offshore wind
As previously stated, the North Sea could host 83 GW ofoffshore wind by 2030 which makes this region quite attractivefor studies and analysis of different scenarios and systems. Themethodology developed for this study can be applied to anyregion of the North Sea. For study purposes, wind data wasobtained from the joint Reanalysis project (Kalnay et al., 1996)for a representative point in an area of wind farm developmentclose to eastern coast of the UK (Latitude 54.285, Longitude 0).These data4 contain wind speed values at six-hour (6-h) intervalsat the altitude of 10 m. The location of the specific wind datapoint is identified in Fig. 2, and was selected due to its proximityto areas proposed for off-shore wind farm expansion in theNorth Sea.
The 6-h interval data does not allow for analysis of acuteweather changes, such as the passage of a storm front, howeverthe resolution of the data was found to be sufficient for off-shorewind. This is due to the spatial aggregation effect which leads tosignificant power smoothing among wind turbines within the1000 MW capacity wind farm (Purvins et al., 2011). In addition,Norgaard and Holttinen (2004) found that significant smoothingof hourly variations was achieved from the combined output fromfive onshore wind farms extended over a distance of 200 km offthe western coast of Finland. Also, off-shore wind has smallerpower variations over short time intervals (EWEA, 2009b). This isdue to the stable air flow conditions (as compared with onshore)resulting from nearly laminar sea surfaces with only minortopographical barriers. For the above reasons, the 6-h data was
4 The spatial coverage is a T62 Gaussian grid with 192�94 points (2.0 degree
latitude�1.75 degree longitude).
considered to be sufficient for modeling aggregated wind powerof 1000 MW offshore.
Even though variations on hourly time scale are homogenized,the variations and trends are captured over longer time frames(12–24 h). According to the data from the joint Reanalysis project(Kalnay et al., 1996), the average 6-h wind speed correlation is0.88 between the wind data point in Fig. 2 and offshore datapoints located 100 km to the east and 200 km to the north. Fromthis high correlation, we conclude that aggregating wind powerover a larger distance will not lead to significant reduction inwind smoothing over 6-h variations. Based on these conditions,the wind turbines within one wind farm were assumed to operateat the essentially the same 6-h wind speed. This speed isestimated at the presumed height of 100 m for new off-shorewind turbines. A logarithmic extrapolation of wind speed andtower height (Gipe, 2004) is used as provided in Eq. (1):
V ¼V0UlnðH=kÞ
lnðH0=kÞð1Þ
where: V is (unknown) wind speed at the height H (100 m); V0 is(known) wind speed at the height H0 (10 m); k is a roughnesslength constant equal to 0.0002 for water surface.
The calculated wind speed in 2010 for the data point (Lat.54.285, Long. 0) at 100 m height has the yearly characteristics asshown in Fig. 3.
The power output from an entire wind farm takes on char-acteristics beyond the performance of the individual turbines.Wind farm power production can be calculated with the aid ofTradeWind regional offshore equivalent power curve projection(McLean, 2008). These projections include several functions thattend to reduce the wind farm power output, such as the arrayefficiency (due to wakes of upstream wind turbines), high windspeed cut out, regional topography, spatial averaging, availability,and electrical losses. According to this projection shown in Fig. 4,the ratio of generated power to rated power is presented as afunction of off-shore wind speed. In this curve, the generationnever reaches 100% of rated power. Rather, the maximum
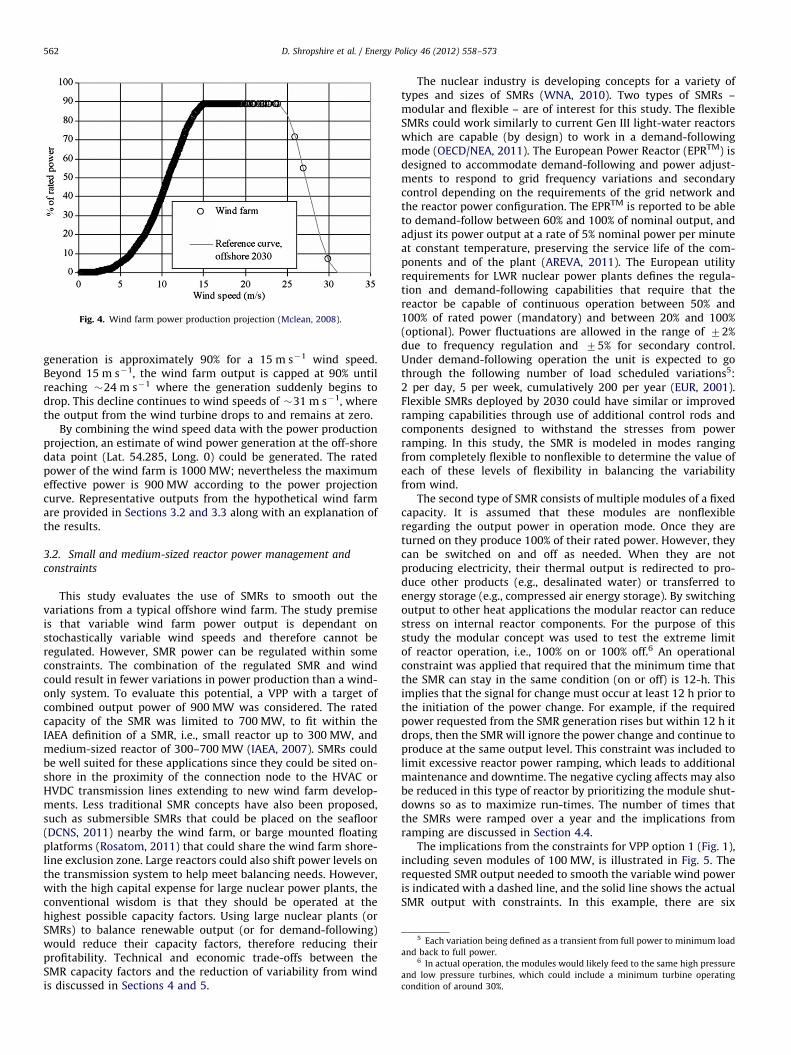
Fig. 4. Wind farm power production projection (Mclean, 2008).
5 Each variation being defined as a transient from full power to minimum load
and back to full power.6 In actual operation, the modules would likely feed to the same high pressure
and low pressure turbines, which could include a minimum turbine operating
condition of around 30%.
D. Shropshire et al. / Energy Policy 46 (2012) 558–573562
generation is approximately 90% for a 15 m s�1 wind speed.Beyond 15 m s�1, the wind farm output is capped at 90% untilreaching �24 m s�1 where the generation suddenly begins todrop. This decline continues to wind speeds of �31 m s�1, wherethe output from the wind turbine drops to and remains at zero.
By combining the wind speed data with the power productionprojection, an estimate of wind power generation at the off-shoredata point (Lat. 54.285, Long. 0) could be generated. The ratedpower of the wind farm is 1000 MW; nevertheless the maximumeffective power is 900 MW according to the power projectioncurve. Representative outputs from the hypothetical wind farmare provided in Sections 3.2 and 3.3 along with an explanation ofthe results.
3.2. Small and medium-sized reactor power management and
constraints
This study evaluates the use of SMRs to smooth out thevariations from a typical offshore wind farm. The study premiseis that variable wind farm power output is dependant onstochastically variable wind speeds and therefore cannot beregulated. However, SMR power can be regulated within someconstraints. The combination of the regulated SMR and windcould result in fewer variations in power production than a wind-only system. To evaluate this potential, a VPP with a target ofcombined output power of 900 MW was considered. The ratedcapacity of the SMR was limited to 700 MW, to fit within theIAEA definition of a SMR, i.e., small reactor up to 300 MW, andmedium-sized reactor of 300–700 MW (IAEA, 2007). SMRs couldbe well suited for these applications since they could be sited on-shore in the proximity of the connection node to the HVAC orHVDC transmission lines extending to new wind farm develop-ments. Less traditional SMR concepts have also been proposed,such as submersible SMRs that could be placed on the seafloor(DCNS, 2011) nearby the wind farm, or barge mounted floatingplatforms (Rosatom, 2011) that could share the wind farm shore-line exclusion zone. Large reactors could also shift power levels onthe transmission system to help meet balancing needs. However,with the high capital expense for large nuclear power plants, theconventional wisdom is that they should be operated at thehighest possible capacity factors. Using large nuclear plants (orSMRs) to balance renewable output (or for demand-following)would reduce their capacity factors, therefore reducing theirprofitability. Technical and economic trade-offs between theSMR capacity factors and the reduction of variability from windis discussed in Sections 4 and 5.
The nuclear industry is developing concepts for a variety oftypes and sizes of SMRs (WNA, 2010). Two types of SMRs –modular and flexible – are of interest for this study. The flexibleSMRs could work similarly to current Gen III light-water reactorswhich are capable (by design) to work in a demand-followingmode (OECD/NEA, 2011). The European Power Reactor (EPRTM) isdesigned to accommodate demand-following and power adjust-ments to respond to grid frequency variations and secondarycontrol depending on the requirements of the grid network andthe reactor power configuration. The EPRTM is reported to be ableto demand-follow between 60% and 100% of nominal output, andadjust its power output at a rate of 5% nominal power per minuteat constant temperature, preserving the service life of the com-ponents and of the plant (AREVA, 2011). The European utilityrequirements for LWR nuclear power plants defines the regula-tion and demand-following capabilities that require that thereactor be capable of continuous operation between 50% and100% of rated power (mandatory) and between 20% and 100%(optional). Power fluctuations are allowed in the range of 72%due to frequency regulation and 75% for secondary control.Under demand-following operation the unit is expected to gothrough the following number of load scheduled variations5:2 per day, 5 per week, cumulatively 200 per year (EUR, 2001).Flexible SMRs deployed by 2030 could have similar or improvedramping capabilities through use of additional control rods andcomponents designed to withstand the stresses from powerramping. In this study, the SMR is modeled in modes rangingfrom completely flexible to nonflexible to determine the value ofeach of these levels of flexibility in balancing the variabilityfrom wind.
The second type of SMR consists of multiple modules of a fixedcapacity. It is assumed that these modules are nonflexibleregarding the output power in operation mode. Once they areturned on they produce 100% of their rated power. However, theycan be switched on and off as needed. When they are notproducing electricity, their thermal output is redirected to pro-duce other products (e.g., desalinated water) or transferred toenergy storage (e.g., compressed air energy storage). By switchingoutput to other heat applications the modular reactor can reducestress on internal reactor components. For the purpose of thisstudy the modular concept was used to test the extreme limitof reactor operation, i.e., 100% on or 100% off.6 An operationalconstraint was applied that required that the minimum time thatthe SMR can stay in the same condition (on or off) is 12-h. Thisimplies that the signal for change must occur at least 12 h prior tothe initiation of the power change. For example, if the requiredpower requested from the SMR generation rises but within 12 h itdrops, then the SMR will ignore the power change and continue toproduce at the same output level. This constraint was included tolimit excessive reactor power ramping, which leads to additionalmaintenance and downtime. The negative cycling affects may alsobe reduced in this type of reactor by prioritizing the module shut-downs so as to maximize run-times. The number of times thatthe SMRs were ramped over a year and the implications fromramping are discussed in Section 4.4.
The implications from the constraints for VPP option 1 (Fig. 1),including seven modules of 100 MW, is illustrated in Fig. 5. Therequested SMR output needed to smooth the variable wind poweris indicated with a dashed line, and the solid line shows the actualSMR output with constraints. In this example, there are six
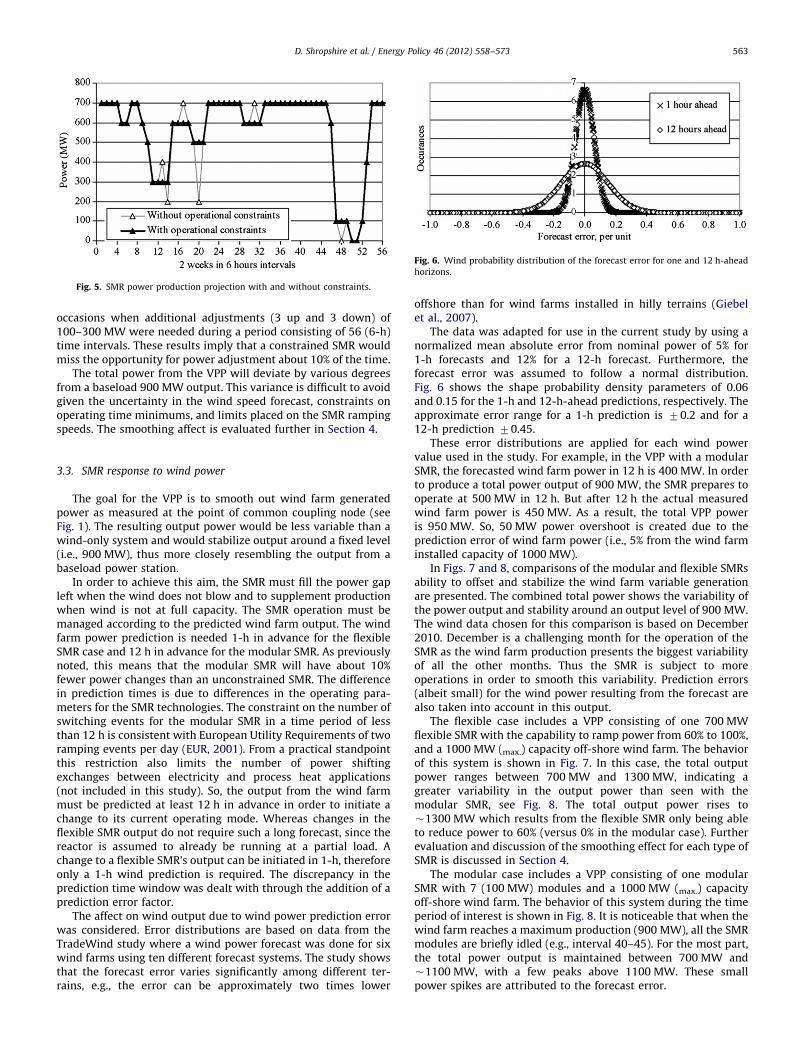
Fig. 5. SMR power production projection with and without constraints.
Fig. 6. Wind probability distribution of the forecast error for one and 12 h-ahead
horizons.
D. Shropshire et al. / Energy Policy 46 (2012) 558–573 563
occasions when additional adjustments (3 up and 3 down) of100–300 MW were needed during a period consisting of 56 (6-h)time intervals. These results imply that a constrained SMR wouldmiss the opportunity for power adjustment about 10% of the time.
The total power from the VPP will deviate by various degreesfrom a baseload 900 MW output. This variance is difficult to avoidgiven the uncertainty in the wind speed forecast, constraints onoperating time minimums, and limits placed on the SMR rampingspeeds. The smoothing affect is evaluated further in Section 4.
3.3. SMR response to wind power
The goal for the VPP is to smooth out wind farm generatedpower as measured at the point of common coupling node (seeFig. 1). The resulting output power would be less variable than awind-only system and would stabilize output around a fixed level(i.e., 900 MW), thus more closely resembling the output from abaseload power station.
In order to achieve this aim, the SMR must fill the power gapleft when the wind does not blow and to supplement productionwhen wind is not at full capacity. The SMR operation must bemanaged according to the predicted wind farm output. The windfarm power prediction is needed 1-h in advance for the flexibleSMR case and 12 h in advance for the modular SMR. As previouslynoted, this means that the modular SMR will have about 10%fewer power changes than an unconstrained SMR. The differencein prediction times is due to differences in the operating para-meters for the SMR technologies. The constraint on the number ofswitching events for the modular SMR in a time period of lessthan 12 h is consistent with European Utility Requirements of tworamping events per day (EUR, 2001). From a practical standpointthis restriction also limits the number of power shiftingexchanges between electricity and process heat applications(not included in this study). So, the output from the wind farmmust be predicted at least 12 h in advance in order to initiate achange to its current operating mode. Whereas changes in theflexible SMR output do not require such a long forecast, since thereactor is assumed to already be running at a partial load. Achange to a flexible SMR’s output can be initiated in 1-h, thereforeonly a 1-h wind prediction is required. The discrepancy in theprediction time window was dealt with through the addition of aprediction error factor.
The affect on wind output due to wind power prediction errorwas considered. Error distributions are based on data from theTradeWind study where a wind power forecast was done for sixwind farms using ten different forecast systems. The study showsthat the forecast error varies significantly among different ter-rains, e.g., the error can be approximately two times lower
offshore than for wind farms installed in hilly terrains (Giebelet al., 2007).
The data was adapted for use in the current study by using anormalized mean absolute error from nominal power of 5% for1-h forecasts and 12% for a 12-h forecast. Furthermore, theforecast error was assumed to follow a normal distribution.Fig. 6 shows the shape probability density parameters of 0.06and 0.15 for the 1-h and 12-h-ahead predictions, respectively. Theapproximate error range for a 1-h prediction is 70.2 and for a12-h prediction 70.45.
These error distributions are applied for each wind powervalue used in the study. For example, in the VPP with a modularSMR, the forecasted wind farm power in 12 h is 400 MW. In orderto produce a total power output of 900 MW, the SMR prepares tooperate at 500 MW in 12 h. But after 12 h the actual measuredwind farm power is 450 MW. As a result, the total VPP poweris 950 MW. So, 50 MW power overshoot is created due to theprediction error of wind farm power (i.e., 5% from the wind farminstalled capacity of 1000 MW).
In Figs. 7 and 8, comparisons of the modular and flexible SMRsability to offset and stabilize the wind farm variable generationare presented. The combined total power shows the variability ofthe power output and stability around an output level of 900 MW.The wind data chosen for this comparison is based on December2010. December is a challenging month for the operation of theSMR as the wind farm production presents the biggest variabilityof all the other months. Thus the SMR is subject to moreoperations in order to smooth this variability. Prediction errors(albeit small) for the wind power resulting from the forecast arealso taken into account in this output.
The flexible case includes a VPP consisting of one 700 MWflexible SMR with the capability to ramp power from 60% to 100%,and a 1000 MW (max.) capacity off-shore wind farm. The behaviorof this system is shown in Fig. 7. In this case, the total outputpower ranges between 700 MW and 1300 MW, indicating agreater variability in the output power than seen with themodular SMR, see Fig. 8. The total output power rises to�1300 MW which results from the flexible SMR only being ableto reduce power to 60% (versus 0% in the modular case). Furtherevaluation and discussion of the smoothing effect for each type ofSMR is discussed in Section 4.
The modular case includes a VPP consisting of one modularSMR with 7 (100 MW) modules and a 1000 MW (max.) capacityoff-shore wind farm. The behavior of this system during the timeperiod of interest is shown in Fig. 8. It is noticeable that when thewind farm reaches a maximum production (900 MW), all the SMRmodules are briefly idled (e.g., interval 40–45). For the most part,the total power output is maintained between 700 MW and�1100 MW, with a few peaks above 1100 MW. These smallpower spikes are attributed to the forecast error.
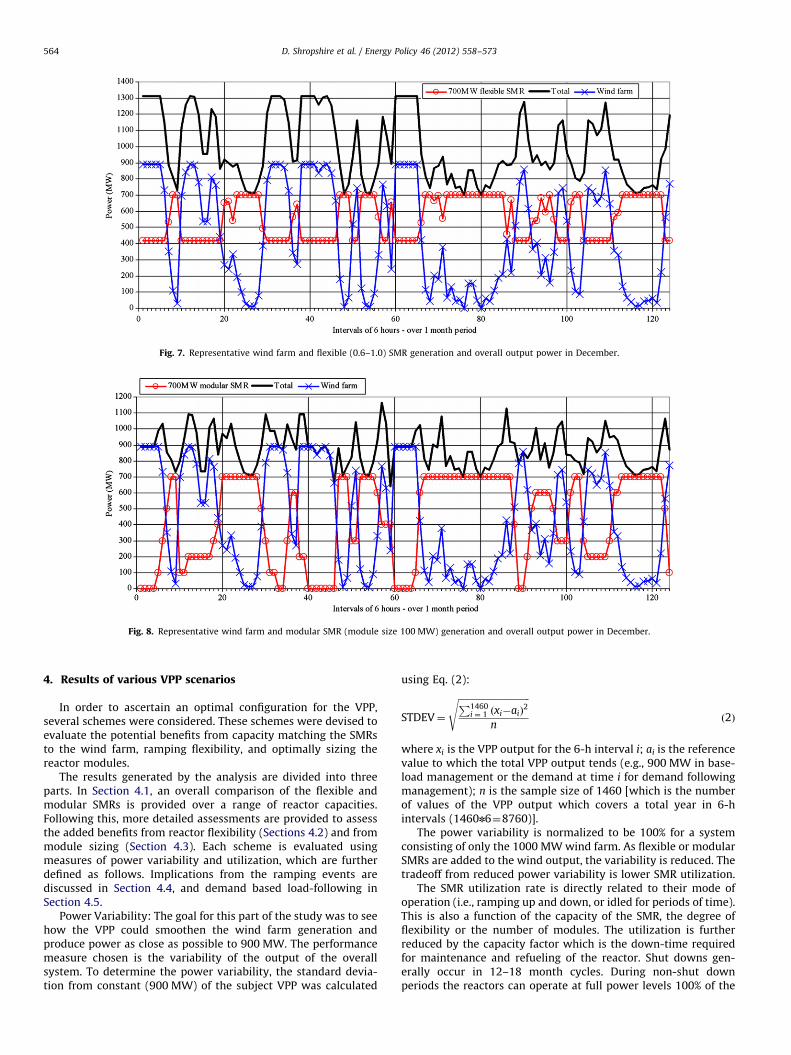
Fig. 7. Representative wind farm and flexible (0.6–1.0) SMR generation and overall output power in December.
Fig. 8. Representative wind farm and modular SMR (module size 100 MW) generation and overall output power in December.
D. Shropshire et al. / Energy Policy 46 (2012) 558–573564
4. Results of various VPP scenarios
In order to ascertain an optimal configuration for the VPP,several schemes were considered. These schemes were devised toevaluate the potential benefits from capacity matching the SMRsto the wind farm, ramping flexibility, and optimally sizing thereactor modules.
The results generated by the analysis are divided into threeparts. In Section 4.1, an overall comparison of the flexible andmodular SMRs is provided over a range of reactor capacities.Following this, more detailed assessments are provided to assessthe added benefits from reactor flexibility (Sections 4.2) and frommodule sizing (Section 4.3). Each scheme is evaluated usingmeasures of power variability and utilization, which are furtherdefined as follows. Implications from the ramping events arediscussed in Section 4.4, and demand based load-following inSection 4.5.
Power Variability: The goal for this part of the study was to seehow the VPP could smoothen the wind farm generation andproduce power as close as possible to 900 MW. The performancemeasure chosen is the variability of the output of the overallsystem. To determine the power variability, the standard devia-tion from constant (900 MW) of the subject VPP was calculated
using Eq. (2):
STDEV¼
ffiffiffiffiffiffiffiffiffiffiffiffiffiffiffiffiffiffiffiffiffiffiffiffiffiffiffiffiffiffiffiP1460i ¼ 1 ðxi�aiÞ
2
n
sð2Þ
where xi is the VPP output for the 6-h interval i; ai is the referencevalue to which the total VPP output tends (e.g., 900 MW in base-load management or the demand at time i for demand followingmanagement); n is the sample size of 1460 [which is the numberof values of the VPP output which covers a total year in 6-hintervals (1460n6¼8760)].
The power variability is normalized to be 100% for a systemconsisting of only the 1000 MW wind farm. As flexible or modularSMRs are added to the wind output, the variability is reduced. Thetradeoff from reduced power variability is lower SMR utilization.
The SMR utilization rate is directly related to their mode ofoperation (i.e., ramping up and down, or idled for periods of time).This is also a function of the capacity of the SMR, the degree offlexibility or the number of modules. The utilization is furtherreduced by the capacity factor which is the down-time requiredfor maintenance and refueling of the reactor. Shut downs gen-erally occur in 12–18 month cycles. During non-shut downperiods the reactors can operate at full power levels 100% of the
D. Shropshire et al. / Energy Policy 46 (2012) 558–573 565
time. However, the average annual capacity factor ranges from75% to 95%. The capacity factor could be as high as 95% for SMRsoperating with low flexibility requirements, and as low as 75% forreactors operating more flexibly. Future SMRs could potentiallyachieve high capacity factors by extending the period betweenrefueling.
In our study the wind farm utilization rate is assumed toalways be 100%, meaning that wind is never curtailed at anymoment. The VPP functions to utilize the flexibility of the SMRs toenhance the deployment of renewable energy through theremoval of output constraints resulting from insufficient demandor sufficient balancing resources. A discussion on the economicviability of these systems is provided in Section 5.
4.1. Overall comparison of flexible and modular SMRs
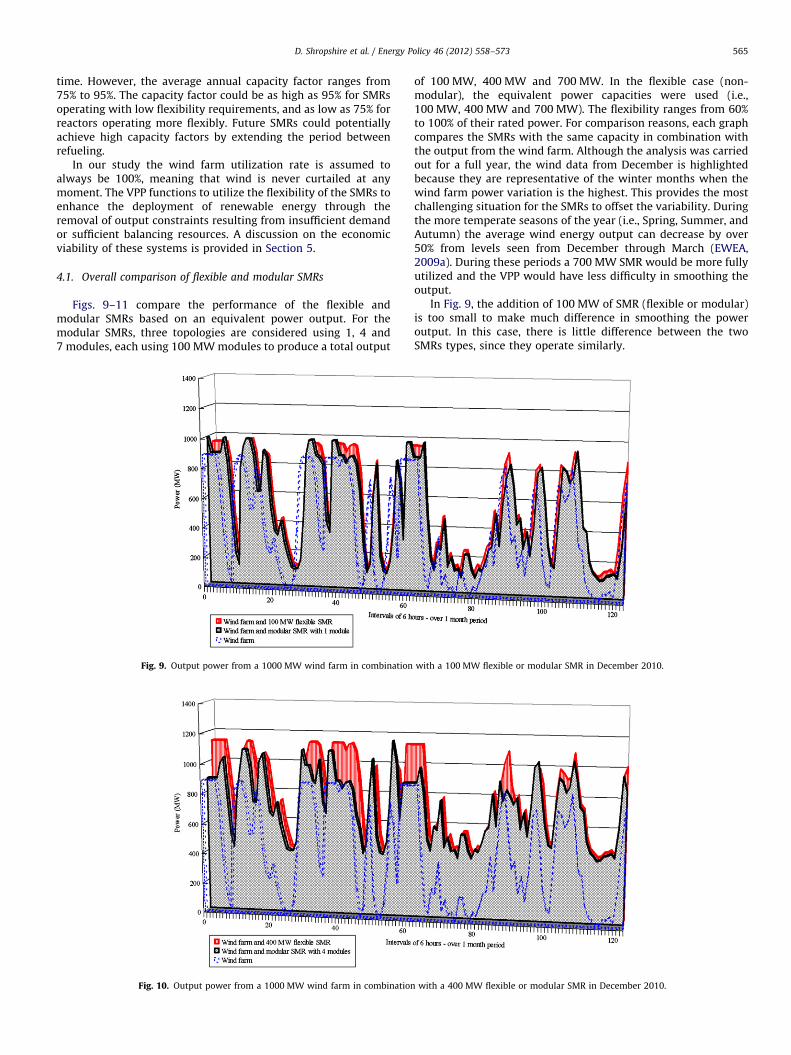
Figs. 9–11 compare the performance of the flexible andmodular SMRs based on an equivalent power output. For themodular SMRs, three topologies are considered using 1, 4 and7 modules, each using 100 MW modules to produce a total output
Fig. 9. Output power from a 1000 MW wind farm in combination
Fig. 10. Output power from a 1000 MW wind farm in combination
of 100 MW, 400 MW and 700 MW. In the flexible case (non-modular), the equivalent power capacities were used (i.e.,100 MW, 400 MW and 700 MW). The flexibility ranges from 60%to 100% of their rated power. For comparison reasons, each graphcompares the SMRs with the same capacity in combination withthe output from the wind farm. Although the analysis was carriedout for a full year, the wind data from December is highlightedbecause they are representative of the winter months when thewind farm power variation is the highest. This provides the mostchallenging situation for the SMRs to offset the variability. Duringthe more temperate seasons of the year (i.e., Spring, Summer, andAutumn) the average wind energy output can decrease by over50% from levels seen from December through March (EWEA,2009a). During these periods a 700 MW SMR would be more fullyutilized and the VPP would have less difficulty in smoothing theoutput.
In Fig. 9, the addition of 100 MW of SMR (flexible or modular)is too small to make much difference in smoothing the poweroutput. In this case, there is little difference between the twoSMRs types, since they operate similarly.
with a 100 MW flexible or modular SMR in December 2010.
with a 400 MW flexible or modular SMR in December 2010.
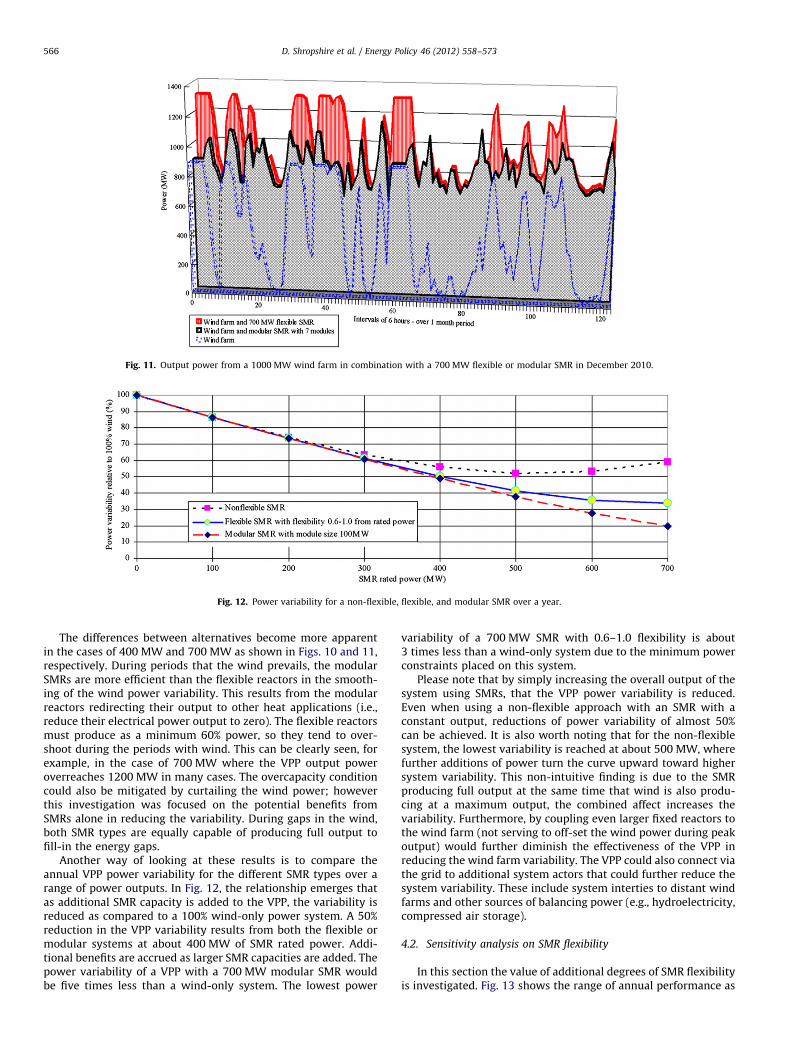
Fig. 11. Output power from a 1000 MW wind farm in combination with a 700 MW flexible or modular SMR in December 2010.
Fig. 12. Power variability for a non-flexible, flexible, and modular SMR over a year.
D. Shropshire et al. / Energy Policy 46 (2012) 558–573566
The differences between alternatives become more apparentin the cases of 400 MW and 700 MW as shown in Figs. 10 and 11,respectively. During periods that the wind prevails, the modularSMRs are more efficient than the flexible reactors in the smooth-ing of the wind power variability. This results from the modularreactors redirecting their output to other heat applications (i.e.,reduce their electrical power output to zero). The flexible reactorsmust produce as a minimum 60% power, so they tend to over-shoot during the periods with wind. This can be clearly seen, forexample, in the case of 700 MW where the VPP output poweroverreaches 1200 MW in many cases. The overcapacity conditioncould also be mitigated by curtailing the wind power; howeverthis investigation was focused on the potential benefits fromSMRs alone in reducing the variability. During gaps in the wind,both SMR types are equally capable of producing full output tofill-in the energy gaps.
Another way of looking at these results is to compare theannual VPP power variability for the different SMR types over arange of power outputs. In Fig. 12, the relationship emerges thatas additional SMR capacity is added to the VPP, the variability isreduced as compared to a 100% wind-only power system. A 50%reduction in the VPP variability results from both the flexible ormodular systems at about 400 MW of SMR rated power. Addi-tional benefits are accrued as larger SMR capacities are added. Thepower variability of a VPP with a 700 MW modular SMR wouldbe five times less than a wind-only system. The lowest power
variability of a 700 MW SMR with 0.6–1.0 flexibility is about3 times less than a wind-only system due to the minimum powerconstraints placed on this system.
Please note that by simply increasing the overall output of thesystem using SMRs, that the VPP power variability is reduced.Even when using a non-flexible approach with an SMR with aconstant output, reductions of power variability of almost 50%can be achieved. It is also worth noting that for the non-flexiblesystem, the lowest variability is reached at about 500 MW, wherefurther additions of power turn the curve upward toward highersystem variability. This non-intuitive finding is due to the SMRproducing full output at the same time that wind is also produ-cing at a maximum output, the combined affect increases thevariability. Furthermore, by coupling even larger fixed reactors tothe wind farm (not serving to off-set the wind power during peakoutput) would further diminish the effectiveness of the VPP inreducing the wind farm variability. The VPP could also connect viathe grid to additional system actors that could further reduce thesystem variability. These include system interties to distant windfarms and other sources of balancing power (e.g., hydroelectricity,compressed air storage).
4.2. Sensitivity analysis on SMR flexibility
In this section the value of additional degrees of SMR flexibilityis investigated. Fig. 13 shows the range of annual performance as
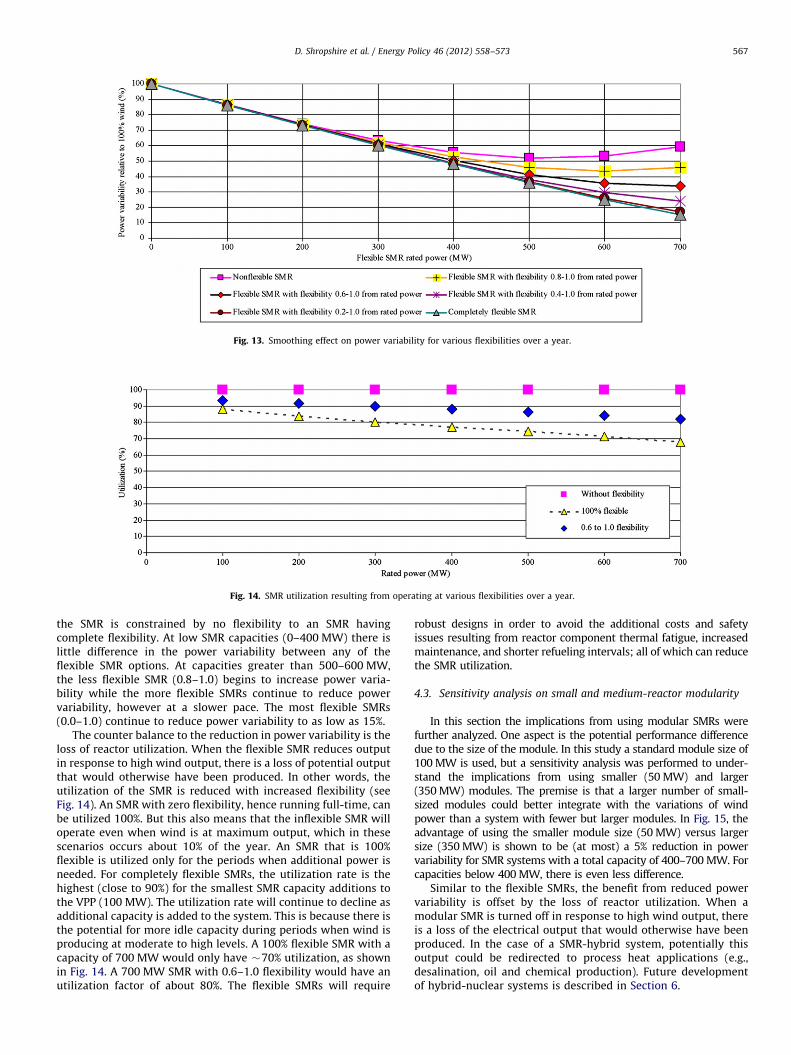
Fig. 13. Smoothing effect on power variability for various flexibilities over a year.
Fig. 14. SMR utilization resulting from operating at various flexibilities over a year.
D. Shropshire et al. / Energy Policy 46 (2012) 558–573 567
the SMR is constrained by no flexibility to an SMR havingcomplete flexibility. At low SMR capacities (0–400 MW) there islittle difference in the power variability between any of theflexible SMR options. At capacities greater than 500–600 MW,the less flexible SMR (0.8–1.0) begins to increase power varia-bility while the more flexible SMRs continue to reduce powervariability, however at a slower pace. The most flexible SMRs(0.0–1.0) continue to reduce power variability to as low as 15%.
The counter balance to the reduction in power variability is theloss of reactor utilization. When the flexible SMR reduces outputin response to high wind output, there is a loss of potential outputthat would otherwise have been produced. In other words, theutilization of the SMR is reduced with increased flexibility (seeFig. 14). An SMR with zero flexibility, hence running full-time, canbe utilized 100%. But this also means that the inflexible SMR willoperate even when wind is at maximum output, which in thesescenarios occurs about 10% of the year. An SMR that is 100%flexible is utilized only for the periods when additional power isneeded. For completely flexible SMRs, the utilization rate is thehighest (close to 90%) for the smallest SMR capacity additions tothe VPP (100 MW). The utilization rate will continue to decline asadditional capacity is added to the system. This is because there isthe potential for more idle capacity during periods when wind isproducing at moderate to high levels. A 100% flexible SMR with acapacity of 700 MW would only have �70% utilization, as shownin Fig. 14. A 700 MW SMR with 0.6–1.0 flexibility would have anutilization factor of about 80%. The flexible SMRs will require
robust designs in order to avoid the additional costs and safetyissues resulting from reactor component thermal fatigue, increasedmaintenance, and shorter refueling intervals; all of which can reducethe SMR utilization.
4.3. Sensitivity analysis on small and medium-reactor modularity
In this section the implications from using modular SMRs werefurther analyzed. One aspect is the potential performance differencedue to the size of the module. In this study a standard module size of100 MW is used, but a sensitivity analysis was performed to under-stand the implications from using smaller (50 MW) and larger(350 MW) modules. The premise is that a larger number of small-sized modules could better integrate with the variations of windpower than a system with fewer but larger modules. In Fig. 15, theadvantage of using the smaller module size (50 MW) versus largersize (350 MW) is shown to be (at most) a 5% reduction in powervariability for SMR systems with a total capacity of 400–700 MW. Forcapacities below 400 MW, there is even less difference.
Similar to the flexible SMRs, the benefit from reduced powervariability is offset by the loss of reactor utilization. When amodular SMR is turned off in response to high wind output, thereis a loss of the electrical output that would otherwise have beenproduced. In the case of a SMR-hybrid system, potentially thisoutput could be redirected to process heat applications (e.g.,desalination, oil and chemical production). Future developmentof hybrid-nuclear systems is described in Section 6.
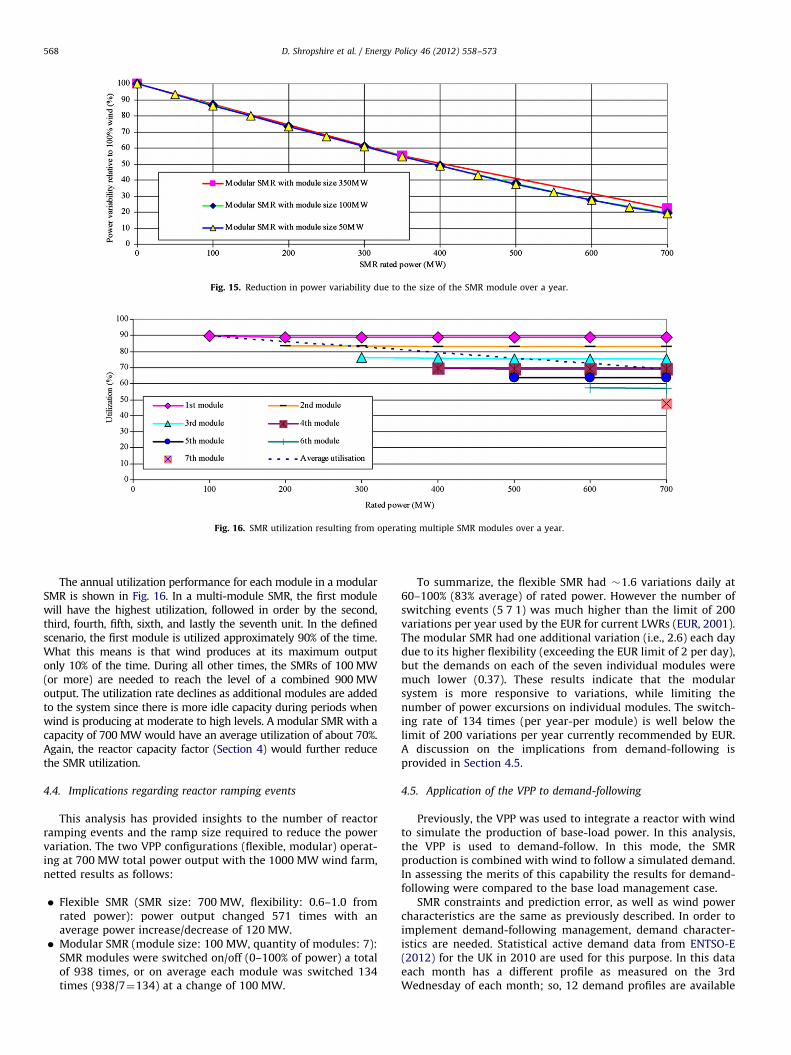
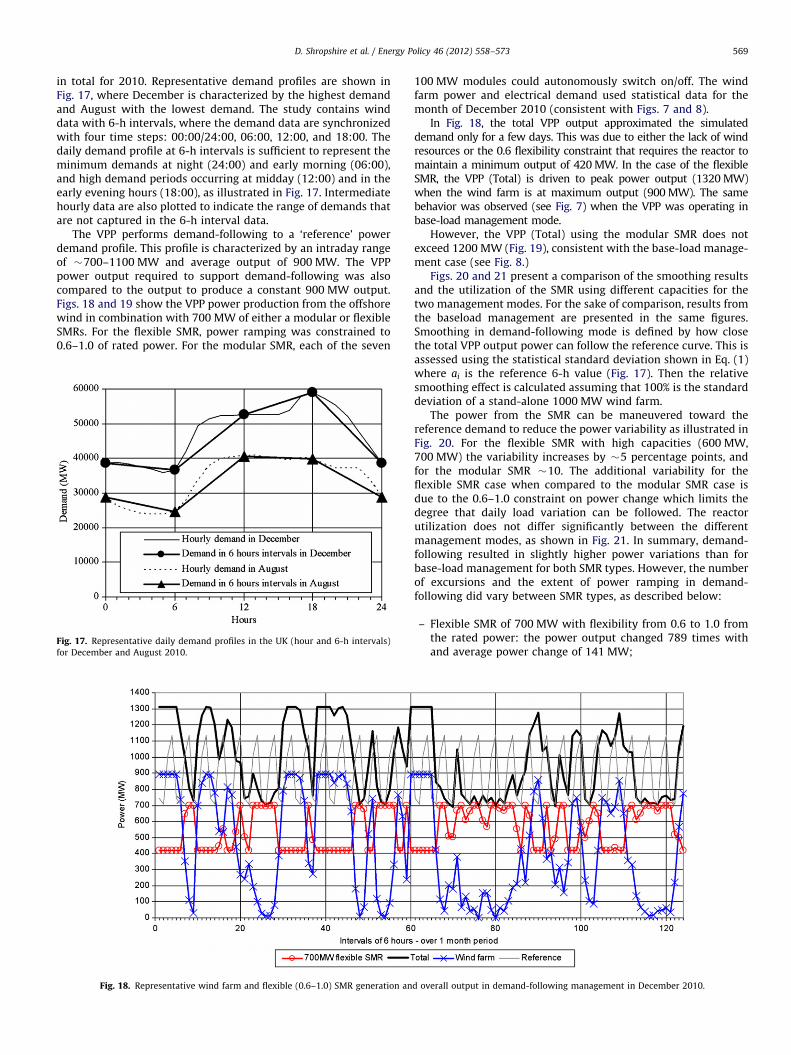
Fig. 15. Reduction in power variability due to the size of the SMR module over a year.
Fig. 16. SMR utilization resulting from operating multiple SMR modules over a year.
D. Shropshire et al. / Energy Policy 46 (2012) 558–573568
The annual utilization performance for each module in a modularSMR is shown in Fig. 16. In a multi-module SMR, the first modulewill have the highest utilization, followed in order by the second,third, fourth, fifth, sixth, and lastly the seventh unit. In the definedscenario, the first module is utilized approximately 90% of the time.What this means is that wind produces at its maximum outputonly 10% of the time. During all other times, the SMRs of 100 MW(or more) are needed to reach the level of a combined 900 MWoutput. The utilization rate declines as additional modules are addedto the system since there is more idle capacity during periods whenwind is producing at moderate to high levels. A modular SMR with acapacity of 700 MW would have an average utilization of about 70%.Again, the reactor capacity factor (Section 4) would further reducethe SMR utilization.
4.4. Implications regarding reactor ramping events
This analysis has provided insights to the number of reactorramping events and the ramp size required to reduce the powervariation. The two VPP configurations (flexible, modular) operat-ing at 700 MW total power output with the 1000 MW wind farm,netted results as follows:
�
Flexible SMR (SMR size: 700 MW, flexibility: 0.6–1.0 fromrated power): power output changed 571 times with anaverage power increase/decrease of 120 MW. � Modular SMR (module size: 100 MW, quantity of modules: 7):SMR modules were switched on/off (0–100% of power) a totalof 938 times, or on average each module was switched 134times (938/7¼134) at a change of 100 MW.
To summarize, the flexible SMR had �1.6 variations daily at60–100% (83% average) of rated power. However the number ofswitching events (5 7 1) was much higher than the limit of 200variations per year used by the EUR for current LWRs (EUR, 2001).The modular SMR had one additional variation (i.e., 2.6) each daydue to its higher flexibility (exceeding the EUR limit of 2 per day),but the demands on each of the seven individual modules weremuch lower (0.37). These results indicate that the modularsystem is more responsive to variations, while limiting thenumber of power excursions on individual modules. The switch-ing rate of 134 times (per year-per module) is well below thelimit of 200 variations per year currently recommended by EUR.A discussion on the implications from demand-following isprovided in Section 4.5.
4.5. Application of the VPP to demand-following
Previously, the VPP was used to integrate a reactor with windto simulate the production of base-load power. In this analysis,the VPP is used to demand-follow. In this mode, the SMRproduction is combined with wind to follow a simulated demand.In assessing the merits of this capability the results for demand-following were compared to the base load management case.
SMR constraints and prediction error, as well as wind powercharacteristics are the same as previously described. In order toimplement demand-following management, demand character-istics are needed. Statistical active demand data from ENTSO-E(2012) for the UK in 2010 are used for this purpose. In this dataeach month has a different profile as measured on the 3rdWednesday of each month; so, 12 demand profiles are available
D. Shropshire et al. / Energy Policy 46 (2012) 558–573 569
in total for 2010. Representative demand profiles are shown inFig. 17, where December is characterized by the highest demandand August with the lowest demand. The study contains winddata with 6-h intervals, where the demand data are synchronizedwith four time steps: 00:00/24:00, 06:00, 12:00, and 18:00. Thedaily demand profile at 6-h intervals is sufficient to represent theminimum demands at night (24:00) and early morning (06:00),and high demand periods occurring at midday (12:00) and in theearly evening hours (18:00), as illustrated in Fig. 17. Intermediatehourly data are also plotted to indicate the range of demands thatare not captured in the 6-h interval data.
The VPP performs demand-following to a ‘reference’ powerdemand profile. This profile is characterized by an intraday rangeof �700–1100 MW and average output of 900 MW. The VPPpower output required to support demand-following was alsocompared to the output to produce a constant 900 MW output.Figs. 18 and 19 show the VPP power production from the offshorewind in combination with 700 MW of either a modular or flexibleSMRs. For the flexible SMR, power ramping was constrained to0.6–1.0 of rated power. For the modular SMR, each of the seven
Fig. 17. Representative daily demand profiles in the UK (hour and 6-h intervals)
for December and August 2010.
Fig. 18. Representative wind farm and flexible (0.6–1.0) SMR generation an
100 MW modules could autonomously switch on/off. The windfarm power and electrical demand used statistical data for themonth of December 2010 (consistent with Figs. 7 and 8).
In Fig. 18, the total VPP output approximated the simulateddemand only for a few days. This was due to either the lack of windresources or the 0.6 flexibility constraint that requires the reactor tomaintain a minimum output of 420 MW. In the case of the flexibleSMR, the VPP (Total) is driven to peak power output (1320 MW)when the wind farm is at maximum output (900 MW). The samebehavior was observed (see Fig. 7) when the VPP was operating inbase-load management mode.
However, the VPP (Total) using the modular SMR does notexceed 1200 MW (Fig. 19), consistent with the base-load manage-ment case (see Fig. 8.)
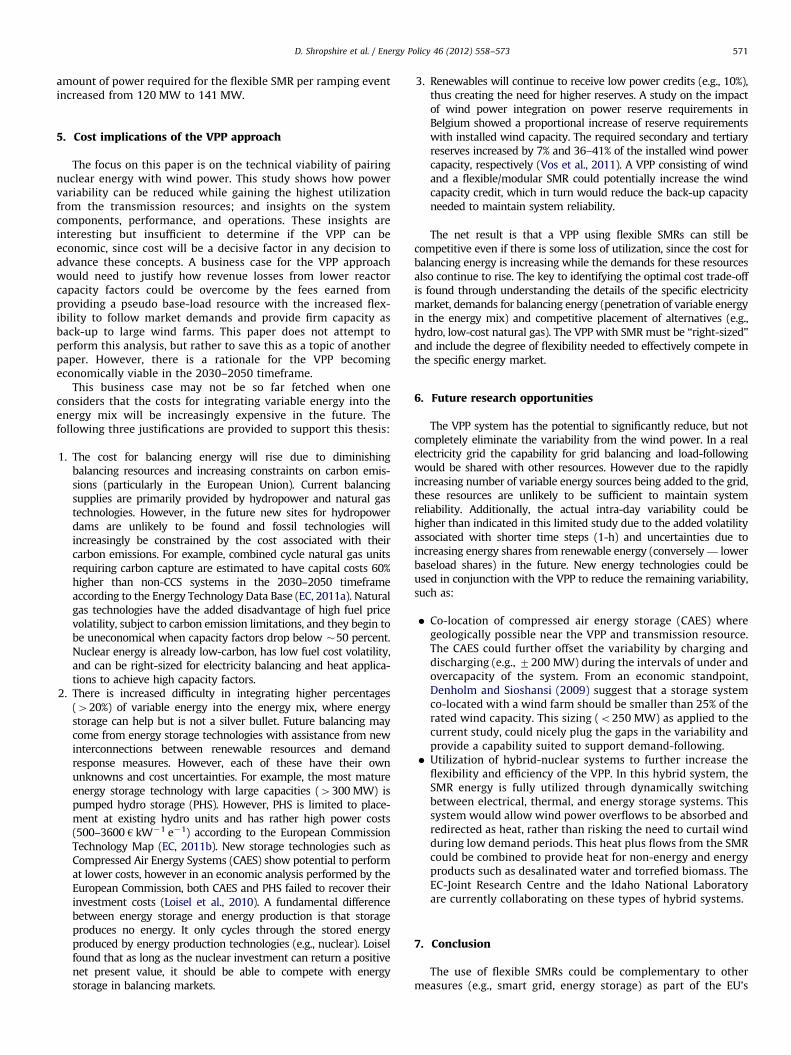
Figs. 20 and 21 present a comparison of the smoothing resultsand the utilization of the SMR using different capacities for thetwo management modes. For the sake of comparison, results fromthe baseload management are presented in the same figures.Smoothing in demand-following mode is defined by how closethe total VPP output power can follow the reference curve. This isassessed using the statistical standard deviation shown in Eq. (1)where ai is the reference 6-h value (Fig. 17). Then the relativesmoothing effect is calculated assuming that 100% is the standarddeviation of a stand-alone 1000 MW wind farm.
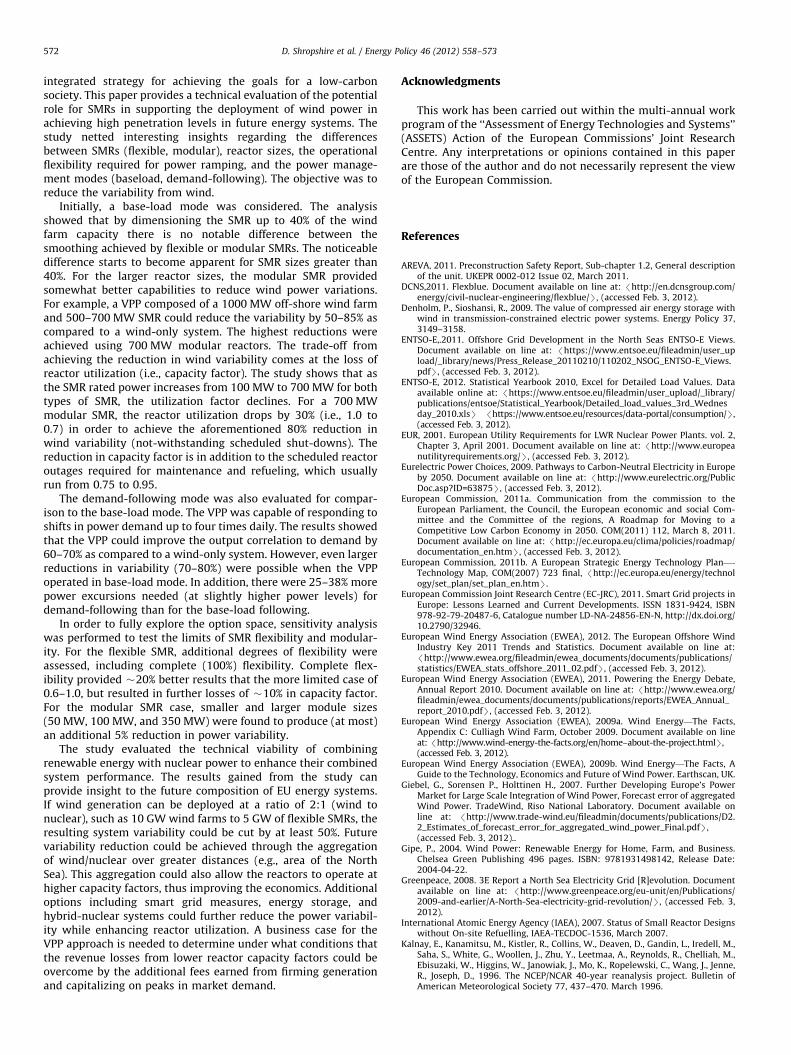
The power from the SMR can be maneuvered toward thereference demand to reduce the power variability as illustrated inFig. 20. For the flexible SMR with high capacities (600 MW,700 MW) the variability increases by �5 percentage points, andfor the modular SMR �10. The additional variability for theflexible SMR case when compared to the modular SMR case isdue to the 0.6–1.0 constraint on power change which limits thedegree that daily load variation can be followed. The reactorutilization does not differ significantly between the differentmanagement modes, as shown in Fig. 21. In summary, demand-following resulted in slightly higher power variations than forbase-load management for both SMR types. However, the numberof excursions and the extent of power ramping in demand-following did vary between SMR types, as described below:
–
d ov
Flexible SMR of 700 MW with flexibility from 0.6 to 1.0 fromthe rated power: the power output changed 789 times withand average power change of 141 MW;
erall output in demand-following management in December 2010.
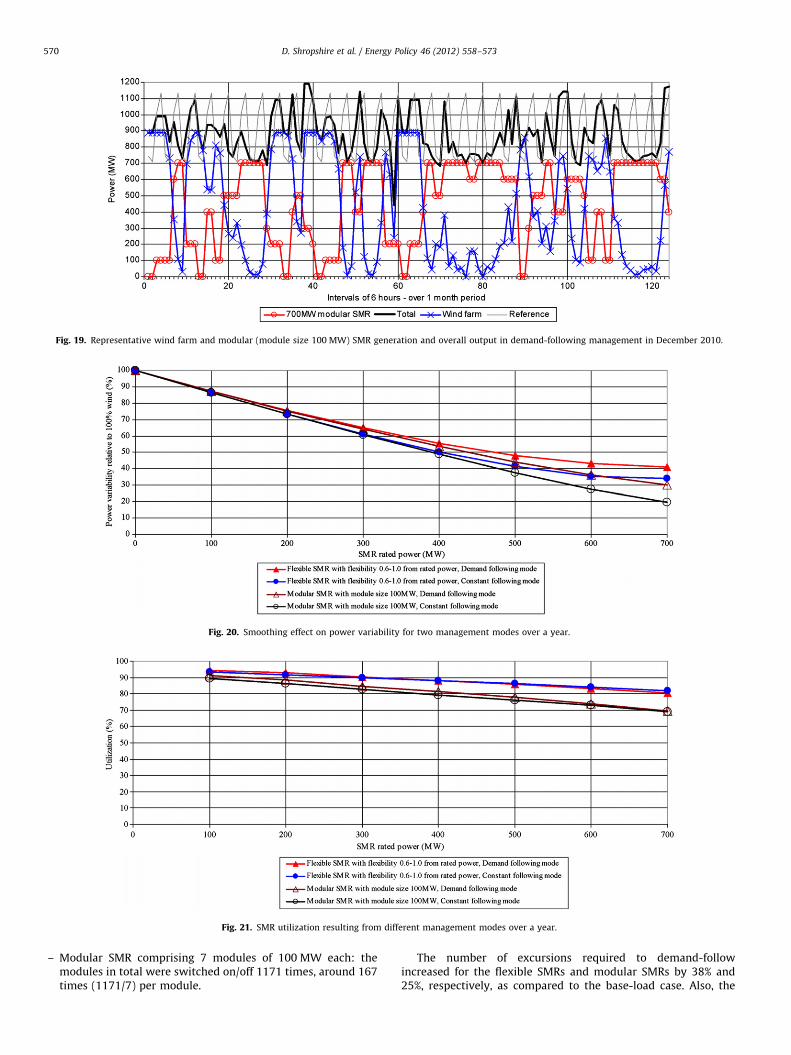
Fig. 19. Representative wind farm and modular (module size 100 MW) SMR generation and overall output in demand-following management in December 2010.
Fig. 20. Smoothing effect on power variability for two management modes over a year.
Fig. 21. SMR utilization resulting from different management modes over a year.
D. Shropshire et al. / Energy Policy 46 (2012) 558–573570
–
Modular SMR comprising 7 modules of 100 MW each: themodules in total were switched on/off 1171 times, around 167times (1171/7) per module.The number of excursions required to demand-followincreased for the flexible SMRs and modular SMRs by 38% and25%, respectively, as compared to the base-load case. Also, the
D. Shropshire et al. / Energy Policy 46 (2012) 558–573 571
amount of power required for the flexible SMR per ramping eventincreased from 120 MW to 141 MW.
5. Cost implications of the VPP approach
The focus on this paper is on the technical viability of pairingnuclear energy with wind power. This study shows how powervariability can be reduced while gaining the highest utilizationfrom the transmission resources; and insights on the systemcomponents, performance, and operations. These insights areinteresting but insufficient to determine if the VPP can beeconomic, since cost will be a decisive factor in any decision toadvance these concepts. A business case for the VPP approachwould need to justify how revenue losses from lower reactorcapacity factors could be overcome by the fees earned fromproviding a pseudo base-load resource with the increased flex-ibility to follow market demands and provide firm capacity asback-up to large wind farms. This paper does not attempt toperform this analysis, but rather to save this as a topic of anotherpaper. However, there is a rationale for the VPP becomingeconomically viable in the 2030–2050 timeframe.
This business case may not be so far fetched when oneconsiders that the costs for integrating variable energy into theenergy mix will be increasingly expensive in the future. Thefollowing three justifications are provided to support this thesis:
1.
The cost for balancing energy will rise due to diminishingbalancing resources and increasing constraints on carbon emis-sions (particularly in the European Union). Current balancingsupplies are primarily provided by hydropower and natural gastechnologies. However, in the future new sites for hydropowerdams are unlikely to be found and fossil technologies willincreasingly be constrained by the cost associated with theircarbon emissions. For example, combined cycle natural gas unitsrequiring carbon capture are estimated to have capital costs 60%higher than non-CCS systems in the 2030–2050 timeframeaccording to the Energy Technology Data Base (EC, 2011a). Naturalgas technologies have the added disadvantage of high fuel pricevolatility, subject to carbon emission limitations, and they begin tobe uneconomical when capacity factors drop below �50 percent.Nuclear energy is already low-carbon, has low fuel cost volatility,and can be right-sized for electricity balancing and heat applica-tions to achieve high capacity factors.2.
There is increased difficulty in integrating higher percentages(420%) of variable energy into the energy mix, where energystorage can help but is not a silver bullet. Future balancing maycome from energy storage technologies with assistance from newinterconnections between renewable resources and demandresponse measures. However, each of these have their ownunknowns and cost uncertainties. For example, the most matureenergy storage technology with large capacities (4300 MW) ispumped hydro storage (PHS). However, PHS is limited to place-ment at existing hydro units and has rather high power costs(500–3600 h kW�1 e�1) according to the European CommissionTechnology Map (EC, 2011b). New storage technologies such asCompressed Air Energy Systems (CAES) show potential to performat lower costs, however in an economic analysis performed by theEuropean Commission, both CAES and PHS failed to recover theirinvestment costs (Loisel et al., 2010). A fundamental differencebetween energy storage and energy production is that storageproduces no energy. It only cycles through the stored energyproduced by energy production technologies (e.g., nuclear). Loiselfound that as long as the nuclear investment can return a positivenet present value, it should be able to compete with energystorage in balancing markets.3.
Renewables will continue to receive low power credits (e.g., 10%),thus creating the need for higher reserves. A study on the impactof wind power integration on power reserve requirements inBelgium showed a proportional increase of reserve requirementswith installed wind capacity. The required secondary and tertiaryreserves increased by 7% and 36–41% of the installed wind powercapacity, respectively (Vos et al., 2011). A VPP consisting of windand a flexible/modular SMR could potentially increase the windcapacity credit, which in turn would reduce the back-up capacityneeded to maintain system reliability.The net result is that a VPP using flexible SMRs can still becompetitive even if there is some loss of utilization, since the cost forbalancing energy is increasing while the demands for these resourcesalso continue to rise. The key to identifying the optimal cost trade-offis found through understanding the details of the specific electricitymarket, demands for balancing energy (penetration of variable energyin the energy mix) and competitive placement of alternatives (e.g.,hydro, low-cost natural gas). The VPP with SMR must be ‘‘right-sized’’and include the degree of flexibility needed to effectively compete inthe specific energy market.
6. Future research opportunities
The VPP system has the potential to significantly reduce, but notcompletely eliminate the variability from the wind power. In a realelectricity grid the capability for grid balancing and load-followingwould be shared with other resources. However due to the rapidlyincreasing number of variable energy sources being added to the grid,these resources are unlikely to be sufficient to maintain systemreliability. Additionally, the actual intra-day variability could behigher than indicated in this limited study due to the added volatilityassociated with shorter time steps (1-h) and uncertainties due toincreasing energy shares from renewable energy (conversely — lowerbaseload shares) in the future. New energy technologies could beused in conjunction with the VPP to reduce the remaining variability,such as:
�
Co-location of compressed air energy storage (CAES) wheregeologically possible near the VPP and transmission resource.The CAES could further offset the variability by charging anddischarging (e.g., 7200 MW) during the intervals of under andovercapacity of the system. From an economic standpoint,Denholm and Sioshansi (2009) suggest that a storage systemco-located with a wind farm should be smaller than 25% of therated wind capacity. This sizing (o250 MW) as applied to thecurrent study, could nicely plug the gaps in the variability andprovide a capability suited to support demand-following. � Utilization of hybrid-nuclear systems to further increase theflexibility and efficiency of the VPP. In this hybrid system, theSMR energy is fully utilized through dynamically switchingbetween electrical, thermal, and energy storage systems. Thissystem would allow wind power overflows to be absorbed andredirected as heat, rather than risking the need to curtail windduring low demand periods. This heat plus flows from the SMRcould be combined to provide heat for non-energy and energyproducts such as desalinated water and torrefied biomass. TheEC-Joint Research Centre and the Idaho National Laboratoryare currently collaborating on these types of hybrid systems.
7. Conclusion
The use of flexible SMRs could be complementary to othermeasures (e.g., smart grid, energy storage) as part of the EU’s
D. Shropshire et al. / Energy Policy 46 (2012) 558–573572
integrated strategy for achieving the goals for a low-carbonsociety. This paper provides a technical evaluation of the potentialrole for SMRs in supporting the deployment of wind power inachieving high penetration levels in future energy systems. Thestudy netted interesting insights regarding the differencesbetween SMRs (flexible, modular), reactor sizes, the operationalflexibility required for power ramping, and the power manage-ment modes (baseload, demand-following). The objective was toreduce the variability from wind.
Initially, a base-load mode was considered. The analysisshowed that by dimensioning the SMR up to 40% of the windfarm capacity there is no notable difference between thesmoothing achieved by flexible or modular SMRs. The noticeabledifference starts to become apparent for SMR sizes greater than40%. For the larger reactor sizes, the modular SMR providedsomewhat better capabilities to reduce wind power variations.For example, a VPP composed of a 1000 MW off-shore wind farmand 500–700 MW SMR could reduce the variability by 50–85% ascompared to a wind-only system. The highest reductions wereachieved using 700 MW modular reactors. The trade-off fromachieving the reduction in wind variability comes at the loss ofreactor utilization (i.e., capacity factor). The study shows that asthe SMR rated power increases from 100 MW to 700 MW for bothtypes of SMR, the utilization factor declines. For a 700 MWmodular SMR, the reactor utilization drops by 30% (i.e., 1.0 to0.7) in order to achieve the aforementioned 80% reduction inwind variability (not-withstanding scheduled shut-downs). Thereduction in capacity factor is in addition to the scheduled reactoroutages required for maintenance and refueling, which usuallyrun from 0.75 to 0.95.
The demand-following mode was also evaluated for compar-ison to the base-load mode. The VPP was capable of responding toshifts in power demand up to four times daily. The results showedthat the VPP could improve the output correlation to demand by60–70% as compared to a wind-only system. However, even largerreductions in variability (70–80%) were possible when the VPPoperated in base-load mode. In addition, there were 25–38% morepower excursions needed (at slightly higher power levels) fordemand-following than for the base-load following.
In order to fully explore the option space, sensitivity analysiswas performed to test the limits of SMR flexibility and modular-ity. For the flexible SMR, additional degrees of flexibility wereassessed, including complete (100%) flexibility. Complete flex-ibility provided �20% better results that the more limited case of0.6–1.0, but resulted in further losses of �10% in capacity factor.For the modular SMR case, smaller and larger module sizes(50 MW, 100 MW, and 350 MW) were found to produce (at most)an additional 5% reduction in power variability.
The study evaluated the technical viability of combiningrenewable energy with nuclear power to enhance their combinedsystem performance. The results gained from the study canprovide insight to the future composition of EU energy systems.If wind generation can be deployed at a ratio of 2:1 (wind tonuclear), such as 10 GW wind farms to 5 GW of flexible SMRs, theresulting system variability could be cut by at least 50%. Futurevariability reduction could be achieved through the aggregationof wind/nuclear over greater distances (e.g., area of the NorthSea). This aggregation could also allow the reactors to operate athigher capacity factors, thus improving the economics. Additionaloptions including smart grid measures, energy storage, andhybrid-nuclear systems could further reduce the power variabil-ity while enhancing reactor utilization. A business case for theVPP approach is needed to determine under what conditions thatthe revenue losses from lower reactor capacity factors could beovercome by the additional fees earned from firming generationand capitalizing on peaks in market demand.
Acknowledgments
This work has been carried out within the multi-annual workprogram of the ‘‘Assessment of Energy Technologies and Systems’’(ASSETS) Action of the European Commissions’ Joint ResearchCentre. Any interpretations or opinions contained in this paperare those of the author and do not necessarily represent the viewof the European Commission.
References
AREVA, 2011. Preconstruction Safety Report, Sub-chapter 1.2, General descriptionof the unit. UKEPR 0002-012 Issue 02, March 2011.
DCNS,2011. Flexblue. Document available on line at: /http://en.dcnsgroup.com/energy/civil-nuclear-engineering/flexblue/S, (accessed Feb. 3, 2012).
Denholm, P., Sioshansi, R., 2009. The value of compressed air energy storage withwind in transmission-constrained electric power systems. Energy Policy 37,3149–3158.
ENTSO-E,.2011. Offshore Grid Development in the North Seas ENTSO-E Views.Document available on line at: /https://www.entsoe.eu/fileadmin/user_upload/_library/news/Press_Release_20110210/110202_NSOG_ENTSO-E_Views.pdfS, (accessed Feb. 3, 2012).
ENTSO-E, 2012. Statistical Yearbook 2010, Excel for Detailed Load Values. Dataavailable online at: /https://www.entsoe.eu/fileadmin/user_upload/_library/publications/entsoe/Statistical_Yearbook/Detailed_load_values_3rd_Wednesday_2010.xlsS /https://www.entsoe.eu/resources/data-portal/consumption/S,(accessed Feb. 3, 2012).
EUR, 2001. European Utility Requirements for LWR Nuclear Power Plants. vol. 2,Chapter 3, April 2001. Document available on line at: /http://www.europeanutilityrequirements.org/S, (accessed Feb. 3, 2012).
Eurelectric Power Choices, 2009. Pathways to Carbon-Neutral Electricity in Europeby 2050. Document available on line at: /http://www.eurelectric.org/PublicDoc.asp?ID=63875S, (accessed Feb. 3, 2012).
European Commission, 2011a. Communication from the commission to theEuropean Parliament, the Council, the European economic and social Com-mittee and the Committee of the regions, A Roadmap for Moving to aCompetitive Low Carbon Economy in 2050. COM(2011) 112, March 8, 2011.Document available on line at: /http://ec.europa.eu/clima/policies/roadmap/documentation_en.htmS, (accessed Feb. 3, 2012).
European Commission, 2011b. A European Strategic Energy Technology Plan—-
Technology Map, COM(2007) 723 final, /http://ec.europa.eu/energy/technology/set_plan/set_plan_en.htmS.
European Commission Joint Research Centre (EC-JRC), 2011. Smart Grid projects inEurope: Lessons Learned and Current Developments. ISSN 1831-9424, ISBN978-92-79-20487-6, Catalogue number LD-NA-24856-EN-N, http://dx.doi.org/10.2790/32946.
European Wind Energy Association (EWEA), 2012. The European Offshore WindIndustry Key 2011 Trends and Statistics. Document available on line at:/http://www.ewea.org/fileadmin/ewea_documents/documents/publications/statistics/EWEA_stats_offshore_2011_02.pdfS, (accessed Feb. 3, 2012).
European Wind Energy Association (EWEA), 2011. Powering the Energy Debate,Annual Report 2010. Document available on line at: /http://www.ewea.org/fileadmin/ewea_documents/documents/publications/reports/EWEA_Annual_report_2010.pdfS, (accessed Feb. 3, 2012).
European Wind Energy Association (EWEA), 2009a. Wind Energy—The Facts,Appendix C: Culliagh Wind Farm, October 2009. Document available on lineat: /http://www.wind-energy-the-facts.org/en/home–about-the-project.htmlS,(accessed Feb. 3, 2012).
European Wind Energy Association (EWEA), 2009b. Wind Energy—The Facts, AGuide to the Technology, Economics and Future of Wind Power. Earthscan, UK.
Giebel, G., Sorensen P., Holttinen H., 2007. Further Developing Europe’s PowerMarket for Large Scale Integration of Wind Power, Forecast error of aggregatedWind Power. TradeWind, Riso National Laboratory. Document available online at: /http://www.trade-wind.eu/fileadmin/documents/publications/D2.2_Estimates_of_forecast_error_for_aggregated_wind_power_Final.pdfS,(accessed Feb. 3, 2012)..
Gipe, P., 2004. Wind Power: Renewable Energy for Home, Farm, and Business.Chelsea Green Publishing 496 pages. ISBN: 9781931498142, Release Date:2004-04-22.
Greenpeace, 2008. 3E Report a North Sea Electricity Grid [R]evolution. Documentavailable on line at: /http://www.greenpeace.org/eu-unit/en/Publications/2009-and-earlier/A-North-Sea-electricity-grid-revolution/S, (accessed Feb. 3,2012).
International Atomic Energy Agency (IAEA), 2007. Status of Small Reactor Designswithout On-site Refuelling, IAEA-TECDOC-1536, March 2007.
Kalnay, E., Kanamitsu, M., Kistler, R., Collins, W., Deaven, D., Gandin, L., Iredell, M.,Saha, S., White, G., Woollen, J., Zhu, Y., Leetmaa, A., Reynolds, R., Chelliah, M.,Ebisuzaki, W., Higgins, W., Janowiak, J., Mo, K., Ropelewski, C., Wang, J., Jenne,R., Joseph, D., 1996. The NCEP/NCAR 40-year reanalysis project. Bulletin ofAmerican Meteorological Society 77, 437–470. March 1996.

D. Shropshire et al. / Energy Policy 46 (2012) 558–573 573
Loisel, R., Mercier, A., Gatzen, C., Elms, N., Petric, H., 2010. Valuation framework forlarge scale electricity storage in a case with wind curtailment. Energy Policy38 (11), 7323–7337, http://dx.doi.org/10.1016/j.enpol.2010.08.007.
McLean, J.R., 2008. WP2.6—Equivalent Wind Power Curves, Trade Wind. Docu-ment available on line at: /http://www.trade-wind.eu/fileadmin/documents/publications/D2.4_Equivalent_Wind_Power_Curves_11914bt02c.pdfS,(accessed Feb. 3, 2012).
Nicholson, R., Bigliani, R., Torchia, M., Jaffe, S., 2009. Defining the Virtual PowerPlant, IDC Energy Insights. Document no. EI221035, December, 2009. Docu-ment available on line at : /http://www.idc-ei.com/getdoc.jsp?sessionId=&containerId=EI221035S, (accessed Feb. 3, 2012).
Norgaard, P.; Holttinen, H. 2004. A Multi-Turbine Power Curve Approach, 1.—2.3.2004Gothenburg, Sweden: Proceedings of Nordic Wind Power Conference 2004.
OECD/NEA, 2011. Technical and Economic Aspects of Load Following with NuclearPower Plants. June 2011. Document available on line at: /http://www.oecd-nea.org/ndd/reports/2011/load-following-npp.pdfS, (accessed Feb. 3, 2012).
Pattanariyankool, S., Lave, L., 2010. Optimizing transmission from distant windfarms. Energy Policy 38, 2806–2815.
Purvins, A., Zubaryeva, A., Llorente, M., Tzimas, E., Mercier, A., 2011. Challengesand options for a large wind power uptake by the European electricity system.Applied Energy 88, 1461–1469.
Rosatom, 2011. World’s First Floating Power Unit Launched, Information andPublic Relations Administration of Risenergoatom Concern JSC, Press Centre ofConsol, June 30, 2010. Document available on line at: /http://www.rosatom.ru/wps/wcm/connect/rosatom/rosatomsite.eng/presscentre/highlights/fc933180432ee7c2ab57eb539abab8a1S, (accessed Feb. 3, 2012).
Vos, K., Morbee, J., Driesen J., 2011. Impact of wind power integration on BelgianPower reserve requirements. 34th IAEE International Conference, Stockholm,June 19–23, 2011.
Windspeed, 2012. Roadmap to the deployment of offshore wind energy in theCentral and Southern North Sea (2020–2030). Document available on line at:/http://www.windspeed.eu/media/publications/WINDSPEED_Roadmap_110719_final.pdfS, (accessed Feb. 3, 2012).
World Nuclear Association (WNA), 2010. Information Papers-Small Nuclear PowerReactors. Document available on line at: /www.world-nuclear.org/info/inf33.htmlS, (accessed Feb. 3, 2012).