beirut city profile - un-habitat
TRANSCRIPT
B E I R U T
CITY
PROFILE2021

B E I R U T
CITY
PROFILE
2021
IV
UN-Habitat mandateUN-Habitat, the United Nations Human Settlements Programme, is mandated by the United Nations General Assembly to promote socially and environmentally sustainable towns and cities, and adequate housing for all, and is the lead agency within the United Nations system for coordinating activities in the field of human settlements. It is mandated through the Habitat Agenda1 to take the lead in disaster mitigation and post-crisis rehabilitation capabilities in human settlements.
UN-Habitat’s global responsibilities in emergency, humanitarian and post-crisis response are to support national and decentralized governments as well as civil society in strengthening their capacity for managing human-made and natural disasters affecting human settlements. Experience has shown that the potential for development gain is high in the immediate aftermath of a crisis, and this is a key principle underlying UN-Habitat’s efforts to deploy at the earliest opportunity following a disaster. UN-Habitat’s added value is that it is the United Nations agency specialized in working in cities and human settlements.
Since 2006, the agency has been present in Lebanon, first involved in recovery and reconstruction efforts in South Lebanon, Beirut, and Northern Lebanon (particularly in the Nahr el Bared Camp crisis response in 2007), and in efforts to improve the living conditions in the 43 Palestinian out-of-camp concentrations. Since 2013, UN-Habitat has been involved in responding to the Syrian refugee crisis, and since 4 August 2020 to the Beirut blast.
For more information: United Nations Human Settlements Programme (UN-Habitat)UN House, 5th floor, Riad El SolhBeirut, LebanonE: [email protected]: www.unhabitat.org
DisclaimerThe designations employed and the presentation of the material in this document do not imply the expression of any opinion whatsoever on the part of the Secretariat of the United Nations concerning the legal status of any country territory, city or area, or of its authorities, or concerning delimitation of its frontiers or boundaries, or regarding its economic system or degree of development. The analysis, conclusions and recommendations of this document do not necessarily reflect the views of the United Nations Human Settlements Programme, the Governing Council of the United Nations Human Settlements Programme or its Member States. References to names of firms and commercial products and processes do not imply their endorsement by the United Nations, and a failure to mention a particular firm, commercial product or process is not a sign of disapproval. Excerpts from the text may be reproduced without authorization, on condition that the source is indicated.
1 United Nations, “United Nations Conference on Human Settlements (Habitat II): The Habitat Agenda,” 1996.
Note that this report includes slight revisions made to an earlier printed version launched on 11 June 2021.Citation format: UN-Habitat Lebanon (2021) Beirut City Profile 2021, Beirut: UN-Habitat Lebanon. Copyright © 2021 UN-Habitat. All rights reserved.
V
Credits and acknowledgmentsUN-Habitat Lebanon gratefully acknowledges the support of the Cities Alliance and NORCAP (the Norwegian Refugee Council’s global provider of expertise), and the Norwegian Ministry of Foreign Affairs for the development of this report. The generous cooperation, advice and information provided by municipalities and unions of municipalities covered in this report are recognized. Other United Nations agencies and humanitarian partners kindly gave their advice and time to the process of developing and reviewing the profile, as well as provided valuable data for the analysis. Several academics have also kindly provided time and knowledge to inform the profile. In particular, we would like to acknowledge the contributions of:
Report team
Written by Synne Bergby, Urban-A Ida Zeline W-F Lien, Urban-ABergljot Prebensen, Urban-A
Reviewed by Taina Christiansen, UN-HabitatNanor Karageozian, UN-Habitat
Researched by Bassam Abdel Samad, former UN-Habitat (2017 draft) Christelle Khalil, former UN-Habitat (2017 draft)Suzanne Maguire, UN-HabitatSawsan Saad, former UN-Habitat (2017 draft)
GIS mapping by Charbel Abou Chakra, UN-HabitatChristelle Bercachy, former UN-Habitat (2017 draft)Ali Saad, former UN-Habitat (2017 draft)Racha Serhal, former UN-Habitat (2017 draft)
Graphic design by Concept design by Made for BrandsContent design for this profile by Synne Bergby and Ida Zeline W-F Lien, Urban-A
Chapter Reviewed by
Full report review Maha Ayoubi, Norwegian Refugee Council (NRC)Lianna Badamo, NRCStuart Brooks, NRCMaroun el-Daccache, Lebanese American University Jihad Farah, Lebanese UniversityMona Fawaz, American University of Beirut (AUB) (2017 draft)Are John Knudsen, Christian Michelsen Institute (CMI)Christine Mady, Notre Dame UniversityLeon Telvizian, UPLoAD Claire Wilson, UN Women
Context Erling Lorentzen, University of Oslo (UiO)
Demography Ali Saad, UNHCRJad Ghosn, UNHCR
Economy and Livelihoods Kevork Baboyan, UNDP/UN-HabitatMarija De Wijn, UNDP/UN-Habitat Ghassan Nehme, UNDP/UN-Habitat
Education Lama Ghanem, UNICEF Georges Haddad, UNICEF
Housing Bernardo Ribeiro de Almeida, Leiden UniversityBruno Marot, Independent Consultant
Environment Jihan Seoud, UNDP
With generous contributions from all of UN-Habitat Lebanon and UN-Habitat Regional Office for Arab States and Headquarters.

VI
VII
Foreword by United Nations Resident and Humanitarian Coordinator for Lebanon As Lebanon continues to face unprecedented and multifaceted crises on different fronts – marked by the ensuing socioeconomic and financial crises, compounded by the COVID-19 pandemic and further exacerbated by the Beirut Port explosions of 4 August 2020 – the United Nations in Lebanon continues to support the people and Government of Lebanon and commits to defend their rights to dignity, peace and justice.
Despite the unfolding humanitarian crisis and continued development challenges in the country, the importance of laying the foundational elements that facilitate the humanitarian-development-peace nexus remains high and vital. One of these elements is the Beirut City Profile that provides an important opportunity to reflect on and underscore the multidimensional needs of the residents, through a comprehensive, multisectoral and area-based approach to analysing and diagnosing the capital city, both before and after the explosion.
The Beirut City Profile can form an important basis for all stakeholders engaged in supporting the ongoing recovery and reconstruction of the city and beyond, by addressing existing humanitarian and development challenges. The findings and recommendations generating from this profile equally offer the opportunity to move towards an integrated urban recovery approach that requires coordinated and concerted efforts that ensure government engagement to explore the dynamics of a city as influenced by the vulnerability, poverty, inequality and tension that exist. This will help reduce the impact of recurrent shocks and stresses, as well as support the preservation or restoration of stability that is indispensable for sustainable development.
Women’s rights are integral to both the immediate response to shocks and to longer-term development outcomes. The Beirut City Profile underscores the relevance of these rights to achieve an inclusive and sustainable recovery and reconstruction process. Similarly, the profile emphasizes the substantial role of local leadership and the need to develop national and local systems that are capable to take full accountability for the provision of essential basic and social services and offer better prospects for appropriate, sustainable and transformative responses to similar crises/shocks.
The expertise offered by UN-Habitat through its extensive profiling work in Lebanon is critical. By adopting an area-based approach to data gathering and synthesis, the United Nations hopes to inform integrated programming for communities, national and local authorities, in ways that benefit all residents and leave no one behind.
Najat RochdiUnited Nations Deputy Special Coordinator for Lebanon, Resident and Humanitarian Coordinator
VI
Foreword by United Nations Resident and Humanitarian Coordinator for Lebanon
As Lebanon continues to face unprecedented and multifaceted crises on different fronts – marked by the ensuing socioeconomic and financial crises, compounded by the COVID-19 pandemic and further exacerbated by the Beirut Port explosions of 4 August 2020 – the United Nations in Lebanon continues to support the people and Government of Lebanon and commits to defend their rights to dignity, peace and justice.
Despite the unfolding humanitarian crisis and continued development challenges in the country, the importance of laying the foundational elements that facilitate the humanitarian-development-peace nexus remains high and vital. One of these elements is the Beirut City Profile that provides an important opportunity to reflect on and underscore the multidimensional needs of the residents, through a comprehensive, multisectoral and area-based approach to analysing and diagnosing the capital city, both before and after the explosion.
The Beirut City Profile can form an important basis for all stakeholders engaged in supporting the ongoing recovery and reconstruction of the city and beyond, by addressing existing humanitarian and development challenges. The findings and recommendations generating from this profile equally offer the opportunity to move towards an integrated urban recovery approach that requires coordinated and concerted efforts that ensure government engagement to explore the dynamics of a city as influenced by the vulnerability, poverty, inequality and tension that exist. This will help reduce the impact of recurrent shocks and stresses, as well as support the preservation or restoration of stability that is indispensable for sustainable development.
Women’s rights are integral to both the immediate response to shocks and to longer-term development outcomes. The Beirut City Profile underscores the relevance of these rights to achieve an inclusive and sustainable recovery and reconstruction process. Similarly, the profile emphasizes the substantial role of local leadership and the need to develop national and local systems that are capable to take full accountability for the provision of essential basic and social services and offer better prospects for appropriate, sustainable and transformative responses to similar crises/shocks.
The expertise offered by UN-Habitat through its extensive profiling work in Lebanon is critical. By adopting an area-based approach to data gathering and synthesis, the United Nations hopes to inform integrated programming for communities, national and local authorities, in ways that benefit all residents and leave no one behind.
Najat RochdiUnited Nations Deputy Special Coordinator for Lebanon, Resident and Humanitarian Coordinator
VIII
Foreword by Governor of Beirut Lebanon historically suffers from a lack of well-developed and evidence-based urban policies, which have contributed, along with other issues, to an unplanned process of local social and economic development. Since the end of the Lebanese Civil War, successive governments have not been able to agree on a clear mechanism that seeks to ensure equitable and sustainable regional and local development.
The absence of a sound urban policy framework has given rise to various issues and challenges, such as internal migration from rural areas to the cities, especially to the capital Beirut and its suburbs, in search of jobs and better standards of living. Internal displacement caused by the civil war further increased economic and social pressures on major cities. Cities have thus expanded outside their official administrative boundaries in an accelerated and often unorganized manner. This expansion has contributed to the creation of informal neighbourhoods and pockets of poverty that suffer from various forms of vulnerability, including social tensions that could lead to a deterioration of the security situation. The Syrian refugee crisis came to further raise the level of challenges for cities, especially marginalized neighbourhoods, where the rise in the population size has increased stresses on the provision of basic and social services as well as the availability of job opportunities.
The repercussions of the Beirut Port explosion have highlighted the weakness of the state’s capacity to face disasters and crises. This has been demonstrated in terms of the absence of national plans to respond to the consequences of the explosion, and in terms of the lack of adequate physical and human resources, of updated data, as well as of administrative and legal frameworks and mechanisms that enable local authorities to work collectively - and in coordination with other relevant actors - to lead an effective response and recovery process. The explosion shed light on major challenges related to housing and property issues, in addition to basic municipal services, and the relationship between state institutions at the coordination and operational levels.
We hope that this report, the Beirut City Profile, represents a real opportunity for decision makers, at the national and local levels, to define short- and longer-term development priorities and to join efforts and consolidate resources in order to secure a better future for all residents and ensure their right to an adequate standard of living. We also hope that the findings and recommendations of this report will help to better coordinate and integrate programmes and support provided by donors and international organizations, including the United Nations, which will ensure the implementation of priority projects in an effective and transparent manner.
We urge UN-Habitat to continue the gathering, analysis and updating of urban data, facts and statistics that would provide a clear picture on the challenges facing our cities and place them at the disposal of all stakeholders in order to achieve fair, balanced and sustainable development.
Judge Marwan AbboudBeirut Governor
IX
Foreword by Governor of Mount Lebanon Since the end of the Lebanese Civil War in 1990, life emerged again from under the rubble and the reconstruction journey was launched in an effort to turn the page on a painful conflict-filled chapter that left infrastructure and buildings heavily damaged in Beirut and other parts of the country.
In this post-war phase, the country witnessed prosperity and the inflows of external transfers poured into its banks. However, the productive sectors did not develop, while the number of specialized degree holders increased with no sufficient job opportunities, leading to an increased brain drain and rural-urban migration, triggered often by the search for employment. This has contributed to humanitarian, social and economic hardships impacting the whole country, while the trade balance deficit kept on increasing. The scale and rate of population movement – along with other challenges – exceeded the capacities of the consecutive governments in establishing frameworks to promote local economic development and to limit the internal migration, which has led to the expansion of major cities beyond their administrative boundaries in an unplanned manner. This unplanned expansion has led to the proliferation of poor neighbourhoods, which have become a haven for vulnerable groups lacking any safety nets and subsequently became prone to humanitarian, social and security issues.
In parallel, the Syrian refugee crisis added to the challenges and risks inside cities, especially within vulnerable neighbourhoods, where the growing population increased the competition over access to basic services and jobs, sometimes evolving into violent clashes and crimes that could have developed further had they not been swiftly contained.
The catastrophic 4 August 2020 explosion in the Port of Beirut added to these pre-existing crises. The blast destroyed housing units, displaced many families that used to live in stability, killed over 200 persons, and wounded thousands. These repercussions were beyond the already strained capacities of the Lebanese state. The state was not ready to face a multifaceted disaster with its financial or human resources, as well as its administrative and legal frameworks, nor in terms of coordination mechanisms with the local governments – including municipalities and unions of municipalities – on one hand, and with non-governmental organizations and civil society groups, on the other hand. This has led to announcing Beirut as a “city in disaster” and resorting to the United Nations, the Arab League and all supportive countries to lend a helping hand and support the recovery to avoid more humanitarian crises.
We greatly hope that the Beirut City Profile published by UN-Habitat represents a real opportunity for decision makers, at the national and local levels, to define development priorities and to join efforts and consolidate resources in order to secure a better future for all residents and ensure their right to an adequate standard of living. We also hope that the findings and recommendations of this report will help to better coordinate and integrate programmes and support provided by donors and international organizations, including the United Nations, which will ensure the implementation of priority projects in an effective and transparent manner.
We urge UN-Habitat to persevere in its efforts to gather new data and update the collected information on the challenges Beirut and our other cities are facing and to place them at the disposal of all stakeholders in order to achieve fair, balanced and sustainable development.
Judge Mohammad MekkawyMount Lebanon Governor
X
Table of contentsUN-Habitat mandate . . . . . . . . . . . . . . . . . . . . . . . . . . . . . . . . . . . . . . . . . . . . . . . . . . . . . . . . . . . . . . . . . . . . . . . . . . . . . . . . . . . . . . . . . . . . . . . . IVDisclaimer . . . . . . . . . . . . . . . . . . . . . . . . . . . . . . . . . . . . . . . . . . . . . . . . . . . . . . . . . . . . . . . . . . . . . . . . . . . . . . . . . . . . . . . . . . . . . . . . . . . . . . . . . . IVCredits and acknowledgment . . . . . . . . . . . . . . . . . . . . . . . . . . . . . . . . . . . . . . . . . . . . . . . . . . . . . . . . . . . . . . . . . . . . . . . . . . . . . . . . . . . . . . . . . .VForeword by United Nations Resident and Humanitarian Coordinator for Lebanon . . . . . . . . . . . . . . . . . . . . . . . . . . . . . . . . . . . . . . . . VIIForeword by Governor of Beirut . . . . . . . . . . . . . . . . . . . . . . . . . . . . . . . . . . . . . . . . . . . . . . . . . . . . . . . . . . . . . . . . . . . . . . . . . . . . . . . . . . . . . . VIIIForeword by Governor of Mount Lebanon . . . . . . . . . . . . . . . . . . . . . . . . . . . . . . . . . . . . . . . . . . . . . . . . . . . . . . . . . . . . . . . . . . . . . . . . . . . . . IXKey definitions . . . . . . . . . . . . . . . . . . . . . . . . . . . . . . . . . . . . . . . . . . . . . . . . . . . . . . . . . . . . . . . . . . . . . . . . . . . . . . . . . . . . . . . . . . . . . . . . . . . . . . XIIIList of main abbreviations and acronyms . . . . . . . . . . . . . . . . . . . . . . . . . . . . . . . . . . . . . . . . . . . . . . . . . . . . . . . . . . . . . . . . . . . . . . . . . . . . . . XIV
Executive summary . . . . . . . . . . . . . . . . . . . . . . . . . . . . . . . . . . . . . . . . . . . . . . . . . . . . . . . . . . . . . . . . . . . . . . . . . XVIIFrom shock absorption towards transformation: Recommendations on the way forward . . . . . . . . . . . . . . . . . . . . . . . . . . . . . . . . . . . XXFive principles for urban recovery . . . . . . . . . . . . . . . . . . . . . . . . . . . . . . . . . . . . . . . . . . . . . . . . . . . . . . . . . . . . . . . . . . . . . . . . . . . . . . . . . . . . . XXIRecovery ladder for Beirut City . . . . . . . . . . . . . . . . . . . . . . . . . . . . . . . . . . . . . . . . . . . . . . . . . . . . . . . . . . . . . . . . . . . . . . . . . . . . . . . . . . . . . . .XXIIRecommendations for urban recovery at the city level . . . . . . . . . . . . . . . . . . . . . . . . . . . . . . . . . . . . . . . . . . . . . . . . . . . . . . . . . . . . . . . . . .XXIIRecommendations for urban recovery at the neighbourhood level . . . . . . . . . . . . . . . . . . . . . . . . . . . . . . . . . . . . . . . . . . . . . . . . . . . . . . . .XXIIRecommendations for urban recovery at the national level . . . . . . . . . . . . . . . . . . . . . . . . . . . . . . . . . . . . . . . . . . . . . . . . . . . . . . . . . . . . . XXIII
Introduction . . . . . . . . . . . . . . . . . . . . . . . . . . . . . . . . . . . . . . . . . . . . . . . . . . . . . . . . . . . . . . . . . . . . . . . . . . . . . . . . . 2Methodology . . . . . . . . . . . . . . . . . . . . . . . . . . . . . . . . . . . . . . . . . . . . . . . . . . . . . . . . . . . . . . . . . . . . . . . . . . . . . . . . . . . . . . . . . . . . . . . . . . . . . . . .4
Context . . . . . . . . . . . . . . . . . . . . . . . . . . . . . . . . . . . . . . . . . . . . . . . . . . . . . . . . . . . . . . . . . . . . . . . . . . . . . . . . . . . . . 13Spatial development and organization . . . . . . . . . . . . . . . . . . . . . . . . . . . . . . . . . . . . . . . . . . . . . . . . . . . . . . . . . . . . . . . . . . . . . . . . . . . . . . . . 14City expansion . . . . . . . . . . . . . . . . . . . . . . . . . . . . . . . . . . . . . . . . . . . . . . . . . . . . . . . . . . . . . . . . . . . . . . . . . . . . . . . . . . . . . . . . . . . . . . . . . . . . . . 16History . . . . . . . . . . . . . . . . . . . . . . . . . . . . . . . . . . . . . . . . . . . . . . . . . . . . . . . . . . . . . . . . . . . . . . . . . . . . . . . . . . . . . . . . . . . . . . . . . . . . . . . . . . . . . 18Conflicts and tension . . . . . . . . . . . . . . . . . . . . . . . . . . . . . . . . . . . . . . . . . . . . . . . . . . . . . . . . . . . . . . . . . . . . . . . . . . . . . . . . . . . . . . . . . . . . . . . . 24Interlinked shocks . . . . . . . . . . . . . . . . . . . . . . . . . . . . . . . . . . . . . . . . . . . . . . . . . . . . . . . . . . . . . . . . . . . . . . . . . . . . . . . . . . . . . . . . . . . . . . . . . . . 25
Demography . . . . . . . . . . . . . . . . . . . . . . . . . . . . . . . . . . . . . . . . . . . . . . . . . . . . . . . . . . . . . . . . . . . . . . . . . . . . . . . . .29Population estimates for Lebanon . . . . . . . . . . . . . . . . . . . . . . . . . . . . . . . . . . . . . . . . . . . . . . . . . . . . . . . . . . . . . . . . . . . . . . . . . . . . . . . . . . . . 31Population in Beirut City . . . . . . . . . . . . . . . . . . . . . . . . . . . . . . . . . . . . . . . . . . . . . . . . . . . . . . . . . . . . . . . . . . . . . . . . . . . . . . . . . . . . . . . . . . . . . 32Density. . . . . . . . . . . . . . . . . . . . . . . . . . . . . . . . . . . . . . . . . . . . . . . . . . . . . . . . . . . . . . . . . . . . . . . . . . . . . . . . . . . . . . . . . . . . . . . . . . . . . . . . . . . . . 32Gender . . . . . . . . . . . . . . . . . . . . . . . . . . . . . . . . . . . . . . . . . . . . . . . . . . . . . . . . . . . . . . . . . . . . . . . . . . . . . . . . . . . . . . . . . . . . . . . . . . . . . . . . . . . . . 36Children and youth . . . . . . . . . . . . . . . . . . . . . . . . . . . . . . . . . . . . . . . . . . . . . . . . . . . . . . . . . . . . . . . . . . . . . . . . . . . . . . . . . . . . . . . . . . . . . . . . . . 37Elderly . . . . . . . . . . . . . . . . . . . . . . . . . . . . . . . . . . . . . . . . . . . . . . . . . . . . . . . . . . . . . . . . . . . . . . . . . . . . . . . . . . . . . . . . . . . . . . . . . . . . . . . . . . . . . 37Refugees . . . . . . . . . . . . . . . . . . . . . . . . . . . . . . . . . . . . . . . . . . . . . . . . . . . . . . . . . . . . . . . . . . . . . . . . . . . . . . . . . . . . . . . . . . . . . . . . . . . . . . . . . . . 38Mixed migration . . . . . . . . . . . . . . . . . . . . . . . . . . . . . . . . . . . . . . . . . . . . . . . . . . . . . . . . . . . . . . . . . . . . . . . . . . . . . . . . . . . . . . . . . . . . . . . . . . . . . 39
Theme 1: Governance and accountability . . . . . . . . . . . . . . . . . . . . . . . . . . . . . . . . . . . . . . . . . . . . . . . . . . . . . . .47National governance . . . . . . . . . . . . . . . . . . . . . . . . . . . . . . . . . . . . . . . . . . . . . . . . . . . . . . . . . . . . . . . . . . . . . . . . . . . . . . . . . . . . . . . . . . . . . . . . . 48Legal framework . . . . . . . . . . . . . . . . . . . . . . . . . . . . . . . . . . . . . . . . . . . . . . . . . . . . . . . . . . . . . . . . . . . . . . . . . . . . . . . . . . . . . . . . . . . . . . . . . . . . 52Urban governance . . . . . . . . . . . . . . . . . . . . . . . . . . . . . . . . . . . . . . . . . . . . . . . . . . . . . . . . . . . . . . . . . . . . . . . . . . . . . . . . . . . . . . . . . . . . . . . . . . . 53Beirut governance structure . . . . . . . . . . . . . . . . . . . . . . . . . . . . . . . . . . . . . . . . . . . . . . . . . . . . . . . . . . . . . . . . . . . . . . . . . . . . . . . . . . . . . . . . . . 54Governance of Palestinian camps and gatherings . . . . . . . . . . . . . . . . . . . . . . . . . . . . . . . . . . . . . . . . . . . . . . . . . . . . . . . . . . . . . . . . . . . . . . . 56Legal and regulatory framework for urban space . . . . . . . . . . . . . . . . . . . . . . . . . . . . . . . . . . . . . . . . . . . . . . . . . . . . . . . . . . . . . . . . . . . . . . . . 57Public spending and finance . . . . . . . . . . . . . . . . . . . . . . . . . . . . . . . . . . . . . . . . . . . . . . . . . . . . . . . . . . . . . . . . . . . . . . . . . . . . . . . . . . . . . . . . . 60Non-state actors . . . . . . . . . . . . . . . . . . . . . . . . . . . . . . . . . . . . . . . . . . . . . . . . . . . . . . . . . . . . . . . . . . . . . . . . . . . . . . . . . . . . . . . . . . . . . . . . . . . . 63Youth representation . . . . . . . . . . . . . . . . . . . . . . . . . . . . . . . . . . . . . . . . . . . . . . . . . . . . . . . . . . . . . . . . . . . . . . . . . . . . . . . . . . . . . . . . . . . . . . . . 64Women’s participation . . . . . . . . . . . . . . . . . . . . . . . . . . . . . . . . . . . . . . . . . . . . . . . . . . . . . . . . . . . . . . . . . . . . . . . . . . . . . . . . . . . . . . . . . . . . . . . 64
Theme 2: Economy and livelihoods . . . . . . . . . . . . . . . . . . . . . . . . . . . . . . . . . . . . . . . . . . . . . . . . . . . . . . . . . . . .67Macroeconomic context . . . . . . . . . . . . . . . . . . . . . . . . . . . . . . . . . . . . . . . . . . . . . . . . . . . . . . . . . . . . . . . . . . . . . . . . . . . . . . . . . . . . . . . . . . . . . . 69Economic development and governance . . . . . . . . . . . . . . . . . . . . . . . . . . . . . . . . . . . . . . . . . . . . . . . . . . . . . . . . . . . . . . . . . . . . . . . . . . . . . . . 70Employment . . . . . . . . . . . . . . . . . . . . . . . . . . . . . . . . . . . . . . . . . . . . . . . . . . . . . . . . . . . . . . . . . . . . . . . . . . . . . . . . . . . . . . . . . . . . . . . . . . . . . . . 80Informal sector . . . . . . . . . . . . . . . . . . . . . . . . . . . . . . . . . . . . . . . . . . . . . . . . . . . . . . . . . . . . . . . . . . . . . . . . . . . . . . . . . . . . . . . . . . . . . . . . . . . . . . 81Poverty . . . . . . . . . . . . . . . . . . . . . . . . . . . . . . . . . . . . . . . . . . . . . . . . . . . . . . . . . . . . . . . . . . . . . . . . . . . . . . . . . . . . . . . . . . . . . . . . . . . . . . . . . . . . 82Food security . . . . . . . . . . . . . . . . . . . . . . . . . . . . . . . . . . . . . . . . . . . . . . . . . . . . . . . . . . . . . . . . . . . . . . . . . . . . . . . . . . . . . . . . . . . . . . . . . . . . . . . 83Remittances . . . . . . . . . . . . . . . . . . . . . . . . . . . . . . . . . . . . . . . . . . . . . . . . . . . . . . . . . . . . . . . . . . . . . . . . . . . . . . . . . . . . . . . . . . . . . . . . . . . . . . . . 84Women in the economy . . . . . . . . . . . . . . . . . . . . . . . . . . . . . . . . . . . . . . . . . . . . . . . . . . . . . . . . . . . . . . . . . . . . . . . . . . . . . . . . . . . . . . . . . . . . . . 85Youth in the economy . . . . . . . . . . . . . . . . . . . . . . . . . . . . . . . . . . . . . . . . . . . . . . . . . . . . . . . . . . . . . . . . . . . . . . . . . . . . . . . . . . . . . . . . . . . . . . . 86
Theme 3: Social protection and social inclusion . . . . . . . . . . . . . . . . . . . . . . . . . . . . . . . . . . . . . . . . . . . . . . . . .89Social protection governance . . . . . . . . . . . . . . . . . . . . . . . . . . . . . . . . . . . . . . . . . . . . . . . . . . . . . . . . . . . . . . . . . . . . . . . . . . . . . . . . . . . . . . . . . 91Protection concerns for vulnerable groups . . . . . . . . . . . . . . . . . . . . . . . . . . . . . . . . . . . . . . . . . . . . . . . . . . . . . . . . . . . . . . . . . . . . . . . . . . . . . 92Social stability and inclusion . . . . . . . . . . . . . . . . . . . . . . . . . . . . . . . . . . . . . . . . . . . . . . . . . . . . . . . . . . . . . . . . . . . . . . . . . . . . . . . . . . . . . . . . . 96
XI
List of tablesTable 1 Overview of vulnerability mappings in Lebanon and Beirut City . . . . . . . . . . . . . . . . . . . . . . . . . . . . . . . . . . . . . . . . . . . . . . . . . . . .6Table 2 Disadvantaged areas on a subcadastral level in Beirut City, based on the list of 498 areas.. . . . . . . . . . . . . . . . . . . . . . . . . . . . 7
Table 3 Disadvantaged areas on a cadastral level in Beirut City, based on the list of 498 areas.. . . . . . . . . . . . . . . . . . . . . . . . . . . . . . . 7Table 4 Overview of neighbourhood profiling in Beirut . . . . . . . . . . . . . . . . . . . . . . . . . . . . . . . . . . . . . . . . . . . . . . . . . . . . . . . . . . . . . . . . . . .9Table 5 Governorates, districts, municipalities, cadastres and unions of municipalities in Beirut City. . . . . . . . . . . . . . . . . . . . . . . . . 20Table 6 Population figures for the most populous cadastres in Beirut by nationality cohort.. . . . . . . . . . . . . . . . . . . . . . . . . . . . . . . . . 36Table 7 Cadastres in Beirut with the highest population densities.. . . . . . . . . . . . . . . . . . . . . . . . . . . . . . . . . . . . . . . . . . . . . . . . . . . . . . . . 36Table 8 Refugee cohorts in the 16 cadastres with the largest presence of refugees in Beirut City and in the entire city. . . . . . . . . . 40Table 9 Palestinian gatherings and official camps in Beirut City . . . . . . . . . . . . . . . . . . . . . . . . . . . . . . . . . . . . . . . . . . . . . . . . . . . . . . . . . . 43Table 10 Urban planning policies and master plans with implications for Beirut . . . . . . . . . . . . . . . . . . . . . . . . . . . . . . . . . . . . . . . . . . . . 59Table 11 IMF annual transfers to municipalities . . . . . . . . . . . . . . . . . . . . . . . . . . . . . . . . . . . . . . . . . . . . . . . . . . . . . . . . . . . . . . . . . . . . . . . . . 60Table 12 Number of municipal councillors and mukhtars and female representation by municipality, based on 2016 municipal and
mukhtar official election results.. . . . . . . . . . . . . . . . . . . . . . . . . . . . . . . . . . . . . . . . . . . . . . . . . . . . . . . . . . . . . . . . . . . . . . . . . . . . . . . 63Table 13 Businesses across eight profiled neighbourhoods in Beirut City. . . . . . . . . . . . . . . . . . . . . . . . . . . . . . . . . . . . . . . . . . . . . . . . . . 74Table 14 Public employment in 2018.. . . . . . . . . . . . . . . . . . . . . . . . . . . . . . . . . . . . . . . . . . . . . . . . . . . . . . . . . . . . . . . . . . . . . . . . . . . . . . . . . 80Table 15 Poverty levels across eight profiled neighbourhoods in Beirut City. . . . . . . . . . . . . . . . . . . . . . . . . . . . . . . . . . . . . . . . . . . . . . . . 82Table 16 Number of hospital beds in Beirut and Mount Lebanon governorates. . . . . . . . . . . . . . . . . . . . . . . . . . . . . . . . . . . . . . . . . . . . .104Table 17 Most commonly reported types of health conditions in surveyed Lebanese and non-Lebanese households . . . . . . . . . .
across eight profiled neighbourhoods in Beirut City.. . . . . . . . . . . . . . . . . . . . . . . . . . . . . . . . . . . . . . . . . . . . . . . . . . . . . . . . . . . . . 105Table 18 Residents (aged 3+) by level of education attained and gender in Beirut, Aley, Baabda and El-Metn districts.. . . . . . . . . 111Table 19 Government actors and responsibilities. . . . . . . . . . . . . . . . . . . . . . . . . . . . . . . . . . . . . . . . . . . . . . . . . . . . . . . . . . . . . . . . . . . . . . . . 170Table 20 Primary health-care centres (PHCCs) in Beirut urban area . . . . . . . . . . . . . . . . . . . . . . . . . . . . . . . . . . . . . . . . . . . . . . . . . . . . . 173Table 21 Private and public hospitals in the Beirut metropolitan area . . . . . . . . . . . . . . . . . . . . . . . . . . . . . . . . . . . . . . . . . . . . . . . . . . . . . 175
Theme 4: Basic and social services . . . . . . . . . . . . . . . . . . . . . . . . . . . . . . . . . . . . . . . . . . . . . . . . . . . . . . . . . . . .99Health . . . . . . . . . . . . . . . . . . . . . . . . . . . . . . . . . . . . . . . . . . . . . . . . . . . . . . . . . . . . . . . . . . . . . . . . . . . . . . . . . . . . . . . . . . . . . . . . . . . . . . . . . . . . . 101Education . . . . . . . . . . . . . . . . . . . . . . . . . . . . . . . . . . . . . . . . . . . . . . . . . . . . . . . . . . . . . . . . . . . . . . . . . . . . . . . . . . . . . . . . . . . . . . . . . . . . . . . . . . 108Energy . . . . . . . . . . . . . . . . . . . . . . . . . . . . . . . . . . . . . . . . . . . . . . . . . . . . . . . . . . . . . . . . . . . . . . . . . . . . . . . . . . . . . . . . . . . . . . . . . . . . . . . . . . . . . 112Water, sanitation and hygiene (WaSH) . . . . . . . . . . . . . . . . . . . . . . . . . . . . . . . . . . . . . . . . . . . . . . . . . . . . . . . . . . . . . . . . . . . . . . . . . . . . . . . . . 118Solid waste management . . . . . . . . . . . . . . . . . . . . . . . . . . . . . . . . . . . . . . . . . . . . . . . . . . . . . . . . . . . . . . . . . . . . . . . . . . . . . . . . . . . . . . . . . . . . 123Transport . . . . . . . . . . . . . . . . . . . . . . . . . . . . . . . . . . . . . . . . . . . . . . . . . . . . . . . . . . . . . . . . . . . . . . . . . . . . . . . . . . . . . . . . . . . . . . . . . . . . . . . . . . . 124
Theme 5: Housing . . . . . . . . . . . . . . . . . . . . . . . . . . . . . . . . . . . . . . . . . . . . . . . . . . . . . . . . . . . . . . . . . . . . . . . . . . 129Housing governance . . . . . . . . . . . . . . . . . . . . . . . . . . . . . . . . . . . . . . . . . . . . . . . . . . . . . . . . . . . . . . . . . . . . . . . . . . . . . . . . . . . . . . . . . . . . . . . . . 132Supply, affordability and quality of housing . . . . . . . . . . . . . . . . . . . . . . . . . . . . . . . . . . . . . . . . . . . . . . . . . . . . . . . . . . . . . . . . . . . . . . . . . . . . 132Housing tenure . . . . . . . . . . . . . . . . . . . . . . . . . . . . . . . . . . . . . . . . . . . . . . . . . . . . . . . . . . . . . . . . . . . . . . . . . . . . . . . . . . . . . . . . . . . . . . . . . . . . . 136Impact of the 4 August 2020 blast on the housing sector . . . . . . . . . . . . . . . . . . . . . . . . . . . . . . . . . . . . . . . . . . . . . . . . . . . . . . . . . . . . . . . 137Legal measures . . . . . . . . . . . . . . . . . . . . . . . . . . . . . . . . . . . . . . . . . . . . . . . . . . . . . . . . . . . . . . . . . . . . . . . . . . . . . . . . . . . . . . . . . . . . . . . . . . . . .140
Theme 6: Environment . . . . . . . . . . . . . . . . . . . . . . . . . . . . . . . . . . . . . . . . . . . . . . . . . . . . . . . . . . . . . . . . . . . . . . 143Environmental governance . . . . . . . . . . . . . . . . . . . . . . . . . . . . . . . . . . . . . . . . . . . . . . . . . . . . . . . . . . . . . . . . . . . . . . . . . . . . . . . . . . . . . . . . . . . 145Environmental threats . . . . . . . . . . . . . . . . . . . . . . . . . . . . . . . . . . . . . . . . . . . . . . . . . . . . . . . . . . . . . . . . . . . . . . . . . . . . . . . . . . . . . . . . . . . . . . . 145Climate change adaptation . . . . . . . . . . . . . . . . . . . . . . . . . . . . . . . . . . . . . . . . . . . . . . . . . . . . . . . . . . . . . . . . . . . . . . . . . . . . . . . . . . . . . . . . . . . 146Impact of the 4 August 2020 blast on the environment . . . . . . . . . . . . . . . . . . . . . . . . . . . . . . . . . . . . . . . . . . . . . . . . . . . . . . . . . . . . . . . . . 147Public spaces . . . . . . . . . . . . . . . . . . . . . . . . . . . . . . . . . . . . . . . . . . . . . . . . . . . . . . . . . . . . . . . . . . . . . . . . . . . . . . . . . . . . . . . . . . . . . . . . . . . . . . . 147
Theme 7: Cultural Heritage . . . . . . . . . . . . . . . . . . . . . . . . . . . . . . . . . . . . . . . . . . . . . . . . . . . . . . . . . . . . . . . . . . 151Cultural heritage in Beirut . . . . . . . . . . . . . . . . . . . . . . . . . . . . . . . . . . . . . . . . . . . . . . . . . . . . . . . . . . . . . . . . . . . . . . . . . . . . . . . . . . . . . . . . . . . 153Cultural heritage management . . . . . . . . . . . . . . . . . . . . . . . . . . . . . . . . . . . . . . . . . . . . . . . . . . . . . . . . . . . . . . . . . . . . . . . . . . . . . . . . . . . . . . . 153Impact of the 4 August 2020 blast on cultural heritage . . . . . . . . . . . . . . . . . . . . . . . . . . . . . . . . . . . . . . . . . . . . . . . . . . . . . . . . . . . . . . . . . 153
Recommendations for urban recovery . . . . . . . . . . . . . . . . . . . . . . . . . . . . . . . . . . . . . . . . . . . . . . . . . . . . . . . . 157Diagnosis summary . . . . . . . . . . . . . . . . . . . . . . . . . . . . . . . . . . . . . . . . . . . . . . . . . . . . . . . . . . . . . . . . . . . . . . . . . . . . . . . . . . . . . . . . . . . . . . . . . 159Key findings . . . . . . . . . . . . . . . . . . . . . . . . . . . . . . . . . . . . . . . . . . . . . . . . . . . . . . . . . . . . . . . . . . . . . . . . . . . . . . . . . . . . . . . . . . . . . . . . . . . . . . . . 159Principles for urban recovery . . . . . . . . . . . . . . . . . . . . . . . . . . . . . . . . . . . . . . . . . . . . . . . . . . . . . . . . . . . . . . . . . . . . . . . . . . . . . . . . . . . . . . . . . 164From shock absorption towards transformation: Recommendations on the way forward . . . . . . . . . . . . . . . . . . . . . . . . . . . . . . . . . . . 165Recovery ladder . . . . . . . . . . . . . . . . . . . . . . . . . . . . . . . . . . . . . . . . . . . . . . . . . . . . . . . . . . . . . . . . . . . . . . . . . . . . . . . . . . . . . . . . . . . . . . . . . . . . 165
Recommendations for urban recovery at the city level . . . . . . . . . . . . . . . . . . . . . . . . . . . . . . . . . . . . . . . . . . . . . . . . . . . . . . . . . . . . . 165Recommendations for urban recovery at the neighbourhood level . . . . . . . . . . . . . . . . . . . . . . . . . . . . . . . . . . . . . . . . . . . . . . . . . . . 167Recommendations for urban recovery at the national level . . . . . . . . . . . . . . . . . . . . . . . . . . . . . . . . . . . . . . . . . . . . . . . . . . . . . . . . . 168
Appendices . . . . . . . . . . . . . . . . . . . . . . . . . . . . . . . . . . . . . . . . . . . . . . . . . . . . . . . . . . . . . . . . . . . . . . . . . . . . . . . . . 169Appendix 1: Government actors and responsibilities on central, city and municipal levels . . . . . . . . . . . . . . . . . . . . . . . . . . . . . . . . . . 170Appendix 2: Health facilities . . . . . . . . . . . . . . . . . . . . . . . . . . . . . . . . . . . . . . . . . . . . . . . . . . . . . . . . . . . . . . . . . . . . . . . . . . . . . . . . . . . . . . . . . . 173
Bibliography . . . . . . . . . . . . . . . . . . . . . . . . . . . . . . . . . . . . . . . . . . . . . . . . . . . . . . . . . . . . . . . . . . . . . . . . . . . . . . . . 176Related studies/assessments (to be) conducted and publications (to be) authored or co-authored by UN-Habitat Lebanon . . . 185
XII
List of figuresFigure 1 Lebanon and Beirut City. . . . . . . . . . . . . . . . . . . . . . . . . . . . . . . . . . . . . . . . . . . . . . . . . . . . . . . . . . . . . . . . . . . . . . . . . . . . . . . . . . . . . . . 2Figure 2 Socioeconomic vulnerability by operational zone in Beirut central area.. . . . . . . . . . . . . . . . . . . . . . . . . . . . . . . . . . . . . . . . . . . . 5Figure 3 498 disadvantaged areas at cadastral and subcadastral levels in Lebanon and Beirut. and 251 most vulnerable localities in Lebanon and Beirut . . . . . . . . . . . . . . . . . . . . . . . . . . . . . . . . . . . . . . . . . . . . . . . . . . . . . . . . . . . . . . . . . . . . . . . . . . . . . . . .6Figure 4 Location of the eight neighbourhood profiles carried out in Beirut City. . . . . . . . . . . . . . . . . . . . . . . . . . . . . . . . . . . . . . . . . . . . 10Figure 5 Topography of Beirut City and surrounding areas. . . . . . . . . . . . . . . . . . . . . . . . . . . . . . . . . . . . . . . . . . . . . . . . . . . . . . . . . . . . . . . 14Figure 6 Boundary of the continuously built-up Beirut urban area, defined as Beirut City in this report. . . . . . . . . . . . . . . . . . . . . . . 15Figure 7 Land use in Beirut City. Remote analysis from satellite imagery. . . . . . . . . . . . . . . . . . . . . . . . . . . . . . . . . . . . . . . . . . . . . . . . . . 16Figure 8 Historic growth of Beirut City (1880-1998).. . . . . . . . . . . . . . . . . . . . . . . . . . . . . . . . . . . . . . . . . . . . . . . . . . . . . . . . . . . . . . . . . . . . . .17Figure 9 Spatial development timeline. . . . . . . . . . . . . . . . . . . . . . . . . . . . . . . . . . . . . . . . . . . . . . . . . . . . . . . . . . . . . . . . . . . . . . . . . . . . . . . . . .17Figure 10 Beirut City and governorates.. . . . . . . . . . . . . . . . . . . . . . . . . . . . . . . . . . . . . . . . . . . . . . . . . . . . . . . . . . . . . . . . . . . . . . . . . . . . . . . . 18Figure 11 Municipalities, cadastres and unions of municipalities of Beirut. . . . . . . . . . . . . . . . . . . . . . . . . . . . . . . . . . . . . . . . . . . . . . . . . . 19Figure 12 Areas affected by the Beirut Port blast . . . . . . . . . . . . . . . . . . . . . . . . . . . . . . . . . . . . . . . . . . . . . . . . . . . . . . . . . . . . . . . . . . . . . . . 25Figure 13 Satellite image of the Port of Beirut before the blast.. . . . . . . . . . . . . . . . . . . . . . . . . . . . . . . . . . . . . . . . . . . . . . . . . . . . . . . . . . . 26Figure 14 Satellite image of the Port of Beirut after the blast.. . . . . . . . . . . . . . . . . . . . . . . . . . . . . . . . . . . . . . . . . . . . . . . . . . . . . . . . . . . . 27Figure 15 Lebanese and refugee population across Beirut’s 31 municipalities.. . . . . . . . . . . . . . . . . . . . . . . . . . . . . . . . . . . . . . . . . . . . . . 33
Figure 16 Population densities for different cohorts. . . . . . . . . . . . . . . . . . . . . . . . . . . . . . . . . . . . . . . . . . . . . . . . . . . . . . . . . . . . . . . . . . . . . 35Figure 17 Gender distribution in Beirut City districts. . . . . . . . . . . . . . . . . . . . . . . . . . . . . . . . . . . . . . . . . . . . . . . . . . . . . . . . . . . . . . . . . . . . . 37Figure 18 Share of youth and children on a district level in Beirut City. . . . . . . . . . . . . . . . . . . . . . . . . . . . . . . . . . . . . . . . . . . . . . . . . . . . . 38Figure 19 Share of youth and children across seven profiled neighbourhoods in Beirut City.. . . . . . . . . . . . . . . . . . . . . . . . . . . . . . . . . 38Figure 20 Share of elderly on a district level in Beirut City.. . . . . . . . . . . . . . . . . . . . . . . . . . . . . . . . . . . . . . . . . . . . . . . . . . . . . . . . . . . . . . . 38Figure 21 Share of elderly across seven profiled neighbourhoods in Beirut City.. . . . . . . . . . . . . . . . . . . . . . . . . . . . . . . . . . . . . . . . . . . 38Figure 22 Resident share based on nationality for seven neighbourhoods in Beirut City. . . . . . . . . . . . . . . . . . . . . . . . . . . . . . . . . . . . . 39Figure 23 Population distribution in three neighbourhoods in Beirut Municipality. . . . . . . . . . . . . . . . . . . . . . . . . . . . . . . . . . . . . . . . . . 41Figure 24 Palestinian camps and out-of-camp Palestinian concentrations within Beirut City. . . . . . . . . . . . . . . . . . . . . . . . . . . . . . . . 44Figure 25 Key governance features in Beirut City. . . . . . . . . . . . . . . . . . . . . . . . . . . . . . . . . . . . . . . . . . . . . . . . . . . . . . . . . . . . . . . . . . . . . . . . 55Figure 26 The first and second rings of Beirut overlayed with Beirut urban areas as per 1998. . . . . . . . . . . . . . . . . . . . . . . . . . . . . . . 58Figure 27 Number of enterprises per municipality.. . . . . . . . . . . . . . . . . . . . . . . . . . . . . . . . . . . . . . . . . . . . . . . . . . . . . . . . . . . . . . . . . . . . . . 73Figure 28 Share of Lebanese and non-Lebanese business owners across eight profiled neighbourhoods in Beirut City. . . . . . . . . 74Figure 29 Tenure arrangements for enterprises across eight profiled neighbourhoods in Beirut City.. . . . . . . . . . . . . . . . . . . . . . . . . . 74Figure 30 Lebanese and non-Lebanese employees (in surveyed enterprises) in eight profiled neighbourhoods in Beirut City.. . . . . . . . . . . . . . . . . . . . . . . . . . . . . . . . . . . . . . . . . . . . . . . . . . . . . . . . . . . . . . . . . . . . . . . . . . . . . . . . . . . . . . . . . . . . . . . 78Figure 31 Change in employment and salary levels since the start of COVID-19 measures.. . . . . . . . . . . . . . . . . . . . . . . . . . . . . . . . . . 78Figure 32 Consumer Price Indices in Beirut and Mount Lebanon governorates, as well as nationally. . . . . . . . . . . . . . . . . . . . . . . . . . 82Figure 33 Remittances by relatives as a source of household income across eight profiled neighbourhoods in Beirut City. . . . . . 82Figure 34 Employment by gender across seven profiled neighbourhoods in Beirut City. . . . . . . . . . . . . . . . . . . . . . . . . . . . . . . . . . . . . 84Figure 35 Female business owners across seven profiled neighbourhoods in Beirut City. . . . . . . . . . . . . . . . . . . . . . . . . . . . . . . . . . . . 84Figure 36 Young women (15-19) currently married on neighbourhood, governorate and national levels . . . . . . . . . . . . . . . . . . . . . . . 93Figure 37 Children (5-17) involved in economic activities across eight profiled neighbourhoods in Beirut City. . . . . . . . . . . . . . . . . . 94Figure 38 Number of crimes involving weapons and/or violence . . . . . . . . . . . . . . . . . . . . . . . . . . . . . . . . . . . . . . . . . . . . . . . . . . . . . . . . . 97Figure 39 Governance structure of the national PHC network . . . . . . . . . . . . . . . . . . . . . . . . . . . . . . . . . . . . . . . . . . . . . . . . . . . . . . . . . . . 101Figure 40 Operating entities of PHCCs. . . . . . . . . . . . . . . . . . . . . . . . . . . . . . . . . . . . . . . . . . . . . . . . . . . . . . . . . . . . . . . . . . . . . . . . . . . . . . . . 101Figure 41 Actors contributing to the success of PHCCs. . . . . . . . . . . . . . . . . . . . . . . . . . . . . . . . . . . . . . . . . . . . . . . . . . . . . . . . . . . . . . . . . . 101Figure 42 Primary health-care centres in Beirut. . . . . . . . . . . . . . . . . . . . . . . . . . . . . . . . . . . . . . . . . . . . . . . . . . . . . . . . . . . . . . . . . . . . . . . . . 102Figure 43 Secondary health-care centres in Beirut. . . . . . . . . . . . . . . . . . . . . . . . . . . . . . . . . . . . . . . . . . . . . . . . . . . . . . . . . . . . . . . . . . . . . . 102Figure 44 Care seeking for diarrhoea across eight profiled neighbourhoods in Beirut City.. . . . . . . . . . . . . . . . . . . . . . . . . . . . . . . . . . . 105Figure 45 Awareness about, usage of and satisfaction with subsidized primary health-care services among surveyed households across eight profiled neighbourhoods in Beirut City. . . . . . . . . . . . . . . . . . . . . . . . . . . . . . . . . . . . . . . . . . . . . . . . . . 106Figure 46 Public schools in Beirut City 2020-2021. . . . . . . . . . . . . . . . . . . . . . . . . . . . . . . . . . . . . . . . . . . . . . . . . . . . . . . . . . . . . . . . . . . . . . 108Figure 47 Level of damage to private schools in Beirut, following the 4 August 2020 blast. . . . . . . . . . . . . . . . . . . . . . . . . . . . . . . . . . 110Figure 48 Educational attainment levels in Lebanon. . . . . . . . . . . . . . . . . . . . . . . . . . . . . . . . . . . . . . . . . . . . . . . . . . . . . . . . . . . . . . . . . . . . 110Figure 49 Share of Lebanese and non-Lebanese students in public schools. . . . . . . . . . . . . . . . . . . . . . . . . . . . . . . . . . . . . . . . . . . . . . . 112Figure 50 Streets connected to an electrical grid in bad condition across eight profiled neighbourhoods in Beirut City. . . . . . . . . 114Figure 51 Buildings connected with critical defects to the public electrical grid (%) across eight profiled neighbourhoods in Beirut City.. 114Figure 52 Streets with no street lightning (%). . . . . . . . . . . . . . . . . . . . . . . . . . . . . . . . . . . . . . . . . . . . . . . . . . . . . . . . . . . . . . . . . . . . . . . . . . . 114Figure 53 Electricity in Daouk-Ghawash neighbourhood . . . . . . . . . . . . . . . . . . . . . . . . . . . . . . . . . . . . . . . . . . . . . . . . . . . . . . . . . . . . . . . . 116Figure 54 Electricity in Hayy El-Jadid and Nabaa neighbourhoods. . . . . . . . . . . . . . . . . . . . . . . . . . . . . . . . . . . . . . . . . . . . . . . . . . . . . . . . 116Figure 55 Electricity in Karm El-Zeytoun neighbourhood. . . . . . . . . . . . . . . . . . . . . . . . . . . . . . . . . . . . . . . . . . . . . . . . . . . . . . . . . . . . . . . . 116Figure 56 Total water fee collection between January and March during the last four years (in billions LBP). . . . . . . . . . . . . . . . . . . 118Figure 57 Buildings not connected to the domestic water network across eight profiled neighbourhoods in Beirut City . . . . . . . . 120Figure 58 Condition of buildings’ connection to the network in Nabaa neighbourhood. . . . . . . . . . . . . . . . . . . . . . . . . . . . . . . . . . . . . . 120Figure 59 Buildings with blocked or no connection to the wastewater network across eight profiled neighbourhoods in Beirut City.. . 121Figure 60 BRT alignment and its feeder bus network in Beirut. . . . . . . . . . . . . . . . . . . . . . . . . . . . . . . . . . . . . . . . . . . . . . . . . . . . . . . . . . . 125Figure 61 Modal share of motorized private mode versus GDP/capita. . . . . . . . . . . . . . . . . . . . . . . . . . . . . . . . . . . . . . . . . . . . . . . . . . . . . 125Figure 62 Vacant housing units and unexecuted permits in Beirut Municipality. . . . . . . . . . . . . . . . . . . . . . . . . . . . . . . . . . . . . . . . . . . . 133Figure 63 Buildings in need of major repair/emergency interventions in their exterior conditions across eight profiled neighbourhoods in Beirut City. . . . . . . . . . . . . . . . . . . . . . . . . . . . . . . . . . . . . . . . . . . . . . . . . . . . . . . . . . . . . . . . . . . . . . . . . . . . . . . . . . . . . . . . . . . . . . . . 135Figure 64 Mapped evictions for selected areas (marked with blue) in Beirut Municipality. . . . . . . . . . . . . . . . . . . . . . . . . . . . . . . . . . . . 135Figure 65 Households that own their own housing across eight profiled neighbourhoods in Beirut City. . . . . . . . . . . . . . . . . . . . . . . 136Figure 66 Damage to buildings in Beirut Municipality.. . . . . . . . . . . . . . . . . . . . . . . . . . . . . . . . . . . . . . . . . . . . . . . . . . . . . . . . . . . . . . . . . . 138Figure 67 Damage to buildings in Bourj Hammoud Municipality.. . . . . . . . . . . . . . . . . . . . . . . . . . . . . . . . . . . . . . . . . . . . . . . . . . . . . . . . . 138Figure 68 Housing damage across the areas most affected by the blast. . . . . . . . . . . . . . . . . . . . . . . . . . . . . . . . . . . . . . . . . . . . . . . . . . 138Figure 69 Public-owned parcels and open sites used by the public and Beirut Municipality. . . . . . . . . . . . . . . . . . . . . . . . . . . . . . . . . 148Figure 70 The post-blast state of heritage buildings in Saifi, Rmeil and Medawar. . . . . . . . . . . . . . . . . . . . . . . . . . . . . . . . . . . . . . . . . . 154Figure 71 Heritage buildings in Beirut, excluding Beirut Central District, in relation to the blast site. . . . . . . . . . . . . . . . . . . . . . . . . . . 154
XIII
Key definitions
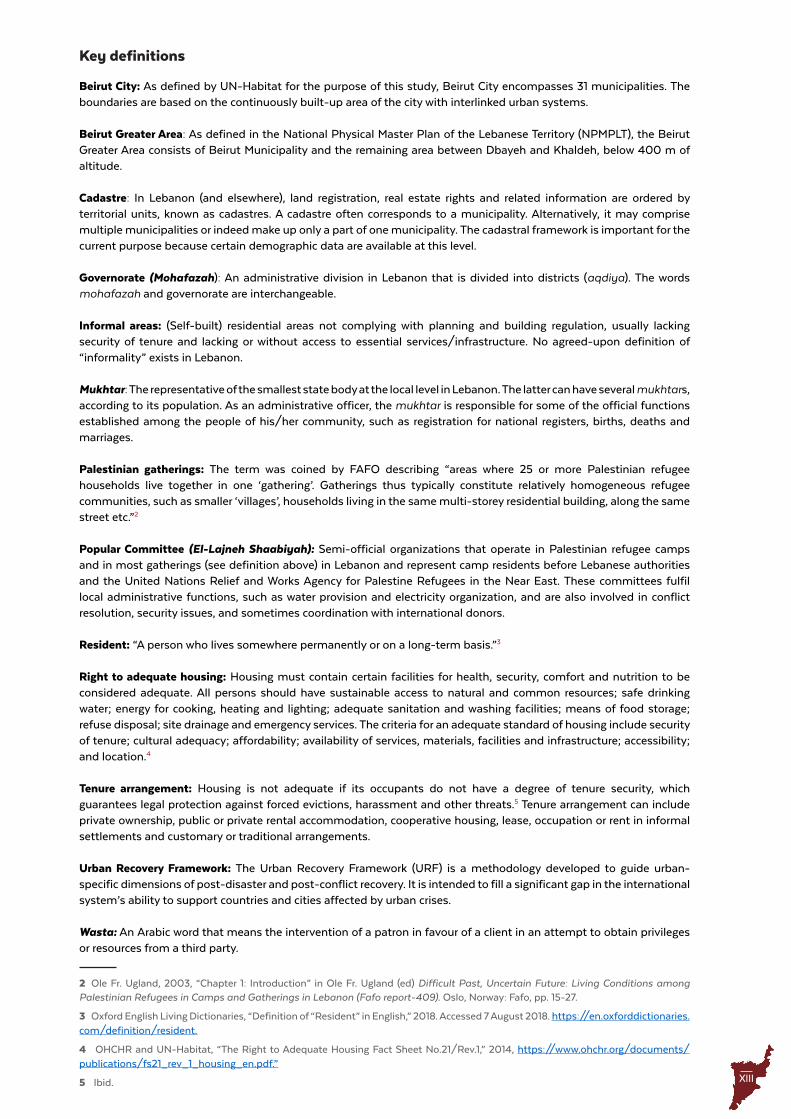
Beirut City: As defined by UN-Habitat for the purpose of this study, Beirut City encompasses 31 municipalities. The boundaries are based on the continuously built-up area of the city with interlinked urban systems.
Beirut Greater Area: As defined in the National Physical Master Plan of the Lebanese Territory (NPMPLT), the Beirut Greater Area consists of Beirut Municipality and the remaining area between Dbayeh and Khaldeh, below 400 m of altitude.
Cadastre: In Lebanon (and elsewhere), land registration, real estate rights and related information are ordered by territorial units, known as cadastres. A cadastre often corresponds to a municipality. Alternatively, it may comprise multiple municipalities or indeed make up only a part of one municipality. The cadastral framework is important for the current purpose because certain demographic data are available at this level.
Governorate (Mohafazah): An administrative division in Lebanon that is divided into districts (aqdiya). The words mohafazah and governorate are interchangeable.
Informal areas: (Self-built) residential areas not complying with planning and building regulation, usually lacking security of tenure and lacking or without access to essential services/infrastructure. No agreed-upon definition of “informality” exists in Lebanon.
Mukhtar: The representative of the smallest state body at the local level in Lebanon. The latter can have several mukhtars, according to its population. As an administrative officer, the mukhtar is responsible for some of the official functions established among the people of his/her community, such as registration for national registers, births, deaths and marriages.
Palestinian gatherings: The term was coined by FAFO describing “areas where 25 or more Palestinian refugee households live together in one ‘gathering’. Gatherings thus typically constitute relatively homogeneous refugee communities, such as smaller ‘villages’, households living in the same multi-storey residential building, along the same street etc.”2
Popular Committee (El-Lajneh Shaabiyah): Semi-official organizations that operate in Palestinian refugee camps and in most gatherings (see definition above) in Lebanon and represent camp residents before Lebanese authorities and the United Nations Relief and Works Agency for Palestine Refugees in the Near East. These committees fulfil local administrative functions, such as water provision and electricity organization, and are also involved in conflict resolution, security issues, and sometimes coordination with international donors.
Resident: “A person who lives somewhere permanently or on a long-term basis.”3
Right to adequate housing: Housing must contain certain facilities for health, security, comfort and nutrition to be considered adequate. All persons should have sustainable access to natural and common resources; safe drinking water; energy for cooking, heating and lighting; adequate sanitation and washing facilities; means of food storage; refuse disposal; site drainage and emergency services. The criteria for an adequate standard of housing include security of tenure; cultural adequacy; affordability; availability of services, materials, facilities and infrastructure; accessibility; and location.4
Tenure arrangement: Housing is not adequate if its occupants do not have a degree of tenure security, which guarantees legal protection against forced evictions, harassment and other threats.5 Tenure arrangement can include private ownership, public or private rental accommodation, cooperative housing, lease, occupation or rent in informal settlements and customary or traditional arrangements.
Urban Recovery Framework: The Urban Recovery Framework (URF) is a methodology developed to guide urban-specific dimensions of post-disaster and post-conflict recovery. It is intended to fill a significant gap in the international system’s ability to support countries and cities affected by urban crises.
Wasta: An Arabic word that means the intervention of a patron in favour of a client in an attempt to obtain privileges or resources from a third party.
2 Ole Fr. Ugland, 2003, “Chapter 1: Introduction” in Ole Fr. Ugland (ed) Difficult Past, Uncertain Future: Living Conditions among Palestinian Refugees in Camps and Gatherings in Lebanon (Fafo report-409). Oslo, Norway: Fafo, pp. 15-27.
3 Oxford English Living Dictionaries, “Definition of “Resident” in English,” 2018. Accessed 7 August 2018. https://en.oxforddictionaries.com/definition/resident.
4 OHCHR and UN-Habitat, “The Right to Adequate Housing Fact Sheet No.21/Rev.1,” 2014, https://www.ohchr.org/documents/publications/fs21_rev_1_housing_en.pdf.”
5 Ibid.
XIV
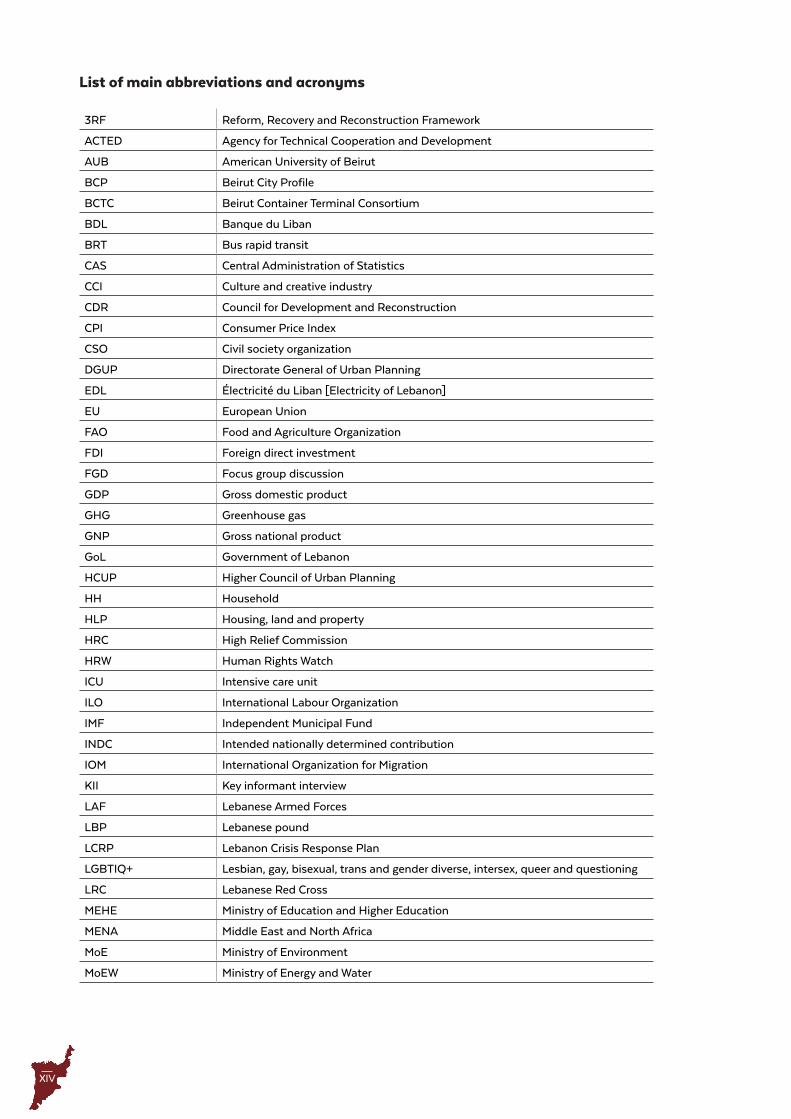
List of main abbreviations and acronyms
3RF Reform, Recovery and Reconstruction Framework
ACTED Agency for Technical Cooperation and Development
AUB American University of Beirut
BCP Beirut City Profile
BCTC Beirut Container Terminal Consortium
BDL Banque du Liban
BRT Bus rapid transit
CAS Central Administration of Statistics
CCI Culture and creative industry
CDR Council for Development and Reconstruction
CPI Consumer Price Index
CSO Civil society organization
DGUP Directorate General of Urban Planning
EDL Électricité du Liban [Electricity of Lebanon]
EU European Union
FAO Food and Agriculture Organization
FDI Foreign direct investment
FGD Focus group discussion
GDP Gross domestic product
GHG Greenhouse gas
GNP Gross national product
GoL Government of Lebanon
HCUP Higher Council of Urban Planning
HH Household
HLP Housing, land and property
HRC High Relief Commission
HRW Human Rights Watch
ICU Intensive care unit
ILO International Labour Organization
IMF Independent Municipal Fund
INDC Intended nationally determined contribution
IOM International Organization for Migration
KII Key informant interview
LAF Lebanese Armed Forces
LBP Lebanese pound
LCRP Lebanon Crisis Response Plan
LGBTIQ+ Lesbian, gay, bisexual, trans and gender diverse, intersex, queer and questioning
LRC Lebanese Red Cross
MEHE Ministry of Education and Higher Education
MENA Middle East and North Africa
MoE Ministry of Environment
MoEW Ministry of Energy and Water
XV
MoF Ministry of Finance
MoIM Ministry of Interior and Municipalities
MoPH Ministry of Public Health
MoPWT Ministry of Public Works and Transport
MoSA Ministry of Social Affairs
(M)SMEs (Micro-,) small and medium-sized enterprises
MSNA Multi-sector Needs Assessment
NGO Non-governmental organization
NPMPLT National Physical Master Plan of the Lebanese Territory
NSSF National Social Security Fund
OCHA [United Nations] Office for the Coordination of Humanitarian Affairs
OEA Order of Engineers and Architects
PHC Primary health care
PHCC Primary health-care centre
PLO Palestinian Liberation Organization
PoB Port of Beirut
PoT Port of Tripoli
PPE Personal protective equipment
PPP Public−private partnership
PRL Palestine refugees in Lebanon
PRS Palestine refugees from Syria
RDNA Rapid Damage and Needs Assessment
SDC Social development centre
SGBV Sexual and gender-based violence
Solar PV Solar photovolaic
SWM Solid waste management
Syr Syrian refugees
TEU Twenty-foot equivalent unit
UoM Union of municipalities
UNDP United Nations Development Programme
UNFCCC United Nations Framework Convention on Climate Change
UN-Habitat United Nations Human Settlements Programme
UNHCR United Nations High Commissioner for Refugees
UNICEF United Nations Children’s Fund
UNRWA United Nations Relief and Works Agency for Palestine Refugees in the Near East
URF Urban Recovery Framework
USD United States dollar
VAT Value-added tax
WaSH Water, sanitation and hygiene
WE Water Establishment
WFP World Food Programme
WHO World Health Organization
XVI
UN
-HA
BIT
AT
/ L
EB
AN
ON
/ C
ITY
PR
OFI
LE
S /
BE
IRU
T /
20
21
/ E
XEC
UT
IVE
SU
MM
AR
Y
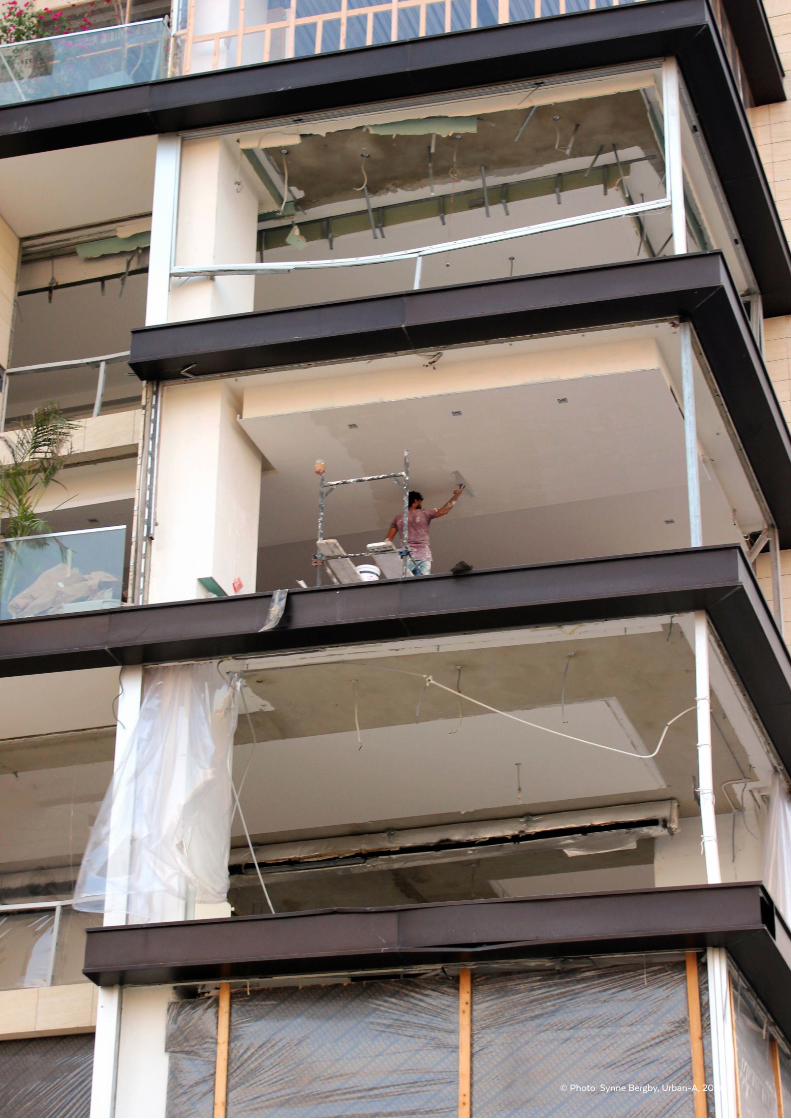
© Photo: Synne Bergby, Urban-A, 2020.
XVII
The massive destruction and human suffering caused by the blast that struck Beirut on 4 August 2020 will have lasting impacts on Lebanon’s capital beyond the central areas most directly affected by the blast. The city, and the country, have experienced a series of shocks – including the protracted Syrian refugee crisis, a collapse of the economy, a political crisis, large-scale civil protests and the COVID-19 pandemic over the past years. Moreover, a large portion of Beirut’s residents live in chronic poverty. Many residents live in disadvantaged neighbourhoods across the city, and especially in pockets of poverty surrounding the inner-city centre. With the economic collapse further exacerbated by the blast, the number of families struggling to put food on the table is on the rise; every second Lebanese is now living in poverty. Tension and unrest over lockdown measures, scarce food and household items, and electricity cuts have been reported in the first half of 2021, signifying an emerging risk of punctual or city-wide conflicts. The ripple effect of these compounded shocks renders the whole city in a state of crisis, beyond the neighbourhoods physically affected by the blast, where the main attention of the immediate response to the blast has been focused. A further deterioration of the situation in Beirut, as the political and economic centre of the country, may spill over to other regions of the country.
The Beirut City Profile provides a cross-sectoral and spatial analysis to help inform a common understanding of how these shocks and vulnerabilities manifest across the city. The analysis highlights existing systems and governance structures’ respective capacities to absorb shocks and suggests how these can be further strengthened to help the city bounce back and transform from a current fragile state towards a resilient and inclusive city.
The diagnosis offered in this report can be summarized as follows:
Compounding crises and overlapping shocks - with their severe economic, environmental and social impact on Lebanon - have reinforced structural patterns of economic and social division within the rapidly growing capital city . The Lebanese Civil War from 1975 to 1990 increased sociodemographic divisions in Beirut, which manifested in more pronounced patterns of spatial
segregation of populations according to economic, ethnic and religious factors. Moreover, the conflict that erupted in Syria in 2011 and the subsequent large influx of Syrian refugees into Beirut (and other areas of the country) have placed significant additional demands on already strained infrastructure and service delivery, and have contributed to the increase of competition for jobs and housing. The economic instability has been heightened by widespread protests and the closing of economic activities and banks, to the point of economic, monetary and financial collapse. Adding to long-standing unresolved economic and social grievances, COVID-19 and the 4 August 2020 blast are causing an already extremely precarious situation to rapidly deteriorate.
The current situation in Beirut City is one of depleted business activities, high unemployment, heightened tenure and food insecurity and a significant rise in poverty levels . In the months after the blast, many apartments were left dark, while stores and restaurants remained closed. What used to be some of the most vibrant neighbourhoods in the city, and indeed in the country and region, were for months left quiet and empty. Although some residential buildings and businesses have managed to repair and reopen and life has modestly returned to houses and streets, economic and social activities across the city have been stifled by COVID-19 measures. The physical and psychological damage and destruction caused by the 4 August 2020 blast on people, housing, businesses, offices and infrastructure, including the Port of Beirut, will have a lasting negative effect. Escalating poverty levels demonstrate the severity of the situation. More than half of Lebanon’s population is estimated to be trapped in poverty and struggling for bare necessities, almost double the 2019 rate. Extreme poverty has registered a threefold increase from 8 per cent in 2019 to 23 per cent in 2020,6 with 9 out of 10 Syrian refugees living in extreme poverty nationally, and disproportionally impacting women and female-headed households.7
6 ESCWA, “Poverty in Lebanon: Solidarity is Vital to Adress the Impact of Multiple Overlapping Shocks: Policy Brief 15,” 2020.
7 Inter-Agency Coordination Lebanon, “VASyR 2020 Key Findings,” 2020.
Executive summaryCompounding shocks: Beirut City in a state of crisis

XVIII
UN
-HA
BIT
AT
/ L
EB
AN
ON
/ C
ITY
PR
OFI
LE
S /
BE
IRU
T /
20
21
/ E
XEC
UT
IVE
SU
MM
AR
Y This Beirut City Profile uses a definition of Beirut City based on the continuously built-up area encompassing 31 municipalities . The definition of the geographical footprint of “Beirut City” sets the parameters for how policies, service delivery and assistance are informed, developed and implemented and for whom. By using the continuously built-up area, this report underscores that most of the issues facing Beirut - and the interconnectedness of economic, social, environmental and political systems by which these manifest - are on a scale that extends much beyond the most central areas of the city and the administrative boundaries of Beirut Municipality. Recognition of this fact is paramount in diagnosing the state of Beirut City. Without spatial boundaries that recognize the updated expansive urban fabric that is today the capital, service provision and good urbanization cannot unfold. Understanding socioeconomic and social dynamics, as well as gaps in access to service provision across the city, will allow for designing holistic and cost-efficient responses anchored through an equity principle.
There is no single authority in charge of Beirut City . The 31 municipalities making up Beirut City operate within their administratively assigned territory. Beyond the three unions of municipalities (UoMs) in Beirut City, municipalities are left without formal mechanisms to respond to the larger system which they are a part of. This poses serious constraints to unified city-wide governance and planning that would join central city areas with one another and link these with their growing suburbs. It also hinders the realization of adequate, reliable, equitable and cost-efficient provision of infrastructure and services and access to markets in Beirut.
The influx of both refugees and migrants to Beirut over the years has contributed to the expansion and informal growth of the city, with close to 300,000 Syrian and Palestinian refugees estimated to live in Beirut . This constitutes almost one quarter of the estimated population in the city (see below point on population data). A large share of refugees lives in what is today the most densely populated neighbourhoods, such as Nabaa, Shatila and Sabra. This is due to several factors, including affordability of accommodation, as well as proximity to economic opportunities and services. Several of the old Palestinian refugee camps as well as adjacent areas to these camps have for similar reasons seen an explosive unregulated vertical growth, and are at the same time areas of little municipal control. These areas are subject to informal and quasi-formal governance.
Current planning tools; lack of accurate, reliable, up-to-date, multisectoral and disaggregated urban data; a dire financial situation; and large discrepancies between registered and the actual number of residents render municipalities unable to adequately respond to urban disparities, the effects of the Syrian refugee crisis, or recent shocks . As a result of the 4 August 2020 blast and subsequent policy measures, the most affected municipalities of Beirut and Bourj Hammoud are required
to respond to the vast damages and destruction while lacking key data to inform the response and recovery in a timely and comprehensive manner, and in a time when their municipal revenues have been considerably reduced. A plethora of assessments - including the Rapid Damage Needs Assessment (RDNA) by the World Bank, European Union (EU) and the United Nations, as well as the Multi-sector Needs Assessment (MSNA) conducted by several partners - have tried to fill this gap. However, gaps in comprehensive data across Beirut City and analysis of data in terms of longer-term planning needs and requirements of systems and services persist.
More specifically, there are no accurate population figures for Beirut City . The Lebanon Crisis Response Plan (LCRP) data puts Beirut City’s total population at 1,291,280. However, experience from other Lebanese cities as well as triangulation of population and housing data available for different parts of Beirut City8 suggest that the actual population figures may diverge significantly from this, particularly within certain areas of the city. Moreover, neighbourhood profile data suggests that the age composition of residents varies greatly between neighbourhoods. This is even more pronounced when considering Lebanese and non-Lebanese differences. The overall lack of reliable population data on city and local levels in Lebanon limits the ability of local authorities and service providers to conduct appropriate planning, enhance systems efficiency and provide adequate services. There is thus an urgent need to access granular information, de-homogenize data and identify intracity variances to inform service provision planning and overall response.
Beirut is characterized by significant socioeconomic inequalities . A large part of the economic growth in the city has been decoupled from sustainable employment and value creation, and the economic growth pattern has led to stark inequalities. Some of the most vulnerable residents in Beirut City - including a rising number of poor Lebanese, Syrian and Palestinian refugees, and migrants living inside and outside of camps - are concentrated in marginalized neighbourhoods. Data on a neighbourhood level shows that these population groups are consistently worse off in terms of access to services, income opportunities, protection and tenure security.
Given the structural inequalities in the labour market, the effect of recent shocks on livelihood opportunities will disproportionally affect vulnerable groups, including women, youth, disabled persons, LGBTIQ+
8 One key source of local data in Beirut is the UN-Habitat’s neighbourhood profiles. These have been developed to offer a cross-sectoral perspective on urban vulnerabilities with the aim of informing holistic and inclusive interventions by local authorities, humanitarian partners and others to respond to needs and alleviate poverty among host and displaced populations. Eight profiles have been developed for neighbourhoods in Beirut City, seven in partnership with UNICEF and one in partnership with RELIEF Centre (see Methodology section).
XIX
groups (particularly among transwomen and transmen), refugees, migrant workers and un- or low-skilled Lebanese men . Certain neighbourhoods in Beirut City will face larger repercussions based on pre-existing socioeconomic vulnerabilities in the population. Women are among the most economically deprived within each population cohort. The existence of structural gender inequalities means that the impact of recent shocks and the current economic collapse will disproportionally harm women. Among Syrians, the ratio of men to women is higher, while among residents with other nationalities, this is reverse. This is likely to reflect the type of livelihood opportunities present for men and women in Beirut. Many female non-Syrian migrant workers are likely to have come to Beirut to find domestic work, and male Syrian migrants are likely to have come to look for manual work in construction and so forth. The dire situation for many working migrants in Beirut is reflected in the share of migrants who have left, or who express their intent to leave, the city.
The multitude of actors, coordination systems and response efforts to the 4 August 2020 blast and other recent shocks poses challenges in terms of data sharing and coordination of assessments, needs identification and implementation of prioritized activities in the immediate and longer term . Specifically, volunteers – women, men and youth – have shown impressive capacity to mobilize work on the ground in the immediate aftermath of the blast. Instant response efforts seem to have been concentrated in the areas most physically damaged by the blast, while other areas directly and indirectly affected across the city, where the blast had severe socioeconomic impacts, for instance, have received less attention. Furthermore, the somewhat unlinked pre-blast humanitarian response, and the concentrated post-blast assistance, including the myriad of civil society and private sector actors, risk duplication of work with limited long-term effects.
The economic and financial collapse has aggravated the consequences of poor public social infrastructure and weak protection schemes . The lack of access to comprehensive and inclusive social safety nets is affecting a large share of Beirut’s population, including a growing number among the middle class. This is manifesting in different ways, such as increased prevalence of negative coping mechanisms, sexual and gender-based violence (SGBV) and more out-of-school children. Moreover, the collective and individual trauma in the aftermath of the 4 August 2020 blast has led to an acute need for mental health services.
Indications of increasing tensions have been witnessed between groups in Beirut along social, ethnic and religious fault lines, with risks of increased fragmentation of the city’s social and cultural fabric . Religious and political division and fights over power, economic tension and historical legacies are among the main factors driving social tension, with a spike in intracommunal tensions reported since the 4 August
2020 blast. Moreover, there is a rising trend of “hunger-crime” (e.g. theft) in Beirut. At the same time, the post-October 2019 civil uprising and the solidarity displayed after the 4 August 2020 blast illustrate how people have come together in the face of extreme difficulties.
Service delivery and infrastructure provision have suffered from decades of civil unrest, conflict, underinvestment, lack of reliable data, unmanaged city growth and poor governance - combined with high demand from a rapidly growing population . Insufficient service provision affects all, and particularly vulnerable segments of Beirut’s population, who experience systemic inequities in access to services and have fewer financial resources and social safety nets to make up for these gaps. Unreliable and inadequate provision of water, energy, education and health services has led to increased reliance on private suppliers for those who can afford it. A collapsing economy, COVID-19 and the 4 August 2020 blast have further deteriorated the state of service provision, at the same time as people’s purchasing power and ability to withdraw money from their bank accounts has been severely limited, and acute needs are intensifying.
A large share of Beirut City’s residents is suffering from a lack of affordable and adequate housing due to a mismatch between supply and demand in terms of prices, tenure arrangements and quality of housing . The large-scale urban renewal of Downtown Beirut after the Lebanese Civil War, combined with housing policies favouring homeownership for middle-income earners in the outskirts of Beirut City, has contributed to or reinforced pre-existing divisions along socioeconomic and sectarian lines. Central areas of the city have pockets of urban poverty characterized by high density, overcrowded and poorly serviced accommodations and weak tenure security side-by-side with high-end real estate development. Rental and housing prices have increased drastically in Beirut over this period, rendering adequate housing unattainable for a growing number of the city’s population. Recent shocks might further drive this trend, while intensifying rent disputes, heightened tenure insecurity, and potentially triggering a collapse in property prices. The risks of eviction and homelessness have been reported to increase as a result of the 4 August 2020 blast, and particularly affecting vulnerable groups, including migrant workers and the LGBTIQ+ community.
Risks of water scarcity, flooding and forest fires, further heightened by climate change, pose a serious threat to Beirut’s natural environment and its residents’ public health and livelihoods . The city lacks urban governance mechanisms and planning to mitigate and adapt to these risks; in fact, the development of Beirut City has augmented the negative impact of environmental issues and climate change. Deforestation, impermeable surfaces in the city, lack of drainage systems, unsuitable construction techniques and materials and insufficient waste management are all contributing factors. The availability of and access to public spaces, which offer
XX
UN
-HA
BIT
AT
/ L
EB
AN
ON
/ C
ITY
PR
OFI
LE
S /
BE
IRU
T /
20
21
/ E
XEC
UT
IVE
SU
MM
AR
Y significant environmental and public health benefits, have been severely reduced as a result of redevelopment and privatization.
Beirut City’s rich cultural heritage and identity spans more than 5,000 years . Many historical buildings, businesses in the creative and cultural industries and religious sites in proximity to the 4 August 2020 blast epicentre have been damaged, and activities discontinued. Two of Beirut’s most important neighbourhoods in terms of social and cultural life, Gemmayze and Mar Mikhael, were among the most adversely impacted neighbourhoods by the blast. While crucial to the tourism industry, these places were first and foremost a meeting place for residents and a hotspot for the cultural scene in Beirut. In combination with COVID-19 lockdown measures and residents’ rapidly decreasing purchasing power, the physical and social impact from the blast will thus have a lasting negative effect on economic activities in these areas, with repercussions far beyond. The potential exodus of active contributors to the city’s cultural life and social scene could change. This poses the question of who will take part in shaping the city and creating a sense of place going forward. Conversely, in many of the city’s neighbourhoods that did not suffer the same levels of damage from the blast, there is a vast stock of heritage buildings and sites that were damaged during the Lebanese Civil War and are yet to be rehabilitated. Many of these houses are surrounded by gardens and are thus equally some of the few plots providing green infrastructure to the city. The rapid real estate development in Beirut has for years put pressure on those plots. With the current attention to heritage recovery concentrated in blast-affected neighbourhoods, the direct and indirect values of heritage buildings across the rest of the city risk being overlooked.
From shock absorption towards transformation: Recommendations on the way forwardThe compounded shocks that have affected Beirut City, as outlined above and analysed in this profile, have exacerbated pre-crises structural issues, stressors and vulnerabilities. Beirut has exhibited strength and resilience in the face of these challenges, especially through its civil society and youth population, underscoring the presence of building blocks necessary to set a transformative course moving forward. However, the overlapping and interconnected shocks and stressors have a reinforcing effect on one another. The continuous downturn of the economy, high poverty levels not seen for decades, and rising tensions are worrying signs for what might come next for Lebanon’s capital, and the country as a whole.
This renders the whole Beirut City in a state of crisis rather than faced by multiple crises, where there are no simple pathways for recovery and sustainable development .
The Beirut City Profile is aimed to help form a shared
understanding of how this situation manifests at the city scale and identify the needs and composite challenges to be addressed across the city, as well as opportunities to be leveraged in urban recovery initiatives. Drawing on the report diagnosis and along this objective, a set of principles to guide longer-term recovery of Beirut has been put forward.
Five principles for urban recovery1. Be based on a principle of equity and consider the
compounded crises faced by the population across the city through a holistic, “whole-of-city” approach.
2. Consider the spatial boundaries of today’s Beirut (i.e. beyond its administrative boundaries), recognizing the interconnectedness of economic, social, environmental and political systems.
3. Apply a combined “bottom-up” and “top-down” approach, acknowledging the role of interlocutors and government at the local level as “first responders” to shocks and in addressing local needs, and of the role of national counterparts in devising enabling legislation and regulations.
4. Identify avenues for aligning and magnifying interventions by the multitude of actors responding to recent shocks and long-standing grievances.
5. Follow a “build-back-better” principle and ensure that efforts to rehabilitate and upgrade basic and social services are based on holistic systems analysis and evidence-based planning, including understanding of market dynamics of current service provision.
The principles draw attention to the need for short-to-longer-term interventions to consider the broader city, beyond the neighbourhoods directly affected by the 4 August 2020 blast, to halt further deterioration of the economy and to prevent more families from falling into the poverty trap with associated risks of rise of (new) tensions over already inadequate or lacking resources and services. They also underscore the need to consolidate the capacities and efforts of local and international actors around responses that consider both time and geographical scales to steer the recovery towards transformative change focused on strengthening local systems and capacities to absorb, adapt and recover from shocks. This is essential to both mitigate unequal support to communities with similar levels of vulnerabilities – be they directly affected by the blast or in dire need due to overlapping socioeconomic deprivations and long-standing marginalization – and to ensure community interventions are balanced with macro-level and longer-term interventions. For longer-term recovery and stabilization, attention is therefore required on both localized recovery plans at the city and neighbourhood levels, and on regional and national policies and regulations.
Recovery ladder for Beirut City In support of the Reform, Recovery and Reconstruction Framework (3RF) of the United Nations, EU and World
XXI
Bank, the profile provides a spatial dimension to localize the identified priorities of the track 1 and track 2 interventions (short to medium-term, respectively) and set the course for longer-term transformative actions.
The short- and long-term consequences for a Beirut City in crisis can be understood as multiple temporalities to be planned for and responded to in parallel. This means that interventions should be identified and implemented through a flexible and iterative process covering the immediate response and “quick wins”, including measures identified in the 3RF’s track 1, with longer-term development. The report divided these temporalities into a “recovery ladder” with three phases. Recommendations for strategic entry points on a neighbourhood, city and national level are outlined for each phase:
• Absorptive, responding to immediate needs;• Adaptive, medium-term response, including building-
back-better; and• Transformative, longer-term response, including
disruptive and bounce-forward measures.
In the following sections, a summary of recommendations for each phase of the recovery ladder is presented, indicating possible strategic entry points to target both stressors and root causes of vulnerabilities and needs. The recommendations are intended as a starting point to be further developed through a cross-sectoral and multi-stakeholder engagement, building on the strategic course set by the 3RF.
Recommendations for urban recovery at the city level
Absorptive• Strengthen and consolidate urban data and information
management.• Identify options for a city-wide area-based coordination
body for urban recovery efforts.• Define a longer-term recovery vision and plan, outlining
roles and responsibilities across the city.
Adaptive• Support the establishment of technical offices and
municipal information systems under municipalities or UoMs to collect, analyse and make available disaggregated data to inform planning.
• Develop and implement holistic, linked, comprehensive and phased plans for infrastructure and basic service delivery across the city.
• Support and strengthen value chains in Beirut through local economic development plans.
• Develop and implement plans for blue-green infrastructure.
• Strengthen urban spatial planning.
Transformative• Design and implement a phased urban mobility and
transportation plan.
• Design and implement bankable local economic development and infrastructure enhancement packages.
• Pilot local incubation set-ups to support innovation and entrepreneurship.
• Leverage digital technology in designing e-governance systems, including an information portal and two-way-communication platform.
• Rehabilitate heritage buildings damaged from the 4 August 2020 blast and buildings damaged from the 1975-1990 civil war, and expand list and increase protection of traditional blocks and neighbourhoods through a legislative framework for heritage buildings.
Recommendations for urban recovery at the neighbourhood level
Absorptive• Strengthen social development centres (SDCs)
(under Ministry of Social Affairs [MOSA]), legal clinics (including for housing, land and property rights [HLP] rights issues), protection units at hospitals and legal clinics, as well as social teams within the municipalities.
• Create platforms to facilitate dialogue between representatives from communities, civil society organizations (CSOs), think tanks, academia, private sector and central and local governments.
• Implement immediate repairs and interventions to secure minimum standards (housing; water, sanitation and hygiene [WaSH], etc.).
• Repair communal services (schools, health facilities, etc.).
Adaptive• Promote localized and participatory community action
plans.• Pilot options for community-contracting modalities
and direct support of neighbourhood committees.• Establish “community hubs” to provide activities,
training and services aimed at supporting women and youth access to livelihood opportunities and skills development.
Transformative• Promote conflict mitigation measures.• Design and implement inclusive green public spaces
as well as street profiles with integrated street design (i.e. increasing green cover while tackling surface water management, etc.).
• Elaborate and implement “whole-of-system” upgrades of infrastructural services, including assessing interlinked reliance of, for example, water and electricity systems, and identify interventions that will have the greatest impact on service access for households, communal services and enterprises alike.
• Pilot interventions that make use of renewable energy, new technology and concepts of circular economy.
• Pilot localized mobility plans that promote soft mobility within residential neighbourhoods, connecting to greater city-wide mobility plans.
© Photo: UN-Habitat
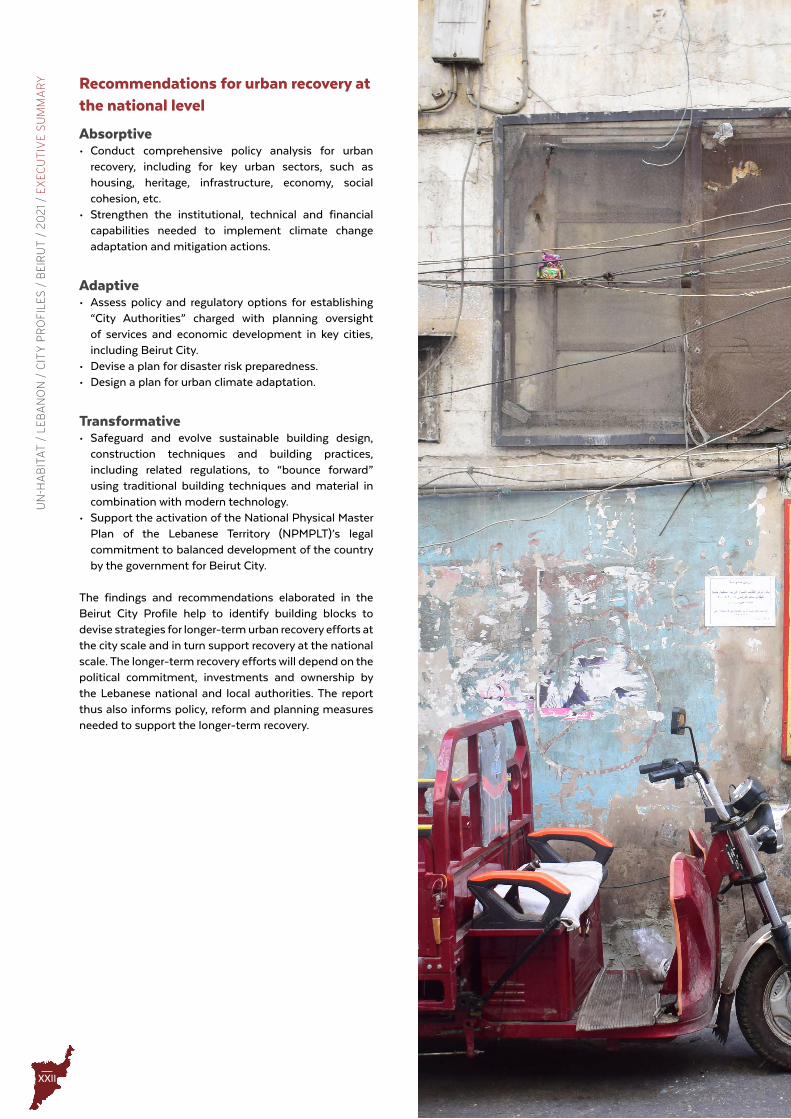
XXII
UN
-HA
BIT
AT
/ L
EB
AN
ON
/ C
ITY
PR
OFI
LE
S /
BE
IRU
T /
20
21
/ E
XEC
UT
IVE
SU
MM
AR
Y Recommendations for urban recovery at the national level
Absorptive• Conduct comprehensive policy analysis for urban
recovery, including for key urban sectors, such as housing, heritage, infrastructure, economy, social cohesion, etc.
• Strengthen the institutional, technical and financial capabilities needed to implement climate change adaptation and mitigation actions.
Adaptive• Assess policy and regulatory options for establishing
“City Authorities” charged with planning oversight of services and economic development in key cities, including Beirut City.
• Devise a plan for disaster risk preparedness.• Design a plan for urban climate adaptation.
Transformative• Safeguard and evolve sustainable building design,
construction techniques and building practices, including related regulations, to “bounce forward” using traditional building techniques and material in combination with modern technology.
• Support the activation of the National Physical Master Plan of the Lebanese Territory (NPMPLT)’s legal commitment to balanced development of the country by the government for Beirut City.
The findings and recommendations elaborated in the Beirut City Profile help to identify building blocks to devise strategies for longer-term urban recovery efforts at the city scale and in turn support recovery at the national scale. The longer-term recovery efforts will depend on the political commitment, investments and ownership by the Lebanese national and local authorities. The report thus also informs policy, reform and planning measures needed to support the longer-term recovery.
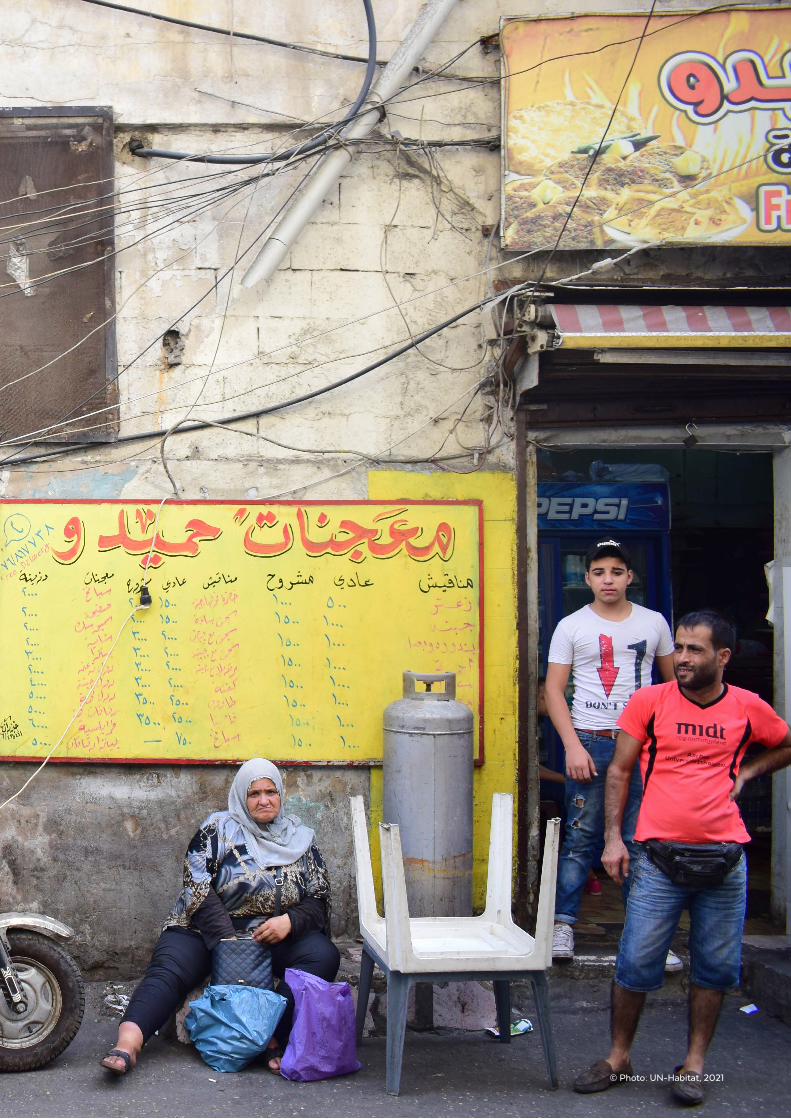
XXIII© Photo: UN-Habitat, 2021
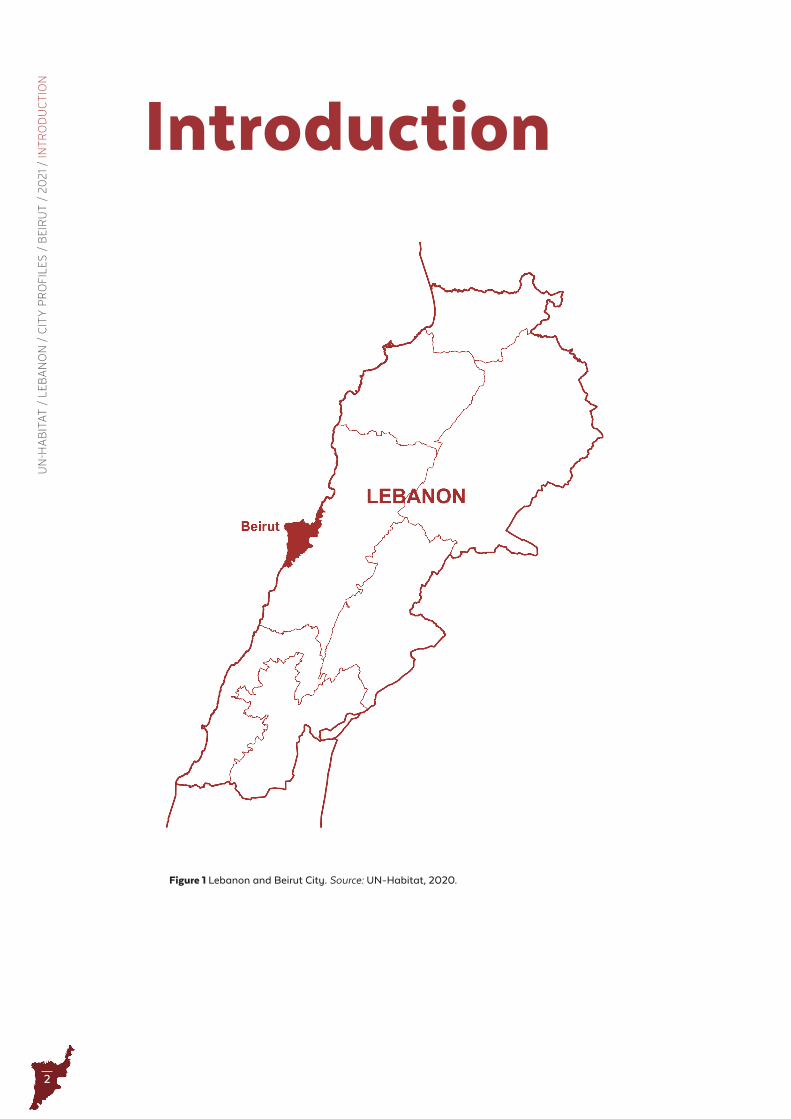
2
UN
-HA
BIT
AT
/ L
EB
AN
ON
/ C
ITY
PR
OFI
LE
S /
BE
IRU
T /
20
21
/ IN
TR
OD
UC
TIO
N
Figure 1 Lebanon and Beirut City . Source: UN-Habitat, 2020 .
Introduction
3
On 4 August 2020, large parts of Beirut City9 were severely damaged by an explosion in the Beirut port, impacting around 300,000 people and leading to more than 200 deaths and 6,500 injuries. The blast hit Lebanon’s capital after nine years of a protracted Syrian refugee crisis, a deepening economic crisis that had rendered an estimated 37 per cent of the population unemployed in February 2020 and 49 per cent by August 2020,10 an 80 per cent devaluation of the Lebanese pound (LBP) relative to the US dollar11 (USD), months of lockdown due to the COVID-19 pandemic, as well as political impasse and civil protests. Besides these crises, residents have been suffering from chronically underperforming public services and structural challenges. In Beirut City, inadequate governance and planning systems have further enforced patterns of urban disparities and contributed to the socioeconomic exclusion of poor host and refugee communities. The situation is reflected in the enduring housing crisis rendering a large part of the population with grossly inadequate housing, limited access to and severe deficiency in critical urban service delivery (including power and water shortages), increasing scarcity of food and medical supplies, heightened protection risks and increased social fragmentation.
The Beirut City Profile (BCP) has been developed to provide a cross-sectoral and spatial analysis that may inform ongoing efforts to respond to compounding shocks, including most recently the 4 August 2020 blast, and longer-term development. The BCP makes use of existing available information on structural challenges and the effects of overlapping crises to provide a diagnosis of key factors relevant to the response, recovery and reconstruction efforts, and a lens to think holistically around recovery efforts across the city scale – even beyond the Beirut Port explosion. The report also seeks to shed light on potential threats to further socioeconomic deterioration and increased tension.
The analysis and diagnosis from the BCP align with the 3RF12 and constitute a starting point to develop a shared understanding for holistic and longer-term urban recovery (see next page). The BCP can also be used to inform the COVID-19 socioeconomic recovery framework and other
9 Beirut City, as defined in this report, encompasses 31 municipalities. The boundaries are based on the continuously built-up area of the city. See Context chapter for detailed information.
10 World Bank, “Lebanon Economic Monitor: The Deliberate Depression,” December 2020.
11 The Economist, “Taking a Fall - After the Blast, Lebanon’s Prime Minister Quits” August 15, 2020. https://www.economist.com/middle-east-and-africa/2020/08/13/after-the-blast-lebanons-prime-minister-quits.
12 The 3RF is prepared by the EU, United Nations and World Bank with the aim to provide a roadmap to operationalize findings from the Beirut RDNA and other assessments, based on a “whole of Lebanon” approach. The framework builds on four pillars: 1) Improving Governance and Accountability; 2) Jobs and Economic Opportunities; 3) Social Protection, Inclusion and Culture; and 4) Improving Services and Infrastructure, within an 18-month timeframe until the third quarter of 2022.
forthcoming initiatives, including serving as a basis from which to enhance Beirut’s preparedness and resilience to future crises. By using a spatial approach that recognizes the interconnectedness of different geographical and administrative scales, the BCP highlights both local-level dynamics and urban systems on city, regional and national levels. The focus is on the most directly and indirectly affected and high-vulnerability areas to illustrate how overlapping and compounding shocks impact on social groups, systems and markets and to suggest what this means for response and development efforts.
The BCP aims to inform urban recovery in Beirut in collaboration with a range of actors from governmental, academic and international organizations. It provides a multisectoral and spatial analysis and diagnosis of the impacts of compounded crises on Beirut City. In other words:
The BCP is developed as an analytical base to identify key needs, challenges, gaps and opportunities that can be used to inform both immediate as well as medium-to-longer-term urban recovery .
The report is structured across seven thematic chapters:
1. Governance and Accountability2. Economy and Livelihoods3. Social Protection and Social Inclusion4. Basic and Social Services5. Housing6. Environment7. Cultural Heritage
The initial three chapters each follow the three first pillars of the 3RF (Improving Governance and Accountability; Jobs and Economic Opportunities; and Social Protection, Inclusion and Culture), while chapters 4-7 all inform the last pillar (Improving Services and Infrastructure). This division aligns with the pillars of the Urban Recovery Framework methodology developed by UN-Habitat (see Urban Recovery Framework section). In addition, the report contains two introductory chapters on the Beirut City Context and Demography. This situates the analysis within Beirut’s historic development, its demographic composition and recent shocks. Finally, a Diagnosis Summary provides a summary of findings from the analysis, while the final Recommendations chapter suggests guiding principles for urban recovery that consider the current stressors impacting the whole of Beirut City, as well as programmatic recommendations based on these findings.
Throughout the chapters, the report aims to shed light on various historic developments, conditions, systems and more, which are relevant to capture a snapshot of the current situation in Beirut City across sectors and areas of the city. While this makes the report rich in the subjects and data covered, the report only covers a small part of available and detailed research and studies on
4
UN
-HA
BIT
AT
/ L
EB
AN
ON
/ C
ITY
PR
OFI
LE
S /
BE
IRU
T /
20
21
/ IN
TR
OD
UC
TIO
N each one of these topics. The report should therefore be read for its intended use as a snapshot of the current situation to initiate discourse around urban recovery and development of Beirut City, and as a starting point for further in-depth readings within the respective sectors covered.
MethodologyCity profiles are an integral part of UN-Habitat’s area- and evidence-based methodology and approach to addressing key urban challenges and how they affect humanitarian and development crises and responses.13 City profiles provide a diagnosis of a city’s current situation, highlighting the contributing factors and effects to inform a shared understanding of current recovery needs and vulnerabilities. City profiles may also present an important opportunity to guide urban recovery following a particular shock, and in this case, can be applicable to the recovery and reconstruction of Beirut City. The information and multisectoral analysis presented in this report draws on recent available data and assessments on the effects of the economic crisis, COVID-19 and the 4 August 2020 blast; available data on Beirut and its governance structures, service provision systems and economy; secondary analysis of primary data previously collected as part of neighbourhood profiling conducted by UN-Habitat with other partners (see Neighbourhood Data section below); as well as other relevant sources. Importantly, key data and input have been provided by partners. To ensure solid and relevant data and analysis, the chapters have been reviewed by technical experts within their respective fields and partner organizations (see full overview in the Credits and Acknowledgements).
Urban Recovery Framework While a longer-term plan for the recovery of Beirut City, as defined in this report, has not been developed at the time of writing, UN-Habitat profiling tools, such as this city profile, is intended to form a shared understanding of needs to devise a longer-term recovery plan with the 3RF as a starting point. The Urban Recovery Framework (URF) methodology has been developed by UN-Habitat and partners in the region to guide urban-specific dimensions of post-disaster and post-conflict recovery and could in the case of Beirut help design a multisectoral and multi-stakeholder approach adopted to urban systems and conditions. Most crisis response approaches are organized along sectoral lines, without recognizing their interdependence in urban areas, and most do not account for local dynamics. Economic, social, cultural, environmental and political dimensions manifest differently across cities and scales of human settlements, and recovery programmes thus require a locally tailored approach. A tested methodology in the Middle East and North Africa (MENA) region, the URF process incorporates both city- and community-level approaches while also paying attention to national policies. This is to identify and strengthen linkages,
13 In Lebanon, UN-Habitat has developed city profiles for Tyre City (2017) and Tripoli City (2017) to date.
connections and synergies in response across areas and systems. Furthermore, as a temporal framework, the URF accommodates a need for both immediate response and longer-term adaptive and transformative measures in cities. As such, the URF can serve to fill a significant gap in the international system’s ability to support countries and cities affected by urban crises, along the emergency humanitarian and medium-to-long-term development continuum.
The URF can be described as an enabling institutional and policy framework and related programming to support resilient urban recovery at scale, and the renewal of the social contract .
As response efforts in Beirut move into a new phase, beyond the immediate relief to the 4 August 2020 blast, and as the effects of city-wide compounded crises are evident, area-based urban recovery approaches, such as an URF, may help to guide a “whole-of-city” approach, addressing overlapping needs in an equitable manner. The URF is designed to help and galvanize the national and subnational governments’ crisis response and planning efforts with a view to assist in the consolidation of multiple United Nations agencies, international and local non-governmental organizations (NGOs), as well as civil society actors on the ground. This can contribute to a cohesive, cross-sectoral and multisectoral response that takes into consideration the spatial connectivity and complexity of Beirut City. Moreover, the URF represents a useful and complementary instrument to introduce a spatial dimension to current initiatives - including the 3RF, COVID-19 socioeconomic recovery framework, and the LCRP - to facilitate a localized and area-based response. To this end, as mentioned above, the BCP is a point of departure where the diagnosis at local and city levels may be expanded and further built upon with the contribution of a range of stakeholders.
Notably, the URF is also relevant for other Lebanese cities that over the past years have suffered from unplanned growth, overlaid with compounding shocks and economic deterioration.
The URF methodology entails three main parts:1. Diagnostics and analysis (BCP).2. Identification of absorptive, adaptive and
transformative priorities – including the mobilization of stakeholders for multi-stakeholder action plans.
3. Implementation of URF priorities at city and neighbourhood levels.
Urban dataMajor data gaps persist in Lebanon. There is a lack of reliable and up-to-date data, where data sets generated by different actors for different purposes are often incompatible. The inadequate overview of existing data and access to reliable and comprehensive analysis of this data on a city and neighbourhood level is a further significant challenge to overcome. The United Nations Country Team (UNCT) recognizes the lack of good-quality data as a barrier constraining the design of evidence-
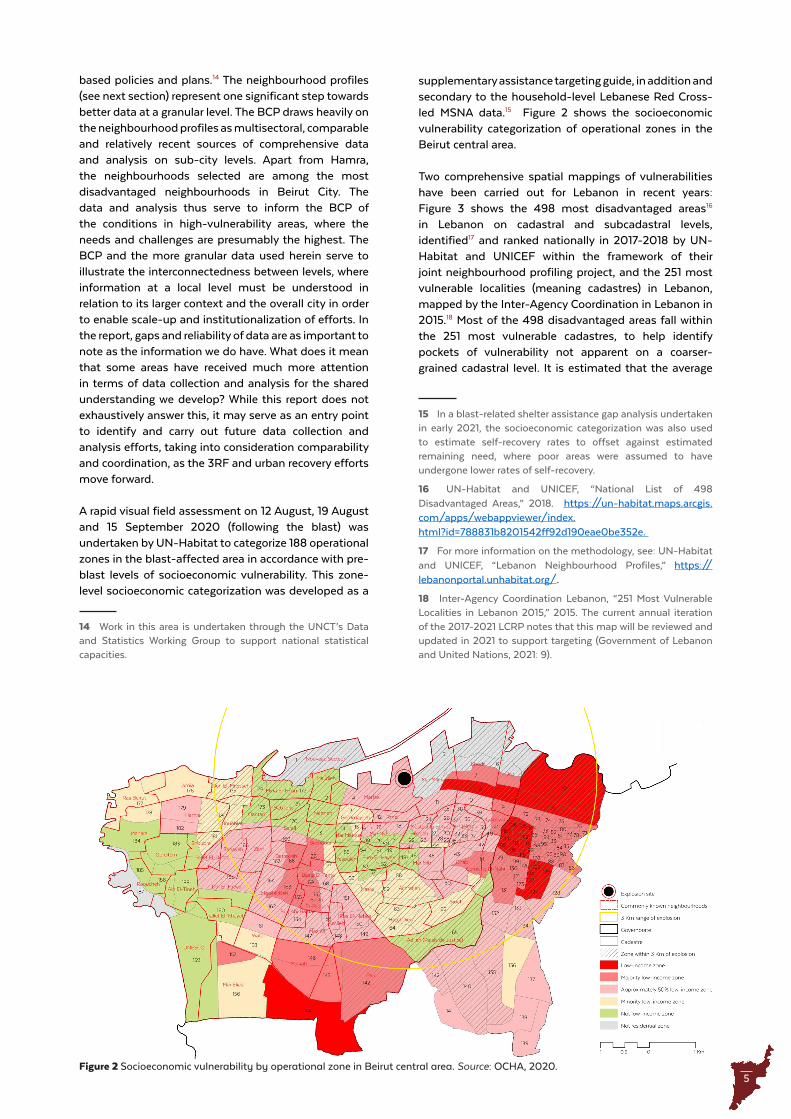
5
based policies and plans.14 The neighbourhood profiles (see next section) represent one significant step towards better data at a granular level. The BCP draws heavily on the neighbourhood profiles as multisectoral, comparable and relatively recent sources of comprehensive data and analysis on sub-city levels. Apart from Hamra, the neighbourhoods selected are among the most disadvantaged neighbourhoods in Beirut City. The data and analysis thus serve to inform the BCP of the conditions in high-vulnerability areas, where the needs and challenges are presumably the highest. The BCP and the more granular data used herein serve to illustrate the interconnectedness between levels, where information at a local level must be understood in relation to its larger context and the overall city in order to enable scale-up and institutionalization of efforts. In the report, gaps and reliability of data are as important to note as the information we do have. What does it mean that some areas have received much more attention in terms of data collection and analysis for the shared understanding we develop? While this report does not exhaustively answer this, it may serve as an entry point to identify and carry out future data collection and analysis efforts, taking into consideration comparability and coordination, as the 3RF and urban recovery efforts move forward.
A rapid visual field assessment on 12 August, 19 August and 15 September 2020 (following the blast) was undertaken by UN-Habitat to categorize 188 operational zones in the blast-affected area in accordance with pre-blast levels of socioeconomic vulnerability. This zone-level socioeconomic categorization was developed as a
14 Work in this area is undertaken through the UNCT’s Data and Statistics Working Group to support national statistical capacities.
Figure 2 Socioeconomic vulnerability by operational zone in Beirut central area . Source: OCHA, 2020 .
supplementary assistance targeting guide, in addition and secondary to the household-level Lebanese Red Cross-led MSNA data.15 Figure 2 shows the socioeconomic vulnerability categorization of operational zones in the Beirut central area.
Two comprehensive spatial mappings of vulnerabilities have been carried out for Lebanon in recent years: Figure 3 shows the 498 most disadvantaged areas16 in Lebanon on cadastral and subcadastral levels, identified17 and ranked nationally in 2017-2018 by UN-Habitat and UNICEF within the framework of their joint neighbourhood profiling project, and the 251 most vulnerable localities (meaning cadastres) in Lebanon, mapped by the Inter-Agency Coordination in Lebanon in 2015.18 Most of the 498 disadvantaged areas fall within the 251 most vulnerable cadastres, to help identify pockets of vulnerability not apparent on a coarser-grained cadastral level. It is estimated that the average
15 In a blast-related shelter assistance gap analysis undertaken in early 2021, the socioeconomic categorization was also used to estimate self-recovery rates to offset against estimated remaining need, where poor areas were assumed to have undergone lower rates of self-recovery.
16 UN-Habitat and UNICEF, “National List of 498 Disadvantaged Areas,” 2018. https://un-habitat.maps.arcgis.com/apps/webappviewer/index.html?id=788831b8201542ff92d190eae0be352e.
17 For more information on the methodology, see: UN-Habitat and UNICEF, “Lebanon Neighbourhood Profiles,” https://lebanonportal.unhabitat.org/.
18 Inter-Agency Coordination Lebanon, “251 Most Vulnerable Localities in Lebanon 2015,” 2015. The current annual iteration of the 2017-2021 LCRP notes that this map will be reviewed and updated in 2021 to support targeting (Government of Lebanon and United Nations, 2021: 9).
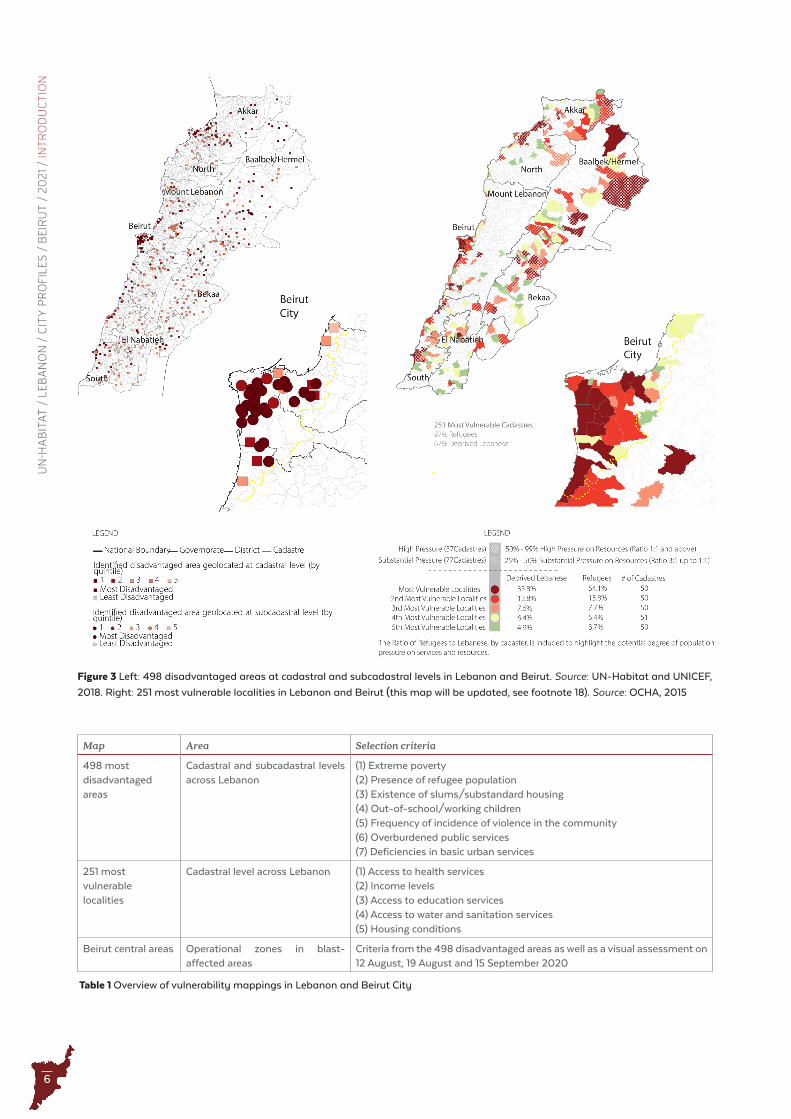
6
UN
-HA
BIT
AT
/ L
EB
AN
ON
/ C
ITY
PR
OFI
LE
S /
BE
IRU
T /
20
21
/ IN
TR
OD
UC
TIO
N
Map Area Selection criteria
498 most disadvantaged areas
Cadastral and subcadastral levels across Lebanon
(1) Extreme poverty(2) Presence of refugee population(3) Existence of slums/substandard housing(4) Out-of-school/working children(5) Frequency of incidence of violence in the community(6) Overburdened public services(7) Deficiencies in basic urban services
251 most vulnerable localities
Cadastral level across Lebanon (1) Access to health services (2) Income levels(3) Access to education services(4) Access to water and sanitation services(5) Housing conditions
Beirut central areas Operational zones in blast-affected areas
Criteria from the 498 disadvantaged areas as well as a visual assessment on 12 August, 19 August and 15 September 2020
Table 1 Overview of vulnerability mappings in Lebanon and Beirut City
Figure 3 Left: 498 disadvantaged areas at cadastral and subcadastral levels in Lebanon and Beirut . Source: UN-Habitat and UNICEF,
2018 . Right: 251 most vulnerable localities in Lebanon and Beirut (this map will be updated, see footnote 18) . Source: OCHA, 2015
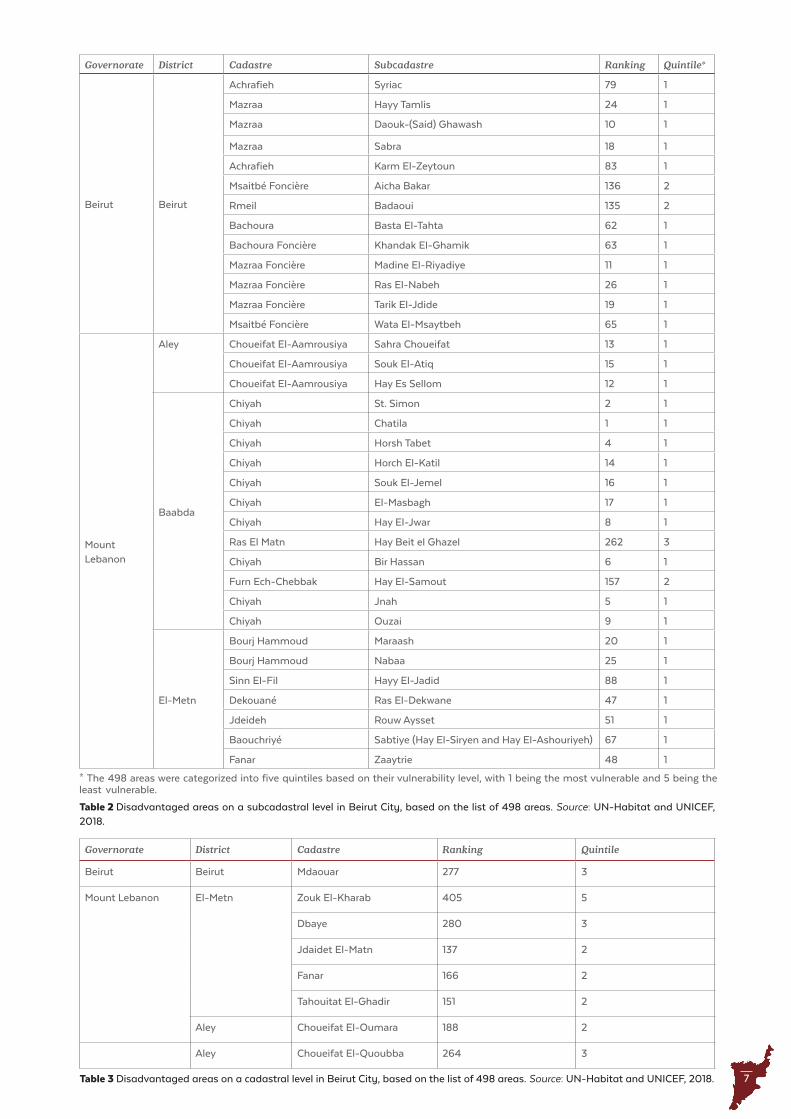
7
Table 2 Disadvantaged areas on a subcadastral level in Beirut City, based on the list of 498 areas . Source: UN-Habitat and UNICEF, 2018 .
Table 3 Disadvantaged areas on a cadastral level in Beirut City, based on the list of 498 areas . Source: UN-Habitat and UNICEF, 2018 .
Governorate District Cadastre Subcadastre Ranking Quintile*
Beirut Beirut
Achrafieh Syriac 79 1
Mazraa Hayy Tamlis 24 1
Mazraa Daouk-(Said) Ghawash 10 1
Mazraa Sabra 18 1
Achrafieh Karm El-Zeytoun 83 1
Msaitbé Foncière Aicha Bakar 136 2
Rmeil Badaoui 135 2
Bachoura Basta El-Tahta 62 1
Bachoura Foncière Khandak El-Ghamik 63 1
Mazraa Foncière Madine El-Riyadiye 11 1
Mazraa Foncière Ras El-Nabeh 26 1
Mazraa Foncière Tarik El-Jdide 19 1
Msaitbé Foncière Wata El-Msaytbeh 65 1
Mount Lebanon
Aley Choueifat El-Aamrousiya Sahra Choueifat 13 1
Choueifat El-Aamrousiya Souk El-Atiq 15 1
Choueifat El-Aamrousiya Hay Es Sellom 12 1
Baabda
Chiyah St. Simon 2 1
Chiyah Chatila 1 1
Chiyah Horsh Tabet 4 1
Chiyah Horch El-Katil 14 1
Chiyah Souk El-Jemel 16 1
Chiyah El-Masbagh 17 1
Chiyah Hay El-Jwar 8 1
Ras El Matn Hay Beit el Ghazel 262 3
Chiyah Bir Hassan 6 1
Furn Ech-Chebbak Hay El-Samout 157 2
Chiyah Jnah 5 1
Chiyah Ouzai 9 1
El-Metn
Bourj Hammoud Maraash 20 1
Bourj Hammoud Nabaa 25 1
Sinn El-Fil Hayy El-Jadid 88 1
Dekouané Ras El-Dekwane 47 1
Jdeideh Rouw Aysset 51 1
Baouchriyé Sabtiye (Hay El-Siryen and Hay El-Ashouriyeh) 67 1
Fanar Zaaytrie 48 1
Governorate District Cadastre Ranking Quintile
Beirut Beirut Mdaouar 277 3
Mount Lebanon El-Metn Zouk El-Kharab 405 5
Dbaye 280 3
Jdaidet El-Matn 137 2
Fanar 166 2
Tahouitat El-Ghadir 151 2
Aley Choueifat El-Oumara 188 2
Aley Choueifat El-Quoubba 264 3
* The 498 areas were categorized into five quintiles based on their vulnerability level, with 1 being the most vulnerable and 5 being the least vulnerable.
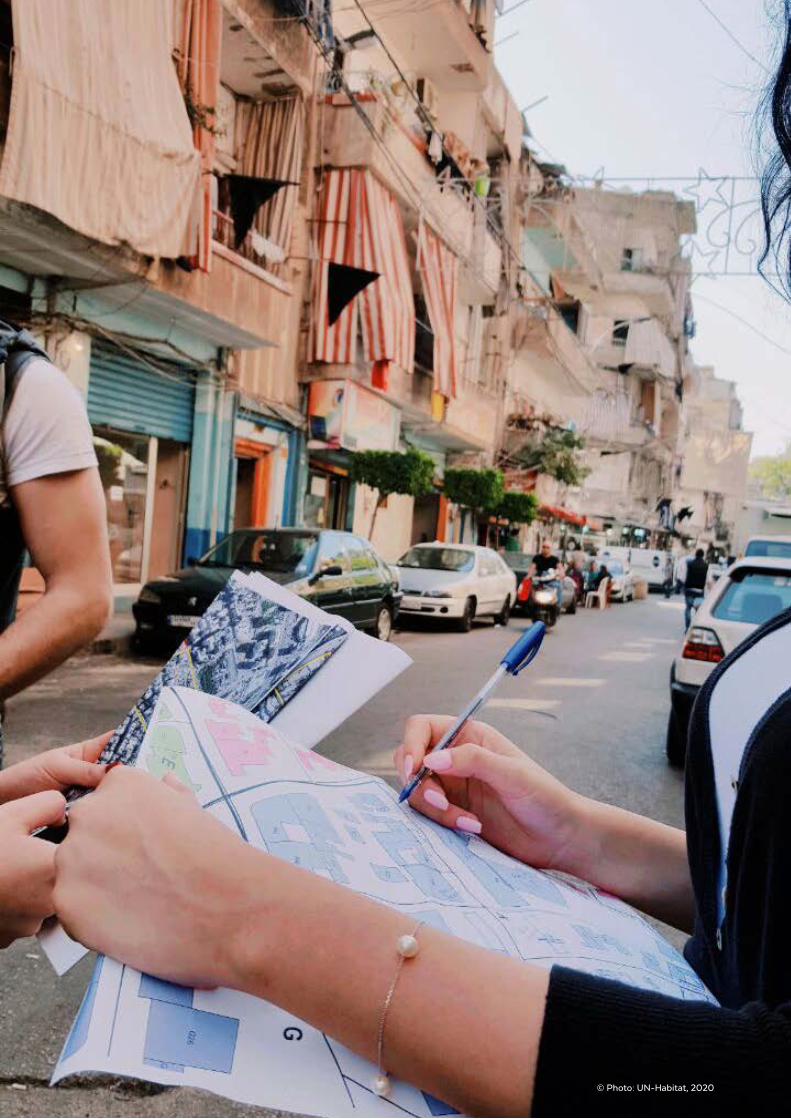
8© Photo: UN-Habitat, 2020
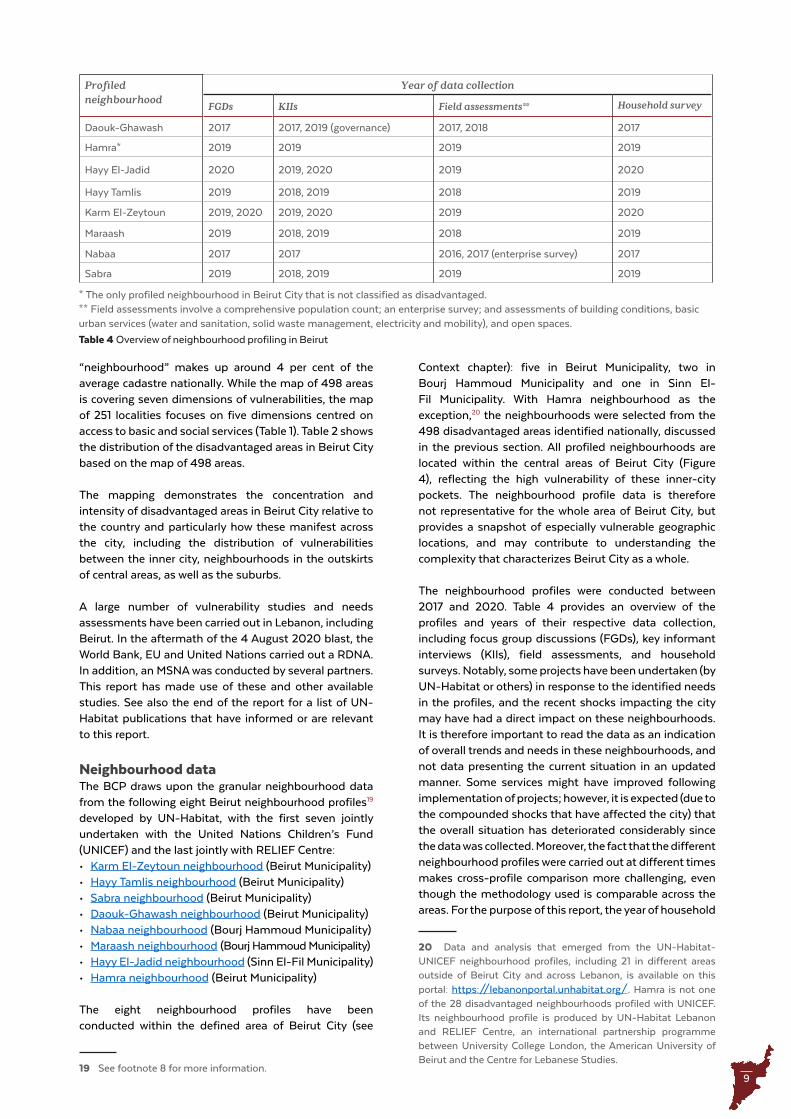
9
“neighbourhood” makes up around 4 per cent of the average cadastre nationally. While the map of 498 areas is covering seven dimensions of vulnerabilities, the map of 251 localities focuses on five dimensions centred on access to basic and social services (Table 1). Table 2 shows the distribution of the disadvantaged areas in Beirut City based on the map of 498 areas.
The mapping demonstrates the concentration and intensity of disadvantaged areas in Beirut City relative to the country and particularly how these manifest across the city, including the distribution of vulnerabilities between the inner city, neighbourhoods in the outskirts of central areas, as well as the suburbs.
A large number of vulnerability studies and needs assessments have been carried out in Lebanon, including Beirut. In the aftermath of the 4 August 2020 blast, the World Bank, EU and United Nations carried out a RDNA. In addition, an MSNA was conducted by several partners. This report has made use of these and other available studies. See also the end of the report for a list of UN-Habitat publications that have informed or are relevant to this report.
Neighbourhood dataThe BCP draws upon the granular neighbourhood data from the following eight Beirut neighbourhood profiles19 developed by UN-Habitat, with the first seven jointly undertaken with the United Nations Children’s Fund (UNICEF) and the last jointly with RELIEF Centre:• Karm El-Zeytoun neighbourhood (Beirut Municipality)• Hayy Tamlis neighbourhood (Beirut Municipality)• Sabra neighbourhood (Beirut Municipality)• Daouk-Ghawash neighbourhood (Beirut Municipality)• Nabaa neighbourhood (Bourj Hammoud Municipality)• Maraash neighbourhood (Bourj Hammoud Municipality)• Hayy El-Jadid neighbourhood (Sinn El-Fil Municipality)• Hamra neighbourhood (Beirut Municipality)
The eight neighbourhood profiles have been conducted within the defined area of Beirut City (see
19 See footnote 8 for more information.
Context chapter): five in Beirut Municipality, two in Bourj Hammoud Municipality and one in Sinn El-Fil Municipality. With Hamra neighbourhood as the exception,20 the neighbourhoods were selected from the 498 disadvantaged areas identified nationally, discussed in the previous section. All profiled neighbourhoods are located within the central areas of Beirut City (Figure 4), reflecting the high vulnerability of these inner-city pockets. The neighbourhood profile data is therefore not representative for the whole area of Beirut City, but provides a snapshot of especially vulnerable geographic locations, and may contribute to understanding the complexity that characterizes Beirut City as a whole.
The neighbourhood profiles were conducted between 2017 and 2020. Table 4 provides an overview of the profiles and years of their respective data collection, including focus group discussions (FGDs), key informant interviews (KIIs), field assessments, and household surveys. Notably, some projects have been undertaken (by UN-Habitat or others) in response to the identified needs in the profiles, and the recent shocks impacting the city may have had a direct impact on these neighbourhoods. It is therefore important to read the data as an indication of overall trends and needs in these neighbourhoods, and not data presenting the current situation in an updated manner. Some services might have improved following implementation of projects; however, it is expected (due to the compounded shocks that have affected the city) that the overall situation has deteriorated considerably since the data was collected. Moreover, the fact that the different neighbourhood profiles were carried out at different times makes cross-profile comparison more challenging, even though the methodology used is comparable across the areas. For the purpose of this report, the year of household
20 Data and analysis that emerged from the UN-Habitat-UNICEF neighbourhood profiles, including 21 in different areas outside of Beirut City and across Lebanon, is available on this portal: https://lebanonportal.unhabitat.org/. Hamra is not one of the 28 disadvantaged neighbourhoods profiled with UNICEF. Its neighbourhood profile is produced by UN-Habitat Lebanon and RELIEF Centre, an international partnership programme between University College London, the American University of Beirut and the Centre for Lebanese Studies.
Profiled neighbourhood
Year of data collection
FGDs KIIs Field assessments** Household survey
Daouk-Ghawash 2017 2017, 2019 (governance) 2017, 2018 2017
Hamra* 2019 2019 2019 2019
Hayy El-Jadid 2020 2019, 2020 2019 2020
Hayy Tamlis 2019 2018, 2019 2018 2019
Karm El-Zeytoun 2019, 2020 2019, 2020 2019 2020
Maraash 2019 2018, 2019 2018 2019
Nabaa 2017 2017 2016, 2017 (enterprise survey) 2017
Sabra 2019 2018, 2019 2019 2019
Table 4 Overview of neighbourhood profiling in Beirut
* The only profiled neighbourhood in Beirut City that is not classified as disadvantaged.** Field assessments involve a comprehensive population count; an enterprise survey; and assessments of building conditions, basic urban services (water and sanitation, solid waste management, electricity and mobility), and open spaces.

10
UN
-HA
BIT
AT
/ L
EB
AN
ON
/ C
ITY
PR
OFI
LE
S /
BE
IRU
T /
20
21
/ IN
TR
OD
UC
TIO
N
Figure 4 Location of the eight neighbourhood profiles carried out in Beirut City . Source: UN-Habitat, 2020 .
data collection will be referenced for the respective neighbourhood profiling data. In cases where only non-household data is used, the reader will be referred to this section for more information on when the data collection took place. For three neighbourhood profiles (Hayy El-Jadid, Hayy Tamlis and Karm El-Zeytoun), at least part of the data collection was carried out after the civil uprising in October 2019, after the economic deterioration in the country had started accelerating. In two neighbourhoods (Hayy El-Jadid and Karm El-Zeytoun), data collection was undertaken in March 2020, around the time when COVID-19 measures were introduced. All data was collected prior to the 4 August 2020 blast. It should also be noted that the data collection for Hamra differs slightly from data collection in the other areas, and specifically
that when the household survey-based neighbourhood data referred to in this report cites “non-Lebanese,” this refers only to Syrians in the case of Hamra.
The caveats for data analysis and comparison outlined above notwithstanding, the neighbourhood profiles provide valuable insight into socioeconomic, demographic and built environment conditions in vulnerable neighbourhoods and indicate large intracity variations. This suggests the need for further de-homogenization of urban data. Not all vulnerable neighbourhoods are vulnerable in the same way, while there might be similar vulnerabilities or potentials across neighbourhoods with different socioeconomic, demographic and built environment profiles.

11
© Photo: UN-Habitat, 2017
© Photo: UN-Habitat, 2019
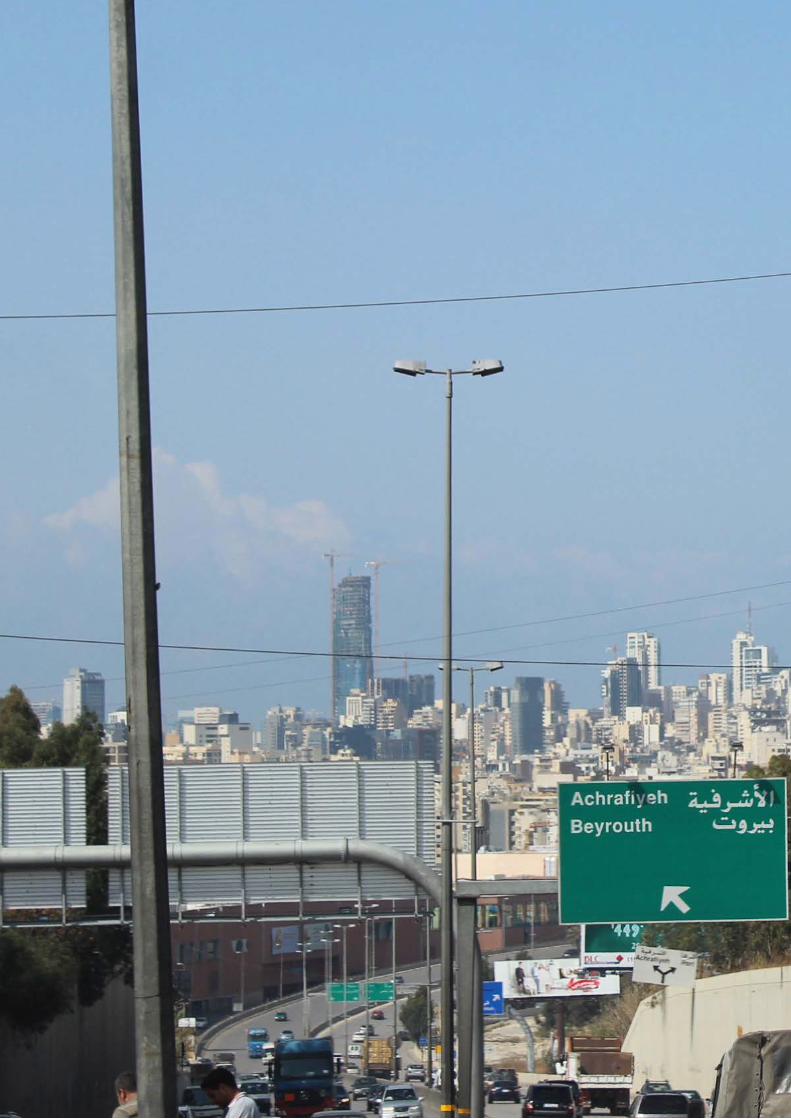
12
UN
-HA
BIT
AT
/ L
EB
AN
ON
/ C
ITY
PR
OFI
LE
S /
BE
IRU
T /
20
21 /
CO
NT
EX
T
13
Context
© Photo: Synne Bergby, 2017
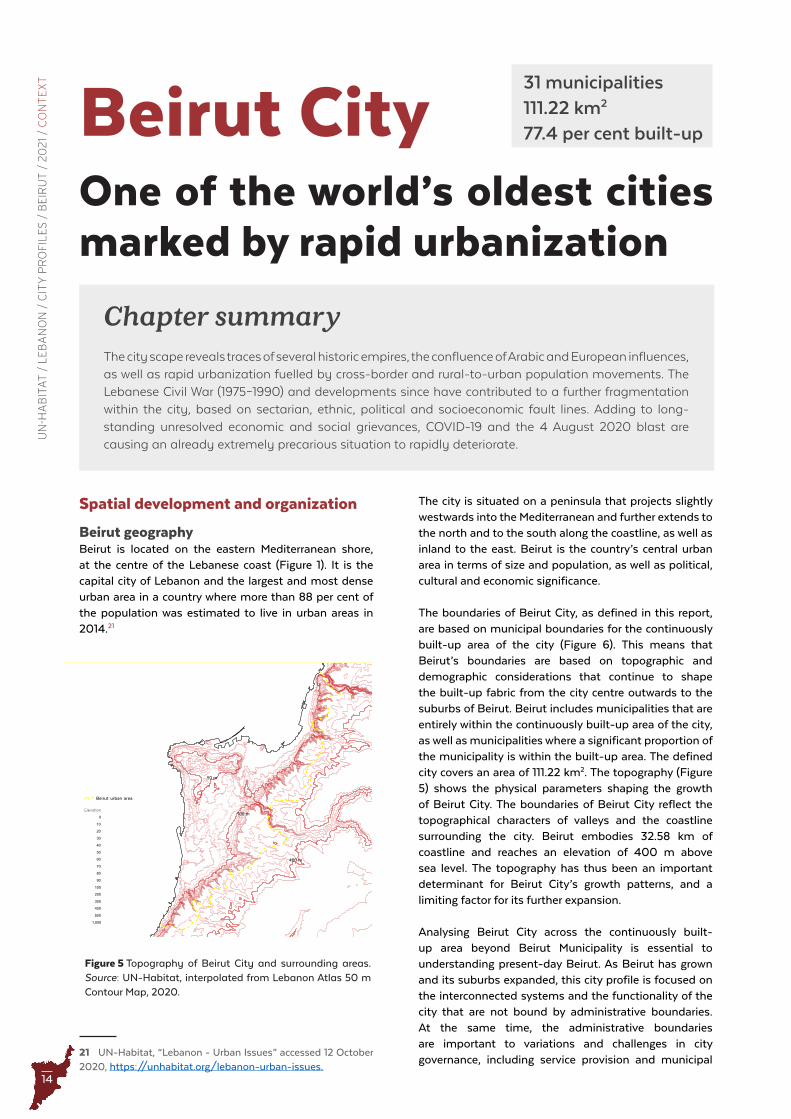
14
UN
-HA
BIT
AT
/ L
EB
AN
ON
/ C
ITY
PR
OFI
LE
S /
BE
IRU
T /
20
21 /
CO
NT
EX
T
Spatial development and organization
Beirut geographyBeirut is located on the eastern Mediterranean shore, at the centre of the Lebanese coast (Figure 1). It is the capital city of Lebanon and the largest and most dense urban area in a country where more than 88 per cent of the population was estimated to live in urban areas in 2014.21
21 UN-Habitat, “Lebanon - Urban Issues” accessed 12 October 2020, https://unhabitat.org/lebanon-urban-issues.
Elevation
0
10
20
30
40
50
60
70
80
90
100
200
300
400
500
1,000
50 m
100 m
400 m
Beirut urban area
Figure 5 Topography of Beirut City and surrounding areas . Source: UN-Habitat, interpolated from Lebanon Atlas 50 m Contour Map, 2020 .
Beirut City31 municipalities111.22 km2
77.4 per cent built-up
One of the world’s oldest cities marked by rapid urbanization
Chapter summary The city scape reveals traces of several historic empires, the confluence of Arabic and European influences, as well as rapid urbanization fuelled by cross-border and rural-to-urban population movements. The Lebanese Civil War (1975–1990) and developments since have contributed to a further fragmentation within the city, based on sectarian, ethnic, political and socioeconomic fault lines. Adding to long-standing unresolved economic and social grievances, COVID-19 and the 4 August 2020 blast are causing an already extremely precarious situation to rapidly deteriorate.
The city is situated on a peninsula that projects slightly westwards into the Mediterranean and further extends to the north and to the south along the coastline, as well as inland to the east. Beirut is the country’s central urban area in terms of size and population, as well as political, cultural and economic significance.
The boundaries of Beirut City, as defined in this report, are based on municipal boundaries for the continuously built-up area of the city (Figure 6). This means that Beirut’s boundaries are based on topographic and demographic considerations that continue to shape the built-up fabric from the city centre outwards to the suburbs of Beirut. Beirut includes municipalities that are entirely within the continuously built-up area of the city, as well as municipalities where a significant proportion of the municipality is within the built-up area. The defined city covers an area of 111.22 km2. The topography (Figure 5) shows the physical parameters shaping the growth of Beirut City. The boundaries of Beirut City reflect the topographical characters of valleys and the coastline surrounding the city. Beirut embodies 32.58 km of coastline and reaches an elevation of 400 m above sea level. The topography has thus been an important determinant for Beirut City’s growth patterns, and a limiting factor for its further expansion.
Analysing Beirut City across the continuously built-up area beyond Beirut Municipality is essential to understanding present-day Beirut. As Beirut has grown and its suburbs expanded, this city profile is focused on the interconnected systems and the functionality of the city that are not bound by administrative boundaries. At the same time, the administrative boundaries are important to variations and challenges in city governance, including service provision and municipal
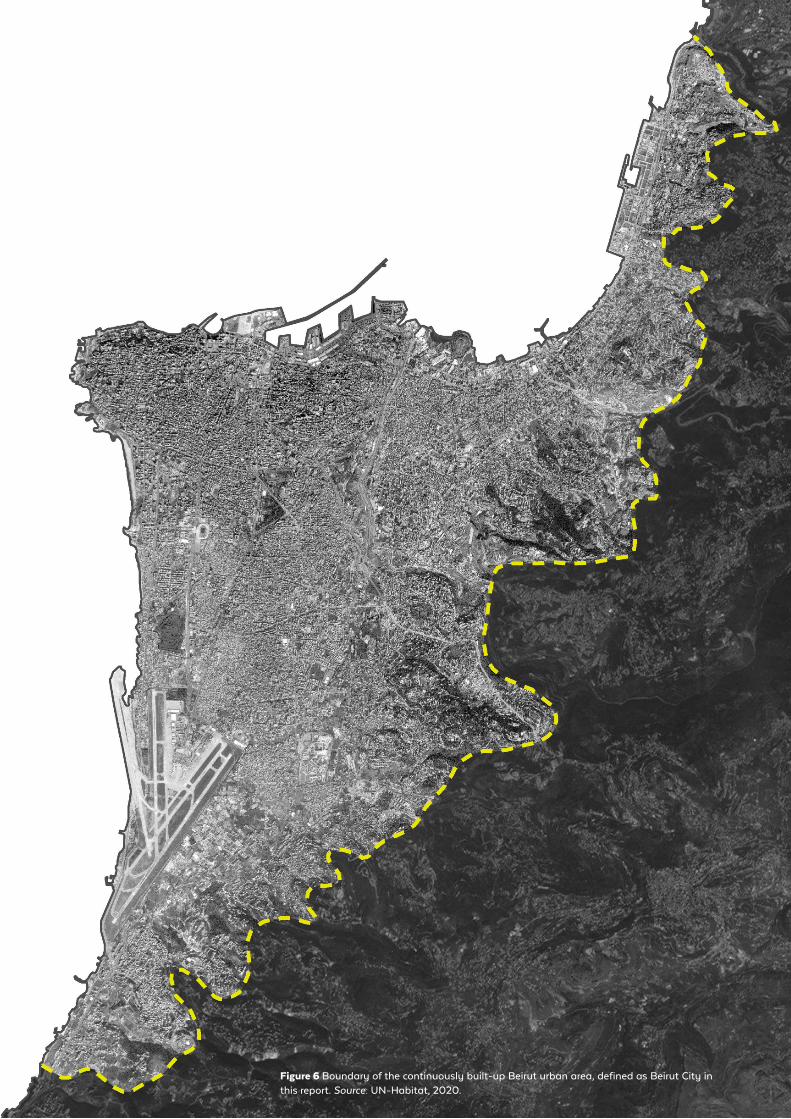
15Figure 6 Boundary of the continuously built-up Beirut urban area, defined as Beirut City in this report . Source: UN-Habitat, 2020 .
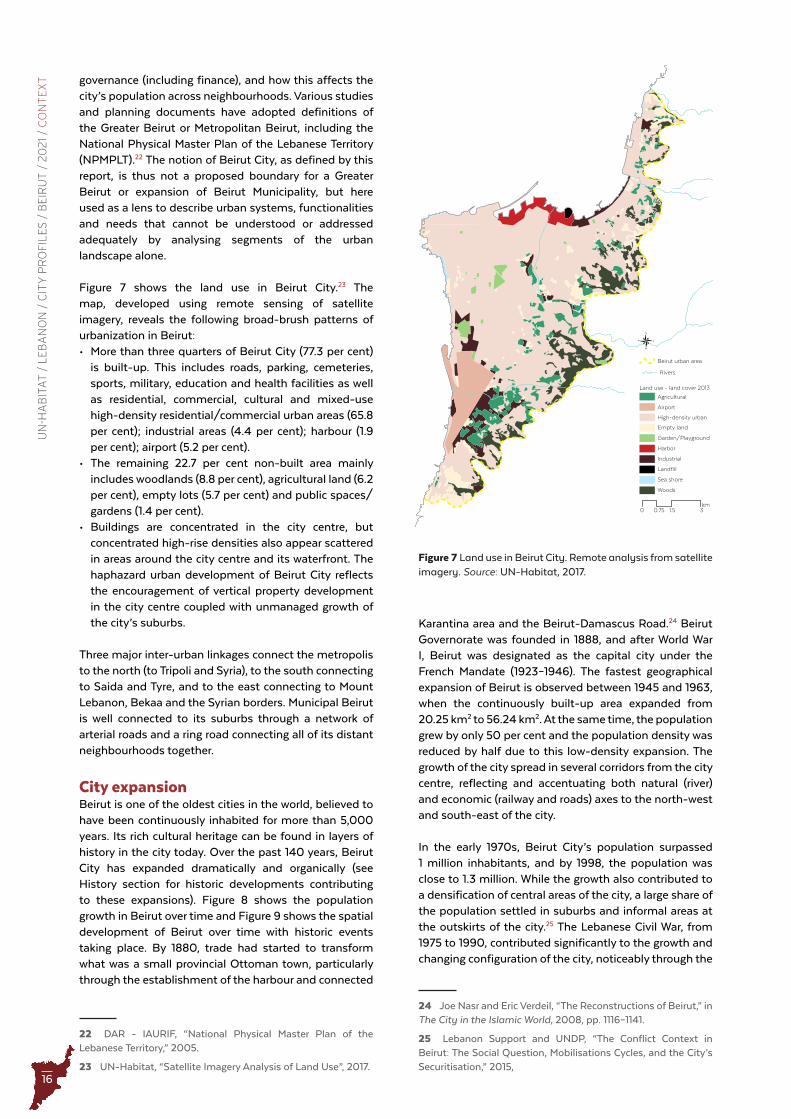
16
UN
-HA
BIT
AT
/ L
EB
AN
ON
/ C
ITY
PR
OFI
LE
S /
BE
IRU
T /
20
21 /
CO
NT
EX
T
0 1.5 30.75km
Land use - land cover 2013
Agricultural
Airport
High-density urban
Empty land
Garden/Playground
Harbor
Industrial
Landfill
Sea shore
Woods
Beirut urban area
Rivers
Figure 7 Land use in Beirut City . Remote analysis from satellite imagery . Source: UN-Habitat, 2017 .
governance (including finance), and how this affects the city’s population across neighbourhoods. Various studies and planning documents have adopted definitions of the Greater Beirut or Metropolitan Beirut, including the National Physical Master Plan of the Lebanese Territory (NPMPLT).22 The notion of Beirut City, as defined by this report, is thus not a proposed boundary for a Greater Beirut or expansion of Beirut Municipality, but here used as a lens to describe urban systems, functionalities and needs that cannot be understood or addressed adequately by analysing segments of the urban landscape alone.
Figure 7 shows the land use in Beirut City.23 The map, developed using remote sensing of satellite imagery, reveals the following broad-brush patterns of urbanization in Beirut:• More than three quarters of Beirut City (77.3 per cent)
is built-up. This includes roads, parking, cemeteries, sports, military, education and health facilities as well as residential, commercial, cultural and mixed-use high-density residential/commercial urban areas (65.8 per cent); industrial areas (4.4 per cent); harbour (1.9 per cent); airport (5.2 per cent).
• The remaining 22.7 per cent non-built area mainly includes woodlands (8.8 per cent), agricultural land (6.2 per cent), empty lots (5.7 per cent) and public spaces/gardens (1.4 per cent).
• Buildings are concentrated in the city centre, but concentrated high-rise densities also appear scattered in areas around the city centre and its waterfront. The haphazard urban development of Beirut City reflects the encouragement of vertical property development in the city centre coupled with unmanaged growth of the city’s suburbs.
Three major inter-urban linkages connect the metropolis to the north (to Tripoli and Syria), to the south connecting to Saida and Tyre, and to the east connecting to Mount Lebanon, Bekaa and the Syrian borders. Municipal Beirut is well connected to its suburbs through a network of arterial roads and a ring road connecting all of its distant neighbourhoods together.
City expansionBeirut is one of the oldest cities in the world, believed to have been continuously inhabited for more than 5,000 years. Its rich cultural heritage can be found in layers of history in the city today. Over the past 140 years, Beirut City has expanded dramatically and organically (see History section for historic developments contributing to these expansions). Figure 8 shows the population growth in Beirut over time and Figure 9 shows the spatial development of Beirut over time with historic events taking place. By 1880, trade had started to transform what was a small provincial Ottoman town, particularly through the establishment of the harbour and connected
22 DAR - IAURIF, “National Physical Master Plan of the Lebanese Territory,” 2005.
23 UN-Habitat, “Satellite Imagery Analysis of Land Use”, 2017.
Karantina area and the Beirut-Damascus Road.24 Beirut Governorate was founded in 1888, and after World War I, Beirut was designated as the capital city under the French Mandate (1923–1946). The fastest geographical expansion of Beirut is observed between 1945 and 1963, when the continuously built-up area expanded from 20.25 km2 to 56.24 km2. At the same time, the population grew by only 50 per cent and the population density was reduced by half due to this low-density expansion. The growth of the city spread in several corridors from the city centre, reflecting and accentuating both natural (river) and economic (railway and roads) axes to the north-west and south-east of the city.
In the early 1970s, Beirut City’s population surpassed 1 million inhabitants, and by 1998, the population was close to 1.3 million. While the growth also contributed to a densification of central areas of the city, a large share of the population settled in suburbs and informal areas at the outskirts of the city.25 The Lebanese Civil War, from 1975 to 1990, contributed significantly to the growth and changing configuration of the city, noticeably through the
24 Joe Nasr and Eric Verdeil, “The Reconstructions of Beirut,” in The City in the Islamic World, 2008, pp. 1116–1141.
25 Lebanon Support and UNDP, “The Conflict Context in Beirut: The Social Question, Mobilisations Cycles, and the City’s Securitisation,” 2015,
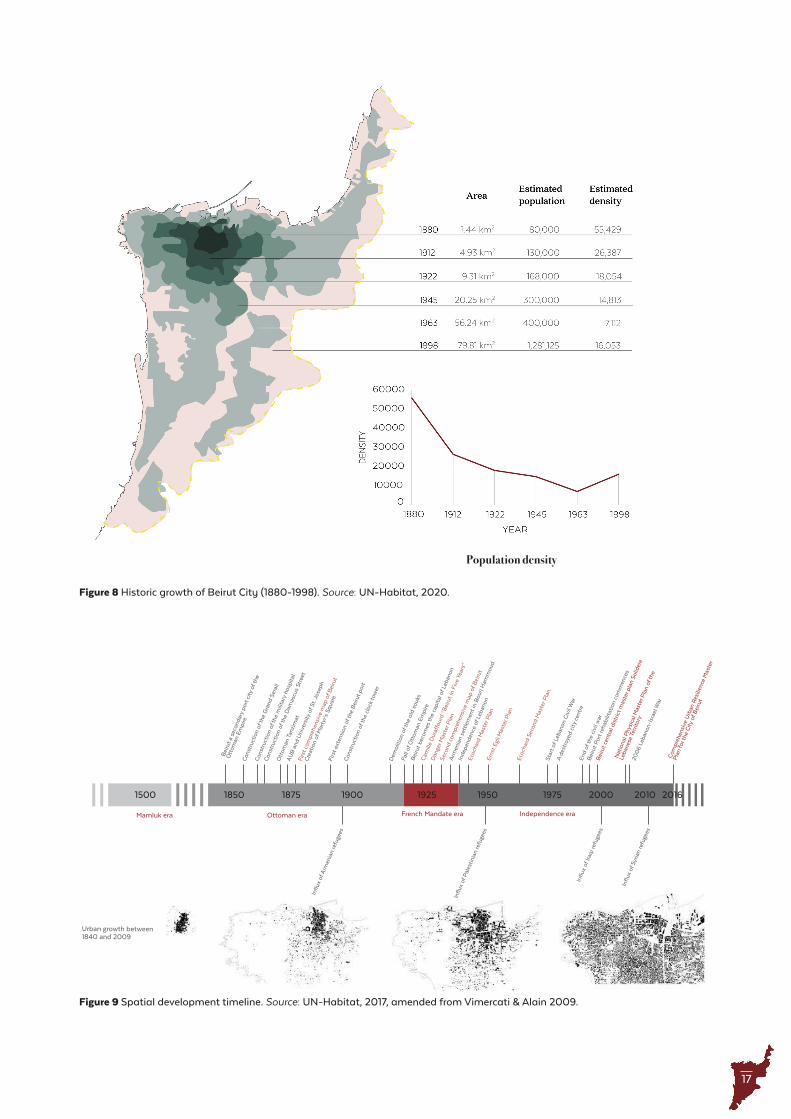
17
Figure 8 Historic growth of Beirut City (1880-1998) . Source: UN-Habitat, 2020 .
Figure 9 Spatial development timeline . Source: UN-Habitat, 2017, amended from Vimercati & Alain 2009 .
Population density
Mamluk era Ottoman era French Mandate era Independence era
Bei
rut a
sec
onda
ry p
ort c
ity o
f the
Ott
oman
Em
pire
C
onst
ruct
ion
of th
e G
rand
Ser
ail
Con
stru
ctio
n of
the
mili
tary
hos
pita
l
Con
stru
ctio
n of
the
Dam
ascu
s St
reet
Ott
oman
Tan
zim
at
AU
B a
nd U
nive
rsity
of S
t. Jo
seph
Firs
t com
preh
ensi
ve m
ap o
f Bei
rut
Cre
atio
n of
Mar
tyr’s
Squ
are
Firs
t ext
ensi
on o
f the
Bei
rut p
ort
Con
stru
ctio
n of
the
cloc
k to
wer
Dem
oliti
on o
f the
old
sou
ks
Influ
x of
Arm
enia
n re
fuge
es
Influ
x of
Pal
estin
ian
refu
gees
Influ
x of
Iraq
i ref
ugee
s
Influ
x of
Syr
ian
refu
gees
Fall
of O
ttom
an E
mpi
re
Bei
rut b
ecom
es th
e ca
pita
l of L
eban
on
Cam
ille
Dur
affo
urd
“Bei
rut i
n Fi
ve Y
ears
”
Seco
nd c
ompr
ehen
sive
map
of B
eiru
t
Arm
enia
n se
ttle
men
t in
Bou
rj H
amm
oud
Inde
pend
ence
of L
eban
on
Star
t of L
eban
on C
ivil
War
A d
estr
oyed
city
cen
tre
End
of th
e ci
vil w
ar
Bei
rut P
ort r
ehab
ilita
tion
com
men
ces
200
6 Le
bano
n-Is
rael
War
Bei
rut c
entr
al d
istr
ict m
aste
r pla
n So
lider
e
Nat
iona
l Phy
sica
l Mas
ter P
lan
of th
e
Leba
nese
Ter
ritor
y
Com
preh
ensi
ve U
rban
Res
ilien
ce M
aste
r
Pla
n fo
r the
City
of B
eiru
t
Ecoc
hard
Mas
ter P
lan
Ecoc
hard
Sec
ond
Mas
ter P
lan
Erns
t Egl
i Mas
ter P
lan
Dan
ger M
aste
r Pla
n
1500 1850 1875 1900 1925 1950 1975 2000 2010 2016
Urban growth between 1840 and 2009
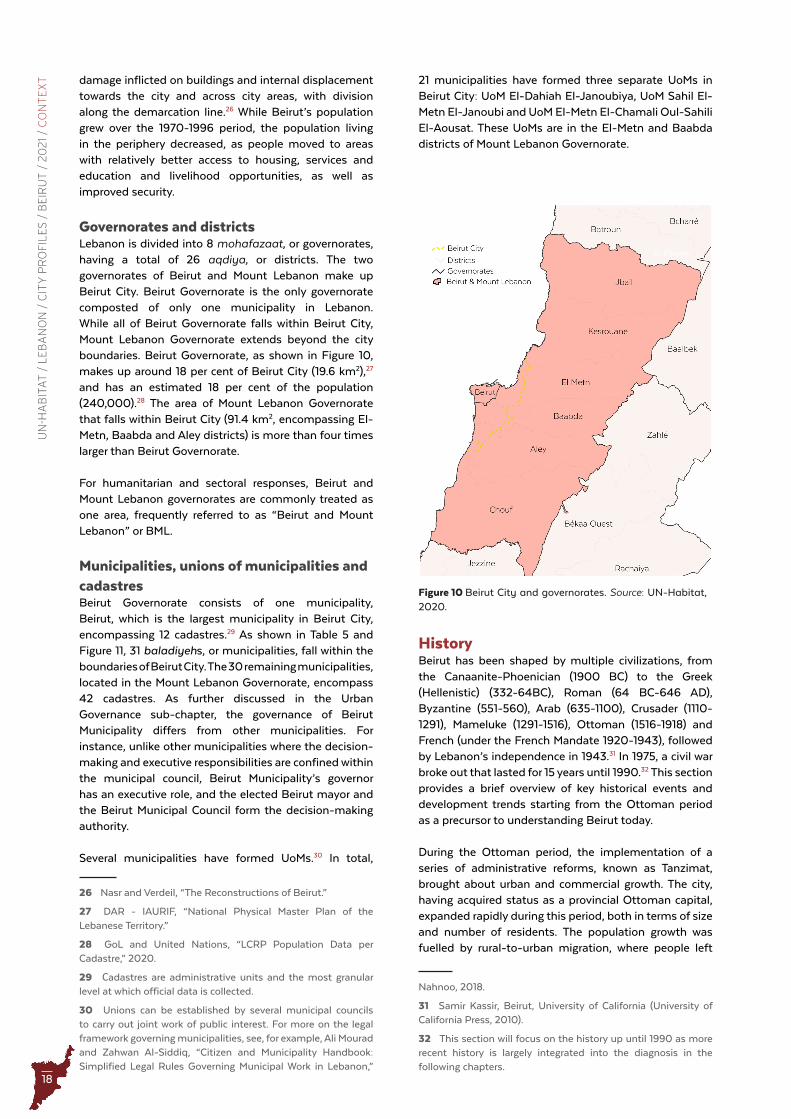
18
UN
-HA
BIT
AT
/ L
EB
AN
ON
/ C
ITY
PR
OFI
LE
S /
BE
IRU
T /
20
21 /
CO
NT
EX
T 21 municipalities have formed three separate UoMs in Beirut City: UoM El-Dahiah El-Janoubiya, UoM Sahil El-Metn El-Janoubi and UoM El-Metn El-Chamali Oul-Sahili El-Aousat. These UoMs are in the El-Metn and Baabda districts of Mount Lebanon Governorate.
HistoryBeirut has been shaped by multiple civilizations, from the Canaanite-Phoenician (1900 BC) to the Greek (Hellenistic) (332-64BC), Roman (64 BC-646 AD), Byzantine (551-560), Arab (635-1100), Crusader (1110-1291), Mameluke (1291-1516), Ottoman (1516-1918) and French (under the French Mandate 1920-1943), followed by Lebanon’s independence in 1943.31 In 1975, a civil war broke out that lasted for 15 years until 1990.32 This section provides a brief overview of key historical events and development trends starting from the Ottoman period as a precursor to understanding Beirut today.
During the Ottoman period, the implementation of a series of administrative reforms, known as Tanzimat, brought about urban and commercial growth. The city, having acquired status as a provincial Ottoman capital, expanded rapidly during this period, both in terms of size and number of residents. The population growth was fuelled by rural-to-urban migration, where people left
Nahnoo, 2018.
31 Samir Kassir, Beirut, University of California (University of California Press, 2010).
32 This section will focus on the history up until 1990 as more recent history is largely integrated into the diagnosis in the following chapters.
Figure 10 Beirut City and governorates . Source: UN-Habitat, 2020 .
damage inflicted on buildings and internal displacement towards the city and across city areas, with division along the demarcation line.26 While Beirut’s population grew over the 1970-1996 period, the population living in the periphery decreased, as people moved to areas with relatively better access to housing, services and education and livelihood opportunities, as well as improved security.
Governorates and districtsLebanon is divided into 8 mohafazaat, or governorates, having a total of 26 aqdiya, or districts. The two governorates of Beirut and Mount Lebanon make up Beirut City. Beirut Governorate is the only governorate composted of only one municipality in Lebanon. While all of Beirut Governorate falls within Beirut City, Mount Lebanon Governorate extends beyond the city boundaries. Beirut Governorate, as shown in Figure 10, makes up around 18 per cent of Beirut City (19.6 km2),27 and has an estimated 18 per cent of the population (240,000).28 The area of Mount Lebanon Governorate that falls within Beirut City (91.4 km2, encompassing El-Metn, Baabda and Aley districts) is more than four times larger than Beirut Governorate.
For humanitarian and sectoral responses, Beirut and Mount Lebanon governorates are commonly treated as one area, frequently referred to as “Beirut and Mount Lebanon” or BML.
Municipalities, unions of municipalities and cadastresBeirut Governorate consists of one municipality, Beirut, which is the largest municipality in Beirut City, encompassing 12 cadastres.29 As shown in Table 5 and Figure 11, 31 baladiyehs, or municipalities, fall within the boundaries of Beirut City. The 30 remaining municipalities, located in the Mount Lebanon Governorate, encompass 42 cadastres. As further discussed in the Urban Governance sub-chapter, the governance of Beirut Municipality differs from other municipalities. For instance, unlike other municipalities where the decision-making and executive responsibilities are confined within the municipal council, Beirut Municipality’s governor has an executive role, and the elected Beirut mayor and the Beirut Municipal Council form the decision-making authority.
Several municipalities have formed UoMs.30 In total,
26 Nasr and Verdeil, “The Reconstructions of Beirut.”
27 DAR - IAURIF, “National Physical Master Plan of the Lebanese Territory.”
28 GoL and United Nations, “LCRP Population Data per Cadastre,” 2020.
29 Cadastres are administrative units and the most granular level at which official data is collected.
30 Unions can be established by several municipal councils to carry out joint work of public interest. For more on the legal framework governing municipalities, see, for example, Ali Mourad and Zahwan Al-Siddiq, “Citizen and Municipality Handbook: Simplified Legal Rules Governing Municipal Work in Lebanon,”
© Photo:
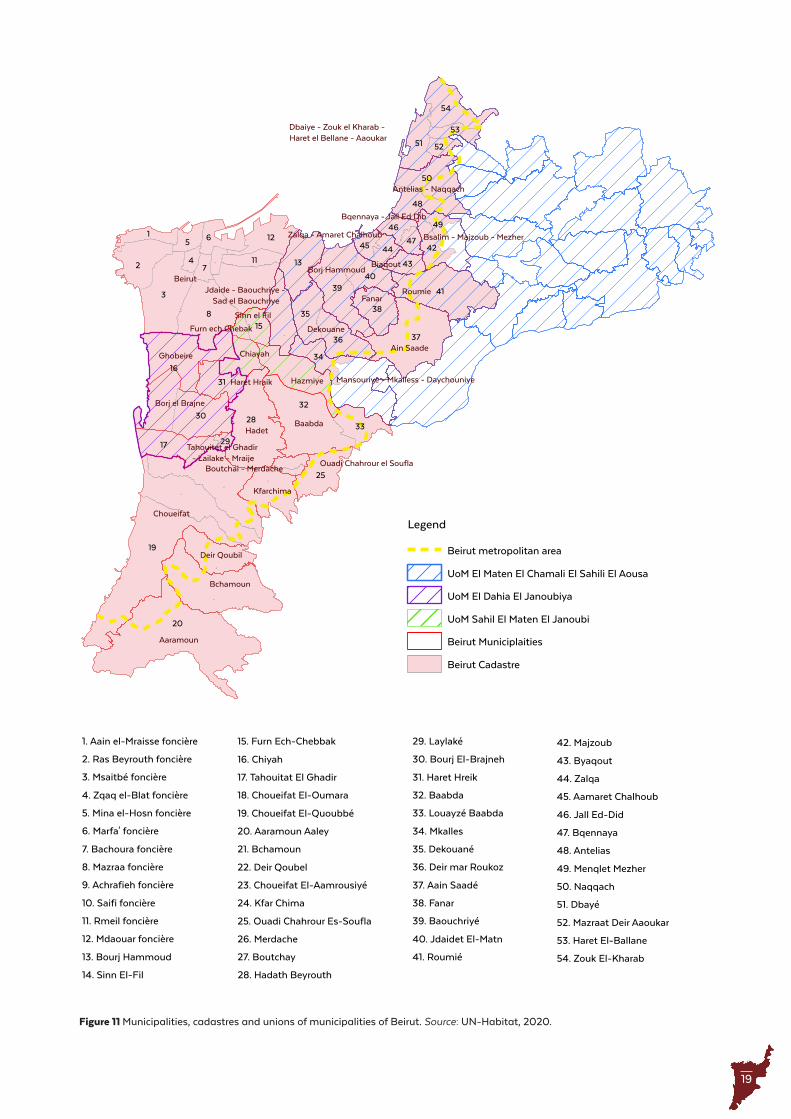
19
Figure 11 Municipalities, cadastres and unions of municipalities of Beirut . Source: UN-Habitat, 2020 .
20
19
16
32
3
8
9
21
28
37
23
41
2
18
39
30
24
6
22
13
17
54
50
25
14
36
38
121
48
35
31
51
33
40
5
34
42
117
15
43444
46 49
4745
52
29
53
27
10
26
Beirut
Choueifat
Aaramoun
BaabdaHadet
Roumie
Ain SaadeGhobeire
Borj el Brajne
Fanar
Hazmiye
Bchamoun
Dekouane
Kfarchima
Deir Qoubil
Antelias - Naqqach
Sinn el Fil
Chiayah
Borj Hammoud
Haret Hraik Mansouriye - Mkalless - Daychouniye
Jdaide - Baouchriye - Sad el Baouchriye
Biaqout
Bsalim - Majzoub - Mezher
Dbaiye - Zouk el Kharab - Haret el Bellane - Aaoukar
Ouadi Chahrour el Soufla
Furn ech Chebak
Tahouitet el Ghadir - Lailake - Mraije
Bqennaya - Jall Ed Dib
Zalqa - Amaret Chalhoub
Boutchai - Merdache
1. Aain el-Mraisse foncière
2. Ras Beyrouth foncière
3. Msaitbé foncière
4. Zqaq el-Blat foncière
5. Mina el-Hosn foncière
6. Marfa' foncière
7. Bachoura foncière
8. Mazraa foncière
9. Achrafieh foncière
10. Saifi foncière
11. Rmeil foncière
12. Mdaouar foncière
13. Bourj Hammoud
14. Sinn El-Fil
15. Furn Ech-Chebbak
16. Chiyah
17. Tahouitat El Ghadir
18. Choueifat El-Oumara
19. Choueifat El-Quoubbé
20. Aaramoun Aaley
21. Bchamoun
22. Deir Qoubel
23. Choueifat El-Aamrousiyé
24. Kfar Chima
25. Ouadi Chahrour Es-Soufla
26. Merdache
27. Boutchay
28. Hadath Beyrouth
29. Laylaké
30. Bourj El-Brajneh
31. Haret Hreik
32. Baabda
33. Louayzé Baabda
34. Mkalles
35. Dekouané
36. Deir mar Roukoz
37. Aain Saadé
38. Fanar
39. Baouchriyé
40. Jdaidet El-Matn
41. Roumié
42. Majzoub
43. Byaqout
44. Zalqa
45. Aamaret Chalhoub
46. Jall Ed-Did
47. Bqennaya
48. Antelias
49. Menqlet Mezher
50. Naqqach
51. Dbayé
52. Mazraat Deir Aaoukar
53. Haret El-Ballane
54. Zouk El-Kharab
Legend
Beirut metropolitan area
UoM El Maten El Chamali El Sahili El Aousa
UoM El Dahia El Janoubiya
UoM Sahil El Maten El Janoubi
Beirut Municiplaities
Beirut Cadastre

20
Governorate District UoM Municipality Cadastre Area (km2)
Beirut -
-
Beirut
Achrafieh 3.18
- Ain el-Mreisse 1.00
- Bachoura 0.53
- Beirut Central District 0.62
- Mazraa 3.80
- Medawar 2.04
- Minet el-Hosn 0.60
- Moussaytbeh 4.06
- Port 0.98
- Ras Beyrouth 2.51
- Remeil 1.04
- Saife 0.42
- Zoukak el-Blatt 0.47
Mount Lebanon
Aley
- Aaramoun Aramoun Aley 11.67
- Bchamoun Bchamoun 6.25
-
Choueifat
Chouaifat Amroussyat 5.25
- Chouaifat Oumara 4.34
- Chouaifat Qobbat 9.20
- Deir Qoubil Deir-Koubel 2.67
Baabda
- Hadet Hadace 5.52
-Boutchai - Merdache
Boutchay 060
- Mardachat 0.23
- Ouadi Chahrour el Soufla Wadi Chahrour el Soufla 2.38
- Kfarchima Kfarchima 2.83
-Baabda - Louize
Louize 1.79
-Baabda - Hazmiye 8.73
UoM Sahil El-Metn El-Janoubi
Hazmiye
Furn ech Chebak Forn El-Chobbek 1.05
ChiyahChiah 8.82
UoM El-Dahla El-Janoubiya
Ghobeire
Tahouitet el Ghadir - Lailake - MraijeLaylaki 0.35
Tahouitat-el-Ghadir 2.54
Bourj El-Brajneh Borge el Baragenat 3.32
Haret Hreik Haret Horaik 1.82
El-Metn
- Ain Saade Ain Saade 5.47
UoM El-Metn El-Chamali Oul-Sahili El-Aousat
Bourj Hammoud Bourj Hammoud 2.64
Jdaide - Baouchriyeh - Sad el BaouchriyehJodaidat 1.67
Baouchariat 3.93
Bqennaya- Lail el DibBkennaya 0.67
Jal-el-Dib 0.86
Bsalim - Majzoub - Mezhir
Majdoub 1.27
Mezher 0.70
Mkalles-Mansouriye Mkalles 1.56
Roumie Roumieh 5.06
Sinn El-Fil Senn el Fil 2.31
Fanar Fanar 2.10
DekouaneMar Roukose et Dahr El-Hossain 2.18
Dekouanet 1.91
Dbalye - Zouk el Karrab - Haret el Ballene
Dbaye 1.80
Haret El-Belleni 0.87
Mazraet Deir Aoukar 0.63
Zouk-Khrab 2.53
Biaqout Biaqout 0.99
Antelias NawwachAntelias 1.99
Nawwach 2.51
Zaiqa - Amaret ChalhhoubZaiqa 0.90
Amaret Chalhhoub 0.64
Table 5 Governorates, districts, municipalities, cadastres and unions of municipalities in Beirut City . Source: UN-Habitat, 2020 .
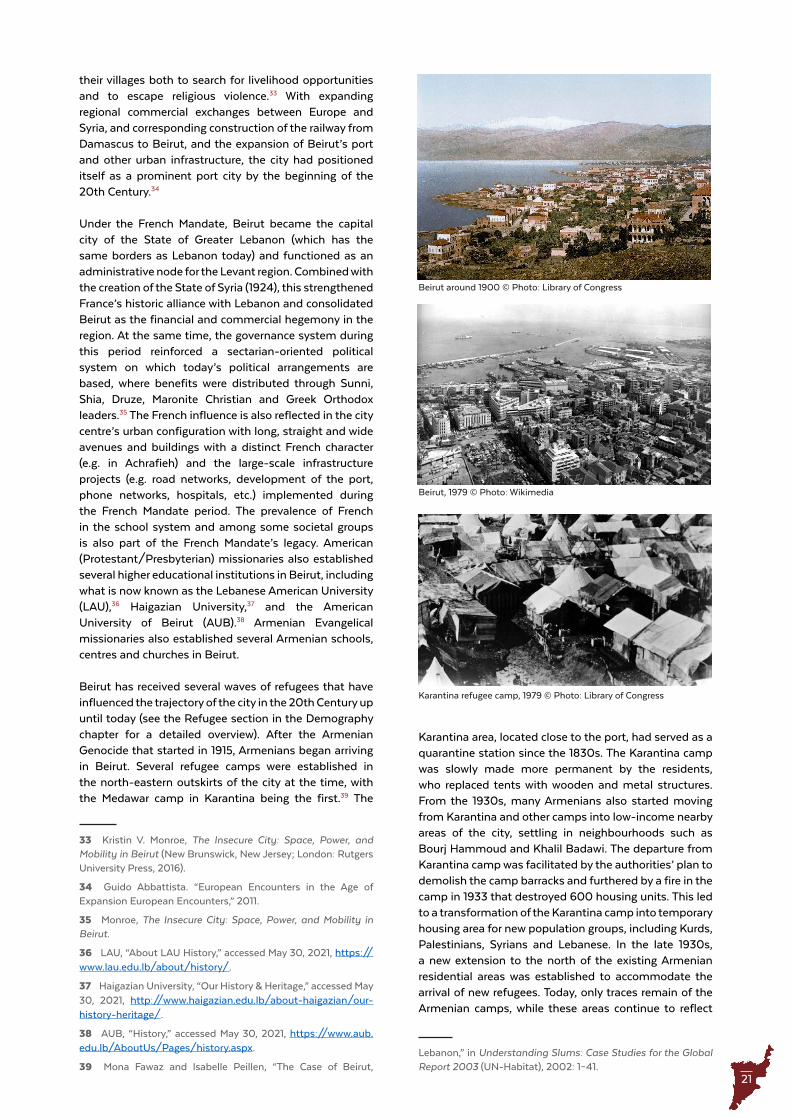
21
their villages both to search for livelihood opportunities and to escape religious violence.33 With expanding regional commercial exchanges between Europe and Syria, and corresponding construction of the railway from Damascus to Beirut, and the expansion of Beirut’s port and other urban infrastructure, the city had positioned itself as a prominent port city by the beginning of the 20th Century.34
Under the French Mandate, Beirut became the capital city of the State of Greater Lebanon (which has the same borders as Lebanon today) and functioned as an administrative node for the Levant region. Combined with the creation of the State of Syria (1924), this strengthened France’s historic alliance with Lebanon and consolidated Beirut as the financial and commercial hegemony in the region. At the same time, the governance system during this period reinforced a sectarian-oriented political system on which today’s political arrangements are based, where benefits were distributed through Sunni, Shia, Druze, Maronite Christian and Greek Orthodox leaders.35 The French influence is also reflected in the city centre’s urban configuration with long, straight and wide avenues and buildings with a distinct French character (e.g. in Achrafieh) and the large-scale infrastructure projects (e.g. road networks, development of the port, phone networks, hospitals, etc.) implemented during the French Mandate period. The prevalence of French in the school system and among some societal groups is also part of the French Mandate’s legacy. American (Protestant/Presbyterian) missionaries also established several higher educational institutions in Beirut, including what is now known as the Lebanese American University (LAU),36 Haigazian University,37 and the American University of Beirut (AUB).38 Armenian Evangelical missionaries also established several Armenian schools, centres and churches in Beirut.
Beirut has received several waves of refugees that have influenced the trajectory of the city in the 20th Century up until today (see the Refugee section in the Demography chapter for a detailed overview). After the Armenian Genocide that started in 1915, Armenians began arriving in Beirut. Several refugee camps were established in the north-eastern outskirts of the city at the time, with the Medawar camp in Karantina being the first.39 The
33 Kristin V. Monroe, The Insecure City: Space, Power, and Mobility in Beirut (New Brunswick, New Jersey; London: Rutgers University Press, 2016).
34 Guido Abbattista. “European Encounters in the Age of Expansion European Encounters,” 2011.
35 Monroe, The Insecure City: Space, Power, and Mobility in Beirut.
36 LAU, “About LAU History,” accessed May 30, 2021, https://www.lau.edu.lb/about/history/.
37 Haigazian University, “Our History & Heritage,” accessed May 30, 2021, http://www.haigazian.edu.lb/about-haigazian/our-history-heritage/.
38 AUB, “History,” accessed May 30, 2021, https://www.aub.edu.lb/AboutUs/Pages/history.aspx.
39 Mona Fawaz and Isabelle Peillen, “The Case of Beirut,
Karantina area, located close to the port, had served as a quarantine station since the 1830s. The Karantina camp was slowly made more permanent by the residents, who replaced tents with wooden and metal structures. From the 1930s, many Armenians also started moving from Karantina and other camps into low-income nearby areas of the city, settling in neighbourhoods such as Bourj Hammoud and Khalil Badawi. The departure from Karantina camp was facilitated by the authorities’ plan to demolish the camp barracks and furthered by a fire in the camp in 1933 that destroyed 600 housing units. This led to a transformation of the Karantina camp into temporary housing area for new population groups, including Kurds, Palestinians, Syrians and Lebanese. In the late 1930s, a new extension to the north of the existing Armenian residential areas was established to accommodate the arrival of new refugees. Today, only traces remain of the Armenian camps, while these areas continue to reflect
Lebanon,” in Understanding Slums: Case Studies for the Global Report 2003 (UN-Habitat), 2002: 1–41.
Beirut, 1979 © Photo: Wikimedia
Karantina refugee camp, 1979 © Photo: Library of Congress
Beirut around 1900 © Photo: Library of Congress
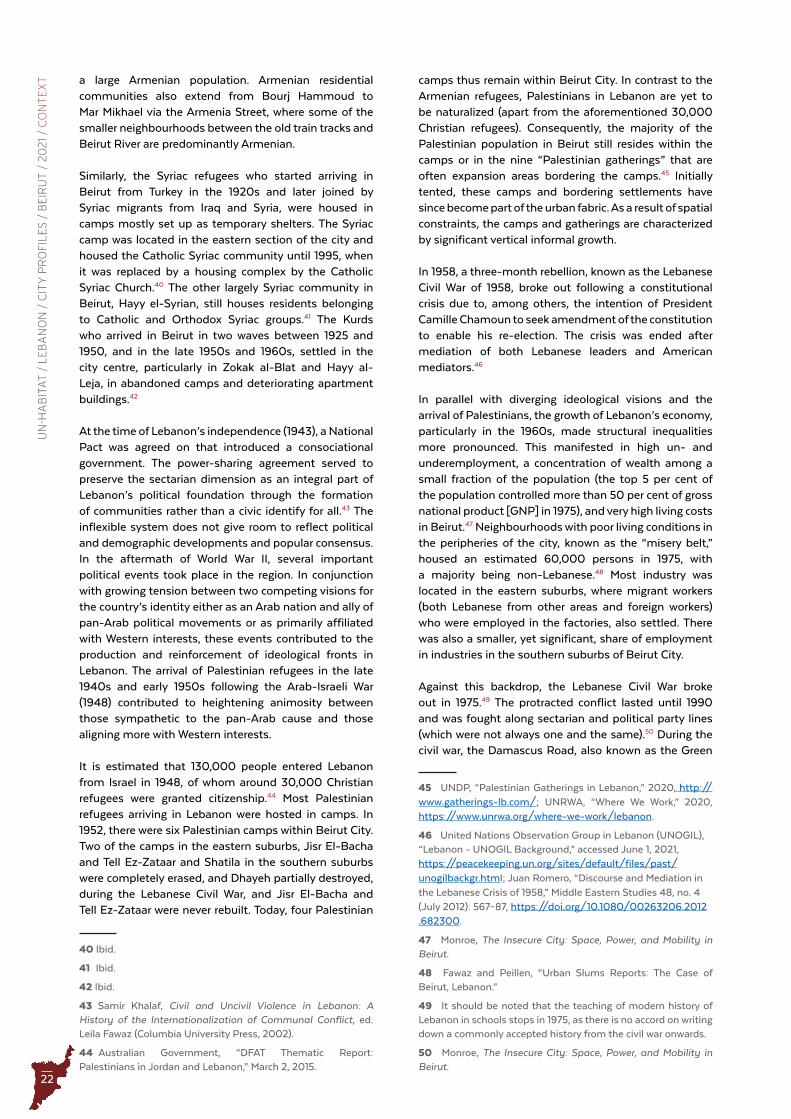
22
UN
-HA
BIT
AT
/ L
EB
AN
ON
/ C
ITY
PR
OFI
LE
S /
BE
IRU
T /
20
21 /
CO
NT
EX
T a large Armenian population. Armenian residential communities also extend from Bourj Hammoud to Mar Mikhael via the Armenia Street, where some of the smaller neighbourhoods between the old train tracks and Beirut River are predominantly Armenian.
Similarly, the Syriac refugees who started arriving in Beirut from Turkey in the 1920s and later joined by Syriac migrants from Iraq and Syria, were housed in camps mostly set up as temporary shelters. The Syriac camp was located in the eastern section of the city and housed the Catholic Syriac community until 1995, when it was replaced by a housing complex by the Catholic Syriac Church.40 The other largely Syriac community in Beirut, Hayy el-Syrian, still houses residents belonging to Catholic and Orthodox Syriac groups.41 The Kurds who arrived in Beirut in two waves between 1925 and 1950, and in the late 1950s and 1960s, settled in the city centre, particularly in Zokak al-Blat and Hayy al-Leja, in abandoned camps and deteriorating apartment buildings.42
At the time of Lebanon’s independence (1943), a National Pact was agreed on that introduced a consociational government. The power-sharing agreement served to preserve the sectarian dimension as an integral part of Lebanon’s political foundation through the formation of communities rather than a civic identify for all.43 The inflexible system does not give room to reflect political and demographic developments and popular consensus. In the aftermath of World War II, several important political events took place in the region. In conjunction with growing tension between two competing visions for the country’s identity either as an Arab nation and ally of pan-Arab political movements or as primarily affiliated with Western interests, these events contributed to the production and reinforcement of ideological fronts in Lebanon. The arrival of Palestinian refugees in the late 1940s and early 1950s following the Arab-Israeli War (1948) contributed to heightening animosity between those sympathetic to the pan-Arab cause and those aligning more with Western interests.
It is estimated that 130,000 people entered Lebanon from Israel in 1948, of whom around 30,000 Christian refugees were granted citizenship.44 Most Palestinian refugees arriving in Lebanon were hosted in camps. In 1952, there were six Palestinian camps within Beirut City. Two of the camps in the eastern suburbs, Jisr El-Bacha and Tell Ez-Zataar and Shatila in the southern suburbs were completely erased, and Dhayeh partially destroyed, during the Lebanese Civil War, and Jisr El-Bacha and Tell Ez-Zataar were never rebuilt. Today, four Palestinian
40 Ibid.
41 Ibid.
42 Ibid.
43 Samir Khalaf, Civil and Uncivil Violence in Lebanon: A History of the Internationalization of Communal Conflict, ed. Leila Fawaz (Columbia University Press, 2002).
44 Australian Government, “DFAT Thematic Report: Palestinians in Jordan and Lebanon,” March 2, 2015.
camps thus remain within Beirut City. In contrast to the Armenian refugees, Palestinians in Lebanon are yet to be naturalized (apart from the aforementioned 30,000 Christian refugees). Consequently, the majority of the Palestinian population in Beirut still resides within the camps or in the nine “Palestinian gatherings” that are often expansion areas bordering the camps.45 Initially tented, these camps and bordering settlements have since become part of the urban fabric. As a result of spatial constraints, the camps and gatherings are characterized by significant vertical informal growth.
In 1958, a three-month rebellion, known as the Lebanese Civil War of 1958, broke out following a constitutional crisis due to, among others, the intention of President Camille Chamoun to seek amendment of the constitution to enable his re-election. The crisis was ended after mediation of both Lebanese leaders and American mediators.46
In parallel with diverging ideological visions and the arrival of Palestinians, the growth of Lebanon’s economy, particularly in the 1960s, made structural inequalities more pronounced. This manifested in high un- and underemployment, a concentration of wealth among a small fraction of the population (the top 5 per cent of the population controlled more than 50 per cent of gross national product [GNP] in 1975), and very high living costs in Beirut.47 Neighbourhoods with poor living conditions in the peripheries of the city, known as the “misery belt,” housed an estimated 60,000 persons in 1975, with a majority being non-Lebanese.48 Most industry was located in the eastern suburbs, where migrant workers (both Lebanese from other areas and foreign workers) who were employed in the factories, also settled. There was also a smaller, yet significant, share of employment in industries in the southern suburbs of Beirut City.
Against this backdrop, the Lebanese Civil War broke out in 1975.49 The protracted conflict lasted until 1990 and was fought along sectarian and political party lines (which were not always one and the same).50 During the civil war, the Damascus Road, also known as the Green
45 UNDP, “Palestinian Gatherings in Lebanon,” 2020, http://www.gatherings-lb.com/; UNRWA, “Where We Work,” 2020, https://www.unrwa.org/where-we-work/lebanon.
46 United Nations Observation Group in Lebanon (UNOGIL), “Lebanon - UNOGIL Background,” accessed June 1, 2021, https://peacekeeping.un.org/sites/default/files/past/unogilbackgr.html; Juan Romero, “Discourse and Mediation in the Lebanese Crisis of 1958,” Middle Eastern Studies 48, no. 4 (July 2012): 567–87, https://doi.org/10.1080/00263206.2012.682300.
47 Monroe, The Insecure City: Space, Power, and Mobility in Beirut.
48 Fawaz and Peillen, “Urban Slums Reports: The Case of Beirut, Lebanon.”
49 It should be noted that the teaching of modern history of Lebanon in schools stops in 1975, as there is no accord on writing down a commonly accepted history from the civil war onwards.
50 Monroe, The Insecure City: Space, Power, and Mobility in Beirut.
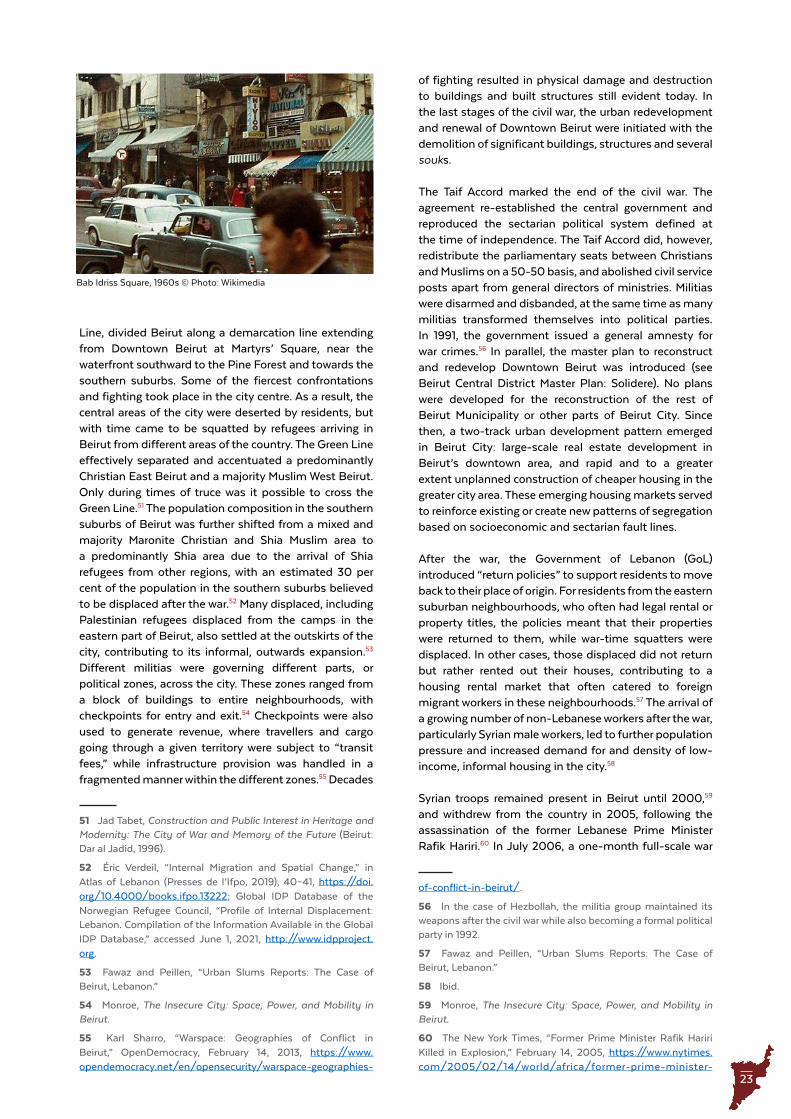
23
Line, divided Beirut along a demarcation line extending from Downtown Beirut at Martyrs’ Square, near the waterfront southward to the Pine Forest and towards the southern suburbs. Some of the fiercest confrontations and fighting took place in the city centre. As a result, the central areas of the city were deserted by residents, but with time came to be squatted by refugees arriving in Beirut from different areas of the country. The Green Line effectively separated and accentuated a predominantly Christian East Beirut and a majority Muslim West Beirut. Only during times of truce was it possible to cross the Green Line.51 The population composition in the southern suburbs of Beirut was further shifted from a mixed and majority Maronite Christian and Shia Muslim area to a predominantly Shia area due to the arrival of Shia refugees from other regions, with an estimated 30 per cent of the population in the southern suburbs believed to be displaced after the war.52 Many displaced, including Palestinian refugees displaced from the camps in the eastern part of Beirut, also settled at the outskirts of the city, contributing to its informal, outwards expansion.53 Different militias were governing different parts, or political zones, across the city. These zones ranged from a block of buildings to entire neighbourhoods, with checkpoints for entry and exit.54 Checkpoints were also used to generate revenue, where travellers and cargo going through a given territory were subject to “transit fees,” while infrastructure provision was handled in a fragmented manner within the different zones.55 Decades
51 Jad Tabet, Construction and Public Interest in Heritage and Modernity: The City of War and Memory of the Future (Beirut: Dar al Jadid, 1996).
52 Éric Verdeil, “Internal Migration and Spatial Change,” in Atlas of Lebanon (Presses de l’Ifpo, 2019), 40–41, https://doi.org/10.4000/books.ifpo.13222; Global IDP Database of the Norwegian Refugee Council, “Profile of Internal Displacement: Lebanon. Compilation of the Information Available in the Global IDP Database,” accessed June 1, 2021, http://www.idpproject.org.
53 Fawaz and Peillen, “Urban Slums Reports: The Case of Beirut, Lebanon.”
54 Monroe, The Insecure City: Space, Power, and Mobility in Beirut.
55 Karl Sharro, “Warspace: Geographies of Conflict in Beirut,” OpenDemocracy, February 14, 2013, https://www.opendemocracy.net/en/opensecurity/warspace-geographies-
of fighting resulted in physical damage and destruction to buildings and built structures still evident today. In the last stages of the civil war, the urban redevelopment and renewal of Downtown Beirut were initiated with the demolition of significant buildings, structures and several souks.
The Taif Accord marked the end of the civil war. The agreement re-established the central government and reproduced the sectarian political system defined at the time of independence. The Taif Accord did, however, redistribute the parliamentary seats between Christians and Muslims on a 50-50 basis, and abolished civil service posts apart from general directors of ministries. Militias were disarmed and disbanded, at the same time as many militias transformed themselves into political parties. In 1991, the government issued a general amnesty for war crimes.56 In parallel, the master plan to reconstruct and redevelop Downtown Beirut was introduced (see Beirut Central District Master Plan: Solidere). No plans were developed for the reconstruction of the rest of Beirut Municipality or other parts of Beirut City. Since then, a two-track urban development pattern emerged in Beirut City: large-scale real estate development in Beirut’s downtown area, and rapid and to a greater extent unplanned construction of cheaper housing in the greater city area. These emerging housing markets served to reinforce existing or create new patterns of segregation based on socioeconomic and sectarian fault lines.
After the war, the Government of Lebanon (GoL) introduced “return policies” to support residents to move back to their place of origin. For residents from the eastern suburban neighbourhoods, who often had legal rental or property titles, the policies meant that their properties were returned to them, while war-time squatters were displaced. In other cases, those displaced did not return but rather rented out their houses, contributing to a housing rental market that often catered to foreign migrant workers in these neighbourhoods.57 The arrival of a growing number of non-Lebanese workers after the war, particularly Syrian male workers, led to further population pressure and increased demand for and density of low-income, informal housing in the city.58
Syrian troops remained present in Beirut until 2000,59 and withdrew from the country in 2005, following the assassination of the former Lebanese Prime Minister Rafik Hariri.60 In July 2006, a one-month full-scale war
of-conflict-in-beirut/.
56 In the case of Hezbollah, the militia group maintained its weapons after the civil war while also becoming a formal political party in 1992.
57 Fawaz and Peillen, “Urban Slums Reports: The Case of Beirut, Lebanon.”
58 Ibid.
59 Monroe, The Insecure City: Space, Power, and Mobility in Beirut.
60 The New York Times, “Former Prime Minister Rafik Hariri Killed in Explosion,” February 14, 2005, https://www.nytimes.com/2005/02/14/world/africa/former-prime-minister-
Bab Idriss Square, 1960s © Photo: Wikimedia
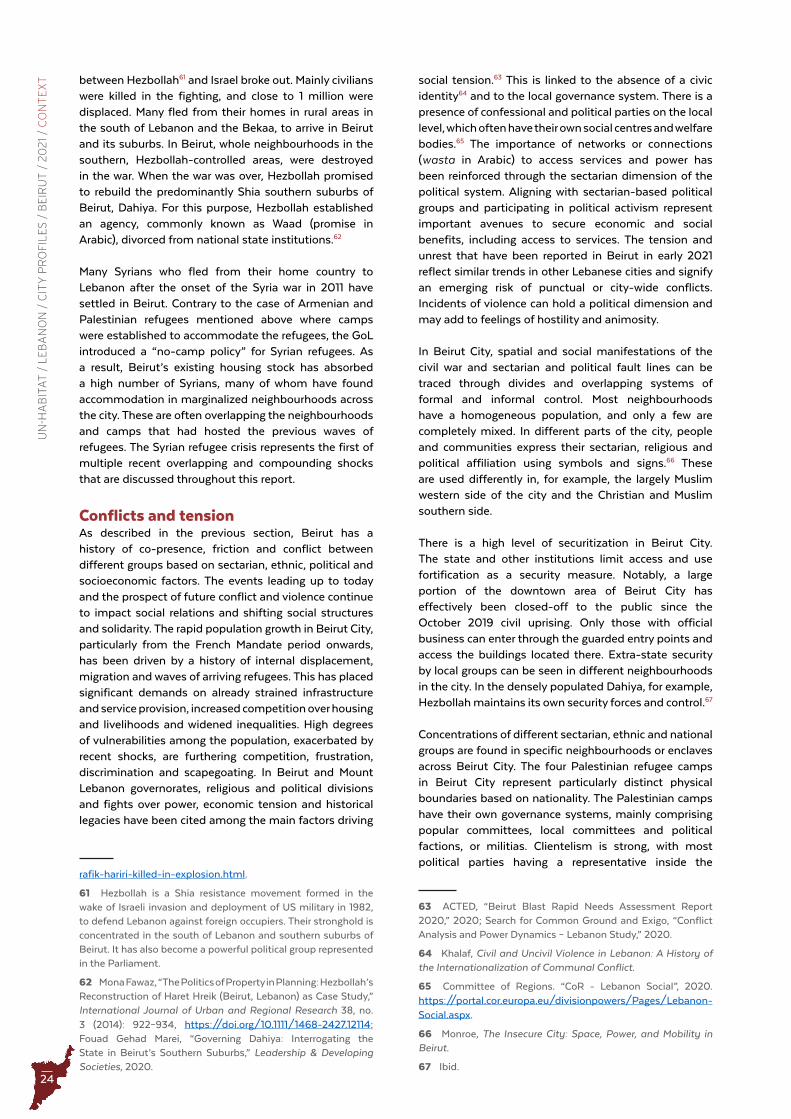
24
UN
-HA
BIT
AT
/ L
EB
AN
ON
/ C
ITY
PR
OFI
LE
S /
BE
IRU
T /
20
21 /
CO
NT
EX
T between Hezbollah61 and Israel broke out. Mainly civilians were killed in the fighting, and close to 1 million were displaced. Many fled from their homes in rural areas in the south of Lebanon and the Bekaa, to arrive in Beirut and its suburbs. In Beirut, whole neighbourhoods in the southern, Hezbollah-controlled areas, were destroyed in the war. When the war was over, Hezbollah promised to rebuild the predominantly Shia southern suburbs of Beirut, Dahiya. For this purpose, Hezbollah established an agency, commonly known as Waad (promise in Arabic), divorced from national state institutions.62
Many Syrians who fled from their home country to Lebanon after the onset of the Syria war in 2011 have settled in Beirut. Contrary to the case of Armenian and Palestinian refugees mentioned above where camps were established to accommodate the refugees, the GoL introduced a “no-camp policy” for Syrian refugees. As a result, Beirut’s existing housing stock has absorbed a high number of Syrians, many of whom have found accommodation in marginalized neighbourhoods across the city. These are often overlapping the neighbourhoods and camps that had hosted the previous waves of refugees. The Syrian refugee crisis represents the first of multiple recent overlapping and compounding shocks that are discussed throughout this report.
Conflicts and tensionAs described in the previous section, Beirut has a history of co-presence, friction and conflict between different groups based on sectarian, ethnic, political and socioeconomic factors. The events leading up to today and the prospect of future conflict and violence continue to impact social relations and shifting social structures and solidarity. The rapid population growth in Beirut City, particularly from the French Mandate period onwards, has been driven by a history of internal displacement, migration and waves of arriving refugees. This has placed significant demands on already strained infrastructure and service provision, increased competition over housing and livelihoods and widened inequalities. High degrees of vulnerabilities among the population, exacerbated by recent shocks, are furthering competition, frustration, discrimination and scapegoating. In Beirut and Mount Lebanon governorates, religious and political divisions and fights over power, economic tension and historical legacies have been cited among the main factors driving
rafik-hariri-killed-in-explosion.html.
61 Hezbollah is a Shia resistance movement formed in the wake of Israeli invasion and deployment of US military in 1982, to defend Lebanon against foreign occupiers. Their stronghold is concentrated in the south of Lebanon and southern suburbs of Beirut. It has also become a powerful political group represented in the Parliament.
62 Mona Fawaz, “The Politics of Property in Planning: Hezbollah’s Reconstruction of Haret Hreik (Beirut, Lebanon) as Case Study,” International Journal of Urban and Regional Research 38, no. 3 (2014): 922–934, https://doi.org/10.1111/1468-2427.12114; Fouad Gehad Marei, “Governing Dahiya: Interrogating the State in Beirut’s Southern Suburbs,” Leadership & Developing Societies, 2020.
social tension.63 This is linked to the absence of a civic identity64 and to the local governance system. There is a presence of confessional and political parties on the local level, which often have their own social centres and welfare bodies.65 The importance of networks or connections (wasta in Arabic) to access services and power has been reinforced through the sectarian dimension of the political system. Aligning with sectarian-based political groups and participating in political activism represent important avenues to secure economic and social benefits, including access to services. The tension and unrest that have been reported in Beirut in early 2021 reflect similar trends in other Lebanese cities and signify an emerging risk of punctual or city-wide conflicts. Incidents of violence can hold a political dimension and may add to feelings of hostility and animosity.
In Beirut City, spatial and social manifestations of the civil war and sectarian and political fault lines can be traced through divides and overlapping systems of formal and informal control. Most neighbourhoods have a homogeneous population, and only a few are completely mixed. In different parts of the city, people and communities express their sectarian, religious and political affiliation using symbols and signs.66 These are used differently in, for example, the largely Muslim western side of the city and the Christian and Muslim southern side.
There is a high level of securitization in Beirut City. The state and other institutions limit access and use fortification as a security measure. Notably, a large portion of the downtown area of Beirut City has effectively been closed-off to the public since the October 2019 civil uprising. Only those with official business can enter through the guarded entry points and access the buildings located there. Extra-state security by local groups can be seen in different neighbourhoods in the city. In the densely populated Dahiya, for example, Hezbollah maintains its own security forces and control.67
Concentrations of different sectarian, ethnic and national groups are found in specific neighbourhoods or enclaves across Beirut City. The four Palestinian refugee camps in Beirut City represent particularly distinct physical boundaries based on nationality. The Palestinian camps have their own governance systems, mainly comprising popular committees, local committees and political factions, or militias. Clientelism is strong, with most political parties having a representative inside the
63 ACTED, “Beirut Blast Rapid Needs Assessment Report 2020,” 2020; Search for Common Ground and Exigo, “Conflict Analysis and Power Dynamics – Lebanon Study,” 2020.
64 Khalaf, Civil and Uncivil Violence in Lebanon: A History of the Internationalization of Communal Conflict.
65 Committee of Regions. “CoR - Lebanon Social”, 2020. https://portal.cor.europa.eu/divisionpowers/Pages/Lebanon-Social.aspx.
66 Monroe, The Insecure City: Space, Power, and Mobility in Beirut.
67 Ibid.

25
Beirut Central District
Corniche El-mazraaWata El-mousaitbeh
Madina Al Ryadiah
Khandak Al GhamikBechara El-KhourySakiet El-Jenzir
Tallet El-Khayat
Tarik El-jdideh
Ramlet El-baida
Borj Abi Haidar
Ain El-mrayseh
Hawd El-wilaya
Ramel El-zarif
Martyrs Square Port of Beirut
Minet El-hosn
Debbas SquareKaracol Drouz
Ras el-nabeh
Ain El Tineh
Aecha Bakkar
Zkak El-blat
Borj El Murr Riad El-solh Mar MikhaelRas Beirut
Bab Idriss
Mousaitbeh
Salim Slam
Clemencau Karantina
Ashrafieh
Mar Elias
Zeidanieh
Gemmayzeh
Zeitoune
Nazareth
Bachoura
Medawar
RaoucheBarbour
Noueiri
RaoucheKraytem
Sanayeh
Kantari
Tabaris
Manara
Badaro
MathafAdlieh
Kaskas
Barbir
Sodeco
Unesco
Verdun
Witwat
Hamra
Rmeil
Sabra
Zarif
Malla
Saifi
Basta
Jnah
Cola
Qobaiyat
GeitawiCorniche el-Naher
El Ghabe
Sioufi
Hotle Dieu
Explosion site
3km2km1km
0 0.5 10.25km
Beirut Municipality limit
Roads
Figure 12 Areas affected by the Beirut Port blast
camps to coordinate efforts on behalf of their respective constituencies. The Palestinian camps have been used to advance political agendas, and as places for recruitment to different political and religious causes. While access to the camps is restricted, local economies exist across camp boundaries, including systems for service delivery. The Palestinian gatherings are less distinct, yet discernible, enclaves hosting relatively homogeneous refugee communities.
Interlinked shocksThe conflict that erupted in Syria in 2011 has had a significant economic and social impact on Lebanon, including on the capital city. Since the start of the conflict, hundreds of thousands of Syrians have sought refuge in Lebanon, many of whom have settled in Beirut City. The government estimates that around 1.5 million Syrians are living in Lebanon, while 879,529 refugees are registered with the Office of the United Nations High Commissioner for Refugees (UNHCR) (see Demography chapter). The influx of Syrian refugees has placed significant and unequally distributed stress on already strained service delivery and infrastructure and has increased demand for employment and housing in the city. In parallel, the economic and financial situation in the country has worsened to the point of economic and financial collapse – placing additional stress on the same public services. In 2020, Lebanon had the highest rate of public indebtedness in the MENA region and one of the highest globally.68 In March 2020, the government defaulted on a loan for the first time in the country’s history, while having an estimated debt equivalent to 150 per cent of the gross domestic product (GDP). At that time, the LBP had already lost 40 per cent of its value on the black market.69 The
68 Bertelsmann Stiftung, “BTI 2020 - Lebanon Country Report,” 2020.
69 The Economist, “Resilient No More - For the First Time,
deteriorating economic situation, characterized by high and rising unemployment, increasing poverty levels and inadequate public service provision, combined with the announcement of new taxes on essential services led to a widespread civil uprising across the country in October 2019. According to The Economist,70 one in five people in Lebanon participated in the protests,71 the largest in the last 15 years, that led to the government’s resignation in late October 2019. This has since been followed by the subsequent resignation of another government and difficulties in forming a third.
COVID-19Adding to unresolved long-standing economic and social grievances, compounded stressors and overlapping shocks - most recently COVID-19 from early 2020 and the 4 August 2020 port blast - are causing an already extremely precarious situation to rapidly deteriorate.72
In response to COVID-19, a series of measures have been put in place. In March 2020, the Ministry of Interior and Municipalities (MoIM) passed a decision
Lebanon Defaults on Its Debts” March 14, 2020, https://www.economist.com/middle-east-and-africa/2020/03/12/for-the-first-time-lebanon-defaults-on-its-debts.
70 The Economist, “Message Not Received - A Surge of Public Anger Sends Lebanon’s Politicians Reeling” October 26, 2019, https://www.economist.com/middle-east-and-africa/2019/10/24/a-surge-of-public-anger-sends-lebanons-politicians-reeling.
71 It should be noted, however, that Search for Common Ground and Exigo found the majority of refugees to be neutral with respect to the protests, and that across population groups, the great majority’s perception is that refugees are not welcome to take part in the protests (“Conflict Analysis and Power Dynamics – Lebanon Study,” 2020).
72 International Crisis Group, “Pulling Lebanon out of the Pit: International Crisis Group Middle East & North Africa Report,” June 2020.
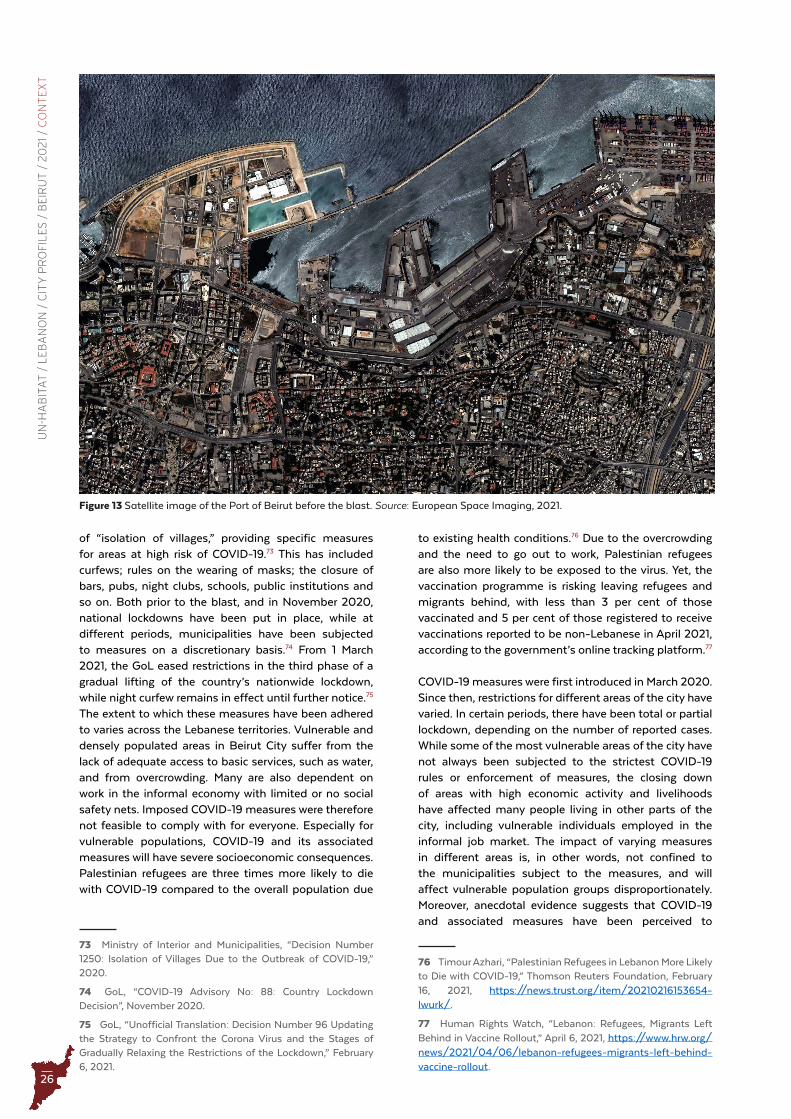
26
UN
-HA
BIT
AT
/ L
EB
AN
ON
/ C
ITY
PR
OFI
LE
S /
BE
IRU
T /
20
21 /
CO
NT
EX
T
Figure 13 Satellite image of the Port of Beirut before the blast . Source: European Space Imaging, 2021 .
of “isolation of villages,” providing specific measures for areas at high risk of COVID-19.73 This has included curfews; rules on the wearing of masks; the closure of bars, pubs, night clubs, schools, public institutions and so on. Both prior to the blast, and in November 2020, national lockdowns have been put in place, while at different periods, municipalities have been subjected to measures on a discretionary basis.74 From 1 March 2021, the GoL eased restrictions in the third phase of a gradual lifting of the country’s nationwide lockdown, while night curfew remains in effect until further notice.75 The extent to which these measures have been adhered to varies across the Lebanese territories. Vulnerable and densely populated areas in Beirut City suffer from the lack of adequate access to basic services, such as water, and from overcrowding. Many are also dependent on work in the informal economy with limited or no social safety nets. Imposed COVID-19 measures were therefore not feasible to comply with for everyone. Especially for vulnerable populations, COVID-19 and its associated measures will have severe socioeconomic consequences. Palestinian refugees are three times more likely to die with COVID-19 compared to the overall population due
73 Ministry of Interior and Municipalities, “Decision Number 1250: Isolation of Villages Due to the Outbreak of COVID-19,” 2020.
74 GoL, “COVID-19 Advisory No: 88: Country Lockdown Decision”, November 2020.
75 GoL, “Unofficial Translation: Decision Number 96 Updating the Strategy to Confront the Corona Virus and the Stages of Gradually Relaxing the Restrictions of the Lockdown,” February 6, 2021.
to existing health conditions.76 Due to the overcrowding and the need to go out to work, Palestinian refugees are also more likely to be exposed to the virus. Yet, the vaccination programme is risking leaving refugees and migrants behind, with less than 3 per cent of those vaccinated and 5 per cent of those registered to receive vaccinations reported to be non-Lebanese in April 2021, according to the government’s online tracking platform.77
COVID-19 measures were first introduced in March 2020. Since then, restrictions for different areas of the city have varied. In certain periods, there have been total or partial lockdown, depending on the number of reported cases. While some of the most vulnerable areas of the city have not always been subjected to the strictest COVID-19 rules or enforcement of measures, the closing down of areas with high economic activity and livelihoods have affected many people living in other parts of the city, including vulnerable individuals employed in the informal job market. The impact of varying measures in different areas is, in other words, not confined to the municipalities subject to the measures, and will affect vulnerable population groups disproportionately. Moreover, anecdotal evidence suggests that COVID-19 and associated measures have been perceived to
76 Timour Azhari, “Palestinian Refugees in Lebanon More Likely to Die with COVID-19,” Thomson Reuters Foundation, February 16, 2021, https://news.trust.org/item/20210216153654-lwurk/.
77 Human Rights Watch, “Lebanon: Refugees, Migrants Left Behind in Vaccine Rollout,” April 6, 2021, https://www.hrw.org/news/2021/04/06/lebanon-refugees-migrants-left-behind-vaccine-rollout.

27
Figure 14 Satellite image of the Port of Beirut after the blast . Source: European Space Imaging, 2021 .
increase stigma and tension between host and refugee communities.78
4 August 2020 blast The 4 August 2020 blast severely damaged large parts of Beirut City, including its historic core and central commercial and cultural districts. The explosion directly impacted around 300,000 persons who lived within 3 km of the explosion’s epicentre (Figure 12) and led to more than 200 deaths and 6,500 injuries.79 As a result of the blast, critical social and basic infrastructure was damaged and incapacitated, while a range of socioeconomic realms were severely and negatively impacted. Many of the affected households continued to live within their damaged homes,80 while others were displaced or temporarily relocated to other areas of the city or the country or have emigrated abroad.81 In the months after the blast, many apartments in the city centre were left dark, while economic activity was slow to resume or had completely stagnated.
78 Alternative Frequencies in Conversation with Jasmin Lilian Diab, “Episode 12 - Neglected Vicitms: Refugees and GBV in the Age of a Pandemic,” 2020.
79 Shelter Sector, “Beirut Port Explosions: Shelter Sector Dashboard,” September 2020.
80 For some tenants, the risk of not being able to return once temporarily displaced has been a deterrent to relocation from damaged apartments after the blast.
81 Arwa Ibrahim, “A New Exodus from Lebanon after Deadly Beirut Blast,” Al Jazeera. 22 August 2020, https://www.aljazeera.com/news/2020/8/22/a-new-exodus-from-lebanon-after-deadly-beirut-blast.
Each new shock in the country reinforces the effects of previous shocks. For example, the 4 August 2020 blast is said to have contributed to a sharp rise in COVID-19 cases shortly after. Nationally, from a daily average of 50 persons contracting COVID-19 before the explosion, the number steadily increased to 500 persons a day until 24 September 2020, to more than 3,900 by 28 January 2021.82 In turn, COVID-19 has further challenged the government’s ability to address needs and provide services (for instance, intensive care unit bed occupancy was consistently at or close to 100 per cent in Beirut Governorate and a little lower, at around 85 per cent, in Mount Lebanon Governorate83). Furthermore, COVID-19 measures have been the second most significant contributor to the contraction of the economy in 2020 after the economic crisis, with a multiplier effect on access to a range of services, including health services.84 These combined stressors, and especially following the further collapse of the economy due to COVID-19, have raised concerns of further political unrest. According to a youth survey conducted in 2020, close to three out of four young people believed that protests were “much more or somewhat more likely” because of COVID-19.85
82 WHO, “09 November 2020: Lebanon COVID-19 Daily Brief,” 2020; WHO, “28 January 2021: Lebanon COVID-19 Daily Brief,” 2021.
83 WHO, “07 November 2020: Lebanon Covid-19 Daily Brief,” 2020.
84 World Bank, “Lebanon Economic Monitor: The Deliberate Depression.”
85 ASDA’A BCW, “Arab Youth Survey: A Voice for Change,” 2020.
28
UN
-HA
BIT
AT
/ L
EB
AN
ON
/ C
ITY
PR
OFI
LE
S /
BE
IRU
T /
20
21
/ D
EM
OG
RA
PH
Y
29
Demography
© Photo: UN-Habitat, 2011
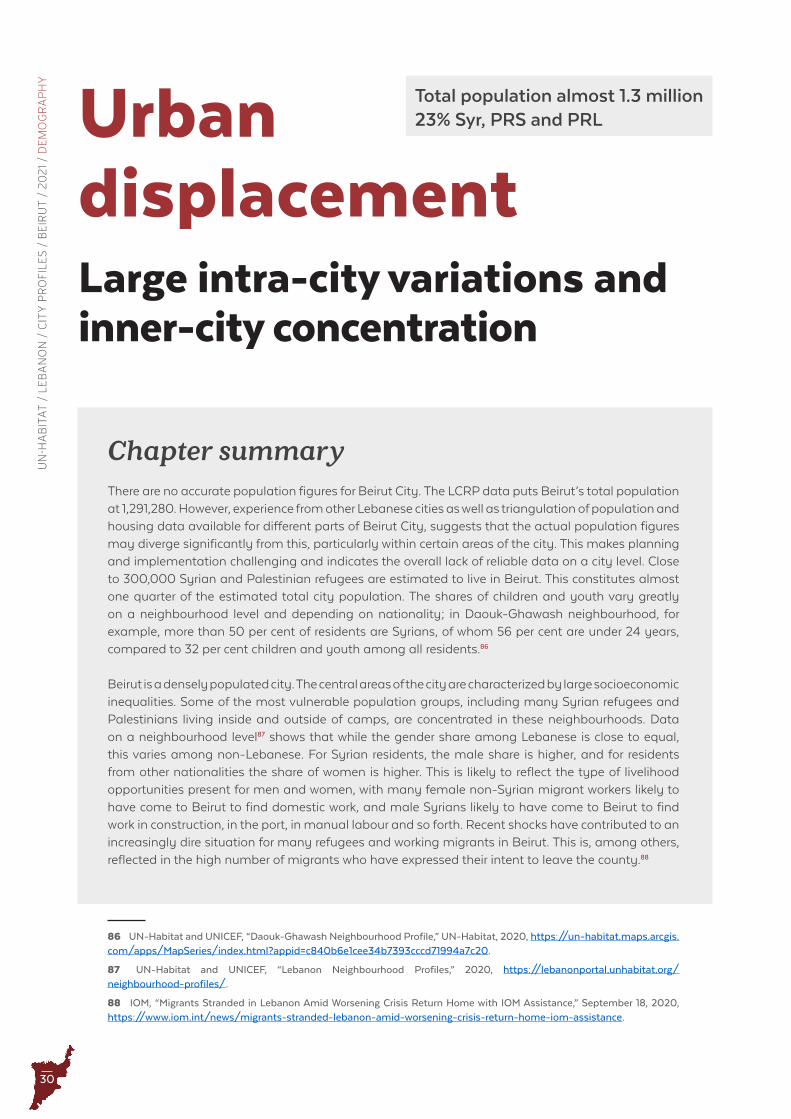
30
UN
-HA
BIT
AT
/ L
EB
AN
ON
/ C
ITY
PR
OFI
LE
S /
BE
IRU
T /
20
21
/ D
EM
OG
RA
PH
Y
Urban displacement
Total population almost 1.3 million 23% Syr, PRS and PRL
Large intra-city variations and inner-city concentration
Chapter summary There are no accurate population figures for Beirut City. The LCRP data puts Beirut’s total population at 1,291,280. However, experience from other Lebanese cities as well as triangulation of population and housing data available for different parts of Beirut City, suggests that the actual population figures may diverge significantly from this, particularly within certain areas of the city. This makes planning and implementation challenging and indicates the overall lack of reliable data on a city level. Close to 300,000 Syrian and Palestinian refugees are estimated to live in Beirut. This constitutes almost one quarter of the estimated total city population. The shares of children and youth vary greatly on a neighbourhood level and depending on nationality; in Daouk-Ghawash neighbourhood, for example, more than 50 per cent of residents are Syrians, of whom 56 per cent are under 24 years, compared to 32 per cent children and youth among all residents.86
Beirut is a densely populated city. The central areas of the city are characterized by large socioeconomic inequalities. Some of the most vulnerable population groups, including many Syrian refugees and Palestinians living inside and outside of camps, are concentrated in these neighbourhoods. Data on a neighbourhood level87 shows that while the gender share among Lebanese is close to equal, this varies among non-Lebanese. For Syrian residents, the male share is higher, and for residents from other nationalities the share of women is higher. This is likely to reflect the type of livelihood opportunities present for men and women, with many female non-Syrian migrant workers likely to have come to Beirut to find domestic work, and male Syrians likely to have come to Beirut to find work in construction, in the port, in manual labour and so forth. Recent shocks have contributed to an increasingly dire situation for many refugees and working migrants in Beirut. This is, among others, reflected in the high number of migrants who have expressed their intent to leave the county.88
86 UN-Habitat and UNICEF, “Daouk-Ghawash Neighbourhood Profile,” UN-Habitat, 2020, https://un-habitat.maps.arcgis.com/apps/MapSeries/index.html?appid=c840b6e1cee34b7393cccd71994a7c20.
87 UN-Habitat and UNICEF, “Lebanon Neighbourhood Profiles,” 2020, https://lebanonportal.unhabitat.org/neighbourhood-profiles/.
88 IOM, “Migrants Stranded in Lebanon Amid Worsening Crisis Return Home with IOM Assistance,” September 18, 2020, https://www.iom.int/news/migrants-stranded-lebanon-amid-worsening-crisis-return-home-iom-assistance.
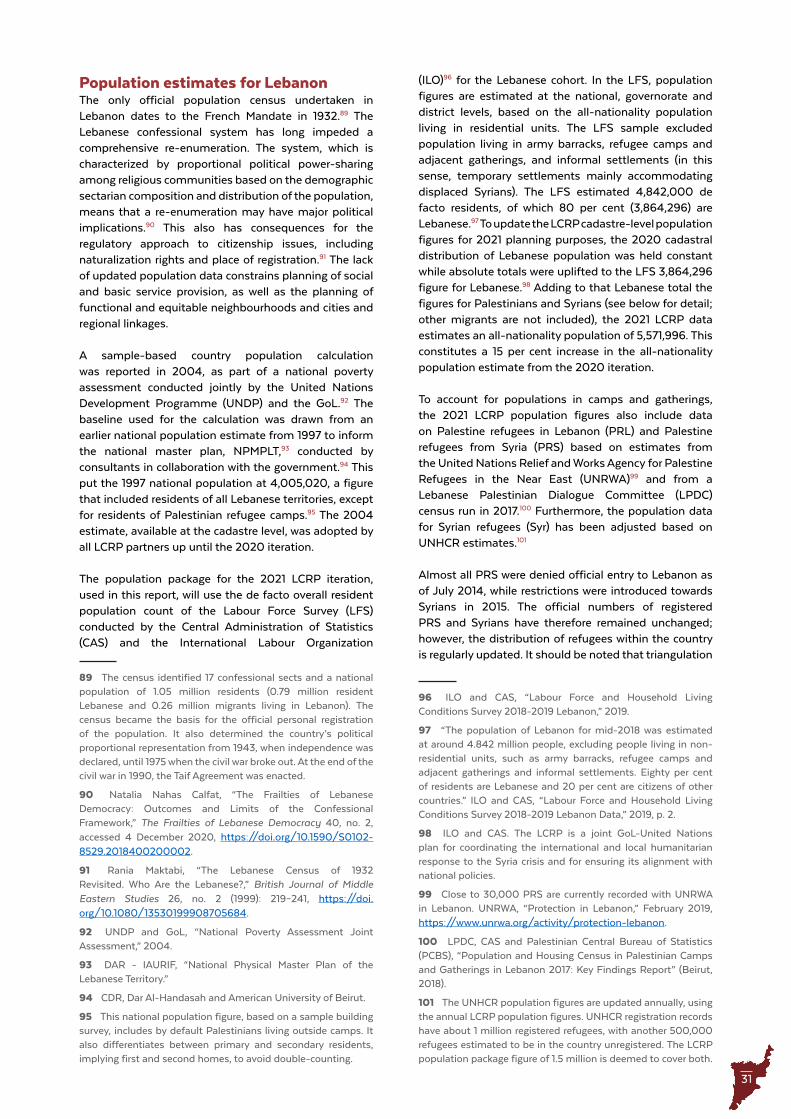
31
Population estimates for LebanonThe only official population census undertaken in Lebanon dates to the French Mandate in 1932.89 The Lebanese confessional system has long impeded a comprehensive re-enumeration. The system, which is characterized by proportional political power-sharing among religious communities based on the demographic sectarian composition and distribution of the population, means that a re-enumeration may have major political implications.90 This also has consequences for the regulatory approach to citizenship issues, including naturalization rights and place of registration.91 The lack of updated population data constrains planning of social and basic service provision, as well as the planning of functional and equitable neighbourhoods and cities and regional linkages.
A sample-based country population calculation was reported in 2004, as part of a national poverty assessment conducted jointly by the United Nations Development Programme (UNDP) and the GoL.92 The baseline used for the calculation was drawn from an earlier national population estimate from 1997 to inform the national master plan, NPMPLT,93 conducted by consultants in collaboration with the government.94 This put the 1997 national population at 4,005,020, a figure that included residents of all Lebanese territories, except for residents of Palestinian refugee camps.95 The 2004 estimate, available at the cadastre level, was adopted by all LCRP partners up until the 2020 iteration.
The population package for the 2021 LCRP iteration, used in this report, will use the de facto overall resident population count of the Labour Force Survey (LFS) conducted by the Central Administration of Statistics (CAS) and the International Labour Organization
89 The census identified 17 confessional sects and a national population of 1.05 million residents (0.79 million resident Lebanese and 0.26 million migrants living in Lebanon). The census became the basis for the official personal registration of the population. It also determined the country’s political proportional representation from 1943, when independence was declared, until 1975 when the civil war broke out. At the end of the civil war in 1990, the Taif Agreement was enacted.
90 Natalia Nahas Calfat, “The Frailties of Lebanese Democracy: Outcomes and Limits of the Confessional Framework,” The Frailties of Lebanese Democracy 40, no. 2, accessed 4 December 2020, https://doi.org/10.1590/S0102-8529.2018400200002.
91 Rania Maktabi, “The Lebanese Census of 1932 Revisited. Who Are the Lebanese?,” British Journal of Middle Eastern Studies 26, no. 2 (1999): 219–241, https://doi.org/10.1080/13530199908705684.
92 UNDP and GoL, “National Poverty Assessment Joint Assessment,” 2004.
93 DAR - IAURIF, “National Physical Master Plan of the Lebanese Territory.”
94 CDR, Dar Al-Handasah and American University of Beirut.
95 This national population figure, based on a sample building survey, includes by default Palestinians living outside camps. It also differentiates between primary and secondary residents, implying first and second homes, to avoid double-counting.
(ILO)96 for the Lebanese cohort. In the LFS, population figures are estimated at the national, governorate and district levels, based on the all-nationality population living in residential units. The LFS sample excluded population living in army barracks, refugee camps and adjacent gatherings, and informal settlements (in this sense, temporary settlements mainly accommodating displaced Syrians). The LFS estimated 4,842,000 de facto residents, of which 80 per cent (3,864,296) are Lebanese.97 To update the LCRP cadastre-level population figures for 2021 planning purposes, the 2020 cadastral distribution of Lebanese population was held constant while absolute totals were uplifted to the LFS 3,864,296 figure for Lebanese.98 Adding to that Lebanese total the figures for Palestinians and Syrians (see below for detail; other migrants are not included), the 2021 LCRP data estimates an all-nationality population of 5,571,996. This constitutes a 15 per cent increase in the all-nationality population estimate from the 2020 iteration.
To account for populations in camps and gatherings, the 2021 LCRP population figures also include data on Palestine refugees in Lebanon (PRL) and Palestine refugees from Syria (PRS) based on estimates from the United Nations Relief and Works Agency for Palestine Refugees in the Near East (UNRWA)99 and from a Lebanese Palestinian Dialogue Committee (LPDC) census run in 2017.100 Furthermore, the population data for Syrian refugees (Syr) has been adjusted based on UNHCR estimates.101
Almost all PRS were denied official entry to Lebanon as of July 2014, while restrictions were introduced towards Syrians in 2015. The official numbers of registered PRS and Syrians have therefore remained unchanged; however, the distribution of refugees within the country is regularly updated. It should be noted that triangulation
96 ILO and CAS, “Labour Force and Household Living Conditions Survey 2018-2019 Lebanon,” 2019.
97 “The population of Lebanon for mid-2018 was estimated at around 4.842 million people, excluding people living in non-residential units, such as army barracks, refugee camps and adjacent gatherings and informal settlements. Eighty per cent of residents are Lebanese and 20 per cent are citizens of other countries.” ILO and CAS, “Labour Force and Household Living Conditions Survey 2018-2019 Lebanon Data,” 2019, p. 2.
98 ILO and CAS. The LCRP is a joint GoL-United Nations plan for coordinating the international and local humanitarian response to the Syria crisis and for ensuring its alignment with national policies.
99 Close to 30,000 PRS are currently recorded with UNRWA in Lebanon. UNRWA, “Protection in Lebanon,” February 2019, https://www.unrwa.org/activity/protection-lebanon.
100 LPDC, CAS and Palestinian Central Bureau of Statistics (PCBS), “Population and Housing Census in Palestinian Camps and Gatherings in Lebanon 2017: Key Findings Report” (Beirut, 2018).
101 The UNHCR population figures are updated annually, using the annual LCRP population figures. UNHCR registration records have about 1 million registered refugees, with another 500,000 refugees estimated to be in the country unregistered. The LCRP population package figure of 1.5 million is deemed to cover both.
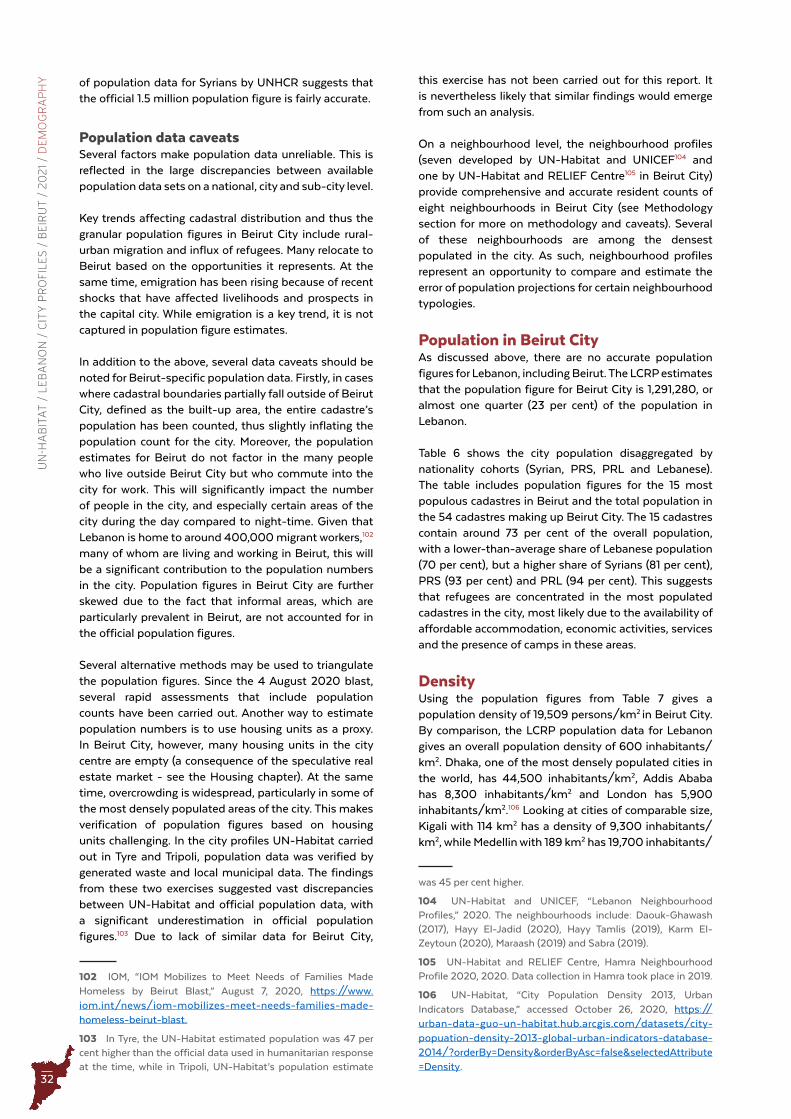
32
UN
-HA
BIT
AT
/ L
EB
AN
ON
/ C
ITY
PR
OFI
LE
S /
BE
IRU
T /
20
21
/ D
EM
OG
RA
PH
Y of population data for Syrians by UNHCR suggests that the official 1.5 million population figure is fairly accurate.
Population data caveatsSeveral factors make population data unreliable. This is reflected in the large discrepancies between available population data sets on a national, city and sub-city level.
Key trends affecting cadastral distribution and thus the granular population figures in Beirut City include rural-urban migration and influx of refugees. Many relocate to Beirut based on the opportunities it represents. At the same time, emigration has been rising because of recent shocks that have affected livelihoods and prospects in the capital city. While emigration is a key trend, it is not captured in population figure estimates.
In addition to the above, several data caveats should be noted for Beirut-specific population data. Firstly, in cases where cadastral boundaries partially fall outside of Beirut City, defined as the built-up area, the entire cadastre’s population has been counted, thus slightly inflating the population count for the city. Moreover, the population estimates for Beirut do not factor in the many people who live outside Beirut City but who commute into the city for work. This will significantly impact the number of people in the city, and especially certain areas of the city during the day compared to night-time. Given that Lebanon is home to around 400,000 migrant workers,102 many of whom are living and working in Beirut, this will be a significant contribution to the population numbers in the city. Population figures in Beirut City are further skewed due to the fact that informal areas, which are particularly prevalent in Beirut, are not accounted for in the official population figures.
Several alternative methods may be used to triangulate the population figures. Since the 4 August 2020 blast, several rapid assessments that include population counts have been carried out. Another way to estimate population numbers is to use housing units as a proxy. In Beirut City, however, many housing units in the city centre are empty (a consequence of the speculative real estate market - see the Housing chapter). At the same time, overcrowding is widespread, particularly in some of the most densely populated areas of the city. This makes verification of population figures based on housing units challenging. In the city profiles UN-Habitat carried out in Tyre and Tripoli, population data was verified by generated waste and local municipal data. The findings from these two exercises suggested vast discrepancies between UN-Habitat and official population data, with a significant underestimation in official population figures.103 Due to lack of similar data for Beirut City,
102 IOM, “IOM Mobilizes to Meet Needs of Families Made Homeless by Beirut Blast,” August 7, 2020, https://www.iom.int/news/iom-mobilizes-meet-needs-families-made-homeless-beirut-blast.
103 In Tyre, the UN-Habitat estimated population was 47 per cent higher than the official data used in humanitarian response at the time, while in Tripoli, UN-Habitat’s population estimate
this exercise has not been carried out for this report. It is nevertheless likely that similar findings would emerge from such an analysis.
On a neighbourhood level, the neighbourhood profiles (seven developed by UN-Habitat and UNICEF104 and one by UN-Habitat and RELIEF Centre105 in Beirut City) provide comprehensive and accurate resident counts of eight neighbourhoods in Beirut City (see Methodology section for more on methodology and caveats). Several of these neighbourhoods are among the densest populated in the city. As such, neighbourhood profiles represent an opportunity to compare and estimate the error of population projections for certain neighbourhood typologies.
Population in Beirut CityAs discussed above, there are no accurate population figures for Lebanon, including Beirut. The LCRP estimates that the population figure for Beirut City is 1,291,280, or almost one quarter (23 per cent) of the population in Lebanon.
Table 6 shows the city population disaggregated by nationality cohorts (Syrian, PRS, PRL and Lebanese). The table includes population figures for the 15 most populous cadastres in Beirut and the total population in the 54 cadastres making up Beirut City. The 15 cadastres contain around 73 per cent of the overall population, with a lower-than-average share of Lebanese population (70 per cent), but a higher share of Syrians (81 per cent), PRS (93 per cent) and PRL (94 per cent). This suggests that refugees are concentrated in the most populated cadastres in the city, most likely due to the availability of affordable accommodation, economic activities, services and the presence of camps in these areas.
DensityUsing the population figures from Table 7 gives a population density of 19,509 persons/km2 in Beirut City. By comparison, the LCRP population data for Lebanon gives an overall population density of 600 inhabitants/km2. Dhaka, one of the most densely populated cities in the world, has 44,500 inhabitants/km2, Addis Ababa has 8,300 inhabitants/km2 and London has 5,900 inhabitants/km2.106 Looking at cities of comparable size, Kigali with 114 km2 has a density of 9,300 inhabitants/km2, while Medellin with 189 km2 has 19,700 inhabitants/
was 45 per cent higher.
104 UN-Habitat and UNICEF, “Lebanon Neighbourhood Profiles,” 2020. The neighbourhoods include: Daouk-Ghawash (2017), Hayy El-Jadid (2020), Hayy Tamlis (2019), Karm El-Zeytoun (2020), Maraash (2019) and Sabra (2019).
105 UN-Habitat and RELIEF Centre, Hamra Neighbourhood Profile 2020, 2020. Data collection in Hamra took place in 2019.
106 UN-Habitat, “City Population Density 2013, Urban Indicators Database,” accessed October 26, 2020, https://urban-data-guo-un-habitat.hub.arcgis.com/datasets/city-popuation-density-2013-global-urban-indicators-database-2014/?orderBy=Density&orderByAsc=false&selectedAttribute=Density.
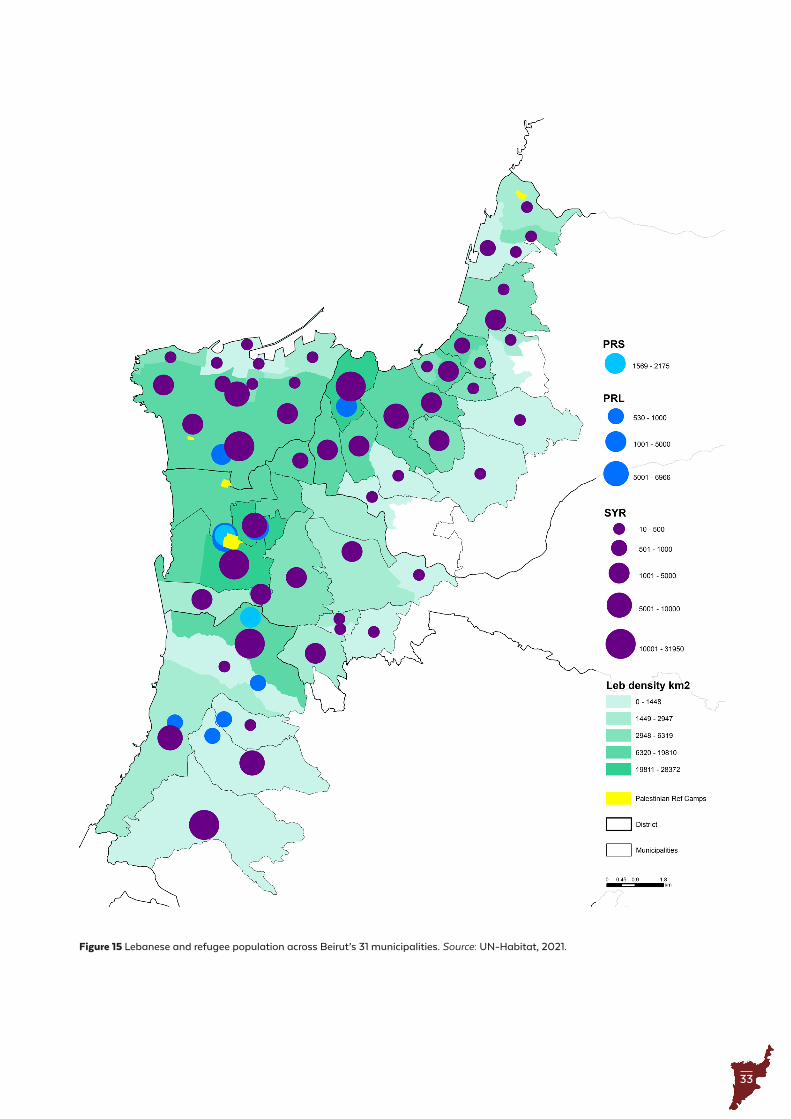
33
Figure 15 Lebanese and refugee population across Beirut’s 31 municipalities . Source: UN-Habitat, 2021 .
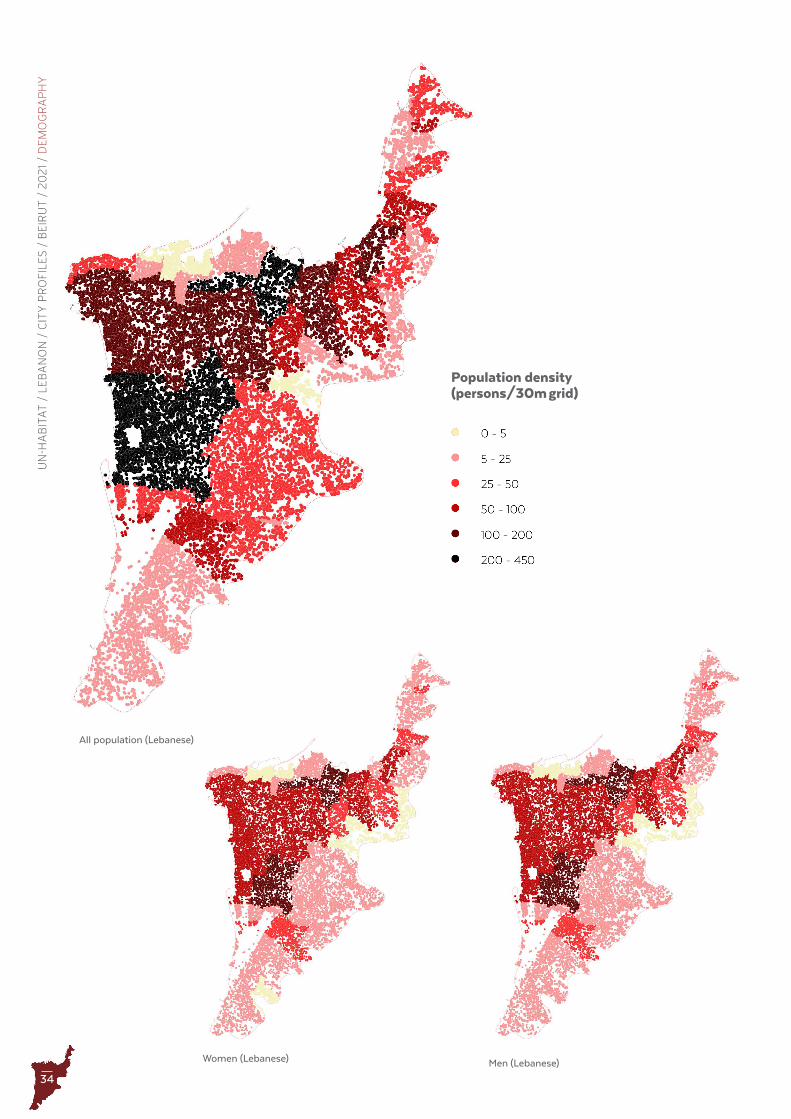
34
UN
-HA
BIT
AT
/ L
EB
AN
ON
/ C
ITY
PR
OFI
LE
S /
BE
IRU
T /
20
21
/ D
EM
OG
RA
PH
Y
All population (Lebanese)
Men (Lebanese)Women (Lebanese)
Population density (persons/30m grid)
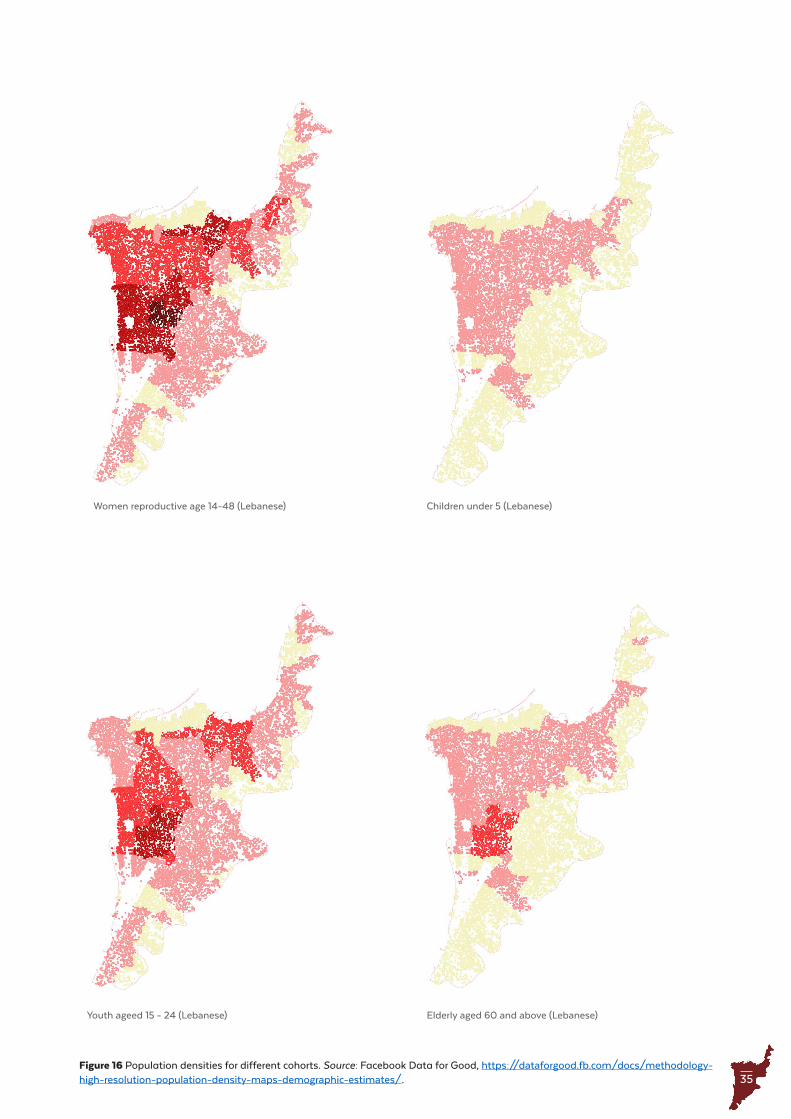
35Figure 16 Population densities for different cohorts . Source: Facebook Data for Good, https://dataforgood.fb.com/docs/methodology-high-resolution-population-density-maps-demographic-estimates/.
Women reproductive age 14-48 (Lebanese) Children under 5 (Lebanese)
Youth ageed 15 - 24 (Lebanese) Elderly aged 60 and above (Lebanese)
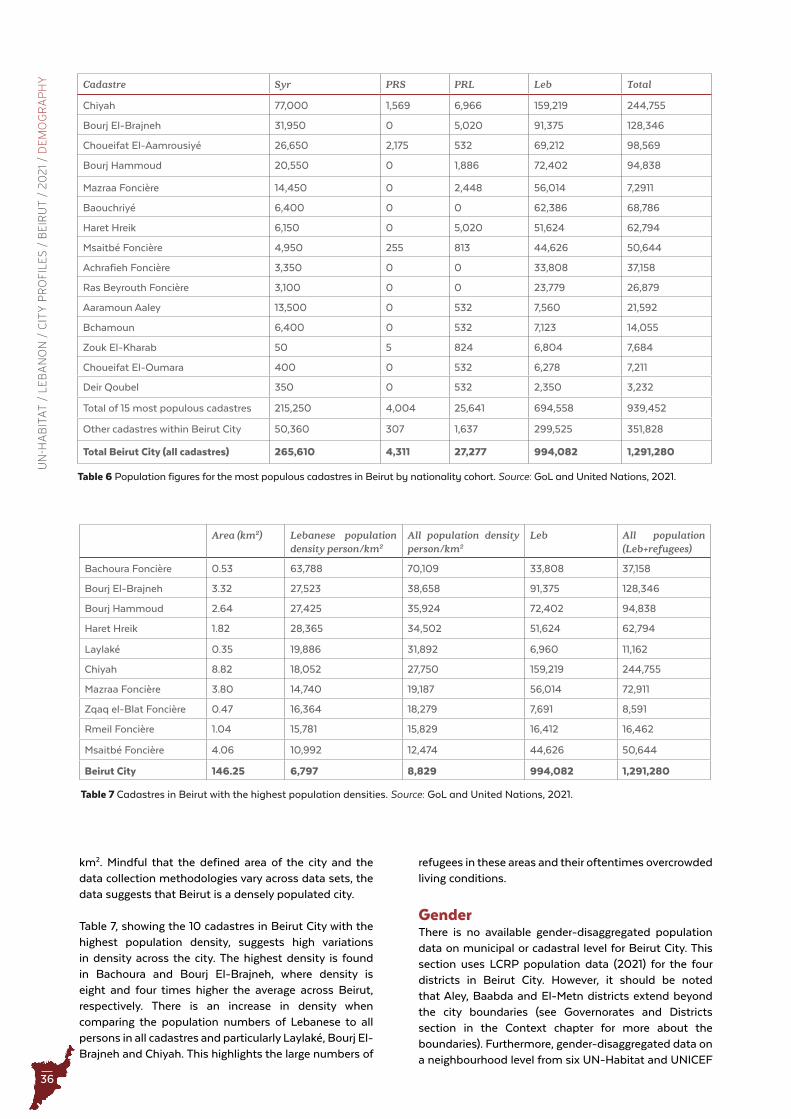
36
UN
-HA
BIT
AT
/ L
EB
AN
ON
/ C
ITY
PR
OFI
LE
S /
BE
IRU
T /
20
21
/ D
EM
OG
RA
PH
Y
Table 7 Cadastres in Beirut with the highest population densities . Source: GoL and United Nations, 2021 .
Area (km2) Lebanese population density person/km2
All population density person/km2
Leb All population (Leb+refugees)
Bachoura Foncière 0.53 63,788 70,109 33,808 37,158
Bourj El-Brajneh 3.32 27,523 38,658 91,375 128,346
Bourj Hammoud 2.64 27,425 35,924 72,402 94,838
Haret Hreik 1.82 28,365 34,502 51,624 62,794
Laylaké 0.35 19,886 31,892 6,960 11,162
Chiyah 8.82 18,052 27,750 159,219 244,755
Mazraa Foncière 3.80 14,740 19,187 56,014 72,911
Zqaq el-Blat Foncière 0.47 16,364 18,279 7,691 8,591
Rmeil Foncière 1.04 15,781 15,829 16,412 16,462
Msaitbé Foncière 4.06 10,992 12,474 44,626 50,644
Beirut City 146 .25 6,797 8,829 994,082 1,291,280
Cadastre Syr PRS PRL Leb Total
Chiyah 77,000 1,569 6,966 159,219 244,755
Bourj El-Brajneh 31,950 0 5,020 91,375 128,346
Choueifat El-Aamrousiyé 26,650 2,175 532 69,212 98,569
Bourj Hammoud 20,550 0 1,886 72,402 94,838
Mazraa Foncière 14,450 0 2,448 56,014 7,2911
Baouchriyé 6,400 0 0 62,386 68,786
Haret Hreik 6,150 0 5,020 51,624 62,794
Msaitbé Foncière 4,950 255 813 44,626 50,644
Achrafieh Foncière 3,350 0 0 33,808 37,158
Ras Beyrouth Foncière 3,100 0 0 23,779 26,879
Aaramoun Aaley 13,500 0 532 7,560 21,592
Bchamoun 6,400 0 532 7,123 14,055
Zouk El-Kharab 50 5 824 6,804 7,684
Choueifat El-Oumara 400 0 532 6,278 7,211
Deir Qoubel 350 0 532 2,350 3,232
Total of 15 most populous cadastres 215,250 4,004 25,641 694,558 939,452
Other cadastres within Beirut City 50,360 307 1,637 299,525 351,828
Total Beirut City (all cadastres) 265,610 4,311 27,277 994,082 1,291,280
Table 6 Population figures for the most populous cadastres in Beirut by nationality cohort . Source: GoL and United Nations, 2021 .
km2. Mindful that the defined area of the city and the data collection methodologies vary across data sets, the data suggests that Beirut is a densely populated city.
Table 7, showing the 10 cadastres in Beirut City with the highest population density, suggests high variations in density across the city. The highest density is found in Bachoura and Bourj El-Brajneh, where density is eight and four times higher the average across Beirut, respectively. There is an increase in density when comparing the population numbers of Lebanese to all persons in all cadastres and particularly Laylaké, Bourj El-Brajneh and Chiyah. This highlights the large numbers of
refugees in these areas and their oftentimes overcrowded living conditions.
GenderThere is no available gender-disaggregated population data on municipal or cadastral level for Beirut City. This section uses LCRP population data (2021) for the four districts in Beirut City. However, it should be noted that Aley, Baabda and El-Metn districts extend beyond the city boundaries (see Governorates and Districts section in the Context chapter for more about the boundaries). Furthermore, gender-disaggregated data on a neighbourhood level from six UN-Habitat and UNICEF
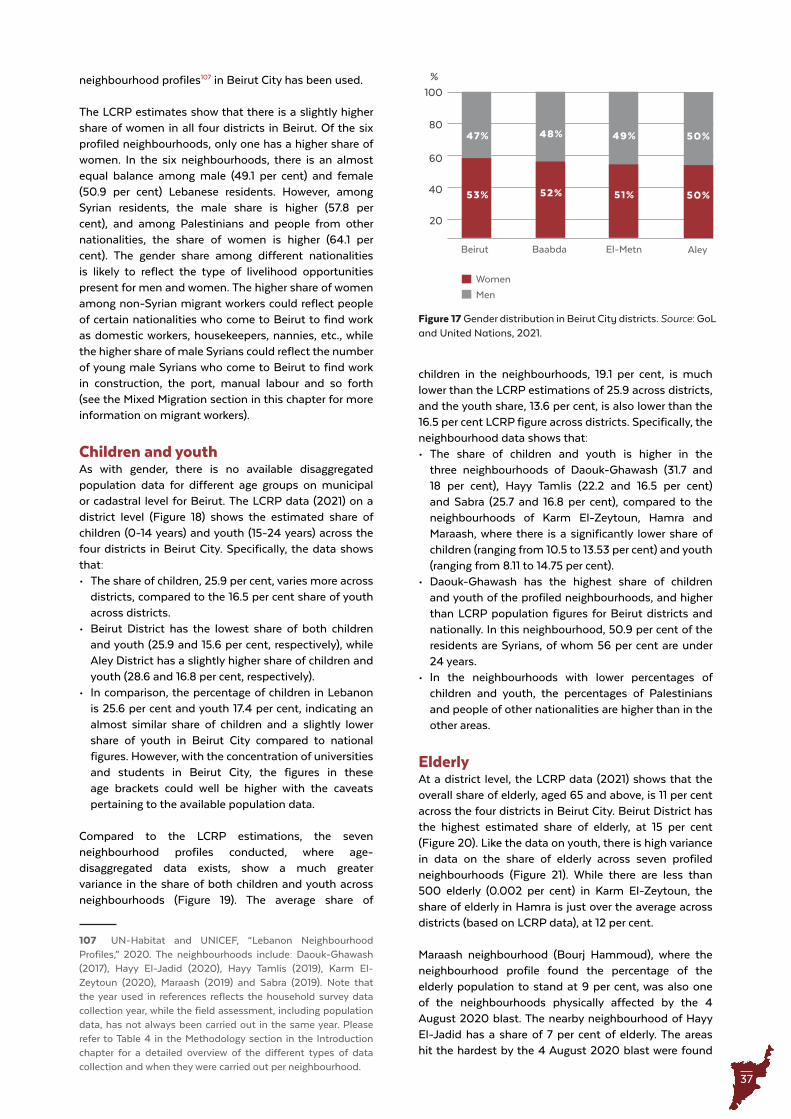
37
Figure 17 Gender distribution in Beirut City districts . Source: GoL and United Nations, 2021 .
Beirut
Women
Men
AleyEl-MetnBaabda
50%
50%
53%
47%
51%
49%
52%
48%
100
80
60
40
20
%
children in the neighbourhoods, 19.1 per cent, is much lower than the LCRP estimations of 25.9 across districts, and the youth share, 13.6 per cent, is also lower than the 16.5 per cent LCRP figure across districts. Specifically, the neighbourhood data shows that:• The share of children and youth is higher in the
three neighbourhoods of Daouk-Ghawash (31.7 and 18 per cent), Hayy Tamlis (22.2 and 16.5 per cent) and Sabra (25.7 and 16.8 per cent), compared to the neighbourhoods of Karm El-Zeytoun, Hamra and Maraash, where there is a significantly lower share of children (ranging from 10.5 to 13.53 per cent) and youth (ranging from 8.11 to 14.75 per cent).
• Daouk-Ghawash has the highest share of children and youth of the profiled neighbourhoods, and higher than LCRP population figures for Beirut districts and nationally. In this neighbourhood, 50.9 per cent of the residents are Syrians, of whom 56 per cent are under 24 years.
• In the neighbourhoods with lower percentages of children and youth, the percentages of Palestinians and people of other nationalities are higher than in the other areas.
ElderlyAt a district level, the LCRP data (2021) shows that the overall share of elderly, aged 65 and above, is 11 per cent across the four districts in Beirut City. Beirut District has the highest estimated share of elderly, at 15 per cent (Figure 20). Like the data on youth, there is high variance in data on the share of elderly across seven profiled neighbourhoods (Figure 21). While there are less than 500 elderly (0.002 per cent) in Karm El-Zeytoun, the share of elderly in Hamra is just over the average across districts (based on LCRP data), at 12 per cent.
Maraash neighbourhood (Bourj Hammoud), where the neighbourhood profile found the percentage of the elderly population to stand at 9 per cent, was also one of the neighbourhoods physically affected by the 4 August 2020 blast. The nearby neighbourhood of Hayy El-Jadid has a share of 7 per cent of elderly. The areas hit the hardest by the 4 August 2020 blast were found
neighbourhood profiles107 in Beirut City has been used.
The LCRP estimates show that there is a slightly higher share of women in all four districts in Beirut. Of the six profiled neighbourhoods, only one has a higher share of women. In the six neighbourhoods, there is an almost equal balance among male (49.1 per cent) and female (50.9 per cent) Lebanese residents. However, among Syrian residents, the male share is higher (57.8 per cent), and among Palestinians and people from other nationalities, the share of women is higher (64.1 per cent). The gender share among different nationalities is likely to reflect the type of livelihood opportunities present for men and women. The higher share of women among non-Syrian migrant workers could reflect people of certain nationalities who come to Beirut to find work as domestic workers, housekeepers, nannies, etc., while the higher share of male Syrians could reflect the number of young male Syrians who come to Beirut to find work in construction, the port, manual labour and so forth (see the Mixed Migration section in this chapter for more information on migrant workers).
Children and youthAs with gender, there is no available disaggregated population data for different age groups on municipal or cadastral level for Beirut. The LCRP data (2021) on a district level (Figure 18) shows the estimated share of children (0-14 years) and youth (15-24 years) across the four districts in Beirut City. Specifically, the data shows that:• The share of children, 25.9 per cent, varies more across
districts, compared to the 16.5 per cent share of youth across districts.
• Beirut District has the lowest share of both children and youth (25.9 and 15.6 per cent, respectively), while Aley District has a slightly higher share of children and youth (28.6 and 16.8 per cent, respectively).
• In comparison, the percentage of children in Lebanon is 25.6 per cent and youth 17.4 per cent, indicating an almost similar share of children and a slightly lower share of youth in Beirut City compared to national figures. However, with the concentration of universities and students in Beirut City, the figures in these age brackets could well be higher with the caveats pertaining to the available population data.
Compared to the LCRP estimations, the seven neighbourhood profiles conducted, where age-disaggregated data exists, show a much greater variance in the share of both children and youth across neighbourhoods (Figure 19). The average share of
107 UN-Habitat and UNICEF, “Lebanon Neighbourhood Profiles,” 2020. The neighbourhoods include: Daouk-Ghawash (2017), Hayy El-Jadid (2020), Hayy Tamlis (2019), Karm El-Zeytoun (2020), Maraash (2019) and Sabra (2019). Note that the year used in references reflects the household survey data collection year, while the field assessment, including population data, has not always been carried out in the same year. Please refer to Table 4 in the Methodology section in the Introduction chapter for a detailed overview of the different types of data collection and when they were carried out per neighbourhood.
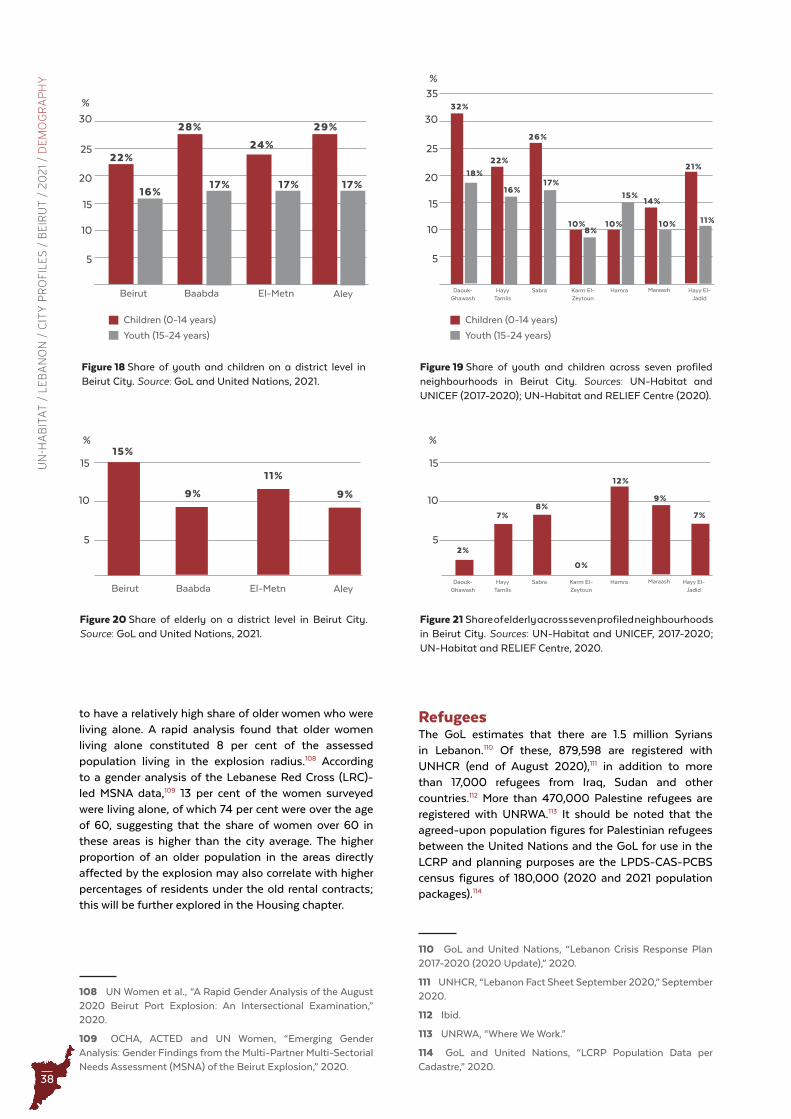
38
UN
-HA
BIT
AT
/ L
EB
AN
ON
/ C
ITY
PR
OFI
LE
S /
BE
IRU
T /
20
21
/ D
EM
OG
RA
PH
Y
Figure 19 Share of youth and children across seven profiled neighbourhoods in Beirut City . Sources: UN-Habitat and UNICEF (2017-2020); UN-Habitat and RELIEF Centre (2020) .
10%8%
10%
15%14%
10%
32%
18%21%
11%
22%
16%17%
26%
30
35
25
20
15
10
5
Children (0-14 years)
Youth (15-24 years)
%
Figure 18 Share of youth and children on a district level in Beirut City . Source: GoL and United Nations, 2021 .
22%
16%
28%
17%
29%
17%
24%
17%
30
25
20
15
10
5
Children (0-14 years)
Youth (15-24 years)
%
Beirut AleyEl-MetnBaabda
9%
11%
15%
9%
15
10
5
Figure 20 Share of elderly on a district level in Beirut City . Source: GoL and United Nations, 2021 .
%
Beirut AleyEl-MetnBaabda
Hamra Maraash Hayy El-Jadid
Hayy Tamlis
SabraDaouk-Ghawash
Figure 21 Share of elderly across seven profiled neighbourhoods in Beirut City . Sources: UN-Habitat and UNICEF, 2017-2020; UN-Habitat and RELIEF Centre, 2020 .
12%
0%
2%
7%7%8%
9%
15
10
5
%
Hamra Maraash Hayy El-Jadid
Hayy Tamlis
SabraDaouk-Ghawash
Karm El-Zeytoun
Karm El-Zeytoun
to have a relatively high share of older women who were living alone. A rapid analysis found that older women living alone constituted 8 per cent of the assessed population living in the explosion radius.108 According to a gender analysis of the Lebanese Red Cross (LRC)-led MSNA data,109 13 per cent of the women surveyed were living alone, of which 74 per cent were over the age of 60, suggesting that the share of women over 60 in these areas is higher than the city average. The higher proportion of an older population in the areas directly affected by the explosion may also correlate with higher percentages of residents under the old rental contracts; this will be further explored in the Housing chapter.
108 UN Women et al., “A Rapid Gender Analysis of the August 2020 Beirut Port Explosion: An Intersectional Examination,” 2020.
109 OCHA, ACTED and UN Women, “Emerging Gender Analysis: Gender Findings from the Multi-Partner Multi-Sectorial Needs Assessment (MSNA) of the Beirut Explosion,” 2020.
RefugeesThe GoL estimates that there are 1.5 million Syrians in Lebanon.110 Of these, 879,598 are registered with UNHCR (end of August 2020),111 in addition to more than 17,000 refugees from Iraq, Sudan and other countries.112 More than 470,000 Palestine refugees are registered with UNRWA.113 It should be noted that the agreed-upon population figures for Palestinian refugees between the United Nations and the GoL for use in the LCRP and planning purposes are the LPDS-CAS-PCBS census figures of 180,000 (2020 and 2021 population packages).114
110 GoL and United Nations, “Lebanon Crisis Response Plan 2017-2020 (2020 Update),” 2020.
111 UNHCR, “Lebanon Fact Sheet September 2020,” September 2020.
112 Ibid.
113 UNRWA, “Where We Work.”
114 GoL and United Nations, “LCRP Population Data per Cadastre,” 2020.
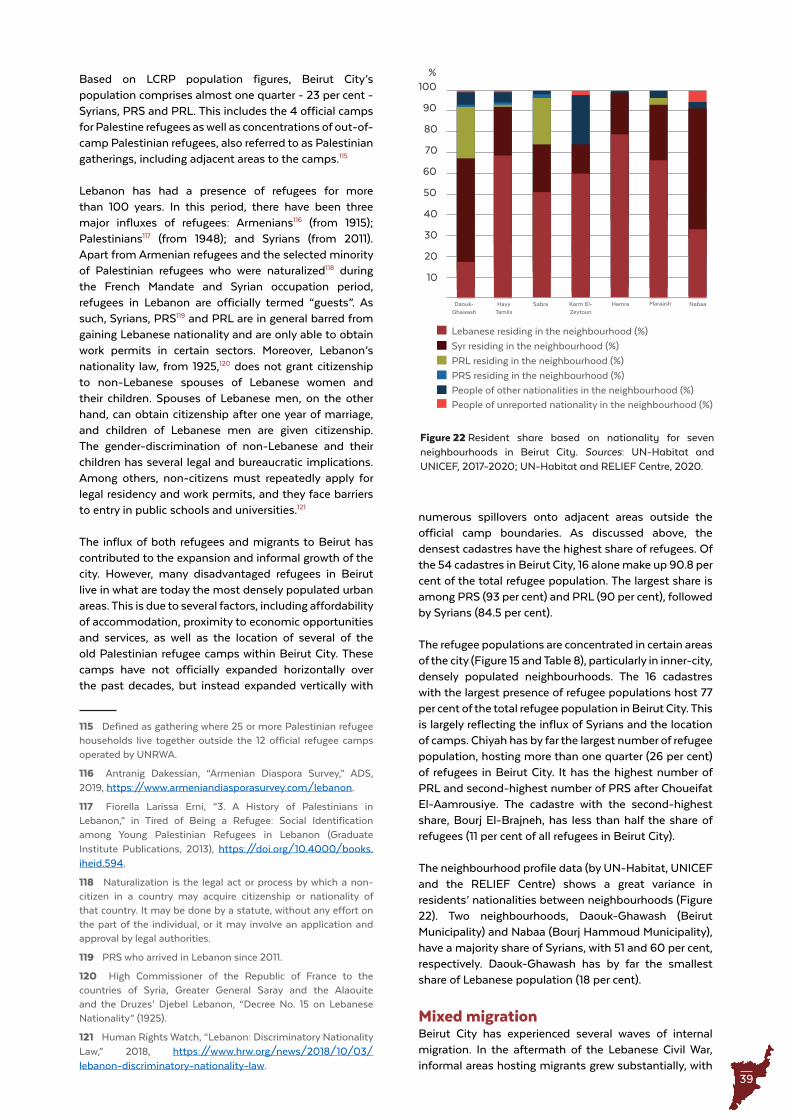
39
Based on LCRP population figures, Beirut City’s population comprises almost one quarter - 23 per cent - Syrians, PRS and PRL. This includes the 4 official camps for Palestine refugees as well as concentrations of out-of-camp Palestinian refugees, also referred to as Palestinian gatherings, including adjacent areas to the camps.115
Lebanon has had a presence of refugees for more than 100 years. In this period, there have been three major influxes of refugees: Armenians116 (from 1915); Palestinians117 (from 1948); and Syrians (from 2011). Apart from Armenian refugees and the selected minority of Palestinian refugees who were naturalized118 during the French Mandate and Syrian occupation period, refugees in Lebanon are officially termed “guests”. As such, Syrians, PRS119 and PRL are in general barred from gaining Lebanese nationality and are only able to obtain work permits in certain sectors. Moreover, Lebanon’s nationality law, from 1925,120 does not grant citizenship to non-Lebanese spouses of Lebanese women and their children. Spouses of Lebanese men, on the other hand, can obtain citizenship after one year of marriage, and children of Lebanese men are given citizenship. The gender-discrimination of non-Lebanese and their children has several legal and bureaucratic implications. Among others, non-citizens must repeatedly apply for legal residency and work permits, and they face barriers to entry in public schools and universities.121
The influx of both refugees and migrants to Beirut has contributed to the expansion and informal growth of the city. However, many disadvantaged refugees in Beirut live in what are today the most densely populated urban areas. This is due to several factors, including affordability of accommodation, proximity to economic opportunities and services, as well as the location of several of the old Palestinian refugee camps within Beirut City. These camps have not officially expanded horizontally over the past decades, but instead expanded vertically with
115 Defined as gathering where 25 or more Palestinian refugee households live together outside the 12 official refugee camps operated by UNRWA.
116 Antranig Dakessian, “Armenian Diaspora Survey,” ADS, 2019, https://www.armeniandiasporasurvey.com/lebanon.
117 Fiorella Larissa Erni, “3. A History of Palestinians in Lebanon,” in Tired of Being a Refugee: Social Identification among Young Palestinian Refugees in Lebanon (Graduate Institute Publications, 2013), https://doi.org/10.4000/books.iheid.594.
118 Naturalization is the legal act or process by which a non-citizen in a country may acquire citizenship or nationality of that country. It may be done by a statute, without any effort on the part of the individual, or it may involve an application and approval by legal authorities.
119 PRS who arrived in Lebanon since 2011.
120 High Commissioner of the Republic of France to the countries of Syria, Greater General Saray and the Alaouite and the Druzes’ Djebel Lebanon, “Decree No. 15 on Lebanese Nationality” (1925).
121 Human Rights Watch, “Lebanon: Discriminatory Nationality Law,” 2018, https://www.hrw.org/news/2018/10/03/lebanon-discriminatory-nationality-law.
numerous spillovers onto adjacent areas outside the official camp boundaries. As discussed above, the densest cadastres have the highest share of refugees. Of the 54 cadastres in Beirut City, 16 alone make up 90.8 per cent of the total refugee population. The largest share is among PRS (93 per cent) and PRL (90 per cent), followed by Syrians (84.5 per cent).
The refugee populations are concentrated in certain areas of the city (Figure 15 and Table 8), particularly in inner-city, densely populated neighbourhoods. The 16 cadastres with the largest presence of refugee populations host 77 per cent of the total refugee population in Beirut City. This is largely reflecting the influx of Syrians and the location of camps. Chiyah has by far the largest number of refugee population, hosting more than one quarter (26 per cent) of refugees in Beirut City. It has the highest number of PRL and second-highest number of PRS after Choueifat El-Aamrousiye. The cadastre with the second-highest share, Bourj El-Brajneh, has less than half the share of refugees (11 per cent of all refugees in Beirut City).
The neighbourhood profile data (by UN-Habitat, UNICEF and the RELIEF Centre) shows a great variance in residents’ nationalities between neighbourhoods (Figure 22). Two neighbourhoods, Daouk-Ghawash (Beirut Municipality) and Nabaa (Bourj Hammoud Municipality), have a majority share of Syrians, with 51 and 60 per cent, respectively. Daouk-Ghawash has by far the smallest share of Lebanese population (18 per cent).
Mixed migrationBeirut City has experienced several waves of internal migration. In the aftermath of the Lebanese Civil War, informal areas hosting migrants grew substantially, with
People of unreported nationality in the neighbourhood (%)
People of other nationalities in the neighbourhood (%)
PRS residing in the neighbourhood (%)
PRL residing in the neighbourhood (%)
Syr residing in the neighbourhood (%)
Lebanese residing in the neighbourhood (%)
30
70
60
100
20
50
90
10
40
80
%
Hamra Maraash NabaaHayy Tamlis
SabraDaouk-Ghawash
Karm El-Zeytoun
Figure 22 Resident share based on nationality for seven neighbourhoods in Beirut City . Sources: UN-Habitat and UNICEF, 2017-2020; UN-Habitat and RELIEF Centre, 2020 .
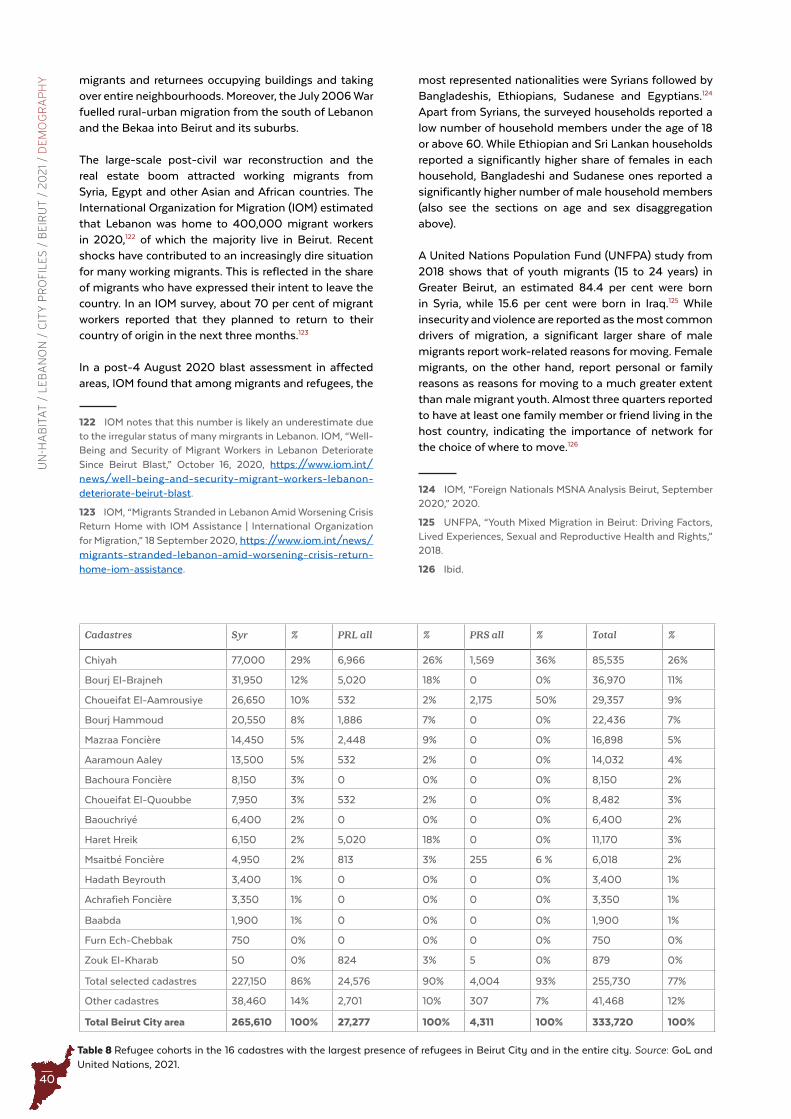
40
UN
-HA
BIT
AT
/ L
EB
AN
ON
/ C
ITY
PR
OFI
LE
S /
BE
IRU
T /
20
21
/ D
EM
OG
RA
PH
Y
Table 8 Refugee cohorts in the 16 cadastres with the largest presence of refugees in Beirut City and in the entire city . Source: GoL and United Nations, 2021 .
Cadastres Syr % PRL all % PRS all % Total %
Chiyah 77,000 29% 6,966 26% 1,569 36% 85,535 26%
Bourj El-Brajneh 31,950 12% 5,020 18% 0 0% 36,970 11%
Choueifat El-Aamrousiye 26,650 10% 532 2% 2,175 50% 29,357 9%
Bourj Hammoud 20,550 8% 1,886 7% 0 0% 22,436 7%
Mazraa Foncière 14,450 5% 2,448 9% 0 0% 16,898 5%
Aaramoun Aaley 13,500 5% 532 2% 0 0% 14,032 4%
Bachoura Foncière 8,150 3% 0 0% 0 0% 8,150 2%
Choueifat El-Quoubbe 7,950 3% 532 2% 0 0% 8,482 3%
Baouchriyé 6,400 2% 0 0% 0 0% 6,400 2%
Haret Hreik 6,150 2% 5,020 18% 0 0% 11,170 3%
Msaitbé Foncière 4,950 2% 813 3% 255 6 % 6,018 2%
Hadath Beyrouth 3,400 1% 0 0% 0 0% 3,400 1%
Achrafieh Foncière 3,350 1% 0 0% 0 0% 3,350 1%
Baabda 1,900 1% 0 0% 0 0% 1,900 1%
Furn Ech-Chebbak 750 0% 0 0% 0 0% 750 0%
Zouk El-Kharab 50 0% 824 3% 5 0% 879 0%
Total selected cadastres 227,150 86% 24,576 90% 4,004 93% 255,730 77%
Other cadastres 38,460 14% 2,701 10% 307 7% 41,468 12%
Total Beirut City area 265,610 100% 27,277 100% 4,311 100% 333,720 100%
migrants and returnees occupying buildings and taking over entire neighbourhoods. Moreover, the July 2006 War fuelled rural-urban migration from the south of Lebanon and the Bekaa into Beirut and its suburbs.
The large-scale post-civil war reconstruction and the real estate boom attracted working migrants from Syria, Egypt and other Asian and African countries. The International Organization for Migration (IOM) estimated that Lebanon was home to 400,000 migrant workers in 2020,122 of which the majority live in Beirut. Recent shocks have contributed to an increasingly dire situation for many working migrants. This is reflected in the share of migrants who have expressed their intent to leave the country. In an IOM survey, about 70 per cent of migrant workers reported that they planned to return to their country of origin in the next three months.123
In a post-4 August 2020 blast assessment in affected areas, IOM found that among migrants and refugees, the
122 IOM notes that this number is likely an underestimate due to the irregular status of many mirgrants in Lebanon. IOM, “Well-Being and Security of Migrant Workers in Lebanon Deteriorate Since Beirut Blast,” October 16, 2020, https://www.iom.int/news/well-being-and-security-migrant-workers-lebanon-deteriorate-beirut-blast.
123 IOM, “Migrants Stranded in Lebanon Amid Worsening Crisis Return Home with IOM Assistance | International Organization for Migration,” 18 September 2020, https://www.iom.int/news/migrants-stranded-lebanon-amid-worsening-crisis-return-home-iom-assistance.
most represented nationalities were Syrians followed by Bangladeshis, Ethiopians, Sudanese and Egyptians.124 Apart from Syrians, the surveyed households reported a low number of household members under the age of 18 or above 60. While Ethiopian and Sri Lankan households reported a significantly higher share of females in each household, Bangladeshi and Sudanese ones reported a significantly higher number of male household members (also see the sections on age and sex disaggregation above).
A United Nations Population Fund (UNFPA) study from 2018 shows that of youth migrants (15 to 24 years) in Greater Beirut, an estimated 84.4 per cent were born in Syria, while 15.6 per cent were born in Iraq.125 While insecurity and violence are reported as the most common drivers of migration, a significant larger share of male migrants report work-related reasons for moving. Female migrants, on the other hand, report personal or family reasons as reasons for moving to a much greater extent than male migrant youth. Almost three quarters reported to have at least one family member or friend living in the host country, indicating the importance of network for the choice of where to move.126
124 IOM, “Foreign Nationals MSNA Analysis Beirut, September 2020,” 2020.
125 UNFPA, “Youth Mixed Migration in Beirut: Driving Factors, Lived Experiences, Sexual and Reproductive Health and Rights,” 2018.
126 Ibid.
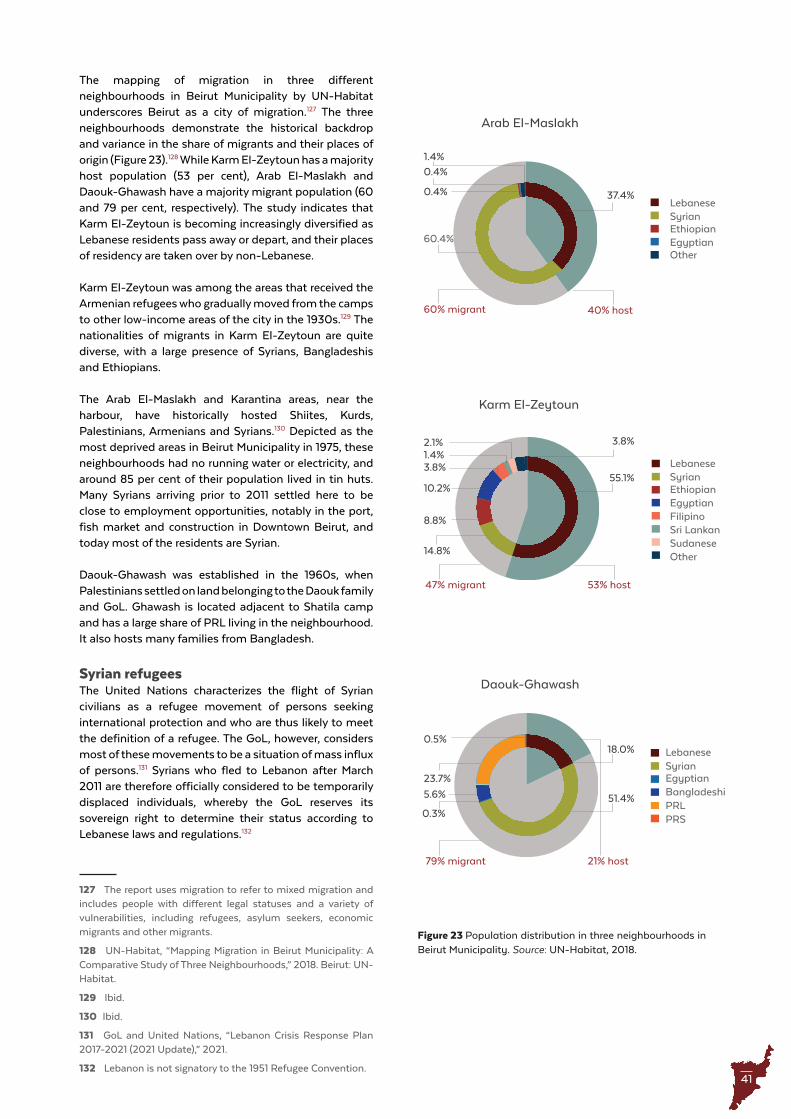
41
The mapping of migration in three different neighbourhoods in Beirut Municipality by UN-Habitat underscores Beirut as a city of migration.127 The three neighbourhoods demonstrate the historical backdrop and variance in the share of migrants and their places of origin (Figure 23).128 While Karm El-Zeytoun has a majority host population (53 per cent), Arab El-Maslakh and Daouk-Ghawash have a majority migrant population (60 and 79 per cent, respectively). The study indicates that Karm El-Zeytoun is becoming increasingly diversified as Lebanese residents pass away or depart, and their places of residency are taken over by non-Lebanese.
Karm El-Zeytoun was among the areas that received the Armenian refugees who gradually moved from the camps to other low-income areas of the city in the 1930s.129 The nationalities of migrants in Karm El-Zeytoun are quite diverse, with a large presence of Syrians, Bangladeshis and Ethiopians.
The Arab El-Maslakh and Karantina areas, near the harbour, have historically hosted Shiites, Kurds, Palestinians, Armenians and Syrians.130 Depicted as the most deprived areas in Beirut Municipality in 1975, these neighbourhoods had no running water or electricity, and around 85 per cent of their population lived in tin huts. Many Syrians arriving prior to 2011 settled here to be close to employment opportunities, notably in the port, fish market and construction in Downtown Beirut, and today most of the residents are Syrian.
Daouk-Ghawash was established in the 1960s, when Palestinians settled on land belonging to the Daouk family and GoL. Ghawash is located adjacent to Shatila camp and has a large share of PRL living in the neighbourhood. It also hosts many families from Bangladesh.
Syrian refugeesThe United Nations characterizes the flight of Syrian civilians as a refugee movement of persons seeking international protection and who are thus likely to meet the definition of a refugee. The GoL, however, considers most of these movements to be a situation of mass influx of persons.131 Syrians who fled to Lebanon after March 2011 are therefore officially considered to be temporarily displaced individuals, whereby the GoL reserves its sovereign right to determine their status according to Lebanese laws and regulations.132
127 The report uses migration to refer to mixed migration and includes people with different legal statuses and a variety of vulnerabilities, including refugees, asylum seekers, economic migrants and other migrants.
128 UN-Habitat, “Mapping Migration in Beirut Municipality: A Comparative Study of Three Neighbourhoods,” 2018. Beirut: UN-Habitat.
129 Ibid.
130 Ibid.
131 GoL and United Nations, “Lebanon Crisis Response Plan 2017-2021 (2021 Update),” 2021.
132 Lebanon is not signatory to the 1951 Refugee Convention.
Figure 23 Population distribution in three neighbourhoods in Beirut Municipality . Source: UN-Habitat, 2018 .
60 .4%
37 .4%
Arab El-Maslakh
Lebanese
Lebanese
Lebanese
Syrian
Syrian
Syrian
Ethiopian
Ethiopian
Egyptian
Egyptian
Egyptian
Bangladeshi
Filipino
PRL
Other
Other
SudaneseSri Lankan
PRS
40% host 60% migrant
0 .4%
0 .4%
1 .4%
18 .0%
51 .4%5 .6%
0 .3%
23 .7%
0 .5%
Daouk-Ghawash
21% host 79% migrant
55 .1%
14 .8%
8 .8%
10 .2%
3 .8%1 .4%
Karm El-Zeytoun
2 .1% 3 .8%
53% host 47% migrant
42
UN
-HA
BIT
AT
/ L
EB
AN
ON
/ C
ITY
PR
OFI
LE
S /
BE
IRU
T /
20
21
/ D
EM
OG
RA
PH
Y At the start of the Syrian refugee crisis, the Lebanese border was open to Syrians without restrictions. At the time, Syrians were automatically granted a free visa. However, a “no-camp policy” was set by the government at the very beginning of the Syrian refugee crisis, commonly attributed to the fear of repeating the experience of the Palestinian refugee camps. In May 2014, the GoL effectively closed its borders to incoming PRS, and in December 2014 to Syrians. Since, it has become increasingly difficult for Syrians to access the territory after the GoL’s April 2019 decision to deport Syrians who have (re)entered Lebanon illegally, and with the closure of Lebanon’s borders in March 2020 to limit the spread of COVID-19.133
As discussed above, the official Syrian population in Lebanon is 1.5 million. Almost 20 per cent of Syrians live in informal tented settlements (camp-like settings comprising temporary makeshift timber and tarpaulin residential structures, in mainly rural areas), whereas the majority of the remaining 80 per cent live in vulnerable urban areas across Lebanon.134
The household surveys from the UN-Habitat-UNICEF and UN-Habitat-RELIEF Centre neighbourhood profiles across Beirut City reveal significant differences in the period of arrival of Syrian refugee households in the different neighbourhoods. The 2011 threshold is used to reflect the start of the Syria crisis. The share of pre-2011 Syrian arrivals ranges from 3 per cent in Daouk-Ghawash to 85 per cent in Hayy Tamlis. Of the remaining neighbourhoods, the pre-2011 arrivals share was 25 per cent or below.
Palestinian refugeesFollowing the establishment of the state of Israel in 1948, an estimated 140,000 Palestinian refugees arrived in Lebanon.135 The GoL granted 30,000 refugees with citizenship (most of whom were Christians), and most of the arriving refugees were settled in 15 Palestinian camps in the main cities, including 6 in Beirut. Despite the GoL’s preferred option of return for Palestinians, close to 475,000 registered Palestinian refugees, of which 180,000 are estimated to currently reside in Lebanon.136 The influx of PRS into Lebanon from 2011 has intensified both Palestinian camp and out-of-camp concentrations.Palestinians are by Lebanese law defined as foreigners, but are rendered without the civil rights usually granted through a reciprocal arrangement between the person’s home country and Lebanon. Palestinians’ status as stateless excludes them from claiming the same rights as other foreigners in Lebanon, and they face legal restrictions on access to their social, political and economic rights. This includes the prohibition to own
133 UNHCR, “Lebanon Fact Sheet September 2020.”
134 UNHCR, UNICEF and WFP, “VASyR 2019: Vulnerability Assessment of Syrian Refugees in Lebanon,” 2019.
135 Australian Government, “DFAT Thematic Report: Palestinians in Jordan and Lebanon.”
136 UNRWA, “Where we Work.”
property as well as to access state-provided services, such as health and education and civil documentation.137
CampsNationally, around 45 per cent of all PRL are estimated to be living in the 12 official refugee camps, which together with the 56 gatherings hold most of the Palestinian refugee population. It should be noted that the Palestinian population census, which was carried out in 2017, estimated that almost half of registered refugees are not permanently residing in Lebanon.138
In Beirut City, a total of 35,704 persons are registered to live in four Palestinian refugee camps, and 12,650 persons live in the nine gatherings (Table 9 and Figure 24). It should be noted that for several of the gatherings the data is from as early as 2013, and it is likely to have changed.
Burj Barajneh Palestine Refugee Camp The League of Red Cross Societies established the Burj Barajneh camp in 1948 to accommodate refugees who fled from the Galilee in northern Palestine.139 The camp is the largest in Beirut City, and is located in Burj Barajneh Municipality in the southern suburbs of Beirut, near Beirut International Airport. The Israeli invasion in 1982 and the Lebanese Civil War led to large-scale damage and destruction in the camp. Originally hosting around 3,500 persons, the current population is 19,539, an almost six-fold increase.140 This was fuelled by the influx of refugees from other Palestinian refugee camps during the civil war and the ongoing Syrian crisis. The significant increase in population density led to additional pressure on already strained housing, services and infrastructure provision, random and non-regulated building work and extremely narrow streets.
Mar Elias Palestine Refugee CampThe Mar Elias camp is located southwest in Beirut Municipality. Mar Elias is the smallest camp in Lebanon. It was founded in 1952 by the Mar Elias Greek Orthodox Convent to accommodate Palestine refugees from the Galilee in northern Palestine. The camp hosts Palestinian refugees as well as a large non-Palestinian population.141
Shatila Palestine Refugee CampThe Shatila camp is located in Ghobeire Municipality in southern Beirut. The camp was established in 1949 by the International Committee of the Red Cross for refugees arriving from villages in northern Palestine. It
137 UNRWA, “Protection in Lebanon.”
138 LPDC, CAS and PCBS, “Population and Housing Census in Palestinian Camps and Gatherings in Lebanon 2017: Key Findings Report.”
139 UNRWA, “Burj Barajneh Camp,” accessed February 14, 2021, https://www.unrwa.org/where-we-work/lebanon/burj-barajneh-camp.
140 Ibid.
141 UNRWA, “Mar Elias Camp,” accessed February 14, 2021, https://www.unrwa.org/where-we-work/lebanon/mar-elias-camp.
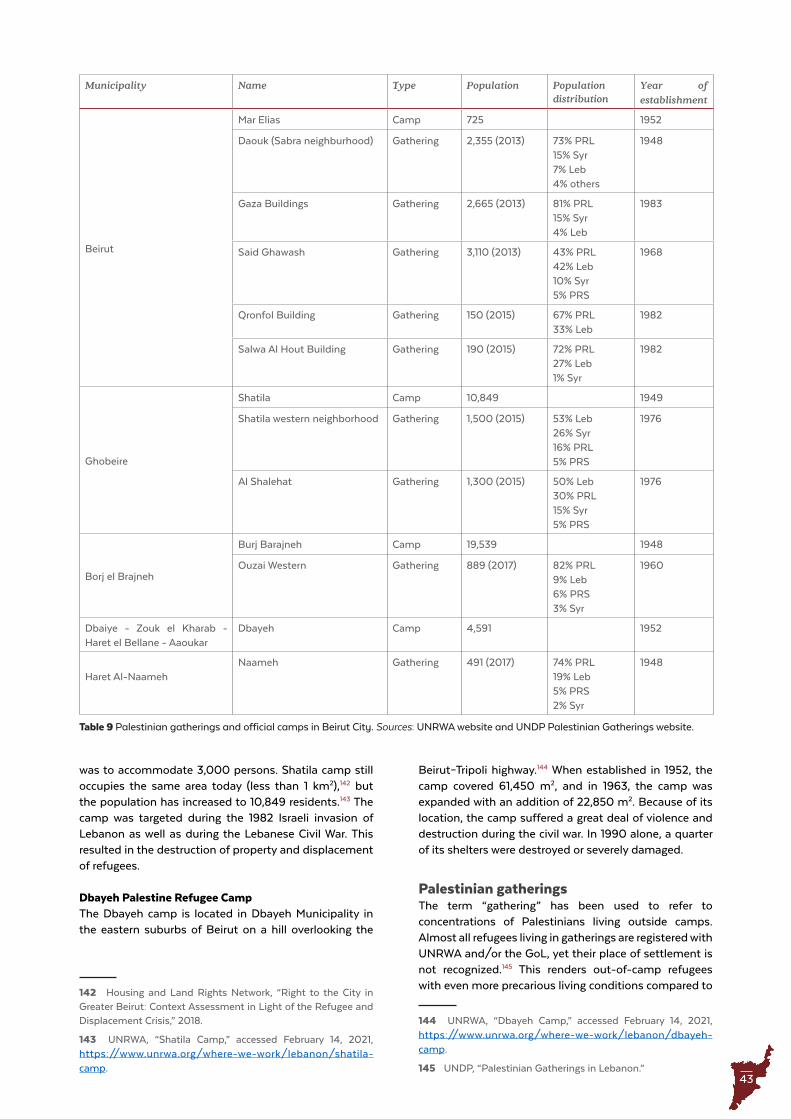
43
Municipality Name Type Population Population distribution
Year of establishment
Beirut
Mar Elias Camp 725 1952
Daouk (Sabra neighburhood) Gathering 2,355 (2013) 73% PRL15% Syr7% Leb4% others
1948
Gaza Buildings Gathering 2,665 (2013) 81% PRL15% Syr4% Leb
1983
Said Ghawash Gathering 3,110 (2013) 43% PRL42% Leb10% Syr5% PRS
1968
Qronfol Building Gathering 150 (2015) 67% PRL33% Leb
1982
Salwa Al Hout Building Gathering 190 (2015) 72% PRL27% Leb1% Syr
1982
Ghobeire
Shatila Camp 10,849 1949
Shatila western neighborhood Gathering 1,500 (2015) 53% Leb26% Syr16% PRL5% PRS
1976
Al Shalehat Gathering 1,300 (2015) 50% Leb30% PRL15% Syr5% PRS
1976
Borj el Brajneh
Burj Barajneh Camp 19,539 1948
Ouzai Western Gathering 889 (2017) 82% PRL9% Leb6% PRS3% Syr
1960
Dbaiye - Zouk el Kharab - Haret el Bellane - Aaoukar
Dbayeh Camp 4,591 1952
Haret Al-NaamehNaameh Gathering 491 (2017) 74% PRL
19% Leb5% PRS2% Syr
1948
Table 9 Palestinian gatherings and official camps in Beirut City . Sources: UNRWA website and UNDP Palestinian Gatherings website .
was to accommodate 3,000 persons. Shatila camp still occupies the same area today (less than 1 km2),142 but the population has increased to 10,849 residents.143 The camp was targeted during the 1982 Israeli invasion of Lebanon as well as during the Lebanese Civil War. This resulted in the destruction of property and displacement of refugees.
Dbayeh Palestine Refugee CampThe Dbayeh camp is located in Dbayeh Municipality in the eastern suburbs of Beirut on a hill overlooking the
142 Housing and Land Rights Network, “Right to the City in Greater Beirut: Context Assessment in Light of the Refugee and Displacement Crisis,” 2018.
143 UNRWA, “Shatila Camp,” accessed February 14, 2021, https://www.unrwa.org/where-we-work/lebanon/shatila-camp.
Beirut–Tripoli highway.144 When established in 1952, the camp covered 61,450 m2, and in 1963, the camp was expanded with an addition of 22,850 m2. Because of its location, the camp suffered a great deal of violence and destruction during the civil war. In 1990 alone, a quarter of its shelters were destroyed or severely damaged.
Palestinian gatheringsThe term “gathering” has been used to refer to concentrations of Palestinians living outside camps. Almost all refugees living in gatherings are registered with UNRWA and/or the GoL, yet their place of settlement is not recognized.145 This renders out-of-camp refugees with even more precarious living conditions compared to
144 UNRWA, “Dbayeh Camp,” accessed February 14, 2021, https://www.unrwa.org/where-we-work/lebanon/dbayeh-camp.
145 UNDP, “Palestinian Gatherings in Lebanon.”
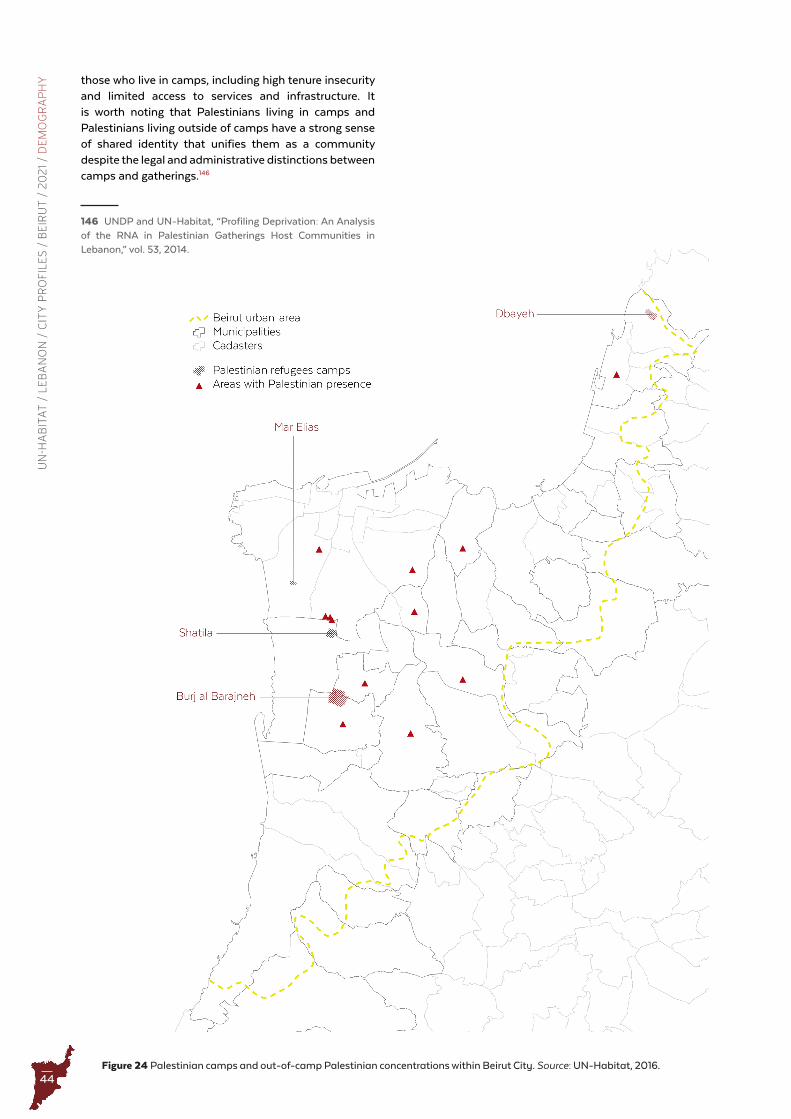
44
UN
-HA
BIT
AT
/ L
EB
AN
ON
/ C
ITY
PR
OFI
LE
S /
BE
IRU
T /
20
21
/ D
EM
OG
RA
PH
Y
Figure 24 Palestinian camps and out-of-camp Palestinian concentrations within Beirut City . Source: UN-Habitat, 2016 .
those who live in camps, including high tenure insecurity and limited access to services and infrastructure. It is worth noting that Palestinians living in camps and Palestinians living outside of camps have a strong sense of shared identity that unifies them as a community despite the legal and administrative distinctions between camps and gatherings.146
146 UNDP and UN-Habitat, “Profiling Deprivation: An Analysis of the RNA in Palestinian Gatherings Host Communities in Lebanon,” vol. 53, 2014.
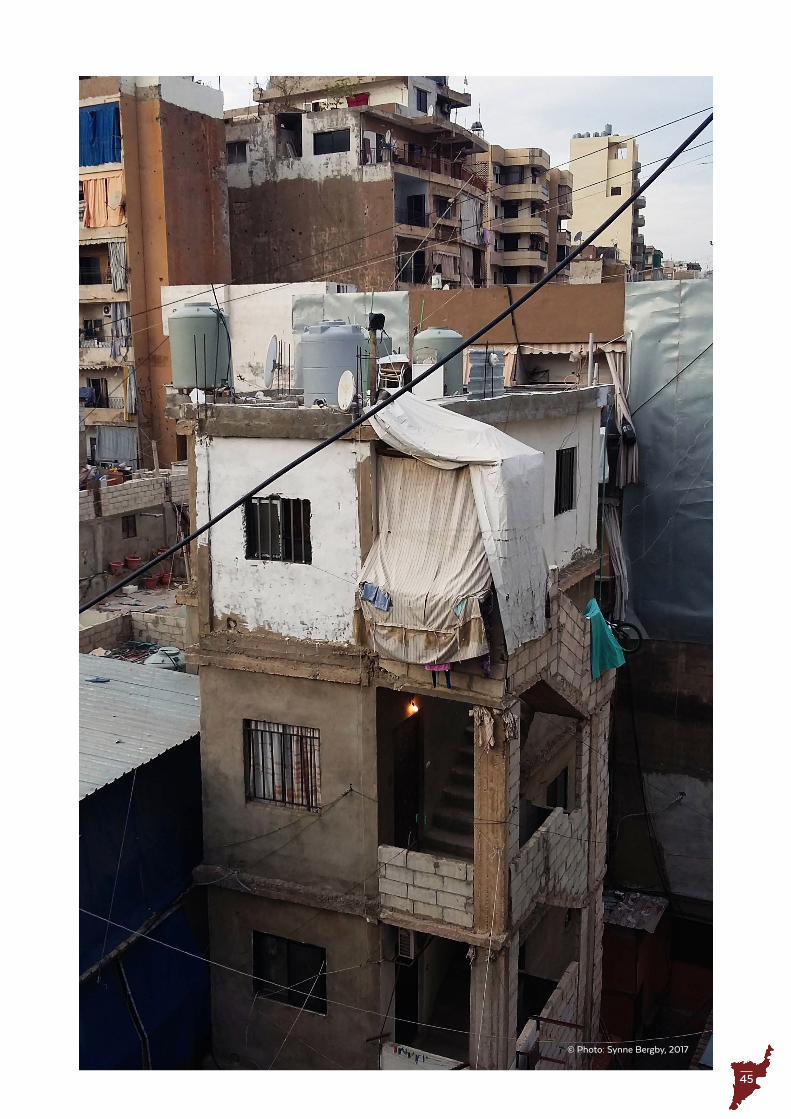
45
© Photo: Synne Bergby, 2017
46
UN
-HA
BIT
AT
/ L
EB
AN
ON
/ C
ITY
PR
OFI
LE
S /
BE
IRU
T /
20
21
/ G
OV
ER
NA
NC
E &
AC
CO
UN
TAB
ILIT
YTHEME 1
Theme 1 Governance and
Accountability

47
Theme 1 Governance and
Accountability
© Photo: Synne Bergby, Urban-A, 2017
48
UN
-HA
BIT
AT
/ L
EB
AN
ON
/ C
ITY
PR
OFI
LE
S /
BE
IRU
T /
20
21
/ G
OV
ER
NA
NC
E &
AC
CO
UN
TAB
ILIT
YTHEME 1
governance and accountability Chapter summaryUnlike other cities in Lebanon and despite previous efforts to establish a governance body for Greater Beirut, there is no single authority in charge of Beirut City. Beyond the UoMs, the 31 municipalities in Beirut City operate within their administratively assigned territory without formal consideration of the larger system which they are a part of. Although a range of issues - such as traffic congestion and ineffective public transportation, housing scarcity, water and electricity outages and inadequate solid waste management - are manifested on a scale that goes beyond the municipality level, municipalities do not collectively and coherently assess or discuss the needs and challenges they face, or the provision of services and infrastructure required. Furthermore, there is an absence of regional planning to integrate urban areas with their hinterlands, including river basins, forests and mountain ranges. This poses a serious constraint to unified city-wide governance and planning that would join central city areas with one another and link them with their growing suburbs and the regions’ ecosystems. By only responding to Lebanon’s territorial and demographic specificities, municipalities cannot adequately tackle cross-cutting urban disparities, the effects of the Syrian crisis, or recent shocks, including the 4 August 2020 blast.
Among the main challenges for urban governance is the lack of accurate, reliable, up-to-date, multisectoral and disaggregated urban data. Available data is often aggregated at the cadastral, municipal or regional levels, while data on a city or urban agglomerate level is lacking. Several additional factors affect the municipalities’ capacities for service and infrastructure delivery. These include lack of political will at national and local levels, low tax collection rates, unpredictable redistribution system for taxes from the central to municipal level (where the grants received do not correspond to the actual size of the population in each municipality) and centralized service provision despite a strong focus on decentralization since the country’s independence. As a result of the blast and subsequent policy measures, the most affected municipalities of Beirut and Bourj Hammoud are required to respond to the vast damage and destruction without integrated analysis of data to inform the response. The municipalities’ capacities to respond are further limited by the considerable reduction in municipal revenues.
A large range of actors have taken part in the blast response efforts. This includes Lebanese central and decentralized governments, the United Nations, (international) non-governmental organizations ([I]NGOs), academic institutions, local and international volunteers, foreign governments and religious groups. Volunteers have shown an impressive capacity to mobilize work on the ground in the immediate aftermath of the blast. However, the multitude of actors represents a challenge when it comes to coordination of assessments, needs identification and implementation of prioritized activities. Moreover, a largely absent central government and limited capacity at the municipal level have made coordination challenging. There has been a concentration of response efforts in certain areas - notably Geitawi, Mar Mikhael, Karantina and Achrafieh - while other affected areas have received less attention. The ripple effects of the blast have impacted areas outside of the physically affected areas to various degrees, augmenting pre-existing vulnerabilities, yet these areas have to a large extent been neglected in assessments and response.
Political representation and the opportunity to partake in decision-making is limited among youth and women in Lebanon. This is due to several structural factors. Particularly for youth, activism has become an alternative to formal participation, and young people have been central to the social movement and recent civil uprising in Beirut and throughout the country.147 At the same time, a high and increased number of young people want to emigrate, with the perceived lack of future possibilities being a key driver.148
147 Mona Harb, “Cities and Political Change: How Young Activists in Beirut Bred an Urban Social Movement,” 2016.
148 ASDA’A BCW, “Arab Youth Survey: A Voice for Change”.
49
National governanceConsolidated by the French Mandate and promoted by the Taif Agreement (1989), the amended 1926 Constitution of a confessional political arrangement for the country is still in effect to this day.149 The arrangement has been updated to the current allocation of parliamentary seats between Christian and Muslims on a 50-50 basis. It further stipulates that the president must be a Maronite Christian, the prime minister a Sunni Muslim and the speaker of the Parliament a Shiite Muslim. The Taif Agreement was intended to lead Lebanon towards a secular government in the future; however, the current situation is one of increased institutionalization of Lebanon’s political sectarianism.150 Moreover, while there has been a focus on decentralization of power since the country’s independence, Lebanon’s governance is still characterized by a heavily centralized system. At the same time, the electoral law passed in 2017151 and the parliamentary elections in May 2018, 10 years after the last election in 2009, represented a step towards strengthening representation at the municipal level.152
Political representatives are elected based on their religious affiliation and are as such de facto representatives of the religious communities that elect them. Lebanon recognizes 18 religious sects, nearly all of which are represented in the political system, albeit not according to their relative shares of the population today.153 The system thus effectively excludes those who are not, or do not wish to be, affiliated with a recognized group. Furthermore, Palestinian and Syrian refugees do not qualify for citizenship and as such do not have political rights. Moreover, citizens may only vote or run for municipal office in the municipality in which they are registered. Place of registration is inherited by the father and determined by birth. Given the high mobility in Lebanon, and particularly in Beirut, the place of voting for residents in Beirut is seldom the place of current residence. There are significant barriers to the transfer of people’s official residence for voting purposes.154 This means that many residents do not vote, and that many cannot use their vote to influence decision-making where they live.
149 In political science terminology, confessionalism is a system of government (political arrangement) that proportionally allocates political power among a country’s communities, whether religious or ethnic, according to their percentage of the population. Taken from USIP, “Lebanon’s Confessionalism: Problems and Prospects” March 30, 2006. https://www.usip.org/publications/2006/03/lebanons-confessionalism-problems-and-prospects
150 Minority Rights Group International, “The Leaves of One Tree: Religious Minorities in Lebanon,” 2014.
151 International Foundation for Electoral Systems, “Lebanon’s 2017 Parliamentary Election Law,” 2017.
152 Nayla Geagea and Andre Sleiman, “Local Governance in Lebanon: A Roadmap for Solid Waste Management, Public Safety, Accountabilit and Citizen Participation,” 2017.
153 Freedom House, “Freedom in the World 2020 - Lebanon.”
154 Ibid.
The civil uprising that started on 17 October 2019 called for a complete overhaul of the political system and an end to sectarianism. The protests were triggered by a proposed increase in value-added tax (VAT) and new mobile messaging service fees, in the wake of unprecedented and unmanaged wildfires that were spreading across the country.155 Although there had been multiple waves of social unrest in the past, this was the first time people mobilized at such scale, cutting across class, sectarian and ethnic divisions. At the same time, it should be noted that a survey found that most refugees reported to be neutral with respect to the protests, and that more than 90 per cent of respondents across nationalities believed that refugees are not welcomed to participate in the protests.156 Moreover, almost 50 per cent of the surveyed refugees believed the protests would affect them negatively. While the demonstrations have spread throughout the country, Beirut - given its political, historical and economic importance - has continued to be the epicentre of the protests. Following the 4 August port explosion, a new surge in protests was observed.157 Consequently, two governments resigned in less than a year – the last resignation on 10 August 2020 in the wake of the port explosion. The political crisis leaves Lebanon in a precarious situation. The state of emergency for Beirut, approved on 13 August 2020, instated the Lebanese Armed Forces (LAF) in charge of the government’s response efforts to the 4 August 2020 blast. The state of emergency grants the LAF power over civilian affairs, including the power to impose curfews and censorship, and to ban assemblies.158 In September 2020, and following the resignation of Prime Minister Hassan Diab, Mustafa Adib, who was nominated by the former Prime Minister Hariri, resigned in less than a month after failing to secure enough support for his non-partisan cabinet.159 At the time of writing, Lebanon has been governed for nine months by a caretaker government headed by Prime Minister Diab. MP Saad Hariri, who had resigned from his post in late-October 2019, has been re-appointed, but no cabined has been formed yet.
155 FP, “In Lebanon, Pan-Sectarian Protests are Raging as Forest Fires Burn,” 21 October 2019, https://foreignpolicy.com/2019/10/21/lebanon-sectarian-protests-forest-fires-self-immolation/.
156 Search for Common Ground and Exigo, “Conflict Analysis and Power Dynamics – Lebanon Study.”
157 Timour Azhari, “Lebanon’s Year of Fire,” Al Jazeera, October 16, 2020, https://www.aljazeera.com/features/2020/10/16/lebanons-year-of-fire; Al Jazeera, “Dozens Injured in Anti-Lockdown Protests in Lebanon’s Tripoli,” 27 January 2021, https://www.aljazeera.com/news/2021/1/27/dozens-injured-in-lockdown-protests-in-lebanons-tripoli.
158 Timour Azhari, “Lebanon Parliament Approves Sweeping Powers for the Army,” Al Jazeera. August 13, 2020, https://www.aljazeera.com/news/2020/8/13/lebanon-parliament-approves-sweeping-powers-for-the-army.
159 DW, “Lebanon: Prime Minister-Designate Mustapha Adib Resigns,” 26 September 2020, https://www.dw.com/en/lebanon-prime-minister-designate-mustapha-adib-resigns/a-55062582.
50
UN
-HA
BIT
AT
/ L
EB
AN
ON
/ C
ITY
PR
OFI
LE
S /
BE
IRU
T /
20
21
/ G
OV
ER
NA
NC
E &
AC
CO
UN
TAB
ILIT
YTHEME 1
Governance structureSince independence, there has been a focus on decentralization of power in Lebanon, with the first post-war municipal elections held in 1998.160 Over this period, a high number of municipalities have been established. With its 1,108 municipalities covering 10,452 km2 and an estimated population of 5.6 million,161 Lebanon has a very high ratio of municipalities to land and population by international standards.162 As defined in this report, Beirut City covers 111.22 m2, encompassing 31 municipalities and three UoMs. By comparison, this is one seventh the size of Greater Amman Municipality, which has progressively expanded to encompass the expansions of the city.163
The decentralization process has led to the transfer of a range of responsibilities to local-level governments. However, Lebanon’s governance is still characterized by a heavily centralized state. Most service provision is indeed centralized (notably for agriculture, industry, tourism, education, housing, environment, health, water and transport), where ministries responsible for these areas do not have local representatives, and some also not at the regional level. This means that many local and regional governments do not have decision-making power in key service provision areas.164 In fact, it can be argued that the “deconcentration” of government in Lebanon, where the central government is placing representatives at the local level, has increased the central government’s influence.165 Despite service provision being highly centralized, larger and medium-sized municipalities, notably in Beirut, provide a range of services, including education and health, and work actively to incentivize the local economy, principally by encouraging tourism and attracting foreign direct investment (FDI). Smaller municipalities mainly provide small-scale services (such as street cleaning and lighting), set up road signs and asphalting, rehabilitate or develop sewage and drainage systems and manage solid waste.166
Appendix 1 gives an overview of government actors and responsibilities on central, city and municipal levels. This highlights the concentration of responsibilities at the central level, and the vacuum of legal entities to govern on a city scale. As further elaborated on in this chapter, governorates and districts form an integral part of the MoIM but are not legal units. Thus, city-level governance in Beirut falls between the central government and municipal level. It is worth noting that there was an attempt during the 1990s to create a council of “Greater
160 Democracy Reporting International, “Reforming Decentralization in Lebanon: The State of Play,” April 2017.
161 Based on the 2020 cadastral-level population estimated by UNHRC.
162 Democracy Reporting International, “Reforming Decentralization in Lebanon.
163 World Bank, “Amman, Jordan: Comprehensive Climate Plans”, 2020.
164 LCPS, “Local Governments and Public Goods: Assessing Decentralization in the Arab World,” Vol. 1, 2015.
165 Ibid.
166 Ibid.
Beirut,” a suggestion supported by the Prime Minister Rafic Hariri. However, due to political disagreements, this never came to fruition. The solid waste collection plan, initially operated by SUKLEEN and now split between RAMCO and City Blue, further discussed in the Basic and Social Services chapter, was the only project that has been implemented across the whole Beirut and Mount Lebanon area, with the exception of a few municipalities. Beirut City, represented by 31 municipalities across two governorates, is thus to a large extent governed by the central government, as well as separate UoMs and municipalities.
In practical terms, the governance structure renders local governments with limited fiscal autonomy or decision-making power to deliver on their obligations. Coupled with minimal state policies to govern a substantial number of urban actors, including large and powerful private sector actors, service and infrastructure provision has therefore to a large extent been taken over by non-governmental actors.
The largest administrative unit under the central government is the governorate or mohafazah.167 Each of the eight governorates in Lebanon is led by a governor. The governor is appointed by a decree of the Council of Ministers to serve a six-year term. The COVID-19 pandemic has required effective coordination from the national to the local level to prevent spread and to respond to the increasing caseload of persons contracting the virus. The Ministry of Public Health (MoPH), MoIM, the Ministry of Education and Higher Education (MEHE), the Ministry of Social Affairs (MoSA), the World Health Organization (WHO) and other main United Nations agencies are leading this response. MoIM has called upon governors to undertake the full supervision of the implementation of decisions and the follow-up with authorities in charge of implementation.168
Governorates are divided into districts or aqdiya. Several administrative processes are dealt with at the district level. For example, the Directorate General of Urban Planning has district level representation for all building permits and zoning. The same with the MoPH, which has “district doctors” who deal and approve all matters related to the ministry. CAS conducts surveys and develops statistics on a district level. However, neither governorates nor districts are independent from the central administration. Rather than being legal entities, governorates and districts represent an integral part of MoIM.
UoMs can be formed by municipalities within their respective districts of the same governorates. There are no requirements for the number of members, geographical area, or population size of a UoM.169 The
167 Mourad and Al-Siddiq, “Citizen and Municipality Handbook: Simplified Legal Rules Governing Municipal Work in Lebanon.”
168 MoIM, “Circular COVID-19, 19 March 2020,” 2020, p. 7.
169 UN-Habitat, “National Urban Policies Programme in Lebanon: Diagnosis Report,” 2018.
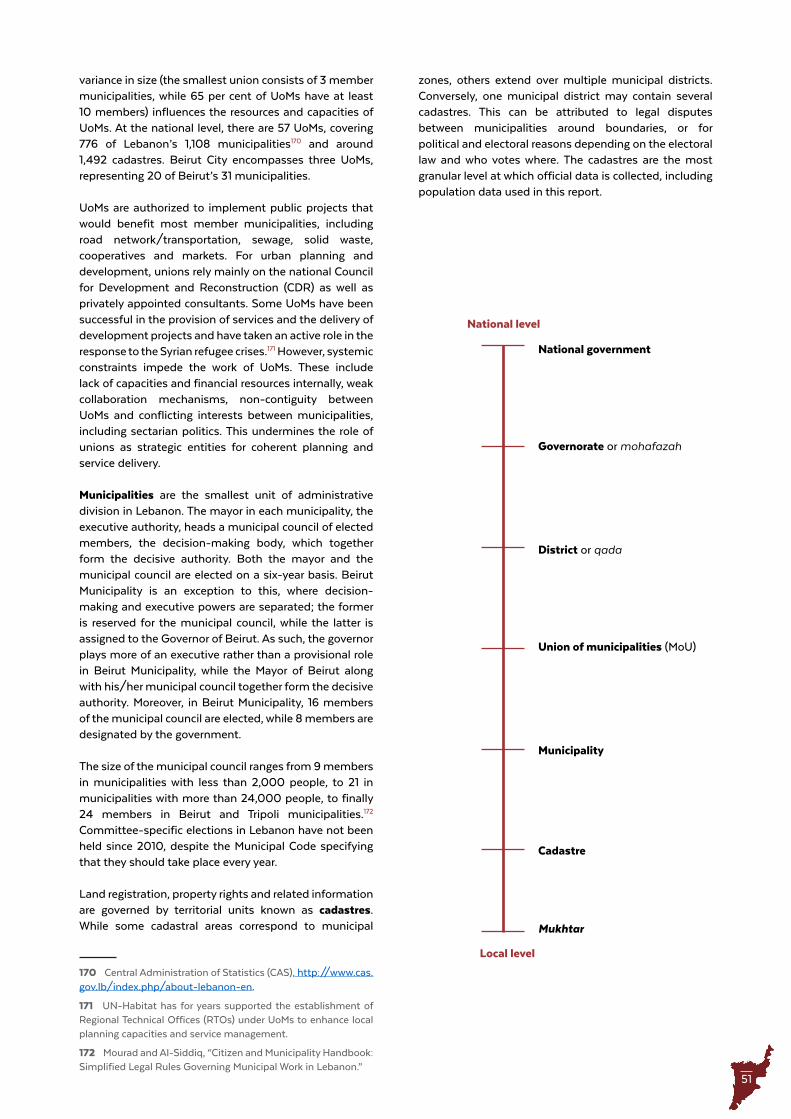
51
variance in size (the smallest union consists of 3 member municipalities, while 65 per cent of UoMs have at least 10 members) influences the resources and capacities of UoMs. At the national level, there are 57 UoMs, covering 776 of Lebanon’s 1,108 municipalities170 and around 1,492 cadastres. Beirut City encompasses three UoMs, representing 20 of Beirut’s 31 municipalities.
UoMs are authorized to implement public projects that would benefit most member municipalities, including road network/transportation, sewage, solid waste, cooperatives and markets. For urban planning and development, unions rely mainly on the national Council for Development and Reconstruction (CDR) as well as privately appointed consultants. Some UoMs have been successful in the provision of services and the delivery of development projects and have taken an active role in the response to the Syrian refugee crises.171 However, systemic constraints impede the work of UoMs. These include lack of capacities and financial resources internally, weak collaboration mechanisms, non-contiguity between UoMs and conflicting interests between municipalities, including sectarian politics. This undermines the role of unions as strategic entities for coherent planning and service delivery.
Municipalities are the smallest unit of administrative division in Lebanon. The mayor in each municipality, the executive authority, heads a municipal council of elected members, the decision-making body, which together form the decisive authority. Both the mayor and the municipal council are elected on a six-year basis. Beirut Municipality is an exception to this, where decision-making and executive powers are separated; the former is reserved for the municipal council, while the latter is assigned to the Governor of Beirut. As such, the governor plays more of an executive rather than a provisional role in Beirut Municipality, while the Mayor of Beirut along with his/her municipal council together form the decisive authority. Moreover, in Beirut Municipality, 16 members of the municipal council are elected, while 8 members are designated by the government.
The size of the municipal council ranges from 9 members in municipalities with less than 2,000 people, to 21 in municipalities with more than 24,000 people, to finally 24 members in Beirut and Tripoli municipalities.172 Committee-specific elections in Lebanon have not been held since 2010, despite the Municipal Code specifying that they should take place every year.
Land registration, property rights and related information are governed by territorial units known as cadastres. While some cadastral areas correspond to municipal
170 Central Administration of Statistics (CAS), http://www.cas.gov.lb/index.php/about-lebanon-en.
171 UN-Habitat has for years supported the establishment of Regional Technical Offices (RTOs) under UoMs to enhance local planning capacities and service management.
172 Mourad and Al-Siddiq, “Citizen and Municipality Handbook: Simplified Legal Rules Governing Municipal Work in Lebanon.”
zones, others extend over multiple municipal districts. Conversely, one municipal district may contain several cadastres. This can be attributed to legal disputes between municipalities around boundaries, or for political and electoral reasons depending on the electoral law and who votes where. The cadastres are the most granular level at which official data is collected, including population data used in this report.
National government
National level
District or qada
Governorate or mohafazah
Union of municipalities (MoU)
Municipality
Cadastre
Mukhtar
Local level
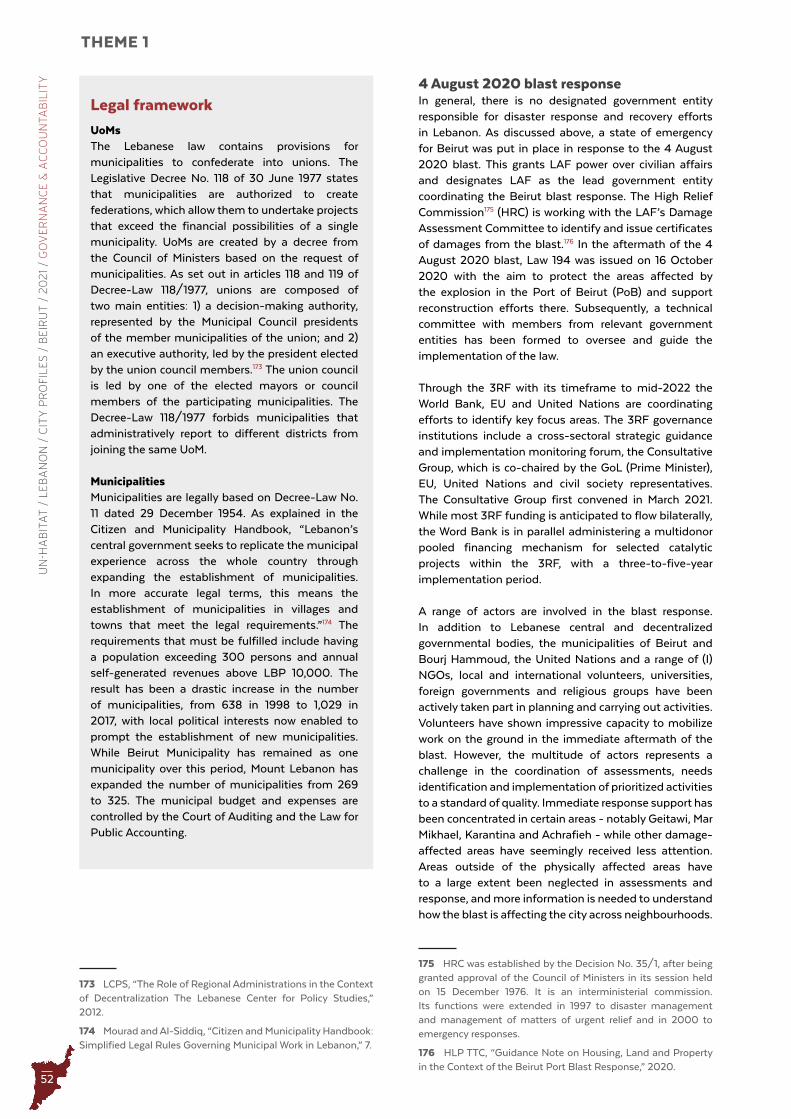
52
UN
-HA
BIT
AT
/ L
EB
AN
ON
/ C
ITY
PR
OFI
LE
S /
BE
IRU
T /
20
21
/ G
OV
ER
NA
NC
E &
AC
CO
UN
TAB
ILIT
YTHEME 1
Legal framework
UoMs The Lebanese law contains provisions for municipalities to confederate into unions. The Legislative Decree No. 118 of 30 June 1977 states that municipalities are authorized to create federations, which allow them to undertake projects that exceed the financial possibilities of a single municipality. UoMs are created by a decree from the Council of Ministers based on the request of municipalities. As set out in articles 118 and 119 of Decree-Law 118/1977, unions are composed of two main entities: 1) a decision-making authority, represented by the Municipal Council presidents of the member municipalities of the union; and 2) an executive authority, led by the president elected by the union council members.173 The union council is led by one of the elected mayors or council members of the participating municipalities. The Decree-Law 118/1977 forbids municipalities that administratively report to different districts from joining the same UoM.
MunicipalitiesMunicipalities are legally based on Decree-Law No. 11 dated 29 December 1954. As explained in the Citizen and Municipality Handbook, “Lebanon’s central government seeks to replicate the municipal experience across the whole country through expanding the establishment of municipalities. In more accurate legal terms, this means the establishment of municipalities in villages and towns that meet the legal requirements.”174 The requirements that must be fulfilled include having a population exceeding 300 persons and annual self-generated revenues above LBP 10,000. The result has been a drastic increase in the number of municipalities, from 638 in 1998 to 1,029 in 2017, with local political interests now enabled to prompt the establishment of new municipalities. While Beirut Municipality has remained as one municipality over this period, Mount Lebanon has expanded the number of municipalities from 269 to 325. The municipal budget and expenses are controlled by the Court of Auditing and the Law for Public Accounting.
173 LCPS, “The Role of Regional Administrations in the Context of Decentralization The Lebanese Center for Policy Studies,” 2012.
174 Mourad and Al-Siddiq, “Citizen and Municipality Handbook: Simplified Legal Rules Governing Municipal Work in Lebanon,” 7.
4 August 2020 blast responseIn general, there is no designated government entity responsible for disaster response and recovery efforts in Lebanon. As discussed above, a state of emergency for Beirut was put in place in response to the 4 August 2020 blast. This grants LAF power over civilian affairs and designates LAF as the lead government entity coordinating the Beirut blast response. The High Relief Commission175 (HRC) is working with the LAF’s Damage Assessment Committee to identify and issue certificates of damages from the blast.176 In the aftermath of the 4 August 2020 blast, Law 194 was issued on 16 October 2020 with the aim to protect the areas affected by the explosion in the Port of Beirut (PoB) and support reconstruction efforts there. Subsequently, a technical committee with members from relevant government entities has been formed to oversee and guide the implementation of the law.
Through the 3RF with its timeframe to mid-2022 the World Bank, EU and United Nations are coordinating efforts to identify key focus areas. The 3RF governance institutions include a cross-sectoral strategic guidance and implementation monitoring forum, the Consultative Group, which is co-chaired by the GoL (Prime Minister), EU, United Nations and civil society representatives. The Consultative Group first convened in March 2021. While most 3RF funding is anticipated to flow bilaterally, the Word Bank is in parallel administering a multidonor pooled financing mechanism for selected catalytic projects within the 3RF, with a three-to-five-year implementation period.
A range of actors are involved in the blast response. In addition to Lebanese central and decentralized governmental bodies, the municipalities of Beirut and Bourj Hammoud, the United Nations and a range of (I)NGOs, local and international volunteers, universities, foreign governments and religious groups have been actively taken part in planning and carrying out activities. Volunteers have shown impressive capacity to mobilize work on the ground in the immediate aftermath of the blast. However, the multitude of actors represents a challenge in the coordination of assessments, needs identification and implementation of prioritized activities to a standard of quality. Immediate response support has been concentrated in certain areas - notably Geitawi, Mar Mikhael, Karantina and Achrafieh - while other damage-affected areas have seemingly received less attention. Areas outside of the physically affected areas have to a large extent been neglected in assessments and response, and more information is needed to understand how the blast is affecting the city across neighbourhoods.
175 HRC was established by the Decision No. 35/1, after being granted approval of the Council of Ministers in its session held on 15 December 1976. It is an interministerial commission. Its functions were extended in 1997 to disaster management and management of matters of urgent relief and in 2000 to emergency responses.
176 HLP TTC, “Guidance Note on Housing, Land and Property in the Context of the Beirut Port Blast Response,” 2020.
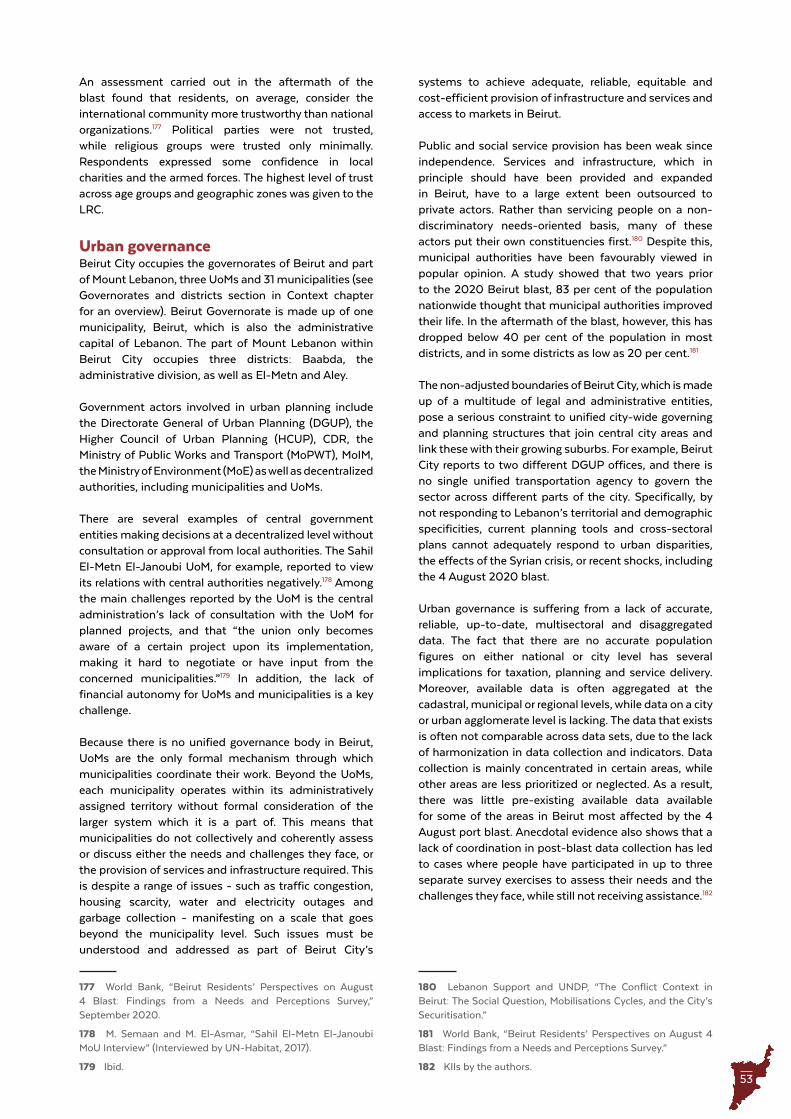
53
An assessment carried out in the aftermath of the blast found that residents, on average, consider the international community more trustworthy than national organizations.177 Political parties were not trusted, while religious groups were trusted only minimally. Respondents expressed some confidence in local charities and the armed forces. The highest level of trust across age groups and geographic zones was given to the LRC.
Urban governanceBeirut City occupies the governorates of Beirut and part of Mount Lebanon, three UoMs and 31 municipalities (see Governorates and districts section in Context chapter for an overview). Beirut Governorate is made up of one municipality, Beirut, which is also the administrative capital of Lebanon. The part of Mount Lebanon within Beirut City occupies three districts: Baabda, the administrative division, as well as El-Metn and Aley.
Government actors involved in urban planning include the Directorate General of Urban Planning (DGUP), the Higher Council of Urban Planning (HCUP), CDR, the Ministry of Public Works and Transport (MoPWT), MoIM, the Ministry of Environment (MoE) as well as decentralized authorities, including municipalities and UoMs.
There are several examples of central government entities making decisions at a decentralized level without consultation or approval from local authorities. The Sahil El-Metn El-Janoubi UoM, for example, reported to view its relations with central authorities negatively.178 Among the main challenges reported by the UoM is the central administration’s lack of consultation with the UoM for planned projects, and that “the union only becomes aware of a certain project upon its implementation, making it hard to negotiate or have input from the concerned municipalities.”179 In addition, the lack of financial autonomy for UoMs and municipalities is a key challenge.
Because there is no unified governance body in Beirut, UoMs are the only formal mechanism through which municipalities coordinate their work. Beyond the UoMs, each municipality operates within its administratively assigned territory without formal consideration of the larger system which it is a part of. This means that municipalities do not collectively and coherently assess or discuss either the needs and challenges they face, or the provision of services and infrastructure required. This is despite a range of issues - such as traffic congestion, housing scarcity, water and electricity outages and garbage collection - manifesting on a scale that goes beyond the municipality level. Such issues must be understood and addressed as part of Beirut City’s
177 World Bank, “Beirut Residents’ Perspectives on August 4 Blast: Findings from a Needs and Perceptions Survey,” September 2020.
178 M. Semaan and M. El-Asmar, “Sahil El-Metn El-Janoubi MoU Interview” (Interviewed by UN-Habitat, 2017).
179 Ibid.
systems to achieve adequate, reliable, equitable and cost-efficient provision of infrastructure and services and access to markets in Beirut.
Public and social service provision has been weak since independence. Services and infrastructure, which in principle should have been provided and expanded in Beirut, have to a large extent been outsourced to private actors. Rather than servicing people on a non-discriminatory needs-oriented basis, many of these actors put their own constituencies first.180 Despite this, municipal authorities have been favourably viewed in popular opinion. A study showed that two years prior to the 2020 Beirut blast, 83 per cent of the population nationwide thought that municipal authorities improved their life. In the aftermath of the blast, however, this has dropped below 40 per cent of the population in most districts, and in some districts as low as 20 per cent.181
The non-adjusted boundaries of Beirut City, which is made up of a multitude of legal and administrative entities, pose a serious constraint to unified city-wide governing and planning structures that join central city areas and link these with their growing suburbs. For example, Beirut City reports to two different DGUP offices, and there is no single unified transportation agency to govern the sector across different parts of the city. Specifically, by not responding to Lebanon’s territorial and demographic specificities, current planning tools and cross-sectoral plans cannot adequately respond to urban disparities, the effects of the Syrian crisis, or recent shocks, including the 4 August 2020 blast.
Urban governance is suffering from a lack of accurate, reliable, up-to-date, multisectoral and disaggregated data. The fact that there are no accurate population figures on either national or city level has several implications for taxation, planning and service delivery. Moreover, available data is often aggregated at the cadastral, municipal or regional levels, while data on a city or urban agglomerate level is lacking. The data that exists is often not comparable across data sets, due to the lack of harmonization in data collection and indicators. Data collection is mainly concentrated in certain areas, while other areas are less prioritized or neglected. As a result, there was little pre-existing available data available for some of the areas in Beirut most affected by the 4 August port blast. Anecdotal evidence also shows that a lack of coordination in post-blast data collection has led to cases where people have participated in up to three separate survey exercises to assess their needs and the challenges they face, while still not receiving assistance.182
180 Lebanon Support and UNDP, “The Conflict Context in Beirut: The Social Question, Mobilisations Cycles, and the City’s Securitisation.”
181 World Bank, “Beirut Residents’ Perspectives on August 4 Blast: Findings from a Needs and Perceptions Survey.”
182 KIIs by the authors.
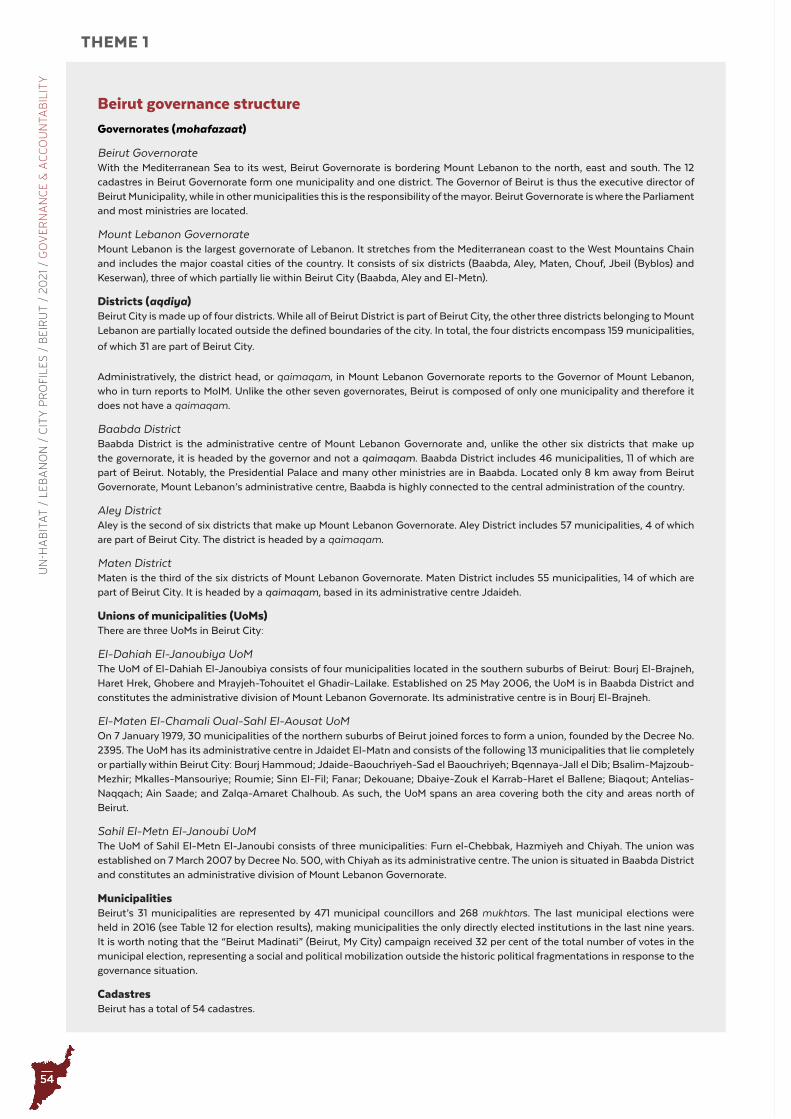
54
UN
-HA
BIT
AT
/ L
EB
AN
ON
/ C
ITY
PR
OFI
LE
S /
BE
IRU
T /
20
21
/ G
OV
ER
NA
NC
E &
AC
CO
UN
TAB
ILIT
YTHEME 1
Beirut governance structure
Governorates (mohafazaat)
Beirut Governorate With the Mediterranean Sea to its west, Beirut Governorate is bordering Mount Lebanon to the north, east and south. The 12 cadastres in Beirut Governorate form one municipality and one district. The Governor of Beirut is thus the executive director of Beirut Municipality, while in other municipalities this is the responsibility of the mayor. Beirut Governorate is where the Parliament and most ministries are located.
Mount Lebanon Governorate Mount Lebanon is the largest governorate of Lebanon. It stretches from the Mediterranean coast to the West Mountains Chain and includes the major coastal cities of the country. It consists of six districts (Baabda, Aley, Maten, Chouf, Jbeil (Byblos) and Keserwan), three of which partially lie within Beirut City (Baabda, Aley and El-Metn).
Districts (aqdiya)Beirut City is made up of four districts. While all of Beirut District is part of Beirut City, the other three districts belonging to Mount Lebanon are partially located outside the defined boundaries of the city. In total, the four districts encompass 159 municipalities,
of which 31 are part of Beirut City.
Administratively, the district head, or qaimaqam, in Mount Lebanon Governorate reports to the Governor of Mount Lebanon, who in turn reports to MoIM. Unlike the other seven governorates, Beirut is composed of only one municipality and therefore it does not have a qaimaqam.
Baabda District Baabda District is the administrative centre of Mount Lebanon Governorate and, unlike the other six districts that make up the governorate, it is headed by the governor and not a qaimaqam. Baabda District includes 46 municipalities, 11 of which are part of Beirut. Notably, the Presidential Palace and many other ministries are in Baabda. Located only 8 km away from Beirut Governorate, Mount Lebanon’s administrative centre, Baabda is highly connected to the central administration of the country.
Aley DistrictAley is the second of six districts that make up Mount Lebanon Governorate. Aley District includes 57 municipalities, 4 of which are part of Beirut City. The district is headed by a qaimaqam.
Maten DistrictMaten is the third of the six districts of Mount Lebanon Governorate. Maten District includes 55 municipalities, 14 of which are part of Beirut City. It is headed by a qaimaqam, based in its administrative centre Jdaideh.
Unions of municipalities (UoMs)There are three UoMs in Beirut City:
El-Dahiah El-Janoubiya UoMThe UoM of El-Dahiah El-Janoubiya consists of four municipalities located in the southern suburbs of Beirut: Bourj El-Brajneh, Haret Hrek, Ghobere and Mrayjeh-Tohouitet el Ghadir-Lailake. Established on 25 May 2006, the UoM is in Baabda District and constitutes the administrative division of Mount Lebanon Governorate. Its administrative centre is in Bourj El-Brajneh.
El-Maten El-Chamali Oual-Sahl El-Aousat UoMOn 7 January 1979, 30 municipalities of the northern suburbs of Beirut joined forces to form a union, founded by the Decree No. 2395. The UoM has its administrative centre in Jdaidet El-Matn and consists of the following 13 municipalities that lie completely or partially within Beirut City: Bourj Hammoud; Jdaide-Baouchriyeh-Sad el Baouchriyeh; Bqennaya-Jall el Dib; Bsalim-Majzoub-Mezhir; Mkalles-Mansouriye; Roumie; Sinn El-Fil; Fanar; Dekouane; Dbaiye-Zouk el Karrab-Haret el Ballene; Biaqout; Antelias-Naqqach; Ain Saade; and Zalqa-Amaret Chalhoub. As such, the UoM spans an area covering both the city and areas north of Beirut.
Sahil El-Metn El-Janoubi UoMThe UoM of Sahil El-Metn El-Janoubi consists of three municipalities: Furn el-Chebbak, Hazmiyeh and Chiyah. The union was established on 7 March 2007 by Decree No. 500, with Chiyah as its administrative centre. The union is situated in Baabda District and constitutes an administrative division of Mount Lebanon Governorate.
MunicipalitiesBeirut’s 31 municipalities are represented by 471 municipal councillors and 268 mukhtars. The last municipal elections were held in 2016 (see Table 12 for election results), making municipalities the only directly elected institutions in the last nine years. It is worth noting that the “Beirut Madinati” (Beirut, My City) campaign received 32 per cent of the total number of votes in the municipal election, representing a social and political mobilization outside the historic political fragmentations in response to the governance situation.
CadastresBeirut has a total of 54 cadastres.
Source: Esri, DigitalGlobe, GeoEye, Earthstar Geographics, CNES/Airbus DS, USDA, USGS, AEX, Getmapping,Aerogrid, IGN, IGP, swisstopo, and the GIS User Community
MoI
1
4
5
2
6
15
31
11
3
8
22
17
24
7
25
9
30
20
29
12
23
13
28
18
14
26
10
16
21
19
27
Ministry of Industry
Beirut Municipality
General Security
The Grand Serail
The Parliament
Central Bank
MoIM
Establishment of The Water of Beirut and ML
UoM El Matn El Chemelai El Sahele El Aousat
UoM Sahel El Matn El Janoubi
MoPH
The Presidential Palace
UoMEl Dahia El Janoubiya
Choueifat municipality
Ministry of Education
Municipality of Hadat
Baabda Municipality
Internal Security
Palais de Justice
Ministry of Labor
Old Serail - GoML
UNESCO
MoTeleESCWA
MoEW
MoSA
MoPW
MoSY
MoFA
MoD
CDR
MoF
MoC
MoT
54
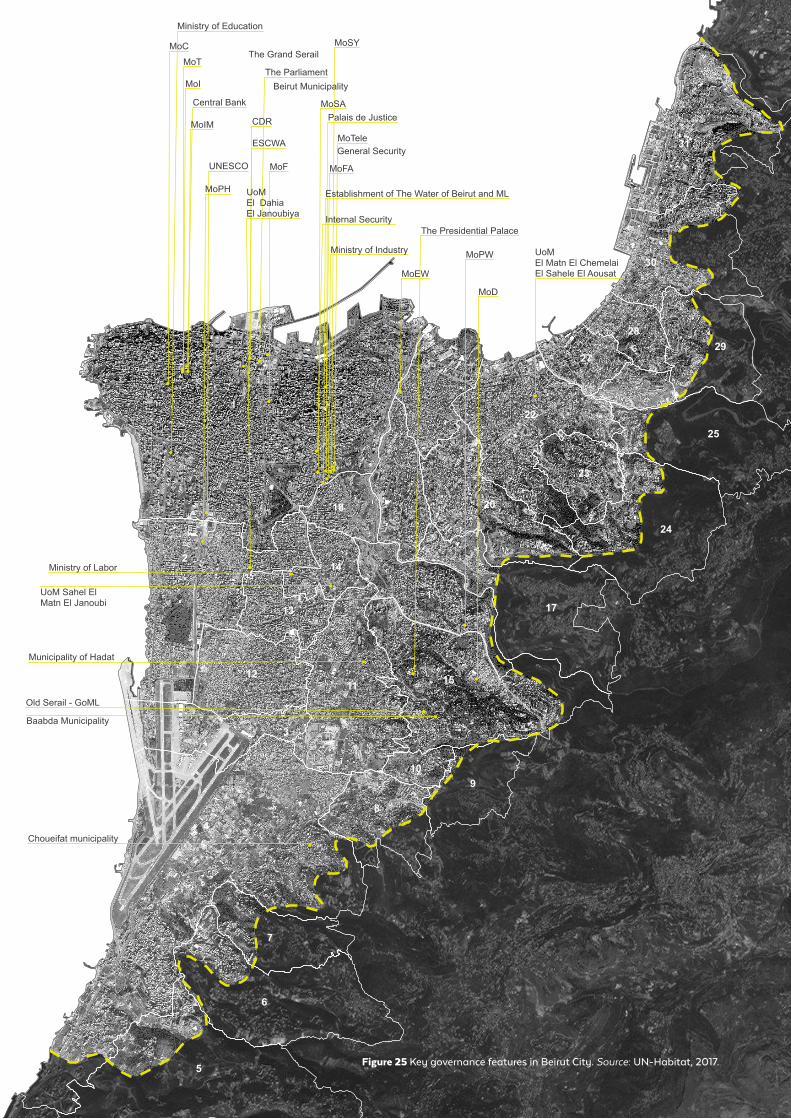
55Source: Esri, DigitalGlobe, GeoEye, Earthstar Geographics, CNES/Airbus DS, USDA, USGS, AEX, Getmapping,Aerogrid, IGN, IGP, swisstopo, and the GIS User Community
MoI
1
4
5
2
6
15
31
11
3
8
22
17
24
7
25
9
30
20
29
12
23
13
28
18
14
26
10
16
21
19
27
Ministry of Industry
Beirut Municipality
General Security
The Grand Serail
The Parliament
Central Bank
MoIM
Establishment of The Water of Beirut and ML
UoM El Matn El Chemelai El Sahele El Aousat
UoM Sahel El Matn El Janoubi
MoPH
The Presidential Palace
UoMEl Dahia El Janoubiya
Choueifat municipality
Ministry of Education
Municipality of Hadat
Baabda Municipality
Internal Security
Palais de Justice
Ministry of Labor
Old Serail - GoML
UNESCO
MoTeleESCWA
MoEW
MoSA
MoPW
MoSY
MoFA
MoD
CDR
MoF
MoC
MoT
Figure 25 Key governance features in Beirut City . Source: UN-Habitat, 2017 .
56
UN
-HA
BIT
AT
/ L
EB
AN
ON
/ C
ITY
PR
OFI
LE
S /
BE
IRU
T /
20
21
/ G
OV
ER
NA
NC
E &
AC
CO
UN
TAB
ILIT
YTHEME 1
Governance of Palestinian camps and gatheringsWith the arrival of a large number of Palestinian refugees from 1948 onwards, several refugee camps were established to accommodate the new arrivals. Due to limited space in the camps, gatherings also emerged, often as expansions of camp areas. Some were also established by refugees of Bedouin origin whose lifestyle of breeding animals could not be accommodated in the densely populated camps.183 The camps have been characterized by major population shifts over the last decades, and continue to be disadvantaged by poor living conditions, and housing and infrastructure that are still suffering from damages from the civil war (1975–1990). Due to the legal status of most Palestinians, camps and gatherings host a large share of Palestinian refugees also today (see History section in the Context chapter and the Refugees section in the Demography chapter for more).
The Palestinian Liberation Organization (PLO), after having been driven out of Jordan, established its new base in Beirut, with a stronghold in the camps in 1969. In the 1970s, PLO established local committees to organize influential families in the camps and ensure they would not pose a challenge to the governance militias.184 Over time, these local committees have developed to become autonomous bodies, where neighbours and relatives collaborate on services in their respective neighbourhoods, such as water and electricity. While the local committees, according to PLO policies, are democratically elected, this is not the case in practical terms, and the committees do not allow for democratically elected committees with women, men and young people being represented.185
The committees are part of the camp governance system that falls outside of the formal governance system in Lebanon, and comprises mainly popular committees, local committees, political factions or militias, as well as local and international organizations. Gatherings are also excluded from municipal service provision and planning. The militias that govern the camps are organized hierarchically, largely based on seniority. Access to the camps is controlled - and many times restricted - by Lebanese security forces. Clientelism is present, with most political parties having a representative who is coordinating efforts on behalf of their respective constituencies. The camps have been part of larger political agendas and have served as a place for recruitment to different political and religious causes. This was particularly the case between 2012 and 2017, where Syrians who were supporting a potential expansion of the conflict in Syria to Lebanon were arriving to the camps.
Local and international organizations provide key services to the camps, with UNRWA being the main provider of services and infrastructure. Most residents are living in overcrowded housing units with limited or poor basic and social service delivery. Inadequate access to and poor-quality services in the camps have been a source of contestation and protests among residents. The existence of damaged and dangerous electricity networks is one major issue. Électricité du Liban (EDL) owns the electricity network and is, according to UNRWA, responsible for maintenance and rehabilitation of electricity infrastructure.186 The bad state of the electricity infrastructure is illustrated by the number of fatal accidents attributed to damaged wires; from 2010 to 2012 alone, more than 20 people in Bourj El-Barajneh camp were reportedly killed by electrocution.187 In August 2015, at the time of the waste crisis in Beirut and the “You Stink” campaign188 (see Solid Waste Management section in the Basic and Social Services chapter for more), demonstrations also took place in Burj El-Barajneh. The direct trigger of the demonstrations was the death of a young Palestinian who came into contact with a damaged electrical wire.189 Then in 2016, a new wave of protests started when a young Palestinian lit himself on fire in response to UNRWA’s health reform requiring camp residents to pay between 5 and 20 per cent of their hospital bills themselves. Also, drinking water is of poor quality and unpredictable supply.190 The lack of access to and information on conditions in the camps, lack of trust between organizations and residents, and competition between established service providers and projects make service provision by external actors challenging.191 The failure of a water project implemented in Shatila camp, for example, illustrates how a lack of trust and politics within the camps is making cooperation and project implementation very difficult.192
183 Nora Stel, “ Eviction and Migration in an Institutional Vacuum: The Case of a Palestinian Gathering in South Lebanon,” November 29, 2013.
184 Erling Lorentzen Sogge, “«du Stinkar Også» Ungdomsopprør Og Protestrørsler i Dei Palestinske Leirane i Libanon,” 2015.
185 Ibid.
186 Annie Slemrod, “No Accountability for Deadly Burj Al-Barajneh Electrocutions,” The Daily Star, February 18, 2012, http://dailystar.com.lb/News/Lebanon-News/2012/Feb-18/163745-no-accountability-for-deadly-burj-al-barajneh-electrocutions.ashx.
187 Ibid.
188 Al Jazeera, “Lebanese Protest against Waste-Disposal Crisis,” July 26, 2015, https://www.aljazeera.com/news/2015/7/26/lebanese-protest-against-waste-disposal-crisis.
189 Lorentzen Sogge, “«du Stinkar Også» Ungdomsopprør Og Protestrørsler i Dei Palestinske Leirane i Libanon.”
190 S Khoury et al., “Drinking Water System Treatment and Contamination in Shatila Refugee Camp in Beirut, Lebanon,” Eastern Mediterranean Health Journal 22, no. 8 (2016).
191 Victoria Yan, “Water Project a Hard Sell for Wary Palestinians,” The Daily Star, April 21, 2017, https://www.pressreader.com/lebanon/the-daily-star-lebanon/20170421/281612420280647.
192 Bjørnar Skaar Haveland, “The Island of (in)Stability or a Hotel for Visiting Foreigners in the Middle of Town,” 2019.
57
There is limited information shared from local authorities to residents on plans and current activities193 and few channels to influence decision-making on issues that pertain to the residents. This limits municipalities’ use of participatory planning and budgeting. Furthermore, as mentioned, the registered population does not reflect the actual population living in an area. This means that in Beirut, the residents who can elect their local representatives only represent a share of the overall local population.194 The current system and governance mechanisms significantly impair accountability on the part of local governments and limits representativeness in local elections.
The spread of COVID-19 has augmented structural challenges of urban governance and has placed local authorities at the frontline of the COVID-19 response.195 In Beirut, damage and destruction form the 4 August 2020 blast impacted health and education facilities, housing, offices and key economic structures. The effect on buildings, people, the economy, infrastructure and the environment has added to the responsibilities and challenges faced by and placed on local authorities and other actors in Beirut City.
As shown in Figure 25, key national governance institutions are concentrated in Beirut. Public administration and most public institutions are located in three main neighbourhoods of the municipality of Beirut: Beirut’s Central District, Hamra and Adlieh. The governance institutions include: the Nejmeh Square or Place de l’Étoile (the Parliament); the Grand Serail (where the prime minister and the Cabinet are based); the Central Bank; and several ministries. The area where public administration is located has effectively been closed-off to the public since the October 2019 civil uprising. Only those with official business can enter through the guarded entry points and access the buildings located there. Consequently, a large part of the downtown area of Beirut City is not accessible to residents or visitors.
Other public institutions are scattered around Beirut City with a large presence in Baabda, where the Presidential Palace, the Old Serail (the administrative centre of the Mount Lebanon Governorate), and several other ministries are located.
Legal and regulatory framework for urban spaceLegal and regulatory frameworks for urban space mostly encompass regulations related to property rights, construction, planning and protection and management
193 Geagea and Sleiman, “Local Governance in Lebanon: A Roadmap for Solid Waste Management, Public Safety, Accountability and Citizen Participation.”
194 Estimated at 50 per cent of Greater Beirut’s residents, referenced in LCPS, “Local Governments and Public Goods: Assessing Decentralization in the Arab World.”
195 For an assessment of the COVID-19 response at the local level, see UN-Habitat, “UN-Habitat Lebanon Unions of Municipalities’ COVID-19 Rapid Assessment Report,” 2020.
of common goods.196 The laws and regulations that most specifically pertain to urban areas include: Real Estate Property Code (1930), Decree on the Location of Certain Industrial and Commercial Buildings (1932), Decree on the Protection of Historic Monuments and Antiquities (1933), Law on the Protection of Natural Sites (1939), Decree on the Protection of the Coastline (1966), Law on the Protection of Forests (1966), Code on Urban Planning (1983), Code on the Environment (2002), Building Code (2004) and the Ministerial Decree on the NPMPLT (2009).197
Urban Planning LawThe Urban Planning Law of Lebanon, Law No. 69, was issued in September 1983 to replace the previous law from 24 July 1962. The law pertains to the entire Lebanese territory rather than city and town planning, with a focus on zoning and definition of street networks. While according to the law, cities and towns that are considered administrative centres as well as other centres of importance, are obligated to have master plans and detailed plans, only 15 per cent of the territory of Lebanon is surveyed and zoned through 180 master plans (Table 10 shows master plans particularly affecting Beirut City).198 The law allows for establishing two types of institutions for land development and reconstruction: real estate companies and public authorities.199 This has been instrumental in the redevelopment of central Beirut (see Beirut Central District Master Plan: Solidere in this section). Law 117 of 1991 regulates the establishment of Lebanese real estate companies aiming at the reconstruction of war-damaged areas, in accordance with an officially approved master plan. Although the Urban Planning Law includes several important environment provisions, there is a need to better anchor these within institutions and to enforce them in practice.200
Spatial planning policiesThere is no coherent spatial policy hierarchy cascading across municipal, region/union and central government levels. Nevertheless, several spatial policies have been developed to guide development and address challenges in different parts of the city of Beirut. The policy in the post-civil war period up until today has been market-oriented and focused on the city centre.201 This development has failed to address the basic needs of a large share of society and has reinforced inequalities, favouring large-scale construction projects. In most cases, the implementation of urban plans has been constrained
196 UN-Habitat, “National Urban Policies Programme in Lebanon: Diagnosis Report.”
197 Ibid.
198 Public Works, “The Production of Inequality in Lebanese Urban Planning” (Beirut, 2018).
199 UN-Habitat, “National Urban Policies Programme in Lebanon Diagnosis Report.”
200 MoE and UNDP, “State and Trends of the Lebanese Environment (SOER),” 2010.
201 Lebanon Support and UNDP, “The Conflict Context in Beirut: The Social Question, Mobilisations Cycles, and the City’s Securitisation.”

58
UN
-HA
BIT
AT
/ L
EB
AN
ON
/ C
ITY
PR
OFI
LE
S /
BE
IRU
T /
20
21
/ G
OV
ER
NA
NC
E &
AC
CO
UN
TAB
ILIT
YTHEME 1
Figure 26 The first and second rings of Beirut overlayed with Beirut urban areas as per 1998 . Source: DAR-IAURIF, 2005 .
First ring
Second ring
Aley
Jbail
Jounié
Aajaltoun
Damour
Broumana Beit Meri Baabdat
Beirut urban area
Districts
Urban areas 1998
Main urban agglomerations
Beirut urban agglomeration
NPMPLT urban agglomerations
by the sociopolitical and governance situation, as well as a lack of finances, with only a few examples of plans coming to fruition. Urban planning has also largely failed to include necessary environmental infrastructure, and in other cases, plans have made grave errors or had adverse impacts on the environment.202
National Physical Master Plan of the Lebanese Territory (NPMPLT)The NPMPLT, published in 2005 and ratified in 2009, defined the Beirut Central Urban Area (Greater Beirut and its urban agglomerations) as an urban entity comprising three concentric spaces (Figure 26). These include the city of Beirut (understood here as Beirut Municipality); the first ring (the remaining part of “Greater Beirut” between Dbayeh and Khaldeh, below 400 m of altitude); and the second ring (consisting of the agglomerations of Jounieh, Bikfaya, Broummana, Aley and Damour).203 The Central
202 MoE and UNDP, “State and Trends of the Lebanese Environment (SOER).”
203 DAR - IAURIF, “National Physical Master Plan of the Lebanese Territory.”
Urban Area is proposed as an integrated entity on the functional level that requires comprehensive solutions to address systemic issues of transportation, water, sewage, solid waste and green spaces.
The NPMPLT extends the city to include an additional area of 55 km2 to accommodate the anticipated population increase. The plan focuses on better organization of existing functions and earning competitiveness among the major metropolises of the Near East. Central to the plan’s vision for Beirut is the continued importance of the city centre and the first ring area as the primate city in Lebanon, while ensuring efforts to rebalance development between regions in Lebanon.
UN-Habitat similarly recognizes Beirut City to extend beyond the current municipal boundaries to accommodate the expansion of the city. Using these city boundaries, Beirut City can thus be understood as the continuously built-up area of the city with interlinked urban systems. While not interchangeable, the NPMPLT definition of the city’s area is close to what is used in this report.
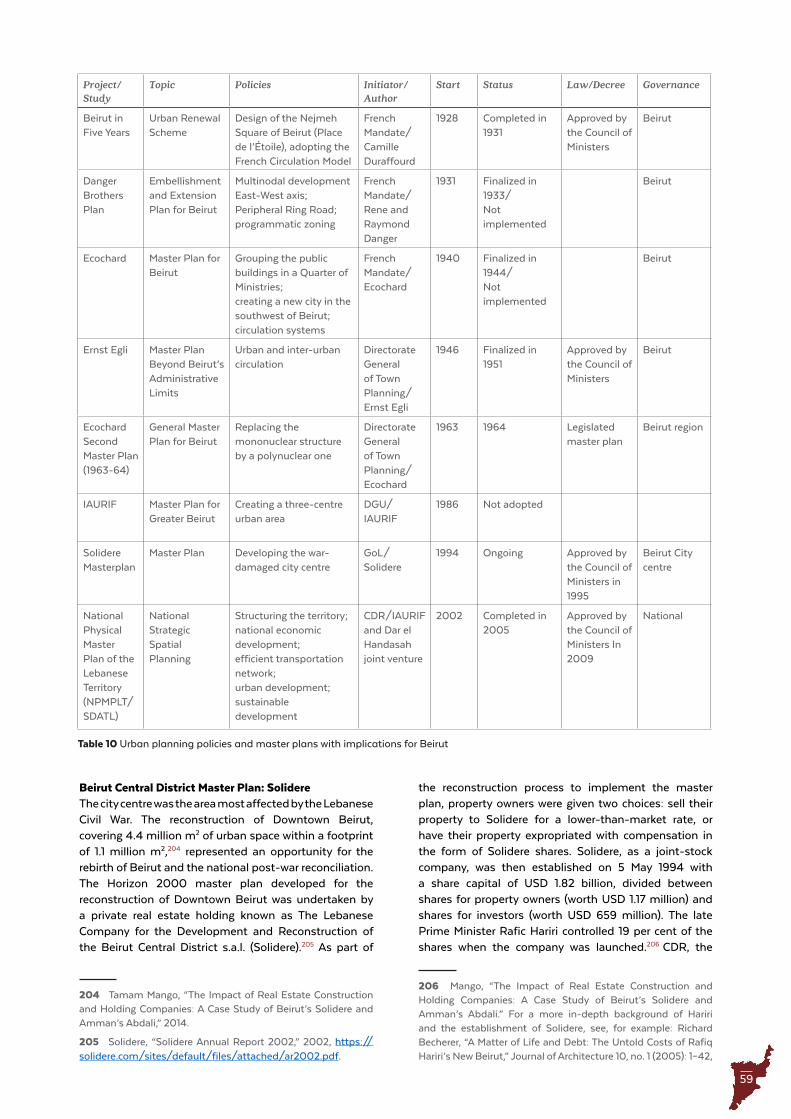
59
Beirut Central District Master Plan: SolidereThe city centre was the area most affected by the Lebanese Civil War. The reconstruction of Downtown Beirut, covering 4.4 million m2 of urban space within a footprint of 1.1 million m2,204 represented an opportunity for the rebirth of Beirut and the national post-war reconciliation. The Horizon 2000 master plan developed for the reconstruction of Downtown Beirut was undertaken by a private real estate holding known as The Lebanese Company for the Development and Reconstruction of the Beirut Central District s.a.l. (Solidere).205 As part of
204 Tamam Mango, “The Impact of Real Estate Construction and Holding Companies: A Case Study of Beirut’s Solidere and Amman’s Abdali,” 2014.
205 Solidere, “Solidere Annual Report 2002,” 2002, https://solidere.com/sites/default/files/attached/ar2002.pdf.
the reconstruction process to implement the master plan, property owners were given two choices: sell their property to Solidere for a lower-than-market rate, or have their property expropriated with compensation in the form of Solidere shares. Solidere, as a joint-stock company, was then established on 5 May 1994 with a share capital of USD 1.82 billion, divided between shares for property owners (worth USD 1.17 million) and shares for investors (worth USD 659 million). The late Prime Minister Rafic Hariri controlled 19 per cent of the shares when the company was launched.206 CDR, the
206 Mango, “The Impact of Real Estate Construction and Holding Companies: A Case Study of Beirut’s Solidere and Amman’s Abdali.” For a more in-depth background of Hariri and the establishment of Solidere, see, for example: Richard Becherer, “A Matter of Life and Debt: The Untold Costs of Rafiq Hariri’s New Beirut,” Journal of Architecture 10, no. 1 (2005): 1–42,
Project/Study
Topic Policies Initiator/Author
Start Status Law/Decree Governance
Beirut in Five Years
Urban Renewal Scheme
Design of the Nejmeh Square of Beirut (Place de l’Étoile), adopting the French Circulation Model
French Mandate/Camille Duraffourd
1928 Completed in 1931
Approved by the Council of Ministers
Beirut
Danger Brothers Plan
Embellishment and Extension Plan for Beirut
Multinodal development East-West axis;Peripheral Ring Road;programmatic zoning
French Mandate/Rene and Raymond Danger
1931 Finalized in 1933/Not implemented
Beirut
Ecochard Master Plan for Beirut
Grouping the public buildings in a Quarter of Ministries;creating a new city in the southwest of Beirut; circulation systems
French Mandate/Ecochard
1940 Finalized in 1944/Not implemented
Beirut
Ernst Egli Master Plan Beyond Beirut’s Administrative Limits
Urban and inter-urban circulation
Directorate General of Town Planning/ Ernst Egli
1946 Finalized in 1951
Approved by the Council of Ministers
Beirut
Ecochard Second Master Plan (1963-64)
General Master Plan for Beirut
Replacing the mononuclear structure by a polynuclear one
Directorate General of Town Planning/ Ecochard
1963 1964 Legislated master plan
Beirut region
IAURIF Master Plan for Greater Beirut
Creating a three-centre urban area
DGU/IAURIF
1986 Not adopted
Solidere Masterplan
Master Plan Developing the war-damaged city centre
GoL/Solidere
1994 Ongoing Approved by the Council of Ministers in 1995
Beirut City centre
National Physical Master Plan of the Lebanese Territory (NPMPLT/SDATL)
National Strategic Spatial Planning
Structuring the territory;national economic development;efficient transportation network;urban development;sustainable development
CDR/IAURIF and Dar el Handasah joint venture
2002 Completed in 2005
Approved by the Council of Ministers In 2009
National
Table 10 Urban planning policies and master plans with implications for Beirut
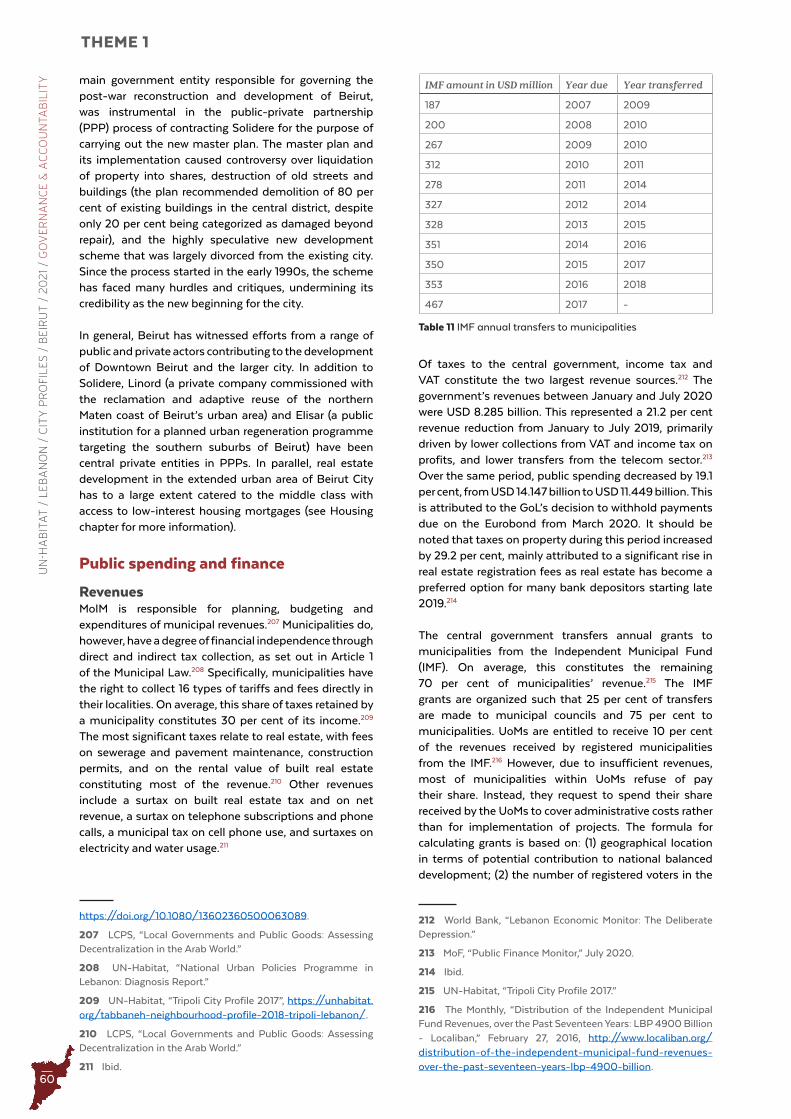
60
UN
-HA
BIT
AT
/ L
EB
AN
ON
/ C
ITY
PR
OFI
LE
S /
BE
IRU
T /
20
21
/ G
OV
ER
NA
NC
E &
AC
CO
UN
TAB
ILIT
YTHEME 1
IMF amount in USD million Year due Year transferred
187 2007 2009
200 2008 2010
267 2009 2010
312 2010 2011
278 2011 2014
327 2012 2014
328 2013 2015
351 2014 2016
350 2015 2017
353 2016 2018
467 2017 -
Table 11 IMF annual transfers to municipalities
main government entity responsible for governing the post-war reconstruction and development of Beirut, was instrumental in the public-private partnership (PPP) process of contracting Solidere for the purpose of carrying out the new master plan. The master plan and its implementation caused controversy over liquidation of property into shares, destruction of old streets and buildings (the plan recommended demolition of 80 per cent of existing buildings in the central district, despite only 20 per cent being categorized as damaged beyond repair), and the highly speculative new development scheme that was largely divorced from the existing city. Since the process started in the early 1990s, the scheme has faced many hurdles and critiques, undermining its credibility as the new beginning for the city.
In general, Beirut has witnessed efforts from a range of public and private actors contributing to the development of Downtown Beirut and the larger city. In addition to Solidere, Linord (a private company commissioned with the reclamation and adaptive reuse of the northern Maten coast of Beirut’s urban area) and Elisar (a public institution for a planned urban regeneration programme targeting the southern suburbs of Beirut) have been central private entities in PPPs. In parallel, real estate development in the extended urban area of Beirut City has to a large extent catered to the middle class with access to low-interest housing mortgages (see Housing chapter for more information).
Public spending and finance
RevenuesMoIM is responsible for planning, budgeting and expenditures of municipal revenues.207 Municipalities do, however, have a degree of financial independence through direct and indirect tax collection, as set out in Article 1 of the Municipal Law.208 Specifically, municipalities have the right to collect 16 types of tariffs and fees directly in their localities. On average, this share of taxes retained by a municipality constitutes 30 per cent of its income.209 The most significant taxes relate to real estate, with fees on sewerage and pavement maintenance, construction permits, and on the rental value of built real estate constituting most of the revenue.210 Other revenues include a surtax on built real estate tax and on net revenue, a surtax on telephone subscriptions and phone calls, a municipal tax on cell phone use, and surtaxes on electricity and water usage.211
https://doi.org/10.1080/13602360500063089.
207 LCPS, “Local Governments and Public Goods: Assessing Decentralization in the Arab World.”
208 UN-Habitat, “National Urban Policies Programme in Lebanon: Diagnosis Report.”
209 UN-Habitat, “Tripoli City Profile 2017”, https://unhabitat.org/tabbaneh-neighbourhood-profile-2018-tripoli-lebanon/.
210 LCPS, “Local Governments and Public Goods: Assessing Decentralization in the Arab World.”
211 Ibid.
Of taxes to the central government, income tax and VAT constitute the two largest revenue sources.212 The government’s revenues between January and July 2020 were USD 8.285 billion. This represented a 21.2 per cent revenue reduction from January to July 2019, primarily driven by lower collections from VAT and income tax on profits, and lower transfers from the telecom sector.213 Over the same period, public spending decreased by 19.1 per cent, from USD 14.147 billion to USD 11.449 billion. This is attributed to the GoL’s decision to withhold payments due on the Eurobond from March 2020. It should be noted that taxes on property during this period increased by 29.2 per cent, mainly attributed to a significant rise in real estate registration fees as real estate has become a preferred option for many bank depositors starting late 2019.214
The central government transfers annual grants to municipalities from the Independent Municipal Fund (IMF). On average, this constitutes the remaining 70 per cent of municipalities’ revenue.215 The IMF grants are organized such that 25 per cent of transfers are made to municipal councils and 75 per cent to municipalities. UoMs are entitled to receive 10 per cent of the revenues received by registered municipalities from the IMF.216 However, due to insufficient revenues, most of municipalities within UoMs refuse of pay their share. Instead, they request to spend their share received by the UoMs to cover administrative costs rather than for implementation of projects. The formula for calculating grants is based on: (1) geographical location in terms of potential contribution to national balanced development; (2) the number of registered voters in the
212 World Bank, “Lebanon Economic Monitor: The Deliberate Depression.”
213 MoF, “Public Finance Monitor,” July 2020.
214 Ibid.
215 UN-Habitat, “Tripoli City Profile 2017.”
216 The Monthly, “Distribution of the Independent Municipal Fund Revenues, over the Past Seventeen Years: LBP 4900 Billion - Localiban,” February 27, 2016, http://www.localiban.org/distribution-of-the-independent-municipal-fund-revenues-over-the-past-seventeen-years-lbp-4900-billion.

61
municipality217 (not the number of actual residents); (3) area (km2) of the municipality; and (4) the percentage of tax collected during the previous period. This implies that the IMF allocations can increase inequality between municipalities, where wealthier municipalities benefit more than poor ones. It also fails to create incentives to increase local tax collection, since there is no added allocation based on improved fee collection.218 IMF allocations might also be influenced by other factors. For example, in 2017, Mount Lebanon (except Jbeil) and Beirut had a 50 per cent deduction in their grants prior to distribution to cover CDR’s procurement costs for solid waste management companies’ services in the municipalities.219
The IMF transfers tend to be unpredictable, causing significant challenges in financial planning and budgeting for municipalities and UoMs. This is affecting local governments’ capacity to invest in infrastructure, deliver social services, and hire and retain municipal employees. As Table 11 shows, there is usually a two-year lag for transfer of funds. From 2017 onwards, IMF grants are still pending. As a result, some municipalities warned already in January 2020 – prior to the COVID-19 crisis – that they might have to close by summer of 2020 if they did not receive the grants owed in accordance with municipal laws and regulations.220
Municipalities cannot determine the types and weights of taxation used. Neither is there a strong mechanism in place to enforce tax payment. For instance, in 2015, some municipalities reported tax collection rates to be as low as 50 per cent.221 Given the current economic and financial crisis, this figure is likely to have dropped even lower. In part, low tax collection rates can be attributed to the use of tax-collecting agencies, and the difficulties municipalities encounter in checking these agencies’ compliance. At the same time, a lack of transparency and involvement of residents in the municipal finance process results in low trust between residents and local governments, and therefore in reduced tax compliance. This happens despite the Access to Information Act from 2017, which makes publication of information (such as municipal council decisions, budgets, financial and
217 As discussed previously, given the registration system for residents, the population will likely not reflect the actual population figures and corresponding responsibilities on the part of the municipality or UoM. In 2015, it was argued that of 42 UoMs, 11 were receiving half of what they should have, while the remaining receive twice as much as they should.
218 LCPS, “About Administrative Decentralization in Lebanon,” 2015, http://www.lcps-lebanon.org/publications/1573808844-lcps_book-facing_pages-english-2015-03-27.pdf.
219 Internal programme document on IMF updates for the UN-Habitat-UNDP Municipal Empowerment and Resilience (MERP) project.
220 Rahil Dandash, Al Akhbar Newspaper (21 January 2020), Municipalities Heading to Shut Down
221 LCPS, “Local Governments and Public Goods: Assessing Decentralization in the Arab World.”
administrative documents of public nature) mandatory.222
Given the large-scale real estate construction in central Beirut from the 1990s, tax on real estate has historically permitted high revenue collection in Beirut, and particularly for Beirut Municipality. According to the former Governor of Beirut, Nicolas Saba (1995-1999), the rapid increase in the revenues of Beirut Municipality turned the fiscal deficit of USD 12 million to a surplus of USD 30 million within three years and nine months of his term. However, it should be noted that while Beirut municipality had a bank deposit worth around $600 million in October 2019, that same money is only worth $80 million as per June 2021 due to the hyperinflation.223 Fiscal considerations might thus be explanatory factor for why Beirut Governorate has remained as a single municipality, while Mount Lebanon, similarly to the rest of the country, has steadily increased the number of municipalities within its respective territory. According to the 3RF Municipal Sector Note, the average annual revenue of Bourj Hammoud Municipality is USD 22 million, but an interviewed municipal official confirmed that there will be an 80 per cent reduction in revenue collection (USD 17.6 million) due to current crises.224 Similarly, while the average annual revenue of Beirut Municipality is LBP 281 billion, it is expected that the municipality will only receive LBP 100 billion in revenue in 2020, implying almost LBP 181 billion loss in revenue.225 This is largely due to tax exemptions announced by the MoF for properties suffering full or partial damages within a 2.5 km radius of the site of the 4 August 2020 blast.226
ExpendituresThe largest share of government expenditures goes towards public sector personnel costs. Of the GoL’s expenditures between January and July 2020, USD 5.427 billion, or 47 per cent of total expenditures, were on personnel costs. While these costs increased by 3.1 per cent from January-July 2018 to January-July 2019, it decreased by 6.4 per cent from January-July 2019 to January-June 2020. Of other expenditures, EDL accounts for USD 807 billion, 7 per cent, of total expenditures (with a larger than average decrease over the January-July 2018 to January-July 2020 period).227
Municipal expenditures are subject to several control and oversight mechanisms led by the central government. Most of the 75 largest municipalities228 as well as UoMs are subject to the General Accounting Principles Law.
222 VNGi, “Local Government Resilience Programme for the Middle East and North Africa,” 2017.
223 According to Mayor Jamal Itani, speaking at the Mayors Migration Council’s event 23 June 2021.
224 World Bank, EU and United Nations, “Municipal Sector Note 3RF,” 2020.
225 World Bank, EU, and United Nations, “Beirut Rapid Damage and Needs Assessment,” 2020.
226 Ibid.
227 MoF, “Public Finance Monitor.”
228 Identified as such through a decree by the Council of Ministers.
62
UN
-HA
BIT
AT
/ L
EB
AN
ON
/ C
ITY
PR
OFI
LE
S /
BE
IRU
T /
20
21
/ G
OV
ER
NA
NC
E &
AC
CO
UN
TAB
ILIT
YTHEME 1
A chief controller appointed by the Council of Ministers approves all expenditures above LBP 3 million. Expenses above LBP 20 million are approved by the qaimaqam, and those above LBP 80 million are approved by the mohafiz.229
As suggested above, local authorities in Lebanon find themselves in a dire financial position. It has been estimated that up to 70 per cent of local expenditures is directed to basic infrastructure works, while the municipalities remain understaffed and without the resources to hire civil servants to fulfil their roles.230 Moreover, given that the tax collection system is based on registered and not actual residents, municipalities with a net influx of persons have a lower tax base but higher service provision needs than officially recognized by and compensated for through the fiscal system. For Beirut, this is particularly unfavourable given its rapidly growing population due to pull factors (such as economic opportunities, access to services and presence of family or existing networks) and push factors (such as insecurity and lack of livelihood opportunities). Adding to permanent residents, many seasonal residents, including work residents and summer and winter residents, place additional pressure on public services and infrastructure.231
The financial situation and increasing population pressure render municipalities with low resilience and insufficient capacities and resources to respond to overlapping shocks.232 There is currently no legal framework that allows for allocation of funds to municipalities based on need or disaster impact. Limited transfers through the IMF as well as a lack of skilled human capital are two of the principal shortcomings hampering local government response.
Associated losses in tax revenues, particularly but not limited to municipalities affected by the 4 August 2020 blast, are further limiting municipalities’ capacities to respond. As mentioned above, the declared tax exemptions for property owners within 2.5 km radius of the site of the explosion represent a significant reduction in revenues for Beirut and Bourj Hammoud municipalities in a time when they must mobilize substantial resources to respond to the physical damages from the blast.233 Mobility infrastructure, including roads and bridges, accounts for around 50 per cent of damages, in addition to the many public spaces and buildings, and stormwater draining, sewerage infrastructure and other
229 LCPS, “Local Governments and Public Goods: Assessing Decentralization in the Arab World.”
230 Democracy Reporting International, “Reforming Decentralization in Lebanon: The State of Play.”
231 VNGi, “Local Government Resilience Programme for the Middle East and North Africa.”
232 UN-Habitat, “UN-Habitat Lebanon Unions of Municipalities’ COVID-19 Rapid Assessment Report.”
233 World Bank, EU and United Nations, “Municipal Sector Note 3RF.”
movable assets that have been destroyed or damaged. The removal of 53,000 tons of rubble and demolition waste alone amounts an additional expenditure of USD 1 million.
Non-state actorsThere were more than 8,000 non-governmental, non-profit, civil society organizations (CSOs) and academic institutions registered in Lebanon in 2015, equivalent to 1.3 associations per 1,000 inhabitants at the time.234 Non-state entities and multi-actor informal arrangements play an increasingly important role in urban governance, with a large share of actors concentrated in Beirut. At the same time, sectors with the least coverage by such actors include municipal services, urban planning and entrepreneurship.235 Awareness-raising accounts for close to half of CSO efforts, with health, education and social development representing additional areas of focus. This trend has been amplified by bureaucratic limitations on the part of the government, as discussed in this chapter, and corresponding gaps in public social and basic service provision. Over time, public institutions have lost much of their credibility, while other actors have gained increased informal legitimacy. Rather than complementing state institutions, however, these actors oftentimes replace them. The Civil Society Knowledge Centre warns that the “proliferation of the number of CSOs in Lebanon is an indicator of fragmentation rather than a characteristic of a ‘vibrant civil society’, reinforcing sectorial and communal governance systems based on donor requirements with limited development and policy impact.”236 The grass-roots initiatives seeking to enact social and political change are plentiful, many of which are faith-based organizations and/or affiliated with political parties. Religious leaders have thus played a vital role in reasserting this by endorsing actions of non-state actors. As a result, security and public services are embedded in and linked to confessional affiliation in Beirut.237
Youth representationTo date, youth participation in decision-making processes remains limited. The Youth Policy in Lebanon, endorsed on 3 April 2012, recognizes the low level of participation in public and political issues among youth.238 Among the recommendations are the lowering of minimum age of voting to 18 and running for office to 21 years, as well as the revival of the Union of Lebanese Youth and provision of financial support to youth associations.239
234 EU, Beyond Reform and Development, and TRANSTEC, “Mapping Civil Society Organizations in Lebanon,” 2015.
235 Ibid.
236 Marie-Noëlle AbiYaghi, Léa Yammine, and Amreesha Jagarnathsingh, “Civil Society in Lebanon: The Implementation Trap,” Civil Society Knowledge Centre, vol. 1 (Lebanon Support, 2019), 7, https://doi.org/10.28943/cskc.002.70000.
237 Plural Security Insights, “Beirut, a Safe Refuge? Plural Security Insights,” 2016.
238 GoL, “Youth Policy in Lebanon,” 2012.
239 Ibid
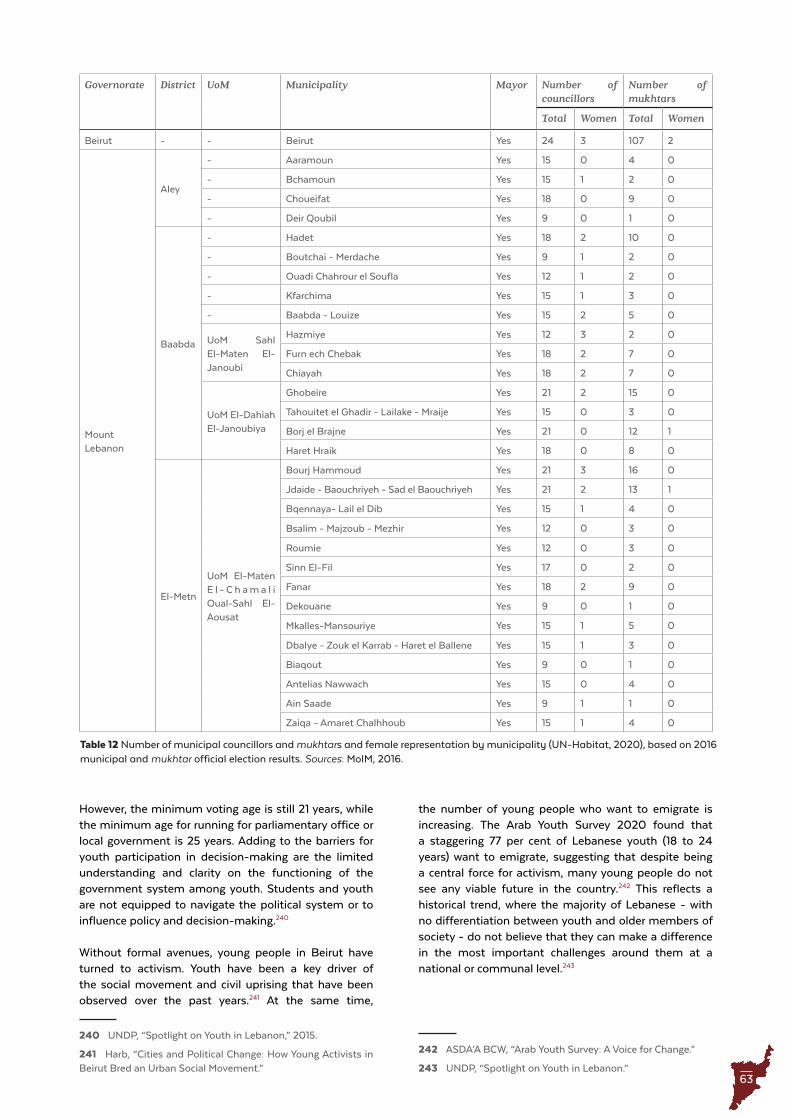
63
Table 12 Number of municipal councillors and mukhtars and female representation by municipality (UN-Habitat, 2020), based on 2016 municipal and mukhtar official election results . Sources: MoIM, 2016 .
Governorate District UoM Municipality Mayor Number of councillors
Number of mukhtars
Total Women Total Women
Beirut - - Beirut Yes 24 3 107 2
Mount Lebanon
Aley
- Aaramoun Yes 15 0 4 0
- Bchamoun Yes 15 1 2 0
- Choueifat Yes 18 0 9 0
- Deir Qoubil Yes 9 0 1 0
Baabda
- Hadet Yes 18 2 10 0
- Boutchai - Merdache Yes 9 1 2 0
- Ouadi Chahrour el Soufla Yes 12 1 2 0
- Kfarchima Yes 15 1 3 0
- Baabda - Louize Yes 15 2 5 0
UoM Sahl El-Maten El-Janoubi
Hazmiye Yes 12 3 2 0
Furn ech Chebak Yes 18 2 7 0
Chiayah Yes 18 2 7 0
UoM El-Dahiah El-Janoubiya
Ghobeire Yes 21 2 15 0
Tahouitet el Ghadir - Lailake - Mraije Yes 15 0 3 0
Borj el Brajne Yes 21 0 12 1
Haret Hraik Yes 18 0 8 0
El-Metn
UoM El-Maten E l - C h a m a l i Oual-Sahl El-Aousat
Bourj Hammoud Yes 21 3 16 0
Jdaide - Baouchriyeh - Sad el Baouchriyeh Yes 21 2 13 1
Bqennaya- Lail el Dib Yes 15 1 4 0
Bsalim - Majzoub - Mezhir Yes 12 0 3 0
Roumie Yes 12 0 3 0
Sinn El-Fil Yes 17 0 2 0
Fanar Yes 18 2 9 0
Dekouane Yes 9 0 1 0
Mkalles-Mansouriye Yes 15 1 5 0
Dbalye - Zouk el Karrab - Haret el Ballene Yes 15 1 3 0
Biaqout Yes 9 0 1 0
Antelias Nawwach Yes 15 0 4 0
Ain Saade Yes 9 1 1 0
Zaiqa - Amaret Chalhhoub Yes 15 1 4 0
However, the minimum voting age is still 21 years, while the minimum age for running for parliamentary office or local government is 25 years. Adding to the barriers for youth participation in decision-making are the limited understanding and clarity on the functioning of the government system among youth. Students and youth are not equipped to navigate the political system or to influence policy and decision-making.240
Without formal avenues, young people in Beirut have turned to activism. Youth have been a key driver of the social movement and civil uprising that have been observed over the past years.241 At the same time,
240 UNDP, “Spotlight on Youth in Lebanon,” 2015.
241 Harb, “Cities and Political Change: How Young Activists in Beirut Bred an Urban Social Movement.”
the number of young people who want to emigrate is increasing. The Arab Youth Survey 2020 found that a staggering 77 per cent of Lebanese youth (18 to 24 years) want to emigrate, suggesting that despite being a central force for activism, many young people do not see any viable future in the country.242 This reflects a historical trend, where the majority of Lebanese - with no differentiation between youth and older members of society - do not believe that they can make a difference in the most important challenges around them at a national or communal level.243
242 ASDA’A BCW, “Arab Youth Survey: A Voice for Change.”
243 UNDP, “Spotlight on Youth in Lebanon.”
64
UN
-HA
BIT
AT
/ L
EB
AN
ON
/ C
ITY
PR
OFI
LE
S /
BE
IRU
T /
20
21
/ G
OV
ER
NA
NC
E &
AC
CO
UN
TAB
ILIT
YTHEME 1
Women’s participationThere is significant underrepresentation of women in public and political life, political parties and labour unions. This includes very low representation of women in public institutions and decision-making bodies, including at the municipal level. Out of 128 parliamentarians, 11 are women, while only 18 per cent of government interministerial response committee members are women.244 Moreover, there is a reported lack of knowledge and sensitivity regarding women’s rights among public servants, including justice officials.245 This also translates to the local level, with an absence of women in local governance positions, including municipal councillors and mukhtars. In the 2016 elections, 6.9 per cent of registered candidates were women.246 In Beirut and the Bekaa, a marginal 56 of 3,767 candidates (1.5 per cent) were women, while in Mount Lebanon 528 out of 6,797 candidates (7.8 per cent) were women (see Table 12). In Beirut and the Bekaa, the number of women who won their candidacy was 57, one more than the number of registered candidates. In Mount Lebanon, close to half of the nominated women won their candidacies. This despite a gender bias in media, where female candidates had enjoyed less access to media than their male counterparts.247 While the number of women who ran for Parliament in 2018 had jumped to 113 from only 12 in 2009, more than 13 per cent mentioned that they were never interviewed by media, while 38 per cent mentioned that they were only interviewed once.248 In the light of the national government and municipalities’ responsibility to plan for a population of which about half are women, this raises serious concerns about the extent to which the authorities can understand and respond to the needs of a significant segment of the population.
The lack of representation of women in formal political positions reflects underlying systems of gender inequality, where structural factors pertaining to personal status codes, social perceptions and legal protection act as barriers to women’s participation in the political sphere.249 Four case studies examining public entities exposed traditional perceptions of gender roles, paternalistic discourse and a low share of women in leadership positions.250 Among those who
244 National Commission for Lebanese Women et al., “Gender Alert on COVID-19 Lebanon,” 2020.
245 UN, “United Nations Strategic Framework (UNSF) Lebanon 2017-2020,” 2017.
246 UNDP, “Women in Municipal Elections 2016,” 2016.
247 UN Women, “3RF Gender Brief Pillar 1 Governance and Accountability,” 2020.
248 Halime El Kaakour, “Pursuing Equality in Rights and Representation: Women’s Experiences Running for Parliament in Lebanon’s 2018 Elections,” 2020.
249 We4L, Hivos, and Lebanon Support, “Women’s Political Participation in Lebanon and the Limits of Aid-Driven Empowerment,” 2020.
250 We4L, Hivos, and Lebanon Support, “Women’s Political Participation: Exclusion and Reproduction of Social Roles Case Studies from Lebanon,” 2018.
live outside of Beirut but have roles and memberships that require in-person participation in the city, women’s opportunities to partake in decision-making and their political advancement were found to be disproportionally negatively affected. The low representation of both youth and women in public institutions and decision-making bodies increases the likelihood that their needs are not adequately accounted for and the potential they represent not factored in when responding to recent shocks.251
251 ACAPS, “Emergency Operations Centre Beirut Assessment & Analysis Cell August 2020,” 2020.
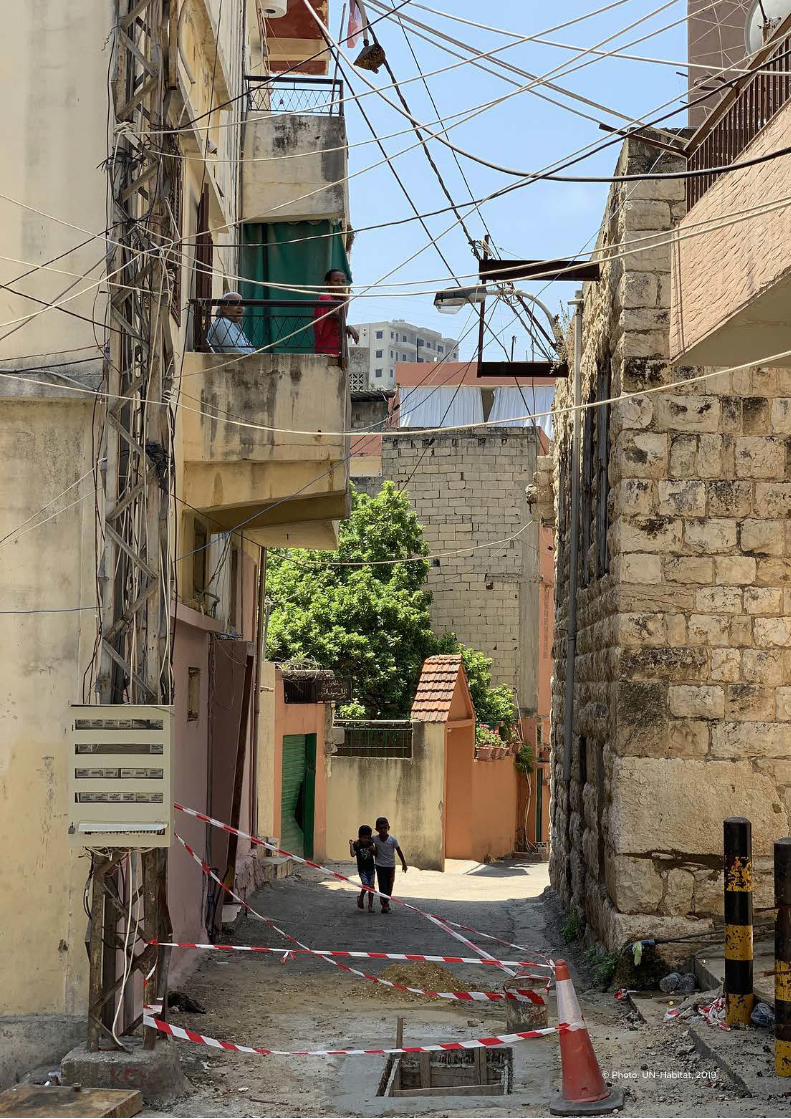
65© Photo: UN-Habitat, 2019
66
UN
-HA
BIT
AT
/ L
EB
AN
ON
/ C
ITY
PR
OFI
LE
S /
BE
IRU
T /
20
21
/ EC
ON
OM
Y &
LIV
EL
IHO
OD
STHEME 2
Theme 2 Economy and
Livelihoods
67
Theme 2 Economy and
Livelihoods
© Photo: Synne Bergby, 2017
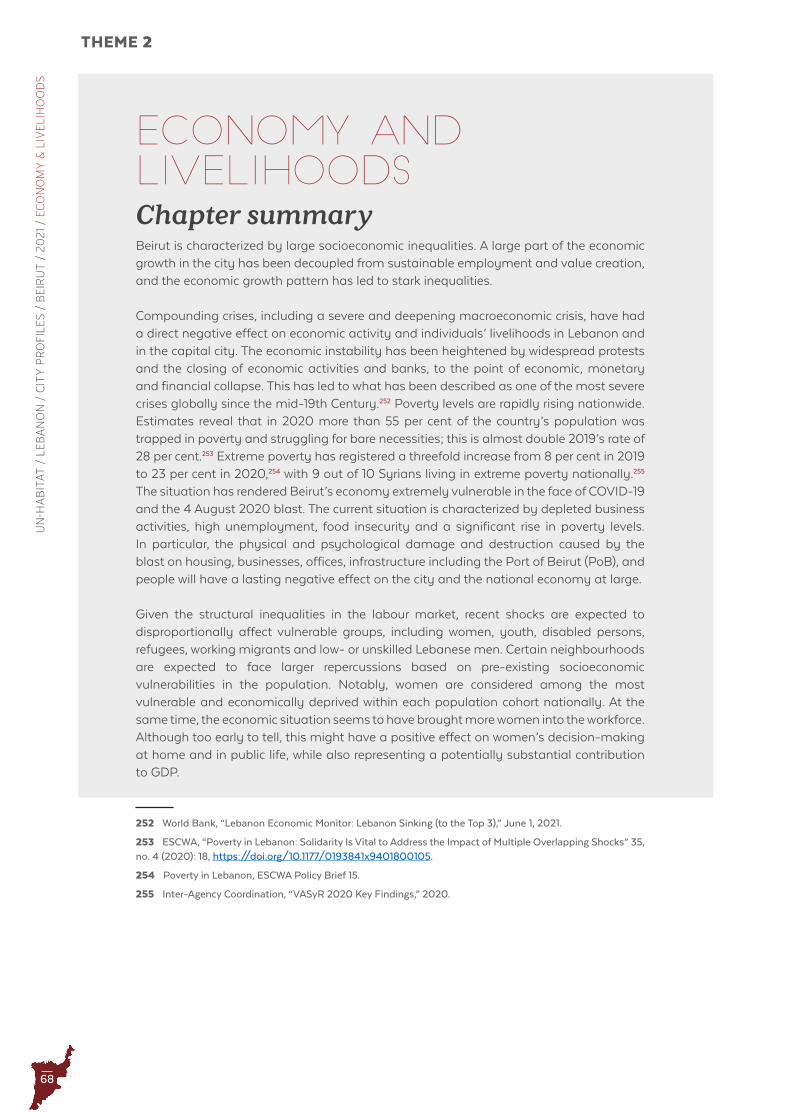
68
UN
-HA
BIT
AT
/ L
EB
AN
ON
/ C
ITY
PR
OFI
LE
S /
BE
IRU
T /
20
21
/ EC
ON
OM
Y &
LIV
EL
IHO
OD
STHEME 2
Economy and livelihoodsChapter summary Beirut is characterized by large socioeconomic inequalities. A large part of the economic growth in the city has been decoupled from sustainable employment and value creation, and the economic growth pattern has led to stark inequalities.
Compounding crises, including a severe and deepening macroeconomic crisis, have had a direct negative effect on economic activity and individuals’ livelihoods in Lebanon and in the capital city. The economic instability has been heightened by widespread protests and the closing of economic activities and banks, to the point of economic, monetary and financial collapse. This has led to what has been described as one of the most severe crises globally since the mid-19th Century.252 Poverty levels are rapidly rising nationwide. Estimates reveal that in 2020 more than 55 per cent of the country’s population was trapped in poverty and struggling for bare necessities; this is almost double 2019’s rate of 28 per cent.253 Extreme poverty has registered a threefold increase from 8 per cent in 2019 to 23 per cent in 2020,254 with 9 out of 10 Syrians living in extreme poverty nationally.255 The situation has rendered Beirut’s economy extremely vulnerable in the face of COVID-19 and the 4 August 2020 blast. The current situation is characterized by depleted business activities, high unemployment, food insecurity and a significant rise in poverty levels. In particular, the physical and psychological damage and destruction caused by the blast on housing, businesses, offices, infrastructure including the Port of Beirut (PoB), and people will have a lasting negative effect on the city and the national economy at large.
Given the structural inequalities in the labour market, recent shocks are expected to disproportionally affect vulnerable groups, including women, youth, disabled persons, refugees, working migrants and low- or unskilled Lebanese men. Certain neighbourhoods are expected to face larger repercussions based on pre-existing socioeconomic vulnerabilities in the population. Notably, women are considered among the most vulnerable and economically deprived within each population cohort nationally. At the same time, the economic situation seems to have brought more women into the workforce. Although too early to tell, this might have a positive effect on women’s decision-making at home and in public life, while also representing a potentially substantial contribution to GDP.
252 World Bank, “Lebanon Economic Monitor: Lebanon Sinking (to the Top 3),” June 1, 2021.
253 ESCWA, “Poverty in Lebanon: Solidarity Is Vital to Address the Impact of Multiple Overlapping Shocks” 35, no. 4 (2020): 18, https://doi.org/10.1177/0193841x9401800105.
254 Poverty in Lebanon, ESCWA Policy Brief 15.
255 Inter-Agency Coordination, “VASyR 2020 Key Findings,” 2020.
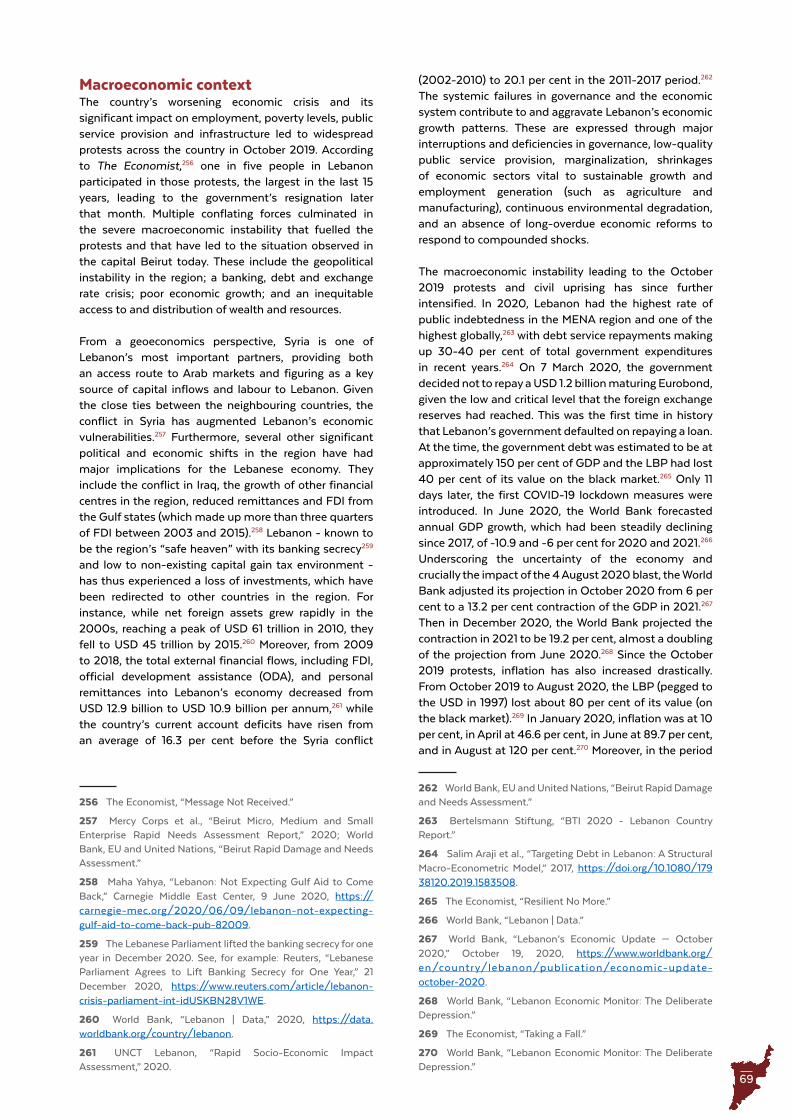
69
Macroeconomic contextThe country’s worsening economic crisis and its significant impact on employment, poverty levels, public service provision and infrastructure led to widespread protests across the country in October 2019. According to The Economist,256 one in five people in Lebanon participated in those protests, the largest in the last 15 years, leading to the government’s resignation later that month. Multiple conflating forces culminated in the severe macroeconomic instability that fuelled the protests and that have led to the situation observed in the capital Beirut today. These include the geopolitical instability in the region; a banking, debt and exchange rate crisis; poor economic growth; and an inequitable access to and distribution of wealth and resources.
From a geoeconomics perspective, Syria is one of Lebanon’s most important partners, providing both an access route to Arab markets and figuring as a key source of capital inflows and labour to Lebanon. Given the close ties between the neighbouring countries, the conflict in Syria has augmented Lebanon’s economic vulnerabilities.257 Furthermore, several other significant political and economic shifts in the region have had major implications for the Lebanese economy. They include the conflict in Iraq, the growth of other financial centres in the region, reduced remittances and FDI from the Gulf states (which made up more than three quarters of FDI between 2003 and 2015).258 Lebanon - known to be the region’s “safe heaven” with its banking secrecy259 and low to non-existing capital gain tax environment - has thus experienced a loss of investments, which have been redirected to other countries in the region. For instance, while net foreign assets grew rapidly in the 2000s, reaching a peak of USD 61 trillion in 2010, they fell to USD 45 trillion by 2015.260 Moreover, from 2009 to 2018, the total external financial flows, including FDI, official development assistance (ODA), and personal remittances into Lebanon’s economy decreased from USD 12.9 billion to USD 10.9 billion per annum,261 while the country’s current account deficits have risen from an average of 16.3 per cent before the Syria conflict
256 The Economist, “Message Not Received.”
257 Mercy Corps et al., “Beirut Micro, Medium and Small Enterprise Rapid Needs Assessment Report,” 2020; World Bank, EU and United Nations, “Beirut Rapid Damage and Needs Assessment.”
258 Maha Yahya, “Lebanon: Not Expecting Gulf Aid to Come Back,” Carnegie Middle East Center, 9 June 2020, https://carnegie-mec.org/2020/06/09/lebanon-not-expecting-gulf-aid-to-come-back-pub-82009.
259 The Lebanese Parliament lifted the banking secrecy for one year in December 2020. See, for example: Reuters, “Lebanese Parliament Agrees to Lift Banking Secrecy for One Year,” 21 December 2020, https://www.reuters.com/article/lebanon-crisis-parliament-int-idUSKBN28V1WE.
260 World Bank, “Lebanon | Data,” 2020, https://data.worldbank.org/country/lebanon.
261 UNCT Lebanon, “Rapid Socio-Economic Impact Assessment,” 2020.
(2002-2010) to 20.1 per cent in the 2011-2017 period.262 The systemic failures in governance and the economic system contribute to and aggravate Lebanon’s economic growth patterns. These are expressed through major interruptions and deficiencies in governance, low-quality public service provision, marginalization, shrinkages of economic sectors vital to sustainable growth and employment generation (such as agriculture and manufacturing), continuous environmental degradation, and an absence of long-overdue economic reforms to respond to compounded shocks.
The macroeconomic instability leading to the October 2019 protests and civil uprising has since further intensified. In 2020, Lebanon had the highest rate of public indebtedness in the MENA region and one of the highest globally,263 with debt service repayments making up 30-40 per cent of total government expenditures in recent years.264 On 7 March 2020, the government decided not to repay a USD 1.2 billion maturing Eurobond, given the low and critical level that the foreign exchange reserves had reached. This was the first time in history that Lebanon’s government defaulted on repaying a loan. At the time, the government debt was estimated to be at approximately 150 per cent of GDP and the LBP had lost 40 per cent of its value on the black market.265 Only 11 days later, the first COVID-19 lockdown measures were introduced. In June 2020, the World Bank forecasted annual GDP growth, which had been steadily declining since 2017, of -10.9 and -6 per cent for 2020 and 2021.266 Underscoring the uncertainty of the economy and crucially the impact of the 4 August 2020 blast, the World Bank adjusted its projection in October 2020 from 6 per cent to a 13.2 per cent contraction of the GDP in 2021.267 Then in December 2020, the World Bank projected the contraction in 2021 to be 19.2 per cent, almost a doubling of the projection from June 2020.268 Since the October 2019 protests, inflation has also increased drastically. From October 2019 to August 2020, the LBP (pegged to the USD in 1997) lost about 80 per cent of its value (on the black market).269 In January 2020, inflation was at 10 per cent, in April at 46.6 per cent, in June at 89.7 per cent, and in August at 120 per cent.270 Moreover, in the period
262 World Bank, EU and United Nations, “Beirut Rapid Damage and Needs Assessment.”
263 Bertelsmann Stiftung, “BTI 2020 - Lebanon Country Report.”
264 Salim Araji et al., “Targeting Debt in Lebanon: A Structural Macro-Econometric Model,” 2017, https://doi.org/10.1080/17938120.2019.1583508.
265 The Economist, “Resilient No More.”
266 World Bank, “Lebanon | Data.”
267 World Bank, “Lebanon’s Economic Update — October 2020,” October 19, 2020, https://www.worldbank.org/en/country/lebanon/publication/economic-update-october-2020.
268 World Bank, “Lebanon Economic Monitor: The Deliberate Depression.”
269 The Economist, “Taking a Fall.”
270 World Bank, “Lebanon Economic Monitor: The Deliberate Depression.”
70
UN
-HA
BIT
AT
/ L
EB
AN
ON
/ C
ITY
PR
OFI
LE
S /
BE
IRU
T /
20
21
/ EC
ON
OM
Y &
LIV
EL
IHO
OD
STHEME 2
from January to September 2020, private sector activity shrank to the lowest level recorded for Lebanon.271
The 4 August 2020 blast is expected to contribute to the deteriorating macroeconomic situation in Lebanon, notably due to the port’s prominence in Lebanese trade and the impact of the severe damage to areas with key economic activities in Beirut. According to the RDNA, the explosion could cause an overall 0.4 percentage point decline in real GDP growth in 2020 and a 0.6 percentage point decline in 2021 as a direct result of the losses to physical capital.272 Moreover, the resulting limitations to imports from the damage alone may further subtract 0.4 percentage points in 2020 and 1.3 percentage points in 2021. The impact on the private sector in 2020 is reflecting the dire state of the economy; In 2020, the economy contracted by 20 per cent, half of all private sector sales stopped, and 23 per cent of full-time employees in private sector have been laid off.273
Since May 2020, Lebanon has been in discussion with the International Monetary Fund for support, which would be contingent on a comprehensive stabilization and reform programme - including governance, social, fiscal, monetary and financial reforms.274 Disagreements between the collapsed banking sector and Banque du Liban (BDL, Central Bank) on the one hand and the government on the other (relating to debt measures, the losses that would be incurred by the financial sector, as well as measures to restructure the banking sector) have prevented such a programme from following through for the moment.275
Economic development and governanceEconomic governance in Lebanon is suffering from a lack of government entities formally in charge of economic development, coupled with ineffective or inadequate urban planning and service delivery. While there is no single ministry responsible for national or city-level economic development,276 the BDL has progressively taken on a governance role to manage economic and financial challenges facing the country.277 As discussed in the Governance and Accountability chapter, the city governance structure poses a series of challenges for coherent and efficient planning and service delivery across sectors. A McKinsey study shows that challenges such as pollution, waste management, deficient or lacking public transportation and the absence of an
271 Ibid.
272 World Bank, EU and United Nations, “Beirut Rapid Damage and Needs Assessment.”
273 ESCWA, “Lebanon’s Formal Private Sector: The Bitter Reality of 2020,” 2021.
274 World Bank, “Lebanon Economic Monitor: The Deliberate Depression.”
275 Ibid.
276 UN-Habitat, “National Urban Policies Programme in Lebanon Diagnosis Report.”
277 World Bank, “Lebanon Economic Monitor: Derisking Lebanon,” 2018.
integrated urban plan, including for land use in the city, are major hinderances to inclusive and sustainable economic development in Beirut.278 These structural barriers have exacerbated the impact on the economic sector by compounded shocks.
Since the civil war, Beirut has been shaped by national policies tending heavily towards a dual economic development model. The reconstruction of central Beirut was realized through a neoliberalist approach, where the state facilitated private companies in the expropriation and redevelopment of these areas. At the same time, other areas of the city were given less attention. Policies were limited to the encouragement of construction and real estate development and reconstruction of the physical infrastructure. In general, the regulatory environment has favoured the development of a “rentier”279 economy with underdeveloped productive sectors. This has generated highly unevenly distributed economic growth that has failed to translate into inclusive and sustainable employment creation. The public sector has absorbed a share of the unemployed, particularly through recruitment by the army, security forces and education sector, while many young and educated Lebanese have emigrated. Among tertiary-educated persons, as many as 44 per cent were estimated to have migrated abroad in 2015.280 Moreover, the macroeconomic framework has been incredibly vulnerable to refinancing risks due to currency fluctuation (a vulnerability to exogenous shocks from high indebtedness and dollarization since 1988) and a persistent reliance on short-term capital inflows to finance long-term and substantial current account and fiscal deficits.281
The national 10-year Horizon 2000 economic development plan launched in 1992 was focused on attracting FDI (especially from expatriates in Gulf countries) and the support of designated sectors.282 The period from 1990 to the mid-2000s was characterized by reconstruction and investment in infrastructure projects to facilitate economic activities.283 Anticipated reforms and increased confidence in the economy in the early 2000s also led to a rise in FDI and remittances, which
278 McKinsey, “Lebanon Economic Vision,” 2018.
279 An economy where productive sectors play a small role compared to financial and real estate sectors driven primarily by speculation rather than true value creation.
280 Eric Le Borgne and Thomas J. Jacobs, “Lebanon: Promoting Poverty Reduction and Shared Prosperity,” 2016, https://doi.org/10986/23102 in GIZ, “Employment and Labour Market Analysis Lebanon,” 2019.
281 World Bank, EU and United Nations, “Beirut Rapid Damage and Needs Assessment.”
282 UN-Habitat, “Guide for Mainstreaming Housing in Lebanon’s National Urban Policy”; Tom Najem, “Horizon 2000: Economic Viability and Political Realities,” Mediterranean Politics 3, no. 1 (2007): 29–56, https://doi.org/10.1080/13629399808414639.
283 Charles Harvie and Ali Salman Saleh, “Lebanon’s Economic Reconstruction After the War: A Bridge Too Far?,” Journal of Policy Modeling 30, no. 5 (September 2008): 857–72, https://doi.org/10.1016/j.jpolmod.2007.04.004.
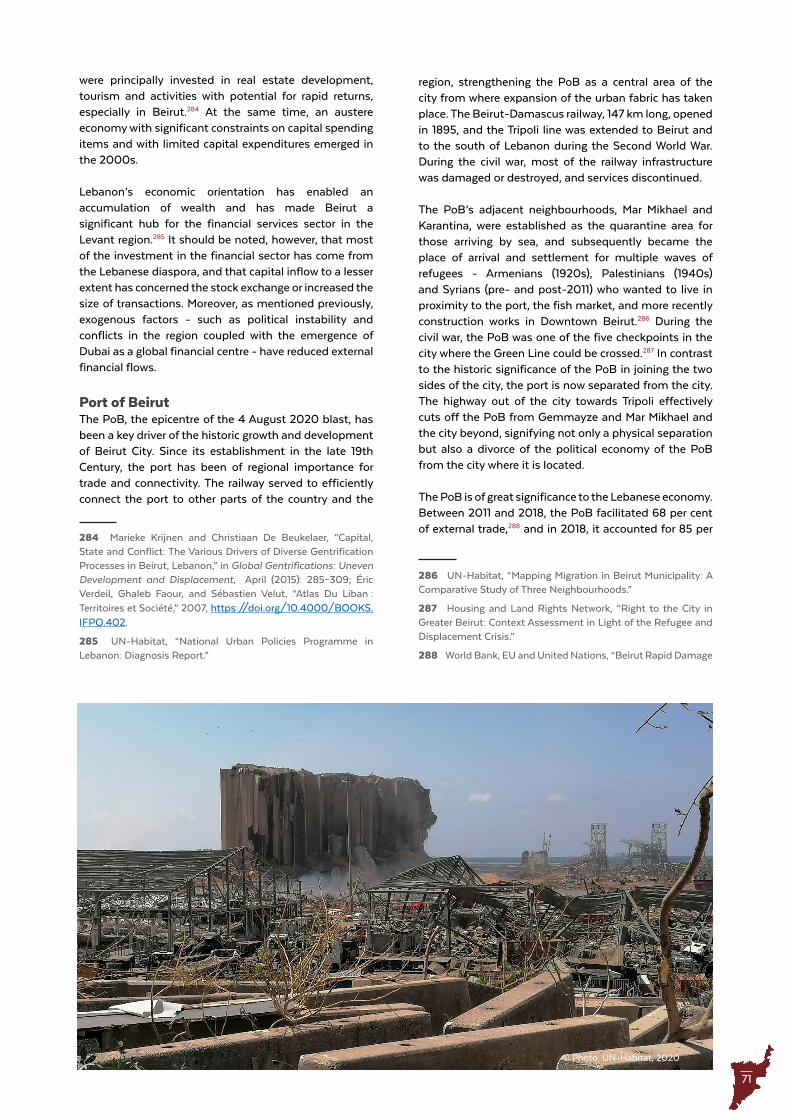
71
were principally invested in real estate development, tourism and activities with potential for rapid returns, especially in Beirut.284 At the same time, an austere economy with significant constraints on capital spending items and with limited capital expenditures emerged in the 2000s.
Lebanon’s economic orientation has enabled an accumulation of wealth and has made Beirut a significant hub for the financial services sector in the Levant region.285 It should be noted, however, that most of the investment in the financial sector has come from the Lebanese diaspora, and that capital inflow to a lesser extent has concerned the stock exchange or increased the size of transactions. Moreover, as mentioned previously, exogenous factors - such as political instability and conflicts in the region coupled with the emergence of Dubai as a global financial centre - have reduced external financial flows.
Port of BeirutThe PoB, the epicentre of the 4 August 2020 blast, has been a key driver of the historic growth and development of Beirut City. Since its establishment in the late 19th Century, the port has been of regional importance for trade and connectivity. The railway served to efficiently connect the port to other parts of the country and the
284 Marieke Krijnen and Christiaan De Beukelaer, “Capital, State and Conflict: The Various Drivers of Diverse Gentrification Processes in Beirut, Lebanon,” in Global Gentrifications: Uneven Development and Displacement, April (2015): 285–309; Éric Verdeil, Ghaleb Faour, and Sébastien Velut, “Atlas Du Liban : Territoires et Société,” 2007, https://doi.org/10.4000/BOOKS.IFPO.402.
285 UN-Habitat, “National Urban Policies Programme in Lebanon: Diagnosis Report.”
region, strengthening the PoB as a central area of the city from where expansion of the urban fabric has taken place. The Beirut-Damascus railway, 147 km long, opened in 1895, and the Tripoli line was extended to Beirut and to the south of Lebanon during the Second World War. During the civil war, most of the railway infrastructure was damaged or destroyed, and services discontinued.
The PoB’s adjacent neighbourhoods, Mar Mikhael and Karantina, were established as the quarantine area for those arriving by sea, and subsequently became the place of arrival and settlement for multiple waves of refugees - Armenians (1920s), Palestinians (1940s) and Syrians (pre- and post-2011) who wanted to live in proximity to the port, the fish market, and more recently construction works in Downtown Beirut.286 During the civil war, the PoB was one of the five checkpoints in the city where the Green Line could be crossed.287 In contrast to the historic significance of the PoB in joining the two sides of the city, the port is now separated from the city. The highway out of the city towards Tripoli effectively cuts off the PoB from Gemmayze and Mar Mikhael and the city beyond, signifying not only a physical separation but also a divorce of the political economy of the PoB from the city where it is located.
The PoB is of great significance to the Lebanese economy. Between 2011 and 2018, the PoB facilitated 68 per cent of external trade,288 and in 2018, it accounted for 85 per
286 UN-Habitat, “Mapping Migration in Beirut Municipality: A Comparative Study of Three Neighbourhoods.”
287 Housing and Land Rights Network, “Right to the City in Greater Beirut: Context Assessment in Light of the Refugee and Displacement Crisis.”
288 World Bank, EU and United Nations, “Beirut Rapid Damage
© Photo: UN-Habitat, 2020
72
UN
-HA
BIT
AT
/ L
EB
AN
ON
/ C
ITY
PR
OFI
LE
S /
BE
IRU
T /
20
21
/ EC
ON
OM
Y &
LIV
EL
IHO
OD
STHEME 2
cent of imported and exported products.289 In 2019, it handled close to three quarters of the country’s imports and half of exports, in addition to transhipments. In comparison, the Port of Tripoli (PoT), which is the second-largest port in Lebanon, handled around 5 per cent of PoB’s traffic in 2018.290 The PoB is governed by the central government and is thus disconnected from the city’s administration. The management of the port is multifaceted, with MoPWT, the Ministry of Finance (MoF) including Lebanese Customs Administration, Lebanese Security Forces including LAF and the Internal Security Forces (ISF), and other actors all having their discrete areas of responsibilities. In 1990, a Temporary Committee for Management and Investment of the PoB was established. However, the void of a real port authority and mismanagement of the port activities by the temporary committee have caused state revenues from the PoB to decline.291 Furthermore, in 2004, operations of the container terminal were subcontracted to the private Beirut Container Terminal Consortium (BCTC). From an initial 20-year management contract, BCTC has subsequently signed a five-year contract, and then renewed contracts on a three-month basis until March 2020 when a public tender was released.292
The 4 August 2020 blast destroyed much of the port, including a large part of the cargo terminal, and severely damaged the area in a 3 km radius around it. Among the damage parts were the 120,000-ton silo containing 15,000 tons of grains and warehouses over an approximate 157,000 m2 area.293 The container terminal was reported to have suffered less damage and was back in operation by the end of August 2020. The estimated economic losses in the transport sector and port activities are between USD 580 million and USD 710 million, in addition to the cost of reconstruction. Moreover, many personnel working at the PoB suffered from fatalities and injuries.294 As one of the principal contributors to the country’s economy and the main access point for imports into the country, the impact of the PoB damage by the blast will extend much beyond the city and even the country.
This includes broad effects on companies across the country, impacting countrywide balance sheets and value chains. PoB is the primary port in the country, while the PoT mostly serves Tripoli and the region.295 However, as
and Needs Assessment.,”
289 UN-Habitat, “National Urban Policies Programme in Lebanon Diagnosis Report.”
290 World Bank, EU and United Nations, “Beirut RDNA Full Report Transport,” 2020.
291 World Bank, EU and United Nations, “Lebanon 3RF Draft Report,” 2020.
292 Ibid.
293 World Bank, EU and United Nations, “Beirut Rapid Damage and Needs Assessment.”
294 Ibid.
295 UN-Habitat, “National Urban Policies Programme in Lebanon Diagnosis Report.”
the only other freight port and one of two additional free trade zones in Lebanon, the PoT serves as an important gateway to the northern part of Lebanon and Syria. There is a plan to extend the PoT’s capacity from 300,000 twenty-foot equivalent units (TEUs) to 700,000 TEU annually by 2023.296 While the concentration of economic activities at the PoB reinforces the impact of the port blast on the national economic performance and on food security, the PoT has the capacity to divert traffic from Beirut and can be used to diversify trade in Lebanon and the reliance on the capital. It should be noted, however, that the additional costs associated with road transportation to Tripoli might be too much for some operators.297
Key sectors for economic growthVarious measures - including allocation of credit, interest rate and exchange rate policies, tax and custom-fee exemptions - have affected economic sectors in Lebanon in different ways. In general, there has been a strong focus on stimulating tourism, real estate, construction and business services sectors to encourage economic growth.
The construction and real estate sectors are significant contributors to Lebanon’s economy. The construction sector contributed with 13 per cent of GDP annual growth rates between 2006 and 2011, before slowing to a 0.5 per cent annual growth from 2011 to 2016.298 The real estate sector has had a lower but more stable annual GDP growth contribution (2.9 between 2006 and 2011 and 2.2 per cent between 2011 and 2016).299 In 2016, the real estate and construction sectors combined contributed with an estimated 21 per cent of GDP, and 12 per cent of employment.300 The construction sector has been particularly focused on real estate, electricity, telecoms, roads and water, with a multiplier effect on employment and other sectors.301 Recent shocks have affected the construction sector. Construction permits and cement deliveries, indicators of construction activities in the real estate market, declined by 30.8 and 32.4 per cent, respectively, in January to June 2019, and by 60 and 52 per cent in January to June 2020.302
For the real estate sector, weak planning regulations, combined with public financial support, have led to high levels of and continued activities, particularly in the central areas of Beirut (see Housing chapter for more information). The real estate sector has attracted
296 World Bank, EU and United Nations, “Beirut RDNA Full Report Transport.”
297 ACAPS, “Emergency Operations Centre Beirut Assessment & Analysis Cell August 2020.”
298 McKinsey, “Lebanon Economic Vision.”
299 Ibid.
300 Ibid.
301 Verdeil, Faour and Velut, “Atlas Du Liban: Territoires et Société.”
302 World Bank, “Lebanon Economic Monitor: The Deliberate Depression.”
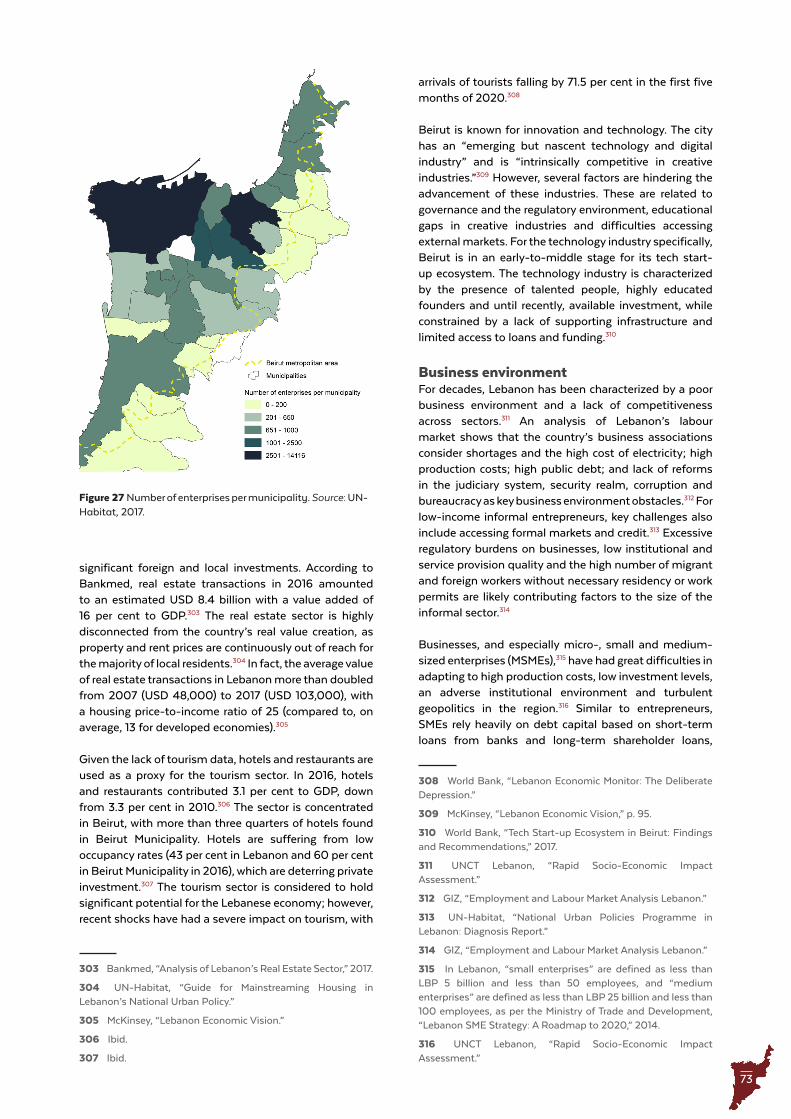
73
Figure 27 Number of enterprises per municipality . Source: UN-Habitat, 2017 .
significant foreign and local investments. According to Bankmed, real estate transactions in 2016 amounted to an estimated USD 8.4 billion with a value added of 16 per cent to GDP.303 The real estate sector is highly disconnected from the country’s real value creation, as property and rent prices are continuously out of reach for the majority of local residents.304 In fact, the average value of real estate transactions in Lebanon more than doubled from 2007 (USD 48,000) to 2017 (USD 103,000), with a housing price-to-income ratio of 25 (compared to, on average, 13 for developed economies).305
Given the lack of tourism data, hotels and restaurants are used as a proxy for the tourism sector. In 2016, hotels and restaurants contributed 3.1 per cent to GDP, down from 3.3 per cent in 2010.306 The sector is concentrated in Beirut, with more than three quarters of hotels found in Beirut Municipality. Hotels are suffering from low occupancy rates (43 per cent in Lebanon and 60 per cent in Beirut Municipality in 2016), which are deterring private investment.307 The tourism sector is considered to hold significant potential for the Lebanese economy; however, recent shocks have had a severe impact on tourism, with
303 Bankmed, “Analysis of Lebanon’s Real Estate Sector,” 2017.
304 UN-Habitat, “Guide for Mainstreaming Housing in Lebanon’s National Urban Policy.”
305 McKinsey, “Lebanon Economic Vision.”
306 Ibid.
307 Ibid.
arrivals of tourists falling by 71.5 per cent in the first five months of 2020.308
Beirut is known for innovation and technology. The city has an “emerging but nascent technology and digital industry” and is “intrinsically competitive in creative industries.”309 However, several factors are hindering the advancement of these industries. These are related to governance and the regulatory environment, educational gaps in creative industries and difficulties accessing external markets. For the technology industry specifically, Beirut is in an early-to-middle stage for its tech start-up ecosystem. The technology industry is characterized by the presence of talented people, highly educated founders and until recently, available investment, while constrained by a lack of supporting infrastructure and limited access to loans and funding.310
Business environmentFor decades, Lebanon has been characterized by a poor business environment and a lack of competitiveness across sectors.311 An analysis of Lebanon’s labour market shows that the country’s business associations consider shortages and the high cost of electricity; high production costs; high public debt; and lack of reforms in the judiciary system, security realm, corruption and bureaucracy as key business environment obstacles.312 For low-income informal entrepreneurs, key challenges also include accessing formal markets and credit.313 Excessive regulatory burdens on businesses, low institutional and service provision quality and the high number of migrant and foreign workers without necessary residency or work permits are likely contributing factors to the size of the informal sector.314
Businesses, and especially micro-, small and medium-sized enterprises (MSMEs),315 have had great difficulties in adapting to high production costs, low investment levels, an adverse institutional environment and turbulent geopolitics in the region.316 Similar to entrepreneurs, SMEs rely heavily on debt capital based on short-term loans from banks and long-term shareholder loans,
308 World Bank, “Lebanon Economic Monitor: The Deliberate Depression.”
309 McKinsey, “Lebanon Economic Vision,” p. 95.
310 World Bank, “Tech Start-up Ecosystem in Beirut: Findings and Recommendations,” 2017.
311 UNCT Lebanon, “Rapid Socio-Economic Impact Assessment.”
312 GIZ, “Employment and Labour Market Analysis Lebanon.”
313 UN-Habitat, “National Urban Policies Programme in Lebanon: Diagnosis Report.”
314 GIZ, “Employment and Labour Market Analysis Lebanon.”
315 In Lebanon, “small enterprises” are defined as less than LBP 5 billion and less than 50 employees, and “medium enterprises” are defined as less than LBP 25 billion and less than 100 employees, as per the Ministry of Trade and Development, “Lebanon SME Strategy: A Roadmap to 2020,” 2014.
316 UNCT Lebanon, “Rapid Socio-Economic Impact Assessment.”
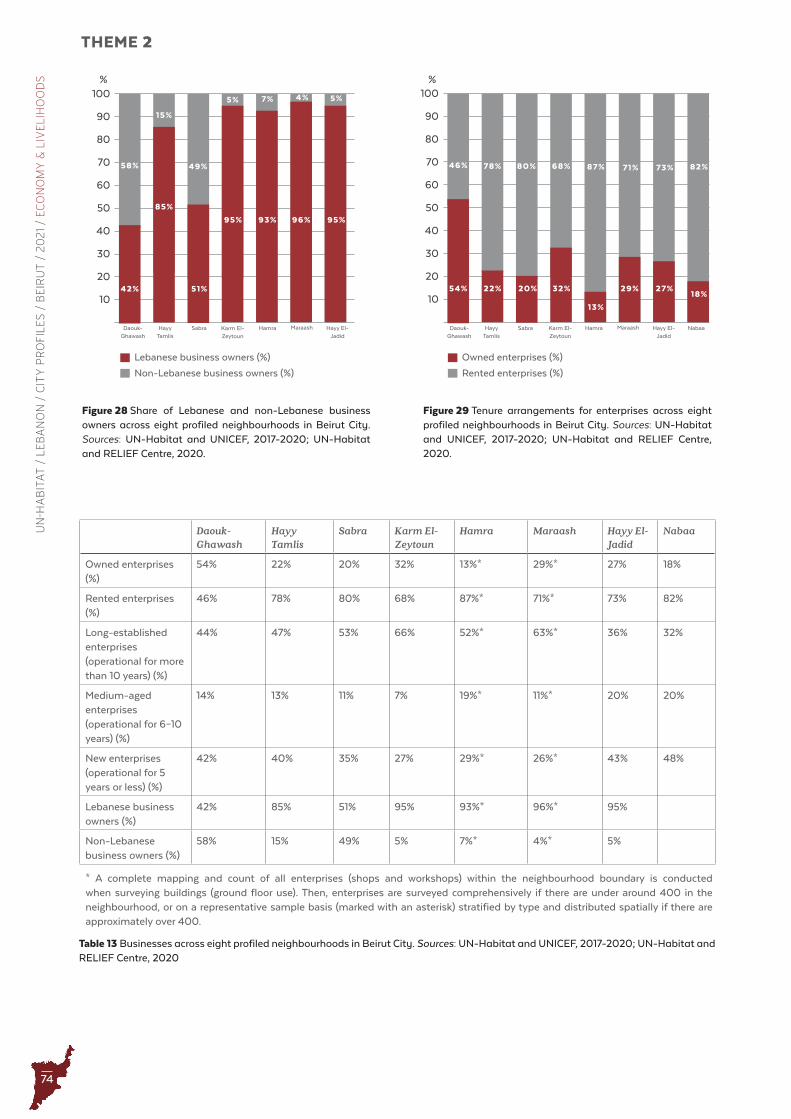
74
UN
-HA
BIT
AT
/ L
EB
AN
ON
/ C
ITY
PR
OFI
LE
S /
BE
IRU
T /
20
21
/ EC
ON
OM
Y &
LIV
EL
IHO
OD
STHEME 2
Daouk-Ghawash
Hayy Tamlis
Sabra Karm El-Zeytoun
Hamra Maraash Hayy El-Jadid
Nabaa
Owned enterprises (%)
54% 22% 20% 32% 13%* 29%* 27% 18%
Rented enterprises (%)
46% 78% 80% 68% 87%* 71%* 73% 82%
Long-established enterprises (operational for more than 10 years) (%)
44% 47% 53% 66% 52%* 63%* 36% 32%
Medium-aged enterprises (operational for 6–10 years) (%)
14% 13% 11% 7% 19%* 11%* 20% 20%
New enterprises (operational for 5 years or less) (%)
42% 40% 35% 27% 29%* 26%* 43% 48%
Lebanese business owners (%)
42% 85% 51% 95% 93%* 96%* 95%
Non-Lebanese business owners (%)
58% 15% 49% 5% 7%* 4%* 5%
Table 13 Businesses across eight profiled neighbourhoods in Beirut City . Sources: UN-Habitat and UNICEF, 2017-2020; UN-Habitat and RELIEF Centre, 2020
* A complete mapping and count of all enterprises (shops and workshops) within the neighbourhood boundary is conducted when surveying buildings (ground floor use). Then, enterprises are surveyed comprehensively if there are under around 400 in the neighbourhood, or on a representative sample basis (marked with an asterisk) stratified by type and distributed spatially if there are approximately over 400.
58%
93% 96% 95%
7% 4%
60
80
70
90
100
50
40
30
20
10
Lebanese business owners (%)
Non-Lebanese business owners (%)
42%
85%
15%
49%
51%
95%
5% 5%
Figure 28 Share of Lebanese and non-Lebanese business owners across eight profiled neighbourhoods in Beirut City . Sources: UN-Habitat and UNICEF, 2017-2020; UN-Habitat and RELIEF Centre, 2020 .
%
Hamra Maraash Hayy El-Jadid
Hayy Tamlis
SabraDaouk-Ghawash
Karm El-Zeytoun
46%
13%
29% 27%
87% 71%
60
80
70
90
100
50
40
30
20
10
Owned enterprises (%)
Rented enterprises (%)
54% 22%
78% 80%
20% 32%
68% 73%
18%
82%
Figure 29 Tenure arrangements for enterprises across eight profiled neighbourhoods in Beirut City . Sources: UN-Habitat and UNICEF, 2017-2020; UN-Habitat and RELIEF Centre, 2020 .
%
Hamra Maraash Hayy El-Jadid
NabaaHayy Tamlis
SabraDaouk-Ghawash
Karm El-Zeytoun
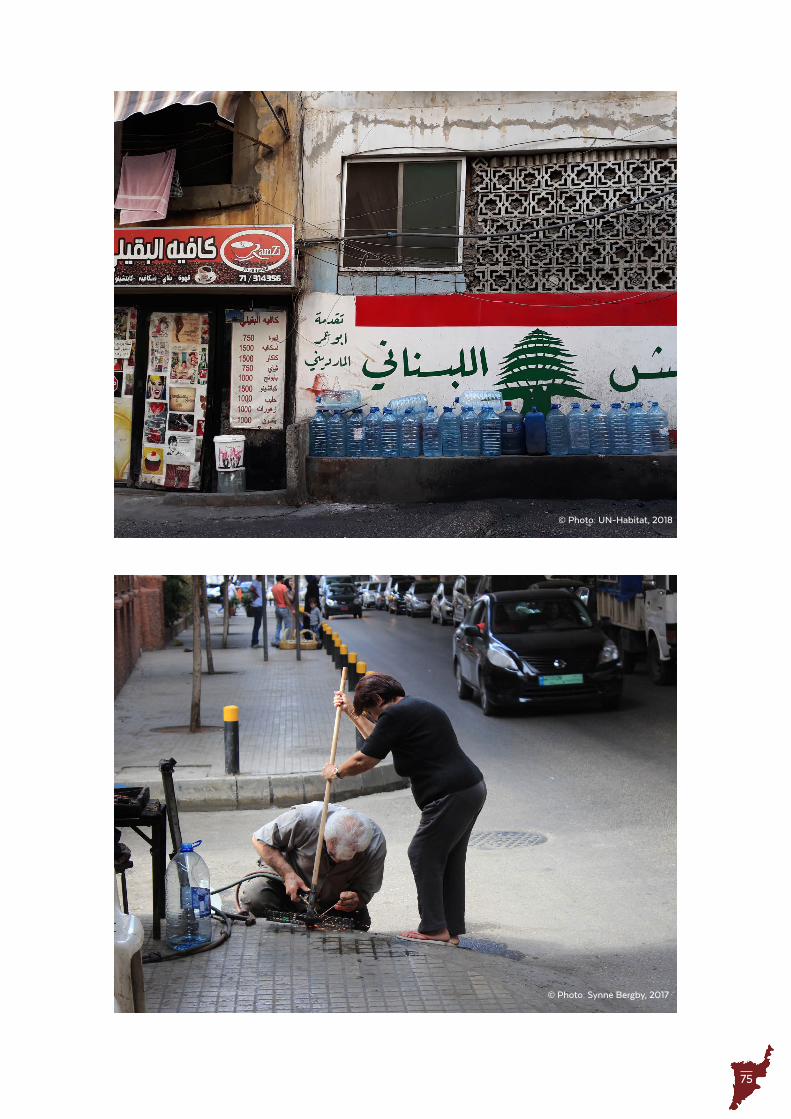
75
© Photo: UN-Habitat, 2018
© Photo: Synne Bergby, 2017
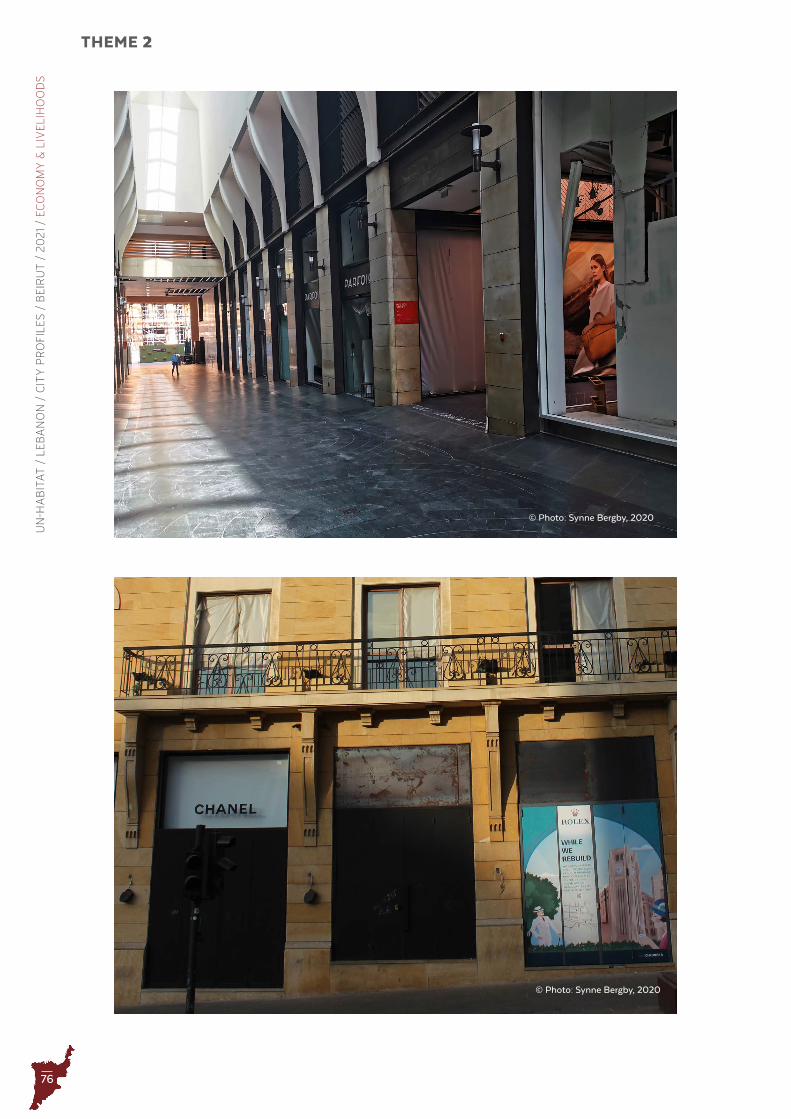
76
UN
-HA
BIT
AT
/ L
EB
AN
ON
/ C
ITY
PR
OFI
LE
S /
BE
IRU
T /
20
21
/ EC
ON
OM
Y &
LIV
EL
IHO
OD
STHEME 2
© Photo: Synne Bergby, 2020
© Photo: Synne Bergby, 2020

77
where resolving insolvency takes approximately three years with low recovery rates.317 Moreover, SMEs suffer from a “one-size fits all taxation,” primarily fixed at 30 per cent. The lack of solid market research and of information on which SMEs and entrepreneurs can develop their business strategies and plans to respond to the market demand is another key challenge.318 It seems plausible to infer that micro-enterprises319 are also affected by these factors due to their small size and lesser ability compared to larger companies to weather shocks and get around structural barriers. To understand the significance of the challenges faced by MSMEs within Beirut, it is helpful to note that in 2017, MSMEs accounted for 90 per cent of officially registered firms in Lebanon,320 with 50 per cent of MSMEs concentrated in Mount Lebanon Governorate and 23 per cent in Beirut Governorate.321 The potential to scale up informal companies is low given a current lack of managerial skills and limited access to the banking sector and growth capital.322
The eight neighbourhood profiles (seven UN-Habitat-UNICEF neighbourhood profiles323 of vulnerable neighbourhoods and one UN-Habitat-RELIEF Centre profile324 in Hamra) provide valuable insight into the economic situation of the people living in these neighbourhoods. In Hayy El-Jadid, Hayy Tamlis and Karm El-Zeytoun neighbourhoods, at least part of the data collection was carried out after the start of the civil uprising (October 2019) and rapid economic deterioration in the country. Recent shocks have severely affected the local economy, as further discussed below, and is likely to have negatively impacted the economic data at the neighbourhood level cited in this chapter. In general, rented enterprises325 are much more common than owned enterprises, reaching more than 80 per cent in Nabaa (Table 13 and Figure 29). Only Daouk-Ghawash has a higher share of owned enterprises relative to rented ones. The share of Lebanese businesses owners is significantly higher than non-Lebanese ones (Figure 28), with Daouk-Ghawash and Sabra as notable exceptions. Together with Nabaa, these are the two neighbourhoods with the lowest share of Lebanese residents. In Daouk-Ghawash, 45 per cent of enterprise owners are PRL, 42 per cent Lebanese and 13 per cent Syrians. In Sabra the
317 MoTD, “Lebanon SME Strategy: A Roadmap to 2020.”
318 Ministry of Trade and Development.
319 “Micro-enterprises” are defined as less than LBP 500 million and less than 10 employees, as per above.
320 UNHCR, “LCRP 2017 Livelihoods Sector Chapter,” 2017, https://data2.unhcr.org/en/documents/details/53666.
321 Beyond Reform and Development, “Skills Gap Analysis for Improved Livelihood Sustainability in Lebanon,” 2017.
322 Ibid.
323 See footnote 107, p. 37.
324 UN-Habitat and RELIEF Centre, Hamra Neighbourhood Profile 2020, 2020. Data collection in Hamra took place in 2019. Note that in the case of Hamra, “non-Lebanese” refers to Syrians only.
325 Enterprises include shops (e.g. boutiques, grocery stores, furniture stores and butchers) and workshops (e.g. mechanics, electronics and metalwork).
distribution between PRL (27 per cent) and Syrian (22 per cent) enterprise owners is about one quarter each, with the remaining half being Lebanese enterprise owners.
Long-established enterprises, that have been operational for more than 10 years, account for, on average, just under half of all enterprises in the eight neighbourhoods. The number of enterprises that have been operational for 6 to 10 years is lower than new (5 years or less) and long-established enterprises. According to the KIIs carried out with local business owners for the neighbourhood profiles, reported challenges included lack of demand for products and linked to this the low wages and high poverty among residents, competition between business owners of different nationalities, lack of safety in the neighbourhoods, competition with imported goods and expensive rent on locales.
Particularly since the earlier days of the currency crisis and the subsequent reduction in purchasing power, suppliers have faced difficulties purchasing raw materials and final products. With faltering demand due to COVID-19 lockdowns, reduced revenues have affected businesses across all sectors. Furthermore, the currency crisis has led to severe USD shortages and restrictions in foreign-currency bank withdrawals. This has added a challenge to businesses that pay claims in USD
and has severely lowered purchasing power, thus further reducing demand for goods and services. At the same time, the financial crisis has incentivized high-end purchases, including luxury cars and apartments, for those who have money in their accounts that cannot be transferred or withdrawn but are rapidly losing value due to hyperinflation. The service sector - mostly composed of real estate, wholesale and retail trade, public administrative services, tourism, and financial services - has long been the most important contributor to GDP in Beirut. From 2004 to 2016, services accounted for 72.4 per cent of the country’s GDP326 and in 2018-2019 for approximately 76 per cent of employment nationally.327 At the same time, economic activity in the service sector has had low productivity and tends to employ high-skilled individuals. The sector has been hit hard by the economic downturn in the past years.
The COVID-19 pandemic and consequent measures have had a significant and negative impact on vulnerable workers and small enterprises. In a survey of 1,987 individuals across the country in May 2020, the ILO found that 51 per cent of businesses had to stop their operations during the national lockdown, primarily due to reduced sales and significant losses in revenue.328 Other
326 UNCT Lebanon, “Rapid Socio-Economic Impact Assessment.”
327 ILO and CAS, “Labour Force and Household Living Conditions Survey 2018-2019 Lebanon.”
328 ILO, “Facing Multiple Crises: Rapid Assessment of the Impact of COVID-19 on Vulnerable Workers and Small-scale Enterprises in Lebanon,” May, 2020.
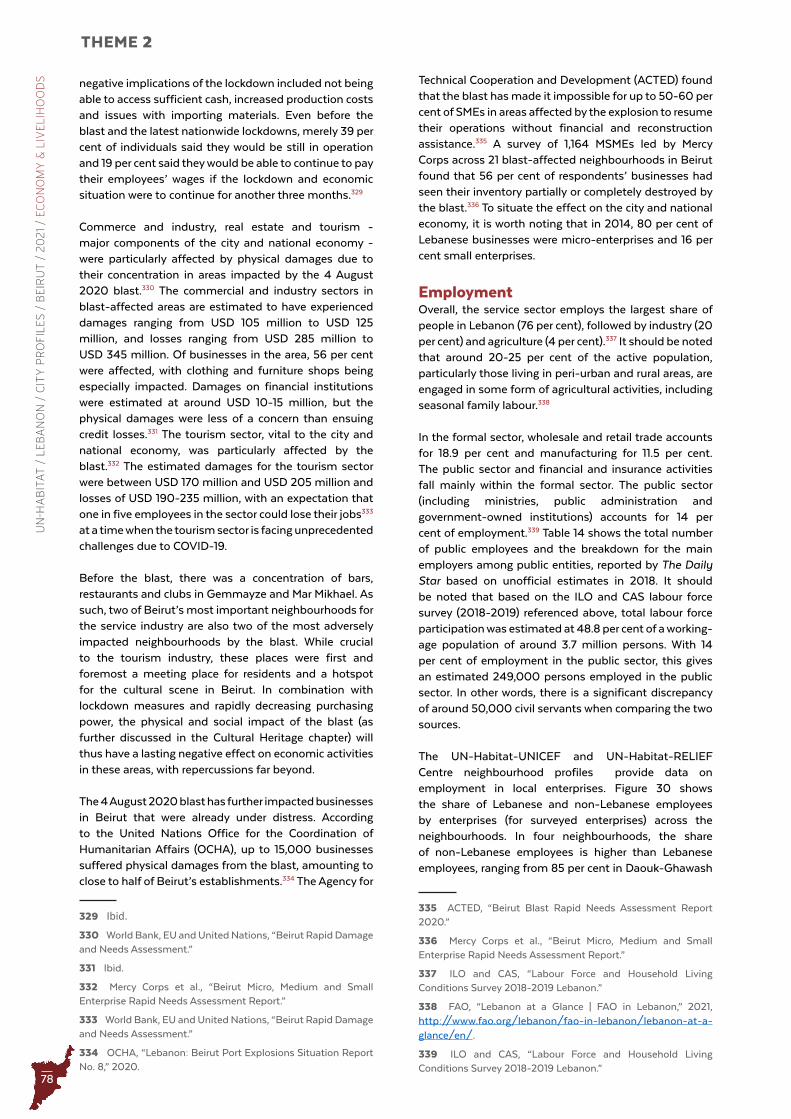
78
UN
-HA
BIT
AT
/ L
EB
AN
ON
/ C
ITY
PR
OFI
LE
S /
BE
IRU
T /
20
21
/ EC
ON
OM
Y &
LIV
EL
IHO
OD
STHEME 2
negative implications of the lockdown included not being able to access sufficient cash, increased production costs and issues with importing materials. Even before the blast and the latest nationwide lockdowns, merely 39 per cent of individuals said they would be still in operation and 19 per cent said they would be able to continue to pay their employees’ wages if the lockdown and economic situation were to continue for another three months.329
Commerce and industry, real estate and tourism - major components of the city and national economy - were particularly affected by physical damages due to their concentration in areas impacted by the 4 August 2020 blast.330 The commercial and industry sectors in blast-affected areas are estimated to have experienced damages ranging from USD 105 million to USD 125 million, and losses ranging from USD 285 million to USD 345 million. Of businesses in the area, 56 per cent were affected, with clothing and furniture shops being especially impacted. Damages on financial institutions were estimated at around USD 10-15 million, but the physical damages were less of a concern than ensuing credit losses.331 The tourism sector, vital to the city and national economy, was particularly affected by the blast.332 The estimated damages for the tourism sector were between USD 170 million and USD 205 million and losses of USD 190-235 million, with an expectation that one in five employees in the sector could lose their jobs333 at a time when the tourism sector is facing unprecedented challenges due to COVID-19.
Before the blast, there was a concentration of bars, restaurants and clubs in Gemmayze and Mar Mikhael. As such, two of Beirut’s most important neighbourhoods for the service industry are also two of the most adversely impacted neighbourhoods by the blast. While crucial to the tourism industry, these places were first and foremost a meeting place for residents and a hotspot for the cultural scene in Beirut. In combination with lockdown measures and rapidly decreasing purchasing power, the physical and social impact of the blast (as further discussed in the Cultural Heritage chapter) will thus have a lasting negative effect on economic activities in these areas, with repercussions far beyond.
The 4 August 2020 blast has further impacted businesses in Beirut that were already under distress. According to the United Nations Office for the Coordination of Humanitarian Affairs (OCHA), up to 15,000 businesses suffered physical damages from the blast, amounting to close to half of Beirut’s establishments.334 The Agency for
329 Ibid.
330 World Bank, EU and United Nations, “Beirut Rapid Damage and Needs Assessment.”
331 Ibid.
332 Mercy Corps et al., “Beirut Micro, Medium and Small Enterprise Rapid Needs Assessment Report.”
333 World Bank, EU and United Nations, “Beirut Rapid Damage and Needs Assessment.”
334 OCHA, “Lebanon: Beirut Port Explosions Situation Report No. 8,” 2020.
Technical Cooperation and Development (ACTED) found that the blast has made it impossible for up to 50-60 per cent of SMEs in areas affected by the explosion to resume their operations without financial and reconstruction assistance.335 A survey of 1,164 MSMEs led by Mercy Corps across 21 blast-affected neighbourhoods in Beirut found that 56 per cent of respondents’ businesses had seen their inventory partially or completely destroyed by the blast.336 To situate the effect on the city and national economy, it is worth noting that in 2014, 80 per cent of Lebanese businesses were micro-enterprises and 16 per cent small enterprises.
EmploymentOverall, the service sector employs the largest share of people in Lebanon (76 per cent), followed by industry (20 per cent) and agriculture (4 per cent).337 It should be noted that around 20-25 per cent of the active population, particularly those living in peri-urban and rural areas, are engaged in some form of agricultural activities, including seasonal family labour.338
In the formal sector, wholesale and retail trade accounts for 18.9 per cent and manufacturing for 11.5 per cent. The public sector and financial and insurance activities fall mainly within the formal sector. The public sector (including ministries, public administration and government-owned institutions) accounts for 14 per cent of employment.339 Table 14 shows the total number of public employees and the breakdown for the main employers among public entities, reported by The Daily Star based on unofficial estimates in 2018. It should be noted that based on the ILO and CAS labour force survey (2018-2019) referenced above, total labour force participation was estimated at 48.8 per cent of a working-age population of around 3.7 million persons. With 14 per cent of employment in the public sector, this gives an estimated 249,000 persons employed in the public sector. In other words, there is a significant discrepancy of around 50,000 civil servants when comparing the two sources.
The UN-Habitat-UNICEF and UN-Habitat-RELIEF Centre neighbourhood profiles provide data on employment in local enterprises. Figure 30 shows the share of Lebanese and non-Lebanese employees by enterprises (for surveyed enterprises) across the neighbourhoods. In four neighbourhoods, the share of non-Lebanese employees is higher than Lebanese employees, ranging from 85 per cent in Daouk-Ghawash
335 ACTED, “Beirut Blast Rapid Needs Assessment Report 2020.”
336 Mercy Corps et al., “Beirut Micro, Medium and Small Enterprise Rapid Needs Assessment Report.”
337 ILO and CAS, “Labour Force and Household Living Conditions Survey 2018-2019 Lebanon.”
338 FAO, “Lebanon at a Glance | FAO in Lebanon,” 2021, http://www.fao.org/lebanon/fao-in-lebanon/lebanon-at-a-glance/en/.
339 ILO and CAS, “Labour Force and Household Living Conditions Survey 2018-2019 Lebanon.”
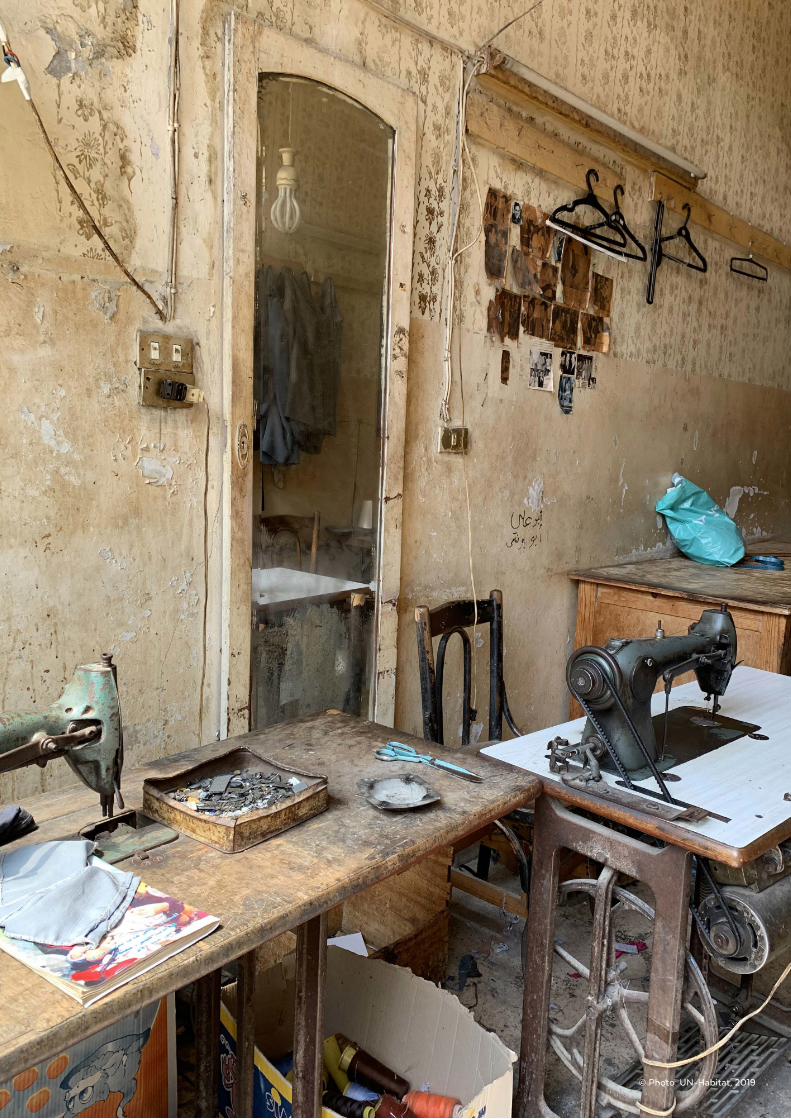
79© Photo: UN-Habitat, 2019
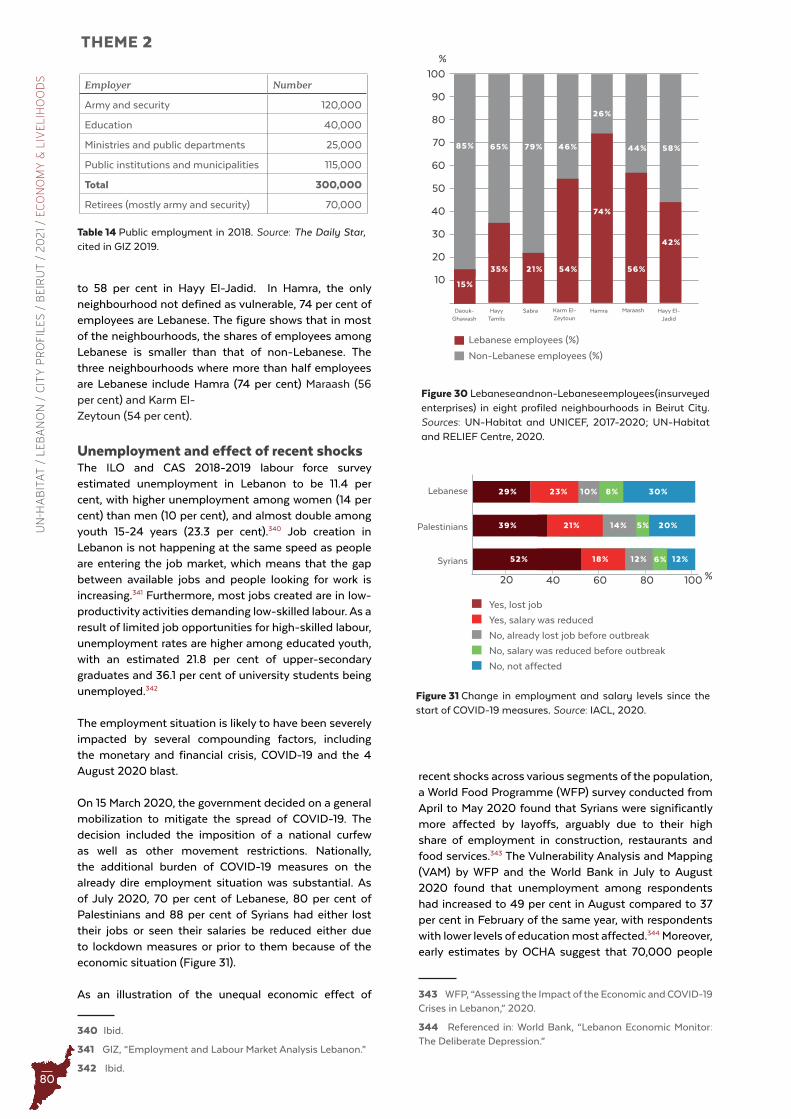
80
UN
-HA
BIT
AT
/ L
EB
AN
ON
/ C
ITY
PR
OFI
LE
S /
BE
IRU
T /
20
21
/ EC
ON
OM
Y &
LIV
EL
IHO
OD
STHEME 2
Employer Number
Army and security 120,000
Education 40,000
Ministries and public departments 25,000
Public institutions and municipalities 115,000
Total 300,000
Retirees (mostly army and security) 70,000
Table 14 Public employment in 2018 . Source: The Daily Star, cited in GIZ 2019 .
to 58 per cent in Hayy El-Jadid. In Hamra, the only neighbourhood not defined as vulnerable, 74 per cent of employees are Lebanese. The figure shows that in most of the neighbourhoods, the shares of employees among Lebanese is smaller than that of non-Lebanese. The three neighbourhoods where more than half employees are Lebanese include Hamra (74 per cent) Maraash (56 per cent) and Karm El-Zeytoun (54 per cent).
Unemployment and effect of recent shocksThe ILO and CAS 2018-2019 labour force survey estimated unemployment in Lebanon to be 11.4 per cent, with higher unemployment among women (14 per cent) than men (10 per cent), and almost double among youth 15-24 years (23.3 per cent).340 Job creation in Lebanon is not happening at the same speed as people are entering the job market, which means that the gap between available jobs and people looking for work is increasing.341 Furthermore, most jobs created are in low-productivity activities demanding low-skilled labour. As a result of limited job opportunities for high-skilled labour, unemployment rates are higher among educated youth, with an estimated 21.8 per cent of upper-secondary graduates and 36.1 per cent of university students being unemployed.342
The employment situation is likely to have been severely impacted by several compounding factors, including the monetary and financial crisis, COVID-19 and the 4 August 2020 blast.
On 15 March 2020, the government decided on a general mobilization to mitigate the spread of COVID-19. The decision included the imposition of a national curfew as well as other movement restrictions. Nationally, the additional burden of COVID-19 measures on the already dire employment situation was substantial. As of July 2020, 70 per cent of Lebanese, 80 per cent of Palestinians and 88 per cent of Syrians had either lost their jobs or seen their salaries be reduced either due to lockdown measures or prior to them because of the economic situation (Figure 31).
As an illustration of the unequal economic effect of
340 Ibid.
341 GIZ, “Employment and Labour Market Analysis Lebanon.”
342 Ibid.
recent shocks across various segments of the population, a World Food Programme (WFP) survey conducted from April to May 2020 found that Syrians were significantly more affected by layoffs, arguably due to their high share of employment in construction, restaurants and food services.343 The Vulnerability Analysis and Mapping (VAM) by WFP and the World Bank in July to August 2020 found that unemployment among respondents had increased to 49 per cent in August compared to 37 per cent in February of the same year, with respondents with lower levels of education most affected.344 Moreover, early estimates by OCHA suggest that 70,000 people
343 WFP, “Assessing the Impact of the Economic and COVID-19 Crises in Lebanon,” 2020.
344 Referenced in: World Bank, “Lebanon Economic Monitor: The Deliberate Depression.”
42%
85%
74%
56%
26%
44%
60
80
70
90
100
%
50
40
30
20
10 15%
35%
65% 79%
21% 54%
46% 58%
Figure 30 Lebanese and non-Lebanese employees (in surveyed enterprises) in eight profiled neighbourhoods in Beirut City . Sources: UN-Habitat and UNICEF, 2017-2020; UN-Habitat and RELIEF Centre, 2020 .
Lebanese employees (%)
Non-Lebanese employees (%)
Hamra Maraash Hayy El-Jadid
Hayy Tamlis
SabraDaouk-Ghawash
Karm El-Zeytoun
Figure 31 Change in employment and salary levels since the start of COVID-19 measures . Source: IACL, 2020 .
Syrians
Palestinians
Lebanese
20 40 60 80 100
52%
39%
29%
21%
23%
14%
10%
18% 12% 12%
20%
30%
6%
5%
8%
Yes, salary was reduced
Yes, lost job
No, already lost job before outbreak
No, salary was reduced before outbreak
No, not affected
%
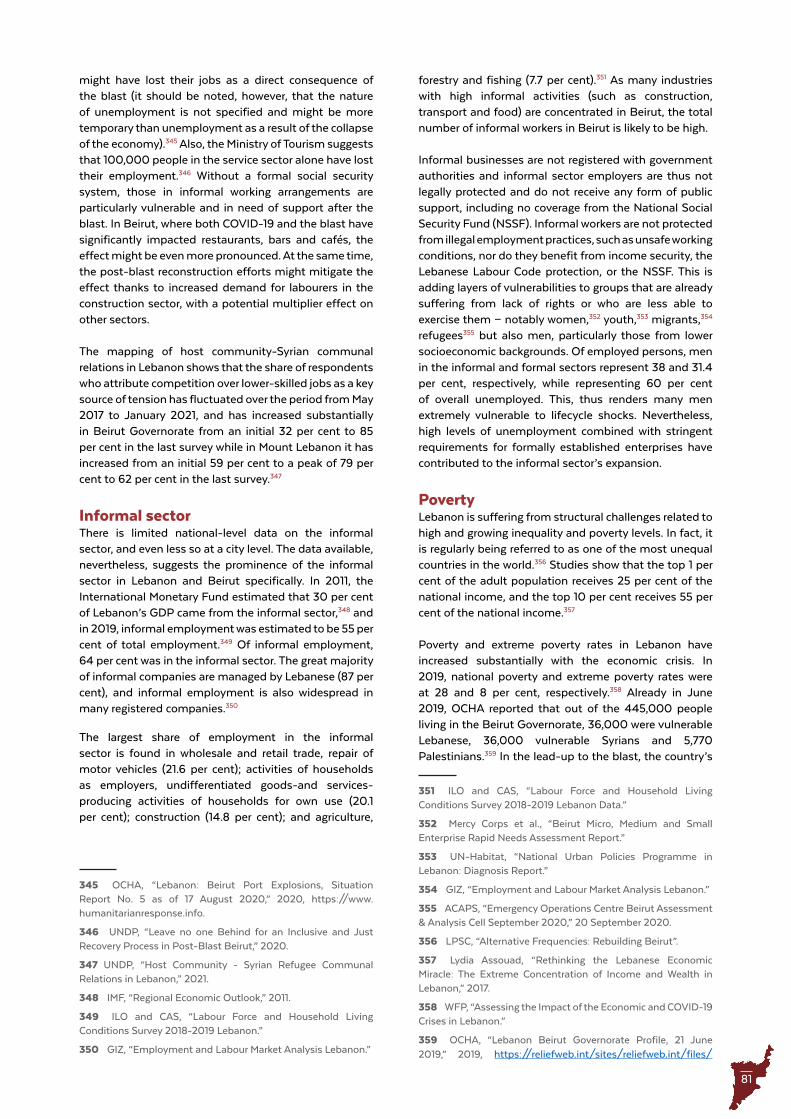
81
might have lost their jobs as a direct consequence of the blast (it should be noted, however, that the nature of unemployment is not specified and might be more temporary than unemployment as a result of the collapse of the economy).345 Also, the Ministry of Tourism suggests that 100,000 people in the service sector alone have lost their employment.346 Without a formal social security system, those in informal working arrangements are particularly vulnerable and in need of support after the blast. In Beirut, where both COVID-19 and the blast have significantly impacted restaurants, bars and cafés, the effect might be even more pronounced. At the same time, the post-blast reconstruction efforts might mitigate the effect thanks to increased demand for labourers in the construction sector, with a potential multiplier effect on other sectors.
The mapping of host community-Syrian communal relations in Lebanon shows that the share of respondents who attribute competition over lower-skilled jobs as a key source of tension has fluctuated over the period from May 2017 to January 2021, and has increased substantially in Beirut Governorate from an initial 32 per cent to 85 per cent in the last survey while in Mount Lebanon it has increased from an initial 59 per cent to a peak of 79 per cent to 62 per cent in the last survey.347
Informal sectorThere is limited national-level data on the informal sector, and even less so at a city level. The data available, nevertheless, suggests the prominence of the informal sector in Lebanon and Beirut specifically. In 2011, the International Monetary Fund estimated that 30 per cent of Lebanon’s GDP came from the informal sector,348 and in 2019, informal employment was estimated to be 55 per cent of total employment.349 Of informal employment, 64 per cent was in the informal sector. The great majority of informal companies are managed by Lebanese (87 per cent), and informal employment is also widespread in many registered companies.350
The largest share of employment in the informal sector is found in wholesale and retail trade, repair of motor vehicles (21.6 per cent); activities of households as employers, undifferentiated goods-and services-producing activities of households for own use (20.1 per cent); construction (14.8 per cent); and agriculture,
345 OCHA, “Lebanon: Beirut Port Explosions, Situation Report No. 5 as of 17 August 2020,” 2020, https://www.humanitarianresponse.info.
346 UNDP, “Leave no one Behind for an Inclusive and Just Recovery Process in Post-Blast Beirut,” 2020.
347 UNDP, “Host Community - Syrian Refugee Communal Relations in Lebanon,” 2021.
348 IMF, “Regional Economic Outlook,” 2011.
349 ILO and CAS, “Labour Force and Household Living Conditions Survey 2018-2019 Lebanon.”
350 GIZ, “Employment and Labour Market Analysis Lebanon.”
forestry and fishing (7.7 per cent).351 As many industries with high informal activities (such as construction, transport and food) are concentrated in Beirut, the total number of informal workers in Beirut is likely to be high.
Informal businesses are not registered with government authorities and informal sector employers are thus not legally protected and do not receive any form of public support, including no coverage from the National Social Security Fund (NSSF). Informal workers are not protected from illegal employment practices, such as unsafe working conditions, nor do they benefit from income security, the Lebanese Labour Code protection, or the NSSF. This is adding layers of vulnerabilities to groups that are already suffering from lack of rights or who are less able to exercise them − notably women,352 youth,353 migrants,354 refugees355 but also men, particularly those from lower socioeconomic backgrounds. Of employed persons, men in the informal and formal sectors represent 38 and 31.4 per cent, respectively, while representing 60 per cent of overall unemployed. This, thus renders many men extremely vulnerable to lifecycle shocks. Nevertheless, high levels of unemployment combined with stringent requirements for formally established enterprises have contributed to the informal sector’s expansion.
PovertyLebanon is suffering from structural challenges related to high and growing inequality and poverty levels. In fact, it is regularly being referred to as one of the most unequal countries in the world.356 Studies show that the top 1 per cent of the adult population receives 25 per cent of the national income, and the top 10 per cent receives 55 per cent of the national income.357
Poverty and extreme poverty rates in Lebanon have increased substantially with the economic crisis. In 2019, national poverty and extreme poverty rates were at 28 and 8 per cent, respectively.358 Already in June 2019, OCHA reported that out of the 445,000 people living in the Beirut Governorate, 36,000 were vulnerable Lebanese, 36,000 vulnerable Syrians and 5,770 Palestinians.359 In the lead-up to the blast, the country’s
351 ILO and CAS, “Labour Force and Household Living Conditions Survey 2018-2019 Lebanon Data.”
352 Mercy Corps et al., “Beirut Micro, Medium and Small Enterprise Rapid Needs Assessment Report.”
353 UN-Habitat, “National Urban Policies Programme in Lebanon: Diagnosis Report.”
354 GIZ, “Employment and Labour Market Analysis Lebanon.”
355 ACAPS, “Emergency Operations Centre Beirut Assessment & Analysis Cell September 2020,” 20 September 2020.
356 LPSC, “Alternative Frequencies: Rebuilding Beirut”.
357 Lydia Assouad, “Rethinking the Lebanese Economic Miracle: The Extreme Concentration of Income and Wealth in Lebanon,” 2017.
358 WFP, “Assessing the Impact of the Economic and COVID-19 Crises in Lebanon.”
359 OCHA, “Lebanon Beirut Governorate Profile, 21 June 2019,” 2019, https://reliefweb.int/sites/reliefweb.int/files/
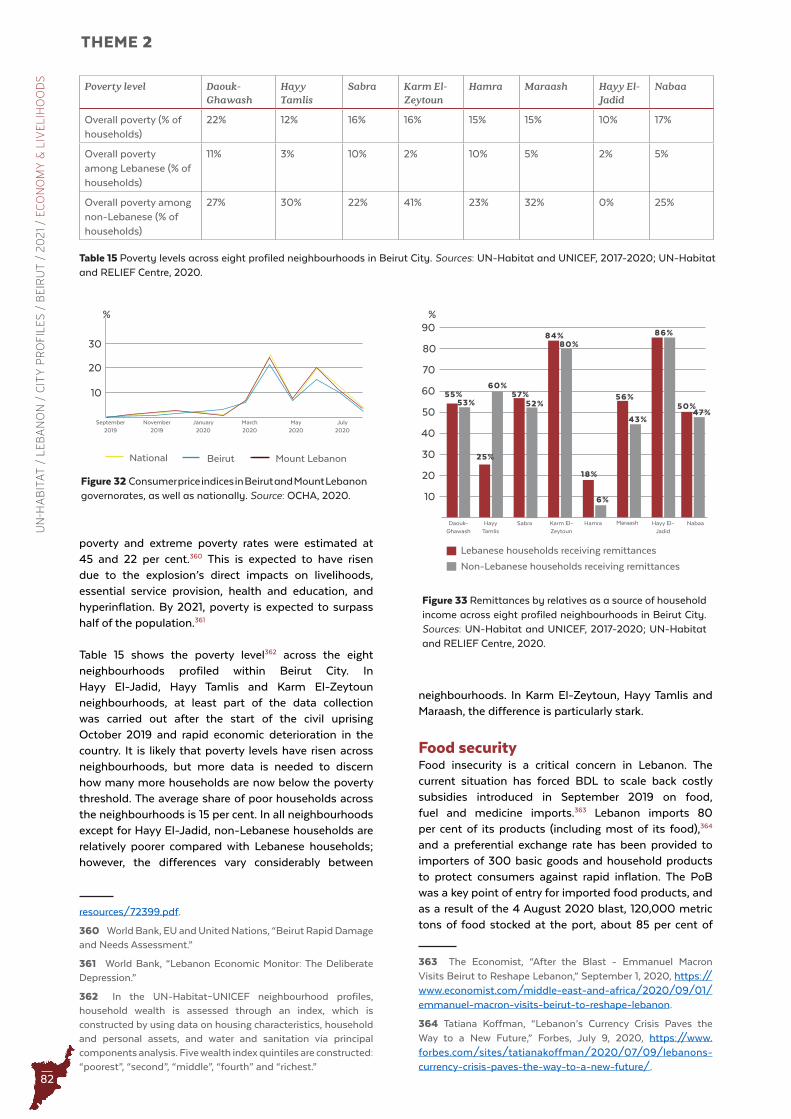
82
UN
-HA
BIT
AT
/ L
EB
AN
ON
/ C
ITY
PR
OFI
LE
S /
BE
IRU
T /
20
21
/ EC
ON
OM
Y &
LIV
EL
IHO
OD
STHEME 2
Poverty level Daouk-Ghawash
Hayy Tamlis
Sabra Karm El-Zeytoun
Hamra Maraash Hayy El-Jadid
Nabaa
Overall poverty (% of households)
22% 12% 16% 16% 15% 15% 10% 17%
Overall poverty among Lebanese (% of households)
11% 3% 10% 2% 10% 5% 2% 5%
Overall poverty among non-Lebanese (% of households)
27% 30% 22% 41% 23% 32% 0% 25%
Table 15 Poverty levels across eight profiled neighbourhoods in Beirut City . Sources: UN-Habitat and UNICEF, 2017-2020; UN-Habitat and RELIEF Centre, 2020 .
86%
50%47%
57%
84%
55%53% 52%
60%
80%
18%
6%
56%
43%
60
70
50
40
30
20
80
90
10
Figure 33 Remittances by relatives as a source of household income across eight profiled neighbourhoods in Beirut City . Sources: UN-Habitat and UNICEF, 2017-2020; UN-Habitat and RELIEF Centre, 2020 .
25%
%
Hamra Maraash Hayy El-Jadid
NabaaHayy Tamlis
SabraDaouk-Ghawash
Lebanese households receiving remittances
Non-Lebanese households receiving remittances
Karm El-Zeytoun
poverty and extreme poverty rates were estimated at 45 and 22 per cent.360 This is expected to have risen due to the explosion’s direct impacts on livelihoods, essential service provision, health and education, and hyperinflation. By 2021, poverty is expected to surpass half of the population.361
Table 15 shows the poverty level362 across the eight neighbourhoods profiled within Beirut City. In Hayy El-Jadid, Hayy Tamlis and Karm El-Zeytoun neighbourhoods, at least part of the data collection was carried out after the start of the civil uprising October 2019 and rapid economic deterioration in the country. It is likely that poverty levels have risen across neighbourhoods, but more data is needed to discern how many more households are now below the poverty threshold. The average share of poor households across the neighbourhoods is 15 per cent. In all neighbourhoods except for Hayy El-Jadid, non-Lebanese households are relatively poorer compared with Lebanese households; however, the differences vary considerably between
resources/72399.pdf.
360 World Bank, EU and United Nations, “Beirut Rapid Damage and Needs Assessment.”
361 World Bank, “Lebanon Economic Monitor: The Deliberate Depression.”
362 In the UN-Habitat–UNICEF neighbourhood profiles, household wealth is assessed through an index, which is constructed by using data on housing characteristics, household and personal assets, and water and sanitation via principal components analysis. Five wealth index quintiles are constructed: “poorest”, “second”, “middle”, “fourth” and “richest.”
neighbourhoods. In Karm El-Zeytoun, Hayy Tamlis and Maraash, the difference is particularly stark.
Food securityFood insecurity is a critical concern in Lebanon. The current situation has forced BDL to scale back costly subsidies introduced in September 2019 on food, fuel and medicine imports.363 Lebanon imports 80 per cent of its products (including most of its food),364 and a preferential exchange rate has been provided to importers of 300 basic goods and household products to protect consumers against rapid inflation. The PoB was a key point of entry for imported food products, and as a result of the 4 August 2020 blast, 120,000 metric tons of food stocked at the port, about 85 per cent of
363 The Economist, “After the Blast - Emmanuel Macron Visits Beirut to Reshape Lebanon,” September 1, 2020, https://www.economist.com/middle-east-and-africa/2020/09/01/emmanuel-macron-visits-beirut-to-reshape-lebanon.
364 Tatiana Koffman, “Lebanon’s Currency Crisis Paves the Way to a New Future,” Forbes, July 9, 2020, https://www.forbes.com/sites/tatianakoffman/2020/07/09/lebanons-currency-crisis-paves-the-way-to-a-new-future/.
Figure 32 Consumer price indices in Beirut and Mount Lebanon governorates, as well as nationally . Source: OCHA, 2020 .
September 2019
November 2019
January 2020
March 2020
July 2020
May 2020
Beirut Mount LebanonNational
%
30
20
10
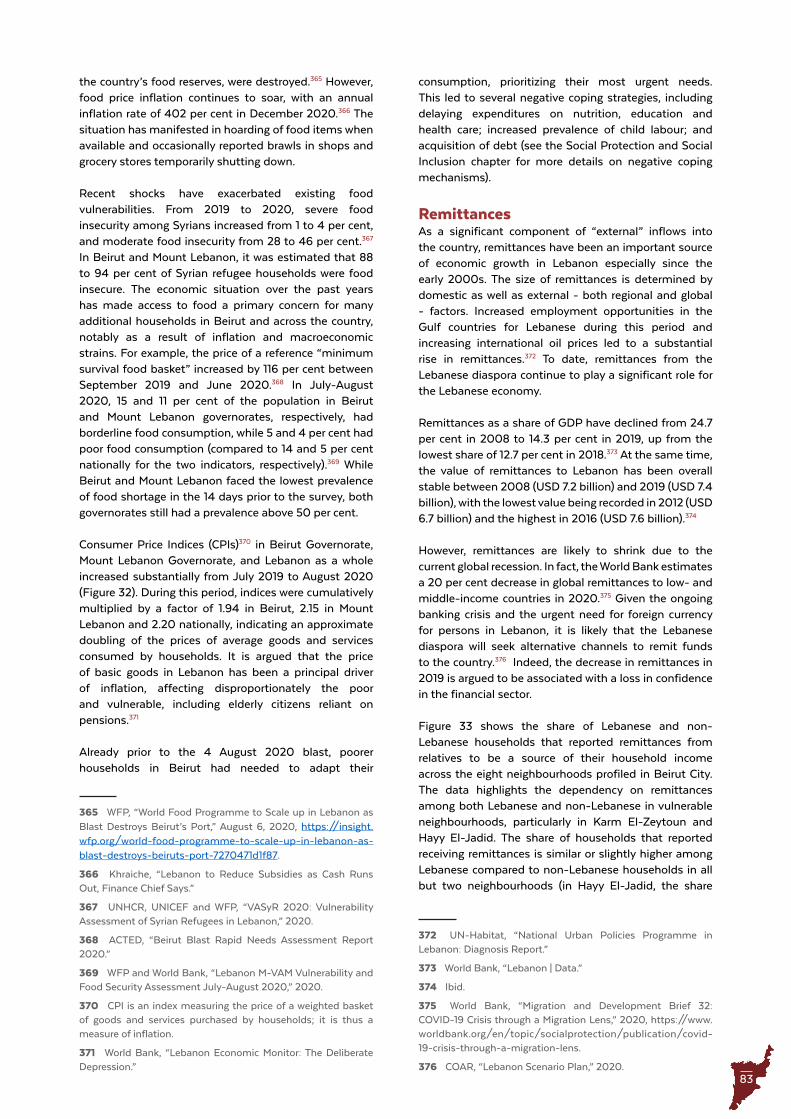
83
the country’s food reserves, were destroyed.365 However, food price inflation continues to soar, with an annual inflation rate of 402 per cent in December 2020.366 The situation has manifested in hoarding of food items when available and occasionally reported brawls in shops and grocery stores temporarily shutting down.
Recent shocks have exacerbated existing food vulnerabilities. From 2019 to 2020, severe food insecurity among Syrians increased from 1 to 4 per cent, and moderate food insecurity from 28 to 46 per cent.367 In Beirut and Mount Lebanon, it was estimated that 88 to 94 per cent of Syrian refugee households were food insecure. The economic situation over the past years has made access to food a primary concern for many additional households in Beirut and across the country, notably as a result of inflation and macroeconomic strains. For example, the price of a reference “minimum survival food basket” increased by 116 per cent between September 2019 and June 2020.368 In July-August 2020, 15 and 11 per cent of the population in Beirut and Mount Lebanon governorates, respectively, had borderline food consumption, while 5 and 4 per cent had poor food consumption (compared to 14 and 5 per cent nationally for the two indicators, respectively).369 While Beirut and Mount Lebanon faced the lowest prevalence of food shortage in the 14 days prior to the survey, both governorates still had a prevalence above 50 per cent.
Consumer Price Indices (CPIs)370 in Beirut Governorate, Mount Lebanon Governorate, and Lebanon as a whole increased substantially from July 2019 to August 2020 (Figure 32). During this period, indices were cumulatively multiplied by a factor of 1.94 in Beirut, 2.15 in Mount Lebanon and 2.20 nationally, indicating an approximate doubling of the prices of average goods and services consumed by households. It is argued that the price of basic goods in Lebanon has been a principal driver of inflation, affecting disproportionately the poor and vulnerable, including elderly citizens reliant on pensions.371
Already prior to the 4 August 2020 blast, poorer households in Beirut had needed to adapt their
365 WFP, “World Food Programme to Scale up in Lebanon as Blast Destroys Beirut’s Port,” August 6, 2020, https://insight.wfp.org/world-food-programme-to-scale-up-in-lebanon-as-blast-destroys-beiruts-port-7270471d1f87.
366 Khraiche, “Lebanon to Reduce Subsidies as Cash Runs Out, Finance Chief Says.”
367 UNHCR, UNICEF and WFP, “VASyR 2020: Vulnerability Assessment of Syrian Refugees in Lebanon,” 2020.
368 ACTED, “Beirut Blast Rapid Needs Assessment Report 2020.”
369 WFP and World Bank, “Lebanon M-VAM Vulnerability and Food Security Assessment July-August 2020,” 2020.
370 CPI is an index measuring the price of a weighted basket of goods and services purchased by households; it is thus a measure of inflation.
371 World Bank, “Lebanon Economic Monitor: The Deliberate Depression.”
consumption, prioritizing their most urgent needs. This led to several negative coping strategies, including delaying expenditures on nutrition, education and health care; increased prevalence of child labour; and acquisition of debt (see the Social Protection and Social Inclusion chapter for more details on negative coping mechanisms).
RemittancesAs a significant component of “external” inflows into the country, remittances have been an important source of economic growth in Lebanon especially since the early 2000s. The size of remittances is determined by domestic as well as external - both regional and global - factors. Increased employment opportunities in the Gulf countries for Lebanese during this period and increasing international oil prices led to a substantial rise in remittances.372 To date, remittances from the Lebanese diaspora continue to play a significant role for the Lebanese economy.
Remittances as a share of GDP have declined from 24.7 per cent in 2008 to 14.3 per cent in 2019, up from the lowest share of 12.7 per cent in 2018.373 At the same time, the value of remittances to Lebanon has been overall stable between 2008 (USD 7.2 billion) and 2019 (USD 7.4 billion), with the lowest value being recorded in 2012 (USD 6.7 billion) and the highest in 2016 (USD 7.6 billion).374
However, remittances are likely to shrink due to the current global recession. In fact, the World Bank estimates a 20 per cent decrease in global remittances to low- and middle-income countries in 2020.375 Given the ongoing banking crisis and the urgent need for foreign currency for persons in Lebanon, it is likely that the Lebanese diaspora will seek alternative channels to remit funds to the country.376 Indeed, the decrease in remittances in 2019 is argued to be associated with a loss in confidence in the financial sector.
Figure 33 shows the share of Lebanese and non-Lebanese households that reported remittances from relatives to be a source of their household income across the eight neighbourhoods profiled in Beirut City. The data highlights the dependency on remittances among both Lebanese and non-Lebanese in vulnerable neighbourhoods, particularly in Karm El-Zeytoun and Hayy El-Jadid. The share of households that reported receiving remittances is similar or slightly higher among Lebanese compared to non-Lebanese households in all but two neighbourhoods (in Hayy El-Jadid, the share
372 UN-Habitat, “National Urban Policies Programme in Lebanon: Diagnosis Report.”
373 World Bank, “Lebanon | Data.”
374 Ibid.
375 World Bank, “Migration and Development Brief 32: COVID-19 Crisis through a Migration Lens,” 2020, https://www.worldbank.org/en/topic/socialprotection/publication/covid-19-crisis-through-a-migration-lens.
376 COAR, “Lebanon Scenario Plan,” 2020.
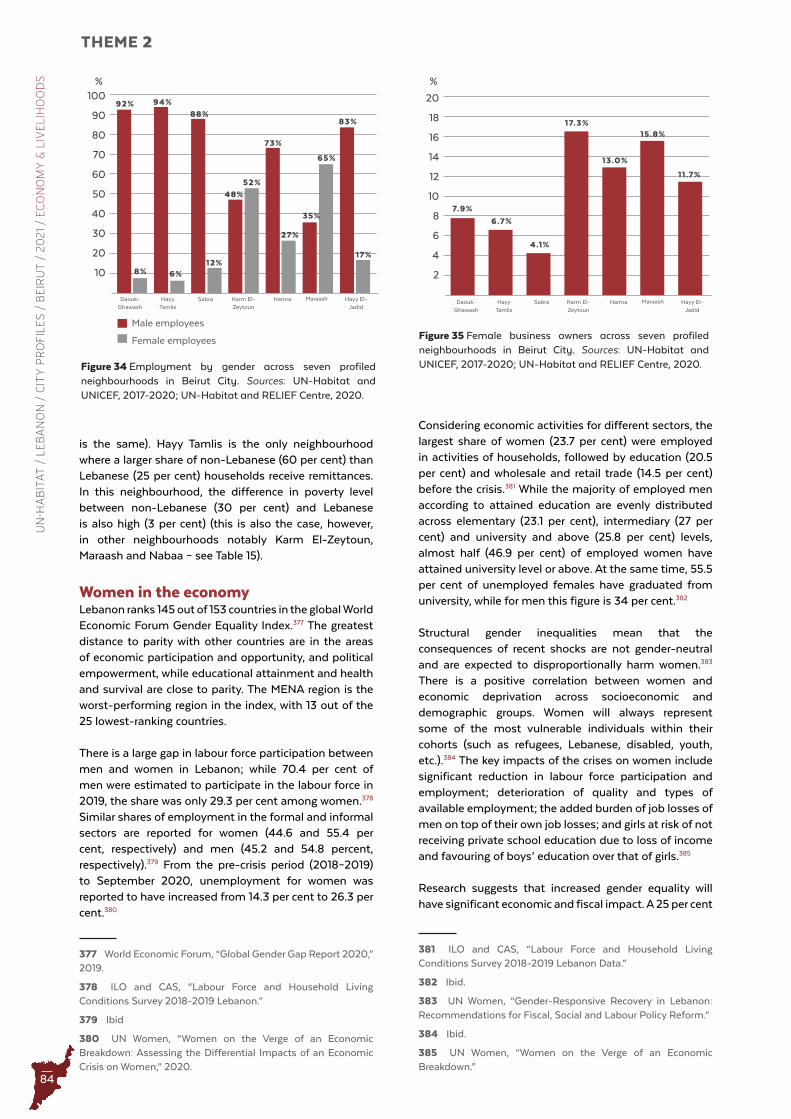
84
UN
-HA
BIT
AT
/ L
EB
AN
ON
/ C
ITY
PR
OFI
LE
S /
BE
IRU
T /
20
21
/ EC
ON
OM
Y &
LIV
EL
IHO
OD
STHEME 2
Figure 34 Employment by gender across seven profiled neighbourhoods in Beirut City . Sources: UN-Habitat and UNICEF, 2017-2020; UN-Habitat and RELIEF Centre, 2020 .
88%92%
8%12%
17%
48%
52%
6%
73%
27%
35%
65%
60
70
80
90
100
50
40
30
20
10
Male employees
Female employees
94%
83%
%
Hamra Maraash Hayy El-Jadid
Hayy Tamlis
SabraDaouk-Ghawash
Karm El-Zeytoun
4.1%
7.9%
17.3%
13.0%
15.8%
12
14
16
18
20
10
8
6
4
2
6.7%
11.7%
%
Hamra Maraash Hayy El-Jadid
Hayy Tamlis
SabraDaouk-Ghawash
Karm El-Zeytoun
is the same). Hayy Tamlis is the only neighbourhood where a larger share of non-Lebanese (60 per cent) than Lebanese (25 per cent) households receive remittances. In this neighbourhood, the difference in poverty level between non-Lebanese (30 per cent) and Lebanese is also high (3 per cent) (this is also the case, however, in other neighbourhoods notably Karm El-Zeytoun, Maraash and Nabaa – see Table 15).
Women in the economyLebanon ranks 145 out of 153 countries in the global World Economic Forum Gender Equality Index.377 The greatest distance to parity with other countries are in the areas of economic participation and opportunity, and political empowerment, while educational attainment and health and survival are close to parity. The MENA region is the worst-performing region in the index, with 13 out of the 25 lowest-ranking countries.
There is a large gap in labour force participation between men and women in Lebanon; while 70.4 per cent of men were estimated to participate in the labour force in 2019, the share was only 29.3 per cent among women.378 Similar shares of employment in the formal and informal sectors are reported for women (44.6 and 55.4 per cent, respectively) and men (45.2 and 54.8 percent, respectively).379 From the pre-crisis period (2018–2019) to September 2020, unemployment for women was reported to have increased from 14.3 per cent to 26.3 per cent.380
377 World Economic Forum, “Global Gender Gap Report 2020,” 2019.
378 ILO and CAS, “Labour Force and Household Living Conditions Survey 2018-2019 Lebanon.”
379 Ibid
380 UN Women, “Women on the Verge of an Economic Breakdown: Assessing the Differential Impacts of an Economic Crisis on Women,” 2020.
Considering economic activities for different sectors, the largest share of women (23.7 per cent) were employed in activities of households, followed by education (20.5 per cent) and wholesale and retail trade (14.5 per cent) before the crisis.381 While the majority of employed men according to attained education are evenly distributed across elementary (23.1 per cent), intermediary (27 per cent) and university and above (25.8 per cent) levels, almost half (46.9 per cent) of employed women have attained university level or above. At the same time, 55.5 per cent of unemployed females have graduated from university, while for men this figure is 34 per cent.382
Structural gender inequalities mean that the consequences of recent shocks are not gender-neutral and are expected to disproportionally harm women.383 There is a positive correlation between women and economic deprivation across socioeconomic and demographic groups. Women will always represent some of the most vulnerable individuals within their cohorts (such as refugees, Lebanese, disabled, youth, etc.).384 The key impacts of the crises on women include significant reduction in labour force participation and employment; deterioration of quality and types of available employment; the added burden of job losses of men on top of their own job losses; and girls at risk of not receiving private school education due to loss of income and favouring of boys’ education over that of girls.385
Research suggests that increased gender equality will have significant economic and fiscal impact. A 25 per cent
381 ILO and CAS, “Labour Force and Household Living Conditions Survey 2018-2019 Lebanon Data.”
382 Ibid.
383 UN Women, “Gender-Responsive Recovery in Lebanon: Recommendations for Fiscal, Social and Labour Policy Reform.”
384 Ibid.
385 UN Women, “Women on the Verge of an Economic Breakdown.”
Figure 35 Female business owners across seven profiled neighbourhoods in Beirut City . Sources: UN-Habitat and UNICEF, 2017-2020; UN-Habitat and RELIEF Centre, 2020 .
85
reduction in the gender gap between male and female labour force participation, for example, is estimated to increase GDP by 9 per cent.386 Having more women in the formal labour market is furthermore expected to expand the tax base. In other words, increased participation of women in the labour market represents an untapped potential for the economy.
Figure 34 shows the share of male and female employees recorded through the neighbourhood profiles. In most neighbourhoods, the majority of employees are men. In Karm El-Zeytoun, however, more than half (52 per cent) of employees are women. In the KIIs with business owners in Karm El-Zeytoun as part of the neighbourhood profiling, both men and women interviewees reported on the challenge of securing their livelihood and that jobs are not stable, and women furthermore pointed to physical harassment and the need for connections to guarantee a job. The fact that half of the workshops in Karm El-Zeytoun do not employ workers, and that 41 per cent of shops employ one individual, suggests that the larger share of female employees might reflect the overall limited number of jobs available in local enterprises.
Interviews conducted in response to COVID-19 show that only 11 per cent of women, compared with 57 per cent of men, reported to have control over their income, while 64 per cent did not have an income.387 Indeed, in 2018-2019, around 18 per cent of households were headed by women and 82 per cent by men. At the same time, in blast-affected areas, the MSNA found that almost half of the households self-identified as being women-headed.388 While unclear why this is the case, the assessment suggests that this is a positive indication of women’s perspectives and economic decision-making in these areas.389
It is interesting to note that the post-blast assessment of 1,164 MSMEs across 21 blast-affected neighbourhoods in Beirut found that a higher share of male-owned businesses, which registered officially (69 per cent) compared to female-owned businesses (50 per cent).390 This indicates less secure employment and livelihood for female businesses. In addition, it was found that larger businesses that are considered to be more resilient to shocks, were more likely to employ men than women.391 Despite the reason for this being unclear, it suggests that female entrepreneurs and employees in Beirut have less business and employment security compared to men.
386 ILO, “How Much Would the World Economy Grow by Closing the Gender Gap?,” in UN Women.
387 ACAPS, “Emergency Operations Centre Beirut Assessment & Analysis Cell August 2020.”
388 OCHA, ACTED and UN Women, “Emerging Gender Analysis: Gender Findings from the Multi-Partner Multi-Sectorial Needs Assessment (MSNA) of the Beirut Explosion.” 2020.
389 OCHA, ACTED and UN Women, “Emerging Gender Analysis.”
390 Mercy Corps et al., “Beirut Micro, Medium and Small Enterprise Rapid Needs Assessment Report.”
391 Ibid.
The seven neighbourhood profiles show that in all neighbourhoods, less than 20 per cent of enterprises are owned by women (Figure 35). The same neighbourhoods that have a relatively higher share of female business owners also have a higher share of female employees. The three neighbourhoods with the lowest share of female business owners (Daouk-Ghawash, Hayy Tamlis and Sabra) also have a lower share of Lebanese business owners and Lebanese employees.
Youth in the economyIt is estimated that unemployment rate among youth (aged 15-24) in Lebanon was 23 per cent in 2019, more than double the overall unemployment rate (11 per cent).392 According to the 2004 Lebanon National Survey of Household Living Conditions report, approximately 70 per cent of the country’s employed youth (aged 15-24) were working in the informal sector.393 This suggests a long-standing lack of stable and secure labour market opportunities for youth, which has persisted and has likely only increased over time.394
More highly educated youth are more affected by unemployment than less educated youth,395 reflecting an untapped potential for “highly skilled” (in the traditional sense) economic development. It is worth noting that at the same time, Lebanese companies report that they have challenges finding the skills they need.396
The emigration of a large a number of young persons is a concern and an increasing challenge, as the perceived and real opportunities to find employment in Beirut have been diminishing. The high share of youth among Lebanese emigrants, who are often highly educated,397 is driven by high unemployment rates and low salaries398 that do not reflect the living costs in Beirut and Mount Lebanon, and most recently as a direct consequence of the 4 August 2020 blast. The previous and potential brain drain has, and continues to, represent a significant limiting factor for the country’s economic and innovation potential.399 As further discussed in the Health section of the Basic and Social Services chapter, the exodus of doctors from Lebanon is one current example of high
392 ILO and CAS, “Labour Force and Household Living Conditions Survey 2018-2019 Lebanon.”
393 Diego F. Angel-Urdinola and Kimie Tanabe, “Micro-Determinants of Informal Employment in the Middle East and North Africa Region,” January 2012, https://doi.org/10.1596/26828.
394 GIZ, “Employment and Labour Market Analysis Lebanon.”
395 Ibid.
396 UNHCR, “LCRP 2017 Livelihoods Sector Chapter.”
397 ETF, “Migrant Support Measures From an Employment and Skills Perspective (MISMES),” 2018.
398 Ghassan Dibeh, Ali Fakih, and Walid Marrouch, “Decision to Emigrate Among the Youth in Lebanon,” International Migration 56, no.1:5-22 (February 2018), https://doi.org/10.1111/imig.12347.
399 United Nations, “United Nations Strategic Framework (UNSF) Lebanon 2017-2020.”
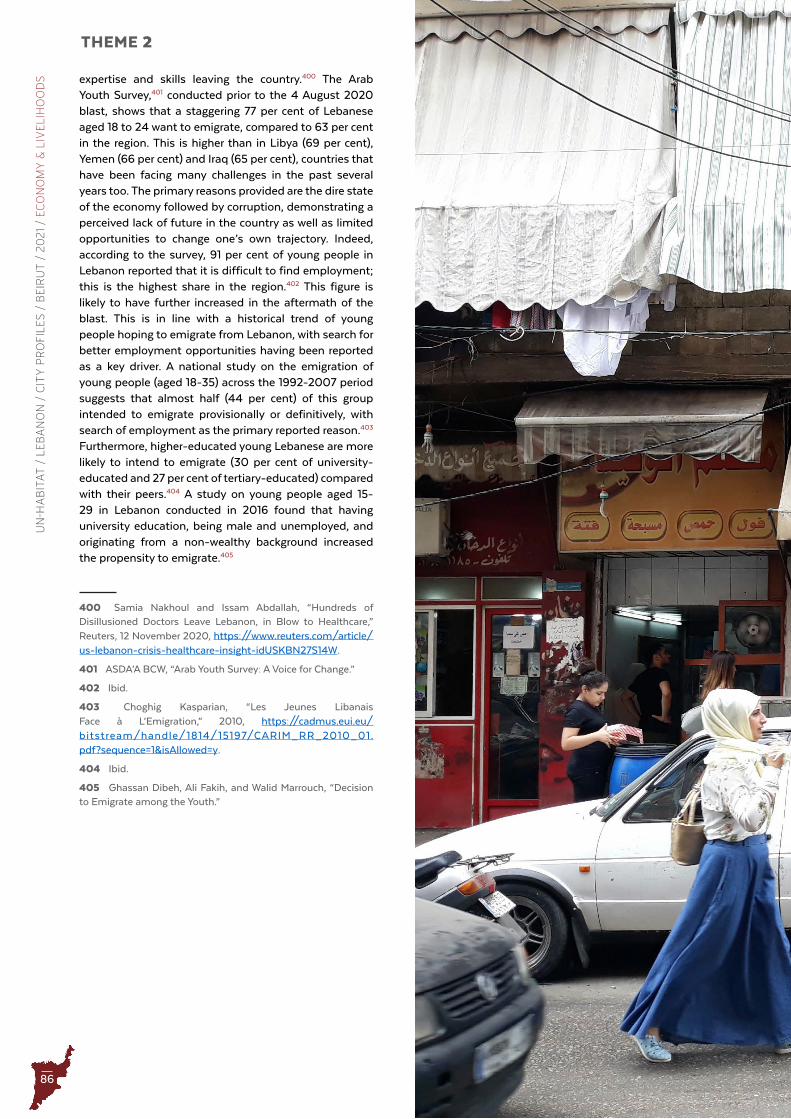
86
UN
-HA
BIT
AT
/ L
EB
AN
ON
/ C
ITY
PR
OFI
LE
S /
BE
IRU
T /
20
21
/ EC
ON
OM
Y &
LIV
EL
IHO
OD
STHEME 2
expertise and skills leaving the country.400 The Arab Youth Survey,401 conducted prior to the 4 August 2020 blast, shows that a staggering 77 per cent of Lebanese aged 18 to 24 want to emigrate, compared to 63 per cent in the region. This is higher than in Libya (69 per cent), Yemen (66 per cent) and Iraq (65 per cent), countries that have been facing many challenges in the past several years too. The primary reasons provided are the dire state of the economy followed by corruption, demonstrating a perceived lack of future in the country as well as limited opportunities to change one’s own trajectory. Indeed, according to the survey, 91 per cent of young people in Lebanon reported that it is difficult to find employment; this is the highest share in the region.402 This figure is likely to have further increased in the aftermath of the blast. This is in line with a historical trend of young people hoping to emigrate from Lebanon, with search for better employment opportunities having been reported as a key driver. A national study on the emigration of young people (aged 18-35) across the 1992-2007 period suggests that almost half (44 per cent) of this group intended to emigrate provisionally or definitively, with search of employment as the primary reported reason.403 Furthermore, higher-educated young Lebanese are more likely to intend to emigrate (30 per cent of university-educated and 27 per cent of tertiary-educated) compared with their peers.404 A study on young people aged 15-29 in Lebanon conducted in 2016 found that having university education, being male and unemployed, and originating from a non-wealthy background increased the propensity to emigrate.405
400 Samia Nakhoul and Issam Abdallah, “Hundreds of Disillusioned Doctors Leave Lebanon, in Blow to Healthcare,” Reuters, 12 November 2020, https://www.reuters.com/article/us-lebanon-crisis-healthcare-insight-idUSKBN27S14W.
401 ASDA’A BCW, “Arab Youth Survey: A Voice for Change.”
402 Ibid.
403 Choghig Kasparian, “Les Jeunes Libanais Face à L’Emigration,” 2010, https://cadmus.eui.eu/bitstream/handle/1814/15197/CARIM_RR_2010_01.pdf?sequence=1&isAllowed=y.
404 Ibid.
405 Ghassan Dibeh, Ali Fakih, and Walid Marrouch, “Decision to Emigrate among the Youth.”
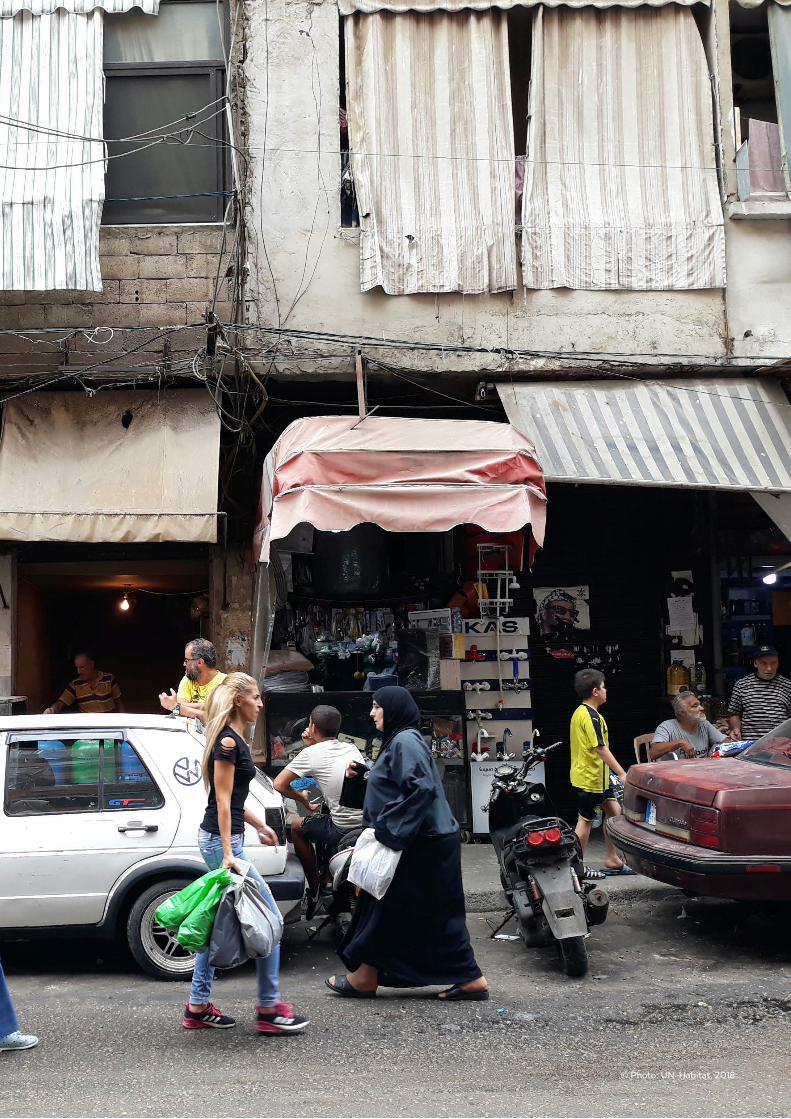
87© Photo: UN-Habitat, 2021
© Photo: UN-Habitat, 2018
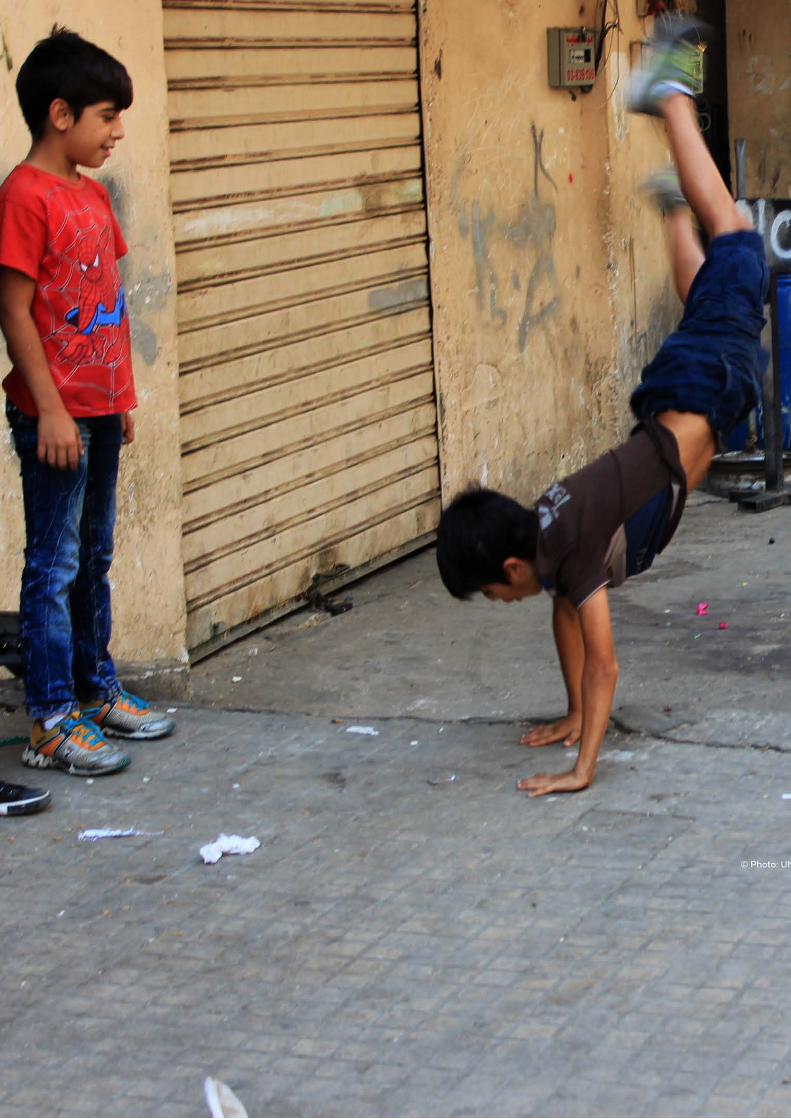
88
THEME 3U
N-H
AB
ITA
T /
LE
BA
NO
N /
CIT
Y P
RO
FIL
ES
/ B
EIR
UT
/ 2
02
1 /
SO
CIA
L P
RO
TEC
TIO
N &
SO
CIA
L IN
CLU
SIO
N
Theme 3 Social Protection
and Social Inclusion
© Photo: UN-Habitat, 2021
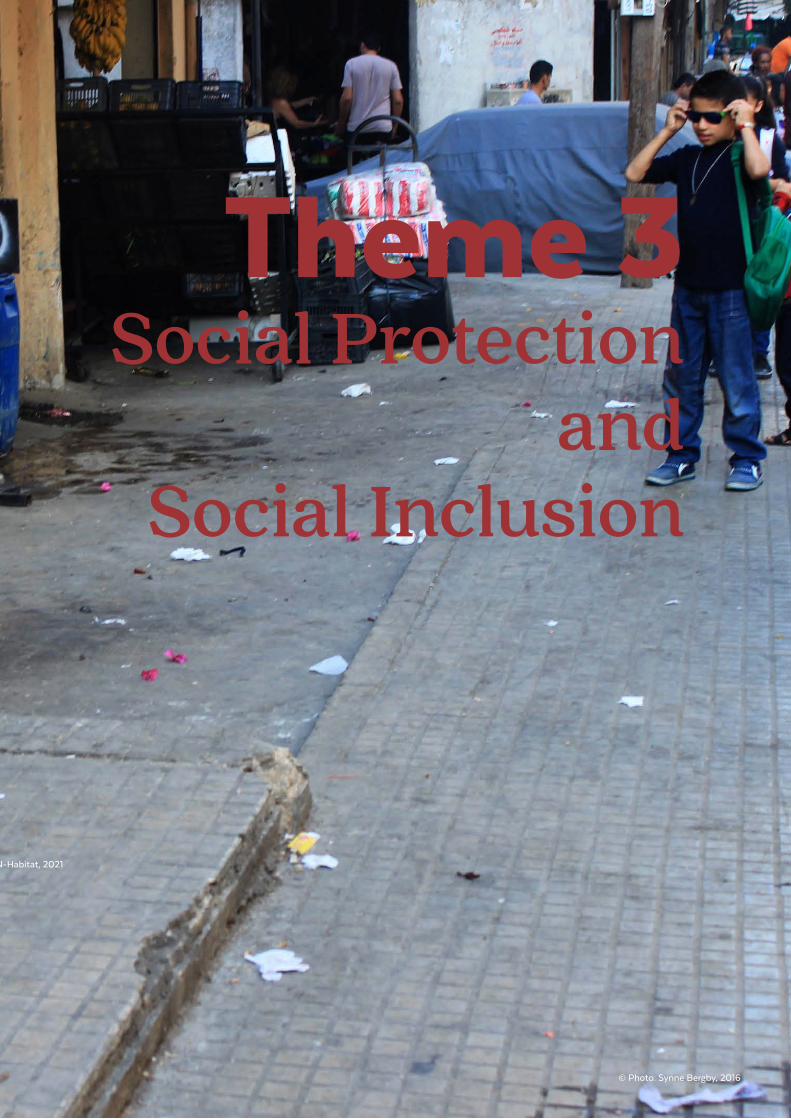
89
Theme 3 Social Protection
and Social Inclusion
© Photo: Synne Bergby, 2016
© Photo: UN-Habitat, 2021

90
THEME 3U
N-H
AB
ITA
T /
LE
BA
NO
N /
CIT
Y P
RO
FIL
ES
/ B
EIR
UT
/ 2
02
1 /
SO
CIA
L P
RO
TEC
TIO
N &
SO
CIA
L IN
CLU
SIO
N
Social protection and social inclusionChapter summary Social protection406 remains highly fragmented in Lebanon. In Beirut, a city suffering from severe structural challenges and high inequalities, compounding crises have raised specific protection concerns. The economic and financial collapse has aggravated the consequences of poor public social infrastructure and weak protection schemes. The lack of access to comprehensive and inclusive social safety nets is affecting a large share of Beirut’s population, including a growing number among the middle class. This is manifesting in different ways, such as increased prevalence of negative coping mechanisms, SGBV and more children out of school. Moreover, the collective and individual trauma in the aftermath of the 4 August 2020 blast has led to an acute need for mental health services.
The situation has contributed to increased tensions between groups in Beirut along social, ethnic and religious fault lines, with risks of increased fragmentation of the city’s social and cultural fabric. There is a rising trend of “hunger-crime” in Beirut. At the same time, the civil uprising and the solidarity displayed after the 4 August 2020 blast illustrate how people have come together in the face of extreme difficulties.
406 Social protection, as defined in the 3RF, includes five components: social assistance; social insurance; financial access to services (especially health and education); economic inclusion and labour activation; and social welfare.
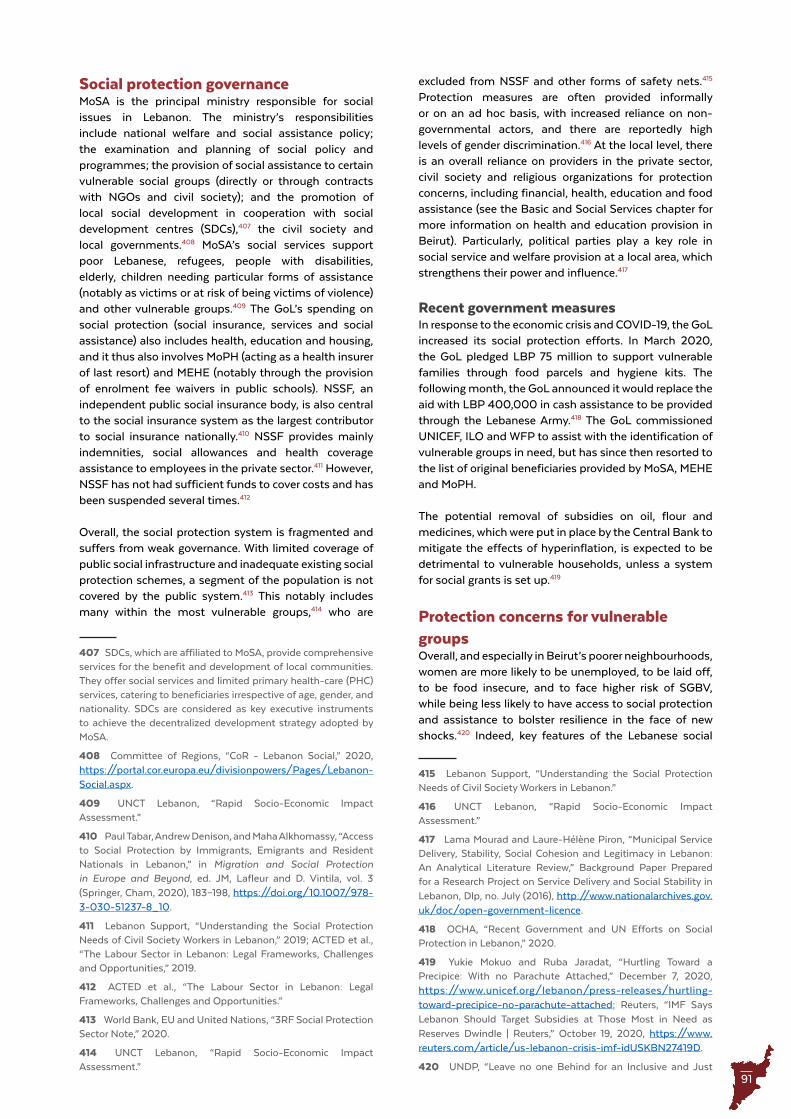
91
Social protection governanceMoSA is the principal ministry responsible for social issues in Lebanon. The ministry’s responsibilities include national welfare and social assistance policy; the examination and planning of social policy and programmes; the provision of social assistance to certain vulnerable social groups (directly or through contracts with NGOs and civil society); and the promotion of local social development in cooperation with social development centres (SDCs),407 the civil society and local governments.408 MoSA’s social services support poor Lebanese, refugees, people with disabilities, elderly, children needing particular forms of assistance (notably as victims or at risk of being victims of violence) and other vulnerable groups.409 The GoL’s spending on social protection (social insurance, services and social assistance) also includes health, education and housing, and it thus also involves MoPH (acting as a health insurer of last resort) and MEHE (notably through the provision of enrolment fee waivers in public schools). NSSF, an independent public social insurance body, is also central to the social insurance system as the largest contributor to social insurance nationally.410 NSSF provides mainly indemnities, social allowances and health coverage assistance to employees in the private sector.411 However, NSSF has not had sufficient funds to cover costs and has been suspended several times.412
Overall, the social protection system is fragmented and suffers from weak governance. With limited coverage of public social infrastructure and inadequate existing social protection schemes, a segment of the population is not covered by the public system.413 This notably includes many within the most vulnerable groups,414 who are
407 SDCs, which are affiliated to MoSA, provide comprehensive services for the benefit and development of local communities. They offer social services and limited primary health-care (PHC) services, catering to beneficiaries irrespective of age, gender, and nationality. SDCs are considered as key executive instruments to achieve the decentralized development strategy adopted by MoSA.
408 Committee of Regions, “CoR - Lebanon Social,” 2020, https://portal.cor.europa.eu/divisionpowers/Pages/Lebanon-Social.aspx.
409 UNCT Lebanon, “Rapid Socio-Economic Impact Assessment.”
410 Paul Tabar, Andrew Denison, and Maha Alkhomassy, “Access to Social Protection by Immigrants, Emigrants and Resident Nationals in Lebanon,” in Migration and Social Protection in Europe and Beyond, ed. JM, Lafleur and D. Vintila, vol. 3 (Springer, Cham, 2020), 183–198, https://doi.org/10.1007/978-3-030-51237-8_10.
411 Lebanon Support, “Understanding the Social Protection Needs of Civil Society Workers in Lebanon,” 2019; ACTED et al., “The Labour Sector in Lebanon: Legal Frameworks, Challenges and Opportunities,” 2019.
412 ACTED et al., “The Labour Sector in Lebanon: Legal Frameworks, Challenges and Opportunities.”
413 World Bank, EU and United Nations, “3RF Social Protection Sector Note,” 2020.
414 UNCT Lebanon, “Rapid Socio-Economic Impact Assessment.”
excluded from NSSF and other forms of safety nets.415 Protection measures are often provided informally or on an ad hoc basis, with increased reliance on non-governmental actors, and there are reportedly high levels of gender discrimination.416 At the local level, there is an overall reliance on providers in the private sector, civil society and religious organizations for protection concerns, including financial, health, education and food assistance (see the Basic and Social Services chapter for more information on health and education provision in Beirut). Particularly, political parties play a key role in social service and welfare provision at a local area, which strengthens their power and influence.417
Recent government measuresIn response to the economic crisis and COVID-19, the GoL increased its social protection efforts. In March 2020, the GoL pledged LBP 75 million to support vulnerable families through food parcels and hygiene kits. The following month, the GoL announced it would replace the aid with LBP 400,000 in cash assistance to be provided through the Lebanese Army.418 The GoL commissioned UNICEF, ILO and WFP to assist with the identification of vulnerable groups in need, but has since then resorted to the list of original beneficiaries provided by MoSA, MEHE and MoPH.
The potential removal of subsidies on oil, flour and medicines, which were put in place by the Central Bank to mitigate the effects of hyperinflation, is expected to be detrimental to vulnerable households, unless a system for social grants is set up.419
Protection concerns for vulnerable groupsOverall, and especially in Beirut’s poorer neighbourhoods, women are more likely to be unemployed, to be laid off, to be food insecure, and to face higher risk of SGBV, while being less likely to have access to social protection and assistance to bolster resilience in the face of new shocks.420 Indeed, key features of the Lebanese social
415 Lebanon Support, “Understanding the Social Protection Needs of Civil Society Workers in Lebanon.”
416 UNCT Lebanon, “Rapid Socio-Economic Impact Assessment.”
417 Lama Mourad and Laure-Hélène Piron, “Municipal Service Delivery, Stability, Social Cohesion and Legitimacy in Lebanon: An Analytical Literature Review,” Background Paper Prepared for a Research Project on Service Delivery and Social Stability in Lebanon, Dlp, no. July (2016), http://www.nationalarchives.gov.uk/doc/open-government-licence.
418 OCHA, “Recent Government and UN Efforts on Social Protection in Lebanon,” 2020.
419 Yukie Mokuo and Ruba Jaradat, “Hurtling Toward a Precipice: With no Parachute Attached,” December 7, 2020, https://www.unicef.org/lebanon/press-releases/hurtling-toward-precipice-no-parachute-attached; Reuters, “IMF Says Lebanon Should Target Subsidies at Those Most in Need as Reserves Dwindle | Reuters,” October 19, 2020, https://www.reuters.com/article/us-lebanon-crisis-imf-idUSKBN27419D.
420 UNDP, “Leave no one Behind for an Inclusive and Just
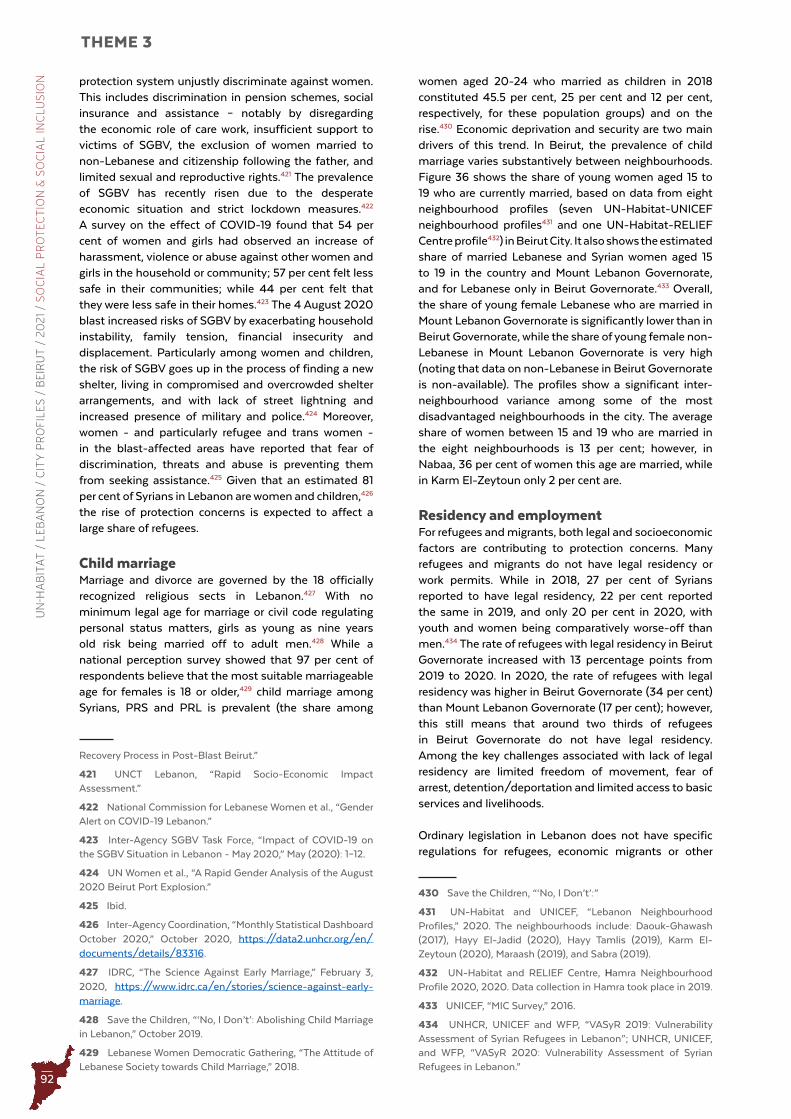
92
THEME 3U
N-H
AB
ITA
T /
LE
BA
NO
N /
CIT
Y P
RO
FIL
ES
/ B
EIR
UT
/ 2
02
1 /
SO
CIA
L P
RO
TEC
TIO
N &
SO
CIA
L IN
CLU
SIO
N protection system unjustly discriminate against women. This includes discrimination in pension schemes, social insurance and assistance – notably by disregarding the economic role of care work, insufficient support to victims of SGBV, the exclusion of women married to non-Lebanese and citizenship following the father, and limited sexual and reproductive rights.421 The prevalence of SGBV has recently risen due to the desperate economic situation and strict lockdown measures.422 A survey on the effect of COVID-19 found that 54 per cent of women and girls had observed an increase of harassment, violence or abuse against other women and girls in the household or community; 57 per cent felt less safe in their communities; while 44 per cent felt that they were less safe in their homes.423 The 4 August 2020 blast increased risks of SGBV by exacerbating household instability, family tension, financial insecurity and displacement. Particularly among women and children, the risk of SGBV goes up in the process of finding a new shelter, living in compromised and overcrowded shelter arrangements, and with lack of street lightning and increased presence of military and police.424 Moreover, women - and particularly refugee and trans women - in the blast-affected areas have reported that fear of discrimination, threats and abuse is preventing them from seeking assistance.425 Given that an estimated 81 per cent of Syrians in Lebanon are women and children,426 the rise of protection concerns is expected to affect a large share of refugees.
Child marriageMarriage and divorce are governed by the 18 officially recognized religious sects in Lebanon.427 With no minimum legal age for marriage or civil code regulating personal status matters, girls as young as nine years old risk being married off to adult men.428 While a national perception survey showed that 97 per cent of respondents believe that the most suitable marriageable age for females is 18 or older,429 child marriage among Syrians, PRS and PRL is prevalent (the share among
Recovery Process in Post-Blast Beirut.”
421 UNCT Lebanon, “Rapid Socio-Economic Impact Assessment.”
422 National Commission for Lebanese Women et al., “Gender Alert on COVID-19 Lebanon.”
423 Inter-Agency SGBV Task Force, “Impact of COVID-19 on the SGBV Situation in Lebanon - May 2020,” May (2020): 1–12.
424 UN Women et al., “A Rapid Gender Analysis of the August 2020 Beirut Port Explosion.”
425 Ibid.
426 Inter-Agency Coordination, “Monthly Statistical Dashboard October 2020,” October 2020, https://data2.unhcr.org/en/documents/details/83316.
427 IDRC, “The Science Against Early Marriage,” February 3, 2020, https://www.idrc.ca/en/stories/science-against-early-marriage.
428 Save the Children, “‘No, I Don’t’: Abolishing Child Marriage in Lebanon,” October 2019.
429 Lebanese Women Democratic Gathering, “The Attitude of Lebanese Society towards Child Marriage,” 2018.
women aged 20-24 who married as children in 2018 constituted 45.5 per cent, 25 per cent and 12 per cent, respectively, for these population groups) and on the rise.430 Economic deprivation and security are two main drivers of this trend. In Beirut, the prevalence of child marriage varies substantively between neighbourhoods. Figure 36 shows the share of young women aged 15 to 19 who are currently married, based on data from eight neighbourhood profiles (seven UN-Habitat-UNICEF neighbourhood profiles431 and one UN-Habitat-RELIEF Centre profile432) in Beirut City. It also shows the estimated share of married Lebanese and Syrian women aged 15 to 19 in the country and Mount Lebanon Governorate, and for Lebanese only in Beirut Governorate.433 Overall, the share of young female Lebanese who are married in Mount Lebanon Governorate is significantly lower than in Beirut Governorate, while the share of young female non-Lebanese in Mount Lebanon Governorate is very high (noting that data on non-Lebanese in Beirut Governorate is non-available). The profiles show a significant inter-neighbourhood variance among some of the most disadvantaged neighbourhoods in the city. The average share of women between 15 and 19 who are married in the eight neighbourhoods is 13 per cent; however, in Nabaa, 36 per cent of women this age are married, while in Karm El-Zeytoun only 2 per cent are.
Residency and employmentFor refugees and migrants, both legal and socioeconomic factors are contributing to protection concerns. Many refugees and migrants do not have legal residency or work permits. While in 2018, 27 per cent of Syrians reported to have legal residency, 22 per cent reported the same in 2019, and only 20 per cent in 2020, with youth and women being comparatively worse-off than men.434 The rate of refugees with legal residency in Beirut Governorate increased with 13 percentage points from 2019 to 2020. In 2020, the rate of refugees with legal residency was higher in Beirut Governorate (34 per cent) than Mount Lebanon Governorate (17 per cent); however, this still means that around two thirds of refugees in Beirut Governorate do not have legal residency. Among the key challenges associated with lack of legal residency are limited freedom of movement, fear of arrest, detention/deportation and limited access to basic services and livelihoods.
Ordinary legislation in Lebanon does not have specific regulations for refugees, economic migrants or other
430 Save the Children, “‘No, I Don’t’:”
431 UN-Habitat and UNICEF, “Lebanon Neighbourhood Profiles,” 2020. The neighbourhoods include: Daouk-Ghawash (2017), Hayy El-Jadid (2020), Hayy Tamlis (2019), Karm El-Zeytoun (2020), Maraash (2019), and Sabra (2019).
432 UN-Habitat and RELIEF Centre, Hamra Neighbourhood Profile 2020, 2020. Data collection in Hamra took place in 2019.
433 UNICEF, “MIC Survey,” 2016.
434 UNHCR, UNICEF and WFP, “VASyR 2019: Vulnerability Assessment of Syrian Refugees in Lebanon”; UNHCR, UNICEF, and WFP, “VASyR 2020: Vulnerability Assessment of Syrian Refugees in Lebanon.”
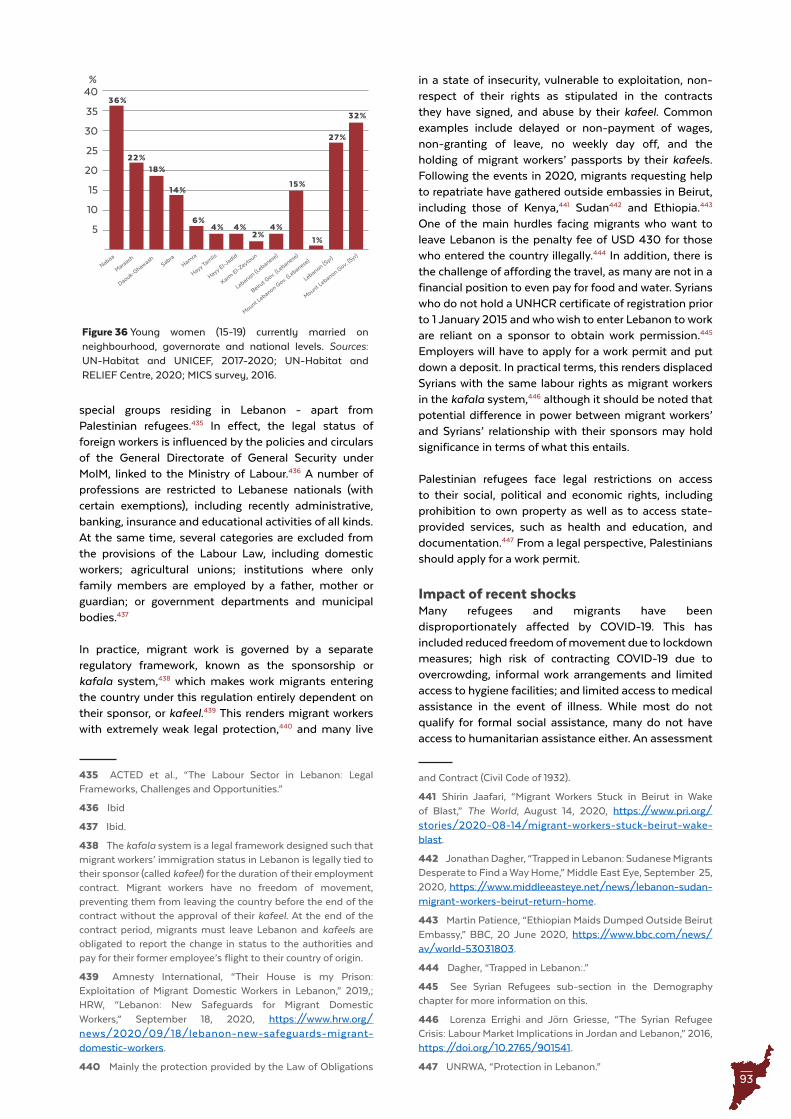
93
Karm El-Z
eytoun
Lebanon (Lebanese
)
Mount Lebanon G
ov. (Lebanese
)
Mount Lebanon G
ov. (Syr)
Beirut G
ov. (Lebanese
)
Lebanon (Syr)
Hayy Tam
lis
6%
Hamra
Maraash
36%
22%
4% 4% 4%2%
14%
Hayy El-Jadid
NabaaSabra
Daouk-Ghawash
27%
15%
1%
30
35
40
25
20
15
10
5
18%
32%
%
Figure 36 Young women (15-19) currently married on neighbourhood, governorate and national levels . Sources: UN-Habitat and UNICEF, 2017-2020; UN-Habitat and RELIEF Centre, 2020; MICS survey, 2016 .
special groups residing in Lebanon - apart from Palestinian refugees.435 In effect, the legal status of foreign workers is influenced by the policies and circulars of the General Directorate of General Security under MoIM, linked to the Ministry of Labour.436 A number of professions are restricted to Lebanese nationals (with certain exemptions), including recently administrative, banking, insurance and educational activities of all kinds. At the same time, several categories are excluded from the provisions of the Labour Law, including domestic workers; agricultural unions; institutions where only family members are employed by a father, mother or guardian; or government departments and municipal bodies.437
In practice, migrant work is governed by a separate regulatory framework, known as the sponsorship or kafala system,438 which makes work migrants entering the country under this regulation entirely dependent on their sponsor, or kafeel.439 This renders migrant workers with extremely weak legal protection,440 and many live
435 ACTED et al., “The Labour Sector in Lebanon: Legal Frameworks, Challenges and Opportunities.”
436 Ibid
437 Ibid.
438 The kafala system is a legal framework designed such that migrant workers’ immigration status in Lebanon is legally tied to their sponsor (called kafeel) for the duration of their employment contract. Migrant workers have no freedom of movement, preventing them from leaving the country before the end of the contract without the approval of their kafeel. At the end of the contract period, migrants must leave Lebanon and kafeels are obligated to report the change in status to the authorities and pay for their former employee’s flight to their country of origin.
439 Amnesty International, “Their House is my Prison: Exploitation of Migrant Domestic Workers in Lebanon,” 2019,; HRW, “Lebanon: New Safeguards for Migrant Domestic Workers,” September 18, 2020, https://www.hrw.org/news/2020/09/18/lebanon-new-safeguards-migrant-domestic-workers.
440 Mainly the protection provided by the Law of Obligations
in a state of insecurity, vulnerable to exploitation, non-respect of their rights as stipulated in the contracts they have signed, and abuse by their kafeel. Common examples include delayed or non-payment of wages, non-granting of leave, no weekly day off, and the holding of migrant workers’ passports by their kafeels. Following the events in 2020, migrants requesting help to repatriate have gathered outside embassies in Beirut, including those of Kenya,441 Sudan442 and Ethiopia.443 One of the main hurdles facing migrants who want to leave Lebanon is the penalty fee of USD 430 for those who entered the country illegally.444 In addition, there is the challenge of affording the travel, as many are not in a financial position to even pay for food and water. Syrians who do not hold a UNHCR certificate of registration prior to 1 January 2015 and who wish to enter Lebanon to work are reliant on a sponsor to obtain work permission.445 Employers will have to apply for a work permit and put down a deposit. In practical terms, this renders displaced Syrians with the same labour rights as migrant workers in the kafala system,446 although it should be noted that potential difference in power between migrant workers’ and Syrians’ relationship with their sponsors may hold significance in terms of what this entails.
Palestinian refugees face legal restrictions on access to their social, political and economic rights, including prohibition to own property as well as to access state-provided services, such as health and education, and documentation.447 From a legal perspective, Palestinians should apply for a work permit.
Impact of recent shocksMany refugees and migrants have been disproportionately affected by COVID-19. This has included reduced freedom of movement due to lockdown measures; high risk of contracting COVID-19 due to overcrowding, informal work arrangements and limited access to hygiene facilities; and limited access to medical assistance in the event of illness. While most do not qualify for formal social assistance, many do not have access to humanitarian assistance either. An assessment
and Contract (Civil Code of 1932).
441 Shirin Jaafari, “Migrant Workers Stuck in Beirut in Wake of Blast,” The World, August 14, 2020, https://www.pri.org/stories/2020-08-14/migrant-workers-stuck-beirut-wake-blast.
442 Jonathan Dagher, “Trapped in Lebanon: Sudanese Migrants Desperate to Find a Way Home,” Middle East Eye, September 25, 2020, https://www.middleeasteye.net/news/lebanon-sudan-migrant-workers-beirut-return-home.
443 Martin Patience, “Ethiopian Maids Dumped Outside Beirut Embassy,” BBC, 20 June 2020, https://www.bbc.com/news/av/world-53031803.
444 Dagher, “Trapped in Lebanon:.”
445 See Syrian Refugees sub-section in the Demography chapter for more information on this.
446 Lorenza Errighi and Jörn Griesse, “The Syrian Refugee Crisis: Labour Market Implications in Jordan and Lebanon,” 2016, https://doi.org/10.2765/901541.
447 UNRWA, “Protection in Lebanon.”
94
THEME 3U
N-H
AB
ITA
T /
LE
BA
NO
N /
CIT
Y P
RO
FIL
ES
/ B
EIR
UT
/ 2
02
1 /
SO
CIA
L P
RO
TEC
TIO
N &
SO
CIA
L IN
CLU
SIO
N
3%
14%13%
6% 6%
4% 4%3%
15
10
5
Figure 37 Children (5-17) involved in economic activities across eight profiled neighbourhoods in Beirut City . Sources: UN-Habitat and UNICEF, 2017-2020; UN-Habitat and RELIEF Centre, 2020 .
%
Hamra Maraash Hayy El-Jadid
NabaaHayy Tamlis
SabraDaouk-Ghawash
Karm El-Zeytoun
of migrant worker vulnerability conducted between May and July 2020 shows that 95 per cent of migrant workers did not receive any humanitarian assistance.448 Palestinian refugees, many of whom depend on emergency cash assistance, are particularly exposed in the face of potential humanitarian fatigue and a possible shift in the architecture of aid.
Protection needs of youth and children in Beirut have been compounded by COVID-19 measures and the 4 August 2020 blast. Beirut was already home to some of the most disadvantaged children prior to recent shocks. Among others, most street-based children in Lebanon work in Beirut, with the highest share in Hamra, Tariq El-Jadideh and Mathaf.449 Data from the eight available neighbourhood profiles in Beirut City (Figure 37) shows that the shares of children engaged in economic activities in Maraash (13.6 per cent) and Nabaa (12.6 per cent) are more than double the rate of the other neighbourhoods. While in general more boys than girls are engaged in economic activities, two neighbourhoods, Hayy Tamlis and Karm El-Zeytoun, have a slightly higher share of girls working. Boys are particularly exposed to hazardous work conditions. In Karm El-Zeytoun, all boys are exposed to hazardous work conditions, while the lowest share is found in Hamra with less than 2 per cent. Although the overall share is lower for girls and none in Hamra and Hayy El-Jadid, the average share of girls who are exposed to hazardous work conditions across neighbourhoods is still one third and reaches 86.3 per cent in Hayy Tamlis. This might be, in part, due to the higher number of boys who are street children compared to girls, and that girls are more exposed to child marriage or, in some instances, also sold to prostitution rings, which are often under the radar and/or located in the outskirts or outside of the city.450
In their estimates for July and August 2020 survival deficits, Save the Children suggests that out of 910,000 people below the survival threshold in Beirut,451 546,000 (60 per cent) are children.452 According to UNICEF, an estimated 100,000 children were living in homes that were damaged or destroyed by the blast.453 The destruction of 92 public and 67 private schools in the blast-affected areas have a direct impact on around
448 IOM, “Migrant Worker Vulnerability Baseline Assessment Report Beirut May-July 2020,” 2020.
449 ILO, UNICEF and Save the Children, “Children Living and Working on the Streets in Lebanon: Profile and Magnitude,” 2015.
450 Daniela Sala, “The Syrian Women and Girls Sold into Sexual Slavery in Lebanon,” Al Jazeera, February 11, 2020, https://www.aljazeera.com/features/2020/2/11/the-syrian-women-and-girls-sold-into-sexual-slavery-in-lebanon.
451 Defined as 100 per cent of minimum food energy needs (2,100 kcals per person), plus drinking water and costs associated with basic shelter, food preparation and consumption.
452 Save the Children, “Urban Greater Beirut Houshold Economy Analysis Scenario Analysis (Pre-Blast),” 2020.
453 UNICEF, “Lebanon Humanitarian Situation Report No. 7,” 2020.
85,000 students,454 adding to the effect of school closures for more than 40 per cent of the 2019-2020 school year and continuing closures at the start of 2021.455 As a result of the blast, at least one out of four children are at risk of missing out on their education, with reasons including uncertainties on how to enrol in alternative schools, fears of another explosion and concerns of not being safe in school.456 The existing inequity in the school system is expected to increase as a result, given that children from poor households in Lebanon have significantly lower learning outcomes and are at higher risk of dropping out before secondary education compared to children from wealthier households.457 This furthermore has implications for the expected wage when entering the workforce and for socioeconomic mobility.
Psychological assistance has been found to be needed by all affected communities from the 4 August 2020 blast, and most urgently among children.458 Up to 600,000 children are estimated to suffer from some form of psychological distress and are in need of immediate psychosocial support.459 In the immediate aftermath, many patients were experiencing acute stress disorders, and doctors anticipate that there will be a long-term increase in anxiety, depression and post-traumatic stress disorder (PTSD) among the population.460 People who have previously suffered from trauma, such as those who experienced the Lebanese Civil War or survivors of the
454 Terre des hommes, “Beirut City: Child Protection and Psychosocial Needs Assessment,” 2020.
455 OCHA, “Humanitarian Context Overview (SDR) Draft - October 2020,” 2020.
456 IRC, “Press Release Beirut: 1 in 4 Children Risk Dropping out of School Warns IRC,” accessed October 8, 2020, https://www.rescue.org/press-release/beirut-1-4-children-risk-dropping-out-school-warns-irc.
457 ILO and CAS, “Labour Force and Household Living Conditions Survey 2018-2019 Lebanon.”
458 Save the Children, “Rapid Needs Assessment Beirut Blast,” 2020.
459 UNICEF, “Lebanon Humanitarian Situation Report No. 7.”
460 Dario Sabaghi, “Invisible Wounds: Beirut Witnesses Mental-Health Crisis After Blast,” Middle East Eye, September 27, 2020, https://www.middleeasteye.net/news/lebanon-beirut-explosion-mental-health-trauma-ptsd-crisis.
95
Syria conflict, are likely to relive those traumas and are at higher risk of experiencing PTSD.461
Among youth, refugee youth are particularly vulnerable. Refugee youth are exposed to exploitation and harassment and have limited opportunities to continue their education or finding employment. Among Syrian male youth, a study from 2014 found 40 per cent to be outside education and without a job, while one third of female youth were outside education.462 Moreover, young Syrian girls reported to not have access to social or cultural avenues and to suffer from restricted mobility. Most Syrian youth do not have Lebanese friends, and around half have never once felt safe in Lebanon. A study from 2018 found that around three quarters of young migrants found their time in Beirut to be more difficult than expected, and 41.5 per cent said their life is worse than their life in their country of origin, with similar rates across male and female migrants.463 The same share reported that their health had deteriorated after arriving to Beirut, with costs being the primary reason for not seeking medical help. Research shows the high share among migrant youth in Lebanon who think about ending their own life.464 This is particularly prevalent among female youth, who are exposed to high levels of sexual harassment, early marriage and a lack of mobility. High and increased suicide rates have been reported across Lebanon, where suicide rates increased by 30 per cent between 2011 and 2014 and have increased year-on-year since 2016 with a doubling of reported suicides in 2020 compared to 2019.465 Key drivers are likely to include socioreligious discrimination, hopelessness about the future, financial instability and joblessness, in addition to the reasons mentioned above.
Negative coping mechanismsA surge in negative coping mechanisms that disproportionally affect women, refugees, children and other vulnerable groups have been observed due to worsening economic conditions. These include reduced food intake (a rapid assessment carried out between 5 and 20 May 2020 found that 85 per cent of women compared with 57 per cent of men, and 8 out of 10 elderly, disabled or chronically ill refugees limited the portion size at mealtime in the last seven days466); incurring greater
461 Ibid
462 UNFPA et al., “Situational Analysis of Youth in Lebanon Affected by the Syrian Crisis,” 2014.
463 UNFPA, “Youth Mixed Migration in Beirut: Driving Factors, Lived Experiences, Sexual and Reproductive Health and Rights.”
464 UNFPA et al., “Situational Analysis of Youth in Lebanon Affected by the Syrian Crisis.”
465 Laetitia Kurban, “Lebanon’s Economy and Its Effect on Mental Health,” LSE, 28 January 2020, https://blogs.lse.ac.uk/mec/2020/01/28/lebanons-economy-and-its-effect-on-mental-health/; The Arab Weekly, “Suicide Spike in Lebanon amid Socio-Economic Turmoil,” July 17, 2020, https://thearabweekly.com/suicide-spike-lebanon-amid-socio-economic-turmoil.
466 CARE, “CARE Begins Distributions and Psychosocial Support to Thousands of Worst Affected by Beirut Blast,” 7
levels of debt; and resorting to child labour and child marriage.467 In Beirut, poorer and vulnerable households have reported reducing or delaying expenditures on nutrition, education and health care;468 reducing the size and frequency of their children’s meals; and withdrawing children from education so that they may work.469 For many female family members, additional unpaid work, including recently caring for family members who have been impacted by the blast, will likely add to existing obligations.470
Social stability and inclusionRecent shocks - with their adverse economic, political, social and environmental effects - have contributed to increased competition, frustration, discrimination and scapegoating among the population. Layers of vulnerability have resulted from displacement, loss of family members, disease outbreak and collapsing basic and social services. Current and future displacement due to the blast is likely to increase fragmentation of the sociocultural fabric in Beirut. The collective and individual trauma from the 4 August 2020 blast, discussed above, is substantial and has heightened social tension,471 while at the same time bringing people together in acts of solidarity and support.
The triggers of social tension vary across Lebanon. In Beirut and Mount Lebanon, religious and political division and fights over power, economic tension and historical legacies are among the main factors driving social tension.472 This is linked to the local governance system, where confessional parties often have their own social centres and welfare bodies.473 Political and religious leaders typically exchange favours and services between them to further their constituencies’ interests. In many cases, leaders acquire their position on a hereditary basis, whereby legitimacy is secured by ideological doctrines and religious commitment of their supporters. This serves to intensify religious and social fault lines. The perception
August 2020, https://www.care-international.org/news/press-releases/care-begins-distributions-and-psychosocial-support-to-thousands-of-worst-affected-by-beirut-blast.
467 ACAPS, “Emergency Operations Centre Beirut Assessment & Analysis Cell September 2020”; GoL and United Nations, “Lebanon Crisis Response Plan 2017-2020 (2020 Update).”
468 World Bank, EU and United Nations, “Beirut Rapid Damage and Needs Assessment”; Save the Children, “Urban Greater Beirut Houshold Economy Analysis Scenario Analysis (Pre-Blast).”
469 UNDP, “Leave no one Behind for an Inclusive and Just Recovery Process in Post-Blast Beirut”, 2020.
470 ACAPS, “Emergency Operations Centre Beirut Assessment & Analysis Cell September 2020”, 20 September 2020.
471 OCHA, “Humanitarian Context Overview Lebanon (Draft),” 2020.
472 ACTED, “Beirut Blast Rapid Needs Assessment Report 2020”; Search for Common Ground and Exigo, “Conflict Analysis and Power Dynamics – Lebanon Study.”
473 Committee of Regions, “CoR - Lebanon Social”, 2020. https://portal.cor.europa.eu/divisionpowers/Pages/Lebanon-Social.aspx.
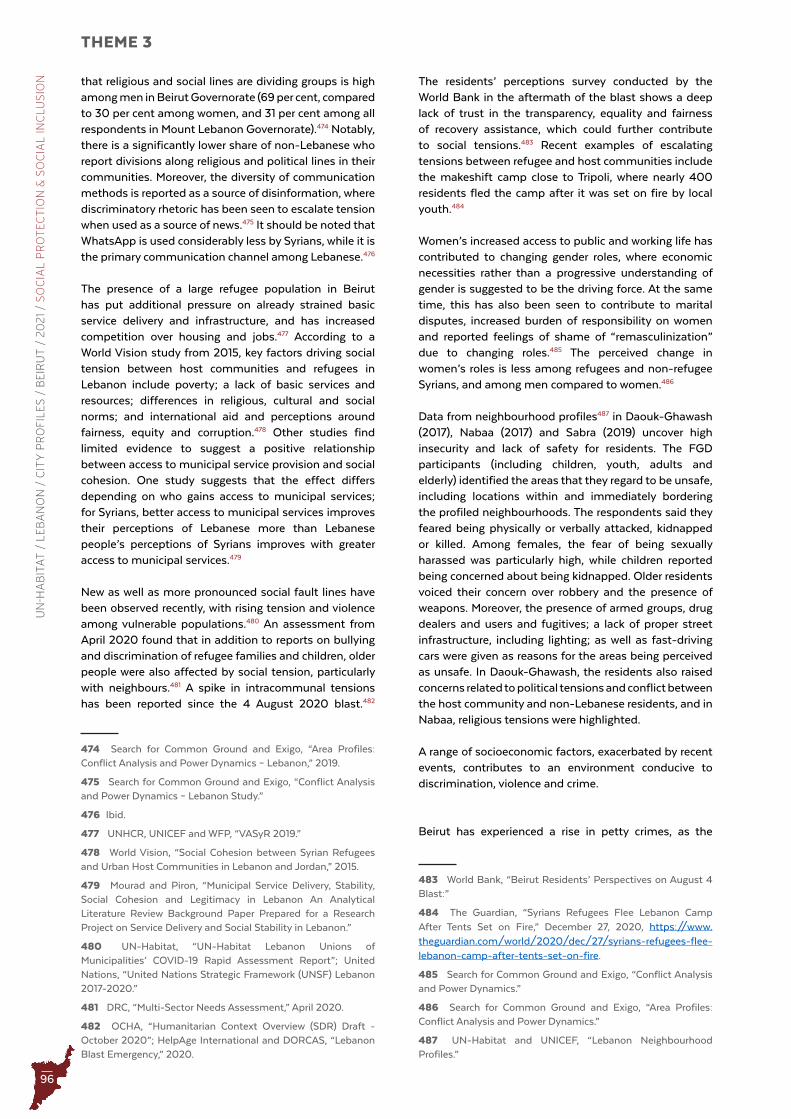
96
THEME 3U
N-H
AB
ITA
T /
LE
BA
NO
N /
CIT
Y P
RO
FIL
ES
/ B
EIR
UT
/ 2
02
1 /
SO
CIA
L P
RO
TEC
TIO
N &
SO
CIA
L IN
CLU
SIO
N that religious and social lines are dividing groups is high among men in Beirut Governorate (69 per cent, compared to 30 per cent among women, and 31 per cent among all respondents in Mount Lebanon Governorate).474 Notably, there is a significantly lower share of non-Lebanese who report divisions along religious and political lines in their communities. Moreover, the diversity of communication methods is reported as a source of disinformation, where discriminatory rhetoric has been seen to escalate tension when used as a source of news.475 It should be noted that WhatsApp is used considerably less by Syrians, while it is the primary communication channel among Lebanese.476
The presence of a large refugee population in Beirut has put additional pressure on already strained basic service delivery and infrastructure, and has increased competition over housing and jobs.477 According to a World Vision study from 2015, key factors driving social tension between host communities and refugees in Lebanon include poverty; a lack of basic services and resources; differences in religious, cultural and social norms; and international aid and perceptions around fairness, equity and corruption.478 Other studies find limited evidence to suggest a positive relationship between access to municipal service provision and social cohesion. One study suggests that the effect differs depending on who gains access to municipal services; for Syrians, better access to municipal services improves their perceptions of Lebanese more than Lebanese people’s perceptions of Syrians improves with greater access to municipal services.479
New as well as more pronounced social fault lines have been observed recently, with rising tension and violence among vulnerable populations.480 An assessment from April 2020 found that in addition to reports on bullying and discrimination of refugee families and children, older people were also affected by social tension, particularly with neighbours.481 A spike in intracommunal tensions has been reported since the 4 August 2020 blast.482
474 Search for Common Ground and Exigo, “Area Profiles: Conflict Analysis and Power Dynamics – Lebanon,” 2019.
475 Search for Common Ground and Exigo, “Conflict Analysis and Power Dynamics – Lebanon Study.”
476 Ibid.
477 UNHCR, UNICEF and WFP, “VASyR 2019.”
478 World Vision, “Social Cohesion between Syrian Refugees and Urban Host Communities in Lebanon and Jordan,” 2015.
479 Mourad and Piron, “Municipal Service Delivery, Stability, Social Cohesion and Legitimacy in Lebanon An Analytical Literature Review Background Paper Prepared for a Research Project on Service Delivery and Social Stability in Lebanon.”
480 UN-Habitat, “UN-Habitat Lebanon Unions of Municipalities’ COVID-19 Rapid Assessment Report”; United Nations, “United Nations Strategic Framework (UNSF) Lebanon 2017-2020.”
481 DRC, “Multi-Sector Needs Assessment,” April 2020.
482 OCHA, “Humanitarian Context Overview (SDR) Draft - October 2020”; HelpAge International and DORCAS, “Lebanon Blast Emergency,” 2020.
The residents’ perceptions survey conducted by the World Bank in the aftermath of the blast shows a deep lack of trust in the transparency, equality and fairness of recovery assistance, which could further contribute to social tensions.483 Recent examples of escalating tensions between refugee and host communities include the makeshift camp close to Tripoli, where nearly 400 residents fled the camp after it was set on fire by local youth.484
Women’s increased access to public and working life has contributed to changing gender roles, where economic necessities rather than a progressive understanding of gender is suggested to be the driving force. At the same time, this has also been seen to contribute to marital disputes, increased burden of responsibility on women and reported feelings of shame of “remasculinization” due to changing roles.485 The perceived change in women’s roles is less among refugees and non-refugee Syrians, and among men compared to women.486
Data from neighbourhood profiles487 in Daouk-Ghawash (2017), Nabaa (2017) and Sabra (2019) uncover high insecurity and lack of safety for residents. The FGD participants (including children, youth, adults and elderly) identified the areas that they regard to be unsafe, including locations within and immediately bordering the profiled neighbourhoods. The respondents said they feared being physically or verbally attacked, kidnapped or killed. Among females, the fear of being sexually harassed was particularly high, while children reported being concerned about being kidnapped. Older residents voiced their concern over robbery and the presence of weapons. Moreover, the presence of armed groups, drug dealers and users and fugitives; a lack of proper street infrastructure, including lighting; as well as fast-driving cars were given as reasons for the areas being perceived as unsafe. In Daouk-Ghawash, the residents also raised concerns related to political tensions and conflict between the host community and non-Lebanese residents, and in Nabaa, religious tensions were highlighted.
A range of socioeconomic factors, exacerbated by recent events, contributes to an environment conducive to discrimination, violence and crime.
Beirut has experienced a rise in petty crimes, as the
483 World Bank, “Beirut Residents’ Perspectives on August 4 Blast:”
484 The Guardian, “Syrians Refugees Flee Lebanon Camp After Tents Set on Fire,” December 27, 2020, https://www.theguardian.com/world/2020/dec/27/syrians-refugees-flee-lebanon-camp-after-tents-set-on-fire.
485 Search for Common Ground and Exigo, “Conflict Analysis and Power Dynamics.”
486 Search for Common Ground and Exigo, “Area Profiles: Conflict Analysis and Power Dynamics.”
487 UN-Habitat and UNICEF, “Lebanon Neighbourhood Profiles.”
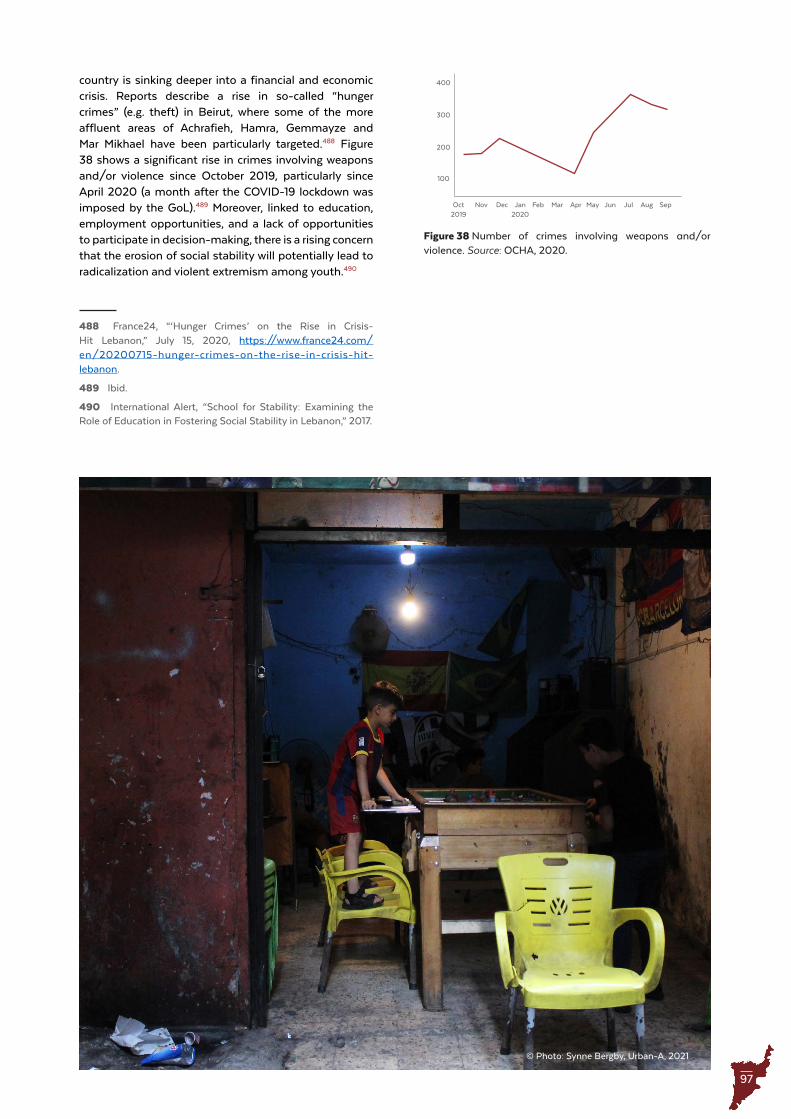
97
Figure 38 Number of crimes involving weapons and/or violence . Source: OCHA, 2020 .
Oct2019
Nov
100
200
400
300
Dec Jan2020
Feb Mar Apr May Jun Jul Aug Sep
country is sinking deeper into a financial and economic crisis. Reports describe a rise in so-called “hunger crimes” (e.g. theft) in Beirut, where some of the more affluent areas of Achrafieh, Hamra, Gemmayze and Mar Mikhael have been particularly targeted.488 Figure 38 shows a significant rise in crimes involving weapons and/or violence since October 2019, particularly since April 2020 (a month after the COVID-19 lockdown was imposed by the GoL).489 Moreover, linked to education, employment opportunities, and a lack of opportunities to participate in decision-making, there is a rising concern that the erosion of social stability will potentially lead to radicalization and violent extremism among youth.490
488 France24, “‘Hunger Crimes’ on the Rise in Crisis-Hit Lebanon,” July 15, 2020, https://www.france24.com/en/20200715-hunger-crimes-on-the-rise-in-crisis-hit-lebanon.
489 Ibid.
490 International Alert, “School for Stability: Examining the Role of Education in Fostering Social Stability in Lebanon,” 2017.
© Photo: Synne Bergby, Urban-A, 2021
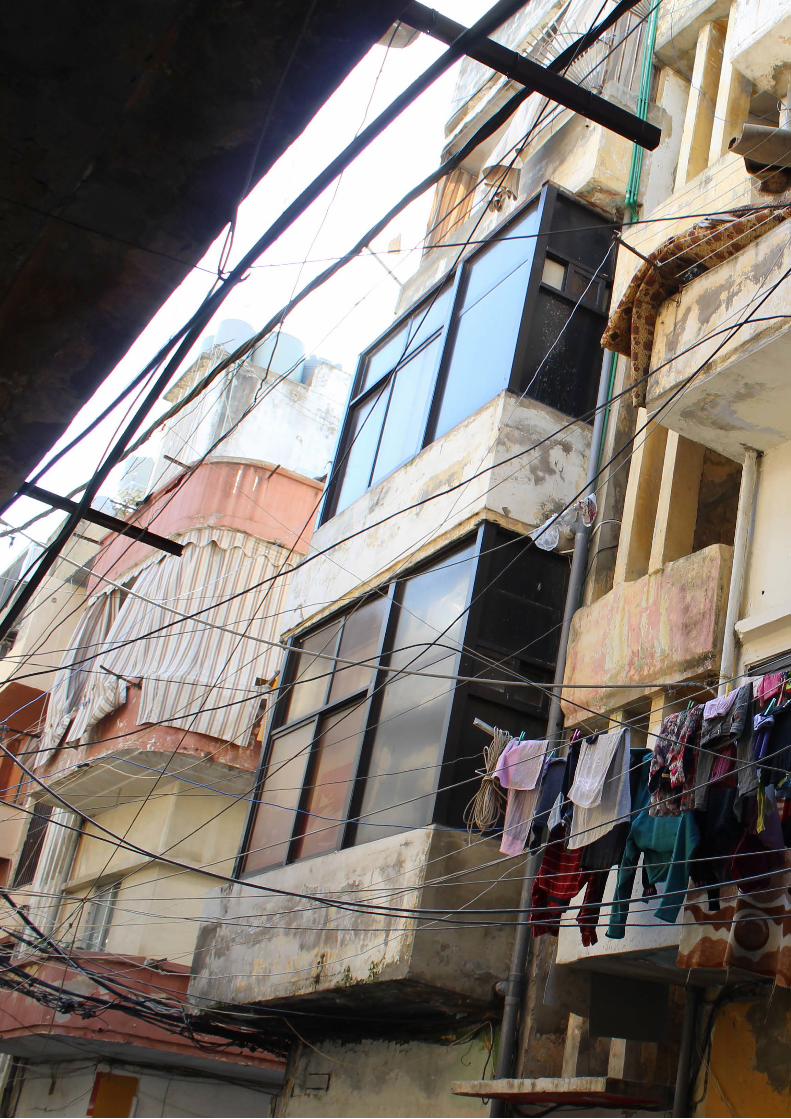
98
THEME 4U
N-H
AB
ITA
T /
LE
BA
NO
N /
CIT
Y P
RO
FIL
ES
/ B
EIR
UT
/ 2
02
1 /
BA
SIC
& S
OC
IAL
SE
RV
ICE
S
Theme 4 Basic and
Social Services
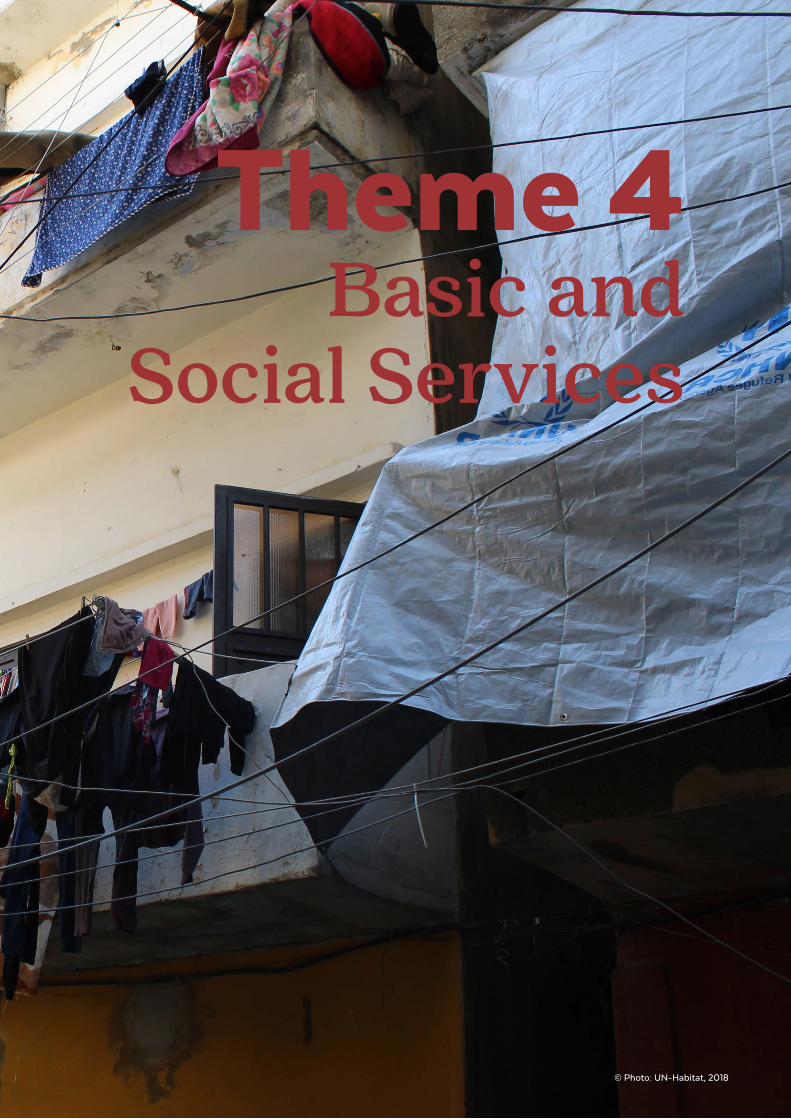
99
Theme 4 Basic and
Social Services
© Photo: UN-Habitat, 2018
100
THEME 4U
N-H
AB
ITA
T /
LE
BA
NO
N /
CIT
Y P
RO
FIL
ES
/ B
EIR
UT
/ 2
02
1 /
BA
SIC
& S
OC
IAL
SE
RV
ICE
S
basic and social
servicesChapter summaryThe quality of essential service delivery and the state of key infrastructure in Beirut have been severely compromised as a result of structural barriers and overlapping crises, including recently the COVID-19 pandemic and the 4 August 2020 blast. Insufficient service provision affects first and foremost the most vulnerable segments of Beirut’s population, who suffer from systemic inequities in access and have fewer financial resources and social safety nets to make up for those gaps. This can be observed through large inter-neighbourhood variations among some of the most disadvantaged neighbourhoods in Beirut City. Service delivery and infrastructure provision have suffered from decades of civil unrest, conflict, underinvestment, lack of reliable data, unmanaged city growth and poor governance. Adding to this is the significant increase in demand, largely due to the high number of Syrians arriving in Beirut City after 2011. This has added further strains on already insufficient municipal resources and on the capacities of local governments to meet the demand. Unreliable and inadequate provision of water, energy, education and health services has led to increased reliance on private providers for those who can afford it. A collapsing economy, COVID-19 and the 4 August 2020 blast have further deteriorated the state of public service provision at a time when there is an acute need and when people’s purchasing power and options to pay for private service delivery are severely reduced.
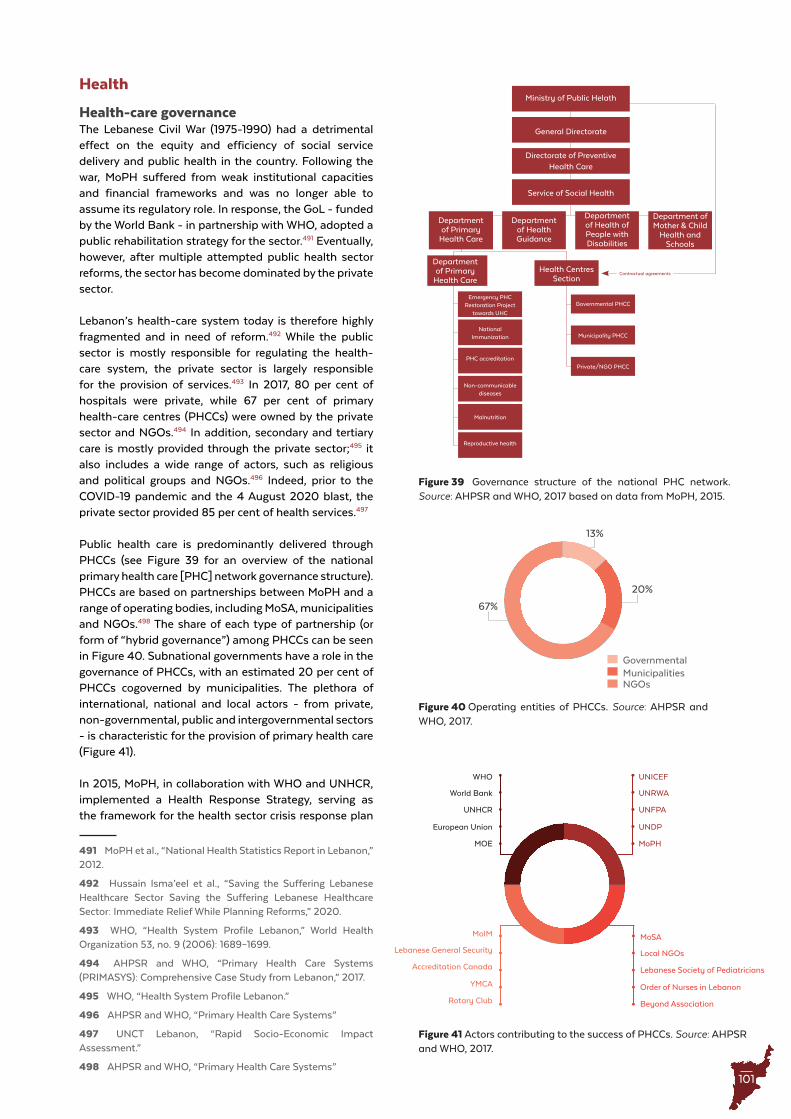
101
Department of Primary
Health Care
Figure 39 Governance structure of the national PHC network . Source: AHPSR and WHO, 2017 based on data from MoPH, 2015 .
Ministry of Public Helath
General Directorate
Directorate of Preventive Health Care
Service of Social Health
Department of Primary
Health CareHealth Centres
Section
Emergency PHC Restoration Project
towards UHC
Governmental PHCC
Municipality PHCC
Private/NGO PHCC
WHO
MoIM
UNICEF
MoSA
UNRWA
Local NGOs
UNFPA
Lebanese Society of Pediatricians
UNDP
Order of Nurses in Lebanon
MoPH
Beyond Association
World Bank
Lebanese General Security
UNHCR
Accreditation Canada
European Union
YMCA
MOE
Rotary Club
National Immunization
PHC accreditation
Malnutrition
Non-communicable diseases
Reproductive health
Department of Health Guidance
Department of Health of People with Disabilities
Department of Mother & Child
Health and Schools
Contractual agreements
13%
20%
67%
GovernmentalMunicipalitiesNGOs
Figure 40 Operating entities of PHCCs . Source: AHPSR and WHO, 2017 .
Figure 41 Actors contributing to the success of PHCCs . Source: AHPSR and WHO, 2017 .
Health
Health-care governanceThe Lebanese Civil War (1975-1990) had a detrimental effect on the equity and efficiency of social service delivery and public health in the country. Following the war, MoPH suffered from weak institutional capacities and financial frameworks and was no longer able to assume its regulatory role. In response, the GoL - funded by the World Bank - in partnership with WHO, adopted a public rehabilitation strategy for the sector.491 Eventually, however, after multiple attempted public health sector reforms, the sector has become dominated by the private sector.
Lebanon’s health-care system today is therefore highly fragmented and in need of reform.492 While the public sector is mostly responsible for regulating the health-care system, the private sector is largely responsible for the provision of services.493 In 2017, 80 per cent of hospitals were private, while 67 per cent of primary health-care centres (PHCCs) were owned by the private sector and NGOs.494 In addition, secondary and tertiary care is mostly provided through the private sector;495 it also includes a wide range of actors, such as religious and political groups and NGOs.496 Indeed, prior to the COVID-19 pandemic and the 4 August 2020 blast, the private sector provided 85 per cent of health services.497
Public health care is predominantly delivered through PHCCs (see Figure 39 for an overview of the national primary health care [PHC] network governance structure). PHCCs are based on partnerships between MoPH and a range of operating bodies, including MoSA, municipalities and NGOs.498 The share of each type of partnership (or form of “hybrid governance”) among PHCCs can be seen in Figure 40. Subnational governments have a role in the governance of PHCCs, with an estimated 20 per cent of PHCCs cogoverned by municipalities. The plethora of international, national and local actors - from private, non-governmental, public and intergovernmental sectors - is characteristic for the provision of primary health care (Figure 41).
In 2015, MoPH, in collaboration with WHO and UNHCR, implemented a Health Response Strategy, serving as the framework for the health sector crisis response plan
491 MoPH et al., “National Health Statistics Report in Lebanon,” 2012.
492 Hussain Isma’eel et al., “Saving the Suffering Lebanese Healthcare Sector Saving the Suffering Lebanese Healthcare Sector: Immediate Relief While Planning Reforms,” 2020.
493 WHO, “Health System Profile Lebanon,” World Health Organization 53, no. 9 (2006): 1689–1699.
494 AHPSR and WHO, “Primary Health Care Systems (PRIMASYS): Comprehensive Case Study from Lebanon,” 2017.
495 WHO, “Health System Profile Lebanon.”
496 AHPSR and WHO, “Primary Health Care Systems”
497 UNCT Lebanon, “Rapid Socio-Economic Impact Assessment.”
498 AHPSR and WHO, “Primary Health Care Systems”
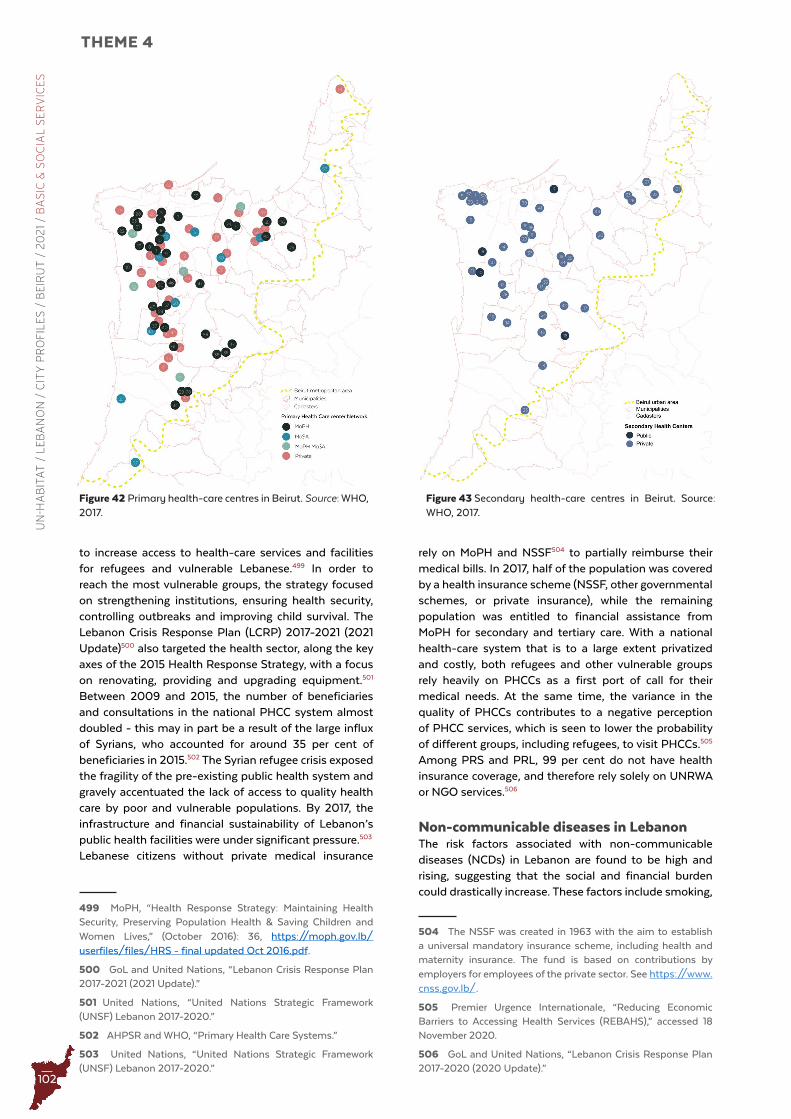
102
THEME 4U
N-H
AB
ITA
T /
LE
BA
NO
N /
CIT
Y P
RO
FIL
ES
/ B
EIR
UT
/ 2
02
1 /
BA
SIC
& S
OC
IAL
SE
RV
ICE
S
Figure 42 Primary health-care centres in Beirut . Source: WHO, 2017 .
Figure 43 Secondary health-care centres in Beirut . Source: WHO, 2017 .
to increase access to health-care services and facilities for refugees and vulnerable Lebanese.499 In order to reach the most vulnerable groups, the strategy focused on strengthening institutions, ensuring health security, controlling outbreaks and improving child survival. The Lebanon Crisis Response Plan (LCRP) 2017-2021 (2021 Update)500 also targeted the health sector, along the key axes of the 2015 Health Response Strategy, with a focus on renovating, providing and upgrading equipment.501 Between 2009 and 2015, the number of beneficiaries and consultations in the national PHCC system almost doubled - this may in part be a result of the large influx of Syrians, who accounted for around 35 per cent of beneficiaries in 2015.502 The Syrian refugee crisis exposed the fragility of the pre-existing public health system and gravely accentuated the lack of access to quality health care by poor and vulnerable populations. By 2017, the infrastructure and financial sustainability of Lebanon’s public health facilities were under significant pressure.503
Lebanese citizens without private medical insurance
499 MoPH, “Health Response Strategy: Maintaining Health Security, Preserving Population Health & Saving Children and Women Lives,” (October 2016): 36, https://moph.gov.lb/userfiles/files/HRS - final updated Oct 2016.pdf.
500 GoL and United Nations, “Lebanon Crisis Response Plan 2017-2021 (2021 Update).”
501 United Nations, “United Nations Strategic Framework (UNSF) Lebanon 2017-2020.”
502 AHPSR and WHO, “Primary Health Care Systems.”
503 United Nations, “United Nations Strategic Framework (UNSF) Lebanon 2017-2020.”
rely on MoPH and NSSF504 to partially reimburse their medical bills. In 2017, half of the population was covered by a health insurance scheme (NSSF, other governmental schemes, or private insurance), while the remaining population was entitled to financial assistance from MoPH for secondary and tertiary care. With a national health-care system that is to a large extent privatized and costly, both refugees and other vulnerable groups rely heavily on PHCCs as a first port of call for their medical needs. At the same time, the variance in the quality of PHCCs contributes to a negative perception of PHCC services, which is seen to lower the probability of different groups, including refugees, to visit PHCCs.505 Among PRS and PRL, 99 per cent do not have health insurance coverage, and therefore rely solely on UNRWA or NGO services.506
Non-communicable diseases in LebanonThe risk factors associated with non-communicable diseases (NCDs) in Lebanon are found to be high and rising, suggesting that the social and financial burden could drastically increase. These factors include smoking,
504 The NSSF was created in 1963 with the aim to establish a universal mandatory insurance scheme, including health and maternity insurance. The fund is based on contributions by employers for employees of the private sector. See https://www.cnss.gov.lb/.
505 Premier Urgence Internationale, “Reducing Economic Barriers to Accessing Health Services (REBAHS),” accessed 18 November 2020.
506 GoL and United Nations, “Lebanon Crisis Response Plan 2017-2020 (2020 Update).”
103
poor nutrition and lack of physical activity, leading to such issues as diabetes and high blood pressure.507 A study from 2016 showed that 50.4 per cent of Syrian and 60.2 per cent of host community households had a member with one of five NCDs (hypertension, cardiovascular disease, diabetes, chronic respiratory disease and arthritis).508
The Global Nutrition Report from 2020 shows that Lebanon is not on course to meet global targets for maternal, infant and young child nutrition.509 Among others, the report shows that 31.2 per cent of women between 15 and 49 are suffering from anaemia, 9.2 per cent of infants have low weight at birth and 16.5 per cent of children under 5 years are stunted. Given the rising food insecurity and increasing poverty levels, these trends are likely to continue. At the same time, according to the report, an estimated 37 per cent of women and 27.4 per cent of men over 18 years are obese, with diabetes affecting 12.2 and 14.5 per cent, respectively.
COVID-19Lebanon recorded its first COVID-19 cases in late February 2020, and on 18 March 2020, the GoL declared a State of General Mobilization with lockdown measures. Since then, the number of cases has increased drastically, with a spike in the aftermath of the 4 August 2020 blast. By 31 January 2021, close to 301,000 cases were registered, with 3,082 deaths, according to the Worldometer.510 It should be noted that there is a discrepancy between this data and the data provided by WHO, where on 30 January 2021, cumulated cases were reported as 296,282, with 2,680 deaths.511 As mentioned in the Context chapter, vulnerable groups are more likely to be exposed to COVID-19 and are at greater risk if they contract the virus. Mortality rates for Palestinian refugees are three times higher than for the overall population, and their chances of contracting are also high due to the overcrowded camp conditions and their dependence on going out for work.512
507 Z. Mansour et al., “Non-Communicable Diseases in Lebanon: Results from World Health Organization STEPS Survey 2017,” Public Health 187 (1 October 2020): 120–126, https://doi.org/10.1016/j.puhe.2020.08.014.
508 Shannon Doocy et al., “Prevalence, Care-Seeking, and Health Service Utilization for Non-Communicable Diseases among Syrian Refugees and Host Communities in Lebanon Bayard Roberts, Kiran Jobunputra, Preeti Patel and Pablo Perel,” Conflict and Health 10, no. 1 (19 October 2016), https://doi.org/10.1186/s13031-016-0088-3.
509 Global Nutrition Report, “Global Nutrition Report | Country Nutrition Profiles,” 2020, accessed 16 January 2021, https://globalnutritionreport.org/resources/nutrition-profiles/asia/western-asia/lebanon/.
510 Worldometer, “Lebanon Coronavirus,” January 4, 2021, https://www.worldometers.info/coronavirus/country/lebanon/.
511 WHO, “30 January 2021: Lebanon COVID-19 Daily Brief,” 2021.
512 Azhari, “Palestinian Refugees in Lebanon More Likely to Die with COVID-19.”
From the initial outbreak of the COVID-19 pandemic in Lebanon to May 2020, subsidized hospital care covered by UNHCR has dropped by 33 per cent for Lebanese citizens and by 28 per cent for refugees.513 Overall, private hospitals have had to reduce their bed capacity by 35 per cent. While there has been an over-supply of physicians (especially specialists), there is a shortage of nurses in the Lebanese health-care system.514 Human resource capacity in the public hospitals continues to be very weak, and has worsened recently due to the emigration of health-care professionals.515 This limits the capacity of hospitals to provide advanced intensive care unit (ICU) care, essential to respond to the pandemic.516 ICU care is particularly limited in Beirut Governorate, where the ICU bed occupancy rate was at 99 per cent (together with Nabatiyeh Governorate, the highest among all governorates) in late January 2021, compared to 95 per cent in Mount Lebanon Governorate.517
Impact of the 4 August 2020 blast on the health sectorThe 4 August 2020 blast had a detrimental impact on the need for and supply of health services in Beirut. The post-blast RDNA estimates damages on the health sector to be in the range of USD 95 million to USD 115 million (losses estimated at USD 200 million to USD 245 million), with up to 36 of 813 health-care facilities (including their equipment) affected in the private and public sectors combined.518 The blast contributed to a severe depletion of medical supplies, already in shortage before the blast - especially personal protective equipment (PPE) - and added acute pressure on strained health-care providers.
Of the 16 hospitals in Beirut, Rosaire, Karantina, Wardieh and Saint George hospitals were so severely damaged by the blast that they were forced to close, while Geitawi and Rizk hospitals were damaged but remained open.519 Moreover, 500 hospital beds were lost from the blast.520 To understand the significance of this loss, it is helpful to consider the count of hospital beds in Beirut and Mount Lebanon governorates in 2015 (Table 16). This indicated a loss in hospital beds of close to 10 percent.
513 UNCT Lebanon, “Rapid Socio-Economic Impact Assessment.”
514 AHPSR and WHO, “Primary Health Care Systems.”
515 The National, “Lebanon Hospitals under Threat as Doctors and Nurses Emigrate - The National,” September 20, 2020, https://www.thenationalnews.com/world/mena/lebanon-hospitals-under-threat-as-doctors-and-nurses-emigrate-1.1077418.
516 UNCT Lebanon, “Rapid Socio-Economic Impact Assessment.”
517 WHO, “30 January 2021: Lebanon COVID-19 Daily Brief.”
518 World Bank, EU and United Nations, “Beirut Rapid Damage and Needs Assessment.”
519 ACTED, “Beirut Blast Rapid Needs Assessment Report 2020.”
520 WHO, “Beirut Port Blast Emergency Strategic Response Plan,” 2020.

104
THEME 4U
N-H
AB
ITA
T /
LE
BA
NO
N /
CIT
Y P
RO
FIL
ES
/ B
EIR
UT
/ 2
02
1 /
BA
SIC
& S
OC
IAL
SE
RV
ICE
S
Governorate No. of hospital beds in 2015
Beirut 2,029
Mount Lebanon 3,487
Total 5,516
Table 16 Number of hospital beds in Beirut and Mount Lebanon governorates . Source: Syndicate of Hospitals, 2015 .
Particularly the ICUs at Geitawi and Rizk hospitals, already at the breaking point due to the rise in COVID-19 cases, were overwhelmed with victims of the blast. The largest number of patients were admitted to Hôtel-Dieu de France, while a number of patients were also sent to hospitals outside the city, and minor injuries were treated also in pharmacies.
A further 16 PHCCs reported damage, affecting 160,000 people relying on their services.521 Out of 55 PHCCs in blast-affected areas surveyed by WHO, less than half were able to resume their operations.522 The number of health personnel, meanwhile, is reduced. Several health personnel were injured or killed in the blast,523 while hundreds had also been laid off due to the economic pressures discussed above,524 a contributing factor to the hundreds of health-care workers who have chosen to emigrate abroad for work. From July to September 2020 alone, more than 300 doctors were estimated to have left the country, and by November 2020, the number had reportedly increased to 400.525
The Karantina warehouse located close to the port, which included one of Lebanon’s main medication, PPE and vaccine stockpiles, equipment and supplies that were already in severe shortage before August 2020, was damaged in the blast. This further limited the capacity of hospitals to adequately prepare for and respond to COVID-19.526 The chaos that followed the blast meant social distancing could not be respected, while the lack of PPE increased risk of transmission for those responding to COVID-19 victims. Among other factors, the situation contributed to a sharp rise in COVID-19 cases observed in Beirut since the blast and added further pressure on the health sector.
521 UNICEF, “Geneva Palais Briefing Note on Situation for Children Affected by Beirut Explosions and UNICEF Response,” August 7, 2020, https://www.unicef.org/press-releases/geneva-palais-briefing-note-situation-children-affected-beirut-explosions-and-unicef.
522 WHO, “Beirut Port Blast Emergency Strategic Response Plan.”
523 International Medical Corps, “Beirut Explosion Situation Report #1 Situation update,” August 5, 2020.
524 Reuters, “Major Beirut Medical Centre Lays off Hundreds as Crisis Bites” July 17, 2020, https://www.reuters.com/article/us-lebanon-crisis-aub-idUSKCN24I2GW.
525 The National, “Lebanon Hospitals Under Threat”; Issam Abdallah and Samia Nakhoul, “Hundreds of Disillusioned Doctors Leave Lebanon, in Blow to Healthcare.”
526 ACAPS, “Emergency Operations Centre Beirut Assessment & Analysis Cell September 2020.”
Victims with severe injuries from the blast or persons with acute COVID-19 symptoms were prioritized over seemingly less urgent cases. These “less urgent” cases include trauma and panic during and after the blast, which require mental health and psychosocial support, as well incidents of internal, and thus less visible, injuries caused by the blast. Particularly for those not able to access medical insurance (such as many refugees, migrant workers and informal workers) alternative medical assistance is critical. Moreover, many hospitals do not provide health services to non-Lebanese. The destruction of the Governmental Hospital of Karantina has therefore affected refugees and migrant workers especially, as this was a key hospital for admittance of patients from these population groups.527 Moreover, several additional factors contribute to the challenges of accessing health services both for Lebanese and refugee/migrant residents. For example, both females and males have reported being hesitant to seek assistance due to stigma or not believing to be a priority group to receive support and not knowing where to register for assistance.528
Population health status and access to services in BeirutWith recent shocks, the need for health-care services in Beirut has dramatically increased, while service capacity and people’s purchasing power have been severely reduced. The economic collapse has restricted the capacity of private hospitals to procure necessary medical supplies and equipment, forcing a rationing of services nationwide.529 As a consequence, there has been a drop in the provision of essential health services since 2019, around the time when the economic crisis began. The capacity to provide and ensure access to assistance for persons with certain health-related issues (such as reproductive health, including prenatal care and assisted delivery; mental health; SGBV care; and malnutrition) is suffering. At the same time, the caseload, especially within the most vulnerable groups - including persons with disabilities, migrant domestic workers, refugees, people without identification papers, LGBTI+ persons, children and women - is rising. For example, data collected in Beirut shows a 6 per cent increase in sexual assault incidents between August (10 per cent) and September (16 per cent) 2020.530 See the Social Protection and Social Inclusion chapter for more information on protection-related health challenges, including SGBV.
The eight neighbourhood profiles from Beirut City provide valuable data on the general health status of the population and access to services in vulnerable neighbourhoods in the city. Health data collected at
527 UNDP, “Leave no one Behind for an Inclusive and Just Recovery Process in Post-Blast Beirut.”
528 World Bank, “Beirut Residents’ Perspectives on August 4 Blast: Findings from a Needs and Perceptions Survey.”
529 UNCT Lebanon, “Rapid Socio-Economic Impact Assessment.”
530 Inter-Agency Coordination, “Gender-Based Violence Information Management System - Ongoing Impact of COVID-19, Economic Situation and Beirut Blast Quarter 3 – 2020,” 2020.
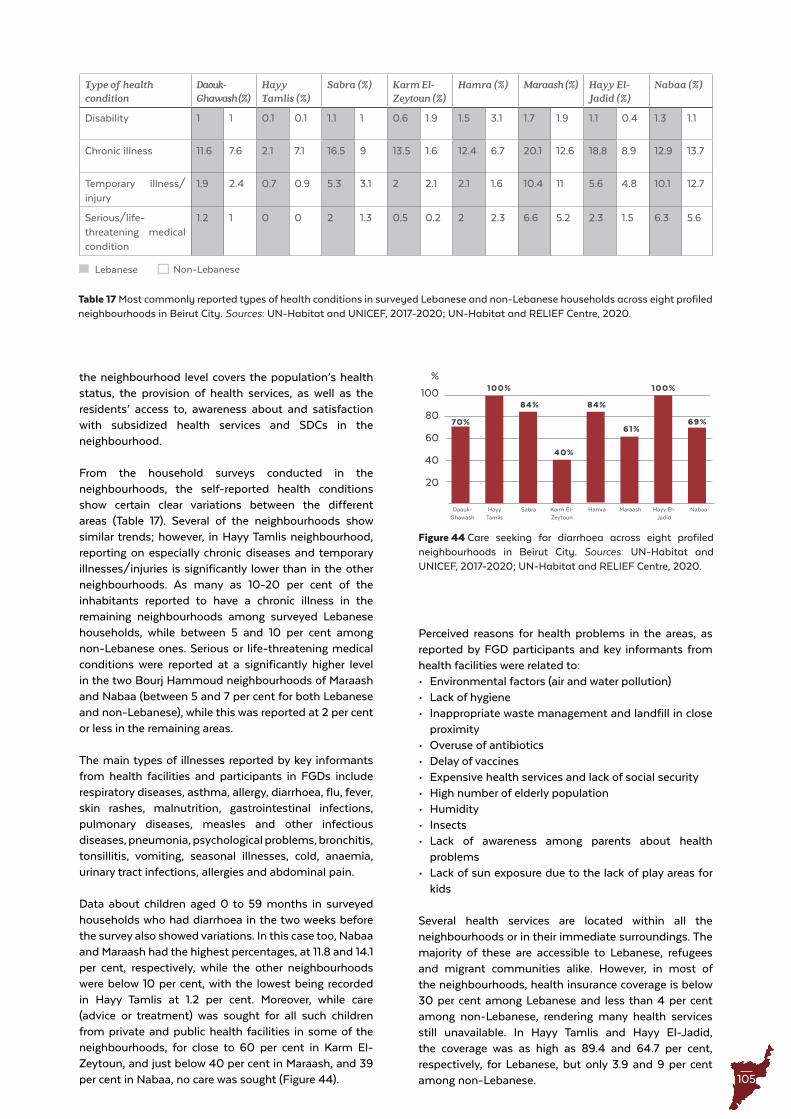
105
Type of health condition
Daouk-Ghawash (%)
Hayy Tamlis (%)
Sabra (%) Karm El-Zeytoun (%)
Hamra (%) Maraash (%) Hayy El-Jadid (%)
Nabaa (%)
Disability 1 1 0.1 0.1 1.1 1 0.6 1.9 1.5 3.1 1.7 1.9 1.1 0.4 1.3 1.1
Chronic illness 11.6 7.6 2.1 7.1 16.5 9 13.5 1.6 12.4 6.7 20.1 12.6 18.8 8.9 12.9 13.7
Temporary illness/injury
1.9 2.4 0.7 0.9 5.3 3.1 2 2.1 2.1 1.6 10.4 11 5.6 4.8 10.1 12.7
Serious/life-threatening medical condition
1.2 1 0 0 2 1.3 0.5 0.2 2 2.3 6.6 5.2 2.3 1.5 6.3 5.6
Lebanese Non-Lebanese
Table 17 Most commonly reported types of health conditions in surveyed Lebanese and non-Lebanese households across eight profiled neighbourhoods in Beirut City . Sources: UN-Habitat and UNICEF, 2017-2020; UN-Habitat and RELIEF Centre, 2020 .
Figure 44 Care seeking for diarrhoea across eight profiled neighbourhoods in Beirut City . Sources: UN-Habitat and UNICEF, 2017-2020; UN-Habitat and RELIEF Centre, 2020 .
69%
84% 84%
40%
70%
100% 100%
61%
100
80
60
20
40
%
Hamra Maraash Hayy El-Jadid
NabaaHayy Tamlis
SabraDaouk-Ghawash
Karm El-Zeytoun
the neighbourhood level covers the population’s health status, the provision of health services, as well as the residents’ access to, awareness about and satisfaction with subsidized health services and SDCs in the neighbourhood.
From the household surveys conducted in the neighbourhoods, the self-reported health conditions show certain clear variations between the different areas (Table 17). Several of the neighbourhoods show similar trends; however, in Hayy Tamlis neighbourhood, reporting on especially chronic diseases and temporary illnesses/injuries is significantly lower than in the other neighbourhoods. As many as 10-20 per cent of the inhabitants reported to have a chronic illness in the remaining neighbourhoods among surveyed Lebanese households, while between 5 and 10 per cent among non-Lebanese ones. Serious or life-threatening medical conditions were reported at a significantly higher level in the two Bourj Hammoud neighbourhoods of Maraash and Nabaa (between 5 and 7 per cent for both Lebanese and non-Lebanese), while this was reported at 2 per cent or less in the remaining areas.
The main types of illnesses reported by key informants from health facilities and participants in FGDs include respiratory diseases, asthma, allergy, diarrhoea, flu, fever, skin rashes, malnutrition, gastrointestinal infections, pulmonary diseases, measles and other infectious diseases, pneumonia, psychological problems, bronchitis, tonsillitis, vomiting, seasonal illnesses, cold, anaemia, urinary tract infections, allergies and abdominal pain.
Data about children aged 0 to 59 months in surveyed households who had diarrhoea in the two weeks before the survey also showed variations. In this case too, Nabaa and Maraash had the highest percentages, at 11.8 and 14.1 per cent, respectively, while the other neighbourhoods were below 10 per cent, with the lowest being recorded in Hayy Tamlis at 1.2 per cent. Moreover, while care (advice or treatment) was sought for all such children from private and public health facilities in some of the neighbourhoods, for close to 60 per cent in Karm El-Zeytoun, and just below 40 per cent in Maraash, and 39 per cent in Nabaa, no care was sought (Figure 44).
Perceived reasons for health problems in the areas, as reported by FGD participants and key informants from health facilities were related to:• Environmental factors (air and water pollution)• Lack of hygiene• Inappropriate waste management and landfill in close
proximity• Overuse of antibiotics• Delay of vaccines• Expensive health services and lack of social security• High number of elderly population• Humidity• Insects• Lack of awareness among parents about health
problems• Lack of sun exposure due to the lack of play areas for
kids
Several health services are located within all the neighbourhoods or in their immediate surroundings. The majority of these are accessible to Lebanese, refugees and migrant communities alike. However, in most of the neighbourhoods, health insurance coverage is below 30 per cent among Lebanese and less than 4 per cent among non-Lebanese, rendering many health services still unavailable. In Hayy Tamlis and Hayy El-Jadid, the coverage was as high as 89.4 and 64.7 per cent, respectively, for Lebanese, but only 3.9 and 9 per cent among non-Lebanese.
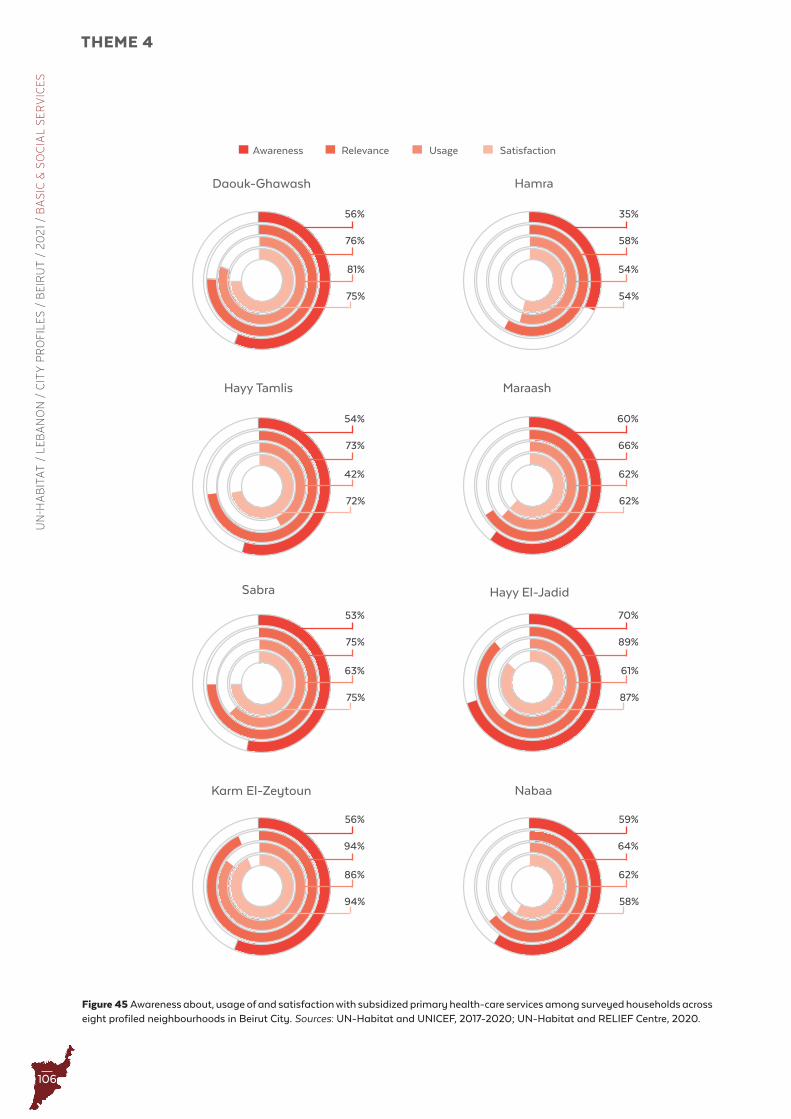
106
THEME 4U
N-H
AB
ITA
T /
LE
BA
NO
N /
CIT
Y P
RO
FIL
ES
/ B
EIR
UT
/ 2
02
1 /
BA
SIC
& S
OC
IAL
SE
RV
ICE
S
Figure 45 Awareness about, usage of and satisfaction with subsidized primary health-care services among surveyed households across eight profiled neighbourhoods in Beirut City . Sources: UN-Habitat and UNICEF, 2017-2020; UN-Habitat and RELIEF Centre, 2020 .
Awareness Relevance Usage Satisfaction
56%
76%
81%
75%
35%
58%
54%
54%
60%
66%
62%
62%
70%
89%
61%
87%
59%
64%
62%
58%
54%
73%
42%
72%
53%
75%
63%
75%
56%
94%
86%
94%
Daouk-Ghawash
Karm El-Zeytoun
Hamra
Maraash
Hayy El-Jadid
Nabaa
Hayy Tamlis
Sabra
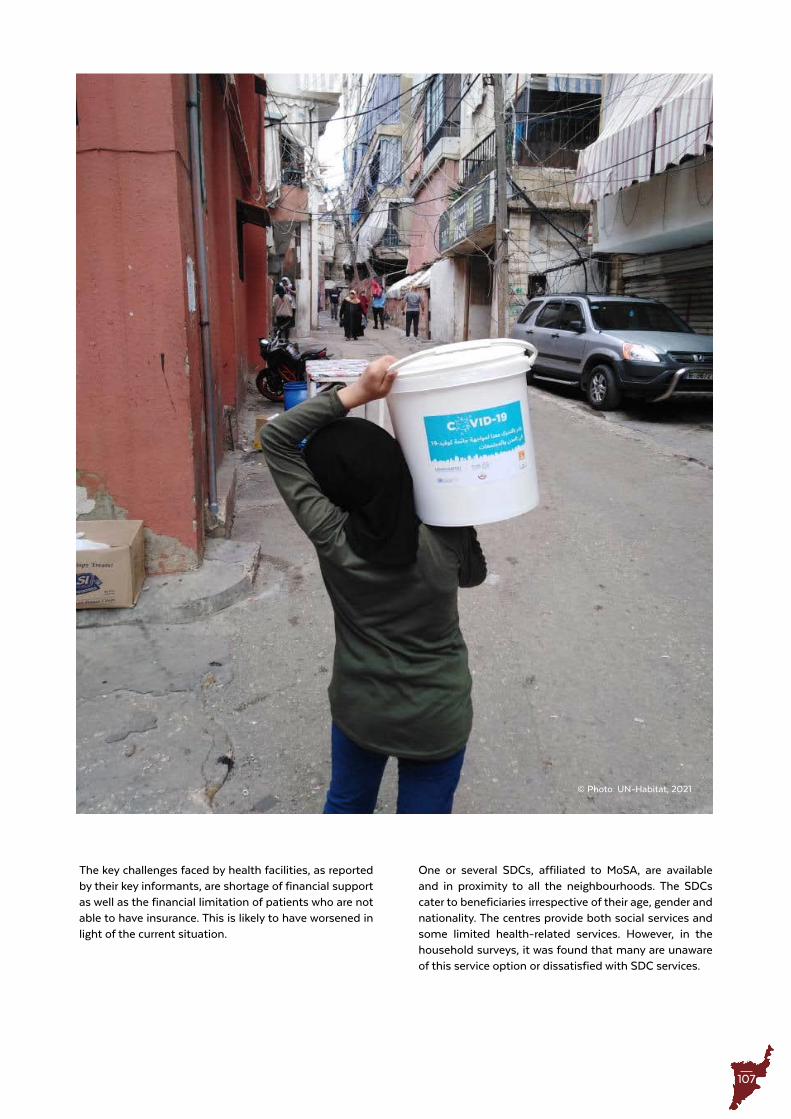
107
The key challenges faced by health facilities, as reported by their key informants, are shortage of financial support as well as the financial limitation of patients who are not able to have insurance. This is likely to have worsened in light of the current situation.
© Photo: UN-Habitat, 2021
One or several SDCs, affiliated to MoSA, are available and in proximity to all the neighbourhoods. The SDCs cater to beneficiaries irrespective of their age, gender and nationality. The centres provide both social services and some limited health-related services. However, in the household surveys, it was found that many are unaware of this service option or dissatisfied with SDC services.
108
THEME 4U
N-H
AB
ITA
T /
LE
BA
NO
N /
CIT
Y P
RO
FIL
ES
/ B
EIR
UT
/ 2
02
1 /
BA
SIC
& S
OC
IAL
SE
RV
ICE
S Education
Education governanceThe Lebanese educational system is centralized, and all stakeholders within the sector are regulated by MEHE. MEHE governs the subnational education system levels through its regional offices.531 The regional offices supervise the respective regions’ public schools and act as an interface with the central ministry in Beirut. Municipal councils must give consent to the creation, closure or transfer of public schools in their respective localities. They also have the right to establish, manage or finance public schools, nurseries and technical schools in their localities.532 An autonomous body under MEHE, the Center for Educational Research and Development (CERD) is responsible for drafting, adjusting and implementing pre-university curricula; conducting research on the education sector; and providing university teacher training.533 Both public and private schools teach the national curriculum.534 To address the pressing education needs in the country, MEHE has developed an overall strategy to guide the education sector’s work: Reaching all Children with Education Plans (RACE I: 2014-2016535 and RACE II: 2017-2021536).
Schools in Lebanon can be divided into four types: public schools (referred to as formal schooling) (44 per cent); free private confessional schools (13 per cent); private schools (oftentimes run by for-profit organizations) (41 per cent); and UNRWA schools (2 per cent).537
The national public education system has been in decline due to decades of underinvestment, inefficient allocation of resources; and funds being skewed away from investments focused on children and social systems.538 MEHE has had a weakened capacity to run the public educational infrastructure or maintain high-quality and trained teachers and administrative employees. As a result, public schools have experienced a rapid increase in contractual teachers and “a significant over-supply of under-qualified teaching staff in public schools.”539 To illustrate the inadequate provision of educational services, the World Bank’s Public Expenditure Review from 2017 showed that public schools in Lebanon
531 European Committee of the Regions, “Lebanon,” 2020, https://portal.cor.europa.eu/divisionpowers/Pages/Lebanon-Education.aspx.
532 Ibid.
533 Ibid.
534 WENR, “Education in Lebanon,” 2020, https://wenr.wes.org/2017/05/education-in-lebanon.
535 MEHE, “Reaching all Children with Education: RACE I:2014-2016,” 2014.
536 MEHE, “Reaching all Children with Education: RACE II (2017-2021),” 2016.
537 International Alert, “School for Stability”; Blominvest Bank, “The Educational Landscape in Lebanon 2016-2017,” 2018.
538 UNCT Lebanon, “Rapid Socio-Economic Impact Assessment.”
539 MEHE, “Reaching all Children with Education: RACE II (2017-2021),” 2016, p. 8.
experienced lower academic outcomes in both national and international assessments.540
Distribution of schools in BeirutIn 2017, Beirut Governorate hosted the highest concentration of schools in the country, with 24.4 per cent of the national total being located in the city, encompassing the following: 129 public schools with a total of 45,000 pupils, 76 private schools with around 265,000 pupils, and 11 UNRWA schools with around 5,200 pupils. The suburbs of Beirut City have the largest concentration of private schools in the country.541 This is followed by Beirut Municipality and the larger Mount Lebanon areas. The high enrolment numbers in private schools in Beirut City is due to various factors directly relating to the deteriorating condition of public schools, including lack of space and the quality of teaching.
Figure 46 shows that the spatial distribution of public schools is not in line with population density in Beirut. While public schools in some areas are significantly underutilized, they are overcrowded in other areas.
Higher educationHigher education is provided by university colleges, university institutes, universities, and technical and vocational institutes. University colleges, university institutes and universities are under the MEHE Directorate General of Higher Education. Technical and vocational institutes are governed by the MEHE Directorate General for Vocational and Technical Education.542 The only public university in the country, the Lebanese University, is located in Beirut, and has a much larger student body than any other university.543 The lack of public universities is contributing to the low overall enrolment in universities.544 The preference for shorter employment and employment-geared vocational and technical education also renders university enrolment less competitive. In total, Beirut has 25 universities, including AUB, the Lebanese American University, and Saint Joseph University. These institutions represent the long academic history of Beirut and are important repositories of knowledge. AUB is the oldest university, established in 1866 in Hamra, while both Saint Joseph University and Université La Sagesse were established in 1875. AUB is ranked as the top two university in the Arab world by Quacquarelli Symonds in 2021545 and has a large international student body - with 2,002 international students (22 per cent) from 90 countries in 2018.546
540 World Bank “Lebanon: Education Public Expenditure Review 2017”, 2017.
541 UNDP, “Spotlight on Youth in Lebanon.”
542 WENR, “Education in Lebanon.”
543 European Committee of the Regions, “Lebanon.”
544 Bankmed, “Analysis of Lebanon’s Education Sector.”
545 Quacquarelli Symonds, “QS University Rankings for Arab 2021,” 2021, https://www.topuniversities.com/university-rankings/arab-region-university-rankings/2021.
546 AUB, “American Univerity of Beirut: Why AUB,” n.d., https://www.aub.edu.lb/oip/internationals/Documents/
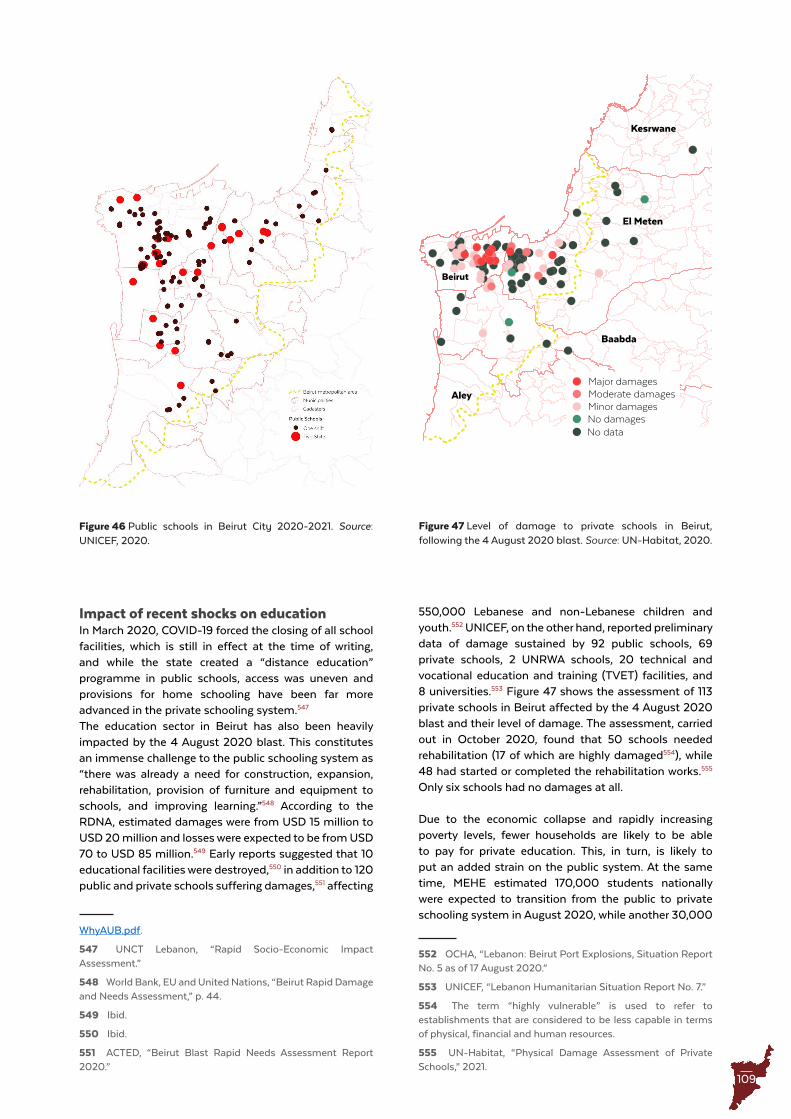
109
Figure 46 Public schools in Beirut City 2020-2021 . Source: UNICEF, 2020 .
Impact of recent shocks on educationIn March 2020, COVID-19 forced the closing of all school facilities, which is still in effect at the time of writing, and while the state created a “distance education” programme in public schools, access was uneven and provisions for home schooling have been far more advanced in the private schooling system.547
The education sector in Beirut has also been heavily impacted by the 4 August 2020 blast. This constitutes an immense challenge to the public schooling system as “there was already a need for construction, expansion, rehabilitation, provision of furniture and equipment to schools, and improving learning.”548 According to the RDNA, estimated damages were from USD 15 million to USD 20 million and losses were expected to be from USD 70 to USD 85 million.549 Early reports suggested that 10 educational facilities were destroyed,550 in addition to 120 public and private schools suffering damages,551 affecting
WhyAUB.pdf.
547 UNCT Lebanon, “Rapid Socio-Economic Impact Assessment.”
548 World Bank, EU and United Nations, “Beirut Rapid Damage and Needs Assessment,” p. 44.
549 Ibid.
550 Ibid.
551 ACTED, “Beirut Blast Rapid Needs Assessment Report 2020.”
550,000 Lebanese and non-Lebanese children and youth.552 UNICEF, on the other hand, reported preliminary data of damage sustained by 92 public schools, 69 private schools, 2 UNRWA schools, 20 technical and vocational education and training (TVET) facilities, and 8 universities.553 Figure 47 shows the assessment of 113 private schools in Beirut affected by the 4 August 2020 blast and their level of damage. The assessment, carried out in October 2020, found that 50 schools needed rehabilitation (17 of which are highly damaged554), while 48 had started or completed the rehabilitation works.555 Only six schools had no damages at all.
Due to the economic collapse and rapidly increasing poverty levels, fewer households are likely to be able to pay for private education. This, in turn, is likely to put an added strain on the public system. At the same time, MEHE estimated 170,000 students nationally were expected to transition from the public to private schooling system in August 2020, while another 30,000
552 OCHA, “Lebanon: Beirut Port Explosions, Situation Report No. 5 as of 17 August 2020.”
553 UNICEF, “Lebanon Humanitarian Situation Report No. 7.”
554 The term “highly vulnerable” is used to refer to establishments that are considered to be less capable in terms of physical, financial and human resources.
555 UN-Habitat, “Physical Damage Assessment of Private Schools,” 2021.
Baabda
El Meten
AleyMajor damagesModerate damagesMinor damagesNo damagesNo data
Kesrwane
Beirut
Zahle
Figure 47 Level of damage to private schools in Beirut, following the 4 August 2020 blast . Source: UN-Habitat, 2020 .

110
THEME 4U
N-H
AB
ITA
T /
LE
BA
NO
N /
CIT
Y P
RO
FIL
ES
/ B
EIR
UT
/ 2
02
1 /
BA
SIC
& S
OC
IAL
SE
RV
ICE
S
students to withdraw from private school, of which 40 per cent are students at private schools in Beirut and Mount Governorates.556 Combined, this is likely to magnify the differences in the quality of education and socioeconomic background of students in public and private schools. See Social Protection and Social Inclusion chapter for more information on protection challenges linked to education for children and young persons in Beirut.
Educational levelIn Lebanon, the most widely attained educational level is elementary school (25.7 per cent), followed by intermediary (21.5 per cent) and university and above (21.4 per cent) and a slightly lower share among secondary graduates (15.5 per cent) (Figure 48). Approximately 86 per cent of higher education students in Lebanon are
556 World Bank, EU and United Nations, “Beirut Rapid Damage and Needs Assessment.”
Lebanese, with an overall higher share of female (54 per cent) to male (46 per cent) students.557
The Labour Force and Household Living Conditions Survey 2018-2019 by districts shows the variance in education attainment between the Beirut,558 Aley, Baabda and El-Metn districts (Table 18). In all districts, the share of women who are illiterate is greater than that of men. The lowest rates of illiteracy are reported in El-Metn with 4.8 and 2.5 per cent illiteracy for women and men, respectively. The highest share of men with university degrees is in Beirut (31 per cent) and for women in El-Metn (29.8 per cent), around one third more than in Aley (18.1 and 19.3 per cent, respectively).
The eight neighbourhood profiles produced in Beirut City provide further interesting data on the education level in different areas of the city.
Data from the profiles shows that an almost equal proportion of male and female children (aged 3–14) in surveyed households in Sabra, Daouk-Ghawash, Hayy El-Jadid and Nabaa have attended primary school as their highest reached level of education. A higher proportion of female than male children in Hayy Tamlis households had attended primary school as their highest reached level of education, while in Maraash households, a slightly higher proportion of male children was reported.
In all the above-mentioned neighbourhoods, between 17 and 25 per cent of surveyed youth (aged 15–24) had attended a level of education higher than secondary school and higher technical secondary school. An exception was found in Hayy Tamlis, where the percentage stood at 54.2 per cent.
Of surveyed heads of households in these neighbourhoods, between 26 and 42 per cent reported to have completed not more than primary school. The highest percentage was reported in Nabaa at 42 per cent. Notably, in some of the neighbourhoods, for instance, Daouk-Ghawash and Hayy El-Jadid, where above 30 per cent did not complete more than primary school, the share was highest among non-Lebanese. The share in Nabaa, however, was greatest among the Lebanese population (49.3 per cent) compared to non-Lebanese (38.1 per cent), which is an interesting finding, as 60.4 per cent of the population in the neighbourhood is Syrian. This could indicate a long-standing gap and lack of access to services also for Lebanese in this neighbourhood. The percentage of heads of households reporting to have completed secondary school as their highest level of education varied from 7 to 14 per cent in all neighbourhoods. The exception is Maarash, where 24 per cent had completed secondary school. Across all neighbourhoods, 7 to 15.2 per cent had never received education.
557 Bankmed, “Analysis of Lebanon’s Education Sector,” 2014.
558 CAS, “Labour Force and Household Living Conditions Survey 2018-2019 in Beirut,” 2020.
© Photo: UN-Habitat, 2021
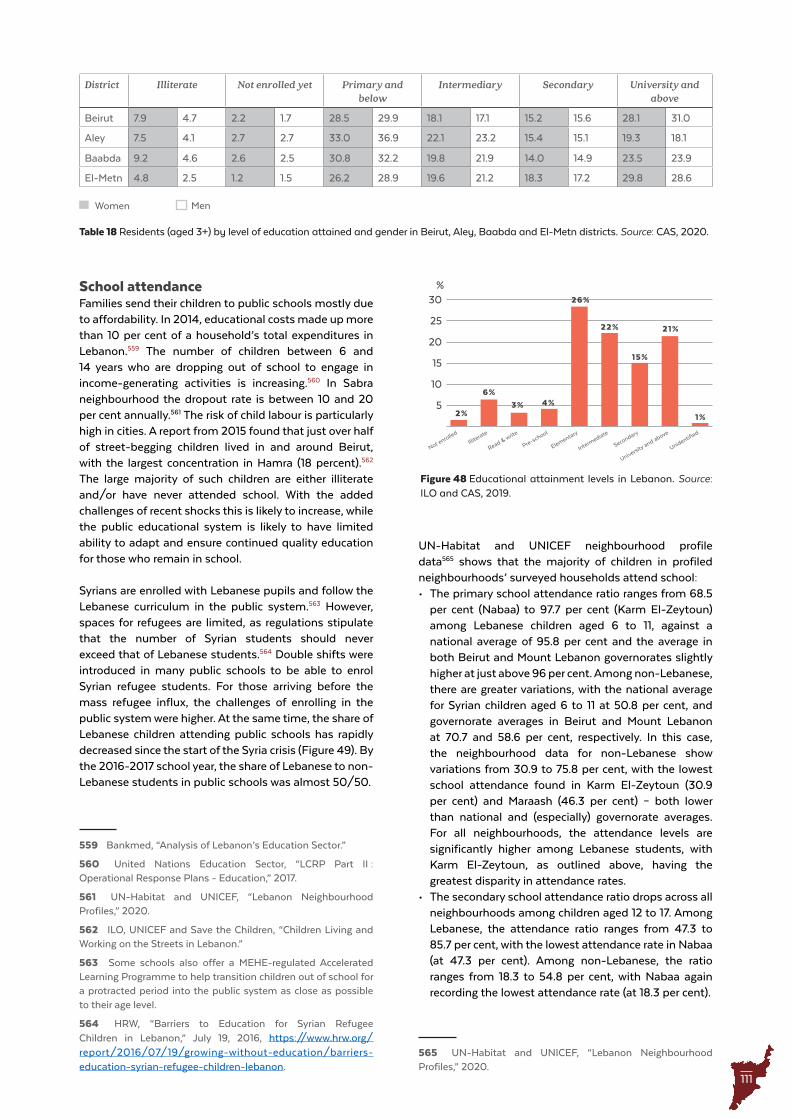
111
Figure 48 Educational attainment levels in Lebanon . Source: ILO and CAS, 2019 .
21%
1%
Pre-school
2%
6%
3% 4%
Elementary
Intermediate
Secondary
University and above
Unidentified
Illiterate
Read & write
Not enrolled
26%
22%
15%
30
25
20
15
10
5
%
District Illiterate Not enrolled yet Primary and below
Intermediary Secondary University and above
Beirut 7.9 4.7 2.2 1.7 28.5 29.9 18.1 17.1 15.2 15.6 28.1 31.0
Aley 7.5 4.1 2.7 2.7 33.0 36.9 22.1 23.2 15.4 15.1 19.3 18.1
Baabda 9.2 4.6 2.6 2.5 30.8 32.2 19.8 21.9 14.0 14.9 23.5 23.9
El-Metn 4.8 2.5 1.2 1.5 26.2 28.9 19.6 21.2 18.3 17.2 29.8 28.6
Table 18 Residents (aged 3+) by level of education attained and gender in Beirut, Aley, Baabda and El-Metn districts . Source: CAS, 2020 .
School attendanceFamilies send their children to public schools mostly due to affordability. In 2014, educational costs made up more than 10 per cent of a household’s total expenditures in Lebanon.559 The number of children between 6 and 14 years who are dropping out of school to engage in income-generating activities is increasing.560 In Sabra neighbourhood the dropout rate is between 10 and 20 per cent annually.561 The risk of child labour is particularly high in cities. A report from 2015 found that just over half of street-begging children lived in and around Beirut, with the largest concentration in Hamra (18 percent).562 The large majority of such children are either illiterate and/or have never attended school. With the added challenges of recent shocks this is likely to increase, while the public educational system is likely to have limited ability to adapt and ensure continued quality education for those who remain in school.
Syrians are enrolled with Lebanese pupils and follow the Lebanese curriculum in the public system.563 However, spaces for refugees are limited, as regulations stipulate that the number of Syrian students should never exceed that of Lebanese students.564 Double shifts were introduced in many public schools to be able to enrol Syrian refugee students. For those arriving before the mass refugee influx, the challenges of enrolling in the public system were higher. At the same time, the share of Lebanese children attending public schools has rapidly decreased since the start of the Syria crisis (Figure 49). By the 2016-2017 school year, the share of Lebanese to non-Lebanese students in public schools was almost 50/50.
559 Bankmed, “Analysis of Lebanon’s Education Sector.”
560 United Nations Education Sector, “LCRP Part II : Operational Response Plans - Education,” 2017.
561 UN-Habitat and UNICEF, “Lebanon Neighbourhood Profiles,” 2020.
562 ILO, UNICEF and Save the Children, “Children Living and Working on the Streets in Lebanon.”
563 Some schools also offer a MEHE-regulated Accelerated Learning Programme to help transition children out of school for a protracted period into the public system as close as possible to their age level.
564 HRW, “Barriers to Education for Syrian Refugee Children in Lebanon,” July 19, 2016, https://www.hrw.org/report/2016/07/19/growing-without-education/barriers-education-syrian-refugee-children-lebanon.
Women Men
© Photo: UN-Habitat, 2017
UN-Habitat and UNICEF neighbourhood profile data565 shows that the majority of children in profiled neighbourhoods’ surveyed households attend school:• The primary school attendance ratio ranges from 68.5
per cent (Nabaa) to 97.7 per cent (Karm El-Zeytoun) among Lebanese children aged 6 to 11, against a national average of 95.8 per cent and the average in both Beirut and Mount Lebanon governorates slightly higher at just above 96 per cent. Among non-Lebanese, there are greater variations, with the national average for Syrian children aged 6 to 11 at 50.8 per cent, and governorate averages in Beirut and Mount Lebanon at 70.7 and 58.6 per cent, respectively. In this case, the neighbourhood data for non-Lebanese show variations from 30.9 to 75.8 per cent, with the lowest school attendance found in Karm El-Zeytoun (30.9 per cent) and Maraash (46.3 per cent) – both lower than national and (especially) governorate averages. For all neighbourhoods, the attendance levels are significantly higher among Lebanese students, with Karm El-Zeytoun, as outlined above, having the greatest disparity in attendance rates.
• The secondary school attendance ratio drops across all neighbourhoods among children aged 12 to 17. Among Lebanese, the attendance ratio ranges from 47.3 to 85.7 per cent, with the lowest attendance rate in Nabaa (at 47.3 per cent). Among non-Lebanese, the ratio ranges from 18.3 to 54.8 per cent, with Nabaa again recording the lowest attendance rate (at 18.3 per cent).
565 UN-Habitat and UNICEF, “Lebanon Neighbourhood Profiles,” 2020.
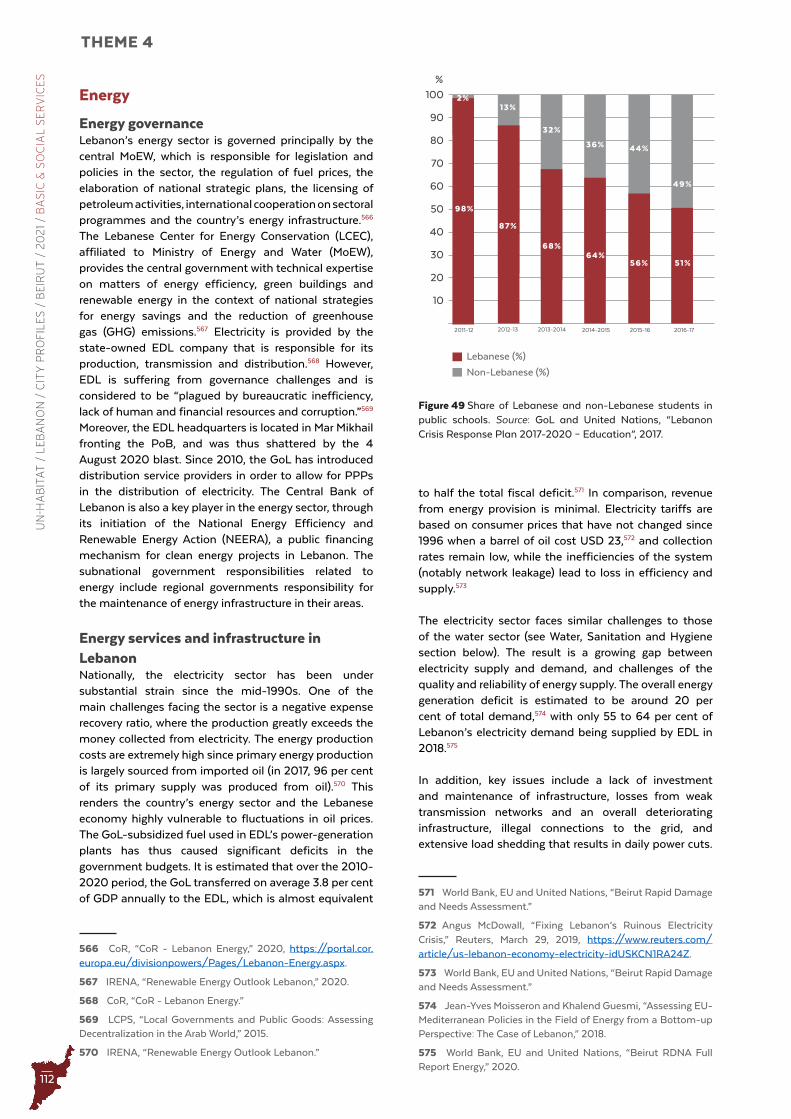
112
THEME 4U
N-H
AB
ITA
T /
LE
BA
NO
N /
CIT
Y P
RO
FIL
ES
/ B
EIR
UT
/ 2
02
1 /
BA
SIC
& S
OC
IAL
SE
RV
ICE
S
Figure 49 Share of Lebanese and non-Lebanese students in public schools . Source: GoL and United Nations, “Lebanon Crisis Response Plan 2017-2020 – Education”, 2017 .
2014-2015 2015-16 2016-17
85%
2012-13 2013-20142011-12
56%
44%
60
80
70
90
100
%
50
40
30
20
10
98%
2%
87%
13%
32%
68%64%
36%
51%
49%
Lebanese (%)
Non-Lebanese (%)
Energy
Energy governanceLebanon’s energy sector is governed principally by the central MoEW, which is responsible for legislation and policies in the sector, the regulation of fuel prices, the elaboration of national strategic plans, the licensing of petroleum activities, international cooperation on sectoral programmes and the country’s energy infrastructure.566 The Lebanese Center for Energy Conservation (LCEC), affiliated to Ministry of Energy and Water (MoEW), provides the central government with technical expertise on matters of energy efficiency, green buildings and renewable energy in the context of national strategies for energy savings and the reduction of greenhouse gas (GHG) emissions.567 Electricity is provided by the state-owned EDL company that is responsible for its production, transmission and distribution.568 However, EDL is suffering from governance challenges and is considered to be “plagued by bureaucratic inefficiency, lack of human and financial resources and corruption.”569 Moreover, the EDL headquarters is located in Mar Mikhail fronting the PoB, and was thus shattered by the 4 August 2020 blast. Since 2010, the GoL has introduced distribution service providers in order to allow for PPPs in the distribution of electricity. The Central Bank of Lebanon is also a key player in the energy sector, through its initiation of the National Energy Efficiency and Renewable Energy Action (NEERA), a public financing mechanism for clean energy projects in Lebanon. The subnational government responsibilities related to energy include regional governments responsibility for the maintenance of energy infrastructure in their areas.
Energy services and infrastructure in LebanonNationally, the electricity sector has been under substantial strain since the mid-1990s. One of the main challenges facing the sector is a negative expense recovery ratio, where the production greatly exceeds the money collected from electricity. The energy production costs are extremely high since primary energy production is largely sourced from imported oil (in 2017, 96 per cent of its primary supply was produced from oil).570 This renders the country’s energy sector and the Lebanese economy highly vulnerable to fluctuations in oil prices. The GoL-subsidized fuel used in EDL’s power-generation plants has thus caused significant deficits in the government budgets. It is estimated that over the 2010-2020 period, the GoL transferred on average 3.8 per cent of GDP annually to the EDL, which is almost equivalent
566 CoR, “CoR - Lebanon Energy,” 2020, https://portal.cor.europa.eu/divisionpowers/Pages/Lebanon-Energy.aspx.
567 IRENA, “Renewable Energy Outlook Lebanon,” 2020.
568 CoR, “CoR - Lebanon Energy.”
569 LCPS, “Local Governments and Public Goods: Assessing Decentralization in the Arab World,” 2015.
570 IRENA, “Renewable Energy Outlook Lebanon.”
to half the total fiscal deficit.571 In comparison, revenue from energy provision is minimal. Electricity tariffs are based on consumer prices that have not changed since 1996 when a barrel of oil cost USD 23,572 and collection rates remain low, while the inefficiencies of the system (notably network leakage) lead to loss in efficiency and supply.573
The electricity sector faces similar challenges to those of the water sector (see Water, Sanitation and Hygiene section below). The result is a growing gap between electricity supply and demand, and challenges of the quality and reliability of energy supply. The overall energy generation deficit is estimated to be around 20 per cent of total demand,574 with only 55 to 64 per cent of Lebanon’s electricity demand being supplied by EDL in 2018.575
In addition, key issues include a lack of investment and maintenance of infrastructure, losses from weak transmission networks and an overall deteriorating infrastructure, illegal connections to the grid, and extensive load shedding that results in daily power cuts.
571 World Bank, EU and United Nations, “Beirut Rapid Damage and Needs Assessment.”
572 Angus McDowall, “Fixing Lebanon’s Ruinous Electricity Crisis,” Reuters, March 29, 2019, https://www.reuters.com/article/us-lebanon-economy-electricity-idUSKCN1RA24Z.
573 World Bank, EU and United Nations, “Beirut Rapid Damage and Needs Assessment.”
574 Jean-Yves Moisseron and Khalend Guesmi, “Assessing EU-Mediterranean Policies in the Field of Energy from a Bottom-up Perspective: The Case of Lebanon,” 2018.
575 World Bank, EU and United Nations, “Beirut RDNA Full Report Energy,” 2020.
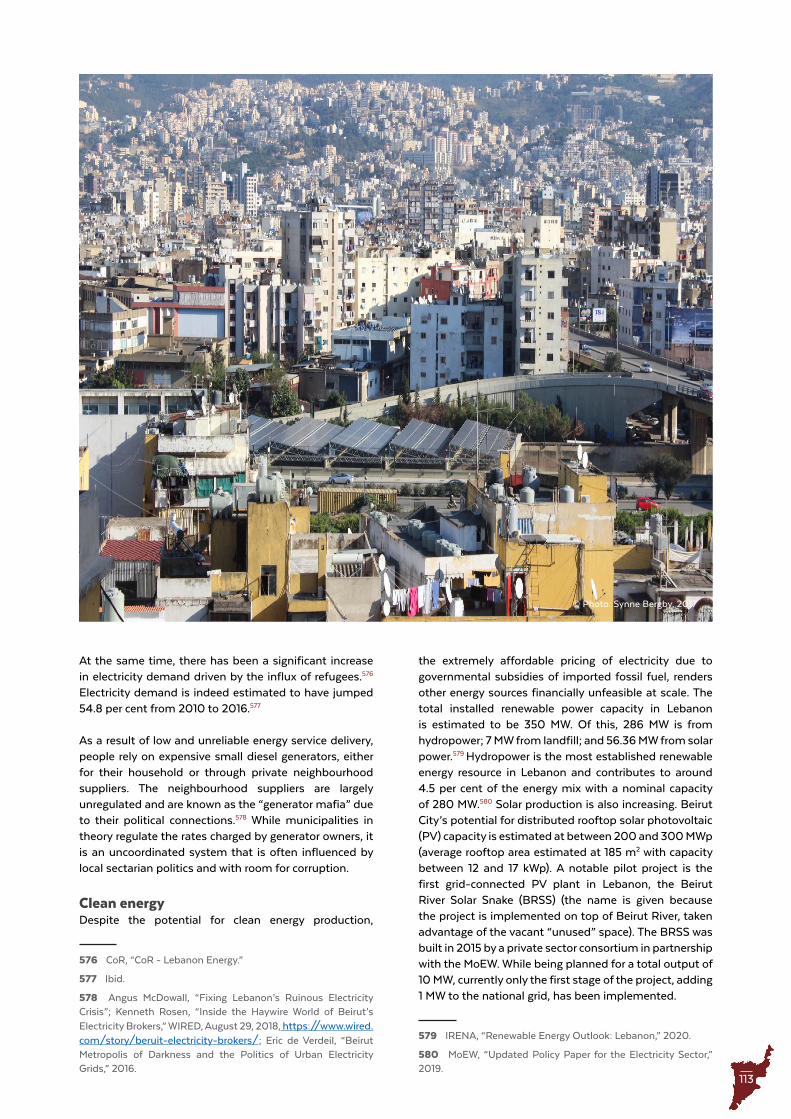
113
At the same time, there has been a significant increase in electricity demand driven by the influx of refugees.576 Electricity demand is indeed estimated to have jumped 54.8 per cent from 2010 to 2016.577
As a result of low and unreliable energy service delivery, people rely on expensive small diesel generators, either for their household or through private neighbourhood suppliers. The neighbourhood suppliers are largely unregulated and are known as the “generator mafia” due to their political connections.578 While municipalities in theory regulate the rates charged by generator owners, it is an uncoordinated system that is often influenced by local sectarian politics and with room for corruption.
Clean energyDespite the potential for clean energy production,
576 CoR, “CoR - Lebanon Energy.”
577 Ibid.
578 Angus McDowall, “Fixing Lebanon’s Ruinous Electricity Crisis”; Kenneth Rosen, “Inside the Haywire World of Beirut’s Electricity Brokers,” WIRED, August 29, 2018, https://www.wired.com/story/beruit-electricity-brokers/; Eric de Verdeil, “Beirut Metropolis of Darkness and the Politics of Urban Electricity Grids,” 2016.
the extremely affordable pricing of electricity due to governmental subsidies of imported fossil fuel, renders other energy sources financially unfeasible at scale. The total installed renewable power capacity in Lebanon is estimated to be 350 MW. Of this, 286 MW is from hydropower; 7 MW from landfill; and 56.36 MW from solar power.579 Hydropower is the most established renewable energy resource in Lebanon and contributes to around 4.5 per cent of the energy mix with a nominal capacity of 280 MW.580 Solar production is also increasing. Beirut City’s potential for distributed rooftop solar photovoltaic (PV) capacity is estimated at between 200 and 300 MWp (average rooftop area estimated at 185 m2 with capacity between 12 and 17 kWp). A notable pilot project is the first grid-connected PV plant in Lebanon, the Beirut River Solar Snake (BRSS) (the name is given because the project is implemented on top of Beirut River, taken advantage of the vacant “unused” space). The BRSS was built in 2015 by a private sector consortium in partnership with the MoEW. While being planned for a total output of 10 MW, currently only the first stage of the project, adding 1 MW to the national grid, has been implemented.
579 IRENA, “Renewable Energy Outlook: Lebanon,” 2020.
580 MoEW, “Updated Policy Paper for the Electricity Sector,” 2019.
© Photo: Synne Bergby, 2017
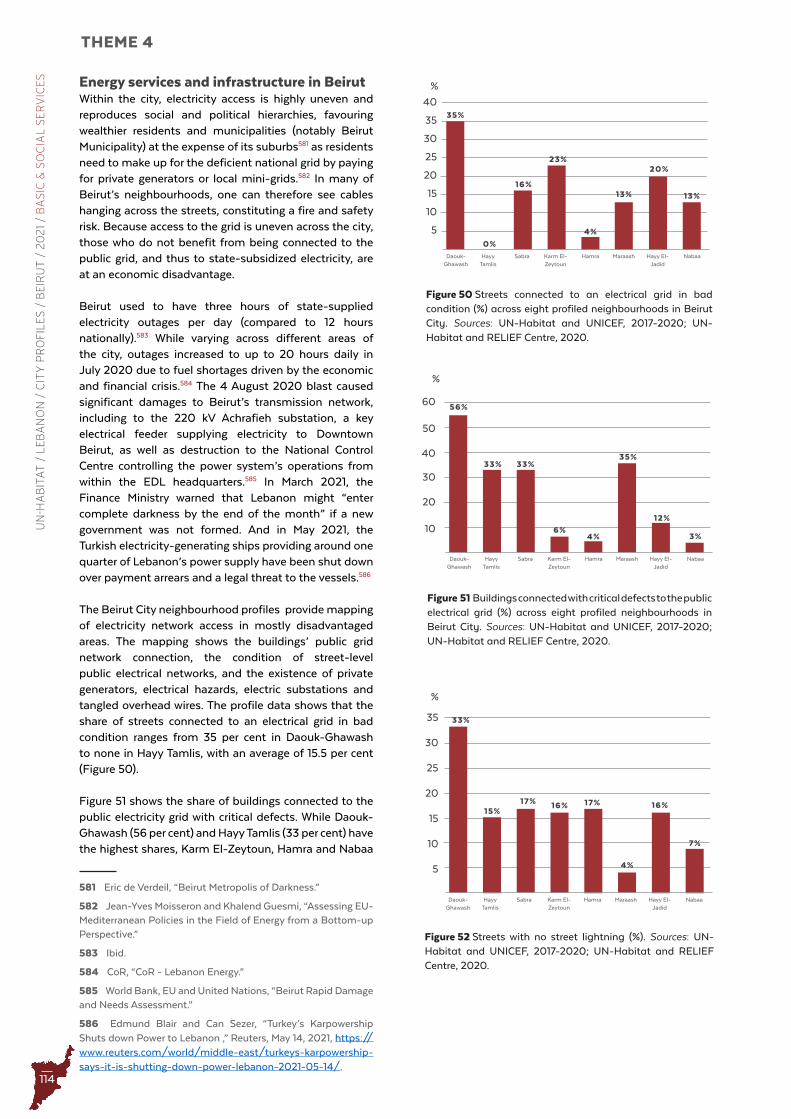
114
THEME 4U
N-H
AB
ITA
T /
LE
BA
NO
N /
CIT
Y P
RO
FIL
ES
/ B
EIR
UT
/ 2
02
1 /
BA
SIC
& S
OC
IAL
SE
RV
ICE
S
Figure 50 Streets connected to an electrical grid in bad condition (%) across eight profiled neighbourhoods in Beirut City . Sources: UN-Habitat and UNICEF, 2017-2020; UN-Habitat and RELIEF Centre, 2020 .
Figure 51 Buildings connected with critical defects to the public electrical grid (%) across eight profiled neighbourhoods in Beirut City . Sources: UN-Habitat and UNICEF, 2017-2020; UN-Habitat and RELIEF Centre, 2020 .
13%16%
23%
35%
0%
4%
13%
20%25
30
35
40
20
15
10
5
%
3%
7%
33%
17%
6%
16%
56%
33%
33%
15%
4%
17%
35%
4%
12%
16%
30
15
40
20
50
25
60
30
35
20
10
10
5
%
%
Figure 52 Streets with no street lightning (%) . Sources: UN-Habitat and UNICEF, 2017-2020; UN-Habitat and RELIEF Centre, 2020 .
Hamra Maraash Hayy El-Jadid
NabaaHayy Tamlis
SabraDaouk-Ghawash
Hamra Maraash Hayy El-Jadid
NabaaHayy Tamlis
SabraDaouk-Ghawash
Karm El-Zeytoun
Hamra Maraash Hayy El-Jadid
NabaaHayy Tamlis
SabraDaouk-Ghawash
Karm El-Zeytoun
Karm El-Zeytoun
Energy services and infrastructure in BeirutWithin the city, electricity access is highly uneven and reproduces social and political hierarchies, favouring wealthier residents and municipalities (notably Beirut Municipality) at the expense of its suburbs581 as residents need to make up for the deficient national grid by paying for private generators or local mini-grids.582 In many of Beirut’s neighbourhoods, one can therefore see cables hanging across the streets, constituting a fire and safety risk. Because access to the grid is uneven across the city, those who do not benefit from being connected to the public grid, and thus to state-subsidized electricity, are at an economic disadvantage.
Beirut used to have three hours of state-supplied electricity outages per day (compared to 12 hours nationally).583 While varying across different areas of the city, outages increased to up to 20 hours daily in July 2020 due to fuel shortages driven by the economic and financial crisis.584 The 4 August 2020 blast caused significant damages to Beirut’s transmission network, including to the 220 kV Achrafieh substation, a key electrical feeder supplying electricity to Downtown Beirut, as well as destruction to the National Control Centre controlling the power system’s operations from within the EDL headquarters.585 In March 2021, the Finance Ministry warned that Lebanon might “enter complete darkness by the end of the month” if a new government was not formed. And in May 2021, the Turkish electricity-generating ships providing around one quarter of Lebanon’s power supply have been shut down over payment arrears and a legal threat to the vessels.586
The Beirut City neighbourhood profiles provide mapping of electricity network access in mostly disadvantaged areas. The mapping shows the buildings’ public grid network connection, the condition of street-level public electrical networks, and the existence of private generators, electrical hazards, electric substations and tangled overhead wires. The profile data shows that the share of streets connected to an electrical grid in bad condition ranges from 35 per cent in Daouk-Ghawash to none in Hayy Tamlis, with an average of 15.5 per cent (Figure 50).
Figure 51 shows the share of buildings connected to the public electricity grid with critical defects. While Daouk-Ghawash (56 per cent) and Hayy Tamlis (33 per cent) have the highest shares, Karm El-Zeytoun, Hamra and Nabaa
581 Eric de Verdeil, “Beirut Metropolis of Darkness.”
582 Jean-Yves Moisseron and Khalend Guesmi, “Assessing EU-Mediterranean Policies in the Field of Energy from a Bottom-up Perspective.”
583 Ibid.
584 CoR, “CoR - Lebanon Energy.”
585 World Bank, EU and United Nations, “Beirut Rapid Damage and Needs Assessment.”
586 Edmund Blair and Can Sezer, “Turkey’s Karpowership Shuts down Power to Lebanon ,” Reuters, May 14, 2021, https://www.reuters.com/world/middle-east/turkeys-karpowership-says-it-is-shutting-down-power-lebanon-2021-05-14/.
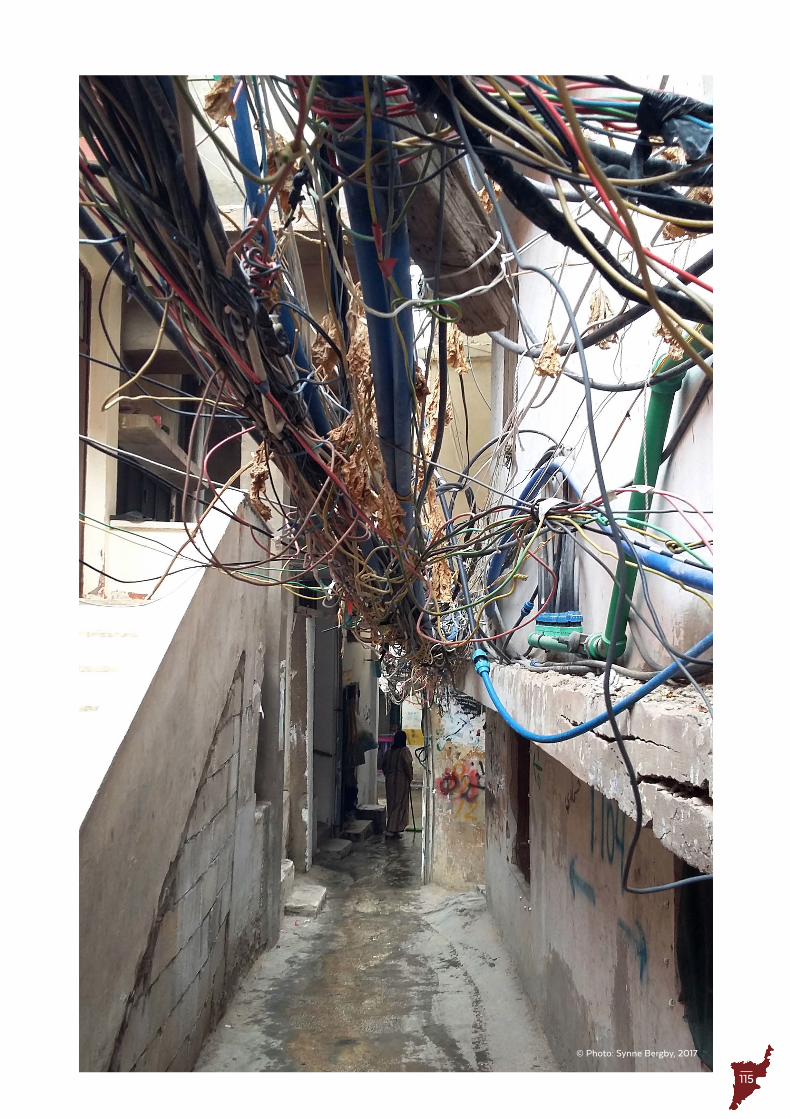
115
© Photo: Synne Bergby, 2017
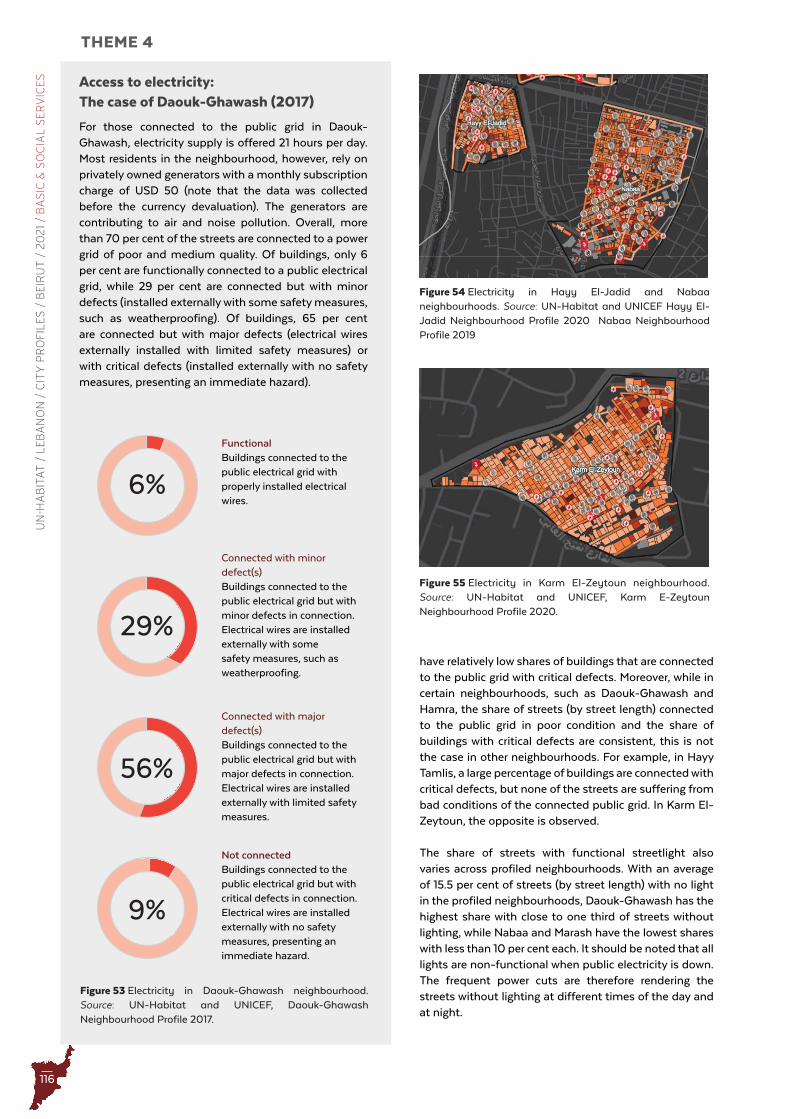
116
THEME 4U
N-H
AB
ITA
T /
LE
BA
NO
N /
CIT
Y P
RO
FIL
ES
/ B
EIR
UT
/ 2
02
1 /
BA
SIC
& S
OC
IAL
SE
RV
ICE
S Access to electricity: The case of Daouk-Ghawash (2017)
For those connected to the public grid in Daouk-Ghawash, electricity supply is offered 21 hours per day. Most residents in the neighbourhood, however, rely on privately owned generators with a monthly subscription charge of USD 50 (note that the data was collected before the currency devaluation). The generators are contributing to air and noise pollution. Overall, more than 70 per cent of the streets are connected to a power grid of poor and medium quality. Of buildings, only 6 per cent are functionally connected to a public electrical grid, while 29 per cent are connected but with minor defects (installed externally with some safety measures, such as weatherproofing). Of buildings, 65 per cent are connected but with major defects (electrical wires externally installed with limited safety measures) or with critical defects (installed externally with no safety measures, presenting an immediate hazard).
6%
29%
56%
9%
Figure 53 Electricity in Daouk-Ghawash neighbourhood . Source: UN-Habitat and UNICEF, Daouk-Ghawash Neighbourhood Profile 2017 .
FunctionalBuildings connected to the public electrical grid with properly installed electrical wires.
Connected with minor defect(s)Buildings connected to the public electrical grid but with minor defects in connection. Electrical wires are installed externally with some safety measures, such as weatherproofing.
Connected with major defect(s)Buildings connected to the public electrical grid but with major defects in connection. Electrical wires are installed externally with limited safety measures.
Not connectedBuildings connected to the public electrical grid but with critical defects in connection. Electrical wires are installed externally with no safety measures, presenting an immediate hazard.
Figure 54 Electricity in Hayy El-Jadid and Nabaa neighbourhoods . Source: UN-Habitat and UNICEF Hayy El-Jadid Neighbourhood Profile 2020 Nabaa Neighbourhood Profile 2019
Figure 55 Electricity in Karm El-Zeytoun neighbourhood . Source: UN-Habitat and UNICEF, Karm E-Zeytoun Neighbourhood Profile 2020 .
6%
29%
56%
9%
have relatively low shares of buildings that are connected to the public grid with critical defects. Moreover, while in certain neighbourhoods, such as Daouk-Ghawash and Hamra, the share of streets (by street length) connected to the public grid in poor condition and the share of buildings with critical defects are consistent, this is not the case in other neighbourhoods. For example, in Hayy Tamlis, a large percentage of buildings are connected with critical defects, but none of the streets are suffering from bad conditions of the connected public grid. In Karm El-Zeytoun, the opposite is observed.
The share of streets with functional streetlight also varies across profiled neighbourhoods. With an average of 15.5 per cent of streets (by street length) with no light in the profiled neighbourhoods, Daouk-Ghawash has the highest share with close to one third of streets without lighting, while Nabaa and Marash have the lowest shares with less than 10 per cent each. It should be noted that all lights are non-functional when public electricity is down. The frequent power cuts are therefore rendering the streets without lighting at different times of the day and at night.

117
© Photo: Synne Bergby, Urban-A, 2020
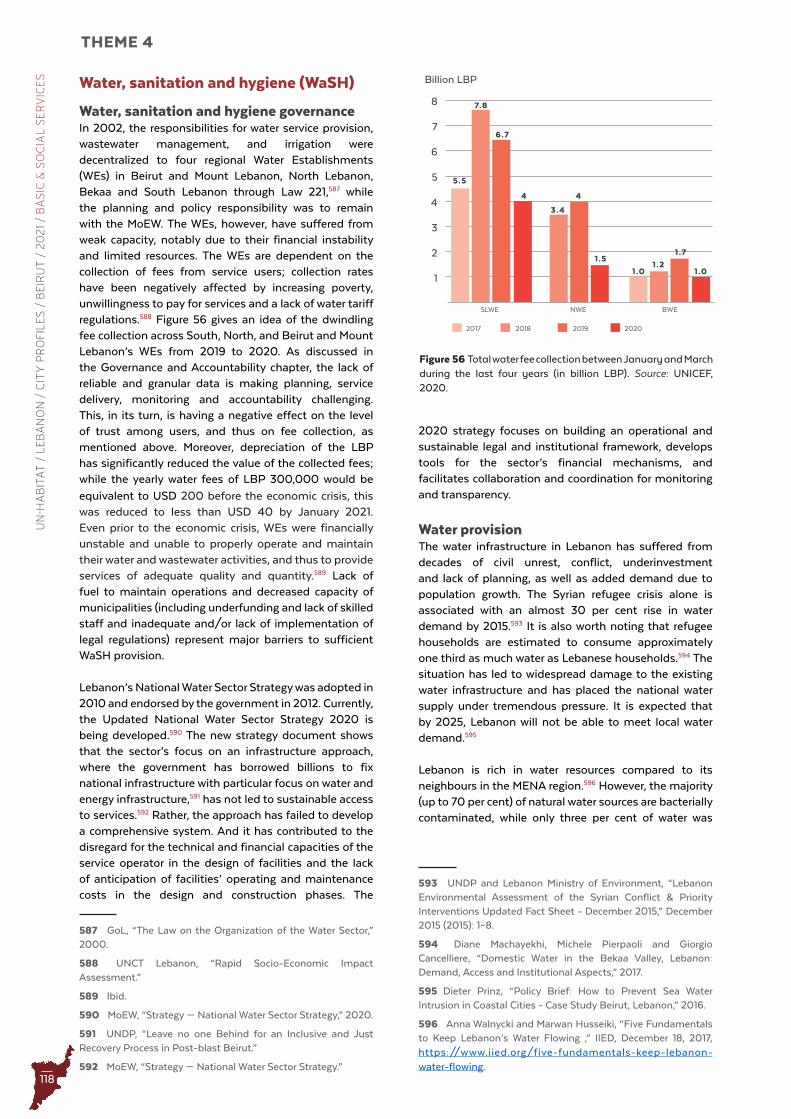
118
THEME 4U
N-H
AB
ITA
T /
LE
BA
NO
N /
CIT
Y P
RO
FIL
ES
/ B
EIR
UT
/ 2
02
1 /
BA
SIC
& S
OC
IAL
SE
RV
ICE
S
Figure 56 Total water fee collection between January and March during the last four years (in billion LBP) . Source: UNICEF, 2020 .
3.4
5.5
7.8
6.7
4 4
1.5
1.0 1.01.2
1.7
3
4
5
6
7
8
Billion LBP
2
1
NWESLWE
2017 2018 2019 2020
BWE
Water, sanitation and hygiene (WaSH)
Water, sanitation and hygiene governanceIn 2002, the responsibilities for water service provision, wastewater management, and irrigation were decentralized to four regional Water Establishments (WEs) in Beirut and Mount Lebanon, North Lebanon, Bekaa and South Lebanon through Law 221,587 while the planning and policy responsibility was to remain with the MoEW. The WEs, however, have suffered from weak capacity, notably due to their financial instability and limited resources. The WEs are dependent on the collection of fees from service users; collection rates have been negatively affected by increasing poverty, unwillingness to pay for services and a lack of water tariff regulations.588 Figure 56 gives an idea of the dwindling fee collection across South, North, and Beirut and Mount Lebanon’s WEs from 2019 to 2020. As discussed in the Governance and Accountability chapter, the lack of reliable and granular data is making planning, service delivery, monitoring and accountability challenging. This, in its turn, is having a negative effect on the level of trust among users, and thus on fee collection, as mentioned above. Moreover, depreciation of the LBP has significantly reduced the value of the collected fees; while the yearly water fees of LBP 300,000 would be
equivalent to USD 200 before the economic crisis, this was reduced to less than USD 40 by January 2021. Even prior to the economic crisis, WEs were financially unstable and unable to properly operate and maintain their water and wastewater activities, and thus to provide services of adequate quality and quantity.589 Lack of fuel to maintain operations and decreased capacity of municipalities (including underfunding and lack of skilled staff and inadequate and/or lack of implementation of legal regulations) represent major barriers to sufficient WaSH provision.
Lebanon’s National Water Sector Strategy was adopted in 2010 and endorsed by the government in 2012. Currently, the Updated National Water Sector Strategy 2020 is being developed.590 The new strategy document shows that the sector’s focus on an infrastructure approach, where the government has borrowed billions to fix national infrastructure with particular focus on water and energy infrastructure,591 has not led to sustainable access to services.592 Rather, the approach has failed to develop a comprehensive system. And it has contributed to the disregard for the technical and financial capacities of the service operator in the design of facilities and the lack of anticipation of facilities’ operating and maintenance costs in the design and construction phases. The
587 GoL, “The Law on the Organization of the Water Sector,” 2000.
588 UNCT Lebanon, “Rapid Socio-Economic Impact Assessment.”
589 Ibid.
590 MoEW, “Strategy — National Water Sector Strategy,” 2020.
591 UNDP, “Leave no one Behind for an Inclusive and Just Recovery Process in Post-blast Beirut.”
592 MoEW, “Strategy — National Water Sector Strategy.”
2020 strategy focuses on building an operational and sustainable legal and institutional framework, develops tools for the sector’s financial mechanisms, and facilitates collaboration and coordination for monitoring and transparency.
Water provisionThe water infrastructure in Lebanon has suffered from decades of civil unrest, conflict, underinvestment and lack of planning, as well as added demand due to population growth. The Syrian refugee crisis alone is associated with an almost 30 per cent rise in water demand by 2015.593 It is also worth noting that refugee households are estimated to consume approximately one third as much water as Lebanese households.594 The situation has led to widespread damage to the existing water infrastructure and has placed the national water supply under tremendous pressure. It is expected that by 2025, Lebanon will not be able to meet local water demand.595
Lebanon is rich in water resources compared to its neighbours in the MENA region.596 However, the majority (up to 70 per cent) of natural water sources are bacterially contaminated, while only three per cent of water was
593 UNDP and Lebanon Ministry of Environment, “Lebanon Environmental Assessment of the Syrian Conflict & Priority Interventions Updated Fact Sheet - December 2015,” December 2015 (2015): 1–8.
594 Diane Machayekhi, Michele Pierpaoli and Giorgio Cancelliere, “Domestic Water in the Bekaa Valley, Lebanon: Demand, Access and Institutional Aspects,” 2017.
595 Dieter Prinz, “Policy Brief: How to Prevent Sea Water Intrusion in Coastal Cities - Case Study Beirut, Lebanon,” 2016.
596 Anna Walnycki and Marwan Husseiki, “Five Fundamentals to Keep Lebanon’s Water Flowing ,” IIED, December 18, 2017, https://www.iied.org/five-fundamentals-keep-lebanon-water-flowing.
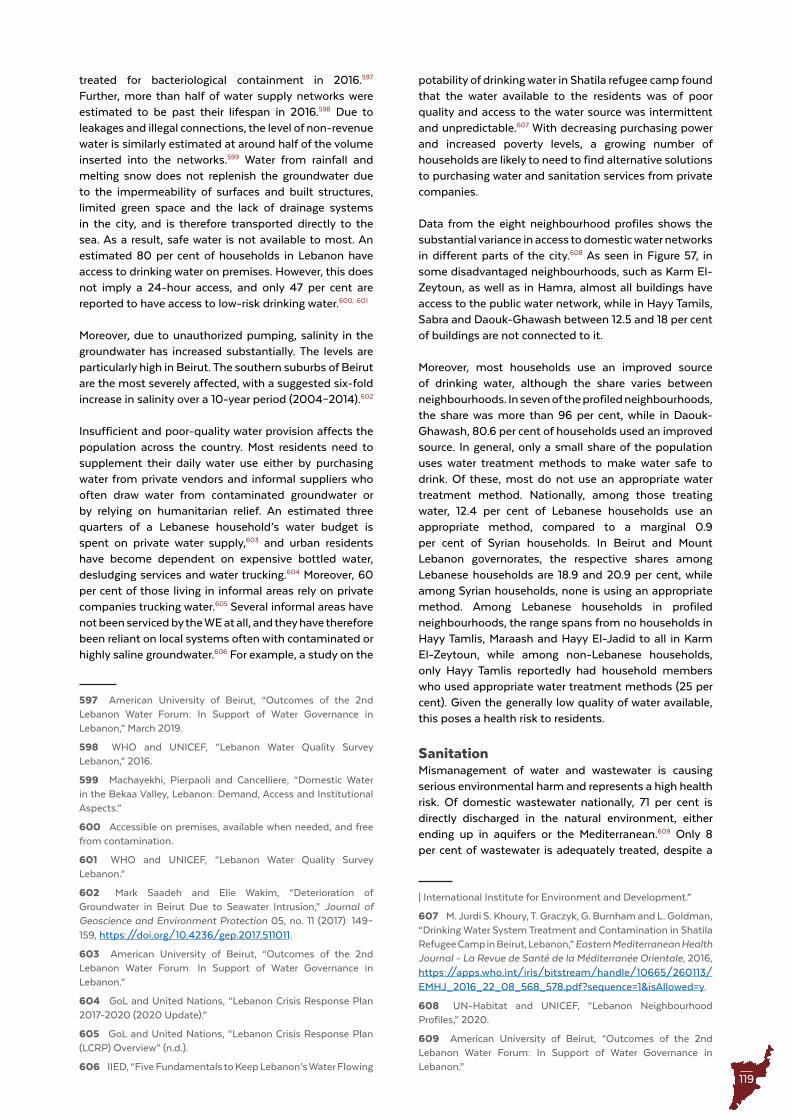
119
treated for bacteriological containment in 2016.597 Further, more than half of water supply networks were estimated to be past their lifespan in 2016.598 Due to leakages and illegal connections, the level of non-revenue water is similarly estimated at around half of the volume inserted into the networks.599 Water from rainfall and melting snow does not replenish the groundwater due to the impermeability of surfaces and built structures, limited green space and the lack of drainage systems in the city, and is therefore transported directly to the sea. As a result, safe water is not available to most. An estimated 80 per cent of households in Lebanon have access to drinking water on premises. However, this does not imply a 24-hour access, and only 47 per cent are reported to have access to low-risk drinking water.600, 601
Moreover, due to unauthorized pumping, salinity in the groundwater has increased substantially. The levels are particularly high in Beirut. The southern suburbs of Beirut are the most severely affected, with a suggested six-fold increase in salinity over a 10-year period (2004–2014).602
Insufficient and poor-quality water provision affects the population across the country. Most residents need to supplement their daily water use either by purchasing water from private vendors and informal suppliers who often draw water from contaminated groundwater or by relying on humanitarian relief. An estimated three quarters of a Lebanese household’s water budget is spent on private water supply,603 and urban residents have become dependent on expensive bottled water, desludging services and water trucking.604 Moreover, 60 per cent of those living in informal areas rely on private companies trucking water.605 Several informal areas have not been serviced by the WE at all, and they have therefore been reliant on local systems often with contaminated or highly saline groundwater.606 For example, a study on the
597 American University of Beirut, “Outcomes of the 2nd Lebanon Water Forum: In Support of Water Governance in Lebanon,” March 2019.
598 WHO and UNICEF, “Lebanon Water Quality Survey Lebanon,” 2016.
599 Machayekhi, Pierpaoli and Cancelliere, “Domestic Water in the Bekaa Valley, Lebanon: Demand, Access and Institutional Aspects.”
600 Accessible on premises, available when needed, and free from contamination.
601 WHO and UNICEF, “Lebanon Water Quality Survey Lebanon.”
602 Mark Saadeh and Elie Wakim, “Deterioration of Groundwater in Beirut Due to Seawater Intrusion,” Journal of Geoscience and Environment Protection 05, no. 11 (2017): 149–159, https://doi.org/10.4236/gep.2017.511011.
603 American University of Beirut, “Outcomes of the 2nd Lebanon Water Forum: In Support of Water Governance in Lebanon.”
604 GoL and United Nations, “Lebanon Crisis Response Plan 2017-2020 (2020 Update).”
605 GoL and United Nations, “Lebanon Crisis Response Plan (LCRP) Overview” (n.d.).
606 IIED, “Five Fundamentals to Keep Lebanon’s Water Flowing
potability of drinking water in Shatila refugee camp found that the water available to the residents was of poor quality and access to the water source was intermittent and unpredictable.607 With decreasing purchasing power and increased poverty levels, a growing number of households are likely to need to find alternative solutions to purchasing water and sanitation services from private companies.
Data from the eight neighbourhood profiles shows the substantial variance in access to domestic water networks in different parts of the city.608 As seen in Figure 57, in some disadvantaged neighbourhoods, such as Karm El-Zeytoun, as well as in Hamra, almost all buildings have access to the public water network, while in Hayy Tamils, Sabra and Daouk-Ghawash between 12.5 and 18 per cent of buildings are not connected to it.
Moreover, most households use an improved source of drinking water, although the share varies between neighbourhoods. In seven of the profiled neighbourhoods, the share was more than 96 per cent, while in Daouk-Ghawash, 80.6 per cent of households used an improved source. In general, only a small share of the population uses water treatment methods to make water safe to drink. Of these, most do not use an appropriate water treatment method. Nationally, among those treating water, 12.4 per cent of Lebanese households use an appropriate method, compared to a marginal 0.9 per cent of Syrian households. In Beirut and Mount Lebanon governorates, the respective shares among Lebanese households are 18.9 and 20.9 per cent, while among Syrian households, none is using an appropriate method. Among Lebanese households in profiled neighbourhoods, the range spans from no households in Hayy Tamlis, Maraash and Hayy El-Jadid to all in Karm El-Zeytoun, while among non-Lebanese households, only Hayy Tamlis reportedly had household members who used appropriate water treatment methods (25 per cent). Given the generally low quality of water available, this poses a health risk to residents.
SanitationMismanagement of water and wastewater is causing serious environmental harm and represents a high health risk. Of domestic wastewater nationally, 71 per cent is directly discharged in the natural environment, either ending up in aquifers or the Mediterranean.609 Only 8 per cent of wastewater is adequately treated, despite a
| International Institute for Environment and Development.”
607 M. Jurdi S. Khoury, T. Graczyk, G. Burnham and L. Goldman, “Drinking Water System Treatment and Contamination in Shatila Refugee Camp in Beirut, Lebanon,” Eastern Mediterranean Health Journal - La Revue de Santé de la Méditerranée Orientale, 2016, https://apps.who.int/iris/bitstream/handle/10665/260113/EMHJ_2016_22_08_568_578.pdf?sequence=1&isAllowed=y.
608 UN-Habitat and UNICEF, “Lebanon Neighbourhood Profiles,” 2020.
609 American University of Beirut, “Outcomes of the 2nd Lebanon Water Forum: In Support of Water Governance in Lebanon.”
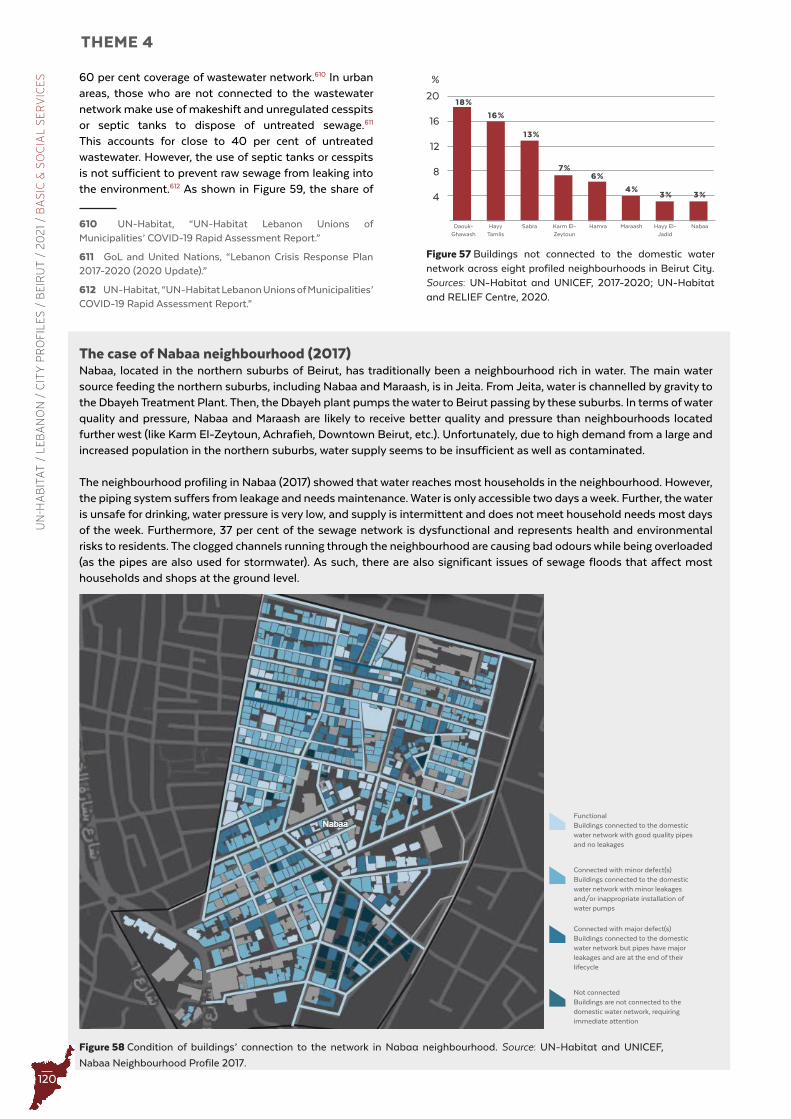
120
THEME 4U
N-H
AB
ITA
T /
LE
BA
NO
N /
CIT
Y P
RO
FIL
ES
/ B
EIR
UT
/ 2
02
1 /
BA
SIC
& S
OC
IAL
SE
RV
ICE
S
Figure 57 Buildings not connected to the domestic water network across eight profiled neighbourhoods in Beirut City . Sources: UN-Habitat and UNICEF, 2017-2020; UN-Habitat and RELIEF Centre, 2020 .
3%
13%
7%
18%
16%
6%
4%3%
12
16
20
8
4
%
Figure 58 Condition of buildings’ connection to the network in Nabaa neighbourhood . Source: UN-Habitat and UNICEF,
Nabaa Neighbourhood Profile 2017 .
Karm El-Zeytoun
Hamra Maraash Hayy El-Jadid
NabaaHayy Tamlis
SabraDaouk-Ghawash
The case of Nabaa neighbourhood (2017) Nabaa, located in the northern suburbs of Beirut, has traditionally been a neighbourhood rich in water. The main water source feeding the northern suburbs, including Nabaa and Maraash, is in Jeita. From Jeita, water is channelled by gravity to the Dbayeh Treatment Plant. Then, the Dbayeh plant pumps the water to Beirut passing by these suburbs. In terms of water quality and pressure, Nabaa and Maraash are likely to receive better quality and pressure than neighbourhoods located further west (like Karm El-Zeytoun, Achrafieh, Downtown Beirut, etc.). Unfortunately, due to high demand from a large and increased population in the northern suburbs, water supply seems to be insufficient as well as contaminated.
The neighbourhood profiling in Nabaa (2017) showed that water reaches most households in the neighbourhood. However, the piping system suffers from leakage and needs maintenance. Water is only accessible two days a week. Further, the water is unsafe for drinking, water pressure is very low, and supply is intermittent and does not meet household needs most days of the week. Furthermore, 37 per cent of the sewage network is dysfunctional and represents health and environmental risks to residents. The clogged channels running through the neighbourhood are causing bad odours while being overloaded (as the pipes are also used for stormwater). As such, there are also significant issues of sewage floods that affect most households and shops at the ground level.
60 per cent coverage of wastewater network.610 In urban areas, those who are not connected to the wastewater network make use of makeshift and unregulated cesspits or septic tanks to dispose of untreated sewage.611 This accounts for close to 40 per cent of untreated wastewater. However, the use of septic tanks or cesspits is not sufficient to prevent raw sewage from leaking into the environment.612 As shown in Figure 59, the share of
610 UN-Habitat, “UN-Habitat Lebanon Unions of Municipalities’ COVID-19 Rapid Assessment Report.”
611 GoL and United Nations, “Lebanon Crisis Response Plan 2017-2020 (2020 Update).”
612 UN-Habitat, “UN-Habitat Lebanon Unions of Municipalities’ COVID-19 Rapid Assessment Report.”
FunctionalBuildings connected to the domestic water network with good quality pipes and no leakages
Connected with minor defect(s)Buildings connected to the domestic water network with minor leakages and/or inappropriate installation of water pumps
Connected with major defect(s)Buildings connected to the domestic water network but pipes have major leakages and are at the end of their lifecycle
Not connected Buildings are not connected to the domestic water network, requiring immediate attention
120
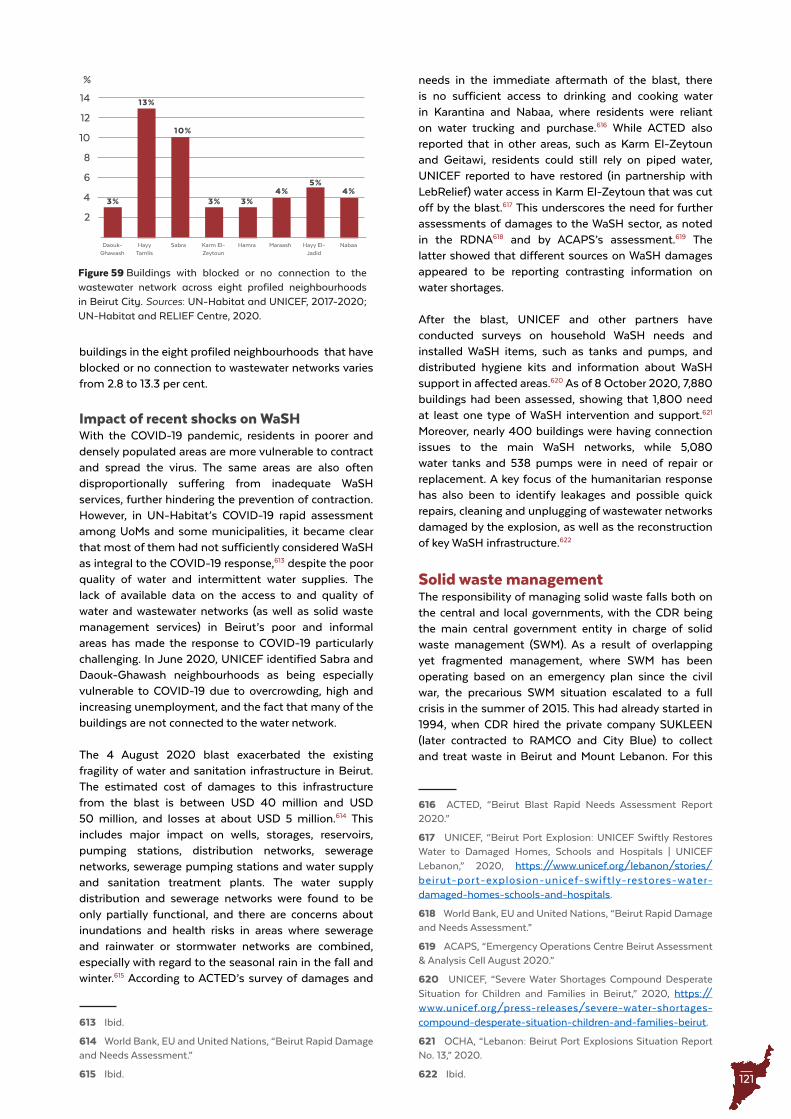
121
4%
10%
3%3%
13%
3%4%
5%6
8
10
12
14
4
2
%
Figure 59 Buildings with blocked or no connection to the wastewater network across eight profiled neighbourhoods in Beirut City . Sources: UN-Habitat and UNICEF, 2017-2020; UN-Habitat and RELIEF Centre, 2020 .
Karm El-Zeytoun
Hamra Maraash Hayy El-Jadid
NabaaHayy Tamlis
SabraDaouk-Ghawash
buildings in the eight profiled neighbourhoods that have blocked or no connection to wastewater networks varies from 2.8 to 13.3 per cent.
Impact of recent shocks on WaSHWith the COVID-19 pandemic, residents in poorer and densely populated areas are more vulnerable to contract and spread the virus. The same areas are also often disproportionally suffering from inadequate WaSH services, further hindering the prevention of contraction. However, in UN-Habitat’s COVID-19 rapid assessment among UoMs and some municipalities, it became clear that most of them had not sufficiently considered WaSH as integral to the COVID-19 response,613 despite the poor quality of water and intermittent water supplies. The lack of available data on the access to and quality of water and wastewater networks (as well as solid waste management services) in Beirut’s poor and informal areas has made the response to COVID-19 particularly challenging. In June 2020, UNICEF identified Sabra and Daouk-Ghawash neighbourhoods as being especially vulnerable to COVID-19 due to overcrowding, high and increasing unemployment, and the fact that many of the buildings are not connected to the water network.
The 4 August 2020 blast exacerbated the existing fragility of water and sanitation infrastructure in Beirut. The estimated cost of damages to this infrastructure from the blast is between USD 40 million and USD 50 million, and losses at about USD 5 million.614 This includes major impact on wells, storages, reservoirs, pumping stations, distribution networks, sewerage networks, sewerage pumping stations and water supply and sanitation treatment plants. The water supply distribution and sewerage networks were found to be only partially functional, and there are concerns about inundations and health risks in areas where sewerage and rainwater or stormwater networks are combined, especially with regard to the seasonal rain in the fall and winter.615 According to ACTED’s survey of damages and
613 Ibid.
614 World Bank, EU and United Nations, “Beirut Rapid Damage and Needs Assessment.”
615 Ibid.
needs in the immediate aftermath of the blast, there is no sufficient access to drinking and cooking water in Karantina and Nabaa, where residents were reliant on water trucking and purchase.616 While ACTED also reported that in other areas, such as Karm El-Zeytoun and Geitawi, residents could still rely on piped water, UNICEF reported to have restored (in partnership with LebRelief) water access in Karm El-Zeytoun that was cut off by the blast.617 This underscores the need for further assessments of damages to the WaSH sector, as noted in the RDNA618 and by ACAPS’s assessment.619 The latter showed that different sources on WaSH damages appeared to be reporting contrasting information on water shortages.
After the blast, UNICEF and other partners have conducted surveys on household WaSH needs and installed WaSH items, such as tanks and pumps, and distributed hygiene kits and information about WaSH support in affected areas.620 As of 8 October 2020, 7,880 buildings had been assessed, showing that 1,800 need at least one type of WaSH intervention and support.621 Moreover, nearly 400 buildings were having connection issues to the main WaSH networks, while 5,080 water tanks and 538 pumps were in need of repair or replacement. A key focus of the humanitarian response has also been to identify leakages and possible quick repairs, cleaning and unplugging of wastewater networks damaged by the explosion, as well as the reconstruction of key WaSH infrastructure.622
Solid waste managementThe responsibility of managing solid waste falls both on the central and local governments, with the CDR being the main central government entity in charge of solid waste management (SWM). As a result of overlapping yet fragmented management, where SWM has been operating based on an emergency plan since the civil war, the precarious SWM situation escalated to a full crisis in the summer of 2015. This had already started in 1994, when CDR hired the private company SUKLEEN (later contracted to RAMCO and City Blue) to collect and treat waste in Beirut and Mount Lebanon. For this
616 ACTED, “Beirut Blast Rapid Needs Assessment Report 2020.”
617 UNICEF, “Beirut Port Explosion: UNICEF Swiftly Restores Water to Damaged Homes, Schools and Hospitals | UNICEF Lebanon,” 2020, https://www.unicef.org/lebanon/stories/beirut-port-explosion-unicef-swiftly-restores-water-damaged-homes-schools-and-hospitals.
618 World Bank, EU and United Nations, “Beirut Rapid Damage and Needs Assessment.”
619 ACAPS, “Emergency Operations Centre Beirut Assessment & Analysis Cell August 2020.”
620 UNICEF, “Severe Water Shortages Compound Desperate Situation for Children and Families in Beirut,” 2020, https://www.unicef.org/press-releases/severe-water-shortages-compound-desperate-situation-children-and-families-beirut.
621 OCHA, “Lebanon: Beirut Port Explosions Situation Report No. 13,” 2020.
622 Ibid.
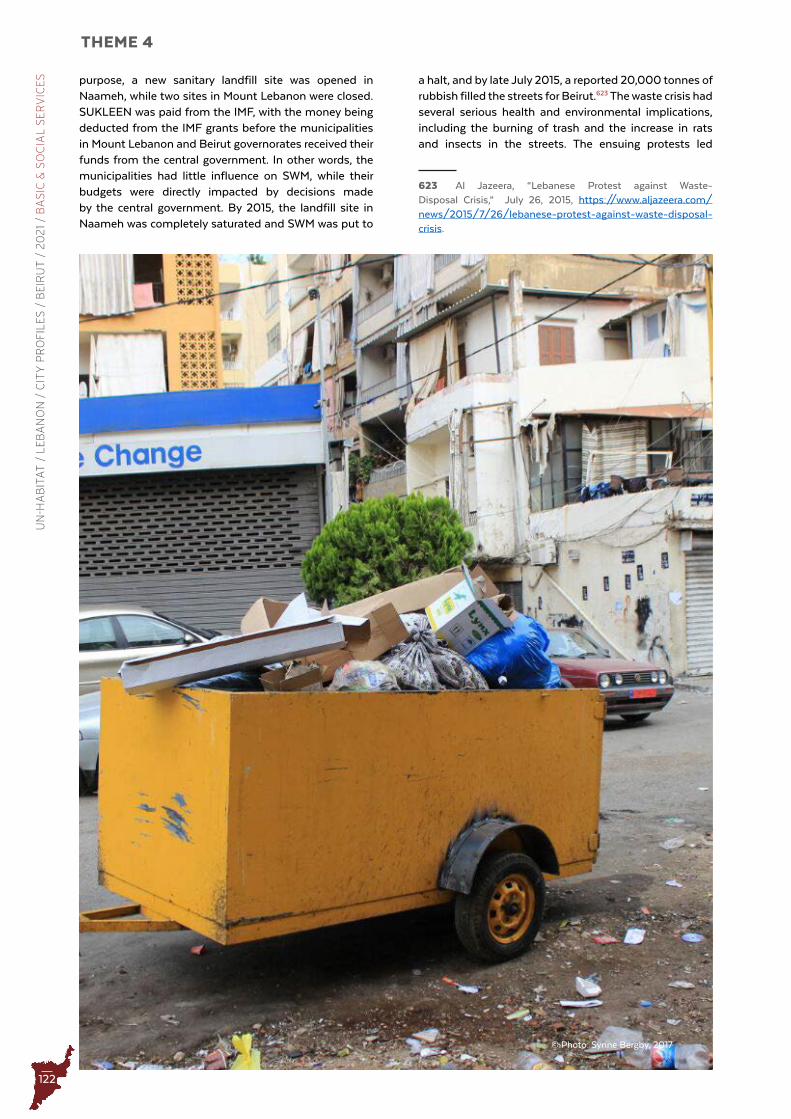
122
THEME 4U
N-H
AB
ITA
T /
LE
BA
NO
N /
CIT
Y P
RO
FIL
ES
/ B
EIR
UT
/ 2
02
1 /
BA
SIC
& S
OC
IAL
SE
RV
ICE
S a halt, and by late July 2015, a reported 20,000 tonnes of rubbish filled the streets for Beirut.623 The waste crisis had several serious health and environmental implications, including the burning of trash and the increase in rats and insects in the streets. The ensuing protests led
623 Al Jazeera, “Lebanese Protest against Waste-Disposal Crisis,” July 26, 2015, https://www.aljazeera.com/news/2015/7/26/lebanese-protest-against-waste-disposal-crisis.
purpose, a new sanitary landfill site was opened in Naameh, while two sites in Mount Lebanon were closed. SUKLEEN was paid from the IMF, with the money being deducted from the IMF grants before the municipalities in Mount Lebanon and Beirut governorates received their funds from the central government. In other words, the municipalities had little influence on SWM, while their budgets were directly impacted by decisions made by the central government. By 2015, the landfill site in Naameh was completely saturated and SWM was put to
© Photo: Synne Bergby, 2017
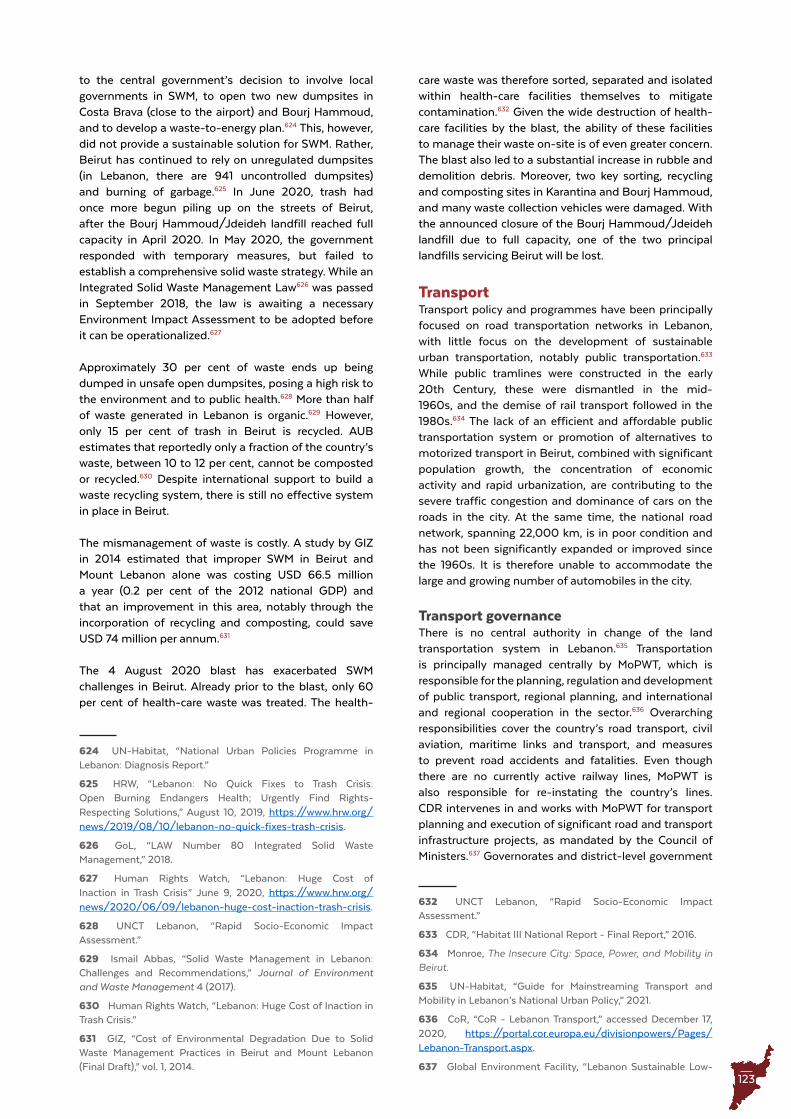
123
to the central government’s decision to involve local governments in SWM, to open two new dumpsites in Costa Brava (close to the airport) and Bourj Hammoud, and to develop a waste-to-energy plan.624 This, however, did not provide a sustainable solution for SWM. Rather, Beirut has continued to rely on unregulated dumpsites (in Lebanon, there are 941 uncontrolled dumpsites) and burning of garbage.625 In June 2020, trash had once more begun piling up on the streets of Beirut, after the Bourj Hammoud/Jdeideh landfill reached full capacity in April 2020. In May 2020, the government responded with temporary measures, but failed to establish a comprehensive solid waste strategy. While an Integrated Solid Waste Management Law626 was passed in September 2018, the law is awaiting a necessary Environment Impact Assessment to be adopted before it can be operationalized.627
Approximately 30 per cent of waste ends up being dumped in unsafe open dumpsites, posing a high risk to the environment and to public health.628 More than half of waste generated in Lebanon is organic.629 However, only 15 per cent of trash in Beirut is recycled. AUB estimates that reportedly only a fraction of the country’s waste, between 10 to 12 per cent, cannot be composted or recycled.630 Despite international support to build a waste recycling system, there is still no effective system in place in Beirut.
The mismanagement of waste is costly. A study by GIZ in 2014 estimated that improper SWM in Beirut and Mount Lebanon alone was costing USD 66.5 million a year (0.2 per cent of the 2012 national GDP) and that an improvement in this area, notably through the incorporation of recycling and composting, could save USD 74 million per annum.631
The 4 August 2020 blast has exacerbated SWM challenges in Beirut. Already prior to the blast, only 60 per cent of health-care waste was treated. The health-
624 UN-Habitat, “National Urban Policies Programme in Lebanon: Diagnosis Report.”
625 HRW, “Lebanon: No Quick Fixes to Trash Crisis: Open Burning Endangers Health; Urgently Find Rights-Respecting Solutions,” August 10, 2019, https://www.hrw.org/news/2019/08/10/lebanon-no-quick-fixes-trash-crisis.
626 GoL, “LAW Number 80 Integrated Solid Waste Management,” 2018.
627 Human Rights Watch, “Lebanon: Huge Cost of Inaction in Trash Crisis” June 9, 2020, https://www.hrw.org/news/2020/06/09/lebanon-huge-cost-inaction-trash-crisis.
628 UNCT Lebanon, “Rapid Socio-Economic Impact Assessment.”
629 Ismail Abbas, “Solid Waste Management in Lebanon: Challenges and Recommendations,” Journal of Environment and Waste Management 4 (2017).
630 Human Rights Watch, “Lebanon: Huge Cost of Inaction in Trash Crisis.”
631 GIZ, “Cost of Environmental Degradation Due to Solid Waste Management Practices in Beirut and Mount Lebanon (Final Draft),” vol. 1, 2014.
care waste was therefore sorted, separated and isolated within health-care facilities themselves to mitigate contamination.632 Given the wide destruction of health-care facilities by the blast, the ability of these facilities to manage their waste on-site is of even greater concern. The blast also led to a substantial increase in rubble and demolition debris. Moreover, two key sorting, recycling and composting sites in Karantina and Bourj Hammoud, and many waste collection vehicles were damaged. With the announced closure of the Bourj Hammoud/Jdeideh landfill due to full capacity, one of the two principal landfills servicing Beirut will be lost.
TransportTransport policy and programmes have been principally focused on road transportation networks in Lebanon, with little focus on the development of sustainable urban transportation, notably public transportation.633 While public tramlines were constructed in the early 20th Century, these were dismantled in the mid-1960s, and the demise of rail transport followed in the 1980s.634 The lack of an efficient and affordable public transportation system or promotion of alternatives to motorized transport in Beirut, combined with significant population growth, the concentration of economic activity and rapid urbanization, are contributing to the severe traffic congestion and dominance of cars on the roads in the city. At the same time, the national road network, spanning 22,000 km, is in poor condition and has not been significantly expanded or improved since the 1960s. It is therefore unable to accommodate the large and growing number of automobiles in the city.
Transport governanceThere is no central authority in change of the land transportation system in Lebanon.635 Transportation is principally managed centrally by MoPWT, which is responsible for the planning, regulation and development of public transport, regional planning, and international and regional cooperation in the sector.636 Overarching responsibilities cover the country’s road transport, civil aviation, maritime links and transport, and measures to prevent road accidents and fatalities. Even though there are no currently active railway lines, MoPWT is also responsible for re-instating the country’s lines. CDR intervenes in and works with MoPWT for transport planning and execution of significant road and transport infrastructure projects, as mandated by the Council of Ministers.637 Governorates and district-level government
632 UNCT Lebanon, “Rapid Socio-Economic Impact Assessment.”
633 CDR, “Habitat III National Report - Final Report,” 2016.
634 Monroe, The Insecure City: Space, Power, and Mobility in Beirut.
635 UN-Habitat, “Guide for Mainstreaming Transport and Mobility in Lebanon’s National Urban Policy,” 2021.
636 CoR, “CoR - Lebanon Transport,” accessed December 17, 2020, https://portal.cor.europa.eu/divisionpowers/Pages/Lebanon-Transport.aspx.
637 Global Environment Facility, “Lebanon Sustainable Low-
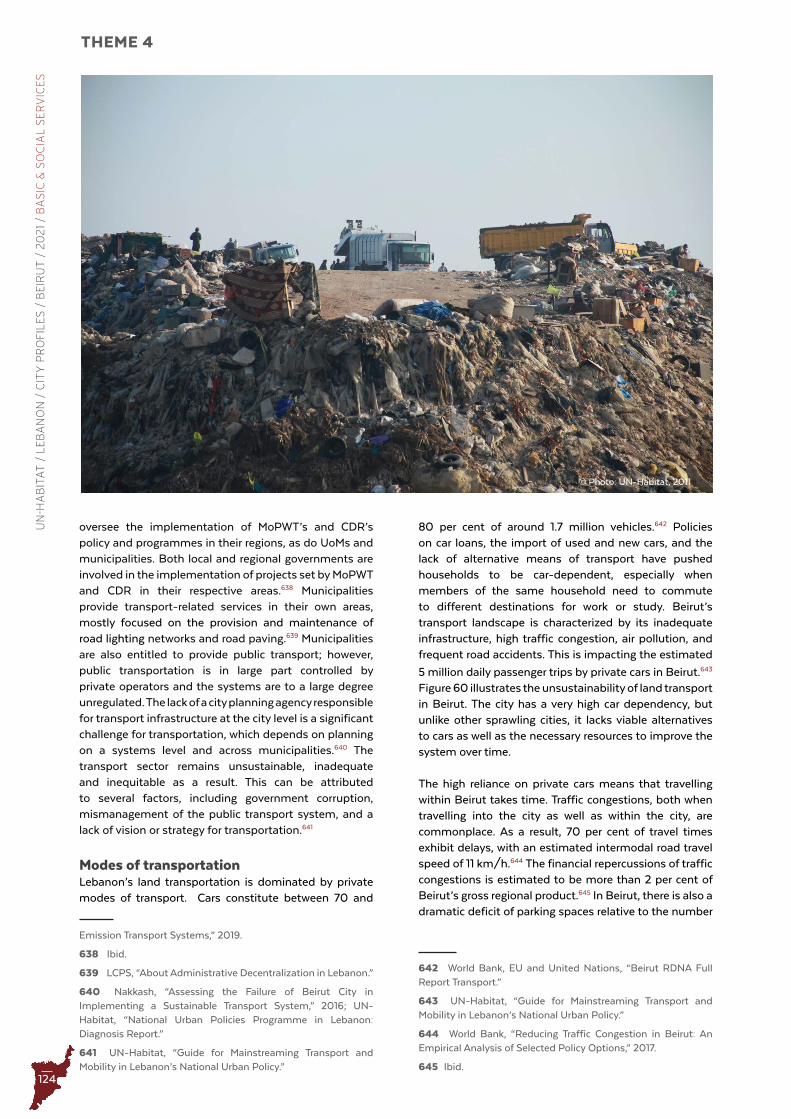
124
THEME 4U
N-H
AB
ITA
T /
LE
BA
NO
N /
CIT
Y P
RO
FIL
ES
/ B
EIR
UT
/ 2
02
1 /
BA
SIC
& S
OC
IAL
SE
RV
ICE
S
oversee the implementation of MoPWT’s and CDR’s policy and programmes in their regions, as do UoMs and municipalities. Both local and regional governments are involved in the implementation of projects set by MoPWT and CDR in their respective areas.638 Municipalities provide transport-related services in their own areas, mostly focused on the provision and maintenance of road lighting networks and road paving.639 Municipalities are also entitled to provide public transport; however, public transportation is in large part controlled by private operators and the systems are to a large degree unregulated. The lack of a city planning agency responsible for transport infrastructure at the city level is a significant challenge for transportation, which depends on planning on a systems level and across municipalities.640 The transport sector remains unsustainable, inadequate and inequitable as a result. This can be attributed to several factors, including government corruption, mismanagement of the public transport system, and a lack of vision or strategy for transportation.641
Modes of transportationLebanon’s land transportation is dominated by private modes of transport. Cars constitute between 70 and
Emission Transport Systems,” 2019.
638 Ibid.
639 LCPS, “About Administrative Decentralization in Lebanon.”
640 Nakkash, “Assessing the Failure of Beirut City in Implementing a Sustainable Transport System,” 2016; UN-Habitat, “National Urban Policies Programme in Lebanon: Diagnosis Report.”
641 UN-Habitat, “Guide for Mainstreaming Transport and Mobility in Lebanon’s National Urban Policy.”
80 per cent of around 1.7 million vehicles.642 Policies on car loans, the import of used and new cars, and the lack of alternative means of transport have pushed households to be car-dependent, especially when members of the same household need to commute to different destinations for work or study. Beirut’s transport landscape is characterized by its inadequate infrastructure, high traffic congestion, air pollution, and frequent road accidents. This is impacting the estimated
5 million daily passenger trips by private cars in Beirut.643 Figure 60 illustrates the unsustainability of land transport in Beirut. The city has a very high car dependency, but unlike other sprawling cities, it lacks viable alternatives to cars as well as the necessary resources to improve the system over time.
The high reliance on private cars means that travelling within Beirut takes time. Traffic congestions, both when travelling into the city as well as within the city, are commonplace. As a result, 70 per cent of travel times exhibit delays, with an estimated intermodal road travel speed of 11 km/h.644 The financial repercussions of traffic congestions is estimated to be more than 2 per cent of Beirut’s gross regional product.645 In Beirut, there is also a dramatic deficit of parking spaces relative to the number
642 World Bank, EU and United Nations, “Beirut RDNA Full Report Transport.”
643 UN-Habitat, “Guide for Mainstreaming Transport and Mobility in Lebanon’s National Urban Policy.”
644 World Bank, “Reducing Traffic Congestion in Beirut: An Empirical Analysis of Selected Policy Options,” 2017.
645 Ibid.
© Photo: UN-Habitat, 2011
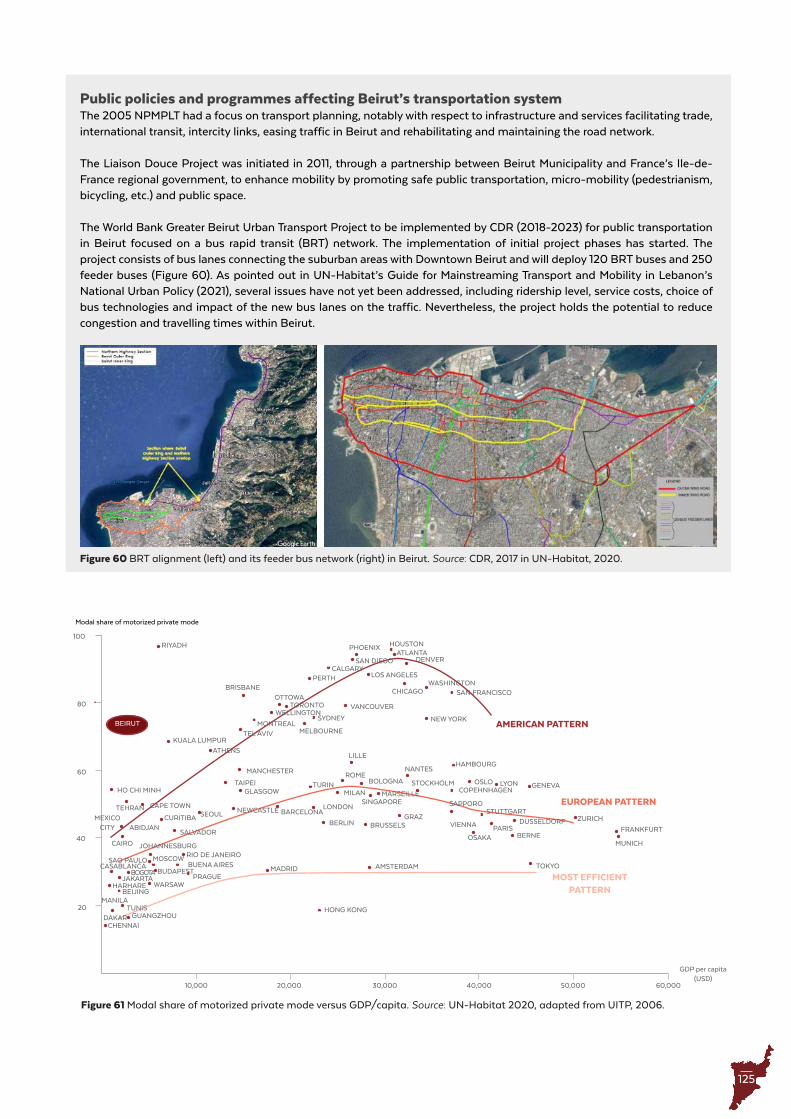
125
Public policies and programmes affecting Beirut’s transportation systemThe 2005 NPMPLT had a focus on transport planning, notably with respect to infrastructure and services facilitating trade, international transit, intercity links, easing traffic in Beirut and rehabilitating and maintaining the road network.
The Liaison Douce Project was initiated in 2011, through a partnership between Beirut Municipality and France’s Ile-de-France regional government, to enhance mobility by promoting safe public transportation, micro-mobility (pedestrianism, bicycling, etc.) and public space.
The World Bank Greater Beirut Urban Transport Project to be implemented by CDR (2018-2023) for public transportation in Beirut focused on a bus rapid transit (BRT) network. The implementation of initial project phases has started. The project consists of bus lanes connecting the suburban areas with Downtown Beirut and will deploy 120 BRT buses and 250 feeder buses (Figure 60). As pointed out in UN-Habitat’s Guide for Mainstreaming Transport and Mobility in Lebanon’s National Urban Policy (2021), several issues have not yet been addressed, including ridership level, service costs, choice of bus technologies and impact of the new bus lanes on the traffic. Nevertheless, the project holds the potential to reduce congestion and travelling times within Beirut.
Figure 60 BRT alignment (left) and its feeder bus network (right) in Beirut . Source: CDR, 2017 in UN-Habitat, 2020 .
Figure 61 Modal share of motorized private mode versus GDP/capita . Source: UN-Habitat 2020, adapted from UITP, 2006 .
BEIRUT
HO CHI MINH
TEHRAN
MEXICO CITY ABIDJAN
SALVADOR
SEOUL NEWCASTLE
GLASGOWTURINTAIPEI
MANCHESTER
KUALA LUMPUR
ATHENS
TEL AVIVMONTREAL
TORONTOOTTOWA
PERTHCALGARY
SAN DIEGO DENVERATLANTA
HOUSTONPHOENIX
LOS ANGELES
CHICAGO
VANCOUVER
WASHINGTONSAN FRANCISCO
NEW YORK
BRISBANE
RIYADH
MELBOURNE
WELLINGTONSYDNEY
BARCELONALONDON
BERLIN
MADRID
HONG KONG
10,000
20
40
60
80
100
20,000 30,000 40,000 50,000 60,000
GDP per capita (USD)
Modal share of motorized private mode
MOST EFFICIENT PATTERN
EUROPEAN PATTERN
AMERICAN PATTERN
PRAGUE
BUENA AIRESRIO DE JANEIROMOSCOWSAO PAULO
JOHANNESBURG
BUDAPEST
WARSAWBEIJING
HARHAREJAKARTA
CASABLANCABOGOTA
MANILA
GUANGZHOUTUNIS
DAKARCHENNAI
BRUSSELS
AMSTERDAM
SINGAPOREMARSEILLE
BOLOGNA
NANTES
STOCKHOLMCOPEHNHAGEN
SAPPORO
VIENNA
OSAKAPARIS
BERNE
TOKYO
ZURICH
FRANKFURT
MUNICH
DUSSELDORFSTUTTGART
HAMBOURG
OSLO LYON GENEVA
ROME
LILLE
MILAN
GRAZCURITIBA
CAIRO
CAPE TOWN

126
THEME 4U
N-H
AB
ITA
T /
LE
BA
NO
N /
CIT
Y P
RO
FIL
ES
/ B
EIR
UT
/ 2
02
1 /
BA
SIC
& S
OC
IAL
SE
RV
ICE
S
© Photo: UN-Habitat, 2011
127
of cars, particularly in the city centre.646 This has been exacerbated by the vertical development and additional residents – many of whom are car owners – in central areas of the city.647 This is despite a new law mandating that new buildings provide underground parking for their residents.648 Several projects to improve parking in the city are ongoing, including the construction of underground parking facilities underneath Hassan Khaled Public Garden in Mousaitbeh, Beirut Municipal Civic Center in Mazraa and Jesuite Public Garden in Achrafieh, as well as the construction of underground parking and/or a public bus station at the Cola Roundabout.649
The public transportation network is composed of public and private buses, minibuses and taxis, including shared taxis (or “service”) with low capacity that are largely operating on an ad hoc basis. While often uncoordinated, unreliable and unsafe, there are also examples of places where the system works effectively, such as the Connex buses serving passengers mainly from and around Tripoli who commute to Beirut. Due to the unattractiveness of the public transport system, there are very low average occupancy rates on public transport in Beirut, with approximately 12 passengers per bus and 6 passengers per van.650 Also, the car occupancy rate of approximately 1.2 passengers per vehicle is very low compared to international standards.651 The shared taxi system has become an essential public transport mode due to the flexibility of the many taxis on the streets of Beirut.
While half of the journeys made within Beirut are shorter than 5 km long, the use of micro-mobility modes (such as walking, cycling or scootering) remains scarce. This is influenced by multiple factors, including the lack of zoning or land use planning to encourage walking and cycling, the lack of sidewalks and random barriers on the sidewalks and streets that reduce accessibility, lack of pedestrian crossing, minimal public and green spaces, no dedicated bicycle lanes or operative bike-sharing systems (although a few were installed in Beirut in 2018) and as a result no culture of walking or cycling.652 Due to the inadequate soft mobility infrastructure in Beirut,
646 Adib Haydar, “‘Unparking’: How can Smart Mobility Reduce Parking Demand in our Cities to the Minimum? (Beirut Case Study),” Smart Cities 3, no. 2 (29 March 2020): 172–185, https://doi.org/10.3390/smartcities3020010.
647 Monroe, The Insecure City: Space, Power, and Mobility in Beirut.
648 Ibid.
649 UN-Habitat, “Guide for Mainstreaming Transport and Mobility in Lebanon’s National Urban Policy.”
650 Global Environment Facility, “Lebanon Sustainable Low-Emission Transport Systems.”
651 Ibid.
652 UN-Habitat, “Guide for Mainstreaming Transport and Mobility in Lebanon’s National Urban Policy.”
walking or biking represent a safety hazard; indeed, 29 per cent of casualties and 33 per cent of killed persons from car accidents are pedestrians.653
Impact of recent shocks on transportationCOVID-19 temporarily changed people’s travel patterns. Lockdowns and/or recommendations to work from home lowered the number of cars on the roads and thus reduced travel time and congestion. At the same time, social distancing discouraged people from using shared transportation. According to TRACS NGO, 44 per cent of respondents to a recent survey said that they would prefer to walk or bike for commuting to uphold social distancing.654
With the already dire financial situation, the potential end of fuel subsidies and price hike of gas will have serious implications for fossil-fuel-intensive private and public transportation in Lebanon. Even before the economic collapse and hyperinflation, the cost of commuting to work was considerable. The inability to pay for public transportation services and a reduction in the demand for transportation due to COVID-19 restrictions are severely affecting the taxi industry. Reportedly, close to 85 per cent of taxi drivers have stopped working.655 In response to the situation, the government increased the service price from LBP 2,000 to LBP 3,000 in June 2020, and again to LBP 4,000 in March 2021. If the fuels subsidies are lifted, the black-market price of 20 litres of gasoline is predicted to increase to LBP 70,000, which will translate into service ride prices of LBP 9,000 and up to LBP 45,000 in the inner-city.
The estimated costs of damages to maritime, land and food infrastructure (including the PoB, further discussed in the Governance and Accountability chapter) from the 4 August 2020 blast are between USD 280 and 345 USD million, and losses at USD 580 million to USD 710 million.656 This includes transport infrastructure essential to food imports and to Lebanon’s food security. The blast also damaged 40 of the 50 buses operated by the Railway and Public Transport Authority (RPTA), 1.5 km of road infrastructure, 430 vehicles, as well as 16,000 km2 of RPTA infrastructure that is used to fuel and repair buses.
653 Elias M. Choueiri, Georges M. Choueiri, and Bernard M. Choueiri, “An Overview of Road Safety in Lebanon,” 2013.
654 UN-Habitat, “Guide for Mainstreaming Transport and Mobility in Lebanon’s National Urban Policy.”
655 Tala Ramadan, “Pulled Over ,” NOW, May 11, 2021, https://nowlebanon.com/pulled-over/.
656 World Bank, EU and United Nations, “Beirut Rapid Damage and Needs Assessment.”
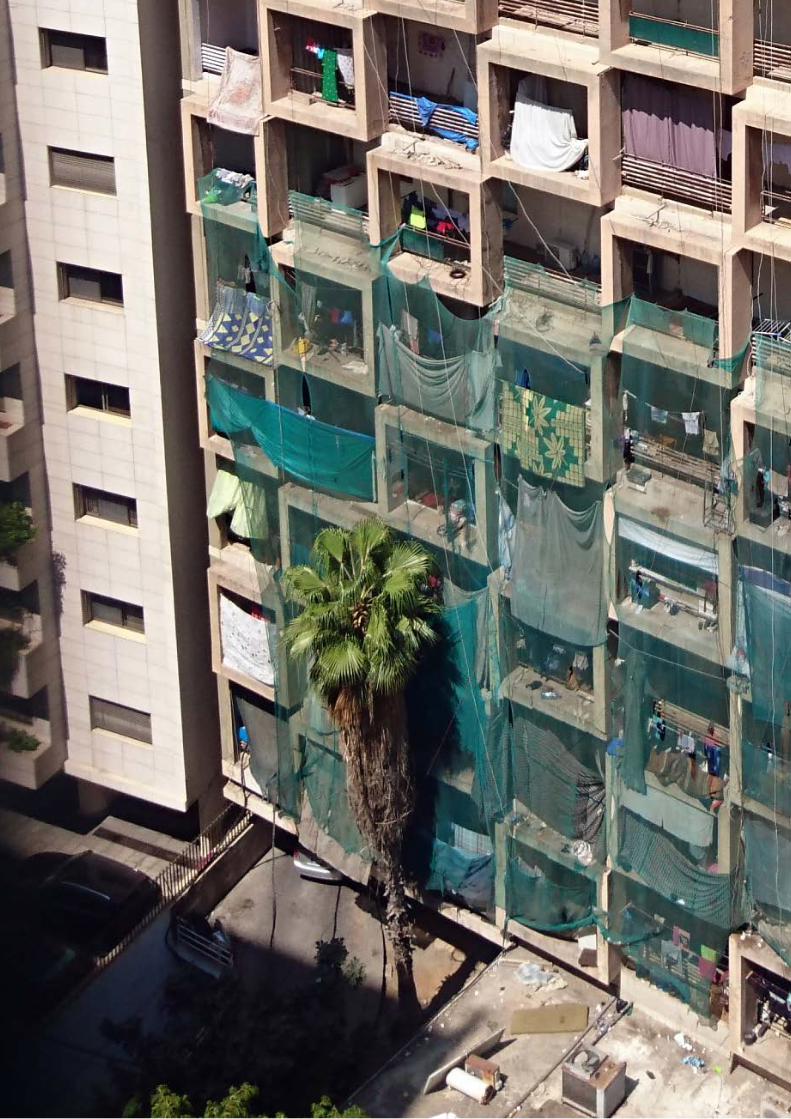
128
THEME 5U
N-H
AB
ITA
T /
LE
BA
NO
N /
CIT
Y P
RO
FIL
ES
/ B
EIR
UT
/ 2
02
1 /
HO
US
ING
Theme 5 Housing

129
Theme 5 Housing
© Photo: Synne Bergby, 2017
130
THEME 5U
N-H
AB
ITA
T /
LE
BA
NO
N /
CIT
Y P
RO
FIL
ES
/ B
EIR
UT
/ 2
02
1 /
HO
US
ING
HousingChapter summary
A large and increasing share of Beirut City’s residents are suffering from a lack of affordable and adequate housing. There is a supply-demand mismatch in terms of prices, tenure arrangements and quality of housing. The housing market is to a large extent segregated, catering to different socioeconomic as well as sectarian groups. The large-scale urban renewal of Downtown Beirut and central neighbourhoods including Mar Mikhael, Achrafieh and Zokak El-Blat after the civil war, combined with housing policies favouring homeownership for middle-income earners in the outskirts of Beirut, has contributed to or reinforced pre-existing divisions along socioeconomic and sectarian lines. Over the post-war period, rental and housing prices have increased drastically, rendering adequate housing unattainable for a growing number of residents. Central areas of the city are characterized by very high density, overcrowded and poorly serviced accommodations and precarious tenure in pockets next to high-end real estate development of which a large share is vacant or unsold. The compounding crises represent risks of further exacerbating the situation, including a potential collapse in property prices, increased rent disputes, further overcrowding, increasingly precarious tenure and renters seeking more affordable housing options outside the city.
131
Beirut housing marketWhile Beirut has attracted significant investment in and development of real estate, a large and increasing share of the city’s residents are suffering from a lack of affordable and adequate housing.657 The market is characterized by a mismatch of housing supply and demand in terms of price brackets, tenure arrangements and housing quality, among others. The reasons for this mismatch are multifaceted, where the real estate sector is suffering from long-term structural issues, notably: a lack of sound real estate policies, such as tax regulations incentivizing speculative land and real estate property (including empty apartments) investments; the promotion of homeownership over other forms of tenure arrangements (such as private rental contracts);658 a deteriorating housing stock; and the predominant influence of actors involved in property development.659 Moreover, there is no social housing provided by the government. A collapsing economy, COVID-19 and the 4 August 2020 blast have exacerbated the challenge of securing affordable and adequate housing in Beirut. Lebanese, Syrian and Palestinian refugees and foreign workers - particularly those living in informal areas and pockets of urban poverty - have reported greater housing insecurity and a rise in evictions by landowners because of these recent shocks.660 While these housing market characteristics manifest across the country, they are particularly pronounced in the capital Beirut.
The housing market in Beirut has been characterized by mortgages and rental and property prices that are largely based on exchange, or market value, driven by speculation rather than the use value it would offer someone living in the housing unit. Typically, homeowners are middle-income families with access to low-interest housing mortgages who have found the housing that they seek outside the boundaries of Beirut Municipality, within the greater city area. For those who are not able to access the higher-end rental market or to purchase a home, alternatives such as apartment rentals in deteriorating and unsafe buildings, squatting or informal rentals, or commuting from the outskirts of the city or beyond have become prevalent. Moreover, there is a rising trend
657 Adequate housing, derived from the right to an adequate standard of living, must fulfil the following criteria: habitability; availability of services, materials, facilities and infrastructure; affordability; legal security of tenure against forced eviction, harassment and other threats; and location that allows access to employment and services and away from pollution sources.
658 For more background on the rent control system in Lebanon and the consequences of moving away from this system, see Bruno Marot, “Jadaliyya - The end of Rent Control in Lebanon: Another Boost to the ‘Growth Machine?’” 2014, https://www.jadaliyya.com/Details/30811/The-End-of-Rent-Control-in-Lebanon-Another-Boost-to-the-“Growth-Machine.”
659 UN-Habitat, “Guide for Mainstreaming Housing in Lebanon’s National Urban Policy.”
660 Inter-Agency Coordination Lebanon, “In Focus - Rise in Evictions Due to Increased Economic Vulnerability (July 2020),” 2020.HLP TTC, “Guidance Note on Housing, Land and Property in the Context of the Beirut Port Blast Response.”
of informal rental arrangements in Beirut Municipality, where apartments are subdivided and rented out. The housing market is to a large extent segregated, catering to different socioeconomic as well as sectarian groups. The urban renewal and housing development in Beirut have thus contributed to or reinforced pre-existing divisions along socioeconomic and sectarian lines.661
Housing governanceFrom a legal perspective, the right to adequate housing and protection of households’ HLP rights is preserved through Lebanon’s legal framework and its international obligations (such as the Universal Declaration of Human Rights and the International Covenant on Economic, Social and Cultural Rights).662 However, this principle is not well-enshrined in existing governance structures. Firstly, Lebanon lacks a national strategy and policy for the housing sector. Also, it does not have a specialized governance body mandated with ensuring housing for all, such as a ministry for housing.
The role of the government in the housing sector has been limited to subsidizing housing loans. The Corporation for Housing was established with the support of the Central Bank to initiate the housing finance model in 1997-1998.663 The loans have primarily been granted to upper-middle-income individuals to enable them to access liquidity to purchase housing at low interest rates (these subsidized home loans were suspended in 2018). It should be noted, however, that this model was primarily a way to strengthen GDP growth by supporting the real estate sector and contribute to financial stability, rather than a way to secure housing ownership for the middle class. Other institutions - such as DGUP, CDR, the Order of Engineers and Architects (OEA) and municipalities - are key stakeholders that would be involved in conducting studies on the housing sector and informing policy, but they have had limited contribution to policy to date.
In the post-civil war period, Beirut’s built environment has been transformed through a comprehensive urban renewal process along two tracks: while Beirut’s downtown area has been subject to large-scale real estate development, the greater city area has grown more informally with rapid construction of cheaper informal housing.664 Even though not officially adopted and endorsed by the Lebanese Parliament, housing provision in Beirut was considered part of a profit-seeking urban strategy665 that favoured high- and middle-income
661 Marot, “Jadaliyya - The End of Rent Control in Lebanon: Another Boost to the ‘Growth Machine?’”; UN-Habitat, “Guide for Mainstreaming Housing in Lebanon’s National Urban Policy.”
662 UN-Habitat and UNHCR, “Housing, Land and Property Issues of Syrian Refugees in Lebanon from Homs City,” 2018.
663 UN-Habitat, “Guide for Mainstreaming Housing in Lebanon’s National Urban Policy.”
664 Lebanon Support and UNDP, “The Conflict Context in Beirut: The Social Question, Mobilisations Cycles, and the City’s Securitisation.”
665 Marot, “Jadaliyya - The End of Rent Control in Lebanon: Another Boost to the ‘Growth Machine?’”
132
THEME 5U
N-H
AB
ITA
T /
LE
BA
NO
N /
CIT
Y P
RO
FIL
ES
/ B
EIR
UT
/ 2
02
1 /
HO
US
ING households without presenting a clear vision on how
to address housing affordability for low-income and vulnerable groups. The urban production can arguably be described as a property-led “growth machine” without policies that would also secure affordable housing for the population.666
The speculative property development that has taken place in Beirut has been furthered by government incentives in combination with inadequate utilization or enforcement of land use and urban planning policies. Absent and/or biased urban and land policies have favoured privatization, which combined with weak urban planning and poor service provision has contributed to increased inequality in access to adequate housing.667 This includes the government’s incentivization of real estate and construction activities through FDI from diaspora and foreign investors from the late 1990s, and the facilitation of expropriation of private property for redevelopment projects in central areas of Beirut. At the same time, land use and urban planning policies have not been adequately utilized or enforced to govern housing development in Beirut. For example, location (such as sea-facing apartments) rather than zoning regulations appears to be the key determinant of project size,668 while high levels of vacancy of building units are incentivized through a tax exemption from municipal and property taxes on empty apartments.669 As a result, real estate development has been realized through the concentration of development in prime locations in the city; the demolition of existing buildings to allow for new construction; and the use of land agglomeration to facilitate construction of large-scale projects.670
Supply, affordability and quality of housingWith its 665,000 residences, Greater Beirut accounts for more than half of the housing stock in Lebanon (52.5 per cent).671 The housing stock in Beirut comprises 90 per cent residential complexes, compared to 85.5 per cent nationally.
As a result of the speculative housing market, land and real estate prices have risen sharply. According to Infopro, land prices in Beirut increased an exorbitant 600 per cent from 2003 to 2013, while real estate prices inflated 200
666 Ibid.
667 UNDP, “Leave No One Behind for an Inclusive and Just Recovery Process in Post-Blast Beirut”; UN-Habitat, “Lebanon Urban Profile,” 2011.
668 Hayat Gebara, Mona Khechen, and Bruno Marot, “Mapping New Constructions in Beirut (2000-2013),” Jadaliyya, 16 November 2016, https://www.jadaliyya.com/Details/33751/Mapping-New-Constructions-in-Beirut-2000-2013.
669 Beirut Urban Lab, “Beirut: A City for Sale?,” https://www.beiruturbanlab.com/en/Details/612.
670 Gebara, Khechen and Marot, “Mapping New Constructions in Beirut (2000-2013).”
671 CAS, “Central Administration of Statistics - About Lebanon,” 2020, http://www.cas.gov.lb/index.php/about-lebanon-en.
per cent over the same period.672 In Beirut Municipality, the increase in home prices in the 2000s was five times that of income nationally, while rents in different areas of Beirut City increased by 30 to 75 per cent over the same period.673 In 2019-2020, housing-related expenditures made up on average 36 and 29 per cent of annual household spending in Beirut and Mount Lebanon governorates, respectively. Moreover, the average mid-market family unit in Beirut is priced at USD 350,000, 23 times the average per capita annual income (prior to the current crises) of USD 12,610.674 Properties tailored to wealthy and foreign residents have accounted for about 27 per cent of the new housing stock in Beirut over the past 20 years.675 At the same time, the size of housing units has been reduced drastically. In Beirut Municipality, where many of the speculative large-scale redevelopment projects have been carried out, the average size of new apartments was reduced from 310 m2 to 182 m2, or 41 per cent over the period from 2009 to 2017.676 From 2016 to 2017 alone, the average apartment size went down from 198 m2 to 182 m2.
The housing market in Beirut has been under immense additional pressure due to the large number of Syrians in need of housing. With an oversupply of high-income housing and an underserved low-income housing market, the pressure on housing has led many refugees, migrants and urban poor to settle in informal settlements at the outskirts of the city or overcrowded inner-city housing units, often with insecure tenure, deteriorating living conditions, and inflating prices.677
It has been common among real estate and finance professionals in Beirut to argue that land shortage is the culprit for the insufficient supply of affordable housing.678 Yet, there is no shortage of vacant or temporarily occupied land lots or housing units in Beirut.679 Figure 62 shows unsold or vacant apartments and unexecuted building permits within Beirut Municipality prior to 2019. The mapping suggests that distribution and affordability rather than the supply of housing is a driving force for the housing shortage in central Beirut. The high vacancy rates across the city illustrate the disconnect between local
672 InfoPro, “Business Opportunities in Lebanon – Year XI. Real Estate in Greater Beirut [Database],” 2014.
673 UN-Habitat, “Guide for Mainstreaming Housing in Lebanon’s National Urban Policy.”
674 Ibid.
675 Ibid.
676 Blominvest Bank, “RAMCO: Average Size of New Apartments in Beirut down by 8% in 2017,” 20 June 2018, https://blog.blominvestbank.com/26121/ramco-average-size-new-apartments-beirut-8-2017/.
677 UN-Habitat, “Guide for Mainstreaming Housing in Lebanon’s National Urban Policy.”
678 Gebara, Khechen and Marot, “Mapping New Constructions in Beirut (2000-2013)”; Bruno Marot, “Land Scarcity in Beirut : Myths and Realities,” Le Commerce, 18 April 2019, https://www.lecommercedulevant.com/article/28992-land-scarcity-in-beirut-myths-and-realities.
679 Beirut Urban Lab, “Vacancy,” 2020.
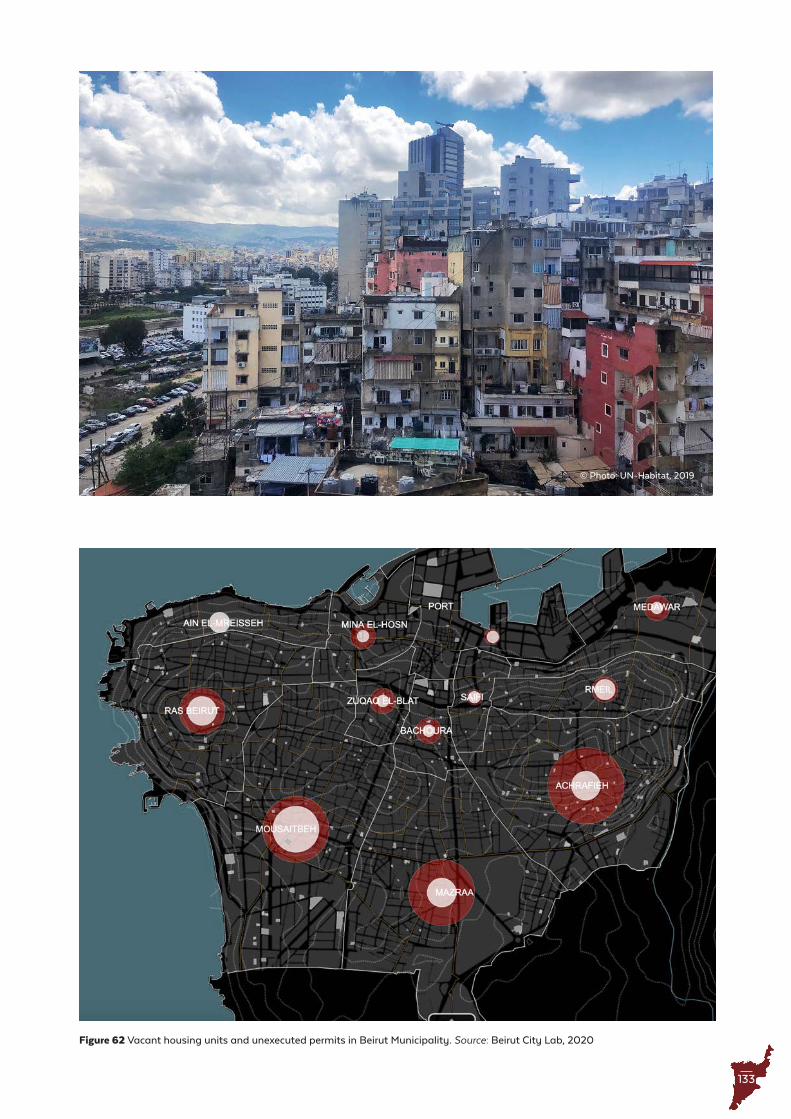
133
Figure 62 Vacant housing units and unexecuted permits in Beirut Municipality . Source: Beirut City Lab, 2020
© Photo: UN-Habitat, 2019
134
THEME 5U
N-H
AB
ITA
T /
LE
BA
NO
N /
CIT
Y P
RO
FIL
ES
/ B
EIR
UT
/ 2
02
1 /
HO
US
ING needs and wealth accumulation in the housing sector. For
example, the vacancy rate for plots of land was about one third,680 while vacancy of higher-end apartments in Beirut Municipality exceeded 50 per cent.681 At the same time, there was no shortage of building permits to be executed nor shortage of unsold or unoccupied apartments in the city. It should be noted that these are pre-2019 figures, and that due to the temporary capital flight related to high-end property as a result of the financial and monetary crisis, the vacancy rates are most likely significantly reduced. As discussed in the Governance and Accountability chapter, the increase in government revenue from property taxes from January to July 2020 (29.2 per cent) is mainly attributed to a significant rise in real estate registration fees.682 This reflects a rising trend of real estate investments for bank depositors that started in late 2019. However, while this largely represents opportunistic investment, other drivers - such as the reduced purchasing power, low external capital influx in Lebanon, suspension of subsidized housing loans in 2018, rapidly increasing interest rates in 2019, and non-performing housing and construction loans - might trigger a longer-term price contraction of real estate.683 Already, this has likely furthered the mismatch between local demand and supply for affordable housing, driven by a middle class that is increasingly no longer in a position to access housing loans or afford to buy housing.
Housing conditionsBeirut has a particularly high share of older residential buildings, with more than 85 per cent of its residential stock constructed before 1993 and 59 per cent constructed before the 1970s.684 A large share of Beirut’s housing stock is deteriorating and in need of renovation and maintenance works. At the same time, the rent control system685 has contributed to the high share of rental units in the city. The lack of coordinated policies and support systems for property owners and occupants, however, has rendered housing conditions contingent upon the owners’ ability or willingness to pay for necessary works.686 Cost represents a major impediment for preservation, as there are no incentives in place for property owners or occupants to maintain their housing units and buildings nor a monitoring system or other compliance mechanisms to enforce a certain standard for housing conditions.
Building materials and construction methods have not
680 Marot, “Land Scarcity in Beirut: Myths and Realities.”
681 Beirut Urban Lab, “Beirut: A City for Sale?”
682 MoF, “Public Finance Monitor.”
683 UN-Habitat, “Guide for Mainstreaming Housing in Lebanon’s National Urban Policy.”
684 CAS, “Central Administration of Statistics - About Lebanon.”
685 First introduced in 1939 as a regulatory mechanisms to ensure affordable housing - see section on Rent Control below for further details.
686 UN-Habitat, “Guide for Mainstreaming Housing in Lebanon’s National Urban Policy.”
been adapted to the natural environment in Lebanon (see the Environment chapter for more on this). For instance, despite Lebanon being an earthquake-prone country, a significant number of buildings do not have appropriately secure and solid foundations that could withstand seismic hazards.687 There is also limited, if at all, control on the quality of construction. Moreover, mainstream construction methods are not energy-friendly; most construction materials and design solutions require high electrical usage for heating and cooling. Considering the hot climate in Beirut, and further increase in temperatures due to climate change and the heat island effect in Beirut,688 the demand for cooling of buildings is very likely to increase in the years ahead.
The neighbourhood profiles provide insight into the conditions of residential and commercial buildings in disadvantaged neighbourhoods as well as Hamra. As shown in Figure 63, in all neighbourhoods except for Hamra, a large share (between 30 and 62 per cent) of buildings need major repair or emergency intervention to their exterior.689 In Daouk-Ghawash, the neighbourhood with the highest share of substandard or critical exterior building conditions690 (62 per cent), around two thirds of the residents live in buildings in need of major repair or emergency intervention. Hayy Tamlis is the second-most deprived neighbourhood in terms of exterior building conditions; the 52 per cent of buildings needing major repair or emergency intervention to their exterior house 31 per cent of the residents. This suggests that in Hayy Tamlis, a smaller share of residents live in housing that is in substandard or critical condition relative to the overall population density per housing unit. In comparison, in Hamra, 9 per cent of buildings, housing 9 per cent of the residents, need major repair or emergency intervention.
Housing tenure
Rent controlChanges in rent control and incentives for property ownership are central to understand the liberalization of the housing market and the current housing situation in Beirut. First introduced in 1939, rent control was one of the principal regulatory mechanisms to protect modest-income households in the city from exorbitant prices.691 With the rent control reform in 1992 following the civil war, all contracts signed before 1992 remained under rent control, whereas those signed after became completely liberalized. This affected many modest-
687 Ibid.
688 Noushig Kaloustian and Youssef Diab, “Effects of Urbanization on the Urban Heat Island in Beirut,” Urban Climate 14 (1 December 2015): 154–165, https://doi.org/10.1016/j.uclim.2015.06.004.
689 Exterior building conditions cover exterior walls, windows, doors and balconies.
690 The two categories to signify major repair and emergency intervention, respectively.
691 Bruno Marot, “Crise du Logement et Fin du Contrôle des Loyers à Beyrouth: La Poursuite d’une Production Urbaine Exclusive,” 2015. https://doi.org/10.3917/come.092.0101
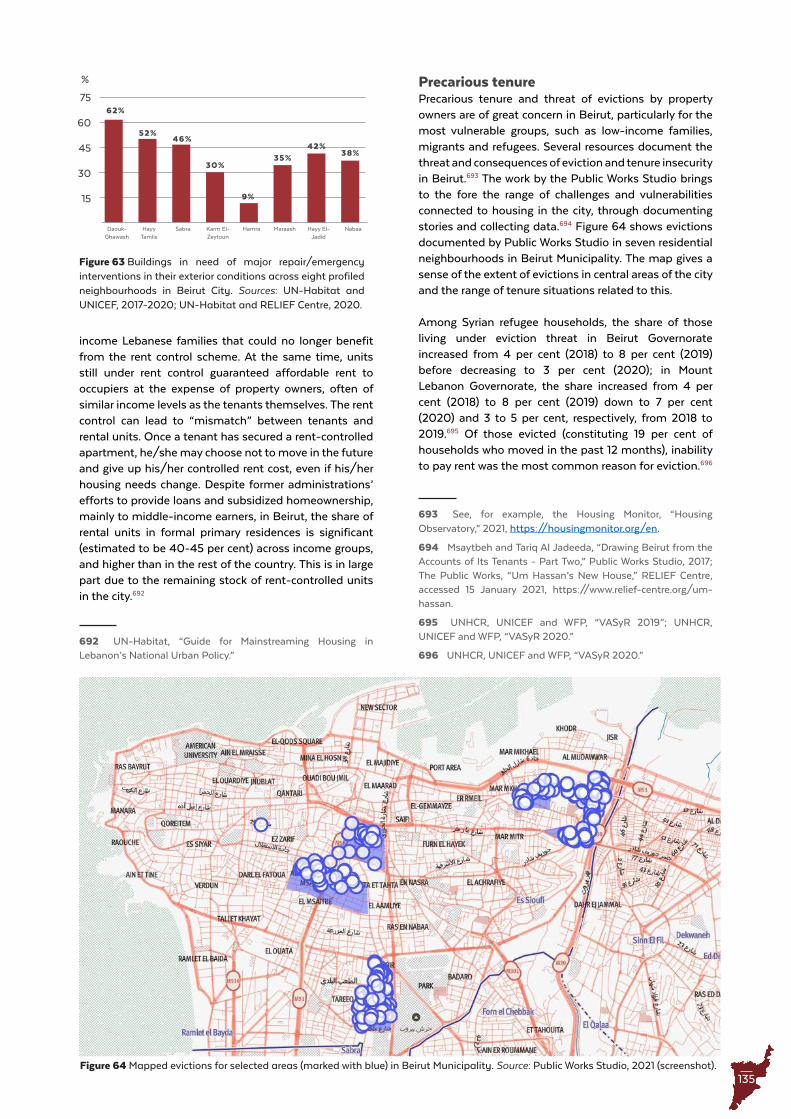
135
Figure 63 Buildings in need of major repair/emergency interventions in their exterior conditions across eight profiled neighbourhoods in Beirut City . Sources: UN-Habitat and UNICEF, 2017-2020; UN-Habitat and RELIEF Centre, 2020 .
38%
46%
30%
62%
52%
9%
35%42%45
60
75
30
15
%
Figure 64 Mapped evictions for selected areas (marked with blue) in Beirut Municipality . Source: Public Works Studio, 2021 (screenshot) .
Karm El-Zeytoun
Hamra Maraash Hayy El-Jadid
NabaaHayy Tamlis
SabraDaouk-Ghawash
income Lebanese families that could no longer benefit from the rent control scheme. At the same time, units still under rent control guaranteed affordable rent to occupiers at the expense of property owners, often of similar income levels as the tenants themselves. The rent control can lead to “mismatch” between tenants and rental units. Once a tenant has secured a rent-controlled apartment, he/she may choose not to move in the future and give up his/her controlled rent cost, even if his/her housing needs change. Despite former administrations’ efforts to provide loans and subsidized homeownership, mainly to middle-income earners, in Beirut, the share of rental units in formal primary residences is significant (estimated to be 40-45 per cent) across income groups, and higher than in the rest of the country. This is in large part due to the remaining stock of rent-controlled units in the city.692
692 UN-Habitat, “Guide for Mainstreaming Housing in Lebanon’s National Urban Policy.”
Precarious tenurePrecarious tenure and threat of evictions by property owners are of great concern in Beirut, particularly for the most vulnerable groups, such as low-income families, migrants and refugees. Several resources document the threat and consequences of eviction and tenure insecurity in Beirut.693 The work by the Public Works Studio brings to the fore the range of challenges and vulnerabilities connected to housing in the city, through documenting stories and collecting data.694 Figure 64 shows evictions documented by Public Works Studio in seven residential neighbourhoods in Beirut Municipality. The map gives a sense of the extent of evictions in central areas of the city and the range of tenure situations related to this.
Among Syrian refugee households, the share of those living under eviction threat in Beirut Governorate increased from 4 per cent (2018) to 8 per cent (2019) before decreasing to 3 per cent (2020); in Mount Lebanon Governorate, the share increased from 4 per cent (2018) to 8 per cent (2019) down to 7 per cent (2020) and 3 to 5 per cent, respectively, from 2018 to 2019.695 Of those evicted (constituting 19 per cent of households who moved in the past 12 months), inability to pay rent was the most common reason for eviction.696
693 See, for example, the Housing Monitor, “Housing Observatory,” 2021, https://housingmonitor.org/en.
694 Msaytbeh and Tariq Al Jadeeda, “Drawing Beirut from the Accounts of Its Tenants - Part Two,” Public Works Studio, 2017; The Public Works, “Um Hassan’s New House,” RELIEF Centre, accessed 15 January 2021, https://www.relief-centre.org/um-hassan.
695 UNHCR, UNICEF and WFP, “VASyR 2019”; UNHCR, UNICEF and WFP, “VASyR 2020.”
696 UNHCR, UNICEF and WFP, “VASyR 2020.”
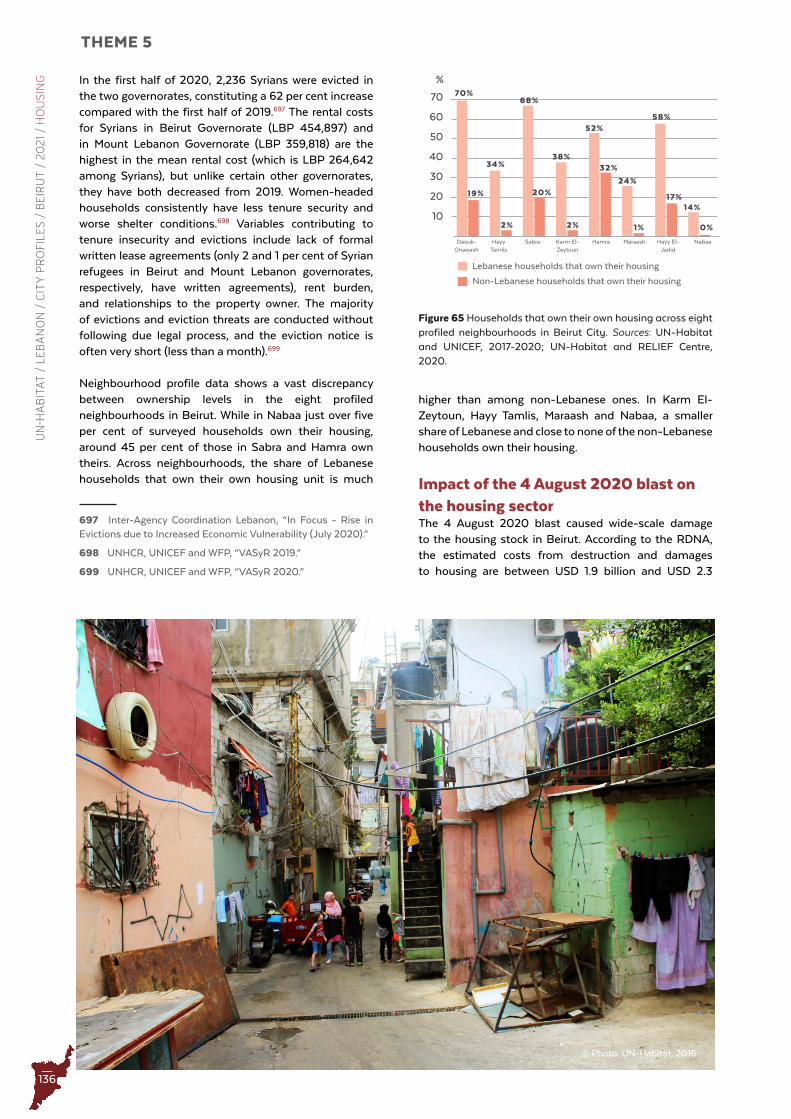
136
THEME 5U
N-H
AB
ITA
T /
LE
BA
NO
N /
CIT
Y P
RO
FIL
ES
/ B
EIR
UT
/ 2
02
1 /
HO
US
ING
Figure 65 Households that own their own housing across eight profiled neighbourhoods in Beirut City . Sources: UN-Habitat and UNICEF, 2017-2020; UN-Habitat and RELIEF Centre, 2020 .
0%
14%
68%
20%
38%
70%
19%
34%
2% 2% 1%
52%
32%
24%
58%
17%
30
40
50
60
70
20
10
%
Lebanese households that own their housing
Non-Lebanese households that own their housing
Karm El-Zeytoun
Hamra Maraash Hayy El-Jadid
NabaaHayy Tamlis
SabraDaouk-Ghawash
In the first half of 2020, 2,236 Syrians were evicted in the two governorates, constituting a 62 per cent increase compared with the first half of 2019.697 The rental costs for Syrians in Beirut Governorate (LBP 454,897) and in Mount Lebanon Governorate (LBP 359,818) are the highest in the mean rental cost (which is LBP 264,642 among Syrians), but unlike certain other governorates, they have both decreased from 2019. Women-headed households consistently have less tenure security and worse shelter conditions.698 Variables contributing to tenure insecurity and evictions include lack of formal written lease agreements (only 2 and 1 per cent of Syrian refugees in Beirut and Mount Lebanon governorates, respectively, have written agreements), rent burden, and relationships to the property owner. The majority of evictions and eviction threats are conducted without following due legal process, and the eviction notice is often very short (less than a month).699
Neighbourhood profile data shows a vast discrepancy between ownership levels in the eight profiled neighbourhoods in Beirut. While in Nabaa just over five per cent of surveyed households own their housing, around 45 per cent of those in Sabra and Hamra own theirs. Across neighbourhoods, the share of Lebanese households that own their own housing unit is much
697 Inter-Agency Coordination Lebanon, “In Focus - Rise in Evictions due to Increased Economic Vulnerability (July 2020).”
698 UNHCR, UNICEF and WFP, “VASyR 2019.”
699 UNHCR, UNICEF and WFP, “VASyR 2020.”
higher than among non-Lebanese ones. In Karm El-Zeytoun, Hayy Tamlis, Maraash and Nabaa, a smaller share of Lebanese and close to none of the non-Lebanese households own their housing.
Impact of the 4 August 2020 blast on the housing sectorThe 4 August 2020 blast caused wide-scale damage to the housing stock in Beirut. According to the RDNA, the estimated costs from destruction and damages to housing are between USD 1.9 billion and USD 2.3
© Photo: UN-Habitat, 2016

137
billion, affecting 351,000 individuals.700 In comparison, OCHA estimated that the blast had a direct impact on 72,265 apartments across 9,700 buildings within a three-kilometre radius of the explosion, with 291,180 individuals affected.701 Real estate sector losses to the economy are estimated at USD 1-1.2 billion. The impact of damages is unevenly distributed across households - with low-income households, constituting 64 per cent of all households, being particularly affected.702
Several damage assessments of buildings were carried out in the areas most affected by the blast. Housing unit-level assessments of damage were integral to the LRC-led MSNA, which commenced within days of the blast, with damage categorized as Level 1 (minor damage), Level 2 (major but not structural damage) and Level 3 (structural damage). This information formed the basis for the United Nations Shelter Sector’s humanitarian response, though many shelter actors also operated outside this coordination. In parallel, the municipalities of Beirut703 and Bourj Hammoud,704 in collaboration with UN-Habitat, carried out rapid building-level damage assessments of affected areas (Figures 66 and 67). The assessments covered around half (approximately 5 km2) of the overall area of Beirut Municipality, and the entirety of Bourj Hammoud Municipality (2.7 km2). This amounted to 14,173 assessed buildings, 10,280 in Beirut and 3,893 in Bourj Hammoud. It should be noted that the Bourj Hammoud Municipality assessment included areas outside the 5 km radius of the blast. Furthermore, the OEA has carried out a damage assessment of 2,509 buildings in the most-affected areas of Saifi, the PoB, Rmeil and Medawar (Figure 68).705
As shown in the figures, in both Beirut and Bourj Hammoud municipalities, 0.1 per cent of the buildings have completely collapsed. The share of buildings with minor or no damage in Bourj Hammoud Municipality was 94.2 per cent. The share of buildings with minor or no damage in Beirut Municipality was 66.4 per cent; however, it should be noted that 21.8 per cent of the buildings were not classified. In the most affected areas, the OEA found that 44.5 per cent of the buildings had suffered some degree of damage.
At the time of writing and in the last months of the
700 World Bank, EU and United Nations, “Beirut Rapid Damage and Needs Assessment.”
701 OCHA, “Flash Appeal 14 August 2020 Lebanon,” August 2020.
702 World Bank, EU, and United Nations, “Beirut Rapid Damage and Needs Assessment.”
703 Municipality of Beirut and UN-Habitat, “Beirut Port Explosions Response: Beirut Municipality Rapid Building-level Damage Assessment,” 2020.
704 Municipality of Bourj Hammoud and UN-Habitat, “Beirut Port Explosions Response: Bourj Hammoud Municipality Rapid Building-level Damage Assessment,” 2020.
705 Order of Engineers and Architects, “Beirut Port Explosion of Aug 04 2020: Buildings Final Structural Assessment Report,” 2020.
implementation period of the humanitarian response phase, housing unit repairs for those with damage Levels 1 and 2 are mostly completed through a mix of assistance and some self-recovery, with limited outstanding cases; while units and buildings remaining in need of repair are mainly those Level 3 damage, requiring more costly structural works, encompassing historic including heritage-grade buildings.
Legal measuresSeveral legal steps were taken in the immediate aftermath of the blast to protect HLP rights and to limit opportunistic activities in the real estate sector. However, among tenants and property owners in blast-affected areas, there is a reported lack of awareness of their rights, responsibilities and the support or compensation mechanisms available to them.706 The tenants in these neighbourhoods - including old tenants, new tenants, and tenants without contracts - were already vulnerable to eviction.707
Beyond the immediate consequences from the physical damages on buildings are the uncertainties of the long-term effect of the explosion on the housing market, and whether this opens for further housing speculation through the redevelopment of central areas of Beirut and/or increased pressure on affordable housing options in already densely populated suburbs. The HLP issues identified by humanitarian organizations in the areas affected by the blast underscore these risks, which include the following: owners’ plans to repurpose or upgrade property; the refusal of owners to rehabilitate damaged property, particularly in cases where the tenants’ rental arrangement is about to expire and the owner does not wish to extend it; and pressure on property owners who do not have the financial means to carry out repairs to sell their properties to developers or investors.708 This includes tenants (many of whom are older) in the blast-affected areas who still pay a reduced rent in accordance with their pre-1992 rent control agreements. Displacement from these apartments and / or redevelopment of buildings in response to the damage inflicted may lead residents to lose their apartment and their right to lower rent.
Despite the damages to their homes, many residents in the affected areas chose to stay in their apartments rather than to relocate in the aftermath of the blast. The primary motivation for this is reportedly the fear of not being able to return home once temporarily relocated,709
706 HLP TTC, “Guidance Note on Housing, Land and Property in the Context of the Beirut Port Blast Response.”
707 Abir Saksouk and Nadine Bekdache, “Protecting the Tenants: A Core Issue in Recovering a Viable City,” The Peace Building in Lebanon, 16 September 2020, https://www.peacebuildingsupplement.org/Articles/cultural-heritage/490/undp-the-peace-building-news/en.
708 HLP TTC, “Guidance Note on Housing, Land and Property in the Context of the Beirut Port Blast Response.”
709 Terre des hommes, “Beirut City: Child Protection and Psychosocial Needs Assessment.”
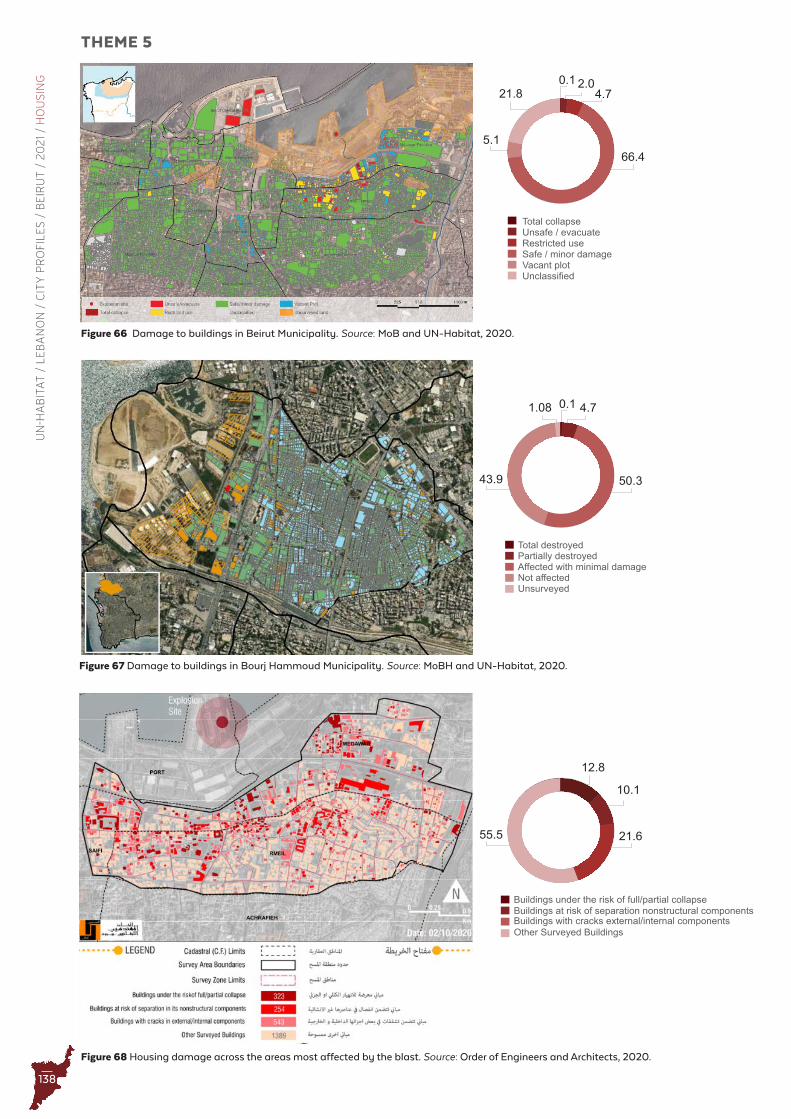
138
THEME 5U
N-H
AB
ITA
T /
LE
BA
NO
N /
CIT
Y P
RO
FIL
ES
/ B
EIR
UT
/ 2
02
1 /
HO
US
ING
0.14.7
Total collapseUnsafe / evacuateRestricted useSafe / minor damageVacant plotUnclassified
66.45.1
21.82.0
0.1 4.7
50.343.9
1.08
12.8
10.1
21.655.5
Total destroyedPartially destroyedAffected with minimal damageNot affectedUnsurveyed
Buildings under the risk of full/partial collapseBuildings at risk of separation nonstructural componentsBuildings with cracks external/internal componentsOther Surveyed Buildings
Beirut
Figure 66 Damage to buildings in Beirut Municipality . Source: MoB and UN-Habitat, 2020 .
Figure 67 Damage to buildings in Bourj Hammoud Municipality . Source: MoBH and UN-Habitat, 2020 .
Figure 68 Housing damage across the areas most affected by the blast . Source: Order of Engineers and Architects, 2020 .
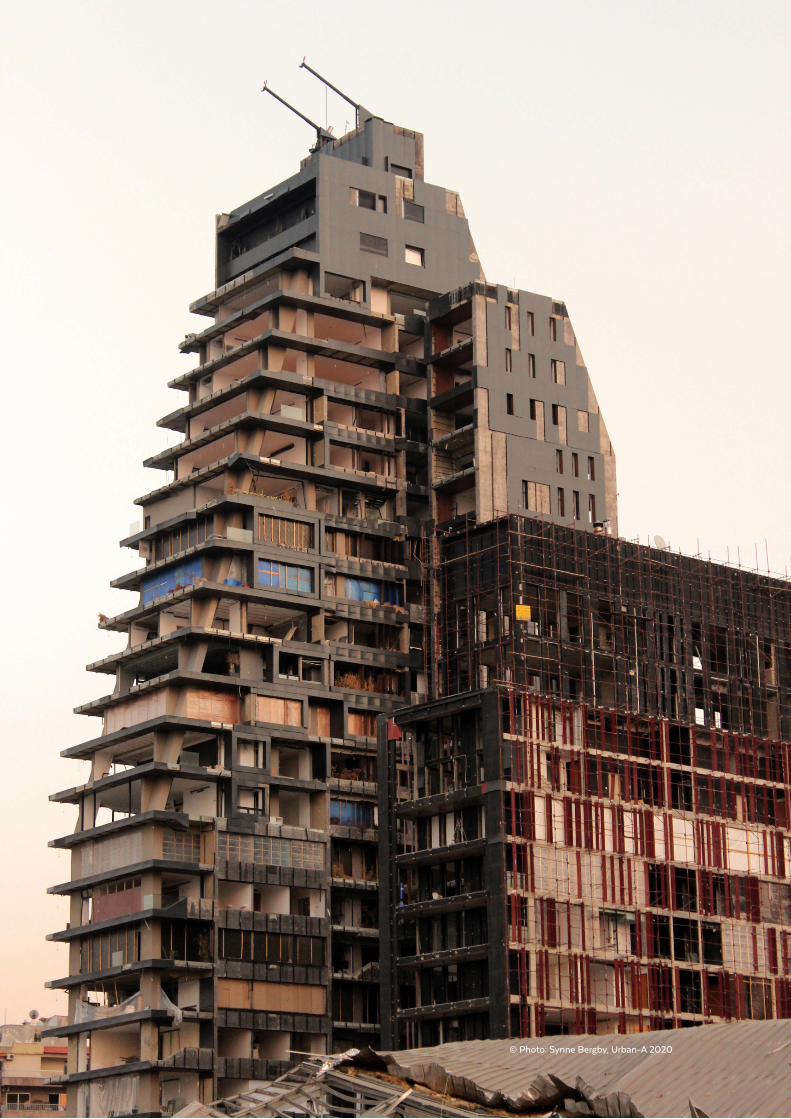
139
© Photo: Synne Bergby, Urban-A 2020
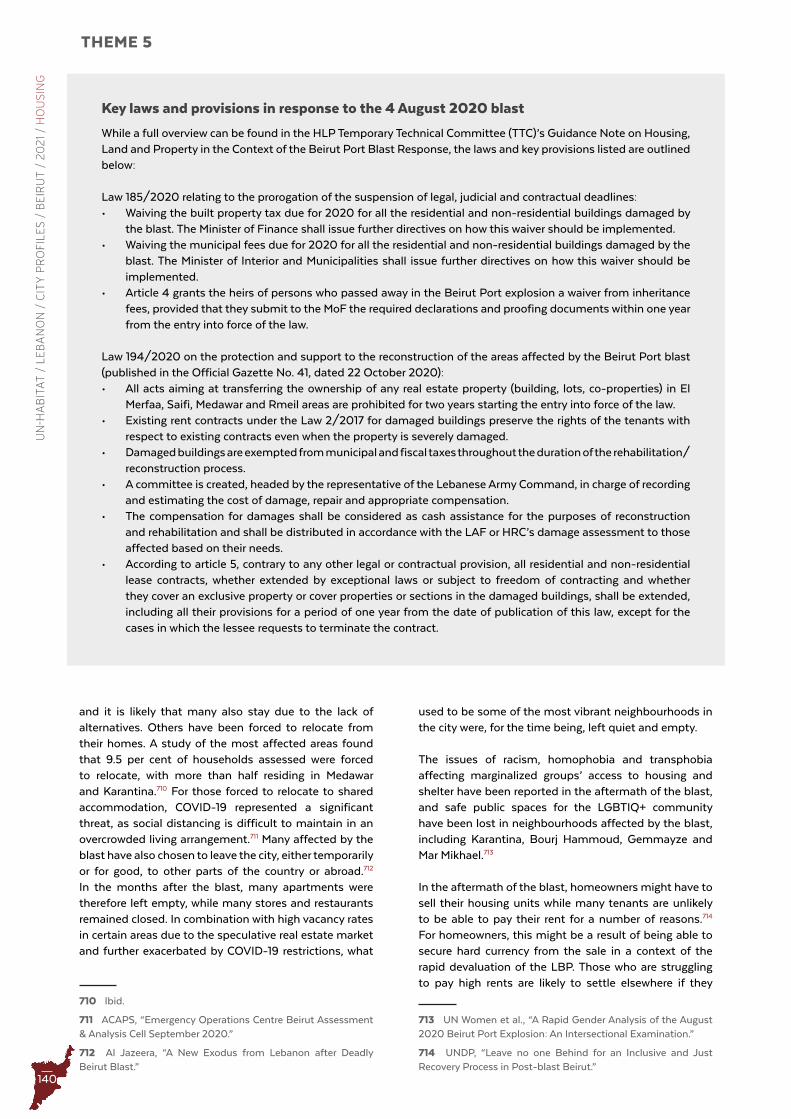
140
THEME 5U
N-H
AB
ITA
T /
LE
BA
NO
N /
CIT
Y P
RO
FIL
ES
/ B
EIR
UT
/ 2
02
1 /
HO
US
ING
and it is likely that many also stay due to the lack of alternatives. Others have been forced to relocate from their homes. A study of the most affected areas found that 9.5 per cent of households assessed were forced to relocate, with more than half residing in Medawar and Karantina.710 For those forced to relocate to shared accommodation, COVID-19 represented a significant threat, as social distancing is difficult to maintain in an overcrowded living arrangement.711 Many affected by the blast have also chosen to leave the city, either temporarily or for good, to other parts of the country or abroad.712 In the months after the blast, many apartments were therefore left empty, while many stores and restaurants remained closed. In combination with high vacancy rates in certain areas due to the speculative real estate market and further exacerbated by COVID-19 restrictions, what
710 Ibid.
711 ACAPS, “Emergency Operations Centre Beirut Assessment & Analysis Cell September 2020.”
712 Al Jazeera, “A New Exodus from Lebanon after Deadly Beirut Blast.”
used to be some of the most vibrant neighbourhoods in the city were, for the time being, left quiet and empty.
The issues of racism, homophobia and transphobia affecting marginalized groups’ access to housing and shelter have been reported in the aftermath of the blast, and safe public spaces for the LGBTIQ+ community have been lost in neighbourhoods affected by the blast, including Karantina, Bourj Hammoud, Gemmayze and Mar Mikhael.713
In the aftermath of the blast, homeowners might have to sell their housing units while many tenants are unlikely to be able to pay their rent for a number of reasons.714 For homeowners, this might be a result of being able to secure hard currency from the sale in a context of the rapid devaluation of the LBP. Those who are struggling to pay high rents are likely to settle elsewhere if they
713 UN Women et al., “A Rapid Gender Analysis of the August 2020 Beirut Port Explosion: An Intersectional Examination.”
714 UNDP, “Leave no one Behind for an Inclusive and Just Recovery Process in Post-blast Beirut.”
Key laws and provisions in response to the 4 August 2020 blast
While a full overview can be found in the HLP Temporary Technical Committee (TTC)’s Guidance Note on Housing, Land and Property in the Context of the Beirut Port Blast Response, the laws and key provisions listed are outlined below:
Law 185/2020 relating to the prorogation of the suspension of legal, judicial and contractual deadlines:• Waiving the built property tax due for 2020 for all the residential and non-residential buildings damaged by
the blast. The Minister of Finance shall issue further directives on how this waiver should be implemented.• Waiving the municipal fees due for 2020 for all the residential and non-residential buildings damaged by the
blast. The Minister of Interior and Municipalities shall issue further directives on how this waiver should be implemented.
• Article 4 grants the heirs of persons who passed away in the Beirut Port explosion a waiver from inheritance fees, provided that they submit to the MoF the required declarations and proofing documents within one year from the entry into force of the law.
Law 194/2020 on the protection and support to the reconstruction of the areas affected by the Beirut Port blast (published in the Official Gazette No. 41, dated 22 October 2020):• All acts aiming at transferring the ownership of any real estate property (building, lots, co-properties) in El
Merfaa, Saifi, Medawar and Rmeil areas are prohibited for two years starting the entry into force of the law. • Existing rent contracts under the Law 2/2017 for damaged buildings preserve the rights of the tenants with
respect to existing contracts even when the property is severely damaged.• Damaged buildings are exempted from municipal and fiscal taxes throughout the duration of the rehabilitation/
reconstruction process.• A committee is created, headed by the representative of the Lebanese Army Command, in charge of recording
and estimating the cost of damage, repair and appropriate compensation. • The compensation for damages shall be considered as cash assistance for the purposes of reconstruction
and rehabilitation and shall be distributed in accordance with the LAF or HRC’s damage assessment to those affected based on their needs.
• According to article 5, contrary to any other legal or contractual provision, all residential and non-residential lease contracts, whether extended by exceptional laws or subject to freedom of contracting and whether they cover an exclusive property or cover properties or sections in the damaged buildings, shall be extended, including all their provisions for a period of one year from the date of publication of this law, except for the cases in which the lessee requests to terminate the contract.
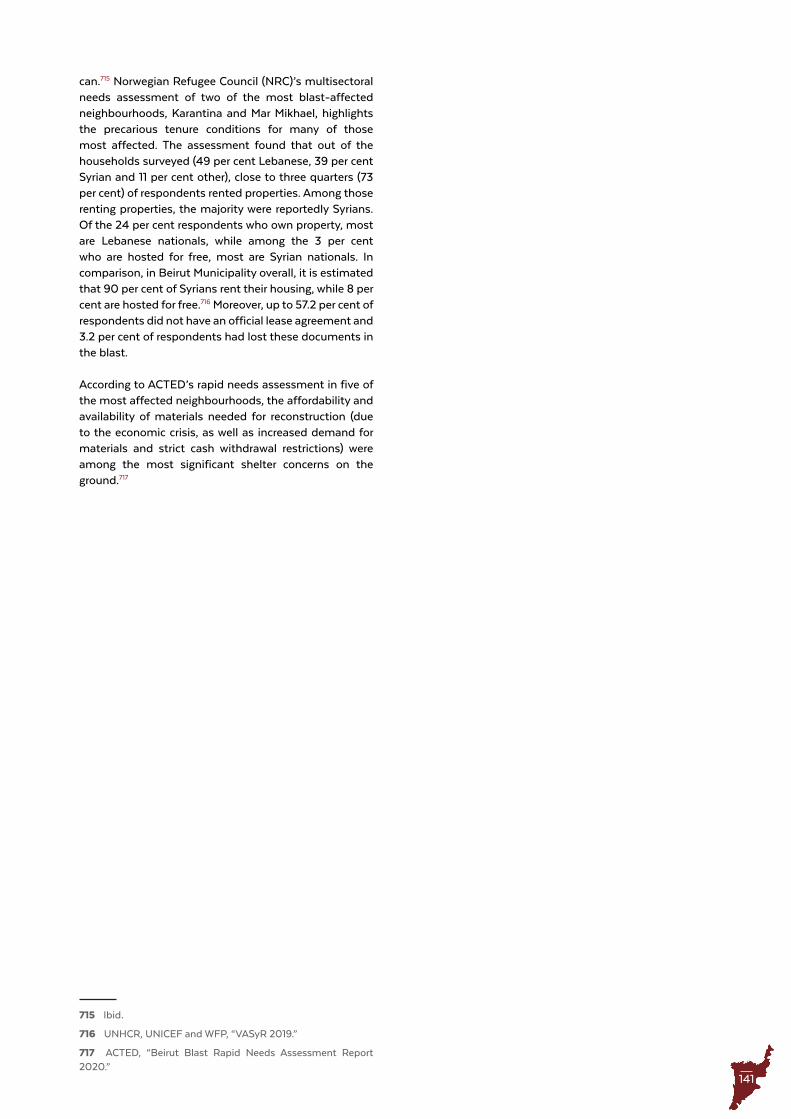
141
can.715 Norwegian Refugee Council (NRC)’s multisectoral needs assessment of two of the most blast-affected neighbourhoods, Karantina and Mar Mikhael, highlights the precarious tenure conditions for many of those most affected. The assessment found that out of the households surveyed (49 per cent Lebanese, 39 per cent Syrian and 11 per cent other), close to three quarters (73 per cent) of respondents rented properties. Among those renting properties, the majority were reportedly Syrians. Of the 24 per cent respondents who own property, most are Lebanese nationals, while among the 3 per cent who are hosted for free, most are Syrian nationals. In comparison, in Beirut Municipality overall, it is estimated that 90 per cent of Syrians rent their housing, while 8 per cent are hosted for free.716 Moreover, up to 57.2 per cent of respondents did not have an official lease agreement and 3.2 per cent of respondents had lost these documents in the blast.
According to ACTED’s rapid needs assessment in five of the most affected neighbourhoods, the affordability and availability of materials needed for reconstruction (due to the economic crisis, as well as increased demand for materials and strict cash withdrawal restrictions) were among the most significant shelter concerns on the ground.717
715 Ibid.
716 UNHCR, UNICEF and WFP, “VASyR 2019.”
717 ACTED, “Beirut Blast Rapid Needs Assessment Report 2020.”

142
THEME 6U
N-H
AB
ITA
T /
LE
BA
NO
N /
CIT
Y P
RO
FIL
ES
/ B
EIR
UT
/ 2
02
1 /
EN
VIR
ON
ME
NT
Theme 6 Environment
143
Theme 6 Environment
© Photo: Synne Bergby, 2017
144
THEME 6U
N-H
AB
ITA
T /
LE
BA
NO
N /
CIT
Y P
RO
FIL
ES
/ B
EIR
UT
/ 2
02
1 /
EN
VIR
ON
ME
NT
EnvironmentChapter summary
Lebanon is a country prone to environmental hazards. Further heightened by climate change, risks of water scarcity, flooding, soil depletion, risk to biodiversity and forest fires pose serious threats to Lebanon’s natural environment, public health and livelihoods. Beirut City lacks urban governance and planning that mitigates and adapts to the situation; on the contrary, the development of the city has augmented many of these risks. Deforestation, impermeable surfaces in the city, lack of drainage systems, unsuitable construction techniques and materials, and insufficient waste management all contribute to the exacerbation of existing environmental challenges and the impact of climate change. The availability of and access to green public spaces in Beirut City have been severely reduced as a result of redevelopment and privatization. These spaces, which have the potential of offering significant environmental and public health benefits, are also comparatively lower than in a significant number of other cities in developed and developing countries.
145
Beirut City is located on the Lebanese coast on a cape that extends 9 km into the sea.718 Over the years, the city has extended into the southern sandy plains, eastern agricultural plains, northern coastal plains as well as the mountainous areas, mostly through informal development. The climate is characterized by mild winters and hot, humid summers, with seasonal rainfalls during winter. Beirut mainly consists of built-up areas (77.3 per cent), but it also has woodlands (8.8 percent), agricultural land (6.2 per cent), empty lots (5.7 per cent) and some limited public space/gardens (1.4 per cent) (see Beirut Geography section in the Context chapter).719 The city comprises three major rivers, Beirut River (central) bordering municipal Beirut, El-Kalb River (north) and El-Ghadir River (south), which is led under the airport through a tunnel. Both Beirut and El-Ghadir rivers are highly polluted and mostly dry throughout the year. The urban area surrounding El-Ghadir River, characterized by informal encroachment of buildings onto the riverbanks, is subject to seasonal floods. Urban agriculture is rare in Beirut City, and where existent, such practices are of a very micro scale.
Environmental governanceIn Lebanon, environmental planning and laws and their implementation are centralized under the Ministry of Environment (MoE).720 Lebanon has been a party to the United Nations Framework Convention on Climate Change (UNFCCC) since 1994, acceded to the Kyoto Protocol in 2006. Furthermore, in 2015, Lebanon submitted its intended nationally determined contribution (INDC) to the UNFCCC in relation to the Paris Agreement.721
These international commitments notwithstanding, the environmental governance in Lebanon remains inadequate to protect the natural environment. The deteriorating natural environment and devastation of Lebanon’s natural assets can in large part be attributed to the GoL’s failure to enforce environmental legislation. As mentioned in the Governance and Accountability chapter, the Urban Planning Law includes several important environment provisions. However, the anchoring within institutions and practice for these provisions is weak.722 The situation has become a risk to Lebanon’s economy and its residents’ public health and well-being.723 To illustrate the effect on the economy, it was estimated by MoE and UNDP that in 2018, environmental degradation cost between 3.1 and 3.5 per cent of the GDP, an
718 Fawaz and Peillen, “Urban Slums Reports: The Case of Beirut, Lebanon.”
719 UN-Habitat, “Satellite imagery analysis of land use”, 2017.
720 European Committee of the Regions, “Lebanon - Environment and Fight against Climate Change,” https://portal.cor.europa.eu/divisionpowers/Pages/Lebanon-Environment-and-fight-against-climate-change-.aspx.
721 Ibid.
722 MoE and UNDP, “State and Trends of the Lebanese Environment (SOER).”
723 UNCT Lebanon, “Rapid Socio-Economic Impact Assessment.”
equivalent of USD 2.35 billion.724 This is more than four times the estimated USD 0.56 billion in 2000.725
Environmental threatsHigh deforestation, privatization of the country’s coastal areas, and wildfires have led to significant losses of the country’s forest assets and green spaces. In October 2019, over 100 fires erupted over a couple of days from the north to the south of Lebanon. The fires were, according to the Directorate General of Civil Defence, the worst in decades,726 with the Mount Lebanon mountain range east and south-east of Beirut among the areas most heavily affected. Wildfires have also erupted along the coastal mountain range in Syria, indicating a possible wider trend in the region. A striking three million trees had already been lost from forest fires in 2019 prior to October 2019’s ravaging fires.727 This is equivalent to the previous 15 years’ reforestation efforts.728 The deforestation is contributing to frequent flooding and the propensity for severe water shortages in Beirut. Excess water from rainfall, which would have been absorbed by the vegetation, is increasing the speed at which the water enters local river networks – or indeed also the road networks – and magnifies flood risk in the downstream urban areas of Beirut. This is exacerbated due to the impermeability of surfaces and built structures, limited green cover and public spaces, and the lack of drainage systems in the city.
Urbanization has had an adverse effect on the coastal ecosystems in Lebanon, including Beirut. Due to lacking implementation of urban planning and urban legislations, including environmental provisions mentioned above, construction has encroached on coastal areas. The construction activities have been driven by high population pressure and outwards expansion of the city, and include urban development on the public maritime domain, such as port expansion, coastal resorts, recreational pools and gardens and construction of roads and dumpsites along the seafront, often without legal permits or under specific regulations.729 Moreover, over-pumping of water (mainly using illegal wells) has, in combination with the factors described above, limited the natural aquifer recharge. Groundwater pollution by industries and households is also a growing concern.730
724 MoE and UNDP, “Rapid Cost of Environmental Degradation 2018,” 2019.
725 UNCT Lebanon, “Rapid Socio-Economic Impact Assessment.”
726 Timour Azhari, “Lebanon’s Year of Fire” Al Jazeera, October 16, 2020, https://www.aljazeera.com/features/2020/10/16/lebanons-year-of-fire.
727 Timour Azhari, “Lebanon Wildfires: Hellish Scenes in Mountains South of Beirut,” Al Jazeera, October 16, 2019, https://www.aljazeera.com/news/2019/10/16/lebanon-wildfires-hellish-scenes-in-mountains-south-of-beirut.
728 Ibid.
729 UNEP, “Analysis of the Current Land Use and Socio-Economic Activities in the Coastal Zone,” 2012.
730 Prinz, “Policy Brief: How to Prevent Sea Water Intrusion in Coastal Cities - Case Study Beirut, Lebanon.”
146
THEME 6U
N-H
AB
ITA
T /
LE
BA
NO
N /
CIT
Y P
RO
FIL
ES
/ B
EIR
UT
/ 2
02
1 /
EN
VIR
ON
ME
NT SWM is an additional critical environmental challenge
in Lebanon (see WaSH section in the Basic and Social Services chapter for more on this). The garbage crisis in Beirut has had a severe negative effect on the environment (notably through the illegal burning of trash) as well as on public health. A 2017 investigation of the impacts of open waste burning on nearby residents found that the toxic fumes from burning waste induced severe respiratory and skin problems while generating carcinogenic compounds also linked to heart disease and emphysema.731
Beirut’s residents are exposed to high levels of air and noise pollution. A 2015 study found that the concentrations of PM2.5 and PM10 were exceeding WHO annual average limits by 150 and 200 per cent, respectively,732 and a 2020 study found that the entire population of Beirut is regularly exposed to air pollution concentrations exceeding the WHO standards.733 The pollution is predominantly generated by traffic (where cars constitute between 70 and 80 per cent of around 1.7 million vehicles nationally,734 and where the average age of the car fleet is 19 years), the development of real estate,735 diesel generators (in Hamra alone, 53 per cent of buildings had diesel generators, with a total of 469 generators),736 and industry.737
Lebanon has a long history of petroleum explorations in the Levant Basin.738 Since the 1940s, onshore explorations have been carried out, and in 1970, offshore explorations started. While the most recent explorations in May 2020 did not find gas in commercial quantities739 (according
731 HRW, “Lebanon: Huge Cost of Inaction in Trash Crisis | Human Rights Watch.”
732 Myriam Mrad Nakhlé et al., “Beirut Air Pollution and Health Effects - BAPHE Study Protocol and Objectives,” Multidisciplinary Respiratory Medicine 10, no. 1 (June 23, 2015): 21, https://doi.org/10.1186/s40248-015-0016-1.
733 Jad Zalzal et al., “Drivers of Seasonal and Annual Air Pollution Exposure in a Complex Urban Environment with Multiple Source Contributions,” Environmental Monitoring and Assessment 192, no. 7 (June 1, 2020), https://doi.org/10.1007/s10661-020-08345-8.
734 World Bank, EU and United Nations, “Beirut RDNA Full Report Transport.”
735 Nakhlé et al., “Beirut Air Pollution and Health Effects - BAPHE Study Protocol and Objectives.”
736 Nakhlé et al.; Jafri Safa Safa, “AUB Research Guides Policy on Diesel Generator and Vehicle Air Pollution,” AUB, April 13, 2018, https://www.aub.edu.lb/articles/Pages/air-pollution.aspx.
737 Zalzal et al., “Drivers of Seasonal and Annual Air Pollution Exposure in a Complex Urban Environment with Multiple Source Contributions.”
738 Mirvat Abdallah and Houssam Salami, “Overview of the Oil and Gas Exploration in Lebanon,” Mediterranean Gas and Oil International Conference, MedGO 2015 - Conference Proceedings (Institute of Electrical and Electronics Engineers Inc., November 16, 2015), https://doi.org/10.1109/MedGO.2015.7330329.
739 Timour Azhari, “Lebanon’s First Offshore Gas Drill Is a Huge Disappointment,” Al Jazeera, April 27, 2020, https://www.aljazeera.com/economy/2020/4/27/lebanons-first-
to LOGI, it is prudent to assume a 20 per cent change of exploration success), the exploration will continue.740 In addition to risks linked to geopolitical, economic and sociopolitical dimensions, several current and future environmental threats arise from offshore petroleum exploration and potential production. These include: noise; atmospheric emissions; presence of vessels; drilling; and accidents, with consequences for marine mammals, turtles and fishes, human health, air and sea water quality, and underwater archaeological sites, and with negative impacts on climate change.741 While a Strategic Environmental Assessment (SEA) was carried out for Lebanon in 2014, a review of the assessment finds that it is lacking in several areas and must be redone to ensure the protection of the environment and reduce the likelihood of significant impacts.742
Climate change adaptationIn December 1994, the GoL ratified the UNFCCC and in 2015, it submitted its INDC to the UNFCCC.743 The key sectors highlighted for adaptation measures included biodiversity, forestry and agriculture, and water, and an unconditional target of reducing GHG emissions by 15 per cent compared to a business-as-usual scenario towards 2030. There is not yet a coordination unit within the government for disaster risk management.
Beirut is vulnerable to the impact of climate change. While some of the effects of climate change on socioeconomic and biological systems are already observed today, these will only increase in the years to come. Shocks caused by climate change already manifest both directly through heat waves, droughts, storms, flooding and so forth, and indirectly on economic and social factors. For example, Beirut is already exposed to a very hot climate with increasing temperatures due to climate change. Heat island effects in the city due to energy-inefficient buildings, loss of green cover, and density of asphalt744 will exacerbate the rising heat effect in the city. As also discussed in the Housing chapter, this is expected to increase demand for cooling, where a 1°C increase in temperature is estimated to increase electricity consumption by 1.8 per cent, and a 3°C increase by 5.8 per cent.745 Rising temperatures might also increase the incidences of infectious diseases, morbidity and mortality as well as more frequent extreme weather events.
offshore-gas-drill-is-a-huge-disappointment.
740 LOGI, “Lebanon’s Offshore Gas Sector: Shifting towards Domestic Growth,” May 2020.
741 Ricardo Khoury and Dima Alhaj, “Strengthening Environmental Governance of the Oil and Gas Sector in Lebanon,” 2015; LOGI, “Environmental Impact of Petroleum Activities in Lebanon,” 2017.
742 LOGI, “Environmental Impact of Petroleum Activities in Lebanon.”
743 GoL, “Lebanon’s Intended Nationally Determined Contribution under the United Nations Framework Convention on Climate Change,” 2015.
744 Kaloustian and Diab, “Effects of Urbanization on the Urban Heat Island in Beirut.”
745 MoE, UNDP and GEF, “Economic Costs to Lebanon from Climate Change: A First Look,” 2015.
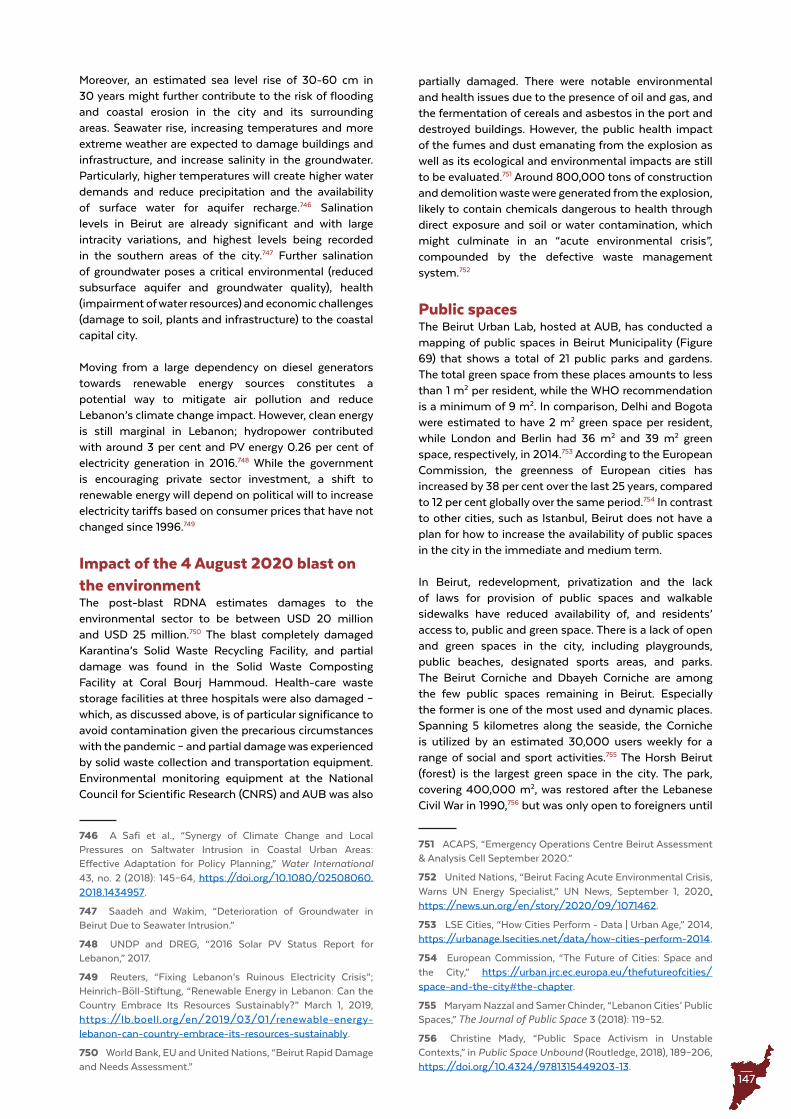
147
Moreover, an estimated sea level rise of 30-60 cm in 30 years might further contribute to the risk of flooding and coastal erosion in the city and its surrounding areas. Seawater rise, increasing temperatures and more extreme weather are expected to damage buildings and infrastructure, and increase salinity in the groundwater. Particularly, higher temperatures will create higher water demands and reduce precipitation and the availability of surface water for aquifer recharge.746 Salination levels in Beirut are already significant and with large intracity variations, and highest levels being recorded in the southern areas of the city.747 Further salination of groundwater poses a critical environmental (reduced subsurface aquifer and groundwater quality), health (impairment of water resources) and economic challenges (damage to soil, plants and infrastructure) to the coastal capital city.
Moving from a large dependency on diesel generators towards renewable energy sources constitutes a potential way to mitigate air pollution and reduce Lebanon’s climate change impact. However, clean energy is still marginal in Lebanon; hydropower contributed with around 3 per cent and PV energy 0.26 per cent of electricity generation in 2016.748 While the government is encouraging private sector investment, a shift to renewable energy will depend on political will to increase electricity tariffs based on consumer prices that have not changed since 1996.749
Impact of the 4 August 2020 blast on the environmentThe post-blast RDNA estimates damages to the environmental sector to be between USD 20 million and USD 25 million.750 The blast completely damaged Karantina’s Solid Waste Recycling Facility, and partial damage was found in the Solid Waste Composting Facility at Coral Bourj Hammoud. Health-care waste storage facilities at three hospitals were also damaged – which, as discussed above, is of particular significance to avoid contamination given the precarious circumstances with the pandemic – and partial damage was experienced by solid waste collection and transportation equipment. Environmental monitoring equipment at the National Council for Scientific Research (CNRS) and AUB was also
746 A Safi et al., “Synergy of Climate Change and Local Pressures on Saltwater Intrusion in Coastal Urban Areas: Effective Adaptation for Policy Planning,” Water International 43, no. 2 (2018): 145–64, https://doi.org/10.1080/02508060.2018.1434957.
747 Saadeh and Wakim, “Deterioration of Groundwater in Beirut Due to Seawater Intrusion.”
748 UNDP and DREG, “2016 Solar PV Status Report for Lebanon,” 2017.
749 Reuters, “Fixing Lebanon’s Ruinous Electricity Crisis”; Heinrich-Böll-Stiftung, “Renewable Energy in Lebanon: Can the Country Embrace Its Resources Sustainably?” March 1, 2019, https://lb.boell.org/en/2019/03/01/renewable-energy-lebanon-can-country-embrace-its-resources-sustainably.
750 World Bank, EU and United Nations, “Beirut Rapid Damage and Needs Assessment.”
partially damaged. There were notable environmental and health issues due to the presence of oil and gas, and the fermentation of cereals and asbestos in the port and destroyed buildings. However, the public health impact of the fumes and dust emanating from the explosion as well as its ecological and environmental impacts are still to be evaluated.751 Around 800,000 tons of construction and demolition waste were generated from the explosion, likely to contain chemicals dangerous to health through direct exposure and soil or water contamination, which might culminate in an “acute environmental crisis”, compounded by the defective waste management system.752
Public spacesThe Beirut Urban Lab, hosted at AUB, has conducted a mapping of public spaces in Beirut Municipality (Figure 69) that shows a total of 21 public parks and gardens. The total green space from these places amounts to less than 1 m2 per resident, while the WHO recommendation is a minimum of 9 m2. In comparison, Delhi and Bogota were estimated to have 2 m2 green space per resident, while London and Berlin had 36 m2 and 39 m2 green space, respectively, in 2014.753 According to the European Commission, the greenness of European cities has increased by 38 per cent over the last 25 years, compared to 12 per cent globally over the same period.754 In contrast to other cities, such as Istanbul, Beirut does not have a plan for how to increase the availability of public spaces in the city in the immediate and medium term.
In Beirut, redevelopment, privatization and the lack of laws for provision of public spaces and walkable sidewalks have reduced availability of, and residents’ access to, public and green space. There is a lack of open and green spaces in the city, including playgrounds, public beaches, designated sports areas, and parks. The Beirut Corniche and Dbayeh Corniche are among the few public spaces remaining in Beirut. Especially the former is one of the most used and dynamic places. Spanning 5 kilometres along the seaside, the Corniche is utilized by an estimated 30,000 users weekly for a range of social and sport activities.755 The Horsh Beirut (forest) is the largest green space in the city. The park, covering 400,000 m2, was restored after the Lebanese Civil War in 1990,756 but was only open to foreigners until
751 ACAPS, “Emergency Operations Centre Beirut Assessment & Analysis Cell September 2020.”
752 United Nations, “Beirut Facing Acute Environmental Crisis, Warns UN Energy Specialist,” UN News, September 1, 2020, https://news.un.org/en/story/2020/09/1071462.
753 LSE Cities, “How Cities Perform - Data | Urban Age,” 2014, https://urbanage.lsecities.net/data/how-cities-perform-2014.
754 European Commission, “The Future of Cities: Space and the City,” https://urban.jrc.ec.europa.eu/thefutureofcities/space-and-the-city#the-chapter.
755 Maryam Nazzal and Samer Chinder, “Lebanon Cities’ Public Spaces,” The Journal of Public Space 3 (2018): 119–52.
756 Christine Mady, “Public Space Activism in Unstable Contexts,” in Public Space Unbound (Routledge, 2018), 189–206, https://doi.org/10.4324/9781315449203-13.
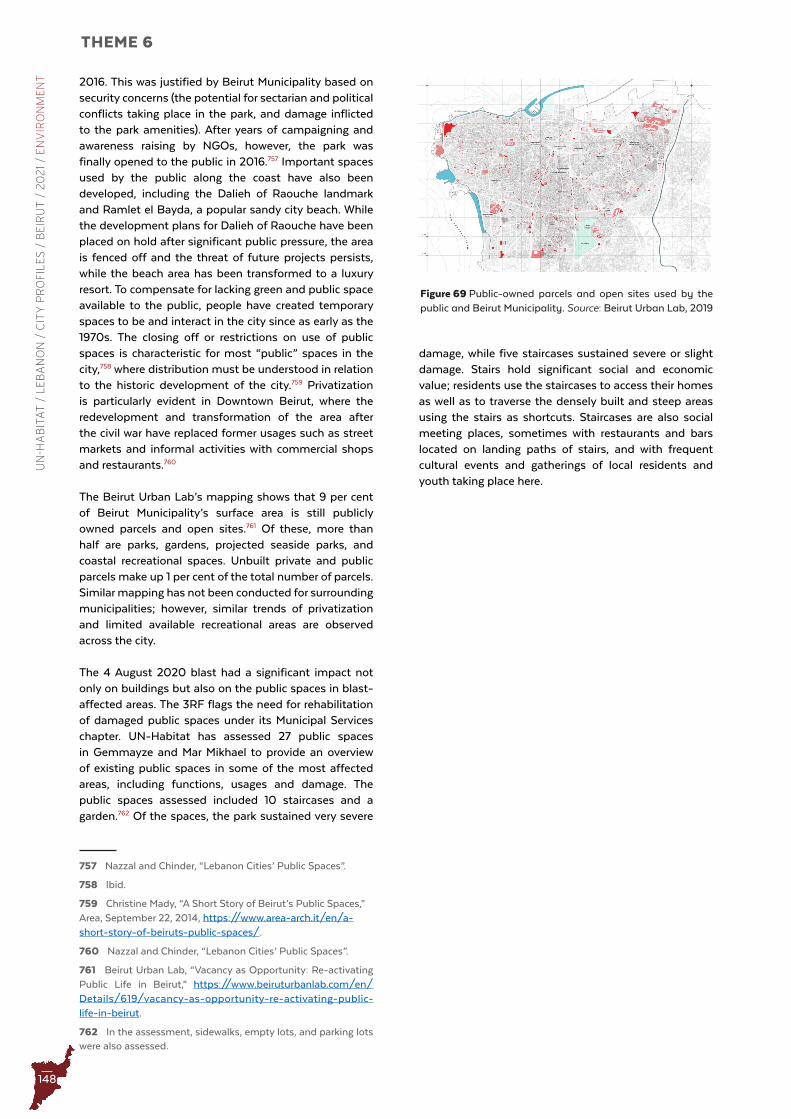
148
THEME 6U
N-H
AB
ITA
T /
LE
BA
NO
N /
CIT
Y P
RO
FIL
ES
/ B
EIR
UT
/ 2
02
1 /
EN
VIR
ON
ME
NT
Figure 69 Public-owned parcels and open sites used by the public and Beirut Municipality . Source: Beirut Urban Lab, 2019
2016. This was justified by Beirut Municipality based on security concerns (the potential for sectarian and political conflicts taking place in the park, and damage inflicted to the park amenities). After years of campaigning and awareness raising by NGOs, however, the park was finally opened to the public in 2016.757 Important spaces used by the public along the coast have also been developed, including the Dalieh of Raouche landmark and Ramlet el Bayda, a popular sandy city beach. While the development plans for Dalieh of Raouche have been placed on hold after significant public pressure, the area is fenced off and the threat of future projects persists, while the beach area has been transformed to a luxury resort. To compensate for lacking green and public space available to the public, people have created temporary spaces to be and interact in the city since as early as the 1970s. The closing off or restrictions on use of public spaces is characteristic for most “public” spaces in the city,758 where distribution must be understood in relation to the historic development of the city.759 Privatization is particularly evident in Downtown Beirut, where the redevelopment and transformation of the area after the civil war have replaced former usages such as street markets and informal activities with commercial shops and restaurants.760
The Beirut Urban Lab’s mapping shows that 9 per cent of Beirut Municipality’s surface area is still publicly owned parcels and open sites.761 Of these, more than half are parks, gardens, projected seaside parks, and coastal recreational spaces. Unbuilt private and public parcels make up 1 per cent of the total number of parcels. Similar mapping has not been conducted for surrounding municipalities; however, similar trends of privatization and limited available recreational areas are observed across the city.
The 4 August 2020 blast had a significant impact not only on buildings but also on the public spaces in blast-affected areas. The 3RF flags the need for rehabilitation of damaged public spaces under its Municipal Services chapter. UN-Habitat has assessed 27 public spaces in Gemmayze and Mar Mikhael to provide an overview of existing public spaces in some of the most affected areas, including functions, usages and damage. The public spaces assessed included 10 staircases and a garden.762 Of the spaces, the park sustained very severe
757 Nazzal and Chinder, “Lebanon Cities’ Public Spaces”.
758 Ibid.
759 Christine Mady, “A Short Story of Beirut’s Public Spaces,” Area, September 22, 2014, https://www.area-arch.it/en/a-short-story-of-beiruts-public-spaces/.
760 Nazzal and Chinder, “Lebanon Cities’ Public Spaces”.
761 Beirut Urban Lab, “Vacancy as Opportunity: Re-activating Public Life in Beirut,” https://www.beiruturbanlab.com/en/Details/619/vacancy-as-opportunity-re-activating-public-life-in-beirut.
762 In the assessment, sidewalks, empty lots, and parking lots were also assessed.
damage, while five staircases sustained severe or slight damage. Stairs hold significant social and economic value; residents use the staircases to access their homes as well as to traverse the densely built and steep areas using the stairs as shortcuts. Staircases are also social meeting places, sometimes with restaurants and bars located on landing paths of stairs, and with frequent cultural events and gatherings of local residents and youth taking place here.
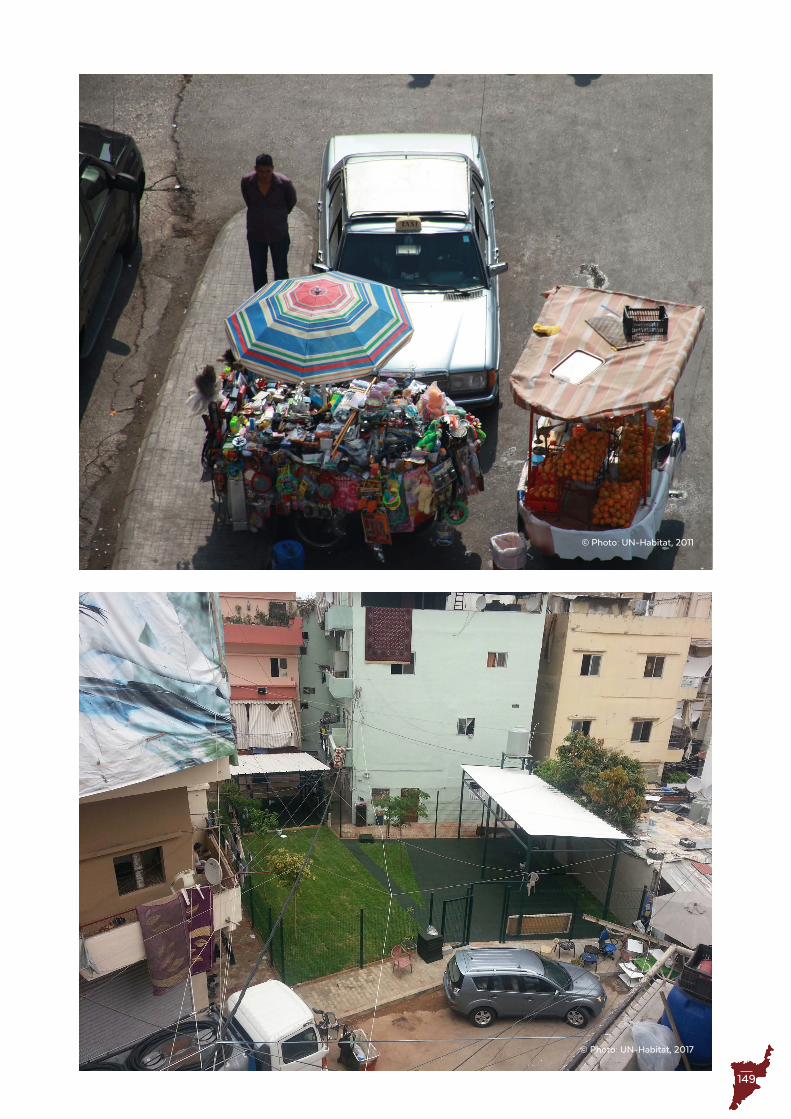
149
© Photo: UN-Habitat, 2017
© Photo: UN-Habitat, 2011
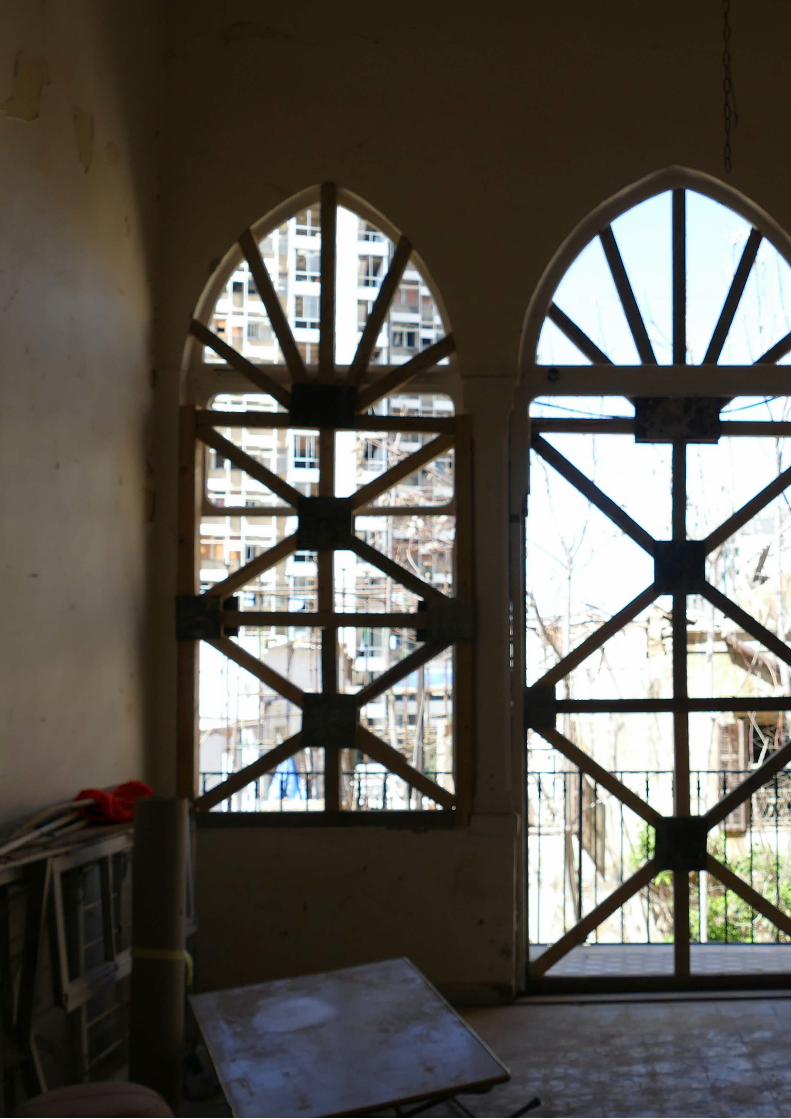
150
THEME 7U
N-H
AB
ITA
T /
LE
BA
NO
N /
CIT
Y P
RO
FIL
ES
/ B
EIR
UT
/ 2
02
1 /
CU
LTU
RA
L H
ER
ITA
GE
Theme 7 Cultural
Heritage
151
Theme 7 Cultural
Heritage
© Photo: UN-Habitat, 2021
152
THEME 7U
N-H
AB
ITA
T /
LE
BA
NO
N /
CIT
Y P
RO
FIL
ES
/ B
EIR
UT
/ 2
02
1 /
CU
LTU
RA
L H
ER
ITA
GE
Cultural HeritageChapter summary
Beirut City’s rich cultural heritage and identity, spanning more than 5,000 years, have been significantly impacted, both directly and indirectly, by the 4 August 2020 blast. Many historic buildings, businesses in the creative and cultural industries, libraries, religious sites and national monuments in proximity to the explosion site have been damaged, and activities discontinued or reduced. The potential exodus of active contributors to the city’s cultural life and social scene might change Beirut’s sociocultural configuration and who will take part in shaping the city and a sense of place going forward.
153
Cultural heritage in Beirut Beirut has a rich culture and history, which can be observed in the city’s urban pattern, architectural expressions, and sociocultural fabric. Many of the heritage buildings now under threat after the 4 August 2020 in Achrafieh are French- and Ottoman-era buildings. Many of these buildings were family mansions with gardens surrounding them. However, many of these have subsequently been sub-divided into smaller plots and reconverted into dense urban fabric, particularly as a result of the introduction of cement by the French. Beyond its tangible cultural heritage, Beirut is also an intellectual and creative centre. Based on its rich and multilayered cultural history, the city has been further developed as a hub for intellectuals and business under the French Mandate, with the establishment of private universities, schools and hospitals, and by undertaking a range of architectural, infrastructure and business projects.763
The reconstruction of Downtown Beirut after the civil war represented an opportunity to redefine the city. In other words, “the question of reconstruction after the end of the war was, therefore, not only a question of the high cost of reconstruction, but posed anew the question of the city’s identity, its centre and public spaces, and the different actors’ role in actualizing this identity”.764 However, the ‘Solidere’ master plan (see Governance and Accountability chapter for more on this) which was developed for the reconstruction of Downtown Beirut, failed to provide the population with affordable housing or a “new beginning” for the city. Instead, large-scale, speculative construction projects were made possible by expropriation of property and a recommended demolition of 80 per cent of the existing buildings in the central district,765 including public space and historical buildings.
In parallel, a strong cultural scene and creative industry has flourished in Beirut. Since the civil war, the city has hosted a range of locally as well as internationally renowned art, music, fashion, performing arts and literature artists. Moreover, a significant number of new cultural venues and art scenes has emerged over the past 10 years, mainly clustered in the neighbourhoods most impacted by the 4 August 2020 blast.
Cultural heritage management The Ministry of Culture (MoC) oversees matters of heritage, antiques, arts, cultural industries, and management of cultural and historical property, including museums and monuments. Its responsibilities include public policy and planning, promotion of
763 Lebanon Support and UNDP, “The Conflict Context in Beirut: The Social Question, Mobilisations Cycles, and the City’s Securitisation.”
764 Ibid. p. 10.
765 Mango, “The Impact of Real Estate Construction and Holding Companies: A Case Study of Beirut’s Solidere and Amman’s Abdali.”
Lebanese culture nationally, heritage preservation, establishment and enforcement of taxation regimes on the entertainment sector, and collaboration with international organizations, governments and agencies766 on cultural projects, among others, the ongoing Cultural Heritage and Urban Development (CHUD) Project.767 The MoC is divided into three units: the Directorate General of Antiquities, the Directorate General of Cultural Affairs and the Joint Administrative Service.
Under the Law 194/2020768 on the protection of and support to the reconstruction of the areas affected by the Beirut Port, the MoC was assigned to put in place a plan for the reconstruction and/or restoration of the damaged buildings classified as heritage.769 Reconstruction of damaged heritage buildings will, according to the law, require a clearance from the ministry to ensure that the design and characteristics of those properties are maintained.770 However, the heritage sector’s current regulatory frameworks do not provide adequate guidelines or incentives for the preservation of Beirut’s heritage, which has reduced the MoC’s ability to adequately respond to the blast.771 This adds to the historic grievances due to poor governance, looting and limited funds for restoration.
Impact of the 4 August 2020 blast on cultural heritageAs mentioned above, some of the most affected neighbourhoods from the 4 August 2020 blast are known for their social and cultural dimensions, with a concentration of cultural arenas; culture and creative industry (CCI) businesses; and restaurants, bars and other social spaces. These neighbourhoods had been revitalized over the past seven-eight years with the growth of the creative scene. Interlinked with the rich offers of restaurant and bars, the neighbourhoods had become destinations for people in the city, the country, and from afar – increasingly transforming into touristic sites themselves. Moreover, the clubs and concert scenes in both Mar Mikhail and Bourj Hammoud have attracted musicians and visitors from across the world. All of this has contributed to shaping an identity and sense of place for different groups and particularly young people in the city through a space that is to a greater degree divorced from sectarian and political lines. The blast has had an adverse impact on the built and social environment in these areas. The experience of redevelopment after the civil war - which has increased inequalities, limited access to the city - and replaced many heritage buildings in the
766 The World Bank, the Agence Française de Développement and the French and Italian governments.
767 The CHUD aims to restore and protect historical sites in Tyre, Tripoli, Baalbek, and Byblos.
768 Published in the Official Gazette No. 41, dated 22 October 2020.
769 HLP TTC, “Guidance Note on Housing, Land and Property in the Context of the Beirut Port Blast Response.”
770 Ibid.
771 United Nations, “3RF Culture,” 2020.
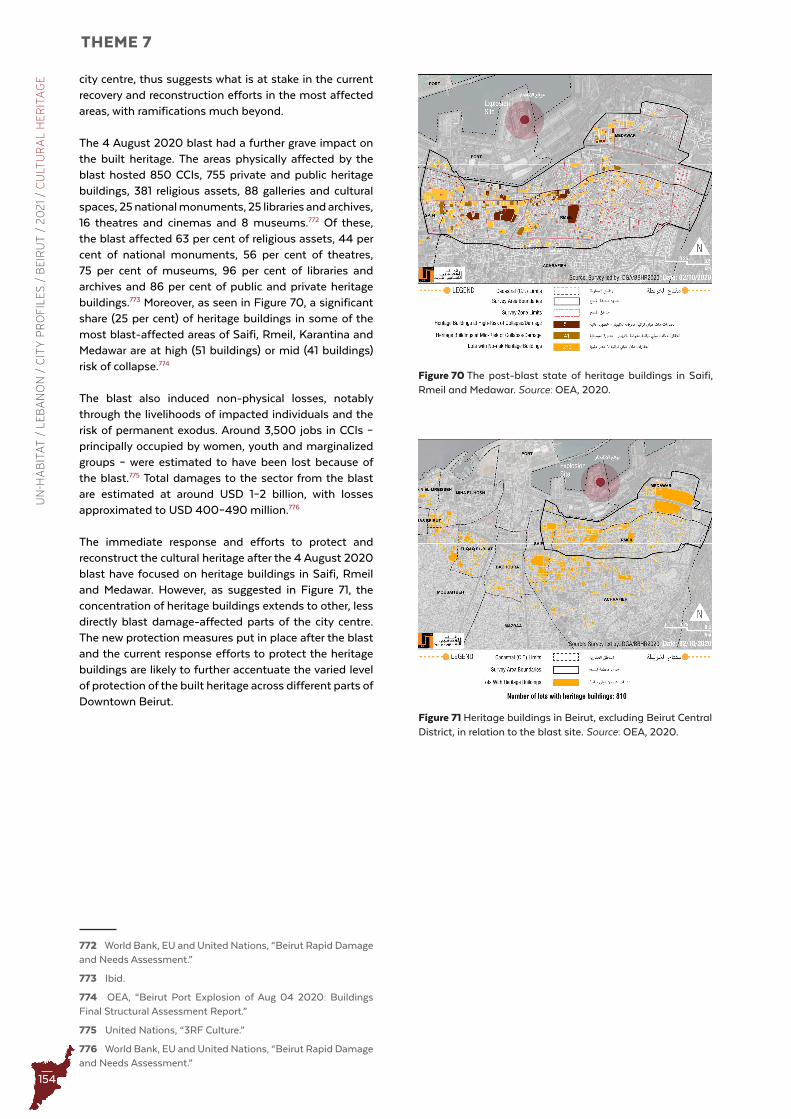
154
THEME 7U
N-H
AB
ITA
T /
LE
BA
NO
N /
CIT
Y P
RO
FIL
ES
/ B
EIR
UT
/ 2
02
1 /
CU
LTU
RA
L H
ER
ITA
GE
Figure 70 The post-blast state of heritage buildings in Saifi, Rmeil and Medawar . Source: OEA, 2020 .
Figure 71 Heritage buildings in Beirut, excluding Beirut Central District, in relation to the blast site . Source: OEA, 2020 .
city centre, thus suggests what is at stake in the current recovery and reconstruction efforts in the most affected areas, with ramifications much beyond.
The 4 August 2020 blast had a further grave impact on the built heritage. The areas physically affected by the blast hosted 850 CCIs, 755 private and public heritage buildings, 381 religious assets, 88 galleries and cultural spaces, 25 national monuments, 25 libraries and archives, 16 theatres and cinemas and 8 museums.772 Of these, the blast affected 63 per cent of religious assets, 44 per cent of national monuments, 56 per cent of theatres, 75 per cent of museums, 96 per cent of libraries and archives and 86 per cent of public and private heritage buildings.773 Moreover, as seen in Figure 70, a significant share (25 per cent) of heritage buildings in some of the most blast-affected areas of Saifi, Rmeil, Karantina and Medawar are at high (51 buildings) or mid (41 buildings) risk of collapse.774
The blast also induced non-physical losses, notably through the livelihoods of impacted individuals and the risk of permanent exodus. Around 3,500 jobs in CCIs – principally occupied by women, youth and marginalized groups – were estimated to have been lost because of the blast.775 Total damages to the sector from the blast are estimated at around USD 1–2 billion, with losses approximated to USD 400–490 million.776
The immediate response and efforts to protect and reconstruct the cultural heritage after the 4 August 2020 blast have focused on heritage buildings in Saifi, Rmeil and Medawar. However, as suggested in Figure 71, the concentration of heritage buildings extends to other, less directly blast damage-affected parts of the city centre. The new protection measures put in place after the blast and the current response efforts to protect the heritage buildings are likely to further accentuate the varied level of protection of the built heritage across different parts of Downtown Beirut.
772 World Bank, EU and United Nations, “Beirut Rapid Damage and Needs Assessment.”
773 Ibid.
774 OEA, “Beirut Port Explosion of Aug 04 2020: Buildings Final Structural Assessment Report.”
775 United Nations, “3RF Culture.”
776 World Bank, EU and United Nations, “Beirut Rapid Damage and Needs Assessment.”
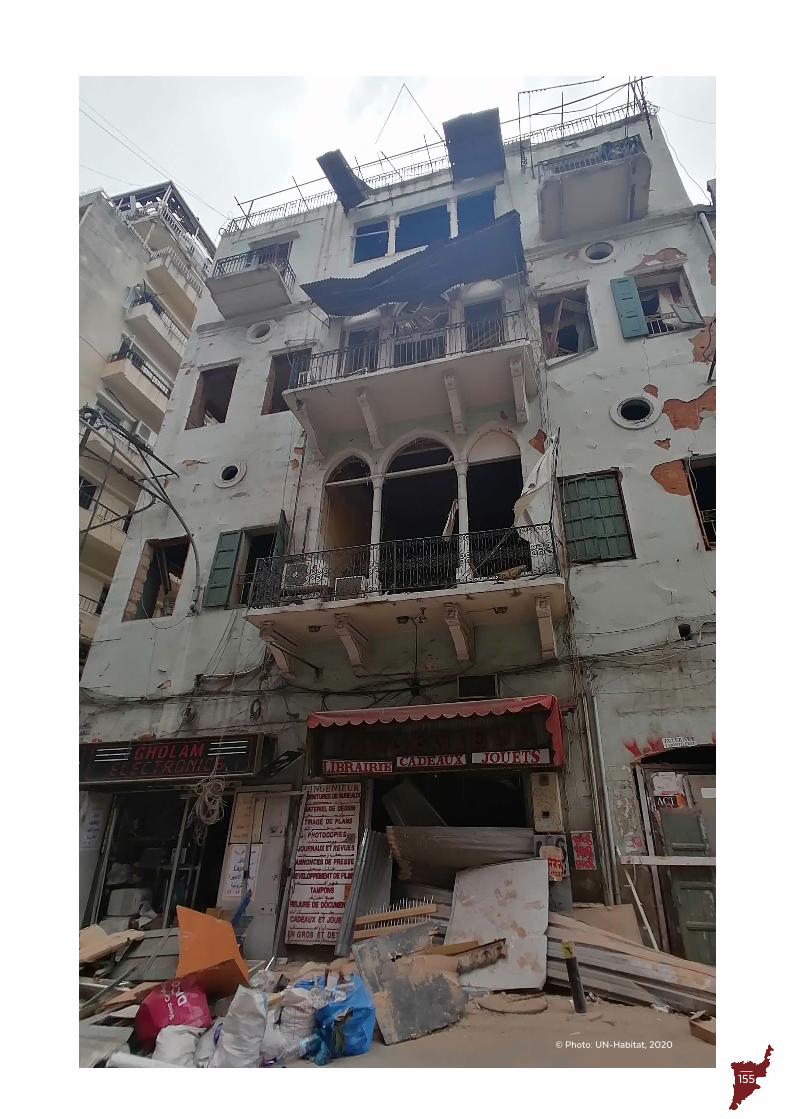
155
© Photo: UN-Habitat, 2020
156
RECOMMENDATIONSU
N-H
AB
ITA
T /
LE
BA
NO
N /
CIT
Y P
RO
FIL
ES
/ B
EIR
UT
/ R
ECO
MM
EN
DA
TIO
NS
157
Recommendations for Urban Recovery
© Photo: Synne Bergby, Urban-A, 2020
158
RECOMMENDATIONSU
N-H
AB
ITA
T /
LE
BA
NO
N /
CIT
Y P
RO
FIL
ES
/ B
EIR
UT
/ R
ECO
MM
EN
DA
TIO
NS
Diagnosis summaryBeirut City777 has been severely affected by compounded shocks that have exacerbated pre-crises structural issues, stressors and vulnerabilities. As described in this city profile, sectors and systems in the city are impacted by rapid population growth (including the influx of refugees), uncontrolled urbanization, poor governance and high and increasing inequalities in access to services, jobs and adequate housing. Environmental hazards and the effects of climate change are posing further threats to the city and its residents. Beirut has exhibited strength and resilience in the face of these challenges, especially through its civil society and youth population, underscoring the presence of building blocks necessary to set a transformative course moving forward. However, the overlapping and interconnected shocks and stressors have a reinforcing effect on one another. The continuous downturn of the economy, high poverty levels not seen for decades, and rising tensions are worrying signs for what might come next for Lebanon’s capital.
This renders the whole Beirut City in a state of crisis rather than faced by multiple crises,778 where there are no simple pathways for recovery and sustainable development .
The objective of this Beirut City Profile is to help form a shared understanding of how this situation manifests at the city scale and identify needs across the city. In the report, access to and functionality of services, housing issues, the urban economy and markets, people’s access to legal rights, social protection and inclusion, threats to cultural heritage and the environment, as well as the capacities and resources within local governments for planning and executing policies have been studied and exemplified. Some of the key challenges identified are also among the root causes of endemic and historic grievances; these need due attention for Beirut City to recover from recent shocks while simultaneously moving towards a sustainable and inclusive city. This chapter provides a summary of the diagnosis presented in the report, and outlines some of the composite challenges to be addressed and opportunities to be leveraged in urban recovery initiatives.
Key findings A history of co-existence, rapid expansion, and external and internal shocks continue to shift and shape the trajectory of one of the world’s oldest cities .
Beirut’s strategic location by the Mediterranean has been decisive for its legacy as a prominent port city whose history has been shaped by multiple civilizations and
777 Beirut City, as defined in this report, encompasses 31 municipalities. The boundaries are based on the continuously built-up area of the city. See Methodology section in the Introduction chapter for detailed information.
778 Paraphrased, Lucy Earle, “Haiti Earthquake 10 Years on – a New Chapter in Disaster Response” January 12, 2020. https://www.iied.org/haiti-earthquake-10-years-new-chapter-disaster-response
political events taking place in the region. Historically, Beirut has been a city of co-existence of a multitude of religious, ethnic and nationality groups. The city scape reveals traces of several historic empires, the confluence of Arabic and European influences, as well as rapid urbanization fuelled by cross-border and rural-to-urban population movements. The city’s role as an important economic centre has manifested through economic growth that has, among others, increased inequalities, led to rapid expansion, and contributed to high living costs. The Lebanese Civil War (1975-1990) and developments since – including recent shocks – have contributed to a further fragmentation within the city, based on sectarian, ethnic, political and socioeconomic fault lines. The main findings of this report can be summarized in the following overarching challenges:
Beirut’s defragmented and under-resourced governance structures pose a hindrance to sound planning and provision of adequate basic and social services .1. The absence of a single authority in charge of Beirut
City hinders effective planning of social and basic service systems, as well as spatial planning that considers efficient land use of residential, industrial, commercial and recreational areas bound together with efficient transportation systems. This negatively impacts people’s access to services, reinforces clientelist dependencies, and adds environmental strains with unchecked pressure on resources. Housing scarcity, water and electricity outages, inadequate waste management, and interrupted value chains - are some of the issues that manifest on a scale that goes beyond the municipality level, and where transformative development is hindered by the lack of coherent administration and planning.
2. The lack of accurate, updated, multisectoral and disaggregated urban data poses significant constraints to planning adequate and reliable services. This also links to low tax collection rates and an unpredictable tax redistribution system from central to municipal levels. This renders municipalities ill-equipped to respond to service and planning needs, as well as to sudden shocks. Effectively, this means that the city has an expensive and heavy administrative system, yet without the means to deliver on its commitments to its inhabitants. As defined in this report, Beirut City covers 111.22 m2, encompassing 31 municipalities and three UoMs. For comparison, this is one seventh the size of Greater Amman Municipality, which has progressively expanded to encompass the expansions of the city.779
3. Limited representation of women, youth and marginalized groups in decision-making from local to national levels represents a structural barrier to identify and address priority needs experienced by a large share of the population. This has been seen to increase distrust in local and national governance. Particularly for youth, activism has become an
779 World Bank, “Amman, Jordan: Comprehensive Climate Plans,” 2020.
159
alternative to formal participation, and young people have been central to the recent social movement and civil uprising in the city.780 With limited options that allow for envisioning a future in Lebanon, young people are increasingly emigrating, or considering it. This is posing a risk of brain drain and loss of human capital necessary to develop new and innovative avenues for recovery and sustainable development. Youth disenfranchisement also makes youth more susceptible to recruitment into illicit activities and violent groups.
A rentier economy781 hit by augmented shocks has rendered economic sectors and livelihoods in Beirut City vulnerable, with a rapid rise in unemployment and poverty levels that cuts across the population, yet disproportionally affects certain population groups based on structural inequalities .4. A large part of the economic growth in Beirut has
been decoupled from sustainable employment and value creation and has led to stark inequalities in income and socioeconomic opportunities. The economic instability has been heightened by widespread protests and the closing of economic activities and banks, to the point of economic, monetary and financial collapse. The situation has rendered Beirut’s economy extremely vulnerable in the face of COVID-19 and the 4 August 2020 blast, which will have lasting negative effects on the city and the national economy at large. The current situation is characterized by depleted business activities, high unemployment, food insecurity, and an alarming rise in poverty levels.
5. Structural inequalities in the labour market make vulnerable groups disproportionally affected by recent shocks, with increased humanitarian needs beyond refugee populations and those directly affected by the blast. However, the effect is also felt by the city’s middle class, where hyperinflation and limited access to money in bank accounts are translating into significant reduction in purchasing power. The impoverishment of the middle class and upper-middle class will have a long-term impact with potential threat to human development and improvement of standards of living made over the past decades. Women are considered among the most economically deprived within each population group.
6. The Port of Beirut has historically been a key driver of growth and development of Beirut City and is of great significance to the Lebanese economy. However, its physical separation from the city also signifies its divorce from the political economy of the same city. The massive damages from the 4 August 2020 blast to the port, including warehouses and the grain silos, have had a devastating impact
780 Harb, “Cities and Political Change: How Young Activists in Beirut Bred an Urban Social Movement.”
781 An economy where productive sectors play a small role compared to financial and real estate sectors, driven primarily by speculation rather than true value creation.
on economic activities and food security across the country. The needed reconstruction poses an opportunity to rethink the port layout, including reintegrating it into the city, as well as planning for efficient and well-connected value chains.
Protection risks are increasing, with women, children, refugees and migrants disproportionately exposed, while social cohesion is seen to be reducing .7. Social protection782 remains highly fragmented.
The recent crises have led to a surge in protection concerns, including increased prevalence of negative coping mechanisms, more SGBV cases, and a higher number of out-of-school children. Moreover, the collective and individual trauma in the aftermath of the 4 August 2020 blast has led to an acute need for mental health services. The economic collapse has aggravated inequalities in access to and the consequences of the poor state of public social infrastructure and protection schemes.
8. The rapid population growth of the city since the French Mandate has been driven by internal displacement, migration and waves of arriving refugees. This has placed significant demands on already strained service provision, increased competition over housing and livelihoods, and widened inequalities. High levels of vulnerabilities among the population, exacerbated by recent shocks, are furthering competition, discrimination and scapegoating. The situation has contributed to increased tensions between groups in Beirut along social, ethnic, nationality and religious fault lines, with risks of increased fragmentation of the city’s social fabric. There is also a rising trend of “hunger-crime” in Beirut, as well as rise in conflict incidents associated with obtaining essential food items, such as formula for kids. With the scaling back of food subsidies at the same time as food inflation is soaring and people are struggling to secure the bare necessities, the situation is likely to further deteriorate. At the same time, the civil uprising starting October 2019 and the solidarity displayed after the 4 August 2020 blast illustrate how people have come together in the face of extreme difficulties.
Insufficient and lacking basic and social services are most severely affecting vulnerable segments of the population based on spatial and socioeconomic factors .9. The quality of essential service delivery and the state
of key infrastructure in Beirut have been severely compromised due to pre-existing and long-standing structural barriers and overlapping crises. Basic and social services have suffered from decades of conflict, underinvestment, unmanaged city growth, and poor governance, paralleled by a significant rise in demand, as mentioned above. This has placed further strains on already insufficient resources
782 Social protection, as defined in the 3RF, includes five components: social assistance; social insurance; financial access to services (especially health and education); economic inclusion and labour activation; and social welfare.
160
RECOMMENDATIONSU
N-H
AB
ITA
T /
LE
BA
NO
N /
CIT
Y P
RO
FIL
ES
/ B
EIR
UT
/ R
ECO
MM
EN
DA
TIO
NS
and capacities of local governments to meet the demand.
10. Unreliable and inadequate provision of water, energy, education and health services has led to a reliance on private providers for those who can afford it. Poor households are thus more exposed to systemic inequities in service access, without financial resources and social safety nets to make up for those gaps. Moreover, the collapsing economy, COVID-19 and the 4 August 2020 blast have further deteriorated public service provision at a time when there is an acute need and when people’s ability to pay for private service delivery is severely reduced.
11. While Lebanon is rich in water resources compared to its neighbours,783 people are suffering from a lack of access to potable water. This is due to a number of factors, among others, the majority (up to 70 per cent) of natural water sources are bacterially contaminated,784 a high share of water supply networks is past their lifespan,785 water is lost due to leakages and illegal connections,786 and replenishment of the groundwater is hindered due to the impermeability of surfaces and built structures, limited green spaces and the lack of drainage systems.
12. High enrolment numbers in private schools are triggered by the deteriorating condition of public schools. At the same time, due to the economic situation, fewer households are likely to be able to pay for private education, which in turn will place an added strain on the public system. This is likely to magnify the differences in the quality of education and socioeconomic background of students in public and private schools.
Lack of affordable and safe tenure, furthered by absent and inadequate enforcement of land use and planning policies, is a key barrier for poor households to find a way out of poverty .13. A large and increasing share of the city’s residents
are suffering from a lack of affordable and adequate housing, with a supply-demand mismatch in terms of prices, tenure arrangements, and quality of housing. The housing market is to a large extent segregated, catering to different socioeconomic groups. The large-scale urban renewal of Downtown Beirut after the civil war, combined with housing policies favouring homeownership for middle-income earners in the outskirts of the city, contributed to and reinforced pre-existing divisions along socioeconomic and sectarian lines. In the
783 IIED, “Five Fundamentals to Keep Lebanon’s Water Flowing | International Institute for Environment and Development.”
784 American University of Beirut, “Outcomes of the 2nd Lebanon Water Forum: In Support of Water Governance in Lebanon,” March 2019.
785 WHO and UNICEF, “Lebanon Water Quality Survey Lebanon.”
786 Machayekhi, Pierpaoli and Cancelliere, “Domestic Water in the Bekaa Valley, Lebanon: Demand, Access and Institutional Aspects.”
post-war period, rental and housing prices increased drastically, rendering adequate housing unattainable for a growing share of residents.
14. Central areas of the city are characterized by pockets of high density, overcrowded and poorly serviced accommodations, and precarious tenure, next to high-end real estate of which a large share is vacant or unsold. The current crisis might further exacerbate this situation, including a potential collapse in property prices, increased rent disputes, further overcrowding, more precarious tenure, and tenants seeking affordable housing options outside the city. There is a high share of vacant properties in the city due to rapid construction activities catering for housing speculation and investments, translating to missed opportunities to provide more affordable housing. Despite measures put in place to address HLP issues following the 4 August 2020 blast, the concern is that this speculation on housing and properties will spiral in the years to come if not greater measures are put in place to ensure housing development and regulations anchored in overarching city development plans.
Beirut City is increasingly exposed to environmental and climate change impacts that increase vulnerabilities due to poverty, while poor planning, lack of climate adaptive construction, and malfunctioning infrastructure are all contributing to the magnification of the effects of climate change .15. Lebanon is a country prone to natural and
environmental hazards, including earthquakes. Further heightened by climate change, risks of water scarcity, flooding and forest fires pose a serious threat to the natural environment, public health, and livelihoods. Due to lacking implementation of urban planning and legislations, including environmental provisions, redevelopment and privatization have encroached on coastal areas and forest assets, and have severely limited availability of and access to green public spaces. Deforestation as well as poor and insufficient water and sanitation management all contribute to the exacerbation of existing environmental challenges and climate change exposure.
16. While some of the effects of climate change are already observed, these will only increase in the years to come. Shocks caused by climate change manifest both directly - through heat waves, droughts, storms, flooding and so forth - and indirectly on economic and social factors. For example, Beirut City is already subject to a hot climate with increasing temperatures as a result of climate change. Heat island effects in the city due to energy-inefficient buildings, loss of green cover, and density of asphalt will further exacerbate the rising heat effect in the city. Moreover, salination levels in Beirut are significant, with the highest levels being reported in the southern areas.787 Further salination
787 Saadeh and Wakim, “Deterioration of Groundwater in Beirut Due to Seawater Intrusion.”
161
of groundwater, due to rising sea levels and increased temperatures, poses critical environmental, health and economic challenges.
The 4 August 2020 blast caused heavy damage to Beirut’s cultural heritage, adding to existing threats to heritage buildings yet to be rehabilitated after the civil war .17. Beirut City’s rich cultural heritage has been
significantly impacted, directly and indirectly, by the 4 August 2020 blast. Many historical buildings and heritage sites, as well as businesses in the creative and cultural industries were damaged and their activities discontinued or reduced. The potential exodus of contributors to the city’s cultural life might change Beirut’s sociocultural configuration. This poses the question of who will take part in shaping the city and creating a sense of place going forward.
18. Some of the neighbourhoods most affected by the 4 August 2020 blast had been revitalized over the past seven-eight years with the growth of the creative scene. Interlinked with the rich offers of restaurant and bars, these areas had become destinations for people from within and outside the city, contributing to shaping an identity and sense of place that is to a greater degree divorced from sectarian and political lines. The recent experience of redevelopment after the war - which increased inequalities, limited access to the city, and replaced many heritage buildings in the city centre - suggests that what is at stake in the current recovery and reconstruction efforts in the most affected areas has ramifications much beyond.
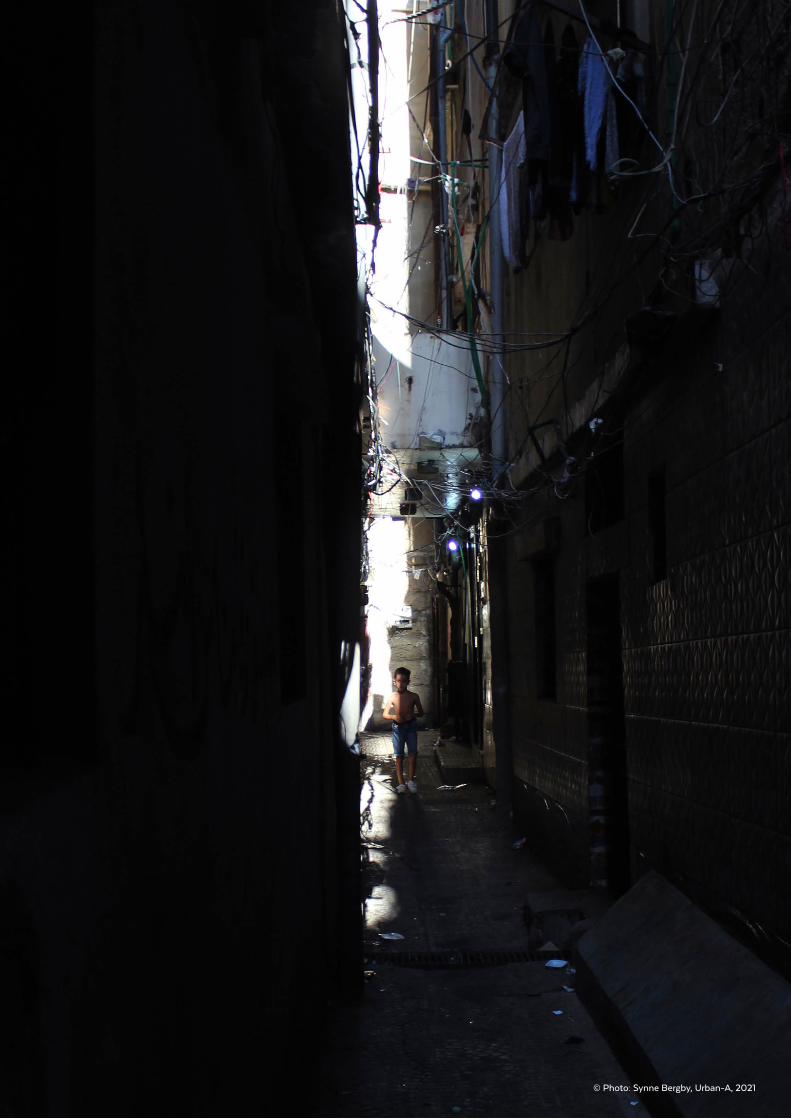
162
RECOMMENDATIONSU
N-H
AB
ITA
T /
LE
BA
NO
N /
CIT
Y P
RO
FIL
ES
/ B
EIR
UT
/ R
ECO
MM
EN
DA
TIO
NS
© Photo: Synne Bergby, Urban-A, 2021
163
Principles for urban recoveryThe analysis of multisectoral needs and the impact of recent shocks on Beirut City, as presented in this report, depicts a capital city in crisis where overlapping shocks have had detrimental impacts on the population across the whole city. The findings suggest that short-to-longer-term interventions need to consider the broader city, beyond the directly affected neighbourhoods of the 4 August 2020 blast, to halt further deterioration of the local economy and to prevent more families from falling into the poverty trap with associated risks of rise of (new) tensions over already failing or inadequate resources and services. Further, there is a need to consolidate the capacities and efforts of local and international actors around responses that consider both time and geographical scales to steer the recovery towards transformative change focused on strengthening local systems and capacities to absorb, adapt and recover from shocks. This is essential both to mitigate unequal support to communities with similar levels of vulnerabilities – be they directly affected by the blast or in dire need due to overlapping socioeconomic deprivations and long-standing marginalization – and to ensure community interventions are balanced with macro-level and longer-term interventions. For longer-term recovery and stabilization, attention is therefore required on both localized recovery plans at the city and neighbourhood levels, and on regional and national policies and regulations. This will be critical for addressing the root causes of current stressors at scale, keeping in mind how a further deterioration of the situation in Beirut City will impact Lebanon as a whole.
The report informs the 3RF788 (initiated by the United Nations, EU and World Bank) by providing a spatial dimension to support localization of identified priorities of the track 1 and track 2 interventions (short to medium term, respectively). The findings help to identify building blocks to devise strategies for longer-term urban recovery efforts at the city scale and - noting the importance of Beirut to Lebanon as a particularly small country - that will in turn support recovery at the national scale. The longer-term recovery efforts will depend on the political commitment, investments and ownership by the Lebanese national and local authorities. The report thus also informs policy, reform and planning measures needed to support the longer-term recovery. As such, the following list suggests a set of principles for the longer-term urban recovery of Beirut:
1. Urban recovery will be based on a principle of equity and will consider the compounded crises faced by the population across the city through a holistic, “whole-of-city” approach . A holistic city approach will need to address the effects of the severe economic, social and environmental situation, overlaid with the critical state of the built environment, in both blast-affected neighbourhoods and marginalized poverty pockets throughout the city. Moreover, it must consider how recent shocks affect vulnerable groups disproportionately, including poor Lebanese, refugees, migrants, people with disabilities, women, youth and children.
2. Urban recovery will consider the spatial boundaries of today’s Beirut (i .e . beyond its administrative boundaries), recognizing the interconnectedness of economic, social, environmental and political systems . Recovery efforts should support planning for local economic development by linking interventions at the sub-city, city and regional levels - in addition to planning and integrating residential, industrial and business districts, as well as recreational areas through efficient mobility systems - to improve both living conditions and productivity within the city.
3. Urban recovery will be based on a combined “bottom-up” and “top-down” approach, acknowledging the role of interlocutors and government at the local level as actors first responding to shocks and addressing local needs, and of the role of national counterparts in devising enabling legislation and regulations . Longer-term recovery efforts should strengthen the capacity of local actors to take a lead in planning and response and should actively promote inter-municipal collaboration and engagement of local authorities across political and sectarian lines to combat resource inefficiency and administrative overlaps. Conversely, the central government should be engaged in policy and legislative review and in setting the national-level urban recovery agenda.
4. Urban recovery will identify avenues for aligning and magnifying interventions by the multitude of actors responding to recent shocks and long-standing grievances . Recovery efforts should capitalize on the broad contribution of various interlocutors to relief efforts, and should support enhanced coordination at the local level - complementing the coordination systems of international actors. To avoid duplication of assessments, planning and implementation, and be able to identify opportunities for efficient and scalable solutions, the central roles of and possible contributions from civil society, community groups, local authorities, private sector and semi-formal or informal actors and power brokers on the ground must be integrated.
5. Urban recovery will follow a “build-back-better” principle and ensure that efforts to rehabilitate and upgrade basic and social services are based on holistic systems analysis and evidence-based planning, including understanding of market dynamics of current service provision . Interventions to enhance service provision in Beirut should seek to maximize the effect of and return on investments and should contribute to reduced pressure on resources. Spatial, fiscal and planning coordination is therefore required with and between responsible authorities beyond the municipal levels, and advocacy for policy strengthening within respective sectors.
Guided by these principles, the following section provides a set of recommendations for the recovery of Beirut City that respond to the composite challenges the city is faced with.
788 World Bank, EU and United Nations, “Lebanon Reform, Recovery and Reconstruction Framework (3RF),” December 2020.
164
RECOMMENDATIONSU
N-H
AB
ITA
T /
LE
BA
NO
N /
CIT
Y P
RO
FIL
ES
/ B
EIR
UT
/ R
ECO
MM
EN
DA
TIO
NS
From shock absorption towards transformation: Recommendations on the way forwardThe short- and long-term consequences for a Beirut City in crisis can be understood as multiple temporalities to be planned for and responded to in parallel. The identification of interventions should be done through a flexible, iterative process in order to navigate shifting needs and challenges in the immediate/short term towards the medium and long term. As such, it is an exercise in balancing immediate response and “quick wins,” including the measures identified within the 3RF’s track 1, with longer-term development with a scope and scale determined by needs, implementation capacities, and available resources. The temporalities can be divided into three “phases” with corresponding measures:
1. Absorptive, responding to immediate needs;2. Adaptive, medium-term response, including “build-back-better”; and3. Transformative, longer-term response, including disruptive and bounce-forward measures.
The absorptive, adaptive and transformative phases must be linked and addressed on national, city and neighbourhood/community levels in parallel. In Beirut, political, historical, environmental and socioeconomic factors contribute to both strong commonalities and differences among various neighbourhoods and between different groups and individuals living within these neighbourhoods. This requires urban recovery efforts to be adapted to the specificities of various areas, working with communities, local governments and relevant urban actors through a sound participatory process. While any recovery effort must be linked upward to the national level, and down to the community and individual levels, it should centre on the systems and capacities in Beirut City that will aid in identifying strategic entry points for transformation and sustainable development.
The below recommendations for a “recovery ladder” indicate possible strategic entry points to target both stressors and root causes of current vulnerabilities. This provides a foundation to identify opportunities and suggest absorptive, adaptive and transformative measures across the urban scales. In an urban-anchored recovery process (or a city-wide area-based approach), these strategic entry points will be further developed and added to through cross-sectoral and multi-stakeholder engagement, with the objective to agree on priorities with the greatest value for money in recovery at city and neighbourhood levels, building on the strategic course set by the 3RF.
Recovery ladder
Recommendations for urban recovery at the city level
Absorptive:• Strengthen and consolidate urban data and information management: Taking the current Beirut City
Profile as a starting point, the collection of multisectoral, disaggregated, comparable, monitorable and publicly accessible data and the establishment of appropriate and resourced Municipal Information System infrastructure and custodianship at city and sub-city levels will facilitate equitable needs analysis to identify context-specific challenges and opportunities over time. This will enable local authorities to enhance coordination and management; improve planning, delivery and management of safe, inclusive and efficient social and basic services delivery; and support greater fiscal autonomy and mechanisms for tax collection locally and design of compliance systems in local spending. Moreover, improved data collection, management and monitoring systems will support the national government to adopt an evidence-based approach to urban policy, mainstreaming the use of data in decision-making and evaluation processes, and to hence contribute to increasing transparency and accountability in governance. This city-level action should be framed as part of wider UNCT’s efforts currently under way to enhance the capacities of Lebanon’s public national statistical system.
• Identify options for a city-wide area-based coordination body for urban recovery efforts: This will support consideration of the spatial implications of identified needs, and promote joint and coordinated efforts of decentralized authorities in planning recovery efforts and delivery of services in complement to the EU-World Bank-United Nations governance structure set up to guide the 3RF. Enhanced urban municipal information systems mentioned above will help to programme and then monitor the effects of interventions, identifying opportunities for convergence in planning in the process.
• Define a longer-term recovery vision and plan, outlining roles and responsibilities across the city: This will support the longer-term recovery with phased and scalable interventions for short- to longer-term response at the city scale linked to the national scale, with the 3RF as a starting point, yet with key attention to the rising vulnerabilities in areas beyond the blast-affected areas.
165
Adaptive:• Develop holistic, linked, comprehensive and phased plans for infrastructure and basic service
delivery across the city: Highlighting multisectoral, spatial interdependencies, the evidence-led plans will promote the use of adaptive technologies and renewable resources, reducing reliance on non-renewable resources. This will entail stronger collaboration across ministries and across municipalities; sound mechanisms to do so would need to be installed. To execute the plans, options to promote financially sustainable solutions in partnership with the private sector will be explored, with a focus on circular economies, conservation, recycling and management of resources.
• Support and strengthen value chains in Beirut through local economic development plans: The plans will consider facilities and associated structures of the port area as well as central commercial districts, alternatives for expanding innovative businesses, assessing infrastructure and transportation needs and identifying options to develop and strengthen linkages between intra/inter-city and/or rural production systems. This will help enhance, among others, food production value chains, improving economic gains from agricultural production and reduce food losses through better processing and storage opportunities and cold chains. The built heritage, CCI and tourism ecosystem may also be mapped with a view to optimizing their economic, social and environmental value capture, as well as supporting preservation of technical know-how within different sectors, especially in traditional fields.
• Develop and implement plans for blue-green infrastructure: The plans will consider options such as sustainable drainage systems and recovery of green coverage with native species to capture stormwater and recharge the water table, and to mitigate heat island effects. In line with the “build-back-better” principle, the plans will also guide construction to reduce energy usage and pollution from cooling down buildings in summer and heating buildings in winter. The plans will build upon scenarios to investigate the potential risks and costs of not addressing environmental and climate risks, as well as to guide plans for green networks to enhance walkability and availability of open space, and reinforcement of building structures and infrastructure in high-risk zones, and to minimize new housing development in hazard-prone areas.
• Strengthen urban spatial planning: This will contribute to mitigating unplanned, haphazard expansion of informal areas due to rapid population growth (including the influx of refugees), while promoting inclusion of informal areas in service provision, to mitigate dependency on costly, inefficient and harmful informal service provision systems. Similarly, strengthened spatial planning will contribute to revisit existing, yet deteriorating “formal” neighbourhoods to maintain compact and liveable central areas in the city.
Transformative:• Design and implement a phased urban mobility and transportation plan: This will contribute
to economic productivity, will increase access to livelihoods through soft mobility789 and public transportation, and will enhance efficient transportation of goods by a tiered and zoned mobility plan while reducing the negative health impacts associated with car dependencies and traffic congestion in Beirut and beyond.
• Design and implement bankable local economic development and infrastructure enhancement packages: This will support the diversification of the current local economy, based on the comprehensive mapping of value chains and infrastructure systems to identify options to support labour-intensive activities, sustainable value chains, and circular economy, including avenues for green economy.
• Pilot local incubation set-ups to support innovation and entrepreneurship: This will support value chain creation and entrepreneurship including among women, young adults and small- and medium-sized businesses with ambition to scale up.
• Leverage digital technology in designing e-governance systems, including an information portal and two-way-communication platform: This will facilitate access to information and subscription to municipal services, such as registration, documentation and reporting of local businesses, as well as feedback loops on services and plans to increase accountability towards residents. E-governance systems will also enhance urban data availability for planning purposes and tax collection for local authorities to allow for improved planning and provision of municipal services.
• Rehabilitate heritage buildings damaged from the 4 August 2020 blast and buildings damaged from the 1975-1990 civil war: This will contribute to the preservation of buildings that have cultural and social value and that are critical for preserving some of the remaining few plots of urban gardens and green coverage, while presenting an opportunity to increase access to substantial building volumes for housing, offices, commercial activities, including CCIs, or community structures, and also reducing pressure for new construction and city expansion.
789 Soft mobility includes walking, bicycling, scooter, etc.
166
RECOMMENDATIONSU
N-H
AB
ITA
T /
LE
BA
NO
N /
CIT
Y P
RO
FIL
ES
/ B
EIR
UT
/ R
ECO
MM
EN
DA
TIO
NS
Recommendations for urban recovery at the neighbourhood level
Absorptive:• Bolstering social safety nets through the provision of basic assistance to the increasing number of
poor families: This will be based on the longer-term recovery plan for the city, with keen attention to and prioritization of interventions based on vulnerabilities across different neighbourhoods.
• Strengthen SDCs under MoSA, legal clinics (including for HLP rights issues), protection units at hospitals and legal clinics, as well as social teams within the municipalities: This will contribute to improving access to protection mechanisms, legal rights, livelihoods and education. Further, it will help increase health support and stress management for children, women and men who suffer from PTSD caused by the blast, and access to protection, including safe and discreet treatment for SGBV victims.
• Create platforms to facilitate dialogue between representatives from communities, CSOs, think tanks, academia, private sector, and central and local governments: The platforms will convene discussions to help build consensus for recovery efforts, promote equitable planning, and strengthen accountability. The platforms will stress the inclusion of youth, children, women, and other vulnerable population groups, allowing them to voice their concerns, perceptions of exclusion and ideas to foster inclusive communities. Mapping of incidents and risks of community tension among community groups within and between neighbourhoods in the city will inform the establishment of the platforms.
Adaptive: • Promote localized community action plans: Based on multisectoral area-based evidence gathered
to the extent possible, the plans will promote social cohesion and reduce vulnerabilities by devising measures at the neighbourhood level to address obstacles for sound service delivery, support strengthening of local economic activities and improvements of markets and improve access to safe urban spaces for women, men, girls and boys. Building on the dialogue platforms explained above, the plans will be designed through participatory processes with broad and representative community representation.
• Pilot options for community-contracting modalities and direct support of neighbourhood committees: This will help build the capacities of community groups in identifying and responding to local needs, including simple maintenance work, to reduce the dependency on informal or private service providers and/or slow response systems.
• Establish “community hubs”: Building on existing networks and ad hoc support systems already existing in the neighbourhoods, the hubs will provide activities, training and services aimed at supporting women and youth to access livelihood opportunities, skills development, and activities for youth and children. These hubs could also serve as meeting places, bringing together youth and children from different communities. Moreover, the community hubs could provide protection support, legal assistance and referral mechanisms.
Transformative:• Promote conflict mitigation measures: This will address structural barriers to participation in
economic and political life, particularly among women, youth, refugees and migrants. It will promote more equitable access to services, while also helping identify root causes of current conflicts and raising awareness and promoting sound mitigative actions.
• Design and implement inclusive green public spaces, as well as street profiles (i .e integrated street design increasing green cover while tackling surface water management, etc .): This will help increase access to recreational areas, with physical and psychological health benefits for children, youth and populations in deprived neighbourhoods. Sound design of green spaces will contribute to restoring green coverage, enhancing surface water capture, and reducing heat island effects. Awareness-raising on the maintenance and value of public spaces will be provided to and through community groups. Promote increased utilization of existing open spaces and playgrounds, such as opening school outdoor play facilities for neighbourhood children.
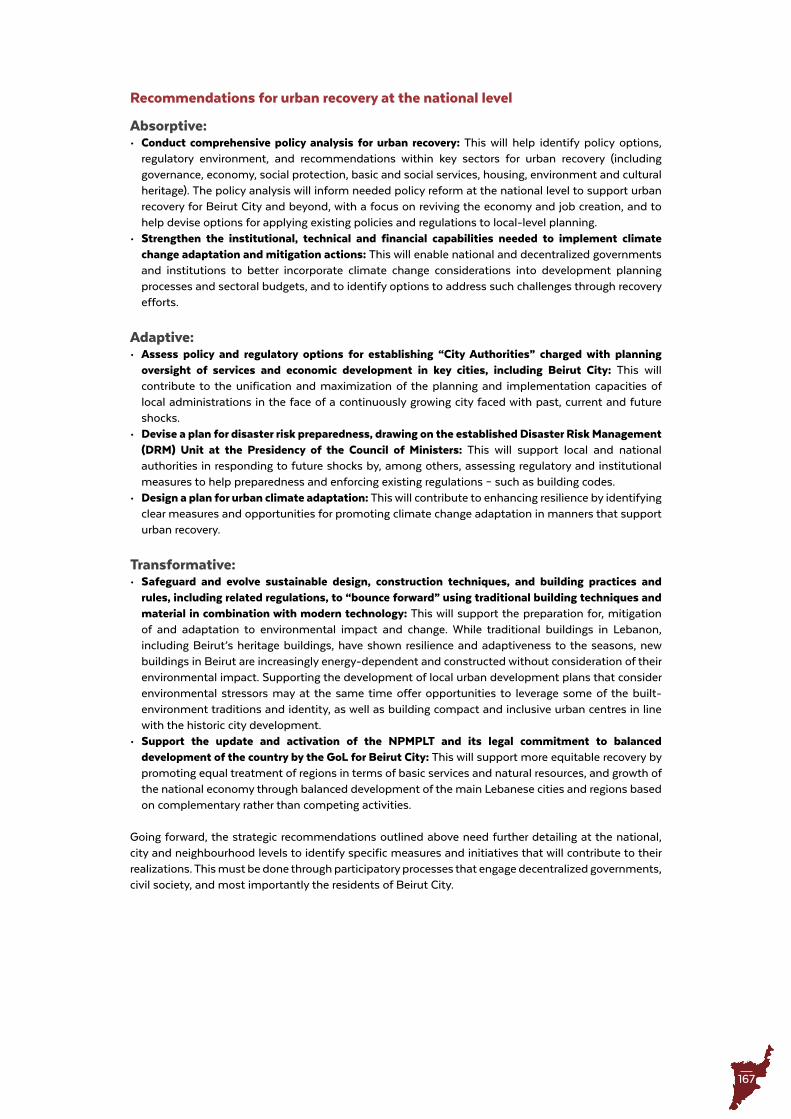
167
Recommendations for urban recovery at the national level
Absorptive:• Conduct comprehensive policy analysis for urban recovery: This will help identify policy options,
regulatory environment, and recommendations within key sectors for urban recovery (including governance, economy, social protection, basic and social services, housing, environment and cultural heritage). The policy analysis will inform needed policy reform at the national level to support urban recovery for Beirut City and beyond, with a focus on reviving the economy and job creation, and to help devise options for applying existing policies and regulations to local-level planning.
• Strengthen the institutional, technical and financial capabilities needed to implement climate change adaptation and mitigation actions: This will enable national and decentralized governments and institutions to better incorporate climate change considerations into development planning processes and sectoral budgets, and to identify options to address such challenges through recovery efforts.
Adaptive:• Assess policy and regulatory options for establishing “City Authorities” charged with planning
oversight of services and economic development in key cities, including Beirut City: This will contribute to the unification and maximization of the planning and implementation capacities of local administrations in the face of a continuously growing city faced with past, current and future shocks.
• Devise a plan for disaster risk preparedness, drawing on the established Disaster Risk Management (DRM) Unit at the Presidency of the Council of Ministers: This will support local and national authorities in responding to future shocks by, among others, assessing regulatory and institutional measures to help preparedness and enforcing existing regulations – such as building codes.
• Design a plan for urban climate adaptation: This will contribute to enhancing resilience by identifying clear measures and opportunities for promoting climate change adaptation in manners that support urban recovery.
Transformative:• Safeguard and evolve sustainable design, construction techniques, and building practices and
rules, including related regulations, to “bounce forward” using traditional building techniques and material in combination with modern technology: This will support the preparation for, mitigation of and adaptation to environmental impact and change. While traditional buildings in Lebanon, including Beirut’s heritage buildings, have shown resilience and adaptiveness to the seasons, new buildings in Beirut are increasingly energy-dependent and constructed without consideration of their environmental impact. Supporting the development of local urban development plans that consider environmental stressors may at the same time offer opportunities to leverage some of the built-environment traditions and identity, as well as building compact and inclusive urban centres in line with the historic city development.
• Support the update and activation of the NPMPLT and its legal commitment to balanced development of the country by the GoL for Beirut City: This will support more equitable recovery by promoting equal treatment of regions in terms of basic services and natural resources, and growth of the national economy through balanced development of the main Lebanese cities and regions based on complementary rather than competing activities.
Going forward, the strategic recommendations outlined above need further detailing at the national, city and neighbourhood levels to identify specific measures and initiatives that will contribute to their realizations. This must be done through participatory processes that engage decentralized governments, civil society, and most importantly the residents of Beirut City.
168
RECOMMENDATIONSU
N-H
AB
ITA
T /
LE
BA
NO
N /
CIT
Y P
RO
FIL
ES
/ B
EIR
UT
/ R
ECO
MM
EN
DA
TIO
NS
Appendices
© Photo: UN-Habitat, 2019
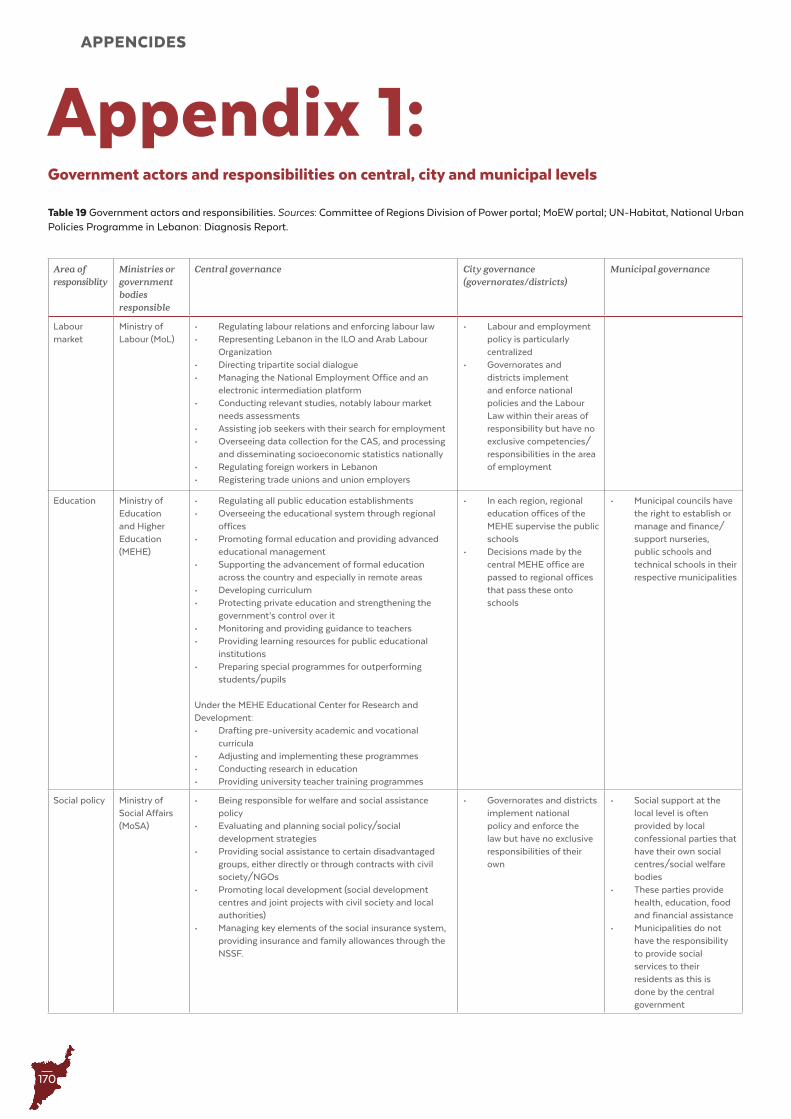
170
APPENCIDES
Appendix 1: Government actors and responsibilities on central, city and municipal levels
Table 19 Government actors and responsibilities . Sources: Committee of Regions Division of Power portal; MoEW portal; UN-Habitat, National Urban Policies Programme in Lebanon: Diagnosis Report .
Area of responsiblity
Ministries or government bodies responsible
Central governance City governance (governorates/districts)
Municipal governance
Labour market
Ministry of Labour (MoL)
• Regulating labour relations and enforcing labour law• Representing Lebanon in the ILO and Arab Labour
Organization• Directing tripartite social dialogue• Managing the National Employment Office and an
electronic intermediation platform• Conducting relevant studies, notably labour market
needs assessments• Assisting job seekers with their search for employment• Overseeing data collection for the CAS, and processing
and disseminating socioeconomic statistics nationally• Regulating foreign workers in Lebanon• Registering trade unions and union employers
• Labour and employment policy is particularly centralized
• Governorates and districts implement and enforce national policies and the Labour Law within their areas of responsibility but have no exclusive competencies/responsibilities in the area of employment
Education Ministry of Education and Higher Education (MEHE)
• Regulating all public education establishments• Overseeing the educational system through regional
offices• Promoting formal education and providing advanced
educational management• Supporting the advancement of formal education
across the country and especially in remote areas• Developing curriculum• Protecting private education and strengthening the
government’s control over it• Monitoring and providing guidance to teachers• Providing learning resources for public educational
institutions• Preparing special programmes for outperforming
students/pupils
Under the MEHE Educational Center for Research and Development: • Drafting pre-university academic and vocational
curricula• Adjusting and implementing these programmes• Conducting research in education• Providing university teacher training programmes
• In each region, regional education offices of the MEHE supervise the public schools
• Decisions made by the central MEHE office are passed to regional offices that pass these onto schools
• Municipal councils have the right to establish or manage and finance/support nurseries, public schools and technical schools in their respective municipalities
Social policy Ministry of Social Affairs (MoSA)
• Being responsible for welfare and social assistance policy
• Evaluating and planning social policy/social development strategies
• Providing social assistance to certain disadvantaged groups, either directly or through contracts with civil society/NGOs
• Promoting local development (social development centres and joint projects with civil society and local authorities)
• Managing key elements of the social insurance system, providing insurance and family allowances through the NSSF.
• Governorates and districts implement national policy and enforce the law but have no exclusive responsibilities of their own
• Social support at the local level is often provided by local confessional parties that have their own social centres/social welfare bodies
• These parties provide health, education, food and financial assistance
• Municipalities do not have the responsibility to provide social services to their residents as this is done by the central government
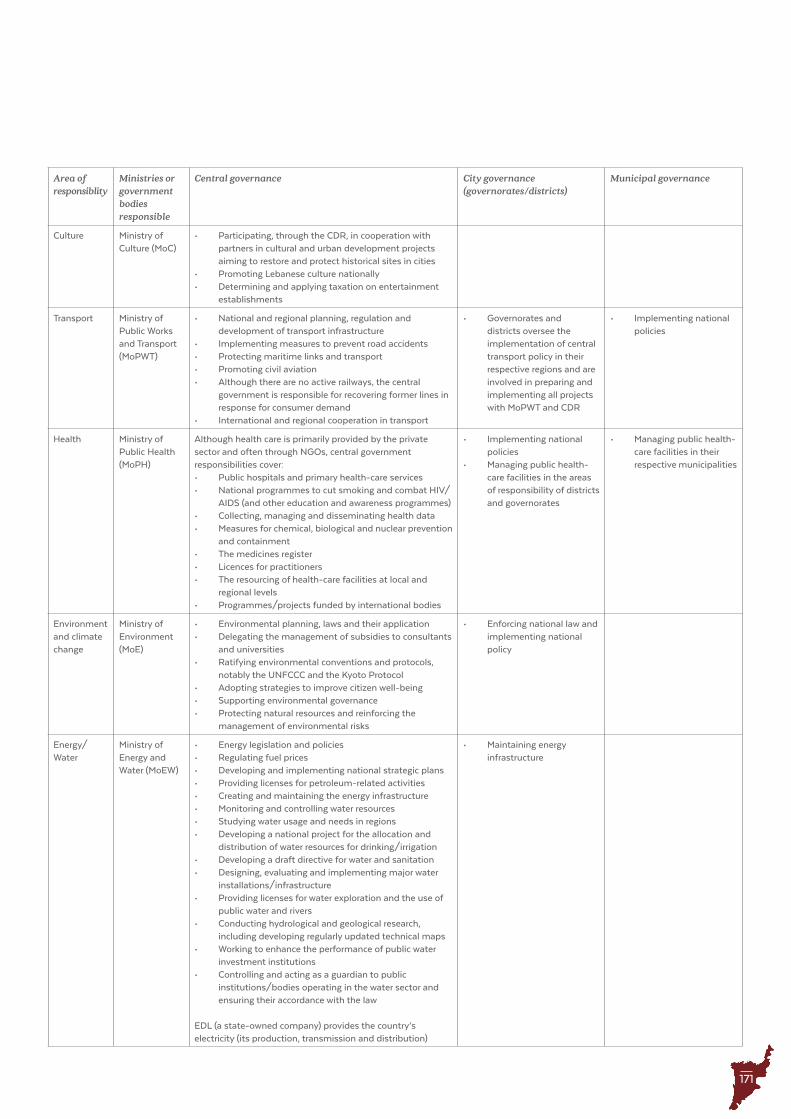
171
Area of responsiblity
Ministries or government bodies responsible
Central governance City governance (governorates/districts)
Municipal governance
Culture Ministry of Culture (MoC)
• Participating, through the CDR, in cooperation with partners in cultural and urban development projects aiming to restore and protect historical sites in cities
• Promoting Lebanese culture nationally• Determining and applying taxation on entertainment
establishments
Transport Ministry of Public Works and Transport (MoPWT)
• National and regional planning, regulation and development of transport infrastructure
• Implementing measures to prevent road accidents• Protecting maritime links and transport• Promoting civil aviation• Although there are no active railways, the central
government is responsible for recovering former lines in response for consumer demand
• International and regional cooperation in transport
• Governorates and districts oversee the implementation of central transport policy in their respective regions and are involved in preparing and implementing all projects with MoPWT and CDR
• Implementing national policies
Health Ministry of Public Health (MoPH)
Although health care is primarily provided by the private sector and often through NGOs, central government responsibilities cover:• Public hospitals and primary health-care services• National programmes to cut smoking and combat HIV/
AIDS (and other education and awareness programmes)• Collecting, managing and disseminating health data• Measures for chemical, biological and nuclear prevention
and containment• The medicines register• Licences for practitioners• The resourcing of health-care facilities at local and
regional levels• Programmes/projects funded by international bodies
• Implementing national policies
• Managing public health-care facilities in the areas of responsibility of districts and governorates
• Managing public health-care facilities in their respective municipalities
Environment and climate change
Ministry of Environment (MoE)
• Environmental planning, laws and their application• Delegating the management of subsidies to consultants
and universities• Ratifying environmental conventions and protocols,
notably the UNFCCC and the Kyoto Protocol• Adopting strategies to improve citizen well-being • Supporting environmental governance• Protecting natural resources and reinforcing the
management of environmental risks
• Enforcing national law and implementing national policy
Energy/Water
Ministry of Energy and Water (MoEW)
• Energy legislation and policies• Regulating fuel prices• Developing and implementing national strategic plans• Providing licenses for petroleum-related activities• Creating and maintaining the energy infrastructure• Monitoring and controlling water resources• Studying water usage and needs in regions• Developing a national project for the allocation and
distribution of water resources for drinking/irrigation• Developing a draft directive for water and sanitation• Designing, evaluating and implementing major water
installations/infrastructure• Providing licenses for water exploration and the use of
public water and rivers• Conducting hydrological and geological research,
including developing regularly updated technical maps • Working to enhance the performance of public water
investment institutions • Controlling and acting as a guardian to public
institutions/bodies operating in the water sector and ensuring their accordance with the law
EDL (a state-owned company) provides the country’s electricity (its production, transmission and distribution)
• Maintaining energy infrastructure
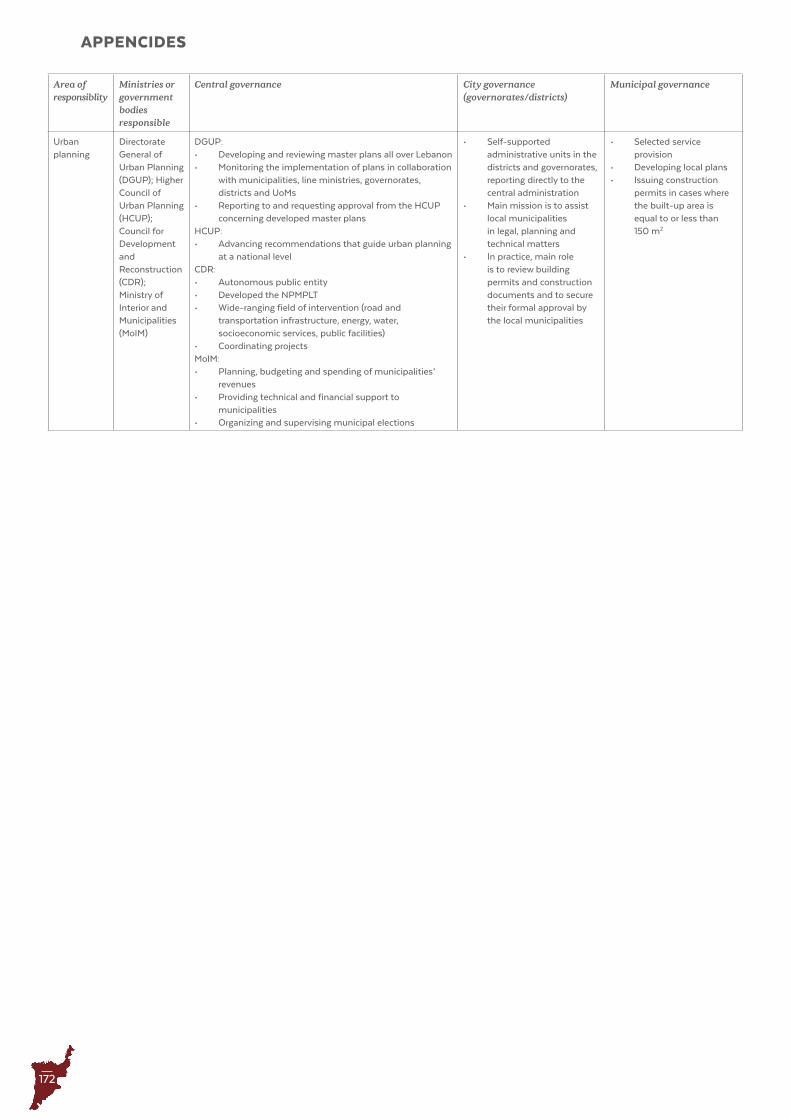
172
APPENCIDES
Area of responsiblity
Ministries or government bodies responsible
Central governance City governance (governorates/districts)
Municipal governance
Urban planning
Directorate General of Urban Planning (DGUP); Higher Council of Urban Planning (HCUP); Council for Development and Reconstruction (CDR);Ministry of Interior and Municipalities (MoIM)
DGUP: • Developing and reviewing master plans all over Lebanon• Monitoring the implementation of plans in collaboration
with municipalities, line ministries, governorates, districts and UoMs
• Reporting to and requesting approval from the HCUP concerning developed master plans
HCUP:• Advancing recommendations that guide urban planning
at a national levelCDR:• Autonomous public entity• Developed the NPMPLT• Wide-ranging field of intervention (road and
transportation infrastructure, energy, water, socioeconomic services, public facilities)
• Coordinating projectsMoIM: • Planning, budgeting and spending of municipalities’
revenues• Providing technical and financial support to
municipalities• Organizing and supervising municipal elections
• Self-supported administrative units in the districts and governorates, reporting directly to the central administration
• Main mission is to assist local municipalities in legal, planning and technical matters
• In practice, main role is to review building permits and construction documents and to secure their formal approval by the local municipalities
• Selected service provision
• Developing local plans• Issuing construction
permits in cases where the built-up area is equal to or less than 150 m2
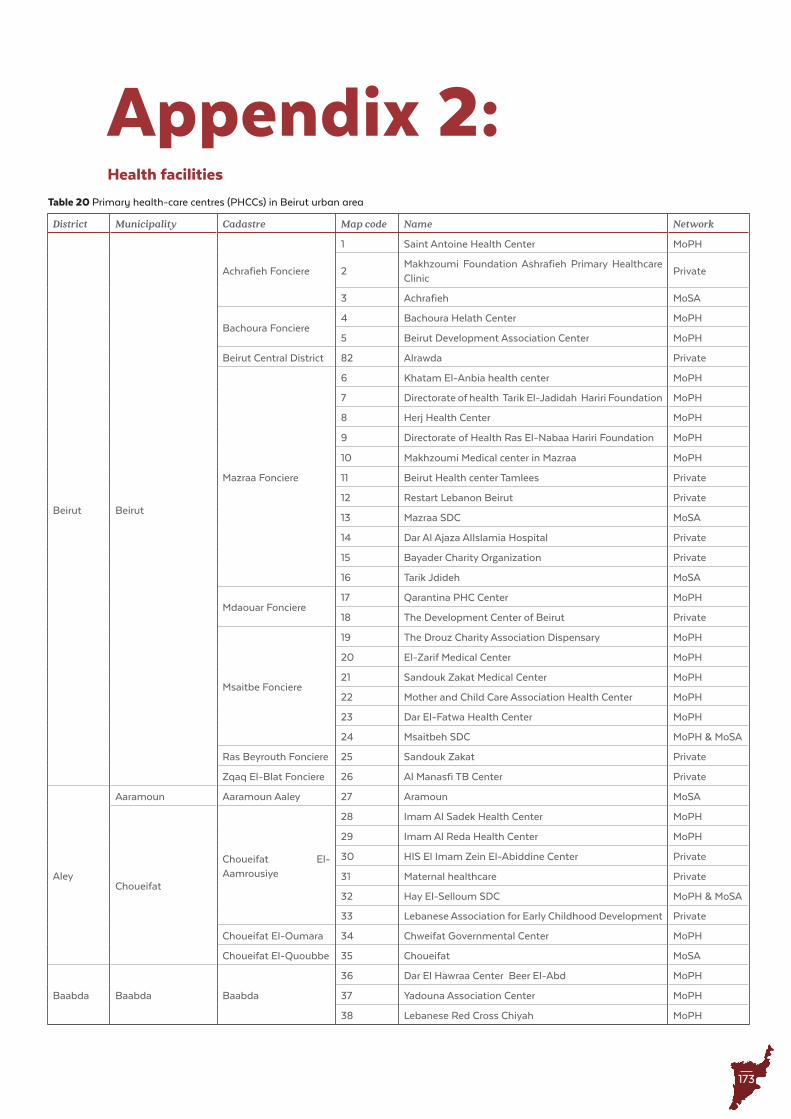
173
Appendix 2: Health facilities
District Municipality Cadastre Map code Name Network
Beirut Beirut
Achrafieh Fonciere
1 Saint Antoine Health Center MoPH
2Makhzoumi Foundation Ashrafieh Primary Healthcare Clinic
Private
3 Achrafieh MoSA
Bachoura Fonciere4 Bachoura Helath Center MoPH
5 Beirut Development Association Center MoPH
Beirut Central District 82 Alrawda Private
Mazraa Fonciere
6 Khatam El-Anbia health center MoPH
7 Directorate of health Tarik El-Jadidah Hariri Foundation MoPH
8 Herj Health Center MoPH
9 Directorate of Health Ras El-Nabaa Hariri Foundation MoPH
10 Makhzoumi Medical center in Mazraa MoPH
11 Beirut Health center Tamlees Private
12 Restart Lebanon Beirut Private
13 Mazraa SDC MoSA
14 Dar Al Ajaza AlIslamia Hospital Private
15 Bayader Charity Organization Private
16 Tarik Jdideh MoSA
Mdaouar Fonciere17 Qarantina PHC Center MoPH
18 The Development Center of Beirut Private
Msaitbe Fonciere
19 The Drouz Charity Association Dispensary MoPH
20 El-Zarif Medical Center MoPH
21 Sandouk Zakat Medical Center MoPH
22 Mother and Child Care Association Health Center MoPH
23 Dar El-Fatwa Health Center MoPH
24 Msaitbeh SDC MoPH & MoSA
Ras Beyrouth Fonciere 25 Sandouk Zakat Private
Zqaq El-Blat Fonciere 26 Al Manasfi TB Center Private
Aley
Aaramoun Aaramoun Aaley 27 Aramoun MoSA
Choueifat
Choueifat El-Aamrousiye
28 Imam Al Sadek Health Center MoPH
29 Imam Al Reda Health Center MoPH
30 HIS El Imam Zein El-Abiddine Center Private
31 Maternal healthcare Private
32 Hay El-Selloum SDC MoPH & MoSA
33 Lebanese Association for Early Childhood Development Private
Choueifat El-Oumara 34 Chweifat Governmental Center MoPH
Choueifat El-Quoubbe 35 Choueifat MoSA
Baabda Baabda Baabda
36 Dar El Hawraa Center Beer El-Abd MoPH
37 Yadouna Association Center MoPH
38 Lebanese Red Cross Chiyah MoPH
Table 20 Primary health-care centres (PHCCs) in Beirut urban area
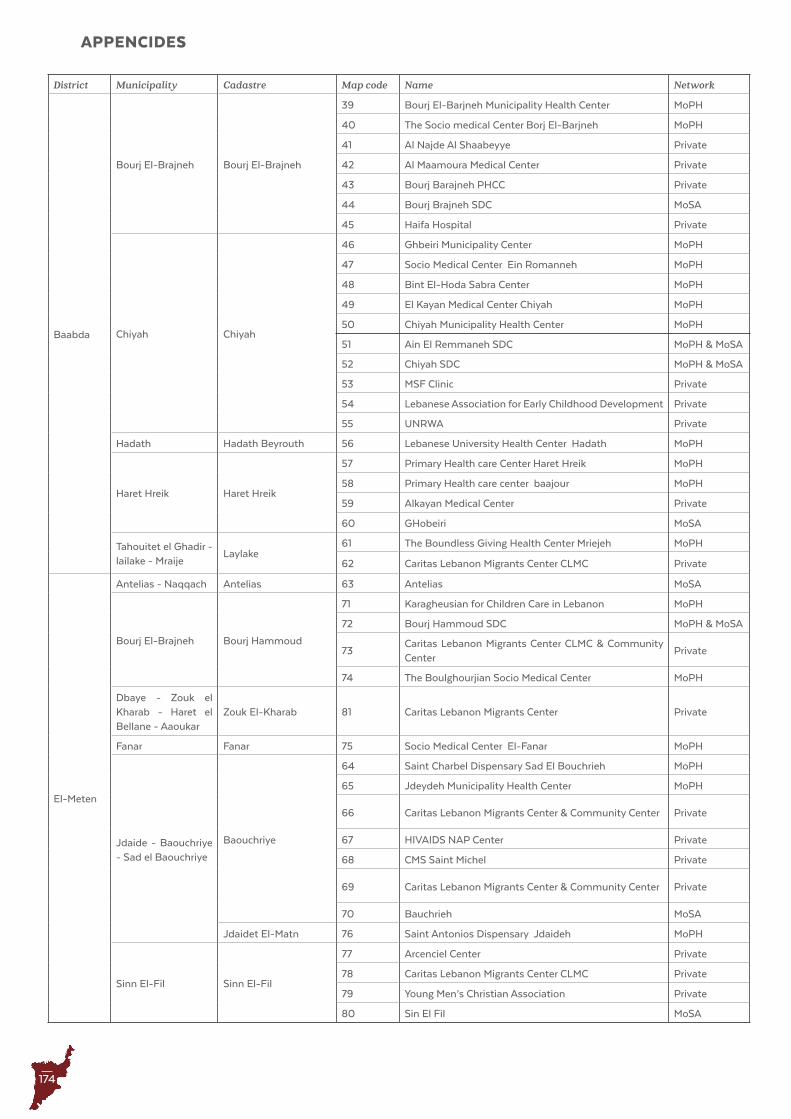
174
APPENCIDES
District Municipality Cadastre Map code Name Network
Baabda
Bourj El-Brajneh Bourj El-Brajneh
39 Bourj El-Barjneh Municipality Health Center MoPH
40 The Socio medical Center Borj El-Barjneh MoPH
41 Al Najde Al Shaabeyye Private
42 Al Maamoura Medical Center Private
43 Bourj Barajneh PHCC Private
44 Bourj Brajneh SDC MoSA
45 Haifa Hospital Private
Chiyah Chiyah
46 Ghbeiri Municipality Center MoPH
47 Socio Medical Center Ein Romanneh MoPH
48 Bint El-Hoda Sabra Center MoPH
49 El Kayan Medical Center Chiyah MoPH
50 Chiyah Municipality Health Center MoPH
51 Ain El Remmaneh SDC MoPH & MoSA
52 Chiyah SDC MoPH & MoSA
53 MSF Clinic Private
54 Lebanese Association for Early Childhood Development Private
55 UNRWA Private
Hadath Hadath Beyrouth 56 Lebanese University Health Center Hadath MoPH
Haret Hreik Haret Hreik
57 Primary Health care Center Haret Hreik MoPH
58 Primary Health care center baajour MoPH
59 Alkayan Medical Center Private
60 GHobeiri MoSA
Tahouitet el Ghadir - lailake - Mraije
Laylake61 The Boundless Giving Health Center Mriejeh MoPH
62 Caritas Lebanon Migrants Center CLMC Private
El-Meten
Antelias - Naqqach Antelias 63 Antelias MoSA
Bourj El-Brajneh Bourj Hammoud
71 Karagheusian for Children Care in Lebanon MoPH
72 Bourj Hammoud SDC MoPH & MoSA
73Caritas Lebanon Migrants Center CLMC & Community Center
Private
74 The Boulghourjian Socio Medical Center MoPH
Dbaye - Zouk el Kharab - Haret el Bellane - Aaoukar
Zouk El-Kharab 81 Caritas Lebanon Migrants Center Private
Fanar Fanar 75 Socio Medical Center El-Fanar MoPH
Jdaide - Baouchriye - Sad el Baouchriye
Baouchriye
64 Saint Charbel Dispensary Sad El Bouchrieh MoPH
65 Jdeydeh Municipality Health Center MoPH
66 Caritas Lebanon Migrants Center & Community Center Private
67 HIVAIDS NAP Center Private
68 CMS Saint Michel Private
69 Caritas Lebanon Migrants Center & Community Center Private
70 Bauchrieh MoSA
Jdaidet El-Matn 76 Saint Antonios Dispensary Jdaideh MoPH
Sinn El-Fil Sinn El-Fil
77 Arcenciel Center Private
78 Caritas Lebanon Migrants Center CLMC Private
79 Young Men’s Christian Association Private
80 Sin El Fil MoSA
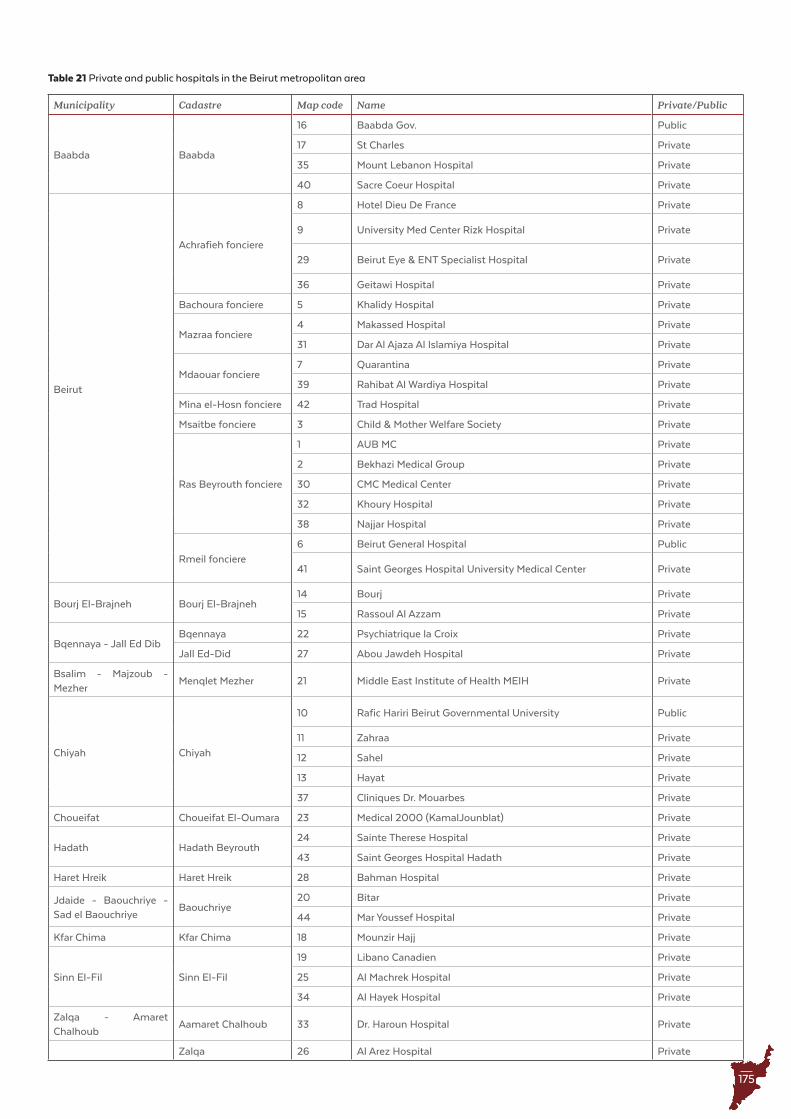
175
Municipality Cadastre Map code Name Private/Public
Baabda Baabda
16 Baabda Gov. Public
17 St Charles Private
35 Mount Lebanon Hospital Private
40 Sacre Coeur Hospital Private
Beirut
Achrafieh fonciere
8 Hotel Dieu De France Private
9 University Med Center Rizk Hospital Private
29 Beirut Eye & ENT Specialist Hospital Private
36 Geitawi Hospital Private
Bachoura fonciere 5 Khalidy Hospital Private
Mazraa fonciere4 Makassed Hospital Private
31 Dar Al Ajaza Al Islamiya Hospital Private
Mdaouar fonciere7 Quarantina Private
39 Rahibat Al Wardiya Hospital Private
Mina el-Hosn fonciere 42 Trad Hospital Private
Msaitbe fonciere 3 Child & Mother Welfare Society Private
Ras Beyrouth fonciere
1 AUB MC Private
2 Bekhazi Medical Group Private
30 CMC Medical Center Private
32 Khoury Hospital Private
38 Najjar Hospital Private
Rmeil fonciere6 Beirut General Hospital Public
41 Saint Georges Hospital University Medical Center Private
Bourj El-Brajneh Bourj El-Brajneh14 Bourj Private
15 Rassoul Al Azzam Private
Bqennaya - Jall Ed DibBqennaya 22 Psychiatrique la Croix Private
Jall Ed-Did 27 Abou Jawdeh Hospital Private
Bsalim - Majzoub - Mezher
Menqlet Mezher 21 Middle East Institute of Health MEIH Private
Chiyah Chiyah
10 Rafic Hariri Beirut Governmental University Public
11 Zahraa Private
12 Sahel Private
13 Hayat Private
37 Cliniques Dr. Mouarbes Private
Choueifat Choueifat El-Oumara 23 Medical 2000 (KamalJounblat) Private
Hadath Hadath Beyrouth24 Sainte Therese Hospital Private
43 Saint Georges Hospital Hadath Private
Haret Hreik Haret Hreik 28 Bahman Hospital Private
Jdaide - Baouchriye - Sad el Baouchriye
Baouchriye20 Bitar Private
44 Mar Youssef Hospital Private
Kfar Chima Kfar Chima 18 Mounzir Hajj Private
Sinn El-Fil Sinn El-Fil
19 Libano Canadien Private
25 Al Machrek Hospital Private
34 Al Hayek Hospital Private
Zalqa - Amaret Chalhoub
Aamaret Chalhoub 33 Dr. Haroun Hospital Private
Zalqa 26 Al Arez Hospital Private
Table 21 Private and public hospitals in the Beirut metropolitan area

176
BIBLIOGRAPHY
BibliographyAbbas, Ismail. “Solid Waste Management in Lebanon: Challenges and Recommendations.” Journal of Environment and
Waste Management 4, 53-66 (2017)..Abdallah, Mirvat and Houssam Salami. “Overview of the Oil and Gas Exploration in Lebanon.” Mediterranean Gas and Oil
International Conference, MedGO 2015 - Conference Proceedings. Institute of Electrical and Electronics Engineers Inc., November 16, 2015. https://doi.org/10.1109/MedGO.2015.7330329.
Abdallah, Issam and Samia Nakhoul. “Hundreds of Disillusioned Doctors Leave Lebanon, in Blow to Healthcare,” Reuters, November 12, 2020. https://www.reuters.com/article/us-lebanon-crisis-healthcare-insight-idUSKBN27S14W
AbiYaghi, Marie-Noëlle, Léa Yammine, and Amreesha Jagarnathsingh. “Civil Society in Lebanon: The Implementation Trap.” Civil Society Knowledge Centre. Vol. 1. Lebanon Support, 2019. https://doi.org/10.28943/cskc.002.70000.
ACAPS. “Emergency Operations Centre Beirut Assessment & Analysis Cell August 2020,” 2020.———. “Emergency Operations Centre Beirut Assessment & Analysis Cell September 2020,” 2020.ACTED. “Beirut Blast Rapid Needs Assessment Report 2020,” 2020.ACTED, CARE, DRC, Oxfam, and Save the Children. “The Labour Sector in Lebanon: Legal Frameworks, Challenges and
Opportunities,” 2019.AHPSR, and WHO. “Primary Health Care Systems (PRIMASYS): Comprehensive Case Study from Lebanon,” 2017.Al, Tariq and Msaytbeh Jadeeda. “Drawing Beirut from the Accounts of its Tenants - Part Two.” Public Works Studio, 2017.Al Jazeera. “Dozens Injured in Anti-Lockdown Protests in Lebanon’s Tripoli,” January 27, 2021. https://www.aljazeera.com/
news/2021/1/27/dozens-injured-in-lockdown-protests-in-lebanons-tripoli.———. “Lebanese Protest against Waste-Disposal Crisis,” July 26, 2015. https://www.aljazeera.com/news/2015/7/26/leba-
nese-protest-against-waste-disposal-crisis.———. “Luxury Purchases: How Lebanese Work around Cash Withdrawal Limits,” 2020. https://www.aljazeera.com/econo-
my/2020/1/26/luxury-purchases-how-lebanese-work-around-cash-withdrawal-limits.Alternative Frequencies in conversation with Jasmin Lilian Diab. “Episode 12 - Neglected Vicitms: Refugees and GBV in the
Age of a Pandemic,” 2020.American University of Beirut. “Outcomes of the 2nd Lebanon Water Forum: In Support of Water Governance in Lebanon,”
2019.Amnesty International. “Their House Is My Prison: Exploitation of Migrant Domestic Workers in Lebanon,” 2019.Angel-Urdinola, Diego F., and Kimie Tanabe. “Micro-Determinants of Informal Employment in the Middle East and North
Africa Region,” January 2012. https://doi.org/10.1596/26828.Araji, Salim, Vladimir Hlasny, Layal Mansour Ichrakieh, and Vito Intini. “Targeting Debt in Lebanon: A Structural Mac-
ro-Econometric Model,” 2017. https://doi.org/10.1080/17938120.2019.1583508.ASDA’A BCW. “Arab Youth Survey: A Voice for Change,” 2020.Assouad, Lydia. “Rethinking the Lebanese Economic Miracle: The Extreme Concentration of Income and Wealth in Leba-
non,” 2017. AUB. “American Univerity of Beirut: Why AUB.” n.d. https://www.aub.edu.lb/oip/internationals/Documents/WhyAUB.pdf.———. “Strategic Health Initiative, SHI - Health 2025 - Towards a Healthier Beirut 2022,” 2016.Australian Government. “DFAT Thematic Report: Palestinians in Jordan and Lebanon,” March 2, 2015.Azhari, Timour. “Lebanon’s First Offshore Gas Drill is a Huge Disappointment.” Al Jazeera, April 27, 2020. https://www.alja-
zeera.com/economy/2020/4/27/lebanons-first-offshore-gas-drill-is-a-huge-disappointment.———.“Lebanon Parliament Approves Sweeping Powers for the Army,” August 13, 2020. https://www.aljazeera.com/
news/2020/8/13/lebanon-parliament-approves-sweeping-powers-for-the-army.———.“Palestinian Refugees in Lebanon More Likely to Die with COVID-19.” Thomson Reuters Foundation, February 16,
2021. https://news.trust.org/item/20210216153654-lwurk/.———. “Lebanon Wildfires: Hellish Scenes in Mountains South of Beirut,” Al Jazeera, October 16, 2019. https://www.aljazeera.
com/news/2019/10/16/lebanon-wildfires-hellish-scenes-in-mountains-south-of-beirut.———. “Lebanon’s Year of Fire,” Al Jazeera, October 16, 2020. https://www.aljazeera.com/features/2020/10/16/leban-
ons-year-of-fire.Bankmed. “Analysis of Lebanon’s Real Estate Sector,” 2017.Bankmed. “Analysis of Lebanon’s Education Sector,” 2014.Becherer, Richard. “A Matter of Life and Debt: The Untold Costs of Rafiq Hariri’s New Beirut.” Journal of Architecture 10, no.
1 (2005): 1–42. https://doi.org/10.1080/13602360500063089.Beirut Urban Lab. “Beirut: A City for Sale?” https://www.beiruturbanlab.com/Details/612.———. “Vacancy as Opportunity: Re-activating Public Life in Beirut.” https://www.beiruturbanlab.com/en/Details/619/vacan-
177
cy-as-opportunity-re-activating-public-life-in-beirut.Bertelsmann Stiftung. “BTI 2020 - Lebanon Country Report,” 2020.Beyond Reform and Development. “Skills Gap Analysis for Improved Livelihood Sustainability in Lebanon,” 2017.Blominvest Bank. “RAMCO: Average Size of New Apartments in Beirut down by 8% in 2017,” June 20, 2018. https://blog.
blominvestbank.com/26121/ramco-average-size-new-apartments-beirut-8-2017/.———. “The Educational Landscape in Lebanon 2016-2017,” 2018.Borgne, Eric Le, and Thomas J. Jacobs. “Lebanon: Promoting Poverty Reduction and Shared Prosperity,” 2016. https://doi.
org/10986/23102.Burnham, G., S. Khoury, S., T. Graczyk, M. Jurdi, and L. Goldman. “Drinking Water System Treatment and Contamination in
Shatila Refugee Camp in Beirut, Lebanon.” Eastern Mediterranean Health Journal-La Revue de Santé de la Méditer-ranée Orientale, 22 no.8 (2016).
Calfat, Natalia Nahas. “The Frailties of Lebanese Democracy: Outcomes and Limits of the Confessional Framework.” The Frailties of Lebanese Democracy 40, no. 2. https://doi.org/10.1590/S0102-8529.2018400200002.
CARE. “CARE Begins Distributions and Psychosocial Support to Thousands of Worst Affected by Beirut Blast,” August 7, 2020. https://www.care-international.org/news/press-releases/care-begins-distributions-and-psychosocial-support-to-thou-
sands-of-worst-affected-by-beirut-blast.CAS. “Central Administration of Statistics - About Lebanon,” 2020. http://www.cas.gov.lb/index.php/about-lebanon-en.———. “Labour Force and Household Living Conditions Survey 2018-2019 in Beirut,” 2020.CDR. “Habitat III National Report - Final Report,” 2016.Choueiri, Elias M, Georges M Choueiri, and Bernard M Choueiri. “An Overview of Road Safety in Lebanon,” 2013.COAR. “Lebanon Scenario Plan,” 2020.CoR. “CoR - Lebanon Social,” 2020. https://portal.cor.europa.eu/divisionpowers/Pages/Lebanon-Social.aspx.———. “CoR - Lebanon Energy.” https://portal.cor.europa.eu/divisionpowers/Pages/Lebanon-Energy.aspx.———. “CoR - Lebanon Transport.” https://portal.cor.europa.eu/divisionpowers/Pages/Lebanon-Transport.aspx.Dagher, Jonathan. “Trapped in Lebanon: Sudanese Migrants Desperate to Find a Way Home.” Middle East Eye, September
25, 2020. https://www.middleeasteye.net/news/lebanon-sudan-migrant-workers-beirut-return-home.Dakessian, Antranig. “Armenian Diaspora Survey .” ADS, 2019. https://www.armeniandiasporasurvey.com/lebanon.DAR - IAURIF. “National Physical Master Plan of the Lebanese Territory,” 2005.De Verdeil, Eric. “Beirut Metropolis of Darkness and the Politics of Urban Electricity Grids” 2016.Democracy Reporting International. “Reforming Decentralisation in Lebanon: The State of Play,” April 2017.Dibeh, Ghassan, Ali Fakih and Walid Marrouch. “Decision to Emigrate amongst the Youth in Lebanon.” International Migra-
tion 56, no. 1 (February 1, 2018): 5–22. https://doi.org/10.1111/imig.12347.Doocy, Shannon, Emily Lyles, Baptiste Hanquart, and Michael Woodman. “Prevalence, Care-Seeking, and Health Service
Utilization for Non-Communicable Diseases among Syrian Refugees and Host Communities in Lebanon Bayard Rob-erts, Kiran Jobunputra, Preeti Patel and Pablo Perel.” Conflict and Health 10, no. 1 (October 19, 2016). https://doi.
org/10.1186/s13031-016-0088-3.DRC. “Multi-Sector Needs Assessment,” April 2020.DW. “Lebanon: Prime Minister-Designate Mustapha Adib Resigns,” September 26, 2020. https://www.dw.com/en/leba-
non-prime-minister-designate-mustapha-adib-resigns/a-55062582.Earle, Lucy “Haiti Earthquake 10 Years on – a New Chapter in Disaster Response” January 12, 2020. https://www.iied.org/
haiti-earthquake-10-years-new-chapter-disaster-response El Kaakour, Halime. “Pursuing Equality in Rights and Representation: Women’s Experiences Running for Parliament in Leb-
anon’s 2018 Elections,” UN Women, 2020.Erni, Fiorella Larissa. “3. A History of Palestinians in Lebanon.” In Tired of Being a Refugee: Social Identification among Young
Palestinian Refugees in Lebanon. Graduate Institute Publications, 2013. https://doi.org/10.4000/books.iheid.594.Errighi, Lorenza, and Jörn Griesse. “The Syrian Refugee Crisis: Labour Market Implications in Jordan and Lebanon,” 2016.
https://doi.org/10.2765/901541.ESCWA. “Lebanon’s Formal Private Sector: The Bitter Reality of 2020,” 2021.———. “Poverty in Lebanon: Solidarity is Vital to Adress the Impact of Multiple Overlapping Shocks: Policy brief 15,” 2020. ETF. “Migrant Support Measures From an Employment and Skills Perspective (MISMES),” 2018.EU, Beyond Reform and Development, and TRANSTEC. “Mapping Civil Society Organizations in Lebanon,” 2015.European Commission. “The Future of Cities: Space and the City.” n.d. https://urban.jrc.ec.europa.eu/thefutureofcities/space-
and-the-city#the-chapter.European Committee of the Regions. “Lebanon,” 2020. https://portal.cor.europa.eu/divisionpowers/Pages/Lebanon-Education.
aspx.———. “Lebanon - Environment and Fight Against Climate Change.” Accessed November 20, 2020. https://portal.cor.europa.
eu/divisionpowers/Pages/Lebanon-Environment-and-fight-against-climate-change-.aspx.FAO. “Lebanon at a Glance,” 2021. http://www.fao.org/lebanon/fao-in-lebanon/lebanon-at-a-glance/en/.Ugland, Ole Fr., 2003, “Chapter 1: Introduction” in Ole Fr. Ugland (ed) Difficult Past, Uncertain Future: Living Conditions
among Palestinian Refugees in Camps and Gatherings in Lebanon (Fafo report-409). Oslo, Norway: Fafo, pp. 15-27. Fawaz, Mona. “The Politics of Property in Planning: Hezbollah’s Reconstruction of Haret Hreik (Beirut, Lebanon) as Case
Study.” International Journal of Urban and Regional Research 38, no. 3 (2014): 922–934. https://doi.org/10.1111/1468-
178
BIBLIOGRAPHY
2427.12114.Fawaz, Mona, and Isabelle Peillen. “The Case of Beirut, Lebanon.” in Understanding Slums: Case Studies for the Global Re-
port 2003 (UN-Habitat), 2002, 1–41. https://www.ucl.ac.uk/dpu-projects/Global_Report/pdfs/Beirut.pdf.Foreign Policy, “In Lebanon, Pan-Sectarian Protests Are Raging as Forest Fires Burn,” October 21, 2019. https://foreignpolicy.
com/2019/10/21/lebanon-sectarian-protests-forest-fires-self-immolation/.France24. “‘Hunger Crimes’ on the Rise in Crisis-Hit Lebanon,” 2020. https://www.france24.com/en/20200715-hunger-crimes-
on-the-rise-in-crisis-hit-lebanon.Freedom House. “Freedom in the World 2020 - Lebanon,” 2020. https://freedomhouse.org/country/lebanon/free-
dom-world/2020.Geagea, Nayla, and Andre Sleiman. “Local Governance in Lebanon: A Roadmap for Solid Waste Management, Public Safety,
Accountability and Citizen Participation,” 2017. http://decentralization-lb.org/LawProject.aspx.Gebara, Hayat, Mona Khechen, and Bruno Marot. “Mapping New Constructions in Beirut (2000-2013).” Jadaliyya, Novem-
ber 16, 2016. https://www.jadaliyya.com/Details/33751/Mapping-New-Constructions-in-Beirut-2000-2013.General Saray, High Commissioner of the Republic of France to the Countries of Syria, Greater Lebanon, and the Alaouite
and the Druzes’ Djebel Lebanon. Decree No. 15 on Lebanese Nationality (1925).GIZ. “Cost of Environmental Degradation Due to Solid Waste Management Practices in Beirut and Mount Lebanon (Final
Draft).” Vol. 1, 2014.———. “Employment and Labour Market Analysis Lebanon,” 2019.Global Environment Facility. “Lebanon Sustainable Low-Emission Transport Systems,” 2019. https://gefportal.worldbank.org.Global Nutrition Report. “Global Nutrition Report | Country Nutrition Profiles.” 2020. https://globalnutritionreport.org/resourc-
es/nutrition-profiles/asia/western-asia/lebanon/.GoL. “LAW Number 80 Integrated Solid Waste Management,” 2018.———. “Lebanon’s Intended Nationally Determined Contribution under the United Nations Framework Convention on Cli-
mate Change,” 2015.———. “The Law on the Organization of the Water Sector,” 2000.———. “Unofficial Translation: Decision Number 96 Updating the Strategy to Confront the Corona Virus and the Stages of
Gradually Relaxing the Restrictions of the Lockdown,” February 6, 2021.———. “Youth Policy in Lebanon,” 2012.GoL and United Nations. “LCRP Population Data per Cadastre,” 2020.———. ”Lebanon Crisis Response Plan (LCRP) Overview,” 2020.———. “Lebanon Crisis Response Plan 2017-2020 (2020 Update),” 2020.———. “Lebanon Crisis Response Plan 2017-2021 (2021 Update),” 2021. https://data2.unhcr.org/en/documents/de-
tails/85374.Hamad, Fatma Ben. “Young Mother Shot Dead amid Growing Insecurity in Lebanon’s Shatila Camp.” France 24, June 17,
2020. https://observers.france24.com/en/20200617-footage-shooting-death-mother-insecurity-shatila-camp-traffic-drug.Harb, Mona. “Cities and Political Change: How Young Activists in Beirut Bred an Urban Social Movement,” 2016.Harvie, Charles and Ali Salman Saleh. “Lebanon’s Economic Reconstruction After the War: A Bridge Too Far?” Journal of
Policy Modeling 30, no. 5 (September 2008): 857–872. https://doi.org/10.1016/j.jpolmod.2007.04.004.Haveland, Bjørnar Skaar. “The Island of (in)Stability or a Hotel for Visiting Foreigners in the Middle of Town,” 2019.Haydar, Adib. “‘Unparking’: How Can Smart Mobility Reduce Parking Demand in Our Cities to the Minimum? (Beirut Case
Study).” Smart Cities 3, no. 2 (March 29, 2020): 172–185. https://doi.org/10.3390/smartcities3020010.Heinrich-Böll-Stiftung. “Renewable Energy in Lebanon: Can the Country Embrace its Resources Sustainably?” March 1, 2019.
https://lb.boell.org/en/2019/03/01/renewable-energy-lebanon-can-country-embrace-its-resources-sustainably.HelpAge International and DORCAS. “Lebanon Blast Emergency,” 2020.HLP TTC. “Guidance Note on Housing, Land and Property in the Context of the Beirut Port Blast Response,” 2020.Housing and Land Rights Network. “Right to the City in Greater Beirut: Context Assessment in Light of the Refugee and
Displacement Crisis,” 2018.Housing Monitor. “Housing Observatory,” 2021. https://housingmonitor.org/en.Human Rights Watch. “Barriers to Education for Syrian Refugee Children in Lebanon | HRW,” July 19, 2016. https://www.hrw.
org/report/2016/07/19/growing-without-education/barriers-education-syrian-refugee-children-lebanon.———. “Lebanon: Huge Cost of Inaction in Trash Crisis” June 9, 2020. https://www.hrw.org/news/2020/06/09/leba-
non-huge-cost-inaction-trash-crisis.———. “Lebanon: Discriminatory Nationality Law,” October 3, 2018. https://www.hrw.org/news/2018/10/03/lebanon-discrimi-
natory-nationality-law.———. “Lebanon: New Safeguards for Migrant Domestic Workers,” September 18, 2020. https://www.hrw.org/news/2020/09/18/
lebanon-new-safeguards-migrant-domestic-workers.———. “Lebanon: No Quick Fixes to Trash Crisis: Open Burning Endangers Health; Urgently Find Rights-Respecting Solu-
tions,” August 10, 2019. https://www.hrw.org/news/2019/08/10/lebanon-no-quick-fixes-trash-crisis.
Husseiki, Marwan and Walnycki, Anna. “Five Fundamentals to Keep Lebanon’s Water Flowing,” IIED, December 18, 2017. https://www.iied.org/five-fundamentals-keep-lebanon-water-flowing. Ibrahim, Arwa “A New Exodus from Lebanon after Deadly Beirut Blast,” Aljazeera. August 22, 2020. https://www.aljazeera.com/news/2020/8/22/a-new-exodus-from-leb-
anon-after-deadly-beirut-blast.
179
IDRC. “The Science Against Early Marriage,” February 3, 2020. https://www.idrc.ca/en/stories/science-against-early-marriage.ILO. “Facing Multiple Crises: Rapid Assessment of the Impact of COVID-19 on Vulnerable Workers and Small-Scale Enter-
prises in Lebanon,” May, 2020.ILO and CAS. “Labour Force and Household Living Conditions Survey 2018-2019 Lebanon,” 2019.———. “Labour Force and Household Living Conditions Survey 2018-2019 Lebanon Data,” 2019.ILO, UNICEF and Save the Children. “Children Living and Working on the Streets in Lebanon: Profile and Magnitude,” 2015.IMF. “Regional Economic Outlook : Middle East and Central Asia.” International Monetary Fund, 2011.InfoPro. “Business Opportunities in Lebanon – Year XI. Real Estate in Greater Beirut [Database],” 2014.Inter-Agency Coordination Lebanon. “Gender-Based Violence Information Management System - Ongoing Impact of
COVID-19, Economic Situation and Beirut Blast - Quarter 3 – 2020,” 2020. https://data2.unhcr.org/en/documents/
details/83310.———. “Montly Statistical Dashboard October 2020,” October 2020. https://data2.unhcr.org/en/documents/details/83———. “In Focus - Rise in Evictions Due to Increased Economic Vulnerability (July 2020),” 2020. ———. “VASyR 2020 Key Findings,” 2020.
———. “251 Most Vulnerable Localities In Lebanon 2015,” 2015. https://data2.unhcr.org/en/documents/details/45715.Inter-Agency SGBV Task Force. “Impact of COVID-19 on the SGBV Situation in Lebanon - May 2020,” May, 2020: 1–12.International Alert. “School for Stability: Examining the Role of Education in Fostering Social Stability in Lebanon,” 2017.
www.international-alert.org.International Crisis Group. “Pulling Lebanon out of the Pit.” June 8, June, 2020. https://libproxy.wlu.ca/login?url=https://search.
proquest.com/docview/2410551385?accountid=15090%0Ahttps://ocul-wlu.primo.exlibrisgroup.com/discovery/openurl?insti-tution=01OCUL_WLU&vid=01OCUL_WLU:WLU_DEF&?url_ver=Z39.88-2004&rft_val_fmt=info:ofi/fmt:kev:m.
International Foundation for Electoral Systems. “Lebanon’s 2017 Parliamentary Election Law,” 2017.International Medical Corps. “Beirut Explosion Situation Report #1 Situation Update,” August 5, 2020. https://www.theguard-
ian.com/world/live/2020/aug/04/beirut-explosion-huge-blast-port-lebanon-capital.IOM. “Foreign Nationals MSNA Analysis Beirut, September 2020,” 2020.———. “IOM Mobilizes to Meet Needs of Families Made Homeless by Beirut Blast,” August 7, 2020. https://www.iom.int/news/
iom-mobilizes-meet-needs-families-made-homeless-beirut-blast.———. “Migrant Worker Vulnerability Baseline Assessment Report Beirut May-July 2020,” 2020.———. “Migrants Stranded in Lebanon Amid Worsening Crisis Return Home with IOM Assistance,” September 18, 2020.
https://www.iom.int/news/migrants-stranded-lebanon-amid-worsening-crisis-return-home-iom-assistance.IRC. “Beirut: 1 in 4 Children Risk Dropping out of School Warns IRC - Lebanon | ReliefWeb.” Accessed October 8, 2020.
https://www.rescue.org/press-release/beirut-1-4-children-risk-dropping-out-school-warns-irc.IRENA. Renewable Energy Outlook Lebanon, 2020.Isma’eel, Hussain, Nadim El Jamal, Nuhad Yazbik Dumit and Elie Al-Chaer. “Saving the Suffering Lebanese Healthcare Sec-
tor Saving the Suffering Lebanese Healthcare Sector: Immediate Relief While Planning Reforms,” 2020.Jaafari, Shirin. “Migrant Workers Stuck in Beirut in Wake of Blast.” The World, August 14, 2020. https://www.pri.org/sto-
ries/2020-08-14/migrant-workers-stuck-beirut-wake-blast.Jaradat, Ruba and Yukie Mokuo. “Hurtling Toward a Precipice: With no Parachute Attached,” UNICEF, December 7, 2020. https://www.unicef.org/lebanon/press-releases/hurtling-toward-precipice-no-parachute-attached.
Jean-Yves Moisseron and Khalend Guesmi. “Assessing EU-Mediterranean Policies in the Field of Energy from a Bottom-up Perspective: The Case of Lebanon,” 2018.
Kaloustian, Noushig and Youssef Diab. “Effects of Urbanization on the Urban Heat Island in Beirut.” Urban Climate 14 (De-cember 1, 2015): 154–165. https://doi.org/10.1016/j.uclim.2015.06.004.
Kasparian, Choghig. “Les Jeunes Libanais Face à L’émigration,” Institut universitaire européen, 2010.Kassir, Samir. Beirut. University of California Press, 2010.Khoury, Ricardo, and Dima Alhaj. “Strengthening Environmental Governance of the Oil and Gas Sector in Lebanon,” 2015.Khoury, S, T Graczyk, G Burnham, M Jurdi, and L Goldman. “Drinking Water System Treatment and Contamination in Shatila
Refugee Camp in Beirut, Lebanon.” Eastern Mediterranean Health Journal 22, no. 8 (2016).Khraiche, Dana. “Lebanon to Reduce Subsidies as Cash Runs Out, Finance Chief Says.” Bloomberg, March 16, 2021. https://
www.bloomberg.com/news/articles/2021-03-16/lebanon-to-reduce-subsidies-as-cash-runs-out-finance-chief-says.Koffman, Tatiana. “Lebanon’s Currency Crisis Paves The Way To a New Future,” Forbes, July 9, 2020. https://www.forbes.com/
sites/tatianakoffman/2020/07/09/lebanons-currency-crisis-paves-the-way-to-a-new-future/.Krijnen, Marieke, and Christiaan De Beukelaer. “Capital, State and Conflict: The Various Drivers of Diverse Gentrification
Processes in Beirut, Lebanon.” Global Gentrifications: Uneven Development and Displacement, April, 2015: 285–309.Kurban, Laetitia. “Lebanon’s Economy and Its Effect on Mental Health .” LSE, January 28, 2020. https://blogs.lse.ac.uk/
mec/2020/01/28/lebanons-economy-and-its-effect-on-mental-health/.LCPS. “About Administrative Decentralisation in Lebanon,” 2015.———. “Local Governments and Public Goods: Assessing Decentralization in the Arab World.” Vol. 1, 2015.———. “The Role of Regional Administrations in the Context of Decentralization The Lebanese Center for Policy Studies,”
2012.Lebanese Palestinian Dialogue Committee (LPDC), Central Administration of Statistics (CAS), and Palestinian Central Bu-
reau of Statistics. “Population and Housing Census in Palestinian Camps and Gatherings in Lebanon 2017: Key Find-ings Report.” Beirut, 2018.
180
BIBLIOGRAPHY
Lebanese Women Democratic Gathering. “The Attitude of Lebanese Society towards Child Marriage,” 2018.Lebanon Support. “Understanding the Social Protection Needs of Civil Society Workers in Lebanon,” 2019.Lebanon Support and UNDP. “The Conflict Context in Beirut: The Social Question, Mobilisations Cycles, and the City’s Se-
curitisation,” 2015.LOGI. “Environmental Impact of Petroleum Activities in Lebanon,” 2017.———. “Lebanon’s Offshore Gas Sector: Shifting Towards Domestic Growith,” May 2020.Lorentzen Sogge, Erling. “«du Stinkar Også» Ungdomsopprør Og Protestrørsler i Dei Palestinske Leirane i Libanon,” 2015.LSE Cities. “How Cities Perform - Data | Urban Age,” 2014. https://urbanage.lsecities.net/data/how-cities-perform-2014.Machayekhi, Diane, Michele Pierpaoli and Giorgio Cancelliere. “Domestic Water in the Bekaa Valley, Lebanon: Demand, Ac-
cess and Institutional Aspects,” 2017.Maktabi, Rania. “The Lebanese Census of 1932 Revisited. Who Are the Lebanese?” British Journal of Middle Eastern Studies
26, no. 2 (1999): 219–241. https://doi.org/10.1080/13530199908705684.Mango, Tamam. “The Impact of Real Estate Construction and Holding Companies: A Case Study of Beirut’s Solidere and
Amman’s Abdali,” 2014.Mansour, Z., R. Said, H. Dbaibo, P. Mrad, L. Torossian, A. Rady and C. Dufouil. “Non-Communicable Diseases in Lebanon:
Results from World Health Organization STEPS Survey 2017.” Public Health 187 (October 1, 2020): 120–126. https://doi.
org/10.1016/j.puhe.2020.08.014.Marei, Fouad Gehad. “Governing Dahiya: Interrogating the State in Beirut’s Southern Suburbs.” Leadership & Developing
Societies, 2020.Marot, Bruno. “Crise du Logement et Fin du Contrôle des Loyers à Beyrouth: La Poursuite d’une Production Urbaine Exclu-
sive,” 2015. https://doi.org/10.3917/come.092.0101.———. “Jadaliyya - The End of Rent Control in Lebanon: Another Boost to the ‘Growth Machine?,’” 2014. https://www.jadaliyya.
com/Details/30811/The-End-of-Rent-Control-in-Lebanon-Another-Boost-to-the-“Growth-Machine.———. “Land Scarcity in Beirut : Myths and Realities.” Le Commerce, April 18, 2019. https://www.lecommercedulevant.com/
article/28992-land-scarcity-in-beirut-myths-and-realities.McDowall, Angus, “Fixing Lebanon’s Ruinous Electricity Crisis,” Reauter, March 29, 2019. https://www.reuters.com/article/
us-lebanon-economy-electricity-idUSKCN1RA24Z
McKinsey. “Lebanon Economic Vision,” 2018.Mercy Corps, ACF, ACTED, CARE International, DRC, IRC, Al Majouma, and Save the Children. “Beirut Micro, Medium and
Small Enterprise Rapid Needs Assessment Report,” 2020.Minority Rights Group International. “The Leaves of One Tree: Religious Minorities in Lebanon,” 2014.MoE and UNDP. “Mobility Cost: A Case Study for Lebanon,” 2015.———. “Rapid Cost of Enrivonmental Degradation 2018,” 2019.———. “State and Trends of the Lebanese Environment (SOER),” 2010.MoE, UNDP and GEF. “Economic Costs to Lebanon from Climate Change: A First Look,” 2015.MEHE. “Reaching All Children with Education: RACE II (2017-2021),” 2016.———. “Reaching All Children with Education: RACE I: 2014-2016,” 2014.MoEW. “Strategy — National Water Sector Strategy,” 2020.MoF. “Public Finance Monitor,” July 2020.MoIM. “Circular COVID-19, 19 March 2020,” 2020.———. “Decision Number 1250: Isolation of Villages Due to the Outbreak of COVID-19,” 2020.———. “Municipal Elections Results 2016”, 2016. MoTD. “Lebanon SME Strategy: A Roadmap to 2020,” 2014.Monroe, Kristin V. The Insecure City: Space, Power, and Mobility in Beirut. New Brunswick, New Jersey; London: Rutgers
University Press, 2016.MoPH. “Health Response Strategy: Maintaining Health Security, Preserving Population Health & Saving Children and Wom-
en Lives,” no. October (2016): 36.MoPH, IGSPS, USJ and WHO. “National Health Statistics Report in Lebanon,” 2012.Mourad, Ali, and Zahwan Al-Siddiq. “Citizen and Municipality Handbook: Simplified Legal Rules Governing Municipal Work
in Lebanon.” Nahnoo, 2018.Mourad, Lama, and Laure-Hélène Piron. “Municipal Service Delivery, Stability, Social Cohesion and Legitimacy in Lebanon
An Analytical Literature Review Background Paper Prepared for a Research Project on Service Delivery and Social Stability in Lebanon.” Dlp, no. July (2016).
Municipality of Beirut and UN-Habitat. “Beirut Port Explosions Response: Beiru Municipality Rapid Building-level Damage Assessment,” 2020.
Municipality of Bourj Hammoud and UN-Habitat. “Beirut Port Explosions Response: Bourj Hammoud Municipality Rapid Building-level Damage Assessment,” 2020.
Najem, Tom. “Horizon 2000: Economic Viability and Political Realities.” Mediterranean Politics 3, no. 1 (2007): 29–56. https://doi.org/10.1080/13629399808414639.
Nakhlé, Myriam Mrad, Wehbeh Farah, Nelly Ziade, Maher Abboud, Marie Louise Coussa-Koniski, and Isabella Annesi-Maes-ano. “Beirut Air Pollution and Health Effects - BAPHE Study Protocol and Objectives.” Multidisciplinary Respiratory Medicine 10, no. 1 (June 23, 2015): 21. https://doi.org/10.1186/s40248-015-0016-1.
181
Nakkash. “Assessing the Failure of Beirut City in Implementing a Sustainable Transport System,” 2016.Nasr, Joe, and Eric Verdeil. “The Reconstructions of Beirut.” In The City in the Islamic World, 1116–141, 2008.National Commission for Lebanese Women, World Health Organization, UNFPA, and UN Women. “Gender Alert on COV-
ID-19 Lebanon,” 2020.Nazzal, Maryam, and Samer Chinder. “Lebanon Cities’ Public Spaces.” The Journal of Public Space 3 (2018): 119–152.OCHA. “Flash Appeal 14 August 2020 Lebanon,” August 2020.———. “Humanitarian Context Overview (SDR) Draft - October 2020,” 2020.———. “Humanitarian Context Overview Lebanon (Draft),” 2020.———. “Lebanon: Beirut Port Explosions, Situation Report No. 5,” 2020. ———. “Lebanon: Beirut Port Explosions Situation Report No. 13,” 2020.———. “Lebanon: Beirut Port Explosions Situation Report No. 8,” 2020.———. “Lebanon Beirut Governorate Profile, 21 June 2019,” 2019.———. “Recent Government and UN Efforts on Social Protection in Lebanon,” 2020.OCHA, ACTED, and UN Women. “Emerging Gender Analysis: Gender Findings from the Multi-Partner Multi-Sectorial Needs
Assessment (MSNA) of the Beirut Explosion,” 2020.OHCHR and UN-Habitat. “The Right to Adequate Housing Fact Sheet No. 21/Rev. 1,” 2014.OEA. “Beirut Port Explosion of Aug 04 2020: Buildings Final Structural Assessment Report,” 2020.Oxford English Living Dictionaries “Definition of “Resident” in English,” 2018. Accessed 7 August 2018. https://en.oxford-
dictionaries.com/definition/resident. Patience, Martin. “Ethiopian Maids Dumped Outside Beirut Embassy.” BBC, June 20, 2020. https://www.bbc.com/news/av/
world-53031803.Phillips, Indi. “The Rise of Hunger Crimes in Beirut: Side Effects of a Pandemic-Triggered Economic Crisis.” Riskline, July 24,
2020. https://www.riskline.com/articles/the-rise-of-hunger-crimes-in-beirut-side-effects-of-a-pandemic-triggered-econom-
ic-crisis.Plural Security Insights. “Beirut, a Safe Refuge? Plural Security Insights,” 2016.Premier Urgence Internationale. “Reducing Economic Barriers to Accessing Health Services (REBAHS).” n.d.Prinz, Dieter. “Policy Brief: How to Prevent Sea Water Intrusion in Coastal Cities - Case Study Beirut, Lebanon,” 2016.Quacquarelli Symonds. “QS University Rankings for Arab 2021” 2021. https://www.topuniversities.com/university-rankings/ar-
ab-region-university-rankings/2021.Reuters. “IMF Says Lebanon Should Target Subsidies at Those Most in Need as Reserves Dwindle,” October 19, 2020. https://
www.reuters.com/article/us-lebanon-crisis-imf-idUSKBN27419D.———. “Lebanese Parliament Agrees to Lift Banking Secrecy for One Year,” 2020. https://www.reuters.com/article/lebanon-cri-
sis-parliament-int-idUSKBN28V1WE.———. “Major Beirut Medical Centre Lays off Hundreds as Crisis Bites,” July 17, 2020. https://www.reuters.com/article/us-leb-
anon-crisis-aub-idUSKCN24I2GW.Rosen, Kenneth. “Inside the Haywire World of Beirut’s Electricity Brokers” WIRED, August 29, 2018. https://www.wired.com/
story/beruit-electricity-brokers/.Saadeh, Mark, and Elie Wakim. “Deterioration of Groundwater in Beirut Due to Seawater Intrusion.” Journal of Geoscience
and Environment Protection 05, no. 11 (2017): 149–159. https://doi.org/10.4236/gep.2017.511011.Sabaghi, Dario. “Invisible Wounds: Beirut Witnesses Mental-Health Crisis after Blast,” Middle East Eye, September 27, 2020.
https://www.middleeasteye.net/news/lebanon-beirut-explosion-mental-health-trauma-ptsd-crisis. Safa, Jafri Safa. “AUB Research Guides Policy on Diesel Generator and Vehicle Air Pollution.” AUB, April 13, 2018. https://
www.aub.edu.lb/articles/Pages/air-pollution.aspx.Safi, A., G. Rachid, M. El-Fadel, J. Doummar, M. Abou Najm, and I. Alameddine. “Synergy of Climate Change and Local Pres-
sures on Saltwater Intrusion in Coastal Urban Areas: Effective Adaptation for Policy Planning.” Water International 43, no. 2 (2018): 145–164. https://doi.org/10.1080/02508060.2018.1434957.
Saksouk, Abir, and Nadine Bekdache. “Protecting the Tenants: A Core Issue in Recovering a Viable City.” The Peace Build-ing in Lebanon, September 16, 2020. https://www.peacebuildingsupplement.org/Articles/cultural-heritage/490/undp-the-
peace-building-news/en.Sala, Daniela, “The Syrian Women and Girls Sold into Sexual Slavery in Lebanon,”| Al Jazeera, February 11, 2020. https://www.
aljazeera.com/features/2020/2/11/the-syrian-women-and-girls-sold-into-sexual-slavery-in-lebanon.Save the Children. “‘No, I Don’t’: Abolishing Child Marriage in Lebanon,” October 2019.———. “Rapid Needs Assessment Beirut Blast,” 2020.———. “Urban Greater Beirut Houshold Economy Analysis Scenario Analysis (Pre-blast),” 2020.Search for Common Ground and Exigo. “Area Profiles: Conflict Analysis and Power Dynamics – Lebanon,” 2019.———. “Conflict Analysis and Power Dynamics – Lebanon Study,” 2020.Semaan, M. and M. El-Asmar. “Sahl El-Metn El-Janoubi MoU Interview.” Interviewed by UN-Habitat, 2017.Sharro, Karl. “Warspace: Geographies of Conflict in Beirut.” Open Democracy, February 14, 2013. https://www.opendemocracy.
net/en/opensecurity/warspace-geographies-of-conflict-in-beirut/.Shelter Sector. “Beirut Port Explosions: Shelter Sector Dashboard,” September 2020.Slemrod, Annie. “No Accountability for Deadly Burj Al-Barajneh Electrocutions.” The Daily Star, February 18, 2012. http://dai-
lystar.com.lb/News/Lebanon-News/2012/Feb-18/163745-no-accountability-for-deadly-burj-al-barajneh- electrocutions.ashx.
182
BIBLIOGRAPHY
Solidere. “Solidere Annual Report 2002,” 2002.Stel, Nora. “Eviction and Migration in an Institutional Vacuum: The Case of a Palestinian Gathering in South Lebanon,”
Jadaliyya, November 29, 2013. https://www.jadaliyya.com/Details/29878/Eviction-and-Migration-in-an-Institutional-Vac-
uum-The-Case-of-a-Palestinian-Gathering-in-South-Lebanon.Tabar, Paul, Andrew Denison, and Maha Alkhomassy. “Access to Social Protection by Immigrants, Emigrants and Resident
Nationals in Lebanon.” In Migration and Social Protection in Europe and Beyond, edited by J.M. Lafleur and D. Vintila, 3: 183–198. Springer, Cham, 2020. https://doi.org/10.1007/978-3-030-51237-8_10.
Terre des hommes. “Beirut City: Child Protection and Psychosocial Needs Assessment,” 2020.The Arab Weekly. “Suicide Spike in Lebanon amid Socio-Economic Turmoil ,” July 17, 2020. https://thearabweekly.com/
suicide-spike-lebanon-amid-socio-economic-turmoil.The Economist. “After the Blast - Emmanuel Macron Visits Beirut to Reshape Lebanon,” September 1, 2020. https://www.
economist.com/middle-east-and-africa/2020/09/01/emmanuel-macron-visits-beirut-to-reshape-lebanon.———. “Broken Cover - The Explosion at Beirut’s Port Will Blow a Hole in Insurers’ Balance-Sheets,” August 29, 2020.
https://www.economist.com/finance-and-economics/2020/08/27/the-explosion-at-beiruts-port-will-blow-a-hole-in-insur-
ers-balance-sheets.———. “Message Not Received - A Surge of Public Anger Sends Lebanon’s Politicians Reeling,” October 26, 2019. https://
www.economist.com/middle-east-and-africa/2019/10/24/a-surge-of-public-anger-sends-lebanons-politicians-reeling.———. “Resilient No More - For the First Time, Lebanon Defaults on its Debts” March 14, 2020. https://www.economist.com/
middle-east-and-africa/2020/03/12/for-the-first-time-lebanon-defaults-on-its-debts.———. “Taking a Fall - After the Blast, Lebanon’s Prime Minister Quits” August 15, 2020. https://www.economist.com/mid-
dle-east-and-africa/2020/08/13/after-the-blast-lebanons-prime-minister-quits.The Guardian. “Syrians Refugees Flee Lebanon Camp after Tents Set on Fire,” December 27, 2020. https://www.theguardian.
com/world/2020/dec/27/syrians-refugees-flee-lebanon-camp-after-tents-set-on-fire.The Monthly. “Distribution of the Independent Municipal Fund Revenues, over the Past Seventeen Years: LBP 4900 Bil-
lion - Localiban,” February 27, 2016. http://www.localiban.org/distribution-of-the-independent-municipal-fund-reve-
nues-over-the-past-seventeen-years-lbp-4900-billion.The National. “Lebanon Hospitals under Threat as Doctors and Nurses Emigrate” September 2020.The New York Times. “Former Prime Minister Rafik Hariri Killed in Explosion,” February 14, 2005. https://www.nytimes.
com/2005/02/14/world/africa/former-prime-minister-rafik-hariri-killed-in-explosion.html.The Public Works. “Um Hassan’s New House.” RELIEF Centre. Accessed January 15, 2021. https://www.relief-centre.org/
um-hassan.UN-Habitat. “City Population Density 2013, Urban Indicators Database.” https://urban-data-guo-un-habitat.hub.arcgis.com/
datasets/city-popuation-density-2013-global-urban-indicators-database-2014/data?orderBy=Density&orderByAsc=false&se-
lectedAttribute=Density.———. “Guide for Mainstreaming Housing in Lebanon’s National Urban Policy,” 2021.———. “Guide for Mainstreaming Transport and Mobility in Lebanon’s National Urban Policy,” 2021.———. “Lebanon - Urban Issues | UN-Habitat.” Accessed October 12, 2020. https://unhabitat.org/lebanon-urban-issues.———. “Lebanon Urban Profile,” 2011.———. “Mapping Migration in Beirut Municipality: A Comparataive Study of Three Neighbourhoods,” 2018.———. “National Urban Policies Programme in Lebanon Diagnosis Report,” 2018.———. “Physical Damage Assessment of Private Schools (Forthcoming),” 2021.———. “Tripoli City Profile 2017,” 2017.———. “UN-Habitat Lebanon Unions of Municipalities’ COVID-19 Rapid Assessment Report,” 2020.UN-Habitat and UNHCR. “Housing, Land and Property Issues of Syrian Refugees in Lebanon from Homs City,” 2018.UN-Habitat and UNICEF. “Daouk-Ghawash Neighbourhood Profile.” UN-Habitat, 2020.———. “Lebanon Neighbourhood Profiles.” https://lebanonportal.unhabitat.org/.———. “National List of 498 Disadvantaged Areas,” 2018.United Nations, “3RF Culture,” 2020.———. “United Nations Strategic Framework (UNSF) Lebanon 2017-2020,” 2017.———. “United Nations Conference on Human Settlements (Habitat II): The Habitat Agenda,” 1996.———. “Beirut Facing Acute Environmental Crisis, Warns UN Energy Specialist,” UN News September 1, 2020. https://news.
un.org/en/story/2020/09/1071462.United Nations Education Sector. “LCRP Part II: Operational Response Plans-Education,” 2017.UN Women. “3RF Gender Brief Pillar 1 Governance and Accountability,” 2020.———. “Gender-Responsive Recovery in Lebanon: Recommendations for Fiscal, Social and Labour Policy Reform.” ———. “Women on the Verge of an Economic Breakdown: Assessing the Differential Impacts of an Economic Crisis on
Women,” 2020. UN Women, CARE, UN ESCWA, ABAAD and UNFPA. “A Rapid Gender Analysis of the August 2020 Beirut Port Explosion:
An Intersectional Examination,” 2020.UNCT Lebanon. “Rapid Socio-Economic Impact Assessment,” 2020.UNDP. “Leave No One Behind for an Inclusive and Just Recovery Process in Post-Blast Beirut,” 2020.———. “Palestinian Gatherings in Lebanon,” 2020. http://www.gatherings-lb.com/.
183
———. “Spotlight on Youth in Lebanon,” 2015.———. “Women in Municipal Elections 2016,” 2016.UNDP and DREG. “2016 Solar PV Status Report for Lebanon,” 2017.UNDP,and GoL. “National Poverty Assessment Joint Assessment,” 2004.UNDP and Lebanon Ministry of Environment. “Lebanon Environmental Assessment of the Syrian Conflict & Priority Interventions Updated Fact Sheet - December 2015,” December 2015.UNDP and UN-Habitat. “Profiling Deprivation: An Analysis of the RNA in Palestinian Gatherings Host Communities in
Lebanon.” Vol. 53, 2014.UNEP. “Analysis of the Current Land Use and Socio-Economic Activities in the Coastal Zone,” 2012.UNFPA. “Youth Mixed Migration in Beirut: Driving Factors, Lived Experiences, Sexual and Reproductive Health and Rights,”
2018.UNFPA, UNESCO, UNICEF, UNHCR, and SCI. “Situational Analysis of Youth in Lebanon Affected by the Syrian Crisis,” 2014.UNHCR. “Guidelines for Referral Health Care in Lebanon: Standard Operating Procedures,” 2017.———. “LCRP 2017 Livelihoods Sector Chapter,” 2017.———. “Lebanon Fact Sheet September 2020,” September 2020. UNHCR, UNICEF, and WFP. “VASyR 2019: Vulnerability Assessment of Syrian Refugees in Lebanon,” 2019.———. “VASyR 2019: Vulnerability Assessment of Syrian Refugees in Lebanon,” 2019.———. “VASyR 2020: Vulnerability Assessment of Syrian Refugees in Lebanon,” 2020.UNICEF. “Beirut Port Explosion: UNICEF Swiftly Restores Water to Damaged Homes, Schools and Hospitals,” 2020. https://
www.unicef.org/lebanon/stories/beirut-port-explosion-unicef-swiftly-restores-water-damaged-homes-schools-and-hospitals.———. “Geneva Palais Briefing Note on Situation for Children Affected by Beirut Explosions and UNICEF Response,” 2020.
https://www.unicef.org/press-releases/geneva-palais-briefing-note-situation-children-affected-beirut-explosions-and-unicef.———. “Lebanon Humanitarian Situation Report No. 7,” 2020.———. “MIC Survey,” 2016.———. “Severe Water Shortages Compound Desperate Situation for Children and Families in Beirut,” 2020. https://www.
unicef.org/press-releases/severe-water-shortages-compound-desperate-situation-children-and-families-beirut.UNRWA. “Burj Barajneh Camp.” https://www.unrwa.org/where-we-work/lebanon/burj-barajneh-camp.———. “Dbayeh Camp.” https://www.unrwa.org/where-we-work/lebanon/dbayeh-camp.———. “Mar Elias Camp.” https://www.unrwa.org/where-we-work/lebanon/mar-elias-camp.———. “Shatila Camp.” https://www.unrwa.org/where-we-work/lebanon/shatila-camp.———. “Where We Work,” 2020. https://www.unrwa.org/where-we-work/lebanon.———. “Protection in Lebanon,” February 2019. https://www.unrwa.org/activity/protection-lebanon.USIP, “Lebanon’s Confessionalism: Problems and Prospects” March 30, 2006. https://www.usip.org/publications/2006/03/
lebanons-confessionalism-problems-and-prospects
Verdeil, Éric, Ghaleb Faour, and Sébastien Velut. “Atlas Du Liban : Territoires et Société,” 2007. https://doi.org/10.4000/
BOOKS.IFPO.402.VNGi. “Local Government Resilience Programme for the Middle East and North Africa,” 2017.We4L, Hivos, and Lebanon Support. “Women’s Political Participation: Exclusion and Reproduction of Social Roles Case
Studies from Lebanon,” 2018.———. “Women’s Political Participation in Lebanon and the Limits of Aid-Driven Empowerment,” 2020.WENR. “Education in Lebanon,” 2020. https://wenr.wes.org/2017/05/education-in-lebanon.
WFP. “Assessing the Impact of the Economic and COVID-19 Crises in Lebanon,” 2020.———. “World Food Programme to Scale up in Lebanon as Blast Destroys Beirut’s Port” August 6, 2020. https://insight.wfp.
org/world-food-programme-to-scale-up-in-lebanon-as-blast-destroys-beiruts-port-7270471d1f87.WFP, and World Bank. “Lebanon M-VAM Vulnerability and Food Security Assessment July-August 2020,” 2020.WHO. “07 November 2020: Lebanon Covid-19 Daily Brief,” 2020.———. “09 November 2020: Lebanon Covid-19 Daily Brief,” 2020.———. “28 January 2021: Lebanon COVID-19 Daily Brief,” 2021.———. “30 January 2021: Lebanon COVID-19 Daily Brief,” 2021.———. “Beirut Port Blast Emergency Strategic Response Plan,” 2020.———. “Health System Profile Lebanon.” World Health Organization 53, no. 9 (2006): 1689–1699.WHO, and UNICEF. “Lebanon Water Quality Survey Lebanon,” 2016.World Bank. “Amman, Jordan: Comprehensive Climate Plans”, 2020. ———. “Beirut Residents’ Perspectives on August 4 Blast: Findings from a Needs and Perceptions Survey,” September
2020.———. “Lebanon’s Economic Update — October 2020,” October 19, 2020. https://www.worldbank.org/en/country/lebanon/
publication/economic-update-october-2020.———. “Lebanon | Data,” 2020. https://data.worldbank.org/country/lebanon.———. “Lebanon Economic Monitor: Derisking Lebanon,” 2018.———. “Lebanon Economic Monitor: The Deliberate Depression,” December 2020.———. “Lebanon: Education Public Expenditure Review 2017”, 2017.———. “Migration and Development Brief 32: COVID-19 Crisis through a Migration Lens,” April 22, 2020. https://www.world-
184
BIBLIOGRAPHY
bank.org/en/topic/socialprotection/publication/covid-19-crisis-through-a-migration-lens.———. “Reducing Traffic Congestion in Beirut: an Empirical Analysis of Selected Policy Options,” 2017.———. “Tech Start-up Ecosystem in Beirut: Findings and Recommendations,” 2017.World Bank, EU and United Nations. “Beirut RDNA Full Report Energy,” 2020.———. “Beirut RDNA Full Report Transport,” 2020.———. “Lebanon 3RF Draft Report,” 2020.———. “Municipal Sector Note 3RF,” 2020.———. “3RF Social Protection Sector Note,” 2020.———.“Beirut Rapid Damage and Needs Assessment,” 2020.World Economic Forum. “Global Gender Gap Report 2020,” 2019. World Vision. “Social Cohesion between Syrian Refugees and Urban Host Communities in Lebanon and Jordan,” 2015.Worldometer. “Lebanon Coronavirus,” January 4, 2021. https://www.worldometers.info/coronavirus/country/lebanon/.Yahya, Maha. “Lebanon: Not Expecting Gulf Aid to Come Back.” Carnegie Middle East Center, 2020. https://carnegie-mec.
org/2020/06/09/lebanon-not-expecting-gulf-aid-to-come-back-pub-82009.Yan, Victoria. “Water Project a Hard Sell for Wary Palestinians.” The Daily Star (Lebanon), April 21, 2017. https://www.press-
reader.com/lebanon/the-daily-star-lebanon/20170421/281612420280647.Zalzal, Jad, Ibrahim Alameddine, Mutasem El-Fadel, Scott Weichenthal, and Marianne Hatzopoulou. “Drivers of Seasonal
and Annual Air Pollution Exposure in a Complex Urban Environment with Multiple Source Contributions.” Environ-mental Monitoring and Assessment 192, June 1, 2020. https://doi.org/10.1007/s10661-020-08345-8.
185
Related studies/assessments (to be) conducted and publications (to be) authored or co-authored by UN-Habitat Lebanon
• State of Lebanese Cities Report (forthcoming)• Physical damage assessment of private schools (forthcoming)• Report on a housing, land and property assessment in selected blast-affected areas (forthcoming)• Guide for Mainstreaming Housing in Lebanon’s National Urban Policy (2021)• Guide for Mainstreaming Transport and Mobility in Lebanon’s National Urban Policy (2021)• UN-Habitat amd UNICEF neighbourhood profiles (2017-2020)• Lebanon Unions of Municipalities’ COVID-19 Rapid Assessment Report (2020)• Beirut Municipality Rapid Building-level Damage Assessment (2020)• Bourj Hammoud Municipality Rapid Building-level Damage Assessment (2020)• National Urban Policies Programme in Lebanon: Diagnosis Report (2018)• Mapping Migration in Beirut Municipality: A Comparative Study of Three Neighbourhoods (2018)• Tripoli City Profile (2017)• Tyre City Profile (2017)
186
UN
-HA
BIT
AT
/ L
EB
AN
ON
/ C
ITY
PR
OFI
LE
S /
BE
IRU
T /
20
21 /
CO
NT
EX
T
Norwegian Ministry of Foreign Affairs