banding in nickel-base superalloys and steels
TRANSCRIPT
BANDING IN NICKEL-BASE SUPERALLOYS AND
STEELS
by
Ting Li
B. Eng., University of Science and Technology, Beijing, 2004
A THESIS SUBMITTED IN PARTIAL FULFILLMENT OFTHE REQUIREMENTS FOR THE DEGREE OF
MASTER OF APPLIED SCIENCE
in
The Faculty of Graduate Studies
(Materials Engineering)
THE UNIVERSITY OF BRITISH COLUMBIA
December 2007
© Ting Li, 2007
Abstract
Process irregularities in remelting furnace operation have an impact on the ingot
solidification structure which depends on the local thermal conditions and the alloy
concerned. In this work, a laboratory investigation into the structures resulting from
interruptions in solid growth is presented in order to understand the cause and effect
relationship between the solidification interruption and banding. The results
demonstrate the range of structure, segregation and precipitation changes which are
experienced by a range of alloys including Inconel 718, Nimonic 80A, Waspaloy and
M50. In the case of alloys which form primary precipitates, the interruption period is
shown to give rise to structure changes. Segregations are found due to the interruption.
We also comment on the differences observed between industrial examples of
banding and the laboratory samples which may be due to the absence of liquid
movement in the latter technique. It is concluded that the interruption in solidification
condition during a directionally solidification itself can produce banding through its
effects on the morphology of precipitates.
ii
Table of Contents
Abstract ^ iiTable of Contents ^ .iiiList of Tables^ vList of Figures^ viAcknowledgements ^ viii
1. Introduction^ 1
2. Literature Review^ 5
2.1 Theories on Banding Formation^ 5
2.2 The Influence of Banding on Mechanical Properties^ 11
2.3 ESR and VAR Industrial Processes^ 132.3.1 ESR^ 132.3.2 VAR^ 152.3.3 Solidification Conditions ^ 18
3. Objectives and Scope^ 21
4. Materials and Experimental Procedure^ 22
4.1 Materials ^ 224.1.1 Inconel 718^ 234.1.2 Nimonic 80A^ 254.1.3 Waspaloy^ 264.1.4 M50^ 26
4.2 DS/DSQ Furnace^ 28
4.3 Techniques for Characterization^ 304.3.1 Etching^ 304.3.2 Optical Microscopy^ 304.3.3 SEM, EDS and BSE^ 30
5. Results^ 32
5.1 Inconel 718^ 325.1.1 Industrial Ingot Containing Banding^ 325.1.2 Laboratory Simulation of Banding^ 33
5.2 Nimonic 80A and Waspaloy^ 365.2.1 Industrial Ingot Containing Banding^ 365.2.2 Laboratory Simulation of Banding^ 37
5.3 M50 Steel^ 38
6. Discussion^ 40
111

6.1 Banding in Industrial Ingots^ 40
6.2 Banding in the Laboratory Simulation^ 42
6.3 Comparison of Industrial and Lab-simulated Banding^ 47
7. Conclusion^ 49
Tables^ 52
Figures^ 60
Bibliography^ 95
iv
List of Tables
Table 4.1: Nominal composition of original materials ^ 52
Table 4.2: Major phases and reactions in Inconel 718 ^ 52
Table 4.3: Segregation coefficients of various elements in Inconel 718 5° ^ .53
Table 4.4: Average segregation coefficients of various elements in nickel-base superalloys
^ .53
Table 4.5: Solidification sequence of M2 steel 50, 56 ^53
Table 4.6: Segregation coefficients of the major segregating elements in T1 tool steel ^ 54
Table 4.7: Averaged analytical results of the elements content in the carbides in M50 ^ 54
Table 4.8: Interruption during the laboratory experiment and that occurring during
Production^ 55
Table 4.9: Designations used for various sequences^ 56
Table 4.10: Etchants used during specimen preparation ^ ..56
Table 5.1: Concentration of principle segregating elements within and outside the banded
region in industrial Inconel 718 ^ 57
Table 5.2: Schemes used in the laboratory to simulate banding ^ .57
Table 5.3: The composition of Laves phase found in Inconel 718-E specimen ^ .58
Table 5.4: Measured concentration of the segregating elements content within and outside
the banded region for industrial Waspaloy ^ 58
Table 5.5: The average segregating element content within and outside the banded region
industrial Waspaloy^ 59
Table 5.6 The segregating element contents in the four zones of Waspaloy-E specimen 59
List of Figures
Figure 2.1: Beech's banding formation theory 23 ^ 60
Figure 2.2: Description on ESR process ^ .61
Figure 2.3: Heat flow in ESR process 32 ^ . 62
Figure 2.4: Description on VAR system 4^ 63
Figure 2.5: Heat flow during VAR system 35 ^ 64
Figure 2.6: Metal and current injection on the surface of the pool; the left plot is for a
diffuse arc and the right plot is for a constricted arc ^ .65
Figure 2.7: Fluid velocity and temperature field for alloy Inconel 718 ^ 66
Figure 2.8: Temperature distribution during a practical VAR process for Ti-64 alloy ^67
Figure 2.9: Variation of primary dendrite arm spacing with cooling rate ^68
Figure 2.10: Morphologies of Directionally solidified Nickel based superalloys ^ 69
Figure 4.1: Laves phase and carbides of a directional solidified Inconel 718 sample 49 ^ 70
Figure 4.2: Carbides in a directional solidified and quenched Inconel 718 sample 49 ^70
Figure 4.3: Interdendritic liquid segregation in Inconel 718 5° ^ 71
Figure 4.4: The equilibrium solidification of M2 steel 50^ 72
Figure 4.5: Interdendritic liquid density in M2 steel 50 ^ 73
Figure 4.6: Apparatus of the DSQ furnace and its affiliate ^ 74
Figure 4.7: A schematic drawing of the DS/DSQ furnace^ 74
Figure 5.1: Tree rings in the industrial Inconel 718 ingot^ 75
Figure 5.2: Laves phase and delta phase combination in the industrial Inconel 718 ^ 75
Figure 5.3: Laves phase and 6 phase combination in industrial Inconel 718 ^ ..76
Figure 5.4: A scanning electron micrograph of Inconel 718-DS specimen ^ .76
Figure 5.5: Band observed in Inconel 718-E sample ^ 77
vi
Figure 5.6: Dendrite structure in normal growth region of Inconel 718-E ^ .77
Figure 5.7: Dendrite structure in interrupted region of Inconel 718-E ^78
Figure 5.8: Dendrite structure in the interrupted region of Inconel 718-E ^ .78
Figure 5.9: A high magnification optical micrograph of zone 1 ^ .79
Figure 5.10: A high magnification optical micrograph of zone 2 ^79
Figure 5.11: A high magnification optical micrograph of zone 3 ^80
Figure 5.12: Schematic description on Inconel 718 quenched specimen^ 80
Figure 5.13: An optical micrograph of zone 2 of Inconel 718-EQ ^ ..81
Figure 5.14: An optical micrograph of zone 2 of Inconel 718-EWQ ^ ..81
Figure 5.15: Bulk Nb compositional analysis of Inconel 718-E sample ^82
Figure 5.16: Inconel 718-E heat treated sample ^ .82
Figure 5.17: Banding in the industrial Waspaloy ingot^ 83
Figure 5.18: The precipitates inside the banded region in the industrial Waspaloy ^83
Figure 5.19: Outside of the banded region in the industrial Waspaloy sample ^ 84
Figure 5.20: Nimonic 80A-E, morphology of normal growth region (zone 1) ^ 84
Figure 5.21: Nimonic 80A-E, morphology of interrupted region (zone2) ^ .85
Figure 5.22: Nimonic 80A-E, morphology of interrupted region (zone 3) ^ .85
Figure 5.23: Waspaloy-E, morphology of normal growth region (zone 1) ^ .86
Figure 5.24: Waspaloy- E, morphology of interrupted region (zone 2) ^ .86
Figure 5.25: Waspaloy-E, morphology of interrupted region (zone 3) ^ 87
Figure 5.26: Bulk Ti compositional analysis of Nimonic80 A-E^87
Figure 5.27: Schematic description of different zones of M50-E specimen^ 88
Figure 5.28: Carbide Morphology of M50-E, normal growth region (bottom) ^ ..88
Figure 5.29: Carbide morphology of M50-E, interrupted growth ^ ..89
Figure 5.30: Carbide morphology of M50-E, normal growth region (top) ^89
Figure 5.31: Bulk vanadium compositional analysis of M50-E^ .90
Figure 6.1: Flow fields during the ESR process for MMC ingot^91
Figure 6.2: Flow field during the ESR process for Bochler ingot ^ .92
Figure 6.3: Schematic Summary of Single-Phase Solidification Morphologies 59 ^ .93
Figure 6.4: Predicted microstructures during seed melt-back with flat isotherms 61 ......94
vii
Acknowledgements
The author would like to thank particularly her supervisor, Dr. A. Mitchell, for his
guidance through this M.A.Sc.
A special thank should go to the author's co-supervisor Dr. S. L. Cockcroft for his
innumerable helpful advice during this work.
The author is very thankful to Dr. A. Akhtar for his assistance and invaluable support
throughout the duration of this work.
All the support staff in the department of Metals & Materials Engineering at UBC
was also most helpful.
1. Introduction
Banding, also called tree rings, is a defect or anomaly observed in steel and other
alloy products in which alternating bands of different structures develop. These
differences can be attributed to alternating structures on a micro or macro scale,
differing elemental compositions, and in some cases, distinct grain types 1 . This
phenomenon has been studied extensively because it can result in a deterioration of
the mechanical properties, poor machineability, uneven response to surface hardening,
heat treatment distortion, poor corrosion resistance, cold cracking and poor impact
resistance 2 . In addition, tree-ring structures are of interest because they have been
associated with the occurrence of other ingot defects 3 ' 4 . The banding structures
observed frequently in VAR and ESR ingots have been simulated and examined in the
present work.
Efforts to eliminate the banding defect in the ingots by homogenizing at a high
temperature proved to be impractical industrially 5 . The temperature, 1300 °C for
instance, which is needed to remove the associated segregation through diffusion in a
reasonable time period is high. This high temperature can result in structural damage
through "overheating" i.e. grain boundary liquidation. A lower temperature
homogenization would require holding ingots for extremely long times, for example,
two weeks, which would not be cost effective in practice. Therefore, once banding
1
appears in the ingot product, it is common industrial practice to crop the portion of the
ingot containing the bands rather than process the entire ingot further.
Solidification instability can form alternating structures or phases which develop
mostly parallel to the S/L front 6 ' 7 . Those structures are called internal banding. Such
banded structures are observed in several peritectic systems. Kurz et al 6 have stated
that internally driven bands form due to reactions at the solid-liquid interface. They
investigated the origin of inherent banded patterns of low velocity peritectic
solidification as well as high velocity non-equilibrium solidification, and concluded
that banding is produced at a low interface velocity due to the nucleation of another
phase at the growing interface during the establishment of a steady state growth
condition. The unique solidification process of the peritectic system plays a role in the
process. The solid solution phase y is precipitated through a reaction between the
liquid phase(L) and the higher temperature phase S. Oscillatory transformation
alternating between ö and y can give rise to a banded structure parallel to the S/L
interface.
Non-equilibrium banded structures have also been observed at high growth rates.
At those high rates of growth, the solute can not diffuse efficiently. This type of
banded structure forms due to the loss of local equilibrium at the interface and is not
restricted to any specific type of phase diagram. The banded microstructure is thought
to be formed by an oscillatory exchange of two different solidification growth
2
morphologies, i.e. dendrites and plane front. Kurz et al 6 observed a transition at a
critical growth rate, above which the steady-state growth of the columnar dendrites
gave rise to an oscillatory instability of the solid/liquid interface. These oscillations
created the light and dark bands which are approximately parallel to the S/L interface.
Although banding may be caused by the internal instability which happens
during solidification as illustrated above, external irregularities happening during
production process can also produce tree-ring structures. During an industrial
remelting process, such as VAR or ESR, it is difficult to maintain a stable
melting/freezing status throughout the entire production, which would amongst other
things require the provision of a perfect electrode (as opposed to one containing the
normal structural defects such as inclusion and porosity). The maintenance of a
constant heat balance is a delicate operation requiring critical decisions on the part of
the operator regarding control response and choice of operating parameters. Therefore
process instabilities can easily occur and cause the formation of tree rings in ingots 8 .
In both ESR and VAR processes, banding in the ingot results from instabilities either
inherent in the solidification process or caused by a disruption in the processing
parameters. Therefore this type of defect can be eliminated in principle by correct
conduct of the process, nonetheless it is important to understand both the mechanisms
and the structural consequences of the effect. With that knowledge, it may also be
possible to alter the process parameters so as to move the solidification conditions
3

toward conditions that are conducive to greater stability at the solid/liquid (S/L)
interface.
Clearly, there exists a need for a better understanding of the mechanism or
mechanisms responsible for the formation of tree rings. The focus of the present work
is to examine in detail features present in industrial ingots containing bands, and, to
shed light on the mechanisms responsible for their formation through conducting
laboratory experiments under controlled conditions of solidification.
4
2. Literature Review
2.1 Theories on Banding Formation
There is no universally accepted definition of banding because various
micro/macro structures and features can give rise to this type of structure. Moreover,
there are clearly a variety of mechanisms by which they can form. However, there
have been several attempts to better define this phenomenon. Banding is considered
by Krauss I to be a microstructural condition in which alternating bands of different
microstructures develop in alloy products. It is usually a region consisted of columnar
dendrites, in which the content of solute elements is different from the normal bulk. It
may also contain equiaxed grains. Sawa et al 8 observed tree-ring patterns consisting
of "white stripes" on a macro-etched surface of a section taken from a VAR ingot.
They also indicated that bands are composed of fine equiaxed crystals, in which the
contents of the solute elements are lower than in the adjacent "normal" material.
Theories have also been forwarded since early in the twentieth century to explain
the mechanism responsible for the formation of the banded structures. The early
theories invoked the concept of a reaction taking place in the "Inclusion" and
"phosphorous" 9-11 . Banding was thought to be caused by the uneven distribution of
inclusion or phosphorous in the alloy. However, progress in metallurgical processes
has rendered these descriptions of historical interest only. They have essentially no
relevance to the present work except to emphasize the fact that banding has been an
5
industrial problem for a long time. More recent studies have provided better insight.
Jatczak et al 12 studied the banding phenomenon in AISI steels of the type1340, 2340,
4140, 4340 and 5140 and indicated that chemical heterogeneity produces visible
banding through its effect on nucleation and growth of ferrite and pearlite from
austenite. In other words, the primary cause of banding in steels is the effect of alloy
segregation on carbon-rich location. In their analysis, carbide forming type elements,
for example, Cr tended to increase the carbon concentration in their vicinity whereas,
elements like nickel which have a large carbon solubility, tended to decrease carbon
concentration in their vicinity. Therefore, the degree of carbon segregation and the
location of high and low carbon areas depend only on the amount and distribution of
the alloying elements. In multi-alloyed steels, these visual banded conditions depend
upon the influence of the various types of alloying elements, their amounts and
distribution. Bastien 13 concluded that in steels each element which remains in solid
solution and produces a displacement of the Ar3 temperature (i.e. Austenite
decomposition temperature) can give rise to a banded structure. For example, if this
temperature is lowered by the solute, then proeutectoid ferrite nucleates first in the
solute lean region. Otherwise, if this temperature is raised, the preeutectoid ferrite
nucleates in the solute rich region. In either case, carbon atoms are rejected from the
proeutectoid ferrite, thus producing carbon rich regions of austenite, which eventually
transform to pearlite. In addition, he investigated the effect of cooling rate on the
appearance of banded structure, and it was found that increasing the cooling rate in
carbon and low-alloy steels of the hypoeutectic type resulted in the banded region
6
disappearing. Kirkaldy et al 14 designed a series of experiments for the purpose of
finding out which theory, Jatczak's 12 or Bastien's 13 , is correct. The results showed
that the dominant effect in producing microstructural banding is the constitutional
effects of alloying elements in shifting Ar 3 lines as proposed by Bastien. Thompson
and Howell 15 investigated the effect of austenite grain size as well as the cooling rate
on the propensity for microstructure banding in a low-alloy steel, and found that the
banding disappeared when the austenite grain size was 2-3 times larger than the
banding wavelength. In addition, the microstructural banding areas were still present
when the austenite grain size was considerably less than the banding wavelength. As
for cooling rate, it was proposed that the intensity or degree of microstructural
banding increases as cooling rate decreases. Lavender and Jones 5 investigated the
photomicrographs and microradiographs of banding in ASTM type G 122, G 136, G
663 and G 684 steels and calculated the temperature required to remove banding.
They concluded that a high temperature treatment in the range of 1200-1350 °C could
remove banding. In all the cases they investigated, the high temperatures would also
result in overheating of the steel. As noted earlier, heat treatment as a method of
removing banding cannot be considered of practical interest. Based on a sinusoidal
variation of composition, they also claimed that several hundred years would be
required to remove the segregates at a relatively lower temperature, such as 625 °C.
Krauss I concluded from his work that the root cause of banding is residual
interdendritic microsegregation. Although segregation was found to be almost always
present irrespective of the formation of bands, the microstructural manifestations of
7
banding depended on austenite grain size and cooling conditions that control austenite
decomposition to other phases.
The following theories have been proposed to explain macroscopic banding in
casting and remelting processes. Sawa et al 8 considered that the origin of tree-ring
structure is the alteration of solidification condition caused by the change of magnetic
stirring intensity. They observed a fine equiaxial structure within the tree-rings in
which the presence of eutectic carbides could not be detected. It was proposed that
this segregation is formed by solidification taking place earlier than in the vicinity
possibly due to either the nucleation of equiaxial crystals or deposition of fragments
of dendrites in a thin layer near the solidification front under the change of the stirring
intensity. Jackson 16 proposed a model for the formation of the carbon concentration
bands during the "power-on-off' sequence of a remelting process. Two process
transients were examined; turning the power off, and turning the power on. In the first
transient, the solidification rate would gradually increase as the liquid pool shrinks
from the steady state profile. When power supply is turned back on, the melt rate of
the electrode would be higher than its equilibrium value, resulting in a deeper liquid
metal pool profile. Finally, the system would try to return to its equilibrium, which
requires the increase of the solidification rate in the center region of the ingot.
Increased solidification rate would force the effective distribution coefficient (Ke) for
carbon in the system to approach unity. As the value of Ke increases, the
concentration of carbon in the solid metal would be increased. Lee et al 4 investigated
8
the banded structure on nickel-based superalloy Inconel 718. In their description,
banding is observed as strings of equiaxed grains interrupting a predominately
columnar-dendritic structure. They stated that this structure forms due to a transient
caused by process perturbation at the solidification front. Furthermore, they concluded
that grains inside the tree-ring must have formed by a nucleation mechanism which
occurs due to the perturbation in the thermal and solutal field ahead of the mushy
zone. It was suggested that this perturbation could be caused by either a reduction in
the convective flow so that less heat could be supplied by the liquid above or through
a reversal of the flow carrying cooler liquid from the central zone of the ingot along
the front of the columnar mushy zone. A third mechanism considered plausible was a
change in the flow direction, such that the solute-rich liquid is replaced by the bulk
liquid from the pool.
Electromagnetic stirring on the formation of band in continuous casting has been
investigated extensively 17-24. For instance, Shah and Moore 19 studied in detail the
solidification morphology and "white band" formation in continuously cast steels.
They attributed the columnar-equiaxed transition to the convective fluid flow. Strong
convective fluid can detach parts of the mushy zone due to diffusion of dendrite heads
or simply break off dendrite tips. The detached dendrite particles may then act as
nuclei for the formation of equiaxed crystallization. Stirring can arrest the columnar
crystallization and promote the formation of a fine and columnar equiaxed zone. Also,
when the stirring power is too high, a band of negative segregation will appear at the
9
limit of the columnar crystals. It was suggested that the bands of negative segregation
are produced by the solute-enriched liquid being swept away from the solidification
front by the effect of the stirring motion and the arresting of the columnar
solidification front. Another study on the formation of the band segregation during the
electromagnetic stirring of a strand-cast steel has been done by Bridge and Rogers 22 .
They described banding as a white band with negative segregation corresponding to
the position of the solidification front during stirring. Following hot working of the
material containing the white bands can act as an obstacle to the customer acceptance
of the product. Calculations have demonstrated that the observed segregation could
arise as a result of changes in the velocity of the liquidus front at the start and end of
stirring. These velocity changes are caused primarily by a change in thermal
conditions at the liquidus resulting in a slowing down and subsequent speeding up of
the isotherm. Some solute depleted bands were observed when aluminum —gold alloys
were partially remelted and then held under a constant temperature gradient. Beech 23
studied this phenomenon and the conclusions made were summarized as shown in
Figure 2.1. During the casting, the cells may be represented as in (a). On rapid
remelting, the liquidus isotherm will retreat faster than the solidus in the steeper
temperature gradient (line A in (c)). As remelting ceases and the furnace stabilizes,
the temperature gradient decreases (line B in (c)). This causes the cells to grow into
the liquid and remelting occurs further into the cell roots leading to an increase in the
apparent liquid plus solid zone. In addition, solute will diffuse towards the bulk liquid
creating a concentration distribution within the interdendritic liquid, as shown in (b).
10
Stabilization and solute diffusion from between the cells would cause the initial band
to widen and become solute depleted. Zanner et a! 24 analyzed the origin of tree-ring
formation in VAR ingots. According to their observation, it is very likely that either
the sudden stirring of the melt or the electromagnetic fluctuations is the cause of VAR
banding. In the former case, the high liquid velocity created by the stirring coil swept
away the Nb rich liquid leaving a depleted region. In the latter case, if the pathway for
current undergoes periodic fluctuations, then the fluctuations in the spatial
distributions of Lorenz force could lead to fluctuations in the local intensity or
direction of flow in the pool. Given that the liquidus isotherm velocity is influenced
by the temperature and composition of the liquid flowing past the dendrite tips,
changes in the fluid velocity profile within the pool could easily lead to composition
banding.
2.2 The Influence of Banding on Mechanical Properties
Mechanical properties are influenced by the heterogeneity caused by banding.
The impact of banding varies among different types of alloys. Schwartzbart 25
investigated the mechanical properties of a 0.21 wt% carbon, 1.47 wt% manganese
steel which exhibited severe manganese banding. The transverse mechanical
properties of the bulk material improved through manganese homogenization which
removed this variation. Working on a heavily banded 0.3 % carbon steel, Jatczak et al
12 , however, concluded that homogenization causes little alteration in longitudinal
mechanical properties, and only slight, commercially insignificant, improvements in
11
the transverse ductility and impact strength. Owen et a1 26 compared the behavior of
low-carbon steel with banded and homogenized microstructures and found no
difference in impact properties below the ductile to brittle transition temperature.
However, in the testing temperature range for ductile fracture, both longitudinal and
transverse energy absorptions were higher in homogenized specimens. Grange 27
concluded that both microstructural banding and elongated inclusions cause
anisotropy in mechanical properties in wrought (0.25 wt%C and 1.5 wt%Mn) steel.
Elimination of banding was effective in reducing anisotropy but resulted in only slight
improvement of anisotropy in the steel containing many elongated inclusions. Heiser
and Hertzberg 28 found that the ductility and impact-resistance anisotropy in banded
steel was controlled by the delaminations which occurred by inclusion/matrix
interface separation in the mechanically fibred material. When delamination occurs
normal to the growth direction, they are beneficial, by increasing the fracture energy
and ductility, but when they occur in the growth direction and on the fracture plane,
they are detrimental. Rao 29 studied the influence of banding on the impact and fatigue
properties of a high strength SAE steel and concluded that the elimination of banding
brought about an increase in impact strength and fatigue properties, and this was more
pronounced at lower temperatures than at higher temperatures. The endurance limit
was also raised by 8 % by the removal of banding. Jackson 16 found that in AISI 630
grade stainless steel banding consists of ferrite rich bands with the ferrite particles
having higher concentration of chromium and lower concentration of nickel and
copper. The bands contained 19 percent ferrite, which is higher than the specified
12
range of 5 to 7 percent. Cracks originated along the ferrite rich banded structure
during rolling. Stauffer et al 30 examined low alloy steels. The presence of significant
amounts of manganese, chromium, and molybdenum were found in the interdendritic
region thus causing the segregated bands. Tensile testing of specimen oriented in the
short transverse direction of the plate showed low ductility and a large variation in
failure strains, depending on the continuity of the bands as well as the presence of
large precipitate particles within the bands. Crack initiation in line pipe service
failures has been traced to martensitic or hard segregation bands outcropping on the
pipe surface 21 . It is known that hydrogen diffuses to the site of inclusions which exist
in the macro-segregated regions causing catastrophic in-service failures.
2.3 ESR and VAR Industrial Processes
Since banding in ESR and VAR ingots is the focus of the present work, an
overview of these two remelting processes is presented below.
2.3.1 ESR
Electroslag Remelting (ESR) is regarded as a method of refining metals using a
molten slag that is electrically heated by its resistance 31 .This process has the
advantage of being able to control both the composition and the microstructure of the
ingot.
13
In an ESR process, the metal to be refined is usually in the form of an electrode,
which is the product of a more conventional process. The lower end of an electrode is
submerged in a bath of molten slag contained in a water-cooled mould. A schematic
diagram of the process is shown in Figure 2.2. The required heat is generated by the
electric current flowing between the electrode and the conducting baseplate on which
the mould stands. As the slag temperature rises above the melting temperature of the
metal, the tip of the electrode melts and thus collecting into droplets, being refined by
reacting with the slag before falling through it and being collected in a pool in the
mould. By matching of the melt rate to the cooling rate, conditions can be established
to produce the desired microstructure.
The overall heat balance in ESR process has been illustrated by numerous
workers. Figure 2.3 illustrates the nature of heat transfer 32 . Clearly, the heat flow is
quite complicated. About one third of the energy input to the system is used in
melting the metal 31 . The superheated droplets supply the major part of the heat at the
ingot top. Heat removal from the ingot is mainly via the mould walls, and the heat
transfer coefficient at this site is greatly dependent on the extent to which a
contraction gap has appeared between the ingot and the mould.
Instability occurs during production. There are two main root causes of the
instability, inconsistency in the movement of the slag and inability to control the
position of the electrode. The interaction of two forces i.e. Lorenz force and buoyancy
14
force, changes strongly as the electrode/slag contact varies. Any changes in the
process operation will immediately influence solidification and result in quality
problems in the ingot 33 . The second cause of the instability, namely the control of
electrode position, may be considered next. The magnitude of the interfacial
resistance due to the contact of the electrode on the slag is dependent on current
density and so it changes as the contact area varies with time. It is reasonable to
anticipate that in a practical system used to control the electrode such an ill-defined
control parameter can be incorrectly used, causing the electrode position to vary over
an unacceptable range. If this change is sufficiently severe, the ingot thermal profile
will vary and thus leading to segregation defects. Instability problem may also occur
due to a change in the ambient atmosphere. Some industrial ESR melting processes
are carried out under argon instead of air in order to minimize oxidation. The presence
of argon stabilizes arc formation in the non-contact area between the electrode tip and
the slag surface, leading to wrong response of the electrode movement, hence to a
sharp change in the ingot thermal regime.
2.3.2 VAR
Vacuum arc remelting (VAR) is the principal, secondary melting process used to
produce ingots of nickel-based alloys and of high quality steels 4 . The aim of VAR is
to produce an ingot that is free of macrosegregation, porosity, shrinkage cavities, or
any other defects resulted from solidification during conventional casting. In the VAR
process, a cylinder-shaped, alloy electrode (usually prepared by conventional casting)
15
is loaded into the water-cooled, copper crucible of a VAR furnace, the furnace is
evacuated, and a direct current arc is struck between the electrode (cathode) and some
starting material and the electrode tip, eventually melting both. As the electrode tip is
melted away, molten metal drips off forming a melt pool. The solidification profile is
shown schematically in Figure 2.4 4 .
The general principle of the process is similar to that in ESR, but with many
differences in detail. VAR can be operated to give higher cooling rates in the ingot
and hence to provide less segregation than does ESR 34 . The general heat transfer is
shown schematically in Figure 2.5. During this process, 50 % of the heat input is
removed by the mould cooling water 35 . Without the insulating effect of the slag skin
against the mold wall, the VAR ingot has a higher cooling rate than ESR, leading to
generally shallower pools at the same melting rates and hence to products which
contains less segregation 34 . An additional feature of VAR is that He (g) may be
injected into the gap which develops between the mold wall and the contacting,
solidifying ingot. The additional conduction effect of He increases ingot heat loss and
further increases the ingot temperature gradients thus enhancing the tendency to
reduced segregation.
The VAR process is inherently unstable 33 . Any change to the current, for
example the momentary interruption of primary power input by an electrical event
such as lightning storms, will abruptly change the two dominant forces (i.e. buoyancy
16
force and electromagnetic force) which control the flow pattern, thus giving rise to a
change in pool profile. In general the operating system remains successful in
preventing any significant excursions from the intended pool profile. However, if the
parameters are incorrectly chosen instability can occur. Instability results from the
electrode containing cracks, cavities or slag which abruptly change the arc behavior.
The system may not be able to respond sufficiently quickly so as to prevent an abrupt
change in the ingot heat balance. Also, the change of arc behavior can influence the
voltage and current, thus changing the electromagnetic force on the ingot pool,
resulting in a change of the heat balance at the liquidus. In addition, the electrode
movement may not match the melting rate and so permit the arc length to extend. The
heat balance is then changed to reflect an energy concentration at a single point,
which distorts the normal parabolic shape which contains a depression on the "hot"
side and a shallow region on the "cold" side. This effect has been modeled by Zanner
et a! 24 . Figure 2.6 shows the melt rate and the current across the radius of the ingot.
Parts of the ingot will have undergone a freeze/remelt sequence, which may lead to
segregation defects. The constricted arc condition is also frequently associated with
the presence of electrode cavities, and hence with the formation of the white spot
defect in the ingot. There are also other features during VAR process which can give
rise to instability. Failing of the ingot to maintain contact with baseplate due to the
cooling and contracting of the ingot's lower section. The use of helium which is
injected into the mold/ingot gap as a coolant is another factor.
17
2.3.3 Solidification Conditions
The modeling of the remelting process is of great interest due to the important
role of these processes played in steel and alloy-making industry. Based on the
knowledge of the heat transfer and fluid flow mentioned earlier, a number of
41computing models 36- have been formulated by applying different numerical and
analytical methods.
Ballantyne 39 applied an implicit finite difference technique. Problems involve
the solution of two-dimensional partial differential equations subject to specified
initial and boundary conditions. A more comprehensive computational model for the
prediction of the performance of the ESR process was presented by Kelkar et a/ 40 ' 41
for axisymmetric, steady state conditions, using a Computational Fluid Dynamics
(CFD) approach and modeling the slag simultaneously with the ingot. There are
several differences between the two models mentioned above. One difference lies in
their solution to the liquid pool conductivity. In the finite difference model, deducted
by Ballantyne, in order to account for the liquid movement, an elevated liquid pool
conductivity has to be assumed which is not true in reality. On the other hand,
Kelkar's model computes the effective conductivity using a turbulence model, which
is more accurate. Another difference between these two models is the consideration of
the heat flow in the slag. Ballantyne's assumption on temperature distribution across
the top of the ingot does not have anything to do with the temperature and heat flow
within the slag. Kelkar's model is more accurate because it calculates the thermal
18
profile of the slag instead of making an assumption about it. In spite of the advantages
of Kelkar's model over Ballantyne's, the results of the model are not very different.
Figure 2.7 41 and Figure 2.8 40 show the temperature distribution acquired in the ESR
(Inconel 718) and VAR (Ti-64) ingots respectively. Kelkar's model had been used in
the computations of the two profiles mentioned above. Models and experiments have
also been developed to predict the primary dendrite arm spacing as well as the
transition from one morphology to another for different solidification rates and
temperature gradients. The results reported in the literature are show in Figure 2.9 42
and Figure 2.10 43 .
During the remelting process, the sudden power interruption can cause the
change of solidification condition. Jackson 16 investigated the heat transfer and
thermal behavior of VAR and ESR ingots during power-off mode. His conclusion is
summarized below: There are four main areas affected by the loss of heat input
caused by the power interruption. They are: liquid metal/slag skin interface, liquid
slag/slag skin interface, liquid slag/atmosphere interface and liquid metal/liquid slag
interface. For the first three, the results show that the rate of heat loss from these
interfaces drops off very rapidly and that they respond instantaneously to the
"power-off' condition. The heat transfer across the slag/metal interface is dependent
on the value of the heat transfer coefficient due to the small temperature gradient
across the interface. This heat supply would reduce the extent of the solidification in
19

the metal pool. The process finally resulted in a tree-ring structure as mentioned
earlier.
20

3. Objectives and Scope
The objective of this work is to enhance the understanding of the cause and
effect relationship between the solidification interruption and banding. In order to
achieve this objective, two industrial samples as well as seven laboratory-produced
samples were investigated. Industrial samples include an as-cast Inconel 718 sample
and a forged Waspaloy sample. Both these samples contain banding in their structures.
The laboratory-produced samples were made as a part of this investigation. Castings
using four materials, including three nickel-base superalloys ( Inconel 718, Nimonic
80A and Waspaloy) and one tool steel ( M50) were produced under a variety of
solidification conditions. The scope of the present work includes is microstructure
investigations and compositional analyses. Investigations were performed using
optical microscopy and scanning electron microscopy.
21
4. Materials and Experimental Procedure
4.1 Materials
Samples of the industrial ingots received as well as the specimens prepared in the
laboratory were made of three nickel based superalloys (Inconel 718, Nimonic 80A
and Waspaloy) and a steel (M50). Their nominal compositions are shown in Table 4-1.
The industrial specimens were made of Inconel 718 and Waspaloy. The choice of
those four compositions was made based on their solidification characteristics.
Inconel 718 has a segregated interdendritic liquid which is heavier than the bulk
liquid. For Waspaloy and Nimonic 80A, however, the segregating liquid would be
lighter than the bulk liquid. If there is significant flow of the interdendritic liquid
during an interruption in solidification, the alloys should show corresponding
observable differences in the bulk composition. The choice of M50 was made on the
basis that it shows a wider gap between dendrites than do superalloys. In addition,
M50 precipitates various carbides under different cooling conditions, which makes it
possible to understand the solidification mechanism through observations made on the
type of carbide formed. An overview of each of the four alloys with emphasis on its
solidification characteristics follows.
22
4.1.1 Inconel 718
Superalloys have been developed in order to meet the demand of increasing high
temperature application. The required properties of this special species are the
strength and corrosion resistance at high temperature. Inconel 718 ( Inconel is a
registered trademark of Special Metals Group of Companies, designated as UNS
N07718) represents the most widely used alloy for turbine vanes and discs in
aero-engine applications with working temperatures up to 700 *c 44
Inconel 718 is a precipitation-strengthened nickel-iron-base superalloy. The
reactions occurring upon cooling and the phases generated as a result are summarized
in Table 4-2 45, 46 The process of strengthening is primarily achieved through the
precipitation of y" with a secondary hardening taking place through the precipitation
of y' 47 . Another strengthening phase, the 5 phase, prevents grain growth through
being precipitated on the grain boundaries 48 . The obvious advantages of this alloy lie
in that it has good strength, corrosion resistance and ductility, good weldability, along
with long time stability within the working temperature range and has only a few
critical alloying elements. With the improvement of casting technique, large
components of Inconel 718 have been made cost effectively which has further
promoted its usage 44
The melting range of Inconel 718 is 1336 C to 1260 °C. The solidification of
Inconel 718 starts with the proeutectic y reaction at about 1336 "C, followed by the
23
precipitation of (Ti,Nb)C inside the dendrites at 1290 °C. The (y + Laves phase)
eutectic reaction occurs at about 1175 °C, and the 8 phase precipitation happens at
about 1145 °C. The final y' and y" precipitation occurs at 1000 "C 46
The solidification structure and the associated precipitates encountered in the
final microstructure of this alloy are shown in Figure 4.1 and Figure 4.2 49. The
segregation existing in this alloy remains a big issue in terms of production and
application. The segregation coefficients (k=Xs/XL, where Xs and X L are the mole
fractions of solute in the solid state and liquid in equilibrium at a given temperature)
of the main alloying elements in Inconel 718 are listed in Table 4.3 50 . The
interdendritic segregation coefficients of the major elements during solidification
have been compiled by Auburtin, as shown in Figure 4.3. Niobium is the most
segregated element in this material and its concentration in interdendritic liquid
increases as the solidification proceeds. The enrichment of this heavy element results
in an increasing value of interdendritic liquid density, from 7.45 g/cm 3 at 1336 °C to
7.74 g/cm3 at 1260 °C 50 .Laves phases have a formula of AB2, where the A atoms
are ordered as in diamond, hexagonal diamond, or a related structure, and the B atoms
form tetrahedra around the A atoms. In The case of Inconel 718, the formula is
(Ni,Fe,Cr)2(Nb,Ti,Mo,S i).
24
4.1.2 Nimonic 80A
Nimonic 80A ( Nimonic is the registered trademark of Henry Wiggin &
Company Ltd., designated as UNS N07080) is a nickel-base precipitation-hardening
superalloy. It is one of the alloys used for wrought turbine blades. In recent years,
there has been a significant increase in the use of Nimonic 80A in steam-power
generating plant. The composition and the heat treatment of the alloy have evolved so
as to obtain increasingly high strengths at elevated temperatures. This alloy can be
age-hardened by the controlled precipitation of intragranular sub-microscopic y',
which contributes to creep resistance by acting as a barrier to dislocation movement
51
The melting range of this alloy is 1379 °C to 1313 °C. The various phases
present in the final microstructure are: y', the major strengthening phase,
intragranular-occuring primary carbides, nitrides or carbon-nitrides [ M(C,N), where
M is usually Ti], and B as well as Cr- rich grain boundary carbides of the M 7C3 and
M23C6 types 51 .The data on segregation coefficients of each element for Nimonic 80A
are not available. However, an average segregation coefficients of nickel-base
superalloys are shown in Table 4.4 50 . Aluminum and titanium are the major
segregated elements during solidification and their segregations into interdendritic
region would result in a lighter interdendritic liquid than the bulk.
25
4.1.3 Waspaloy
Waspaloy (designated as UNS N07001) is a nickel-base, age hardenable
superalloy with excellent high-temperature strength and good corrosion resistance. It
has good resistance to oxidation at service temperatures up to 560 °C for critical
rotating applications, and up to 870 °C for other less demanding applications. The
high-temperature strength of this alloy is derived from its solid solution strengthening
elements, molybdenum, cobalt and chromium, and its age hardening elements,
aluminum and titanium. Its strength and stability ranges are higher than those
typically available for Inconel 718 52 . In Waspaloy, the y' phase functions as the
hardening phase 53 .
The melting range of Waspaloy is 1360 °C to 1330 °C. Its solidification and
precipitation sequence is: (1) Proeutectic y at about 1360 °C, (2) (y+ MC) eutectic at
about 1240 °C, (3) precipitation of y' at about 1045 °C 53 . Similar with Nimonic
80A, aluminum and titanium are the major segregating elements. Therefore, the
segregation of these two elements into the interdendritic region also results in a lighter
interdendritic liquid.
4.1.4 M50
M50 (AISI designation) is derived from a group of high speed steels, with
tungsten removed. It has a high hardness after tempering, and wear resistance with
good toughness. The steel is widely used in aerospace applications. Its working
26
temperature lies between 150 °C and 300 °C. The alloying elements used form fine
precipitated carbides which increase the mechanical properties during the secondary
hardening step 54 ' 55
The microstructure of M50 has not been investigated thoroughly in the past.
Therefore, the available information on a similar steel M2 is summarized here. The
melting range of M2 steel is 1420 °C to 1231 °C . The solidification sequence is
listed in Table 4-5. The segregation profiles as well as the variation of the
interdendritic liquid density of M2 are shown in Figure 4.4 and Figure 4.5 50
Carbides M6C and MC are found in the equilibrium structure, with M 2C appearing at
low LST (local solidification time) values 56 . The presence of M6C is considered
undesirable. It increases the carbide size after heat treatment, which leads to degraded
performance in service. Therefore, a low LST is desirable in this alloy in view of
suppressing the formation of MX. It can be seen from Figure 4.5 that the
interdendritc liquid density always increases as the solidification proceeds. Then close
to the end of the solidification, the density decreases because the liquid is depleted in
carbide forming heavy elements (Mo and W). The segregation coefficients of M2 are
not available, yet the data in a tool steel T1 can be used as a reference ( Table 4.6) 50 .
The solidification sequence of M50 is similar to that of M2 steel, although the
transition temperatures are slightly different. Another important difference between
these two steels lies in that M50 does not contain tungsten. Due to the existence of
27
alloying elements Mo, Cr, V in M50 steel, various carbides can be expected in the
final microstructures. The composition of the carbides is listed in Table 4.7 55 .
4.2 DS/DSQ Furnace
The equipment used to simulate the interrupted solidification process in
remelting is called Directional Solidification and Quenching (DSQ) furnace. Figure
4.6 shows a photograph of the apparatus. A computer controls the rate of removal of
the sample from the hot zone containing the alloy sample and a schematic
representation of the process is shown in Figure 4.7.
The molten sample having a small diameter as compared with its length was
extracted at a controlled withdrawal rate from the furnace. With this arrangement,
unidirectional solidification was achieved as the solidification front moved upwards
in a closed-end alumina tube. The furnace contains a cylindrical high-density
graphite susceptor, which is heated by a high frequency induction device. At this
frequency (450 Hz), the induced magnetic field remains confined to the graphite
susceptor. Therefore, stirring of the molten material does not take place with eddy
currents. Argon gas (98 %) flows through the furnace chamber during melting and
withdrawal of the specimen. Quenching is realized by installing a brass tube filled
with water below the susceptor.
28
This steady-state technique of solidification can realize the control on the
temperature gradient of the liquid front G as well as the velocity of the growth front
R. Therefore, these parameters can be set in order to simulate the practical thermal
condition. In addition, the equipment allows the solidifying specimen to be quenched,
which makes it possible to observe the development of dendrite microstructure and
solute segregation.
Specimens were machined to a diameter of 4 mm and a length of about 60 mm
so as to fit inside the alumina containment tubes (outer D 6.26 mm). Calibration of the
furnace temperature gradient was done with a type-D (Tungsten 3 %Re and Tungsten
25 %Re) thermocouple. A molybdenum specimen, with the thermocouple inserted in
it was kept in the hot zone of the graphite susceptor. The temperature gradient was
measured as 8.6 °C/mm near the melting temperature. The cooling rate was about 54
°C/min at a withdrawal rate of 6 mm/min.
The specimen was held stationary in the furnace hot zone for one hour at a
temperature above its melting temperature in order to establish thermal equilibrium.
Withdrawal from the hot zone was made through the established temperature gradient
using a pre-selected rate. An interruption for a pre-specified time or a reversal to the
direction and withdrawal was achieved using computer programs. For example, the
following sequence was used in the program "6DSRSDS" and the resulting sample
was labeled as "E". The sample was lowered (i.e. directionally solidified) at a speed
29
of 6 mm/min for 5 mins, the direction of travel reverses (i.e. re-melt) at the same
speed for 30 secs, stop for 30 secs, then re-establish directional solidification at 6
mm/min. The "reverse" and "hold" simulate the condition that power is turned back
on after a sudden power shut-down. The corresponding process in the real production
is explained in Table 4.8. Other labels which have been used to designate the samples
are "-EQ", "EWQ", "DS" and "DSQ" and the corresponding processes are listed in
Table 4.9.
4.3 Techniques for Characterization
All specimens examined under the optical microscope and the scanning electron
microscope were polished down to 1 micron on a diamond lap.
4.3.1 Etching
The materials and the corresponding etchants are listed in Table 4.10.
4.3.2 Optical Microscopy
An optical microscope was used to analyze the bulk dendrite structures as well as
the small precipitates. The Optical Microscope used was Nikon Epiphot 300 with
CIeMEX vision PETM 3.5.
4.3.3 SEM, EDS and BSE
A Hitachi S-3000N scanning electron microscope (SEM) was used to observe
the microstructures using an accelerating voltage of 20 kV. Energy Dispersive
30

Spectroscopy (EDS) using secondary X-rays was used along with the SEM for
analyzing compositions. When using spot as well as area EDS scanning, readings
were taken for 100 secs. Backscattered Scanning Electron (BSE) was employed to
enhance image contrast due to differences in atomic numbers of the elements.
31
5. Results
5.1 Inconel 718
5.1.1 Industrial Ingot Containing Banding
An industrial Inconel 718 sample which included tree-ring structures was
examined first. Figure 5.1 shows the appearance of the industrial banding (as received
from Aubert & Duval Corp, Les Ancizes, France, macroetched). The bands are
perpendicular to columnar dendrites and appear lighter than the non-banded regions
as indicated in the macrograph. Under a higher magnification, the slightly etched
specimen showed that Laves phase and delta phase combinations (Figure 5.2) are
orderly distributed along the bands, as shown in Figure 5.3. In order to analyze the
compositions of the banded and non-banded regions, only light etching was used. The
analyzed area covers a dimension of (200 X 100) ilm2 . One measurement of each
region was made. The banded region covers those lined up precipitates (A in Figure
5.3). The non-banded region covers the area between two adjacent tree rings (B in
Figure 5.3). The acquired data are limited but the results in Table 5.1 show that
possibly there is a difference of Nb content between a banded region and the region in
between the bands. The errors appearing in the data are the statistical calculation
errors and they can show how reliable the results are.
32

5.1.2 Laboratory Simulation of Banding
Figure 5.4 shows the morphology of the carbides and Laves phase in a
directionally solidified Inconel 718 specimen. Strip-like carbides and bulky Laves
phases are distributed in this microstructure.
In an attempt to reproduce the tree-ring structure in the laboratory, a number of
schemes were designed for simulating the interruption of the solidification process.
Those schemes are listed in Table 5.2. A band of structural difference was observed in
Inconel 718-E specimen as shown in Figure 5.5. The other schemes did not produce
any band.
There is an obvious difference in the etching response of the microstructures
within the interrupted region, which can be observed in Figure 5.5. There is no sign of
the formation of equiaxial grains during the interrupted region, although this structure
is sometimes found in an industrial ingot.
Four distinct zones were observed. They are marked 1 through 4 in Figure 5.5.
Zone 1 and zone 4 correspond to normal growth, while zones 2 and 3 represent the
interrupted solidification. The microstructures of zone 1, 2 and 3 as seen under a
somewhat higher magnification are shown in Figures 5.6, 5.7 and 5.8 respectively.
The microstructure in zone 4 was similar to that in zone 1. It can be seen that the
directionally solidified dendrite structure does not change during the interruption. The
33
dendrite spacing, which has been measured, remains similar in each zone, with a
value of approximately 100 gm. EDX analysis is used to identify the precipitates and
the Laves phase composition is listed in Table 5.3. The microstructures of each zone
under a yet higher magnification are shown in Figure 5.9 to Figure 5.11. The
observation on this sample clarifies the evolution of the precipitates during the
interrupted directional solidification. In the micrograph of the normal growth region,
primary and secondary dendrites are seen (Figure 5.6). The interdendritic space
contains the primary carbides and the final eutectic carbides as well as Laves phase
(Figure 5.9). A closer examination of zone 2 revealed that the primary dendrite
spacing remained essentially unchanged, however, the secondary arms became almost
entirely dissolved. The types of precipitates found in the region between the primary
dendrites remain unchanged. However, the morphology of these precipitates changed.
The microstructures seen under a yet higher magnification are shown in Figures
5.9 to 5.11. From the micrographs it is seen that the average amount of precipitates in
zone 2 (Figure 5.10) is less than in zone 1 (Figure 5.9). The Laves phase and the
carbide precipitates had dissolved. Semi-quantitative analyses have been done by
counting the quantities of different precipitates under the same magnification. In zone
3, there were more precipitates and they were elongated along the liquid channel. The
size of Laves phase existing in zone 3 was found to be bigger than in zone 1. In
addition, the relative proportion of Laves phase to the carbides was higher in zone 3
as compared with that in zone 1.
34
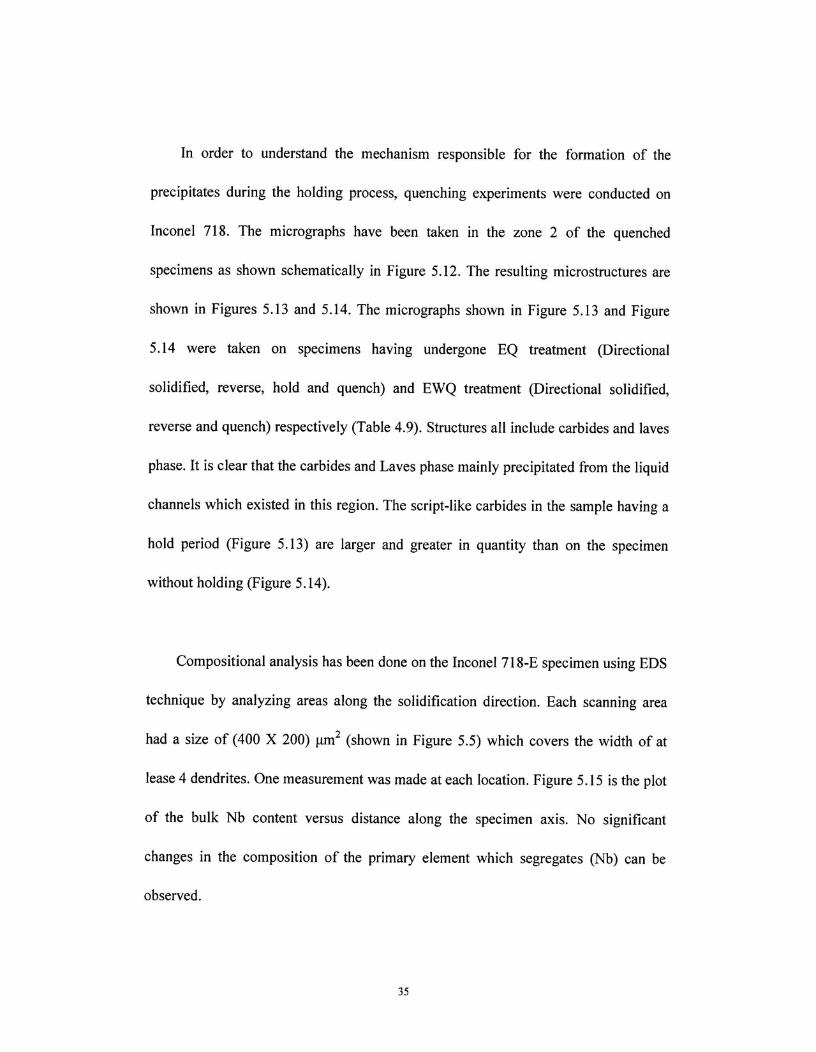
In order to understand the mechanism responsible for the formation of the
precipitates during the holding process, quenching experiments were conducted on
Inconel 718. The micrographs have been taken in the zone 2 of the quenched
specimens as shown schematically in Figure 5.12. The resulting microstructures are
shown in Figures 5.13 and 5.14. The micrographs shown in Figure 5.13 and Figure
5.14 were taken on specimens having undergone EQ treatment (Directional
solidified, reverse, hold and quench) and EWQ treatment (Directional solidified,
reverse and quench) respectively (Table 4.9). Structures all include carbides and laves
phase. It is clear that the carbides and Laves phase mainly precipitated from the liquid
channels which existed in this region. The script-like carbides in the sample having a
hold period (Figure 5.13) are larger and greater in quantity than on the specimen
without holding (Figure 5.14).
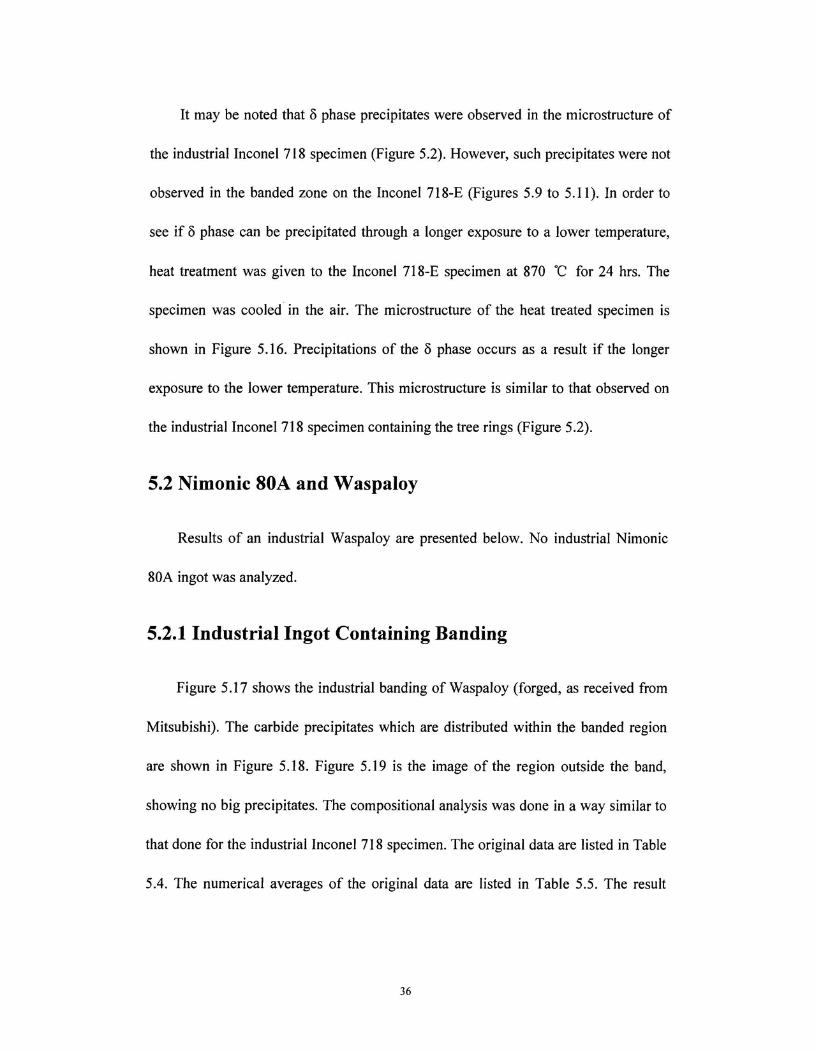
Compositional analysis has been done on the Inconel 718-E specimen using EDS
technique by analyzing areas along the solidification direction. Each scanning area
had a size of (400 X 200) ixm 2 (shown in Figure 5.5) which covers the width of at
lease 4 dendrites. One measurement was made at each location. Figure 5.15 is the plot
of the bulk Nb content versus distance along the specimen axis. No significant
changes in the composition of the primary element which segregates (Nb) can be
observed.
35
It may be noted that 8 phase precipitates were observed in the microstructure of
the industrial Inconel 718 specimen (Figure 5.2). However, such precipitates were not
observed in the banded zone on the Inconel 718-E (Figures 5.9 to 5.11). In order to
see if S phase can be precipitated through a longer exposure to a lower temperature,
heat treatment was given to the Inconel 718-E specimen at 870 °C for 24 hrs. The
specimen was cooled in the air. The microstructure of the heat treated specimen is
shown in Figure 5.16. Precipitations of the 8 phase occurs as a result if the longer
exposure to the lower temperature. This microstructure is similar to that observed on
the industrial Inconel 718 specimen containing the tree rings (Figure 5.2).
5.2 Nimonic 80A and Waspaloy
Results of an industrial Waspaloy are presented below. No industrial Nimonic
80A ingot was analyzed.
5.2.1 Industrial Ingot Containing Banding
Figure 5.17 shows the industrial banding of Waspaloy (forged, as received from
Mitsubishi). The carbide precipitates which are distributed within the banded region
are shown in Figure 5.18. Figure 5.19 is the image of the region outside the band,
showing no big precipitates. The compositional analysis was done in a way similar to
that done for the industrial Inconel 718 specimen. The original data are listed in Table
5.4. The numerical averages of the original data are listed in Table 5.5. The result
36
shows no significant difference in the element contents (especially Ti) between
banded and non-banded regions.
5.2.2 Laboratory Simulation of Banding
The microstructural responses of Nimonic 80A and Waspaloy to the interruption
were found to be similar. Therefore, the results are presented together. The
interruptions ( reverse, hold, directional solidified) were made in a manner identical to
that of Inconel 718-E. Figures 5.20 to 5.22 show the microstructures as observed on
Nimonic 80A-E specimen. Microstructures seen on the Waspaloy-E specimen are
shown in Figures 5.23 to 5.25. The primary dendrite spacing as measured is
approximately 100 pm. Nimonic 80A-E sample did not show a faint band upon
etching. However, Waspaloy-E showed a small band upon etching. As for
microstructure, like Inconel 718-E, similar general microstructual evolution was
observed in the interrupted region. However, differences were found in the
appearance of precipitates, as described in the following.
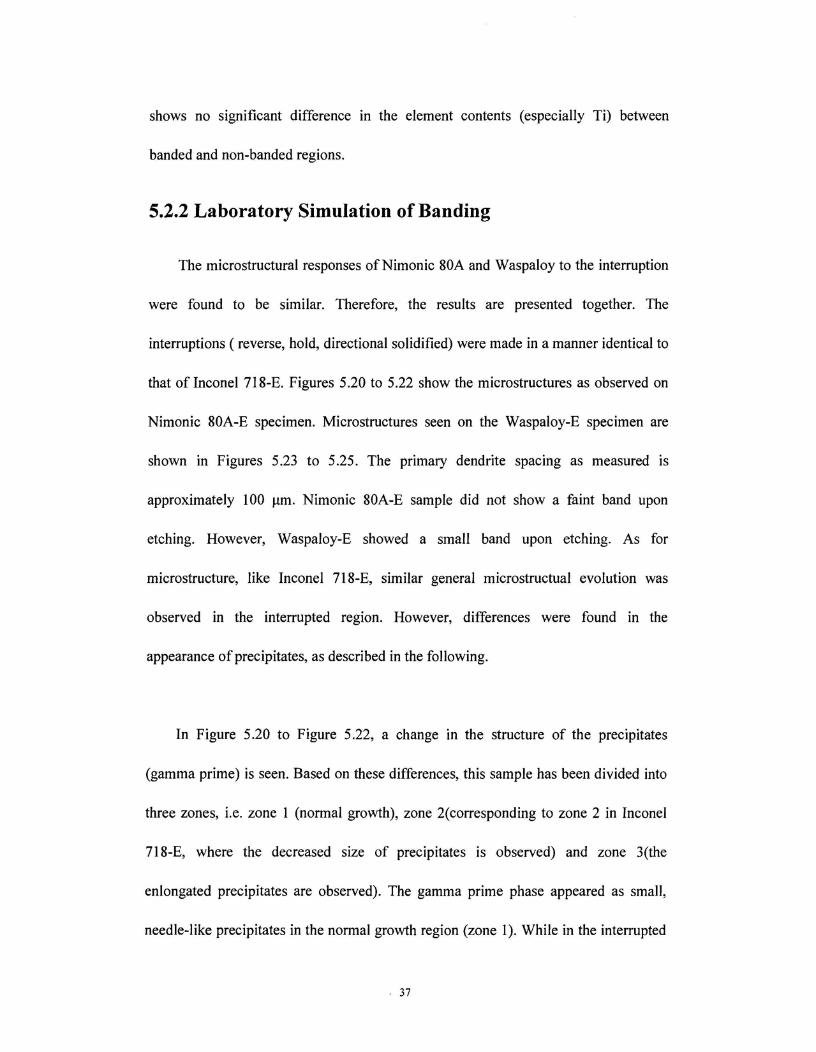
In Figure 5.20 to Figure 5.22, a change in the structure of the precipitates
(gamma prime) is seen. Based on these differences, this sample has been divided into
three zones, i.e. zone 1 (normal growth), zone 2(corresponding to zone 2 in Inconel
718-E, where the decreased size of precipitates is observed) and zone 3(the
enlongated precipitates are observed). The gamma prime phase appeared as small,
needle-like precipitates in the normal growth region (zone 1). While in the interrupted
37
region, the size of the gamma prime became even smaller in zone 2. Elongated and
aligned precipitates were observed in the interdendrtic channels in zone 3. Similar
observations were made with the microstructure on Waspaloy (Figure 5.23 to 5.25).
The EDX analysis was also done for Nimonic 80A-E. Similar to the analysis on
Inconel 718-E,one measurement was made at each location. Again, the compositional
analysis (Figure 5.26) does not indicate any obvious change in the concentration of Ti,
the principal element segregating into the liquid during solidification. The results of
the 4-zone compositional analysis on Waspaloy-E are listed in Table 5.6. No
significant change was observed.
5.3 M50 Steel
An industrial ingot was not available. Only the results obtained in the laboratory
are presented.
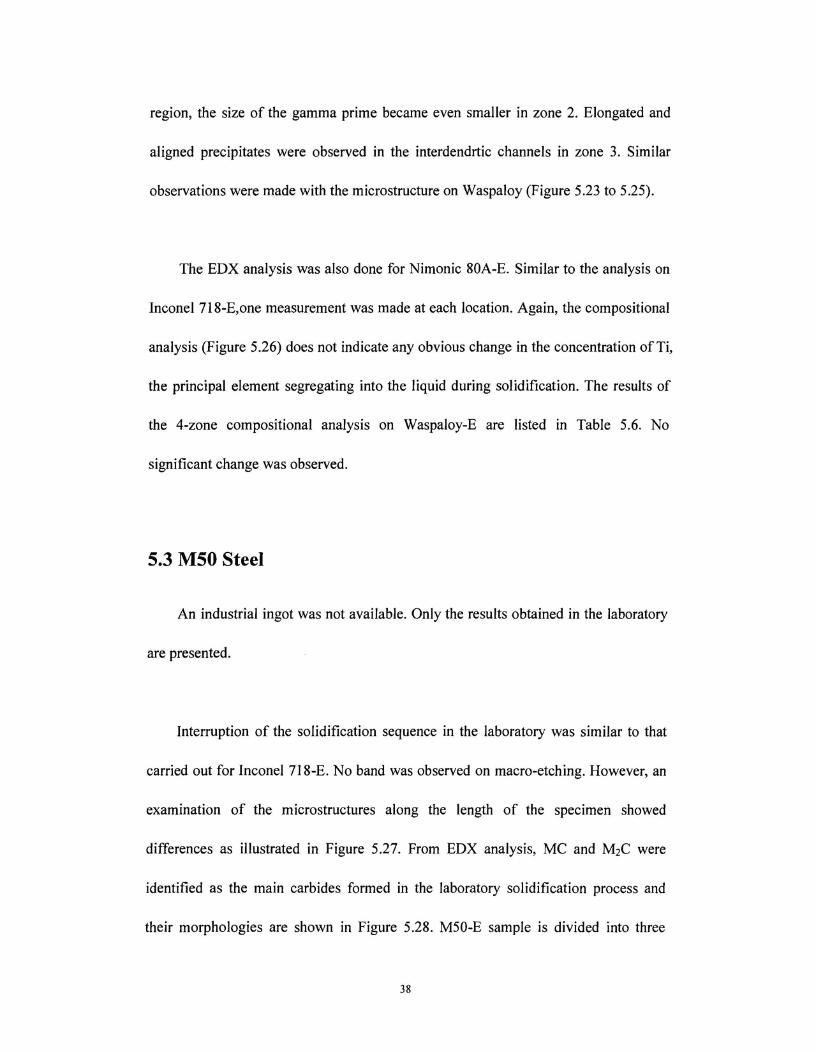
Interruption of the solidification sequence in the laboratory was similar to that
carried out for Inconel 718-E. No band was observed on macro-etching. However, an
examination of the microstructures along the length of the specimen showed
differences as illustrated in Figure 5.27. From EDX analysis, MC and M 2C were
identified as the main carbides formed in the laboratory solidification process and
their morphologies are shown in Figure 5.28. M50-E sample is divided into three
38
zones according to the relative proportion of MC/M 2C as shown in Figures 5.28 to
5.30. It has been found that zone 1 is dominated by MC with a small amount of M 2C,
while in zone 2, more M2C carbides show up. In the last zone, the amount of M 2C
decreased to about the same extent as in zone 1.
The bulk compositional analysis with an area of (1000 X 500) tt1112 is shown in
Figure 5.31. One measurement was made at each location. It indicates that the
composition of vanadium varied with length along the direction of solidification.
From left to right, the bulk compositional analysis started form the bottom to the top
of the sample M50-E. Due to the larger Liquid —Solid temperature difference of M50
relative to superalloys noted earlier, the EDS analysis required covering a greater
distance along the specimen axis. Starting from the bottom of the specimen, the
composition of vanadium decreases somewhat upon entry into the interrupted region.
The decrease of vanadium composition remains until it reaches about 18 mm. After
20 mm the vanadium concentration is restored to that of the bulk material. Possibly a
region which has a higher vanadium concentration than that of the bulk material exists
between 18 mm and 20 mm( indicated by the arrow in Figure 5.30). A concentration
variation in carbon may also exist. However, carbon concentration could not be
measured with EDX.
39
6. Discussion
6.1 Banding in Industrial Ingots
Examination of the industrial Inconel 718 ingot carried out in the present work
shows that large precipitates exist within the bands (Figure 5.2). Moreover, a
composition difference was found between banded and non-banded regions in respect
of Nb content (Table 5.1). This difference, although small, is significant from an
industrial perspective. For Nb contents greater than 5.3 wt%, the homogenization
treatment needed to eliminate Laves phase is not feasible.
The measured composition difference could result from the liquid metal
movement caused by electromagnetic and buoyancy forces in the ingot liquid pool.
Momentum transfer between the bulk liquid and the mushy zone would then cause
segregated liquid to flow through the dendrite network and collect in larger volumes
than the original interdendritic spaces. A locally higher Nb content, formed by this
mechanism has been postulated for the initial stage of freckle formation 57 . There is
general agreement in the literature that the above mechanism represents the initiation
stage of freckle formation in this type of alloy in spite of the fact that model
simulations of the remelting processes consistently show little or no liquid circulation
at the liquidus line. One example of such work applied to the ESR process is shown in
Figures 6.1 and Figure 6.2 58 . It is seen from the figures that the velocity of the fluid
flow in front of the liquidus line reaches zero, indicating the absence of fluid flow at
40
this location. However, in the present work an actual difference in local composition
has been measured (Table 5.1). It is difficult to account for this observation by any
other mechanism than the above and so it is suggested that in industrial Inconel 718,
fluid flow in front of the liquidus line must have taken place. The observation made in
the present work is hence not consistent with the prediction of the models. It is to be
noted that the models assume an axisymmetric 2-D steady state condition for the flow
computation. One reason for the discrepancy noted above could be that instability in
the process temporarily upsets the assumed axisymmetric force distribution and hence
could generate a local flow not predicted in the steady state.
Observation of the delta-phase formed in the heat-treated Inconel 718-E
specimen (Figure 5.16), which has a similar thermal history to the industrial 718 ingot
(Figure 5.2), suggests that the low cooling rate of the industrial "as-cast" Inconel 718
sample is responsible for the observed microstructural difference between these cases
and the as-cast laboratory samples. This inevitable low cooling rate of a large ingot
thus produces a form of heat treatment even when the nominal condition is "as-cast".
Unlike industrial 718, the industrial Waspaloy ingot showed no composition
difference between banded and non-banded regions (Table 5.3). It can be concluded
from this observation that the compositional difference does not necessarily exist in
any banded structure and the existence of this difference is determined by the alloy
type and the process parameters. A difference in microstructures between the banded
41
and non-banded region was found in the industrial Waspaloy specimen. The carbide
precipitates which were found within the banded region (Figure 5.18) did not exist
outside the band (Figure 5.19). This finding agrees with the results acquired from the
laboratory-produced Waspaloy-E specimen (no composition change, but the change
of precipitates).
6.2 Banding in the Laboratory Simulation
For superalloys, based on the data of the temperature and cooling rate during the
ESR and VAR processes (Figure 2.7 and Figure 2.8), we simulated the solidification
of the mid-radius region of a typical industrial ingot. According to the experimental
and modeling results shown in Figure 2.9 and Figure 2.10, our laboratory conditions,
a temperature gradient of 8.6 °C/mm and a cooling rate of 54 °C/min, would result in
a columnar dendrite structure (Figure 2.10) with a primary dendrite spacing of
approximately 100 p.m( Figure 2.9). This was found to be the case in the laboratory
simulation (Section 5.1.2).
According to Kurtz's 59 diagram on single phase solidification morphologies as
shown in Figure 6.3, our experimental conditions would result in equiaxed dendrites
(designated by the arrow), which is different from the results according to
Fernihough's morphology diagram in Figure 2.10 42 . As Fernihough's diagram
predicted, the real solidification morphology is columnar dendrite. Therefore, Kurtz's
diagram is not reliable enough to estimate the solidification morphology.
42
According to the present results from each material ( Inconel 718, Nimonic 80A,
Waspaloy, M50), it is found that the difference between the banded area and the
non-banded area in the laboratory simulation lies in the appearance of precipitates
corresponding to different solidification conditions. The variation in Laves phase size
due to the interruption in solidification (Inconel 718-E, Figures 5.9 to 5.11) can be
explained as follows. The interruption gave the solidified structures in zone 2 (Figure
5.10). The observed zone 2 was completely solidified before remelting occurred.
During the interruption, this region did not undergo melting, but was maintained at a
high temperature in the solid state. That high temperature exposure resulted in a
modification of the structure in which the Laves phase precipitates became smaller in
size. In contrast, zone 3 (Figure 5.11) was partly solidified before the remelting took
place. The lowering of cooling rate during solidification gave increased segregation as
expected, thus giving the Laves phase formers, such as Nb, Cr, Ni, enough time to
collect locally. As noted in Section 5.1.2 the increased proportion of Laves phase
relative to carbides in zone 3 is consistent with this explanation. The greater amount
of carbides in Inconel 718-EQ (Figure 5.13) than Inconel 718-EWQ (Figure 5.14)
indicates that the holding period enhances the nucleation and growth of carbides. The
same hypothesis can be applied to explain the variation of y' phase in Nimonic 80A-E
as well as in Waspaloy-E. In the case of M50 steel, the change of the ratio of
MC/M2C (Figures 5.28 and 5.29) occurred during the interrupted solidification, with a
lower value of MC/M2C in the interrupted region. This effect is partly due to the
43
method of counting the M2C particles metallographically. MC precipitates at a higher
temperature than does M2C 56 and MC is precipitated at a liquid fraction of at least 0.6.
Therefore, the interrupted process does not substantially affect the quantity or size
distribution of MC. In the normal solidification region, most M 2C is of a small size
(small LST value). During the remelting, the secondary arms dissolved thus the
eutectic volume became larger than during normal growth. Therefore, M 2C
precipitates became numerous and larger than in the normal growth region thus
helping to decrease the measured MC/M 2C ratio based on particle counting.
No compositional difference between normal growth and interrupted regions
were observed in the three superalloys examined in the present work (Figure 5.15,
Figure 5.26 and Table 5.3 ). This finding is to be expected in the case of Inconel 718
because the density of the segregated liquid in this material is heavier than in the bulk
liquid due to the segregation of Nb. Therefore, during solidification, the interdendritic
liquid would remain in the interdendritic region thus not causing thermosolutal
convection flow. However, in the case of Nimonic 80A and Waspaloy, due to the
segregation of aluminum and titanium, the interdendritic liquid should become lighter
than the bulk liquid. In the accepted freckle formation theory 57, the creation of a
liquid of a lower density below that of a heavier liquid would set up thermosolutal
convection due to the density difference. In the configuration used in the present
experiments, the dendrite network is formed in a vertical direction and so if there was
significant upward flow of interdendritic liquid during the interruption, the alloy
44
should have shown corresponding observable differences in bulk composition when
the sample was analyzed in the vertical direction i.e. along the sample axis. Such a
difference was not observed. Based on the results from compositional analysis on
Nimonic 80A (Figure 5.26), it is postulated that the reason for the absence of such
flow arises in the relatively small interdendritic spacing. According to Wang's 60 work
on freckle formation mechanism of Nimonic 80A, freckling occurs at a freezing rate
of 0.05 °C/s, but not at 0.3 r /s. The first cooling rate results in a primary dendrite
spacing of about 200/250 pm, the second is 110 pm. The primary dendrite spacing in
our research is in the range of 100 Inn which is not sufficient to permit the fluid flow
according to the theory. Because of the value of kAI and kT, 50 (0.92, 0.69), the main
segregating elements in Nimonic 80A and Waspaloy would not cause severe
segregations. Therefore, the flow would not develop easily in the above two alloys.
For M50 steel, the vanadium composition near the top of the sample (at 18 mm, the
composition peak) is higher than in the interrupted region (Figure 5.31), which
suggests bulk convection flow from the solidifying region driven by the lower density
due to vanadium segregation of the interrupted region. The rejection of vanadium
from the interrupted region also results in more M2C carbides (poor in V) and less
MC carbides (rich in V) in this region.
A model has been proposed by Yang et al 61 to simulate the formation of the
stray grains during the single crystal casting of a nickel-base alloy. The melt-back
process during which the stray grains are often found in single crystal castings is
45
similar to the interrupted solidification process that has been discussed in the current
research. The predicted microstructure during the melt-back of a single crystal seed
under a condition of flat isotherms is shown in Figure 6-4. An initial steady-state
microstructure was produced by simulating for 40 s at a constant pulling velocity. The
melt-back process was then simulated by moving the isotherms downward by 2.25
mm, raising the temperature around the tips of the primaries above their liquidus. The
seed was then held at this temperature for 10 sec. During melt-back, the sharp
curvature of the stems where the secondaries are attached to the primaries melts
before the secondaries themselves, pinching them off from the primaries. And the
cores of primaries are the last to melt. The melt back and pinch-off secondary arms
and their subsequent rotation due to the local fluid flow altered the crystallographic
orientation, resulting in the random stray grains. As the mold withdrawal begins
again, the primaries and pinched-off secondaries ripen and grow. This simulation
given by Yang explains the reason for the existence of stray grains during the
melt-back process and could possibly also account for the equiaxed grains frequently
found in the banding of industrial ingots.
In an industrial process, the fluid flow which is caused by electromagnetic force
and buoyancy force has two effects. First, it causes fluctuations in the thermal field.
This fluctuation results in the supercooling at the solidification front thus enhancing
the possibility of the occurrence of equiaxed grains. Moreover, this flow encourages
the break-off of secondary arms. The broken arms having undergone a change in
46
orientation as a result of the flow become sites for the nucleation of equiaxed grains.
In the lab simulation made in the present work, no equiaxed grains were observed.
This finding has two possible explanations. One possibility is that the thermal field
during the experiment was stable due to the absence of fluid flow. Because of the
small size of the sample and the absence of magnetic stirring, it is unlikely that the
fluid flow will exist during the unidirectional solidification. Another explanation may
be that the secondary dendrites were completely remelted during the interruption thus
being unable to provide the nucleation site.
6.3 Comparison of Industrial and Lab-simulated Banding
The laboratory-produced banded structures are different from those in the
industrial ingots. One of the differences lies in the composition variation of the main
segregating elements which was found in the industrial Inconel 718 but not in the
lab-produced specimens. Another difference lies in the precipitates which are the
main characteristic used to identify banded structures. In the lab-produced banded
Incone 718 sample, only the morphology change of Laves phase can be observed
(Inconel 718-E, Figures 5.9 to 5.11). However, in the industrial Inconel 718 sample,
the big Laves phase precipitates were present within the band but absent outside the
band (Figure 5.3). For lab-produced Waspaloy, the change in the morphology of the
gamma prime phase is the main feature to identify the banded region (Figures 5.23 to
5.25). Whereas, for industrial sample, the existence of carbide precipitates was found
within the band but not outside the band (Figure 5.18, Figure 5.19). This finding
47

indicates the following points. The compositional difference, in other words,
segregation does not necessarily exist in the banded structure. Instead, the
microstructure variation in precipitates is the essential feature of the banding. The
different characteristics of the banded structures between the industrial and the
lab-produced samples is probably due to the more complicated processing and heat
treatment during the real industrial production.
48
7. Conclusion
There are several conclusions which can be made based on the present research
work having been done.
1. The compositional variations observed in the banded region of the industrial
ingot of Inconel 718 were not observed in the interrupted region of any of the
directional solidified samples examined. It is to be concluded that these features arise
in the industrial ingot due to the momentum transfer from the bulk liquid to the
interdendritic zone during the event which produces the banding.
2. The compositional variations measured in the industrial ingot of Inconel 718
indicate movement of the interdendritic liquid to form collections of segregated liquid
which can subsequently be the initiation point for freckle formation. The remelting of
secondary dendrites which was observed in the interrupted region of the DS possibly
changes the permeability of the dendrite mesh.
3. The response of Inconel 718 to interrupted solidification shows primarily in
the morphology and distribution of primary precipitates. The primary carbides are
enlarged and since the eutectic pool size is increased, the eutectic carbides and Laves
phase particles are also enlarged. Due to removal of the secondary dendrite arms, the
49
eutectic regions are elongated in the primary solidification direction. These effects are
to be anticipated due to the holding time in the high temperature region.
4. Similar effects to those described above were found in Nimonic 80A and in
Waspaloy. In these alloys, the affected precipitates are primary gamma prime, which
do not appear to change subsequently in size, but which are aligned in the same
manner as that described above.
5. M50 steel shows some differing characteristics to the superalloys. The
variation in vanadium composition in this steel proved the existence of interdendritic
fluid flow during the interruption, thus resulting in the variation of the MC/M2C ratio.
6. The interruption in solidification condition during a directionally solidification
itself can produce banding. The compositional difference is not necessarily required to
form the banded structure. Instead, the microstructure variation in precipitates is the
essential feature of the banding. The different characteristics of the banded structures
between the industrial and the lab-produced samples is probably due to the more
complicated processing and heat treatment during the real industrial production.
7. The effect of interrupted solidification on mechanical behavior is beyond the
scope of this work. However, it is clear that the changes described above would
influence the materials properties in the interrupted regions. The extent to which the
50

properties would be affected is clearly dependent on the severity of the interruption
and on the alloy grade.
51
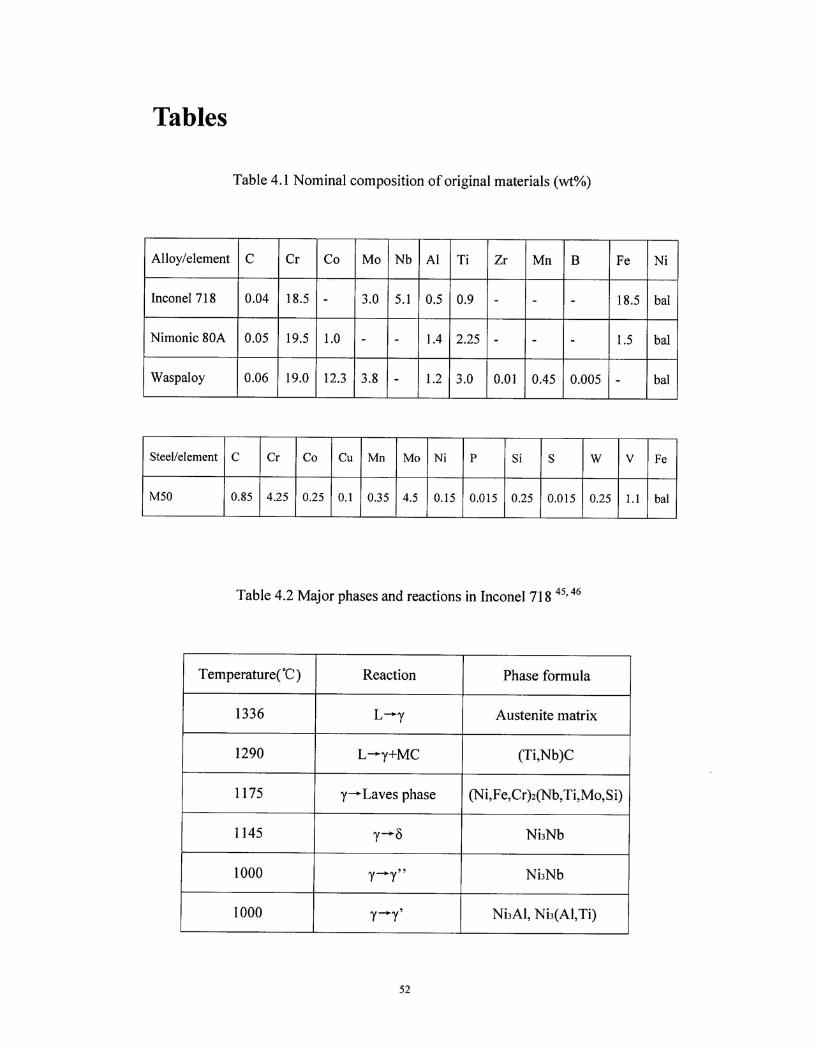
Tables
Table 4.1 Nominal composition of original materials (wt%)
Alloy/element C Cr Co Mo Nb Al Ti Zr Mn B Fe Ni
Inconel 718 0.04 18.5 - 3.0 5.1 0.5 0.9 - - - 18.5 bal
Nimonic 80A 0.05 19.5 1.0 - - 1.4 2.25 - - - 1.5 bal
Waspaloy 0.06 19.0 12.3 3.8 - 1.2 3.0 0.01 0.45 0.005 - bal
Steel/element C Cr Co Cu Mn Mo Ni P Si S W V Fe
M50 0.85 4.25 0.25 0.1 0.35 4.5 0.15 0.015 0.25 0.015 0.25 1.1 bal
Table 4.2 Major phases and reactions in Inconel 718 45 ' 46
Temperature(°C) Reaction Phase formula
1336 L-.-y Austenite matrix
1290 L---►y+MC (Ti,Nb)C
1175 y-Laves phase (Ni,Fe,Cr)2(Nb,Ti,Mo,Si)
1145 'Y'S Ni3Nb
1000 Y►Y" Ni3Nb
1000 7►7' Ni3A1, Ni3(A1,Ti)
52
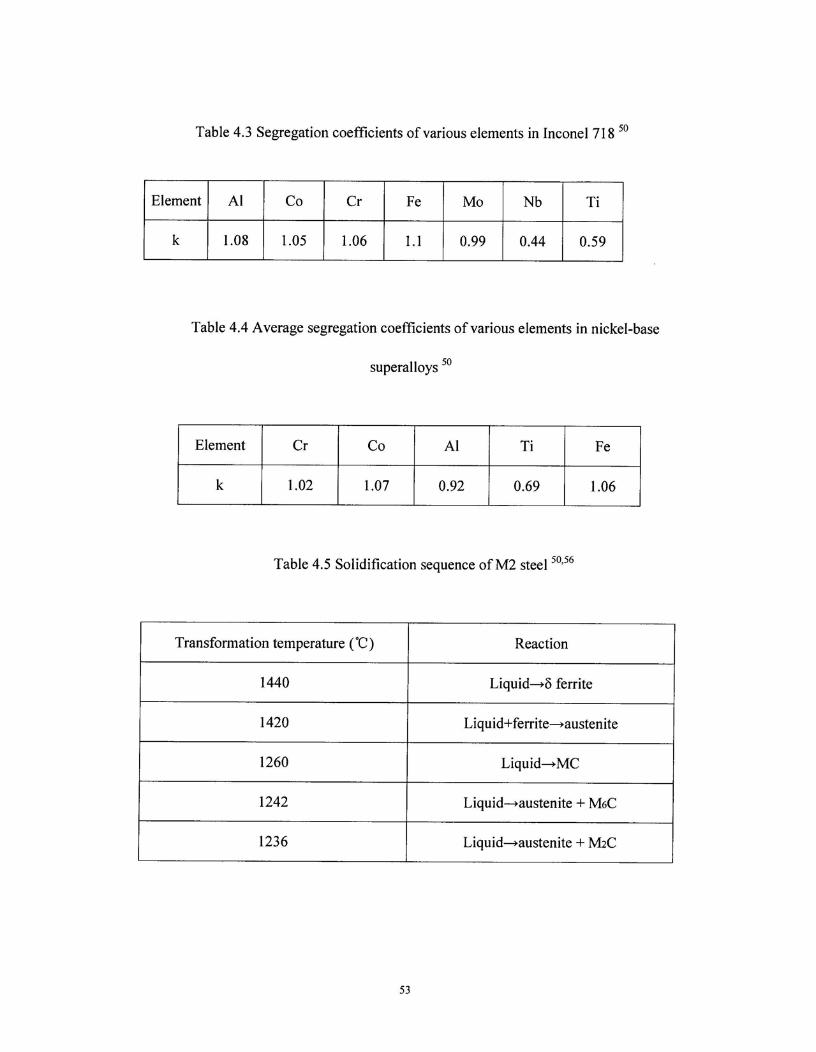
Table 4.3 Segregation coefficients of various elements in Inconel 718 50
Element Al Co Cr Fe Mo Nb Ti
k 1.08 1.05 1.06 1.1 0.99 0.44 0.59
Table 4.4 Average segregation coefficients of various elements in nickel-base
superalloys 50
Element Cr Co Al Ti Fe
k 1.02 1.07 0.92 0.69 1.06
Table 4.5 Solidification sequence of M2 steel 50,56
Transformation temperature (°C) Reaction
1440 Liquid—>8 ferrite
1420 Liquid+feffite—>austenite
1260 Liquid—*MC
1242 Liquid--*austenite + M6C
1236 Liquid--*austenite + M2C
53
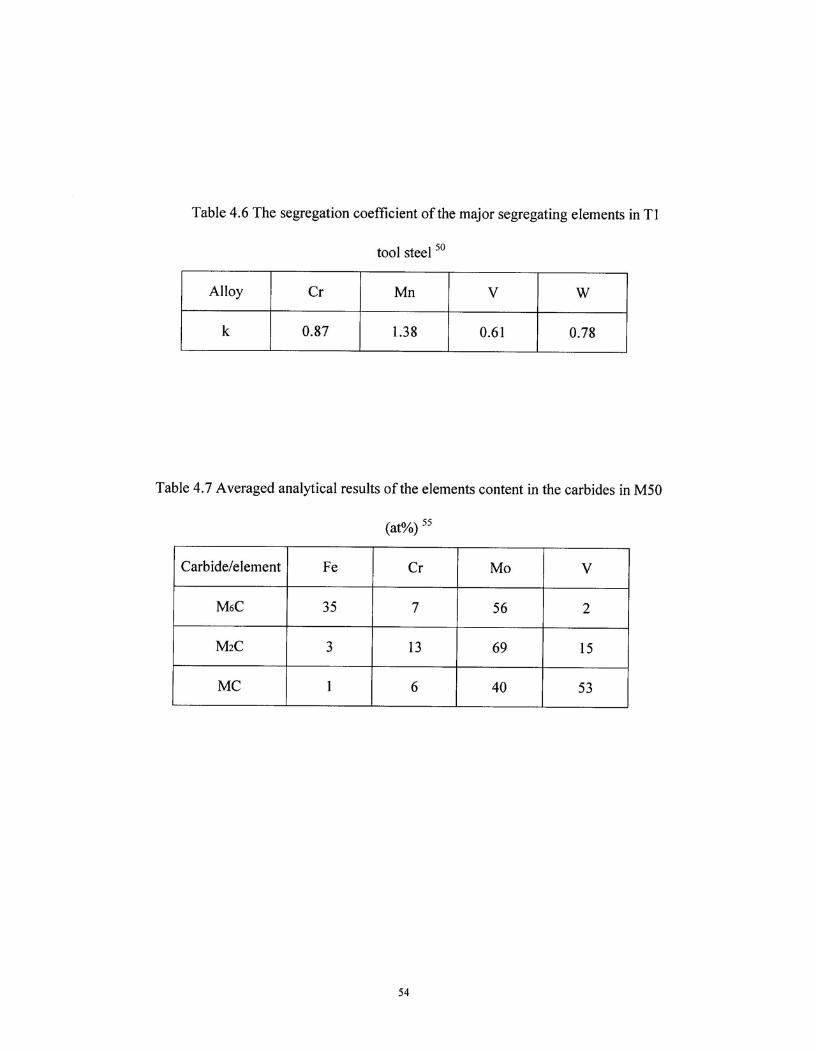
Table 4.6 The segregation coefficient of the major segregating elements in Ti
tool steel 50
Alloy Cr Mn V W
k 0.87 1.38 0.61 0.78
Table 4.7 Averaged analytical results of the elements content in the carbides in M50
(at%) 55
Carbide/element Fe Cr Mo V
M6C 35 7 56 2
M2C 3 13 69 15
MC 1 6 40 53
54
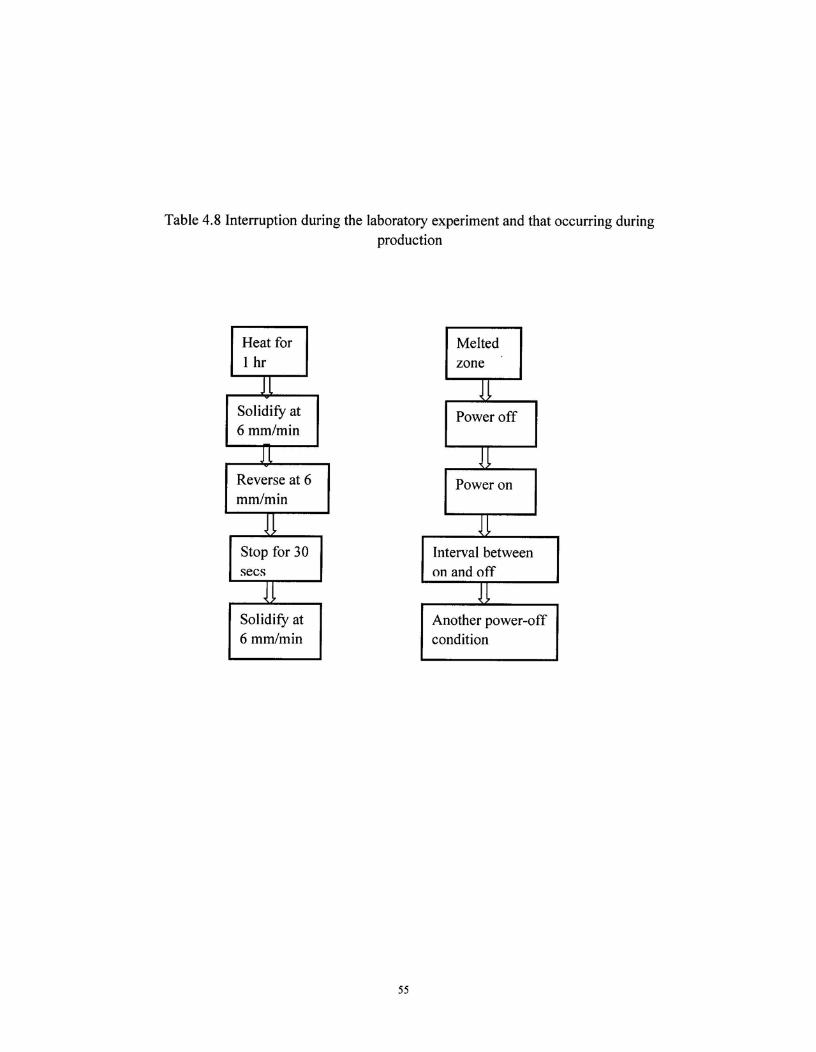
Heat for1 hr
4Solidify at6 mm/min
Reverse at 6mm/min
11Stop for 30secs
itSolidify at6 mm/min
Table 4.8 Interruption during the laboratory experiment and that occurring duringproduction
Meltedzone
11Power off
11Power on
Interval betweenon and off
11
Another power-offcondition
55
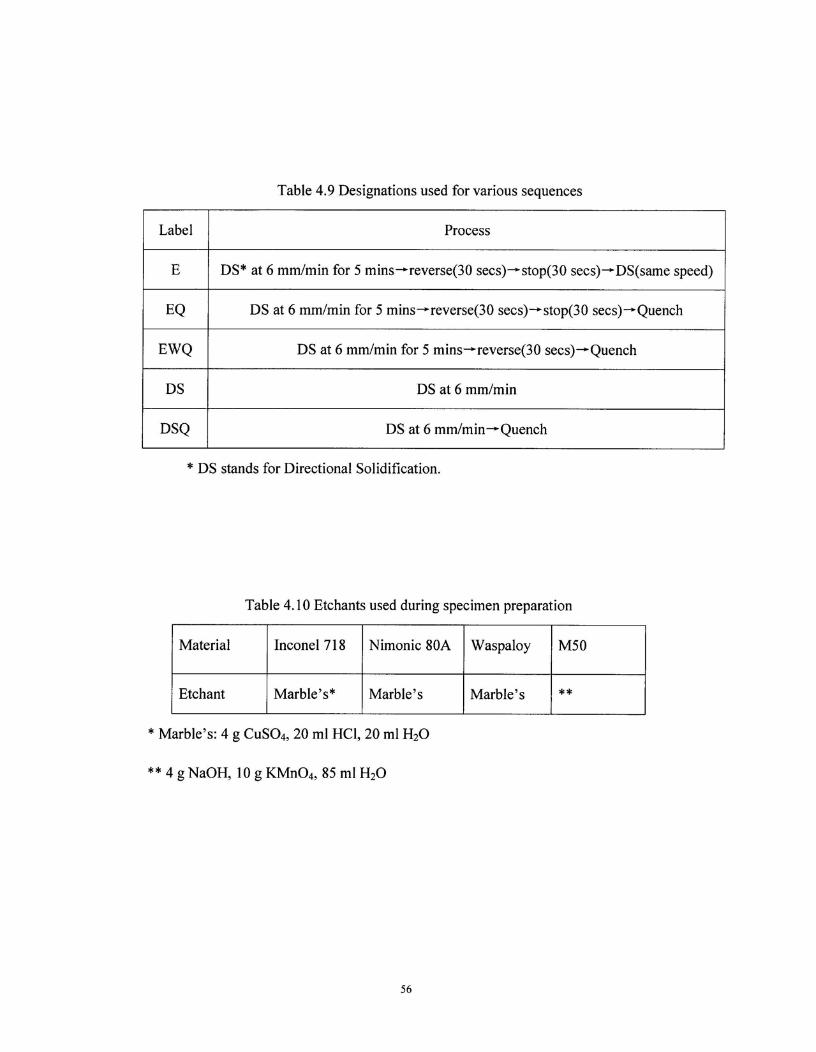
* DS stands for Directional Solidification.
Table 4.10 Etchants used during specimen preparation
* Marble's: 4 g CuSO4, 20 ml HC1, 20 ml H2O
Material Inconel 718 Nimonic 80A Waspaloy M50
Etchant Marble's* Marble's Marble's **
Table 4.9 Designations used for various sequences
Label Process
E DS* at 6 mm/min for 5 minsreverse(30 secs)—stop(30 secs)—DS(same speed)
EQ DS at 6 mm/min for 5 mins—reverse(30 secs)—, stop(30 secs)—Quench
EWQ DS at 6 mm/min for 5 mins—.reverse(30 secs)—Quench
DS DS at 6 mm/min
DSQ DS at 6 mm/min—Quench
** 4 g NaOH, 10 g KMnO 4, 85 ml H2O
56
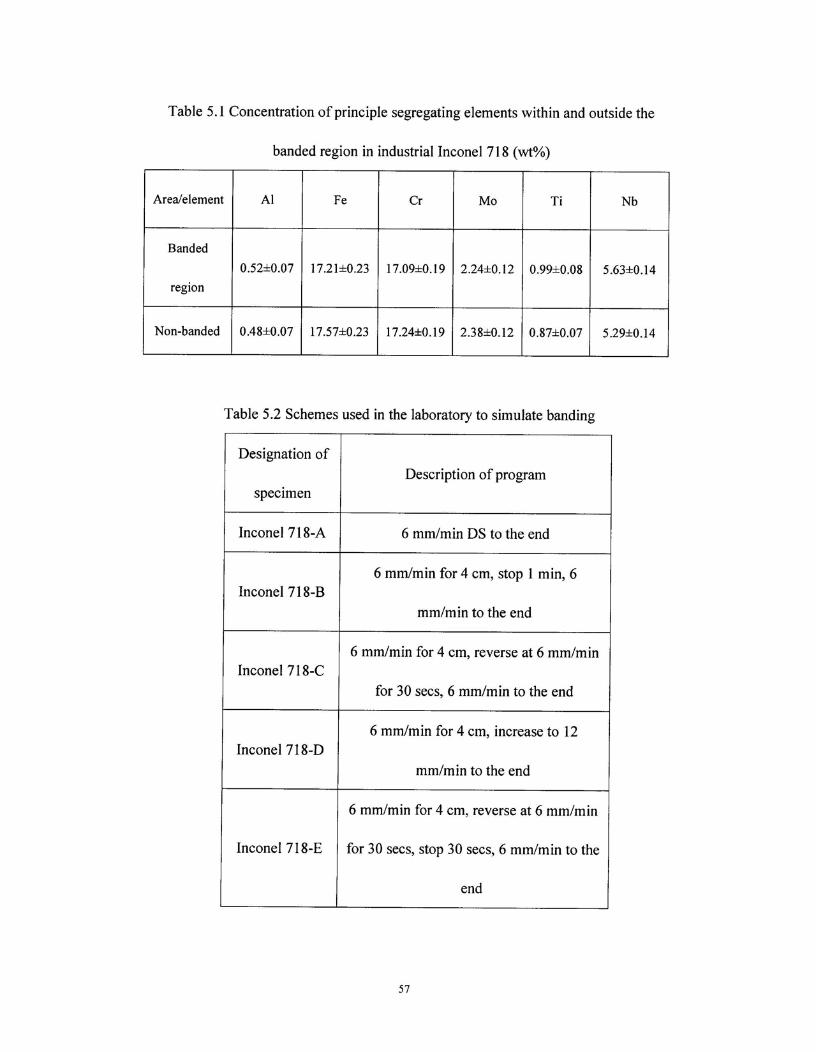
Table 5.1 Concentration of principle segregating elements within and outside the
banded region in industrial Inconel 718 (wt%)
Area/element Al Fe Cr Mo Ti Nb
Banded
region0.52±0.07 17.21±0.23 17.09±0.19 2.24±0.12 0.99±0.08 5.63±0.14
Non-banded 0.48±0.07 17.57±0.23 17.24±0.19 2.38±0.12 0.87±0.07 5.29±0.14
Table 5.2 Schemes used in the laboratory to simulate banding
Designation of
specimenDescription of program
Inconel 718-A 6 mm/min DS to the end
Inconel 718-B6 mm/min for 4 cm, stop 1 min, 6
mm/min to the end
Inconel 718-C6 mm/min for 4 cm, reverse at 6 mm/min
for 30 secs, 6 mm/min to the end
Inconel 718-D6 mm/min for 4 cm, increase to 12
mm/min to the end
Inconel 718-E
6 mm/min for 4 cm, reverse at 6 mm/min
for 30 secs, stop 30 secs, 6 mm/min to the
end
57
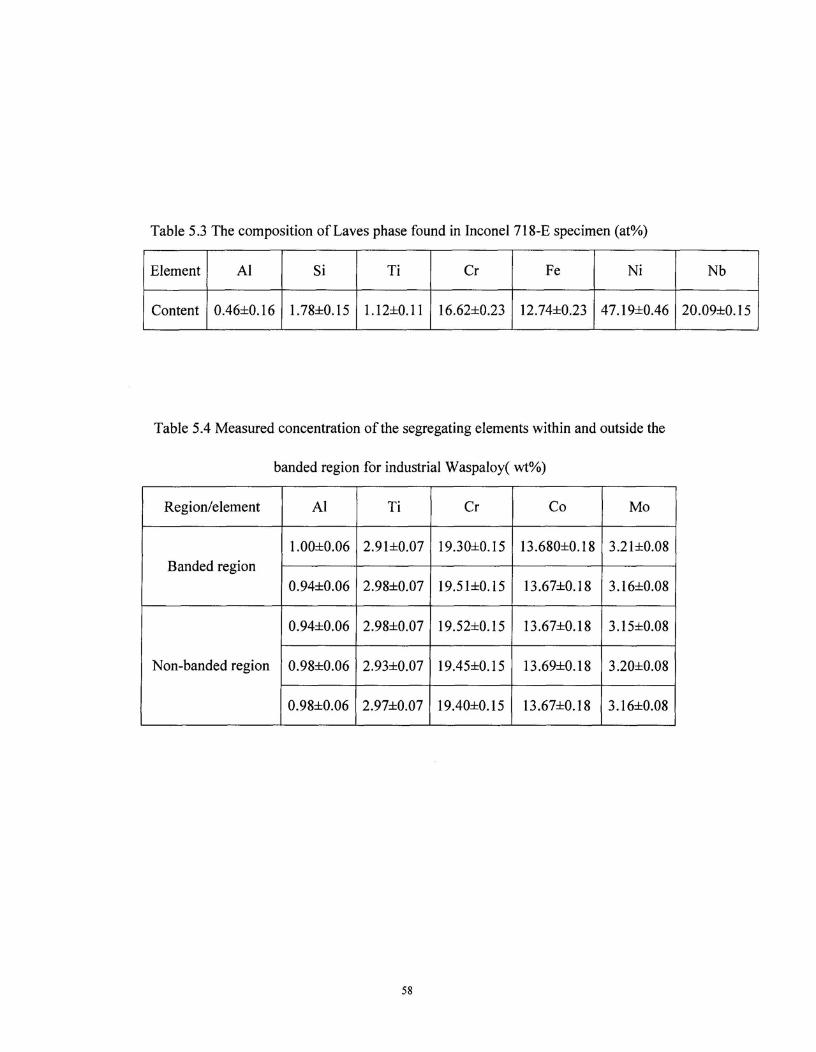
Table 5.3 The composition of Laves phase found in Inconel 718-E specimen (at%)
Element Al Si Ti Cr Fe Ni Nb
Content 0.46+0.16 1.78+0.15 1.12+0.11 16.62+0.23 12.74+0.23 47.19+0.46 20.09±0.15
Table 5.4 Measured concentration of the segregating elements within and outside the
banded region for industrial Waspaloy( wt%)
Region/element Al Ti Cr Co Mo
Banded region1.00+0.06 2.91+0.07 19.30+0.15 13.680+0.18 3.21+0.08
0.94+0.06 2.98+0.07 19.51+0.15 13.67+0.18 3.16+0.08
Non-banded region
0.94+0.06 2.98+0.07 19.52+0.15 13.67+0.18 3.15+0.08
0.98+0.06 2.93+0.07 19.45+0.15 13.69+0.18 3.20+0.08
0.98+0.06 2.97+0.07 19.40+0.15 13.67+0.18 3.16+0.08
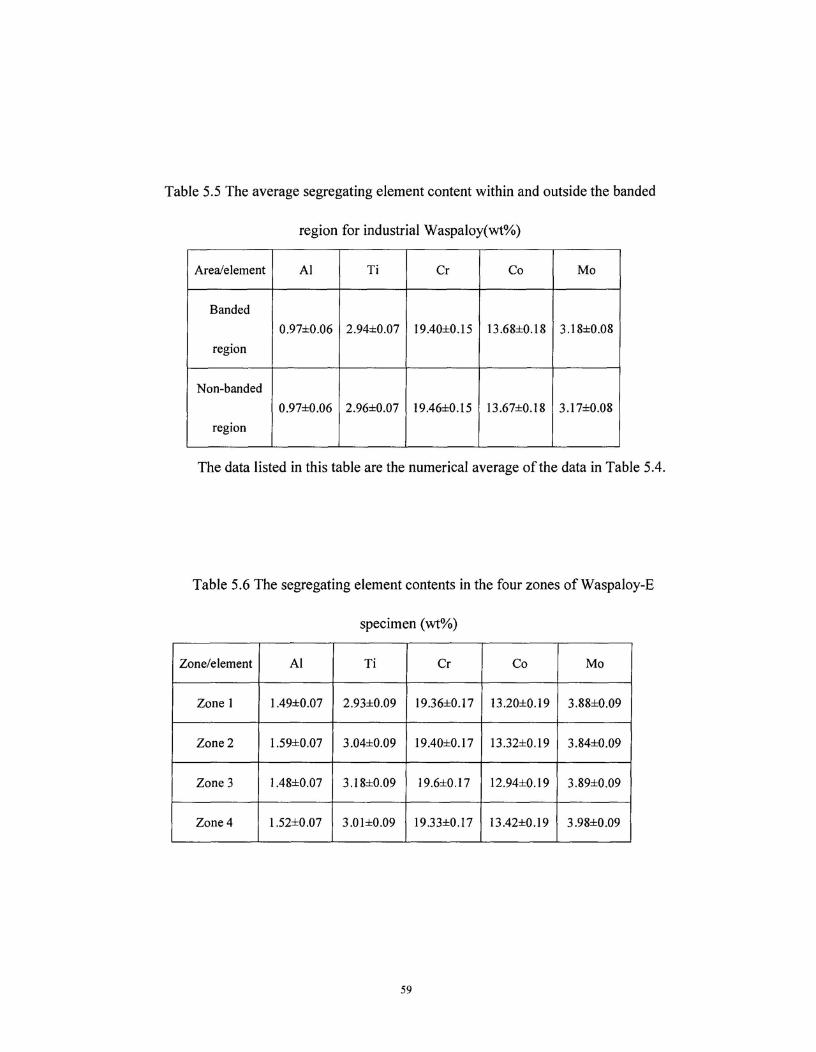
Table 5.5 The average segregating element content within and outside the banded
region for industrial Waspaloy(wt%)
Area/element Al Ti Cr Co Mo
Banded
region0.97±0.06 2.94±0.07 19.40±0.15 13.68±0.18 3.18±0.08
Non-banded
region0.97±0.06 2.96±0.07 19.46±0.15 13.67±0.18 3.17±0.08
The data listed in this table are the numerical average of the data in Table 5.4.
Table 5.6 The segregating element contents in the four zones of Waspaloy-E
specimen (wt%)
Zone/element Al Ti Cr Co Mo
Zone 1 1.49±0.07 2.93±0.09 19.36±0.17 13.20±0.19 3.88±0.09
Zone 2 1.59±0.07 3.04±0.09 19.40±0.17 13.32±0.19 3.84±0.09
Zone 3 1.48±0.07 3.18±0.09 19.6±0.17 12.94±0.19 3.89±0.09
Zone 4 1.52±0.07 3.01±0.09 19.33±0.17 13.42±0.19 3.98±0.09
59
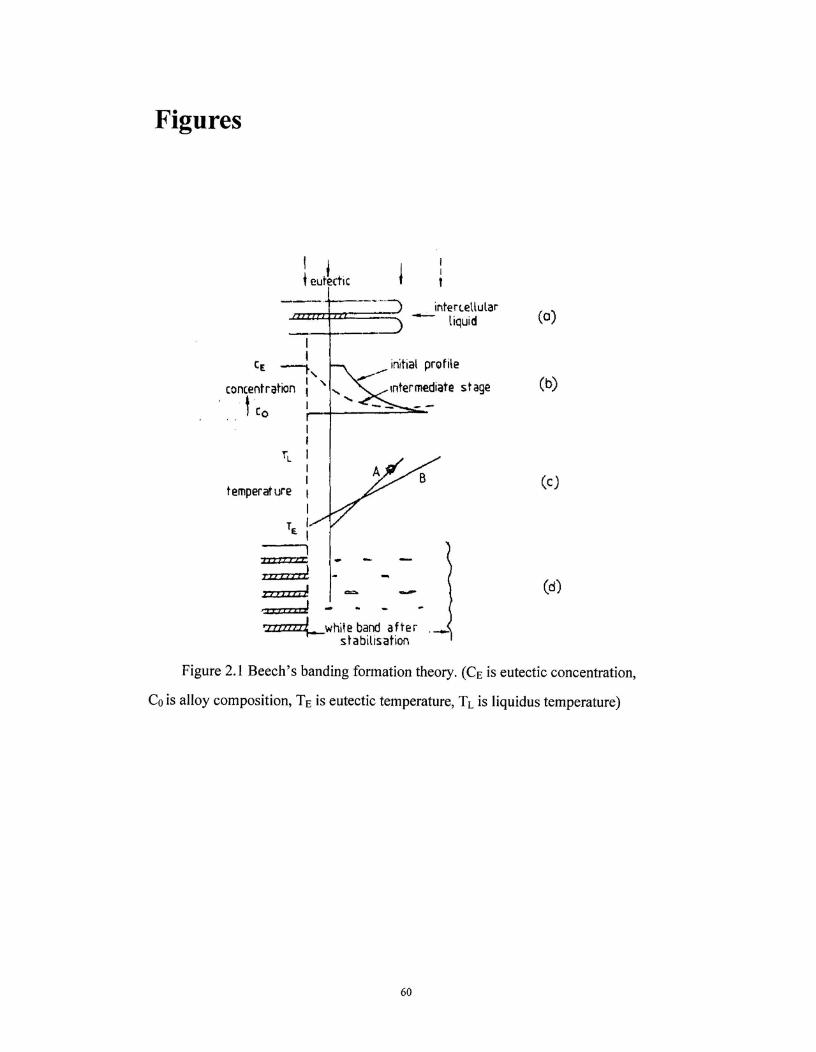
1eutectic 1^,
intercellularliquid^(a)
C E
concentration ;
co
temperature
TE I
(c)
====^— -__2:=7:2 -
.EZZ=J^==.^.......
'2===z4 -t•2272=__white band after
stabilisation
(d)
initial profile
Intermediate stage^(b)
Figures
Figure 2.1 Beech's banding formation theory. (CE is eutectic concentration,
Co is alloy composition, TE is eutectic temperature, T L is liquidus temperature)
60
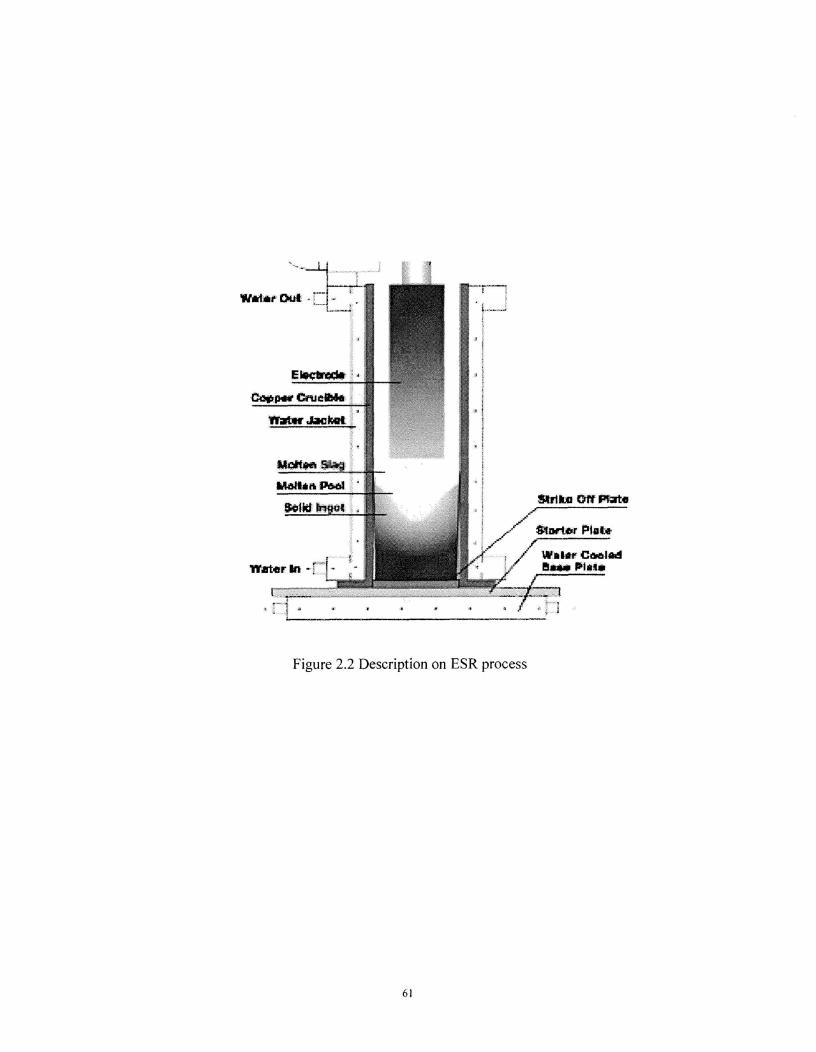
Figure 2.2 Description on ESR process
61
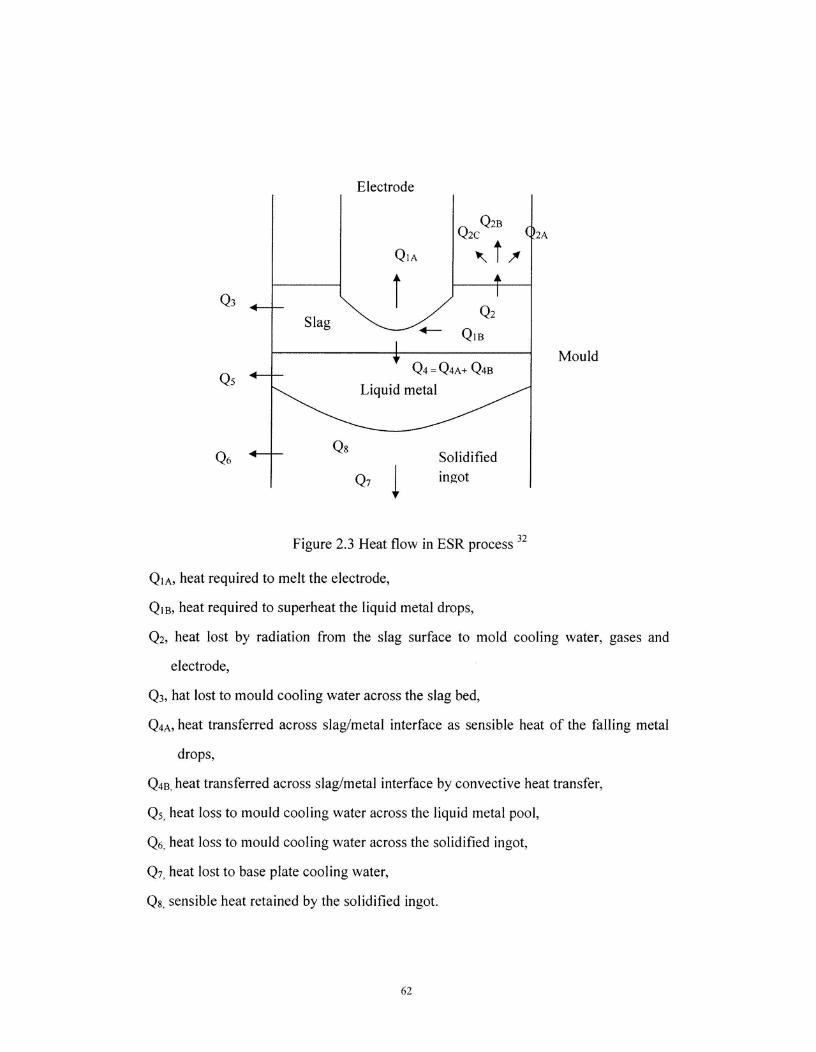
Electrode
QIA
Q2CQ2B
Q2A
I
Slag Q2
QIB
Mould
SolidifiedQ7^ingot
Figure 2.3 Heat flow in ESR process 32
QIA, heat required to melt the electrode,
QIB, heat required to superheat the liquid metal drops,
Q2, heat lost by radiation from the slag surface to mold cooling water, gases and
electrode,
Q, hat lost to mould cooling water across the slag bed,
Q4A, heat transferred across slag/metal interface as sensible heat of the falling metal
drops,
Q4B, heat transferred across slag/metal interface by convective heat transfer,
Q5,heat loss to mould cooling water across the liquid metal pool,
Q6,heat loss to mould cooling water across the solidified ingot,
Q7,heat lost to base plate cooling water,
Q8,sensible heat retained by the solidified ingot.
Q5 1
Q6^Q8
Q4 =Q4A+ Q4B
Liquid metal
62
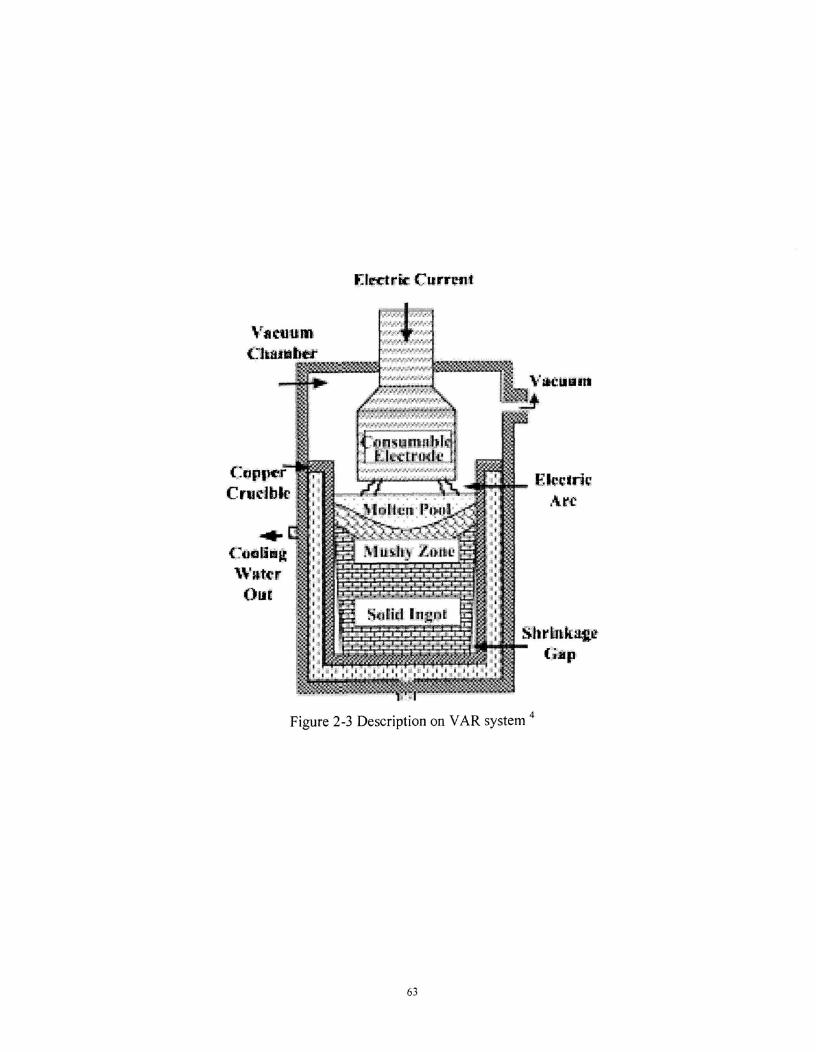
Etrctric ritnrrini
Vitt um
irrsidn1:11)k,1 ,..ctrRIc
C:upiplurCrucible
ric
'14**COO E IS g
'Ir"4° tbt4 rOur
[(Pi I^1111-il I
1, 1 11 sir^/.^u
1 , 1
SI rink:MtGap
'
Figure 2-3 Description on VAR system 4
•..
63
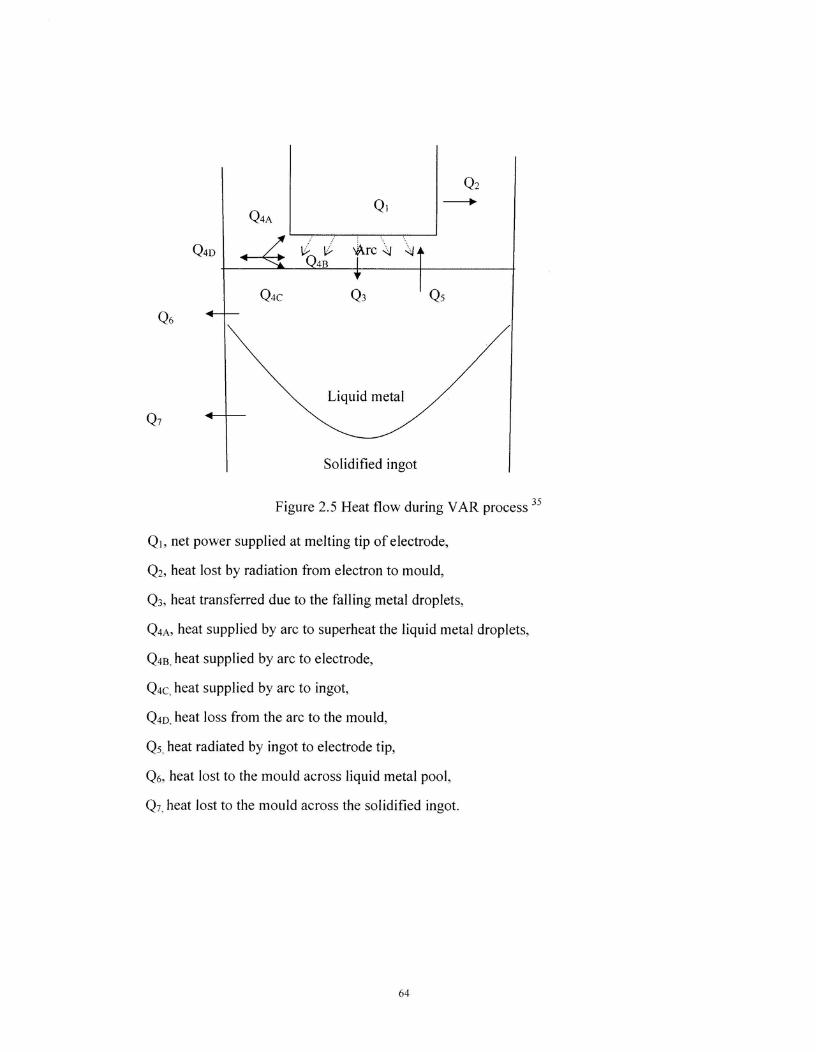
Solidified ingot
Figure 2.5 Heat flow during VAR process 35
Q i , net power supplied at melting tip of electrode,
Q2, heat lost by radiation from electron to mould,
Q3, heat transferred due to the falling metal droplets,
Q4A, heat supplied by arc to superheat the liquid metal droplets,
Q4B, heat supplied by arc to electrode,
Q4C, heat supplied by arc to ingot,
Q4D, heat loss from the arc to the mould,
Q5 heat radiated by ingot to electrode tip,
Q6, heat lost to the mould across liquid metal pool,
Q7,heat lost to the mould across the solidified ingot.
Q7
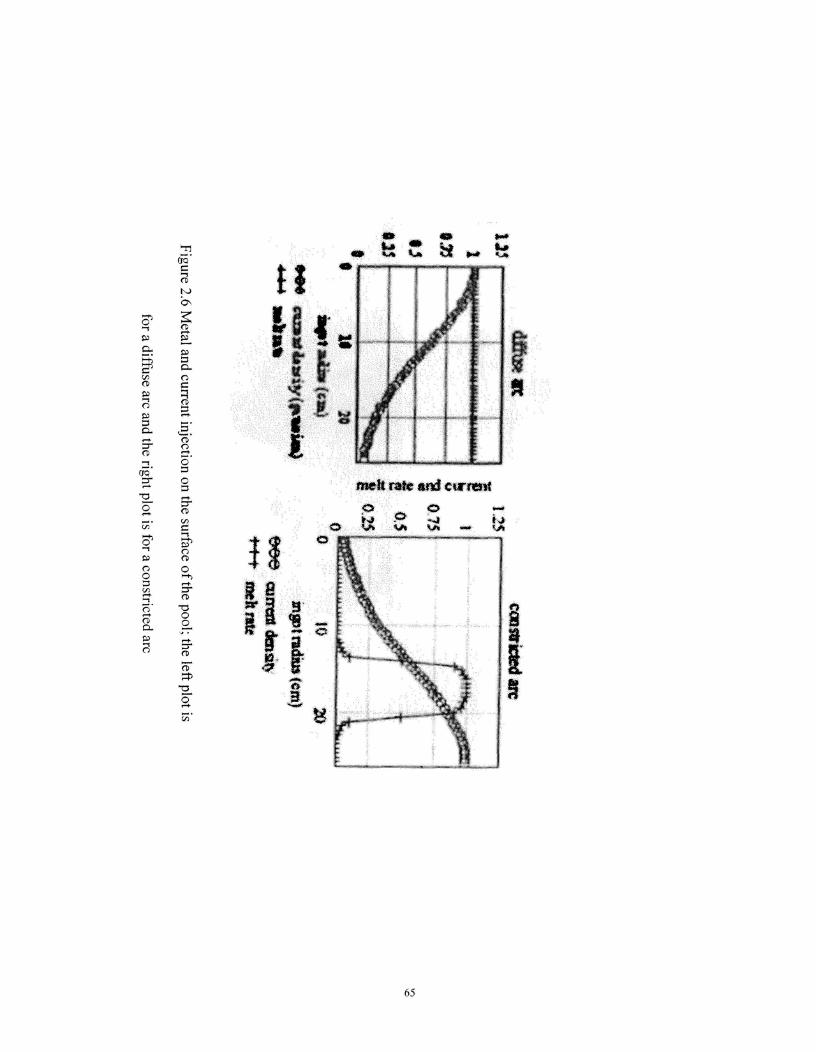
IMP^I.^Iwo,,ha-^Lira., IL^^■-•
I I
Ca
3
melt rate and current
01t4^5:1'^-40 V. tit
0 (I
icm
I
65
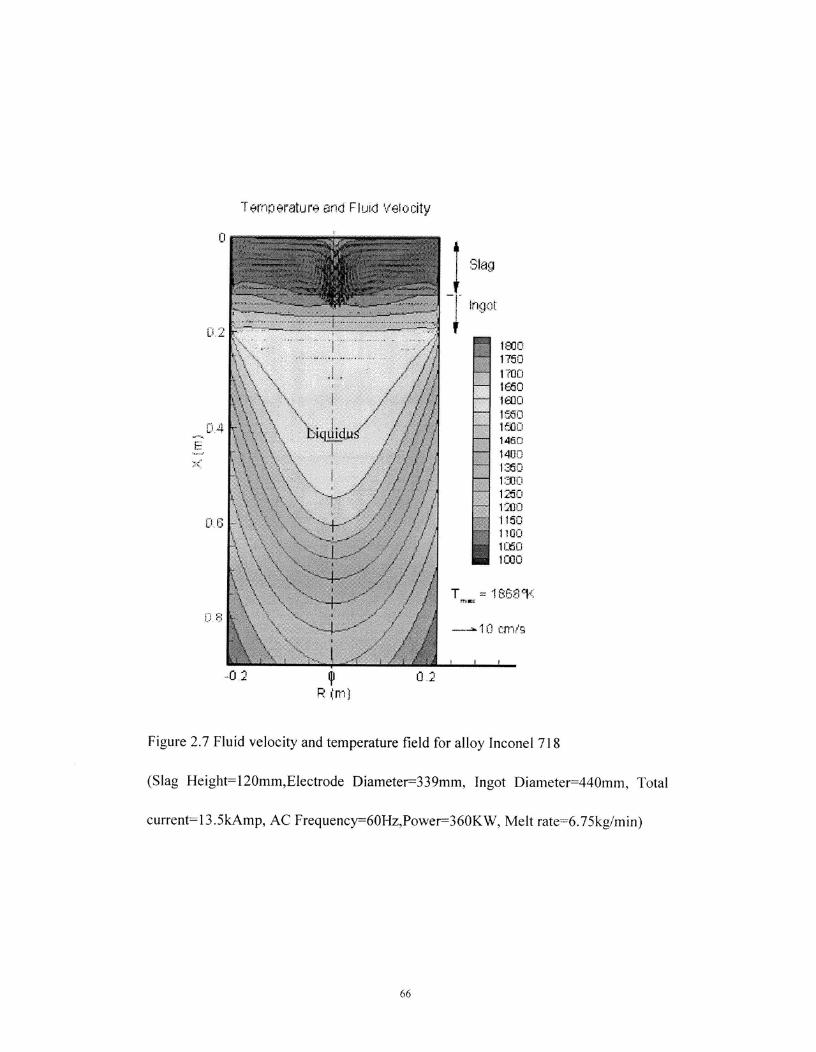
.H'ature grid Flu,.i Velocity
193017501 MO105010:101'7,501t001460140012501C1301 250111301150110011_601cco
-0.2^ 0.2P
Figure 2.7 Fluid velocity and temperature field for alloy Inconel 718
(Slag Height=120mm,Electrode Diameter=339mm, Ingot Diameter=440mm, Total
current=13.5kAmp, AC Frequency=60Hz,Power=360KW, Melt rate=6.75kg/min)
66
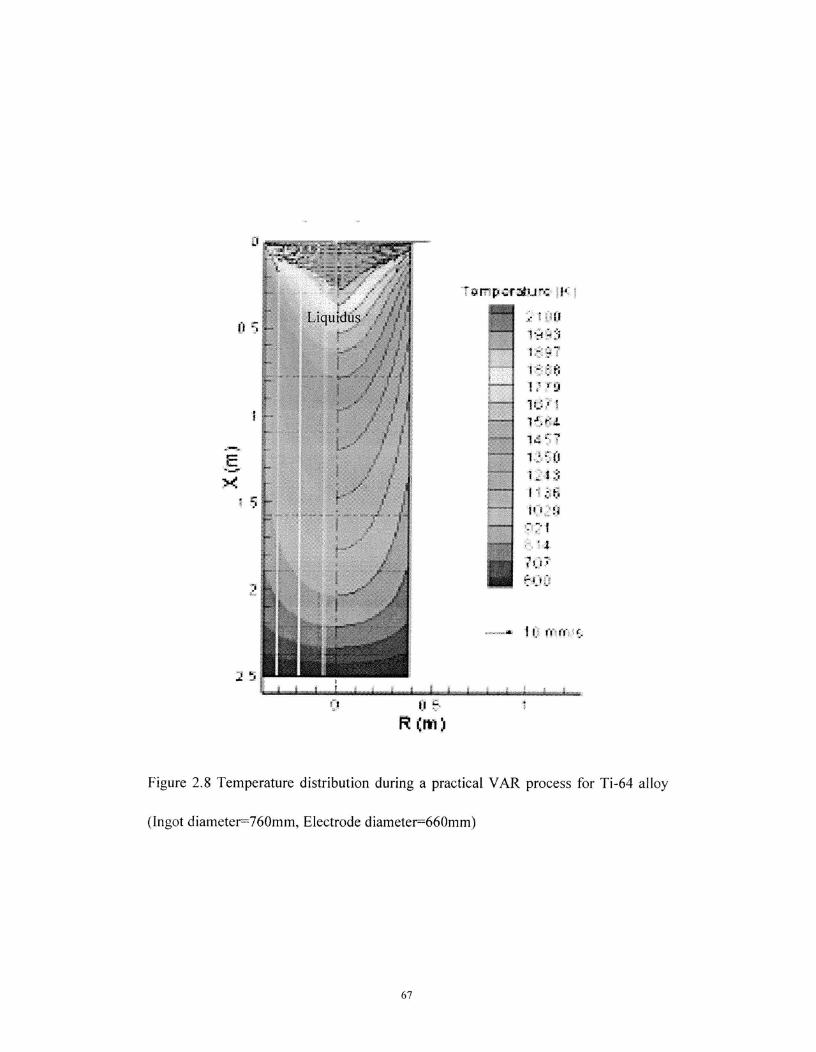
(
t=,14Z Om)
Figure 2.8 Temperature distribution during a practical VAR process for Ti-64 alloy
(Ingot diameter=760mm, Electrode diameter=660mm)
67
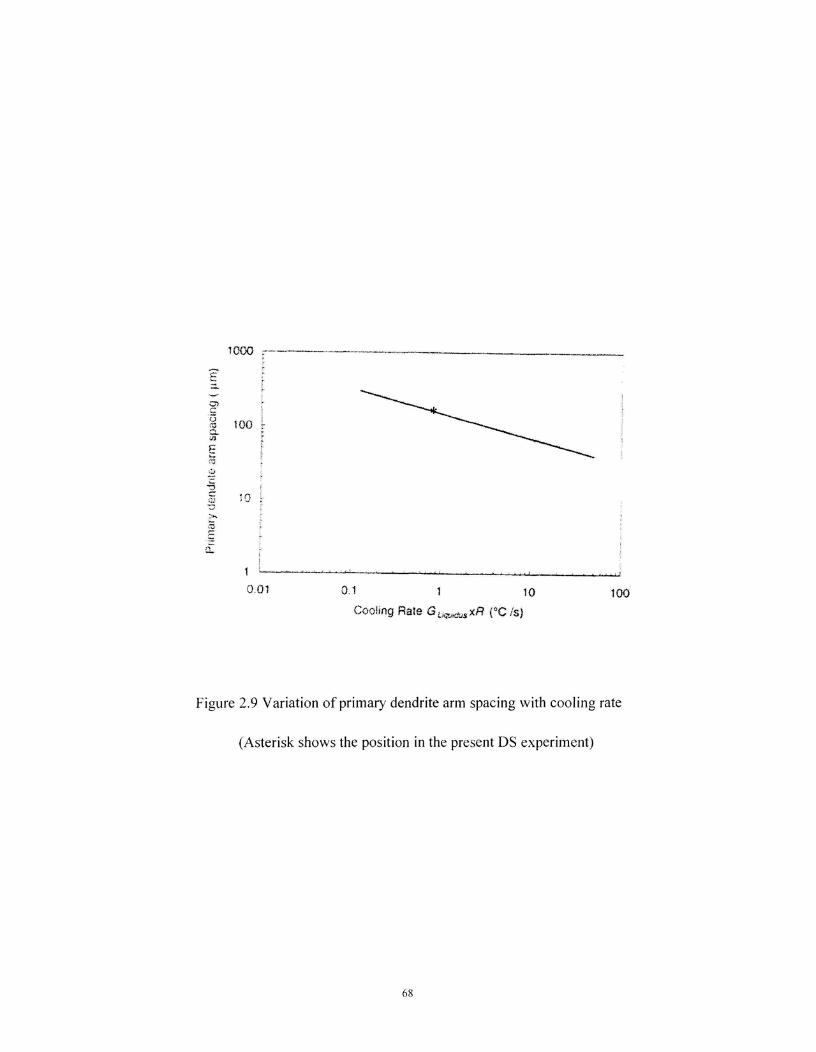
100
0-01^0 1^1^10^100Coo!mg Rate^°C Is)
Figure 2.9 Variation of primary dendrite arm spacing with cooling rate
(Asterisk shows the position in the present DS experiment)
68
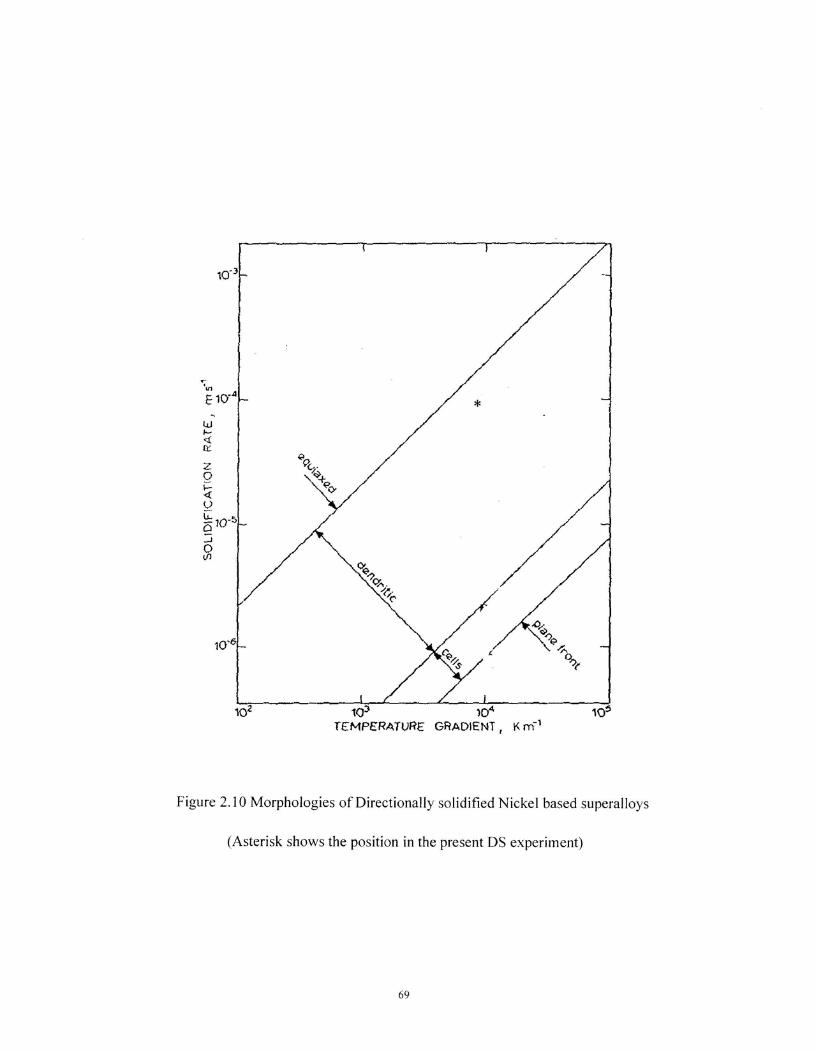
102 10)^)Q4TEMPERATURE GRADIENT K r6-1
Figure 2.10 Morphologies of Directionally solidified Nickel based superalloys
(Asterisk shows the position in the present DS experiment)
6 9
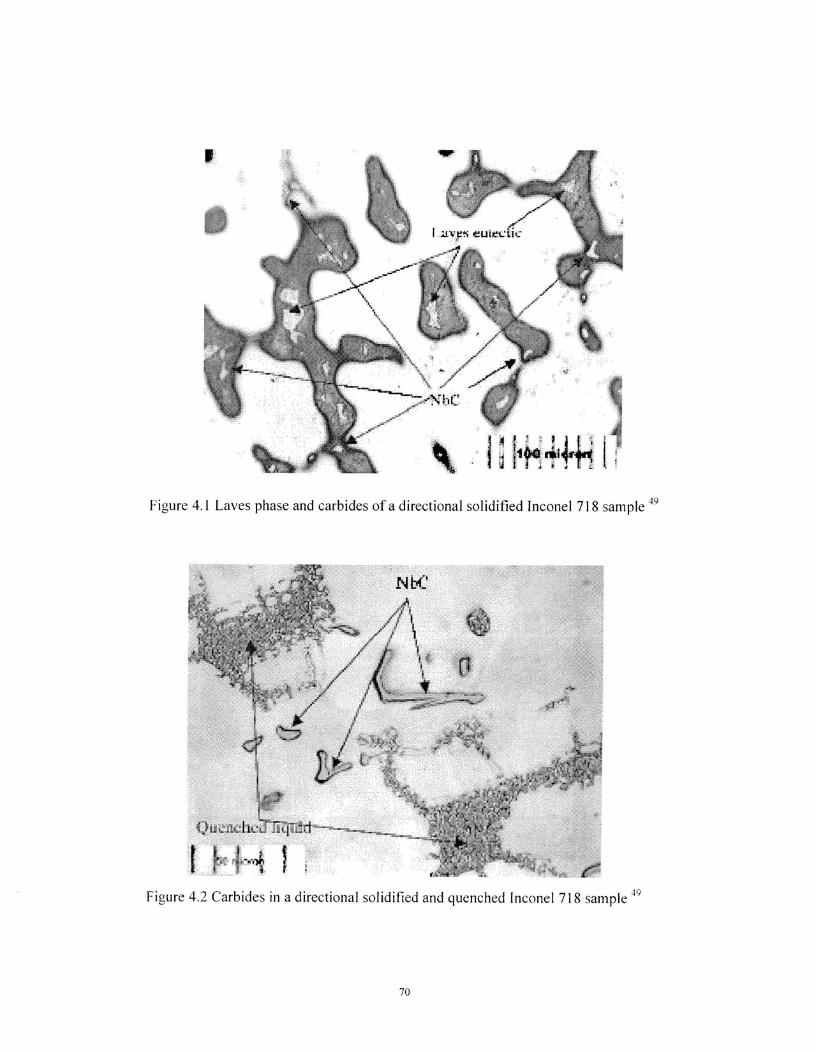
Figure 4.1 Laves phase and carbides of a directional solidified Inconel 718 sample 49
Figure 4.2 Carbides in a directional solidified and quenched Inconel 718 sample 49
70
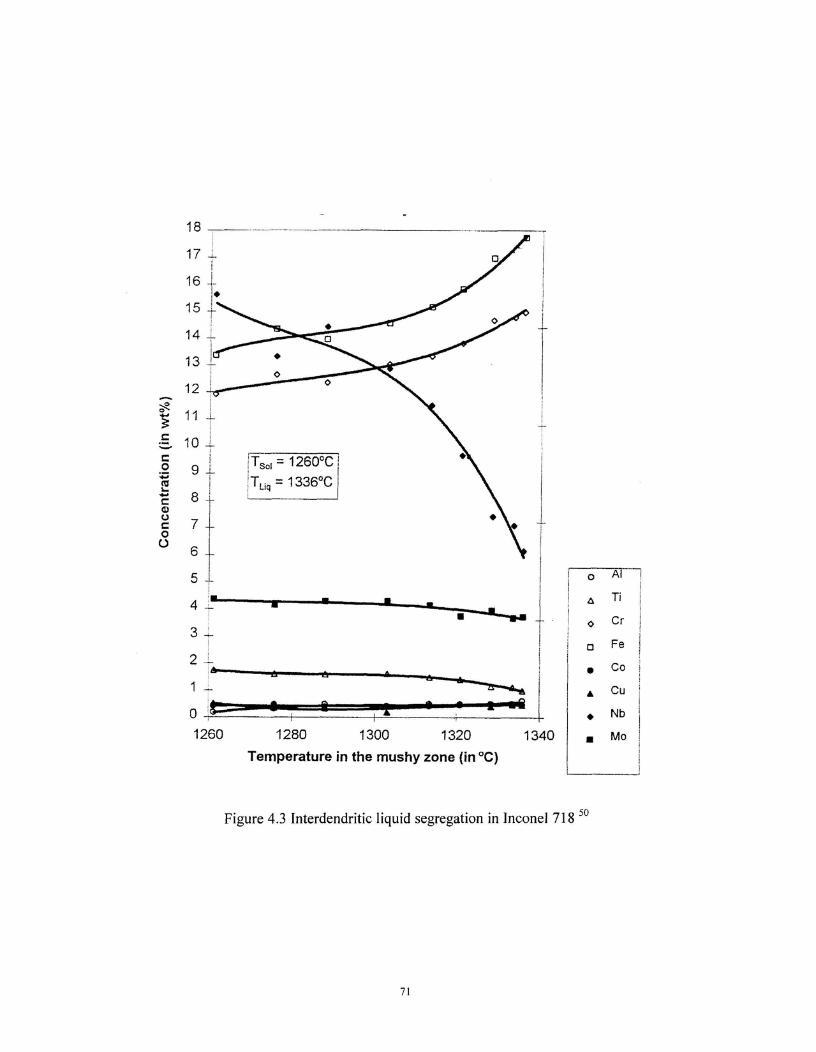
•••••••
O
,arar•
18 ^
17 _
16 1_
15
14
13
12
11 4_
10o0 9^l' T$0 = 1260°C
...«.;^IIar^I^' T Li 4 = 1336°C,...^,'5^8 '
70
6
5,
4
3
2 —
1 -0 t==21.1"e•u1==fil--a•rg""'"e'""'4a■ew.IPfi
1260^1280^1300^1320^1340Temperature in the mushy zone (in °C)
o Al 7A Ti
o Cr
o Fe
• Co
• Cu1
♦ Nb
• Mo
Figure 4.3 Interdendritic liquid segregation in Inconel 718 5°
71
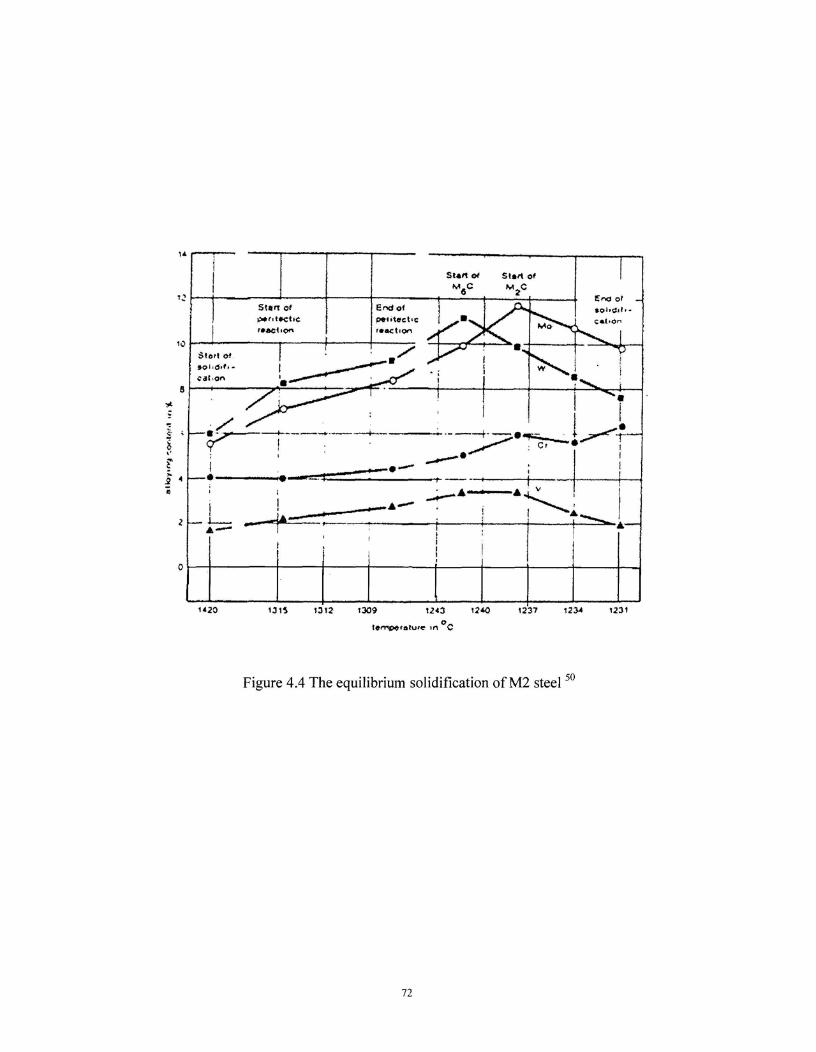
1420^1315^1312^t309^1243
teenperatute .11 °C
1237^1234^1231
Figure 4.4 The equilibrium solidification of M2 steel 50
72
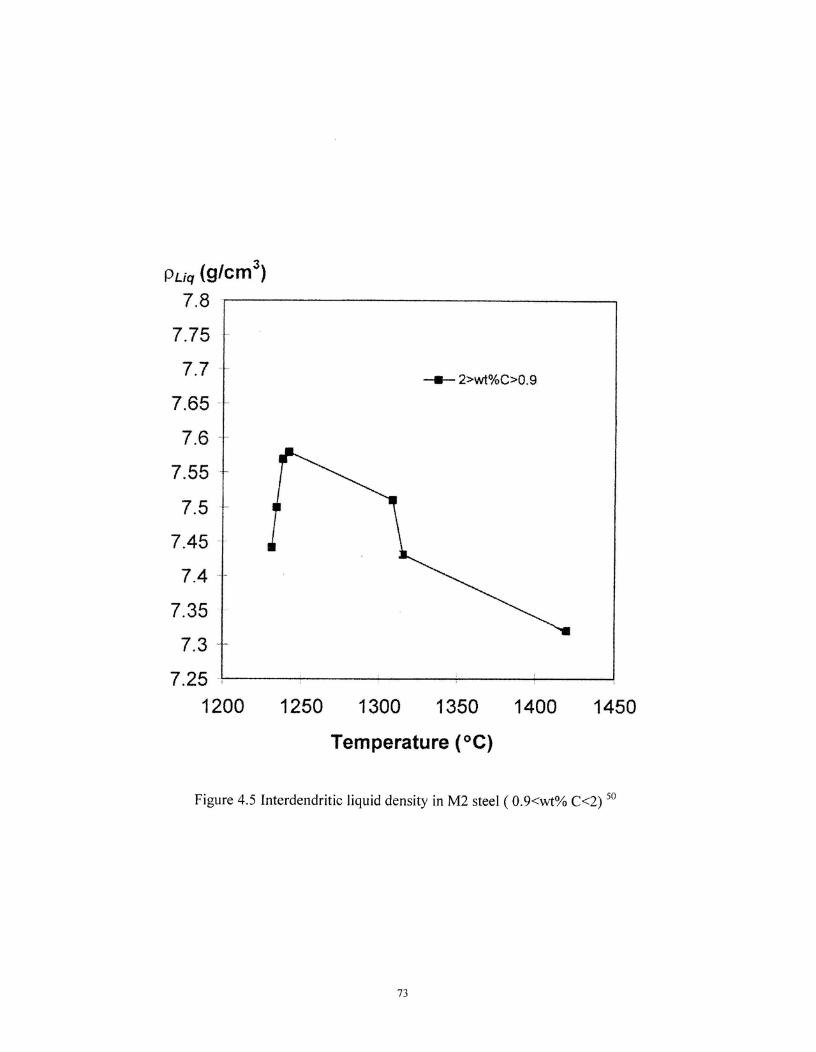
Pug (g/cm 3 )7.8
7.75
7.7
7.65
7.6
7.55
7.5
7.45
7.4
7.35
7.3
7.251200 1250
^1300^1350^1400
^1450
--a— 2>wt%C>0.9
Temperature (°C)
Figure 4.5 Interdendritic liquid density in M2 steel ( 0.9<wt% C<2) 5°
73
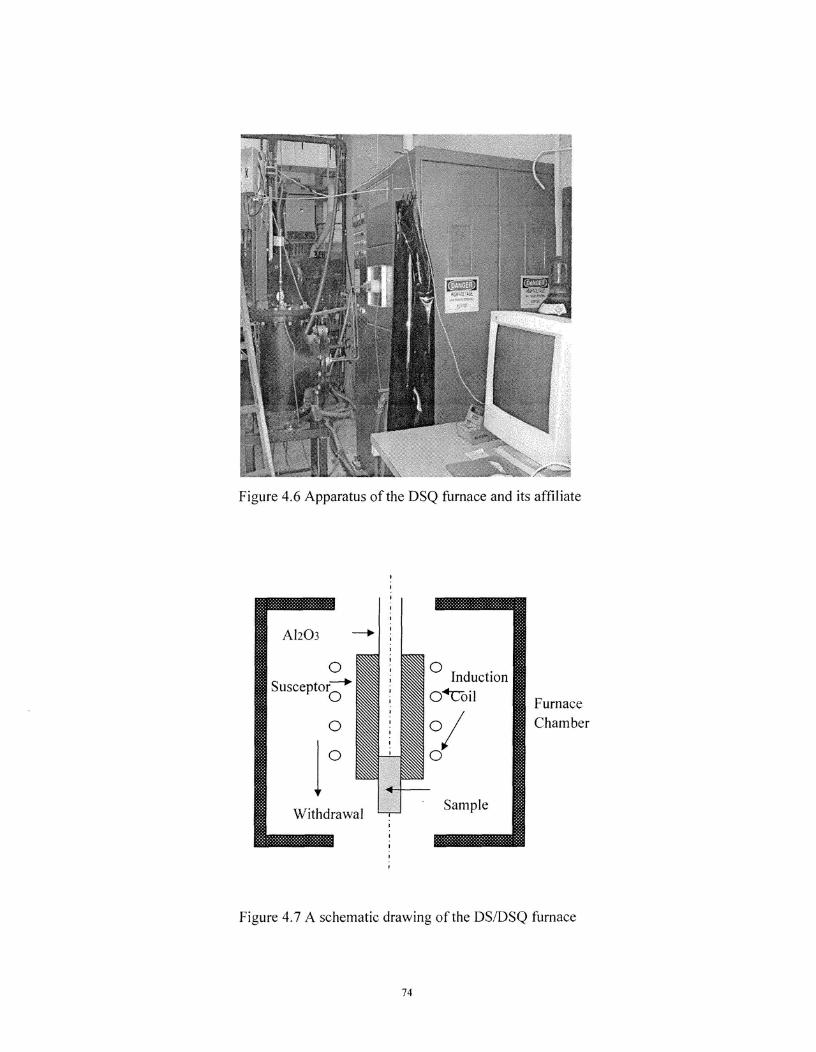
0Susceptor-1"
0
0FurnaceChamber
0
•Withdrawal
Figure 4.6 Apparatus of the DSQ furnace and its affiliate
Figure 4.7 A schematic drawing of the DS/DSQ furnace
74
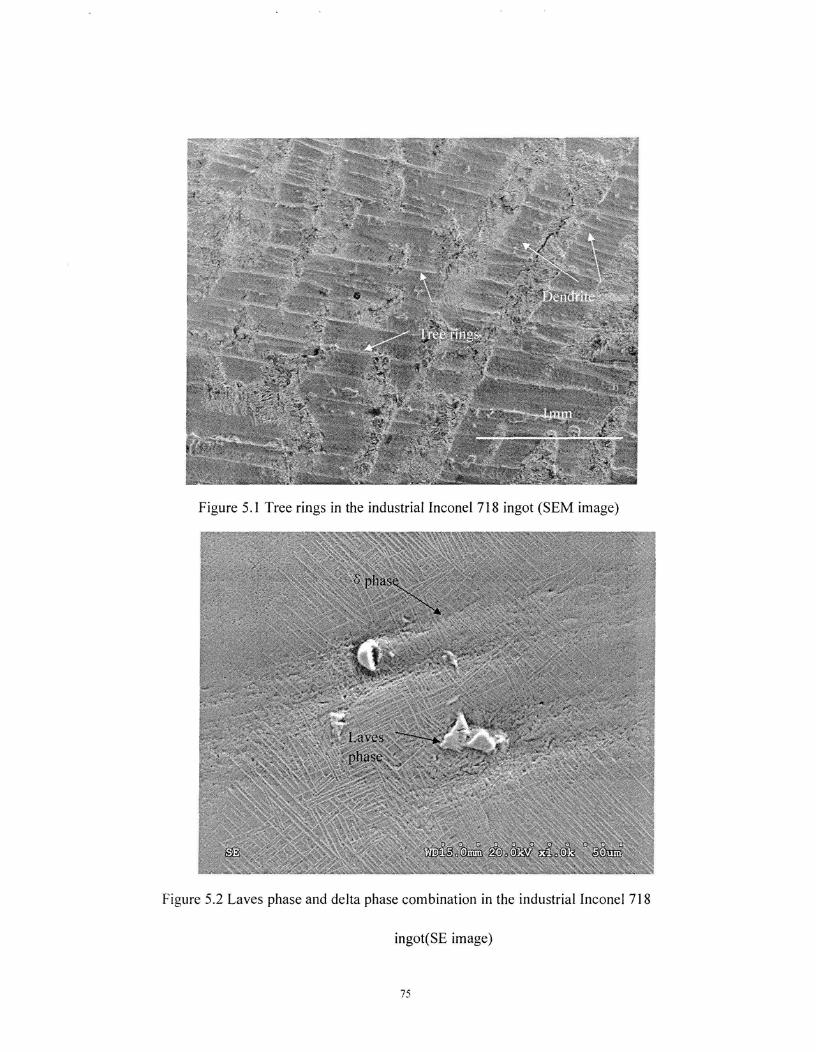
Figure 5.1 Tree rings in the industrial Inconel 718 ingot (SEM image)
Figure 5.2 Laves phase and delta phase combination in the industrial Inconel 718
ingot(SE image)
75
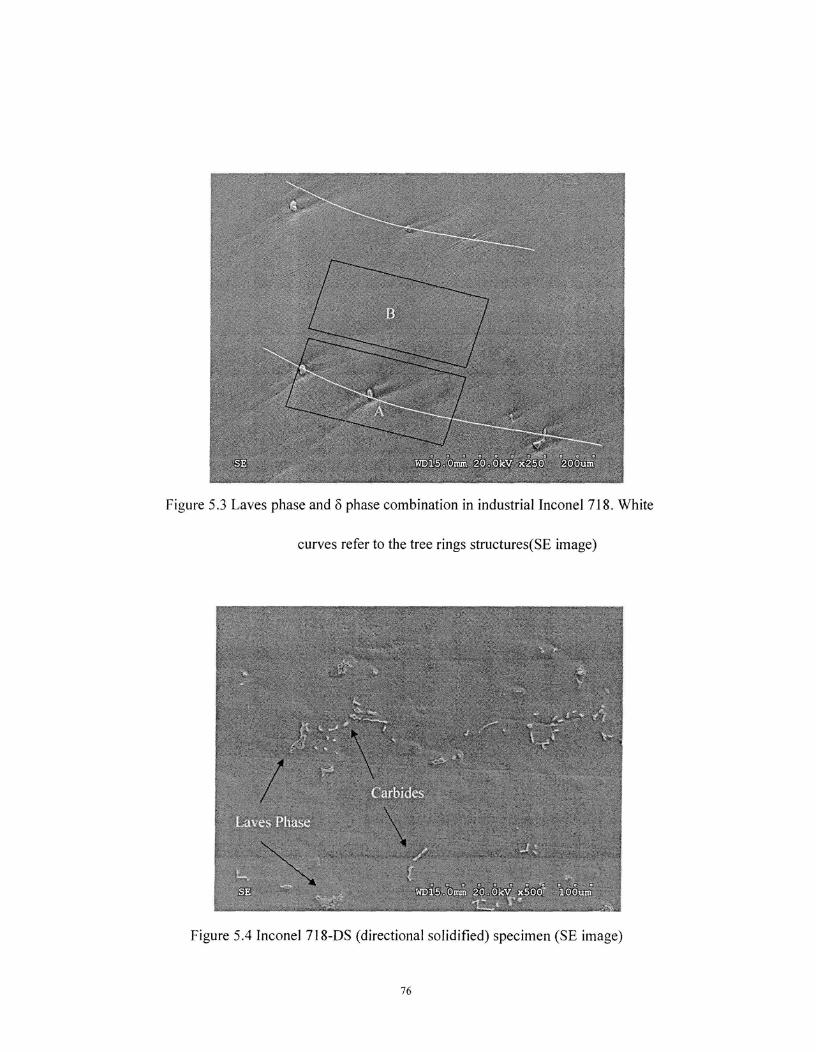
Figure 5.3 Laves phase and 6 phase combination in industrial Inconel 718. White
curves refer to the tree rings structures(SE image)
Figure 5.4 Inconel 718-DS (directional solidified) specimen (SE image)
76
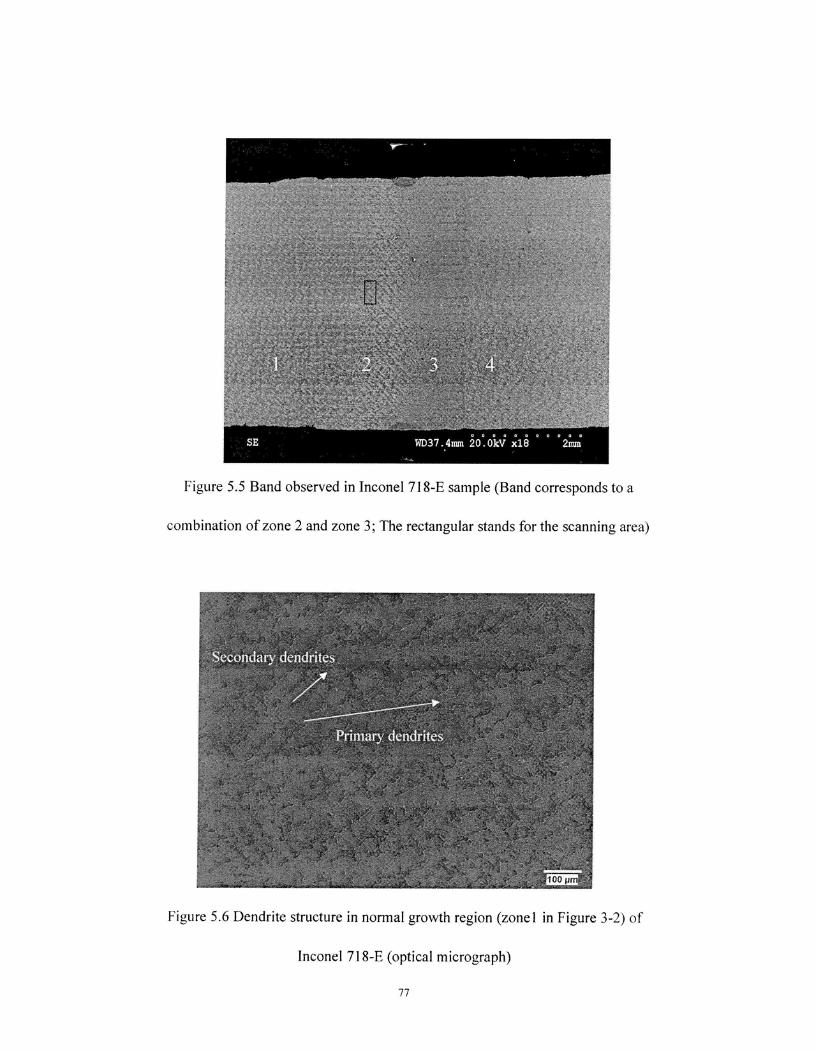
00000001,9V
SE^
WD37.4mm 20.0kV x18^2mm
Figure 5.5 Band observed in Inconel 718-E sample (Band corresponds to a
combination of zone 2 and zone 3; The rectangular stands for the scanning area)
Figure 5.6 Dendrite structure in normal growth region (zonel in Figure 3-2) of
Inconel 718-E (optical micrograph)
77
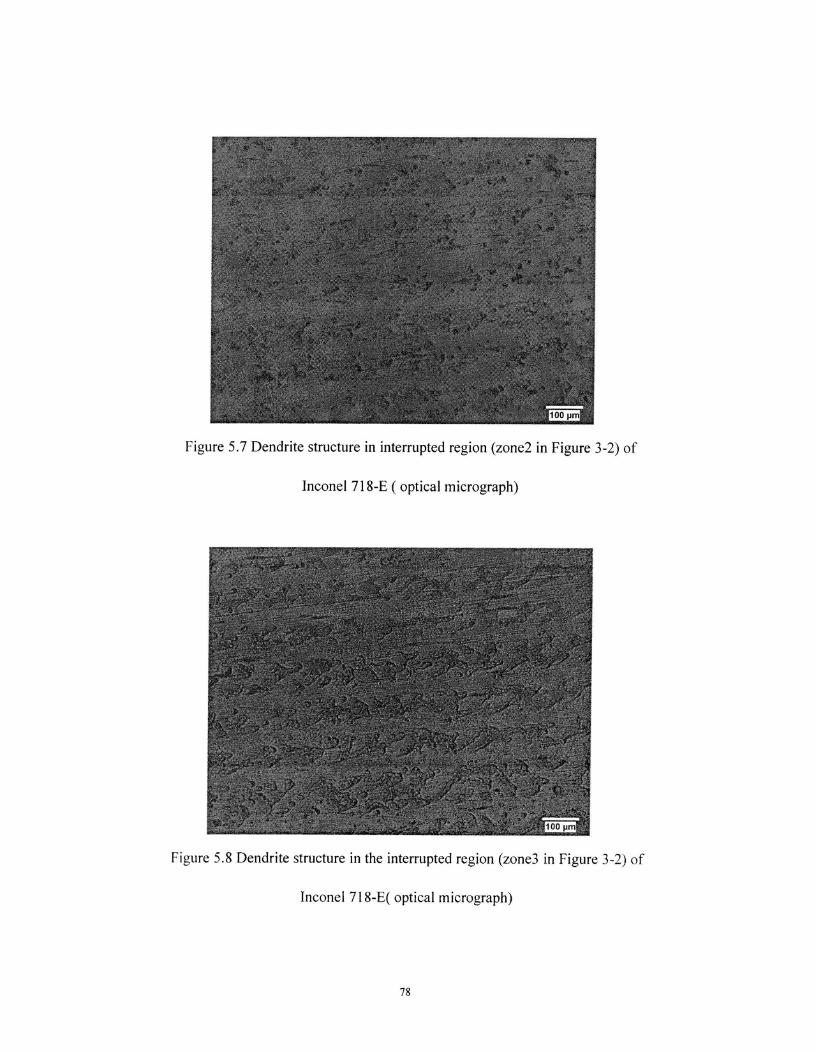
00
Figure 5.7 Dendrite structure in interrupted region (zone2 in Figure 3-2) of
Inconel 718-E ( optical micrograph)
Figure 5.8 Dendrite structure in the interrupted region (zone3 in Figure 3-2) of
Inconel 718-E( optical micrograph)
78
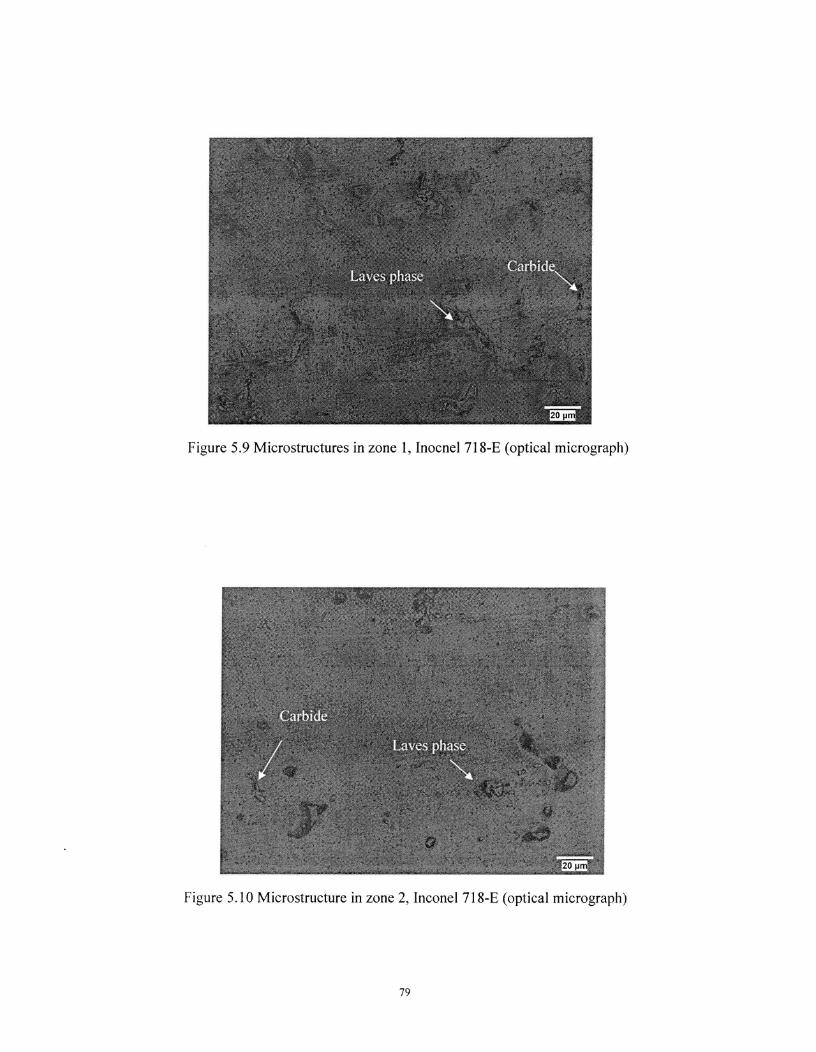
"20 um
Figure 5.9 Microstructures in zone 1, Inocnel 718-E (optical micrograph)
Figure 5.10 Microstructure in zone 2, Inconel 718-E (optical micrograph)
79
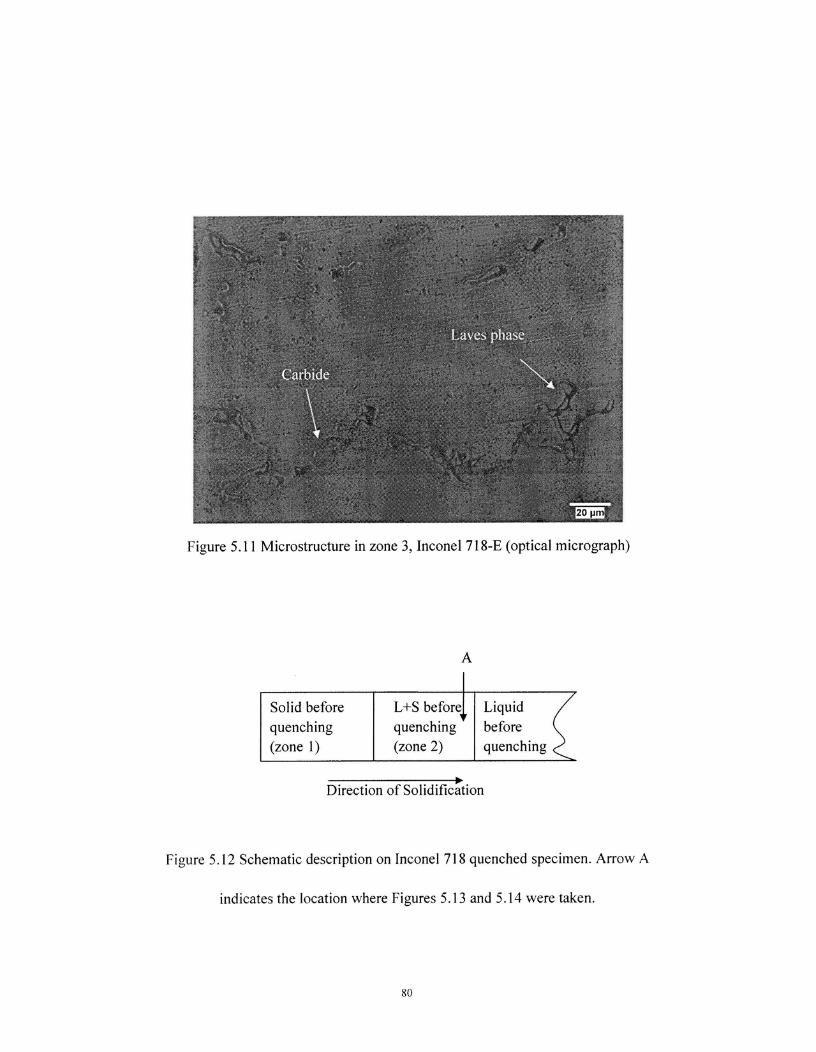
Solid beforequenching(zone 1)
1L+S beforequenching(zone 2)
Liquidbeforequenching
Figure 5.11 Microstructure in zone 3, Inconel 718-E (optical micrograph)
A
Direction of Solidification
Figure 5.12 Schematic description on Inconel 718 quenched specimen. Arrow A
indicates the location where Figures 5.13 and 5.14 were taken.
80
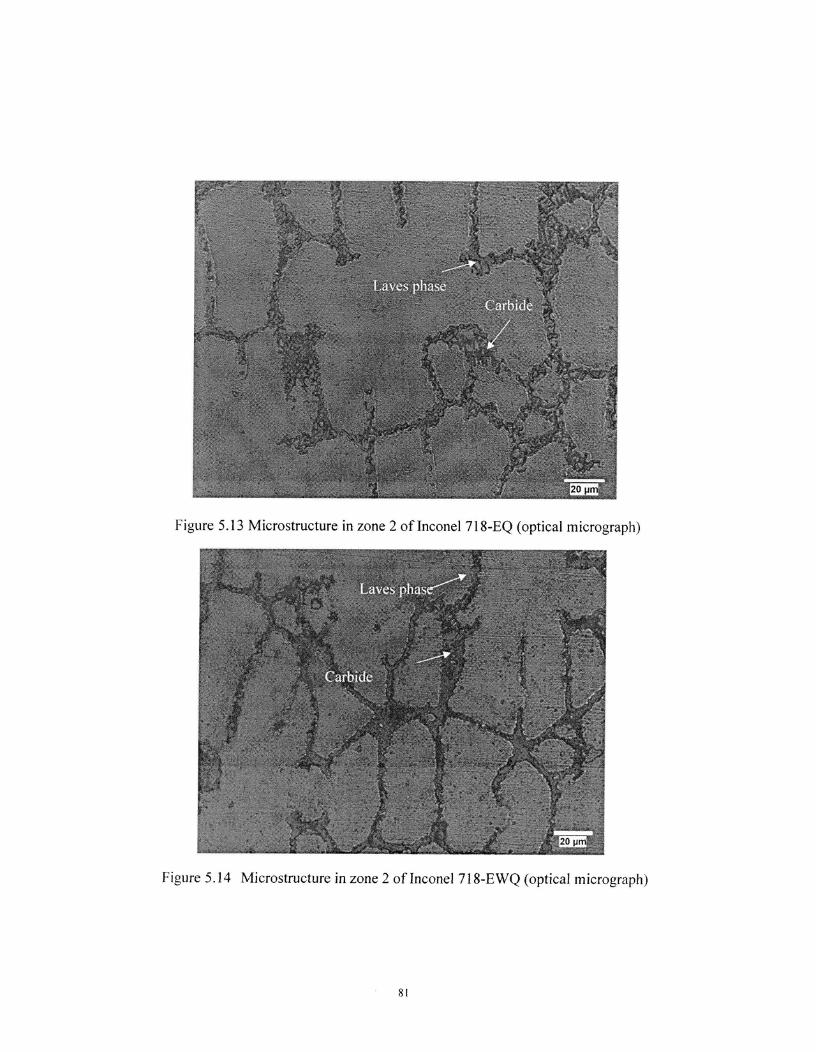
Figure 5.13 Microstructure in zone 2 of Inconel 718-EQ (optical micrograph)
Figure 5.14 Microstructure in zone 2 of Inconel 718-EWQ (optical micrograph)
81
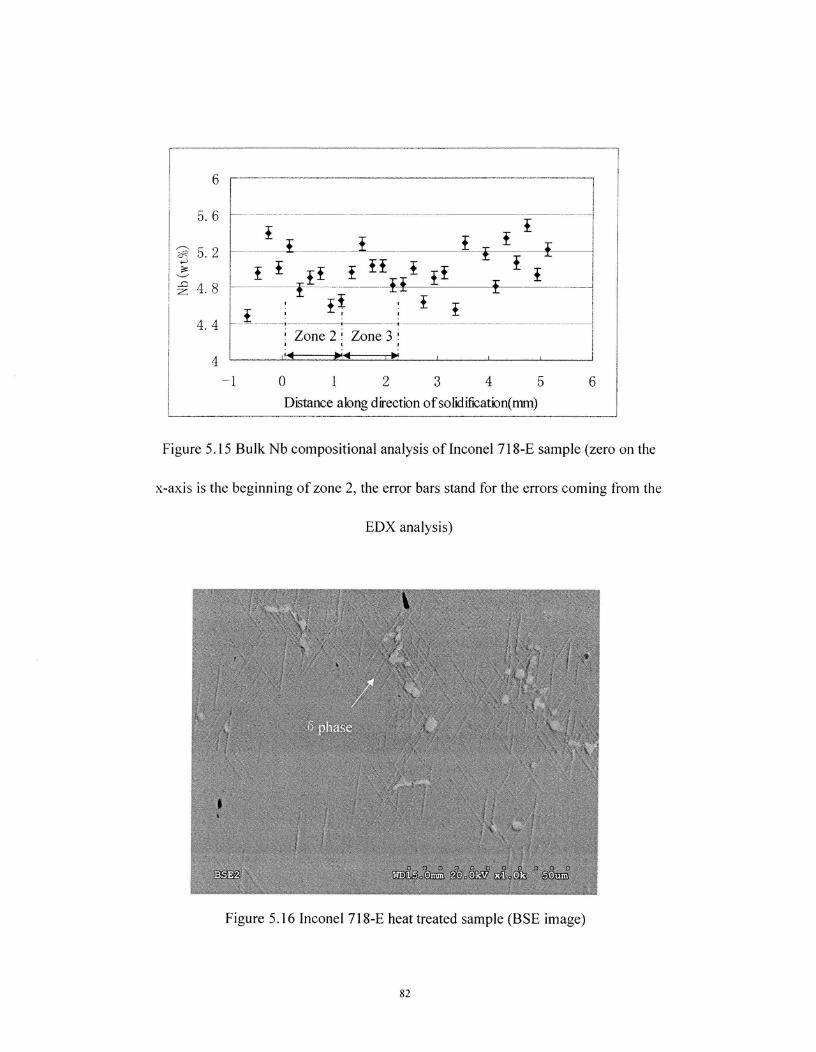
I-i
f i^i f^f f fI I
I-I^i
i^fI^I
i I-I-
I^'^i tZone 2 : Zone 3
■"0---0"1---1-1.: „ i
6Distance along direction of solidification(mm)
4- 1^0^1^2^3^4^5
6
5. 6
5. 2
4. 8
4. 4
Figure 5.15 Bulk Nb compositional analysis of Inconel 718-E sample (zero on the
x-axis is the beginning of zone 2, the error bars stand for the errors coming from the
EDX analysis)
Figure 5.16 Inconel 718-E heat treated sample (BSE image)
82
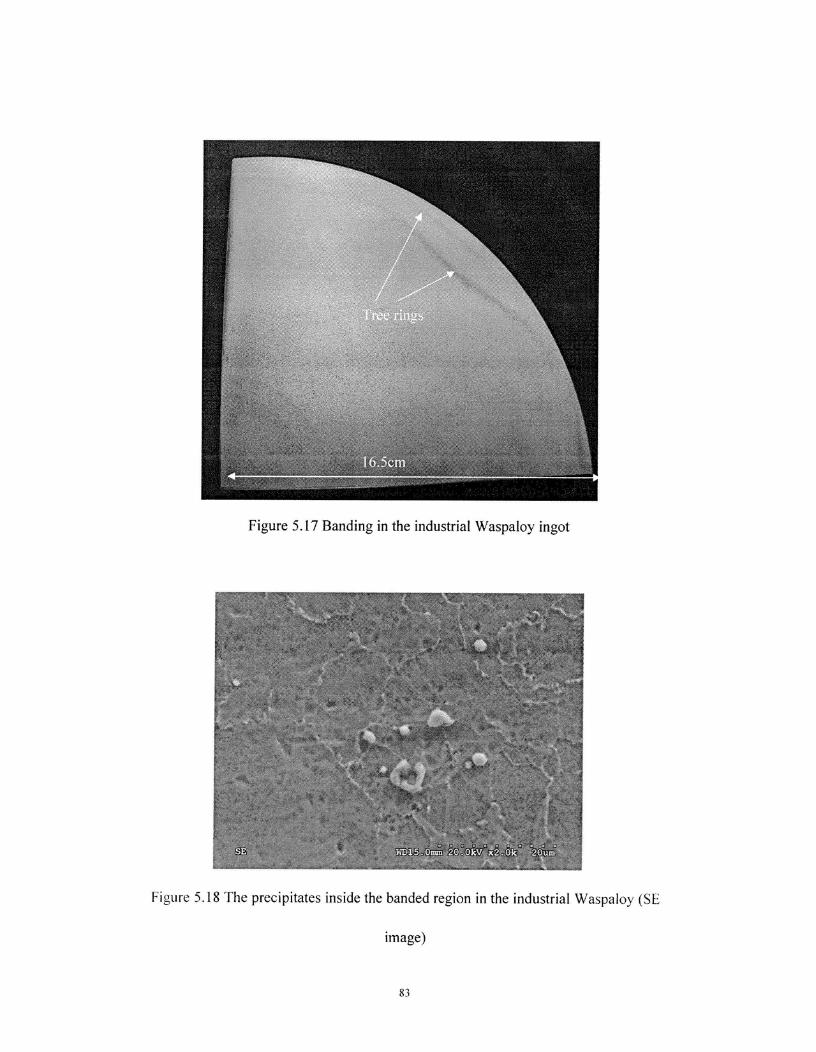
Figure 5.17 Banding in the industrial Waspaloy ingot
Figure 5.18 The precipitates inside the banded region in the industrial Waspaloy (SE
image)
83
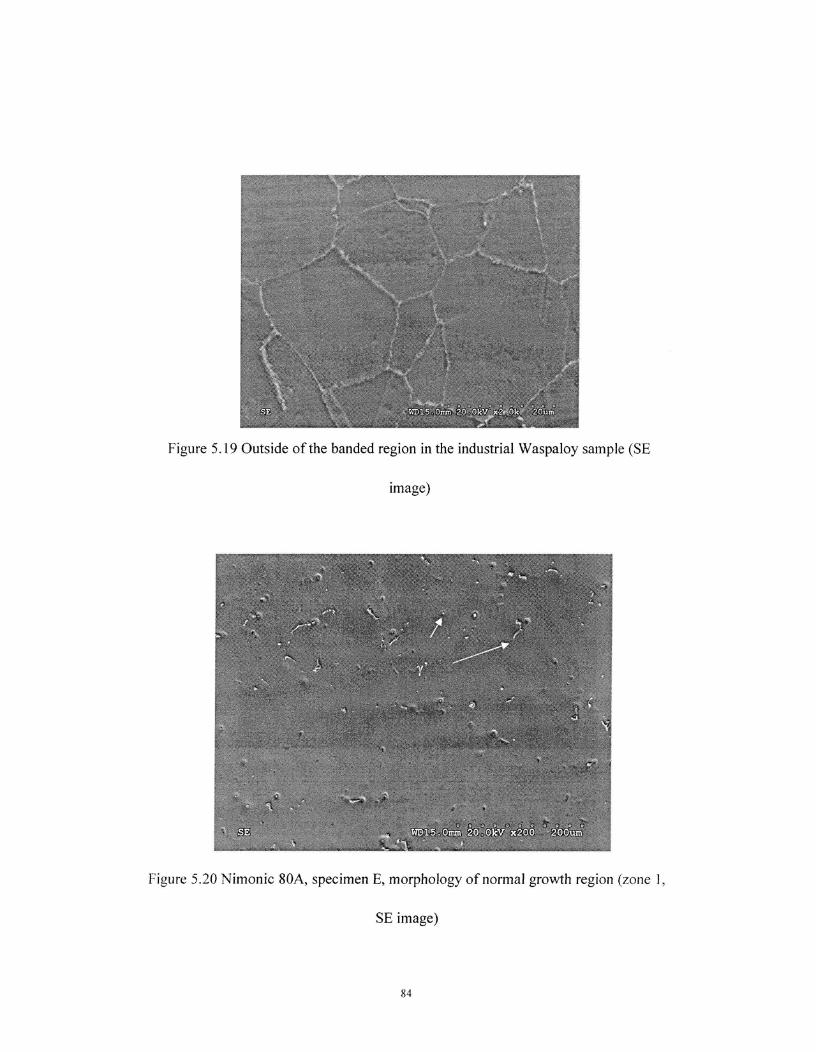
Figure 5.19 Outside of the banded region in the industrial Waspaloy sample (SE
image)
Figure 5.20 Nimonic 80A, specimen E, morphology of normal growth region (zone 1,
SE image)
84
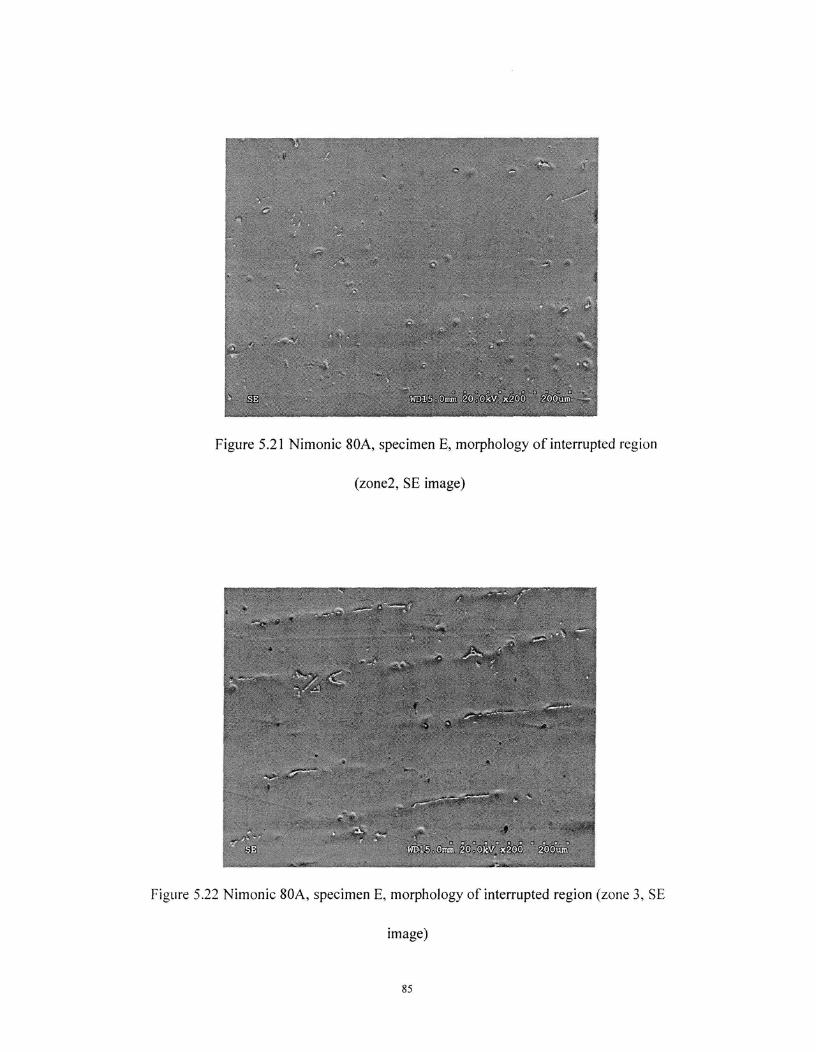
Figure 5.21 Nimonic 80A, specimen E, morphology of interrupted region
(zone2, SE image)
Figure 5.22 Nimonic 80A, specimen E, morphology of interrupted region (zone 3, SE
image)
85
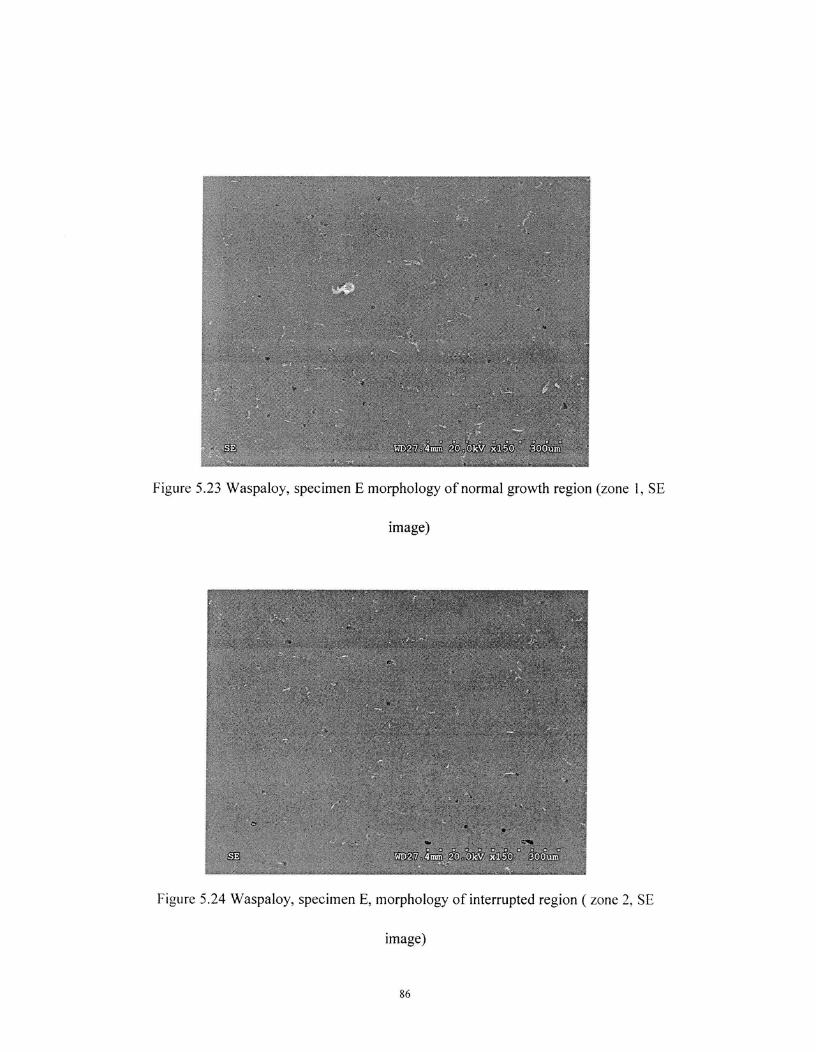
Figure 5.23 Waspaloy, specimen E morphology of normal growth region (zone 1, SE
image)
Figure 5.24 Waspaloy, specimen E, morphology of interrupted region ( zone 2, SE
image)
86
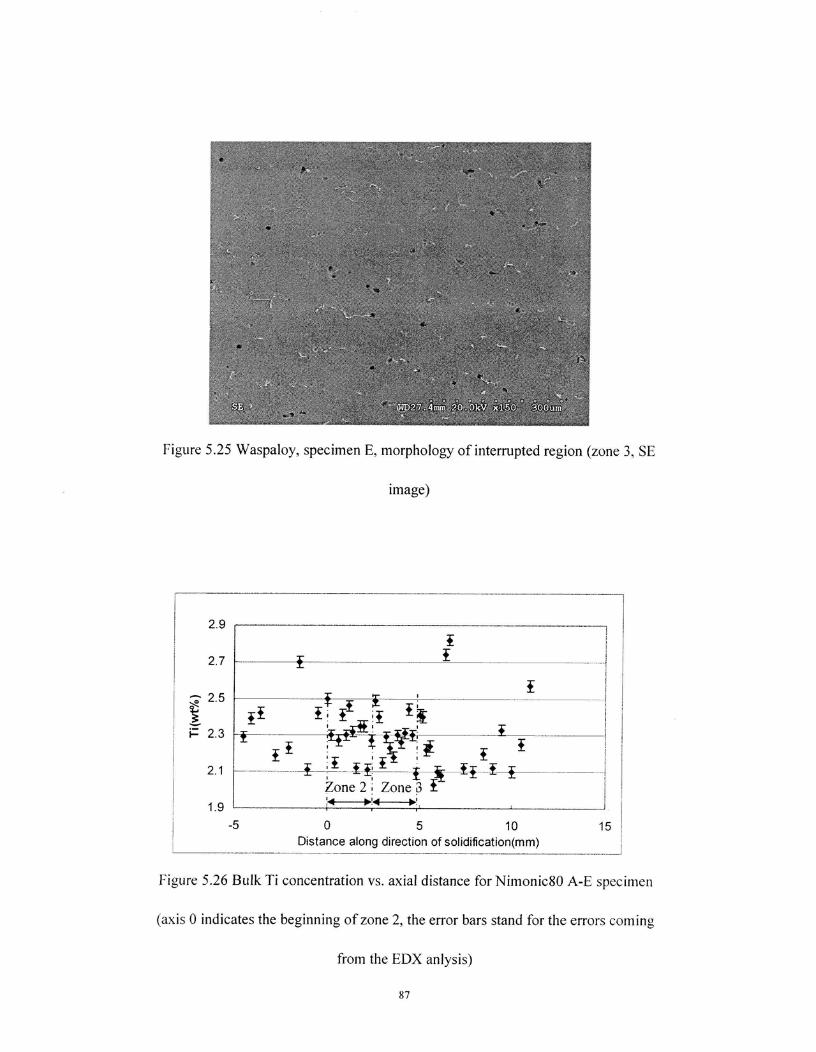
2.1
1.9
-5 0^5 10^15
2.9
2.7
^ 2.5
i^2.3
Zone 2 Zone 3lo!.1^10-
,J!
Distance along direction of solidification(mm)
27.4mm
Figure 5.25 Waspaloy, specimen E, morphology of interrupted region (zone 3, SE
image)
Figure 5.26 Bulk Ti concentration vs. axial distance for Nimonic80 A-E specimen
(axis 0 indicates the beginning of zone 2, the error bars stand for the errors coming
from the EDX anlysis)
87
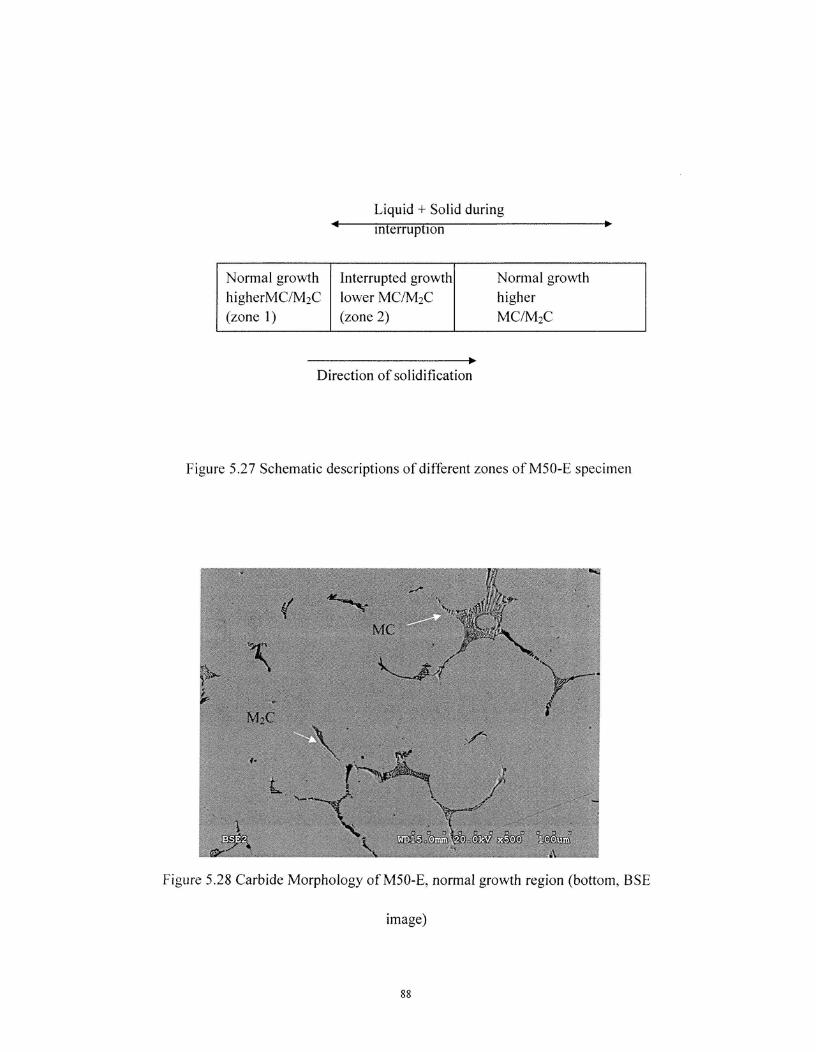
Normal growthhigherMC/M 2C(zone 1)
Interrupted growthlower MC/M2C(zone 2)
Normal growthhigherMC/M2C
•^ Liquid + Solid duringinterruption
Direction of solidification
Figure 5.27 Schematic descriptions of different zones of M50-E specimen
Figure 5.28 Carbide Morphology of M50-E, normal growth region (bottom, BSE
image)
88
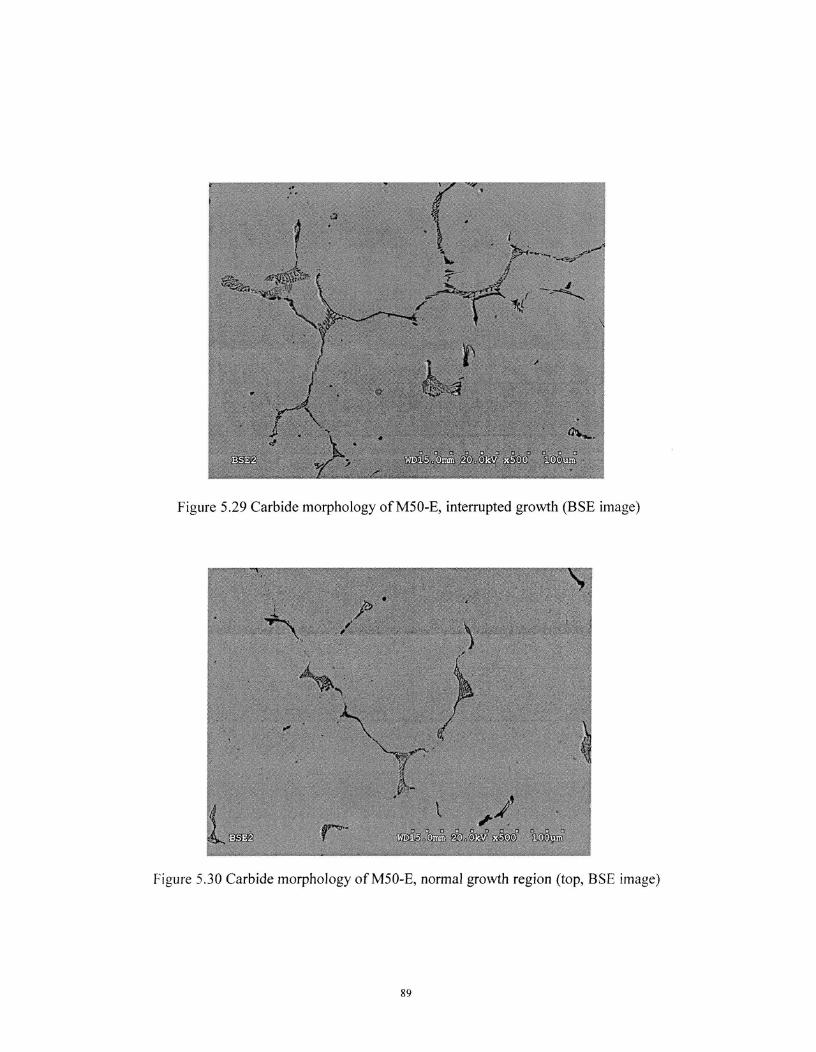
Figure 5.29 Carbide morphology of M50-E, interrupted growth (BSE image)
Figure 5.30 Carbide morphology of M50-E, normal growth region (top, BSE image)
89
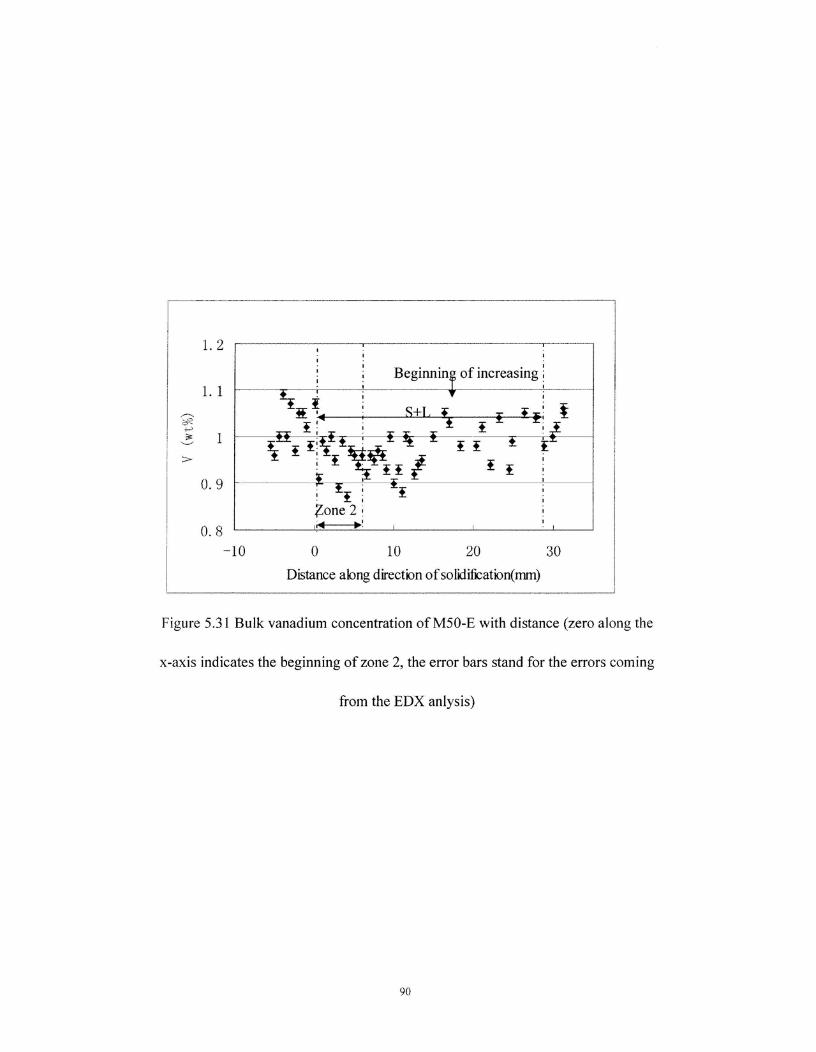
-10^0^10^20^30Distance along direction of solidification(mm)
Beginnin ^of increasing
1 1 , 4;.EEE.:,f^i i k i II
I^w/.I^ki-
iv-fk i
If :Zone 2 i
Er.--.!
I,
1. 2
0. 9
0. 8
1. 1
Figure 5.31 Bulk vanadium concentration of M50-E with distance (zero along the
x-axis indicates the beginning of zone 2, the error bars stand for the errors coming
from the EDX anlysis)
90
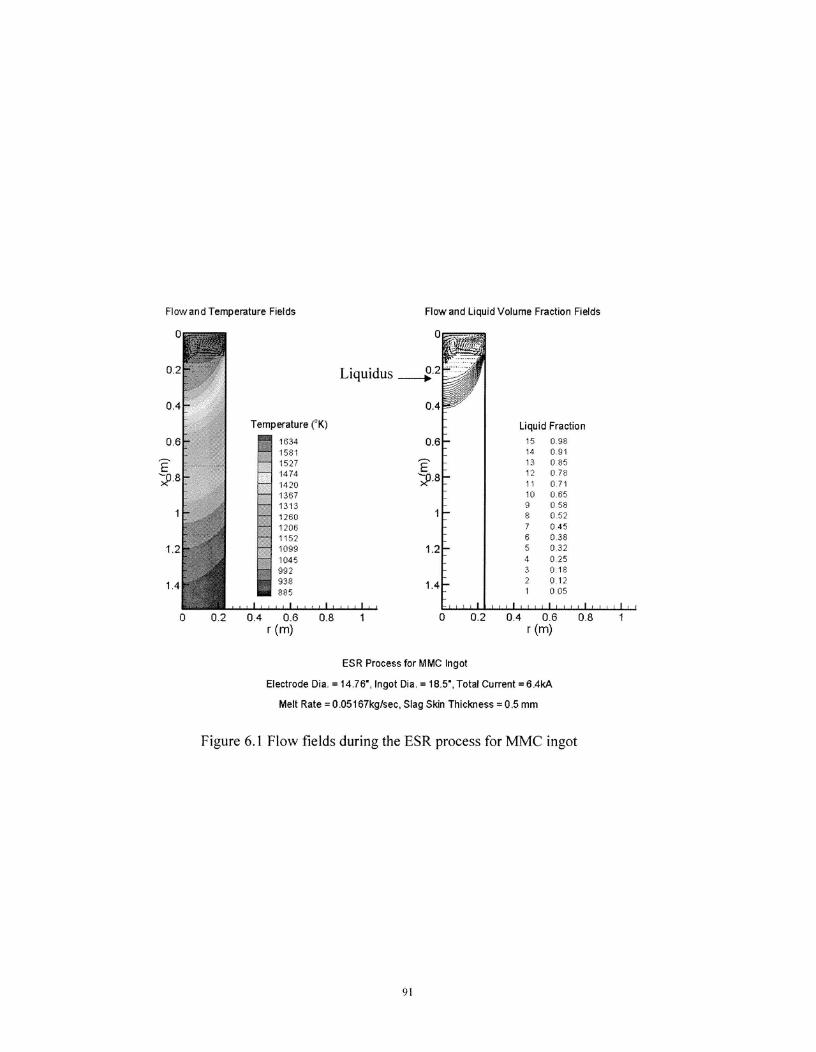
Flow and Temperature Fields^
Flow and Liquid Volume Fraction Fields
0^ 0
0.2^ Liquidus
0.4^ 0.4
Temperature (° K)
0.2^0.4^0.6^0.81 (m)
Liquid Fraction15 0.9814 0 9113 08512 07811 0.7110 0.659 0588 0527 0456 0.385 0.324 0253 0182 0121 0.05
0.4^0.6^0.8r(m)
0.6
E.8
1.2
1.4
163415811527147414201367131312601206115210991045992938885
0.6
EX.8
1.2
1.4
ESR Process for MMC Ingot
Electrode Dia. = 14.76', Ingot Dia. = 18.5", Total Current = 6.4kA
Melt Rate = 0.05167kg/sec, Slag Skin Thickness = 0.5 mm
Figure 6.1 Flow fields during the ESR process for MMC ingot
91
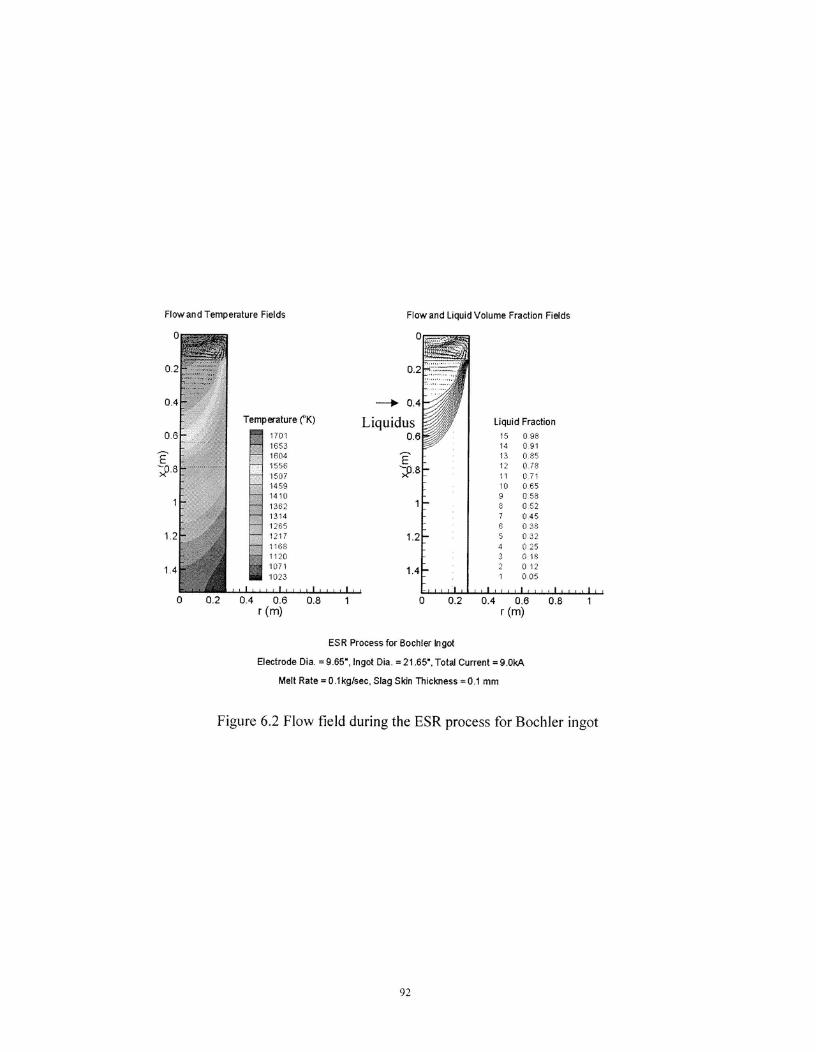
Flow and Temperature Fields^
Flow and Liquid Volume Fraction Fields
Temperature (°K)
170116", S16041556150714591410136213141 5121711t11201071
i.r441 1023
III^I^1.111■11111111/
0
0.2
—4- 0.4
Liquidus0.6
E
1.2
1.4
Liquid Fraction15 09814 09113 0-8512 0.7811 07110 0659 0588 0527 0456 0385 0324 0253 0 182 0121 0-05
0
0.2
0.4
0.6
E
1.2
1.4
0.2^0.4^0.6^0.8^
0.2^0.4^0.6^0.8^r (m)
^1 (m)
ESR Process for Bochler Ingot
Electrode Dia. =9.65", Ingot Dia. =21.65', Total Current =9.0kA
Melt Rate =0.1kg/sec, Slag Skin Thickness =0.1 mm
Figure 6.2 Flow field during the ESR process for Bochler ingot
92
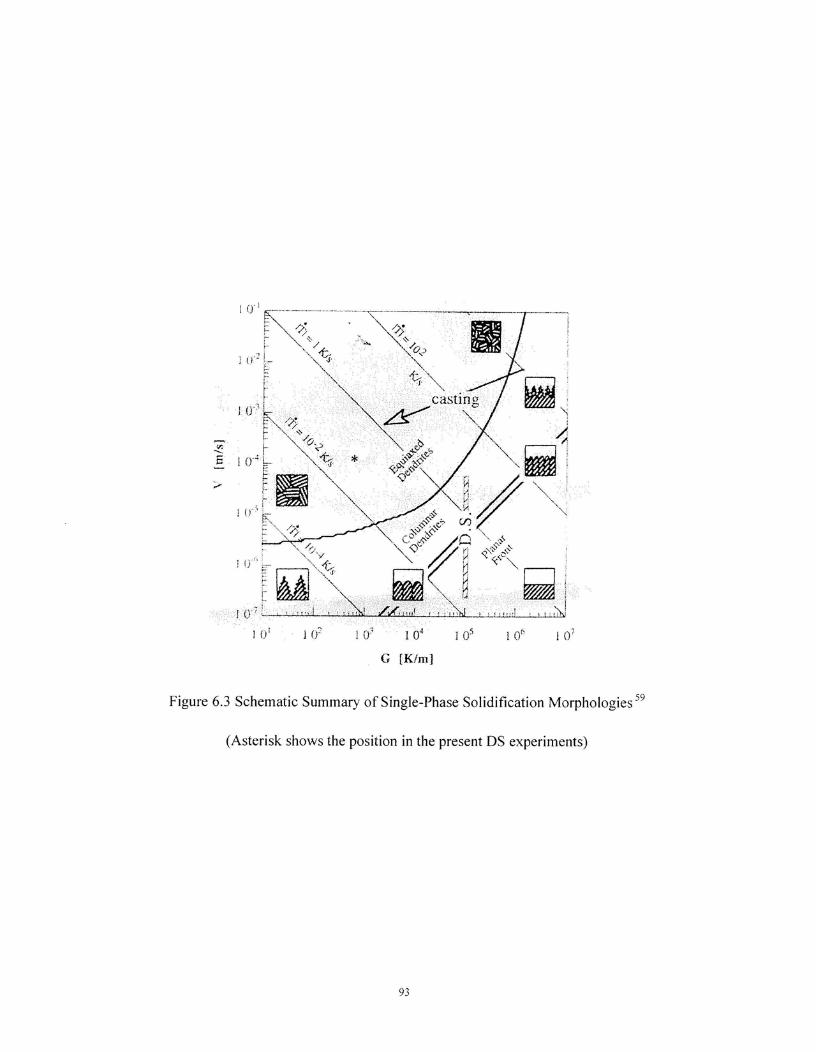
I^I a'^1 0'^104
G [Kim]
Figure 6.3 Schematic Summary of Single-Phase Solidification Morphologies 59
(Asterisk shows the position in the present DS experiments)
93
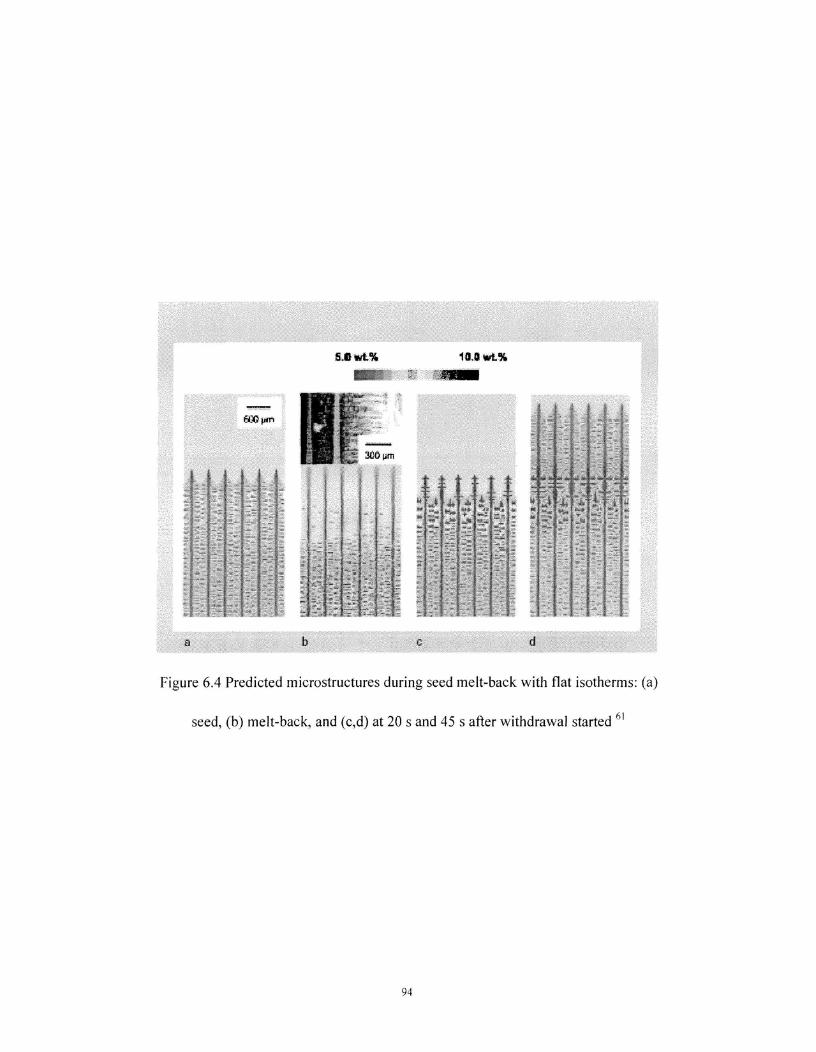
ISA wt.%^18.0 wt.%
gain
n
Cl
Figure 6.4 Predicted microstructures during seed melt-back with flat isotherms: (a)
seed, (b) melt-back, and (c,d) at 20 s and 45 s after withdrawal started 61
94
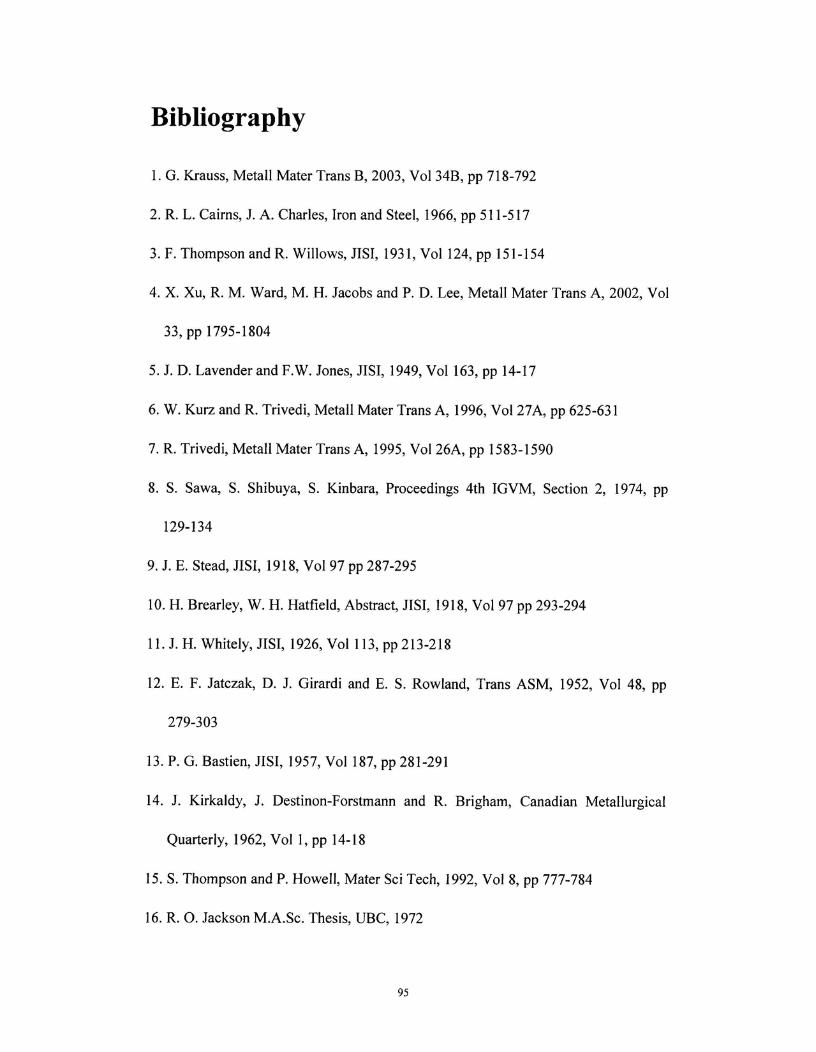
Bibliography
1. G. Krauss, Metall Mater Trans B, 2003, Vol 34B, pp 718-792
2. R. L. Cairns, J. A. Charles, Iron and Steel, 1966, pp 511-517
3. F. Thompson and R. Willows, JISI, 1931, Vol 124, pp 151-154
4. X. Xu, R. M. Ward, M. H. Jacobs and P. D. Lee, Metall Mater Trans A, 2002, Vol
33, pp 1795-1804
5. J. D. Lavender and F.W. Jones, JISI, 1949, Vol 163, pp 14-17
6. W. Kurz and R. Trivedi, Metall Mater Trans A, 1996, Vol 27A, pp 625-631
7. R. Trivedi, Metall Mater Trans A, 1995, Vol 26A, pp 1583-1590
8. S. Sawa, S. Shibuya, S. Kinbara, Proceedings 4th IGVM, Section 2, 1974, pp
129-134
9. J. E. Stead, JISI, 1918, Vol 97 pp 287-295
10.H. Brearley, W. H. Hatfield, Abstract, JISI, 1918, Vol 97 pp 293-294
11. J. H. Whitely, JISI, 1926, Vol 113, pp 213-218
12. E. F. Jatczak, D. J. Girardi and E. S. Rowland, Trans ASM, 1952, Vol 48, pp
279-303
13.P. G. Bastien, JISI, 1957, Vol 187, pp 281-291
14. J. Kirkaldy, J. Destinon-Forstmann and R. Brigham, Canadian Metallurgical
Quarterly, 1962, Vol 1, pp 14-18
15. S. Thompson and P. Howell, Mater Sci Tech, 1992, Vol 8, pp 777-784
16. R. 0. Jackson M.A.Sc. Thesis, UBC, 1972
95
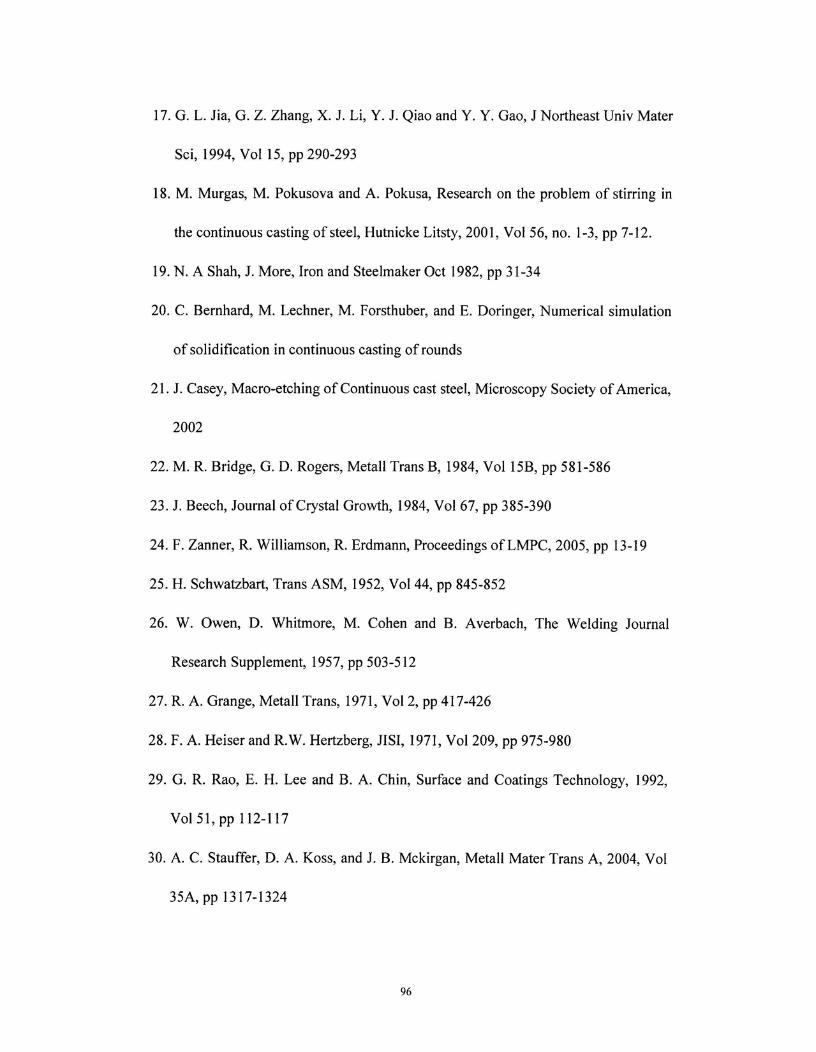
17. G. L. Jia, G. Z. Zhang, X. J. Li, Y. J. Qiao and Y. Y. Gao, J Northeast Univ Mater
Sci, 1994, Vol 15, pp 290-293
18. M. Murgas, M. Pokusova and A. Pokusa, Research on the problem of stirring in
the continuous casting of steel, Hutnicke Litsty, 2001, Vol 56, no. 1-3, pp 7-12.
19.N. A Shah, J. More, Iron and Steelmaker Oct 1982, pp 31-34
20. C. Bernhard, M. Lechner, M. Forsthuber, and E. Doringer, Numerical simulation
of solidification in continuous casting of rounds
21. J. Casey, Macro-etching of Continuous cast steel, Microscopy Society of America,
2002
22. M. R. Bridge, G. D. Rogers, Metall Trans B, 1984, Vol 15B, pp 581-586
23. J. Beech, Journal of Crystal Growth, 1984, Vol 67, pp 385-390
24. F. Zanner, R. Williamson, R. Erdmann, Proceedings of LMPC, 2005, pp 13-19
25. H. Schwatzbart, Trans ASM, 1952, Vol 44, pp 845-852
26. W. Owen, D. Whitmore, M. Cohen and B. Averbach, The Welding Journal
Research Supplement, 1957, pp 503-512
27. R. A. Grange, Metall Trans, 1971, Vol 2, pp 417-426
28. F. A. Heiser and R.W. Hertzberg, JISI, 1971, Vol 209, pp 975-980
29. G. R. Rao, E. H. Lee and B. A. Chin, Surface and Coatings Technology, 1992,
Vol 51, pp 112-117
30. A. C. Stauffer, D. A. Koss, and J. B. Mckirgan, Metall Mater Trans A, 2004, Vol
35A, pp 1317-1324
96
31. G. Hoyle, Electroslag processes principles and practice,1983, Applied Science
Publishers
32. S. V. Joshi, Ph.D. Thesis, UBC 1971
33. A. Mitchell, Process parameters in ESR and VAR as applied to superalloy
melting, unpublished
34. A. Mitchell, Material Science and Engineering A, 2005, Vol 413-414, pp 10-18
35. A. Jardy, L. Falk and D. Abitzer, Ironmaking and Steelmaking, 1992, Vol 19, pp
226-232
36. A. D. Patel, Liquid Metals Processing and Casting 2003, pp 205-213
37. A. Mitchell and S. Joshi, Metall Transactions, 1973, Vol 4, pp 631-642
38. B. Hernandez-Morales and A. Mitchell, Iron and Steelmaking,1999, Vol 26, pp
423-438
39. A. S. Ballantyne, Ph.D. thesis, UBC, 1978
40. K. M. Kelkar, S. V. Patankar, A. Mitchell, 0. Kanou, N. Fukada, K. Suzuki,
Computational modeling of the Vacuun Arc Remelting Process used for the
production of Ingots of Titanium Alloys, 2006, Report
41. K. M. Kelkar, Computational analysis of electroslag remelting and vaccum arc
remelting process used for the production of high-performance alloys,
presentation at Innovative Research
42. P. Auburtin, Ph.D. thesis, UBC, 1998
43. M. McLean, Directionally Solidified Materials for High Temperature Service,
1983, The Metals Society, London
97
44. M. J. Donachie and S. J. Donachie, Superalloys-A technical Guide, ASM, 2002
45. ASM Handbook, Vol 10
46. A. Formenti, A. Eliasson, A. Mitchell and H. Fredriksson, High temperature
materials and processes, 2005, Vol 24, pp 239-258
47. M. Abdellaoui, C. Slama, Journal of Alloys and Compounds, 2000, Vol 306, pp
277-284
48. Y. Desvallees, M. Bouzidi, F. Bois and N. Beaude, Superalloys 1994, TMS, pp
281-291
49. T. Antonsson and H. Fredriksson, Metall Mater Trnas B, 2005, Vol 36B, pp 85-96
50. P. L Auburtin, M.A.Sc thesis, UBC, 1995
51. W. Betteridge and J. Heslop, The Nimonic alloys, 1974, Crane, Russak &
Company
52. Report, Special Metals Corporation, 2004
53. Y. Murata, M. Morinaga, N. Yukawa, H. Ogawa and M. Kato, Proceeding of The
first Pacific Rim International Conference of Advanced Materials, 1992, pp
269-274
54. C. Djega-Mariadassou, B. Decaudin, L. Bessais and G. Cizerron, J Phys Mater,
1997, Vol 9, pp 4931-4942
55. B. Decaudin, C. Djega-Mariadassou and G. Cizerron, Journal of Alloys and
Compounds, 1995, pp 208-212
56. A. S. Ballantyne and A. Mitchell, Proceeding of Solidification and Casting of
Metals, 1977, Metals Society, pp 363-370
98
57. P. Auburtin, T. Wang, S. L. Cockcroft, and A. Mitchell, Metall Mater Trans B,
2001, Vol 31, pp 801-811
58. K. M. Kelkar, J. Mok, S. V. Patankar and A. Mitchell, Computational Modelling
of Electroslag Remelting Process, J Phys N, 2004, pp 421-428
59. W. Kurtz and D. J. Fisher, Fundamentals of Solidification, 1989, Trans Tech
Publications, p 88
60. T. Wang, M.A.Sc thesis, UBC, 2000
61. X. L. Yang, P. D. Lee and N. D'Souza, Journal of Materials, 2005, Vol 57, pp
40-44
99