avalanches of ideas
TRANSCRIPT


Avalanches of Ideas
R. Alexander Bentley and Herbert D. G. Maschner
INTRODUCTION
The preceding three chapters discussed theseemingly ubiquitous power-law distributionthat characterizes the accumulation ofwealth or power in human society, examplesof which can be found among businesses(Amaral et al. 1998; Axtell 2001; Stanley etal. 1996), university research departments(Plerou et al. 1999), personal incomes (Bod-ley 1999; Bouchaud and Mezard 2000;Pareto 1907), and prehistoric households onthe North Pacific coast (Chapter 3). Power-law distributions are also found in the accumulation of other attributes, such as connections between Internet websites (Adamic andHuberman 2000; Albert et al. 1999, 2000;Barabasi and Albert 1999; Huberman et al.1998; Tu 2000), actors' personal contacts inHollywood (Amaral et al. 2000; Barabasiand Albert 1999; Newman et al. 2001), andsexual partners among modern Europeans(Liljeros et al. 2001). In archaeology, a similar rich-get-richer effect may lie behind theprimate distribution in rank-size analysis ofarchaeological sites, in that larger sites tendto attract more people (e.g., Reed 2002; Savage 1997).
In this chapter, we turn from a discussionof power-law distributions of some accumulated quantity to similar distributions ofevents in time. A power-law distribution ofevents means that change occurs at all scales.Most changes are small and incremental, butoccasionally large and catastrophic changes
occur. Such avalanches of change have oftenbeen modeled for physical systems of interacting parts, whether as avalanching grainsin a pileof rice, earthquakesin sliding blocksoftheearth's crust, or fires spreading throughtrees in a forest (foroverviews, see Bak 1996;Buchanan 2001; Jensen 1998; Turcutte1997)- Theanalogy to economic and politicalevents is a natural one to make, and theavalanching of events has been discussed formodern economic markets (Lux and March-esi 1999; Mantegna and Stanley 1995;Scheinkman and Woodford 1994) and eventhe sizes of wars in history (Robertsand Tur-cotte 1998). Archaeological examples mayinclude the comings and goings of potterystyles (Bentley and Maschner 2001), and wewill discuss an exploration of this by Bentleyand Shennan (2003) in this chapter.
We lookat twoapproaches to explaining apower-law distribution of avalanche eventsin time. The first is the idea that events maybe seen as occurring within a constantlygrowing, interconnected network, in that onetriggering eventmaygive riseto multipleconsequent events, which in turn lead to otheroccurrences, and so on. In this view, the process develops into something like the fractalstructure of many river systems, with thelargest river as the most momentous event,and tributaries as the ensuing consequencesof less and less significance as time goes on(Figure 4.1). This approach can accommodate aspects of contingency and punctuated
61

Bentley and Maschner
Second-order
"spin-off"styles
First order
"spin-off' styles
Originalidea/style
Figure 4.1. Illustration of the spread of an idea asa fractal growth process. Adapted from a realriver network depicted by Turcotte (i997:Figure8.1).
change discussed in the rest of this book:Once a network of events and their conse
quent events has formed, the seminal eventcan be seen as the most "well-connected"node. Go back in time and remove that node,and the network of would-be ideas collapses(cf. Albert et al. 2000).
The second explanation we explore, whichis less deterministic than the network growthmodel, is the theory of "self-organizedcriticality" (Bak 1996; Bak et al. 1987; Jensen 1998), introduced in Chapter 1. Self-organized criticality is a theory based uponthe development of simple models that produce patterns similar to the complex reality.Often the justification offered for such amodel will be that its rules are reasonable
simplifications of interactions between individual agents and that its emergent properties, such as power-law distributions, replicate the emergent properties of the realsystem. The obvious objection to such models is that producing comparable emergentproperties from a simplified model does notguarantee that the model represents reality.This is one reason why we consider bothnetwork and self-organized criticality approaches in this chapter, as they have differ
ent but complementary merits. The networkmodel is easier to conceptualize and makepredictions from, while self-organized criticality, which is more computational, has thecapacity to capture more complexity.
APPROACH 1:
STOCHASTIC NETWORK GROWTH
As discussed in Chapter 2, the majority ofagents in a scale-freenetwork are poorly connected, while almost all connections tend tolead through a few highly connected agents(see Figure 3.2). The reason for this is thatscale-free networks grow in a tree-like fashion but with the added rule of preferentialattachment (Albert and Barabasi 2002; Barabasi and Albert 1999). For example, the Internet grows as a scale-free network becausethe more popular a site is, the more likely anynew site will include a link to it. Similarly, ithas been known for some time that the most
oft-cited papers are the most likely to be citedby others in the near future (Lotka 1926;Redner 1998; Shockley 1957). Modern academic journal literature, with its custom ofciting all the previous sources that inspiredeach new article, is a potential arena in whichto study whether the spread of ideas exhibitsa tree-like, potentially fractal growth pattern.In this section, we propose to illustrate theprocess of the dissemination of ideas in contemporary culture by following the appearances of a particular idea through the scientific literature. Following that, we discuss anapplication to prehistoric stylistic evolution(Bentley and Shennan 2003) and then alsothe relevance of stochastic network growthto the way that a new behavior such as farming could have taken hold abruptly in a prehistoric region.
The Spreadofan Idea inModern Academic Literature
Ideas, like stories, technologies, cultural beliefs, and styles, are transmitted through cultural systems and across generations. Because of the difficulties in isolating the unitsof these phenomena, it is difficult to trackquantitatively what is often qualitatively recognized: that cultural phenomena such as
62

Avalanches of Ideas
a>
b) 1»_Journal artic
0.1 - ©• ©
0.01 -0
<5
0.001 - •
e0.0001
o•
0.00001 - O DLA
• soc• o
0.000001 -model
•
5
0.0000001 -
1.0 10.0 100.0 1000.0 10000.0
Time* cited
Figure 4.2. (a) The cumulative number of articles on "self-organized criticality" (SOC) by year. Year 1 is 1987. The increase is as a power law rather thanexponential (gray line), (b) The citations of journal articles on particular topics.The x-axisshows the number of other papers that had cited eacharticle bythe end of 1999. One distribution is for articles (N = 1131) with "self-organizedcriticality" (SOC) in the title or keywords from its origin in 1987 (Baketal. 1987), and the other for articleson "diffusion limitedaggregation" (DLA)from its origin in 1981 (Witten and Sander 198T). Despite the two differenttopics and dates of introduction, the probability distributions are similar,each with an approximately power-law tail, with slope (exponent) -2.1 ±0.2for SOC, and -2.1 ± 0.2 for DLA. Also shown is the model distribution, as described in the text.
fads, for example, seem to disseminate in anavalanche of interconnected events. In fact, itmay be appropriate to envision such an avalanche of ideas as a growing tree—one seminal idea gives rise to several "spin-off" ideas,which in turn give rise to other, less significant spin-off ideas, and so on, until anothernew seminal idea starts its own avalanche,again disseminating in this tree-like growth,as in Figure 4.1. If the creation of each ideawere recorded, this network could be seen
growing in time and spreading into increasingly remote corners of contemporary culture. Since the most powerful or popularideas are the most likely to inspire relatedideas, they can be seen conceptually as themost well-connected loci in a scale-free net
work of ideas.
As a tractable example of the growth of ascale-free network, we followed the spread ofan idea in academic literature (Bentley andMaschner 2000). It seems appropriate that
63

Bentley and Maschner
the spread of the topic "self-organizedcriticality," a theory about avalanches ofinterconnected events, itself resembles anavalanche that began when the term wasintroduced by Bak et al. (1987). The Webof Science (WOS) database (www.webofscience.com) lists 1,131 journal articlespublished between 1987 and the end of 1999with "self-organized criticality" as a keyword. The number of articles published onself-organized criticality grew exponentiallyfor the first four years but has grown linearlysince then (Figure 4.2a), probably havingreached the limit of space in interested journals. In addition, the average bibliography nhof these articles has grown according to afractal relationof about nb =6t°-6\wheret isin years (Bentleyand Maschner 2000). Bytheend of 1999, the distribution of the numberof citations these papers had from other papers was highly skewed, with a power-lawtail (Figure 4.2b).
These observations suggest that the idea ofself-organized criticality in journal literaturespread like the growth of a scale-free network, in which new vertices are continuallyadded and attach preferentially to verticesthat are already well connected (Albert et al.2000; Barabasi and Albert 1999). Specifically, we suspect that Bak et al. (1987) inspired related papers (new vertices) in otherfields that, in turn, inspired others to publishvariants of the idea in more specialized sub-fields, and so on, with each paper citing thosethat inspired it. While the majority of newpapers have minor influence on other authors, each new participating author is likelyto read, or at least cite, the original article byBak et al. (1987). Such a process may explainwhy the influence of these articles appears tobe distributed as a power law.
This resembles the growth of the Internet,in which the sizes of web pages have becomepower-law distributed (Albert and Barabasi1999; Huberman et al. 1998; Huberman andAdamic 1999). We compared the data to amodel for the random network growth of theWorld Wide Web by Adamic and Huberman(2000), discussed in detail in Appendix 2A.Our adoption of the model works based on
the premise that each new article is cited at arate proportional to how many times it hasalready been cited, plus or minus some random component. So if a new article is luckyenough to be cited, it will be more likely tobe cited again in the future. The result of themodel is that the distribution of times cited is
a log-normal function for each year, but ifthe network is one that is continually growing, the cumulative result is a power-law distribution of times-cited for all articles (seeAppendix 2A). We found this process to betrue for the journal articles,1 and a histogramof the model results fits the data and looks to
have a power-law tail (Figure 4.2b). This isconsistent with other scale-free networks
(Adamic and Huberman 1999; Barabasi andAlbert L999), and because we observe thepower-law distribution form approximately,rather than exactly, we believe the modeldownplays the need for certainty that thefunction that fits the citation data is truly anexact power law (Bentley and Maschner2000; Laherrere and Sornette 1998; Redner1998).
It has been proposed that the power-law(or nearly power-law) distribution of authorimpact is due to a multiplication of factors inherent to the author, such as ability to select agood problem, writing skills, efficiency, publicity skills, and so on (Laherrere and Sornette 1998; Montroll and Shlesinger 1982;Shockley 1957; West and Deering 1995). Weargue here, however, that interconnectionsbetween authors, as part of the citation process, have more effect on each paper's impactthan such multiplicative factors. The dispersion in the distributions of times cited with
article age shows small initial differences resulting in large disparities in impact overtime. Whatever the nature of these initial dif
ferences, they are amplified by the fractalgrowth of the citation network to an ever-increasing scale. This effect is not unique tothe case presented here; we find a similarpower-law tail (Figure 4.2b) in the distribution of times cited for articles on "diffusion
limited aggregation,"a highly influential concept in physics, introduced two decades agoby Witten and Sander (1981).
M

Avalanches of Ideas
Figure 4.3. The way Bentleyand Shennan (2003) model a case of prestige-biased transmissionas stochastic network growth. In their example from Neolithic Germany, Bentleyand Shennan(2003) model LBK households as the nodes of the network, and copies of pottery motifs, whichwe take to represent the different household identities, as connections leading toward eachnode. LBK pots after Behrends (1997), LBK longhouse after Liining (1984). After BentleyandShennan (2003:Figure 19).
TheSpreadofIdeas on Neolithic PotteryTurning now to archaeology, Bentley andShennan (2003) have applied the Adamic andHuberman (2000) model to a case study ofstylistic evolution from early Neolithic Central Europe, using Frirdich's (1994) detailedchronology of pottery motifs in the Merz-bach Valley of Germany. In order to modelunbiased stylistic transmission as stochasticnetwork growth, Bentley and Shennan (2003)begin by making an assumption, based on thecorrelation between the number of houses
and different motifs, that each household
maintained its own "identity" motif, whilealso copying styles from other houses. Viewedthis way, each household is a node of the network, and the copies of its pottery are referential links toward it (Figure 4.3).
The network growth model of Adamicand Huberman (2000) implies that newconnections (motif copies) are preferentially attached to (copied after) already well-connected nodes (prestigious households).As shown in Figure 4.4a, Bentley and Shennan (2003) predict that, over time, a log-normal distribution will develop among the
65
Bentley and Maschner
0.00001
Merzbach >alley
pottery
1 10 100 1000 10000
Copies
(b)
i0.001
£ o.oooi
0000001
♦
x
Data, phase 6
Data, phase 7
Data, phases 9-13
Model 6
- Model 7
Model 9-13
!00
Copies
Model 2 vs. data
1000
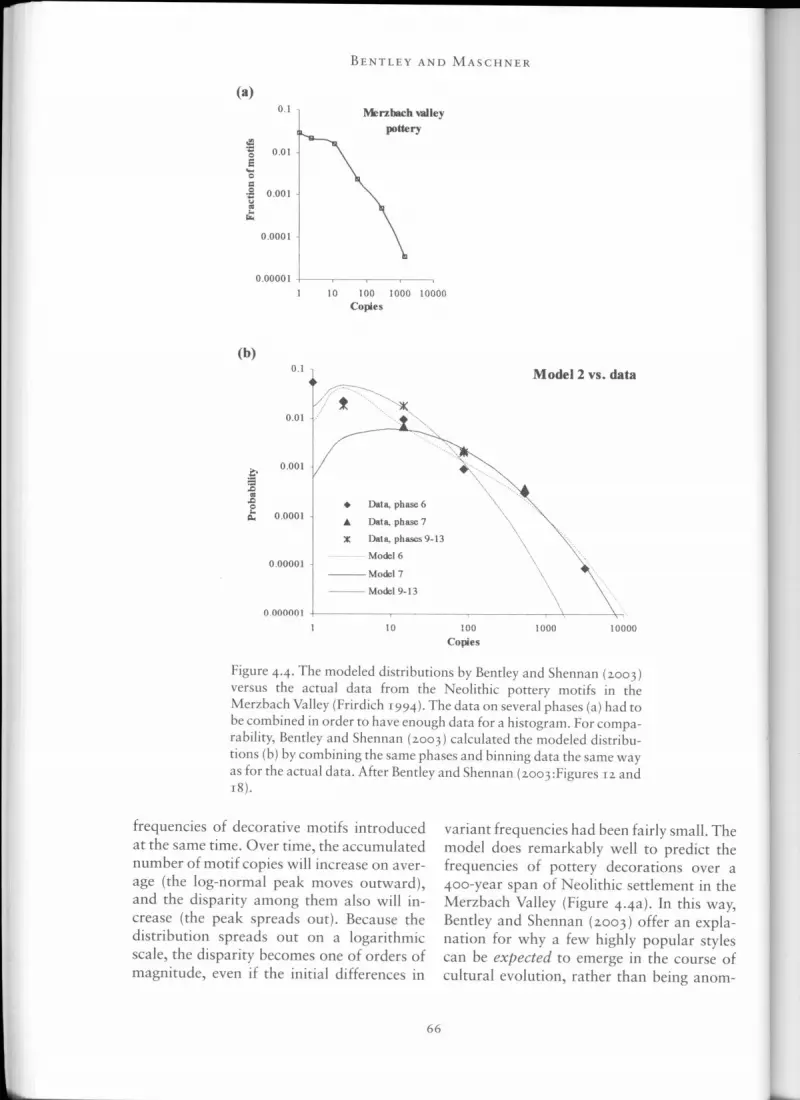
Figure 4.4.Themodeled distributions byBentley and Shennan (2003)versus the actual data from the Neolithic pottery motifs in theMerzbach Valley (Frirdich 1994). Thedata onseveral phases (a) hadtobe combined inorder tohave enough data for a histogram. For comparability, Bentley and Shennan (2003) calculated the modeled distributions (b) by combining thesame phases andbinning datathe same wayasfor theactual data. After Bentley and Shennan (2oo3:Figures 12 and18).
frequencies of decorative motifs introducedat the same time. Over time, the accumulatednumber of motif copies will increase on average (the log-normal peak moves outward),and the disparity among them also will increase (the peak spreads out). Because thedistribution spreads out on a logarithmicscale, the disparity becomes one of orders ofmagnitude, even if the initial differences in
variant frequencies had been fairlysmall.Themodel does remarkably well to predict thefrequencies of pottery decorations over a400-year span of Neolithic settlement in theMerzbach Valley (Figure 4.4a). In this way,Bentley and Shennan (2003) offer an explanation for why a few highly popular stylescan be expected to emerge in the course ofcultural evolution, rather than being anom-
66

Avalanches of Ideas
alous. This suggests that in studying culturalevolution, we may need to place more emphasis on transmission rather than focusingexclusively on natural selection.
One might note that the distributions inFigure 4.4a are not power laws. In fact, evenwhen they are all combined, the resultantoverall distribution of motif frequencies (Figure 4.4b) is much closer to a log-normal thana power law. The reason for this is that theMerzbach network was not always growing,since the number of longhouses rose and fellover the 400-year span of Neolithic occupation. As mentioned above, a scale-free network forms as a result of preferential attachment and continual growth in the populationof agents. In the Merzbach case, we still havea mixture of log-normals whose magnitudesdepend on the number of agents introducedin a particular time step and whose widthsdepend on the time that has passed since theywere introduced. If the number of agentsis constant or declining, the youngest log-normal curves will still be narrow, but not astall as they would need to be to form a powerlaw. Hence when we add up the curves (Figure 4.4b), the leftmost portion of the overalldistribution is more like a log-normal than apower law. At the same time, however, as theoldest log-normal distributions continue tospread outward over time, the high end of theoverall distribution still extends to a form approaching a power law tail.
Approach 2: Self-organized CriticalityNow we look at avalanches of change interms of the theory of self-organized criticality,which was introduced by Bak et al. (1987)to explain the power-law distributions characterizing many complex systems. We expectto find self-organized criticality in "slowlydriven, interaction-dominated threshold systems" (Jensen 1998:126) that naturally gravitate toward a critical state in which some
perturbations only trigger small changes,while others can cause an avalanche of conse
quent events. Generally, most models of self-organized criticality involve a population ofinteracting agents, each of which tends to
remain in its current state unless that state
exceeds a certain threshold. Each agent canbe pushed beyond its threshold by the influence of a neighboring agent, and this changemay influence the next neighboring agent,and so on in an avalanche of change. The system is slowly driven, meaning that smallchanges are continually, though not necessarily predictably, induced from the outside environment. In its critical state, the systemexperiences everything from insignificantperturbations to system-sweeping chain reactions, such that the distribution of avalanchesizes is a power law. Some systems must betuned to this critical state, as when the modeler sets the right parameter values. A self-organized critical system gravitates naturallyto this critical state.
As mentioned in Chapter 1, a common example of a self-organized system is a pile ofrice (Bak 1996; Frette et al. 1996). If onepours rice onto one spot on a table, a pilegrows until it reaches the angle of repose onall sides, bounded by the edges of the table.As more rice is poured, the pile reaches thecritical slope where one falling grain can trigger an avalanche, the largest of which culminates with grains at the edges of the tablefalling to the floor (and out of the observedsystem). The threshold for each rice grain inthe pile is the number of other grains restingupon it. If this threshold is exceeded, thegrain falls, adding its weight to another grainfurther down. The critical state of rice pile isself-organized because most grains are nearthe threshold and the pile hovers betweentwo extremes—the continual pouring of ricepushes the slope above the angle of reposebut also triggers avalanches that keep it fromexceeding its maximum slope. In this self-organized critical state, the distribution ofsizes of avalanches on the sides of the rice pileis a power law. Note, however, that the sizeand slope of the pile stays very nearly constant in the critical state (Jensen i998:Figure4.3). The sizes of the avalanches only becomesignificant once the "trend" in the data, i.e.the slope of the pile, is removed. This pointbecomes important below, when we look at
^

Bentley and Maschner
.Inn 63 .lan-67 Jan-71 Jan-75 .(an-79 .lan-83
(b)
o.i
0.01 f
0.001
3•§ 0.0001XI
£* 0.00001
o.oooooi
0.0000001
-ccs
X
(c)
01
0.01
0.000001
0.01
10 100
Album lifespan (weeks)
0.1 1avalanche site
1000
10
Figure 4.5. (a) Cumulative activity on the Billboard Pop Chart,1963-1985, in terms of the fraction of albums exiting each week.The turnover rate during this period was remarkably consistent atabout 5.6 percent per week for over 20 years, (b) Life spans of albums on the Billboard Chart (binned by powers of 2). (c) Distribution of avalanche sizes, measured as the fraction of the 200 albumson the chart. An avalanche was defined as a period of consecutiveweeks above a threshold of 5.6 percent of the chart per week (seeBentley and Maschner 1999 for details).
68

Avalanches of Ideas
the long-term trends in technological changedata.
What could a rice pile have to do with socioeconomic change? Socioeconomic networks appear to be interconnected in thesame hierarchical way as the rice grains onthe pile. On the sides of the rice pile, it is natural to imagine that the rice grains form afractal network of connected dynamicalpaths, so that the power-law distribution ofavalanche sizes reflects the various sizes of
the activated regions within the fractal (Jensen 1998:5-6). As discussed above and inChapter 2, networks of human interactionmay self-organize in hierarchical, possiblyfractal patterns, characterized by power-lawdistributions of connections leading towardeach agent. As a result, the majority of agentsin such a network are poorly connected,while a few are very highly connected, andgetting from one agent to another tends tolead through a few highly connected agents(see Figure 3.2). If this typifies networks ofhuman interaction, then actions by people atthe major nodes can trigger large avalanches,while the influence of most people, in moreisolated branches, may be orders of magnitude less.
The example discussed above concerningjournal citations suggests that human interaction may take place in a fractal-like network, but is it self-organized criticality? Letus look at another example, involving popular music, previously explored in relation toself-organized criticality by Bentley andMaschner (1999). Popular music in our market economy is a technology in the sense thatnew music is built on the advances made in
previous successful songs. By "advance" wedo not mean that popular music gets betterby any objective sense, but rather that someelement—a harmony, catchy motif, or beat—makes a song sell many copies. A mainstreamrecord of popular music taste is the Billboard"Top 200" Pop Chart (Whitburn 1986).Bentley and Maschner (1999) found that thePop Chart exhibits a surprisingly steadyturnover rate for albums leaving the chart,which stayed at about 5.6 percent per weekfor over 20 years (Figure 4.5a). Remark
ably, this turnover rate appears to be self-organized because we know of no externaldirection that would have fixed it at 5.6 percent over such a long period of time.
In the abstract, could the linear turnoverrates in pop albums be similar to the self-organized, nearly constant slope of a rice pile?In order to invoke this as an explanation, wemust consider whether the Pop Chart is aslowly driven, interaction-dominated threshold system. It is slowly driven because, likepouring rice, there is an inflow of new albumsthat break into the chart each week, and likerice falling off the table, albums must leavethe chart every week. The thresholds for albums on the Pop Chart may relate to people'slasting preference for a good album, whichstays popular for a period of time until morepopular albums bump it off the chart. In fact,Bentley and Maschner (1999) argue that thepower-law tail in the distribution of lifetimesof albums on the Pop Chart (Figure 4.5b)mayhavea direct analogy with the power lawfor agent lifetimes in a model of self-organized criticality known as the Bak-Sneppenmodel (Bak and Sneppen 1993; Sneppen et al.1995). Finally, a necessary characteristic ofself-organized criticality is a successionof avalanches whose sizes are power-law distributed. The interconnections between albums
most likely involve efforts to copy another'ssuccess; a successful album can trigger an avalanche of "copy-cat" albums. The rapid riseof disco, for example, was arguably triggeredby Van McCoy's song, "The Hustle," in1975. Figure 4.5c shows that the distributionof "avalanche" sizes for albums, defined asthe fraction of chart turnover during consecutive weeks of activity above a certain threshold, has a power-law form (see Bentley andMaschner 1999 for details on how avalanches were defined). In sum, the changes inmusic popularity are qualitatively and quantitatively consistent with self-organized criticality (Bentley and Maschner 1999).
TECHNOLOGICAL EVOLUTION AS A
SELF-ORGANIZING PROCESS
Self-organized criticality is an attractive potential model for technological evolution,
69

Bentley and Maschner
which tends to be punctuated rather thansmooth and incremental (Krugman 1996).Models of self-organized criticality maycapture some macroscopic aspects of technological evolution. Inventions, while morecomplex than rice in a pile to be sure, arenonetheless built upon interconnected ideas,which may justify the analogy. More specifically, is technological evolution a slowlydriven, interaction-dominated threshold system? The slow drive may be seen as people'screativity and desire for something better, butwhat are the interconnections and thresholds
between components of technology?The thresholds in inventive activity should
be determined by the costs of updating fromone established technology to another, suchas the mental effort it takes to design something new, the expense of changing the modeof production, or sentimental attachment toan existing design (cf. Fitzhugh 2001). Theidea recalls the catastrophe theory that Renfrew (1978; Renfrew and Cooke 1979)adapted to show how abrupt transitionscould take place in prehistoric technology(see Chapter 1). Renfrew (1978) pointed outthat two optimal solutions may emerge at theends of the spectrum of decisions, while acompromise strategy can be the worst option. As external parameters change, Renfrew argued, small adaptive modifications inbehavior can lead to a "bifurcation" point,where it is suddenly necessary to make adrastic change in order to maintain the optimal behavior (see also Ormerod 1998).Hence individual thresholds inevitably giveway to the continual technological advancesin our modern economy, as over time any invention inevitably loses its cutting edge andits compatibility with other products in themarket, and at some point its design must bechanged in order to stay relevant. Producersshould take on greater risks, and therefore bemore innovative, when production is low andthey essentially have less to lose by abandoning their current technology (Fitzhugh 2001).For example, the manufacturers of plasticCD jewel cases may gradually make their designs slimmer and slimmer. Eventually, athreshold is exceeded, such that a manufac
turer of compact disc storage racks must redesign the racks with smaller shelves in orderto stay competitive.
The interconnections in inventive activityought to stem from the competition and interdependence of related technologies. AsKauffman (1995:217) sees it, "[G]oods andservices 'live' in niches created by other goodsand services." For example, the invention ofthe compact disc player has rendered vinylrecords nearly obsolete. At the same time, ithas motivated an avalanche of related inven
tions that includes not only better compactdisc players and discs but also CD racks, colored CD jewel cases, CD-tuner-tape players,CD-ROMs, and so on. These inventions arehighly interconnected: If CDs were suddenlymade smaller, the sizes of the jewel casesracks and cases would have to change as well.
To demonstrate this by example, Bentleyand Diaz-Guilera (n.d.) looked to the recordof patents filed at the United States Patentand Trademark Office (USPTO 2002a),which reveals how modern technologicalevolution resembles the citation process discussed above for journal articles. Similar to adatabase of journal citations, the USPTOdatabase lists all US patents by the date filed,and with each is a list of references to previous patents that influenced the currentpatent. To continue with our compact discexample, consider the 615 patents with"compact disc" in the title between the firstoccurrence in 1984 and 2000 (see Bentleyand Diaz-Guilera n.d. for details). The cumulative time series (Figure 4.6) shows that therate of CD-related inventions increased dur
ing a transient phase and then settled on asteady-state after about 1991 with a nearlyconstant rate of invention: about 55 patentsper year. This is remarkable because thereseems to be no external regulation forcing thefixed rate of activity. The rate should be fairlyunaffected by bureaucratic aspects such as acertain number of patents issued per day because the USPTO office deals with over two
hundred thousand patents per year (USPTO2002b), or several thousand per week. Instead, it would appear that the nearly constant rate of invention is somehow self-
70

Avalanches of Ideas
/ouu -us patents with "compact disc" anywhere
6000 -
a 5000 -
*
a 4000 •
|3 3000 -
£ <ts Linear trend:
U 2000 -
1000 -
0 1 I
y = 1.423x-46219
r2 = 0.99
1 1 1
Jan-82 Jan-85 Jan-88 Jan-91 Jan-94 Jan-97 Jan-00
Figure 4.6. The cumulative number of patents filed at the U.S. Patent office with the exactwords "compact disc" in the title of the patent (» = 600). The cumulative number grew at a linear rate after 1991. After Bentley and Diaz-Guilera (n.d.).
0.1
jS" 0.0134s0. 0.001
0.0001
0.00001
• "Compact disc" in title
O "Compact disc" anywhere
••»'8S.
\K
1 1(1
Times cited
Figure 4.7. Number of times "compact disc" patents were cited by other patents. Thehistogram uses bins in powers of 2. After Bentley and Diaz-Guilera (n.d.).
100
organized, especially as we see the rate approach its limit and remain steadily there byabout 1991. Note also the similarity of thistrend with the number of articles publishedon self-organized criticality, which grew exponentially for the first four years but linearly after that (Figure 4.2a). As for avalanches, the "compact disc" patents alsoshow a power-law distribution of times cited(Figure 4.7), quite similar to what we haveseen with the journal articles.
Bentley and Diaz-Guilera (n.d.) also foundpower-law distributions in the citations ofapproximately five thousand "automobile"patents since 1976 and also among the almost three million patents in the databasesince 1963. These patterns support the ideathat inventions inspire one another in a fractal pattern as conceptually diagrammed inFigure 4.1 (Bentley and Diaz-Guilera n.d.). Insum, this case study of US patents supportsother claims that technological evolution is a
71

Bentley and Maschner
self-organized critical process (see also Arenas et al. 2000; Guardiola et al. 2002).
IMPLICATIONS AND POTENTIAL
APPLICATION FOR ARCHAEOLOGISTS
We believe that archaeologists can considerthe spread of ideas through a cultural orsocial system as a form of scale-free networkgrowth. Scale-free network growth is probably common in cultural phenomena becausethe basic principle—that the most well-connected agents are the most likely to gainfurther connections—is itself common. If the
scale-free network growth is accompanied bya system that credits the contribution of eachagent, then a highly skewed, power-law distribution can develop in power, status, orwealth. This is shown with house sizes for
prehistoric Alaska (Chapter 3, this volume).For the example from the scientific citationprocess, Bak and colleagues have acquired atremendous amount of academic status
partly as a result of their seminal publication.If scientists were paid each time their paperswere cited, Bak and colleagues would have athousand times the wealth of the majority ofother authors in their subject area.
To suggest an archaeological example, theidea of farming may somehow have becomeknown to one person in a particular region,from whom a few people may have been inspired to try their own gardens, which overtime inspired a generation of families to farmfull-time for their subsistence, which in turninspired related innovations such as terracing, until eventually the majority of thechildren in the community learn the basicconcepts of farming by an early age. This example is conjecture of course, because it isimpossible to trace the historical and oralpathways of the concepts related to the advent of farming. However, it is actually one ofthe examples that Renfrew (1978) described,using catastrophe theory (see Chapter 1). Incontrast with Renfrew's use of "control vari
ables" that describe the state of the system asa whole, we can envision the spread of agriculture as an avalanche of ideas that beganwith a single agent. Consider the Mesolithic-Neolithic transition in Central Europe. Upon
the arrival of Linearbandkeramik (LBK)farmers, indigenous groups were exposed tonew forms of prestige items. Exchange between contemporary Mesolithic and Neolithic groups most likely involved cattle andsmaller stock, among other things (Gronen-born 1999; Thorp 2000; Zvelebil and Lillie2000).
As argued in Chapter 2, wealth inequalityin pastoralist societies is indicative of scale-free network growth, resulting in highlyskewed distributions of livestock ownership.Such wealth inequality, even if not hereditary,certainly increased economic competition.The first dealings in livestock, prestige goods,or grain by indigenous groups in NeolithicEurope may have lead to a few individuals ina given area dominating the exchange, asseen in Endicott's (1987) example, quoted inChapter 2, about the Batek De' and the ga-haru wood trade. With such success, manywould attempt to do the same. In this way,one idea can have an avalanching effect(Bentley and Maschner 2000). Hayden(1996, 2001) has suggested that, during theEuropean Neolithic, the introduction of livestock to the economic sphere of Mesolithicgroups would have increased the potentialfor competitive feasting and hence hastenedthe adoption of agriculture by indigenousgroups who were pulled into the competitionfor material wealth. Fewster (2001) describesan ethnological case from Botswana in whicha forager named Petso tried to cultivate afield in the way of neighboring farmers. Onemay envision a similar process for the firstMesolithic forager in a group who began tobreed cattle or harvest wheat. Whoever suc
ceeded may have inspired others to do thesame not because he or she "discovered" a
new way of subsistence, of which others weresurely aware, but because they had runawaysuccess, like the Batek man.
If the system is not properly poised foran avalanche of change, however, the ideadoes not catch (Gladwell 2000; Kauffman1995). Many attempts at farming would havefailed, or simply not inspired many others,in an immediate-return society (Barnardand Woodburn 1987; Hall 1986:48; Ingold
_i

Avalanches of Ideas
1986). On the scale of the individualMesolithic forager, we can envision repeatedinstances of an individual having a go at agriculture with little success or influence, especiallywhen such a change for others might violate an ideology regarding free access toland and resources, as opposed to the appropriated access characteristic of agriculturalor pastoral societies (Davidson 1989). Forexample, Endicott (1987) describes howsome of the Batek De' planted fields of rice inthe mid-1970s with government help. Theirkinspeople simply came to these fields andfreely collected these crops, since by Batekprinciples it was within their rights to eat thecultivated food as long as they harvested itthemselves. It was thus impossible for theBatek to farm for their own private benefitwithout repudiating their obligation to sharefood beyond their immediate needs (Endicott1987:125-126). In this case, the rich-get-richer process could not get going because thesocial principles of private property were notestablished. Thus, if agents are not allowed tobenefit in proportion to that which they havealready accumulated, an avalanche may notoccur. In this way the rules of citation wereintegral to how the avalanche of papers onself-organized criticality took place.
CONCLUSION
The concepts presented here about networks,avalanches, self-organized criticality, and thespread of ideas are not new (e.g., Kauffman1995; Bak 1996) and are even emerging in aseries of recent books (Buchanan 2001; Glad-well 2000; Ormerod 1998). In fact, the idea
of avalanches is evident in commonly usedexpressions like "the whole thing snowballed," "viral marketing," and "let's see ifwe reach a critical mass with this." Our purpose has been to contribute toward transforming this common-sense understandinginto a quantitative one that we may apply toarchaeological or ethnographic data. Quantitative examples of the spread of culturalphenomena are being added to a growing listof applications in the literature (e.g., Bentleyand Maschner 2000, 2001; Roberts and Tur-cotte 1998) that in themselves may constitutea small avalanche, one that includes this verychapter. Because of the growth of complexsystems research, anthropologists and archaeologists are now in a position to quantifyand mathematically model the spread ofideas, beliefs, technologies, and other aspectsof social systems. This should create new andnovel areas of research as anthropologists increase their knowledge and sophistication inthe use of these techniques.
Note1. We fitted a log-normal function to the distri
bution of times cited for each year and foundthat the mean value of In (times cited) increases linearly with the age of the article, giving gg = 0-32- + °-°2 from eq(2) in Appendix2A of this volume. The standard deviations aare less regular, but increase approximatelywith oz = 0.25 + 0.05. These relations havebeen presented by Bentley and Maschner(20oo:Figure 7). We created model distributions of times cited for article ages from 1 to 12years, using these values of g and az. The amplitude for each yearly distribution was takenfrom the data.
73