avalanche release and snow characteristics
TRANSCRIPT
AVALANCHE RELEASE AND SNOW CHARACTERISTICS
.. . . ~ . .
.fA. ~~~,i~::ft~~.-t~:;,~···~·~·· . :: .
Richard L. Armstrong and Jack D. Ives, Editors
Occasional Paper No. 19, 1976 Report to the Bureau of Reclamation
UNITED STATES PROGRAM ON MAN AND THE
BIOSPHERE Unesco MAB Project 6
INSTITUTE OF ARCTIC AND ALPINE RESEARCH• UNIVERSITY OF COLORADO
MS•280 (2·72) Bureau or Reclamation
1. REPORT NO.
INSTAAR-14-06-D-71 4. TITLE AND SUBTITLE
Avalanche Release and Snow Characteristics, San Juan Mountains, Colorado
7 . AUTHOR($)
Richard L. Armstrong and Jack D. Ives (Eds.)
9 . PERFORMING ORGANIZATION NAME AND ADDRESS
Institute of Arctic and Alpine Research University of Colorado Boulder, Colorado 80309
12. SPONSORING AGENCY NAME AND ADDRESS
Division of Atmospheric Water Resources Mgt. Bureau of Reclamation Denver Federal Center, Denver, Colorado 80225
15 . SUPPLEMENTARY NOTES
16 . ABSTRACT
5. REPORT DATE
May 1976 6. PERFORMING ORGANIZATION CODE
8. PERFORMING ORGANIZATION REPORT NO .
NSTAAR-14-06-D-7155-4
10 . WORK UNIT NO .
11. CONTRACT OR GRANT NO.
14-06-D-7155 13 . TYPE OF REPORT AND PER I OD
COVERED
Final Report April 1971-Sept. 1975
14. SPONSORING AGENCY CODE
A methodology for the accurate prediction of snow avalanche occurrence has been developed through investigation of quantitative relationships among terrain, climate, snowcover properties and avalanche formation. An instrumentation network was established to measure air and snowpack temperatures, wind speed and direction, precipitation rate and amount, snow settlement rate, net all-wave radiation, and stratigraphic snow density values. Avalanche events were monitored by direct observation of , 214 avalanche paths. Detailed investigations into the physical properties of the snow within the study area were carried out by stratigraphic studies at standard, level snow study sites, test slopes representative of avalanche release zones and actual avalanche fracture lines. Such studies allowed definition of a local snow climate. An "in-house" stability evaluation and avalanche forecast were prepared at daily intervals during three winters. Each forecast was evaluated the following day in terms of actual events subsequent to the initial forecast. A statistical forecast model based on discriminant function analysis of four years of data was developed.
17 . KEY WORDS AND DOCUMENT ANAL YSIS
a . DESCR /PTORS--
avalanche, Colorado, snow, weather modification
b . IDENTIFIERS--
c . COSATI Field/Grou p
18 . DISTRIBUTION STATEMENT
Available from the National Technical Informat i on Service . Operations Division , Springfield , Virginia 2215/ .
No limitations
19 . SECURITY CLASS 21. NO. OF PAGE
256 (THIS REPORT)
UNCLASSIFIED 20 . SECURITY CLASS 22 . PRICE
(THIS PAGE)
UNCLASSIFIED
AVALANCHE RELEASE AND SNOW CHARACTERISTICS,
SAN JUAN MOUNTAINS, COLORADO
Final Report 19 71 - 1975
May 1976
Richard L. Armstrong and Jack D. Ives (Eds.)
San Juan Avalanche Project
Institute of Arctic and Alpine Research
University of Colorado
Boulder, Colorado 80309
Prepared for:
Division of Atmospheric Water Resources Management U.S. Bureau of Reclamation Department of the Interior
Denver, Colorado 80225
Contract No. 14-06-D-7155
A contribution to the United States Unesco Man and the Biosphere (MAB) Program Project 6:
Study of the impact of human activities on mountain and tundra ecosystems
University of Colorado
Institute of Arctic and Alpine Research
Occasional Paper 19
ISSN 0069-6145
ii
© Copyright 1976, The Regents of the University of Colora do All rights reserved.
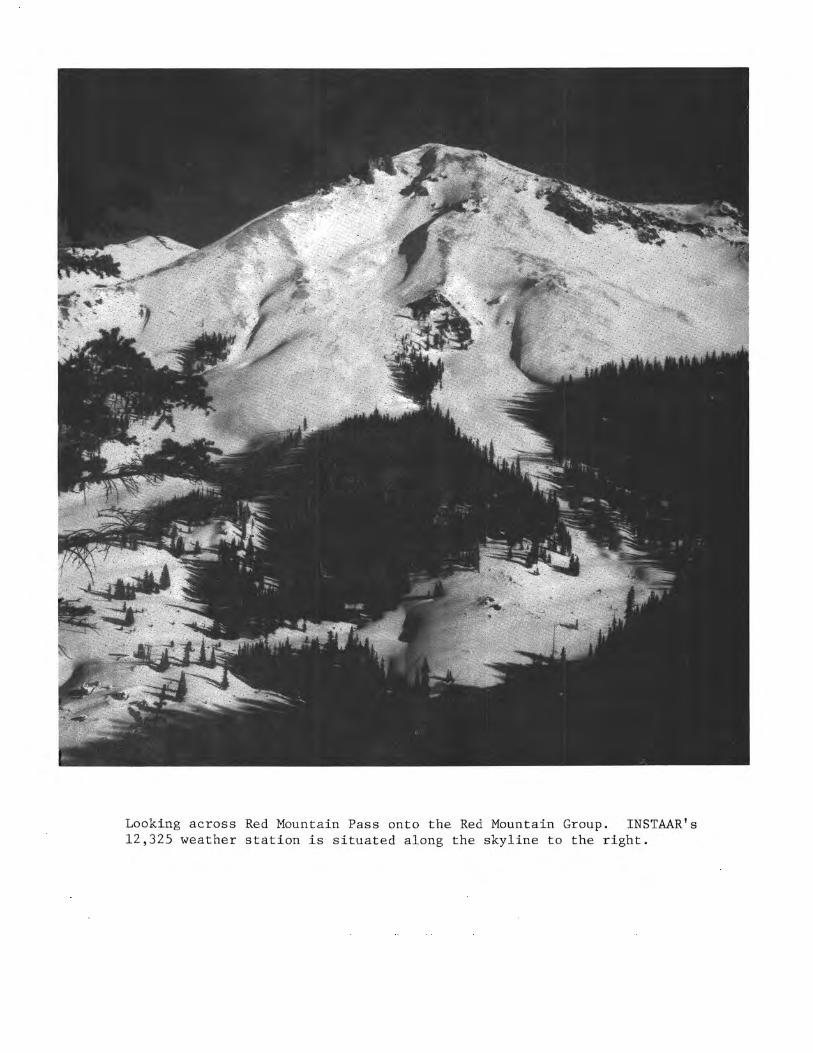
Looking across Red Mountain Pass onto the Red Mountain Group. INSTAAR's 12,325 weather station is situated along the skyline to the right.

V
PREFACE
This INSTAAR Occasional Paper represents the final report to the Division of Atmospheric Water Resources Management of the Bureau of Reclamation, United States Department of the Interior. An original three-year contract was signed in May 1971 that was subsequently extended to permit data collection during a fourth winter season (1974-75) and to facilitate data analysis and write-up during the current winter (1975-76). The report has also been designated as a contribution to the United States Unesco Man and the Biosphere (MAB) Program, especially since its objectives fall so naturally within the scope of US MAB Directorate 6A: study of the impact of human activities on mountain ecosystems.
During the course of the previous five years, the Silverton avalanche research project, as originally conceived, has evolved extensively and has undergone many changes. Personnel have changed, methods of study have been refined, and some of the original areas of investigation, especially those concerning seismic and infrasonic signals from avalanches, carried out under the direction of J. C. Harrison, were completed earlier. Nevertheless, this report has been prepared so as to ensure that the user has as complete an understanding as possible of the overall avalanche project. This has necessitated some duplication of data presentation and discussion. However, the report is intended to supersede all earlier interim publications and to stand as the final statement on work emanating directly from Bureau of Reclamation Contract No. 14-06-D-7155.
A few words about project organization and personnel should be of assistance to the reader. The initial contract, awarded to INSTAAR, designated Jack D. Ives, J. Christopher Harrison and Donald L. Alford as principal investigators, with Edward R. Lachapelle, Malcolm Mellor (snow mechanics) and Wilford Weeks (statistical analysis) as principal consultants. Christopher Harrison was responsible for the seismic and infrasonic studies. Donald Alford played a vital role in the setting up of the operational framework and by serving as Silverton Field Director during the first winter (1971-72). Subsequently, Richard Armstrong succeeded to the position of Field Director and became a principal investigator, and indeed carried the main burden of the project through to its completion such that he rightly deserves the first author position indicated here. The three consultants proved invaluable throughout and INSTAAR has been highly privileged to have such support. Edward Lachapelle, in particular, has de facto played the role of a principal investigator and, as a Research Associate of INSTAAR, has been a pivotal member of the research team throughout, making readily available his wealth of personal experience in snow and avalanche research.
Second only to the contributions of the principals have been those of the field team. These included Betsy Armstrong, Don Bachman, Juris Krisjansons, Gail Davidson, Bill Isherwood, Fred Johnson, Phillip Laird, Bill McClelland, Len Miller, Rod Newcomb and Imants Virsnieks. All played a vital role, often under exacting physical and mental conditions. It need not be stressed that four full winter seasons between 3,000 and 4,000 meters elevation in avalanche terrain is not entirely devoid of personal risk. That no accident was incurred is a tribute to each individual and to the team as a unit.
Administrative and clerical back-up has also been extensive. Claudia Van Wie acted as scientific assistant for the first three years and helped extensively

vi
with editing, preparation of interim reports and statistical analysis in particular, and in all other phases of the project. Her enthusiasm and critical faculty are especially acknowledged. Laura Osborn provided budgetary assistance and Marilyn Joel undertook all the drafting. Ann Stites, as administrative assistant to the INSTAAR Director, helped extensively, including organization of this report. John Clark, INSTAAR climatologist, assisted with the meteorological instrument site selection, calibration and maintenance, and, our remarkably good climatological data collection is largely due to his persistence and dedication.
Michael J. Bovis entered the project in a special capacity and at a relatively late stage, and made a major contribution by breaking through the mass of data and developing the statistical approach to avalanche forecasting. This is reflected in Chapter 5 of this report and Michael's separate publications which constitute a significant advance in the field of avalanche forecasting. In this he was assisted by Nel Caine of the INSTAAR faculty and consultant Wilford Weeks.
Our contacts with and assistance from persons outside of INSTAAR have been extensive. These are acknowledged separately innnediately following this preface, although the special supportive role of Olin Foehner, contract monitor, Bureau of Reclamation, must be emphasized above all. The backbone of the project, however, was Richard and Betsy Armstrong and daughter Johanna, who entered this world as an avalanche baby. For some years Betsy and Richard had their second name substituted by "Avalanche" and people in Silverton came to regard them as decidedly odd since they were not like the other visitors to Silverton who came in the sunnner and departed with the first snows of autumn; they came with the bad weather and stayed through summer also.
Projects of this nature invariably induce scientific excursions in parallel and divergent directions. The intimately related projects include studies of snow temperature-gradient metamorphism, supported by US Army Research Office (Durham), Grant No. DARCO 4-75-G-0028, assessment of alternate methods for artificial avalanche release, supported by grants from the Highway Departments of the states of Colorado and Washington, and the Federal Department of Transportation (University of Washington Subcontract No. 845043). A special project, funded in part from this project, and in part from NASA Office of University Affairs Grant No. NGL-06-003-200 and San Juan County, resulted in the publication of the San Juan County Avalanche Atlas as INSTAAR Occasional Paper No. 17. Support from the same sources also culminated in the publication of INSTAAR Occasional Paper No. 18 "A Century of Struggle Against Snow: A History of Avalanche Hazard in San Juan County" by Betsy Armstrong. Of major importance has been development of expertise in mapping areas subject to natural hazards in the northern tier of the San Juan Mountain counties as one of the major objectives of NASA Grant No. NGL-06-003-200, applications of space technology to the solution of land-use problems in mountain Colorado. Our thanks go to grant monitor Joseph Vitale for his guidance and extensive encouragement. This made it possible to interchange several key personnel amongst these major research projects. It also facilitated the staging of a very effective avalanche and natural hazards workshop in Silverton in June/July 1975 which included leading participants from Switzerland, Canada and several United States agencies.
It is perhaps fitting to end with the statement that although this report may represent completion of contractual obligations under the original contract, it is intended as a beginning of attempts to widen our understanding of environmental conditions and processes in the San Juan Mountains. This magnificent
vii
mountain area with its stalwart people and their attendant problems of natural hazard assessment, resource development and land-use policy requirements, is considered as a superb na ural laboratory for the enlargement of an important segment of the United Sta es Man and the Biosphere Program. This should be pursued in three forms: asic research, applied research and in training and education.
Director, INSTAAR and Professor of Geography Chairman, United States MAB Directorate 6A
27 April 1976
Acknowledgments: to indi iduals and agencies for assistance and advice in many p the research project
UNITED STATES FORES SERVICE - Alpine Snow and Avalanche Project Pete Martinelli Ron Perla - curr tly with Environment Canada, Calgary West Wide Data N twork Arthur Judson Knox Williams
COLORADO DEPARTMENT OF HIGHWAYS Tuffy Foster Ray Ledford Noel Peterson Blaine Thompson Lyn Watson
SAN JUAN COUNTY Avalanche School Sheriff Virgil John "Scotty" Ja
E G AND G INC. Synoptic Meteoro ogical Data (Weather Forecasts) Larry Hjermstad Dick Medenwald Art Ragno
WESTERN SCIENTIFIC ERVICES Meteorological D ta Exchange
SWISS FEDERAL INSTI UTE FOR SNOW AND AVALANCHE RESEARCH
viii
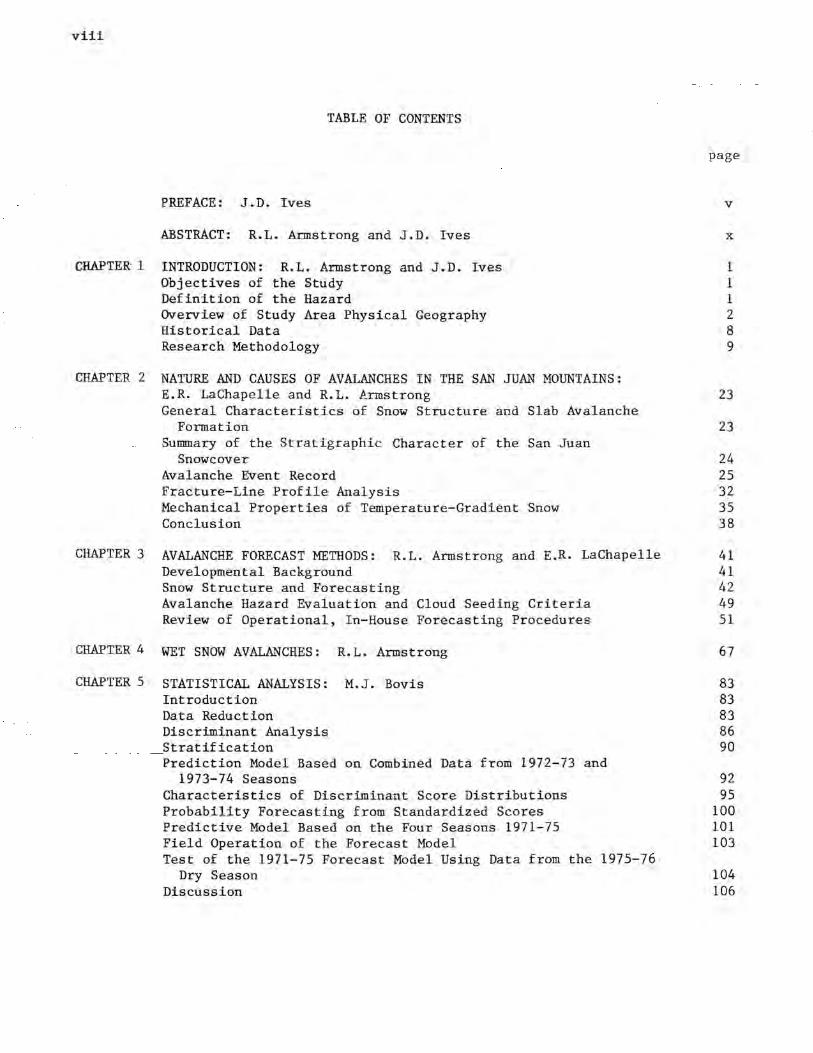
TABLE OF CONTENTS
page
PREFACE: J.D. Ives V
ABSTRACT: R.L. Armstrong and J.D. Ives X
CHAPTER 1 INTRODUCTION: R.L. Armstrong and J.D. Ives Objectives of the Study
1 1 1 2 8 9
Definition of the Hazard Overview of Study Area Physical Geography Historical Data Research Methodology
CHAPTER 2 NATURE AND CAUSES OF AVALANCHES IN THE SAN JUAN MOUNTAINS: E.R. Lachapelle and R.L. Armstrong General Characteristics of Snow Structure and Slab Avalanche
Formation Surmnary of the Stratigraphic Character of the San Juan
Snowcover Avalanche Event Record Fracture-Line Profile Analysis Mechanical Properties of Temperature-Gradient Snow Conclusion
23
23
24 25 32 35 38
CHAPTER 3 AVALANCHE FORECAST METHODS: R.L. Armstrong and E.R. LaChapelle 41 Developmental Background 41 Snow Structure and Forecasting 42 Avalanche Hazard Evaluation and Cloud Seeding Criteria 49 Review of Operational, In-House Forecasting Procedures 51
CHAPTER 4 WET SNOW AVALA..NCHES: R. L. Armstrong 67
CHAPTER 5 STATISTICAL ANALYSIS: M.J. Bovis 83 Introduction 83 Data Reduction 83 Discriminant Analysis 86 Stratification 90 Prediction Model Based on Combined Data from 1972-73 and
1973-74 Seasons 92 Characteristics of Discriminant Score Distributions 95 Probability Forecasting from Standardized Scores 100 Predictive Model Based on the Four Seasons 1971-75 101 Field Operation of the Forecast Model 103 Test of the 1971-75 Forecast Model Using Data from the 1975-76
Dry Season Discussion
104 106
ix
page
Appendices 109 A. Characteristics of the Avalanche Data Tape and Instructions
B. C. D.
to Users Listing of Data Files on the Magnetic Tape Description of Data Reduction Programs Discriminant Function Coefficients from Combined Seasons 1971-75
CHAPTER 6 THE APPLICATION OF ISOTOPIC PROFILING SNOW GUAGE DATA TO AVALANCHE RESEARCH: R.L. Armstrong Introduction Installation of the Profiling Snow Guage Field Calibration Application of Data to Avalanche Research Data Analysis Performance History
CHAPTER 7 SEISMIC SIGNALS FROM AVALANCHES: J.C. Harrison Introduction Results Conclusions
REFERENCES
APPENDICES 1. 1974-1975 Winter Sununary: R.L. Armstrong 2. 1971-1975 Meteorological and Avalanche Summary Tables 3. An Example of Data from an Avalanche Atlas for San Juan
County: L. Miller, B.R. Armstrong, and R.L. Armstrong 4. Fracture Line Profiles
109 111 116
130
131 131 133 134 137 138 143
145 145 146 150
151
153 153 167
217 223
X
ABSTRACT
This final report covers research conducted by the San Juan Avalanche Project, Institute of Arctic and Alpine Research (INSTAAR), University of Colorado for the period August 1971 to June 1975. The research was supported by Contract No. 14-06-D-7155 with the Division of Atmospheric Water Resources Management, U.S. Bureau of Reclamation, Department of the Interior, and has had as its purpose the study of the nature and causes of snow avalanches within the vicinity of Red Mountain Pass, Malas Pass, and Coal Bank Pass in the San Juan Mountains of southwestern Colorado. The ultimate objective of the project was to develop- a methodology to accurately forecast avalanche occurrences through study of the complex relationship which exists among terrain, climate, snow stratigraphy, and avalanche formation. When the project was initiated, only a limited amount of climatological data was available for the study area. Recognizing that an avalanche prediction model relies heavily upon data gathered from highly accurate, reliable instruments installed on carefully selected sites, a network of fixed instrumentation was utilized to measure meteorological parameters, determine physical properties within the snowpack, and detect avalanche events.
The primary snow study site located at Red Mountain Pass (3400 m) included instrumentation to measure air temperature, temperatures within the snowpack, wind speed and direction, precipitation rate and amount, snow settlement rate, and net all-wave radiation at the snow surface. In addition an isotopic profiling snow gauge provided snow density and water equivalent values throughout the snowpack at 1.0 cm intervals. Seismic and infrasonic instrumentation for avalanche event detection was investigated during the first two winters, but neither of these systems proved feasible.
Detailed investigations into the physical properties of the snow within the study area were prompted by the fact that the San Juan Mountains exhibit climatic extremes not found in more northerly latitudes where most practical and scientific knowledge of snow avalanche formation has been accumulated. The combination of high altitude, low latitude and predominately continental climate produces a specific radiation snow climate. Generally, this condition is the result of two factors. First, the extreme nocturnal radiational cooling occurring on all exposures produces snowpack temperature gradients of a magnitude sufficient to cause significant recrystallization or temperature-gradient metamorphism. The second factor is the substantial amount of solar energy available to slopes with a southerly exposure. This daytime condition causes melt at the snow surface and subsequent freeze-thaw crusts. These two situations continue to influence the snowcover throughout the winter. The resulting stratigraphy is highly complex and often unstable.
During the second winter many snow pits were dug to collect data on snow stratigraphy. These snow pits were of three types. One type was located at standard, level snow study sites, while a second was located on test
xi
slopes or avalanche release zones. Special emphasis was given to the third type associated with the actual avalanche fracture lines. The first two types are acquired as a series at fixed sites to determine changes in snow structure with time. During the third and fourth winters, these received the major emphasis with particular attention directed towards the temperature gradient process. Snow temperatures were measured throughout the depth of the snowcover on a daily basis at sites at three different elevations. Periodic snowpits at these sites demonstrated the relationship between the magnitude of the temperature-gradient and the type and extent of subsequent metamorphism.
As a part of the daily operational procedure during the 1972-73, 1973-74, and 1974-75 winters this project produced an "in-house" stability evalu-ation and avalanche occurrence forecast for the research area. Such forecasts were made for each 24 hour period and at more frequent intervals during storms. Each avalanche occurrence forecast was evaluated the following day in terms of actual conditions and events subsequent to the initial forecast. During the third winter the avalanche forecast procedure was further refined to give forecasts for specific groups of paths, as well as general area forecasts. Methods employed by the field observers to evaluate numerous meteorological and snowcover parameters in order to produce an avalanche forecast were isolated and described. Forecasting accuracies of 81 percent for the general area and 73 percent for specific path groups were achieved. On the completion of the third winter's data collection, work began on the development of a statistical model for the purpose of avalanche prediction.
Following the fourth winter's research, the statistical forecast model was further refined. During this final winter an unusually high level of avalanche activity prevailed, allowing twice the annual average number of avalanche events to be included in the statistical analysis. The stepwise discriminant function program allowed stratification of avalanche and nonavalanche days in terms of antecedent conditions described by ten variables over five, three and two-day periods prior to each avalanche or non-avalanche day. Analysis suggests that the two-day time step is most efficient, thus reducing the amount of computation, with no loss in forecasting precision. A clear difference is found between dry snow and wet snow avalanche conditions. The dry snow avalanche days are most clearly identified by reference to precipitation totals during the few hours prior to avalanche release and by air temperature over varying time periods according to the magnitude of event being considered. The wet snow avalanche days are best related to the mean and maximum two hour air temperatures in the 12 to 24 hour period prior to the- avalanche event. While rapid temporary warming may often preceed cycles of small wet loose avalanches, a more prolonged period of warming is required for larger wet avalanche cycles to occur. A measure of the relative distance of a discriminant score from the discriminant index allows a more precise forecast than a simple "yes" or "no". This refinement enables the forecast to be stated in probability terms, an approach not previously attempted in numerical avalanche forecasting.
xii
Evidence suggests that avalanche release within sub-freezing snow layers is primarily dependent on precipitation to trigger unstable layers deep within the snowcover. Delayed-action events are extremely rare. While avalanche frequency and magnitude are influenced by precipitation rates and amounts, they are thus determined primarily by the snow structure which exists within the release zone at the time precipitation-loading occurs. Avalanche magnitude is further affected by mechanical strength of all snow layers in mid-track, for this determines the penetration depth of sliding snow and the ultimate volume of the moving avalanche.
In conclusion, the claim is made that the Silverton Avalanche Research Project has been able to produce for the first time an approach to an operational real-time statistical forecast model. This model which, for major avalanche cycles during the dry and wet snow seasons, has an accuracy of 88% and 82% respectively, is also the first to be applied to groups of starting zones and individual paths, and to predict magnitude of avalanche occurrence.
Richard L. Armstrong and Jack D. Ives (Eds.) Institute of Arctic and Alpine Research University of Colorado, Boulder
27 April 1976
CHAPTER 1: INTRODUCTION
Richard L. Armstrong and Jack D. Ives
Objectives of the Study
An investigation into the nature and extent of snow avalanche activity was carried out during four consecutive winters (1971-1975) by the Institute of Arctic and Alpine Research (INSTAAR), University of Colorado. The research was undertaken through contractual arrangements with the Bureau of Reclamation, U.S. Department of the Interior (Contract No. 14-06-D-7155).
1
The initial objective of the research was to identify and catalog those areas of significant avalanche activity within the study area and to acquire an understanding of the nature and type of its snow avalanche releases. The second step was to develop a methodology that would determine the specific causes of local avalanche activity and, finally, a third step was to construct a forecast model for the prediction of avalanche occurrence. This summary report contains a comprehensive analysis of all relevant meteorological, snowcover and avalanche data collected over the past four winters. The most comprehensive previous account, that includes the first serious attempt at statistical forecasting, is contained in Armstrong et al. (1974).
Definition of the Hazard
Information regarding the relationship between augmented winter precipitation and avalanche occurrence, that could in turn create economic and public safety problems, was considered a vital segment in analysis of the United States Bureau of Reclamation Project Skywater winter cloud-seeding experiment. In May of 1971, INSTAAR was awarded a contract to provide this information, with J. D. Ives, J.C. Harrison and D. L. Alford as the original principal investigators. During the period of the INSTAAR study, the Upper Colorado River Basin Pilot Project was involved in winter cloud-seeding experiments in the San Juan Mountains although the original target area was reduced so as not to include the northwestern sections of the mountains wherein practically all permanent human habitations were concentrated. Therefore, research was directed toward study of the relationships among avalanche activity and natural precipitation patterns and other environmental factors in this a:rea. Observations of actual avalanche activity were concentrated within an area immediately adjacent to a 58 km section of U.S. Highway 550 between Coal Bank Hill and the town of Ouray, as well as 14 km of Colorado Highway 110 north of the town of Silverton and the environs of Silverton itself: the major avalanche hazard in San Juan County occurs within this area. While unknown numbers of avalanches occur in the San Juan Mountains each winter, only those that come into contact with man or his property constitute a hazard. One hundred fifty-six avalanche paths directly threaten the above mentioned highways and 13 affect property with-in the town of Silverton with varying frequency. The sections of highways 550 and 110 and the land immediately adjacent to them that are the objective
2
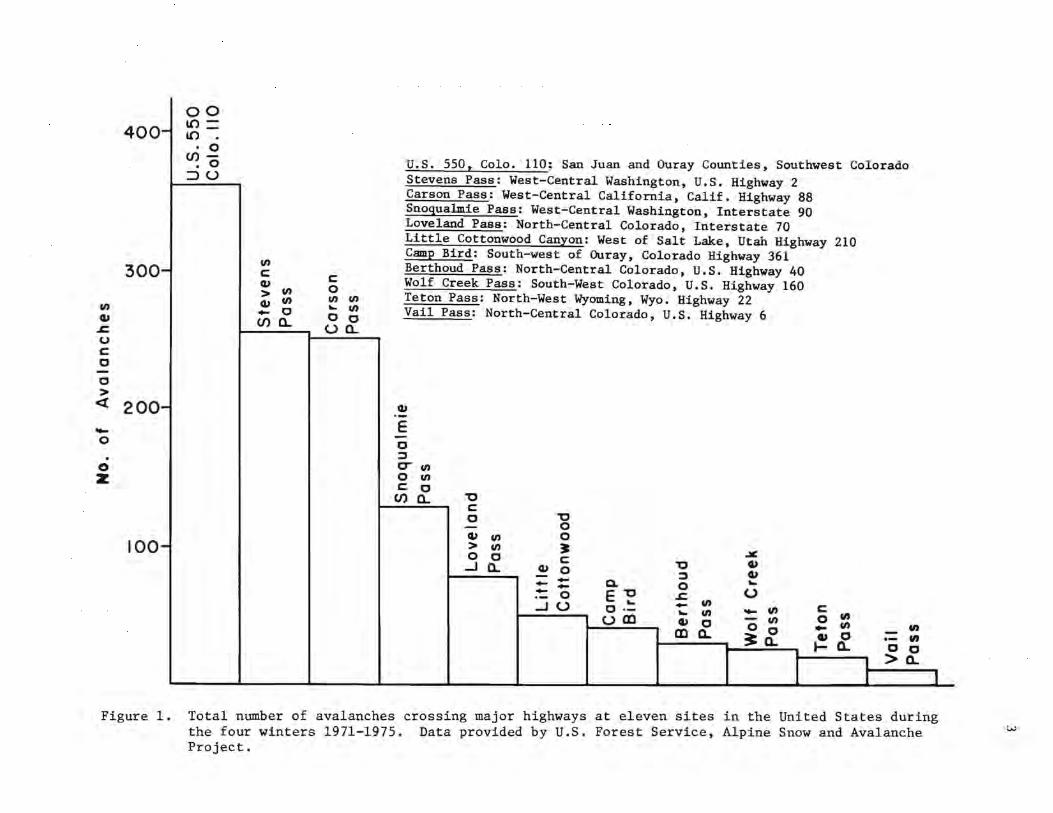
of this study experience a higher degree of avalanche activity than any other section of highway in the United States (Figure 1). Present-day traffic within and through this area is light, so that the magnitude of the actual avalanche hazard is relatively low, although despite this, four deaths and considerable property damage have been caused by avalanches since 1950. Moreover, it is anticipated that traffic flow will increase in the years ahead. The mining industry, the original economic base of the region, has appreciable potential for growth as world shortages become more acute and prices rise. This must be viewed against the situation prevalent during the mining boom (1875-1918) when 89 avalanche-related deaths and extensive property damage occurred in San Juan County alone (B. Armstrong, 1976a). In addition, the comparatively new phenomenon of rapid acceleration in recreational use of mountain lands, dramatized by the mushroom growth of ski resorts such as Vail and Aspen, is gradually ' penetrating the San Juan Mountain area (Ives et al., 1976). The downhill ski resort of Purgatory, 20 km south of Coal Bank Hill, has doubled its lift capacity in the last five years while a steady growth is occurring in cross-country skiing, snowmobiling, winter mountaineering and other forms of back-country recreation.
In summary, therefore, avalanche hazard can be defined as the product of density of human usage, size of area affected by avalanche run-out and frequency of avalanche occurrence. The first variable, while highly relevant to determination of the degree of hazard, lies beyond the scope of this investigation. The second and third variables and the factors influencing them become of immediate concern.
Overview of Study Area Physical Geography
The San Juan Mountains are located in the southwestern quadrant of Colorado and their crest-line, forming the Continental Divide, runs in a great backward trending curve from the New Mexico state line turning more westerly to point roughly toward Silverton. Within 15 km of the town the Divide turns abruptly east-northeast for some 30 km and then northerly again. Fourteen peaks exceed 14,000 ft (4308 m) and numerous large rivers have dissected the major mountain mass into subranges and a complex system of ridges and valleys. The major rivers include the Rio Grande and the San Juan with a series of important tributaries including the San Miguel, Dolores , Animas, and Los Pinos. A central core of intrusive granite-gneisses and quartzites form the southern limits of San Juan County, including the Needles and Grenadier ranges. This central core is skirted by great accumulations of volcanic ashes and tuffs, agglomerates, basalts and dolorites, and metamorphosed sediments with subhorizontal stratification. Repeated growth of ice sheets and radiating valley glacier systems characterized the late-Cenozoic period and glacial sculpturing is responsible for much of the more rugged relief and deep, U-shaped valleys typical of the area today. In the immediate study area, this glacial widening and overdeepening has been important in shaping the spectacular East and North Animas Fork valleys and Ironton Park of the upper Uncomphagre drainage that form the main
oo 400 l() =
l() . •O
Cl)-U.S. 550t Colo • 110: San Juan and Ouray Counties, Southwest Colorado . o
::> 0 Stevens Pass: West-Central Washington, U.S. Highway 2 Carson Pass: West-Central California, Calif. Highway 88 Snoqualmie Pass: West-Central Washington, Interstate 90 Loveland Pass: North-Central Colorado, Interstate 70
300
1/)
cu .J::.
Little Cottonwood Canyon: West of Salt Lake, Utah Highway 210 Camp Bird: South-west of Ouray, Colorado Highway 361
1/) Berthoud Pass: North-Central Colorado, U.S. Highway 40 C
ca, C Wolf Creek Pass: South-West Colorado, U.S. Highway 160 > 1/) 0
Teton Pass: North-West Wyoming, Wyo. Highway 22 ca, 1/) en 1/) ~ 1/) Vail Pass: North-Central Colorado, U.S. Highway 6 - 0 0 0 Cl) Cl.
0 Cl. u C 0 -0 >
<t 200 - ca, ·-- E 0 -
0 . :::, 0 er II)
z 0 Cl)
C 0 Cl) Cl. "O
C 0 "O - 0
100 cu Cl) 0 > Cl) 3 .lll: 0 0 C "O cu _J Cl. CU O :::, cu == Q. 0 ~ - 0 E -o .J::. 0 ·- Cl) _J 0 ~ - C O·- ~ Cl) - Cl)
um - Cl) 0 en cu 0 0 0 - Cl) en m a.. CU 0 - .,, 3 Cl. ·-I
t- Cl. 0 0
I I >n.. I I
Figure 1, Total number of avalanches crossing major highways at eleven sites in the United States during the four winters 1971-1975. Data provided by U.S. Forest Service, Alpine Snow and Avalanche Project.
w
4
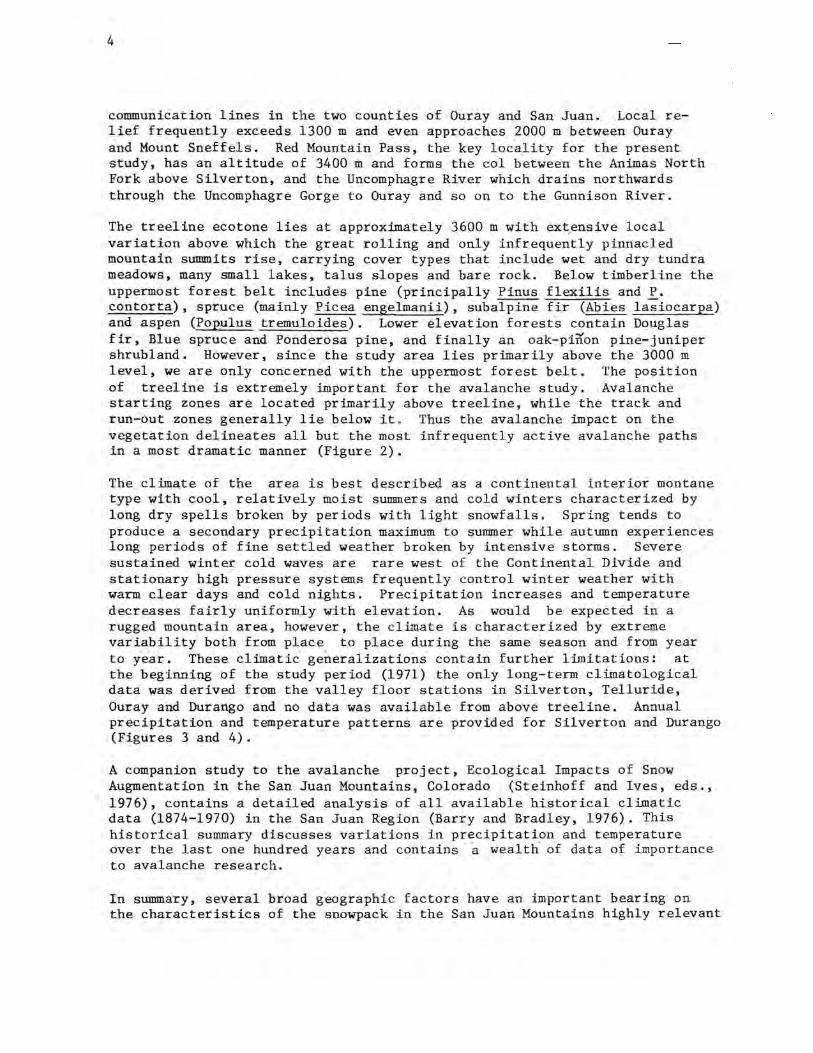
communication lines in the two counties of Ouray and San Juan. Local relief frequently exceeds 1300 m and even approaches 2000 m between Ouray and Mount Sneffels. Red Mountain Pass, the key locality for the present study, has an altitude of 3400 m and forms the col between the Animas North Fork above Silverton, and the Uncomphagre River which drains northwards through the Uncomphagre Gorge to Ouray and so on to the Gunnison River.
The treeline ecotone lies at approximately 3600 m with extensive local variation above which the great rolling and only infrequently pinnacled mountain summits rise, carrying cover types that include wet and dry tundra meadows, many small lakes, talus slopes and bare rock. Below timberline the uppermost forest belt includes pine (principally Pinus flexilis and P. contorta), spruce (mainly Picea engelmanii), subalpine fir (Abies lasiocarpa) and aspen (Populus tremuloides). Lower elevation forests contain Douglas fir, Blue spruce and Ponderosa pine, and finally an oak-pinon pine-juniper shrubland. However, since the study area lies primarily above the 3000 m level, we are only concerned with the uppermost forest belt. The position of treeline is extremely important for the avalanche study. Avalanche starting zones are located primarily above treeline, while the track and run-out zones generally lie below it . Thus the avalanche impact on the vegetation delineates all but the most infrequently active avalanche paths in a most dramatic manner (Figure 2).
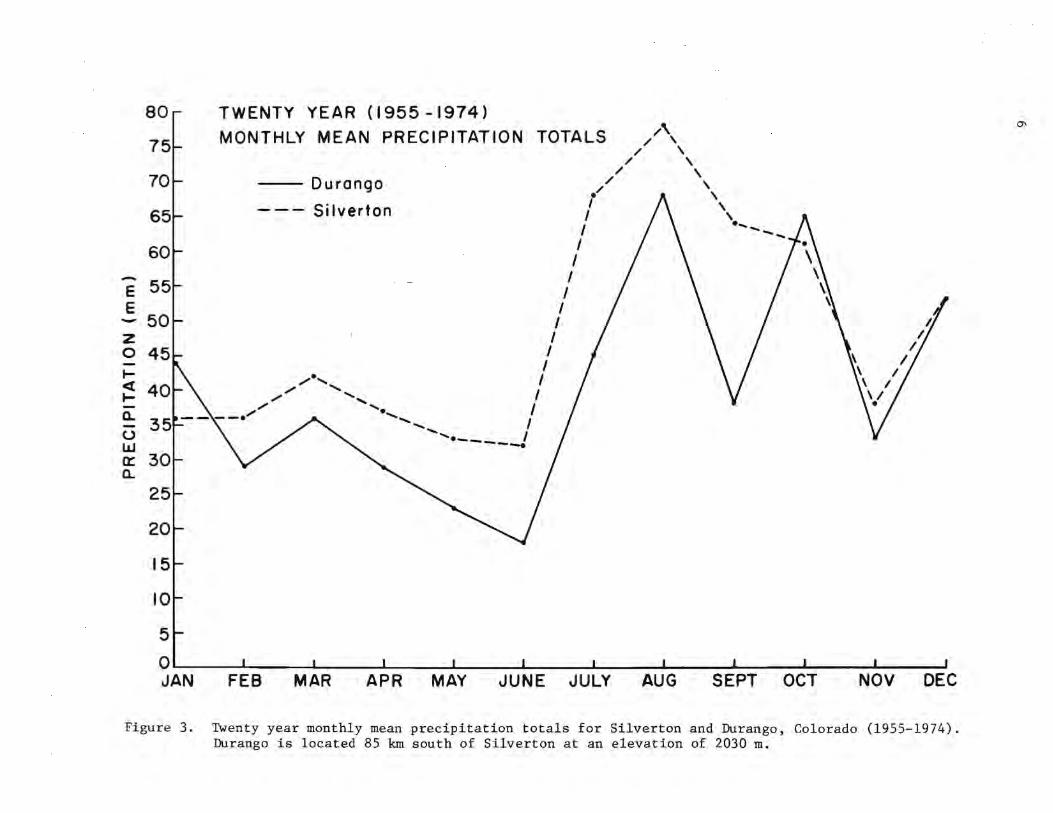
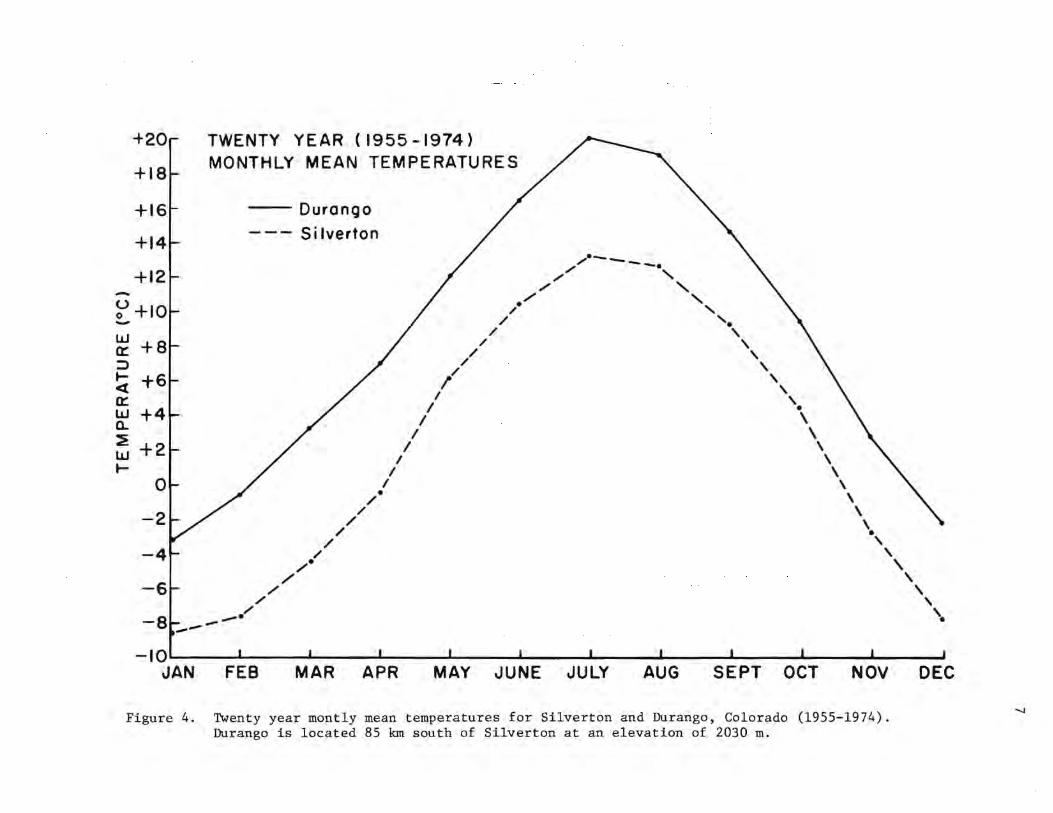
The climate of the area is best described as a continental interior montane type with cool, relatively moist suilllllers and cold winters characterized by long dry spells broken by periods with light snowfalls. Spring tends to produce a secondary precipitation maximum to suilllller while autumn experiences long periods of fine settled weather broken by intensive storms. Severe sustained winter cold waves are rare west of the Continental Divide and stationary high pressure systems frequently control winter weather with warm clear days and cold nights. Precipitation increases and temperature decreases fairly uniformly with elevation. As would be expected in a rugged mountain area, however, the climate is characterized by extreme variability both from place to place during the same season and from year to year. These climatic generalizations contain further limitations: at the beginning of the study period (1971) the only long-term climatological data was derived from the valley floor stations in Silverton, Telluride, Ouray and Durango and no data was available from above treeline. Annual precipitation and temperature patterns are provided for Silverton and Durango (Figures 3 and 4).
A companion study to the avalanche project, Ecological Impacts of Snow Augmentation in the San Juan Mountains, Colorado (Steinhoff and Ives, eds., 1976), contains a detailed analysis of all available historical climatic data (1874-1970) in the San Juan Region (Barry and Bradley, 1976). This historical summary discusses variations in precipitation and temperature over the last one hundred years and contains -a wealth of data of importance to avalanche research.
In summary, several broad geographic factors have an important bearing on the characteristics of the snowpack in the San Juan Mountains highly relevant
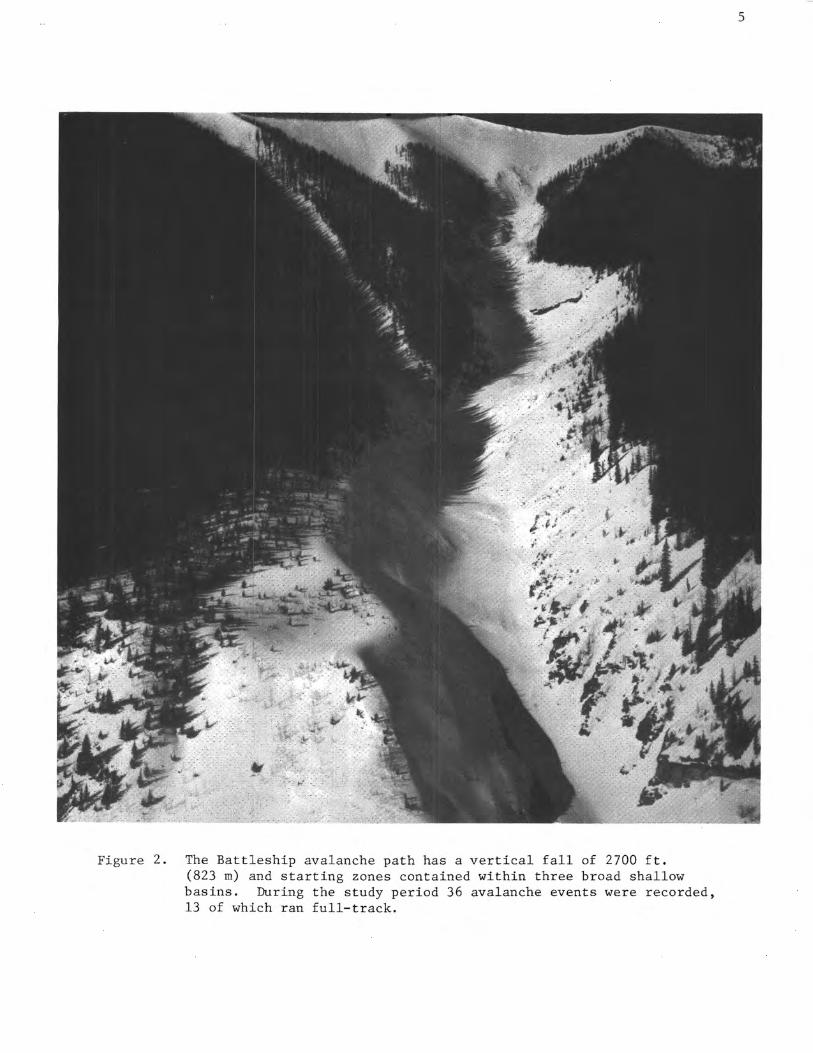
Figure 2 . The Battleship avalanche path has a vertical fall of 2700 f t. (823 rn) and starting zones contained within three broad shallow basins . During the study period 36 avalanche events were r ecorded , 13 of which ran fu ll-track.
5
80
75
70
65
60
e 55 E - 50 z O 45 ~
<C 40 ~
Cl.
u w a:: Cl.
30
25
20
15
10
5
0 JAN
TWENTY YEAR ( 1955 -1974) MONTHLY MEAN PRECIPITATION TOTALS /\
/ \ / \
-- Durango
- - - Silverton
FEB MAR APR
/ \ / \
. \ I \
/ ·----/
// A \ I
I I I
I I I I I I I I ,, I
'•-----·
MAY JUNE JULY AUG SEPT OCT NOV DEC
Figure 3. Twenty year monthly mean precipitation totals for Silverton and Durango, Colorado (1955~1974). Durango is located 85 km south of Silverton at an elevation of 2030 m.
0\
-
+20
+18
+16
+14
+12
u+IO 0 -w a: +8 => .... ct a: w CL ~ w ....
+6
+4
+2
0
-2
TWENTY YEAR ( 1955 -1974) MONTHLY MEAN TEMPERATURES
Durango
--- Silverton
,,,,•-,, -,,,, -·
/ ' ./ '
/ ' / '
/ ' / . // '
/ ' / ' I '
I ' I '
I ' I • I \
I \ I \
/. ' / '
-6
// ' / '
,/ ' / ' / .
/ ' -81- / ' ----· \
-4
' ' ' ' • -10.":'":"':~~:-:--~~~--......_ ____ L..... __ --1. ____ ....,L ____ ....1..... ____ L_ __ .......J. ____ -1.. __ ____J
JAN FEB MAR APR MAY JUNE JULY AUG SEPT OCT NOV DEC
Figure 4. Twenty year montly mean temperatures for Silverton and Durango, Colorado (1955-1974). Durango is located 85 km south of Silverton at an elevation of 2030 m.
-..J
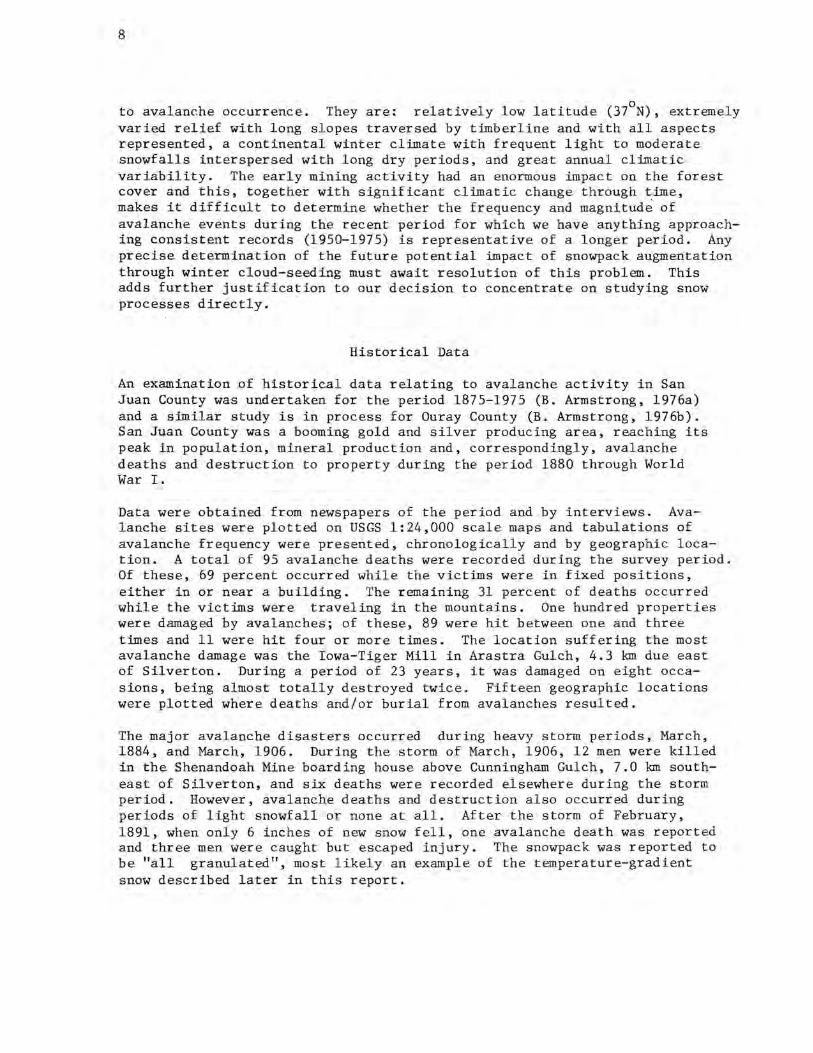
8
to avalanche occurrence. They are: relatively low latitude (37°N), extremely varied relief with long slopes traversed by timberline and with all aspects represented, a continental winter climate with frequent light to moderate snowfalls interspersed with long dry periods, and great annual climatic variability. The early mining activity had an enormous impact on the forest cover and this, together with significant climatic change through time, makes it difficult to determine whether the frequency and magnitude of avalanche events during the recent period for which we have anything approaching consistent records (1950-1975) is representative of a longer period. Any precise determination of the future potential impact of snowpack augmentation through winter cloud-seeding must await resolution of this problem. This adds further justification to our decision to concentrate on studying snow processes directly.
Historical Data
An examination of historical data relating to avalanche activity in San Juan County was undertaken for the period 1875-1975 (B. Armstrong, 1976a) and a similar study is in process for Ouray County (B. Armstrong, 1976b). San Juan County was a booming gold and silver producing area, reaching its peak in population, mineral production and, correspondingly, avalanche deaths and destruction to property during the period 1880 through World War I.
Data were obtained from newspapers of the period and by interviews. Avalanche sites were plotted on USGS 1:24,000 scale maps and tabulations of avalanche frequency were presented, chronologically and by geographic location. A total of 95 avalanche deaths were recorded during the survey period. Of these, 69 percent occurred while the victims were in fixed positions, either in or near a building. The remaining 31 percent of deaths occurred while the victims were traveling in the mountains. One hundred properties were damaged by avalanches; of these, 89 were hit between one and three times and 11 were hit four or more times. The location suffering the most avalanche damage was the Iowa-Tiger Mill in Arastra Gulch, 4.3 km due east of Silverton. During a period of 23 years, it was damaged on eight occasions, being almost totally destroyed twice. Fifteen geographic locations were plotted where deaths and/or burial from avalanches resulted.
The major avalanche disasters occurred during heavy storm periods, March, 1884, and March, 1906. During the storm of March, 1906, 12 men were killed in the Shenandoah Mine boarding house above Cunningham Gulch, 7.0 km southeast of Silverton, and six deaths were recorded elsewhere during the storm period. However, avalanche deaths and destruction also occurred during periods of light snowfall or none at all. After the storm of February, 1891, when only 6 inches of new snow fell, one avalanche death was reported and three men were caught but escaped injury. The snowpack was reported to be "all granulated", most likely an example of the temperature-gradient snow described later in this report.
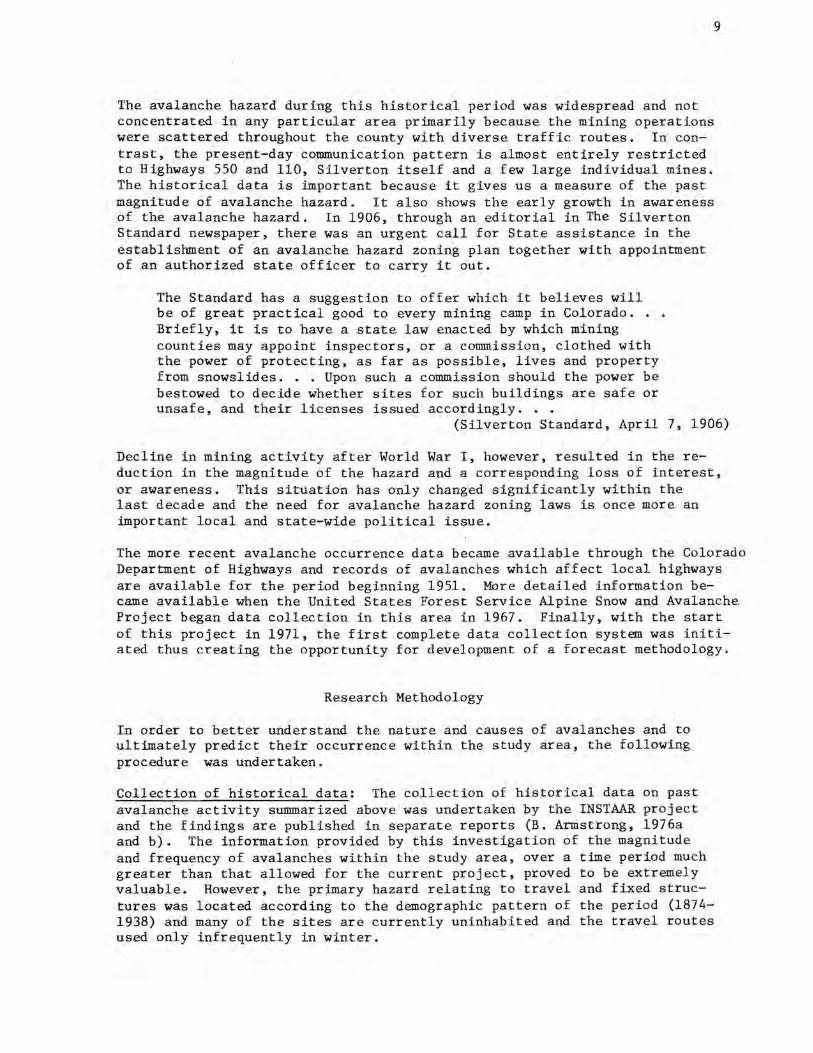
The avalanche hazard during this historical period was widespread and not concentrated in any particular area primarily because the mining operations were scattered throughout the county with diverse traffic routes. In contrast, the present-day communication pattern is almost entirely restricted to Highways 550 and 110, Silverton itself and a few large individual mines. The historical data is important because it gives us a measure of the past magnitude of avalanche hazard. It also shows the early growth in awareness of the avalanche hazard. In 1906, through an editorial in The Silverton Standard newspaper, there was an urgent call for State assistance in the establishment of an avalanche hazard zoning plan together with appointment of an authorized state officer to carry it out.
The Standard has a suggestion to offer which it believes will be of great practical good to every mining camp in Colorado .•• Briefly, it is to have a state law enacted by which mining counties may appoint inspectors, or a commission, clothed with the power of protecting, as far as possible, lives and property from snowslides ... Upon such a commission should the power be bestowed to decide whether sites for such buildings are safe or unsafe, and their licenses issued accordingly .•.
9
(Silverton Standard, April 7, 1906)
Decline in mining activity after World War I, however, resulted in the reduction in the magnitude of the hazard and a corresponding loss of interest, or awareness. This situation has only changed significantly within the last decade and the need for avalanche hazard zoning laws is once more an important local and state-wide political issue.
The more recent avalanche occurrence data became available through the Colorado Department of Highways and records of avalanches which affect local highways are available for the period beginning 1951. More detailed information became available when the United States Forest Service Alpine Snow and Avalanche Project began data collection in this area in 1967. Finally, with the start of this project in 1971, the first complete data collection system was initiated thus creating the opportunity for development of a forecast methodology.
Research Methodology
In order to better understand the nature and causes of avalanches and to ultimately predict their occurrence within the study area, the following procedure was undertaken.
Collection of historical data: The collection of historical data on past avalanche activity summarized above , was undertaken by the INSTAAR project and the findings are published in separate reports (B. Armstrong, 1976a and b). The information provided by this investigation of the magnitude and frequency of avalanches within the study area, over a time period much greater than that allowed for the current project, proved to be extremely valuable. However, the primary hazard relating to travel and fixed structures was located according to the demographic pattern of the period (1874-1938) and many of the sites are currently uninhabited and the travel routes used only infrequently in winter.
10
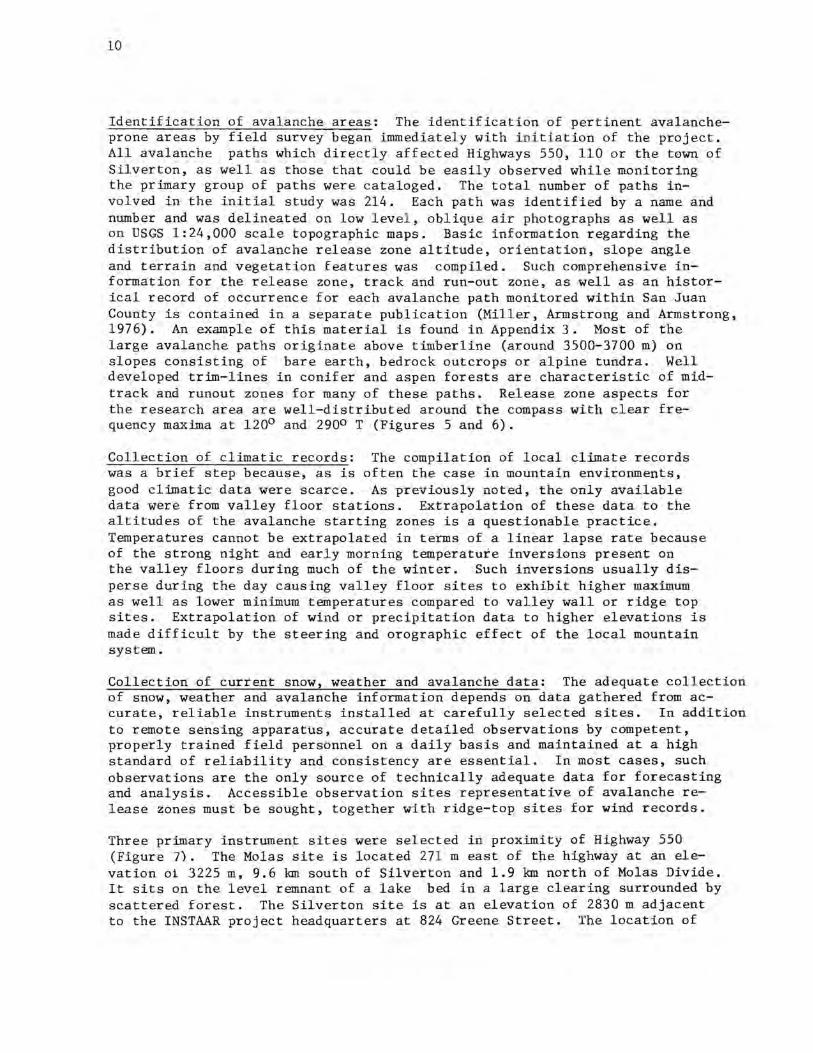
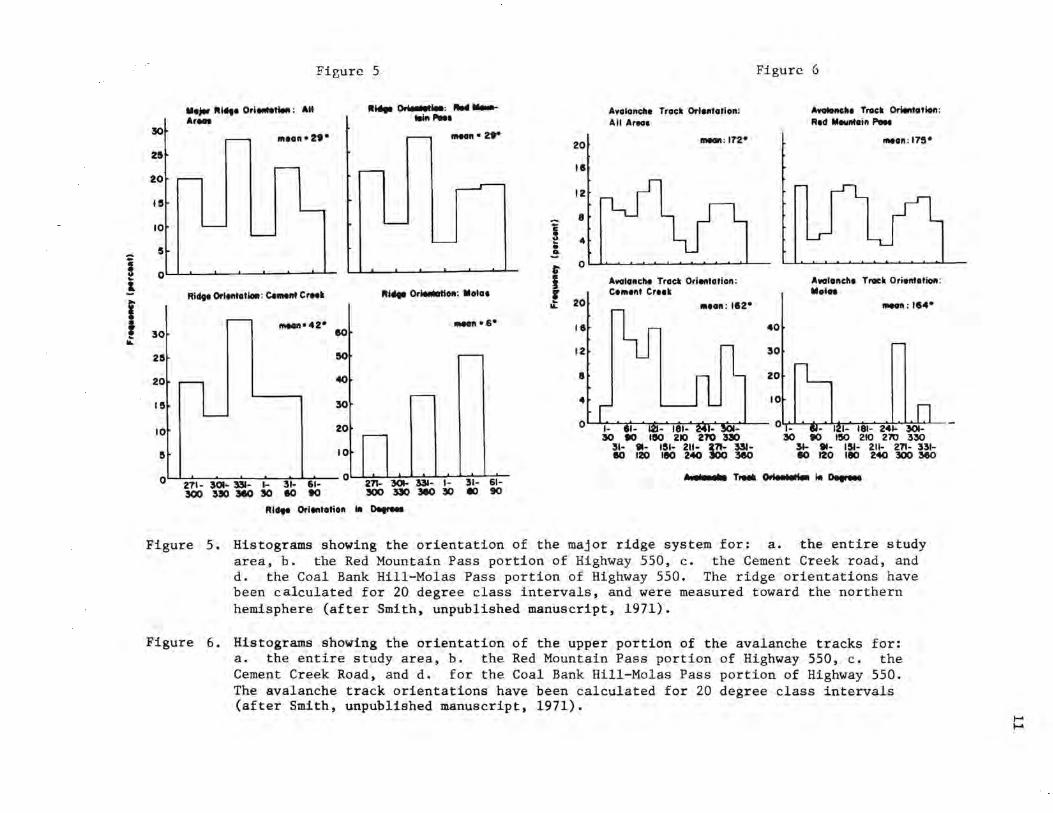
Identification of avalanche areas: The identification of pertinent avalancheprone areas by field survey began immediately with initiation of the project. All avalanche paths which directly affected Highways 550, 110 or the town of Silverton, as well as those that could be easily observed while monitoring the primary group of paths were cataloged. The total number of paths involved in the initial study was 214. Each path was identified by a name and number and was delineated on low level, oblique air photographs as well as on USGS 1:24,000 scale topographic maps. Basic information regarding the distribution of avalanche release zone altitude, orientation, slope angle and terrain and vegetation features was compiled. Such comprehensive information for the release zone, track and run-out zone, as well as an historical record of occurrence for each avalanche path monitored within San Juan County is contained in a separate publication (Miller, Armstrong and Armstrong, 1976). An example of this material is found in Appendix 3. Most of the large avalanche paths originate above timberline (around 3500-3700 m) on slopes consisting of bare earth, bedrock outcrops or alpine tundra. Well developed trim-lines in conifer and aspen forests are characteristic of midtrack and runout zones for many of these paths. Release zone aspects for the research area are well-distributed around the compass with clear frequency maxima at 120° and 290° T (Figures 5 and 6).
Collection of climatic records: The compilation of local climate records was a brief step because, as is often the case in mountain environments, good climatic data were scarce. As previously noted, the only available data were from valley floor stations. Extrapolation of these data to the altitudes of the avalanche starting zones is a questionable practice. Temperatures cannot be extrapolated in terms of a linear lapse rate because of the strong night and early morning temperature inversions present on the valley floors during much of the winter. Such inversions usually disperse during the day causing valley floor sites to exhibit higher maximum as well as lower minimum temperatures compared to valley wall or ridge top sites. Extrapolation of wind or precipitation data to higher elevations is made difficult by the steering and orographic effect of the local mountain system.
Collection of current snow, weather and avalanche data: The adequate collection of snow, weather and avalanche information depends on data gathered from accurate, reliable instruments installed at carefully selected sites. In addition to remote sensing apparatus, accurate detailed observations by competent, properly trained field personnel on a daily basis and maintained at a high standard of reliability and consistency are essential. In most cases, such observations are the only source of technically adequate data for forecasting and analysis. Accessible observation sites representative of avalanche release zones must be sought, together with ridge-top sites for wind records.
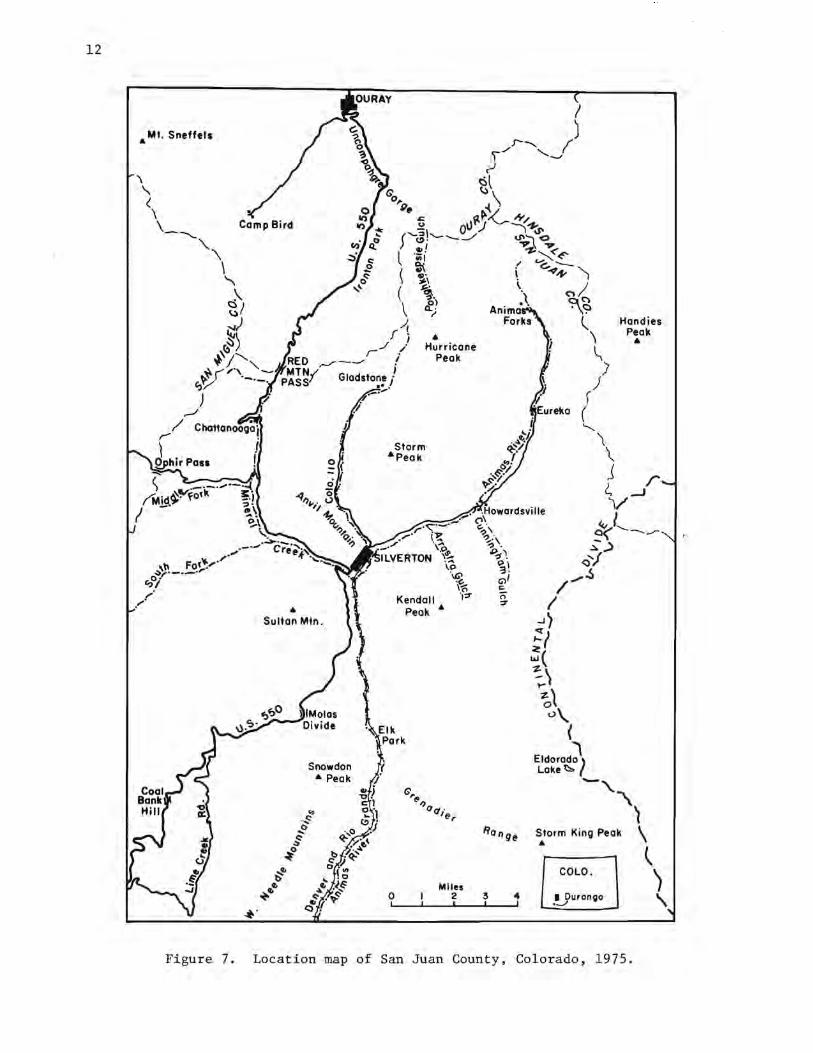
Three primary instrument sites were selected in proximity of Highway 550 (Figure 7). The Malas site is located 271 m east of the highway at an elevation oi 3225 m, 9.6 km south of Silverton and 1.9 km north of Malas Divide. It sits on the level remnant of a lake bed in a large clearing surrounded by scattered forest. The Silverton site is at an elevation of 2830 m adjacent to the INSTAAR project headquarters at 824 Greene Street. The location of
! • l
f t ...
Figure 5
Mejer Rillte Orl ..... tiell : All R .... ~iea: IIM..__ Ar- t
leitl .....
!Ot rl 111eon•tt• .---, -11·2 ..
25
20
15
10
5
0
Ricloe 0,fe,itotioft : c.-nt CrHII: 1114tl Ori.-tiOft: Molas
IIINll•42· I _.,. 30 eo
25 50~ ,---
20 40
15 301 r-
10 201
' :t I . I I I I . 10
I 0 271- 30f• 331- 1- 31- 61- 271- 30I- 331-. 1- 31- 61-300 3,0 34IO 30 eo 90 300 3JO 34IO 30 IO 90
Rfdte Orientation ill DetreN
j • .!
f r . IL.
20•
II
12
8
4
0
20~
16
12
8
4
Avolonc:lle Trocll Orientation: All Area,
_ , ,12•
Awolanclle Track Orientation: ce11,ent c, .. 11:
111ean: 112•
Figure 6
40
30
20
10
AwolaRClle Traci! Orlentatiorl: Red Meuntainl"we
-an : 175•
Avalanche Trocll Orientotiofl : fllfef ..
- : 114·
O' ,_ I ii- I iti- I 1e1-' At-' !Oi-' I 0 ·1~ I I '1- I 11f1-' 181- 24~· 130!.: I
30 to 150 2IO 210 3lO 30 tO 1!50 2IO 270 330 31. •- 151- 211- a11- 331. 31- 11- 151. 211- 211- 331. 60 120 180 240 300 3eO 60 120 180 240 300 3eO
Figure 5. Histograms showing the orientation of the major ridge system for: a. the entire study area, b. the Red Mountain Pass portion of Highway 550, c. the Cement Creek road, and d. the Coal Bank Hill-Malas Pass portion of Highway 550. The ridge orientations have been calculated for 20 degree class intervals, and were measured toward the northern hemisphere (after Smith, unpublished manuscript, 1971).
Figure 6. Histograms showing the orientation of the upper portion of the avalanche tracks for: a. the entire study area, b. the Red Mountain Pass portion of Highway 550, c. the Cement Creek Road, and d, for the Coal Bank Hill-Malas Pass portion of Highway 550. The avalanche track orientations have been calculated for 20 degree class intervals (after Smith, unpublished manuscript, 1971).
..... .....
12
• Mt. Sneffels
• Sultan Mtn.
Snowdon • Peak
• .Howardsville _ ..... c,\
""·-· c;· r ·-p ., ' _,.. ,.... ~-\ __ .,,, \o ., . ILVERTON \~ °"'%,"-1
0
\~ 3, ~ G'>I
\"c'i C
Kendall Peak •
'1::r o ::r
G',. e,, 0(/ . 'e,
MIies 2 3 4
COLO.
I Duron90 -~
Handies Peak •
Figure 7. Location map of San Juan County, Colorado, 1975.
13
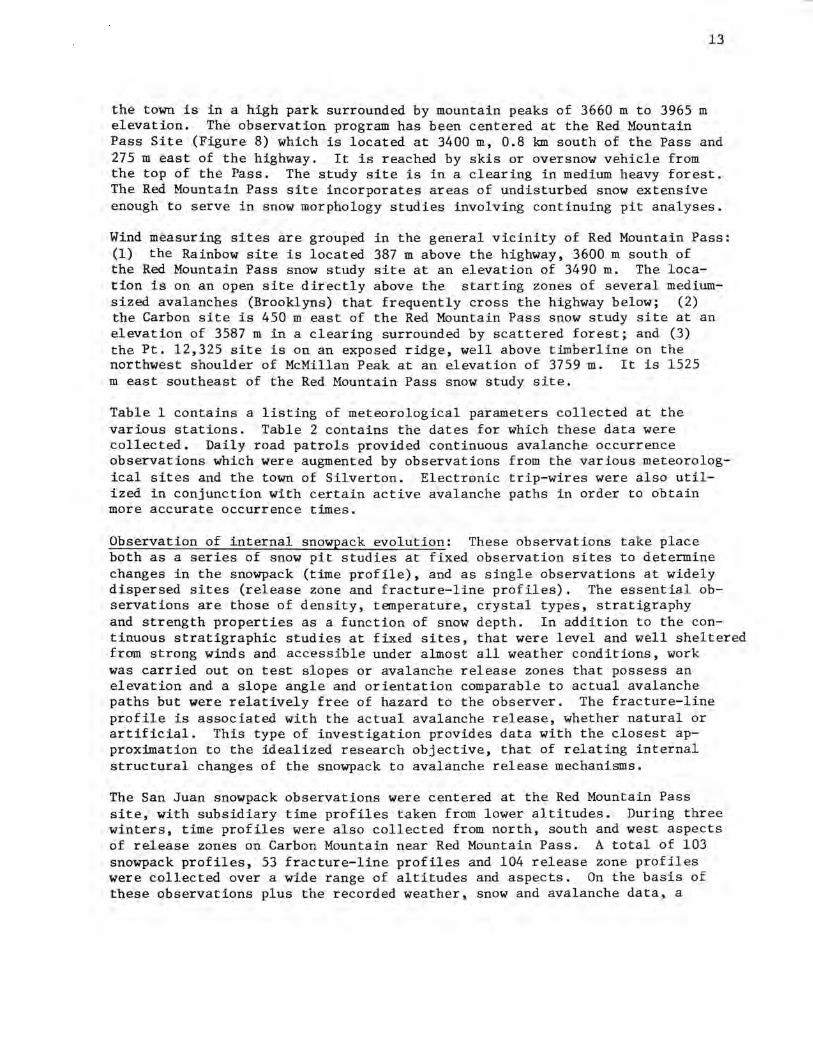
the town is in a high park surrounded by mountain peaks of 3660 m to 3965 m elevation. The observation program has been centered at the Red Mountain Pass Site (Figure 8) which is located at 3400 m, 0.8 km south of the Pass and 275 m east of the highway. It is reached by skis or oversnow vehicle from the top of the Pass. The study site is in a clearing in medium heavy forest. The Red Mountain Pass site incorporates areas of undisturbed snow extensive enough to serve in snow morphology studies involving continuing pit analyses.
Wind measuring sites are grouped in the general vicinity of Red Mountain Pass: (1) the Rainbow site is located 387 m above the highway, 3600 m south of the Red Mountain Pass snow study site at an elevation of 3490 m. The location is on an open site directly above the starting zones of several mediumsized avalanches (Brooklyns) that frequently cross the highway below; (2) the Carbon site is 450 m east of the Red Mountain Pass snow study site at an elevation of 3587 min a clearing surrounded by scattered forest; and (3) the Pt. 12,325 site is on an exposed ridge, well above timberline on the northwest shoulder of McMillan Peak at an elevation of 3759 m. It is 1525 m east southeast of the Red Mountain Pass snow study site.
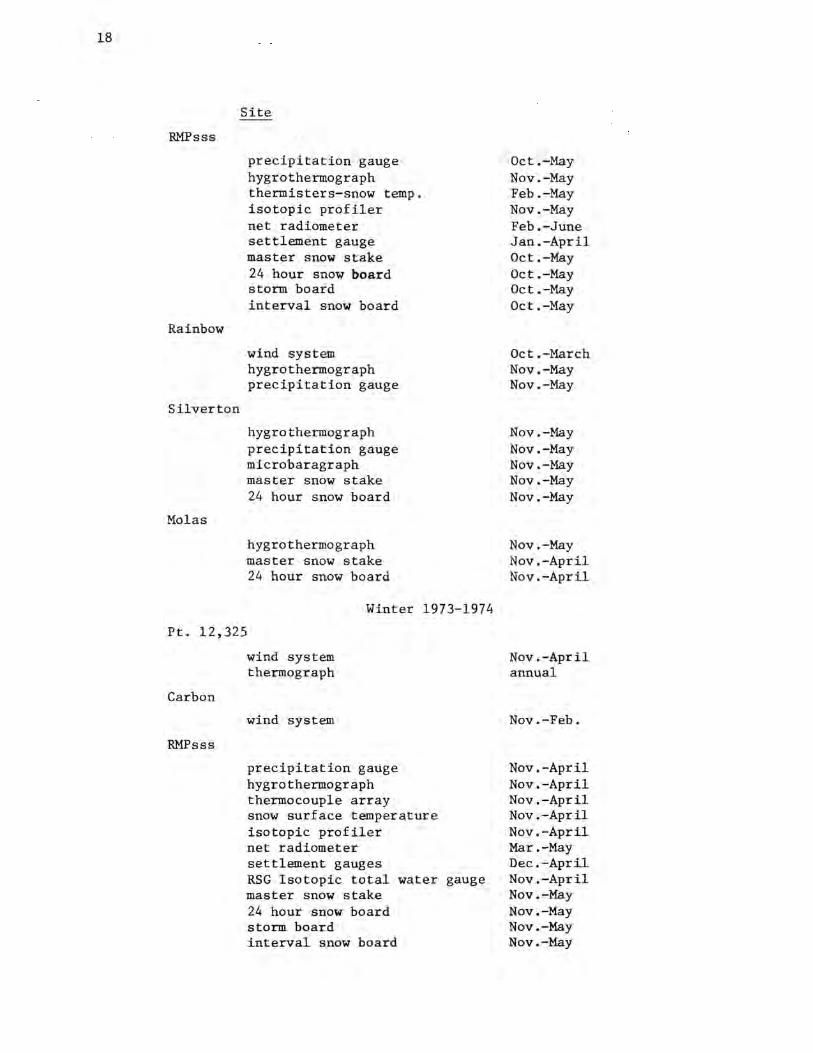
Table 1 contains a listing of meteorological parameters collected at the various stations. Table 2 contains the dates for which these data were collected. Daily road patrols provided continuous avalanche occurrence observations which were augmented by observations from the various meteorological sites and the town of Silverton. Electr0nic trip-wires were also utilized in conjunction with certain active avalanche paths in order to obtain more accurate occurrence times.
Observation of internal snowpack evolution: These observations take place both as a series of snow pit studies at fixed observation sites to determine changes in the snowpack (time profile), and as single observations at widely dispersed sites (release zone and fracture-line profiles). The essential observations are those of density, temperature, crystal types, stratigraphy and strength properties as a function of snow depth. In addition to the continuous stratigraphic studies at fixed sites, that were level and well sheltered from strong winds and accessible under almost all weather conditions, work was carried out on test slopes or avalanche release zones that possess an elevation and a slope angle and orientation comparable to actual avalanche paths but were relatively free of hazard to the observer. The fracture-line profile is associated with the actual avalanche release, whether natural or artificial. This type of investigation provides data with the closest approximation to the idealized research objective, that of relating internal structural changes of the snowpack to avalanche release mechanisms.
The San Juan snowpack observations were centered at the Red Mountain Pass site, with subsidiary time profiles taken from lower altitudes. During three winters, time profiles were also collected from north, south and west aspects of release zones on Carbon Mountain near Red Mountain Pass. A total of 103 snowpack profiles, 53 fracture-line profiles and 104 release zone profiles were collected over a wide range of altitudes and aspects. On the basis of these observations plus the recorded weather, snow and avalanche data, a

14
Figure 8. Part of the snow study plot at Red Mountain Pass. From right to left instrumentation includes: recording precipitation gauge with Alter shield; standard meteorological screen; "zig-zag" isotopic snow profiler (immediately behind screen); 'snow settlement gauge; isotopic snow profiler (4 upright posts and connecting limbs); fixed thermocouple array. The three snow boards, master stake and data read-out shack are off the picture to right.
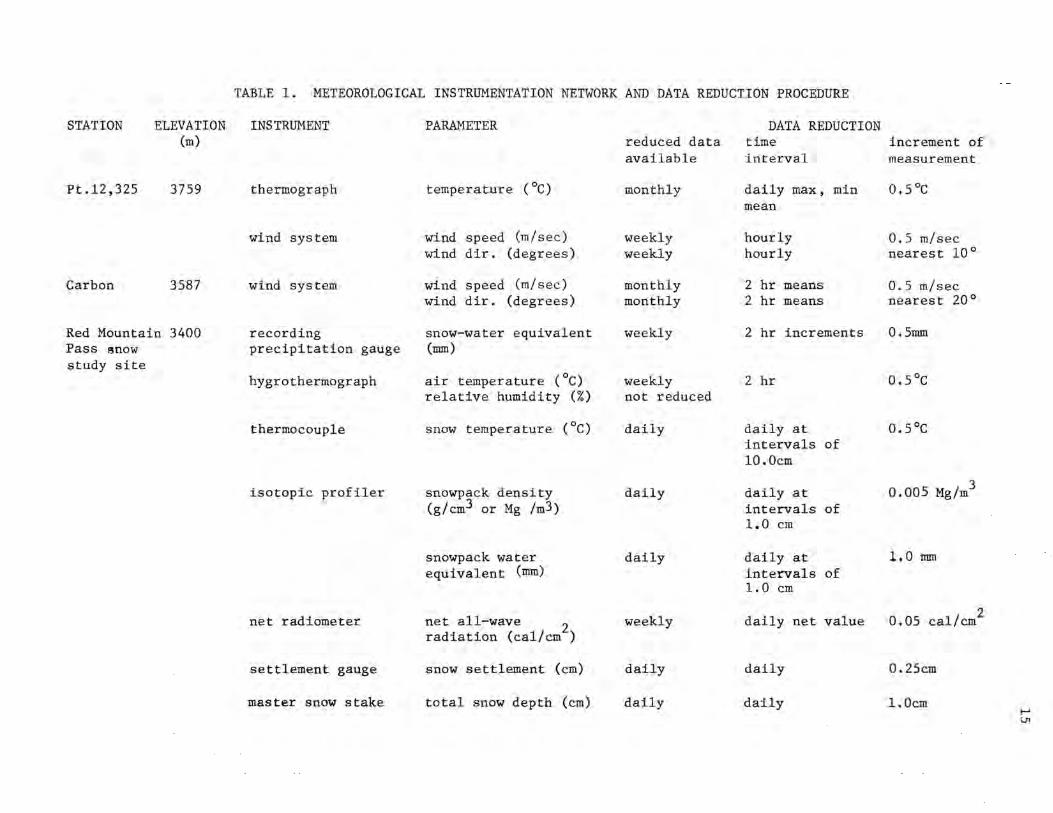
TABLE 1. METEOROLOGICAL INSTRUMENTATION NETWORK AND DATA REDUCTION PROCEDURE
STATION ELEVATION INSTRUMENT PARAMETER DATA REDUCTION (m) reduced data time increment of
available interval measurement
Pt.12,325 3759 thermograph temperature ( °C) monthly daily max, min 0.5 °C mean
wind system wind speed (m/sec) weekly hourly 0.5 m/sec wind dir. (degrees) weekly hourly nearest 10°
Carbon 3587 wind system wind speed (m/sec) monthly 2 hr means 0.5 m/sec wind dir. (degrees) monthly 2 hr means nearest 20°
Red Mountain 3400 recording snow-water equivalent weekly 2 hr increments 0.5mm Pass snow precipitation gauge (mm) study site
hygrothermograph air temperature (°C) weekly 2 hr 0. 5 °c relative humidity (%) not reduced
thermocouple snow temperature (°C) daily daily at o. 5 °c intervals of 10.0cm
isotopic profiler snowpack density daily daily at . 3
0.005 Mg/m (g/cm3 or Mg /m3) intervals of
1.0 cm
snowpack water daily daily at l.O mm equivalent (mm) intervals of
1.0 cm
net radiometer net all-wave 2 weekly daily net value 0.05 cal/cm 2
radiation (cal/cm)
settlement gauge snow settlement (cm) daily daily 0.25cm
master snow stake total snow depth (cm) daily daily 1.0cm ~ Vl

Rainbow 3490
Silverton 2830
Molas 3225
24 hr snow board
interval snow board
recording precipitation gauge
hygrothermograph
wind system
hygrothermograph
recording precipitation gauge
microbarograph
master snow stake
24 hr snow board
hygrothermograph
master snow stake
24 hr snow board
24 hr new snow depth(cm) daily 24 hr new snow density daily (Mg/m3)
3 hr interval new snow depth (cm) 3 hr interval new 3 snow density (Mg/m)
snow-water equivalent (nun)
air temperature (°C) relative humidity (%)
wind speed (m/sec) wind dir. (degrees)
air temperature (°C) relative humidity (%)
snow-water equivalent (mm)
air pressure (mb)
total snowfall (cm)
3 hr
3 hr
weekly
monthly not reduced
monthly monthly
weekly not reduced
weekly
not reduced
daily
24 hr new snow depth(cm) daily 24 hr new snow daily density (Mg/m3)
air temperature (°C) relative humidity(%)
total snowfall (cm)
weekly
weekly
24 hr new snow depth(cm) daily 24 hr new snow daily density (Mg/m3)
daily daily
3 hr
3 hr
2 hr increments
daily mean
2 hr mean 2 hr mean
2 hr
2 hr increments
daily
daily daily
2 hr
weekly
daily daily
0.5cm 3 0.005 g/cm
0.5cm
3 0.005 Mg/m
0. 5mm
0.5°C
0.5 m/sec nearest 20°
0.5°C
0.5mm
1.0cm
0.5cm 3 0.00-5 Mg/m
0.5°C
1.0cm
0.5cm 3 0.005 Mg/m
f--1
°'
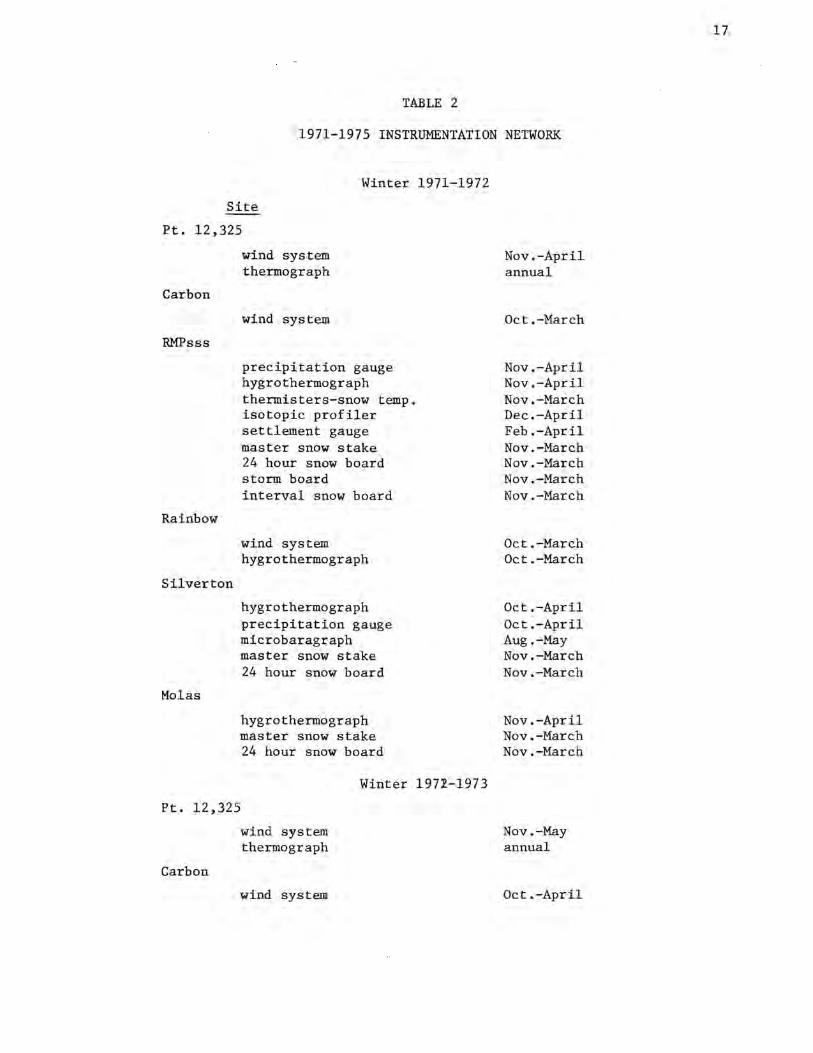
TABLE 2
1971-1975 INSTRUMENTATION NETWORK
Winter 1971-1972
Site
Pt. 12,325
Carbon
RMPsss
Rainbow
Silverton
Molas
wind system thermograph
wind system
precipitation gauge hygrothermograph thermisters-snow temp. isotopic profiler settlement gauge master snow stake 24 hour snow board storm board interval snow board
wind system hygrothermograph
hygrothermograph precipitation gauge microbaragraph master snow stake 24 hour snow board
hygrothermograph master snow stake 24 hour snow board
Winter 1972-1973
Pt. 12,325
Carbon
wind system thermo graph
wind system
Nov.-April annual
Oct.-March
Nov.-April Nov.-April Nov.-March Dec.-April Feb .-April Nov.-March Nov.-March Nov.-March Nov.-March
Oct.-March Oct.-March
Oct .-April Oct .-April Aug.-May Nov.-March Nov.-March
Nov.-April Nov.-March Nov.-March
Nov.-May annual
Oct.-April
17
18
RMPsss
Rainbow
Silverton
Molas
Site
precipitation gauge hygrothermograph thermisters-snow temp. isotopic profiler net radiometer settlement gauge master snow stake 24 hour snow board storm board interval snow board
wind system hygrothermograph precipitation gauge
hygrothermograph precipitation gauge microbaragraph master snow stake 24 hour snow board
hygrothermograph master snow stake 24 hour snow board
Winter 1973-1974
Pt. 12,325
Carbon
RMPsss
wind system thermograph
wind system
precipitation gauge hygrothermograph thermocouple array snow surface temperature isotopic profiler net radiometer settlement gauges RSG Isotopic total water gauge master snow stake 24 hour snow board storm board interval snow board
Oct.-May Nov.-May Feb.-May Nov.-May Feb.-June Jan.-April Oct.-May Oct.-May Oct.-May Oct.-May
Oct.-March Nov.-May Nov.-May
Nov.-May Nov.-May Nov.-May Nov.-May Nov.-May
Nov.-May Nov.-April Nov .-April
Nov.-April annual
Nov .-Feb.
Nov .-April Nov.-April Nov .-April Nov .-April Nov.-April Mar.-May Dec.-April Nov.-April Nov.-May Nov.-May Nov.-May Nov.-May
Site
Rainbow
wind system hygrothermograph precipitation gauge
Chattanooga
Silverton
hygrothermograph master snow stake 24 hour snow board thermocouple array
hygrothermograph precipitation gauge microbaragraph master snow stake thermocouple array 24 hour snow board
Winter 1974-1975
Pt. 12,325
RMPsss
Rainbow
wind system thermograph
precipitation gauge hygrothermograph thermocouple array snow surface temperature isotopic profiler net radiometer settlement gauges RSG Isotopic Total Water Gauge 24 hour snow board storm board interval board
wind system precipitation gauge
Chattanooga
Silver t on
hygrothermograph master snow stake 24 hour snow board t hermocouple array
hygrothermograph precipitation gauge microbaragraph master snow stake
Nov.-March Nov.-May Nov.-May
Dec.-April Dec.-April Dec.-April Nov.-March
Nov.-April Nov .-April Nov.-April Nov.-April Nov.-March Nov.-April
Nov.-April annual
Oct.-May Oct.-May Oct.-May Oct.-May Oct.-June April-June Nov.-June Oct.-June Oct.-May Oct.-May Oct.-May
Nov.-March Nov.-March
Oct.-May Nov.-May Nov.-May Nov.-April
Oct.-May Oct.-May Oct.-May Nov.-May
19
20
radiation snow climate was identified in the San Juan Mountains (Lachapelle, in Ives et al., 1973 and Chapter 2 of this report). The winter snowpack in this area is characterized by relatively light snowfalls, very wide diurnal swings in snow surface temperature related to intense daytime insolation and nocturnal radiation cooling at this latitude and altit~d~, extensive temperature-gradient metamorphism typically involving some 70 percent or more of the snowcover, and a highly differentiated stratigraphy with very low mechanical strength on all slope exposures. Over 80 percent of the observed fracture-line profiles exhibited a climax avalanche structure wherein slab failure took place in older snow layers deposited and metamorphosed prior to the triggering precipitation event.
Establish a program of operational avalanche forecasting: The above five sections provide an outline of the preliminary observational and data analysis steps required before the primary objective of development of an avalanche forecasting system can be approached. The primary test of understanding weather, snow and avalanche conditions in a given area is the ability to evaluate current slope stability and, given adequate weather forecasts, predict possible avalanche occurrences. It was not possible to develop any type of forecast model based on statistical correlations between historic climatological data and avalanche occurrences due to the lack of appropriate meteorological data as mentioned above. The recently available record of avalanche activity within the study area was intermittent and contained only those events that interfered significantly with highway traffic.
Conventional avalanche forecasting techniques have been applied on a formal basis as part of the San Juan Avalanche Project (LaChapelle, in Armstrong et al., 1974). A systematic evaluation procedure has shown that daily forecasts for the entire winter averaged 81 percent accurate and were 89 percent accurate for severe hazard conditions. Conventional techniques for area forecasts were also extended to the much more difficult task of forecasting occurrence time and magnitude for the specific avalanche paths that most actively affected Highway 550. An overall accuracy of 73 percent was achieved for this pioneering effort. Analysis of the conventional forecasting technique is contained in Chapter 3 of this report.
Utilization of accumulated data and experience to develop a numerical avalanche forecasting scheme: For regional forecasting where a large data base can be established, statistical analysis of the relationship between contributory factors and avalanche occurrence becomes feasible. This can provide an objective basis for developing improved avalanche forecasts, although the complexity of the avalanche phenomena and the imperfect state of knowledge about it probably precludes an exclusively numerical forecast, especially for small areas or individual avalanche paths. In order to acquire the highest level of accuracy with a numerical method, it is likely that an essential ingredient may continue to be the subjective input of a trained field observer, well versed in the general concepts of the physical and mechanical properties of snow, and especially as to how these properties are influenced by the local snow climate. This implies the need for training and support of highly skilled forecasters with extensive local knowledge.

21
Other than those associated with the relatively limited geographic confines of a downhill ski area, persons possessing such qualifications in the United States, or anywhere else in mountainous areas throughout the world, are extremely limited. It could be said that there are currently no more than 10 or 20 persons in the United States who would possess a high degree of expertise in the area of avalanche occurrence forecasting.
Accumulated meteorological and avalanche data for the winters 1972-1973, 1973-1974, and 1974-1975 in the San Juan research area have been subject ~o discriminant function analysis (Bovis, 1976; and Chapter 5 of this report). The stratification of avalanche versus non-avalanche days has been examined in the light of 13 different meteorological variables considered over varying lengths of time prior to each test date. A clear difference is found between wet snow and dry snow avalanche conditions. The dry snow avalanche days are most clearly identified by reference to precipitation and six-hour wind averages during the 24 hours prior to the avalanche event. The wet snow avalanche days are best related to the mean and maximum twohour air temperatures in the 12 to 24-hour period prior to the avalanche event. Forecasting by discriminant function analysis appears feasible in the San Juan Mountains and the accuracy can be improved as an extended body of data becomes available.
Other related research undertakings: The very presence of an avalanche research team based in Silverton during four winters led to development of other related research activities for which funding was obtained beyond the limits of this Bureau of Reclamation contract. This included: (1) a de-tailed evaluation of snow stratigraphy with emphasis on the recrystallization process associated with temperature-gradient metamorphism (supported by United States Army Research Office-Durham Grant No. DAHC04-75-G-0028 1974-76). -Specific temperature and vapor pressure gradients required to cause recrystallization within various snow types over varying time periods are being studied (Lachapelle and Armstrong, in preparation); (2) development of methods alternate to conventional explosives for the purpose of artificial avalanche release. Some of the methods currently being tested include the inflation of air bags to dislodge cornices, pneumatic vibratory devices and various oxygen-acetylene gas-fired exploder systems to cause snow failure within the starting zones. All systems are designed to be activated remotely. This work is being performed under contract to the Colorado State Highways Department and the Washington State Highways Department (LaChapelle et al., 1975); (3) mapping of areas county-wide subject to avalanche and other geophysical, or natural hazards, such as landslides, rockfall, debris flows, etc., supported by a grant from the National Aeronautics and Space Administration Office of University Affairs and performed in conjunction with county response to Colorado State House Bill 1041 (NASA-PY Grant No. NGL-06-003-200).

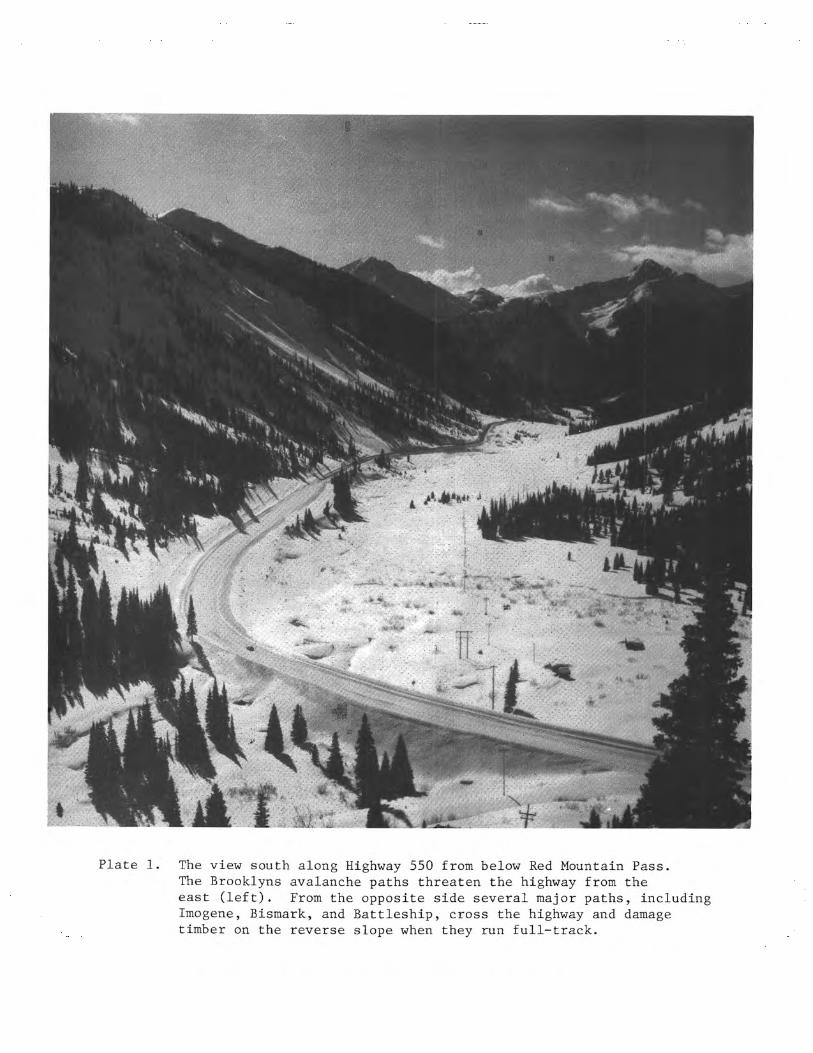
Plate 1. The view south along Highway 550 from below Red Mountain Pass. The Brooklyns avalanche paths threaten the highway from the east (left). From the opposite side several major paths, including Imogene, Bismark, and Battleship, cross the highway and damage timber on the reverse slope when they run full-track.
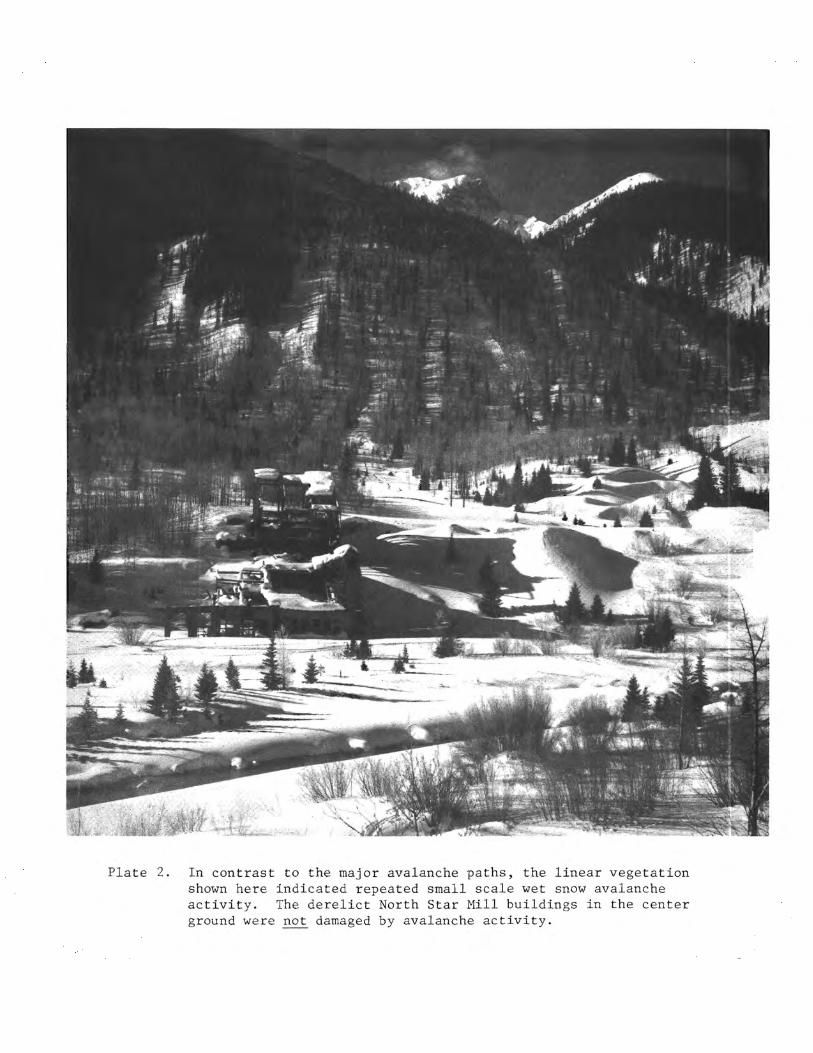
Plate 2. In contrast to the major avalanche paths, the linear vegetation shown here indicated repeated small scale wet snow avalanche activity. The derelict North Star Mill buildings in the center ground were not damaged by avalanche activity.

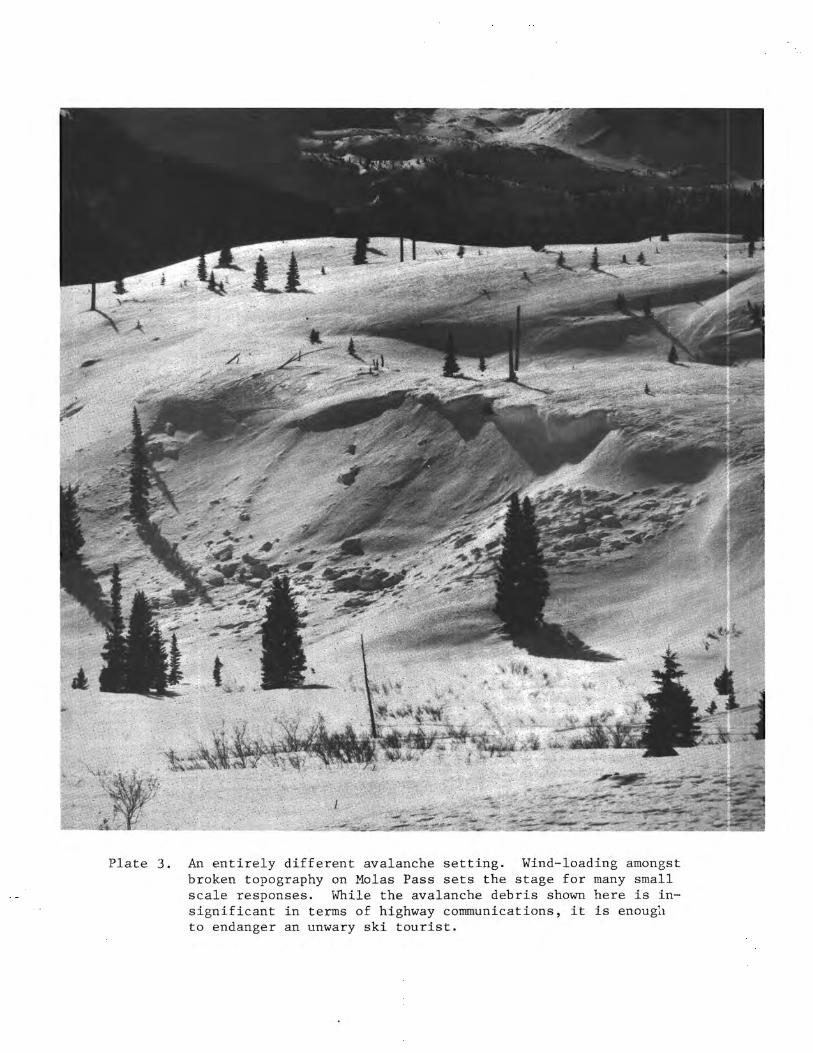
Plate 3. An entirely different avalanche setting. Wind-loading amongst broken topography on Molas Pass sets the stage for many small scale responses. While the avalanche debris shown here is insignificant in terms of highway communications, it is enough to endanger an unwary ski tourist.
23
CHAPTER 2: NATURE AND CAUSES OF AVALANCHES IN THE SAN JUAN MOUNTAINS
Edward Lachapelle and Richard L. Armstrong
General Characteristics of Snow Structure and Slab Avalanche Formation
As new snow acctnnulates on the ground, a complex matrix develops composed of a delicate cellular material, only 5-10 percent of which is ice grains, the remainder being vacant pore space. Upon initial observation, the stratigraphy may appear homogeneous but even at this stage a distinct layered structure is developing as the result of variations in certain parameters during the storm, such as crystal type and size, amount of crystal riming, wind speed and direction, and temperature. During the period between precipitation events the development of a layered system within the snowcover continues as settlement rates vary and metamorphic processes begin, both producing variations in structure and density. The layered structure is further enhanced by weathering actions at the snow-air interface such as freeze-thaw crust formation, surface hoar development, and densification due to wind action. The primary significance of this layered structure to the avalanche phenomenon is the wide range of strengths associated with the respective layers and the wide variations in inter-layer bonding.
In order to provide the conditions for an avalanche, this snow structure must be developing on a slope and the same processes are at work here that occur at a level site. The situation becomes more complex as each point on a slope is responding according to specific orientation and slope angle. In mountainous regions, climate and terrain interact to produce a distinct topoclimate which in turn establishes the local snow structure. Slopes facing the noon sun and inclined so that the sun's rays are essentially normal to the surface receive maximum solar energy. Depending upon the intensity of insolation, enhanced sintering may stabilize these slopes, surface crusts resulting from diurnal freeze-thaw cycles may form, or, if the temperatures are high enough, free water may be produced in sufficient quantities to destroy the intergranular bonding with a consequent reduction in strength. North-facing slopes and those which are topographically shaded much of the time receive relatively little direct short-wave radiation. These areas are characterized by lower surface temperatures which inhibit sintering and favor the formation of cohesionless snow deposits or depth hoar. Specific conditions in the San Juan Mountains are often considerably more complex, as will be described later in this report.
When snow lies on a slope, the relationship between stress and strength becomes of prime importance. The vertical force of gravity is resolved into two components, one normal to the slope and tending to hold the snow on the slope and one parallel to the slope, the shear force, causing the snow to move downslope (creep and glide). The snow also gradually densifies under compressive bulk stress (settlement). Generally, deformation rates
24
depend on the structure and temperature of the snow and the body forces. Elastic strain energy is stored in the snow when irregularities of settlement, creep and glide introduce tensile, compressive and shear stresses. In most cases this stored energy is slowly dissipated through viscous deformation of the snowcover (relaxation). But in some instances the stresses, particularly in tension and shear, may exceed the mechanical strength of snow layers or inter-layer bonds and failure can then occur, either spontaneously or through an external initiation (triggering). When this failure takes place on a sufficiently steep slope, a slab avalanche may be released as one or more snow layers slide away.
Summary of the Stratigraphic Character of the San Juan Snowcover
In the second INSTAAR Interim Report, 1973, E. R. LaChapelle, in his description of the physical causes of avalanches within the study area, identified what he called a predominately radiation snow climate. After two winters of snow structure analysis, it had become apparent that the local stratigraphy exhibited properties which differed greatly from the more northerly latitude of U.S.A., Canada, Europe and Japan where most practical and scientific knowledge of snow avalanche formation had been obtained. The latitude of the Red Mountain Pass snow study site is 37° 54'N, some 1200 1an closer to the equator than the Swiss Alps. The avalanche release zones within the research area range in altitude from 2800 m to 4000 m with a mean altitude of 3400 m. This combination of high altitude, low latitude and a continental climate produces what is described as a radiation snow climate.
A substantial amount of solar energy is available to slopes with a southerly aspect, even at midwinter, and this increases as spring approaches. This slope aspect includes a majority of the avalanche release zones in the study area. At the same time, the combination of high altitude and low atmospheric moisture leads to the intense nocturnal radiation cooling of all exposures. The annual snow accumulation within the release zones generally amounts to depths from 1.5 to 3.0 m and is not sufficient to suppress the development of significant temperature gradients. While the mean internal temperature gradients of north- and south-facing slopes do not differ to a significant extent, such values being a function of long-term mean daily air temperatures, it is within the near surface layers that the radical contrast exists. Slopes with a southerly exposure experience subsurface warming due to the penetration and absorption of solar radiation. At any time during the winter season this warming can be sufficient to cause the snow temperature to reach the melting point with the eventual formation of a freeze-thaw crust. Even at the warmest point in the diurnal temperature cycle, when melt is occurring 1.0-3.0 cm beneath the surface, the temperature of the snow-air interface, due to radiation cooling, often remains well below freezing, creating an extremely steep temperature gradient within this uppermost layer. This combination provides optimum conditions for temperature-gradient recrystallization; mean snow temperatures at or near freezing providing maximum water vapor supply and snow structure of
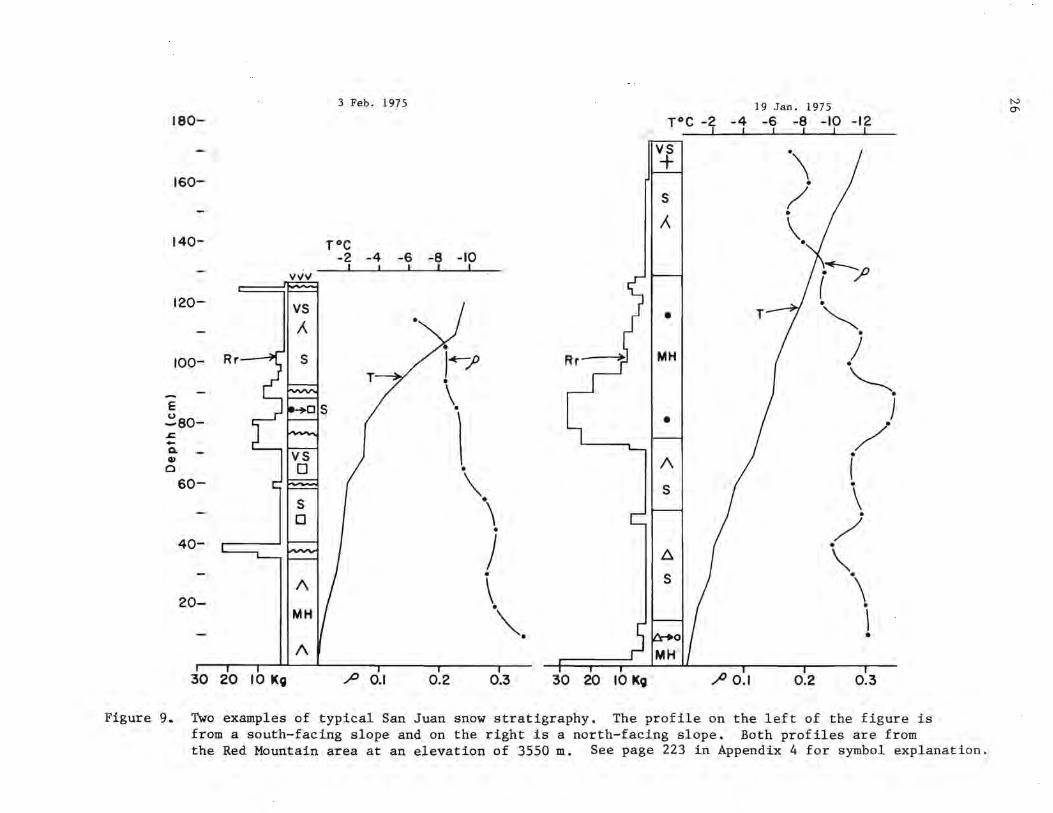
low density allowing maximum vapor diffusion with a temperature gradient as high as several degrees per centimeter. The large diurnal fluctuations in the radiation-determined temperature of the near surface snow layers continue throughout the winter and a highly complex stratigraphy develops, characterized by large variations in structure and strength. Layers of relatively homogeneous, stronger snow, comprising the individual precipitation increments, are sepa~ated by thin layers of temperature-gradient snow and freeze-thaw crusts1 that have developed during clear weather periods between storms (Fig~re 9). Poor layer bonding is prevalant in these situations and the snowcover can be described as conditionally unstable, i.e. highly susceptible to load-induced or thaw-induced avalanche release. The general concept of the stabilization of southerly slopes associated with the effect of solar radiation simply is not applicable in the San Juan Mountains. A more detailed analysis of the effect of nearsurface temperature gradients can be found in LaChapelle and Armstrong (in preparation). The identification of a local radiation snow climate
may be as much a result of the detailed snow structure studies undertaken by INSTAAR as a consequence of any unique climatic situation. Similar snow properties may well be associated with other high altitude continental sites but these areas have not been studied in sufficient detail so as to identify this condition. Such additional studies are needed in order to better understand relationships between climate and snow structure.
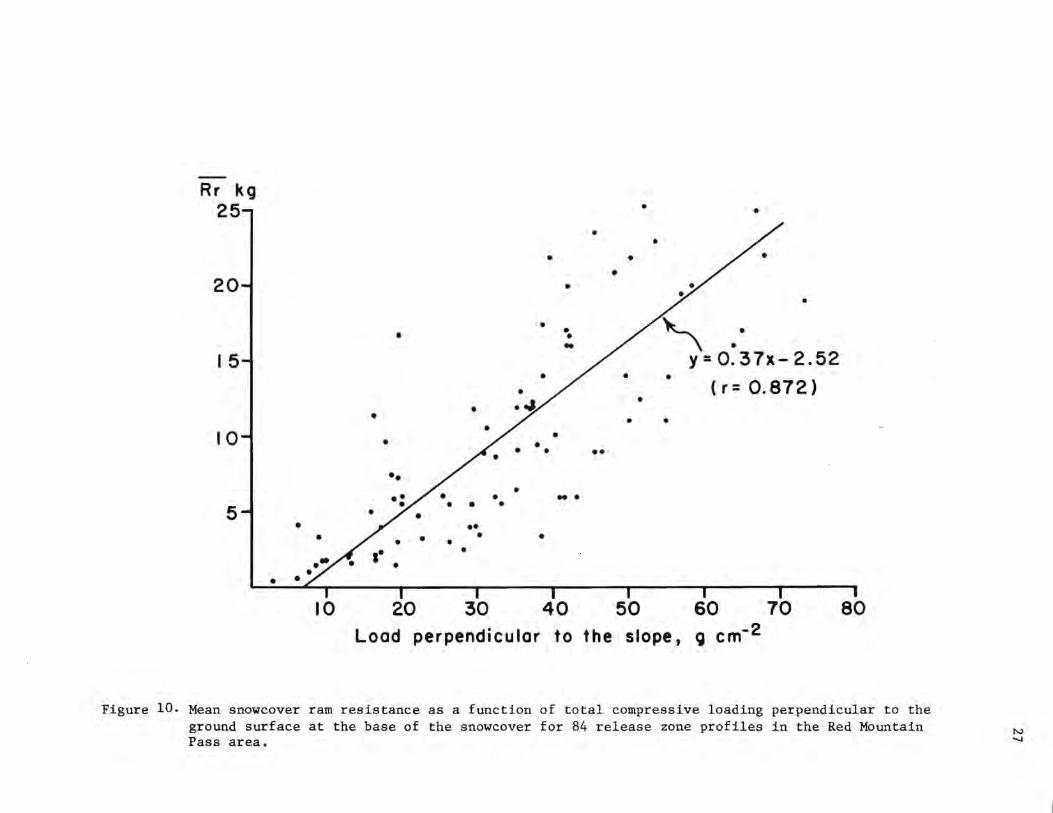
Snowcover data from the first two years of the INSTAAR project revealed a persistent pattern of lower average mechanical strength of the snowcover in avalanche release zones than in the level study sites. Following subsequent data analysis, LaChapelle suggested that this difference was in large part due to variations in compressive metamorphism between level ground and the inclined avalanche slopes. The component of body force acting perpendicular to the ground - the component which provides the compressive loading - declines with the cosine of slope angle for a given snow layer thickness. Comparison of mean snowcover ram resistance with total loading perpendicula~ to the ground showed a consistent correlation between these two parameters (Figure 10). The overall results confirm the conclusion that the distribution of snowdepths commonly found in the San Juan research area is such that compressive load values associated with higher snow strengths appear early in the winter on level ground but do not appear until much later in the winter on slopes steeper than 300 which are ~haracteristic of avalanche release zones.
Avalanche Event Record
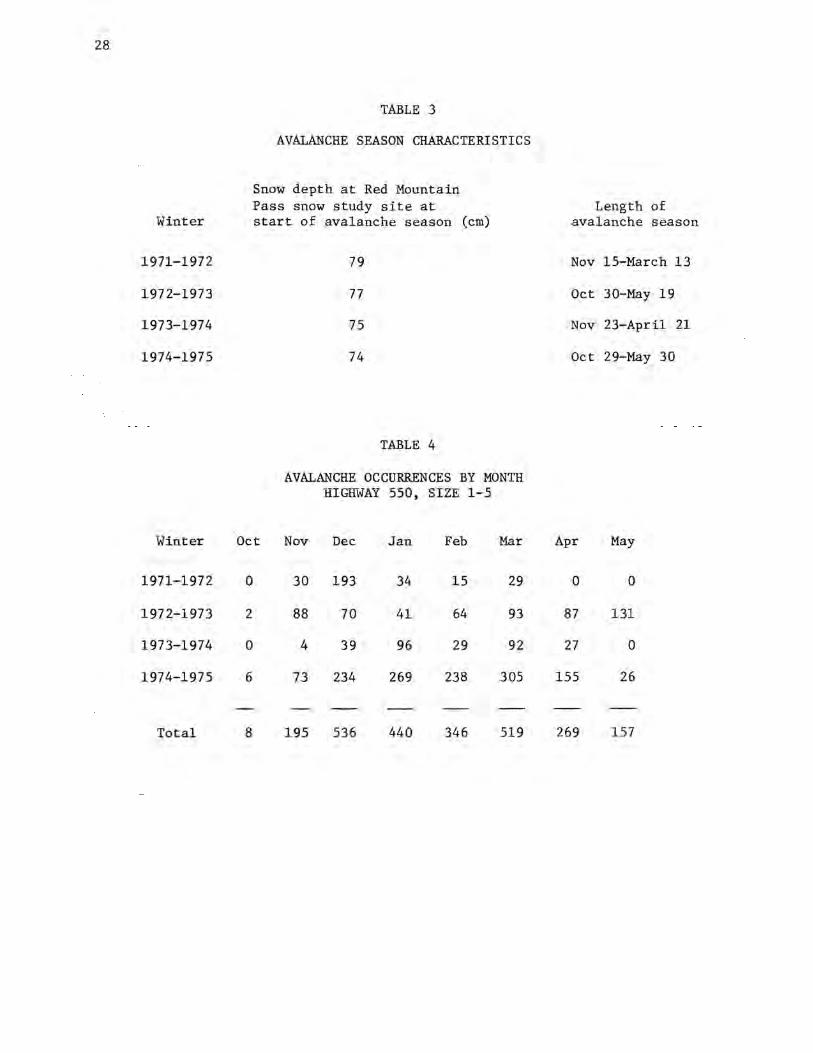
Snow avalanches were observed within the study area as early as October 29, and as late as May 30 during the 4 season period. The length of each of the four avalanche seasons studied is shown in Table 3. Table 3 also includes the snow depths at the Red Mountain Pass snow study site at the time when the first significant avalanching was recorded. Although the sample is small, it is worth noting that there is little deviation from the average depth of 76. 3 cm. "Significant avalanche activity" was defined
25
180-
160-
140-
120-
100-
E ~80-.c -Q. QI 0
60-
40-
20-
30 20 10 Kg
I\
3 Feb. 1975
T°C -2 -4 -6 -8 -10
~ 0.1
}~-)' \.
\ \.
\ •
J \ ·""·
0.2 0.3 30 20 10 Kg
19 Jan. 1975
T°C -2 -4 -6 -8 -10 -12
vs + s /...
I\
s
b.
s
,,,0 0.1 0.2
~~ ( -~
•
J -~ )
• / i \
•
/ \.
\ \ •
0.3
Figure 9. Two examples of typical San Juan snow stratigraphy. The profile on the left of the figure is from a south-facing slope and on the right is a north-facing slope. Both profiles are from the Red Mountain area at an elevation of 3550 m. See page 223 in Appendix 4 for symbol explanation.
N
""
Rr kg 251 • •
• • • •
• 20, •
7 •
• ~: 15-I y=0.37x-2.52
• (r= 0.872)
• • 10-I •
•• • • ...
5-t -- • • • • • /. • • • • • • • •
• • -~ I I I I I I I
10 20 30 40 50 60 70 80 Load perpendicular to the slope, g cm- 2
Figure 10. Mean snowcover ram resistance as a function of total compressive loading perpendicular to the ground surface at the base of the snowcover for 84 release zone profiles in the Red Mountain Pass area.
N -...J
28
Winter
.1971-1972
1972-1973
1973-1974
1974-1975
Winter
1971-1972
1972-1973
1973-1974
1974-1975
Total
TABLE 3
AVALANCHE SEASON CHARACTERISTICS
Snow depth at Red Mountain Pass snow study site at start of avalanche season (cm)
79
77
75
74
TABLE 4
AVALANCHE OCCURRENCES BY MONTH HIGHWAY 550, SIZE 1-5
Oct Nov Dec Jan Feb Mar
0 30 193 34 15 29
2 88 70 41 64 93
0 4 39 96 29 92
6 73 234 269 238 305
8 195 536 440 346 519
Length of avalanche season
Nov 15-March 13
Oct 30-May 19
Nov 23-April 21
Oct 29-May 30
Apr May
0 0
87 131
27 0
155 26
269 157
29
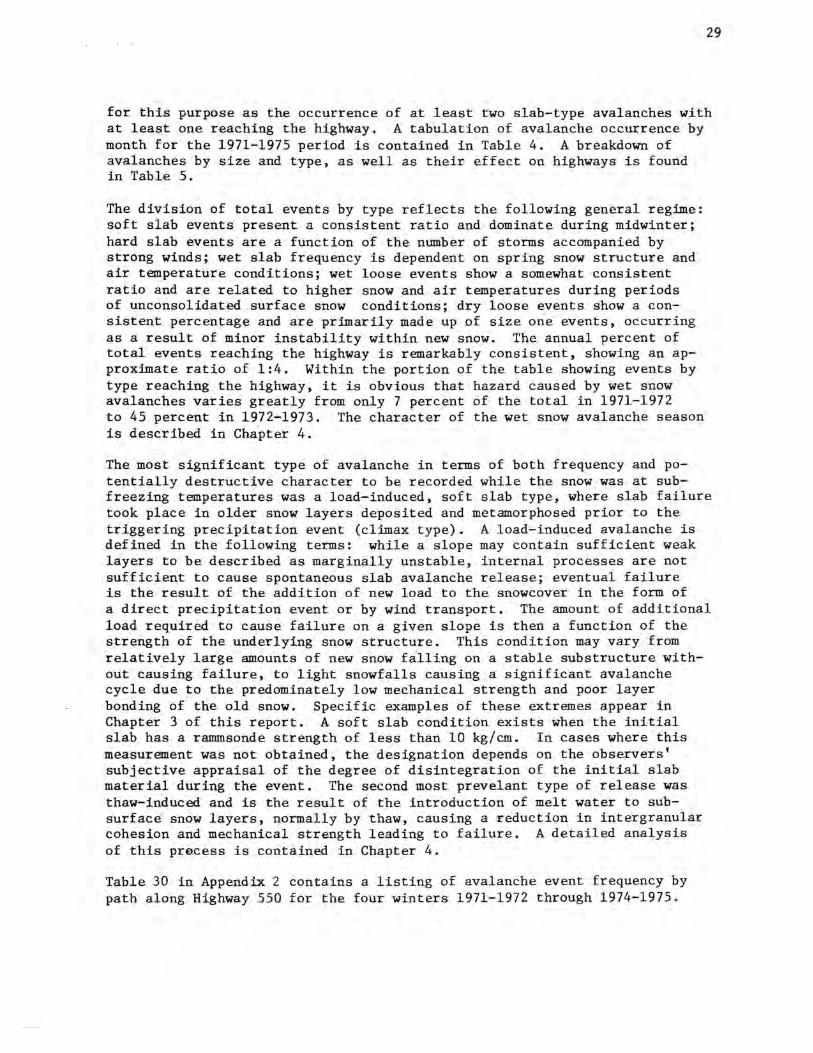
for this purpose as the occurrence of at least two slab-type avalanches with at least one reaching the highway. A tabulation of avalanche occurrence by month for the 1971-1975 period is contained in Table 4. A breakdown of avalanches by size and type, as well as their effect on highways is found in Table 5.
The division of total events by type reflects the following general regime: soft slab events present a consistent ratio and dominate during midwinter; hard slab events are a function of the number of storms accompanied by strong winds; wet slab frequency is dependent on spring snow structure and air temperature conditions; wet loose events show a somewhat consistent ratio and are related to higher snow and air temperatures during periods of unconsolidated surface snow conditions; dry loose events show a consistent percentage and are primarily made up of size one events, occurring as a result of minor instability within new snow. The annual percent of total events reaching the highway is remarkably consistent, showing an approximate ratio of 1:4. Within the portion of the table showing events by type reaching the highway, it is obvious that hazard caused by wet snow avalanches varies greatly from only 7 percent of the total in 1971-1972 to 45 percent in 1972-1973. The character of the wet snow avalanche season is described in Chapter 4.
The most significant type of avalanche in terms of both frequency and potentially destructive character to be recorded while the snow was at subfreezing temperatures was a load-induced, soft slab type, where slab failure took place in older snow layers deposited and metamorphosed prior to the triggering precipitation event (climax type). A load-induced avalanche is defined in the following terms: while a slope may contain sufficient weak layers to be described as marginally unstable, internal processes are not sufficient to cause spontaneous slab avalanche release; eventual failure is the result of the addition of new load to the snowcover in the form of a direct precipitation event or by wind transport. The amount of additional load required to cause failure on a given slope is then a function of the strength of the underlying snow structure. This condition may vary from relatively large amounts of new snow falling on a stable substructure without causing failure, to light snowfalls causing a significant avalanche cycle due to the predominately low mechanical strength and poor layer bonding of the old snow. Specific examples of these extremes appear in Chapter 3 of this report. A soft slab condition exists when the initial slab has a rammsonde strength of less than 10 kg/cm. In cases where this measurement was not obtained, the designation depends on the observers' subjective appraisal of the degree of disintegration of the initial slab material during the event. The second most prevelant type of release was thaw-induced and is the result of the introduction of melt water to subsurface snow layers, normally by thaw, causing a ~eduction in intergranular cohesion and mechanical strength leading to failure. A detailed analysis of this pre.cess is contained in Chapter 4.
Table 30 in Appendix 2 contains a listing of avalanche event frequency by path along Highway 550 for the four winters 1971-1972 through 1974-1975.
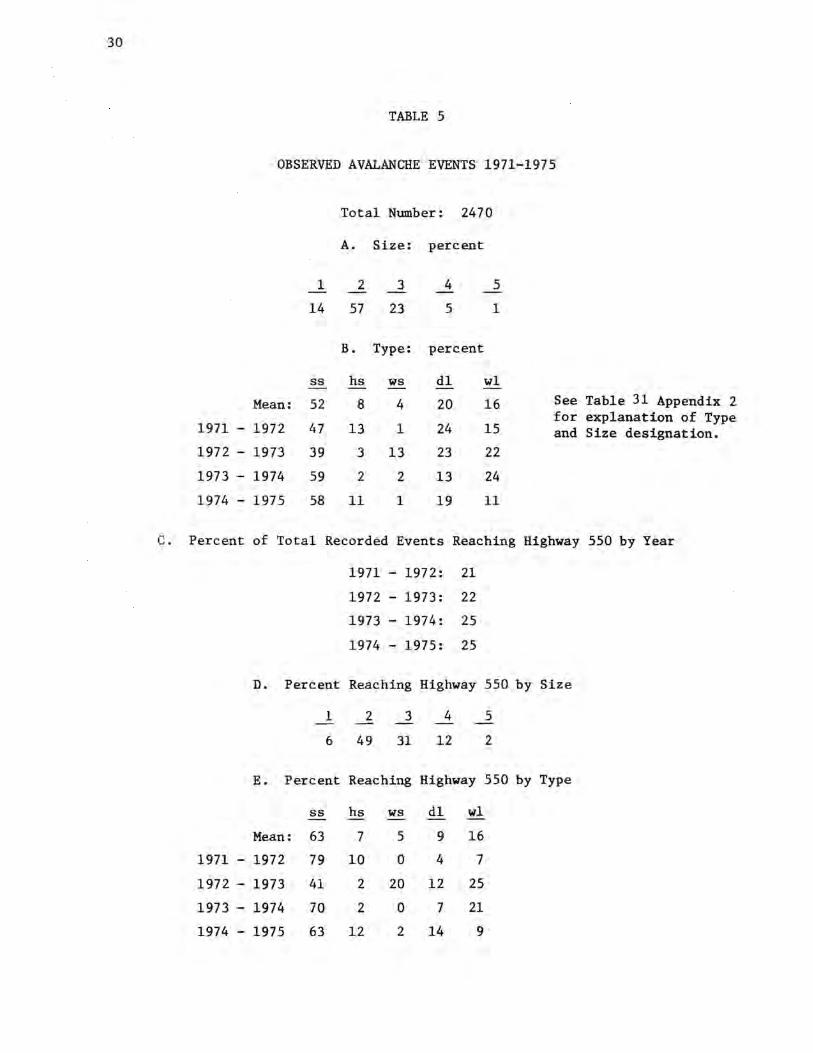
30
C.
1971 -
1972 -
1973 -
1974 -
Percent
1971 -
1972 -
1973 -
TABLE 5
OBSERVED AVALANCHE EVENTS 1971-1975
Mean:
1972
1973
1974
1975
1
14
ss
52
47
39
59
58
Total Number: 2470
A. Size: percent
2 3
57 23
B. Type:
hs ws
8 4
13 1
3 13
2 2
11 1
4
5
percent
dl
20
24
23
13
19
5
1
wl
16
15
22
24
11
See for and
Table 31 Appendix 2 explanation of Type Size designation.
of Total Recorded Events Reaching Highway 550 by Year
1971 - 1972: 21
1972 - 1973: 22
1973 - 1974: 25
1974 - 1975: 25
D. Percent Reaching Highway 550 by Size
1 2 3 4 5
6 49 31 12 2
E. Percent Reaching Highway 550 by Type
ss hs WS dl wl
Mean: 63 7 5 9 16
1972 79 10 0 4 7
1973 41 2 20 12 25
1974 70 2 0 7 21
1974 - 1975 63 12 2 14 9
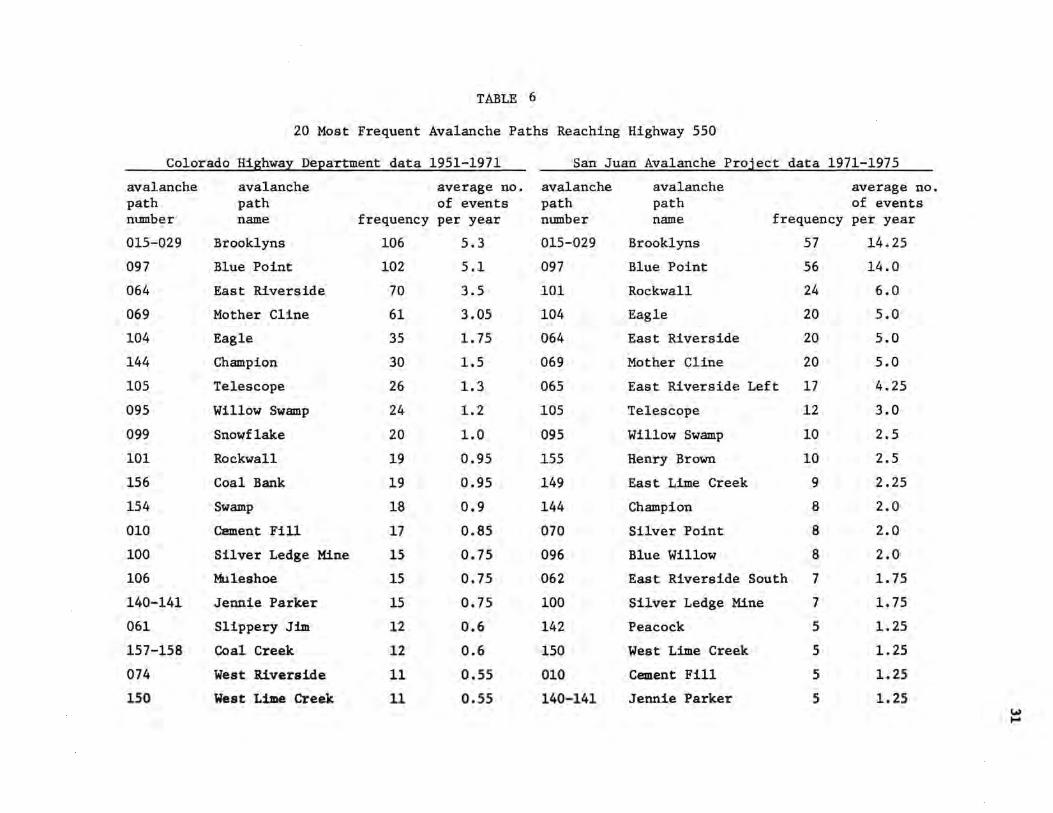
TABLE 6
20 Most Frequent Avalanche Paths Reaching Highway 550
Colorado HighwaI DeEartment data 1951-1971 San Juan Avalanche Project data 1971-1975
avalanche avalanche average no. avalanche avalanche average no. path path of events path path of events number name frequency per year number name frequency per year
015-029 Brooklyns 106 5.3 015-029 Brooklyns 57 14.25
097 Blue Point 102 5.1 097 Blue Point 56 14.0
064 East Riverside 70 3.5 101 Rockwall 24 6.0
069 Mother Cline 61 3.05 104 Eagle 20 5.0
104 Eagle 35 1. 75 064 East Riverside 20 5.0
144 Champion 30 1.5 069 Mother Cline 20 5.0
105 Telescope 26 1.3 065 East Riverside Left 17 4.25
095 Willow Swamp 24 1.2 105 Telescope 12 3.0
099 Snowflake 20 1.0 095 Willow Swamp 10 2.5
101 Rockwall 19 0.95 155 Henry Brown 10 2.5
156 Coal Bank 19 0.95 149 East Lime Creek 9 2.25
154 Swamp 18 0.9 144 Champion 8 2.0
010 Cement Fill 17 0.85 070 Silver Point 8 2.0
100 Silver Ledge Mine 15 0.75 096 Blue Willow 8 2.0
106 Muleshoe 15 0.75 062 East Riverside South 7 1. 75
140-141 Jenn::(.e Parker 15 0.75 100 Silver Ledge Mine 7 1. 75
061 Slippery Jim 12 0.6 142 Peacock 5 1.25
157-158 Coal Creek 12 0.6 150 West Lime Creek 5 1.25
074 West Riverside 11 0.55 010 Cement Fill 5 1.25
150 West Lime Creek 11 0.55 140-141 Jennie Parker 5 1.25 I.> ....
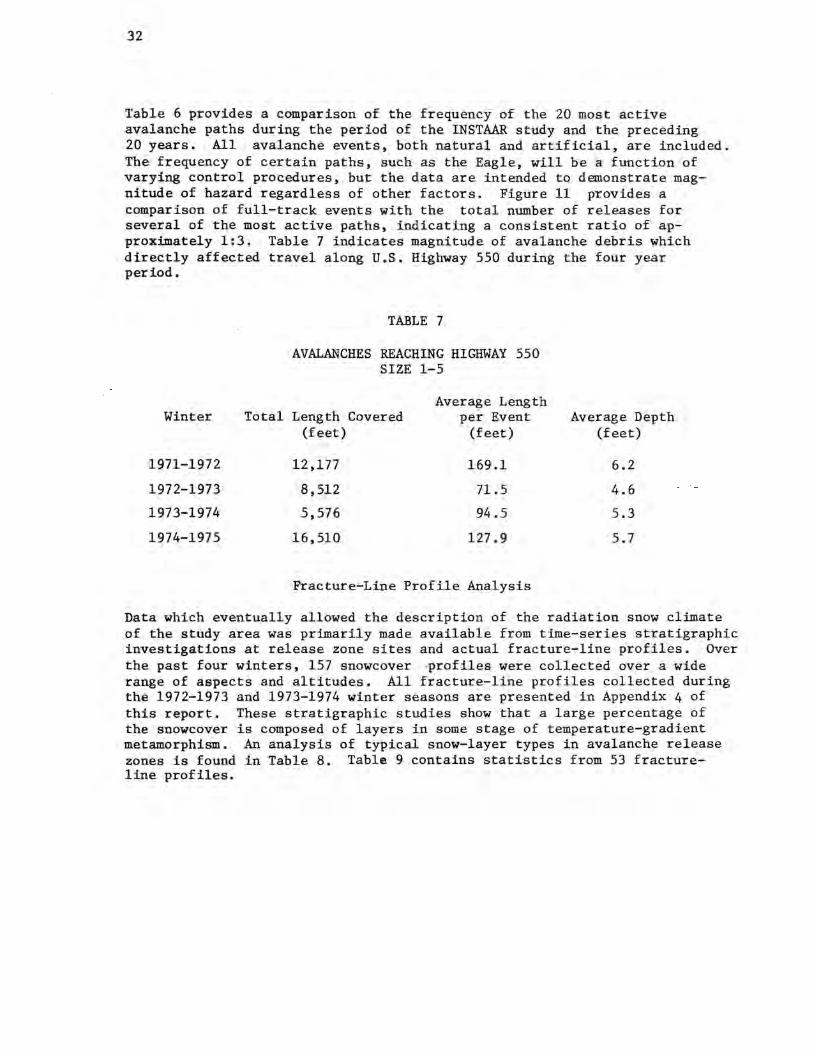
32
Table 6 provides a comparison of the frequency of the 20 most active avalanche paths during the period of the INSTAAR study and the preceding 20 years. All avalanche events, both natural and artificial, are included. The frequency of certain paths, such as the Eagle, will be a function of varying control procedures, but the data are intended to demonstrate magnitude of hazard regardless of other factors. Figure 11 provides a comparison of full-track events with the total number of releases for several of the most active paths, indicating a consistent ratio of approximately 1:3. Table 7 indicates magnitude of avalanche debris which directly affected travel along U.S. Highway 550 during the four year period.
Winter
1971-1972
1972-1973
1973-1974
1974-1975
Total
TABLE 7
AVALANCHES REACHING HIGHWAY 550 SIZE 1-5
Average Length Length Covered per Event
(feet) (feet)
12,177 169.1
8,512 71.5
5,576 94.5
16,510 127.9
Fracture-Line Profile Analysis
Average Depth (feet)
6.2
4.6
5.3
5.7
Data which eventually allowed the description of the radiation snow climate of the study area was primarily made available from time-series stratigraphic investigations at release zone sites and actual fracture-line profiles. Over the past four winters, 157 snowcover ,profiles were collected over a wide range of aspects and altitudes. All fracture-line profiles collected during the 1972-1973 and 1973-1974 winter seasons are presented in Appendix 4 of this report. These stratigraphic studies show that a large percentage of the snowcover is composed of layers in some stage of temperature-gradient metamorphism. An analysis of typical snow-layer types in avalanche release zones is found in Table 8. Table 9 contains statistics from 53 fractureline profiles.
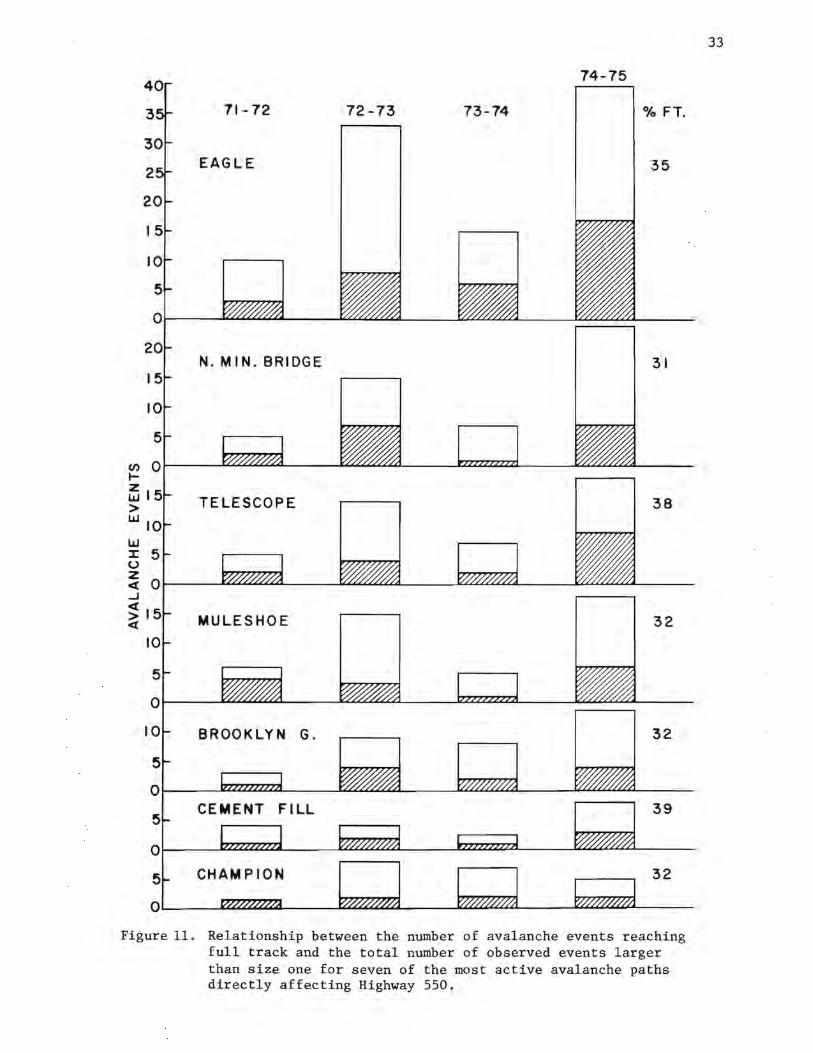
40
3
2
20
15
10
5
71-72
EAGLE
74-75
72-73 73-74 % FT.
35
01----................ """"" ....... ---..o<.<.L,{.,/.,"""'"""----J.,U...<..L..LJ.:.£.£.£.L,IL._ __ __,"""-'""-'-'-...U:..U-.---
20
15
10
5
N. MIN. BRIDGE 31
~ o1-----~~~a_ __ ...Y..::;~:;(L.::;~--_i:zzzz;:zzzzz1-__ _...IG~~~--
~
~ 15 > Li.I 10 Li.I :::c 5 u
TELESCOPE 38
~ Ot-----L,t;.LLL""-L'-"''---""""""JJ.6.""'-'-"""'----_.l<..£.{..Lu~""-"'----IU.L'--'-'-' ........ .....__ __ _ ..J
~15 MULESHOE 32 ci:
10
5
ol--- -1~~~--~~~a_ __ ..tzzzzzz.:.!'ZZ.21. __ ____.r.:~~~--
10 BROOKLYN G. 32
5
0L--_lzzzzz.;1ZZZ12f...._ _ __J~~~ - - ~~~--~~~a._ _ _
5 CEMENT FILL 39 ·
ol------.tz12ZZZ2ZZZil___~~~L_-_t.zzzzz:;i2z:Z2:t.__---1::2:~~L_ __
5 CHAMPION 32
oL- ~~L-_ _m~:a_-~~m._ _ __1:~~- -
Figure 11 . Relationship between the number of avalanche events reaching full track and the total number of observed events larger than size one for seven of the most active avalanche paths directly affecting Highway 550.
33
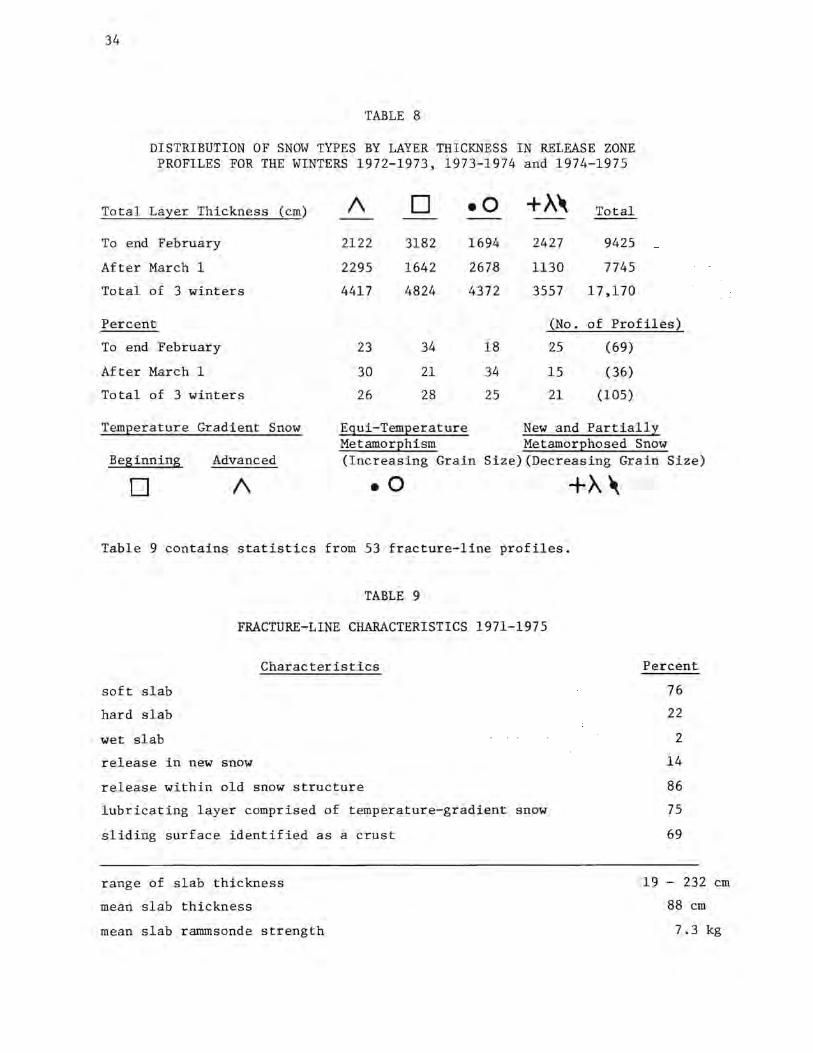
34
TABLE 8
DISTRIBUTION OF SNOW TYPES BY LAYER THICKNESS IN RELEASE ZONE PROFILES FOR THE WINTERS 1972-1973, 1973-1974 and 1974-1975
Total Layer Thickness (cm) I\ D .o +A\ Total
To end February 2122 3182 1694 2427 9425
After March 1 2295 1642 2678 1130 7745
Total of 3 winters 4417 4824 4372 3557 17,170
Percent (No. of Profiles2
To end February 23 34 18 25 (69)
After March 1 30 21 34 15 (36)
Total of 3 winters 26 28 25 21 (105)
TemEerature Gradient Snow Egui-TemEerature New and Partially MetamorEhism MetamorEhosed Snow
Beginning Advanced (Increasing Grain Size)(Decreasing Grain Size)
D I\ .o +A\
Table 9 contains statistics from 53 fracture-line profiles.
TABLE 9
FRACTURE-LINE CHARACTERISTICS 1971-1975
Characteristics
soft slab
hard slab
wet slab
release in new snow
release within old snow structure
lubricating layer comprised of temperature-gradient snow
sliding surface identified as a crust
range of slab thickness
mean slab thickness
Percent
76
22
2
14
86
75
69
19 - 232
88 cm
cm
mean slab rammsonde strength 7.3 kg
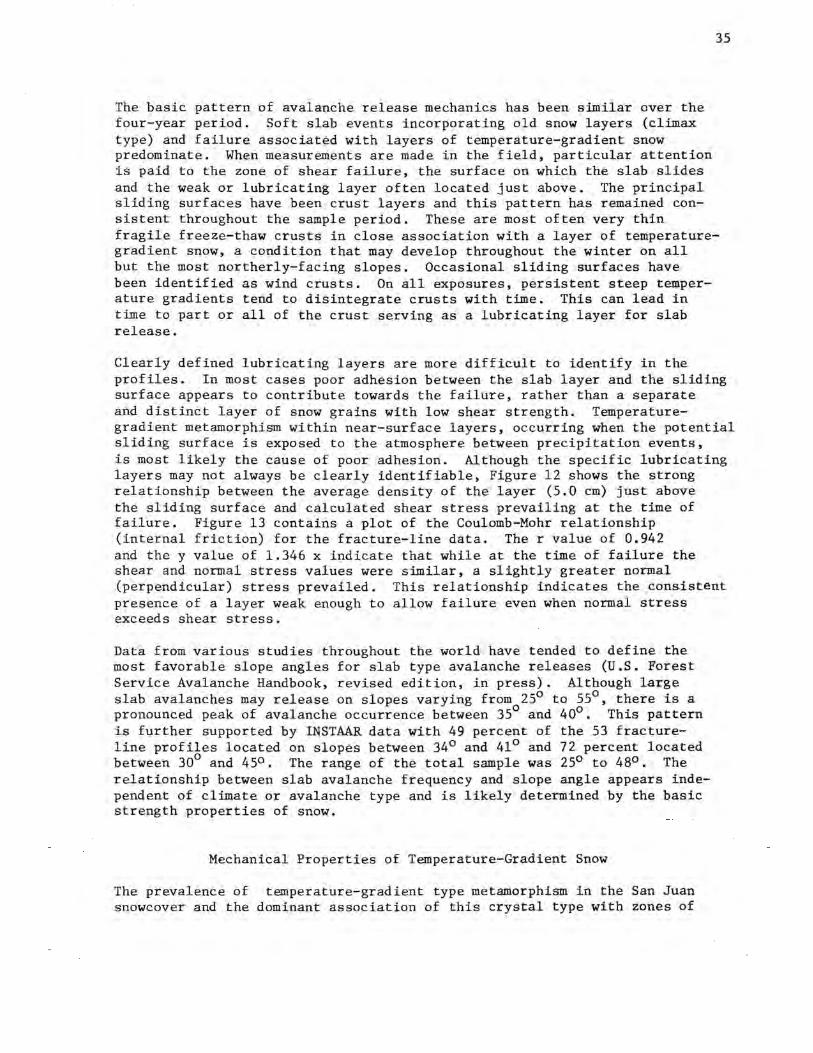
35
The basic pattern of avalanche release mechanics has been similar over the four-year period. Soft slab events incorporating old snow layers (climax type) and failure associated with layers of temperature-gradient snow predominate. When measurements are made in the field, particular attention is paid to the zone of shear failure, the surface on which the slab slides and the weak or lubricating layer often located just above. The principal sliding surfaces have been crust layers and this pattern has remained consistent throughout the sample period. These are most often very thin fragile freeze-thaw crusts in close association with a layer of temperaturegradient snow, a condition that may develop throughout the winter on all but the most northerly-facing slopes. Occasional sliding surfaces have been identified as wind crusts. On all exposures, persistent steep temperature gradients tend to disintegrate crusts with time. This can lead in time to part or all of the crust serving as a lubricating layer for slab release.
Clearly defined lubricating layers are more difficult to identify in the profiles. In most cases poor adhesion between the slab layer and the sliding surface appears to contribute towards the failure, rather than a separate and distinct layer of snow grains with low shear strength. Temperaturegradient metamorphism within near-surface layers, occurring when the potential sliding surface is exposed to the atmosphere between precipitation events, is most likely the cause of poor adhesion. Although the specific lubricating layers may not always be clearly identifiable, Figure 12 shows the strong relationship between the average density of the layer (5.0 cm) just above the sliding surface and calculated shear stress prevailing at the time of failure. Figure 13 contains a plot of the Coulomb-Mohr relationship (internal friction) for the fracture-line data. The r value of 0.942 and they value of 1.346 x indicate that while at the time of failure the shear and normal stress values were similar, a slightly greater normal (perpendicular) stress prevailed. This relationship indicates the ,consistent presence of a layer weak enough to allow failure even when normal stress exceeds shear stress.
Data from various studies throughout the world have tended to define the most favorable slope angles for slab type avalanche releases (U.S. Forest Service Avalanche Handbook, revised edition, in press). Although large slab avalanches may release on slopes varying from 25° to 55°, there is a pronounced peak of avalanche occurrence between 35° and 40°. This pattern is further supported by INSTAAR data with 49 percent of the 53 fractureline profiles located on slopes between 34° and 41° and 72 percent located between 30° and 45°. The range of the total sample was 25° to 48°. The relationship between slab avalanche frequency and slope angle appears independent of climate or avalanche type and is likely determined by the basic strength properties of snow.
Mechanical Properties of Temperature-Gradient Snow
The prevalence of temperature-gradient type metamorphism in the San Juan snowcover and the dominant association of this crystal type with zones of
36
• 24.0
• 22.0
20.0 •
• • 18.0 •
• •
16.0
• •
_14.0 • "'e
u
' • 212.0 >-)(
b 10.0 •
• • • •• • 8.0 • •
• • • •
6.0 • • • • • •• •
• • 4.0 • • • • • •
• '· 2.0 •
0.100 0.200 0. 00 0.400 Density Cg /cm 3 )
Figure 12. The relationship between snow slab shear stress at the point of failure (fracture line) and the density of the 5.0 cm layer (lubricating layer) at the base of the slab for 46 fracture line profiles.

35.0
30.0
25.0
-20.0 N E 0
' E c,,15.0 -~ • ~ • b
• 10.0
•
5.0
5.0
• •
• •
•
•• •
• •
• •
y = l.346x + 0.0001
r = 0.942
10.0 15.0 20.0 25.0 dxy(g/cm2 )
Figure 13. The Coulomb-Mohr relationship of shear stress vs. normal stress (internal friction) for 47 fracture line profiles.
37
30.0
38
shear failure in fracture-line profiles has already been emphasized. It is appropriate, therefore, to discuss some of the mechanical properties of this snow type.
The densification with time is a basic characteristic of the snowcover that relates directly to avalanche formation through effects on snow strength. Densification rates are dependent on climate and on the type of metamorphism involved (Lachapelle, 1974). When snow is resting on a slope the settlement, or densification, resulting from the forces of gravity and metamorphism is resolved into two components, one promoting shear stress and the other causing normal stress. It is true that the shear resistance of a given layer can be strengthened by increasing the normal pressure across the layer, as when new snow accUIIiulates. However, it has been noted (Mellor, 1968) that this situation is complicated by the fact that shear resistance is improved not so much by normal pressure~ se, but by irreversible structural changes induced in the snow layers by that pressure. Under compressive bulk stress most snow densifies and creates new bonds and shear strength increases. Under fixed bulk stress, shear strength then becomes a function of time and if the bulk stress is relaxed, the improved shear strength gained by its application does not disappear. However, temperature-gradient snow, the type most frequently found within the shear failure zone of the San Juan fracture-line profiles, does not behave in this fashion, Snow structure studies conducted by INSTAAR (Lachapelle and Armstrong, in preparation) as well as other research (Akitaya, 1974) have indicated that while temperature-gradient snow is quite weak in shear, it retains a relatively high compressive strength and once the initial changes in the new snow have taken place, temperature-gradient metamorphism tends to severely inhibit the densification process. Even under the loading effect of the majority of the winter snowcover, temperature gradient layers near the ground densify only slightly (Figure 14) compared to layers not influenced by temperature-gradient metamorphism. Very little new intergranular bonding occurs and even after an initially steep temperature gradient is removed from the layer, only insignificant increases in strength occur. Generally the large, coarse, cohesionless grains continue to exhibit very low mechanical strength throughout the winter and remain weak in shear strength.
Conclusion
It was the intention of this project at the outset to stress snowcover as well as meteorological parameters in the development of an avalanche forecast methodology. Although no comprehensive snow or avalanche studies had previously been conducted in the San Juan Mountains, the local snow structure had been recognized as one which, due to its complex stratigraphy, would consistently involve slab avalanche releases within old snow layers (Lachapelle, 1965). However, it was the inadequate correlation between precipitation factors and avalanche release encountered during the initial period of research which placed further emphasis on the need for a detailed investigation of local snow structure. The need to extrapolate from a level study site to the slopes of the avalanche release zones led to a comparison of the general physical and mechanical properties associated with
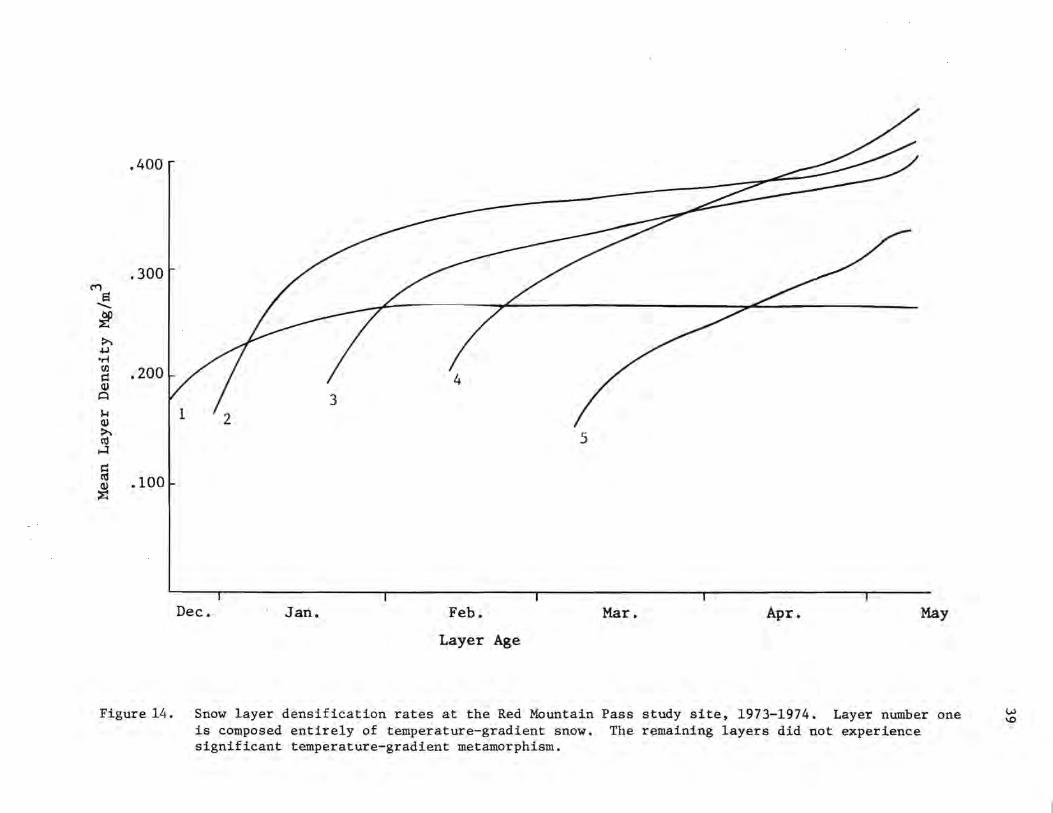
C""')
a ........
l ~
,I.J
-ri Cll i::: Q> A
1-1 Q> ~ co
...:I
~ ~
.400
.300
.200
.100
2 5
Dec. Jan. Feb. Mar. Apr. May
Layer Age
Figure 14. Snow layer densification rates at the Red Mountain Pass study site, 1973-1974. Layer number one is composed entirely of temperature-gradient snow. The remaining layers did not experience significant temperature-gradient metamorphism.
w \0
40
the snow structures of the two locations. The next step was to identify the particular stratigraphic snow structure patterns of various slope orientations and to analyze the meteorological conditions which created them. In stmnnary, a predominately radiation snow climate, the result of a very wide range in snow surface temperature related to intense daytime insolation and nocturnal radiation cooling, was identified which produced extensive temperature-gradient metamorphism of the snowcover. This metamorphism in turn created conditions of predominately low mechanical strength and a highly differentiated stratigraphy on all slope exposures. The local snow structure was characterized as being conditionally unstable throughout the major portion of a winter season. By this, it is meant that at any given time while the snowcover is at sub-freezing temperatures, it is only marginally unstable with respect to spontaneous slab release due to internal causes, but it remains throughout each winter highly susceptible to load~induced avalanche release. The critical point to be made here is that in terms of precipitation-triggered avalanche events, the most, important factor in occurrence forecasting may often no~ be the amount of precipitation provided by the storm, but rather the mechanical strength of the old snow structure on which the new snow load is acclllll.ulating. Over 80 percent of the observed fracture-line profiles exhibited a climax avalanche structure wherein slab failure took place in older snow layers deposited and metamorphosed prior to the triggering precipitation event. Accurate avalanche forecasting in the San Juan Mountains must rely heavily on an adequate understanding and continuous monitoring of the metamorphic processes contributing to the development of the snow structure. This point is further emphasized in the following chapter.
41
CHAPTER 3: AVALANCHE FORECAST METHODS
RichaFd L. Armstrong and Edward Lachapelle
Developmental Background
At the beginning of the project, two parallel techniques were proposed for development of a method for forecasting avalanches in the San Juan Mountains. The first was an operational, in-house, forecasting program initially based on established forecasting techniques, but to be continually upgraded on the basis of experience and empirical evidence obtained as the investigation of the local snow climate continued. The second would be based on acquisition of sufficient snow, weather and avalanche data to allow a statistical analysis of the relations between avalanche occurrence and contributing snow and weather factors. Direct investigation of snowcover structure and the physical causes of avalanches as determined by after-the-fact analysis would augment both approaches. A detailed account of the procedure adopted for the first approach by Lachapelle is in Armstrong et al. (1974) and is reproduced for the current report at the conclusion of this chapter. Following the third winter's study, initial statistical analysis was undertaken, the results being reported by Bovis (1976). The updated results of this work, including the unusually large sample of avalanche events from the 1974-1975 winter, are contained in Chapter 5 of this report.
Data providing the basis for conventional avalanche forecasting is generally available from two sources; direct evidence, where the condition of snow stability is obtained from direct examination of snowcover structure, and indirect evidence, that utilizes meteorological data only. The respective application of these techniques is related to the type of slab avalanche anticipated (Lachapelle, 1965). Direct snowcover data are required when the avalanche is caused primarily by weak layers that have developed within the old snowcover. By means of stratigraphic investigations, such incipient structural development can usually be detected well in advance of the actual avalanche release. Indirect, or meteorological evidence can be relied on more heavily when forecasting involves avalanches which release primarily as a result of instability within the newly-fallen snow. This condition is often associated with very rapid, widespread hazard development and therefore does not readily lend itself to systematic, time-constlllling examination of snow structure. Empirical evidence indicates that a number of weather factors determine the stability of newly-fallen snow but the subjective weighing of the individual importance of each factor is the critical ingredient in an accurate forecast (U.S. Forest Service, 1961; Perla and Martinelli, 1976; and the last section of this Chapter). The first systematic effort directed .. towards avalanche forecasting in the San Juan Mountains was based on indirect or meteorological evidence (Rhea, 1970).
The application of physical models to the problem of avalanche release has to date been avoided due to the general lack of quantitative information regarding the complex nature of snow as a material. The inhomogeneity of a natural snowpack has thus far prevented any comprehensive detailed

42
analytical treatment of the physical, mechanical and thermodynamic properties of snow. Such basic properties as the strength (tensile, shear and compressive), elasticity and viscosity of snow are highly dependent on temperature and structure and therefore experiments done in the laboratory regarding such properties are valid for only one set of conditions. Problems also arise in attempting to relate strength values obtained from relatively small laboratory samples to stress patterns associated with the much larger volumes comprising the avalanche release zones within a natural snowpack. Consequently, there is no universally accepted set of failure criteria for snow as a material and therefore no currently well established body of scientific knowledge to calculate quantitatively the causes of avalanches in general.
Snow Structure and Forecasting
As INSTAAR proceeded to develop an avalanche forecast methodology, it soon became apparent that emphasis would be directed toward the "direct evidence" described above. The decision to devote a significant effort towards a better understanding of the relationship between snowcover, climate and avalanche formation in the San Juan Mountains came partly as a result of the identification of the unusual snow structure conditions prevalent in the area, but also as a result of the initial attempt to apply indirect or meteorological evidence to avalanche forecasting. Attempts to relate precipitation rates and amounts, within varied time frames, to specific avalanche releases were not successful. Avalanche events were sub-divided according to size and/or type, time increments were varied from one hour precipitation rates and amounts to storm and winter totals but such efforts continued to producer values in the .346 to .438 range. Relationships between total winter precipitation and avalanche events can be found in Figures 15 and 16. In Figure 16, the upper data points include all avalanches larger than size one to the end of March and the lower data points include only avalanches larger than size two to the end of March. It is of interest to note that while the sample including all avalanches larger than size one shows a direct relationship between precipitation and avalanche events, this sample would include many size two loose snow events (Table 5) and proportionally fewer large slab-type events. The second sample, which indicates a poor, in this case inverse relationship, would primarily be made up of large, destructive slab-type avalanches, again indicating the need for snow structure data in order to forecast this type of release with any degree of precision.
It became apparent that avalanches within the study site were primarily triggered by precipitation; over 90 percent of the mid-winter events occur during storm periods. Therefore, they are classified as direct-action, climax type avalanches because older snow layers are incorporated into the avalanche. This does not include events occurring in spring which result from the loss of internal strength due to the increasing free-water content of the snow. Recommended forecasting procedures for wet snow avalanches are reported in Chapter 4 of this report. However, even though the trigger was new-snow loading, an adequate understanding of conditions leading to
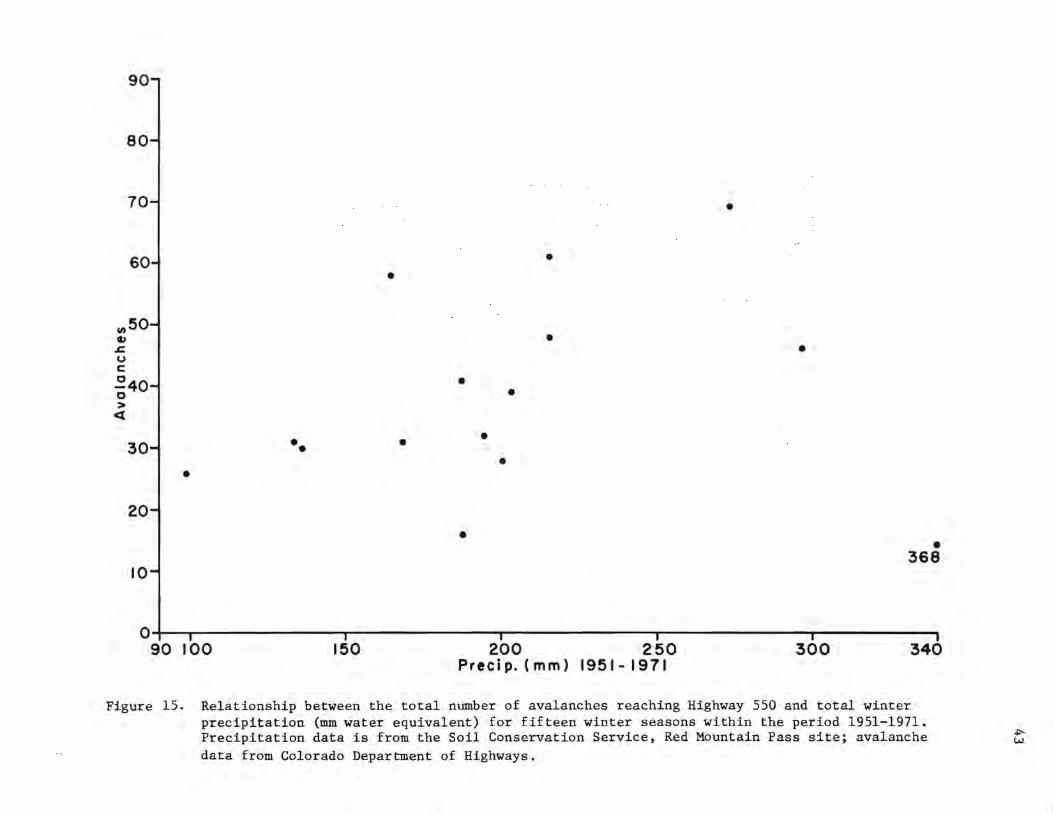
90
80
70 •
601 • •
.,,50 a, I .s::. • • u C
:40~ • • >
<X
30~ •• • • • •
I 20
I • • 368 10
0;---.------.-------.---------,.---------,.-----90 100 150 200 250 300 340
Precip. (mm) 1951-1971
Figure 15. Relationship between the total number of avalanches reaching Highway 550 and total winter precipitation (mm water equivalent) for fifteen winter seasons within the period 1951-1971. Precipitation data is from the Soil Conservation Service, Red Mountain Pass site; avalanche data from Colorado Department of Highways.
~ v.J
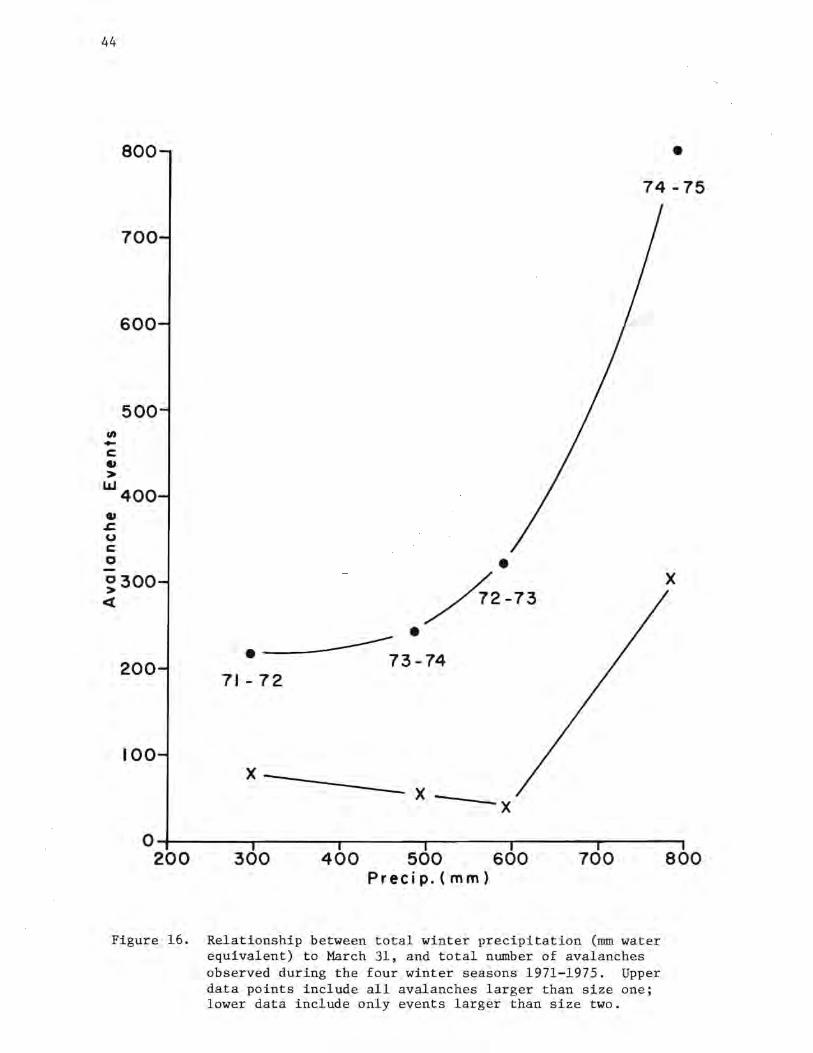
44
800 • 74 -75
en -C ., >
700
600
500
U.1400 ., .s= u C 0
~300 <l
200
100
0 200
• /2-73 ------- . • 73-74
71- 72
X X - -x
300 400 500 600 Preci p. (mm)
700
Figure 16. Relationship between total winter precipitation (mm water equivalent) to March 31, and total number of avalanches observed during the four winter seasons 1971-1975. Upper data points include all avalanches larger than size one; lower data include only events larger than size two.
X
800
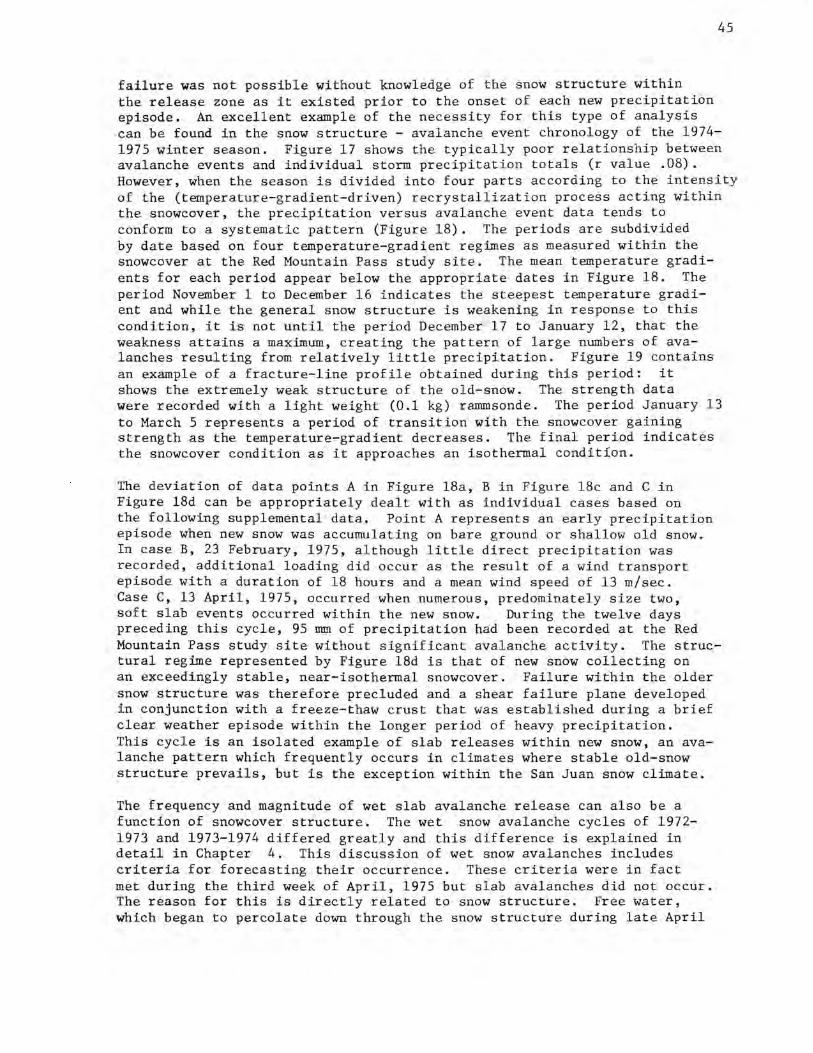
failure was not possible without knowledge of the snow structure within the release zone as it existed prior to the onset of each new precipitation episode. An excellent example of the necessity for this type of analysis
45
can be found in the snow structure - avalanche event chronology of the 1974-1975 winter season. Figure 17 shows the typically poor relationship between avalanche events and individual storm precipitation totals (r value .08). However, when the season is divided into four parts according to the intensity of the (temperature-gradient-driven) recrystallization process acting within the snowcover, the precipitation versus avalanche event data tends to conform to a systematic pattern (Figure 18). The periods are subdivided by date based on four temperature-gradient regimes as measured within the snowcover at the Red Mountain Pass study site. The mean temperature gradients for each period appear below the appropriate dates in Figure 18. The period November 1 to December 16 indicates the steepest temperature gradi-ent and while the general snow structure is weakening in response to this condition, it is not until the period December 17 to January 12, that the weakness attains a maximum, creating the pattern of large numbers of avalanches resulting from relatively little precipitation. Figure 19 contains an example of a fracture-line profile obtained during this period: it shows the extremely weak structure of the old-snow. The strength data were recorded with a light weight (0.1 kg) rammsonde. The period January 13 to March 5 represents a period of transition with the snowcover gaining strength as the temperature-gradient decreases. The final period indicates the snowcover condition as it approaches an isothermal condition.
The deviation of data points A in Figure 18a, Bin Figure 18c and C in Figure 18d can be appropriately dealt with as individual cases based on the following supplemental data, Point A represents an early precipitation episode when new snow was accumulating on bare ground or shallow old snow. In case B, 23 February, 1975, although little direct precipitation was recorded, additional loading did occur as the result of a wind transport episode with a duration of 18 hours and a mean wind speed of 13 m/sec. Case C, 13 April, 1975, occurred when numerous, predominately size two, soft slab events occurred within the new snow. During the twelve days preceding this cycle, 95 mm of precipitation had been recorded at the Red Mountain Pass study site without significant avalanche activity. The structural regime represented by Figure 18d is that of new snow collecting on an exceedingly stable, near-isothermal snowcover. Failure within the older snow structure was therefore precluded and a shear failure plane developed in conjunction with a freeze-thaw crust that was established during a brief clear weather episode within the longer period of heavy precipitation. This cycle is an isolated example of slab releases within new snow, an avalanche pattern which frequently occurs in climates where stable old-snow structure prevails, but is the exception within the San Juan snow climate.
The frequency and magnitude of wet slab avalanche release can also be a function of snowcover structure. The wet snow avalanche cycles of 1972-1973 and 1973-1974 differed greatly and this difference is explained in detail in Chapter 4. This discussion of wet snow avalanches includes criteria for forecasting their occurrence. These criteria were in fact met during the third week of April, 1975 but slab avalanches did not occur. The reason for this is directly related to snow structure. Free water, which began to percolate down through the snow structure during late April
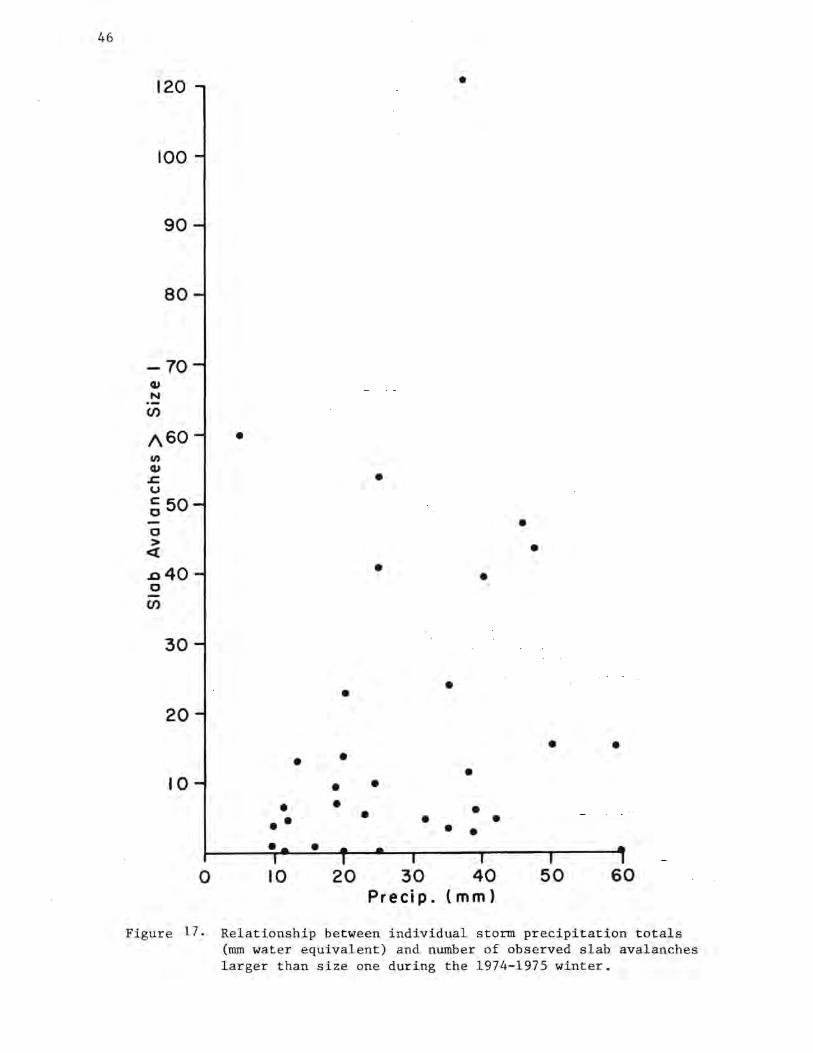
46
120 •
100
90
80
-70 Cl) N
Cf)
f\60 • en Cl)
.s::. • u C 50 0 • 0 > • <l
.a40 • • 0 Cf)
30
• • 20
• • • • • 10 • •
• • • • • • • • • • • • 0 10 20 30 40 50 60
Precip. (mm)
Figure 17. Relationship between individual storm precipitation totals (mm water equivalent) and number of observed slab avalanches larger than size one during the 1974-1975 winter.
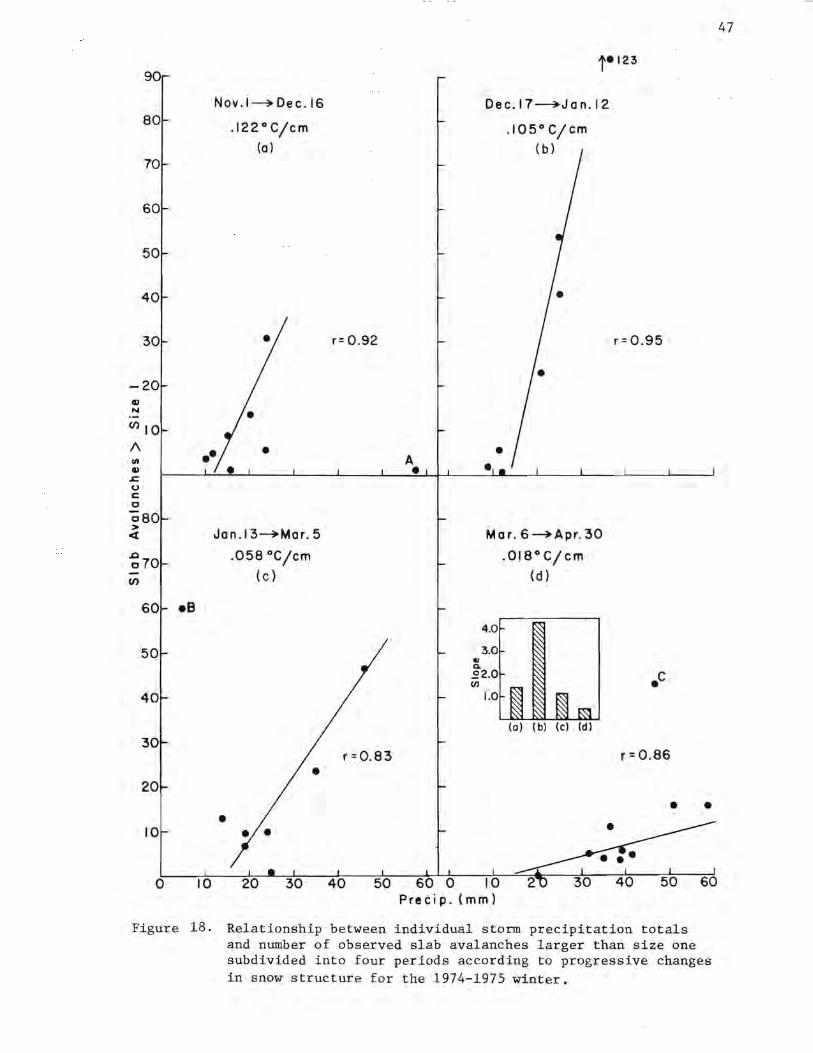
90
Nov.l~Dec.16 80
.122°C/cm (a)
70
60
50
40
30
-20 Q)
N
(/)10
I\ UI Q)
.c (.)
C 0
080 >
Jan.13~Mar.5 <l
~70 .058 °C/cm
(/) (c)
60 •B
50
40
30
20
• 10
r= 0.92
A •
r =0.83
.. Q.
Dec.17~Jan. I 2
.105°C/cm ( b)
•
Mar. G~Apr.30
.018°C/cm ( d)
4.0
3.0
22.0 Cl)
1.0
r = 0.95
.c
r = 0.86
• •
I I
•
I
0 10 20 30 40 50 60 0 10 50 60 Precip. (mm)
Figure 18. Relationship between individual storm precipitation totals and number of observed slab avalanches larger than size one subdivided into four periods according to progr essive changes i n snow structure f or the 1974-1975 winter.
47
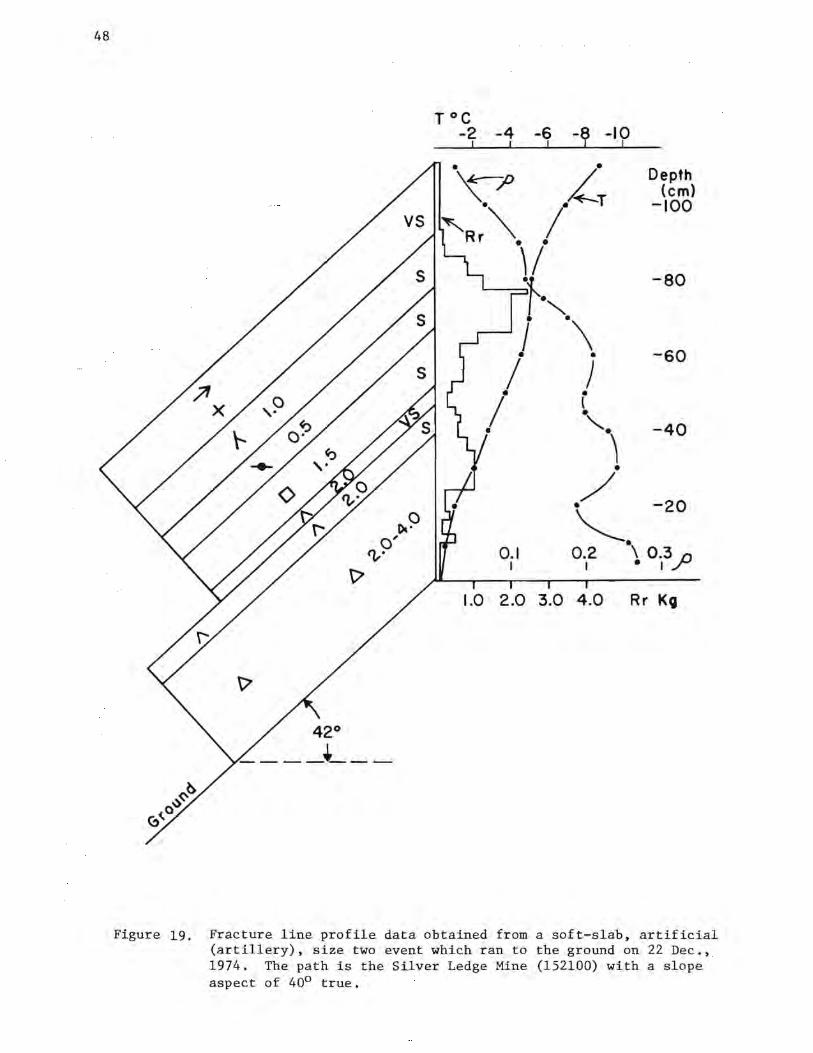
48
42°
----~---
T°C -2 -4 -6 -A -IOI
I I I I .
. \k-p /.
"'· /~T ~Rr "\. /
\I l·". I \
i j i •
• l • "· ' •
Depth (cm)
-100
-ao
-so
-40
/ "-· -20
0.2 \ 0.3 D 0.1 I
1.0 2.0 3.0 4.0
• Ir
Rr KCJ
Figure 19. Fracture line profile data obtained from a soft-slab, artificial (artillery), size two event which ran to the ground on 22 Dec., 1974. The path is the Silver Ledge Mine (152100) with a slope aspect of 40° true.
of 1973 encountered a thick layer of well-developed temperature-gradient snow near the ground in most release zones. Avalanche activity had been minimal during the preceeding winter within many paths, causing the percolating free water to come into contact with a complex stratigraphy which, in some cases, had been developing during the previous four to six months. The typical snow structure of the Red Mountain Pass area consisting of alternating layers of weak temperature-gradient snow and stronger freezethaw crusts and wind slabs, in combination with the melt water, created the conditions at the shear boundaries required to initiate slab-type avalanches. In contrast, during the 1974-1975 winter, very extensive avalanching occurred as a result of the extremely weak old-snow structure during December, January and February within nearly all observed paths.
49
As a result, when optimum conditions for wet slab releases occurred, little or no snow structure conducive to this type of snow failure existed within the release zones. Instead, the structural regime was one which allowed releases primarily within the new snow. A comparable situation has been recognized in the Swiss Alps during seasons when late fall and early winter meteorological and snowcover conditions do not promote the formation of a layer of temperature-gradient snow near the ground. Without this structural weakness, which persists into spring, the opportunity for significant wet slab releases is eliminated.*
Avalanche Hazard Evaluation and Cloud Seeding Criteria
The inconsistent relationships which exist between precipitation patterns and avalanche events, caused by the complexities of snow structure, have been discussed in the preceeding chapters. The answer to the question, which is of primary concern when establishing cloud seeding criteria with respect to avalanche hazard, "does more precipitation mean more avalanches?" is "not always." Avalanches in the San Juan Mountains are largely precipitation-triggered but the climax character of 80 to 90 percent of the total events is directly related to snow accumulation and metamorphism patterns evolving over weeks or even months. A light snowfall, or its lack, in November may set the stage for an avalanche in February by providing, through complex processes, a weak failure plane deep within the snowpack. Since most precipitation events above a certain size will trigger at least a few avalanches, there may be a valid reason to avoid seeding a light storm which would thereby be pushed above the critical size. Heavy storms will usually trigger many avalanches naturally, so an additional increment in precipitation will probably not make any significant difference to avalanche activity. But the lighter storms can also leave a snow layer that may provide a later snowpack weakness to cause climax avalanching, and the enhancement of such a snowfall by seeding can diminish this possibility.
Due to the complex relationships that exist between a given period of avalanche activity and the intricate and often prolonged series of meteorological conditions, there appears no practical way to determine the effect of any single cloud-seeding event on subsequent avalanche patterns. The results of seeding, or not seeding, a storm in November could not be predicted in terms of how the particular stratigraphic layer within the snowcover composed of that precipitation event would react to an avalanche cycle two or three months later.
* Frutiger, H., 1975: personal communication.
50
Even though the effect of seeding a given storm on subsequent avalanche activity, or even the failure to seed it, is extremely difficult to identify, certain criteria for the suspension, or initiation, of cloud seeding might be applicable. Artificial augmentation of snowfall theoretically could be used as an avalanche control or "management" technique. In light of previous discussions regarding the San Juan snow climate, periods might exist when seeding efforts could be used to augment precipitation and encourage avalanche activity at a time when smaller avalanches are anticipated, thus limiting the size of later avalanches. For example, the heavy seeding of the first big storm in December following a long period of cold clear weather and the associated development of unstable temperature-gradient snow within the existing shallow snowcover would cause extensive avalanching and remove the weak substructure, perhaps for the remainder of the winter. Such a procedure would be compatible with the basic concept of active avalanche control, the replacement of infrequent, but large avalanches with smaller frequent events. While small frequent avalanching would often cause a significant amount of snow to reach the respective highways due to numerous areas of bank slides, the size and impact force of such events would be less, thus representing a reduced hazard level. Finally, if storms approaching from various directions were to be seeded, avalanche paths would be grouped in order to consider each group with respect to appropriate precipitation patterns. For example, many short paths affecting the highway in the Uncompahgre Gorge respond in an entirely different manner compared to the high release zones to the south of Red Mountain Pass, such as the Muleshoe group, when a storm approaches from the north.
In summary, let us assume that the basic aim of augmenting winter precipitation would be to optimize seeding results and minimize avalanche hazard. It has be~n shown that increased snowfall and increased avalanche hazard are not always directly related. In addition, precipitation augmentation by seeding is dispersed over a wide area, while avalanche problems exist only in a few concentrated locations, with high hazard areas being even less numerous. To generally reduce or suspend seeding in order to reduce the effects of avalanches, especially within the San Juan snow climate, would be extremely inefficient both with respect to seeding results as well as reducing avalanche hazard. The natural variations in hazard are much greater than any likely to be produced by snowfall augmentation. Due to the extreme complexities presented by this situation, it is suggested that operational cloud seeding in this area might best proceed for optimum yield, with the avalanche question being dealt with by an effective hazard evaluation (natural and artificial) and forecasting effort that would work with the augmented snowcover as it actually develops each winter. These data would provide the basis for an information service which would issue warnings as well as implement road closures and control measures. If such a comprehensive program were conducted with maximum efficiency, public safety would, without question, be increased over conditions where a natural precipitation regime, but no such hazard identification effort, existed.
To emphasize the point further, it can be stated categorically that the existing avalanche-control procedure along Highways 550 and 110 could be rendered much more efficient with relatively little expenditure. The
following procedure should be undertaken whether or not an operational cloud-seeding project is applied to this area: artificial release of avalanches at a time when initial snowcover instability exists but before the resulting artificial event would present a significant hazard, i.e. produce a series of small, less harmful avalanches rather than one large event. Such a procedure must be implemented during storm periods and therefore necessitates a methodology which is not dependent on the release zone being visible. INSTAAR, in cooperation with the University of Washington, Seattle, Washington, is currently involved in the development of techniques to artificially release avalanches by remote methods (Lachapelle, et al., 1975).
Review of Operational, In-house Forecasting Procedures
(The following is reproduced from Chapter 4 of
51
INSTAAR Occasional Paper No. 13, 1974, and is written by E. R. LaChapelle.)
During the first winter of the Project, practical experience with the area was being developed by the Project staff. Forecasting and evaluation of avalanche hazard were limited to an informal basis. During the second and third winters, a formal forecasting program was established. Daily evaluations and forecasts were prepared and then were evaluated 24 hours later for accuracy. The method of compiling forecasts and the summary of their evaluations for the s e cond winter have been discussed briefly in the Second Interim Report (September, 1973), Chapter 4, PP• 32-35. The same me thod of compiling forecasts was continued the third winter. Results from the third winter will now be given and the significance analyzed in more detail.
Briefly recapitulating, the avalanche forecast each day for the coming 24 hours was assigned an index number from I to V according to the anticipated degree of snow instability. The degree of instability characterized by each index number is given in Table 10. At the end of each 24-hour period (nominally from 0900 to 0900 each day) the actual degree of instability which was observed during the period was described by the same index numbers. This constituted the evaluation. Because the forecasting duty was rotated each day among the Project staff (three forecasters the second winter, four the third), the evaluation of the previous day's forecast was done by a different person than the forecaster and a degree of objectivity was preserved. This indexing method described here is a simple formalization f or the r esults of conventional avalanche forecasting procedure s which combine empirical experience with an analysis of contributory snow and weather factors. Other observers in other areas might well choose a different scale of index numbers or define them differ ently, but the basic methodology would be essentially the same . To this extent, the San Juan Avalanche Pro ject has simply applied standard, deve loped practice in avalanche f orecasting to a specifi c mountain area, t hen sought to maximize its accuracy on the basis of informed experience.
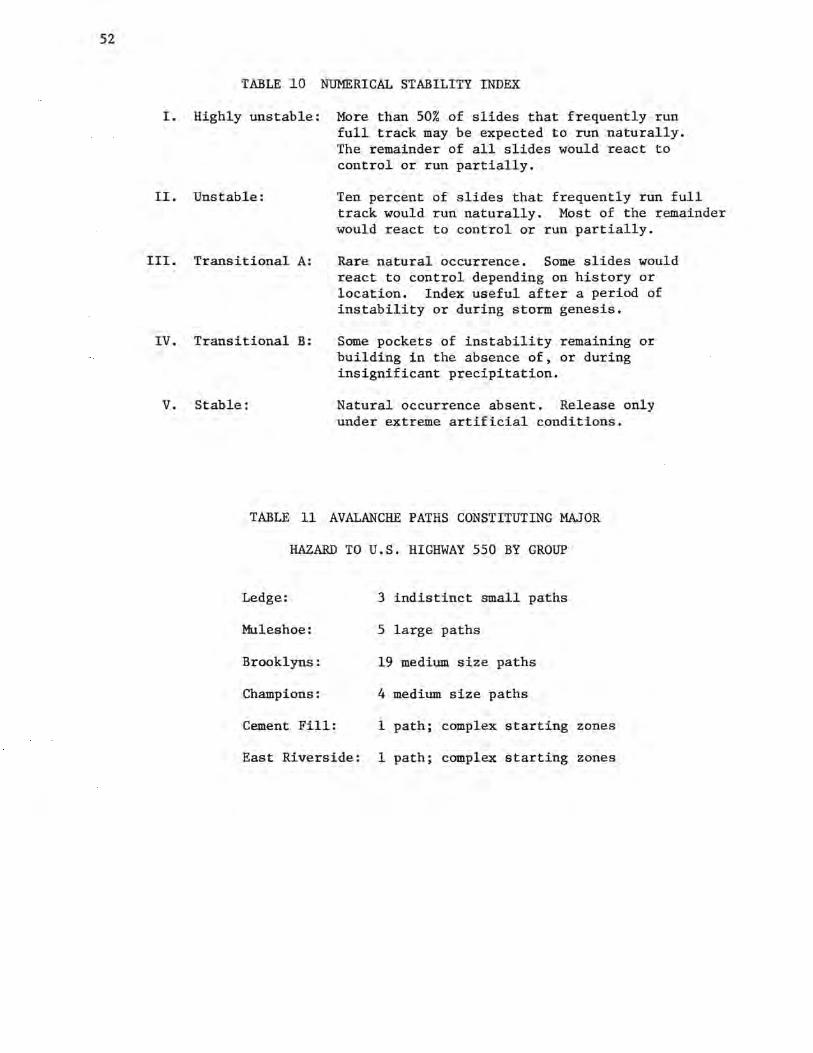
52
TABLE 10 NUMERICAL STABILITY INDEX
I. Highly unstable: More than 50% of slides .that frequently run full track may be expected to run naturally. The remainder of all slides would react to control or run partially.
II. Unstable: Ten percent of slides that frequently run full track would run naturally. Most of the remainder would react to control or run partially.
III. Transitional A: Rare natural occurrence. Some slides would react to control depending on history or location. Index useful after a period of instability or during storm genesis.
IV. Transitional B: Some pockets of instability remaining or building in the absence of, or during insignificant precipitation.
V. Stable: Natural occurrence absent. Release only under extreme artificial conditions.
TABLE 11 AVALANCHE PATHS CONSTITUTING MAJOR
HAZARD TO U.S. HIGHWAY 550 BY GROUP
Ledge: 3 indistinct small paths
Muleshoe: 5 large paths
Brooklyns: 19 medium size paths
Champions: 4 medium size paths
Cement Fill: 1 path; complex starting zones
East Riverside: 1 path; complex starting zones
53
Additionally, beginning in mid-winter of 1972/73 and for the full winter of 1973/74, an attempt has been made to prepare highly specific forecasts for certain groups of avalanche paths which constitute the major hazard to U.S. Highway 550 in the research area. Each of these groups is geographically limited in extent and consists of paths with similar characteristics and behavior. These paths are listed in Table 11. Each day a short-term (3-hour forecast--essentially a current evaluation) plus a 24-hour forecast was prepared for each of these groups. These forecasts specified whether a natural release was likely and whether release by artificial triggering was possible. Furthermore, probable avalanches, both natural and artificial, were specified according to whether they would run in the upper track, to mid-track or for full length of the path for each group.
This degree of specificity introduces a new advance in avalanche forecasting in the United States. To our knowledge, no such forecasting precision has heretofore been formally and systematically attempted for an entire winter on so many diverse avalanche paths. The results discussed below demonstrate that forecasting of this type is operationally feasible in the hands of trained and experienced observers. Following the format in the Second Interim Report (Table 4, P• 35), the sunnnary of forecast evaluations for the general forecasts (index numbers) is presented in Table 12. The final (end-of-season) evaluation is onnnited, for improved rigor of the 24-hour evaluation was obtained during the third winter. Days for which either a forecast or an evaluation are missing are omitted from this sunnnary.
Discussion and analysis are essential to understanding the bare information presented in Table 12. First, the index numbers form an ordinal scale divided on an arbitrary and not necessarily uniform basis. A substantial amount of subjective judgment is involved in assigning the index to any given forecast, no matter what degree of objectivity may have gone into the forecast itself. This is less true of the evaluation, which can be based in most cases on actual observation of avalanche occurrences, but even here the distinction between Index Conditions IV and Vis not easy to determine. Consequently, the evaluation of forecast accuracy in Table12 can be regarded only as a general indicator rather than a highly specific assessment. In the winter of 1973/74 there were 26 forecasting errors (evaluation index differed from forecast index) out of 128 days examined, giving an overall accuracy rating of 80%. Out of these 26 errors, 12 involved an error between Index IV and V, a distinction determined by subjective assessment of rather stable conditions largely irrelevant to serious avalanche hazards. Eleven more of the errors involved Index III, a transitional state predicting rare natural avalanche releases. Thus there remained only three errors for the entire winter involving Index II; the other two were overestimates of hazard. While the overall accuracy declined slightly from the second to the third winter (80% vs. 82%), this, in part, was a consequence of many more Index IV days occurring the third winter, a condition difficult to evaluate accurately. The maintenance of nearly the same accuracy in spite of this fact speaks for an increase in forecasting skill which is further born out by the success
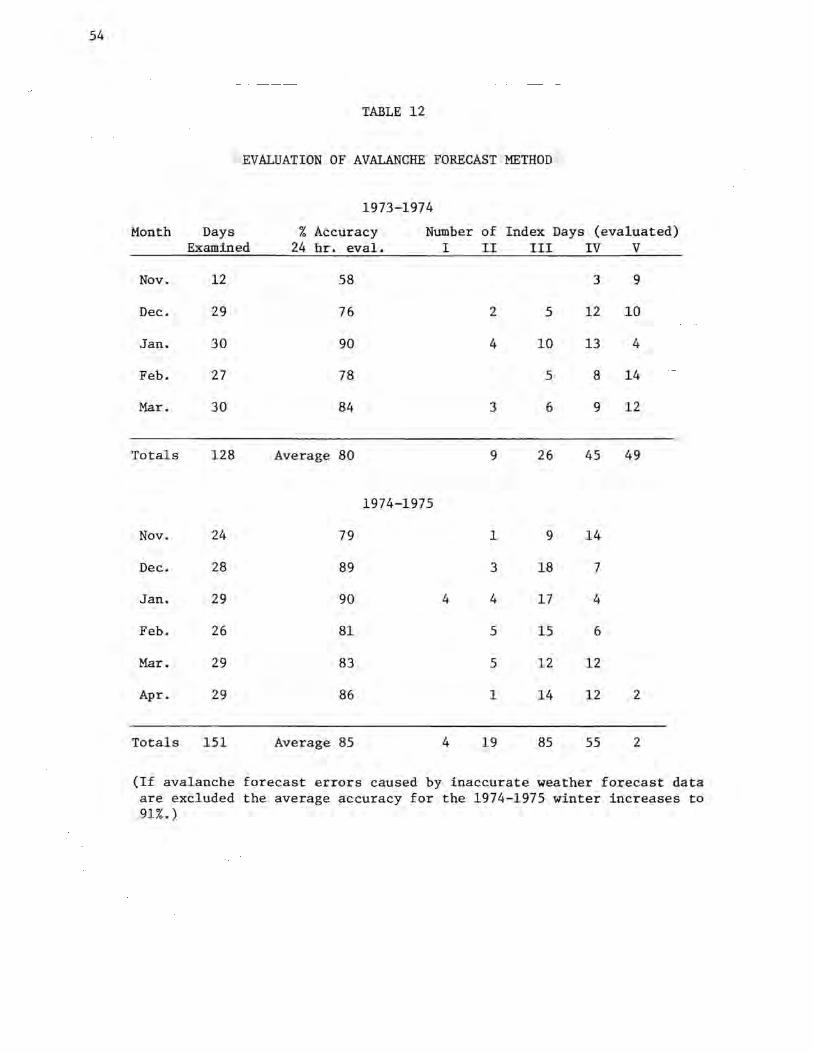
54
TABLE 12
EVALUATION OF AVALANCHE FORECAST METHOD
1973-1974
Month Days % Accuracy Number of Index Days (evaluated) Examined 24 hr. eval. I II III IV V
Nov. 12 58 3 9
Dec. 29 76 2 5 12 10
Jan. 30 90 4 10 13 4
Feb. 27 78 5 8 14
Mar. 30 84 3 6 9 12
Totals 128 Average 80 9 26 45 49
1974-1975
Nov. 24 79 1 9 14
Dec. 28 89 3 18 7
Jan. 29 90 4 4 17 4
Feb. 26 81 5 15 6
Mar. 29 83 5 12 12
Apr. 29 86 1 14 12 2
Totals 151 Average 85 4 19 85 55 2
(If avalanche forecast errors caused by inaccurate weather forecast data are excluded the average accuracy for the 1974-1975 winter increases to 91%.)
in forecasting for specific path groups (see below). With only one failure to foresee a serious instability (Index II) out of nine such days during the winter, the practically important forecasting accuracy is in fact 89%.
Of much greater importance to practical avalanche hazards in the San Juan Mountains is the specific and detailed forecasts for avalanche path groups which affect U.S. 550. In Tablel3 these forecasts for the winter of 1973/74 are compared with the record of actual avalanche occurrences which deposited snow on the highway. This, like the Index II situation above, is the only real test of forecasting accuracy: were the forecast procedures actually able to predict the avalanches which did occur? Including all the forecasts of stable conditions in
55
a forecasting accuracy assessment gives a distorted picture, for stable conditions prevail most of the time. (In fact, someone completely ignorant of avalanche forecasting and the target area could achieve a creditable paper score by simply forecasting no avalanches every day of the winter--but practically this would be useless.)
For the 26 days on which avalanches reached the highway, forecasting errors were made on 7 days, giving a formal accuracy rating of 73%. Of these 7 errors, 3 involved the failure to predict large natural avalanches and, hence, were the most serious failures. More significant than the errors , though, is the fact that avalanches, both natural and artificial, were predicted on numerous occasions with high precision. Considering the technical difficulties of making such specific forecasts and the fact that new ground was being broken in the application of conventional forecasting procedures, the overall accuracy depicted in Table 13 is remarkable. Trained and experienced observers, building on experience with a given area, can apply conventional avalanche forecasting techniques in a highly specific fashion with good success.
Closer examination of some of the errors in forecasting avalanches which reached the highway is instructive. One error, that of 2 March, occurred when high wind transport of snow, developing after the forecast had been prepared, led to natural releases. The area meteorological forecast failed to predict this high wind. Four of the 7 errors occurred during the first half of March, during a period of transition from winter cold snow to spring wet snow conditions. Two of the errors, 12 and 15 March, were made by an inexperienced observer who was not alert to the problems of this transition period, but this period may, in fact, be a difficult one to forecast even by an experienced hand.
The daily forecasts during 1973/74 were prepared on a rotating basis by four different observers except for November, when one man did most of both forecasting and evaluating. These four observers can be ranked in order of decreasing experience as follows:
Observer A - Many years of experience with avalanche forecasting and control at a major ski area. With San Juan Project all three years.
56
Observer B - Diverse but interrupted experience with avalanche forecasting and control in ski areas. With San Juan Project all three years.
Observer C - Experienced meteorological observer but no avalanche experience prior to San Juan Project. With Project all three years.
Observer D - Experienced meteorological observer but no ava-lanche experience prior to 1973/74.
Observer D was intentionally added to the staff the third winter in order to ascertain how much of the developed experience with forecasting in the San Juan Mountains could be conununicated to a newcomer. The individual forecasting scores (as determined from the Index analysis) for these four observers are listed in Table 14. Obviously, the forecasters were conservative: overestimates of hazard predominated over underestimates, 18 to 8. The newcomer accumulated a substantial error score, as might be expected, but even maximum experience does not guarantee success, for Observer A made the only underestimate of an Index II condition for the entire winter. Observer B's high error score is perhaps unfair, for 5 of the 12 errors were recorded in November when he was the only observer preparing his own evaluations, which he did all too conscienciously when dealing with the tricky problems of separating Index IV from Index v.
The record of operational avalanche forecasting by the San Juan Project has demonstrated to date that application of conventional methodology, informed by the accumulated data on conditions peculiar to the San Juan Mountains, can lead to a successful general forecasting scheme and can, furthermore, allow the state of the art to be carried to the point where highly specific and accurate forecasts can be generated for individual avalanche paths or path groups. Forecasting accuracy is by no means 100% overall, but critical errors involving the prediction of serious snow instability have been reduced to a remarkably low minimum. In spite of the complex character of the natural phenomena involved, plus the uncertainties of mountain weather forecasts, it can be safely stated that an operational avalanche forecasting scheme is possible for the San Juan Mountains based on conventional procedures alone. The remaining problem now is to place the developed methodology on a formal basis which can be communicated to subsequent users. As a first step to this end, the four forecasters working during winter of 1973/74 were asked to put down on paper their individual operating procedures, including a list of the contributory factors which they reviewed in preparing their daily forecasts. The results are illuminating, but difinitely leave some unsolved problems.
Table 15 sunnnarizes the factors of terrain, weather, snow and avalanche occurrence that each observer/forecaster deemed to be significant in his own forecasting. The outstanding feature of Table 15 is the lack of agreement on what was significant. Each forecaster obviously had his own ideas about how to forecast avalanches, or at least said he did.

The latter seems to be the actual case, as will be developed in this discussion. There is only one unanimous factor--wind speed and direction. Several other factors, such as snow stratigraphy, precipitation intensity, old snow stability, and new snow density and crystal type, are uniformly recognized as important by the experienced men. Obviously, the newcomer had developed a much shorter list of factors during the short history of his experience. This is only to be expected. But some of the anomalies among the experienced observers are less expected and deserve comment. Two observers, A and C, gave strong emphasis in their written reports to test-skiing on test slopes near the Red Mountain Pass station during storms. This is the classic and effective method of identifying soft slab, direct-action avalanche conditions. It is addressed to instabilities in 'new-fallen sriow but is notoriously unreliable for climax avalanche conditions. The threeyear record of fracture line profiles accumulated by this Project have demonstrated that no less than 89"fu of all avalanche releases examined are climax in nature. Does this reliance on test skiing come from habit? Does it represent self-deception on the part of the observers, or is there a real link between new snow instability and climax avalanche release in the San Juan Mountains whose physical nature has yet to be established? Further examination of Table 15 reveals other peculiarities. For instance, only two observers reported that they considered topographic features and current winter avalanche history of individual paths in preparing a forecast. Consideration of these factors is essential to the success in specific path forecasting described above. In fact, such forecasting is impossible without regard to these factors. It seems obvious that the other forecasters indeed did take them into account, but failed to so report.
The general conclusion here must be that the forecasters' written reports about what they did diverge widely from what they actually did. These men have definite skills in recognizing unstable snow, sharpened these skills for a particular area, and were able to communicate some of them to a newcomer on a daily tutelage basis. But the systematic codification of these skills and their written transmission is yet an unsolved problem. This problem is not peculiar to this Project, for it has been reported many times over by other workers in the field. In fact it is not peculiar to avalanche forecasting. A speed skater
57
can tell that one rink has a different "feel" from another but he cannot explain what the difference is. A master baker can judge unerringly the quality of bread dough, but he cannot explain in words how he does it. An Australian aborigine can predict the occurrence of rain many miles away while leaving a Western observer completely puzzled about how he does it. 'Such examples can be multiplied many times over whenever complex natural phenomena are involved in human perception. Solution to this problem of how to communicate ill-defined but real skills is a pressing goal in psychology which lies outside the scope of this present study. We must conclude that an accurate forecasting methodology for the San Juan Mountains can be developed and applied by using conventional forecasting methods, but that this in large measure must be done by on-the-job training and experience rather than by formal pedagogy.
58
Nevertheless, a reasonable synthesis can be made of the forecasters' experience in this research area by examining the composite forecasting methodology in the light of information developed by investigating the physical causes of avalanching in the San Juan Mountains (summarized in Chapter 3). The conclusions reached in this fashion constitute the essential finding of this Project for the application of conventional forecasting methodology to this area. The following specific factors will need to be considered by anyone producing operational avalanche forecasts for the San Juan Mountains:
1. Dry snow avalanches are very predominantly the climax soft slab ~- This information tells the experienced forecaster that he is dealing with an unstable snowcover of low structural strength and with frequent weak interface bonding between snow layers. Most, but not necessarily all, significant precipitation events will load at least some slopes to the point of failure.
2. Major avalanches generated by fair-weather transport of snow by the wind are rare. Only one path, Cement Fill, consistently produces a threat to the highway from this source.
3. Wet snow avalanches are confined to a clearly-defined spring cycle associated with initial thaw of the snow cover. Onset of wet avalanching appears to be closely related to rise of the mean daily air temperature above o0 c in the release zones.
4. There are large meso-scale variations in snowfall and avalanche activity within the study area. Snowfall distributi0n is strongly affected by meteorological character of individual storms and especially by prevailing direction of moisture-laden winds.
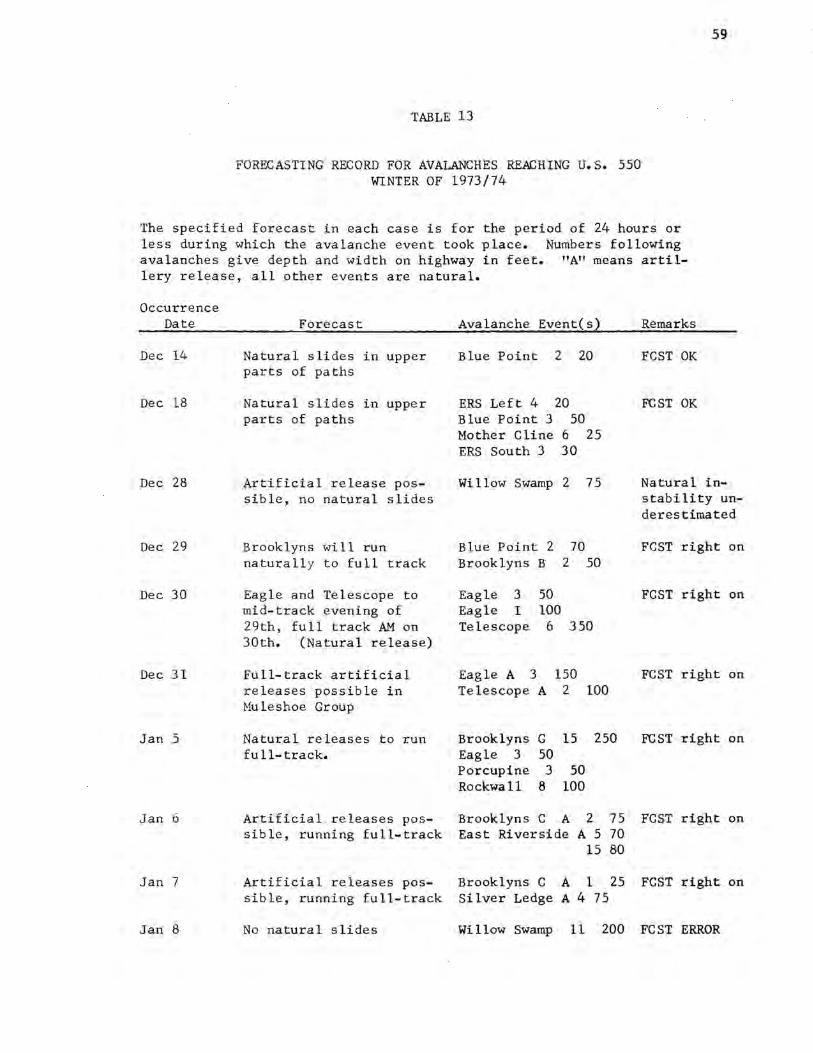
TABLE 13
FORECASTING RECORD FOR AVALANCHES REACHING U.S. 550 WINTER OF 1973/74
59
The specified forecast in each case is for the period of 24 hours or less during which the avalanche event took place. Numbers following avalanches give depth and width on highway in feet. "A" means artillery release, all other events are natural.
Occurrence Date
Dec 14
Dec 18
Dec 28
Dec 29
Dec 30
Dec 31
Jan 5
Jan 6
Jan 7
Jan 8
Forecast
Natural slides in upper parts of paths
Natural slides in upper parts of paths
Artificial release possible, no natural slides
Brooklyns will run naturally to full track
Eagle and Telescope to mid-track evening of 29th, full track AM on 30th. (Natural release)
Full-track artificial releases possible in Muleshoe Group
Natural releases to run fu 11- track.
Artificial releases pos-sible, running full-track
Artificial releases pos-sible, running full-track
No natural slides
Avalanche Event(s)
Blue Point 2 20
ERS Left 4 20 Blue Point 3 50 Mother Cline 6 25 ERS South 3 30
Willow Swamp 2 75
Blue Point 2 70 Brooklyns B 2 50
Eagle 3 50 Eagle I 100 Telescope 6 350
Eagle A 3 150 Telescope A 2 100
Brooklyns G 15 250 Eagle 3 50 Porcupine 3 50 Rockwall 8 100
Brooklyns C A 2 75 East Riverside A 5 70
15 80
Brooklyns C A 1 25 Silver Ledge A 4 75
Willow Swamp 11 200
Remarks
FCST OK
FCST OK
Natural instability underestimated
FCST right on
FCST right on
FCST right on
FCST right on
FCST right on
FCST right on
FCST ERROR
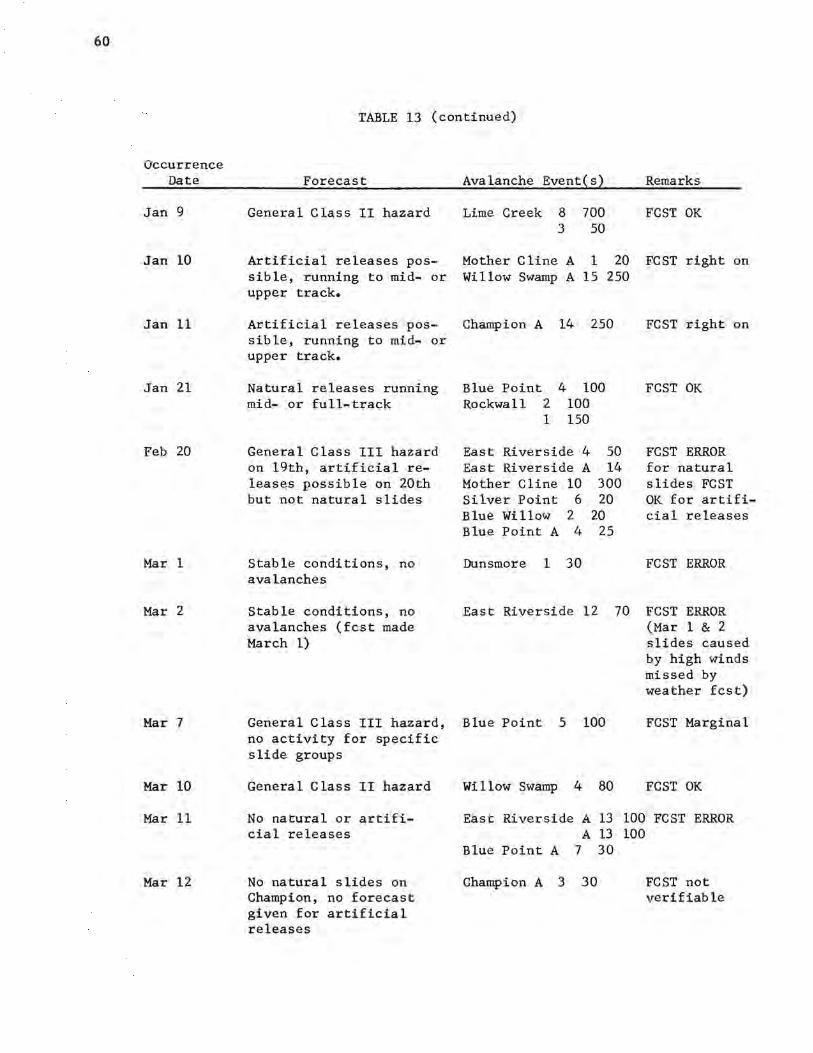
60
Occurrence Date
Jan 9
Jan 10
Jan 11
Jan 21
Feb 20
Mar 1
Mar 2
Mar 7
Mar 10
Mar 11
Mar 12
TABLE 13 (continued)
Forecast
General Class II hazard
Artificial releases possible, running to mid- or upper track.
Avalanche Event(s)
Lime Creek 8 700 3 50
Mother Cline A 1 20 Willow Swamp A 15 250
Remarks
FCST OK
FCST right on
Artificial releases pos- Champion A 14 250 sible, running to mid- or
FCST right on
upper track.
Natural releases running mid- or full-track
General Class III hazard on 19th, artificial releases possible on 20th but not natural slides
Stable conditions, no avalanches
Stable conditions, no avalanches (fest made March 1)
General Class III hazard, no activity for specific slide groups
General Class II hazard
No natural or artifi-cial releases
No natural slides on Champion, no forecast given for artificial releases
Blue Point Rockwall 2
1
4 100 100 150
East Riverside 4 50 East Riverside A 14 Mother Cline 10 300 Silver Point 6 20 Blue Willow 2 20 Blue Point A 4 25
Dunsmore 1 30
FCST OK
FCST ERROR for natural slides FCST OK for artifi-cial releases
FCST ERROR
East Riverside 12 70 FCST ERROR (Mar 1 & 2 slides caused by high winds missed by weather fest)
Blue Point 5 100 FCST Marginal
Willow Swamp 4 80 FCST OK
East Riverside A 13 100 FCST ERROR A 13 100
Blue Point A 7 30
Champion A 3 30 FCST not verifiable
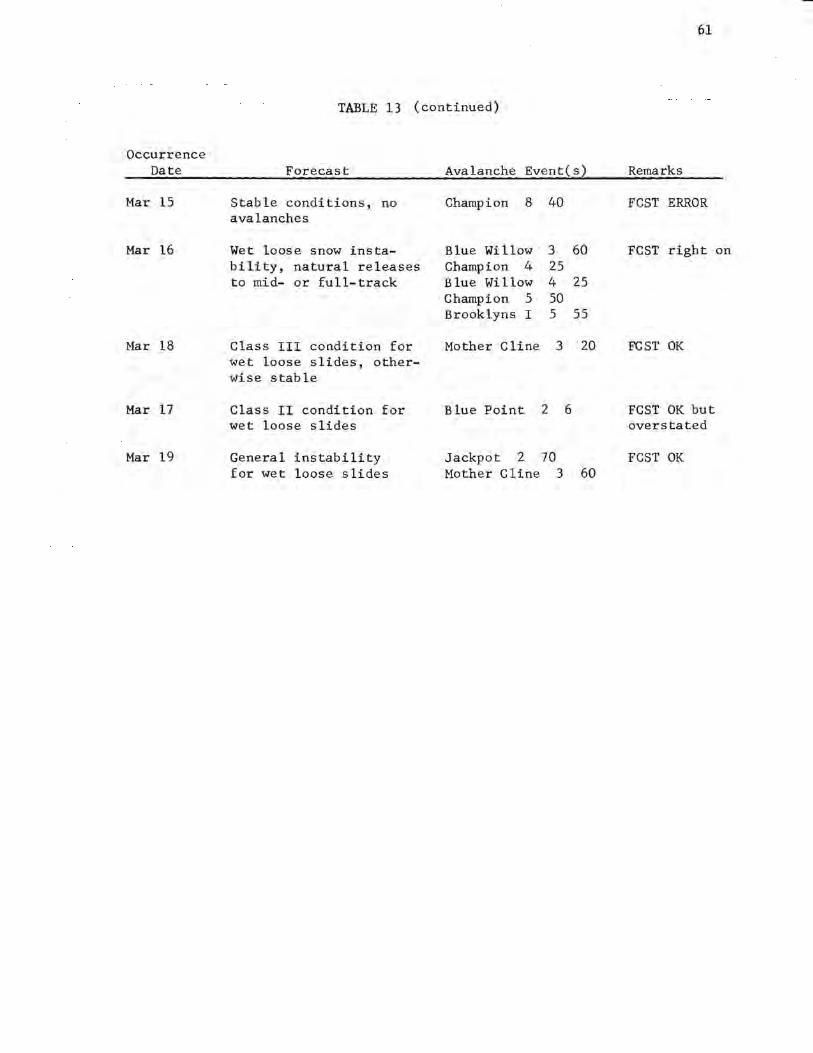
Occurrence Date
Mar 15
Mar 16
Mar 18
Mar 17
Mar 19
TABLE 13 (continued)
Forecast
Stable conditions, no avalanches
Wet loos·e snow instability, natural releases to mid- or full-track
Class III condition for wet loose slides, otherwise stable
Class II condition for wet loose slides
General instability for wet loose slides
Avalanche Event(s)
Champion 8 40
Blue Willow · 3 60 Champion 4 25 Blue Willow 4 25 Champion 5 50 Brooklyns I 5 55
Mother Cline 3 20
Blue Point 2 6
Jackpot 2 70 Mother Cline 3 60
61
Remarks
FCST ERROR
FCST right on
FCST OK
FCST OK but overstated
FCST OK
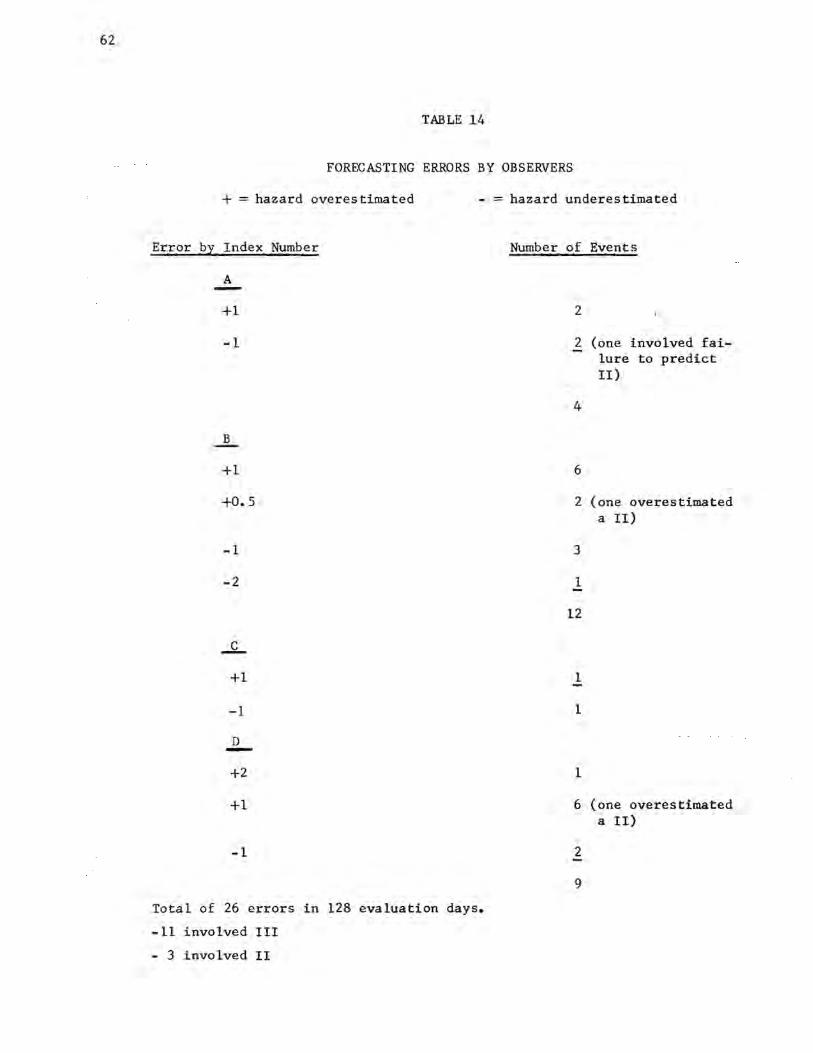
62
TABLE 14
FORECASTING ERRORS BY OBSERVERS
+=hazard overestimated - = hazard underestimated
Er.ror by Index Number
A
+l
-1
B
+l
+0.5
-1
-2
+l
-1
D -+2
+l
-1
Total of 26 errors in 128 evaluation days.
-11 involved III
- 3 involved II
Number of Events
2
2 (one involved failure to predict II)
4
6
2
3
1
12
1
1
1
(one overestimated a II)
6 (one overestimated a II)
2
9
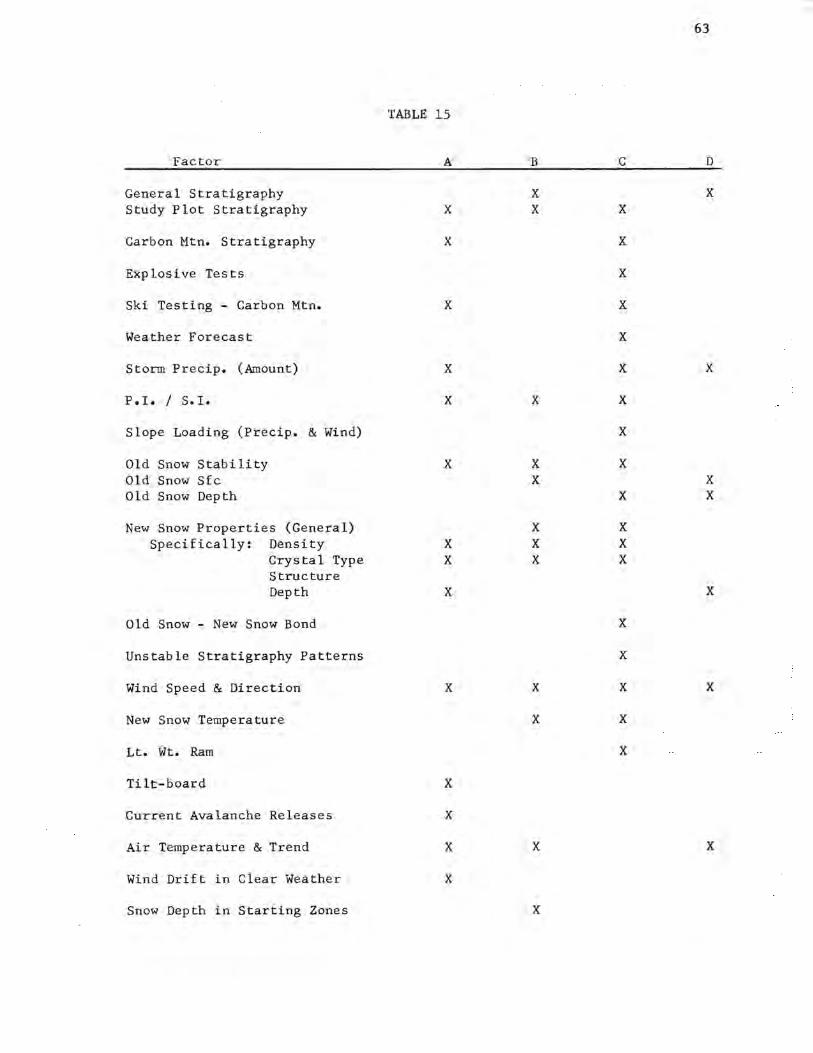
63
TABLE 15
Factor A B C D
General Stratigraphy X X Study Plot Stratigraphy X X X
Carbon Mtn. Stratigraphy X X
Explosive Tests X
Ski Testing - Carbon Mtn. X X
Weather Forecast X
Storm Precip. (Amount) X X X
P.I. I S. I. X X X
Slope Loading (Precip. & Wind) X
Old Snow Stability X X X Old Snow Sfc X X Old Snow Depth X X
New Snow Properties (General) X X Specifically: Density X X X
Crystal Type X X X Structure Depth X X
Old Snow - New Snow Bond X
Unstable Stratigraphy Patterns X
Wind Speed & Direction X X X X
New Snow Temperature X X
Lt. Wt. Ram X
Tilt-board X
Current Avalanche Releases X
Air Temperature & Trend X X X
Wind Drift in Clear Weather X
Snow Depth in Starting Zones X
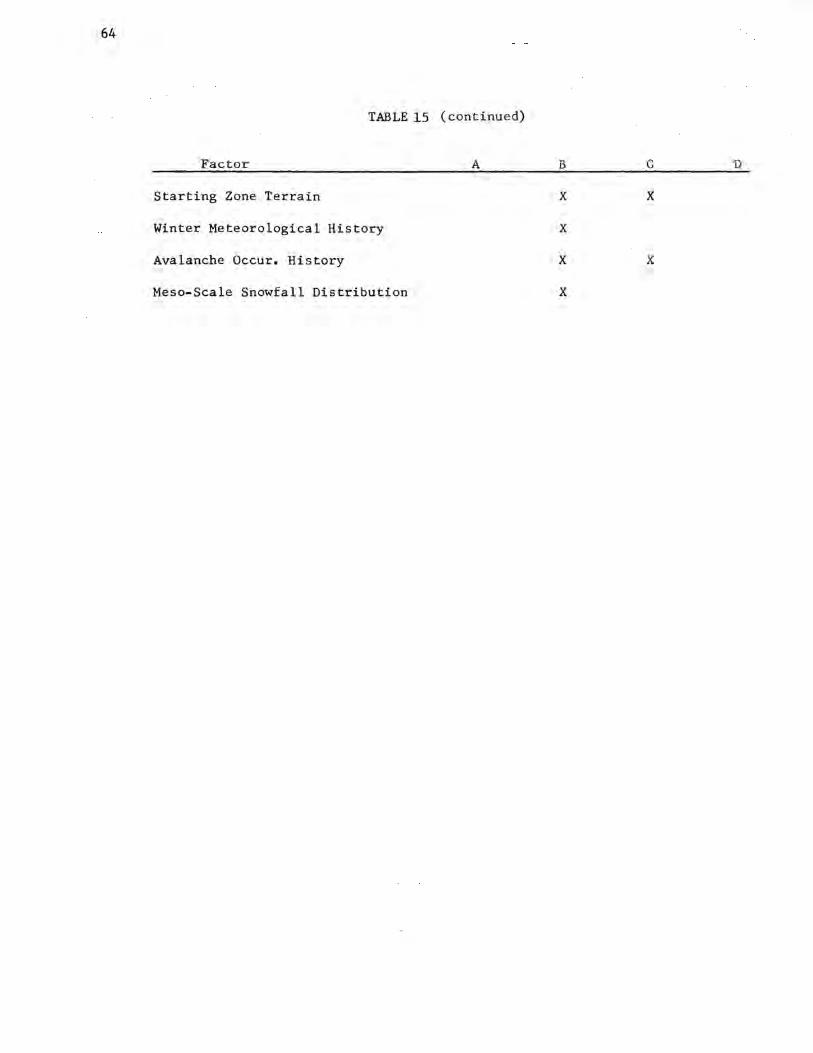
64
TABLE 15 ( continued)
Factor
Starting Zone Terrain
Winter Meteorological History
Avalanche Occur. History
Meso-Scale Snowfall Distribution
A B
X
X
X
X
C D
X
X
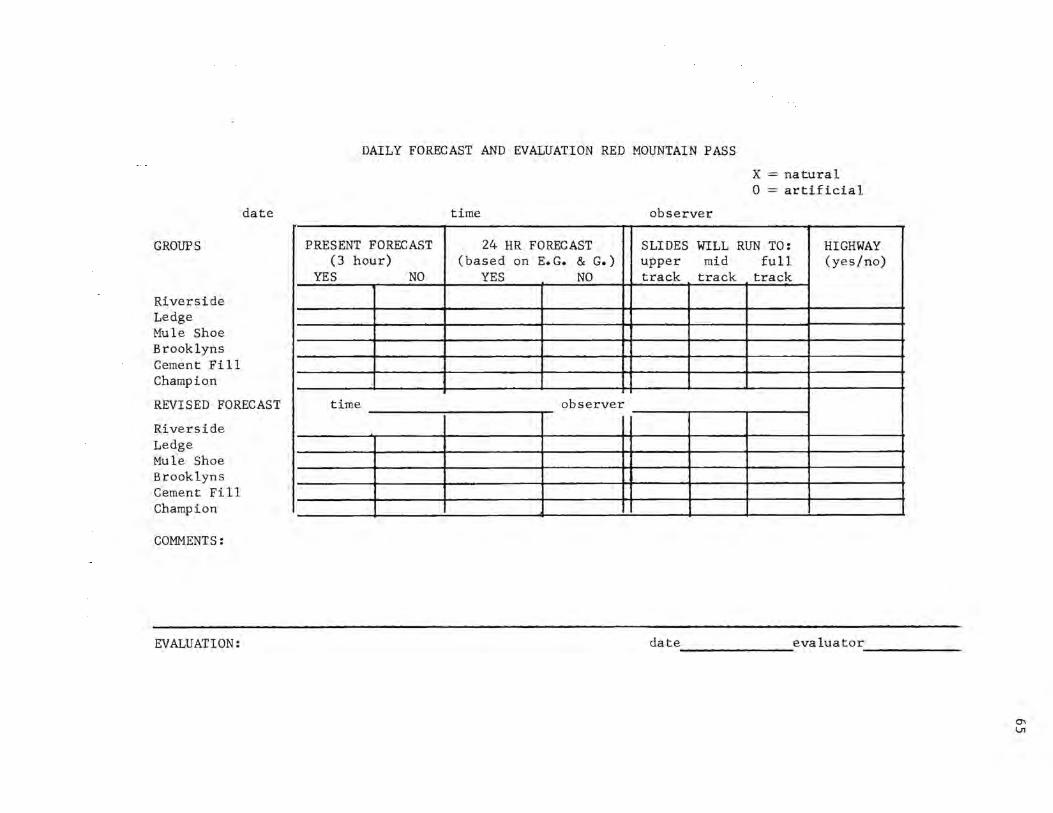
GROUPS
Riverside Ledge Mule Shoe Brooklyns Cement Fi 11 Champion
date
REVISED FORECAST
Riverside Ledge Mule Shoe Brooklyns Cement Fill Champion
COMMENTS:
EVALUATION:
DAILY FORECAST AND EVALUATION RED MOUNTAIN PASS
X = natural 0 = artificial
time observer
PRESENT FORECAST 24 HR FORECAST SLIDES WILL RUN TO: HIGHWAY (3 hour) (based on E.G. & G.) upper mid full (yes/no)
YES NO YES NO track track track
time observer
date evaluator -------
°' iJ1

CHAPTER 4: WET SNOW AVALANCHES
Richard L. Armstrong
By definition, the potential for wet avalanches is absent as long as the entire snowcover is below 0.0°c. Water in the liquid phase and thus a snow temperature equal to o.o 0 c is the required ingredient for the formation of wet avalanches. Because of this rather simple relationship, it is sometimes felt that the time and location of wet avalanche releases can be predicted with greater precision than dry snow avalanches. Whether or not this is true, the need to accurat"ely forecast wet snow avalanche occurrence is acute. This is because unlike dry snow, a wet snowcover does not respond in the desired manner to control by explosives. The physical properties of the wet snow suppress the propagation of the shock wave essential to the release of a snow slab. This condition may be due to an accelerated rate of stress relaxation through creep, preventing the existence of a mechanical condition comparable to the unstable dry slab. Therefore, while an efficient mid-winter avalanche control program may be capable of eliminating major portions of a given hazard, a comparable opportunity is not available in the case of wet snow avalanches. Wet avalanches must be forecast as natural occurrences and appropriate precautions taken at the predicted time and location of the event.
The need to acquire specific information regarding wet snow avalanches in the Red Mountain Pass area is emphasized by the fact that more than 30% of the avalanches recorded during the 1972/73 and 1973/74 winters were within this category. Of the avalanches reaching the highway, again more than 30% were of the wet snow type. Perhaps the most readily available data which can be used in the forecasting of wet snow avalanches is air temperature. Figures 20 and 21 show the relationship between mean daily air temperature as measured in a standard weather shelter at the snow study site at Red Mountain Pass and the occurrence of wet snow avalanches for the two periods, April 25-29 and May 7-12, 1973. Figure 22 shows this same relationship for March 15-19, 1974. The fact that temperature values exceed the freezing point at the time when the avalanching begins is simply a coincidental index value. Air temperatures within the areas of some starting zones may well be lower than those recorded at the Red Mountain Pass study site and snow temperatures of certain south-facing release zones could be expected to be higher than snow temperatures within the study site. However, these index values, as observed for two spring avalanche cycles do provide substantial information regarding event forecasting.
The following is a discussion of some of the meteorological and snowcover data which influence the formation of wet snow avalanches. The value of each parameter is analyzed in terms of wet snow avalanche forecasting in the Red Mountain Pass area of the San Juan Mountains. While the San Juan Avalanche Project has been in operation for three winters, data regarding wet snow avalanches is available for only two of these. This is because the 1971/72 winter experienced a low total snowfall, 60% of the fifteen-year average according to the Soil Conservation Service. In addition, several storms during the late winter produced sustained periods of high winds resulting in the catchment
67
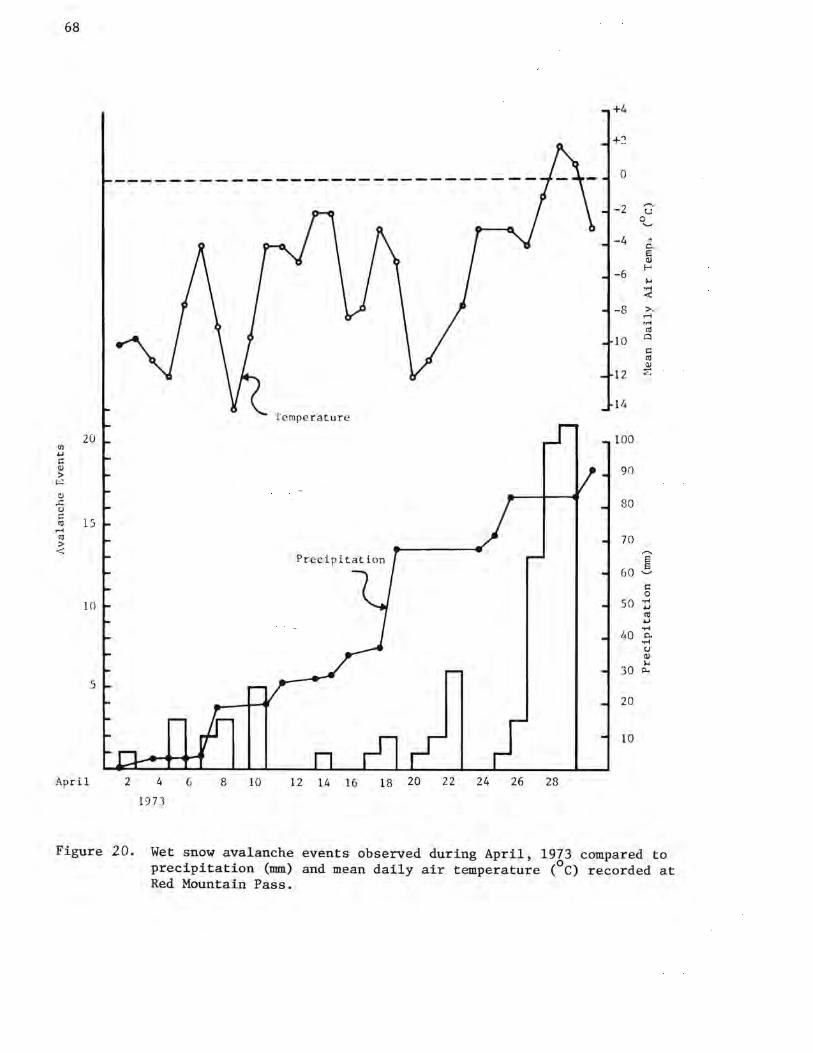
68
+4
+2
----------------------------- 0
CJl +J C (l)
> "-' CJ .c u
20
~ 15 ..... ctl
~
10
s
April 2
Figure 20.
4
1973
6 8 10
Temperature
12 14 16 18 20 22 24
-2
-4
-6
-8
10
12
14
100
90
80
70
60
so
40
30
20
10
26 28
,--.. u
0 ._.,
c.. s (l)
E---<
I,< ..... < >, ..... ..... ctl
0
C ctl (l)
;:;::
,--.. s e ._.,
C 0
•.-4 +J ctl +J ..... 0. ..... u (l) I,<
p..
Wet snow avalanche events observed during April, 1973 compared to precipitation (mm) and mean daily air temperature (0 c) recorded at Red Mountain Pass.
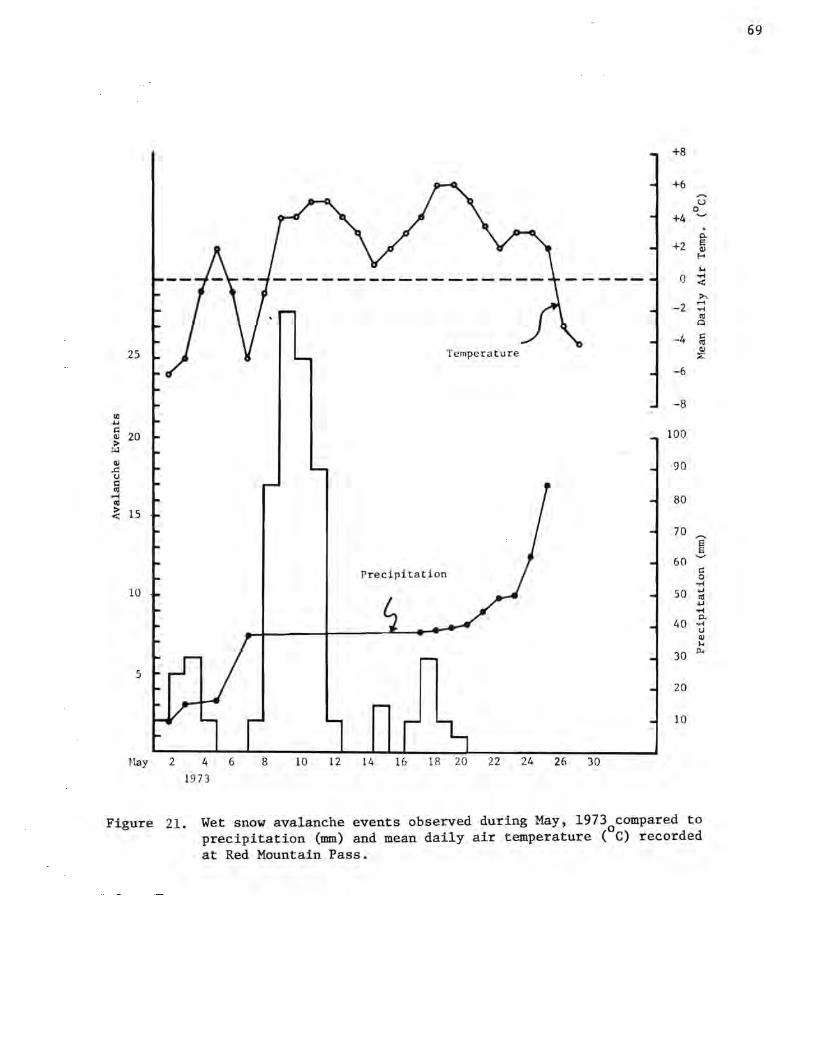
25
tll ... I:: Qi 20 > ::-l
Qi .c:: u I:: 11'
.-t lO > < 15
10
5
Hay 2 4 6
19 73
8 10 12
Precipitation
14 16 18 20 22 24 26
+8
+6 ....... u
0
+4 '-'
. p.
+2 s Qi
E-<
i...
0 ..-t < >,
-2 .-t
'" 11' Cl
-4 I:: 11'
~ - 6
-8
100
90
80
70 ....... §
60 '-'
I:: 0
..-t
50 ... 11' ... ..-t
40 p.
..-t u Qi I-<
30 P<
20
10
30
Figure 21. Wet snow avalanche events observed during May, 1973 compared to precipitation (mm) and mean daily air temperature (°C) recorded at Red Mountain Pass.
69
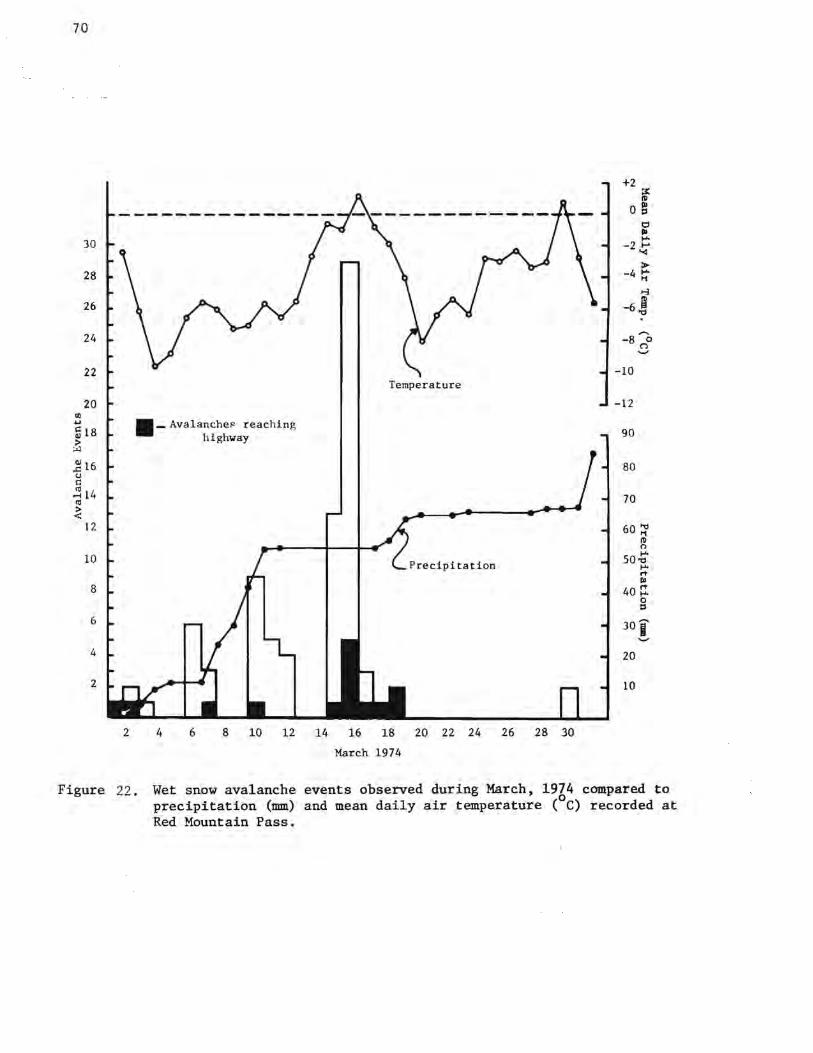
70
tO ...
30
28
26
24
22
20
~ 18 > ;il
] 16 u i::
~ 14 ctl
~ 12
10
8
6
4
2
2
•- Avalanche!" reaching highway
Temperature
Precipitation
4 6 8 10 12 14 16 18 20 22 24 26 28 30
March 1974
+2 f
0 t C, c» """ -2~
> -4 ~
.., -6!
-10
-12
90
80
70
60 ~ !ti ()
50~ """ r, c»
40 ::r,
20
10
0 ::I
Figure 22. Wet snow avalanche events observed during March, 1974 compared to precipitation (mm) and mean daily air temperature (0 c) recorded at Red Mountain Pass.
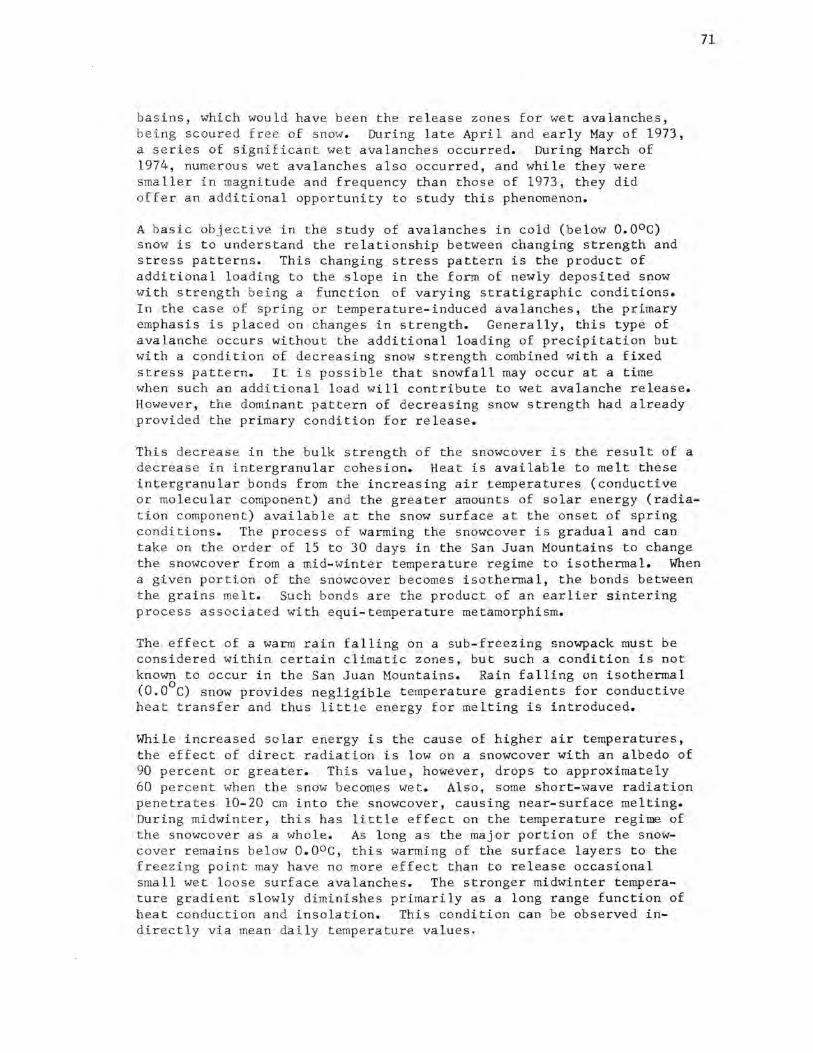
basins, which would have been the release zones for wet avalanches, being scoured fr ee of snow. During late April and early May of 1973, a s e ries of significant wet avalanches occurred. During March of 1974, numerous wet avalanches also occurred, and while they were smaller in magnitude and frequency than those of 1973, they did offer an additional opportunity to study this phenomenon.
A basic objective in the study of avalanches in cold (below 0.0°C) snow is to understand the relationship between changing strength and stress patterns. This changing stress pattern is the product of additional loading to the slope in the form of newly deposited snow with strength being a function of varying stratigraphic conditions. In the case of spring or temperature-induced avalanches, the primary emphasis is placed on changes in strength. Generally, this type of avalanche occurs without the additional loading of precipitation but with a condition of decreasing snow strength combined with a fixed stress pattern. It is possible that snowfall may occur at a time when such an additional load will contribute to wet avalanche release. However, the dominant pattern of decreasing snow strength had already provided the primary condition for release.
This decrease in the bulk strength of the snowcover is the result of a decrease in intergranular cohesion. Heat is available to melt these intergranular bonds from the increasing air temperatures (conductive or molecular component) and the greater amounts of solar energy (radiation component) available at the snow surface at the onset of spring conditions. The process of warming the snowcover is gradual and can take on the order of 15 to 30 days in the San Juan Mountains to change the snowcover from a mid-winter temperature regime to isothermal. When a given portion of the snowcover becomes isothermal, the bonds between the grains melt. Such bonds are the product of an earlier sintering process ass ociated with equi-temperature metamorphism.
The effect of a warm rain falling on a sub-freezing snowpack must be considered within certain climatic zones, but such a condition is not known to occur in the San Juan Mountains. Rain falling on isothermal (0.0°c) snow provides negligible temperature gradients for conductive heat transfer and thus little energy for melting is introduced.
While increased solar energy is the cause of higher air temperatures, the effect of direct radiation is low on a snowcover with an albedo of 90 percent or greater. This value, however, drops to approximately 60 percent when the snow becomes wet. Also, some short-wave radiation penetrate s 10-20 cm into the snowcover, causing near-surface melting. During midwinter, this has little effect on the temperature regime of the snowcover as a whole. As long as the major portion of the snowcover remains below O.ooc, this warming of the surface layers to the freezing point may have no more effect than to release occasional small wet loose surface avalanches. The stronger midwinter temperature gradient slowly diminishes primarily as a long range function of heat conduction and insolation. This condition can be observed indirectly via mean daily temperature values.
71
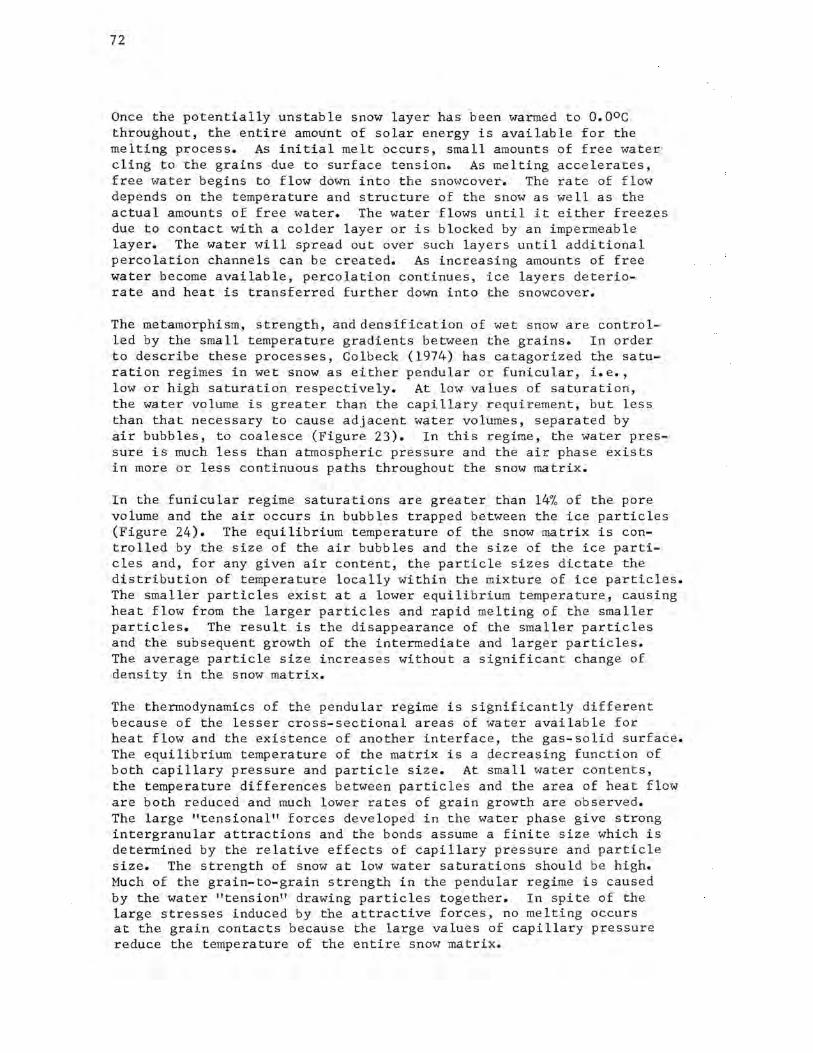
72
Once the potentially unstable snow layer has been warmed to o.ooc throughout, the entire amount of solar energy is available for the melting process. As initial melt occurs, small amounts of free water cling to the grains due to surface tension. As melting accelerates, free water begins to flow down into the snowcover. The rate of flow depends on the temperature and structure of the snow as well as the actual amounts of free water. The water flows until it either freezes due to contact with a colder layer or is blocked by an impermeable layer. The water will spread out over such layers until additional percolation channels can be created. As increasing amounts of free water become available, percolation continues, ice layers deteriorate and heat is transferred further down into the snowcover.
The metamorphism, strength, anddensification of wet snow are controlled by the small temperature gradients between the grains. In order to describe these processes, Colbeck (1974) has catagorized the saturation regimes in wet snow as either pendular or funicular, i.e., low or high saturation respectively. At low values of saturation, the water volume is greater than the capillary requirement, but less than that necessary to cause adjacent water volumes, separated by air bubbles, to coalesce (Figure 23). In this regime, the water pressure is much less than atmospheric pressure and the air phase exists in more or less continuous paths throughout the snow matrix.
In the funicular regime saturations are greater than 14% of the pore volume and the air occurs in bubbles trapped between the ice particles (Figure 24). The equilibrium temperature of the snow matrix is controlled by the size of the air bubbles and the size of the ice particles and, for any given air content, the particle sizes dictate the distribution of temperature locally within the mixture of ice particles. The smaller particles exist at a lower equilibrium temperature, causing heat flow from the larger particles and rapid melting of the smaller particles. The result is the disappearance of the smaller particles and the subsequent growth of the intermediate and larger particles. The average particle size increases without a significant change of density in the snow matrix.
The thermodynamics of the pendular regime is significantly different because of the lesser cross-sectional areas of water available for heat flow and the existence of another interface, the gas-solid surface. The equilibrium temperature of the matrix is a decreasing function of both capillary pressure and particle size. At small water contents, the temperature differences between particles and the area of heat flow are both reduced and much lower rates of grain growth are observed. The large "tensional" forces developed in the water phase give strong intergranular attractions and the bonds assume a finite size which is determined by the relative effects of capillary pressure and particle size. The strength of snow at low water saturations should be high. Much of the grain-to-grain strength in the pendular regime is caused by the water "tension" drawing particles together. In spite of the large stresses induced by the attractive forces, no melting occurs at the grain contacts because the large values of capillary pressure reduce the temperature of the entire snow matrix.
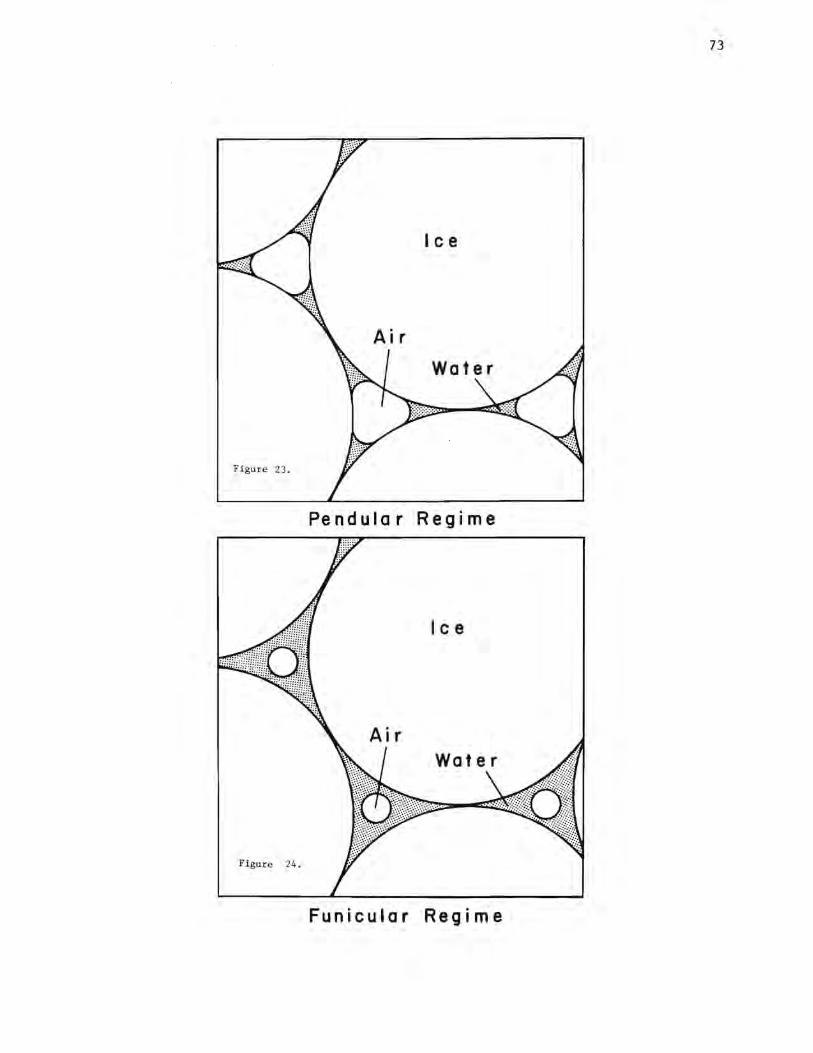
73
Ice
Figure 23 .
Pendula r Regime
Ice
Figure 24 .
Funicular Regime
74
In the funicular regime rings of water coalesce forming isolated bubbles of air trapped between the ice grains and the water phase exists in con-. tinuous paths completely surrounding the snow grains. The permeability to liquid water is greatly increased at larger saturations and the capillary pressure, or 11 tension", of the liquid water is reduced. In the funicular regime, the equilibrium temperature at a contact between grains is d~creased by the compressive stress between the grains. The temperature depression is further increased by overburden pressure causing melting of the intergrain contacts and removing bond-to-bond strength.
Optimum conditions for the existence of the funicular regime would occur over impermeable boundaries, at stratigraphic interfaces, and within highly permeable zones capable of large flow rates. The type of snow structure common to the Red Mountain Pass area, consisting of alternating layers of coarse-grained, cohesionless temperature-gradient snow and stronger freeze-thaw crusts and wind slabs, would be highly conducive to the funicular regime. Melt associated with the equilibrium temperature depression occurring in the funicular regime would create extensive zones of minimal shear strength and provide those conditions contributing to the release of wet-slab avalanches.
Once the bulk of the snowcover has become isothermal, the immediate potential for wet avalanche release is greatly increased. The next period providing significantly warm air temperatures will be of much greater importance than an earlier period with comparable air temperatures but subfreezing snow temperatures. As noted above, wet snow has a lower albedo than dry snow. Therefore, as the surface layers begin to melt, the wet snow is capable of absorbing more solar radiation, which in turn causes more melt to occur. Once the deteriorating strength of the snowcover reaches the point where it can no longer resist gravitational stresses, it will release as either a loose or wet slab avalanche, depending on shear boundary conditions. These boundaries may be caused by stratigraphic irregularities within the snowcover or the snow-ground interface itself. While the slab type is often of greater magnitude, due to its release over a broader area, wet loose avalanches can also incorporate large amount of snow depending on how deep into the snowcover the percolation of meltwater has advanced prior to release, and how much additional snow may be released by the moving avalanche.
As mentioned above, the effect of rising air temperatures on avalanche occurrence is not independent of snow temperature. One would not expect significant wet snow avalanching if above freezing air temperatures occurred when the snowcover existed within a midwinter temperature regime. The first indicator of significant snow temperature increases occurs when the snowcover of the south-facing study area on Carbon Mountain becomes isothermal throughout. This has occurred approximately 10-15 days prior to signif'icant spring avalanche cycles. In using the level study site as an index, the following observations were made. When the entire thickness of the snowcover has warmed to within 2.0°c or less of freezing, the possibility of thaw-induced
avalanche events greatly increases. Once this criteria is met, the next requirement is for the mean daily air temperature to exceed the freezing level and at that point avalanches occur.
75
During both the late winter and early spring of 1973 and 1974, measurements of net all-wave radiation were made at the Red Mountain Pass study site. Daily net positive values did occur during these periods, but as with air temperature, such values were associated with significant wet snow avalanches only after the snowcover had warmed to the appropriate extent. Once this had been accomplished, daily net radiation values approaching zero (-5.0 to -15.0 cal/cm2) occurred on those days just prior to the wet avalanche cycles. Because air temperature is partially a function of this radiation regime and since temperature data are both easier to record and reduce, greater emphasis is placed on the temperature parameter in the effort to forecast wet avalanche release.
As meteorological conditions begin to reflect a springtime regime, the responses within the snowcover are apparent at the study site. With the initial melting of intergranular bonds, rartnnsonde strength decreases. During both years when wet avalanches have been observed, this trend has been apparent prior to the beginning of the cycles. Snow settlement also appears to respond to the presence of free water within the snowcover. Accelerated settlement rates appear in late spring (see Figure 14, Chapter 2) but apparently occur only at that point when the snowcover is totally saturated with percolating free water, a condition which has occurred in the study site from two to six weeks following the wet avalanche cycle. Snow temperature is the critical parameter within the snowcover as values progress towards the freezing point. If the study site is to be used as an index, it would appear that when the entire snowcover has been warmed to a temperature between -2.0 and o.o0 c, conditions are adequate for wet snow avalanches given appropriate daytime air temperatures. These three parameters, air temperature, rammsonde resistance, and snow temperature, which do act as indicators before the fact, are shown for 1973 and 1974 in Figures 25 and 26 together with the avalanche event record. During both periods, snow temperature and rammsonde data have indicated that the stage was set, but in each case the avalanche cycle began only after the mean daily air temperature exceeded 0.0°c.
During both 1973 and 1974, an additional predictor has appeared in the form of wet snow avalanche events occurring on south and east facing slopes at elevations considerably lower than those of the release zones of the Red Mountain Pass area. On April 22, 1973, wet loose avalanches occurred on Engineer Mountain A (159); B (160); and C (161), five days prior to the major spring wet avalanche cycle. On April 25, 1973, a wet slab size three avalanche released to the ground on Engineer C, indicating the extent to which free water had penetrated the snowcover at that location. Again in 1974, a WS-N-3-G was recorded at Engineer Bon March 12, three days prior to the major spring wet avalanche cycle. The elevation of the release area of the Engineer group is approximately 500 m lower than those with similar slope aspect in the Red Mountain Pass area. The value of wet snow

76
.., ~ IC .. 7 ... ~- 6
5
f 4
., ~ 100 ., u ""'b ~ o 80 g ~] 60 0 r:l O "' .
---·---•---•---•---·---• ---· /. N~ 40 .-· ~
u ~
.;. m H
k .... <
.. .. r:l ., > "' ., .c u ; ... • ~ ... • k ::I .. .. z
Figure 25 .
+2 0
-2
-4 -6 -8
- 10 -1 2
20
15
10
5
~~, 0 ----------------------------------'-----o.o c
11 12 13 i4 15 16 17 18 19 20 21 22 23 24 25 26 27 28 29 30
April 1973
A comparison of integrated ram resis t ance, percent of snowcover bet ween - 2.0 and 0.0°c, and mean daily air t emperature (0 c) at Red Mountain Pas s and observed natural wet snow avalanche events during Apri l, 1973. (D = dry snow event)
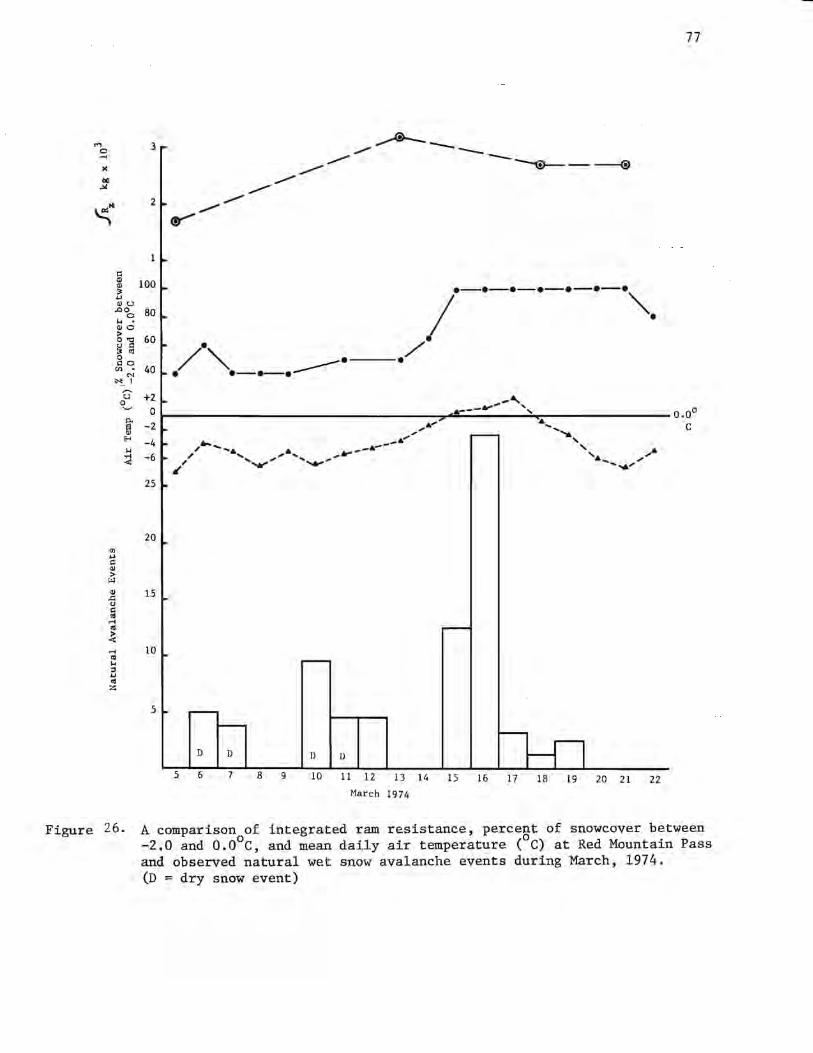
,., 0
ij ~ ~ (1) u
3
2
100
..c°o 80 I-< • <1)0
g"" 60 ~ § 0 i:; 0
"'~ 40 ~I
,....
77
/."-... •-•/ . ·-·-·----
;-·-·-·-·-·-·""-. •
u +2 __ ...
~ 0 t---------------------,,..:•:.----------'~,....,..-________ 0 .oo ~<1) -2 •" •, C ,, .......... ~ -4 ~ ' / ............ _ --~ / •, .,,.•, , .... --·- ' .,,• :;;j -6 , ... ., ............. '•... .,,
~ ~ -~ 25
20
5
D D
5 6 7 8 9
D !)
10 11 12 13 14 15 16 17 18 19 20 21 22
March 1974
Figure 26. A comparison of integrated ram resistance, percent of snowcover between -2.0 and o.o0 c, and mean daily air temperature (0 c) at Red Mountain Pass and observed natural wet snow avalanche events during March, 1974. (D = dry snow event)
78
avalanche activity on Engineer Mountain as a precurser to a major cycle in the Red Mountain Pass area is enhanced by the fact that these paths present little or no hazard to the highway.
During those days when wet avalanches occur, the time of an event is, to a considerable extent, a function of slope aspect. The possibility of a consistent relationship is complicated by several factors. If a release area is adjacent to exposed soil or rock surfaces, the snowcover will be receiving increased amounts of heat due to long-wave radiation from the bare ground. Consequently, the snow may be warmed at a rate greater than another area with more favorable slope angle and aspect regarding direct solar radiation. If the release zone possesses the topography of a steep-sided gully, the sides of the gully may be receiving maximum solar radiation at some time prior to that which would be expected when considering the aspect of the overall release zone. An avalanche releasing on such a sidewall could set the main track in motion. As described earlier, optimum conditions for release exist not necessarily at the time of maximum air temperature or solar radiation but somewhat later in the day when the wet snow surface is capable of absorbing increased amounts of solar radiation. Therefore, even though optimum sun angle for a south-facing slope might occur at noon, avalanching may not begin to occur until sometime later, perhaps coincidental with slopes possessing a more westerly orientation.
Figure 27 shows the extent to which the time of release is a function of the slope orientation within selected groups of avalanche tracks which frequently affect the highway during spring cycle conditions. A relationship between time of day and slope aspect is apparent, but an even more striking pattern appears within the clusters representing individual avalanche path groups. The large crosses indicate the time at which the appropriate slope angle and aspect of the given release zone would theoretically receive maximum direct, clear-sky solar radiation. The slope with the more easterly aspect shows a definite time lag between maximum energy received and the beginning of avalanche activity. This condition agrees with the concept of increased productivity of free water, and subsequent avalanche release at some point following that time when the surface snow first becomes wet. As the day progresses the lag diminishes because as time elapses, the snowcover is being gradually warmed by the increasing air temperatures so that when optimum solar angle occurs, a significant amount of melt has already taken place at the surface.
All of the preceeding information has related to the determination of the onset of the wet avalanche cycle. Once initiated, high hazard will continue until certain criteria are met. Avalanches will continue to release over a period of time depending upon slope angle, aspect and elevation of starting zones. Once north-facing slopes with relatively high elevations have released, such as East Riverside (064) and the Mill Creek Cirque Group (108-114) in the Red Mountain Pass area, general hazard could be considered diminished.
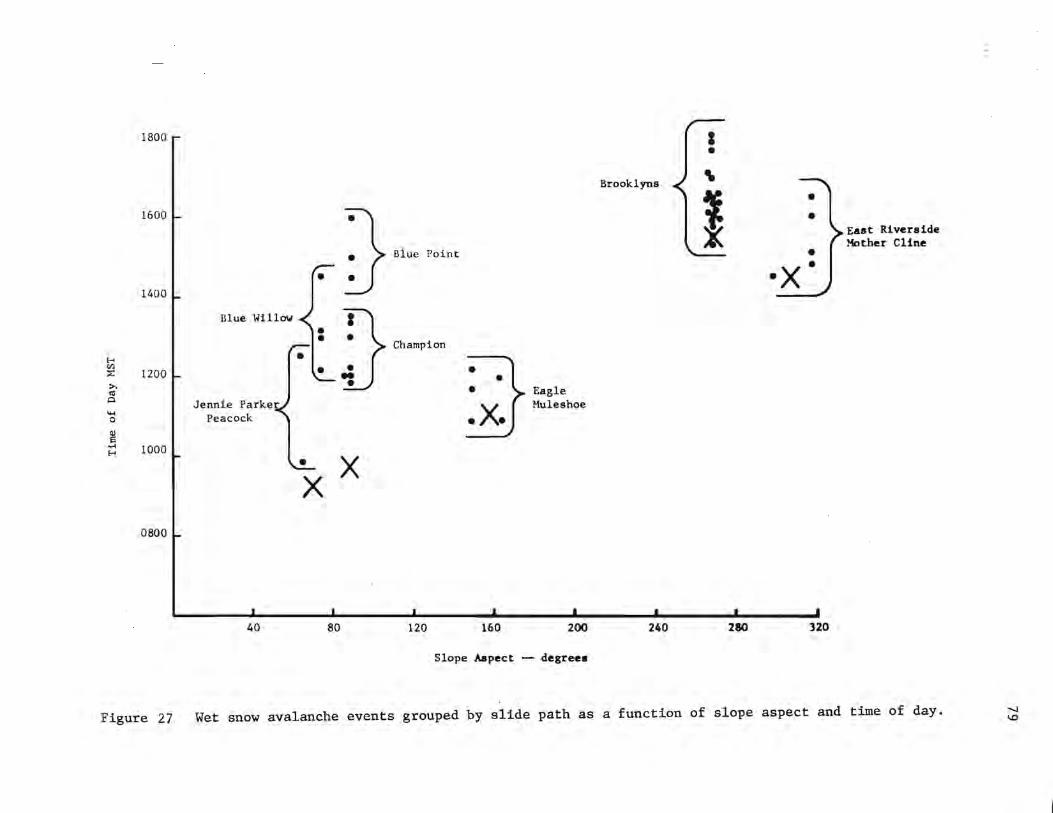
1800
1600
1400 ~
~
1200 ~ Vl :z >, <II 0
.... 0
~ .... 1000 ~ -
0800
Figure 27
- ( -• • •
~-~~ Jennie Parker •
Peacock
• X -X
40 80
Blue Point
Champion
• • • .x .
120 160
Slope Aspect
Eagle Muleshoe
200
degrees
I • Brooklyns 'It
l
240 280
• •
• ·X.
320
East Riverside Mother Cline
Wet snow avalanche events grouped by slide path as a function of slope aspect and time of day. ........ \0
80
Finally, some discussion is necessary to explain those characteristics which caused the 1973 wet avalanche cycle to differ from that occurring in 1974. During late April and early May of 1973, the wet avalanche cycle produced 187 events, of which 60 crossed the highway. Thirty percent of the avalanches were slab type. During mid-March of 1974, a total of 68 wet snow avalanches were recorded, of which 13 crossed the highway. Only 4% of the avalanches were slab type. Not only did the frequency and type of wet avalanche differ from 1973 to 1974, but also the magnitude. In 1973, 24% of the events were size three or larger, while during 1974, avalanches of this magnitude accounted for only 13% of the total. Factors contributing to these differences are as follows. The total snowcover depth and water content at the time of the 1973 cycle exceeded that of 1974 by 60%. The spring cycle of 1973 occurred six weeks later in time, beginning on April 27 as opposed to March 15 of 1974. On the later date, 22% more solar energy is ideally available on a south-facing slope with an angle representative of actual release zones. The snowcover of 1973 was in, or very near to, an isothermal condition for at least eight days prior to the beginning of the April 27-29 cycle as can be seen in Figure 25-Each night during this period, air temperatures were 6.0 to 11.50 below freezing causing the surface snow layers to refreeze. This condition, however, would retard the melt process for only a short period. During the next cycle of May 8-12, air temperatures at an elevation of 3400 m remained above freezing throughout each night.
Nevertheless, it is likely that the snow surface within the avalanche release zones did reach sub-freezing temperatures due to radiationcooling. However, the thickness of the crust and extent of sub-freezing temperatures within the surface layers must have produced minimal effect in terms of the energy required for melting the following day. This was the situation which preceeded the early morning release on the east-facing Peacock (142) at 0952 MST on May 11. This was a wet loose, size five avalanche which ran to the ground and crossed the highway for a distance of 50 m with a maximum depth of 2 m. In contrast, at the onset of the cycle of March 15, 1974, the snowcover had only begun to approach an isothermal condition (Figure 26). On the morning of the 15th, the temperature of the top 30 cm of the snowcover at Red Mountain Pass was between -10.0 and -2.o0c with the 90 cm layer beneath being -1.0 and -2.0°c, and only the lowermost 40 cm being at or near o.o0 c. The additional amount of solar energy available in late April and early May of 1973, combined with a snowcover temperature regime which caused only minimal amounts of heat to be consumed in raising the temperature of the snow to the freezing point created a condition where very rapid melt and subsequent percolation of free water prevailed. This rapid and deep percolation of melt water followed by an almost immediate loss of intergranular strength may have precluded any possible adjustment of stress conditions by slower creep deformation and caused instead the large volume releases associated with this particular period. The greater number of slab avalanches which occurred during the 1973 cycle may be explained by looking at the snow structure and avalanche occurrence record of the preceding winter period. Not only did precipitation

81
during the 1972-1973 winter greatly exceed that of the following winter, but considerably more snow existed within the various release zones and avalanche paths for an additional reason. Numerous storms which produced moderate to heavy amounts of precipitation were associated with only small and infrequent avalanche events, causing significant amounts of snow to remain within the avalanche tracks. In such a snowcover, percolating free water came in contact with a complex stratigraphy which had been developing over the past four to six months. A snow structure, common to the Red Mountain Pass area, consisting of alternating layers of weak temperature-gradient snow and stronger freeze-thaw crusts and wind slabs, in combination with the melt water, created the inadequate strength conditions at the shear boundaries required to initiate slab-type avalanches.
The occurrence of wet snow avalanches depends largely upon air temperatures, heat flux and water content in the snow. The usual period for widespread release of wet snow avalanches is spring when snow temperatures rise and melting begins as a function of the seasonal trend of air temperature. Since the initial requirement for a wet snow avalanche is melting temperatures through the bulk of the snowpack, systematic snow temperature measurements are essential in order to forecast the onset of wet snow conditions. Once the snow is "warm," within 2.0°c of the melting temperature in the case of the Red Mountain data, the probability of release varies with the amount of free water held in the pore space of the snow and the effect of this free water on snow structure. Although it is possible to directly measure free water content as well as its subsequent effect on intergranular strength within the snowcover, emphasis here is given to indirect estimates of the generation of melt water. Air temperature is considered in conjunction with snow temperature data. In addition, consideration is given to slope exposure and radiation balance. Regarding the latter, it must be emphasized that the short-wave (solar) component of the radiation balance may not be a dominant factor for such a highly reflective material as snow. Long-wave radiation from warm clouds as well as warm winds are highly effective in melting snow.

CHAPTER 5: STATISTICAL ANALYSIS
Michael J. Bovis
Introduction
The purpose of this chapter is to outline the development of a real-time, statistical forecast model to predict avalanche occurrences along Highway 550 (Station 152), based on an analysis of data from the four seasons 1971-75. A preliminary test of the model is included, using independent
83
data from the 1975-76 season. Climatic and snowpack variables incorporated into the model are from the Red Mountain Pass snow study site, or telemetered from the remote wind station at 3757 m. This ensures that future real-time testing of the model can be based on relatively accessible climatic stations. The calibration of the model to occurrences along Station 152 does not preclude its application to a somewhat wider area within the San Juan Mountains, since this stretch of Highway 550 involves over 150 slidepaths of different size and activity. However, it is likely that spatial variation in weather conditions will result in a loss of predictive accuracy as a function of distance from Red Mountain Pass. A controlled test of the regional applicability of the method has yet to be carried out.
Data Reduction
The continuous record of precipitation, air temperature, windspeed and wind direction is reduced to consecutive two-hour values (or one-hour values for wind variables), with calendar months demarcated by logical records; file markers are written on each data block at the end of the avalanche season (Appendix A to this chapter, Figure A.1). Avalanche occurrences on Station 152 are written in chronological sequence; on a given avalanche day, occurrences are ordered by slidepath number. No logical records are written, but each season is written as a separate file. Daily observations of snow density, surface condition, ram hardness are listed as a single file, with months defined by logical records. A sequential listing of all data files from 1971 through 1975 is given in Appendix B to this chapter. The magnetic tape described in Appendix Bis a multi-file catalog of data, from which working copies are obtained in the manner outlined in Figure 28 and Appendix A.
The data reduction program in Figure 28 consists of several subroutines •~o reduce raw data to a set of input variables (Table 16). The operation of this program and other routines used in the development of the model is ctescribed in Appendix C to this chapter. Certain variables can be integrated over varying time periods to provide a recursive element in a forecast situation (Table 16).
A sequential list of avalanche days is obtained from the occurrence file using program AVAL; from this list, a non-avalanche day file is written using the data generator described in program NONAVAL (Appendix C). The
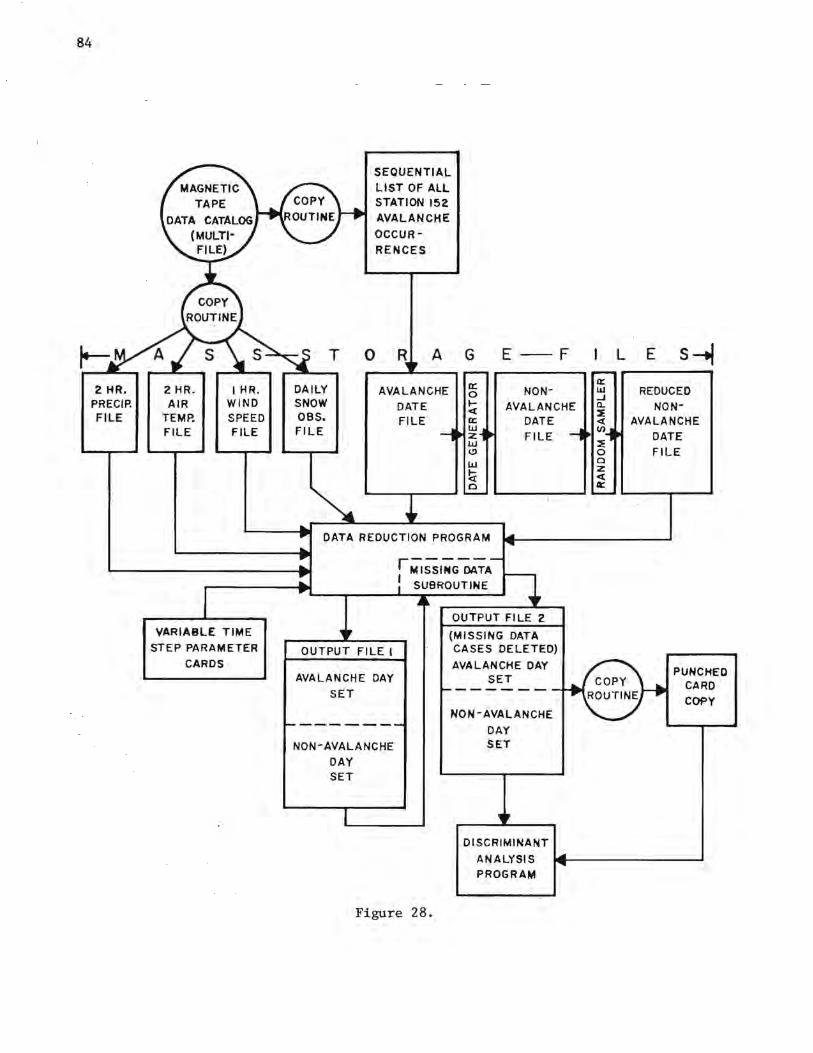
84
2 HR. PRECIP. FILE
2 HR. I HR. AIR WIND
TEMP. SPEED FILE FILE
VARIABLE TIME
STEP PARAMETER
CARDS
DAILY SNOW OBS, FILE
SEQUENTIAL LIST OF ALL STATION 152 AVALANCHE
OCCUR
RENCES
R A
AVALANCHE DATE FILE
G E-F
a: NON-0 I- AVALANCHE ct a: DATE w z FILE LLJ C,
LLJ
~ 0
DATA REDUCTION PROGRAM
r;jsstNG-DATA
I SUBROUTINE
OUTPUT FILE I
AVALANCHE DAY
SET
NON-AVALANCHE
DAY SET
Figure 28.
OUTPUT FILE 2
(MISSING DATA CASES DELETED)
AVALANCHE DAY SET
NON-AVALANCHE
DAY SET
DISCRIMINANT
ANALYSIS PROGRAM
L
a:. l.lJ ..J a.. ~ <l (/)
~ 0 0 z ct k
E s~ REDUCED
NON-AVALANCHE
DATE FILE
PUNCHED CARD
COPY
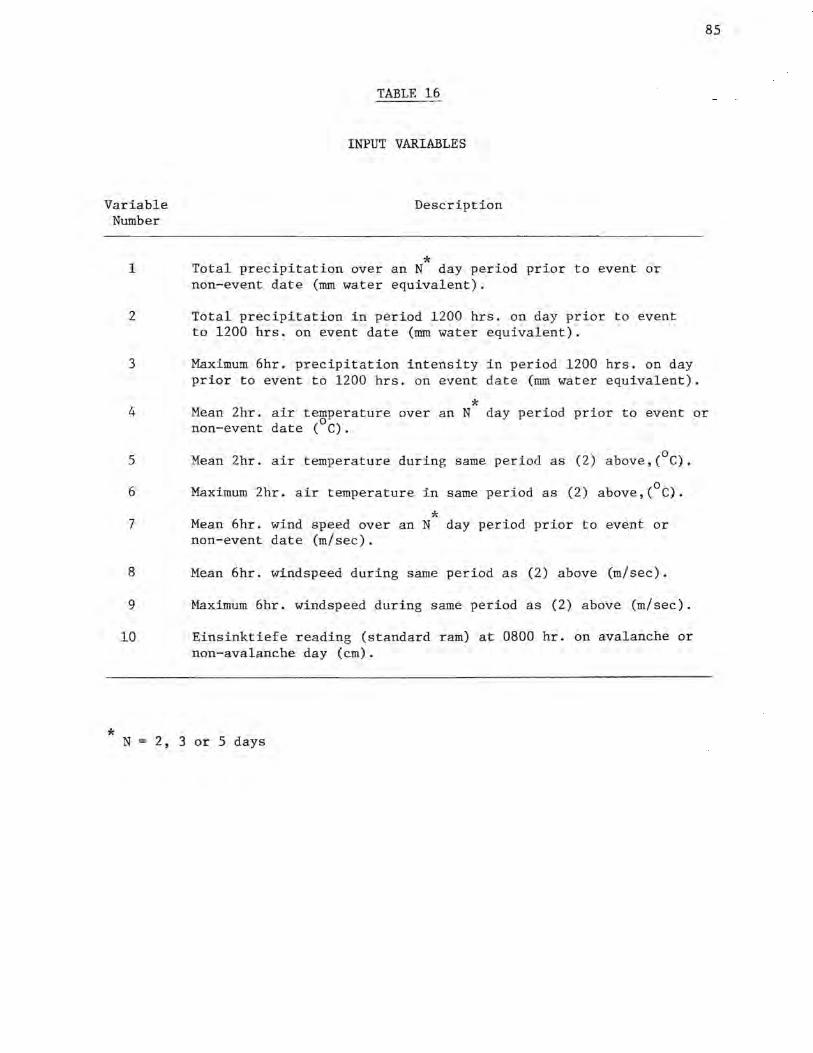
Variable Number
TABLE 16
INPUT VARIABLES
Description
* 1 Total precipitation over an N day period prior to event or non-event date (mm water equivalent).
2 Total precipitation in period 1200 hrs. on day prior to event to 1200 hrs. on event date (mm water equivalent).
3 Maximum 6hr. precipitation intensity in period 1200 hrs. on day prior to event to 1200 hrs. on event date (mm water equivalent).
*
85
4 Mean 2hr. air temperature over an N day period prior to event or non-event date (0 c).
*
5 Mean 2hr. air temperature during same period as (2) above,(°C).
6 Maximum 2hr. air temperature in same period as (2) above,( 0 c).
* 7 Mean 6hr. wind speed over an N day period prior to event or non-event date (m/sec).
8 Mean 6hr. windspeed during same period as (2) above (m/sec).
9 Maximum 6hr. windspeed during same period as (2) above (m/sec).
10 Einsinktiefe reading (standard ram) at 0800 hr. on avalanche or non-avalanche day (cm).
N = 2, 3 or 5 days

86
non-avalanche day file is bounded by the first and last recorded occurrences along Station 152 and usually is reduced to approximately the same length as the avalanche day file by random sampling. As noted by Bois et al. (1974), this approa~h reduces serial correlation between days, such as might occur from persistence of a weather pattern; also it equalizes the sampling errors for parameters in each population of events.
The value of N, the number of days prior to an avalanche or non-avalanche day, (Table 16)is specified by the user (Figure 28) to produce an output file of reduced variables for all days in a season. Cases with missing data are eliminated prior to the statistical analysis and card copy of the remaining data is made for future reference (Figure 28).
Discriminant Analysis
The method described here is similar to those discussed previously by Judson and Erikson (1973) and Bois et al. (1974) in that it is based on linear discriminant functions computed from meteorological and snowpack variables measured on sets of avalanche and non-avalanche days, the purpose of the analysis being to select variables which maximize the separation of the two groups in multi-dimensional space. A two-variable case is illustrated in Figure 29, ,which inrlicates that the densities of the points in <liscri~inant space are generated by a one-to-one mapping from the original score space. This is achieved by forming the dot product between a vector of coefficients, {\} and a vector of scores on selected variables in Table 16, for each avalanche and non-avalanche day. A scalar measure (discriminant score, D) is assigned to each day from:
D = {X}•{A} (1)
where {X}={x1 , x 2 , .•. x }, with subscripts corresponding to variable numbers in Table 1. The vector r{A} is derived empirically from the matrix operation:
{A}= {V}-1{d} (2)
in which the first term on the right hand side is the inverse of the pooled dispersion (variance-covariance) matrix for the two groups and {d} is the vector of differences among the means of the r variables over both groups (Hope, 1968).
An assumption of the analysis is that the dispersion (variance-covariance) matrices in each group are approximately equal. When this is not satisfied, the likelihood function for the two groups is not a straight line, so that a linear discriminant function may produce a significant amount of misclassification of avalanche and non-avalanche days. Both the linear and non-linear cases are illustrated in Figure 30. In both cases, the likelihood function is drawn through the points of intersection of corresponding percentile contours in each group; therefore, it is the locus of points which have equal probability of belonging to either group.
Given that the linear assumption holds true, a cutting point, or discriminant index is chosen, midway between the two means in discriminant space (Figure 29),
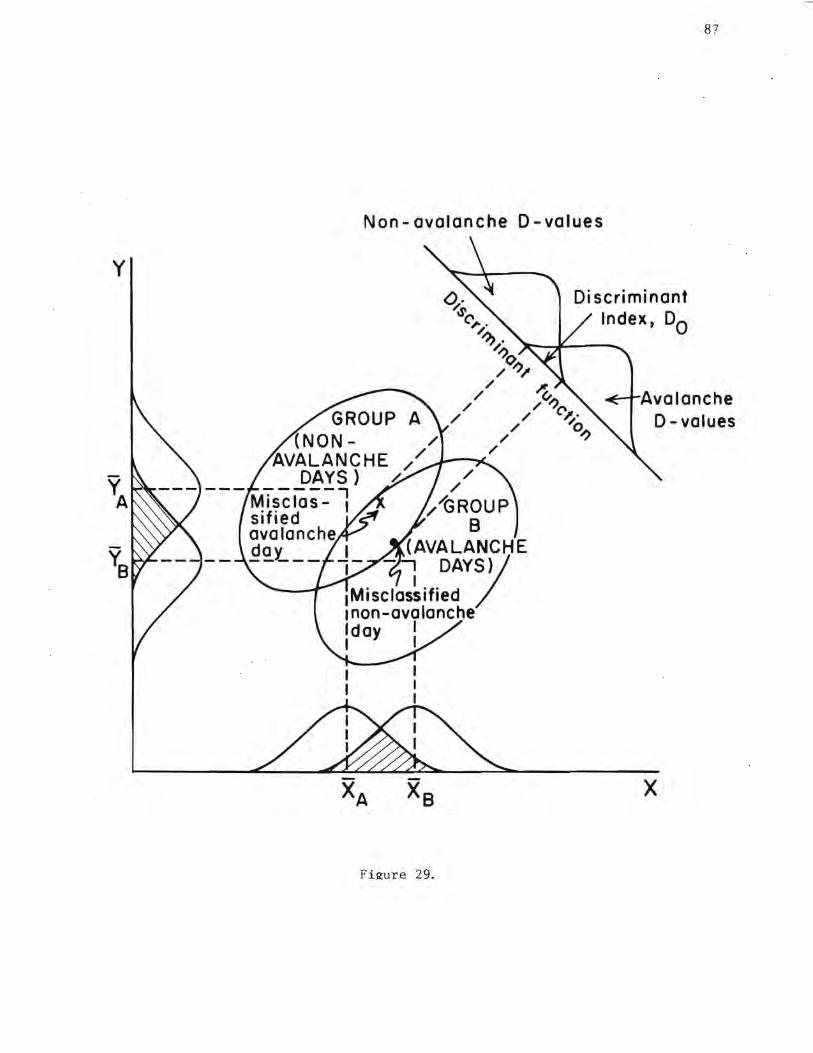
y
87
Non-avalanche D-values
1 non-avalanche lday I I I
Figure 29.
Discriminant Index, Do
Avalanche D-values
X
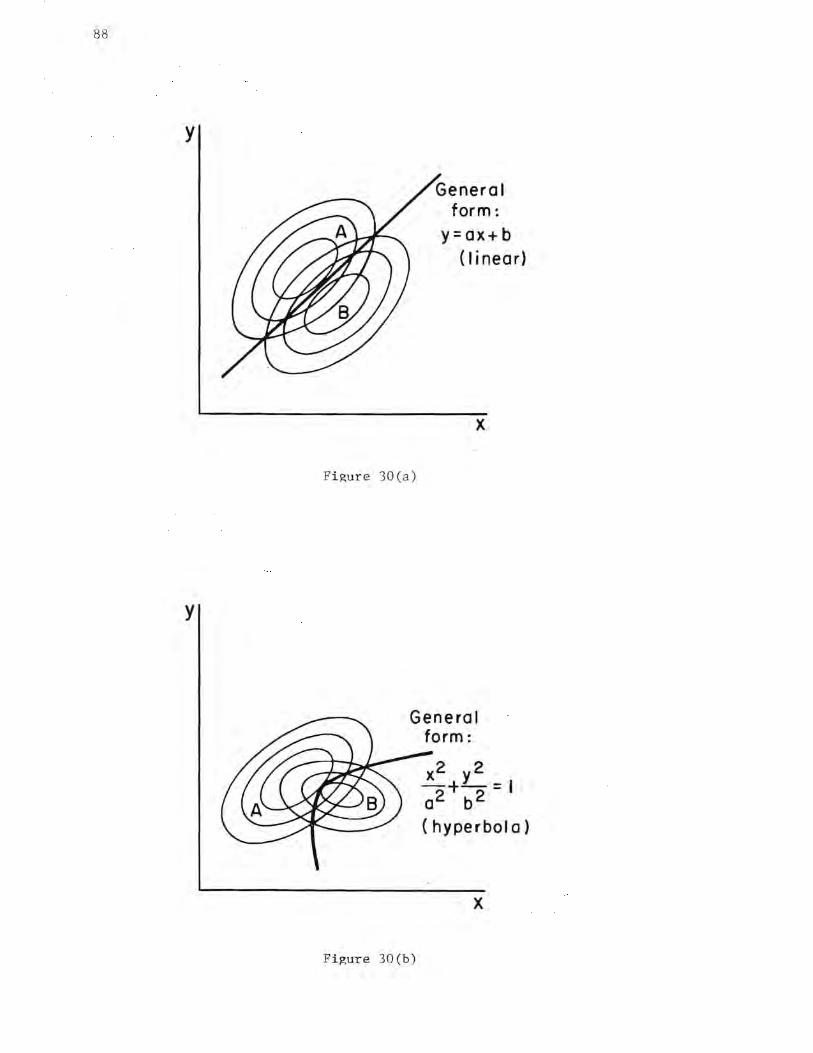
88
y
Fi gu r e 30(a)
y
Figure 30(b)
General form:
y= ax+ b (linear)
X
x2 y2 - +--- = I 02 b2
(hyperbola)
X
89
which can be used to decide the status of a future event according to the decision rule:
D > D0 : avalanche day
D < D0 : non-avalanche day (3)
As Figure 29 suggests, an approximate test of the validity of the linear model is that roughly equal numbers, or percentages, of objects (days) should be misclassified in each group (Hope, 1968). If this is not the case, the assumption of equal dispersion matrices has probably been violated. It should be noted that n0 need not be chosen midway between the two discriminant score means (Figure 29). However, this is the conventional choice, so that the discriminant index is defined by:
1 r Do= ~ -2 L... ;\. (A. + B.)
i=l l. l. l.
where A. is the ith coefficient of the discriminant function and A. and B. are, re!pectively, the mean values of variable i . over groups A and 1 B in 1
the original score space.
It is desirable to reduce the dimensions of the X matrix by choosing a set of input variables which maximize the separation of the avalanche and nonavalanche day means in multivariate space. Therefore, the order of {V}, {A} and {d} will generally be less than r, thereby removing redundant variables from the model. This has the added advantage of minimizing the amount of data reduction in a real-time field test of the model. In this study, variables have been selected according to a stepwise-discriminant procedure (program BMD 07M)*, in which the first variable entered is always that which maximizes the initial difference between the means of the two groups rela-
(4)
tive to the pooled within groups variance. Using the notation of Hoel (1971), this amounts to maximizing the function:
- - 2 (zl - z2)
G = (5) 2 n. _ 2 L Li. (z .. - z.)
i=l j=l l.J l.
In this two-dimensional example, the z terms are group means, i refers to groups, and j to items within groups. In a discriminant analysis of avalanche versus non-avalanche days, it is likely that the first term in the discriminant function will be a precipitation variable, at least within the dry slide season. Subsequent variables are entered which produce the greatest increase in the value of the function G.
At each stage of the stepwise discriminant analysis, a classification of all days is made, using the list of variables included prior to that step. The Mahalanobis' distance between the groups is computed and an F statistic applied to test the significance of the difference between the two multivariate means:
*Biomedical Series, University of California, Berkeley, available at University of Colorado.
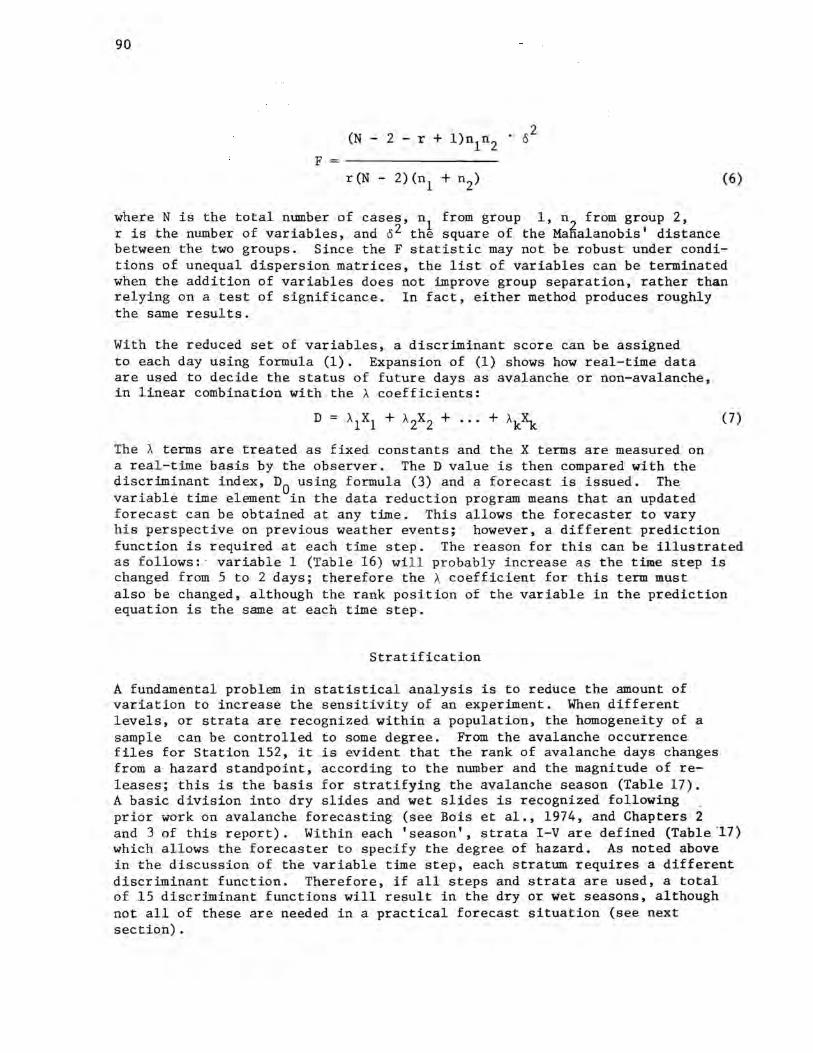
90
(6)
where N is the total number of cases, n1 from group 1, n from group 2, r is the number of variables, and o2 the square of the Ma~alanobis' distance between the two groups. Since the F statistic may not be robust under conditions of unequal dispersion matrices, the list of variables can be terminated when the addition of variables does not improve group separation, rather than relying on a test of significance. In fact, either method produces roughly the same results.
With the reduced set of variables, a discriminant score can be assigned to each day using formula (1). Expansion of (1) shows how real-time data are used to decide the status of future days as avalanche or non-avalanche, in linear combination with the A coefficients:
The A terms are treated as fixed constants and the X terms are measured on a real-time basis by the observer. The D value is then compared with the discriminant index, n0 using formula (3) and a forecast is issued. The variable time element in the data reduction program means that an updated forecast can be obtained at any time. This allows the forecaster to vary
(7)
his perspective on previous weather events; however, a different prediction function is required at each time step. The reason for this can be illustrated as follows: · variable 1 (Table 16) will probably increase as the time step is changed from 5 to 2 days; therefore the A coefficient for this term must also be changed, although the rank position of the variable in the prediction equation is the same at each time step.
Stratification
A fundamental problem in statistical analysis is to reduce the amount of variation to increase the sensitivity of an experiment. When different levels, or strata are recognized within a population, the homogeneity of a sample can be controlled to some degree. From the avalanche occurrence files for Station 152, it is evident that the rank of avalanche days changes from a hazard standpoint, according to the number and the magnitude of releases; this is the basis for stratifying the avalanche season (Table 17). A basic division into dry slides and wet slides is recognized following prior work on avalanche forecasting (see Bois et al., 1974, and Chapters 2 and 3 of this report). Within each 'season', strata I-V are defined (Table.17) which allows the forecaster to specify the degree of hazard. As noted above in the discussion of the variable time step, each stratum requires a different discriminant function. Therefore, if all steps and strata are used, a total of 15 discriminant functions will result in the dry or wet seasons, although not all of these are needed in a practical forecast situation (see next section).
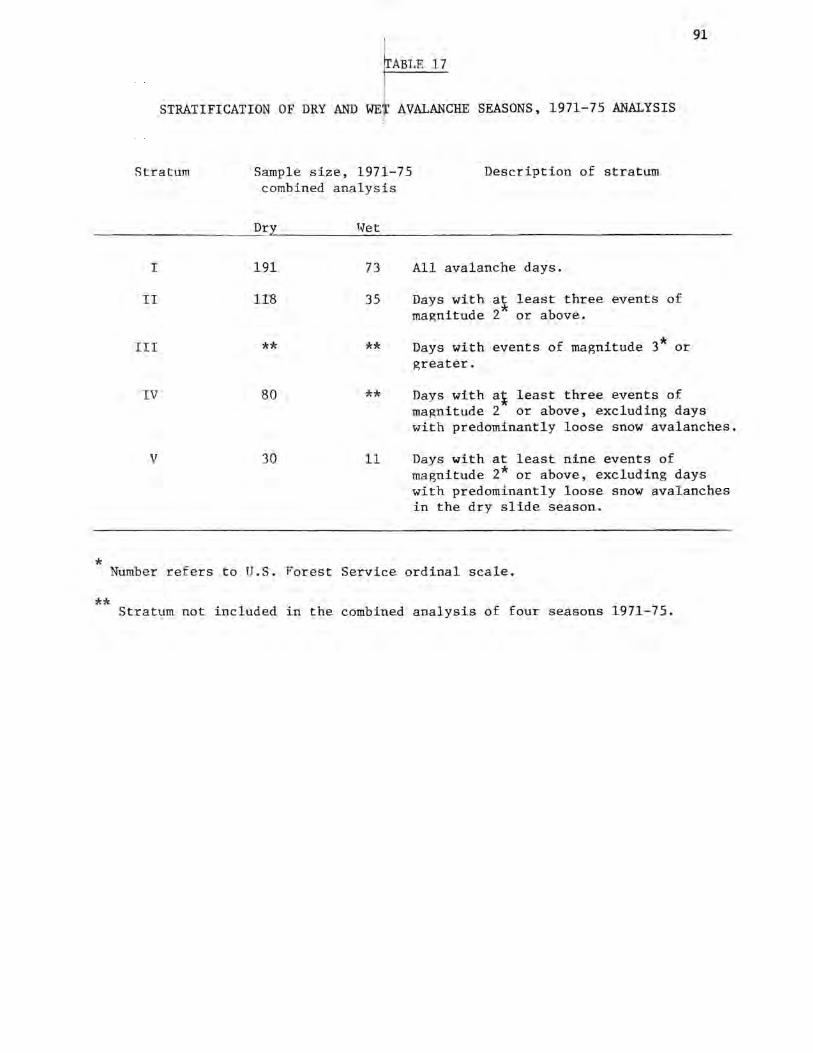
*
**
91
ABLE 17
STRATIFICATION OF DRY AND WE AVALANCHE SEASONS, 1971-75 ANALYSIS
Stratum
I
II
III
IV
V
Sample size, 1971-75 combined analysis
Dr
191
**
80
30
~t
73
35
**
**
11
Description of stratum
All avalanche days.
Days with at least three events of magnitude 2* or above.
Days with events of magnitude 3* or greater.
Days with at least three events of magnitude 2 or above, excluding days with predominantly loose snow avalanches.
Days with at least nine events of magnitude 2* or above, excluding days with predominantly loose snow avalanches in the dry slide season.
Number refers to U.S. Forest Service ordinal scale.
Stratum not included in the combined analysis of four seasons 1971-75.
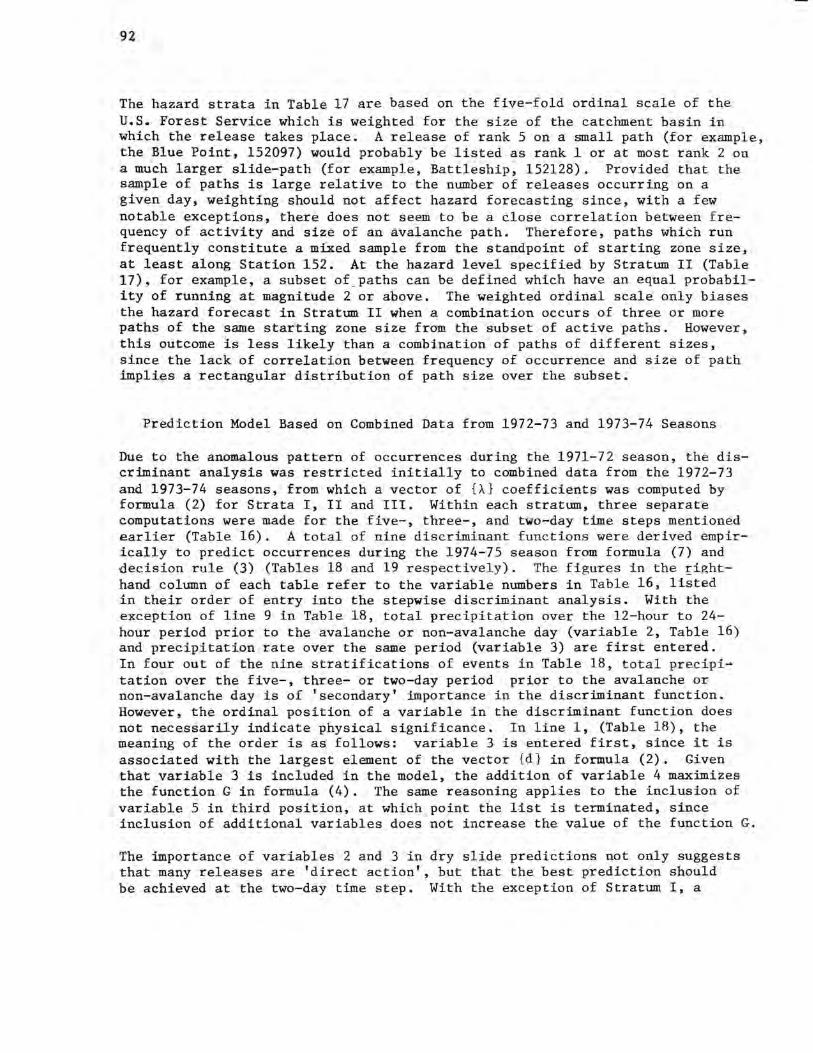
92
The hazard strata in Table 17 are based on the five-fold ordinal scale of the U.S. Forest Service which is weighted for the size of the catchment basin in which the release takes place. A release of rank 5 on a small path (for example, the Blue Point, 152097) would probably be listed as rank 1 or at most rank 2 on a much larger slide-path (for example, Battleship, 152128). Provided that the sample of paths is large relative to the number of releases occurring on a given day, weighting should not affect hazard forecasting since, with a few notable exceptions, there does not seem to be a close correlation between frequency of activity and size of an avalanche path. Therefore, paths which run frequently constitute a mixed sample from the standpoint of starting zone size, at least along Station 152. At the hazard level specified by Stratum II (Table 17), for example, a subset of _paths can be defined which have an equal probability of running at magnitude 2 or above. The weighted ordinal scale only biases the hazard forecast in Stratum II when a combination occurs of three or more paths of the same starting zone size from the subset of active paths. However, this outcome is less likely than a combination of paths of different sizes, since the lack of correlation between frequency of occurrence and size of path implies a rectangular distribution of path size over the subset.
Prediction Model Based on Combined Data from 1972-73 and 1973-74 Seasons
Due to the anomalous pattern of occurrences during the 1971-72 season, the discriminant analysis was restricted initially to combined data from the 1972-73 and 1973-74 seasons, from which a vector of {A} coefficients was computed by formula (2) for Strata I, II and III. Within each stratum, three separate computations were made for the five-, three-, and two-day time steps mentioned earlier (Table 16). A total of nine discriminant functions were derived empirically to predict occurrences during the 1974-75 season from formula (7) and decision rule (3) (Tables 18 and 19 respectively). The figures in the Iighthand column of each table refer to the variable numbers in Table 16, listed in their order of entry into the stepwise discriminant analysis. With the exception of line 9 in Table 18, total precipitation over the 12-hour to 24-hour period prior to the avalanche or non-avalanche day (variable 2, Table 16) and precipitation rate over the same period (variable 3) are first entered. In four out of the nine stratifications of events in Table 18, total precipitation over the five-, three- or two-day period prior to the avalanche or non-avalanche day is of 'secondary' importance in the discriminant function. However, the ordinal position of a variable in the discriminant function does not necessarily indicate physical significance. In line 1, (Table 18), the meaning of the order is as follows: variable 3 is entered first, since it is associated with the largest element of the vector {d} in formula (2). Given that variable 3 is included in the model, the addition of variable 4 maximizes the function Gin formula (4). The same reasoning applies to the inclusion of variable 5 in third position, at which point the list is terminated, since inclusion of additional variables does not increase the value of the function G.
The importance of variables 2 and 3 in dry slide predictions not only suggests that many releases are 'direct action', but that the best prediction should be achieved at the two-day time step. With the exception of Stratum I, a
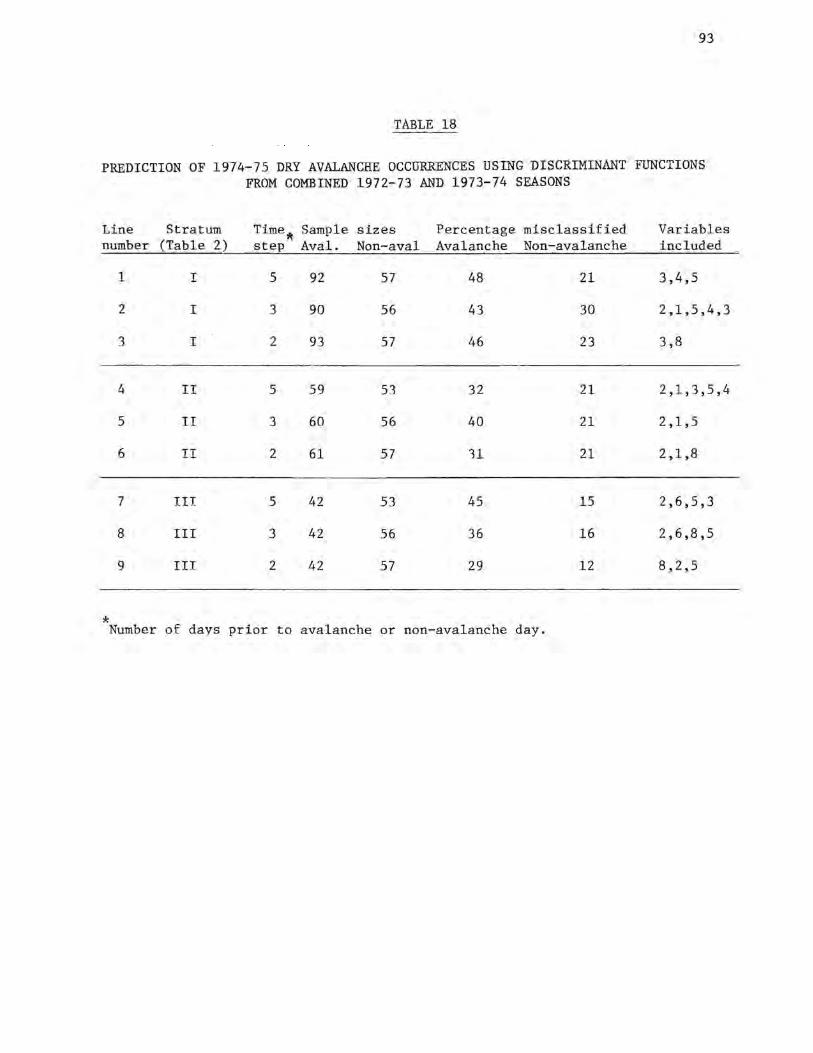
93
TABLE 18
PREDICTION OF 1974-75 DRY AVALANCHE OCCURRENCES USING DISCRIMINANT FUNCTIONS FROM COMBINED 1972-73 AND 1973-74 SEASONS
Line Stratum Time~ Sample sizes Percentage misclassified Variables number (Table 2) step Aval. Non-aval Avalanche Non-avalanche included
1 I 5 92 57 48 21 3,4,5
2 I 3 90 56 43 30 2,1,5,4,3
3 I 2 93 57 46 23 3,8
4 II 5 59 53 32 21 2,1,3,5,4
5 II 3 60 56 40 21 2,1,5
6 II 2 61 57 11 21 2,1,8
7 III 5 42 53 45 15 2,6,5,3
8 III 3 42 56 36 16 2,6,8,5
9 III 2 42 57 29 12 8,2,5
* Number of days prior to avalanche or non-avalanche day.
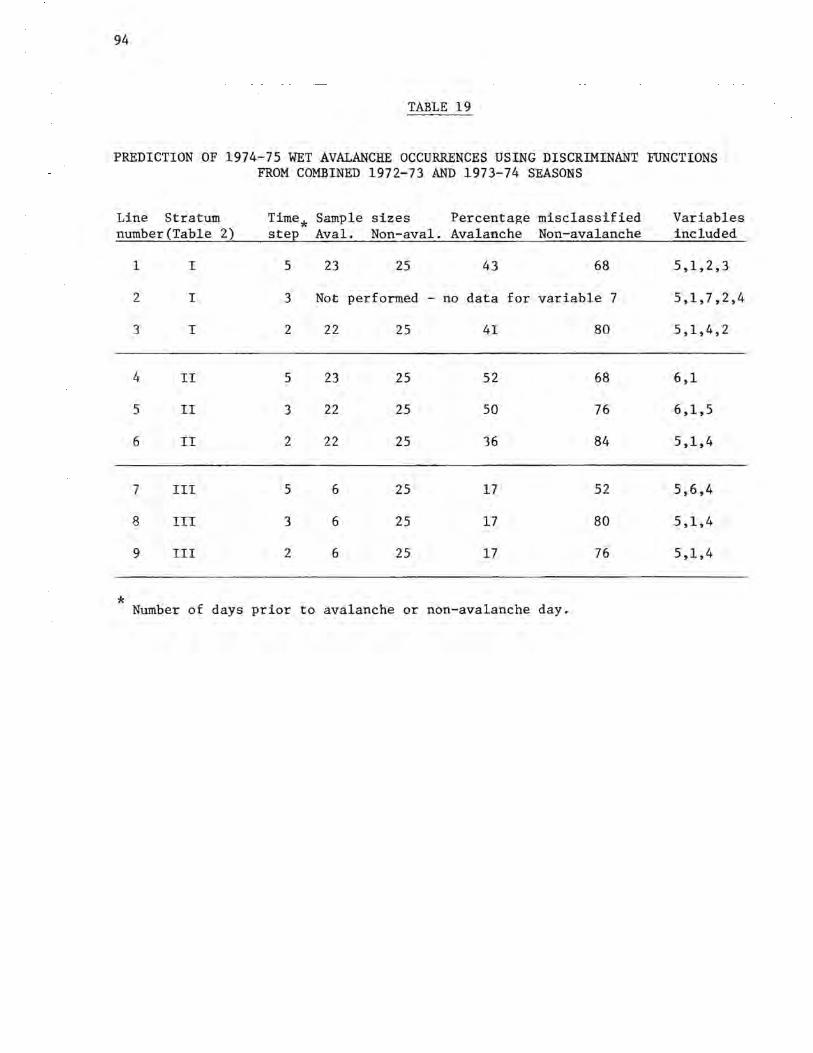
94
TABLE 19
PREDICTION OF 1974-75 WET AVALANCHE OCCURRENCES USING DISCRIMINANT FUNCTIONS FROM COMBINED 1972-73 AND 1973-74 SEASONS
Line Stratum number(Table 2)
*
1
2
3
4
5
6
7
8
9
I
I
I
II
II
II
III
III
III
Time* Sample sizes Percentage misclassified step Aval. Non-aval. Avalanche Non-avalanche
5
3
2
5
3
2
5
3
2
23 25 43 68
Not performed - no data for variable 7
22
23
22
22
6
6
6
25
25
25
25
25
25
25
41
52
50
36
17
17
17
80
68
76
84
52
80
76
Number of days prior to avalanche or non-avalanche day.
Variables included
5,1,2,3
5,1,7,2,4
5,1,4,2
6,1
6,1,5
5,1,4
5,6,4
5,1,4
5,1,4
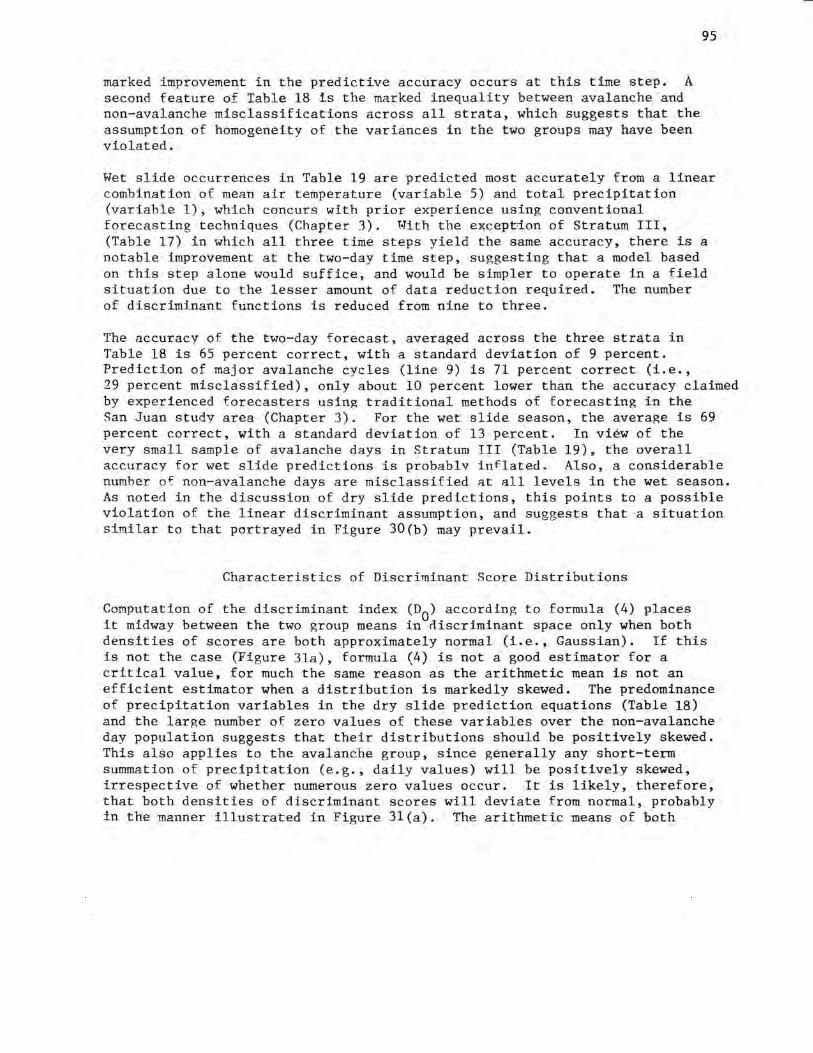
marked improvement in the predictive accuracy occurs at this time step. A second feature of Table 18 is the_marked inequality between avalanche ·and non-avalanche misclassifications across all strata, which suggests that the assumption of homogeneity of the variances in the two groups may have been violated.
95
Wet slide occurrences in Table 19 are predicted most accurately from a linear combination of mean air temperature (variable 5) and total precipitation (variable 1), which concurs with prior experience using conventional forecasting techniques (Chapter 3). With the except,ion of Stratum III, (Table 17) in which all three time steps yield the same accuracy, there is a notable improvement at the two-day time step, suggesting that a model based on this step alone would suffice, and would be simpler to operate in a field situation due to the lesser amount of data reduction required. The number of discriminant functions is reduced from nine to three.
The accuracy of the two-day forecast, averaged across the three strata in Table 18 is 65 percent correct, with a standard deviation of 9 percent. Prediction of major avalanche cycles (line 9) is 71 percent correct (i.e., 29 percent misclassified), only about 10 percent lower than the accuracy claimed by experienced forecasters using traditional methods of forecasting in the San Juan study area (Chapter 3). For the wet slide season, the average is 69 percent correct, with a standard deviation of 13 percent. In view of the very small sample of avalanche days in Stratum III (Table 19), the overall accuracy for wet slide predictions is probablv inflated. Also, a considerable number of non-avalanche days are misclassified at all levels in the wet season. As noted in the discussion of dry slide predictions, this points to a possible violation of the linear discriminant assumption, and suggests that --a situation similar to that portrayed in Figure 30(b) may prevail.
Characteristics of Discriminant Score Distributions
Computation of the discriminant index (D0) according to formula (4) places it midway between the two group means in discriminant space only when both densities of scores are both approximately normal (i.e., Gaussian). If this is not the case (Figure 31a), formula (4) is not a good estimator for a critical value~ for much the same reason as the arithmetic mean is not an efficient estimator when a distribution is markedly skewed. The predominance of precipitation variables in the dry slide prediction equations (Table 18) and the large number of zero values of these variables over the non-avalanche day population sugsests that their distributions should be positively skewed. This also applies to the avalanche group, since generally any short-term summation of precipitation (e.g., daily values) will be positively skewed, irrespective of whether numerous zero values occur. It is likely, therefore, that both densities of discriminant scores will deviate from normal, probably in the manner illustrated in Figure 3l(a). The arithmetic means of both
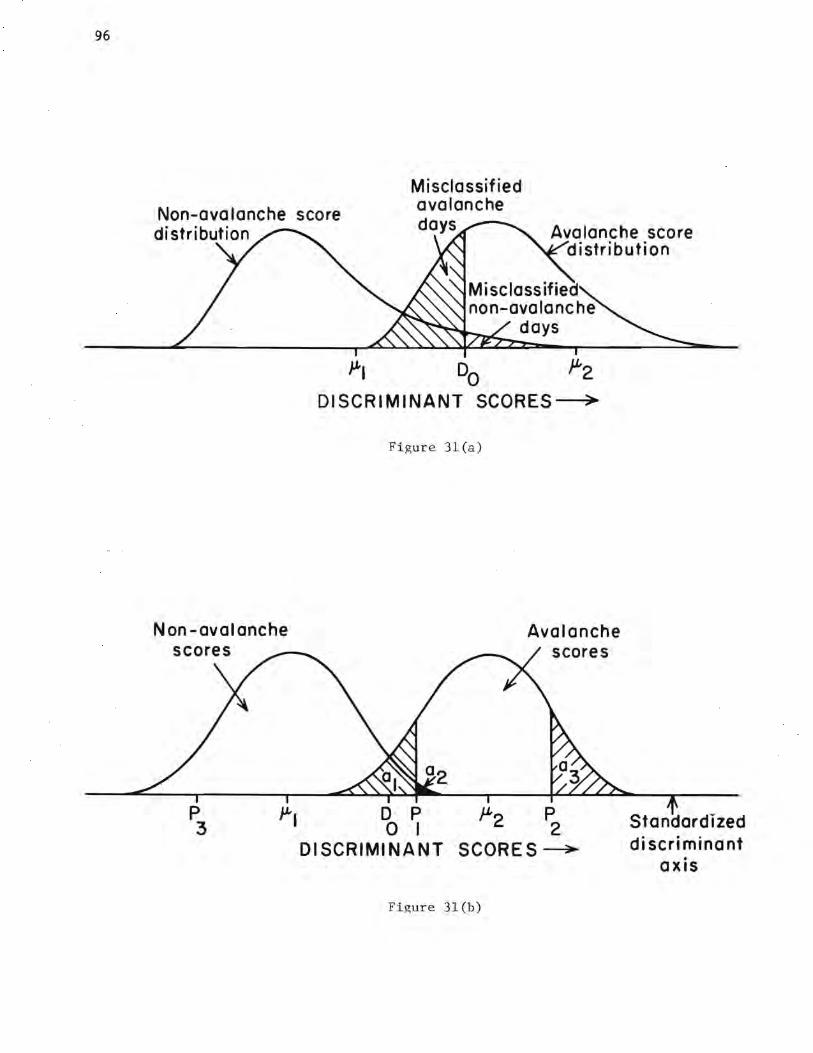
96
Non-avalanche score
Misclassified avalanche
days Avalanche score distribution
Non-avalanche
distribution
Misclassified non-avalanche
days
JJ,I D0 fL2
DISCRIMINANT SCORES >
Figure 3l(a)
Avalanche scores
p 3 JJ-1 i ~ µ,2 p2 Standardized
di scri min ant axis
DISCRIMINANT SCORES~
Figure 3l(b)
97
distrihutions (µ 1 ,µ 2) are deflected to the right of their respective centers of mass since they are not good estimators of central tendency. By placing n0 midway between these two values, a higher level of misclassification results for the avalanche day group (Table 18). This is not dependent on the degree of overlap between the two distributions, but is related to their relative position on the discriminant axis. This never changes on account of the high precipitation scores on most avalanche days and is preserved in the wet slide season also since avalanche days score higher on air temperature variables than do non-avalanche days. The greater number of misclassifications of non-avalanche days during the wet slide season may be attributable to negative, rather than positive, skewness in both distributions of scores.
The amount of skewness present in the discriminant scores is examined in Table 20 over the four dry slide seasons 1971-75. Results of the discriminant analysis are given in Table 20(a) and a Chi-square goodness-of-fit test for normality in Table 20(b). The null hypothesis that the two distributions of scores are normal is soundlv rejected;, due primarily to positive skewness. This can be removed or mitigated by applying a logarithmic transformation to the precipitation variables:
ln(X. + 1) l
The arbitrary constant of one is added since ln(O) is minus infinity. The X~ are transformed scores, with i = 1,2,3 in Table 20(a).
(8)
The analysis is then repeated using formula (8) and results in a ten percent improvement in the accuracy of the avalanche day forecast. Also, the disparity in the numbers of misclassified days between the avalanche and nonavalanche groups is reduced to 12 percent in Table 2l(a) versus 29 percent in Table 20(a). The Chi-square values in Table 2l(b) are much lower than in Table 20(b), the computed value for avalanche days just exceeding the 95 percentage point (14.1 for seven degrees of freedom). Therefore, if a five percent chance is taken of rejecting a true null hypothesis (i.e., normal distribution in the scores), then the avalanche day sample can be considered as normal. Although not very stringent, the test indicates that the distribution of transformed scores may approach normality in the long-term, an important consideration in future applications of the forecast method.
The hypothesis is rejected in Table 2l(b) for non-avalanche days, the 99.5 percentage point being 20.3 for seven degrees of freedom. Rejection is due to persistent positive skewness in the discriminant scores on account of the zero level of variables 1 and 2 on many non-avalanche days. (Under the transformation in formula (8), days with zero precipitation remain zero).
For wet slide days in the same period, the Chi-square values are as follows, using transformed precipitation scores:
Avalanche <lays: Non-analanche days:
Chi-square= 6.6 for 7 degrees of freedom Chi-square= 2.2 for 5 degrees of freedom
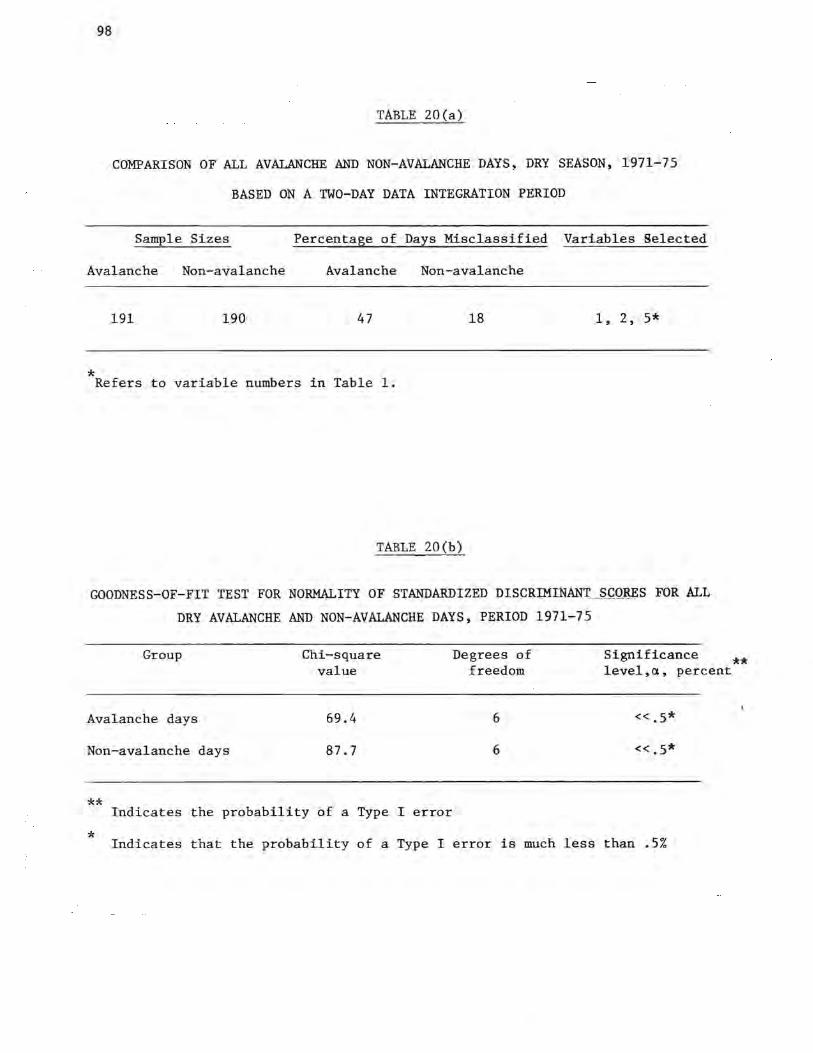
98
TABLE 20(a)
COMPARISON OF ALL AVALANCHE AND NON-AVALANCHE DAYS~ DRY SEASON, 1971-75
BASED ON A TWO-DAY DATA INTEGRATION PERIOD
Sample Sizes Percentage of Days Misclassified Variables Selected
Avalanche Non-avalanche Avalanche Non-avalanche
191 190 47 18 1, 2, 5*
* Refers to variable numbers in Table 1.
TABLE 20(b)
GOODNESS-OF-FIT TEST FOR NORMALITY OF STANDARDIZED DISCRlMINAN'l' _ _S_~Ql!ES FOR ALL
DRY AVALANCHE AND NON-AVALANCHE DAYS, PERIOD 1971-75
Group
Avalanche days
Non-avalanche days
**
Chi-square value
69.4
87.7
Indicates the probability of a Type I error
*
Degrees of freedom
6
6
Significance ** level,Cl, percent
<<.5*
<<.5*
Indicates that the probability of a Type I error is much less than .5%
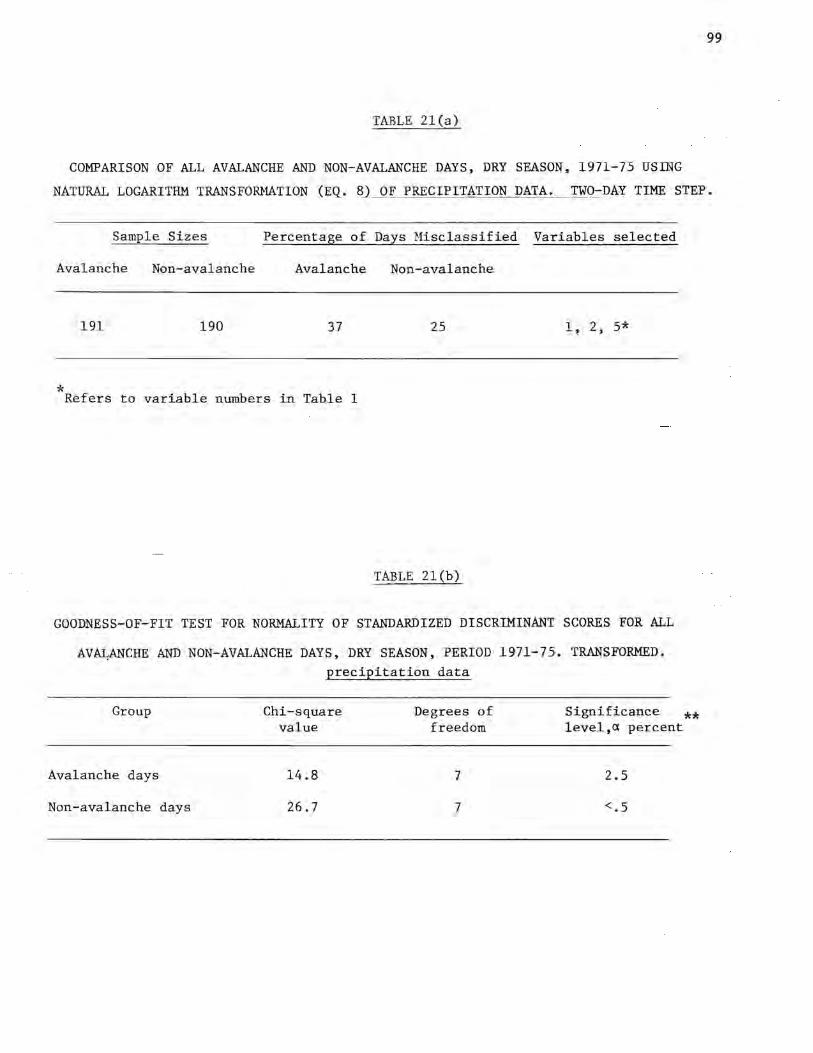
99
TABLE 2l(a)
COMPARISON OF ALL AVALANCHE AND NON-AVALANCHE DAYS, DRY SEASON, 1971-75 USING
NATURAL LOGARITHM TRANSFORMATION (EQ. 8J_QI_PRECIPITATION DATA. TWO-DAY TIME STEP.
Sample Sizes Percentage of Days Misclassified Variables selected
Avalanche Non-avalanche Avalanche Non-avalanche
191 190 37 25 1, 2, 5*
* Refers to variable numbers in Table 1
TABLE 2l(b)
GOODNESS-OF-FIT TEST FOR NORMALITY OF STANDARDIZED DISCRIMINANT SCORES FOR ALL
AVAI,ANCHE AND NON-AVALANCHE DAYS, DRY SEASON, PERIOD 1971-75. TRANSFORMED. precipitation data
Group
Avalanche days
Non-avalanche days
Chi-square value
14.8
26.7
Degrees of freedom
1
7
Significance ** level,a percent
2.5
<.5
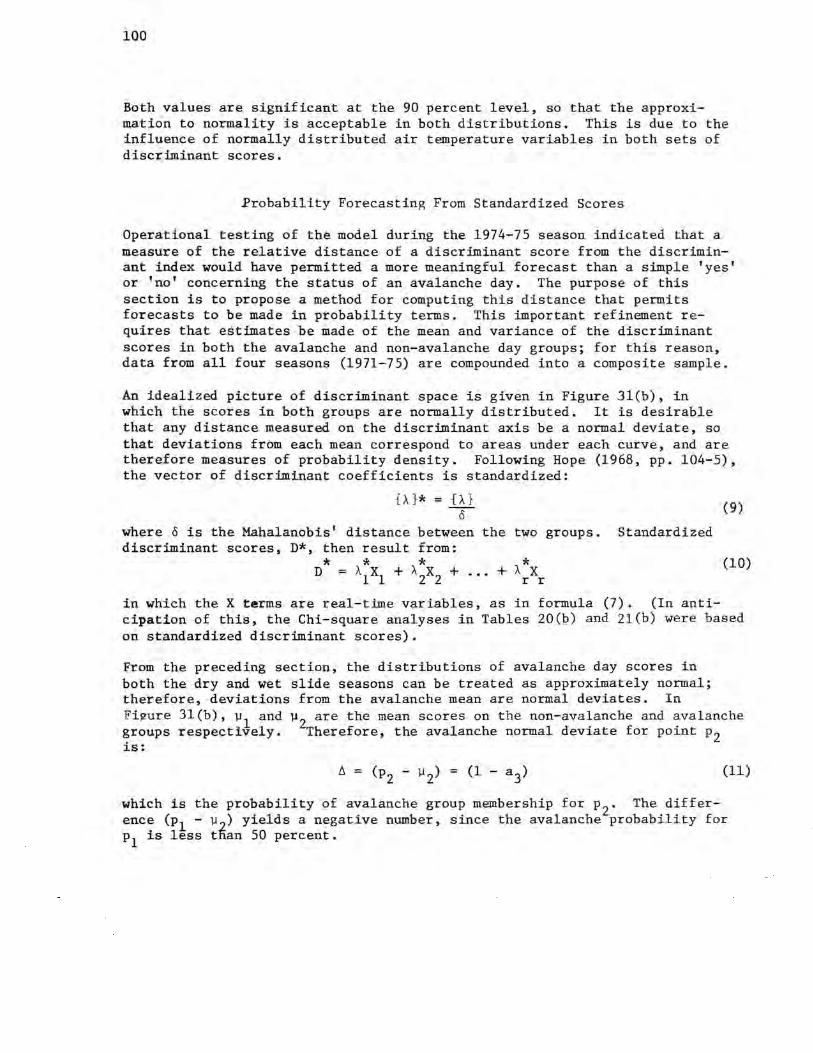
100
Both values are significant at the 90 percent level, so that the approximation to normality is acceptable in both distributions. This is due to the influence of normally distributed air temperature variables in both sets of discriminant scores.
Probability Forecasting From Standardized Scores
Operational testing of the model during the 1974-75 season indicated that a measure of the relative distance of a discriminant score from the discriminant index would have permitted a more meaningful forecast than a simple 'yes' or 'no' concerning the status of an avalanche day. The purpose of this section is to propose a method for computing this distance that permits forecasts to be made in probability terms. This important refinement requires that estimates be made of the mean and variance of the discriminant scores in both the avalanche and non-avalanche day groups; for this reason, data from all four seasons (1971-75) are compounded into a composite sample.
An idealized picture of discriminant space is given in Figure 3l(b), in which the scores in both groups are normally distributed, It is desirable that any distance measured on the discriminant axis be a normal deviate, so that deviations from each mean correspond to areas under each curve, and are therefore measures of probability density. Following Hope (1968, pp. 104-5), the vector of discriminant coefficients is standardized:
{A}*={~} (9)
where 8 is the Mahalanobis' distance between the two groups. Standardized discriminant scores, D*, then result from:
* * * * (10) D = AlXl + A2X2 + ... + ArXr
in which the X terms are real-time variables, as in formula (7). (In anticipation of this, the Chi-square analyses in Tables 20(b) and 2l(b) were based on standardized discriminant scores).
From the preceding section, the distributions of avalanche day scores in both the dry and wet slide seasons can be treated as approximately normal; therefore, deviations from the avalanche mean are normal deviates. In Fi~ure 3l(b), µ 1 and µ 2 are the mean scores on the non-avalanche and avalanche groups respectively. Therefore, the avalanche normal deviate for point p2 is:
~ = (p - µ) = (1 - a) 2 2 3 (11)
which is the probability of avalanche group membership for p2 . The difference (p1 - µ 2) yields a negative number, since the avalanche probability for pl is less tlian 50 percent.
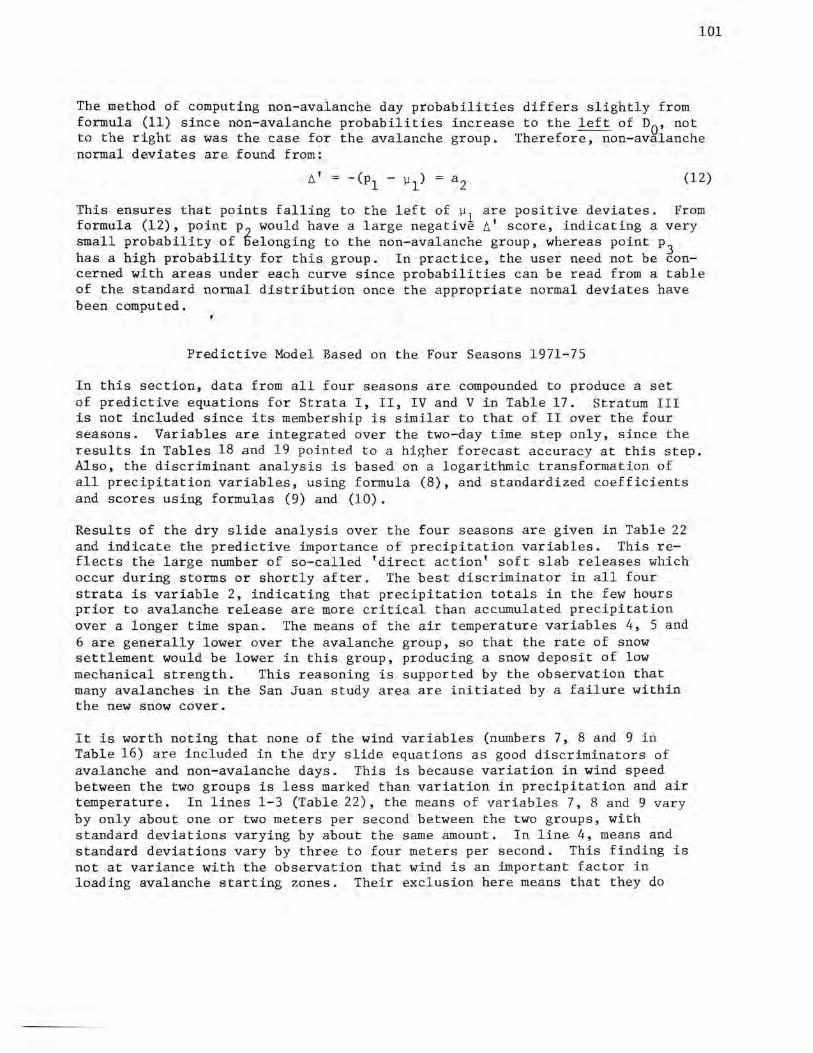
101
The method of computing non-avalanche day probabilities differs slightly from formula (11) since non-avalanche probabilities increase to the left of n0 , not to the right as was the case for the avalanche group. Therefore, non-avalanche normal deviates are found from:
(12)
This ensures that points falling to the left of µ 1 are positive deviates. From formula (12), point p would have a large negative~· score, indicating a very small probability of Selonging to the non-avalanche group, whereas point p3 has a high probability for this group. In practice, the user need not be concerned with areas under each curve since probabilities can be read from a table of the standard normal distribution once the appropriate normal deviates have been computed.
Predictive Model Based on the Four Seasons 1971-75
In this section, data from all four seasons are compounded to produce a set of predictive equations for Strata I, II, IV and Vin Table 17. Stratum III is not included since its membership is similar to that of II over the four seasons. Variables are integrated over the two-day time step only, since the results in Tables 18 and 19 pointed to a higher forecast accuracy at this step. Also, the discriminant analysis is based on a logarithmic transformation of all precipitation variables, using formula (8), and standardized coefficients and scores using formulas (9) and (10).
Results of the dry slide analysis over the four seasons are given in Table 22 and indicate the predictive importance of precipitation variables. This reflects the large number of so·-called 'direct action' soft slab releases which occur during storms or shortly after. The best discriminator in all four strata is variable 2, indicating that precipitation totals in the few hours prior to avalanche release are more critical than accumulated precipitation over a longer time span. The means of the air temperature variables 4, 5 and 6 are generally lower over the avalanche group, so that the rate of snow settlement would be lower in this group, producing a snow deposit of low mechanical strength. This reasoning is supported by the observation that many avalanches in the San Juan study area are initiated by a failure within the new snow cover.
It is worth noting that none of the wind variables (numbers 7, 8 and 9 in Table 16) are included in the dry slide equations as good discriminators of avalanche and non-avalanche days. This is because variation in wind speed between the two groups is less marked than variation in precipitation and air temperature. In lines 1-3 (Table 22), the means of variables 7, 8 and 9 vary by only about one or two meters per second between the two groups, with standard deviations varying by about the same amount. In line 4, means and standard deviations vary by three to four meters per second. This finding is not at variance with the observation that wind is an important factor in loading avalanche starting zones. Their exclusion here means that they do

102
*
TABLE 22
* DISCRIMINANT ANALYSIS OF OCCURRENCES IN DRY SLIDE SEASONS 1971-75
Line Stratum Sample sizes Percentage of days misclassified Variables number
Aval. Non-aval. Avalanche Non-avalanche Overall included
1. I 191 190 37 25 31 2,1,5
2. II 118 118 31 23 27 2,1,6,5
1. IV 80 80 19 23 21 2,1,6
4. V 30 30 13 10 12 2,4
* Based on a logarithmic transformation of variables 1,2 and standardized discriminant scores.
TABLE 23
* DISCRIMINANT ANALYSIS OF OCCURRENCES IN WET SLIDE SEASONS 1971-75
Line Stratum Sample sizes Percentage of days misclassified number Aval. Non-aval. Avalanche Non-avalanche Overall
1. I 73 63 37 43 40
2. II 35 35 31 29 30
1. V 11 11 18 18 18
Variables included
6,4
6,1,4
5,1,2
Based on a logarithmic transfor~ation of variables 1,2 and standardized discriminant scores.
103
not produce a significant increase in the value of Gin formula (5); therefore, wind velocity is not an important discriminator. This characteristic of discriminant analysis should be clearly understood by persons implementing the model.
In lines 3 and 4 (Table 22), days with predominantly dry, loose snow avalanches are eliminated from the sample since it was found that the model would not predict properly under these conditions. In line 2, over half of the days misclassified were of this type; the improvement in the forecast accuracy between lines 2 and 3 is striking.
The order of entry of variables into the wet slide discriminant functions (Table 23) emphasizes the importance of air temperature variables and is, therefore, consistent with the findings of the traditional methods of forecasting used in this study (Chapter 3). The importance of variable 6 (Table 23) in lines 1 and 2 may indicate that a rapid rate of warming is responsible for small cycles of loose snow avalanches. The entry of variable 5 first in line 3 suggests that larger wet avalanche cycles require a more prolonged warming over a 24 hour period prior to avalanche release. The means of the air temperature variables differ by one or two degrees Celsius over avalanche and non-avalanche groups in lines 1 and 2, but differ by more than five degrees in line 3. Stratum III was not used in the wet slide analysis since its membership does not vary much from that of II over the four seasons. Also, Stratum IV was not used since many wet avalanche days would have been eliminated. In Stratum V, wet loose events are retained, since the accuracy of the model is not affected by their inclusion.
An important feature of Tables 22 and 23 is the approximately equal numbers of misclassified avalanche and non-avalanche days, particularly Stratum Vin both seasons. This indicates that a linear function is effective in discriminating between avalanche and non-avalanche days. The overall accuracy figure in both tables is the average of the two preceding columns and refers to the average expected accuracy of the model. For major avalanche cycles in the dry and wet seasons, the accuracy figures are 88 percent and 82 percent, respectively.
Field Operation of the Forecast Model
Discriminant function coefficients for each stratum in Tables 22 and 23 are listed in Appendix D to this chapter, along with the mean discriminant score for each group. In both dry and wet seasons, variables 1, 2, 4, 5 and 6 are required. Given real-time data sunnnaries for these variables, the steps involved in computing avalanche and non-avalanche probabilities for a given day are as follows:
(1) Perform the transformation in formula (8) to all precipitation variables included in a particular stratum. This is done by first adding 1 to the raw precipitation value and then taking the natural logarithm (ln) of this sum.
104
(2) Compute D* from formula (10), by forming the sum of products between the coefficients in Appendix D and the real-time variables obtained in (1) above.
* (3) Subtract D from the appropriate group mean score in Appendix D. Use formula (11) for the avalanche group deviate and formula (12) for the non-avalanche group deviate, paying particular attention to the sign of the result.
(4) Read off the probabilities corresponding to the deviates obtained in step (3), using a table of the standard normal distribution. (This is reproduced in most statistics texts and in mathematical handbooks).
(5) Issue the forecast, or proceed to the next hazard stratum in Table 17, repeating steps (1) through (4) above, using the appropriate sets of coefficients and means from Appendix D.
To reduce the amount of computation, begin with the highest level in each downwards to Stratum I if necessary. to be detected as early as possible.
it is recommended that the forecaster season (i.e., Stratum V) and then work This will allow a high hazard situation
The coefficients for variables 2, 5 and 6 in Appendix D, are calibrated to the period 1200 hr. on the day prior to the current day (day j-1), to 1200 hr. on the forecast day (day j). However, most observations are taken at about 0800 hr. on day j and a forecast issued shortly thereafter. For this reason, the observer should integrate these three variables over the period 1200 hr. on day (j-1) to 0800 hr. on day j. It is then possible to up-date the forecast during day j by reducing subsequent two-hour values for variables 2, 5 and 6. Therefore, at the end of day i, these variables will have been summed up to 2400 hr. The portion from 1200 hr. to 2400 hr. on day j now becomes the input for the succeeding day, (j+l). Also, the input for variables 1 and 4 on day (.i+l) is derived from days (j-1) and j, since both require a two-day integration.
Test of the 1971-75 Forecast Model Using Data From fhe 1975-76 Dry Season
Two days are selected from the 1975-76 dry avalanche season to test the accuracy of forecasting using the coefficients listed in Appendix D. Real-time data summaries are given for both days in Table 24(a), with figures in parentheses referring to logarithmic transformation of the precipitation variables 1 and 2 according to formula (8). Results of a simulated real-time forecast are given in Table 24(b) for the four hazard strata V, IV, II and I. In each case, avalanche and non-avalanche deviates and probabilities are computed according to steps (1) through (4) above.
The avalanche probability for day A is high in line 1 and continues to increase as the hazard level is relaxed in lines 3, 5 and 7. The non-avalanche figure rema.ins at less than one percent throughout all strata. The hazard forecaster would have to conclude that day A would probably give rise to a level V pattern of occurrences.
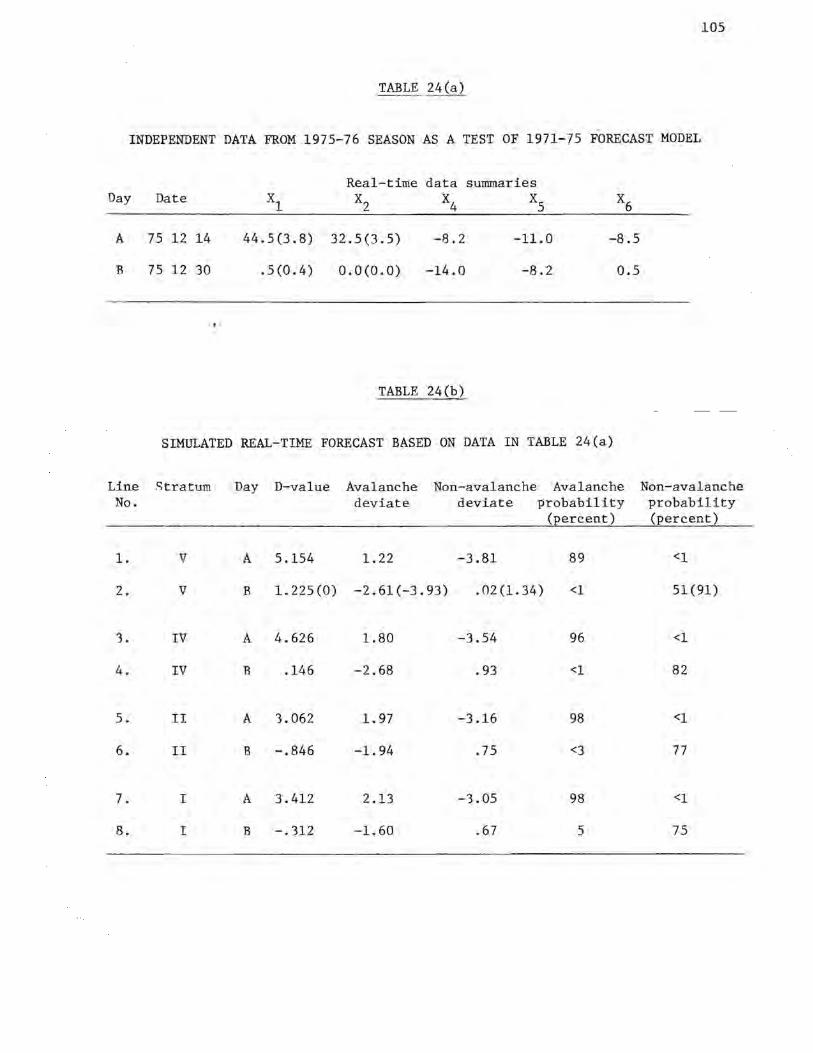
105
TABLE 24(a)
INDEPENDENT DATA FROM 1975-76 SEASON AS A TEST OF 1971-75 FORECAST MODEL
Real-time data sunnnaries Day Date xl x2 x4 XS x6
A 75 12 14 44.5(3.8) 32.5(3.5) -8.2 -11.0 -8.5
B 75 12 30 .5(0.4) 0.0(0.0) -14.0 -8.2 0.5
TABLE 24(b)
SIMULATED REAL-TIME FORECAST BASED ON DATA IN TABLE 24(a)
Line Stratum Day D-value Avalanche Non-avalanche Avalanche Non-avalanche No. deviate deviate probability probability
(percent) (percent)
1. V A 5.154 1.22 -3.81 89 <l
2. V B 1. 225 (O) -2.61(-3.93) . 02 (1. 34) <l 51(91)
3. IV A 4.626 1.80 -3.54 96 <l
4. IV B .146 -2.68 .93 <l 82
5. II A 3.062 1. 97 -3.16 98 <l
6. II B -.846 -1.94 .75 <3 77
7. I A 3.412 2.13 -3.05 98 <l
8. I B -.312 -1.60 .67 5 75
106
Day B represents a different situation from day A, reflected in the very low scores on variables 1 and 2 and the much lower mean two-hour temperature figure for variable 4 (Table 24a). AD value of 1.225 is obtained using the coefficients in line 1 of Appendix D, indicating an avalanche probability of less than one percent and a non-avalanche probability of 51 percent. In line 4, however, the non-avalanche probability increases to 82 percent, which is inconsistent with a reduced level of hazard in Stratum IV. This is explained by the effect of the very low mean temperature for variable 4 combined with low or zero scores on precipitation variables. When variable 4 is removed from the prediction equation, the figures in parentheses in line 2, Table 24(b) result. The avalanche figure remains unchanged but the non-avalanche figure increases to 91 percent. This indicates that the Stratum V equation may give false alarms when very low precipitation scores co-incide with very low air temperatures. Under these conditions, variable 4 should be dropped from the model and the prediction should be based on variable 2 only. Since the weight on variable 4 is small (-0.09422), this will introduce very little bias into the forecast.
The status of day Bin strata II and I suggests that avalanching, even at magnitude 1, is unlikely to occur since the non-avalanche probability is 75 percent at level I. The actual occurrences on the two days used in this test are as follows:
14 December 1975: 45 loose releases, magnitude 1
1 soft slab release, magnitude 1
7 loose releases, magnitude 2
TOTAL: 53 releases
30 December 1975: 1 loose release, magnitude 1
Although Stratum Vis not calibrated for loose avalanche forecasting, the model was correct in pre<licting widespread instability on December 14. Also the non-avalanche day forecast for 30 December was largely correct, since only one release was recorded.
Discussion
The model presented here does not include any weighting for avalanche releases prior to a given forecast day, nor does it attempt to 'decay' precipitation over the duration of a storm, and in these respects, it differs from the methods proposed by Judson and Erikson(1973) and Bois et al.(1974). The study of Judson and Erikson involved only 23 slide paths near Berthoud Pass, Colorado, and led to the ~evelopment of a model in which running three-hour precipitation intensities were decayed over the duration of a storm. This was included to simulate progressive stabilization of the snowpack as avalanche releases occurred.
The study of Bois et al.(1974) included factors for the number of avalanche days since the beginning of the winter and the number of avalanche days per number of precipitation sequences, both of which were designed to serve as surrogates for the amount of snow removed from starting zones during past cycles of avalanche activity.
A statistical reason for including variables describing past avalanche activity is that dependence may develop between avalanche days when a large number of
releases occur relative to the total sample of paths. It is therefore appropriate to address the question of the independence of avalanche days
107
on Station 152. There are 161 named slidepaths along Highway 550, many of which have multiple starting zones. Therefore, the total number of potential release points is probably closer to 200. It is unusual that more than a small fraction of this total population is active on any given day, and in fact days with more than 20 releases per day represent less than five percent of all avalanche days in the period 1971-75, which leaves well over 150 zones in which avalanches can occur. During very unstable conditions certain paths have more than one natural release per day, due either to co~secutive slides from more than one starting zone, particularly on the larger paths, or to a rapid regeneration of the snowpack on small paths from wind loading. It is therefore erroneous to assume that avalanching, on a slidepath basis, necessarily constitutes'sampling without replacement', since it is likely that the cessation of avalanching during a particular cycle is to be attributed to an increased state of stability in the snowpack rather than to the emptying of all starting zones during the cycle. Provided that forecasts are not attempted for specific slidepaths, it is likely that parameters describing prior avalanche occurrences will not need to be included in the model, at least during the dry slide season.
During the wet slide season, however, many starting zones are removed from the sample of avalanche release points due to large wet slab releases, following which the snowpack does not regenerate. Under these conditions, the probability of avalanches occurring must decrease as a function of time since the number of sample points is progressively reduced. Under extreme conditions, cessation of the wet slide cycle may occur when the supply of snow is depleted from widespread slab avalanching, so that the discriminant functions will over-estimate avalanche hazard. As in the dry slide season, however, it is much more likely that activity in the wet season will diminish in response to a progressive increase in snow stability. This view is supported by the relatively abrupt cessation of wet slab avalanchinP, throughout the study area, and the fact that many starting zones retain a thick snow cover at the end of the wet season.
Given the large sample of release zones along Station 152, inclusion of variables describing previous avalanche cycles is regarded as a refihement of the existing method, rather than as a vital component at this stage. Also, the relative weighting of variables in Appendix D to this chapter suggests that decaying of precipitation over the period of a storm should not be necessary, during either the dry or wet seasons. The weighting of variable 2 is always greater than variable 1 in all four dry season equations (Appendix D). The 12-hour to 24-hour sunnnation of variable 2 means that it can respond quickly to changing precipitation patterns, provided it is up-dated with successive two-hour observations after the 0800 hr. forecast. A slight lag may develop between discriminant scores and avalanche occurrences that amounts to an over-estimation of prevailing hazard for several-hours, although this can be viewed as a built-in safety factor in the method, rather than a shortcoming.
108
Conclusion
The forecast method outlined in this chapter enables probability estimates to be made for several levels of avalanche hazard. A basic stratification into dry and wet slide seasons corresponds to two distinct sets of predictive equations that are calibrated to real-time data sununaries.
None of the forecast equations require data integration for more than two days prior to an avalanche or non-avalanche day and provision is made for up-dating certain variables during the day on which forecasts are issued. This ensures that the model will respond relatively quickly to both improving and deteriorating hazard situations, so that avalanche occurrences and avalanche forecasts are only slightly out of phase with each other.
Provided that real-time data sununaries can be obtained, on at least a two-hour basis, probability forecasting can be carried out with the aid of a- r,ocket, progranunable calculator, such as the Hewlett-Packard HP-65. The magnetic card storage capability of this machine allows the discriminant function terms (Appendix D) to be copied to storage registers without error at the time of the forecast. Also, retrievable programs can be written to speed up data reduction and calculations required to compute normal deviates. Although this machine can be progranuned to compute areas under a normal curve, this will very likely necessitate using most of the storage registers, so that preceding results are destroyed if not first written down. Since this increases the chances of error from incorrectly entered data, it is reconunended that a table of the normal curve be consulted, leaving the machine free to compute standardized discriminant scores and deviations from each group mean. Other, more sophisticated hardware configurations could be used that might involve automatic telemetering from all sensors, a digital clock for accurate timing of observations and a small desktop computer capable of blocking reduced data to storage locations in readiness for input into the prediction equations. (A system similar to the Tektronix 31 is envisioned here). Exclusive of data telemetry costs, then, a real-time data reduction system could be established for $800 to $4,500.
109
APPENDIX A
CHARACTERISTICS OF THE AVALANCHE DATA TAPE AND INSTRUCTIONS TO USERS
Introduction
The format of a typical segment of the 7-track avalanche data tape is shown in Figure A.1. Data are written in odd parity as card images at a density of 556 binary digits (bits) per inch~PI). On the CDC 6400 KRONOS 2.1 system at the University of Colorado, Boulder, the tape is in so-called 'binary' format. This distinguishes it from blocked BCD tapes which are written in even parity.
Irrespective of the length of a particular data file or record, the system writes data in physical record units (PRU's) of 512 central memory words in length. At the end of each month, logical record marks are written, each record consisting of an integer multiple of a PRU plus a fraction of a PRU, assuming tape record marks and logrcal record marks do not co-incide.
The highest level data unit on the tape is the file, specified by an end-of-file mark (EOF). As Figure A.1 indicates, logical records are nested within files. The entire tape is, therefore, a multi-file catalog; however, the system does not write 'catalog' marks on tapes, so that this term is meaningful to the user and not to the system, in this context.
Reading the Tape
The tape is filed at INSTAAR under the internal tape library number AA 224. The user should transport the tape to the Computing Center and request a Volume Serial Number (VSN) and then request the tape to be mounted as follows:
LABEL(TAPEl,VSN=NNNNNN,F=X,LB=KU,PO=R)
in which the tape is equivalenced to local file TAPEl, the VSN is acquired at the Center, F=X indicates compatibility with the defunct KRONOS 2.0 system, LB=KU means the tape is of the KRONOS, unlabeled type and PO=R says that the processing option is read.
(1)
After the tape has been mounted, it is rewound to the beginning-of-information point (BOI) by:
REWIND(TAPEl)
The list of files in Appendix Bis then consulted so as to position the tape at the beginning of the first file to be read. If a working copy is required of file number 2 on disk, the following system cards are needed:
SKIPF(TAPEl,l)
COPYRF(BF,TAPEl,PRECIP)
(2)
(3)
(4)
where PRECIP is an arbitrary local file name (LFN) for this precipitation file. Workin~ copies of other files are obtained by skipping the required number of file marks using (3) and the fast copy routine in (4). When reckoning the number of files to be skipped, do not include the EOF of the file just copied. Also, the LFN in (4) may be changed, otherwise a multi-file file will result under the name PRECIP.
When all files are copied from the tape, the tape drive is returned to the system. Users should'consult persons knowledgable with the system before writing on the tape.
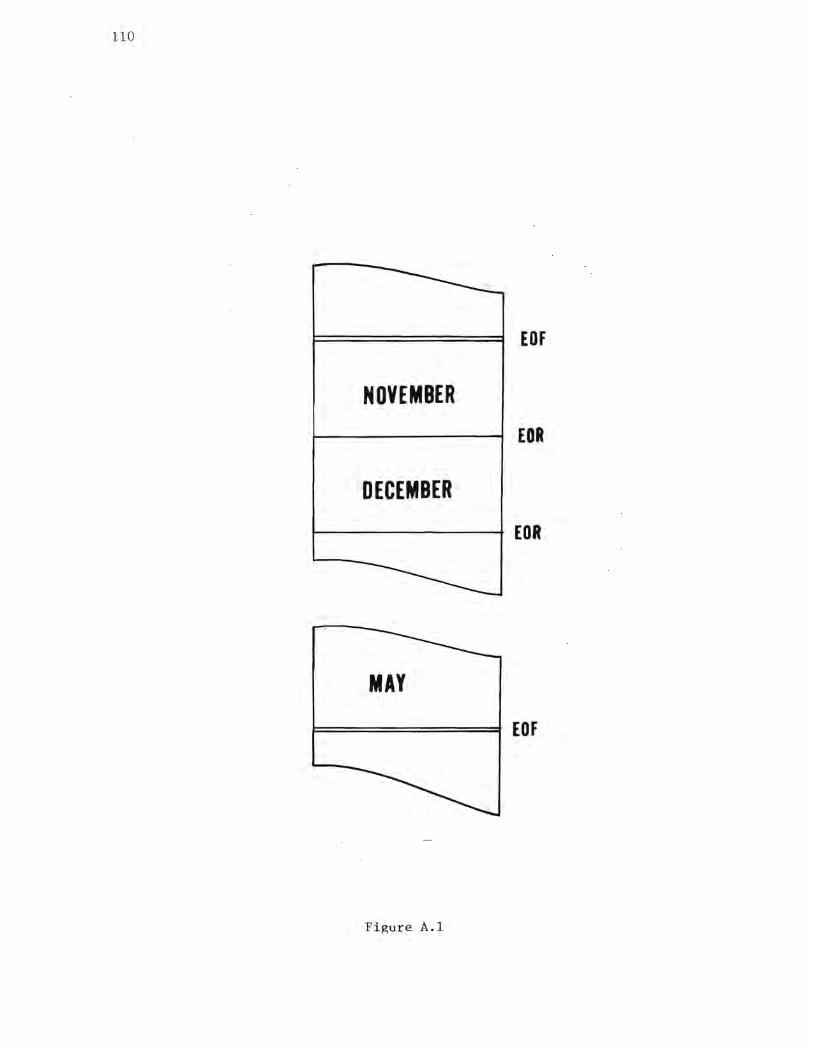
llO
EDF
NOVEMBER
EOR
DECEMBER
MAY
f===============~ EDF
Figure A.l
111
APPENDIX B
LISTING OF DATA FILES ON THE MAGNETIC TAPE
A sequential listing of all data files for the period 1971-75 inclusive, is given in Table B.l of this appendix. The format used in the avalanche occurrence data (file numbers 20, 21, 43-45, 69-71 and 90-92) is explained in Appendix 2 prior to the listing of all occurrences. To assist the user, the format of all other data files is given below.
In most cases, there is only one card for each day in each data file. For example, the logical record for December, 1971 in File 2 (2-hr precipitation, Red Mountain Pass Study Site) consists of 31 card images. Exceptions to this rule are: (1) All wind speed and direction files for Pt. 12,325; due to the 1-hour data
reduction, there are two cards per day on these files in all seasons.
(2) Western Scientific precipitation data for Ironton and Molas; again, the 1-hour data reduction means two cards per day.
(3) Daily observations, Red Mountain Pass, for 1974-75 only. Here, there is one card for each observation within a given day. Therefore, there may be from one to as many as five cards per day on this file.
Irrespective of the number of cards per day, the date and site identification format listed below applies to all cards on all data files:
Year: cols. 1,2. Month: cols. 4,5. Day: cols. 7,8.
Site (abbreviated): cols. 10-14. The abbreviations are self-explanatory when compared to the listing of files in Table B.l.
Type of data: cols. 16-19. A two-digit alphabetical abbreviation is used, followed by a two-digit number, specifying the period over which data was reduced. For example, 2-hour precipitation becomes PP02; 2-hour air temperature, TM02. One-hour windspeed becomes WS01. Snow temperatures(daily readings) from all fixed thermocouple arrays are listed as TS24. For Red Mountain Pass, 1974-75, an additional array was run adjacent to the isotopic profiler (File Number 75) and this is identified by TP24. The term 'snow surface temperatures' is possibly misleading and is explained more fully here. These files are all identified by TF24, and the data were gathered by inserting a battery of sensors fixed to rods of length 2:5 cm., 5 cm etc. into the snow from the surface._ This is in contrast to readings from fixed thermocouple arrays (TS24, TP24) which involve measurement at levels that are fixed with respect to the ground surface.
Digit to describe numbers of cards per day or numbers of observations per day, where this is not constant (e.g., snow temperature): col. 20. On all files listed in (1) and (2) above, column 20 on the first card of each pair is punched '1', and the same column on the second card is punched '2'. In (3) above, column 20 is used to specify the number of observations (i.e., cards) for that day. On the TP24 and TS24 files, column 20 is used to specify the number of observations (i.e., temperature levels read) on a given day. Above 9, an alphabetical coding is used: i.e., A=lO, etc.
112
From the foregoing, it is seen that the actual observations for a given day always begin in column 21. The floating-point decimal formats for each type of data are as follows:
(1) Precipitation - 12F4.1, in millimeters, with decimal point punched. (2) Air temperature - 12F5.1, in degrees centigrade, with decimal point punched. (3) Wind speed - 12(F3.0,1X), in meters per second. (4) Wind direction - 12(F3.0,1X), azimuth. (5) Snow temperatures - 12F5.l, in degrees centigrade, decimal point punched. (6) Snow depth - F5.l, stake reading in centimeters, decimal point punched.
The format for daily observations is as follows for the seasons 1971-74:
Cols. 21-23: . , 24-27: II 29-31: II 32-35: II 36-19:
Master stake reading, centimeters, F3.0 . 24-hour board reading, centimeters, in F4.1, decimal point punched. Einsinktiefe reading, centimeters, F3.0. Crystal type (International classification), A4 format. 24-hour water equivalent, millimeters, F4.1, decimal punched.
The format for daily observations for the season 1974-75 is as follows:
Cols. 21: " 23-26: II 28-30: II 32-34: " 35: II 36-38: II 40-42: II 44-46: " 48-50: " 51: II 52-54: II 55-57: I! 59-62:
Number of observations on given day. Time of observation, 24-hour clock. Master stake reading, centimeters, F3.0. Interval board reading, centimeters, F3.0. Punch 'D' if board was dumped after observation; otherwise, blank. Density of interval board sample, F3.3, no decimal punched. 24-hour board reading, centimeters, F3.0. Density of 24-hour board sample, F3.3, no decimal punched. Storm board reading, centimeters, F3.0. µunch 'D' if board was dumped after ohservation; otherwise, blank. Density of storm board sample, F3.3, no decimal punched. Einsinktiefe reading, centimeters, F3.0. Crystal type (Jnternational classification), A4 format.
If the data set is t0 be up-dated, (End-of-record) card at the end of card at the end of each data file.
the user should remember to include a 7-8-9 each calendar month, and a 6-7-9(End-of-file) This will enable all data to be manipulated
with the existing data reduction programs, described in Appendix C.
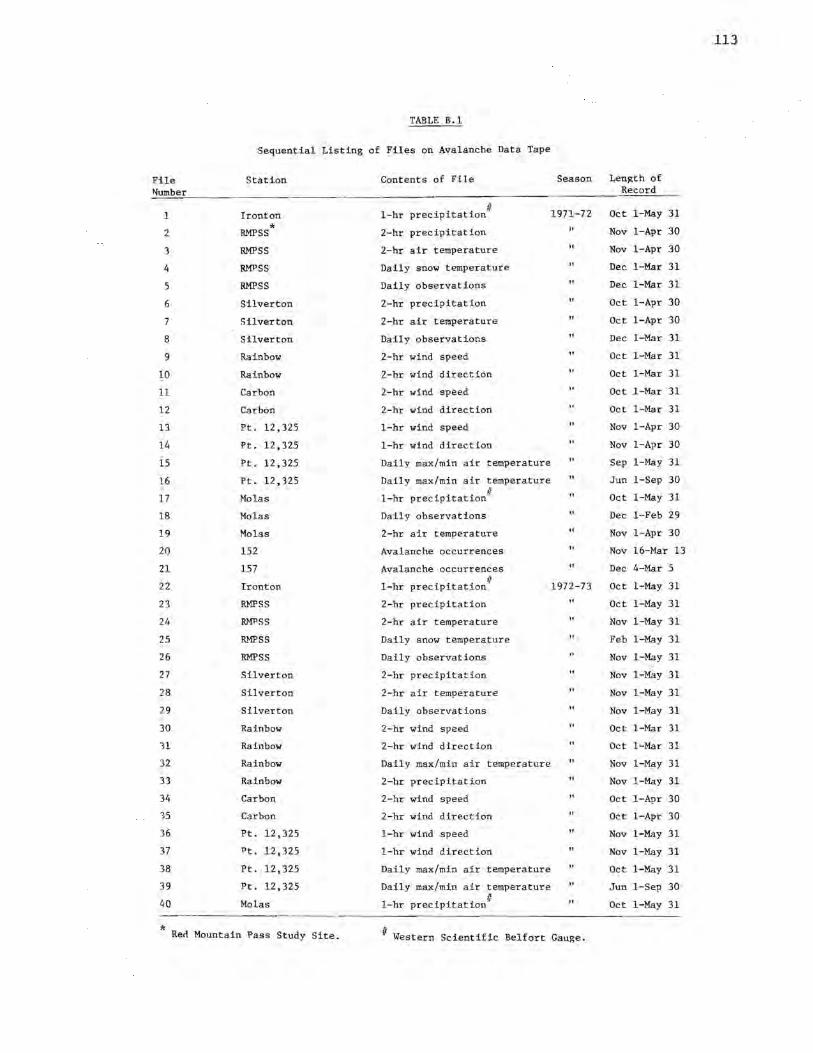
113
TABLE B.l
Sequential Listing of Files on Avalanche Data Tape
File Station Contents of File Season Len)l;th of Number Record
1 1-hr precipitation II 1971-72 Oct 1-May 31 Ironton
* 2 RMPSS 2-hr precipitation Nov 1-Apr 30
3 RMPSS 2-hr air temperature Nov 1-Apr 30
4 RMPSS Daily snow temperature Dec 1-Mar 31
5 RMPSS Daily observations Dec 1-Mar 31
6 Silverton 2-hr precipitation Oct 1-Apr 30
7 Silverton 2-hr air temperature Oct 1-Apr 30
8 Silverton Daily observations Dec 1-Mar 31
9 Rainbow 2-hr wind speed Oct 1-Mar 31
10 Rainbow 2-hr wind direction Oct 1-Mar 31
11 Carbon 2-hr wind speed Oct 1-Mar 31
12 Carbon 2-hr wind direction Oct 1-Mar 31
13 Pt. 12,325 1-hr wind speed Nov 1-Apr 30
14 Pt. 12,325 1-hr wind direction Nov 1-Apr 30
15 Pt. 12,325 Daily max/min a ir temperature Sep 1-May 31
16 Pt. 12,325 Daily max/min air temperature Jun 1-Sep 30
17 Molas 1-hr precipitation II Oct 1-May 31
18 Molas Daily observations Dec 1-Feb 29
19 Molas 2-hr air temperature Nov 1-Apr 30
2() 152 Avalanche occurrences Nov 16-Mar 13
21 157 Avalanche occurrences Dec 4-Mar 5
22 Ironton 1-hr precipitation II 1972-73 Oct 1-May 31
23 RMPSS 2-hr precipitation Oct 1-May 31
24 RMPSS 2-hr air temperature Nov 1-May 31
25 RMPSS Daily snow temperature Feb 1-May 31
26 RMPSS Daily observations Nov 1-May 31
27 Silverton 2-hr precipitation Nov 1-May 31
28 Silverton 2-hr air temperature Nov 1-May 31
29 Silverton Daily observations Nov 1-May 31
30 Rainbow 2-hr wind speed Oct 1-Mar 31
31 Rainbow 2-hr wind direction Oct 1-Mar 31
32 Rainbow Daily max/min air temperature Nov 1-May 31
33 Rainbow 2-hr precipitation Nov 1-May 31
34 Carbon 2-hr wind speed Oct 1-Apr 30
'35 Carbon 2-hr wind direction Oct 1-Apr 30
36 Pt. 12,325 1-hr wind speed Nov 1-May 31
37 Pt, 12,325 1-hr wind direction Nov 1-May 31
38 Pt. 12,325 Daily max/min air temperature Oct 1-May 31
39 Pt. 12,325 Daily max/min air temperature Jun 1-Sep 30
40 Molas 1-hr precipitation II Oct 1-May 31
* II Western Red Mountain Pass Study Site. Scientific Belfort Gauge.
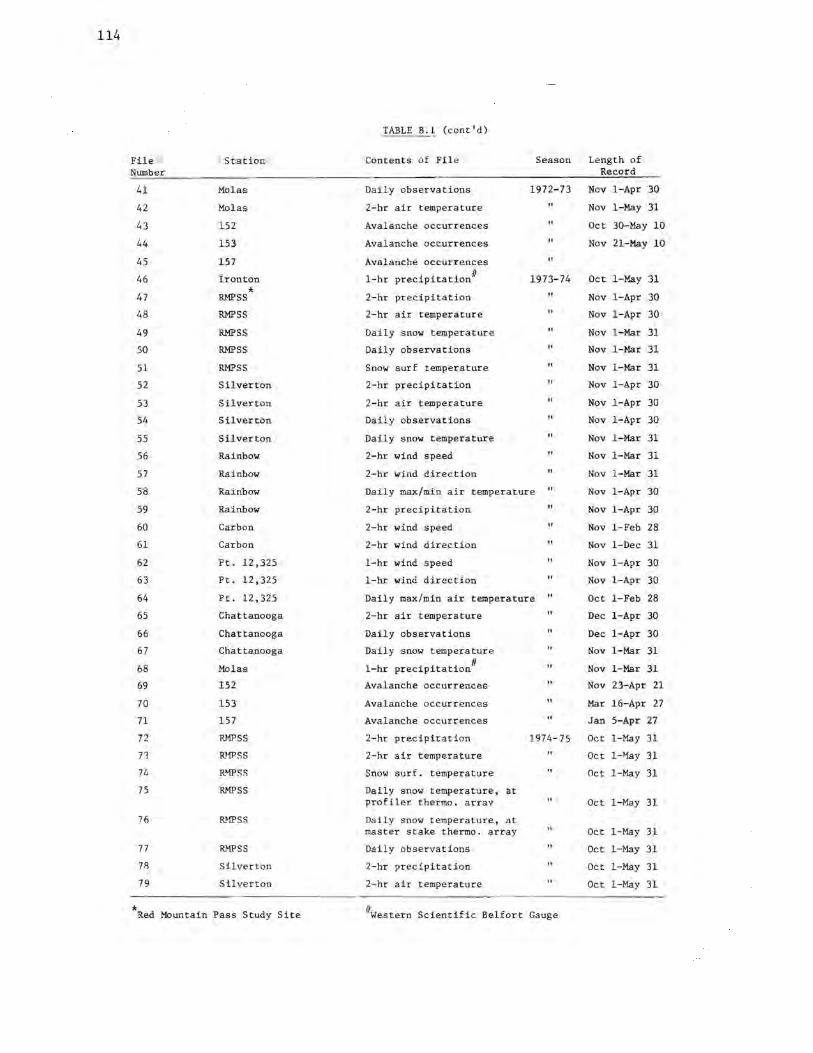
114
TABLE B.l (cont'd)
File Station Contents of File Season Length of Number Record
41 Molas Daily observations 1972-73 Nov 1-Apr 30
42 Molas 2-hr air temperature Nov 1-May 31
43 152 Avalanche occurrences Oct 30-May 10
44 153 Avalanche occurrences Nov 21-May 10
45 157 Avalanche occurrences
46 Ironton 1-hr precipitation II 1973-74 Oct 1-May 31
* 47 RMPSS 2-hr precipitation Nov 1-Apr 30
48 RMPSS 2-hr air temperature Nov 1-Apr 30
49 RMPSS Daily snow temperature Nov 1-Mar 31
50 RMPSS Daily observations Nov 1-Mar 31
51 RMPSS Snow surf temperature Nov 1-Mar 31
52 Silverton 2-hr precipitation Nov 1-Apr 30
53 Silverton 2-hr air temperature Nov 1-Apr 30
54 Silverton Daily observations Nov 1-Apr 30
55 Silverton Daily snow temperature " Nov !-Mar 31
56 Rainbow 2-hr wind speed Nov 1-Mar 31
57 Rainbow 2-hr wind direction Nov 1-Mar 31
58 Rainbow Daily max/min air temperature Nov 1-Apr 30
59 Rainbow 2-hr precipitation Nov 1-Apr 30
60 Carbon 2-hr wind speed Nov 1-Feb 28
61 Carbon 2-hr wind direction Nov 1-Dec 31
62 Pt. 12,325 1-hr wind speed Nov 1-Apr 30
63 Pt. 12,325 1-hr wind direction Nov 1-Apr 30
64 Pt. 12,325 Daily max/min air temperature " Oct 1-Feb 28
65 Chattanooga 2-hr air temperature Dec 1-Apr 30
66 Chattanooga Daily observations Dec 1-Apr 30
67 Chattanooga Daily snow temperature Nov 1-Mar 31
68 Molas 1-hr precipitation II Nov 1-Mar 31
69 152 Avalanche occurrences II Nov 23-Apr 21
70 153 Avalanche occurrences " Mar 16-Apr 27
71 157 Avalanche occurrences Jan 5-Apr 27
72 RMPSS 2-hr precipitation 1974-75 Oc t 1-May 31
73 ID1PSS 2-hr air temperature Oct 1-~fay 31
74 R>.fPSS Snow surf. temperature Oct 1-May 31
75 RMPSS Daily snow temperature, at profiler thermo. array Oct 1-May 31
76 RMPSS Daily snow temperature, at master stake thermo. array Oct 1-May 31
77 RMPSS Daily observations Oct 1-May 31
78 Silverton 2-hr precipitation Oct 1-May 31
79 Silverton 2-hr air temperature Oct 1-May 31
* 11western Red Mountain Pass Study Site Scientific Belfort Gauge
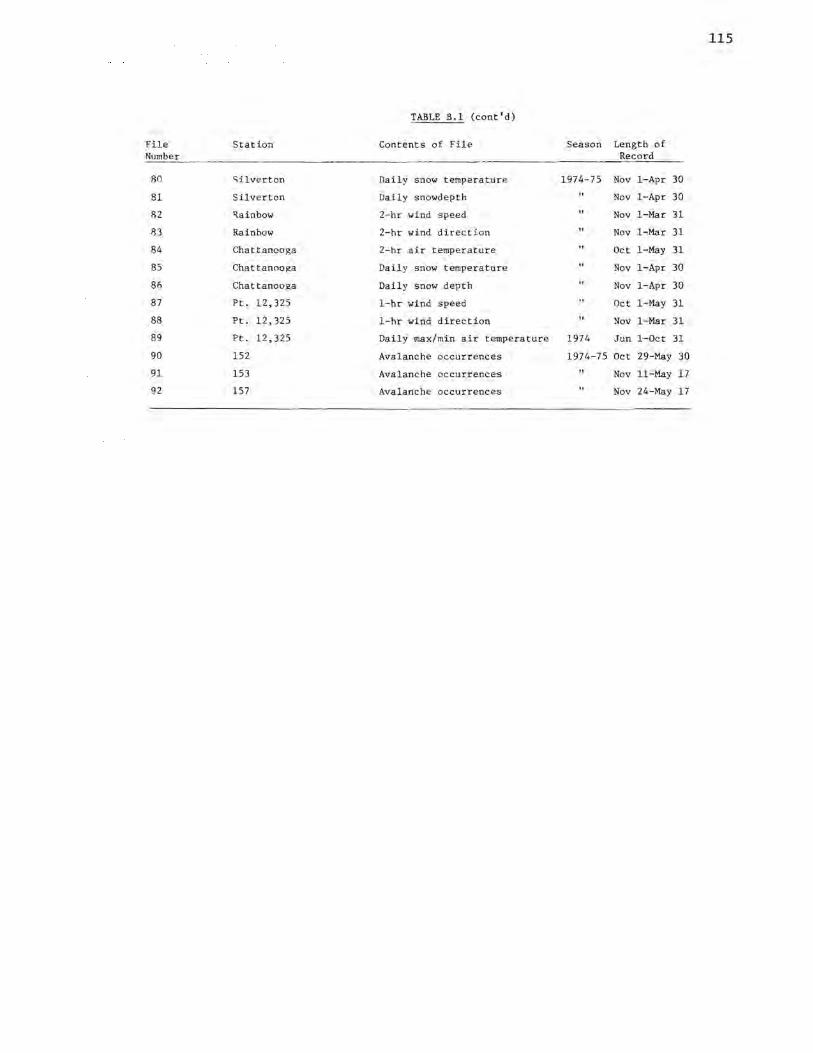
115
TABLE B.l (cont'd)
File Station Contents of File Season Length of Number Record
80 ',ilverton Daily snow temperature 1974-75 Nov 1-Apr 30
81 Silverton Daily snowdepth Nov 1-Apr 30
82 'l.ainbow 2-hr wind s peed Nov 1-Mar 31
83 Rainbow 2-hr wind direc tion Nov 1-Mar 31
84 Chattanooga 2-hr air temperature Oct 1-May 31
85 Chattanooga Daily snow temperature Nov 1-Apr 30
86 Chattanooga Daily snow depth Nov 1-Apr 30
87 Pt. 12,325 1-hr wind speed Oct 1-May 31
88 Pt. 12,325 1-hr wind direction Nov !-Mar 31
89 Pt. 12,325 Daily max/min air temperature 1974 Jun !-Oct 31
90 152 Avalanche occurrences 1974-75 Oct 29-May 30
91 153 Avalanche occurrences Nov 11-May 17
92 157 Avalanche o ccurrences Nov 24-May 17
116
APPENDlX C
DESCRIPTION OF DATA REDUCTION PROGRAMS
Program AVAL
This program generates a list of dates on which avalanches occurred from a sequential listing of all avalanche occurrences (Appendix 2), which should be copird to local file TAPEl prior to program execution. If the copy is made from the magnetic tape catalog, the latter should be equivalenced to a local file other than TAPEl to avoid confusion (See Appendix A). Avalanche dates are written onto local file TAPE2 in the format required by the data reduction program PRELIM (described below). To avoid confusion in later work involving several permanent files (See KRONOS 2.1 system Reference Manual) local file TAPE2 should be saved under an alphabetical name (e.g., AVAL) as follows:
SAVE(TAPE2=AVAL) (1)
There is no confusion between the program name and the permanent file name. A listing of the program is given at the end of this appendix.
Program NONAVAL
Since the discriminant analysis involves avalanche and non-avalanche days, it would be tedious for the user to have to supply the latter set of days. Instead, these are generated by NONAVAL from the output file of AVAL (i.e., local file TAPE2). Therefore, NONAVAL reads from TAPE2 and writes its output on local file TAPE3, so that both sets of dates can be generated in a single run. However, TAPE2 must be rewound before executing NONAVAL since the pointer is at EOF on this file after program AVAL. The output from NONAVAL can be saved as a permanent file under the same name as the program using (1) above when the LFN is changed. A listing of the program is given at the end of this appendix.
Prdgram PRELIM
This is the main data reduction routine of this set of programs and comprises several subroutines which have clearly-defined functions. The main program (PRELIM) handles card input and printing of results and calls all other subroutines requested by the user in the array OPTION. Subroutines PRECIP, AIRTEMP and WSPEED reduce precipitation, air temperature and wind speed data respectively. The number of data points per day is specified by array NPOINT in program PRELIM. Subroutine FINDAY makes sure that each data file is positioned at the appropriate date before data reduction begins. This allows certain variables to be integrated over variable time periods (Table 16), the length of this period being specified by array NDAY in program PRELIM and by integer variable KOUNT in other subroutines. Subroutine Tl200 creates an array of observations from 1200 hr on day (j-1) to 1200 hr on day j from card images which are punched in 0000 hr to 2400 hr format (Table 16). Subroutine CASELIM eliminates cases (days) which have any missing data. These variables are printed as -0.0 in the sample of output from PRELIM given at the end of this appendix. The card input to PRELIM from which the sample output was generated is listed at the end of subroutine CASELIM. Ordinarily, these cards would not be listed in this way. Special note: It is especially important that the variable INIT be ihcluded on
117
card number 4 of the input sequence to PRELIM. This is the month (e.g. 10 = October) in which data reduction is to commence, and is used by FINDAY to ensure that previous 16gical records (months) on the weather data files are skipped. For example, if all data files begin with October in a particular year, but the avalanche season did not start until November, then the number 11 would be punched for variable INIT at READ 580 in PRELIM. The file is always rewound by FINDAY, following which (!NIT - 10) logical records are skipped. Also, FINDAY will only make allowance for leap years up to and including 1976.
Irrespective of the length of the data reduction period specified under NDAY for all three weather data files, variables 2, 3, 5, 6, 8 and 9 (Table 16) will always be generated by PRELIM. Therefore, only the levels of variables 1, 4 and 7 are changed by using a different time step. The variables are generated in the same order as the list in Table 16. However, if, say, the air temperature file is omitted under array OPTION, the three windspeed variables will be listed as 4, 5 and 6 on the output file. The output file with missing data cases deleted resides on TAPES and can be saved as a permanent file using (1) above with different local file and permanent file names.
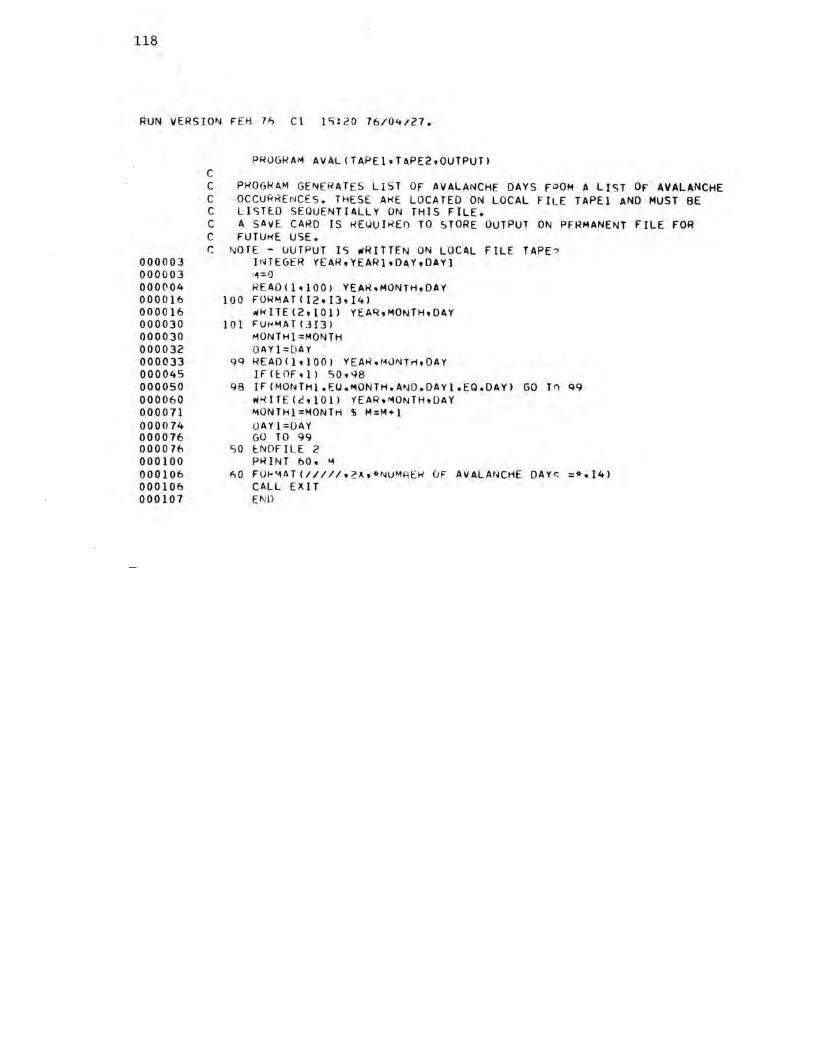
118
RUN VERSION FE8 7A Cl JS:20 76/04/27.
000003 000003 000(104 000016 000016 000030 000030 000032 000033 000045 000050 000060 000071 000074 000076 000076 000100 000106 000106 000107
PROGRA~ AVALCTAPE1,TAPE2,0UTPUTI C C PROGRAM GENERATES LIST OF AVALANCHE DAYS FOOM A LIST OF AVALANCHE C ~CCUR~ENCES. THESE AME LOCATED ON LOCAL FILE TAPEl AND MUST BE C LISTED SEQUENTIALLY ON THIS FILE. C A SAVE CARD IS MEUUIREO TO $TORE OUTPUT ON PERMANENT FILE FOR C FUTUt-<E. USE. C NOTE - OUTPUT 15 wRITTEN ON LOCAL FILE TAPE?
INTEGER YEAR,YEAR!,DAY,DAYI •<l=IJ READ<l,1001 YEAR,MONTH,DAY
100 F0RMAT(I2,I3,I41 #RITE<2,1011 YEAR,MONTH,DAY
101 FUf<MATUI31 "10NTHl=MONTH l)AYl=DAY
qq READ1l,l00l YEAR,M0NTrl,DAY Iflt.Ofdl ",0,98
98 IFIMONTHl.EU.MONTH.A~D.DAYl.EQ.DAYI GO Tn Q9 l'l><lTE(l'.,1011 'fEAR,r-lONTH,OAY MONTHl=MONTH $ M=M•l UAYl=OAY GO TO 99
SO t.NDfILE 2 PRINT 60, "-4
AO FOf<~AT(/////, 2 ~,*NUMREM OF AVALANCHE DAY ~ =*,141 CALL EXIT [NL)
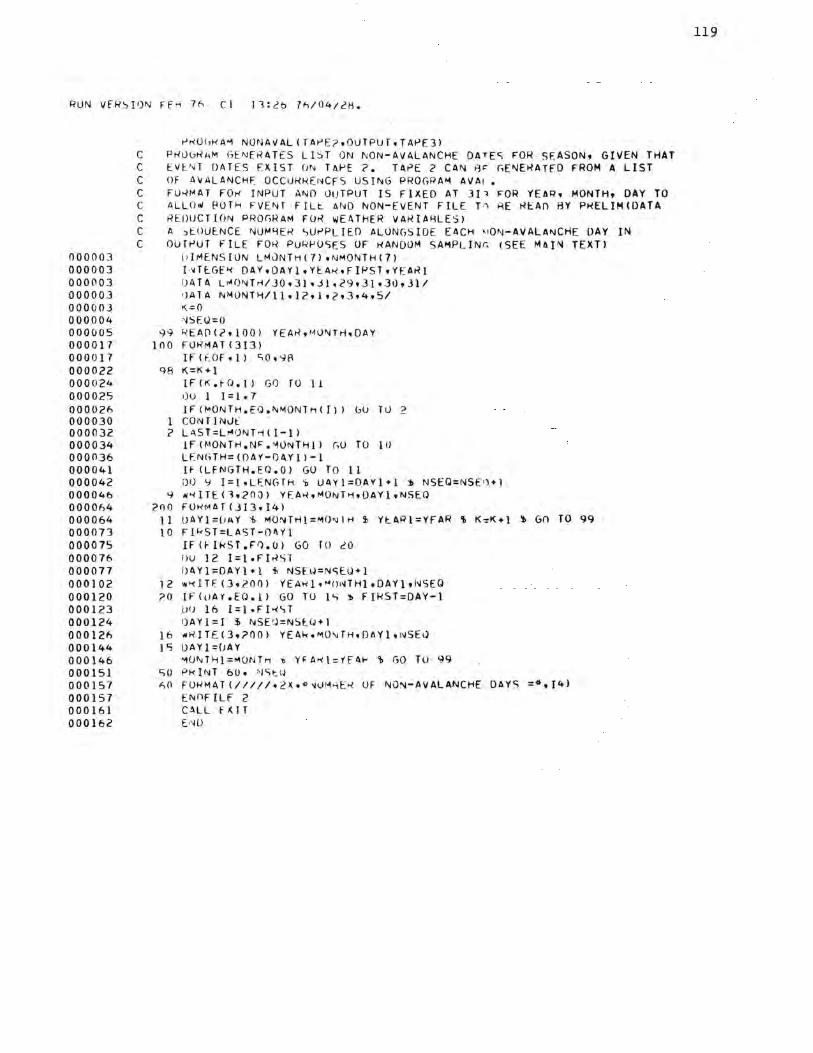
RUN VfH~!IJN ff~ 76 Cl Jl:~b 7A/04/iH.
000003 000003 000003 000003 000003 000004 000005 000017 000017 000022 000024 000025 000026 000030 000032 000034 000036 000041 000042 000046 000064 000064 000073 000075 000076 000077 000102 000120 000123 000124 00012,:, 000144 000146 000151 000157 000157 000161 000162
r't-<0(,KA"1 NONAVAL(TAPE?,OUTPUT,TAPE3l C PKUGK~M GENERATES LIST ON ~ON-AVALANCHE DATES FOR SF.ASON, GIVEN THAT C EVE~l OATES EXIST UN TA~E ?. TAPE 2 CAN 8~ ~ENERATED FROM A LIST C OF A~ALANCHF. OCCUMMENCFS USING PROGRA"4 AVAi. C fU~MAT FO~ INPUT ANO LltJTPUT IS FIXED AT JP l"OR YEAR, MONTH, DAY TO C ALLO~ 80TH FVENT FIL~ A~D NON-EVENT FILE T~ ~E REAn BY PMELIM(DATA C REDUCTION PROGRAM FUR WEATHER VAMIA~LES) C A ,EOUE.NCE f\JU~YER <,UPPLIEO ALONGSIDE EACH "ON-AVALANCHE DAY IN C OUTPUT FILE FOR PUR~USES UF RANDOM SAMPLINr, (SEE MAJN TEXT)
ldMENSION LM0NTH(7l ,NMONTH(7) !~TE.GE~ DAY,DAYl,YEAK,FlRST,YEARl OATA L~ONT~/JO,Jl,Jl.29,31,J0,31/ •JAl A N"4LHH1-1/l l, l2, l t2t3,4,5/ r<=O ·\ISEQ=O
99 REA0(2,100) YEAR,MLlNTrl,DAY 100 FLlRr-1AT(3I3)
!F(f_CJFdl c;o,~f\ 98 K=K+l
IF(K.f(J.l) GIJ ro 11 l)U l I= l • 7 !F(MONTH.EQ.NMONTh(I)l bU TU 2
l CONTlNvt: ? LAST=L~ONT~(I-ll
lF (~IONTH.N~ .~LlNTHl l r,o TO 10 LfNGTH=(OAf-OAYlJ-1 H (LFNGTH. EO.O) GO TO 11 DO 9 I=l,Lf: NGTH 'i> UAYl=OAYl+l :t, NSEQ=NSE •Hl
9 N~ITE(1,20J) YfAM,MONTH,DAYl,NSEQ 2()0 FOM~AT(JI3•I4)
11 UAYl=UAY \ MONTHl=~O~lH j YtAAl=YFAR \ K:K+l i GO TO 99 10 FlkST=LAST-OAYl
If(flkST.F~.U) GO TO iO i )U 12 I=l•FirlS1 IJAYl=DAYl+l i, NSElJ=NSE.U+l
1 2 w~ !Tf ( 3 • ?.0 ()) YE AK}, "01'-IT Hl • DAY 1, l'iSEQ ?0 IF (LJAY .E(J. l) GO TO 1, '!I F If<ST=DAY-1
U!J 16 l=l•FH<;T QAYl=I $ NSELl=NSE.~+1
16 ~MlTE(3,?00l YEAk,~O~TH,DAYl,NSEQ IC, lJAYl=!JAY
~U~THl=~UNTrl t YFA~l =YF A~ \ GO TU 99 SO PKINT 60, ~St~ ~n FOMMAT(/////•2~• * '-l0M~EM OF NON-AVALANCHE DAYS =*,J4)
ENnfILF 2 CALL f..<IT uw
119
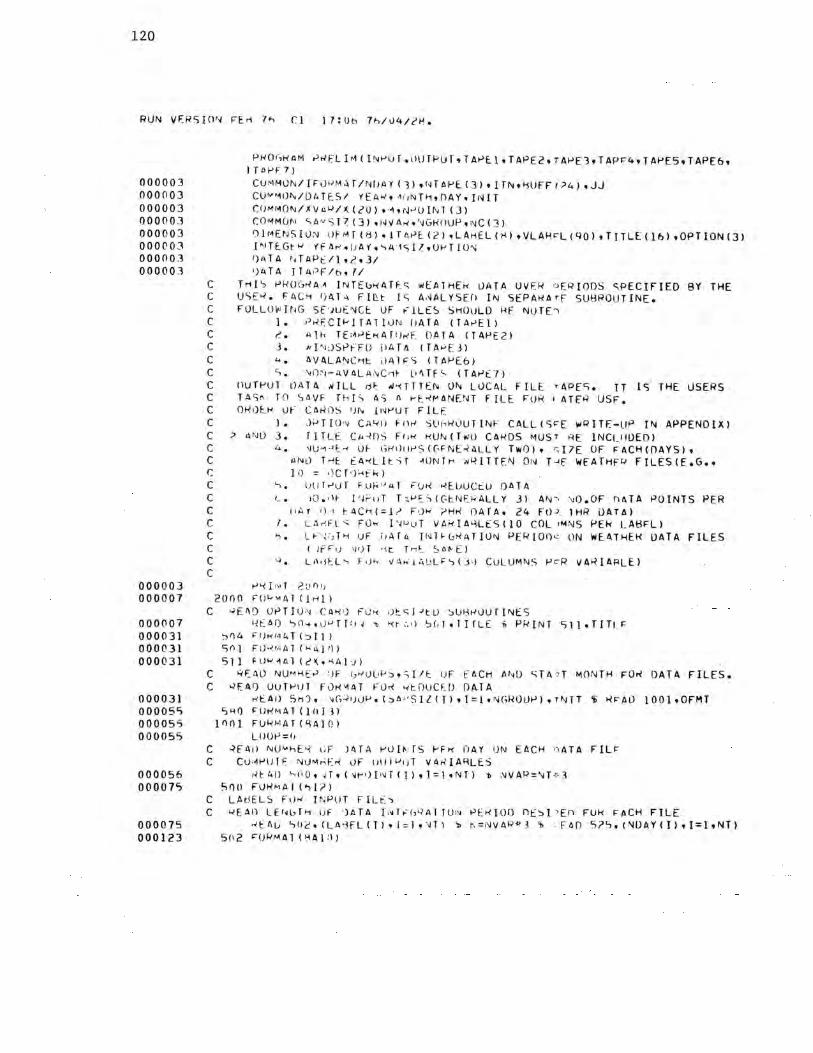
120
RUN VERS!O~ FErl 7~ Cl 17:Ut, 7h/U4/2H.
000003 000003 000003 000003 000003 000003 00000] 000003
000003 000007
000007 000031 000031 000031
000031 00005', 000055 000055
000056 00007">
000075 000123
P K(}(,K AM t-'~ I: L I "1 < I Nt-'U f • 1 It) T PLJ T, TAPE I , TAPE 2, TAPE 3, T APIC 4, TAPE 5, TAPE 6, l Tof-' F 7 >
CU />1MIJN/ IF O'-' M.:. T /NI lll'f ( 1) , rH APE ( 3) , l TN t liUFF ( ?4) , JJ CU 1n~t)N/0ATf_S/ l'EA><!, a,1NTH,[)AY, !NIT CUMM0N/XVaµ/K(2U),~,N~O!NT(3) C0"'1M(Jf\l "- A" ST 7. ( 3) ''"I/Ar<, ''JGHOUP, i\lC (}) ') 1 r~ENSI \J ;",l 1.lf M f < 8 > , 1 T /\t>c. ( 2) , L AHEL < I:'\ l , VL AHi::-L ( go l , TIT LE ( 16 l , OPT ION ( 3 l f'.!Tf:.Gt"' Yfll,-,,t J A'f',',A '1C,l1.,UPT 10"< ~ ATA ~ TAP~/l,2,3/ 1J4TA IT4 •) Fft>,f/
C THI~ PkOG><A~ INTEbKAT~s wEATHEk 0ATA OVER aERIOOS SPECIFIED BY THE C USE~. f4C'1 f) Al .. Fllc.t le, A,H•LYSEf> IN 5EPAKATF SUHROUTINE. C FOLLO~I~G Sf~UE~Ct. UF ~lLE~ SHOULD Hf NUTE~ C J. t)><FCIPJTAllUN [)ATA (TA,->El) C ?.. Alf< TtM,.,E.KAl tJt<'E OATA <TAPE2) C J . ,, l'·JJSP~'FD ()Ar ll ( r A,C,f j)
C "• AVALANC1-1t i.l AlF<; <TAf-'E6J C c, . 1\/<)~i-4 VAL 4 ,\,C ,1~ L• Hf~ ( T At-'C7)
C OUTPUT LlATA ..iILL d~ il >-< TTTEN U", LIJCAL FILE •APES. IT I<; THE USERS C TA S !\ TO SA VF T f< I S 4 S fl t- ~- ·H• AN E ~H F ILE F ll R I AT f ~ US F • C Ok 1)t.f< UF CA,<l) S <Jr>. l>~t-'UT F ILF C J. J;.>T[ (H CA'-< n F!l"' S L> l's l-<0UTINF CALL(Si=-E \,IRlTF.-uP I"4 APPENDIX) C ? <1Nl) 3. TITLE Ci.~ll':> Fr , t< HUN< Two CAHOS "1UST f'.IE lNCt_llL)EO) C 4. 'JlJ ·~ ·'l -< Uf- ;;1-<1 Jllt-' S (GFNE ,U1LLY TwOl • ~ I7E OF F"ACH(()AYSl • C ANO T~E EA'<LltST ~llNT~ ~~lTTEN ON T~f WfATHFR FILES<E.G •• C C C C C C C C C
10 = ,)CT ·Hfk) " · lJlJT~ur F Uf<' ' "'l i'(Jt-< >-?E.lJUCt:LJ DATA '·· · 1() . , lF 1 ··Ji-'11T T ,_ µ 1:.", (('.tNfc,<ALLY J) AN -· :\J O.OF nATA POINTS PER
1,Ay <l t t ACt-1(:l? F•J i-< ;.>Hr< DATA, 24 FtP. lHR OATA) T. L Ar. F.L c; FO"' l 'JuuJ VAi:<!A•Kt:5(10 COL t"4NS PEk LAHFL)
>:i . u · ; :, T>-l uF r,Afc, r1~H G"<4TlU"- PER!On ~ ON Wf:ATHEf>< DATA FILES ( fr- Fu ,11JT ·s t: Tr-: !: Sot-E)
'-1 . L,1,it::L '> F<J"' v'A>ii.'.'d.J L•'>(J ,1 Cv LUMNS P c- R VARIARLEl
µ><r ," r 2 c1 n 1J 2000 F ll k"AT(lHJ)
C ~E~~ UPTIU ~ CAK 0 fUt< 0t~l~tU ~U8MOUT!NES
C C
C C
C C
1~ t: A o .., n .. , u w r r , , i .,, >< r- :. , > ':> <, i. 1 r r LE ,, P f.l I N r s 1 1 • T I T, . F ':,()4 i:tJ1< 1,1r..T<:::>Ill ',f')j F t)'S MAl (><i\} 1))
511 HJ'"'~Al (,:'l(o"AI J )
~EAU NUN"1 E~ •JF b'< UL>P ~ ,;I/ l uF fACH A",0 ~TA J T MONTH FOK DATA FILES. .;>[Af) OuJµuT F ~)t-<"1A T FO>< '<tDUCU) OAT A
,-,EA1J S!'l), 'lG:.•JUµo(::,O >'SlL(Jl,T:i,•\j(;ROLJP).rt<..JrT 'ii Ri=-AL) 1001,0FMT ",><0 FUt-<MAl(lOl.3)
1no1 FU~ MAT(~AJ O)
.;,fA() NU"'kE '< l;f )ATA t-'O[~, rs f-'F>< DAY ON EIICH ,' ,ATA FILI'" ClHf-'lJff' Nt.JM,.;E>< OF 11111µ1)1 V<l"lARLt.S
><1:-41) c.,r,o • .r,(~t-<)l1~T([>,l=!,NT) 1> ,\IVAR=\iT ;; ] 5()0 FUHMAf(,-,J?l
LAtJELS Fll..i P,PUT FI Lt'> ..IEAI) LErit,T>-t uF ')ATA l ,'ITe(;« Al ru , ... PEK[l)f) nt:~I )[n FOk FACH FILE
-itl\L, ')(lc'•(LA•JFL(Thl=J, ·fli 'I> r, =NVAR*3"' . for> 5?5,(NOAY(l),I=l,NT) sn2 F<J><'4A 1 < ':IA 1 n >
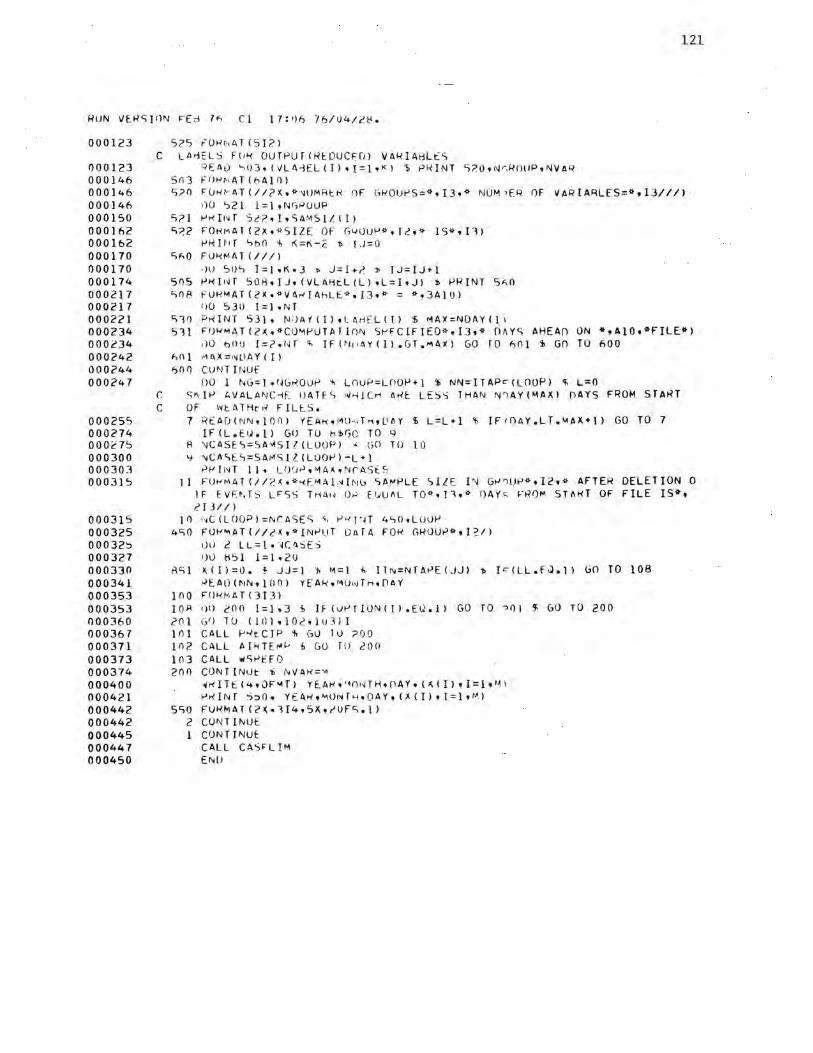
121
RUN Vf.R<;JOI\J Ffd 7A Cl 17:•)f-, 76/U4/c8.
000123 C
000123 000146 000146 000146 000150 000162 000162 000170 000170 000174 000217 000217 000221 000234 000,'34 000242 000244 000247
r. C
000255 000274 000.:'75 000300 000303 000315
000315 000325 00032:> 000327 000330 000341 000353 000353 000360 000367 000371 000373 000374 000400 000421 000442 000442 000445 000447 000450
525 rOH r·,AT (5I?l
LArlELS FUR OUfPUf(REDUCFOl VAR!ABL~S Qf::AI) '-iti3dVLl\-ifl(ll,I=l,K) 'Ii PRINT S;>Q,Nr,RntlP,NVAI'~
5!13 FOH~1AT(t>Al/J) 5?0 FUH~AT(//?K•*~UMktl-i OF GROUPS=*,I3,* NU~ •ER OF VARIA~LES=*,13///)
1)() ':>21 1 = l, N'j>JCJUP S?l Pi-ilNf St?•l,SAMS!l(l) 5;>2 F0HMAl(2Ko*S!ZE OF G~UUP*,I2,• 15•,ll)
t-' H I I I T ', b () '\, ~ = K - 2 1> T ,J = 0 SAO FUH~1AT (///)
,JU 50~ l=l,K•J :r, J=l+? l> IJ=IJ+l 505 f-'HI1JT SOBt!JdVLAHt.l(ll,L=I,J) 1> PRINT S.;O sn~ f0H~AT(2X•*VAH!AhLl:*.I3•* = •,3Al0)
Ii() 530 I=! •NT Sl!J Pi-ilNT 531, N :)Al' ( I l ,L /\rlt. L (Tl $ r-lAX=NDAY ( l 1
511 FIJ~MAT(2x,•co~PUTATlnN 5PfCIFIEO•,I3,• OhYS AHEAn ON *,AlO,*FILE*) .lO o!lU I=?.!H q, IF(Nr•AY(Il.GT.l"IAXl GO TO 601 :I> GO TO 600
h!l l ,'11\X=•'WAY ( I l 60/J cu,n Ii.of
00 l ~•G=1.qGHOuP '4> LnuP=LOOt-'+l '.I> NN=ITAPc(LOOP} <i; L=O S~IP AVALA~C~E llATF\ ~~!CH Al-it LESS THAN N~ AY(~AXl OAYS FROM START OF WtATHt~ FlltS. 7 READ(NN,100) YEAM,MU ~ TH,DAY I L=L•l I !FtOAY.LT.~AX•l) GO TO 7
IFCL.Ell.ll GO TO b:bGO TO 9 A 'JCASES=SA'15Il(LOOP} ~ t,O TO 10 Y 'JCASES=SAMSIZ(LOOPl-L+l
P~!NT ll• LOO~,~A~•NrASt.5 l l FUHMAT (//?.~•*-<f.'"1Al.~IN\J SAMPLE SILE I'~ GWHJP*.!2,• AFTER DELETION 0
IF EVF.~.Ts L•SS THAI~(),.; fl.,1Ufll ro•,r,,• [)AYc:; FRO"' STM<T OF FILE IS*, 2!3//)
J/J ~C(LOOPJ:NCASES ~ P~T~T 4~0,LOUf-' 4SO FOR"IAT(//2)(,*JNPUT OaTA FOM GROU~•,l~/l
1)l) 2 LL=l , .K ASES
1)0 t:151 1=1·20 MSl )((!)=0. f JJ=l 'j, t-1=1 +. !TN=NTA~E(Jj} 1> !C(LL.fJ.]) GO TO 108
~l:AO(NN,100) YEAH,~UNTH,DAY 100 F0i-l MA T()I3l }OR 1)() 200 1=1,3 !> H(1.IPTION(Jl.EQ.ll GO TO ".>()J 'f GO TO 200 201 GfJ l(J (JOJ,102do1ll 101 CALL P~tCIP i GU lU ?00 1!12 CALL AIHTE~~ i GU TU 200 103 CALL wSPffO 2()/J CONTINUt i N VAl-i=~
,i H I T t. ( 4 , 0 F '4 T l YE. AH , '4 n r~ T H , 0 A Y • ( ,<. ( I l • l = l • 1~ 1
PHINT S:,(). Y,:A,<,"1\)r~r'"'.OAY, (,X (I). I=l •''l 5SO FURMAT(c(•ll4,5X,IUFS.ll
2 CONTINUE. l CONTINUE:
CALL CASFL !"I EMl
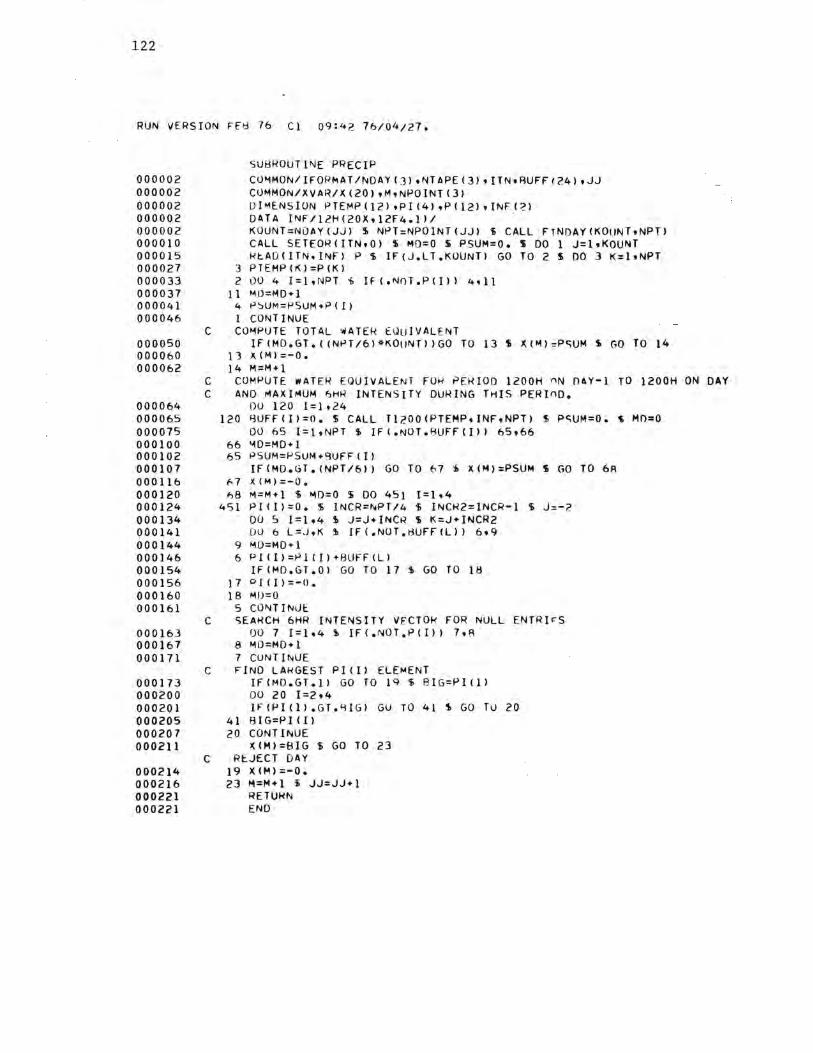
122
RUN VERSION Ff~ 76 Cl Q9:42 76/04/27.
000002 000002 000002 000002 000002 000010 000015 000027 000033 000037 000041 000046
C 000050 000060 000062
C C
000064 000065 000075 000100 000102 000107 000116 000120 000124 000134 000141 000144 000146 000154 000156 000160 000161
C 000163 000167 000171
C 000173 000200 000201 000205 000207 000211
C 000214 000216 000221 000221
SUBROUTINE PRECIP CU"'1MON/IFOR~AT/NOAY(3J,NTAPE(3l,ITN,RUFF<24),JJ CUMMON/XVAR/X(20J,M,NPOINT(3) DIMENSION PTEMP ( 12> ,Pl (4) ,P ( 12>, INF (?l DATA INF/12H(20X,12F4.ll/ . KOUNT=NOAY(JJ) $ NPT:NPOINT(JJ) $ CALL FTNDAY<KOUNT,NPTl CALL SETEOR(ITN,01 $ MO=O $ PSUM=O. $ DO l J:l,KOUNT RtAD(lTN,INF) P $ IF(J.LT.KOUNT) GO TO 2 $ 00 3 K=l,NPT
3 PTE.MP(K)=P(Kl 2 DO 4 I=l,NPT 'S IF(.l'll()T.P<Ill 4'11
11 "'10=MO+l 4 P~UM=PSUM+P(l) l CONTINUE COMPUTE TOTAL ~ATER E~uIVALENT
IF(MO.GT.((NPT/6)*K0tJNT))G0 TO 13 S X(Ml:Pc;UM $GOTO 14 11 Jl.(M)::-0. 14 M=M+l
COMPUTE WATER EQUIVALENT FOR PERIOD 1200H nN OAY-1 TO 1200H ON DAY ANO MAXIMUM ~HR INTENSITY DURING THIS PERinD.
DO 120 l=l ,24 120 8UFf(l)=O. $ CALL Tl200(PTEMP,INF,NPT) $ Pc;UM=O. S MO=O
DO 65 l=l,NPT $ IFI.NOT.BUFF(lll 65,66 66 "lO=MD+l 65 PSUM=PSUM+9UFF(I)
lf(MO.GT.(NPT/6)1 GO TO f,7 $ X(M)=PSUM $GOTO 6A f.7 )((M)=-0. 68 M=M+l $ MD=O $ DO 451 I=l,4
451 Pl(ll=O. $ INCR=NPT/4 $ INCR2=1NCR-l $ J::-2 00 5 l=l,4 $ J:J+INCR $ K=J+INCR2 DU 6 L=J,K $ IF ( .NOT .t3UFF <L>) 6,9
9 MO=MD+l 6 Pl(l)=Pl(l)+8Uff(l)
If<MD.GT.Ol GO TO 17 $GOTO 18 17 D{(l)=-0. 18 MD=O
5 CONTINUE. SEARCH 6HR INTENSITY VECTOR FOR NULL ENTRl~S
00 7 l=l,4 $ IF(.NOT.P(I)) 7,R 8 MO=MO+l 7 CONTINUE FIND LARGEST Pl<I) ELEMENT
IF(MD.GT.l) GO TO 19 $ 8IG=Pl(ll DO 20 1=2,4 IF<Pl(ll.GT.BIGl GU TO 41 $ GO TU 20
41 8IG=PI <I) 20 CONTINUE
X(M)=BIG $GOTO 23 REJECT DAY
19 X<Ml=-0. 23 M=M+l $ JJ:JJ+l
RETURN ENO
123
RUN VER5ION FEH 76 Cl 09:42 76/04/27.
000002 000002 000002 000002 000002 000011 000012 000014 000016 000020 000022 000030 000033 000034 000040 000042 000044 000046 000053 000055
000064 000071 000073 000075 000076 000101 000104 000106 000107 000111 000113
000120 000132 000136 000141 000143 000147
000151 000156 000161 000161
SUBROUTINE AIRTEMP COMMON/IFORMAT/NOAYl1l,NTAPE13l,ITN,BUfF!24l,JJ COMMON/XVAR/X(20l,M,NPOINT(3) OIMENSION TTEMPl12l,Tll2l,lNFl2l OATA INF/12Hl20X,12F5.ll/ KOUNT=NDAYIJJ) $ NPT:NPOINT(JJ) ~ ITN=NT~Pf(JJ) $ ANPT=NPT AKOUNT=KOUNT CALL FINOAY(KOUNT,NPT) MD=O $ TSUM=O. CALL SETEORIITN,Ol 00 1 L=l,KOUNT READ I ITN, I NF) T IFIL.LT.KOIJNT> GO TO 2 DO 40 J=l,NPT
40 TTEMP(Jl=TIJ) 2 f)O 3 l=l,NPT
IFI.NOT.T<Ill 3,11 11 MIJ=MD+l
3 TSUM=TSUM+Tlll 1 CONTINUE
lF(MD.GT.l(NPT/6)*KOUNTllGO TO 113 $ AMO:MO C MEAN TEMPERATURE OF PRF.CEDING NOAY PERIOU
X(Ml=TSUM/((ANPT*AKOUNT)-AMDl S GO TO 114 113 X(M)=-0. 114 M=M+l
00 120 l=l ,24 120 ~UFF<Il=O.
CALL Tl200(TTEMP,INF,NPT> MD=O 3, TSUM=O. 00 8 l=l,NPT lf(.NOT.RUFF(ll) 8,9
9 "4D=MD+l 8 TSUM=TSUM+BUFF<I>
C MEAN AIR TEMP. l200H-l200H If(MO.GT.NPT/6) GO To 10 \ AMO=MO $ X(M):TSUM/(ANPT-AMOIIGO TO 31
10 ~(M)=-0. $ X(M+l>=-0. $GOTO 500 31 M=M+l $ BIG=BUFF!ll
1)0 20 1=2,NPT If(BUFF<Il.GT.BIG> GO TO 21 S GO TO 20
21 BIG=RUFF<IJ C MAX AIR TEMP. l200H-1200H
20 CONTINUES X(M)=RIG 500 M=M+l S JJ:JJ+l
RETURN END
124
RUN VERSION FEB 76 Cl 09:42 76/04/27.
000002 000002 000002 000002 000002 000007 000013
000025 000037 000043 000047 000057 000064 000066 000071 000077 000102 000107 000112 000120 000122 000124 000135 000142 000144
000146 000147 000157 000171 000173 000200 000202 000212 000215
000222 000232 000234 000243 000247 000256
000263 000266 000272 000274 000300 000302 000302
SUBROUTINE WSPEED COMMON/IFORMAT/NDAY(Jl,NTAP£(3l,ITN,BUFF(24l,JJ C0MMON/XVAR/X(20l,M,NP0INT(3l DIMENSION WTEMP(24ltWS(40),W(24l,INF(4l DATA INF/34H(20X,12(F3.0,IXl/,20X,12(f3.n,1x1>1 ITN=NTAPE(JJ) $ KOUNT=NDAY(JJ) $ NPT=NPOTNT(JJl CALL FINOAY(KOUNT,NPTl $ 00 150 I=l,40
150 WS(ll=O. $ KK=O ~ MM:NPT/4 $ NSTEP=NPT-(~M-1) S Ll=MM-1SAMM=MM C COMPUTE MEAN WINDSPEEO OVER NDAY PERIOD PRFCfDING EVENT DATE.
CALL SETEOR(ITN,Ol S DO 100 K=l,KOUNT $ oEAD(ITN,JNFl W IF<K.LT.KOUNT) GO TO 2 $ DO 3 l=l,NPT
3 WTEMP(ll=W(ll 2 DO 6 l=l,NSTEP,MM $ MO=O S J=I+LL $ KK=K~+l $ DO 7 L=I,J
WS(KK)=WS(KK)+W(Ll $ IF(.NOT.W(l)l 7,11 11 MD=MD+l
7 CONTINUE lf(MD.GT.NPT/6lGO TO 12 ~GOTO 14
12 ~S(KKl=-0. $GOTO 6 14 AMD=MD $ WS(KKl=W~(KK)/(AMM-AMD)
6 CONTINUE 100 CONTINUE$ K=KOUNT*4 $ MD:O $ WSUM=O. $ ~o 8 l=l.K
IF(.NOT.WS(Ill 8,9 9 MD=MD+l 8 WSUM=WSUM+WS(Il $ IFcMO.GT.KOuNTl GO TO ?0 $ AK=K
AMD=MD $ X(Ml=WSUM/(AK-AMDl $GOTO 21 20 X(M)=-0. 21 M=M+l
C COMPUTE MEAN AND MAXIMUM 6HR WINDSPEED OVEG l200H-I?00H PERIOD. DO 120 l=l,24
120 8UFF(ll=O. $ CALL fl200(WTEMP,INF,NPTl $ 00 ?9 l=lt40 29 WS(ll=O. $ KK=O S DO 30 I=l,NSTEP,MM $ J~I+LL $ MO=O I KK=KK+l
IJU 31 L= It J wS(KKl=WS(KKl+BUFf(L> $ lf(.NOT.~UFF<Lll 31,32
32 MO=MD+l 31 CONTINUE$ IF(MD.GT.(NPT/6ll GO TO 33 $ GO TO 14 ]3 WSCKKl=-O. $GOTO 30 34 AMD=MD S WS(KK)=WSIK~l/(AMM-AMD)
C COMPUTE MEAN 6HR SPEED. 30 CONTINUE$ MO=O $ WSUM=O. $ DO 400 I=1,4 $IF(.NOT.WSll)l400,401
401 MD=MD+l 400 CONTINUE$ IF(MD.GT.1> GO TO 40 $ 00 4n2 I=l,4 402 WSUM=WSUM+WS(ll
AMD=MD $ XIMl=WSUM/(4.-AMDl $ M=M+l $GOTO 61 40 X(Ml=-0. $ M:M+l $ X(Ml=-0. $GOTO 60
C COMPUTE MAX. 6HR SPEED 61 BIG=WS(ll $ DO 50 l=l,4
IF(WS(Il.GT.BIGl GO TO 51 S GO TO 50 ">l BIG=WS(Il 50 CONTINUE$ X(Ml=BIG 60 JJ=JJ+ l
RETURN END
125
RUN VERSION FEB 76 Cl 09:42 76/04/27.
000005 000005 000005 000005 000005 000005 000005 000006 000010
000012 000030 000036 000041 000042 000055 000055
000056 000060 000062 000064 000066
000072 000075 000077
000104 000111 000114 000117 000132 000135 000142 000144 000160 000165 000167 000203 000204
SUBROUTINE FINDAY(KOUNT,NPT) C C THIS SUBROUTINE POSITIONS POINTER ON DATA FILES SO THAT READING CAN C BEGIN AT CORRECT DATE WHEN RETURN TO CALLING SUBROUTINE OCCURS. C KOUNT IS LENGTH Of DATA INTEGRATION PERIOD. FILE MUST BE POSITIONED C ON DAY PRECEDING THIS nATE BEFORE RETURN Tn CALLING SUAROUTJNE. C
C
C
C C
C
COMMON/IFORMAT/NDAY<3>,NTAPE<J>,ITN,BUFFC24),JJ COMMON/OATES/ YEAR,MONTH,OAY,INIT DIMENSION LMONTH!8l,NMONTH(8) INTEGER OAYl,DAY DATA LMONTH/31,30,31,31,28,31,30,31/ DATA NMONTH/10,11,12,1,2,3,4,5/ K=ITN CALL SETEOR(Kdl REliIND K
CHECK FOR LEAP YEAR IF(YEAR.EQ.72.0R.YEAR.EQ.76) LMONTH(5)=2q, N=INJT-10 S J=l IF!NPT.EQ.241 J=2 S If(MONTH.EQ.NMONTH(ll) GO TO 199 S GO TO 200
199 IF(OAY.EQ.(KOUNT+l)l GO TO 50 DO 20 l I=l ,J
201 READ<ITN,100) MONTHl,DAYl 100 FORMAT(2X,2I3l
GO TO 40 FIND MONTH IN WHICH EVENT DATE LIES
200 00 8 I=l,8 IF(MONTH.EQ.NMONTH(l)) GO TO 9
8 CONTINUE 9 LAST=LMONTH(I-1>
IF<DAY.GE.(KOUNT+l)) GO TO 45 S GO TO 46 POSITION FILE AT BEGINNING OF CURRENT MONT~ N IS SUBTRACTED FROM THE RECORD COUNT TO KFEP THE ROOK~ STRAIGHT----
45 NR=I-1-N CALL SKIP(K,O,NR) If(DAY.GT.(KOUNT+l)) GO TO 47 i GO TO 50
POSITION FILE AT BEGINNING OF PRECEDING MONTH 46 NR=l-2-N S IF(NR.LT.o> NR=O
CALL SKIP<K,O,NR> 47 DO 205 I=l ,J
205 READ(ITN,100) MONTHl,DAYl lf(OAY.LE.<KOUNT+l)) GO TO 10
40 LENGTH=DAY-DAYl I IF(LENGTH.EQ.<KOUNT+l)l GO TO ~O 211 DO 210 I=l,J 210 READ(ITN,100) MONTHl,DAYl S GO TO 40
10 LENGTH=LAST-DAYl+DAY-1 S IF(LENGTH.EQ.KOIINT> GO TO 50 DO 61 l=l,J .
61 REAO(ITN,100) MONTHl,DAYl S GO TO 10 50 RETURN
ENO
126
RUN VERSION FE~ 76 Cl 09:42 76/04/27.
000006 000006 000006 000011 000013 000015 000022 000024 000051 000055 000062 000062
SUBROUTINE Tl200(0tJNF,NPTl COMMON/IFORMAT/NDAYIJ),NTAPE(JltlTN,8UFF1?4),JJ OIMENSION Ql24J,JNF14l ~~=(N~T/2)+1 ~ J:O OU l K=MX•NPT J=J+l
1 t,UFF(Jl=OIK) CALL SETEOR(ITN,O) READ(!TN,JNFJ (Q(ll,I=ltNPTl $ MX=NPT/2 OU 2 K=l,MX $ J:J+l
2 ~UFFIJ):Q(K) KET URN END
RUN VERSION FE~ 76 Cl 09:42 76/04/27•
000002 000002 000002 000012 000012 000013 000026
000026 000032 000050 000050 000055 000056 000060 0001!).l 000120 000120 000132 000132 000135 000135
111
SUBROUTINE CASELIM COMMON SAMSIZ(3l,NVAP,NGROUP,NC(3) DIMENSION Al3l,Bl20) REWIND 4 $REWINDS i PRINT 20
20 FORMAT(lHl) L=O DO l K=l,NGROUP $ KK:O $ PRINT 30.K,NVAR
30 f0RMATl//2X,*INPUT DATA FOR GROUP*,12,* rASES WITH MISSING DATA EL 1IMINATED*/,2X,*NUMBER OF VARIABLES IS•,I,/l
L=L+l $ NCASES=NC<L> 00 2 J=l,NCASES i REA014,100) AtlR(ll,I=l,NVARl ~ MD=O
100 FORMAT(3I3,15f5.l) DO 3 N=l,NVAR $ IF<.NOT.B<Nll 4,5
4 GU TO 3 5 MD=MD+l 3 CONTINUE$ IF(MD.GT.o> GO TO 2 $ WRITE(S.100) A,(R(l),l=ltNVAR)
PRINT 10, A,(8IIl•l=1,NVAR) $ KK=KK+l 10 FORMATl2X,3I4,5X,l~F~.ll
2 CONTINUE$ PRINT 40,K,KK 40 FORMATl/2X,*REMAINlNG SAMPLE SIZE IN GR011P•t12,*=••I3l
l CONTINUE RETURt-i END
CARD INPUT FOR TEST EXAMPLE WHICH FOLLOWS --- USUALLY~ LISTED AT THIS POINT
DISCRIMINANT ANALYSIS - Tl::ST SEGMENT Of 1974-7':> DRY AVAi ANOiE SfASON PRECIP., AIRTE~P. FROM RFn MTN. PASS. ~IND SPEFO FROM ~DINT 12.125.
2 26 26 10 <JI3,9FS.l> 31212?4
PRECIP 2 2 2
WINn ~PEE1>
WAT.EQUIV. ? OAY~ PRIO~ FVENT MAX.6HR.INTEN.1200H-1200H MEAN 2~R.AIRTF.MP.l200rl-I2?H MEAN 6HR.W.SPEED 2 DAYS PRJOK MAX.6HR.w.SPFED l200H-l200~
WA1.[0UIV.1200H-l200H ~fAN ?~R.AJRTEMP.2 DAYS PDIOP MAX.2H~.AJkTEMP.1200H-120~H MEAN AHR.w.SPEED 1200H-l200H

OISCNIMINANT ANALYSIS - TEST SEGMENT OF 1974-75 DRY AVSLANCHE 5fAS0N PRfCIP •• AJ RTE~~. FHO~ RED ~TN. ~A5S. WINO SPEED FRO~ POINT 12,325.
NU~AER OF GROUPS= 2 NUMHER OF VARJABLFS= 9
SIZE OF GROUP 1 IS 26 SIZE OF GROUP 2 I~?"'
VARIABLE VARIABLf VARIABLE VARIABLE VARIABLE VARIABLE VAMIABLE VARIABLE VARIABLE
l = WAT.EQUIV. 2 OAY5 PRJOR EVENT 2 = WAT.E~UIV.1200H-1200H 3 = ~AX.6HR.INTEN.1200H-}c00H 4 = MEAN 2HM.AIRTEMP.~ 8AYS P~IUR 5 = ~EAN ?HR.AIRTEMP.lcOOH-l22H 6 = MAX.2HM.AI~TE~P.1200H-1200H 7 = MEAN bHR.W.SPEED 2 DAYS PMIOR 8 = MfAN 6HM.W.SPEED l200H-l200H 9 = ~AX.oHR.W. SPEEU l200H-12DOH
COMPUTATION SPECIFIED ? DAYS AhEAn ON PRECIP COMPUTATION SPECIFifO 2 DAYS AHEAD ON A lt·HEMP
FILE FILE
COMPUTATION SPECIF I ff) ;;> D fl YS AHEAD ()N 1o I1'\jQ SPEECJF ILE
INPUT DATA FOR GROUP 1
74 10 29 -o.o 2~.o 17.0 -1. 7 -2.Y 1.0 -o.o 74 l 1 l 11.s i<,.O 2.0 -R.3 -f,.4 -3.0 -o.o 74 l l 2 l fi. 0 H,.':> 9.5 -1.0 -6.0 -2.0 -o.o 74 11 7 o.o o.o o.o -R.5 -7.8 1.5 -o.o 74 11" "I o.o o.o o.o -7.3 -5.6 s.o 2.8 74 11 11 n. ::> o.o o.o -6.2 -7.J -2.0 3.0 74 11 13 o.o o.o o.o -4.6 -.2 4.S 4.4 74 11 14 0. () o.o o.o -1. q -3.9 1.0 7.3 74 11 15 o.o o.o o.o -2.s -2.s 3.5 8.3 74 l 1 19 l • ':> 5.5 4.0 -, .1 -4.9 -2.0 5.2 74 11 22 o.o o.o o.o -4.0 -1.9 8.5 3. t, 74 11 23 7. ') 21 .5 9.0 -1.0 -4.3 3.5 s.o 74 11 2R o.o 2.5 2.5 -1.3 -5.4 4.0 5 .1 74 11 29 8.0 6. l 4.':, -7.9-13.l -9.0 4.6 74 12 2 o.o o.o o.o -6.9 -4.3 4.5 3.5 74 12 s o.o 4.5 2.5 -5.', -1.9 3.0 3.5 74 12 6 10.0 J.5 4.0 -s.s -7.':> -5.0 4.2 74 12 q 2.s o.o O.O-l,:>.7-12.3 -7.0 2.8 74 12 11 o.o o.o o.o -R.] -9.3 -1.5 2.9 74 12 p o.o 1.0 1.0 -P.4 -9.2 -2.s 3.3 74 12 13 1.0 3.0 3.0 -9.8-10.5 -4.0 3.5 74 12 14 8.':> 7.0 2.5-11.1-15.4-10.o 6.3 74 12 15 11 • 0 l?.. ':, 7.0-14.5-14.2-12.S 7.7 74 12 1 f, l 6. 5 5.j 3.0-14.4-12.4-10.5 8.1 74 12 l~ ~.o 4.5 2.0-10.2-10.9 -.5 9.8 74 12 20 6.0 4.5 1.s-11.J-11.0-10.0 9.2
_,,. 0 -o.o -'1 .o -o.o -n.o -o.o
1 .R 3.4 c;. 3 6.0 4 • l 6.2 1.9 11.2 <l.O 11.3 ",.? 8.2
1 :>. 0 15.8 c;. l 8.5 ", .? 9.2 c;; l 7.3 1.1 4.2 ?.} 3.3 4.7 5.3 1.0 3.5 ?.9 3.2 1.1 3.8 4. 1 6.2 c;. 0 9.8 q.4 13.2 0 .1 14.S o.7 13.8 o.,., 13.S .... 7 11.3
127
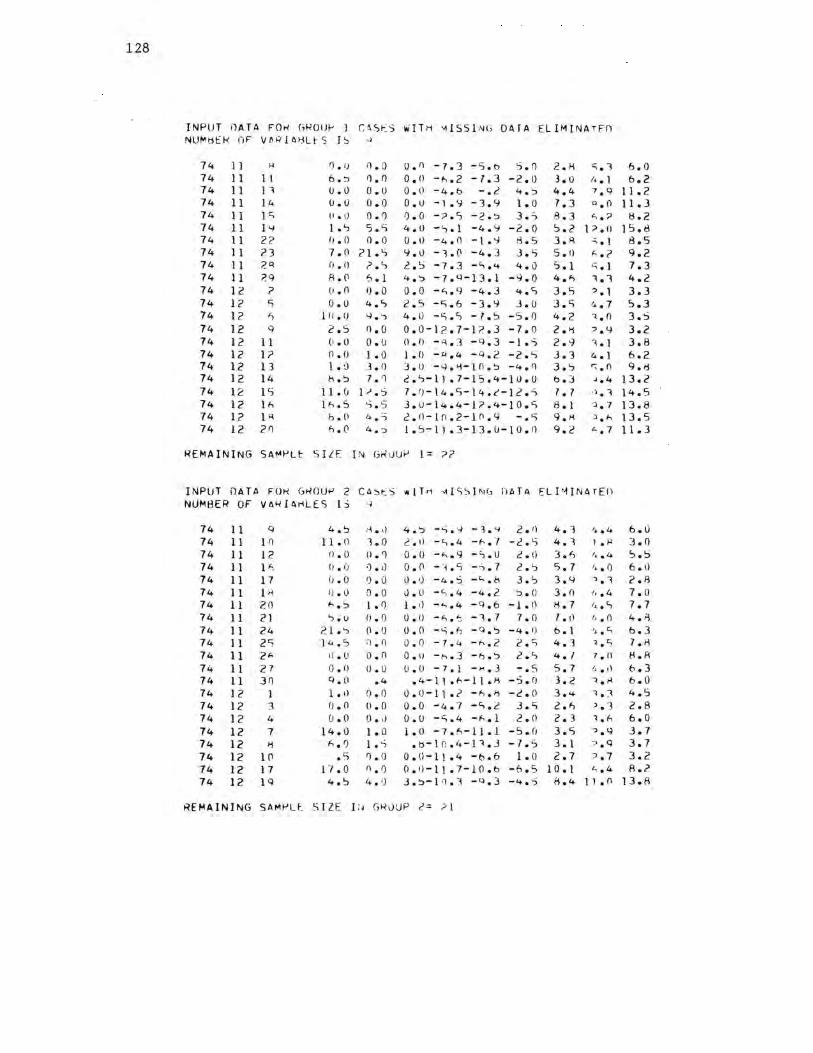
128
INPUT i)ATA FOrl r;ROUI-' J c1.s~: s \I/ITH '1 ISSI ,\JG DATA ELIMINATff) NUMtll::k OF VM./lt;f:lLtS b ~
74 1 I µ f) • () n.o u. I) -7.3 -S.o s. () 2.H c:;. 1 6.0 74 1 1 1 l 6.::, /] . () 0. () -1-, .2 - T. 3 -2.0 J. o I,• 1 6.2 74 l 1 J 1 u.o 0. o 0. ll -4.b - • C. 4. ':, 4.4 7.q 11 • 2 74 11 14 (). 0 (J. 0 o.u -1 .9 -3.9 l • 0 7.3 o.o 11 • J 74 l l lS (1 • \) 0. !) I). 0 -?.S -2 .::, J.s 8.3 .... ? ti. 2 74 11 l '-I I • 'J s.s 4. o -c,.1 -4.9 -2.0 S. 2 l ;:>. () 15.8 74 l l 22 r,. o i). I) 0. ll -4.0 -1 • '-J t3. 5 3. >\ .; • 1 8.5 74 l l 23 1.0 ? l. ", 9. o -1.0 -4.3 3. ', 5. () 1-..? 9.2 74 l l 2<l r, • o ?.'-, 2.s -J.3 -S.<+ 4.0 S .1 .:; • l 7.3 74 I l zq 8. (1 i:, • I 4. ':) -7.<-1-13.1 -9.0 4.,, 1.1 4.2 74 12 ? (I. 0 (). 0 o.o -1-..9 -4.J 4. C, 3.5 ?.J 3.3 74 12 c; o.o 4. ", 2.5 -c;.6 -3.9 J.O 3. c; 4.7 5.3 74 12 r, I (I • () y. '"> 4.0 -s.s - '. 5 -5. I) 4.2 <. () 3.S 74 12 q 2.5 /]. 0 0.0-12.1-12.J -7.0 2. )1 ?.4 3.2 74 12 l l (1. 0 0. (J o. 0 -:. • 3 -q.J -1. S 2.9 ·1. I 3.B 74 12 l? 0. () l • 0 l • () -t,.4 -q.z -2.s J.3 4.J 6.2 74 12 1) l • •J J. () 3. ll -y.>i-10.::, -4.0 3. ':i r, • n 9. /j 74 12 14 H • '> 7. ') c..'->-1 J. 7-15.4-10.0 t,. 3 .j .4 13.2 74 12 1 c; 11. (J P.S 7.0-14.5-14.1-12.S T. 7 ,1. 1 14.5 74 12 1 h 1 h. 5 s.s J.0-1,..4-I?.'+-10.s 8. I -:i. 7 13.8 74 12 l >l h. () 4.:, 2.o-1n.2-1n.q - • "5 9 .1-1 :i. h 13.5 74 12 2/J f,. (\ 4.:, l.5-lJ.3-13.0-10.0 9.2 /... 7 1 l • 3
REMAINING SA~t-'Lt SILE IN GRuUi-' l= ??
INPUT OATA FOt-i (jriOUf-' 2 CllSt:. S w I Tri ,1J<;SI~1G f'lATA Ell'HNATEI) NUMHER OF VI\Rll\t1LES I:; ,,
74 1 1 q 4. '::, ;4 • d 4. '::, -c.,. '-i - '." 2. I) 4.1 ,._ .4 6.0 74 11 1 () 11 • 0 1.0 2 • II -c, .4 -(-,. 7 -2.s 4.1 1 • µ 3.0 74 11 12 n.o () . ') 0. () -;.,.q -',. 0 2. () 3. 6 1,. 4 :, . '::, 74 l 1 1~ () • 0 ·1 • 0 0. (\ -~1. S -:., • 7 2. ':, 5.7 '". 0 6. 0 74 11 17 (J • () (). 0 ll • <J -4.'::i - -'-.b 3. ':, 3.9 ., • 1 2.8 74 l 1 18 CJ • L\ (). 0 J.u -C,.4 -4.2 :, • 0 3.0 l , • 4 7.0 74 11 20 (-,.::, 1 • 0 1 • 1) - .... 4 -q.6 -1. I) 1:1.7 I.J.. • ', 7.7 74 11 21 ':,.v (). 0 ll • I) -,; . ~ -1.7 7.0 7. 1) { i • n 4. Ii 74 1 1 24 21. ':> (). 0 o.o -c:;. f, -o.:, -4.fl 6. l 'J. • c; 6.3 74 1 1 2S I 4 • :, :) . () o.o - 7 • 4 -h.2 2. c::; 4.3 l • c::; 7.H 74 11 2f- I) • (J o.o 0. \) -1-,.J -6.S 2 .c., 4. / 1.0 8.8 74 1 1 27 0. () 0. L) lJ • 0 - 7 • l -1-<. 3 -.5 5.7 .'J, • 1) 6. 3 74 11 Jf) q. (\ .4 .4-ll.1-,-11.1:1 -s. [J 3.2 <oM 6.0 74 12 l 1 • 1l I). 0 0.0-11.? -h. fl -2.0 3 ... ,. • :1 <+.5 74 12 3 (). 0 o.o o.o -4.7 -c,.2 J.s 2. f, ,.3 2.8 74 12 4 o. 0 o.<> o.o -c;.4 -h.l 2.0 2.1 '•" 6.0 74 12 7 14.0 1 • 0 l • 0 -7.A-l!.l -5.0 3.5 ,, • q 3.7 74 12 H f,. I) I •-; .b-l0.4-1•.J - 7. ':, 3. l ?.Q 3.7 74 12 1 () .s 'l. 0 0.0-11.4 -t,.6 1 • u 2.7 ?.7 3.2 74 12 1 7 17.0 n • {) o.c)-1 J. 7-10.t> -6.5 10. I .... 4 R.? 74 12 lQ 4 .'::, 4. <,) J.':>-!'1.3 -'.l • 3 -<+.S 8.4 l 1 • ll 13.8
REMAINING SAMt-'U_ SIZE I :; GRu:JP c= ? I
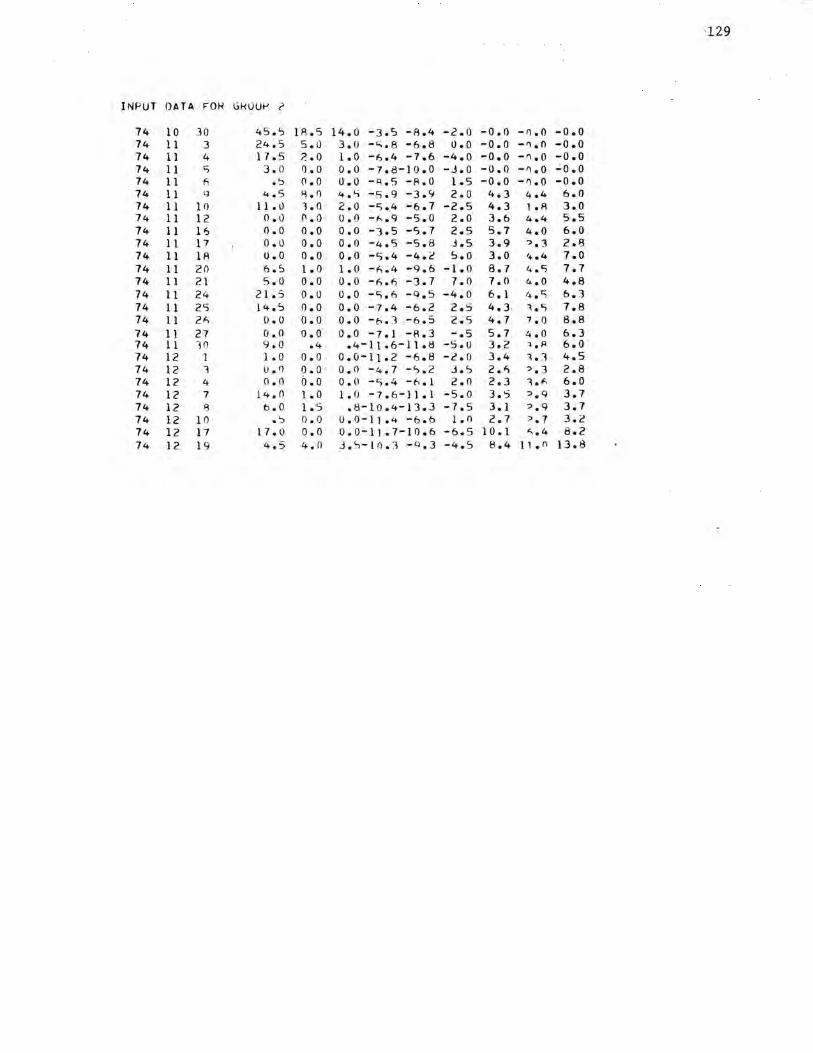
·129
INPUT DATA FOR Gf-<liUt-' i?
74 10 JO 45.S 18.5 14.0 -3.s -8.4 -2.0 -o.o -o.o -o.o 74 11 3 24.5 5. o 3. (J -c;.8 -6.8 0. 0 -o.o -'l.0 -o.o 74 11 4 17.5 2.0 1 • 0 -f,.4 -7.6 -4.0 -o.o -1). 0 -o.o 74 1 1 c:; J. () 0. 0 o.o -1.a-10.0 -J.O -o.o -1). 0 ..:o. 0 74 11 A • :j (). 0 o.o -R.5 -R.O 1.5 -o.o -1) .o -o.o 74 l 1 q 4.5 ~. f) 4. '-i -5.9 -3.9 2.0 4.3 4.4 6.0 74 11 10 11. l) 1.0 2.0 -c;.4 -6.7 -2.5 4.3 l .R 3.0 74 11 12 0. o (1. 0 u.o _,.,_9 -s.o 2.0 3.6 4.4 5.5 74 11 16 o.o o.o o.o -3.5 -5.7 2.5 5 .• 7 4.0 6.0 74 1 l 17 0. l) o.o o.o -4.S -5.8 J.5 3.9 ? • :i 2.8 74 11 18 u.o o.o o.o -5.4 -4.2 ':>.O 3.0 4.4 1.0 74 1 l 20 6.S 1.0 1.0 -f,.4 -9.6 -1.0 8.7 4.c; 7.7 74 11 21 s.o o.o o.o -r-,.+, ·-3. 7 1.0 7.0 4.0 4.8 74 l 1 24 21.5 o.o o.o -c;.6 -Q.5 -4.0 6. l I+• c; 6.3 74 11 25 14. ':, o.o o.o -7.4 -6.2 2.5 4. 3, 1. c; 7.8 74 11 26 o.o o.o o.o -t,.3 -6.5 2.5 4.7 1.0 8.8 74 1 l 27 o.o o.o o.o -1.1 -P..3 -.s 5.7 4.0 6.3 74 11 10 9.0 .4 .4-1).6-11.8 -5.0 3.2 1.P 6.0 74 12 l 1 • 0 o.o 0.0-1,1.2 -6.8 -2.0 3.4 1.3 4.5 74 12 1 u. () 9.0 o.o -4.7 -':, .2 j. ', 2.6 ?.3 2.8 74 12 4 o.o o.o o.o -c:;.4 -f.. 1 2.0 2.3 lo"' 6.0 74 12 7 l '+. n l • 0 1 • () -1.6-11.1 -5.o 3.5 ?.9 3.7 74 12 8 t>. 0 1.5 .8-l0.4-13~3 -7.5 3.1 ?.·q 3.7 74 12 10 . '::, (). 0 0.0-11.'+ -6.t> 1.0 2.7 ;>. 7 3.2 74 12 17 17.0 o.o 0.0-11.1-10.6 -6.5 1 0. 1 ",. 4 8.2 74 12 19 4.5 4. 0 J.<,-10.3 -ci.3 -4.S 8.4 l 1 • n 13.8
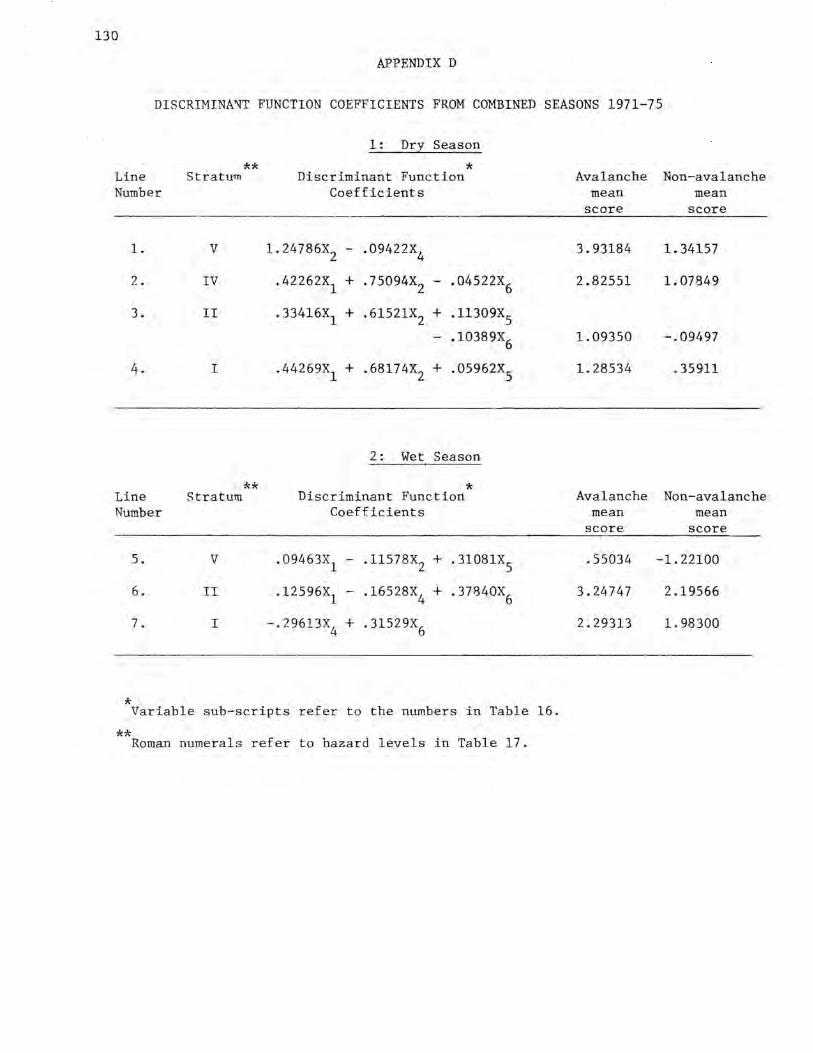
130
APPENDIX D
DISCRIMINA~T FUNCTION COEFFICIENTS FROM COMBINED SEASONS 1971-75
Line Number
1.
2.
3.
4.
Line Number
5.
6.
7.
*
1: Dry Season
** * Stratu~ Discriminant Function Coefficients
V l.24786X2 - .09422X4
IV .42262X1 + .75094X2 - .04522X6
II .33416X1 + .61521X2 + .11309X5 - .10389X6
I .44269X1 + .68174X2 + .05962X5
2: Wet Season
** * Stratum Discriminant Function Coefficients
V .09463X1 - .11578X2 + .31081X5
II .12596X1 - .16528X4 + .37840X6
I -. 29613X4 + .31529X6
Variable sub-scripts refer to the numbers in Table 16.
** Roman numerals refer to hazard levels in Table 17.
Avalanche Non-avalanche mean mean
score score
3.93184 1.34157
2.82551 1.07849
1.09350 -.09497
1.28534 .35911
Avalanche Non-avalanche mean mean
score score
.55034 -1. 22100
3.24747 2.19566
2. 29313 1. 98300
CHAPTER 6: THE APPLICATION OF ISOTOPIC PROFILING SNOW GAUGE DATA TO AVALANCHE RESEARCH
Richard L. Armstrong
Introduction
131
A profiling isotopic snow gauge has been a part of the instrumentation network utilized by this project during five consecutive winters. An Aer.oj'et Nuclear gauge was operated during the first three winter periods, 1971-1974, while a modified gauge, constructed by Idaho Industrial Tnstuments, was operated during the latter two winter periods, 1974-1976.
The earlier gauge was installed by Aerojet Nuclear personnel in December of 1971 at the Red Mountain Pass site (3400 m). The prototype of this isotopic gauge was developed by Dr. James L. Smith, U.S. Department of Agriculture, Forest Service, Berkeley, California. The first radioactive gamma transmission snow gauge was used sucessfully during the winter of 1964-1965 (Smith, 1965, 1967). As this first gauge required an operator, the next step in the development was the fabrication of a remotely operated, telemetered gauge. This work was undertaken by the Aerojet Nuclear Company with funding from the Division of Isotopes Development of the Atomic Energy Connnission.
The field unib9f the Aerojet Nuclear gauge consists of a radioactive · source, 10 me Cs, and a scintillation detector, each horizontally suspended in one of the two parallel access tubes which extend vertically from below ground to a height greater than the maximum anticipated snow accumulation. The scintillation detector is a sodium iodide crystal. This crystal is attached to a photomultiplier tube and both are sealed in a cylindrical aluminum case. The photomultiplier signal is transmitted by a coiled cable to a preamplifier housed in the lift unit. The lift unit consists of two reels connected to a drive shaft. One reel is positioned at the top of each of the parallel access tubes.
A remote gauge of this type requires the following additional components: l)a telemetry system via commercial data-telephone, which communicates data and connnands between the field unit and the base station; 2) a field unit which has the function of decoding and executing commands (i.e. taking snow density data, running the lift motor, etc.) and formating the acquired data for transmission; and 3) a base station which receives the data, formats the commands for transmission to the field unit, and reduces and prints out the data in digital and analog form. The base station for this gauge was located in Idaho Falls, Idaho, at the Aerojet Nuclear facility, National Reactor Testing Station. The personnel at
132
Aerojet would transmit the resultant data to INSTAAR Project Headquarters, Silverton, Colorado, by mail. The original intent was that the Aerojet gauge could be interrogated daily, or more frequently, at prescribed intervals. However, the low quality of telephone transmission between Red Mountain Pass and Idaho Falls precluded the operation of the computer link in an automatic mode. Therefore, data runs were essentially limited to one per day during the conventional work week when personnel were available at the base station.
The INSTAAR study was concerned with monitoring physical changes within the snowcover on a daily or even hourly basis. The full value of the gauge could only be realized if data acquisition could continue uninterrupted from one day to the next. It was therefore necessary to develop some type of locally operated on-site readout capability. Such a facility would not only provide continuous data access, but the location of the gauge would no longer be dependent on the availability of telephone service. The loss of both telephone service and 110 VAC power at a high alpine site is not unusual during storm periods, the very time when data regarding avalanche studies must be available.
The existing gauge was modified to meet various new specifications by Idaho Industrial Instruments, Inc. While the modified version is similar in structure to the Aerojet gauge, basic differences exist in the measurement technique and data acquisition systems. A collimated co60 source and a ganged GM tube detector system replaces the cs137 source and photomultiplier detector. Cobalt60 has approximately four times the water penetration ability of cs137 enabling greater spacing between source and detector, thus increasing the horizontal zone of measurement. Access tube spacing was increased to 1.0 m. Geiger-M~ller tubes provide excellent temperature stability over a range of +so0 c to -so0 c. They are durable, long lasting and inexpensive. The GM tube is a straight digital event transducer and is not count rate sensitive. No precision pulse shaping or high precision power supply is required. The lower efficiency compared to the photomultiplier systems is overcome by paralleling several GM tubes within the detection unit. By collimating the source the scatter is greatly reduced. Coupled with sufficient counting time, the GM tube acts as a discriminator and approaches the overall efficiency of a photomultiplier system.
The onsite controller and readout located in the instrument cabin 30 m from the gauge allow both manual and automatic operation. The detector unit may be operated in a manual mode within any segment of the snowcover where specific measurements are required or the system may be placed in automatic mode and a profile of the entire snowcover made with the detector system automatically returning to the bottom after reaching a preset upper limit. A console LED display indicates the vertical position of the detector system and nuclear counts for each position. A printer also provides a hard copy of the count data. The system is powered by direct-current with the batteries receiving occasional trickle-charging from 110 VAC. The Red Mountain gauge can be operated for approximately two weeks without the need for charging the batteries.
Any isotopic source is gradually decaying and requires a constant correction for this decay. The calibration of the present gauge is achieved by having the measurement event dependent rather than time dependent. This is accomplished by a reference detector which is driven by a small microcurie source of the isotope used. The reference scaler is progrannned to accept a specific number of counts from the source and then terminate the counting period. This establishes the same statistical accuracy for the system throughout the lifetime of the source; however a longer time period is required to obtain a specific measurement. As an example, if the time to receive 10,000 counts at the detector is 10 seconds initially, in 5.2 years the time constant would gradually have increased to 20 seconds.
Installation of the Prof:i,J.ing Snow Gauge
133
When a profiling snow gauge is to be utilized in avalanche research, careful consideration must be given to the location of the gauge. For the INSTAAR study, the location was initially determined by the availability of 110 VAC power and telephone service. Fortunately, both were available at the Red Mountain Pass snow study site. Numerous parameters relating to meteorology and snow structure are measured at this location and it was considered highly desirable to be able to have access to such data adjacent to the snow gauge.
A standard snow study site is by definition a level area, below tree line, protected from the wind and easily accessible by the observer. An actual avalanche starting zone is certain to be in sharp contrast with the above definition. A common dilennna in avalanche research results. While it is highly desirable, theoretically, to locate instrumentation within an avalanche starting zone, the practical limitations are obvious. In addition to the need to avoid the destructive force of the avalanche itself, sloping surfaces offer additional difficulties. Local snow structure is influenced by solar radiation and wind patterns, according to slope angle and orientation. Mechanical processes involved in creep and glide of the snowpack relate to the type and shape of the ground surface beneath the snow as well as to the slope angle and orientation. The difficulties involved in determining a representative slope become apparent and one returns to the concept of a standard snow study site for instrument location.
It then becomes necessary to extrapolate data obtained at a level, sheltered site to what may actually be happening on adjacent slopes, both above and below timberline. Such empirical relationships can be established between study plot and release zone, although many years of observation may well be an essential requirement. Therefore, if a profiling snow gauge is to be installed for avalanche research in an area where such a relationship has been or is in the process of being established, it should certainly be located at the site where these studies are underway.
Support structures required for the access tubes should be located in the lee of the instrument opposite the direction of the prevailing wind to prevent drifting of snow near the tubes. The access tubes should be maintained with a ,highly reflective surface in regard to both short and long
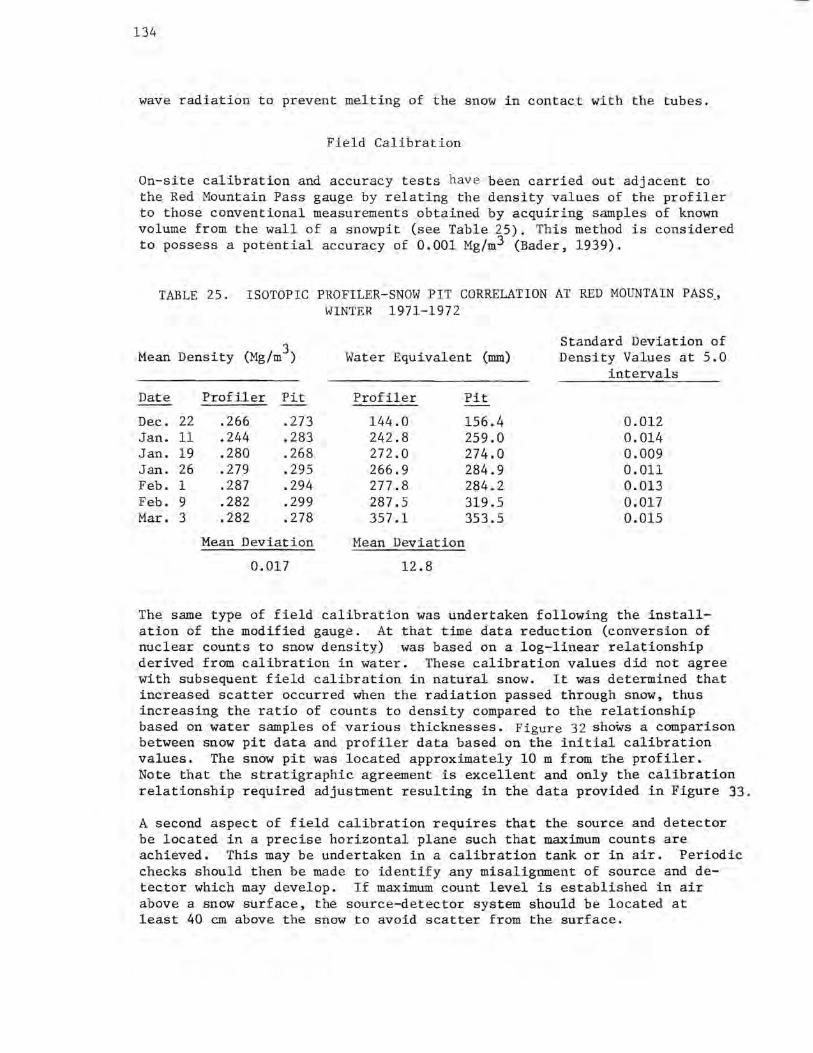
134
wave radiation to prevent melting of the snow in contact with the tubes.
Field Calibration
On-site calibration and accuracy tests have been carried out adjacent to the Red Mountain Pass gauge by relating the density values of the profiler to those conventional measurements obtained by acquiring samples of known volume from the wall of a snowpit (see Table 25). This method is considered to possess a potential accuracy of 0.001 Mg/m3 (Bader, 1939).
TABLE 25. ISOTOPIC PROFILER-SNOW PIT CORRELATION AT RED MOUNTAIN PASS_, WINTER 1971-1972
3 Standard Deviation of Mean Density (Mg/m) Water Equivalent (mm) Density Values at 5.0
intervals
Date Profiler Pit Profiler Pit
Dec. 22 .266 .273 144.0 156.4 0.012 Jan. 11 .244 .283 242.8 259.0 0.014 Jan. 19 .280 .268 272.0 274.0 0.009 Jan. 26 .279 .295 266.9 284.9 0.011 Feb. 1 .287 .294 277.8 284.2 0.013 Feb. 9 .282 .299 287.5 319.5 0.017 Mar. 3 .282 .278 357.1 353.5 0.015
Mean Deviation Mean Deviation
0.017 12.8
The same type of field calibration was undertaken following the installation of the modified gauge. At that time data reduction (conversion of nuclear counts to snow density) was based on a log-linear relationship derived from calibration in water. These calibration values did not agree with subsequent field calibration in natural snow. It was determined that increased scatter occurred when the radiation passed through snow, thus increasing the ratio of counts to density compared to the relationship based on water samples of various thicknesses. Figure 32 shows a comparison between snow pit data and profiler data based on the initial calibration values. The snow pit was located approximately 10 m from the profiler. Note that the stratigraphic agreement is excellent and only the calibration relationship required adjustment resulting in the data provided in Figure 33.
A second aspect of field calibration requires that the source and detector be located in a precise horizontal plane such that maximum counts are achieved. This may be undertaken in a calibration tank or in air. Periodic checks should then be made to identify any misalignment of source and detector which may develop. If maximum count level is established in air above a snow surface, the source-detector system should be located at least 40 cm above the snow to avoid scatter from the surface.
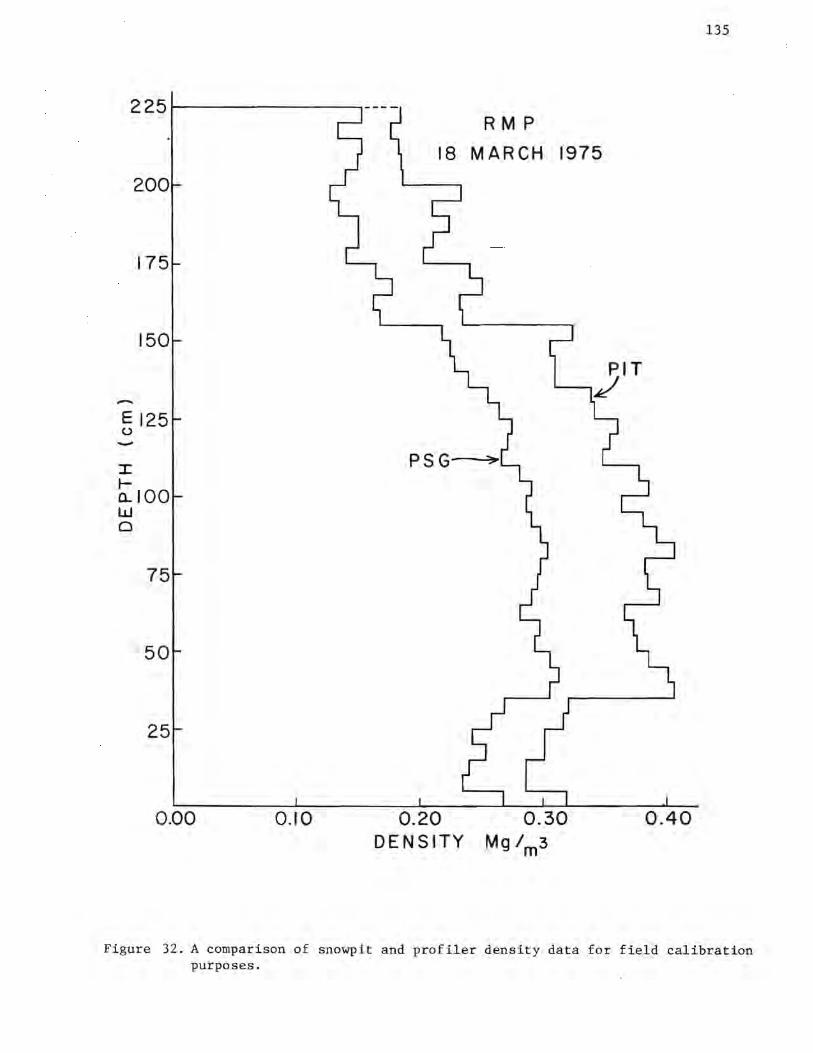
200
175
150
-E125 u -I lo..100 w 0
75
50
25
0.00
135
RMP 18 MARCH 1975
0.10 0.20 0.30 0.40 DENSITY Mg/m3
Figure 32. A comparison of snowpit and profiler density data for field calibration purposes.
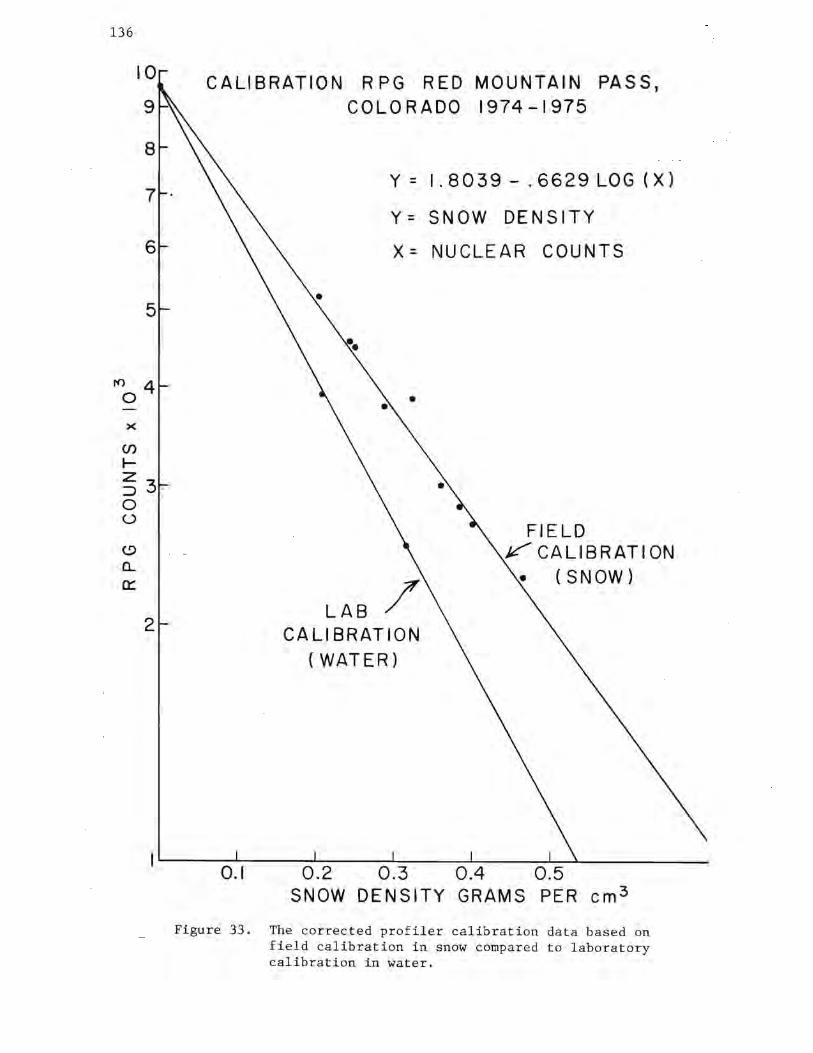
136
10
9
8
7
6
5
ro 4 0
X
(f)
~
~3 0 0
<.!)
a... a::
2
CALIBRATION RPG RED MOUNTAIN PASS, COLOR ADO 1974 -1975
0.1
Figure 33.
Y= l.8039-.6629LOG(X)
Y= SNOW DENSITY
X= NUCLEAR COUNTS
•
LAB/ CALI BRAT ION
( WATER)
FIELD ~ CALIBRATION
(SNOW)
0.2 0.3 0.4 0.5 SNOW DENSITY GRAMS PER cm3
The corrected profiler calibration data based on field calibration in snow compared to laboratory calibration in water.
137
Application of Data to Avalanche Research
There are numerous criteria in use today for categorizing types of snow avalanches. One basic genetic discriminator divides all avalanches into two groups: direct action and delayed action. A direct action avalanche occurs during or illllllediately after a storm and is the result of the increased stress applied to the snowpack in the form of new snow. This type of avalanche is the immediate consequence of a prevailing meteorological situation. A delayed action avalanche is the result of gradual changes taking place within the snowcover over a longer period of time. Such avalanches may occur as the culmination of a slow load build-up, with a weak layer within the snowpack being the eventual zone of failure, or may occur without the increased stress of additional loading when gradual adverse metamorphism continues until existing stress exceeds the deteriorating strength at some point within the snowpack. This may occur both during mid-winter when temperature-gradient metamorphism results in depth hoar formation, and in the spring when the snowpack becomes isothermal and the bonds between the individual grains break down. Therefore, instrumentation and field methods have been developed to measure new-snow accumulation as well as changes in old-snow structure.
The standard methods for monitoring physical and structural changes on and within the snowpack involve the following. To measure accumulation, some type of recording precipitation gauge is used. Special problems are encountered, however, as most gauges available are primarily designed to measure precipitation in the liquid phase. When the intent is to monitor the precipitation rate of snow, provision must be made to prevent capping or clogging of the gauge orifice due to high snowfall rates. Periods of high precipitation intensity are of great interest to avalanche research and therefore an unfortunate moment not to be receiving data. An additional drawback associated with this method of snowfall recording is that the accuracy of the gauge may be greatly influenced by the wind field in the vicinity of the orifice. At wind speeds often associated with winter storms such a gauge tends to underestimate the actual amount of mass being delivered to the snowpack. An alternate method is to measure new snow increments falling on a snow board placed on the surface of the snow prior to the storm and to melt samples taken from . the boards in order to determine water equivalent. Inaccurate measurements by this method result when the initial portion of the sample is removed by wind, as well as when melt occurs through solar heating of the board. The ideal surface on which to measure new snow increments is not an artificial device which obstructs the natural terrain, but rather the snow surface itself. Such a method is employed by the profiling gauge.
Among the derived properties of snow, density is perhaps the most used as an index of snow type. The standard method in avalanche studies for measuring density involves digging a pit through the pack to the ground and then extracting samples of a known volume from the wall of the pit and weighing each sample to determine density. The stratigraphic frequency at which these values can be obtained is determined py the thickness of the sample container, generally from 3.0 to 5.0 cm. Since zones of weakness are often only 0.5 cm or less in thickness, critical information concerning the strength properties of the snowpack may well be
138
overlooked with this method. In addition, this type of measurement is destructive and therefore useless in terms of accurate in situ studies of changes in density with time. The anisotropic natur;-of snow precludes the possibility of taking density samples in adjacent locations during successive days or perhaps even hours in time and still being able to assume an accurate time-stratigraphic profile. Changes in snow structure as a function of spatial variation may equal or exceed those changes which one wishes to monitor.
The rate and amount of settlement which takes place within the snowpack is another index which can be related to snow strength. A layer of newly fallen snow in the absence of wind exists as a delicate cellular matrix. Although the individual crystals may interlock mechanically, they adhere weakly at points of mutual contact. Gradually as the snow settles, the stellar or similarly complex crystalline shapes are reduced to a more spherical grain. Such a shape permits greater amounts of connnon surface area to exist among the grains. In the absence of significant temperature gradients (approximately O.lOC/cm), intergranular bonding is enhanced and strength increases. The density profiles produced by the isotopic gauge may serve as an indicator of snow settlement. One simply locates a particular layer within the snowpack which is easily identifiable due to a particularly high or low density value in relation to surrounding layers. The vertical movement of this layer reflects the degree of settlement within this immediate area. The settlement rate of snow involved in an individual storm can be observed by noting the compression of that layer which represents the appropriate storm increment.
Data Analysis
In terms of general snow structure, two types of avalanche release exist. The first is referred to as a loose-snow avalanche and occurs when snow crystals which adhere poorly to each other collect on a slope steeper than their angle of repose. Failure begins near the surface when a small amount of cohesionless snow slips out of place and starts moving down the slope. The second type is known as a slab avalanche and occurs when snow lies on a slope in a cohesive layer which is poorly bonded to the snow or ground below. The slab event presents a greater hazard because it incorporates larger amounts of snow, and also. because the wide variety of snow conditions which lead to its formation cause problems in predicting such events.
The layered structure of a natural snowcover is directly related to slab releases. Stratigraphic data regarding the alternating weak and strong layers within the snowcover are extremely valuable to avalanche prediction. Weak layers comprising potential shear failure zones exist within new snow, at old snow-new snow interfaces, and within the old snow structure. Stratigraphy within new snow is primarily a function of meteorological conditions at the time of deposition while structure within older snow layers may be a consequence of metamorphic changes occurring over .a period of weeks or even months. An example of a weak layer within new snow as detected by the profiling gauge and a light-weight (O.l kg) ram penetrometer appears in Figure 34. This condition alone did not produce
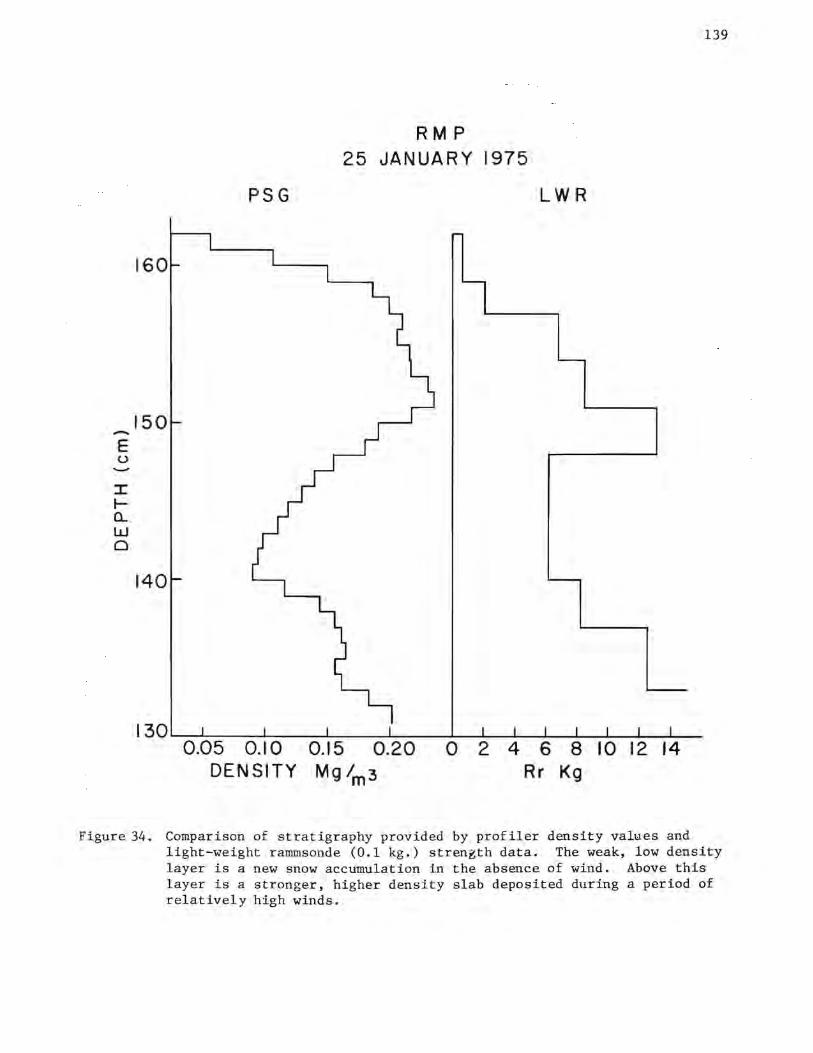
-E (.) -
::I: t-a.. w 0
RMP 25 JANUARY 1975
PSG LWR
160
150
140
130....__.......__ __ ....._ _ _._ __ _.___ __ .___.....____,_-'_.....___---L-__.._.....____
0.05 0.10 DENSITY
0.15 0.20 Mg/m3
0 2 4 6 8 10 12 14 Rr Kg
139
Figure 34. Comparison of stratigraphy provided by profiler density values and light-weight rammsonde (0.1 kg.) strength data. The weak, low density layer is a new snow accumulation in the absence of wind. Above this layer is a stronger, higher density slab deposited during a period of relatively high winds.
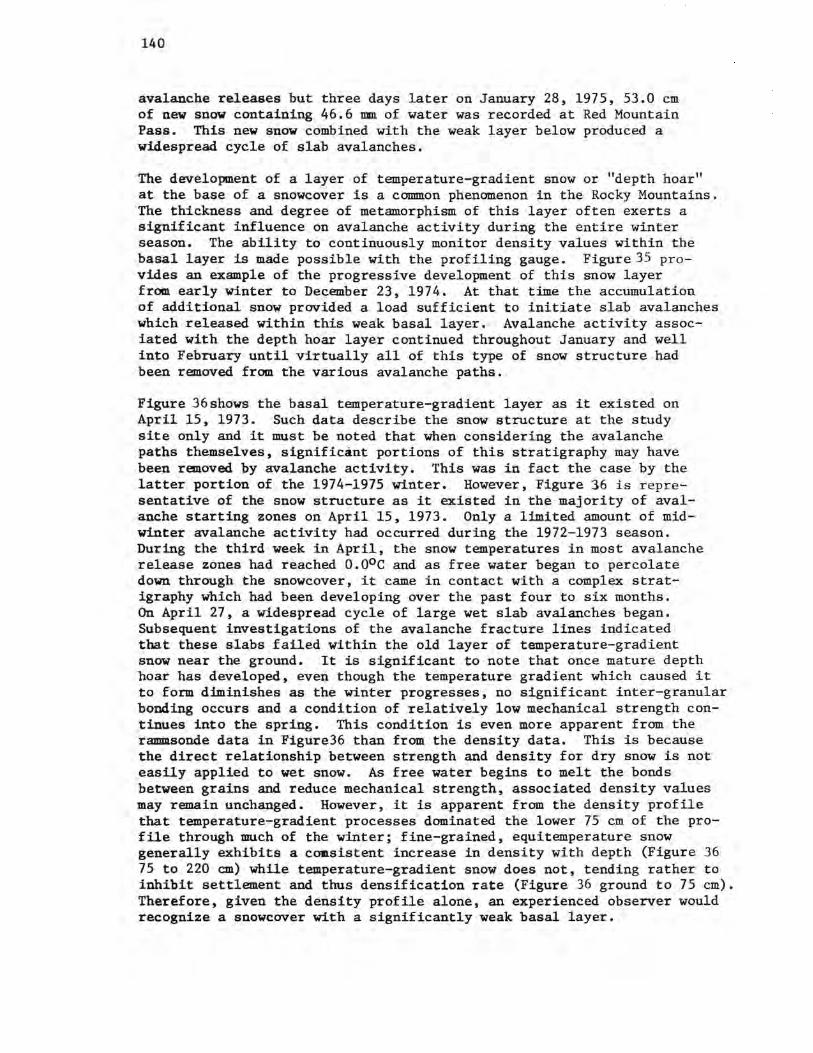
140
avalanche releases but three days later on January 28, 1975, 53.0 cm of new snow containing 46.6 mm of water was recorded at Red Mountain Pass. This new snow combined with the weak layer below produced a widespread cycle of slab avalanches.
The development of a layer of temperature-gradient snow or "depth hoar" at the base of a snowcover is a common phenomenon in the Rocky Mountains. The thickness and degree of metamorphism of this layer often exerts a significant influence on avalanche activity during the entire winter season. The ability to continuously monitor density values within the basal layer is made possible with the profiling gauge. Figure35 provides an example of the progressive development of this snow layer from early winter to December 23, 1974. At that time the accumulation of additional snow provided a load sufficient to initiate slab avalanches which released within this weak basal layer. Avalanche activity associated with the depth hoar layer continued throughout January and well into February until virtually all of this type of snow structure had been removed from the various avalanche paths.
Figure 36shows the basal temperature-gradient layer as it existed on April 15, 1973. Such data describe the snow structure at the study site only and it must be noted that when considering the avalanche paths themselves, significant portions of this stratigraphy may have been removed by avalanche activity. This was in fact the case by the latter portion of the 1974-1975 winter. However, Figure 36 is representative of the snow structure as it existed in the majority of avalanche starting zones on April 15, 1973. Only a limited amount of midwinter avalanche activity had occurred during the 1972-1973 season. During the third week in April, the snow temperatures in most avalanche release zones had reached o.o0 c and as free water began to percolate down through the snowcover, it came in contact with a complex strat~ igraphy which had been developing over the past four to six months. On April 27, a widespread cycle of large wet slab avalanches began. Subsequent investigations of the avalanche fracture lines indicated that these slabs failed within the old layer of temperature-gradient snow near the ground. It is significant to note that once mature depth hoar has developed, even though the temperature gradient which caused it to form diminishes as the winter progresses, no significant inter-granular bonding occurs and a condition of relatively low mechanical strength continues into the spring. This condition is even more apparent from the raunnsonde data in Figure36 than from the density data. This is because the direct relationship between strength and density for dry snow is not easily applied to wet snow. As free water begins to melt the bonds between grains and reduce mechanical strength, associated density values may remain unchanged. However, it is apparent from the density profile that temperature-gradient processes dominated the lower 75 cm of the profile through much of the winter; fine-grained, equitemperature snow generally exhibits a consistent increase in density with depth (Figure 36 75 to 220 cm) while temperature-gradient snow does not, tending rather to inhibit settlement and thus densification rate (Figure 36 ground to 75 cm). Therefore, given the density profile alone, an experienced observer would recognize a snowcover with a significantly weak basal layer.
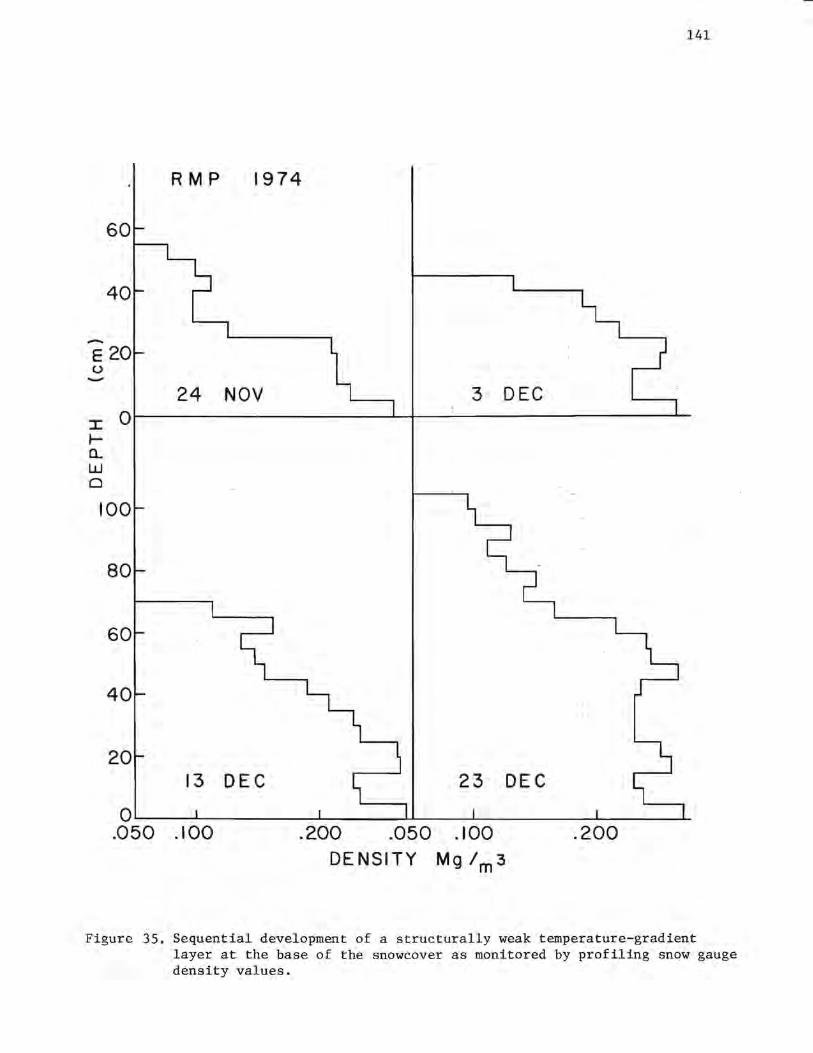
60
40
-E 20 (.) -J: 0 l-a.. w 0
100
80
60
40
20
141
RMP 1974
24 NOV 3 DEC
13 DEC 23 DEC
Q..._ __ L--_____ .__ ___ ........... __ __._ _____ __._ ___ ~
.050 .100 .200 .050 .100 .200 DENSITY Mg /m3
Figure 35. Sequential development of a structurally weak temperature-gradient layer at the base of the snowcover as monitored by profiling snow gauge density values.
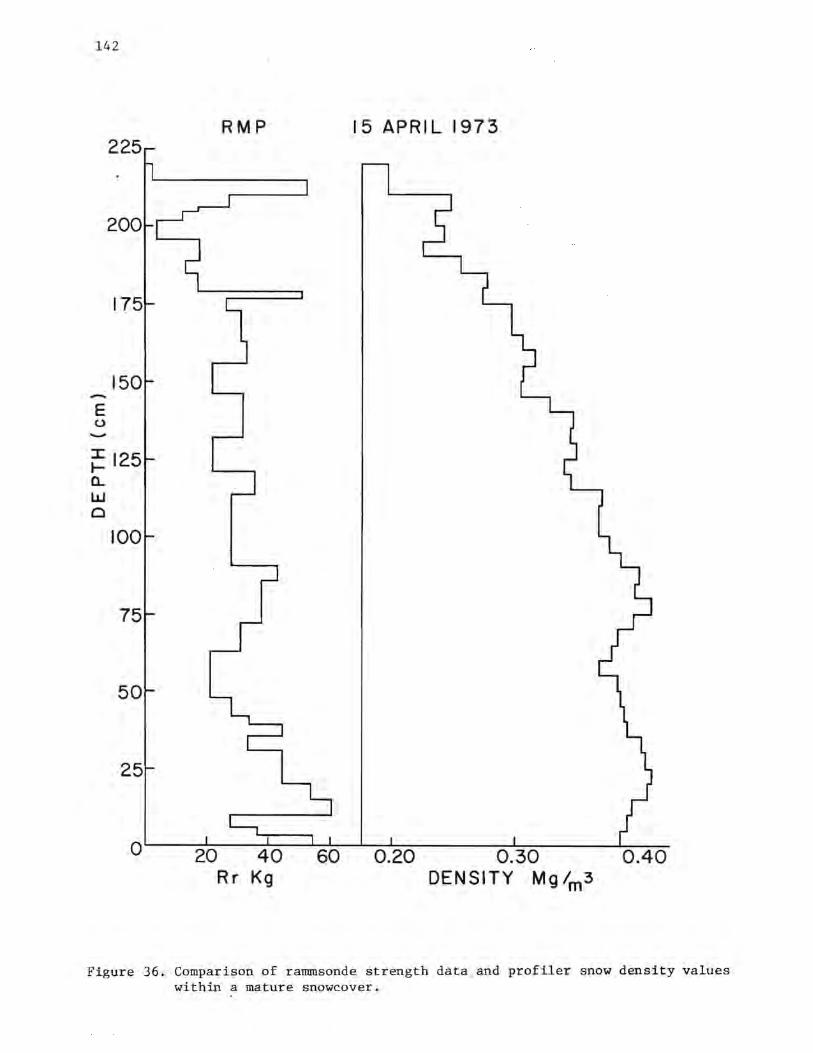
142
225
200
175
150 -E 0 -
::i: 125 .... a.. LLJ C
100
75
50
25
RMP 15 APRIL 1973
o ....__-----:2::"':0::-------:4:"-:o=--~601::--~o...1.:. 2:--:0-----:--""""".'.o....J.. 3~0 ___ ....1.0-.-4-0
Rr Kg DENSITY Mg/m3
Figure 36 . Comparison of rammsonde strength data and profiler snow density values within a mature snowcover .
143
Performance History
During the winter of 1971-1972, the Aerojet isotopic profiling snow gauge successfully provided this study with data on a total of 31 occasions. This number would have been substantially higher had not an instrument failure within the field logic unit required nearly three weeks to correct. Aerojet intentionally designed the remote gauge in such a way as to provide all field electronics mounted on plug-in cards to facilitate rapid and easy repair by field personnel unfamiliar with the inherent electronics. Such an effort is to be praised considering the great distance of the Red Mountain Pass gauge from Idaho Falls. One such repair was carried out within three days as a result of Aerojet personnel mailing the necessary replacement component. Unfortunately, the above mentioned lengthy interruption was caused by lack of availability of the necessary component.
During the 1972-1973 season, successful data runs were made on a total of 108 days, from November 2 to May 1. Within this period, standard daily data acquisition was prevented on 13 occasions, 9 due to telephone transmission difficulties, and only 4 due to malfunction within the snow gauge itself.
During the 1973-1974 winter the profiling gauge was operated from November 19 to May 28. Of a total of 133 days during which the gauge could have operated, data was not available on 43 days. Problems causing these interruptions included poor quality or interrupted telephone transmission, malfunctions within the electronic components at the Red Mountain Pass site, as well as two periods when moisture, resulting from either condensation or a leak in the seal at the base of the access tubes, froze in the tubes and prevented the vertical travel of the detector unit.
The current RPG Idaho Industrial Instruments snow gauge has been operated from November 1, 1974 through June 23, 1975 and from October 23, 1975 through March of 1976. An uninterrupted series of daily data runs was achieved for this period, with more frequent runs often made according to the needs of the study.

145
CHAPTER 7: SEISMIC SIGNALS FROM AVALANCHES
J. C. Harrison
Introduction
In schemes of avalanche prediction which either use a data bank of past occurrence together with meteorological and other conditions at the time, or which use test slopes observed to run under the same conditions as, and prior to, slopes posing a hazard to highway traffic, it is important to have good records of time of avalanche release on slopes which probably will not be visible from the highway under storm conditions. Thus, a network of a few sensors which remotely could detect and locate avalanches during storm conditions over an area of a few square miles would have important application. The investigations described here were made to evaluate possible application of seismic and infrasonic techniques to avalanche detection.
Seismometers and infrasonic microphones were operated at Red Mountain Pass, and, in cooperation with the U.S. Forest Service, at Berthoud Pass during the early months of 1972. The spring of 1972 had few avalanches and results were inconclusive (see Ives, et al., 1972). Two things, however, became evident: 1) the mountain passes are noisy sites for both the infrasonic and seismic installations owing to the high winds during the storms; and 2) avalanches generate high frequency seismic signals which cannot be adequately resolved on a drum recorder operating at normal seismic speeds.
It was therefor e decided to install the seismic and infrasonic detectors at the Chattanooga Ranch on the south side of Red Mountain Pass for the 1972-1973 winter season. Seismic equipment from Byrd Station, Antarctica, became available for the winter on a loan basis. This included a 14-track tape recorder with amplifiers allowing four data channels to be recorded, each at three different gains, in addition to time reference marks. Two data channels were used for a vertical and a horizontal component Benioff seismometer installed in a stable on the ranch on a site chosen to be as far as possible from the road. The horizontal seismometer gave trouble, evidently because of the low temperature of operation, and was replaced with a Hall-Sears HS-10 1-second horizontal geophone. The other two channels were used to record signals from two infrasonic microphones. The noise levels on these microphones were reduced by using two perpendicular 200 foot hoses and spatial filters in place of the single 100 foot length used during the previous winter. In addition the seismic signals were monitored on a 2-pen helicorder drum running at 30 mm per minute which could record either the seismic amplifier outputs or a slightly delayed playback from the tape. Normally vertical component signal and playback were monitored in order to check operation of the tape recorder. The infrasonic signals were likewise monitored directly and on playback using Esterline Angus chart recorders. The pass band of the seismic amplifier and tape recorder was 5-.05hz; the helicorder pens would respond up to 30 hz although this signal could not be resolved. The high frequency end of the infrasonic signal was limited by the response of the microphones themselves to 0.3 hz, leading to a pass band of 0.3-0.05 hz on the tape recorded signal. The vertical seismometer was calibrated by means of a weightlift test and was normally run at a gain of 108,000 at one hz, which was determined by the noise level. The limiting factor here is the strong signals from heavy vehicles.
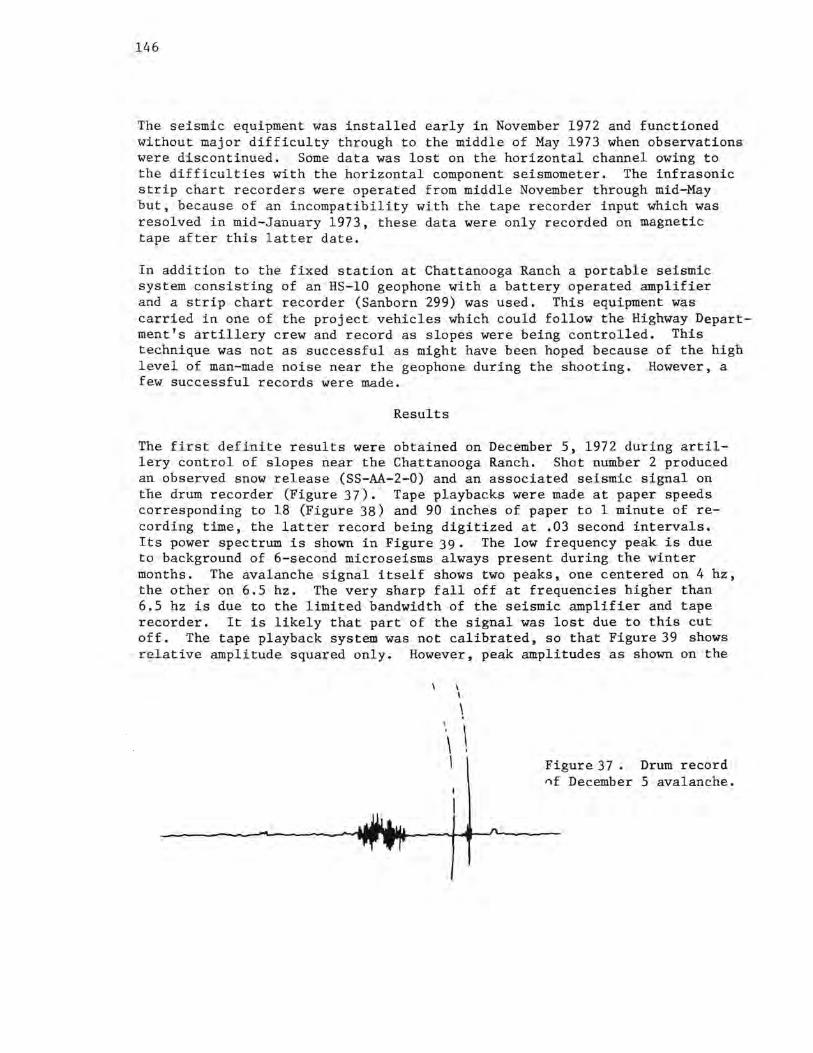
146
The seismic equipment was installed early in November 1972 and functioned without major difficulty through to the middle of May 1973 when observations were discontinued. Some data was lost on the horizontal channel owing to the difficulties with the horizontal component seismometer. The infrasonic strip chart recorders were operated from middle November through mid-May but, because of an incompatibility with the tape recorder input which was resolved in mid-January 1973, these data were only recorded on magnetic tape after this latter date.
In addition to the fixed station at Chattanooga Ranch a portable seismic system consisting of an HS-10 geophone with a battery operated amplifier and a strip chart recorder (Sanborn 299) was used. This equipment was carried in one of the project vehicles which could follow the Highway Department's artillery crew and record as slopes were being controlled. This technique was not as successful as might have been hoped because of the high level of man-made noise near the geophone during the shooting. However, a few successful records were made.
Results
The first definite results were obtained on December 5, 1972 during artillery control of slopes near the Chattanooga Ranch. Shot number 2 produced an observed snow release (SS-AA-2-0) and an associated seismic signal on the drum recorder (Figure 37), Tape playbacks were made at paper speeds corresponding to 18 (Figure 38) and 90 inches of paper to 1 minute of recording time, the latter record being digitized at .03 second intervals. Its power spectrum is shown in Figure 39. The low frequency peak is due to background of 6-second microseisms always present during the winter months. The avalanche signal itself shows two peaks, one centered on 4 hz, the other on 6.5 hz. The very sharp fall off at frequencies higher than 6.5 hz is due to the limited bandwidth of the seismic amplifier and tape recorder. It is likely that part of the signal was lost due to this cut off. The tape playback system was not calibrated, so that Figure 39 shows relative amplitude squared only. However, peak amplitudes as shown on the
I I
\ . ·. \ \ . I Figure37. Drum record
0f December 5 avalanche.
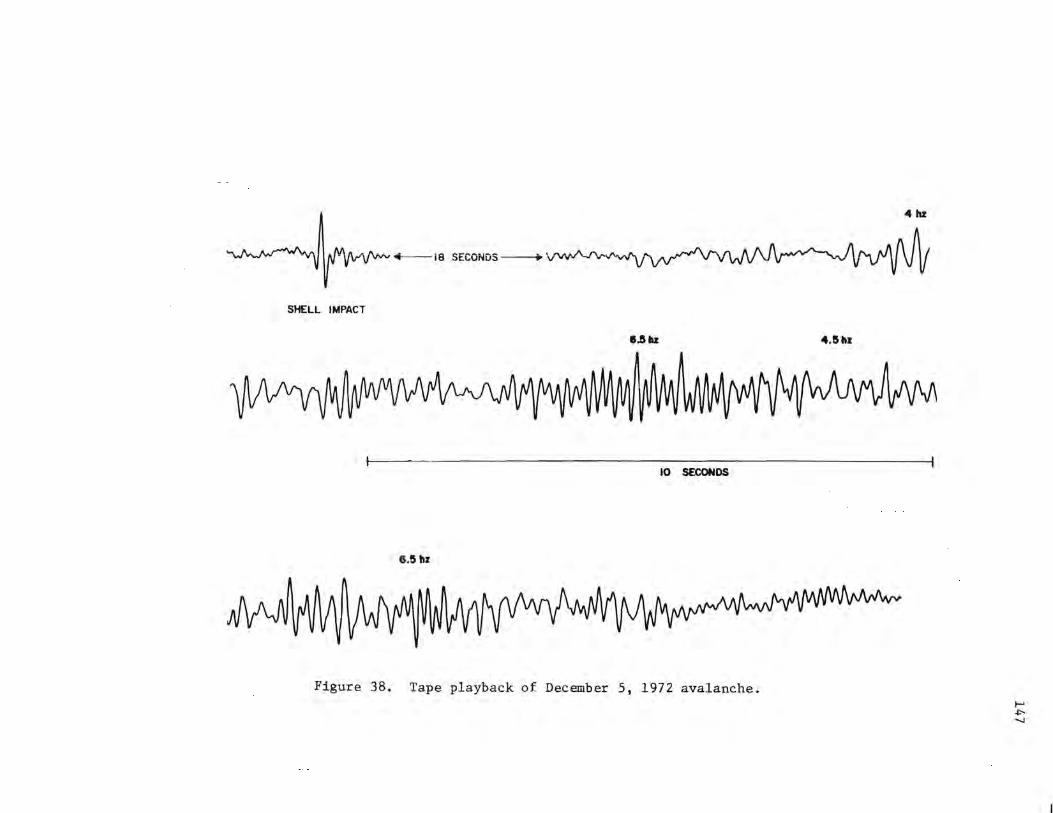
~·~~ .. SECONDS---e
SHELL IMPACT
e.s11z
10 SECONDS
6.5 hz
Figure 38. Tape playback of December 5, 1972 avalanche.
4 hz
4.5 hi
I-' .f:'......,
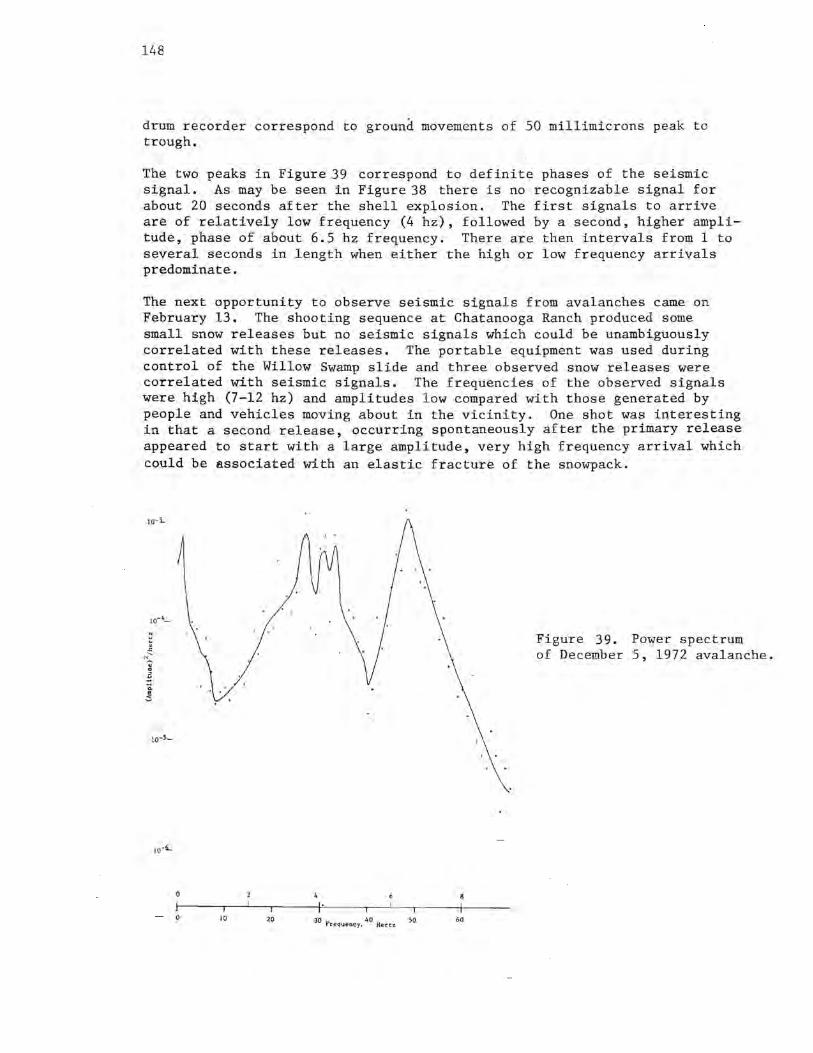
148
drum recorder correspond to ground movements of 50 millimicrons peak to trough.
The two peaks in Figure 39 correspond to definite phases of the seismic signal. As may be seen in Figure 38 there is no recognizable signal for about 20 seconds after the shell explosion. The first signals to arrive are of relatively low frequency (4 hz), followed by a second, higher amplitude, phase of about 6.5 hz frequency. There are then intervals from 1 to several seconds in length when either the high or low frequency arrivals predominate.
The next opportunity to observe seismic signals from avalanches came on February 13. The shooting sequence at Chatanooga Ranch produced some small snow releases but no seismic signals which could be unambiguously correlated with these releases. The portable equipment was used during control of the Willow Swamp slide and three observed snow releases were correlated with seismic signals. The frequencies of the observed signals were high (7-12 hz) and amplitudes low compared with those generated by people and vehicles moving about in the vicinity. One shot was interesting in that a second release, occurring spontaneously after the primary release appeared to start with a large amplitude, very high frequency arrival which could be associated with an elastic fracture of the snowpack.
Figure 39. Power spectrum of December 5, 1972 avalanche.
10 20 JO Frequ~ncy. 40 He rtz SO 60
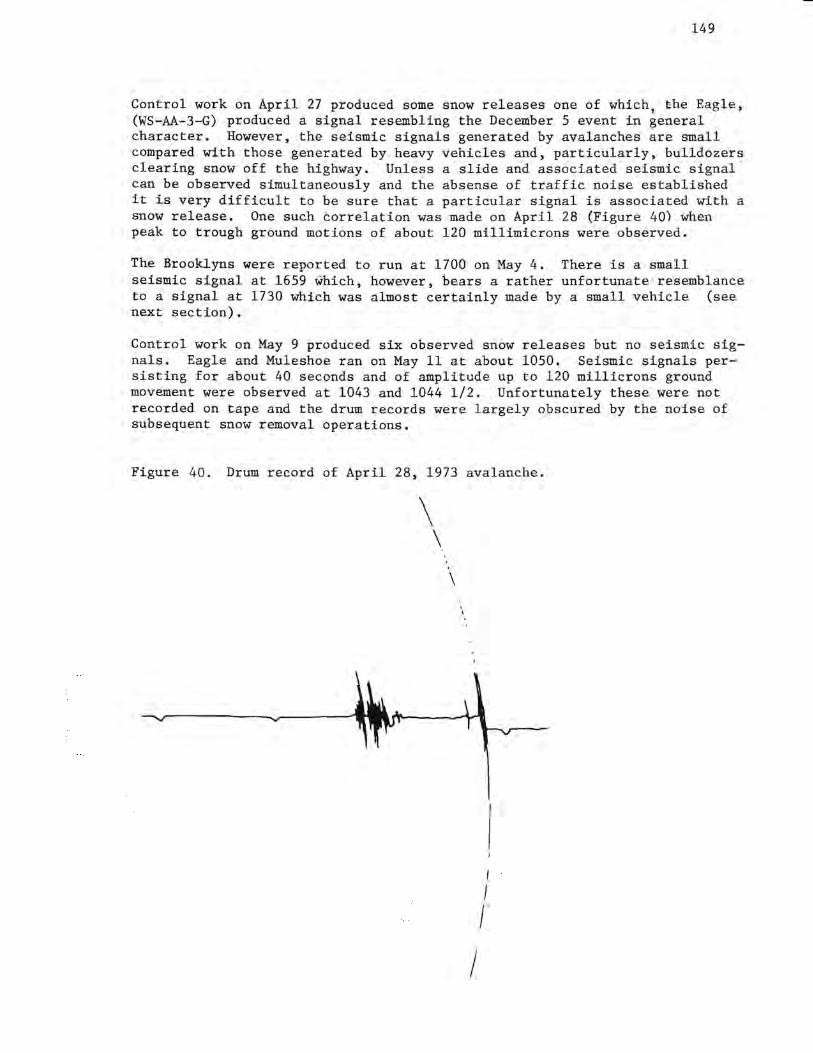
149
Control work on April 27 produced some snow releases one of which, the Eagle, (WS-AA-3-G) produced a signal resembling the December 5 event in general character. However, the seismic signals generated by avalanches are small compared with those generated by heavy vehicles and, particularly, bulldozers clearing snow off the highway. Unless a slide and associated seismic signal can be observed simultaneously and the absense of traffic noise established it is very difficult to be sure that a particular signal is associated with a snow release. One such correlation was made on April 28 (Figure 40) when peak to trough ground motions of about 120 millimicrons were observed.
The Brooklyns were reported to run at 1700 on May 4. There is a small seismic signal at 1659 which, however, bears a rather unfortunate resemblance to a signal at 1730 which was almost certainly made by a small vehicle (see next section).
Control work on May 9 produced six observed snow releases but no seismic signals. Eagle and Muleshoe ran on May 11 at about 1050. Seismic signals persisting for about 40 seconds and of amplitude up to 120 millicrons ground movement were observed at 1043 and 1044 1/2. Unfortunately these were not recorded on tape and the drum records were largely obscured by the noise of subsequent snow removal operations.
Figure 40. Drum record of April 28, 1973 avalanche.
\ \
\
I
I I
I
150
Conclusions
A number of weak, high frequency seismic signals have been correlated with small snow releases. No large avalanches occurred in the vicinity of the seismic station during the winter. No infrasonic signals were observed to correlate with the snow releases; if the seismic and sound signals be supposed to have a common cause, then it would be necessary to look for signals of much higher frequency (2-30 hz) than could be detected with the microphones used in this work (high frequency cut-off at about .3 hz).
Traffic generated seismic signals lie in the same frequency band as the avalanche signals and heavy vehicles produce larger signals. It was noted that a heavy vehicle produces a very characteristic signal; one approaching from the south can be detected for about 40 seconds passing beneath the foot of the Brooklyns slides. Amplitudes are generally fairly low but there are several bursts of higher than average amplitude giving the record a "lumpy" look. The signal disappears abruptly as the vehicle crosses North Mineral Creek, giving about 20 seconds of quiet, only to reappear and give about 10 seconds of a very high amplitude signal as the vehicle passes the trailer itself. The signal level falls rapidly after the ranch is passed but persists as a low level spiky signal as the vehicle rounds the Muleshoe bend and starts to ascend the steep grade to Red Mountain Pass. The vehicle's direction of travel can easily be determined by a quick inspection of the record and its speed of travel and size estimated. This characteristic vehicle-associated signal allows many traffic generated signals to be immediately identified as such; however, small vehicles near the threshold of detection do not always produce recognizable signals and the operational gain of the system is limited by the large traffic generated signals.
The weakness of the avalanche generated signals precludes the monitoring of slide activity in an area of many square miles with a few conventional seismic stations. However, the positive results obtained do suggest that such monitoring could be successful on a limited scale. Steps recommended include:
1. Use of a high frequency system -- it appears that the relevant bandwidth is 2-20hz;
2. Location of geophone halfway up the sides of the valleys, well above the highways and close to the slopes being maintained;
3. Use of pattern recognition techniques to aid in dis.crimination of the signals received for generally vehicles will move slowly through an array and generate a characteristic pattern at each site (at least our records at Chattanooga suggest this). Avalanche signals will be detected nearly simultaneously by geophones in the slide vicinity and signal amplitudes will decrease away from the slide. This discrimination could be done in real time by use of a mini-computer, probably using signal amplitude in various pass-bands as a function of time, rather than actual wave forms.
REFERENCES
Akitaya, E., 1974: Studies on depth hoar. Institute of Low Temperature Science, Hokkaido University, Series A, No. 26, 1-67.
Armstrong, B., 1976a: avalanche hazard Colorado INSTAAR
Century of struggle against snow: a history of in San Juan County, Colorado. University of Occasional Paper No. 18 (in press).
Armstrong, B., 1976b: A history of avalanche hazard in Ouray County, Colorado. University of Colorado INSTAAR Occasional Paper (in preparation).
Armstrong, R. L. et al.,1974: Development of methodology for evaluation and prediction of avalanche hazard in the San Juan Mountains of southwestern Colorado. University of Colorado INSTAAR Occasional Paper No. 13. 141 pp.
Bader, H. et al., 1939: Snow and its metamorphism. Translation 14, U.S. Army Cold Regions Research and Engineering Laboratory, Hanover, New Hampshire. 313 pp.
Bois, P., Obled, C., and Good, W., 1974: Multivariate data analysis as a tool for day-by-day avalanche forecast. Paper presented at the International Symposium on Snow Mechanics, Grindelwald, Switzerland, 1974 (in press).
Bovis, M. J., 1976: Statistical forecasting of snow avalanches, San Juan Mountains, southern Colorado. Journal of Glaciology (in press).
151
Colbeck, s. C., 1974: Grain and bond growth in wet snow. Paper presented at the International Symposium on Snow Mechanics, Grindelwald, Switzerland, 1974 (in press).
Hoel, P. G., 1971: Introduction to mathematical statistics. Wiley, New York. 409 pp.
Hope, K., 1968: New York.
Methods of multivariate analysis. 288 pp.
Gordon and Breach,
Ives, J. D., Harrison, J. C.,and Alford, D. L., 1972: Development of methodology for evaluation and prediction of avalanche hazard in the San Juan Mountain area of southwestern Colorado. Interim Report for the Division of Atmospheric Water Resources Management, Bureau of Reclamation. 88 pp.
Ives, J. D., Harrison, J. C., and Armstrong, R. 1., 1973: Development of methodology for evaluation and prediction of avalanche hazard in the San Juan Mountain area of southwestern Colorado. Interim Report for the Division of Atmospheric Water Resources Management, Bureau of Reclamation. 122 pp .
152
Ives, J. D. et al., 1976: Natural hazards in mountain Colorado. Annals of the Association of American Geographers, 66(1): 129-144.
Judson, A. and Erikson, B., 1973: Predicting avalanche intensity from weather data: a statistical analysis. U.S. Department of Agriculture Forest Service Research Paper, RM-112. 12 pp.
LaChapelle, E. R., 1965: Avalanche forecasting - a modern synthesis. International Association of Scientific Hydrology, Publication No. 69, International Symposium on Scientific Aspects of Snow and Ice Avalanches, Davos, Switzerland, April 1965, 350-356.
LaChapelle, E. R. et al., 1975: Alternate methods of avalanche control. 1974-75 Interim Report prepared for Washington State Highway Commission by Geophysics Program and Department of Civil Engineering, University of Washington, Seattle, Washington. 158 pp.
Lachapelle, E. R., and Armstrong, R. L., 1976: Snowcover, temperature and metamorphism patterns in the San Juan Mountains of southwestern Colorado. University of Colorado INSTAAR Occasional Paper (in preparation).
Mellor, M., 1968: Avalanches. Cold Regions Science and Engineering, Part III: Engineering, Section A3: Snow Technology, U.S. Army Cold Regions Research and Engineering Laboratory, Hanover, New Hampshire. 215 pp.
Miller, L., Armstrong, B. and Armstrong, R. L., 1976: Avalanche atlas: San Juan County, Colorado. University of Colorado INSTAAR Occasional Paper No. 17. 233 pp.
Perla, R. I. and Martinelli, M.,Jr., 1976: Avalanche handbook. U.S. Department of Agriculture Forest Service Handbook No. 489. 235 pp.
Rhea, O., 1970: In Installation and operation of an opportunity recognition and cloud seeding system for operational weather modification research in Colorado. Phase I. Comprehensive Field Report. EGG Environmental Services Corporation. Prepared for U.S. Bureau of Reclamation, Denver, Colorado.
Smith, J. L., Willen, D. W., and Owens, M. S., 1965: .Measurement of snowpack profiles with radioactive isotopes. Weatherwise 18: 246-251.
Smith, J. L., Willen, D. W., and Owens, M. S., 1967: Isotope for determining hydrologic characteristics of snowpacks. Techniques in the Hydrologic Cycle, American Geophysical Geophysical Monograph Series 11: 11-21.
snow gauges In Isotope
Union,
Smith, S.D., 1971: Avalanche track geomorphology in the San Juan Mountains of southwestern Colorado. Unpublished NSF sponsored summer research paper.
U.S. Forest Service, 1961: Snow avalanches: a handbook of forecasting and control measures. U.S. Department of Agriculture Handbook No. 194. 84 pp.

APPENDIX 1
1974-1975 WINTER SUMMARY
Richard L. Armstrong
During the period November 1 through April 30 precipitation occurred in the form of snow on 109 days at the Red Mountain Pass study site. On April 30 the snow:pack contained 937 mm of water. Total snowfall measured at daily intervals amounted to 1295 cm. Maximum snowdepth at this site was 310 cm on April 13. The average new snow density was .077 Mg/m3. The mean daily temperature for the Red Mountain Pass site for the period November through April was -8. 4 °c with the mean minimum and maximum being -13.6°C and -2.3°C respectively. The lowest recorded temperature was -27.0°c and occurred on January 12. During this period the average wind speed at Pt. 12,325 was 6.0 m/sec, with the highest one-hour average being 28.0 m/sec recorded on March 25. Monthly sunnnaries of temperature, precipitation, and wind speed data are contained in Table 29 og Appendix 2.
Within the boundaries of the study area and along the 58 km of U.S. Highway 550 between Coal Bank Hill and Bear Creek Falls in the Uhcompaghre Gorge, 1008 avalanches were observed during the 1974-1975 winter season with 252 of these events coming in contact with the highway system. Of all avalanches observed, soft slab avalanches amounted to 58%; hard slab, 11%; wet slab, 1%; dry loose, 19%; and wet loose, 11%. Of the total avalanche events listed above, 69 were released by artificial means.
A graphical presentation of precipitation, air temperature~ wind speed and avalanche occurrence for the winter period is found in Figures 41 and 42. The variation in the density of the snowcover with time at the Red Mountain Pass study site is presented in Figure ·· 43. The isolines within the upper portion of the snowcover reflect a general increase in density with time and snow depth. The lower portion, to a depth of approximately 50.0 cm, deviates from this pattern due to the development of temperature-gradient snow, or "depth hoar" within this layer. Above this layer the snowcover is primarily made up of fine-grained, equi-temperature snow which continues to increase in density while the lower portion is comprised of coarsegrained, temperature-gradient snow which due to its inherent mechanical properties is resistant to settlement and thus densification. This retarded densification rate is also evident in Figure 44 where platter number one represents the settlement rate of the "depth hoar" layer. This layer of weaker temperature-gradient snow at the base of the snowcover is a common phenomenon in the Rocky Mountains and has been identified within the Red Mountain Pass study area, as well as on all slope aspects, throughout the four year research period. However, the thickness of this layer during the 1974-1975 winter was approximately twice that which had been observed during the three preceeding winters and this additional amount of unstable snow at the base of the snowcover provided the lubricating layer for the higher than normal frequency and magnitude of avalanche events during the months of December, January and February.
A time-stratigraphic diagram of temperature variations (°C) within the snowcover at the Red Mountain Pass study site appears in Figure 45. The
153
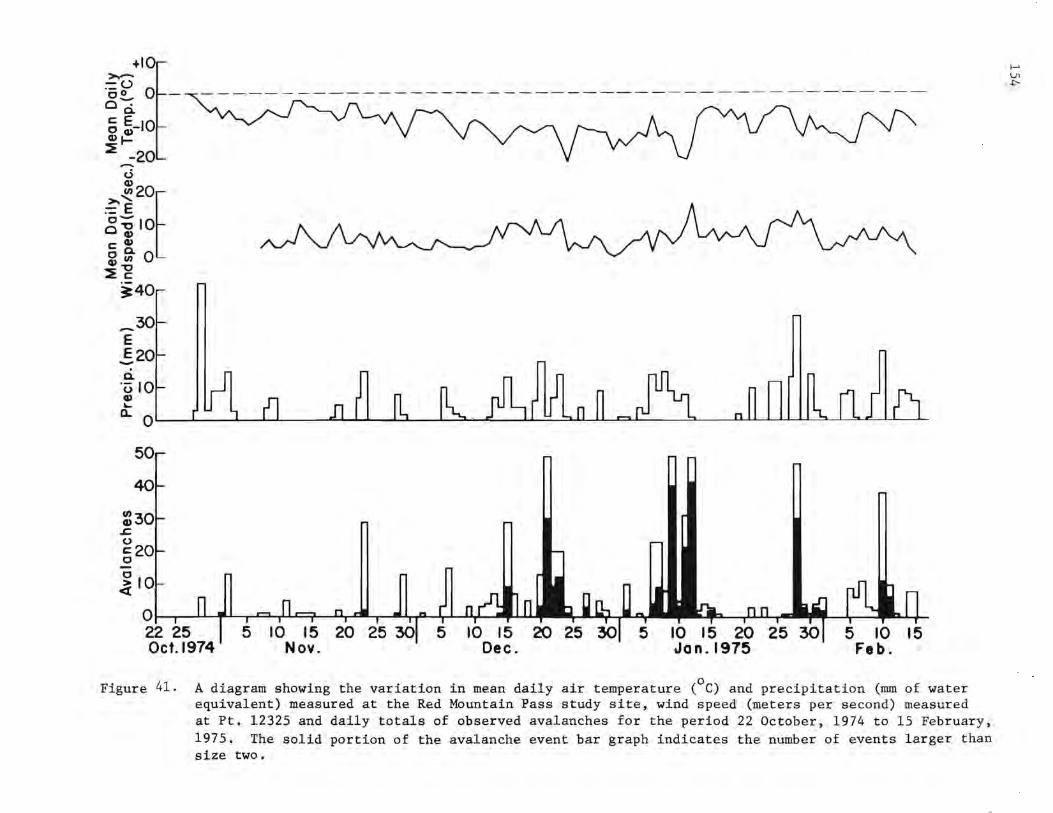
+10 >--== (..) oO O C---:' a. c:E 0 Q)-10 Q) I-~ ,...:-20
(.) .~~20t o-c"O 10 Q) C: Q)
0 a. 0 Q) 1/J
~-g ~40
_30 E .§.20 a.
•0- 10 ', r' I
._, 11 11 I I I I I .., Q) II - =, II II c::, I '- ,. I 1::J I ., .. CL QI I I I I
50
40
:30 .c:. 0 c:20 0
~,o <t
o, II r• c::,119 II CII Ml O I I 111 "'Ill, I I I I I 11 I I
22 25 Oct.1974
Figure 41. A diagram showing the variation in mean daily air temperature (°C) and precipitation (mm of water equivalent) measured at the Red Mountain Pass study site, wind speed (meters per second) measured at Pt. 12325 and daily totals of observed avalanches for the period 22 October, 1974 to 15 February, 1975, The solid portion of the avalanche event bar graph indicates the number of events larger than size two.
f-' Ul -I'-
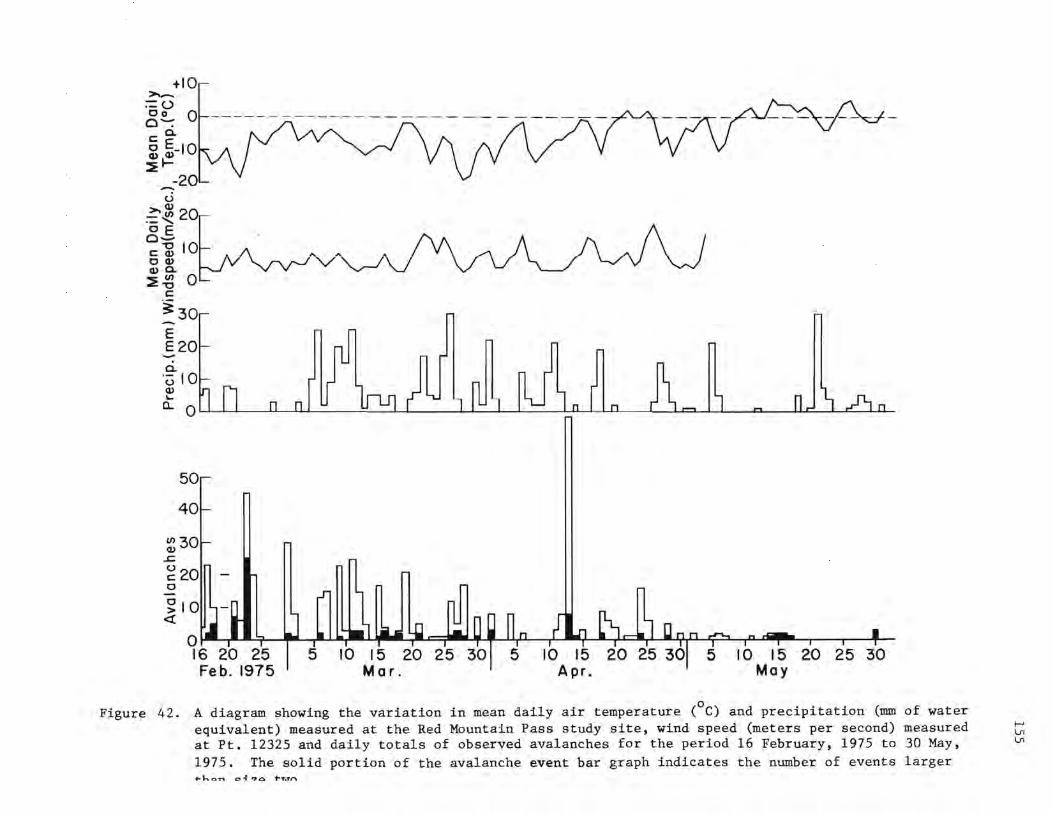
+10 >-
:= (.) Co 0 0"'"'"7 C: 0.
o E-10 ~~
_-20 u
OE -~~20L 11 I: VyyJ~~c,/vl\J C:
~30 E E20
50
40
(/) 30 (1)
.r::.
g20 0
~10 <(
ol• 117 .. 111.:;-11Pffi':jii lffll~, Ila I._,,• lc:411 W90 r:p, a ' 16 2b 25 ' I r I r r r r r 1 , , , 20 25 30
Feb. 1975
Figure 42. A diagram showing the variation in mean daily air temperature (°C) and precipitation (mm of water equivalent) measured at the Red Mountain Pass study site, wind speed (meters per second) measured at Pt. 12325 and daily totals of observed avalanches for the period 16 February, 1975 to 30 May, 1975. The solid portion of the avalanche event bar graph indicates the number of events larger +- 'h ~ n o -{ '7 0 t-TaTf"'\
I-' \J1 \J1
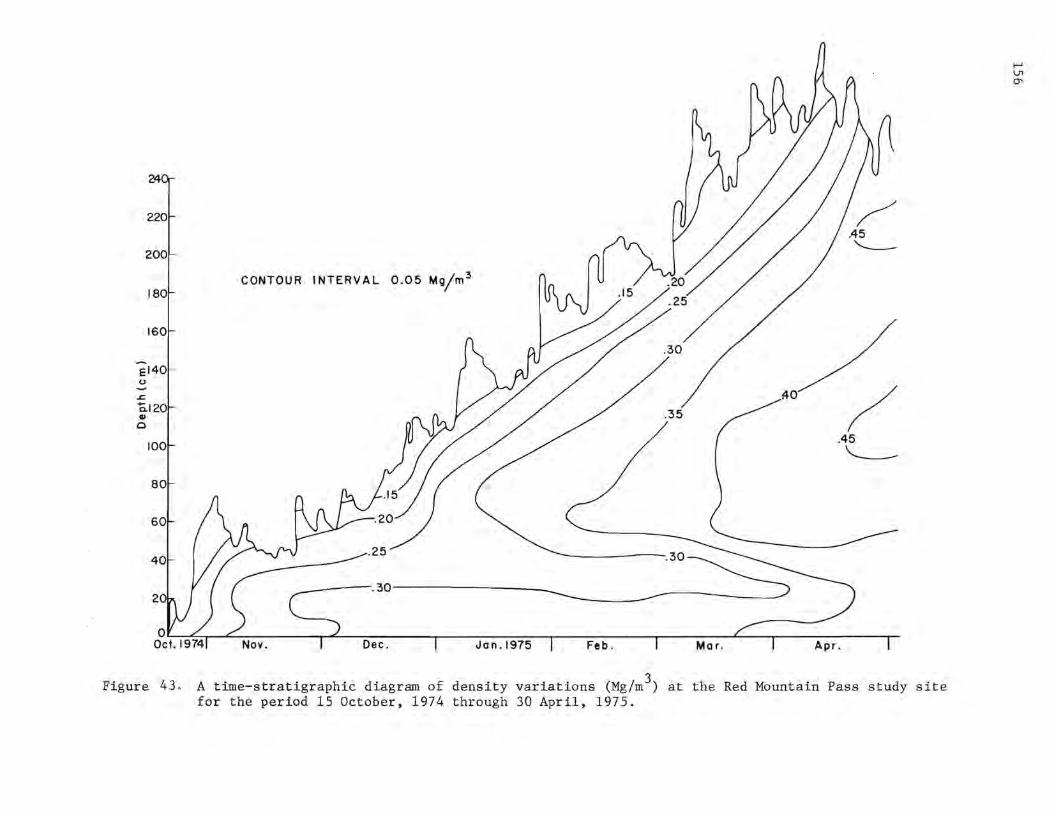
24
220
200
180
160
el40 0 -~ "ti.120 GI 0
100
80
60
40
CONTOUR INTERVAL 0.05 Mgjm 3
~o / .45 \___
.30---------~
Dec. Jan.1975 Feb. Mar. Apr.
Figure 43 . A time-stratigraphic diagram of density variations (Mg/m3) at the Red Mountain Pass study site for the period 15 October, 1974 through 30 April, 1975.
t-' Vl
°'
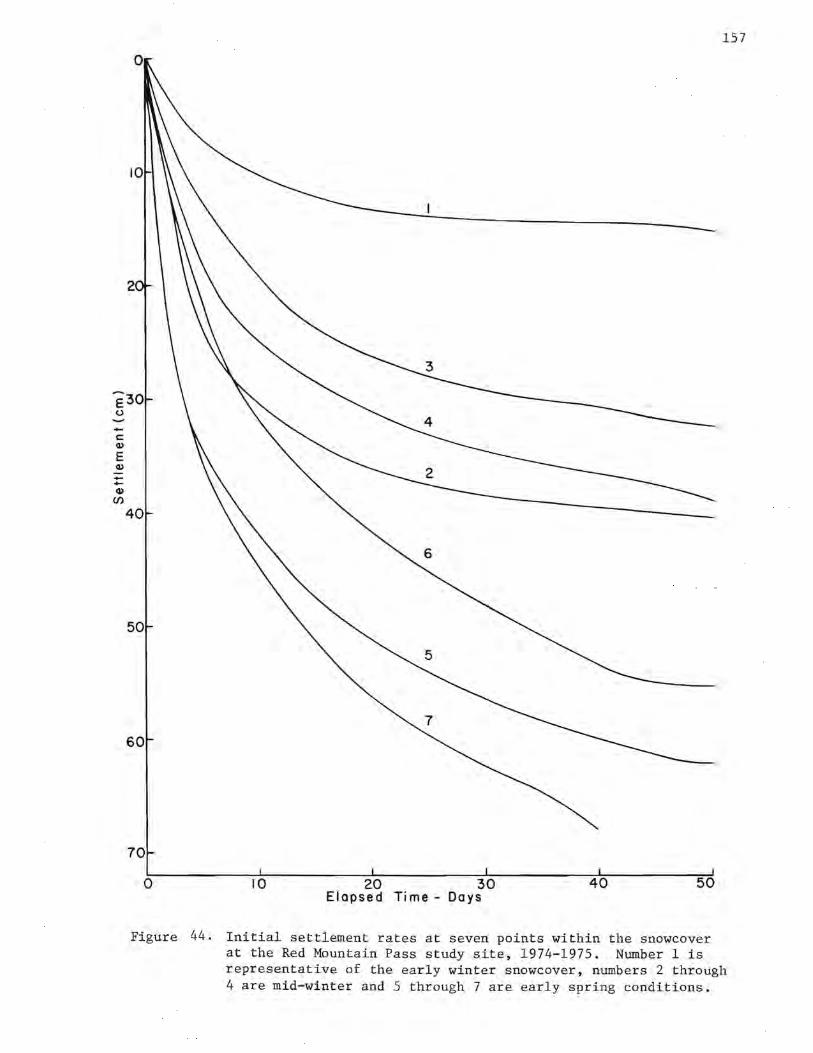
157
0
2
e3o 0
C: Q)
E Q) --Q)
C/)
40
50
60
70
0 10 20 30 40 50 Elapsed Time - Days
Figure 44. Initial settlement rates at seven points within the snowcover at the Red Mountain Pass study site, 1974-1975. Number 1 is representative of the early winter snowcover, numbers 2 through 4 are mid-winter and 5 through 7 are early spring conditions.
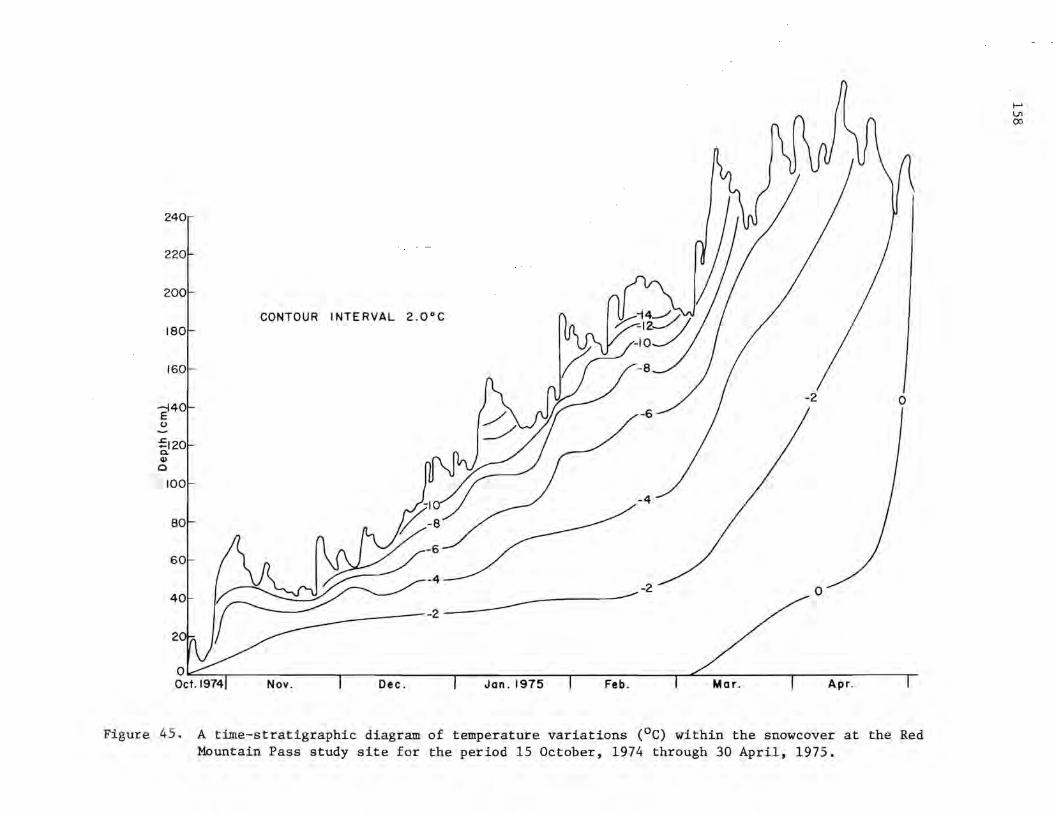
240
220
200
180
160
--HO E 0
~120 a. Cl)
0
100
CONTOUR INTERVAL 2 .0°C
-2
2~
I
-2 0
__...,-2 - 0 ----- L Jon.1975 I Feb . I Mor. I Apr.
Figure 45. A time-stratigraphic diagram of temperature variations (°C) within the snowcover at the Red Mountain Pass study site for the period 15 October, 1974 through 30 April, 1975.
I--' V, OJ
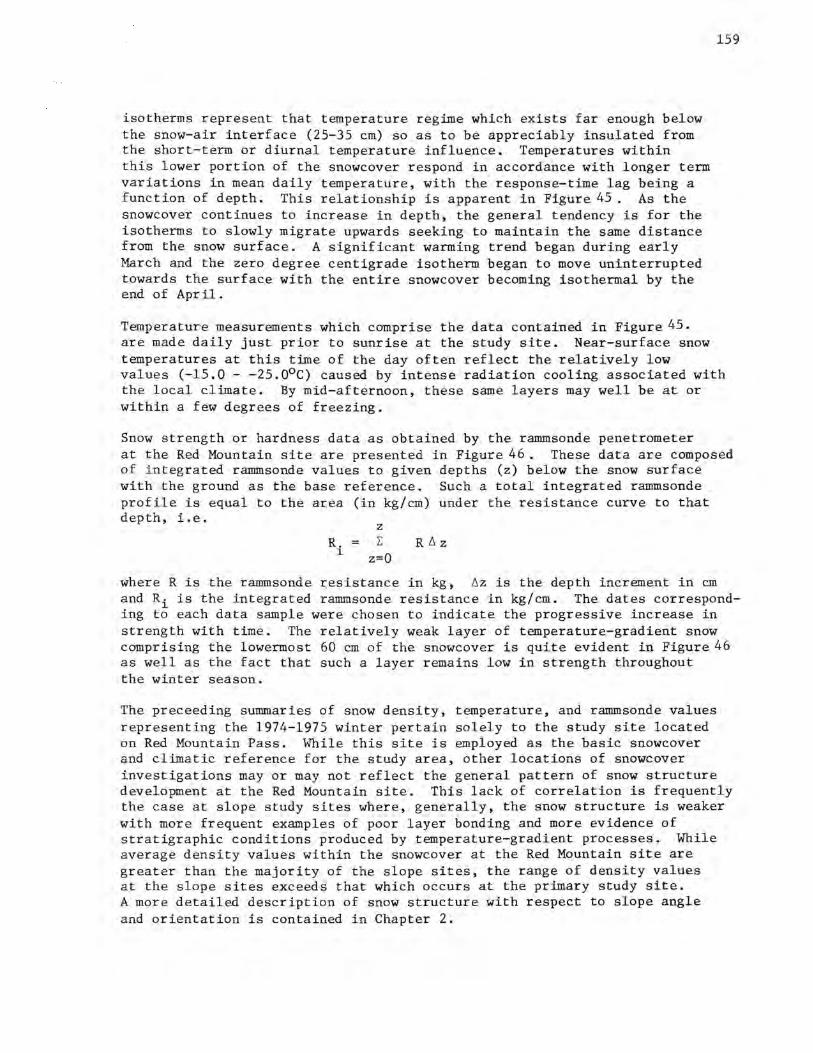
isotherms represent that temperature regime which exists far enough below the snow-air interface (25-35 cm) so as to be appreciably insulated from the short-term or diurnal temperature influence. Temperatures within this lower portion of the snowcover respond in accordance with longer term variations in mean daily temperature, with the response-time lag being a function of depth. This relationship is apparent in Figure 45. As the snowcover continues to increase in depth, the general tendency is for the isotherms to slowly migrate upwards seeking to maintain the same distance from the snow surface. A significant warming trend began during early March and the zero degree centigrade isotherm began to move uninterrupted towards the surface with the entire snowcover becoming isothermal by the end of April.
Temperature measurements which comprise the data contained in Figure 45.
159
are made daily just prior to sunrise at the study site. Near-surface snow temperatures at this time of the day often reflect the relatively low values (-15.0 - -25.0°C) caused by intense radiation cooling associated with the local climate. By mid-afternoon, these same layers may well be at or within a few degrees of freezing.
Snow strength or hardness data as obtained by the rammsonde penetrometer at the Red Mountain site are presented in Figure 46. These data are composed of integrated ranunsonde values to given depths (z) below the snow surface with the ground as the base reference. Such a total integrated rammsonde profile is equal to the area (in kg/cm) under the resistance curve to that depth, i.e.
R. 1
z E
z=O
where R is the rammsonde resistance in kg, ~z is the depth increment in cm and Riis the integrated rammsonde resistance in kg/cm. The dates corresponding to each data sample were chosen to indicate the progressive increase in strength with time. The relatively weak layer of temperature-gradient snow comprising the lowermost 60 cm of the snowcover is quite evident in Figure46 as well as the fact that such a layer remains low in strength throughout the winter season.
The preceeding summaries of snow density, temperature, and rammsonde values representing the 1974-1975 winter pertain solely to the study site located on Red Mountain Pass. While this site is employed as the basic snowcover and climatic reference for the study area, other locations of snowcover investigations may or may not reflect the general pattern of snow structure development at the Red Mountain site. This lack of correlation is frequently the case at slope study sites where, generally, the snow structure is weaker with more frequent examples of poor layer bonding and more evidence of stratigraphic conditions produced by temperature-gradient processes. While average density values within the snowcover at the Red Mountain site are greater than the majority of the slope sites, the range of density values at the slope sites exceeds that which occurs at the primary study site. A more detailed description of snow structure with respect to slope angle and orientation is contained in Chapter 2.
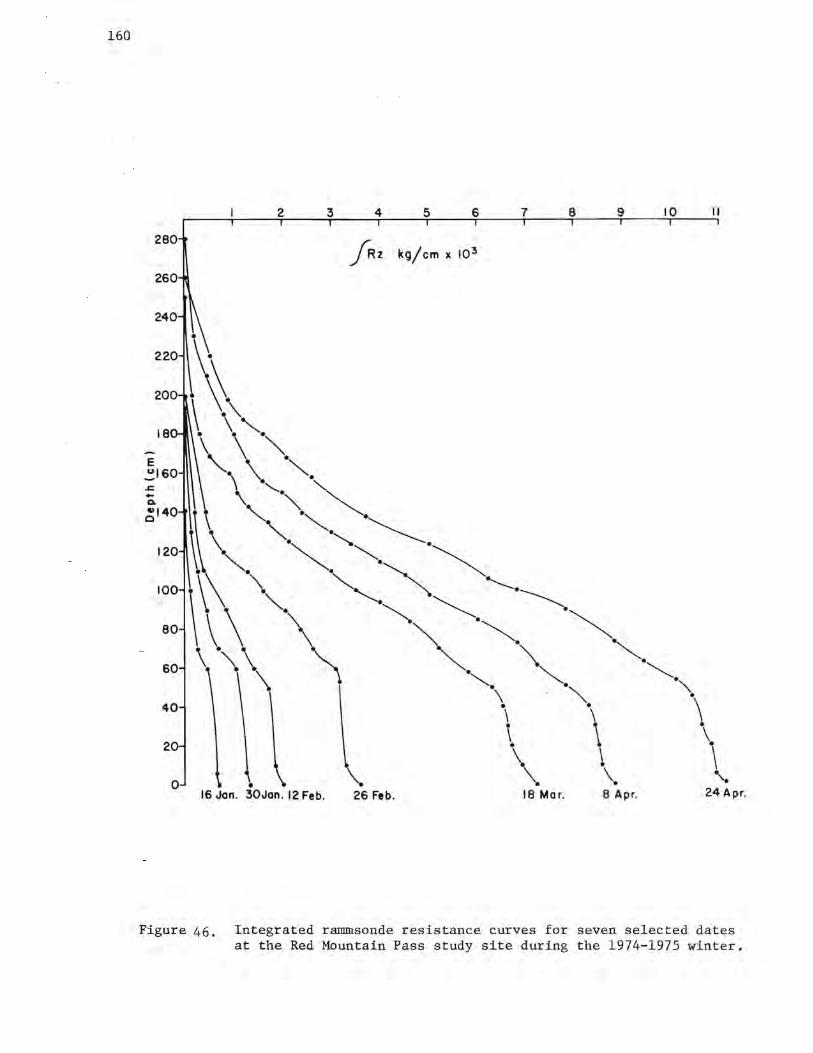
160
280
260
240
220
J: -~
18
~140
120
10
40
2
0
2 3
\ 16 Jon. 30Jon. 12 Feb.
4 5 6 7 8 9 10 II
/Rz kg/cm x 103
26 Feb. 18 Mor. 8 Apr. 24 Apr.
Figure 46. Integrated rammsonde resistance curves for seven selected dates at the Red Mountain Pass study site during the 1974-1975 winter.
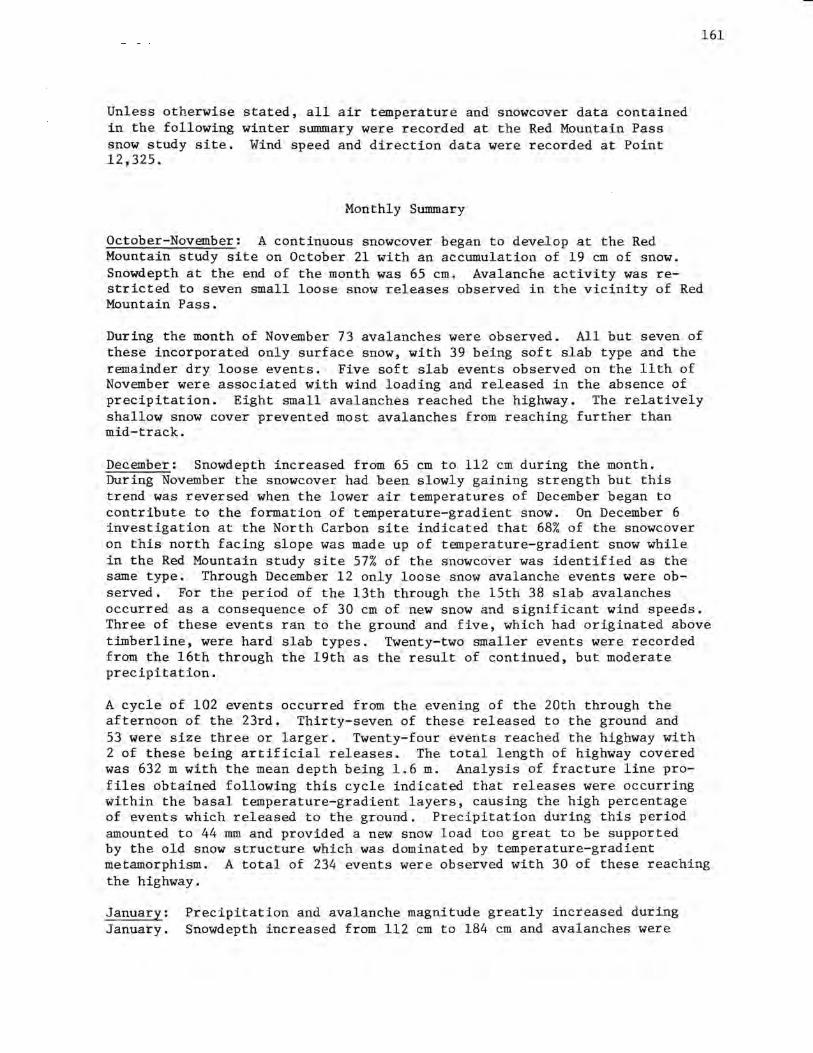
Unless otherwise in the following snow study site. 12,325.
stated, all air temperature and snowcover data contained winter summary were recorded at the Red Mountain Pass
Wind speed and direction data were recorded at Point
Monthly Summary
161
October-November: A continuous snowcover began to develop at the Red Mountain study site on October 21 with an accumulation of 19 cm of snow. Snowdepth at the end of the month was 65 cm. Avalanche activity was restricted to seven small loose snow releases observed in the vicinity of Red Mountain Pass.
During the month of November 73 avalanches were observed. All but seven of these incorporated only surface snow, with 39 being soft slab type and the remainder dry loose events. Five soft slab events observed on the 11th of November were associated with wind loading and released in the absence of precipitation. Eight small avalanches reached the highway. The relatively shallow snow cover prevented most avalanches from reaching further than mid-track.
December: Snowdepth increased from 65 cm to 112 cm during the month. During November the snowcover had been slowly gaining strength but this trend was reversed when the lower air temperatures of December began to contribute to the formation of temperature-gradient snow. On December 6 investigation at the North Carbon site indicated that 68% of the snowcover on this north facing slope was made up of temperature-gradient snow while in the Red Mountain study site 57% of the snowcover was identified as the same type. Through December 12 only loose snow avalanche events were observed. For the period of the 13th through the 15th 38 slab avalanches occurred as a consequence of 30 cm of new snow and significant wind speeds. Three of these events ran to the ground and five, which had originated above timberline, were hard slab types. Twenty-two smaller events were recorded from the 16th through the 19th as the result of continued, but moderate precipitation.
A cycle of 102 events occurred from the evening of the 20th through the afternoon of the 23rd. Thirty-seven of these released to the ground and 53 were size three or larger. Twenty-four events reached the highway with 2 of these being artificial releases. The total length of highway covered was 632 m with the mean depth being 1.6 m. Analysis of fracture line profiles obtained following this cycle indicated that releases were occurring within the basal temperature-gradient layers, causing the high percentage of events which released to the ground. Precipitation during this period amounted to 44 mm and provided a new snow load too great to be supported by the old snow structure which was dominated by temperature-gradient metamorphism. A total of 234 events were observed with 30 of these reaching the highway.
January: Precipitation and avalanche magnitude greatly increased during January. Snowdepth increased from 112 cm to 184 cm and avalanches were

162
recorded on 21 days during the month. A total of 269 events were recorded with 71 of these ' reaching the highway. The weak old-sn·ow structure which had developed during December persisted through January causing 32% of the observed avalanches to release to the ground surface. An example of the snow structure prevalent at this time is presented in Figure 47.
Of the total events 75% occurred during a period of continuous storm conditions between the 6th and 12th. On the night of the 6th the East Riverside avalanche reached the highway and deposited debris 10 m deep over a distance of 30 m. Increased precipitation rates and windspeeds developed on January 8 and contributed to the release of 71 events on the 9th, 14 of which reached U.S. Highway 550 with an additional 4 crossing Colorado Highway 110, the Standard Metals Mine access road between Silverton and Gladstone. The debris deposited by the avalanches on Colorado 110 was significant enough to cause the road to be closed for several days.
During this portion of the cycle 50% of the events reached full track and 25% released to full depth removing the snow in the starting zone to the ground. Such conditions reflect exceptionally low snow strengths both within the starting zones as well as within the tracks of the individual avalanche paths. Although precipitation continued, only 4 events were observed on the 10th. On the 11th 43 additional events were recorded, 9 of which crossed the highway with the West Riverside depositing debris to a depth of 5 mover a distance of 35 m. Sixty-six percent of the events on the 11th reached full track, 50% released to the ground and 67% were size 3 or larger. On the 12th, 61 events were recorded with 16 crossing the highway. Within these events 75% reached full track, 50% released to the ground and 78% were size three or larger. Of the avalanches reaching U.S. Highway 550 during the entire cycle, which in total closed this highway for 20 hours, the release in the Muleshoe avalanche path on January 12 was the largest, averaging 6 min depth for a distance of 100 m along the highway. The avalanche occurrences during this seven day period were significant not only because of their frequency but also due to the high percentages of events reaching full track and releasing to the ground. The fact that the snowcover at the Red Mountain study site attained an average depth of 143 cm during this period offers some indication of the volumes of snow involved in these releases.
No significant precipitation occurred again until the 24th when a total of 35 nun of water was recorded. During and after this storm period wind transport of snow was significant and it is exceptional that no new slab releases were reported. New snow was accumulating on bare ground in many of the starting zones due to the extensive cycle of January 6 through 12 and a warming trend which developed during the last portion of the storm and continued for two days following the storm contributed to a more stable snowcover than had previously existed. On January 26 the maximum air temperature was +3.0°C and the mean daily air temperature was -2.3°C.
During the 24 hour period beginning at noon on the 27th 53 cm of snow containing 46 nun of water were recorded. This new snow added to that of the
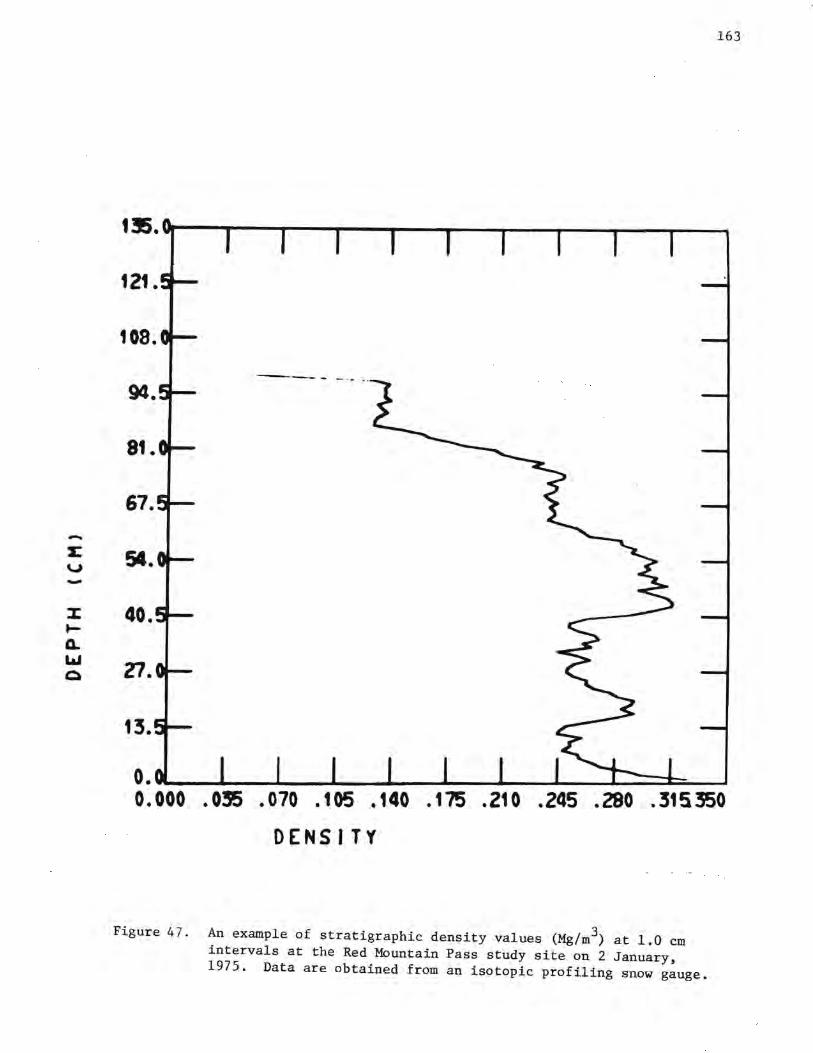
-2:: u -:x: t-0.. LI.I Q
163
t!S.
121.
108.
---- -·-- · -· 94.
81.
67.
54.
40.
-n.
13.
~: 000 . 035 . 0 70 . 105 . 140 . 175 . 21 0 . 245 • 280 . 315 350
DENSITY
Figure 47. An example of stratigraphic density values (Mg/m3) at 1.0 cm intervals at the Red Mountain Pass study site on 2 January, 1975. Data are obtained from an isotopic profiling snow gauge.
164
24th and 25th in combination with significant wind speeds was sufficient to produce 48 slab avalanches on the morning of the 28th. Of the total events 68% were size three or larger, 62% reached full track, but only 23% released to the ground. At this point the weaker snow layers at the base of the snowcover had been removed in most paths by previous avalanche activity and failures were taking place in the relatively stronger layers of the newer snow. The general condition of the snowcover was still described as unstable however, and on the 29th artificial control ca~sed the Willow Swamp to reach the highway with a depth of 4.5 m for a distance of 100 m.
February: Precipitation as well as avalanche activity decreased compar_ed to January but both remained above average for monthly values during · the 4. year study. Snowdepth increased from 180 cm to only 193 cm during the month but 238 avalanche events were recorded with 40 reaching the highway. While total avalanche frequency remained high, the number reaching the highway decreased by 62% indicating a more stable snow structure within the avalanche tracks which restricted full track events.
An avalanche cycle consisting of 41 soft slab events occurred on the 10th and 11th as the result of 35 mm of water contained in 49.5 cm of new snow. The Eagle and the Telescope avalanches released during the evening of the 10th closing the road for several hours. On the following day artificial control produced releases in 10 of 16 paths. A significant warming trend followed this storm.
Light but nearly continuous precipitation from the 13th through the 18th produced 34.4 mm of water in 52.0 cm of snow. Twenty-three slab events were recorded on the 17th. Control efforts on the 18th produced avalanches in 10 of 16 paths. Precipitation totalling 20.0 cm of snow and 18 mm of water was recorded from midnight on the 19th through midnight on the 21st. During early morning on the 23rd a cycle of hard slab releases in the absence of precipitation began. Most releases occurred between 0400 and 1000 hours during which time winds from the north averaged 13.0 m/sec with frequent gusts to 20.0 m/sec. A total of 42 hard slab events were recorded with 8 reaching the highway. The majority of the releases occurred in catchment basins above timberline with loading aspects favorable to north winds such as the Muleshoe and Cement Fill to the north of Silverton and the Springs and Waterfall to the south . Mean fracture line depths were estimated to be 1.0 m.
March: Avalanche activity continued to be high with 305 events observed, 46 of which reached the highway. Precipitation during the month exceeded that of any winter month since data collection began in October of 1971; 296 cm of snow containing 244.4 mm of water were recorded. Snowfall occurred on 24 days and total depth increased from 192 cm to 262 cm.
Although precipitation amounts and avalanche frequency were very high, avalanche magnitude was minimal. In general snowpack structure gained strength due to higher snow temperatures and the formation of freeze-thaw crusts on all but north-facing slopes. Therefore, in spite of maximum precipitation
165
amounts, optimum conditions for large load-induced avalanches did not exist. Only 8% of the observed avalanches were larger than size 2 and only one of these was size 4. Only 2% released to the ground surface. Storm precipitation amounts that would have been sufficient to cause extreme avalanche conditions during mid-winter accumulated on a stable old-snow structure (see Figure 42). Of the 46 events which did reach the highway, more than 50% were classified as bank slides which released no more than 20 to 30 m in vertical distance above the highway. This type of event occurred frequently in the Uncompahgre Gorge and in the Ledge and Rockwall area.
The two major precipitation periods of March 8 through 12 and 22 through 27 produced 83 mm and 92 mm respectively. However, of the resulting avalanche events only 12% were larger than size 2. This pattern of high frequency and minimal magnitude is apparent in Figure 42.
On the 16th the East Riverside reached the highway with debris being 3 m deep over a distance of 10 m. The estimated depth of the fracture line was 3 m. This event was one of five slab avalanches observed during the evening of the 16th and the morning of the 17th. These releases were preceeded by nine hours of wind speeds with an average of 14 m/sec.
April: During this month 155 avalanches were observed with 50 reaching the highway. Total snowdepth increased from 262 cm to a maximum of 310 cm on the 13th and then decreased to a depth of 265 cm by the 30th. The average depth for the month was 283 cm. The majority of the avalanches occurring before mid-month were dry loose surface events, while those occurring after mid-month were wet loose surface events. Both types were small in size releasing only to shallow depths and sliding on near-surface freeze-thaw crusts. Mean daily temperatures remained above freezing during the period April 22-25, the snowcover on south- and west-facing slopes became isothermal and the conditions appeared optimum for the release of significant wet snow slab avalanches. However, colder temperatures occurred on the 26th and by the 29th the mean daily temperature had dropped to -11.0°c eliminating the possibility of wet snow avalanche activity.
The most significant precipitation period occurred on the 11th and 12th when 49.5 cm of snow containing 36.3 mm of water was recorded. For the period of the 11th through the 13th, 86 avalanches were recorded. Only 11 events occurred on the 11th and 12th with the remainder releasing on the 13th. Of the total, 50% were soft slab type but only 10% were larger than size two. This period of activity was restricted to releases in the new snow due to the adequate bearing strength of the freeze-thaw crusts below.
The increasing air temperatures of the 22nd through the 25th, (average daily maximum temperature of +7.5°C) resulted in 24 wet snow releases, 5 of which were slab events. Four of the 11 avalanches which reached the highway during this period released from the Mother Cline slide path between the hours of 1630 and 1830 on the 25th. The fourth event buried and caused considerable damage to a Colorado Department of Highways snowplow and the driver received minor injuries.
166
May: The mean monthly temperature was O.o0 c but all precipitation was in the form of snow and amounted to 90 cm, 3containing 89 mm of water resulting in a mean new snow density of .098 Mg/m, a value representative of late spring snowfall. A total of 26 avalanches were observed with 2 reaching the highway. Eighteen of 26 events occurred between the 14th and 17th during a cycle of wet snow avalanches resulting from increasing air temperatures. The remaining events were small direct action surface releases in new snow which was deposited during storms on the 5th and 21st. On the 30th three wet slabs released on north-facing slopes but involved only the new snow deposited on the 21st. The fact that these releases were in catchment basins of relatively high altitude, (Mill Creek Cirque, 3700 m and Snowslide Gulch, 3500 m) indicated the extent to which the snowcover of even north-facing, high altitude slopes had warmed. Due to this fact no additional wet snow avalanching on the remaining slopes was anticipated or encountered.
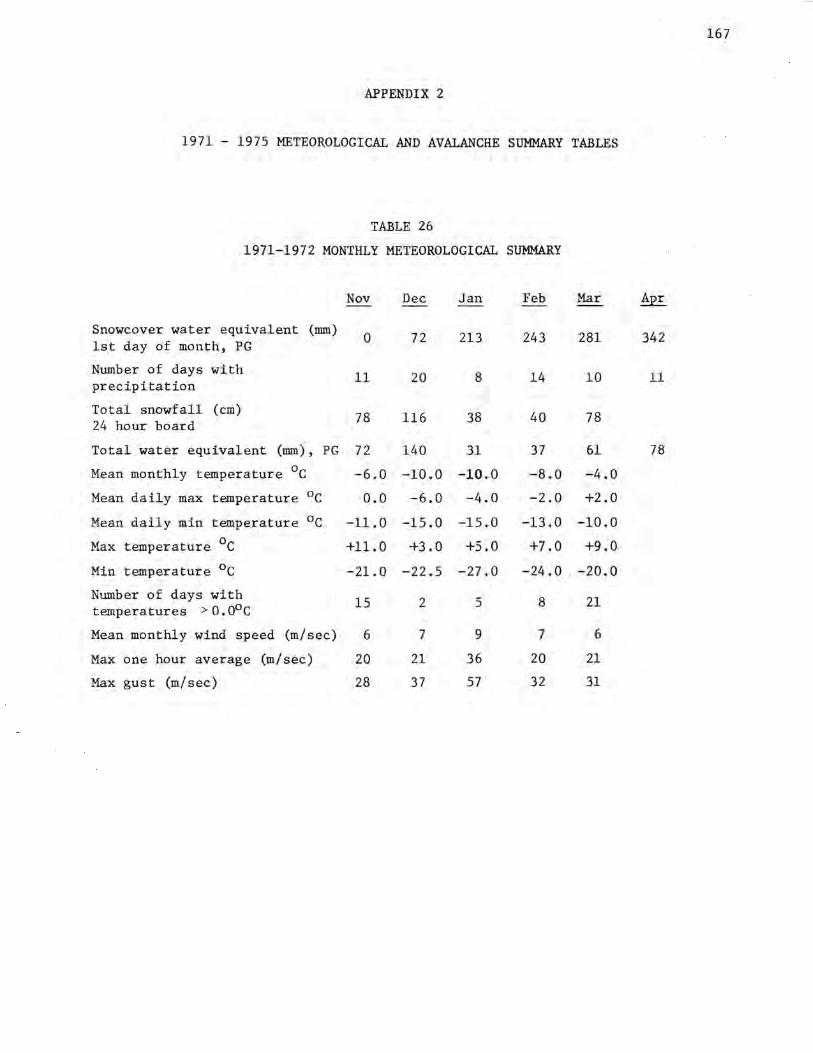
APPENDIX 2
1971 - 1975 METEOROLOGICAL AND AVALANCHE SUMMARY TABLES
TABLE 26
1971-1972 MONTHLY METEOROLOGICAL SUMMARY
Snowcover water equivalent (mm) 1st day of month, PG
Number of days with precipitation
Total snowfall (cm) 24 hour board
Nov Dec
0 72
11 20
78
Jan Feb Mar
213 243 281
8 14 10
Total water equivalent (mm), PG 72
116
140
38
31
40
37
78
61
Mean monthly temperature 0 c Mean daily max temperature 0 c Mean daily min temperature 0 c Max temperature 0 c Min temperature 0 c Number of days with temperatures > 0.0°C
Mean monthly wind speed (m/sec)
Max one hour average (m/sec)
Max gust (m/sec)
-6.0 -10.0 -10.0 -8.0 -4.0
0.0 -6.0 -4.0 -2.0 +2.0
-11.0 -15.0 -15.0 -13.0 -10.0
+11.0 +3.o +5.o +1.0 +9:o
-21.0 -22.5 -27.0
15
6
20
28
2
7
21
37
5
9
36
57
-24.0 . -20.0
8
7
20
32
21
6
21
31
167
342
11
78
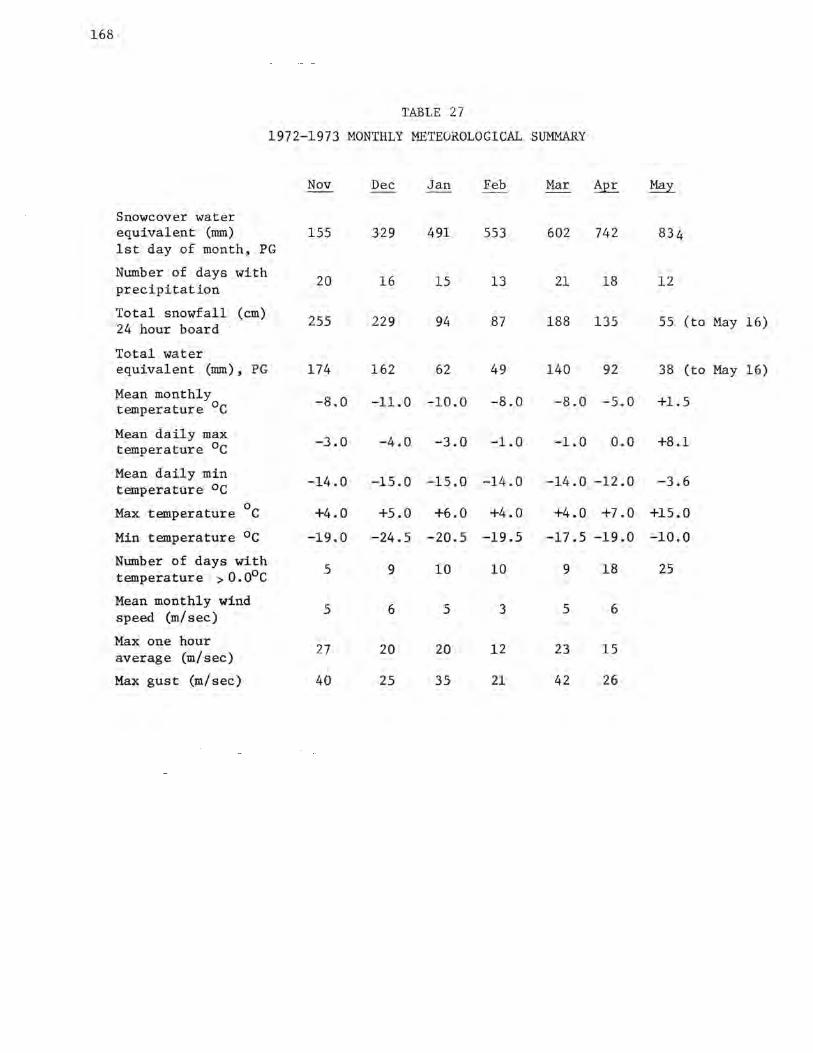
168
TABLE 27
1972-1973 MONTHLY METEOROLOGICAL SUMMARY
Nov Dec Jan Feb Mar Apr May
Snowcover water equivalent (mm) 155 329 491 553 602 742 834 1st day of month, PG
Number of days with 20 16 15 13 21 18 12 precipitation
Total snowfall (cm) 255 229 94 87 188 135 55 (to May 16) 24 hour board
Total water equivalent (mm)' PG 174 162 62 49 140 92 38 (to May 16)
Mean monthly temperature 0 c -8.0 -11.0 -10.0 -8.0 -8.0 -5.0 +1.5
Mean daily max -3.0 -4.0 -3.0 -1.0 -1.0 0.0 +8.1 temperature 0 c
Mean daily min -14.0 -15.0 -15.0 -14.0 -14.0 -12.0 -3.6 temperature oc
Max temperature oc +4.0 +5.0 +6.0 +4.0 +4.0 +7.0 +15.0
Min temperature oc -19.0 -24.5 -20.5 -19.5 -17.5 -19.0 -10.0
Nwnber of days with 5 9 10 10 9 18 25
temperature > 0. o0 c Mean monthly wind
5 6 5 3 5 6 speed (m/sec)
Max one hour 27 20 20 12 23 15 average (m/ sec)
Max gust (m/sec) 40 25 35 21 42 26
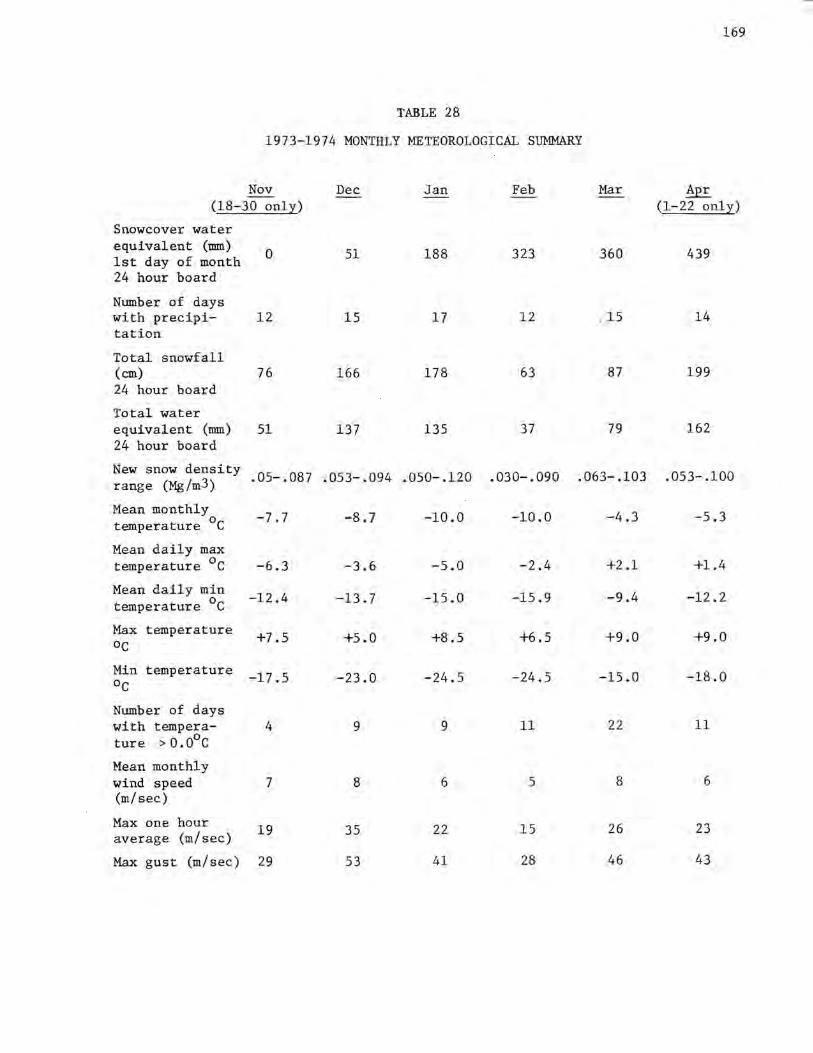
TABLE 28
1973-1974 MONTHLY METEOROLOGICAL SUMMARY
Nov (18-30 only)
Snowcover water equivalent (mm) 1st day of month 24 hour board
Number of days with precipitation
Total snowfall (cm) 24 hour board
Total water equivalent (mm) 24 hour board
0
12
76
51
Dec Jan Feb
51 188 323
15 17 12
166 178 63
1'37 135 37
Mar
360
, 15
87
79
169
Apr (1-22 only)
439
14
199
162
New snow density range (Mg/m3) .05-.087 .053-.094 .050-.120 .030-.090 .063-.103 .053-.100
Mean monthly temperature 0 c Mean daily max temperature 0 c Mean daily min temperature 0 c Max temperature oc Min temperature Oc Number of days with temperature > O.o0 c Mean monthly wind speed (m/sec)
Max one hour average (m/ sec)
Max gust (m/sec)
-7.7
-6.3
-12.4
+7.5
-17.5
4
7
19
29
-8.7
-3.6
-13.7
+5.0
-23.0
9
8
35
53
-10.0
-5.0
-15.0
+8.5
-24.5
9
6
22
41
-10.0
-2.4
-15.9
+6.5
-24.5
11
5
15
28
-4.3
+2.1
-9.4
+9.0
-15.0
22
8
26
46
-5.3
+1.4
-12.2
+9.0
-18.0
11
6
23
43

170
TABLE 29
1974-1975 MONTHLY METEOROLOGICAL SUMMARY
Nov Dec Jan Feb Mar Apr May
Snowcover water equivalent (mm)
87 172 294 501 622 869 1050 1st day of month 24 hour board
Number of days with precipi- 12 19 20 17 24 17 15 tation
Total snowfall (cm) 125 161 235 152 296 224 90 24 hour board
Total water equivalent (mm) 85 122 207 121 247 181 85 24 hour board
New snow density. 056_. 076 range (Mg/m3) .042-.118 .029-.166 .027-.109 .050-.116 .053-.123 .043-.174
Mean monthly temperature 0 c -6.3 -10.5 -10.0 -10.0 -8.0 -5.3 0.0
Mean daily max +1.4 -4.3 -4.6 -3.3 -3.9 +1.1 +6. 7 temperature
Mean daily min temperature -11.2 -15.3 -15.0 -15.8 -13.2 -11.0 -5.0
Max temperature +9.0 +4.5 +3.0 +5.0 +7.0 +9.0 +13.0 oc
Min temperature -20.0 -25.5 -27.0 -23.5 -25.5 -19.5 -14.0 OC
Number of days with temper- 18 6. 7 6 11 17 28 ature > 0.0°C
Mean monthly wind speed 5 5 7 5 6 7 (m/ sec)
Max one hour 21 22 23 17 28 25
average (m/sec)
Max gust (rn/sec) 29 38 32 30 40 35
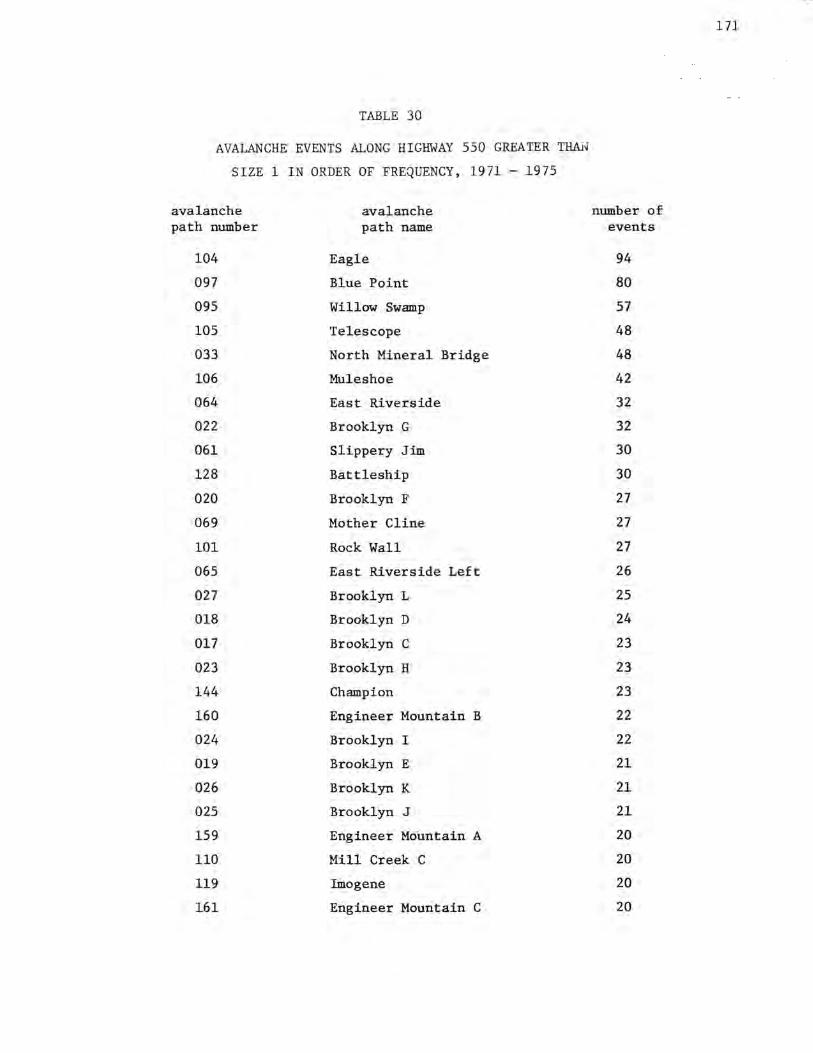
TABLE 30
AVALANCHE EVENTS ALONG HIGHWAY 550 GREATER THAN
SIZE 1 IN ORDER OF FREQUENCY, 1971 - 1975
avalanche path number
104
097
095
105
033
106
064
022
061
128
020
069
101
065
027
018
017
023
144
160
024
019
026
025
159
110
119
161
avalanche path name
Eagle
Blue Point
Willow Swamp
Telescope
North Mineral Bridge
Muleshoe
East Riverside
Brooklyn G
Slippery Jim
Battleship
Brooklyn F
Mother Cline
Rock Wall
East Riverside Left
Brooklyn L
Brooklyn D
Brooklyn C
Brooklyn H
Champion
Engineer Mountain B
Brooklyn I
Brooklyn E
Brooklyn K
Brooklyn J
Engineer Mountain A
Mill Creek C
Imogene
Engineer Mountain C
number of events
94
80
57
48
48
42
32
32
30
30
27
27
27
26
25
24
23
23
23
22
22
21
21
21
20
20
20
20
171
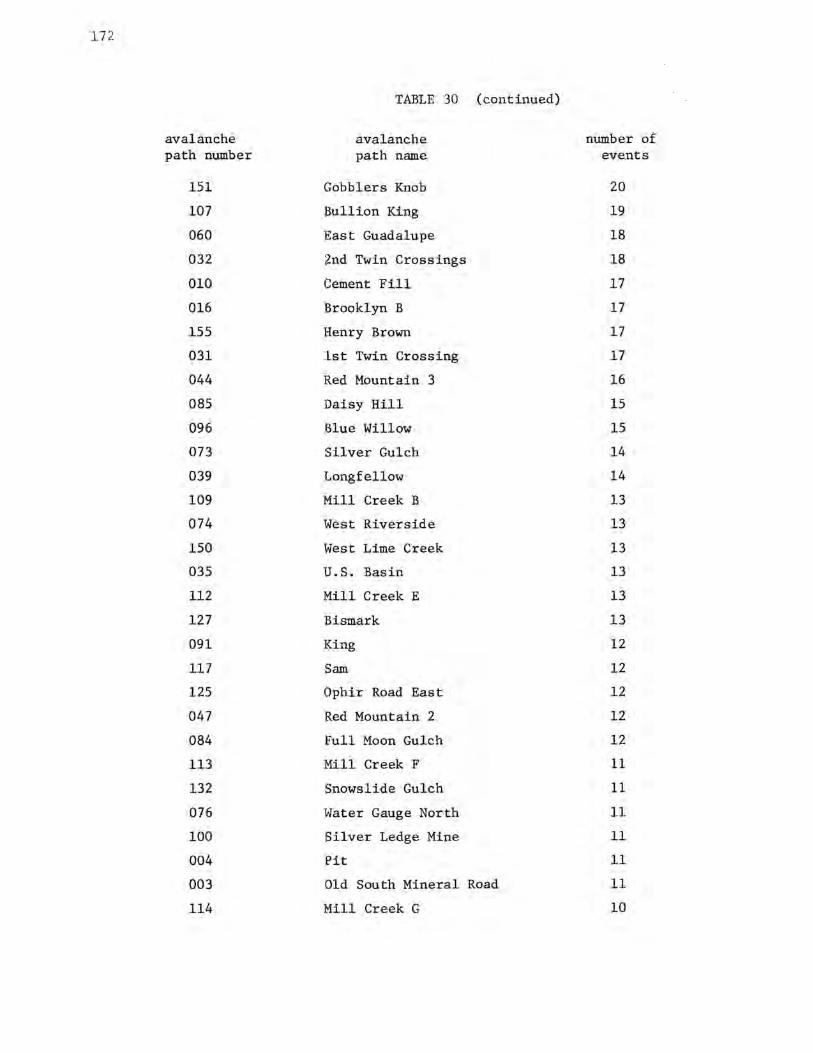
172
avalanche path number
151
107
060
032
010
016
155
031
044
085
096
073
039
109
074
150
035
112
127
091
117
125
047
084
113
132
076
100
004
003
114
TABLE 30 (continued)
avalanche path name
Gobblers Knob
Bullion King
East Guadalupe
2nd Twin Crossings
Cement Fill
Brooklyn B
Henry Brown
1st Twin Crossing
Red Mountain 3
Daisy Hill
Blue Willow
Silver Gulch
Longfellow
Mill Creek B
West Riverside
West Lime Creek
U.S. Basin
Mill Creek E
Bismark
King
Sam
Ophir Road East
Red Mountain 2
Full Moon Gulch
Mill Creek F
Snowslide Gulch
Water Gauge North
Silver Ledge Mine
Pit
Old South Mineral Road
Mill Creek G
number of eve.nts
20
19
18
18
17
17
17
17
16
15
15
14
14
13
13
13
13
13
l.3
12
12
12
12
12
11
11
11
11
11
11
10
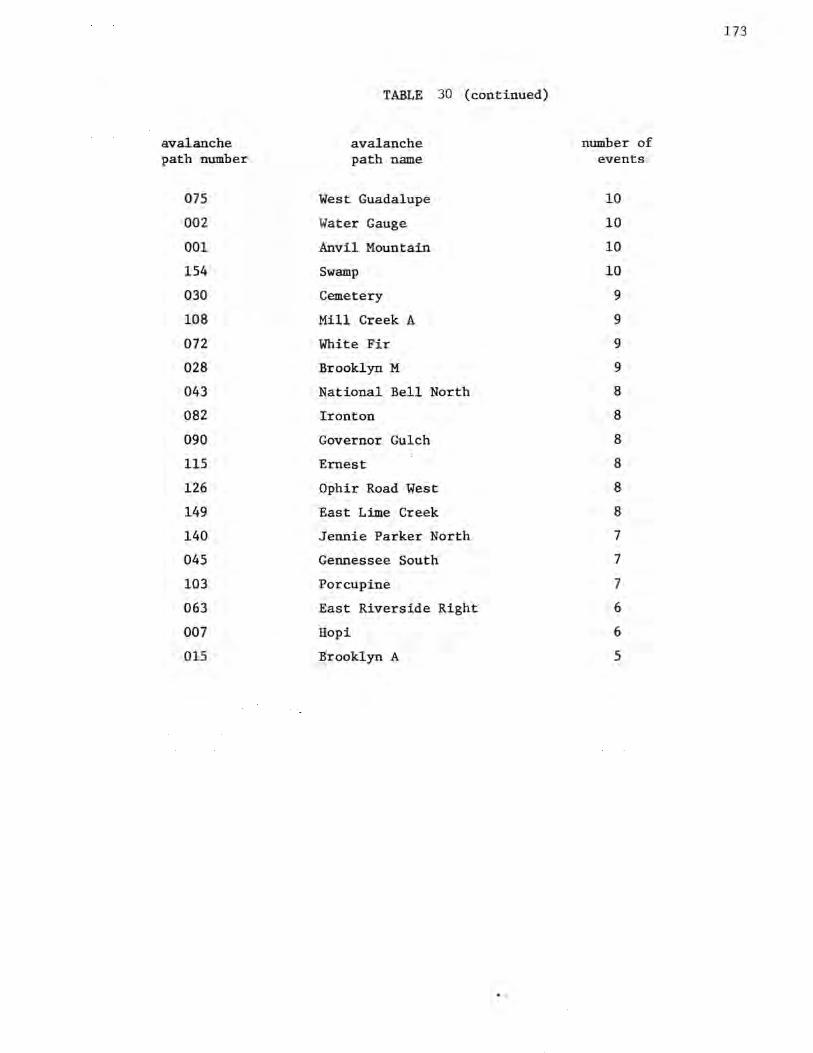
avalanche path number
075
002
001
154
030
108
072
028
043
082
090
115
126
149
140
045
103
063
007
015
TABLE 30 (continued)
avalanche path name
West Guadalupe
Water Gauge
Anvil Mountain
Swamp
Cemetery
Mill Creek A
White Fir
Brooklyn M
National Bell North
Ironton
Governor Gulch
Ernest
Ophir Road West
East Lime Creek
Jennie Parker North
Gennessee South
Porcupine
East Riverside Right
Hopi
Brooklyn A
number of events
10
10
10
10
9
9
9
9
8
8
8
8
8
8
7
7
7
6
6
5
173
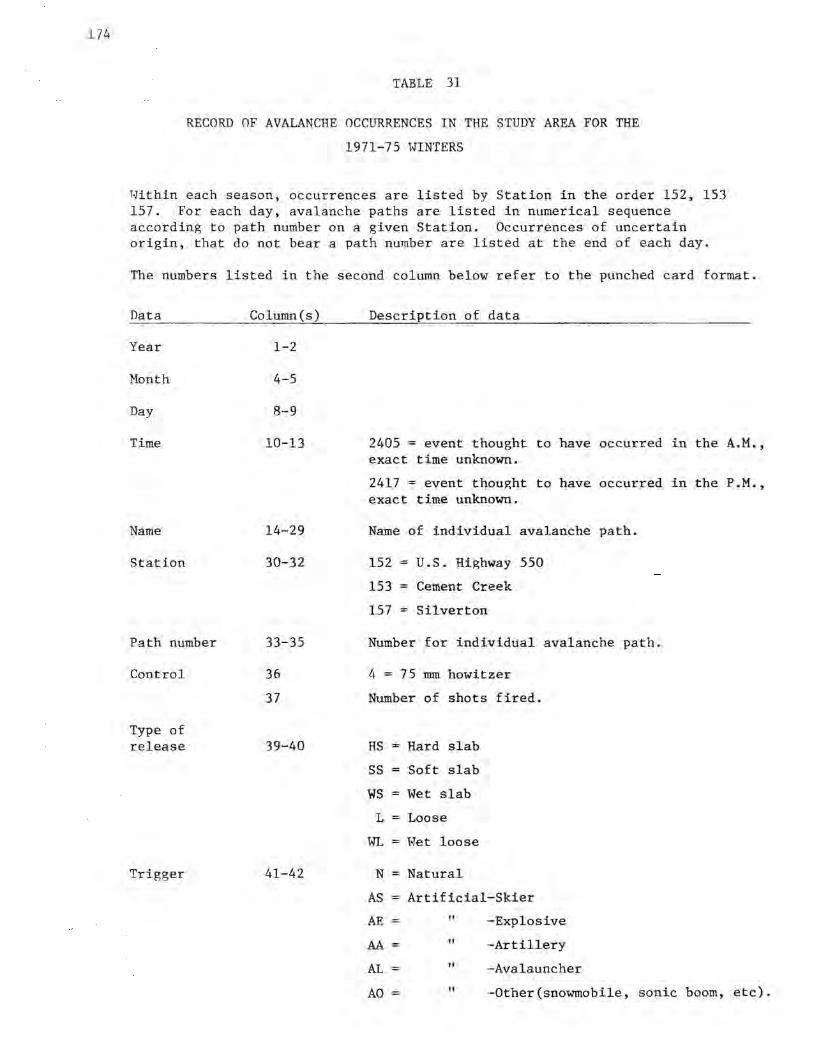
174
TABLE 31
RECORD OF AVALANCHE OCCURRENCES IN THE STUDY AREA FOR THE
1971-75 WINTERS
Within each season, occurrences are listed by Station in the order 152, 153 157. For each day, avalanche paths are listed in numerical sequence according to path number on a given Station. Occurrences of uncertain origin, that do not bear a path number are listed at the end of each day.
The numbers listed in the second column below refer to the punched card format.
Data
Year
Month
Day
Time
Name
Station
Path number
Control
Type of release
Trigger
Column(s)
1-2
4-5
8-9
10-13
14-29
3-0-32
33-35
36
37
39-40
41-42
Description of data
2405 = event thought to have occurred in the A.M., exact time unknown.
2417 = event thought to have occurred in the P.M., exact time unknown.
Name of individual avalanche path.
152 = U.S. Highway 550
153 = Cement Creek
157 = Silverton
Number for individual avalanche path.
4 = 75 mm howitzer
Number of shots fired.
HS = Hard slab
ss =
ws = L =
WL =
N = AS = AE
AA = AL=
AO=
Soft slab
Wet slab
Loose
Wet loose
Natural
Artificial-Skier
" -Explosive
" -Artillery
" -Ava launcher
" -Other(snowmobile, sonic boom, etc).
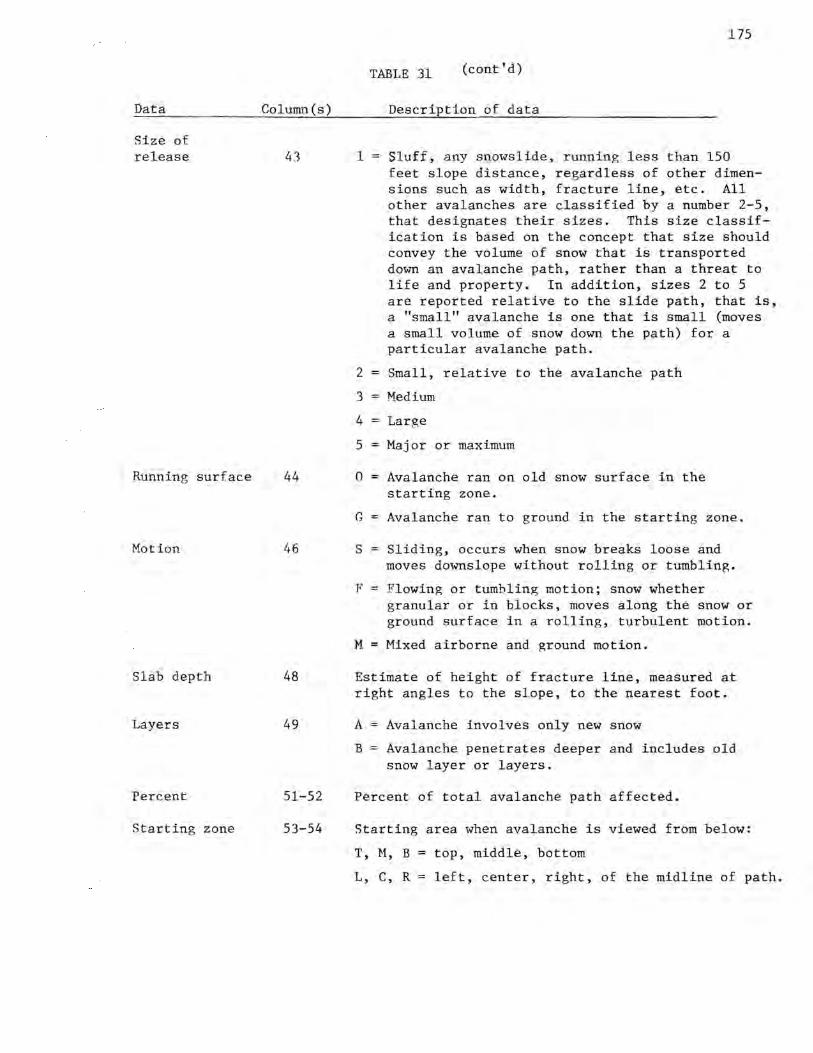
Data
Size of release
Running
Motion
surface
Slab depth
Layers
Percent
Starting zone
Column(s)
43
44
46
48
49
51-52
53-54
175
TABLE 31 (cont'd)
Description of data
1 = Sluff, any snowslide, running less than 150
2 =
3 =
4 =
5 =
0 =
G =
feet slope distance, regardless of other dimensions such as width, fracture line, etc. All other avalanches are classified by a number 2-5, that designates their sizes. This size classification is based on the concept that size should convey the volume of snow that is transported down an avalanche path, rather than a threat to life and property. In addition, sizes 2 to 5 are reported relative to the slide path, that is, a "small" avalanche is one that is small (moves a small volume of snow down the path) for a particular avalanche path.
Small, relative to the avalanche path
Medium
Large
Major or maximum
Avalanche ran on old snow surface in the starting zone.
Avalanche ran to ground in the starting zone.
S = Sliding, occurs when snow breaks loose and moves downslope without rolling or tumbling.
F = Flowing or tumbling motion; snow whether . granular or in blocks, moves along the snow or ground surface in a rolling, turbulent motion.
M = Mixed airborne and ground motion.
Estimate of height of fracture line, measured at right angles to the slope, to the nearest foot.
A= Avalanche involves only new snow
B = Avalanche penetrates deeper and includes old snow layer or layers.
Percent of total avalanche path affected.
Starting area when avalanche is viewed from below:
T, M, B = top, middle, bottom
L, C, R = left, center, right, of the midline of path.
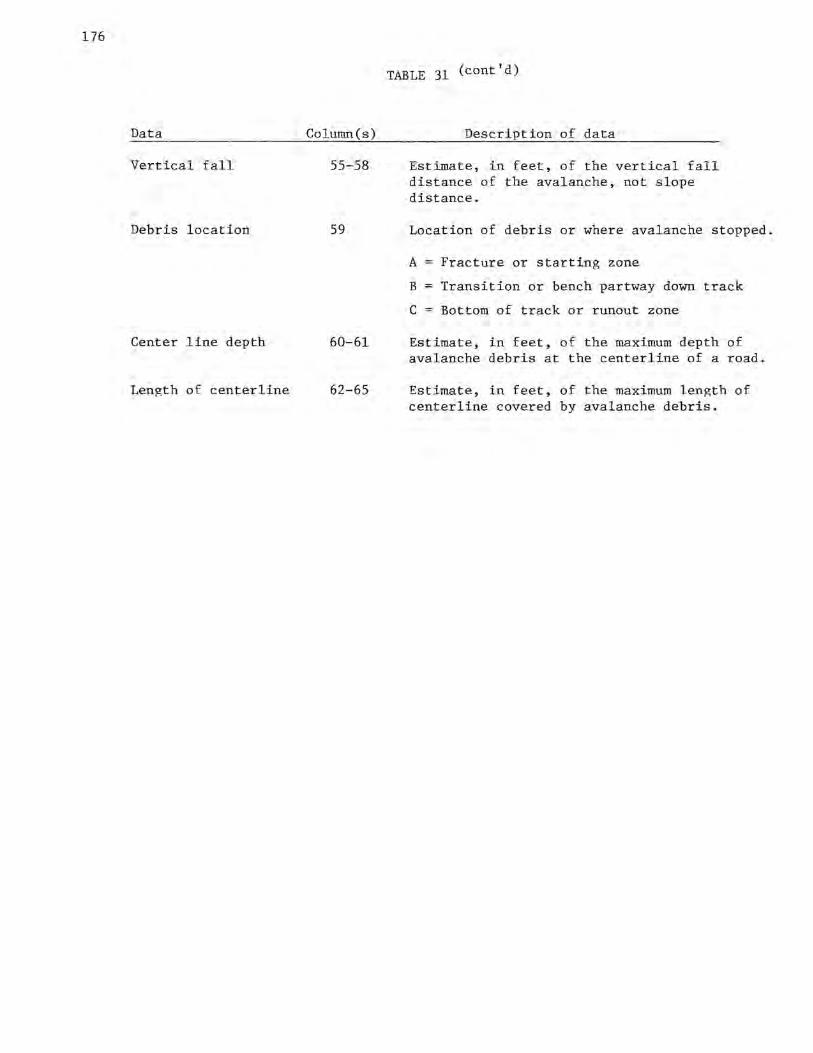
176
Data Column(s)
Vertical fall 55-58
Debris location 59
Center line depth 60-61
Length of centerline 62-65
TABLE 31 (cont'd)
Description of data
Estimate, in feet, of the vertical fall distance of the avalanche, not slope distance.
Location of debris or where avalanche stopped.
A= Fracture or starting zone
B = Transition or bench partway down track
C = Bottom of track or runout zone
Estimate, in feet, of the maximum depth of avalanche debris at the centerline of a road.
Estimate, in feet, of the maximum length of centerline covered by avalanche debris.
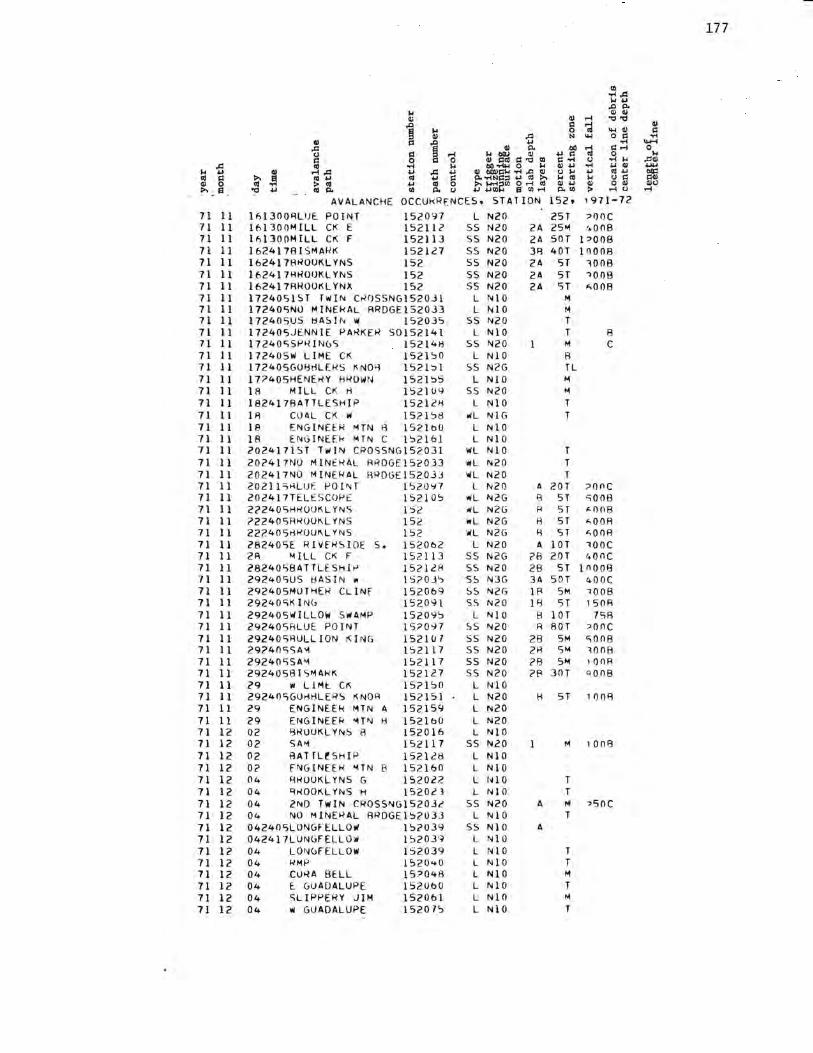
177
Ul .... ,.c: k ... ..0""
k Cl) Cl) Cl) Cl) ,..; """" 1 s:: ,..; Cl)
k 0 "' .... Cl) s:: Cl) ,.c: N .... 0 s:: ....
" s:: 1 ... .... ...,..; ,.c: Cl) "" 00 ,..; s::,..; 0
e r:I ,..; k ll(IJ Cl) ... s:: "' 0 k 0 s:: 0 " S::o! s:: "" Ul s:: .... 0 .... k .CCI)
,.c: .... k 00 ....... 0 k Cl) ... .... ... Cl) ...... k ... " ,..; ,.c: ... ,.c: ... Cl) bQl)S::k .... ..0 Cl) 0 k ... "' ... 00::
"' s:: >, ~ "' ... "' ... s:: ~-... ms::::,.., "' >, k "' k 0 s:: S::<11 Cl) 0 "' > "' ... "' 0 ... tlrie'° ~ ';;J ~ Cl) ... Cl) 0 Cl) <110 >, s "" ... "'"" Ul "" 0 ""Ul > ,..; 0 ,..;
AVALANCHE OCCUkRENCES, STAT ION 152, 1971-72
71 11 lnl300RLIJE POINT 152097 L N20 25T :>OOC 71 11 161300"llLL CK E 15211,? 55 N20 2A 25M ,.000 71 11 lnl300MILL Cr< F 152113 ss N20 2A SOT l::>008 71 11 l624l7R1SMARK 152127 ss N20 3A 40T lflOOR 71 11 162417RROOKLYNS 152 ss N20 2A ST 1008 71 11 162417HROOKLYNS 152 ss N20 2A ST 100B 71 11 l62417RROOKLYNX 152 ss N20 2A ST <.OOR 71 11 1724051ST TWIN C~OS5NG1520Jl L NlO M
71 11 l72405NO MINEkAL RRDGE1520J3 L NlO M 71 11 17240SUS HAS!N 111 152035 ss N20 T 71 11 172405JENN1E PARKER S0l52l4l L NlO T B 71 11 1724055P41N<,S 15214H 55 N20 M C 71 11 172405\rl LIME Cr< 152150 L NlO R 71 11 172405GO~tlLERS KNO~ 1521~1 55 N2G TL 71 11 17?40SHENERY HRO\rlN 15215S L NlO "' 71 11 lA MILL CK H 152109 5S N20 "' 71 11 l824178ATTLESHIP 15212H L NlO T 71 11 lA CO AL Cr< w 152158 wL NlG T 71 11 1e ENGINEER t-1TN 8 1S2lb0 L NlO 71 11 lA E.NGINEfk MTN C 1 ':>2161 L NlO 71 11 2024171ST Tw!N CR05SNG15203l 11/L NlO T 71 11 202417NO MlNEkAL RRDGE152033 WL N20 T 71 11 202417NO MINERAL RRDGEl520JJ ltll N20 T 71 11 202115HLUE POJ"lT l520'i7 L N20 A 20T ;:,one 71 11 202417TELESCOP£ 15210':> wL N2G 8 ST SOOB 71 11 2?2405HROOKLYNS 152 wL N2G H ST "-008 71 11 ?2240SRROOKLYN5 152 WL N2G H ST <.OOR 71 11 222405HrWUKL YN5 152 \Ill N2G A ST <.OOR 71 11 28240SE RIVfRSIDE 5. 1520b2 L N20 A lOT 100c 71 11 2A MILL CK f 152113 ss N2G ?B 20T 4011C 71 11 28240SBATTLESHIP 15?12A 55 N20 28 ST 1noo8 71 11 292<+0SUS tlASIN w l S?OJ", ss N3G )A SOT 400C 71 11 292405MOTHER CLlNF 152069 ss N2G lR SM 1008 71 11 29240SK IN(j 152091 S<, N20 18 ST 150A 71 11 29240SIIIILLOW SwAMP 152095 L NlO B lOT 75A 71 11 292405RLUE POINT 15?097 '>S r-.20 A 80T ::>011C 71 11 29240SAULLION r< l NG 1521 !J 7 S5 N20 28 SM S0/18 71 11 29240SSA"1 152117 55 N20 2H 5"1 100H 71 11 29240SSA'I 152117 55 N20 ?8 SM 1 011A 71 11 2924058l5t-1Af<K 152127 ss N20 ?8 30T "008 71 11 29 w LlMt. CK 15?1':>0 L NlO 71 11 29240SG0rlHLERS KNOR 152151 L N20 H ST 1 011A 71 11 29 ENGINE.Ek MTN A 152159 L N20 71 11 29 ENGINE.Ek ... TN f:l 152lb0 L N20 71 12 02 8ROOKLYNS 8 152016 L NlO 71 12 02 SA'4 152117 ss N20 M 1 011A 71 12 02 AATTLl!.SHIP 152128 L NlO 71 12 O? FNGINEER "ITN B 152160 L NlO 71 12 04 AROOKLYNS G 152022 L ,~ l 0 T 71 12 04 ~I-IOOKL Yt,15 H 152023 L NIO T 71 12 04 2ND TWIN CROS5NG1520Jt 55 N20 A M ">SOC 71 12 04 NO MINERAL RRDGE152033 L NlO T 71 12 04240SLONGFELLOw 15?039 5S NlO A 71 12 042417LUNGFE.LLO~ l':>2039 L NlO 71 12 04 LONGFELLOW 152039 L NlO T 71 12 04 RMP 1520<+0 L NlO T 71 12 04 CLlRA BELL 15?048 L Nl 0 M 71 12 04 E. GUADALUPE 152Uo0 L NlO T 71 12 04 SLIPPERY JIM 152061 L NlO M
71 12 04 w GUADALUPE 1520 7':, L NlO T
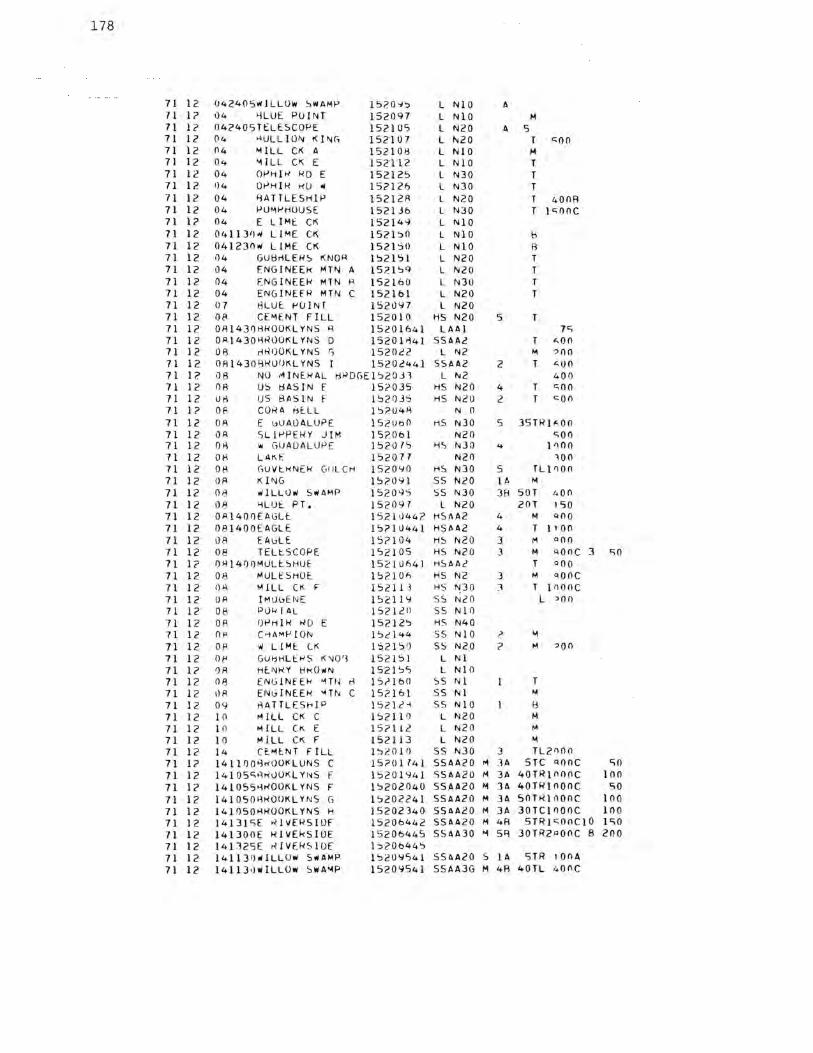
178
71 12 042405wlLLOw SWAMP 1520 'i'::, L NlO A 71 l? 04 YLUE POINT 152097 L NlO M 71 12 042405TELESCOPE 152105 L N20 A 5 71 12 04 ><ULLION Kl"IG 152107 L N20 T c;oo 71 12 04 MILL CK A 152101:l L NlO M 71 12 04 "l I LL CK E 152112 L NlO T 71 12 04 01-'Hlel 1-<D E 152125 L N30 T 71 12 1)4 01-'H 11-< KO w 152126 L N30 T 71 12 04 YATTLESHIP 15212A L N20 T 400A 7 1 12 04 1-'U"lt-'HOUSE 152136 L N30 T 1 c;ooc 71 12 04 E L !Mt:. CK 152149 L NlO 71 12 04113(),/ LIME CK 1521:>0 L NlO ti 71 12 041230• LIME CK l521SO L NlO A 71 12 04 GU8rlLERS KNO" l '::,2151 L N20 T 71 12 1)4 fNGINEEk MTN A 15i'l'::,'I L NZO T 71 12 04 ENGINEER MTN R 152160 L N30 T 71 12 04 ENG!NEtR MTN C 152161 L N20 T 71 12 07 tlLUE t->OJNT 152097 L N20 71 12 08 CE,.,ENT FILL 152010 HS N20 5 T 71 12 0Al43()13k00KLYNS " 15201641 LAA! 7c:, 71 12 OA l 430f.\t<OOKL ms D 15201841 SSAA2 T '-00 71 12 OR t1ROOKLYNS r, l 520c2 L "l2 ,., ?00 71 12 0Al430'1riUOKLYNS I 15202441 SSAA2 2 T <-00 71 12 08 NU ,'1INEYAL 8><DGE1520J1 L NZ 400 71 12 08 US 8AS!N f 15?035 HS N20 4 T c;oo 71 12 UB US BASIN F l':JZOJ:, HS N20 2 T c;oo 71 12 Of< CORA 8ELL l ':J204A N 0 71 12 08 E \JUAOALUPE 152Uo0 HS N30 5 35TR1<-0o 71 12 OA SL!t->PEkY JIM 15?061 N20 c;oo 71 12 OR w GUAOALUl-'E 1520 7", HS NJO .. 11100 71 12 OR LAKI: 1S2077 N20 ~on 71 12 08 GUVt><NEk G1JLCH 152090 HS N30 5 TLl'lOO 71 12 OA K ll\JG l '::>2091 55 N20 1 A M
71 12 013 ,i ILLUIII Swll.MP 15209:, ss NJO JH SOT 400 71 12 1)8 '"lLUt PT, 152097 L N20 2flT 150 71 12 0Al400EAGLE 1521tl442 HSI\A2 4 M <>00 71 12 08l400EAGLE l':J?IU441 HSAll.2 4 T 1, o o 7 l 12 tl8 EAGLE 152104 HS N20 3 l'I aoo 71 12 08 TELtSCOf>E 152105 HS N20 3 M AOflC 3 c;o 71 l? /Jf.ll4/JOMULtSHUE J521U641 HSAAc T ooo 71 12 08 MULESHOE. 15? l 01', HS N2 3 M ciooc 71 12 ()~ MILL CK F 15211 l HS ~30 1 r 11100c 71 12 OR lMUl:Jt.NE 152119 ss N20 L ::>Ofl 7 l 12 08 P04[AL 1521211 ss NlO 71 12 OR <Jf-'Hli-< .ID E 152 J 2'::, HS N40 71 12 OR C'1AMf'I0N I ':Jc J <+4 ss NlO ;> M
71 12 OR 'II L !ME CK 1'52 J':, ') ss N20 ? ,., ::>QO 71 12 Ot< GUrJHLEHS K'JO'~ 152151 L Nl 71 I? /JR HE"lriY Ht-<OwN 1521 ':JS L NIO 71 12 OR EN<jJNfEk '1TI~ rl JS?l60 ss N l T 71 12 llR ENGINED< '1TN C 152161 ss NI M
71 12 09 tlATTLESt-<IP 1521<:'-s ss NlO l::l 71 12 1 () MILL CK C 1521 l () L N20 M 71 12 Io "'ILL CK E 152112 L N20 M
71 12 IO MILL CK F 152113 L N20 M
71 12 14 CE. .. ENT FILL l'::,2010 SS N30 3 TL21'10() 71 l? l4l lfJ08H00t<LUNS C l5?0lf4l SSAA20 l'I lA 5TC ciooc c;o 71 12 14105'-8"1uUKL Yr,s F IS20l94l S5AA20 M 3A 40TR1nooc 100 71 l? l41055H"100KLYNS F l '::,202040 SSAA20 M 311. 40TRlOOOC 50 71 12 l41050HROUKLYNS G J'::,202241 SSAA20 M JA 50TRJOOOC 100 71 12 l4l050HROOKLYNS H 15202)40 SSAA20 M 3A 30TCIOOOC 100 71 12 l413J<;E .11\/Ei-<SIDf 15206442 SSAA20 M 4R STR1c;onc10 I c;o 71 12 141300£ RIVEkSlDE 15206445 SSAA30 M 5~ 30TR2AQOC 8 200 71 12 l4ll25E ,<I VEkS JOE lj20b44"> 71 12 141131)# ILLOol SliAMP l':>209541 SSAA20 s IA 'iTR 1QnA 71 12 l4l l3•l-1ILL0w S111A"4P 15209541 SSAA3G M 4A 40TL 400C
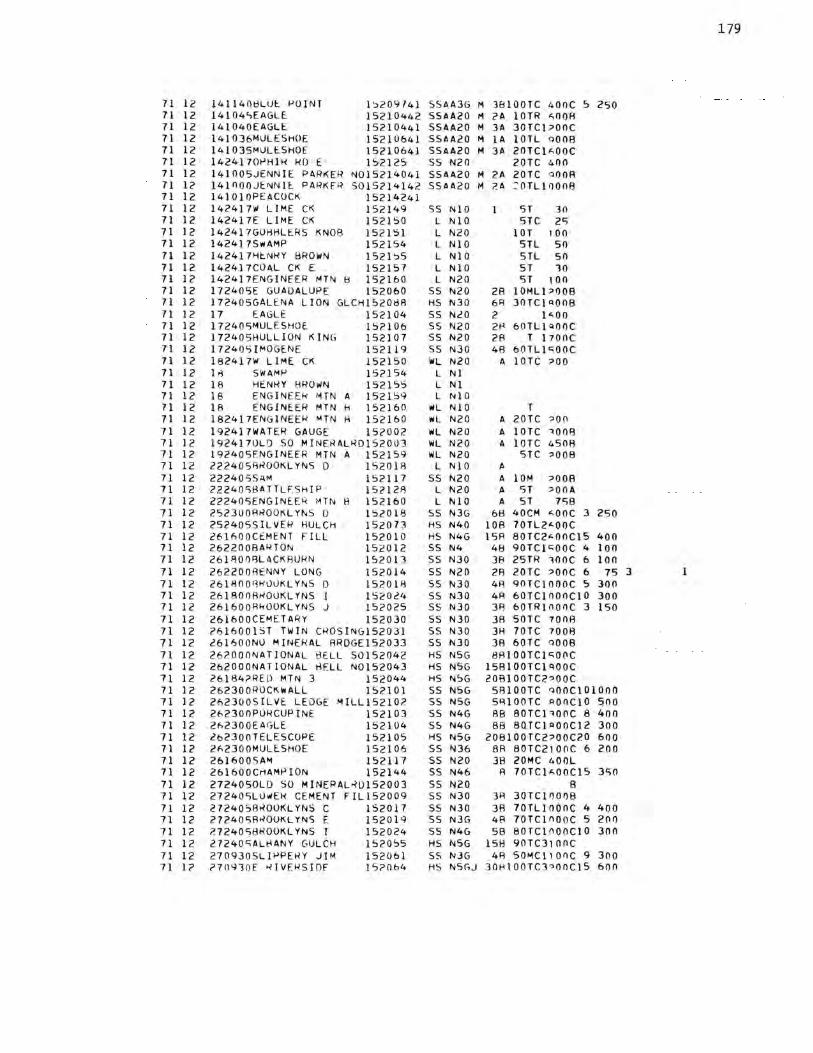
179
71 12 141140~LUE POINT 1~209741 SSAA3G M 3BlOOTC 400C 5 250 71 12 14104',EAGLE 15210442 SSAA20 M ?A lOTR <.OOR 71 12 l41040EAGLE 15210441 SSAA20 M 3A 30TCPOOC 71 12 l41036MULESHOE 15210641 SSAA20 M lA lOTL q008 71 12 l41035MULESHOE 15210641 SSAA20 M 3A 20TCl"-OOC 71 12 14241701-'HlR RD E 152125 SS N20 20TC 400 71 12 141005JENNIE PARKER N01521404l SSAA20 M 2A 2orc oooR 71 12 141DOOJENNIE PARKFR S0l5?I4l42 SSAA20 M ?.A : OTLl 0008 71 12 141010PEACOC"- 15214241 71 12 14241 U LIME CK 152149 55 NlO 5T 30 71 12 142417E LIME CK 152150 L NlO STC 2c; 71 12 142417GOHHLERS KNOB 152151 L N20 lOT 1 00 71 12 l424175WAMP 152154 L NlO STL so 71 12 l42417HENRY BROWN 1521~5 L NlO STL sn 71 12 l424.l 7C0AL CK E 152157 L NlO ST 10 71 12 l42417ENGINEER MTN El 152160 L N20 5T 100 71 12 172405E GUADALUPE 152060 ss N20 2A lOMLPOOB 71 12 172405GALENA LION GLCH15208A HS N30 68 30TC1Q00B 71 12 17 EAGLE 152104 55 NlO 2 1 <.OO 71 12 17240S"1ULESHOE. 152106 55 N20 21-l 60TLl«OOC 71 12 l72405HULLI0N KING 152107 ss N20 2A T l700C 71 12 17240SIMOGENE 152119 ss N30 48 60TLl<iOOC 71 12 182417W LIME CK 152150 WL N20 A lOTC ?00 71 12 l >l SWAMP 15?154 L Nl 71 12 18 HENRY HRO\IIN 152155 L Nl 71 12 18 ENGINEO< MTN A 152159 L NlO 71 12 18 ENGINEER MTN f1 152160 WL NlO T 71 12 l82417ENGINEER MTN H 152160 WL N20 A 20TC ?00 71 12 l92417WATER GAUGE 152002 WL N20 A lOTC ct008 71 12 l924170L0 SO MINERALRD152003 WL N20 A !OTC 4508 71 12 l92405FNGINE.ER MTN A 152159 WL N20 5TC ?008 71 12 222405AROOKLYNS D 152018 L NlO A 71 12 2224055/.IM 152117 ss N20 A lOM ?00B 71 12 22240Sl:lATTLF. 5 HIP 152'12A L N20 A ST ?QOA 71 12 222405ENG!NEER MTN B 152160 L NlO A ST 75B 71 12 252300RROOKLYNS 0 1S2018 5S N3G 68 40CM "-OOC 3 250 71 12 252405SILVER HULCH 1520 73 HS N40 lOB 70TL2"-00C 71 12 261600CEMENT FILL 152010 HS N4G 15R 80TC2"-00C15 400 71 12 262200BA4TON 152012 55 N4 48 90TCl<iOOC 4 100 71 12 26lAOflRLACKRUHN 152013 ss N30 3B 25TR lOOC 6 100 71 12 262200AENNY LONG 152014 55 N20 2R 20TC ?OOC 6 75 3 71 12 261AOOYHUUKLYNS D 152018 55 N30 4R 90TC1000C 5 300 71 12 261801)13'/0UKL YNS I 1520.:!4 55 N30 4R 60TC1000Cl0 300 71 12 261600RkOOKLYNS J 152025 ss N30 3R 60TRlOOllC 3 150 71 12 261600CEMETARY 152030 55 N30 JR sore 100B 71 12 ?616001ST TWIN CROSING152031 55 NJO 3H 70TC 7008 71 12 261600NU MINERAL ARDGE152033 55 N30 38 60Tc oooa 71 12 262000NATIONAL BELL 50152042 HS N5G 8RlOOTCl<i0(lC 71 12 262000NATIONAL HELL N0152043 HS NSG l5RlOOTClqOoc 71 12 26184?REll MTN 3 152044 HS N5G 20Bl00TC2?00C 71 12 262300ROCKIIALL 152101 55 NSG 5BlOOTC oooc101000 71 12 262300SILVE LEDGE MILL152102 ss NSG SRlOOTC AOOClO ~00 71 12 262300PORCUPINE 152103 55 N4G 88 80TC1100C 8 400 71 12 2h2300EAGLE 152104 55 N4G 88 8QTC1AOOC12 300 71 12 262300TELESCOPE 152105 HS N5G 20B100TC2?00C20 600 71 12 2h2300MULE.SHOE 152106 ss N36 88 80TC2100C 6 200 71 12 261600SAM 152117 ss N20 3B 20MC 400L 71 12 26l600Ct1AMPI0N 152144 ss N46 A 70TCl"-OOC15 3<;0 71 12 2724050LO SO MINERALRD152003 55 N20 B 71 12 27240SLUwER CEMENT FIL152009 ss N30 3R 30TC1/l0/l8 71 12 272405RROOKLYNS C 152017 ss N30 3A 70TLlOOOC 4 400 71 12 27240SBROOKLYN5 E 152019 5S N3G 48 70TClllOOC 5 20/l 71 12 27240S8ROOKLYNS I 152024 55 N4G 58 BOTClllOOClO 300 71 12 27240SALHANY GULCH 152055 HS NSG 15B 90TC31onc 71 12 270930SLIPPERY JIM 152061 ss N3G 4R so,..c11onc 9 300 71 l? ?70930f RIVERSIOF JS?Ot,4 HS NSGJ 30Hl00TC3"00Cl5 600

180
71 12 27240551LVE~ GULCH 152073 SS N.30 5 20TC20008 71 12 271245W RIVERSIDE 1S207446 HSAA40 M 88 70TL2qOOC 2 ?O 71 12 272405W GUADALUPE 152075 HS N)O AA 30TL20008 71 12 272405IRUNTON PARK 1520M2 5S N4G 5AlOOTCl<.OOC 71 12 272405TI0Y 152083 SS N30 3RlOOTClflOOC 71 12 27240SFULL MOON GULCH 15?084 SS N)O 38 9orc1;::iooc 71 12 27121SKING 152091 SSAA20 71 12 271200W!LLOW SWAMP 15209541 5SAA20 s l A STL :>OOB 71 12 27120SRLUE POI1~T 1520~741 5SAA30 5 2A 20T3 ?00910 so 71 12 27lll=iPU>-<CUf'INE 15210341 71 12 271100EAGLE 15210441 5SAA20 38 20TR1400 3 75 71 12 ?71 lOOEAGLE 15210444 71 12 2724051-lULLlON qNG 152107 5S N40 6 90TC2000C 71 12 272405MILL Ct< A 1S2lu8 55 N20 2 30MC qooc 71 12 272405MILL CK ,-J 1521 \)Cj ss N20 2 )OMC "00C 71 12 272405MILL CK C 152110 ss N20 2 30MC "00C 71 12 27240SMILL CK E 152112 S5 N20 2 30MC <>OOC 71 12 272405MlLL CK F 152113 55 N20 ? )OMC ,ooc 71 12 272405SAM 152117 ss N)O 3 sore <.ooc 71 12 2724050UTLAW 152121 ss NJO 3 lOOTCl:>OOC 71 12 27240SSAN JUAN 152122 ss N40 4 lOOTCl400C 71 12 272405TAVl:.RN 152123 ss N30 3 1 OOTCl ;,one 71 12 27240SOPHIR RO E 152125 ss N30 5 90TCl qooc 71 12 2724050f'f-i!R R[J w 152 126 55 N30 5 90TCl><OOC 71 12 27240SB1SMARK 152127 ss N40 3Rl00TC?'IOOC 71 12 2724058ATTLESHIP 15?12R ss N40 4fll00TC2400C 71 12 272405DESTROYE~ 152129 ss N40 38100TC1400C 71 12 27?405SN0WSLI0E GULCH 1S2132 HS N40 6HIOOTC2?00C 71 12 272405AEAR CK 'If 152134 ss N)O lOOTClqOOC 71 12 272405PUMf'HUUSE 152136 ss N40 4 lOOTC21100C 71 12 272405NORTH STAf< 152137 ss N30 20TRlOOOA 71 12 272405JENNIE PARKER 15?141 55 N)O 18 2rJTR1rJ00B 2 so 71 12 272405t<ENO MINE 152 14b ss N30 31-l 'IC 700H 71 12 272405~E~EMY PROWN l ':i2 l ':i'> ss 1'120 28 30TL 400A 71 12 281150PEACOCK 15214242 5SAA4G M SH 90TC1SOOC18 200 71 12 281155HA~LEY SHORT 1521'+342 5SAA2 0 s 2A 50TC 1508 2 10 n 71 12 291200BMOOKLYNS E 15 2 01941 SSAAJG 1R JOTR1nnnc12 200 71 12 290~00~ROOKLYNS F 152020 SS NJ G F~ 70Tc1 nonCl2 )00 72 0 1 O)llOOLIMt. CK "' 1S21S044 72 01 03 1045COO.L CK "' 1521SH43 72 01 0)1030ENGINEEM MTN 8 152 1604:, S5 AA20 A 30 ;::i oo 72 0 1 042417CUMA l::lELL 152 048 ss N20 20MR ? 00 72 01 042417\IIILLOW S\IIAMP 152095 ss N20 20MC 150 72 01 042417RLUE 1-'0INT 152097 ss N2 0 20TC 1 00 72 01 042405HEN~Y l::lMOWN 152155 L N l 0 HL so 72 0 1 062405ALUE f'OINT 1520 '-i7 L N20 ti. 2nTc ?00 72 01 0624050PHIR ROAD E l 5?.125 ss NJO 3 )OMC c.ion 72 01 11 1-lROOKLYNS 1-l 152 016 ss N)O ? tlOTC Q l)O
72 01 11 I TALI AN 15205 1 ss N20 ? 70TR qoo 72 01 11 AULL ION i<ING 152107 55 N2 0 72 01 11 MILL CK 8 l S? IOCJ HS N2 0 I 158C ?0 0 72 01 11 MILL Ct< C 1s2110 HS N20 1 l 5 "1C '!On 72 01 11 MILL CK E 152112 HS N20 1 20MC 100 72 01 11 MILL CK F 152 113 HS N2 0 1 20MC 10 0 72 01 130900EAGLE 15?l\J4 HS N30 3 SOTLlC::OOC 4 350 72 01 13 MILL CK G 152114 HS N2G J 40MC <.00 72 01 l42405IMOGENE 152119 HS N20 2 lOTL !, 00 72 01 14 SAN JUAN 152 122 55 NlO 5 -.l C so 72 01 14 TAVERN 152123 ss N20 l 40TC 40n 72 0 1 14 BATTLESHIP 15212A HS N30 3 TCl qO O 72 01 18151 3E RIVERSIDE SO 15206? ss N20 l RR 100 2 4n 72 01 2024l7SLIPPERY JIM 152061 WL N20 58C 15() 72 01 222417MOTHER CLINE 152069 \Ill N20 51::lR ?00 2 ?O 72 02 18 RLUE POINT 152097 wL N20 STL 1 on 72 02 11:!2417TELt.SCOPE 152105 WL N20 !OTC :>00 72 02 14 SL I 1-'f' b<Y JIM lS?Of>l wL N20 S~L ;,on
161
72 02 212417BWUUKLYNS J 152025 t,jl N20 30TC "150 72 02 22 NO MINERAL BRDGE152033 WL NlO 5 so 72 02 222417LONGFELLOW 152039 WL N20 5 100 12 02 22 MOE 152057 WL N20 30 ::>SO 72 02 22 SLIPPERY JIM 152061 WL N20 SAR 150 72 02 22 f RIVERSIDE 152063 WL N20 SBR 100 3 15 72 02 22241',0UNSMORE 152068 WL NlO 5BC 75 l 25 72 02 22 DUNSMORE 152068 WL N20 lOTL 150 72 02 22 DUNSMORE 152068 WL N20 lOTR ::>OO 10 72 02 22 SILVER GULCH 1520 7'3 WL N20 SMC ::>SO 72 02 22 LAKE 1520 77 WL N20 40MR 100 12 03 011620AROOKLYNS B 152016 WLAS20 s lOT 1<008 12 03 011620BROOKLYNS C 152017 WLASlO s SM 758 12 03 012417E GUADALUPE 152060 WL N20 SM :>508 12 03 012417SLIPPERY JIM 152061 WL N20 SM lOOR 72 OJ 012417E RIVERSIDE LEFT152065 WL N20 SBC ::>OOB 72 03 021500NO MINERAL BRDGE152033 WL N20 lOT 1508 72 03 021 SOORED MTN 3 152044 ws N20 2 SBC 1508 72 03 022417WATER GUAGE NO 152076 WL N20 lSTC ;>SOB 72 03 021000BATTLESHIP 15212A WL N20 ST ::>OOB 72 03 032417E RIVERSIOE LEFT152065 WL N20 SMC 1508 72 03 03241751LVER GULCH 1520 73 WL NlO SMC 75R 72 03 03 SILVEW GULCH 152073 ss N20 lSMC OOOB 12 03 031200MILLCK C 152110 ss N20 75 700C 72 03 051300GALENA LION GLCH15208AA ill_ N2 20TC 100A 72 03 05 WILLOW SWAMP 15209'5 SS N20 20TR ?008 12 03 052417EAGLE 152104 WL N20 lSTC 1008 12 03 052417SAM 152117 ss N20 2 20TC ?008 72 03 052417SAN SUAN 152122 ss N20 l SOMC ::>OOB 72 03 051300Gl 152130 WL N2 20TC ::>OO 72 03 051300 G.I. 152130 t,jl N2 20TC 17SB 72 03 052417PICKLE BARREL 152131 oil N20 20TC l7SB 72 03 l02417HROOKLYNS G 152022 ws N2G l 30TC 700A 72 03 l024l7BATTLESHlP 152128 HS N30 3 40TCl'-OOC 72 03 l32417RROOKLYNS H 152023 ws N2G 40TC '-008
AVALANCHE OCCURRENCES, STATION 157, 1971-72
71 12 04 RIO GRANDE 1S7002 L N20 T son 71 12 04 Wt::STERN 157003 L N20 T c;oo 71 12 04 IDAHO 157004 L N20 T soo 71 12 04 TIG!:.R GULCH 157041 ss N20 TR 71 12 04 BILLBOARD 157042 ss N20 QOO 71 12 04 BILLBOAl<D 157042 ss N20 qOO 71 12 04 B1LL8UARO 157042 ss N20 QOO 71 12 04 BILLBOAPD 157042 ss N20 «00 71 12 04 GRASSY GULCH 157043 ss N20 TR 71 12 l42405ARCADE 157008 SS N20 30"4Rl ::>OO 71 12 161030IRENE 15700541 HSAA30 M SB 30TR1100C 71 12 l61030IRENt. 15700541 HSAA30 MlOA 40TL1::>00C 71 12 161130W JUMP A 15702841 SSAA20 M 38 TC QOOB 71 12 161130W JUMP t:l 15702941 71 12 161045FAIRV1Ew 15701641 HSAA20 M SB 30TRl0008 71 12 161045FAIRVIEW 15701641 HSAA40 MlOB 70TC QOOC 2 50 71 12 16l045FAI1<11IE111 15701645 71 12 l6llOOORY GULCH w 15703 941 SSAA40 M 38 90TC1400C 2 75 71 12 24240SORY GULCH NO 157027 SS N30 3A 40TL AOOC 71 12 27240S0[1'-j\lER 157001 SS N30 68 40MC1SOO 71 12 272405HENRIE:.TTA GULCH 157004 SS N40 BRlOOTC2000C 71 12 270530 IDAHO 157004 HS N5GJ 20AlOOTC3SOO 71 12 270600ARCADE 157009 HS N4GJ 128 BOTC?aoo 71 12 27240 5 E,HE 1S70l4 ss N20 ?A 40TC ,one
182
71 12 27240SMICHIGAN 157015 ss N4G 51:HOOTC 700C 3 100 71 12 272405FAit-1VIEW 157016 HS N3G SA 20TR1nooc 71 12 272405f!EATLES 157017 ss NJO 3A 90TC qQOC 71 12 272405GEORGIA GULC~ 157021 HS N3G 68 20TL2?00C 71 12 27240SW JUMP B 157029 ss N4G 58 90TC qOOC 4 150 71 12 272405MOGUL 157030 ss N30 31'! eoTc 1onc 4 300 71 12 272405STANOARO MINE 157031 ss N30 38 60TC QOOC 71 12 272405COLORAD0 SLIDE 157032 HS N40 6FllOOTClOOOC 71 12 272405DRY BULCH SO 157040 55 N30 qoo 71 12 272405TIGEt-1 GULCH 157041 HS N4G 6A 60TL2'lOOC 71 12 27240SGRASSY GULCH 157043 HS N4G 88 80TC2000C 72 02 21 BEATLES 157017 WL N20 30TC 100 72 03 051000MICHIGAN 157015 WL N20 lOTL ?008 72 03 051000GEORGIN GULCH 157021 ss N20 5BL ?508 72 03 OSlOOOORY GULCH NO 157027 55 N20 5BL ?SOB
AVALANCHE OCCURR~NCES• STATION 152• 1'172-73
72 10 302417RED MTN 3 152044 55 N30 30TC qQOB 72 10 301300FlLUE POINT 152097 L N20 SOTC 1508 72 11 012405RED MTN 2 152047 ss N20 2 STL 400M 72 11 Ol2405AULL10N KING 152107 55 N30 3 25TC qQOM 72 11 Ol2405ENG MTN 8 152160 WL NlO 5 7r:; 72 11 0624178ROOKLYN G 152022 WL N20 lOTC 100M 72 11 062405MARMOT TOWN 15203>1 L NlO STR 75M 72 11 062405NATL BELL 152042 L N20 STL 100M 72 11 062405KING 152091 L NlO STR 75T 72 11 062405WILLOW 5wAMP 152095 L NlO STR 1ST 72 11 062405BLUE WILLOW 152096 L NlO 20TC 7SB 72 11 062405f!LUE POINT 152097 55 NlO SML 7SM 72 11 062405BLUE POINT 152097 L N20 lOTC 150M 72 11 062405ENG MTN B 1S2160 L NlO STC 6ST 72 11 082417NATIONAL HELL NC152043 55 N20 STL ?SOM 72 11 082417BLUE POINT 152097 55 N20 80TC 100Fl 3 1r:;o 72 11 082417FENCE 152098 55 NlG dOTC 75A 2 40 72 11 082417SNOW FLAKE 152099 55 NlO 60TC 7SR 2 10 72 11 082200R0CKWALL 152101 55 N20 70TC ?QOM 4 200 72 11 092405£ RIVERSIDE 152U64 ss N30 3 25TC3t')00B 4 so 72 11 091330EAST RIVERSIDE 15206443 72 11 091045EAGLE 15210444 SSAA20 STC 400M 72 11 091045TELESCOPE 15210542 72 11 091050MULE SHO~ 15210641 72 l I 092405ENG MTN A l521S9 L N20 STC 100T 72 I l 121000LONGFELLOW 152039 ss N20 STR 100M 72 11 122405MILL CK A 152109 ss N20 25TR c;ooM 72 11 122405MILL Cl<. C 152110 55 N20 25TR c;onM 72 11 12240SMILL CK D 152111 ss N20 lSTR r:;ooM 72 11 12240SMILL CK F 152113 55 N20 30TR c;QOM 72 11 131345BI-IOOKLYN E 152019 55 N20 lOMC ?SOM 72 11 13134Sf3ROOKLYN F 152020 L N20 lOMC ?.SOM 72 11 131447BROOKLYN N 152029 WL N20 F A 1 OHL ?SOM 72 11 131345NC MIN BOG 152033 L N20 SMC ?SOM 72 11 13240SREO MTN 3 152044 55 N20 2 STL 100T 72 11 132417£ GUAOALUPE 152060 WL N20 SMC 400M 72 11 132417E RIVERSIDE S0UT152062 L N20 lOMC 1508 72 11 l32417E RIVERSIUE LEFT152065 WL N20 STR ?008 72 11 13124SGOVERNER GULCH 152090 L N20 STC 150T 72 11 13240SWILLOW SWAMP 152095 55 NlO TR 75 72 11 13124SBLUE WILLOW 152096 L NlO sore 7SB 72 11 132405MILL CK F 152113 55 N20 2 SOTC qQQFl 72 11 l32405MILL CK G 152114 ss N20 2 30TR qOOFl 72 11 132405ENG MTN B 15211,/) 55 N20 l )OTC ?OOM
183
72 11 13240SNC SNUWOON 152 55 N3 T AOO 72 11 l42405RED MTN 3 152044 HS N20 STR 450M 72 11 1~0945TWIN CROSSINGS 152032 L N20 SMR 100M 72 11 20240SBROOKLYN K 152026 55 N20 lA !OTC ::>SOM 72 11 201000MARMOT TOWN 152038 ss NlO lA STR 75M 72 11 202405BLUE WILLOW 152096 55 NlO lA SOTC 758 72 11 202405FlLUE POINT 152097 55 N20 lA 2STR !SOB 72 11 2021008LUE POINT 152097 55 N20 A 25T 1508 2 10 72 11 20240SMILL CREEK A 152108 55 N20 lA 25TC :>OOM 72 11 202405MILL CREEK 8 152109 55 N20 lA 2STR :>SOM 72 11 20240SSNOWSLIDE GULCH 152132 55 N20 lA lOTR AOOM 72 11 ?0240SBEAR CREEK EAST 15213~ ss N20 lA }OTC 700M 72 11 212405CEMtNT FILL 152010 5S N20 2A STR ::>OOT 72 11 ?.llOOOIWOOKLYN H 15202341 72 11 21100SRROOKLYN J 15202541 72 11 210915NC MINERAL BRIDG152033 ss N20 lA SMC ::>SOM 72 11 210200E RIVERSIDE SOUT152062 ss N20 lA 25TC 1008 2 25 72 11 2lll30E RIVERSIOE 15200444 72 11 210200E RIVERSIDE LEFT152065 5S NlO lA }OMC 708 72 11 211010EAGLE 15210441 5SAA20 IA STC 400M 72 11 211015EAGLE 15210441 SSAA20 M lA STR ::>OOT 72 11 2ll020MULESHOE 15210641 SSAA20 M l A STR !SOT 72 11 272405CEMENT FILL 152010 HS N30 2 lOTllOOOM 72 11 270700BROOKLYN F l!:12020 SS N20 2 SOTC <1008 l 100 72 11 270700BROUKLYN G 152022 SS N20 2 SOTC ASOl'l 72 11 2724051ST TwIN CROSSIN1520Jl 55 N20 l 1 OTLl OOOA 72 11 270830NCRTH MINERAL 60152033 55 N20 2 25TR AOOA 72 1 l 27240SE GUADALUPE 152060 55 N20 SMLl llOOA 72 11 27240SRICHMOND 152086 55 N30 3 SOTC 700M 72 11 272405WILLUW SWAMP 152095 55 N20 l STR 1 SOM 72 11 272405EAGLE 152104 55 N20 3 25TL AOOM 72 11 272405TELi: SCOPE 152105 55 N30 75T }AOOB 30 72 11 272405MULESHOE 152106 55 N20 SOT 1~008 72 11 27240SRULLION KING 152107 ss N30 75T 1A008 72 11 27240SI"l0GENE l 52119 55 N30 2 75TR}q00B 72 11 2724050PHIR ROAU EAST 15212!:> 55 N30 2 SOTLlSOOR 72 11 2724058ATTLESHIP 152128 HS N30 3 SOTR2J008 72 11 272405SNOWSLIOE GULCH 152132 55 N20 l lOTLlOOOA 72 11 29240SRED "lTN 3 152044 HS N20 STL °'SOM 72 11 301000EAGLf 152104 55 N20 2 STR 'iOOM 72 12 Ol2417WATER GAGE 152002 L N20 s STC 400M 72 12 012405SLIPPERY JIM 152061 L N20 5 SAL !SOB 72 12 01240SGALENA LION GULC152088 L N20 s STCl0008 72 12 0424178ROUKLYN t3 152016 55 N30 SOTC 7008 3 100 72 12 042417RROOKLYN H 152023 55 N30 75T A008 4 100 72 12 042417E GUADALUPE 152060 55 N20 STL 400M 72 12 042030E RIVERSIDE LEFT152065 55 N20 SOTC ::>008 3 70 72 12 042417W RIVERSIDE 152074 55 11130 2STL1Q008 72 12 042417BLUE:. POINT 152097 55 N20 25TC 1508 s ?5 72 12 0424178LUE POINT 152097 55 N20 25TC 1508 s ?.5 72 12 0424178LVE POINT 152097 55 N20 25TC JSOB s ?.5 72 12 0424178LUE POINT 152097 ss N20 25TC 1508 5 ;,5 72 12 042115ROCKWALL 152101 ss N20 25MC 1508 5 100 72 12 042415MULESHOE l !:12106 55 N30 SOTClQOOA 72 12 042417IMOGENE 152119 55 N20 SOT lAOOB 72 12 04201SPEACOCK 152142 55 N20 50TC AOOA 3 75 72 12 04201SHARLEY SHORT 152143 55 NlO 50 C 608 2 75 72 12 042000CHAMPION 152144 55 N20 2STC AQOB 5 120 72 12 04241 Sil LIME CK 152150 55 NlO lOMR 608 1 50 72 12 0416305ilAMP 152154 55 N20 SOTC ::>OOA 1 30 72 12 041630HENRY BROWN 15215>5 55 N20 75TC 1508 3 20 72 12 042lOOL0wERLEDGE 152 L N20 M 100TC11)00 8 250 72 12 042200L0wER PONO 152 L N20 M lOOTClllOO 5 100 72 12 052405N MINERAL 8RIDGE152033 55 N20 2 SML 1508 72 12 052405N MINERAL BRI0GE152033 55 N20 2 lOML SOOR 72 12 O'il400E ~IV~~SIDE 15206441 SSAA30 F 25TR2SOll8 9 4('1
184
72 12 051400E RIVERSIDE 15206444 72 12 051225WILLOW SWAMP 15209542 HSAA20 M 2A 25TL lOOB 72 12 051150SILVER LEDGE MIN15210042 72 12 051115EAGLE 15210444 SSAA30 M 4 75TC2f}00B 72 12 051115TELESCOPE 15210542 SSAA20 M 3 50TC2000B 72 12 070900FlROOKLYN H 152023 SS N20 3 lOMR "l00B 72 12 070900FlROOKLYN J 152025 55 N20 2 25TR 400M 72 12 070900N MINERAL RRIDGE152033 SS N20 3 SOTClOOOR 72 12 092405ENG MTN B 152160 55 N20 2 25TC 1008 72 12 092405ENG MTN C 152161 55 N30 3 50TC 150R 72 12 lll400E RIVERSIDE 15206444 72 12 lll230TELESCOPE 152105 L N20 lOTR lOOM 12 12 l 12417BATTLESHIP 152128 L N20 STR 700M 72 12 ll2417BATTLESHIP 152128 L N20 5TR '-OOM 72 12 lll500JEANNIE PARKER Nl5214041 72 12 lll500JEANNIE PARKER 515214141 72 12 122405BROOKLYN D 152018 L N20 TR ,OOM 72 12 122405BROUKLYN L 152027 L N20 TR 400M 72 12 121540ENG MTN C 152161 SSAE20 lA 25TC 1508 12 12 1615000LU S MINERAL RD152003 WL N20 5TC lOOB 72 12 161500PIT 152004 WL N20 50TC 7009 72 12 171500E LIME CK 152149 WL NlO 5MR 708 72 12 211300WATER GUAGE 152002 L N20 lOTL '-OOM 12 12 2l24I7PIT 152004 L N20 s 25TR lOOM 72 12 211045E RIVERSIDE 15206447 72 12 210900wATER GUAGE NO 152076 ss N20 3 lOMC lOOM 12 12 210900FULL MOON GULCH 152084 ss N20 3 25TClllOOM 72 12 211000EAGLE 152104 ss N20 3 I0TC2000B 72 12 212417TELESCOPE 152105 L NlO 12 12 212417MULESHOE 152106 L NlO 72 12 232405EAGLE 152104 L N20 5TC 100M 72 12 251345CEMENT FILL 152010 HS N30 M 3 50TC2400R 1 100 12 12 262405EAGLE 152104 ss N20 IA lOTRl?OOM 72 12 282417BROOl<LYN L 152027 ss N20 lOTC 400M 12 12 28241 7 IDAR ADO 15?094 ss NlO IA 75TC 408 3 30 72 12 282405WILLOW SWAMP 152095 ss N20 l lOTL ;>QOM 12 12 28l l30BLUE PO INT 152097 55 N20 B 4 200 12 12 29I600CEMENT FILL 15201042 72 12 291130BROOKLYN F 15201941 SSAA20 F IA 5TR ?50M 72 12 29lll5AROOKLYN H 15202341 SSAA20 F IA 5TR lOOM 12 12 29IllOBROOKLYN J 15202541 SSAA20 F IA lOTC lOOM 72 12 291IOOBROOKLYN M 15202841 SSAA20 F IA 5TR 100M 12 12 29ll40WILLOW SWAMP 15209542 SSAA20 F IA 5TC ?50M 72 12 29ll50BLUE POINT 15209741 SSAA20 s lA 25TC ?008 10 12 12 290300ROCKWALL 152101 SS N20 A 4 300 72 12 291035EAGLE 15210443 LAA20 s A 5ML <.OOB 12 12 291050TELESCOPE 15210541 72 12 291045"1ULESHOE 15210642 73 01 042405E GUADALUPE 152060 HS N30 3 25TL2000B 73 01 041400WEST LIME CK 152150 L NlO TM 100 73 01 041300COAL CK EAST 152157 L NlO 5T 100 ;>O 73 01 041400ENGINEER MTN A 152159 ss N20 2 75TC <.00 73 01 052405BLUE POINT 152097 ss NlO l 5TC SOB 73 01 051900BLUE POINT 152097 ss N20 l IOTL 1008 20 73 01 051000SWAMP 15215441 73 01 051000HENRY BROWN 15215541 SSAA20 l 25TC ?50 2 40 73 01 052405ENGINEER MTN A 152159 55 N30 l lOOTC F-008 73 01 0509SOENGINEER MTN B 15216041 SSAAlO 1 5TC 75A 73 01 0509SOENGINEER MTN C 15216141 SSAA20 l lOTL lOOFl 73 01 061000M1LL CK F 152113 SS N20 l lOTL q008 73 01 09ll30WILLOW SWAMP 152095 55 N20 25TL ?508 73 01 0910008LUE PT 152097 55 N20 lOTL 1 SOB 2 100 73 01 102417EAGLE 152104 SS N 0 STR 1008 73 01 l024l7TELESCOPE 152105 SS N20 lOTCllOOFl 73 01 l02405G0BHLERS KNOB 152151 55 N20 2 lOTL ?508 73 01 ll?.4l78ULL10N KING 1521 0 7 55 N20 STC <-008
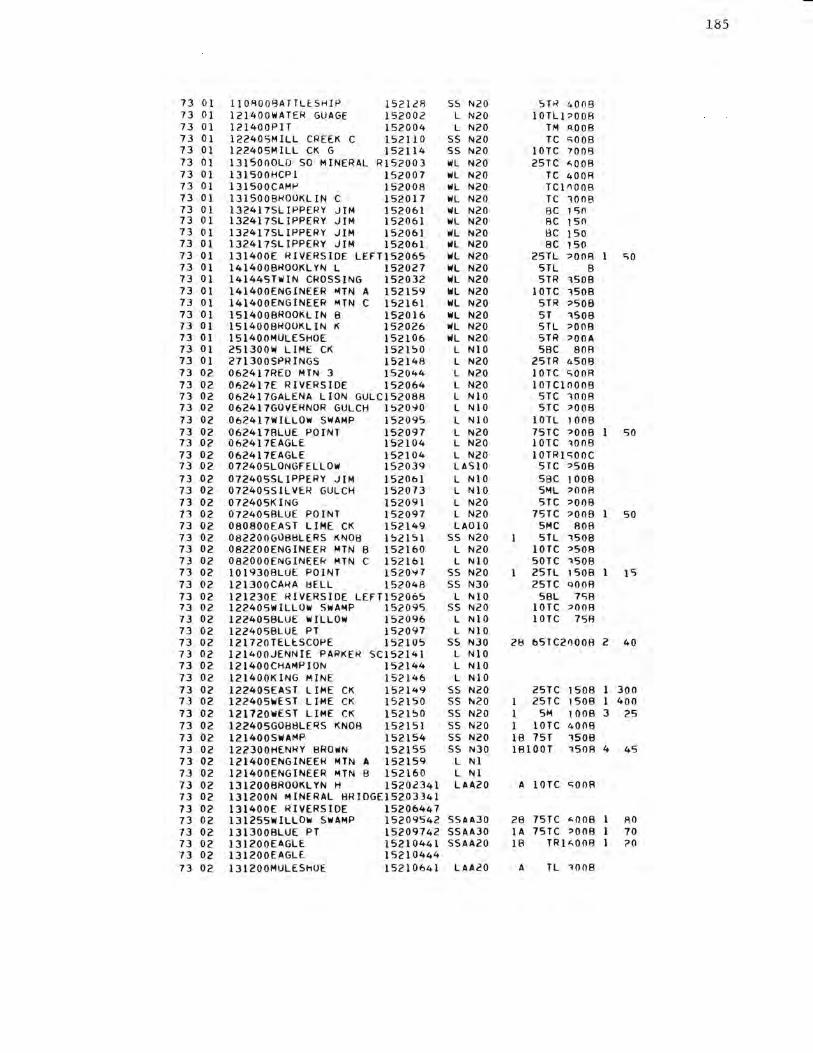
185
73 01 llOflOOBATTLt.SHIP 15212fl 55 N20 5TR 4008 73 01 121400WATER GUAGE 152002 L N20 lOTLl ?00B 73 01 l21400PIT 152004 L N20 TM AOOB 73 01 122405MILL CREEK C 152110 55 N20 TC <iOOB 73 01 122405MILL CK G 152114 55 N20 lOTC 7008 73 01 1315000LD SO MINERAL Rl52003 11/L N20 25TC ,<,QQB 73 01 131500HCP1 152007 WL N20 TC 400A 73 01 l31500CAMt-' 152008 WL N20 Tc1noos 73 01 131500BROOKLIN C 152017 WL N20 TC 1008 73 01 1324l 7SLIPPERY JIM 152061 WL N20 BC 150 73 01 1324l 7SLIPPERY JIM 152061 WL N20 RC J 50 73 01 13241 7SLI PPERY JIM 152061 WL N20 BC J 50 73 01 132417SLIPPERY JIM 152061 11/L N20 BC J 50 73 01 131400E RIVERSIDE LEFT152065 WL N20 25TL ?008 so 73 01 l414008ROOKLYN L 152027 IIIL N20 STL 8 73 01 l4l445TWIN CROSSING 152032 WL N20 STR 1508 73 01 l41400ENGINEER MTN A 152159 WL N20 lOTC 1508 73 01 l4l400ENGINEER MTN C 152161 WL N20 STR ?508 73 01 l5l400BROOKLIN B 152016 WL N20 ST 1508 73 01 1514008ROOKLIN K 152026 11/L N20 STL ?008 73 01 151400MULESHOE 152106 WL N20 STR ?OOA 73 01 251300W LIME CK 152150 L NlO SBC 80A 73 01 271300SPRINGS 152148 L N20 25TR 4508 73 02 062417RED MTN 3 152044 L N20 lOTC <iOOR 73 02 062417E RIVERSIDE 152064 L N20 lOTCl0008 73 02 062417GALENA LION GULC152088 L NlO STC 100B 73 02 062417GOVERNOR GULCH 152090 L NlO STC ?008 73 02 062417WILLOW SWAMP 152095 L NlO lOTL 1008 73 02 062417RLUE POINT 152097 L N20 75TC ?008 50 73 02 062417EAGLE 152104 L N20 lOTC 1008 73 02 062417EAGLE 152104 L N20 10TR1c;ooc 73 02 072405LONGFELLOW 152039 LASlO STC ?508 73 02 072405SLIPPERY JIM 152061 l NlO SBC 1008 73 02 072405SILVER GULCH 152073 l NlO SML ?OOR 73 02 072405KING 152091 L N20 5TC ?008 71 02 072405RLUE POINT 152097 L N20 75TC ?008 50 73 02 080800EAST LIME CK 152149 LA010 SMC 80B 73 02 082200G08BLERS KNOB l 521 ':> 1 55 N20 STL 1508 73 02 082200ENGINEER MTN B 152160 L N20 lOTC ::>508 73 02 082000ENGINEER MTN C 152161 L NlO sore 1508 73 02 101930BLUE POINT 1520~7 SS N20 25TL 1508 l 15 73 02 121300CARA 1:iELL 152048 SS N30 25TC QOOR 73 02 121230E RIVERSIDE LEFT15206':> L NlO SBL 7SB 73 02 12240511/ILLOW SWAMP 152095 SS N20 lOTC ?008 73 02 1224058LUE WILLOW 152096 L NlO lOTC 758 73 02 1224058LUE. PT 152097 L NlO 73 02 121720TELt.SCOPE 152105 55 N30 2B 65TC2nOOA 2 40 73 02 121400JENNIE PARKER SC152141 L NlO 73 02 l2l400CHAMPI0N 152144 L NlO 73 02 121400KING MINE 152146 L NlO 73 02 l22405EAST LIME CK 152149 SS N20 25TC 1508 l 300 73 02 122405WEST LIME CK 152150 55 N20 25TC 1508 1 400 73 02 121720WEST LIME CK 152150 55 N20 SM 1008 3 25 73 02 122405G088LERS KNOB 152151 55 N20 lOTC 4008 73 02 121400SWAMP 152154 55 N20 18 75T 1508 13 02 122300HENRY BROIIIN 152155 55 N30 lAlOOT 150A 4 45 73 02 121400ENGINEER MTN A 152159 L Nl 73 02 121400ENGINEER MTN 8 152160 L Nl 73 02 1312008ROOKLYN H 15202341 LAA20 A lOTC c;ooR 73 02 131200N MINERAL BRIDGE.15203341 73 02 l31400E RIVERSIDE 15206447 73 02 131255WILLOW SWAMP 15209542 SSAA30 28 75TC "'008 1 AO 73 02 1313008LUE PT 15209742 SSAA30 lA 75TC ::>OOB l 10 13 02 131200EAGLE 15210441 SSAA20 18 TRl,<,008 1 ?O 73 02 131200EAGLE 15210444 73 02 131200MULESHOE 15210641 LAA20 A TL 1008
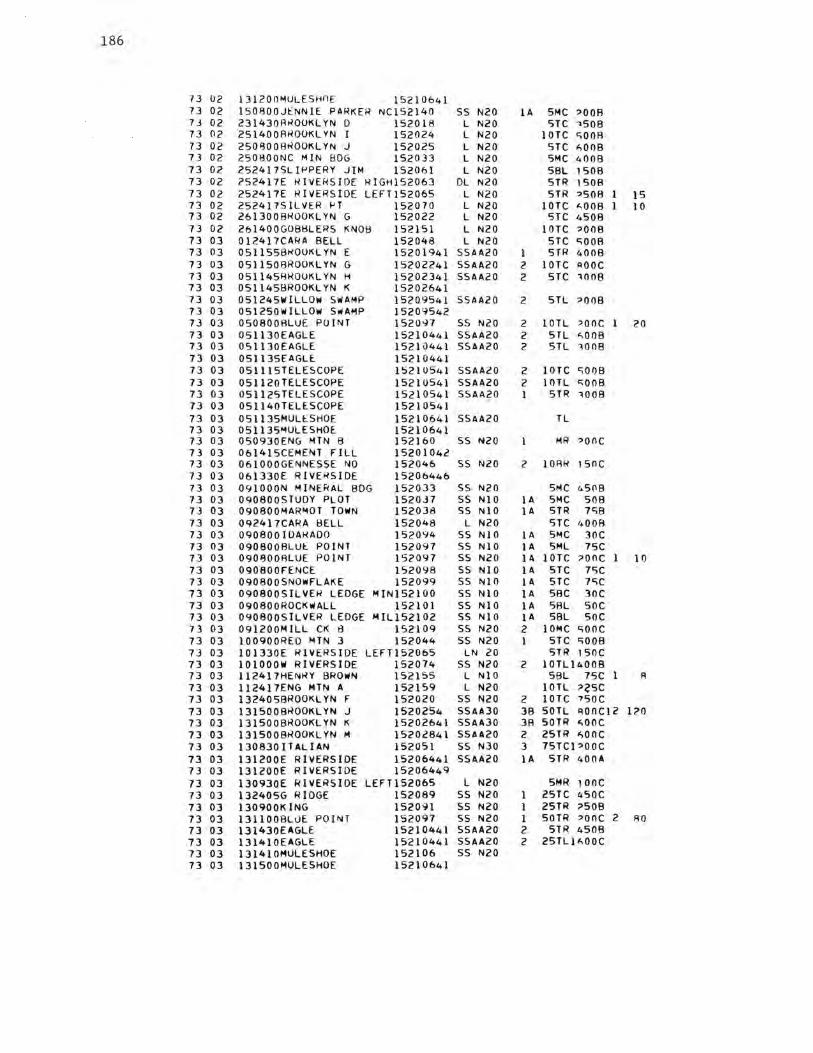
186
73 02 131200"1ULESHOE 15210641 73 02 150800JENNIE. PARKER NC152140 ss N20 lA SMC ::>OOA 7J 02 231430RROOKLYN D 152018 L N20 5TC ,sos 73 02 251400AROOKLYN I 152024 L N20 lOTC c;ooA 73 02 250800AROOKLYN J 152025 L N20 STC ,<,OOB 73 02 250800NC MIN BDG 152033 L N20 5MC 4009 73 02 252417SLIPPERY JIM 152061 L N20 SBL 1509 73 02 ?52417E RIVERSIDE RIGH152063 DL N20 STR 150B 73 02 252417E RIVERSIDE LEFT152065 L N20 STR ::>508 15 73 02 252417SILVER PT 152070 L N20 lOTC <,OOB 10 73 02 261300AROOKLYN G 152022 L N20 STC 4509 73 02 26l400GOB8LERS KN08 152151 L N20 lOTC ::>OOB 73 03 012417CARA BELL 152048 L N20 STC c;oos 73 03 0511558k00KLYN E 15201941 SSAA20 l STR 4008 73 03 0511508ROOKLYN G 15202241 SSAA20 2 lOTC AOOC 73 03 05ll45RROUKLYN H 15202341 SSAA20 2 STC 1008 73 03 051145BROOKLYN K 15202641 73 03 051245WILLOW SWAMP 15209541 SSAA20 2 STL ::>OOB 73 03 051250WILLOW SwAMP 15209542 73 03 050800RLUE POINT 152097 SS N20 2 lOTL ::>OOC 20 73 03 051 l30EAGLE 15210441 SSAA20 2 STL <,008 73 03 051130EAGLE 152lil44l SSAA20 2 STL 1008 73 03 05113SEAGLE. 15210441 73 03 051115TELESCOPE 15210541 SSAA20 2 lOTC c;ooa 73 03 051120TELESCOPE 15210541 SSAA20 2 lOTL c;ooa 73 03 051125TELESCOPE 15210541 5SAA20 l STR 1000 73 03 051140TELESCOPE 15210541 73 03 051135MULt::SHOE 15210641 55AA20 TL 73 03 051135""ULESHOE. 15210641 73 03 050930ENG MTN 8 152160 55 1'120 MR ::>OOC 73 03 061415CEMENT FILL 15201042 73 03 061000GENNESSE NO 152046 55 N20 2 lORR ,soc 73 03 061330E RIVERSIDE 15206446 73 03 091000N MINERAL BDG 152033 ss N20 SMC 45!1B 73 03 090800STUDY PLOT 152037 ss NlO lA SMC 508 73 03 090800MAR""OT TOWN 152038 55 NlO IA STR 7S8 73 03 092417CARA BELL 152048 L N20 STC 4008 73 03 090800 lDAt-<ADO 152094 55 NlO lA SMC 30C 73 03 090800FlLUt:: POINT 152097 ss NlO lA SML 75C 73 03 090'300ALUE POINT 152097 ss N20 IA lOTC ?OOC 10 73 03 090800FENCE 152098 ss NlO lA STC 7SC 73 03 090800SNOWFLAKE 152099 ss NlO l A STC 7"iC 73 03 090800SILVER LEDGE MIN152100 55 NlO IA SBC 30C 73 03 090800ROCKwALL 152101 ss NlO IA SAL soc 73 03 090800SILVER LEDGE MIL152102 ss NlO IA SBL soc 73 03 091200MILL CK B 152109 ss N20 2 lOMC "iOOC 73 03 l00900REO MTN 3 152044 SS N20 l STC "iOOB 73 03 l01330E RIVERSIDE LEFT152065 LN 20 STR 150C 73 03 101000W RIVERSIDE 152074 SS N20 2 l0Tll400B 73 03 ll2417HENRY BROWN 152155 L NlO 5BL 75C 1 A 73 03 112417ENG MTN A 152159 L N20 lOTL ??SC 73 03 132405BROOKLYN F 152020 SS N20 2 lOTC 750C 73 03 131500BROOKLYN J 1520254 SSAA30 38 SOTL qOOC12 l?O 73 03 l31500BROOl<LYN K 15202641 SSAA30 3B 50TR «.OOC 73 03 l315008ROOKLYN M 15202841 SSAA20 2 2STR i<,OOC 73 03 130 830 I TALI AN 152051 55 N30 3 75Tc1,ooc 73 03 131200E RIVERSIDE 15206441 SSAA20 lA STR 400A 73 03 131200E RIVERSIDE 15206449 73 03 130930E RIVERSIDE LEFT152065 L N20 SMR 100c 73 03 132405G R IOGE 152089 SS N20 1 25TC 450C 73 03 130900KING 152091 SS N20 l 2STR ?SOB 73 03 l3llOOBLUE POl!',jT 152097 SS N20 l SOTR ,ooc 2 AO 73 03 131430EAGLE 15210441 SSAA20 2 STR 4508 73 03 131410EAGLE 15210441 SSAA20 2 2STLU,OOC 73 03 131410MULE.SHOE 152106 55 N20 73 03 131SOOMULE.SHOE 15210641
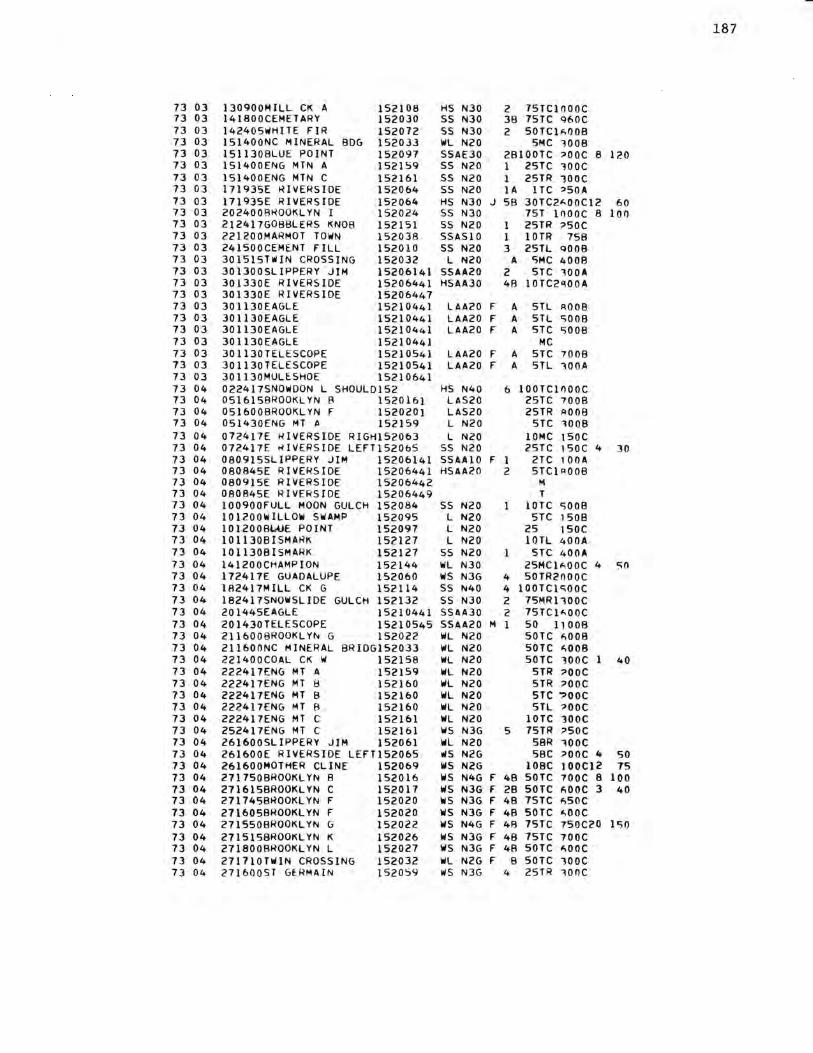
187
73 03 130900MILL CK A 152108 HS N30 2 75TClOOOC 73 03 l41800CEMETA.RY 152030 ss N30 3B 75TC %0C 73 03 l42405WHITE FIR 152072 55 N30 2 50TC11,,008 73 03 151400NC MINERAL BOG 152033 WL N20 SMC 1008 73 03 151130BLUE POINT 152097 SSAE30 28100TC ::>OOC 8 120 73 03 151400ENG MTN A 152159 55 N20 1 25TC lOOC 73 03 151400ENG MTN C 152161 SS N20 1 25TR lOOC 73 03 171935E RIVERSIDE 152064 55 N20 lA lTC ::>50A 73 03 171935E RIVERSIDE 152064 HS N30 J ss 30TC21,,ooc12 60 73 03 2024008ROOKLYN I 152024 55 N30 75T lOOOC 8 100 73 03 2l24l7G0BBLERS KNOB 152151 SS N20 l 25TR ::>SOC 73 03 221200MARMOT TOWN 152038 SSA.510 l lOTR 758 73 03 241500CEMENT FILL 152010 SS N20 3 25TL QOOB 73 03 301515TW!N CROSSING 152032 L N20 A 5MC 400B 73 03 30l300SL1PPERY JIM 15206141 5SAA20 2 STC lOOA 73 03 301330E RIVERSIDE 15206441 HSAA30 48 10TC2~00A 73 03 301330E RIVERSIDE 15206447 73 03 301130EAGLE 15210441 LAA20 F A 5TL AOOB 73 03 301130EAGLE 15210441 LAA20 F A STL c;ooa 73 03 301130EAGLE 15210441 LAA20 F A 5TC c:;000 73 03 30 l l30EAGLE 15210441 MC 73 03 30ll30TELESCOPE 15210541 LAA20 F A STC 7008 73 03 30ll30TELESCOPE 15210541 LAA20 f A STL 100A 73 03 301130MULESHOE 15210641 73 04 022417SNOWDON L SHOULD152 HS N40 6 lOOTClOOOC 73 04 0516158ROOKLYN 8 152016} LAS20 25TC 7008 13 04 0516008ROOKLYN F 1520201 LAS20 25TR AOOB 73 04 051430ENG MT f> 152159 L N20 5TC 1008 73 04 072417E RIVERSIDE RIGH152063 L N20 lOMC }SOC 73 04 072417E RIVERSIDE LEFT152065 SS N20 2src 15oc 4 30 73 04 0809155LIPPERY JIM 15206141 SSAA.10 F l 2TC 100A 73 04 080845E RIVERSIDE 15206441 HSAA20 2 5TC}A008 73 04 080915E RIVERSIDE 15206442 M 73 04 080845E RIVERSIDE 15206449 T 73 04 100900FULL MOON GULCH 152084 55 N20 lOTC c:;000 73 04 101200WILLOW SWAMP 152095 L N20 STC 1508 13 04 l012008WE POINT 152097 L N20 25 !SOC 73 04 10ll3081SMARK 152127 L N20 lOTL 400A 73 04 101130BISMARK 152127 ss N20 l STC 400A 73 04 141200CHAMPION 152144 WL N30 25 MC}1,,00C 4 50 13 04 172417E GUADALUPE 152060 ws N3G 4 50TR2000C 73 04 182417MILL CK G 152114 5S N40 4 lOOTC}c;ooc 73 04 182417SNOWSLIDE GULCH 152132 55 N30 2 75MRllOOC 73 04 201445EAGLE 15210441 SSAA30 2 1src11,,ooc 73 04 201430TELESCOPE 15210545 SSAA.20 M l 50 11009 73 04 2116008ROOKLYN G 152022 WL N20 50TC Fi00B 73 04 2ll600NC MINERAL BR IDGl 52033 WL N20 50TC i<,OOB 73 04 221400COAL CK W 152158 WL N20 50TC lOOC l 40 73 04 222417ENG MT A 152159 WL N20 5 TR ::>OOC 73 04 222417ENG MT 8 152160 WL N20 5TR ::>OOC 73 04 222417ENG MT B 152160 WL N20 STC ?OOC 73 04 222417ENG MT B 152160 WL N20 STL ::>OOC 73 04 222417ENG MT C 152161 WL N20 lOTC 300C 73 04 252417ENG MT C 152161 WS N3G 5 75TR ::>SOC 73 04 261600SLIPPERY JIM 152061 WL N20 SBR lOOC 73 04 26l600E RIVERSIDE LEFT152065 1115 N2G SBC ::>OOC 4 50 73 04 261600MOTHER CLINE 152069 WS N2G lOBC IOOC12 75 73 04 271750BROOKLYN B 152016 WS N4G f 48 50TC 700C 8 100 73 04 271615BROOKLYN C 152017 WS N3G f 28 SOTC F.OOC 3 40 73 04 2717458ROOKLYN F 152020 WS N3G f 48 75TC F.SOC 73 04 2716058ROOKLYN F 152020 WS N3G F 48 SOTC i<,OOC 73 04 2715508ROOKLYN G 152022 WS N4G F 48 75TC 750C20 150 73 04 271515BROOKLYN K 152026 ws N)G f 48 75TC 700C 73 04 271800BROOKLYN L 152027 WS N3G F 48 sore 1,ooc 73 04 2717lOTWIN CROSSING 152032 WL N2G f B 50TC lOOC 73 04 2 71600ST GERMAIN 152059 WS N3G 4 25TR lOOC
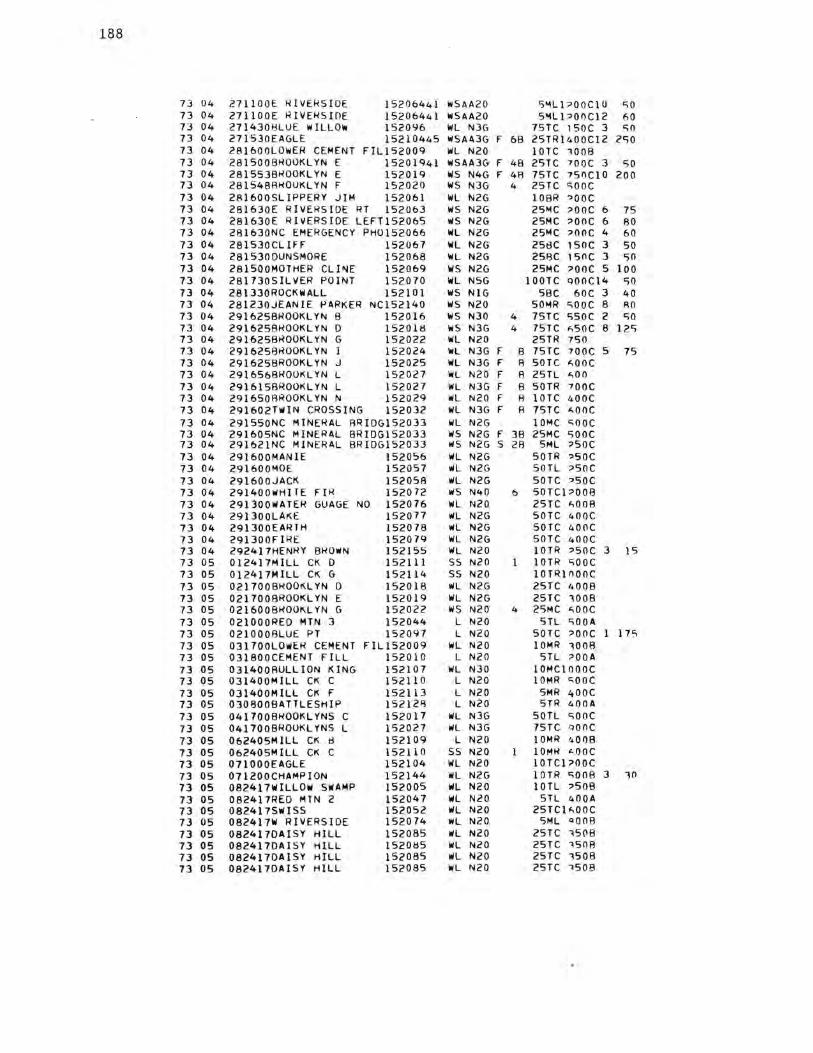
188
73 04 271100E RIVERSIDE 15206441 wSAA20 5"1LPOOC10 50 73 04 27llOOE RIVERSIDE 15206441 wSAA20 S"IL POOC12 60 73 04 2714308LUE WILLOw 152096 WL N3G 75TC 1 SOC 3 50 73 04 271530EAGLE 15210445 WSAA3G F 68 25TR1400Cl2 2c;o 73 04 2Bl600LOWER CEMENT FIL152009 WL N20 lOTC 1008 73 04 281500BROOKLYN E 15201941 WSAA3G F 48 25TC 700C 3 50 73 04 281553BROOKLYN E 152019 WS N4G F 48 75TC 750Cl0 200 73 04 281548AK0UKLYN F 152020 WS N3G 4 2src c;ooc 73 04 281600SLIPPERY JIM 152061 WL N2G l08R ?QOC 73 04 281630E RIVERSIDE RT 152063 WS N2G 25MC ?OOC 6 75 73 04 281630E RIVERSIDE LEFT152065 WS N2G 25MC ?OOC 6 80 73 04 28l630NC EMERGENCY PH0152066 WL N2G 25MC ?OOC 4 60 73 04 281530CLIFF 152067 WL N2G 258C 1soc 3 50 73 04 2815300UNSMORE 152068 WL N2G 258C 150C 3 c;o 73 04 281500MOTHER CLI~E 152069 WS N2G 25MC ?OOC 5 100 73 04 281730SILVER POINT 152070 WL N5G lOOTC QOOC14 c;o 73 04 281330R0CKWALL 152101 WS NlG SBC 60C 3 40 73 04 2Bl230JEANIE PARKER NC152140 WS N20 50"1R c;ooc a AO 73 04 291625BROOKLYN B 152016 ws N30 4 75TC c;soc 2 c;o 73 04 291625BROOKLYN D 152018 ws N3G 4 75TC F,SOC 8 12c; 73 04 2916258ROOKLYN G 152022 WL N20 25TR 750 73 04 2916258ROOKLYN I 152024 WL N3G F B 75TC 700C 5 75 73 04 291625BROOKLYN J 152025 WL N3G F 8 SOTC <iOOC 73 04 29l656BROUKLYN L 152027 WL N20 F A 25TL <,00 73 04 2916158ROOKLYN L 152027 WL N3G F 8 SOTR 700C 73 04 291650AROOKLYN N 152029 WL N20 F A lOTC 400C 73 04 29l602TWIN CROSSING 152032 WL N3G F A 75TC <iOOC 73 04 2915SONC MINERAL ARIDG152033 WL N2G lOMC c;ooc 73 04 291605NC MINERAL BRIDG152033 ws N2G F 38 25MC c;ooc 73 04 291621NC MINERAL BRIDG152033 WS N2G s 2A SML ?SOC 73 04 291600MANIE 152056 WL N2G SOTR ?SOC 73 04 291600MOE 152057 WL N2G SOTL ?SOC 73 04 291600JACK 152058 WL N2G sore ?Soc 73 04 291400WHITE FIR 152072 ws N40 6 SOTC1?008 73 04 291300WATER GUAGE NO 152076 WL N20 25TC F,008 73 04 291300LAKE 152077 WL N2G SOTC 400C 73 04 291300EARTH 152078 WL N2G SOTC 40ClC 73 04 291300FIRE 152079 WL N2G SOTC 400C 73 04 292417HENRY BROWN 152155 WL N20 lOTR ?SOC 3 15 73 05 012417MILL CK D 152111 ss N20 lOTR c;ooc 73 05 012417MILL CK G 152114 55 N20 lOTRlOOOC 73 05 0217008t-100K.LYN D 152018 WL N2G 25TC 4008 73 05 021700BROOKLYN E 152019 WL N2G 25TC 1008 73 05 0216008ROUK.LYN G 152022 ws N20 4 25MC <iOOC 73 05 021000RED MTN 3 152044 L N20 5TL 500A 73 05 021000BLUE PT 152097 L N20 SOTC ?OOC l l 7"> 73 05 031700LOWER CEMENT FIL152009 WL N20 lOMR 1008 73 05 031800CEMENT FILL 152010 L N20 5TL ?OOA 73 05 031400AULLION KING 152107 WL N30 lOMClOOOC 73 05 031400MILL CK C 152110 L N20 lOMR c;ooc 73 05 031400MILL CK F 152113 L N20 SMR 400C 73 05 0308008ATTLESHIP 15212~ L N20 STR 400A 73 05 0417008ROOKLYNS C 152017 WL N3G SOTL c;ooc 73 05 0417008ROUKLYNS L 152027 WL N3G 75TC QOOC 73 05 062405MILL CK 8 152109 L N20 lOMR 4008 73 05 062405MILL CK C 152110 ss N20 lOMR i:.ooc 73 05 071000EAGLE 152104 WL N20 lOTCl;>OOC 73 05 071200CHAMPION 152144 WL N2G lOTR 5008 3 10 73 05 082417WILLOW SWAMP 152005 WL N20 lOTL ?508 73 05 082417RED MTN 2 152047 WL N20 STL 400A 73 05 082417SWISS 152052 WL N20 25TC1<,00C 73 05 082417W RIVERSIDE 152074 WL N20 5ML QOOA 73 05 0824170AISY HILL 152085 WL N20 25TC 1508 73 05 0824170AISY HILL 152085 WL N20 25TC 1508 73 05 082417DAISY HILL 15ic>085 Wl N20 25TC 1508 73 05 0824170AISY HILL 152085 WL N20 25TC 1508
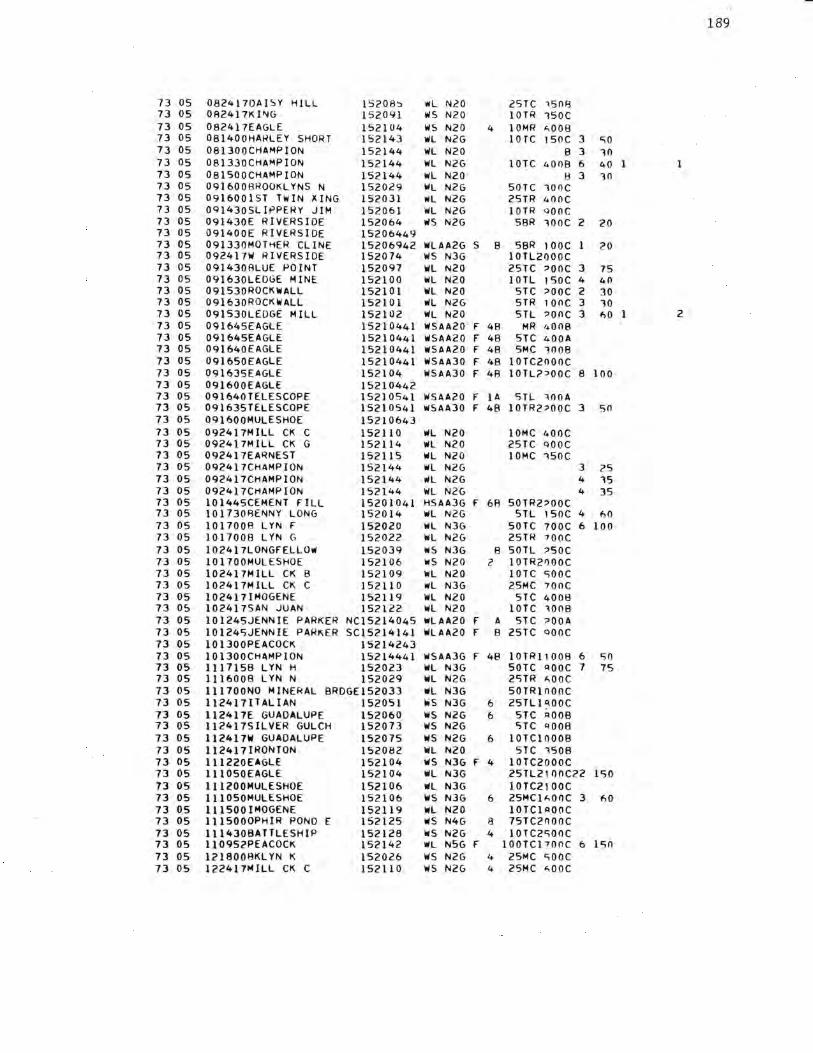
189
73 05 0824170AISY HILL 15208':> WL N20 25TC 150A 13 05 0824l7KI"1G 152091 lliS N20 lOTR 150C 73 05 082417EAGLE 152104 lliS N20 4 lOMR ",008 13 05 081400HARLEY SHORT 152143 lliL N2G lOTC lSOC 3 c;o 13 05 081300CHAMPION 152144 lliL N20 B 3 10 73 05 081330CHAMPION 152144 lliL N2G !OTC 40()8 6 40 73 05 081500CH.V1PION 152144 lliL N20 fl 3 10 73 05 091600BROOKLYNS N 152029 WL N2G 50TC lOrJC 73 05 0916001ST TlliIN XING 152031 lliL N2G 25TR 400C 73 05 091430SLIPPERY JIM 152061 WL N2G lOTR 400C 73 05 091430E RIVERSIDE 152064 ws N2G 58R lOOC 2 20 73 05 091400E RIV[RSIDE 15206449 73 05 091330MOTHER CLINE 15206942 WLAA2G s B SBR lOOC ;;,o 73 05 092417W RIVERSIDE 152074 WS N3G lOTL2000C 73 05 0914308LUE POINT 152097 WL N20 25TC ::>OOC 3 75 73 05 091630LEDGE MINE 152100 WL N20 lOTL 1soc 4 40 73 05 091530ROCKWALL 152101 WL N20 STC ::>OOC 2 30 73 05 091630R0CKWALL 152101 WL N2G STR 1onc 3 10 73 05 091530LEOGE MILL 152102 WL N20 5TL ::>one 3 hO 2 73 05 091645EAGLE 15210441 WSAA20 F 4B MR ,.000 73 05 091645EAGLE 15210441 WSAA20 F 48 STC 400A 73 05 091640EAGLE 15210441 WSAA20 F 48 SMC 1008 73 05 091650EAGLE 15210441 WSAA30 F 48 10TC2000C 73 05 091635EAGLE 152104 WSAA30 F 48 10TL2::>00C 8 100 73 05 091600EAGLE 15210442 73 05 091640TELESCOPE 15210541 lliSAA20 F lA STL 100A 73 05 09l635TELESCOPE 15210541 IIISAA30 F 48 10TR2::>00C 3 50 73 05 091600MULESHOE 15210643 73 05 092417MILL CK C 152110 wL N20 lOMC 400C 73 05 0924l 7M.1LL CK G 152114 WL N20 25TC QOOC 73 05 092417EARNEST 152115 WL N20 lOMC 150C 73 05 0924l 7CHAMPI0N 152144 WL N2G 3 25 73 05 092417CHAMPION 152144 WL N2G 4 15 73 05 0924l7CHAMPI0N 152144 WL N2G 4 35 73 05 10l445CEMENT FILL 15201041 HSAA3G F 6A 50TR2::>00C 73 05 l01730AENNY LONG 152014 WL N2G 5TL 1soc 4 hO 73 05 1017008 LYN F 152020 WL N3G 50TC 700C 6 100 73 05 1017008 LYNG 152022 WL N2G 25TR 7QOC 73 05 l02417LONGFELLOW 152039 ws N3G B SOTL ::>SOC 73 05 101700MULESHOE 152106 ws N20 2 10TR21JOOC 73 05 102417MILL CK B 152109 WL N20 10Tc sooc 73 05 l02417MILL CK C 152110 WL N3G 25MC 700C 73 05 I02417IMOGENE 152119 WL N20 STC 400B 73 0$ l02417SAN JUAN 15?122 WL N20 !OTC lOOB 73 05 I0l245JENNIE PARKER NC15214045 WLAA20 f A STC ::>OOA 73 05 10124SJENNIE PARKER SC15214141 WLAA20 F 8 25TC oooc 73 05 10I300PEAC0CK 15214243 73 05 l0l300CHAMPI0N 15214441 WSAA3G f 48 lOTRllOOB 6 c;o 73 05 1117156 LYN H 152023 WL N3G 50TC AOOC 7 75 73 05 lll600B LYNN 152029 WL N2G 2STR ,:,OoC 73 05 lll700NO MINERAL BRDGE152033 WL N3G 50TRlOOOC 73 05 11241 7 I TALI AN 152051 ws N3G 6 25Tll qOQC 73 OS ll2417E GUADALUPE 152060 ws N2G 6 5TC A00B 73 05 1I24l7SILVER GULCH 152073 ws N2G STC qOOB 73 OS 112417W GUADALUPE 152075 ws N2G 6 lOTCIOOOB 73 05 ll24171RONTON 152082 WL N20 5TC 1508 73 OS lll220EAGLE 152104 ws N3G f 4 10TC2000C 73 05 lll050EAGLE 152104 WL N3G 25TL2JOOC22 150 73 05 1Il200MULESHOE 152106 WL N3G 10TC2100C 73 05 lll050MULESHOE 152106 WS N3G 6 25MC!l,OOC 3 tiO 73 05 lllSOOIMOGENE 152119 WL N20 lOTClAOOC 73 05 lll5000PHIR POND E 152125 ws N4G 8 75TC2000C 73 05 l l l430BATTLESHIP 152128 ws N2G 4 10Tc2c;ooc 73 05 ll0952PEACOCK 152142 WL NSG F lOOTCPOOC 6 150 73 05 li?lBOOAKL YN K 152026 WS N2G 4 2SMC c;ooc 73 05 122417MILL CK C 152110 ws N2G 4 25MC ,:,OOC
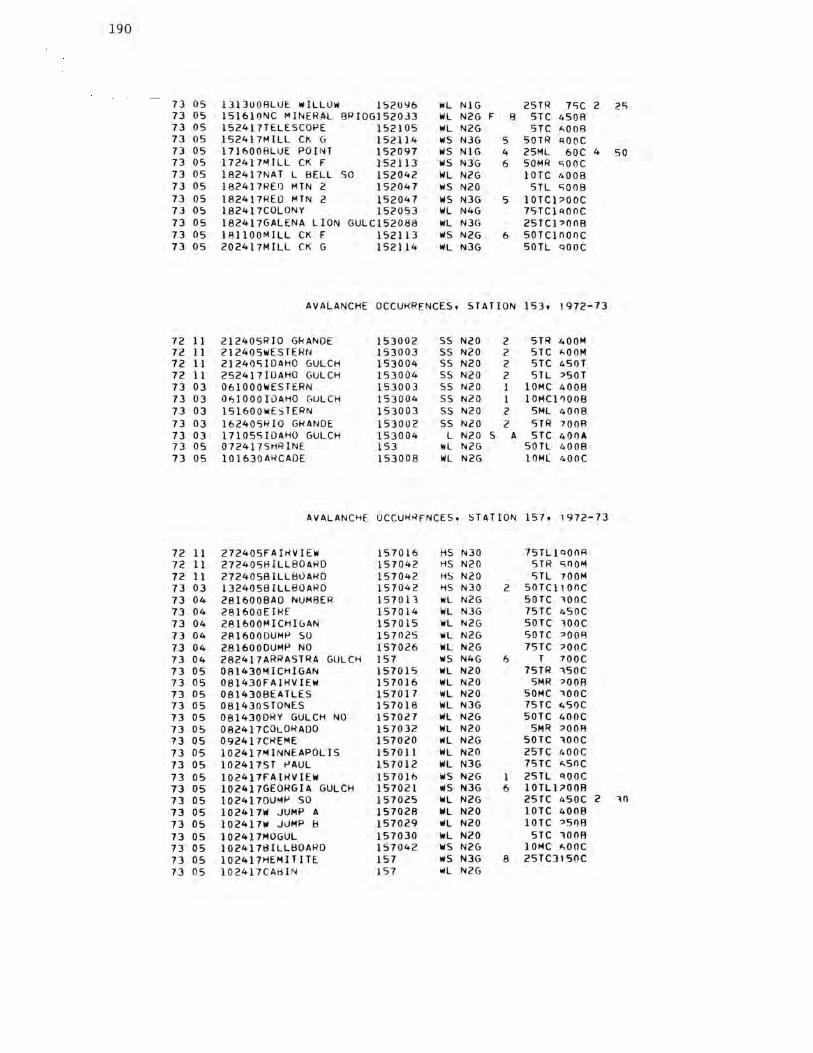
190
73 05 1313008LUE WILLOW 1520% WL NlG 25TR 7'iC 2 25 73 05 1516lONC MINERAL 8RIDG1520J3 WL N2G F 8 STC 4SOA 73 05 152417TELESCOPE 152105 WL N2G 5TC ~008 73 05 152417MILL CK G 152114 W5 N3G 5 SOTR J:\OOC 73 05 171600BLUE POINT 152097 1115 NlG 4 25ML 60C 4 50 73 05 172417MILL CK F 152113 W5 N3G 6 SOMR sooc 73 05 l82417NAT L BELL so 152042 WL N2G lOTC 4008 73 05 l82417REI) MTN 2 152047 1115 N20 STL c;008 73 05 182417REO 1'1TN 2 152047 WS N3G 5 lOTCPOOC 73 05 182417COLONY 152053 WL N4G 75TC11'100C 73 05 182417GALENA LION GULC152088 loll N3G 2STC1:>008 73 OS 181100MILL CK F 152113 ws N2G 6 SOTClOOOC 73 05 202417MILL CK G 152114 WL N3G SOTL QOOC
AVALANCHE OCCUl-iRENCES, STATION 153, 1972-73
72 11 2l240SRI0 Gf.<ANOE 153002 55 N20 2 5TR 400M 72 11 212405111ESTERN 153003 55 N20 2 STC ~ooM 72 11 21240'il0AH0 GULCH 153004 55 N20 2 STC 450T 72 11 25241710AHO GULCH 153004 55 N20 2 5TL :>SOT 73 03 061000WESTERN 153003 55 N20 l lOMC 4008 73 03 O~lOOOIOAHO GULCH 153004 S5 N20 l lOMCl'l008 73 03 151600WESTERN 153003 ss N20 2 SML 4008 73 03 162405RIO GkANOE 153002 55 N20 2 STR 7008 73 03 l7105510AH0 GULCH 153004 L N20 s A STC 400A 73 OS 072417SHRINE 153 wl N2G 50TL 4008 73 05 101630ARCAOE 153008 WL N2G lOMl 400C
AVALANCHE OCCUR~FNCES, STATION 157, 1972-73
72 11 272405FAIRVIEIII 157016 HS N30 75Tll QQOR 72 11 272405BILLBOARO 157042 HS N20 STR c;ooM 72 11 272405BILLB0ARO 157042 HS N20 STL 700M 73 03 1324058ILLBOARO 157042 HS N30 2 50TC1100C 73 04 2816008AO NUMBER 157013 loll N2G 50TC 100C 73 04 281600Eif.ff 157014 loll N3G 75TC 450C 73 04 281600MICHIGAN 157015 WL N2G SOTC 100C 73 04 2816000UMP 50 157025 loll N2G sore :>QOR 73 04 2816000UMP NO 157026 WL N2G 75TC ?OOC 73 04 282417ARRASTRA GULCH 157 1115 N4G 6 T 100c 73 05 081430"1ICHIGAN 157015 WL N20 75TR 150C 73 05 081430FAIRVIE111 157016 loll N20 SMR ?008 73 05 081430BEATLES 157017 WL N20 50MC 100C 73 05 0814305TONE5 157018 WL N3G 7STC 450C 73 05 0814300RY GULCH NO 157027 WL N2G SOTC 400C 73 05 082417COLORA00 157032 loll N20 SMR ?008 73 05 092417Cl-iEME 157020 lil N2G 50TC 100c 73 OS l024l7MINNEAPOLI5 157011 loll N20 25TC 400C 73 OS 102411ST PAUL 157012 WL N3G 75TC ~soc 73 OS 102417FAIRVIEW 157016 ws N2G l 25Tl J:\OOC 73 05 102417GEORGIA GULCH 157021 liS N3G 6 1 OTL POOB 73 05 l024l7DU"'P SO 157025 loll N2G 2STC 450C 2 10 73 OS 102417W JUMP A 157028 WL N20 lOTC 400B 73 05 102417W JUMP B 157029 WL N20 lOTC :>51JB 73 05 102417MOGUL 157030 WL N20 STC 1008 73 05 l 024l 71HLLBOARD 157042 ws N2G lOMC ~ooc 73 05 l02417HEMITITE 157 ws N3G 8 25TC3150C 73 05 l024l7CAHIN 157 WL N2G
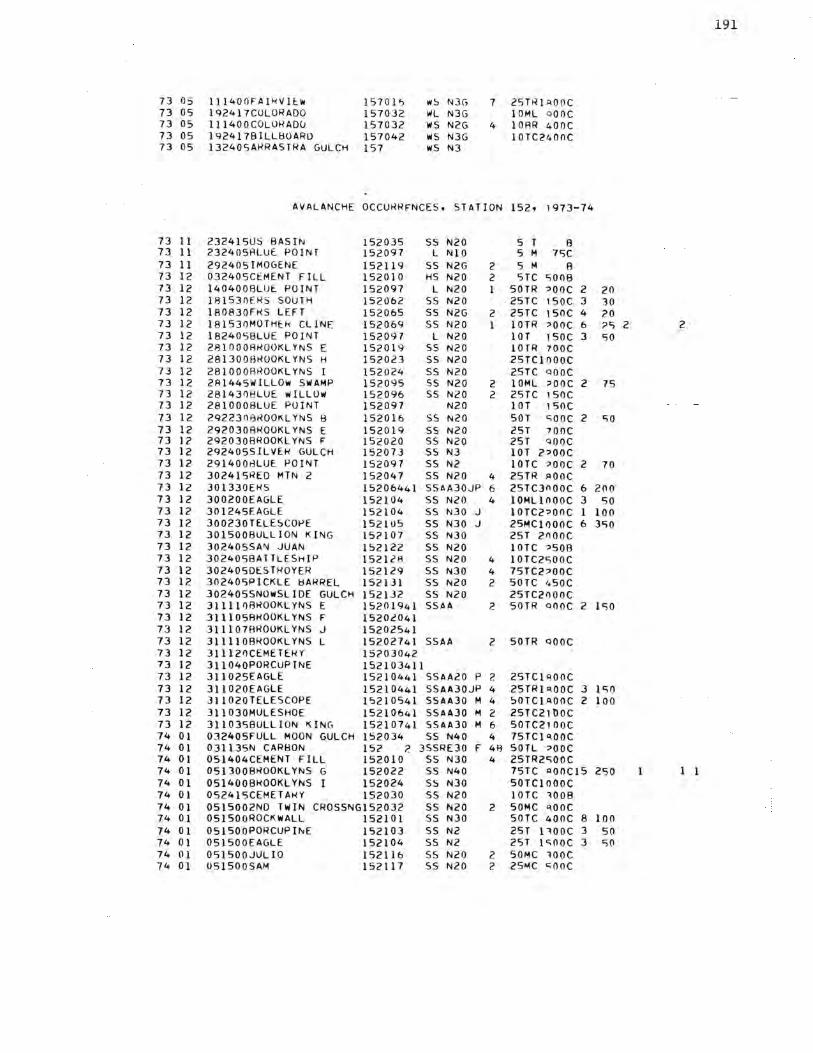
73 05 73 05 73 05 73 05 73 05
73 11 73 11 73 11 73 12 73 12 73 12 73 12 73 12 73 12 73 12 73 12 73 12 73 12 73 12 73 12 73 12 73 12 73 12 73 12 73 12 73 12 73 12 73 12 73 12 73 12 73 12 73 12 73 12 73 12 73 12 73 12 73 12 73 12 73 12 73 12 73 12 73 12 73 12 73 12 73 12 73 12 73 12 74 01 74 01 74 01 74 01 74 01 74 01 74 01 74 01 74 01 74 01 74 01 74 01
l l 1400FAlkVlE:.w l92417COL0RAOO lll400COLORAOu 192417BILLBOARD 132405ARRASTRA GULCH
AVALANCHE
232415US BASIN 232405RLUf. POINT 292405IMOGE.NE 032405CEMENT FILL l40400BLUE POINT l81530fRS SOUTH l80830FRS LEFT 181530MOTHE:.k CLINE 182405BLUE POINT 281000RROOKLYNS E 281300HROOKLYN5 H 281000RROOKLYNS I 281445WILLOW SWAMP 281430HLUE WILLOW 281000BLUE POINT 292230BROOKLYNS B 292030RROOKLYNS E 292030BROOKLYNS F 292405SILVE.R GULCH 2914008LUE POINT 302415REO MTN 2 301330ER5 300200EAGLE 301245EAGLE. 300230TELESCOPE 30l500BULLI0N KING 302405SAN JUAN 3024058ATTLE5HIP 3024050ES TROYER 302405PlCKLE BARREL 302405SNOWSLIOE GULCH 3llllOBROOKLYN5 E 31110SRROOKLYN5 F 3lll07AROOKLYNS J 3llll08ROOKLYNS L 311121lCEMETERY 311040PORCUPINE 311025EAGLE 311020EAGLE 311020TELE5COPE 311030MULE5HOE 311035BULLION ~ING 03240SfULL MOON GULCH 031135N CARBON 051404CEMENT FILL 05 1300RROOKLYN5 G 051400B~OOKLYNS I 052415CEMETARY
15701', 157032 157032 157042 157
wS N3G WL N3G W5 N2G W5 N3G ws N3
1 25TtHa.ooc lOML a ooc
4 lORR 400C 10TC2400C
OCCURRFNCES, STATION 152, 1973-74
152035 ss N20 5 T B 152097 L NlO 5 M 7SC 152119 ss N2G 2 5 M 8 152010 HS N20 2 5TC SOOB 152097 L N20 l SOTR ?OOC 2 152062 5S N20 25TC 150C 3 152065 S5 N2G 2 25TC ,soc 4 152069 ss N20 1 lOTR ?QOC 6 152097 L N20 lOT 150C 3 152019 55 N20 lOTR 700C 152023 55 N20 25TClOOOC 152024 ss N20 25TC aooc 152095 ss N20 2 lOML ?OOC 2 152096 5S NZO 2 25TC 150C 152097 N20 lOT 15oc 152016 55 N20 SOT c;ooc 2 152019 S5 N20 251 700C 152020 ss N20 25T 'lOOC 152073 ss N3 lOT 2?00C 152097 5S N2 lOTC ?OOC 2 152047 ss N20 4 25TR i:iooc 1520644} SSAA30JP 6 25TC3nooc 6 152104 SS N20 4 lOMLlOOOC 3 152104 SS N30 J 10TC2?00C l 152105 SS N30 J 25MClOOOC 6 15?107 5S N30 25T 2nooc 152122 SS N20 !OTC ?508 152128 5S N20 4 101c2c;ooc 152129 55 N30 4 75TC2::>00C 152131 55 N20 2 50TC 450C 152132 5S N20 2STC21lOOC
20 30 20 ;,c; c;o
75
c;o
70
200 50
100 350
15201941 55AA 2 50TR aooC 2 1c;o 15202041 15202541 15202741 S5AA 2 SOTR aooc 15?03042 152103411 15210441 SSAA20 P 2 2STCla.OOC 15210441 S5AA30JP 4 2srR1a.ooc 3 1 c; 0 1'>210541 55AA30 M 4 '>OTCIAOOC 2 100 15210641 SSAA30 M 2 2src21noc 15210741 SSAA30 M 6 SOTC2100C 152034 SS N40 4 1src1a.ooc 152 ?. 3SSRE30 f 4B 50TL ::>OOC 152010 55 N30 4 25TR2<;QQC 152022 SS N40 1src a.ooc15 250 152024 SS N30 SOTClOOOC 152030 SS N2 0 lOTC 1008
0515002ND TWIN CR05SNG152032 SS N20 2 SOMC a.ooc 051500R0CKWALL 152101 55 N30 SOTC 400C 8 100 OSlSOOPORCUPil'IE 152103 55 N2 25T 1100c 3 so 051500EAGLE 152104 5S N2 25T 1c;ooc 3 so 05150QJULlO 152116 SS N20 2 50MC 100C 051500SAM 152117 SS N20 2 25"1C c; ooc
191
2 2
l l 1
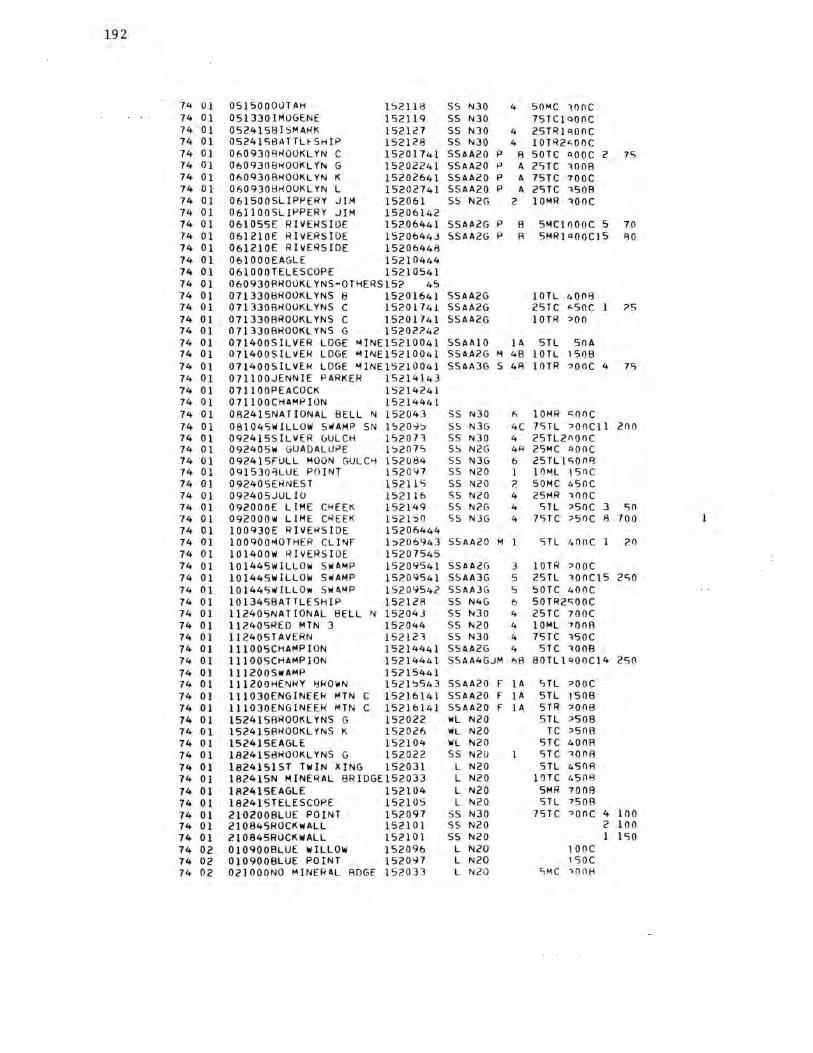
192
74 0 l 05150000TAH 152118 55 N30 4 50MC 100c 74 01 051330IMOGENE 152119 55 N30 7STC1QOOC 74 01 0524158I5MARK 152127 55 N30 4 2sTR1qooc 74 01 0S24l5BATTL~5HIP 152128 5S N30 4 10TR2<,00C 74 01 060930BROOKL'l'N C 15201741 5SAA20 p B SOTC <lOOC 2 75 74 01 0609308ROOKL'l'N G 15202241 SSAA20 p A 25TC 1008 74 01 060930BROOKL'l'N K 15202641 SSAA20 p A 75TC 700C 74 01 060930!:ll'iOOKL 'l'N L 15202741 SSAA20 p A 25TC 1508 74 01 061500SLIPPERY JIM 152061 55 N2G 2 lOMR 100C 74 01 0611005LIPPERY JIM 15206142 74 01 061055E RIVERSIDE 15206441 SSAA2G p A SMClOOOC 5 70 74 01 061210£ RIVERSIDE 15206443 SSAA2G p R SMRlAOOClS 130 74 01 061210E RIVERSIDE 15206448 74 01 061000EAGLE 15210444 74 01 061000TELESCOPE 15210541 74 01 060930RROOKLYNS-OTHERS152 45 74 01 071330BROOKLYNS B 15201641 S5AA2G lOTL 4008 74 01 071330BROOKLYNS C 15201741 SSAA2G 25TC <,SOC ?5 74 01 071330BROOKL'l'NS C 15201741 SSAA2G lOTR ?00 74 01 0713308ROOKL'l'N5 G 15202242 74 01 071400SILVER LOGE MINE15210041 SSAAlO lA STL SOA 74 01 071400SILVER LDGE MINE15210041 5SAA2G M 48 lOTL l50B 74 01 0714005ILVER LDGE MINE15210041 SSAA3G s 4R lOTR ?OOC 4 75 74 01 071100JENNIE PARKER 15214143 74 01 071100PEACOCK 15214241 74 01 07ll00CHAMPI0N 15214441 74 01 082415NATIONAL BELL N 152043 ss N30 6 lOMR c;ooc 74 01 081045111ILLOW SIIIAMP SN 1520~~ ss N3G 4C 75TL ?00Cll 200 74 01 0924155ILVER GULCH 152071 55 N30 4 25TL21100C 74 01 092405W GUADALUPE 152075 ss N2G 4A 25MC <lOOC 74 01 092415FULL MOON GULCH 152084 ss N3G 6 25TL1S0'1'1 74 01 0915308LUI:. POINT 152097 55 N20 1 l 0"1L 150C 74 01 092405ERNEST 15211 '> 55 N20 2 SOMC 4SOC 74 01 09240SJULIO 152116 S5 N20 4 25MR 1QOC 74 01 092000£ LIME CREEK 152149 5S N2G 4 5TL ?SOC 3 c; n 74 01 092000111 LIME CREEK 152150 55 N3G 4 7STC ?SOC 8 700 74 01 100930E RIVERSIDE 15206444 74 01 l00900MOTHER CLINF 1~206943 5SAA20 M STL 400C 20 74 01 101400111 RIVERSIDE 15207545 74 01 lOl445WlLLOW SIIIAMP 15209541 SSAA2G 3 lOTR ?OOC 74 01 l0l445WILLOW SWAMP 15209541 5SAA3G 5 2STL 1onc1s 2SO 74 01 l01445111lLLOIII 5111AMP 15209542 5SAA3G 5 sore 40nc 74 01 101345BATTLESHIP 152128 SS N4G 6 SOTR2c;ooc 74 01 ll2405NATIONAL BELL N 152043 55 N30 4 2STC 700C 74 01 l 12405RED MTN 3 152044 55 N20 4 lOML 7008 74 01 112405TAVERN 152121 55 N30 4 75TC isoc 74 01 lll005CHAMPION 15214441 55AA2G 4 5TC 1008 74 01 lll005CHAMPI0N 15214441 5SAA4GJM 1',8 80TLl<lOOC14 250 74 01 l l 12005111A"IP 15215441 74 01 lll200HENRY YROWN 15215543 5SAA20 F lA STL ?OOC 74 01 111030ENGINEER MTN C 15216141 55AA20 F lA STL 1508 74 01 111030ENGINEER MTN C 15216141 55AA20 F lA STR ?008 74 01 152415BROOKLYNS G 152022 WL N20 STL ?SOB 74 01 1524158ROOKL'l'NS K 152026 IIIL N20 TC ?SOB 74 01 152415EAGLE 152104 IIIL N20 STC 400B 74 01 l82415B~00KL'1'N5 G 152022 55 N20 5TC 1onf:l 74 01 1824151ST TWIN XING 152031 L N20 STL 4508 74 01 182415N MINERAL 8RIDGE152033 L N20 lOTC 45()f:l 74 01 l82415EAGLE 152104 L N20 SMR 7008 74 01 18241STELESCOPE 152105 L N20 STL 750B 74 01 210200BLUE POINT 152097 S5 N30 7STC "00C 4 100 74 01 210845ROCKIIIALL 152101 55 N20 2 100 74 01 210845RuCKWALL 152101 ss N20 l 150 74 02 010900BLUE WILLOW l 52096 L N20 100c 74 02 0109008LUE POINT 1520'j7 L N20 1soc 74 02 02}000NO "IINER~L RDGE 15?.033 L N20 SMC ~OOH
193
74 n2 l l24l 7wILLOIII SWAMI-' 15?095 L r,2u lOTL 14nR 74 02 1904201\JO CAriHO N 152 LASc'O TC ;,ooc 74 02 20241,SIIIISS 152052 55 N30 4 75"1C1:;ooc 74 02 201300E ><l\lERSIUE 15206444 SSAAc:'0 4 l OMC?. ;, 011c1 '+ 70 74 02 ?0240',E >< IV!YS IOE 152064 N 4 sn 74 02 201300E h' l VE.PS IUE 1520644? 74 02 20240'-,MOTHEf< CLINE 15206<./ 55 N20 7STC ?SOCIO 300 74 02 200230SILVER 1-'0 INT 1S2U70 L N20 SOT •>OIIC 6 ?O 74 02 201100\lllLLOw SIIIAMP 15?09">41 SAA20 STL 1 SnR 74 02 20ll00o1ILL0W ',IOIAMP 1520 '1S L N20 STC ? nnc 74 02 201000RLUE. \II ILL Ow l'::i20'16 ss N20 2STC ;,nnc 2 ?f1 74 02 ?Oll004LlJt POINT 1520974? SSAA20 2STL ,one 4 ?S 74 02 20I030EAGU l',210442 74 02 20103flTELt.SCOPE. 1521U">4J 74 02 2ll500LUNGFELLOw l ':>20J\l ss N20 25TC ?OOC 74 02 ?}?40'-,MfLL CK A 15? l ()'< ss N20 SMC ?()08 74 02 21240S'IILL CK C 152110 ss ,-...20 lOMC 1008 74 n2 21240SMILL CK 0 l':,2111 ss f';20 25MC ~0oc 74 02. 21240SIMOGE.NE 15211 9 ss N20 5 TR ,or,R 74 02 22124SE e<IVEf<Sl('F 15206449 74 02 221300\ol f-/JVERSIUE 1520744fi 74 02 23l500MULLIUN KI "J(; 152107 ss Mc'O lOTL?"OIIC 74 0.? 2Sl030RROOKLYN5 K l ':>202'> L N20 lOTC ,;ooc 74 02 2h2417Tt.LESCOf'E l'::i210S L N.?O STR , snR 74 02 2724D<;Rf-lOOKLYNS C 152017 L N20 lOTC 400B 74 02 27llOONO M H,ERAL 80GE l520Jl L N20 SMC •SOR 74 03 0124170UN'>MORE lS?ll6R loll N20 2STC :>Snc 30 74 03 0?240SSLIPPt:RY JIM 15.?061 HS N30 4R 25Tll AOO>, 74 03 0201:!00E t-ill/ERSIDE 152004 HS N30 7R 2STR2~00Cl2 70 74 03 031300SN01,1jSLIUE GL 15?1J2 ss N?.O STLlnQn'3 74 03 06240Sf-H<OOKL YN S H 15.?0lh L N20 ,sn 74 03 06240,q~()UKLYNS H 152023 L N20 400 74 03 062405,-JROOKLYN S I l':>2024 L l'.20 400 74 03 062405Ht-<OUKLYNS N 15202\l L N20 "'1 ,on 74 03 062405EAGLE. 152104 5$ N20 lOML C::OOfl 74 03 072417Hf-lOOKLYN5 152024 ss ,..30 ,, MC ..,one 74 03 072417flrlOOKLYl'.S M 15202>J ss N20 l 2'>'-IC ,. snc 74 03 071330>,LlJE. POINl 1S21J-17 ss NJO I 7STC :>SOC :, l no 74 03 l 024 l 7RrWOKL YNS 0 15?01R ss rs.20 2 sore ,,soc 74 c,3 1024!7qr<UUKLYI~'> f I S?<J l 4 ss r, 2 11 ,, SOTC :;;o ne 74 03 l 024 l 71'1><()UKL n,s t 15?020 ss N20 l sore o onc 74 03 102417>-lf-lOUKLYNS r; !S?uc? ss N20 <'.'. sore 1onc 74 03 l 02<+1 7'"1t-<UIJKL H,:, K 15?.026 ss N.?O I sore ,;ooc 74 03 1024l 7wlLLu'•I SwAMP l ':>?.LIY'> ss N2G 2 l 0'-IL ,soc 4 >lO 74 03 10?40<;EAlJLE. 1'>2104 55 N20 2 SHL 40nC 74 03 l 024U'>MlJLt 5H(Jt 15?1 ()<', ss NcO 74 03 1024l 7Et-<"\JE.ST 15211 '> S5 N3G 2 SOTC .;ooc 7'+ 03 ll?4}7rl"<OUKLYNS ,; 1'>?02? L NlO 74 03 1124 l 7tlr<OUKL YNS H 152023 ss N20 50 74 03 ll2417Hr<OOKLYNS 15<'0<'4 L N20 50 'IQ() 74 03 ll084SAI-IOUKLYNS J 15202541 LAA20 75TC QO(I 74 03 ll?.417f1rl00KLYNC:, K 15?02'> L N20 25 ion 74 03 ll0H45Hf-10UKLYN 5 L 15202741 <,5 ftA20 "1 2 7S Q0/1 74 03 ll0845Hr<OOKLYN5 ., l S.?02'341 S5AA20 M l TC 1011R 74 03 llOA4SRriOOK.LYNS "' 15?02-141 SSAA2G 7 2 7'> .;ooc 74 03 11240'-)NATIONAL tff LL N01520<+3 HS N20 5 cSM>< :>5nR 74 03 lll030E r<lVE.HSWE 15.?00441 SSAA2L 2 MLllOO 74 03 llll20E >< I VEt-<S IDE !5?0n441 SSAA30 ;>IJ M 21n0Cl3 !no 74 03 llll20E rilVf:RSIOE 1520t>44l SSAl\30 2U 'I ,?700Cl3 Ion 74 03 l!ll20E ><IVEt-<SIOE l ':i?01J4<+ 7 74 03 llll2nE RI VEHS !OE 1520t>44J 74 03 111050111 1-111/Et-lS IDE 1520/442 74 03 ll091SW1LL0W SWAMP 15?.0'l':>4<' H<;AA20 M 2 75TC 1511c 74 03 ll092">HLUI:. POINT 1520'174} SSAA30 ~ ?A 7STC ;,qnc 7 10 74 03 ll08l'>PUriCUl-'INE 15.? 1 0 l4<+ LAAlU 74 03 ll081SEAGLE l ':>?.l 0441 LAAlO T ,lOA
194
74 OJ 11 OHfi Tt:.Lf_SCUr'I: 1!'>21\J:>42 SSAAt'U 1100 74 03 l 10>l3C,"1UU:SHOE 15?10f>4l SSAA20 "009 74 03 122417Hr<ll0KLY~ C 152017 L N20 1,50 74 03 1?2417Hr<OU"-LYN 0 1520H L N20 50 c:;oo 74 03 l?lOlSJt.NNlE f'ArlKE~ 15214045 74 03 12101 Si-'t.ACUCK 1S2I424l 74 03 121030CHAMf->ION IS214443 LAA30 25 J:>OOC 3 30 74 03 l21500ENG!NEEk :-ITN A !S21:><J WL N20 50TC "00B 74 03 l?.l?UOENGINfEr< MTN B 152160 ws NJG 75TL 700( 74 03 151600t1rlOOKLYNS C 152017 WL N2(, 25TC 100B 74 03 151600Rr<OOKLYNS C 152017 WL N2G 25TC 1008 74 01 l <; l 60 0 Hr<OOKL H1S f) 1521)18 WL N3G 75TC i:.snc 74 03 l'>l600HRl.lllKLYNS G 152022 WL N2G 2'>TC S008 74 03 15160QHKUUKLYNS 11 152023 WL N3G 7STR ~one 74 03 lC,l600Hr<OOKLYNS K 15?026 WL N2G SOTC t,OOR 74 03 1516008k0UKLYN5 L 1!'>2027 •l N2G 75TC 400R 74 03 151600N MINE~AL BRIDGE 1520 .n WL N2G 25MC 100H 74 03 1524175LiPf-'tKY JIM 15,'06 l WL N<'O SHC 10()
74 03 152417E ><lVE.r<Sll>E 152064 loll tll2(, 58L c:;ooc 74 03 152417DAISY HILL I :,2085 ill N20 STA ~OflR 74 03 152417DAISY HILL 152085 WL N20 5TC lOOH 74 03 lC,l200CrlAMP IOI~ h?l'+4 IOIL NJ(, lOMC ASOR 8 40 74 03 1617001:1-<0l)KLYNS F 152020 loll N2G IOTL <,OOR 74 03 lfil5JOR-<UUKLYNS G l:>2022 wL N? G 10 TC c:; 1)0'1 74 03 lf,150011-<0llKL YNS rl 152023 WL N2G 25TC 1'> flR 74 03 l6l'>JtlHrlOUKLYNS I 152024 •L NJG 75TC ,1n no ", c;s 74 03 1613008r1UOKLYNS L 15?027 io/L N20 lOTR '• () () >l 74 03 lA1100CEMt.TARY l':i20J(J ws N20 5ML lOnR 74 03 16160021~1) Tio/ IN CR05S"1Gl520J2 ws N3G 25ML i:. onc 74 03 lfil500'~ MINE1-<AL 'lrJGE 15 ,' 0JJ lillS N3 G .1 25 TL '<OOR 74 03 l61200 S T GERMAIN 1 '::>2(J",C/ WL N20 25TL 15013 74 03 161 lOOoiH! TE FIR 1 SZO I c wL N2G l OTL <. OOH 74 03 lhl lOOc:;{LVFR bULCH 1520 / 3 !!IL N2ll 5ML c,()flR 74 03 161100W <JIJA[JALtJPE I'><' o 7 S loll N20 5HL lOOC 74 03 lAllOO.iATErl GlJAGF \j l 52tl 7'> iol N2U SOTC lflOB 74 03 lf, l2I'lt1LUt lill lLL UW I ':i ?0'11> WL "'l l) 75TC 1r::.c 3 l'.11
74 03 161300HLUE WILLOio/ 1"> ?0% wl N2G 2srn ,ooc 4 ?5 74 03 l 6 12IO hLrJE POIN T l ':i20 '17 !OL N20 1 o rn ,1sc 74 03 1"1 1030RllCKwALL 15? IO 1 WL Nl G 513R 7 'iC 74 03 lr',l 700EAGLE l '>? l ll4 '"L "4 20 S TKI ', OOR 74 03 l61200TAVtrlN I ':i2123 loll M20 2STL 100C 74 03 161400Jt1~NI E PARK E-I " l ':12 1'+ 0 '"L Nt'O ST C "'>flR 74 03 161320CHAMfJION !S21<+4 loll N2G 2'>TR q O Ml 5 r::.o 74 03 16l21 SC HAMi-'!0"4 15?1 '+4 wl "12 (; ?STC ->OOR 4 ?S 74 03 172417wATEee GiJAGE N IS? 0 71> WL N3G 75TC i.. ooc 74 03 172417 EAt-lfH I S?fl 71-' WL N2G 7',MC ~snc 74 03 I71 5 00t3L Ut. /J OINT l '>2 1JY7 WL N2G 25 TR 150C 2 6 74 03 l'll450MUTH E. k (L I I\J F l '::>?llb4 wl N2ll S TR -:>SOC 3 ?n 74 03 l9163flMOTHtK CLINE l '> 20o9 WL N20 lOM R :>OOC 3 f,()
74 03 I9l600JA CKfJ0T IS?O II WL NJO 5 0TC ~soc 2 70 74 03 30l500Mlll CK II b c l O'l L N20 5f:lC 17SC 74 03 J OI500M1LL CK C 1 :,,? 11 IJ L N20 1 ()M C 100R 74 04 0210001-iKOOKLYNS t< I ::,? Och ss N20 25TC c;;()OM 74 04 tJ?lOO OHLlJt PUINI l':i?O 'J I 55 "4 20 :,OTC ? 00 A 74 04 0324171 ST TwII\/ CRO'iSNG l 5?0 .ll ss "1 20 l fl TR C: ()()M 74 04 0 32 l 4SE A,,L t b?lU4 ss NJU 25 Tr/l? 0 flH 74 04 04240',RRUOK L n, Gt JL Cl-i l ':>20::, 4 55 N20 S ML 1()()f,I
74 04 04 24Rc; l;UA OALUfJf h?:J6ll ',:, N20 5 '1L ,.onM 74 04 04240 SE RIVERSIOf R 1S206 l ss "J20 2 5TL 1'>08 74 04 04 240 5f -< IV t.t<5 I uE L 15?06'1 L M,'0 TC ?',OR 74 04 04.?405 Ml.lTHER Cll 's E l ':>20o<.J 5S N20 lOML ? 5 0M 74 04 040~ 30 '~UTH[k CLl'sE l S2 0o9 L N20 74 04 041000f<LtJt r' O !NT 1S2U'17 ss N20 5rJTC ;, QnR 74 04 05160111',T TWIN (K055:fol52UJ1 ""L N?G 5ML 100M 74 04 05?417N '11Ntr<AL 4 f)G f. 15?033 wl NZG 5 "1 ~o nM 74 (\ 4 0'-> l hOn'l><l)UKL YNS l ':J ? .. L Ne,; c; T l',O M
195
74 04 J n J f:,O O He/ <JUK L Yi~S F I ~2tJc0 l•l N20 STC 1() f\"1 74 04 I h I AO O >lr-<tJOKL YN5 G 1'>?0 22 wL N20 l OTC ,.ooM 74 04 161600,-!K<)OKL YNS K 15202A WL N20 5TL ;>Q()M
74 04 16lf>OON M !Nt_RAL fH) GE 1~2033 WL N2G SMC 100M 74 04 1", 1 f,O OT t.U:. SCOl-'E 15?105 WL N20 5MC 150M 74 04 16lf:,OOMIJLt.5H0t. 152106 WL N20 STC -:>SOM 74 04 l 71600EA•;Lf 152104 I'll N20 5TC <>QOM 74 04 1716<JOMULt.':>HOE 152106 WL N20 5TC 400M 74 04 <'01300wlLLOw ',wA"1P 1520 ':15 ss N20 25TL ?OOM 74 04 ?01301)HLUE 1-UINT 152()':;7 ss N20 75TC -:>QOB 7c; 74 04 2 0 240 SE 111,L F 152 1Ll4 N20 ti 74 04 l.J l 14c;EA0LE 1521 -)4 wl N30 ':>OT 1 :.QIJR 6 10
AVALANCHE OCCUKKFNCES, STATION lSJ, 1973-74 74 03 1612001lE'llVt.t< 1S3001 WL N20 lOTLJ?OO 74 04 On240SSwANSEA GULCH 1S3 55 N30 5 25TR2nooM
AVALAr,CHF OCCUKRFNCt.S, s r Ar rnN l c; 7, 1973-74 74 01 0Sl600E"11E 157014 ss N30 lOOTC 4SOC 3 1 so 74 0 1 051600MlCH!bAN 1'>701'> ss N20 2 25MC 1'508 74 01 051600FAir-<Vlfw 15701h ss NJ() 4 25Tll <>OOC 74 01 0516001:iEATLES 157017 ss N20 4 SIJTC t,IJPC 74 0 1 051600STONES 157011, ss N3G 4 75TC ssoc 74 0 1 OSI600wH•J 15 7u 1 <; ss N20 2 50TC 400C 74 01 051600CKEME 157020 ss N30 4 75TC 10flC 74 0 I 051600<,t.Of-lGIA GULC H 15 7021 ss N40 6 50TC?400C 200 74 01 05ln00r)f-lY GULCH N 15 7027 ss N30 4 75 TC aonc 74 () l Ot;Jf,QOW JUMP A 157 02" ss "130 4 75TC aonc 3 75 74 01 oc; J 60<l '"' JUMP H 15 7 0 2'-l ss N40 5 IOOTC <>OOCIO 200 74 01 05160()"40<.JUL 1570JlJ ss t,30 50TC cone 74 0 1 09140()Ir-< E.N F 15700542 SSAA3G 4 50TRJ«onc 74 0 1 09l43flFAlf-<V IFw 157ull:,4I 74 01 rJ915SODr-<Y GULCH s 15 703942 74 01 09l445<;Cl)F h'ED 1-'(l I"' T 15 7 NJ G 4 75 MC :> OIIC 74 01 l0l4 30FA!f-lV1 Ew 15 70 l ·'i ss N4 GJ 6 75 TC1700Cl2 2no 74 ( 1 l 2 1? 4Jc;I r-<ENE 15700, ss N20 4 S,~Rl'lOOR 74 01 21241SCr-< E"IE 157020 ss NcO 3 25TR ?SOR 74 03 0n24l7It-1FNE 15700'-, WL N20 5ML c;ooR 74 03 161200FI><E 157014 wL NJG 75TC '-OOC 74 OJ 1',l 33rJM I CH I GAN 1S701S WL "13G 7'5r-lR 400C 74 (13 161330 5 fONES 1570 1':I W'.:, N3G 7STR i;onc 74 03 ]1',JJ30WH<J b7019 >'IL N2G 25TC c; ooc 74 0 3 I h240 SGE•Jf-lb I A GUL CH ~70£'.l ws N20 4 5"4C ~soR 74 03 lnl3300t-l Y GULCH N 1':,71) 2 7 wL •~3G 25TL 4 00C 74 04 ?7 24 17FAI >< VHw 1~7011, wL N30 25Tll<>OOR
AVALAN CHF OCCU«,-F NCES , S TAT ION 152, 1974-75
1 .. 10 lYl l OO wlLLUio S"tAMP l ':>20 9 ':, L N2 5TL ;,SO B 74 10 ?9 1 lOO i<Ll )t. wI LLO w l ':>? O'-lt, L N2 S TC , soc 1 74 10 29 1 lOO dLUt PO I NT 15 209 7 L Nl STL soc 1 74 l 0 ;;><i l lOO ALUt. PO I NT 1~209 7 L "i2 S TL 150C l 74 10 2'lll008LUt_ 1-'0 INT 1520 '7 7 L "12 5 TR 1snc l 74 I 0 ?91 lOORLUt POINT l S?0'-1 7 L "1 2 3 TC , s oc 1 74 11 1240 5US >iAS Jt, 15 2 uJ5 H', N36 4 ':>OT c; ooc 74 11 ?04001STTwI~i Cei l)SS I ·•GI ':i ? O J l L N2 S TC -:> OOR

196
74 I I ('040021\l•JTW il-1 Cf<0S51NGl':>c'U-'<' L .... ~ SIC ~OOH 74 l l ?'J4 0 ON "1 INEl-'AL RR!DGEl52033 L NZ 5TC :>OnR 74 11 ?04008LUE:. POINT 15?0'?7 L NZ 5TR ~one 7 74 I l 21l400MILL Cf<[l:K H } ':,cl ll9 55 N2G 2 25TC ,one 74 11 20400M1LL CriE: Ei<. D 152111 55 N2G ? ?5TC 7()()(
74 1 1 21200\~ LIME. CREFK l '.J?l 5() LS N 1 C, 1 lOMC 1 one 74 11 ?12()0W LiMt:: CREEK 1521 ':>/J 55 N2G I 1 llTR lOrlR 74 11 2l?OOG0Hf:lLERS KNO.-l 1 521 ':> 1 5S N2 I 5TR 15f1H 7<+ 11 2120001::ER CREEK 5 1521 ':>3 L J[l 74 I 1 2120051"Ar~P 15? J ':,4 S5 "12 25TC 1 0 [1
74 11 212()()HENRY '-lf<OWN 1S21'>5 55 N2 , on 74 11 ?0400RROOKLYt.S 152 L Nl 5TC l OOA 74 11 72417NATL l:iELL N 1520<+3 55 N2 SMC -.50~ 74 11 Bl43'll:lLUt_ POINT 1 S2'J97 LdO? F 4 lOfL :>r)f)( 74 11 1112311MILL CriEE"' A 152lll8 ss N2 2 l lJTC <,QrlR
74 11 llOROOMILL CRFFK H 152109 ss Ni:' 2 l 'lTC 400R 74 11 ll2405MILL CREEK C 15? 11 ll ss N2 ? l lJTR <;()OP 74 11 112417l"10GE:.NE l '>2119 ss NZ ? STR :>OOA 74 11 11240SRATTLESHIP 152128 S5IN2 ? STR 1,SOt-l 74 1 1 131645CE.·~ENT F ILL 15?01 ll HS Nt' 4 STL '.5Ml 74 11 l4llOORROOKLYNS H 1S202J L NZ 5MR 400R 74 11 15?4 l 701-'•i I ri RUAf) f l':>212':> 55 N2(; ML -.one 74 11 1915001·»-<UUKL YN (", 152022 ss N2 5T 1 OOR 74 I I l C.240SGE:.Nrit::SSF 5 1S20 <+':> 55 t-..2 5t-l 1 01)( 74 11 2c045SLOl\iGFELLOw 15cOJ9 wL N2G sore 1 c;oc 74 11 ?314f10Rrll)OP\LYN I: 1 ':, ::>(11 ·-, L N2 ST>-/ 40n8 74 l l 231400R>./OOKLYN F 15?020 L N2 S TC ,:,()f1R
74 11 2302001-;e<OUKLYN rl 1:,2023 -.orrn 74 11 230200RRIJOKL YN I 15?024 1,00R 74 11 231400?N•) TwlN CROSS I ~Jl 52UJi' L NJ 74 l 1 23140rJ2NO TWIN CRO<;S!NlS2032 L Nl 74 1 1 23 14002ND T., IN CRU':iSl"115?tl32 ss Nt' I s.,c 1 SOR 74 11 230700NAT IONAL t<E"LL N l ':>?\l<+J ss NJ 3 2,.,c l()()(
74 11 230100..iEt> MT J l S2L44 ss N2 2 SMC lOOH 74 I l 230200Gf"INESSf '" J ':,2046 '>5 ;.2 2 2STC >008 74 11 2J0700><t:t) ~ T ? 15cG 47 ':>S N2 2STL 1,00R 74 11 ?30200E GUAOALUt-'f IS 2060 ss N2 ? 5"1R ;,nnR 74 I 1 231l200f >./ 1 Vb<S l il f: l ':> ?0b 4 ML 74 11 2302001,,1 rl!Vf_rl'.:,lOF 1 :-20 74 TL 74 11 23020f1If<0NTUN l '.:>2G'1? ss N2 STC "008 74 11 230200FULL MOON GlJLC >-1 J ':,;>0>;4 L N2 5TC ,;onR 74 11 230?.00FULL i'\l)ON c,UL C>-1 l'.:> c.U >l4 L '<<' STL ,:,onR 74 11 230 20 0 GUVUIN()H ;t c; f,IIL CHI :i?OYO sc, N2G 5TR ~onA 74 11 i'3021JO"' Ir·,b 1 :, ?OY I ss Ne ? lOTC 'J()()(
74 11 230200wlLLUW 5>1id"'1P l 520'1':, TL R 74 11 ?.30200i4LlJE:. t-'O!Nl 1,;c,-n ss- Ne 25TC ::>'j()( l l no 74 11 230S00S•\l0WFLA~ t 152\lY>l 74 I 1 230H4SLJ0CKWALL lS?l OI ;s Nl c;o.1 40( 74 11 e3120llPORClJt-'l"'E l ':>210 ·1 ss N2 src :>Sn A 74 11 23/J?OOF'At.,U 1·,i:'104 ss N2 STC •OOR 74 11 23JSOOE.AGLE. 1 :,? l ll4 L N2 STRlOQOf-l 74 11 23l?OOM1LL CriU:I". n l ':,2 11 1 8 74 11 231200·AILL C~f f:~ F l 5? 11 l R
74 l 1 ?.30500 I ~1)bl::NE J '::,? 11 q 55 "12 5TR ?':,I)
74 11 231230Kl •'-JC, f<ffl MULE l :,? '-,S NJ 4 TC -.ooA 74 11 c'<l">OOU~ tlA~ll\J 1 S2 03'> rl:, NJ ? 25TF >OOC 74 11 ?91000'-lt<UOKLYN E 15?019 L NI 5TC 50A 74 11 ?910008'-<0UP\L YN f l '::Ji:'Oc•J L Nl 5TC ·soA 74 11 c91 OOOrH-WOKL YN l~ 15?.022 L Nl STC 51)A 74 l 1 l91000>1r-<UUKLYN K l '>2 ')26 L l\jj ">TC SOA 74 11 c910002N0 TWIN LROSS l':>~OJ2 L NI STL ~onA
74 11 291 '10021\r(J hlN Ct<OSS l ':>? u 3 ~ L NJ STf< ::>()nA
74 11 29JOOncNL) Ti. l N Cf<OSS J '::,20 32 L Nl '>TC ~no A 74 11 <'9100,12 1\jl) T"' IN C>-/05:. l S? 0 3! L "l ":JTF ':>OA
74 11 ?4lOOOwILLUw SwA.,1-' l 5i?09S L l\r l S TL 50A 74 1 1 ?4lUOOt-lLLJt f.' o I , l 1 s;.,o-n L "1 51 ?OA
197
74 11 cC/?4J7MlLL lt<t f_K 4 1??104 5~ N2 r >50R 74 11 zqz417MILL CRE_fr<: C l :,;> 11 o 55 Ni:: !OTC ,()Of:l 74 11 zq241 7 I Mf)\JENI:. 1 '::,;>l) '} 55 N2 src ?SOR 74 12 ?2417MIN~YAL HA51N LTl'::>2 S5 N2 25TR 1onc 74 12 5?.41 7EAl;LI:. IS2104 l N2 STC <;()()8
74 12 S?.4! 7TEU:.SCOI-E ) '.,?) I)'., L "12 STC :;008 74 12 521 nnrltJLL I0'sJ KIN<, 152107 N TC :;oo A 74 12 60A00r't<OOKLYNS I) 15201'1 l NI 1orc 7Si"-l 74 12 F:,O'lOOPt<OOKLYNS F l '32Ll<'tl L NI !OTC 7SR 74 12 l',/lfl0f1R"<UUKL YNS G l '::,?0?2 L Nl 1 fJTC 7SR 74 12 hOl'IOOlit-<OOKL fNS H 1S2o2J L NI !OTC 75R 7 '+ 12 ~OtlOOHROOKLYNS T 1520<'4 L Nl !OTC 7<;R 74 12 '>0R00'1~00KLYNS j 152025 L r,; l lOTC 7SR 74 12 h0ROOt~t<1)0KL Yr-.S K 15?0<'(:, L "'1 !OTC 7SR 74 12 60AOORROOKLYN5 L 1S2021 L Nl !OTC 7',R 74 l? 60i:\0()2 ,~I> Tw IN CQO<;S 1 s;,uJc L N2 l OMC ?OOR 74 12 60H0'1N "1!NfRAL Rl,,>JDGE15?UJJ L NZ lOMC ?Q()f:l 74 12 6 7241\/ "11Nf.r1Al RR IDGt 15203 l L 1',2 5TC ~OOR 74 12 f.OROOwlLLOw SWAMP )5?QY5 L N2 5TL 1008 74 12 f,OfHIOr'Lul:. WILLOW 1S2U'}f:, L N2 25TC 91JC 74 12 6240/lHATTLESHIP 1S212H ss NZ ? 5TR1'100H 74 12 nl OOOGOR.-JLl:.RS KNOR )'::,21':>l L NZ STL :>(JOA 74 1 ?. <;,) 500"l>-IOOKL YN5 F 1s2020 L Ne ST B 74 l? 9150/lRh'OOKL Yl,S F 1521),:'0 L r,;,: ST R 74 l 2 91401)N M!Nff.lAL 8h' !DGF:l ':>?u3 3 L N2 SMR TOOR 74 l? ll2417wlLLOw SWA.'4P l ':>?.O '}'-> L N2 STL 150A 74 12 ll24)7RLUt POINT 1S20"7 L NI S'IL 7SC 74 12 ll24)78LUE t->O I "IT l '.,c'tH 1 L NZ STR 1,?SR 74 12 l2240SM!LL CREEK ClfN b2 s~ N2 !,{)()
74 12 1?240SPUf.lPrlkY ti Ac;! "I I':><' ss N? ,on 74 12 13140QR'IP l ':>?040 55 N2 2STL 1 one 74 12 1 J?.41 7Gt•~tSE f 5 l ':>?U<+"> ss ",3 1 /l"1R 150c 74 l? 132417MCINTY>-1E GULCH l ':>20d 7 S5 NJ 10 T 15nR 74 12 130AOOHLUf_ PO l ,, l I -=i21J'-17 L ~d r, lOTL SOR 74 12 13241 70P>1If.l 1-'0NO w l S?. l cf.i ss N2 5"1R ,nns 74 12 l32417HATHL5r-tJP 1 ':,?.I<' >1 55 "<<' 5TC!-:>OOR 74 l?. l 3241 71:lR(JwN ,.q ARFI\ 1 s;:, ss "-<' 74 12 14120 O"'I:.•) ·'IT J ):,2044 5S "-2 c SMC 1 ()()C
74 12 l4240t;r<t.l) MT 1 l ':>?0<+ '~ ss N)(j J )OM 1S/l C 74 12 142417SlLVEt-< GULCH IS?.013 ss N2G SML r,Onc 74 l? 1507)0hr((JOKLYNS f) 15?01>< N T C 74 12 l 5240Srlr<0UI\L n,s l l :,,:>r1;>4 ss N2 2src 7!lOC 74 12 150930Rt<00KLYNS j l :>?02:> ss NJ 2 ">OTC JO nc 74 12 152405H><00KLYNS L 1?20 <'7 S5 I',,' l()Tk C:Q()P 74 12 15?.40Si:i>-100KLYN', M l ':i20<'n ss N2 2 STL ,soc 74 12 152405H.-<UtJt<LYN'J N l S2 ,J2Y '>S Ne I STk :>Sllt'l 74 12 l 50300h' r-,P l ':><'0411 ss 'J 1 ST 40C 74 12 1524(lt:;5Ll"Pth'Y JIM l,?Ool ss N?G ? TR lSOA 74 12 15240",F: r< Iv t. '-' S IllF: s l S2flb2 '>S Ne 5"'L 10ni1 74 I? 1507301 >< J Vf:,..5 IDF: s ) ':>?llb2 N C 2 10 74 12 151 (145RLIJt 1-'t)!NT bc0"7 5S "-2 2 2SMC , ()nC 3 I',()
74 12 15240':,HULL IO,·, •<:!NG 1S2l'J7 t-,'.:, :,2 ·i STC 4QOR 74 12 l52405MILL Ch'~ I:"- A IS210t< N C 74 12 152405'-llLL (rif.fr<: C l '>21 l 0 ss N2 l /l"4R ,noc 74 12 15240SM1LL (f.lf.f.K E I ':>cl I? 55 1\13 ? SOMR c:ooc 74 l? 151 l00"'1lLL CI-IFF:r<: G 15? 11 <+ ss r•c ;, SMR :>~OH 74 12 1Sl200SA"1 l '.,? 11 I ss "'"' ? lOTF 1 SOA 74 12 15120000TAM 1::.2111' ss r,l ·~f.l 5<18 74 12 l 5?405 I,~OGl:NE 15? 11 '- HS I',) 2STC lOOH 74 l? 1 c; 1 ?008A rTU.S h IP h?I cfi ..;~ N2 ST!< 'l()nH 74 12 l '.,240SCHAMP IOr-. 1 '.),') '+4 N R 74 12 15 'I! LL Ct<l:.Et< .\.~I:- <I 1-'i? ss l\u:'
74 12 l 5240SPO.-!t-'HE~Y t:l ~<;I'• l ':> ~ HS N~ son 74 12 15240"iCOMMOLJOt<F GuLC'i I:>? ',', ,, 1 1 >',1) 74 12 l5?4Qc;:--1ILL Ct<f f.K A,;f::.11 l ...,,... ":>5 "'3 74 12 15241)',M !"lt.i-lAL I-IAS!N l">l" '-<', "1:l 4 r 1 r\0/\C
198
14 i;, J':,24 0'i f-'U'"''"'Ht'<Y -<A ) I., l ') <' '1':, ,u,, 3 40flC 74 12 l S?40SPU><f'rlt- f.<Y ~ASJr-. lS2 ss N3G 3 ?l)(l
74 12 15240"iTk!CU HASIN l'::i? ss NJ 2 T ,OrHl 74 12 U, <lf) 0 0 CI:.-~ U1 T FILL [ 5?Ll [ \) ':>S N2 lOTC[ n OflH 74 12 lb240"it:l><0Ur<;LYNS F 152019 r, C 74 12 1 f,1)400,i fLLUW S·•. SrlL0k. l ':>20 -,c, ss N2G Sfl , ooc ;:>(l
74 12 l b0f>3(1W ILL Ow 5 ,iAMI-' [ ':,;>Q -;5;, l SSAE2 2 lOTL '.>Qf)l'j
74 12 Jf,}':,)•1WILL()w ';,IA"'P l ':>?0-1S,q l 74 12 lF,16(10,ilLLVW ':,,iA"1P J:,20'1':>Pl 74 I? lh?.4tl'JEAGLE b;,[ 04 ss NZ Tk :> 011 A 74 12 160600'1ULtSH\)t l :.2106 ss N2 1.::ooc 74 I? l60f>OOMILL (>If E"- 4 !S?!Ol:l N C 74 12 IH WILLOW SW4'1P l':>20'1:i L NI 74 12 IR ~L•Jt w ILLUW I S?O'il'- L NI 74 l? l R24! 7dL<Jt. WILLOW l '::,20 '16 L Ne TC 1 c;nc 74 12 lR2417f-<LUt WILLOW l':>2U'1'> L N2 TC 1snc 74 12 IR YUH: 1-'0INT 1s20-.1 L NI 74 I? 202200ht-<IJ0"-L YNS C l '::i2 (I 1 7 ss N2Li 2 snTc c;o()C 74 12 202400<-1t-<OUKLYNS G l':>201'.'2 S5 N)l; 4 75TC1100C 74 12 202?00N "1!Nff-'AL rlR![)t;l:.l':,2031 5S NI'.' ,' 1 Q-.L ?SOC 74 12 202417E 1;UAl)ALUµE l ':>2060 N 74 12 2024l7SL!µµFRY JIM l ':>206 l L 'l2 l c;r,
74 12 20 5 IL Vt R (,UL Crl l ':>20 7 3 L N 74 12 20 w ><!VE~SllJE !S2'J74 L N 74 12 20 w <ju A[) AL Ui"f:: !S?Oh L N 74 12 202300'<0CK.iALL 15? l u l N 74 12 c'02200Tt.Lt:.SC0f'F l':>?10'> 55 N.l TL?~onc
7<+ 12 20?4!7"1LL Ch't- EK A l ':><'l J '1 S5 l\j2 2S~k ,. n nc 74 12 ?.O '1 l'H: '<AL C«, A>lf 11 l ':>? ss N2G 74 12 ?0?300Pt-< l':>f't Cl [,ULCH J :,? H'., 1,4 c; ,or 74 12 ?I l 300ANV lL 5Hk I :ff l ':>?00 l ss N3t, 2 fl 1,()f)(
74 12 ?.124(1",l•JI~ 1 j ':,,'/)\Jf-, .... .., N.l(, fl C 74 12 ?}240Set::-,1t.NT t- ILL l ':, ,' <)l 0 55 '"2 3 "( t. o ntl 74 12 2 l l O O O ><.t \J <s Y L()\J (J l '"J2 <il 4 S', N<' c' "i'-'C l 0111-1 74 le 2102/)()o-<,<l)\)i<L YNS I\ l ">.-'P J ':, ..,5 "IJ\J ,, 7STF <.'lOC 74 12 ?l 02li0"'KtlVo<.L fr'"-:, l-, c' q I'> c,5 l~JG ? fS f F ssr.c 2 I no 74 12 2!0?.\ll)r-<t-<0V"-LYNS "" l'-,?.l),:' I) c.,5 NlG 4 50"1( ,, c;nc 1 1 c; (1
74 12 2101'-3o·HOUKL Y•>"> 'i l S?.IJ<' ~ c.,s N Jh ? 7STF 701lC 1 f,{)
74 12 21 ()41 OH'<vL)KL n,s 15?01'.'4 ss NJG 3 sore "511C 74 12 210301)'1,-l(Jl)~, l YN') K 1 S?Uc'6 -:,S NJG 1 2STC ::, (11)(
74 12 ?l l)fl00f-sr<l)OKL YNS L 1s202, ...,5 Nc'G 2 2src 1,1)1)(
74 12 21 OflQOH,-l<Jlit<L YN<; M [ ':,?t),:'H ss r.3 1 1c; T F ,,one 74 12 210200CtMETt:.RY l ':>?u J11 ss N2 ;, 2'5MF ,one
74 12 212<+lhU~ riAS]N l':>203':, c,5 N2 TL t.'ln
74 12 21 OJ00"'A'"''~UT Tth••~ l ':>20Jk S'> NZ ? !OTC 1 rinc
74 12 2114'50 Gt:. ,t .. SSE.Ee ") l ::020-+':> ss NJ 1 TL ..;one
74 I? ?l?40S•l"'f 1 S?IJ 79 L "12 1c;Tc 1011.c
74 12 21 ?4(1C, I ·r<vNTO'lf 1-i?Otlc' ss N2(, TL ..;ooR 74 12 21240'ilK()<\ITO'\J l ':>20<1? ss NJ(, 1 S0Tf<l '100C 74 12 21240',Tl !JY J :,2U ':<1 ~~ "let, ,, TF , n Ml
74 12 2110000Al':>Y 'illl l '"J2 0 dS 55 NJ l 1"ifF ;'.,()(1(
74 12 ? I O 7 0 fll'< I C W1()" l) 1 '.>?. I i db --!':, N4G 4 1ST 74 12 210800GAU:. Nt\ L 10 "1 •J<J >J .1 S2 0 nH >-1S f\,J(; .. l'lfCJ,;,noc 74 12 21 OROO<;OVE><1N(W f,Ut..(rl l '-, ?O'i O ':,~ "'" 11'1 T F 1 .. ()nH
74 12 2! l030S'<0•FL11KE. 1 S 2 tl'1>1 5S N4 4 !OOTF 1onc 6 zc;o 74 12 ,' I Oq )()RU(K w/lLL l S?[IJ l ss N2C, 1 lOTL ,SOI-! 4 1 c;n 74 12 211}4)llRUCKWALL l:.2 1Ul ss f\12(; 3 lOTR e>':,()H ':, Jc;o
74 12 2! 24fJ',f:Al,Lf hi::'1 0 4 S5 "12 "-"'CJ c,f)llC
74 12 2J074<1EAGLt l ':),' I <)4 ss NJ ', 25Tll <-floe 74 12 210 7J() 'idLL)(IN K I'< <~ l '"J? 1 •l 7 '>S "13 3 50H ;>none
74 12 ?.!OlOOfk'"l~_',l l ':>211 '::> ss 1\/3 ;> 75TF ">OOC
74 12 ? l Cl IO o JUL l fJ ) ':>211 h s~ NJ ; sore c;onc
74 12 210200SA ·~ l ':>211 7 ss N)1; 1 SOTF '101)(
74 12 210loOOL>fAH 1:,211 4 ',S N2 c IF ,S CJC
14 12 ? l O 2 0 I) J •~(Jl.Jf Nt b?l [Y H', ;\l<'.G 4 1 or" ~ 0 Ori
74 12 21n2ooouTLA-' l'or'l -' l ")', "1 2 ? ':,O 1 C ,nnc
199
74 I? ? I O?lJfl T AVU-'t.; l':, r'I 2 ~ ~ c; 'd 3 h 1 F Dnne 74 12 ?I 020rl'iu"'..i o •ii-! I l>Gf 1~2124 ss N2 ,.,_ 2STe ?()O f'! 7 '+ 12 21 OJOOl)f-' •-il'< l-' 0N0 f 1 ':> 2 lt".'J ss N2 2 SML ,one 74 1 ?. ? J04Jl)H}-,"IAKK 152 12 7 ss N3G 3 ISTFJaone 74 12 ?!?40'i .... tf) ~I T f-'AS S wF S fJ ':,;> ss N2 74 l? 21240 'i (HA,~P I O~J r<A S U, l ':>2 HS NJ 3 100( 74 12 21240',CO>-<KSCRf,i l,ULCrl I '.:>2 ss N3G 3 <; ()I)
74 l? ?! 1JSf10·~ ill e"E:.F .. K A><t.A 152 ss N) 4 :io0 74 12 2!2405!141Nt:f-<AL rlASlN 152 ss N),-; '3 ,o:;r 74 12 21 ?40S"I l •~t.kAL 'iASJ!\I 152 HS N3 ':, 7()()
74 12 21 OJO()()f-'H!rl I\Rl:A ! 5? ss N3 3 .:;noc 74 12 ? l O 3000Pri ! R llkf.A l':>2 5S N) 5 2nooe 74 l? ?lOlOORMf-' N l S?. ':>5 N3G 3 TF 1 one 3 100 74 12 2224<hN >1A'<fOr,,, I ':> 2 0 12 S5 NJ C 74 12 2?102n"1-<UU~LY"1S J l'.:>2 02S4! S5 AA2 ,,., 2 1 OTR <,()()(
74 12 22 l O ht11-<0l)KL YNS ~ l':>202":>41 LAA2 F SHI ?() OH 74 12 2224()SRE fJ '°'T 3 15?044 H~ N3G 25TR a one 74 12 22240<;>-<E ') ·~ T 2 l '>2 04 7 ss N2 '3 5MC ~soc 74 12 22124SSLif-'f-'fflY J Jr,, 1520bl41 74 12 221 ?4SF "'IVt:W:, luF 152Ub44l S54A2 ;~ ?SO 74 12 22124SE ~iVER S IOF: 1520b44S 74 12 2?0 ':>00..,ILL O\ol ',wl\MP l ':>20YS ss NJt, 2STL •OOe s 200 74 12 2205Q ORL!Jt. t-'Ll I N l l '::>20'17 ss N2 IO fl , on 4 c;o 74 12 2?0':>)nwILL O\ol ', w A,~f-' !S20Y / ss NJG 3 s or e 1,onc 1 o 100 74 12 22241 7Ft::. ·~CE l ':>? OY 'i ss NZ TR 1 one 74 12 ?20',Q()S ILVt.R Lt::.UGF "1I1\11 ._,? 1 O 0 ss NZ TL ??SC 4 7S 74 12 22134',SlLVEY Lt-. llGE M Jr~J S? l lJl)t,2 SSAA<'G s T 1 c;nc 2 1n 74 12 ?2l40fll-i0(Kwt>LL l',?lUl c;s N2c, c:;TR ,onH12 1c:;n 74 12 ?2!00()EAGLt::. l '.:> 2 1044 l HS0A3GJ~ SA SOTf.l?! one1s I r:;o 74 12 22 1 0 l()H.Lt SCUf-'E:. IS2105td 74 12 22101 n•~Ul r .. ShOt:. l'::>? 1064 1 5S AA 2 3 STL 4 00R 74 1 2 22241 7 I '-1()(.,F !s f l S ill '1 HS N3 7STL? -:>50C 74 12 2224()c;Qf),-,[k f)()',I) f 15212"., <:,S N3 SOTLl ., OO e 74 I? 2??40c;>sAT TU. ',H!f-' 1S2 12~ ss N4GJ c; 7c;lF2<,fJr)e 74 12 22240'-ilJS tlAS I"' Ah'FA IS? ss N2G .3 ,one 74 12 2??'t0SPA .~ AI) I S t:. FA Cr:: 1 ', 2 sc; r,,,4 G s 1 o o TF 1 ,, n n c 74 12 23240SwAH."" (,Al.)(,t, l':>?OUt.' ss NZ 2 2S TRJl)QnR 74 12 ? ]?40SCE ,...t-.. '~ T F I LL 1':,20 10 '>S Ne SMk ,; one 74 12 23 100f1RK()0KLYN (.:, ! S? ll22 N e 74 12 ?324 0c:; h T T,dr,, ( .;O', S • l ">r'O 11 ss NJ ,!_ ISMF "-OOH 74 12 23?40 <; 21\0 T \II IN Cf.'O SS . I , ?0 3? ss NJ ?. 75 MF c, QnA 74 12 23090()1'1 M!Nl><AL r1>< l IJ(;t .. l ':>20 JJ ss N2 2SML t. On e 74 l? 2 )0A(10 LUi'l(;Ff_LL Ur1 1520 .l9 ss NJG 3 S() Te ;,;,c;;c 74 12 2324! 7Gt. 'l t. 'iSt:t s l':>c o4~ HS N2 3 ! OMR ,.oue 74 12 ?32405-<t. ri ·H ,, l ':>;-' (14 7 HS N3 l 01 ~ ccooe 74 12 2324! 7~1CH"'•JNU 1 s;-0 ,;,-, ss N3 l'>rFI , on 74 12 2324J 7M eJN TOt G•Jl..Ch J ',,'UM 7 ss NJ 1 25ff AOOC 74 12 ?3240",K I -\ ( (, I :,?O'i l ss NZ 1 5()TR , one 74 12 230900f.sll !t I-'() I N 1 l ':> ? U'-17 ss NJ(, 3 7 5 TF 100c 6 100 74 12 2324 J 7 •~1LL C"'E ~" f' 1 :,? 11? ss N3 J 7 5'4 ~ ,, ooe 74 12 ?124J 7 <; A~J JUAlv l S?!N ss 1'1 2 1 10 e ,. o ne 74 12 ,;,3 ;, on111i.vt1,; r., 15? 12 .l <;5 Ne 1 I 0"1L ? QOB 7'+ 12 23240SUt::.~TkOYE,< 152 1 t".9 ss N) s 75TL2?00C 74 12 23240SC•)i-<>< '.':,l. ><f'" 1.,tJLC rl 15 2 c,s N3 ) T l?OOC 74 12 ?JlAO()~ 1,~co •ACF l':>2 HS N3 3 7STF Cl/)0( 74 12 232417T><ICO HASIN I ':>? ss N3G 3 T c,one 74 I c 2424JfF rl I ll t >< S I DF. LEFT15?u 6 '> L N2 STe -:>O OC 74 12 2405PllPTAL 1s c 121J ss N3 l SOTC ~one 74 12 2 408 30~E:. D MT f-'ASS "' 15? ss Nl 1 7S 74 12 ?71000"1 •~!Nt.~Alt:< 1-1rnr,E l Sc.OJ'3 ss NJ j 2STR J ?0 0 C 7<+ 12 c7 l 3f)ORH, 1-11.)R(o l'.:>i-'.OJIJ L NI S TC 40R 7 '+ 1 2 27llflrJWILLUw Sol A Mt' 1-1 T • 1 ':>? 0 'J S ss NJG ? 7 5TF 1,0C1e 74 12 27 11 O'l~LUt. f-'ll IN T l '::>? O-n ss Nl '>TC ROR 1 7'+ I ? ?7Jl()•HL •.Jf. i-'U i'.f J ':,20 -I 1 ss I'll I STL 70R 1 74 12 27 ~ULA S Af., f I> J ',? 55 , ... 2 -:> Q n 74 12 ? 7 ?'+ LI c; C, '. ; i..J ,; 1.)~ N .~ r Al-I~ A I ::,; ss N) 4 .:. o fl
200
74 I 2 ,:>c;2<+0'"-"i-<UUI\L '!'isS <, 1 :,("112?. s~ N2 1 c.., T '< '+OOH 74 l? ?l/J OOON "'1 lNt."IALH ~1DG£l::i20J3 ss N) 3 25TL ')00C 74 l t' ?'J240'iGll>iHLt.HS KNGh l ':>c I'.:> 1 ss '<2 74 12 29 f-:"IGlNEf.k "IT "' )':,r'l60 ss N2 3 I OOR 74 l? ?9 LI·-lt. Chl£t.K A""EA l':i? ss N2 2 74 l? i024 I 7GUi'lHLb<S KN0'"1 1521'.:>I L NZ 74 l?. 301500N CI\Hf10r,, l '::>2 21 SSAE lG 2 I 7'iC 75 0 I ??.4171-'r<OOKLYN C 152017 ss Nl l l OTC SOA 75 01 22417>-<kOUKLYN u l':,2018 55 Nl l c; 5fJA 75 01 ?240S"lr<UOKL yt,5 ,:; 1s2oa L Nl ST 50A 75 01 2240S8~UUKLYNS I ':>2024 L Nl ST SOA 75 01 ?2405"lkOOKL'rN', l':>2024 L Nl ST 50A 75 01 2240ST£LtSCOPE 1521 O':i L NZ 'iT C ,O()H 75 01 22405"1lLL C'<~_Ei<: C l ':>2110 L N2 SMC '.>OO C 75 01 224l7MILL Ck£EK E 152112 5S NJG 3 l 00 TF 'lOO C 75 01 ?24l 7bATTLt.St-ilP 15? 12 >l ss Nl I srn SOA 75 01 22417M!Nf:.kAL MASI'• 152 HS "13 3 25TL1'100C 75 () l 4122?.MOlHfk CLINE !5?009 L Nl 75 01 62200LONGFfLLOw 15?039 ss NJ ? cSMC rooc 75 0 1 60900SL p.>n RY J 1 M J5?0ol L N2 SH l ()()
75 01 f0900SL lt-'1-'tr<Y JIM l S?Ool L N2 75 0 l f. l O )OE ><IVE«SIOF l ':>?06<+ ss tJ 75 0 l 60900W GU ADALUPE 1 s21, 1 ':i L NI 75 01 liOCJOOwATl:.H GAUGE l '>?O 7,-, L Nl ,sn 75 01 6240STkO'JTllN 15?.0rl 2 ss N2 1 <lTL 1 sn11. 7':, 0 l n0900K l•ih JS? O·,l :,,s N2 Z'>TC 1 nnR
75 01 f:,0600K l '~b l '::l? U'i 1 ss NJ 7"iTI< 1508 75 () l 60SOOWILLllw S 'N<1.•1P j ':,20 -;-, ss Nl 75 01 60900 ~/ l LL Ow ':, oiAr,.<P l ':>20 95 ss N2 7SMF :>OOR 75 01 nllJOOt4LUt. w lllll•/ i 5?U'-1/o ss Nl I OOTF 50R 75 01 AO 100/..\LlJt. POINT l 52U'-I 7 ss NI I 00 F 30 7'.:> 01 60 30 O h'UCK W 4LL l ':>2 l u I L Nl c; T 3,, T
75 0 l 601001-<0CKWALL l ::i2 l i) l L Nl ST 75 0 l n030fl'<CiCKwALL 15?1 l I L '-il ST 3f1 ii
75 O I n0410EAGLE. l '>? I 04 l N l 5TL 'il)A
75 01 nl900TELt.SCOf-'C: J ':,21 d'"> ss ·~3 C 75 0 l 6l9JfJTtLESCOPE l ::i? l O':, ss NJ C 75 01 f,Ol3<J8ATTLt5HIP l ':i? I cR ss 'it' ? iSTfl O()()A
75 01 621001,J Ll"'E CR tf i<: J':,;,j'::,()
75 0 1 6l2(J<;'1INt.kAL HAS I·~ l'::>2 ss N2 7c; r F l SOR 7':, 0 l 6120S~IJNE.'<AL rlA <; I 'J 152 ss Ni 7'>TF l SOrl 75 0 l 60JC'OPO~PHER~ ~I\S i"' l'::>2 5~ Ne 2 2STC ?()() R
7S 01 71 ':>20 ('£,...t':N T ~ ILL IS?vlO ss NJ C 2 - JO() 75 n 1 7?417"<t-lOUl<L 'fl\/ ::j n I ':,;>,J lR H', NJ 2STC ?() ()><
75 01 72417fir<()Ol<LYN'> E. l'::l20 l Y S':> N2 ,' ':iOTF ? OOH 75 01 72417 Rc<00K L Y~J', F l '::l? 1)2t) ':,', N2 <' ':,O TF '.>OO H 75 0 1 7241 ?Hr<OUKLYI\IS <, l ':,?il2? c;s N? ? SOTF :>OIJR
75 0 l 7?41 7R""')Ul< L HJS I 1 ·,;r, 2 4 ss Ne i' ':,nTF ;,(] 0.4
75 01 72417>-l«OUr<LYi','> .J l :, ?U 2'> ss N? ,) SOTF :>OflR 75 (J 1 7?417 ':JPOUI\ LYNS L 1 :,?<Jc r s ~ Ne' 2 ':,O TF ?()OH
75 01 72417CE ·•t.lt.4Y l '::l?ll 3fl ss NJ ? lOOTF ~ooc 75 O I 71 ?3SE ;:,, 1 VHIC, ltlr J ':,?\tl:,4t.d SS ~AJG ~ 8 75 01 7130()f ><lVEr1SJ1lF LEFrl'.:>t"1Jb, ss Nl 5,'I 4nc 7S 0 l 71 1?.rJ MOT '1U< CL 1 Nf: l :,?\)t) ~ ':>S N J "' 7':, 01 71200>'lLLll\rl SwAAP 1 ·~?1)'1'-, '-,', "Ii:' ,, JOT ~ 7c; 0 l 71300<-lLlH-_ w!LL O• 1, ? (1'/r ss •H 4()(
75 0 l 7}40(1RLU£ 1-'IJ [NT ]':,2 (!'1 7 SS A04 ,, ?Hl Of)TR ,nnc b on 75 0 l 70JOOrlllCK•<ALL l 'J?J•J J sc, "<l 1 c:;Tc '-,(l(
7S 01 71">30TELfS COI-E I':>? 1 u, Sc, NJ C 7c; 0 I 7241 7'-;A -1 l '::>21 l / c,c., "r I '-irlP ,one 75 0 I 7?417Sll,,, l '.:>? 11 7 ss N2 1 t1L c ' 7'=> (Jl 7?417P ,Jr1TA L j':,;Ji:'ii HC, 1\/j 3 ""L J.,fl(
75 0 l 7?40S <;Ao; JUA~, l '::>?I?? ':,'-, i-.J3 C 75 01 7021(1 '.,r L!Mt Ci<Ur: l'Jci '> ·l "' " 7':, 0 I 7?40SrlLH<J ~ r -l lJOt, I ::i? '-,'-, I\IJ /SH 1 n n
75 0 l Al?0!1Ct~':.•IT F I LL l ':>?0 l ') ,-')
201
7S 0 l i-, j l)41Jc'r/1Jcll\ L ~ r, t l ',,,, lJ 1 '-i<. i "):'"'Li~c' r ,,, IL <()11c 7'::> 01 Al 04iJ4'<00KL 'ff" C l ':,,' I ) I I .. 1 ·~c., b Ac M <' 1 oon, ,, () I) rl
7c, (: l Aj(l40•l><OOI\LYis C 1 :,? 1J 1 7 ,~ I S'::,AA,' •"I j lUOTL ,,onH 7c; (JI Al 10'1R><OU><LY1'1 F ] :,;>(I j '-14 j 75 01 A I (14c:;ur1uur<-L n. (' ,, 1 ':,,:()2?4? S'::,AA I c:; TL c:;llA 75 0 I A l4(l(l,',-( CJfJl<'L YN r, I '->c 1J?. l '::,'.-, NJ C10 71l
75 0 l ><l l/J()C\rl()OKLY1~ j l',?f12'::>4l 7'::J 0 l f<llOO,;Kl)(Jr<.LYI/ l l':>?1)2/4] '>St A,' F ? T" 8 7"> 01 Alll"itilGLI: lS?l0444 'iSAA? M l fJTLl <;Oil( 75 01 A 111 r-; T t.U:. S(O,-;t l '>2 I (1,41 75 01 P.l l l C,MULt SHO f l =>21 Vl-i4 l 75 01 F<240c:;,, Ir~t ><AL C~.A-H_A l '::, 2 '.:,::, ·.i l tOnTF 40( 75 0 l QO 10 0 •1 A Tf.R GAUC;f: l :,?.1) 02 '1~ NJ 2 l O O TF 1 ,, 0 () H 7'::, 01 qo1ooc; 'I [Nl:f-'AL ><CM) l S?'l'.J _! ss ,~2 ?. 50t<'C '(1 (l ,i
·15 01 40300f>IT L5?0V4 c;:, "1 2 1 25TC "-Of1R 75 01 Q,?OOfJ"r/()IJ• L Y1, C ! '::,?II 1 l ','-, r,2 2 ":,OTL 1,()08 75 0 l 9?.00fJRk'.)OKL HJ tJ l '>2 0 l '< S'.-- N ? 50TF 400R 7':> 0 l 9?000Yrt0Ur<L ni F l ':>2021' '::,'.:, ~H l ":,()MC ,ooc 3 · )fl
75 0 I Q030fJU s '1ASIN 15?1/J") H'::, N3G ', zc:;·~F ld)OC 75 01 <,,'4Q<;JTi1LIAN l :i?ll:, l ss ~d(j 1 ':,f)Tf 1 ·~llnC 75 (I} 91 SO'lF. rl 1 Vt."S l LJF l ':> 2\Jt>4 H~ NcG j lOMRlllUOR 75 0 l 901'101)E -ilVE>i<,lf:lf "' l '.>?Vb:, ',C, N2 1 25TL 1 l)nH 3 q(,
75 01 90P.1SE >1 l Vt.>1$ IQE ~· 1 5?fJ oS S:, Ne M
75 (Jl <il401JMUTHtH' CL!NF I :,?oJh•,44 S'::,AA 1 'I ? ·15 TF 1,()0R 3 3no 7S 01 90lll <; S1LV0< hJINT l '::>t'fJ 7 ·. ) ss N<'G I 1 OTF '>()nfl 2 10 7':, o I Ql 0011111 HI \It'."'> I i_Jf S ~· .. )N l :,/IJ 74 S':-, N'+(,J 3 I OOTF 1 ?()nC 7':, 0 I 9241711 t,U'\OAL.Ur'f l ':>2lJ 7':'> HS NJ(; 7 °>TL C>OOrl 75 01 <1241 7I >!l)'~l t)!\j l ::,('()H;> :,'::, :-;J ;:, 7STFl CC/l llC
75 01 40300>-<UCKIIIALL IS?l O L 55 "11 5TL SOH 2 l c; 7S 01 QQJOOF A(,l F l'::>?104 ss N3 ? 5fJTCI :>Qn 75 01 9030flM•JL~. SHOf l ':>2 1 0 .., <,<; 'l2 I ::,OTC LflflR 7S 0 l 9()30n'1ILL ( ,J~ f'\ t' l :,? I l ..> 5'., ,~c ? 7c;TF .:: ()nR
75 01 QO lOOE>< ' ff'> T l '::>2 11 "> ss ~d .l l O 0 ~ 1.nnc 75 01 40300,JUL }II 1 -,c' 11 h ',:-, N<+ 3 1 0 ll F "-OOC 75 (IJ QOlOOC::,A·~ l :, c' l I I :,'::, N4 3 lOflTF l"-rJOC 7S 01 9fJ31JOOuTllh 1 ::,; l I-< <,5 ,~4 .3 l OOTF .:;one
75 0 I 40 3()0 I -~O f,f-_N~ 1:, ,' l l ci :','.:, I\J1 JQflnC F, 01 CJ03000UTLO.i l':, ? Lcl S '.> N4 TF C 75 01 9l?Oll~l',M1,f-,<, I :>r' 1 ?. I ',"- I\J j .? '::>11 T>-< l '- onr. 75 01 QI) 1 fl I) HA T T Lt- -, r ! I-' l ':><' I cH ::,'., ' 4 .l ;> 7 c; TF C 75 01 910 inJt.•~>nr 1-'A~KF'-' " l '::>c l4 1>4J ·:;<, ~ A.l ,., !:JSH R 3 1 c;o 75 01 q IO lll .Jr:.',Fll t. ~ ·•H'"\ ~ t,,,. j ;,' [4),.J ',', AA 3 ,., i:!STF HlO ;>',
75 01 Q l O 3 SPI: ·iCt•C" 1 '->,, I .. ;, <+ l :..,'-,~Jlj ,., 9 ,J TF l " 'l'1C ":, c;n
75 01 Yl031lC"' ~"i-'lU 1, i ',~ ) -+4<.h! 75 () l 9?4osc;P""l "'(,s j :>r'l 4M '>:> i\jJ 7',Tf C J 10 75 0 l 0?40';': L l '-'t l -<ff. I '>? 1 -.-i :) ~ r"c,., 50TC 1 SOH 3 1 Rfl 75 01 <;,'4() c;," L l"L (' "< f t r, l 7> r' l ,11 <; :, ,, ,, (, Sfl"IC 1 SO/i j 3on 75 01 424oc;., L 1 "f. ( •·,.'f: I- "· l :or' J -,1 ) '-', l\lc'l .. SOMC 7':, 0 l Q?41 7(,•J·~"' l t_-< ::, r'f ,.) .1 h e h 1 S'i t.,.itJ ,) ':,() Tk VlOC 75 01 Q;:>41) c; I)~ i:: .... C"" t . F ,,.;, ' I :,? l ::, l S'i N l 1 l t> 0 > 1) n,~ 7 1 c;o
75 U 1 q;,4oc;1)ff_>1 l''<H:. K '-, l S? I'::> I ',:, "j ,) Tk 15011 3 qn
75 O I 9?4tJt;S:,.' f\ "' t-' l ">? l ">4 ', ::, N? ? IO 0 f' H
75 01 4?40 c;,-1E_,,J;.! Y .< t<U ·• N I ',? l ::,, '-,'::, 1\14 ? 100 r:· R 3 140 75 Ill 9?40S(<J ~l C« U:. " f l:.,?l:>7 '-;', ..,1 l lOTL ?'-H
75 01 Y240SCU!\L Cf-'f f ,c; .,J ~ t.; T I':, t'l '.)" L NI l O ()MF lfJR
75 01 o;><+O s~ , ,; r ~,t F'"' • T '\ l :,?I':> ·./ ',S r, 3 ? lOOTF C
75 0 l 4240",fN<,lNff,-; 1,q ,·J d l .,;, I ,,,1 <;:, I'd < 100 T F C 7 5 0 I '-1240::; f rl!G I t, F F:,< .... T ' -4 C I '>? I" I ','::, NJ ,) I 00TF C 75 01 <;.? 40 S L !"If:_ c;.F_F•. A.; f: 0. j ') ,' ':',', N ?(, ? 1()()(
75 0 1 4140 '-,F N', !l~F E_ ,-, ""T ~Kt. "1 ::,? ','::, ' )4 c lOOTF}:>()OC
75 () l l/240 ", N ,)f c, p,-, I'< (, AH, Al".j ,' ', '.:, 1 J4f, 3 7 c:; TF ..ionc
7S 0 1 ()4 f..J 1 c~A>\, ;""u l '::>? 1)H" H'- N3 TL I ·,()OH
75 01 I0012S•<t \11\iY LU .-~C, l ':>,: t) l 4 ',S ~14 ' 75 TF >0<1C 7 60(1
7S 01 lOll 3()<1i-lL •lt ..i 1 LLu .v l ~r'\! y,-.. ', ', , Jc l l 'i TL '-l('\t-.1.
75 0 l IO I Sl ")f ll (,LF [ ',,' 1 0 4 S'::, NJ C :, Cl()
75 0 l I 0?4J 7Ft~ , :. 1,,~ f .... ,, T ! , ,, "" "l ,,, 1on n C

202
h (') 111 '\t.rv l.'.IL t"'I " .. l'-or l '1 () f)
7'> () l l l?j()f)(t:_Mtr,Jl , l LL l '1?1) 10 hS ~. j(j '-o 50Te2,0flR 75 Cl l li'OJi)t-J><()l)KLYl,S A 1 ':,? i) i '> ~s N2L, 1 :; n r rl ·,one 75 01 l 121)Jf)>-l>11i1J1>;L Yr-,<; C 1 5?0 l 7 :-,'::, NJ(, ' ':>OTC 7QnCJH lAO 75 0 1 11;,1n,1r,.;u1J..;L re,-; () 1 :52 U i >< ss NJG ' 2STC l'QOC 7", 0 l l J ;>O Jl)Hr/lJ!Ji<;L yr,c; f:. l ':i?U j 4 ss l'.4G ..., 7STF1 ,OOC14 ',fl 75 01 110'1 J 'jrl-1•JUI\L Y"J r< l 5?0?'- '-.S NJ ,Ofl 5 Q(}
7S ('1 ll' ?lOnlST T W l"' (,>IJSS . I '.:>?OJ\ ~', 1\14 ', 7STFl .J()flC 7', (J 1 11? 1 on ;,,"1J T,. J ~; c .... 0ss. I S?<1 J2 HS N)C, J 7STFI :>Ooe 75 l, 1 ll?l0 11N ~ [!\If cl i'.>L el" !1J..,F. l '.:>2ll jj H', N4G s I O()Tf l '-'OOC 75 () l l lO'lO()AKCHlt l ,?U 34 ss NJ(, 3 50TF ;,c_;nc
7S 01 110,iJOS f1J1JY PL,ll I 5r'O 3 r ',S N4,, 3 l OOTf ,.one 7"-::, 01 11 O>l30'1A-1·~uT Tll"N 1 s20 J'-1 ss N4G 1 2STR 400( 7...;, 0 1 11 0 >l 10 LlJ\llJF f-1. LO"' l ,?UJ'• ss N3 3 1 OOTF ,one 7S 0 1 ll24!7E lj!Ji'.>UALUPF. l ':,?U60 rlS Nc'(i ' STL '-OOR 7', O l 11240",f SIJAIII\LUo.Jf: J ':,?1)6() HS NJ(; ., z c; •~Rl1,00R 7c, 0 1 l l 2001)E t-'IV~RS1 C1F L 1 :ir'06'1 7S (, 1 l l J •l!)fl<; lLV~K PO I~, T L I :i?O 70 ss NZ 5 1n 75 () l lll401)SJLVEf< (,(JL(H 152(17 I HS N4(,J ':, 7STL? ..,nn c 3 1 c;o 7'J 01 11 ?00 n ... rl I VEPS fr'E. L ! 5?U f4 rlS N4t, J 7C,Tt-<?l'JnC15 1 l n 75 n 1 112100.ilLLOW
""' l'-41-l '.:><'.'0 ',I') ss N 2 ) "1fi C
75 0 1 l l 223n~,1cl\..,ALL. ·\J l :,;>J·J\ C.<, Ne r' 1001>-/ l '>Orl 4 l ~fl
75 n 1 11 ??J1'R0Ci<;Wi.LL s l '.:>2111 l ..,5 (~J r' lOOTK lOOR q 4t;O 7S (, 1 l 1?23•1SJLVE>-< L F 1, Gf- ·J I LL l :, c' l • J .> ..,5 1,4 ,, IOOTFI :>()OC 9 4c;o 75 (J 1 llclOOS!H I '-Jc' l l 7 HC, N4G l l O O T F JI, I) n C 75 ()J 1 1 2 4 1 1 r, L 11 , 1 s r r_, i-,, E ·'• j ':,?[ JH ss 1~3 7STF >:;()()('
75 0 1 11110 noE.r" Cf.>FU. 15c 1 :i" L Nl C,MF SflH 75 0 1 11 ?41 J",A"J"- SL lr'S l ':>2 ::,<, 'il G 75 (Jl 11241 7F L l "1t' C'\. t.r/F A ! S2 ss N21, 3 T :>5nC 75 n 1 11 ?4l 7S •JIJNl)ft, Ac1 E A I 'J? sc,
"'"' 4 T ,,nnc 75 () J ll?lOOS K'~P 1,ULL. A.;,:~ l '1? >-1S Ne(, 1 TF 1c;c 75 O I 11 ;.,41 7TU,-<"" >-1r ,.\ D l :,? HS ,13 ~0 II
75 0 l ll?l00G><fY CtJ()P r '-' •iL('"1 I '.:>? HS ~14 .-, r, 11 n oc 75 0 l l??.417J.>I r \ ,?'l ·/4 c;c; '" 3,l ?',Te ,,nnc
75 0 l l?.?OOnC A• f' l '->?llO., '::,'-, N J j 75TF l "Onrl 75 (! 1 1 ?0 4001.uwt.>-< ft . ..., t- \ 1 T r IL 1,111 U" '-,:, "<c' ?.S 1 ',() OR
75 0 l 1?090()'1A.;fl)~J <; l :,2lJ l l ,,c, ·~ C 75 0 l l i? 2-. IJ ',RA"' T < J" '" I :, c'" l > '-S (~j k
75 01 l c 1 'l Cl 11'-'L ;;(1>;Hl1r'·-.J l :,,' ,11 l Sc: '\j j(', J IC C 3 h()
7'::, 01 1 2 lh(Jf)Ht NY L! -,J,; I '">,:'II 14 '-,':-, 1·, 1 ;> ',11
75 0 1 1?030 IJ R><.)UK L YT:; J ">ell.:'':> S'- N 3(, 1 50TCll\OflC 75 0 l I ?O JUO>-<t-<.lU"L YN'-, r( l 'J('i)?h :,':-, 1,4(, 1nnrf1,,onc 3 90 7c.; 0 1 l 20300Yr<UUI\L yr._, c; L 1 ·,2•1,' 1 ss NJ(, TL ·1 onc
75 0 1 1?0 JQl)Y~1JUKL Y'JC, ·~ l ':>?u c>< ','::, "<:>G l OIJ TFl•'O<'C 9 QI)
75 0 1 l20301JN '1 !NtKAL "" I tl Gt: l ,? 1l j l ~s ~.4 ') l 0/JTFI o n0e 75 0 l l ;;>()4()() kl l, rll)~ •'lj I ,c'l.J j"o C,'.-- i',]1, sore 1 <,oc
75 01 l ? l':iO OPU [.JfY I->_ t. ~ · 1 [ :,r'il <+l H', "14(, " 50TK 7()/)e
7':, 0 l 12040(\(,tr~-,t C,C,f c ..., I :>r t'-+" He ', )l, c; 7S fF •one
75 01 l 20900bt. ,t.SSF~ l':il.lJ'+I, ss 'dG .! 7STF S l)OC 7'::i 0 l J?QJO()( (l >A o-tFLL l"> r'll'+'1 t-<S I\IJ(j l 2St.1R ,.nnc
75 01 I ?C, 100>< lr'i-'U. I '.:>?II'.:>•.) ss NJ 3 75TF 4/)f)(
75 OJ }??41J-:,'-Lli-'>-'~._,y .JJ'·' l':, ?Ci '>l ss NJ(j ' i?STR <-one 5 7c;
75 0 l l ?240'-i.iH l Tr F !rl l'.:>20 ,,, ss N)G :, 75fL:>:>l)OC
75 01 1?030()"' 1),JALl!\l l) ...... ~ 1':>c 11h 1-1', N2 ? 7',HF ,one
75 01 l?/JJOnFULL Ml)(J'-.J !Jh·'F-< I :,?u>14 H'-. NJG s 2S1R >OOH
75 0 1 l?Ol01FtJLL MUIJi'a l J 0 ~.) r ·< [ :,?(, /j4 ... ~ i\13(, s 2.:;...,K aone
75 0 l I? 0 30 ,1 f) ~ l SY MJLL I :,~Od-:, ':,5 NJ ., lUOTF <.()()(
7S 0 1 1 ?0 4() ,)(j "I!)(,~ F n,r 1 :,/l)tl'j ss ~. 3 ? 7'> TF 1,Qfl(
75 o I 1?. l :>00 J l)IIKADrJ >-<11' .J I\ :; L ,) l :,;>(J'-14 '::iS 'HG j() 3 F,(l
75 01 l?ll)OfJ C: !LVf:" L ,v., . "I '•f 1,,; 1 ,HJ c,s .d .l 2STC 1 ;>c.;1-1 <I ",O
75 n 1 l?0730F~ •., l f l '::>21 t/4 He, N)G ? lOTFPOnC (-, l?f\ 75 01 1 ?0",J()MULt '>r1Ur 15?lih HS 1~4(, 7 91\ T 2'-00C?O ,oo 7'5 01 l ?06 3<JHULL I ()', l's UH, I:,? I u 1 rl S N4t, 7 ':JOT t''-nnc
75 () l I ?0 lQ O." ILL C><FF" F [ '),' l 1? ..;<, '\it.+t, ':, 7C,TC t ·>CJnC
75 U 1 1?010[)"11LL l,cl t t' >< f i:,;., I l ) HS 1\I L+ tj -, 7:,'1F 1 none
7':J fJ I I ??4C\ S[·i ·J S -, 1 i .,; 11 ..., ss '\ SOTC 1n nc
203
7'> 0 1 1 ?0 l(Jt1) ,~Uur-.l\ll:. l :,(' 11 ·~ HS I~'+ 3 7SfL?.l)(l0C 2 JC:, 7S OJ I ?010"':>A-. JUA'i h2 lc? ss /\jj 3 75TF C 7':, (l J I 20301J TAllr..,N l':ii:'121 S5 N4 ? lOOTF C 7"'> 01 l? ;,4() <;HUh'"U Hf.I !IJGf. l ':l? l <:'.4 ss N3 3 l OOTF C 7S O I l ?2000rJt">i!I-I P()NO f l ':>2 l 2S ss Ne 1 1 o"'L l ;,ooc 75 () 1 120100H]',MAkl\ b?l2 f HS N3 6 Tl21100C 75 01 120q00HAlTLfSH!I,) 1 ':i2 121i HS NJG l 35TC??Of1C 7S 01 12030/l (, I l ':i2 I 311 ss NJ 3 75TFl?OOC 7':i 0 l 12010()>-'!CKL t Ht.riRfL 152131 ss N3 3 7':>TFl t'\OOC 75 01 1 ?040rJDt .,uwuOIJ 1 5? ) '+'.> ':,S 1,3 TR C ? ;, c;
7'=> 0 l l 2240S'< '1" I\) AKl:.A l ':,2 ss r.2 3 l OOTF C 75 0 l 12240C:,RrW ', At'i f' A l ':>2 ss Ncli 3 IOOTF C 7':, 0 l l20QOOLl:FT HlJf<"<O f-l i' GF: I S2 ss ~13 3 lOOTFlC100C 75 01 l ??41 7iJS dAS!N AP•:.. l'.J ?. HS NJ 5 T r;onA 75 01 l20300M1LL CRtU, r1r;,,,.1 s2 HS N4 5 T ll'JOOC 75 () l 1?030'lKALST0"4 c,,r F-.; lS2 rlS N4 ? 7ST C 7S 01 13)',00AN\/!L b 2lJU l wL N2G TR ,1 00C 75 0 1 131,011'.~rll rr f- l>-1 15?.U 7? HS N3G 2 lOMR ·,oo,; 75 n 1 l42417A1~\/IL 152001 .-IL N l r, 5MC soc 7S OJ l4?4l 7THI1-<TY l S2 0 ll':> WL N2(, 5TL JOOH 75 n 1 14?41 7,iATEf< GAUGF l ':i;>{)71) wL N2 50TL ,ooi:i 75 01 l4lSOO,dLLO\<I s .. 1.1:.1;:, l S? 1J'1':l HS N2G ..., lOHI 1 C,Ofl 75 01 !Sl]OOHUl,)l 1 S20 Ll 7 "S "l2G ML -:>OOR 7':i 01 151200',L \i-'Pt_riY JIM l':>20nl42 75 01 1511501: ><lVckS!iJI: J::,?Ot>443 75 0 1 15135 )Pl)h'CUPO l ·~t l S? l iJ l4 l .-.':,A ll4 (i ., c, -;1 00 TF J 120C fl Jc;() 75 0 1 15131SfAGLt l':,?Jll44h 7S () l l 'i 1350 T ELI'. 5COt-'E l Si l <l'>4'+ HSA A4(, '~ 1? 75 l ', 20C h 310 7S Cl lhl320Ct~,t:NT FILL 1s2utn44 7S f' l l 612':>Si-lt-WUKL Y 1, ,. l':>2 •tl':>4l 75 01 l f, l ?,c; "l"1l)OKL YI\' " l ':>2lilfi4? 75 0 l 1 h 1 c;o n F ll(Jlt'. l ':>2 j\)4 ri', 1,2 1 10MRlnOl18 75 (' 1 l hl 40 OCHA•~!-' l u;, l ':>i'J '+44'+ 7S 0 l l 6 l 445CHA ~t-' l (J~, l ':>c' l<t44? 75 01 211401)"1UTHEh' CL lNf- l':>i:'Uo" ss ~J l {, 5,~K ',OR l 75 01 i? J l400SlLVch' ..,U l ~iT l ::>?Cl ( ,) ',C, N l (, S•~rl ?OR 75 0 l 2ll'>OOSILIIE"' LFUGF "1 liH "',71 •JO S':, 1, 1 5"1L 20H 7S 01 2315000ll) ', Ml \ if: >-1.l L ../ J l ::,;, () ,) l <Ill N2(; 2STC ~'l11R
75 0 l ;>3Jt;OnDIT l':, 2(i<l'+ SL N2L> 25TC <-fl OR 7c; 0 1 ?31300,. !LL <J'~ ', ts /!Mi-' J -j?(iY"),>J H',H2<j .,
' l rJ TL L.008 75 01 2hlh?llw1LLOW S .illMt" 1 s1r,--.");, 1 HSAf'3l, F ,::' ~ lOTL 'l00R 75 01 27 l 54SC0"1M,)JJl)'<E GlJL CH l ':>c' ?2 ',SA/\2 F 1 I 7':>TF ?OOC 7S 01 ?R0300HUP! 15?0,ll ss N3 TF 40flC 7':, 0 1 ?R07311HLA(l\f:IIH'\/ l ':,,:> <) l ~ b PO 75 (l J ?R0400HKUUKL Yr~ F I ':>?020 ss Ne H
75 0 1 ?AOY00.-1.-i<JO'<L y,, l':>?Oc?. -;5 :~2 1 TL 8 75 01 2AO'l00..Jt-lt)UKL YI\> .... lS?UcJ ss N3 l MF C '.:> 00
75 0 l ?80Y00 ·-1,;u,Ji<L Yrs. J l '.:>;>O,', :-,S l\iJ,; ?. 7'>TF C l 75 01 ,>flQ401)H><0lJKLYN I\ J ::,,>u,'n ss N3G ,> 75TF C l 75 01 ?RO'lr101sr Ti,, T 1" ('./(JC:-, . h c'C JJ '>S 'J3 l M C 75 01 c!<OY0021HJ T,dl\ Ch'OSS. l'i?OJ<' ss NJ l TF C 75 "I ,'R090<11\J "I I l'-.E "< .:.L '-ih' I l)Gf J <:,;>,JJ l ss ,,4 1 lOOTF C 75 01 ?.i<O Hll) lle<(HH. l':> ?034 ',:, Ne' ,::' "' •ooc 75 01 ?H0301)US ,, "-,;Ir, 1,c'J ,-, -.,s •·,J TC c:ooc 7':, 01 ?R HI,, rl(J ..,~. 1 "l? ,)Jh 80 7S <'l ?AJOO'llU~GF~LLU~ j ::, ;:>,; J~ -.,s I\JZG j 2"iTL lAOC 75 0 1 <'AO YO •) LV' H,F ELL u .. l ':>2<l Jc/ ss NJG ", TF C 7c, '11 i:'f<Oq01)R.'I>-' 1 .., i:' fl'+ cJ H':, f\i ':, C, .., 1 O()TF !SOC 7'::, 0 I ?ii040rJNAT IIJ"IAL ,ffLL s I ">2tl._? HS N3 s T~ 40'1C 75 (l} ?A04001-'[ J ,q 3 J <-,;:,0 .. 4 HS NJ(; 3 TCl40nl-l 75 O I c'RO 30 () Gi:. ~E SSE.E. :, l '>?Ll4', ss N3l, 3 TF ciooc 7":, OJ ?iiO 30 O <,~. ·~'~t SU " l S?04,, '>S N3 1 TL 1-,ooc 75 0 l 2H0300C0e<A 1.1f.LL l ':,?. 'J'+ >; :-,:, N3 (; 1 TF 1:l 7'> 01 )A010'1r1e< JUK L Yr, hJLCH ) ':,,'[)':)4 ':,~ Ne 3 I ()ML '-l111H
75 O I 2A0100,1 <, 1JA(,l>l ' J'"'~ j ',,'/J h ss /\,) ..., TL 75 r 1 ?P ! ',IJ f• , , ~ 1 ~. h' r. u..i(,-: J -,?ll ,~. "" I\J.l ? 2 c; TC 1 ° 11(1.c
204
7S u l i."<0 30 ,1F cJLL ~"l; J lJ f\1 livLCH l ~) r';) ~4- :,S Ne'. _j l Or-1 '< onnc 7"> O I ?i10300FULL W)lJ'I GllLCH IS2fld4 ::iS NJ l IOTRl?OOtl 75 O I 2R0301)1JAI-::,i >ilLL l ':,?(J d', ss N2 l 2ST ·)0 08 75 01 ?RO 300tlA I 'iY r1ILL l 'J/"'On"> S<, I~,:' I 25T )f)()fj
75 01 ?R03f)0DA!'JY HILL l '::,,)0 'j':) '.:>S N2 I 2ST QOOR 75 (' 1 2M0300DAI'.:>Y rllLL ] 'J?UdS ss Ni::' 1 2ST ,one 75 0 1 2t\u900Tw II\ ><HI D(iES [ ':,;>!J-,? ss .-.2 ] TF AOC 3 60 7S 01 ?R ·• ILL OW c; ,i A ~P l '>?(• s/':, H':, 1\1] 'l TL C 3 AO 75 0 1 21-i "'LUE f-'IJ INT l 5?1l'1 7 ss 1\14(j 2 lOOTF C 6 1 c;n 75 0 1 ?f<090n,.,ucrswt:.LL l '.:>2 l lJ I S'i Ne Bo 3 30 7'S 0 l <'81J90n~:t1•jLt I Scl 04 ss N4 3 7STF C 3 l?n 75 0 1 ,'R0900TELt SCUl-'E l ':>21 (J') S<; .-.J 7STC C 75 0 1 ?RO 730"-IULt St-<Ot lS?l OF, ss NJ 90TFZ100C 75 01 2R FflNtST l '>21 l '::, '.:>S ",2 '~L ?QOC 1'::> 01 ?R0300llUTLAw 1s2121 ss NJ 90TCl'.OOC 75 0 1 ?ROJO()(WHik 1-'0'\!!i w 1 Sc 1 ,:>1-, ss NJ 3 2'1TC 75 01 2R0300i<lS"1AHK lS21 c7 5S NJ s 7STL I ~0nc 75 0 1 ?R0900'1ATTUShlf' l '>Z 1 <'" ss ,~2(i f., 1 OML 1noR 75 01 2i<O lO<lSNlll'ISL IDE GlJLCf-1 b?l3? ss N4 i:'5TC C 75 () 1 2 8 0 30 () PUt-11-'Hf.f; Y 1:SAS Io, l'::ic ':,':, i',j 3 .1 "'1L 75 01 ?il0400S OF WAT[k GAlJ1;E]':>? ss NJ TL 1,ooc 75 01 2R0400CHl\;"1f'I0N fJULCH }",? C,':, 1·~4t) 3 '1F ti
75 0 I 290'-13SHfiiJUKL YJ\J E l':,?1Jl44.1 7S 01 240'cllClH"00KL Yr" L ] ':,?ii,:' 741 75 01 ?9093'JCt."'1Ut."'Y l '>?03il42 7S () 1 29JJ:,SE >ITVf>ISll)f l 52(Jfi44f, H':,AAJli ., 1n<.1t-1JsonR 7S 0 1 24l420t-10THE:.H CL I :'ff JS;.>06'14? SSA~2 2 20TC 1 S()C 75 01 ?4l':i4Sw ../lVtH'iillF L,?1)7444 75 0 1 29h2SN!LLU\o 'i''i AM,-) l ':>20'1':>/+ 1 SSAA4 ..., r.; 75TC "-OOCJ S 3nn 75 0 1 ?91 c;zs ... Lu,_ w ILL O..i } ',(' IJ 'I'- SSA A41, t' 5 l OOH 1 ()(\( ':, l?n 75 01 ?YlOlOTtLE:.SCU,-JE:. l '>2 l ,h4t' 75 01 ,!<; I 005,-,ULt">Hllt l ':>?Iv '>4 l 75 01 30241 7SN(),i':,L !Dt. (JtJL Ct~ h?l l? ss ,,2 ?STf.11 ?OOC 75 01 3!240S>'c<OLlrLYi',j I 1 J2 1JC!.t ',", 1\431) 7ST ,--ionc
75 01 31104ShLUf POlNT 1 ",cf1"7"' S':,/Wc M 2A 1 o rn "'00C 4 10 75 01 31240S8ATTLFSHI"' l ,? J 2'\ S~, t"J(, s 51MC C 75 01 3}0400ST.-<INh ALU"JI, 1S2JJ3 ss t~j lO<lTFI ,one 75 02 l lf>O'l.iILLUw ::,"' AMf' l ':>? 11-I':>-' I HStf.'::,G F SR}()OTL <-nnc 75 02 llOJOSlLVfk LEUGF MI~ l '::>21 ()I/ L Nl s 'j(l"l
75 02 l!OJOSILVF""' LELJr+ M ! ',I':>? [ :J ') L 1, 1 ':, 5r,11 75 0? 1240SE A1;Lf: I ':le I 04 ',S I~ 1 s SM 1 <lllR 7S oz 1240SM[LL Ckr >:~ ] ',? ss hJ.!1, .., 50 ,.nnc 75 oz 1240SMILL Ct<FE'\ 1 J? c;s N<+(i ?S 1 :>ooc 75 02 SO :!OO><><UUKL YI' E l '1<' .')? I) L Nl .., 5fH 1 OOH 75 0? 50301lkrl00KL n, j l '::,;., IJ ,:'.., '-,:, N2 I 5Trl .,11nR
75 0? ':d7011Ft1<,f k r "t' -1s 1,11' S l ':>2u.,? '-,':, :~2 ? S•iL 0 0 () 7 c;n
75 ('2 Sl72SEAST HI 1/t.K'-, I l)f. LI ::,?11,..,._, ':'>S "'"' I sore ,.o nc12 7c; 75 02 SO 70()>WCK>1 ALL l ':,,.>\ li l c;<; ~11 1 l 0Mk ;>nR
75 02 Sl300RUCKWALL 1 '::,? l lJ l 5::, n1 1 om 50H 75 02 'Sl4()()f.'.l'.jLf j :,? I •J4 '-,':, Nt' r' ,'4,-1 ~ 011'1 75 02 51400EASU: 1 :,/])4 ss hl2 2 -,L 1,1)08 1"> 1)2 SO"fOO'-?U 1LlUT 1 ::)£2 -,<, r-n 1 1 !lTL ',()fj
75 oz 61200CA"W l '::>c' 11.J "'I L N<' '> T >< l ? IHI C 7S 0? hl l45Ei\S T ,.; IV F. "'" I !1f. ~l '.o?('':>?4'1 75 02 61J5nEA':il k!VE><Sl'lt ::,} ':>?Ila?:.,:'
75 02 612001':AGLE + T EL ~-; l vu 1 ">;., 1 •l 4 i IL "le' src ?QI)(
75 02 f.,() 900 '• LIME: Cwt f'\ J 5?} .:>1 1 ss N2 2STC "'00C 75 0? "-040'1GOrl,~Lf- "" '\'JU"' j '.);:> 1,1 S<; "'" 3ST ?5()"1
75 0? 6090()>-itl\JrlY >-JKLl ,j\J l c:u' 1 JS ss "12 lOTC '<51)C
75 Oc fl O 9 IJ o EN r; I"' t F: >- ' r ~ l '::>?} '1,1 S:, N2 10-,c :>'JOC
75 02 724} 7Rk0'JKL YNS ,) 1 ::,c' 0 l f< c;s I\J2 TC ,()OH
75 02 71S(JOP.-< ULJKL Y"J'-, I :i?.t12-; L N2 src 10 nfJ 75 02 724174f.lLJUl<LYN S '\ 1 ':>cO?.n ':,':, ''<c ST L 150H 75 02 71 C,QOrlr<<)LlKL YNS L I ::,2iJ2 7 L Ne STL >() ()4
75 oz 71':lOO! ST Tw I I\ C..,1) SS. 1 ':>c' U J I '-,<; "'"' 1 OT" ? 7c:,1-,,
7S 0? 71 f.. ,, ,, I-, I r .. I• c~.,-...; ..... . j ·,> ·, q ~ ~- 1,, ) J 1) T" .,~{!;..(
205
7':> lli:' 711) 0 Owl LL uw S WA ~.-' l ::,,: o r-, l. '• ('. rL ::>':,OH 7S 0? 7111001-iL<lt- 1-'0 I •\J T [ ':><'.'.U-, f L ~.2 l I) T F 1:;oc 7'> 02 71':>00S!LVEh LEOGF "'11,\J l ':>? j lJ(I ss N2 lOHI 150C 75 02 7 ! ':>0()1-HJCKwALL l :> ? l O l J:\ L 1102 s~c ~0nc 7S 02 71100Rl'<I-' lie-I~ A l ':>2 L Nl 75 02 RlcOl)11rlUUKLYN~ "'. l':>2od, ss r,2 STC "00B 7':, 02 f<l;:>Oflf:AGL[ + TELE SCUt-'lS2l0'-+ L N2 TL ?l)OC 70, 02 r1 l 200FA '.,Lt- • TE.L F,(Ul-'l':>?104 l NZ T,.; , snc 7S 0? 4l 400CU ,~L Cl-'FfK w I ':>?l ':> n s s NI 5TC 3n..i 75 02 Ql401)S~OwFL11~EC~0L6 S )l5Z ss NI lOTL 20c 75 02 10!',,()()0LI) s M I "< E"t..L c-<U J ':>200 J L r~ 1 TC 50H 7<:, 02 10ll()()HE_i~NY l(),vr; l ':>21)14 S!o N3 2 lOOTFlllOOC 7S 02 lOIIOO'i-<UOKLYN I\ 1 5 2 u l S ss N4 1 l 00 TF C 75 02 101500.<"<() lJKLYN C I S21J l 7 ss N2 I 50 rF ?008 75 02 l011DOHR0UKLYl\i C l ':>? 0 l 7 ss "43 3 75TF C 75 02 l O l ">OO•NOUKL YN () l ':>2U l "l L Nl !OTC 50'i 75 02 l O 11 OOHrtUOKL YI, l) 152Ulf1 ss N4 3 TF C 75 02 lOll00-1"<00KLYf'.. t l S?O l <.J ss N3 3 lOOTF C 75 02 101500N 0~ nh'OOKLY\J G l:i21lc?. ss Nl 2 75 02 100700>-<t<OOKLYl\iS l l':>?02/ ss :\J2 J "'IL C 75 02 100700L0NGFELLUW l':>21JN s~ N2 l lOTL ?SOC 75 02 102 lOO SL 11-'l-'t."1' JI M l S2 Jo 1 L Nl 75 C2 102l00WAT t. k l, /I \I '.; F. "J l ':>2 1) 7,-, L "l l 7 5 02 1U2l00TI 1l Y l ':> 2tJ >l l 5'.:> ,~,, 25Tf< ?()()!'!
75 02 102100FULL MOUN iiASIN l 520>:S4 ss N3 25TFl110f1>l 75 02 10210!JGALt.NA LI ON C,L CH1':>2UH>l L N2 7S 02 10210()GOI/Et<NltH t,IJL Crl I ':>20'-i() L NZ 75 02 1 0 l 10 O >< l.lJ t t-'U INT l Si:'. 11 '-i 7 ss NJ STL 7t::;R 75 02 lOlA451:AGLE 1S?IU4 :,S N3 ,' 7 5 TF2'l00Cl2 l c:; (I
75 02 l01900Tt::Lt·. '>C01-' ~ 1s2 1u, ss Ne ,> l OOTF2'100 C 6 l no 75 02 l O l 40 0 "'1UU. 5H•.lt l ':>2 \ Uh s s N2 ? 100TF2nonc 7C:, 02 IO 1 lll)n 11iJLL l 0 •J "I "J G l '::>2 l v / '::,", r,2 I lOOTF2 "0n C 75 02 1015001'10(,E Nf:: I => 2 11 ~ ss N3 ? 51l"IC J 1.0 n C 75 02 102100Qf-'Hlt-! P() ' J, J F l ':><' I 2 ::i s s Nt! I C1 o.1C ?0()8 75 02 10210001-'tilk f-' l)'\j l ) " l':>21<'.'.A ss N? I 0 ,"'C ?0/lR 75 02 l O 2 I O O i:l l S ,, A" r<. ! Sd 2 7 ", '.) "I l r~C 508 75 02 10?.l008J-,,.,.llf-, ~ J:,,:'127 55 N2 ~ 2STL ~on~ 75 02 10lQOn8AT1U 5 f-'! t-' I '.:> 21 "" ss Ne:'. I MR ~ /l/))i 75 02 102100t-'l Cl'\ L t t< /\ ..;LIFL l S;, l JI ss N2 2 5MC e>OQB 75 0? 1001onnEf. « ( Htf ~ s 1 '.>2 l ':> l L Nl ML 4(1 ( 75 0 2 lOllOO CUAL CkE.Er( t l :i2 l=>7 L Nl 75 02 lOllOOCU AL C"'F E~- ., [ :,? ]:,;<. J\Jl 75 0? I 00900f NGlNt.E" ,q
""' l':i 21 /J !1 '>5 rd ? lOOTF '-OOC
75 02 I (JO 4 0 0 f ,~ 1, IN E f:,... Mf C J ':,?IC I s s N.3 ? lOOTF '-0/lC 75 02 101200><1'11-' AKF. A l':>r.' L NI 75 r2 1014lc:;-<AY'-, tl Ar,-< "-L l L>F l ':>2 S5 ~ rj I i' T 4 SC 75 02 l l) l 3 00 [ l) AHALJ() '-,LIHS TAT .l '.:> 2 ss "1 2 ?. T 1 flO C 75 r 2 l u l 9 ll lJl-'kO'>f->t:. C l ~AS IN I S2 '-> S ,,3 2 TF -> fJOC 7 5 r2 1111 2/l H.;QlJKL'fN '· l'.:i 2 ll 194 1 SS AAJ "I 2 50 TR 7QllC12 QO 7 5 fl ?. 1111 I A~ tWOKL YN " \ '-, ,'(J ,c'IJ 4 ) SSA AJ "" ;, S flTCJ non e 7 5 0 2 11111 f,H c-l OUKL YN G 15 ?0 c ? 41 SS AA2 ? 5 0Tc1,onc 6 6 0 7 5 0 2 lllll4HK00t<'LYN ..., l Si:'fl c :l4 l '.:>S IIA J •'1 3 ':> OTC! 1 OOC 75 C? 11111 ?tlrlOUKL YfJ j l '::>r.'U2'-i4 l SS A A JfJ M 3 75TCl 0 00C 75 C2 l ! ll Oil tW,JOt\LY ~i L l :i2 ll ?.. 7 4) SS LIAJ L, I~ l 75TCl ll On C 75 02 l l l lOO Ct'~ E. Tun l :>c' IJ .30 1.+ j
75 O? l J 15JOSLil-'Pf:RY J J •A l ':> 2 0fi l t. 1 75 0 2 lllSOO E ..;I11t:.t-< S l llF l :,('lJt>44'1 75 02 lll 5l fl E -.[v Er1':>I1J f. l ':> ? IJt> '-+4 l 75 0 2 11131 '-i WILLO w SS/A>~ P l':>2 Q'j ',4 [ SS AA2 "'1 2 2 S TL rnn c 7 5 0 2 lll3! SW! L L 0 W ', wA'-'i' 1 ::>e o-, ::i S~ A0 2C; "" I SOTR lOO C 7 5 02 l l 105 0Tt l t.SCOl-' F. l '.:> ? I 0 ':>4 r' 5 ':>A A3 M J 75 ML C 2 90 7'i 02 11 l 0'-+ , 1-nJL~. <, r-,() t l':>dUt>4 2 5S AA 2 '1 ,> 7 5 TC C 7 '> 0 2 111':iOflJt '~I\JIE f'At<K F ../ "' l ':> 2 l '-+<1 4 l 7c, 02 l l l b tlO ,JtNN ! E. f->A ../ KF-< s I 'J c 1 ~ l 4 l 7", 02 1?0300 '-llll C«t El\ A-< ~ A [ :, I" ':, ~ t, t' T 1 .:c on c 7"> 0? l4?4J 7Jc.'\JN !r f-> li t<~. F '< ··-J I :,,; 1 .. :1 l "-I
206
7'-> ('? lt.?411('1,1··'1-' ['.', l e>c )4" L l"i l 7..;, O? 14241 7(,l)rlKLf,./', '\ ,i()'4 l:,?l'>l L td 7'-> C'? 14?4] 7lltF« Ct-Ff K I -o? 1 '>? L "Jl 7'-, (•? l424l 7rlt- ··,HY >-it-'(),..r,i h?l':>'> ss "<l S"-IC SOR 7':J 02 l42417(UAL CH Et.,\ F 1:, i: 1:, ' L NI 7':, 0? l4?417CUi;L C><f-EK N I':>? l '>'1 L "1 7S C2 14241 7FN!;IN[Ff-<' "'T r: l ':J216 l 55 N2 Ss1F ~SfJR 75 G? lS;:>4\72'<1> T"' I•, C,<,JSS, l '>21JJ,' 55 'J,' SM 10() 7c, 0? !S2/l0()N ··~ i N[:'-' AL 4t<I[1l,t:l':>r'1JJ3 55 N2 TR lflOH 75 CZ l S<00 ,1N '1 l Nt..., AL ''" !UGEI ':>21JJ.l ss NZ '1L 10(),4 75 02 15200,JN M !Nt-,AL H,< I L'•G!:. l ':>ZUJJ ss N2 '1C 1()()1:,
7'> C 2 I"? 0 0 r1 E ,; i,L t I':,,' l U4 ss t,2 5'1L son.:i 75 02 l S?fl On TE Lt. SC'Jt-'F l':>210S ss N2 -,c 7508 7", 02 1Sc40SM!LL C'"'F !:.•. " l':>r'lO'I L NZ lOMR ,:,one 75 0? l 5Z4l 7Pt<,)Sl-'t.CT f:'AS ]1'> IS? L 1';2 75 0? lt,2100LUNG f- t:LL CJ,i 1 sc11 J-, ss NZ ':>0 TC l50rl 75 0? lh0Y0()!4LIJ!: WILLu.i l ':>c<J 'it> L N2 !OTC 1 nnc 7S U? lliO'-iOO-<LUt-. hl IN 1 l '>clJ'-1 7 ss N2 lOML 1 one 75 02 lf,091 OM ILL co-1u~ A--IEA l:,,' L N2 F A 15n 75 02 170 300'-<WQ(JKL YfJS [ 1 ,21JZ4 ss N2 2SMC <-OnR 7'> 02 l 72417'-<ROUKL YN K l ':>2(JZ'1 ss N1 ? TF 10nc 75 02 170JOOWlLLrlw C,wAM," l ':J?UYS ss :~2 l 25TL ?()fl>l
75 02 170 300EAGL!:. l ::,21 c!4 ss N2 lOMRl~OnR 7':, 02 l 70300MULt.SH<lF I::,;, l ilh ss N2 lOML 7008 75 02 l 70300HULL ION KT NG b21 J 7 ss NZ 25TC21100C 75 C2 17?4()',WAff"<FALL 15?147 ss N? 50TR C 2 10 75 (2 l '/i'4l 7E LIME C"t.EK l ':,2149 L NI 25MR c;nc 75 C'2 l 'f,'4l 7GLl'iHLE'<"- ~ l\-4L~ k l 'Jt' 1:, l L N2 lF 1 O()R 7':, 02 1 7?40',Dl:F-:« C;.<Ef:K c; l ':, 2 l::, 3 ss f\; l lOTF c; 0 >l 75 02 1 7241 7ntf:.t-' C><t I-'-< s l ':>2 l ':> l L f';l SOTC c:;nc 75 02 1 f?40SHE'.,'IY Yk<).,·'J l ':>? l ':>S ss N2 TC 1 flflR 75 02 17?417Cui;L HAf',,h. \::,?l':>h L NI SOTF soc 75 02 17240C,CUI\L C'<F t" F l '>? l ':> 7 c;c, Nl lOTL 30C 75 (l? 172417CUAL (Wf- F'\ E 1'>21:>l L Nl 2STC ;,n,i
75 02 172417CUAL C><~ Er<: ' l ':>2 l ':>i-1 L ~11 75MF 2nc 75 02 l72417f>\JGINtFI- "'T ~ hr l:,Y L Nl 2STF so~ 75 02 17?41 7FNG!~Jf- F '< MT H l ':>? l ol' L f~ l '>OTF SnR 75 02 l 7?40Sf'H,1Nt.f'.>I "'r .J 1:,2100 ss N2 1 OflTF ,.one 75 02 1 7241 7FNG !NE::f:K MT C b?lbl L "JI 50TF SOR 7S 0? 17240',tNC;!N~ F>< ·•T C l':>211>1 C,<; "12 lOOTF ,,one
75 02 17?417S FU><r, Ml'J,C-<tEK1'>2 ss N2 75 02 17?40S><l"ll, SlJLOr-10<, l '>c ">S NJ 3 15T 27nnc 6 7C, 75 0? l!<l lOSLt"-1!:.NT F I LL l':>r'UIU4'> 7,;;;, n2 !RI 127'lf-<'00KL yr-,;c; A l ::,;,() l ':>4 l SSAAJ ,'I 3A ':>OTL C 75 02 l81J2t;R,<Q<JKLYNS H l:>?01641 c;sAA4 3 C 9 300 7,;;;, 0 t' l r\ 1131 rs../OOKL YNS C l':>clll 741 SSAAJ .., ?H 75Tk H 75 02 lf31 l40HKOUKL n,c, l':>?OlY42 75 O? 1811 l•Yr<OUKL n a ,, l ':>?•),'?4 l ',',ltd F l A 5TR A
75 02 lRlfJ?fJCHAMPIUN I':>? l 44t,4 H<;AAZ j
75 02 l,sl41Sw LIM~- (.,<f- f o<; l ':>2 l '>114 l SSAA2 F A TL B 75 02 1~13':,nSwAMf-' l':>2!':>44? SSAAJ r' SOTL R 7S 02 l Rl 3':>SHF'l><Y r' h' ().., '·! ! St' l '>'>4t' <,C, AA 1 F cA 25TK A 1'::, 02 1 fl l ':>O O :JNCUMt-' A<,H>lf' GUr<, l S2 m Nl 75 02 lR0300MlLL C'"'F F K CIRrl,l':>c ',',, NJGJ I 75TL1 innc
75 02 ?Jl500f<MIJ s 152U4<l c,c; N2 1 on
75 02 <'1030DEr<IVt:><c:;1,1E: LF:FT 1 S2u1:,~ ss 1'<2 l 50TR ;,5nc 2 l()
7.:; 02 210300W h' I llfRS IuE. 1'>2074 ss N3 1 2STL 1 oonc 75 02 210300E " I II E ><SI l1F: 1 S,:O f 4 ss NJ :i 25MLloonc
75 02 210300.i :;UAOALUl"'f: !Scoh HS N3 1 2sTc2snoc
7S 02 2llfllt;fAGLE l '::,,'lo .. ~.s l\l3 l ':>Orn Cl5 00
7':, 02 21 ()1-'o; l R kOAl) ,I l ':><'12/.i ss N3 2 25Mf C 7S 02 <'l~IOflO~Hl>< i-UAI) ., l':>t'l ,'I, ss NJ J Z5MF C 7S 02 21 t<lt.TTL!:SHII-' l ':>2121' 5S NZ ? STC oQO A
75 02 212101JL1Mt. c;,t f,( 'A l ':>c 1 :,o 55 l\l2 ',HL 17SC 75 02 ?l l'>OflM!Nt:rlAL 'C!AS !"I l '>2 5S ,~2 ? <-On 75 02 ? 1 fl~OflS1,u•1tJE'< AKfA l '>? HS N1 j ,.c;o
207
7'J 02 ? CI) 13/l Ht 1'J:-JY LOn(", l Seu J ,'.+ c,s Nl 5fC ':>llC 75 02 22130<ic;LJPµUn JP• J'JcOol4l 7e; Oi? 221200E .-<lVER<;!f)E l':>206441 75 02 221 l 30S1LVE.i'I LEO Gt- MI -H":>c!U04J 7<-; 02 2?0030R0CKIIIIALL 152101 ss Nl l !OTC 6nFJ 7c, 02 221UJOE4GLE l':>210443 S', AA2 M l TL C 7S 02 221 I\ 30 T !:Lt SCIH-'E l':>;>105,.[ <;SAA2 M l '3 25fR 10/H3 75 Oi? 221030MuLESHuF 152l0fit.? <;SAA2 F 1 lOTF .>OOA 75 02 221':>00COAL HAN!<' " l ':>21 ":>R 5S Nl 3 58C 40C 2 sn 75 02 2315 007Ul\l l 1:,200 6 fiS Ne 3 5TC t.OOR 75 02 230'l3fll0>1Ui CfMENT f- IL15i?004 ss N2 2'>fl 7 5 0?. ? 30 73fl Ct1~£NT FILL 1520 10 l-1S N4 5 75T 2<-0PCl l 20n 7S 02 230300Flk00KLYNS F 152020 HS N2 l 25TClnOn8 75 02 230300RROOKLYNS I l':>?024 ss ~J2 2 lOTC <- On8 75 02 230JOO"l><v0KLYNS I 152024 S5 N2 3 lOTC "-DOR 7'J Oi? 2]0]Q()8><0i)KLYN<; J 1s2oc5 HS N2 2 lOTC c:;()Ofl 75 02 230300Rf<OOKLYNS K 1 ":>2flcA HS N2 2 lOMC c:;oos 75 02 23090()f GUAOALUPf- l ':>2(JolJ H', NJ J l0t-1Llc:;Ol)C 75 02 2J090fJWAff>-1 GAUGE N l '::ii'O 76 ss N2 2 25 'iOll 75 <'2 230)00f AR[H l ':5207>l 5S N2 l 2'>TC ,.00 75 02 2JoJoo It-io~no,~ l':>20d2 ss N2 2 5TC 400A 7S 0? ?3040•)M:.CIN TYk E GlJLCt1 1Si?Orl7 HS N3 3 T 75 02 ?30CJOOGALt:NA LION GLCrl l '.:>2Udd HS N2 3 ST 4008 75 02 ? 3 0 10 /l Gu v' l:Y l\ll1 fl GULC'i 15;,0-.0 HS '<3 J 5TChOllC 75 02 ?JOJO OK !,\I r; 152091 ss N2 j ..,c 12'-75 02 23 l 34SP0KClJP J 1~[ bell) 3 HS 1\13 j ':> 0 TC lt,OOC 8 100 7'-J 02 23030flf:AL(,t: l':>2l<J4 HS !\jJ ";) 25T>-12?00C 75 O;:> 23073rJMULt SHOF b?.lll ':, r1'.:, N] ', SOTC?.<-OOC ~ 200 75 02 23l0008ULL!UN KI NG l ':>2 l U 7 HS NJ 7 50 75 02 230300 I1~ut;fNE 1S?ll4 t1~ NJ 3 TR2.,onc 75 0? 230300BATTU-_SHIµ b2 12 h H'.:, N) 3 Tc1c:;ooc 75 O? 230900'1AS!N 8ATTLF<;t1IPlS?lt'~ HS N3G '-, T C 75 02 2314301\1 ST Af< l St'l J7 HS NJ(, ., 75 02 230600CHAMPIUN 1 S2 l t.<+ '.:, f\.2 t' TC <-OOC 3 ?O 75 02 230101)K I ,~O MIN>: l ">2146 HS H s 75 0 2 ?30430 ·-~A H '< FALL 1 s1.1 .. 1 HS N4 T l'lOOCl2 l?o 75 0 2 2304305r''<!NbS l ':>2 l <+tl HS 1\14 75T lOOllC 9 70 75 P2 2Jl'>OOf L!Mt <.Kt.ff< l ";>,' 14 ') WL NI ',Ht< 40 75 0? 23040/l E L IMF_ (>-JI: Fi< hcl<+4 HS N2 2 25TL :>OOH 4 Jc:;o h 02 23 fl400 E LIME: C"'t Er< l ">t' l <+4 H<; N2 I 25MR l '>OH 4 1c:; o 75 02 2 :H ":>00 ENG1Nff,., 'IT ~ l :,;> I :,4 L N2 ST :>SO 75 02 231 '300RT .OF Th IC !) '-IAS.l':>? HS I\J2 75 02 ?,09001111 L!Mt CK.A;.i':A 1 ':>?. HS llt2 2 1 5 () 75 0? ?J09008t t\>-1 Cf.it!- t< i\•ff:. l S?. HS l\jJG '-,
7S 02 23240',ENGIN.~T.E.FAC': 1 :,,? HS N3 s M 1:;ooc 7'> 02 2 30 '>0 ni< t•,1 >ALL l\t<'~A b ?. H::, NJ 3 1'=1 02 2312{IOM!LL c1-1u:" A~l:_I\ 15? HS NJ C 75 0? ?JOJOOM!<, f: >-1AL -iA <; J!\J l :,2 rlS NJ J <,1)1)
75 02 ?JOJOOklMCO fACt: wILLwl'.:>? HS NJ G J 5<JTC :;one 7",. 02 23 1 JQ()q f . ,JF HdCO 1-lA:-, . l '.:> i? HS N]t,
75 02 231300', M lNf.i<AL l':>?. H'.:, NJ ., 75 02 ?30300SUL T :.I" Mi)L A'i Shi'Jl 52 .-,s NJ ,1 c:1JnC 75 02 23lcOO Tt-iICO HA:-, !~I 152 >-t S NJ 75 02 r>J?405h!L IG>-tT P• Ar< ]":>l'. ,, <, N4 c; I "'fln 75 02 i?4l':>OQANVIL 15200 1 DL N2 25TC ,OOR 75 0 2 24l50()WATt"'GAU~t 1 ":>2U u,' llL Ne 25TC A()OB 75 02 ?41400olATf_.., C,A UG F l ':>20ll? ss N2 ? 2'>TL ,;ooc 75 02 /4l50f)tlLu ", "'J !\jt_ t-1 ~L '-11)1 ':,,)(l t) ·1 fl L N2 25TC 1008 75 02 24l401)0L,) '.:> • ., l ;~. "'v a 0 152 \lJ .1 L N2 <. 25f c:; onc 75 O? ?4 l 5Cl!W IT !:><'.'OU'+ i)l llt c! I <l TC ,ooH 75 0? l4l40()µJf l ':>20U4 ss N2 2 25TL .:;one 7', 02 2415nO>-ii)Pl l:,i?O'l7 !ll Ni 25fC <-OnR 7'i 02 24l5301-1UPI 15<'0 tl 7 L Ne SOTR 4 00C 7r:, 02 241<+/JOIST lto, IN C -. C; 5S . l':>?0 H L NI SM 100R 75 02 241':>00lSf T .- IN t •< iSS . b20Jl [IL N2 TC ?()OH 7S O? ?4l~OOE' R!Vr~ SJnF LtF I l ':>?O~S '.:,::, ,..,., C
208
7') (,2 ?41,:,011'-ilLVtr< f-' U l ·,, T i :,c'd I U wL N2 C 3 ?n 7S 02 24J'-,OOSILVE>< U·_l)r,f MII\IJ':>cliJO I'll NI cSTC 51)H 7S 02 ?4l 401)Ht HIC:t-_r, !04+10S l':>2104 L Ne R R 7"> 02 -'4 2 '- l 75-. A '~f-' I ':>t'l ':>4 .il N2 cSTL ?() OR 7S 02 24140 0 ~ ·'1P SO,Hrl IS 2 ss NI 2 SM ll)nH 75 (J? 24 l'-Ollr<UiiOUT 1::, 2 ss Nl I 10"1 1 noc 75 C2 2 4l '>OOr101'1 OFF l:>2 HS NZ 1 25TC 1009 75 (12 24 1 ">0 fJ t11~cu~,p AG.-i..; f' ' jQf<. 1 :,,' WL N2 7S 02 ?',OhOOSLlt-'n f<Y JI.• !::,?Vol "l NZ Ml lOOC 7S 02 ?f>l !O OW !LLOW '-,,JAMP l '>2Ll -,•j4 _J 7r.:, 03 111:>0 0 THJrlTY l':>200'-i WL NZ 1 om ~.OOB 7S 03 111:lO O c11 ,~» l ':>?OUk WL NJ 75 TRJ 11QOC 75 03 116001-'t< ')<)KL Y~I S C 152U l 7 WL N2 STR 400H 75 CJ J lr,l)OfH<UUe<L Yl'b I) lS2 tilh .rL r~2 SlC t,00!-3 75 03 1160 0 ,<~UuKL. Yr, S E 1 ',,:'ti l-; ill N2 l 0TC "-008 75 03 l l 600rlr<00KL YI\/:, f' ] ',,'t)c' I) loll Ne lflT '"COOR 75 03 I l60()iNUUKLYN5 G l':>202? WL tJ2 1 nm "-OOR 75 03 I 1601) •NOOKL YNS T l ':>2 U24 WL N2 :, TC ~on 11 7':, 03 l 160()1')f<JUKL vt~S L l ':>;:> 0 2 l WL N2 STL 100fl 7':, 01 llhO()l'>T I 11! IN Ch'US'.> . I ':>20 31 WL Ne 5TR 150R 75 03 Jlr,002•\JO T I• IN Ct4iJ5S . b2UV >IL "'<' 1 r) Ld)Ml 75 r,3 116001\J ,• [I\J~ "<AL P>< I D;if. l ':>?U.l l :oil Ne l () 7(HlR
75 03 l lt'>l">MA../"IOT TVIKl\i 1:,?0 J>l WL Ne' 1 ()fl 75 03 l lbl 'i l_U,\JGFFLL O·• l ::>c<> jy •,IL I\J2 l', I)
75 03 l 1400SL11->PERY ,JI..., l ::,r'Ub I WL NJ 1flnC 1"> 03 ll400F: r< I lit><:, I uF I_ I :,cub-, wL Ne !OT .,onc 2 ?O 75 0) 11 :i()()i)U1\Jc,"IU-<t I ::i,:>iJr,is ll<L N2 25TC :>Sr,c 1'5 OJ 11:>00JACKPOT 1::, 2 0 71 ,1 '::, •'JJG <' SOMC 1 soc ? 7,;, 75 ()3 l l60t)~0CKw4L L l :,?. l •>l wl ,,2 7S 03 l lf-001: AGL F l :>t:' l U4 wL N? TL "10011 7 S 03 1160flMULL'-iHOL 1:,2 }1) 1) ..il /\l e T ,i lOflA 7S (13 l 1400 ,Jt1,N/t fJ ~>-<KI::'-< ,, I':>? I '+'I wL i\Jl ST 51l A 75 03 J l 400Jt"J ·Ht ,., ,\ ../KU) ·:; l ':>? 141 -Ill NI S T ',I' II
75 03 l 1400C'1•Hr'l01\, I:,; J .. 4 .. l ·d ST SOIi 7c, 03 J 1400 GUrl t:<Lfh' 5 K~IO, I':> ? I :, I ..!L Ne STC 1 SOI-I 7', 0) } } 401) ',•1rnMI-> l ·.,,, I :,4 JI L N2 'iTL 1 fl fl A 75 03 \ J4 0QHtN-<Y dl-<U,,\J l :>r' l:i" .. 1, 111e 5Tk 1 0011 75 OJ 1 l 40 o Er" r; 11-iu: .., ·H ~ 1 S? l ,-; "''- ~i2 ", J ~ • S 04 75 (IJ 11400EN!,lN~ E..., •'] -< l :,,' J ,:,11 WL Ne STC 1 Sf'IR 7 5 03 11400\o l I 'It CK . 11 •1 ~ 1-\ I'>? '•L Ne' , on 7 5 03 ?1 2 001\ ·\lV IL l ':>c' llli I v,L 1'< 2 TC ;,c:;n13 7 5 01 ? 1?00J1'sV!L l :,? 11 () l '"l Nr' T ,OOR 75 OJ ?!??21\NVll. MT C l,..i ._; 1 ~.i t-=. 1':'>cllli l '..il NJ T ~soc 75 03 c l cO (l •AT t !< •,A iJ<Jf-. l -, ,.-o ,) ? "'· ~ Nl'. STR ?fl OH 7 5 03 2 140,JHL! IC. "ILL <1w 1>:,,,,,.,., ""L Nl S8 41lC 75 03 2 l40'1 >' LU I: f-'0 I l\i T l -,;, ,, .. ' •·L •• I '>H 41lC 7S OJ 2 1'-,0QGU><lit l\kf- A 1'12 ~L N I 7S 03 ? l'+IJO ClJ,"1 ,~UiJllkf: ,.. ~ ', T ' i'><' .. l "IC 'O flflR
7'c, 0 3 AO>l()OIJ:o HA S It, • j ~2 iJ j ':, SC. ·; j 3 2STC 1110C 7 'i, 0 3 Ac.>on ..i ,.., ... I , 2 l•<+J -;c, '< 1 ? ST SPA
75 03 f,090<1MU THI: K CL I "' r l :, ,' II h'I ..;5 "-12 2<; f1 3 75 03 A24 J 711,q <,y ,. ILL J ', ,)11-\', L Nl 75 03 A2 4 l 7.:-,} ,,,, l :>? II-, J L ta l 75 03 h -'41 7vd L U 1 • -., ,o (1 -~ ,-, l '.'l r" I sJ ') N I 7S 03 6 111'-iHL>lt pn !'< T j:,,'1)-17 LAU! STF 4M,j
7 5 03 AO>lOO--<L\.Jt. Prl J 1·1 T l :, ?11,-, I '-,:C, ';(' 25 TC -109 f,
75 03 1',0600S IL 1/t•' Lr JJGE. '1 l 1" l '::>c' l u IJ c.s Ne S TC 1 ",()rl
7 S 03 A l 10fl"1 lll [~ >- ~ K I :,? 1 .; ~ ·JS 1\JJ C 7 S 03 AO 100 !:cl Jr_ ST 1 -, <' 1 1 -, -;~ "l e ML 75 ()1 ,-,l40 nCUc\L 1-d\1' f\ l -:, <' l ':, >< L '" l
2S TF l',('
75 03 t,2 41 7t1t<0::,n CT ,.. r, '> I'·, 15-' L NI 7c, OJ 7 l '.i 1 11 Cf "1 t 1, f r [ LL l ':>?•, l <1 7 I 1c; 03 7 1 O '+ O Ct._, tr, T F I!... L l':> i-'U I U4l 75 03 71 1 l ',-1r<1)01\L Hs •j l ':>,,U c?4l :,:,11 11 2 M I 25TC ~O OR
75 01 7 1400>1;-/JIJF\ L Yr, H 1:,c'Oe l WL Ne lOT C :> OflY -,i.:; 01 7 -1.-<PdF\L y 1,, -., I"> ;.><J <' c, '-" l l\JI
209
7~ (13 7 .-o r<J'.J I\L T,J~ ,<: l ':>r112;, ,it_ NI 75 (11 71 I I 'iCt r~t-J,TAh''f' I S?O J 1J4 2 75 03 713l'iE Kl\11:.>l',Jl\f 1S?O o44'-i 7'::, 03 7 ,iA l t,; (,AI J(,f: 'J l 520 r f, L Ne 25TC ,soc 7', 03 71 OOOFtJLL MOON GllLCl1 l '.> 2 0d4 <,S Nl STL 50A 7S 03 7 rlLUt w ILL O,~ 1 S?IJ'-1'> .,l Nl 7c, 03 71000HLUt f-'0 INT l Sc ll'1 7 IOL Nl 7':J 03 7123n.;oc"''"ALL 1 S;;> l ' 1 J •l N2 "iM>< 1 onp 2 1c; 75 03 7111 'iE AGLE. l ':J? l J44 l SS AA2 "I l 25TL C 7S 03 7lllc;EA<,Lt 15?10471 7S 03 7111 'iTt:Lt:.SCOl-'E l':>210'>4.3 SSAA2 I" l 25TC C 75 03 711) 308AT rLt: 5 H!f' is c 12H4<' S':,AA2 F ? TC 100A 75 03 7093o<;f'RlNGS 15?.l41i71 LAOl lOTR 70A 75 03 70930 ,, L [Mt- O.>Efr<; l::>~ l':Jfl7l 7cc, 03 7 GU.-<(,E Arif.~ 15? •'L NI 75 03 7 JL)AKA()'I ~r.r :~LI ,JE l -:,;> lol Nl 75 03 90600K'100KLYN rl l~,? lllb L N2 25TR 11)08 75 03 Q(l,-,01)H'10V'\L Yr, -! ! S?O ln L N2 2ST>I • OOB 75 03 90600"1-<00r<LYfl; 0 15~01'\ L N2 2STC 1 ?.58 75 OJ 9!0008'1U0KL Yrs ') 15?01 4 L N2 75 03 ql lOOf<,-/OOi<:.L Yfl; j l S,'02':> ss N2 50TC :>()r\f3 7c, 03 9lln00t-w,JOP';L YN L l ':>?Ot:' 7 L Nl lOTL 5(\F\ 75 03 9 !f,Oll 1 ST lwIN cµoss . l S?ll J\ '.:,':, N2 s r~ 4 00R 75 03 91600?.Nu TWI N CROSS . l .,;;. fi 3 ;> ss l\j,:' Sr..t 411/lR 75 03 9160/J t, ,~ tr~t-<AL 'lt-< I OGE. l ':>? t/J l '.:>S "l i:' 5 TC 1,008 75 03 ql43'lLO·~GFt.LLU" lS?UJ '-1 l ,,c 7c, 75 03 41600 E '"'l VE_P <, !OF l.. l ':>206 5 c,s "l2 2'? TC :>c;nc 3 1 n o 75 03 411'00CL !ff l ':>2 1J h l WL N-! S T><' 1 noc
75 03 9lOOOWILLOw C, w'1t-'. 5HL •)l 5 ?0"':, L Nl 25TC 50B 75 03 90QOO><l rJ E. w ILLUL~ l ':>211<-;I) L Nl 5 0 q()
75 03 910001:JLlJE. PO I'~ T l ':> 20 Y 7 ':,$ N2 TF R08 3 QO 75 03 90S3 00 SI LV EK Lf t)GF MI , I ':>? J IJO <;c, "'1 l l) TL SOF\ l 7S 03 9l0 01)RO Cl'-WALL l 5? l O I '.:,'.:, Nl ':JO TF 508 2 15 1 75 03 9lb3f1'1UCK"IALL h?lfl\ ss N2 ', TR 1 'i r)H 2 loo 75 03 9li:'OOF:llGLf: 15?1V4 C.,':, N2 75 03 90>10/l'IULf:',H(Jf l ':> t:' I 1J ,-, C., C ·' "'2 75 03 9090 0 ,, 1 "lt. HAL ><tC, ,llr' r .. Al ':>2 '>S NC 1 c;n 75 03 ql401)'1 t:rJ ,.q s .'.IJF ~ l ':Jr' ','.:, Ne l OOH 75 03 Qi:'lOOTHJCO >1AS I 'I ~,.>~Al :::,? '-iS NJ T u ooc 75 03 90~00CU TfllsiJ\ ,H/W l ) 4 --, l :::, ..,
75 03 10 1 lOO C, Lll-'t-'Ef<Y JI '-I l':> i"Ut> l Ill Nl 1 00 7 S 03 1 () f:. '<I VE K<;i 'jF l ':>r'IJ .,44 '-' 75 03 1021 00E " l llt.>/5 I OF: L l ':>?Uc,S L NC '>TC 15nc 3 4c; 75 03 10210 0 1-1VT•ff.j.,> CL I ',F I :::,?1Jo " L Ne 25MR :> OOR 3 4c; 75 03 11130/lRo<VOl'-L YNS R l ':> ,:' 1)1 h 7 l 7S 03 11 U60'l A,..(,·ilt I ':> ,> 0 j4 c.,5 ·~2 ?. 25TL l onc 75 03 l 10600US tsA':,] i'i l ::,?OJ'"> ss NJ 25MC 1 one 75 03 llU60n>-1 1', H(),<r, 15?0Jh L ,n IO 0 hOC 7':i 03 ll0600R"I..> l ':>204 0 L NI 75 03 11 E >! 1 Vf ,;<, I UF J ':,2 rJ t)44'-I 75 03 110600v.i ILLO., ':,w)lt-' SHL •Jl Si:' tJ9"> L Nl TR 60H 75 OJ 11 ?4 17.wILLO IO S_,At.l f-' l S?O '-IS L N l 7 5 03 11 0600 wlLLUw S "i'-1,-> S>-iltll ':>20 9 5 L Ne 25TL 15 n R 75 OJ llllO OwlLLOw """p S'1L ,ll ??0-i'>>< 7-., 03 1106001-\l f l~ WI LLUto1 l':i?.09 ,., L Ne 10 0 TF ROC 6 1 7 5 03 111 l OO i1 L U~. f'()Jl\il 1 Sc 'J'-' r L flU l 2 10 75 03 11 ?4l 7 RLU t. PO I \J f 1 ::,?fl'-i 7 L Nl 75 03 110600HL•Jt FO Jl\ll l S?II '! 7 L "'2 90TF 90B 3 QO
7 5 03 110600Ft•~C t l S20 -i Y '.:, ~ "I l 25 TR 30C 7 5 0 3 l 10600S!L V!:.k U ~·.lGF. M l "l i '> ;, I Oil S"-J Nl 25TC 70H 75 03 lllA)nSIL \/ t..- Lt-' UC,~. M !•'II':>? 1 Otl L 11;2 2 5 ">< :>O OH 1 qo
7S 03 l 11 ?)nc,JL Vt" Lt. ll C,F ~- { ,\J 1 '>i' 1 u 'l 7 l '--Sul J F 2 2S TR "> (l('fj 6 7 C,
75 03 lliJOO S ILVt>-' LE L)Gf Mll\l! S?JU07 1 75 (•3 lllJFillOKOC'· ;,Al.L 15? 1 U I '.:,'.:, r.l S0TF 7nH
7 5 03 11 OhOn~·vcK .. ALL I S'c I tJ 1 ':,'.:, Nl ':>OTF 71lf-l 3 'I 7', 03 11 l JOM<\J(P';s·t. 1 l I'> ? t •JI 7J c,c, ~L 1 l OTL 1 SilR
21-0
7-c, i1J l l I h1/1·«!(" < 4LL i':> ,, l>J l I I '>"u L ? t:'S It-< ,,onR ., ':) 03 1 J I/\J(l!:,.•,Lt j ':,?1 •J4 L NJ SOTF2"'00C 3 4', 7-; OJ 11 '160n TtU·_ 'iCC•Pf: )':,(']()') ss N2 251-lF :>OOC 7S ()J l ]06Q ,h<LIL LI CH K l'J ,-, l 'J? j ,)7 L !~ j 2S 7S ()J l l •)AOfl,~JLL c,-,1- F,<; ~ ; \:,?l 1H SC. ·~2 -.JO TC ,one 7':, 01 11 (t10.•1P l')'-' l':> ? ]44• L A A 1 75 03 11060flCL 1t-·r S HI~ l 04-') )':,? L I'.,' 1 OOH qoc 7'S n3 l? F.: ,,1JADAl.lJr'l l':>t'\111<) L. rd :>OOB 7'-, 01 1? F.: ,,JJAilll l UPF_ l ':>?11611 -,s Ne ·,on 7S ()J 1 2?4 1 7-,, "'Iv f ,--, I ui:- ) -,,J I) 74 '>S i,c ? 5"1L ·10 oc 7':, 03 l? .Ii ILL Ow S ,.AMP l':>c'O ·h L Ne .:; TL >OMl 75 0 3 !?! A/)l)wATl-_,.f Al..L I':,? l 4 / ':,':, Nj SOTI-< 700H 4 70 7':, 03 l?l600F L l '.~c ( "'t-. 1- ,<, l S?] 4<.J ss 1'<2 I 0 ,'3 l c:; 0 75 fl) I? 15()() ',\Jt1Hl.["' ' !'\ l•J t)-i I S2! ':>l S'::i "2 5<'1L 1 008 7':, 03 1? 1 sn o-; i)t-_ t" C'<l'_F'\ b?l':,1 ss 1'<2 5TL l SOR 7':-, 03 I? l '-.'l fl-, I; < f.,, C-<t F" I 'J?l ':, l ',', Nt:'. I 1 or~ l 'iOR 7"> OJ I? l'>J0<,..i11r,,r> ISd':>4 ')', Ne l !OTC ,001-l 7':, 03 J?)f:,J()Ht ,Jf.if ~.q,,.: \) ~·\J J':)?j ':)':J :'")~ N,' l 'J ClT C ">51\ 4 21\f'I 7':, 03 1?09f'lfl fN1, I 1~1- 1-: >-< "'T 1\ l 'S2] :><.J c;c, NJ 1 ':,()TIC t,5 0C 7S OJ 1? l sooi:r.,, 1r,1-i::~ "T C ] ':>!Io l ',<... NJ 2 ':,flML •OOC 75 OJ I? co,~ ;~lJ \JUr-E r,dLC,., I:,? L IIJ! 75 01 l ?l '>O ,l"iJLt.'-i 11kt. ~ l S? ':,', NI 75 03 I? GU,,l,• • I "UN Tl.) ,~ l ':>? 7S 03 13120 fl :./JLLOW :, .. t. ,~1-' I :,2U r, "'L NI s r~ C:,r, A
75 03 131200 ,JL.J I- v, !LL O..i l 5?•JY<, "'L N I 5'1 soc 75 03 J 31 ?ll'l><LUt P •J l, I l 'j ;.,> ' ) ·.J ! ,.t_ NI St·' L 50( 75 03 131 ~o rHUC r "'AL L l :i? I :JI L N? 'iML 1 n fl>i
75 03 l:il20()CU~"lliLJ(l><i: cl~ '-i I'- l ')? ',':, "'" ", •0011 7'> 01 15 l 'i OOP l T ! '),:'\JIJ4 L "J? !OTC t,S OR 7S 0 3 l r..; 1 ':Ir, n T '-1 r .... r r l L.),) (11):, L NJ ?">fC "011R 7"> 03 IC, I '>Ii O (<l">-' I :,?Ovi-> wL N2 l O Tf< .;fl ()1,3
75 03 1 5 l ':, CJ fl CE ~ H~ T f I LL J :,?1/ 1 n ','.-, "'I lTL 50A 75 OJ I ', 1 "> 0 o.; '<, J UK L Y'" ~ C l ::,,-' 0 l 7 IJL Ne lOT 1008 7'-, L3 ) 5 J':,0 0F-<1JU~. LY I"<~ :J l ,?" l >- ' IL N,' 1 OT ,ooA 75 03 151',()() R><UU •LYl', S I' ] ">?U l Y IJL '\ii I fl T ,onR 7', 03 1 SJ ':,()1)'''"JO"L YN', e I ::,,;11 ,:? I ''L ,, <'. 1 OT 1 00':l 7'-, 03 I c; I ':, () () .., ,, r JU t<. L Y I, C, (, [ '.,?()2,' <IL N l l f'I T lOflR 7 'j 03 l',J'-o{)IJ" " ')UH Y'~ ',,
,, I S! •,2 '1 1)1_ N I l 'l T \OOR
75 ()J IS1">00 "-'UOKL fN-; '· 1..,:>11,'') l•L "1 I OT 100R 7S 03 }S]':,()() <-<",JUt.LY'- '-i L I·,?"<" l ill NI 1 .)T !OOfl 75 ()J 151 Sn !J ""'•JUKL Y~iS ·, I 'o2•1-'.'. ~ Ill 1, 1 l O 1 1()()H
7c, (JJ l C:, l ') '/fl N ·4 t . .., .. ...-AL , Ht-<! , ,, , f:. 1 :>r {'I JJ iJL Ne 5'1C 1 011 T 75 03 ] ':,] ':, 0 ON -t I t, t >' t. L K~ [ (J\;C:: l :,,' f ) j"j [Jl N2 :> (J(]M
7"> U] 1 'i l 'i () fP'JL t-. 'io-,fJf: l Cl,., l IJ I, L I\Jc'
75 03 l c; ! SO 0'1 I LL Cr< C [ .. . , ,;:. 1,2 iJL IIJ2 7"> 03 l h? I fl o..it. •) Mf .1 l SclJ44 rl '.-, NJ -1 2:,'1~ 7()0R 75 03 ]h?lOOC\J-<d 1,t LL } ':>('1h.+I-C ',C, "i 2 ':,OTC ,ony 7S {)j 11,?()Q () I- -< I VF_~c; l 1,• 1-,;:;,_.,-,4 t1':, 1,J . ) -; Tf.l,>1..,00 C c., GO 7'j (1J l h? 1 n 0 ':lo-<JJ "" ··!l Ai-< f A l 'J2 rl ', r,J h " ·~O OR 7S (13 l 7 •1 l O O ,o/ ,., ( Vt -<'::i l :)F l S?t! /4 ', c, NJ 2 c'STL!JOOC 7':, 03 J A)4l l)IINV1 L r-1T ~ F .iCF 1 ':>?O 'J l "'l r,,_j l 0 TL ·>OOC 7 ', 03 ]is F -< l v r '"':i l, 1F J-, ;>,:t, 44-,
7:> 03 l R ,~U T o-,Ei-< CL !~~ ) '-,('(1')'-l4? 7'i 03 l f.. \ ?O 'li-'U,<C , 1)J-' J 1-:[ ] ':, .-' ] <J 14]
75 (13 lR]?OOfA <,Lf l ':,,~ l 1J4 71 c,c, ti.L c F l l fl TR] ,onR 75 (J3 1 M l ? fJ n F '> j L I- l ':>r' 1 <J4,, j
75 03 liil200E~ •j Lf_ lS?lH/2 75 03 l"'l20 0 Tt_U _::,(11" r .. I ::,,-,J i -, 1,1 <.:.',At,, .l cSTCl a'1 <1R
7S (JJ lK Jt'< >dt p~~J( •. f.l -; l':i?l4l 7r'
75 ()' ]A r't ~( l l(,<, j ':),:'] 4 ?4 l
75 03 l I,. (H~"'P l'Jt•, l :>? 14471 7S 1il l"' c,..,~~t-> ICJ•, l ':>r' l '+4 4 1
75 03 l t1 ,)t. ~IJ·•JOU l S? l'+ ':>7r. 7S OJ 1 ._, 1 4 O O •, .i T t >< 'J/.llbF j ':,,'iJ v? '"L ~e ] () 1(1 OH 7':, (, l l '-1 l4 \J()1)[,,l ', "l 'JI:-< AL ..,, J) '.>?U 0 l "L I\J2 c5TC ·,c; (l f:l
7'-o , , 1 J q}4 1) •' l_ l}u ~ .J r t "" ~ '\ 1 I- f L l Jr' 1• J '" ,.[ "" l fl TC ',()/18
211
h n3 I '-1] 41Jl1"tc,,,Y LU·,C, I '->cll 14 <NL I\Jc lOTC 1 onR 75 03 I 4] 4 0 n i-<" ') u KL Y"' h l ':i?O 1 h WL NZ 2STC t..008 75 OJ l<.Jl40ili=<kiJ0KLYN C l:,,'i)l 7 '"'L NZ Z'iTC 40f1R 75 03 141400Hr<0UKLYN L) I ':>?LI l ~ WL N2 Z5TC 400R 7S 03 l91400kr<UUKL.YN F l ':,2CJ20 WL NZ 25TC ,.ooR 7S (JJ l4l401J'-l../1JUKL YN G ] :,?Ile? WL NZ Z5TC t../JOR 75 01 l91401)Hc<UUKLYN h 1521JcJ WL N2 zsrc t.001'1 75 03 l<.Jl4(Jll,1.-<C)UKLYI\J 152li24 WL N2 25TC ,.onR 75 03 1 41 4 0 0 Hr< 0 UK l. YI~ j l ':i202S wL N2 25TC t,0() R 75 OJ l 4 l401l«><!JUKL Yr, K 1 ':i?£,cf> WL NZ 25TC 400H 7S 03 l <.Jl401)Hr<!..)IJKL YN L l ':i202 7 WL. NZ 25TC t,OOR 75 03 l4l4!JtJH../UU~LYN !~ l ':ic02'l WL. N2 25TC t.OOR 75 (JJ l91400N '1!NEh'AL 4R l()GEl :,?033 11/L N2 50TF <1.00R 7'> 03 l<H200WH1 ff. F J-i l:i?.0/ 2 L "12 lOTCl<1.0Ml 75 OJ l91400EAGLE. 152 104 ,,;L Ne 10 t,008 7, 03 l c., I/JO() 1iU•-l>iL~.f!" Kl~l).-l l S?hl l. Ne TF :>50A 75 03 1c;1uooF.1~<,lNEth' MT C l ':i?l o] L N2 TF >5013 75 03 l4l4C'llT.,IN ~L] llES lS? wl r,2 50TF 150 75 OJ ?U 140 0 DUI\JS~O.i1:. l S2Ubtl L 1~2 ?OOC 75 OJ ?.02417G f! I fJGE 152Ul:iC. <,~ NZ TC c;oriR 75 03 ?.JOC.0:1 Il AL!AN 1 S20':i I ',~ Ne "IRl?OOH 75 03 211300l.AKt 152,)77 WL MJ 50TC 450C 7':, 03 ? I 110 v Ii l S ·~ A f! K 1 S2 l 27 ss 'it'. TL ,ooA 7'> 03 ?l l30nkl',;~Af<K 1 ':,21 2 7 ',~ NZ TC 100A 75 03 211300(,.J,«,I:. Af<fA l':,? wS N3G T t.. 50C 7':i 03 23lflOOF: "'l Vf f.<S I I Jf ,./ 1 :ir'OOJ ss NZ 25MC :>OOC In 75 03 ?4 E >-<lVl:.r<Slf\E 1 :,2(11)44':, 75 03 ?4241 fw lLLUw So!A"I-' J:,,'lJ':h ',':, "12 ?TL ?008
75 03 ?5223f1Cr1AMPI0N I::,? l <+4 c,s NZ 25MC ?OOA ?5 75 OJ 26110 () i<f.<(J()KL Y ~,S C I:,;., o l 7 '>S Ml 5TL 1 flOA 75 03 261 lOOA.-<0\JKLYNS D 1 ':,2(,lH ~s NZ 2 5 TK <-OOH 75 OJ 260/lOrJ SL lPf't:ciH j j"1 1 ::,20bl s~ N 2 1 l Of;L ,one 75 03 260900E >-< I llf_RS rnt· 1 S2UiJ4 ss Ni:' 1 5':lF ;:> OOC 6 Q()
7'> OJ ?6040 0"'1U TH E. >< Cl. I NF 1 Si:'0 '>4 ss NZ 1 2S•IF ?50C 3 Q()
75 03 260gOOSlLVEf< (,ULCH 1 :,co 7 l ss Ne 1 1 QMC .:;ooc 75 OJ ?rO<.JOOw >-< IVtR'dO• J ':,?(• 74 sc, Ne 1 1 Q"IC <>011C 75 03 26040fJHL1J~. 1-'0 I ,~T l ':ii:'<lY I ss N2 2 1 OOTF ?QOC b 3(\ 7"> 03 ?f,0400HL!.Jt P(J I J T l ':i2U':I 7 L i\12 l UOTF >OOC 75 03 262417Mll.L C><t F: K r) l ':>? 111 s s N4 3 7SMF "one 7i:;, OJ ?'i0900MU"'U-,fNT l':, I' :-,'.:, N2 1 ':,OTC ·.> cJoC 7-, 0) ?60400RAL ST(, IIJ C><f:FK 1:,? '>S i,2 1 2'>TC ":; ()(18
75 (lJ 2713001: ../lVF~':-!' 1f s l ::,? u'144 h 7 5 (lJ ?7I430Jt1\JN!f 1-'At~K E f< ·J l :,? l '+ (142 75 03 ?7 J 4J,1.H:. W, It fJ A <K •:..J s 1 ':i r'l '+ 1.:. l 75 03 2714JOPEACUCK l:i?l'+242 75 OJ 17 l44'-,Crll 1·1J-' ION J':,?1444? ':>SA/12 TR 75 03 ?71200CUAL CH. fK l':,?l :,M ss Nl I 1 n TF 45C 75 03 271 IOnfNG ll\J~ t>< ,., r l ':>21 ::,<J ss NJ 2 75TF ,.5oq
75 03 <'711 OOf ,,r:, J Nf Fl' MT l':> 2 t r,O :,S NJ c 80TF ;;; one 75 03 271 lOOfr,,r;If>JEf-_h ,.q 1:,? l o l SS l~j l 80TF c; onc 75 03 ?Rl0',0HkUUKLYI\J5 G 1:,7 r1e24 l :,<,AA2 F 1 !OTC <-OM! 7 5 03 ?Rl05()Hr<u0><.L HJ S L l :,cL) ~ 1,.1 7':, OJ cR090Q 5 L !I-'µ~ RY JIM ! S20ol L 1~2 5 HC 1QOC 7'> 03 ?Rl23UI:. f! I Vt .i c, I OF 152(,044') 75 03 ?Rl2JOMvfHt,.., CL IIIJE l':l?Ut>'i4l LAA?. F !OTC ?(lOC 3 10 75 OJ 281230~0 f Ht.f! C:L 1-',E l':ii:'OoC/t+l L~A2 F InTC :> One 3 10 75 03 2Al2JOMvTHEh' CL INF l ':l?Ob'-141 LAA2 F lOTC ?OOC 3 10 75 03 ?8130() ', !l.Vf:. h ..- p 1"' r I '::> r' u 7 r. L NI 75 03 280900w>-il Tl- FI>< l'>?Of? ss NJ 25TR1;:>00C 75 03 ?P0900W 1;lJAllAL UPt l '>20 /':, l. ~.2 'iRC lOOC 75 03 281 lOO "lLIJI:. ,-,o 1 N r I'> ? () ':I'" LAU2 F 75TC :i5oc 3 10 7 5 03 ? P. 0440><0C r<.w ALL l::, ?! t) l L I\J c F 'i>lR 1 c; n s
75 03 ?80930fAC,Lf l:it:!!04 L Ne <;..;L , c,oc
75 OJ 2Pl04f\Fllf,Lt i :i? 1 d.:. ,,] :,':, ,iA ? f ST>< 1 OOR 75 03 ?Rl 1)4(J EA•,L t J 5;:> l 04,. l LA At' :, TC 1 () 0 i3 7':> f'3 ?>l l <J 1 ,1TtL~'-.C:<.' n l '>., l IJ',,. I <;c; n Ac f l t1 TC ,; 011R
212
'.., (3 ,..,~,) 'j ;Jf)f.., 1J~hr- A"'<~~;•, l::,? L ,' I 1 7':> 03 -'is040UMUNlJr~fNT 152 L Nl TC l ZSC 7':, 03 ? ,HJ 8 J fJ ,-, l LL (;;FFK A"it I\ l-,;:, ss N2 10 T 1,()()R
7S r.1 30131,0P!I l 'S?.004 L N2 lOTC !..OOR 7':, 03 lOlJOOThl...!fY l '=>20US L N2 lOTL !,.()()13
7S (JJ 30 l l000L (J c., M [ ·'lf_,U,l "<tJI ::,?OJ l L N2 5TL ?"iOR 75 03 30 lJ•)()FA../. I h 15?•J7H WL NZ 25TC snoc 75 OJ rn 14ll o >'u...,c 1 1f-' p .f. l:>2103 L ~12 'i>-ll l soc 75 03 1014001-l/ ·~ 104 + l lJ c:; 1 :,2 L N2 1 OTF l CjOR 7', 03 -lU l 4 U O IJ ,J f' "< + M I l. L CK • ~" F I\ l ':, t' L NJ T c;;QoR 75 04 1 1 SO Ow J L Ul w SWA-·~p l ',20':I'> ss 1\/2 ? 25T~ :>SOR 7':> \14 111 30f-<LUt'. t-'l![N T l 5,.,U'-17 L ·~2 lOTL lSOC J 40 75 04 llOOORUCKwALL l ':>2 l O 1 L N? 5ML 1 nnc 2 1(1 75 04 l 240SS"i0WSL I()F GlJL Crl l ':>21 J?. ',S "iJ 50TL C 75 04 l ;>41 7SNUW'>l I L)E GtJL C"i ]5?1J? ss N3 SfJTL ~
75 04 I 15'10Ct1n·<PlOI, l ':>2144 '12 75 04 l l600SWA 1~P 15? 1::,1. ss 1\/2 5TC :>OOR 75 04 l l630Ht.l\f1<'! Hf.>OWN 15? l':, C, ss N3 ? IO Q TF 1soc 6 son 75 04 4l400i\NI/IL c;,-,-1 I /\IE 1:i?Olil <IL NZ r ~SOR 75 04 4l500QL) s ·~!'H:-l~l .,,JI :,c'(l(j l WL NI j,)T 150,3 75 04 <+1500>'lf 1 S201J4 ,1/l NZ 'i T ,SOR 7"> ('14 4l4LJOE ,<JVF~SillE s 15?06? L N2 25TC 1n0c 3 so 7'::o 04 4l401lE f.llVE.,.<,Illf L l '.:J2{1o':J L "J2 In TC 15oC 3 10 (l
7'> 04 41200,illL')W <,,. A"I P I ~211'1"> L 1'<2 75 04 4l400Jt:N•\/Jt f-'A><KE~ ,\j 1521<+1) Wl_ N2 5Tw ?()()Fj
7 <, 04 4120()<,lli-seJLI:""', K,\J O<.; l':,21">1 Wl N? src :>O nR 75 04 61200GU..\l-lLERS K~•o ~ l'.:J?l':>l Wl NZ src e>()O"l
75 04 hJ200Ht. •JkY '<Kl) V"J 1521::,"J 1Ml N2 S T'1 l "i'JH 75 04 1109001-l><Ull"-L YNS [) l ':>?O I'-\ L N2 STC ll'l0r1 75 04 110<./()l)>-1-<i)OKL '(,~':, ,_ [ :,?ll ! 'I L N? ",ff.I 1/)()H
75 04 I JO<.i01)8><l)liKLYNS G I :>202? L "12 ,TL l'.5()A 75 04 1213nnt1NV!L l"><"lUI l N? T -~ o n11
75 04 l?l?lJOE LI "it (-1 ~ F ..:: [ ">?\'+Cl l N2 "ii" 1 noc 2 1n 75 04 1? 120 IJ • L ['11: ( -<t ~-" 1-,.:> j ':,() :,':, •,2 s"" 1 one 75 04 12123'1<; .,iA''f-' j'.j,)J':,4 ss N2 l src ?{)()f:j
7S 04 l?l,'3nHf ' ,><Y Hn) .~<\/ IS?! '.:l'> ':,':, N2 ? 1 r)TL 1onc s 21111
75 04 12 12 0 of ~ 1J I'< t::. Ek A l '.:J? j ::,<.; ss ·\/2 1 SOT ,.one 75 04 1?120'1•\JG[N~r"' "' [ ::,? 1 oil '>S "J2 l ?ST 1, ')flR 75 04 lcl?OOFN',!Nrr.-< r J::,?\61 ':,$ NZ l 25T ·,O r,k 75 1)4 lJl3'10~N•/lL 1 :>20ll l l N2 T c;()()l:l
75 04 131700"'0µ1 1 ':,;.>(J,) 7 .oil N2 lOTC <- 0 Ol'i
7'-> li4 13 CA•W 1 S?PIJ.>< L NJ ;, so r >< 1 ;,o nR 7':> 04 130SOO..;,<UUKL no " l':>cvlf> ss 1~2 l 1 nTF 1onR 75 04 131200 k,<,_)ll'\L Y '·"- n [ ::, 2 1! [ >< L ,,2 l 1 ore "-O'lR 7S 04 130'>0(),N<) UKL 'f,,C.. • I 5?01 '-1 ss N2 2 Jill~ c..OOR 75 04 13 H-/l)UKL Y's'> >-_ I "it'1,l Y wl N2 STh' "0nR 75 04 130 j()(1"">< ')1JKL Y,,c; F l '=>?<1c•, '.:>S NJ 2 90T I nooc 75 04 1 ~U 11) ,) ,H1)•J~ L Y,,c; ., 1 :;211 c ) c,c, N2 I 1ST 7()08
75 04 1.31 11 <;H../IJlJI< L Y"'i >-l I :,,:'rl2J C,'., N2 1nrc '-1108
75 04 l 1 J 'll1fl<-<-l i )!lr', L Yr, 'i lS? <1 ?4 '-,', Ne l;) TC ,, 0011
75 (14 J 31 J() 1) '-'"•)IJK L Yi,,-, L 1 :,,' !),:'' ss 1'12 l '1 TC ,,onR 7S 04 1113/Jn ... ,,;J u •LY ,,,., , ) 5? '),:',< ::,<, "'2 l /J TC ,, n nrl
75 04 l 30 30 n T"' I'" c,...i)S'.> J ·11; :, l S2<1 JI :::,~/ NJ lOTK '•()I) i3 75 04 1 lO JO nl\i •·1 l l\Jr ",, L ·,~ [ I JIJt) ::,;, •i l j r,? zc:; <.Oflrl
75 04 1303 011 •-J 1 It-, t_ '"· L H«! i)G t.l::, Z') J 'l '>S "1 2 2:, c..OPH 7S 04 IJ1)r<Of1lh rl~'-slt l:i c'. · ' l ':, S':, Ne' srn ~ ') () 11
7S 04 1 ·rn5onMA·~"'·UT TU,i•~ 1 '> c' 11 l 'J L ., I
75 04 i 3 0 5 0 n LU "I l, f' r LL ,) • l :,('1\ .l '~ l ,1
7S 04 130500kt) n J l :,?()44 ss r,2 c, TL S f) n R 75 04 l 105fl<lf,t:: 'If:. SSf:_t .., I'->,.., o '+'> ~c- "' 2 lL 1i.r1 n~ 75 04 13010()-"1:J _l •IT ? l :,21)4 7 ss '"2 I c, 70()H 75 04 1101/J /)"'tc ' ) ,. r 2 l':>/•H 7 L Ni? 1n 7(Jf\rl
75 ()4 l JOJQO,<t.1> "1T ;, I :>?O<+ 7 ::,S M2 ;> 10M..i ',01)8
75 04 1.105()'1~ 1.J,)AIJAL U>-'•_ l :,;;>()t,I) L "'l 7':> 04 131201) SL I t-'Pt:_e1Y ,lj.., l ::,?Ool L N2 75 1)1, 1 ,()",(1 nF ...,[Vt..,Sir·,.- l ':,)ll',4 Nl
213
7':, 04 l 3 I JJOE "IV[><':, I ' it L l 'i.- Ub 'o WL !\le I() fl-< lOOC 2 AO 75 04 131)':>()0E ><!VfkSIOf L !':><'Do':> ss NJ 2 sn,lf lf)OC 7 l c; f) 75 04 l305ClON ""'t.><Gt_r-.C y 1-'HO"J l '52Ub6 c;s N2 1 50M l ooc 4 71.j
75 04 IJOSOOMOfHEK CLINF l'::>2069 ss NJ I l OOTF ,,one s 800 75 04 130500,lrllTf. FI>< 152072 L Nl 75 04 130500SILVU< <ii.JLCl-i 15?ll73 L Nl 75 04 130500',oi ,:,i.JAOALUl-'E 1S2U7S L Nl 75 04 130500,iATft< l,AUGF t~ 1520/6 L Nl 75 04 }31200•/IITf:.R GAUGE N 1S2076 L N2 7S (14 130500011!':,Y h!LL 1S2lltb L r.l 75 04 130500GALl:.NA LION GLCHl 521P:iH L Nl 75 04 ) 3tJ500GUVtKl"OR GULCH I ::.20'}() L Nl 75 04 130500GOVt.RNOt< GULCH l '::>?.O'JO L Nl 75 04 13050 ()KI 1\1(, 1 '::>?. 0 'J 1 L Nl 75 04 130500K I \j(; 1520'}1 L Nl 7S 04 l:lOSOOWILLOw SwA,..P 1520'1 "> L N2 lOTL 100!'! 75 04 13 RL1JE 1>ILLOw I 520'J6 L N2 ST "00C 75 04 130SOOFL•Jt f-'Ol'H 15? fl '-17 L NJ 7S ()4 1303008Li.Jt POINT Lt:FT 1520'17 <:,S r,2 !OT :>OOC 5 l O fl 75 04 l31200SILVE~ LE0Gt M! ··ns2100 L N2 75 04 130500ROCKl<IALL 152101 ss "l2 lOTR 150C 2 2c:;o 75 04 l 31200ROCK•'ALL bt'l <J 1 L N2 75 04 130500P0-<CUf'lt'<f 152103 L :\l2 5Kf l?SC 2 40 7S 04 I 30301)EA ,,LE l ':>2104 ss Ne 2 lOTLl o008 75 04 131 lJOEAf;LE 15?lil4 L N2 5'1R AOOR 7S 04 13 Tt.LtSCllf-'E I '::>c?l o S c;s N2 2 20TR ~noR 75 04 11 Mi.JLESHOE 15?10'> c;5 N3 l SnTF?nOofl 75 04 11 HULL ION KIN <; lS?lU7 ss 1\jJ 2 75TF2t.00C 75 04 l30300M!LL CPEfK A l':>?lUH ss N2 25 ll'lOOC 75 04 130300,nLL C><r ft< ' l':> 2 1 OY ss N2 2s 1 none 75 04 130100'HLL c~F: ft< C 15211 O ss N2 25 1 nooc 75 04 130300MJLL (.:lftK lJ l ':,? 11 l ss N2 25 l o101lC 75 04 l30300MILL C><EEK f 15?11? c; s N2 25 I nl)OC 75 04 J 30300M!ll C><f: f:,<; I Si' 11 l s~ 1~2 2'> 111onc 75 04 l 30500RAT I LE St1l P l '::>2! 2>l L NI 75 04 1105001-'IC"l !:. >1At<.:lt.L IS?lJl L NI 75 04 l31200E LI '~t. C"'!:.fK J ':>2 l 4Y L N2 75 04 131200.i LIME Cc!EEK 152 1':>IJ L N2 75 04 131200GO':l lllf.><S K>JO>-l J 5?1 'JI L N2 75 04 130 lOOft'll!,!NfE;.> A l Sci SY L N2 :::, 1 OOR 75 04 130301)fN<.,lNEEt< A l '::>?) ':>9 ss N2 c., 1008 75 04 130300FNGHitff.' t< !S2l611 ss Ne l !OTC lOl)R 75 04 130300ENGINEEt< C lS?Jol ss N? 1 !OTC ,008 75 04 13050 0 Rb) '1TN.PAS S A><EA1':>? L "'l 75 04 130500<./URY CLI f FS l 'J? L Nl 75 04 131 ?OOMOl'-li.JMENl 152 L t\i2 75 04 lll)OOTUI-IKS I-if: Al) A-If A 15? ss N2 ? T :> OOB 75 04 I 312001JNCUMPA(,-<E G,JR<;E l Sc wL N2 75 04 130100M l1'IERAL HAS.AREAlS? ss NJ 2 T ~one 75 04 l32417TwlllGHT i->K. ARF !\ l S2 ss N4 75T C 75 04 l4240ST.ilLlbHT f'K. !\kEAl '::>2 55 N4 75T C 75 04 15 Hf.'uOKLYNS n 1520 l 'l loll 1,2 2t:;TF 4',08 75 04 1516011;'.J><tJlJKLYNS j 15202', "'L N2 STR SOOR 75 04 151431\E lJMt. C-1!:.f K l':>2149 .iL NJ TC C 2 5 75 04 1Fl2100FAGLE. b?l04 L "J2 lOTLlQOOR 75 04 1 F<~ l 00 Tt:Ll:.S CO I-E 15210'"> L Ne lOTRl:>OOR 75 04 181500MULl:.SHOE 1S210h L NZ 5TC 'iOOB 75 04 l!lclOOMi.Jlt. SrlOt. l '::>21 01', L "l2 lQTCl1-.00C 75 04 lfl2100M!LL C~tEK f 152112 ss Ne 2 25TClOOOC 75 04 181500M!LL Cl<U:K G 15?114 N2 C 75 04 l8l900ClJMM0[)0RE GLAREAIS2 ss N2 2 1-.00 75 04 l R2417PR\)SPCT tjAS.AREA152 ss NJ 3 Tfll\OOC 75 04 lP}QOOTK!CO HASI"l AREA1S2 ss N3 ? T l:>OOC 75 04 l91200ANV!L 1S200 l wL N2 TL ,ong 75 04 191100N ,'1 !NtYAL Rk!DGU5?0J3 L N2 STL 700R 75 04 l9}f,OOS1LVEt< f'L)!NT 152070 t!il N2 B 6 c;o
214
7 ', ()4 l Y l cO()W lLLLJw S••A"11-' l :ic'(J-;:, L 1\42 ">TL 151JR 75 04 !YllrJ()'"'LUt t-0 Jr~ T J':,?0-H L Ne l fJTR '>()()
75 ()4 JQJ?OfJ~AGLE l :i<' I 04 L N2 5TR 1,SOR 7":, 04 cO I ?'l O ~r<0UKL yr,,:, K 1520 I /Ci L N2 STC 100B 75 04 t.'0 I ?fJOF r;UALJALIJl-'f 15?06() «L N2 5"1C 1008 75 (14 ?0 I cOO •,JH [ H . FI '-I l '::>?0 I? L r>.2 I0TLJ100H 75 04 ?Ol?U()c;JLVE>< (,,IL CH 15?0 73 L N? ',ML ,:,o 08 7c, 04 r' ??4J7 SL!t-t-r><Y JI·• I :i?ur:, I vll N,' IOMF 17SC 7"> 04 r'JJ)C)I)(, ~ l tl(,E 15 ,?0>:l'-1 wL NZ 1 OTC ,50R 75 (J4 ?4 J 4tl ')ULll ", "1111t:.w ~L .-<,)! ::>20111 v/L N? 10 TC! f\0/\R 7:, 04 ?4lfi00K'-10\JKLYI\• I, 152022 WL NJ(; 2STL ::i onR 75 o,, ? 4lhOQ.:>..IOOKLYN j l ':>?lie', .,L N2 !OTC '-SOR 7'::> 04 ?4lo0('N ,~!Nt'-IAL Hf.lIOGEl'::>2PJ) WL N2 SMC •SOR 75 (14 ?4l40'lE ,,,JA[)ALIJ'-'f 1 ::>2060 WL N2 5'1L 1,()1)'3
75 04 ?406(}1)MUTHf:.1< C.LlNf l 5?0t>Y ws NZ(, t!. 1 om ?OOC 5 Rfl 75 04 ?4 [2()t1V!rl] It FI"' 15?. 0 7 i' wl Ne STL c;onR 75 <,4 ?.41200SlLVE.1< (;uLCH I :>20 T 3 'oil Nt!. SML ::;ooB 75 04 241 300111 R!Vt:.><S1Df l',?074 WL "<2 5ML J t,011R 75 (J4 r4120f1wAH>< GAUGE N 1520 71-i l!IL NZ l OMC lOOC 75 04 c4 l ;,onrJ ... r ::,y HILL 15?,l>:l'-i WL Ni' STR :>OOB 75 ()4 ?414flrJ~L•JE IN ILLO-i 1 :,,''lYt:, '1L Ne !OTC , noc ?()
7S 04 24?4 l 7HLdr. P1)I , f I ScllY 7 WL Ne IOTL ,one ?O 7S (J4 ?4l?00kUCKi.ALL I:, 21111 ·..iL Nl 75 04 ;> 4 0 YS ') l<tJCK ,, ALL l '::>21 u I "L ,~2 '-i'1L 100H 4 '"' 7<; 04 ?41.l3()t-'01<CUI-' !f,E l:>210341 75 04 <:'41 :nnF. A<,U: I':>? 1 U44c, «L AAJG F 1orc21ooc 4 300 75 04 c4 l l30TELESC01-'f. l':>?.lU':>41 75 04 2SIAJn •~tJTHh< CL I 1~E ] '::>?06Y wS N2G '>O •OOri 75 04 2Sl70tl"'VTHE« CL I "<E l :>2/JoY ws N?G 7S 04 251 70•1~1UT.-lt_r< CL!'JF I S;><rt,'! .. s Ne(; 75 04 ;,c; l HJ0"10THE1< CL l NE. l :i20t>Y ws N2G "1 <OOH 6 101) l l l 1 I 75 04 ;,c; 120 ()•it."" Y HK ~)\1-1""4 J ':>cl=>.., I'll NC ':,ML , soc I I fl 75 04 ?5 f rsG I Nt: F.'"' ...,T ~ I':>< l '>Y WL NZ "iTC 10 OR 75 04 ?.i> Ol',0'1><fd "11 I l ':l20'+ 7 L Ne TC <. () "'1 75 04 2>-i050•J>< lNt, l:i 2U 'il L NJ SOTF 100R 75 04 21'< 0 t,O I) csLIJf~ .- I) I·~ I J "??1197 L Ni:'. 7STF 8 3 1s 7'::, CJ4 ZA0'100"LUr .- T j '::,;>1H 7 L N2 TC 150c 1 Io 75 04 ?POJOO'l!LL {,>H 1,_, C 15?. l I 0 NZ
75 04 '30150fl!Sf T,. J I\J c«1JSS. l ':i?OJ 1 "L NZ !OTC ,OOB 75 04 10120flOJCK·..iALL l "> 2 1 II I ol/L Ne SM IOOR 7':, 05 ?1600EAGLt:. I Sc! 04 wL N2 JOT "1(}08
7S 05 ?I 600"1ULl:SHOE l '::>?. l t!A ·..iL Nt!. IO T 1t10R 75 05 5104S'lLUI:. PO INT l SZOY7 L NZ lOTL ?OOC c I',()
75 OS 1',?41)Sw ILLO.r SwA '1P l ':>?(J'j'-, ss Ne I() TL ?008 75 05 A24J"/MiLL CK F l S?. I l 3 N2 75 05 7~40S1>1!LLO,i c,INA"'1JJ l'-i 20 'i'> L N2 5TL 1 c;np
75 05 1 J;:>4171:NGINf tk '1fN C l:>211)1 w':, N2 I ')MC 1 Of1R 7S (15 J 1J4()1) S lLI/Fk u:1,r;f. '-l!LIS?lu?. "L Nt!.G .,,., 1 SllH
75 05 141401)1-'C [NT Yr<I: GL I :>clld 1 wL NJG ', lllTClnOoR 75 OS 14!":>0fl l l>-'rllk 1-'lJNI, N l:>r'.12'1 .;L N2 l () fl "" nt-1 75 OS l 5 l40()EA(,L~ l ':>?l 1)44) 75 05 hl4!0TELt.'>C·)l-'E l '>? J •J':>4 I 75 (15 l C,?.4} 71:NG JI\JEff/ "T l\j 152 ws NJ C, '1 (, or,c
75 OS 1524! 7fr,Jt,!Nr f." ·,A T. ~ l -,? .. ~ N 'lG 5 '-I 400( 75 05 I6?4J7C0LONY 15?0"> 1 vi', NJG 5 2S'1C2111)11C
75 (l", } h24J7F. 'J\.)AI •A L' 11-'f.'. l ':>201-i'l .,.., ·~)(, r< 2'; TL2'-fl0'< 75 05 171600DE4COC« 1 :,? l <+? wL NJG l5TC 7flOR I 0 70
75 05 V12417MlLL (,0\ L.l l :i? 111 i,/':, NJ 2SH a nn '< 7"', 05 J0;:>4J 7M!LL (!\ F l :ic 11? vi'.:, •,J t!.SP< .:il)OH
7'::> (IS lOr'4l 7Ss•> ·..i',L! lJt t,L l '>? l Jr' w:, N] SOTCP008
AV ~LA'IC"":O CJCCLl"<'-lf .,u:s • ~f4[j()r,, l..,,. 1474-7">
74 . 11 ll <4 ! 7oJf.. '-,Htsr h\(J)l ",'.:, Ne' ? s,,c •OOR
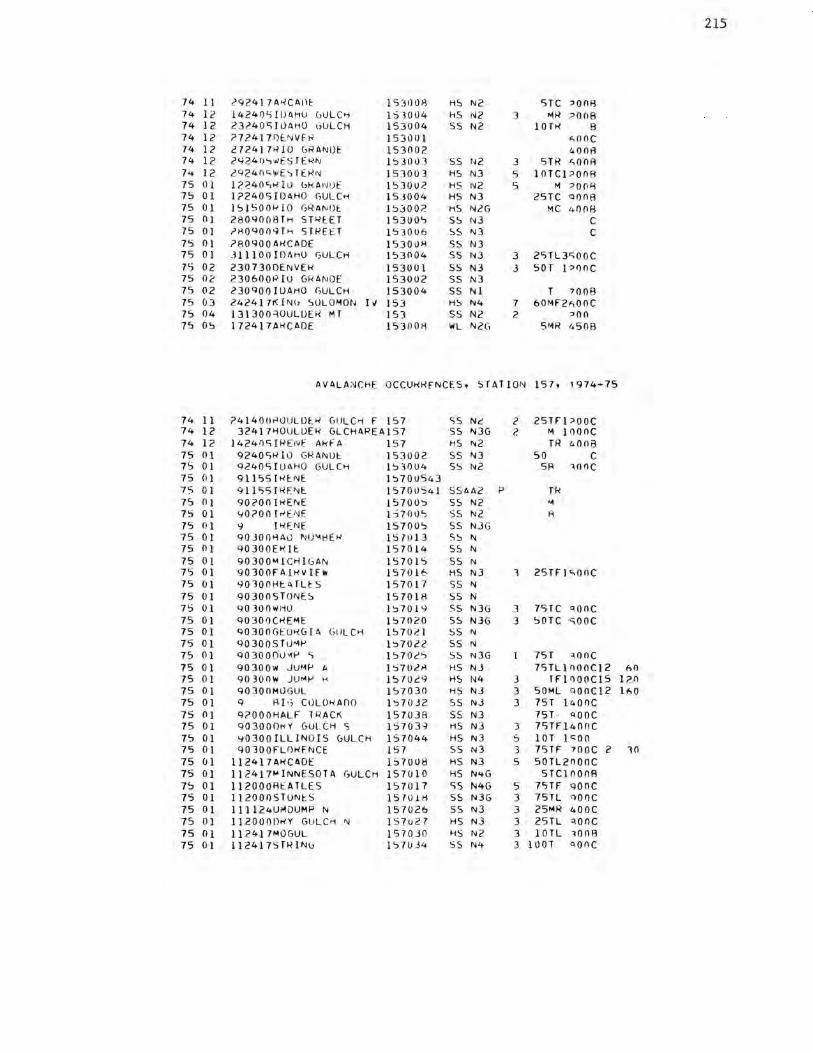
215
74 11 i.'CJ24l 7ARCAllE 15300R H!::> N2 5TC :>OOA 74 12 14240',!DAHU GULC>-1 153004 HS N2 3 "1R ?OOB 74 12 23?.40S ll)AHO t;ULCH 153004 ss N2 lOTR B 74 12 ?724171)1:NVER 153001 400C 74 l? 2724l 7•HO GR AN Of. 153002 400A 74 12 i.'<i24fJ-,,.iES TE>IN l ':,3003 55 N2 3 5TR <,OOA 74 12 2CJ240t;wE'> T tR1~ 15)003 HS N3 5 lOTCPOOR 75 01 1?<'40',>./IL) bk Al~!)f l 530U? HS 1'12 5 M :>OOR 75 01 1?2405IDAH0 ,,ULCt-i 153004 HS N3 25TC 0()08 75 0 l l51500h>l0 GRAf\l!)t l ':>3002 HS N2G MC Ml 08 75 01 2809008TH ST RE.ET 15300'> S!::> NJ C 75 01 ?l-l0900qTi; STREt:T 153006 !::>S N3 C 75 0 l ?80'10QARCADE 15301.)>I ss N3 75 0 1 JlllOO!DAHO GULCH 153004 55 N3 3 25TL3c;ooc 75 02 2307300ENVEfl 153001 ss N3 3 SOT 1 ;,one 75 02 230600RIO GRANDE 153002 ss N3 75 02 230CJOO ll)AHO GULCH 153004 55 Nl T 7008 75 03 24241 ?r<. IN(, SOL0"10N I,/ 153 HS N4 7 60Mf2<,00C 75 04 13130()"\0ULDER MT 153 55 N2 2 ?00 75 O!J 172417AriCADE 15300H WL N2G 5"'1R 1,508
AVALA,\JCHE OCCURRfNCESt STAT IOI~ 157t 1974-75
74 11 ?41400.-luULDt'< (,ULC>-i F 157 ss N,: ? 25TF1:>00C 74 12 32417>-!0ULUER GLCHAREA157 ss N3G 2 M l 000C 74 12 l424fJSIRE•"f Al-<F A 157 HS 1';2 TR 400i3 75 01 9240SRIO GRANl)t 153002 55 N3 50 C 75 01 9240S!UAH0 GULCH l':>3004 ss N2 SR ,one 75 01 91155IRE:.NE l':>700543 75 01 91155IRENt l 570tl541 SSAA2 p Tf,(
75 (lJ 90?00IREi'<E 15700':> 55 NZ "' 7S 01 90?00 !"ENE l 570 I)', ss N2 R
75 01 'I I ~ENE 157005 55 N3G 75 01 CJOJOO>-lAt.l NU'1tJER 157013 ss l\j
75 01 90300E~IE 157014 ss N 75 0 1 90300"1lCHIGAi'< 15701<; ss N
75 0 1 90300FA!RV!fw 157016 HS N3 .1 25TF I c.ooc 75 0 1 C/0100Ht11 TU: S 157017 55 N 75 01 90300STONES 157018 ss N 1':J 01 90100W,·H) l':>7019 ss N3G 3 75TC qooc 75 01 CJ0301JCRE,_,E 1':J7020 ss NJG 3 ':JOTC sooc 75 01 QOJOOGEO~G!II Gl!LC>-i l ':>70c I ss N
75 0 1 90300STU'11-' l':>7022 55 flj
75 0 1 CJ0300DU>1P '> 1570~5 S!::> N3G 75T qooc 75 01 903001'11 JU,_,P A 15702H HS NJ 75Tll OOOCl 2 I',()
75 01 90 300\11 JUMf-' H 1570~'/ HS N4 J TFll\OOC15 l ?.O 75 01 90300MOGUL 157030 HS NJ 3 SOML QOOC12 lnO 75 0 1 9 RI,; CULO~ A[)O 157032 ss NJ 3 75T 11.ooc 75 01 9?000HALF lRACr<. 157038 55 N3 75T· qooc 75 01 C,Q3000t-<Y GULCH S 15703~ HS NJ 3 75TF1400C 75 01 ~0300ILL!NOIS GULCH 157044 HS N3 5 lOT 1 c;oo 75 0 1 90 30 0 FL/lr<fNCE 157 ss N3 3 75TF 100c 2 10 75 0 1 ll2417AflCIIDE 157008 HS N3 5 50TL2flOOC 75 0 1 1)2417"'1NNESOTA f,ULCH 157010 HS N'+G 5TClOOnA 7':, 01 112000Ht:ATLES l':,7017 55 N4G s 75TF CJOOC 75 01 l l2000ST0Nt:S 1570!8 ss N3G 3 75TL QQOC 75 01 llll24UMDUMP N 157026 55 N3 3 25MR 400C 7S () 1 1120000MY GULCH f\/ 157u27 HS NJ 3 25TL qooc 75 01 11?417MOGUL 157030 HS N2 3 lOTL lOOA 75 01 11241 75 TR }Nt, 1 ':,7(JJ4 ss N4 3 1001 qonc
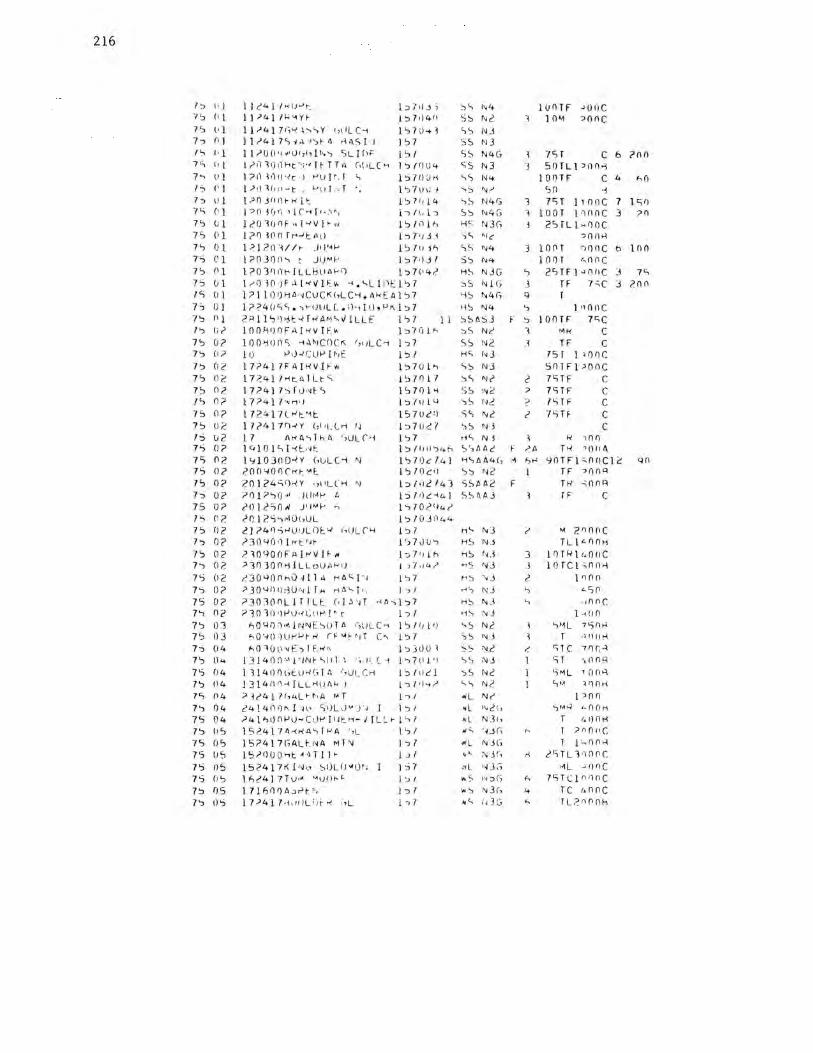
216
I-::, , , ] I I c4 I /><U..,t-_ 1:, 7 •JJ) :,C, 1,4 lUOTF "00C 7':, (1 I 11 ?4\ /1-<'IH I':> 7•14" S'::> r-.2 ~ 10"1 ?()/\C 7S l' l I l ,'4 j ?<i'-i 1,-,y ,,, IL c-, l':,70-.l S':, I\IJ 7-::, f,J ll?417C,,.:. ,,':,c~ rlll.S !·J l ':, 7 ss ~u /':, I• 1 11,'(J(l•i,1\)(,hl"-'> S L I flF 1 ':, 1 ss N4G 7S T C 6 ?no 7", ,, l I;,) 10:lHt ,,.,I~ TT £1 (,l iL(.., I 'J /OU<+ <;5 NJ 3 50TL l ?OfH 7..., lll J ? il l •)I)'< t ) >-'U !'. I C, 1 S 70 J ,i -.s l'J4 100TF C 4 f,()
h r, I l ,'•} 'l/1:1-t ; "u J .·• T l ':> 7U U ! ,::, "'" sn -~ 7:, Ul l ?O Jil fl c"" i 1-_ l'::>71,!4 ',:, N4G ' 7c:; T 11 one 7 1 c:; () 7c, (' ] I ·a fl l r1 r, ·, l (',... I' .;, ,, i J / 11 i ·-:, '::,:, f\t4G l lOOT l ·'lOOC 3 ?11 7'::, (J 1 1;011111F ~r .... v1 ,,., l SI i1 1,-., 1-i ~: NJG 3 2srL1 ~noc 7':, ll l l?rJ lfln fr-<..,,U• 1> I'.'> 7•JJ _i -~c:., ' IC ;on~ 7'> 01 Pl?OV/t- jl l'<f.' l '::, / ll jf, ss l\i4 3 1 0 () T .-,one t, 10 O 7S 0 1 I?() J () th t jlJM~• I :i ?•U I S'::> 1\14 1 0 () T r,n n c 7':, () 1 1 ?0 '31J()t, ILLb\tll" f) I':> 71''+<' HS NJG '> 2STFJ -,r,11( j 7,;., 7.C, (J 1 J ,-,o lO JF .-I I ..,I/If: 11, ... . "L mu':, 1 ::,'::, i's l(j J fF 1:.c j ?Oil I c:, 01 l?l lO<)t1,HCuO<<,LC'1.ll.><EAl'J7 "i'::, 1',4(, q T 7', 0 I 1??40",C,. ~HJUL L . lh ltl,>-'>\ l '.> 7 ,i :, "s4 '> 1 none 7':> ''l 2~ 11Sllijt~f"AM, V!LLf l '> 7 11 '.-:,',ASJ F '; I on TF 7C.C I'; U2 100 1-\<JO FAJ><V Jf.1< I::, 7 0 I " ::,'.', N<' 1 "'1k C 7':, ()? l O 0':lOOC, .-1A•,coc~ ,,,,LC'1 l':, 7 <,'::, 1~2 J TF C 7':, (I? Jr_j i-> ,)..,, CUf.' I ~,E l ':, I t-<C. lsJ 75 T 1 ,one 7 ':, (>2 l 7?4J 7F.11[ 1-iV J Fw I ':>7U \ ,-., <;', NJ 50TFPOOC 7'> n?. 17241 />-<t_ ti 1 Lt-<; I':, 7 () l 7 ':,C, N£' 2 ?STF C 7':, O? 17?417':i ru,-;t'> l'::i?fJH ss ,~2 ;, ?ST F C 7c.., O? 17?4\ 7•-,-1,1 I'.>/ u I 4 ') ', 1'12 ;;, fSTF C 7S II? 1 72'+17L"t ''l 1 S 7Uc'I 'i', Ne 2 7SH C 7'::, u?. 1 72'•] 7'1-IY (,I 11. l rl IJ l::, 7 ll c I ':,S NJ C IS U2 l 7 1\1-< A'> T k u ' iULC·l I ':>7 ''" 1\1 j ' k )()()
7S 0? \<,JIJl'.J--<t ,·lf_ 1 ':, / (/ ,, ';,." s ·,~ Ac ?.A T '< ,>()II f\ 7c:; O?. l<:,IOJOD~Y (,l.JL C,; I\J 1'>7 0c /4l '1SA.114(, .~ ,.., ... 9orF1-=-noc12 QO
75 O? 200 c;OllC"'r_ "l I':, I() c. •> ', :, N2 I TF ;()Ol'l 7 ', O? ?O} ?4SfH Y ,,t•LCH N 1::, / '·" t!. / 4) SSA A2 F Tri -; n ni~
h u? ?fl 1 ?':,() .• , . )lit~ f' l IS l•l.:'~4 l SS~AJ rF C 75 O? 2012,0..i jl JMf.' ...; } '; 70<''14 2 7 "-, n?. .>I) l 2Sc,,,\0{,UL I':> /OJ,144 7':, ()?. 21 ?4/IS>-IU!JUlt'< i,tJL('Y !:ii HS l',j ? "1 2nooc 7':> O? ?1040•) I1-<t 0, r 1 ') 7 J lJ '-> HS N.j TL\ <.'1nH 7'::, 02 ?10400Fill"l/1f-,. I::, 7·i I h H', Id 3 1 /J Th' l 1, 0 n C 7"> (I?. ?1f))Q0HlLLoUA"'J l ) / ,14? ~s ,,3 J 1 o rc1 ; nn>1 Vi 02 £']0400h0 J 11 A t·dl,['·J l '> 7 r':, ·,J ?. 1 non h O? ?Jocinn,1u 1.,1 r .. nAI... f ,, I ::,I r< ':, NJ .., t..C,(\
7 5 02 ?JOJOOL l T J Lt (, I~ 'IT ..<11.., l '.> 7 H:, i',J '-, .. one 7'-i Oc ;.,10111 l)f-'U,<ClW ! 'r h I t·1 ', \JJ j " [I()
7':, lll l)OllO,,,,, lNl\iE <-,u T A r,uLC" )'::,/IJ (tJ '>S N2 S•~L 7',[\t-<
7':, 03 ~o •.;o .) 1_w.., ~ r1 r~ ", ,, T ['\ 1 'J 7 ':, ', l~j T ,1111) t-<
7'5 (14 h0 l(Jp•,,1::-, J'f_ri l\ I:, .HJ O 1 s~ ·\Jc ,'_ c; 1 C 7{)r,~
7':, O« I 3 l 4 n n '·1 l' J N t- '> ( J T l , ; , ,: (. '1 I,-, 7 ti l '! '-,', NJ l ST ·, 11 nR 7S ()4 } 1}41)0tit.Uri(;J,~ ',Ut_Cr< I :, 111c I ':,'.', 1,2 SML ,on.:i ?':, 04 J 3 14 11 /'H ILLHUl1h- I L::, 7 'I-.? c,-, Ne '-,M V)()H
7S ()4 ;, l?4\ 71,i,L•~•A ,.. T J -,/ .iL Ne' I ,on 7 '; 04 c 4 I 4ill)" I ·H, C,•)L,.J V')' J l ':> I •l '"C i, SM"-< ,sO()H
75 04 ?4 \ 1i1)0f-'U~CUI-' [ IJtH- / !L e. , I ', I • l NJI, T r,l)OK
7S (IC, ]5~417~.-<c<A'-,ff-'£1 ' ,L 1':> I .,c, ';J r, " T ;,r,n"c 7 c; OS 15?4 I 7(,ALt-.Nl'.I M l"J l:, 7 wL NJ C, 1 I c..()(lt-<
75 OS 15,'tl(JQ ,-,t•Hll>- I J I ,c ....... 3 r, ,4 c'i TL l ·, () n C:
?S 05 ! 5?4 J 7K i'~c, SOL (J "ll', I ::i 7 NL 1, .Fi •~L C /) '1C 7S (J '::, lli ?. 417Tu,• ''UiJ~ ~ ]'.;/ ~s j\J'.::, () f, 7STC1 n,,nc 7':> 05 1 7160() 6_ar-'t " ' l:, 7 W ') ,\JJ(, 4 TC 4()(\( ,.., OS 17?41 7r1,i1JL• )t.., :,L I ~ 7 • <., ;~ 3G 1-, TL ,?/\00h
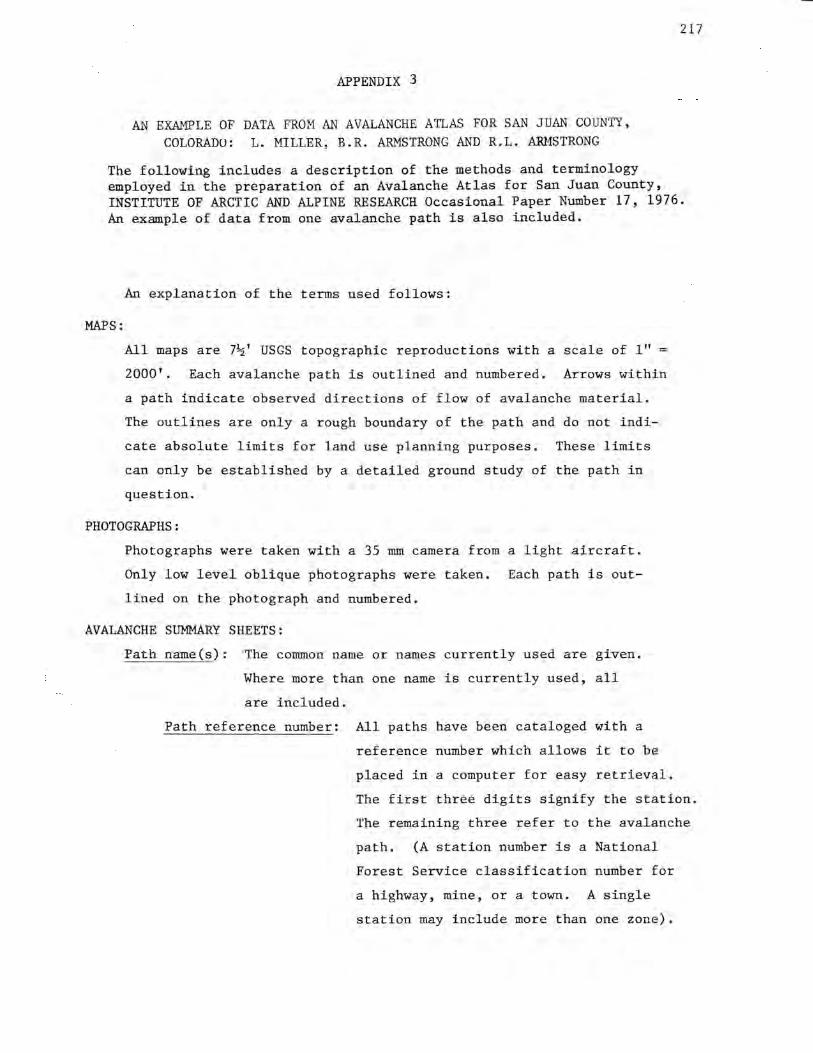
217
APPENDIX 3
AN EXAMPLE OF DATA FROM AN AVALANCHE ATLAS FOR SAN JUAN COUNTY, COLORADO: L. MILLER, B.R. ARMSTRONG AND R.L~ ARMSTRONG
The following includes a description of the methods and terminology employed in the preparation of an Avalanche Atlas for San Juan County, INSTITUTE OF ARCTIC AND ALPINE RESEARCH Occasional Paper Number 17, 1976. An example of data from one avalanche path is also included.
MAPS:
An explanation of the terms used follows:
All maps are 7~' USGS topographic reproductions with a scale of l" =
2000'. Each avalanche path is outlined and numbered, Arrows within
a path indicate observed directions of flow of avalanche material.
The outlines are only a rough boundary of the path and do not indi
cate absolute limits for land use planning purposes. These limits
can only be established by a detailed ground study of the path in
question.
PHOTOGRAPHS:
Photographs were taken with a 35 mm camera from a light aircraft.
Only low level oblique photographs were taken. Each path is out
lined on the photograph and numbered.
AVALANCHE SUMMARY SHEETS:
Path name(s): The common name or names currently used are given.
Where more than one name is currently used, all
are included.
Path reference number: All paths have been cataloged with a
reference number which allows it to be
placed in a computer for easy retrieval,
The first three digits signify the station.
The remaining three refer to the avalanche
path. (A station number is a National
Forest Service classification number for
a highway, mine, or a town. A single
station may include more than one zone).

218
Zone:
Area:
Map number:
Photograph number:
Specifications:
A zone is a region of geographic similarity;
for example the deep valley from Silverton
to Gladstone (Cement Creek) is considered
a single zone.
This category groups paths with similar
release characteristics.
Each map in the atlas is numbered, This
number appears on all avalanche summary
sheets to which it applies.
Each photograph is numbered. This
number appears on all avalanche summary
sheets to which it applies,
Elevations and vertical fall: Elevations and vertical fall are
taken directly from 1:24,000 scale maps.
Path lengths: Path lengths are computed as the sum of
the individually calculated lengths for
each of the three segments of the avalanche
path.
Number of starting zones: The number of starting zones are ob-
Starting zone:
Track:
Runout zone:
tained from maps and field observations.
In cases where the number of starting zones
is difficult to obtain due to the complexity
of terrain the term multiple is used.
The starting zone is the section of the
path where the initial rupture of the snow
pack occurs and the avalanche begins its
downward course.
The track is that section of the path that
funnels or guides the mass of falling snow
from the starting zone to the runout zone.
The runout zone is the section of the path
where an avalanche comes to rest. This is
the hazard zone principally because it is
frequently characterized by valley bottom
slopes which provide some of the few
areas in mountains that have slopes gentle
enough for construction purposes.
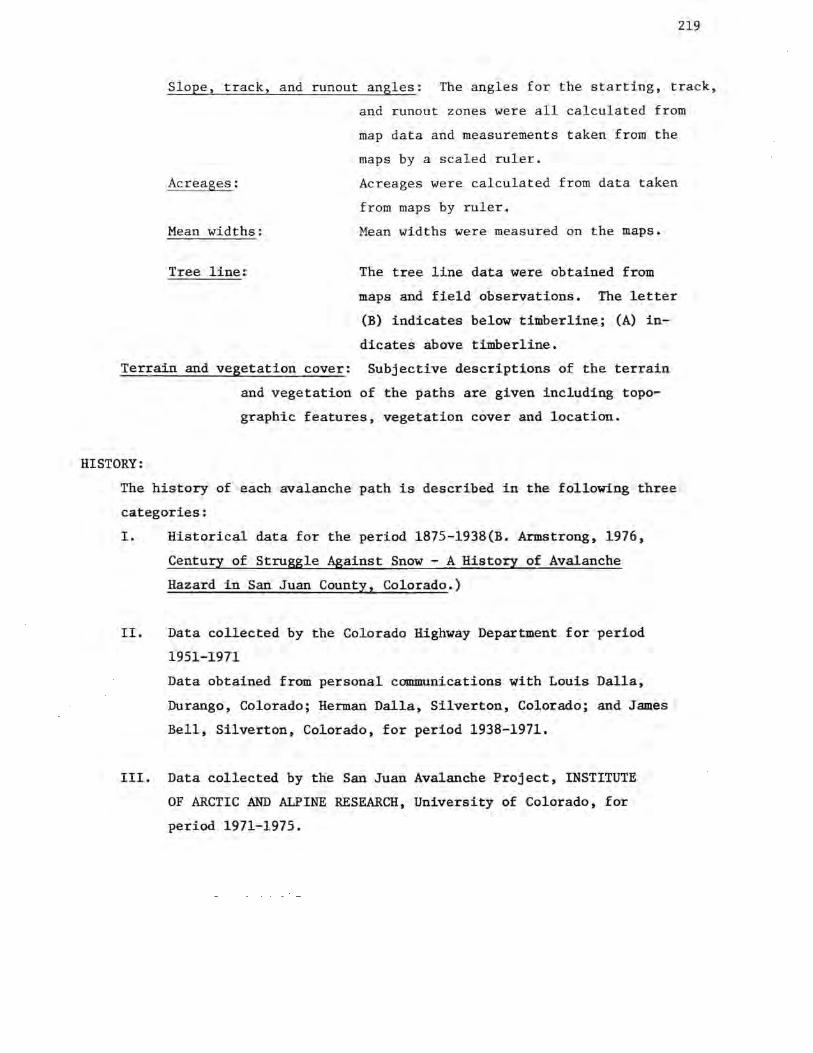
219
Slope, track, and runout angles: The angles for the starting, track,
and runout zones were all calculated from
map data and measurements taken from the
maps by a scaled ruler.
Acreages:
Mean widths:
Tree line:
Acreages were calculated from data taken
from maps by ruler.
Mean widths were measured on the maps.
The tree line data were obtained from
maps and field observations. The letter
(B) indicates below timberline; (A) in
dicates above timberline.
Terrain and vegetation cover: Subjective descriptions of the terrain
and vegetation of the paths are given including topo-
graphic features, vegetation cover and location.
HISTORY:
The history of each avalanche path is described in the following three
categories:
I. Historical data for the period 1875-1938(B. Armstrong, 1976,
Century of Struggle Against Snow - A History of Avalanche
Hazard in San Juan County, Colorado.)
II. Data collected by the Colorado Highway Department for period
1951-1971
Data obtained from personal communications with Louis Dalla,
Durango, Colorado; Herman Dalla, Silverton, Colorado; and James
Bell, Silverton, Colorado, for period 1938-1971.
III. Data collected by the San Juan Avalanche Project, INSTITUTE
OF ARCTIC AND ALPINE RESEARCH, University of Colorado, for
period 1971-1975.

220
AVAIJNGlE SUflmRY SHEET
PATH NAME ( 's): Eagle
Path Reference Number: 152104 Zone: IV Area: 6
Map Number: 3 ---- Photograph Number: 16,17
SPECIFICATIONS:
Top Elev.: 1260~ Bottom Elev.: 10400' Vertical Fall: 2200'
Length of Path: 4565' Number of Starting Zones: 3
Slope Angle
Area Acres
Tree Line
Starting Zone
41°
11
Above
Track
Mean Width 500'
Length 2332'
Below
TERRAIN AND VEGETATION COVER:
Starting Zone: Broad open slope, smooth cliffs
----Runout Zone
Area Acres 35
:selow
Track: Upper portion: broad open slope with broad v-shaped drainages; Lower portion: drainages narrow to single v-shaped gully. Light coniferous1
grass and bare ground
Runout Zone:
HISTORY: I.
Prior to 1951
Broadening fan, light coniferous, willows and grass
In March, 1884, the town of Chattanooga was struck by an avalanche from Independence Mt., northwest of town, which destroyed four buildings. The Independence mining claim is located in the Eagle slide path.
II. crossed highway: 35 1951-1971 during the winter of 1951-1952, the Eagle ran 6 times
III. events: 99 1971-1975 highway: 27
full-track: 38
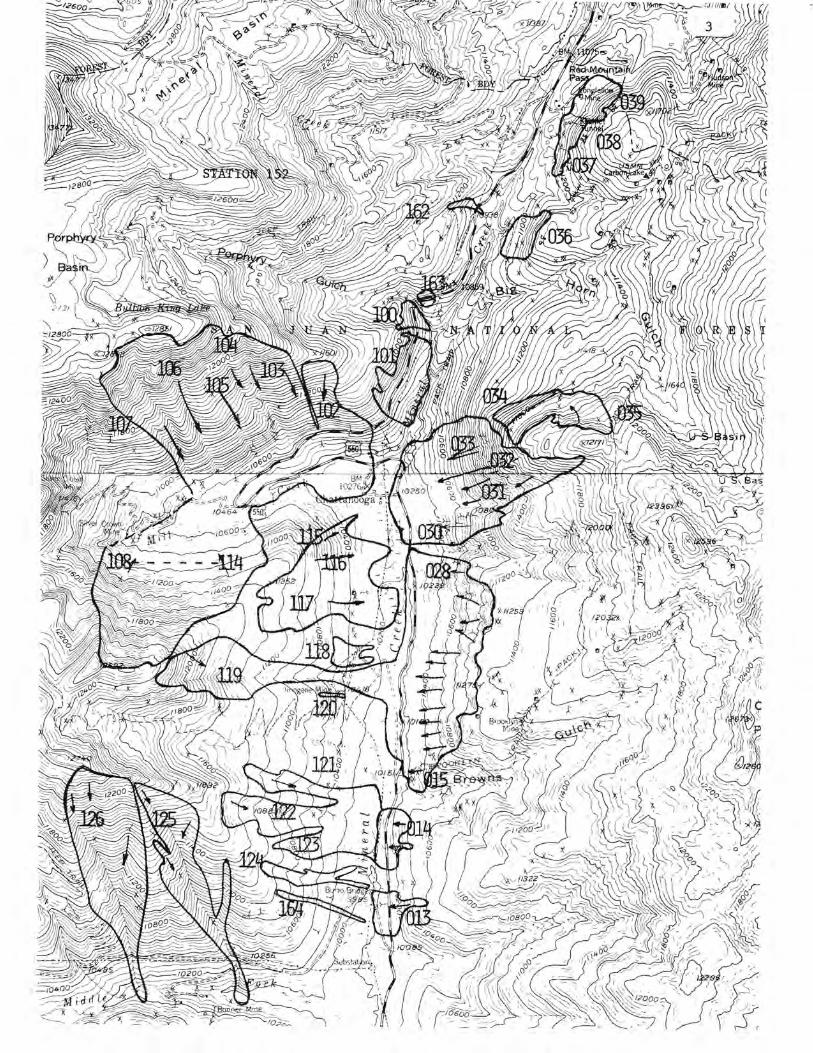
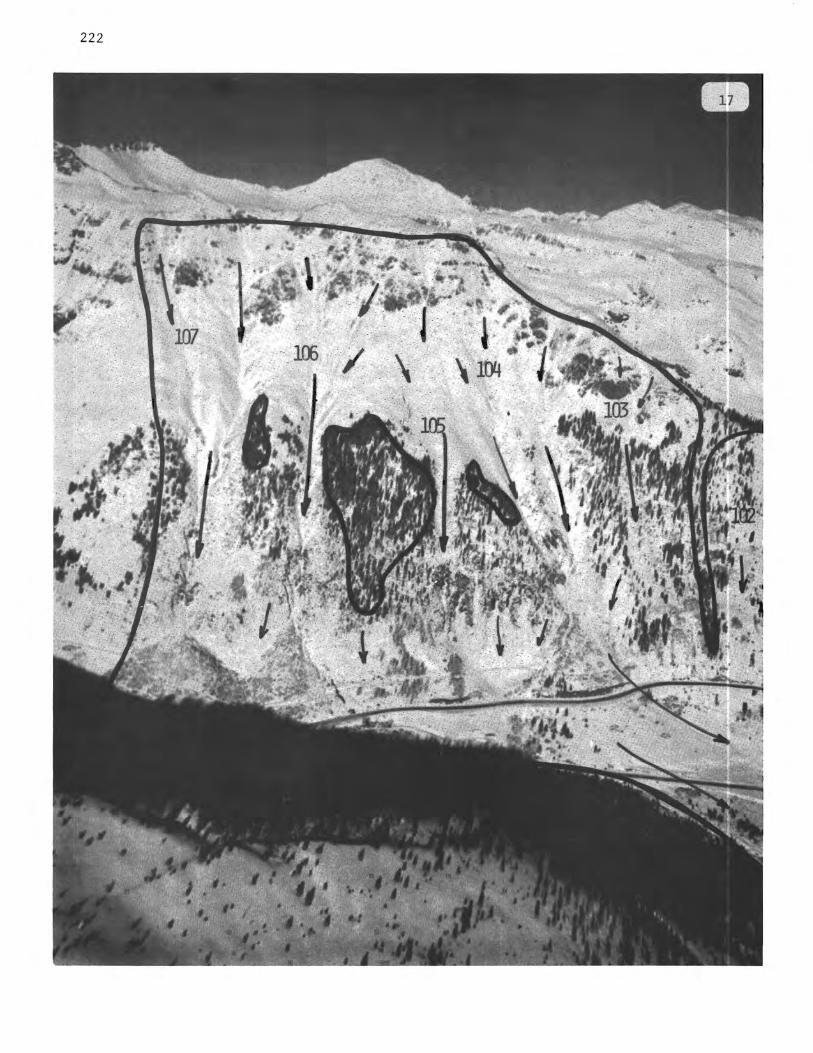
222
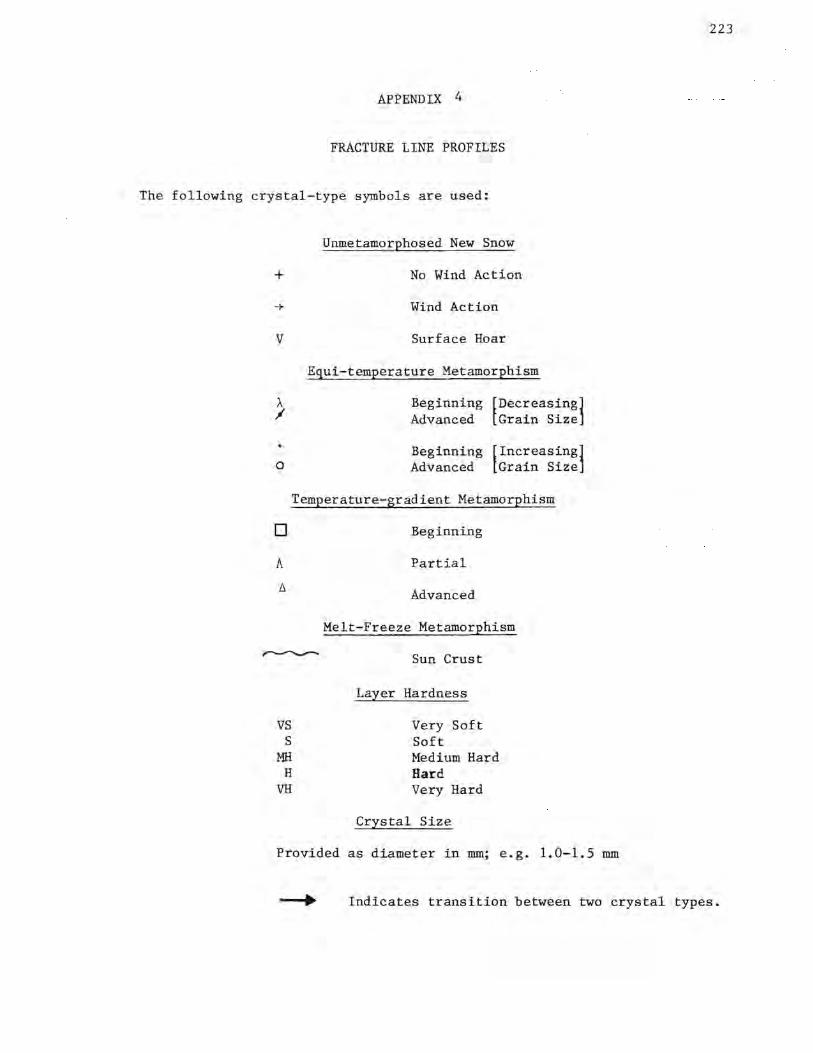
APPENDIX 4
FRACTURE LINE PROFILES
The following crystal-type symbols are used:
+
+
V
0
Unmetamorphosed New Snow
No Wind Action
Wind Action
Surface Hoar
Equi-temperature Metamorphism
Beginning [Decreasing] Advanced tGrain Size]
Beginning [Increasing] Advanced [Grain SizeJ
D
Temperature-gradient Metamorphism
Beginning
vs s
MH H
VH
Partial
Advanced
Melt-Freeze Metamorphism
Sun Crust
Layer Hardness
Very Soft Soft Medium Hard Hard Very Hard
Crystal Size
Provided as diameter in mm; e.g. 1.0-1.5 mm
223
Indicates transition between two crystal types.
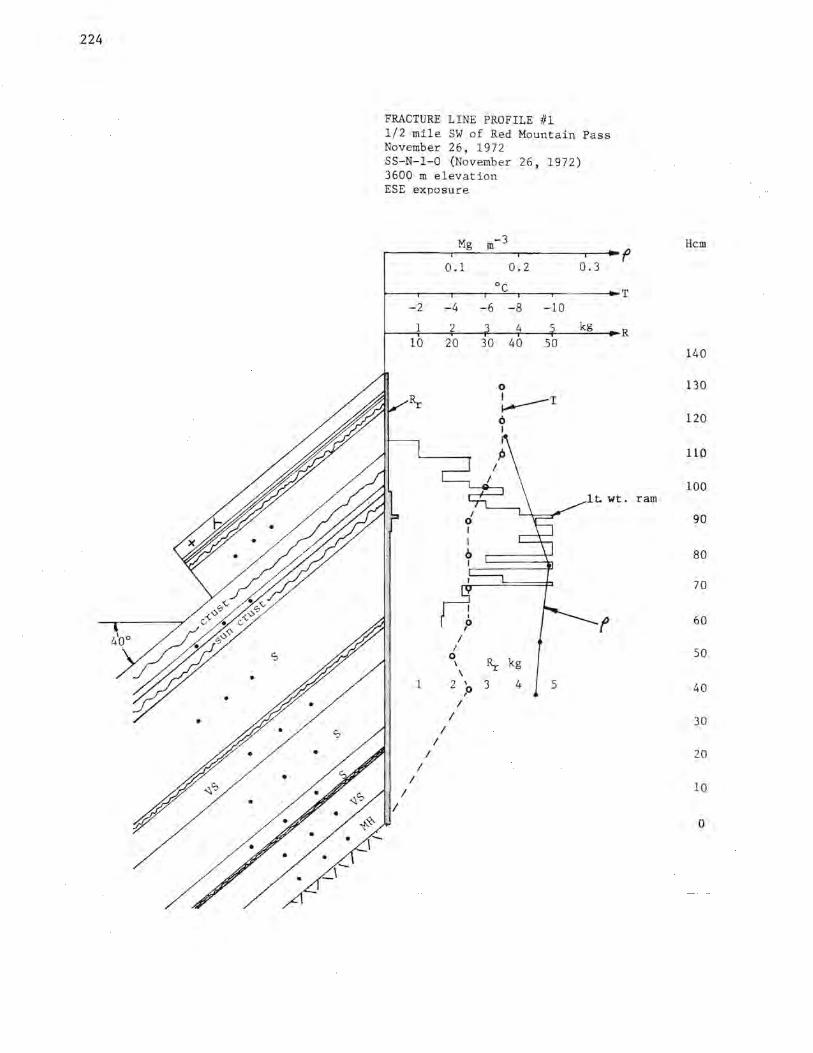
224
FRACTURE LINE PROFILE #1 1/2 mile SW of Red Mounta in Pa ss November 26 , 1972 SS-N-1-0 (November 26, 1972) 3600 m elevation ESE exposure
Mg m-3 Hem f
0.1 0.2 0.3
oc T
-2 -4 -6 -8 -10
1 2 kg R 10 20 30 40 50
140
130
120
110
100
90
80
70
I I
f 60 0 I
I I 50 0
Rr kg ' \ 1 2 \
,0 3 4 5 40 I
I I
30
I I 20
I I
10 I I
0
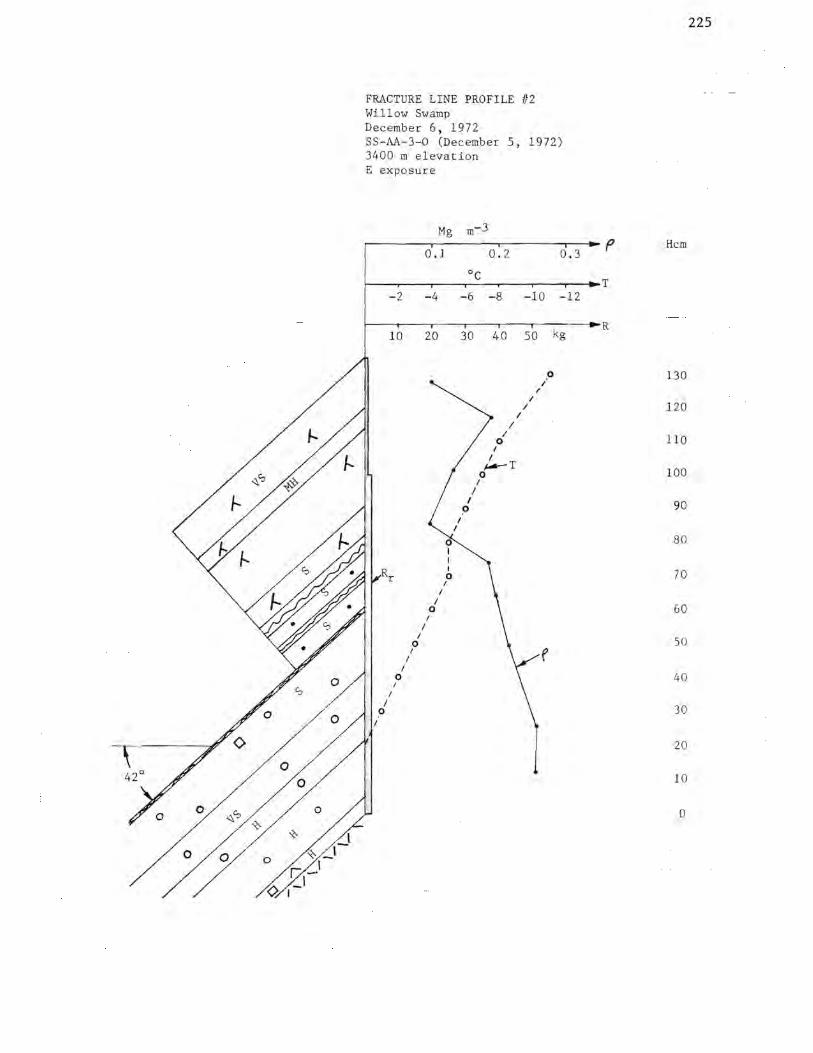
-' » _, G _I
<;>, I _I
FRACTURE LINE PROFILE #2 Willow Swamp December 6, 1972 SS-AA-3-0 (December 5, 1972) 3400 m elevation E exposure
Mg m-3
0,1 0.2 0.3
oc -2 -4 -6 -8 -10 -12
f
T
kg ----R
10 20 30 40 50
.o /
/ I
/ I
I I
0 I
I JJ,-T
0 I
I I
.o I
I
I I I
r 0 I
I I
0 I
I I
0 I f I
I 0
225
Hem
130
120
110
100
90
80
70
60
50
40
30
20
10
0
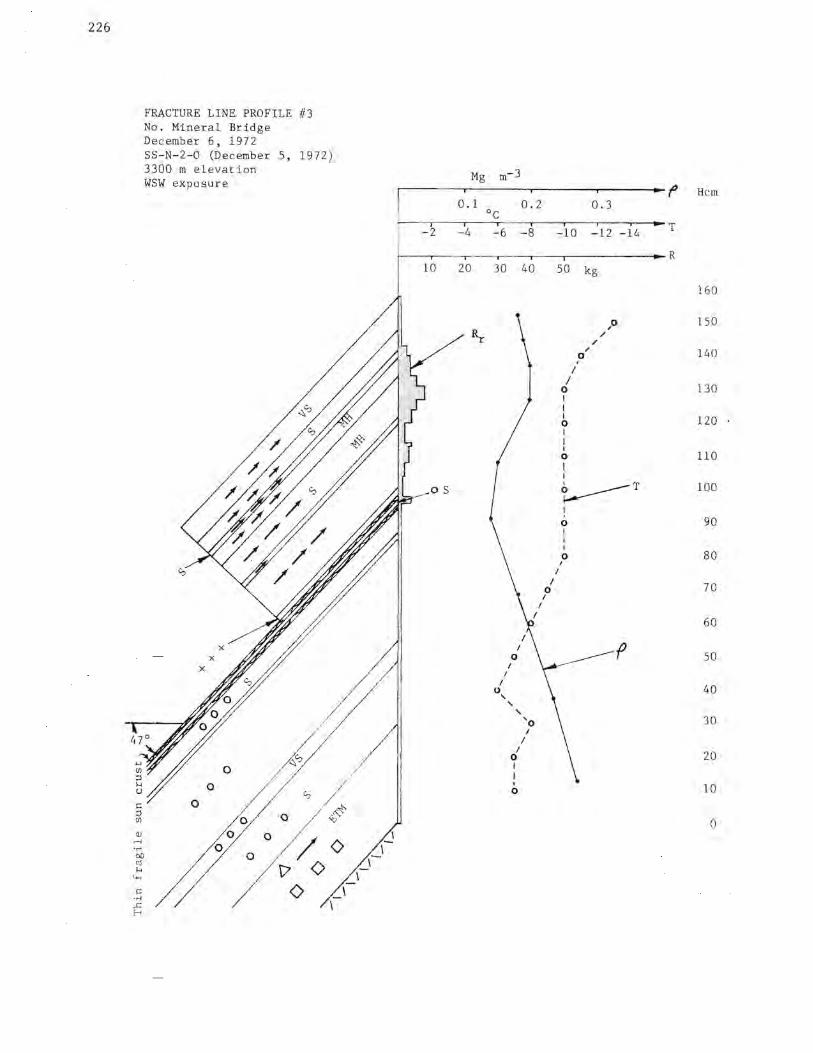
226
~ ::l [J)
Cl)
.-I . .-,
FRACTURE LINE PROFILE #3 No. Mineral Bridge December 6 , 1972 SS-N-2-0 (December 5, 1972) 3300 m elevation WSW exposure
X
X
~ /
/
0 l'.).C;,
/
0 C;, / 0 /
Q // "'~~ 0 0 0
0 bO 0 / / 0 / 170 <> rel i-,
I
"" ~ \
·.-i -.r:: ,....
Mg
0. 1
-2 -4
------.-10 20
.J _\
m-3
oc -6
30
I I
0
'
I 0
I
'
0.2
- 8
40
I
' 'o
I 0 I I ' 0
I
I
-10
so
I 0 I I I 0 I I I 0 I I
0 ' I
0.3
-12
kg
/
/ /
0 ,
-14
~T
I
0 I
I I 0
f' Hem
T
R
160
150
140
130
120
11 0
100
90
80
70
60
so
40
30
20
10
0
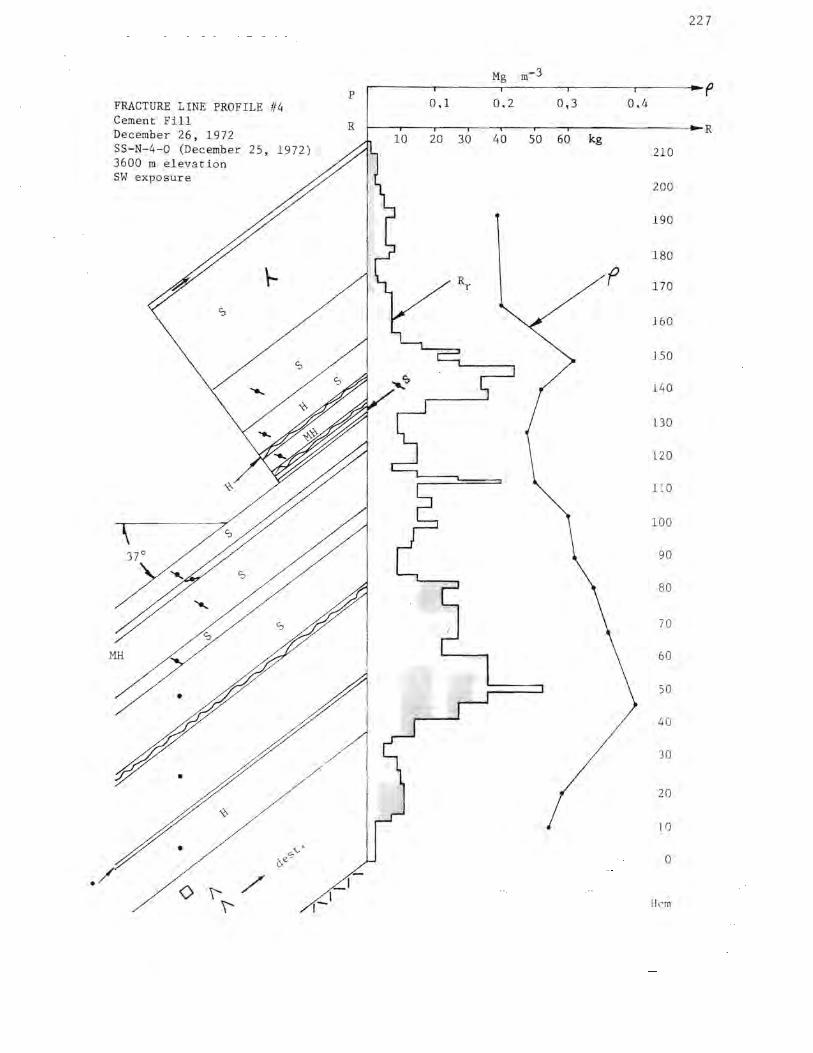
22 7
Mg m-3
p f FRACTURE LINE PROFILE t/4 0.1 0.2 0,3 0.4 Cement Fill R R December 26, 1972 10 20 30 40 50 60 kg SS-N-4-0 (December 25, 1972) 210 3600 m elevation SW exposure
200
190
180
Rr f 170
160
150
140
130
120
1 10
100
90
80
70
60
50
40
30
20
10
o.e 0"" 0
<) \' / I
\' ,- Hem
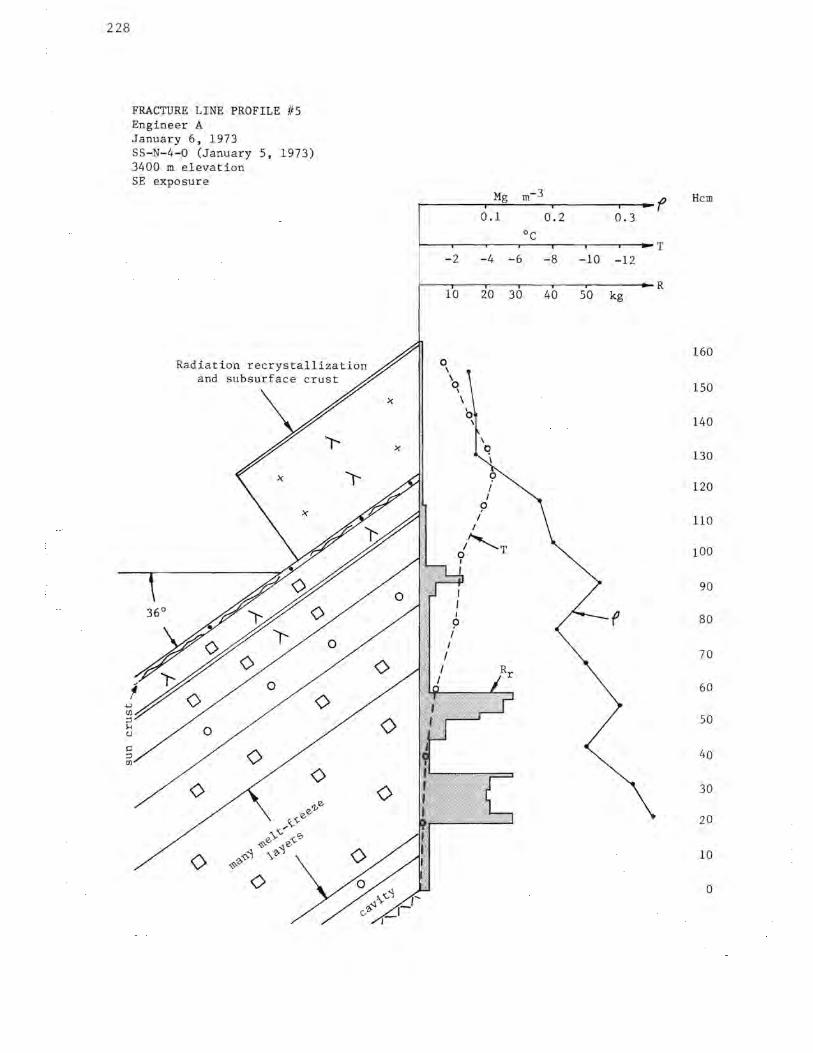
228
FRACTURE LINE PROFILE #5 Engineer A January 6, 1973 SS-N-4-0 (January 5, 1973) 3400 m elevation
.w (/)
;:l !-< u
SE exposure
36°
Radiation recrystallization and subsurface crust
<> <>
<>
<> ()
)(
)(
-2
10
0 \ \ q
\
0 \
I
Mg
0.1
-4
20
\ q
I
9 I I
9 I
t••,,T 0 I
I
9
m-3 f Hem
0.2 0.3 oc
T -6 - 8 -10 -12
R 30 40 so kg
160
150
140
130
120
110
100
90
f 80
70
60
so
40
30
20
10
0
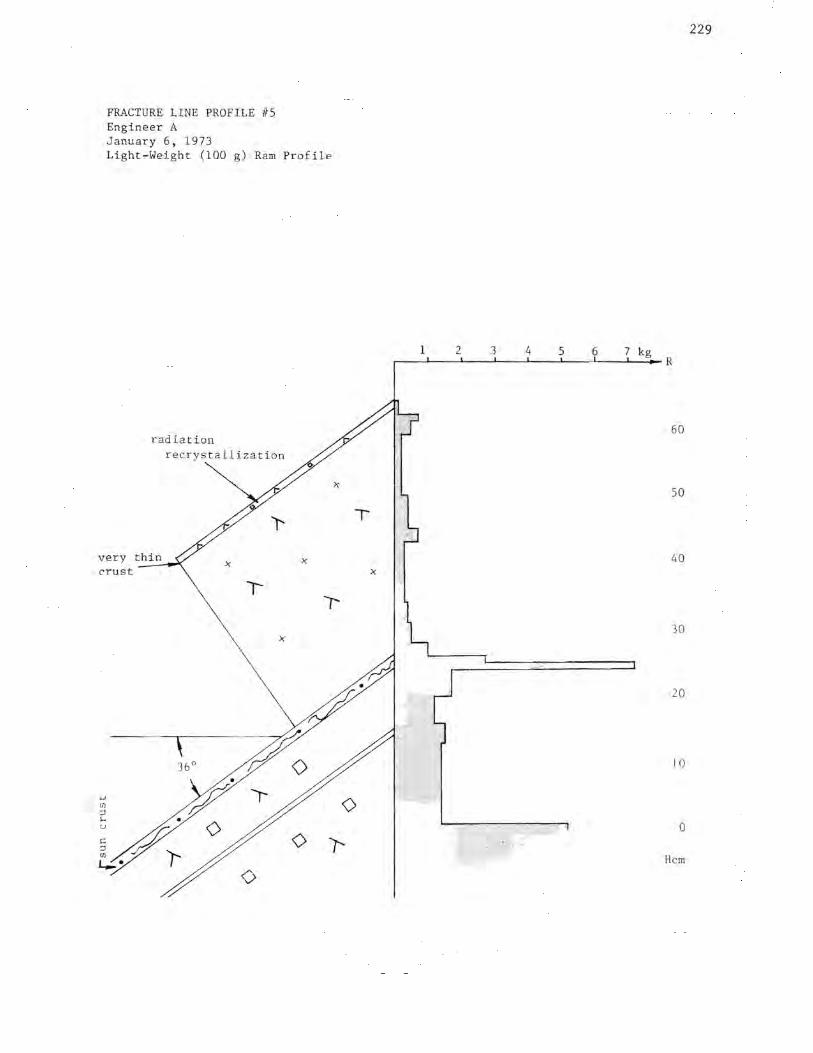
FRACTURE LINE PROFILE #5 Enginee r A Januar y 6, 1973 Light-Wei ght (100 g) Ram Prof ile
radiation recrystalli za tion
)'
very thin X X
crust
i-
X
+J (JJ
:J ~ u
C :, (JJ
i....:..
)(
229
7 kg ~ -.J.._ _ _._ _ _J_ _ ___.__--''--- -'-----'---,- R
1 2 3 4 5 6
60
50
T
40 X
30
20
10
0
Hem
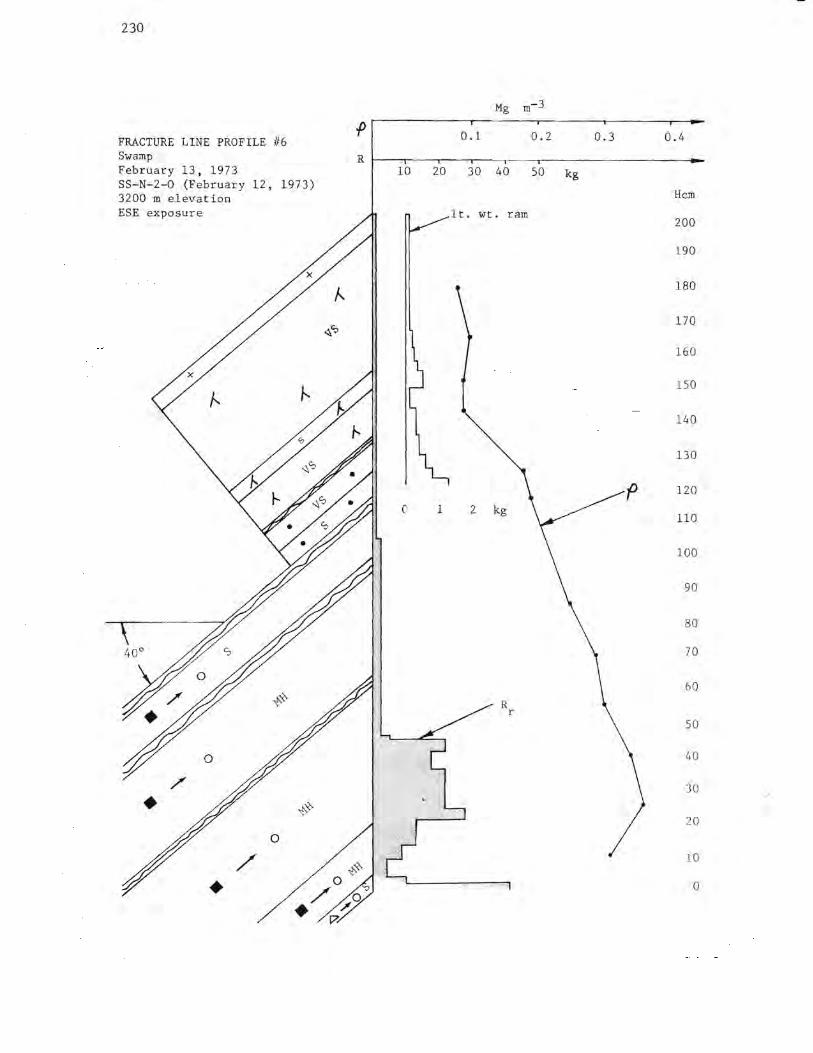
230
FRACTURE LINE PROFILE #6 Swamp February 13, 1973 SS-N-2-0 (February 12, 1973) 3200 m elevation ESE exposure
.p
R 10 20
0 1
Mg m-3
0.1 0.2
30 40 50
lt. wt. ram
2
R r
0.3
kg
0.4
Hem
200
190
180
170
160
150
140
130
120
llO
100
90
80
70
60
so
40
JO
20
10
0
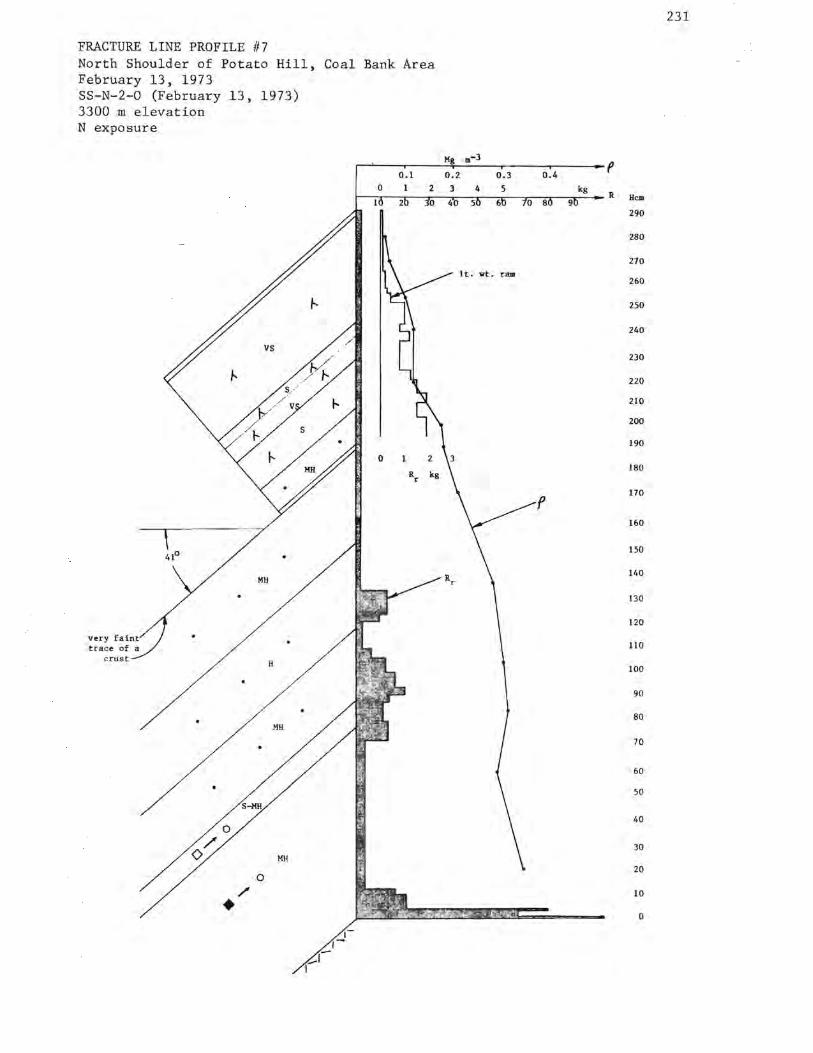
FRACTURE LINE PROFILE #7 North Shoulder of Potato Hill, Coal Bank Area February 13, 1973 SS-N-2-0 (February 13, 1973) 3300 m elevation N exposure
Mil
H
MH
MH
0
/' • _,I
I ,-
Mg .,-3
0.1 0.2 0.3 0 2 3 4 5
231
0.4 p
kg R
9 Hem
290
280
270
260
250
240
230
220
210
200
190
180
f 170
160
150
140
130
120
110
100
90
80
70
60
50
40
30
20
10
0
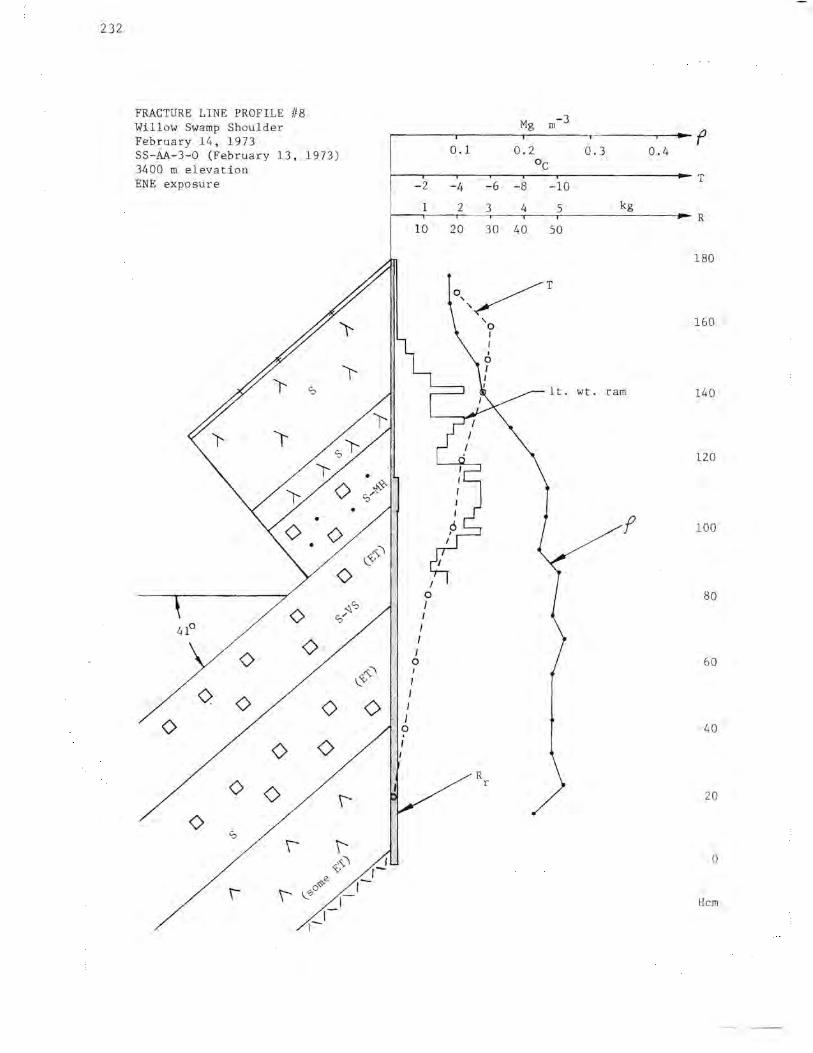
232
FRACTURE LINE PROFILE #8 m-3 Willow Swamp Shoulder Mg
February 14, 1973 f SS-AA-3-0 (February 13, 1973) 0.1 0.2 0.3 0.4 3400 m elevation OC
ENE exposure -2 -6 -8 T
-4 -10
1 2 3 4 5 kg R
10 20 30 40 so
180
o,,/T
'o 160 I I
'r-s lt. wt. ram 140
T' 120
• ~Y;-s/
• f 100
&""' I
0 80
<> ~s I s/ I
4i° I
<> I
<> I 0 60
&""' I
I
<> <> I
<> I
<> I 0 40 '
<> 0 I
R <) 0
r 20
<> s \ \'
'<.><\' 0
r-~e ,-
\' \...00 Hem
I 1-
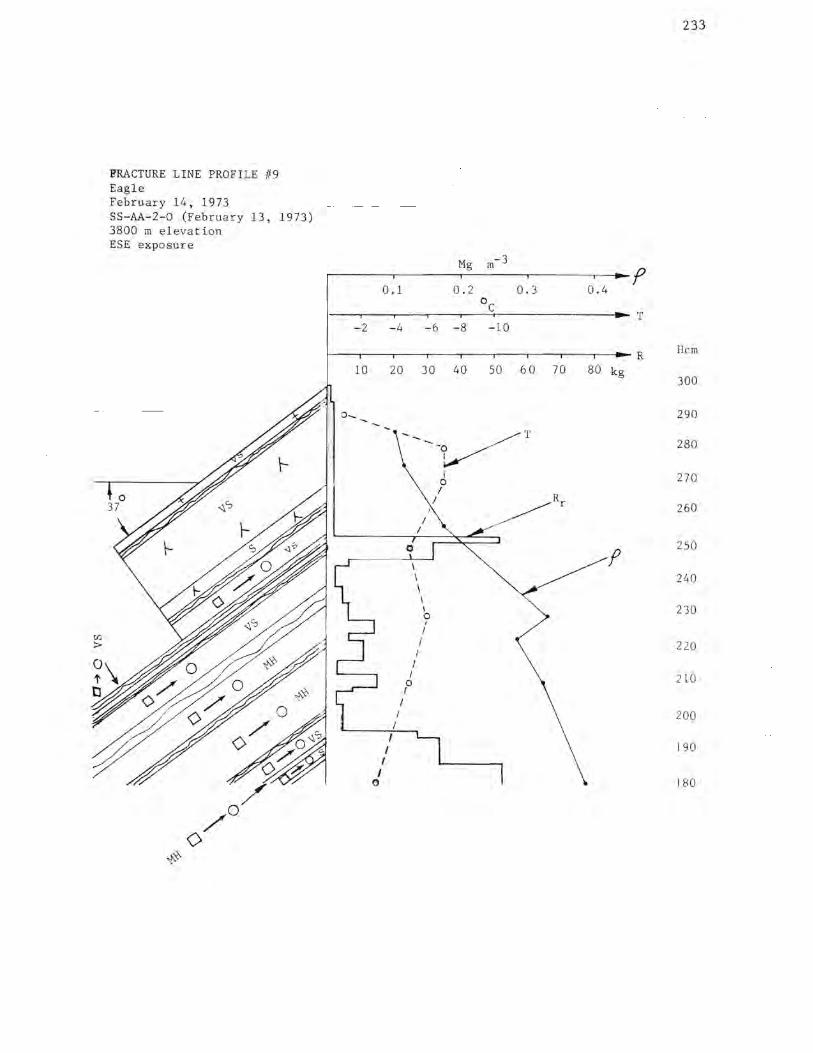
FRACTURE LINE PROFILE #9 Eagle February 14 , 1973 SS-AA-2-0 (Februa ry 13, 1973) 3800 rn elevation ESE exposure
Mg rn-3 ---.---~-f
0.1 0.2 0.3 0.4 oc
1--,---.---,---,---.----------- T -2 -4 - 6 -8 -10
t---.---.---,---.--.--.--.--.--- R
10 20 30 40 50 6 0 70 80 kg
I (')
I I
I
---._ ~T ·o I
I I
I
0
\
I
I I
\
I I
0 I
\ \
I I
I 0 I
I
I
I 0 I
f
233
Hern
300
290
280
270
260
250
240
230
220
210
200
190
180
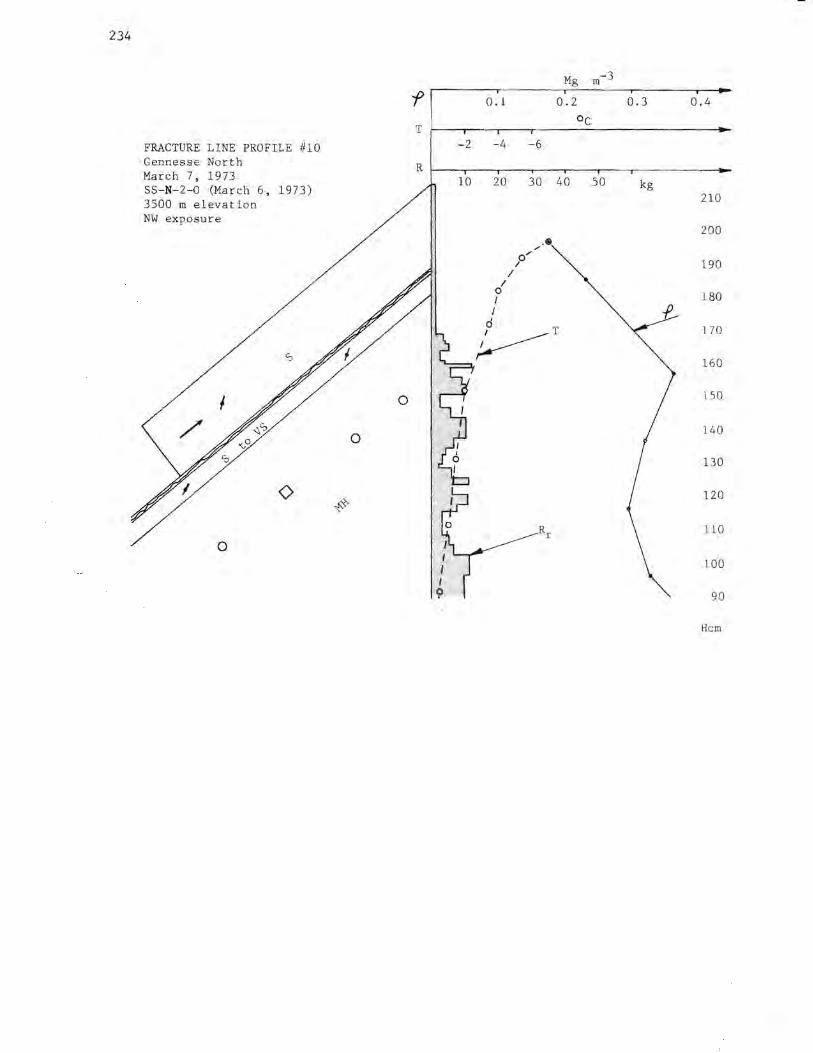
234
FRACTURE LINE PROFILE #10 Gennesse North March 7, 1973 SS-N-2-0 (March 6 , 1973) 3500 m elevation NW exposure
<>
0
0
0
f 0 .1 0.2 0.3 0.4
T
-2 -4 -6
R ~-~----,----.------,,--,--- .-------- --1-10 20
/ 0 I I
/
30 40
o" /
/ .®
d ~T
r
50 kg 210
200
190
180 f_
170
160
150
140
130
120
110
100
90
Hem
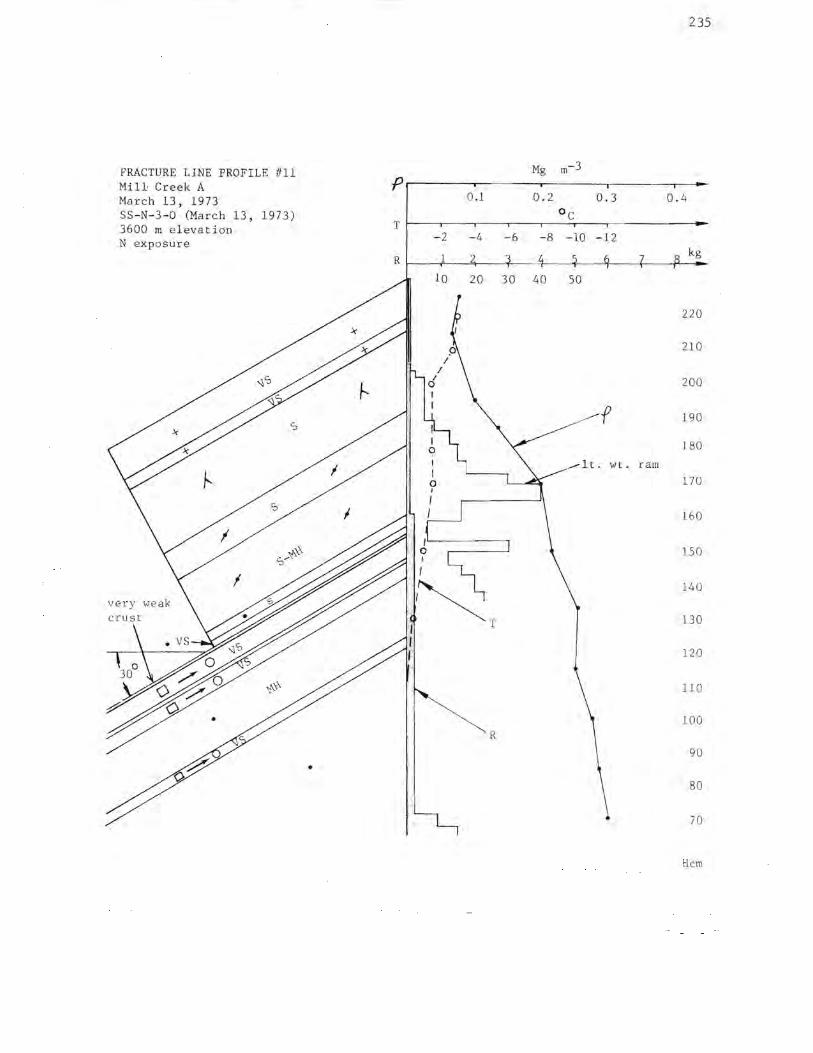
235
FRACTURE LINE PROFILE If ll Mg m-3
Mill· Creek A p March 13, 1973 0.1 0.2 0.3 0 . 4 SS-N-3-0 (March 13, 1973) OC 3600 m eleva tion T
N exposure - 2 -4 -6 - 8 -10 -12
R 1 kg
20 30 40 so
220
210
200
,,,- f 190
180
...-l t. wt. ram 170
160
150
140
130
120
llO
100 R
90
\ 80
• 70
Hem
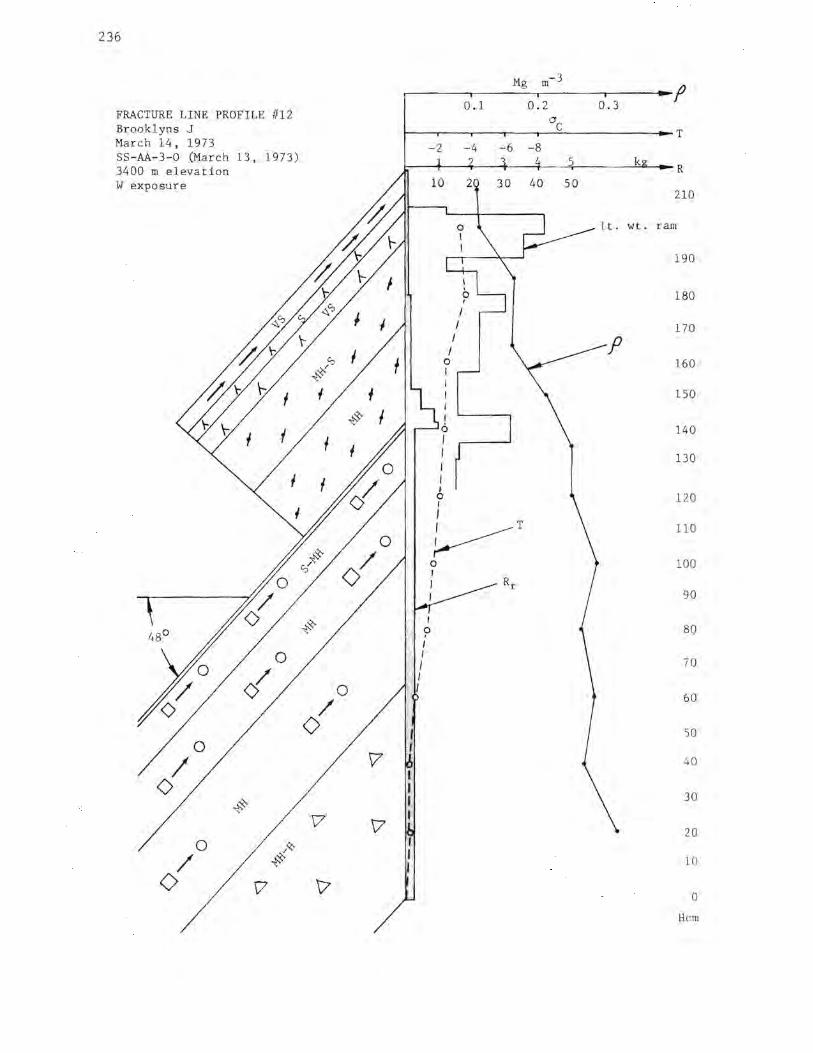
236
FRACTURE LINE PROFILE #12 Brooklyns J March 14, 1973 SS-AA-3-0 (March 13, 1973) 3400 m elevation W exposure
0
d
0 /
<>
v
v
v
-2
10
I 0
' I
I I
I I
0 I
Mg
0 .1
-4 -6
2 30
~T
0 I I Rr ,
m-3
0.2 0.3 f
ac T
-8 5 k
R
40 50 210
l t. wt. ram
190
180
170
160
150
140
130
120
llO
100
90
80
70
60
so
40
30
20
10
0
Hem
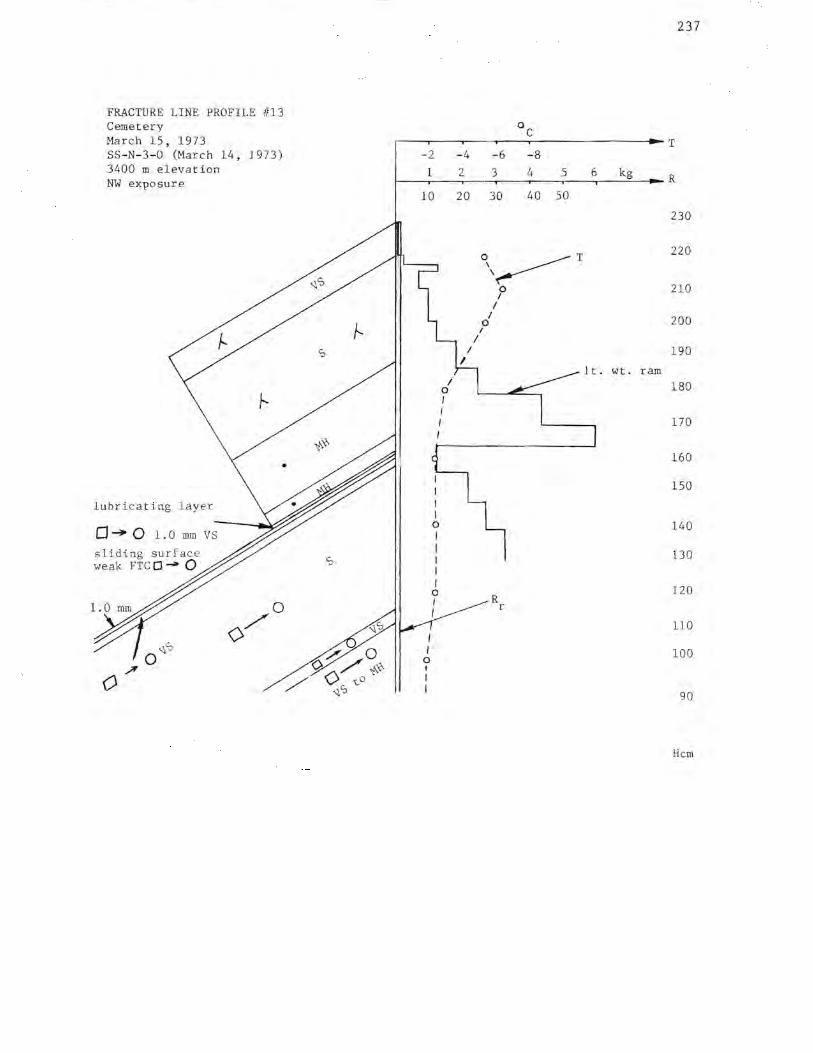
FRACTURE LINE PROFILE f/13 Cemetery March 15, 1973 SS- N-3 -0 (March 3400 m elevation NW exposure
lubricating layer
o~ 0 1.0 mm vs sliding surface weak FTC O- 0
14 , 1973)
•
237
oC ,----,-----.-----.-----,----- ----11-T
-2 -4 - 6 - 8
1 2 3 4 5 6 kg t---....---,---.------,.--..--.....-----R
10 20
I I
I
30 40 50
o,,~ T
0 I
I I
0 I
R r
l t . wt. ram
230
220
210
200
190
180
170
160
150
140
130
120
110
100
90
Hem
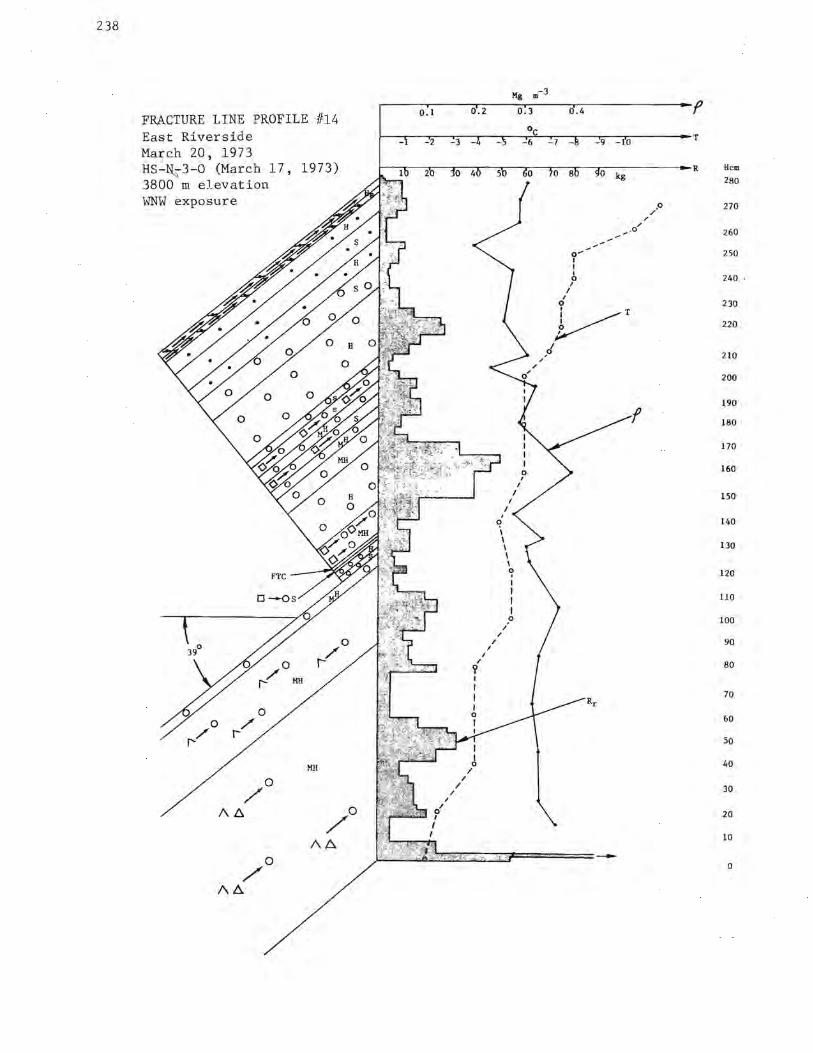
238
FRACTURE LINE PROFILE #14 Ea~t Riverside March 20, 1973 HS-U;3-0 (March 17, 1973) 3800 m elevation WNW exposure
FTC
MH
0.1 0.2
-2 -3
20 0 4
/ /
?
5
I 0
I I I I I
~
/ /
/
I I I I
0 /
0.3 0 . 4
-6 -7 -9 -10
/
o"
0 8 0 kg
I
.,,.-'o~ I I I 0 I
/ .0
I 0 I
~T
d /
f
/
.0 /
f
T
R Hem
280
270
260
250
240 .
230
220
210
200
190
180
170
160
150
140
130
120
110
100
90
80
70
&o
so
40
30
20
10
0
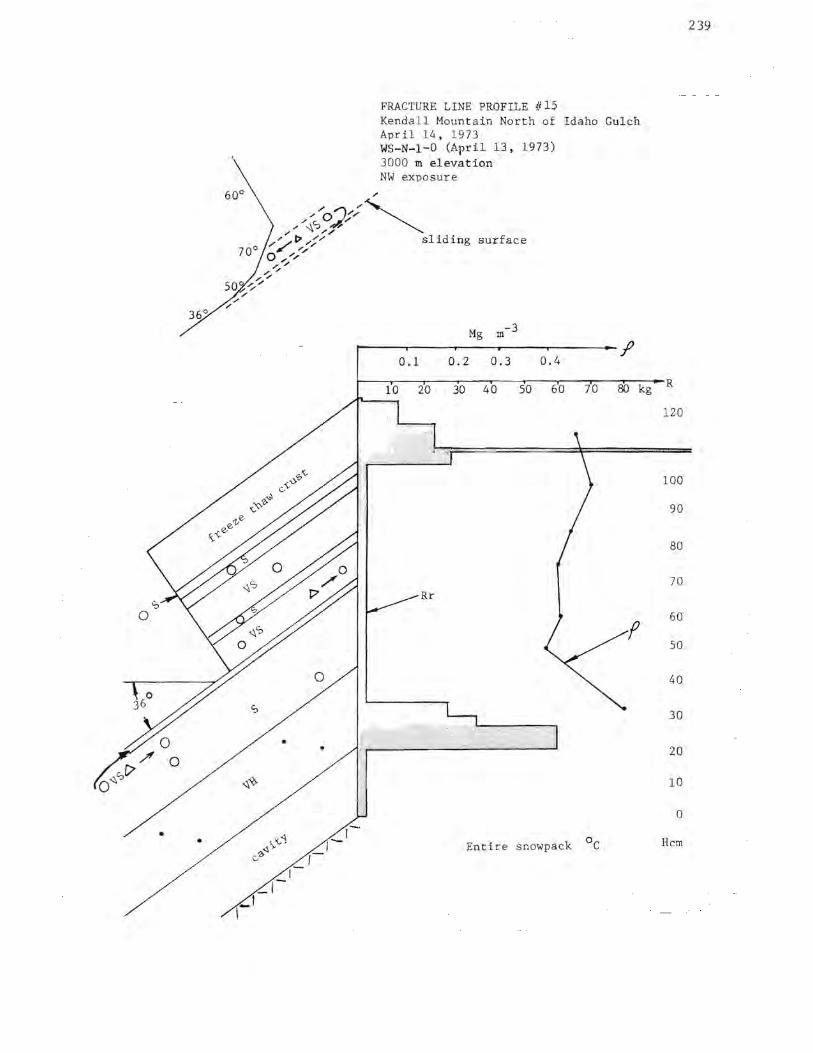
36°
0 ./ 0
<l.c):7 0
• •
I
s
~»
_j _1
0
• .
FRACTURE LINE PROFILE #15 Kendall Mountain North of Idaho Gulch April 14, 1973 WS-N-1-0 (April 13, 1973) 3000 m elevation NW exposure
surface
----.---~-----!' 0.3 0.4 0.1 0.2
t----.--~---.--~----.---,----,~-~---R 10 20 30 40 50 60 70 80 kg
f
Entire snowpack 0 c
120
100
90
80
70
60
50
40
30
20
10
0
Hem
239
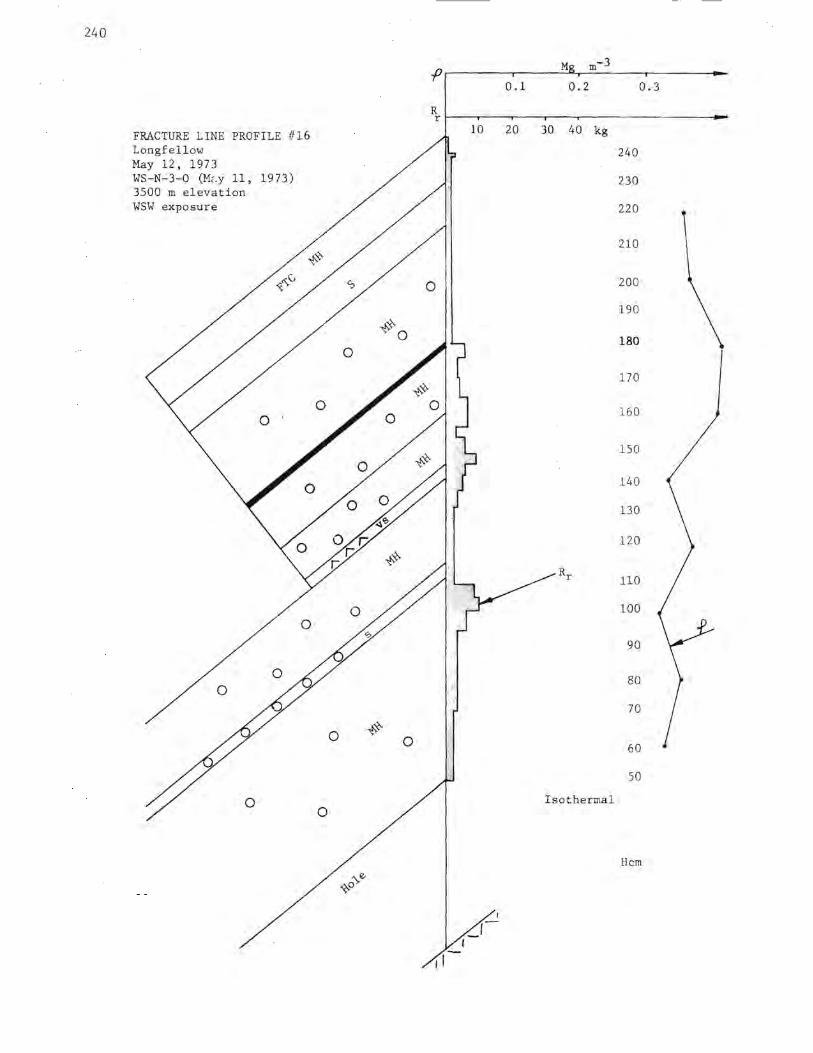
240
-P M m-3
0.1 0.2 0.3
R r
FRACTURE LINE PROFILE #16 10 20 30 40 kg
Longfellow 240 May 12, 1973 WS-N-3-0 (M,.y 11, 1973) 230 3500 m elevation WSW exposure 220
210
0 200
190
+~ 0 180
0
170
0 0
160
150
140
130
120
Rr 110
100
90
80 0
70
0 ~ 0 60
so
0 Isothermal 0
Hem
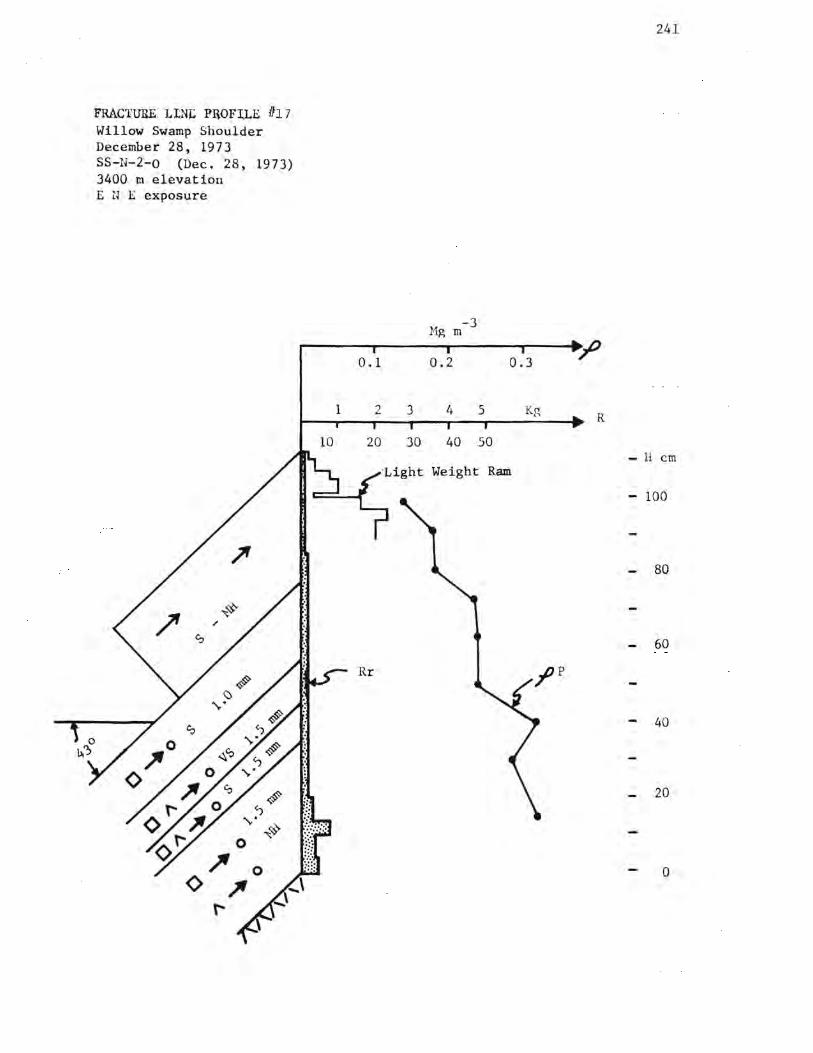
FRAC]URE LlN~ PaOFLLE #17 Willow Swamp Shoulder December 28, 1973 SS-N-2-o (Dec. 28, 1973) 3400 m elevation EU E exposure
10
0.1
1 2
20
Mg m -3
0.2 0.3
3 4 5 Kg
30 40 50
Light Weight Ram
241
R
- H cm
- 100
80
60
40
20
0
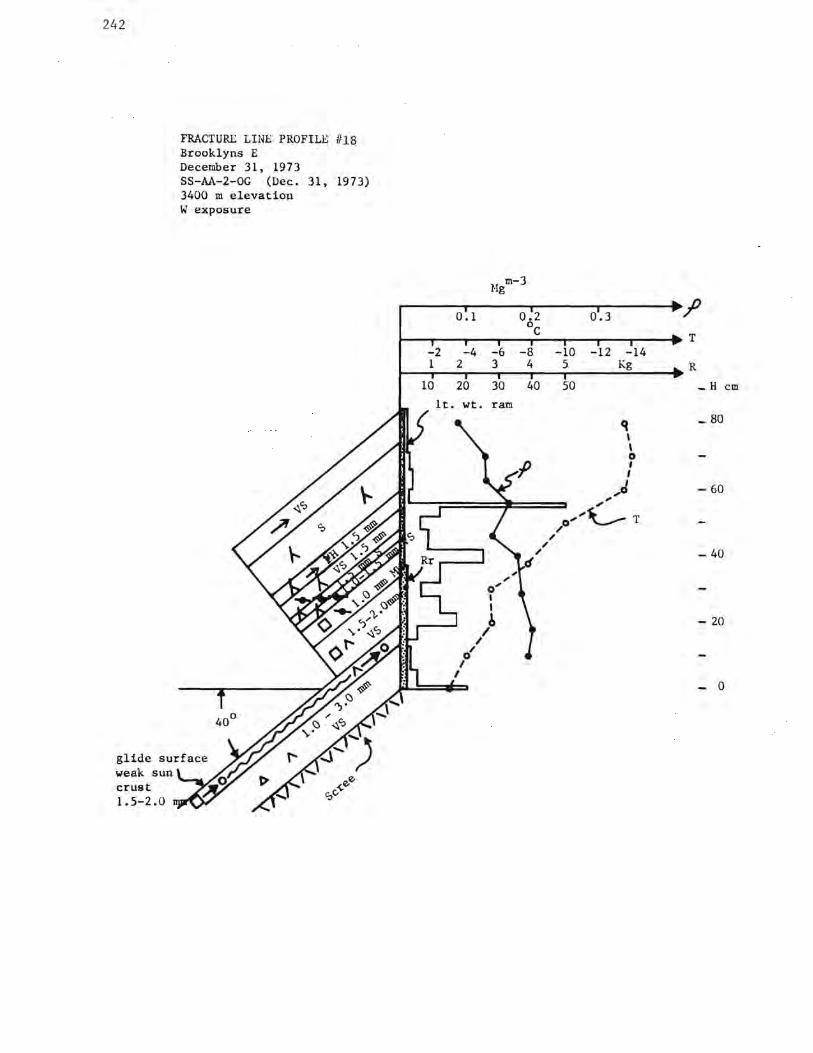
242
crust 1.5-2.0
FRACTURE LINE PROFILE 1118 Brooklyns E December 31, 1973 SS-AA-2-0G (Dec. 31, 1973) 3400 m elevation W exposure
0.1
-2 -4 l 2
10 20 lt. wt.
Hgm-3
0.2 oc
-6 -8 3 4
30 40 ram
/ /
/
0.3 j) T
-10 -12 -14 5 Kg R
50 -H cm
q - 80 \ \ 0
' I
,J - 60 ,, ,, o''\-- T
/
- 40
- 20
0
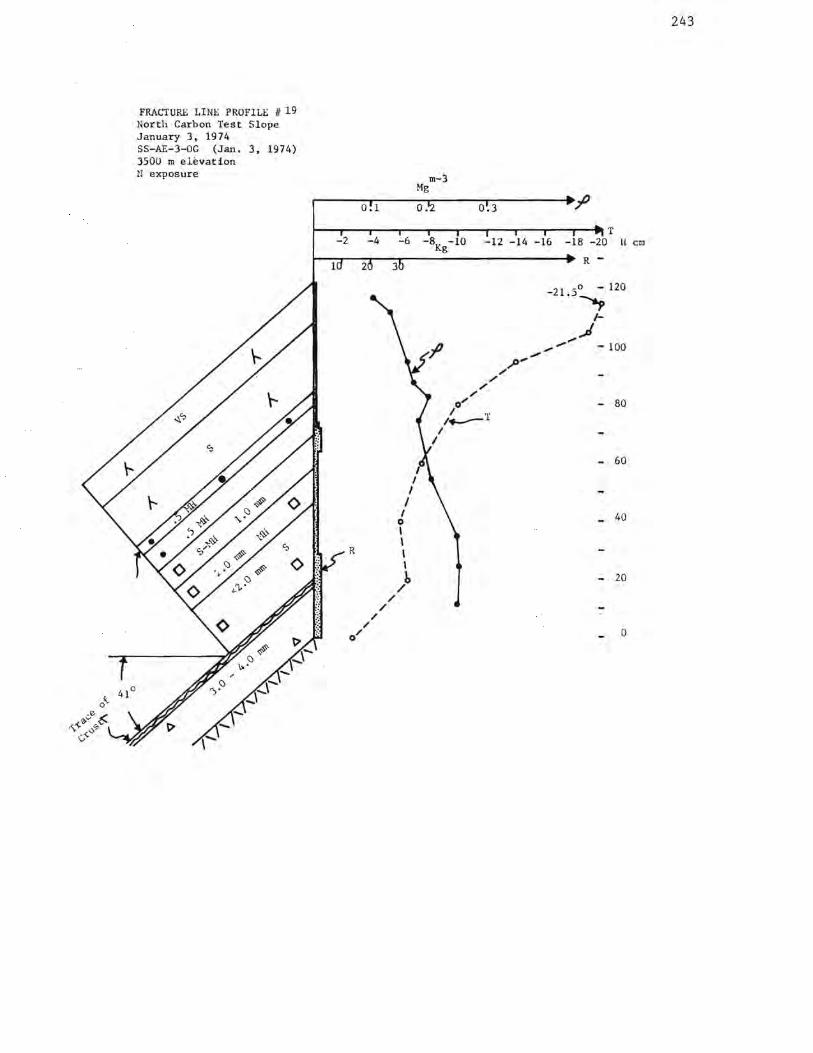
FRACTURE LINE PROFILE II 19 North Carbon Test Slope January 3, 1974 SS-AE-3-0G (Jan. 3, 1974) 3500 m elevation N exposure
-2
0.1
-4
m..:.3 Mg
0.2 0.3
-6 -8 -10 Kg -12
I I
I I
I 0 I I
I
/ /
/ /
o"' / T ,.,__
I .
R I
/ 0/
/ /
/
I
}
;I)
T -14 -16 -18 -20 H cm
.,;:,---
R --21.5~ 120
I-
., ... ....... _,/
- 100
- 80
- 60
40
- 20
0
243
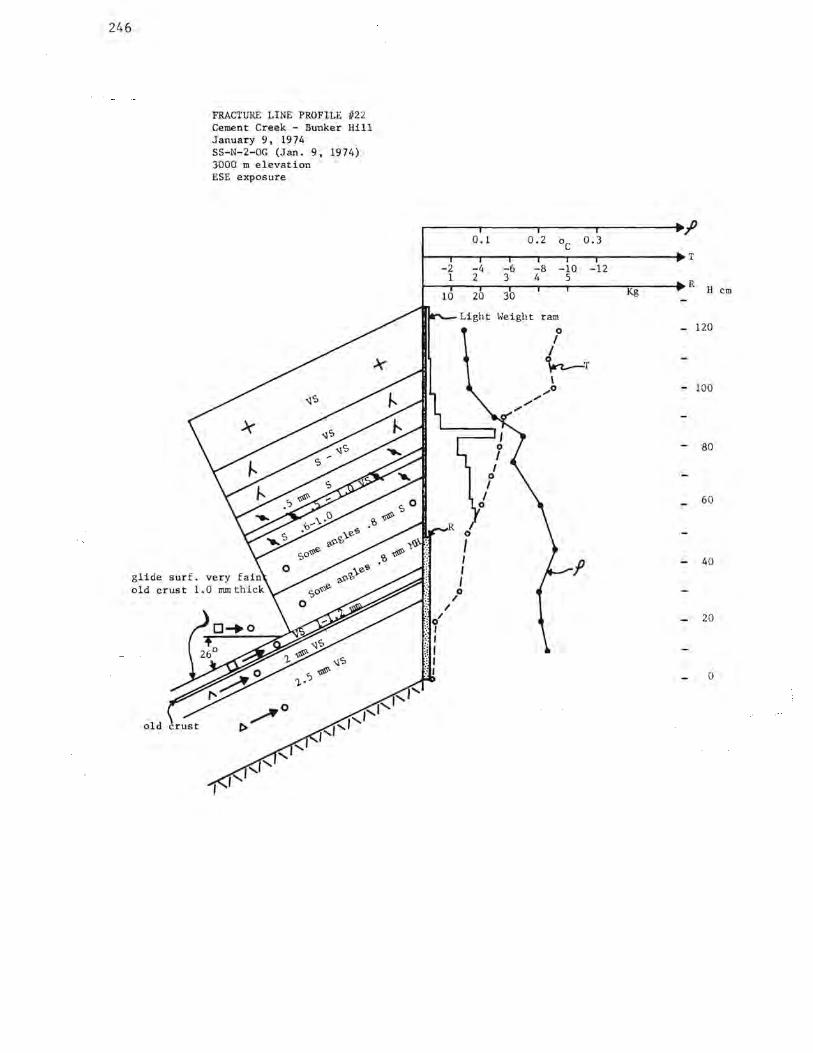
246
old crust
FRACTURE LINE PROFILE /f22 Cement Creek - Bunker Hill January 9, 1974 SS-N-2-0G (Jan. 9, 1974) 3000 m elevation ESE exposure
0. l
-2 -4 l 2
10 20
0
I I I I
0 /
/ 0/ I I I I I
I' 0.2 oc 0.3
T -6 -8 -10 -12 3 4 5
R 30 Kg H cm
Weight ram 0 - 120 I
I ~T
\ .,..o - 100 .,,, ....
/
80
60
40
20
0
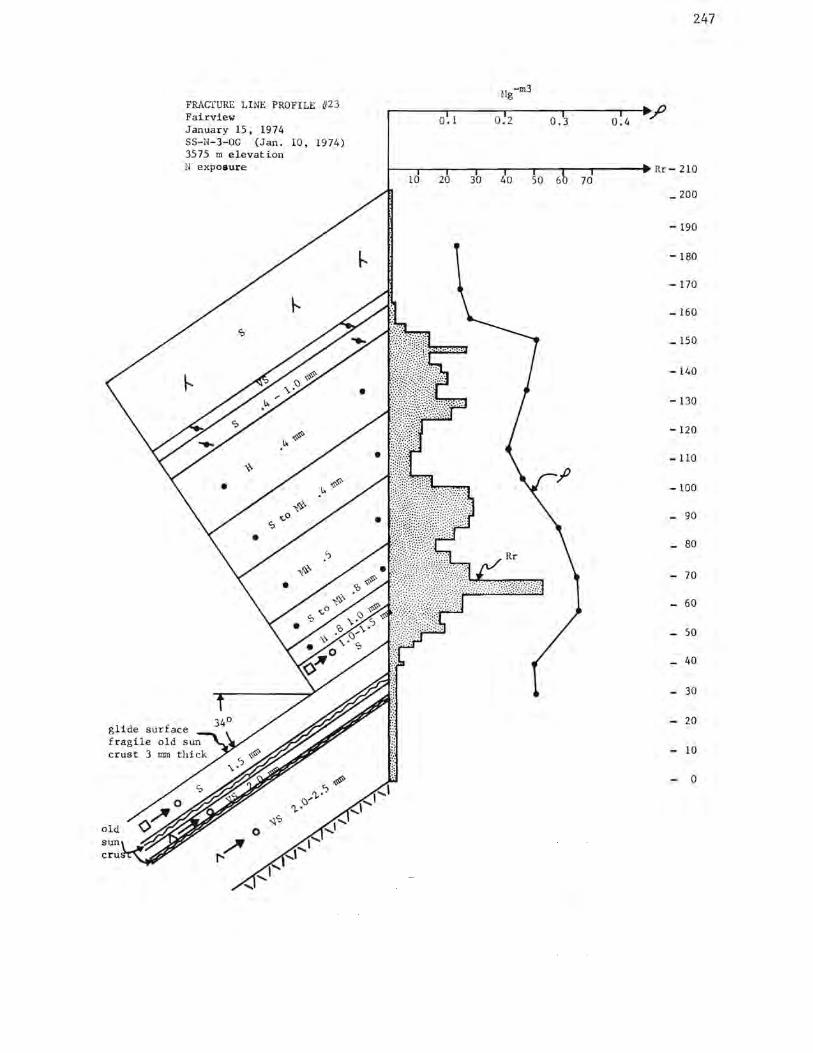
FRACTURE LINE PROFILE Fairview January 15, 1974 SS-N-3-0G (Jan. 3575 m elevation N exposure
glide surface fragile old sun crust 3 rrnn
10,
/f23
1974)
247
Hg-m3
0.1 0.2 0.3 .-----.-----.----~---,----..._,o
0.4
1--,--..--..,---r--.---r---r----p Rr- 210 10 20 30 40 50 6 70
_ 200
-190
- 180
-170
-160
-150
-140
-130
-120
-110
-100
90
80
- 70
60
50
40
30
20
10
0

248
2.5mm
vs
FRACTURE LINE PROFILE #24 NE Shoulder Pt. 12,325 January 23, 1974 HS-N-4-0G (Jan. 21, 1974) 3688 m elevation SE exposure
,,.o I>
0.1
Mg -m3
0.2
-6 -8
0/ /
/
0.3
•l -12
60
0 T
'"5' ,.o /
/ 0.4
T 0 c - 4
Rr H cm - 190
- 180
- 170
- 160
- 150
- 140
- 130
- 120
- 110
- 100
- 90
- 80
- 70
- 60
- so
40
30
- 20
10
0
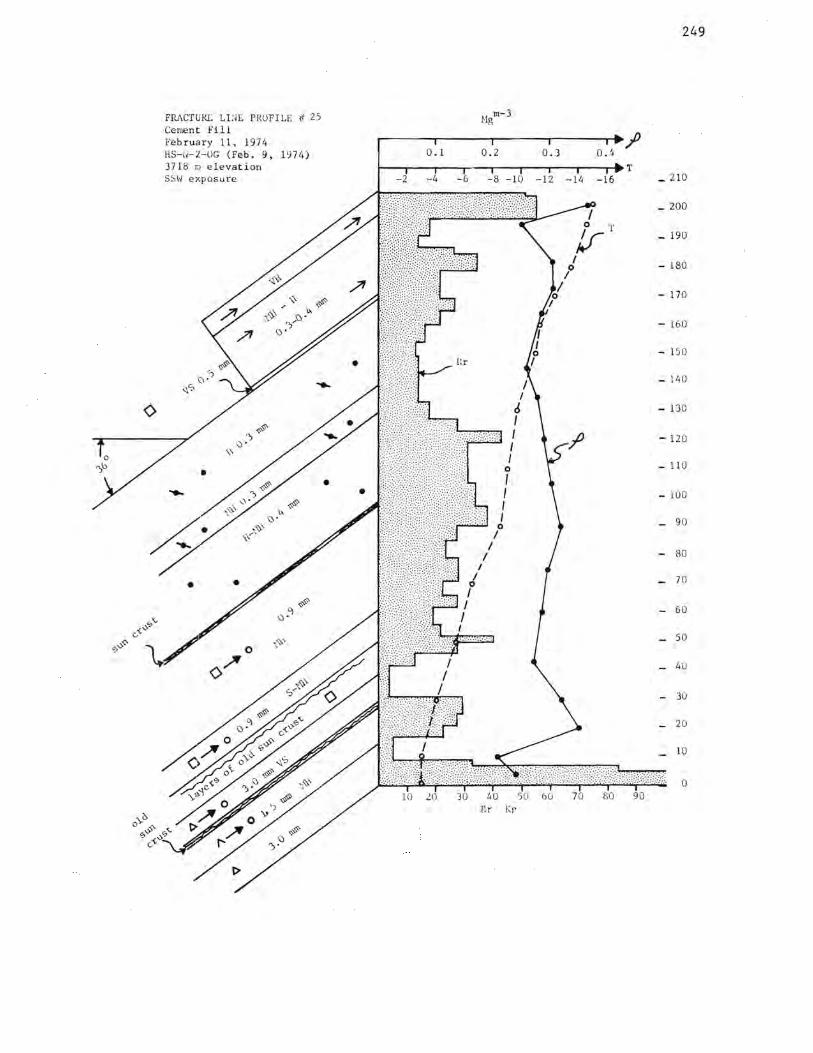
249
FRJ\CTURL LI:<E PROFILE ii 25 Mgm-3 Cement Fill
j) February 11, 1974 HS-U-2-0G (Feb. 9, 1974) 0 . l 0.2 0.3 o.~ 3718 r.i elevation I I I I ,.T SS\,J e xposure -2 -4 -6 -8 -10 -12 -14 -16 _ 210
I - 200
0 T
J.r - 190
I - 180 0 I
I - 170 0 I
I
- 160
- 150 Rr
- 140
<> - 130
<i'<i' ':, - 120 \J . ,,
- 110 • ..... - 100
7· - 90
- 80
• • 70
</'<I' 60 \) .ci -
"'\, '"" C, 50
.;:,<:- .,,~, -"' 0
<>~ - 40
- 30
- 20
10
0
r.r Kr,
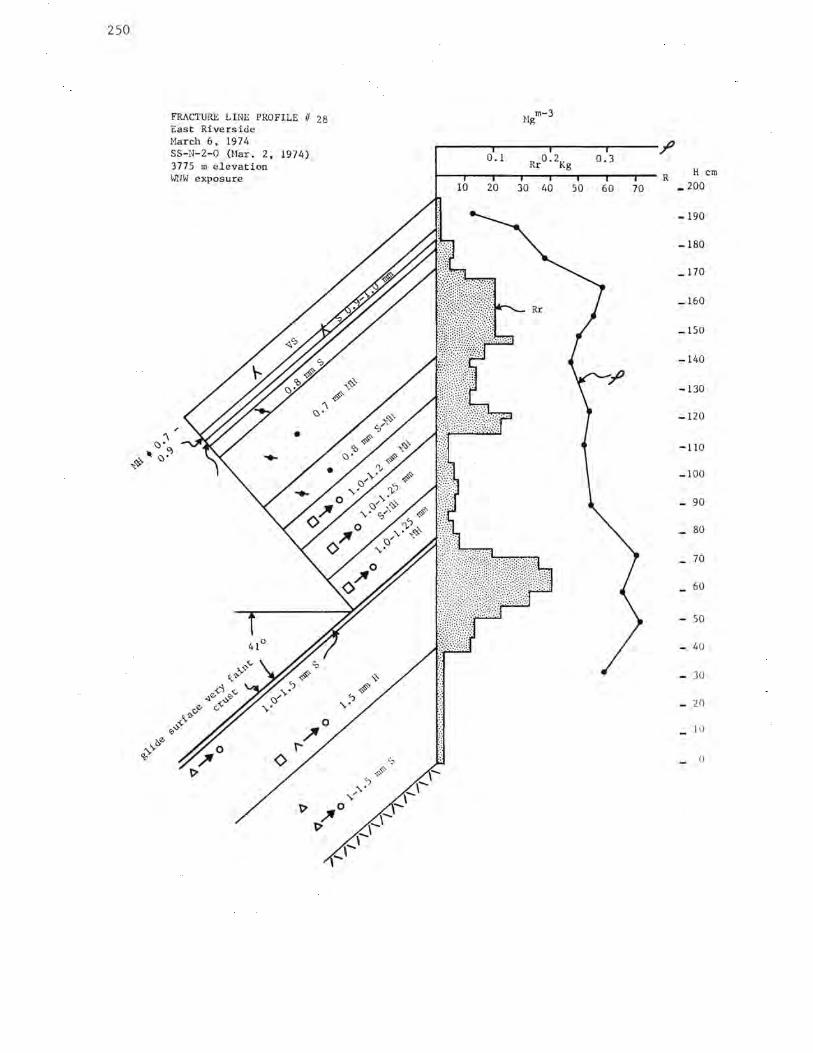
250
FRACTURE LINE PROFILE // 28 East Riverside March 6, 1974 SS-N-2-0 (Mar. 2, 1974) 3775 m elevation WNW exposure
0.1 0.3
10 20 30 40 so 60 70
.I' R
H cm _ 200
-190
-180
_ 170
-160
-150
-140
-130
-120
-110
-100
- 90
80
_ 70
60
- so
- 40
- 30
- 20
]()
()
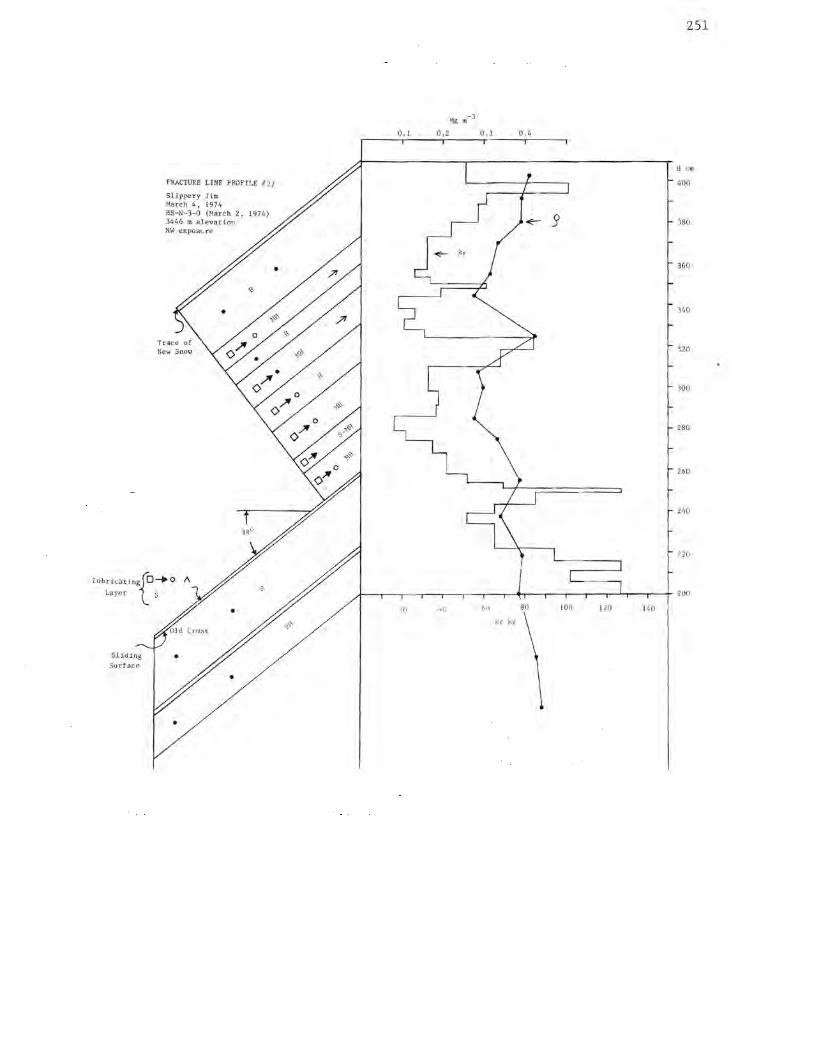
251
Mg m -3
0 .1 0. 2 0. 3 0. 4
H c m
FRACTURE LINE PROFILE I/ 27 400
Slippery Jim Marc h 4, 1974 HS-N-3-0 (March 2,
J 344 6 m elevat i on 380 NW ex posLre
360
34 0
320
300
280
260
240
220
Lu b rica ting{O-. 0 I\
Layer S 200
20 40 60 80 lOO l20 l 40
R. r kg
Surf ace
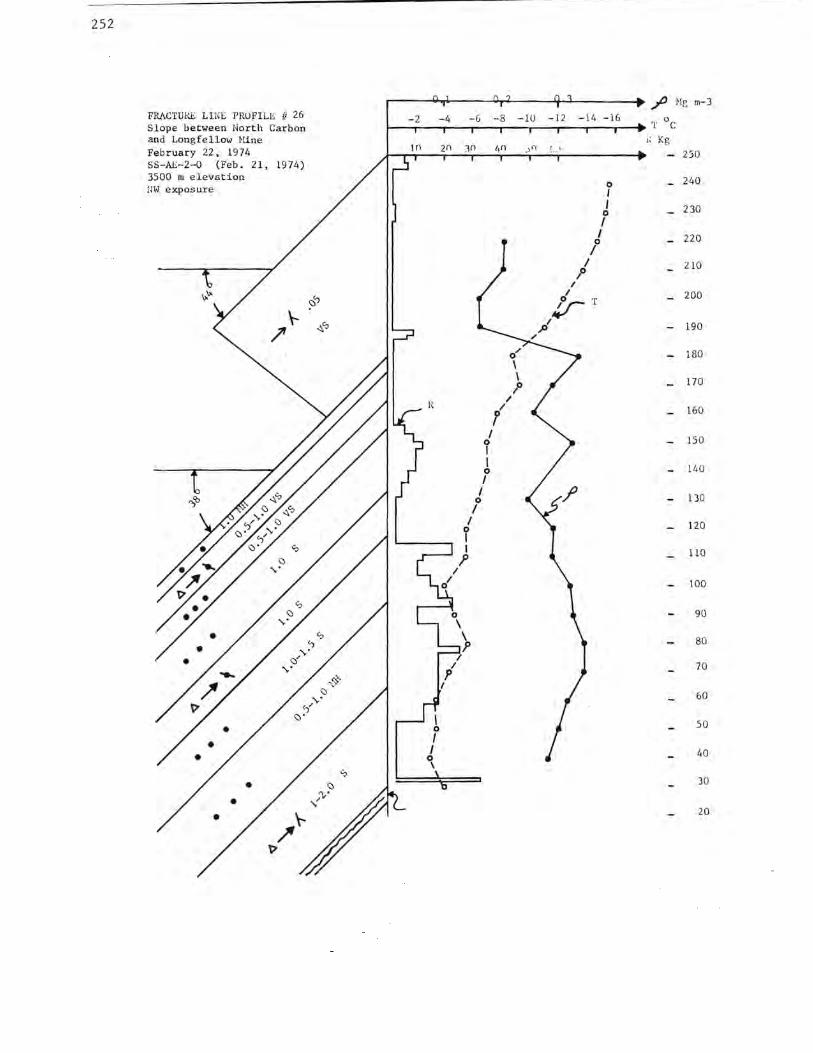
252
FRACTURE LINE PROFILE /I 26 Slope between North Carbon and Longfellow Hine February 22, 1974 SS-AE-2-0 (Feb. 21, 1974) 3500 m elevation ilW exposure
.....---"""°'1...---_....,..,_ __ -'<r-_,_----• ,,,0 Me m-3
-2 -4 -6 -8 -10 -12 -14 -16 1------------.---..--..--,---1~ T 0 c
In 2() 3n /1() ," ! .. '
/
cl
I y I 0 I
I 0 I
I
' I I'
/
0 I I
0 I I
l
/ /
I J>
o T :.r ;ti
"Kg 250
_ 240
230
_ 220
210
200
- 190
- 180
_ 170
160
150
140
130
120
110
100
90
80
70
60
50
40
30
20
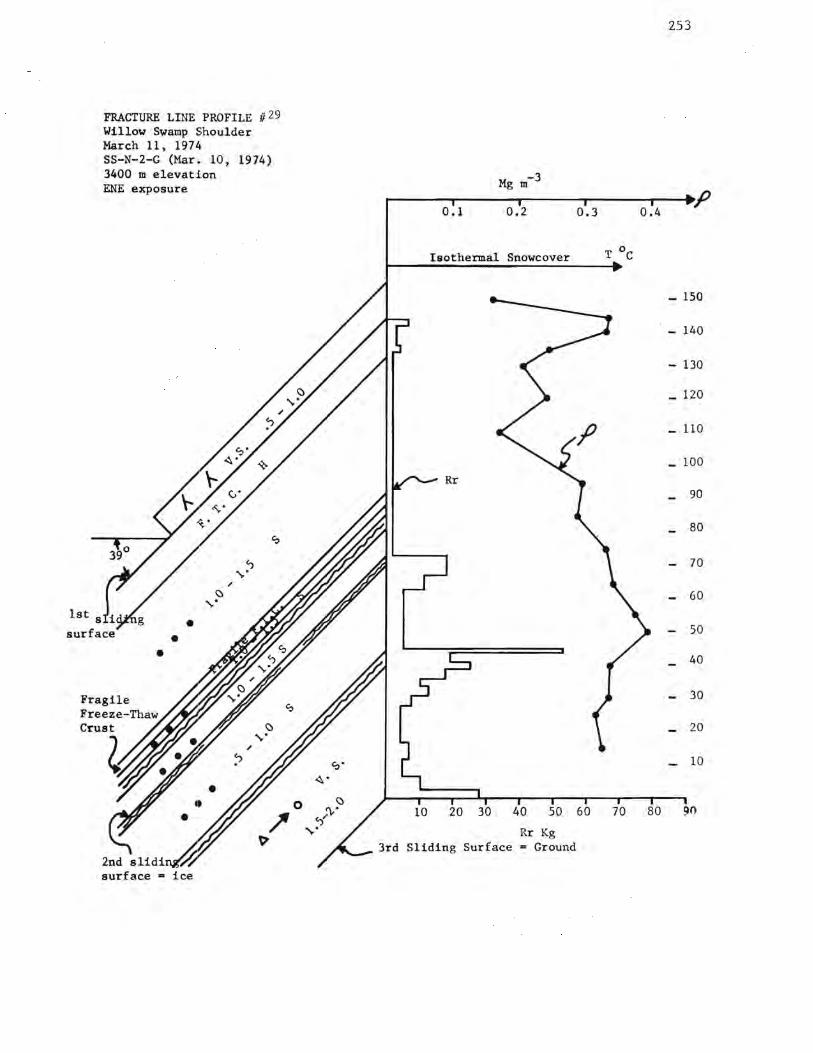
253
FRACTURE LINE PROFILE fl 29 Willow Swamp Shoulder March 11, 1974 SS-N-2-G (Mar. 10, 1974) 3400 m elevation -3 ENE exposure Mg m
0 .1 0.2 0.3 0.4
Isothermal Snowcover T 0 c
- 150
- 140
130
_ 120
110
- 100 Rr
- 90
80 Co
~ - 70 '\,.
/
~ '\,. - 60
• surface • so
• 40
- 30 Co
~ 20 V
/
~ eo· 10
~· • • 0 ~
• J' '.\-' 10 20 30 40 50 60 70 80 90
'-{ '\,. Rr Kg
t, Sliding Surface a Ground 2nd surface= ice
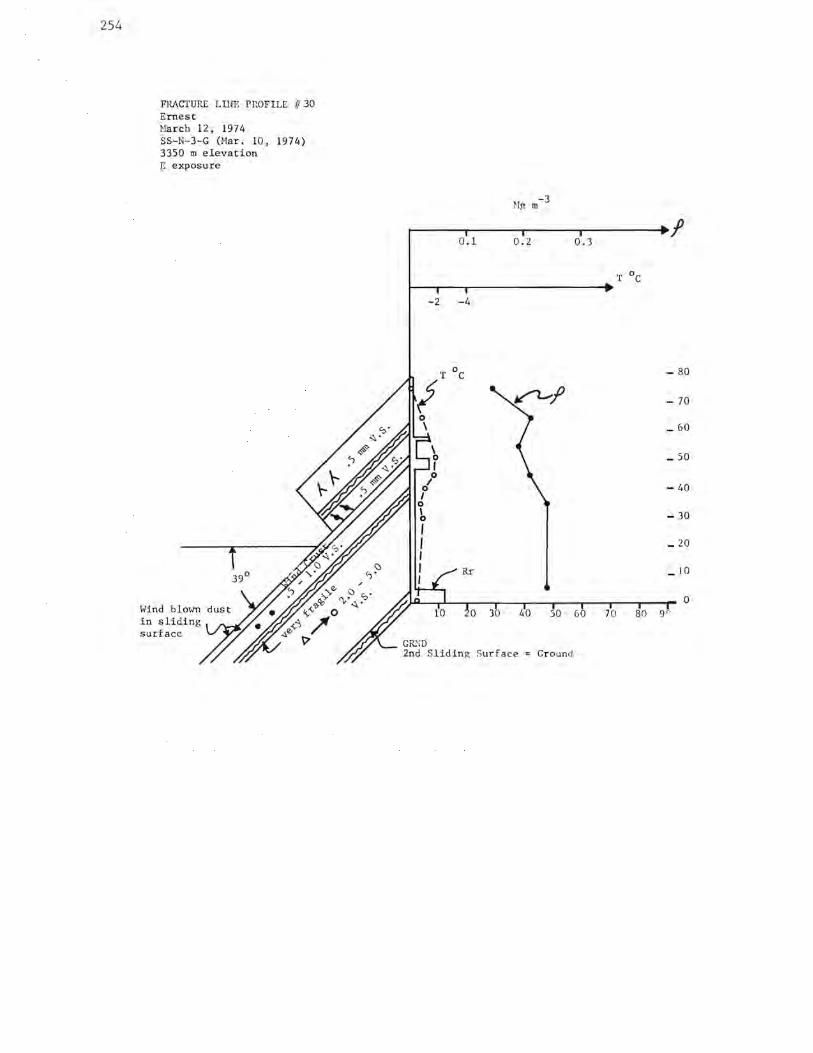
254
FRACTURE LINE PP.OFILE 1,130 Ernest March 12, 1974 SS-N-3-G (Mar. 10, 1974) 3350 rn elevation E exposure
Wind blown in sliding surface
0.1
-2 -4
oc
Rr
-3 Mg rn
0.2 0.3
0 30 40 so 60
Surface Ground
T 0 c
- 80
- 70
_ 60
- 50
- 40
- 30
- 20
_ lO
0
70 80 9''
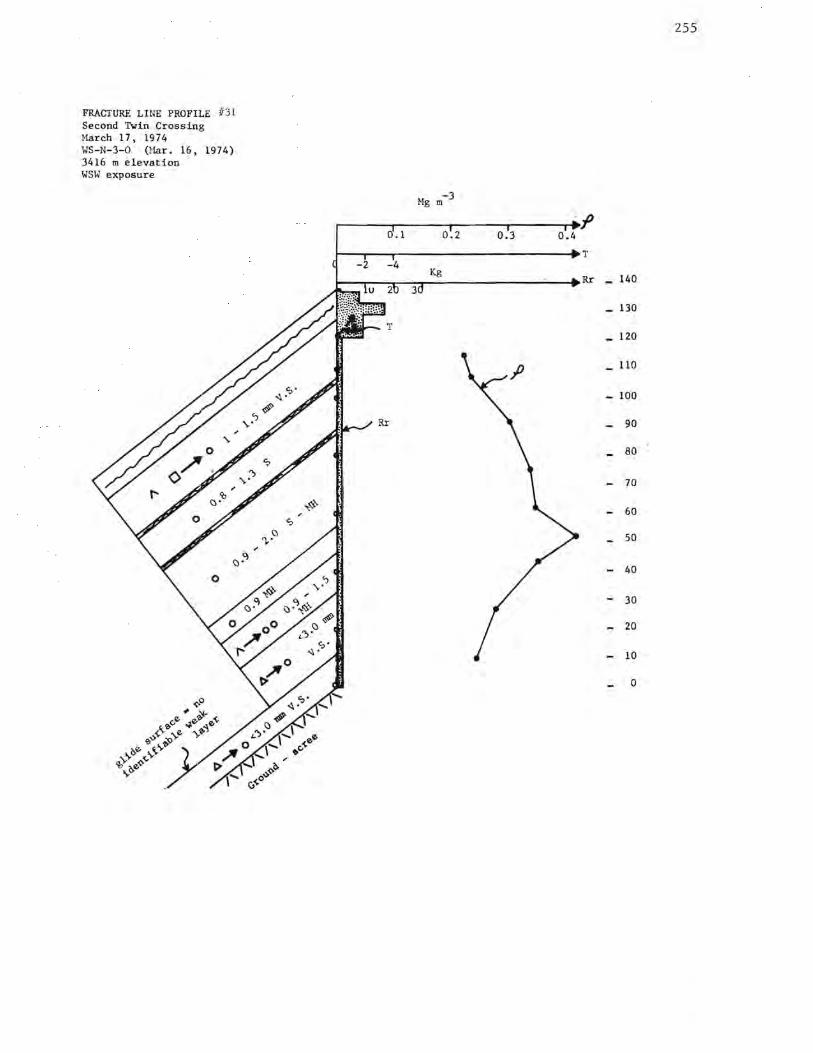
FRACTURE LINE PROFILE 1/31 Second Tvin Crossing March 17 , 1974 WS-N-3-0 (Mar. 16, 1974) 3416 m elevation WSW exposure
0.1
-2 -4
-3 Mg m
.0.2
Kg
0.3 . :P
0.4
T
Rr
255
140
130
120
110
100
- 90
80
- 70
- 60
- so
- 40
- 30
- 20
- 10
0

256
FRACTURE LINE PROFILE #32 Cemetery March 18, 1974 SS-N-2-0 (Mar. 16, 1974) 3300 m elevation NW exposure
-2
10
0 I
I
r1 I I 0 I I
0. I
-4
20
,o ,,,-'
o T :.s 0 I I 0 I I
0 I
: I : 0 • I ;I · \ \ 0 I I
Mg m -3
0.2 0.3 0.4 f
T -6
Rr - 130 JO 40 so 60
120 Rr
110
- 100
90
80
p 70
60
50
40
30
20
10
0

INSTITUTE OF ARCTIC AND ALPINE RESEARCH OCCASIONAL PAPERS
Numbers 1 through 5 are out of print. A second edition of Number 1 is available from the author. Numbers 2, 4, and 5 are available from National Technical Information Service, U.S. Department of Commerce. For details, please write to INSTAAR.
6. Guide to the Mosses of Colorado. By W .A. Weber. 1973. 48 pp. Order from the author, University of Colorado Museum, Boulder, Colorado 80309. $2.50.
7. A Climatological Study of Strong Downslope Winds in the Boulder Area. By W.A.R. Brinkmann. 1973. 228 pp. Order from the author, Institute for Environmental Studies, University of Wisconsin, 1225 West Dayton Street, Madison, Wisconsin 53706.
ta. Environmental Inventory and Land Use Recommendations for Boulder County, Colorado. Edited by R.F. Madole. 1973. 228 pp. 7 plates. $6.00.
t9. Studies of Climate and Ice Conditions in Eastern Baffin Island. 1971-73. By J.D. Jacobs, A.G. Barry, R.S. Bradley, and R.L. Weaver. 1974. 77 pp. $3.00.
t10. Simulation of the Atmospheric Circulation Using the NCAR Global Circulation Model With Present Day and Glacial Period Boundary Conditions. By J.H. Williams. 1974. 328 pp. $4.75.
11. Solar and Atmospheric Radiation Data for Broughton Island, Eastern Baffin Island, Canada, 1971-73. By ~I.D. Jacobs. 1974. 54 pp. (Out of print.)
12. Deglacial Chronology and Uplift History: Northeastern Sector, Laurentide Ice Sheet. By A.S. Dyke. 1974. 113 pp. (Out of print.)
t13. Development of Methodology for Evaluation and Prediction of Avalanche Hazard in the San Juan Mountains of Southwestern Colorado. By R.L. Armstrong, E.R. Lachapelle, M.J. Bovis, and J.D. Ives. 1975. 141 pp. $4.75.
t14. Quality Skiing at Aspen, Colorado: A Study in Recreational Carrying Capacity. By C. Crum London. 1975. 134 pp. 3 plates. $5.50.
t15. Palynological and Paleoclimatic Study of the Late Quaternary Displacements of the Boreal Forest-Tundra Ecotone in Keewatin and Mackenzie, N. W. T., Canada. By H. Nichols. 1975. X + 87 pp. $4.00.
t16. Computer Techniques for the Presentation of Palynological and Paleoenvironmental Data. By M . Nichols, M. Eccles, and H. Nichols. 1976 (in press).
t17. Avalanche A tlas: San Juan County, Colorado. By L. Miller, B.R. Armstrong, and R.L. Armstrong. 1976. 260 pp. 60 plates. $4.25.
t18. Century of Struggle Against Snow: A History of Avalanche Hazard in San Juan County, Colorado. By B.R. Armstrong. 1976 (in press) .
t19. Avalanche Release and Snow Characteristics, San Juan Mountains, Colorado. Edited by R. L. Armstrong and J.D. Ives. 1976 (in press).
t20. Landslides Near Aspen, Colorado. C.P. Harden. 1976 (in press).
tOrder from INSTAAR, University of Colorado, Boulder, Colorado 80309. Orders by mail add 65 cents .
Occasiona/ 1Papers are a miscellaneous collection of reports and papers on work performed by INSTAAR personnel and associates. Generally, these papers are too long for publication as journal articles, or they contain large amounts of supporting data that are normally difficult to publish in the standard literature.

A stylized "ankh," the ancient Egyptian sign for life, has been incorporated into the symbol of the Program on Man and the Biosphere (MAB).