automated molecular formula determination by tandem mass spectrometry (ms/ms
TRANSCRIPT
PAPER www.rsc.org/analyst | Analyst
Automated molecular formula determination by tandem mass spectrometry(MS/MS)†
Suwatchai Jarussophon,ab Stephane Acoca,ac Jin-Ming Gao,ad Christophe Deprez,a Taira Kiyota,‡a
Cristina Draghici,‡a Enrico Purisimaa and Yasuo Konishi*a
Received 20th October 2008, Accepted 12th January 2009
First published as an Advance Article on the web 5th February 2009
DOI: 10.1039/b818398h
Automated software was developed to analyze the molecular formula of organic molecules and
peptides based on high-resolution MS/MS spectroscopic data. The software was validated with 96
compounds including a few small peptides in the mass range of 138–1569 Da containing the elements
carbon, hydrogen, nitrogen and oxygen. A Micromass Waters Q-TOF Ultima Global mass
spectrometer was used to measure the molecular masses of precursor and fragment ions. Our software
assigned correct molecular formulas for 91 compounds, incorrect molecular formulas for 3 compounds,
and no molecular formula for 2 compounds. The obtained 95% success rate indicates high reliability of
the software. The mass accuracy of the precursor ion and the fragment ions, which is critical for the
success of the analysis, was high, i.e. the accuracy and the precision of 850 data were 0.0012 Da and
0.0016 Da, respectively. For the precursor and fragment ions below 500 Da, 60% and 90% of the data
showed accuracy within #0.001 Da and #0.002 Da, respectively. The precursor and fragment ions
above 500 Da showed slightly lower accuracy, i.e. 40% and 70% of them showed accuracy within
#0.001 Da and #0.002 Da, respectively. The molecular formulas of the precursor and the fragments
were further used to analyze possible mass spectrometric fragmentation pathways, which would be
a powerful tool in structural analysis and identification of small molecules. The method is valuable in
the rapid screening and identification of small molecules such as the dereplication of natural products,
characterization of drug metabolites, and identification of small peptide fragments in proteomics. The
analysis was also extended to compounds that contain a chlorine or bromine atom.
Introduction
Over the past decades, the major sources of marketed drugs have
been natural products, or their semi-synthetic derivatives.
Natural products provide larger structural diversity than
combinatorial chemistry products and offer significant oppor-
tunities for finding novel lead compounds.1–5 Each year, a large
number of new natural products are discovered and fully char-
acterized; however, during the courses of isolation, character-
ization and identification, natural products chemists have faced
increasing problems of replication, i.e. re-discovery of known
natural products.6,7
aBiotechnology Research Institute, National Research Council Canada,6100 Royalmount Avenue, Montr�eal, Qu�ebec, Canada H4P 2R2. E-mail:[email protected]; Fax: +1 514 496 5243; Tel: +1 514 4966339bNational Nanotechnology Center, National Science and TechnologyDevelopment Agency, 130 Thailand Science Park, Paholyothin Rd.,Klong Luang, Pathumthani 12120, Thailand. E-mail: [email protected] of Biochemistry, McIntyreMedical Sciences Building,McGillUniversity, 3655 Promenade Sir William Osler, Montr�eal, Qu�ebec, CanadaH3G 1Y6dNatural Products Resource Research Centre, College of Science,Northwest A & F University, Yangling, Shaanxi 712100, PR China
† Electronic supplementary information (ESI) available: Table showingMFA of 5-leucine enkephalin. See DOI: 10.1039/b818398h
‡ Current address: Wyeth Research, 1025 Marcel Laurin Bd.,Saint-Laurent, Qu�ebec, Canada H4R 1J6.
690 | Analyst, 2009, 134, 690–700
A method that identifies and eliminates known compounds in
the early stages of the natural product discovery process is
generally known as dereplication. It plays a key role in phyto-
chemistry and in an effective natural product discovery
program.8–10 Dereplication typically uses a combination of
analytical techniques and database searching11–14 to identify
active compounds. The databases that are extensively used are
Chemical Abstracts (CA), Beilstein, Bioactive Natural Product
Database, Chapman & Hall’s Dictionary of Natural Products and
Natural Products Alert (NAPRALERT). There have been
considerable developments of analytical separation techniques
such as GC, LC and CE, and of spectroscopic characterization
techniques such as PDA, IR, NMR, and MS. Hyphenated
techniques couple the separation techniques with online spec-
troscopic characterization, e.g. LC-MS, GC-MS, CE-MS,
LC-UV and LC-NMR. They are expected to resolve the
complexity of the natural product extracts. Recent advances of
hyphenated techniques and their applications have been reported
by several research laboratories.15–18 In addition, multiple
combinations of the characterization techniques have been
developed, e.g. LC-PDA-MS,19 LC-NMR-MS,20,21 LC-SPE-
NMR,22 LC-PDA-IR-NMR-MS,23 and 2D-LC(IEC-RP)-MS.24
These improve the sample separation, structural characterization
and elucidation, and also the detection of valuable minor
components in natural sources.
Due to high productivity and sensitivity, mass spectrometry
has become the most powerful and essential technique providing
This journal is ª The Royal Society of Chemistry 2009
critical information in many phases of drug discovery and
development. Examples are structural characterization and
identification,25,26 quantitation,27 high-throughput screening,28,29
proteomics,30,31 metabonomics,32–34 metabolomics,35–41 and der-
eplication of natural products. In the area of dereplication, MS
delivers the molecular mass information that can be used as
a search query in almost all databases of small molecules.42,43
Accurate mass obtained from high-resolution MS is commonly
used to search for candidates in literature databases.44 Unfor-
tunately, in general, several molecular formulas (MFs) are
compatible with the observed molecular mass within the exper-
imental accuracy, resulting in a large set of compounds, most of
which are false positives. MS/MS measurements often provide
more information of some sub-structures, or fingerprints of sub-
structures.45,46 There are few databases that provide MS/MS data
such as NIST/EPA/NIH Mass Spectral Library which contains
14 802 MS/MS spectra. They may become practical and useful
when more MS/MS data are accumulated and systematically
analyzed.
The dereplication process starts by using the information
stored in natural product databases. The molecular formula
(MF) is one of the most valuable pieces of information as it is
available in any natural product database and is independent of
the source, of the sample preparation, and of the conditions of
the measurements. Conventional elemental composition analysis
is typically achieved by high-resolution MS47,48 such as magnetic
sector MS, time-of-flight MS (TOF-MS)49 and Fourier transform
MS (FTMS).50 These instruments provide a set of MFs that can
be further narrowed down in combination with NMR data.
However, NMR is much less sensitive than MS, requiring a large
quantity of purified sample. Thus, the combination of MS and
NMR practically brings little contribution to dereplication. It
should be mentioned that the number of possible MFs expo-
nentially increases with the size of the molecules, whereas there
has been no drastic progress to improve accurate mass determi-
nation.51,52
In our previous paper,53 we analyzed MF and fragmentation
pathways of small molecules based on their accurate MS, MS/
MS, and MS/MS/MS data. The method provided detailed
information on the structure and sub-structures and their frag-
mentation pathways. The method is useful when a specific
molecule is targeted for detailed structural analysis. However,
the measurements and the analysis were not automated. Thus, we
have now developed simple, automated, and productive soft-
ware, which determines MF of small molecules and their frag-
ments based on the accurate MS and MS/MS data.
Experimental
Materials
All compounds used in our study were randomly selected from
an organo-chemical drug library (Negwer’s database) and those
that are commercially available. [Glu1]-Fibrinopeptide B was
purchased from Sigma (Oakville, ON, Canada) and used as
a reference compound for the calibration of the mass spec-
trometer. All reagents were used without further purification.
Water and acetonitrile are of HPLC grade and were purchased
from Anachemia (Lachine, QC, Canada) and J. T. Baker
This journal is ª The Royal Society of Chemistry 2009
(Phillipsburg, NJ), respectively. Formic acid was purchased from
Fluka (Oakville, ON, Canada) and was used to aid the positive
ion electrospray ionization process. All solvents were degassed
for at least 30 minutes before use.
Instrumentation
All MS and MS/MS measurements were performed in positive
ion electrospray mode (+ESI) on a Micromass Waters Q-TOF
Ultima Global mass spectrometer equipped with a Z-spray ion
source and NanoLockSpray (Waters, Mississauga, ON, Canada)
source. The m/z was acquired within the mass range of 50–990 m/z
for small organic molecules and 100–1990 m/z for organic
molecules with >900 Da molecular mass and small peptides. The
acquisition time per spectrum was set to 1 s, inter-scan delay was
set to 0.1 s, with the lock spray frequency set to 4 s.54–56 The mass
spectrometer was set up in V mode with instrument resolution
between 9000 and 10 000 based on FWHM. The source and
desolvation temperature were set to 80 and 150 �C, respectively.
The TOF was operated at an acceleration voltage of 9.1 kV,
a cone voltage of 100 V, an RF lens of 45 V, and a capillary
voltage of 3.8 kV. Operating parameters of the ESI interface were
optimized by infusing standard solutions of [Glu1]-fibrinopeptide
B, 100 nM in a solution of water–acetonitrile 50 : 50 (v/v) with
0.1% formic acid at a flow rate of 1.0 mL/min. The instrument was
carefully calibrated such that the error of the MS/MS fragments
of [Glu1]-fibrinopeptide B was less than 4 ppm. All measurements
were performed at room temperature. The MassLynx 4.0 chro-
matographic software was used for instrument control and data
analysis.
MS/MS experiments
A precursor ion of interest was selected at the quadrupole (Q1). It
was fragmented in the hexapole collision cell with argon collision
gas. Fragment ions were measured to obtain their m/z and peak
area. The collision energy was adjusted for each compound
typically from 5 to 40 eV in order to maintain the precursor ion
peak in the range of 35–100 counts/scan, while maximizing the
peak areas of the product ions. Sometimes, high collision energy
was used just to enhance the peak areas of the fragment ions at
low m/z. Fragment ions of 20–400 counts/scan were used for
most of the analyses. The acquired mass spectra were accumu-
lated for at least 2 min. The mass measurements are most accu-
rate when analyte/lock mass intensity ratio is between 0.5 and
2.0.57,58 In a few cases, fragment ions lower than 20 counts/scan
were used for the analysis after accumulating many scans.
Typically, analytes were dissolved in water–acetonitrile 50 : 50 (v/v)
with 0.1% formic acid and directly infused to the mass spec-
trometer using a Harvard syringe pump or autosampler direct
injection. For the reference channel, freshly prepared [Glu1]-
fibrinopeptide B (�1 mM) in water–acetonitrile 50 : 50 (v/v) with
0.1% formic acid was continuously infused to maintain the
constant concentration of reference solution. Both analyte and
reference channels were controlled by NanoLockSpray. The
TOF mass correction (accurate mass measurement) parameters
were performed with the following parameter sets: no back-
ground subtraction;59 Savitsky–Golay’s smooth type; smooth
window 3 channels; number of smooths 1;60 minimum peak
Analyst, 2009, 134, 690–700 | 691
width at half-height 4 channels; centroid top 60%; the dead-time
correction was turned on. Spectral intensity cut-off threshold
setting of 0.1–1.0% was used to simplify and reduce the number
of peaks analyzed which have not sufficient intensity to get good
accuracy.61,62 The TOF transform was used to exclude all isotope
peaks.
The algorithm of molecular formula analysis (MFA)
The forward and reverse MFA algorithms have been described
previously.53 Briefly, the MS/MS experiment of a precursor ion A
generates several fragment ions, A1, A2, A3, A4, A5, A6, A7, A8,
and A9 (Table 1). All possible neutral fragments Ni (i¼ 1–9) and
Nij (i ¼ 1–8; j ¼ 2–9; j > i) are listed in Table 1, i.e. Ni (i ¼ 1–9)
are generated from A and Nij (i¼ 1–8; j¼ 2–9; j > i) are possibly
generated from Ai (i ¼ 1–8). H+ (¼ 1.0078 Da) is added artifi-
cially as the smallest product ion to obtain the corresponding
neutral product N, N1H,., N9H in Table 1.
(1) The first step of the analysis is designated as ‘Forward
Analysis’. Briefly, accurate mass measurement uniquely deter-
mines the MF of some small fragments. The MFs of these small
fragments are then added up sequentially to determine the MF of
the precursor ion, A. More specifically, the MFA was carried out
for the neutral losses NiH (i ¼ 1–9), N, and Ni9 (i ¼ 1–8). Two
restrictions were applied in the search. One is the molecular size
of the neutral loss, which is typically limited to 200–400 Da,
preferably 200 Da, and the other is the error cut-off, which is
0.002–0.003 Da, preferably 0.002 Da. These restrictions reduce
CPU time and enhance the identification of a unique MF,
respectively. The neutral molecules that have been uniquely
identified are highlighted in bold (N9H, N8H, N89, N6H, .,
etc.). It should be emphasized that all Ni9 (i ¼ 1–8) are simply
listed to fill Table 1 and some of them may not exist mathe-
matically or physically. The MF of fragment ion A9 is assigned
from the added MFs (N9H + H+). The observed m/z value of A9
is then replaced with the one calculated from the assigned MF.
The molecular masses of Ni9 (i ¼ 1–8) are also replaced
accordingly. Similarly, the MF of fragment ion A8 is assigned
from (N8H + H+) and (N89 + A9). The process continues up to
the assignment of the MF of A from (N1 + A1), (N2 + A2), (N3 +
A3), (N4 + A4), and (N5 + A5). In most of the analysis, the MF
of A is uniquely assigned; however, sometimes, two or more MFs
are assigned for A. All of the MFs assigned are further examined
in the next step, which is designated as ‘Reverse Analysis’, where
Table 1 Potential neutral losses in the MS/MS experiment in forward MFA
Precursor Product ions and neutral products
A A1 A2 A3 A4A N1 N2 N3 N4A1 N12 N13 N14A2 N23 N24A3 N34A4A5A6A7A8A9
692 | Analyst, 2009, 134, 690–700
each of the MFs of the fragment ions and neutral losses assigned
in ‘Forward Analysis’ is re-examined.
(2) The second step is designated as ‘Reverse Analysis’. First,
the observed m/z value of the precursor ion is replaced with the
m/z value calculated from the assigned MF. The MFs of Ni (i ¼1–9), in which each element is restricted not to exceed that of A,
are analyzed with a cut-off error of 0.002–0.003 Da, but without
limitation of the molecular size. The MF of A1 is determined as
the difference of those of A and N1. The observed m/z value of
A1 is replaced with that of the calculated value. The molecular
masses (MM) of N1i (i ¼ 1–9) are also replaced accordingly.
Similarly, the MF of the fragment ion A2 is assigned from (A �N2), and (A1 � N12). The process continues until the MF of A9
is assigned from (A � N9), (A1 � N19), (A2 � N29), (A3 �N39), (A4 � A49), (A5 � A59), (A6 � N69), (A7 � N79), and
(A8 � N89). If they are not consistent, the MF of Ai is assigned
by taking the one most frequently assigned and using it in the
following steps. Table 2 shows the outcome of the reverse anal-
ysis of brefeldin A.
(3) The third step is designated as ‘Least-squares Index’,
where statistical verification is introduced on the outcome of
‘Reverse Analysis’. This step is designed to select a correct MF
out of multiple MFs that are occasionally found in ‘Forward
Analysis’. It should be recalled that ‘Reverse Analysis’ is per-
formed for all of the MFs derived from ‘Forward Analysis’. The
MFA of brefeldin A is an example that resulted in two MFs of
C16H24O4 and C17H20N4 in ‘Forward Analysis’. Their ‘Reverse
Analysis’ gives quite different MFs of the fragment ions and
neutral losses. Tables 2 and 3 show both correct and incorrect
MFA in the reverse analysis (the formats of precursor ion,
fragment ions and neutral losses are the same as those in Table
1). The two tables have quite different characteristics. The one
with the correct MF of the precursor ion produces the MFs of all
fragment ions and of most of the potential neutral losses. On the
other hand, the one with incorrect MF of the precursor ion fails
to assign the MF of four fragment ions and of several neutral
losses. In order to quantitate the different characteristics of the
tables, a least-squares index was introduced in the automated
evaluation software to evaluate the difference numerically. The
index is based on the observation (illustrated by Table 2) that the
number of possible neutral losses, NLcalc, associated with the
fragment ions linearly increases as the size of the fragment ions
decreases. This gives a range of values for NLcalc. Not all of these
neutral losses are observed in the table, i.e. NLobs is not always
equal to NLcalc. Empirically, we observe that the correlation
A5 A6 A7 A8 A9 H+
N5 N6 N7 N8 N9 NN15 N16 N17 N18 N19 N1HN25 N26 N27 N28 N29 N2HN35 N36 N37 N38 N39 N3HN45 N46 N47 N48 N49 N4H
N56 N57 N58 N59 N5HN67 N68 N69 N6H
N78 N79 N7HN89 N8H
N9H
This journal is ª The Royal Society of Chemistry 2009
Table 2 Reverse MFA of brefeldin A with correct formula of precursor ion
MMobs. 280.1673 262.1569 244.1458 226.1363 216.1521 198.1413 184.1261 162.1419 158.1113 130.0791
C16H24O4 C16H22O3 C16H20O2 C16H18O C15H20O C15H18 C14H16 C12H18 C12H14 C10H10
C16H24O4 — H2O H4O2 H6O3 CH4O3 CH6O4 C2H8O4 C4H6O4 C4H10O4 C6H14O4
C16H22O3 — H2O H4O2 CH2O2 CH4O3 C2H6O3 C4H4O3 C4H8O3 C6H12O3
C16H20O2 — H2O CO CH2O2 C2H4O2 C4H2O2 C4H6O2 C6H10O2
C16H18O — CO C2H2O C4O C4H4O C6H8OC15H20O — H2O CH4O C3H2O C3H6O C5H10OC15H18 — C3 C3H4 C5H8
C14H16 — C2H2 C4H6
C12H18 — H4 C2H8
C12H14 — C2H4
C10H10 —
NLcalca 1 2 3 4 5 6 7 8 9
NLobsb 1 2 3 3 5 5 6 8 9
a The number of possible neutral losses associated with each fragment ion. b The number of neutral losses, of which MFs are assigned, associated witheach fragment ion.
Table 3 Reverse MFA of brefeldin A with incorrect formula of precursor ion
MMobs 280.1673 262.1569 244.1458 226.1363 216.1521 198.1413 184.1261 162.1419 158.1113 130.0791
C17H20N4 C15H18 C14H16 C12H18 C12H14 C10H10
C17H20N4 — C2H2N4 C3H4N4 C5H2N4 C5H6N4 C7H10N4
——
——
C15H18 — C3 C3H4 C5H8
C14H16 — C2H2 C4H6
C12H18 — H4 C2H8C12H14 — C2H4
C10H10 —
NLcalca 1 2 3 4 5
NLobsb 1 1 2 4 5
a The number of possible neutral losses associated with each fragment ion (fragment ions, of which MFs are not assigned, are not counted). b Thenumber of neutral losses, of which MFs are assigned, associated with each fragment ion (fragment ions, of which MFs are not assigned, are not counted).
between NLobs and NLcalc is better when the correct precursor
ion is used. For example, in Tables 2 and 3 the Pearson corre-
lation coefficients R2 are 0.9749 and 0.9292, respectively. Hence,
the MFA giving higher R2 value is taken as the correct MF.
Nitrogen-enriched or oxygen-enriched compounds
Bases such as adenine and cytosine are typical nitrogen-enriched
groups, and saccharides are typical oxygen-enriched groups. As
the molecular masses of CN4 (68.0122 Da) and H4O4 (68.0109
Da) are very close, the MFA of nitrogen-enriched and oxygen-
enriched fragments tends to end up with two MFs. For example,
the analysis of glucose neutral loss (C6H12O6, 180.0633 Da) also
assigns a nitrogen-enriched neutral loss (C7H8N4O2, 180.0647
Da) such as p-xanthine, theophylline, and NSC265259 with
a molecular mass difference of only 0.0013 Da. In this case, they
may be distinguished by another dehydrated neutral loss
(C6H10O5, 162.0528 Da), i.e. dehydration should be observed for
glucose, but not for the base. In order to minimize the failure of
our MFA, a few commonly observed saccharides and bases are
pre-assigned in the software and the presence/absence of the
This journal is ª The Royal Society of Chemistry 2009
dehydrated fragment is manually confirmed later. However,
exceptional cases can still occur. For example, the analysis of
streptomycin failed as it contains both nitrogen-enriched
(C8H18N6O4) and oxygen-enriched (C7H13NO4 and C6H8O4)
sub-structures. Since none of them are commonly present in
small molecules, they are not pre-assigned, resulting in no unique
MF of the precursor molecule. Nucleoside analogs containing
bases and ribose analogs may generally have the same problem.
Results and discussion
Risk of assigning incorrect MF
The first ‘Forward Analysis’ step is typically performed with
a molecular mass cut-off of 200 Da and a mass accuracy of 0.002
Da. We have applied ‘Forward Analysis’ to 96 small molecules
(138–1569 Da) and observed the following:
(1) ‘Forward Analysis’ of 86 out of 96 compounds (90%)
resulted in a unique MF for each precursor molecule. Among
them, 83 were assigned the correct MF and 3 were assigned the
incorrect MF (97% success rate).
Analyst, 2009, 134, 690–700 | 693
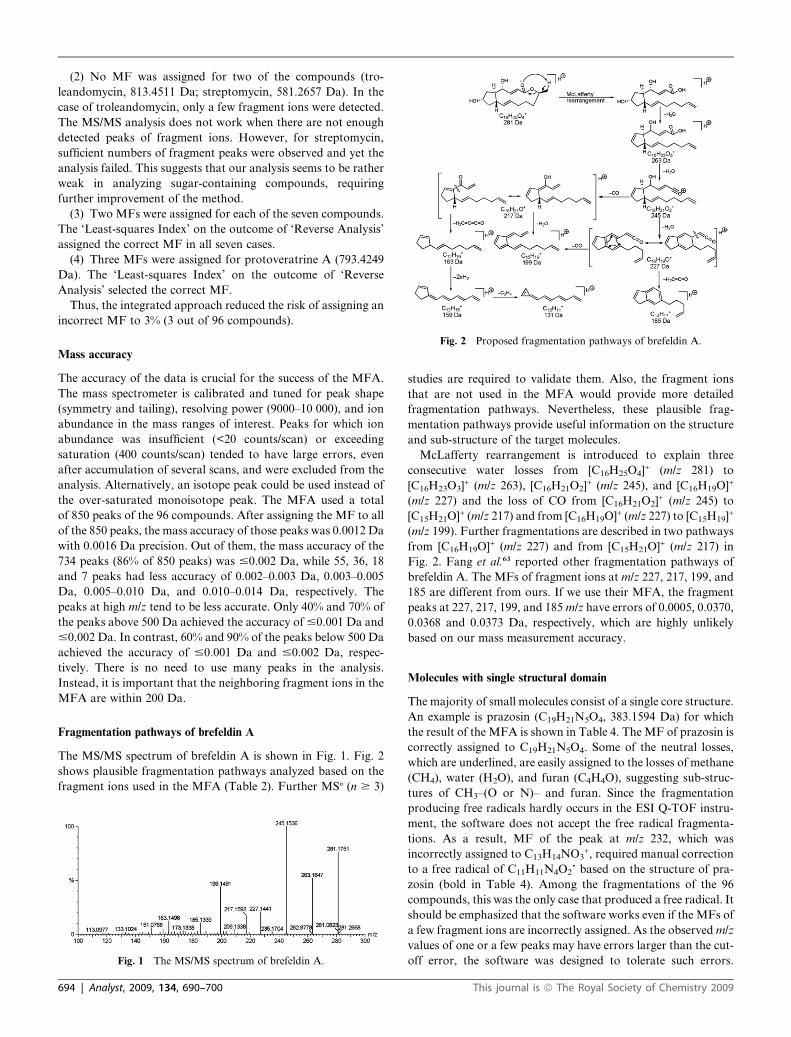
Fig. 2 Proposed fragmentation pathways of brefeldin A.
(2) No MF was assigned for two of the compounds (tro-
leandomycin, 813.4511 Da; streptomycin, 581.2657 Da). In the
case of troleandomycin, only a few fragment ions were detected.
The MS/MS analysis does not work when there are not enough
detected peaks of fragment ions. However, for streptomycin,
sufficient numbers of fragment peaks were observed and yet the
analysis failed. This suggests that our analysis seems to be rather
weak in analyzing sugar-containing compounds, requiring
further improvement of the method.
(3) Two MFs were assigned for each of the seven compounds.
The ‘Least-squares Index’ on the outcome of ‘Reverse Analysis’
assigned the correct MF in all seven cases.
(4) Three MFs were assigned for protoveratrine A (793.4249
Da). The ‘Least-squares Index’ on the outcome of ‘Reverse
Analysis’ selected the correct MF.
Thus, the integrated approach reduced the risk of assigning an
incorrect MF to 3% (3 out of 96 compounds).
Mass accuracy
The accuracy of the data is crucial for the success of the MFA.
The mass spectrometer is calibrated and tuned for peak shape
(symmetry and tailing), resolving power (9000–10 000), and ion
abundance in the mass ranges of interest. Peaks for which ion
abundance was insufficient (<20 counts/scan) or exceeding
saturation (400 counts/scan) tended to have large errors, even
after accumulation of several scans, and were excluded from the
analysis. Alternatively, an isotope peak could be used instead of
the over-saturated monoisotope peak. The MFA used a total
of 850 peaks of the 96 compounds. After assigning the MF to all
of the 850 peaks, the mass accuracy of those peaks was 0.0012 Da
with 0.0016 Da precision. Out of them, the mass accuracy of the
734 peaks (86% of 850 peaks) was #0.002 Da, while 55, 36, 18
and 7 peaks had less accuracy of 0.002–0.003 Da, 0.003–0.005
Da, 0.005–0.010 Da, and 0.010–0.014 Da, respectively. The
peaks at high m/z tend to be less accurate. Only 40% and 70% of
the peaks above 500 Da achieved the accuracy of #0.001 Da and
#0.002 Da. In contrast, 60% and 90% of the peaks below 500 Da
achieved the accuracy of #0.001 Da and #0.002 Da, respec-
tively. There is no need to use many peaks in the analysis.
Instead, it is important that the neighboring fragment ions in the
MFA are within 200 Da.
Fragmentation pathways of brefeldin A
The MS/MS spectrum of brefeldin A is shown in Fig. 1. Fig. 2
shows plausible fragmentation pathways analyzed based on the
fragment ions used in the MFA (Table 2). Further MSn (n $ 3)
Fig. 1 The MS/MS spectrum of brefeldin A.
694 | Analyst, 2009, 134, 690–700
studies are required to validate them. Also, the fragment ions
that are not used in the MFA would provide more detailed
fragmentation pathways. Nevertheless, these plausible frag-
mentation pathways provide useful information on the structure
and sub-structure of the target molecules.
McLafferty rearrangement is introduced to explain three
consecutive water losses from [C16H25O4]+ (m/z 281) to
[C16H23O3]+ (m/z 263), [C16H21O2]+ (m/z 245), and [C16H19O]+
(m/z 227) and the loss of CO from [C16H21O2]+ (m/z 245) to
[C15H21O]+ (m/z 217) and from [C16H19O]+ (m/z 227) to [C15H19]+
(m/z 199). Further fragmentations are described in two pathways
from [C16H19O]+ (m/z 227) and from [C15H21O]+ (m/z 217) in
Fig. 2. Fang et al.63 reported other fragmentation pathways of
brefeldin A. The MFs of fragment ions at m/z 227, 217, 199, and
185 are different from ours. If we use their MFA, the fragment
peaks at 227, 217, 199, and 185 m/z have errors of 0.0005, 0.0370,
0.0368 and 0.0373 Da, respectively, which are highly unlikely
based on our mass measurement accuracy.
Molecules with single structural domain
The majority of small molecules consist of a single core structure.
An example is prazosin (C19H21N5O4, 383.1594 Da) for which
the result of the MFA is shown in Table 4. The MF of prazosin is
correctly assigned to C19H21N5O4. Some of the neutral losses,
which are underlined, are easily assigned to the losses of methane
(CH4), water (H2O), and furan (C4H4O), suggesting sub-struc-
tures of CH3–(O or N)– and furan. Since the fragmentation
producing free radicals hardly occurs in the ESI Q-TOF instru-
ment, the software does not accept the free radical fragmenta-
tions. As a result, MF of the peak at m/z 232, which was
incorrectly assigned to C13H14NO3+, required manual correction
to a free radical of C11H11N4O2c based on the structure of pra-
zosin (bold in Table 4). Among the fragmentations of the 96
compounds, this was the only case that produced a free radical. It
should be emphasized that the software works even if the MFs of
a few fragment ions are incorrectly assigned. As the observed m/z
values of one or a few peaks may have errors larger than the cut-
off error, the software was designed to tolerate such errors.
This journal is ª The Royal Society of Chemistry 2009
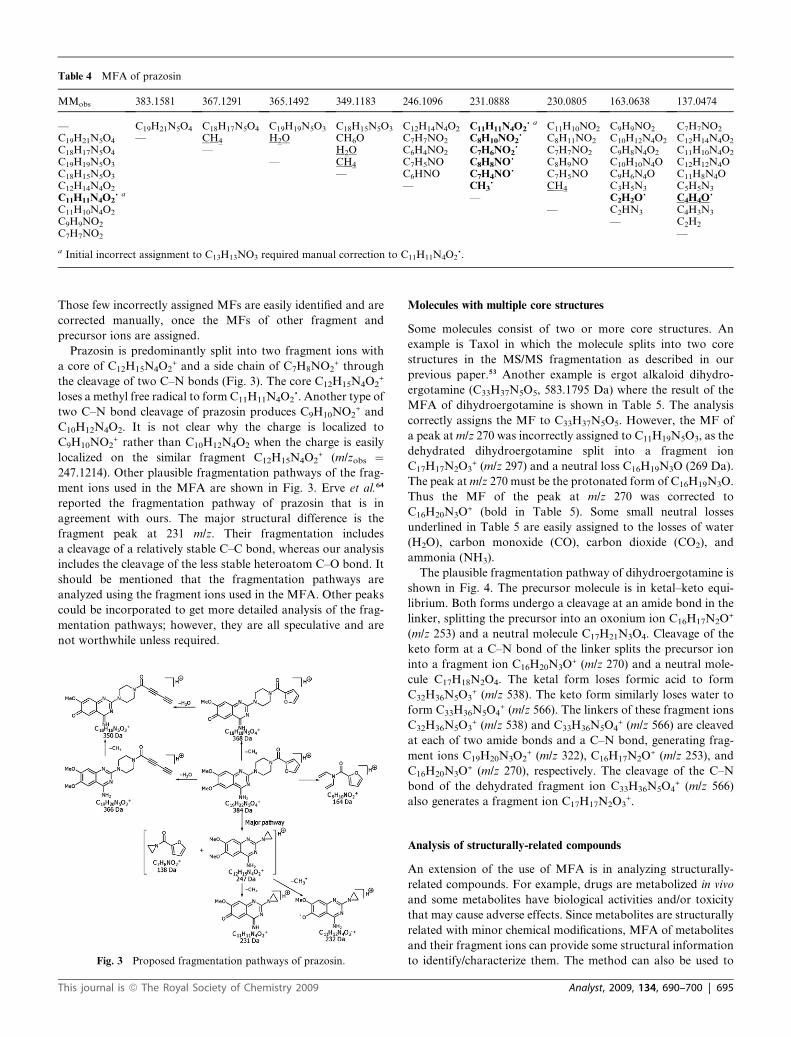
Table 4 MFA of prazosin
MMobs 383.1581 367.1291 365.1492 349.1183 246.1096 231.0888 230.0805 163.0638 137.0474
— C19H21N5O4 C18H17N5O4 C19H19N5O3 C18H15N5O3 C12H14N4O2 C11H11N4O2ca C11H10NO2 C9H9NO2 C7H7NO2
C19H21N5O4 — CH4 H2O CH6O C7H7NO2 C8H10NO2c C8H11NO2 C10H12N4O2 C12H14N4O2
C18H17N5O4 — H2O C6H4NO2 C7H6NO2c C7H7NO2 C9H8N4O2 C11H10N4O2
C19H19N5O3 — CH4 C7H5NO C8H8NOc C8H9NO C10H10N4O C12H12N4OC18H15N5O3 — C6HNO C7H4NOc C7H5NO C9H6N4O C11H8N4OC12H14N4O2 — CH3c CH4 C3H5N3 C5H5N3
C11H11N4O2ca — C2H2Oc C4H4Oc
C11H10N4O2 — C2HN3 C4H3N3
C9H9NO2 — C2H2
C7H7NO2 —
a Initial incorrect assignment to C13H13NO3 required manual correction to C11H11N4O2c.
Those few incorrectly assigned MFs are easily identified and are
corrected manually, once the MFs of other fragment and
precursor ions are assigned.
Prazosin is predominantly split into two fragment ions with
a core of C12H15N4O2+ and a side chain of C7H8NO2
+ through
the cleavage of two C–N bonds (Fig. 3). The core C12H15N4O2+
loses a methyl free radical to form C11H11N4O2c. Another type of
two C–N bond cleavage of prazosin produces C9H10NO2+ and
C10H12N4O2. It is not clear why the charge is localized to
C9H10NO2+ rather than C10H12N4O2 when the charge is easily
localized on the similar fragment C12H15N4O2+ (m/zobs ¼
247.1214). Other plausible fragmentation pathways of the frag-
ment ions used in the MFA are shown in Fig. 3. Erve et al.64
reported the fragmentation pathway of prazosin that is in
agreement with ours. The major structural difference is the
fragment peak at 231 m/z. Their fragmentation includes
a cleavage of a relatively stable C–C bond, whereas our analysis
includes the cleavage of the less stable heteroatom C–O bond. It
should be mentioned that the fragmentation pathways are
analyzed using the fragment ions used in the MFA. Other peaks
could be incorporated to get more detailed analysis of the frag-
mentation pathways; however, they are all speculative and are
not worthwhile unless required.
Fig. 3 Proposed fragmentation pathways of prazosin.
This journal is ª The Royal Society of Chemistry 2009
Molecules with multiple core structures
Some molecules consist of two or more core structures. An
example is Taxol in which the molecule splits into two core
structures in the MS/MS fragmentation as described in our
previous paper.53 Another example is ergot alkaloid dihydro-
ergotamine (C33H37N5O5, 583.1795 Da) where the result of the
MFA of dihydroergotamine is shown in Table 5. The analysis
correctly assigns the MF to C33H37N5O5. However, the MF of
a peak at m/z 270 was incorrectly assigned to C11H19N5O3, as the
dehydrated dihydroergotamine split into a fragment ion
C17H17N2O3+ (m/z 297) and a neutral loss C16H19N3O (269 Da).
The peak at m/z 270 must be the protonated form of C16H19N3O.
Thus the MF of the peak at m/z 270 was corrected to
C16H20N3O+ (bold in Table 5). Some small neutral losses
underlined in Table 5 are easily assigned to the losses of water
(H2O), carbon monoxide (CO), carbon dioxide (CO2), and
ammonia (NH3).
The plausible fragmentation pathway of dihydroergotamine is
shown in Fig. 4. The precursor molecule is in ketal–keto equi-
librium. Both forms undergo a cleavage at an amide bond in the
linker, splitting the precursor into an oxonium ion C16H17N2O+
(m/z 253) and a neutral molecule C17H21N3O4. Cleavage of the
keto form at a C–N bond of the linker splits the precursor ion
into a fragment ion C16H20N3O+ (m/z 270) and a neutral mole-
cule C17H18N2O4. The ketal form loses formic acid to form
C32H36N5O3+ (m/z 538). The keto form similarly loses water to
form C33H36N5O4+ (m/z 566). The linkers of these fragment ions
C32H36N5O3+ (m/z 538) and C33H36N5O4
+ (m/z 566) are cleaved
at each of two amide bonds and a C–N bond, generating frag-
ment ions C19H20N3O2+ (m/z 322), C16H17N2O+ (m/z 253), and
C16H20N3O+ (m/z 270), respectively. The cleavage of the C–N
bond of the dehydrated fragment ion C33H36N5O4+ (m/z 566)
also generates a fragment ion C17H17N2O3+.
Analysis of structurally-related compounds
An extension of the use of MFA is in analyzing structurally-
related compounds. For example, drugs are metabolized in vivo
and some metabolites have biological activities and/or toxicity
that may cause adverse effects. Since metabolites are structurally
related with minor chemical modifications, MFA of metabolites
and their fragment ions can provide some structural information
to identify/characterize them. The method can also be used to
Analyst, 2009, 134, 690–700 | 695
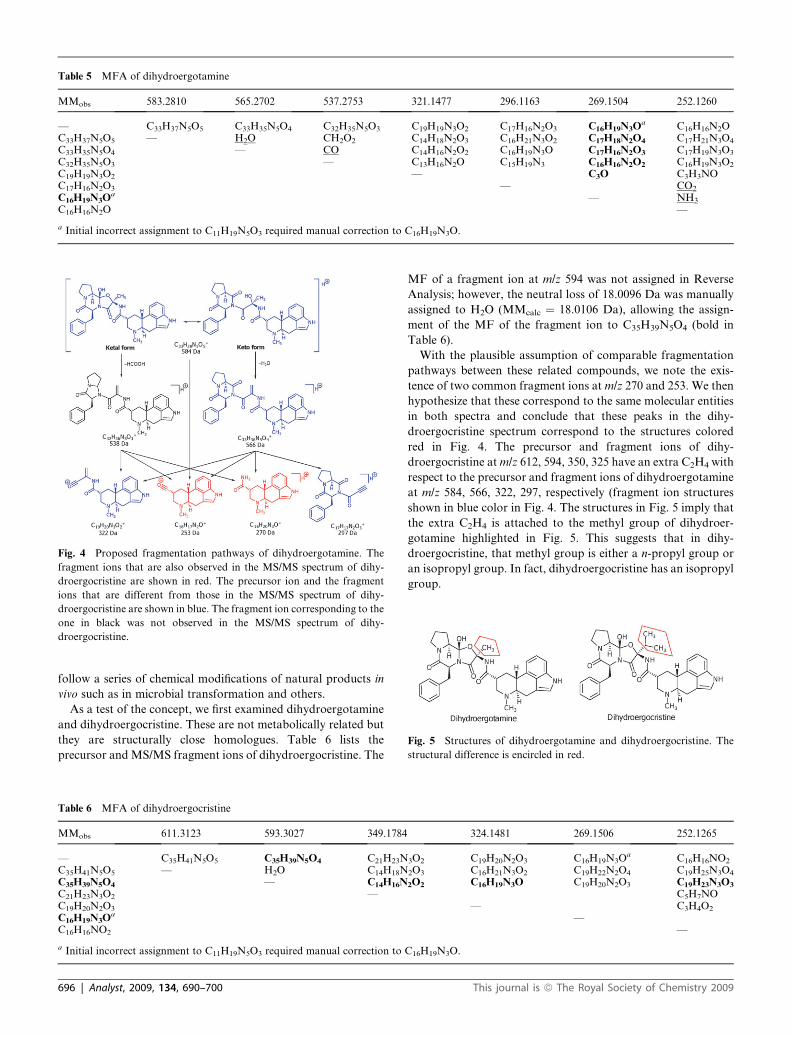
Table 5 MFA of dihydroergotamine
MMobs 583.2810 565.2702 537.2753 321.1477 296.1163 269.1504 252.1260
— C33H37N5O5 C33H35N5O4 C32H35N5O3 C19H19N3O2 C17H16N2O3 C16H19N3Oa C16H16N2O
C33H37N5O5 — H2O CH2O2 C14H18N2O3 C16H21N3O2 C17H18N2O4 C17H21N3O4
C33H35N5O4 — CO C14H16N2O2 C16H19N3O C17H16N2O3 C17H19N3O3
C32H35N5O3 — C13H16N2O C15H19N3 C16H16N2O2 C16H19N3O2
C19H19N3O2 — C3O C3H3NOC17H16N2O3 — CO2
C16H19N3Oa — NH3
C16H16N2O —
a Initial incorrect assignment to C11H19N5O3 required manual correction to C16H19N3O.
Fig. 4 Proposed fragmentation pathways of dihydroergotamine. The
fragment ions that are also observed in the MS/MS spectrum of dihy-
droergocristine are shown in red. The precursor ion and the fragment
ions that are different from those in the MS/MS spectrum of dihy-
droergocristine are shown in blue. The fragment ion corresponding to the
one in black was not observed in the MS/MS spectrum of dihy-
droergocristine.
Fig. 5 Structures of dihydroergotamine and dihydroergocristine. The
structural difference is encircled in red.
follow a series of chemical modifications of natural products in
vivo such as in microbial transformation and others.
As a test of the concept, we first examined dihydroergotamine
and dihydroergocristine. These are not metabolically related but
they are structurally close homologues. Table 6 lists the
precursor and MS/MS fragment ions of dihydroergocristine. The
Table 6 MFA of dihydroergocristine
MMobs 611.3123 593.3027 349.1784
— C35H41N5O5 C35H39N5O4 C21H23NC35H41N5O5 — H2O C14H18NC35H39N5O4 — C14H16NC21H23N3O2 —C19H20N2O3
C16H19N3Oa
C16H16NO2
a Initial incorrect assignment to C11H19N5O3 required manual correction to
696 | Analyst, 2009, 134, 690–700
MF of a fragment ion at m/z 594 was not assigned in Reverse
Analysis; however, the neutral loss of 18.0096 Da was manually
assigned to H2O (MMcalc ¼ 18.0106 Da), allowing the assign-
ment of the MF of the fragment ion to C35H39N5O4 (bold in
Table 6).
With the plausible assumption of comparable fragmentation
pathways between these related compounds, we note the exis-
tence of two common fragment ions at m/z 270 and 253. We then
hypothesize that these correspond to the same molecular entities
in both spectra and conclude that these peaks in the dihy-
droergocristine spectrum correspond to the structures colored
red in Fig. 4. The precursor and fragment ions of dihy-
droergocristine at m/z 612, 594, 350, 325 have an extra C2H4 with
respect to the precursor and fragment ions of dihydroergotamine
at m/z 584, 566, 322, 297, respectively (fragment ion structures
shown in blue color in Fig. 4. The structures in Fig. 5 imply that
the extra C2H4 is attached to the methyl group of dihydroer-
gotamine highlighted in Fig. 5. This suggests that in dihy-
droergocristine, that methyl group is either a n-propyl group or
an isopropyl group. In fact, dihydroergocristine has an isopropyl
group.
324.1481 269.1506 252.1265
3O2 C19H20N2O3 C16H19N3Oa C16H16NO2
2O3 C16H21N3O2 C19H22N2O4 C19H25N3O4
2O2 C16H19N3O C19H20N2O3 C19H23N3O3
C5H7NO— C3H4O2
——
C16H19N3O.
This journal is ª The Royal Society of Chemistry 2009
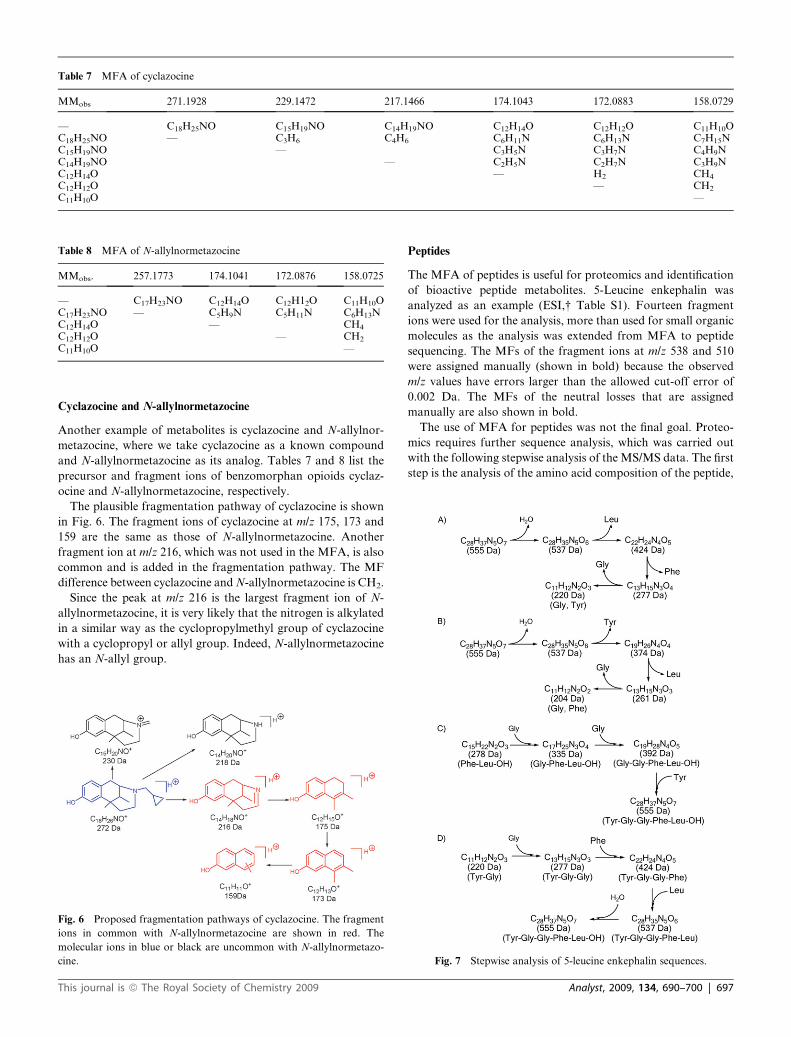
Table 7 MFA of cyclazocine
MMobs 271.1928 229.1472 217.1466 174.1043 172.0883 158.0729
— C18H25NO C15H19NO C14H19NO C12H14O C12H12O C11H10OC18H25NO — C3H6 C4H6 C6H11N C6H13N C7H15NC15H19NO — C3H5N C3H7N C4H9NC14H19NO — C2H5N C2H7N C3H9NC12H14O — H2 CH4
C12H12O — CH2
C11H10O —
Table 8 MFA of N-allylnormetazocine
MMobs. 257.1773 174.1041 172.0876 158.0725
— C17H23NO C12H14O C12H12O C11H10OC17H23NO — C5H9N C5H11N C6H13NC12H14O — CH4
C12H12O — CH2
C11H10O —
Cyclazocine and N-allylnormetazocine
Another example of metabolites is cyclazocine and N-allylnor-
metazocine, where we take cyclazocine as a known compound
and N-allylnormetazocine as its analog. Tables 7 and 8 list the
precursor and fragment ions of benzomorphan opioids cyclaz-
ocine and N-allylnormetazocine, respectively.
The plausible fragmentation pathway of cyclazocine is shown
in Fig. 6. The fragment ions of cyclazocine at m/z 175, 173 and
159 are the same as those of N-allylnormetazocine. Another
fragment ion at m/z 216, which was not used in the MFA, is also
common and is added in the fragmentation pathway. The MF
difference between cyclazocine and N-allylnormetazocine is CH2.
Since the peak at m/z 216 is the largest fragment ion of N-
allylnormetazocine, it is very likely that the nitrogen is alkylated
in a similar way as the cyclopropylmethyl group of cyclazocine
with a cyclopropyl or allyl group. Indeed, N-allylnormetazocine
has an N-allyl group.
Fig. 6 Proposed fragmentation pathways of cyclazocine. The fragment
ions in common with N-allylnormetazocine are shown in red. The
molecular ions in blue or black are uncommon with N-allylnormetazo-
cine.
This journal is ª The Royal Society of Chemistry 2009
Peptides
The MFA of peptides is useful for proteomics and identification
of bioactive peptide metabolites. 5-Leucine enkephalin was
analyzed as an example (ESI,† Table S1). Fourteen fragment
ions were used for the analysis, more than used for small organic
molecules as the analysis was extended from MFA to peptide
sequencing. The MFs of the fragment ions at m/z 538 and 510
were assigned manually (shown in bold) because the observed
m/z values have errors larger than the allowed cut-off error of
0.002 Da. The MFs of the neutral losses that are assigned
manually are also shown in bold.
The use of MFA for peptides was not the final goal. Proteo-
mics requires further sequence analysis, which was carried out
with the following stepwise analysis of the MS/MS data. The first
step is the analysis of the amino acid composition of the peptide,
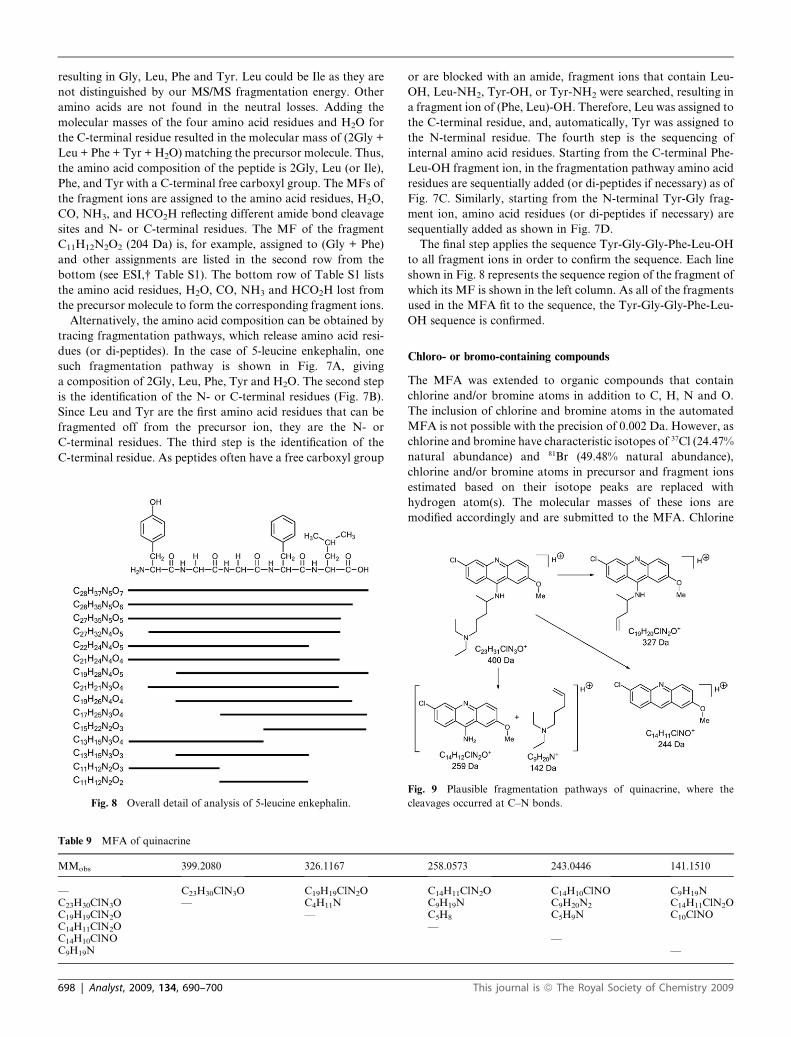
Fig. 7 Stepwise analysis of 5-leucine enkephalin sequences.
Analyst, 2009, 134, 690–700 | 697
resulting in Gly, Leu, Phe and Tyr. Leu could be Ile as they are
not distinguished by our MS/MS fragmentation energy. Other
amino acids are not found in the neutral losses. Adding the
molecular masses of the four amino acid residues and H2O for
the C-terminal residue resulted in the molecular mass of (2Gly +
Leu + Phe + Tyr + H2O) matching the precursor molecule. Thus,
the amino acid composition of the peptide is 2Gly, Leu (or Ile),
Phe, and Tyr with a C-terminal free carboxyl group. The MFs of
the fragment ions are assigned to the amino acid residues, H2O,
CO, NH3, and HCO2H reflecting different amide bond cleavage
sites and N- or C-terminal residues. The MF of the fragment
C11H12N2O2 (204 Da) is, for example, assigned to (Gly + Phe)
and other assignments are listed in the second row from the
bottom (see ESI,† Table S1). The bottom row of Table S1 lists
the amino acid residues, H2O, CO, NH3 and HCO2H lost from
the precursor molecule to form the corresponding fragment ions.
Alternatively, the amino acid composition can be obtained by
tracing fragmentation pathways, which release amino acid resi-
dues (or di-peptides). In the case of 5-leucine enkephalin, one
such fragmentation pathway is shown in Fig. 7A, giving
a composition of 2Gly, Leu, Phe, Tyr and H2O. The second step
is the identification of the N- or C-terminal residues (Fig. 7B).
Since Leu and Tyr are the first amino acid residues that can be
fragmented off from the precursor ion, they are the N- or
C-terminal residues. The third step is the identification of the
C-terminal residue. As peptides often have a free carboxyl group
Fig. 8 Overall detail of analysis of 5-leucine enkephalin.
Table 9 MFA of quinacrine
MMobs 399.2080 326.1167
— C23H30ClN3O C19H19ClN2OC23H30ClN3O — C4H11NC19H19ClN2O —C14H11ClN2OC14H10ClNOC9H19N
698 | Analyst, 2009, 134, 690–700
or are blocked with an amide, fragment ions that contain Leu-
OH, Leu-NH2, Tyr-OH, or Tyr-NH2 were searched, resulting in
a fragment ion of (Phe, Leu)-OH. Therefore, Leu was assigned to
the C-terminal residue, and, automatically, Tyr was assigned to
the N-terminal residue. The fourth step is the sequencing of
internal amino acid residues. Starting from the C-terminal Phe-
Leu-OH fragment ion, in the fragmentation pathway amino acid
residues are sequentially added (or di-peptides if necessary) as of
Fig. 7C. Similarly, starting from the N-terminal Tyr-Gly frag-
ment ion, amino acid residues (or di-peptides if necessary) are
sequentially added as shown in Fig. 7D.
The final step applies the sequence Tyr-Gly-Gly-Phe-Leu-OH
to all fragment ions in order to confirm the sequence. Each line
shown in Fig. 8 represents the sequence region of the fragment of
which its MF is shown in the left column. As all of the fragments
used in the MFA fit to the sequence, the Tyr-Gly-Gly-Phe-Leu-
OH sequence is confirmed.
Chloro- or bromo-containing compounds
The MFA was extended to organic compounds that contain
chlorine and/or bromine atoms in addition to C, H, N and O.
The inclusion of chlorine and bromine atoms in the automated
MFA is not possible with the precision of 0.002 Da. However, as
chlorine and bromine have characteristic isotopes of 37Cl (24.47%
natural abundance) and 81Br (49.48% natural abundance),
chlorine and/or bromine atoms in precursor and fragment ions
estimated based on their isotope peaks are replaced with
hydrogen atom(s). The molecular masses of these ions are
modified accordingly and are submitted to the MFA. Chlorine
258.0573 243.0446 141.1510
C14H11ClN2O C14H10ClNO C9H19NC9H19N C9H20N2 C14H11ClN2OC5H8 C5H9N C10ClNO—
——
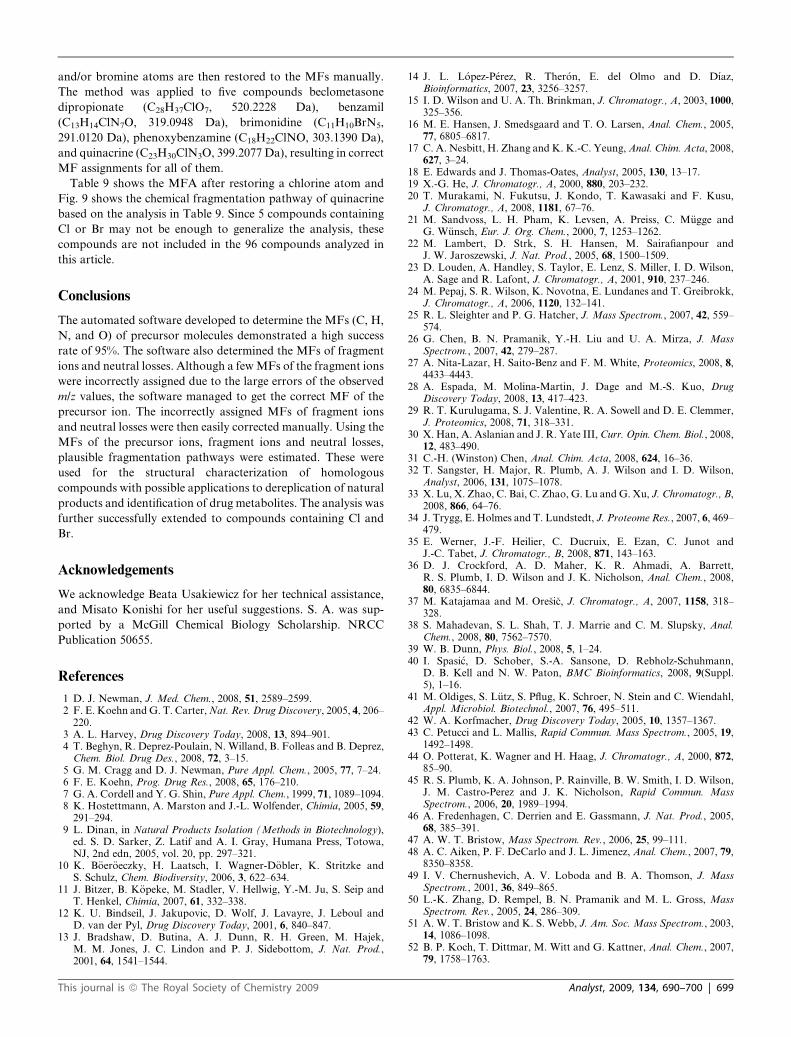
Fig. 9 Plausible fragmentation pathways of quinacrine, where the
cleavages occurred at C–N bonds.
This journal is ª The Royal Society of Chemistry 2009
and/or bromine atoms are then restored to the MFs manually.
The method was applied to five compounds beclometasone
dipropionate (C28H37ClO7, 520.2228 Da), benzamil
(C13H14ClN7O, 319.0948 Da), brimonidine (C11H10BrN5,
291.0120 Da), phenoxybenzamine (C18H22ClNO, 303.1390 Da),
and quinacrine (C23H30ClN3O, 399.2077 Da), resulting in correct
MF assignments for all of them.
Table 9 shows the MFA after restoring a chlorine atom and
Fig. 9 shows the chemical fragmentation pathway of quinacrine
based on the analysis in Table 9. Since 5 compounds containing
Cl or Br may not be enough to generalize the analysis, these
compounds are not included in the 96 compounds analyzed in
this article.
Conclusions
The automated software developed to determine the MFs (C, H,
N, and O) of precursor molecules demonstrated a high success
rate of 95%. The software also determined the MFs of fragment
ions and neutral losses. Although a few MFs of the fragment ions
were incorrectly assigned due to the large errors of the observed
m/z values, the software managed to get the correct MF of the
precursor ion. The incorrectly assigned MFs of fragment ions
and neutral losses were then easily corrected manually. Using the
MFs of the precursor ions, fragment ions and neutral losses,
plausible fragmentation pathways were estimated. These were
used for the structural characterization of homologous
compounds with possible applications to dereplication of natural
products and identification of drug metabolites. The analysis was
further successfully extended to compounds containing Cl and
Br.
Acknowledgements
We acknowledge Beata Usakiewicz for her technical assistance,
and Misato Konishi for her useful suggestions. S. A. was sup-
ported by a McGill Chemical Biology Scholarship. NRCC
Publication 50655.
References
1 D. J. Newman, J. Med. Chem., 2008, 51, 2589–2599.2 F. E. Koehn and G. T. Carter, Nat. Rev. Drug Discovery, 2005, 4, 206–
220.3 A. L. Harvey, Drug Discovery Today, 2008, 13, 894–901.4 T. Beghyn, R. Deprez-Poulain, N. Willand, B. Folleas and B. Deprez,Chem. Biol. Drug Des., 2008, 72, 3–15.
5 G. M. Cragg and D. J. Newman, Pure Appl. Chem., 2005, 77, 7–24.6 F. E. Koehn, Prog. Drug Res., 2008, 65, 176–210.7 G. A. Cordell and Y. G. Shin, Pure Appl. Chem., 1999, 71, 1089–1094.8 K. Hostettmann, A. Marston and J.-L. Wolfender, Chimia, 2005, 59,
291–294.9 L. Dinan, in Natural Products Isolation (Methods in Biotechnology),
ed. S. D. Sarker, Z. Latif and A. I. Gray, Humana Press, Totowa,NJ, 2nd edn, 2005, vol. 20, pp. 297–321.
10 K. B€oer€oeczky, H. Laatsch, I. Wagner-D€obler, K. Stritzke andS. Schulz, Chem. Biodiversity, 2006, 3, 622–634.
11 J. Bitzer, B. K€opeke, M. Stadler, V. Hellwig, Y.-M. Ju, S. Seip andT. Henkel, Chimia, 2007, 61, 332–338.
12 K. U. Bindseil, J. Jakupovic, D. Wolf, J. Lavayre, J. Leboul andD. van der Pyl, Drug Discovery Today, 2001, 6, 840–847.
13 J. Bradshaw, D. Butina, A. J. Dunn, R. H. Green, M. Hajek,M. M. Jones, J. C. Lindon and P. J. Sidebottom, J. Nat. Prod.,2001, 64, 1541–1544.
This journal is ª The Royal Society of Chemistry 2009
14 J. L. L�opez-P�erez, R. Ther�on, E. del Olmo and D. Dı́az,Bioinformatics, 2007, 23, 3256–3257.
15 I. D. Wilson and U. A. Th. Brinkman, J. Chromatogr., A, 2003, 1000,325–356.
16 M. E. Hansen, J. Smedsgaard and T. O. Larsen, Anal. Chem., 2005,77, 6805–6817.
17 C. A. Nesbitt, H. Zhang and K. K.-C. Yeung, Anal. Chim. Acta, 2008,627, 3–24.
18 E. Edwards and J. Thomas-Oates, Analyst, 2005, 130, 13–17.19 X.-G. He, J. Chromatogr., A, 2000, 880, 203–232.20 T. Murakami, N. Fukutsu, J. Kondo, T. Kawasaki and F. Kusu,
J. Chromatogr., A, 2008, 1181, 67–76.21 M. Sandvoss, L. H. Pham, K. Levsen, A. Preiss, C. M€ugge and
G. W€unsch, Eur. J. Org. Chem., 2000, 7, 1253–1262.22 M. Lambert, D. Strk, S. H. Hansen, M. Sairafianpour and
J. W. Jaroszewski, J. Nat. Prod., 2005, 68, 1500–1509.23 D. Louden, A. Handley, S. Taylor, E. Lenz, S. Miller, I. D. Wilson,
A. Sage and R. Lafont, J. Chromatogr., A, 2001, 910, 237–246.24 M. Pepaj, S. R. Wilson, K. Novotna, E. Lundanes and T. Greibrokk,
J. Chromatogr., A, 2006, 1120, 132–141.25 R. L. Sleighter and P. G. Hatcher, J. Mass Spectrom., 2007, 42, 559–
574.26 G. Chen, B. N. Pramanik, Y.-H. Liu and U. A. Mirza, J. Mass
Spectrom., 2007, 42, 279–287.27 A. Nita-Lazar, H. Saito-Benz and F. M. White, Proteomics, 2008, 8,
4433–4443.28 A. Espada, M. Molina-Martin, J. Dage and M.-S. Kuo, Drug
Discovery Today, 2008, 13, 417–423.29 R. T. Kurulugama, S. J. Valentine, R. A. Sowell and D. E. Clemmer,
J. Proteomics, 2008, 71, 318–331.30 X. Han, A. Aslanian and J. R. Yate III, Curr. Opin. Chem. Biol., 2008,
12, 483–490.31 C.-H. (Winston) Chen, Anal. Chim. Acta, 2008, 624, 16–36.32 T. Sangster, H. Major, R. Plumb, A. J. Wilson and I. D. Wilson,
Analyst, 2006, 131, 1075–1078.33 X. Lu, X. Zhao, C. Bai, C. Zhao, G. Lu and G. Xu, J. Chromatogr., B,
2008, 866, 64–76.34 J. Trygg, E. Holmes and T. Lundstedt, J. Proteome Res., 2007, 6, 469–
479.35 E. Werner, J.-F. Heilier, C. Ducruix, E. Ezan, C. Junot and
J.-C. Tabet, J. Chromatogr., B, 2008, 871, 143–163.36 D. J. Crockford, A. D. Maher, K. R. Ahmadi, A. Barrett,
R. S. Plumb, I. D. Wilson and J. K. Nicholson, Anal. Chem., 2008,80, 6835–6844.
37 M. Katajamaa and M. Ore�si�c, J. Chromatogr., A, 2007, 1158, 318–328.
38 S. Mahadevan, S. L. Shah, T. J. Marrie and C. M. Slupsky, Anal.Chem., 2008, 80, 7562–7570.
39 W. B. Dunn, Phys. Biol., 2008, 5, 1–24.40 I. Spasi�c, D. Schober, S.-A. Sansone, D. Rebholz-Schuhmann,
D. B. Kell and N. W. Paton, BMC Bioinformatics, 2008, 9(Suppl.5), 1–16.
41 M. Oldiges, S. L€utz, S. Pflug, K. Schroer, N. Stein and C. Wiendahl,Appl. Microbiol. Biotechnol., 2007, 76, 495–511.
42 W. A. Korfmacher, Drug Discovery Today, 2005, 10, 1357–1367.43 C. Petucci and L. Mallis, Rapid Commun. Mass Spectrom., 2005, 19,
1492–1498.44 O. Potterat, K. Wagner and H. Haag, J. Chromatogr., A, 2000, 872,
85–90.45 R. S. Plumb, K. A. Johnson, P. Rainville, B. W. Smith, I. D. Wilson,
J. M. Castro-Perez and J. K. Nicholson, Rapid Commun. MassSpectrom., 2006, 20, 1989–1994.
46 A. Fredenhagen, C. Derrien and E. Gassmann, J. Nat. Prod., 2005,68, 385–391.
47 A. W. T. Bristow, Mass Spectrom. Rev., 2006, 25, 99–111.48 A. C. Aiken, P. F. DeCarlo and J. L. Jimenez, Anal. Chem., 2007, 79,
8350–8358.49 I. V. Chernushevich, A. V. Loboda and B. A. Thomson, J. Mass
Spectrom., 2001, 36, 849–865.50 L.-K. Zhang, D. Rempel, B. N. Pramanik and M. L. Gross, Mass
Spectrom. Rev., 2005, 24, 286–309.51 A. W. T. Bristow and K. S. Webb, J. Am. Soc. Mass Spectrom., 2003,
14, 1086–1098.52 B. P. Koch, T. Dittmar, M. Witt and G. Kattner, Anal. Chem., 2007,
79, 1758–1763.
Analyst, 2009, 134, 690–700 | 699
53 Y. Konishi, T. Kiyota, C. Draghici, J.-M. Gao, F. Yeboah, S. Acoca,S. Jarussophon and E. Purisima, Anal. Chem., 2007, 79, 1187–1197.
54 C. Eckers, J.-C. Wolff, N. J. Haskins, A. B. Sage, K. Giles andR. Bateman, Anal. Chem., 2000, 72, 3683–3688.
55 J.-C. Wolff, C. Eckers, A. B. Sage, K. Giles and R. Bateman, Anal.Chem., 2001, 73, 2605–2612.
56 J.-C. Wolff, T. R. Fuentes and J. Taylor, Rapid Commun. MassSpectrom., 2003, 17, 1216–1219.
57 K. F. Blom, Anal. Chem., 2001, 73, 715–719.58 M. Colombo, F. R. Sirtori and V. Rizzo, Rapid Commun. Mass
Spectrom., 2004, 18, 511–517.59 J. Wu and H. McAllister, J. Mass Spectrom., 2003, 38, 1043–1053.
700 | Analyst, 2009, 134, 690–700
60 G. Viv�o-Truyols and P. J. Schoenmakers, Anal. Chem., 2006, 78,4598–4608.
61 L. Sleno, D. A. Volmer and A. G. Marshall, J. Am. Soc. MassSpectrom., 2005, 16, 183–198.
62 K. Clauwaert, S. V. Casteele, B. Sinnaeve, D. Deforce, W. Lambert,C. Van Peteghem and J. Van Bocxlaer, Rapid Commun. MassSpectrom., 2003, 17, 1443–1448.
63 M. Fang, J. Wang, Y. Huang and Y. Zhao, Front. Chem. China, 2006,1, 15–19.
64 J. C. L. Erve, S. C. Vashishtha, O. Ojewoye, A. Adedoyin,R. Espina, W. DeMaio and R. E. Talaat, Xenobiotica, 2008, 38,540–558.
This journal is ª The Royal Society of Chemistry 2009