auditory erp components before and after transition to a first psychotic episode
TRANSCRIPT

A
MJa
b
a
ARAA
KUPENP
1
tri(trtAt
aerOl2sae
oN
0d
Biological Psychology 87 (2011) 350– 357
Contents lists available at ScienceDirect
Biological Psychology
jo ur nal homep age : www.elsev ier .com/ locate /b iopsycho
uditory ERP components before and after transition to a first psychotic episode
irjam J. van Trichta,b,∗, Dorien H. Niemana, Johannes H.T.M. Koelmanb, Lo J. Bourb,ohan N. van der Meerb, Thérèse A. van Amelsvoorta, Don H. Linszena, Lieuwe de Haana
Department of Psychiatry, Academic Medical Centre, University of Amsterdam, Meibergdreef 5, 1105 AZ Amsterdam, NetherlandsDepartment of Neurology and Clinical Neurophysiology, Academic Medical Centre, University of Amsterdam, Meibergdreef 9, 1105 AZ Amsterdam, Netherlands
r t i c l e i n f o
rticle history:eceived 19 October 2010ccepted 17 April 2011vailable online 30 April 2011
eywords:
a b s t r a c t
We investigated the course of Event Related Potentials (ERP) from prior to until shortly after a firstpsychotic episode in subjects at Ultra High Risk (UHR) for psychosis. N1, N2, N2b, P2 and P3 amplitudeswere assessed using an auditory active oddball paradigm in 15 UHR subjects who made a transition topsychosis (UHR + T) at follow up, 23 subjects without a transition (UHR + NT) and 17 matched healthycontrols at inclusion and again after approximately 18 months. Repeated-measures analyses revealed
ltra High Risk subjectssychosisRP100300
no significant time effects for any of the ERP components. However, an interaction effect was foundfor N1 amplitudes. Post-hoc analyses showed that N1 amplitudes were smaller at follow up comparedto baseline only in UHR + T subjects. P3 amplitudes showed no further reduction after psychotic onset.These findings suggest that discernable ERP components behave differently during progression from theprodromal phase to the first psychotic episode. These findings may give insight in pathophysiologicalmechanisms underlying the genesis of psychosis.
. Introduction
Early detection and prevention of psychotic disorders has caughthe attention of many researchers worldwide. A frequently appliedesearch strategy that aims at elucidating predictors of psychosiss investigating clinical samples of Ultra High Risk (UHR) subjectsYung et al., 2004, 2006; McGorry et al., 2003). UHR subjects arehought to be at high risk for a first psychotic episode within aelatively short period based on one or more of the following symp-oms: (1) Genetic risk in combination with reduced functioning; (2)ttenuated Positive Symptoms (APS) and (3) Brief Limited Intermit-
ent Psychotic Symptoms (BLIPS).In UHR subjects, before the onset of a first psychotic episode,
bnormalities have been demonstrated at MRI neuro-imaging (Jobt al., 2003; Pantelis et al., 2007; Takahashi et al., 2009a), neu-ophysiological (Frommann et al., 2008; Bramon et al., 2008;zgürdal et al., 2008; van Tricht et al., 2010) and neuropsycho-
ogical (Niendam et al., 2007; Brewer et al., 2006; Seidman et al.,010) assessments. In addition, imaging studies showed progres-
ion of structural brain abnormalities in prefrontal, inferior frontalnd temporal lobe regions as well as in the medial and superior pari-tal cortex before and after the onset of the first psychotic episode∗ Corresponding author at: Academic Medical Centre, Department of Neurol-gy and Clinical Neurophysiology D2-136, P.O. Box 22660, 1100 DD Amsterdam,etherlands. Tel.: +31 205668417; fax: +31 205669187.
E-mail address: [email protected] (M.J. van Tricht).
301-0511/$ – see front matter © 2011 Elsevier B.V. All rights reserved.oi:10.1016/j.biopsycho.2011.04.005
© 2011 Elsevier B.V. All rights reserved.
(Sun et al., 2009; Takahashi et al., 2009b). Studies on the course ofneuropsychological functions in UHR subjects before and after psy-chotic onset have yielded inconsistent results. Whereas two studiesfound no evidence of further neurocognitive deterioration after afirst psychotic episode (Hawkins et al., 2008; Becker et al., 2010),evidence of a decline in visual memory and attentional set-shiftingfollowing psychosis onset was found in another study (Wood et al.,2007).
Event related potentials (ERPs) have frequently been examinedin the search for biologic markers of schizophrenia and psychosis.An ERP that has been studied extensively in schizophrenia is theP300, also known as the P3 or P3b. The P3 is a scalp-recorded lateERP, which occurs about 300 ms after an attended unusual or task-relevant stimulus and has its maximum at parietal scalp position.It is a cognition related wave, closely associated with attentionand memory (van der Stelt et al., 2004; Nieman et al., 2002). TheP3b can be distinguished from the P3a, which is elicited by a rareevent that is not task relevant and has an earlier peak latency and ascalp distribution with a midline fronto-central maximum (Polich,2007). Although P3 abnormalities have been reported in a varietyof disorders, including dementia, traumatic brain injury, ADHD andautism, P3 amplitude reductions are most consistently reported inschizophrenia (Duncan et al., 2009). Recent studies have demon-strated smaller P3 amplitudes prior to the onset of psychosis in
UHR subjects (Frommann et al., 2008; Bramon et al., 2008; Ozgürdalet al., 2008). In a previous study of our group on ERP abnormalitiesin an UHR sample, subjects who made a transition to psychosis atfollow up showed smaller parietal P3 amplitudes at baseline com-
cal Psy
pewOdcrswmepc2
Pta2r1bsdv
nIspdiuafwpptUdtUg
2
2
2
ibuwstt1toy
1
2
M.J. van Tricht et al. / Biologi
ared to UHR subjects who did not make this transition (van Trichtt al., 2010). Moreover, smaller parietal P3 amplitudes at baselineere the only independent predictor of a first psychotic episode.ther ERP components, including the N1, P2 and N2b howeverid not significantly contribute to the prediction of a first psy-hotic episode. To our knowledge, until now only one study haseported abnormalities in these earlier ERP components in UHRubjects before a psychotic episode (Brockhaus-Dumke et al., 2008),hereas other studies in the field found no evidence of impair-ents in these components in the prodromal phase (van Tricht
t al., 2010; Bramon et al., 2008). Abnormalities in earlier ERP com-onents have however been reported in both first episode andhronic schizophrenia patients (Potts et al., 1998; Salisbury et al.,010; O’Donnell et al., 1993; Haenschel et al., 2007).
Some studies in schizophrenia patients have also demonstrated3 amplitude asymmetry, i.e. more pronounced amplitude reduc-ion in the left compared to the right temporal lobe, in addition tomplitude reductions at midline scalp positions (Jeon and Polich,001; Faux et al., 1988). P3 amplitude asymmetry has also beeneported in patients with a first psychotic episode (Salisbury et al.,998; McCarley et al., 2002) and in UHR subjects before a possi-le transition to psychosis (Frommann et al., 2008), although mosttudies in high risk subjects and first episode patients found no evi-ence of P3 asymmetry (Hirayasu et al., 1998; Renoult et al., 2007;an Tricht et al., 2010; Bramon et al., 2008).
To our knowledge, no studies have yet explored the course ofeurophysiological abnormalities before and after a first psychosis.
nvestigation of the course of neurophysiological alterations in UHRubjects who make a transition to psychosis may help to elucidateathophysiological mechanisms that are primarily related to theevelopment of psychosis. Thus, our main objective was to clar-
fy the course of ERP abnormalities in UHR subjects from beforentil shortly after a first psychotic episode. We predicted that P3bnormalities, as established in the prodromal phase, would showurther progression after psychotic onset. In addition, at follow up.e expected P3 decrements in UHR subjects with a transition tosychosis to be more pronounced in left compared to right scalpositions. Finally, we expected a differential course of ERP ampli-udes from baseline to the second assessment in the three groups:HR subjects with a transition to psychosis were expected to showecreased mean N1, N2 and P2 amplitudes at follow up comparedo baseline, whereas no temporal ERP changes were expected inHR subjects without a transition to psychosis (UHR + NT) and aroup of healthy controls.
. Methods
.1. Participants
.1.1. UHR groupSixty-one subjects (19 women) with an UHR for developing psychosis were
ncluded at baseline. Demographic and clinical characteristics of these subjects haveeen described previously (van Tricht et al., 2010). Twenty-three UHR subjects werenavailable for the follow up assessment. Reasons for nonparticipation at follow upere refusal (n = 16), inability to be located (n = 6) and imprisonment (n = 1). The
ubjects who were available for a reassessment did not differ significantly fromhose lost to follow up in terms of demographic or ERP variables at baseline. Never-heless, only UHR subjects with both baseline and follow up assessments (28 males,0 females) were included in the current study. The subjects were examined withinhe Dutch Prediction of Psychosis Study (DUPS) at the Department of Early Psychosisf the AMC. The inclusion criteria for the UHR group were: age between 15 and 35ears, and belonging to one or more of the following three groups:
. Genetic risk in combination with reduced functioning: subjects who have a firstdegree relative with a psychotic disorder, or who themselves have a schizotyp-
ical personality disorder and who have experienced a significant decrease infunctioning during the past year (i.e. 30% reduction of GAF-score for at least 1month).. Attenuated Positive Symptoms (APS): subjects who have experienced sub-threshold, attenuated positive psychotic symptoms, defined by at least 1 of
chology 87 (2011) 350– 357 351
the following symptoms, appearing several times per week for at least 1 weekwithin the last 3 months: unusual thought content/delusional ideas, suspicious-ness/persecutory ideas, grandiosity, perceptual abnormalities/hallucinations,disorganized communication and odd behaviour/appearance.
3. Brief Limited Intermittent Psychotic Symptoms (BLIPS): subjects who haveexperienced episodes of frank psychotic symptoms. BLIPS were defined by hal-lucinations, delusions or formal thought disorders occurring within the last 3months and resolving spontaneously within 1 week.
The exclusion criteria were: previous psychotic episode for more than 1 week(as assessed with the Structured Clinical Interview for Diagnosis, sections B andC; Spitzer et al., 1992), symptoms due to substance abuse (as assessed with theComprehensive International Diagnostic Interview, sections J and L; WHO, 1993;Wittchen, 1994), premorbid IQ below 85 (as assessed with the Dutch National AdultReading Test, NART; Schmand et al., 1991), severe vision and/or auditory disorders,endocrine disease and known neurological impairment (e.g. closed head injury).
2.1.2. Control groupTwenty-eight participants (15 women) served as a control group for ERP perfor-
mance, of whom 17 subjects (6 women) were available for the second assessment.Reasons for nonparticipation at follow up in the control group were refusal (n = 7)and inability to be located (n = 4). Again, only subjects with baseline and follow upassessments were included. Exclusion criteria were similar to the UHR subjects,with the addition of psychiatric illness present or in the past and familial history ofpsychiatric illness (evaluated for first and second degree relatives). Controls werematched on age and estimated premorbid IQ of the UHR subjects.
The investigation was carried out in accordance with the latest version of theDeclaration of Helsinki. The study design was approved by the Medical Ethical Com-mittee of the Academic Medical Center. Informed consent of all participants wasobtained after the nature of the procedures had been fully explained.
2.2. Materials
2.2.1. ERP recordingERPs were assessed using an active auditory-oddball paradigm. The subjects
were seated in a comfortable chair with eyes open, in a dimly lit, quiet room. Tonesconsisting of target stimuli with a frequency of 2000 Hz and standard, non-targetstimuli with a frequency of 1000 Hz, were presented binaurally through headphonesat an intensity of 50 dB above hearing threshold. A total of 300 tones, with a durationof 100 ms, were presented in a random sequence, of which 20% were targets and 80%non-targets. The subjects were instructed to count the targets and respond to themwith a button press. The total number of counted targets was asked at the end of eachsession. To familiarize the subjects with the task, three practice trials with target andnon-target stimuli were presented. The inter-stimulus interval was 1480 ms.
Twenty-one silver silver disc electrodes (impedances <5 k�) were attached toelectrode sites (10–20 system), with a reference electrode on linked mastoids anda ground electrode on the forehead. Additionally four electrodes were attached atthe outer canthi of both eyes and above and below the left eye for the registration ofeye movements and blinks. Vertical and horizontal eye-movements were detectedand removed using eye-movement detection measures developed by Gratton et al.(1982).
The EEG was recorded with an analogue band-pass filter of 0.04–300 Hz and dig-itally stored with a 1000-Hz sampling rate in a database for subsequent off line anal-ysis using Brainvision Analyzer (Brainproducts; http://www.brainproducts.com).After baseline correction, the signals were digitally filtered with a low-pass filterof 30 Hz and a high-pass filter of 0.10 Hz (24 dB/oct) and were epoched at 50 mspre-stimulus and 450 ms post-stimulus. The maximum allowed absolute differencebetween two values in one segment was 200 �V and the maximum allowed volt-age step was 50 �V. Epochs were averaged separately for non-target and targettones. For both target and non-target trials, the recording was excluded from furtheranalyses if less than 50% of the trials included artefact free trials.
Peak amplitudes were semi-automatically detected and calculated relative topre-stimulus baseline of 50 ms. Following previous studies (Salisbury et al., 2010;Ford et al., 2001; O’Donnell et al., 2004), N1 and P2 components were measuredfrom averages elicited by non-target tones. N1 amplitudes were detected as themost negative point between 75 and 125 ms post stimulus whereas P2 amplitudeswere detected as the most positive point following the N1, with a latency range of150–220 ms. N2 and P3 components were calculated from waveforms generated bytarget tones. The N2 was scored as the most negative point within a timeframe of180–320 ms post-stimulus, whereas the P3 was defined as the largest positive valuebetween 250 and 450 ms post-stimulus. The N2b difference score was calculatedby subtracting the most negative point following the non-target stimulus from the
most negative point following the target stimulus within the N2 time frame. Basedon the literature (Salisbury et al., 1994, 2010; Brockhaus-Dumke et al., 2008; Bramonet al., 2004), N1 and N2 components were assessed at central midline (Cz) scalp site,P2 at parietal scalp site (Pz), and P3 components at parietal, central and frontal (Fz)scalp sites. All peaks were visually inspected.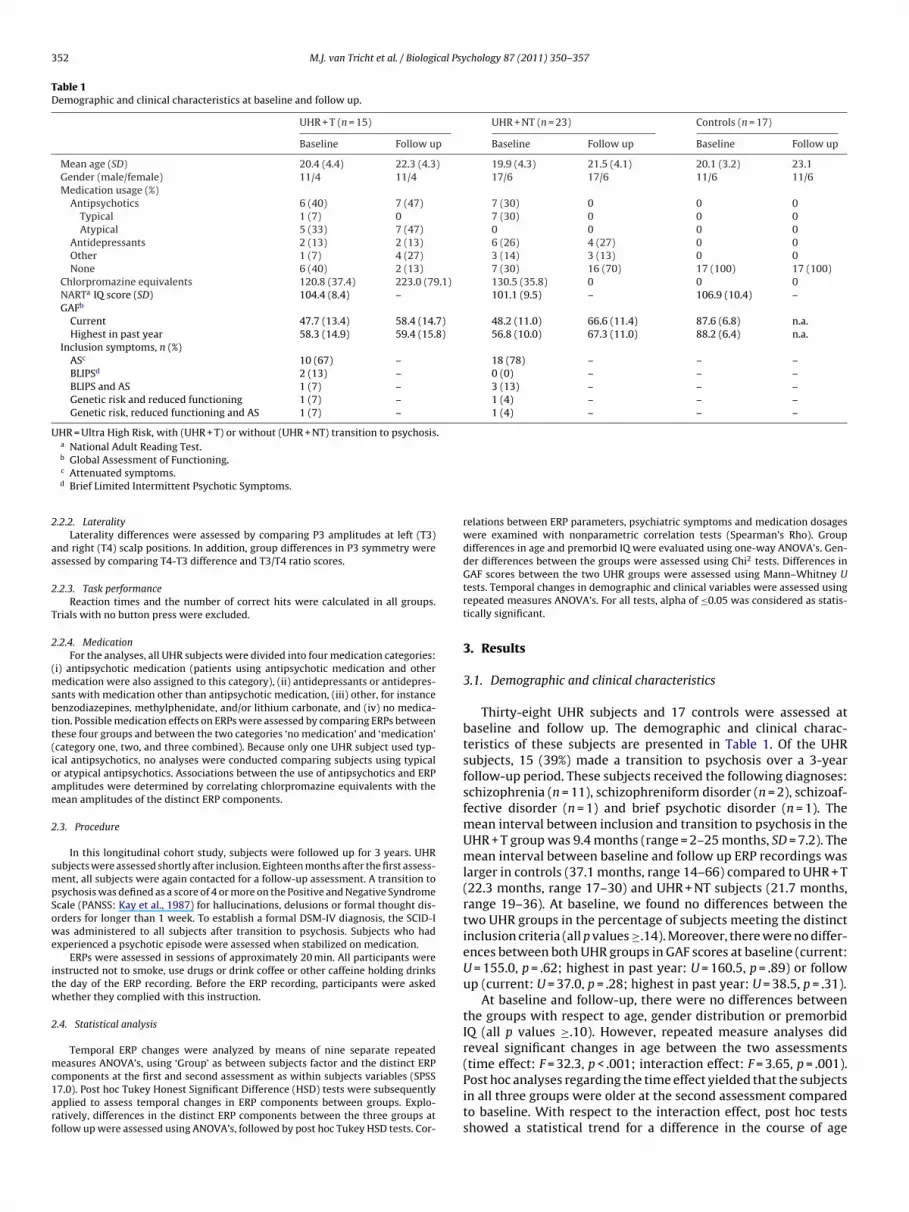
352 M.J. van Tricht et al. / Biological Psychology 87 (2011) 350– 357
Table 1Demographic and clinical characteristics at baseline and follow up.
UHR + T (n = 15) UHR + NT (n = 23) Controls (n = 17)
Baseline Follow up Baseline Follow up Baseline Follow up
Mean age (SD) 20.4 (4.4) 22.3 (4.3) 19.9 (4.3) 21.5 (4.1) 20.1 (3.2) 23.1Gender (male/female) 11/4 11/4 17/6 17/6 11/6 11/6Medication usage (%)
Antipsychotics 6 (40) 7 (47) 7 (30) 0 0 0Typical 1 (7) 0 7 (30) 0 0 0Atypical 5 (33) 7 (47) 0 0 0 0
Antidepressants 2 (13) 2 (13) 6 (26) 4 (27) 0 0Other 1 (7) 4 (27) 3 (14) 3 (13) 0 0None 6 (40) 2 (13) 7 (30) 16 (70) 17 (100) 17 (100)
Chlorpromazine equivalents 120.8 (37.4) 223.0 (79.1) 130.5 (35.8) 0 0 0NARTa IQ score (SD) 104.4 (8.4) – 101.1 (9.5) – 106.9 (10.4) –GAFb
Current 47.7 (13.4) 58.4 (14.7) 48.2 (11.0) 66.6 (11.4) 87.6 (6.8) n.a.Highest in past year 58.3 (14.9) 59.4 (15.8) 56.8 (10.0) 67.3 (11.0) 88.2 (6.4) n.a.
Inclusion symptoms, n (%)ASc 10 (67) – 18 (78) – – –BLIPSd 2 (13) – 0 (0) – – –BLIPS and AS 1 (7) – 3 (13) – – –Genetic risk and reduced functioning 1 (7) – 1 (4) – – –Genetic risk, reduced functioning and AS 1 (7) – 1 (4) – – –
UHR = Ultra High Risk, with (UHR + T) or without (UHR + NT) transition to psychosis.a National Adult Reading Test.
2
aa
2
T
2
(msbtt(ioam
2
smpSowe
itw
2
mc1arf
b Global Assessment of Functioning.c Attenuated symptoms.d Brief Limited Intermittent Psychotic Symptoms.
.2.2. LateralityLaterality differences were assessed by comparing P3 amplitudes at left (T3)
nd right (T4) scalp positions. In addition, group differences in P3 symmetry weressessed by comparing T4-T3 difference and T3/T4 ratio scores.
.2.3. Task performanceReaction times and the number of correct hits were calculated in all groups.
rials with no button press were excluded.
.2.4. MedicationFor the analyses, all UHR subjects were divided into four medication categories:
i) antipsychotic medication (patients using antipsychotic medication and otheredication were also assigned to this category), (ii) antidepressants or antidepres-
ants with medication other than antipsychotic medication, (iii) other, for instanceenzodiazepines, methylphenidate, and/or lithium carbonate, and (iv) no medica-ion. Possible medication effects on ERPs were assessed by comparing ERPs betweenhese four groups and between the two categories ‘no medication’ and ‘medication’category one, two, and three combined). Because only one UHR subject used typ-cal antipsychotics, no analyses were conducted comparing subjects using typicalr atypical antipsychotics. Associations between the use of antipsychotics and ERPmplitudes were determined by correlating chlorpromazine equivalents with theean amplitudes of the distinct ERP components.
.3. Procedure
In this longitudinal cohort study, subjects were followed up for 3 years. UHRubjects were assessed shortly after inclusion. Eighteen months after the first assess-ent, all subjects were again contacted for a follow-up assessment. A transition to
sychosis was defined as a score of 4 or more on the Positive and Negative Syndromecale (PANSS: Kay et al., 1987) for hallucinations, delusions or formal thought dis-rders for longer than 1 week. To establish a formal DSM-IV diagnosis, the SCID-Ias administered to all subjects after transition to psychosis. Subjects who had
xperienced a psychotic episode were assessed when stabilized on medication.ERPs were assessed in sessions of approximately 20 min. All participants were
nstructed not to smoke, use drugs or drink coffee or other caffeine holding drinkshe day of the ERP recording. Before the ERP recording, participants were askedhether they complied with this instruction.
.4. Statistical analysis
Temporal ERP changes were analyzed by means of nine separate repeatedeasures ANOVA’s, using ‘Group’ as between subjects factor and the distinct ERP
omponents at the first and second assessment as within subjects variables (SPSS7.0). Post hoc Tukey Honest Significant Difference (HSD) tests were subsequentlypplied to assess temporal changes in ERP components between groups. Explo-atively, differences in the distinct ERP components between the three groups atollow up were assessed using ANOVA’s, followed by post hoc Tukey HSD tests. Cor-
relations between ERP parameters, psychiatric symptoms and medication dosageswere examined with nonparametric correlation tests (Spearman’s Rho). Groupdifferences in age and premorbid IQ were evaluated using one-way ANOVA’s. Gen-der differences between the groups were assessed using Chi2 tests. Differences inGAF scores between the two UHR groups were assessed using Mann–Whitney Utests. Temporal changes in demographic and clinical variables were assessed usingrepeated measures ANOVA’s. For all tests, alpha of ≤0.05 was considered as statis-tically significant.
3. Results
3.1. Demographic and clinical characteristics
Thirty-eight UHR subjects and 17 controls were assessed atbaseline and follow up. The demographic and clinical charac-teristics of these subjects are presented in Table 1. Of the UHRsubjects, 15 (39%) made a transition to psychosis over a 3-yearfollow-up period. These subjects received the following diagnoses:schizophrenia (n = 11), schizophreniform disorder (n = 2), schizoaf-fective disorder (n = 1) and brief psychotic disorder (n = 1). Themean interval between inclusion and transition to psychosis in theUHR + T group was 9.4 months (range = 2–25 months, SD = 7.2). Themean interval between baseline and follow up ERP recordings waslarger in controls (37.1 months, range 14–66) compared to UHR + T(22.3 months, range 17–30) and UHR + NT subjects (21.7 months,range 19–36). At baseline, we found no differences between thetwo UHR groups in the percentage of subjects meeting the distinctinclusion criteria (all p values ≥.14). Moreover, there were no differ-ences between both UHR groups in GAF scores at baseline (current:U = 155.0, p = .62; highest in past year: U = 160.5, p = .89) or followup (current: U = 37.0, p = .28; highest in past year: U = 38.5, p = .31).
At baseline and follow-up, there were no differences betweenthe groups with respect to age, gender distribution or premorbidIQ (all p values ≥.10). However, repeated measure analyses didreveal significant changes in age between the two assessments(time effect: F = 32.3, p < .001; interaction effect: F = 3.65, p = .001).
Post hoc analyses regarding the time effect yielded that the subjectsin all three groups were older at the second assessment comparedto baseline. With respect to the interaction effect, post hoc testsshowed a statistical trend for a difference in the course of age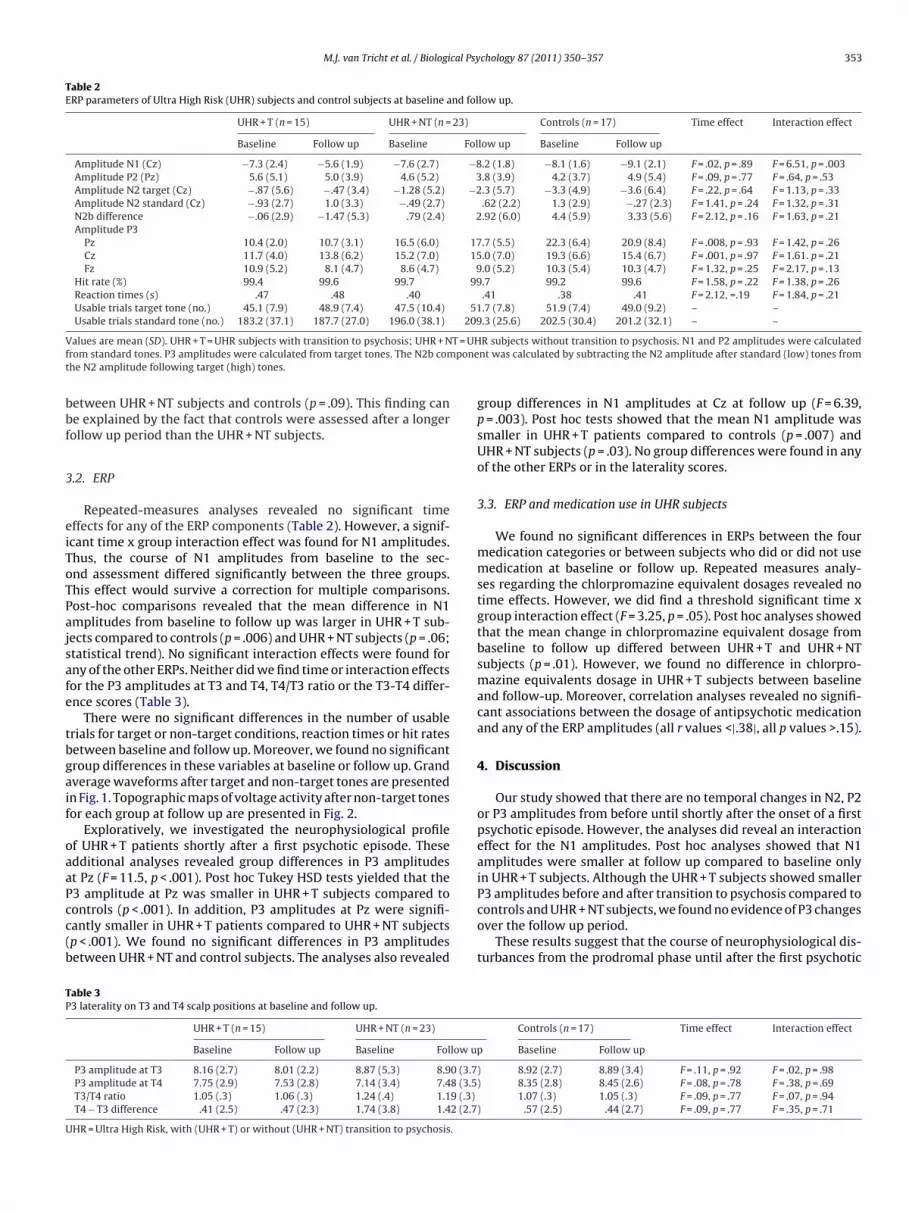
M.J. van Tricht et al. / Biological Psychology 87 (2011) 350– 357 353
Table 2ERP parameters of Ultra High Risk (UHR) subjects and control subjects at baseline and follow up.
UHR + T (n = 15) UHR + NT (n = 23) Controls (n = 17) Time effect Interaction effect
Baseline Follow up Baseline Follow up Baseline Follow up
Amplitude N1 (Cz) −7.3 (2.4) −5.6 (1.9) −7.6 (2.7) −8.2 (1.8) −8.1 (1.6) −9.1 (2.1) F = .02, p = .89 F = 6.51, p = .003Amplitude P2 (Pz) 5.6 (5.1) 5.0 (3.9) 4.6 (5.2) 3.8 (3.9) 4.2 (3.7) 4.9 (5.4) F = .09, p = .77 F = .64, p = .53Amplitude N2 target (Cz) −.87 (5.6) −.47 (3.4) −1.28 (5.2) −2.3 (5.7) −3.3 (4.9) −3.6 (6.4) F = .22, p = .64 F = 1.13, p = .33Amplitude N2 standard (Cz) −.93 (2.7) 1.0 (3.3) −.49 (2.7) .62 (2.2) 1.3 (2.9) −.27 (2.3) F = 1.41, p = .24 F = 1.32, p = .31N2b difference −.06 (2.9) −1.47 (5.3) .79 (2.4) 2.92 (6.0) 4.4 (5.9) 3.33 (5.6) F = 2.12, p = .16 F = 1.63, p = .21Amplitude P3
Pz 10.4 (2.0) 10.7 (3.1) 16.5 (6.0) 17.7 (5.5) 22.3 (6.4) 20.9 (8.4) F = .008, p = .93 F = 1.42, p = .26Cz 11.7 (4.0) 13.8 (6.2) 15.2 (7.0) 15.0 (7.0) 19.3 (6.6) 15.4 (6.7) F = .001, p = .97 F = 1.61. p = .21Fz 10.9 (5.2) 8.1 (4.7) 8.6 (4.7) 9.0 (5.2) 10.3 (5.4) 10.3 (4.7) F = 1.32, p = .25 F = 2.17, p = .13
Hit rate (%) 99.4 99.6 99.7 99.7 99.2 99.6 F = 1.58, p = .22 F = 1.38, p = .26Reaction times (s) .47 .48 .40 .41 .38 .41 F = 2.12, =.19 F = 1.84, p = .21Usable trials target tone (no.) 45.1 (7.9) 48.9 (7.4) 47.5 (10.4) 51.7 (7.8) 51.9 (7.4) 49.0 (9.2) – –Usable trials standard tone (no.) 183.2 (37.1) 187.7 (27.0) 196.0 (38.1) 209.3 (25.6) 202.5 (30.4) 201.2 (32.1) – –
V T = UHf ponet
bbf
3
eiToTPajsafe
tbgaif
oaaPcc(b
TP
U
alues are mean (SD). UHR + T = UHR subjects with transition to psychosis; UHR + Nrom standard tones. P3 amplitudes were calculated from target tones. The N2b comhe N2 amplitude following target (high) tones.
etween UHR + NT subjects and controls (p = .09). This finding cane explained by the fact that controls were assessed after a longerollow up period than the UHR + NT subjects.
.2. ERP
Repeated-measures analyses revealed no significant timeffects for any of the ERP components (Table 2). However, a signif-cant time x group interaction effect was found for N1 amplitudes.hus, the course of N1 amplitudes from baseline to the sec-nd assessment differed significantly between the three groups.his effect would survive a correction for multiple comparisons.ost-hoc comparisons revealed that the mean difference in N1mplitudes from baseline to follow up was larger in UHR + T sub-ects compared to controls (p = .006) and UHR + NT subjects (p = .06;tatistical trend). No significant interaction effects were found forny of the other ERPs. Neither did we find time or interaction effectsor the P3 amplitudes at T3 and T4, T4/T3 ratio or the T3-T4 differ-nce scores (Table 3).
There were no significant differences in the number of usablerials for target or non-target conditions, reaction times or hit ratesetween baseline and follow up. Moreover, we found no significantroup differences in these variables at baseline or follow up. Grandverage waveforms after target and non-target tones are presentedn Fig. 1. Topographic maps of voltage activity after non-target tonesor each group at follow up are presented in Fig. 2.
Exploratively, we investigated the neurophysiological profilef UHR + T patients shortly after a first psychotic episode. Thesedditional analyses revealed group differences in P3 amplitudest Pz (F = 11.5, p < .001). Post hoc Tukey HSD tests yielded that the3 amplitude at Pz was smaller in UHR + T subjects compared to
ontrols (p < .001). In addition, P3 amplitudes at Pz were signifi-antly smaller in UHR + T patients compared to UHR + NT subjectsp < .001). We found no significant differences in P3 amplitudesetween UHR + NT and control subjects. The analyses also revealedable 33 laterality on T3 and T4 scalp positions at baseline and follow up.
UHR + T (n = 15) UHR + NT (n = 23)
Baseline Follow up Baseline Follow u
P3 amplitude at T3 8.16 (2.7) 8.01 (2.2) 8.87 (5.3) 8.90 (3.7P3 amplitude at T4 7.75 (2.9) 7.53 (2.8) 7.14 (3.4) 7.48 (3.5T3/T4 ratio 1.05 (.3) 1.06 (.3) 1.24 (.4) 1.19 (.3)
T4 − T3 difference .41 (2.5) .47 (2.3) 1.74 (3.8) 1.42 (2.7
HR = Ultra High Risk, with (UHR + T) or without (UHR + NT) transition to psychosis.
R subjects without transition to psychosis. N1 and P2 amplitudes were calculatednt was calculated by subtracting the N2 amplitude after standard (low) tones from
group differences in N1 amplitudes at Cz at follow up (F = 6.39,p = .003). Post hoc tests showed that the mean N1 amplitude wassmaller in UHR + T patients compared to controls (p = .007) andUHR + NT subjects (p = .03). No group differences were found in anyof the other ERPs or in the laterality scores.
3.3. ERP and medication use in UHR subjects
We found no significant differences in ERPs between the fourmedication categories or between subjects who did or did not usemedication at baseline or follow up. Repeated measures analy-ses regarding the chlorpromazine equivalent dosages revealed notime effects. However, we did find a threshold significant time xgroup interaction effect (F = 3.25, p = .05). Post hoc analyses showedthat the mean change in chlorpromazine equivalent dosage frombaseline to follow up differed between UHR + T and UHR + NTsubjects (p = .01). However, we found no difference in chlorpro-mazine equivalents dosage in UHR + T subjects between baselineand follow-up. Moreover, correlation analyses revealed no signifi-cant associations between the dosage of antipsychotic medicationand any of the ERP amplitudes (all r values <|.38|, all p values >.15).
4. Discussion
Our study showed that there are no temporal changes in N2, P2or P3 amplitudes from before until shortly after the onset of a firstpsychotic episode. However, the analyses did reveal an interactioneffect for the N1 amplitudes. Post hoc analyses showed that N1amplitudes were smaller at follow up compared to baseline onlyin UHR + T subjects. Although the UHR + T subjects showed smallerP3 amplitudes before and after transition to psychosis compared to
controls and UHR + NT subjects, we found no evidence of P3 changesover the follow up period.These results suggest that the course of neurophysiological dis-turbances from the prodromal phase until after the first psychotic
Controls (n = 17) Time effect Interaction effect
p Baseline Follow up
) 8.92 (2.7) 8.89 (3.4) F = .11, p = .92 F = .02, p = .98) 8.35 (2.8) 8.45 (2.6) F = .08, p = .78 F = .38, p = .69
1.07 (.3) 1.05 (.3) F = .09, p = .77 F = .07, p = .94) .57 (2.5) .44 (2.7) F = .09, p = .77 F = .35, p = .71

354 M.J. van Tricht et al. / Biological Psychology 87 (2011) 350– 357
Fig. 1. Grand average target waveforms for each group at Pz at baseline (A) and follow up (B); Grand average non target waveforms for each group at Cz at baseline (C)a = red lg re lege
eandTaa
ds(tewaNt1oliaipt
nd follow up (D). Ultra High Risk subjects with transition to psychosis (UHR + T)
roup = dashed black lines. (For interpretation of the references to color in this figu
pisode is dissociable for the distinct ERP components. Whereas P3bnormalities are already present before a psychotic episode and doot show progression shortly after psychotic onset, N1 amplitudeso show decrements after the onset of a first psychotic episode.here were no differences in N1 amplitudes between the groupst baseline (see also: van Tricht et al., 2010), suggesting that thesebnormalities arise after the onset of a first psychosis.
In schizophrenia patients, smaller N1 amplitudes have beenemonstrated using various experimental methods, including pas-ive listening experiments, and passive or active oddball paradigmsfor a review see Rosburg et al., 2008). Moreover, reduced N1 ampli-udes have been demonstrated in first hospitalized subjects (Brownt al., 2002). The N1 is an obligate (i.e. produced regardless ofhether the tone was attended; McCarley et al., 2003) response
rising primarily from the auditory cortex (Turetsky et al., 2008).1 decrements are thought to reflect impairments in early audi-
ory sensory processing or reduced sensory registration (Potts et al.,998; Ahveninen et al., 2006). However, the precise functional rolef the N1 is still unclear. The N1 amplitude is related to stimu-us characteristics (e.g. sound intensity). Moreover, many variablesncluding arousal, motivation, fatigue, hearing thresholds and drug
buse influence N1 amplitudes (Rosburg et al., 2008). These find-ngs suggest that the N1 can be classified as an exogenous or sensoryotential. However, the N1 amplitude is also influenced by cogni-ive functions. For instance, it has been demonstrated that the N1ines. Ultra High Risk subjects without transition (UHR + NT) = green lines. Controlnd, the reader is referred to the web version of the article.)
amplitude increases when subjects are asked to direct their atten-tion to the stimuli (O’Donnell et al., 1994). Thus, the N1 amplitudeseems to reflect both exogenous and endogenous processes, signi-fying both top-down and bottom-up stimulus processing (Butleret al., 2007).
Secondary cortical areas in the posterior region of the superiortemporal cortex are thought to be principal generators of the N1(Javitt et al., 1993; Salisbury et al., 2010). Moreover, it has beenshown that compared to UHR subjects, patients with first episodeschizophrenia show gray matter reductions in the superior tempo-ral gyrus (STG) (Witthaus et al., 2009). Therefore, STG gray matterreductions may be an underlying mechanism of the reported N1amplitude reductions. Longitudinal neuro-imaging studies follow-ing UHR subjects from before until after a first psychotic episodeare necessary before any conclusions concerning the underlyingpathology causing N1 impairments can be drawn.
As N1 amplitude abnormalities have also been demonstrated infirst degree relatives of schizophrenia patients, it has been sug-gested that N1 amplitudes may reflect an auditory processingdeficit related to the genetic vulnerability for schizophrenia, thusreflecting an endophenotypic trait marker for the disorder (Force
et al., 2008). However, this study focused on a different population,i.e. a sample of help-seeking UHR subjects. In our UHR sample, as ina comparable group of UHR subjects (Bramon et al., 2008), we foundno evidence of N1 impairments in UHR subjects before a first psy-
M.J. van Tricht et al. / Biological Psychology 87 (2011) 350– 357 355
Fig. 2. Colour-coded topographic maps of N1 voltage activity after non-target tones for each group at follow up. UHR + T = Ultra High Risk patients with transition to psychosis;U on of to
crcDt
so2imbdpPm
theheicoabe
HR + NT = Ultra High Risk patients without transition to psychosis. (For interpretatif the article.)
hotic episode. Moreover, there is some evidence that N1 amplitudeeductions are most pronounced in chronic schizophrenia patientsompared to patients with a first psychotic episode (Brockhaus-umke et al., 2008; Salisbury et al., 2010). These findings suggest
hat N1 abnormalities may be related to disease progression.The absence of P3 amplitude reductions from before until
hortly after psychotic onset concurs with recently published datan neuropsychological functioning in UHR subjects (Hawkins et al.,008; Becker et al., 2010; Seidman et al., 2010), thus suggesting that
mpairments in both neuropsychological and neurophysiologicaleasures associated with attention and memory largely pre-exist
efore the first psychotic episode. Conversely, there is some evi-ence of neurophysiological deterioration following the prodromalhase. For instance, in a cross-sectional study it was suggested that3 abnormalities may show a progressive course from the prodro-al to the chronic stages of schizophrenia (Ozgürdal et al., 2008).We found no group differences with respect to N2 or P2 ampli-
udes at baseline or follow up. To our knowledge, no other studiesave yet investigated these ERP components in UHR subjects. How-ver, there is some evidence of N2 and P2 abnormalities in firstospitalized schizophrenia patients (Salisbury et al., 2010; Brownt al., 2002). We could not confirm the presence of N2 or P2 deficitsn UHR subjects after a first psychotic episode, nor did we findhanges in these components between the prodrome and the onset
f psychosis. Moreover, we found no evidence of P3 amplitudesymmetry in UHR + T subjects at baseline and follow-up. It haseen suggested that this asymmetry develops later in the dis-ase process, after a so-called “critical period”, which is thoughthe references to color in this figure legend, the reader is referred to the web version
to last approximately 5 years (Birchwood et al., 1998). In our study,UHR + T patients were assessed before the end of the critical period,with a mean follow up term of 11.3 months after psychotic onset.
A question that remains to be answered is whether these ERPabnormalities are specific to schizophrenia at disease onset. Forinstance, Salisbury and colleagues (Salisbury et al., 1998) found nodifferences in P3 midline amplitudes between first-episode affec-tive psychotic patients and healthy controls, whereas their subjectswith schizophrenia psychosis did show reduced P3 amplitudesat midline scalp position. In addition, first episode schizophre-nia patients showed abnormal P3 symmetry at disease onset,whereas first-episode affective psychotic patients showed no P3symmetry changes. Although the majority of our UHR + T developedschizophrenia or schizophreniform disorder, a few UHR + T patientswere diagnosed with schizoaffective disorder or brief psychotic dis-order. Unfortunately, the small subgroup samples did not allow usto compare ERP amplitudes between these diagnostic groups.
There are several limitations to the findings of this study. Amajor limitation is the small group samples, in particular therelatively small size of the UHR + T group. Another possible con-founding factor that needs to be acknowledged is the effect ofantipsychotic medication. Until now, there is no consensus of opin-ion on the relationship between medication and P3 amplitudes.Although antipsychotic medication enhanced P3 amplitudes in
some studies (Mathalon et al., 2000; Bramon et al., 2004), P3 ampli-tudes are generally not restored to normal levels (Hirayasu et al.,1998; Jeon and Polich, 2003). As for the N1 it is believed that N1reductions are more pronounced in medicated than unmedicated
3 cal Psy
phwelenasboTso
PUufitpiemLsc
D
iww
R
PMtPMdwp
A
pt
R
A
B
B
56 M.J. van Tricht et al. / Biologi
atients (Rosburg et al., 2008). The use of typical antipsychotics (e.g.aloperidol) has been associated with reduced cortical gray matter,hich may account for the relationship with ERP amplitudes. The
ffect of atypical antipsychotics on cortical gray matter is howeveress clear (Lieberman et al., 2005). Our analyses revealed no differ-nces between the four medication categories in ERP amplitudes,or did we find evidence of a relationship between the dosage ofntipsychotics and the ERP components. Moreover, there was noignificant difference in the mean antipsychotics equivalent dosageetween baseline and follow up in the UHR + T group. Finally, nonef the UHR + T subjects used typical antipsychotics at follow up.hese findings suggest that the reduced N1 amplitudes in UHR + Tubjects are not a result of medication usage. Nevertheless, a sec-ndary effect of medication cannot completely be ruled out.
In conclusion, our study showed no evidence of a progression of3 abnormalities after a first psychotic episode. However, in theHR + T group, N1 amplitudes did show reductions from beforentil after the onset of psychosis. These findings suggest that a dif-erential breakdown occurs in processes that regulate the inflow ofnformation from the environment. Whereas disturbances in rela-ively late, higher-level evaluative cognitive processes are alreadyresent in the prodromal phase, another pathological process, caus-
ng N1 deficits, may accompany the onset of a frank psychoticpisode. Although speculative at this time, these ERP componentsay contribute to the diagnostic process of psychosis in the future.
ongitudinal studies with larger samples are needed to follow UHRubjects with a transition to psychosis over years before any firmonclusions can be drawn.
isclosure statement
None of the authors report any actual or potential conflict ofnterest including any financial, personal or other relationships
ith other people or organizations within 3 years of beginning theork submitted that could inappropriately influence our work.
ole of the funding source
This study was supported by a grant for the Dutch Prediction ofsychosis Study from ZON-MW (ZorgOnderzoek Nederland/NWO-edische Wetenschappen, project #2630.0001) and a grant from
he European Commission in Brussels, Belgium for the Europeanrediction of Psychosis study (grant QLGU-CT-2001-01081). ZON-W and the European Commission had no further role in the study
esign; in the collection, analysis and interpretation of data; in theriting of the report; and in the decision to submit the paper forublication.
cknowledgments
The authors thank the EEG technicians of the Clinical Neuro-hysiology Unit for their assistance in the ERP recordings. We alsohank T. Boerée for his technical assistance.
eferences
hveninen, J., Jääskeläinen, I.P., Osipova, D., Huttunen, M.O., Ilmoniemi, R.J., Kaprio,J., Lönnqvist, J., Manninen, M., Pakarinen, S., Therman, S., Näätänen, R., Cannon,T.D., 2006. Inherited auditory-cortical dysfunction in twin pairs discordant forschizophrenia. Biological Psychiatry 60, 612–620.
ecker, H.E., Nieman, D.H., Wiltink, S., Dingemans, P.M., van der Fliert, J.R., Van
Amelsvoort, T.A., Linszen, D.H., 2010. Neurocognitive functioning before andafter the first psychotic episode: does psychosis result in cognitive deteriora-tion? Psychological Medicine 40, 1599–1606.irchwood, M., Todd, P., Jackson, C., 1998. Early intervention in psychosis. The criticalperiod hypothesis. British Journal of Psyschiatry Supplement 172, 53–59.
chology 87 (2011) 350– 357
Bramon, E., Rabe-Hesketh, S., Sham, P., Murray, R.M., Frangou, S., 2004. Meta-analysisof the P300 and P50 waveforms in schizophrenia. Schizophrenia Research 70,315–329.
Bramon, E., Shaikh, M., Broome, M., Lappin, J., Bergé, D., Day, F., Woolley, J., Tabraham,P., Madre, M., Johns, L., Howes, O., Valmaggia, L., Pérez, V., Sham, P., Murray,R.M., McGuire, P., 2008. Abnormal P300 in people with high risk of developingpsychosis. Neuroimage 41, 553–560.
Brewer, W.J., Wood, S.J., Phillips, L.J., Francey, S.M., Pantelis, C., Yung, A.R., Cornblatt,B., McGorry, P.D., 2006. Generalized and specific cognitive performance in clin-ical high-risk cohorts: a review highlighting potential vulnerability markers forpsychosis. Schizophrenia Bulletin 32, 538–555.
Brockhaus-Dumke, A., Schultze-Lutter, F., Mueller, R., Tendolkar, I., Bechdolf, A.,Pukrop, R., Klosterkötter, J., Ruhrmann, S., 2008. Sensory gating in schizophre-nia: P50 and N100 gating in antipsychotic-free subjects at risk, first-episode,and chronic patients. Biological Psychiatry 64, 376–384.
Brown, K.J., Gonsalvez, C.J., Harris, A.W.F., Williams, L.M., Gordon, E., 2002. Target andnon-target ERP disturbances in first episode vs. chronic schizophrenia. ClinicalNeurophysiology 113, 1754–1763.
Butler, P.D., Martinez, A., Foxe, J.J., Kim, D., Zemon, V., Silipo, G., Mahoney, J.,Shpaner, M., Jalbrzikowski, M., Javitt, D.C., 2007. Subcortical visual dysfunc-tion in schizophrenia drives secondary cortical impairments. Brain 130, 417–430.
Duncan, C.C., Barry, R.J., Connolly, J.F., Fischer, C., Michie, P.T., Näätänen, R., Polich, J.,Reinvang, I., Van Petten, C., 2009. Event-related potentials in clinical research:guidelines for eliciting, recording, and quantifying mismatch negativity, P300,and N400. Clinical Neurophysiology 120, 1883–1908.
Faux, S.F., Torello, M.W., McCarley, R.W., Shenton, M.E., Duffy, F.H., 1988. P300 inschizophrenia: confirmation and statistical validation of temporal region deficitin P300 topography. Biological Psychiatry 15, 776–790.
Force, R.B., Venables, N.C., Sponheim, S.R., 2008. An auditory processing abnor-mality specific to liability for schizophrenia. Schizophrenia Research 103, 298–310.
Ford, J.M., Mathalon, D.H., Kalba, S., Marsh, L., Pfefferbaum, A., 2001. N1 andP300 abnormalities in patients with schizophrenia, epilepsy, and epilepsy withschizophrenialike features. Biological Psychiatry 49, 848–860.
Frommann, I., Brinkmeyer, J., Ruhrmann, S., Hack, E., Brockhaus-Dumke, A., Bechdolf,A., Wölwer, W., Klosterkötter, J., Maier, W., Wagner, M., 2008. Auditory P300 inindividuals clinically at risk for psychosis. International Journal of Psychophys-iology 70, 192–205.
Gratton, G., Coles, M., Donchin, E., 1982. A new method for off-line removal ofocular artifact. Electroencephalogry and Clinical Neurophysiology 55, 468–484.
Haenschel, C., Bittner, R.A., Haertling, F., Rotarska-Jagiela, A., Maurer, K., Singer, W.,Linden, D.E.J., 2007. Contribution of impaired early-stage visual processing toworking memory dysfunction in adolescents with schizophrenia: a study withevent-related potentials and functional magnetic resonance imaging. Archivesof General Psychiatry 64, 1229–1240.
Hawkins, K.A., Keefe, R.S.E., Christensen, B.K., Addington, J., Woods, S.W., Callahan,J., Zipursky, R.B., Perkins, D.O., Tohen, M., Breier, A., McGlashan, T.H., 2008. Neu-ropsychological course in the prodrome and first episode of psychosis: findingsfrom the PRIME North America Double Blind Treatment Study. SchizophreniaResearch 105, 1–9.
Hirayasu, Y., Asato, N., Ohta, H., Hokama, H., Arakaki, H., Ogura, C., 1998. Abnormal-ities of auditory event-related potentials in schizophrenia prior to treatment.Biological Psychiatry 43, 244–253.
Javitt, D.C., Doneshka, P., Zylberman, I., Ritter, W., Vaughan, H.G., 1993. Impair-ment of early cortical processing in schizophrenia: an event-related potentialconfirmation study. Biological Psychiatry 33, 513–519.
Jeon, Y.W., Polich, J., 2001. P300 asymmetry in schizophrenia: a meta-analysis. Psy-chiatry Research 104, 61–74.
Jeon, Y., Polich, J., 2003. Meta-analysis of P300 and schizophrenia:patients, paradigms, and practical implications. Psychophysiology 40,684–701.
Job, D.E., Whalley, H.C., McConnell, S., Glabus, M., Johnstone, E.C., Lawrie, S.M., 2003.Voxel-based morphometry of grey matter densities in subjects at high risk ofschizophrenia. Schizophrenia Research 64, 1–13.
Kay, S.R., Fiszbein, A., Opler, L.A., 1987. The positive and negative syndrome scale(PANSS) for schizophrenia. Schizophrenia Bulletin 13, 261–276.
Lieberman, J.A., Tollefson, G.D., Charles, C., Zipursky, R., Sharma, T., Kahn, R.S., Keefe,R.S.E., Green, A.I., Gur, R.E., McEvoy, J., Perkins, D., Hamer, R.M., Gu, H., Tohen,M., for the HGDH Study Group, 2005. Antipsychotic drug effects on brain mor-phology in first-episode psychosis. Archives of General Psychiatry 62, 361–370.
Mathalon, D.H., Ford, J.M., Pfefferbaum, A., 2000. Trait and state aspects of p300amplitude reduction in schizophrenia: a retrospective longitudinal study. Bio-logical Psychiatry 47, 434–449.
McCarley, R.W., Faux, S.F., Shenton, M.E., Nestor, P.G., Adams, J., 2003. Event-relatedpotentials in schizophrenia: their biological and clinical correlates and newmodel of schizophrenic pathophysiology. Schizophrenia Research 4, 209–231.
McCarley, R.W., Salisbury, D.F., Hirayasu, Y., Yurgelun-Todd, D.A., Tohen, M., Zarate,C., Kikinis, R., Jolesz, F.A., Shenton, M.E., 2002. Association between smaller leftposterior superior temporal gyrus volume on magnetic resonance imaging and
smaller left temporal P300 amplitude in first-episode schizophrenia. Archivesof General Psychiatry 59, 321–331.McGorry, P.D., Yung, A.R., Phillips, L.J., 2003. The “close-in” or ultra high-risk model: asafe and effective strategy for research and clinical intervention in prepsychoticmental disorder. Schizophrenia Bulletin 29, 771–790.

cal Psy
N
N
O
O
O
O
P
P
P
R
R
S
S
S
S
S
M.J. van Tricht et al. / Biologi
ieman, D.H., Koelman, J.H.T.M., Linszen, D.H., Bour, L.J., Dingemans, P.M., Ongerboerde Visser, B.W., 2002. Clinical and neuropsychological correlates of the P300 inschizophrenia. Schizophrenia Research 55, 105–113.
iendam, T.A., Bearden, C.E., Zinberg, J., Johnson, J.K., O’Brien, M., Cannon, T.D., 2007.The course of neurocognition and social functioning in individuals at ultra highrisk for psychosis. Schizophrenia Bulletin 33, 772–781.
’Donnell, B.F., Hokama, H., McCarley, R.W., Smith, R.S., Salisbury, D.F., Mondrow,E., Nestor, P.G., Shenton, M.E., 1994. Auditory ERPs to non-target stimuli inschizophrenia: relationship to probability, task-demands, and target ERPs. Inter-national Journal of Psychophysiology 17, 219–213.
’Donnell, B.F., Shenton, M.E., McCarley, R.W., Faux, S.F., Smith, R.S., Salisbury, D.F.,Nestor, P.G., Pollak, S.D., Kikinis, R., Jolesz, F.A., 1993. The auditory N2 componentin schizophrenia: relationship to MRI temporal lobe gray matter and to otherERP abnormalities. Biological Psychiatry 34, 26–40.
’Donnell, B.F., Vohs, J.L., Hetrick, W.P., Carroll, C.A., Shekhar, A., 2004. Auditoryevent-related potential abnormalities in bipolar disorder and schizophrenia.International Journal of Psychophysiology 53, 45–55.
zgürdal, S., Gudlowski, Y., Witthaus, H., Kawohl, W., Uhl, I., Hauser, M., Gorynia, I.,Gallinat, J., Heinze, M., Heinz, A., Juckel, G., 2008. Reduction of auditory event-related P300 amplitude in subjects with at-risk mental state for schizophrenia.Schizophrenia Research 105, 272–278.
antelis, C., Velakoulis, D., Wood, S.J., Yücel, M., Yung, A.R., Phillips, L.J., Sun, D.Q.,Mcgorry, P.D., 2007. Neuroimaging and emerging psychotic disorders: the Mel-bourne ultra-high risk studies. International Review of Psychiatry 19, 371–379.
olich, J., 2007. Updating P300: an integrative theory of P3a and P3b. Clinical Neu-rophysiology 118, 2128–2148.
otts, G.F., Hirayasu, Y., O’Donnell, B.F., Shenton, M.E., McCarley, R.W., 1998.High-density recording and topographic analysis of the auditory oddball event-related potential in patients with schizophrenia. Biological Psychiatry 44, 982–989.
enoult, L., Prévost, M., Brodeur, M., Lionnet, C., Joober, R., Malla, A., Debruille, J.B.,2007. P300 asymmetry and positive symptom severity: a study in the early stageof a first episode of psychosis. Schizophrenia Research 93, 366–373.
osburg, T., Boutros, N.N., Ford, J.M., 2008. Reduced auditory evoked potential com-ponent N100 in schizophrenia – a critical review. Psychiatry Research 161,259–274.
alisbury, D.F., Collins, K.C., McCarley, R.W., 2010. Reductions in the N1 and P2 audi-tory event-related potentials in first-hospitalized and chronic schizophrenia.Schizophrenia Bulletin 36, 991–1000.
alisbury, D.F., Shenton, M.E., Sherwood, A.R., Fischer, I.A., Yurgelun-Todd, D.A.,Tohen, M., McCarley, R.W., 1998. First-episode schizophrenic psychosis differsfrom first-episode affective psychosis and controls in P300 amplitude over lefttemporal lobe. Archives of General Psychiatry 55, 173–180.
alisbury, D.F., O’Donnell, B.F., McCarley, R.W., Shenton, M.E., Benavage, A., 1994. TheN2 event-related potential reflects attention deficit in schizophrenia. BiologicalPsychology 39, 1–13.
chmand, B.A., Bakker, D., Saan, R., Louman, J., 1991. The Dutch Reading Test forAdults: a measure of premorbid intelligence level. Tijdschrift voor gerontologieen geriatrie 22, 15–19.
eidman, L.J., Giuliano, A.J., Meyer, E.C., Addington, J., Cadenhead, K.S., Cannon, T.D.,McGlashan, T.H., Perkins, D.O., Tsuang, M.T., Walker, E.F., Woods, S.W., Bearden,
chology 87 (2011) 350– 357 357
C.E., Christensen, B.K., Hawkins, K., Heaton, R., Keefe, R.S.E., Heinssen, R., Corn-blatt, B.A., and for the North American Prodrome Longitudinal Study (NAPLS)Group, 2010. Neuropsychology of the prodrome to psychosis in the NAPLS Con-sortium: relationship to family history and conversion to psychosis. Archives ofGeneral Psychiatry 67, 578–588.
Spitzer, R.L., Williams, J.B., Gibber, M., First, M.B., 1992. The Structured ClinicalInterview for DSM-III-R (SCID). I. History, rationale, and description. Archivesof General Psychiatry 49, 624–629.
Sun, D., Phillips, L., Velakoulis, D., Yung, A., McGorry, P.D., Wood, S.J., van Erp,T.G.M., Thompson, P.M., Toga, A.W., Cannon, T.D., Pantelis, C., 2009. Progressivebrain structural changes mapped as psychosis develops in ‘at risk’ individuals.Schizophrenia Research 108, 85–92.
Takahashi, T., Wood, S.J., Yung, A.R., Phillips, L.J., Soulsby, B., McGorry, P.D., Tanino,R., Zhou, S.Y., Suzuki, M., Velakoulis, D., Pantelis, C., 2009a. Insular cortexgray matter changes in individuals at ultra-high-risk of developing psychosis.Schizophrenia Research 111, 94–102.
Takahashi, T., Wood, S.J., Yung, A.R., Soulsby, B., McGorry, P.D., Suzuki, M., Kawasaki,Y., Phillips, L.J., Velakoulis, D., Pantelis, C., 2009b. Progressive gray matter reduc-tion of the superior temporal gyrus during transition to psychosis. Archives ofGeneral Psychiatry 66, 366–376.
Turetsky, B.I., Greenwood, T.A., Olincy, A., Radant, A.D., Braff, D.L., Cadenhead, K.S.,Dobie, D.J., Freedman, R., Green, M.F., Gur, R.E., Gur, R.C., Light, G.A., Mintz, J.,Nuechterlein, K.H., Schork, N.J., Seidman, L.J., Siever, L.J., Silverman, J.M., Stone,W.S., Swerdlow, N.R., Tsuang, D.W., Tsuang, M.T., Calkins, M.E., 2008. Abnormalauditory N100 amplitude: a heritable endophenotype in first-degree relativesof schizophrenia probands. Biological Psychiatry 64, 1051–1059.
van der Stelt, O., Frye, J., Lieberman, J.A., Belger, A., 2004. Impaired P3 generationreflects high-level and progressive neurocognitive dysfunction in schizophrenia.Archives of General Psychiatry 61, 237–248.
van Tricht, M.J., Nieman, D.H., Koelman, J.T.H.M., van der Meer, J.N., Bour, L.J., deHaan, L., Linszen, D., 2010. Reduced parietal P300 amplitude is associated withan increased risk for a first psychotic episode. Biological Psychiatry 68, 642–648.
Wittchen, H.U., 1994. Reliability and validity studies of the WHO-Composite Inter-national Diagnostic Interview (CIDI): a critical review. Journal of PsychiatricResearch 28, 57–84.
Witthaus, H., Kaufmann, C., Bohner, G., Ozgürdal, S., Gudlowski, Y., Gallinat, J.,Ruhrmann, S., Brüne, M., Heinz, A., Klingebiel, R., Juckel, G., 2009. Gray matterabnormalities in subjects at ultra-high risk for schizophrenia and first-episodeschizophrenic patients compared to healthy controls. Psychiatry Research: Neu-roimaging 173, 163–169.
Wood, S.J., Brewer, W.J., Koutsouradis, P., Philips, L.J., Francey, S.M., Profitt, T.M.,Yung, A.R., Jackson, H.J., Mcgorry, P.D., Pantelis, C., 2007. Cognitive declinefollowing psychosis onset: data from the PACE clinic. The British Journal ofPsychiatry: Supplement 51, 52–57.
Yung, A.R., Phillips, L.J., Yuen, H.P., McGorry, P.D., 2004. Risk factors for psychosis inan ultra high-risk group: psychopathology and clinical features. Schizophrenia
Research 67, 131–142.Yung, A.R., Stanford, C., Cosgrave, E., Killackey, E., Phillips, L., Nelson, B., McGorry,P.D., 2006. Testing the Ultra High Risk (prodromal) criteria for the predictionof psychosis in a clinical sample of young people. Schizophrenia Research 84,57–66.