attractiveness of collaborative platforms for sustainable e
TRANSCRIPT

Citation: Sternad Zabukovšek, S.;
Deželak, Z.; Parusheva, S.; Bobek, S.
Attractiveness of Collaborative
Platforms for Sustainable E-Learning
in Business Studies. Sustainability
2022, 14, 8257. https://doi.org/
10.3390/su14148257
Academic Editor: Luigi Aldieri
Received: 17 June 2022
Accepted: 5 July 2022
Published: 6 July 2022
Publisher’s Note: MDPI stays neutral
with regard to jurisdictional claims in
published maps and institutional affil-
iations.
Copyright: © 2022 by the authors.
Licensee MDPI, Basel, Switzerland.
This article is an open access article
distributed under the terms and
conditions of the Creative Commons
Attribution (CC BY) license (https://
creativecommons.org/licenses/by/
4.0/).
sustainability
Article
Attractiveness of Collaborative Platforms for SustainableE-Learning in Business StudiesSimona Sternad Zabukovšek 1,* , Zdenko Deželak 1, Silvia Parusheva 2 and Samo Bobek 1
1 Faculty of Economics and Business, University of Maribor, 2000 Maribor, Slovenia;[email protected] (Z.D.); [email protected] (S.B.)
2 Digital and Distance Learning Center, University of Economics, 9002 Varna, Bulgaria; [email protected]* Correspondence: [email protected]; Tel.: +386-2-22-90-248
Abstract: E-learning platforms have become more and more complex. Their functionality includedin learning management systems is extended with collaborative platforms, which allow bettercommunication, group collaboration, and face-to-face lectures. Universities are facing the challenge ofadvanced use of these platforms to fulfil sustainable learning goals. Better usability and attractivenessbecame essential in successful e-learning platforms, especially due to the more intensive interactivityexpected from students. In the study, we researched the user experience of students who have usedMoodle, Microsoft Teams, and Google Meet. User experience is, in most cases, connected with aperson’s perception, person’s feelings, and satisfaction with the platform used. Data were collectedusing a standard UEQ questionnaire. With this research, we examined whether user experiencefactors: perceived efficiency, perceived perspicuity, perceived dependability, perceived stimulation,and perceived novelty affect perceived attractiveness, which is an important factor in the sustainabilityof e-learning tools. The collected data were processed using SmartPLS. The research study showedthat all studied factors have a statistically significant impact on perceived attractiveness. Factorperceived stimulation has the strongest statistically significant impact on the perceived attractivenessof e-learning platforms, followed by perceived efficiency, perceived perspicuity, perceived novelty,and perceived dependability.
Keywords: e-learning platform; collaboration platform; usability; user experience
1. Introduction
Educational software aims to improve and support learning. Educational softwareshould consider educational processes and especially students’ learning activities. Goodusability of educational software is crucial [1,2]. Therefore, student collaborations withthe educational software should be as spontaneous as possible. Educational softwareshould be embedded in teaching and learning processes, so a synergy between students’interaction with the software and learning processes is achieved. Usability should berelated to efficient interaction of students and software and should also be considered inthe sense of appropriateness for learning tasks [3]. When such synergy happens, we cansay that the educational software is imbedded in education processes [4]. This means that aworking relationship is developed between the actual use of special education software andthe learning process. Many conducted research studies have not studied adequately theimportance and effects of usability of educational software to reach learning purposes [3,5].A so-called instructional interface is needed so the student can concentrate on learningcontent instead of concentrating on how to use software to retrieve the content. Researchhas repeatedly highlighted the need to focus on students’ goals instead of educationaltasks [6]. Alternatively, the requirement for usability is also commonly known in thewebsite design literature as a key measure of quality in determining website or platformuser satisfaction [7–11]. Therefore, the usability of educational software can considerablyinfluence learning [12].
Sustainability 2022, 14, 8257. https://doi.org/10.3390/su14148257 https://www.mdpi.com/journal/sustainability

Sustainability 2022, 14, 8257 2 of 25
Educational software has become more complex in the last decade regarding theeducational content, technology resources, and interaction options [13] offered by thelearning management system (LMS) platforms such as Moodle, Blackboard, etc. However,the user interface quality of these platforms and the ways in which tasks are performed arebecoming increasingly important [14,15]. Learning management systems (LMS) differ fromgeneral online platforms because they have different purposes. This means that users learnnew knowledge using such systems. Very often, such platforms demand that the studentlearn to use them so that he/she may finalise the learning tasks and fulfil the learningobjectives. The problem which emerges very often is that there is greater involvement inthe educational content combined with platform functionalities than involvement in userinterfaces between students and the platform where such content will be presented [16,17].
With the rapid development of information technology, e-learning is becoming anincreasingly important part of the innovative higher education system. E-learning has beenimplemented in the majority of universities today. As part of this progress, universities andcolleges have progressively implemented a new generation of so-called Virtual LearningEnvironments (VLE) that allow teachers and students to connect effectively while focusingon learning purposes [18–20]. However, again, it has been confirmed in several researchpapers that weak usability can significantly affect the effectiveness of communication inthe relationship between teachers and students and the learning of students [21].
The most important task for Human-Computer Interaction (HCI) researchers anddesigners is to create computer interaction to involve beginner users (students) and providedistance learning [22,23]. Educational software should consider the individual ways howstudents learn and, thus, enable as many as possible intuitive (natural) interactions withstudents. This calls for a review of traditional interaction with e-learning platforms tosupport new opportunities and flexibility that are appropriate for e-learning platforms asthey allow students to interact during the learning process [24].
Usability and User Experience (UX) became important factors in developing successfule-learning platforms [25–27]. If the e-learning platform is not useful enough and is difficultto use, students need a lot of time to learn to use it. Thus, the e-learning platform hindersthem from performing their assignments effectively [28]. The International Standards Or-ganization (ISO) describes usability as “the level to which specified users can use a productor service to accomplish particular objectives with effectiveness, efficiency and satisfactionin a specified context” [29]. Today, researchers evaluate usability using various methods,such as analytical approach, specialist heuristic evaluation, surveys, and experimentalapproach [30,31], where specific characteristics of the e-learning platform usability canbe found. For example, in his research, Giannakos [32] evaluated an online e-learningplatform in terms of pedagogical applicability. Usability and user experience (UX) shouldnot be equated as it is user experience (UX) described by the ISO as “observations andreactions of the person resulting from the use and/or expected use of the product, systemor service” [33].
This definition is usually supplemented in research articles and books with phrasessuch as user’s feelings, user’s perception, or user’s satisfaction. Roto et al. [34] and Gordilloet al. [28] pointed out that in addition to these phrases, the words “dynamic” due to chang-ing circumstances, ”subjectivity” due to individual performance, and “content-dependent”are also used to understand the concept of user experience (UX).
Usability and user experience (UX) are important for sustainable learning [25,35]. Itmust be obvious that students feel excellent and self-confident about the expertise, abilities,opinions, and beliefs they have learned. Sustainable education and learning are, thus,becoming crucial to the future lives of people on an increasingly-transforming planet [36].The replacement of technologies and approaches from the past with newer sustainableones, enables people to consume satisfying lifestyles without negatively impacting theenvironment [37]. Sustainability as a concept emerges in many industries i.e., sustain-able business models in automotive industry [38] and many other areas [39–41]. Neworganisational sustainable identity frameworks emerge [42], which will foster also changes

Sustainability 2022, 14, 8257 3 of 25
in higher education organisations, which will become sustainable organisations. TheSustainable Learning Environment (SLE) essentially includes approaches and skills thatsupport teachers in effective substance recovery, reuse, inquiry, etc. [43,44]. In addition, itenables teachers to cope with difficult and complex requirements concerning learning andrelearning [45]. Ben-Eliyahu [46] added that a self-regulated learning framework consistingof four characteristics could be used to understand SLE: (1) renovating and relearning;(2) individual, independent as well as collaborative learning; (3) dynamic learning; and(4) transferability. Due to a literature gap regarding examination of the user experienceof e-learning platforms, which are an important part of SLE, the aim of our research is toevaluate VLE platforms used in a higher education setting from a user experience view-point to get an insight into their attractiveness perceived by students using them. Ourresearch model is based on adapted factors from the User Experience (UX) Model fromHassenzahl [47], Laugwitz, et al. [48], Schrepp [49], and Schrepp et al. [50–52], whichare perceived efficiency (EF), perceived perspicuity (PE), perceived dependability (DE),perceived stimulation (ST), perceived novelty (NO), and perceived attractiveness (AT).From a sustainability point of view, perceived attractiveness could be one of the featuresof an e-learning tool for long-term use. Therefore, the objective of the research is to testhypothesise that all other factors of user experience (UX), namely, perceived efficiency (EF),perceived perspicuity (PE), perceived dependability (DE), perceived stimulation (ST), andperceived novelty (NO), have a positive impact on perceived attractiveness (AT).
The article is structured in a way that in Section 2, the theoretical background ispresented with a focus on e-learning collaboration platforms, the attractiveness of e-learningcollaboration platforms as perceived by students is discussed, and the concepts of userexperience are explained more in-depth. Section 2 concludes with a description of theresearch model. In Section 3, research methodology is described. In Section 4, researchstudy is described, and research results are presented. In Section 5, research findingsare discussed, implications are explained, and limitations and future work suggestionsare presented.
2. Theoretical Background2.1. E-Learning Collaboration Platforms
The usual practice of universities involves using the Learning Management System(LMS), which has its older traditions back in time. Researchers point out that in an opensociety, with increasing distribution as well as access to information dynamics, it is difficultto use it traditionally [53,54]. This determines the paramount role that e-learning platformsplay in higher education. Through them, students gain access to the digital educationalcontent of the courses, tests for self-preparation and assessment, etc. Researchers pointout that using e-learning platforms as a tool for self-study contributes to a substantialdifference in the use of resources and results in increased learning efficiency [55]. LMSsignificantly change the teaching experience of both teachers and students and is used veryintensively [56]. COVID-19 pandemic affected the closure of all educational institutions,including universities, along with the shift to complete online learning and affected a seriesof changes in learning and teaching process which required technology [57]. Implementingeffective learning in a remote, electronic-based environment has become a key issue ineducation [58–61]. As a solution, e-learning platforms, LMS platforms, video conferencingsystems, and online collaboration tools (for example, Microsoft Teams, Zoom, Google Meet,Webex, etc.) have intensified. For the purposes of our study, the use of Moodle, GoogleMeet, and Microsoft Teams is considered and, therefore, special emphasis is placed on them.
E-learning platforms are web-based platforms for providing digital educational con-tent and managing the learning process. As mentioned earlier, universities integrate intotheir e-learning platforms a range of different systems and tools. Among them are world-renowned LMS platforms such as Blackboard, Canvas, Moodle, Google Classroom, andmore. Of these systems, Moodle and Canvas are free platforms. In addition, it should benoted that Moodle is an open-source system, while Blackboard is a paid system. Statistics

Sustainability 2022, 14, 8257 4 of 25
on the use of e-learning platforms show that in more than 1600 institutions surveyed inEurope, 65% of them use Moodle, 12% Blackboard, followed by other platforms (ILIAS,APG Learning /Sakal/, etc.) with a share between 4% and 1% [62]. These figures provethe leading positions of Moodle among the used e-learning platforms. In addition to LMSplatforms, a new generation of e-learning platforms emerged, oriented not only in contentsharing, but also in facilitating e-learning collaboration. In most cases, universities’ use ofGoogle Meet, Zoom, and Microsoft Teams as collaboration tools has intensified.
Somova and Gachkova point out that Moodle is one of the world’s most widely usedplatforms in over 200 countries, with more than 170,000 installations, where 250 millionusers use more than 30 million courses [63]. In addition, Moodle is coded in the PHPprogramming language and is issued under the General Public License (GNU). The plat-form is developed in compliance with the pedagogical principles and is used for blendedlearning, distance learning, flipped classrooms, and other areas of e-learning in schools, anduniversities, to maintain corporate qualifications and more. Some authors emphasise theimportant features that determine its widespread use. Moodle is argued to be the optimalVirtual Learning Environment (VLE) platform in terms of the tools at its disposal and itstechnical aspects [64].
Other authors [65] cite the leading features of Moodle, the excellent organisation ofonline sources, their accessibility and convenience, good structuring, and the effectivenessof communication tools. Evgenievich et al. [66] summarise the opinion of researchers andpractitioners about the benefits of Moodle LMS in several directions: (1) many opportunitiesto increase the individuality and responsibility of students; (2) the possibility of using avariety of platform resources that enrich and at the same time develop skills for workingwith material; (3) the opportunity to progress individual educational paths; and (4) createan environment for acquiring new knowledge, experience exchange, and consulting. Someauthors also emphasise the possibility of synchronous and asynchronous access and groupwork [67].
On the other hand, the authors highlight that communication in Moodle is not sowidespread, with a greater interest in the use of social media and specifically social net-works, as well as mobile applications [61,68]. For this reason, instant communicationapplications, such as Messenger, WhatsApp, Viber, and others, are especially popular andused. The Moodle forum module can be used for asynchronous group communicationand collaboration, while for synchronous communication, Google’s Google Meet tools arepreferred, as well as Microsoft Teams, Zoom, Webex, etc.
Google Meet is defined by the authors [69] as a “synchronous learning tool for distantonline programs”. Google Meet and Microsoft Teams Rooms and their videoconferencingfeatures provide a good basis for active interaction between lecturers and learners. Throughthem, effective synchronous work with students and their fuller engagement in the learningprocess is achieved. Research by many authors indicates the main possibilities usedthrough these applications. Links to web-based classrooms are created by educators andare integrated into learning courses in Moodle. This combines the use of these tools, withMoodle LMS offering much more comprehensive and complete support to students andfaculty through a variety of activities and resources, but primarily asynchronous, andGoogle Meet and Microsoft Teams offering synchronous communication for lectures andseminars. Due to video conferencing functionality, live lectures or seminar sessions areheld with students [70].
Gartner recognised the Microsoft Teams application as a leader for unified commu-nications as a service (UCaaS) and meeting solutions [71]. Microsoft Teams was placedhighest of all solution providers for its ability to execute. Microsoft Teams is an applicationthat supports internal and external team members in connecting and collaborating syn-chronously [72]. People can have one-on-one or many-to-many meetings or calls with fullyintegrated voice and video, informal chats, co-authoring a text, or participate in other appli-cations and services. Microsoft Teams offers a shared workspace for people where we canquickly restore or repeat the project and allows you to work with team files and participate

Sustainability 2022, 14, 8257 5 of 25
in shared results. Every new team created a new group, an online site using SharePointcomplete with a document library, a OneNote notebook, Exchange online (shared calendarand mailbox), and is highly integrated with other Microsoft 365 and Office 365 applications(e.g., Power BI, Planner, Forms etc.) [72]. Microsoft is rapidly developing new capabilitiesinto Microsoft Teams application—there is an update every month, and the dozens addnew features. They also support the UserVoice initiative, with which everyone is able tosuggest new features, and users vote on them—the most requested features get to be addedin the coming updates. More recent added features incorporate [72]:
• “Together mode”, which offers a simulation of actual meeting members being in thesame room;
• Customisable meetings that support setting up breakout rooms for meeting insmaller groups;
• Ability to record the meetings on the go, accompanied with meeting notes and transcripts.
One of the latest investments by Microsoft is Microsoft Teams Rooms, which providesa mutual experience as in a standard office meeting room. This way, users can experiencehybrid work scenarios that support simplified meeting starts and effortless sharing ofcontent with complete audio and video collaboration [72].
Florjancic and Wiechetek [73] compare LMS platforms Moodle and Microsoft Teamsand state that Moodle is a complex tool, but at the same time, it is a complicated platform.On the other hand, they define Microsoft Teams as a relatively new and simple tool with amodern design and easy to use. Particular emphasis is placed on its simplicity, real-timecommunication, and opportunities for integration with Microsoft Office 365.
It can be summarised that Moodle LMS, Microsoft Teams and Google Meet as e-learning tools support educators and students in different but complementary aspects.Moodle has significantly richer capabilities thanks to the many activities and resourcesbuilt into the platform, but mainly for asynchronous support and collaboration. On theother hand, the potential of both Microsoft Teams and Google Meet tools for synchronousonline communication and online lectures and seminars sessions is irreplaceable, especiallyin the difficult times of COVID’s restrictions and the closure of universities.
2.2. Attractiveness of E-Learning Collaboration Platforms for Students
Many researchers have researched e-learning as an approach to providing educationalcontent within study programs, and many publications have been published. Manypublished research studies have been focused on technology issues of online teaching andonline learning. Studies emphasise technological issues related to using online platformsand creating online content such as audio-visual and interactive content in higher education.Some studies are related to the hosting of knowledge bases and accessing such knowledgebases. Other studies are focused on online communication between the teacher and studentsand among the students within study programs.
However, teaching and learning are not all about the technology used in such avirtual environment. It also has its social and psychological dimensions. For sustainablelearning, the teacher’s and student’s needs, desires, motivations, and interests, as wellas perspectives, are also studied and taken into account. Only such a holistic approachcan lead to sustainable higher education, improving the efficiency and effectiveness ofonline learning.
Research studies show that online courses can bring high-quality education to morestudents while online courses are easily accessible to all students, no matter where they aregeographically located [74]. Czerniewicz et al. [75] point out that there are studies inves-tigating the provision of academic content through e-learning in general and mass openonline courses (MOOCs), their problems, and expected benefits. Mulder and Jansen [76]add that MOOCs can improve access to education but that questions related to Internetaccessibility, digital literacy, and the medium of delivery need to be answered first.
Much effort in the e-learning environment relates to the assumption that when contentis offered online, students can access it to meet the course requirements and achieve a

Sustainability 2022, 14, 8257 6 of 25
certain level of knowledge of the topic. However, students participating in online coursesalso face several psychological and socio-cultural problems. These problems can lead toa high rate of non-completion of online courses. In the early 1990s, researchers pointedout that computer-mediated communication is impersonal and antisocial [77,78], which isstill considered one of the main problems today. Wegerif [79] pointed out that the lack ofsocial presence causes a low level of commitment. Moreover, it can also lead to withdrawalfrom the online environment. Penstein Rosé et al. [80] found that social factors make animportant contribution to the use/non-use of online courses.
Numerous studies have shown that students acquire more knowledge and prefer tolearn through direct communication (face-to-face), making it easier also for the teacherto gain a common understanding and conceptual knowledge. Therefore, we need tomonitor and ensure the teacher’s cognitive presence if students are educated online [81,82].The teacher’s cognitive and social presence is very important for more intensive studentinvolvement in the online courses. This often leads to better meeting students’ needs andincreases their motivation for online course participation [83]. Barnett [84] added thatteacher cooperation with students in online courses has a positive effect on the intention ofstudents to attend the online course.
Blended learning is the teaching mode where online access to course content is inte-grated with personal (face-to-face) teaching and personal communication [85]. The blendedteaching model seems to precede online and personal teaching [86]. Therefore, blendedlearning in higher education is recognised as one of the biggest trends in training andeducation [87]. Most blended learning studies have shown that this positively affectsstudent achievement and satisfaction, as the inclusion of online learning resources andactivities for students improves learning outcomes in higher education [88,89].
Some other researchers got up with similar learning outcomes through blended andpersonal (face-to-face) ways of learning [90,91]. In their study, Rossiou and Sifaleras [92]studied the factors influencing student participation in using e-tools and e-content. Theypointed out that the main reasons for not involving students in online courses are lackof internet access, other technical issues, and lack of time, awareness, and engagement.Anderson et al. [93] pointed out in their research that social patterns of student involvementare important, as not all students enrolled in online courses participate in the same way andare not equally engaged. Five categories of students (observer, spectator, collector, versatile,and rescuer) were identified, differing in the style of collaboration and time of interaction.
Research collaboration between teacher and student is a central element of the aca-demic relationship. It should be emphasised that students expect expertise, support, and abalance between creativity and criticism of the teacher [94]. Modern e-learning platforms,especially their collaborative work functionalities, enable new dimensions of blendedlearning. At the same time, personal communication in the classroom can be replaced byface-to-face distant communication via a collaborative platform providing videoconferenc-ing, to use collaborative platforms at an advanced level and ensure more active remoteface-to-face communication by participants accepting these platforms by users/studentsshould be on an advanced level.
In recent years, the phrase “digital collaboration” has been frequently used also ineducation. The extent and different ways of collaboration are usually organisation-specific,influencing the portfolio of tools used to be efficient and successful [95]. Collaborationis inevitable in education, and if we simplify, collaboration occurs every time two ormore persons cooperate towards a common goal—in the case of education, the goal is toachieve the expected learning output. Organisations must consider the reasons for digitalcollaboration to maximise the collaboration results of tools used [95]. Collaboration canbe on different levels, depending on the learning process requirements. The challengethere is in knowing the learning process well enough to support it to the right extent withcollaboration tools. Many advantages come with the digital collaboration, which impactssustainability issues in learning, including the following:

Sustainability 2022, 14, 8257 7 of 25
• Saved time—Being able to finish a process or a task faster automatically means savingtime and, as such, means fewer costs;
• Strengthened team relationships—One can see students enrolled in a course as closelyconnected groups. So, it comes to be very valuable to be capable of maintainingsound and effective relationships within groups of participants. With modern collab-oration tools, this can be supported and elevated so that every student has a betterunderstanding of teamwork and mutual goals, of course, he attends;
• Better organisation of teaching work—Collaboration tools are facilitators to improveteaching, especially active learning.
Digital collaboration within learning in higher education can be described as a com-bination of tools and processes that enable teachers, students, and other participants tocommunicate and interact on different levels. This is achieved using selected platforms andtools [96]. Digital collaboration tools for business are an effective way for organisationsto be able to support different types of employees (working on location, working fromhome, working from anywhere) and still maintain effective business process flow. Similaris in higher education, where participants can use collaboration platforms and face-to-facecommunication tools. We see innovation lately in digital collaboration, which is drivingefficiency and productivity with the combination of traditional tools, social media, andother modern tools that create unique, sustainable working environments [97]. In higher ed-ucation, this is seen in the integration of collaboration platforms and tools with traditionale-learning platforms for access to digitalised content of courses.
Digital collaboration supports remote employees to connect to others seamlessly,completing their tasks and communicating. In higher education, digital collaborationenables students and teachers to be connected seamlessly. This positively impacts efficiencyand enables better group dynamics and relationships within courses conducted in blendedmode and using collaboration platforms and tools. Digital collaboration is in some wayprogressive but is getting increasingly common. For innovative organisations, the challengeis in developing even newer, more advanced platforms and tools to differentiate themselvesand be leaders in their field.
For sustainable learning enabled by blended learning mode, e-learning platformsand collaboration platforms used to foster digitalised face-to-face collaboration must beaccepted by students accordingly. Their user experience with e-learning and collaborationplatforms must be as high as possible.
2.3. User Experience
Different aspects can be used to evaluate software applications from the user’s view-point. Some are quantitative, but it often depends on the user’s subjective opinion, whetherhe or she finds an application good or not. Recently for such evaluations concept of userexperience (UX) has been used. User Experience (UX) is defined as the actual end-userexperience with the application. The International Standards Organization (ISO) describesuser experience as “a consequence of the presentation, system performance, functionality,interactive behaviour, and assistive competencies of an interactive system, both software,and hardware. It is also a consequence of the user’s prior experiences, skills, attitudes,personality, and habits [33]”. It is limited to software products, services, and systems witheverything that suits the user’s journey and creates a user experience before using thesoftware product, service, or system [98].
Great user experience provides better work motivation and performance and canalso impact the welfare of users [99,100]. Therefore, we can assume that a good userexperience will lead to a higher level of satisfaction, which can ensure better use of theproduct, service, or system. User experience is most frequently connected with softwareproducts and applications, concentrating on ensuring end users have a clear and usefulexperience with the solution interface. The concept of user experience is more complexthan the user interface (UI) concept. After all, software cannot be viewed in just one way,as users can gain experience not only while using this software. Users’ perception is also

Sustainability 2022, 14, 8257 8 of 25
influenced by the accompanying service and the entire system of a product [98]. Lallemandet al. [101] expose that usability is often seen as necessary for a good user experience. As wementioned in the introduction part, one of the widely used definitions of usability definedby the International Standards Organization (ISO; standard ISO/IEC 9241) is: “the degree towhich particular users can use a system, service or product to achieve particular goals withefficiency, effectiveness, and satisfaction in a particular context of use [33]”. There is somesignificant distinction between user experience and usability. Hassenzahl [99] revealed thatthe user experience has five unique features that distinguish it from usability. First, it issubjective, as it relies heavily on human perception. Second, it is holistic, including bothhedonic and pragmatic use characteristics. Third, it is dynamic because it changes over theperiod. Fourth, it is context-sensitive, as it is always in some context, and fifth covers thepositive and essential consequences of use. Therefore, user experience is involved with auser’s complete experience while using a system that is more inclined to their emotionalviews. In contrast, usability is evaluating the excellence of their system use based onefficiency, effectiveness, and satisfaction measures. To sum up, user experience can beevaluated regarding reaching different hedonic aims, for example, emotion, and humanbehaviour, as well as response generated based on interactive experience. While usabilityis assessed concerning reaching some performance objectives such as accessibility, safety,learnability, and similar [102].
Designers’ goal regarding positive user experience is to provide the intended softwareapplications with interest, enjoyment, and gratification.
From a user point of view, abilities are apparent, estimated, and experienced in theperspective of use, preferably leading to interest, enjoyment, and gratification. Still, thiscan only be accomplished by a particular degree of hedonic and pragmatic qualities. Aproduct’s substance and usefulness should be sufficient and beneficial with interactionsthat are easy to understand and effortless. Thus, the presentation should be attractive,pleasant, and compatible with the character of the brand [98].
Kashfi et al. [103] expose that agreed-upon lists of principles and practices which willidentify good user experience are still unavailable. Scattered examples of user experienceprinciples and practices can be found in user experience studies. Table 1 summarises userexperience principles, practices, tools, and methods and also shows some examples [103].
Table 1. The definitions of user experience concepts.
Term Description with Examples
UX principlesCritical factors and basic concepts indicate the understanding of the user experience, which professionalsmust consider in their work. Example: The hedonic and pragmatic aspects of software applicationdevelopment play an essential role in user experience design as user experience is temporary.
UX practicesIncludes actions that practitioners need to perform to comply with the user experience principles.Examples of practices are: recognizing users’ personal goals and desires, preparing prototypes, includingusers in the design process, and assessing software from a hedonistic and pragmatic perspective.
UX softwareComputer-aided software that developers or designers use to perform a variety of UX practices is usuallydesigned to support specific methods to allow for more systematic software development. Examples:eye-tracking software, persona preparation, visual design, and prototyping software.
UX techniquesThey allow practitioners to select and load a structure based on best practices, thus allowing them to bemore systematic, and therefore, they are also more likely to succeed. Examples are questionnaires andsurveys, mind plans, cognitive mapping, field research, and design studio.
User experience evaluation is the research topic of many studies, and many assessmenttechniques have been created and used within these research studies. Researchers claimthat it is difficult to assess and measure user experience. People who use a particularsoftware product can have implicit experience with it through anticipations based oncurrent understanding of associated technologies, brands, demonstrations, advertisements,presentations, etc. Roto et al. [34] argue that the implicit experience expands after usage,

Sustainability 2022, 14, 8257 9 of 25
such as the image of the earlier use or changes in the assessment of people’s use. Anotherimportant aspect to consider in user experience is also timeframe. We can argue that userexperience changes over time (prior to use, during use, after use, and past use); we canfocus only on what someone experienced while using the software product in a short time.On the other hand, we can concentrate on the aggregated understanding developed acrossa string of use encounters and phases of non-use that might reach over extended periods.User experience can consequently indicate a specific impression during use (momentaryuser experience), a judgment of a particular episode of usage (episodic user experience),or opinions about a complete system after using it for a longer time (cumulative userexperience). Anticipated user experience could correlate to the time prior to first use. Asummary of different types of user experience is presented in Table 2 [34].
Table 2. User experience dimensions.
When What How
Prior to use Anticipated user experience Expectations about the experience.During use Momentary user experience Facing with the experience.After usage Episodic user experience Thinking about the experience.
Past use Cumulative user experience Call to mind several periods of use.
Various methods are specifically created to assess and research UX-related concepts.For the research study, we used a standard freely available UEQ questionnaire [49,50] tomeasure interactive product and service UX, as explained in the following section.
2.4. Research Model
Our research model is based on adapted factors from the user experience model [47–52].Adapted factors are perceived efficiency (EF), perceived perspicuity (PE), perceived de-pendability (DE), perceived stimulation (ST), perceived novelty (NO), and perceived at-tractiveness (AT). Descriptions of factors and their items are presented in Table 3. From asustainability point of view, perceived attractiveness (AT) could be one of the features ofan e-learning tool for long-term use. Therefore, we can hypothesise that all other adoptedfactors from the user experience model, namely perceived efficiency (EF), perceived per-spicuity (PE), perceived dependability (DE), perceived stimulation (ST), and perceivednovelty (NO), have a positive impact on perceived attractiveness (AT). Relationships be-tween factors can be seen in the research model in Figure 1.
Sustainability 2022, 14, x FOR PEER REVIEW 10 of 26
On the bases of the dependencies of relationships, we can highlight the following hypotheses:
Hypothesis 1 (H1). Factor Perceived efficiency (EF) directly impacts the factor of Perceived at-tractiveness (AT).
Hypothesis 2 (H2). Factor Perceived perspicuity (PE) directly impacts the factor of Perceived attractiveness (AT).
Hypothesis 3 (H3). Factor Perceived dependability (DE) directly impacts the factor of Perceived attractiveness (AT).
Hypothesis 4 (H4). Factor Perceived stimulation (SI) directly impacts the factor of Perceived attractiveness (AT).
Hypothesis 5 (H5). Factor Perceived novelty (NO) directly impacts the factor of Perceived at-tractiveness (AT).
In Table 3 are adjusted measurement variables (indicators) to measure the degree of agreement with the statement.
Figure 1. Research model.
Table 3. Factors and items definition.
Factors Description Items (Measured Variable Codes)
Perceived efficiency (EF)
The degree to which users can solve tasks without unneces-
sary effort.
EF1: The e-learning platform works fast. EF2: The e-learning platform is efficient to use. EF3: The e-learning platform is practical to use. EF4: The e-learning platform is organised.
Perceived perspicuity (PE)
The degree of ease in getting acquainted with the e-learning
PE1: The e-learning platform is understandable to use. PE2: The e-learning platform is easy to learn. PE3: The e-learning platform is easy to use.
Figure 1. Research model.

Sustainability 2022, 14, 8257 10 of 25
Table 3. Factors and items definition.
Factors Description Items (Measured Variable Codes)
Perceived efficiency (EF) The degree to which users can solvetasks without unnecessary effort.
EF1: The e-learning platform works fast.
EF2: The e-learning platform is efficient to use.
EF3: The e-learning platform is practical to use.
EF4: The e-learning platform is organised.
Perceived perspicuity (PE)The degree of ease in getting
acquainted with the e-learningplatform and learning to use it.
PE1: The e-learning platform is understandable to use.
PE2: The e-learning platform is easy to learn.
PE3: The e-learning platform is easy to use.
PE4: The e-learning platform is transparent.
Perceived dependability (DE)The degree to which the user feels in
control of the interaction with thee-learning platform.
DE1: The e-learning platform is predictive.
DE2: The e-learning platform is supportive.
DE3: The e-learning platform is secure.
DE4: The e-learning platform meets expectations.
Perceived stimulation (SI)The degree of excitement and
motivation the user perceives whenusing the e-learning platform.
SI1: The e-learning platform is valuable.
SI2: An e-learning platform is exciting.
SI3: An e-learning platform is interesting.
SI4: An e-learning platform is motivating.
Perceived novelty (NO)The degree to which the e-learningplatform is innovative and creative
attracts users’ interest.
NO1: The e-learning platform encourages creativity.
NO2: An e-learning platform is inventive.
NO3: An e-learning platform is leading edge.
NO4: An e-learning platform is innovative.
Perceived attractiveness (AT)The degree of the user’s general
impression of the e-learning platform.
AT1: The e-learning platform is enjoyable to use.
AT2: The e-learning platform is good to use.
AT3: The e-learning platform is pleasing to use.
AT4: The e-learning platform is pleasant to use.
AT5: The e-learning platform is attractive to use.
AT6: The e-learning platform is friendly to use.
Source: Adapted and supplemented according to Laugwitz et al. [48] and Schrepp [49].
On the bases of the dependencies of relationships, we can highlight the followinghypotheses:
Hypothesis 1 (H1). Factor Perceived efficiency (EF) directly impacts the factor of Perceivedattractiveness (AT).
Hypothesis 2 (H2). Factor Perceived perspicuity (PE) directly impacts the factor of Perceivedattractiveness (AT).
Hypothesis 3 (H3). Factor Perceived dependability (DE) directly impacts the factor of Perceivedattractiveness (AT).
Hypothesis 4 (H4). Factor Perceived stimulation (SI) directly impacts the factor of Perceivedattractiveness (AT).
Hypothesis 5 (H5). Factor Perceived novelty (NO) directly impacts the factor of Perceivedattractiveness (AT).

Sustainability 2022, 14, 8257 11 of 25
In Table 3 are adjusted measurement variables (indicators) to measure the degree ofagreement with the statement.
3. Methodology3.1. Participants and Procedure
We prepared two online versions of the questionnaire (in Slovenian and Bulgarianlanguage) and sent them via e-mail together with an invitation to participate to all studentsof the Faculty of Economics and Business of the University of Maribor (FEB; Sloveniansample) and all students of the Faculty of Computer Science of the University of Economics—Varna (FCS; Bulgarian sample). All students were free to choose to participate in the survey.At the beginning of the online questionnaire, students were presented with the studyitself, its purpose, as well as planned research publication, the data gathering process,and managing the respondents. We collected data without collecting data (i.e., personaldata) with the help of which the identity of students could be revealed. The FEB uses twoe-learning platforms, Microsoft Teams, and Moodle. The FCS also uses two e-learningplatforms, Google Meets, and Moodle. Both groups of students were asked to complete aquestionnaire for all e-learning platforms they use.
3.2. Measurement Instrument
The questionnaire is based on Laugwitz et al. [48] and Schrepp [49], where we changedthe measurement scale of the factors to fit the statements (items) in the context of the e-learning platform. All items were measured on a 7-point Likert scale, where one (1) means“strongly disagree” to seven (7), which means “strongly agree”. The questionnaire wastranslated into Slovenian and Bulgarian languages. Before surveying students, four Slove-nian e-business lecturers checked the clarity of the questionnaire. Based on the comments,we changed the word order in some items, but the meaning remained the same. A similarprocedure was performed in Bulgaria, where three computer science lecturers checked theclarity of the items.
3.3. Data
We received 247 complete questionnaires for the e-learning platform Microsoft Teamsfor Slovenian students, 236 for the e-learning platform Moodle for Slovenian students,130 for the e-learning platform Google Meets for Bulgarian students, and 99 for the e-learning platform Moodle for Bulgarian students. We further examined whether there werestatistical differences between the individual groups. We used multi-group analyses (MGA)to test whether predefined data groups significantly differ in group-specific parameterassessments [104]. We used the PLS-MGA method [105], which is part of the SmartPLStool [106] and is also used in the further data processing. There are no statistically significantdifferences between groups (p < 0.01); therefore, we can proceed with the analysis. Theresults of the processing of PLS-MGA can be obtained from the authors.
The recommended sample size is equal to or greater than 10 times the maximumnumber of structural paths targeting a particular construct in a structural model [107,108].Our research model (see Figure 1) includes five structural paths (so, at least 50 responses).Our sample includes 712 responses and is representative. The average age of respondentsis 18.48 years, most of whom were between 19 and 21 years old. In total, 210 (32%) malesand 448 (63%) females answered the questionnaire. Most respondents, 83% (594), statedthat they were studying in the first level of study, 9% (64) indicated that they were studyingin the second level of study, and 8% (54) did not answer this question. Most students usee-learning tools for one to three years with an average of 2.27 years. At the end of thesurvey, we asked them about their overall impression of working with the e-learning tool.Respondents had a scale from 1 (strongly dislike) to 7 (strongly like), where the averagevalue is 5.503. In Table 4, we can see the means and standard deviations of all factor itemsfrom our research model.

Sustainability 2022, 14, 8257 12 of 25
Table 4. Descriptive statistics, convergent validity, and discriminant validity.
Constructs Item MeanValue
StandardDeviation
IndicatorsLoadings
IndicatorReliability
HTMT ConfidenceInterval
2.5% 97.5%
Perceivedefficiency
(EF)
EF1 5.258 1.655 0.723 0.523 0.264 0.315EF2 5.534 1.489 0.793 0.629 0.327 0.380EF3 5.355 1.595 0.763 0.582 0.289 0.338EF4 5.524 1.604 0.766 0.587 0.325 0.388
Perceivedperspicuity
(PE)
PE1 5.817 1.488 0.817 0.667 0.315 0.363PE2 5.399 1.787 0.753 0.567 0.260 0.319PE3 5.412 1.655 0.764 0.584 0.255 0.306PE4 5.386 1.744 0.795 0.632 0.337 0.396
Perceived de-pendability
(DE)
DE2 5.483 1.613 0.751 0.564 0.435 0.534DE3 5.551 1.628 0.747 0.558 0.325 0.400DE4 5.395 1.573 0.82 0.672 0.413 0.483
Perceivedstimulation
(SI)
SI1 4.851 1.592 0.778 0.605 0.296 0.342SI2 4.448 1.553 0.818 0.669 0.268 0.304SI3 4.959 1.621 0.874 0.764 0.333 0.370SI4 4.596 1.738 0.752 0.566 0.261 0.306
Perceivednovelty (NO)
NO1 4.642 1.786 0.857 0.734 0.579 0.676NO2 4.647 1.794 0.82 0.672 0.517 0.614
Perceived at-tractiveness
(AT)
AT1 5.546 1.516 0.758 0.575 0.185 0.208AT2 5.615 1.583 0.789 0.623 0.199 0.226AT3 5.143 1.522 0.799 0.638 0.184 0.210AT4 5.452 1.448 0.821 0.674 0.200 0.221AT5 5.006 1.594 0.825 0.681 0.203 0.227AT6 5.223 1.546 0.83 0.689 0.199 0.226
4. Results
Structural Equation Modelling (SEM) is one of the most advanced statistical anal-ysis techniques used in the social sciences in the last decade. It involves multivariatetechniques that combine the aspect of factor analysis and regression to allow researchersto simultaneously study the links between measurement variables and latent variables(measurement theory evaluation), as well as among latent variables (structural theoryevaluation) [109,110]. Although there are many methods to implement SEM, the mostcommonly used are covariance-based SEM (CB-SEM), introduced by Karl Jöreskog in1973, and partial least squares SEM (PLS-SEM), presented by Herman Wold in 1960 [111].PLS-SEM has some benefits over CB-SEM, especially in social sciences research, wherethere are smaller samples and complex models with many indicators (items) and rela-tionships [109,112]. Hair et al. [109] also added that CB-SEM is used to confirm (reject)concepts, while PLS-SEM is primarily used to develop concepts. Due to that, we used thePLS-SEM method, also named the PLS path model, consisting of two parts. The first partis an assessment of the measurement model, also named the outer model, which showsthe relationships between constructs and indicators. The second part is an assessment ofthe structural model, also named the inner model, which shows the relationships betweenconstructs of the research model.
For further analysis, we used SmartPLS [106] software. At first, we evaluated themeasurement model (Section 4.1), secondly structural model (Section 4.2), and thirdlyImportance—Performance Map Analysis—IPMA (Section 4.3), following the recommen-dations of Garson [110] and Hair [109,113]. The final version of the model is presented inthe next sections, where items (DE1, NO3, and NO4 from Table 3) were removed from theinitial model because they did not meet the criteria of the measurement model.

Sustainability 2022, 14, 8257 13 of 25
4.1. Reflective Measurement Model Assessment
The measurement model of reflective indicators is checked using three measures:(1) internal consistency reliability with measures Cronbach’s alpha and composite reliability,(2) convergent validity with indicator reliability and average variance extracted (AVE), and(3) discriminant validity [109,110].
Internal consistency reliability is usually checked with Cronbach alpha, which esti-mates the reliability created on the intercorrelation of the studied values of the items. Dueto the limitations of Cronbach’s alpha, it is more suitable to use composite reliability, whichtakes a variety of external loads of items [109,113]. Both measures vary between 0 and 1,where greater values present a greater level of reliability with a threshold value of 0.60 [114].From Table 5, we can see that all Cronbach’s alphas and composite reliability values exceedthe value of 0.60 except Cronbach’s alpha of Perceived novelty (NO), which is 0.579, but itscomposite reliability value is 0.826, which, together with all other values were consideredas good for exploratory research [115].
Table 5. Internal consistency reliability and convergent validity.
Construct
Internal ConsistencyReliability
ConvergentValidity
Cronbach’sAlpha
CompositeReliability AVE
0.60–0.95 0.60–0.95 >0.50
Perceived efficiency (EF) 0.759 0.847 0.58Perceived perspicuity (PE) 0.790 0.863 0.613
Perceived dependability (DE) 0.667 0.817 0.598Perceived stimulation (SI) 0.820 0.881 0.651Perceived novelty (NO) 0.579 0.826 0.703
Perceived attractiveness (AT) 0.891 0.916 0.647
Convergent validity was checked through indicator reliability and average varianceextracted (AVE). The square of a standardised item’s outer loadings represents indicatorreliability with a threshold value of 0.5. All indicator reliability values from Table 4 exceedthe value of 0.5. Measure AVE reflects the average communality for each latent construct ina reflective model with a threshold value of 0.5 [114] and can be used to test convergentand divergent validity. From Table 5, we can see that all AVE values exceed 0.5.
AVE’s square root can also be used to establish discriminant validity by Fornell–Larcker criteria [116]. From Table 6, we can see that all square root of AVE that appearsin the diagonal cells of the table are higher than the values below it, which present nodiscriminant validity. The second measure of discriminant validity is cross-loadings criteria,where indicator loadings (see column indicators loadings in Table 4) should exceed a valueof 0.70 [110]. The third measure of discriminant validity is the heterotrait–monotrait(HTMT) ratio, where each HTMT value of each indicator should not include 1 (see HTMTconfidence interval from 2.5% to 97.5% columns in Table 4).
Sustainability 2022, 14, 8257 14 of 25
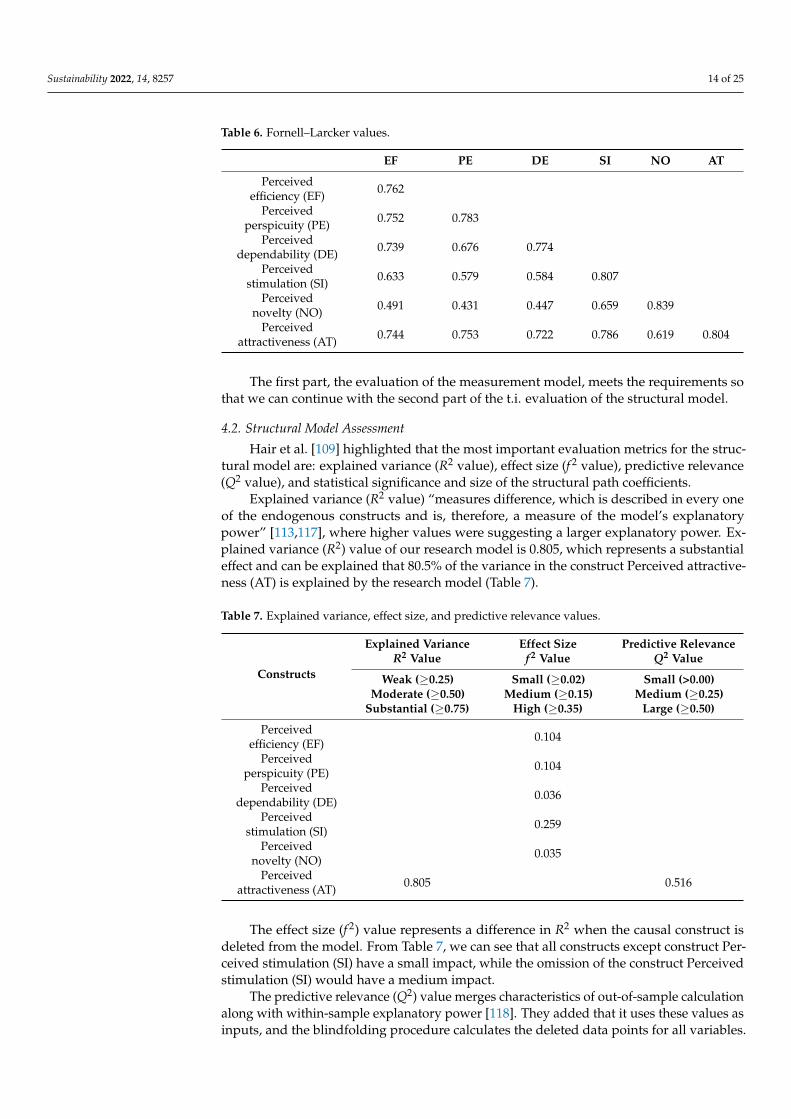
Table 6. Fornell–Larcker values.
EF PE DE SI NO AT
Perceivedefficiency (EF) 0.762
Perceivedperspicuity (PE) 0.752 0.783
Perceiveddependability (DE) 0.739 0.676 0.774
Perceivedstimulation (SI) 0.633 0.579 0.584 0.807
Perceivednovelty (NO) 0.491 0.431 0.447 0.659 0.839
Perceivedattractiveness (AT) 0.744 0.753 0.722 0.786 0.619 0.804
The first part, the evaluation of the measurement model, meets the requirements sothat we can continue with the second part of the t.i. evaluation of the structural model.
4.2. Structural Model Assessment
Hair et al. [109] highlighted that the most important evaluation metrics for the struc-tural model are: explained variance (R2 value), effect size (f 2 value), predictive relevance(Q2 value), and statistical significance and size of the structural path coefficients.
Explained variance (R2 value) “measures difference, which is described in every oneof the endogenous constructs and is, therefore, a measure of the model’s explanatorypower” [113,117], where higher values were suggesting a larger explanatory power. Ex-plained variance (R2) value of our research model is 0.805, which represents a substantialeffect and can be explained that 80.5% of the variance in the construct Perceived attractive-ness (AT) is explained by the research model (Table 7).
Table 7. Explained variance, effect size, and predictive relevance values.
Constructs
Explained VarianceR2 Value
Effect Sizef 2 Value
Predictive RelevanceQ2 Value
Weak (≥0.25)Moderate (≥0.50)
Substantial (≥0.75)
Small (≥0.02)Medium (≥0.15)
High (≥0.35)
Small (>0.00)Medium (≥0.25)
Large (≥0.50)
Perceivedefficiency (EF) 0.104
Perceivedperspicuity (PE) 0.104
Perceiveddependability (DE) 0.036
Perceivedstimulation (SI) 0.259
Perceivednovelty (NO) 0.035
Perceivedattractiveness (AT) 0.805 0.516
The effect size (f 2) value represents a difference in R2 when the causal construct isdeleted from the model. From Table 7, we can see that all constructs except construct Per-ceived stimulation (SI) have a small impact, while the omission of the construct Perceivedstimulation (SI) would have a medium impact.
The predictive relevance (Q2) value merges characteristics of out-of-sample calculationalong with within-sample explanatory power [118]. They added that it uses these values asinputs, and the blindfolding procedure calculates the deleted data points for all variables.
Sustainability 2022, 14, 8257 15 of 25
Slight discrepancies in the middle of the expected and the initial values convert into ahigher Q2 value and show better predictive accuracy. Q2 value of our research model is0.516 for construct Perceived attractiveness (AT), which shows large predictive relevance ofthe structural model for that construct (Table 7).
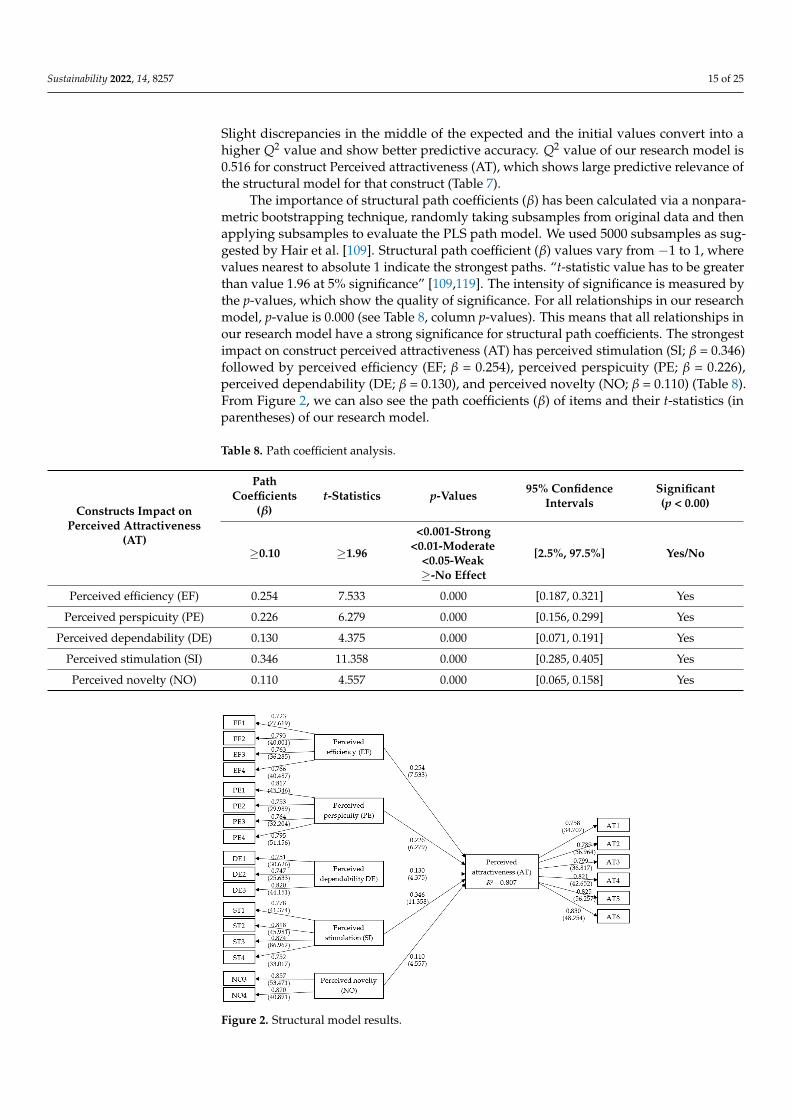
The importance of structural path coefficients (β) has been calculated via a nonpara-metric bootstrapping technique, randomly taking subsamples from original data and thenapplying subsamples to evaluate the PLS path model. We used 5000 subsamples as sug-gested by Hair et al. [109]. Structural path coefficient (β) values vary from −1 to 1, wherevalues nearest to absolute 1 indicate the strongest paths. “t-statistic value has to be greaterthan value 1.96 at 5% significance” [109,119]. The intensity of significance is measured bythe p-values, which show the quality of significance. For all relationships in our researchmodel, p-value is 0.000 (see Table 8, column p-values). This means that all relationships inour research model have a strong significance for structural path coefficients. The strongestimpact on construct perceived attractiveness (AT) has perceived stimulation (SI; β = 0.346)followed by perceived efficiency (EF; β = 0.254), perceived perspicuity (PE; β = 0.226),perceived dependability (DE; β = 0.130), and perceived novelty (NO; β = 0.110) (Table 8).From Figure 2, we can also see the path coefficients (β) of items and their t-statistics (inparentheses) of our research model.
Table 8. Path coefficient analysis.
Constructs Impact onPerceived Attractiveness
(AT)
PathCoefficients
(β)t-Statistics p-Values 95% Confidence
IntervalsSignificant(p < 0.00)
≥0.10 ≥1.96
<0.001-Strong<0.01-Moderate
<0.05-Weak≥-No Effect
[2.5%, 97.5%] Yes/No
Perceived efficiency (EF) 0.254 7.533 0.000 [0.187, 0.321] Yes
Perceived perspicuity (PE) 0.226 6.279 0.000 [0.156, 0.299] Yes
Perceived dependability (DE) 0.130 4.375 0.000 [0.071, 0.191] Yes
Perceived stimulation (SI) 0.346 11.358 0.000 [0.285, 0.405] Yes
Perceived novelty (NO) 0.110 4.557 0.000 [0.065, 0.158] YesSustainability 2022, 14, x FOR PEER REVIEW 16 of 26
Figure 2. Structural model results.
4.3. The Importance—Performance Map Analysis (IPMA) IPMA expands the standard PLS-SEM calculations of path coefficients by adding an
additional element. An IPMA depends on total effects on a specific target construct (in our case Perceived Attractiveness (AT)). “The total effect represents the precursor con-structs’ importance, while their average latent variable scores represent their perfor-mance.” [110]. Processing aims to find precursors with relatively high significance for the target construct and relatively small performance [120]. The aspects on which these con-structions are based represent potential areas for improvement that could be given more attention. In our research model, the construct Perceived stimulation (SI) has the highest value of importance (0.346) on construct Attractiveness (AT). Still, its performance is in fourth place with a value of 62.164, followed by Perceived efficiency (EF) with a value of 0.254 and performance in third place with a value of 73.847 (Table 9, Figure 3).
Table 9. Importance–performance analysis for construct Perceived attractiveness (AT).
Importance Performances Perceived efficiency (EF) 0.254 73.847
Perceived perspicuity (PE) 0.226 75.372 Perceived dependability (DE) 0.13 74.509
Perceived stimulation (SI) 0.346 62.164 Perceived novelty (NO) 0.11 60.742
Figure 2. Structural model results.

Sustainability 2022, 14, 8257 16 of 25
4.3. The Importance—Performance Map Analysis (IPMA)
IPMA expands the standard PLS-SEM calculations of path coefficients by adding anadditional element. An IPMA depends on total effects on a specific target construct (in ourcase Perceived Attractiveness (AT)). “The total effect represents the precursor constructs’importance, while their average latent variable scores represent their performance” [110].Processing aims to find precursors with relatively high significance for the target constructand relatively small performance [120]. The aspects on which these constructions arebased represent potential areas for improvement that could be given more attention. In ourresearch model, the construct Perceived stimulation (SI) has the highest value of importance(0.346) on construct Attractiveness (AT). Still, its performance is in fourth place with a valueof 62.164, followed by Perceived efficiency (EF) with a value of 0.254 and performance inthird place with a value of 73.847 (Table 9, Figure 3).
Table 9. Importance–performance analysis for construct Perceived attractiveness (AT).
Importance Performances
Perceived efficiency (EF) 0.254 73.847Perceived perspicuity (PE) 0.226 75.372
Perceived dependability (DE) 0.13 74.509Perceived stimulation (SI) 0.346 62.164Perceived novelty (NO) 0.11 60.742
Sustainability 2022, 14, x FOR PEER REVIEW 17 of 26
Figure 3. Importance–performance map.
5. Discussion Traditional classroom education is understood to be structured and well methodo-
logically developed, with little opportunity for collaborative, spontaneous or experiential learning (see [121,122]). The rigidity of traditional education often differs from online learning, which involves digital media, such as device use (computer, tablet, or mobile phone) and video [123–125]. Technology has traditionally been used by teachers to sup-port limited and in most cases one-way interaction with students without full integration in courses [126]. Abbas et al. [57] pointed out that the centre point of the educational in-novation projects today are game-based curriculum developments, e-learning platforms, distance and hybrid learning. They added that online synchronised and asynchronous teaching practices had become a widespread alternative to courses, which has been achieved through the modernisation and redesign of education systems that incorporate emerging technologies. E-learning enhances spontaneity, interactivity, and experimental learning. E-learning usually mentions the following skills: problem-solving, teamwork, interdisciplinary thinking, and holistic thinking. These skills, encompassed by problem-based pedagogy, offer students chances to learn to think, especially question how to think instead of question what to think [127], can also be incorporated into its content sustaina-ble pedagogy [43,44,46]. In detecting measures and characteristics for assessing e-learning platforms peculiarity of e-learning has to be considered. The primary goal of the e-learn-ing platform is to enable students to understand didactic content so that as little effort as possible is required to interact with the platform. Interaction between teacher and student is important for better outcomes from teaching [94].
Research of usability and user experience is often limited to the mean values of user experience (UX) factors and their items, but the strength of the influence of individual factors is not tested. With this research, we examined whether user experience (UX) fac-tors (named perceived efficiency (EF), perceived perspicuity (PE), perceived dependabil-ity (DE), perceived stimulation (SI), and perceived novelty (NO)) affect perceived attrac-tiveness (AT), which is an important factor in the sustainability of e-learning tools. We adapted factors from UX model proposed from Hassenzahl [47], Laugwitz et al. [48], Schrepp [49], and Schrepp et al. [50–52]. UX model through UEQ questionnaire (available [128]) measures means of items, where the scale of the items is between −3 (terrible) to +3 (excellent). Then averages of items of factors are calculated.
Figure 3. Importance–performance map.
5. Discussion
Traditional classroom education is understood to be structured and well methodologi-cally developed, with little opportunity for collaborative, spontaneous or experiential learn-ing (see [121,122]). The rigidity of traditional education often differs from online learning,which involves digital media, such as device use (computer, tablet, or mobile phone) andvideo [123–125]. Technology has traditionally been used by teachers to support limited andin most cases one-way interaction with students without full integration in courses [126].Abbas et al. [57] pointed out that the centre point of the educational innovation projectstoday are game-based curriculum developments, e-learning platforms, distance and hy-brid learning. They added that online synchronised and asynchronous teaching practiceshad become a widespread alternative to courses, which has been achieved through themodernisation and redesign of education systems that incorporate emerging technologies.

Sustainability 2022, 14, 8257 17 of 25
E-learning enhances spontaneity, interactivity, and experimental learning. E-learning usu-ally mentions the following skills: problem-solving, teamwork, interdisciplinary thinking,and holistic thinking. These skills, encompassed by problem-based pedagogy, offer stu-dents chances to learn to think, especially question how to think instead of question whatto think [127], can also be incorporated into its content sustainable pedagogy [43,44,46].In detecting measures and characteristics for assessing e-learning platforms peculiarity ofe-learning has to be considered. The primary goal of the e-learning platform is to enablestudents to understand didactic content so that as little effort as possible is required tointeract with the platform. Interaction between teacher and student is important for betteroutcomes from teaching [94].
Research of usability and user experience is often limited to the mean values of userexperience (UX) factors and their items, but the strength of the influence of individualfactors is not tested. With this research, we examined whether user experience (UX) factors(named perceived efficiency (EF), perceived perspicuity (PE), perceived dependability (DE),perceived stimulation (SI), and perceived novelty (NO)) affect perceived attractiveness (AT),which is an important factor in the sustainability of e-learning tools. We adapted factorsfrom UX model proposed from Hassenzahl [47], Laugwitz et al. [48], Schrepp [49], andSchrepp et al. [50–52]. UX model through UEQ questionnaire (available [128]) measuresmeans of items, where the scale of the items is between −3 (terrible) to +3 (excellent). Thenaverages of items of factors are calculated.
To conduct our research, we measured the impact of factors perceived efficiency (EF),perceived perspicuity (PE), perceived dependability (DE), perceived stimulation (SI), andperceived novelty (NO) on perceived attractiveness (AT). From research, we can concludethat they explain a huge part (80.5%) variance of factor perceived attractiveness (AT).The results of the research also show that all factors, namely perceived efficiency (EF),perceived perspicuity (PE), perceived dependability (DE), perceived stimulation (SI), andperceived novelty (NO), have a strong statistically significant influence on factor perceivedattractiveness (AT) of e-learning platforms we researched (see Table 8).
The SUE methodology defines four dimensions [129]. (1) The presentation coversthe external properties of the interface, with an emphasis on the tools and possibilitiesoffered by the didactic module or the e-learning platform. (2) Hypermediality focuseson characteristics related to communication through different channels and allows for anon-consistent structure. At the same time, the personalisation of reading paths as wellas analysis are emphasised. (3) The proactivity of the application enables the instrumentsand modalities with which the application encourages user training and other e-learningactivities. (4) While user activity is aimed at the growing demands of the user that he wouldlike to perform and how software or application handles them [12].
The factor perceived stimulation (SI; t = 11.358) has the strongest statistically significantimpact on perceived attractiveness (AT) of e-learning platforms, followed by perceivedefficiency (EF; t = 7.533), perceived perspicuity (PE; t = 6.279), perceived novelty (NO;t = 4.557), and perceived dependability (DE; t = 4.375). Therefore, we can confirm allhypotheses (H1–H5). Even more, our model shows a large part (51.6%) of predictiverelevance (Q2 = 0.516; see Table 7).
The most important impact on factor perceived attractiveness (AT) was perceivedstimulation (SI), as we mentioned above, and dropped it out of the model; it would have amedium impact (f 2 = 0.259). In contrast, omitting other factors would have a low impact(see Table 7). IPMA also shows that the most important factor is perceived stimulation (SI;importance = 0.346), where their performance is in fourth place with a value of 62.164 (seeTable 8 and Figure 3). This indicates that we have to put more effort into the excitementand motivation the students perceive when using the e-learning platform. The next factorwe need to pay attention to is perceived efficiency (EF) with an importance value of 0.254and performance in third place with a value of 73.847. Factor perceived efficiency showshow users can solve tasks without unnecessary efforts. For example, an e-learning platformworks fast, efficiently, practically, and organised.

Sustainability 2022, 14, 8257 18 of 25
E-learning platform interfaces are especially valuable if they allow students to focus onlearning content instead of accessing it. The need to focus on students’ goals over tasks haslong been emphasised. On the other hand, the need for usability has been recognised in thewebsite design literature as an important quality factor in assessing user satisfaction withthe website [7–11]. Since both concepts are important for e-learning platforms, it can beargued that the usability of an e-learning application has a significant impact on learning.
Moreover, the e-learning platform interface should also be pedagogically appropriate,modern looking, and engaging. This means providing functional modules and a rangeof interactions that will allow students to support individual learning tasks and not justensure the use of (state-of-the-art) technology. They need to be planned on the basisof processes and activities proposed by well-confirmed educational methodologies andresults. An example is multimedia, which needs to be carefully prepared, as this is theonly way to avoid the counterproductive surplus of sensor networks. The use of newtechnologies must not rule out successful traditional teaching strategies, such as problem-based learning and simulation systems. They must allow the integration of such strategiesinto their e-learning platform. E-learning platform interfaces should also have specificfeatures, such as comprehensively supported content and system functionalities, easyand effective navigation, advanced personalisation of content, and clear completion ofindividual chapters/topics.
The new education models are emphasizing more teamwork, real work examplesand critical thinking, for what face-to-face communication between student and teacher isneeded [126]. This requires use of modern learning tools including collaborative platforms.Currently, the constructivist theory is widely accepted among teachers and recogniseslearning as an involved process. An approach where students learn through work al-lows students for cognitive manipulation of recent learning material and creates rationalinteractions between prior knowledge and new information.
For the constructivist theory to be effective, tasks have to be constantly incorporatedin a collaborative and actual context. In this way, students will understand the motivationas well as the objective end goal of the learning task itself. This means that students needto be supported both in developing concepts and in redefining some of their individualideas. From the point of view of constructivist theory, students should be inspired totake responsibility for their own learning and, at the same time, guide them to becomemore aware of their knowledge. This approach is evolving towards social perspectives onlearning, especially with situational learning, which suggests that the learning effects ofusing a new generation of e-learning platforms with extended collaboration functionalitywill depend on the content in which it is used. In doing so, both people and other artefacts(all learning environment components) will interact and contribute to the learning process.Ardito et al. [129] pointed out that combining the constructivism principles with situationallearning is often called “socioconstructivism”.
5.1. Implication of the Study
Ar and Abbas [126] systematic literature review shows that gamification strategies ineducation are highly relevant and effective, especially e-gamification teaching strategies.For support of modern education models face-to face communication based on technologyis necessary. Such technology enabled face-to face communication between students andteachers is possible using collaborative platforms which have appeared recently and becameused widely in COVID circumstances. Collaborative platforms became very efficient andallow communication between high number of participants. University education involvesmany students, therefore, collaborative platforms proved to be very useful. To leverage allbenefits from collaborative platform use in higher education, such platforms must be usedon advanced level which include all functionality they offer. To obtain use of collaborativeplatforms on higher and advanced level, such platforms need to be accepted by userswhich in this case are students on one hand and teachers on another hand. It is knownthat advanced use of certain technology is closely connected with perception of distinct

Sustainability 2022, 14, 8257 19 of 25
technology by users. The more positive the perception, the more likely it is users willuse advanced features of technology and they will use technology more often. Findingsfrom our study show factors which impact perceived attractiveness and even more thestudy shows that all factors are important. Factor perceived stimulation has the highestimpact, so it is important for higher education organisations to imbed stimulation in theireducation models.
The study also shows that integration of collaborative platforms in virtual learningenvironments is needed. Higher education organisations need to consider which tools,solutions and platforms they will use and integrate in their virtual learning environmentwhile functionality of some tools, solutions and platforms overlaps. This opens the questionof whether collaborative platforms will become prevailing technology in higher education.We have to stress that better perceived attractiveness leads to better acceptance of technol-ogy used and this leads to more advanced use of technology which is needed for bettereducation which is expected from new sustainable education models.
Last, but not least, the research is also important for the developers of e-learningplatforms to take into account the researched factors in their development, as well as for allother organisations, because if they want to make the most of e-learning platforms, thenthey can use the results of this research both when choosing an e-learning platform as wellas in achieving a more advanced use of it.
5.2. Limitations and Suggestions for Future Work
Emerging technologies, such as Augment Reality (AR) and Artificial Intelligence (AI),with innovative teaching methods make available the gamification or/and personalisationof learning and creates a structure with encouraging prospects [57], which can lead to betteruser experience and attractiveness of e-learning platforms.
Research has several limitations. The first limitation is the sample. We wantedto develop a research model with this research, so we combined all student responses(Slovenian sample and Bulgaria sample), where we previously checked with PLS-MGA thatthere are no statistically significant differences between students and e-learning platforms.In this phase of the research, the goal was to examine which factors in the research modeland to what extent influence perceived attractiveness (AT). With the confirmation of theresearch model, we can continue with in-depth research of individual e-learning platforms(Moodle, Google Meet, and Microsoft Teams and also other platforms such as Blackboard,Canvas, Zoom, Webex, etc.) (e.g., [62]), different groups of students (e.g., economics,computer science, law, etc.) (e.g., [130,131]), differences by using the same e-learningplatforms in different countries (e.g., [132,133]), gender of students (e.g., [134]), age, etc.Another limitation of the research is that, over time, the importance of the studied factorsof the research model changes [34], so it would be sensible to conduct longitudinal researchin the future.
Future research will be needed to study critical success factors needed for implementa-tion of collaborative platforms for educational purposes in higher education organisations.Research should be also extended in direction of acceptance of collaborative platforms bystudents and by teachers. We can speculate that perhaps acceptance of collaborative plat-forms by students has different characteristics than acceptance of collaboration platformsby students. Due to this we are planning to apply Technology Acceptance model (TAM)proposed by Davis [135,136] to study acceptance of students as users in learning processes.To study acceptance of teachers UTAUT model proposed by Venkatesh et al. [137] could beapplied while several organisational characteristics should be also considered.
It will be also interesting to research how collaborative platforms should be integratedin VLE. Such research could also be extended and linked in the direction of organisationalsustainability identity of higher education organisations.
Author Contributions: Conceptualisation, S.S.Z., Z.D. and S.B.; methodology, S.S.Z. and Z.D.; soft-ware, S.S.Z.; validation, S.P., Z.D. and S.B.; formal analysis, S.S.Z. and Z.D.; investigation, Z.D. andS.P.; resources, S.B.; data curation, Z.D. and S.P.; writing—original draft preparation, S.S.Z. and S.B.;

Sustainability 2022, 14, 8257 20 of 25
writing—review and editing, S.S.Z., Z.D., S.P. and S.B.; visualisation, S.S.Z. and Z.D.; supervision, S.B.;project administration, S.B.; funding acquisition, S.S.Z. and S.B. All authors have read and agreed tothe published version of the manuscript.
Funding: Authors acknowledge the financial support from the Slovenian Research Agency (researchcore funding No. P5–0023, ‘Entrepreneurship for Innovative Society’) and the Erasmus+ programmes(grant No. 2019-1-CZ01-KA203-061374 “Spationomy 2.0”.
Institutional Review Board Statement: Not applicable.
Informed Consent Statement: Not applicable.
Data Availability Statement: The data presented in this study are available on request from thecorresponding author.
Conflicts of Interest: The authors declare no conflict of interest.
References1. Roselli, T.; Pragnelli, M.V.; Rossano, V. Studying usability of an educational software. In Proceedings of the IADIS International
Conference WWW/Internet 2002, ICWI 2002, Lisbon, Portugal, 13–15 November 2002; pp. 810–814. Available online: https://www.researchgate.net/publication/220970004_Studying_Usability_of_an_Educational_Software (accessed on 30 June 2022).
2. Cole, I.J. Usability of Online Virtual Learning Environments: Key Issues for Instructors and Learners. In Student Usability inEducational Software and Games: Improving Experiences; Gonzalez, C., Ed.; IGI Global: Hershey, PA, USA, 2013; pp. 41–58. [CrossRef]
3. Gunesekera, A.I.; Bao, Y.; Kibelloh, M. The role of usability on e-learning user interactions and satisfaction: A literature review.J. Syst. Inf. Technol. 2019, 21, 368–394. [CrossRef]
4. Studiyanti, A.; Saraswati, A. Usability Evaluation and Design of Student Information System Prototype to Increase Student’sSatisfaction (Case Study: X University). Ind. Eng. Manag. Syst. 2019, 18, 676–684. [CrossRef]
5. Squires, D.; Preece, J. Usability and learning: Evaluating the potential of educational software. Comput. Educ. 1996, 27, 15–22.[CrossRef]
6. Midwest Comprehensive Center. Student Goal Setting: An Evidence-Based Practice. 2018. Available online: http://files.eric.ed.gov/fulltext/ED589978.pdf (accessed on 30 June 2022).
7. Ganiyu, A.A.; Mishra, A.; Elijah, J.; Gana, U.M. The Importance of Usability of a Website. IUP J. Inf. Technol. 2017, 8, 27–35.Available online: https://www.researchgate.net/publication/331993738_The_Importance_of_Usability_of_a_Website (accessedon 30 June 2022).
8. Nur Sukinah, A.; Noor Suhana, S.; Wan Nur Idayu Tun Mohd, H.; Nur Liyana, Z.; Azliza, Y. A Review of Website Measurementfor Website Usability Evaluation. J. Phys. Conf. Ser. 2021, 1874, 2045. [CrossRef]
9. Chauhan, S.; Akhtar, A.; Gupta, A. Customer experience in digital banking: A review and future research directions. Int. J. Qual.Serv. Sci. 2022, 14, 311–348. [CrossRef]
10. Artyom, C.; Wunarsa, D.; Shanlong, H.; Zhupeng, L.; Balakrishnan, S. A Review of a E-Commerce Website Based on Its UsabilityElement. EasyChair Preprint No. 6665. 2021. Available online: https://easychair.org/publications/preprint/vNPc (accessed on30 June 2022).
11. Durdu, P.O.; Soydemir, Ö.N. A systematic review of web accessibility metrics. In App and Website Accessibility Developments andCompliance Strategies; Akgül, Y., Ed.; IGI Global: Hershey, PA, USA, 2022; pp. 77–108. [CrossRef]
12. Costabile, M.F.; De Marsico, M.; Lanzilotti, R.; Plantamura, V.L.; Roselli, T. On the Usability Evaluation of E-Learning Applications.In Proceedings of the 38th Annual Hawaii International Conference on System Sciences, Hawaii, HL, USA, 3–6 January 2005;p. 6b. [CrossRef]
13. Duran, D. Learning-by-teaching. Evidence and implications as a pedagogical mechanism. Innov. Educ. Teach. Int. 2017, 54,476–484. [CrossRef]
14. Albert, B.; Tullis, T.; Tedesco, D. Beyond the Usability Lab: Conducting Large-Scale Online User Experience Study; Morgan Kaufmann:Burlington, MA, USA, 2010. [CrossRef]
15. Litto, F.M.; Formiga, M. Educação a Distância: O Estado da Arte; Pearson Education: São Paulo, Brasil, 2009.16. Freire, L.; Arezes, P.; Campos, J. A literature review about usability evaluation methods for e-learning platforms. Work 2012, 41,
1038–1044. [CrossRef]17. Borrás Gené, O.; Martínez Núñez, M.; Fidalgo Blanco, Á. Gamification in MOOC: Challenges, opportunities and proposals for
advancing MOOC model. In Proceedings of the Second International Conference on Technological Ecosystems for EnhancingMulticulturality (TEEM ’14), Salamanca, Spain, 1–3 October 2014; Association for Computing Machinery: New York, NY, USA,2014; pp. 215–220. [CrossRef]
18. Mueller, D.; Strohmeier, S. Design characteristics of virtual learning environments: State of research. Comput. Educ. 2011, 57,2505–2516. [CrossRef]
19. Papanastasiou, G.; Drigas, A.; Skianis, C.; Lytras, M.; Papanastasiou, E. Virtual and augmented reality effects on K-12, higher andtertiary education students’ twenty-first century skills. Virtual Real. 2019, 23, 425–436. [CrossRef]

Sustainability 2022, 14, 8257 21 of 25
20. Potkonjak, V.; Gardner, M.; Callaghan, V.; Mattila, P.; Guetl, C.; Petrovic, V.M.; Jovanovic, K. Virtual laboratories for education inscience, technology, and engineering: A review. Comput. Educ. 2016, 95, 309–327. [CrossRef]
21. Abuhlfaia, K.; de Quincey, E. Evaluating the Usability of an E-Learning Platform within Higher Education from a StudentPerspective. In Proceedings of the 2019 3rd International Conference on Education and E-Learning (ICEEL 2019), Barcelona,Spain, 5–7 November 2019; Association for Computing Machinery: New York, NY, USA, 2019; pp. 1–7. [CrossRef]
22. Cengizhan Dirican, A.; Göktürk, M. Psychophysiological measures of human cognitive states applied in human computerinteraction. Procedia Comput. Sci. 2011, 3, 1361–1367. [CrossRef]
23. MacKenzie, I.S. Human-Computer Interaction: An Empirical Research Perspective; Morgan Kaufmann: Waltham, MA, USA, 2013.24. Ardito, C.; Costabile, F.; De Marsico, M.; Lanzilotti, R.; Levialdi, S.; Roselli, T.; Rossano, V. An approach to usability evaluation of
e-learning applications. Univers. Access Inf. Soc. 2006, 4, 270–283. [CrossRef]25. Salas, J.; Chang, A.; Montalvo, L.; Núñez, A.; Vilcapoma, M.; Moquillaza, A.; Murillo, B.; Paz, F. Guidelines to evaluate the
usability and user experience of learning support platforms: A systematic review. In Human-Computer Interaction. HCI-COLLAB2019. Communications in Computer and Information Science; Ruiz, P., Agredo-Delgado, V., Eds.; Springer: Cham, Switzerland, 2019.[CrossRef]
26. Abuhlfaia, K.; de Quincey, E. The Usability of E-learning Platforms in Higher Education: A Systematic Mapping Study. InProceedings of the 32nd International BCS Human Computer Interaction Conference (HCI), Belfast, UK, 4–6 July 2018; BCSLearning and Development Ltd.: Belfast, UK, 2018. [CrossRef]
27. Handayani, K.; Juningsih, E.; Riana, D.; Hadianti, S.; Rifai, A.; Serli, R. Measuring the Quality of Website Servicescovid19.kalbarprov.go.id Using the Webqual 4.0 Method. J. Phys. Conf. Ser. 2020, 1641, 2049. [CrossRef]
28. Gordillo, A.; Barra, E.; Aguirre, S.; Quemada, J. The usefulness of usability and user experience evaluation methods on ane-Learning platform development from a developer’s perspective: A case study. In Proceedings of the 2014 IEEE Frontiers inEducation Conference (FIE) Proceedings, Madrid, Spain, 22–25 October 2014; pp. 1–8. [CrossRef]
29. ISO 9241-11; Ergonomic Requirements for Office Work with Visual Display Terminals (Vdts): Part 11: Guidance On Usability.International Organization for Standardization (ISO): Geneva, Switzerland, 1998. Available online: https://www.iso.org/standard/16883.html (accessed on 7 May 2022).
30. Hartson, H.R.; Andre, T.S.; Williges, R.C.; Tech, V. Criteria for evaluating usability evaluation methods. Int. J. Hum.-Comput.Interact. 2001, 13, 373–410. [CrossRef]
31. Quintana, C.; Carra, A.; Krajcik, J.; Soloway, E. Learner-centered design: Reflections and new directions. In Human-ComputerInteraction in the New Millennium, 1st ed.; Carrol, J.M., Ed.; Addison Wesley: New York, NY, USA, 2001; pp. 605–626.
32. Giannakos, M.N. The evaluation of an e-Learning web-based platform. In Proceedings of the 2nd International Conference onComputer Supported Education, Valencia, Spain, 7–10 April 2010; pp. 433–438. [CrossRef]
33. ISO 9241-210; Ergonomics of Human-System Interaction Part 210: Human-Centered Design For Interactive Systems. InternationalOrganization for Standardization (ISO): Geneva, Switzerland, 2010. Available online: https://www.iso.org/standard/52075.html(accessed on 7 May 2022).
34. Roto, V.; Law, E.; Vermeeren, A.; Hoonhout, J. (Eds.) User Experience White Paper. Outcome of the Dagstuhl Seminar onDemarcating User Experience, Germany, 2011. Available online: http://www.allaboutux.org/files/UX-WhitePaper.pdf (accessedon 1 June 2022).
35. Liu, Y. A Scientometric Analysis of User Experience Research Related to Green and Digital Transformation. In Proceedings of the2020 Management Science Informatization and Economic Innovation Development Conference (MSIEID), Guangzhou, China,18–20 December 2020; pp. 377–380. [CrossRef]
36. Graham, L.; Berman, J.; Bellert, A. Sustainable Learning: Inclusive Practices for 21st Century Classrooms; Cambridge University Press:Melbourne, Australia, 2015. [CrossRef]
37. Medina-Molina, C.; Rey-Tienda, M.D.L.S. The transition towards the implementation of sustainable mobility. Looking forgeneralization of sustainable mobility in different territories by the application of QCA. Sustain. Technol. Entrep. 2022, 1, 100015.[CrossRef]
38. Trapp, C.T.C.; Kanbach, D.K.; Kraus, S. Sector coupling and business models towards sustainability: The case of the hydrogenvehicle industry. Sustain. Technol. Entrep. 2022, 1, 100014. [CrossRef]
39. Nedjah, N.; de Macedo Mourelle, L.; dos Santos, R.A.; dos Santos, L.T.B. Sustainable maintenance of power transformers usingcomputational intelligence. Sustain. Technol. Entrep. 2022, 1, 100001. [CrossRef]
40. Marinakis, Y.D.; White, R. Hyperinflation potential in commodity-currency trading systems: Implications for sustainabledevelopment. Sustain. Technol. Entrep. 2022, 1, 100003. [CrossRef]
41. Franco, M.; Esteves, L. Inter-clustering as a network of knowledge and learning: Multiple case studies. J. Innov. Knowl. 2020, 5,39–49. [CrossRef]
42. Bouncken, R.B.; Lapidus, A.; Qui, Y. Organizational sustainability identity: ‘New Work’ of home offices and coworking spaces asfacilitators. Sustain. Technol. Entrep. 2022, 1, 100011. [CrossRef]
43. Geitz, G.; de Geus, J. Design-based education, sustainable teaching, and learning. Cogent Educ. 2019, 6, 7919. [CrossRef]44. Sinakou, E.; Donche, V.; Boeve-de Pauw, J.; Van Petegem, P. Designing Powerful Learning Environments in Education for
Sustainable Development: A Conceptual Framework. Sustainability 2019, 11, 5994. [CrossRef]

Sustainability 2022, 14, 8257 22 of 25
45. Sofiadin, A.B.M. Sustainable development, e-learning and Web 3.0: A descriptive literature review. J. Inf. Commun. Ethics Soc.2014, 12, 157–176. [CrossRef]
46. Ben-Eliyahu, A. Sustainable Learning in Education. Sustainability 2021, 13, 4250. [CrossRef]47. Hassenzahl, M. The Effect of Perceived Hedonic Quality on Product Appealingness. Int. J. Hum.-Comput. Interact. 2001, 13,
481–499. [CrossRef]48. Laugwitz, B.; Held, T.; Schrepp, M. Construction and Evaluation of a User Experience Questionnaire. In HCI and Usability for
Education and Work; Holzinger, A., Ed.; Springer: Berlin/Heidelberg, Germany, 2008; pp. 63–76. [CrossRef]49. Schrepp, M. User Experience Questionnaire Handbook. 2019. Available online: https://www.ueq-online.org/Material/
Handbook.pdf (accessed on 10 March 2022).50. Schrepp, M.; Hinderks, A.; Thomaschewski, J. Applying the User Experience Questionnaire (UEQ) in Different Evaluation
Scenarios. In Design, User Experience, and Usability. Theories, Methods, and Tools for Designing the User Experience; Marcus, A., Ed.;Springer International Publishing: Geneva, Switzerland, 2014; pp. 383–392. [CrossRef]
51. Schrepp, M.; Hinderks, A.; Thomaschewski, J. Construction of a benchmark for the User Experience Questionnaire (UEQ). Int. J.Interact. Multimed. Artif. Intell. 2017, 4, 40–44. [CrossRef]
52. Schrepp, M.; Hinderks, A.; Thomaschewski, J. Design and Evaluation of a Short Version of the User Experience Questionnaire(UEQ-S). Int. J. Interact. Multimed. Artif. Intell. 2017, 4, 103–108. [CrossRef]
53. Remali, A.M.; Ghazali, M.A.; Kamaruddin, M.K.; Kee, T.Y. Understanding Academic Performance Based on Demographic Factors,Motivation Factors and Learning Styles. Int. J. Asian Soc. Sci. 2013, 3, 1938–1951.
54. Indreica, S.E. eLearning platform: Advantages and disadvantages on time management. In Proceedings of the 10th InternationalScientific Conference eLearning and Software for Education, Bucharest, Romania, 24–25 April 2014; pp. 236–243. [CrossRef]
55. Virtic, M.P. The role of internet in education. In Proceedings of the DIVAI 2012, 9th International Scientific Conference on DistanceLearning in Applied Informatics, Štúrovo, Slovakia, 2–4 May 2012; pp. 243–249.
56. Alexe, C.M.; Alexe, C.G.; Dumitriu, D.; Mustat,ă, I.C. The Analysis of the Users’ Perceptions Regarding the Learning ManagementSystems for Higher Education: Case Study Moodle. In Proceedings of the 17th International Scientific Conference on eLearningand Software for Education, eLSE 2021, Bucharest, Romania, 22–23 April 2021; pp. 284–293. [CrossRef]
57. Abbas, A.; Hosseini, S.; Núñez, J.L.M.; Sastre-Merino, S. Emerging technologies in education for innovative pedagogies andcompetency development. Australas. J. Educ. Technol. 2021, 37, 1–5. [CrossRef]
58. Alturki, U.; Aldraiweesh, A. Application of Learning Management System (LMS) during the COVID-19 Pandemic: A SustainableAcceptance Model of the Expansion Technology Approach. Sustainability 2021, 13, 10991. [CrossRef]
59. Sarnou, H.; Sarnou, D. Investigating the EFL Courses Shift into Moodle during the Pandemic of COVID-19: The Case of MALanguage and Communication at Mostaganem University. Arab World Engl. J. 2021, 24, 354–363. [CrossRef]
60. Bakhmat, L.; Babakina, O.; Belmaz, Y. Assessing online education during the COVID-19 pandemic: A survey of lecturers inUkraine. J. Phys. Conf. Ser. 2021, 1840, 012050. [CrossRef]
61. Polhun, K.; Kramarenko, T.; Maloivan, M.; Tomilina, A. Shift from blended learning to distance one during the lockdown periodusing Moodle: Test control of students’ academic achievement and analysis of its results. J. Phys. Conf. Ser. 2021, 1840, 012053.[CrossRef]
62. Hill, P. New Release of European LMS Market Report. eLiterate 2016. Available online: https://eliterate.us/new-release-european-lms-market-report/ (accessed on 7 June 2022).
63. Somova, E.; Gachkova, M. Strategy to Implement Gamification in LMS. In Next-Generation Applications and Implementations ofGamification Systems, 1st ed.; Portela, F., Queirós, R., Eds.; IGI Global: Hershey, PA, USA, 2022; pp. 51–72. [CrossRef]
64. Al-Ajlan, A.; Zedan, H. Why Moodle. In Proceedings of the 12th IEEE International Workshop on Future Trends of DistributedComputing Systems, Kunming, China, 21–23 October 2008; pp. 58–64. [CrossRef]
65. Kintu, M.J.; Zhu, C.; Kagambe, E. Blended learning effectiveness: The relationship between student characteristics, designfeatures and outcomes. Int. J. Educ. Technol. High. Educ. 2017, 14, 7. [CrossRef]
66. Evgenievich, E.; Petrovna, M.; Evgenievna, T.; Aleksandrovna, O.; Yevgenyevna, S. Moodle LMS: Positive and Negative Aspectsof Using Distance Education in Higher Education Institutions. Propós. Represent. 2021, 9, e1104. [CrossRef]
67. Oproiu, G.C. Study about Using E-learning Platform (Moodle) in University Teaching Process. Procedia Soc. Behav. Sci. 2015, 180,426–432. [CrossRef]
68. Parusheva, S.; Aleksandrova, Y.; Hadzhikolev, A. Use of Social Media in Higher Education Institutions—An Empirical StudyBased on Bulgarian Learning Experience. TEM J. Technol. Educ. Manag. Inform. 2018, 7, 171–181. [CrossRef]
69. Ironsi, C.S. Google Meet as a synchronous language learning tool for emergency online distant learning during the COVID-19pandemic: Perceptions of language instructors and preservice teachers. J. Appl. Res. High. Educ. 2022, 14, 640–659. [CrossRef]
70. Lewandowski, M. Creating virtual classrooms (using Google Hangouts) for improving language competency. Lang. Issues: ESOLJ. 2015, 26, 37–42.
71. Herskowitz, N. Gartner Recognises Microsoft as Leader in Unified Communications as a Service and Meetings Solutions,Microsoft 365. 2021. Available online: https://www.microsoft.com/en-us/microsoft-365/blog/2021/10/25/gartner-recognizes-microsoft-as-leader-in-unified-communications-as-a-service-and-meetings-solutions/ (accessed on 7 June 2022).
72. Microsoft. Welcome to Microsoft Teams. 2021. Available online: https://docs.microsoft.com/en-us/microsoftteams/teams-overview (accessed on 30 April 2021).

Sustainability 2022, 14, 8257 23 of 25
73. Florjancic, V.; Wiechetek, L. Using Moodle and MS Teams in higher education—A comparative study. Int. J. Innov. Learn. 2022, 31,264–286. [CrossRef]
74. Friedman, T. Come the Revolution. New York Times. 15 May 2012. Available online: http://www.nytimes.com/2012/05/16/opinion/friedman-come-the-revolution.html/ (accessed on 7 May 2022).
75. Czerniewicz, L.; Deacon, A.; Small, J.; Walji, S. Developing world MOOCs: A curriculum view of the MOOC landscape. J. Glob.Lit. Technol. Emerg. Pedagog. 2014, 2, 122–139.
76. Mulder, F.; Jansen, D. MOOCs for opening up education and the openupEd initiative. In MOOCs and Open Education around theWorld; Bonk, C.J., Lee, M.M., Reeves, T.C., Reynolds, T.H., Eds.; Routledge: New York, NY, USA, 2015. [CrossRef]
77. Walther, J.B. Computer-mediated communication. Commun. Res. 1996, 23, 3–43. [CrossRef]78. Walther, J.B.; Anderson, J.F.; Park, D.W. Interpersonal Effects in Computer-Mediated Interaction: A meta-analysis of social and
antisocial communication. Commun. Res. 1994, 21, 460–487. Available online: www.matt-koehler.com/OtherPages/Courses/CEP_909_FA01/Readings/CmC/Walther_1994b.pdf (accessed on 7 June 2022). [CrossRef]
79. Wegerif, R. The social dimension of asynchronous learning networks. J. Asynchronous Learn. Netw. 1998, 2, 34–49. Available online:http://citeseerx.ist.psu.edu/viewdoc/download?doi=10.1.1.103.7298&rep=rep1&type=pdf (accessed on 7 May 2021). [CrossRef]
80. Penstein Rosé, C.; Carlson, R.; Yang, D.; Wen, M.; Resnick, L.; Goldman, P.; Sherer, J. Social factors that contribute to attrition inMOOCs. In Proceedings of the First ACM Conference on Learning @ Scale Conference (L@S’ 14), Atlanta, GA, USA, 4–5 March2014; Association for Computing Machinery: New York, NY, USA, 2014; pp. 197–198. [CrossRef]
81. Paechter, M.; Maier, B. Online or face-to-face? Students’ experiences and preferences in e-learning. Internet High. Educ. 2010, 13,292–297. [CrossRef]
82. Garrison, D.R.; Anderson, T.; Archer, W. Critical thinking, cognitive presence, and computer conferencing in distance education.Am. J. Distance Educ. 2001, 15, 7–23. [CrossRef]
83. Chen, K.C.; Jang, S.J. Motivation in online learning: Testing a model of self-determination theory. Comput. Hum. Behav. 2010, 26,741–752. [CrossRef]
84. Barnett, E.A. Validation experiences and persistence among community college students. Rev. High. Educ. 2011, 34, 193–230.[CrossRef]
85. Graham, C.R. Emerging practice and research in blended learning. In Handbook of Distance Education, 3rd ed.; Moore, M.G., Ed.;Routledge: New York, NY, USA, 2013; pp. 333–350.
86. Ross, B.; Gage, K. Global perspectives on blending learning: Insight from WebCT and our customers in higher education. InHandbook of Blended Learning: Global Perspectives, Local Designs; Bonk, C.J., Graham, C.R., Eds.; Pfeiffer Publishing: San Francisco,CA, USA, 2006; pp. 155–168.
87. Drossos, L.; Vassiliadis, B.; Stefani, A.; Xenos, M.; Sakkopoulos, E.; Tsakalidis, A. Introducing ICT in traditional higher educationenvironment: Background, design and evaluation of a blended approach. Int. J. Inf. Commun. Technol. Educ. 2006, 2, 65–78.[CrossRef]
88. Dziuban, C.; Moskal, P. A course is a course is a course: Factor invariance in student evaluation of online, blended and face-to-facelearning environments. Internet High. Educ. 2011, 14, 236–241. [CrossRef]
89. Means, B.; Toyama, Y.; Murphy, R.; Baki, M. The effectiveness of online and blended learning: A meta-analysis of the empiricalliterature. Teach. Coll. Rec. 2013, 115, 1–47. [CrossRef]
90. Griffiths, R.; Chingos, M.; Mulhern, C.; Spies, R. Interactive Online Learning on Campus: Testing MOOCs and Other Platforms inHybrid Formats in the University System of Maryland; Ithaka S+R: New York, NY, USA, 2014; Volume 10, pp. 1–81.
91. Joseph, A.M.; Nath, B.A. Integration of Massive Open Online Education (MOOC) System with in-Classroom Interactionand Assessment and Accreditation: An Extensive Report from a Pilot Study. WORLDCOMP ‘13. Available online: http://worldcomp-proceedings.com/proc/p2013/EEE3547.pdf (accessed on 11 April 2022).
92. Rossiou, E.; Sifalaras, A. Blended Methods to Enhance Learning: An Empirical Study of Factors Affecting Student Par-ticipation in the Use of E-Tools to Complement F2F Teaching of Algorithms. In Proceedings of the 6th EuropeanConference on e-Learning (ECEL 2007), Dublin, Ireland, 4–5 October 2007; pp. 519–528. Available online: https://www.researchgate.net/publication/248392307_Blended_Methods_to_Enhance_Learning_An_Empirical_Study_of_Factors_Affecting_Student_Participation_in_the_use_of_e-Tools_to_Complement_F2F_Teaching_of_Algorithms (accessed on 10April 2022).
93. Anderson, A.; Huttenlocher, D.; Kleinberg, J.; Leskovec, J. Engaging with massive online courses. In Proceedings of the 23rdInternational Conference on World Wide Web, Seoul, Korea, 7–11 April 2014; pp. 687–698. [CrossRef]
94. Abbas, A.; Arrona-Palacios, A.; Haruna, H.; Alvarez-Sosa, D. Elements of students’ expectation towards teacher-student researchcollaboration in higher education. In Proceedings of the 2020 IEEE Frontiers in Education Conference (FIE), Uppsala, Sweden,21–24 October 2020; pp. 1–5. [CrossRef]
95. Eisenhauer, T. Grow Your Business with Collaboration Tools. Axero Solutions, 2021. Available online: https://info.axerosolutions.com/grow-your-business-with-collaboration-tools (accessed on 5 May 2021).
96. Deloitte. Remote Collaboration Facing the Challenges of COVID-19. 2021. Available online: https://www2.deloitte.com/content/dam/Deloitte/de/Documents/human-capital/Remote-Collaboration-COVID-19.pdf (accessed on 30 April 2021).

Sustainability 2022, 14, 8257 24 of 25
97. Madlberger, M.; Raztocki, N. Digital Cross-Organizational Collaboration: Towards a Preliminary Framework. In Proceedingsof the Fifteenth Americas Conference on Information Systems, San Francisco, CA, USA, 6–9 August 2009. Available online:https://ssrn.com/abstract=1477527 (accessed on 30 April 2021).
98. Van de Sand, F.; Frison, A.K.; Zotz, P.; Riener, A.; Holl, K. The intersection of User Experience (UX), Customer Experience(CX), and Brand Experience (BX). In User Experience Is Brand Experience. Management for Professionals; Springer Nature: Cham,Switzerland, 2020. [CrossRef]
99. Hassenzahl, M. Experience Design: Technology for All the Right Reasons. Synth. Lect. Hum.-Cent. Inform. 2010, 3, 1–95. [CrossRef]100. Nass, C.; Adam, S.; Doerr, J.; Trapp, M. Balancing user and business goals in software development to generate positive user
experience. In Human-Computer Interaction: The Agency Perspective; Springer: Berlin/Heidelberg, Germany, 2012. [CrossRef]101. Lallemand, C.; Gronier, G.; Koenig, V. User experience: A concept without consensus? Exploring practitioners’ perspectives
through an international survey. Comput. Hum. Behav. 2015, 43, 35–48. [CrossRef]102. Zaki, T.; Nazrul Islam, M. Neurological and physiological measures to evaluate the usability and user-experience (UX) of
information systems: A systematic literature review. Comput. Sci. Rev. 2021, 40, 375. [CrossRef]103. Kashfi, P.; Feldt, R.; Nilsson, A. Integrating UX principles and practices into software development organisations: A case study of
influencing events. J. Syst. Softw. 2019, 154, 37–58. [CrossRef]104. Sarstedt, M.; Henseler, J.; Ringle, C.M. Multi-Group Analysis in Partial Least Squares (PLS) Path Modeling: Alternative Methods
and Empirical Results. Adv. Int. Mark. 2011, 22, 195–218. [CrossRef]105. Henseler, J.; Ringle, C.M.; Sinkovics, R.R. The Use of Partial Least Squares Path Modeling in International Marketing. Adv. Int.
Mark. 2009, 20, 277–320. [CrossRef]106. Ringle, C.M.; Wende, S.; Becker, J.-M. SmartPLS 3. Boenningstedt: SmartPLS. 2015. Available online: https://www.smartpls.com
(accessed on 10 June 2021).107. Chin, W.W.; Newsted, P.R. Structural equation modeling analysis with small samples using partial least squares. In Statistical
Strategies for Small Sample Research; Hoyle, R.H., Ed.; Sage Publications: Thousand Oaks, CA, USA, 1999; pp. 307–341.108. Chin, W.W. Commentary: Issues and Opinion on Structural Equation Modeling. MIS Q. 1998, 22, vii–xvi. Available online:
http://www.jstor.org/stable/249674 (accessed on 30 June 2022).109. Hair, F.J.; Hult, G.T.M.; Ringle, C.M.; Sarstedt, M. A Primer on Partial Least Squares Structural Equation Modeling (PLS-SEM), 2nd
ed.; Sage: Los Angeles, CA, USA, 2017.110. Garson, G.D. Partial Least Squares: Regression and Structural Equation Models; Statistical Associates Publishers: Asheboro, NC, USA,
2016.111. Jöreskog, K.G.; Wold, H.O.A. The ML and PLS Techniques for modeling with latent varibles: Historical and comparative aspects.
In Systems under Indirect Obervation, Part I, 1st ed.; Wold, H., Jöreskog, K.G., Eds.; Elsevier: Amsterdam, The Netherlands, 1982;pp. 263–270.
112. Cassel, C.; Hackl, P.; Westlund, A.H. Robustness of partial least squares method for estimating latent variable quality structures.J. Appl. Stat. 1999, 26, 435–446. [CrossRef]
113. Hair, J.F.; Risher, J.J.; Sarstedt, M.; Ringle, C.M. When to use and how to report the results of PLS-SEM. Eur. Bus. Rev. 2019, 31,2–24. [CrossRef]
114. Chin, W.W. The partial least squares approach for structural equation modeling. In Modern Methods for Business Research;Macoulides, G.A., Ed.; Lawrence Erlbaum Associates: Mahwah, NJ, USA, 1998; pp. 295–336.
115. Daskalakis, S.; Mantas, J. Evaluatiing the impact of a service-oriented framework for healthcare interoperability. In eHealth beyondthe Horizont—Get IT There: Proceedings of MIE2008; Anderson, S.K., Klein, G.O., Schulz, S., Aarts, J., Mazzoleni, M.C., Eds.; IOSPress: Amsterdam, The Netherlands, 2008; pp. 285–290.
116. Fornell, C.G.; Larcker, D.F. Evaluating structural equation models with unobservable variables and measurement error. J. Mark.Res. 1981, 18, 39–50. [CrossRef]
117. Shmueli, G.; Koppius, O.R. Predictive analytics in information systems research. MIS Q. 2011, 35, 553–572. [CrossRef]118. Sarstedt, M.; Ringle, C.M.; Hair, J.F. Partial least squares structural equation modeling. In Handbook of Market Research; Homburg,
C., Klarmann, M., Vomberg, A., Eds.; Springer: Cham, Switzerland, 2017. [CrossRef]119. Hair, J.F.; Black, W.C.; Babin, B.J.; Anderson, R.E. Multivariate Data Analysis, 7th ed.; Pearson Prentice Hall: Upper Saddle River,
NJ, USA, 2009.120. Höck, C.; Ringle, C.M.; Sarstedt, M. Management of multi-purpose stadiums: Importance and performance mesurement of
service interfaces. Int. J. Serv. Technol. Manag. 2010, 14, 188–207. [CrossRef]121. UN. Resolutions Adopted by the Conference. A/CONF.151/26/Rev.l. In Report of the United Nations Conference on Environment
and Development, Rio de Janeiro, Brazil, 3–14 June 1992; United Nations: New York, NY, USA, 1993; Volume I. Available online:https://www.un.org/esa/dsd/agenda21/Agenda%2021.pdf (accessed on 25 March 2021).
122. Gibson, R.B. Sustainability assessment: Basic components of a practical approach. Impact Assess. Proj. Apprais. 2006, 24, 170–182.[CrossRef]
123. Hannay, M.; Newvine, T. Perceptions of distance learning: A comparison of online and traditional learning. Merlot J. Online Learn.Teach. 2006, 2, 1–11.
124. Nazarenko, A.L. Blended Learning vs. Traditional Learning: What Works? (A Case Study Research). Procedia-Soc. Behav. Sci.2015, 200, 77–82. [CrossRef]

Sustainability 2022, 14, 8257 25 of 25
125. Engum, S.A.; Jeffries, P.; Fisher, L. Intravenous catheter training system: Computer-based education versus traditional learningmethods. Am. J. Surg. 2003, 186, 67–74. [CrossRef]
126. Ar, A.Y.; Abbas, A. Role of gamification in Engineering Education: A systematic literature review. In Proceedings of the 2021IEEE Global Engineering Education Conference (EDUCON), Vienna, Austria, 21–23 April 2021; pp. 210–213. [CrossRef]
127. Thomas, I. Critical Thinking, Transformative Learning, Sustainable Education, and Problem-Based Learning in Universities.J. Transform. Educ. 2009, 7, 245–264. [CrossRef]
128. UEQ. User Experience Questionnaire. Available online: https://www.ueq-online.org/ (accessed on 10 March 2022).129. Ardito, C.; De Marsico, M.; Lanzilotti, R.; Levialdi, S.; Roselli, T.; Rossano, V.; Tersigni, M. Usability of E-learning tools. In
Proceedings of the Working Conference on Advanced Visual Interfaces (AVI ‘04), Gallipoli, Italy, 25–28 May 2004; Association forComputing Machinery: New York, NY, USA, 2004; pp. 80–84. [CrossRef]
130. Beranic, T.; Hericko, M. The Impact of Serious Games in Economic and Business Education: A Case of ERP Business Simulation.Sustainability 2022, 14, 683. [CrossRef]
131. Beranic, T.; Hericko, M. Introducing ERP Concepts to IT Students Using an Experiential Learning Approach with an Emphasis onReflection. Sustainability 2019, 11, 4992. [CrossRef]
132. Sternad Zabukovšek, S.; Shah Bharadwaj, S.; Bobek, S.; Štrukelj, T. Technology acceptance model-based research on differences ofenterprise resources planning systems use in India and the European Union. Inž. Ekon. 2019, 30, 326–338. [CrossRef]
133. Sternad Zabukovšek, S.; Bobek, S.; Štrukelj, T. Employees’ attitude toward ERP system’s use in Europe and India: Comparingtwo TAM-based studies. In Cross-Cultural Exposure and Connections: Intercultural Learning for Global Citizenship; Birdie, A.K., Ed.;Apple Academic Press: New York, NY, USA, 2020; pp. 29–69. [CrossRef]
134. Rožman, M.; Sternad Zabukovšek, S.; Bobek, S.; Tominc, P. Gender differences in work satisfaction, work engagement and workefficiency of employees during the COVID-19 pandemic: The case in Slovenia. Sustainability 2021, 13, 8791. [CrossRef]
135. Davis, F.D. Perceived usefulness, perceived ease of use, and user acceptance of information technology. MIS Q. 1989, 13, 319–340.[CrossRef]
136. Davis, F.D.; Bagozzi, R.P.; Warshaw, P.R. User acceptance of computer technology: A comparison of two theoretical models.Manag. Sci. 1989, 35, 982–1003. [CrossRef]
137. Venkatesh, V.; Morris, M.G.; Davis, G.B.; Davis, F.D. User Acceptance of Information Technology: Toward a Unified View. MIS Q.2003, 27, 425–478. [CrossRef]