attachment to item 10.1 - town of cambridge
TRANSCRIPT
COUNCIL MEETING
28 APRIL 2020
ATTACHMENT TO ITEM 10.1
MONTHLY FINANCIAL STATEMENTS, REVIEW AND VARIANCES – MARCH 2020
Town of Cambridge
Financial Management StatementsFor the Period Ended 31 March 2020
1 STATUTORY STATEMENTS
Statutory Rate Setting Statement 1.1
Statement of Financial Position 1.2
Statement of Changes in Equity 1.3
2 OPERATING STATEMENT
Governance & Corporate Services Operations 2.1
Community Development & Support Operations 2.1
Library Operations 2.2
Aquatic Centre Operations 2.2
Planning & Development Services Operations 2.3
Ranger & Health Services Operatiions 2.3
Waste Management Operatings 2.4
Works Infrastructure Operations 2.4
Parks Infrastructure Operations 2.5
Building Infrastructure Operations 2.5
Golf Course Operations 2.6
3 CAPITAL STATEMENT
Capital Schedules 3.1Capital Work Graphs 3.3
4 RESERVE/ENDOWMENT LANDS ACCOUNT STATEMENT 4.1
CONTENTS
Page 1.1
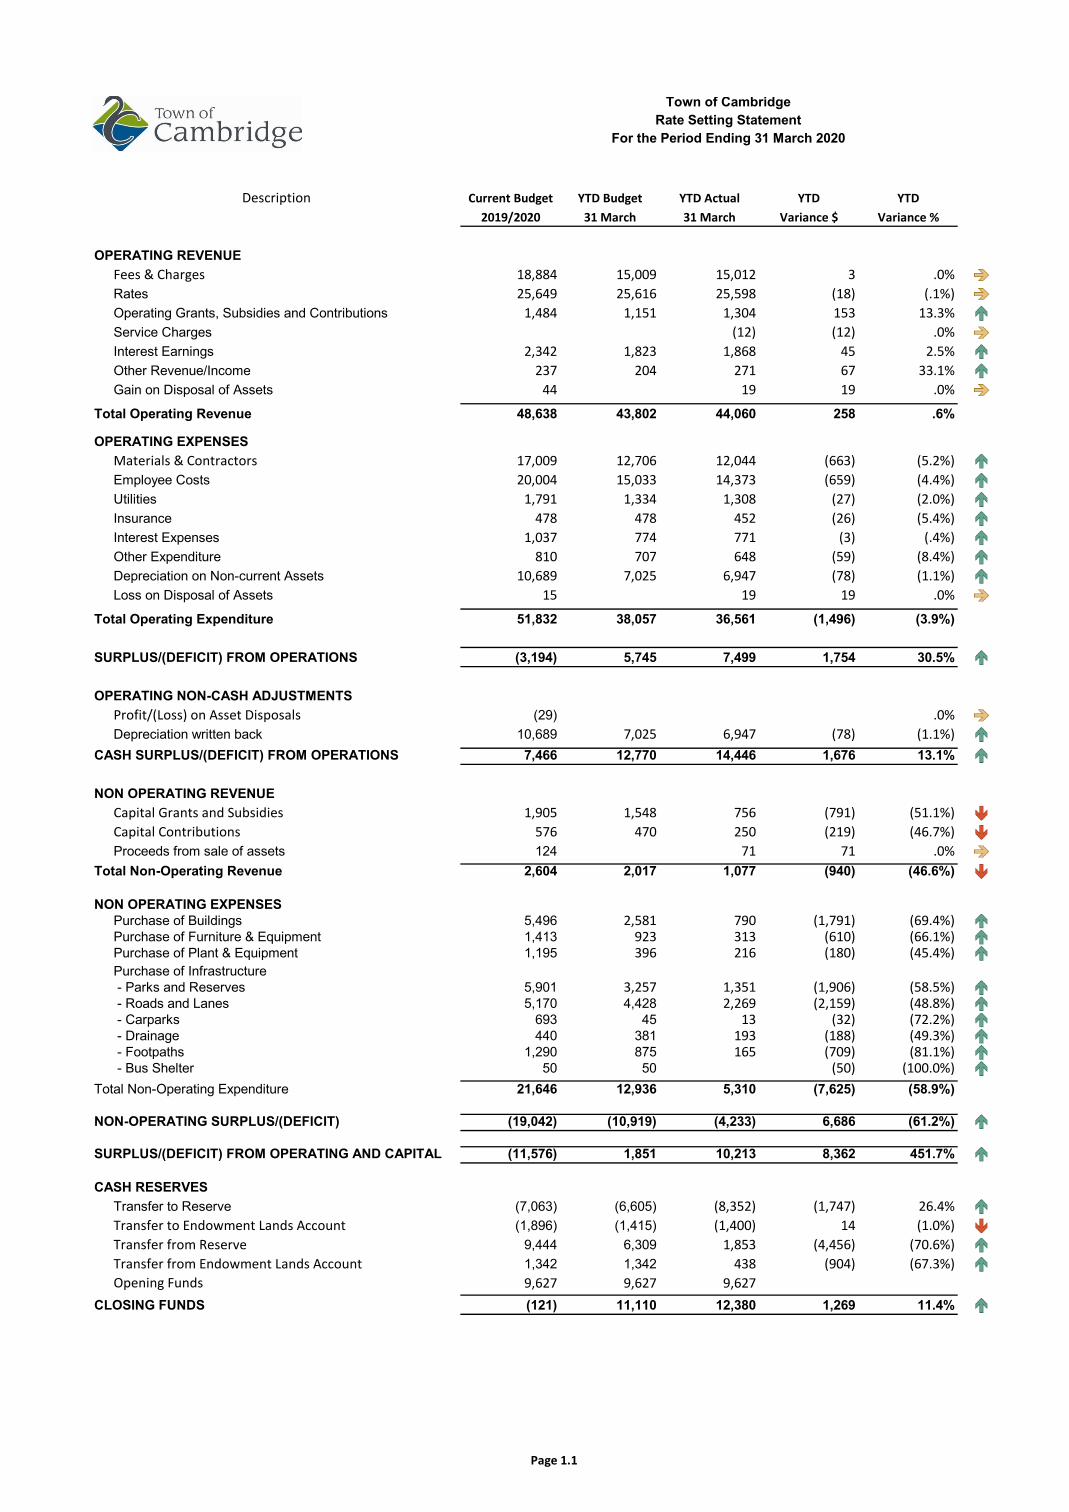
Description Current Budget YTD Budget YTD Actual YTD YTD2019/2020 31 March 31 March Variance $ Variance %
OPERATING REVENUEFees & Charges 18,884 15,009 15,012 3 .0%Rates 25,649 25,616 25,598 (18) (.1%)Operating Grants, Subsidies and Contributions 1,484 1,151 1,304 153 13.3%Service Charges (12) (12) .0%Interest Earnings 2,342 1,823 1,868 45 2.5%Other Revenue/Income 237 204 271 67 33.1%Gain on Disposal of Assets 44 19 19 .0%
Total Operating Revenue 48,638 43,802 44,060 258 .6%
OPERATING EXPENSESMaterials & Contractors 17,009 12,706 12,044 (663) (5.2%)Employee Costs 20,004 15,033 14,373 (659) (4.4%)Utilities 1,791 1,334 1,308 (27) (2.0%)Insurance 478 478 452 (26) (5.4%)Interest Expenses 1,037 774 771 (3) (.4%)Other Expenditure 810 707 648 (59) (8.4%)Depreciation on Non-current Assets 10,689 7,025 6,947 (78) (1.1%)Loss on Disposal of Assets 15 19 19 .0%
Total Operating Expenditure 51,832 38,057 36,561 (1,496) (3.9%)
SURPLUS/(DEFICIT) FROM OPERATIONS (3,194) 5,745 7,499 1,754 30.5%
OPERATING NON-CASH ADJUSTMENTSProfit/(Loss) on Asset Disposals (29) .0%Depreciation written back 10,689 7,025 6,947 (78) (1.1%)
CASH SURPLUS/(DEFICIT) FROM OPERATIONS 7,466 12,770 14,446 1,676 13.1%
NON OPERATING REVENUECapital Grants and Subsidies 1,905 1,548 756 (791) (51.1%)Capital Contributions 576 470 250 (219) (46.7%)Proceeds from sale of assets 124 71 71 .0%
Total Non-Operating Revenue 2,604 2,017 1,077 (940) (46.6%)
NON OPERATING EXPENSESPurchase of Buildings 5,496 2,581 790 (1,791) (69.4%)Purchase of Furniture & Equipment 1,413 923 313 (610) (66.1%)Purchase of Plant & Equipment 1,195 396 216 (180) (45.4%)Purchase of Infrastructure - Parks and Reserves 5,901 3,257 1,351 (1,906) (58.5%) - Roads and Lanes 5,170 4,428 2,269 (2,159) (48.8%) - Carparks 693 45 13 (32) (72.2%) - Drainage 440 381 193 (188) (49.3%) - Footpaths 1,290 875 165 (709) (81.1%) - Bus Shelter 50 50 (50) (100.0%)
Total Non-Operating Expenditure 21,646 12,936 5,310 (7,625) (58.9%)
NON-OPERATING SURPLUS/(DEFICIT) (19,042) (10,919) (4,233) 6,686 (61.2%)
SURPLUS/(DEFICIT) FROM OPERATING AND CAPITAL (11,576) 1,851 10,213 8,362 451.7%
CASH RESERVESTransfer to Reserve (7,063) (6,605) (8,352) (1,747) 26.4%Transfer to Endowment Lands Account (1,896) (1,415) (1,400) 14 (1.0%)Transfer from Reserve 9,444 6,309 1,853 (4,456) (70.6%)Transfer from Endowment Lands Account 1,342 1,342 438 (904) (67.3%)Opening Funds 9,627 9,627 9,627
CLOSING FUNDS (121) 11,110 12,380 1,269 11.4%
Town of CambridgeRate Setting Statement
For the Period Ending 31 March 2020
Page 1.2
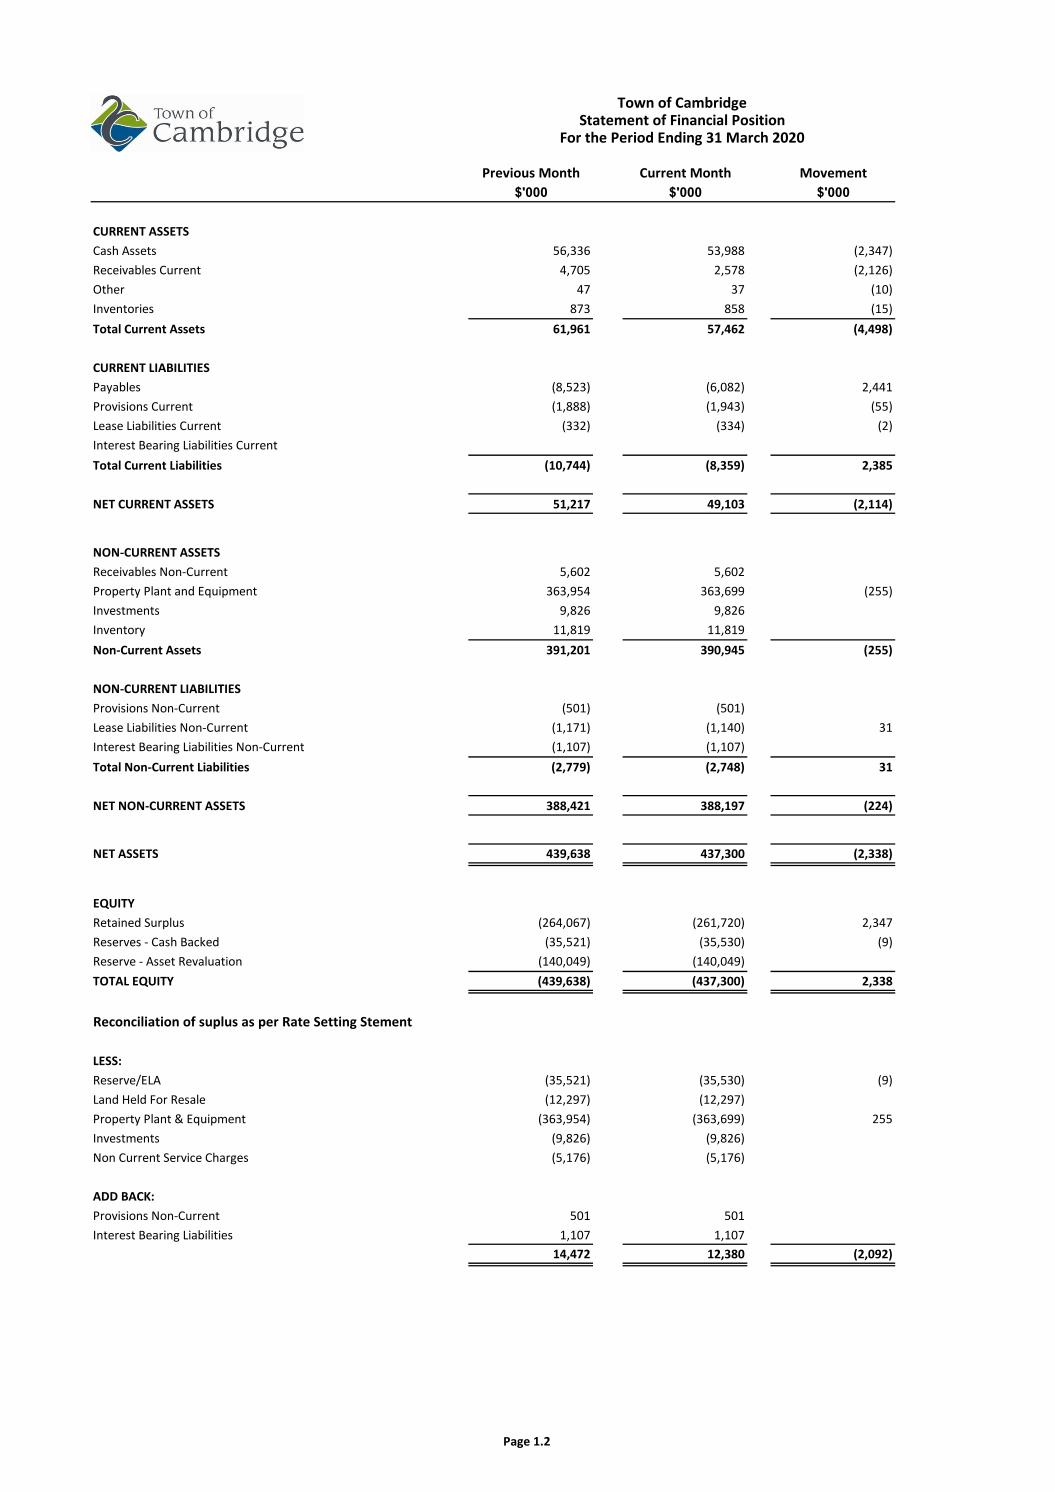
Previous Month Current Month Movement$'000 $'000 $'000
CURRENT ASSETSCash Assets 56,336 53,988 (2,347)Receivables Current 4,705 2,578 (2,126)Other 47 37 (10)Inventories 873 858 (15)Total Current Assets 61,961 57,462 (4,498)
CURRENT LIABILITIESPayables (8,523) (6,082) 2,441Provisions Current (1,888) (1,943) (55)Lease Liabilities Current (332) (334) (2)Interest Bearing Liabilities CurrentTotal Current Liabilities (10,744) (8,359) 2,385
NET CURRENT ASSETS 51,217 49,103 (2,114)
NON-CURRENT ASSETSReceivables Non-Current 5,602 5,602Property Plant and Equipment 363,954 363,699 (255)Investments 9,826 9,826Inventory 11,819 11,819Non-Current Assets 391,201 390,945 (255)
NON-CURRENT LIABILITIESProvisions Non-Current (501) (501)Lease Liabilities Non-Current (1,171) (1,140) 31Interest Bearing Liabilities Non-Current (1,107) (1,107)Total Non-Current Liabilities (2,779) (2,748) 31
NET NON-CURRENT ASSETS 388,421 388,197 (224)
NET ASSETS 439,638 437,300 (2,338)
EQUITYRetained Surplus (264,067) (261,720) 2,347Reserves - Cash Backed (35,521) (35,530) (9)Reserve - Asset Revaluation (140,049) (140,049)TOTAL EQUITY (439,638) (437,300) 2,338
Reconciliation of suplus as per Rate Setting Stement
LESS:Reserve/ELA (35,521) (35,530) (9)Land Held For Resale (12,297) (12,297)Property Plant & Equipment (363,954) (363,699) 255Investments (9,826) (9,826)Non Current Service Charges (5,176) (5,176)
ADD BACK:Provisions Non-Current 501 501Interest Bearing Liabilities 1,107 1,107
14,472 12,380 (2,092)
Town of CambridgeStatement of Financial Position
For the Period Ending 31 March 2020
Page 1.3
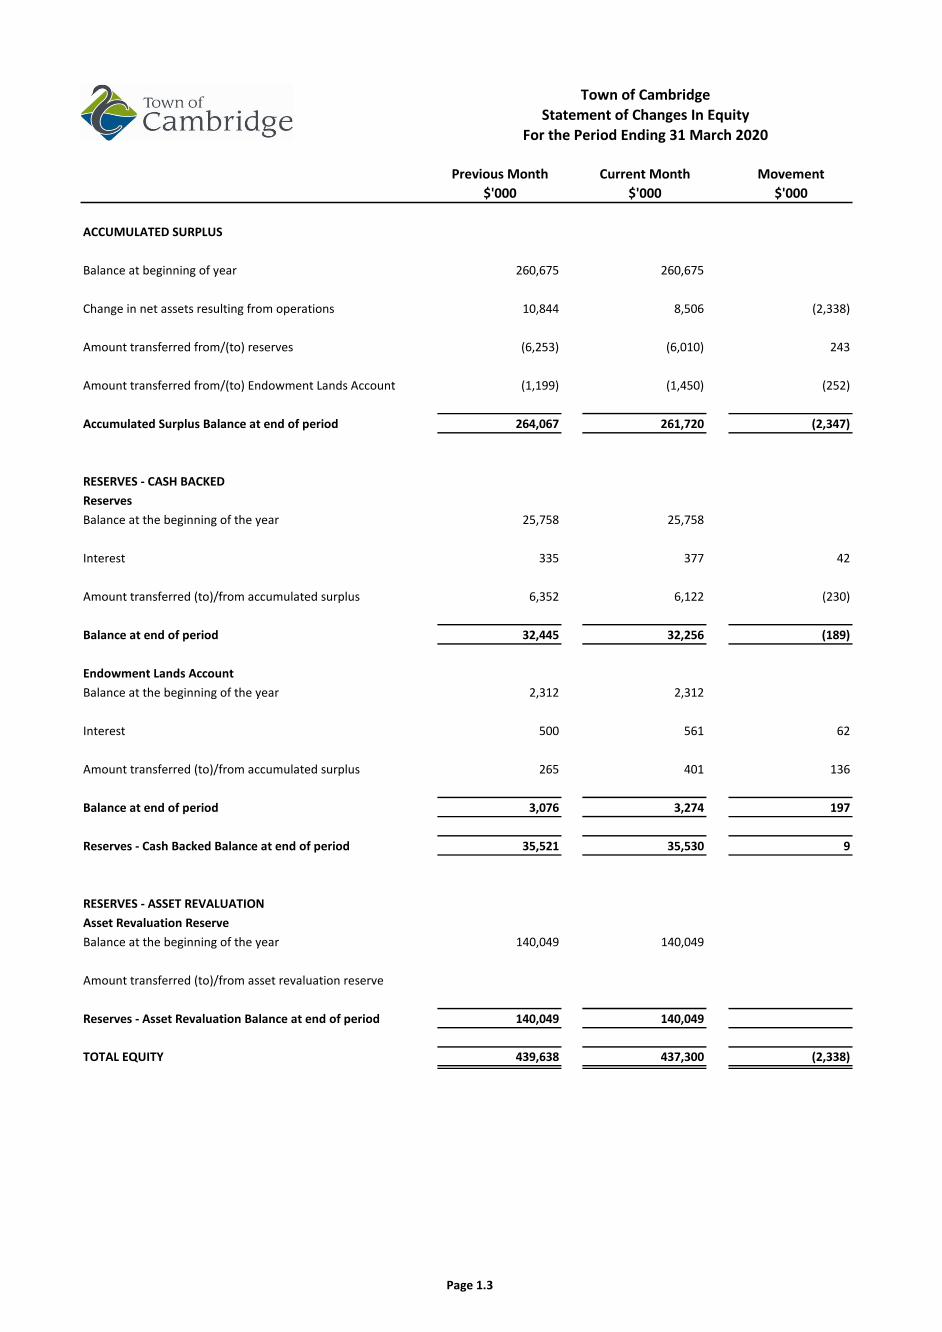
Previous Month Current Month Movement$'000 $'000 $'000
ACCUMULATED SURPLUS
Balance at beginning of year 260,675 260,675
Change in net assets resulting from operations 10,844 8,506 (2,338)
Amount transferred from/(to) reserves (6,253) (6,010) 243
Amount transferred from/(to) Endowment Lands Account (1,199) (1,450) (252)
Accumulated Surplus Balance at end of period 264,067 261,720 (2,347)
RESERVES - CASH BACKEDReservesBalance at the beginning of the year 25,758 25,758
Interest 335 377 42
Amount transferred (to)/from accumulated surplus 6,352 6,122 (230)
Balance at end of period 32,445 32,256 (189)
Endowment Lands AccountBalance at the beginning of the year 2,312 2,312
Interest 500 561 62
Amount transferred (to)/from accumulated surplus 265 401 136
Balance at end of period 3,076 3,274 197
Reserves - Cash Backed Balance at end of period 35,521 35,530 9
RESERVES - ASSET REVALUATIONAsset Revaluation ReserveBalance at the beginning of the year 140,049 140,049
Amount transferred (to)/from asset revaluation reserve
Reserves - Asset Revaluation Balance at end of period 140,049 140,049
TOTAL EQUITY 439,638 437,300 (2,338)
Town of CambridgeStatement of Changes In Equity
For the Period Ending 31 March 2020
Page 2.1
Current Budget$'000
YTD Budget$'000
YTD Actual$'000
YTD Variance$'000
YTD Variance%
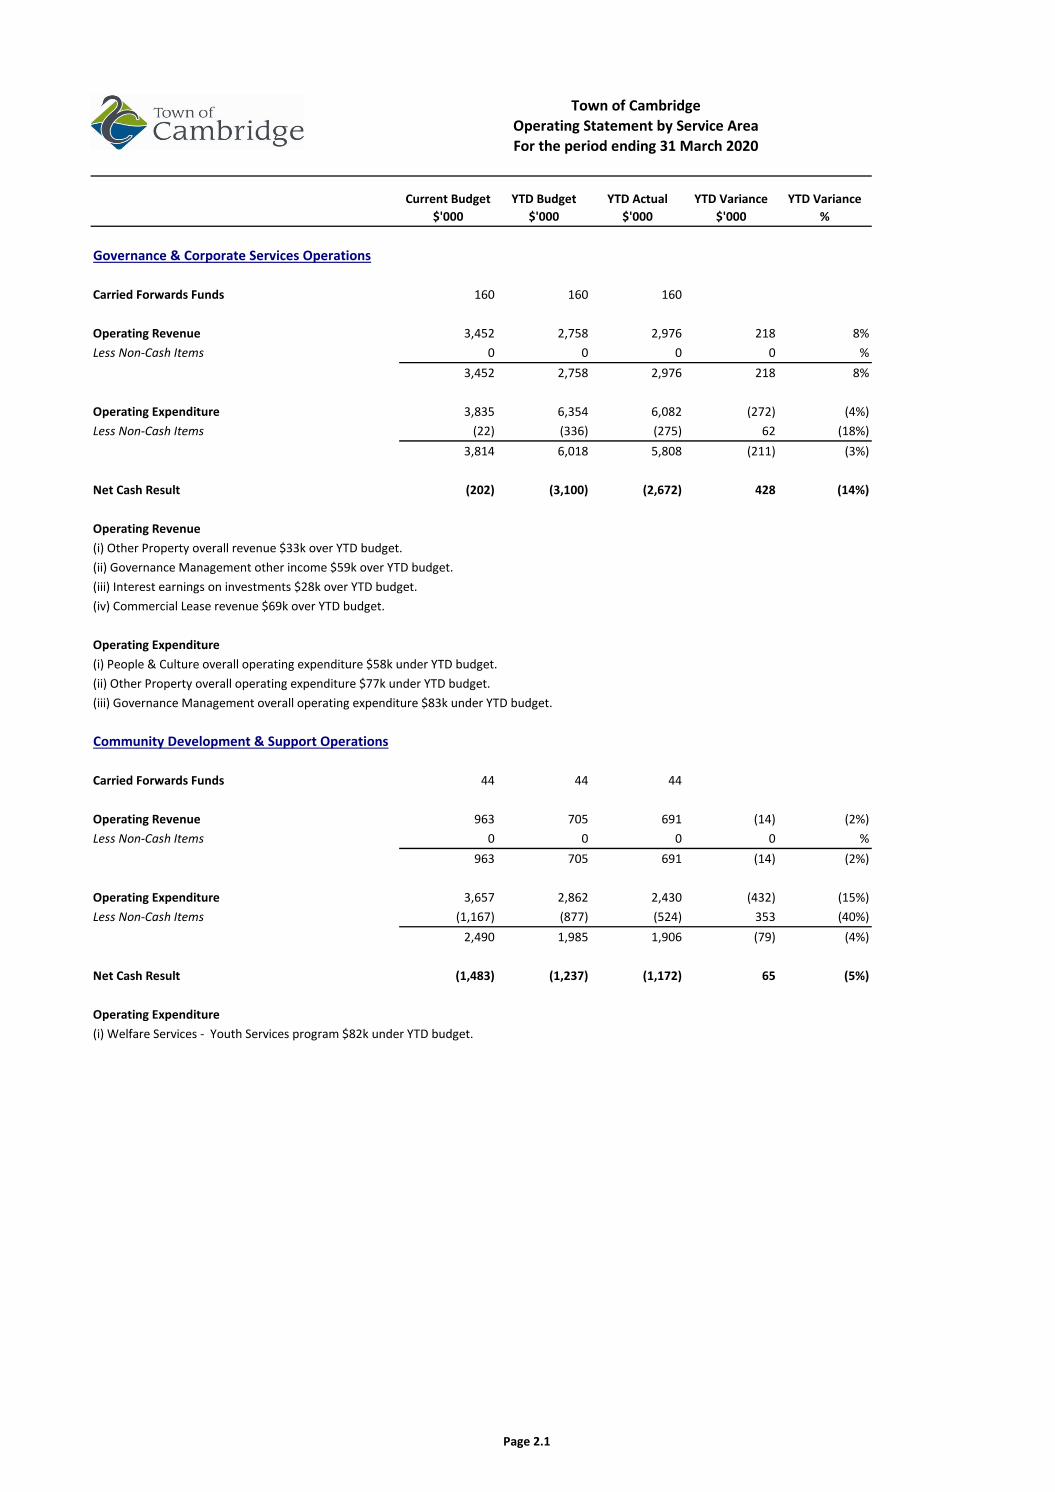
Governance & Corporate Services Operations
Carried Forwards Funds 160 160 160
Operating Revenue 3,452 2,758 2,976 218 8%Less Non-Cash Items 0 0 0 0 %
3,452 2,758 2,976 218 8%
Operating Expenditure 3,835 6,354 6,082 (272) (4%)Less Non-Cash Items (22) (336) (275) 62 (18%)
3,814 6,018 5,808 (211) (3%)
Net Cash Result (202) (3,100) (2,672) 428 (14%)
Operating Revenue(i) Other Property overall revenue $33k over YTD budget.(ii) Governance Management other income $59k over YTD budget.(iii) Interest earnings on investments $28k over YTD budget.(iv) Commercial Lease revenue $69k over YTD budget.
Operating Expenditure(i) People & Culture overall operating expenditure $58k under YTD budget.(ii) Other Property overall operating expenditure $77k under YTD budget.(iii) Governance Management overall operating expenditure $83k under YTD budget.
Community Development & Support Operations
Carried Forwards Funds 44 44 44
Operating Revenue 963 705 691 (14) (2%)Less Non-Cash Items 0 0 0 0 %
963 705 691 (14) (2%)
Operating Expenditure 3,657 2,862 2,430 (432) (15%)Less Non-Cash Items (1,167) (877) (524) 353 (40%)
2,490 1,985 1,906 (79) (4%)
Net Cash Result (1,483) (1,237) (1,172) 65 (5%)
Operating Expenditure(i) Welfare Services - Youth Services program $82k under YTD budget.
Town of CambridgeOperating Statement by Service AreaFor the period ending 31 March 2020
Page 2.2
Current Budget$'000
YTD Budget$'000
YTD Actual$'000
YTD Variance$'000
YTD Variance%
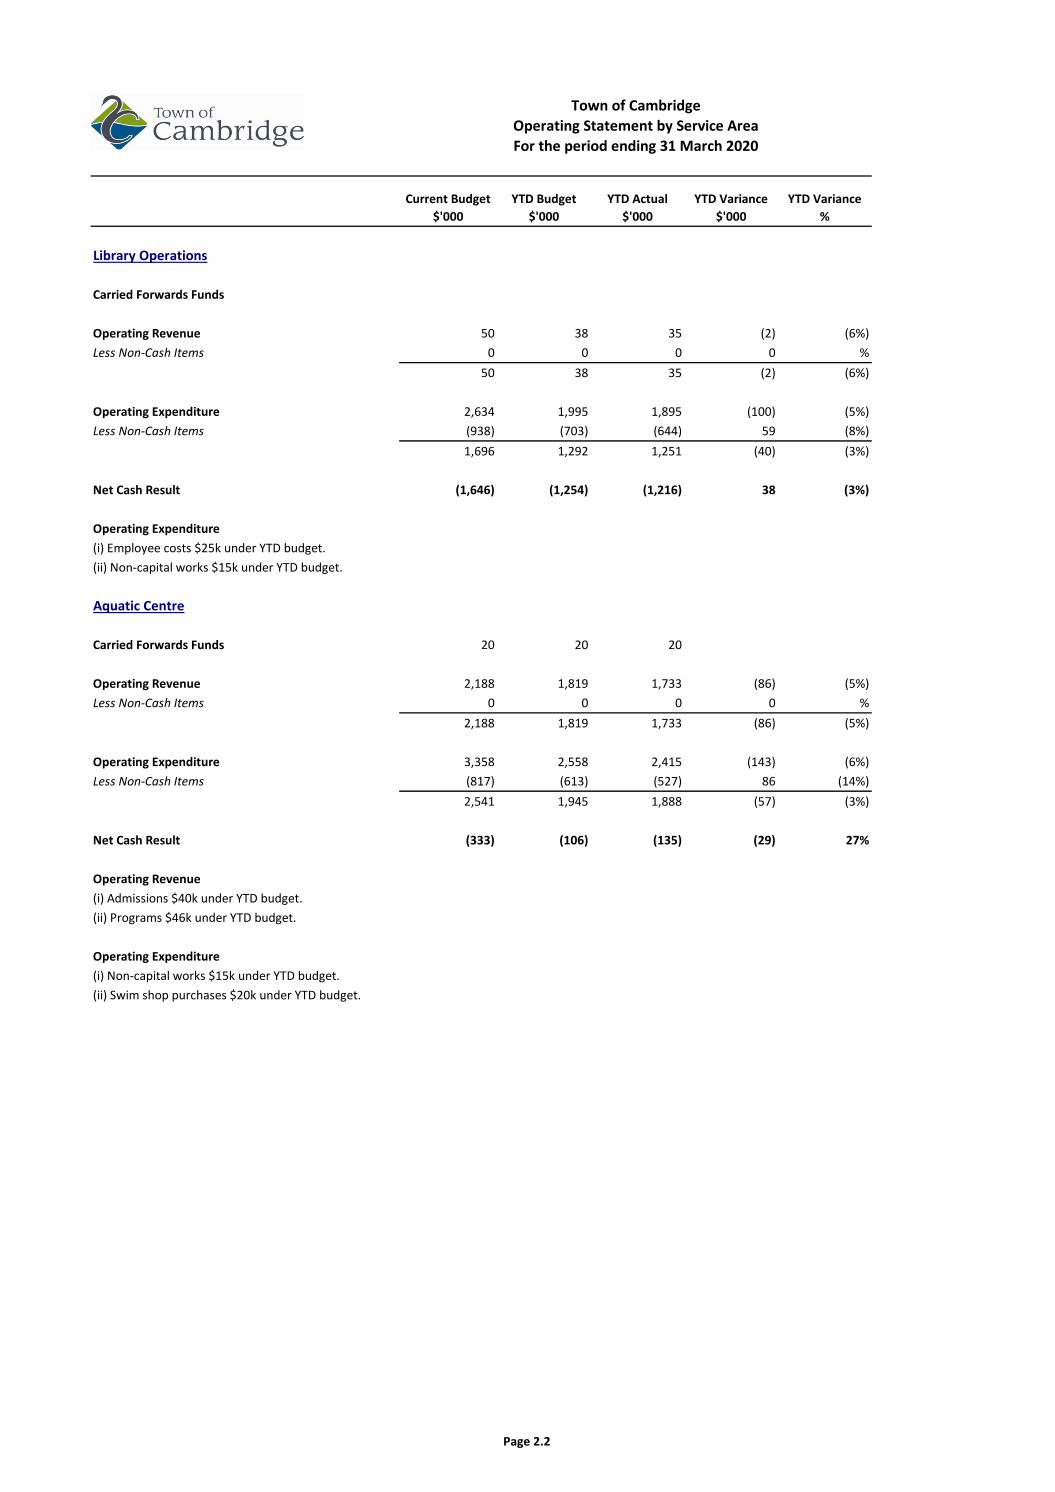
Town of CambridgeOperating Statement by Service AreaFor the period ending 31 March 2020
Library Operations
Carried Forwards Funds
Operating Revenue 50 38 35 (2) (6%)Less Non-Cash Items 0 0 0 0 %
50 38 35 (2) (6%)
Operating Expenditure 2,634 1,995 1,895 (100) (5%)Less Non-Cash Items (938) (703) (644) 59 (8%)
1,696 1,292 1,251 (40) (3%)
Net Cash Result (1,646) (1,254) (1,216) 38 (3%)
Operating Expenditure(i) Employee costs $25k under YTD budget.(ii) Non-capital works $15k under YTD budget.
Aquatic Centre
Carried Forwards Funds 20 20 20
Operating Revenue 2,188 1,819 1,733 (86) (5%)Less Non-Cash Items 0 0 0 0 %
2,188 1,819 1,733 (86) (5%)
Operating Expenditure 3,358 2,558 2,415 (143) (6%)Less Non-Cash Items (817) (613) (527) 86 (14%)
2,541 1,945 1,888 (57) (3%)
Net Cash Result (333) (106) (135) (29) 27%
Operating Revenue(i) Admissions $40k under YTD budget.(ii) Programs $46k under YTD budget.
Operating Expenditure(i) Non-capital works $15k under YTD budget.(ii) Swim shop purchases $20k under YTD budget.
Page 2.3
Current Budget$'000
YTD Budget$'000
YTD Actual$'000
YTD Variance$'000
YTD Variance%
Town of CambridgeOperating Statement by Service AreaFor the period ending 31 March 2020
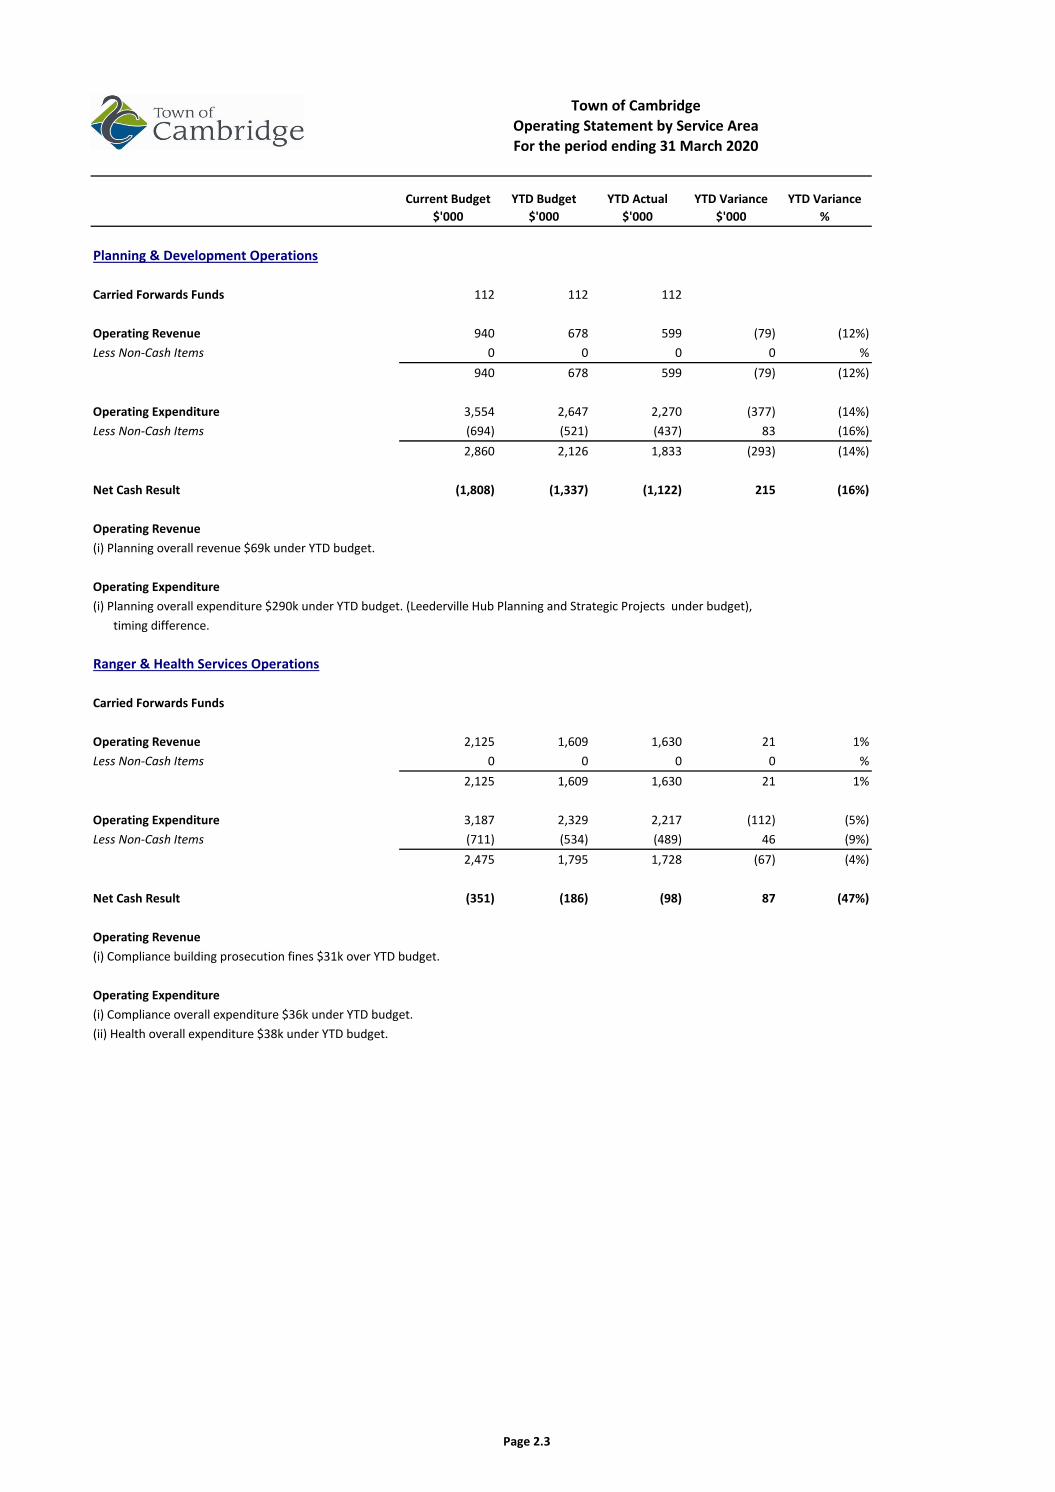
Planning & Development Operations
Carried Forwards Funds 112 112 112
Operating Revenue 940 678 599 (79) (12%)Less Non-Cash Items 0 0 0 0 %
940 678 599 (79) (12%)
Operating Expenditure 3,554 2,647 2,270 (377) (14%)Less Non-Cash Items (694) (521) (437) 83 (16%)
2,860 2,126 1,833 (293) (14%)
Net Cash Result (1,808) (1,337) (1,122) 215 (16%)
Operating Revenue(i) Planning overall revenue $69k under YTD budget.
Operating Expenditure(i) Planning overall expenditure $290k under YTD budget. (Leederville Hub Planning and Strategic Projects under budget),
timing difference.
Ranger & Health Services Operations
Carried Forwards Funds
Operating Revenue 2,125 1,609 1,630 21 1%Less Non-Cash Items 0 0 0 0 %
2,125 1,609 1,630 21 1%
Operating Expenditure 3,187 2,329 2,217 (112) (5%)Less Non-Cash Items (711) (534) (489) 46 (9%)
2,475 1,795 1,728 (67) (4%)
Net Cash Result (351) (186) (98) 87 (47%)
Operating Revenue(i) Compliance building prosecution fines $31k over YTD budget.
Operating Expenditure(i) Compliance overall expenditure $36k under YTD budget.(ii) Health overall expenditure $38k under YTD budget.
Page 2.4
Current Budget$'000
YTD Budget$'000
YTD Actual$'000
YTD Variance$'000
YTD Variance%
Town of CambridgeOperating Statement by Service AreaFor the period ending 31 March 2020
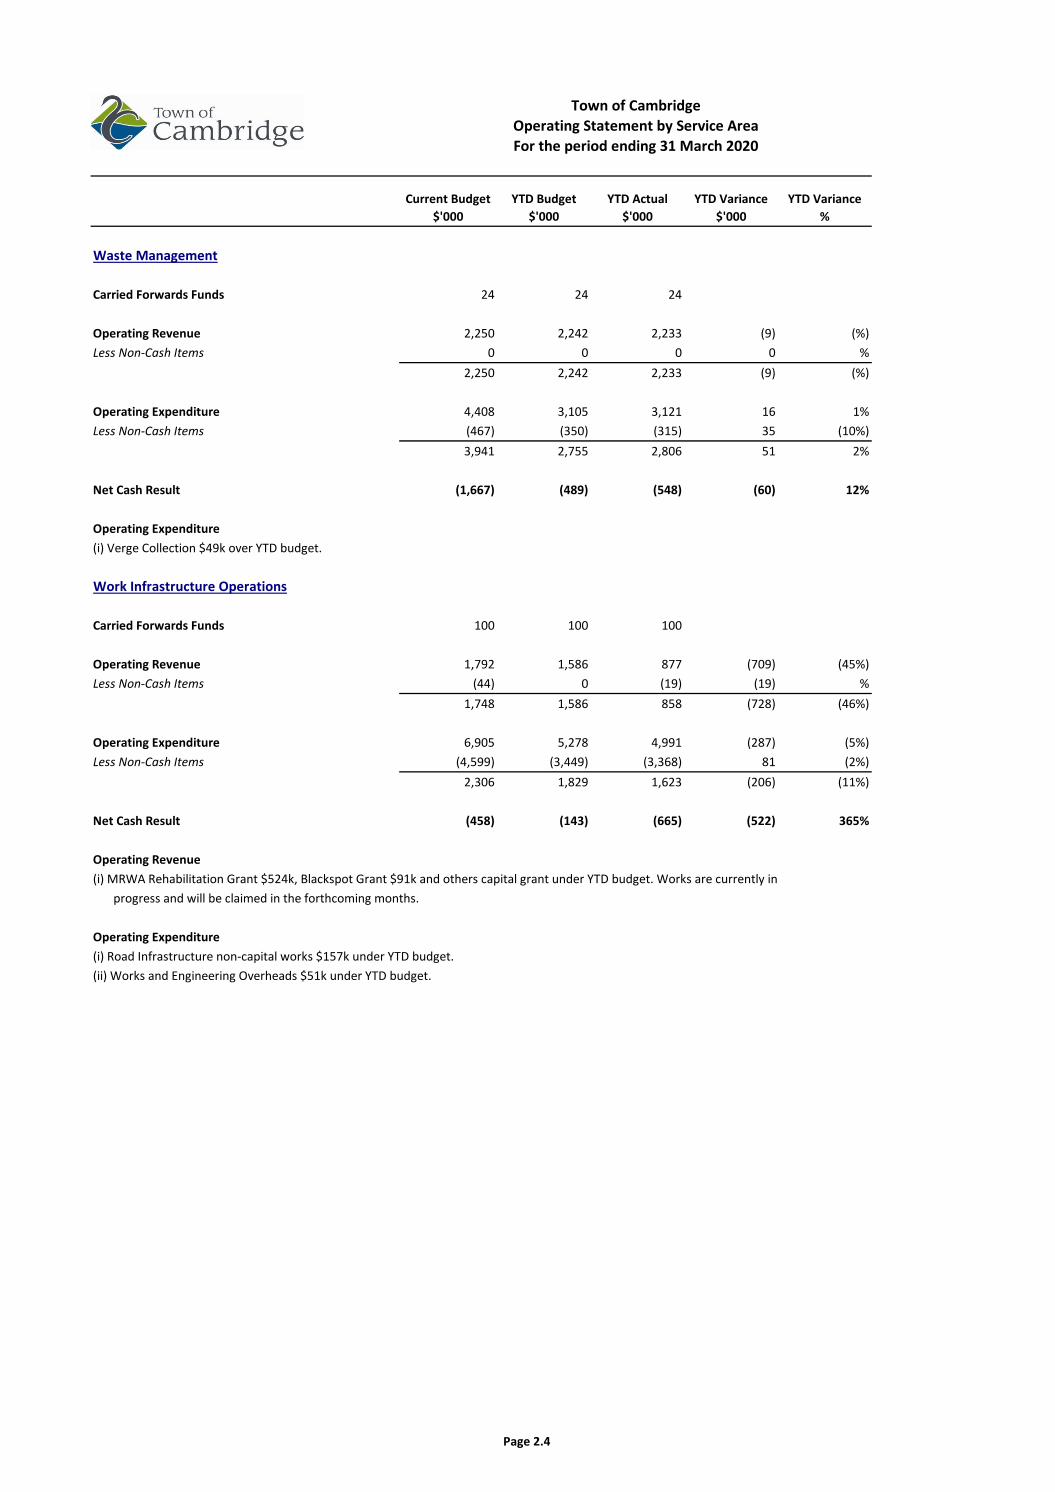
Waste Management
Carried Forwards Funds 24 24 24
Operating Revenue 2,250 2,242 2,233 (9) (%)Less Non-Cash Items 0 0 0 0 %
2,250 2,242 2,233 (9) (%)
Operating Expenditure 4,408 3,105 3,121 16 1%Less Non-Cash Items (467) (350) (315) 35 (10%)
3,941 2,755 2,806 51 2%
Net Cash Result (1,667) (489) (548) (60) 12%
Operating Expenditure(i) Verge Collection $49k over YTD budget.
Work Infrastructure Operations
Carried Forwards Funds 100 100 100
Operating Revenue 1,792 1,586 877 (709) (45%)Less Non-Cash Items (44) 0 (19) (19) %
1,748 1,586 858 (728) (46%)
Operating Expenditure 6,905 5,278 4,991 (287) (5%)Less Non-Cash Items (4,599) (3,449) (3,368) 81 (2%)
2,306 1,829 1,623 (206) (11%)
Net Cash Result (458) (143) (665) (522) 365%
Operating Revenue(i) MRWA Rehabilitation Grant $524k, Blackspot Grant $91k and others capital grant under YTD budget. Works are currently in
progress and will be claimed in the forthcoming months.
Operating Expenditure(i) Road Infrastructure non-capital works $157k under YTD budget.(ii) Works and Engineering Overheads $51k under YTD budget.
Page 2.5
Current Budget$'000
YTD Budget$'000
YTD Actual$'000
YTD Variance$'000
YTD Variance%
Town of CambridgeOperating Statement by Service AreaFor the period ending 31 March 2020
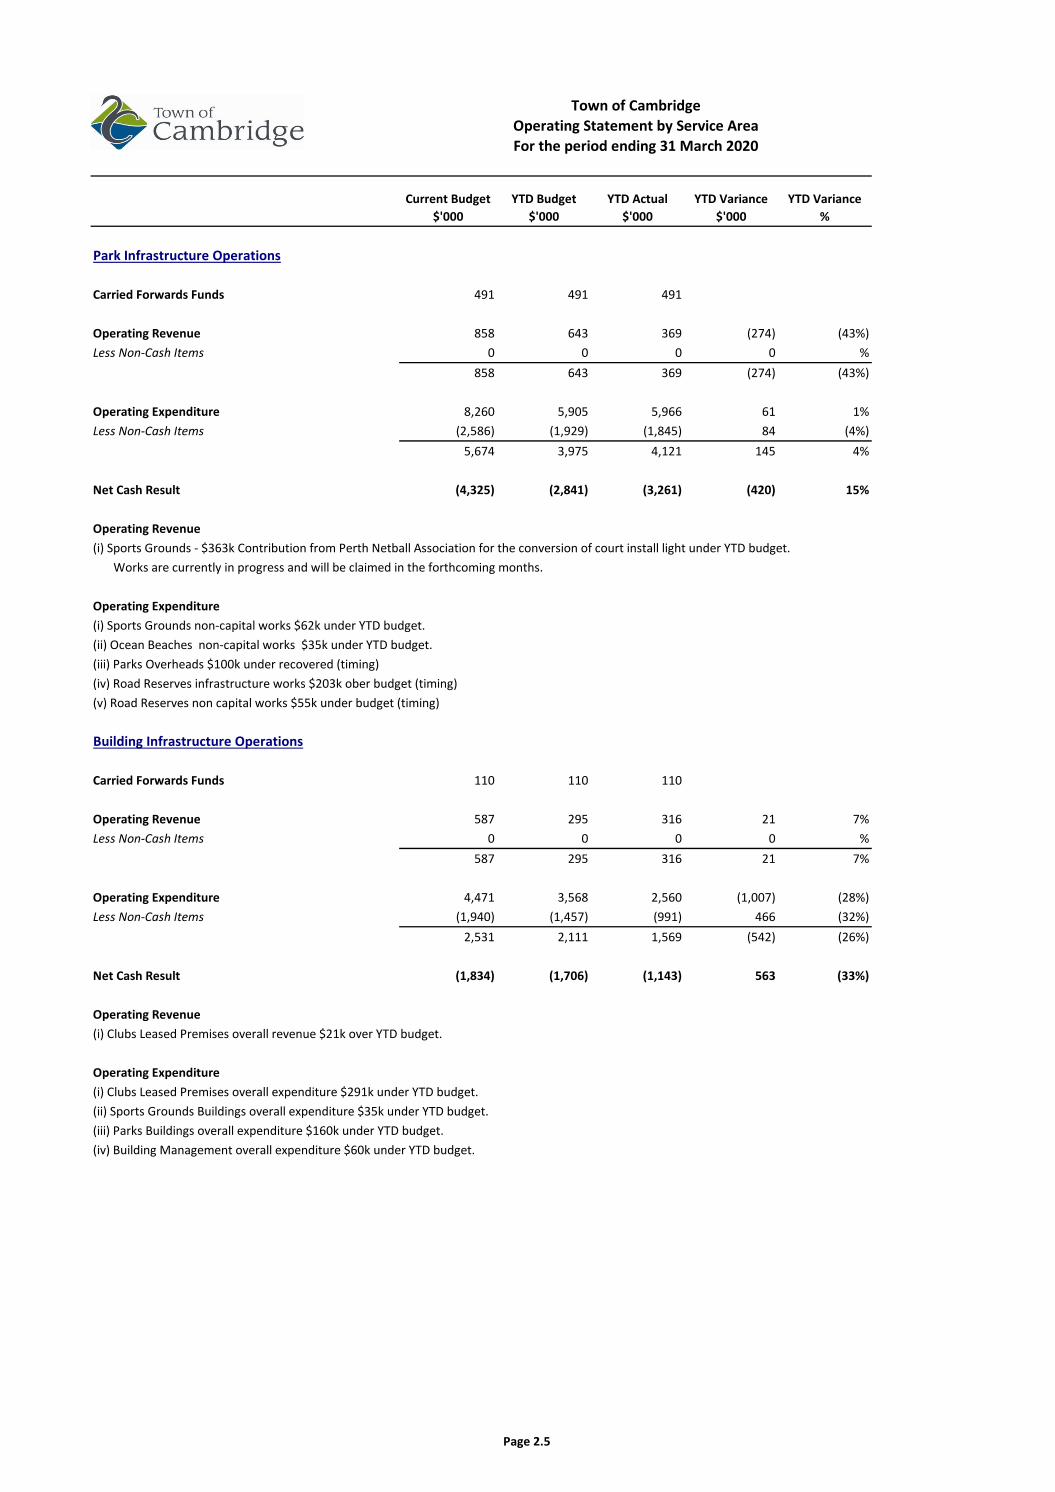
Park Infrastructure Operations
Carried Forwards Funds 491 491 491
Operating Revenue 858 643 369 (274) (43%)Less Non-Cash Items 0 0 0 0 %
858 643 369 (274) (43%)
Operating Expenditure 8,260 5,905 5,966 61 1%Less Non-Cash Items (2,586) (1,929) (1,845) 84 (4%)
5,674 3,975 4,121 145 4%
Net Cash Result (4,325) (2,841) (3,261) (420) 15%
Operating Revenue(i) Sports Grounds - $363k Contribution from Perth Netball Association for the conversion of court install light under YTD budget.
Works are currently in progress and will be claimed in the forthcoming months.
Operating Expenditure(i) Sports Grounds non-capital works $62k under YTD budget.(ii) Ocean Beaches non-capital works $35k under YTD budget.(iii) Parks Overheads $100k under recovered (timing)(iv) Road Reserves infrastructure works $203k ober budget (timing)(v) Road Reserves non capital works $55k under budget (timing)
Building Infrastructure Operations
Carried Forwards Funds 110 110 110
Operating Revenue 587 295 316 21 7%Less Non-Cash Items 0 0 0 0 %
587 295 316 21 7%
Operating Expenditure 4,471 3,568 2,560 (1,007) (28%)Less Non-Cash Items (1,940) (1,457) (991) 466 (32%)
2,531 2,111 1,569 (542) (26%)
Net Cash Result (1,834) (1,706) (1,143) 563 (33%)
Operating Revenue(i) Clubs Leased Premises overall revenue $21k over YTD budget.
Operating Expenditure(i) Clubs Leased Premises overall expenditure $291k under YTD budget.(ii) Sports Grounds Buildings overall expenditure $35k under YTD budget.(iii) Parks Buildings overall expenditure $160k under YTD budget.(iv) Building Management overall expenditure $60k under YTD budget.

Page 2.6
Current Budget$'000
YTD Budget$'000
YTD Actual$'000
YTD Variance$'000
YTD Variance%
Town of CambridgeOperating Statement by Service AreaFor the period ending 31 March 2020
Wembley Golf Course
Carried Forwards Funds
Operating Revenue 8,929 6,828 6,993 165 2%Less Non-Cash Items 0 0 0 0 %
8,929 6,828 6,993 165 2%
Operating Expenditure 7,564 5,796 5,596 (200) (3%)Less Non-Cash Items (1,945) (1,450) (1,091) 359 (25%)
5,619 4,347 4,506 159 4%
Net Cash Result 3,310 2,481 2,487 6 %
Operating Revenue(i) Driving Range overall revenue $215k over YTD budget.(ii) Minin Golf revenue $52k under YTD budget.(iii) Course Revenue $57k over YTD budget.(iv) Pro Shop revenue $33k under YTD budget.
Operating Expenditure(i) Course operations overall expenditure $163k over YTD budget.(ii) Pro Shop Expenditure $92k under YTD budget.(iii) Driving Range overall expenditure $147k under YTD budget.
Page 3.1
DescriptionCurrent Budget
$'000YTD Budget
$'000YTD Actual
$'000Variance
$'000Variance
%Commitment
$'000
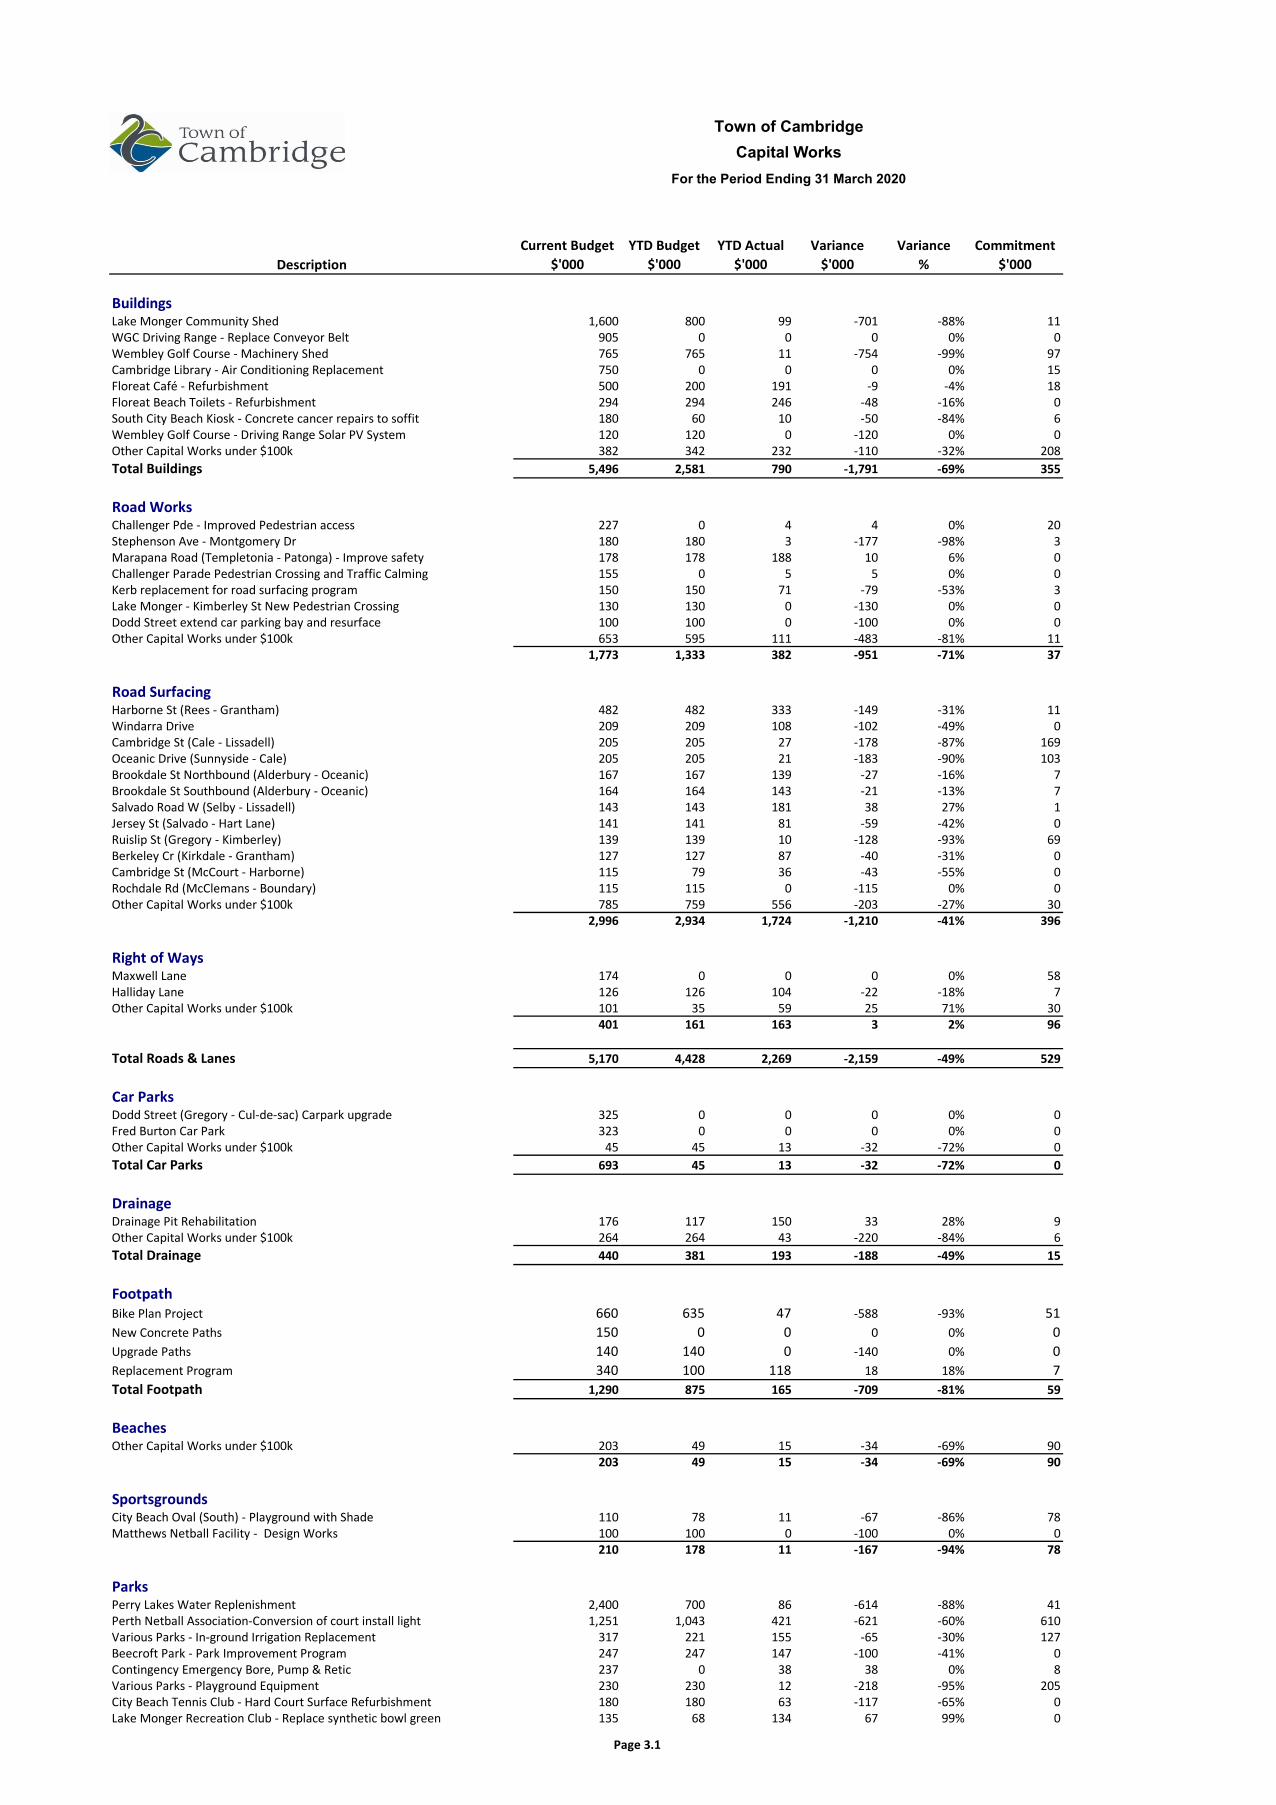
BuildingsLake Monger Community Shed 1,600 800 99 -701 -88% 11WGC Driving Range - Replace Conveyor Belt 905 0 0 0 0% 0Wembley Golf Course - Machinery Shed 765 765 11 -754 -99% 97Cambridge Library - Air Conditioning Replacement 750 0 0 0 0% 15Floreat Café - Refurbishment 500 200 191 -9 -4% 18Floreat Beach Toilets - Refurbishment 294 294 246 -48 -16% 0South City Beach Kiosk - Concrete cancer repairs to soffit 180 60 10 -50 -84% 6Wembley Golf Course - Driving Range Solar PV System 120 120 0 -120 0% 0Other Capital Works under $100k 382 342 232 -110 -32% 208Total Buildings 5,496 2,581 790 -1,791 -69% 355
Road WorksChallenger Pde - Improved Pedestrian access 227 0 4 4 0% 20Stephenson Ave - Montgomery Dr 180 180 3 -177 -98% 3Marapana Road (Templetonia - Patonga) - Improve safety 178 178 188 10 6% 0Challenger Parade Pedestrian Crossing and Traffic Calming 155 0 5 5 0% 0Kerb replacement for road surfacing program 150 150 71 -79 -53% 3Lake Monger - Kimberley St New Pedestrian Crossing 130 130 0 -130 0% 0Dodd Street extend car parking bay and resurface 100 100 0 -100 0% 0Other Capital Works under $100k 653 595 111 -483 -81% 11
1,773 1,333 382 -951 -71% 37
Road SurfacingHarborne St (Rees - Grantham) 482 482 333 -149 -31% 11Windarra Drive 209 209 108 -102 -49% 0Cambridge St (Cale - Lissadell) 205 205 27 -178 -87% 169Oceanic Drive (Sunnyside - Cale) 205 205 21 -183 -90% 103Brookdale St Northbound (Alderbury - Oceanic) 167 167 139 -27 -16% 7Brookdale St Southbound (Alderbury - Oceanic) 164 164 143 -21 -13% 7Salvado Road W (Selby - Lissadell) 143 143 181 38 27% 1Jersey St (Salvado - Hart Lane) 141 141 81 -59 -42% 0Ruislip St (Gregory - Kimberley) 139 139 10 -128 -93% 69Berkeley Cr (Kirkdale - Grantham) 127 127 87 -40 -31% 0Cambridge St (McCourt - Harborne) 115 79 36 -43 -55% 0Rochdale Rd (McClemans - Boundary) 115 115 0 -115 0% 0Other Capital Works under $100k 785 759 556 -203 -27% 30
2,996 2,934 1,724 -1,210 -41% 396
Right of WaysMaxwell Lane 174 0 0 0 0% 58Halliday Lane 126 126 104 -22 -18% 7Other Capital Works under $100k 101 35 59 25 71% 30
401 161 163 3 2% 96
Total Roads & Lanes 5,170 4,428 2,269 -2,159 -49% 529
Car ParksDodd Street (Gregory - Cul-de-sac) Carpark upgrade 325 0 0 0 0% 0Fred Burton Car Park 323 0 0 0 0% 0Other Capital Works under $100k 45 45 13 -32 -72% 0Total Car Parks 693 45 13 -32 -72% 0
DrainageDrainage Pit Rehabilitation 176 117 150 33 28% 9Other Capital Works under $100k 264 264 43 -220 -84% 6Total Drainage 440 381 193 -188 -49% 15
FootpathBike Plan Project 660 635 47 -588 -93% 51New Concrete Paths 150 0 0 0 0% 0Upgrade Paths 140 140 0 -140 0% 0Replacement Program 340 100 118 18 18% 7Total Footpath 1,290 875 165 -709 -81% 59
BeachesOther Capital Works under $100k 203 49 15 -34 -69% 90
203 49 15 -34 -69% 90
SportsgroundsCity Beach Oval (South) - Playground with Shade 110 78 11 -67 -86% 78Matthews Netball Facility - Design Works 100 100 0 -100 0% 0
210 178 11 -167 -94% 78
ParksPerry Lakes Water Replenishment 2,400 700 86 -614 -88% 41Perth Netball Association-Conversion of court install light 1,251 1,043 421 -621 -60% 610Various Parks - In-ground Irrigation Replacement 317 221 155 -65 -30% 127Beecroft Park - Park Improvement Program 247 247 147 -100 -41% 0Contingency Emergency Bore, Pump & Retic 237 0 38 38 0% 8Various Parks - Playground Equipment 230 230 12 -218 -95% 205City Beach Tennis Club - Hard Court Surface Refurbishment 180 180 63 -117 -65% 0Lake Monger Recreation Club - Replace synthetic bowl green 135 68 134 67 99% 0
Town of CambridgeCapital Works
For the Period Ending 31 March 2020
Page 3.2
DescriptionCurrent Budget
$'000YTD Budget
$'000YTD Actual
$'000Variance
$'000Variance
%Commitment
$'000
Town of CambridgeCapital Works
For the Period Ending 31 March 2020
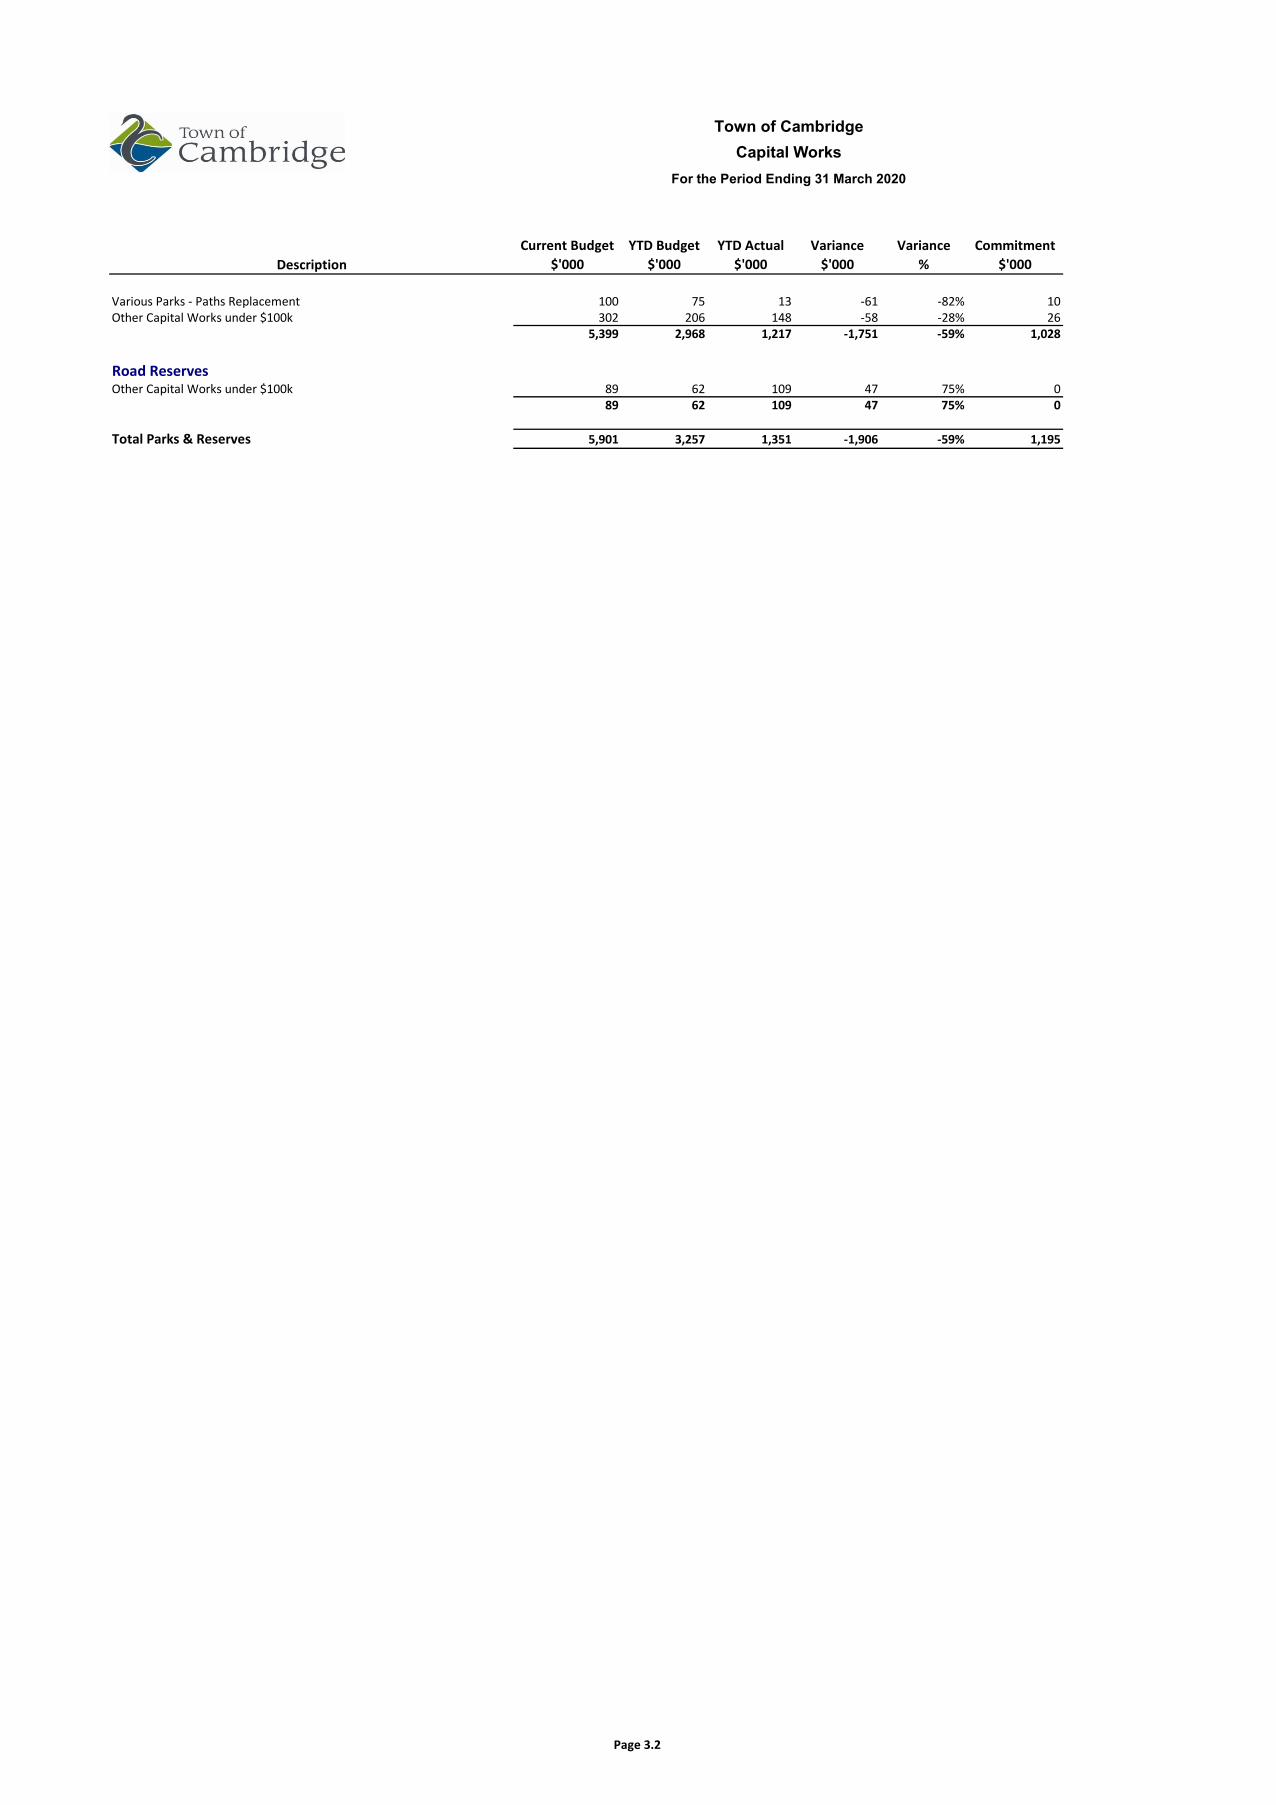
Various Parks - Paths Replacement 100 75 13 -61 -82% 10Other Capital Works under $100k 302 206 148 -58 -28% 26
5,399 2,968 1,217 -1,751 -59% 1,028
Road ReservesOther Capital Works under $100k 89 62 109 47 75% 0
89 62 109 47 75% 0
Total Parks & Reserves 5,901 3,257 1,351 -1,906 -59% 1,195
Page 3.3
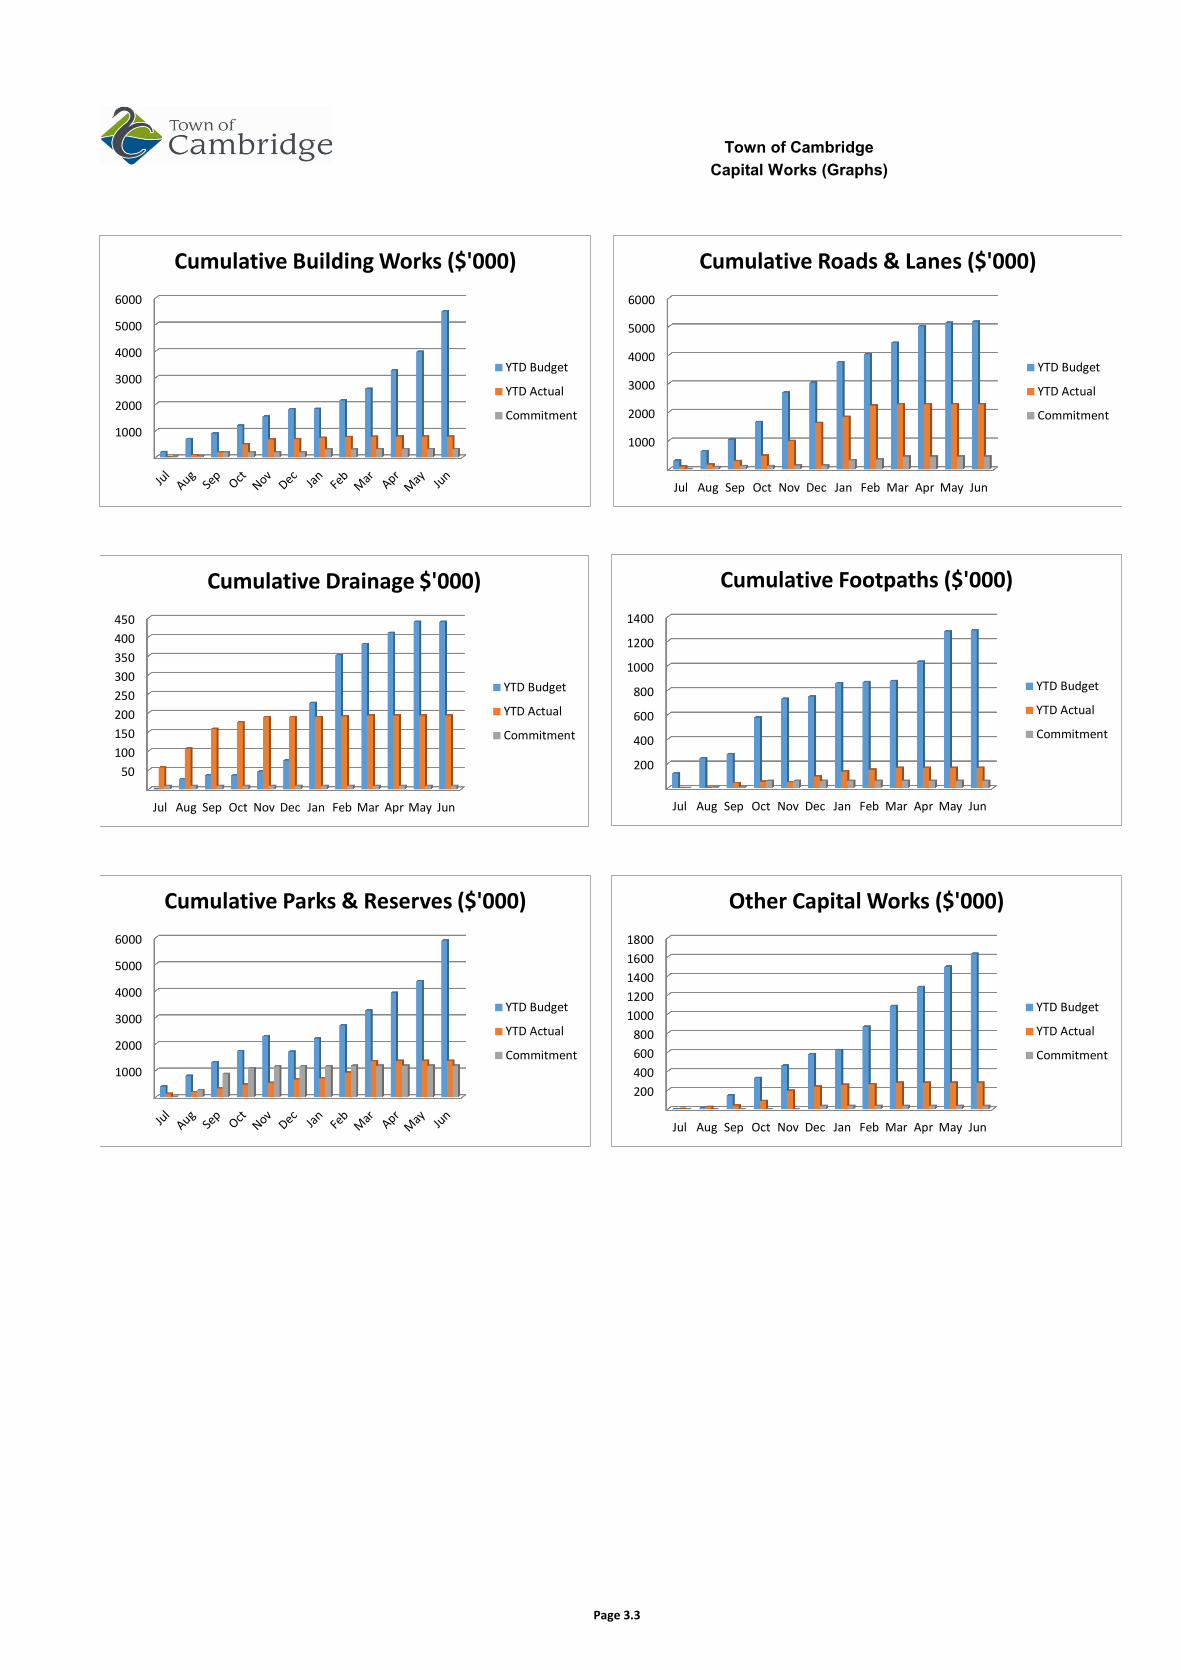
Town of CambridgeCapital Works (Graphs)
1000
2000
3000
4000
5000
6000
Cumulative Building Works ($'000)
YTD Budget
YTD Actual
Commitment
1000
2000
3000
4000
5000
6000
Jul Aug Sep Oct Nov Dec Jan Feb Mar Apr May Jun
Cumulative Roads & Lanes ($'000)
YTD Budget
YTD Actual
Commitment
50100150200250300350400450
Jul Aug Sep Oct Nov Dec Jan Feb Mar Apr May Jun
Cumulative Drainage $'000)
YTD Budget
YTD Actual
Commitment
200
400
600
800
1000
1200
1400
Jul Aug Sep Oct Nov Dec Jan Feb Mar Apr May Jun
Cumulative Footpaths ($'000)
YTD Budget
YTD Actual
Commitment
1000
2000
3000
4000
5000
6000
Cumulative Parks & Reserves ($'000)
YTD Budget
YTD Actual
Commitment
200400600800
10001200140016001800
Jul Aug Sep Oct Nov Dec Jan Feb Mar Apr May Jun
Other Capital Works ($'000)
YTD Budget
YTD Actual
Commitment
Page 4.1
Current Budget YTD Budget YTD Actual Variance Variance2019/2020 31 March 31 March $'000 %
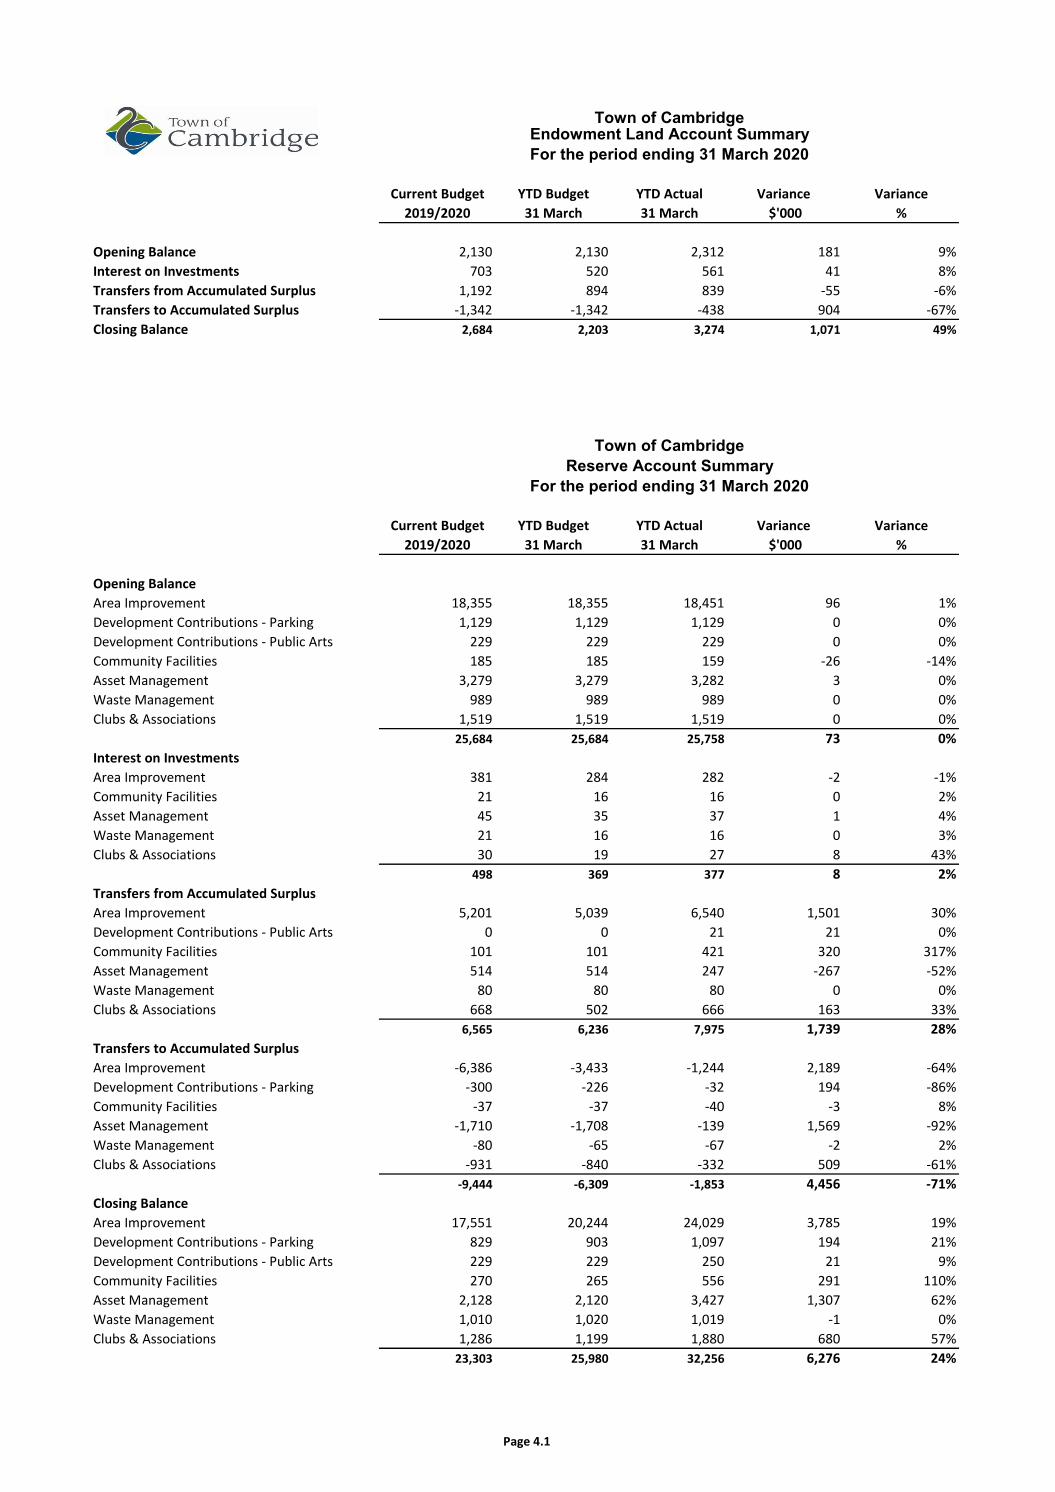
Opening Balance 2,130 2,130 2,312 181 9%Interest on Investments 703 520 561 41 8%Transfers from Accumulated Surplus 1,192 894 839 -55 -6%Transfers to Accumulated Surplus -1,342 -1,342 -438 904 -67%Closing Balance 2,684 2,203 3,274 1,071 49%
Current Budget YTD Budget YTD Actual Variance Variance2019/2020 31 March 31 March $'000 %
Opening BalanceArea Improvement 18,355 18,355 18,451 96 1%Development Contributions - Parking 1,129 1,129 1,129 0 0%Development Contributions - Public Arts 229 229 229 0 0%Community Facilities 185 185 159 -26 -14%Asset Management 3,279 3,279 3,282 3 0%Waste Management 989 989 989 0 0%Clubs & Associations 1,519 1,519 1,519 0 0%
25,684 25,684 25,758 73 0%Interest on InvestmentsArea Improvement 381 284 282 -2 -1%Community Facilities 21 16 16 0 2%Asset Management 45 35 37 1 4%Waste Management 21 16 16 0 3%Clubs & Associations 30 19 27 8 43%
498 369 377 8 2%Transfers from Accumulated SurplusArea Improvement 5,201 5,039 6,540 1,501 30%Development Contributions - Public Arts 0 0 21 21 0%Community Facilities 101 101 421 320 317%Asset Management 514 514 247 -267 -52%Waste Management 80 80 80 0 0%Clubs & Associations 668 502 666 163 33%
6,565 6,236 7,975 1,739 28%Transfers to Accumulated SurplusArea Improvement -6,386 -3,433 -1,244 2,189 -64%Development Contributions - Parking -300 -226 -32 194 -86%Community Facilities -37 -37 -40 -3 8%Asset Management -1,710 -1,708 -139 1,569 -92%Waste Management -80 -65 -67 -2 2%Clubs & Associations -931 -840 -332 509 -61%
-9,444 -6,309 -1,853 4,456 -71%Closing BalanceArea Improvement 17,551 20,244 24,029 3,785 19%Development Contributions - Parking 829 903 1,097 194 21%Development Contributions - Public Arts 229 229 250 21 9%Community Facilities 270 265 556 291 110%Asset Management 2,128 2,120 3,427 1,307 62%Waste Management 1,010 1,020 1,019 -1 0%Clubs & Associations 1,286 1,199 1,880 680 57%
23,303 25,980 32,256 6,276 24%
For the period ending 31 March 2020
Town of CambridgeEndowment Land Account SummaryFor the period ending 31 March 2020
Town of CambridgeReserve Account Summary