atomic carbon in southern hemisphere high‐latitude clouds
TRANSCRIPT
THE ASTROPHYSICAL JOURNAL, 479 :296È302, 1997 April 101997. The American Astronomical Society. All rights reserved. Printed in U.S.A.(
ATOMIC CARBON IN SOUTHERN HEMISPHERE HIGH-LATITUDE CLOUDS
JAMES G. RICHARD A. T. M. AND JAMES M.INGALLS, CHAMBERLIN,1 BANIA, JACKSON
Department of Astronomy, Boston University, 725 Commonwealth Avenue, Boston MA 02215 ;ingalls=bu.edu, cham=ulu.submm.caltech.edu, bania=bu.edu, jackson=bu.edu
AND
ADAIR P. AND ANTONY A.LANE STARK
Smithsonian Astrophysical Observatory, 60 Garden Street, Mail Stop 78, Cambridge MA 02138 ;adair=cfa.harvard.edu, aas=cfa.harvard.edu
Received 1996 August 23 ; accepted 1996 November 4
ABSTRACTWe report the detection of atomic carbon in a sample of eight southern hemisphere high Galactic
latitude molecular clouds, using the Antarctic Submillimeter Telescope and Remote Observatory. The492 GHz transition of [C I] was detected in all of the clouds observed. The C/CO column(3P1] 3P0)density ratio ranges from 0.4 to 2.5 and is similar to the values previously measured in high-latitudeclouds MBM 12 and HD 210121. For all 10 high-latitude clouds observed in [C I], C/CO averages D1.2and decreases with increasing total gas column density as predicted by translucent cloud models.NH,Quantitative comparison with chemical models of homogeneous clouds is unsatisfactory, however, andwe conclude that the clumpy structure of clouds must be taken into account in order to interpret thedata properly.Subject headings : ISM: abundances È ISM: atoms È ISM: clouds È ISM: molecules È
infrared : ISM: lines and bands
1. INTRODUCTION
The high Galactic latitude molecular clouds(b Z 15¡)(HLCs ; see Hartmann, & Speck and refer-Magnani, 1996,ences therein) are an important class of objects the study ofwhich can address many questions about molecule forma-tion in the interstellar medium. The HLCs are predomi-nantly translucent clouds Dishoeck & Black(A
vB 1È5 ; van
associated with IRAS cirrus et al. Models1988) (Low 1984).of the chemistry in translucent clouds (e.g., Dishoeck &vanBlack indicate that they are the transition objects1988)between clouds with most of their carbon in atomic formand most of their carbon in CO. Translucent clouds arethus the simplest regions in which molecules exist in abun-dance and where photo processes dominate the chemistry.
The high-latitude molecular clouds account for only10%È20% of the local molecular mass surface density
et al. However, large-scale surveys imply(Magnani 1996).that most of the molecular gas in the Galaxy is translucent.
et al. determined that a signiÐcant amount ofPolk (1988)the 12CO emission in the Galactic plane is produced bymolecular gas with a lower opacity than that of giantmolecular clouds (GMCs). Furthermore, et al.Chiar (1994)modeled CO (J \ 2È1) and (J \ 1È0) measurements of theGalactic molecular ring as consisting of D40% GMCs andD60% translucent clouds. It is therefore likely that theHLCs sample the average population of molecular gas inthe Galaxy.
As an ensemble, the HLCs are the nearest molecularclouds to the Sun (SdT B 105 pc ; et al. ThusMagnani 1996).the gas distribution can be mapped at high spatialresolution. In addition, most HLCs are far from sources offar-ultraviolet (FUV) (6 eV\ hl\ 13.6 eV) radiation, andprobably receive FUV Ñuxes equal to the average localinterstellar radiation Ðeld in units of the Habing(G0D 1,
1 Current address : Caltech Submillimeter Observatory, Hilo, HI 96720.
Ñux B1.6] 10~3 ergs cm~2 s~1 ; The simpli-Habing 1968).city of these clouds makes them particularly amenable tophotochemical modeling Dishoeck & Black(van 1988 ;
Takahashi, & TielensHollenbach, 1991 ; Spaans 1996).The dominant formation mechanism of neutral atomic
carbon (C) is the photodissociation of CO. In addition, C ispredicted to occur in the regions of clouds where is theH2most abundant species but in which CO is undetectable.Thus C may be one of the best tracers of translucent molec-ular gas. Consequently, our understanding of translucentgas is incomplete without carbon measurements. The lowestlying transition of neutral atomic carbon, the [C I] 492 GHz
Ðne-structure transition, has thus far been(3P1] 3P0)reported in only two HLCs. Bania, & JacksonIngalls,hereafter detected C I toward 10 13CO(1994, IBJ ; 1997)
cores in MBM 12 (Lynds 1457[8), the nearest knownmolecular cloud (d B 65 pc). For these cores they measuredan average value of the C/CO column density ratio of D0.8.
& van Dishoeck observed C I in the molecularStark (1994)cloud toward HD 210121 ; based on modeling, their data fortwo positions gave C/CO column density ratios rangingfrom 3È6. Since the C/CO abundance ratio is theseZ1,HLCs indeed sample the transition between atomic andmolecular carbon-bearing species.
The recently installed Antarctic Submillimeter Telescopeand Remote Observatory (AST/RO) has begun a programto study the photochemistry of translucent HLCs. Theexceptionally dry atmosphere above the South Pole allowsfor measurements of C I in HLCs with unprecedented sensi-tivity. We present here the Ðrst results of the AST/ROsurvey of the Ðne-structure transition of [C I] in(3P1] 3P0)eight southern hemisphere high-latitude clouds.
2. OBSERVATIONS
2.1. T he Source SampleEight HLCs at southern declinations listed in the catalog
of & Myers were observed. Source identiÐca-Keto (1986)
296
ATOMIC CARBON IN HIGH-LATITUDE CLOUDS 297
tions and positions are listed in The clouds are theTable 1.objects in the Keto & Myers catalog which fall in the decli-nation range [25¡ [ d [[80¡ (at the South Pole [d iselevation). The sample clouds have thus far only beenstudied in CO at angular resolution & [email protected] (Keto
except for cloud G225.3[66.3, which has also been1986),observed at higher angular resolution in CO and in thephotographic B band (Stark 1995).
Most of the clouds in our sample are isolated translucentclouds without embedded stars. Two objects are exceptions :G294.4[14.3 is a translucent region located on the fringe ofa molecular cloud in the Chamaeleon dark cloud complex,and G316.5]21.0 contains a young star (see Such° 4.2).objects bridge the gap between isolated translucent cloudsand star-forming dark clouds.
2.2. Atomic Carbon ObservationsObservations of the transition of [C I] at(3P1] 3P0)492.1607 GHz were made during the 1995 Austral winter
with the AST/RO 1.7 m diameter telescope located at theNational Science Foundation Amundsen-Scott South PoleStation. AST/RO operates at submillimeter wavelengthsand is a Ñexible, general purpose instrument capable ofmaking a wide variety of spectroscopic measurements forboth astronomy and aeronomy et al.(Stark 1994, 1997a).The telescope efficiency at 492 GHz was estimated fromskydip measurements Lane, & Stark to(Chamberlin, 1997)be Measurements of the moon surface brightnessg
l\ 0.75.
suggest that this value is close to the main-beam efficiencyWe thus adopt 0.75 for the main-beam efficiency. ThegMB.beam shape was determined using limb scans of the moon,
continuum maps of Jupiter, and spectral line maps ofcompact sources et al. For the observations(Stark 1997a).reported here, the half-power beamwidth of the telescope at492 GHz was D140A, corresponding to a 14,000 AU spatialresolution at 100 pc.
The carbon line was measured using a quasi-optical SISreceiver & LeDuc Zmuid-(Zmuidzinas 1993 ; Engargiola,zinas, & Lo which had a 165 K double sideband1994),(DSB) receiver noise temperature. The intermediate fre-quency output was sampled by a 2048 channel, 1.4 GHzbandwidth acousto-optical spectrometer (AOS) (Schieder,Tolls, & Winnewisser The velocity resolution was1989).0.67 km s~1. System noise temperatures ranged between700 and 1500 K. During the 1995 Austral winter the
median 492 GHz zenith atmospheric opacity for the SouthPole site was 0.70 et al.(Chamberlin 1997).
The HLC observations were made on 1995 September12È14. The [C I] spectra were obtained by position-switching 1¡ in azimuth, well outside the IRAS 100 kmboundaries of the clouds. Because of the unique geographi-cal location of the telescope, position-switched o†sets wereboth at constant elevation and Ðxed on the sky.
Intensity calibration was accomplished by measuringblackbody loads at 40 and 90 K, as well as an ambienttemperature load et al. In order to(Stark 1997a, 1997b).correct for atmospheric attenuation, skydips were per-formed at intervals of approximately 6 hr. In addition, mea-surements of the sky brightness temperature were made atthe position of the current source every 10È15 minutes. Aslab model of the atmosphere was assumed, and an atmo-spheric zenith opacity was computed (see et al.Chamberlin
and subsequently used to correct the data for atmo-1996)spheric attenuation. Finally, the overall intensity cali-bration was checked by observing the compact H II regionG305.3]0.2 once before observing each HLC. This pro-cedure yielded intensities repeatable to ^30%. Since theintensity of G305.3]0.2 was a function of azimuth, thiserror is primarily due to pointing uncertainties of D30A rms
et al.(Stark 1997a).
3. RESULTS
3.1. Observed [C I] -Properties of High-L atitude CloudsThe [C I] transition was detected in all of the(3P1] 3P0)clouds we observed. Because this was a preliminary survey
based upon the Keto & Myers CO data which had rathercoarse angular resolution, the nominal center of each cloudwas mapped in a 3] 3 pixel fully sampled grid. The spectrawere then averaged to form a D5@ diameter ““ superbeam.ÏÏFor the source maps the total on-source integration timesrange from 2.5 to 3.5 hr.
The average [C I] spectra are shown in for eachFigure 1source. Linear baselines were subtracted from these spectra.Intensities are main-beam brightness temperatures, TMB,that is, Rayleigh-Jeans antenna temperature correctedT
Afor both atmospheric attenuation and main-beam efficiency(TMB4 T
A*/gMB).The observed parameters for the [C I] emission from the
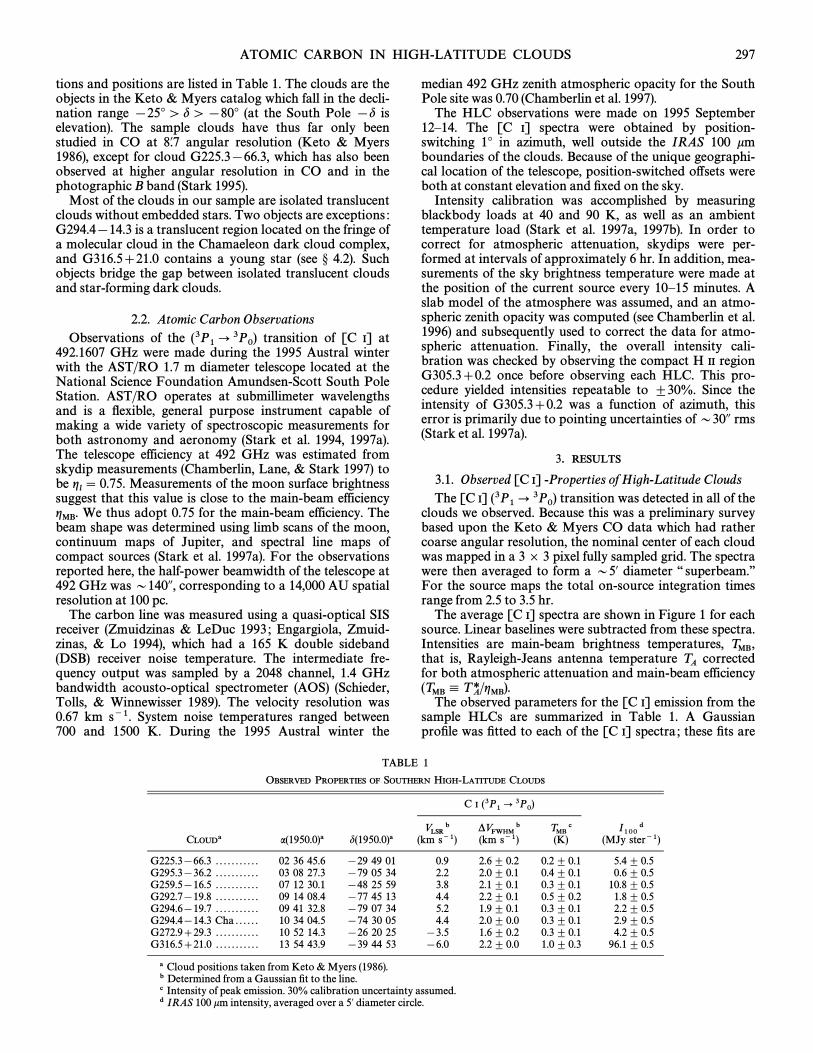
sample HLCs are summarized in A GaussianTable 1.proÐle was Ðtted to each of the [C I] spectra ; these Ðts are
TABLE 1
OBSERVED PROPERTIES OF SOUTHERN HIGH-LATITUDE CLOUDS
C I (3P1] 3P0)
VLSR b *VFWHM b TMB c I100 dCLOUDa a(1950.0)a d(1950.0)a (km s~1) (km s~1) (K) (MJy ster~1)
G225.3[66.3 . . . . . . . . . . . 02 36 45.6 [29 49 01 0.9 2.6 ^ 0.2 0.2^ 0.1 5.4^ 0.5G295.3[36.2 . . . . . . . . . . . 03 08 27.3 [79 05 34 2.2 2.0 ^ 0.1 0.4^ 0.1 0.6^ 0.5G259.5[16.5 . . . . . . . . . . . 07 12 30.1 [48 25 59 3.8 2.1 ^ 0.1 0.3^ 0.1 10.8^ 0.5G292.7[19.8 . . . . . . . . . . . 09 14 08.4 [77 45 13 4.4 2.2 ^ 0.1 0.5^ 0.2 1.8^ 0.5G294.6[19.7 . . . . . . . . . . . 09 41 32.8 [79 07 34 5.2 1.9 ^ 0.1 0.3^ 0.1 2.2^ 0.5G294.4[14.3 Cha . . . . . . 10 34 04.5 [74 30 05 4.4 2.0 ^ 0.0 0.3^ 0.1 2.9^ 0.5G272.9]29.3 . . . . . . . . . . . 10 52 14.3 [26 20 25 [3.5 1.6^ 0.2 0.3^ 0.1 4.2^ 0.5G316.5]21.0 . . . . . . . . . . . 13 54 43.9 [39 44 53 [6.0 2.2^ 0.0 1.0^ 0.3 96.1^ 0.5
a Cloud positions taken from & MyersKeto (1986).b Determined from a Gaussian Ðt to the line.c Intensity of peak emission. 30% calibration uncertainty assumed.d IRAS 100 km intensity, averaged over a 5@ diameter circle.
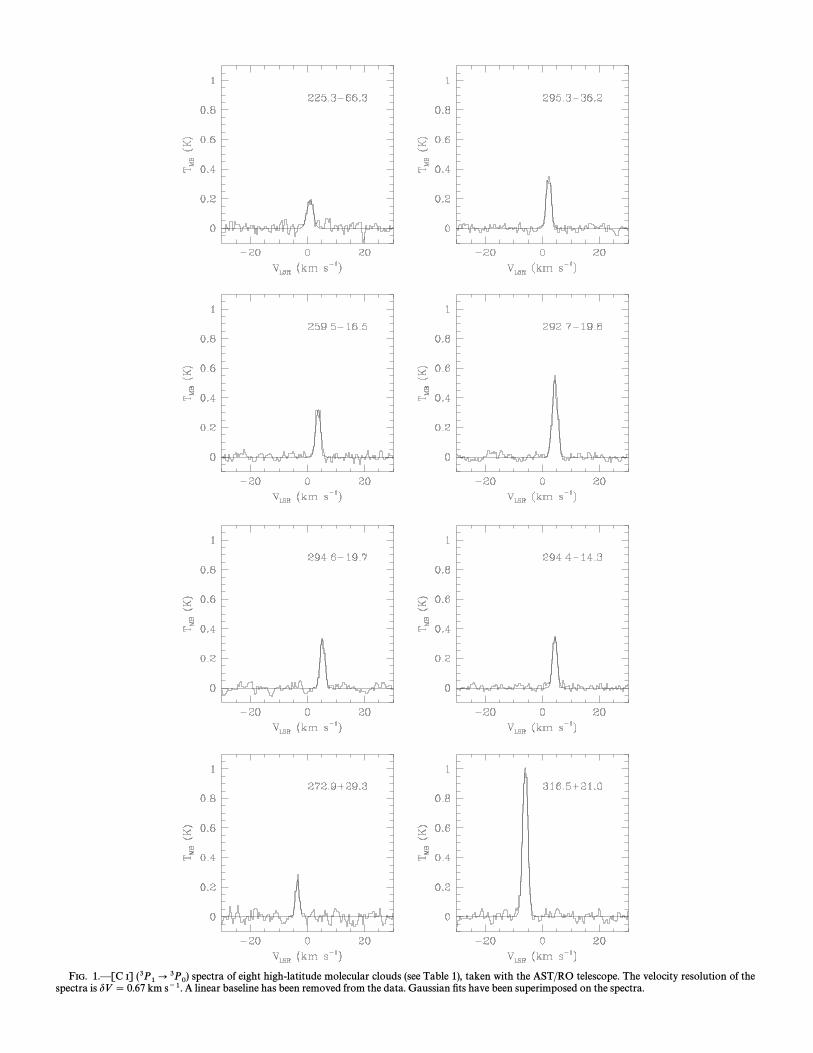
FIG. 1.È[C I] spectra of eight high-latitude molecular clouds (see taken with the AST/RO telescope. The velocity resolution of the(3P1] 3P0) Table 1),spectra is dV \ 0.67 km s~1. A linear baseline has been removed from the data. Gaussian Ðts have been superimposed on the spectra.
ATOMIC CARBON IN HIGH-LATITUDE CLOUDS 299
superimposed on the spectra in The resultingFigure 1.values for line center, line width, and lineVLSR, *VFWHM,peak intensity, are listed in The observed [C I]TMB, Table 1.properties of these clouds are consistent with the assertion,based on CO observations, that the HLCs are local, turbu-lent objects. The average LSR velocity for these HLCs is
km s~1, which is consistent with theSVLSRT \ 1.4^ 4.1HLCs being local ; the average linewidth is S*VFWHMT \2.1^ 0.1 km s~1, much greater than the thermal velocitydispersion of D0.1 km s~1 for 10 K carbon gas, whichshows that the clouds are turbulent. The average [C I]intensity is 0.4 ^ 0.1 K.STMBT \
Estimates of the [C I] column density in each cloud canbe made as follows. We have calculated the [C I]
line center optical depth by assuming(3P1] 3P0) q10,homogeneous clouds in local thermodynamic equilibrium(LTE) :
q10\ [lnC1 [ TMB
Jl(Tex) [ Jl(2.7 K)D
, (1)
where is the radiation temperatureJl
Jl(T ) 4hl10/k
ehl10@kT[ 1(2)
and is the excitation temperature. For [C I]Tex (3P1] 3P0),K. We estimate the total beam-averagedhl10/k \ 23.6atomic carbon column densities, NC :
NC\ 2.49] 1016q10A *VFWHM1 km s~1
B Z(Tex)1 [ e(~23.6 K)@Tex
cm~2 ,
(3)
where is the Gaussian linewidth and is the*VFWHM Z(Tex)ground state partition function for the carbon atom
Z(Tex) \ 1 ] 3e(~23.6 K)@Tex ] 5e(~62.5 K)@Tex . (4)
We assume an excitation temperature K, which isTexD 10typical for the molecular cores in the MBM 12 cloud
Bania, & Wilson The values of and(Pound, 1990). q10 NCderived under these assumptions are listed in WeTable 2.list values for the eight southern HLCs observed withAST/RO and cloud averages and for the otherSq10T SNCT
known [C I] sources MBM 12 and HD 210121. The aver-ages for MBM 12 and HD 210121 were estimated using theaverage measured [C I] line parameters in and &IBJ Starkvan Dishoeck respectively. Note that the atomic(1994),carbon column densities quoted in & van DishoeckStark
for HD 210121 are the result of statistical equilibrium(1994)calculations for a range of cloud densities and temperatures,whereas here we make the LTE assumption with Tex\10 K.
3.2. T otal Gas Column Densities in HL CsAll large-scale surveys of neutral atomic hydrogen at high
Galactic latitudes have angular resolutions exceeding 11@,which is far too coarse to be useful in estimating the H I
column densities toward our HLC sample objects. We can,however, use the D3@ IRAS 100 km images of these regionsto estimate total neutral gas column densities Photo-NH.electric absorption of keV X-rays by neutral gas34(predominantly H, and He) associated with the dustH2,responsible for IRAS 100 km emission yields an anti-correlation between the keV and 100 km intensities. This34anticorrelation has been measured for the high-latitudecloud MBM 12 by McCammon, & VerterSnowden, (1993).Assuming solar abundances for the cloud, they derived theconversion factor
NH/I100 D 1.3~0.1`1.1 ] 1020 cm~2 (MJy ster~1)~1 . (5)
This ratio is very close to the ratio of H I column density to100 km brightness derived toward high-latitude regions by
& Pe� rault Since those authors avoidedBoulanger (1988).lines of sight crossing molecular clouds, most of the gas theystudied was probably atomic. In such regions, H I emissiontraces total gas column density quite well. Thus the resultsof et al. are entirely compatible with thoseSnowden (1993)of & Pe� rault If we assume thatBoulanger (1988). equation
is valid for all HLCs, IRAS 100 km images can be used(5)to estimate beam-averaged total neutral gas column den-sities, NH.
We have obtained HIRES-processed 100 km images ofthe clouds and measured the average value ofTable 1 I100in a 5@ aperture centered on the nominal position of eachcloud. The measured values of are listed in InI100 Table 1.some cases, the & Myers cloud positions wereKeto (1986)
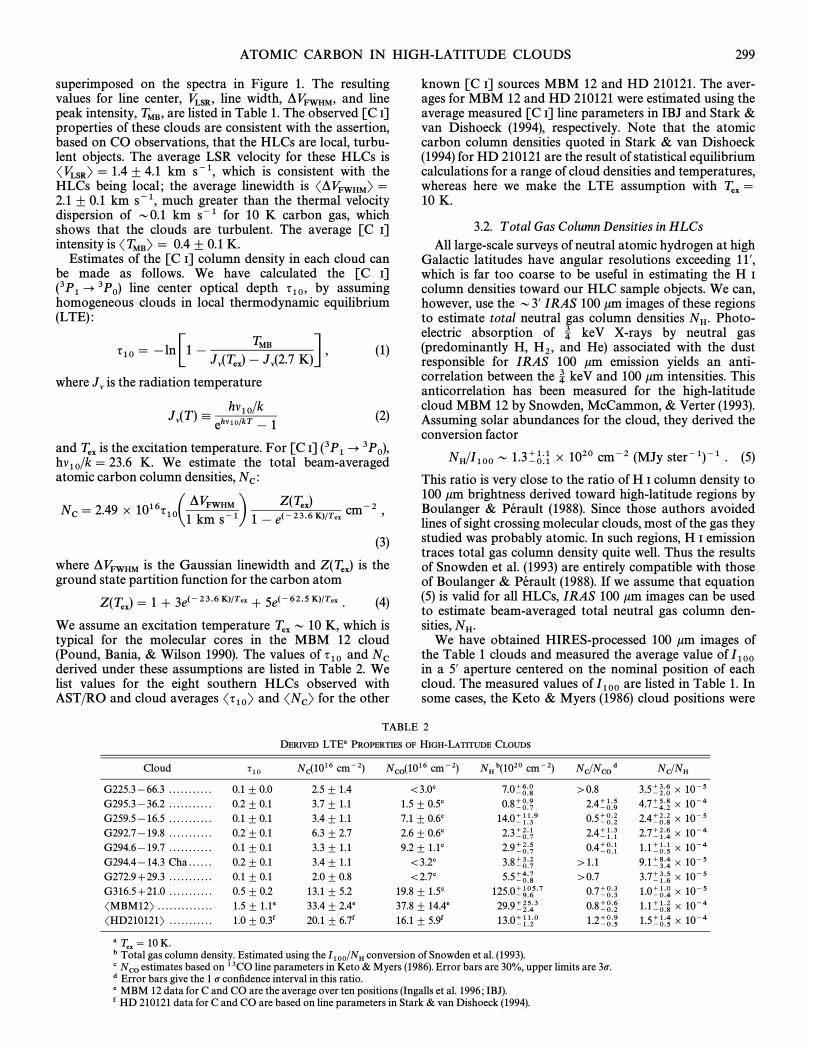
TABLE 2
DERIVED PROPERTIES OF HIGH-LATITUDE CLOUDSLTEa
Cloud q10 NC(1016 cm~2) NCO(1016 cm~2) NH b(1020 cm~2) NC/NCO d NC/NHG225.3[66.3 . . . . . . . . . . . 0.1 ^ 0.0 2.5^ 1.4 \3.0c 7.0~0.8`6.0 [0.8 3.5~2.0`3.6 ] 10~5G295.3[36.2 . . . . . . . . . . . 0.2 ^ 0.1 3.7^ 1.1 1.5^ 0.5c 0.8~0.7`0.9 2.4~0.9`1.5 4.7~4.2`5.8 ] 10~4G259.5[16.5 . . . . . . . . . . . 0.1 ^ 0.1 3.4^ 1.1 7.1^ 0.6c 14.0~1.3`11.9 0.5~0.2`0.2 2.4~0.8`2.2 ] 10~5G292.7[19.8 . . . . . . . . . . . 0.2 ^ 0.1 6.3^ 2.7 2.6^ 0.6c 2.3~0.7`2.1 2.4~1.1`1.3 2.7~1.4`2.6 ] 10~4G294.6[19.7 . . . . . . . . . . . 0.1 ^ 0.1 3.3^ 1.1 9.2^ 1.1c 2.9~0.7`2.5 0.4~0.1`0.1 1.1~0.5`1.1 ] 10~4G294.4[14.3 Cha . . . . . . 0.2 ^ 0.1 3.4^ 1.1 \3.2c 3.8~0.7`3.2 [1.1 9.1~3.4`8.4 ] 10~5G272.9]29.3 . . . . . . . . . . . 0.1 ^ 0.1 2.0^ 0.8 \2.7c 5.5~0.8`4.7 [0.7 3.7~1.6`3.5 ] 10~5G316.5]21.0 . . . . . . . . . . . 0.5 ^ 0.2 13.1^ 5.2 19.8^ 1.5c 125.0~9.6`105.7 0.7~0.3`0.3 1.0~0.4`1.0 ] 10~5SMBM12T . . . . . . . . . . . . . . 1.5 ^ 1.1e 33.4^ 2.4e 37.8^ 14.4e 29.9~2.4`25.3 0.8~0.2`0.6 1.1~0.8`1.2 ] 10~4SHD210121T . . . . . . . . . . . 1.0 ^ 0.3f 20.1^ 6.7f 16.1^ 5.9f 13.0~1.2`11.0 1.2~0.5`0.9 1.5~0.5`1.4 ] 10~4
K.a Tex \ 10b Total gas column density. Estimated using the conversion of et al.I100/NH Snowden (1993).
estimates based on 13CO line parameters in & Myers Error bars are 30%, upper limits are 3p.c NCO Keto (1986).d Error bars give the 1 p conÐdence interval in this ratio.e MBM 12 data for C and CO are the average over ten positions et al.(Ingalls 1996 ; IBJ).f HD 210121 data for C and CO are based on line parameters in & van DishoeckStark (1994).
300 INGALLS ET AL. Vol. 479
found to be far from the peak of Conservative stan-I100.dard errors of 0.5 MJy ster~1 were assumed for the IRASmeasurements. In we list and the fractionalTable 2 NHabundance of atomic carbon, for all HLCs observedNC/NH,in [C I] to date.
3.3. T he C/CO Column Density Ratio in HL CsWe can estimate the C/CO column density ratio in the
sample clouds from 13CO measurements & Myers(Ketomade toward the positions. Although the1986) Table 1
angular resolutions of the 13CO and [C I] observations aredi†erent for 13CO, D5@ for [C I] ), a preliminary C/CO([email protected] can be derived. The C/CO ratio can in fact be under-estimated by no worse than a factor of 3 because of beamsampling e†ects. & Myers assumed opticallyKeto (1986)thick 12CO lines and LTE to derive excitation temperaturesfor the clouds with detectable 13CO lines. The derivedvalues of for the sources range from 6 to 11 K.Tex Table 1For comparison with the [C I] data, we assume K.Tex \ 10We have derived N(13CO) from the line measurements of
& Myers Assuming an abundance ratioKeto (1986).[12CO]/[13CO]B [12C]/[13C]\ 62 & Penzias(Langer
we estimate the column density of 12CO and the1993),resulting column density ratio C/CO. We list andNCOin For the three clouds not detected inNC/NCO Table 2.13CO, we give 3 p upper limits for In addition, weNCO.computed LTE cloud averages, and SC/COT, forSNCOTMBM 12 and HD 210121 using 13CO line parameters com-piled by and & van Dishoeck respectively.IBJ Stark (1994),
4. DISCUSSION
4.1. Implications for Photochemical ModelingThese new observations have substantially increased the
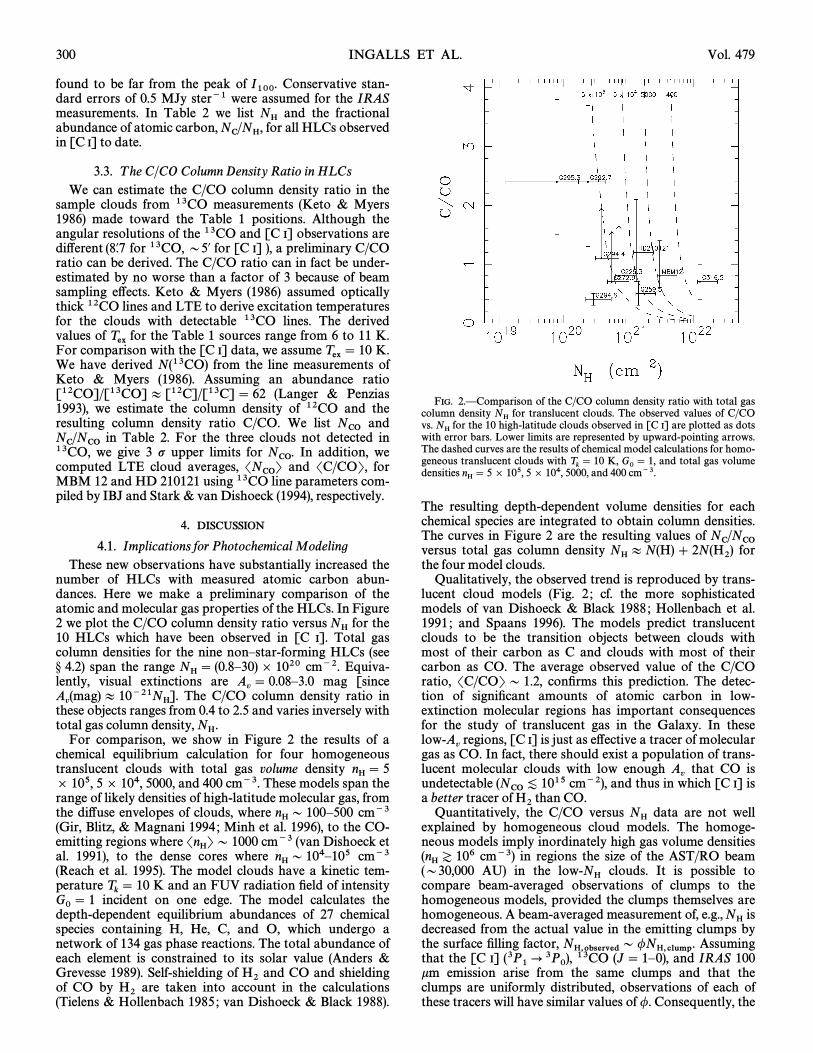
number of HLCs with measured atomic carbon abun-dances. Here we make a preliminary comparison of theatomic and molecular gas properties of the HLCs. In Figure
we plot the C/CO column density ratio versus for the2 NH10 HLCs which have been observed in [C I]. Total gascolumn densities for the nine nonÈstar-forming HLCs (see
span the range cm~2. Equiva-° 4.2) NH \ (0.8È30) ] 1020lently, visual extinctions are mag [sinceA
v\ 0.08È3.0
The C/CO column density ratio inAv(mag)B 10~21NH].
these objects ranges from 0.4 to 2.5 and varies inversely withtotal gas column density, NH.
For comparison, we show in the results of aFigure 2chemical equilibrium calculation for four homogeneoustranslucent clouds with total gas volume density nH \ 5] 105, 5 ] 104, 5000, and 400 cm~3. These models span therange of likely densities of high-latitude molecular gas, fromthe di†use envelopes of clouds, where cm~3nH D 100È500
Blitz, & Magnani et al. to the CO-(Gir, 1994 ; Minh 1996),emitting regions where cm~3 Dishoeck etSnHT D 1000 (vanal. to the dense cores where cm~31991), nH D 104È105
et al. The model clouds have a kinetic tem-(Reach 1995).perature K and an FUV radiation Ðeld of intensityT
k\ 10
incident on one edge. The model calculates theG0\ 1depth-dependent equilibrium abundances of 27 chemicalspecies containing H, He, C, and O, which undergo anetwork of 134 gas phase reactions. The total abundance ofeach element is constrained to its solar value &(AndersGrevesse Self-shielding of and CO and shielding1989). H2of CO by are taken into account in the calculationsH2& Hollenbach Dishoeck & Black(Tielens 1985 ; van 1988).
FIG. 2.ÈComparison of the C/CO column density ratio with total gascolumn density for translucent clouds. The observed values of C/CONHvs. for the 10 high-latitude clouds observed in [C I] are plotted as dotsNHwith error bars. Lower limits are represented by upward-pointing arrows.The dashed curves are the results of chemical model calculations for homo-geneous translucent clouds with K, and total gas volumeT
k\ 10 G0\ 1,
densities 5 ] 104, 5000, and 400 cm~3.nH \ 5 ] 105,
The resulting depth-dependent volume densities for eachchemical species are integrated to obtain column densities.The curves in are the resulting values ofFigure 2 NC/NCOversus total gas column density forNH B N(H)] 2N(H2)the four model clouds.
Qualitatively, the observed trend is reproduced by trans-lucent cloud models cf. the more sophisticated(Fig. 2 ;models of Dishoeck & Black et al.van 1988 ; Hollenbach
and The models predict translucent1991 ; Spaans 1996).clouds to be the transition objects between clouds withmost of their carbon as C and clouds with most of theircarbon as CO. The average observed value of the C/COratio, SC/COT D 1.2, conÐrms this prediction. The detec-tion of signiÐcant amounts of atomic carbon in low-extinction molecular regions has important consequencesfor the study of translucent gas in the Galaxy. In these
regions, [C I] is just as e†ective a tracer of molecularlow-Avgas as CO. In fact, there should exist a population of trans-
lucent molecular clouds with low enough that CO isAvundetectable cm~2), and thus in which [C I] is(NCO[ 1015
a better tracer of than CO.H2Quantitatively, the C/CO versus data are not wellNHexplained by homogeneous cloud models. The homoge-neous models imply inordinately high gas volume densities
cm~3) in regions the size of the AST/RO beam(nH Z 106(D30,000 AU) in the clouds. It is possible tolow-NHcompare beam-averaged observations of clumps to thehomogeneous models, provided the clumps themselves arehomogeneous. A beam-averaged measurement of, e.g., isNHdecreased from the actual value in the emitting clumps bythe surface Ðlling factor, AssumingNH,observedD /NH,clump.that the [C I] 13CO (J \ 1È0), and IRAS 100(3P1] 3P0),km emission arise from the same clumps and that theclumps are uniformly distributed, observations of each ofthese tracers will have similar values of /. Consequently, the
No. 1, 1997 ATOMIC CARBON IN HIGH-LATITUDE CLOUDS 301
e†ects of beam dilution are mitigated somewhat by taking aratio of two beam-averaged measurements,
NC,observedNCO,observed
DNC,clumpNCO,clump
. (6)
The main difficulty with the interpretation of isFigure 2thus scaling by the appropriate values for /.NH has asserted that the volume ÐllingHeithausen (1996)factor of molecular gas in high-latitude clouds is less than1%, i.e., the surface Ðlling factor is (since /P/[ 5%
Taking this value for /, our C/CO versus mea-/volume2@3 ). NHsurements are consistent with the model predictions forhomogeneous clumps with volume densities nH D 103È105cm~3. The existence of dense gas in high-latitude clouds hasbeen observationally veriÐed : et al. surveyedReach (1995)seven HLCs, including MBM 12, in the dense gas tracersCS, HCO], and HCN. They detected all three tracers inMBM 12 and found that the CS emission was subthermallyexcited, indicating densities cm~3. TheirnH D 104È105modeling of the dense cores in cloud MBM 7 indicates thatthe CS-emitting clumps in the cloud are a factor of D10smaller in linear size than the CO-emitting clumps in whichthey are embedded (cf., so indeed /> 1 forTurner 1993),the dense gas.
While our observations and LTE analysis have con-Ðrmed the overall trend predicted by photochemical modelsof translucent clouds, a more general exploration of theparameter space in the chemical models, including a clumpymedium (e.g., coupled with statistical equi-Spaans 1996),librium calculations and more realistic radiative transfer ofthe C and CO line intensities, is required to interpret thedata properly.
4.2. T he Star-Forming HL C G316.5]21.0Most HLCs are probably not gravitationally bound but
are conÐned by the ambient ISM pressure & Myers(KetoTheir star-forming efficiency is unknown (e.g., see1986).
et al. In dark clouds (clouds withMagnani 1995). AvZ 5
mag) which often have ongoing low-mass star formation,the interstellar FUV radiation Ðeld does not penetrate totheir cores. Star formation is thus most a†ected by thedensity and mass distribution of the gas. For translucentclouds, however, the FUV opacity of the gas and dust, aswell as the conÐning pressure of the interstellar medium,must also come into play. The most often-studied HLC withongoing star formation is MBM 12. There are at least two TTauri stars associated with the MBM 12 complex (Magnaniet al. and the discovery of marginally1995 ; Pound 1996),bound dense cores et al. suggests that the(Reach 1995)cloud may form additional stars. There is also evidence forstar formation in the southern hemisphere high-latitudecloud G316.5]21.0, a member of our sample. The cloudhas a 100 km IRAS intensity which is more than 20 timesstronger than the average intensity of the HLCTable 1
sample, which suggests that this cloud may be heated inter-nally. Since the IRAS and CO maps for this source possesssimilar morphologies and since the IRAS peak coincideswith the peaks of the CO and [C I] emission, we assumethat the IRAS source is associated with the molecularcloud. Assuming the cloud is at a distance of 100 pc, its totalIRAS luminosity is 2.5 IRAS maps indicate that theL
_.
source size is and the colors for the associated IRAS[100A,point source ([25È12]\ 0.06 ; [60È25]\ 0.88 ; [100È60]\ 0.48, where are consistent with[i [ j]4 log [I
i/I
j])
the source being an embedded star (cf., Emerson 1988).Future study of this source may provide clues as to theconditions necessary for star formation in translucentmolecular clouds.
5. CONCLUSIONS
We have detected neutral atomic carbon [C I] emissiontoward all eight high-latitude molecular clouds which wehave observed with the newly installed AST/RO telescope.The C/CO column density ratio in all 10 HLCs observed in[C I] to date ranges from 0.4 to 2.5 and averages D1.2. ThisconÐrms the photochemical model prediction that trans-lucent clouds are the transitions between clouds with mostof their carbon in C and clouds with most of their carbon inCO. IRAS observations of the 10 cloud sample imply totalgas column densities of cm~2. TheNH B (0.1È3.0)] 1021C/CO ratio decreases with increasing also consistentNH,with the predictions of photochemical models. Models ofhomogeneous clouds cannot be used quantitatively,however, unless we either invoke unreasonably high gasvolume densities or make some assumptions regarding tele-scope beam Ðlling. We conclude that more detailed modelsof the clouds, which take into account beam dilution ofdense clumps, are necessary to interpret the data properly.One of the clouds in our sample, G316.5]21.0, contains alow-mass star. Further study of this source may help toconstrain theories of star formation in pressure-boundedtranslucent regions.
Most of the molecular gas in the Galaxy is translucent,and our understanding of the photochemistry of translucentgas is incomplete without C I measurements. Until recently,the study of atomic carbon in the interstellar medium hasbeen limited primarily to regions with high C I surfacebrightness and enhanced FUV Ðelds. The AST/RO tele-scope has therefore opened a new window on the study oftranslucent gas in the interstellar medium.
We thank Alberto Bolatto for enlightening discussionand helpful suggestions. This research was supported inpart by the National Science Foundation under a coopera-tive agreement with the Center for Astrophysical Researchin Antarctica (CARA), grant number NSF DPP 89-20223.CARA is a National Science Foundation Science and Tech-nology Center.
REFERENCES
E., & Grevesse, N. 1989, Geochim. Cosmochim. Acta, 53,Anders, 197F., & Pe� rault, M. 1988, ApJ, 330,Boulanger, 964R. A., Lane, A. P., & Stark, A. A. 1997, ApJ, inChamberlin, press
J. E., Kutner, M. L., Verter, F., & Leous, J. 1994, ApJ, 431,Chiar, 658J. P. 1988, in Formation and Evolution of Low Mass Stars, ed.Emerson,
A. K. Dupree & M. T. V. T. Lago (Boston : Kluwer), 193G., Zmuidzinas, J., & Lo, K.-Y. 1994, Rev. Sci. Inst., 65,Engargiola, 1833
B.-Y., Blitz, L., & Magnani, L. 1994, ApJ, 434,Gir, 162H. J. 1968, Bull. Astron. Inst. Netherlands, 19,Habing, 421
A. 1996, A&A, 314,Heithausen, 251
D. J., Takahashi, T., & Tielens, A. G. G. M. 1991, ApJ, 377,Hollenbach,192
J. G., Bania, T. M., & Jackson, J. M. 1994, ApJ, 431, L139Ingalls, (IBJ)1997, inÈÈÈ. preparation
E. R., & Myers, P. C. 1986, ApJ, 304,Keto, 466W. D., & Penzias, A. A. 1993, ApJ, 408,Langer, 539
F. J., et al. 1984, ApJ, 278,Low, L19L., Caillault, J.-P., Buchalter, A., & Beichman, C. A. 1995, ApJS,Magnani,
96, 159L., Hartmann, D., & Speck, B. G. 1996 ApJS, 106,Magnani, 447
302 INGALLS ET AL.
Y. C., Park, Y.-S., Kim, K.-T., Irvine, W. M., Brewer, M. K., &Minh,Turner, B. E. 1996, ApJ, 467, 717
K. S., Knapp, G. R., Stark, A. A., & Wilson, R. W. 1988, ApJ, 332,Polk, 432M. W. 1996, ApJ, 457,Pound, L35M. W., Bania, T. M., & Wilson, R. W. 1990, ApJ, 351,Pound, 165W. T., Pound, M. W., Wilner, D. J., & Lee, Y. 1995, ApJ, 441,Reach, 224
R., Tolls, V., & Winnewisser, G. 1989, Exp. Astron., 1,Schieder, 101S. L., McCammon, D., & Verter, F. 1993, ApJ, 409,Snowden, L21
M. 1996, A&A, 307,Spaans, 271A. A., et al. 1994, Antarctic J. US, 29,Stark, 344
1997a, inÈÈÈ. preparation
A. A., Chamberlin, R. A., Ingalls, J. G., Cheng, J., & Wright, G.Stark,1997b, Rev. Sci. Inst., in press
R. 1995, A&A, 301,Stark, 873R., & van Dishoeck, E. F. 1994, A&A, 286,Stark, L43
A. G. G. M., & Hollenbach, D. 1985, ApJ, 291,Tielens, 722B. E. 1993, ApJ, 405,Turner, 229
Dishoeck, E. F., & Black, J. H. 1988, ApJ, 334,van 771Dishoeck, E. F., Black, J. H., Phillips, T. G., & Gredel, R. 1991, ApJ,van
366, 141J., & LeDuc, H. G. 1993, IEEE Trans. Microwave Theor. &Zmuidzinas,
Tech., 40, 1797